development of sustainable masonry brick
TRANSCRIPT
DEVELOPMENT OF SUSTAINABLE MASONRY BRICK
Tintu Kizhakkethundathil Tomy
A Thesis Submitted to the Faculty of Graduate Studies
in Partial Fulfillment of the Requirements
for the Degree of Master of Applied Science
Graduate Program in Civil Engineering
York University
Toronto, Ontario
December 2019
©Tintu Kizhakkethundathil Tomy, 2019
[ii]
Abstract
Implementation of environmentally-friendly and cost-effective building designs has been a
persistent challenge to the civil engineering community. The current study aims to develop
innovative masonry bricks which could open up the prospects in the future for inexpensive
construction. It is also envisioned that if adopted, the proposed process of the brick fabrication
could benefit the brick manufacturing industry by curtailing the carbon dioxide foot-print and
firing energy levels without compromising the prescribed mechanical and physical properties of
the resulting product. The research explores the potential of incorporating HBS-polymer which is
a biologically-inert product produced after various treatment processes in the Environmental
Laboratory of Lassonde, and Incinerated Sewage Sludge Ash (ISSA) obtained from biological
treatment facilities as alternative raw materials in manufacturing low cost and environmentally-
friendly masonry bricks. The development of geopolymer masonry bricks, that ensures minimum
of 40% reuse of waste glass by weight per brick is an another actively pursued area of the current
research. The geo-polymerization process was done using quarried shale, Recycled Crushed Glass
(RCG) and sodium silicate. In contrast to the conventional masonry bricks fired exclusively over
1000 degree Celsius for no less than 24 hours, the geopolymer bricks were made at a firing
temperature of 400 degree Celsius for four hours. In both cases the materials considered are used
in partial replacement of shale, which in turn makes the geopolymer bricks and the Incinerated
Sewage Sludge Ash bricks a potentially sustainable construction material in the sense that it uses
wastes to replace the use of irreplaceable natural resources. The resulting hybrid bricks will be
tested for the effect in compressive strength, flexural strength, split tensile strength, ultrasonic
pulse velocity, cold as well as hot water absorption, saturation coefficient, efflorescence, freeze
thaw damage, and resonant frequency, all being part of the established quality control procedures
in this industry. For the HBS-polymer bricks, the findings indicate that, while the compressive
strength, hot as well as cold water absorption and resistance to freeze-thaw damage of hybrid bricks
was on par with the control brick without any shale replacement, HBS polymer bricks were much
lighter (apparently owing to a better distribution of fine pores and without a commensurate
increase in water absorption capacity). The results from the study of the Geo-polymer bricks, Bio-
polymer bricks and SSA bricks suggest that they can be a promising solution for the long debated
economical building construction with a reduced carbon footprint and firing energy while offering
an alternative to landfill disposal of waste.

[iii]
Acknowledgements
I would like to extend my sincere and wholehearted appreciation to my dear supervisor Dr.
Pantazopoulou from the Department of Civil Engineering at the York University, for her
acceptance, guidance, advice and encouragement throughout the most challenging two years of
my master’s degree. I would never have been able to finish my degree and dissertation without her
valuable guidance and support. It has been an honor and a privilege to work with her during these
two years.
Also, I would like to deeply thank Dr. Ahmed Eldyasti, for his generosity and kindness in helping
me with the aspects of Environmental Engineering and his interest in my research and the valuable
feedback.
To extend, I would like to thank Civil Engineering Department lab technicians Kunjan Rupakheti,
Riad Rajab, Melessa Salem for their high spirit and continuous support. Appreciation also goes to
Brampton Bricks, The Ashbridges Bay Wastewater Treatment Plant, Toronto for providing me the
research materials.
Special love and gratitude goes to my parents, sister , brother and my husband, Nobish Varghese
for being a constant source of motivation and supporting me through good and bad times. I cannot
leave out my little girl, Iza Maria who missed out many fun moments with me in the course of this
endeavour. Further, I can not thank enough all my friends and colleagues including Michael, Kitty,
Rita, Nicolas, Zoi, Kostas, Adrien, Sebnem, Satbir, Ismail and Fergala. Furthermore, I would like
to thank Ahmed Elzoghby for his wonderful support during the initial stages of my research.
Last but not least, I thank Almighty for giving me the strength for accomplishing the desired goal.
[iv]
Table of Contents
Abstract…………………………………………………………………………………..………..ii
Acknowledgements……………………………………………………………… ………………iii
Table of contents………………………………………………………………………………….iv
List of Tables……………………………………………………………………………………..xii
List of Figures……………………………………………………………………………………xv
List of Acronyms………………………………………………………………………………xxvii
List of Symbols………………………………………………………………………………...xxxi
Chapter 1.Introduction…………………………………………………………………………….1
1.1 Background…………………………………………………………………………....1
1.1.1 Resource Depletion………………………………………………………..3
1.2 Use of Sustainable Construction Materials…………………………………………….4
1.3 Thesis Objectives……………………………………………………………………...4
1.4 Thesis Outline…………………………………………………………………………6
1.4.1 Chapter 2 - Review of Literature ………………………………………….6
1.4.2 Chapter 3 - Preliminary Phase of the Research…………………………….6
1.4.3 Chapter 4 - Main Phase of the Research……………………………………7
1.4.4 Chapter 5 - Experimental Results……………………………………….....7
1.4.5 Chapter 6 - Numerical Simulation for Inverse Analysis….……………….7
1.4.6 Chapter 7 - Correlation Analysis…...……………………………………...8
1.4.7 Chapter 8 - Summary and Conclusions………………….…………………8
Chapter 2. Review of Literature …………………………….…………………………………….9
2.1 Overview………………………………………………………………………………9
2.2 The Quest for Sustainable and Inexpensive Construction …………………….……...10
[v]
2.3 Utilization of Waste Materials in Brick Manufacture…….………………………….14
2.3.1 Limitations of Conventional Masonry Bricks…………...………………....14
2.3.1.1 Resource depletion……………………………………………….14
2.3.1.2 Significant level of embodied energy…………………………….15
2.3.1.3 Environmental pollution……………….…………………………15
2.3.2. Incorporation of Waste Materials for Manufacture of Sustainable Hybrid
Bricks…………………………………………………………...………………..16
Chapter 3. Preliminary Phase of the Research……………………………………………………23
3.1 Overview of Methods and Standards of the Experimental Program………………….23
3.1.1 Geotechnical Analysis……………………………………………………...23
3.1.1.1 Gradation ………………………………………………………...23
3.1.1.1.1 Gradation by sieve analysis………………………….....24
3.1.1.1.2 Gradation by sedimentation (hydrometer)……………...26
3.1.1.1.3 Gradation by particle size analyzer……………………..27
3.1.1.2 Atterberg limits…………………………………………………...28
3.1.1.2.1 Liquid Limit (LL)………………………………………28
3.1.1.2.2 Plastic Limit (PL)………………………………………29
3.1.1.2.3 Plasticity Index (PI)…………………………………….30
3.1.1.3 Proctor compaction test…………………………………………..31
3.1.2 Fabrication of Bricks……………………………………………….............32
3.1.2.1 Design of mold…………………………………………….…..…33
3.1.2.2 Control Bricks (CB)……………………………………………...34
3.1.2.2.1 Chemistry and thermodynamics of control brick firing..35
3.1.2.3 High Bio-Polymer Sludge Bricks………………………………...36
3.1.2.4 High Bio-Polymer Sludge Bricks Type 1 (LHBS-1)………….…36
3.1.2.4.1 LHBS-1-0.24…………………………………………...37
[vi]
3.1.2.4.2 LHBS-1-0.40………………………………………...…38
3.1.2.4.3 Mix composition for Liquid High Biopolymer Sludge
Type 1 Bricks…..………………………………………………...39
3.1.2.5 High Bio-Polymer Sludge Bricks Type 2 (LHBS-2) …………….39
3.1.2.5.1 LHBS-2-0.25…………………………………………...40
3.1.2.5.2 LHBS-2-0.40…………………………………...………40
3.1.2.5.3 LHBS-2-0.50………………………………………...…41
3.1.2.5.4 LHBS-2-1………………………………………………41
3.1.2.5.5 Mix composition for Liquid High Biopolymer Sludge
Type 2 Bricks ……………………………………………………42
3.1.2.6 Dried High Biopolymer Sludge Brick Type 3 (DHBS)…………..42
3.1.2.6.1 Dewatering techniques to remove the excess moisture…43
3.1.2.6.1.1 Centrifugation……………………………..…43
3.1.2.6.1.2 Use of Super Absorbent Polymer (SAP)…….44
3.1.2.6.1.3 Drying in heat control room…………………45
3.1.2.7 Shale-Poraver®- Bricks (SPB)…………………………………..46
3.1.2.8 Shale-Poraver®-Slag Bricks (SPSB)…………………………….47
3.1.2.9 Shale-Poraver®- Na2SiO3 Bricks (SPSSB)……………………....48
3.1.2.9.1 Mix composition (by weight) percent for Shale-Poraver®
bricks……………………………………………………………………..50
3.1.2.10 Geo-polymer Bricks (GB)………………………………………50
3.1.2.10.1 Geo-polymer Bricks (GB-20) ……………………...…52
3.1.2.10.2 Geo-polymer Bricks (GB-30)…………………...…….52
3.1.2.10.3 Geo-polymer Bricks (GB-40)……………………...….53
3.1.2.10.4 Mix composition (by weight) percent for the Geo-
polymer Bricks…………………………………………………...53
3.1.2.11 Chemistry of Geopolymer bricks……………………...………...54
[vii]
3.1.2.12 Shale-Slag-Na2SiO3 Bricks (SSSSB)……………………………54
3.1.2.13 Shale-Flyash-Na2SiO3 Bricks (SFSSB)…………………………55
3.1.2.14 Sludge Ash Bricks (SAB)……………………………………….56
3.1.2.14.1 Sewage Sludge Ash Bricks (SSAB-15)……………….57
3.1.2.14.2 Sewage Sludge Ash Bricks (SSAB-30) ………………58
3.1.2.15 Chemistry of Sewage Sludge Ash Bricks ……………………...58
3.1.2.16 Crushed bricks as a replacement for shale………………………58
3.1.3 Preliminary Test Results……………………………………………………59
3.1.3.1 Compressive Strength Test……………………………………….60
3.1.3.2 Water Absorption Tests…………………………………………..60
3.1.3.3 Weight of the Bricks…………………………………………...…61
Chapter 4. Main Phase of the Experimental Study………………………………………………..62
4.1 Fabrication of Bricks…………………………………………………………………62
4.1.1 Control Bricks (CB)……………………………………………………..…63
4.1.2 Geo-polymer Bricks (GB)……………………………………………...…..63
4.1.3 Dried Biopolymer Bricks (DHBS)………………………………………….64
4.1.4 Sewage Sludge Ash Bricks (SSAB)………………………………………..65
Chapter 5. Experimental Results…………………………………………………………………66
5.1 Destructive Mechanical Tests………………………………………………………..67
5.1.1 Flexural Strength Test……………………………………………...………67
5.1.1.1 Peak load and Flexural Strength calculation……………………..70
5.1.1.2 Failure pattern ……………………………………………………74
5.1.1.3 Load - deformation response from the Flexural Strength test……77
5.1.2 Splitting Tensile Strength Test..………………………...…………………..78
5.1.2.1 Splitting Tensile strength calculation…...………………………...80
5.1.2.2 Failure pattern……………………………………………………83
[viii]
5.1.3 Compressive Strength Tests………………………………………………..85
5.1.3.1 Shellacking and Gypsum capping………………………………..88
5.1.3.2 Compressive strength test- Transverse loading………………..…89
5.1.3.2.1 Peak Load and compressive strength calculation………90
5.1.3.2.2 Failure pattern………………………………………….93
5.1.3.3 Compressive strength test - Longitudinal loading……………….95
5.1.3.3.1 Peak Load and compressive strength Calculation……..95
5.1.3.3.2 Failure pattern………………………………………….99
5.1.3.4 Comparison of Compressive strength in transverse and longitudinal
Loading………………………………………………………………....101
5.2 Non-Destructive Tests……………………………………………………………....102
5.2.1 Resonant Frequency Tests (RF)…………………………………………...102
5.2.1.1 Calculation of transverse resonant frequency and Dynamic Modulus of
Elasticity………………………………………………...……………………...105
5.2.2 Ultrasonic Pulse Velocity Test (UPV)…………………………………….113
5.3 Water Absorption Tests……………………………………………………...……..115
5.3.1 Cold-Water Absorption Tests …………………………………………....116
5.3.2 Hot-Water Absorption Tests ……………………………………………..117
5.3.3 Saturation Coefficient…………………………………………………….119
5.4 Efflorescence Test…………………………………………………………………..120
5.5 Freeze-Thaw Test…………………………………………………………...………121
5.6 Weight of the Bricks…………………………………………………………..……122
Chapter 6. Numerical Simulation for Inverse Analysis…………………………………………123
6.1 Introduction…………………………………………………………………………123
6.2 VecTor 2-Non-Linear Finite Element Software………………………………….....124
6.3 Finite Element Modelling of the masonry brick …………………………………….125
[ix]
6.3.1 Simulation of the Flexural Strength Test – Three Point Bending………….125
6.3.1.1 Mechanical properties and failure patterns ……………………..127
6.3.1.1.1 Control Brick (CB)…………………...……………….128
6.3.1.1.2 Dried High Biopolymer Brick (DHBS)………...……..129
6.3.1.1.3 Geo-Polymer Brick (GB-20) …………………..……...131
6.3.1.1.4 Geo-Polymer Brick (GB-30) …………………..……...133
6.3.1.1.5 Geo-Polymer Brick (GB-40) …………………..……...135
6.3.1.1.6 Sewage Sludge Ash Brick (SSAB-15)……………..…137
6.3.1.1.7 Sewage Sludge Ash Brick (SSAB-30)……………..…139
6.3.1.2 Comparison of numerical and experimental analysis……..……..141
6.3.2 Simulation of the Splitting Tensile Strength Test…………………………142
6.3.2.1 Mechanical properties and failure patterns …………………….143
6.3.2.1.1 Control Brick (CB)……………………………………143
6.3.2.1.2 Dried High Biopolymer Sludge (DHBS) Brick…....….144
6.3.2.1.3 Geo-Polymer Bricks (GB-20)…………………………145
6.3.2.1.4 Geo-Polymer Bricks (GB-30)…………………………146
6.3.2.1.5 Geo-Polymer Bricks (GB-40)…………………………147
6.3.2.1.6 Sewage Sludge Ash Brick (SSAB-15)………………..148
6.3.2.1.7 Sewage Sludge Ash Brick (SSAB-30)………………..149
6.3.2.2 Comparison of numerical and experimental analysis……………150
6.3.3 Simulation of the Compressive Strength Test-Transverse Direction…..…151
6.3.3.1 Mechanical properties and failure patterns ……………………..151
6.3.3.1.1 Control Brick (CB)………………………………..…..152
6.3.3.1.2 Dried High Biopolymer Sludge (DHBS) Brick ………153
6.3.3.1.3 Geo-Polymer Bricks (GB-20)…………………………155
6.3.3.1.4 Geo-Polymer Bricks (GB-30)…………………………156
[x]
6.3.3.1.5 Geo-Polymer Bricks (GB-40)…………………………158
6.3.3.1.6 Sewage Sludge Ash Brick (SSAB-15)………………..159
6.3.3.1.7 Sewage Sludge Ash Brick (SSAB-30)………………..161
6.3.3.2 Comparison of numerical and experimental analysis……………162
6.3.4 Simulation of the Compressive Strength-Longitudinal Direction…..…….163
6.3.4.1 Mechanical properties and failure patterns ……………………..164
6.3.4.1.1 Control Brick (CB)……………………………………164
6.3.4.1.2 Dried High Biopolymer Sludge (DHBS) Brick …...…..166
6.3.4.1.3 Geo-Polymer Bricks (GB-20)…………………………168
6.3.4.1.4 Geo-Polymer Bricks (GB-30)…………………………169
6.3.4.1.5 Geo-Polymer Bricks (GB-40)…………………………171
6.3.4.1.6 Sewage Sludge Ash Brick (SSAB-15)………………..172
6.3.4.1.7 Sewage Sludge Ash Brick (SSAB-30)………………..174
6.3.4.2 Comparison of Numerical and Experimental Analysis…………175
6.3.5 Tensile Strength in Transverse and Longitudinal directions……………...176
6.3.6 Summary…………………………………………………………….……176
Chapter 7 Correlation Analysis ………………………………………………...……………….177
7.1 Correlation between square root of Compressive Strength in transverse direction and
Tensile Strength……………………………………………...…………………………177
7.2 Correlation between square root of Compressive Strength in longitudinal direction and
Tensile Strength……………………………………………………………...…………178
7.3 Correlation between square root of Compressive Strength in transverse direction and
Flexural Strength………..………………………………………………………………178
7.4 Correlation between square root of Compressive Strength in transverse direction and
Splitting Tensile Strength…...…………………………………………………………..179
[xi]
7.5 Correlation between splitting Tensile Strength and Flexural Strength………….......180
7.6 Correlation between square root of Compressive Strength in transverse direction and
Ultrasonic Pulse Velocity………………………………………….……………………181
7.7 Correlation between Compressive Strength in transverse direction and Resonance
Frequency………………………………………………………………………...……..181
7.8 Correlation between Compressive Strength in transverse direction and Modulus of
Elasticity………………………………………………………………………………..182
7.9 Correlation between Density and Compressive Strength in transverse direction ….183
7.10 Correlation between Density and Modulus of Elasticity ………………………….183
7.11 Correlation between Cold-Water Absorption and Ultrasonic Pulse velocity….......184
7.12 Correlation between Hot-Water Absorption and Ultrasonic Pulse velocity….........185
7.13 Correlation between Cold-Water Absorption and Resonance Frequency …………185
7.14 Correlation between Hot-Water Absorption and Resonance Frequency ………….186
7.15 Correlation between Pulse Velocity and Resonance Frequency…………………..187
7.16 Correlation between mechanical and physical properties of masonry bricks……..187
Chapter 8 Summary and Conclusions…………………………………………………………..189
8.1 Mechanical Properties of Hybrid Bricks…………………………...………………..190
8.2 Physical Properties and Durability of Hybrid Bricks……………………………..…191
8.3 Numerical Study of Hybrid Bricks…………..……………………………………...193
8.4 Correlation Analysis……………………………………………………………...…194
8.5 Discussion for Further Development of the Research………………………………194
Bibliography…………………………………………………………………………....………195
Appendices……………………………………………………………………………………...209
Appendix A-Drawings and detailing of the Acrylic Plastic Mold………………...……209
[xii]
Appendix B: Mineral Analysis of Shale, Sewage Sludge Ash and Recycled Crushed
Glass…………………………………………………………………………………….212
Appendix C: Equipment used in the research……………..……………………………213
[xiii]
List of Tables
Chapter 2
Table 2-1(a): The chemical composition of clay and biosolids (Moreno et al., 2016) ……………22
Table 2-1(b): The mineral composition of clay and biosolids (Moreno et al., 2016) ………….….22
Table 2-1(c): The finer particle content in Biosolids (Moreno et al., 2016) …………..…….…….22
Chapter 3
Table-3-1: Gradation by Sieve Analysis………………………………………………………….25
Table 3-2: Mix composition for Liquid High Biopolymer Sludge Type-1 Bricks………..………38
Table 3-3: Mix composition for Liquid High Biopolymer Sludge Type-2 Bricks………….…….41
Table 3-4: Mix composition of Shale-Poraver®- Na2SiO3 Bricks (SPSSB)………………..……49
Table-3-5: Mix composition for the Geopolymer Brick……………………………………….…53
Chapter 5
Table 5-1: Flexural strength of the Control Bricks (CB)…………………………………….……70
Table 5-2: Flexural strength of the Dried High Biopolymer Bricks (HDBS)……………….…….70
Table 5-3: Flexural strength of the Geopolymer Bricks (GB-20)…………………………………71
Table 5-4: Flexural strength of the Geopolymer Bricks (GB-30)…………………………………71
Table 5-5: Flexural strength of the Geopolymer Bricks (GB-40)…………………………………71
Table 5-6: Flexural strength of the Sewage Sludge Ash Bricks (SSAB-15)………………………72
[xiv]
Table 5-7: Flexural strength of the Sewage Sludge Ash Bricks (SSAB-30)………………………72
Table 5-8: Split Tensile strength of the Control Bricks (CB)……………………………………78
Table 5-9: Split Tensile strength of the Dried High Biopolymer Bricks (DHBS)………………78
Table 5-10: Split Tensile strength of the Geopolymer Bricks (GB-20)…………………….…….79
Table 5-11: Split Tensile strength of the Geopolymer Bricks (GB-30)…………………………...79
Table 5-12: Split Tensile strength of the Geopolymer Bricks (GB-40)………………………...…79
Table 5-13: Split Tensile strength of the Sewage Sludge Ash Bricks (SSAB-15)………………..80
Table 5-14: Split Tensile strength of the Sewage Sludge Ash Bricks (SSAB-30)……………….80
Table 5-15: Compressive strength of the Control Bricks (CB)…………………………………..87
Table 5-16: Compressive strength of the Dried High Biopolymer Bricks (DHBS)……………....87
Table 5-17: Compressive strength of the Geopolymer Bricks (GB-20)…………………………..88
Table 5-18: Compressive strength of the Geopolymer Bricks (GB-30)…………………………..88
Table 5-19: Compressive strength of the Geopolymer Bricks (GB-40)………………………….88
Table 5-20: Compressive strength of the Sewage Sludge Ash Bricks (SSAB-15)……………….89
Table 5-21: Compressive strength of the Sewage Sludge Ash Bricks (SSAB-30)……………….89
Table 5-22: Compressive strength of the Control Bricks (CB)…………………………………. 92
Table 5-23: Compressive strength of the Dried High Biopolymer Bricks (DHBS)……..……… 92
Table 5-24: Compressive strength of the Geopolymer Bricks (GB-20)………………….……….92
[xv]
Table 5-25: Compressive strength of the Geopolymer Bricks (GB-30)……………………….… 93
Table 5-26: Compressive strength of the Geopolymer Bricks (GB-40)…………………….…… 93
Table 5-27: Compressive strength of the Sewage Sludge Ash Bricks (SSAB-15)…………...… 93
Table 5-28: Compressive strength of the Sewage Sludge Ash Bricks (SSAB-30)……………… 94
Table 5-29: Values of correction factor, T………………………………………………………107
Chapter 6
Table 6-1: Constitutive models used in VecTor2…………………..…………………….…….121
Chapter 7
Table 7.1 Correlation analysis between the parameters studied……………………………….189
Appendix
Appendix B: Mineral Analysis of Shale, Sewage Sludge Ash and RCG……………….……...213
[xvi]
List of Figures
Chapter 2
Figure 2-1: The current national waste management of the United States (EPA,2018)….................9
Figure 2-2: Depicts reuse and recycling by the incorporation of waste in construction materials
(Sasikumar, 2010) ……………………...……………………………………………………..…10
Figure 2-3: Typical percentage of demolition waste of a developing nation…………………...…13
Chapter 3
Figure 3-1: Sieve shaker from Rotary Lab Sifter…………………………………………………24
Figure 3-2: The US standard sieve series…………………………………………………………24
Figure 3-3: Washing station……………………………………………………….……………..24
Figure 3-4: Wash sieve…………………………………………………………………………...24
Figure 3-5: Particle size distribution by sieve analysis…………………………………………..26
Figure 3-6: Gradation by Particle Size Analyzer, (a) Sample 1, (b) Sample 2, (c) Sample 3...…27
Figure 3-7(a): Fall cone penetrometer and container………………………………………..……28
Figure 3-8: Plastic Limit test Apparatus………………………………………………………….29
Figure 3-9(a): Atterberg Limits Graph (b): Atterberg Limits for the shale sample……………...30
Figure 3-10: Standard proctor compaction test apparatus………………………………………..31
Figure 3-11(a): Acrylic Brick Mold (b): Acrylic Plunger……..…………………………………33
Figure 3-12: Quarried Shale……………………………………………………………...………33
Figure 3-13 Water……………………………………………………..…………………………33
[xvii]
Figure 3-14: Mixing………………………………………………………………………..…….34
Figure 3-15: Molding………………………………………………………………………….....34
Figure 3-16: Air Drying………………………………………………………………………......34
Figure 3-17: Firing in the Furnace…………………………………………………………..…...34
Figure 3-18: Control Brick…………………………………………………………………...…..34
Figure 3-19(a): High Bio-polymer Sludge extraction process from sewage waste water sludge at
the environmental engineering lab, York University…………………………………………….36
Figure 3-19 (b): Liquid High Biopolymer Sludge Type 1(LHBS-1)……………………………..37
Figure 3-20: LHBS-1-0.24 Brick……………………………………………………………...….37
Figure 3-21: Liquid High Biopolymer Sludge Type 1-0.4 Brick (LHBS-1-0.4)……………….…37
Figure 3-22: Liquid High Biopolymer Sludge Type 2 (LHBS-2)…………………………….…..38
Figure 3-23: Liquid High Biopolymer Sludge Type 2-0.25 Brick (LHBS-2-0.25)………………39
Figure 3-24: Liquid High Biopolymer Sludge Type 2-0.40 Brick (LHBS-2-0.40)…..……….….39
Figure 3-25: Liquid High Biopolymer Sludge Type 2-0.50 Brick (LHBS-2-0.50)…………..…..40
Figure 3-26: Liquid High Biopolymer Sludge Type 2-0.40 Brick (LHBS-2-1)………………….40
Figure 3-27: Centrifugation Equipment from Beckman Coulter…………………………………42
Figure 3-28: Centrifugation Bottle……………………………………………………………….42
Figure 3-29: Super Absorbent Polymer…………………………………………………………..43
Figure 3-30: Electrostatic interactions between H and O molecules…………………………….43
Figure 3- 31: DHBS before grinding into powder ………………………………………………44
Figure 3-32: Mortar and Pestle used for powdering DHBS……………………………………..44
Figure 3-33: Dried HBS brick…………………………………………………………………...45
Figure 3-34: Poraver®…………………………………………………………………………...45
[xviii]
Figure 3-35: Poraver® Bricks with shale replacement of 30% by weight……………….……….46
Figure 3-36: Granulated Blast Furnace Slag (GBFS)…………………………………………….46
Figure 3-37: Shale-Poraver®-Slag Bricks (SPSB)…………………………..……………..…….46
Figure 3-38: Sodium Silicate 38% ……………………………………………………………..48
Figure 3-39: SPSS-10 , SPSS-20 Bricks ………………………………………………………....49
Figure 3-40: SPSS -30, SPSS-40 Bricks………………………………………………………….49
Figure 3-41: Recycled Crushed Glass (RCG)…………………………………………………….50
Figure 3-42: Geopolymer Bricks (GB-20) …………………………………………..…………..51
Figure 3-43: Geopolymer Bricks (GB-30) ……………………………………………………….52
Figure 3-44: Geopolymer Bricks (GB-40) ……………………………………………………….52
Figure 3-45(a): SSSS-25 brick (b): SSSS-50 brick……………………………………………….54
Figure 3-46: fly-ash…………………………………………………………………………...…55
Figure 3-47: SFSS-25 brick………………………………………………………………………55
Figure 3-48: SFSS-50 brick………………………………………………………………………55
Figure 3-49: Incineration process of dewatered sludge…………………………………………..56
Figure 3-50(a): Dewatered sludge……………….………...……………………………………..56
Figure 3-50(b): Incinerated Sludge Ash burned at 550 degree Celsius (c): Incinerated Sludge Ash
burned at 900 degree Celsius………………………………………….………………..….……..57
Figure 3-51: Crushed Bricks……………………………………………………………………..58
Figure 3-52: Preliminary Compressive Strength results of Hybrid Bricks………………………59
Figure 3-52: Preliminary cold -water absorption results of Hybrid Bricks……………………...59
Figure 3-53: Preliminary hot- water absorption results of Hybrid Bricks………………………60
Figure 3-54: Preliminary weight results of hybrid bricks………………………………………60
[xix]
Chapter 4
Figure 4-1: Fourteen acrylic brick molds made for the main phase of the research……..………61
Figure 4-2: Geo-polymer Bricks -20 (GB-20)………………………………………………....…63
Figure 4-3: Geo-polymer Bricks -30 (GB-30)………………………………………………...….63
Figure 4-4: Geo-polymer Bricks -40 (GB-40)……………………………………………………63
Figure 4-5: Dried High Biopolymer Sludge Bricks (DHBS)……………………………………..64
Figure 4-6: Sewage Sludge Ash Bricks (SSAB-15)…………………………………………..….65
Figure 4-7: Sewage Sludge Ash Bricks (SSAB-30)………………………………………………65
Chapter 5
Figure 5-1: Dimensions for three-point loading test (a) front view (b) plan…………………….67
Figure 5-1: Dimensions for three-point loading test (c) The steel bearing plate of size 30 x 55 x 6
mm…………………………………………………………. …………………………………....67
Figure 5-2: (a): Gypsum cement used for plastering (b): After mixing with water……………......68
Figure 5-3 (a): Camera and lighting (b) Typical Flexural strength set up (c) Bottom and top rollers
(d) Loading on brick (e) Typical Flexural strength test set up……………………..…………… 69
Figure 5-4 (a): Average Flexural strength of bricks (b) Box plot for flexural strength of all
brick……………………………………………………………...………………………………72
Figure-5-5: Figure-5-5(a) Test Set up (b) Failure Pattern of Control Brick(CB)…………….... 73
Figure-5-6: (a) Test Set up (b) Failure Pattern of Dried High biopolymer Brick (DHBS)……..73
Figure-5-7: (a) Test Set up (b) Failure Pattern of Geopolymer Brick (GB-20)…………………73
Figure-5-8: (a) Test Set up (b) Failure Pattern of Geopolymer Brick (GB-30)…………………74
Figure-5-9: (a) Test Set up (b) Failure Pattern of Geopolymer Brick (GB-40)…………………74
Figure-5-10: (a) Test Set up (b) Failure Pattern of Sewage sludge ash Brick (SSAB-15)………74
[xx]
Figure-5-11: (a) Test Set up (b) Failure Pattern of Sewage sludge ash Brick (SSAB-30)……….75
Figure 5-12: Load - deformation response curve from the flexural strength test………………..76
Figure 5-13: Dimensions for splitting tensile strength test (a) front view (b) plan (c) Steel bearing
rods (d) Steel bearing rod plastered on top and bottom of brick (e) Typical set up for splitting
tensile strength test……………………………………………………………………………….77
Figure 5-14 (a): Splitting Tensile Strength of bricks (b) Box plot for splitting tensile strength of all
brick ...............................................................................................................................................80
Figure 5-15: Failure crack pattern of Control bricks (CB) ……………………………………....81
Figure 5-16: Failure crack pattern of DHBS……………………………………………………...81
Figure 5-17: Failure crack pattern of GB-20 ……………………………………………………..81
Figure 5-18: Failure crack pattern of GB-30……………………………………………………..81
Figure 5-19: Failure crack pattern of GB-40……………………………………………………..82
Figure 5-20: Failure crack pattern of SSAB-15 …………………………………………………..82
Figure 5-21: Failure crack pattern of SSAB-30 ………………………………………………….82
Figure 5-22: Set up and dimensions of the Compressive Load set up (a) Transverse Loading (b)
Longitudinal Loading………………………………………………………………………….…83
Figure 5-23:(a) Sawing machine used to cut the bricks in half (b) Brick Sawing in the Civil
Engineering Laboratory……………………………………………………………….…………83
Figure 5- 24: Controls Pilot compression testing machine and the test set up (a) Transverse loading
(b) Longitudinal Loading………………………………………………………...………………84
Figure 5-25: Sealant used for Gypsum capping…………………………………………………..85
Figure 5-26: Shellacked bricks before the gypsum capping………………………………………85
Figure 5-27: The bricks kept for the drying of gypsum capping…………………………………85
[xxi]
Figure 5-28: Teflon plates used for (a) Transverse loading (b) Longitudinal Loading …………...86
Figure 5-29: (a) Compressive Strength (MPa)-Transverse Loading (b) Box plot for compressive
strength_transverse of all brick…………………………………………………………………...89
Figure 5-30: Failure crack pattern of Control bricks (CB)……………………………………….90
Figure 5-31: Failure crack pattern of DHBS……………………………………………………...90
Figure 5-32: Failure crack pattern of GB-20……………………………………………………...90
Figure 5-33: Failure crack pattern of GB-30 ……………………………………………………..90
Figure 5-34: Failure crack pattern of GB-40……………………………………………………...91
Figure 5-35: Failure crack pattern of SSAB-15…………………………………………………..91
Figure 5-36: Failure crack pattern of SSAB-30 ………………………………………………….91
Figure 5-37: (a) Compressive Strength (MPa)-Longitudinal Loading (b) Box plot for compressive
strength_Longitudinal of all brick………………………………………………………………..95
Figure 5-38: Failure crack pattern of Control bricks (CB)……………………………………….95
Figure 5-39: Failure crack pattern of DHBS………………………………………………..….…95
Figure 5-40: Failure crack pattern of GB-20…………………………………………………..…95
Figure 5-41: Failure crack pattern of GB-30……………………………………………….……..95
Figure 5-42: Failure crack pattern of GB-40……………………………………………………..96
Figure 5-43: Failure crack pattern of SSAB-15………………………………………… ……….96
Figure 5-44: Failure crack pattern of SSAB-30………………………………………………….96
Figure 5-45: The comparison of compressive strength in transverse and longitudinal loading…...96
Figure 5-46: A representation of the resonant frequency test in transverse mode (Giannini,2012).99
Figure 5-47(a): Brick for RFT test (b) : A typical test set up of the resonant frequency test in
transverse mode…………………………………………………………………………………..99
[xxii]
Figure 5-48: (a) acceleration-time graph (b) acceleration- fundamental frequency graph………100
Figure 5-49: Transverse resonant frequency for Control Brick…………………………………101
Figure 5-50: Transverse resonant frequency for Dried High Biopolymer Brick (DHBS)………102
Figure 5-51: Transverse resonant frequency for Geopolymer (GB-20) Brick………………….102
Figure 5-52: Transverse resonant frequency for Geopolymer (GB-30) Brick………………….102
Figure 5-53: Transverse resonant frequency for Geopolymer (GB-40) Brick………………..…104
Figure 5-54: Transverse resonant frequency for Sewage Sludge Ash (SSAB-15) Brick……..…104
Figure 5-55: Transverse resonant frequency for Sewage Sludge Ash (SSAB-30) Brick………..105
Figure 5-56: Fundamental Transverse Resonant Frequency for each brick (Hz) ……………….106
Figure 5-57(a): Average Fundamental Transverse Resonant Frequency (b): Box plot for the RFT
of individual brick………………………………………………………………………………109
Figure 5-58(a): Dynamic Young's Modulus (MPa) of the masonry brick from transverse resonant
frequency Test (b): Box plot for Dynamic Young’s Modulus………………………………….108
Figure 5-59(a): UPV set-up (b) Conducting UPV test in the Civil Engineering High Bay
laboratory……………………………………………………………………………………….109
Figure 5-60 (a): Ultrasonic pulse velocity of masonry bricks (b) Box plot for the Ultrasonic pulse
velocity of the brick……………………………………………………………………………..110
Figure 5-61: Cold water absorption test…………………………………………………………111
Figure 5-62: Cold water absorption of the masonry bricks …………………………………….112
Figure 5-63: Hot water absorption of the masonry bricks………………………………………113
Figure 5-64: Saturation Coefficient of the masonry bricks …………………………………….114
Figure 5-65: The bricks placed in a tray for efflorescence test …………………………………115
Figure 5-66 (a): The bricks placed in the tray for efflorescence test (b): Appearance of the bricks
after the efflorescence test………………………………………………………………………115
[xxiii]
Figure 5-67: Bricks in the thawing tank…………………………………………………………116
Figure 5-68: Bricks inside the freezing chamber………………………………………………..116
Figure 5-69: Weight loss after 50 cycles of freeze-thaw……….…………………………..….117
Figure 5-70: The weight of the bricks………………………………………………………..….117
Chapter 6
Figure 6-1: A finite element model of a masonry unit …………………………………..………118
Figure 6-2: The finite element model of the control brick under three- point bending test............122
Figure 6-3 (a): Properties of the Control Brick used for the modelling in matching analysis with
experiment; (b): The failure pattern of control brick under flexural strength test; (c): Experimental
and FEM response of the Control Brick…………………………………………………………124
Figure 6-4 (a): Properties of the Control Brick used for the modelling in matching analysis with
experiment; (b): The failure pattern of DHBS brick under flexural strength test; (c): Experimental
and FEM response of the DHBS Brick…………………….……………………………………126
Figure 6-5 (a): Properties of the Control Brick used for the modelling in matching analysis with
experiment; (b): The failure pattern of GB-20 brick under flexural strength test; (c): Experimental
and FEM response of the GB-20 Brick…………………….…………………………………...128
Figure 6-6 (a): Properties of the Control Brick used for the modelling in matching analysis with
experiment; (b): The failure pattern of GB-30 brick under flexural strength test; (c): Experimental
and FEM response of the GB-30 Brick………………………………….……………………130
Figure 6-7 (a): Properties of the Control Brick used for the modelling in matching analysis with
experiment; (b): The failure pattern of GB-40 brick under flexural strength test; (c): Experimental
and FEM response of the GB-40 Brick………………………………………….………….…..132
Figure 6-8 (a): Properties of the Control Brick used for the modelling in matching analysis with
experiment; (b): The failure pattern of SSAB-15 brick under flexural strength test; (c):
Experimental and FEM response of the SSAB-15 Brick…………………………………...…..134
[xxiv]
Figure 6-9 (a): Properties of the Control Brick used for the modelling in matching analysis with
experiment; (b): The failure pattern of SSAB-30 brick under flexural strength test; (c):
Experimental and FEM response of the SSAB-30 Brick………………………….………….....136
Figure 6.10: Numerical and experimental analysis of peak load under flexural strength test……137
Figure 6-11: The finite element model of a brick under splitting tensile strength test…………..138
Figure 6-12: The failure pattern of Control brick under Splitting Tensile Strength Test(b) The
analytical load- mid displacement response for Control brick………………………………….139
Figure 6-13: The failure pattern of DHBS brick under Splitting Tensile Strength Test(b) The
analytical load- mid displacement response for DHBS brick……………..…………………...140
Figure 6-14 (a) The failure pattern of GB-20 brick under Splitting Tensile Strength Test (b) The
analytical load- mid displacement response for GB-20 brick……………………………….….141
Figure 6-15: The failure pattern of GB-30 brick under Splitting Tensile Strength Test(b) The
analytical load- mid displacement response for GB-30 brick……………………………….….142
Figure 6-16: The failure pattern of GB-40 brick under Splitting Tensile Strength Test (b) The
analytical load- mid displacement response for GB-40 brick…………………………………..143
Figure 6-17: The failure pattern of SSAB-15 brick under Splitting Tensile Strength Test (b) The
analytical load- mid displacement response for of SSAB-15 brick ……………………………144
Figure 6-18: The failure pattern of SSAB-30 brick under Splitting Tensile Strength Test (b) The
analytical load- mid displacement response for of SSAB-30 brick ……………….……………145
Figure 6-19: Numerical and experimental analysis of peak load under splitting tensile strength
test……………………………………………………………………………………………... 146
Figure 6-20: The finite element model of a brick under compressive strength test in the transverse
direction………………………………………………………………………………………...147
Figure 6-21: The failure pattern of the control brick under compressive strength test in the
transverse direction (b) The analytical load- mid displacement response for control
brick…………………………………………………………………………………………….148
[xxv]
Figure 6-22: The failure pattern of the DHBS brick under compressive strength test in the
transverse direction (b) The analytical load- mid displacement response for DHBS
brick………………………………………………………………………………………….…150
Figure 6-23: The failure pattern of the GB-20 brick under compressive strength test in the
transverse direction (b) The analytical load- mid displacement response for GB-20 brick
…………………………………………………………………………………………………..151
Figure 6-24: The failure pattern of the GB-30 brick under compressive strength test in the
transverse direction (b) The analytical load- mid displacement response for GB-30 brick
......................................................................................................................................................153
Figure 6-25: The failure pattern of the GB-40 brick under compressive strength test in the
transverse direction (b) The analytical load- mid displacement response for GB-40
brick………………………………………………………………………………………….…154
Figure 6-26: The failure pattern of the SSAB-15 brick under compressive strength test in the
transverse direction (b) The analytical load- mid displacement response for SSAB-15
brick………………………………………………………………………………………….....156
Figure 6-27: The failure pattern of the SSAB-30 brick under compressive strength test in the
transverse direction (b) The analytical load- mid displacement response for SSAB-30
brick………………………………………………………………………………………….....157
Figure 6-28: The numerical and experimental analysis of peak load under compressive strength
test in the transverse direction……………………………………….…………………………..158
Figure 6-29: The finite element model of a brick under compressive strength test in the
longitudinal direction………………………………………………………………………...…159
Figure 6-30: (a) Properties of the Control Brick used for the modelling in matching analysis with
experiment; (b): The failure pattern of control brick under longitudinal compressive strength test;
(c): FEM response of the Control Brick………………………………………………………...161
Figure 6-31: (a) Properties of the DHBS used for the modelling in matching analysis with
experiment; (b): The failure pattern of DBBS under longitudinal compressive strength test; (c):
FEM response of the DHBS brick……………………………………………….……………...162
[xxvi]
Figure 6-32: (a) Properties of the GB-20 used for the modelling in matching analysis with
experiment; (b): The failure pattern of GB-20 under longitudinal compressive strength test; (c):
FEM response of the GB-20 brick……………………………………………….……………..164
Figure 6-33: (a) Properties of the GB-30 used for the modelling in matching analysis with
experiment; (b): The failure pattern of GB-30 under longitudinal compressive strength test; (c):
FEM response of the GB-30 brick…………………………………………….………………..165
Figure 6-34: (a) Properties of the ContGB-40used for the modelling in matching analysis with
experiment; (b): The failure pattern of GB-40 under longitudinal compressive strength test; (c):
FEM response of the GB-40 brick……………………………………………….……………..167
Figure 6-35: (a) Properties of the SSAB-15 used for the modelling in matching analysis with
experiment; (b): The failure pattern of SSAB-15under longitudinal compressive strength test; (c):
FEM response of the SSAB-15 brick ……………………………………………………...…..168
Figure 6-36: (a) Properties of the SSAB-30 used for the modelling in matching analysis with
experiment; (b): The failure pattern of SSAB-30 under longitudinal compressive strength test; (c):
FEM response of the SSAB-30 brick …………………………….………………………….....170
Figure 6-37: The numerical and experimental analysis of peak load under compressive strength
test in the longitudinal direction………………………………………………………………...170
Figure 6-38: Tensile strength in transverse and longitudinal direction…………………………171
Chapter 7
Figure 7-1: Correlation between square root of Compressive Strength in transverse direction and
Tensile Strength……………………………………………………………………………...…172
Figure 7-2: Correlation between square root of Compressive Strength in longitudinal direction
and Tensile Strength…………………………………………………………………………….173
Figure 7.3: Correlation between square root of compressive Strength in longitudinal direction and
flexural strength……………………………………………………………………..………….174
Figure 7-4: Correlation between Compressive Strength in transverse direction versus splitting
Tensile Strength………………………………………………………………………………...175
Figure 7-5: Correlation between Splitting Tensile Strength and Flexural Strength……..……...175
[xxvii]
Figure 7-6: Correlation between square root of Compressive Strength in transverse direction and
ultrasonic pulse velocity……………………………………………………………………...…176
Figure 7-7: Correlation between Compressive Strength and Resonance Frequency…………….177
Figure 7.8: Correlation between Compressive Strength and modulus of elasticity……………177
Figure 7-9: Correlation between Density and Compressive Strength in transverse direction …178
Figure 7-10: Correlation between Density and Modulus of Elasticity…………………………..179
Figure 7-11: Correlation between Cold-Water Absorption and Ultrasonic Pulse
Velocity…………………………………………………………………………………………179
Figure 7-12: Correlation between Hot -Water Absorption and Ultrasonic Pulse Velocity…….180
Figure 7-13: Correlation between Cold-Water Absorption and Resonance Frequency ……...…181
Figure 7-14: Correlation between Hot-Water Absorption and Resonance Frequency…………181
Figure 7-15: Correlation between Pulse Velocity and Resonance Frequency………………..…182
Appendices
Figure A-1: Bottom Plate of the Plunger………………………………………………………...205
Figure A-2: Handle for Plunger…………………………………………………………………205
Figure A-3: Side 1 of the Acrylic Brick Mold……………………………………………….…..206
Figure A-4: Bottom Plate of Acrylic Brick Mold……………………………………….………206
Figure A-5: Side 2 of the Acrylic Brick Mold…………………………………………………..207

[xxviii]
List of Acronyms
US DoE United States Department of Energy
HBS High Bio-polymer Sludge
ISSA Incinerated Sewage Sludge Ash
CB Control Bricks
GB Geo-polymer bricks
BP Bio-polymer bricks
ISSAB Incinerated Sewage Sludge Ash Bricks
RCG Recycled Crushed Glass
GBFS Granulated blast furnace slag
FA Fly-Ash
RFT Resonant Frequency Test
UPV Ultrasonic Pulse Velocity Test
FEM Finite Element Model
EPA The United States Environmental Protection Agency
SMM Sustainable Materials Management
CRT Cathode Ray Tubes
KTS Kaolin Tailing Sand
[xxix]
CFBA Circulating Fluidized -Bed Adsorber
NIST National Institute for Standards and Technology's
BEES Building for Environmental and Economic Sustainability
BKBA Brick Kiln Bottom Ash
PMS Paper Mill Sludge
WMP Waste Marble Powder
WGS Waste Glass Sludge
SCBA Sugar Cane Bagasse Ash
SF Silica Fumes
GRPd Glass Reinforced Plastic Dust
NaOH Sodium Hydroxide
Na2SiO3 Sodium Silicate
ASTM American Society for Testing and Materials
LL Liquid Limit
PL Plastic Limit
PI Plasticity Index
LHBS Liquid High-Biopolymer Sludge
PHA Poly Hydroxy Alkanoate
[xxx]
LHBS-1 Liquid High-Biopolymer Sludge Type 1
LHBS-2 Liquid High-Biopolymer Sludge Type 2
DHBS-3 Dried High-Biopolymer Sludge Type 3
SAP Super Absorbent Polymer
SPB Shale-Poraver®- Bricks
SPSB Shale-Poraver®-Slag Bricks
SPSSB Shale-Poraver®- Na2SiO3 Bricks
GB-20 Geo-polymer-20 Bricks
GB-30 Geo-polymer-30 Bricks
GB-40 Geo-polymer-40 Bricks
SSSB Shale-Slag-Na2SiO3 Bricks
SFSSB Shale-Flyash-Na2SiO3 Bricks
SAB Sludge Ash Bricks
SSAB-15 Sewage Sludge Ash Bricks -15
SSAB-30 Sewage Sludge Ash Bricks -30
CWA Cold Water Absorption
HWA Hot Water Absorption
SC Saturation Coefficient

[xxxi]
CAN/ CSA A82 Material standards for Fired masonry brick made from clay or shale
FEA Finite Element Analysis
GUI Graphical User Interface Method
[xxxii]
List of Symbols
Hc Composite Correction
𝛒dry Optimum Dry Density
Wd Dry weight of the half brick in grams,
Ws2 Saturated weight of the half brick after 24 hours submersion in cold water
Wb5 Saturated weight of the half brick after an hour submersion in boiling water
[k] Element stiffness matrices
[K] Global stiffness matrix
{𝑈} Nodal displacements
F Externally applied loads
f’c Compressive strength
Ec, E Modulus of elasticity
𝛒 Density
μ Poisson’s ratio
ft Tensile Strength
fc trans Compressive Strength in transverse direction
fc long Compressive Strength in longitudinal direction
ft flex Flexural Strength

[xxxiii]
ft split Split Tensile Strength test
T Values of correction factor
[1]
Chapter1. Introduction
1.1 Background
Implementation of sustainable, environmentally-friendly and cost-effective building design and
construction has been a persistent challenge to the civil engineering community. Construction
materials cost a major share of the total cost of the building and the production of these materials
involve several steps including procurement and processing of raw materials, manufacture,
transport as well as assembly. These steps are extremely energy intensive and leave a considerable
level of carbon footprint during the process. As per the United States Department of Energy (US
DoE), production of construction materials constitutes around 13% of the energy requirement of
the country and is one of the major sources of greenhouse emissions. Similarly, the Indian
construction industry accounts for nearly 22% of the total greenhouse emissions [EIA., 2019].
With the exception of renewable energy production mechanisms, most traditional forms of energy
production requires material consumption and therefore carbonization of the environment;
material production, in turn, requires energy. This vicious cycle of energy demand for material
production so as to produce more energy but also to produce new materials for construction so as
to meet the needs for development is known as the energy-material nexus: apart from the emission
of CO2 in the environment, an equally serious implication of the continued quarrying of raw
materials is depletion of natural resources. One example is the shale used by the masonry industry,
limestone used by the cement industry, bauxite used by the aluminum industry, coal used for
electricity and so on.
The Paris agreement sets a goal for de-carbonization of energy production by 2030, a target
that is hard to meet by developed and developing countries together, whereas several of the
polluting industries are in denial regarding the effects of pollution on climate [Gibson et.al., 2019].
However, even if the energy part of the nexus is addressed, depletion of natural resources for the
need of construction are not yet part of the ongoing discourse. Sustainable development and
stability of society, along with the increasing standards of living throughout the globe place the
need for continued production of construction materials at the core of stable growth.
At the same time, the annual volume of global waste generation has exceeded 2.01 billion
tons and is expected to increase considerably by 2050 to 3.40 billion tons [Kaza et.al., 2018]. Most
recent research in sustainable construction materials has included waste generation and disposal
[2]
in its ongoing agenda. Reuse rather than disposal, but without compromise in quality and safety
has become an urgent priority. For example research is ongoing, with remarkable success, in the
introduction of recycled aggregate resulting from demolition of older structures in new concrete;
industrial by-products such as ashes and slags are used as cement replacement showing
exceptionally favorable performance to physical or chemical attack; ground recycled glass has
been shown to possess hydraulic behavior (i.e. reacting with water to produce solids) and is being
introduced in the cement industry.
Much less risky exploration regarding implementation of unconventional materials as
replacement of raw materials are considered by the brick manufacturing industries. Manufacturing
processes are set and centered around the quarry and use of shale in lieu of pure clay as the main
ingredient for the red-brick masonry production. Although the cement-industry is considered a
main culprit for CO2 emissions, the masonry industry has been partly spared the controversy.
However, the fact remains that clay resources are depleting, and that brick firing to over 1200oC
for several hours is an energy intensive process. Therefore, developing a rational alternative that
would reduce the raw material exploitation in red-brick manufacturing is an important challenge.
In this regard, past work that has been done by a few researchers [Tay, 1987 ] around the globe
has been focused in the potential use of treated sludge, a by-product of solid waste treatment plants
which is currently deposited in landfills.
For example, in Canada, the rate of municipal solid waste generation crossed 34 million
tons in 2016 and 73% of these wastes is sent to landfills [Statistics Canada 2016]. Further, the
building industry contributes towards 40% of energy usage and 30% of greenhouse emissions in
the world [Lemmet, 2009]. Based on a study from the U.S Environmental Protection Agency
(EPA), around 160 million tons of waste is generated annually from construction and demolition
activities. As the current technology of recycling is not quite adapted in construction industry on
account of lack of established codes and standards regarding structural performance, demolished
construction materials are often landfilled at the end of their useful lives. Being one of the most
extensively used and highly sought-after building material, it is important that the case is no
different for masonry bricks. A tremendous amount of energy which is about 2.800 MJ/kg is
required for producing bricks and 150 kJ/kg of it is spent in firing kilns [Moedinger, 2003].
Additionally, the process also releases an array of harmful air pollutants including carbon as well
[3]
as Sulphur oxides and particulate matter such as black carbon which in turn can cause a remarkable
influence on human health and climate change.
1.1.1 Resource Depletion
Resource depletion is a serious roadblock for the growth of the construction sector. The
construction industry is one of the greatest consumers of natural resources worldwide.
Unfortunately, it relies heavily on non-renewable raw materials owing to the technological barriers
in producing sustainable construction materials and the relative ease in using the available supply
of resources [Schilling & Chiang, 2009]. As of now, most of the widely used construction materials
or composites including concrete, metals and asphalt are associated with conventional natural
reserves in one or other way. While several petroleum products are indispensable and directly used
in construction, production of other materials such as cement and metallic structures use them as
the source of energy. In the same way, most of masonry bricks produced in the world use coal or
natural gas as the source of energy. Additionally, clay used as the major raw material in brick
manufacture is procured from top soil and cause depletion in the availability of farmable land. An
alternative to clay known as shale is a non-replaceable natural resource. Based on current trends,
this level of consumption will continue to increase due to the rapid development and technological
progress. Consequently, the natural stock of resources is at the brink of disappearance.
Furthermore, with the increase in population, processing and disposal of municipal waste has been
a serious issue across the globe. The need for proper disposal of sludge waste from biological
treatment facilities has created heavy financial and technological burdens [Abdel-Shafy &
Mansour, 2018]. The sludge generated in a treatment facility need to be removed periodically and
disposed of in sanitary landfills or by incineration. Incineration is a process of high energy demand
and emits greenhouse gases. On the other hand, disposal in sanitary landfills requires transportation
to secluded landfill sites which in turn utilize non-renewable fuel reserves and cause air pollution.
Additionally, there is concern regarding the re-entrance of heavy metals and other pollutants
through the water cycle (e.g. high amounts of endocrine-stimulating or immune-suppressing
complexes) in the solid waste that are potentially dangerous to long term health of both plant and
animal life [Smith, 2008].
[4]
1.2 Use of Sustainable Construction Materials
A feasible solution to the environmental issues caused by the construction industry is the use of
sustainable construction materials that are abundantly available and easy to procure without
damaging the environment [Kadir et al., 2011]. Avoiding use of non-replaceable natural reserves
and the use of renewable materials that generate less waste are paramount in preserving the existing
natural resources [Owusu & Asumadu-Sarkodi, 2016]. Likewise, usage of source materials with
lower embodied energy and prevention of waste going to landfill is important in reducing the
negative impact on the environment. The recent trend in this direction points towards the
renewable bio-based composites with diminished environmental footprint from cradle to grave of
the material. Moreover, these materials offer further benefits such as the reduction in total
embodied energy of constructed structures, curtailing volatile organic compound off-gassing and
improvement in mechanical and chemical properties such as density, elasticity, absorption as well
as resistance to salt and freeze-thaw damage.
1.3 Thesis Objectives
This study aims to address some of the environmental challenges of the masonry construction
industry as well as municipal waste disposal by using waste as a source material to produce
masonry bricks. In this endeavor, the feasibility of incorporating a variety of waste materials into
the proposed hybrid masonry bricks are investigated. The study includes a detailed experimental
component, where the proposed partial replacement of shale is carried out through all the steps of
the manufacturing process as well as in terms of evaluation of mechanical and physical
performance of the developed product in order to assess the feasibility of each waste type
considered as source material.
Polyhydroxyalkanoates are biogenic polyesters with similar properties with those of
synthetic plastics such as polypropylene and they improve several characteristics of bricks such as
strength, density and absorption when used as partial clay replacement in the form HBS-polymer.
While this offers a viable solution for the envisioned attainment of ‘low-cost, low-emissions’
buildings in the construction sector, the concept is also to create a new application for HBS-
polymers that are currently produced from environmental treatment processes in the
Environmental Engineering Facilities of Lassonde, thereby reducing the landfills and rendering
the biological treatment facility as a productive and futuristic industry.
[5]
Along those lines, Incinerated Sewage Sludge Ash (ISSAB) – a brick source material
obtained by incinerated treated waste generated in municipal sewage treatment facilities, is also
considered as a promising solution for low cost environmentally friendly construction. With the
inherent simplicity in the technique and time-tested durability of structures, masonry bricks remain
as one of the preferred choices in construction industry although the process of bricks’ fabrication
evolved continuously over thousands of years [Fernandes, Lourenço & Castro, 2010; Campbell &
Pryce, 2003]. Several research studies that investigated the feasibility of brick manufacture from
sewage [Okuno and Takahashi, 1997; Wiebusch and Seyfried, 1997; Samadikun et al, 2018] have
suggested that sewage sludge is a prospective brick source material. A few other studies [Lin Deng-
Fong & Weng Chih-Huang, 2001] have explored the feasibility of utilizing incinerated sewage
sludge as an admixture in brick manufacturing. The results from their tests conducted on the
fabricated bricks indicated that up to 40% of ash incorporation yielded compressive strengths
comparable to those of control bricks although 10% was found to be the optimal ratio of
incorporation. Further, addition of incinerated ash decreased the firing shrinkage and weight loss.
Glass, being an indispensable commodity used by the modern society for an assortment of
purposes, also generates vast amounts of waste. Although a limited fraction of the waste glass is
recycled directly, the remaining portion, dumped as waste material, is a cheap and readily
accessible source material for brick manufacture. Finely pulverized glass has been shown to have
pozzolanic activity by virtue of its amorphous state and presence of silicon and calcium in sizeable
quantities [Dyer and Dhir, 2001]. These beneficial characteristics of recycled waste glass make it
an optimum choice as additive in the brick manufacturing process. Previous studies have
investigated the usefulness of various forms of waste glass including recycled glass [Chidiac and
Federico, 2007; Demir, 2009; Smith, 2014], personal computer panels [Dondi et al., 2009],
cathode ray tube glass [Lee et al., 2016] and solar panel glass waste [Lin et al., 2012] in brick
manufacture.
Municipal sewage waste and waste glass are the some of the categories of waste that are
available easily and abundantly. Their availability and the emerging awareness to seek engineering
solutions that would reduce the cost of construction, the carbon dioxide foot-print and firing energy
levels that plague the masonry fabricating industry, as well as the urgency to put a check on ‘the
extent’ of natural resources being dug out of the ground every day for brick manufacture were
[6]
motivating concepts for the present research. This was also paired with the innovative idea of
using the masonry bricks as a host of various wastes- a solution to reducing wastes containing
undesirable compounds in landfills.
As a result, the following objectives pursued in the current research thesis:
1. To develop hybrid masonry bricks from waste materials especially with municipal
sewage sludge and waste glass without compromising the prescribed mechanical and
physical properties.
2. To explore futuristic (hybrid) brick designs as alternative construction products that
enable the effective use of other types of industrial wastes:
i. Bricks containing Geo-polymer technologies (GB)
ii. Bio-polymer bricks containing Bio-materials (BP)
iii. Bricks that contain incinerated sewage sludge ash (ISSA) in partial
replacement of raw shale
1.4 Thesis Outline
The aforementioned objectives have been accomplished by the following steps. All these steps are
described in several chapters.
1.4.1 Chapter 2- Review of Literature
A literature review has been conducted to develop a better understanding of the previously
conducted research studies on the utilization of waste materials for production of added-value
construction materials. The contents of this chapter are divided into two sections – discussing the
quest for sustainable and inexpensive construction and the utilization of waste materials for brick
manufacture.
1.4.2 Chapter 3- Preliminary Phase of the Research
The preliminary phase of the Research focusses on investigating the level of improvement that is
effected in structural and mechanical properties of bricks after partial replacement of principal
source material, quarried shale, with waste products. As a first step toward the research, the shale
sample was subjected to exhaustive geotechnical analyses prior to the commencement of brick
[7]
production to characterize the constituent components and to investigate the ambient casting mix
conditions such as the allowed level of moisture content.
In this regard, Control Bricks (CB) were made without any replacement of shale, and
hybrid bricks with varying shale replacement rates were fabricated using several waste materials
including HBS-polymers, Incinerated sludge ash (ISSA) provided by the Municipal wastewater
treatment facilities, Poraver® expanded glass powder, Recycled Crushed Glass (RCG), Granulated
blast furnace slag (GBFS), fly-ash (FA) etc. Additionally, reference brick specimens were
produced without any shale replacement. All experimental units including the reference bricks
were produced in few trial specimens for each material combination. Then the preliminary analysis
was done considering a range of standardized tests proofing the mechanical and physical
performance of the trial mixes.
1.4.3 Chapter 4- Main Phase of the Experimental Research
The results of the trial investigations were used to guide the formulation of the main phase of the
research. At this stage Control bricks, Geo-polymer bricks, Dried High Bio-polymer bricks and
Sewage Sludge Ash bricks were made in sizable numbers on account of their sustainability and
better performance during the trials. Among them, Geopolymer bricks and sludge ash bricks were
made in several percentage replacement of shale with recycled glass powder and sewage sludge
ash respectively.
1.4.4 Chapter 5- Experimental Results
Several experiments including physical and mechanical tests have been conducted on all the bricks
made during the final phase of the research, replicating the quality control procedures prescribed
by the Masonry Design Code for the characterization of a masonry product in the market. Tests
conducted may be classified into non-destructive and destructive tests. The non-destructive
mechanical tests conducted were, the Resonant Frequency Test (RFT) and Ultrasonic Pulse
Velocity Test (UPV). The destructive mechanical tests conducted were indirect tensile strength
tests such as flexural strength and splitting tensile strength test and compression tests in
longitudinal and transverse directions. Other durability tests performed include resistance to
freeze-thaw damage, efflorescence and water absorption.
[8]
1.4.5 Chapter 6- Numerical Simulation for Inverse Analysis
Finite Element Modelling (FEM) of the mechanical tests conducted during the experimental
phases on control as well as hybrid bricks was conducted to relate the mechanical behavior with
the essential material mechanical properties. The tests included flexural strength, splitting tensile
strength and compression tests in longitudinal as well as transverse directions. Input material
properties used in the FEM models were obtained after iteration to match the load displacement
response of the specimens with the analytical estimation in a consistent manner. This computer-
assisted inverse extraction of the actual characteristic material properties was necessary because
tensile strength and strain capacity are both material properties that cannot be measured directly
but are routinely obtained through inverse analysis of indirect tests (e.g. flexure, splitting) for all
brittle and semi-brittle materials. In this regard, the advanced nonlinear finite element platform,
VecTor2, developed at the University of Toronto was used in the simulation studies.
1.4.6 Chapter 7- Correlation Analysis
In this chapter, correlation between the various mechanical and durability test parameters extracted
from the experiments was sought, aiming to obtain simple predictors of properties that are difficult
to measure or are fraught with uncertainty, from the values obtained either in standard (e.g.
compression) or otherwise, non-destructive tests.
1.4.7 Chapter 8- Summary and Conclusions
This chapter summarizes the findings of the research. It also provides recommendations that could
be adopted in future projects for continuation of the exploration for alternatives to shale in brick
manufacturing.
[9]
Chapter 2. Review of Literature
2.1 Overview
The volume of municipal solid waste generation is increasing drastically with the rise in population
and rate of urbanization across the globe. The annual volume of global waste generation has
exceeded 2.01 billion tonnes and is expected to increase considerably by 2050 to 3.40 billion
tonnes [Kaza et al., 2018]. In Canada, the rate of municipal solid waste generation crossed 33
million tonnes and over 74% of these wastes is sent to landfills [Statistics Canada, 2016b, Statistics
Canada, 2016a]. Furthermore, the building industry is responsible for 40% of the energy usage and
contributes towards 30% of greenhouse emissions in the world [Lemmet, 2009]. Meanwhile, the
growing cost of construction materials makes affordable housing a distant dream for large groups
of the earths’ population [World Economic Forum, 2019]. In light of this state of affairs regarding
the energy-materials nexus, utilization of waste materials in the manufacture of construction
materials is an obvious solution, which can also be sustainable provided the necessary technologies
are developed. The United States Environmental protection Agency (EPA) has been working
effectively on the waste management in the past 30-35 years; now thinking beyond waste, they
have transitioned from focusing on waste management to focusing on Sustainable Materials
Management (SMM), which refers to the use and reuse of materials across their entire life cycle.
SMM conserves resources, reduces waste and minimizes the environmental impacts of materials
we use (EPA, 2018). It is very important to conserve and recycle the resources in all possible
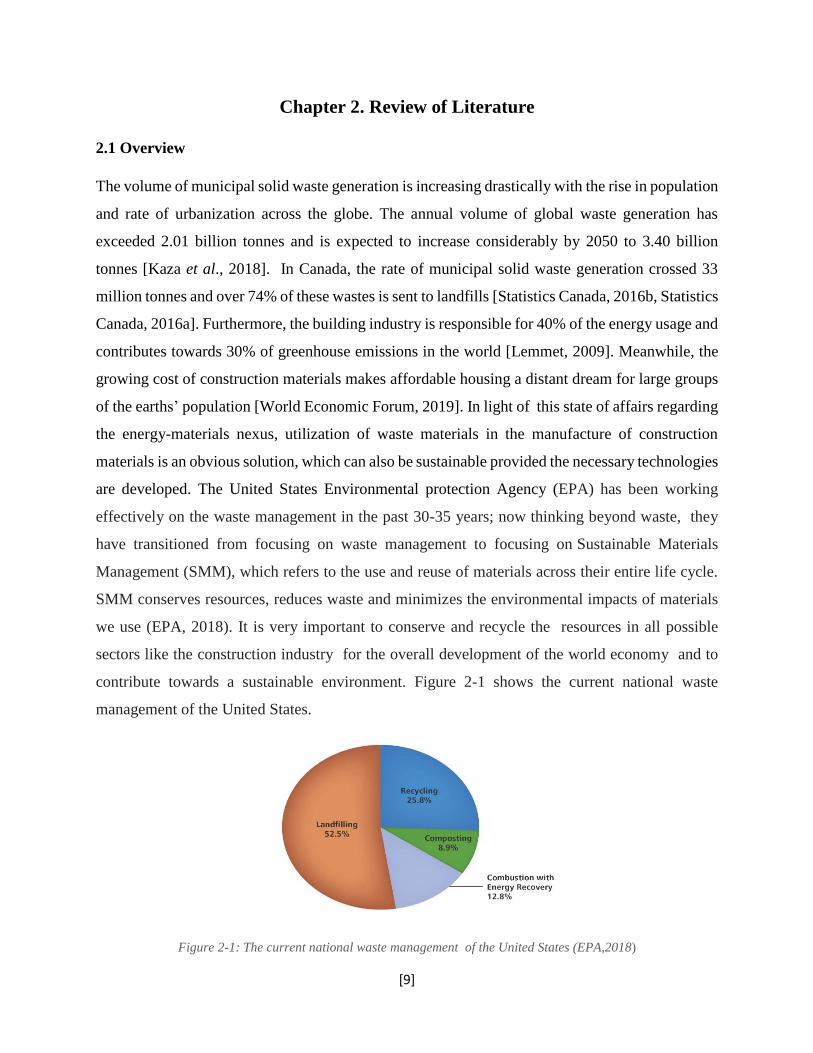
sectors like the construction industry for the overall development of the world economy and to
contribute towards a sustainable environment. Figure 2-1 shows the current national waste
management of the United States.
Figure 2-1: The current national waste management of the United States (EPA,2018)
[10]
Following up on this consideration, the present chapter summarizes the previously
conducted research studies on the utilization of waste materials for construction materials. The
contents of the chapter are divided into two sections – the first referring to the quest for sustainable
and inexpensive construction and the second to the utilization of waste materials for brick
manufacture.
2.2 The Quest for Sustainable and Inexpensive Construction
Before the massive displacement of the masonry by the reinforced concrete, up to the early 20th
century, masonry was the preferred choice in building construction. However, masonry is still used
for the construction in many parts of the world, mainly because of its ecological and economical
advantages, as well as for aesthetic reasons [Pardalopoulos, Karantoni, Pantazopoulou, 2019].
While sustainable development is one of the difficult tasks of the last two centuries [e.g. Sachs &
Warner, 1995], the same holds true for the masonry industry as well. With the extent of pollution,
waste generation and resource depletion caused by the construction industry [Dixon, 2010], the
significance of measures to ensure sustainability is paramount. Further, the complexity and
financial burden of waste disposal makes it a strenuous process. Incorporation of waste in
construction materials offers a promising solution to curtail these issues simultaneously.
Figure 2-2: Depicts reuse and recycling by the incorporation of waste in construction materials (Sasikumar ,2010)
[11]
The drive for sustainable construction has paved the way for characterization of numerous
waste products as valuable source materials. Finely pulverized glass is theoretically pozzolanic by
virtue of its amorphous state and presence of silicon and calcium in sizeable quantities [Dyer and
Dhir, 2001]. Moreover, its cementitious properties have been illustrated before [Archibald et al.,
1995]. These beneficial characteristics motivated the scientific community to explore the
feasibility of recycled glass as sand replacement in construction. The utility of recycled glass as
an admixture for partial sand replacement has been explored in various parts of the world [Bashar
& Ghassan, 2009; Kim, Choi, & Yang, 2018; Cabrera-Covarrubias, Gomez-Soberon, Almaral-
Sanchez, Arredondo-Rea, & Mendivil-Escalante, 2018; Chandra Paul, Šavija, & Babafemi, 2018].
Correspondingly, Cathode ray tubes (CRT), dumped as waste products by the advent of the new
generation widescreen televisions are recycled by utilizing them in the production of high-strength
mortars. Waste cathode ray tubes are ground, sieved and used as aggregate component in the
mortar.
Investigation of mechanical properties of the resulting cementitious compounds have
revealed increased compressive strength upon the incorporation of waste CRT glass [Maschio,
Tonello, & Furlani, 2013]. Utilization of sea shells in cement products is an eco-smart concept
enabling the replacement of fine and coarse aggregates with natural substances. Crushed and
sieved mussel shells [Martínez-García, González-Fonteboa, Martínez-Abella, & Carro- López,
2017] as well as waste oyster shells [Eo & Yi, 2015] have been tested for their utility as partial
aggregate replacement in concrete structures. When sea shells are used as cheap natural
nanoplatelets, they enhance the pore structure and improve the durability of cement-based
products. During such a process, sea shells are rinsed, dried, crushed and subjected to alkali
treatment before they are used as nanoplatelets. Research studies demonstrate significant increase
in compressive strength and drop in chloride penetration of cement paste and mortar after these
nature friendly nanoplatelets are incorporated in the minute scale [Huang, Lv, Liao, Lu, & Xu,
2018]. Feasibility studies investigating the usefulness of excavation soil as an alternative source
material for sand replacement have yielded positive results although the soil had to be stabilized
beforehand [Priyadharshini , Ramamurthy, & Robinson, 2018]. Mining and metallurgical industry
is one of the sources for waste or by-products that could be used as construction grade raw
materials. Kaolin Tailing Sand (KTS), a by-product from kaolin mining industry has been used to
replace fine aggregates in concrete structures and resulted in the improvement of the compressive
[12]
as well as splitting strengths [Xu et al., 2018]. Likewise, blast furnace slag, a non-metallic by-
product of iron ore purification process is a potential Portland cement replacement in the
manufacture of ecofriendly concrete [Mehta & Siddique, 2018].
Agro-waste, generated during agricultural activities is also considered a promising source
material for construction. For instance, the use of composite materials consisting of pea nut shells
and plaster improves the thermal properties of buildings. In other words, the composite material
exhibits significantly reduced thermal conductivity and diffusivity in comparison with a simple
plaster material [Lamrani et al., 2017]. Agricultural waste products such as coconut fibre, rice husk
and oil palm empty fruit bunch have been tested for their effectiveness as filler materials in the
manufacture of concrete paving blocks [Lutfi, Yamin, Rahman, & Ginsel Popang, 2018].
Similarly, light weight concrete structures are produced using coconut fibres. On top of the
significant weight reduction achieved, coconut fibre reinforcement improved the toughness of the
concrete structure while maintaining comparable physical and mechanical properties at low
proportion of fibre incorporation [Hasan, Sobuz, Sayed & Islam, 2012]. Coarse and fine aggregates
such as crushed stone are indispensable constituents of concrete mix design. The relative scarcity
and steep increase in the cost of these materials over the years led to the investigation for
alternatives. Interestingly, agricultural waste products have been proved to be a valuable resource
in this endeavor. Various agricultural waste products such as oil palm shells [Alengaram et al.,
2013; Khankhaje, Salim, Mirza, Hussin & Rafieizonooz, 2016], coconut shells [Kumutha, Vijai,
& Vijayragavan, 2018] , groundnut shells [Sada, Amartey,& Bako, 2013 ], saw dust [Kumar,
Singh, Kumar& Gupta,2014 ] and walnut shells [Kamal et al., 2017 ; Mirza, Anwar, Samarul &
Mohd, 2017] have been identified to be promising options and enabled significant proportion of
aggregate replacement without considerable drop in physical and mechanical properties of
concrete structures.
Incinerated residues of several agro-waste products possess pozzolanic activity and this
characteristic qualify them as supplementary cementitious materials [ASTM C125-16]. Scientific
exploration in this direction investigated the efficacy of an array of agro-waste ash including wheat
straw ash [Qudoos, Kim, Atta-ur-Rehman, & Ryou, 2018], rice husk ash [Chindaprasirt, Rukzon,
2015], sugar cane bagasse ash [Akkarapongtrakul, Julphunthong, Thanongsak, 2017], palm kernel
nut waste ash [Joshua et al., 2017] and corn stalk ash [Raheem, Adedokun, Adeyinka, & Adewole,
2017], cork waste ash [Ramos , Matos & Sousa–Coutinho, 2014], groundnut shell ash [Arshad ,
[13]
Kumar, 2017; Olutoge, Buari & Adeleke,2013] and saw dust ash [Auta et al.,2016 ] as raw
materials for cement replacement. Evidently, such studies established the prospects of agricultural
waste products as prospective components for partial cement replacement. The construction and
demolition sector constitute a considerably large proportion of waste generated globally and
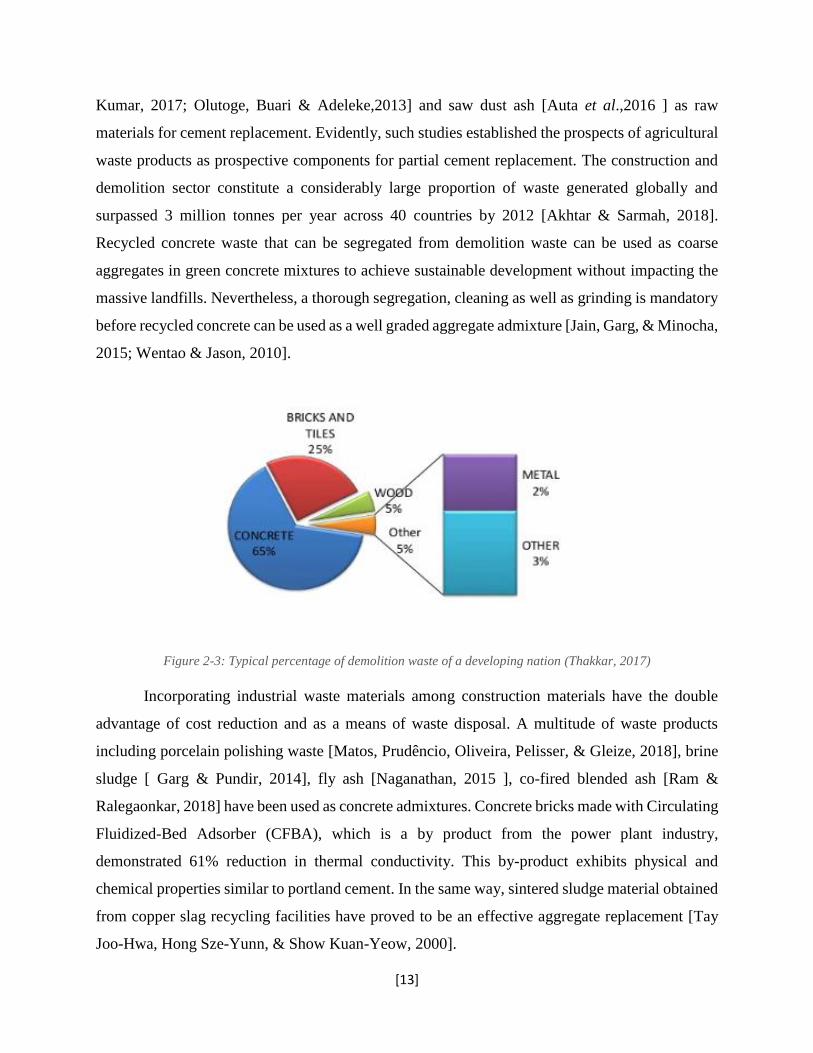
surpassed 3 million tonnes per year across 40 countries by 2012 [Akhtar & Sarmah, 2018].
Recycled concrete waste that can be segregated from demolition waste can be used as coarse
aggregates in green concrete mixtures to achieve sustainable development without impacting the
massive landfills. Nevertheless, a thorough segregation, cleaning as well as grinding is mandatory
before recycled concrete can be used as a well graded aggregate admixture [Jain, Garg, & Minocha,
2015; Wentao & Jason, 2010].
Figure 2-3: Typical percentage of demolition waste of a developing nation (Thakkar, 2017)
Incorporating industrial waste materials among construction materials have the double
advantage of cost reduction and as a means of waste disposal. A multitude of waste products
including porcelain polishing waste [Matos, Prudêncio, Oliveira, Pelisser, & Gleize, 2018], brine
sludge [ Garg & Pundir, 2014], fly ash [Naganathan, 2015 ], co-fired blended ash [Ram &
Ralegaonkar, 2018] have been used as concrete admixtures. Concrete bricks made with Circulating
Fluidized-Bed Adsorber (CFBA), which is a by product from the power plant industry,
demonstrated 61% reduction in thermal conductivity. This by-product exhibits physical and
chemical properties similar to portland cement. In the same way, sintered sludge material obtained
from copper slag recycling facilities have proved to be an effective aggregate replacement [Tay
Joo-Hwa, Hong Sze-Yunn, & Show Kuan-Yeow, 2000].
[14]
Sewage sludge incorporated soil was used in pavement sub layers and the mechanical properties
of soil samples with varying sludge proportions indicated that the stabilized soil sludge mixtures
have significant prospects in pavement construction [de Figueirêdo Lopes Lucena, Thomé Juca,
Soares, & Portela, 2014]. Further, ground sludge ash has been used as cement replacement in
mortar blocks [Pinarli & Kaymal, 1994].
A number of other waste products have been recognized as viable choices for incorporating
into construction materials. While waste packaging tape [Hu et al., 2018] and engine oil [Liu,
Peng, Wu, & Zhou, 2018] improved the rheological properties of bitumen, waste engine oil
inclusion resulted in a drop of viscosity which is helpful in reducing the construction temperature
and energy consumed. Introduction of waste metal in asphalt enabled enhanced resistance to skid
and scraping without considerable changes in mechanical properties of bitumen [Ajam, Gómez-
Meijide, Artamendi, & Garcia, 2018]. Considerable scale of plastic waste incorporation as
aggregate replacement in non-structural concrete offers additional benefit of reduced thermal
conductivity up to seven times compared to conventional concrete [Záleská et al., 2018].
2.3 Utilization of Waste Materials in Brick Manufacture
Masonry bricks represent one of the ancient and widely used construction methods across the globe
that gained widespread popularity during the Mesopotamian, Egyptian and Roman era. With the
inherent simplicity in the technique and time-tested durability of structures, they remain as one of
the preferred choices in construction industry although the process of brick fabrication evolved
continuously over thousands of years [Fernandes, Lourenço & Castro, 2010; Campbell & Pryce,
2003]. Traditional masonry bricks exhibit modest level of specific strength, fire resistance,
chemical as well as corrosion resistance and durability. However, despite these appealing factors,
their dependence on natural resources and energy intensive manufacturing processes undermines
the vision of sustainable construction.
2.3.1 Limitations of Conventional Masonry Bricks
2.3.1.1 Resource depletion
Brick industry is heavily dependent on vast amounts of natural resources such as clay and shale.
Evidently, a growing demand for bricks is taking a toll on the availability of these natural reserves
in various parts of the world. In the same way, construction industry has a major role in the
[15]
depletion of world’s fossil fuel reserves. Unchecked clay usage for brick manufacture has reduced
the area of arable land and is threatening the future of agriculture in China and India [Bhushan,
Basu, Yadav & Kumar, 2016], [Reddy, 2004], [Zhang, 2013]. In China, over a billion square
meters of clay resources is used annually for brick manufacture which in turn is equivalent to the
destruction of 500 thousand acres of farmable land [Xu, 2010]. In addition, roughly 7 thousand
tons of coal is used every year in the country, resulting in the release of approximately 18 thousand
tons of carbon dioxide emissions [China Coal Information Institute, 2015]. As per a survey by
World Energy Council, the global energy demand may increase by over 50% by 2050 and the
global fossil fuel reserves are therefore in great peril if their consumption continues at this alarming
rate.
2.3.1.2 Significant level of embodied energy
The term ‘embodied energy’ refers to the total energy used for the manufacture of construction
materials. It is described as the energy spent in the extraction of raw materials, manufacture and
transport of materials from the plant to the construction site [Fay et al., 2000]. As per Thormark [
Thormark, 2002], the embodied energy can contribute towards nearly 45% of a building’s total
energy needs in a life span of 50 years. Construction materials like fired masonry clay bricks are
manufactured through energy intensive processes and have relatively high embodied energy.
Based on the data from National Institute for Standards and Technology's (NIST) Building for
Environmental and Economic Sustainability (BEES) Database 4.0, the annual embodied energy of
clay bricks manufacture in United States is 86000000 Million British Thermal Units (BTU). The
same resource estimates that roughly 6000 BTUs of fossil fuels are spent in average in making a
fired clay brick [NIST , BEES 4.0].
2.3.1.3 Environmental pollution
Coal based brick factories generate significant level of brick kiln bottom ash (BKBA) that
contaminate soil and water environments of nearby areas through leaching of toxic metals [Mondal
et al., 2017]. Firing of conventional bricks in kilns involves very high temperature around 1400
degree Celsius and consumes large quantities of fuel resulting in the release of polluting gases
such as carbon monoxide, carbon dioxide and ammonia [Heindl & Pendergast,1929].
[16]
2.3.2 Incorporation of Waste Materials for Manufacture of Sustainable Hybrid Bricks
In light of the fact that conventional bricks do not adhere to the principles of sustainable
construction, there is an urgent need for innovative solutions that can develop sustainable and less
expensive alternatives with comparable mechanical, physical as well as thermal performance.
Utilization of waste materials in brick manufacture is a multi-pronged approach that enables green
construction and waste recycling simultaneously.
During the last few decades, research has been done to incorporate various type of waste
materials into the production of bricks including sludge [Lutfi, Yamin, Rahman, & Ginsel Popang,
2018], [Lamrani, Laaroussi, Khabbazi, Khalfaoui, Garoum, & Feiz, 2017], [Taha & Nounu ,
2009], [Zhang & Ingham, 2010], pulp and paper mill residue [Goel & Kalamdhad 2017], olive
industry waste, biomass ash [Iwuagwu & Ugwuanyi 2014], boron waste, spent coffee grounds,
and cigarette butts. Researchers have tried to also use waste materials such as blast furnace slag,
iron tailings, and sludge waste.
The feasibility of utilizing incinerated sewage sludge as an admixture in brick
manufacturing [Lin Deng-Fong & Weng Chih-Huang, 2001]. The results from the tests conducted
on the fabricated bricks indicated that up to 40% of sludge ash incorporation yielded compressive
strengths comparable to that of control bricks. However, 10% was found to be the optimal ratio of
incorporation with a compressive strength of 150kg/cm2. Further, addition of sludge ash decreased
the firing shrinkage by 8% and weight loss by 15%.
The prospects of using paper mill sludge (PMS) was also explored in lightweight brick
manufacture. Drained PMS and soil samples were dried and milled before they were incorporated
in the brick mixture [Goel & Kalamdhad, 2017]. The fabricated bricks were tested for their
mechanical properties and results showed considerable reduction in weight by 24% compared to
conventional bricks. It was noticed that bricks made with PMS incorporation up to 10% by weight
conformed to the required specifications.
Another investigation looked into the viability of using waste marble powder (WMP) in
making bricks [Munir, Abbas, Nehdi, Kazmi, & Khitab, 2018]. Bricks fabricated with WMP
content ranging from 0 to 25% was tested for mechanical and durability characteristics. The results
from the tests specified that the bricks containing up to 10% of WMP satisfied the minimum
compressive strength and flexural strength with only 8% and 3.3% reduction respectively from the
[17]
control specimens with regards to these properties.Besides, usage of up to 5% of WMP resulted in
bricks with no efflorescence and sulphate attack compared to the control bricks.
The feasibility of using sludge from sand beneficiation treatment plant in brick
manufacture was explored by [G. Reddy and Babu, 2013]. Results of experiments on the fabricated
bricks showed that up to 40% sludge by weight of clay could be used to make bricks without loss
in strength whereas other brick characteristics were considered satisfactory for conventional
purposes.
Boro-gypsum generated by the boric acid production industry for making bricks and
improving their properties was analysed. In the case of bricks fabricated with 0-15% of boro-
gypsum were subjected to physical and mechanical tests including compressive strength, water
absorption and resistance to freeze thaw damage [Emrullahoglu, 2014]. The results indicated that
the bricks made with up to 10% of boro-gypsum incorporation had a compressive strength of 40
MPa and water absorption of 8%. Besides, addition of boro-gypsum reduced the brick density and
increased freeze/thaw resistance.
The utilization of waste glass sludge (WGS) in the fabrication of burnt clay bricks. Up to
25% by clay weight of WGS procured from industrial scale glass polishing and cutting facilities
was added as partial clay replacement [Kazmi et al, 2017]. It was observed that the compressive
strength of the bricks was increased 37% by the additions of WGS. Further, WGS incorporated
bricks were lighter in weight and showed reduced water absorption. Furthermore, there are no
signs of efflorescence, sulphate attack and freeze-thaw damage was better after WGS was included
as a raw material.
Using sugar cane bagasse ash (SCBA) and silica fume (SF) wastes as a raw material in
making bricks were also studied [Jiménez-Quero et al, 2017]. Bricks incorporated with SCBA and
SF were tested for physical and mechanical characteristics and the results showed that bricks made
with incorporation of up to 40% by clay weight of SF had no change in physical and mechanical
properties with those of control bricks without clay replacement while the addition of SCBA
significantly reduced the physical and mechanical characteristics of the fabricated bricks especially
with a reduction in compressive strength by 100kg/cm2.
The viability of incorporating several waste materials including demolished bricks, fly ash
and rice husk ash into environmentally-friendly and cheaper fired clay bricks is motivating the
[18]
present research [Hossain et al., 2018]. The study also analyzed the effect of glass cullet addition
in the characteristics of the resultant bricks. The results from mechanical, physical and thermal
tests on the manufactured bricks indicated that that those with up to 80% of waste incorporation
still complied with the technical specifications for masonry units. Note that the disposal of tons
and tons of glass in the form of glass containers in the landfills leads to the emission of green house
gases [Vossberg, 2014], whereas recycling of these waste materials instead of disposing them in
the landfills would help to save 27% of the energy and would achieve a 37% reduction in
greenhouse gas emissions per year.
The applicability of a sea weed based biopolymer known as alginate as a constituent in
unfired clay blocks was explored [Dove et al., (2016]. A number of alginate and soil samples were
tested, and physical and mechanical tests were performed on the fabricated bricks [Hossain et al.,
2018]. Also, these bricks are compared with control bricks in relation to flexural and compressive
strength, microstructure, abrasive strength and hygroscopic behaviour. The results showed that the
mechanical properties on the blocks was dependent on the choice of alginate source and
constituents of the soil used. The bricks crafted with the alginate form Laminaria Hyperboria
showed 52% increase in compressive strength compared to that of the control blocks.
A research study on the viability of using glass reinforced plastic dust (GRPd) waste in
making bricks was also conducted recently [Mobili et al., 2018]. The clay was partially substituted
by a maximum of 10% of GRPd and the fabricated bricks were tested for changes in compressive
and flexural strengths, porosity, density and water absorption. The results revealed that GRPd
incorporation reduced the compressive strength by 46% though there was an increase in total
(connected) porosity and water absorption of 29%. An older laboratory and pilot plant study
[Giugliano et al., 1985] had shown that tannery sludges could also be used in brick manufacture
for up to 10% of the dry weight of bricks. They were made at a firing temperature of 950 °C;
masonry units made with the incorporation of tannery sludge had higher porosity, and similar
flexural strength and frost resistance to that of control brick. Another work was fabricating brick
fabrication by mixing the raw materials, tannery sludge and clay together in different proportions
illustrated that the mechanical and physical properties like water absorption, porosity, linear
shrinkage, leaching and transverse rupture strength of the brick samples made with up to 30%
replacement of clay with tannery sludge were similar to those characteristics specified for control
bricks [Basegio et al., 2002]. The physical and mechanical properties conducted on the prepared
[19]
brick specimens indicated that bricks prepared with 40% and 50% of dried sludge and sludge ash
respectively resulted in good workability and energy saving of 15–47% for 10-40% replacement
of clay with sludge.
Dried sludge and sludge ash from the waste water treatment plant is a promising source
material for the manufacture of masonry bricks. In a pioneering research study, [Tay, 1987]
explored the feasibility of using waste water sludge in making eco-friendly bricks. While
dewatered sludge from wastewater treatment plants creates problems of disposal, incineration
might be an alternative solution for urban areas due to the limited land space for the landfill. Dried
and oven fired sludge samples were ground and bricks samples were prepared with varying
proportions of sludge and sludge ash. The results of the bricks made by the utilization of dried
sludge and sludge ash showed that the maximum replacement ratios of dried sludge and sludge
ash that could be mixed with clay for brick making are 40% and 50% respectively. The
compressive strength of the bricks found to be 87.2 MPa for 0% sludge, decreasing to 37.9MPa
for 40% clay replacement with dried sludge, and 69.4MPa for 50% replacement with sludge ash.
Another study envisioned to craft sustainable bricks from sewage sludge ash [Okuno,1997]
made use of the fact that there are eight full scale sewage sludge incineration plants in Japan. The
researchers fabricated masonry bricks from 100% sewage sludge ash by firing them at about
1000°C. The bricks made with 100% replacement of clay with sewage sludge ash are now widely
accepted for public works such as flooring of plazas or pedestrian walk ways. The overall quality
of the sewage sludge ash brick was not competitive enough initially because of the moss growth
on the exposed surface of the brick owing to its high moisture content and efflorescence by
Calcium Carbonate leaching. These problems were solved by increasing the firing temperature and
application of chemical coating. Masonry brick properties like shrinkage, water absorption,
compressive strength, flexure strength, leaching behaviour and energy consumption were tested
and found similar to control bricks.
In Germany, several aspects of using ashes from sewage sludge incineration in the brick
and tile industry have been examined [Wiebusch et al., 1997]. It was found that the use of
precipitation agents containing heavy metals like iron during the event of dewatering of sludge,
influence the quality of sludge ash as the effects of ash on the brick properties may vary based on
the chemical composition of the sludge. This particular research replaced up to 40% of clay with
sewage sludge ash and found that the water absorption, density and compressive strength similar
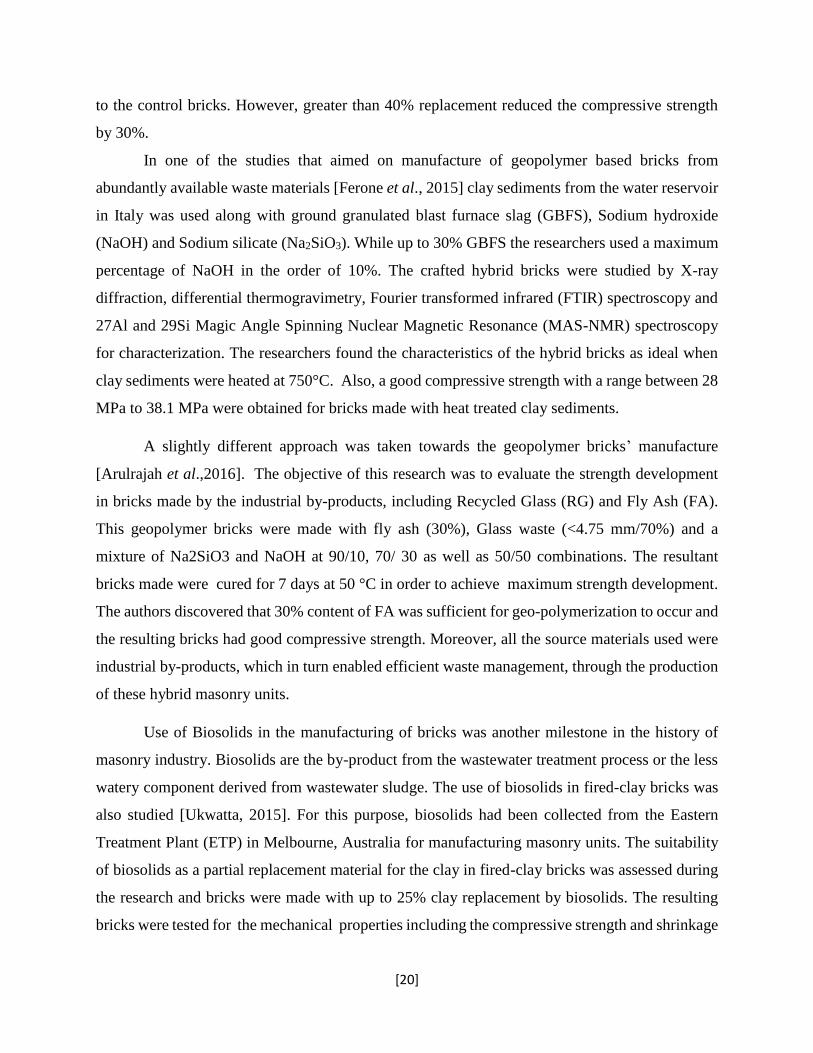
[20]
to the control bricks. However, greater than 40% replacement reduced the compressive strength
by 30%.
In one of the studies that aimed on manufacture of geopolymer based bricks from
abundantly available waste materials [Ferone et al., 2015] clay sediments from the water reservoir
in Italy was used along with ground granulated blast furnace slag (GBFS), Sodium hydroxide
(NaOH) and Sodium silicate (Na2SiO3). While up to 30% GBFS the researchers used a maximum
percentage of NaOH in the order of 10%. The crafted hybrid bricks were studied by X-ray
diffraction, differential thermogravimetry, Fourier transformed infrared (FTIR) spectroscopy and
27Al and 29Si Magic Angle Spinning Nuclear Magnetic Resonance (MAS-NMR) spectroscopy
for characterization. The researchers found the characteristics of the hybrid bricks as ideal when
clay sediments were heated at 750°C. Also, a good compressive strength with a range between 28
MPa to 38.1 MPa were obtained for bricks made with heat treated clay sediments.
A slightly different approach was taken towards the geopolymer bricks’ manufacture
[Arulrajah et al.,2016]. The objective of this research was to evaluate the strength development
in bricks made by the industrial by-products, including Recycled Glass (RG) and Fly Ash (FA).
This geopolymer bricks were made with fly ash (30%), Glass waste (<4.75 mm/70%) and a
mixture of Na2SiO3 and NaOH at 90/10, 70/ 30 as well as 50/50 combinations. The resultant
bricks made were cured for 7 days at 50 °C in order to achieve maximum strength development.
The authors discovered that 30% content of FA was sufficient for geo-polymerization to occur and
the resulting bricks had good compressive strength. Moreover, all the source materials used were
industrial by-products, which in turn enabled efficient waste management, through the production
of these hybrid masonry units.
Use of Biosolids in the manufacturing of bricks was another milestone in the history of
masonry industry. Biosolids are the by-product from the wastewater treatment process or the less
watery component derived from wastewater sludge. The use of biosolids in fired-clay bricks was
also studied [Ukwatta, 2015]. For this purpose, biosolids had been collected from the Eastern
Treatment Plant (ETP) in Melbourne, Australia for manufacturing masonry units. The suitability
of biosolids as a partial replacement material for the clay in fired-clay bricks was assessed during
the research and bricks were made with up to 25% clay replacement by biosolids. The resulting
bricks were tested for the mechanical properties including the compressive strength and shrinkage
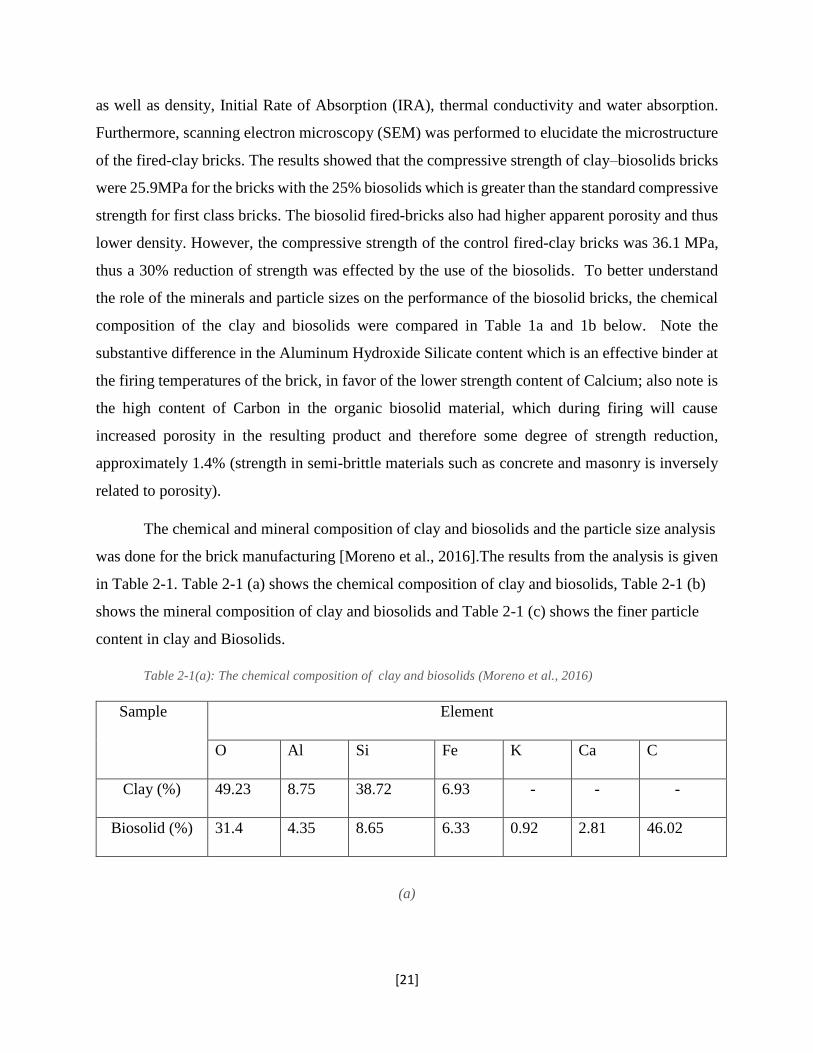
[21]
as well as density, Initial Rate of Absorption (IRA), thermal conductivity and water absorption.
Furthermore, scanning electron microscopy (SEM) was performed to elucidate the microstructure
of the fired-clay bricks. The results showed that the compressive strength of clay–biosolids bricks
were 25.9MPa for the bricks with the 25% biosolids which is greater than the standard compressive
strength for first class bricks. The biosolid fired-bricks also had higher apparent porosity and thus
lower density. However, the compressive strength of the control fired-clay bricks was 36.1 MPa,
thus a 30% reduction of strength was effected by the use of the biosolids. To better understand
the role of the minerals and particle sizes on the performance of the biosolid bricks, the chemical
composition of the clay and biosolids were compared in Table 1a and 1b below. Note the
substantive difference in the Aluminum Hydroxide Silicate content which is an effective binder at
the firing temperatures of the brick, in favor of the lower strength content of Calcium; also note is
the high content of Carbon in the organic biosolid material, which during firing will cause
increased porosity in the resulting product and therefore some degree of strength reduction,
approximately 1.4% (strength in semi-brittle materials such as concrete and masonry is inversely
related to porosity).
The chemical and mineral composition of clay and biosolids and the particle size analysis
was done for the brick manufacturing [Moreno et al., 2016].The results from the analysis is given
in Table 2-1. Table 2-1 (a) shows the chemical composition of clay and biosolids, Table 2-1 (b)
shows the mineral composition of clay and biosolids and Table 2-1 (c) shows the finer particle
content in clay and Biosolids.
Table 2-1(a): The chemical composition of clay and biosolids (Moreno et al., 2016)
Sample Element
O Al Si Fe K Ca C
Clay (%) 49.23 8.75 38.72 6.93 - - -
Biosolid (%) 31.4 4.35 8.65 6.33 0.92 2.81 46.02
(a)
[22]
Table 2-1 (b) The mineral composition of clay and biosolids (Moreno et al., 2016)
Mineral Clay (%) Biosolid (%)
Silicon Oxide (Quartz) 74 71.3
Aluminium Hydroxide
Silicate (Kaolinite 2) 13 -
Aluminium Silicate
Hydroxide (Kaolinite
1) 11 9.9
Iron Oxide Hydroxide
(Goethite) 2 -
Calcium Carbonate
(Calcite) 6.9
Aluminum Hydroxide
(Gibbsite) 11.9
(b)
Table 2-1 (c) The finer particle content in clay and Biosolids (Moreno et al., 2016)
Content of fines in Biosolid Content of fines in Biosolid
Clay (%) Silt (%) Sand (%) Clay (%) Silt (%) Sand (%)
15.99 18.94 65.06 40 32 28
[23]
Chapter 3. Preliminary Phase of the Research
This study investigates the level of improvement that is effected in structural and mechanical
properties of bricks after partial replacement of principal source material, quarried shale, with
waste products. For the needs of the study, Quarried Shale was procured from ‘Brampton Bricks’
during the facility tour in May 2018 which in turn was an occasion to learn extensively regarding
the industry standards and procedures of manufacturing and testing of masonry bricks. The
primary ingredients in the quarried shale are sand, clay and silt which is a combination of calcite
and quartz. In this regard, hybrid bricks with varying shale replacement rates are fabricated using
several waste materials including HBS-polymers which are non-pathogenic products of novel
environmental processes developed in the Environmental Laboratories at Lassonde, Incinerated
Sewage Sludge Ash (ISSA) provided by the Municipal wastewater treatment facilities, Poraver®
expanded glass powder, Recycled Crushed Glass (RCG), Granulated blast furnace slag (GBFS),
fly-ash etc. Additionally, reference brick specimens termed hereon as Control Bricks (CB) are
produced without shale replacement as benchmarks of all the other trials. In the initial phase of the
experimental work, which is the subject of the present chapter, all experimental units including the
reference bricks were produced in few numbers for each material combination. Then the
preliminary analysis was done through a cycle of mechanical and physical tests in order to help
identify those cases that warranted further exploration in the main phase of the study.
3.1 Methods and Standards of the Experimental Program
3.1.1 Geotechnical Analysis
As first step toward the research, the shale sample was subjected to exhaustive geotechnical
analyses prior to the commencement of brick production to characterize the constituent
components and to investigate the ambient casting mix conditions such as the allowed level of
moisture content required for the fabrication of control brick.
3.1.1.1 Gradation
To determine the particle size distribution of the shale sample, gradation has been done. Since the
specimen contains a wide range of particle sizes, gradation has been done using two methods. The
particle size distribution of coarser particles with size greater than 75μm was done using ASTM
D6913M - 17 Standard test methods for particle-size distribution (gradation) of soils through sieve
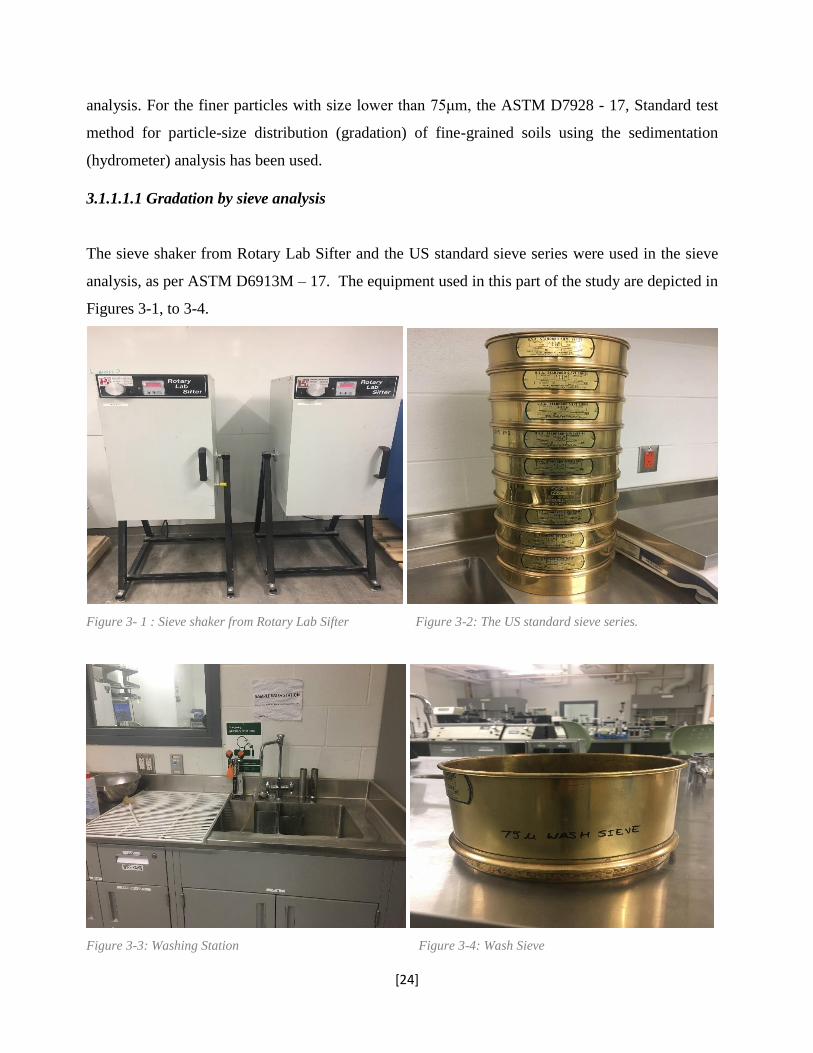
[24]
analysis. For the finer particles with size lower than 75μm, the ASTM D7928 - 17, Standard test
method for particle-size distribution (gradation) of fine-grained soils using the sedimentation
(hydrometer) analysis has been used.
3.1.1.1.1 Gradation by sieve analysis
The sieve shaker from Rotary Lab Sifter and the US standard sieve series were used in the sieve
analysis, as per ASTM D6913M – 17. The equipment used in this part of the study are depicted in
Figures 3-1, to 3-4.
Figure 3- 1 : Sieve shaker from Rotary Lab Sifter Figure 3-2: The US standard sieve series.
Figure 3-3: Washing Station Figure 3-4: Wash Sieve
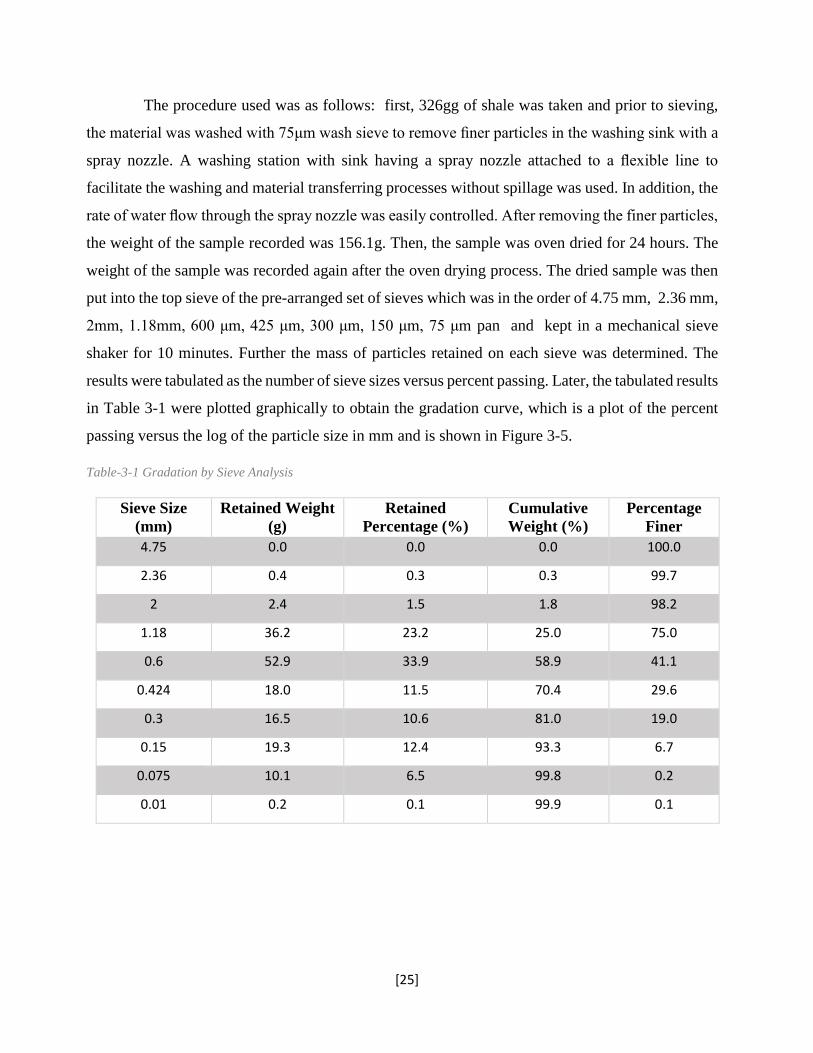
[25]
The procedure used was as follows: first, 326gg of shale was taken and prior to sieving,
the material was washed with 75μm wash sieve to remove finer particles in the washing sink with a
spray nozzle. A washing station with sink having a spray nozzle attached to a flexible line to
facilitate the washing and material transferring processes without spillage was used. In addition, the
rate of water flow through the spray nozzle was easily controlled. After removing the finer particles,
the weight of the sample recorded was 156.1g. Then, the sample was oven dried for 24 hours. The
weight of the sample was recorded again after the oven drying process. The dried sample was then
put into the top sieve of the pre-arranged set of sieves which was in the order of 4.75 mm, 2.36 mm,
2mm, 1.18mm, 600 μm, 425 μm, 300 μm, 150 μm, 75 μm pan and kept in a mechanical sieve
shaker for 10 minutes. Further the mass of particles retained on each sieve was determined. The
results were tabulated as the number of sieve sizes versus percent passing. Later, the tabulated results
in Table 3-1 were plotted graphically to obtain the gradation curve, which is a plot of the percent
passing versus the log of the particle size in mm and is shown in Figure 3-5.
Table-3-1 Gradation by Sieve Analysis
Sieve Size
(mm)
Retained Weight
(g)
Retained
Percentage (%)
Cumulative
Weight (%)
Percentage
Finer
4.75 0.0 0.0 0.0 100.0
2.36 0.4 0.3 0.3 99.7
2 2.4 1.5 1.8 98.2
1.18 36.2 23.2 25.0 75.0
0.6 52.9 33.9 58.9 41.1
0.424 18.0 11.5 70.4 29.6
0.3 16.5 10.6 81.0 19.0
0.15 19.3 12.4 93.3 6.7
0.075 10.1 6.5 99.8 0.2
0.01 0.2 0.1 99.9 0.1
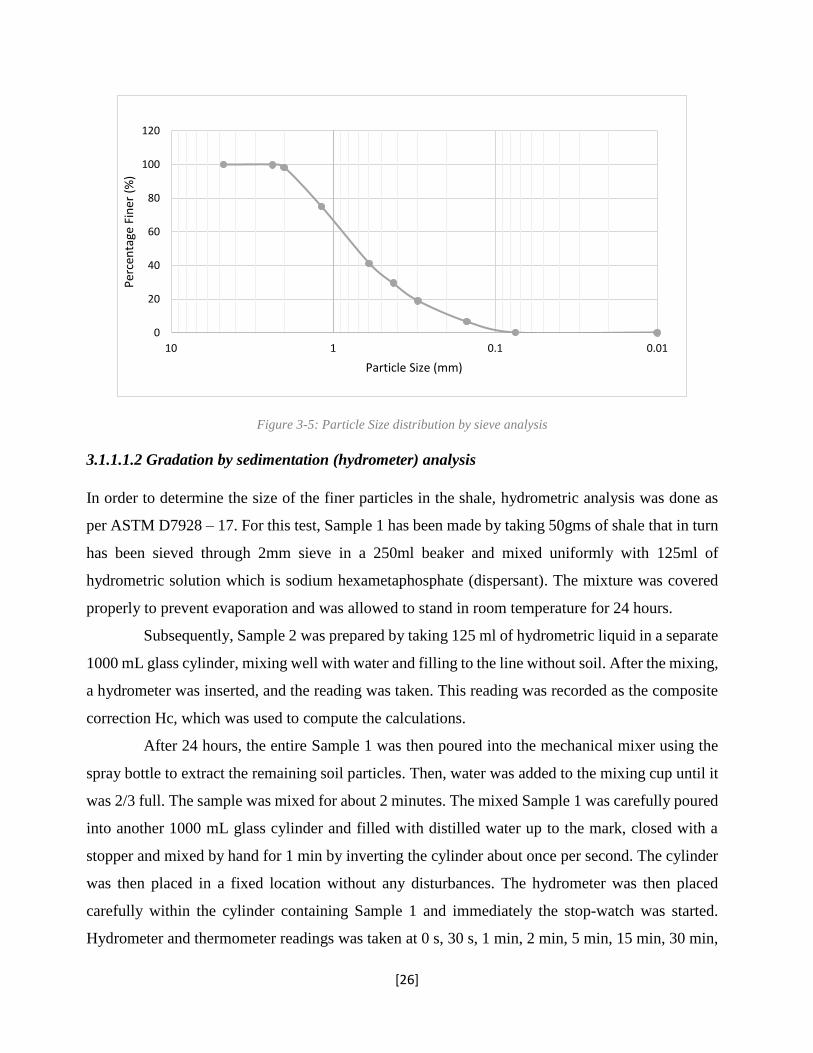
[26]
Figure 3-5: Particle Size distribution by sieve analysis
3.1.1.1.2 Gradation by sedimentation (hydrometer) analysis
In order to determine the size of the finer particles in the shale, hydrometric analysis was done as
per ASTM D7928 – 17. For this test, Sample 1 has been made by taking 50gms of shale that in turn
has been sieved through 2mm sieve in a 250ml beaker and mixed uniformly with 125ml of
hydrometric solution which is sodium hexametaphosphate (dispersant). The mixture was covered
properly to prevent evaporation and was allowed to stand in room temperature for 24 hours.
Subsequently, Sample 2 was prepared by taking 125 ml of hydrometric liquid in a separate
1000 mL glass cylinder, mixing well with water and filling to the line without soil. After the mixing,
a hydrometer was inserted, and the reading was taken. This reading was recorded as the composite
correction Hc, which was used to compute the calculations.
After 24 hours, the entire Sample 1 was then poured into the mechanical mixer using the
spray bottle to extract the remaining soil particles. Then, water was added to the mixing cup until it
was 2/3 full. The sample was mixed for about 2 minutes. The mixed Sample 1 was carefully poured
into another 1000 mL glass cylinder and filled with distilled water up to the mark, closed with a
stopper and mixed by hand for 1 min by inverting the cylinder about once per second. The cylinder
was then placed in a fixed location without any disturbances. The hydrometer was then placed
carefully within the cylinder containing Sample 1 and immediately the stop-watch was started.
Hydrometer and thermometer readings was taken at 0 s, 30 s, 1 min, 2 min, 5 min, 15 min, 30 min,
0
20
40
60
80
100
120
0.010.1110
Per
cen
tage
Fin
er (
%)
Particle Size (mm)
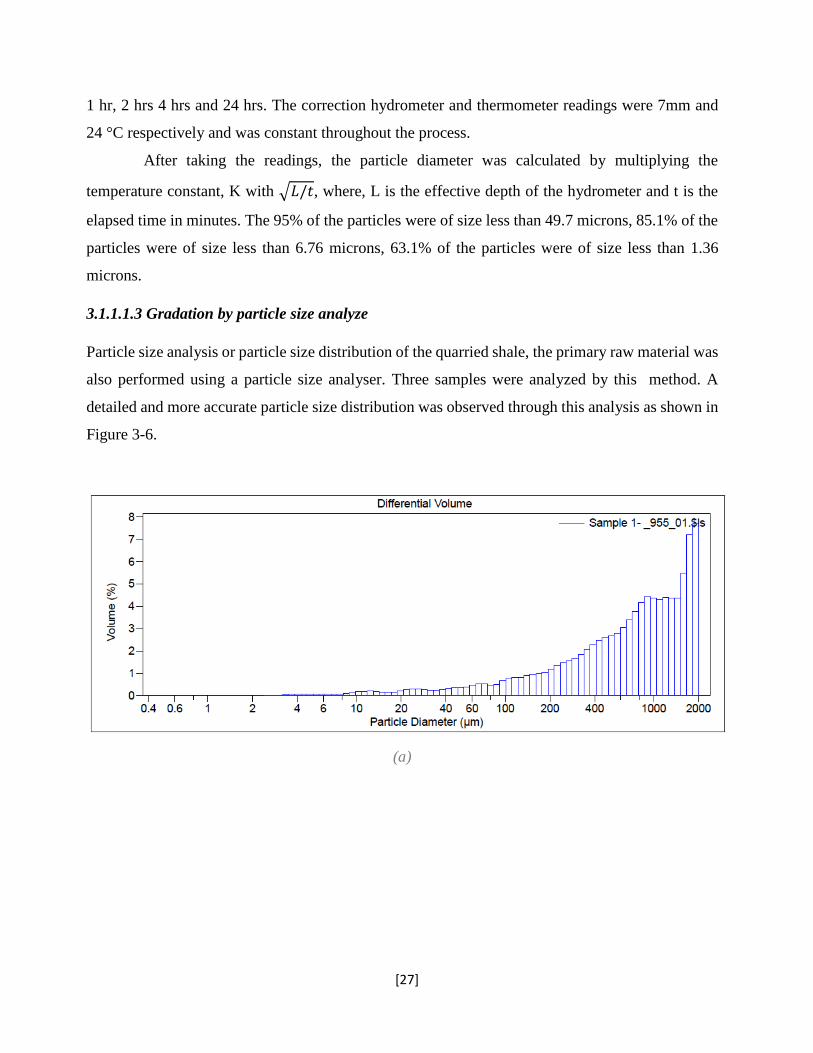
[27]
1 hr, 2 hrs 4 hrs and 24 hrs. The correction hydrometer and thermometer readings were 7mm and
24 °C respectively and was constant throughout the process.
After taking the readings, the particle diameter was calculated by multiplying the
temperature constant, K with √𝐿/𝑡, where, L is the effective depth of the hydrometer and t is the
elapsed time in minutes. The 95% of the particles were of size less than 49.7 microns, 85.1% of the
particles were of size less than 6.76 microns, 63.1% of the particles were of size less than 1.36
microns.
3.1.1.1.3 Gradation by particle size analyze
Particle size analysis or particle size distribution of the quarried shale, the primary raw material was
also performed using a particle size analyser. Three samples were analyzed by this method. A
detailed and more accurate particle size distribution was observed through this analysis as shown in
Figure 3-6.
(a)
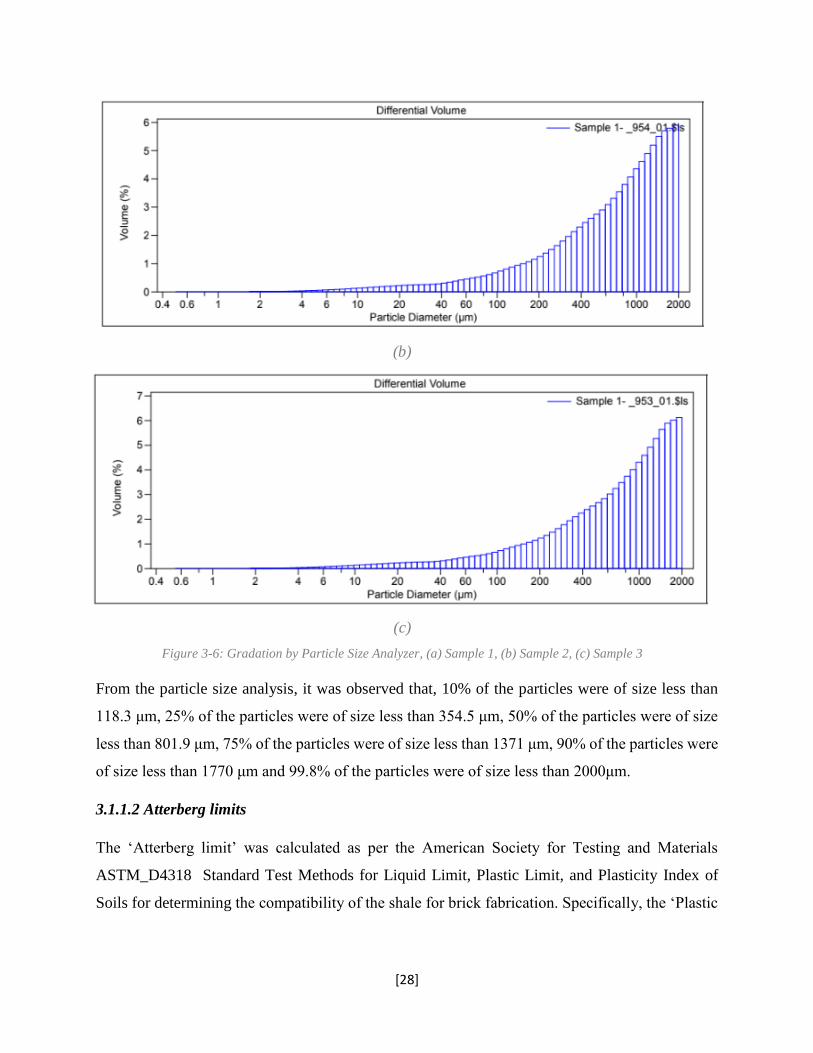
[28]
(b)
(c)
Figure 3-6: Gradation by Particle Size Analyzer, (a) Sample 1, (b) Sample 2, (c) Sample 3
From the particle size analysis, it was observed that, 10% of the particles were of size less than
118.3 μm, 25% of the particles were of size less than 354.5 μm, 50% of the particles were of size
less than 801.9 μm, 75% of the particles were of size less than 1371 μm, 90% of the particles were
of size less than 1770 μm and 99.8% of the particles were of size less than 2000μm.
3.1.1.2 Atterberg limits
The ‘Atterberg limit’ was calculated as per the American Society for Testing and Materials
ASTM_D4318 Standard Test Methods for Liquid Limit, Plastic Limit, and Plasticity Index of
Soils for determining the compatibility of the shale for brick fabrication. Specifically, the ‘Plastic
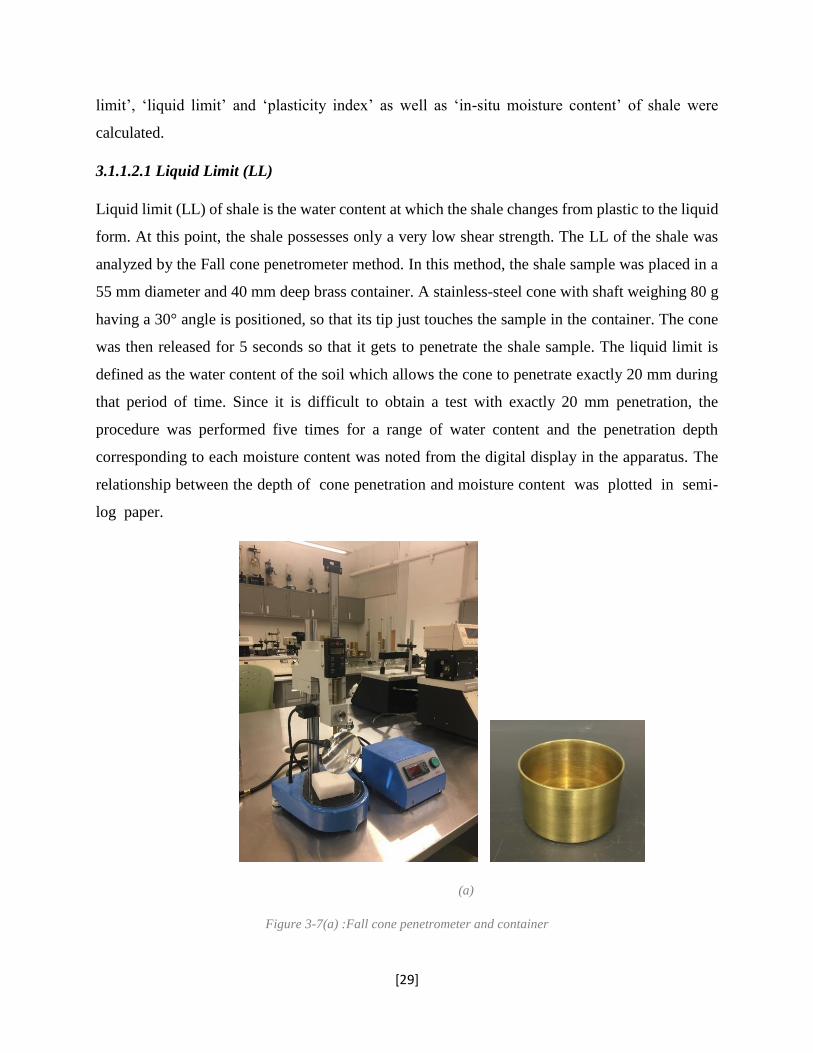
[29]
limit’, ‘liquid limit’ and ‘plasticity index’ as well as ‘in-situ moisture content’ of shale were
calculated.
3.1.1.2.1 Liquid Limit (LL)
Liquid limit (LL) of shale is the water content at which the shale changes from plastic to the liquid
form. At this point, the shale possesses only a very low shear strength. The LL of the shale was
analyzed by the Fall cone penetrometer method. In this method, the shale sample was placed in a
55 mm diameter and 40 mm deep brass container. A stainless-steel cone with shaft weighing 80 g
having a 30° angle is positioned, so that its tip just touches the sample in the container. The cone
was then released for 5 seconds so that it gets to penetrate the shale sample. The liquid limit is
defined as the water content of the soil which allows the cone to penetrate exactly 20 mm during
that period of time. Since it is difficult to obtain a test with exactly 20 mm penetration, the
procedure was performed five times for a range of water content and the penetration depth
corresponding to each moisture content was noted from the digital display in the apparatus. The
relationship between the depth of cone penetration and moisture content was plotted in semi-
log paper.
(a)
Figure 3-7(a) :Fall cone penetrometer and container
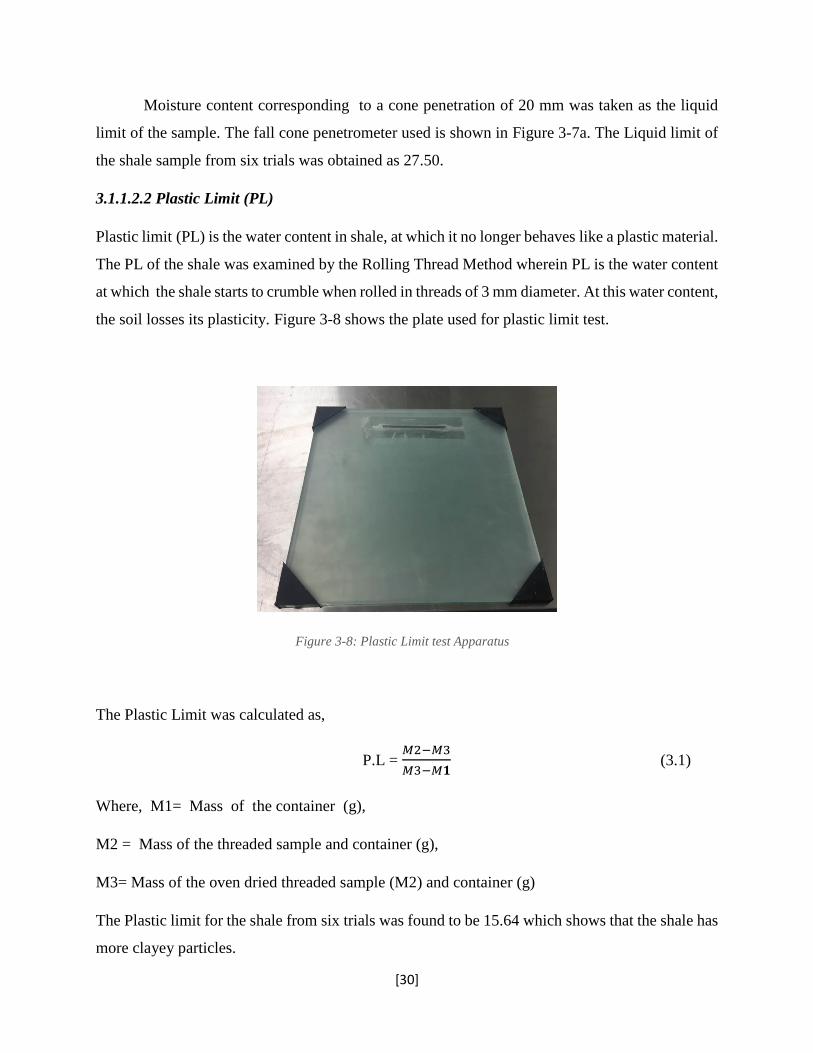
[30]
Moisture content corresponding to a cone penetration of 20 mm was taken as the liquid
limit of the sample. The fall cone penetrometer used is shown in Figure 3-7a. The Liquid limit of
the shale sample from six trials was obtained as 27.50.
3.1.1.2.2 Plastic Limit (PL)
Plastic limit (PL) is the water content in shale, at which it no longer behaves like a plastic material.
The PL of the shale was examined by the Rolling Thread Method wherein PL is the water content
at which the shale starts to crumble when rolled in threads of 3 mm diameter. At this water content,
the soil losses its plasticity. Figure 3-8 shows the plate used for plastic limit test.
Figure 3-8: Plastic Limit test Apparatus
The Plastic Limit was calculated as,
P.L = 𝑀2−𝑀3
𝑀3−𝑀𝟏 (3.1)
Where, M1= Mass of the container (g),
M2 = Mass of the threaded sample and container (g),
M3= Mass of the oven dried threaded sample (M2) and container (g)
The Plastic limit for the shale from six trials was found to be 15.64 which shows that the shale has
more clayey particles.
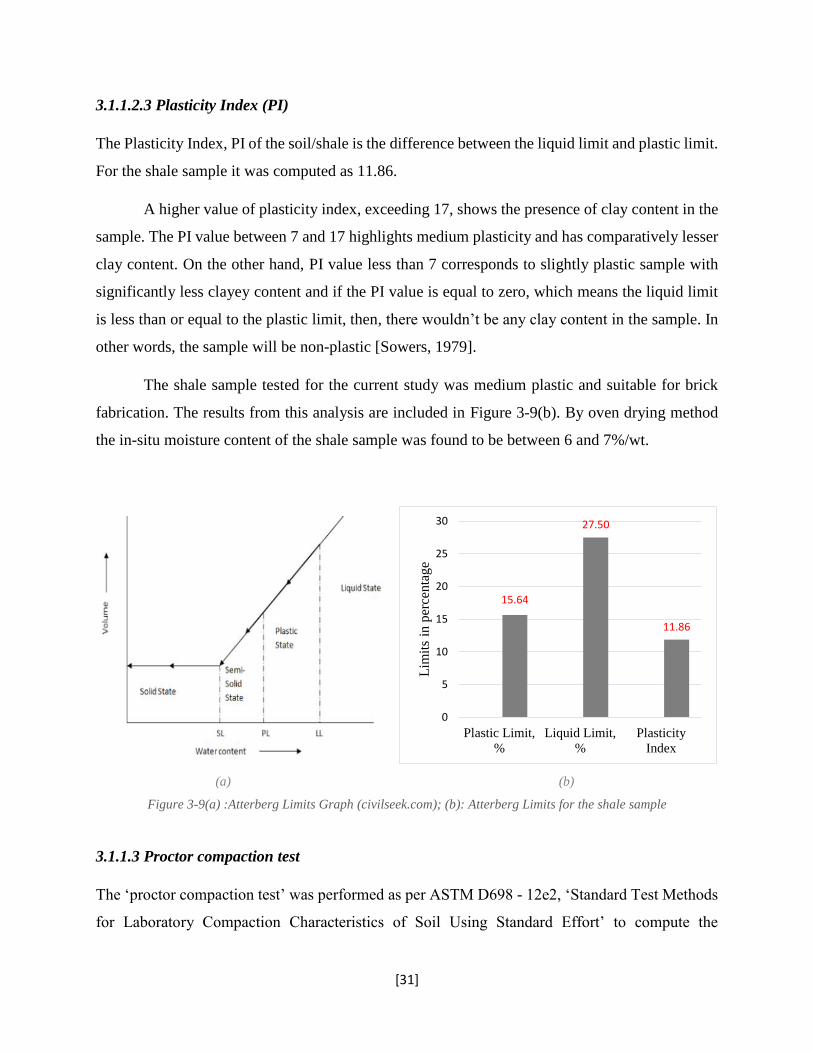
[31]
3.1.1.2.3 Plasticity Index (PI)
The Plasticity Index, PI of the soil/shale is the difference between the liquid limit and plastic limit.
For the shale sample it was computed as 11.86.
A higher value of plasticity index, exceeding 17, shows the presence of clay content in the
sample. The PI value between 7 and 17 highlights medium plasticity and has comparatively lesser
clay content. On the other hand, PI value less than 7 corresponds to slightly plastic sample with
significantly less clayey content and if the PI value is equal to zero, which means the liquid limit
is less than or equal to the plastic limit, then, there wouldn’t be any clay content in the sample. In
other words, the sample will be non-plastic [Sowers, 1979].
The shale sample tested for the current study was medium plastic and suitable for brick
fabrication. The results from this analysis are included in Figure 3-9(b). By oven drying method
the in-situ moisture content of the shale sample was found to be between 6 and 7%/wt.
(a) (b)
Figure 3-9(a) :Atterberg Limits Graph (civilseek.com); (b): Atterberg Limits for the shale sample
3.1.1.3 Proctor compaction test
The ‘proctor compaction test’ was performed as per ASTM D698 - 12e2, ‘Standard Test Methods
for Laboratory Compaction Characteristics of Soil Using Standard Effort’ to compute the
15.64
27.50
11.86
0
5
10
15
20
25
30
Plastic Limit,
%
Liquid Limit,
%
Plasticity
Index
Lim
its
in p
erce
nta
ge
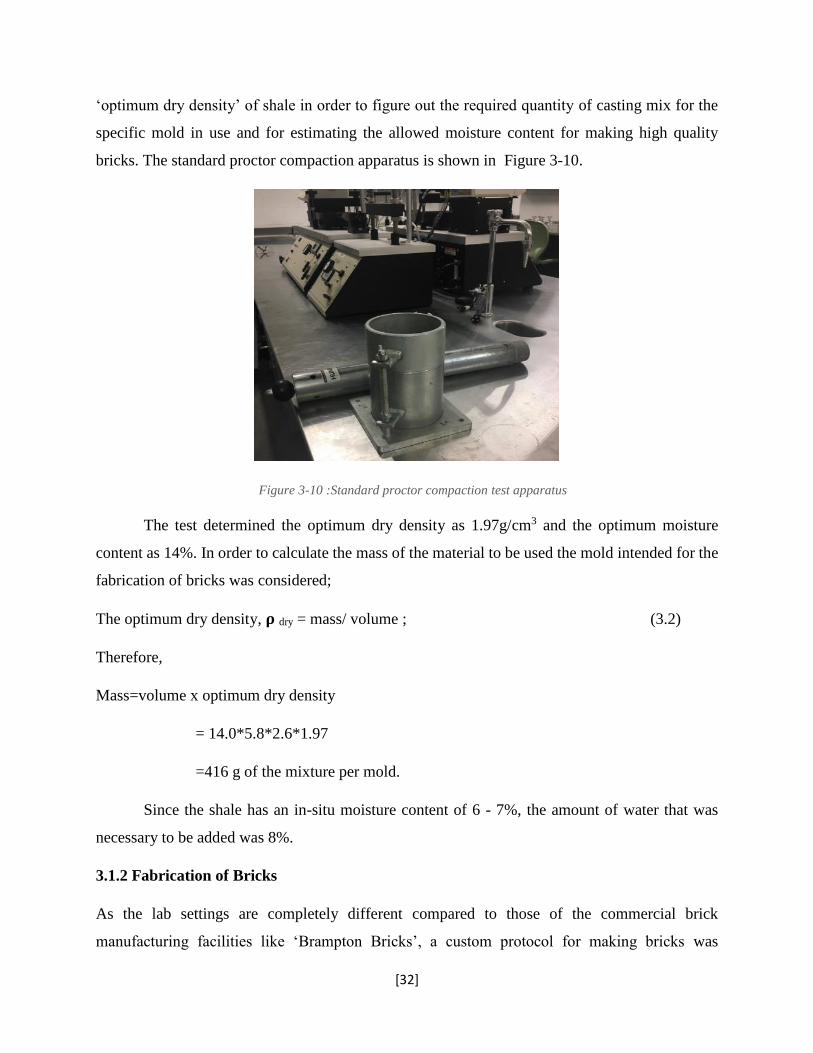
[32]
‘optimum dry density’ of shale in order to figure out the required quantity of casting mix for the
specific mold in use and for estimating the allowed moisture content for making high quality
bricks. The standard proctor compaction apparatus is shown in Figure 3-10.
Figure 3-10 :Standard proctor compaction test apparatus
The test determined the optimum dry density as 1.97g/cm3 and the optimum moisture
content as 14%. In order to calculate the mass of the material to be used the mold intended for the
fabrication of bricks was considered;
The optimum dry density, 𝛒 dry = mass/ volume ; (3.2)
Therefore,
Mass=volume x optimum dry density
= 14.0*5.8*2.6*1.97
=416 g of the mixture per mold.
Since the shale has an in-situ moisture content of 6 - 7%, the amount of water that was
necessary to be added was 8%.
3.1.2 Fabrication of Bricks
As the lab settings are completely different compared to those of the commercial brick
manufacturing facilities like ‘Brampton Bricks’, a custom protocol for making bricks was
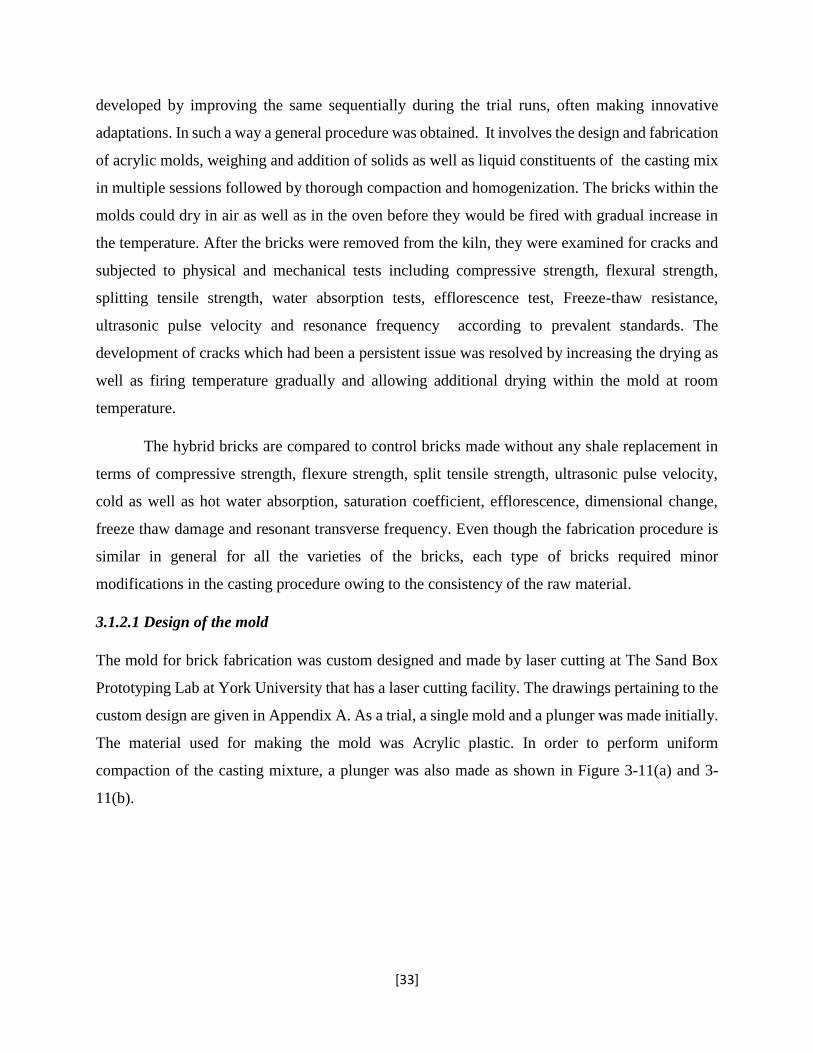
[33]
developed by improving the same sequentially during the trial runs, often making innovative
adaptations. In such a way a general procedure was obtained. It involves the design and fabrication
of acrylic molds, weighing and addition of solids as well as liquid constituents of the casting mix
in multiple sessions followed by thorough compaction and homogenization. The bricks within the
molds could dry in air as well as in the oven before they would be fired with gradual increase in
the temperature. After the bricks were removed from the kiln, they were examined for cracks and
subjected to physical and mechanical tests including compressive strength, flexural strength,
splitting tensile strength, water absorption tests, efflorescence test, Freeze-thaw resistance,
ultrasonic pulse velocity and resonance frequency according to prevalent standards. The
development of cracks which had been a persistent issue was resolved by increasing the drying as
well as firing temperature gradually and allowing additional drying within the mold at room
temperature.
The hybrid bricks are compared to control bricks made without any shale replacement in
terms of compressive strength, flexure strength, split tensile strength, ultrasonic pulse velocity,
cold as well as hot water absorption, saturation coefficient, efflorescence, dimensional change,
freeze thaw damage and resonant transverse frequency. Even though the fabrication procedure is
similar in general for all the varieties of the bricks, each type of bricks required minor
modifications in the casting procedure owing to the consistency of the raw material.
3.1.2.1 Design of the mold
The mold for brick fabrication was custom designed and made by laser cutting at The Sand Box
Prototyping Lab at York University that has a laser cutting facility. The drawings pertaining to the
custom design are given in Appendix A. As a trial, a single mold and a plunger was made initially.
The material used for making the mold was Acrylic plastic. In order to perform uniform
compaction of the casting mixture, a plunger was also made as shown in Figure 3-11(a) and 3-
11(b).
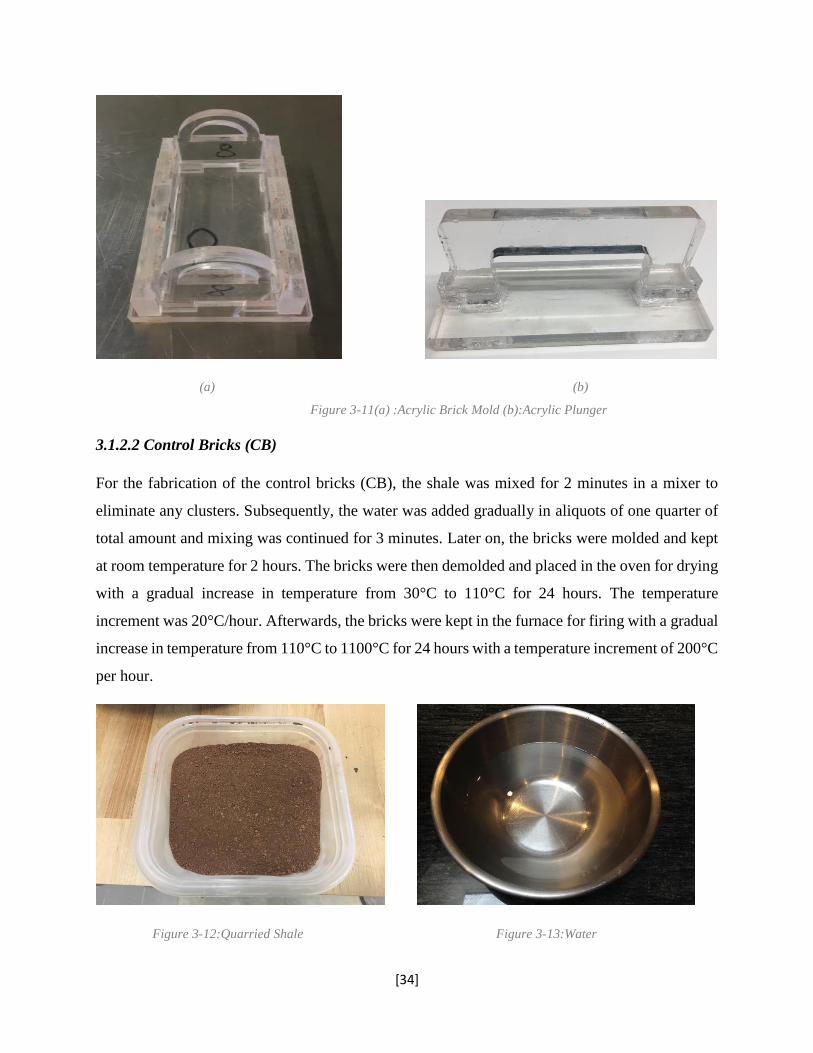
[34]
(a) (b)
Figure 3-11(a) :Acrylic Brick Mold (b):Acrylic Plunger
3.1.2.2 Control Bricks (CB)
For the fabrication of the control bricks (CB), the shale was mixed for 2 minutes in a mixer to
eliminate any clusters. Subsequently, the water was added gradually in aliquots of one quarter of
total amount and mixing was continued for 3 minutes. Later on, the bricks were molded and kept
at room temperature for 2 hours. The bricks were then demolded and placed in the oven for drying
with a gradual increase in temperature from 30°C to 110°C for 24 hours. The temperature
increment was 20°C/hour. Afterwards, the bricks were kept in the furnace for firing with a gradual
increase in temperature from 110°C to 1100°C for 24 hours with a temperature increment of 200°C
per hour.
Figure 3-12:Quarried Shale Figure 3-13:Water
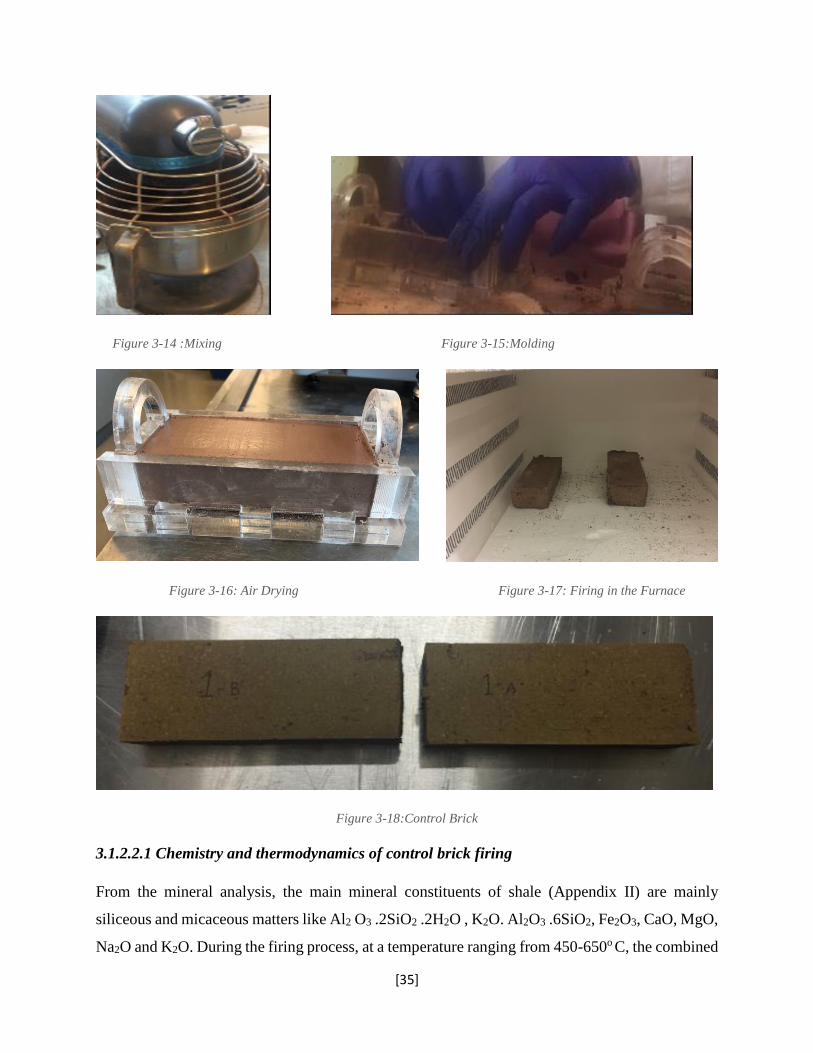
[35]
Figure 3-14 :Mixing Figure 3-15:Molding
Figure 3-16: Air Drying Figure 3-17: Firing in the Furnace
Figure 3-18:Control Brick
3.1.2.2.1 Chemistry and thermodynamics of control brick firing
From the mineral analysis, the main mineral constituents of shale (Appendix II) are mainly
siliceous and micaceous matters like Al2 O3 .2SiO2 .2H2O , K2O. Al2O3 .6SiO2, Fe2O3, CaO, MgO,
Na2O and K2O. During the firing process, at a temperature ranging from 450-650o C, the combined
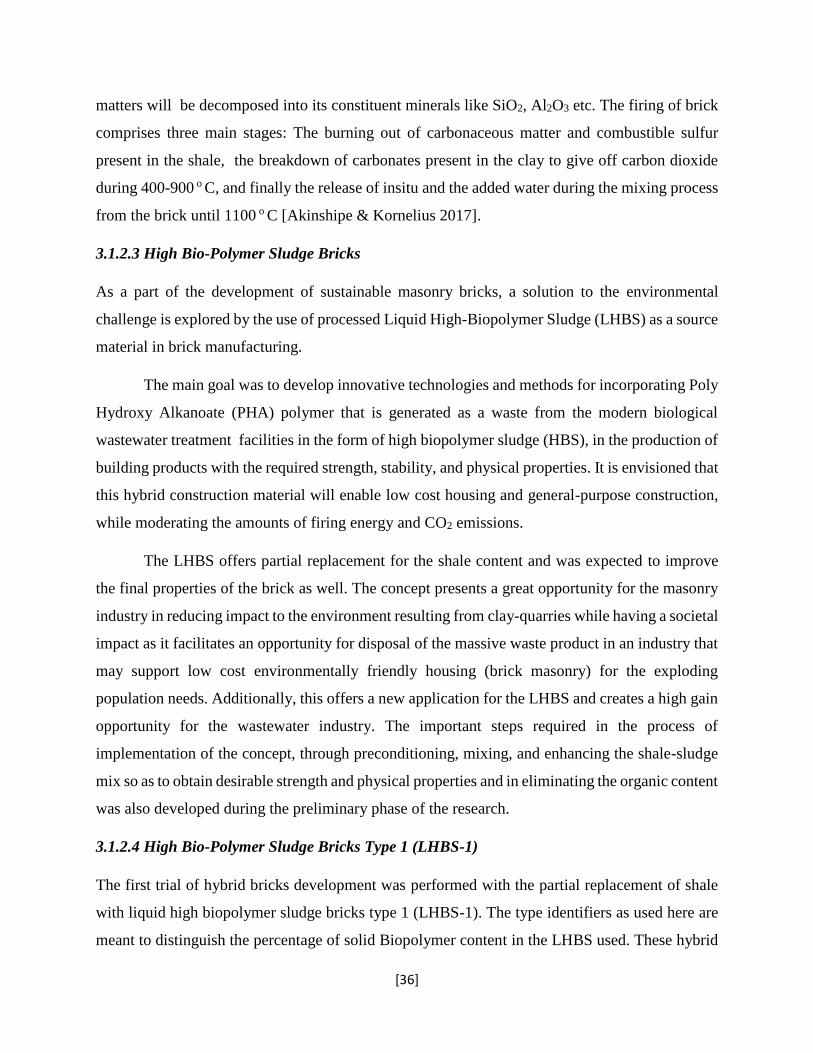
[36]
matters will be decomposed into its constituent minerals like SiO2, Al2O3 etc. The firing of brick
comprises three main stages: The burning out of carbonaceous matter and combustible sulfur
present in the shale, the breakdown of carbonates present in the clay to give off carbon dioxide
during 400-900 o C, and finally the release of insitu and the added water during the mixing process
from the brick until 1100 o C [Akinshipe & Kornelius 2017].
3.1.2.3 High Bio-Polymer Sludge Bricks
As a part of the development of sustainable masonry bricks, a solution to the environmental
challenge is explored by the use of processed Liquid High-Biopolymer Sludge (LHBS) as a source
material in brick manufacturing.
The main goal was to develop innovative technologies and methods for incorporating Poly
Hydroxy Alkanoate (PHA) polymer that is generated as a waste from the modern biological
wastewater treatment facilities in the form of high biopolymer sludge (HBS), in the production of
building products with the required strength, stability, and physical properties. It is envisioned that
this hybrid construction material will enable low cost housing and general-purpose construction,
while moderating the amounts of firing energy and CO2 emissions.
The LHBS offers partial replacement for the shale content and was expected to improve
the final properties of the brick as well. The concept presents a great opportunity for the masonry
industry in reducing impact to the environment resulting from clay-quarries while having a societal
impact as it facilitates an opportunity for disposal of the massive waste product in an industry that
may support low cost environmentally friendly housing (brick masonry) for the exploding
population needs. Additionally, this offers a new application for the LHBS and creates a high gain
opportunity for the wastewater industry. The important steps required in the process of
implementation of the concept, through preconditioning, mixing, and enhancing the shale-sludge
mix so as to obtain desirable strength and physical properties and in eliminating the organic content
was also developed during the preliminary phase of the research.
3.1.2.4 High Bio-Polymer Sludge Bricks Type 1 (LHBS-1)
The first trial of hybrid bricks development was performed with the partial replacement of shale
with liquid high biopolymer sludge bricks type 1 (LHBS-1). The type identifiers as used here are
meant to distinguish the percentage of solid Biopolymer content in the LHBS used. These hybrid
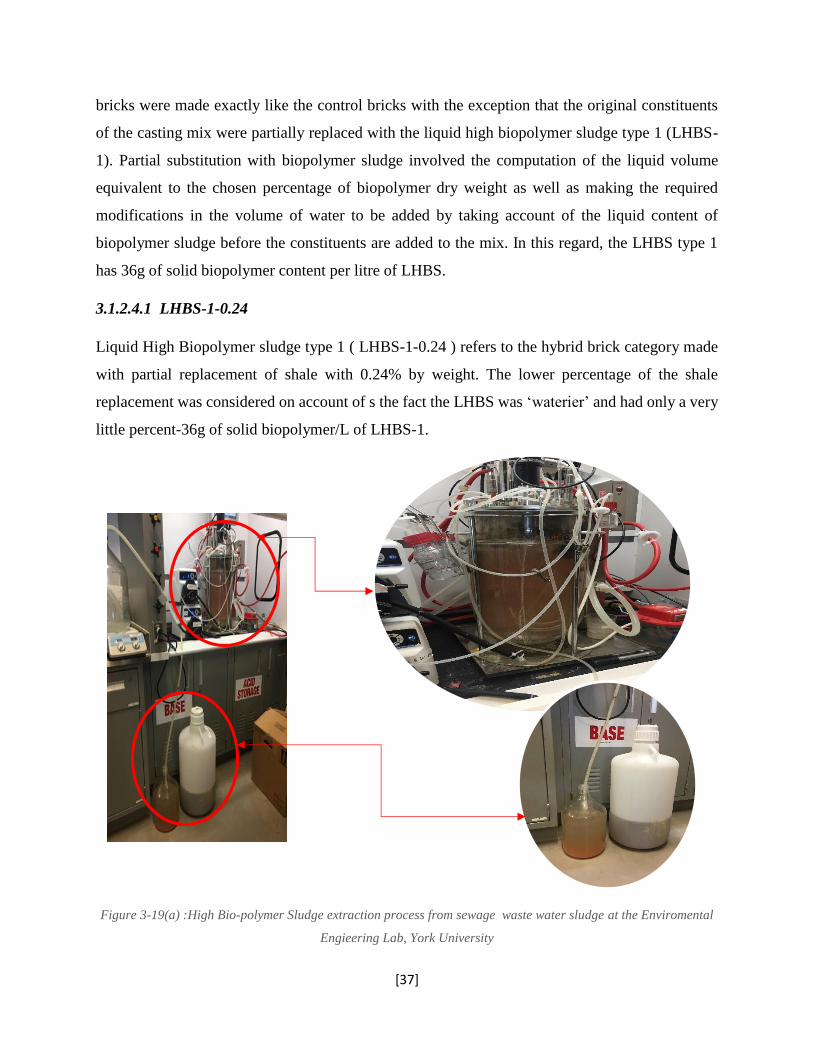
[37]
bricks were made exactly like the control bricks with the exception that the original constituents
of the casting mix were partially replaced with the liquid high biopolymer sludge type 1 (LHBS-
1). Partial substitution with biopolymer sludge involved the computation of the liquid volume
equivalent to the chosen percentage of biopolymer dry weight as well as making the required
modifications in the volume of water to be added by taking account of the liquid content of
biopolymer sludge before the constituents are added to the mix. In this regard, the LHBS type 1
has 36g of solid biopolymer content per litre of LHBS.
3.1.2.4.1 LHBS-1-0.24
Liquid High Biopolymer sludge type 1 ( LHBS-1-0.24 ) refers to the hybrid brick category made
with partial replacement of shale with 0.24% by weight. The lower percentage of the shale
replacement was considered on account of s the fact the LHBS was ‘waterier’ and had only a very
little percent-36g of solid biopolymer/L of LHBS-1.
Figure 3-19(a) :High Bio-polymer Sludge extraction process from sewage waste water sludge at the Enviromental
Engieering Lab, York University
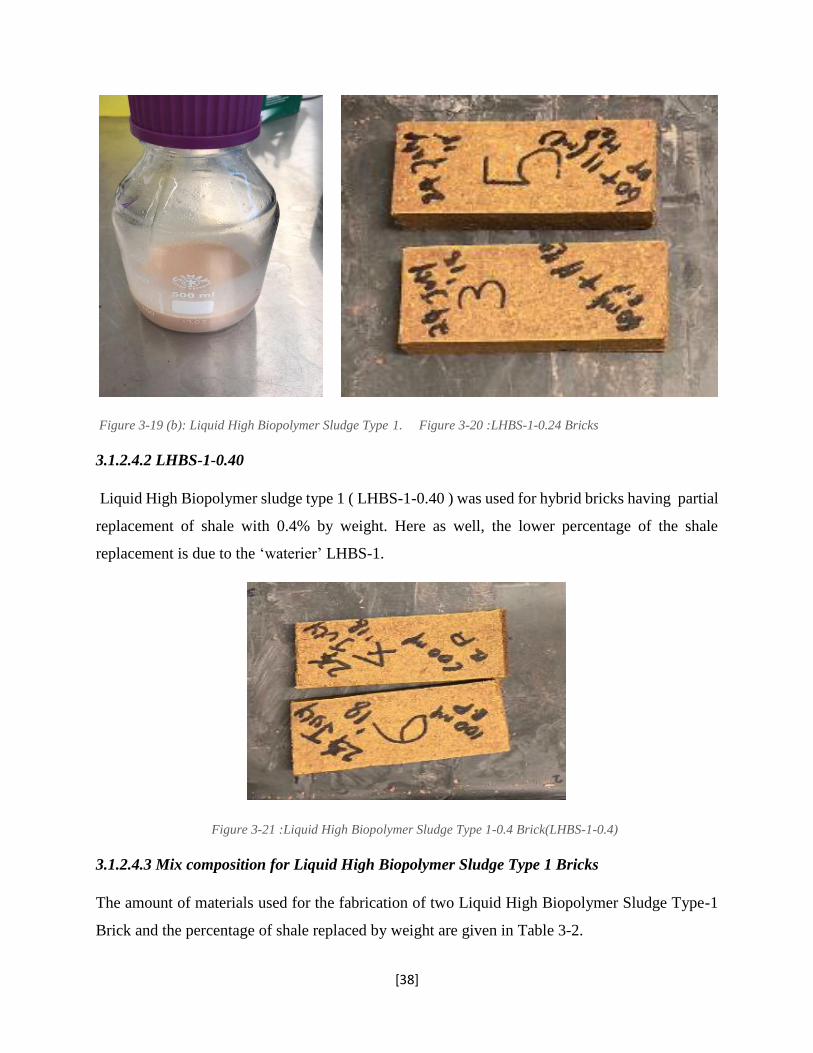
[38]
Figure 3-19 (b): Liquid High Biopolymer Sludge Type 1. Figure 3-20 :LHBS-1-0.24 Bricks
3.1.2.4.2 LHBS-1-0.40
Liquid High Biopolymer sludge type 1 ( LHBS-1-0.40 ) was used for hybrid bricks having partial
replacement of shale with 0.4% by weight. Here as well, the lower percentage of the shale
replacement is due to the ‘waterier’ LHBS-1.
Figure 3-21 :Liquid High Biopolymer Sludge Type 1-0.4 Brick(LHBS-1-0.4)
3.1.2.4.3 Mix composition for Liquid High Biopolymer Sludge Type 1 Bricks
The amount of materials used for the fabrication of two Liquid High Biopolymer Sludge Type-1
Brick and the percentage of shale replaced by weight are given in Table 3-2.
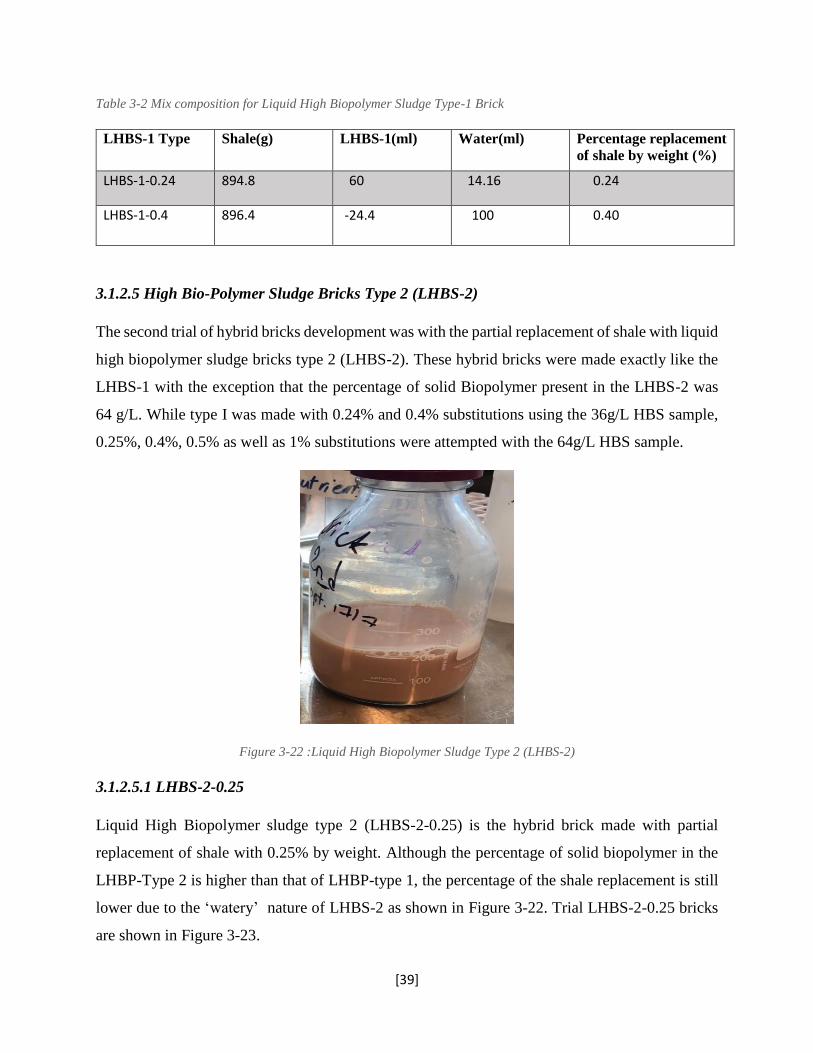
[39]
Table 3-2 Mix composition for Liquid High Biopolymer Sludge Type-1 Brick
LHBS-1 Type Shale(g) LHBS-1(ml) Water(ml) Percentage replacement
of shale by weight (%)
LHBS-1-0.24 894.8 60 14.16 0.24
LHBS-1-0.4 896.4 -24.4 100 0.40
3.1.2.5 High Bio-Polymer Sludge Bricks Type 2 (LHBS-2)
The second trial of hybrid bricks development was with the partial replacement of shale with liquid
high biopolymer sludge bricks type 2 (LHBS-2). These hybrid bricks were made exactly like the
LHBS-1 with the exception that the percentage of solid Biopolymer present in the LHBS-2 was
64 g/L. While type I was made with 0.24% and 0.4% substitutions using the 36g/L HBS sample,
0.25%, 0.4%, 0.5% as well as 1% substitutions were attempted with the 64g/L HBS sample.
Figure 3-22 :Liquid High Biopolymer Sludge Type 2 (LHBS-2)
3.1.2.5.1 LHBS-2-0.25
Liquid High Biopolymer sludge type 2 (LHBS-2-0.25) is the hybrid brick made with partial
replacement of shale with 0.25% by weight. Although the percentage of solid biopolymer in the
LHBP-Type 2 is higher than that of LHBP-type 1, the percentage of the shale replacement is still
lower due to the ‘watery’ nature of LHBS-2 as shown in Figure 3-22. Trial LHBS-2-0.25 bricks
are shown in Figure 3-23.
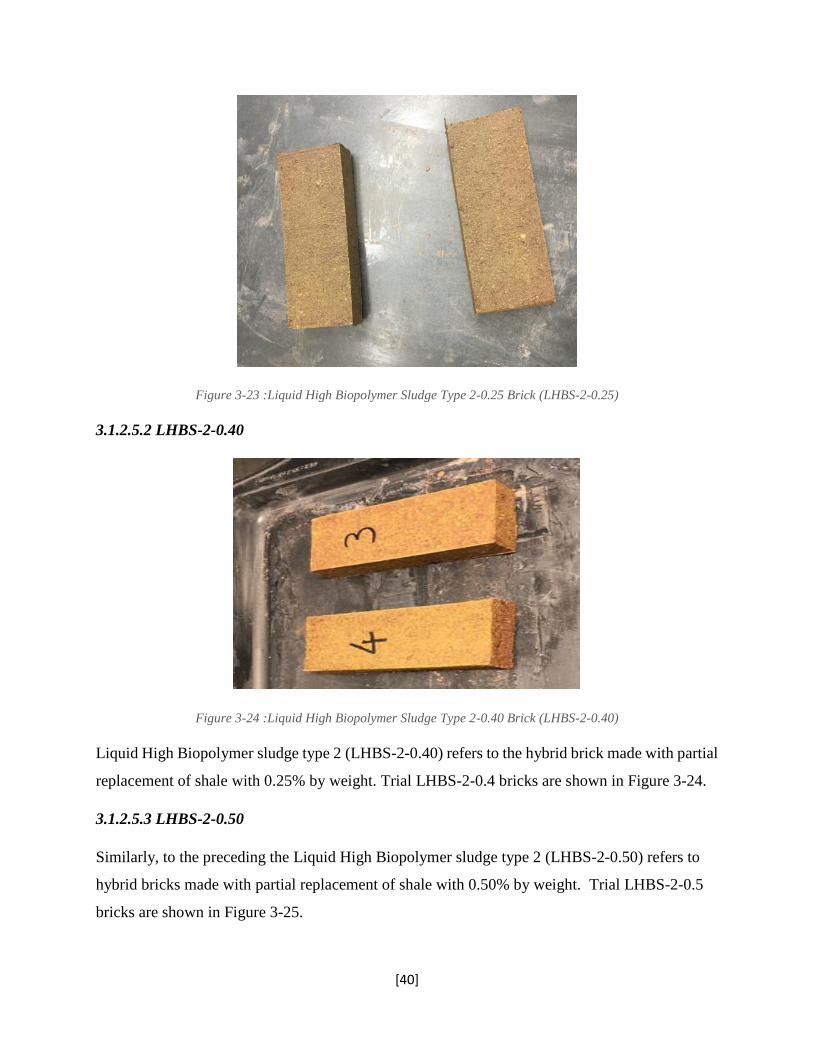
[40]
Figure 3-23 :Liquid High Biopolymer Sludge Type 2-0.25 Brick (LHBS-2-0.25)
3.1.2.5.2 LHBS-2-0.40
Figure 3-24 :Liquid High Biopolymer Sludge Type 2-0.40 Brick (LHBS-2-0.40)
Liquid High Biopolymer sludge type 2 (LHBS-2-0.40) refers to the hybrid brick made with partial
replacement of shale with 0.25% by weight. Trial LHBS-2-0.4 bricks are shown in Figure 3-24.
3.1.2.5.3 LHBS-2-0.50
Similarly, to the preceding the Liquid High Biopolymer sludge type 2 (LHBS-2-0.50) refers to
hybrid bricks made with partial replacement of shale with 0.50% by weight. Trial LHBS-2-0.5
bricks are shown in Figure 3-25.
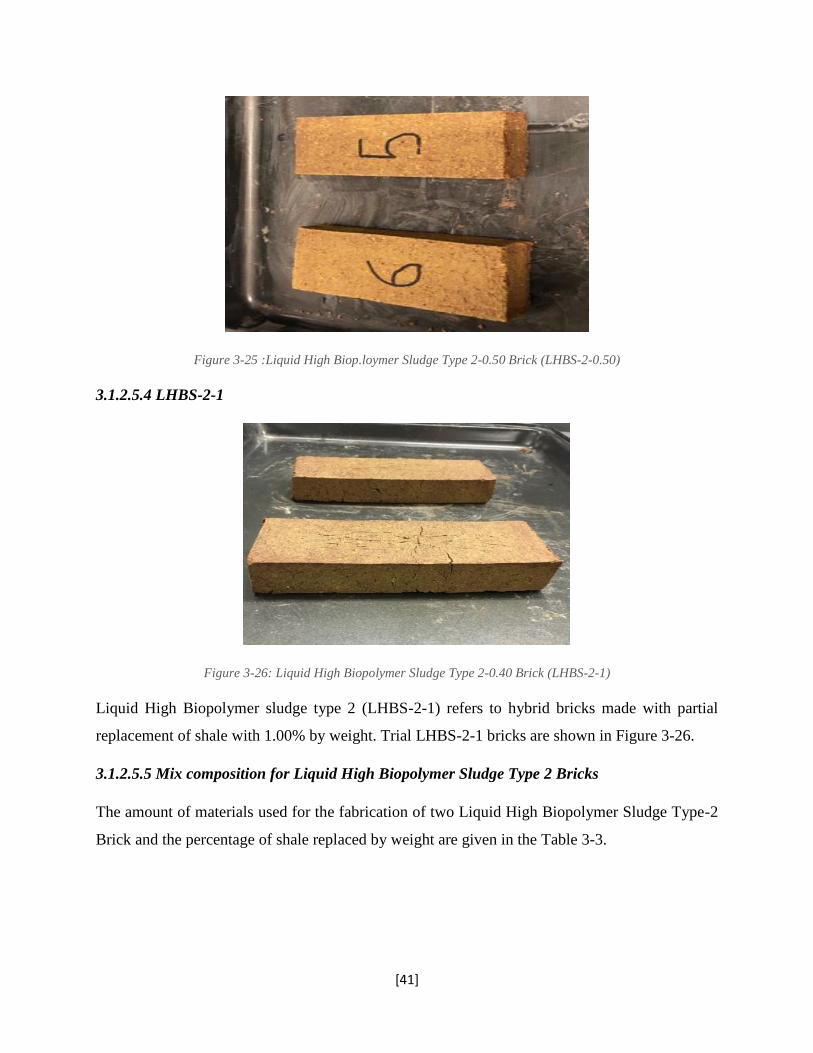
[41]
Figure 3-25 :Liquid High Biop.loymer Sludge Type 2-0.50 Brick (LHBS-2-0.50)
3.1.2.5.4 LHBS-2-1
Figure 3-26: Liquid High Biopolymer Sludge Type 2-0.40 Brick (LHBS-2-1)
Liquid High Biopolymer sludge type 2 (LHBS-2-1) refers to hybrid bricks made with partial
replacement of shale with 1.00% by weight. Trial LHBS-2-1 bricks are shown in Figure 3-26.
3.1.2.5.5 Mix composition for Liquid High Biopolymer Sludge Type 2 Bricks
The amount of materials used for the fabrication of two Liquid High Biopolymer Sludge Type-2
Brick and the percentage of shale replaced by weight are given in the Table 3-3.
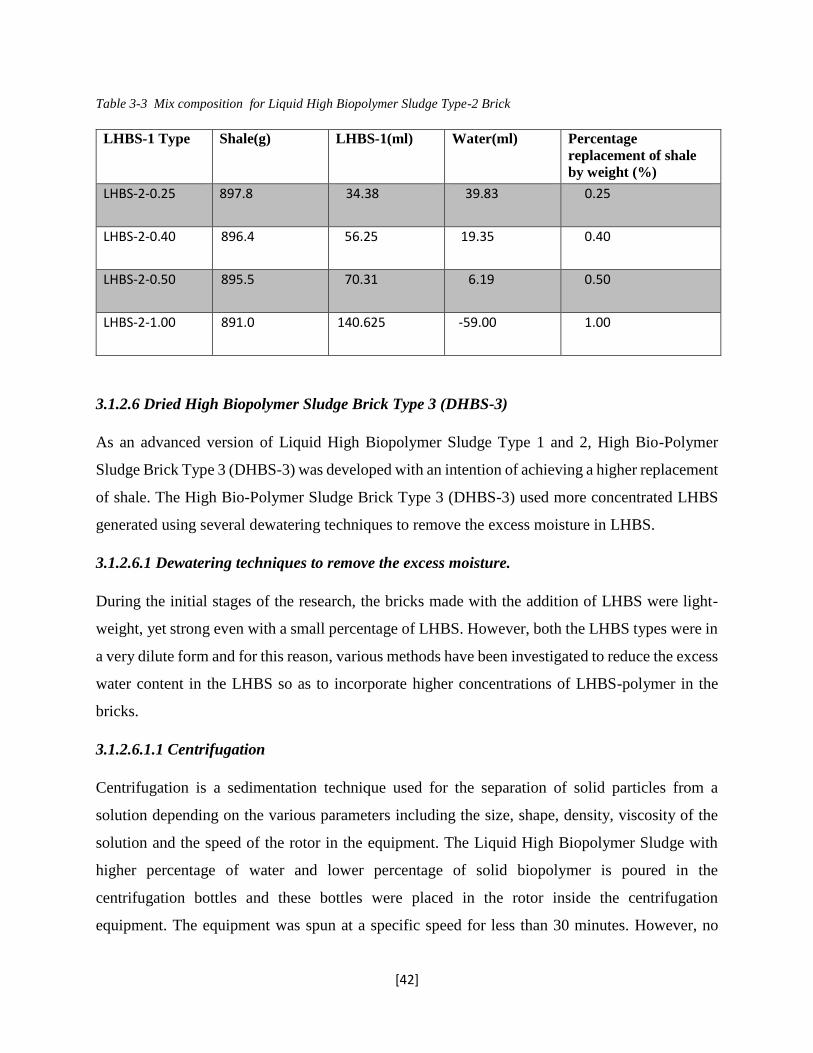
[42]
Table 3-3 Mix composition for Liquid High Biopolymer Sludge Type-2 Brick
LHBS-1 Type Shale(g) LHBS-1(ml) Water(ml) Percentage
replacement of shale
by weight (%)
LHBS-2-0.25
897.8 34.38 39.83 0.25
LHBS-2-0.40 896.4 56.25 19.35 0.40
LHBS-2-0.50 895.5 70.31 6.19 0.50
LHBS-2-1.00 891.0 140.625 -59.00 1.00
3.1.2.6 Dried High Biopolymer Sludge Brick Type 3 (DHBS-3)
As an advanced version of Liquid High Biopolymer Sludge Type 1 and 2, High Bio-Polymer
Sludge Brick Type 3 (DHBS-3) was developed with an intention of achieving a higher replacement
of shale. The High Bio-Polymer Sludge Brick Type 3 (DHBS-3) used more concentrated LHBS
generated using several dewatering techniques to remove the excess moisture in LHBS.
3.1.2.6.1 Dewatering techniques to remove the excess moisture.
During the initial stages of the research, the bricks made with the addition of LHBS were light-
weight, yet strong even with a small percentage of LHBS. However, both the LHBS types were in
a very dilute form and for this reason, various methods have been investigated to reduce the excess
water content in the LHBS so as to incorporate higher concentrations of LHBS-polymer in the
bricks.
3.1.2.6.1.1 Centrifugation
Centrifugation is a sedimentation technique used for the separation of solid particles from a
solution depending on the various parameters including the size, shape, density, viscosity of the
solution and the speed of the rotor in the equipment. The Liquid High Biopolymer Sludge with
higher percentage of water and lower percentage of solid biopolymer is poured in the
centrifugation bottles and these bottles were placed in the rotor inside the centrifugation
equipment. The equipment was spun at a specific speed for less than 30 minutes. However, no
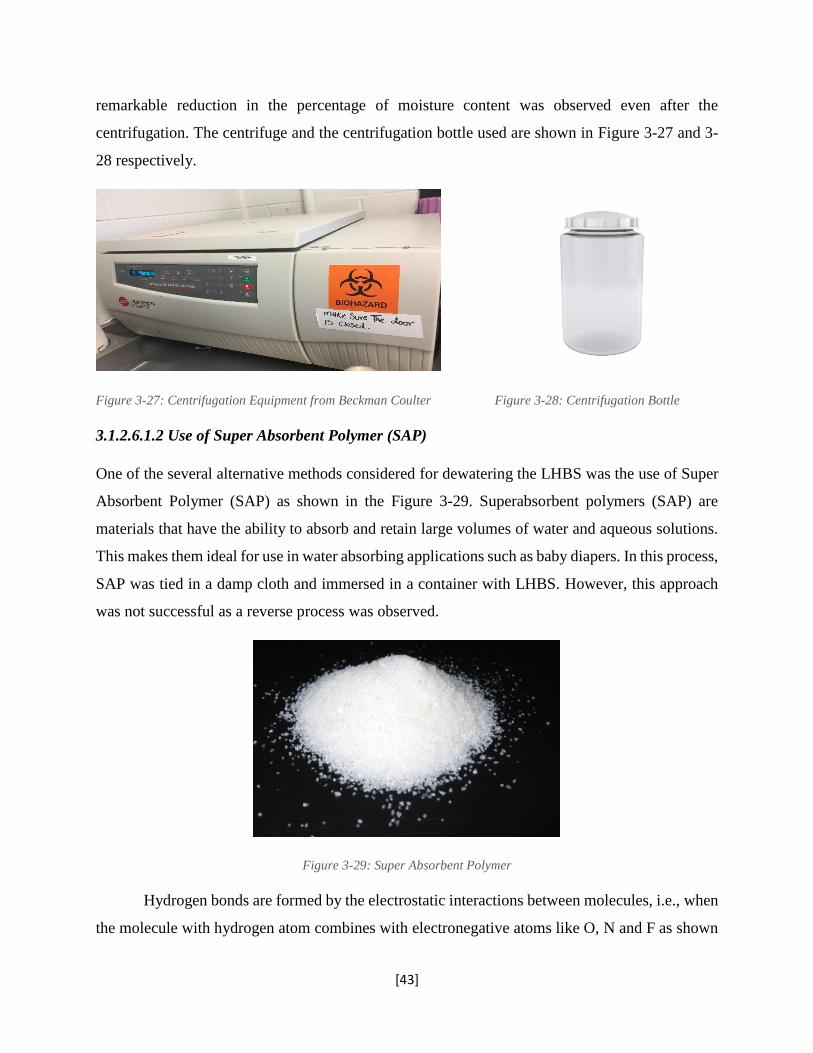
[43]
remarkable reduction in the percentage of moisture content was observed even after the
centrifugation. The centrifuge and the centrifugation bottle used are shown in Figure 3-27 and 3-
28 respectively.
Figure 3-27: Centrifugation Equipment from Beckman Coulter Figure 3-28: Centrifugation Bottle
3.1.2.6.1.2 Use of Super Absorbent Polymer (SAP)
One of the several alternative methods considered for dewatering the LHBS was the use of Super
Absorbent Polymer (SAP) as shown in the Figure 3-29. Superabsorbent polymers (SAP) are
materials that have the ability to absorb and retain large volumes of water and aqueous solutions.
This makes them ideal for use in water absorbing applications such as baby diapers. In this process,
SAP was tied in a damp cloth and immersed in a container with LHBS. However, this approach
was not successful as a reverse process was observed.
Figure 3-29: Super Absorbent Polymer
Hydrogen bonds are formed by the electrostatic interactions between molecules, i.e., when
the molecule with hydrogen atom combines with electronegative atoms like O, N and F as shown
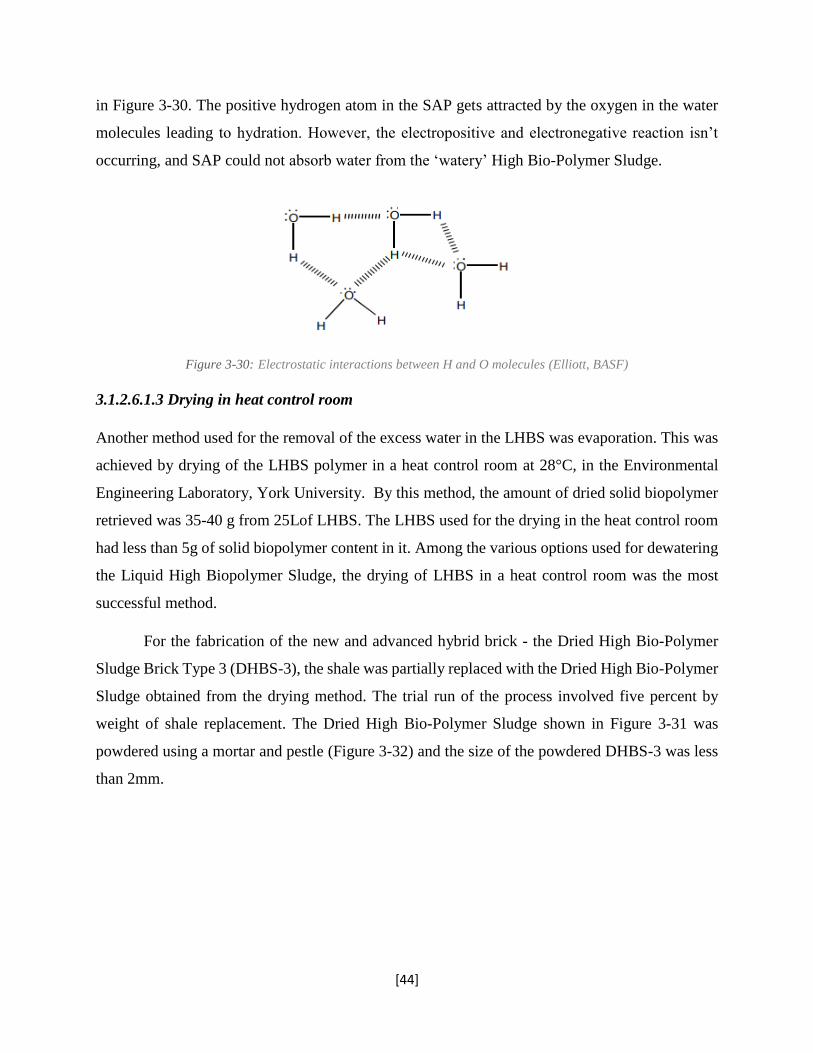
[44]
in Figure 3-30. The positive hydrogen atom in the SAP gets attracted by the oxygen in the water
molecules leading to hydration. However, the electropositive and electronegative reaction isn’t
occurring, and SAP could not absorb water from the ‘watery’ High Bio-Polymer Sludge.
Figure 3-30: Electrostatic interactions between H and O molecules (Elliott, BASF)
3.1.2.6.1.3 Drying in heat control room
Another method used for the removal of the excess water in the LHBS was evaporation. This was
achieved by drying of the LHBS polymer in a heat control room at 28°C, in the Environmental
Engineering Laboratory, York University. By this method, the amount of dried solid biopolymer
retrieved was 35-40 g from 25Lof LHBS. The LHBS used for the drying in the heat control room
had less than 5g of solid biopolymer content in it. Among the various options used for dewatering
the Liquid High Biopolymer Sludge, the drying of LHBS in a heat control room was the most
successful method.
For the fabrication of the new and advanced hybrid brick - the Dried High Bio-Polymer
Sludge Brick Type 3 (DHBS-3), the shale was partially replaced with the Dried High Bio-Polymer
Sludge obtained from the drying method. The trial run of the process involved five percent by
weight of shale replacement. The Dried High Bio-Polymer Sludge shown in Figure 3-31 was
powdered using a mortar and pestle (Figure 3-32) and the size of the powdered DHBS-3 was less
than 2mm.
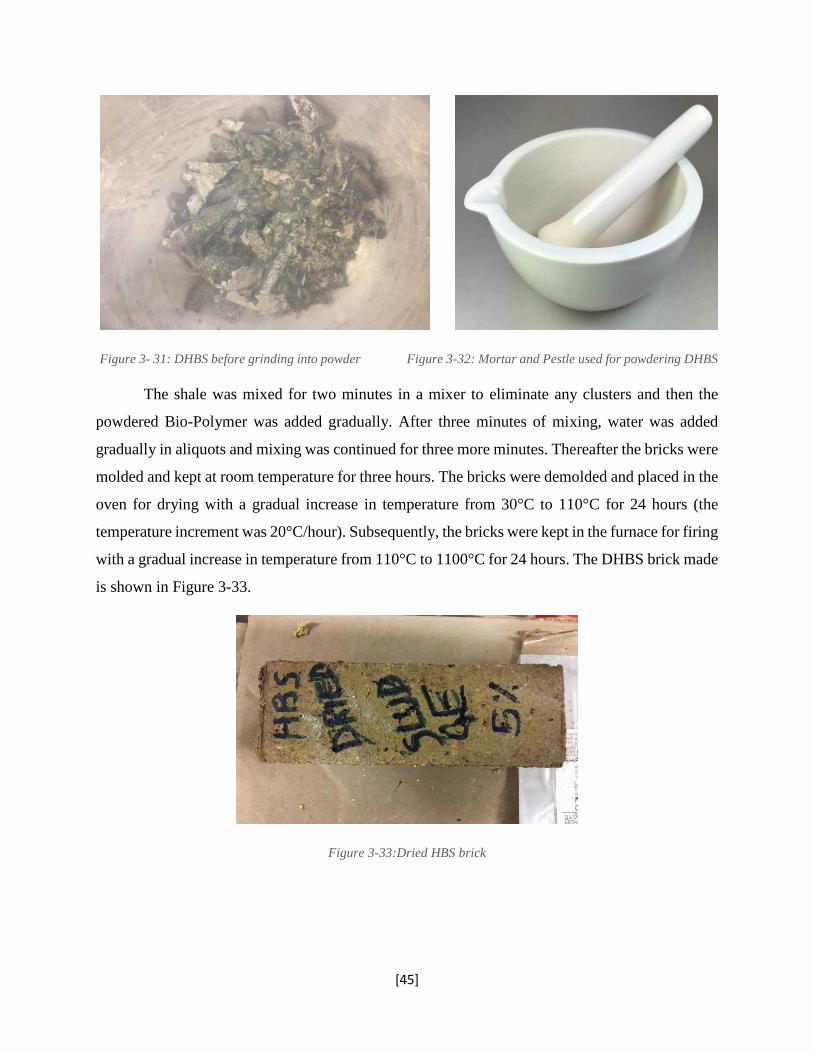
[45]
Figure 3- 31: DHBS before grinding into powder Figure 3-32: Mortar and Pestle used for powdering DHBS
The shale was mixed for two minutes in a mixer to eliminate any clusters and then the
powdered Bio-Polymer was added gradually. After three minutes of mixing, water was added
gradually in aliquots and mixing was continued for three more minutes. Thereafter the bricks were
molded and kept at room temperature for three hours. The bricks were demolded and placed in the
oven for drying with a gradual increase in temperature from 30°C to 110°C for 24 hours (the
temperature increment was 20°C/hour). Subsequently, the bricks were kept in the furnace for firing
with a gradual increase in temperature from 110°C to 1100°C for 24 hours. The DHBS brick made
is shown in Figure 3-33.
Figure 3-33:Dried HBS brick
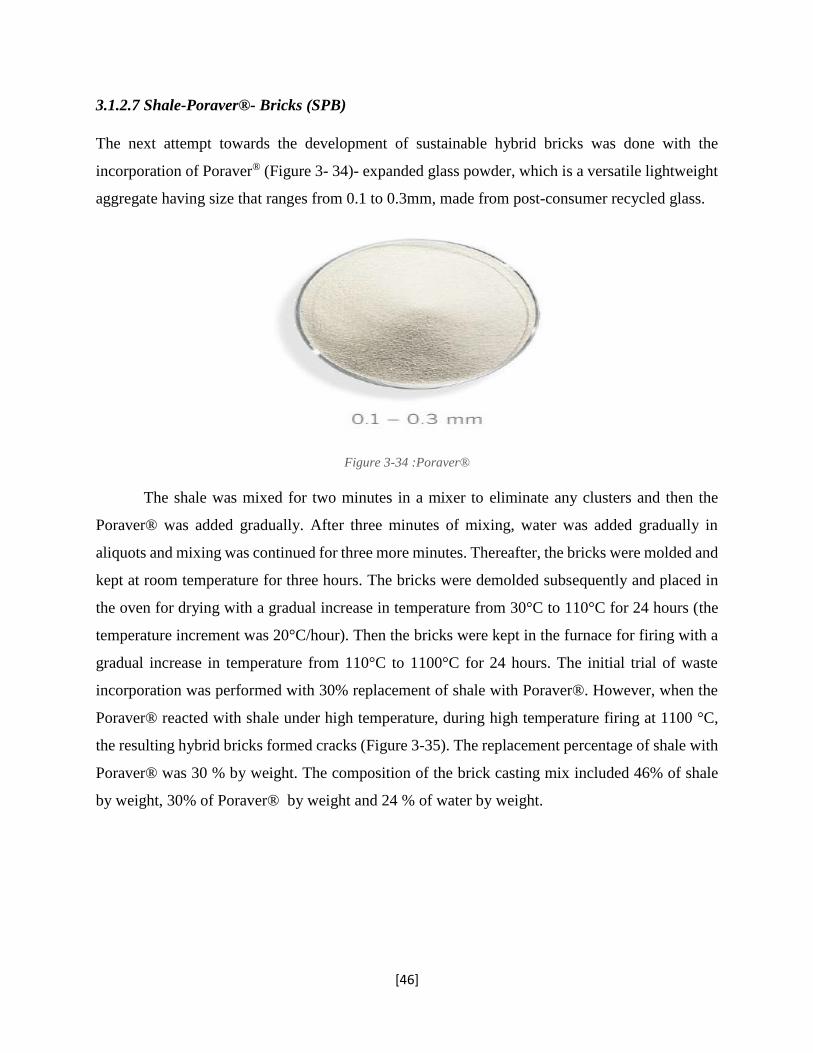
[46]
3.1.2.7 Shale-Poraver®- Bricks (SPB)
The next attempt towards the development of sustainable hybrid bricks was done with the
incorporation of Poraver® (Figure 3- 34)- expanded glass powder, which is a versatile lightweight
aggregate having size that ranges from 0.1 to 0.3mm, made from post-consumer recycled glass.
Figure 3-34 :Poraver®
The shale was mixed for two minutes in a mixer to eliminate any clusters and then the
Poraver® was added gradually. After three minutes of mixing, water was added gradually in
aliquots and mixing was continued for three more minutes. Thereafter, the bricks were molded and
kept at room temperature for three hours. The bricks were demolded subsequently and placed in
the oven for drying with a gradual increase in temperature from 30°C to 110°C for 24 hours (the
temperature increment was 20°C/hour). Then the bricks were kept in the furnace for firing with a
gradual increase in temperature from 110°C to 1100°C for 24 hours. The initial trial of waste
incorporation was performed with 30% replacement of shale with Poraver®. However, when the
Poraver® reacted with shale under high temperature, during high temperature firing at 1100 °C,
the resulting hybrid bricks formed cracks (Figure 3-35). The replacement percentage of shale with
Poraver® was 30 % by weight. The composition of the brick casting mix included 46% of shale
by weight, 30% of Poraver® by weight and 24 % of water by weight.
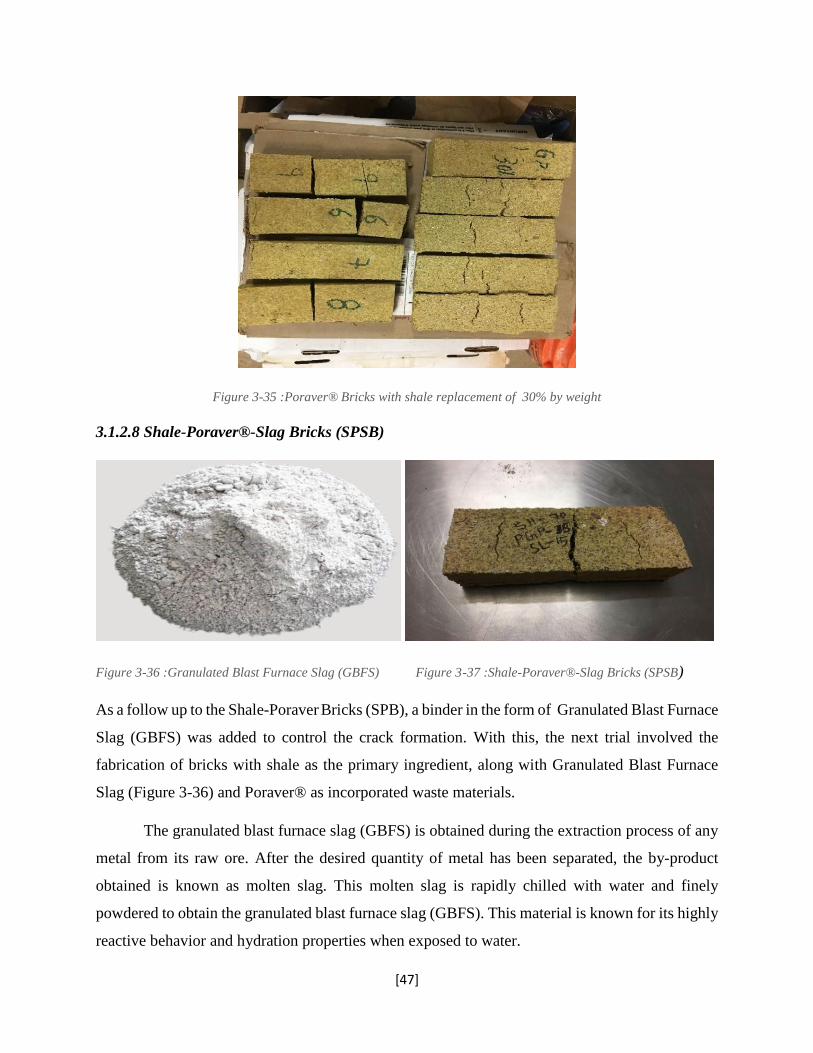
[47]
Figure 3-35 :Poraver® Bricks with shale replacement of 30% by weight
3.1.2.8 Shale-Poraver®-Slag Bricks (SPSB)
Figure 3-36 :Granulated Blast Furnace Slag (GBFS) Figure 3-37 :Shale-Poraver®-Slag Bricks (SPSB)
As a follow up to the Shale-Poraver Bricks (SPB), a binder in the form of Granulated Blast Furnace
Slag (GBFS) was added to control the crack formation. With this, the next trial involved the
fabrication of bricks with shale as the primary ingredient, along with Granulated Blast Furnace
Slag (Figure 3-36) and Poraver® as incorporated waste materials.
The granulated blast furnace slag (GBFS) is obtained during the extraction process of any
metal from its raw ore. After the desired quantity of metal has been separated, the by-product
obtained is known as molten slag. This molten slag is rapidly chilled with water and finely
powdered to obtain the granulated blast furnace slag (GBFS). This material is known for its highly
reactive behavior and hydration properties when exposed to water.
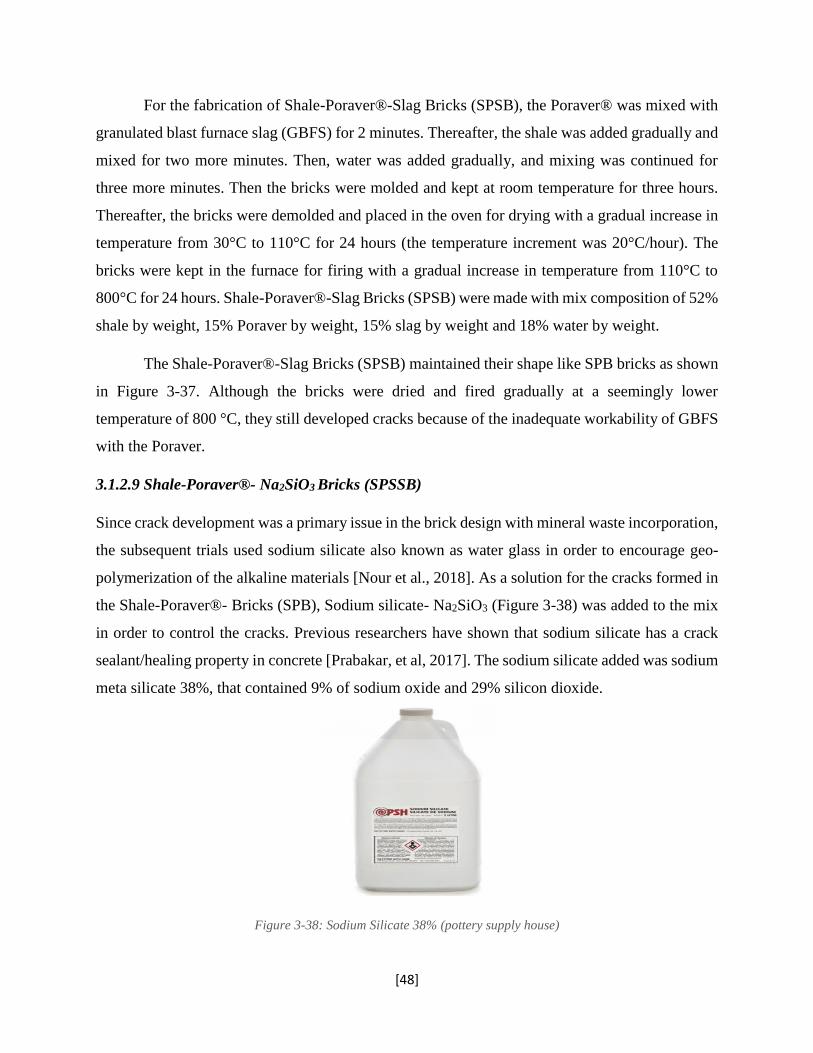
[48]
For the fabrication of Shale-Poraver®-Slag Bricks (SPSB), the Poraver® was mixed with
granulated blast furnace slag (GBFS) for 2 minutes. Thereafter, the shale was added gradually and
mixed for two more minutes. Then, water was added gradually, and mixing was continued for
three more minutes. Then the bricks were molded and kept at room temperature for three hours.
Thereafter, the bricks were demolded and placed in the oven for drying with a gradual increase in
temperature from 30°C to 110°C for 24 hours (the temperature increment was 20°C/hour). The
bricks were kept in the furnace for firing with a gradual increase in temperature from 110°C to
800°C for 24 hours. Shale-Poraver®-Slag Bricks (SPSB) were made with mix composition of 52%
shale by weight, 15% Poraver by weight, 15% slag by weight and 18% water by weight.
The Shale-Poraver®-Slag Bricks (SPSB) maintained their shape like SPB bricks as shown
in Figure 3-37. Although the bricks were dried and fired gradually at a seemingly lower
temperature of 800 °C, they still developed cracks because of the inadequate workability of GBFS
with the Poraver.
3.1.2.9 Shale-Poraver®- Na2SiO3 Bricks (SPSSB)
Since crack development was a primary issue in the brick design with mineral waste incorporation,
the subsequent trials used sodium silicate also known as water glass in order to encourage geo-
polymerization of the alkaline materials [Nour et al., 2018]. As a solution for the cracks formed in
the Shale-Poraver®- Bricks (SPB), Sodium silicate- Na2SiO3 (Figure 3-38) was added to the mix
in order to control the cracks. Previous researchers have shown that sodium silicate has a crack
sealant/healing property in concrete [Prabakar, et al, 2017]. The sodium silicate added was sodium
meta silicate 38%, that contained 9% of sodium oxide and 29% silicon dioxide.
Figure 3-38: Sodium Silicate 38% (pottery supply house)
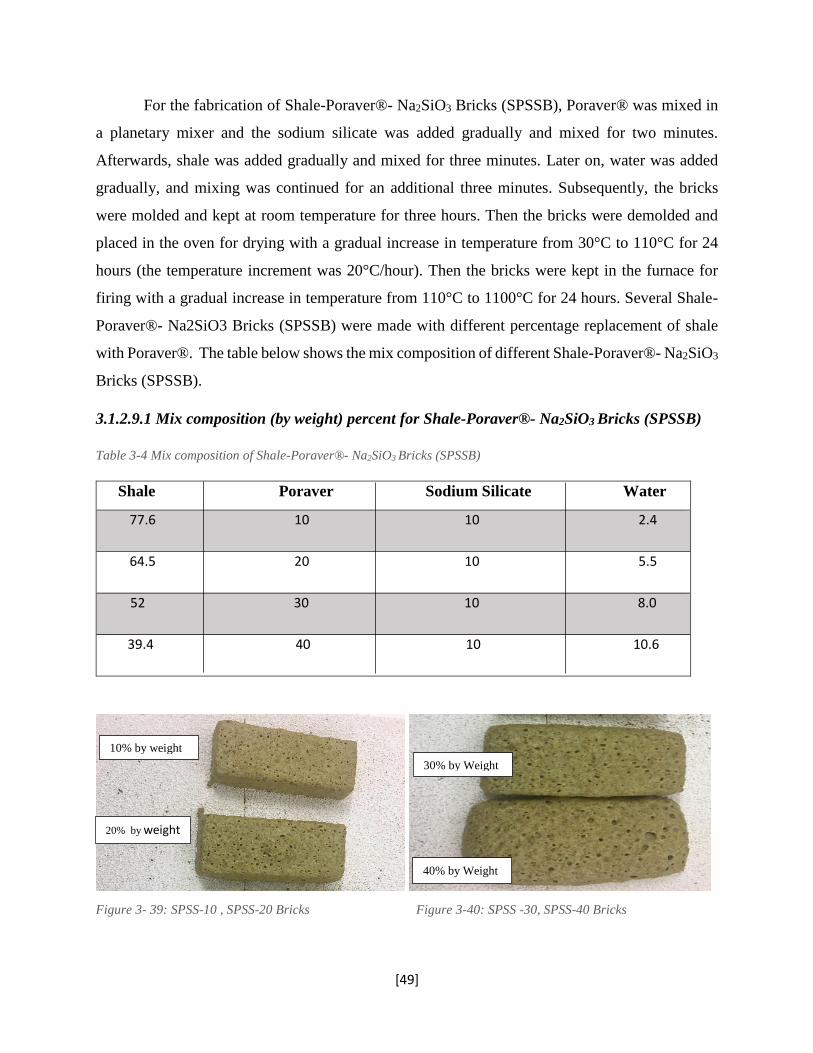
[49]
For the fabrication of Shale-Poraver®- Na2SiO3 Bricks (SPSSB), Poraver® was mixed in
a planetary mixer and the sodium silicate was added gradually and mixed for two minutes.
Afterwards, shale was added gradually and mixed for three minutes. Later on, water was added
gradually, and mixing was continued for an additional three minutes. Subsequently, the bricks
were molded and kept at room temperature for three hours. Then the bricks were demolded and
placed in the oven for drying with a gradual increase in temperature from 30°C to 110°C for 24
hours (the temperature increment was 20°C/hour). Then the bricks were kept in the furnace for
firing with a gradual increase in temperature from 110°C to 1100°C for 24 hours. Several Shale-
Poraver®- Na2SiO3 Bricks (SPSSB) were made with different percentage replacement of shale
with Poraver®. The table below shows the mix composition of different Shale-Poraver®- Na2SiO3
Bricks (SPSSB).
3.1.2.9.1 Mix composition (by weight) percent for Shale-Poraver®- Na2SiO3 Bricks (SPSSB)
Table 3-4 Mix composition of Shale-Poraver®- Na2SiO3 Bricks (SPSSB)
Shale Poraver Sodium Silicate Water
77.6 10 10 2.4
64.5 20 10 5.5
52 30 10 8.0
39.4 40 10 10.6
Figure 3- 39: SPSS-10 , SPSS-20 Bricks Figure 3-40: SPSS -30, SPSS-40 Bricks
10% by weight
20% by weight
30% by Weight
40% by Weight
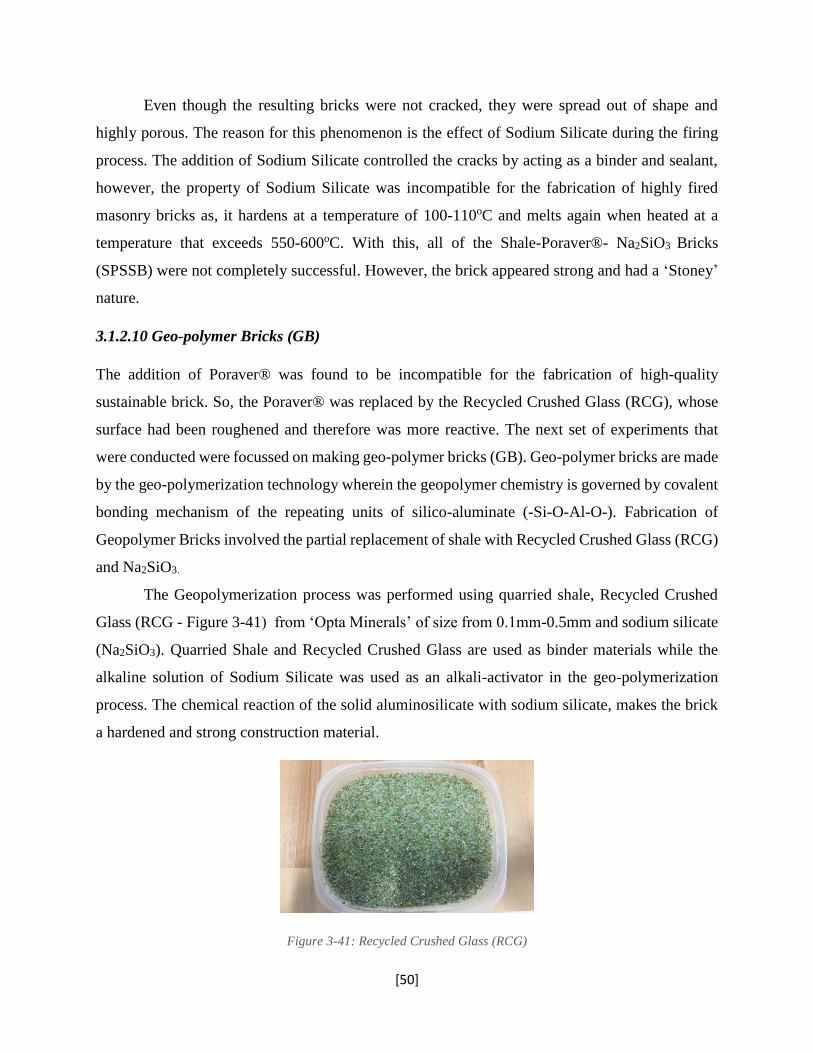
[50]
Even though the resulting bricks were not cracked, they were spread out of shape and
highly porous. The reason for this phenomenon is the effect of Sodium Silicate during the firing
process. The addition of Sodium Silicate controlled the cracks by acting as a binder and sealant,
however, the property of Sodium Silicate was incompatible for the fabrication of highly fired
masonry bricks as, it hardens at a temperature of 100-110oC and melts again when heated at a
temperature that exceeds 550-600oC. With this, all of the Shale-Poraver®- Na2SiO3 Bricks
(SPSSB) were not completely successful. However, the brick appeared strong and had a ‘Stoney’
nature.
3.1.2.10 Geo-polymer Bricks (GB)
The addition of Poraver® was found to be incompatible for the fabrication of high-quality
sustainable brick. So, the Poraver® was replaced by the Recycled Crushed Glass (RCG), whose
surface had been roughened and therefore was more reactive. The next set of experiments that
were conducted were focussed on making geo-polymer bricks (GB). Geo-polymer bricks are made
by the geo-polymerization technology wherein the geopolymer chemistry is governed by covalent
bonding mechanism of the repeating units of silico-aluminate (-Si-O-Al-O-). Fabrication of
Geopolymer Bricks involved the partial replacement of shale with Recycled Crushed Glass (RCG)
and Na2SiO3.
The Geopolymerization process was performed using quarried shale, Recycled Crushed
Glass (RCG - Figure 3-41) from ‘Opta Minerals’ of size from 0.1mm-0.5mm and sodium silicate
(Na2SiO3). Quarried Shale and Recycled Crushed Glass are used as binder materials while the
alkaline solution of Sodium Silicate was used as an alkali-activator in the geo-polymerization
process. The chemical reaction of the solid aluminosilicate with sodium silicate, makes the brick
a hardened and strong construction material.
Figure 3-41: Recycled Crushed Glass (RCG)
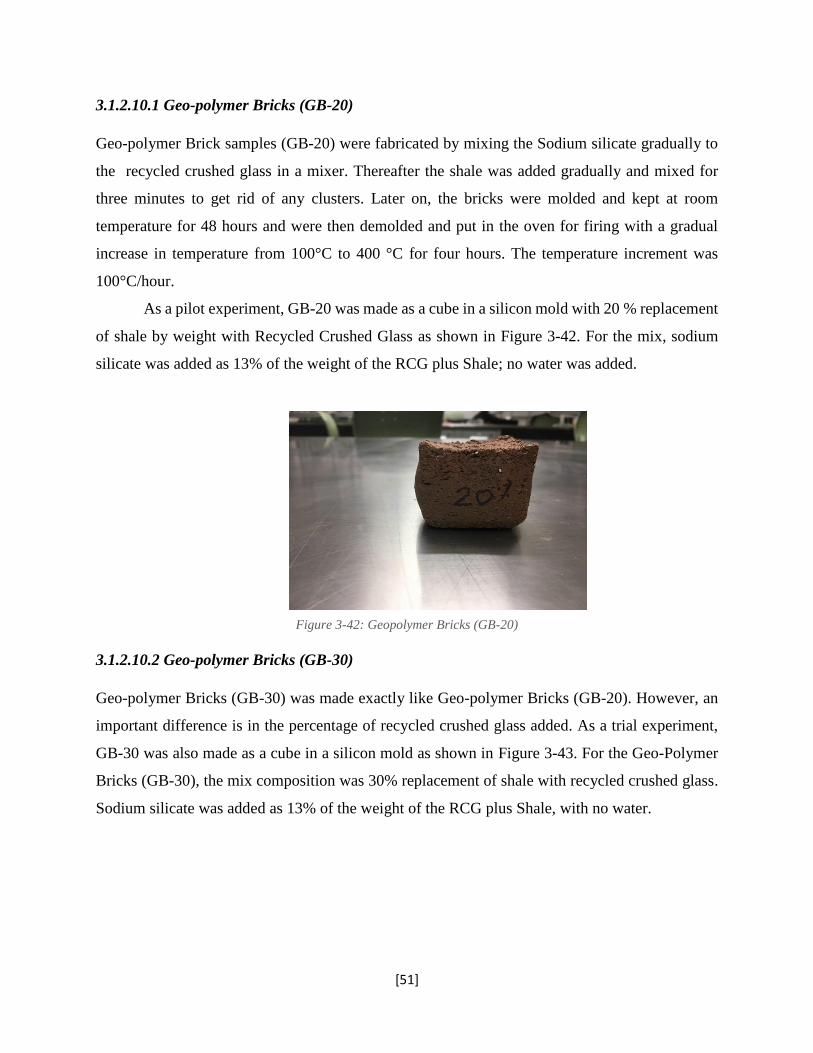
[51]
3.1.2.10.1 Geo-polymer Bricks (GB-20)
Geo-polymer Brick samples (GB-20) were fabricated by mixing the Sodium silicate gradually to
the recycled crushed glass in a mixer. Thereafter the shale was added gradually and mixed for
three minutes to get rid of any clusters. Later on, the bricks were molded and kept at room
temperature for 48 hours and were then demolded and put in the oven for firing with a gradual
increase in temperature from 100°C to 400 °C for four hours. The temperature increment was
100°C/hour.
As a pilot experiment, GB-20 was made as a cube in a silicon mold with 20 % replacement
of shale by weight with Recycled Crushed Glass as shown in Figure 3-42. For the mix, sodium
silicate was added as 13% of the weight of the RCG plus Shale; no water was added.
Figure 3-42: Geopolymer Bricks (GB-20)
3.1.2.10.2 Geo-polymer Bricks (GB-30)
Geo-polymer Bricks (GB-30) was made exactly like Geo-polymer Bricks (GB-20). However, an
important difference is in the percentage of recycled crushed glass added. As a trial experiment,
GB-30 was also made as a cube in a silicon mold as shown in Figure 3-43. For the Geo-Polymer
Bricks (GB-30), the mix composition was 30% replacement of shale with recycled crushed glass.
Sodium silicate was added as 13% of the weight of the RCG plus Shale, with no water.
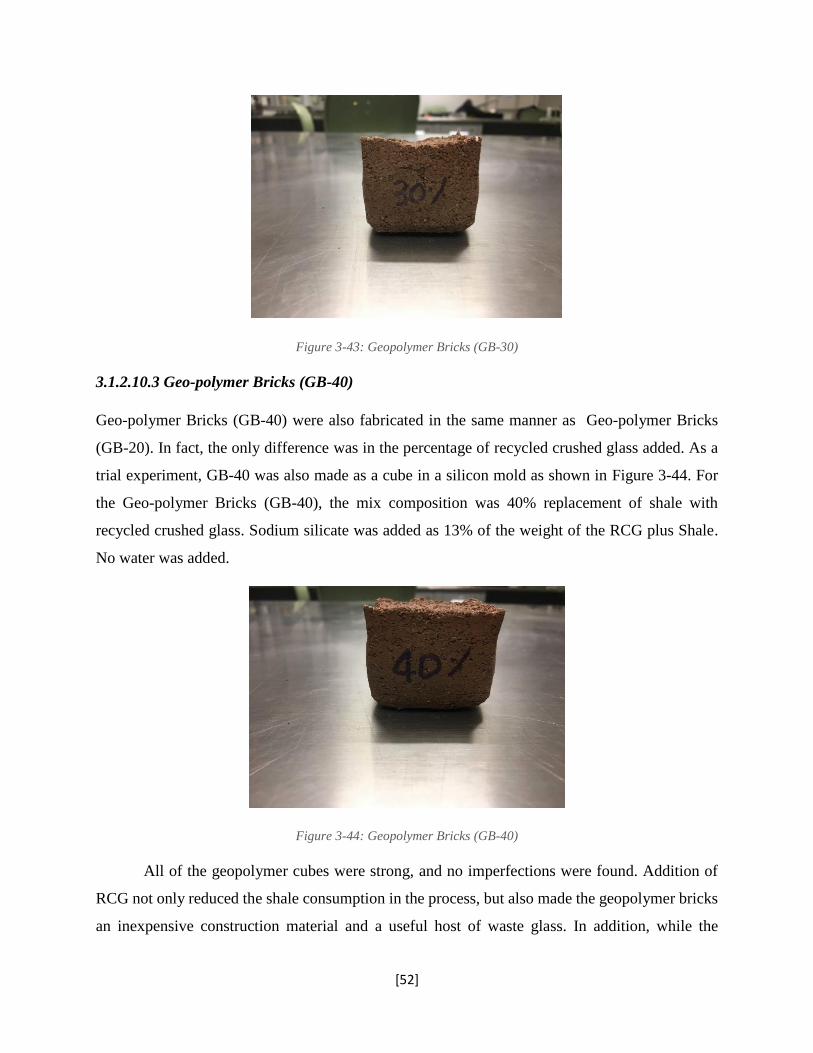
[52]
Figure 3-43: Geopolymer Bricks (GB-30)
3.1.2.10.3 Geo-polymer Bricks (GB-40)
Geo-polymer Bricks (GB-40) were also fabricated in the same manner as Geo-polymer Bricks
(GB-20). In fact, the only difference was in the percentage of recycled crushed glass added. As a
trial experiment, GB-40 was also made as a cube in a silicon mold as shown in Figure 3-44. For
the Geo-polymer Bricks (GB-40), the mix composition was 40% replacement of shale with
recycled crushed glass. Sodium silicate was added as 13% of the weight of the RCG plus Shale.
No water was added.
Figure 3-44: Geopolymer Bricks (GB-40)
All of the geopolymer cubes were strong, and no imperfections were found. Addition of
RCG not only reduced the shale consumption in the process, but also made the geopolymer bricks
an inexpensive construction material and a useful host of waste glass. In addition, while the
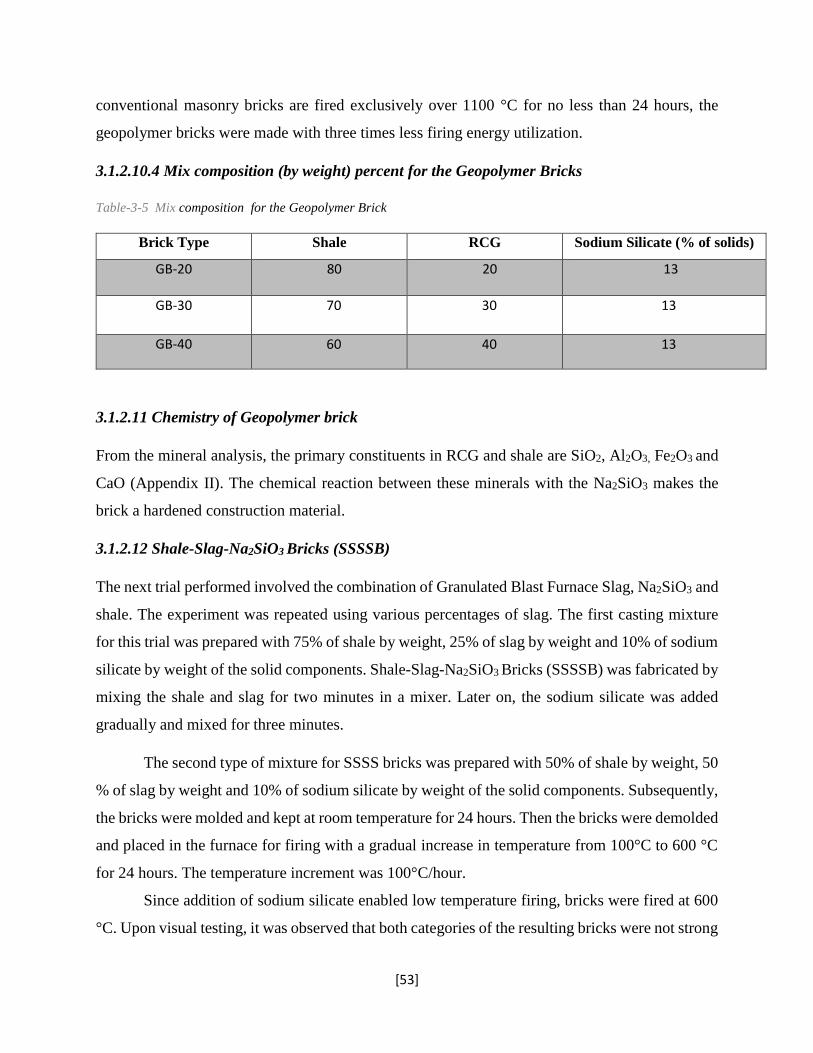
[53]
conventional masonry bricks are fired exclusively over 1100 °C for no less than 24 hours, the
geopolymer bricks were made with three times less firing energy utilization.
3.1.2.10.4 Mix composition (by weight) percent for the Geopolymer Bricks
Table-3-5 Mix composition for the Geopolymer Brick
Brick Type Shale RCG Sodium Silicate (% of solids)
GB-20
80 20 13
GB-30 70 30 13
GB-40 60 40 13
3.1.2.11 Chemistry of Geopolymer brick
From the mineral analysis, the primary constituents in RCG and shale are SiO2, Al2O3, Fe2O3 and
CaO (Appendix II). The chemical reaction between these minerals with the Na2SiO3 makes the
brick a hardened construction material.
3.1.2.12 Shale-Slag-Na2SiO3 Bricks (SSSSB)
The next trial performed involved the combination of Granulated Blast Furnace Slag, Na2SiO3 and
shale. The experiment was repeated using various percentages of slag. The first casting mixture
for this trial was prepared with 75% of shale by weight, 25% of slag by weight and 10% of sodium
silicate by weight of the solid components. Shale-Slag-Na2SiO3 Bricks (SSSSB) was fabricated by
mixing the shale and slag for two minutes in a mixer. Later on, the sodium silicate was added
gradually and mixed for three minutes.
The second type of mixture for SSSS bricks was prepared with 50% of shale by weight, 50
% of slag by weight and 10% of sodium silicate by weight of the solid components. Subsequently,
the bricks were molded and kept at room temperature for 24 hours. Then the bricks were demolded
and placed in the furnace for firing with a gradual increase in temperature from 100°C to 600 °C
for 24 hours. The temperature increment was 100°C/hour.
Since addition of sodium silicate enabled low temperature firing, bricks were fired at 600
°C. Upon visual testing, it was observed that both categories of the resulting bricks were not strong
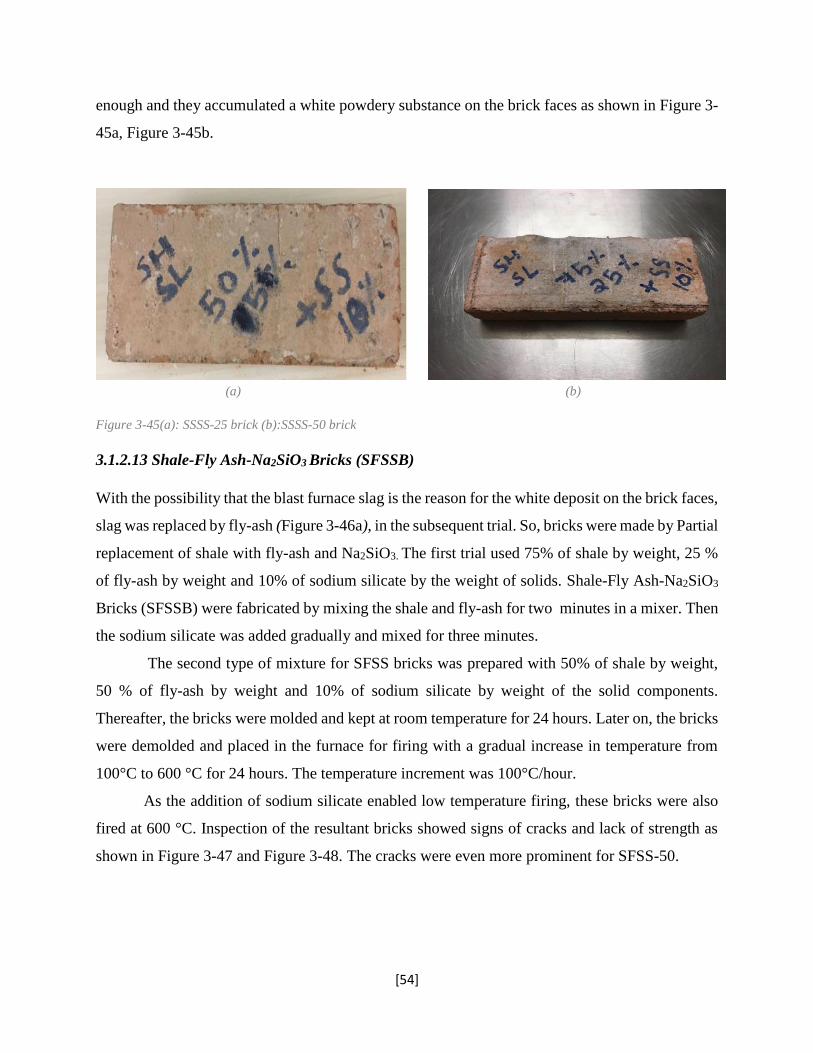
[54]
enough and they accumulated a white powdery substance on the brick faces as shown in Figure 3-
45a, Figure 3-45b.
(a) (b)
Figure 3-45(a): SSSS-25 brick (b):SSSS-50 brick
3.1.2.13 Shale-Fly Ash-Na2SiO3 Bricks (SFSSB)
With the possibility that the blast furnace slag is the reason for the white deposit on the brick faces,
slag was replaced by fly-ash (Figure 3-46a), in the subsequent trial. So, bricks were made by Partial
replacement of shale with fly-ash and Na2SiO3. The first trial used 75% of shale by weight, 25 %
of fly-ash by weight and 10% of sodium silicate by the weight of solids. Shale-Fly Ash-Na2SiO3
Bricks (SFSSB) were fabricated by mixing the shale and fly-ash for two minutes in a mixer. Then
the sodium silicate was added gradually and mixed for three minutes.
The second type of mixture for SFSS bricks was prepared with 50% of shale by weight,
50 % of fly-ash by weight and 10% of sodium silicate by weight of the solid components.
Thereafter, the bricks were molded and kept at room temperature for 24 hours. Later on, the bricks
were demolded and placed in the furnace for firing with a gradual increase in temperature from
100°C to 600 °C for 24 hours. The temperature increment was 100°C/hour.
As the addition of sodium silicate enabled low temperature firing, these bricks were also
fired at 600 °C. Inspection of the resultant bricks showed signs of cracks and lack of strength as
shown in Figure 3-47 and Figure 3-48. The cracks were even more prominent for SFSS-50.
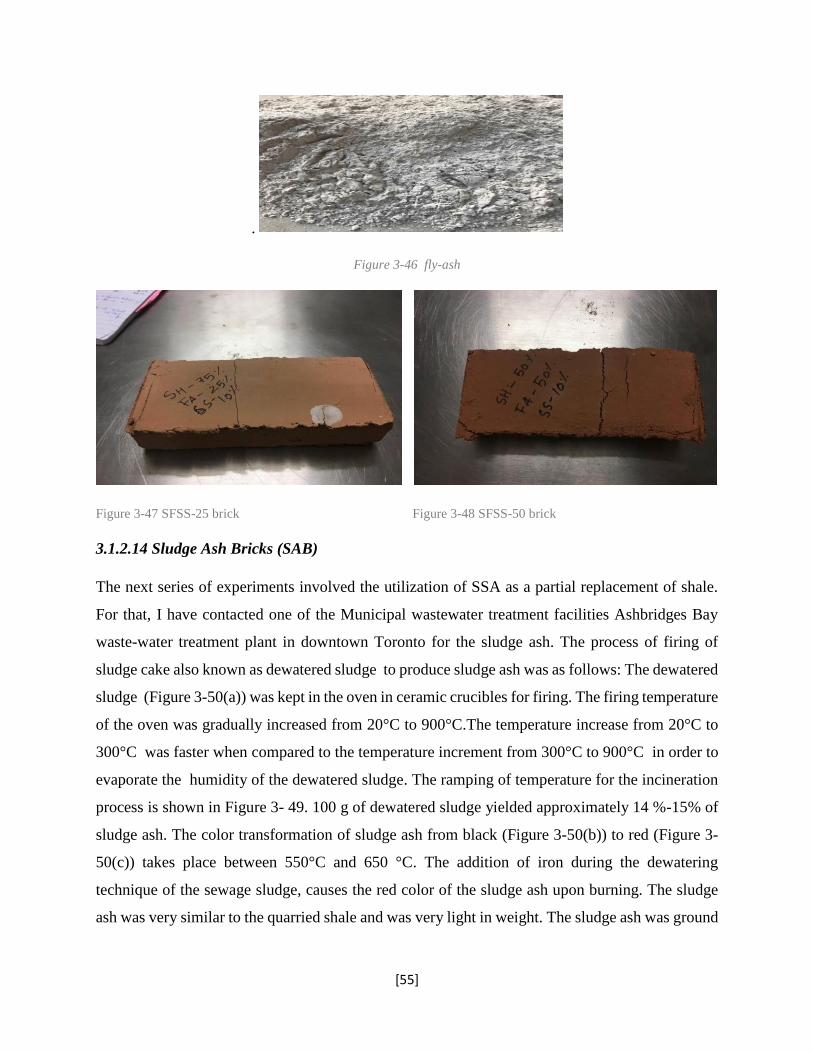
[55]
.
Figure 3-46 fly-ash
Figure 3-47 SFSS-25 brick Figure 3-48 SFSS-50 brick
3.1.2.14 Sludge Ash Bricks (SAB)
The next series of experiments involved the utilization of SSA as a partial replacement of shale.
For that, I have contacted one of the Municipal wastewater treatment facilities Ashbridges Bay
waste-water treatment plant in downtown Toronto for the sludge ash. The process of firing of
sludge cake also known as dewatered sludge to produce sludge ash was as follows: The dewatered
sludge (Figure 3-50(a)) was kept in the oven in ceramic crucibles for firing. The firing temperature
of the oven was gradually increased from 20°C to 900°C.The temperature increase from 20°C to
300°C was faster when compared to the temperature increment from 300°C to 900°C in order to
evaporate the humidity of the dewatered sludge. The ramping of temperature for the incineration
process is shown in Figure 3- 49. 100 g of dewatered sludge yielded approximately 14 %-15% of
sludge ash. The color transformation of sludge ash from black (Figure 3-50(b)) to red (Figure 3-
50(c)) takes place between 550°C and 650 °C. The addition of iron during the dewatering
technique of the sewage sludge, causes the red color of the sludge ash upon burning. The sludge
ash was very similar to the quarried shale and was very light in weight. The sludge ash was ground
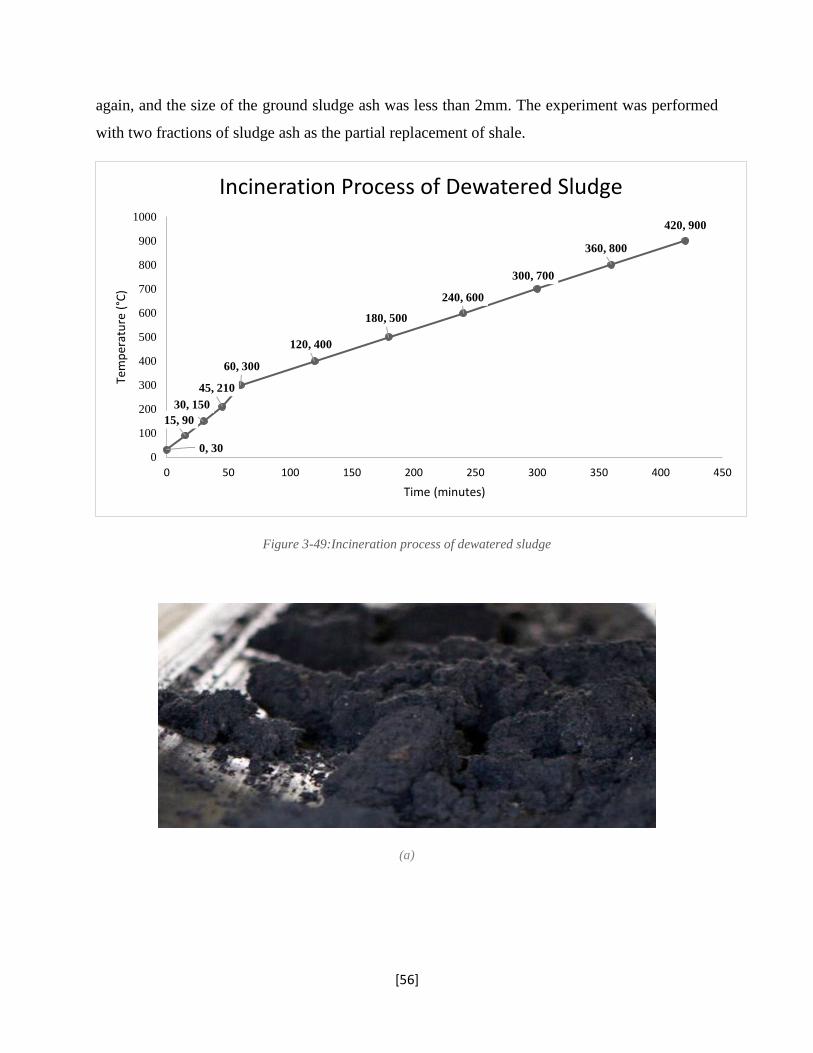
[56]
again, and the size of the ground sludge ash was less than 2mm. The experiment was performed
with two fractions of sludge ash as the partial replacement of shale.
Figure 3-49:Incineration process of dewatered sludge
(a)
0, 30
15, 90
30, 150
45, 210
60, 300
120, 400
180, 500
240, 600
300, 700
360, 800
420, 900
0
100
200
300
400
500
600
700
800
900
1000
0 50 100 150 200 250 300 350 400 450
Tem
per
atu
re (
°C)
Time (minutes)
Incineration Process of Dewatered Sludge
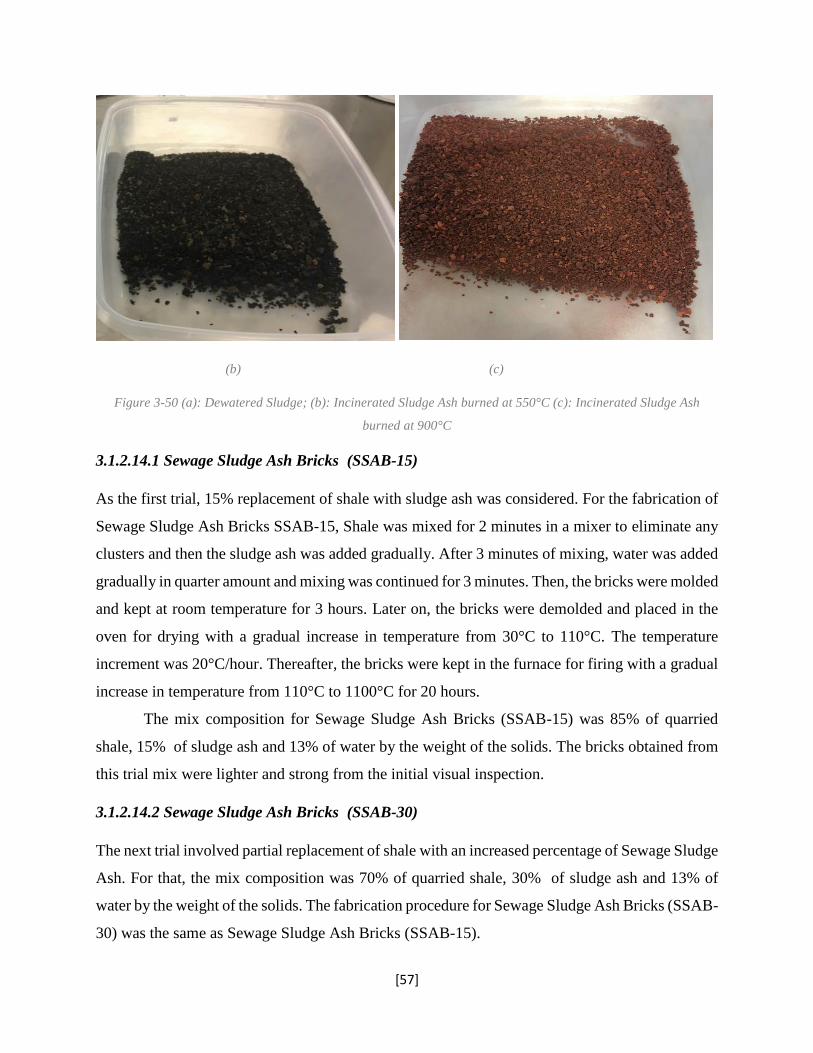
[57]
(b) (c)
Figure 3-50 (a): Dewatered Sludge; (b): Incinerated Sludge Ash burned at 550°C (c): Incinerated Sludge Ash
burned at 900°C
3.1.2.14.1 Sewage Sludge Ash Bricks (SSAB-15)
As the first trial, 15% replacement of shale with sludge ash was considered. For the fabrication of
Sewage Sludge Ash Bricks SSAB-15, Shale was mixed for 2 minutes in a mixer to eliminate any
clusters and then the sludge ash was added gradually. After 3 minutes of mixing, water was added
gradually in quarter amount and mixing was continued for 3 minutes. Then, the bricks were molded
and kept at room temperature for 3 hours. Later on, the bricks were demolded and placed in the
oven for drying with a gradual increase in temperature from 30°C to 110°C. The temperature
increment was 20°C/hour. Thereafter, the bricks were kept in the furnace for firing with a gradual
increase in temperature from 110°C to 1100°C for 20 hours.
The mix composition for Sewage Sludge Ash Bricks (SSAB-15) was 85% of quarried
shale, 15% of sludge ash and 13% of water by the weight of the solids. The bricks obtained from
this trial mix were lighter and strong from the initial visual inspection.
3.1.2.14.2 Sewage Sludge Ash Bricks (SSAB-30)
The next trial involved partial replacement of shale with an increased percentage of Sewage Sludge
Ash. For that, the mix composition was 70% of quarried shale, 30% of sludge ash and 13% of
water by the weight of the solids. The fabrication procedure for Sewage Sludge Ash Bricks (SSAB-
30) was the same as Sewage Sludge Ash Bricks (SSAB-15).
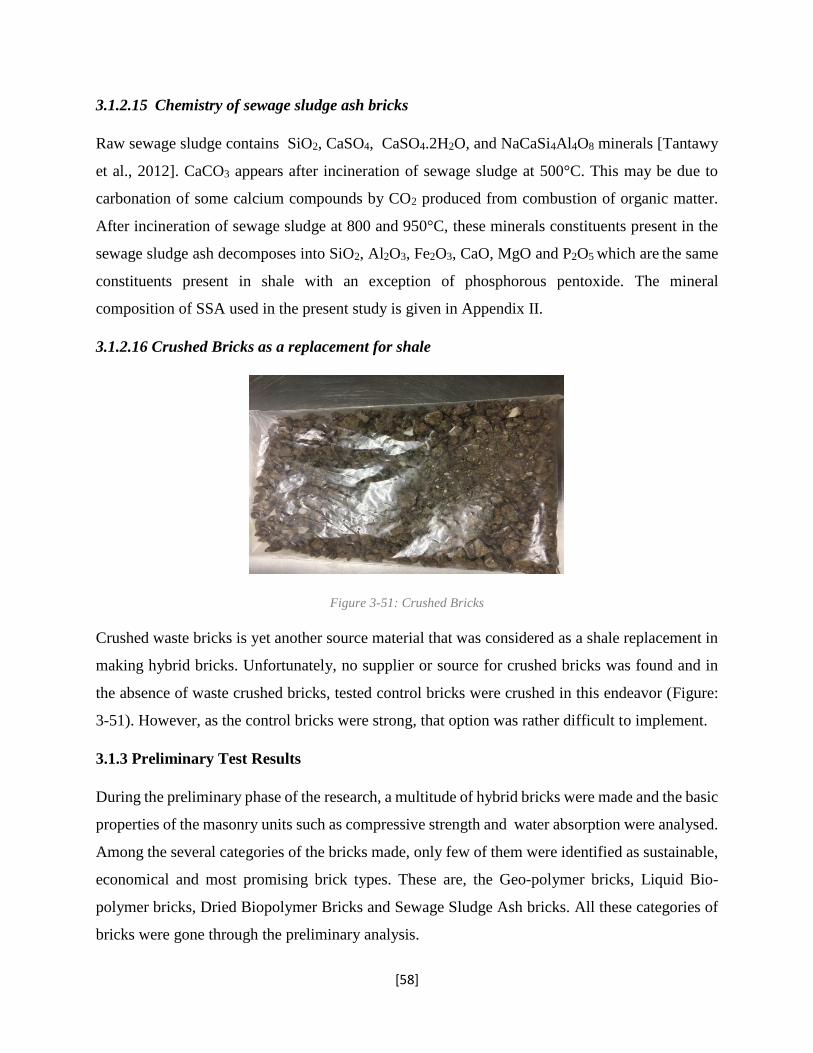
[58]
3.1.2.15 Chemistry of sewage sludge ash bricks
Raw sewage sludge contains SiO2, CaSO4, CaSO4.2H2O, and NaCaSi4Al4O8 minerals [Tantawy
et al., 2012]. CaCO3 appears after incineration of sewage sludge at 500°C. This may be due to
carbonation of some calcium compounds by CO2 produced from combustion of organic matter.
After incineration of sewage sludge at 800 and 950°C, these minerals constituents present in the
sewage sludge ash decomposes into SiO2, Al2O3, Fe2O3, CaO, MgO and P2O5 which are the same
constituents present in shale with an exception of phosphorous pentoxide. The mineral
composition of SSA used in the present study is given in Appendix II.
3.1.2.16 Crushed Bricks as a replacement for shale
Figure 3-51: Crushed Bricks
Crushed waste bricks is yet another source material that was considered as a shale replacement in
making hybrid bricks. Unfortunately, no supplier or source for crushed bricks was found and in
the absence of waste crushed bricks, tested control bricks were crushed in this endeavor (Figure:
3-51). However, as the control bricks were strong, that option was rather difficult to implement.
3.1.3 Preliminary Test Results
During the preliminary phase of the research, a multitude of hybrid bricks were made and the basic
properties of the masonry units such as compressive strength and water absorption were analysed.
Among the several categories of the bricks made, only few of them were identified as sustainable,
economical and most promising brick types. These are, the Geo-polymer bricks, Liquid Bio-
polymer bricks, Dried Biopolymer Bricks and Sewage Sludge Ash bricks. All these categories of
bricks were gone through the preliminary analysis.
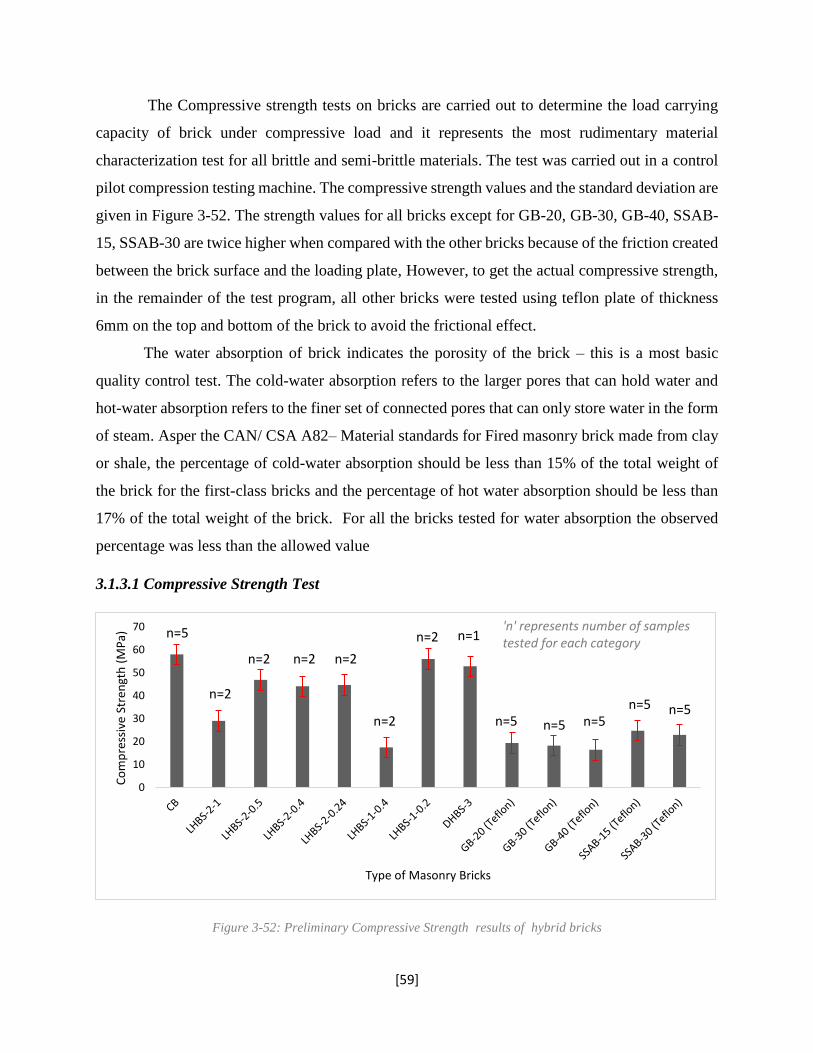
[59]
The Compressive strength tests on bricks are carried out to determine the load carrying
capacity of brick under compressive load and it represents the most rudimentary material
characterization test for all brittle and semi-brittle materials. The test was carried out in a control
pilot compression testing machine. The compressive strength values and the standard deviation are
given in Figure 3-52. The strength values for all bricks except for GB-20, GB-30, GB-40, SSAB-
15, SSAB-30 are twice higher when compared with the other bricks because of the friction created
between the brick surface and the loading plate, However, to get the actual compressive strength,
in the remainder of the test program, all other bricks were tested using teflon plate of thickness
6mm on the top and bottom of the brick to avoid the frictional effect.
The water absorption of brick indicates the porosity of the brick – this is a most basic
quality control test. The cold-water absorption refers to the larger pores that can hold water and
hot-water absorption refers to the finer set of connected pores that can only store water in the form
of steam. Asper the CAN/ CSA A82– Material standards for Fired masonry brick made from clay
or shale, the percentage of cold-water absorption should be less than 15% of the total weight of
the brick for the first-class bricks and the percentage of hot water absorption should be less than
17% of the total weight of the brick. For all the bricks tested for water absorption the observed
percentage was less than the allowed value
3.1.3.1 Compressive Strength Test
Figure 3-52: Preliminary Compressive Strength results of hybrid bricks
0
10
20
30
40
50
60
70
Co
mp
ress
ive
Stre
ngt
h (
MP
a)
Type of Masonry Bricks
n=5
n=5
n=1n=2
n=2
n=2n=2n=2
n=2
n=5 n=5n=5 n=5
'n' represents number of samples tested for each category
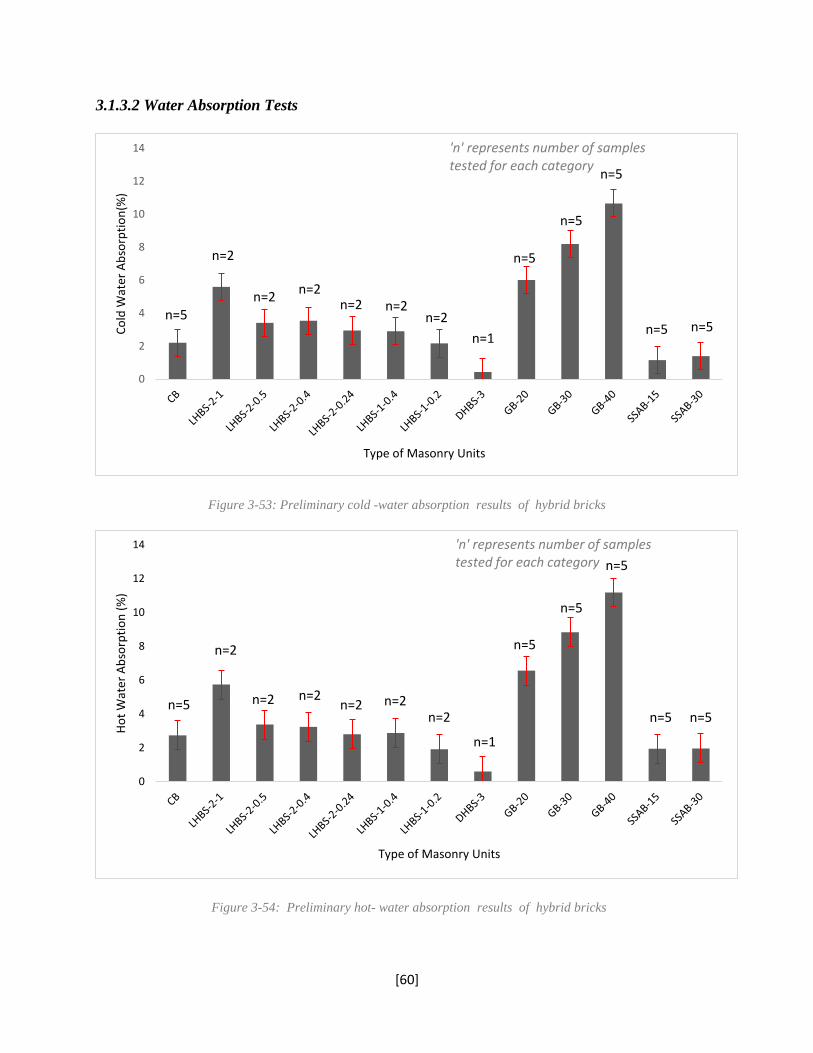
[60]
3.1.3.2 Water Absorption Tests
Figure 3-53: Preliminary cold -water absorption results of hybrid bricks
Figure 3-54: Preliminary hot- water absorption results of hybrid bricks
0
2
4
6
8
10
12
14
Co
ld W
ater
Ab
sorp
tio
n(%
)
Type of Masonry Units
n=5
n=5
n=1
n=2n=2n=2
n=2n=2
n=2
n=5
n=5
n=5 n=5
'n' represents number of samples tested for each category
0
2
4
6
8
10
12
14
Ho
t W
ater
Ab
sorp
tio
n (
%)
Type of Masonry Units
n=5
n=5
n=1
n=2n=2n=2
n=2n=2
n=2
n=5
n=5
n=5 n=5
'n' represents number of samples tested for each category
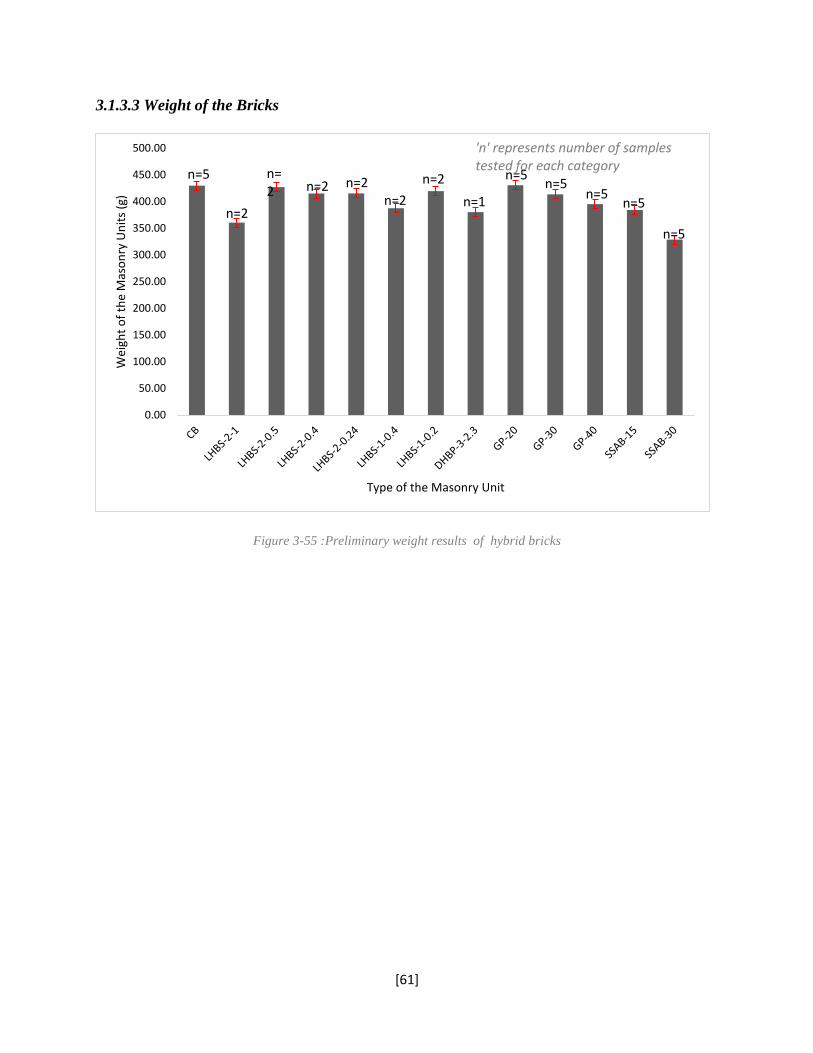
[61]
3.1.3.3 Weight of the Bricks
Figure 3-55 :Preliminary weight results of hybrid bricks
0.00
50.00
100.00
150.00
200.00
250.00
300.00
350.00
400.00
450.00
500.00
Wei
ght
of
the
Mas
on
ry U
nit
s (g
)
Type of the Masonry Unit
n=5 n=5
n=1
n=2
n=2n=2n=2
n=2
n=2
n=5n=5
n=5
n=5
'n' represents number of samples tested for each category
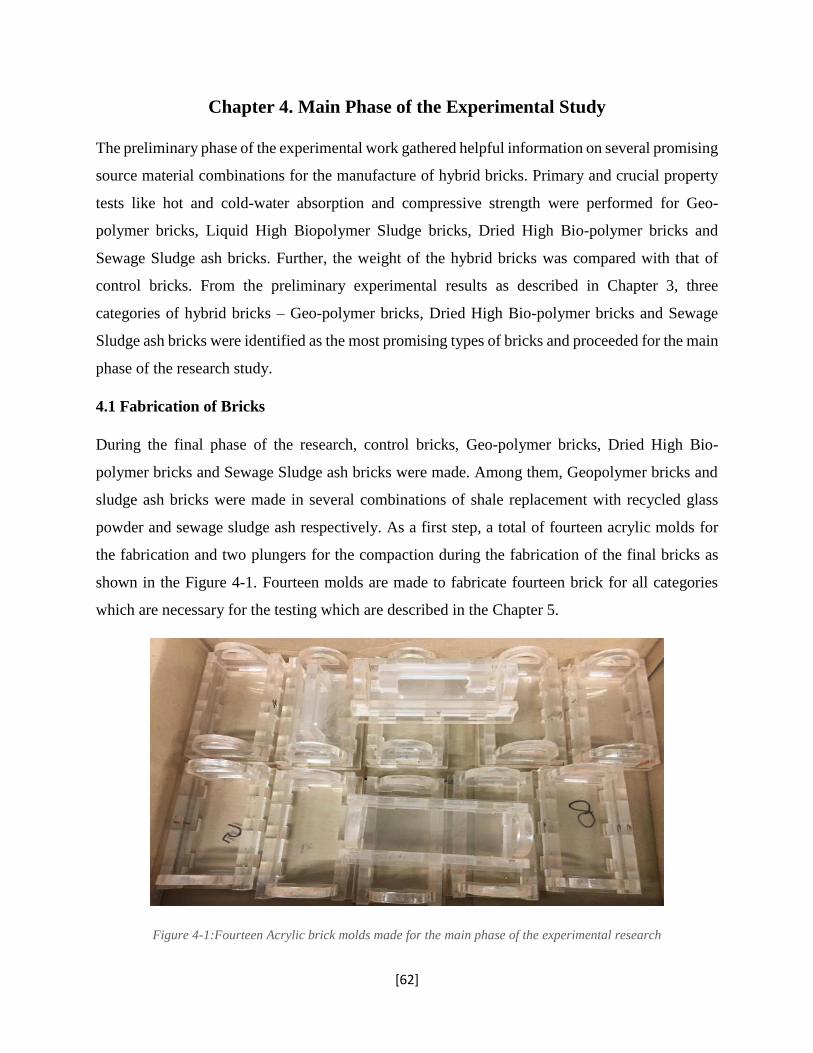
[62]
Chapter 4. Main Phase of the Experimental Study
The preliminary phase of the experimental work gathered helpful information on several promising
source material combinations for the manufacture of hybrid bricks. Primary and crucial property
tests like hot and cold-water absorption and compressive strength were performed for Geo-
polymer bricks, Liquid High Biopolymer Sludge bricks, Dried High Bio-polymer bricks and
Sewage Sludge ash bricks. Further, the weight of the hybrid bricks was compared with that of
control bricks. From the preliminary experimental results as described in Chapter 3, three
categories of hybrid bricks – Geo-polymer bricks, Dried High Bio-polymer bricks and Sewage
Sludge ash bricks were identified as the most promising types of bricks and proceeded for the main
phase of the research study.
4.1 Fabrication of Bricks
During the final phase of the research, control bricks, Geo-polymer bricks, Dried High Bio-
polymer bricks and Sewage Sludge ash bricks were made. Among them, Geopolymer bricks and
sludge ash bricks were made in several combinations of shale replacement with recycled glass
powder and sewage sludge ash respectively. As a first step, a total of fourteen acrylic molds for
the fabrication and two plungers for the compaction during the fabrication of the final bricks as
shown in the Figure 4-1. Fourteen molds are made to fabricate fourteen brick for all categories
which are necessary for the testing which are described in the Chapter 5.
Figure 4-1:Fourteen Acrylic brick molds made for the main phase of the experimental research
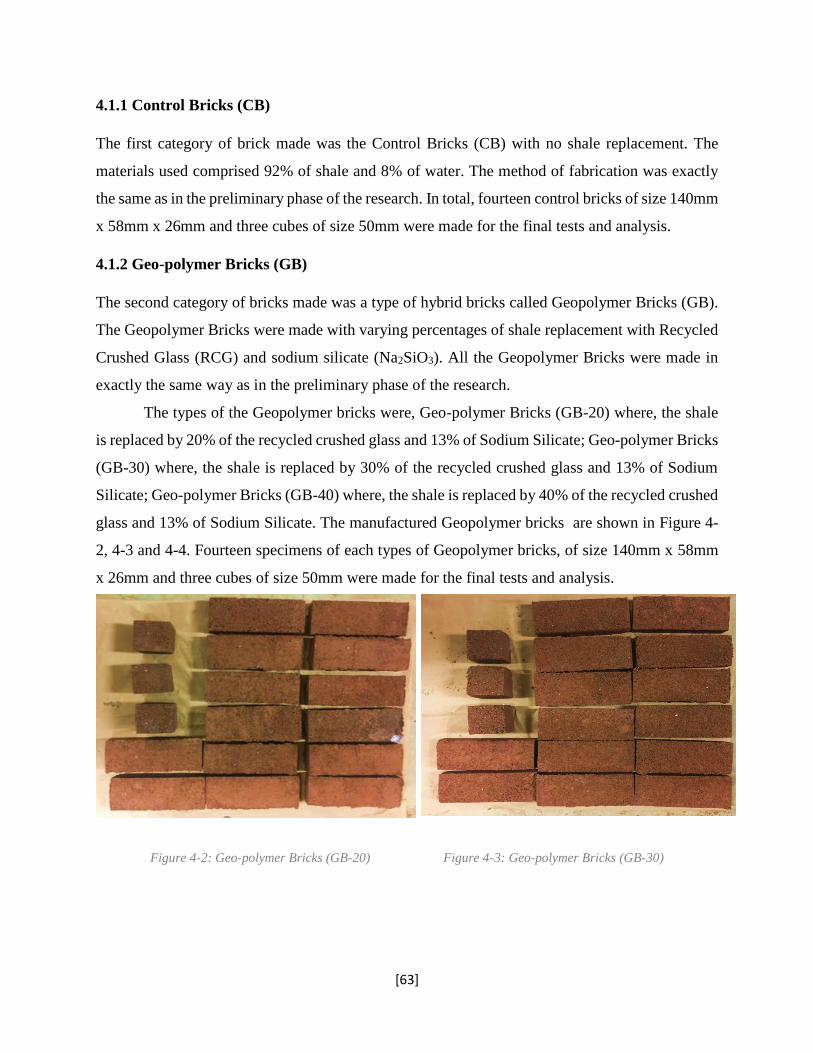
[63]
4.1.1 Control Bricks (CB)
The first category of brick made was the Control Bricks (CB) with no shale replacement. The
materials used comprised 92% of shale and 8% of water. The method of fabrication was exactly
the same as in the preliminary phase of the research. In total, fourteen control bricks of size 140mm
x 58mm x 26mm and three cubes of size 50mm were made for the final tests and analysis.
4.1.2 Geo-polymer Bricks (GB)
The second category of bricks made was a type of hybrid bricks called Geopolymer Bricks (GB).
The Geopolymer Bricks were made with varying percentages of shale replacement with Recycled
Crushed Glass (RCG) and sodium silicate (Na2SiO3). All the Geopolymer Bricks were made in
exactly the same way as in the preliminary phase of the research.
The types of the Geopolymer bricks were, Geo-polymer Bricks (GB-20) where, the shale
is replaced by 20% of the recycled crushed glass and 13% of Sodium Silicate; Geo-polymer Bricks
(GB-30) where, the shale is replaced by 30% of the recycled crushed glass and 13% of Sodium
Silicate; Geo-polymer Bricks (GB-40) where, the shale is replaced by 40% of the recycled crushed
glass and 13% of Sodium Silicate. The manufactured Geopolymer bricks are shown in Figure 4-
2, 4-3 and 4-4. Fourteen specimens of each types of Geopolymer bricks, of size 140mm x 58mm
x 26mm and three cubes of size 50mm were made for the final tests and analysis.
Figure 4-2: Geo-polymer Bricks (GB-20) Figure 4-3: Geo-polymer Bricks (GB-30)
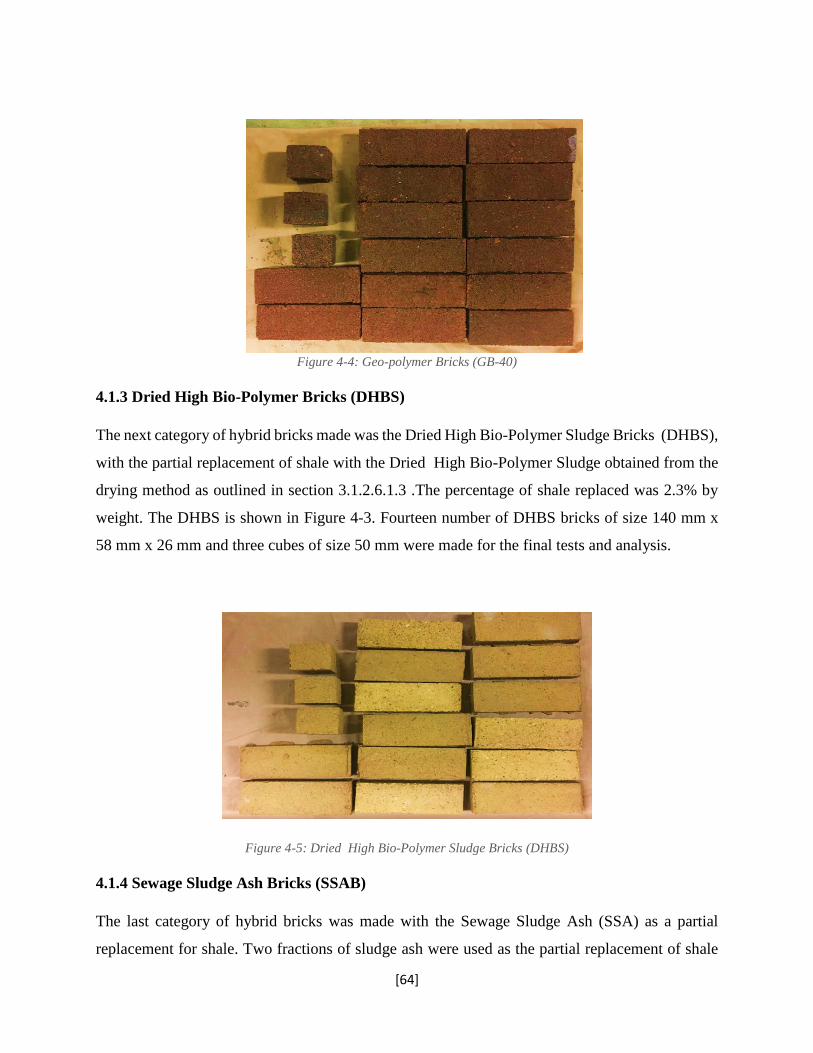
[64]
Figure 4-4: Geo-polymer Bricks (GB-40)
4.1.3 Dried High Bio-Polymer Bricks (DHBS)
The next category of hybrid bricks made was the Dried High Bio-Polymer Sludge Bricks (DHBS),
with the partial replacement of shale with the Dried High Bio-Polymer Sludge obtained from the
drying method as outlined in section 3.1.2.6.1.3 .The percentage of shale replaced was 2.3% by
weight. The DHBS is shown in Figure 4-3. Fourteen number of DHBS bricks of size 140 mm x
58 mm x 26 mm and three cubes of size 50 mm were made for the final tests and analysis.
Figure 4-5: Dried High Bio-Polymer Sludge Bricks (DHBS)
4.1.4 Sewage Sludge Ash Bricks (SSAB)
The last category of hybrid bricks was made with the Sewage Sludge Ash (SSA) as a partial
replacement for shale. Two fractions of sludge ash were used as the partial replacement of shale
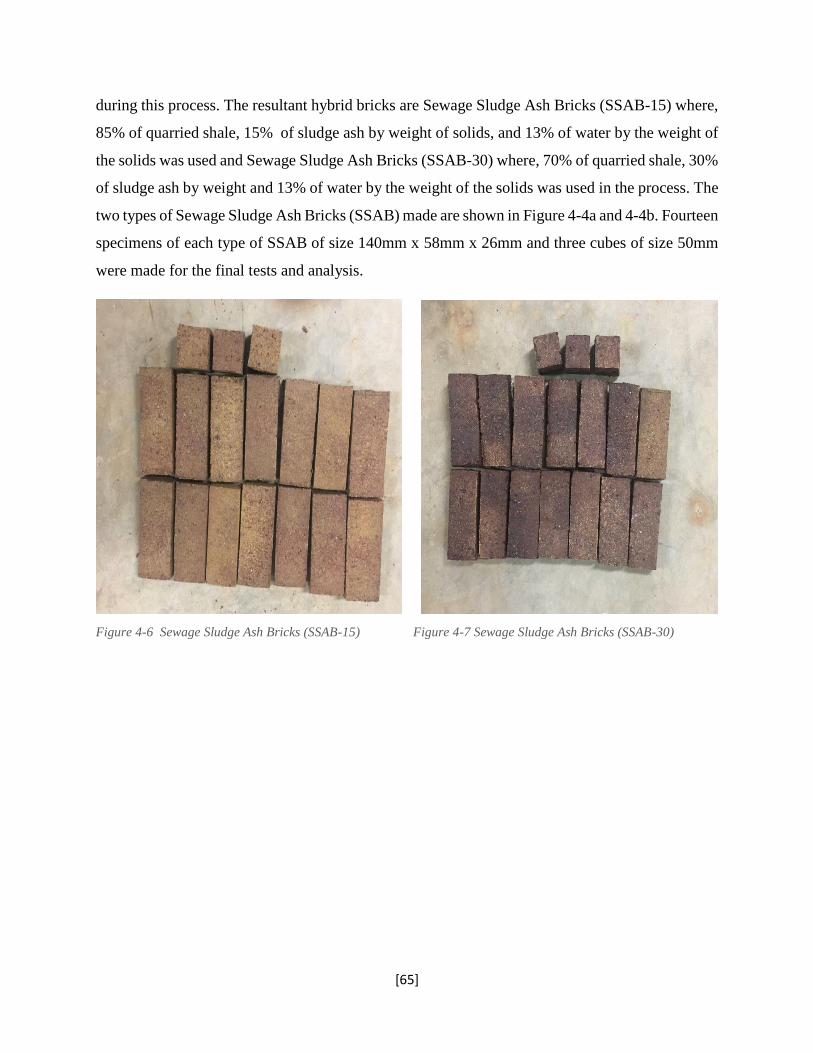
[65]
during this process. The resultant hybrid bricks are Sewage Sludge Ash Bricks (SSAB-15) where,
85% of quarried shale, 15% of sludge ash by weight of solids, and 13% of water by the weight of
the solids was used and Sewage Sludge Ash Bricks (SSAB-30) where, 70% of quarried shale, 30%
of sludge ash by weight and 13% of water by the weight of the solids was used in the process. The
two types of Sewage Sludge Ash Bricks (SSAB) made are shown in Figure 4-4a and 4-4b. Fourteen
specimens of each type of SSAB of size 140mm x 58mm x 26mm and three cubes of size 50mm
were made for the final tests and analysis.
Figure 4-6 Sewage Sludge Ash Bricks (SSAB-15) Figure 4-7 Sewage Sludge Ash Bricks (SSAB-30)
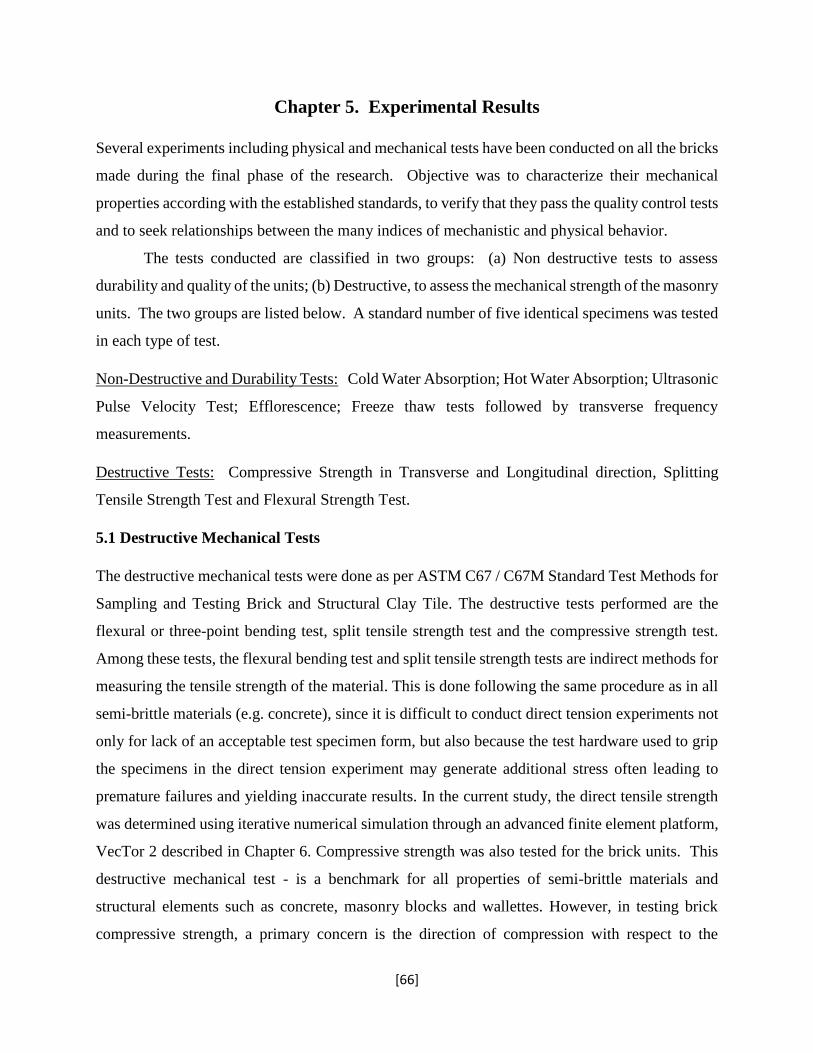
[66]
Chapter 5. Experimental Results
Several experiments including physical and mechanical tests have been conducted on all the bricks
made during the final phase of the research. Objective was to characterize their mechanical
properties according with the established standards, to verify that they pass the quality control tests
and to seek relationships between the many indices of mechanistic and physical behavior.
The tests conducted are classified in two groups: (a) Non destructive tests to assess
durability and quality of the units; (b) Destructive, to assess the mechanical strength of the masonry
units. The two groups are listed below. A standard number of five identical specimens was tested
in each type of test.
Non-Destructive and Durability Tests: Cold Water Absorption; Hot Water Absorption; Ultrasonic
Pulse Velocity Test; Efflorescence; Freeze thaw tests followed by transverse frequency
measurements.
Destructive Tests: Compressive Strength in Transverse and Longitudinal direction, Splitting
Tensile Strength Test and Flexural Strength Test.
5.1 Destructive Mechanical Tests
The destructive mechanical tests were done as per ASTM C67 / C67M Standard Test Methods for
Sampling and Testing Brick and Structural Clay Tile. The destructive tests performed are the
flexural or three-point bending test, split tensile strength test and the compressive strength test.
Among these tests, the flexural bending test and split tensile strength tests are indirect methods for
measuring the tensile strength of the material. This is done following the same procedure as in all
semi-brittle materials (e.g. concrete), since it is difficult to conduct direct tension experiments not
only for lack of an acceptable test specimen form, but also because the test hardware used to grip
the specimens in the direct tension experiment may generate additional stress often leading to
premature failures and yielding inaccurate results. In the current study, the direct tensile strength
was determined using iterative numerical simulation through an advanced finite element platform,
VecTor 2 described in Chapter 6. Compressive strength was also tested for the brick units. This
destructive mechanical test - is a benchmark for all properties of semi-brittle materials and
structural elements such as concrete, masonry blocks and wallettes. However, in testing brick
compressive strength, a primary concern is the direction of compression with respect to the
[67]
longitudinal brick axis. Many of the reported test values are obtained from tests where
compressive pressure is applied over the largest prism side (wherein the longitudinal axis of the
brick is placed in the horizontal orientation, referred to in the remainder as “horizontal” for
brevity). However, concerns may arise from the triaxial state of stress generated in that condition
owing to the stocky aspect ratio of the specimen. To evaluate this effect compression tests were
also done on bricks placed so that the longitudinal axis is oriented vertically, parallel to the
direction of the compression load. In the remainder of this chapter this type of test will be referred
to as ‘vertical’.
5.1.1 Flexural Strength Test
The flexural or the bending strength of a masonry wall is an important mechanical property as it
attempts to quantify the structural strength to tensile loads. Such examples include shear, bending
and service life deflections. When scaling up from the masonry unit to the wall, occasionally, the
mechanical response in tension is controlled by the mortar used for pointing which is the weakest
material. However, measuring directly the tensile strength of the masonry units is not possible on
account of the brittleness of the material. To address this problem several researchers as well as
code standards prescribe the execution of a flexural test – one where the masonry unit is loaded as
a beam with simple supports and a point load in the middle, to generate tension and therefore
cracking failure in the midspan. This type of test is conducted in the present research to extract the
tensile strength of the masonry unit indirectly, either from the stress formulae at the end of the
ascending branch of the load-displacement curve, or through iteration by matching of the
experimental responses with similar responses obtained after finite element simulations. Five
masonry bricks from each category were tested in three-point bending to assess the flexural
strength. The test unit was placed flatwise on two rollers having diameter of 25 mm, as bottom
supports. The top and bottom surfaces of the bricks were plastered using a high strength (1-hour
compressive strength of 27.6MPa) plaster hydro-stone gypsum cement from USG Industrial &
Specialty Solutions (Figure 5-2(a)) to make the surfaces of the brick levelled and smooth so as to
avoid any possible errors during the testing. For 200 grams of hydro-stone plaster, 55 grams of
water was used for the right consistency as shown in Figure 5-2(b).
Loading was applied by the roller to the brick through the steel bearing plate (Figure 5-1)
placed on the top at the centre of the brick. The load was applied in the direction of the depth of
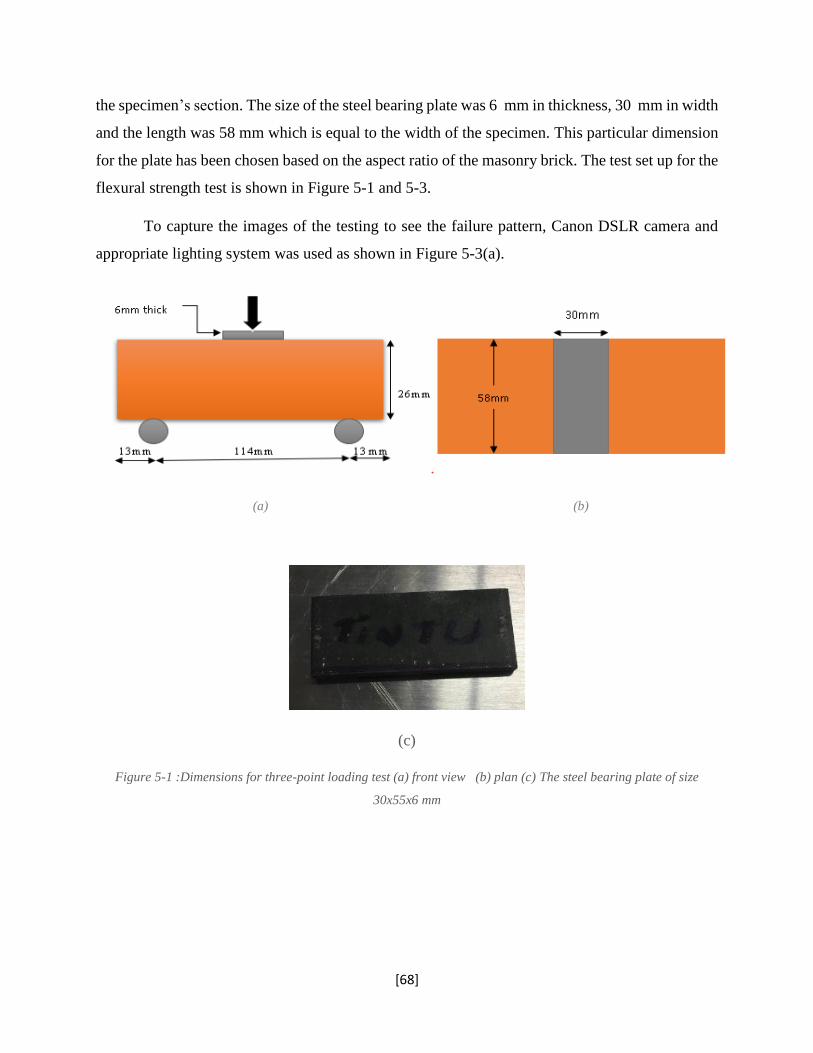
[68]
the specimen’s section. The size of the steel bearing plate was 6 mm in thickness, 30 mm in width
and the length was 58 mm which is equal to the width of the specimen. This particular dimension
for the plate has been chosen based on the aspect ratio of the masonry brick. The test set up for the
flexural strength test is shown in Figure 5-1 and 5-3.
To capture the images of the testing to see the failure pattern, Canon DSLR camera and
appropriate lighting system was used as shown in Figure 5-3(a).
(a) (b)
(c)
Figure 5-1 :Dimensions for three-point loading test (a) front view (b) plan (c) The steel bearing plate of size
30x55x6 mm
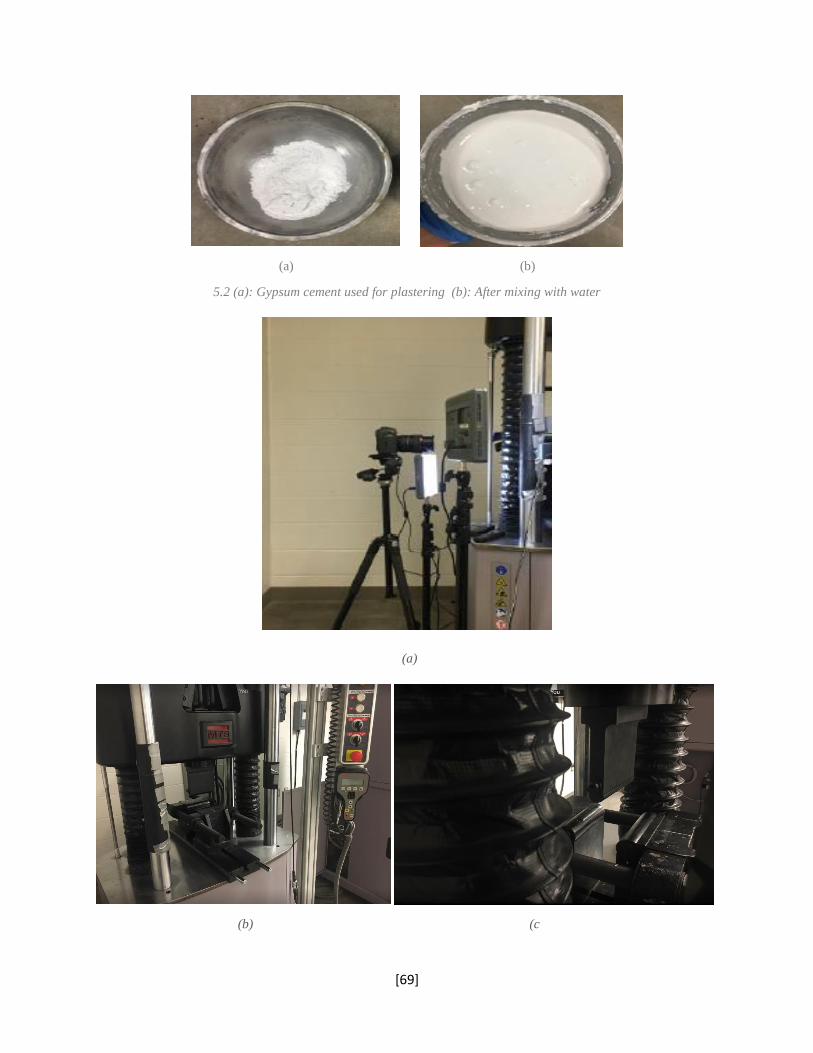
[69]
(a) (b)
5.2 (a): Gypsum cement used for plastering (b): After mixing with water
(a)
(b) (c
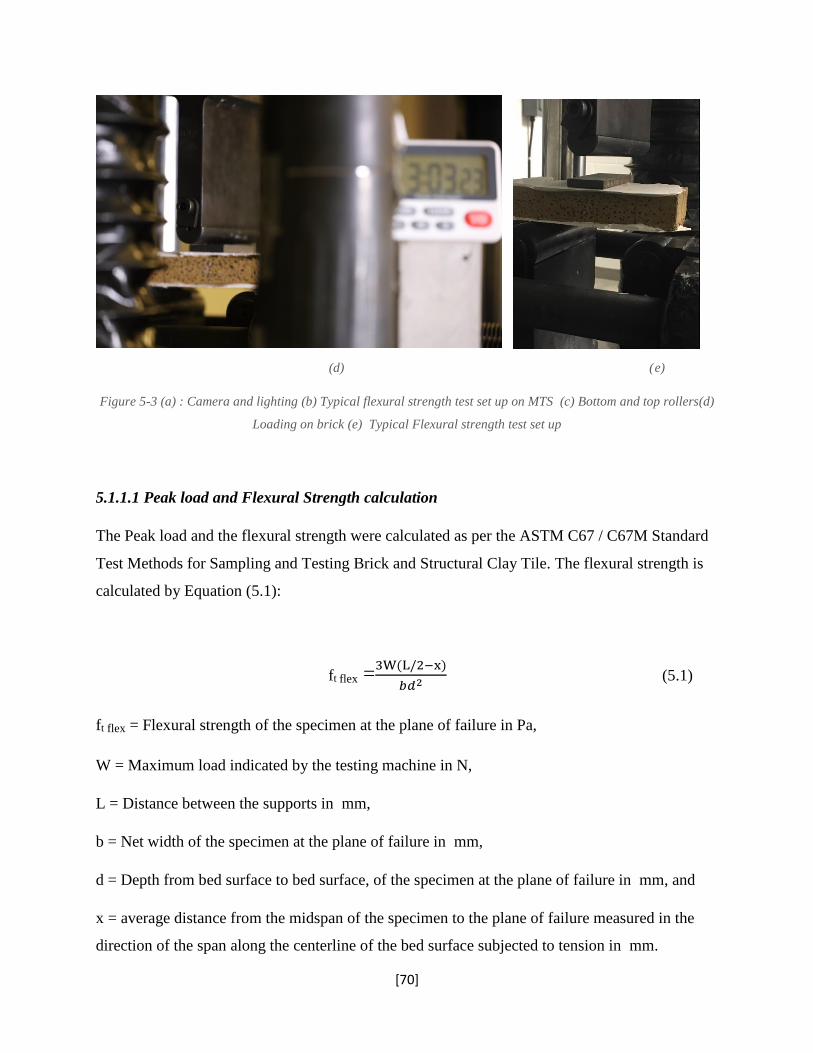
[70]
(d) (e)
Figure 5-3 (a) : Camera and lighting (b) Typical flexural strength test set up on MTS (c) Bottom and top rollers(d)
Loading on brick (e) Typical Flexural strength test set up
5.1.1.1 Peak load and Flexural Strength calculation
The Peak load and the flexural strength were calculated as per the ASTM C67 / C67M Standard
Test Methods for Sampling and Testing Brick and Structural Clay Tile. The flexural strength is
calculated by Equation (5.1):
ft flex =3W(L/2−x)
𝑏𝑑2 (5.1)
ft flex = Flexural strength of the specimen at the plane of failure in Pa,
W = Maximum load indicated by the testing machine in N,
L = Distance between the supports in mm,
b = Net width of the specimen at the plane of failure in mm,
d = Depth from bed surface to bed surface, of the specimen at the plane of failure in mm, and
x = average distance from the midspan of the specimen to the plane of failure measured in the
direction of the span along the centerline of the bed surface subjected to tension in mm.
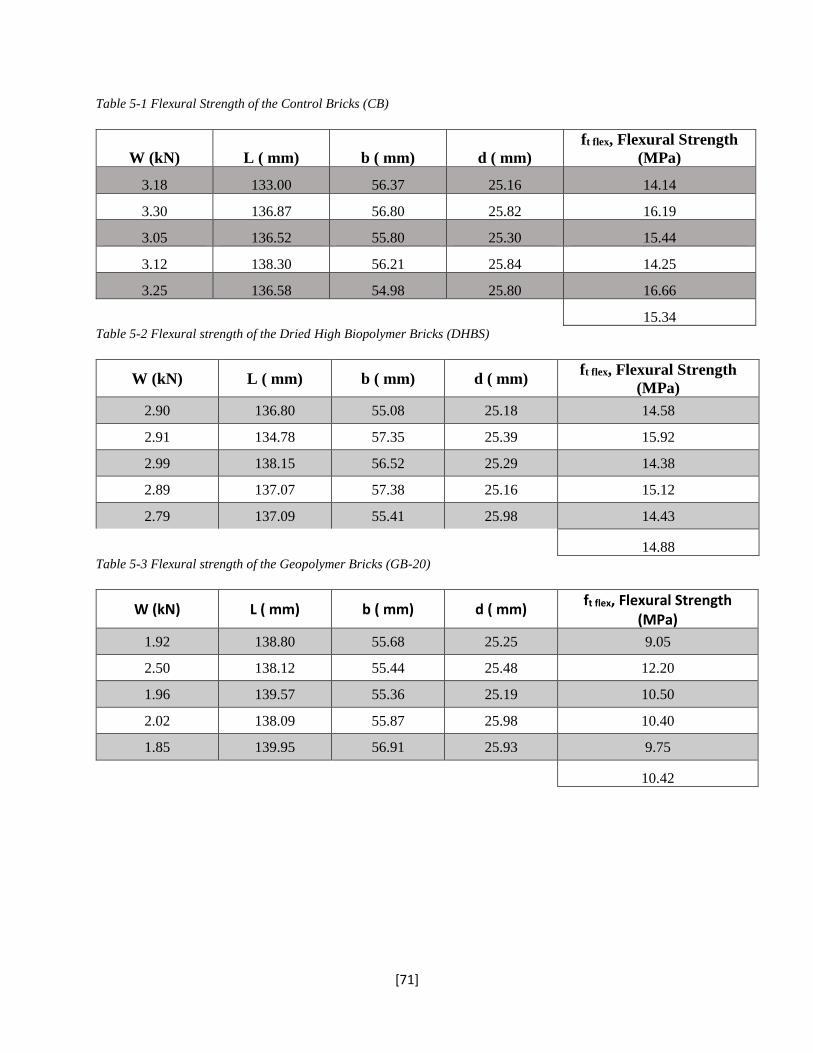
[71]
Table 5-1 Flexural Strength of the Control Bricks (CB)
W (kN) L ( mm) b ( mm) d ( mm)
ft flex, Flexural Strength
(MPa)
3.18 133.00 56.37 25.16 14.14
3.30 136.87 56.80 25.82 16.19
3.05 136.52 55.80 25.30 15.44
3.12 138.30 56.21 25.84 14.25
3.25 136.58 54.98 25.80 16.66
15.34 Table 5-2 Flexural strength of the Dried High Biopolymer Bricks (DHBS)
W (kN) L ( mm) b ( mm) d ( mm) ft flex, Flexural Strength
(MPa)
2.90 136.80 55.08 25.18 14.58
2.91 134.78 57.35 25.39 15.92
2.99 138.15 56.52 25.29 14.38
2.89 137.07 57.38 25.16 15.12
2.79 137.09 55.41 25.98 14.43
14.88 Table 5-3 Flexural strength of the Geopolymer Bricks (GB-20)
W (kN) L ( mm) b ( mm) d ( mm) ft flex, Flexural Strength
(MPa)
1.92 138.80 55.68 25.25 9.05
2.50 138.12 55.44 25.48 12.20
1.96 139.57 55.36 25.19 10.50
2.02 138.09 55.87 25.98 10.40
1.85 139.95 56.91 25.93 9.75
10.42
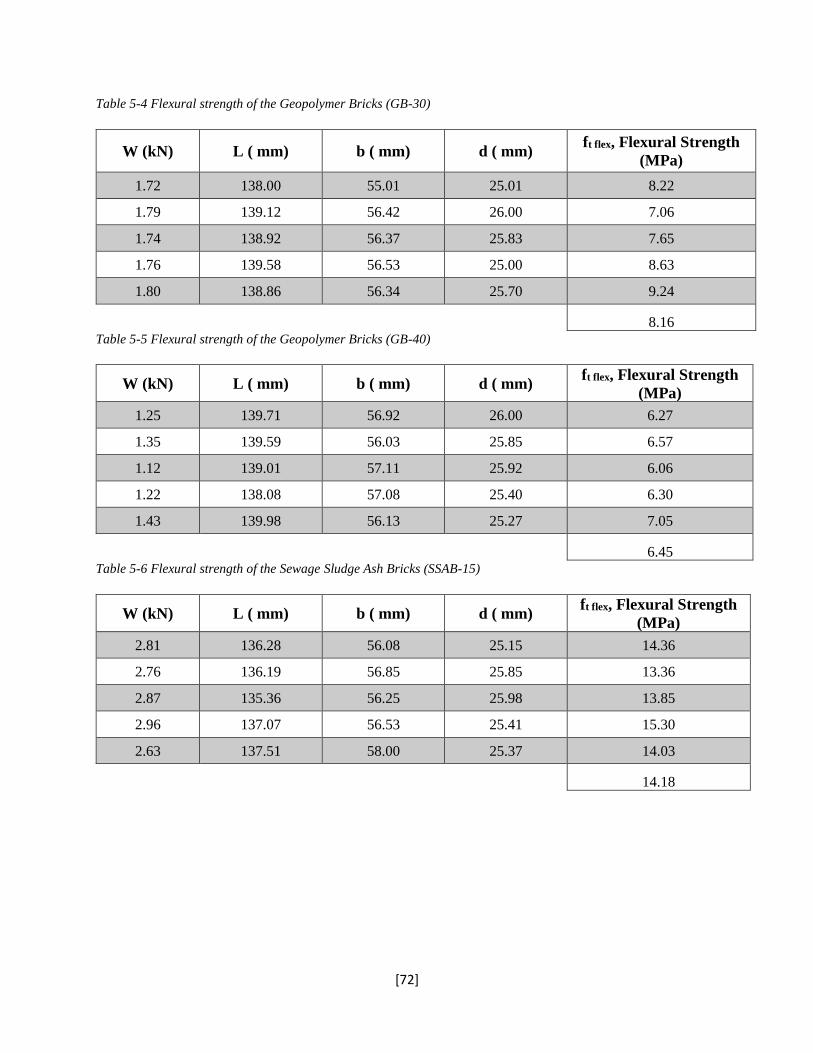
[72]
Table 5-4 Flexural strength of the Geopolymer Bricks (GB-30)
W (kN) L ( mm) b ( mm) d ( mm) ft flex, Flexural Strength
(MPa)
1.72 138.00 55.01 25.01 8.22
1.79 139.12 56.42 26.00 7.06
1.74 138.92 56.37 25.83 7.65
1.76 139.58 56.53 25.00 8.63
1.80 138.86 56.34 25.70 9.24
8.16 Table 5-5 Flexural strength of the Geopolymer Bricks (GB-40)
W (kN) L ( mm) b ( mm) d ( mm) ft flex, Flexural Strength
(MPa)
1.25 139.71 56.92 26.00 6.27
1.35 139.59 56.03 25.85 6.57
1.12 139.01 57.11 25.92 6.06
1.22 138.08 57.08 25.40 6.30
1.43 139.98 56.13 25.27 7.05
6.45 Table 5-6 Flexural strength of the Sewage Sludge Ash Bricks (SSAB-15)
W (kN) L ( mm) b ( mm) d ( mm) ft flex, Flexural Strength
(MPa)
2.81 136.28 56.08 25.15 14.36
2.76 136.19 56.85 25.85 13.36
2.87 135.36 56.25 25.98 13.85
2.96 137.07 56.53 25.41 15.30
2.63 137.51 58.00 25.37 14.03
14.18
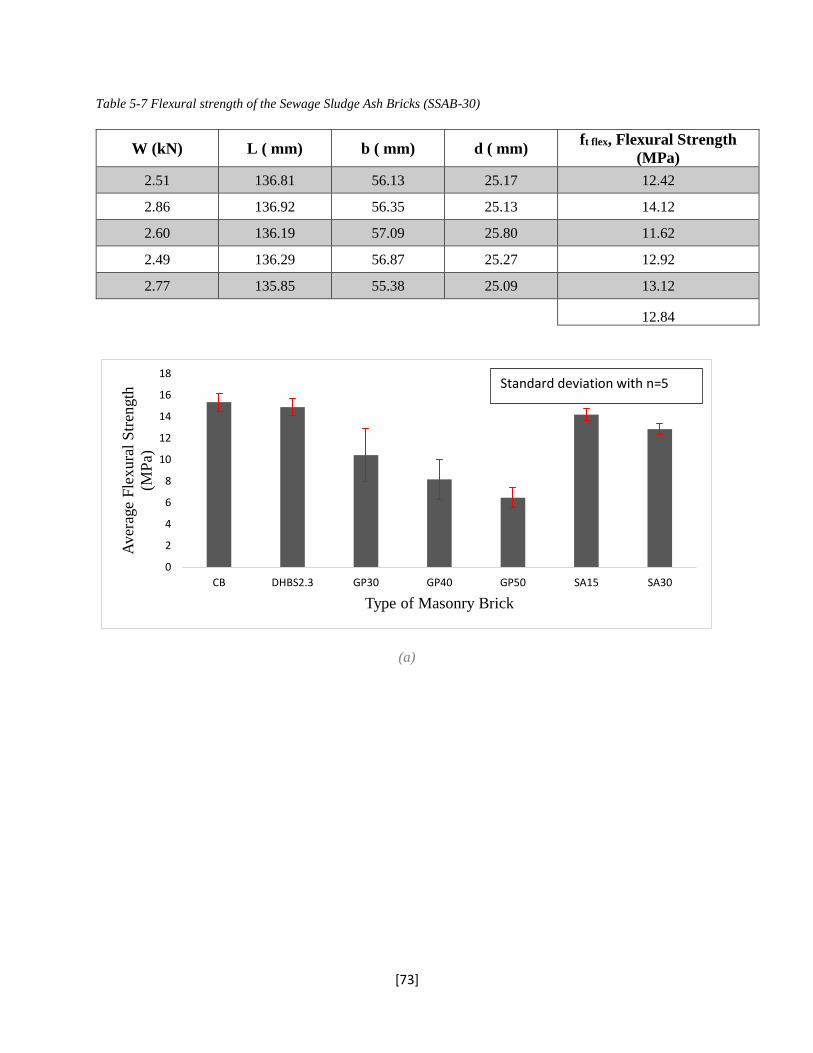
[73]
Table 5-7 Flexural strength of the Sewage Sludge Ash Bricks (SSAB-30)
W (kN) L ( mm) b ( mm) d ( mm) ft flex, Flexural Strength
(MPa)
2.51 136.81 56.13 25.17 12.42
2.86 136.92 56.35 25.13 14.12
2.60 136.19 57.09 25.80 11.62
2.49 136.29 56.87 25.27 12.92
2.77 135.85 55.38 25.09 13.12
12.84
(a)
0
2
4
6
8
10
12
14
16
18
CB DHBS2.3 GP30 GP40 GP50 SA15 SA30
Aver
age
Fle
xura
l S
tren
gth
(MP
a)
Type of Masonry Brick
Standard deviation with n=5
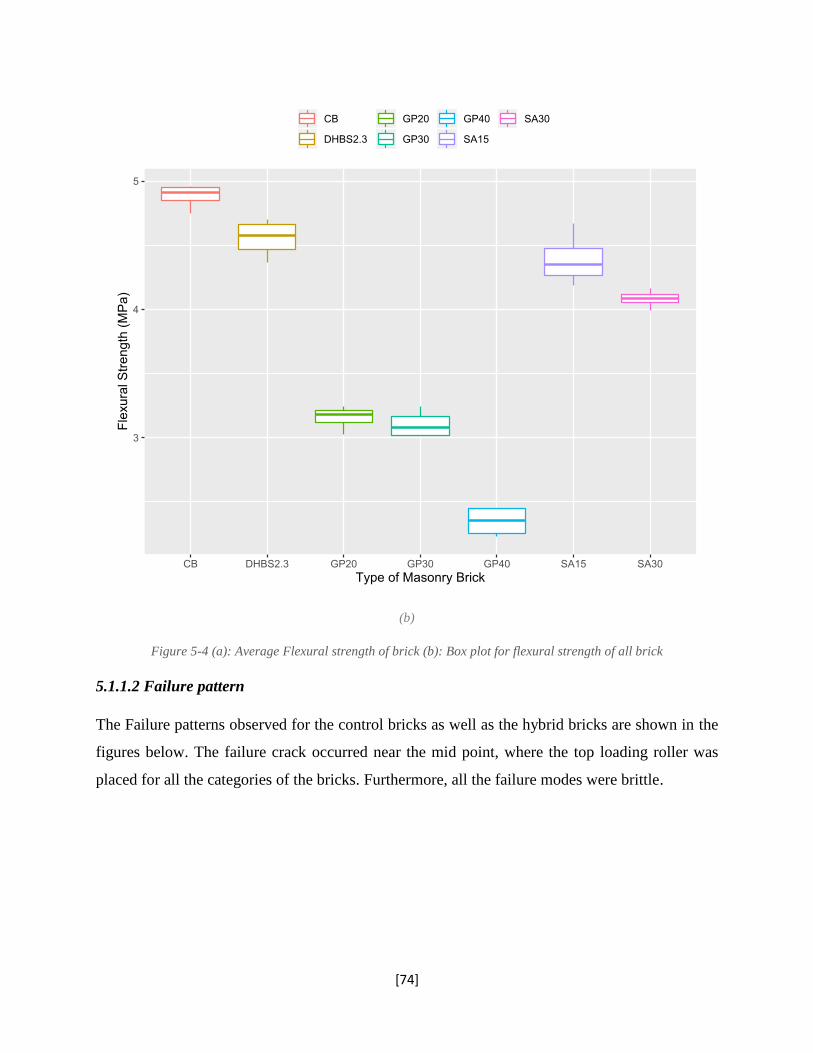
[74]
(b)
Figure 5-4 (a): Average Flexural strength of brick (b): Box plot for flexural strength of all brick
5.1.1.2 Failure pattern
The Failure patterns observed for the control bricks as well as the hybrid bricks are shown in the
figures below. The failure crack occurred near the mid point, where the top loading roller was
placed for all the categories of the bricks. Furthermore, all the failure modes were brittle.
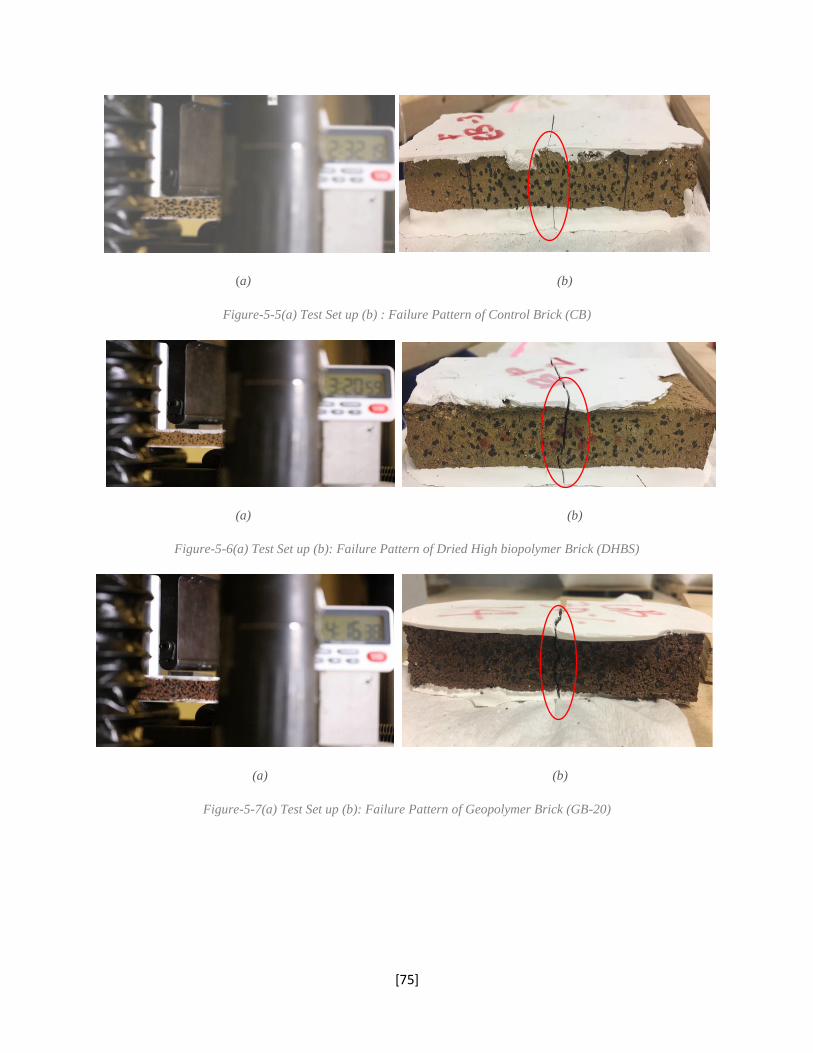
[75]
(a) (b)
Figure-5-5(a) Test Set up (b) : Failure Pattern of Control Brick (CB)
(a) (b)
Figure-5-6(a) Test Set up (b): Failure Pattern of Dried High biopolymer Brick (DHBS)
(a) (b)
Figure-5-7(a) Test Set up (b): Failure Pattern of Geopolymer Brick (GB-20)
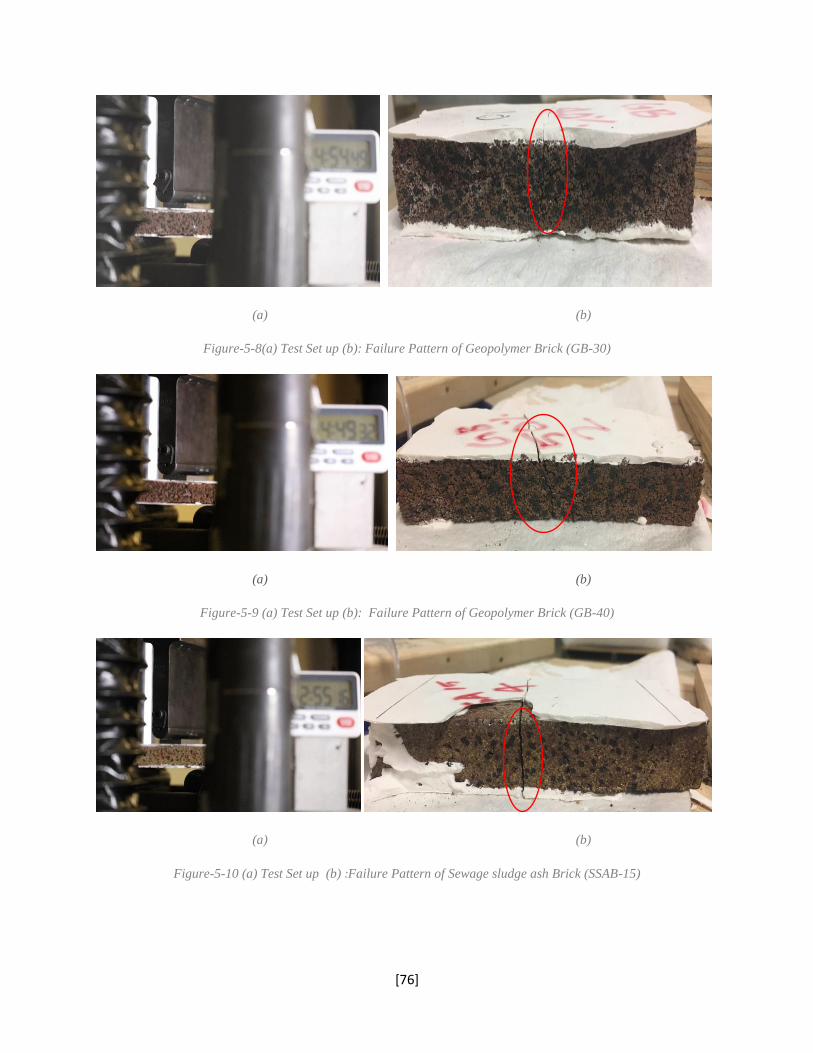
[76]
(a) (b)
Figure-5-8(a) Test Set up (b): Failure Pattern of Geopolymer Brick (GB-30)
(a) (b)
Figure-5-9 (a) Test Set up (b): Failure Pattern of Geopolymer Brick (GB-40)
(a) (b)
Figure-5-10 (a) Test Set up (b) :Failure Pattern of Sewage sludge ash Brick (SSAB-15)
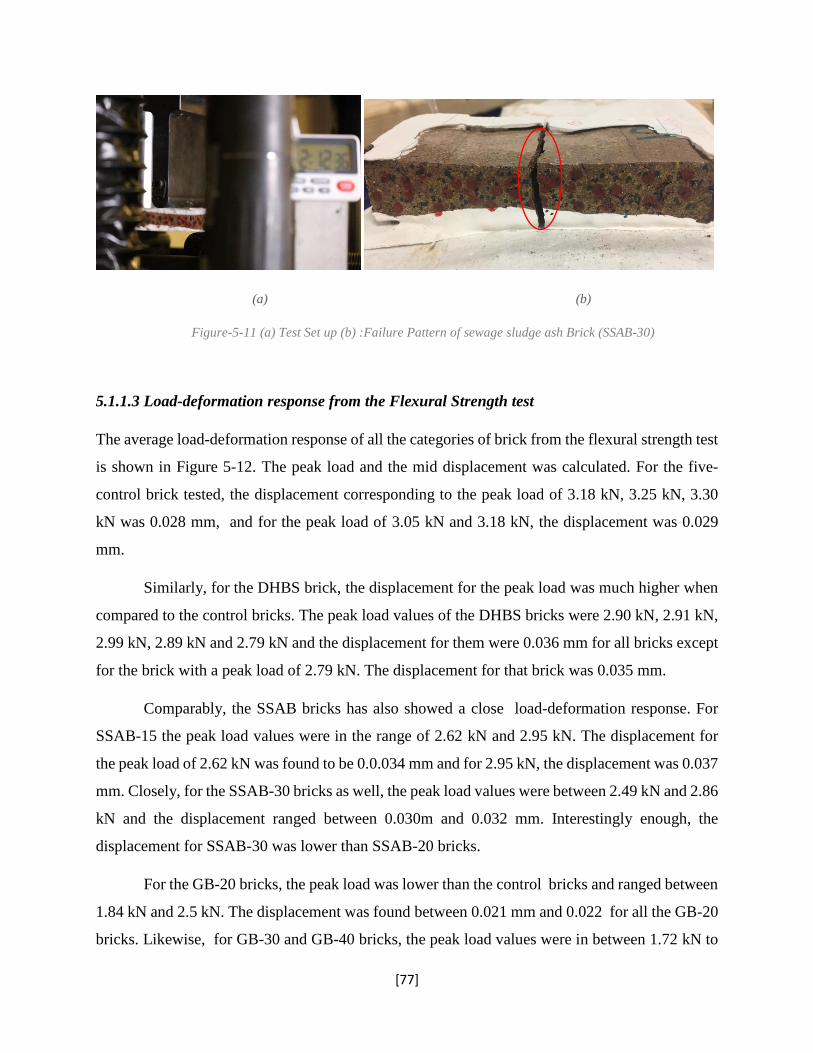
[77]
(a) (b)
Figure-5-11 (a) Test Set up (b) :Failure Pattern of sewage sludge ash Brick (SSAB-30)
5.1.1.3 Load-deformation response from the Flexural Strength test
The average load-deformation response of all the categories of brick from the flexural strength test
is shown in Figure 5-12. The peak load and the mid displacement was calculated. For the five-
control brick tested, the displacement corresponding to the peak load of 3.18 kN, 3.25 kN, 3.30
kN was 0.028 mm, and for the peak load of 3.05 kN and 3.18 kN, the displacement was 0.029
mm.
Similarly, for the DHBS brick, the displacement for the peak load was much higher when
compared to the control bricks. The peak load values of the DHBS bricks were 2.90 kN, 2.91 kN,
2.99 kN, 2.89 kN and 2.79 kN and the displacement for them were 0.036 mm for all bricks except
for the brick with a peak load of 2.79 kN. The displacement for that brick was 0.035 mm.
Comparably, the SSAB bricks has also showed a close load-deformation response. For
SSAB-15 the peak load values were in the range of 2.62 kN and 2.95 kN. The displacement for
the peak load of 2.62 kN was found to be 0.0.034 mm and for 2.95 kN, the displacement was 0.037
mm. Closely, for the SSAB-30 bricks as well, the peak load values were between 2.49 kN and 2.86
kN and the displacement ranged between 0.030m and 0.032 mm. Interestingly enough, the
displacement for SSAB-30 was lower than SSAB-20 bricks.
For the GB-20 bricks, the peak load was lower than the control bricks and ranged between
1.84 kN and 2.5 kN. The displacement was found between 0.021 mm and 0.022 for all the GB-20
bricks. Likewise, for GB-30 and GB-40 bricks, the peak load values were in between 1.72 kN to
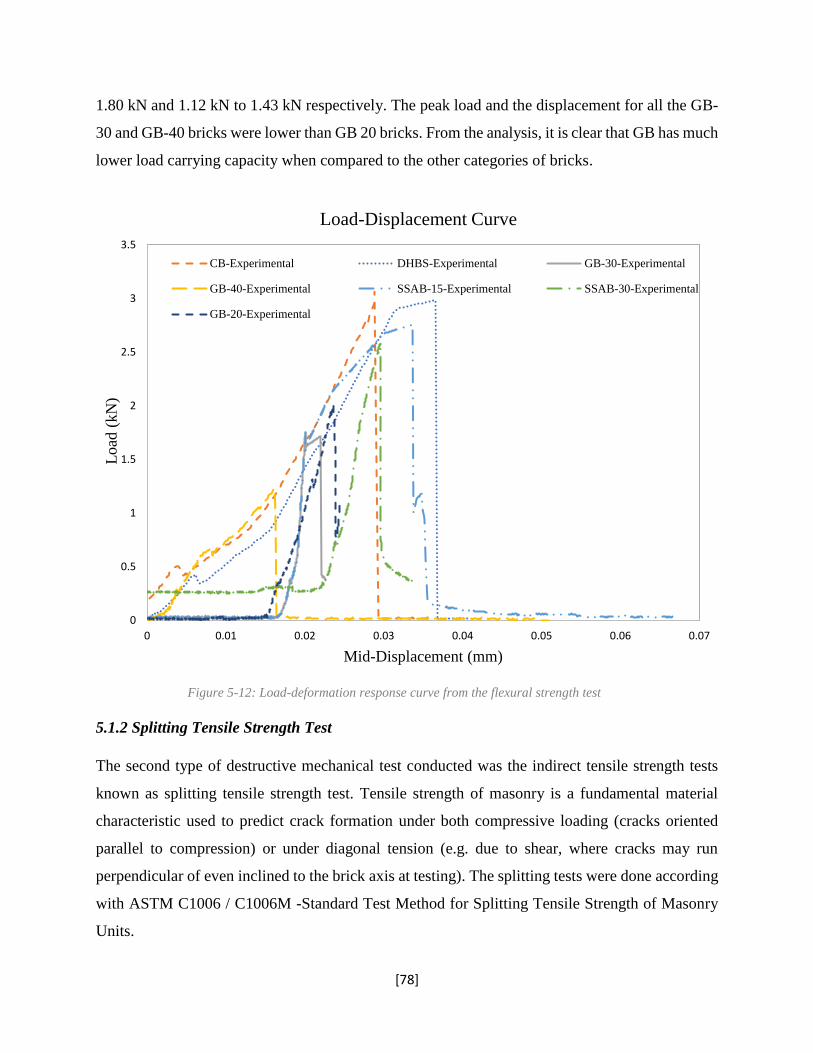
[78]
1.80 kN and 1.12 kN to 1.43 kN respectively. The peak load and the displacement for all the GB-
30 and GB-40 bricks were lower than GB 20 bricks. From the analysis, it is clear that GB has much
lower load carrying capacity when compared to the other categories of bricks.
Figure 5-12: Load-deformation response curve from the flexural strength test
5.1.2 Splitting Tensile Strength Test
The second type of destructive mechanical test conducted was the indirect tensile strength tests
known as splitting tensile strength test. Tensile strength of masonry is a fundamental material
characteristic used to predict crack formation under both compressive loading (cracks oriented
parallel to compression) or under diagonal tension (e.g. due to shear, where cracks may run
perpendicular of even inclined to the brick axis at testing). The splitting tests were done according
with ASTM C1006 / C1006M -Standard Test Method for Splitting Tensile Strength of Masonry
Units.
0
0.5
1
1.5
2
2.5
3
3.5
0 0.01 0.02 0.03 0.04 0.05 0.06 0.07
Load
(kN
)
Mid-Displacement (mm)
Load-Displacement Curve
CB-Experimental DHBS-Experimental GB-30-Experimental
GB-40-Experimental SSAB-15-Experimental SSAB-30-Experimental
GB-20-Experimental
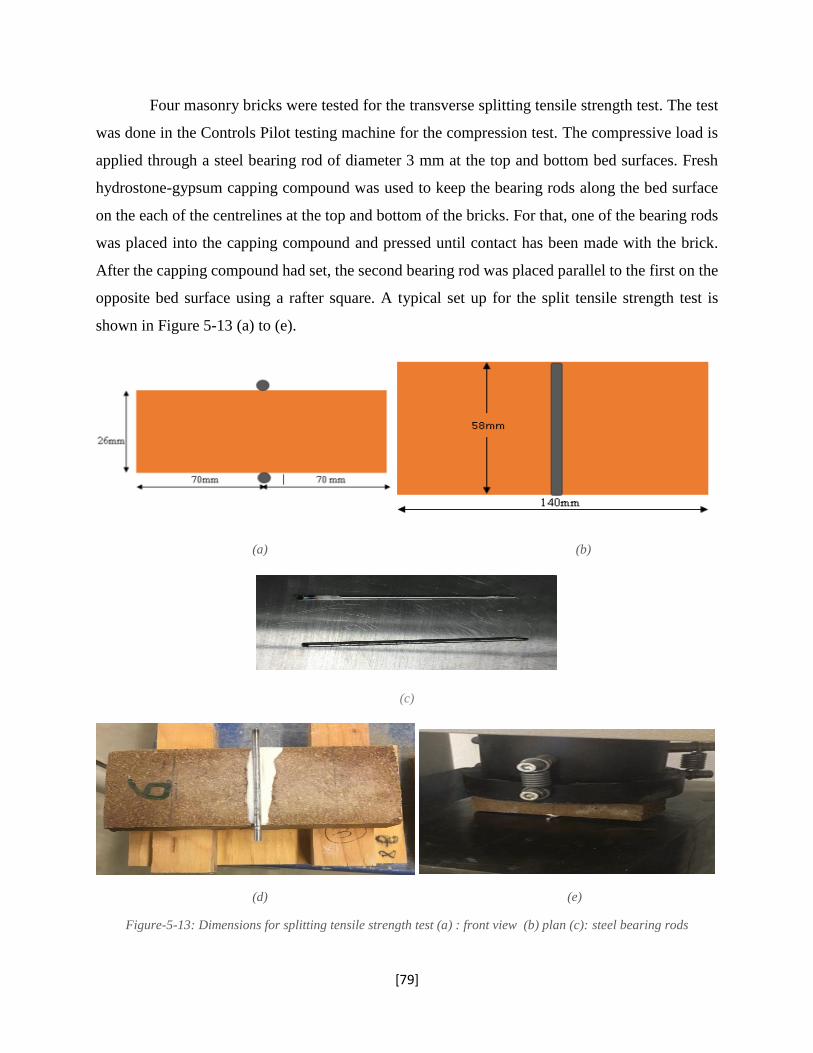
[79]
Four masonry bricks were tested for the transverse splitting tensile strength test. The test
was done in the Controls Pilot testing machine for the compression test. The compressive load is
applied through a steel bearing rod of diameter 3 mm at the top and bottom bed surfaces. Fresh
hydrostone-gypsum capping compound was used to keep the bearing rods along the bed surface
on the each of the centrelines at the top and bottom of the bricks. For that, one of the bearing rods
was placed into the capping compound and pressed until contact has been made with the brick.
After the capping compound had set, the second bearing rod was placed parallel to the first on the
opposite bed surface using a rafter square. A typical set up for the split tensile strength test is
shown in Figure 5-13 (a) to (e).
(a) (b)
(c)
(d) (e)
Figure-5-13: Dimensions for splitting tensile strength test (a) : front view (b) plan (c): steel bearing rods
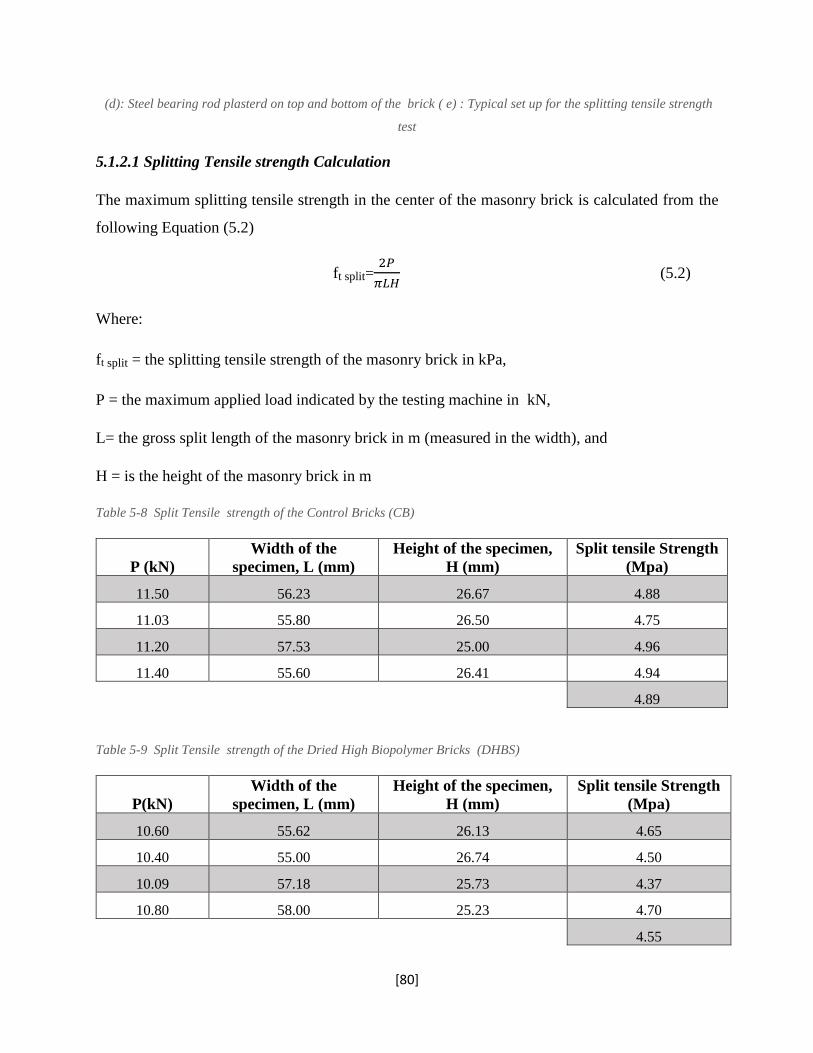
[80]
(d): Steel bearing rod plasterd on top and bottom of the brick ( e) : Typical set up for the splitting tensile strength
test
5.1.2.1 Splitting Tensile strength Calculation
The maximum splitting tensile strength in the center of the masonry brick is calculated from the
following Equation (5.2)
ft split=2𝑃
𝜋𝐿𝐻 (5.2)
Where:
ft split = the splitting tensile strength of the masonry brick in kPa,
P = the maximum applied load indicated by the testing machine in kN,
L= the gross split length of the masonry brick in m (measured in the width), and
H = is the height of the masonry brick in m
Table 5-8 Split Tensile strength of the Control Bricks (CB)
P (kN)
Width of the
specimen, L (mm)
Height of the specimen,
H (mm)
Split tensile Strength
(Mpa)
11.50 56.23 26.67 4.88
11.03 55.80 26.50 4.75
11.20 57.53 25.00 4.96
11.40 55.60 26.41 4.94
4.89
Table 5-9 Split Tensile strength of the Dried High Biopolymer Bricks (DHBS)
P(kN)
Width of the
specimen, L (mm)
Height of the specimen,
H (mm)
Split tensile Strength
(Mpa)
10.60 55.62 26.13 4.65
10.40 55.00 26.74 4.50
10.09 57.18 25.73 4.37
10.80 58.00 25.23 4.70
4.55
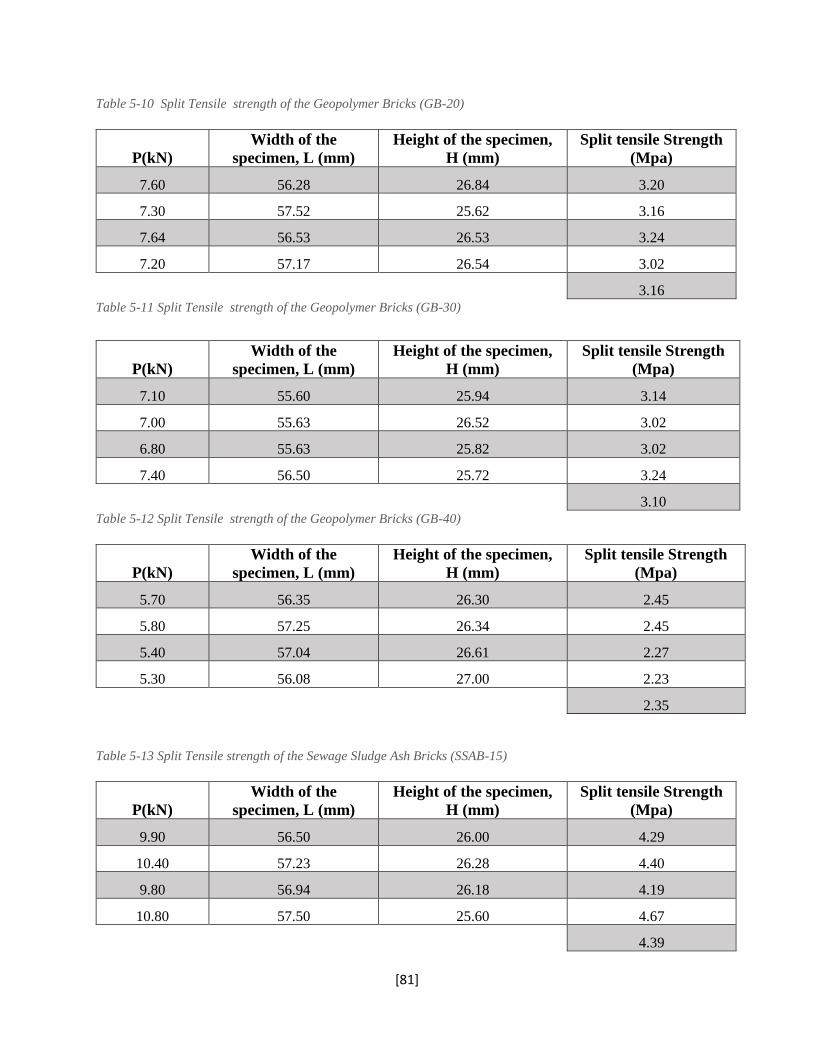
[81]
Table 5-10 Split Tensile strength of the Geopolymer Bricks (GB-20)
P(kN)
Width of the
specimen, L (mm)
Height of the specimen,
H (mm)
Split tensile Strength
(Mpa)
7.60 56.28 26.84 3.20
7.30 57.52 25.62 3.16
7.64 56.53 26.53 3.24
7.20 57.17 26.54 3.02
3.16 Table 5-11 Split Tensile strength of the Geopolymer Bricks (GB-30)
P(kN)
Width of the
specimen, L (mm)
Height of the specimen,
H (mm)
Split tensile Strength
(Mpa)
7.10 55.60 25.94 3.14
7.00 55.63 26.52 3.02
6.80 55.63 25.82 3.02
7.40 56.50 25.72 3.24
3.10 Table 5-12 Split Tensile strength of the Geopolymer Bricks (GB-40)
P(kN)
Width of the
specimen, L (mm)
Height of the specimen,
H (mm)
Split tensile Strength
(Mpa)
5.70 56.35 26.30 2.45
5.80 57.25 26.34 2.45
5.40 57.04 26.61 2.27
5.30 56.08 27.00 2.23
2.35
Table 5-13 Split Tensile strength of the Sewage Sludge Ash Bricks (SSAB-15)
P(kN)
Width of the
specimen, L (mm)
Height of the specimen,
H (mm)
Split tensile Strength
(Mpa)
9.90 56.50 26.00 4.29
10.40 57.23 26.28 4.40
9.80 56.94 26.18 4.19
10.80 57.50 25.60 4.67
4.39
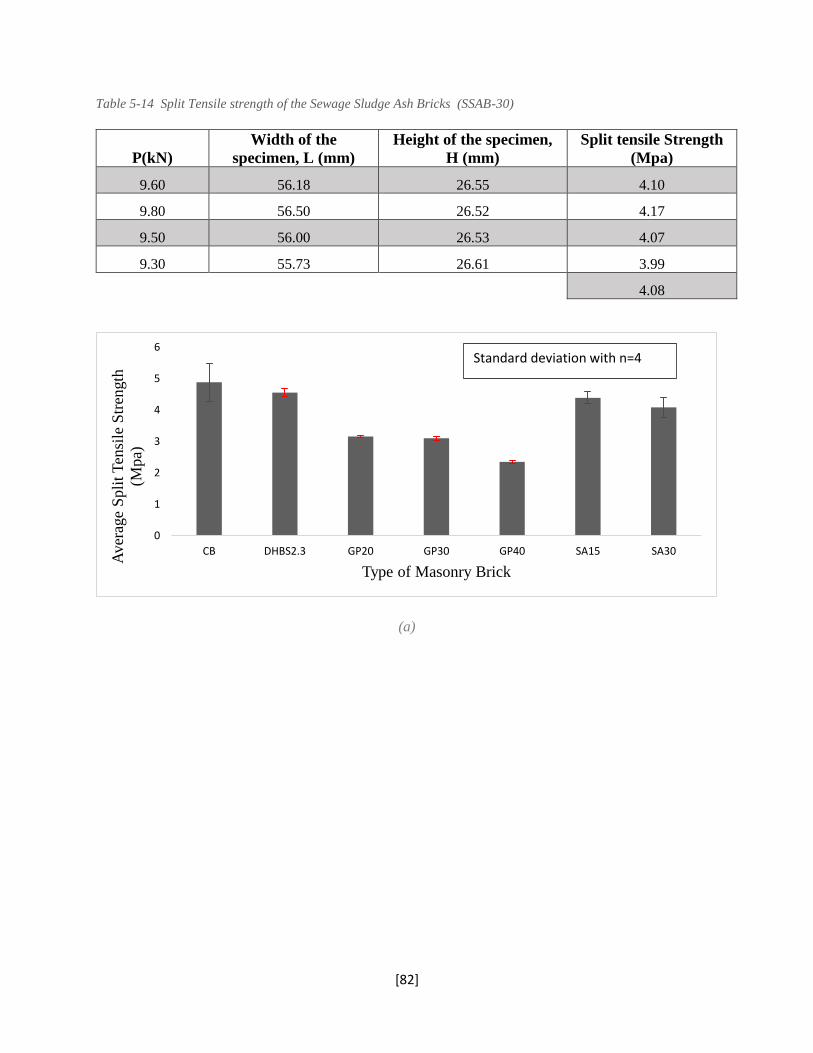
[82]
Table 5-14 Split Tensile strength of the Sewage Sludge Ash Bricks (SSAB-30)
P(kN)
Width of the
specimen, L (mm)
Height of the specimen,
H (mm)
Split tensile Strength
(Mpa)
9.60 56.18 26.55 4.10
9.80 56.50 26.52 4.17
9.50 56.00 26.53 4.07
9.30 55.73 26.61 3.99
4.08
(a)
0
1
2
3
4
5
6
CB DHBS2.3 GP20 GP30 GP40 SA15 SA30
Aver
age
Spli
t T
ensi
le S
tren
gth
(Mpa)
Type of Masonry Brick
Standard deviation with n=4
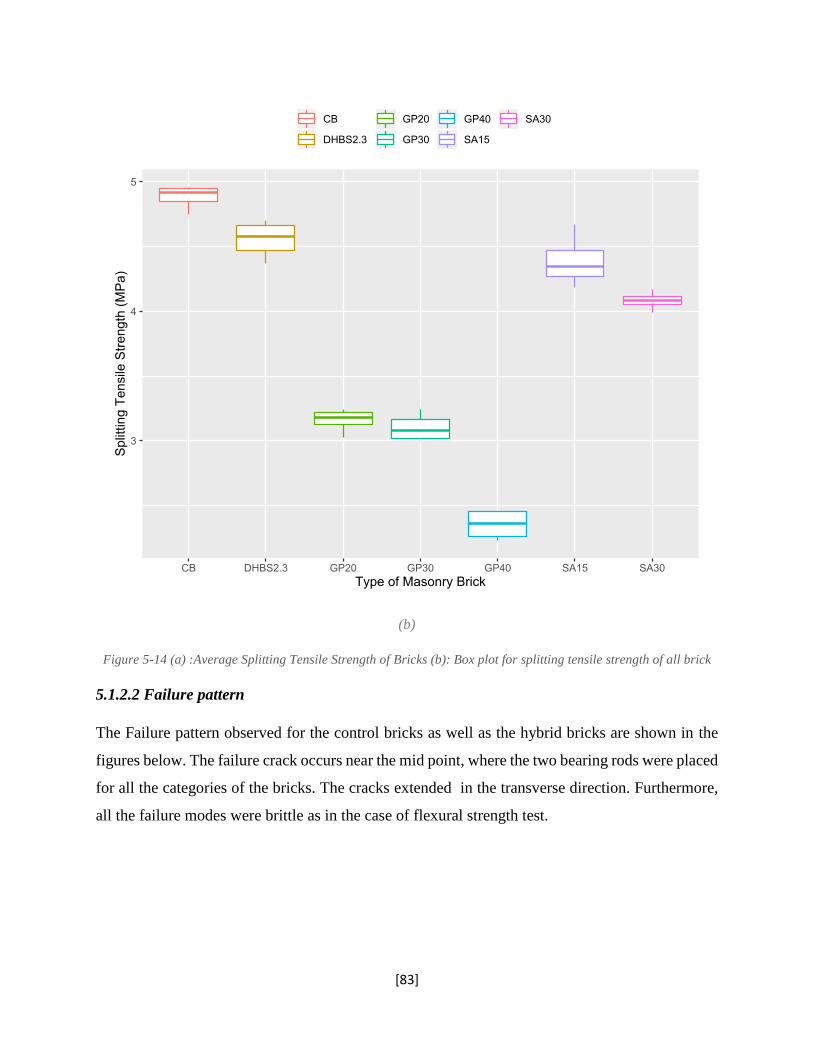
[83]
(b)
Figure 5-14 (a) :Average Splitting Tensile Strength of Bricks (b): Box plot for splitting tensile strength of all brick
5.1.2.2 Failure pattern
The Failure pattern observed for the control bricks as well as the hybrid bricks are shown in the
figures below. The failure crack occurs near the mid point, where the two bearing rods were placed
for all the categories of the bricks. The cracks extended in the transverse direction. Furthermore,
all the failure modes were brittle as in the case of flexural strength test.
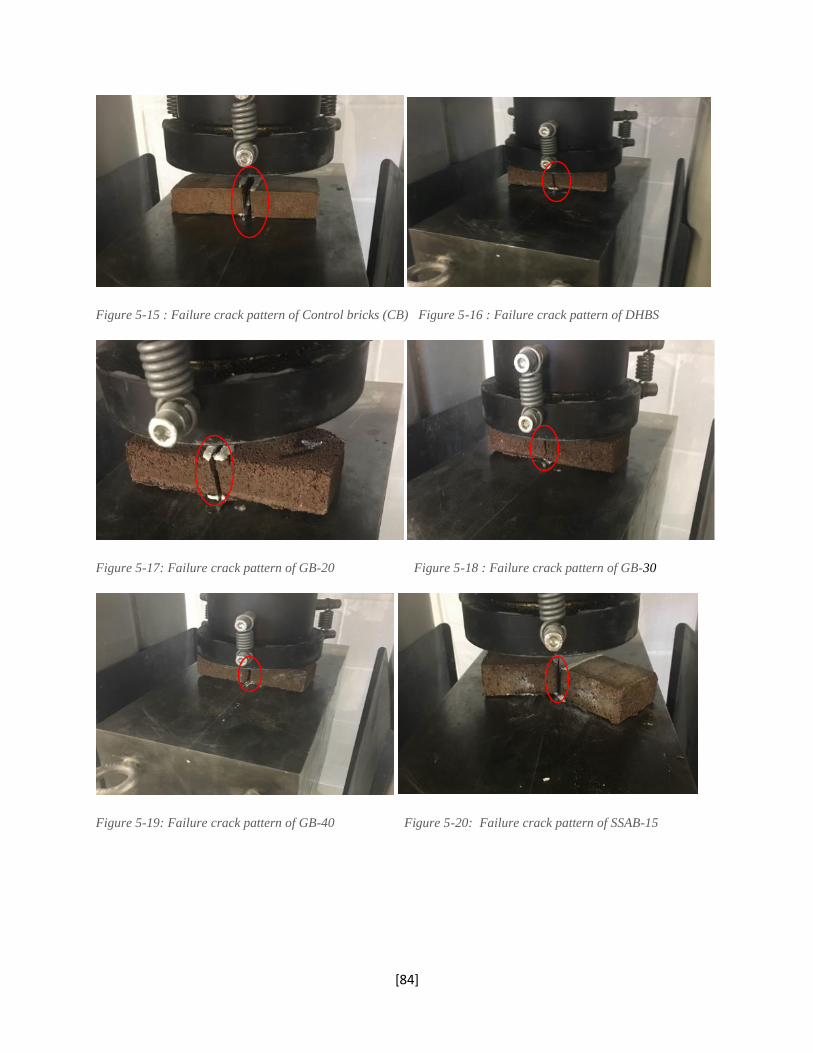
[84]
Figure 5-15 : Failure crack pattern of Control bricks (CB) Figure 5-16 : Failure crack pattern of DHBS
Figure 5-17: Failure crack pattern of GB-20 Figure 5-18 : Failure crack pattern of GB-30
Figure 5-19: Failure crack pattern of GB-40 Figure 5-20: Failure crack pattern of SSAB-15
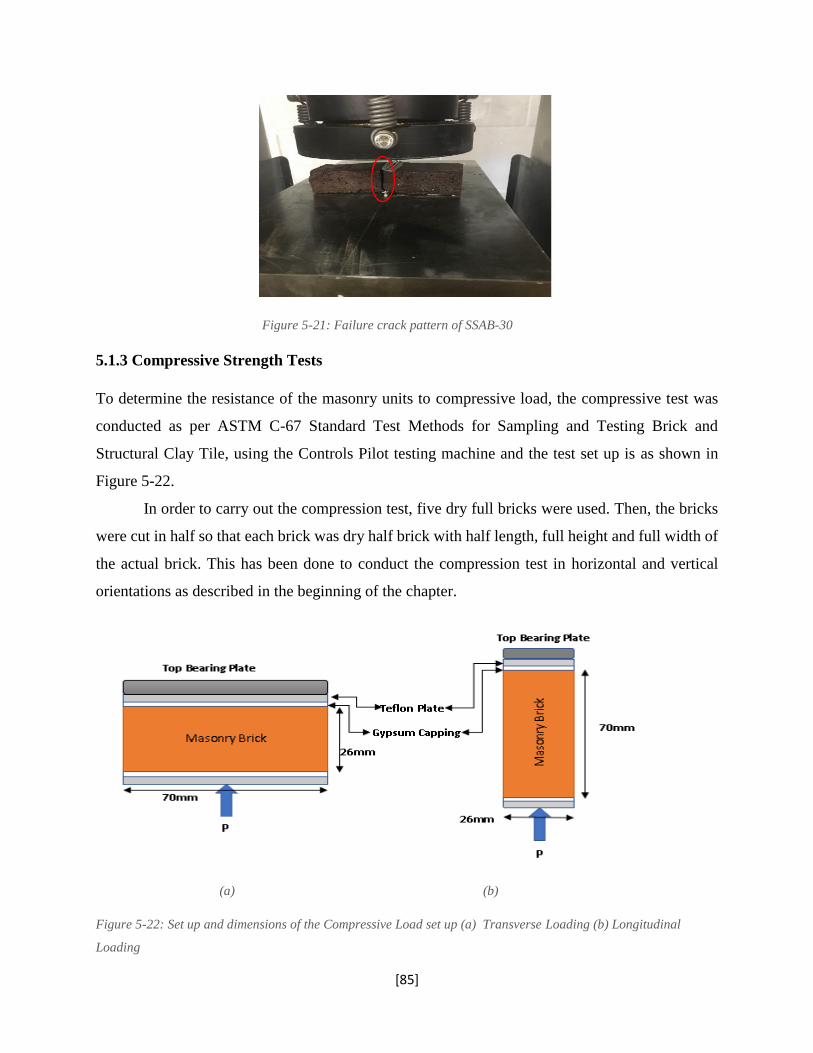
[85]
Figure 5-21: Failure crack pattern of SSAB-30
5.1.3 Compressive Strength Tests
To determine the resistance of the masonry units to compressive load, the compressive test was
conducted as per ASTM C-67 Standard Test Methods for Sampling and Testing Brick and
Structural Clay Tile, using the Controls Pilot testing machine and the test set up is as shown in
Figure 5-22.
In order to carry out the compression test, five dry full bricks were used. Then, the bricks
were cut in half so that each brick was dry half brick with half length, full height and full width of
the actual brick. This has been done to conduct the compression test in horizontal and vertical
orientations as described in the beginning of the chapter.
(a) (b)
Figure 5-22: Set up and dimensions of the Compressive Load set up (a) Transverse Loading (b) Longitudinal
Loading
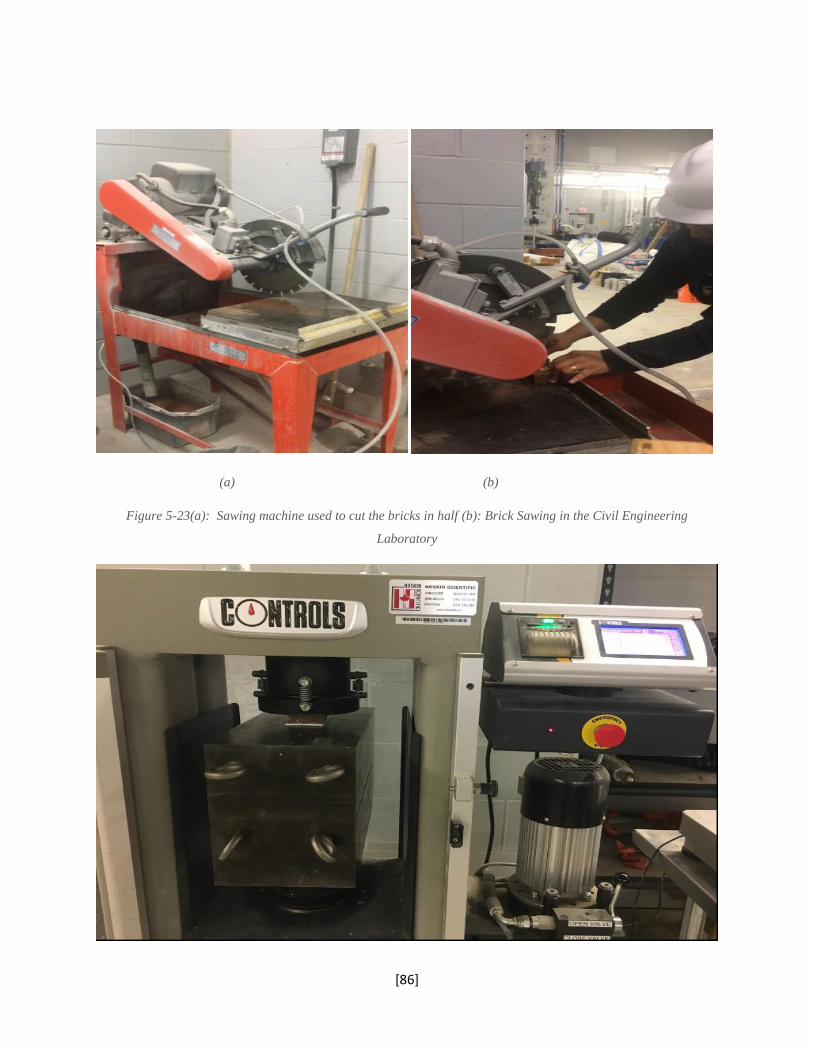
[86]
(a) (b)
Figure 5-23(a): Sawing machine used to cut the bricks in half (b): Brick Sawing in the Civil Engineering
Laboratory
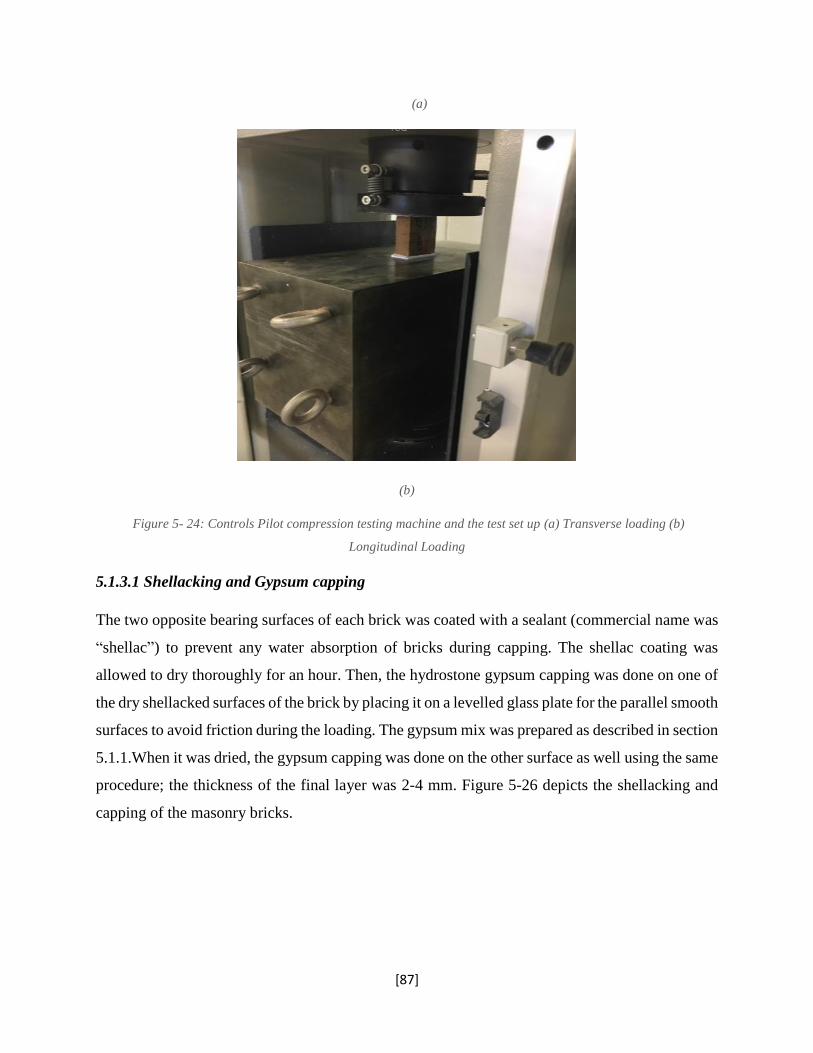
[87]
(a)
(b)
Figure 5- 24: Controls Pilot compression testing machine and the test set up (a) Transverse loading (b)
Longitudinal Loading
5.1.3.1 Shellacking and Gypsum capping
The two opposite bearing surfaces of each brick was coated with a sealant (commercial name was
“shellac”) to prevent any water absorption of bricks during capping. The shellac coating was
allowed to dry thoroughly for an hour. Then, the hydrostone gypsum capping was done on one of
the dry shellacked surfaces of the brick by placing it on a levelled glass plate for the parallel smooth
surfaces to avoid friction during the loading. The gypsum mix was prepared as described in section
5.1.1.When it was dried, the gypsum capping was done on the other surface as well using the same
procedure; the thickness of the final layer was 2-4 mm. Figure 5-26 depicts the shellacking and
capping of the masonry bricks.
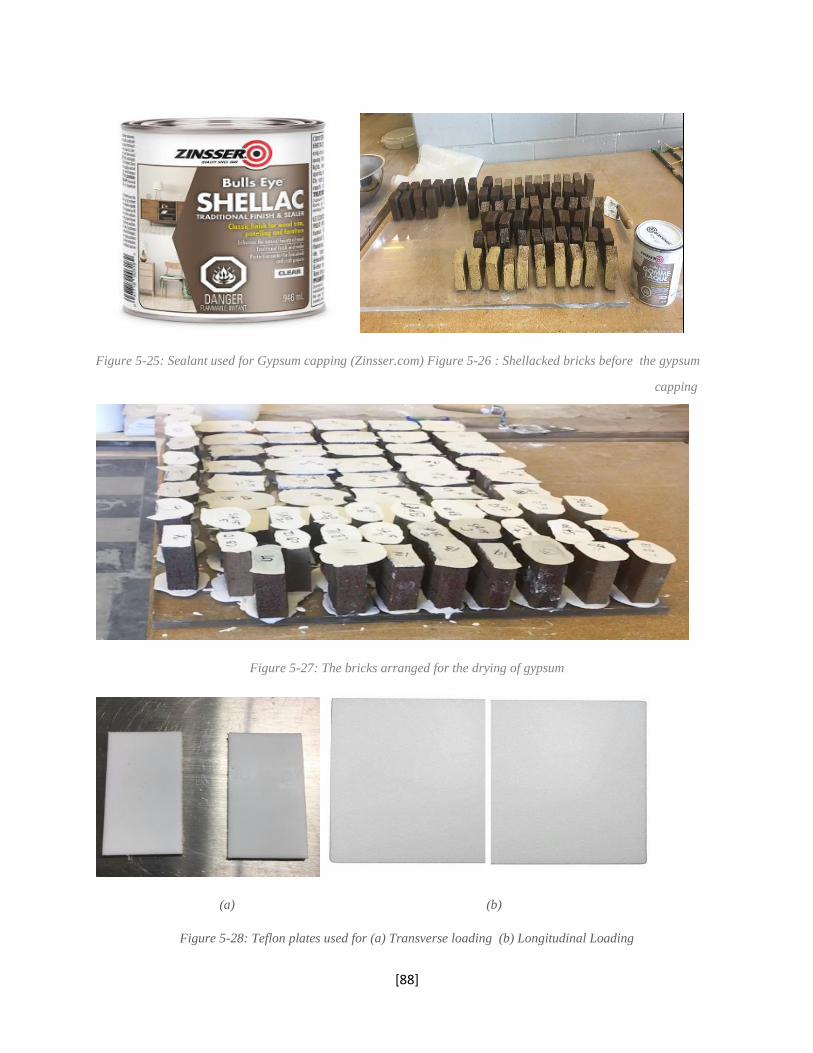
[88]
Figure 5-25: Sealant used for Gypsum capping (Zinsser.com) Figure 5-26 : Shellacked bricks before the gypsum
. capping
Figure 5-27: The bricks arranged for the drying of gypsum
(a) (b)
Figure 5-28: Teflon plates used for (a) Transverse loading (b) Longitudinal Loading
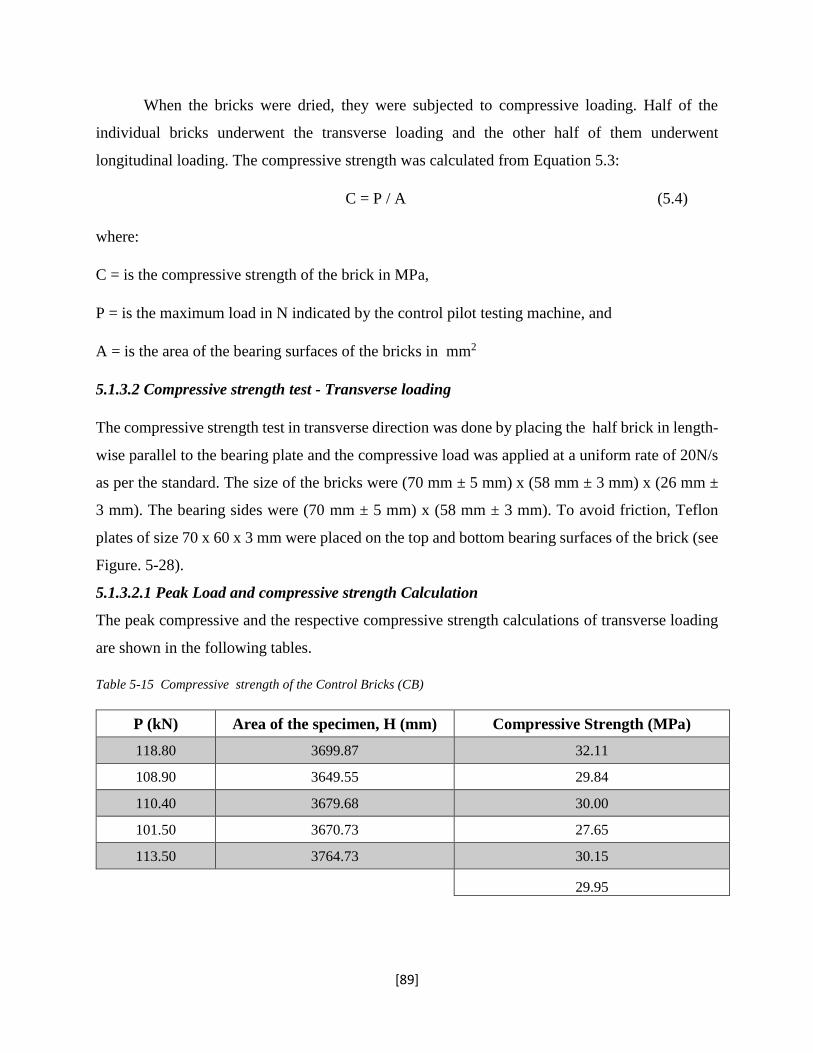
[89]
When the bricks were dried, they were subjected to compressive loading. Half of the
individual bricks underwent the transverse loading and the other half of them underwent
longitudinal loading. The compressive strength was calculated from Equation 5.3:
C = P / A (5.4)
where:
C = is the compressive strength of the brick in MPa,
P = is the maximum load in N indicated by the control pilot testing machine, and
A = is the area of the bearing surfaces of the bricks in mm2
5.1.3.2 Compressive strength test - Transverse loading
The compressive strength test in transverse direction was done by placing the half brick in length-
wise parallel to the bearing plate and the compressive load was applied at a uniform rate of 20N/s
as per the standard. The size of the bricks were (70 mm ± 5 mm) x (58 mm ± 3 mm) x (26 mm ±
3 mm). The bearing sides were (70 mm ± 5 mm) x (58 mm ± 3 mm). To avoid friction, Teflon
plates of size 70 x 60 x 3 mm were placed on the top and bottom bearing surfaces of the brick (see
Figure. 5-28).
5.1.3.2.1 Peak Load and compressive strength Calculation
The peak compressive and the respective compressive strength calculations of transverse loading
are shown in the following tables.
Table 5-15 Compressive strength of the Control Bricks (CB)
P (kN) Area of the specimen, H (mm) Compressive Strength (MPa)
118.80 3699.87 32.11
108.90 3649.55 29.84
110.40 3679.68 30.00
101.50 3670.73 27.65
113.50 3764.73 30.15
29.95
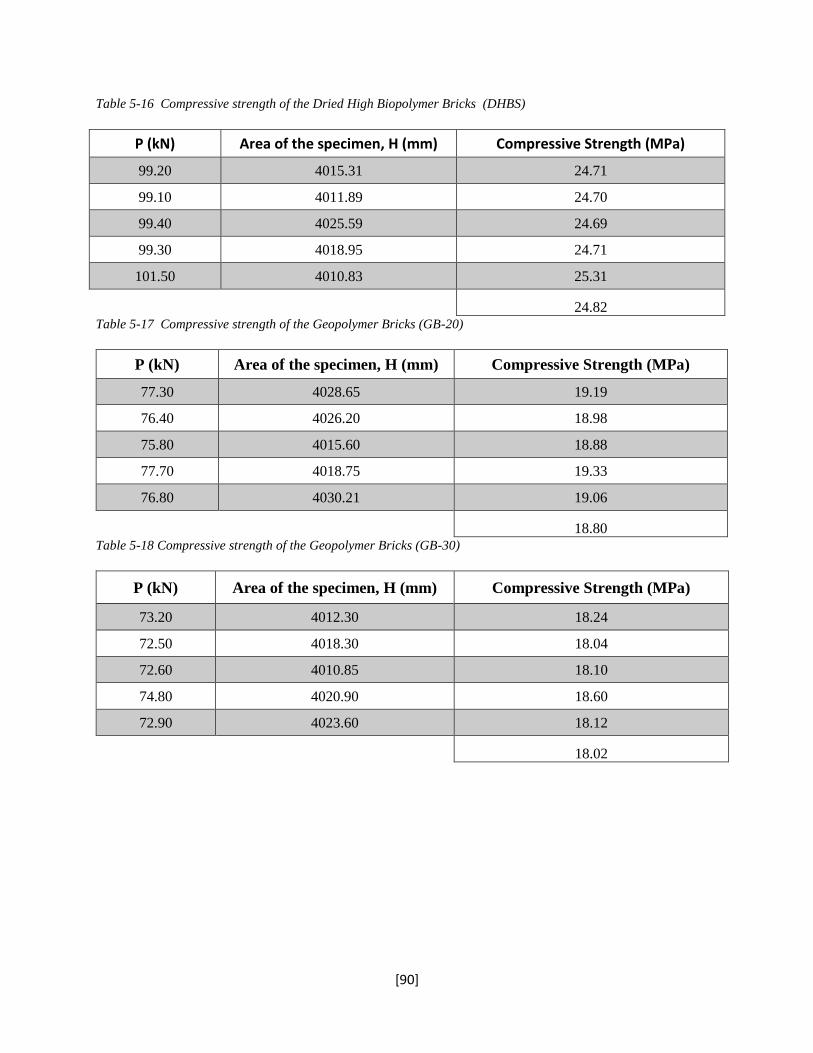
[90]
Table 5-16 Compressive strength of the Dried High Biopolymer Bricks (DHBS)
P (kN) Area of the specimen, H (mm) Compressive Strength (MPa)
99.20 4015.31 24.71
99.10 4011.89 24.70
99.40 4025.59 24.69
99.30 4018.95 24.71
101.50 4010.83 25.31
24.82 Table 5-17 Compressive strength of the Geopolymer Bricks (GB-20)
P (kN) Area of the specimen, H (mm) Compressive Strength (MPa)
77.30 4028.65 19.19
76.40 4026.20 18.98
75.80 4015.60 18.88
77.70 4018.75 19.33
76.80 4030.21 19.06
18.80 Table 5-18 Compressive strength of the Geopolymer Bricks (GB-30)
P (kN) Area of the specimen, H (mm) Compressive Strength (MPa)
73.20 4012.30 18.24
72.50 4018.30 18.04
72.60 4010.85 18.10
74.80 4020.90 18.60
72.90 4023.60 18.12
18.02
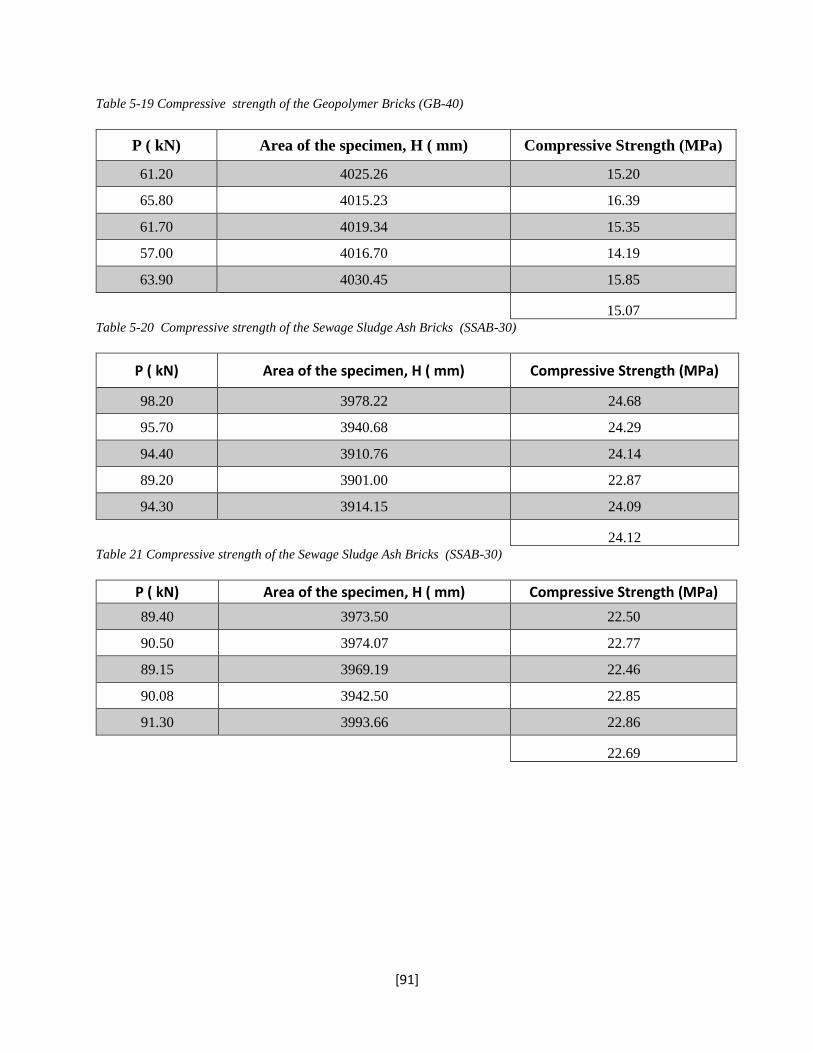
[91]
Table 5-19 Compressive strength of the Geopolymer Bricks (GB-40)
P ( kN) Area of the specimen, H ( mm) Compressive Strength (MPa)
61.20 4025.26 15.20
65.80 4015.23 16.39
61.70 4019.34 15.35
57.00 4016.70 14.19
63.90 4030.45 15.85
15.07 Table 5-20 Compressive strength of the Sewage Sludge Ash Bricks (SSAB-30)
P ( kN) Area of the specimen, H ( mm) Compressive Strength (MPa)
98.20 3978.22 24.68
95.70 3940.68 24.29
94.40 3910.76 24.14
89.20 3901.00 22.87
94.30 3914.15 24.09
24.12 Table 21 Compressive strength of the Sewage Sludge Ash Bricks (SSAB-30)
P ( kN) Area of the specimen, H ( mm) Compressive Strength (MPa)
89.40 3973.50 22.50
90.50 3974.07 22.77
89.15 3969.19 22.46
90.08 3942.50 22.85
91.30 3993.66 22.86
22.69
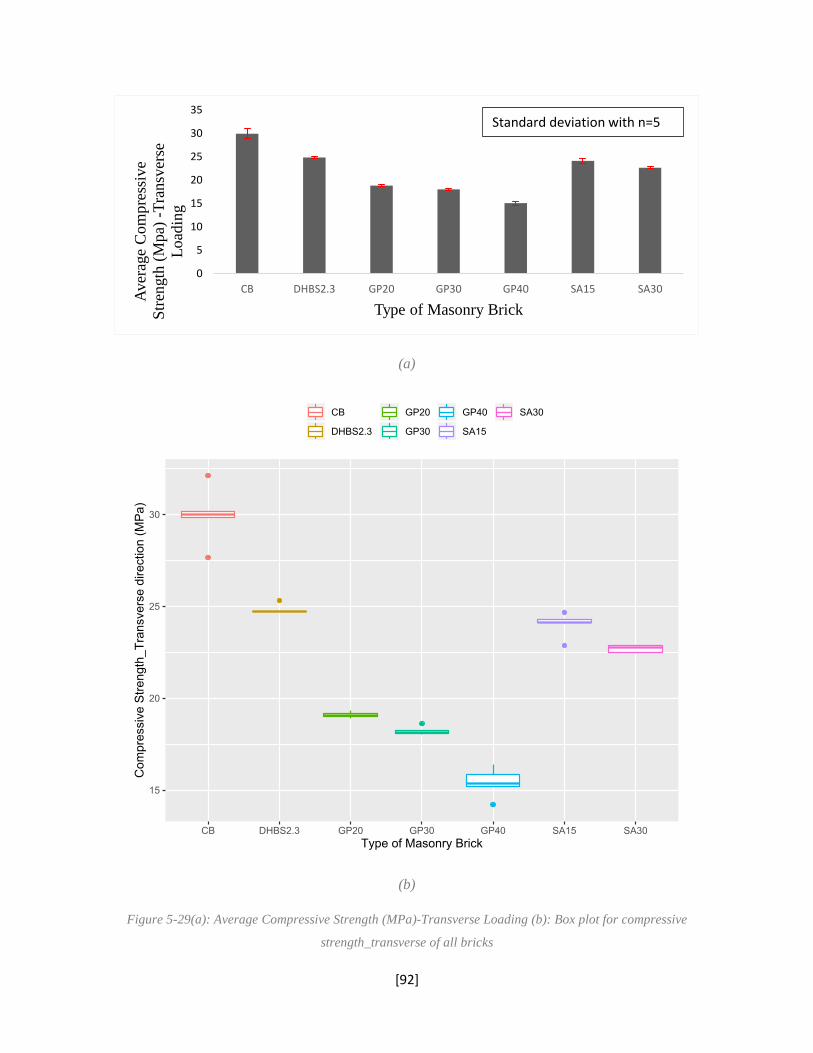
[92]
(a)
(b)
Figure 5-29(a): Average Compressive Strength (MPa)-Transverse Loading (b): Box plot for compressive
strength_transverse of all bricks
0
5
10
15
20
25
30
35
CB DHBS2.3 GP20 GP30 GP40 SA15 SA30
Aver
age
Com
pre
ssiv
e
Str
ength
(M
pa)
-T
ransv
erse
Load
ing
Type of Masonry Brick
Standard deviation with n=5
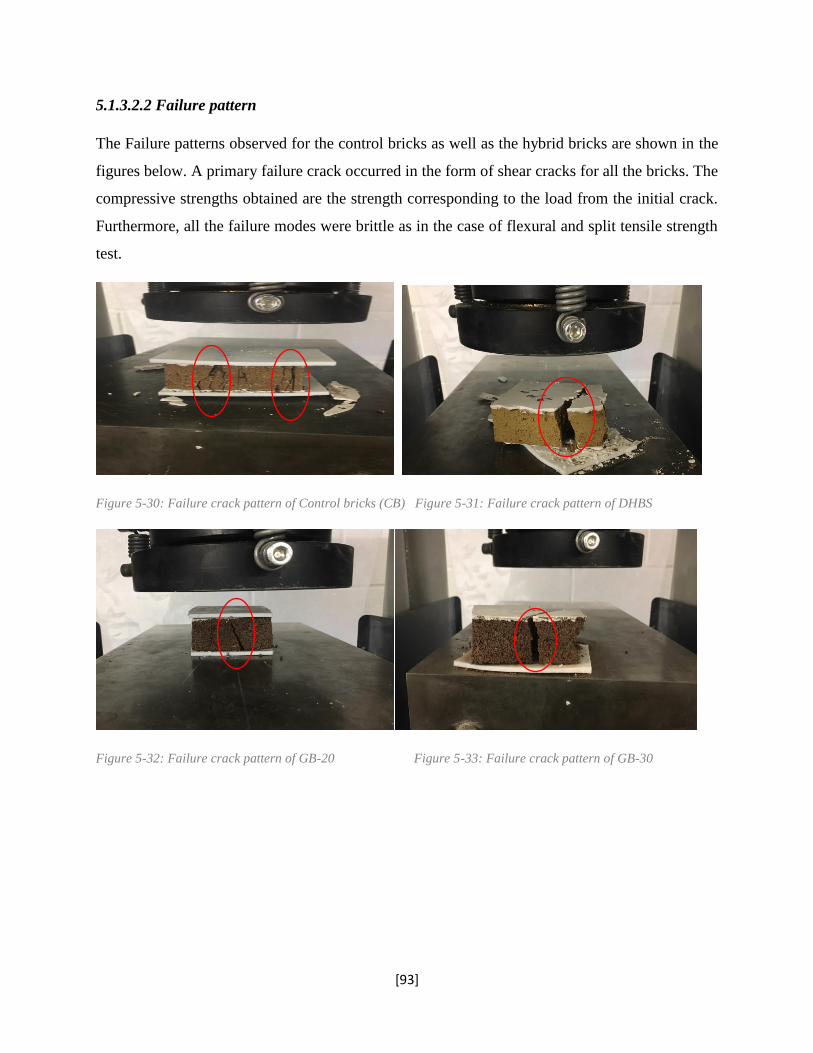
[93]
5.1.3.2.2 Failure pattern
The Failure patterns observed for the control bricks as well as the hybrid bricks are shown in the
figures below. A primary failure crack occurred in the form of shear cracks for all the bricks. The
compressive strengths obtained are the strength corresponding to the load from the initial crack.
Furthermore, all the failure modes were brittle as in the case of flexural and split tensile strength
test.
Figure 5-30: Failure crack pattern of Control bricks (CB) Figure 5-31: Failure crack pattern of DHBS
Figure 5-32: Failure crack pattern of GB-20 Figure 5-33: Failure crack pattern of GB-30
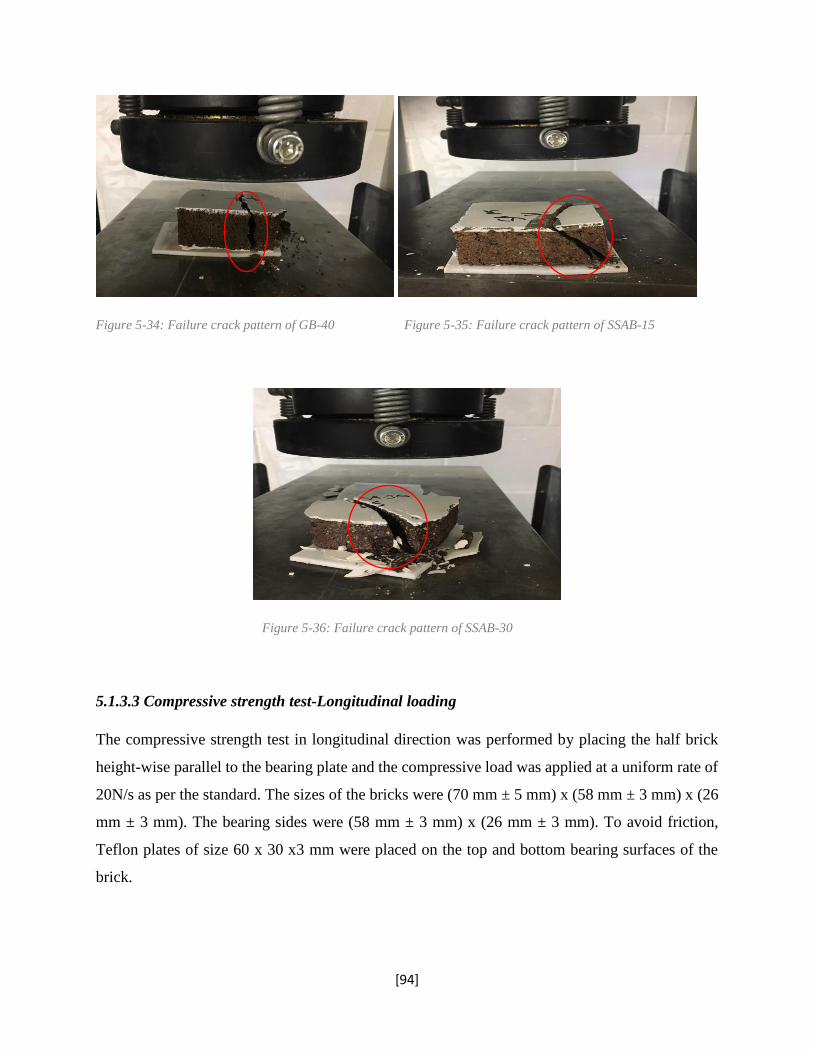
[94]
Figure 5-34: Failure crack pattern of GB-40 Figure 5-35: Failure crack pattern of SSAB-15
Figure 5-36: Failure crack pattern of SSAB-30
5.1.3.3 Compressive strength test-Longitudinal loading
The compressive strength test in longitudinal direction was performed by placing the half brick
height-wise parallel to the bearing plate and the compressive load was applied at a uniform rate of
20N/s as per the standard. The sizes of the bricks were (70 mm ± 5 mm) x (58 mm ± 3 mm) x (26
mm ± 3 mm). The bearing sides were (58 mm ± 3 mm) x (26 mm ± 3 mm). To avoid friction,
Teflon plates of size 60 x 30 x3 mm were placed on the top and bottom bearing surfaces of the
brick.
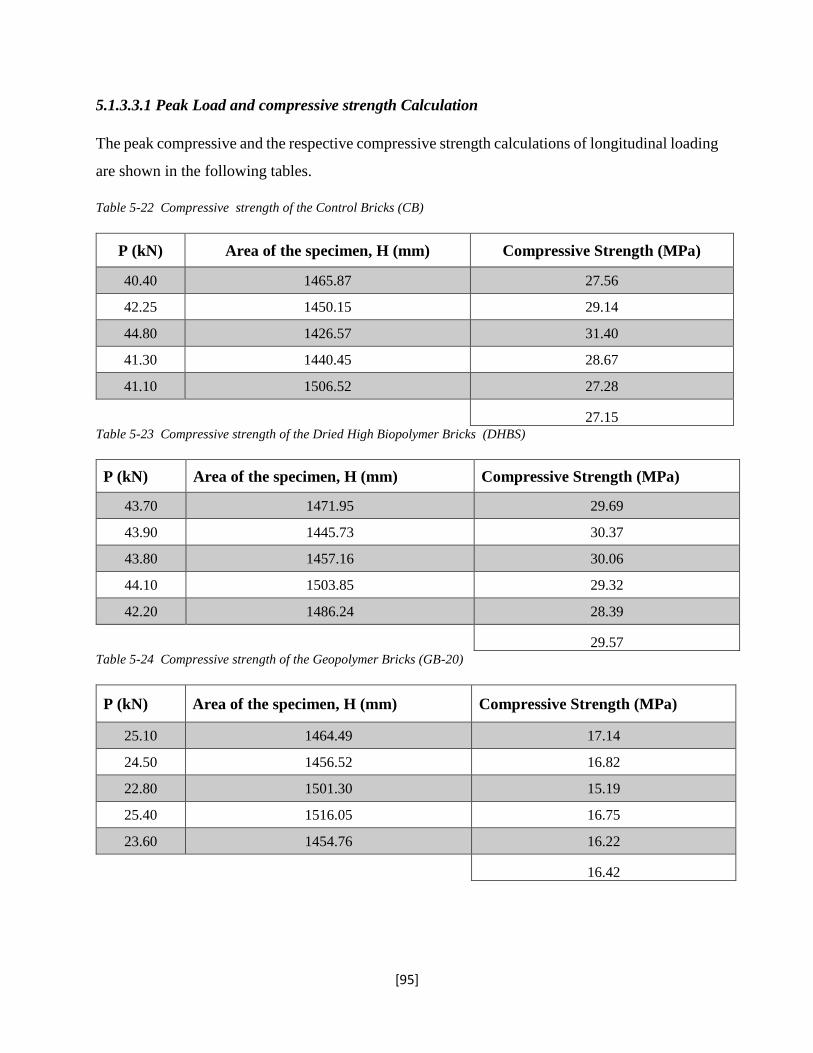
[95]
5.1.3.3.1 Peak Load and compressive strength Calculation
The peak compressive and the respective compressive strength calculations of longitudinal loading
are shown in the following tables.
Table 5-22 Compressive strength of the Control Bricks (CB)
P (kN) Area of the specimen, H (mm) Compressive Strength (MPa)
40.40 1465.87 27.56
42.25 1450.15 29.14
44.80 1426.57 31.40
41.30 1440.45 28.67
41.10 1506.52 27.28
27.15 Table 5-23 Compressive strength of the Dried High Biopolymer Bricks (DHBS)
P (kN) Area of the specimen, H (mm) Compressive Strength (MPa)
43.70 1471.95 29.69
43.90 1445.73 30.37
43.80 1457.16 30.06
44.10 1503.85 29.32
42.20 1486.24 28.39
29.57 Table 5-24 Compressive strength of the Geopolymer Bricks (GB-20)
P (kN) Area of the specimen, H (mm) Compressive Strength (MPa)
25.10 1464.49 17.14
24.50 1456.52 16.82
22.80 1501.30 15.19
25.40 1516.05 16.75
23.60 1454.76 16.22
16.42
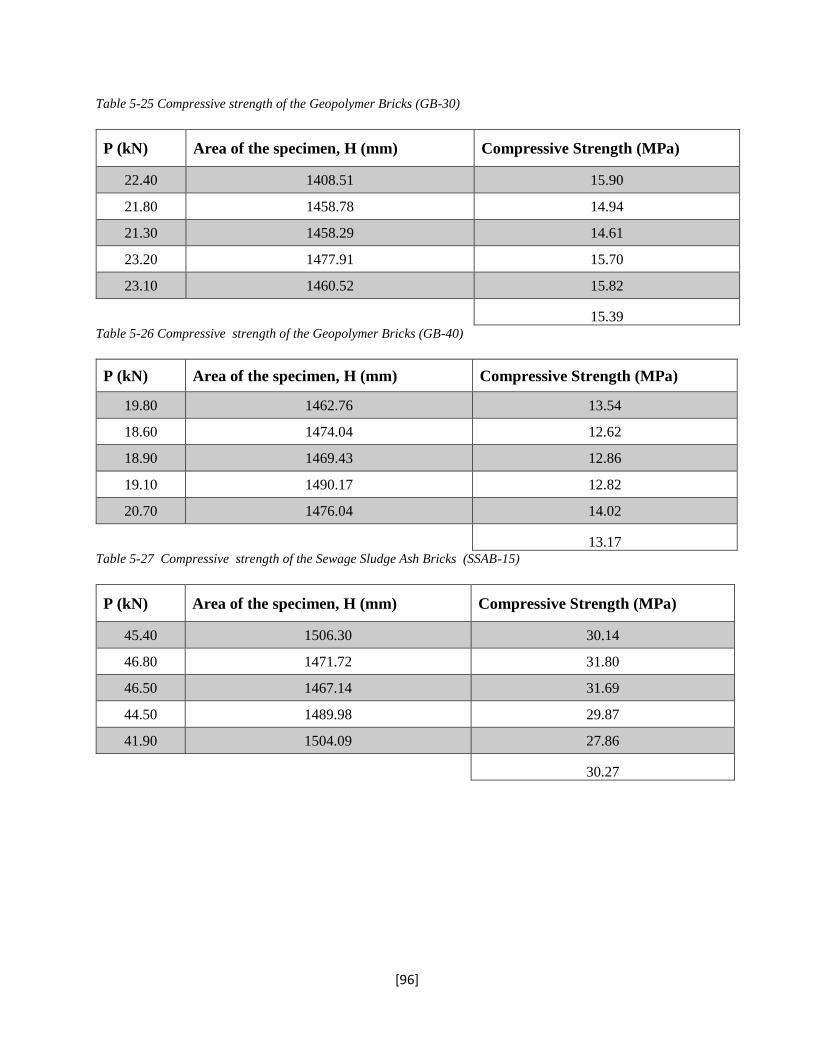
[96]
Table 5-25 Compressive strength of the Geopolymer Bricks (GB-30)
P (kN) Area of the specimen, H (mm) Compressive Strength (MPa)
22.40 1408.51 15.90
21.80 1458.78 14.94
21.30 1458.29 14.61
23.20 1477.91 15.70
23.10 1460.52 15.82
15.39 Table 5-26 Compressive strength of the Geopolymer Bricks (GB-40)
P (kN) Area of the specimen, H (mm) Compressive Strength (MPa)
19.80 1462.76 13.54
18.60 1474.04 12.62
18.90 1469.43 12.86
19.10 1490.17 12.82
20.70 1476.04 14.02
13.17 Table 5-27 Compressive strength of the Sewage Sludge Ash Bricks (SSAB-15)
P (kN) Area of the specimen, H (mm) Compressive Strength (MPa)
45.40 1506.30 30.14
46.80 1471.72 31.80
46.50 1467.14 31.69
44.50 1489.98 29.87
41.90 1504.09 27.86
30.27
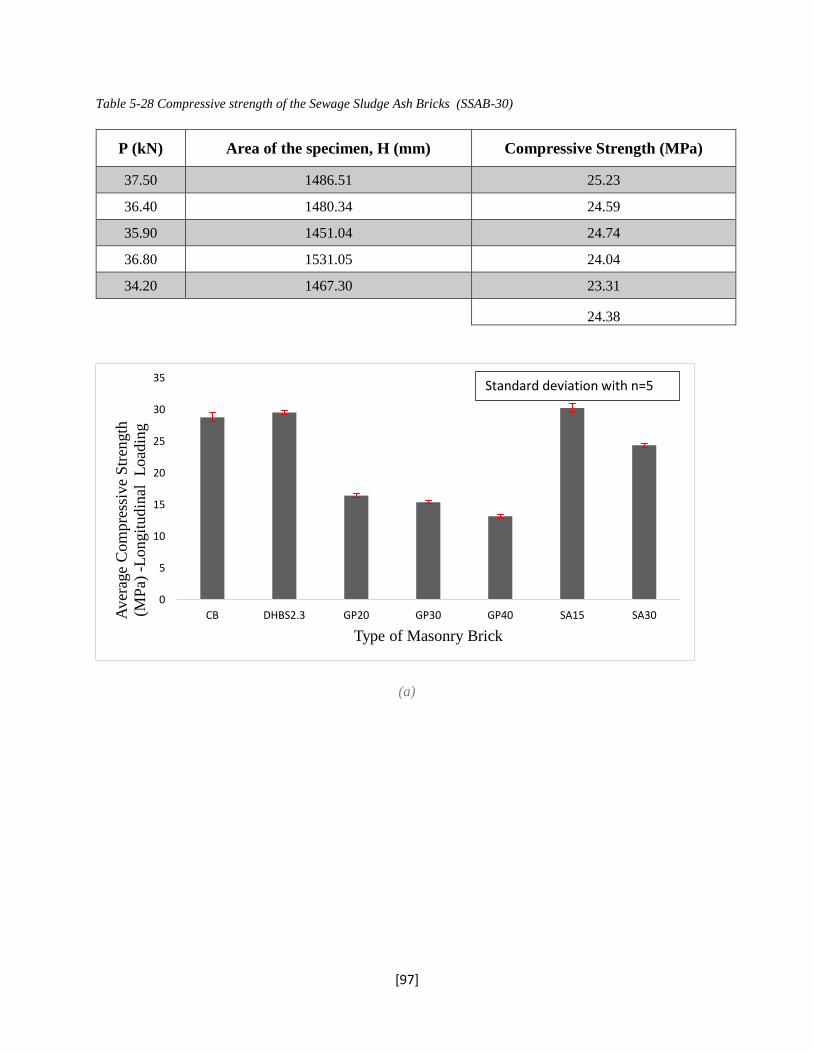
[97]
Table 5-28 Compressive strength of the Sewage Sludge Ash Bricks (SSAB-30)
P (kN) Area of the specimen, H (mm) Compressive Strength (MPa)
37.50 1486.51 25.23
36.40 1480.34 24.59
35.90 1451.04 24.74
36.80 1531.05 24.04
34.20 1467.30 23.31
24.38
(a)
0
5
10
15
20
25
30
35
CB DHBS2.3 GP20 GP30 GP40 SA15 SA30Aver
age
Com
pre
ssiv
e S
tren
gth
(MP
a) -
Longit
udin
al
Load
ing
Type of Masonry Brick
Standard deviation with n=5
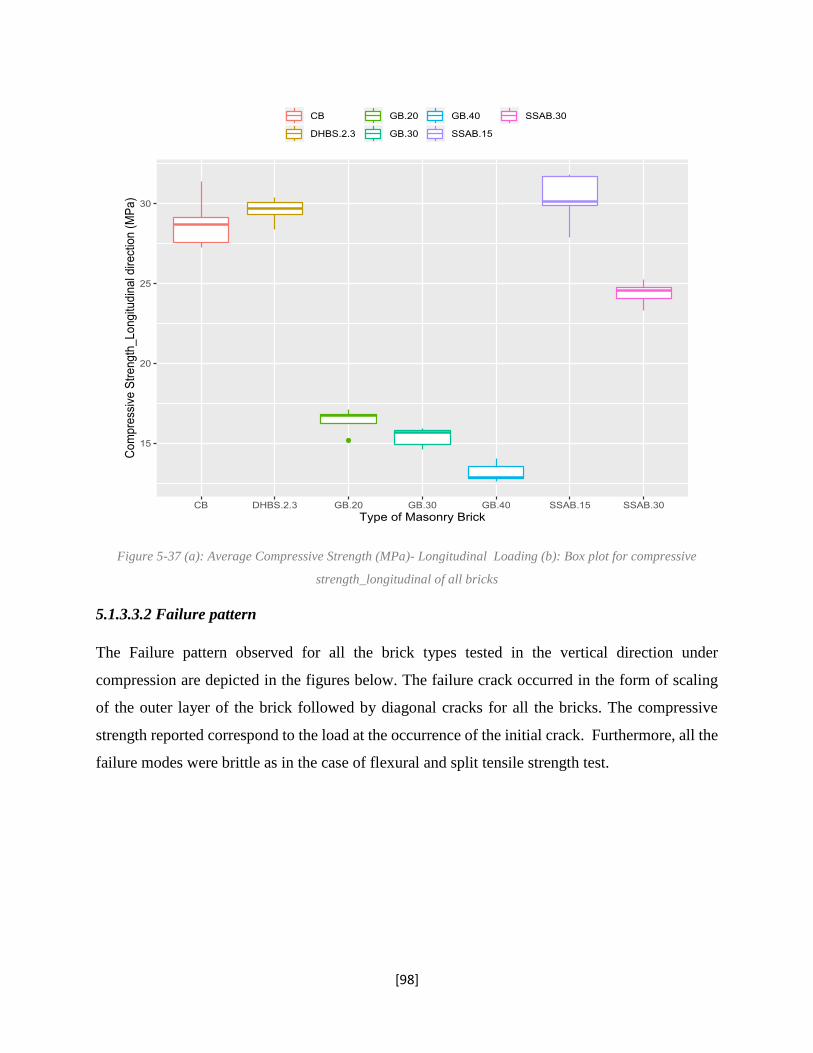
[98]
Figure 5-37 (a): Average Compressive Strength (MPa)- Longitudinal Loading (b): Box plot for compressive
strength_longitudinal of all bricks
5.1.3.3.2 Failure pattern
The Failure pattern observed for all the brick types tested in the vertical direction under
compression are depicted in the figures below. The failure crack occurred in the form of scaling
of the outer layer of the brick followed by diagonal cracks for all the bricks. The compressive
strength reported correspond to the load at the occurrence of the initial crack. Furthermore, all the
failure modes were brittle as in the case of flexural and split tensile strength test.
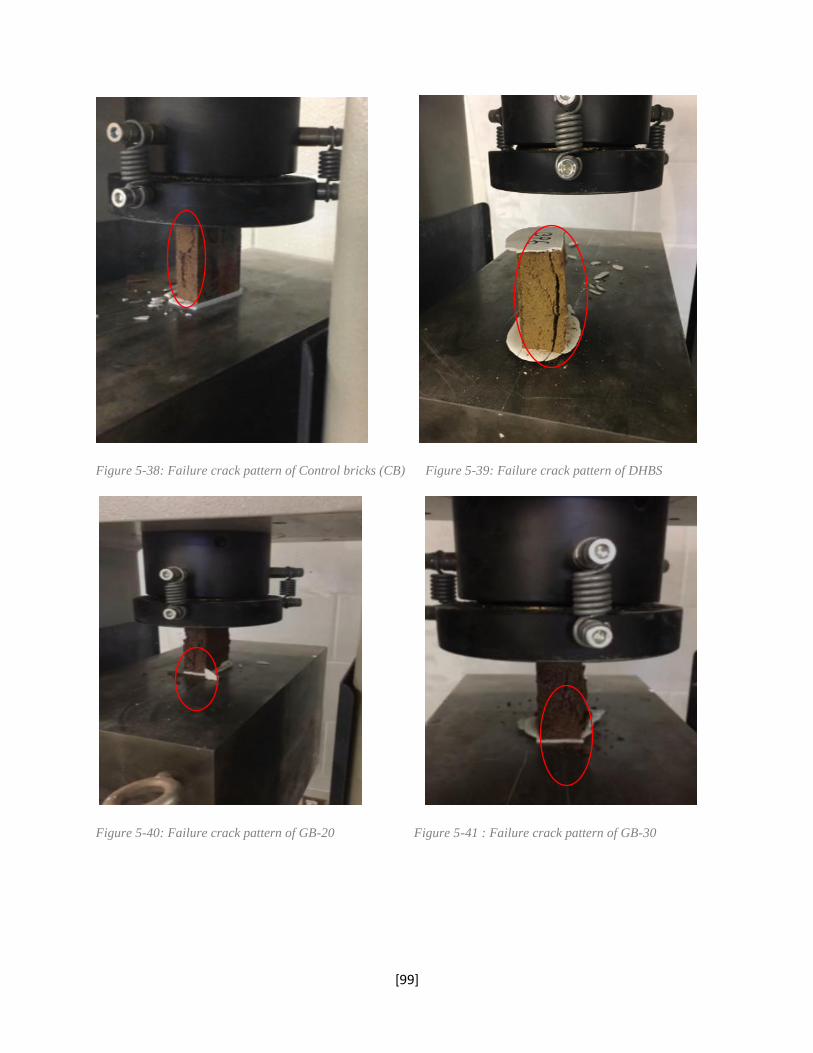
[99]
Figure 5-38: Failure crack pattern of Control bricks (CB) Figure 5-39: Failure crack pattern of DHBS
Figure 5-40: Failure crack pattern of GB-20 Figure 5-41 : Failure crack pattern of GB-30
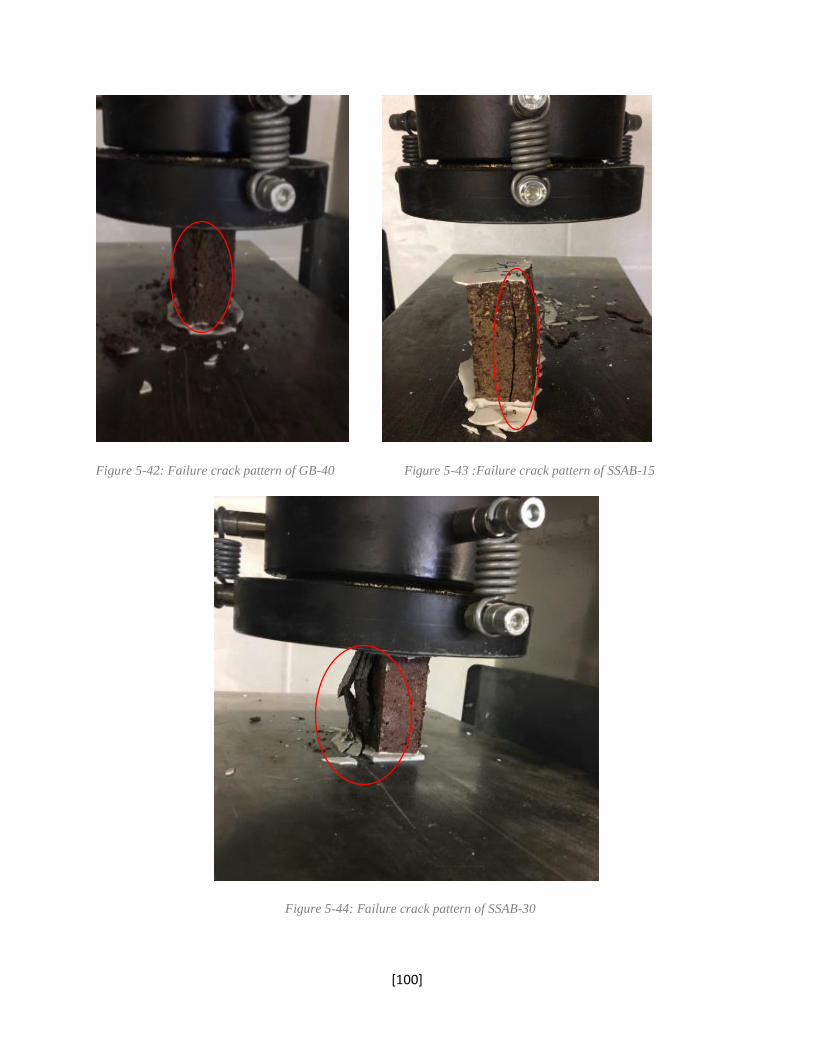
[100]
Figure 5-42: Failure crack pattern of GB-40 Figure 5-43 :Failure crack pattern of SSAB-15
Figure 5-44: Failure crack pattern of SSAB-30
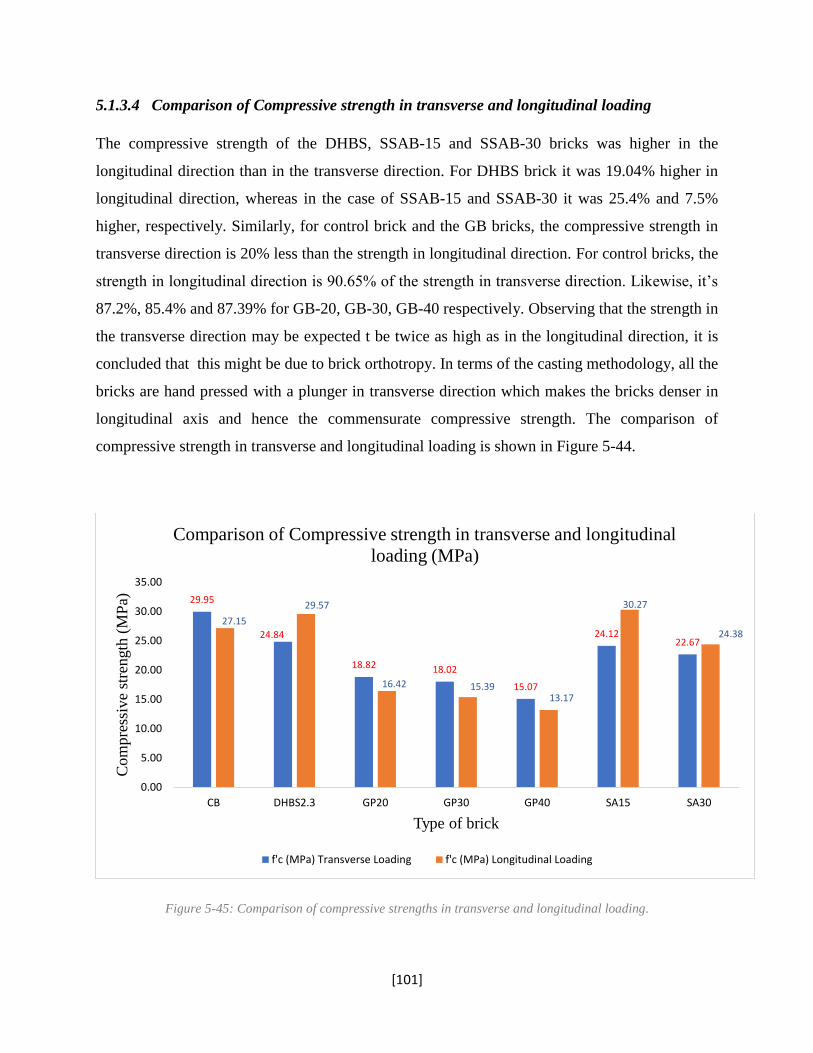
[101]
5.1.3.4 Comparison of Compressive strength in transverse and longitudinal loading
The compressive strength of the DHBS, SSAB-15 and SSAB-30 bricks was higher in the
longitudinal direction than in the transverse direction. For DHBS brick it was 19.04% higher in
longitudinal direction, whereas in the case of SSAB-15 and SSAB-30 it was 25.4% and 7.5%
higher, respectively. Similarly, for control brick and the GB bricks, the compressive strength in
transverse direction is 20% less than the strength in longitudinal direction. For control bricks, the
strength in longitudinal direction is 90.65% of the strength in transverse direction. Likewise, it’s
87.2%, 85.4% and 87.39% for GB-20, GB-30, GB-40 respectively. Observing that the strength in
the transverse direction may be expected t be twice as high as in the longitudinal direction, it is
concluded that this might be due to brick orthotropy. In terms of the casting methodology, all the
bricks are hand pressed with a plunger in transverse direction which makes the bricks denser in
longitudinal axis and hence the commensurate compressive strength. The comparison of
compressive strength in transverse and longitudinal loading is shown in Figure 5-44.
Figure 5-45: Comparison of compressive strengths in transverse and longitudinal loading.
29.95
24.84
18.82 18.02
15.07
24.1222.67
27.15
29.57
16.42 15.3913.17
30.27
24.38
0.00
5.00
10.00
15.00
20.00
25.00
30.00
35.00
CB DHBS2.3 GP20 GP30 GP40 SA15 SA30
Com
pre
ssiv
e st
rength
(M
Pa)
Type of brick
Comparison of Compressive strength in transverse and longitudinal
loading (MPa)
f'c (MPa) Transverse Loading f'c (MPa) Longitudinal Loading
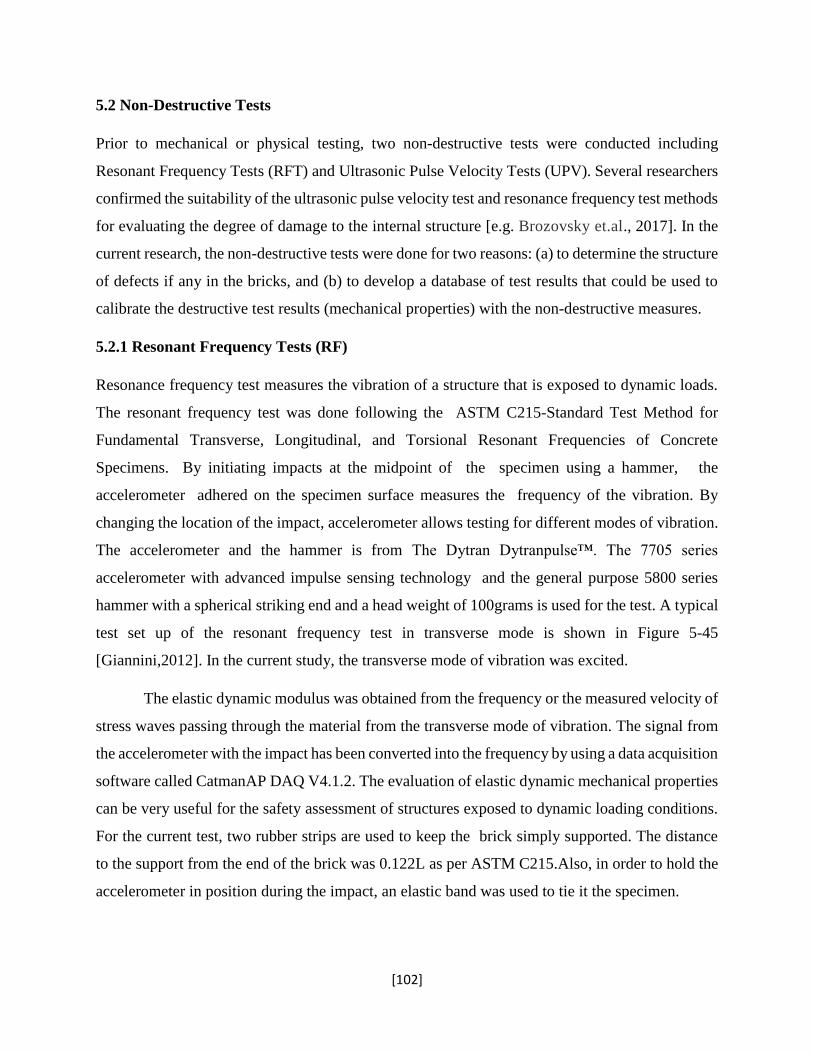
[102]
5.2 Non-Destructive Tests
Prior to mechanical or physical testing, two non-destructive tests were conducted including
Resonant Frequency Tests (RFT) and Ultrasonic Pulse Velocity Tests (UPV). Several researchers
confirmed the suitability of the ultrasonic pulse velocity test and resonance frequency test methods
for evaluating the degree of damage to the internal structure [e.g. Brozovsky et.al., 2017]. In the
current research, the non-destructive tests were done for two reasons: (a) to determine the structure
of defects if any in the bricks, and (b) to develop a database of test results that could be used to
calibrate the destructive test results (mechanical properties) with the non-destructive measures.
5.2.1 Resonant Frequency Tests (RF)
Resonance frequency test measures the vibration of a structure that is exposed to dynamic loads.
The resonant frequency test was done following the ASTM C215-Standard Test Method for
Fundamental Transverse, Longitudinal, and Torsional Resonant Frequencies of Concrete
Specimens. By initiating impacts at the midpoint of the specimen using a hammer, the
accelerometer adhered on the specimen surface measures the frequency of the vibration. By
changing the location of the impact, accelerometer allows testing for different modes of vibration.
The accelerometer and the hammer is from The Dytran Dytranpulse™. The 7705 series
accelerometer with advanced impulse sensing technology and the general purpose 5800 series
hammer with a spherical striking end and a head weight of 100grams is used for the test. A typical
test set up of the resonant frequency test in transverse mode is shown in Figure 5-45
[Giannini,2012]. In the current study, the transverse mode of vibration was excited.
The elastic dynamic modulus was obtained from the frequency or the measured velocity of
stress waves passing through the material from the transverse mode of vibration. The signal from
the accelerometer with the impact has been converted into the frequency by using a data acquisition
software called CatmanAP DAQ V4.1.2. The evaluation of elastic dynamic mechanical properties
can be very useful for the safety assessment of structures exposed to dynamic loading conditions.
For the current test, two rubber strips are used to keep the brick simply supported. The distance
to the support from the end of the brick was 0.122L as per ASTM C215.Also, in order to hold the
accelerometer in position during the impact, an elastic band was used to tie it the specimen.
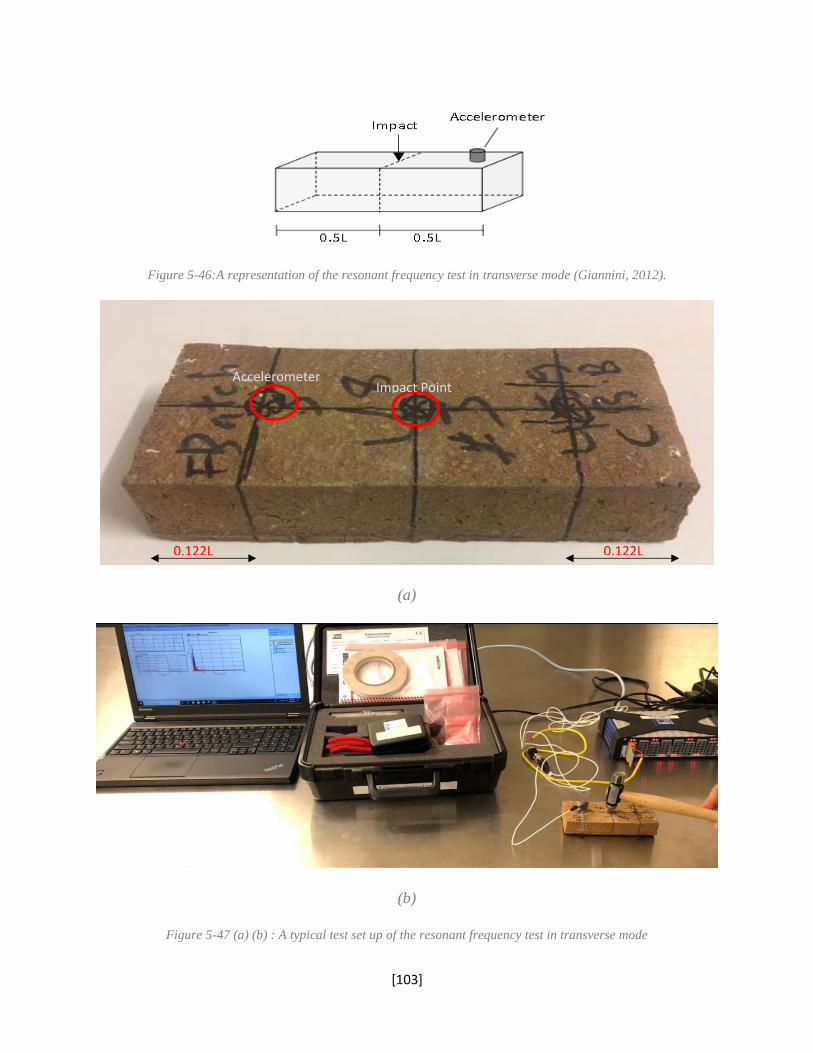
[103]
Figure 5-46:A representation of the resonant frequency test in transverse mode (Giannini, 2012).
(a)
(b)
Figure 5-47 (a) (b) : A typical test set up of the resonant frequency test in transverse mode
Impact Point Accelerometer
0.122L 0.122L
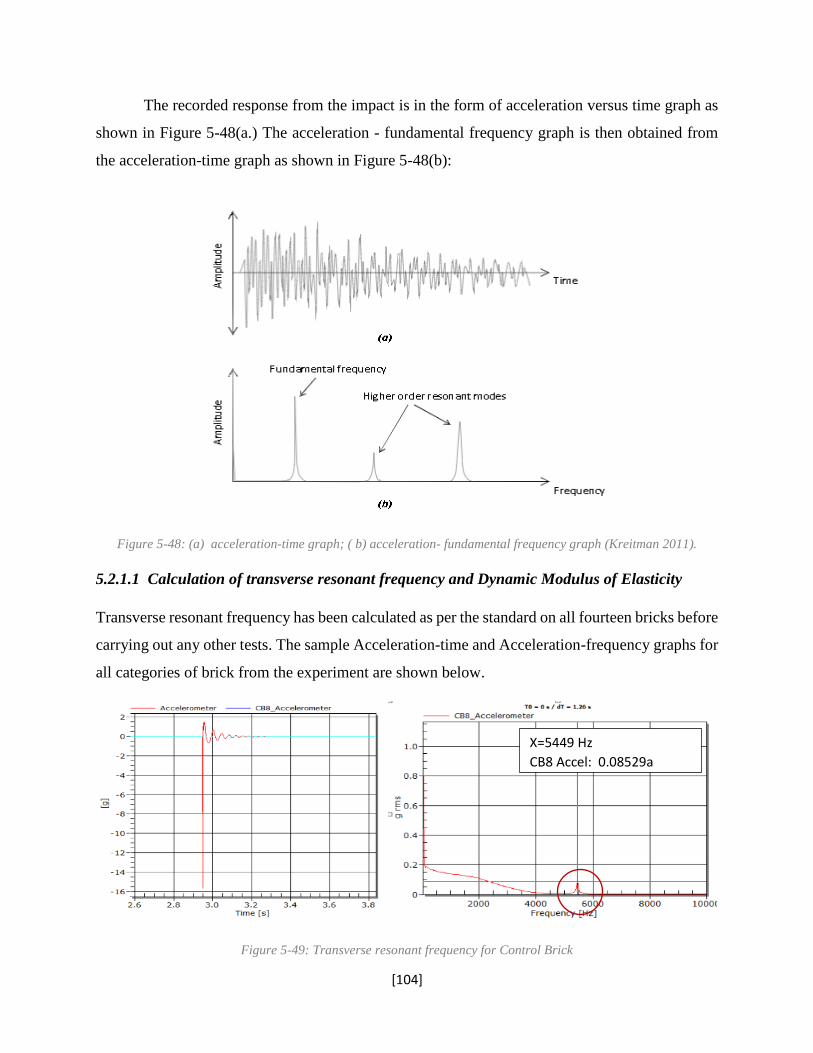
[104]
The recorded response from the impact is in the form of acceleration versus time graph as
shown in Figure 5-48(a.) The acceleration - fundamental frequency graph is then obtained from
the acceleration-time graph as shown in Figure 5-48(b):
Figure 5-48: (a) acceleration-time graph; ( b) acceleration- fundamental frequency graph (Kreitman 2011).
5.2.1.1 Calculation of transverse resonant frequency and Dynamic Modulus of Elasticity
Transverse resonant frequency has been calculated as per the standard on all fourteen bricks before
carrying out any other tests. The sample Acceleration-time and Acceleration-frequency graphs for
all categories of brick from the experiment are shown below.
Figure 5-49: Transverse resonant frequency for Control Brick
X=5449 Hz
CB8 Accel: 0.08529a
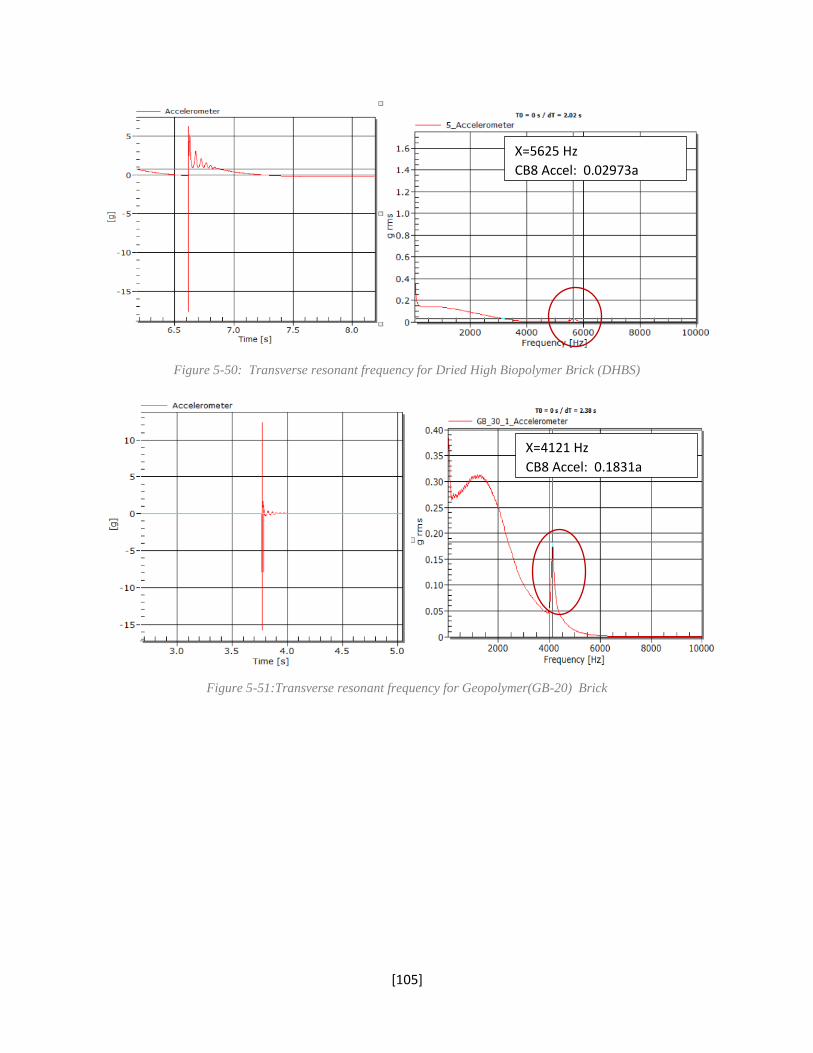
[105]
Figure 5-50: Transverse resonant frequency for Dried High Biopolymer Brick (DHBS)
Figure 5-51:Transverse resonant frequency for Geopolymer(GB-20) Brick
X=5625 Hz
CB8 Accel: 0.02973a
X=4121 Hz
CB8 Accel: 0.1831a
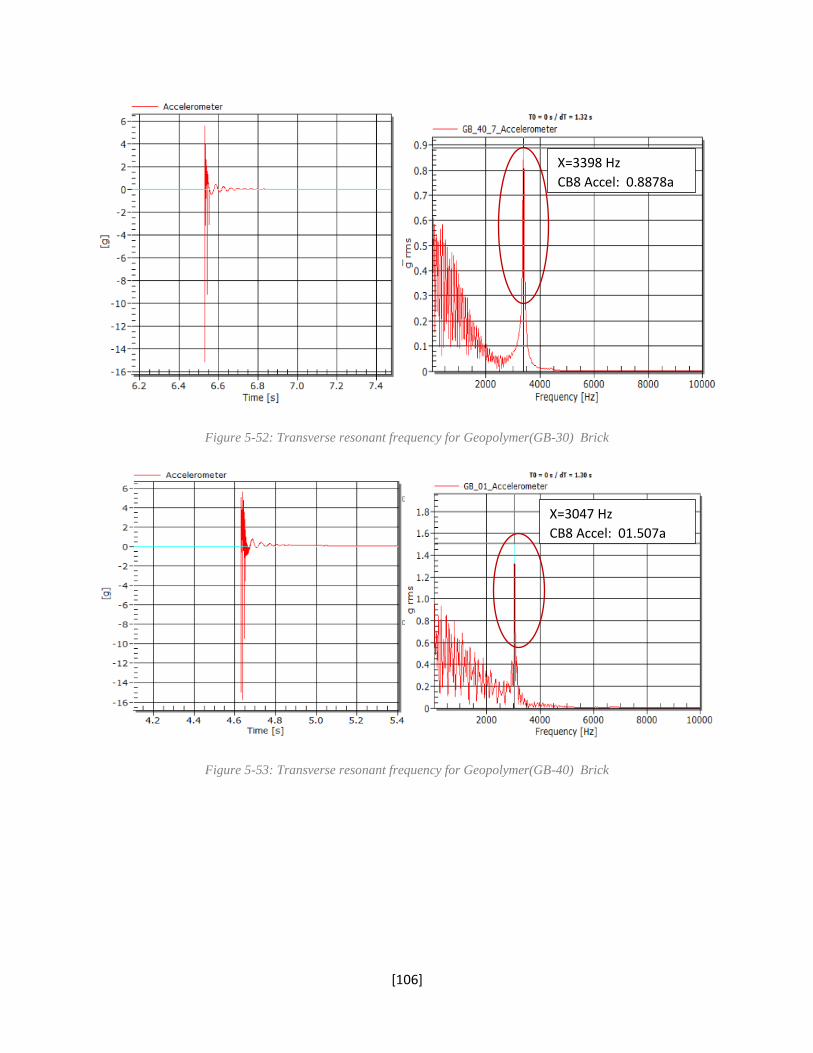
[106]
Figure 5-52: Transverse resonant frequency for Geopolymer(GB-30) Brick
Figure 5-53: Transverse resonant frequency for Geopolymer(GB-40) Brick
X=3398 Hz
CB8 Accel: 0.8878a
X=3047 Hz
CB8 Accel: 01.507a
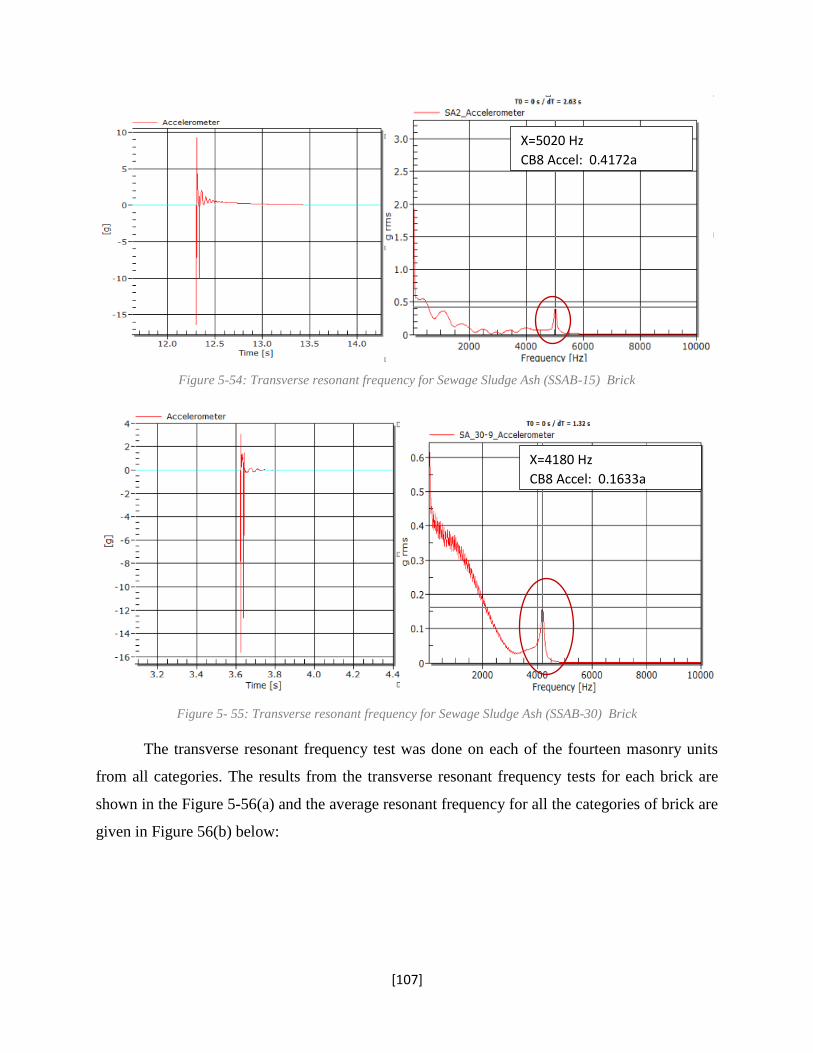
[107]
Figure 5-54: Transverse resonant frequency for Sewage Sludge Ash (SSAB-15) Brick
Figure 5- 55: Transverse resonant frequency for Sewage Sludge Ash (SSAB-30) Brick
The transverse resonant frequency test was done on each of the fourteen masonry units
from all categories. The results from the transverse resonant frequency tests for each brick are
shown in the Figure 5-56(a) and the average resonant frequency for all the categories of brick are
given in Figure 56(b) below:
X=5020 Hz
CB8 Accel: 0.4172a
X=4180 Hz
CB8 Accel: 0.1633a
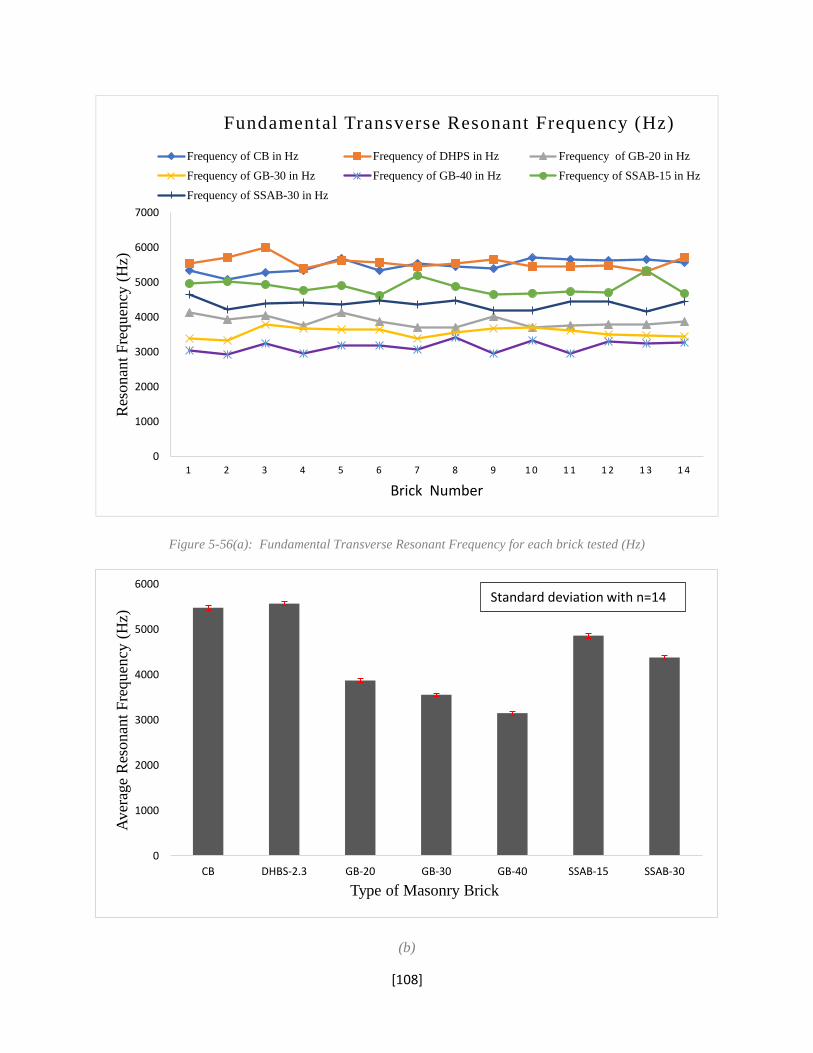
[108]
Figure 5-56(a): Fundamental Transverse Resonant Frequency for each brick tested (Hz)
(b)
0
1000
2000
3000
4000
5000
6000
7000
1 2 3 4 5 6 7 8 9 1 0 1 1 1 2 1 3 1 4
Res
onan
t F
requen
cy (
Hz)
Brick Number
Fundamental Transverse Resonant Frequency (Hz)
Frequency of CB in Hz Frequency of DHPS in Hz Frequency of GB-20 in Hz
Frequency of GB-30 in Hz Frequency of GB-40 in Hz Frequency of SSAB-15 in Hz
Frequency of SSAB-30 in Hz
0
1000
2000
3000
4000
5000
6000
CB DHBS-2.3 GB-20 GB-30 GB-40 SSAB-15 SSAB-30
Aver
age
Res
onan
t F
requen
cy (
Hz)
Type of Masonry Brick
Standard deviation with n=14
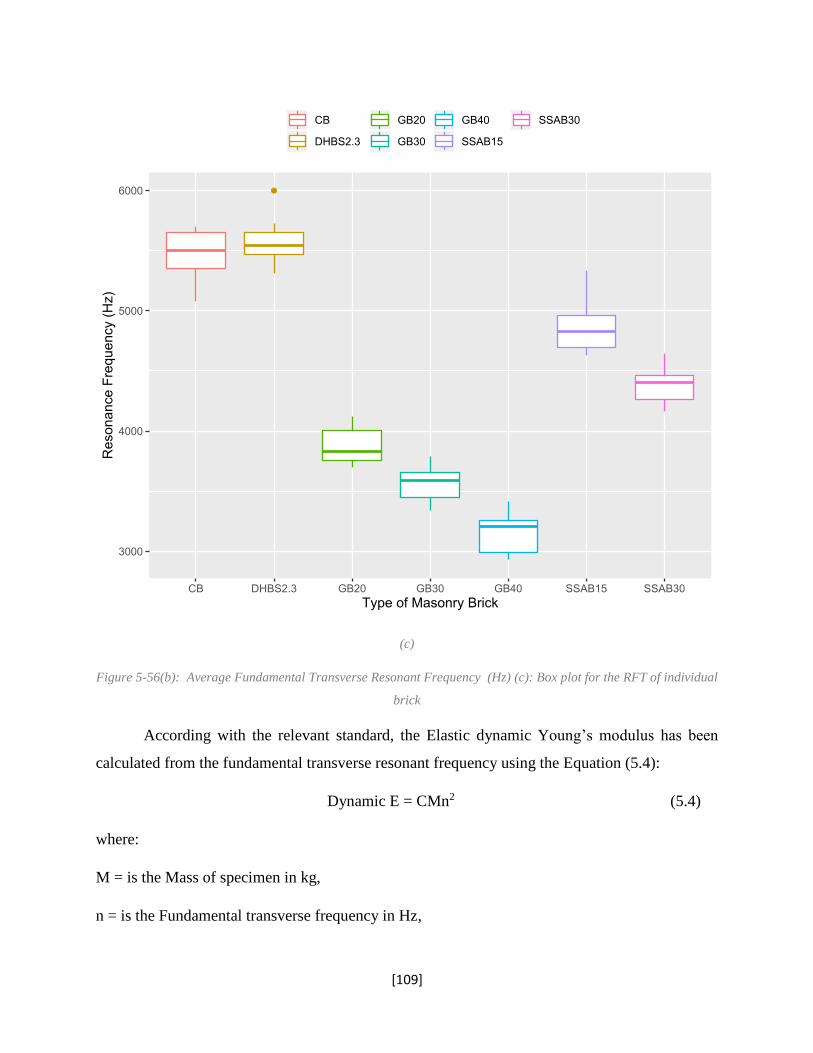
[109]
(c)
Figure 5-56(b): Average Fundamental Transverse Resonant Frequency (Hz) (c): Box plot for the RFT of individual
brick
According with the relevant standard, the Elastic dynamic Young’s modulus has been
calculated from the fundamental transverse resonant frequency using the Equation (5.4):
Dynamic E = CMn2 (5.4)
where:
M = is the Mass of specimen in kg,
n = is the Fundamental transverse frequency in Hz,
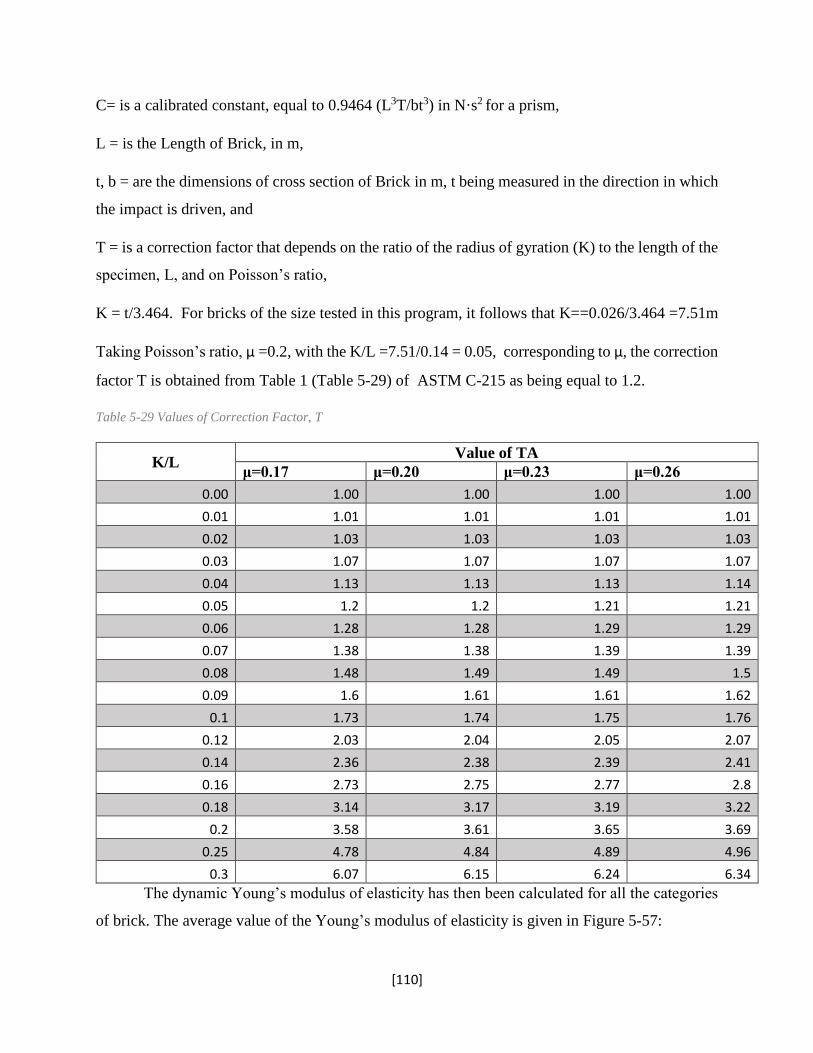
[110]
C= is a calibrated constant, equal to 0.9464 (L3T/bt3) in N·s2 for a prism,
L = is the Length of Brick, in m,
t, b = are the dimensions of cross section of Brick in m, t being measured in the direction in which
the impact is driven, and
T = is a correction factor that depends on the ratio of the radius of gyration (K) to the length of the
specimen, L, and on Poisson’s ratio,
K = t/3.464. For bricks of the size tested in this program, it follows that K==0.026/3.464 =7.51m
Taking Poisson’s ratio, μ =0.2, with the K/L =7.51/0.14 = 0.05, corresponding to μ, the correction
factor T is obtained from Table 1 (Table 5-29) of ASTM C-215 as being equal to 1.2.
Table 5-29 Values of Correction Factor, T
K/L Value of TA
μ=0.17 μ=0.20 μ=0.23 μ=0.26
0.00 1.00 1.00 1.00 1.00
0.01 1.01 1.01 1.01 1.01
0.02 1.03 1.03 1.03 1.03
0.03 1.07 1.07 1.07 1.07
0.04 1.13 1.13 1.13 1.14
0.05 1.2 1.2 1.21 1.21
0.06 1.28 1.28 1.29 1.29
0.07 1.38 1.38 1.39 1.39
0.08 1.48 1.49 1.49 1.5
0.09 1.6 1.61 1.61 1.62
0.1 1.73 1.74 1.75 1.76
0.12 2.03 2.04 2.05 2.07
0.14 2.36 2.38 2.39 2.41
0.16 2.73 2.75 2.77 2.8
0.18 3.14 3.17 3.19 3.22
0.2 3.58 3.61 3.65 3.69
0.25 4.78 4.84 4.89 4.96
0.3 6.07 6.15 6.24 6.34
The dynamic Young’s modulus of elasticity has then been calculated for all the categories
of brick. The average value of the Young’s modulus of elasticity is given in Figure 5-57:
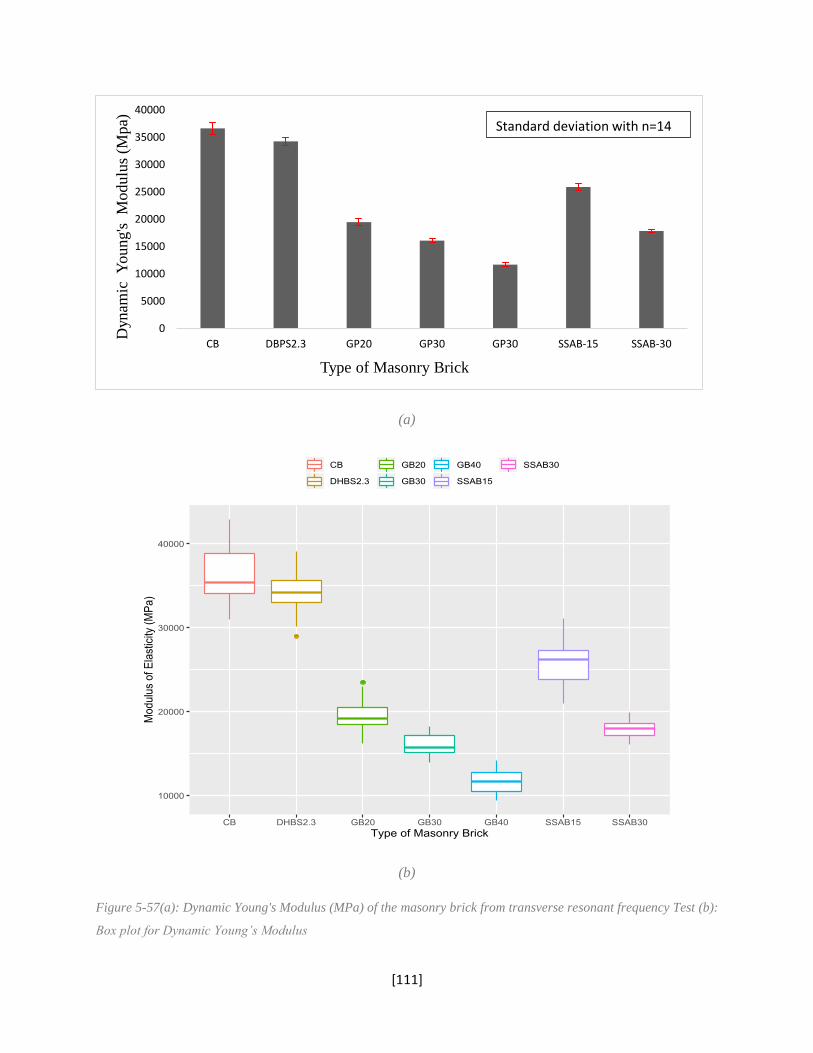
[111]
(a)
(b)
Figure 5-57(a): Dynamic Young's Modulus (MPa) of the masonry brick from transverse resonant frequency Test (b):
Box plot for Dynamic Young’s Modulus
0
5000
10000
15000
20000
25000
30000
35000
40000
CB DBPS2.3 GP20 GP30 GP30 SSAB-15 SSAB-30
Dynam
ic Y
oung's
M
odulu
s (M
pa)
Type of Masonry Brick
Standard deviation with n=14
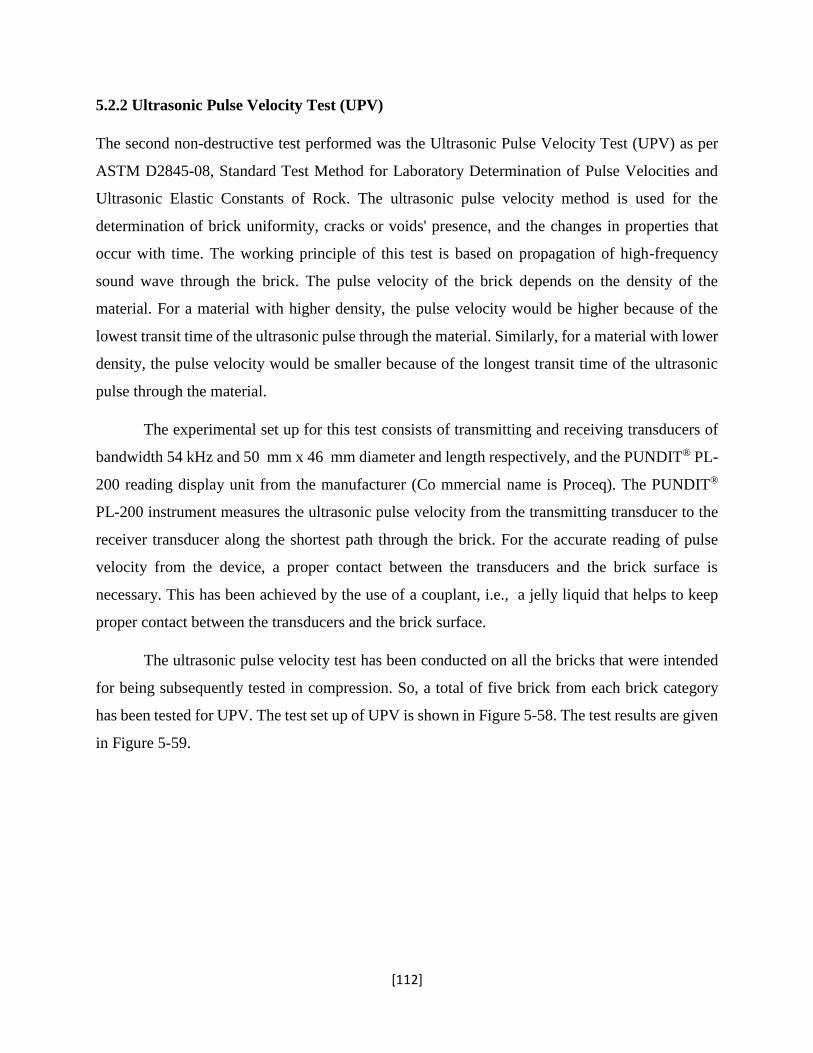
[112]
5.2.2 Ultrasonic Pulse Velocity Test (UPV)
The second non-destructive test performed was the Ultrasonic Pulse Velocity Test (UPV) as per
ASTM D2845-08, Standard Test Method for Laboratory Determination of Pulse Velocities and
Ultrasonic Elastic Constants of Rock. The ultrasonic pulse velocity method is used for the
determination of brick uniformity, cracks or voids' presence, and the changes in properties that
occur with time. The working principle of this test is based on propagation of high-frequency
sound wave through the brick. The pulse velocity of the brick depends on the density of the
material. For a material with higher density, the pulse velocity would be higher because of the
lowest transit time of the ultrasonic pulse through the material. Similarly, for a material with lower
density, the pulse velocity would be smaller because of the longest transit time of the ultrasonic
pulse through the material.
The experimental set up for this test consists of transmitting and receiving transducers of
bandwidth 54 kHz and 50 mm x 46 mm diameter and length respectively, and the PUNDIT® PL-
200 reading display unit from the manufacturer (Co mmercial name is Proceq). The PUNDIT®
PL-200 instrument measures the ultrasonic pulse velocity from the transmitting transducer to the
receiver transducer along the shortest path through the brick. For the accurate reading of pulse
velocity from the device, a proper contact between the transducers and the brick surface is
necessary. This has been achieved by the use of a couplant, i.e., a jelly liquid that helps to keep
proper contact between the transducers and the brick surface.
The ultrasonic pulse velocity test has been conducted on all the bricks that were intended
for being subsequently tested in compression. So, a total of five brick from each brick category
has been tested for UPV. The test set up of UPV is shown in Figure 5-58. The test results are given
in Figure 5-59.
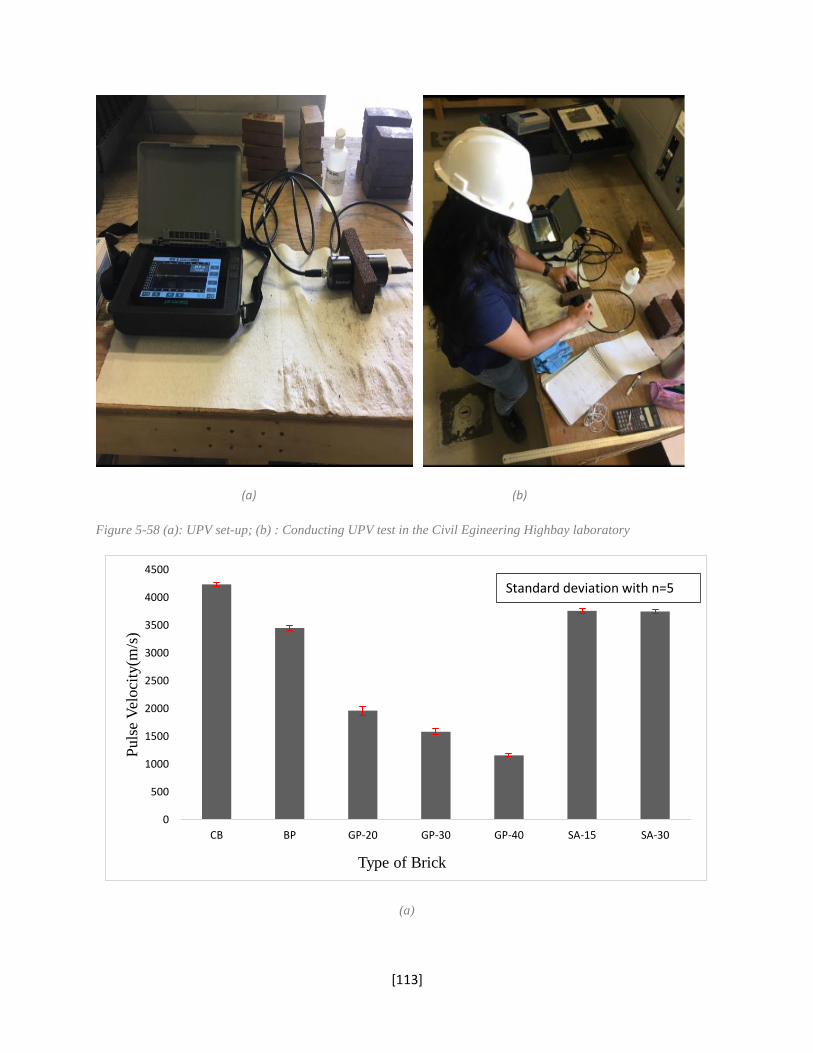
[113]
(a) (b)
Figure 5-58 (a): UPV set-up; (b) : Conducting UPV test in the Civil Egineering Highbay laboratory
(a)
0
500
1000
1500
2000
2500
3000
3500
4000
4500
CB BP GP-20 GP-30 GP-40 SA-15 SA-30
Puls
e V
eloci
ty(m
/s)
Type of Brick
Standard deviation with n=5
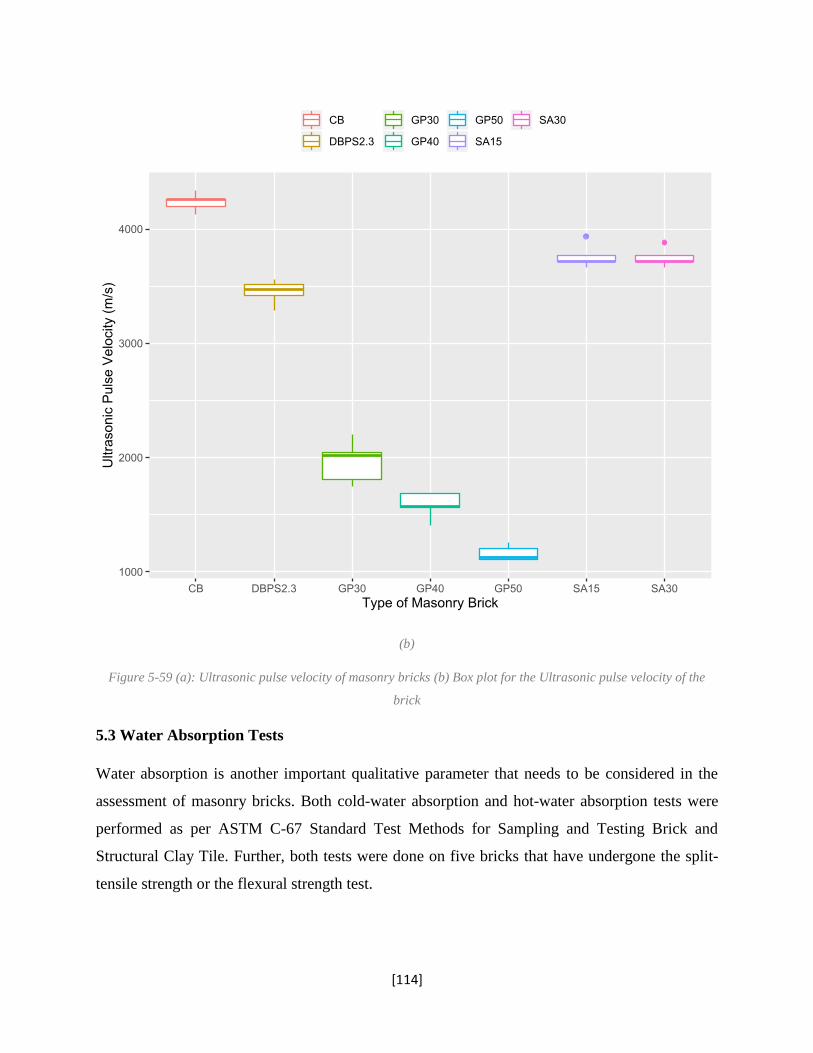
[114]
(b)
Figure 5-59 (a): Ultrasonic pulse velocity of masonry bricks (b) Box plot for the Ultrasonic pulse velocity of the
brick
5.3 Water Absorption Tests
Water absorption is another important qualitative parameter that needs to be considered in the
assessment of masonry bricks. Both cold-water absorption and hot-water absorption tests were
performed as per ASTM C-67 Standard Test Methods for Sampling and Testing Brick and
Structural Clay Tile. Further, both tests were done on five bricks that have undergone the split-
tensile strength or the flexural strength test.
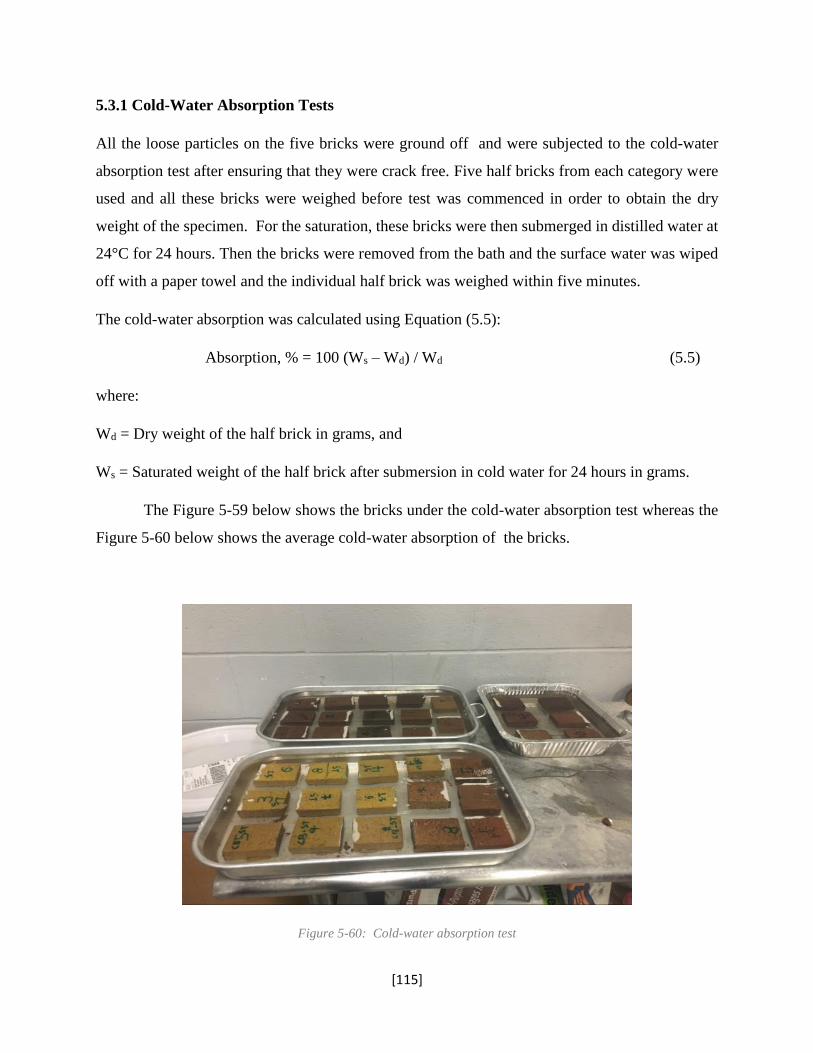
[115]
5.3.1 Cold-Water Absorption Tests
All the loose particles on the five bricks were ground off and were subjected to the cold-water
absorption test after ensuring that they were crack free. Five half bricks from each category were
used and all these bricks were weighed before test was commenced in order to obtain the dry
weight of the specimen. For the saturation, these bricks were then submerged in distilled water at
24°C for 24 hours. Then the bricks were removed from the bath and the surface water was wiped
off with a paper towel and the individual half brick was weighed within five minutes.
The cold-water absorption was calculated using Equation (5.5):
Absorption, % = 100 (Ws – Wd) / Wd (5.5)
where:
Wd = Dry weight of the half brick in grams, and
Ws = Saturated weight of the half brick after submersion in cold water for 24 hours in grams.
The Figure 5-59 below shows the bricks under the cold-water absorption test whereas the
Figure 5-60 below shows the average cold-water absorption of the bricks.
Figure 5-60: Cold-water absorption test
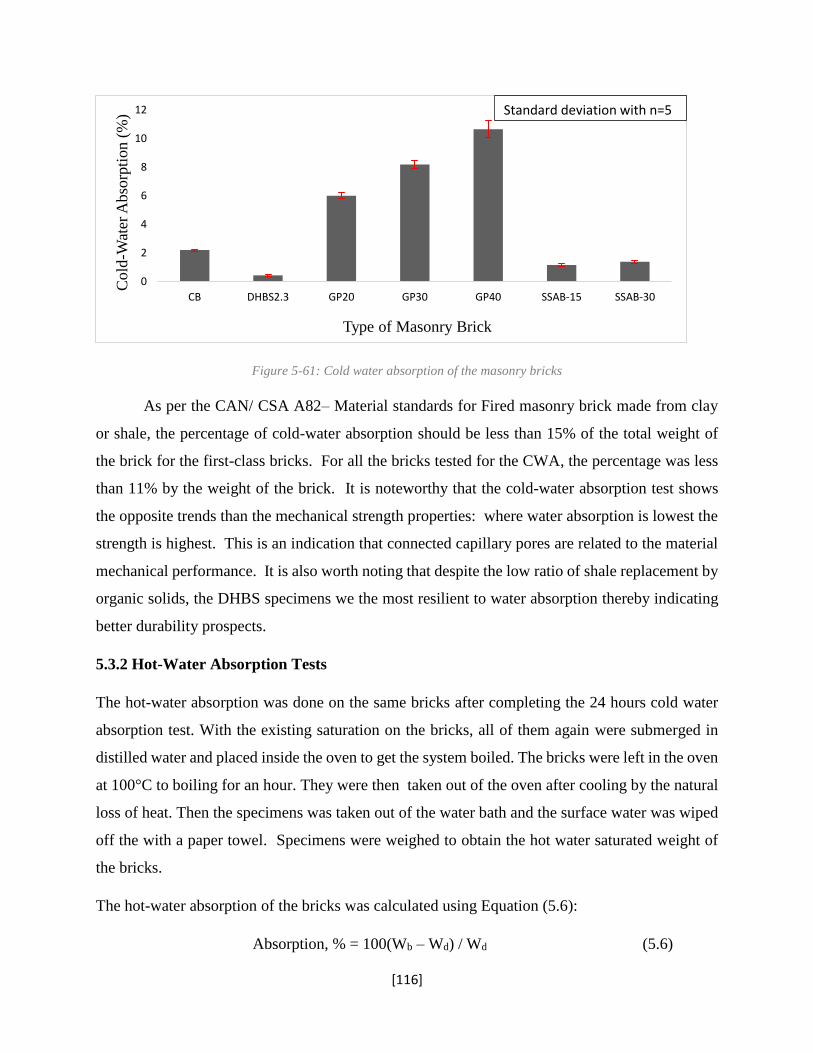
[116]
Figure 5-61: Cold water absorption of the masonry bricks
As per the CAN/ CSA A82– Material standards for Fired masonry brick made from clay
or shale, the percentage of cold-water absorption should be less than 15% of the total weight of
the brick for the first-class bricks. For all the bricks tested for the CWA, the percentage was less
than 11% by the weight of the brick. It is noteworthy that the cold-water absorption test shows
the opposite trends than the mechanical strength properties: where water absorption is lowest the
strength is highest. This is an indication that connected capillary pores are related to the material
mechanical performance. It is also worth noting that despite the low ratio of shale replacement by
organic solids, the DHBS specimens we the most resilient to water absorption thereby indicating
better durability prospects.
5.3.2 Hot-Water Absorption Tests
The hot-water absorption was done on the same bricks after completing the 24 hours cold water
absorption test. With the existing saturation on the bricks, all of them again were submerged in
distilled water and placed inside the oven to get the system boiled. The bricks were left in the oven
at 100°C to boiling for an hour. They were then taken out of the oven after cooling by the natural
loss of heat. Then the specimens was taken out of the water bath and the surface water was wiped
off the with a paper towel. Specimens were weighed to obtain the hot water saturated weight of
the bricks.
The hot-water absorption of the bricks was calculated using Equation (5.6):
Absorption, % = 100(Wb – Wd) / Wd (5.6)
0
2
4
6
8
10
12
CB DHBS2.3 GP20 GP30 GP40 SSAB-15 SSAB-30
Cold
-Wat
er A
bso
rpti
on (
%)
Type of Masonry Brick
Standard deviation with n=5
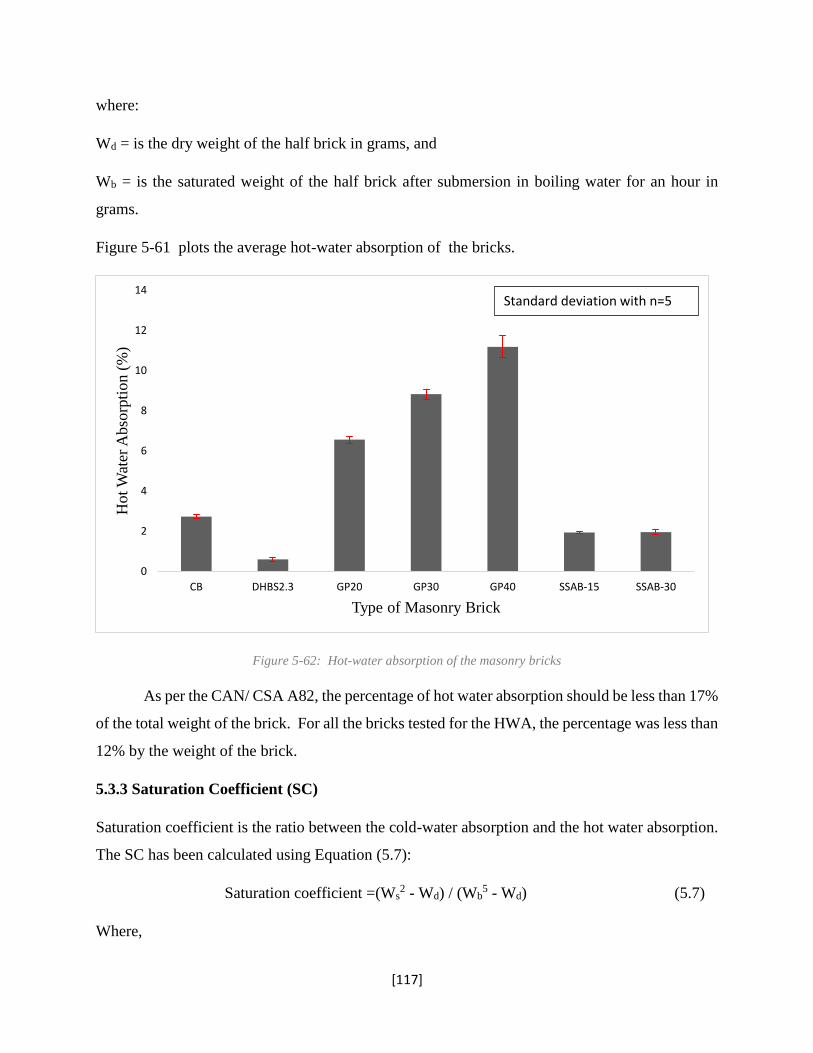
[117]
where:
Wd = is the dry weight of the half brick in grams, and
Wb = is the saturated weight of the half brick after submersion in boiling water for an hour in
grams.
Figure 5-61 plots the average hot-water absorption of the bricks.
Figure 5-62: Hot-water absorption of the masonry bricks
As per the CAN/ CSA A82, the percentage of hot water absorption should be less than 17%
of the total weight of the brick. For all the bricks tested for the HWA, the percentage was less than
12% by the weight of the brick.
5.3.3 Saturation Coefficient (SC)
Saturation coefficient is the ratio between the cold-water absorption and the hot water absorption.
The SC has been calculated using Equation (5.7):
Saturation coefficient =(Ws2 - Wd) / (Wb
5 - Wd) (5.7)
Where,
0
2
4
6
8
10
12
14
CB DHBS2.3 GP20 GP30 GP40 SSAB-15 SSAB-30
Hot
Wat
er A
bso
rpti
on (
%)
Type of Masonry Brick
Standard deviation with n=5
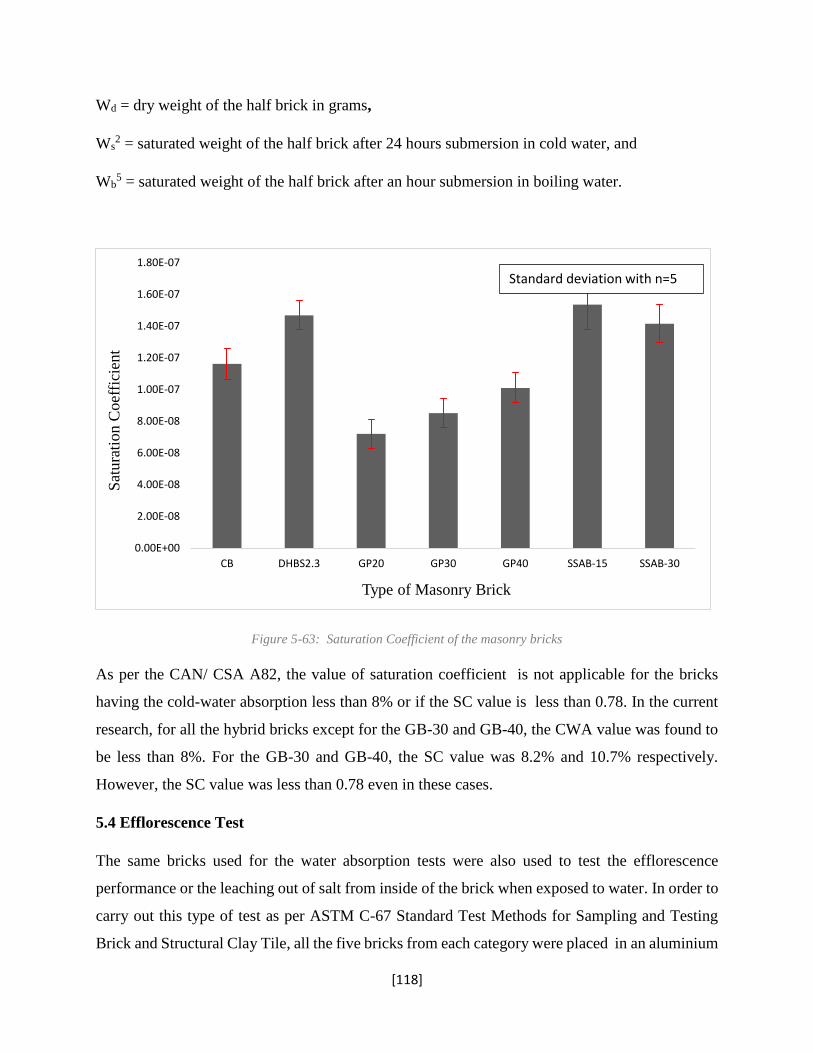
[118]
Wd = dry weight of the half brick in grams,
Ws2 = saturated weight of the half brick after 24 hours submersion in cold water, and
Wb5 = saturated weight of the half brick after an hour submersion in boiling water.
Figure 5-63: Saturation Coefficient of the masonry bricks
As per the CAN/ CSA A82, the value of saturation coefficient is not applicable for the bricks
having the cold-water absorption less than 8% or if the SC value is less than 0.78. In the current
research, for all the hybrid bricks except for the GB-30 and GB-40, the CWA value was found to
be less than 8%. For the GB-30 and GB-40, the SC value was 8.2% and 10.7% respectively.
However, the SC value was less than 0.78 even in these cases.
5.4 Efflorescence Test
The same bricks used for the water absorption tests were also used to test the efflorescence
performance or the leaching out of salt from inside of the brick when exposed to water. In order to
carry out this type of test as per ASTM C-67 Standard Test Methods for Sampling and Testing
Brick and Structural Clay Tile, all the five bricks from each category were placed in an aluminium
0.00E+00
2.00E-08
4.00E-08
6.00E-08
8.00E-08
1.00E-07
1.20E-07
1.40E-07
1.60E-07
1.80E-07
CB DHBS2.3 GP20 GP30 GP40 SSAB-15 SSAB-30
Sat
ura
tion C
oef
fici
ent
Type of Masonry Brick
Standard deviation with n=5
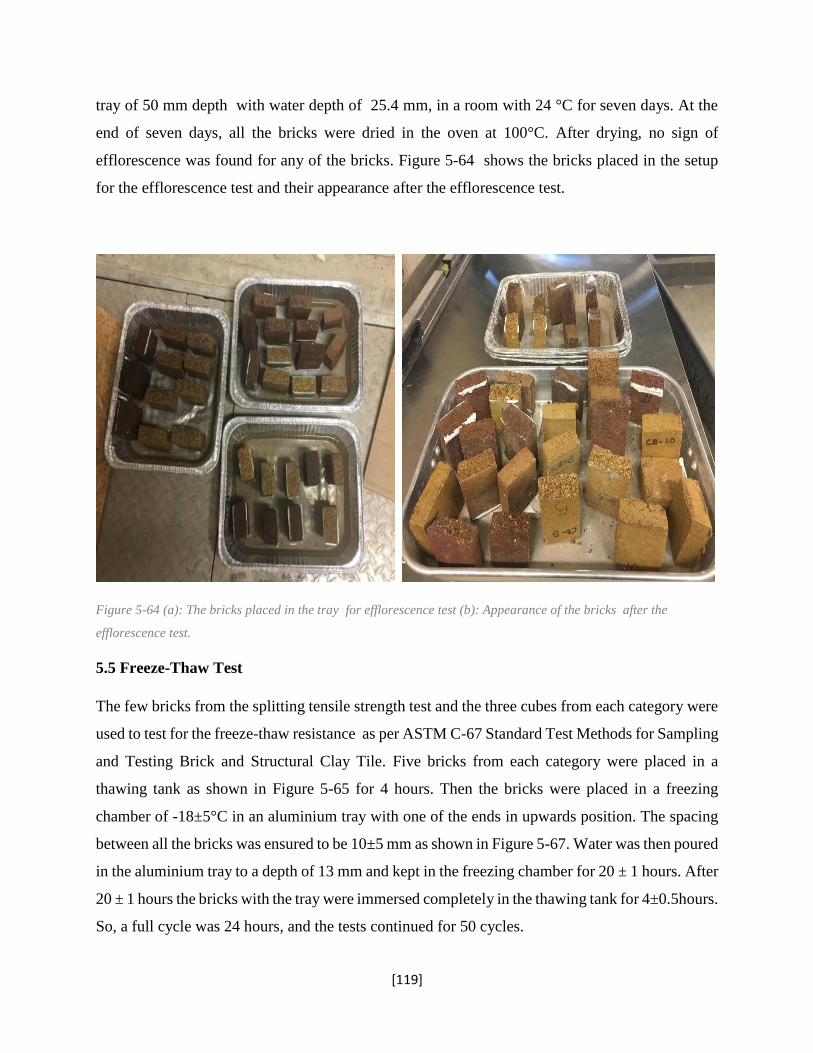
[119]
tray of 50 mm depth with water depth of 25.4 mm, in a room with 24 °C for seven days. At the
end of seven days, all the bricks were dried in the oven at 100°C. After drying, no sign of
efflorescence was found for any of the bricks. Figure 5-64 shows the bricks placed in the setup
for the efflorescence test and their appearance after the efflorescence test.
Figure 5-64 (a): The bricks placed in the tray for efflorescence test (b): Appearance of the bricks after the
efflorescence test.
5.5 Freeze-Thaw Test
The few bricks from the splitting tensile strength test and the three cubes from each category were
used to test for the freeze-thaw resistance as per ASTM C-67 Standard Test Methods for Sampling
and Testing Brick and Structural Clay Tile. Five bricks from each category were placed in a
thawing tank as shown in Figure 5-65 for 4 hours. Then the bricks were placed in a freezing
chamber of -18±5°C in an aluminium tray with one of the ends in upwards position. The spacing
between all the bricks was ensured to be 10±5 mm as shown in Figure 5-67. Water was then poured
in the aluminium tray to a depth of 13 mm and kept in the freezing chamber for 20 ± 1 hours. After
20 ± 1 hours the bricks with the tray were immersed completely in the thawing tank for 4±0.5hours.
So, a full cycle was 24 hours, and the tests continued for 50 cycles.
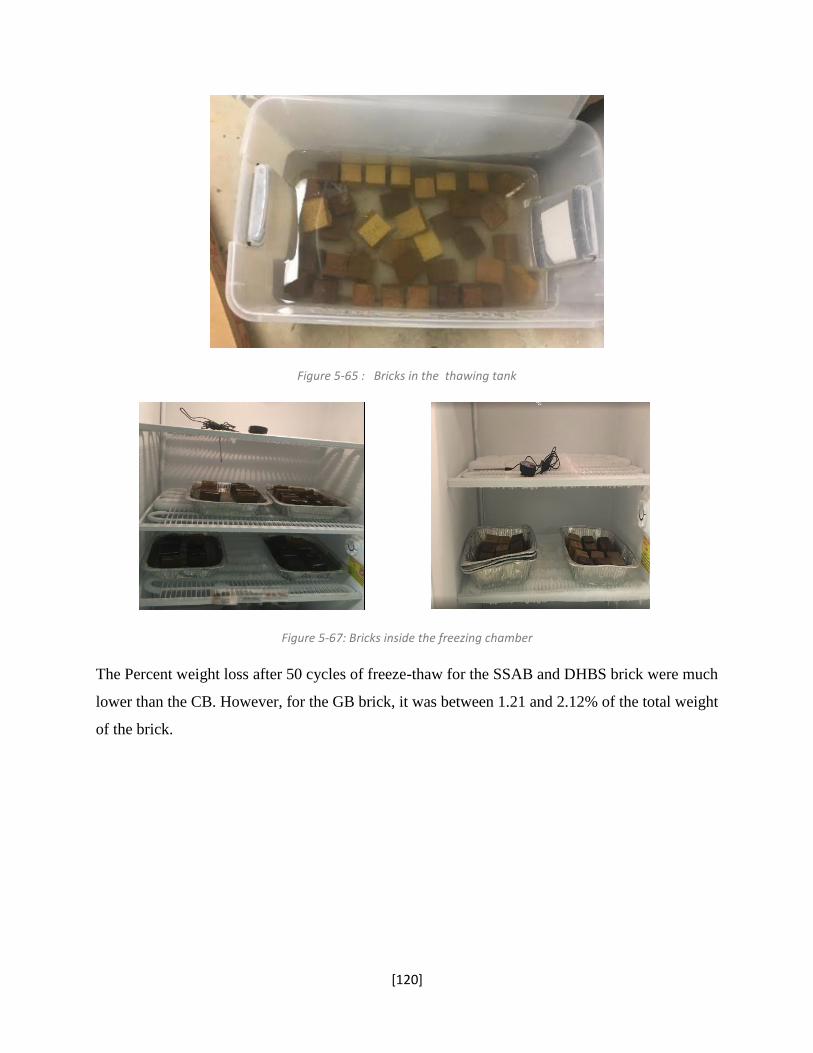
[120]
Figure 5-65 : Bricks in the thawing tank
Figure 5-67: Bricks inside the freezing chamber
The Percent weight loss after 50 cycles of freeze-thaw for the SSAB and DHBS brick were much
lower than the CB. However, for the GB brick, it was between 1.21 and 2.12% of the total weight
of the brick.
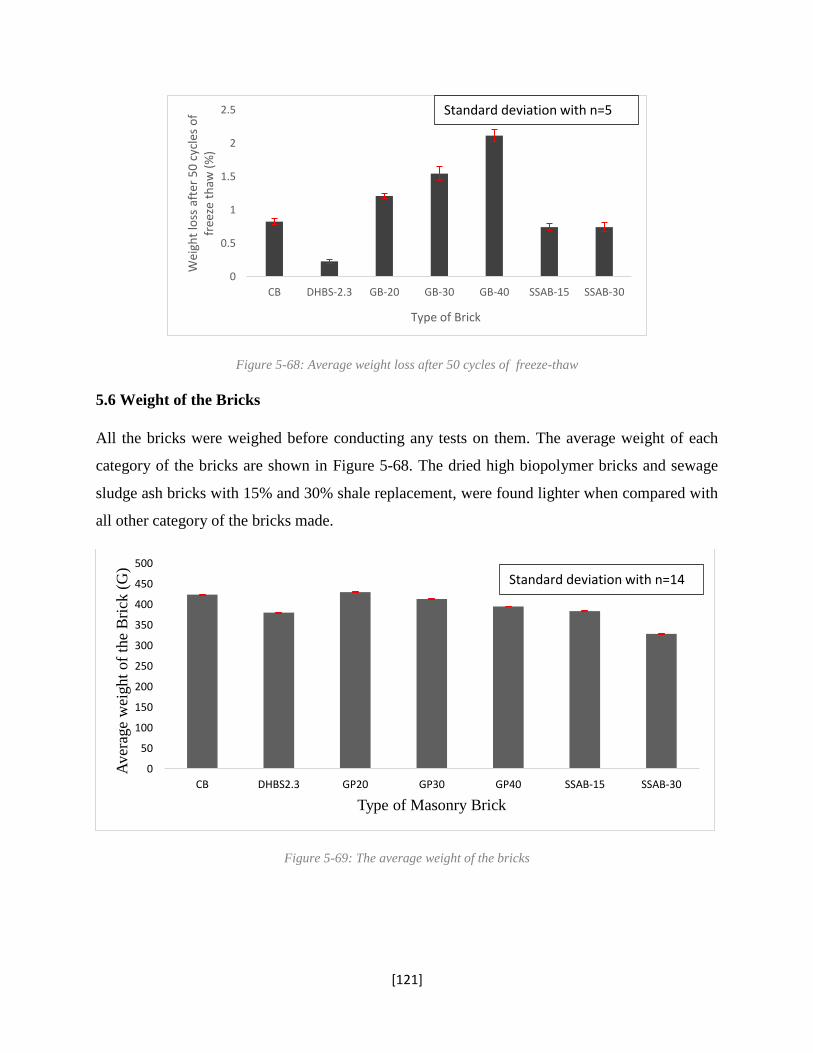
[121]
Figure 5-68: Average weight loss after 50 cycles of freeze-thaw
5.6 Weight of the Bricks
All the bricks were weighed before conducting any tests on them. The average weight of each
category of the bricks are shown in Figure 5-68. The dried high biopolymer bricks and sewage
sludge ash bricks with 15% and 30% shale replacement, were found lighter when compared with
all other category of the bricks made.
Figure 5-69: The average weight of the bricks
0
0.5
1
1.5
2
2.5
CB DHBS-2.3 GB-20 GB-30 GB-40 SSAB-15 SSAB-30
Wei
ght
loss
aft
er 5
0 c
ycle
s o
f fr
eeze
th
aw (
%)
Type of Brick
Standard deviation with n=5
0
50
100
150
200
250
300
350
400
450
500
CB DHBS2.3 GP20 GP30 GP40 SSAB-15 SSAB-30
Aver
age
wei
ght
of
the
Bri
ck (
G)
Type of Masonry Brick
Standard deviation with n=14
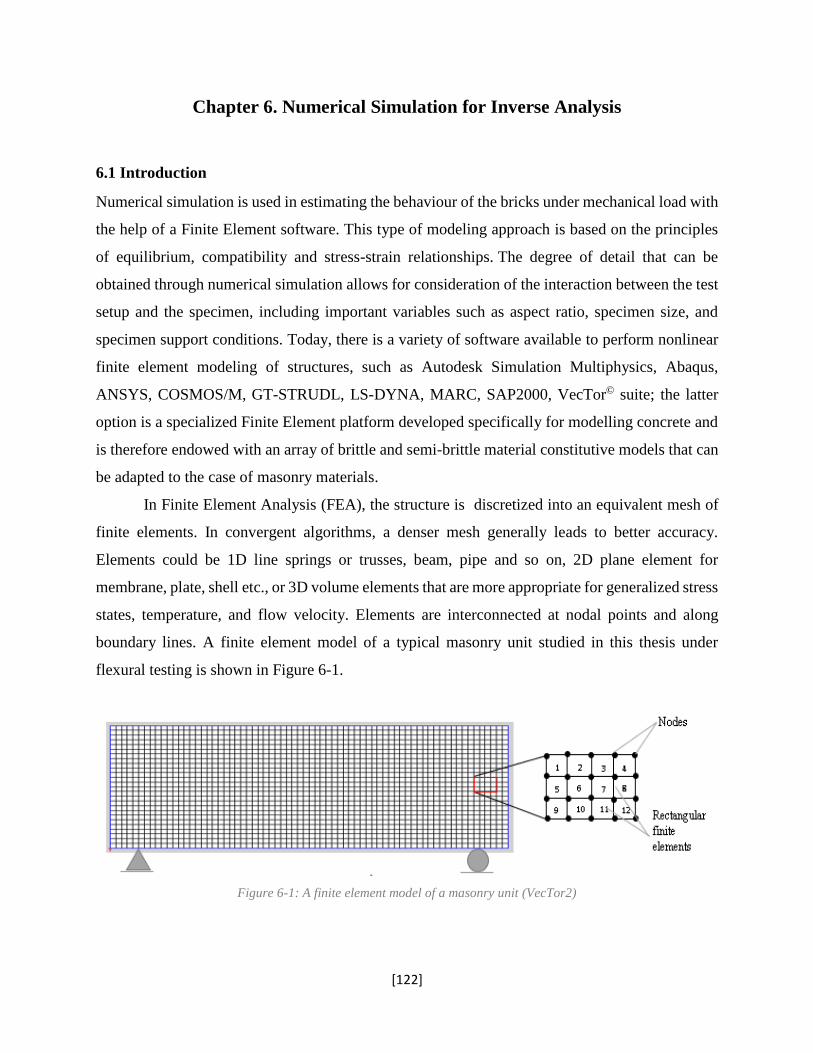
[122]
Chapter 6. Numerical Simulation for Inverse Analysis
6.1 Introduction
Numerical simulation is used in estimating the behaviour of the bricks under mechanical load with
the help of a Finite Element software. This type of modeling approach is based on the principles
of equilibrium, compatibility and stress-strain relationships. The degree of detail that can be
obtained through numerical simulation allows for consideration of the interaction between the test
setup and the specimen, including important variables such as aspect ratio, specimen size, and
specimen support conditions. Today, there is a variety of software available to perform nonlinear
finite element modeling of structures, such as Autodesk Simulation Multiphysics, Abaqus,
ANSYS, COSMOS/M, GT-STRUDL, LS-DYNA, MARC, SAP2000, VecTor© suite; the latter
option is a specialized Finite Element platform developed specifically for modelling concrete and
is therefore endowed with an array of brittle and semi-brittle material constitutive models that can
be adapted to the case of masonry materials.
In Finite Element Analysis (FEA), the structure is discretized into an equivalent mesh of
finite elements. In convergent algorithms, a denser mesh generally leads to better accuracy.
Elements could be 1D line springs or trusses, beam, pipe and so on, 2D plane element for
membrane, plate, shell etc., or 3D volume elements that are more appropriate for generalized stress
states, temperature, and flow velocity. Elements are interconnected at nodal points and along
boundary lines. A finite element model of a typical masonry unit studied in this thesis under
flexural testing is shown in Figure 6-1.
Figure 6-1: A finite element model of a masonry unit (VecTor2)
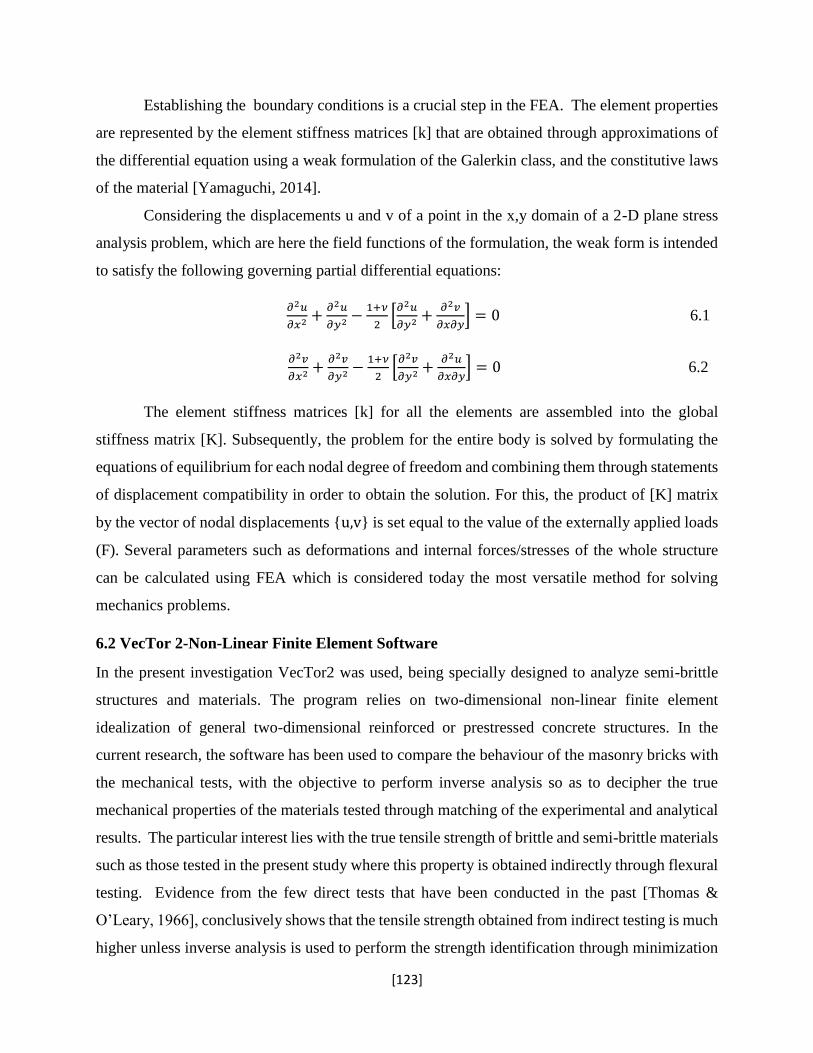
[123]
Establishing the boundary conditions is a crucial step in the FEA. The element properties
are represented by the element stiffness matrices [k] that are obtained through approximations of
the differential equation using a weak formulation of the Galerkin class, and the constitutive laws
of the material [Yamaguchi, 2014].
Considering the displacements u and v of a point in the x,y domain of a 2-D plane stress
analysis problem, which are here the field functions of the formulation, the weak form is intended
to satisfy the following governing partial differential equations:
𝜕2𝑢
𝜕𝑥2+
𝜕2𝑢
𝜕𝑦2−
1+𝜈
2[𝜕2𝑢
𝜕𝑦2+
𝜕2𝑣
𝜕𝑥𝜕𝑦] = 0 6.1
𝜕2𝑣
𝜕𝑥2+
𝜕2𝑣
𝜕𝑦2−
1+𝜈
2[𝜕2𝑣
𝜕𝑦2+
𝜕2𝑢
𝜕𝑥𝜕𝑦] = 0 6.2
The element stiffness matrices [k] for all the elements are assembled into the global
stiffness matrix [K]. Subsequently, the problem for the entire body is solved by formulating the
equations of equilibrium for each nodal degree of freedom and combining them through statements
of displacement compatibility in order to obtain the solution. For this, the product of [K] matrix
by the vector of nodal displacements {u,v} is set equal to the value of the externally applied loads
(F). Several parameters such as deformations and internal forces/stresses of the whole structure
can be calculated using FEA which is considered today the most versatile method for solving
mechanics problems.
6.2 VecTor 2-Non-Linear Finite Element Software
In the present investigation VecTor2 was used, being specially designed to analyze semi-brittle
structures and materials. The program relies on two-dimensional non-linear finite element
idealization of general two-dimensional reinforced or prestressed concrete structures. In the
current research, the software has been used to compare the behaviour of the masonry bricks with
the mechanical tests, with the objective to perform inverse analysis so as to decipher the true
mechanical properties of the materials tested through matching of the experimental and analytical
results. The particular interest lies with the true tensile strength of brittle and semi-brittle materials
such as those tested in the present study where this property is obtained indirectly through flexural
testing. Evidence from the few direct tests that have been conducted in the past [Thomas &
O’Leary, 1966], conclusively shows that the tensile strength obtained from indirect testing is much
higher unless inverse analysis is used to perform the strength identification through minimization
[124]
of the error between measured and calculated results. In the current study, this type of inverse,
iterative analysis is conducted through F.E. simulation.
VecTor2 has two processors - Formwork and Augustus. Formwork [Wong, 2002] works
as a preprocessor where the modelling, meshing, material property definition, support condition,
loading and preliminary steps of the analysis are done on a graphical user interface method (GUI)
whereas Augustus [Bentz, 1996 ] works as a post processor where the structural responses like
load-deformation, stresses, strains, failure modes including cracks may be assessed.
6.3 Finite Element Modelling of the Masonry Brick
The finite element modelling of the masonry brick unit was carried out in VecTor2 by generating
the skeleton-model of the structure using ‘define and mesh structure’. The model was then
discretized with plane-stress rectangular elements. Then the material properties and the boundary
conditions were assigned accordingly to continue with the post processor.
In the current research, the mechanical tests modelled are, the compressive strength tests
in longitudinal and transverse direction, flexural strength test as well as the split tensile strength
test. The referent experimental results correlated through the study concerned all the different types
of bricks made in the main phase of the investigation (i.e., control bricks, dried high biopolymer
sludge bricks, geopolymer bricks with 20 %,30 % and 40 % replacement of shale with recycled
crushed glass and sewage sludge ash brick with 15 % and 30 % replacement of shale by incinerated
sewage sludge ash.) Tests modelled included the flexural strength test, compressive strength test
and splitting tensile strength test with the objective to obtain the actual material properties by
calibrating of analysis and test result.
6.3.1 Simulation of the Flexural Strength Test-Three-Point Bending
The finite element modelling of the flexural strength test set up was done for all the categories of
bricks. All the bricks modelled were 140 mm in length, 58 mm in width and 26 mm in depth. The
model consists of 3928 plane stress rectangular elements of size 1mm x 1mm with an aspect ratio
of 1 and 4150 nodes.
Discrete reinforcement elements
In order to simulate the metallic plate used in the mechanical test, 2-noded truss-bar elements were
placed at the top of the brick mesh for a length of 30mm. The truss element had width of 58mm
[125]
and depth of 6mm which is the exact dimension of the metallic plate. This type of element is
provided in order to de-bond the brick and the metallic plate so as to simulate the failure crack
observed in the actual mechanical test. All the brick models are simulated using a discrete
reinforcing bar in the role of the bearing plate in order to effectively model the flexural strength
test as shown in Figure 6-2(a).
Bond link element properties
All FE models were endowed with bond-link elements to connect the brick with the metallic plate
as a part of a de-bonding mechanism. A total of 30 linkage elements in the form of an unbonded
bar was used.
Support conditions
To model the supports, steel plates with high stiffness were provided to avoid local crushing at the
bearing zones; the support condition at the bottom of the brick were assumed simple supports
allowing translational movement only.
Loading protocol
To simulate the three-point bending test, a point load was applied at the mid length of the brick
model, while loading was displacement controlled using 0.01 mm increments per load step.
Constitutive models utilized in VecTor2
The default models present in VecTor2 are appropriate to perform the nonlinear analysis. The same
default models are utilized in the current numerical analysis to see the response of the of the brick
specimens under the three-point bending test. The constitutive models used for the various aspects
of material simulation are shown in the Table 6-1.
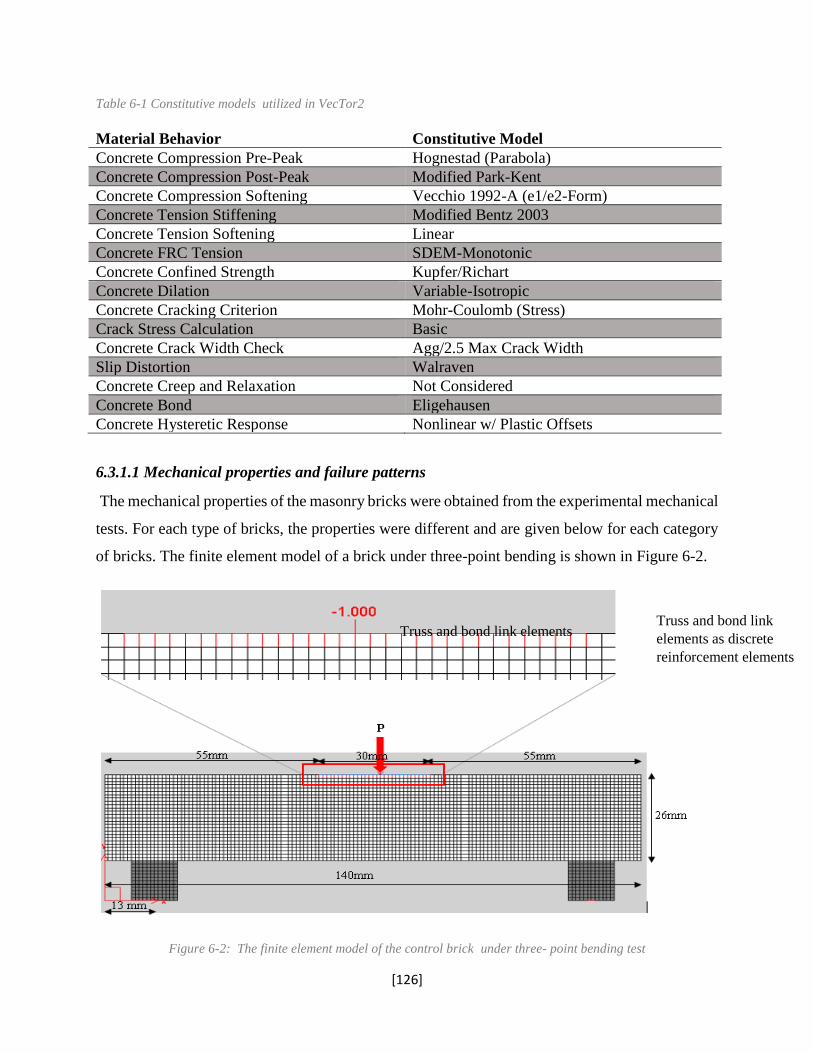
[126]
Table 6-1 Constitutive models utilized in VecTor2
Material Behavior Constitutive Model
Concrete Compression Pre-Peak Hognestad (Parabola)
Concrete Compression Post-Peak Modified Park-Kent
Concrete Compression Softening Vecchio 1992-A (e1/e2-Form)
Concrete Tension Stiffening Modified Bentz 2003
Concrete Tension Softening Linear
Concrete FRC Tension SDEM-Monotonic
Concrete Confined Strength Kupfer/Richart
Concrete Dilation Variable-Isotropic
Concrete Cracking Criterion Mohr-Coulomb (Stress)
Crack Stress Calculation Basic
Concrete Crack Width Check Agg/2.5 Max Crack Width
Slip Distortion Walraven
Concrete Creep and Relaxation Not Considered
Concrete Bond Eligehausen
Concrete Hysteretic Response Nonlinear w/ Plastic Offsets
6.3.1.1 Mechanical properties and failure patterns
The mechanical properties of the masonry bricks were obtained from the experimental mechanical
tests. For each type of bricks, the properties were different and are given below for each category
of bricks. The finite element model of a brick under three-point bending is shown in Figure 6-2.
Figure 6-2: The finite element model of the control brick under three- point bending test
Truss and bond link elements Truss and bond link
elements as discrete
reinforcement elements
[127]
6.3.1.1.1 Control Brick (CB)
The material properties for the control brick were specified by selecting the reference material as
the reinforced concrete in the FEM simulation of the flexural strength test. However, the values of
the parameters including the compressive strength fc’, Modulus of elasticity Ec, and density 𝛒 were
29.9 MPa, 36625 MPa, and 2008.3 kg/m3 respectively as obtained from the Experimental tests.
The value for the Poisson’s ratio μ was assumed as 0.2. The tensile strength of the control brick
that matched the tests was found to be 7.0 MPa. The indirect tensile strength values from the three-
point bending test and the splitting tensile strength test were 15.3 MPa and 4.8 MPa respectively.
The thickness of the control brick for modelling of the flexure test was 58 mm. Apart from
reproducing the load-displacement curve, this analysis yielded the same failure pattern of the brick
as observed during the experiment (see Figure 6-3(b)). The peak load and the maximum
displacement at the midpoint of the brick at failure was 3.0 kN and 0.03 mm respectively. Figure
6-3(c) represents the analytical load-mid displacement response curve for the typical Control
Brick. The peak load and mid displacement from the experimental analysis was 3.1 kN and 0.03
mm respectively and the peak load is represented as a dashed red line in the same response curve.
The analysis produced a load strength that was very close to the experimental values; Acceptable
tolerance for the type of test conducted lies within the magnitude of experimental error, i.e., in the
range of 10% of the peak value (i.e., 0.3 kN).
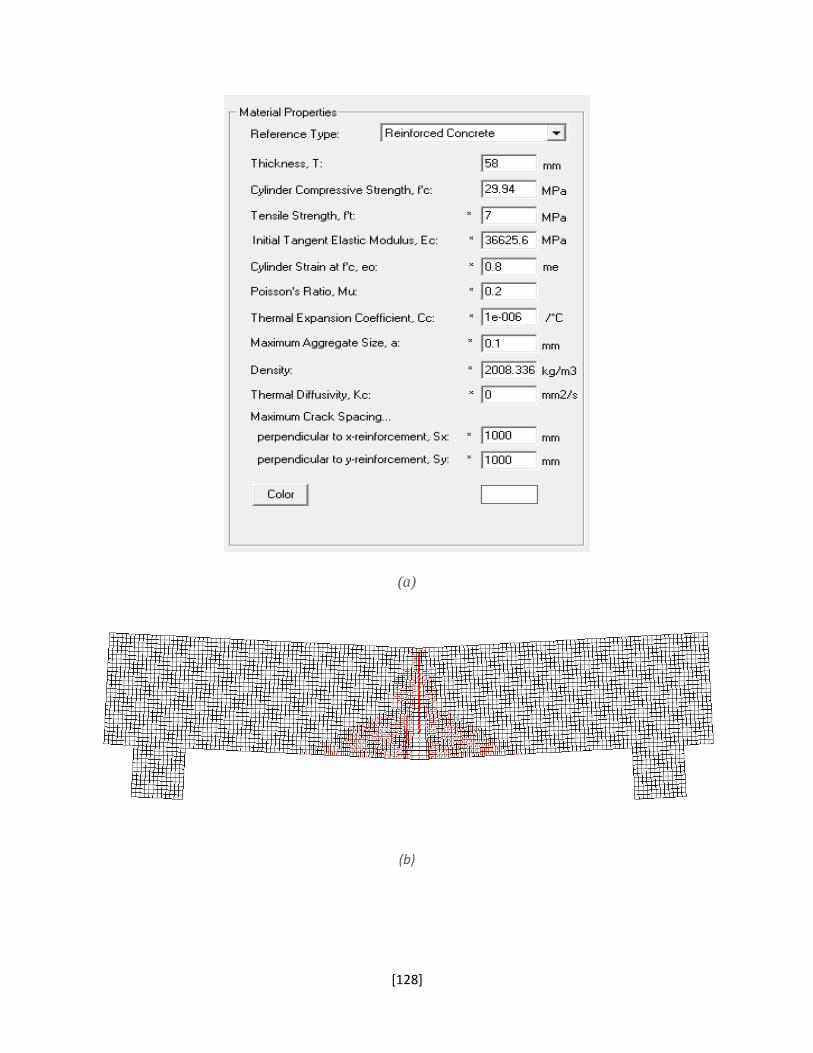
[128]
(a)
(b)
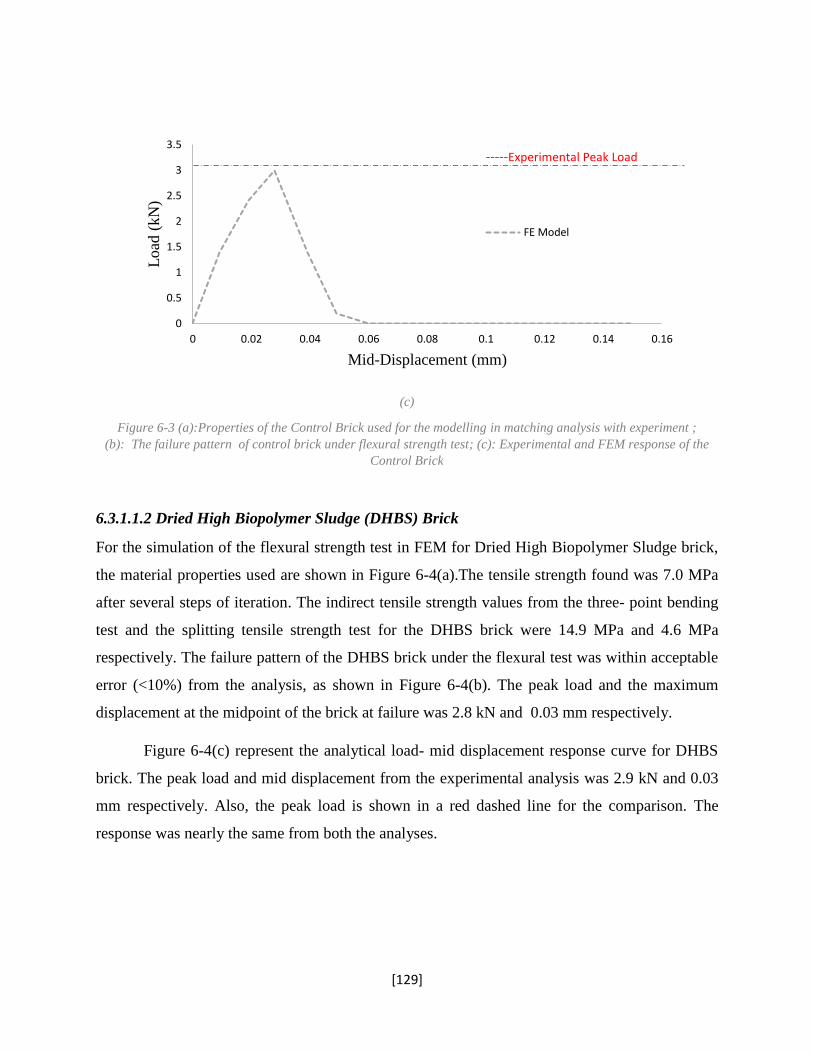
[129]
(c)
Figure 6-3 (a):Properties of the Control Brick used for the modelling in matching analysis with experiment ;
(b): The failure pattern of control brick under flexural strength test; (c): Experimental and FEM response of the
Control Brick
6.3.1.1.2 Dried High Biopolymer Sludge (DHBS) Brick
For the simulation of the flexural strength test in FEM for Dried High Biopolymer Sludge brick,
the material properties used are shown in Figure 6-4(a).The tensile strength found was 7.0 MPa
after several steps of iteration. The indirect tensile strength values from the three- point bending
test and the splitting tensile strength test for the DHBS brick were 14.9 MPa and 4.6 MPa
respectively. The failure pattern of the DHBS brick under the flexural test was within acceptable
error (<10%) from the analysis, as shown in Figure 6-4(b). The peak load and the maximum
displacement at the midpoint of the brick at failure was 2.8 kN and 0.03 mm respectively.
Figure 6-4(c) represent the analytical load- mid displacement response curve for DHBS
brick. The peak load and mid displacement from the experimental analysis was 2.9 kN and 0.03
mm respectively. Also, the peak load is shown in a red dashed line for the comparison. The
response was nearly the same from both the analyses.
0
0.5
1
1.5
2
2.5
3
3.5
0 0.02 0.04 0.06 0.08 0.1 0.12 0.14 0.16
Load
(kN
)
Mid-Displacement (mm)
FE Model
-----Experimental Peak Load
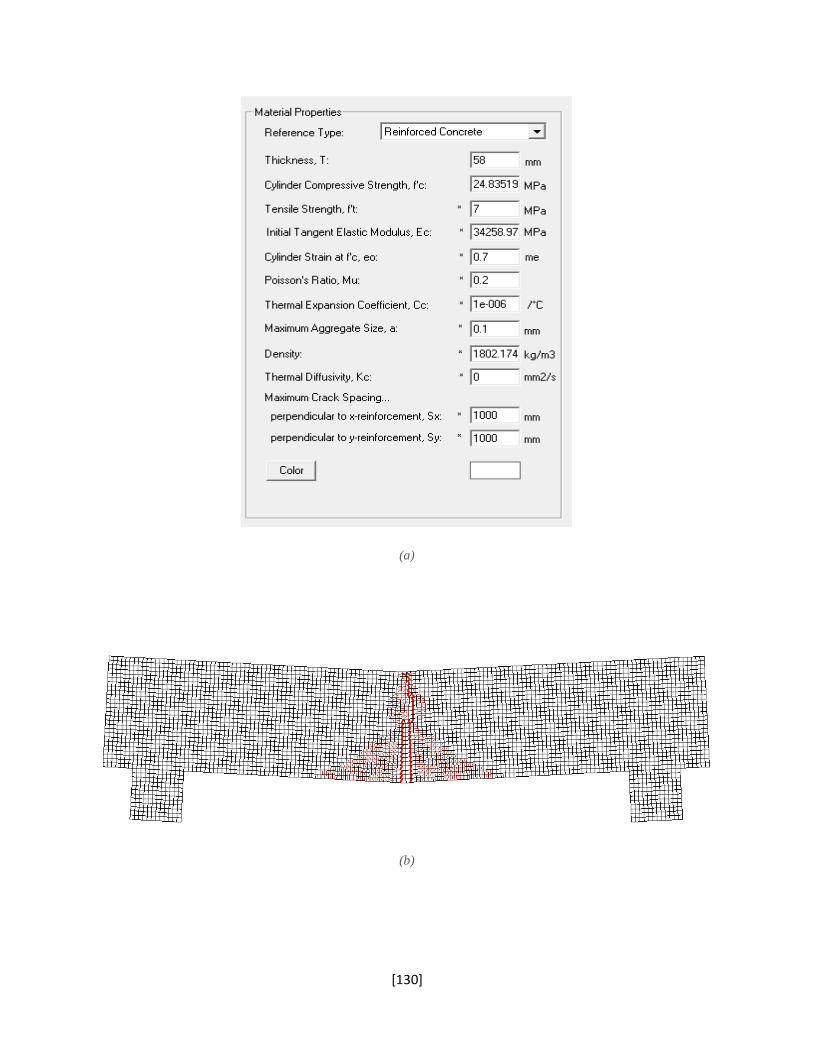
[130]
(a)
(b)
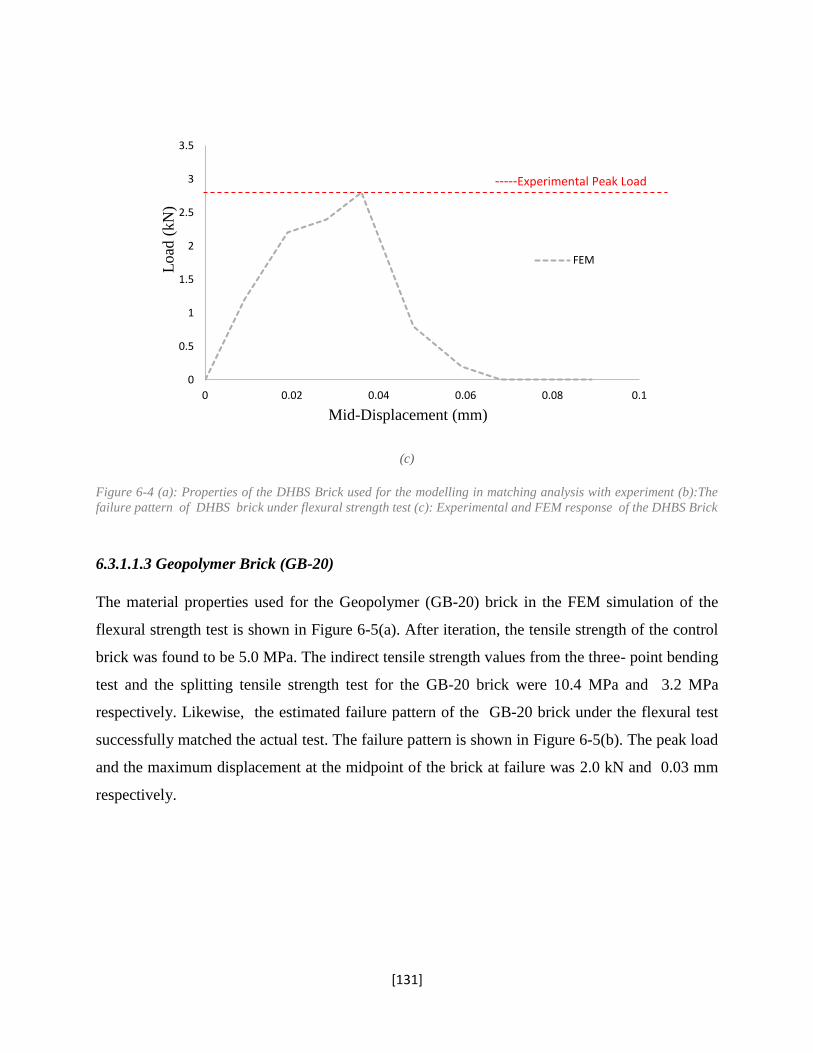
[131]
(c)
Figure 6-4 (a): Properties of the DHBS Brick used for the modelling in matching analysis with experiment (b):The
failure pattern of DHBS brick under flexural strength test (c): Experimental and FEM response of the DHBS Brick
6.3.1.1.3 Geopolymer Brick (GB-20)
The material properties used for the Geopolymer (GB-20) brick in the FEM simulation of the
flexural strength test is shown in Figure 6-5(a). After iteration, the tensile strength of the control
brick was found to be 5.0 MPa. The indirect tensile strength values from the three- point bending
test and the splitting tensile strength test for the GB-20 brick were 10.4 MPa and 3.2 MPa
respectively. Likewise, the estimated failure pattern of the GB-20 brick under the flexural test
successfully matched the actual test. The failure pattern is shown in Figure 6-5(b). The peak load
and the maximum displacement at the midpoint of the brick at failure was 2.0 kN and 0.03 mm
respectively.
0
0.5
1
1.5
2
2.5
3
3.5
0 0.02 0.04 0.06 0.08 0.1
Load
(kN
)
Mid-Displacement (mm)
FEM
-----Experimental Peak Load
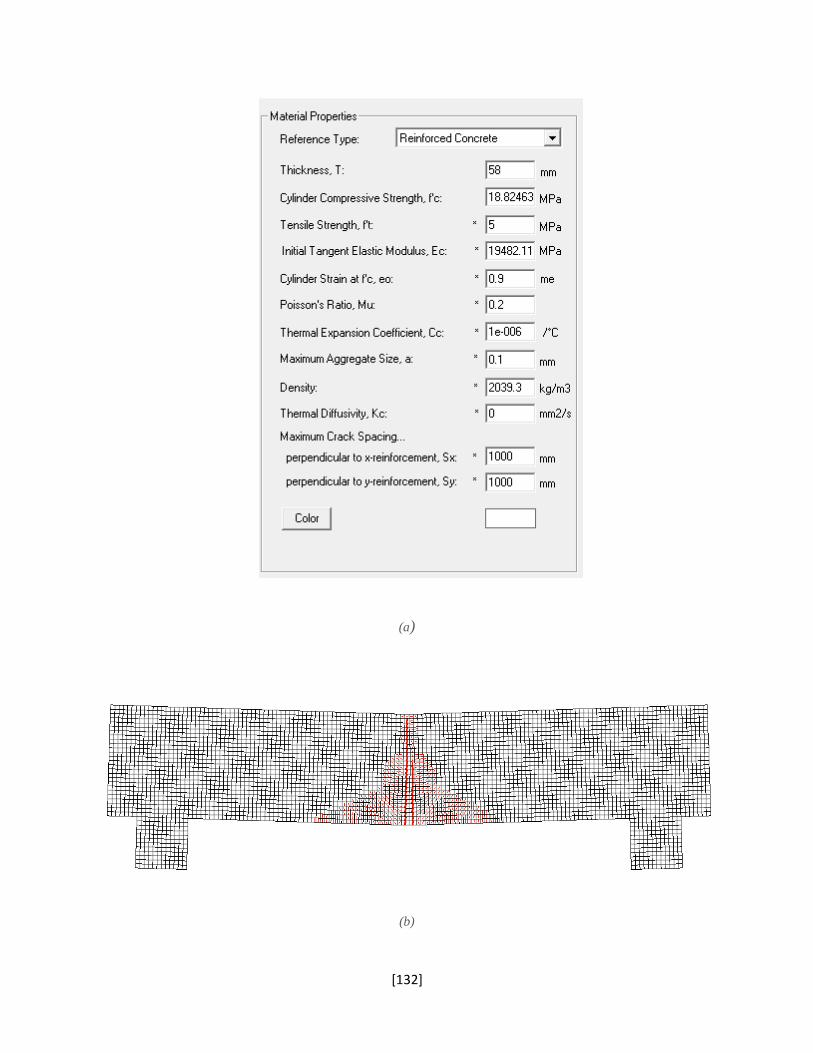
[132]
(a)
(b)
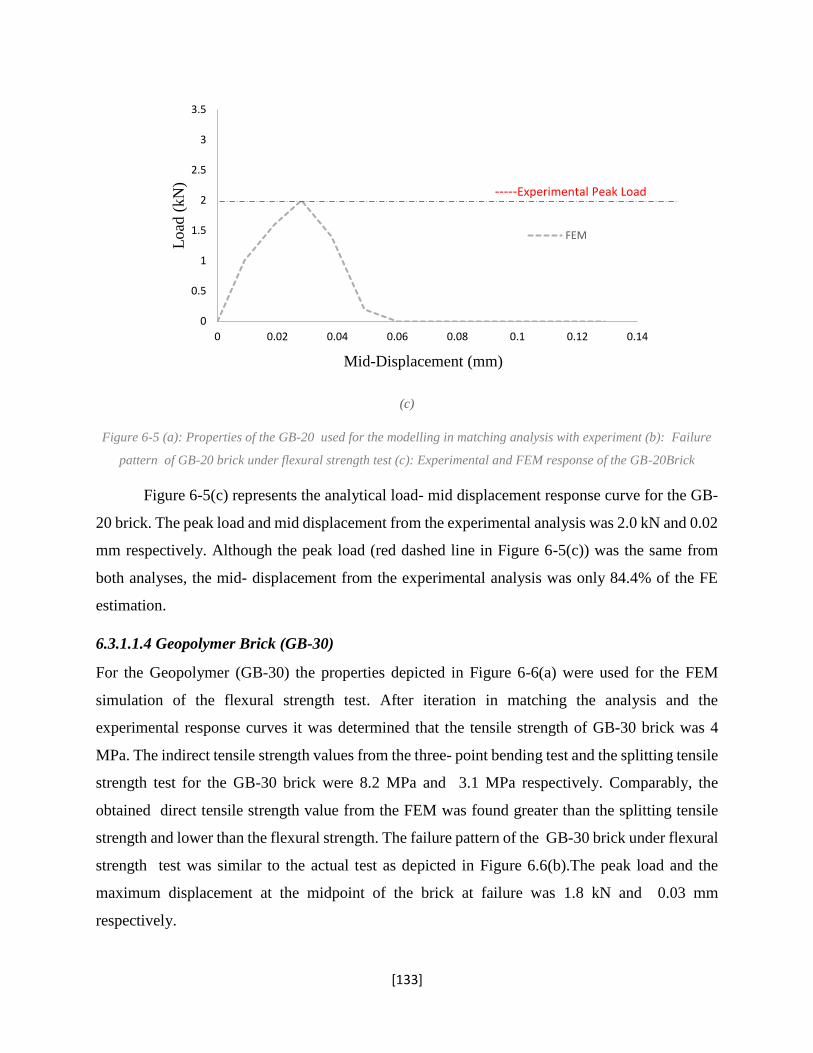
[133]
(c)
Figure 6-5 (a): Properties of the GB-20 used for the modelling in matching analysis with experiment (b): Failure
pattern of GB-20 brick under flexural strength test (c): Experimental and FEM response of the GB-20Brick
Figure 6-5(c) represents the analytical load- mid displacement response curve for the GB-
20 brick. The peak load and mid displacement from the experimental analysis was 2.0 kN and 0.02
mm respectively. Although the peak load (red dashed line in Figure 6-5(c)) was the same from
both analyses, the mid- displacement from the experimental analysis was only 84.4% of the FE
estimation.
6.3.1.1.4 Geopolymer Brick (GB-30)
For the Geopolymer (GB-30) the properties depicted in Figure 6-6(a) were used for the FEM
simulation of the flexural strength test. After iteration in matching the analysis and the
experimental response curves it was determined that the tensile strength of GB-30 brick was 4
MPa. The indirect tensile strength values from the three- point bending test and the splitting tensile
strength test for the GB-30 brick were 8.2 MPa and 3.1 MPa respectively. Comparably, the
obtained direct tensile strength value from the FEM was found greater than the splitting tensile
strength and lower than the flexural strength. The failure pattern of the GB-30 brick under flexural
strength test was similar to the actual test as depicted in Figure 6.6(b).The peak load and the
maximum displacement at the midpoint of the brick at failure was 1.8 kN and 0.03 mm
respectively.
0
0.5
1
1.5
2
2.5
3
3.5
0 0.02 0.04 0.06 0.08 0.1 0.12 0.14
Load
(kN
)
Mid-Displacement (mm)
FEM
-----Experimental Peak Load
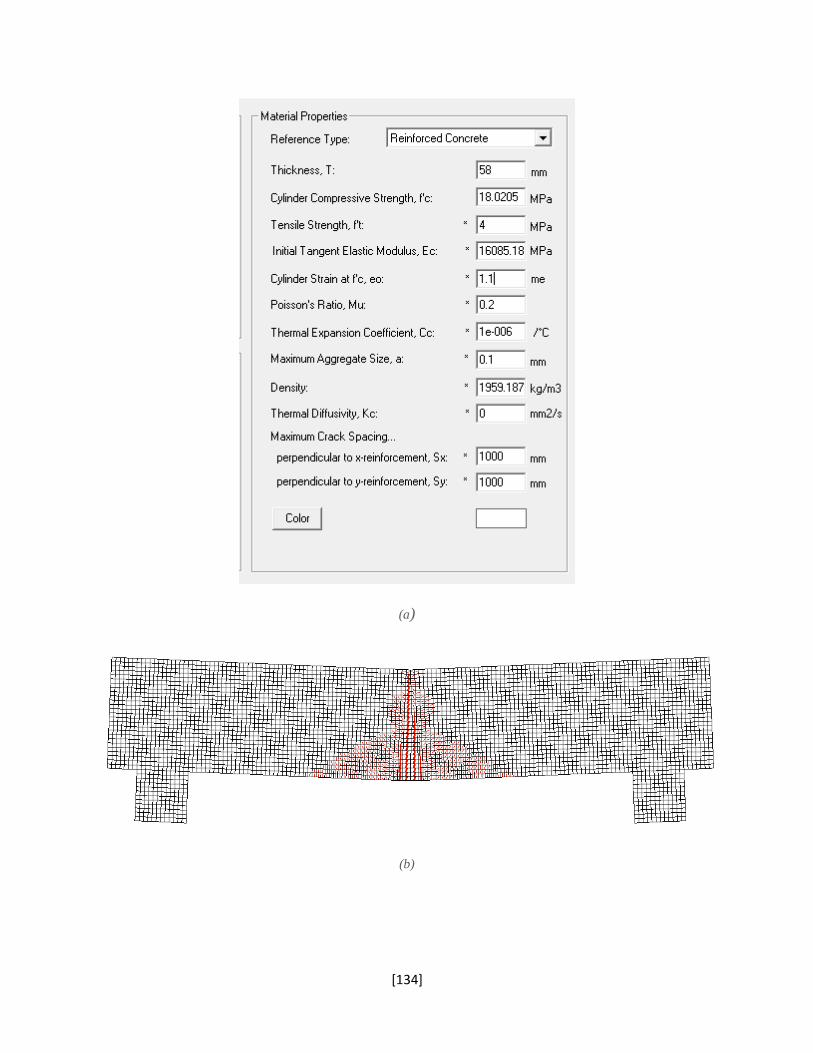
[134]
(a)
(b)
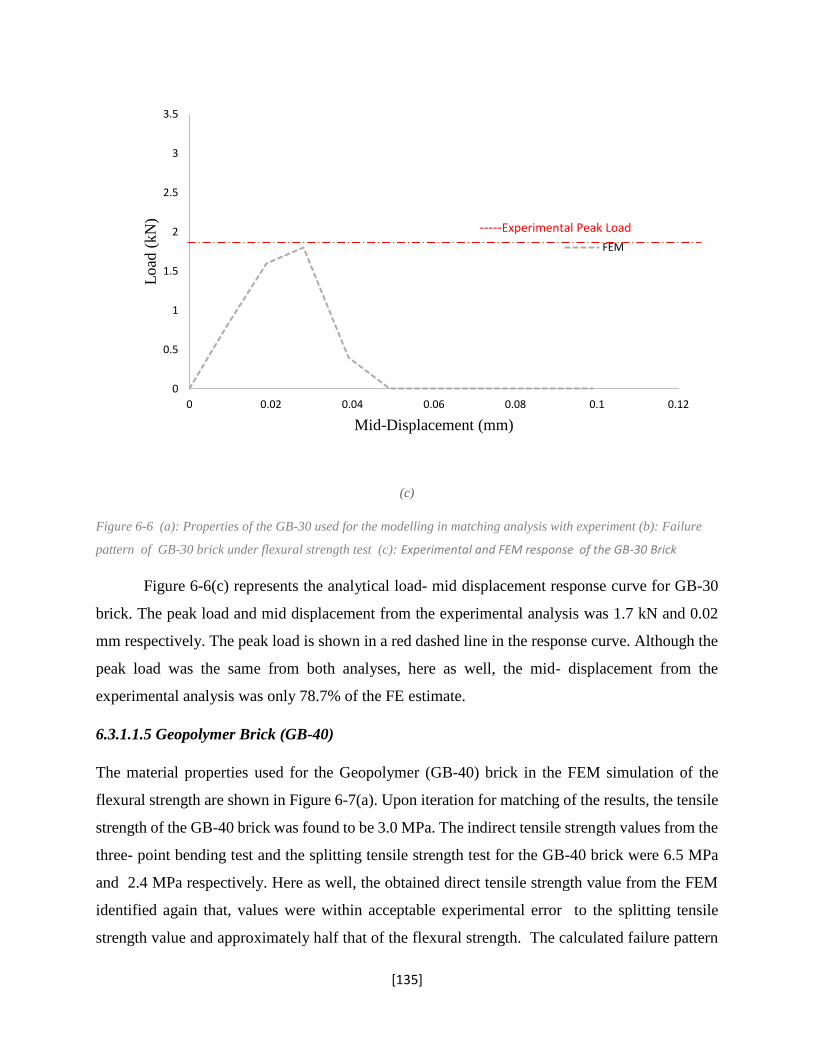
[135]
(c)
Figure 6-6 (a): Properties of the GB-30 used for the modelling in matching analysis with experiment (b): Failure
pattern of GB-30 brick under flexural strength test (c): Experimental and FEM response of the GB-30 Brick
Figure 6-6(c) represents the analytical load- mid displacement response curve for GB-30
brick. The peak load and mid displacement from the experimental analysis was 1.7 kN and 0.02
mm respectively. The peak load is shown in a red dashed line in the response curve. Although the
peak load was the same from both analyses, here as well, the mid- displacement from the
experimental analysis was only 78.7% of the FE estimate.
6.3.1.1.5 Geopolymer Brick (GB-40)
The material properties used for the Geopolymer (GB-40) brick in the FEM simulation of the
flexural strength are shown in Figure 6-7(a). Upon iteration for matching of the results, the tensile
strength of the GB-40 brick was found to be 3.0 MPa. The indirect tensile strength values from the
three- point bending test and the splitting tensile strength test for the GB-40 brick were 6.5 MPa
and 2.4 MPa respectively. Here as well, the obtained direct tensile strength value from the FEM
identified again that, values were within acceptable experimental error to the splitting tensile
strength value and approximately half that of the flexural strength. The calculated failure pattern
0
0.5
1
1.5
2
2.5
3
3.5
0 0.02 0.04 0.06 0.08 0.1 0.12
Load
(kN
)
Mid-Displacement (mm)
FEM
-----Experimental Peak Load
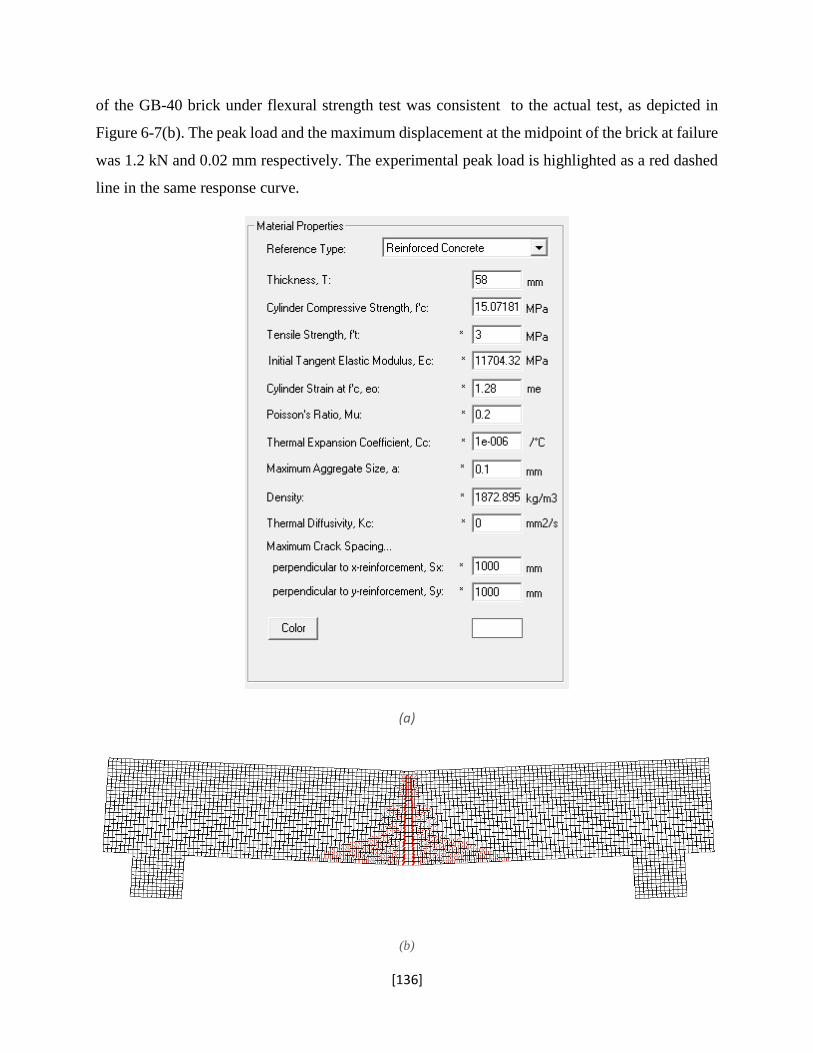
[136]
of the GB-40 brick under flexural strength test was consistent to the actual test, as depicted in
Figure 6-7(b). The peak load and the maximum displacement at the midpoint of the brick at failure
was 1.2 kN and 0.02 mm respectively. The experimental peak load is highlighted as a red dashed
line in the same response curve.
(a)
(b)
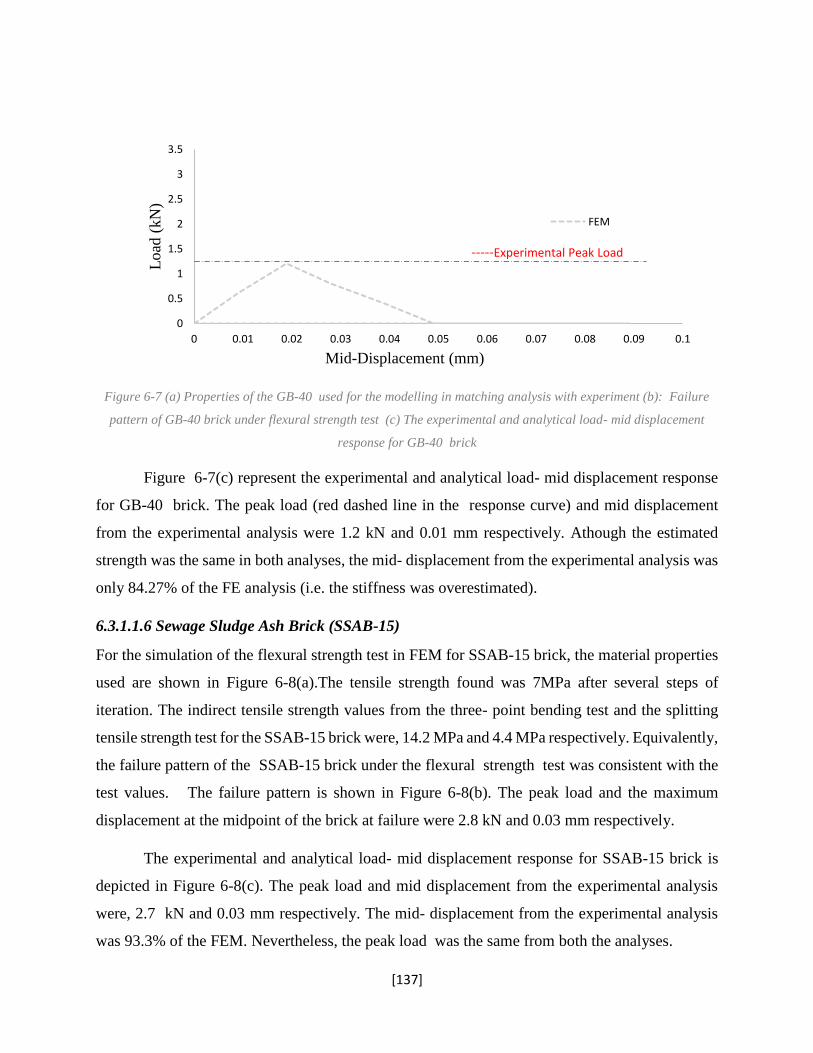
[137]
Figure 6-7 (a) Properties of the GB-40 used for the modelling in matching analysis with experiment (b): Failure
pattern of GB-40 brick under flexural strength test (c) The experimental and analytical load- mid displacement
response for GB-40 brick
Figure 6-7(c) represent the experimental and analytical load- mid displacement response
for GB-40 brick. The peak load (red dashed line in the response curve) and mid displacement
from the experimental analysis were 1.2 kN and 0.01 mm respectively. Athough the estimated
strength was the same in both analyses, the mid- displacement from the experimental analysis was
only 84.27% of the FE analysis (i.e. the stiffness was overestimated).
6.3.1.1.6 Sewage Sludge Ash Brick (SSAB-15)
For the simulation of the flexural strength test in FEM for SSAB-15 brick, the material properties
used are shown in Figure 6-8(a).The tensile strength found was 7MPa after several steps of
iteration. The indirect tensile strength values from the three- point bending test and the splitting
tensile strength test for the SSAB-15 brick were, 14.2 MPa and 4.4 MPa respectively. Equivalently,
the failure pattern of the SSAB-15 brick under the flexural strength test was consistent with the
test values. The failure pattern is shown in Figure 6-8(b). The peak load and the maximum
displacement at the midpoint of the brick at failure were 2.8 kN and 0.03 mm respectively.
The experimental and analytical load- mid displacement response for SSAB-15 brick is
depicted in Figure 6-8(c). The peak load and mid displacement from the experimental analysis
were, 2.7 kN and 0.03 mm respectively. The mid- displacement from the experimental analysis
was 93.3% of the FEM. Nevertheless, the peak load was the same from both the analyses.
0
0.5
1
1.5
2
2.5
3
3.5
0 0.01 0.02 0.03 0.04 0.05 0.06 0.07 0.08 0.09 0.1
Load
(kN
)
Mid-Displacement (mm)
FEM
-----Experimental Peak Load
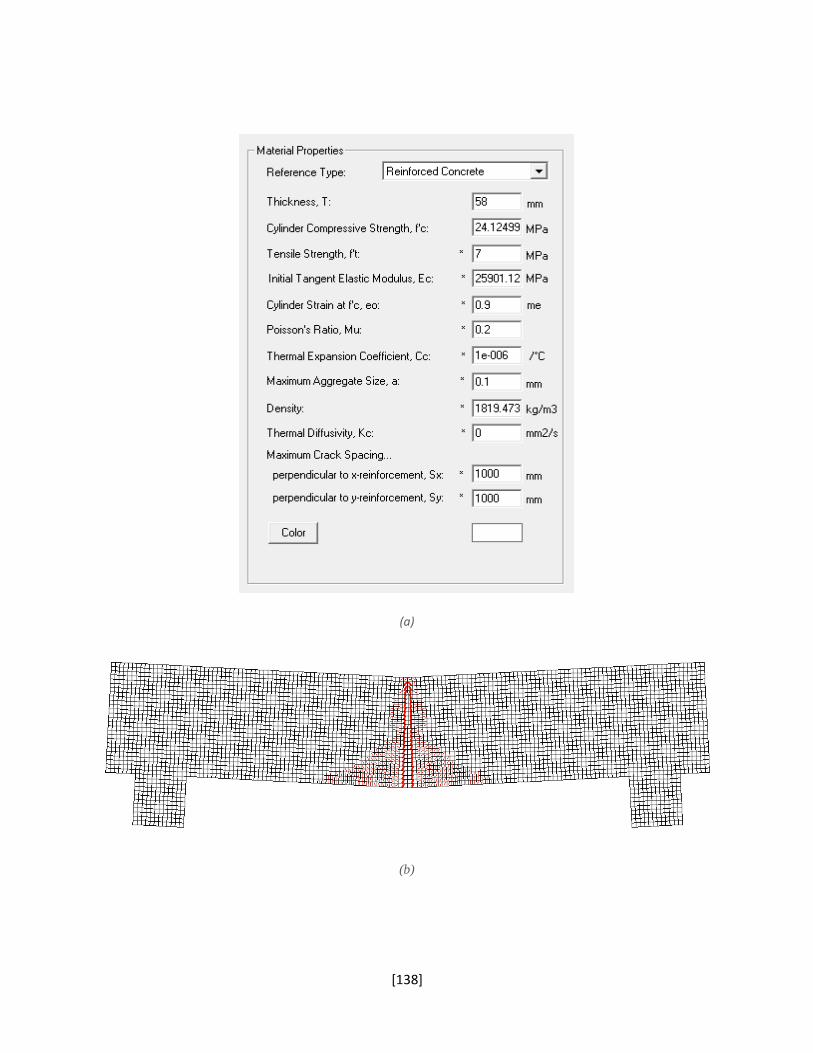
[138]
(a)
(b)
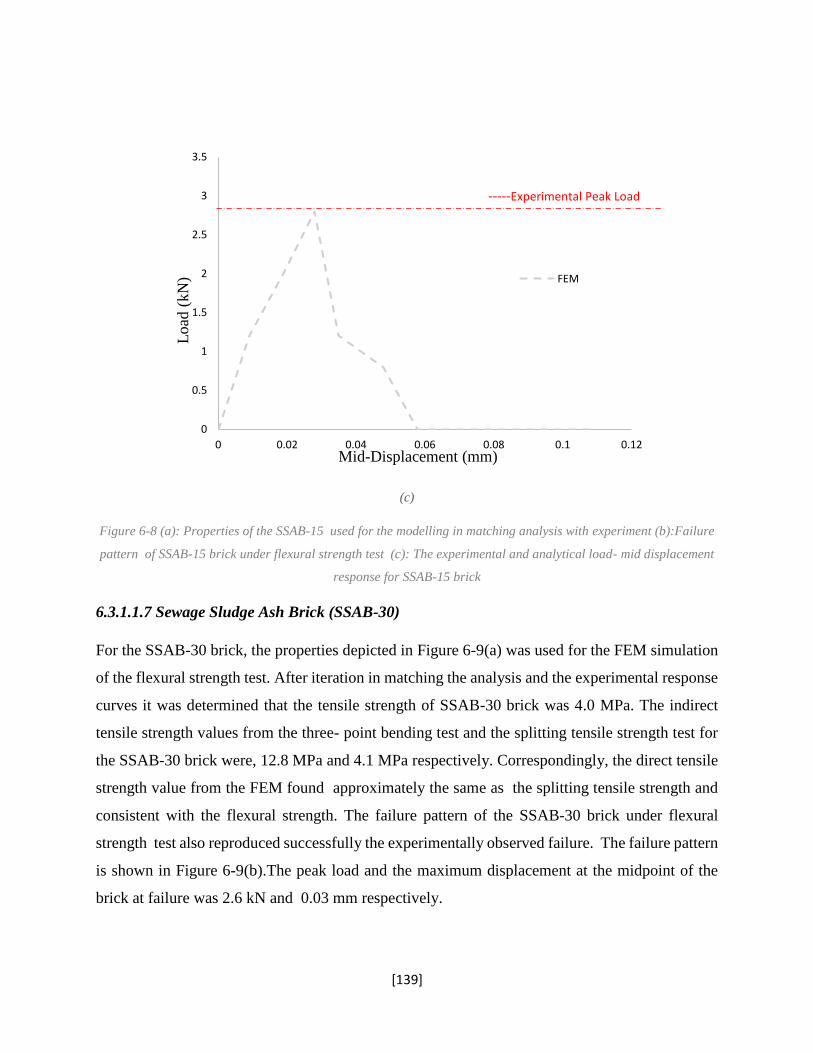
[139]
(c)
Figure 6-8 (a): Properties of the SSAB-15 used for the modelling in matching analysis with experiment (b):Failure
pattern of SSAB-15 brick under flexural strength test (c): The experimental and analytical load- mid displacement
response for SSAB-15 brick
6.3.1.1.7 Sewage Sludge Ash Brick (SSAB-30)
For the SSAB-30 brick, the properties depicted in Figure 6-9(a) was used for the FEM simulation
of the flexural strength test. After iteration in matching the analysis and the experimental response
curves it was determined that the tensile strength of SSAB-30 brick was 4.0 MPa. The indirect
tensile strength values from the three- point bending test and the splitting tensile strength test for
the SSAB-30 brick were, 12.8 MPa and 4.1 MPa respectively. Correspondingly, the direct tensile
strength value from the FEM found approximately the same as the splitting tensile strength and
consistent with the flexural strength. The failure pattern of the SSAB-30 brick under flexural
strength test also reproduced successfully the experimentally observed failure. The failure pattern
is shown in Figure 6-9(b).The peak load and the maximum displacement at the midpoint of the
brick at failure was 2.6 kN and 0.03 mm respectively.
0
0.5
1
1.5
2
2.5
3
3.5
0 0.02 0.04 0.06 0.08 0.1 0.12
Load
(kN
)
Mid-Displacement (mm)
FEM
-----Experimental Peak Load
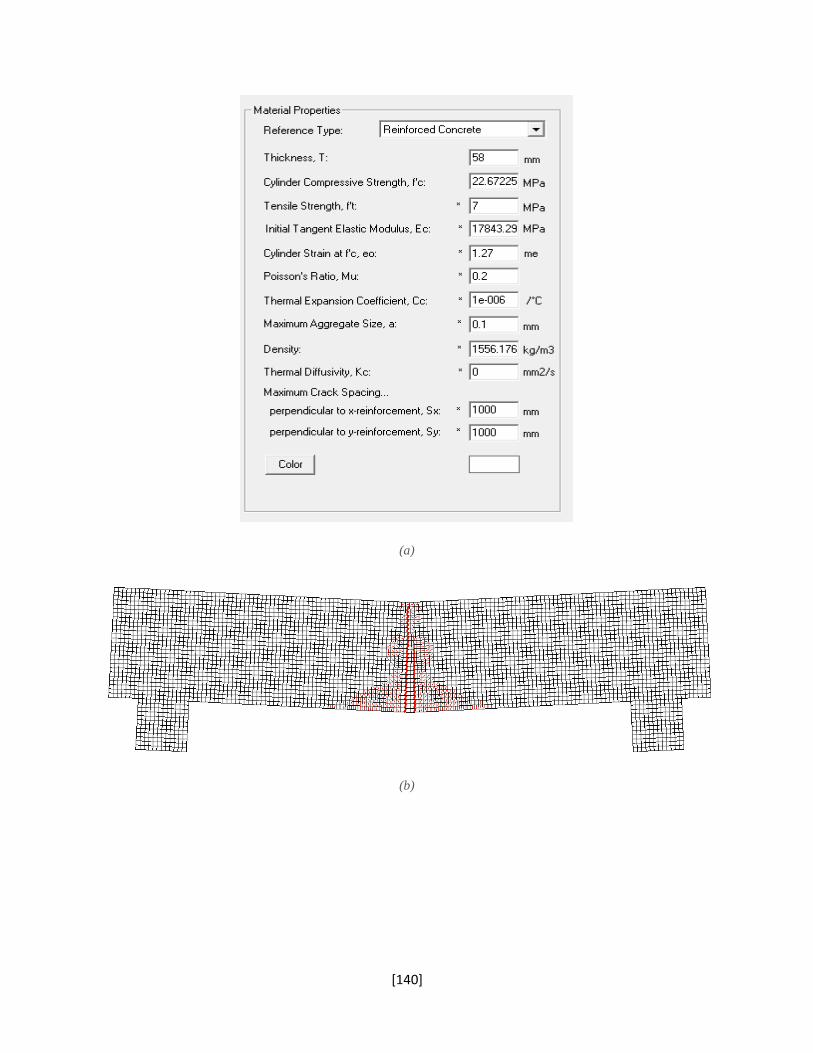
[140]
(a)
(b)
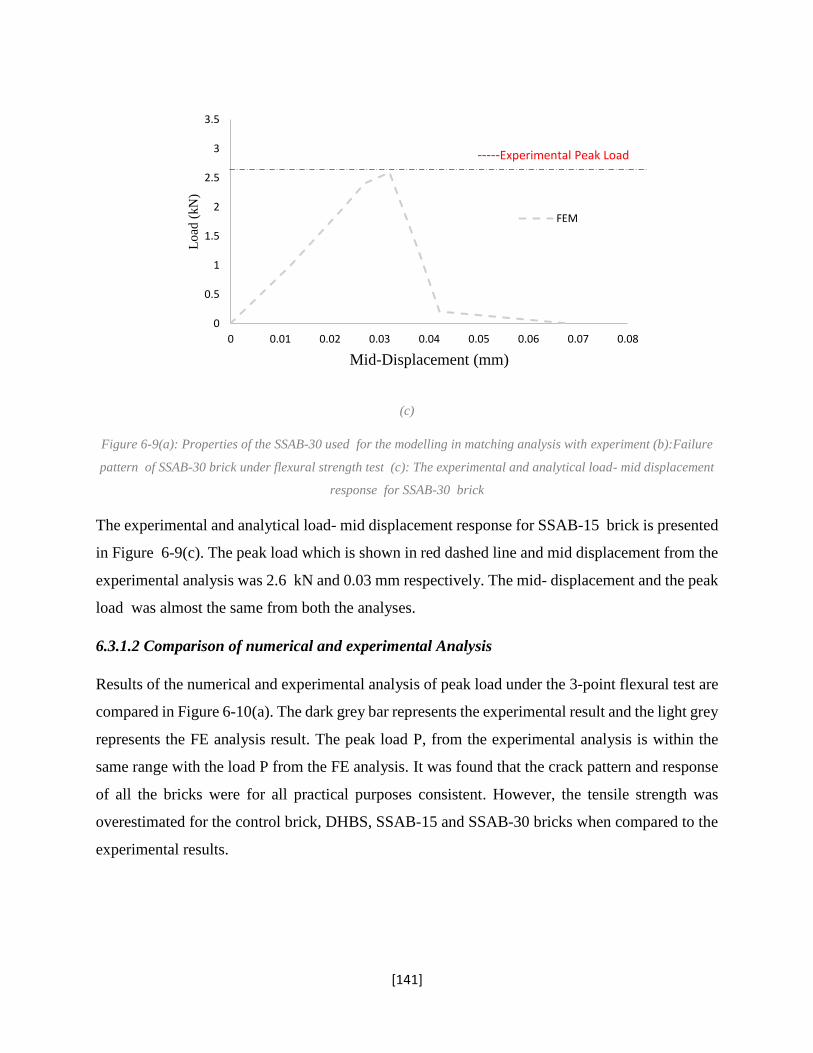
[141]
(c)
Figure 6-9(a): Properties of the SSAB-30 used for the modelling in matching analysis with experiment (b):Failure
pattern of SSAB-30 brick under flexural strength test (c): The experimental and analytical load- mid displacement
response for SSAB-30 brick
The experimental and analytical load- mid displacement response for SSAB-15 brick is presented
in Figure 6-9(c). The peak load which is shown in red dashed line and mid displacement from the
experimental analysis was 2.6 kN and 0.03 mm respectively. The mid- displacement and the peak
load was almost the same from both the analyses.
6.3.1.2 Comparison of numerical and experimental Analysis
Results of the numerical and experimental analysis of peak load under the 3-point flexural test are
compared in Figure 6-10(a). The dark grey bar represents the experimental result and the light grey
represents the FE analysis result. The peak load P, from the experimental analysis is within the
same range with the load P from the FE analysis. It was found that the crack pattern and response
of all the bricks were for all practical purposes consistent. However, the tensile strength was
overestimated for the control brick, DHBS, SSAB-15 and SSAB-30 bricks when compared to the
experimental results.
0
0.5
1
1.5
2
2.5
3
3.5
0 0.01 0.02 0.03 0.04 0.05 0.06 0.07 0.08
Lo
ad (
kN
)
Mid-Displacement (mm)
FEM
-----Experimental Peak Load
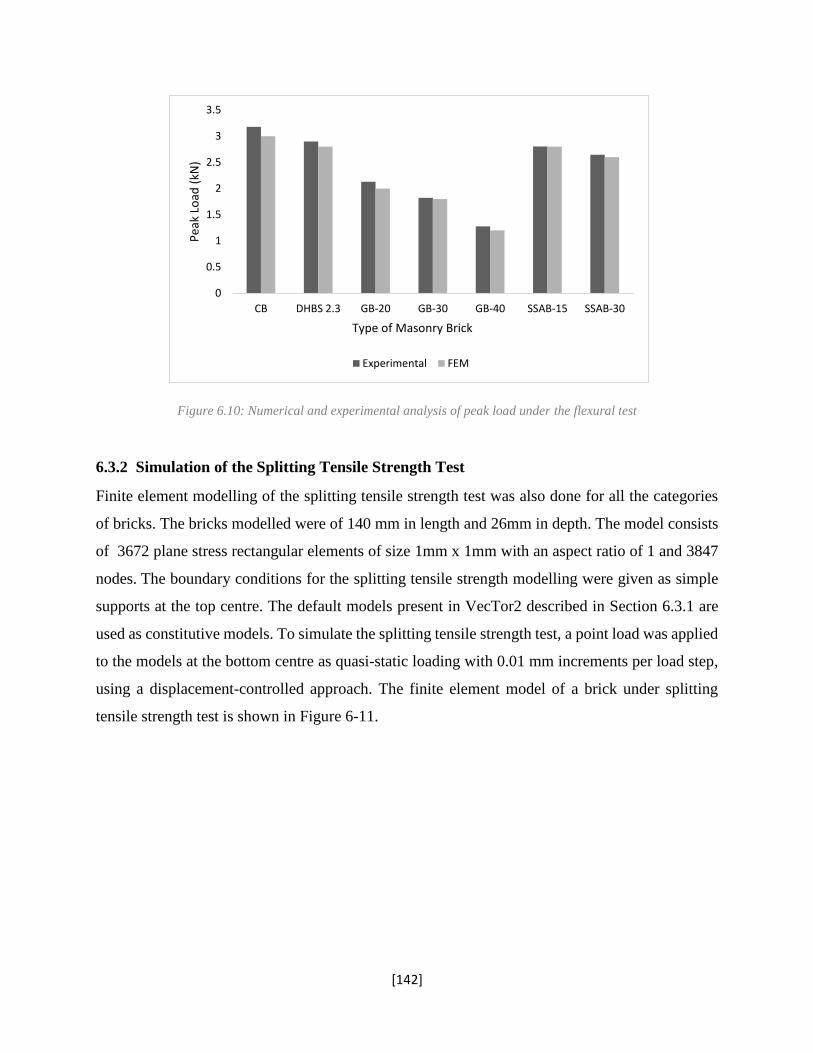
[142]
Figure 6.10: Numerical and experimental analysis of peak load under the flexural test
6.3.2 Simulation of the Splitting Tensile Strength Test
Finite element modelling of the splitting tensile strength test was also done for all the categories
of bricks. The bricks modelled were of 140 mm in length and 26mm in depth. The model consists
of 3672 plane stress rectangular elements of size 1mm x 1mm with an aspect ratio of 1 and 3847
nodes. The boundary conditions for the splitting tensile strength modelling were given as simple
supports at the top centre. The default models present in VecTor2 described in Section 6.3.1 are
used as constitutive models. To simulate the splitting tensile strength test, a point load was applied
to the models at the bottom centre as quasi-static loading with 0.01 mm increments per load step,
using a displacement-controlled approach. The finite element model of a brick under splitting
tensile strength test is shown in Figure 6-11.
0
0.5
1
1.5
2
2.5
3
3.5
CB DHBS 2.3 GB-20 GB-30 GB-40 SSAB-15 SSAB-30
Pea
k Lo
ad (
kN)
Type of Masonry Brick
Experimental FEM
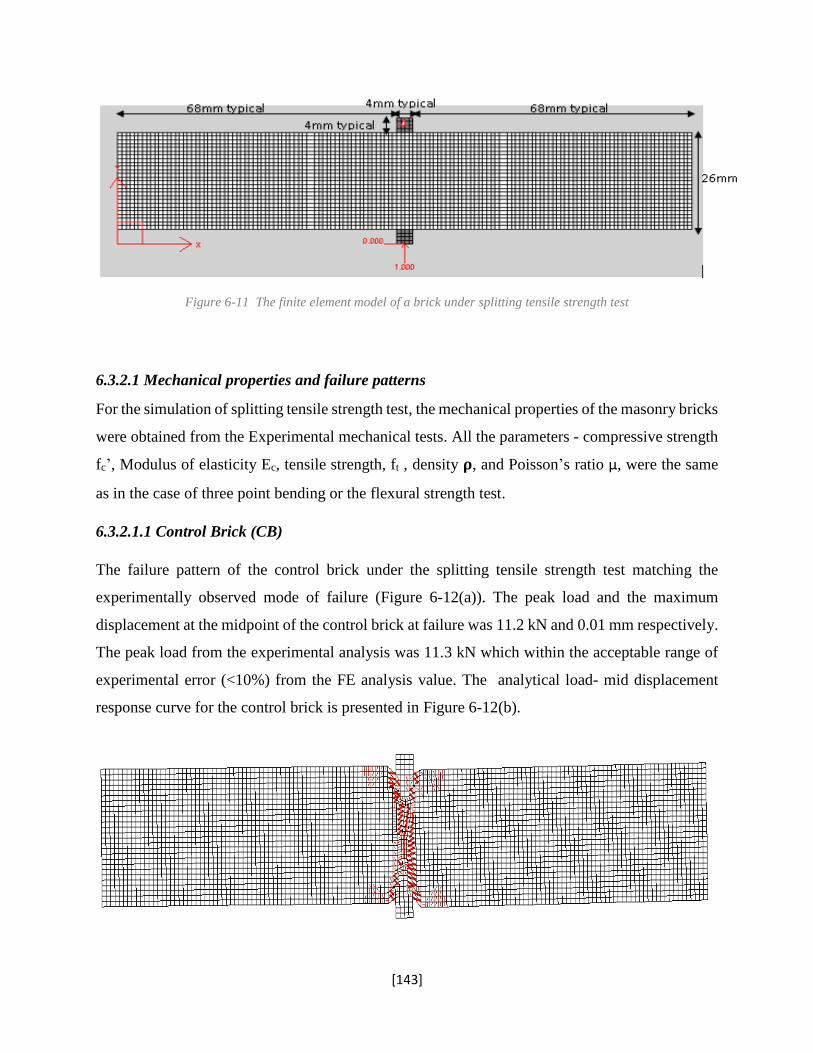
[143]
Figure 6-11 The finite element model of a brick under splitting tensile strength test
6.3.2.1 Mechanical properties and failure patterns
For the simulation of splitting tensile strength test, the mechanical properties of the masonry bricks
were obtained from the Experimental mechanical tests. All the parameters - compressive strength
fc’, Modulus of elasticity Ec, tensile strength, ft , density 𝛒, and Poisson’s ratio μ, were the same
as in the case of three point bending or the flexural strength test.
6.3.2.1.1 Control Brick (CB)
The failure pattern of the control brick under the splitting tensile strength test matching the
experimentally observed mode of failure (Figure 6-12(a)). The peak load and the maximum
displacement at the midpoint of the control brick at failure was 11.2 kN and 0.01 mm respectively.
The peak load from the experimental analysis was 11.3 kN which within the acceptable range of
experimental error (<10%) from the FE analysis value. The analytical load- mid displacement
response curve for the control brick is presented in Figure 6-12(b).
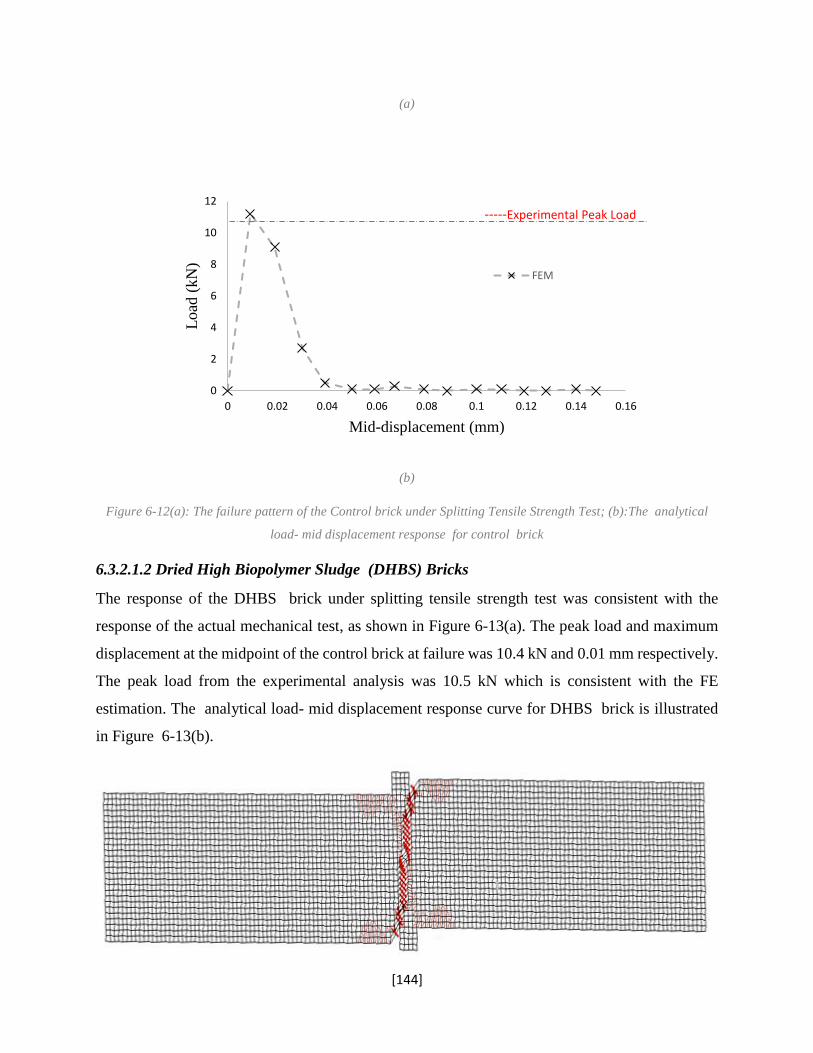
[144]
(a)
(b)
Figure 6-12(a): The failure pattern of the Control brick under Splitting Tensile Strength Test; (b):The analytical
load- mid displacement response for control brick
6.3.2.1.2 Dried High Biopolymer Sludge (DHBS) Bricks
The response of the DHBS brick under splitting tensile strength test was consistent with the
response of the actual mechanical test, as shown in Figure 6-13(a). The peak load and maximum
displacement at the midpoint of the control brick at failure was 10.4 kN and 0.01 mm respectively.
The peak load from the experimental analysis was 10.5 kN which is consistent with the FE
estimation. The analytical load- mid displacement response curve for DHBS brick is illustrated
in Figure 6-13(b).
0
2
4
6
8
10
12
0 0.02 0.04 0.06 0.08 0.1 0.12 0.14 0.16
Lo
ad (
kN
)
Mid-displacement (mm)
FEM
-----Experimental Peak Load
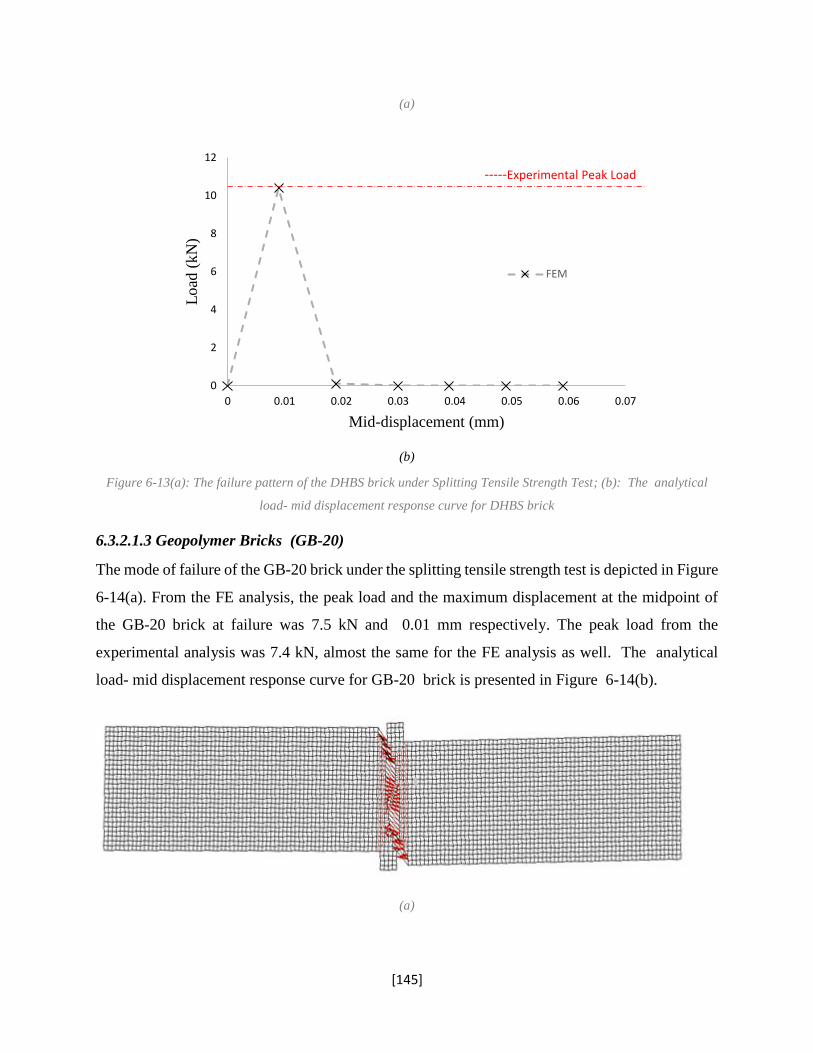
[145]
(a)
(b)
Figure 6-13(a): The failure pattern of the DHBS brick under Splitting Tensile Strength Test; (b): The analytical
load- mid displacement response curve for DHBS brick
6.3.2.1.3 Geopolymer Bricks (GB-20)
The mode of failure of the GB-20 brick under the splitting tensile strength test is depicted in Figure
6-14(a). From the FE analysis, the peak load and the maximum displacement at the midpoint of
the GB-20 brick at failure was 7.5 kN and 0.01 mm respectively. The peak load from the
experimental analysis was 7.4 kN, almost the same for the FE analysis as well. The analytical
load- mid displacement response curve for GB-20 brick is presented in Figure 6-14(b).
(a)
0
2
4
6
8
10
12
0 0.01 0.02 0.03 0.04 0.05 0.06 0.07
Lo
ad (
kN
)
Mid-displacement (mm)
FEM
-----Experimental Peak Load
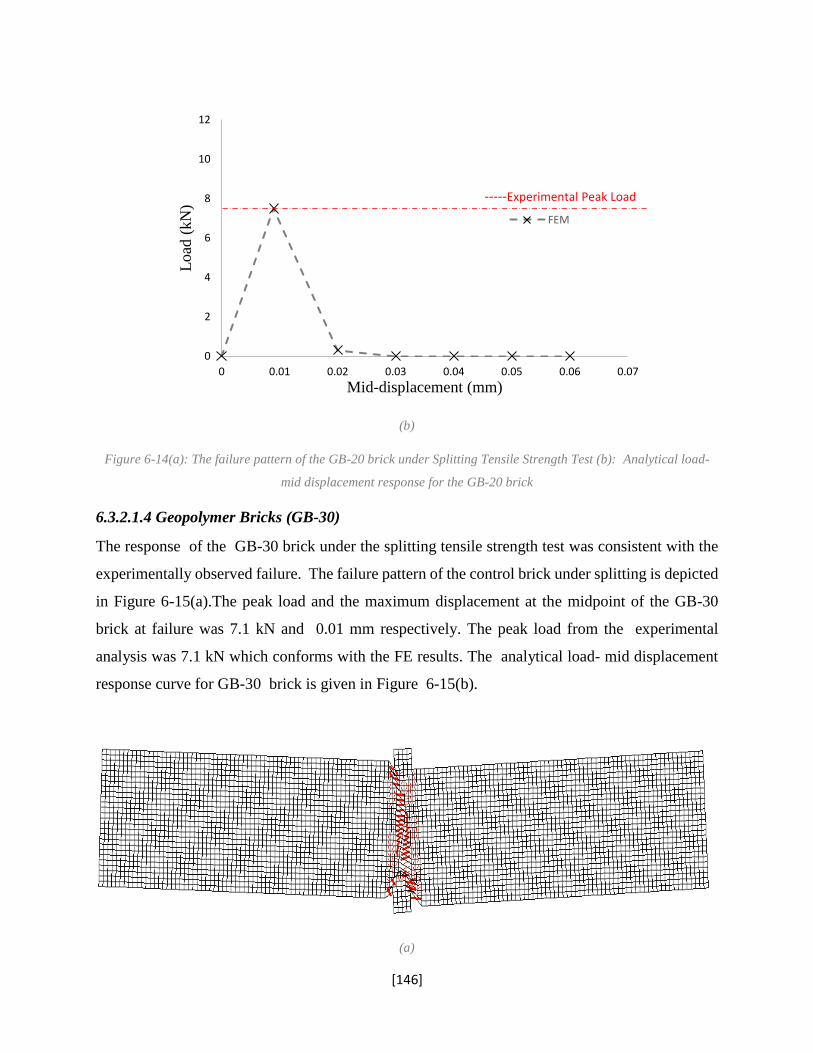
[146]
(b)
Figure 6-14(a): The failure pattern of the GB-20 brick under Splitting Tensile Strength Test (b): Analytical load-
mid displacement response for the GB-20 brick
6.3.2.1.4 Geopolymer Bricks (GB-30)
The response of the GB-30 brick under the splitting tensile strength test was consistent with the
experimentally observed failure. The failure pattern of the control brick under splitting is depicted
in Figure 6-15(a).The peak load and the maximum displacement at the midpoint of the GB-30
brick at failure was 7.1 kN and 0.01 mm respectively. The peak load from the experimental
analysis was 7.1 kN which conforms with the FE results. The analytical load- mid displacement
response curve for GB-30 brick is given in Figure 6-15(b).
(a)
0
2
4
6
8
10
12
0 0.01 0.02 0.03 0.04 0.05 0.06 0.07
Lo
ad (
kN
)
Mid-displacement (mm)
FEM
-----Experimental Peak Load
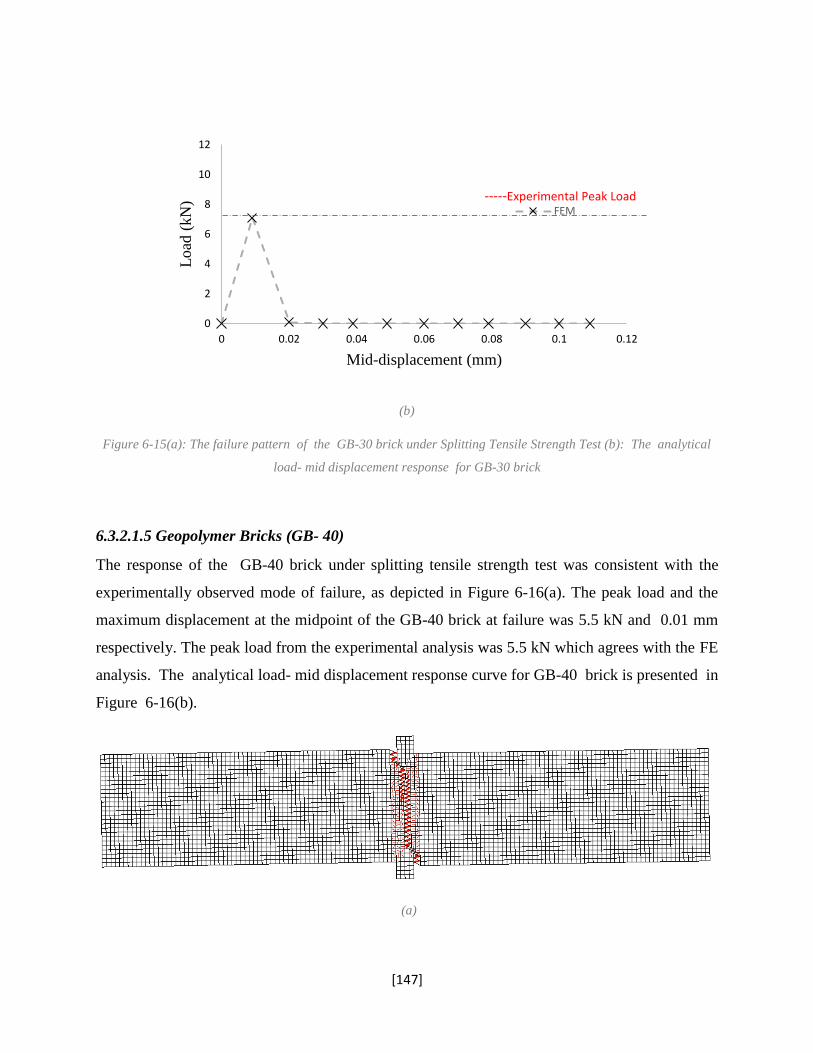
[147]
(b)
Figure 6-15(a): The failure pattern of the GB-30 brick under Splitting Tensile Strength Test (b): The analytical
load- mid displacement response for GB-30 brick
6.3.2.1.5 Geopolymer Bricks (GB- 40)
The response of the GB-40 brick under splitting tensile strength test was consistent with the
experimentally observed mode of failure, as depicted in Figure 6-16(a). The peak load and the
maximum displacement at the midpoint of the GB-40 brick at failure was 5.5 kN and 0.01 mm
respectively. The peak load from the experimental analysis was 5.5 kN which agrees with the FE
analysis. The analytical load- mid displacement response curve for GB-40 brick is presented in
Figure 6-16(b).
(a)
0
2
4
6
8
10
12
0 0.02 0.04 0.06 0.08 0.1 0.12
Lo
ad (
kN
)
Mid-displacement (mm)
FEM-----Experimental Peak Load
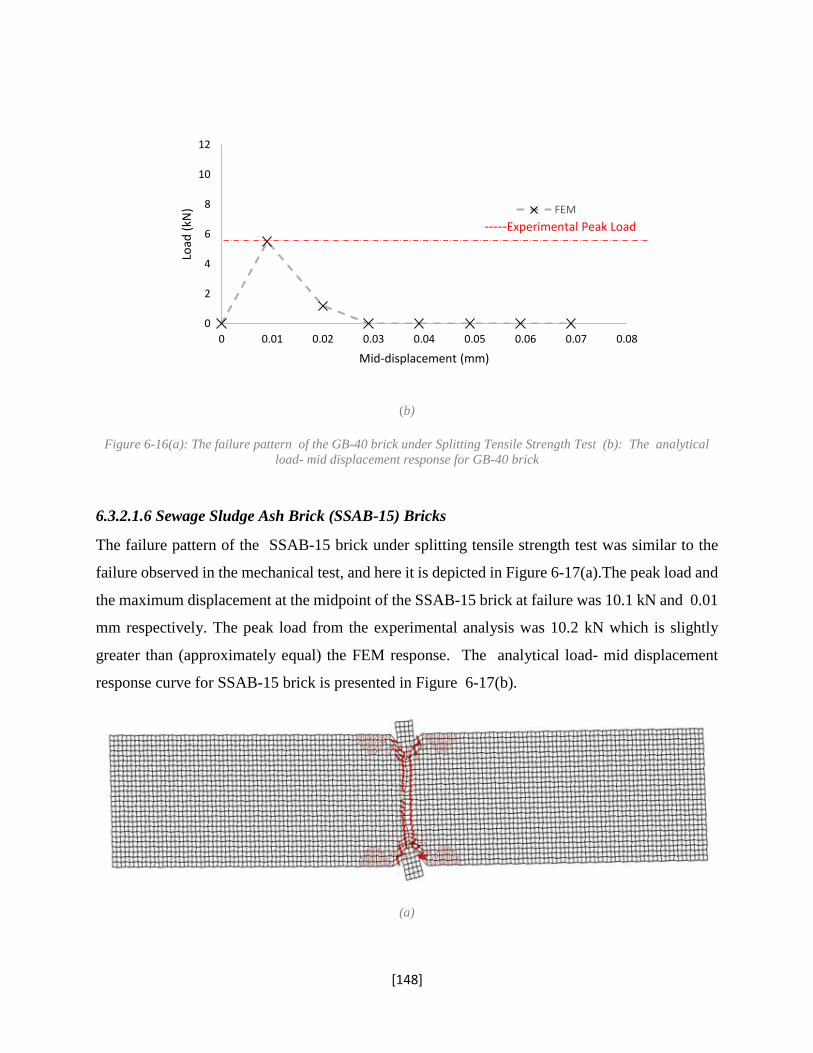
[148]
(b)
Figure 6-16(a): The failure pattern of the GB-40 brick under Splitting Tensile Strength Test (b): The analytical
load- mid displacement response for GB-40 brick
6.3.2.1.6 Sewage Sludge Ash Brick (SSAB-15) Bricks
The failure pattern of the SSAB-15 brick under splitting tensile strength test was similar to the
failure observed in the mechanical test, and here it is depicted in Figure 6-17(a).The peak load and
the maximum displacement at the midpoint of the SSAB-15 brick at failure was 10.1 kN and 0.01
mm respectively. The peak load from the experimental analysis was 10.2 kN which is slightly
greater than (approximately equal) the FEM response. The analytical load- mid displacement
response curve for SSAB-15 brick is presented in Figure 6-17(b).
(a)
0
2
4
6
8
10
12
0 0.01 0.02 0.03 0.04 0.05 0.06 0.07 0.08
Load
(kN
)
Mid-displacement (mm)
FEM
-----Experimental Peak Load
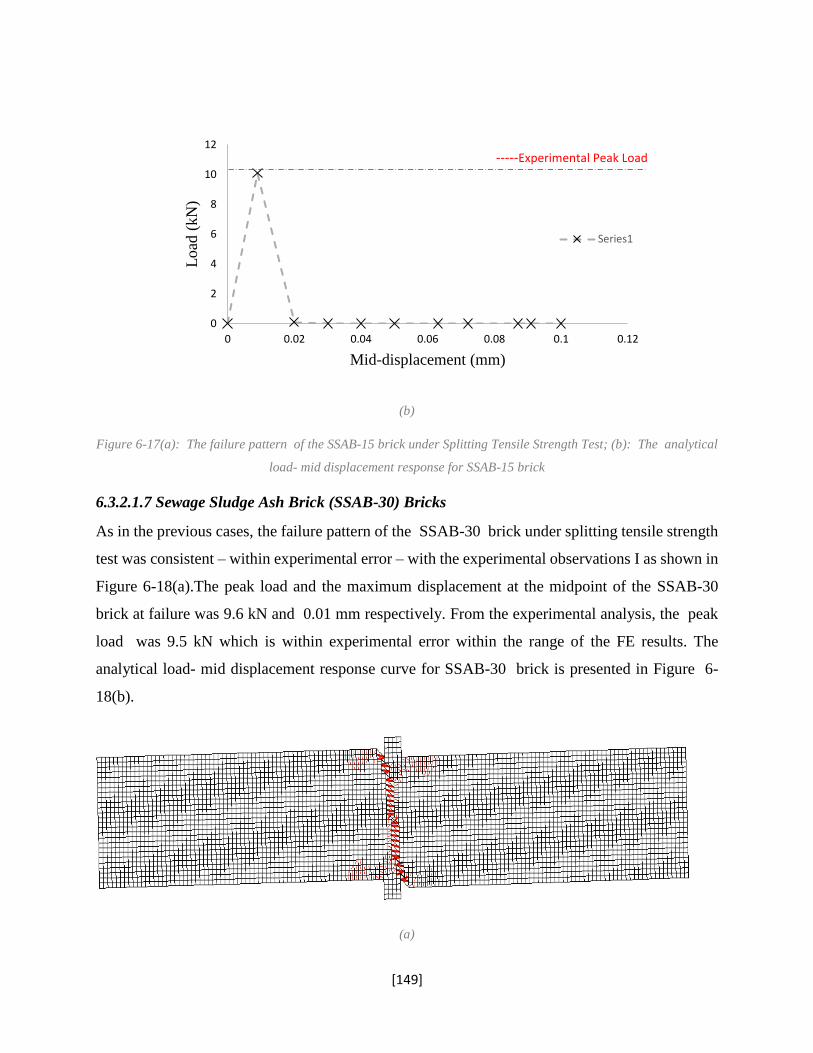
[149]
(b)
Figure 6-17(a): The failure pattern of the SSAB-15 brick under Splitting Tensile Strength Test; (b): The analytical
load- mid displacement response for SSAB-15 brick
6.3.2.1.7 Sewage Sludge Ash Brick (SSAB-30) Bricks
As in the previous cases, the failure pattern of the SSAB-30 brick under splitting tensile strength
test was consistent – within experimental error – with the experimental observations I as shown in
Figure 6-18(a).The peak load and the maximum displacement at the midpoint of the SSAB-30
brick at failure was 9.6 kN and 0.01 mm respectively. From the experimental analysis, the peak
load was 9.5 kN which is within experimental error within the range of the FE results. The
analytical load- mid displacement response curve for SSAB-30 brick is presented in Figure 6-
18(b).
(a)
0
2
4
6
8
10
12
0 0.02 0.04 0.06 0.08 0.1 0.12
Lo
ad (
kN
)
Mid-displacement (mm)
Series1
-----Experimental Peak Load
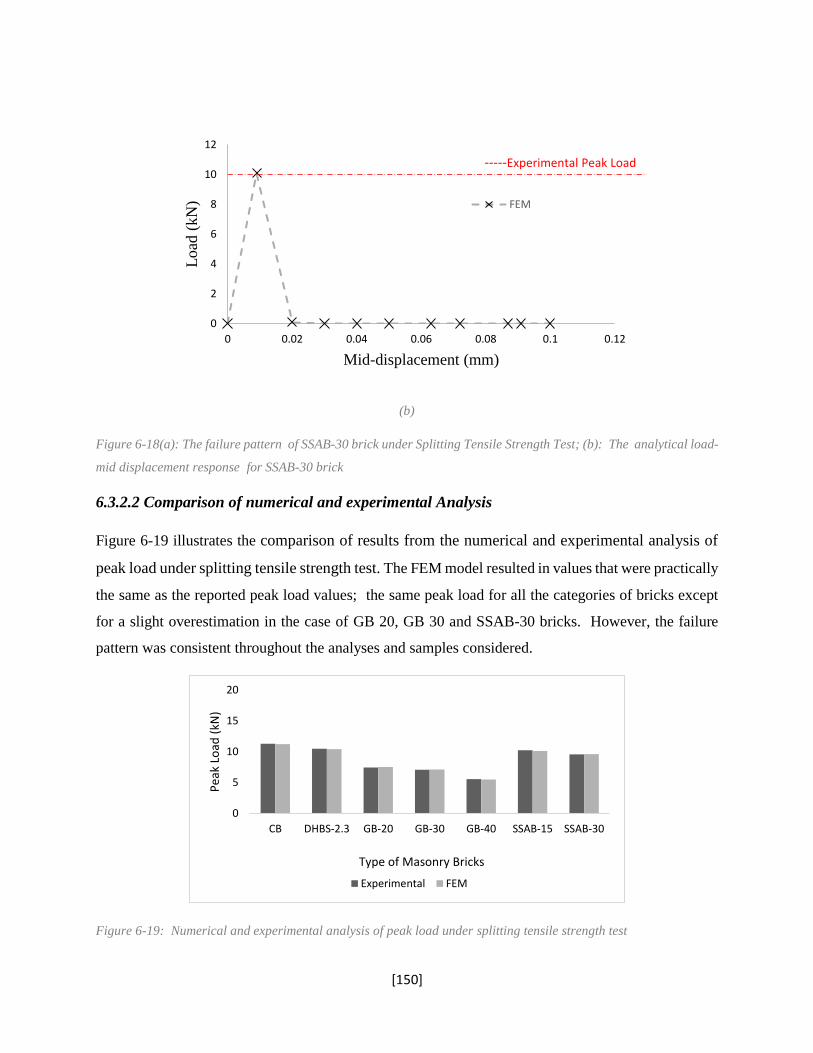
[150]
(b)
Figure 6-18(a): The failure pattern of SSAB-30 brick under Splitting Tensile Strength Test; (b): The analytical load-
mid displacement response for SSAB-30 brick
6.3.2.2 Comparison of numerical and experimental Analysis
Figure 6-19 illustrates the comparison of results from the numerical and experimental analysis of
peak load under splitting tensile strength test. The FEM model resulted in values that were practically
the same as the reported peak load values; the same peak load for all the categories of bricks except
for a slight overestimation in the case of GB 20, GB 30 and SSAB-30 bricks. However, the failure
pattern was consistent throughout the analyses and samples considered.
Figure 6-19: Numerical and experimental analysis of peak load under splitting tensile strength test
0
2
4
6
8
10
12
0 0.02 0.04 0.06 0.08 0.1 0.12
Lo
ad (
kN
)
Mid-displacement (mm)
FEM
-----Experimental Peak Load
0
5
10
15
20
CB DHBS-2.3 GB-20 GB-30 GB-40 SSAB-15 SSAB-30
Pea
k Lo
ad (
kN)
Type of Masonry Bricks
Experimental FEM
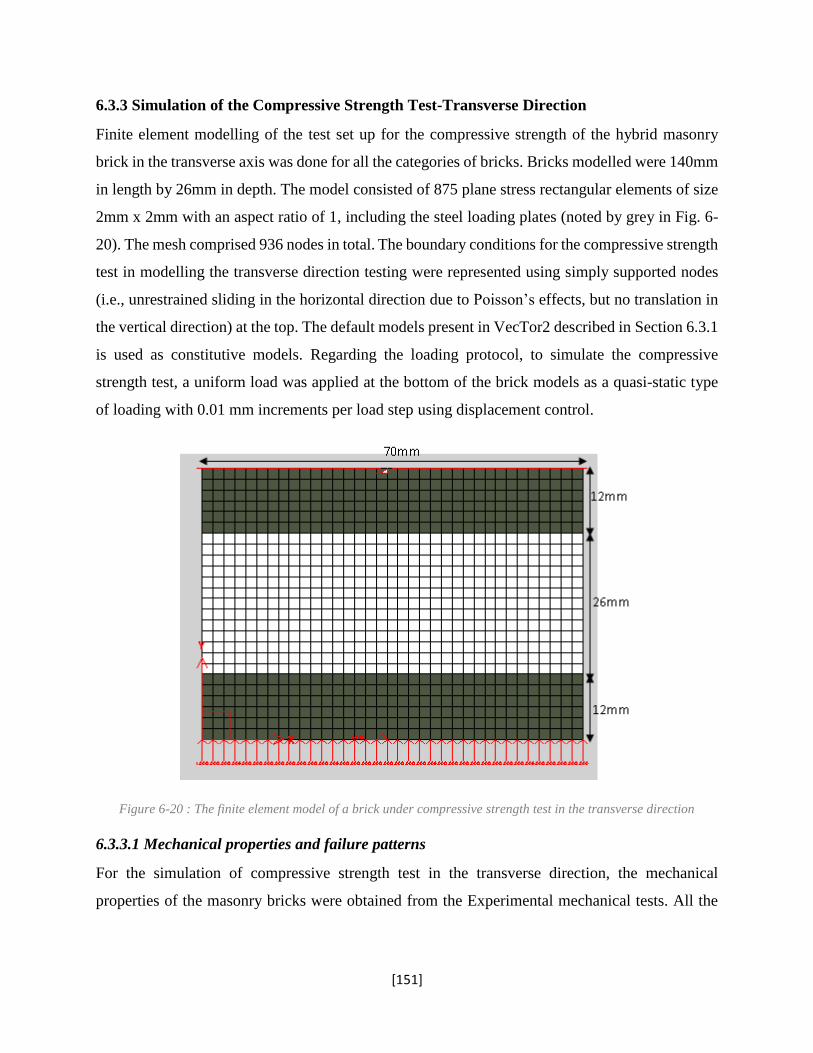
[151]
6.3.3 Simulation of the Compressive Strength Test-Transverse Direction
Finite element modelling of the test set up for the compressive strength of the hybrid masonry
brick in the transverse axis was done for all the categories of bricks. Bricks modelled were 140mm
in length by 26mm in depth. The model consisted of 875 plane stress rectangular elements of size
2mm x 2mm with an aspect ratio of 1, including the steel loading plates (noted by grey in Fig. 6-
20). The mesh comprised 936 nodes in total. The boundary conditions for the compressive strength
test in modelling the transverse direction testing were represented using simply supported nodes
(i.e., unrestrained sliding in the horizontal direction due to Poisson’s effects, but no translation in
the vertical direction) at the top. The default models present in VecTor2 described in Section 6.3.1
is used as constitutive models. Regarding the loading protocol, to simulate the compressive
strength test, a uniform load was applied at the bottom of the brick models as a quasi-static type
of loading with 0.01 mm increments per load step using displacement control.
Figure 6-20 : The finite element model of a brick under compressive strength test in the transverse direction
6.3.3.1 Mechanical properties and failure patterns
For the simulation of compressive strength test in the transverse direction, the mechanical
properties of the masonry bricks were obtained from the Experimental mechanical tests. All the
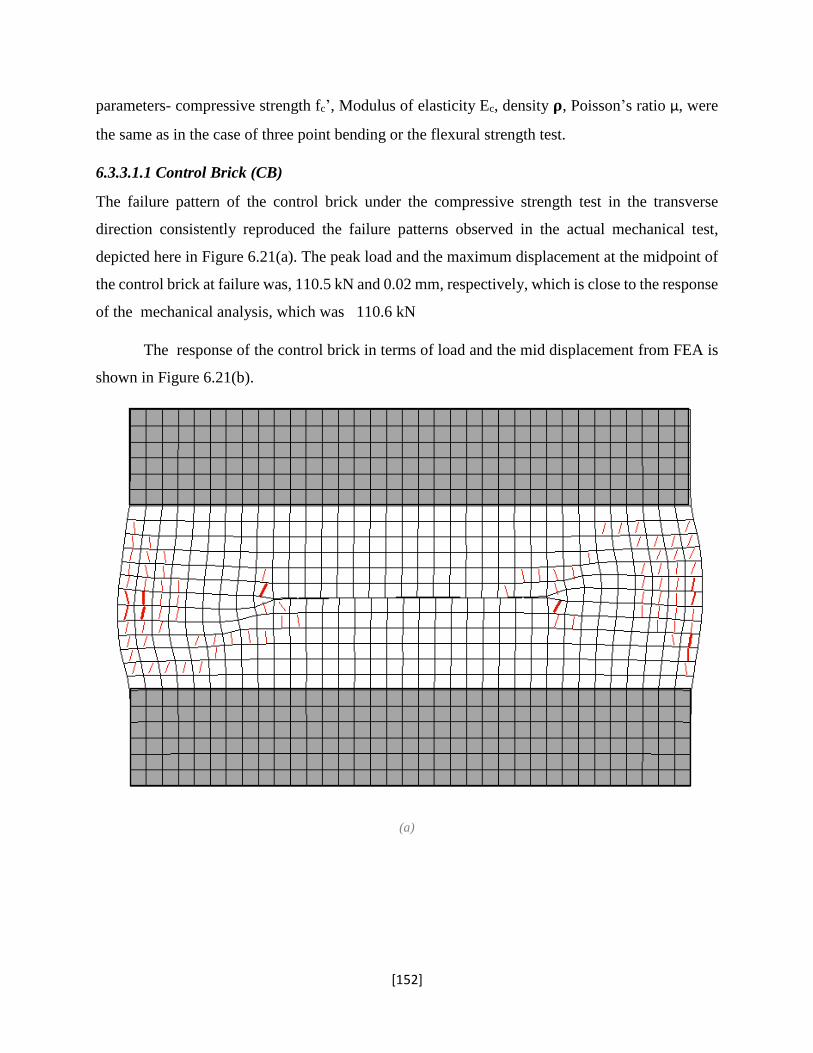
[152]
parameters- compressive strength fc’, Modulus of elasticity Ec, density 𝛒, Poisson’s ratio μ, were
the same as in the case of three point bending or the flexural strength test.
6.3.3.1.1 Control Brick (CB)
The failure pattern of the control brick under the compressive strength test in the transverse
direction consistently reproduced the failure patterns observed in the actual mechanical test,
depicted here in Figure 6.21(a). The peak load and the maximum displacement at the midpoint of
the control brick at failure was, 110.5 kN and 0.02 mm, respectively, which is close to the response
of the mechanical analysis, which was 110.6 kN
The response of the control brick in terms of load and the mid displacement from FEA is
shown in Figure 6.21(b).
(a)
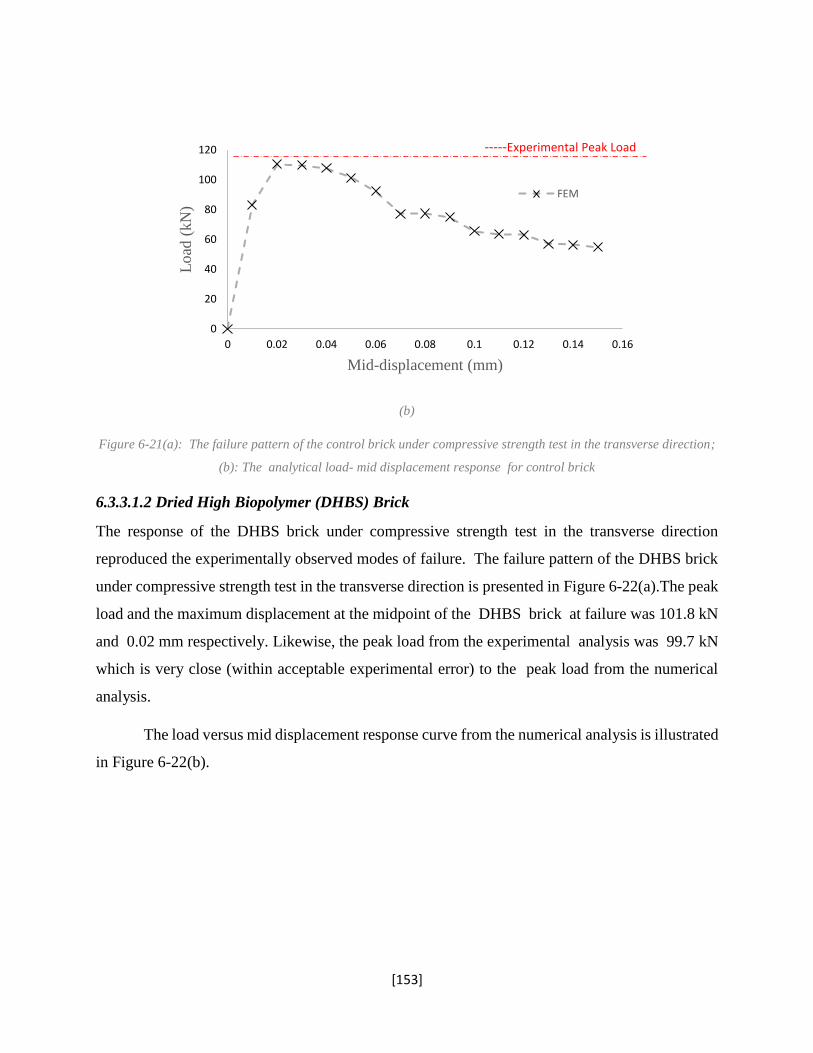
[153]
(b)
Figure 6-21(a): The failure pattern of the control brick under compressive strength test in the transverse direction;
(b): The analytical load- mid displacement response for control brick
6.3.3.1.2 Dried High Biopolymer (DHBS) Brick
The response of the DHBS brick under compressive strength test in the transverse direction
reproduced the experimentally observed modes of failure. The failure pattern of the DHBS brick
under compressive strength test in the transverse direction is presented in Figure 6-22(a).The peak
load and the maximum displacement at the midpoint of the DHBS brick at failure was 101.8 kN
and 0.02 mm respectively. Likewise, the peak load from the experimental analysis was 99.7 kN
which is very close (within acceptable experimental error) to the peak load from the numerical
analysis.
The load versus mid displacement response curve from the numerical analysis is illustrated
in Figure 6-22(b).
0
20
40
60
80
100
120
0 0.02 0.04 0.06 0.08 0.1 0.12 0.14 0.16
Load
(kN
)
Mid-displacement (mm)
FEM
-----Experimental Peak Load
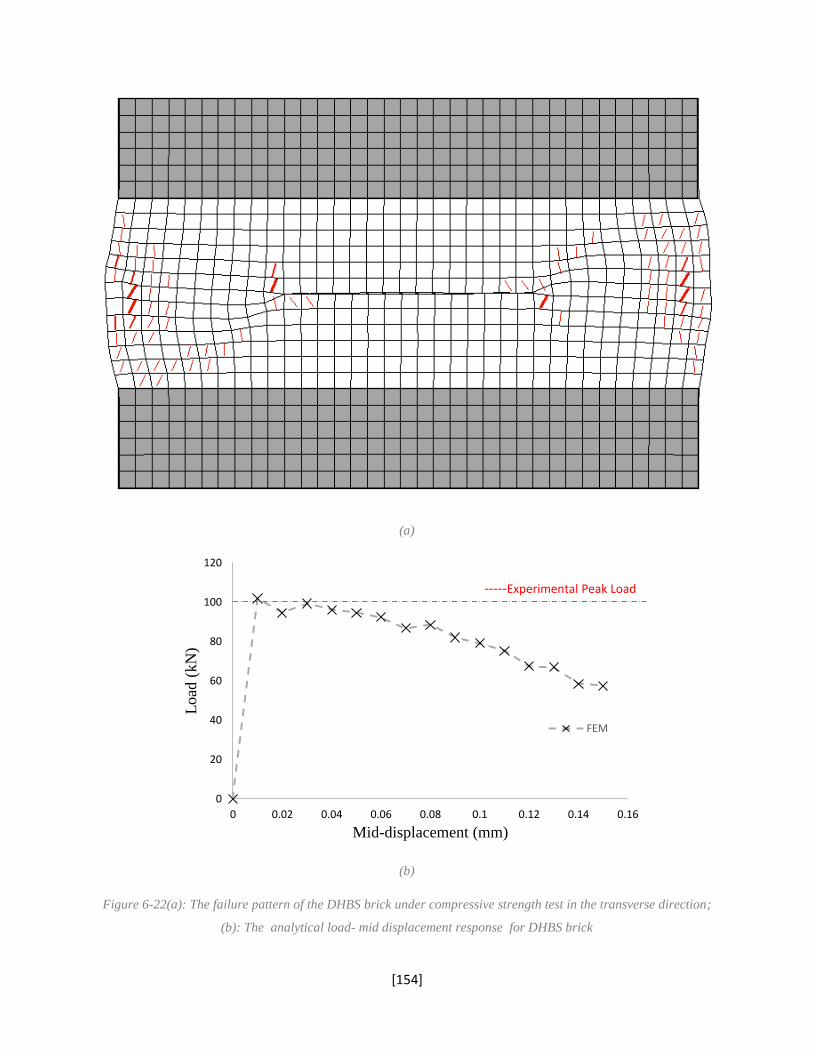
[154]
(a)
(b)
Figure 6-22(a): The failure pattern of the DHBS brick under compressive strength test in the transverse direction;
(b): The analytical load- mid displacement response for DHBS brick
0
20
40
60
80
100
120
0 0.02 0.04 0.06 0.08 0.1 0.12 0.14 0.16
Load
(kN
)
Mid-displacement (mm)
FEM
-----Experimental Peak Load
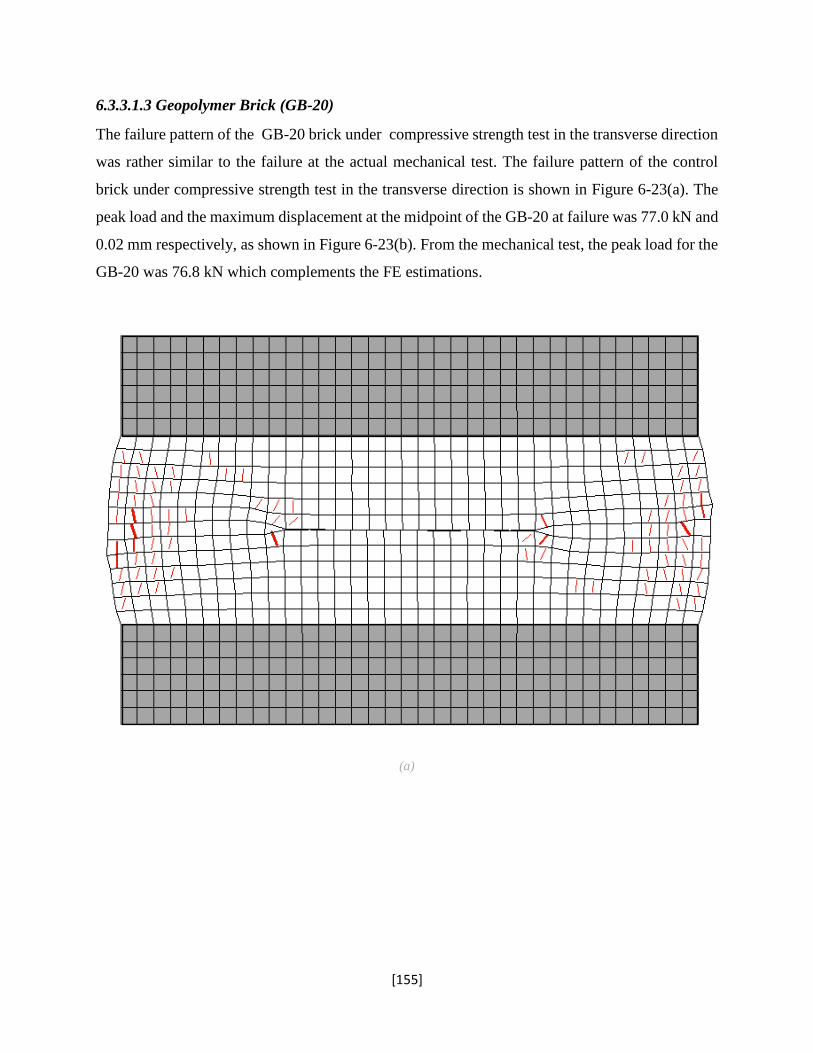
[155]
6.3.3.1.3 Geopolymer Brick (GB-20)
The failure pattern of the GB-20 brick under compressive strength test in the transverse direction
was rather similar to the failure at the actual mechanical test. The failure pattern of the control
brick under compressive strength test in the transverse direction is shown in Figure 6-23(a). The
peak load and the maximum displacement at the midpoint of the GB-20 at failure was 77.0 kN and
0.02 mm respectively, as shown in Figure 6-23(b). From the mechanical test, the peak load for the
GB-20 was 76.8 kN which complements the FE estimations.
(a)
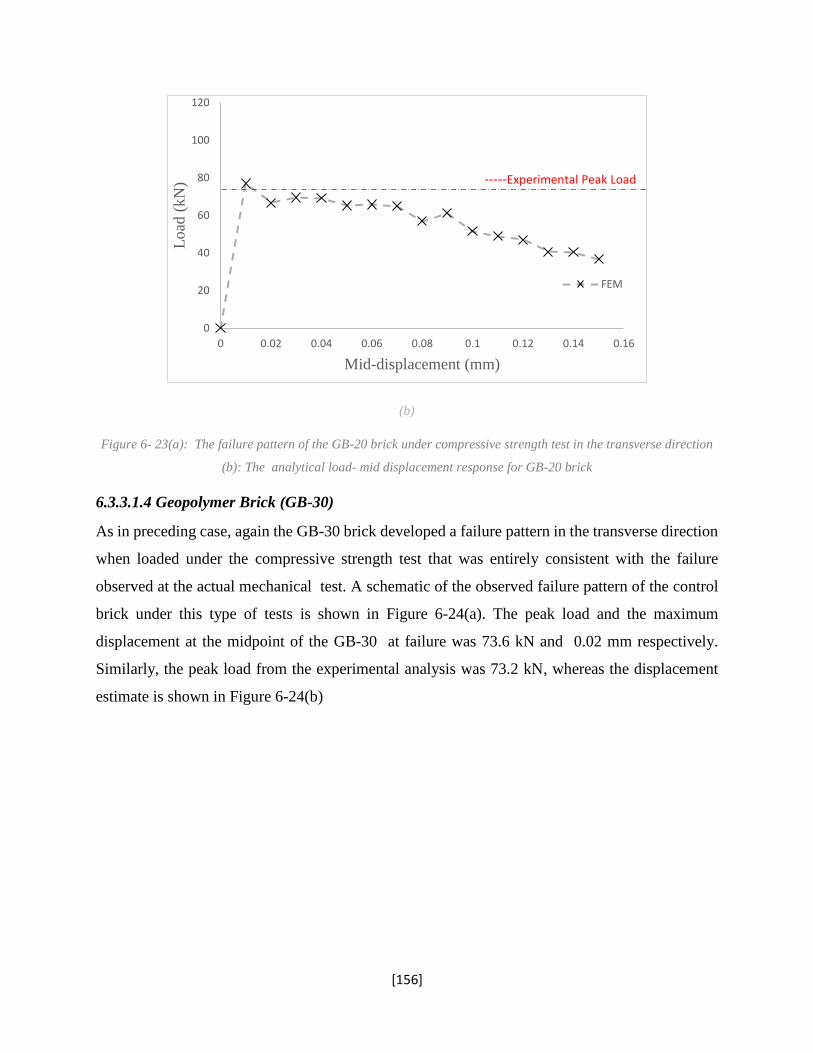
[156]
(b)
Figure 6- 23(a): The failure pattern of the GB-20 brick under compressive strength test in the transverse direction
(b): The analytical load- mid displacement response for GB-20 brick
6.3.3.1.4 Geopolymer Brick (GB-30)
As in preceding case, again the GB-30 brick developed a failure pattern in the transverse direction
when loaded under the compressive strength test that was entirely consistent with the failure
observed at the actual mechanical test. A schematic of the observed failure pattern of the control
brick under this type of tests is shown in Figure 6-24(a). The peak load and the maximum
displacement at the midpoint of the GB-30 at failure was 73.6 kN and 0.02 mm respectively.
Similarly, the peak load from the experimental analysis was 73.2 kN, whereas the displacement
estimate is shown in Figure 6-24(b)
0
20
40
60
80
100
120
0 0.02 0.04 0.06 0.08 0.1 0.12 0.14 0.16
Load
(kN
)
Mid-displacement (mm)
FEM
-----Experimental Peak Load
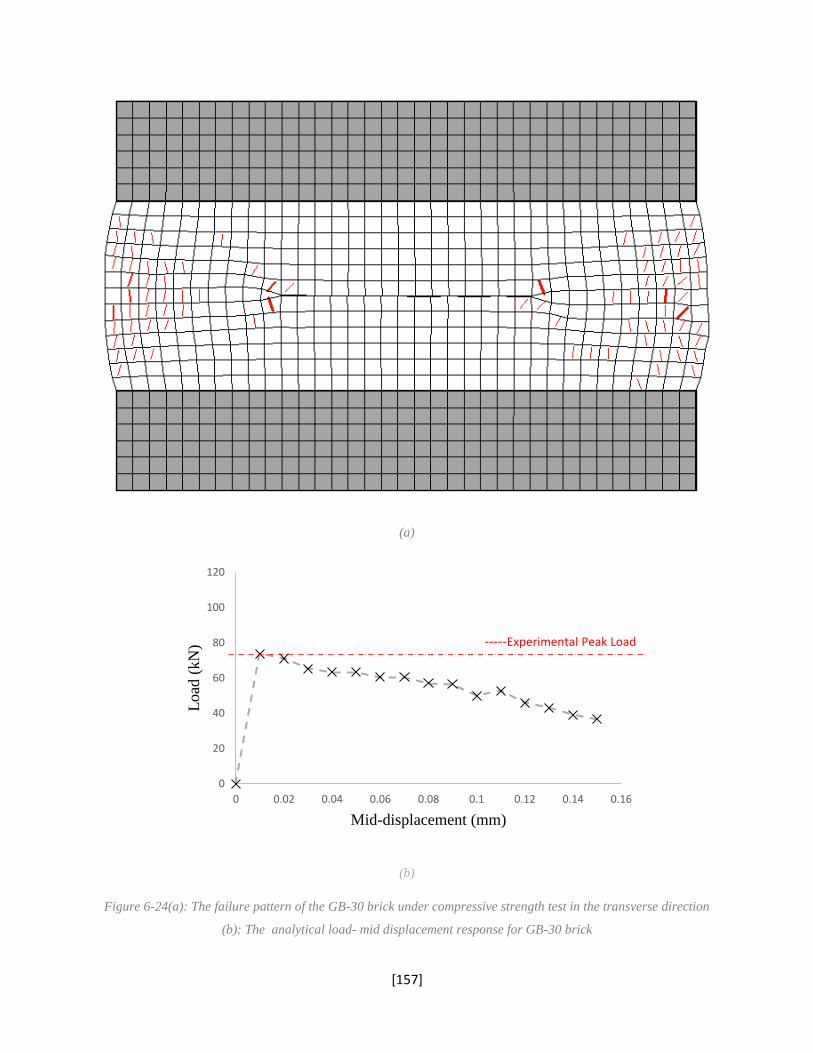
[157]
(a)
(b)
Figure 6-24(a): The failure pattern of the GB-30 brick under compressive strength test in the transverse direction
(b): The analytical load- mid displacement response for GB-30 brick
0
20
40
60
80
100
120
0 0.02 0.04 0.06 0.08 0.1 0.12 0.14 0.16
Load
(kN
)
Mid-displacement (mm)
-----Experimental Peak Load

[158]
6.3.3.1.5 Geopolymer Brick (GB-40)
The response of the GB-40 brick under compressive strength test in the transverse direction was
similar to the response at the actual mechanical test. The failure pattern of the control brick under
the compressive test in the transverse direction is shown in Figure 6-25(a). The peak load and the
maximum displacement at the midpoint of the GB-40 at failure was 62.7 kN and 0.02 mm
respectively. Figure 6-25(b) shows the load -mid displacement curve from the FE analysis. The
response from the FE analysis was consistent with the experimental response where the peak load
was 61.9 kN, within acceptable experimental tolerance.
(a)
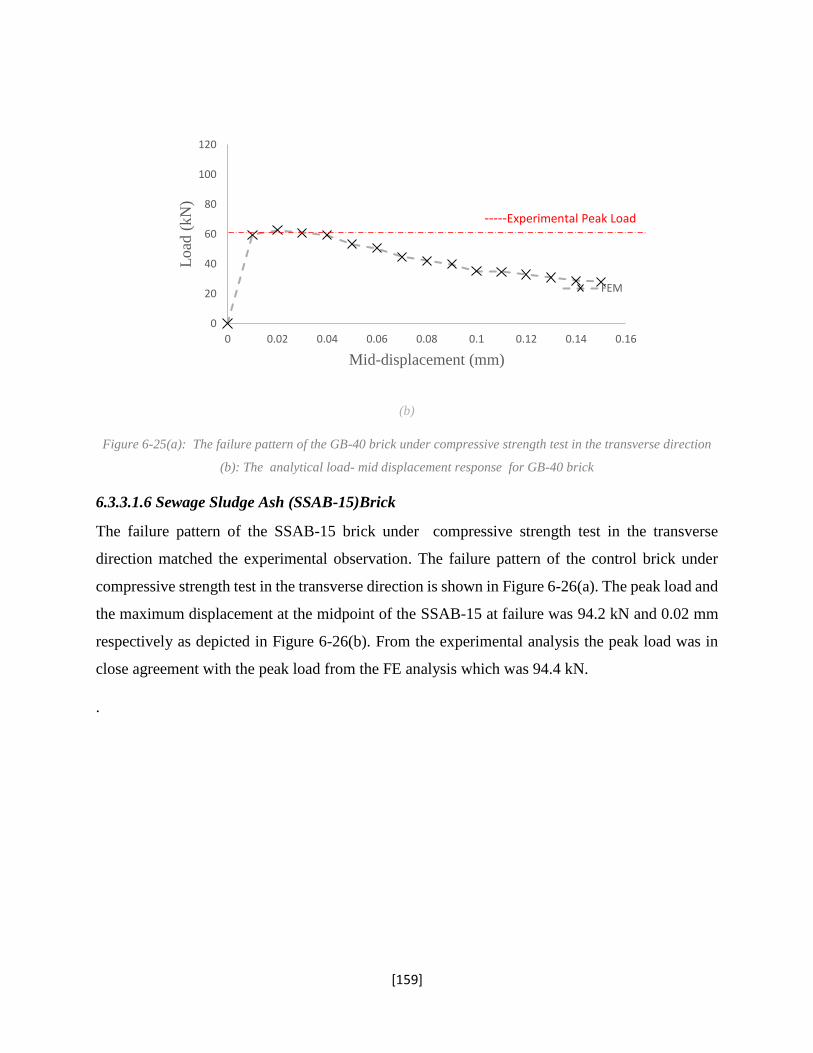
[159]
(b)
Figure 6-25(a): The failure pattern of the GB-40 brick under compressive strength test in the transverse direction
(b): The analytical load- mid displacement response for GB-40 brick
6.3.3.1.6 Sewage Sludge Ash (SSAB-15)Brick
The failure pattern of the SSAB-15 brick under compressive strength test in the transverse
direction matched the experimental observation. The failure pattern of the control brick under
compressive strength test in the transverse direction is shown in Figure 6-26(a). The peak load and
the maximum displacement at the midpoint of the SSAB-15 at failure was 94.2 kN and 0.02 mm
respectively as depicted in Figure 6-26(b). From the experimental analysis the peak load was in
close agreement with the peak load from the FE analysis which was 94.4 kN.
.
0
20
40
60
80
100
120
0 0.02 0.04 0.06 0.08 0.1 0.12 0.14 0.16
Lo
ad (
kN
)
Mid-displacement (mm)
FEM
-----Experimental Peak Load
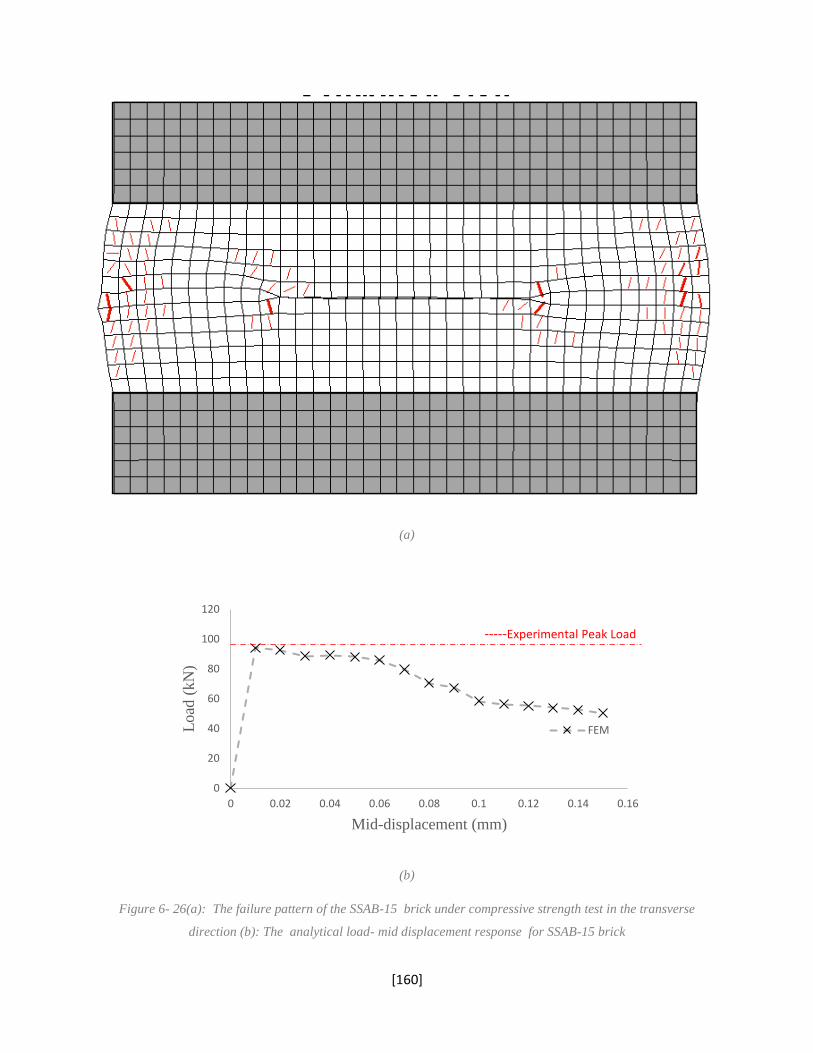
[160]
(a)
(b)
Figure 6- 26(a): The failure pattern of the SSAB-15 brick under compressive strength test in the transverse
direction (b): The analytical load- mid displacement response for SSAB-15 brick
0
20
40
60
80
100
120
0 0.02 0.04 0.06 0.08 0.1 0.12 0.14 0.16
Load
(kN
)
Mid-displacement (mm)
FEM
-----Experimental Peak Load
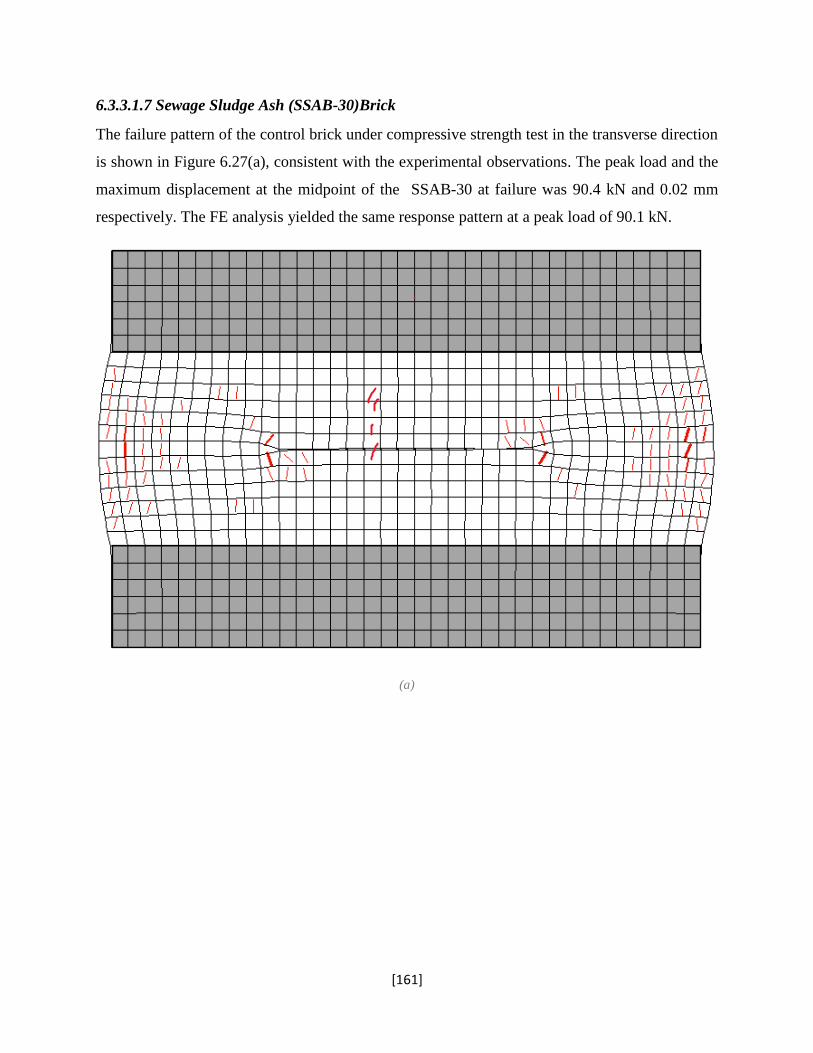
[161]
6.3.3.1.7 Sewage Sludge Ash (SSAB-30)Brick
The failure pattern of the control brick under compressive strength test in the transverse direction
is shown in Figure 6.27(a), consistent with the experimental observations. The peak load and the
maximum displacement at the midpoint of the SSAB-30 at failure was 90.4 kN and 0.02 mm
respectively. The FE analysis yielded the same response pattern at a peak load of 90.1 kN.
(a)
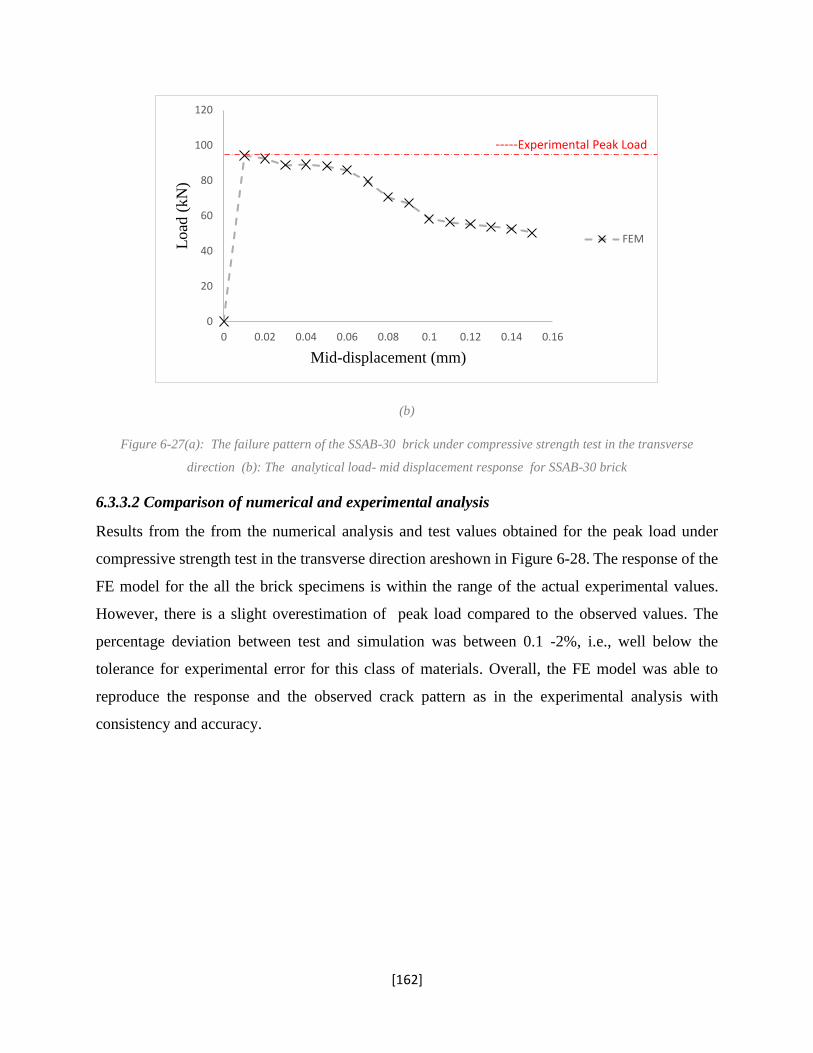
[162]
(b)
Figure 6-27(a): The failure pattern of the SSAB-30 brick under compressive strength test in the transverse
direction (b): The analytical load- mid displacement response for SSAB-30 brick
6.3.3.2 Comparison of numerical and experimental analysis
Results from the from the numerical analysis and test values obtained for the peak load under
compressive strength test in the transverse direction areshown in Figure 6-28. The response of the
FE model for the all the brick specimens is within the range of the actual experimental values.
However, there is a slight overestimation of peak load compared to the observed values. The
percentage deviation between test and simulation was between 0.1 -2%, i.e., well below the
tolerance for experimental error for this class of materials. Overall, the FE model was able to
reproduce the response and the observed crack pattern as in the experimental analysis with
consistency and accuracy.
0
20
40
60
80
100
120
0 0.02 0.04 0.06 0.08 0.1 0.12 0.14 0.16
Load
(kN
)
Mid-displacement (mm)
FEM
-----Experimental Peak Load
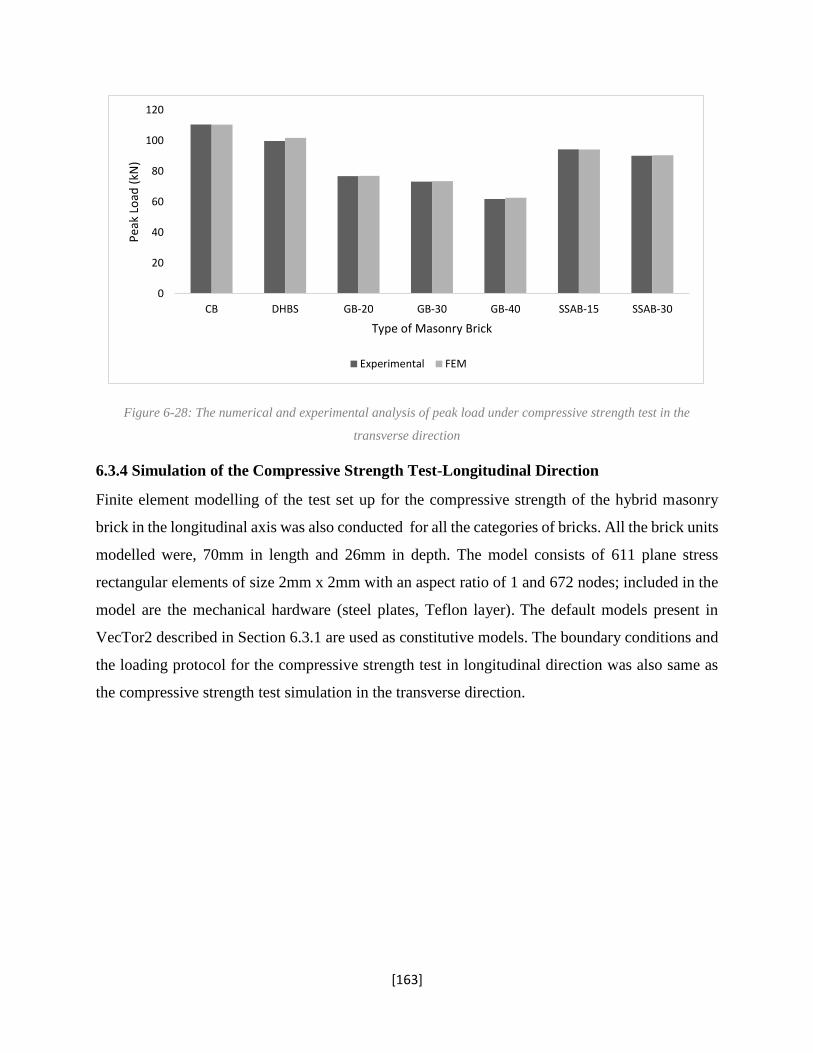
[163]
Figure 6-28: The numerical and experimental analysis of peak load under compressive strength test in the
transverse direction
6.3.4 Simulation of the Compressive Strength Test-Longitudinal Direction
Finite element modelling of the test set up for the compressive strength of the hybrid masonry
brick in the longitudinal axis was also conducted for all the categories of bricks. All the brick units
modelled were, 70mm in length and 26mm in depth. The model consists of 611 plane stress
rectangular elements of size 2mm x 2mm with an aspect ratio of 1 and 672 nodes; included in the
model are the mechanical hardware (steel plates, Teflon layer). The default models present in
VecTor2 described in Section 6.3.1 are used as constitutive models. The boundary conditions and
the loading protocol for the compressive strength test in longitudinal direction was also same as
the compressive strength test simulation in the transverse direction.
0
20
40
60
80
100
120
CB DHBS GB-20 GB-30 GB-40 SSAB-15 SSAB-30
Pea
k Lo
ad (
kN)
Type of Masonry Brick
Experimental FEM
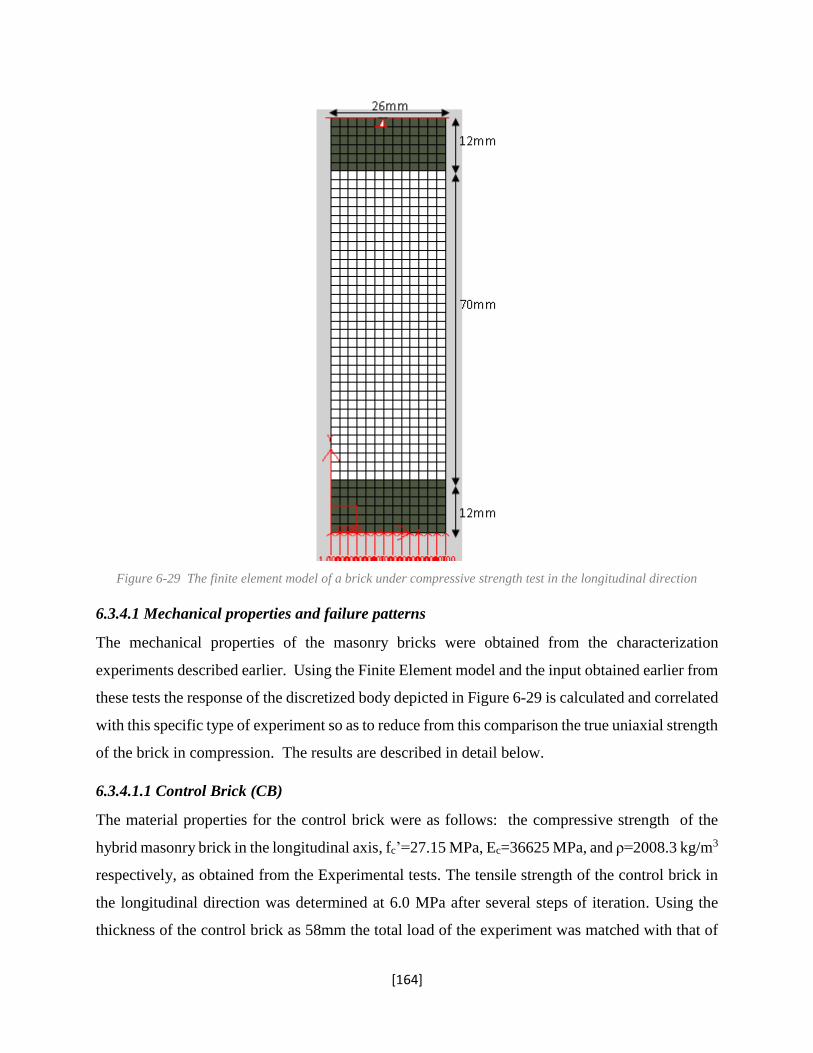
[164]
Figure 6-29 The finite element model of a brick under compressive strength test in the longitudinal direction
6.3.4.1 Mechanical properties and failure patterns
The mechanical properties of the masonry bricks were obtained from the characterization
experiments described earlier. Using the Finite Element model and the input obtained earlier from
these tests the response of the discretized body depicted in Figure 6-29 is calculated and correlated
with this specific type of experiment so as to reduce from this comparison the true uniaxial strength
of the brick in compression. The results are described in detail below.
6.3.4.1.1 Control Brick (CB)
The material properties for the control brick were as follows: the compressive strength of the
hybrid masonry brick in the longitudinal axis, fc’=27.15 MPa, Ec=36625 MPa, and ρ=2008.3 kg/m3
respectively, as obtained from the Experimental tests. The tensile strength of the control brick in
the longitudinal direction was determined at 6.0 MPa after several steps of iteration. Using the
thickness of the control brick as 58mm the total load of the experiment was matched with that of
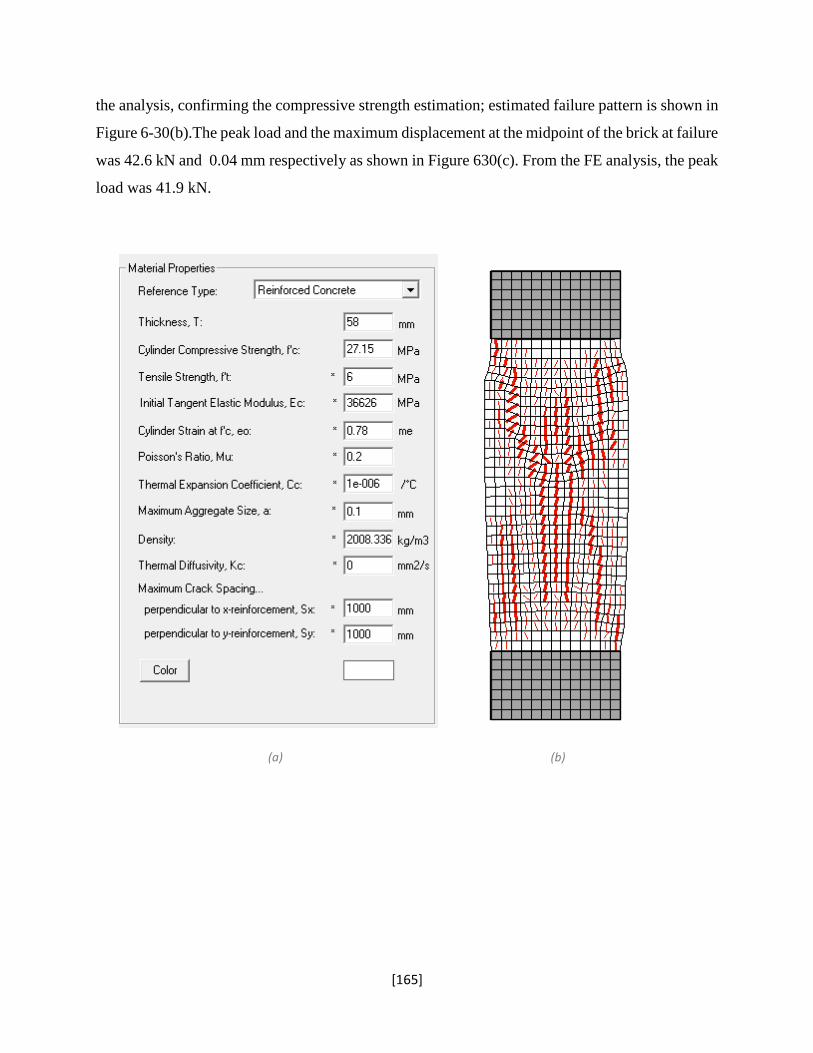
[165]
the analysis, confirming the compressive strength estimation; estimated failure pattern is shown in
Figure 6-30(b).The peak load and the maximum displacement at the midpoint of the brick at failure
was 42.6 kN and 0.04 mm respectively as shown in Figure 630(c). From the FE analysis, the peak
load was 41.9 kN.
(a) (b)
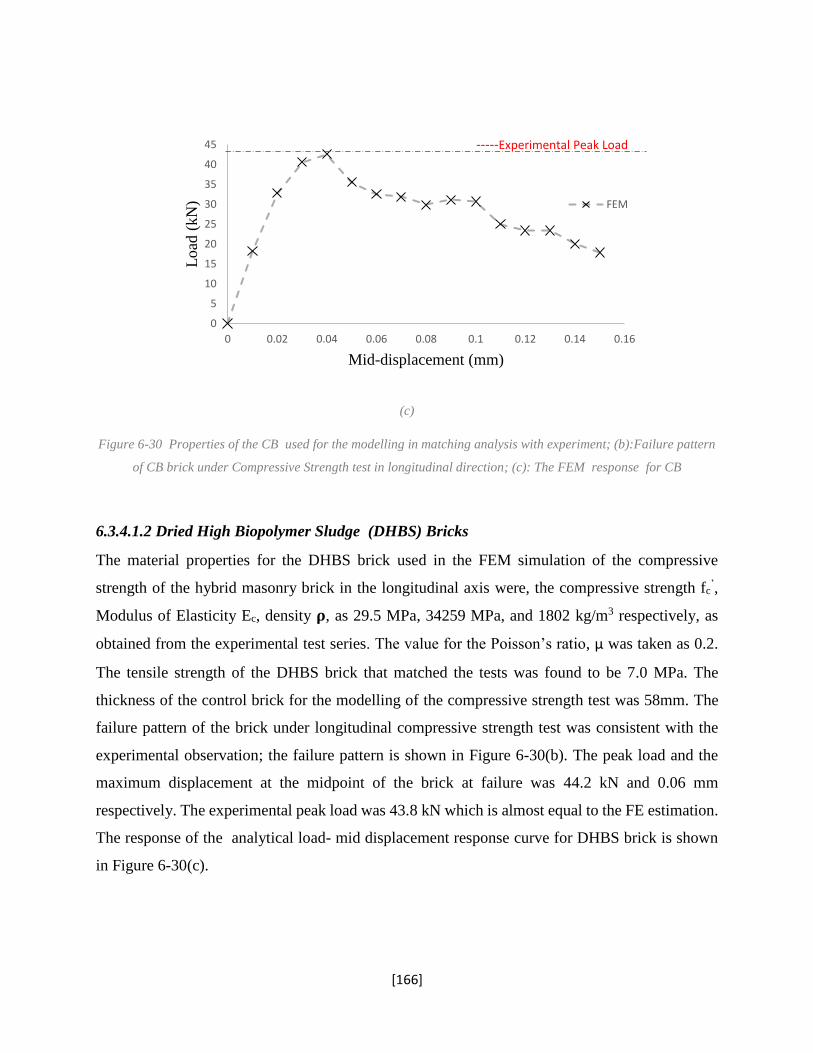
[166]
(c)
Figure 6-30 Properties of the CB used for the modelling in matching analysis with experiment; (b):Failure pattern
of CB brick under Compressive Strength test in longitudinal direction; (c): The FEM response for CB
6.3.4.1.2 Dried High Biopolymer Sludge (DHBS) Bricks
The material properties for the DHBS brick used in the FEM simulation of the compressive
strength of the hybrid masonry brick in the longitudinal axis were, the compressive strength fc’,
Modulus of Elasticity Ec, density 𝛒, as 29.5 MPa, 34259 MPa, and 1802 kg/m3 respectively, as
obtained from the experimental test series. The value for the Poisson’s ratio, μ was taken as 0.2.
The tensile strength of the DHBS brick that matched the tests was found to be 7.0 MPa. The
thickness of the control brick for the modelling of the compressive strength test was 58mm. The
failure pattern of the brick under longitudinal compressive strength test was consistent with the
experimental observation; the failure pattern is shown in Figure 6-30(b). The peak load and the
maximum displacement at the midpoint of the brick at failure was 44.2 kN and 0.06 mm
respectively. The experimental peak load was 43.8 kN which is almost equal to the FE estimation.
The response of the analytical load- mid displacement response curve for DHBS brick is shown
in Figure 6-30(c).
0
5
10
15
20
25
30
35
40
45
0 0.02 0.04 0.06 0.08 0.1 0.12 0.14 0.16
Lo
ad (
kN
)
Mid-displacement (mm)
FEM
-----Experimental Peak Load
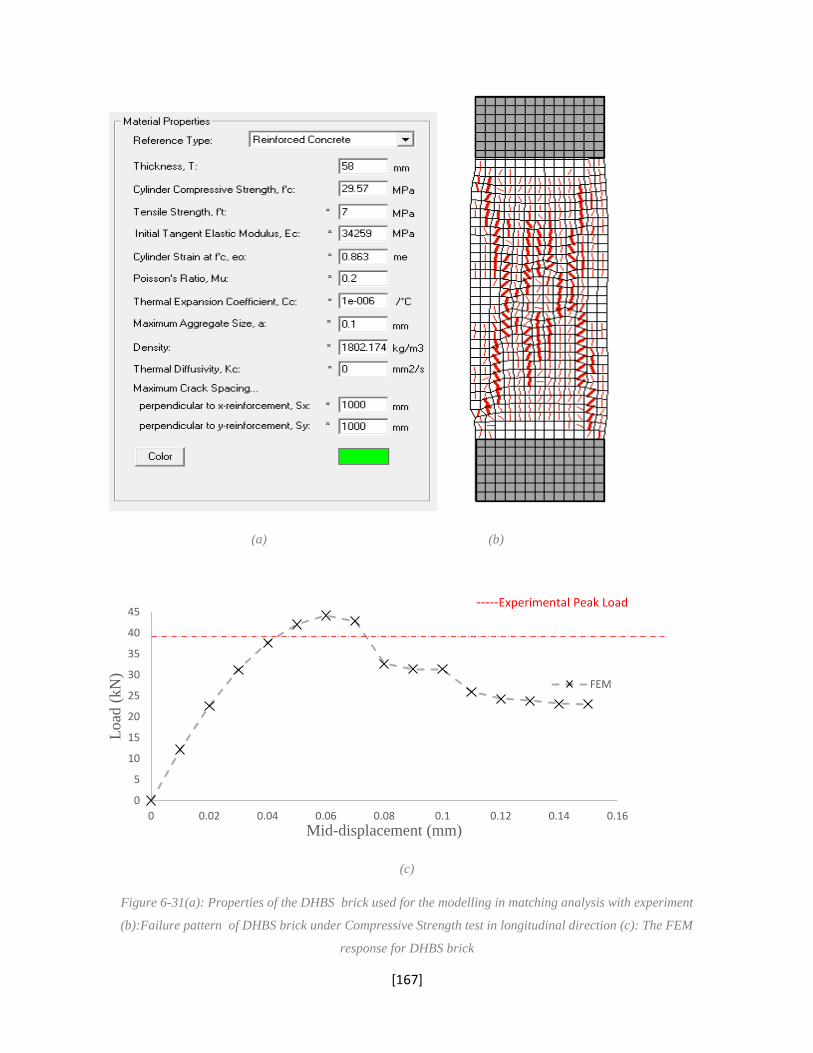
[167]
(a) (b)
(c)
Figure 6-31(a): Properties of the DHBS brick used for the modelling in matching analysis with experiment
(b):Failure pattern of DHBS brick under Compressive Strength test in longitudinal direction (c): The FEM
response for DHBS brick
0
5
10
15
20
25
30
35
40
45
0 0.02 0.04 0.06 0.08 0.1 0.12 0.14 0.16
Load
(kN
)
Mid-displacement (mm)
FEM
-----Experimental Peak Load
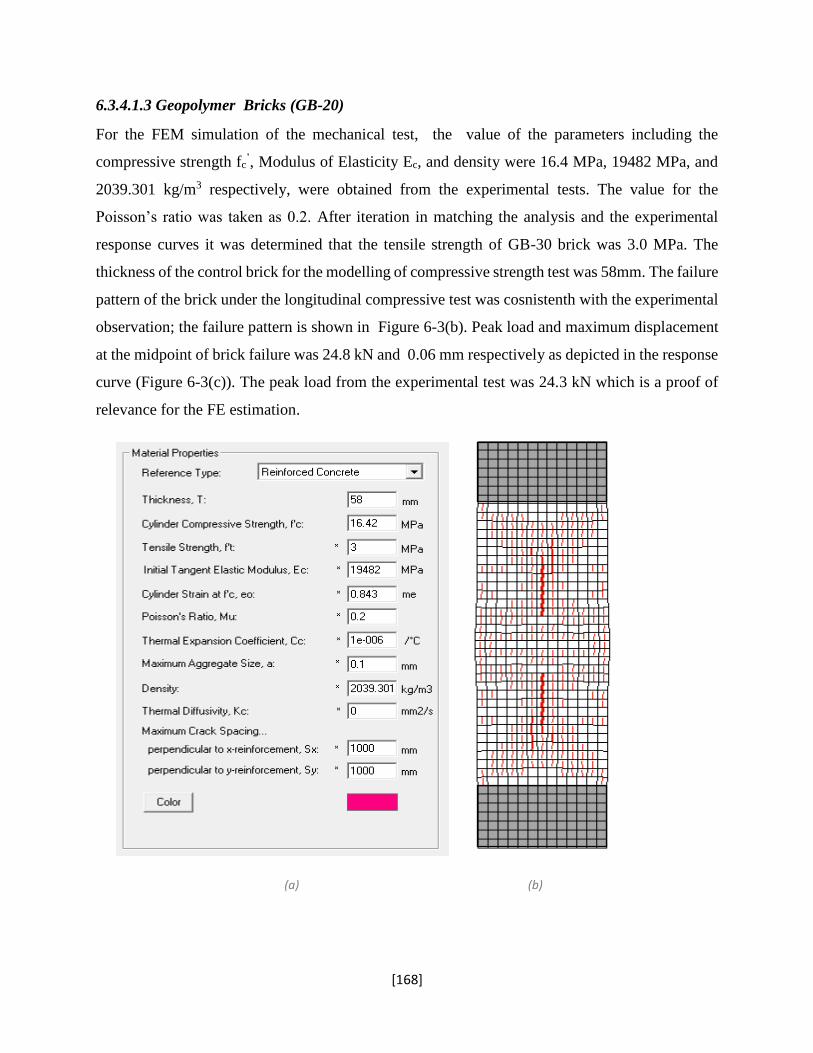
[168]
6.3.4.1.3 Geopolymer Bricks (GB-20)
For the FEM simulation of the mechanical test, the value of the parameters including the
compressive strength fc’, Modulus of Elasticity Ec, and density were 16.4 MPa, 19482 MPa, and
2039.301 kg/m3 respectively, were obtained from the experimental tests. The value for the
Poisson’s ratio was taken as 0.2. After iteration in matching the analysis and the experimental
response curves it was determined that the tensile strength of GB-30 brick was 3.0 MPa. The
thickness of the control brick for the modelling of compressive strength test was 58mm. The failure
pattern of the brick under the longitudinal compressive test was cosnistenth with the experimental
observation; the failure pattern is shown in Figure 6-3(b). Peak load and maximum displacement
at the midpoint of brick failure was 24.8 kN and 0.06 mm respectively as depicted in the response
curve (Figure 6-3(c)). The peak load from the experimental test was 24.3 kN which is a proof of
relevance for the FE estimation.
(a) (b)
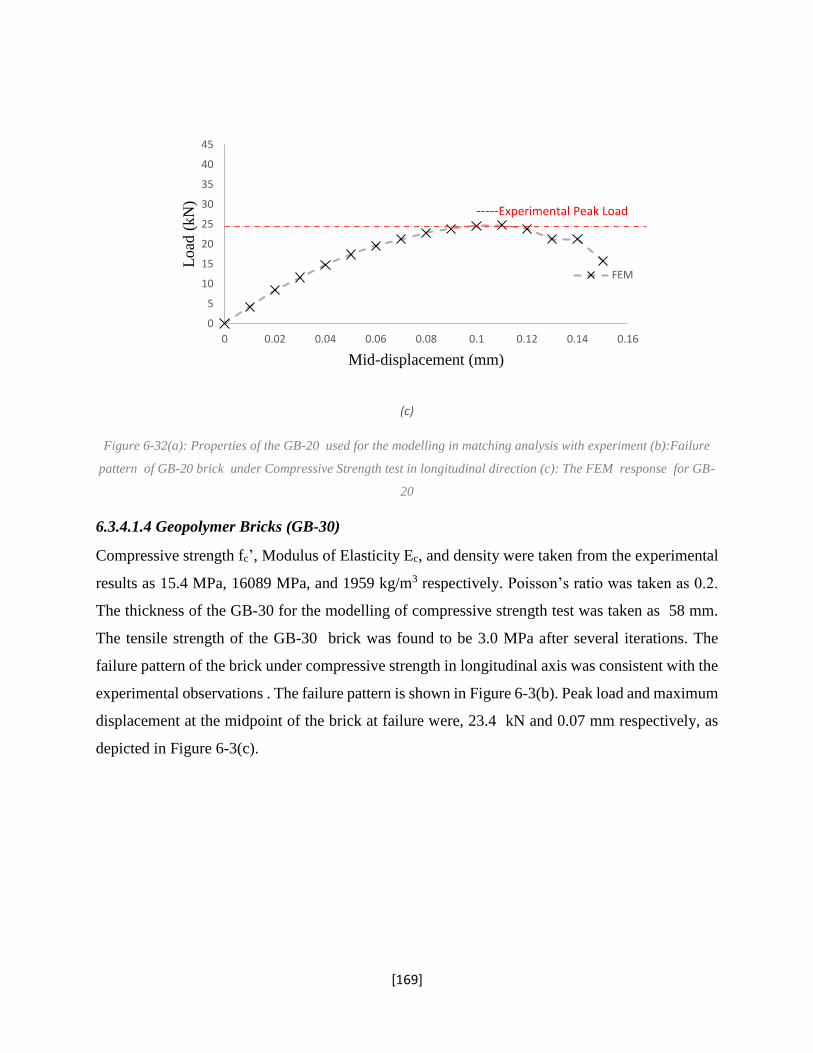
[169]
(c)
Figure 6-32(a): Properties of the GB-20 used for the modelling in matching analysis with experiment (b):Failure
pattern of GB-20 brick under Compressive Strength test in longitudinal direction (c): The FEM response for GB-
20
6.3.4.1.4 Geopolymer Bricks (GB-30)
Compressive strength fc’, Modulus of Elasticity Ec, and density were taken from the experimental
results as 15.4 MPa, 16089 MPa, and 1959 kg/m3 respectively. Poisson’s ratio was taken as 0.2.
The thickness of the GB-30 for the modelling of compressive strength test was taken as 58 mm.
The tensile strength of the GB-30 brick was found to be 3.0 MPa after several iterations. The
failure pattern of the brick under compressive strength in longitudinal axis was consistent with the
experimental observations . The failure pattern is shown in Figure 6-3(b). Peak load and maximum
displacement at the midpoint of the brick at failure were, 23.4 kN and 0.07 mm respectively, as
depicted in Figure 6-3(c).
0
5
10
15
20
25
30
35
40
45
0 0.02 0.04 0.06 0.08 0.1 0.12 0.14 0.16
Lo
ad (
kN
)
Mid-displacement (mm)
FEM
-----Experimental Peak Load
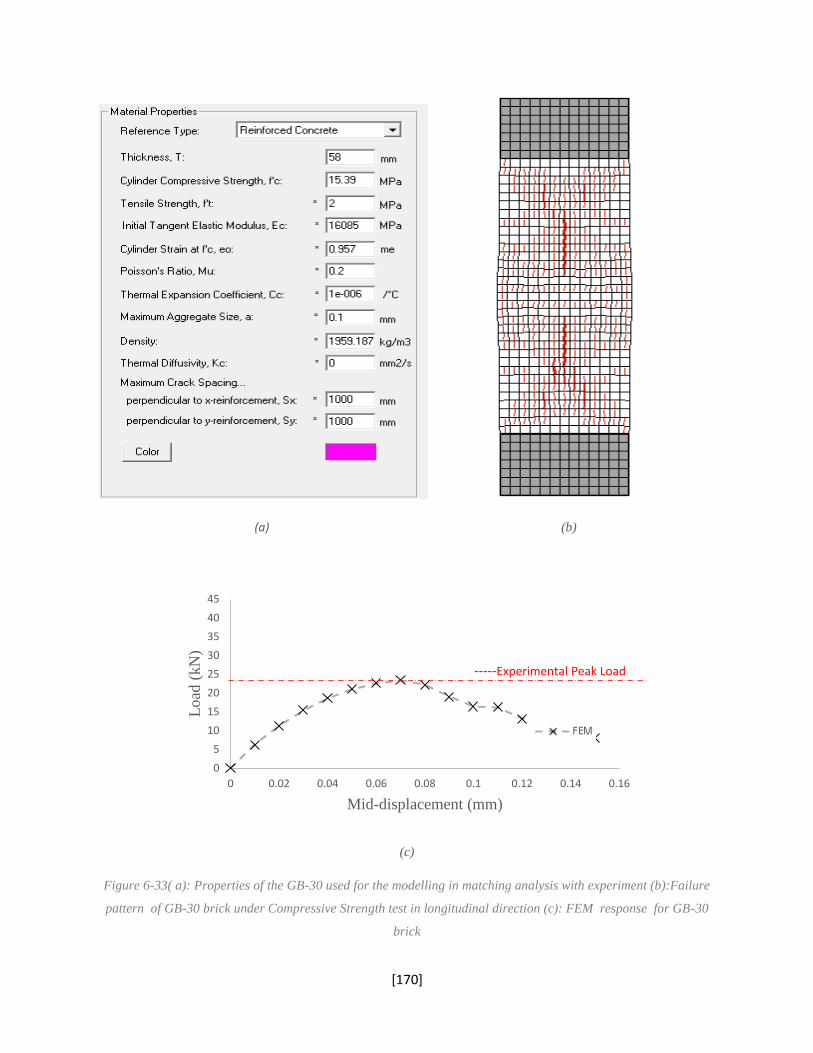
[170]
(a) (b)
(c)
Figure 6-33( a): Properties of the GB-30 used for the modelling in matching analysis with experiment (b):Failure
pattern of GB-30 brick under Compressive Strength test in longitudinal direction (c): FEM response for GB-30
brick
0
5
10
15
20
25
30
35
40
45
0 0.02 0.04 0.06 0.08 0.1 0.12 0.14 0.16
Load
(kN
)
Mid-displacement (mm)
-----Experimental Peak Load
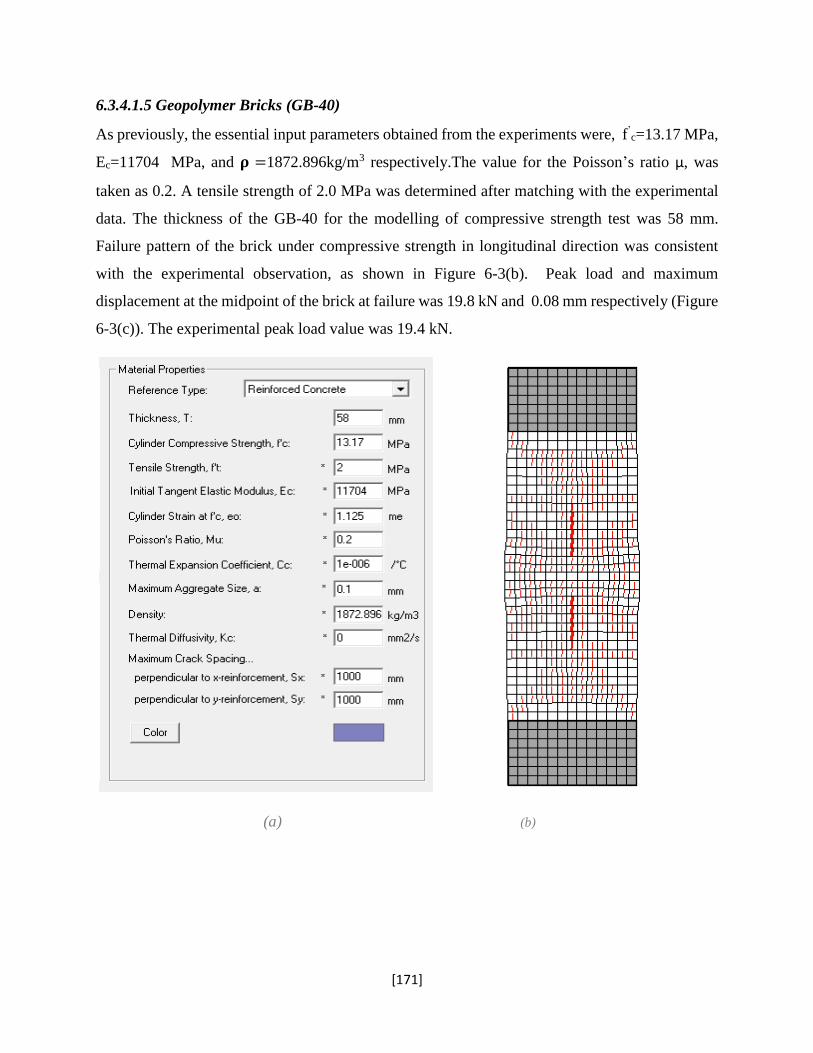
[171]
6.3.4.1.5 Geopolymer Bricks (GB-40)
As previously, the essential input parameters obtained from the experiments were, f’c=13.17 MPa,
Ec=11704 MPa, and 𝛒 =1872.896kg/m3 respectively.The value for the Poisson’s ratio μ, was
taken as 0.2. A tensile strength of 2.0 MPa was determined after matching with the experimental
data. The thickness of the GB-40 for the modelling of compressive strength test was 58 mm.
Failure pattern of the brick under compressive strength in longitudinal direction was consistent
with the experimental observation, as shown in Figure 6-3(b). Peak load and maximum
displacement at the midpoint of the brick at failure was 19.8 kN and 0.08 mm respectively (Figure
6-3(c)). The experimental peak load value was 19.4 kN.
(a) (b)

[172]
(c)
Figure 6-34 : Properties of the GB-40 used for the modelling in matching analysis with experiment (b):Failure
pattern of GB-40 brick under Compressive Strength test in longitudinal direction (c): The FEM response forGB-
40 brick
6.3.4.1.6 Sewage Sludge Ash (SSAB-15) Bricks
For the FEM simulation of the compressive strength of the hybrid masonry brick in the longitudinal
axis the material properties used are obtained from the experimental program as follows:
compressive strength fc’, Modulus of Elasticity Ec, density 𝛒, were, 30.3 MPa, 25901 MPa, and
1819 kg/m3 respectively. The value for the Poisson’s ratio μ, was taken as 0.2. The tensile strength
of the SSAB-15 brick was found to be 6 MPa from several iterations until the difference between
measured and estimated load was within the experimental tolerance. The thickness of the SSAB-
15 for the modelling of compressive strength test was taken as 58 mm. The failure pattern of the
brick under flexural strength test was similar to the actual test. The failure pattern is shown in
Figure 6-31(b). The peak load and the maximum displacement at the midpoint of the brick at
failure was 45.0 kN and 0.08 mm respectively as shown in the response curve (Figure 6-31(c)).
The experimental peak load was 45.0 kN.
0
5
10
15
20
25
30
35
40
45
0 0.02 0.04 0.06 0.08 0.1 0.12 0.14 0.16
Load
(kN
)
Mid-displacement (mm)
-----Experimental Peak Load
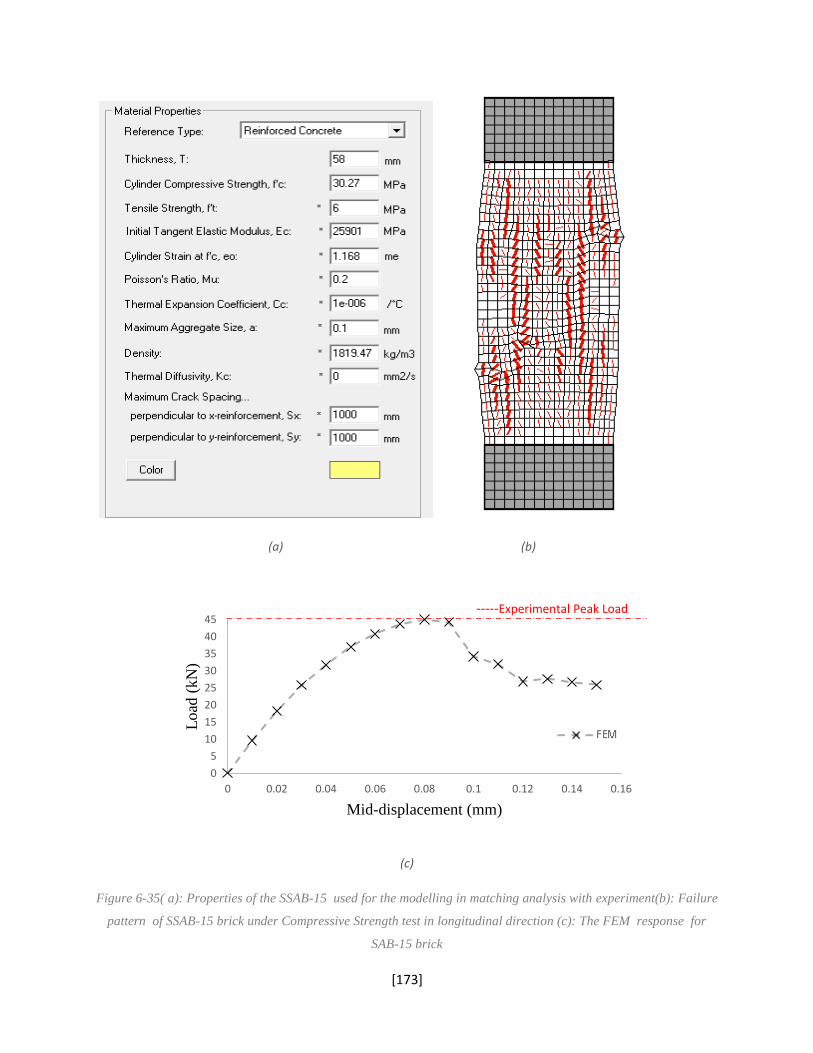
[173]
(a) (b)
(c)
Figure 6-35( a): Properties of the SSAB-15 used for the modelling in matching analysis with experiment(b): Failure
pattern of SSAB-15 brick under Compressive Strength test in longitudinal direction (c): The FEM response for
SAB-15 brick
0
5
10
15
20
25
30
35
40
45
0 0.02 0.04 0.06 0.08 0.1 0.12 0.14 0.16
Load
(kN
)
Mid-displacement (mm)
-----Experimental Peak Load
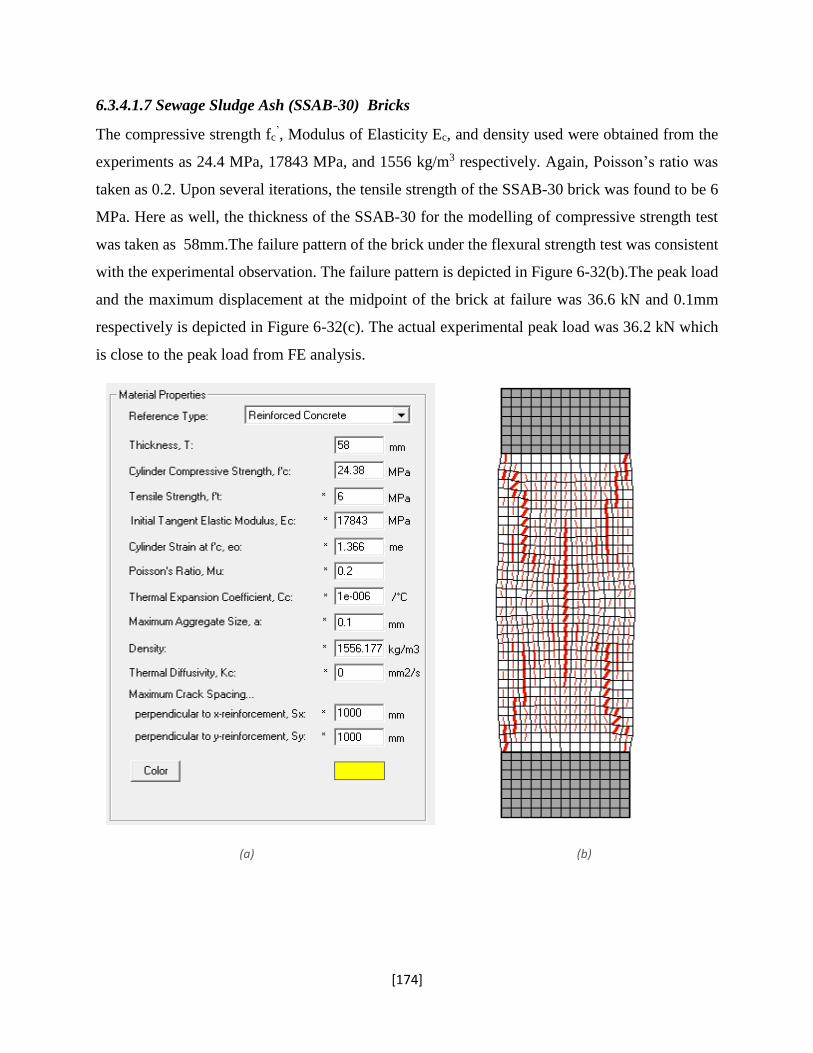
[174]
6.3.4.1.7 Sewage Sludge Ash (SSAB-30) Bricks
The compressive strength fc’, Modulus of Elasticity Ec, and density used were obtained from the
experiments as 24.4 MPa, 17843 MPa, and 1556 kg/m3 respectively. Again, Poisson’s ratio was
taken as 0.2. Upon several iterations, the tensile strength of the SSAB-30 brick was found to be 6
MPa. Here as well, the thickness of the SSAB-30 for the modelling of compressive strength test
was taken as 58mm.The failure pattern of the brick under the flexural strength test was consistent
with the experimental observation. The failure pattern is depicted in Figure 6-32(b).The peak load
and the maximum displacement at the midpoint of the brick at failure was 36.6 kN and 0.1mm
respectively is depicted in Figure 6-32(c). The actual experimental peak load was 36.2 kN which
is close to the peak load from FE analysis.
(a) (b)
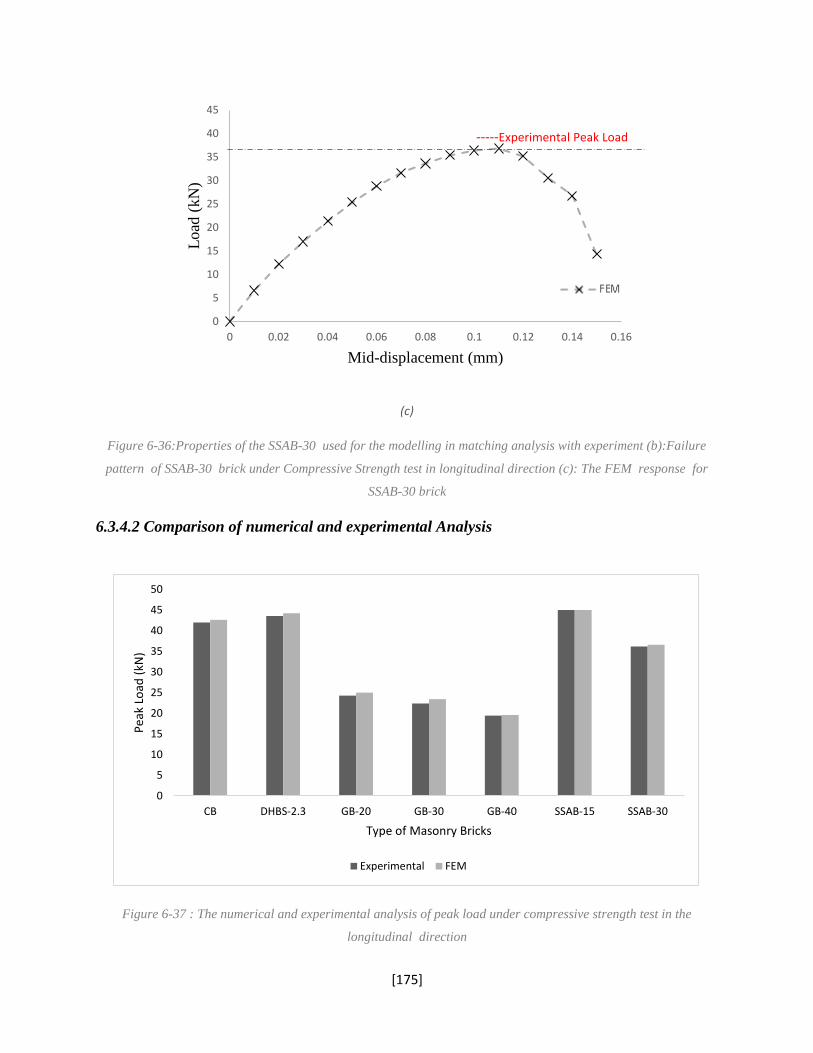
[175]
(c)
Figure 6-36:Properties of the SSAB-30 used for the modelling in matching analysis with experiment (b):Failure
pattern of SSAB-30 brick under Compressive Strength test in longitudinal direction (c): The FEM response for
SSAB-30 brick
6.3.4.2 Comparison of numerical and experimental Analysis
Figure 6-37 : The numerical and experimental analysis of peak load under compressive strength test in the
longitudinal direction
0
5
10
15
20
25
30
35
40
45
0 0.02 0.04 0.06 0.08 0.1 0.12 0.14 0.16
Load
(kN
)
Mid-displacement (mm)
-----Experimental Peak Load
0
5
10
15
20
25
30
35
40
45
50
CB DHBS-2.3 GB-20 GB-30 GB-40 SSAB-15 SSAB-30
Pea
k Lo
ad (
kN)
Type of Masonry Bricks
Experimental FEM
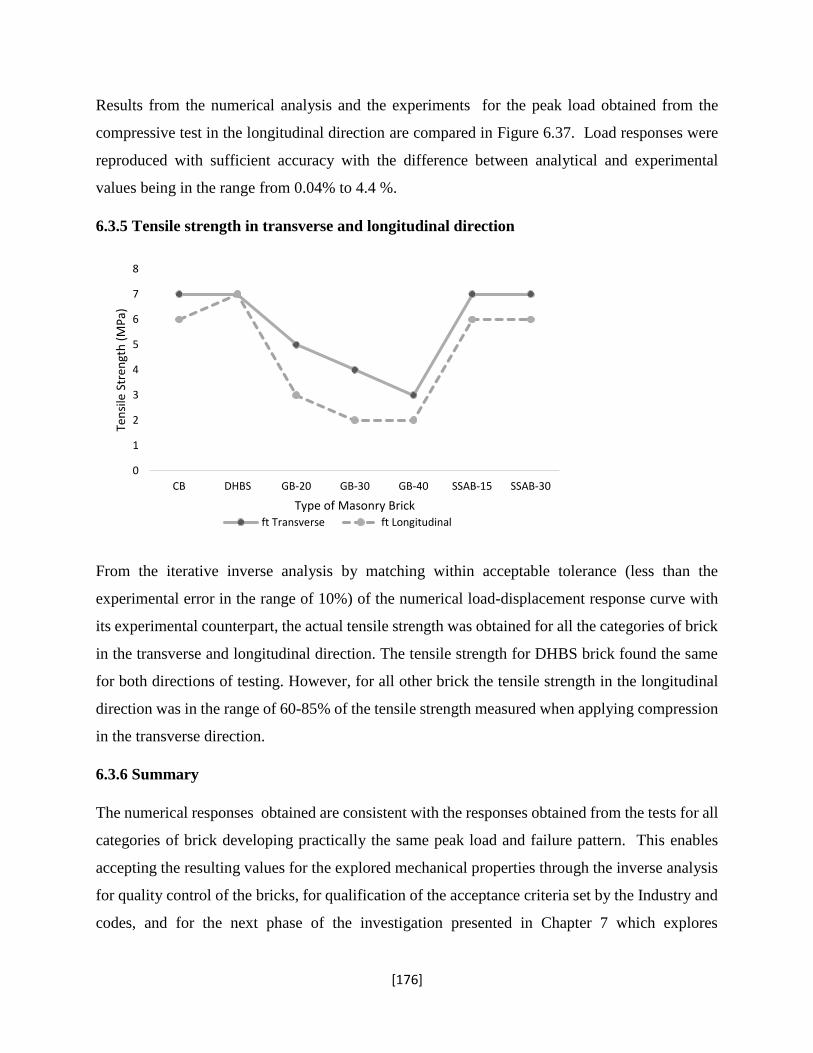
[176]
Results from the numerical analysis and the experiments for the peak load obtained from the
compressive test in the longitudinal direction are compared in Figure 6.37. Load responses were
reproduced with sufficient accuracy with the difference between analytical and experimental
values being in the range from 0.04% to 4.4 %.
6.3.5 Tensile strength in transverse and longitudinal direction
From the iterative inverse analysis by matching within acceptable tolerance (less than the
experimental error in the range of 10%) of the numerical load-displacement response curve with
its experimental counterpart, the actual tensile strength was obtained for all the categories of brick
in the transverse and longitudinal direction. The tensile strength for DHBS brick found the same
for both directions of testing. However, for all other brick the tensile strength in the longitudinal
direction was in the range of 60-85% of the tensile strength measured when applying compression
in the transverse direction.
6.3.6 Summary
The numerical responses obtained are consistent with the responses obtained from the tests for all
categories of brick developing practically the same peak load and failure pattern. This enables
accepting the resulting values for the explored mechanical properties through the inverse analysis
for quality control of the bricks, for qualification of the acceptance criteria set by the Industry and
codes, and for the next phase of the investigation presented in Chapter 7 which explores
0
1
2
3
4
5
6
7
8
CB DHBS GB-20 GB-30 GB-40 SSAB-15 SSAB-30
Ten
sile
Str
engt
h (
MP
a)
Type of Masonry Brickft Transverse ft Longitudinal

[177]
correlations and inter-relationships between values obtained from non-destructive qualifiers and
destructive tests of the fabricated bricks.
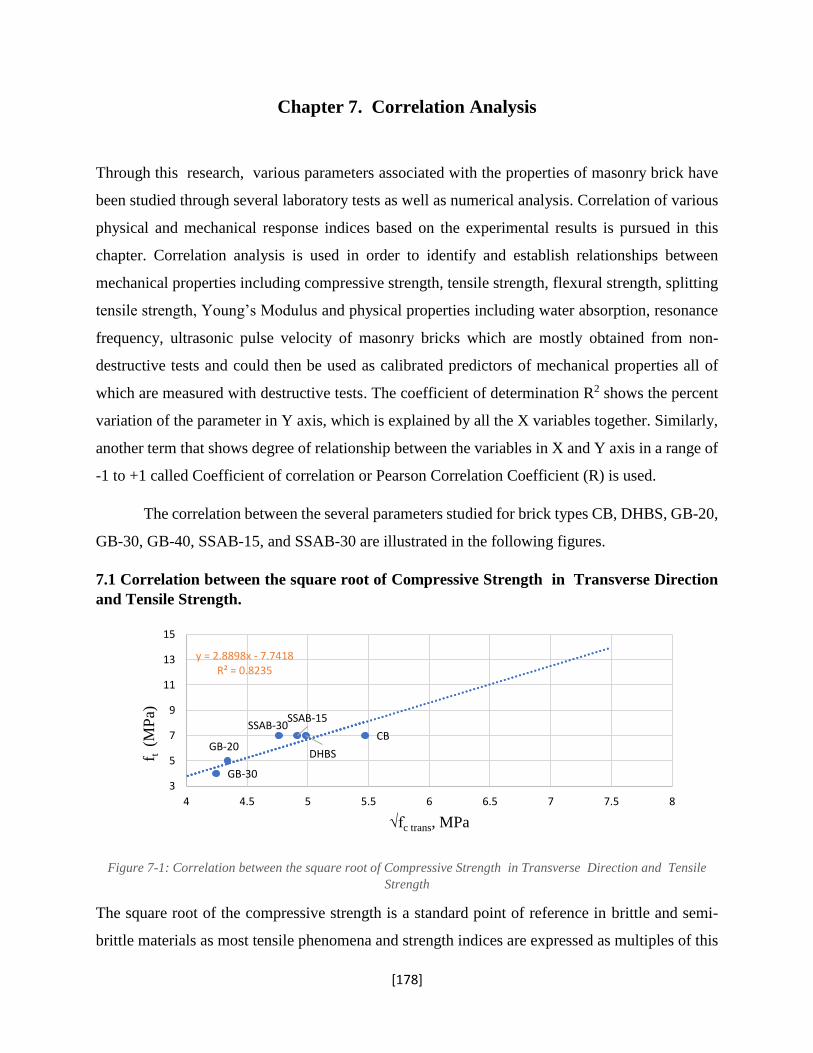
[178]
Chapter 7. Correlation Analysis
Through this research, various parameters associated with the properties of masonry brick have
been studied through several laboratory tests as well as numerical analysis. Correlation of various
physical and mechanical response indices based on the experimental results is pursued in this
chapter. Correlation analysis is used in order to identify and establish relationships between
mechanical properties including compressive strength, tensile strength, flexural strength, splitting
tensile strength, Young’s Modulus and physical properties including water absorption, resonance
frequency, ultrasonic pulse velocity of masonry bricks which are mostly obtained from non-
destructive tests and could then be used as calibrated predictors of mechanical properties all of
which are measured with destructive tests. The coefficient of determination R2 shows the percent
variation of the parameter in Y axis, which is explained by all the X variables together. Similarly,
another term that shows degree of relationship between the variables in X and Y axis in a range of
-1 to +1 called Coefficient of correlation or Pearson Correlation Coefficient (R) is used.
The correlation between the several parameters studied for brick types CB, DHBS, GB-20,
GB-30, GB-40, SSAB-15, and SSAB-30 are illustrated in the following figures.
7.1 Correlation between the square root of Compressive Strength in Transverse Direction
and Tensile Strength.
Figure 7-1: Correlation between the square root of Compressive Strength in Transverse Direction and Tensile
Strength
The square root of the compressive strength is a standard point of reference in brittle and semi-
brittle materials as most tensile phenomena and strength indices are expressed as multiples of this
CB
DHBSGB-20
GB-30
SSAB-15SSAB-30
y = 2.8898x - 7.7418R² = 0.8235
3
5
7
9
11
13
15
4 4.5 5 5.5 6 6.5 7 7.5 8
f t (M
Pa)
√fc trans, MPa

[179]
parameter. The correlation between the square root of compressive strength of the masonry bricks
in the transverse direction and the tensile strength obtained after F.E. calibration is shown in Figure
7-1. The coefficient of determination or the percentage variation of the compressive strength with
respect to the tensile strength is 82.3%. It is clear from the plot that there is a good correlation
between the compressive strength of the masonry bricks in the transverse direction and the tensile
strength, a finding that underlines the similarity in response of masonry with that of concrete and
other brittle materials.
7.2 Correlation between the Square Root of Compressive Strength in Longitudinal direction
and Tensile Strength.
Figure 7-2: Correlation between the square root of Compressive Strength in Longitudinal direction and Tensile
Strength
The coefficient of determination or the percentage variation of the square root of the compressive
strength in the longitudinal direction with respect to the tensile strength obtained after F.E.
matching of the experimental results, is 94.36%. Here it was shown that the tensile strength may
be obtained from the compressive strength using the expression below, which is consistent with
the established practice for masonry (from the Industry):
𝑓𝑡 = 0.6√𝑓𝑐′ (7.1)
CB
DHBS
GB-20
GB-30
GB-40
SSAB-15SSAB-30
𝑓𝑡=0.6√(𝑓𝑐′)R² = 0.9463
0
2
4
6
8
10
12
3 3.5 4 4.5 5 5.5 6 6.5 7 7.5 8
f t (M
Pa)
√fc long (MPa)
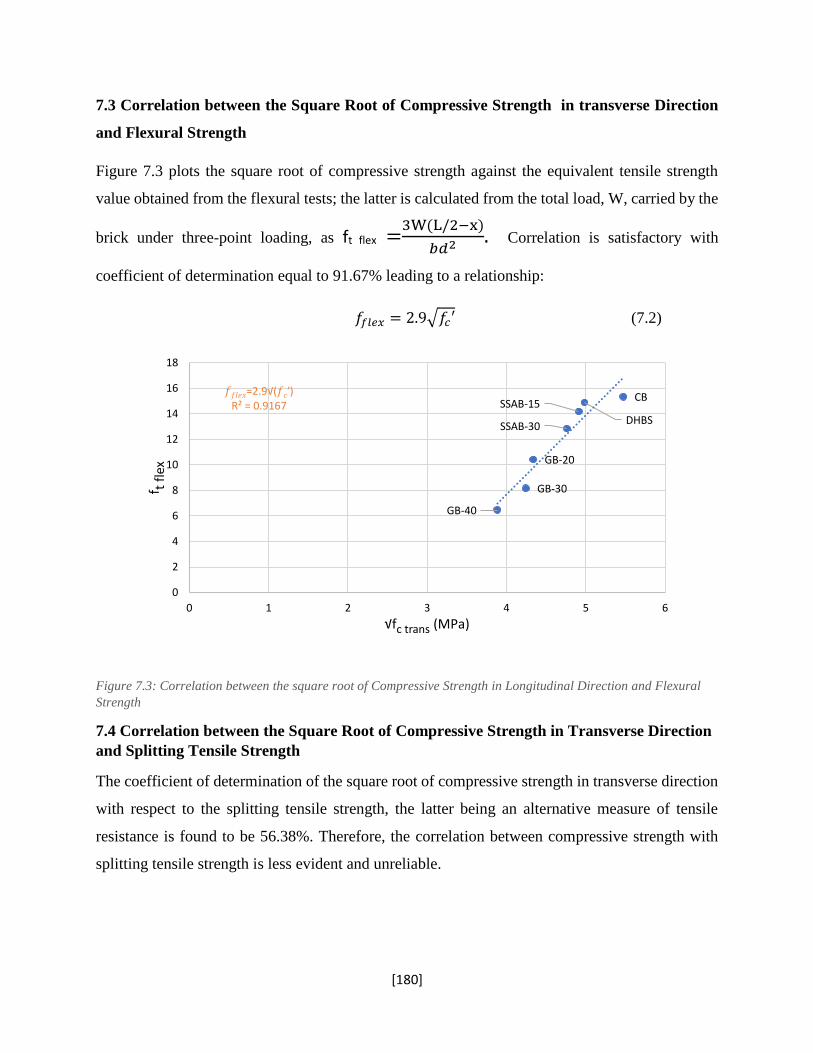
[180]
7.3 Correlation between the Square Root of Compressive Strength in transverse Direction
and Flexural Strength
Figure 7.3 plots the square root of compressive strength against the equivalent tensile strength
value obtained from the flexural tests; the latter is calculated from the total load, W, carried by the
brick under three-point loading, as ft flex =3W(L/2−x)
𝑏𝑑2 . Correlation is satisfactory with
coefficient of determination equal to 91.67% leading to a relationship:
𝑓𝑓𝑙𝑒𝑥 = 2.9√𝑓𝑐′ (7.2)
Figure 7.3: Correlation between the square root of Compressive Strength in Longitudinal Direction and Flexural
Strength
7.4 Correlation between the Square Root of Compressive Strength in Transverse Direction
and Splitting Tensile Strength
The coefficient of determination of the square root of compressive strength in transverse direction
with respect to the splitting tensile strength, the latter being an alternative measure of tensile
resistance is found to be 56.38%. Therefore, the correlation between compressive strength with
splitting tensile strength is less evident and unreliable.
CB
DHBS
GB-20
GB-30
GB-40
SSAB-15
SSAB-30
𝑓𝑓𝑙𝑒𝑥=2.9√(𝑓𝑐′) R² = 0.9167
0
2
4
6
8
10
12
14
16
18
0 1 2 3 4 5 6
f t fl
ex
√fc trans (MPa)
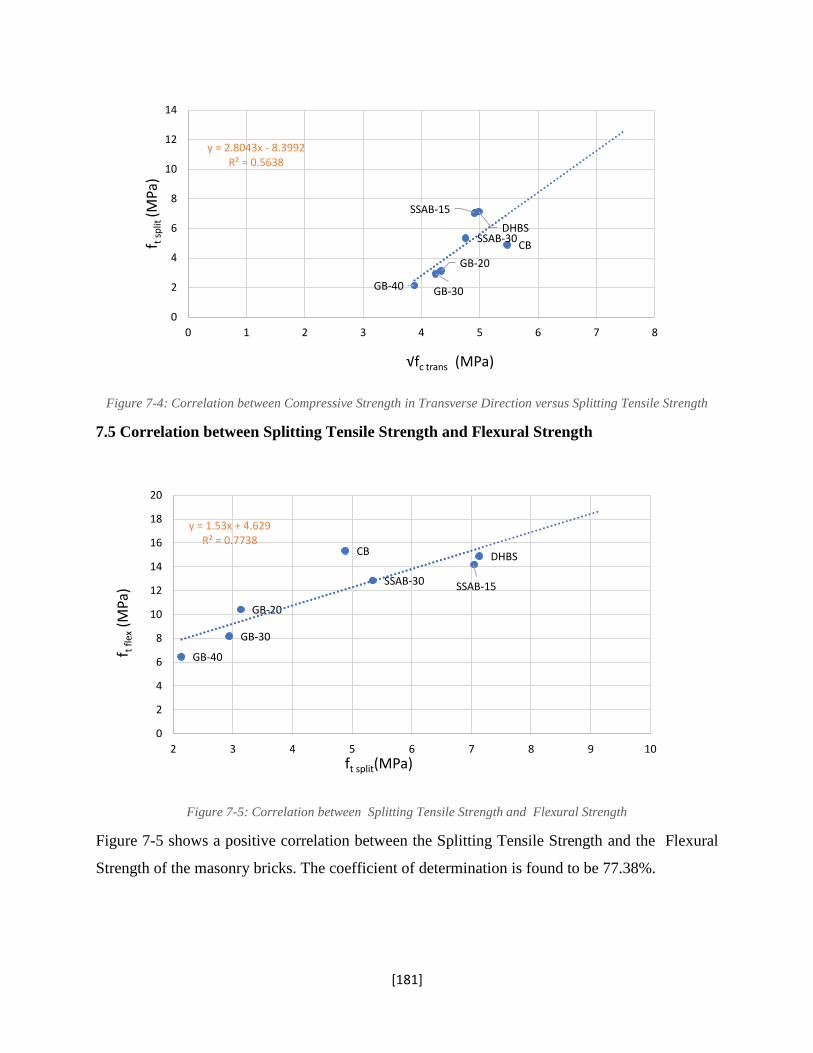
[181]
Figure 7-4: Correlation between Compressive Strength in Transverse Direction versus Splitting Tensile Strength
7.5 Correlation between Splitting Tensile Strength and Flexural Strength
Figure 7-5: Correlation between Splitting Tensile Strength and Flexural Strength
Figure 7-5 shows a positive correlation between the Splitting Tensile Strength and the Flexural
Strength of the masonry bricks. The coefficient of determination is found to be 77.38%.
CB
DHBS
GB-20
GB-30GB-40
SSAB-15
SSAB-30
y = 2.8043x - 8.3992R² = 0.5638
0
2
4
6
8
10
12
14
0 1 2 3 4 5 6 7 8
f t s
plit
(MP
a)
√fc trans (MPa)
CB DHBS
GB-20
GB-30
GB-40
SSAB-15SSAB-30
y = 1.53x + 4.629R² = 0.7738
0
2
4
6
8
10
12
14
16
18
20
2 3 4 5 6 7 8 9 10
f t f
lex
(MP
a)
ft split(MPa)

[182]
7.6 Correlation between the Square Root of Compressive Strength in Transverse Direction
and Ultrasonic Pulse Velocity
Figure 7-6: Correlation between the square root of the Compressive Strength in transverse direction and Ultrasonic
Pulse Velocity
In terms of as the prospects of using non-destructive evaluation tools to assess quality and strength,
the square root of the compressive strength of the bricks in transverse direction is correlated with
the ultra sonic pulse velocity obtained prior to mechanical testing, as shown in Figure 7.6. Note
that the UPV test is a standard quality control test in brick manufacturing. The coefficient of
determination or the percentage variation of the compressive strength with respect to the ultra sonic
pulse velocity is 90.03% indicating a strong dependence between the two parameters.
7.7 Correlation between Compressive Strength in Transverse Direction and Resonance
Frequency
Another type of non-destructive evaluation method is the transverse resonant frequency test which
is used routinely in assessment of freeze thaw damage of structural materials. Here results for
compressive strength are plotted against the resonant frequency value in Figure 7-7. With a
coefficient of determination equal to 88.72%, resonant frequency appears to be a very effective
non-destructive means of projection of brick strength.
CB
DHBSGB-20
GB-30GB-40
SSAB-15
SSAB-30
y = 2191x - 7359.5R² = 0.9003
0
1000
2000
3000
4000
5000
6000
7000
8000
9000
10000
0 1 2 3 4 5 6 7 8
Puls
e V
eloci
ty (
m/s
)
√fc trans(MPa)
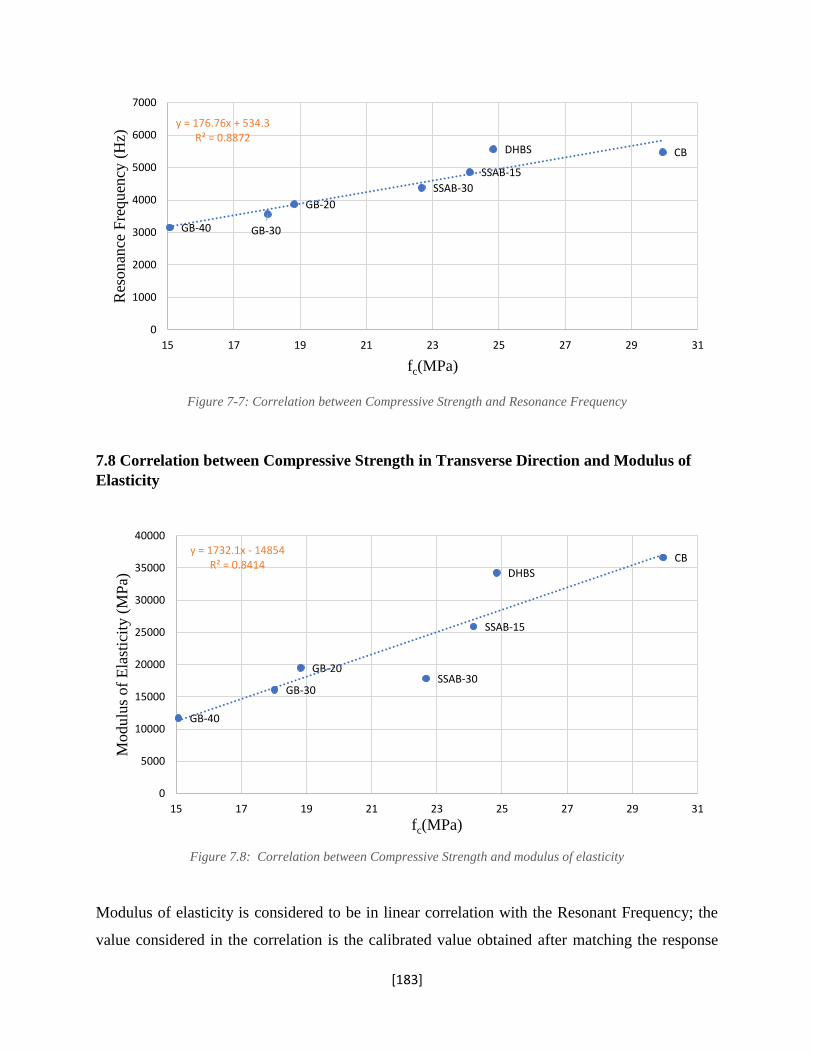
[183]
Figure 7-7: Correlation between Compressive Strength and Resonance Frequency
7.8 Correlation between Compressive Strength in Transverse Direction and Modulus of
Elasticity
Figure 7.8: Correlation between Compressive Strength and modulus of elasticity
Modulus of elasticity is considered to be in linear correlation with the Resonant Frequency; the
value considered in the correlation is the calibrated value obtained after matching the response
CBDHBS
GB-20
GB-30GB-40
SSAB-15
SSAB-30
y = 176.76x + 534.3R² = 0.8872
0
1000
2000
3000
4000
5000
6000
7000
15 17 19 21 23 25 27 29 31
Res
on
ance
Fre
qu
ency
(H
z)
fc(MPa)
CB
DHBS
GB-20
GB-30
GB-40
SSAB-15
SSAB-30
y = 1732.1x - 14854R² = 0.8414
0
5000
10000
15000
20000
25000
30000
35000
40000
15 17 19 21 23 25 27 29 31
Mo
dulu
s of
Ela
stic
ity (
MP
a)
fc(MPa)
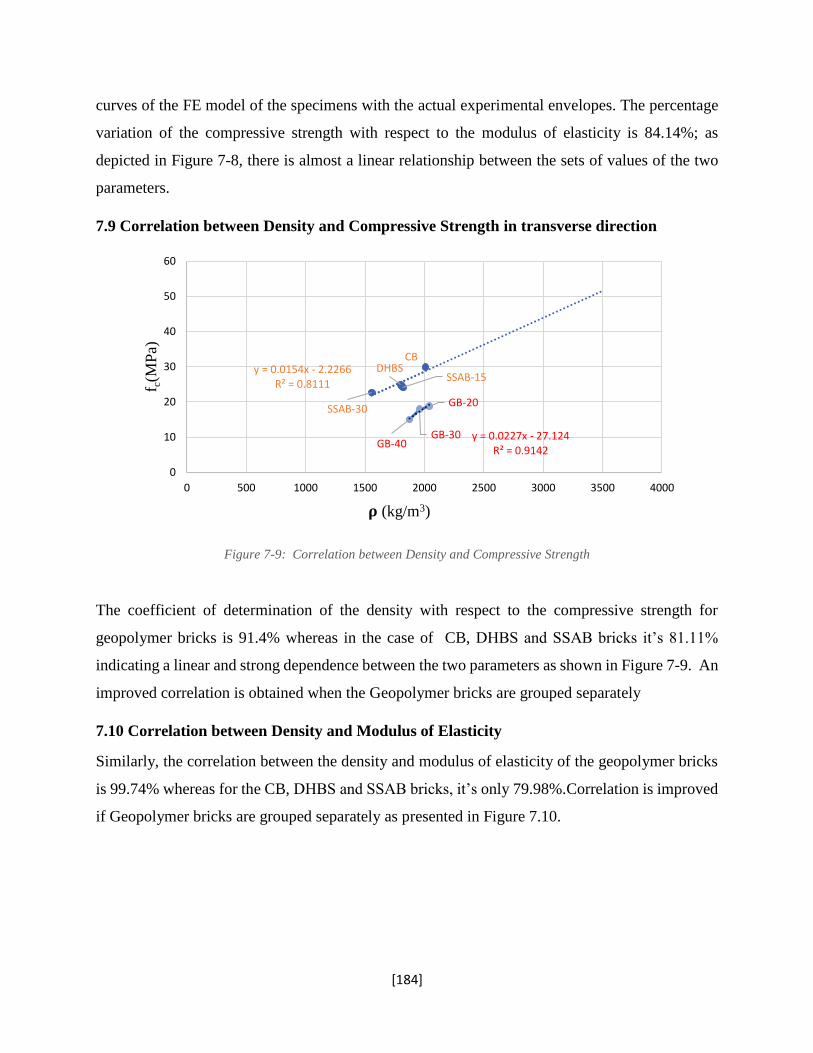
[184]
curves of the FE model of the specimens with the actual experimental envelopes. The percentage
variation of the compressive strength with respect to the modulus of elasticity is 84.14%; as
depicted in Figure 7-8, there is almost a linear relationship between the sets of values of the two
parameters.
7.9 Correlation between Density and Compressive Strength in transverse direction
Figure 7-9: Correlation between Density and Compressive Strength
The coefficient of determination of the density with respect to the compressive strength for
geopolymer bricks is 91.4% whereas in the case of CB, DHBS and SSAB bricks it’s 81.11%
indicating a linear and strong dependence between the two parameters as shown in Figure 7-9. An
improved correlation is obtained when the Geopolymer bricks are grouped separately
7.10 Correlation between Density and Modulus of Elasticity
Similarly, the correlation between the density and modulus of elasticity of the geopolymer bricks
is 99.74% whereas for the CB, DHBS and SSAB bricks, it’s only 79.98%.Correlation is improved
if Geopolymer bricks are grouped separately as presented in Figure 7.10.
CBDHBS
SSAB-15
SSAB-30GB-20
GB-30GB-40
y = 0.0154x - 2.2266R² = 0.8111
y = 0.0227x - 27.124R² = 0.9142
0
10
20
30
40
50
60
0 500 1000 1500 2000 2500 3000 3500 4000
f c(M
Pa)
𝛒 (kg/m3)
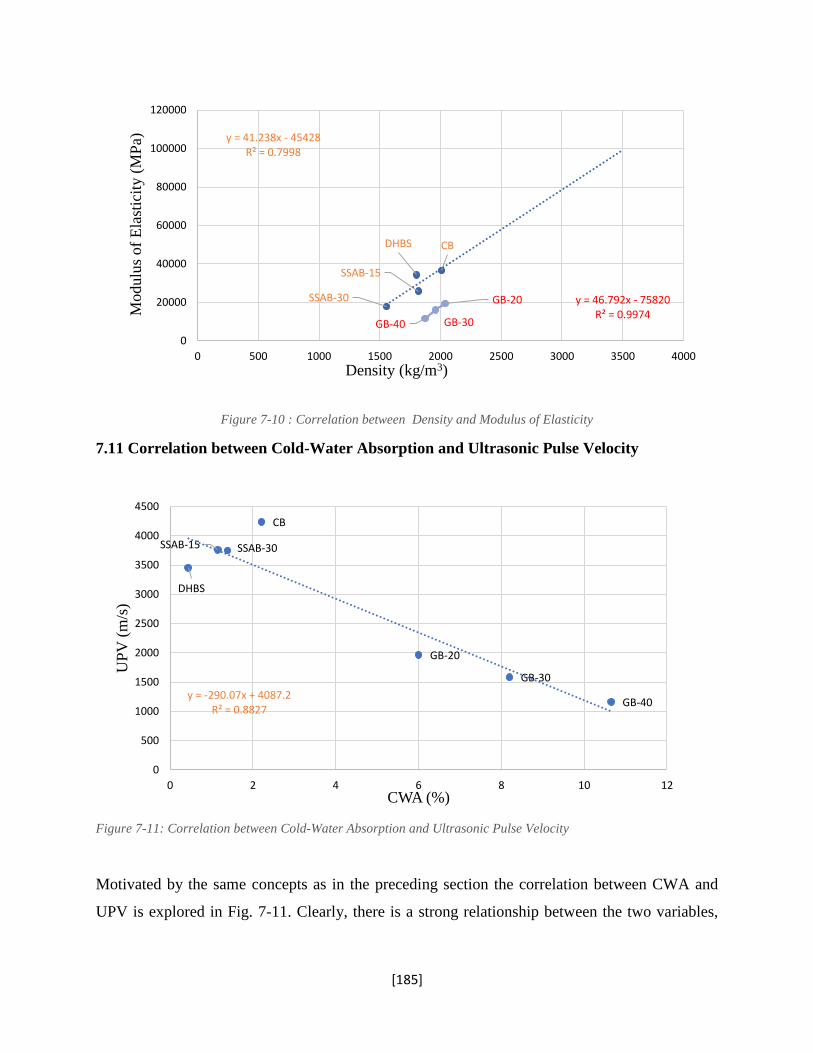
[185]
Figure 7-10 : Correlation between Density and Modulus of Elasticity
7.11 Correlation between Cold-Water Absorption and Ultrasonic Pulse Velocity
Figure 7-11: Correlation between Cold-Water Absorption and Ultrasonic Pulse Velocity
Motivated by the same concepts as in the preceding section the correlation between CWA and
UPV is explored in Fig. 7-11. Clearly, there is a strong relationship between the two variables,
CBDHBS
SSAB-15
SSAB-30 GB-20
GB-30GB-40
y = 41.238x - 45428R² = 0.7998
y = 46.792x - 75820R² = 0.9974
0
20000
40000
60000
80000
100000
120000
0 500 1000 1500 2000 2500 3000 3500 4000
Modulu
s of
Ela
stic
ity (
MP
a)
Density (kg/m3)
CB
DHBS
GB-20
GB-30
GB-40
SSAB-15 SSAB-30
y = -290.07x + 4087.2R² = 0.8827
0
500
1000
1500
2000
2500
3000
3500
4000
4500
0 2 4 6 8 10 12
UP
V (
m/s
)
CWA (%)
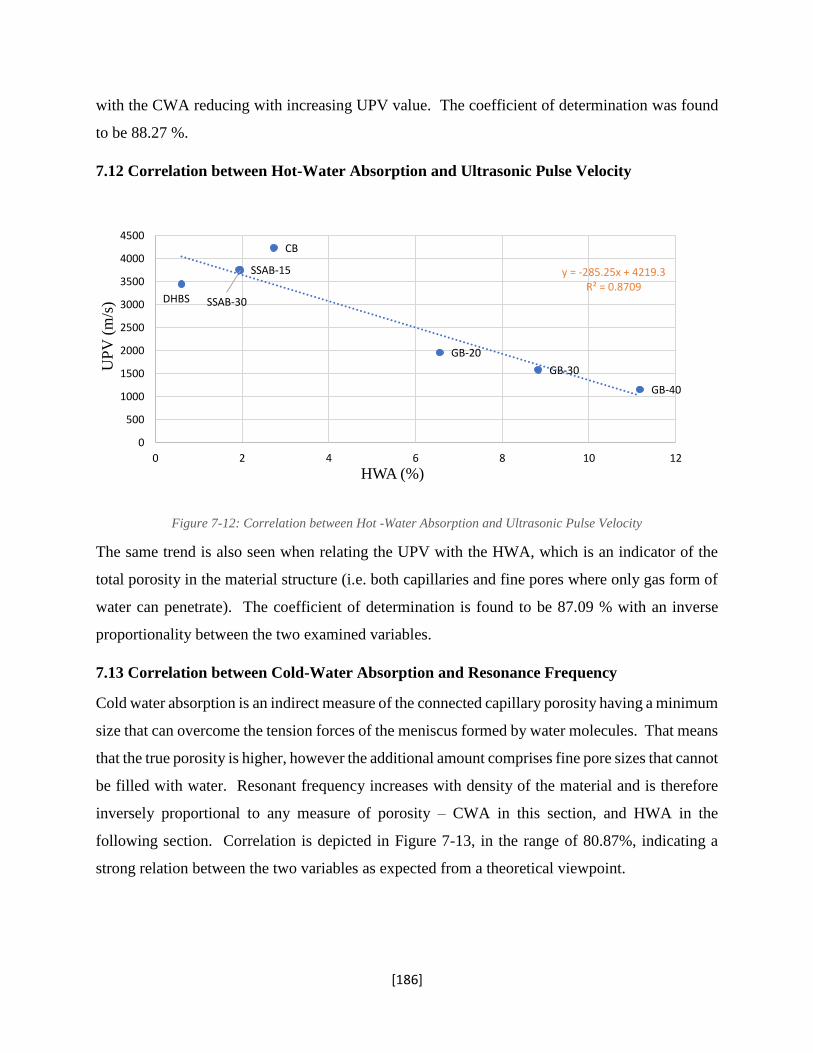
[186]
with the CWA reducing with increasing UPV value. The coefficient of determination was found
to be 88.27 %.
7.12 Correlation between Hot-Water Absorption and Ultrasonic Pulse Velocity
Figure 7-12: Correlation between Hot -Water Absorption and Ultrasonic Pulse Velocity
The same trend is also seen when relating the UPV with the HWA, which is an indicator of the
total porosity in the material structure (i.e. both capillaries and fine pores where only gas form of
water can penetrate). The coefficient of determination is found to be 87.09 % with an inverse
proportionality between the two examined variables.
7.13 Correlation between Cold-Water Absorption and Resonance Frequency
Cold water absorption is an indirect measure of the connected capillary porosity having a minimum
size that can overcome the tension forces of the meniscus formed by water molecules. That means
that the true porosity is higher, however the additional amount comprises fine pore sizes that cannot
be filled with water. Resonant frequency increases with density of the material and is therefore
inversely proportional to any measure of porosity – CWA in this section, and HWA in the
following section. Correlation is depicted in Figure 7-13, in the range of 80.87%, indicating a
strong relation between the two variables as expected from a theoretical viewpoint.
CB
DHBS
GB-20
GB-30
GB-40
SSAB-15
SSAB-30
y = -285.25x + 4219.3R² = 0.8709
0
500
1000
1500
2000
2500
3000
3500
4000
4500
0 2 4 6 8 10 12
UP
V (
m/s
)
HWA (%)
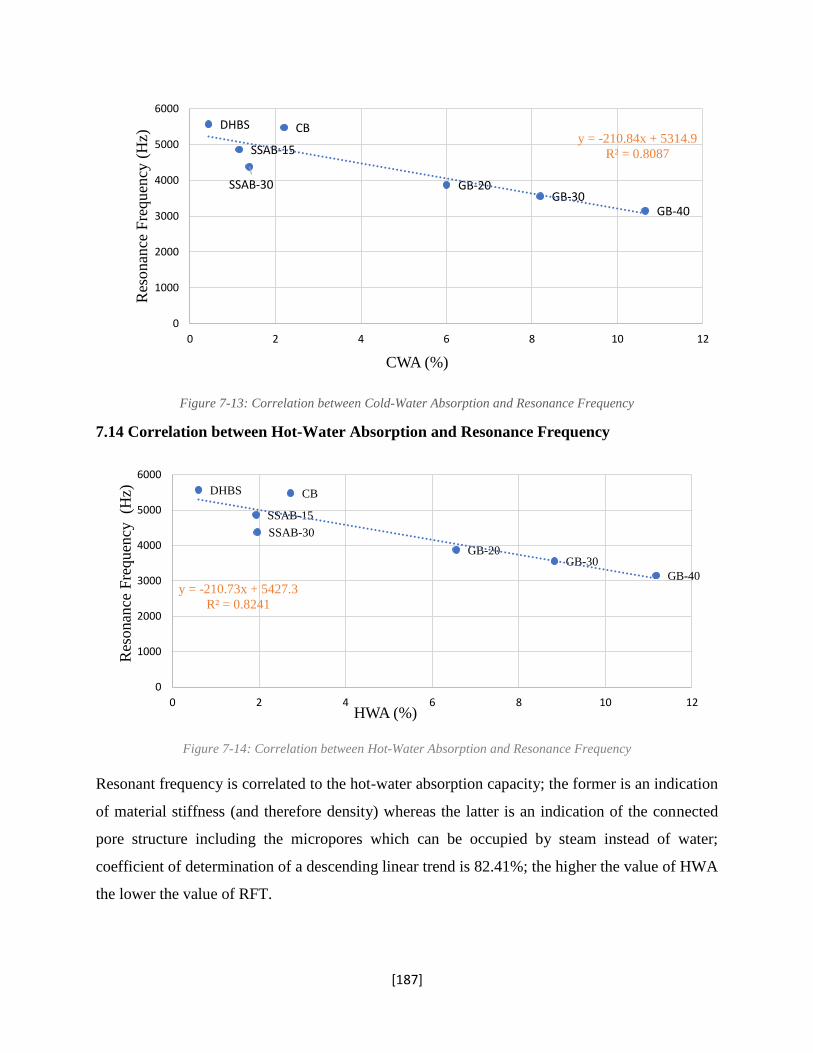
[187]
Figure 7-13: Correlation between Cold-Water Absorption and Resonance Frequency
7.14 Correlation between Hot-Water Absorption and Resonance Frequency
Figure 7-14: Correlation between Hot-Water Absorption and Resonance Frequency
Resonant frequency is correlated to the hot-water absorption capacity; the former is an indication
of material stiffness (and therefore density) whereas the latter is an indication of the connected
pore structure including the micropores which can be occupied by steam instead of water;
coefficient of determination of a descending linear trend is 82.41%; the higher the value of HWA
the lower the value of RFT.
CBDHBS
GB-20GB-30
GB-40
SSAB-15
SSAB-30
y = -210.84x + 5314.9
R² = 0.8087
0
1000
2000
3000
4000
5000
6000
0 2 4 6 8 10 12
Res
on
ance
Fre
qu
ency
(H
z)
CWA (%)
CBDHBS
GB-20GB-30
GB-40
SSAB-15
SSAB-30
y = -210.73x + 5427.3
R² = 0.8241
0
1000
2000
3000
4000
5000
6000
0 2 4 6 8 10 12
Res
onan
ce F
requen
cy
(Hz)
HWA (%)
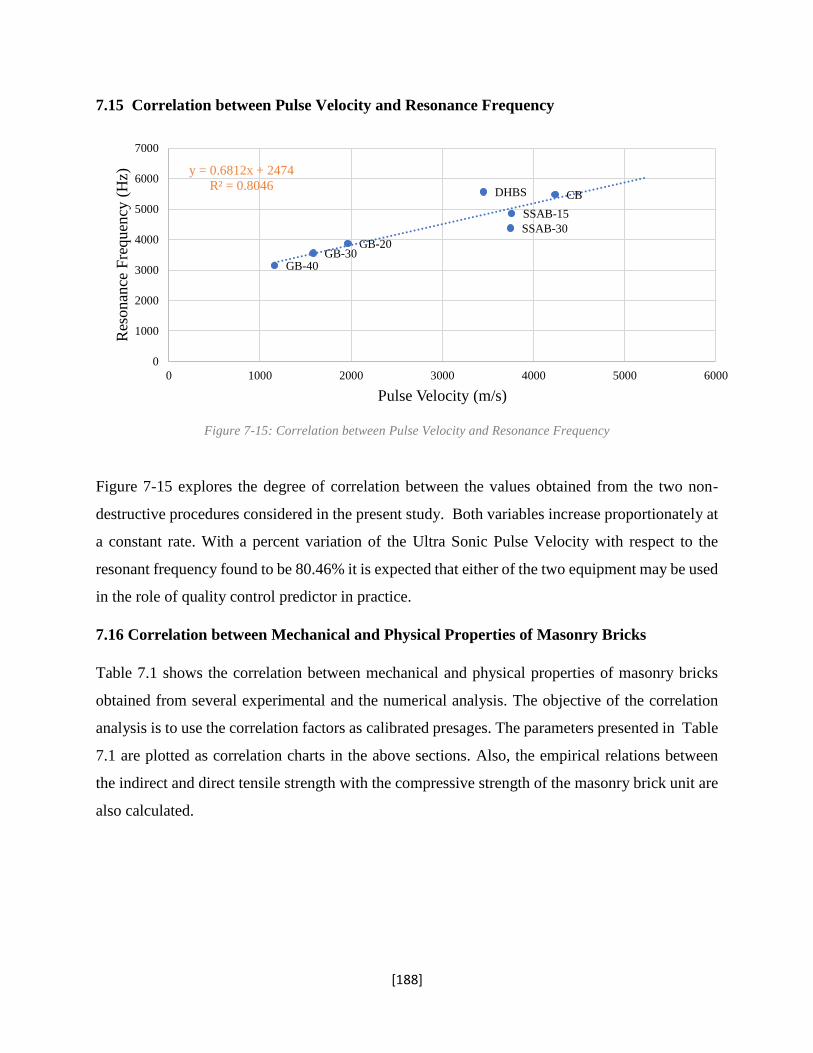
[188]
7.15 Correlation between Pulse Velocity and Resonance Frequency
Figure 7-15: Correlation between Pulse Velocity and Resonance Frequency
Figure 7-15 explores the degree of correlation between the values obtained from the two non-
destructive procedures considered in the present study. Both variables increase proportionately at
a constant rate. With a percent variation of the Ultra Sonic Pulse Velocity with respect to the
resonant frequency found to be 80.46% it is expected that either of the two equipment may be used
in the role of quality control predictor in practice.
7.16 Correlation between Mechanical and Physical Properties of Masonry Bricks
Table 7.1 shows the correlation between mechanical and physical properties of masonry bricks
obtained from several experimental and the numerical analysis. The objective of the correlation
analysis is to use the correlation factors as calibrated presages. The parameters presented in Table
7.1 are plotted as correlation charts in the above sections. Also, the empirical relations between
the indirect and direct tensile strength with the compressive strength of the masonry brick unit are
also calculated.
CBDHBS
GB-20GB-30
GB-40
SSAB-15
SSAB-30
y = 0.6812x + 2474
R² = 0.8046
0
1000
2000
3000
4000
5000
6000
7000
0 1000 2000 3000 4000 5000 6000
Res
onan
ce F
requen
cy (
Hz)
Pulse Velocity (m/s)
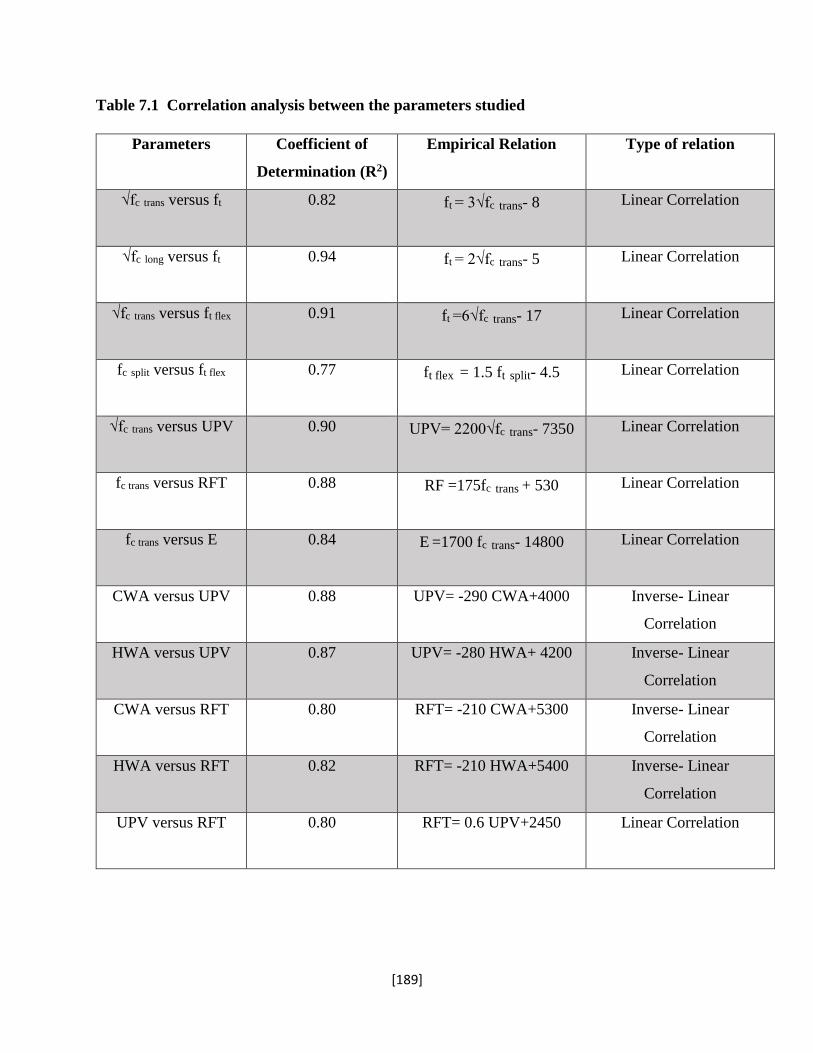
[189]
Table 7.1 Correlation analysis between the parameters studied
Parameters Coefficient of
Determination (R2)
Empirical Relation Type of relation
√fc trans versus ft 0.82 ft = 3√fc trans- 8 Linear Correlation
√fc long versus ft 0.94 ft = 2√fc trans- 5 Linear Correlation
√fc trans versus ft flex 0.91 ft =6√fc trans- 17 Linear Correlation
fc split versus ft flex 0.77 ft flex = 1.5 ft split- 4.5 Linear Correlation
√fc trans versus UPV 0.90 UPV= 2200√fc trans- 7350 Linear Correlation
fc trans versus RFT 0.88 RF =175fc trans + 530 Linear Correlation
fc trans versus E 0.84 E =1700 fc trans- 14800 Linear Correlation
CWA versus UPV 0.88 UPV= -290 CWA+4000 Inverse- Linear
Correlation
HWA versus UPV 0.87 UPV= -280 HWA+ 4200 Inverse- Linear
Correlation
CWA versus RFT 0.80 RFT= -210 CWA+5300 Inverse- Linear
Correlation
HWA versus RFT 0.82 RFT= -210 HWA+5400 Inverse- Linear
Correlation
UPV versus RFT 0.80 RFT= 0.6 UPV+2450 Linear Correlation
[190]
Chapter 8. Summary and Conclusions
The research presented in this thesis aimed to develop a new class of hybrid masonry bricks that
would potentially meet modern sustainability objectives in future construction. Motivating
principles for the research was the quest for a solution that would, if fully exploited in practice,
contribute towards the reduction in the use of quarried materials in while at the same time
facilitating the disposal of non-pathogenic wastes produced from the wastewater treatment
facilities as well as other wastes (such as crushed glass) to embed in the final products significant
added value. The latter objective has several tangible and intangible benefits, ranging from the
ongoing depletion of shales used in clay production, the management of large volumes of sludge
that is inappropriate as fertilizer, the opportunity for the wastewater treatment facilities to better
manage the fate of the sludge produced, and the introduction in useful products of industrial wastes
such as crushed recycled glass that would otherwise end up in landfills. To achieve these
objectives, an extensive experimental campaign has been undertaken which focussed on the
development of manufacturing methods and characterization techniques necessary for innovative
replacement of shale and clay with the proposed solid or liquid wastes without impairing the
structural and physical properties of masonry bricks.
Source shale material was provided by a major brick manufacturer in Canada, to be used as the
control raw ingredient in the brick manufacturing. Control bricks (CB) fabricated according to the
mix design and procedures followed in the field, were made for benchmarking of all other trials.
The experimental development of the work occurred in two phases, namely the preliminary phase
and the main phase of the research.
In the preliminary phase, the effects of several waste replacement options on the important
performance indicators like uniaxial (transverse) Compressive Strength and water absorption were
studied so as to determine the feasibility of the endeavor and to also resolve practical issues that
could hinder the realization of the project’s objectives. In this regard, hybrid bricks with varying
shale replacement rates were fabricated and tested using several waste materials that included
Geopolymer bricks including Recycled Crushed Glass (RCG), Dried High Bio-polymer derived
from sewage sludge, and Incinerated Sewage Sludge Ash (SSA) provided by the Municipal
[191]
wastewater treatment facilities. The following sections summarize the main findings of the study
and conclusions drawn from the experimental and numerical observations.
8.1 Mechanical Properties of Hybrid Bricks
In the main phase of the research, five categories of the waste-shale combinations that were
deemed most promising performers while still the first phase of the tests were studied in greater
detail. Thus, a series of hybrid brick specimens were developed through the research, with different
ingredients in terms of partial shale replacement (i.e., Dried High Biopolymer Sludge – DHBS;
Sludge Ash Bricks – SSAB; Geopolymer Bricks – GB). In order to evaluate the parameters that
decide the quality of the masonry bricks, a total of 119 masonry units were made. Among them,
98 units were whole units of size 140 mm x 58 mm x 26 mm and 21 units were cubes of size 50
mm. All of these bricks underwent several mechanical and durability tests- such as, compressive
strength tests, flexural strength tests, splitting tensile tests, resonance frequency tests, ultrasonic
pulse velocity tests, water absorption tests, efflorescence tests and the resistance to freeze- thaw.
The observations of the experimental campaign are summarized below:
➢ The compressive strengths (in the transverse direction or perpendicular to the bed joint ) of
the DHBS and SSAB-15 brick were almost the same, equal to 24.8 MPa and 24.1 MPa
respectively, i.e., 82.9% and 80.6% of the reference control brick (CB). Also, the
compressive strength value of the SSAB-30 brick, with 30% replacement of sludge, was
22.6 MPa, i.e., 75.7% of the control brick. Similarly, the compressive strength for the GB-
20, GB-30, and GB-40 were, 18.8 MPa, 18.0 MPa, and 15.1 MPa respectively, which is
62.9%, 60.2% and 50.3% of the control brick values. However, all of the brick types
fabricated were within the acceptable range of brick performance as per CSA A82-14: Fired
masonry brick made from clay or shale.
➢ The compressive strength of the masonry units (longitudinal direction or parallel to the bed
joint) was higher than the compressive strength in transverse direction for all the categories
except the GB bricks. The compressive strength for the reference CB was 28.8 MPa.
Interestingly, for the DHBS and SSAB-15, the compressive strength was 8.9% and 11.5%
higher than the CB. For SSAB-30 brick, the strength was 89.8 % of the CB. These are
[192]
believed to be closest to the true intrinsic values of the compressive strength of the brick
by minimizing the effect of friction through the use of Teflon plates during the test. Overall,
the compressive strength of the masonry units was satisfactory, especially for the SSAB
and DHBS bricks.
➢ As one of the indirect tensile strength determination methods, the flexural strength of the
hybrid bricks was calculated by three point bending tests. For the CB flexural strength was
15.3 MPa. The corresponding values for the DHBS and SSAB bricks were very near to this
upper limit (97.1%, 92.5% and 83.7% of flexural strength of CB for DHBS, SSAB-15 and
SSAB-30 bricks respectively.)
➢ The other method to calculate the indirect tensile strength was through the splitting tensile
tests. Strength values were, 4.8 MPa for the reference CB, and 93.2%, 64.6%, 63.5%,
48.1%, 89.9% and 83.6% of this value for DHBS, GB-10, GB-20, GB-30, SSAB-15, and
SSAB-30, respectively. Clearly, all the DHBS and SSAB bricks have shown a consistent
tensile performance very close to that of the CB.
➢ One of the non destructive tests conducted on the bricks was the resonance frequency test
which measures the vibration of a structure that is exposed to dynamic loads. The test also
estimates the dynamic modulus of elasticity of the brick. The resonance frequency of the
CB was 5479 Hz. In fact, DHBS brick had 1.6% higher resonance frequency than the CB,
at 5568 Hz. For all other hybrid bricks the RF was between 57.5% and 88.8% of the control
brick. Dynamic modulus of elasticity of DHBS brick, SSAB-15 and SSAB-30 bricks were
pretty close to that of CB. For the CB, it was 36626 MPa whereas for all other bricks the
dynamic modulus of elasticity was in the range of 93.5% to 32% of the CB values with
DHBS and SSAB being highest.
8.2 Physical Properties and Durability of Hybrid Bricks
The durability and other physical properties of the brick were also evaluated from a number of
pertinent tests, such as the measurement of the Ultrasonic Pulse Velocity (UPV), the Water
Absorption Capacity (both to cold and to hot-water), freeze-thaw and efflorescence performance.
[193]
➢ The ultrasonic pulse velocity test is routinely used to determine the quality of the brick
units in the industry; this concept is extended to the present study, on the basis that the
higher the pulse velocity, the denser the microstructure of the material and the better the
quality of the bricks. The pulse velocity for the CB was 4235.6m/s. Similarly, for DHBS,
GB-20, GB-30, GB-40, SSAB-15, SSAB-30, were 3451 m/s, 1963 m/s, 1583 m/s, 1160
m/s, 3759 m/s and 3748 m/s respectively. From the pulse velocity, with an upper limit of
greater than 3500 m/s and a lower limit of less than 1000 m/s may be considered as a
durable brick [Koroth, Fasio & Feldman, 1998]. All of the hybrid bricks were found to pass
the UPV quality tests especially the SSAB and DHBS bricks. With the exception of the
GB category which had UPV values lower than 2000 m/s, however, well within the lower
limit range of durability, i.e.,1000 m/s.
➢ The cold and hot water absorption tests are indicators of porosity of the brick (the cold-
water test refers to the larger pores that can hold water whereas the hot water test measures
the finer set of connected pores that can only store water in the form of steam). These
variables were 2.2% and 2.7% respectively, for the CB. However, for DHBS bricks, the
biopolymers inside the brick get burned during the firing process thereby creating fine
pores inside the brick which are evidenced in the lighter weight of the brick; however,
evidently these fine pores resulting from this process are not connected to the brick
capillary network and as a result, the DHBS bricks has lower water absorption apparently
owing to a better distribution of fine pores. All other bricks showed similar or less water
absorption than the CB which improves their prospects in terms of durability resilience.
➢ From the freeze thaw tests the Percent weight loss for the SSAB and DHBS brick were
much lower than the CB which was 0.83% of the weight of the brick. However, for the GB
brick, it was between 1.21% and 2.12% of the total weight of the brick.
➢ Efflorescence was another physical property of the bricks studied. None of the hybrid
bricks showed any sign of efflorescence.
[194]
The results from the study of the Geo-polymer bricks indicated that this research field presents an
opportunity for development of an economical building construction material with great added
value that could find use in many applications particularly in masonry construction or as infills;
some of the brick types developed have the advantage of being fabricated with a low firing
temperature, therefore leaving a reduced carbon footprint and requiring less firing energy than
conventional bricks. In fact, the geopolymer bricks utilized only 40% of the firing energy used for
the control bricks, yet, the process yielded a high-quality brick with excellent mechanical and
durability properties.
From the study, it was evident that all the types of the prototype hybrid bricks developed in the
main phase of the research were able to meet the objective of reducing the level of natural resources
quarried for brick manufacturing with no compromise in durability and tensile strength (which are
the key variables in the industry) with a minor up to moderate effect on compressive strength
(which is not likely to control the design strength of masonry walls on account of the prevailing
effect of the mortar in structural performance under compression). The hybrid bricks illustrated
that it is possible, when scaled up to become an industrial product, the could also met the
sustainability objective of the research, either by means of serving as host to industrial / sanitary
wastes that would otherwise be landfilled, or by reducing the firing energy requirements for their
manufacture.
8.3 Numerical Study of Hybrid Bricks
Characterization of the mechanical properties of the bricks required inverse analysis of the
mechanical tests conducted. To this end, all the experiments of the main phase were modelled in
VecTor2©, an advanced nonlinear finite element analysis software with the intent to match –
through sensitivity analysis the output response of the simulation with the corresponding
experimental response curve; the unknowns of the study were the true compressive and tensile
strengths of the materials considered; the input data included the assumed shape of the stress-
strain response of the brick in compression (similar to that of plain concrete according to the
Masonry Design Code (CSA S304-14 – Design of masonry structures) scaled to a peak strength
that was to be determined through the inverse analysis; also input were the material density
(experimental value) and the dynamic modulus of elasticity (from the transverse resonant
[195]
frequency tests). Through this process, and after obtaining the tensile strength from the flexural
tests, and the compressive strength from the longitudinal compression brick tests, it was possible
to reproduce the strength values for all other mechanical tests that were not used in the sensitivity-
matching analysis; simulation was also successful in reproducing the behavioral patterns of these
experiments including the form and distribution of the ultimate cracking at failure.
8.4 Correlation Analysis
Several parameters studied in the experimental part of the research were correlated to each other
in an attempt to obtain simple tools that could be used as predictors of performance in future
investigations without the necessity of destructive testing. Strong correlation (with a coefficient of
variation over 80%) was found between the following pairs of parameters: √fc trans and ft, √fc long
and ft, √fc trans and ft flex, fc split and ft flex, √fc trans and UPV, fc trans and RFT, CWA and UPV, HWA
and UPV, CWA and RFT, HWA and RFT and UPV and RFT.
8.4 Discussion for Further Development of the Research
In the current research, for DHBS bricks, the percentage of shale replacement was just 2.3% by
weight because of several constraints discussed in Section 3.1.2.6. With this amount of shale
replacement, all the parameters studied were very satisfactory with regards to the standards of the
masonry industry and improved in certain aspects owing to the water tightness, and low weight of
these bricks. An improved version of DHBS bricks, by incorporating higher concentrations of high
biopolymer sludge contents, should be a priority in the future once it is possible to achieve high
concentration of solids in HBS in practice.
The SSAB bricks were found to be the most promising in terms of mechanical performance, and
rather a sustainable hybrid masonry brick. Several studies could be done by constructing masonry
walls or wallettes with SSAB bricks and mortar to assess their behaviour in actual structural
components. All hybrid bricks considered demonstrated a superior durability performance,
indicating that this is a promising direction of growth for a sustainable masonry industry.
Shale-Poraver®- Na2SiO3 Bricks was another promising brick, which developed exceptional
strength and solid structure. However, further study would be required to identify the classification
temperature so that the shape effects of the bricks could be also addressed.
[196]
Bibliography
Abdel-Ghani, N. T., Elsayed, H. A., & Abdelmoied, S. (2018). Geopolymer synthesis by the
alkali-activation of blast furnace steel slag and its fire-resistance. HBRC Journal, 14(2), 159-
164.
Adyela. T.M .,Rahmanb. S.H., Islamb. S.M.N., Hossain .M. Sayemc, Khand.M &
Gafur.A.M.D.(2012). Characterization of Brick Making Soil: Geo-engineering, Elemental and
Thermal Aspects, Jahangirnagar University Journal of Science Vol. 35, No.1, pp. 109-118.
Ajam, H., Gómez-Meijide, B., Artamendi, I., & Garcia, A. (2018). Mechanical and healing
properties of asphalt mixes reinforced with different types of waste and commercial metal
particles. Journal of Cleaner Production, 192, 138–150.
Akhtar, A.& Sarmah, A.K. (2018). Construction and demolition waste generation and
properties of recycled aggregate concrete: a global perspective J. Clean. Prod., 186 , pp. 262-
281.
Akinshipe O & Kornelius G (2017) Chemical and Thermodynamic Processes in Clay Brick
Firing Technologies and Associated Atmospheric Emissions Metrics-A Review. J Pollut Eff
Cont 5: 190.
Akkarapongtrakul, A., Julphunthong, P.& Thanongsak, N. (2017). Setting time and
microstructure of Portland cement-bottom ash–sugarcane bagasse ash pastes. Monatsh. Chem.
148, 1355–1362.
Archibald, J. F., DeGagne´, D. O., Lausch, P., & De Souza, E. M. (1995). Ground waste glass
as a pozzolanic consolidation agent for mine backfill. CIM Bull., 88(995), 80–87.
Arulrajah, T.-A. Kua, S. Horpibulsuk, C. Phetchuay, C. Suksiripattanapong, &Y.-J.
Du.(2016). Strength and microstructure evaluation of recycled glass-fly ash geopolymer as low
carbon masonry units, Constr. Build. Mater. 114 .400–406.
[197]
ASTM C1006 (2019). Standard test method for splitting tensile strength of masonry units, astm
international, west conshohocken, pa, 2019.
ASTM C125-16. (2016). Standard terminology relating to concrete and concrete aggregates.
ASTM International.
ASTM C125-19. Standard terminology relating to concrete and concrete aggregates, astm
international, west conshohocken, pa, 2019.
ASTM C215 (2014). Standard test method for fundamental transverse, longitudinal,
and torsional resonant frequencies of concrete specimens, astm international, west
conshohocken, pa, 2014.
ASTM C597 (2016).Standard test method for pulse velocity through concrete, astm
international, west conshohocken, PA, 2016.
ASTM C67 (2019). Standard test methods for sampling and testing brick and structural clay
tile, astm international, west conshohocken, pa, 2019.
ASTM D2845 (2008). Standard test method for laboratory determination of pulse velocities
and ultrasonic elastic constants of rock (withdrawn 2017), astm international, west
conshohocken, pa, 2008.
ASTM D4318 (2017).Standard test methods for liquid limit, plastic limit, and plasticity index
of soils, astm international, west conshohocken, pa, 2017.
ASTM D6913 / D6913M-17, Standard Test Methods for Particle-Size Distribution (Gradation)
of Soils Using Sieve Analysis, ASTM International, West Conshohocken, Pa, 2017.
ASTM D698 (2012).Standard test methods for laboratory compaction characteristics of soil
using standard effort (12 400 ft-lbf/ft3 (600 kn-m/m3)), astm international, west conshohocken,
pa, 2012.
[198]
ASTM D7928 (2017).Standard test method for particle-size distribution (gradation) of fine-
grained soils using the sedimentation (hydrometer) analysis, astm international, west
conshohocken, pa 2017.
Atkinson R.H., Noland J.L.& Kingsley G.R. (1990) Application of NDE to Masonry
Structures; Current Technology and Future Needs. In: Thompson D.O., Chimenti D.E.
(eds) Review of Progress in Quantitative Non-destructive Evaluation. Review of Progress
in Quantitative Non-destructive Evaluation. Springer, Boston, MA,
Auta, S. M.,Uthman,A., Sadiku,S., & Shiwua, A.J.(2016). Flexural strength of reinforced
revibrated concrete beam with sawdust ash as a partial replacement for cement.Constr. of
Unique Build. and Struct. 5 31-45.
Barbara C. L (2007). BEES 4.0: Building for Environmental and Economic Sustainability,
National Institute of Standards and Technology (NIST).
Basegio, F. Berutti, A. Bernardes, C.P. & Bergmann (2002). Environmental and technical
aspects of the utilisation of tannery sludge as a raw material for clay products, J. Eur. Ceram.
Soc. 22 (13) 2251–2259. s0955-2219(02) 00024-9
Bashar, T.& Ghassan, N. (2009). Utilizing Waste Recycled Glass as Sand/Cement
Replacement in Concrete. Journal of Materials in Civil Engineering, 21(12), 709–721.
Bhushan, C., Basu, D.D., Yadav, N.K. & Kumar, R. (2016). National Brick Mission—A
Scoping Paper. Roadmap for Brick Kiln Sector: Challenges and Opportunities. Centre for
Science and Environment, New Delhi.
Brozovsky, J. & Russ J.,(2017). Ultrasonic pulse and resonance method–evaluation of the
degree of damage to the internal structure of repair mortars caused by exposure to high
temperatures, Russian Journal of Non-destructive Testing.
Buchholz , FL & Graham, AT - Modern Superabsorbent Polymer Technology John Wiley &
Sons, November 1997, 0471194115
[199]
C. Thormark (2002). A low energy building in a life cycle—its embodied energy, energy need
for operation and recycling potential. Build Environ, pp. 429-435
Cabrera-Covarrubias, F. G., Gomez-Soberon, J. M., Almaral-Sanchez, J. L., Arredondo-Rea,
S. P., & Mendivil-Escalante, J. M. (2018). Mechanical and basic deformation properties of
mortar with recycled glass as a fine aggregate replacement. International Journal of Civil
Engineering, 16(1), 107-121.
Campbell, J. W. & Pryce, W. (2003). Brick: a world history. London: Thames and Hudson.
Chandra Paul, S., Šavija, B., & Babafemi, A. J. (2018). A comprehensive review on
mechanical and durability properties of cement-based materials containing waste recycled
glass. Journal of Cleaner Production, 198, 891-906.
Chidiac, S. E., & Federico, L. M. (2007). Effects of waste glass additions on the properties and
durability of fired clay brick. Canadian Journal of Civil Engineering, 34(11), 1458-1466.
China Coal Information Institute (2015), China Statistic Yearbook of Coal Industry, Coal
Industry Press, Beijing.
Chindaprasirt, P.& Rukzon, S. (2015). Strength and chloride resistance of the blended Portland
cement mortar containing rice husk ash and ground river sand. Mater. Struct. 48(11), 3771–
3777.
Conti J. (2011) Emission of greenhouse gases in the united states ,2009, US Energy
Information Administration, U.S. department of energy, Washington, Available at :
https://www.eia.gov/ environment/emissions/ ghg_report/ pdf /0 573%282009%29
CSA Standard S304.1-04. (2004) Design of masonry structures, ISBN 1-55397-402-6 ©
Canadian Standards Association — 2004
de Figueirêdo Lopes Lucena, L. C., Thomé Juca, J. F., Soares, J. B., & Portela, M. G. (2014).
Potential Uses of Sewage Sludge in Highway Construction. Journal of Materials in Civil
Engineering, 26(9), 04014051.
[200]
Demir, I. (2009). Reuse of waste glass in building brick production. Waste Management and
Research, 27(6), 572-577.
Dixon, W. (2010). The Impacts of Construction and the Built Environment, Briefing Notes,
Willmott-dixon Group.
Dondi, M., Guarini, G., Raimondo, M., & Zanelli, C. (2009). Recycling PC and TV waste glass
in clay bricks and roof tiles. Waste Management, 29(6), 1945-1951.
Dove, C. A., Bradley, F. F., & Patwardhan, S. V. (2016). Seaweed biopolymers as additives
for unfired clay bricks. Materials and Structures, 49(11), 4463–4482.
Dyer, T. D., & Dhir, R. K. (2001). Chemical reactions of glass cullet used as cement
component. Journal of Materials in Civil Engineering, 13(6), 412-417.
Dyer, T.D.& Dhir, R.K. (2001). Chemical reactions of glass cullet used as cement component.
J Mater Civ Eng, 13 (6) (2001), pp. 412-417.
Emrullahoglu Abi, C. B. (2014). Effect of borogypsum on brick properties. Construction and
Building Materials, 59, 195–203.
Environmental Engineering Laboratory, York University,
http://civil.lassonde.yorku.ca/graduate-facilities/
Eo, S.-H., & Yi, S.-T. (2015). Effect of oyster shell as an aggregate replacement on the
characteristics of concrete. Magazine of Concrete Research, 67(15), 833–842.
European Environment Agency (EEA). Greenhouse gas emission trends and projections in
Europe 2011: tracking progress towards Kyoto and 2020 Targets. Copenhagen: EEA; 2011.
Fay, R., Treloar, G. & Iyer-Raniga, U. (2000), Life-cycle energy analysis of buildings: a case
study, Building Research & Information, Vol. 28 No. 1, pp. 31-41.
Fernandes F.M., Lourenço P.B.& Castro F. (2010) Ancient Clay Bricks: Manufacture and
Properties. In: Dan M.B., Přikryl R., Török Á. (eds) Materials, Technologies and Practice in
Historic Heritage Structures. Springer, Dordrecht.
[201]
Ferone. C. et al.,(2015) Thermally treated clay sediments as geopolymer source material,
Appl. Clay Sci. 107 195–204
Garg, M., & Pundir, A. (2014). Utilization of Brine Sludge in Non-structural Building
Components: A Sustainable Approach. Journal of Waste Management, 2014, 1–7.
Giannini. E.R. (2012) .Evaluation of Concrete Structures Affected by Alkali-Silica Reaction
and Delayed Ettringite Formation., Construction and Building Materials 202:814-824,
Giugliano, M., & Paggi, A. (1985). Use of Tannery Sludge in Brick Production. Waste
Management & Research, 3(1), 361–368.
Goel, G., & Kalamdhad, A. S. (2017). An investigation on use of paper mill sludge in brick
manufacturing.Construction and Building Materials, 148, 334–343.
Hasan, N. M. S., Sobuz, H. R., Sayed, M. S., & Islam, M. S. (2012). The use of coconut fibre
in the production of structural lightweight concrete. Journal of Applied Sciences, 12(9), 831-
839.
Heindl, R.A. & Pendergast, W.L.(1929). A book on Progress Report on investigation of
Fireclay Bricks and the Clays used in their preparation, J. Am. Ceram. Soc., 12 (10) (October
1929), pp. 640-675.
Hossain, S. S., Mathur, L., Majhi, M. R., & Roy, P. K. (2018). Manufacturing of green building
brick: recycling of waste for construction purpose. Journal of Material Cycles and Waste
Management.
Hu, C., Lin, W., Partl, M., Wang, D., Yu, H., & Zhang, Z. (2018). Waste packaging tape as a
novel bitumen modifier for hot-mix asphalt. Construction and Building Materials, 193, 23-31.
Huang, P., Lv, L., Liao, W., Lu, C., & Xu, Z. (2018). Microstructural Properties of Cement
Paste and Mortar Modified by Low Cost Nanoplatelets Sourced from Natural Materials.
Materials, 11(5), 783.
[202]
Iwuagwu, J. O., & Ugwuanyi, J. O. (2014). Treatment and Valorization of Palm Oil Mill
Effluent through Production of Food Grade Yeast Biomass. Journal of Waste Management,
2014, 1–9.
Jain, N., Garg, M., & Minocha, A. K. (2015). Green Concrete from Sustainable Recycled
Coarse Aggregates: Mechanical and Durability Properties. Journal of Waste Management,
2015, 1–8.
Jiménez-Quero, V., Maza-Ignacio, O. T., Guerrero-Paz, J., & Campos-Venegas, K. (2017).
Industrial wastes as alternative raw materials to produce eco-friendly fired bricks. Journal of
Physics: Conference Series, 792, 012065.
Joo-Hwa, J., Sze-Yunn, H., & Kuan-Yeow, S. (2000). Reuse of Industrial Sludge as Pelletized
Aggregate for Concrete. Journal of Environmental Engineering, 126(3), 279–287.
Joshua, O., Olusola, K. O., Ogunde, A. O., Ede, A. N., Olofinnade, R. M., & Nduka, D. O.
(2017). Investigating for pozzolanic activity in palm kernel nut waste ash (PKNWA) with
cement towards a sustainable construction. International Journal of Applied Engineering
Research, 12(23), 13559-13565.
Kadir A.A.& A. Mohajerani, (2011). Bricks: an excellent building material for recycling
wastes–a review.
Kamal. I, Sherwani. A, Ali. A, Khalid .A, Saadi .I & Harbi. A .(2017) Walnut Shell for Partial
Replacement of Fine Aggregate in Concrete: Modeling and Optimization J. of Civ. Eng. Res.
4 109-119.
Kaza, S., Yao, L. C., Bhada-Tata, P., & Van Woerden, F. (2018). What a Waste 2.0: A Global
Snapshot of Solid Waste Management to 2050 (No. 132827; pp. 1–295). Retrieved from The
World Bank website: http://documents. worldbank.org/curated/en/ 697271544470229584/
What-a-Waste-2-0-A-Global-Snapshot-of-Solid-Waste-Management-to-2050
Kazmi, S. M. S., Abbas, S., Nehdi, M. L., Saleem, M. A., & Munir, M. J. (2017). Feasibility
of Using Waste Glass Sludge in Production of Ecofriendly Clay Bricks. Journal of Materials
in Civil Engineering, 29(8), 04017056.
[203]
Khankhaje,E., Salim, M.R., Mirza, J., Hussin, M.W. & Rafieizonooz, M.(2016).Properties of
sustainable lightweight pervious concrete containing oil palm kernel shell as coarse aggregate
Construction and Building Materials 126 1054-1065.
Kim, I. S., Choi, S. Y., & Yang, E. I. (2018). Evaluation of durability of concrete substituted
heavyweight waste glass as fine aggregate. Construction and Building Materials, 184, 269-
277. doi:10.1016/j.conbuildmat.2018.06.221.
Koroth, S.R., Fazio, P., & Feldman, D. (1998). Evaluation of Clay Brick Durability Using
Ultrasonic Pulse Velocity. Journal of Architectural Engineering,Vol. 4, Issue 4 doi: 10.1061
/(asce) 1076- 0431(1998)4:4(142).
Kumar.D, Singh.S, Kumar.N & Gupta.A. (2014) Low Cost Construction Material for Concrete
as Sawdust Int. J. of Current Engineering and Technology 4 3428-3430.
Kumutha, R., Vijai, K. & Vijayragavan, S. (2018). Mechanical properties of concrete using
coconut shells as coarse aggregates. ARPN Journal of Engineering and Applied Sciences,
13(20), 8236-8242.
Lamrani, M., Laaroussi, N., Khabbazi, A., Khalfaoui, M., Garoum, M., & Feiz, A. (2017).
Experimental study of thermal properties of a new ecological building material based on peanut
shells and plaster. Case Studies in Construction Materials, 7, 294–304.
Lee, J., Yoo, H., Park, S., Cho, S., & Seo, Y. (2016). Recycling of cathode ray tube panel
glasses as aggregates of concrete blocks and clay bricks. Journal of Material Cycles and Waste
Management, 18(3), 552-562.
Lin, D.-F., & Weng, C.-H. (2001). Use of Sewage Sludge Ash as Brick Material. Journal of
Environmental Engineering, 127(10), 922–927
Lin, K., Huang, L., Shie, J., Cheng, C., Lee, C., & Chang, T. (2012). Elucidating the effects of
solar panel waste glass substitution on the physical and mechanical characteristics of clay
bricks. Environmental Technology, 1, 1-10.
[204]
Liu, S., Peng, A., Wu, J., & Zhou, S. B. (2018). Waste engine oil influences on chemical and rheological
properties of different asphalt binders. Construction and Building Materials, 191, 1210–1220.
Lutfi, M., Yamin, M., Rahman, M., & Ginsel Popang, E. (2018). A comparative analysis of
the quality of concrete blocks produced from coconut fibre, oil palm empty fruit bunch, and
rice husk as filler material (Vol. 195). Presented at the MATEC Web of Conferences.
Malhotra, V. M., & Carino, N. J. (1991). CRC Handbook on Nondestructive Testing of
Concrete. Boca Raton: CRC Press.
Malhotra, V. M., & Mehta, P. K. (1994). Concrete Technology: Past, Present, and Future:
Proceedings of V. Mohan Malhotra Symposium. Detroit, Michigan:American Concrete
Institute.
Manoj.A., Dhanya.P., Ganapathy.R., Dhanasekar.R., & Sevugamoorthy.(2017). An
experimental study of self healing of cracks in concrete using sodium silicate capsule, Journal
of Chemistry 10(2):577-583.
Markus Schilling & Lichun Chiang. (2009). The depletion of non-renewable resources for non-
sustainable externalities as an economic development policy cpsa annual conference (Canadian
Political Science Association), Available at : https://www.cpsa-acsp.ca/papers-
2009/Schilling.pdf
Martínez-García, C., González-Fonteboa, B., Martínez-Abella, F., & Carro- López, D. (2017).
Performance of mussel shell as aggregate in plain concrete. Construction and Building
Materials, 139, 570–583.
Maschio, S., Tonello, G., & Furlani, E. (2013). Recycling Glass Cullet from Waste CRTs for
the Production of High Strength Mortars. Journal of Waste Management, 2013, 1–8.
Mehta, A., & Siddique, R. (2018). Sustainable geopolymer concrete using ground granulated
blast furnace slag and rice husk ash: Strength and permeability properties. Journal of Cleaner
Production, 205, 49–57.
[205]
Michel, A. T., Srubar, III W. V., & Billington, S. L. (2014). Biobased Materials for Sustainable
Temporary Disaster-Relief Housing. Proceedings of the 3rd International Conference on
Urban Disaster Reduction, Earthquake Engineering Research Institute, Boulder, CO, USA,
2014.
Mirza S .H., Anwar.A., Samarul H & Mohd .A.( 2017). Cost Optimization of concrete by
replacing fine aggregate with walnut shell powder Int. J. of Civil Engineering and Technology
8 82-89.
Mobili, A., Giosuè, C., & Tittarelli, F. (2018). Valorisation of GRP Dust Waste in Fired Clay
Bricks. Advances in Civil Engineering, 2018, 1–9.
Moedinger Fritz (2003). Sustainable clay brick production – a case study.The 2005 World
Sustainable Building Conference, Tokyo, 27-29 September 2005 (SB05Tokyo)
Mondal, A., Das, S., Sah, R. K., Bhattacharyya, P., & Bhattacharya, S. S. (2017).
Environmental footprints of brick kiln bottom ashes: Geostatistical approach for assessment of
metal toxicity. Science of the Total Environment, 609, 215-224.
Mozo Moreno, W. R & Gómez, A.(2016). Biosolids and Biosolid Ashes as Input for Producing
Brick-like Construction Materials, TECCIENCIA, Vol. 12 No. 21, 45-51.
Mozo Moreno, W. R. & Gómez, A.(2016). Biosolids and Biosolid Ashes as Input for
Producing Brick-like Construction Materials, TECCIENCIA, Vol. 12 No. 21, 45-51, 2016.
Munir, M. J., Abbas, S., Nehdi, M. L., Kazmi, S. M. S., & Khitab, A. (2018). Development of
Eco-Friendly Fired Clay Bricks Incorporating Recycled Marble Powder. Journal of Materials
in Civil Engineering, 30(5), 04018069.
Naganathan., A.Y.O. Mohamed. & K.N. Mustapha.(2015). Performance of bricks made sing
fly ash and bottom ash, Constr. Build. Mater. 576–580.
Okuno, N., & Takahashi, S. (1997). Full scale application of manufacturing bricks from
sewage. Water Science and Technology, 36(11), 243-250.
[206]
Olutoge, F.A., Buari,T.A. & Adeleke, J.S.(2013).Characteristics Strength and Durability of
Groundnut Shell Ash (GSA) Blended Cement Concrete in Sulphate Environment. International
Journal of Scientific & Engineering Research 4 2122-134.
Owusu, P. A., & Asumadu-Sarkodie, S. (2016). A review of renewable energy sources,
sustainability issues and climate change mitigation. Cogent Engineering, 3(1), 1167990.
Pardalopoulos, S. I., Karantoni, F. V., & Pantazopoulou, S. J. (2019). Practical assessment of
the seismic behavior of a confined masonry system. Soil Dynamics and Earthquake
Engineering, 127, 105831.
Pinarli, V., & Kaymal, G. (1994). An innovative sludge disposal option‐reuse of sludge ash by
incorporation in construction materials. Environmental Technology, 15(9), 843–852.
Priyadharshini, P., Ramamurthy, K., & Robinson, R. G. (2018). Reuse potential of stabilized
excavation soil as fine aggregate in cement mortar. Construction and Building Materials, 192,
141–152.
Qudoos, A., Kim, H. G., Atta-ur-Rehman, & Ryou, J.-S. (2018). Effect of mechanical
processing on the pozzolanic efficiency and the microstructure development of wheat straw
ash blended cement composites. Construction and Building Materials, 193, 481–490.
Raheem, A. A., Adedokun, S. I., Adeyinka, E. A., & Adewole, B. V. (2017). Application of
corn stalk ash as partial replacement for cement in the production of interlocking paving stones.
International Journal of Engineering Research in Africa, 30, 85-93.
Ram, S., & Ralegaonkar, R. V. (2018). Development of low thermal conductivity walling
material using industrial by-product. Journal of Cleaner Production, 204, 767–777.
Reddy Babu, G.& Venkata Ramana, N. (2013). Durability of Bricks Cast with Industrial
Sludge. IOSR Journal of Mechanical and Civil Engineering, 6(4), 43–46.
Reddy, B.V.V. (2004). Sustainable building technologies. Curr. Sci., 87 (7) (2004), pp. 899-
907.
[207]
Robert B. Gibson, Karine Péloffy, Daniel Horen Greenford, Meinhard Doelle, H. Damon
Matthews, Christian Holz, Kiri Staples, Bradley Wiseman & Frédérique Grenier. (2019). From
Paris to Projects Clarifying the implications of Canada’s climate change mitigation
commitments for the planning and assessment of projects and strategic undertakings, Available
at :https://uwaterloo.ca/paris -to-projects/ sites/ca.paris- to-projects/files /uploads/files/p2p_
full_report_23jan19.pdf.
S. Lemmet. (2009). Buildings and climate change: Summary for decision-makers: United
Nations Environment Programme (UNEP) (2009), pp. 1-56.
Sachs, J.& Warner, A. (1995). Natural resource abundance and economic growth. Harvard
Institute for International Development, Cambridge (MA).
Sada,B. H., Amartey,Y. D., Bako,S. & Nigeria. (2013). An investigation into the use of
groundnut shell as fine aggregate replacement Nigerian Journal of Technology 32 54-60.
Samadikun, B. P., Rukayah, S., Priyambada, I. B., Lumbantobing, S. T. R., & Budihardjo, M.
A. (2018). Potential utilization of SSA from water treatment plant as brick material. Paper
presented at the E3S Web of Conferences, , 73.
Sasikumar C.R (2010). Building from debris, Indianexpress.com, available at:
https://indianexpress.com/article/opinion/columns/building-from-debris/
Shafy Hussein Abdel-Shafy & Mona S. M. Mansour. (2018). Solid waste issue: Sources,
composition, disposal, recycling, and valorization, Egyptian Journal of Petroleum 27(4):1275-
1290.
Smith S.R. (2008). A critical review of the bioavailability and impacts of heavy metals in
municipal solid waste composts compared to sewage sludge. Environ Int. 2009 Jan;35(1):142-
56.
Smith, A. S. (2004). Recycled glass as a brick fluxing agent. Paper presented at the Proceedings
of the International Conference on Sustainable Waste Management and Recycling: Glass
Waste, 149-165.
[208]
Sowers, G. F., (1979), Introductory soil Mechanics and foundations: geotechnical engineering,
4th edition,copyright, Macmilan Publising Co., Inc., New-York,
Statistics Canada 2018 : www150.statcan.gc.ca/n1/daily-quotidien/180615/dq180615d-
eng.html
Thakkar. Krishan (2017): https://www.slideshare.net/KishanThakkar7/demolished-waste-as-
coarse-aggregate.
U. Rajarathnam, V. Athalye, S. Ragavan, S. Maithel, D. Lalchandani, S. Kumar, E. Baum, C.
& Weyant, T. Bond. Assessment of air pollutant emissions from brick kilns. Atmos. Environ.,
98 (2014), pp. 549-553.
U.S. Department of State (DOS). U.S. climate action report 2010: fifth national communication
of the United States of America under the United Nations Framework Convention on Climate
Change. Washington, DC: DOS; 2010.
Ukwatta, A. Mohajerani, S. Setunge, & N. Eshtiaghi. (2015).Possible use of biosolids in fired-
clay bricks, Constr. Build. Mater. 91. 86–93.
Wentao, Z., & Jason, M.I. (2010). Using Recycled Concrete Aggregates in New Zealand
Ready-Mix Concrete Production. Journal of Materials in Civil Engineering, 22(5), 443–450.
Wiebusch, & C.F. Seyfried,(1997). Utilization of sewage sludge ashes in the brick and tile
industry, Water Sci. Technol. 36 (11) 251–258
Wiebusch, B., & Seyfried, C. F. (1997). Utilization of SSA in the brick and tile industry. Water
Science and Technology, 36(11), 251-258.
World Economic Forum (2019) Making Affordable Housing – A reality in cities report ,
Available at http://www3.weforum.org/docs/
World Energy Council (WEC). 2013 Survey of World Energy Resources. London: WEC;
2013.
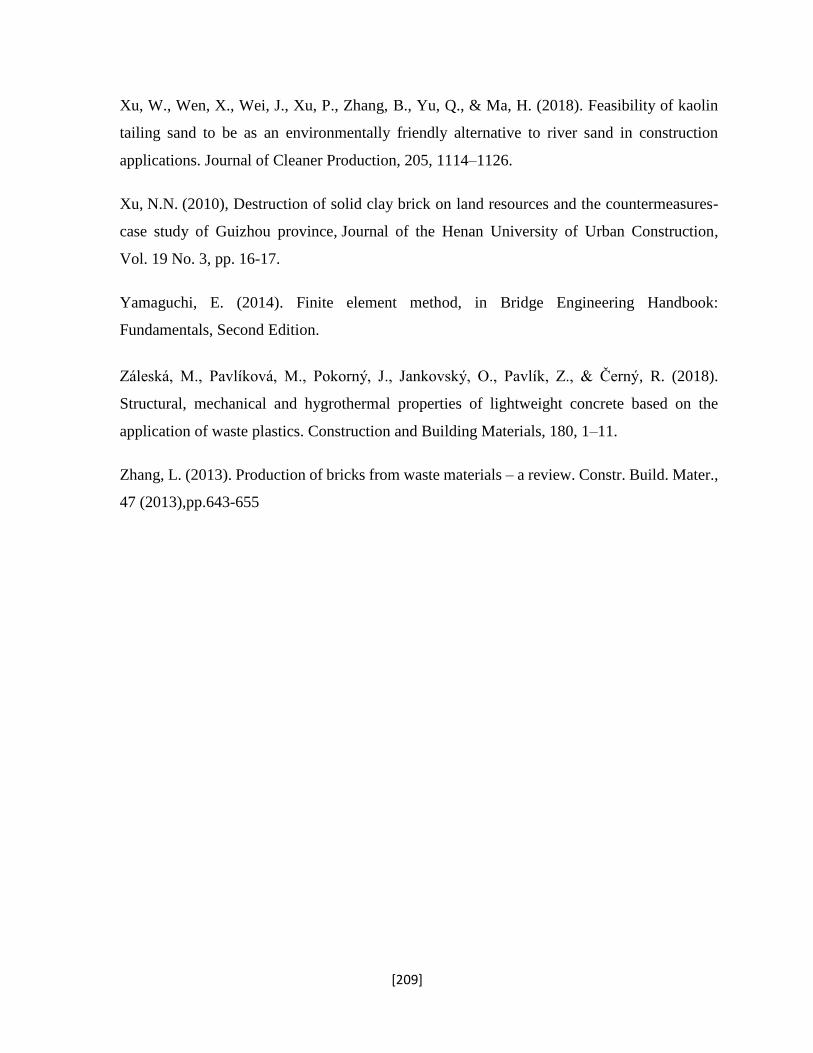
[209]
Xu, W., Wen, X., Wei, J., Xu, P., Zhang, B., Yu, Q., & Ma, H. (2018). Feasibility of kaolin
tailing sand to be as an environmentally friendly alternative to river sand in construction
applications. Journal of Cleaner Production, 205, 1114–1126.
Xu, N.N. (2010), Destruction of solid clay brick on land resources and the countermeasures-
case study of Guizhou province, Journal of the Henan University of Urban Construction,
Vol. 19 No. 3, pp. 16-17.
Yamaguchi, E. (2014). Finite element method, in Bridge Engineering Handbook:
Fundamentals, Second Edition.
Záleská, M., Pavlíková, M., Pokorný, J., Jankovský, O., Pavlík, Z., & Černý, R. (2018).
Structural, mechanical and hygrothermal properties of lightweight concrete based on the
application of waste plastics. Construction and Building Materials, 180, 1–11.
Zhang, L. (2013). Production of bricks from waste materials – a review. Constr. Build. Mater.,
47 (2013),pp.643-655
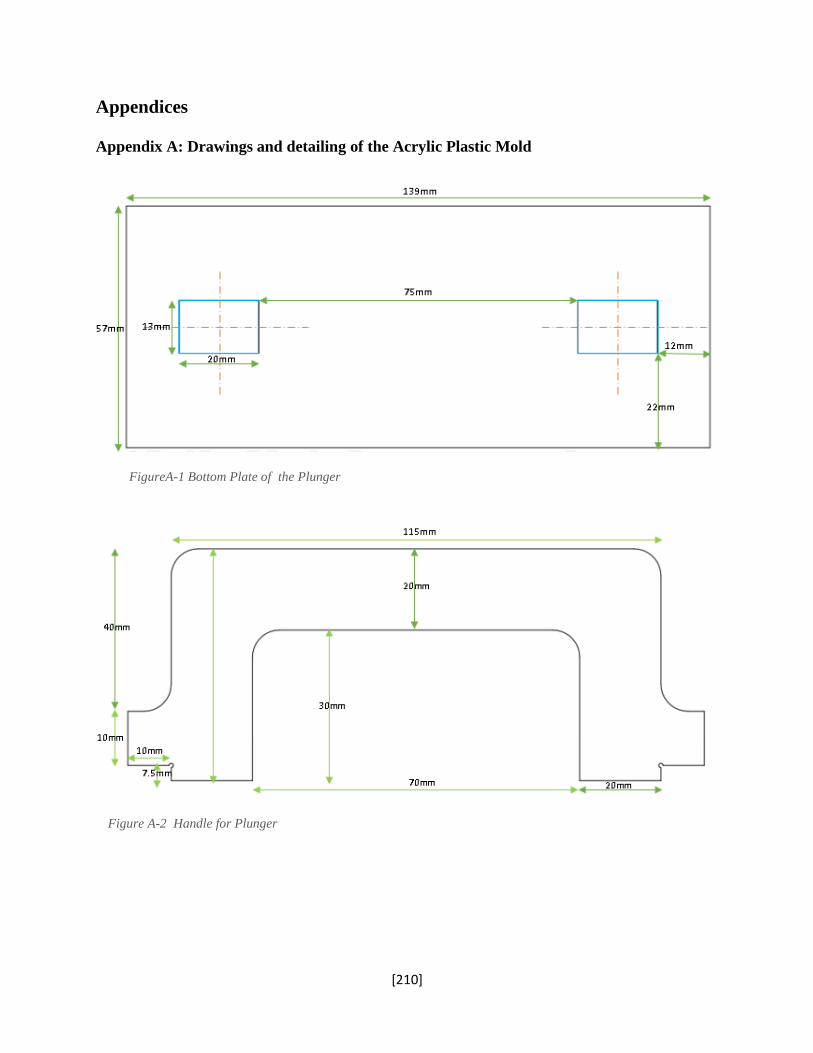
[210]
Appendices Appendix A: Drawings and detailing of the Acrylic Plastic Mold
FigureA-1 Bottom Plate of the Plunger
Figure A-2 Handle for Plunger
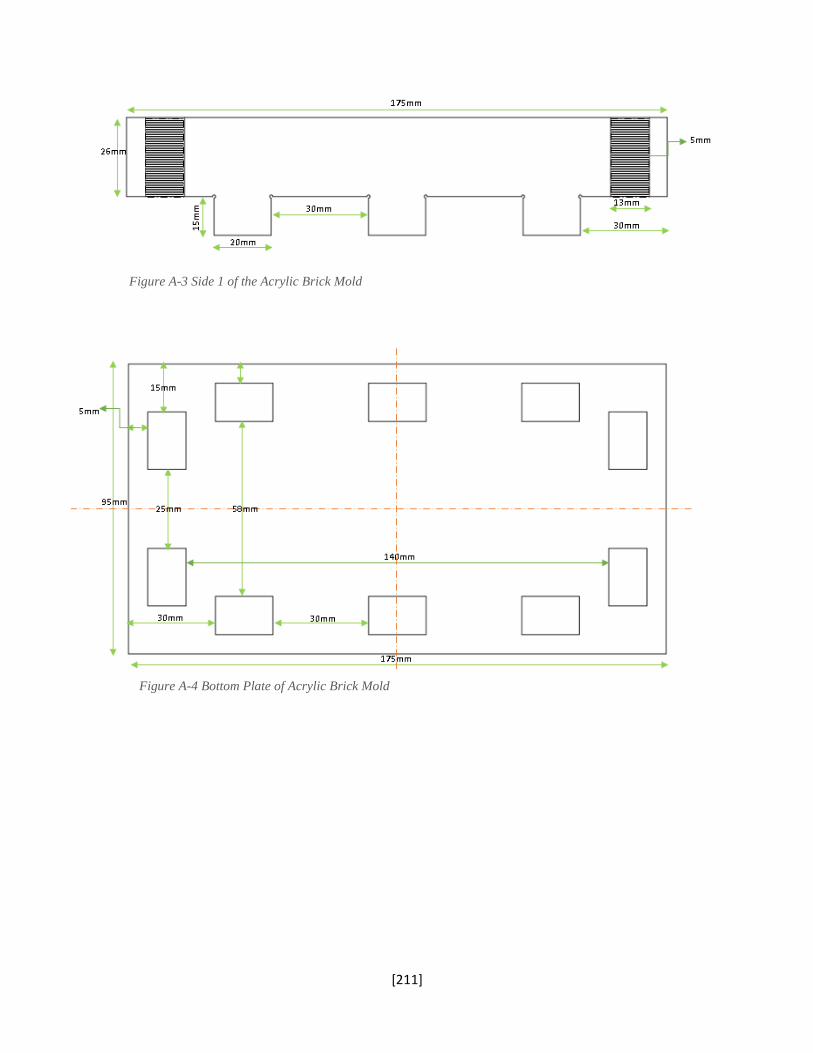
[211]
Figure A-3 Side 1 of the Acrylic Brick Mold
Figure A-4 Bottom Plate of Acrylic Brick Mold
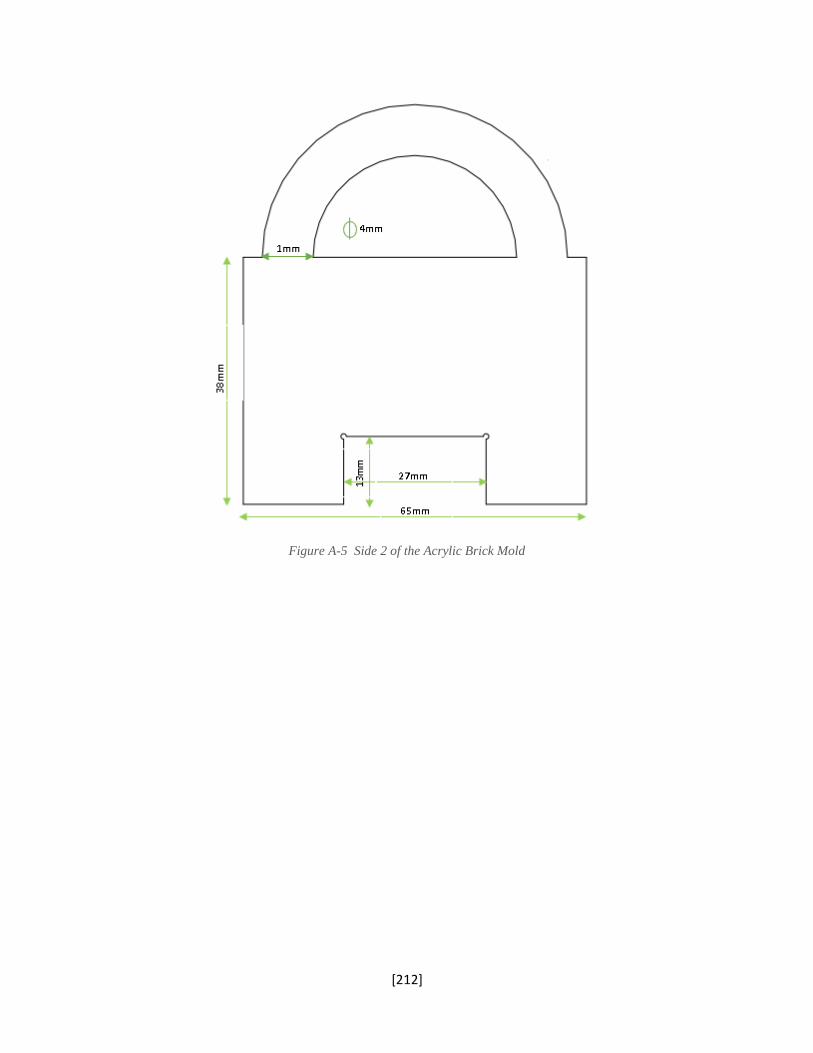
[212]
Figure A-5 Side 2 of the Acrylic Brick Mold
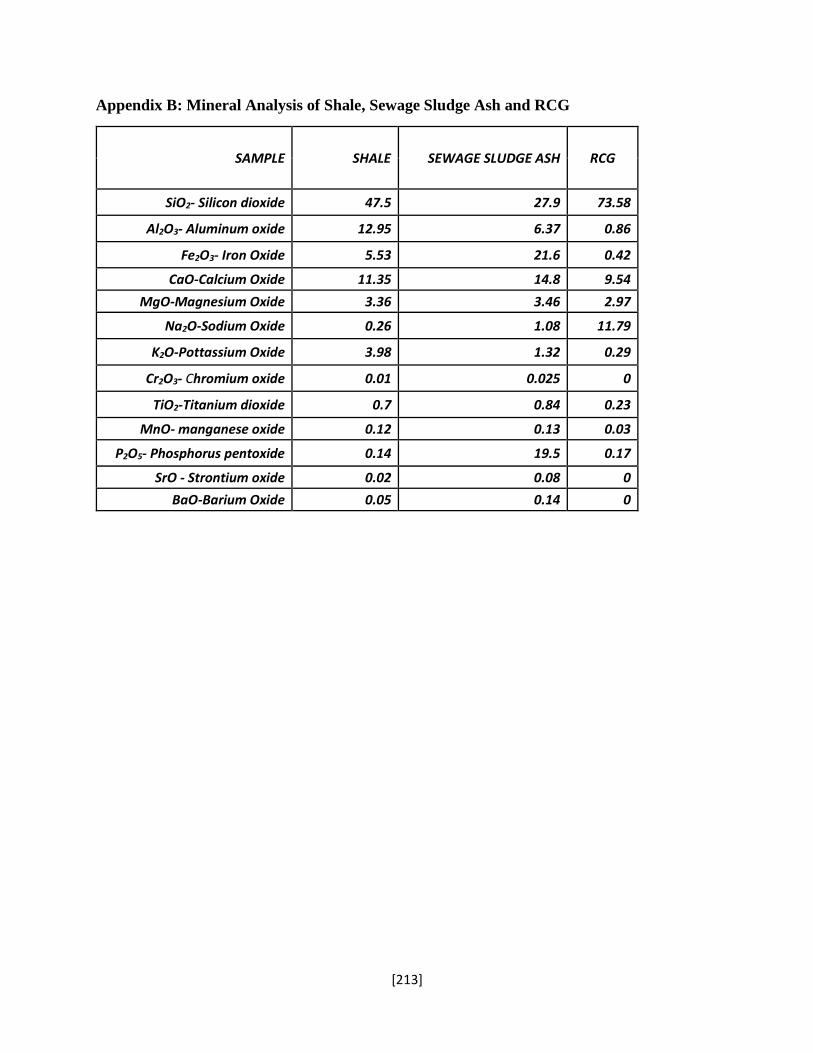
[213]
Appendix B: Mineral Analysis of Shale, Sewage Sludge Ash and RCG
SAMPLE SHALE SEWAGE SLUDGE ASH RCG
SiO2- Silicon dioxide 47.5 27.9 73.58
Al2O3- Aluminum oxide 12.95 6.37 0.86
Fe2O3- Iron Oxide 5.53 21.6 0.42
CaO-Calcium Oxide 11.35 14.8 9.54
MgO-Magnesium Oxide 3.36 3.46 2.97
Na2O-Sodium Oxide 0.26 1.08 11.79
K2O-Pottassium Oxide 3.98 1.32 0.29
Cr2O3- Chromium oxide 0.01 0.025 0
TiO2-Titanium dioxide 0.7 0.84 0.23
MnO- manganese oxide 0.12 0.13 0.03
P2O5- Phosphorus pentoxide 0.14 19.5 0.17
SrO - Strontium oxide 0.02 0.08 0
BaO-Barium Oxide 0.05 0.14 0
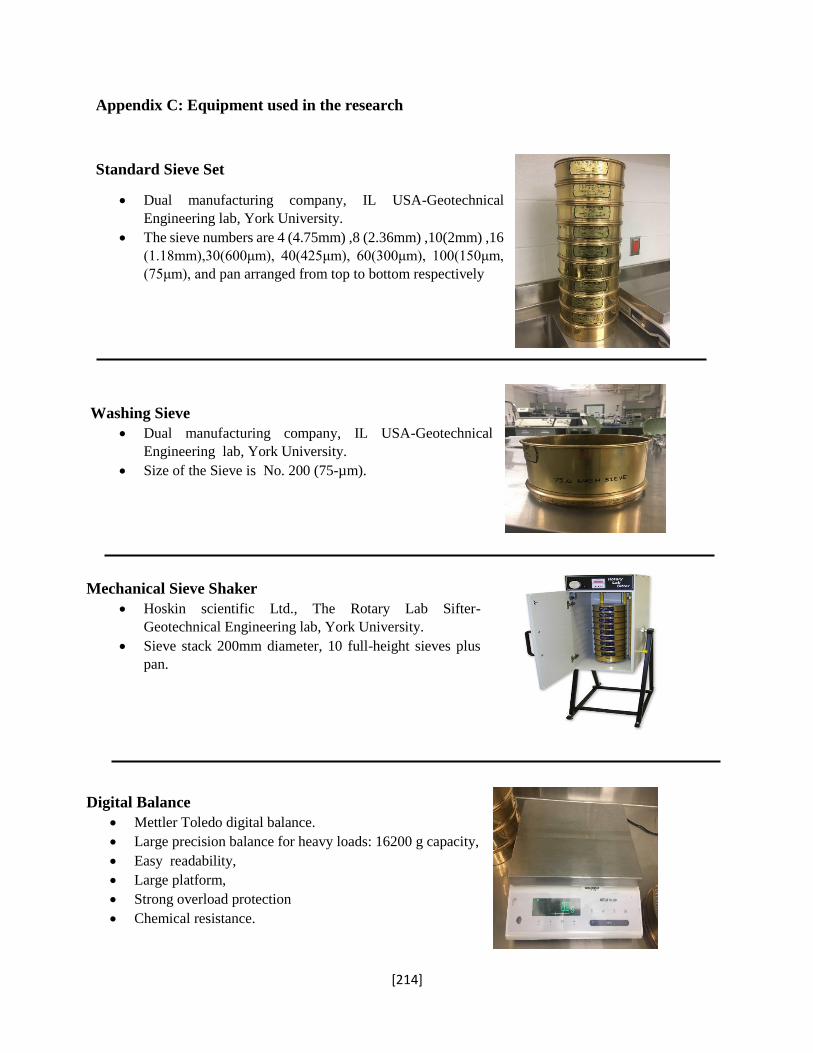
[214]
Appendix C: Equipment used in the research
Standard Sieve Set
• Dual manufacturing company, IL USA-Geotechnical
Engineering lab, York University.
• The sieve numbers are 4 (4.75mm) ,8 (2.36mm) ,10(2mm) ,16
(1.18mm),30(600μm), 40(425μm), 60(300μm), 100(150μm,
(75μm), and pan arranged from top to bottom respectively
Washing Sieve
• Dual manufacturing company, IL USA-Geotechnical
Engineering lab, York University.
• Size of the Sieve is No. 200 (75-µm).
Mechanical Sieve Shaker
• Hoskin scientific Ltd., The Rotary Lab Sifter-
Geotechnical Engineering lab, York University. • Sieve stack 200mm diameter, 10 full-height sieves plus
pan.
Digital Balance
• Mettler Toledo digital balance.
• Large precision balance for heavy loads: 16200 g capacity, • Easy readability,
• Large platform,
• Strong overload protection
• Chemical resistance.
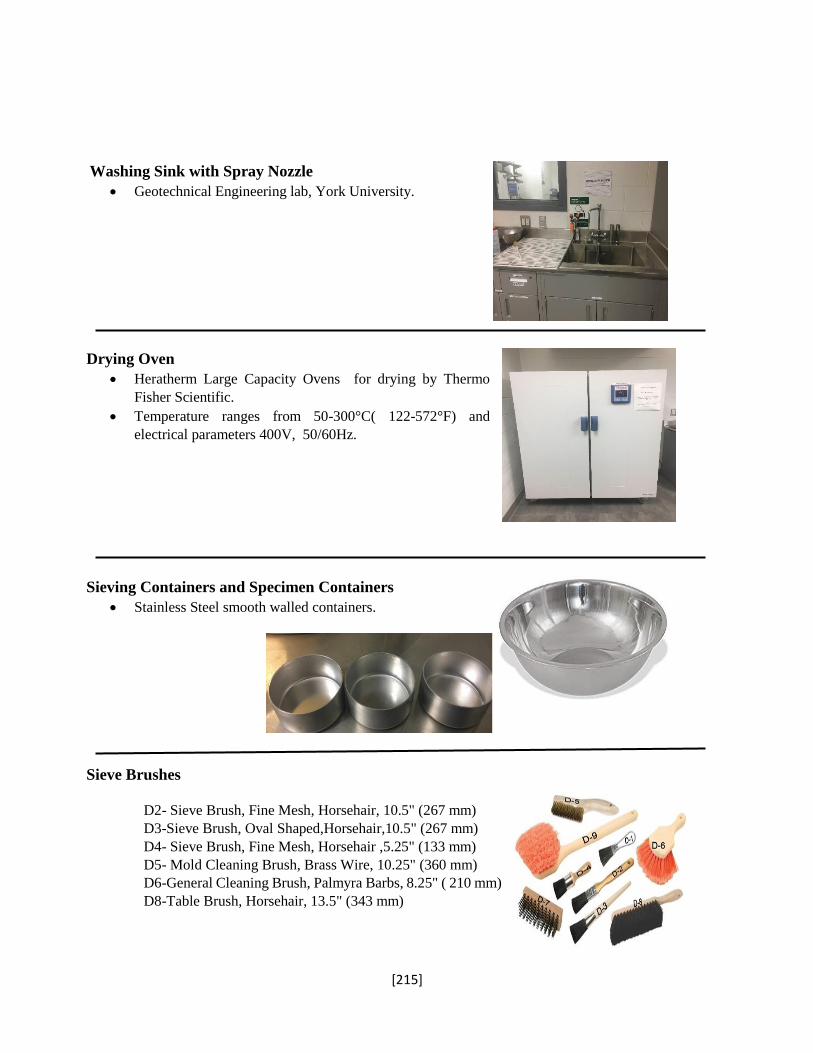
[215]
Washing Sink with Spray Nozzle
• Geotechnical Engineering lab, York University.
Drying Oven
• Heratherm Large Capacity Ovens for drying by Thermo
Fisher Scientific.
• Temperature ranges from 50-300°C( 122-572°F) and
electrical parameters 400V, 50/60Hz.
Sieving Containers and Specimen Containers
• Stainless Steel smooth walled containers.
Sieve Brushes
D2- Sieve Brush, Fine Mesh, Horsehair, 10.5" (267 mm)
D3-Sieve Brush, Oval Shaped,Horsehair,10.5" (267 mm)
D4- Sieve Brush, Fine Mesh, Horsehair ,5.25" (133 mm)
D5- Mold Cleaning Brush, Brass Wire, 10.25" (360 mm)
D6-General Cleaning Brush, Palmyra Barbs, 8.25" ( 210 mm)
D8-Table Brush, Horsehair, 13.5" (343 mm)
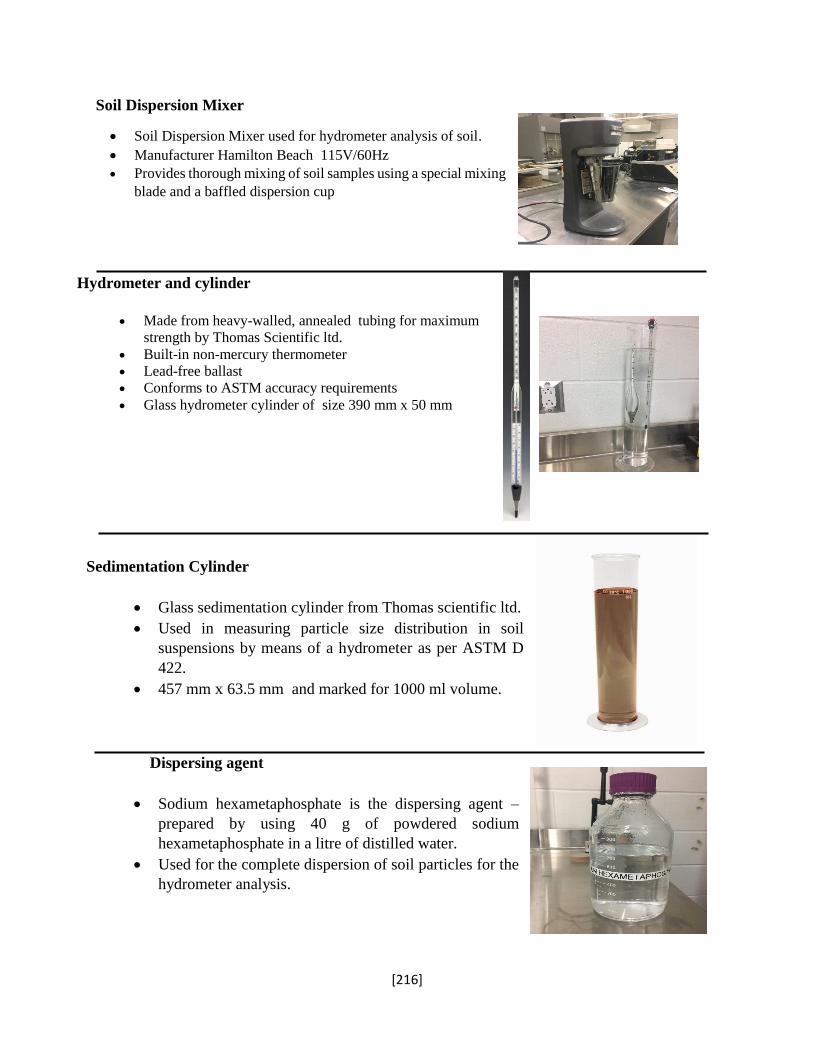
[216]
Soil Dispersion Mixer
• Soil Dispersion Mixer used for hydrometer analysis of soil.
• Manufacturer Hamilton Beach 115V/60Hz
• Provides thorough mixing of soil samples using a special mixing
blade and a baffled dispersion cup
Hydrometer and cylinder
• Made from heavy-walled, annealed tubing for maximum
strength by Thomas Scientific ltd.
• Built-in non-mercury thermometer
• Lead-free ballast
• Conforms to ASTM accuracy requirements
• Glass hydrometer cylinder of size 390 mm x 50 mm
Sedimentation Cylinder
• Glass sedimentation cylinder from Thomas scientific ltd.
• Used in measuring particle size distribution in soil
suspensions by means of a hydrometer as per ASTM D
422.
• 457 mm x 63.5 mm and marked for 1000 ml volume.
Dispersing agent
• Sodium hexametaphosphate is the dispersing agent –
prepared by using 40 g of powdered sodium
hexametaphosphate in a litre of distilled water.
• Used for the complete dispersion of soil particles for the
hydrometer analysis.
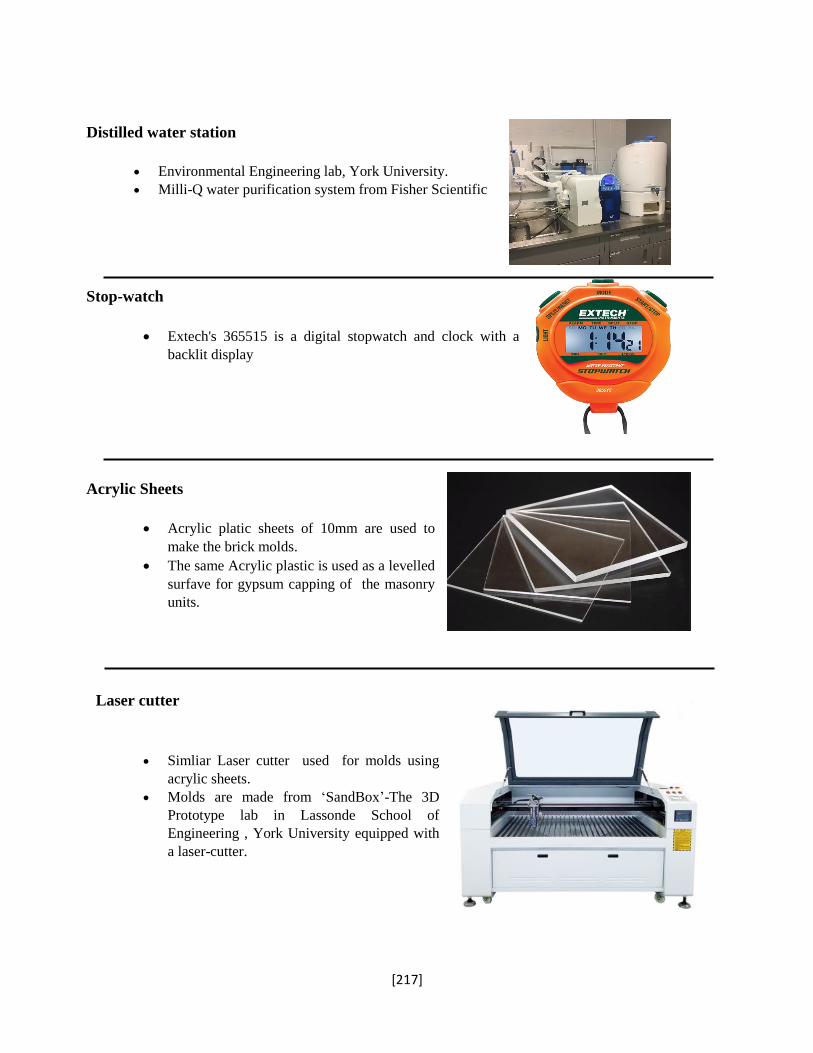
[217]
Distilled water station
• Environmental Engineering lab, York University.
• Milli-Q water purification system from Fisher Scientific
Stop-watch
• Extech's 365515 is a digital stopwatch and clock with a
backlit display
Acrylic Sheets
• Acrylic platic sheets of 10mm are used to
make the brick molds.
• The same Acrylic plastic is used as a levelled
surfave for gypsum capping of the masonry
units.
Laser cutter
• Simliar Laser cutter used for molds using
acrylic sheets.
• Molds are made from ‘SandBox’-The 3D
Prototype lab in Lassonde School of
Engineering , York University equipped with
a laser-cutter.
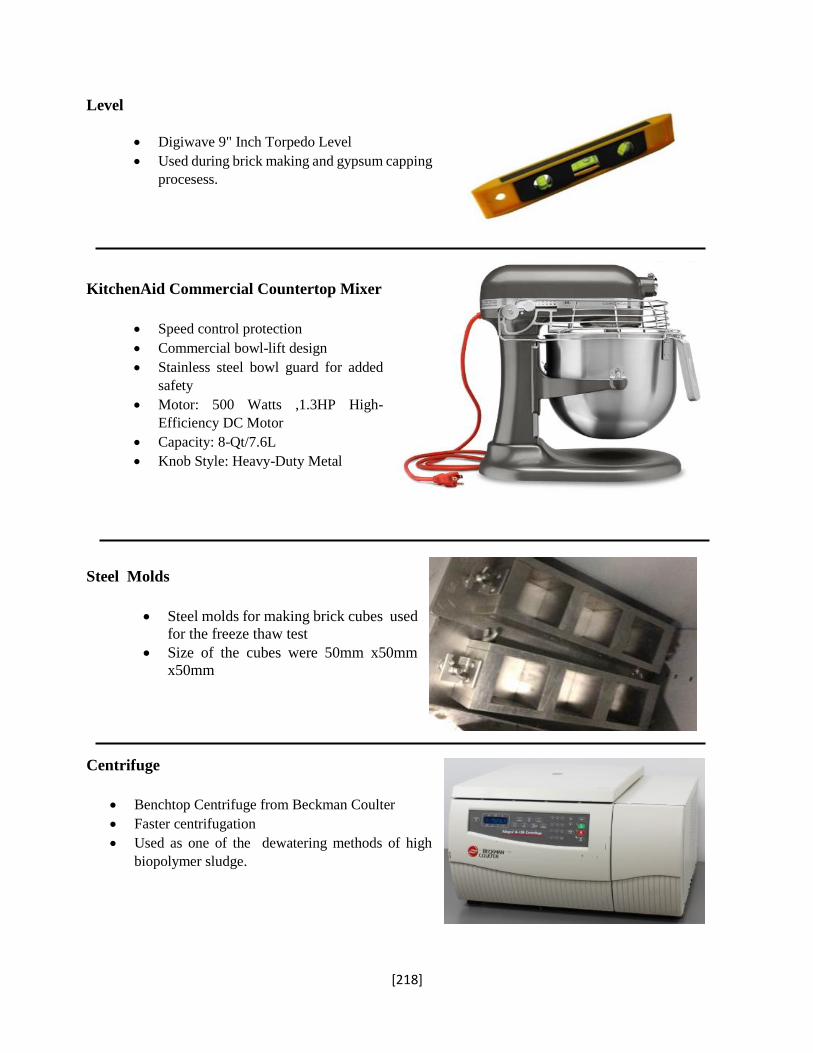
[218]
Level
• Digiwave 9" Inch Torpedo Level
• Used during brick making and gypsum capping
procesess.
KitchenAid Commercial Countertop Mixer
• Speed control protection
• Commercial bowl-lift design
• Stainless steel bowl guard for added
safety
• Motor: 500 Watts ,1.3HP High-
Efficiency DC Motor
• Capacity: 8-Qt/7.6L
• Knob Style: Heavy-Duty Metal
Steel Molds
• Steel molds for making brick cubes used
for the freeze thaw test
• Size of the cubes were 50mm x50mm
x50mm
Centrifuge
• Benchtop Centrifuge from Beckman Coulter
• Faster centrifugation
• Used as one of the dewatering methods of high
biopolymer sludge.
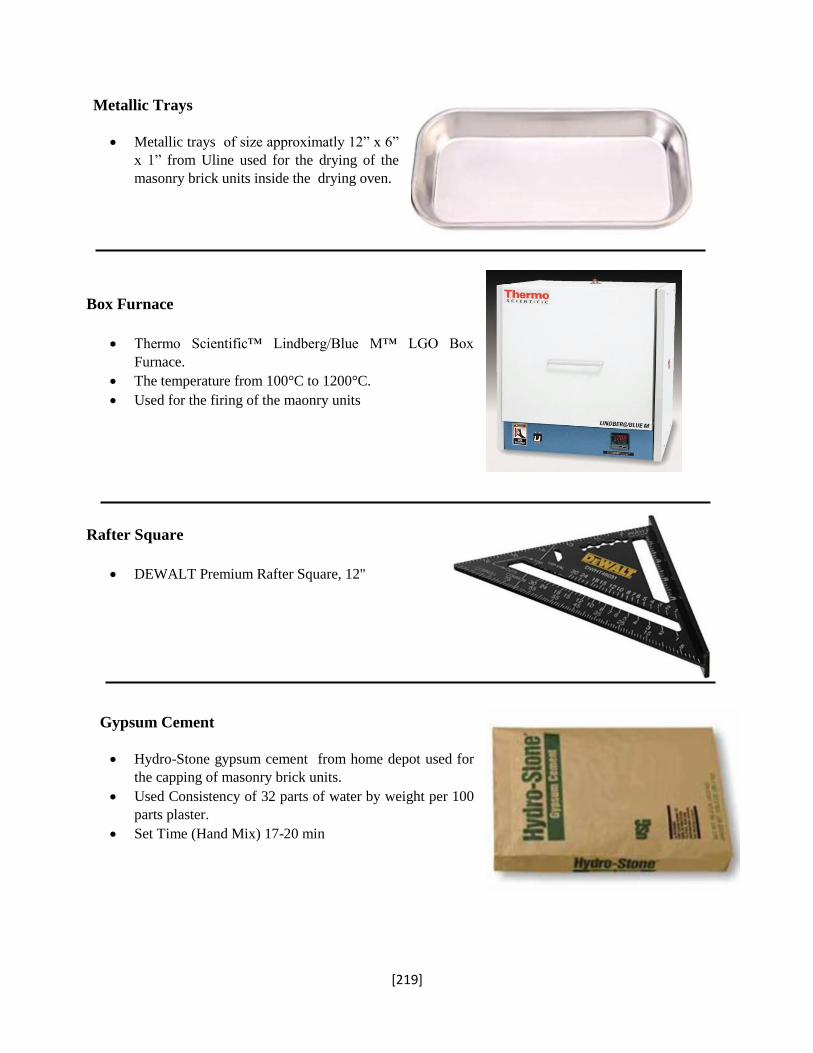
[219]
Metallic Trays
• Metallic trays of size approximatly 12” x 6”
x 1” from Uline used for the drying of the
masonry brick units inside the drying oven.
Box Furnace
• Thermo Scientific™ Lindberg/Blue M™ LGO Box
Furnace.
• The temperature from 100°C to 1200°C.
• Used for the firing of the maonry units
Rafter Square
• DEWALT Premium Rafter Square, 12"
Gypsum Cement
• Hydro-Stone gypsum cement from home depot used for
the capping of masonry brick units.
• Used Consistency of 32 parts of water by weight per 100
parts plaster.
• Set Time (Hand Mix) 17-20 min
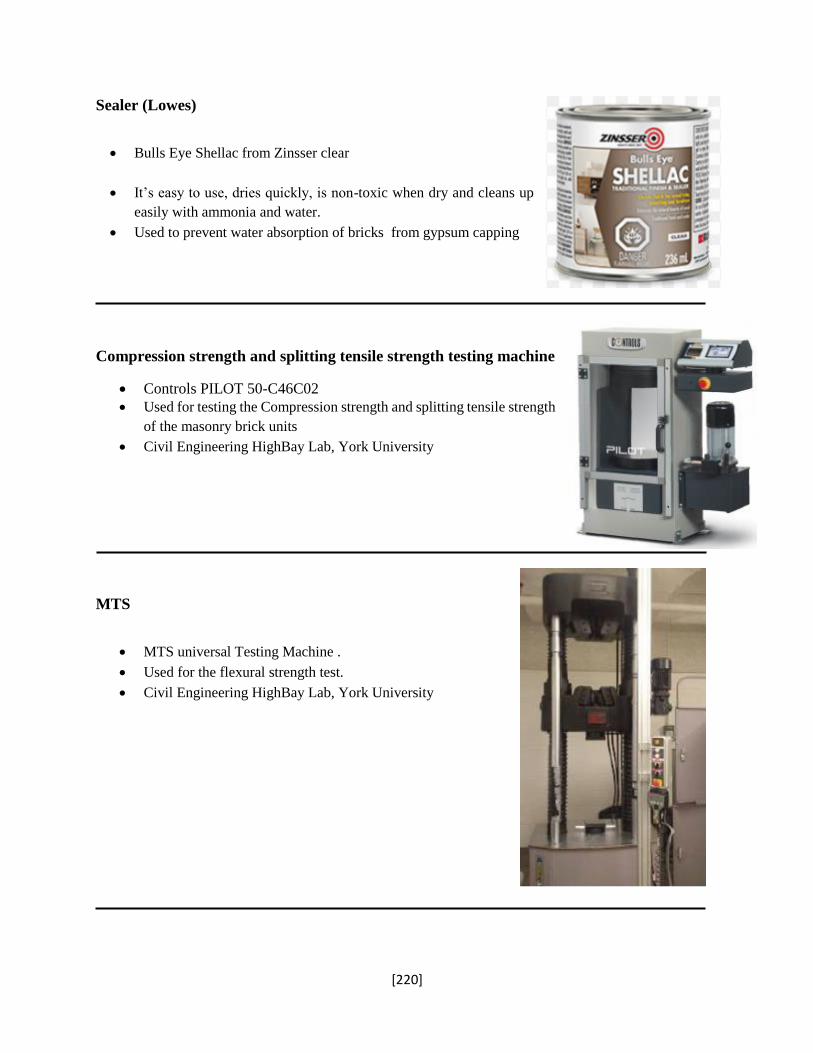
[220]
Sealer (Lowes)
• Bulls Eye Shellac from Zinsser clear
• It’s easy to use, dries quickly, is non-toxic when dry and cleans up
easily with ammonia and water.
• Used to prevent water absorption of bricks from gypsum capping
Compression strength and splitting tensile strength testing machine
• Controls PILOT 50-C46C02
• Used for testing the Compression strength and splitting tensile strength
of the masonry brick units
• Civil Engineering HighBay Lab, York University
MTS
• MTS universal Testing Machine .
• Used for the flexural strength test.
• Civil Engineering HighBay Lab, York University
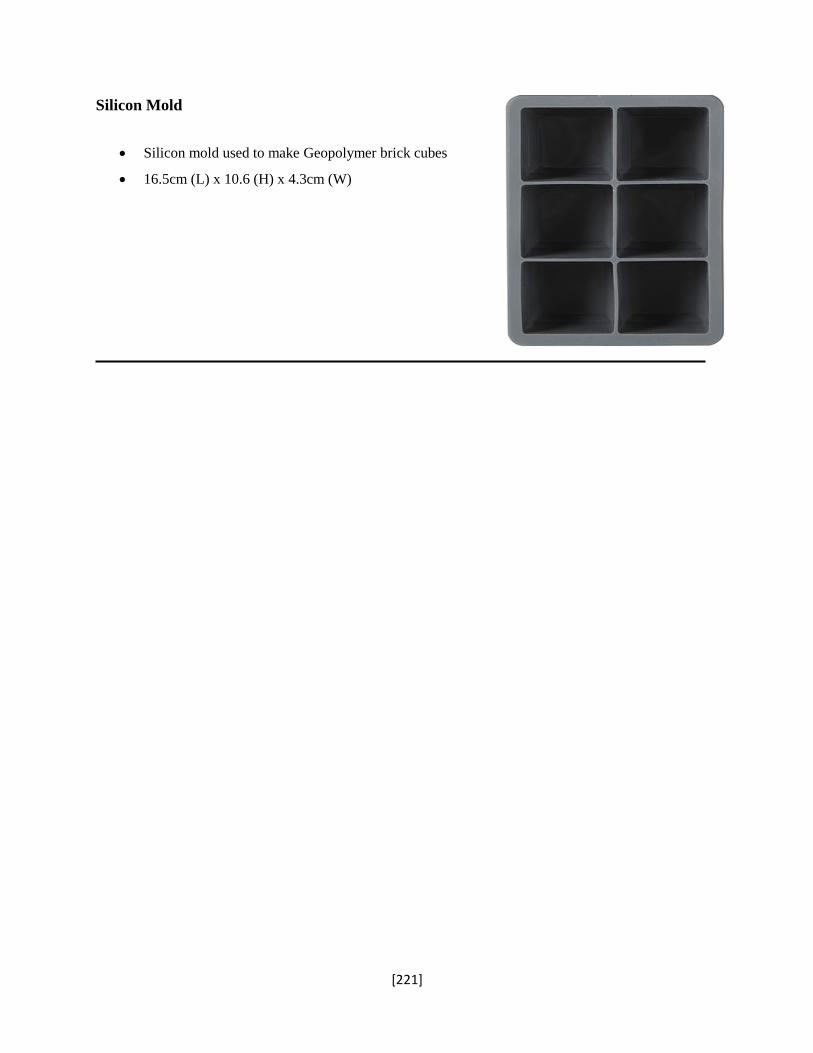
[221]
Silicon Mold
• Silicon mold used to make Geopolymer brick cubes
• 16.5cm (L) x 10.6 (H) x 4.3cm (W)