emergency cash transfer programs, stigma, and access
TRANSCRIPT
Emergency cash transfer programs, stigma, and access:
Factors in the prevention and treatment of child acute malnutrition
A Dissertation
Presented to the Faculty of the Graduate School
of Cornell University
in Partial Fulfillment of the Requirements for the Degree of
Doctor of Philosophy
by
Jessica Robin Bliss
August 2014
© 2014 Jessica Robin Bliss
Emergency cash transfer programs, stigma, and access:
Factors in the prevention and treatment of child acute malnutrition
Jessica Robin Bliss, Ph. D.
Cornell University 2014
Acute malnutrition puts over 50 million children at high risk of morbidity and mortality each
year. Although treatment programs are efficacious, they neglect to address the condition’s non-
dietary causes and program coverage rates are estimated to be below 15%. Interest in multi-
sectoral approaches for the prevention and treatment of acute malnutrition has grown rapidly
over the last decade; rigorous evidence regarding the impact of such approaches is lacking. The
objectives of this dissertation were to (1) examine the role of emergency cash transfer programs
(CTPs) in the prevention of acute malnutrition, and (2) to determine whether stigma associated
with acute malnutrition limits access to treatment programs.
We used a longitudinal dataset from a cohort of 453 children and households targeted by an
unconditional emergency CTP in Maradi, Niger, to identify factors associated with the risk of
developing acute malnutrition during a food crisis in 2012. We then used data from a quasi-
experimental study of a conditional emergency CTP in Tahoua, Niger, to evaluate its impact on
child diet and weight gain during the same period, comparing 212 beneficiary children to 212
concurrent controls. Finally, we conducted a cross-sectional survey of 711 caregivers attending
health facilities in Marsabit County, Kenya, to assess barriers to accessing treatment for children
with acute malnutrition.
iv
In Niger, our longitudinal study indicated that health and wealth-related factors were significant
determinants of acute malnutrition risk. Diet-related factors and food expenditures were not
associated with risk. Our quasi-experimental study revealed remarkable improvements in the
diet and weight gain of beneficiary CTP children relative to controls. In Kenya, caregivers of
acutely malnourished children were significantly more likely than others to report shame as a
barrier to accessing treatment.
We conclude that emergency CTPs have great potential to prevent acute malnutrition in contexts
similar to the 2012 food crisis in Niger, although their ability to influence the health environment
or to compensate for chronic poverty appears limited. Access to treatment for acute malnutrition
is likely constrained by stigma in addition to a number of other well-established access barriers.
There is a need for further critical evaluation of emergency CTPs as well as mechanisms to
identify and reduce the sources of acute malnutrition-related stigma.
iii
BIOGRAPHICAL SKETCH
Jessica Robin Bliss grew up in Wisconsin, Alabama, and Oregon. She attended the University of
Oregon, graduating summa cum laude with a Bachelor’s of Science in Environmental Science in
2005. She served as an AmeriCorps volunteer in Oregon and as a Peace Corps volunteer in
Niger before matriculating at Cornell University in 2010.
iv
DEDICATION
This work is dedicated to the residents of Foloa, Niger.

v
ACKNOWLEDGEMENTS Foremost thanks to my adviser, David Pelletier, and to my committee members: Kathleen
Rasmussen, Rebecca Stoltzfus, and Per Pinstrup-Andersen, for guiding me through this process
with patience and humor. I am also grateful for the instruction given by Jason Barry and
Francoise Vermeylen of the Cornell Statistical Consulting Unit. Generous funding from the
National Science Foundation IGERT in Food Systems and Poverty Reduction and the Fulbright-
Hays Doctoral Dissertation Research Award made this work possible.
I owe an enormous thank you to Kate Golden, Bridget Fenn, and Regine Koppolow for opening
the doors that led me to my dissertation research. Many thanks to Martin Njenga, Samuel
Kirichu, and the fabulous and dedicated Concern Worldwide staff in Nairobi, Marsabit Central,
and Moyale, for making everything come together so brilliantly in Kenya.
Djeinam Toure, Elizabeth Fox, Erica Phillips, Amanda McClain, and Catherine Wiggins: I was
tremendously fortunate to have made such fine friends during this period of my life.
I am grateful to my parents, John and Kerry Bliss, whose encouragement, curiosity, love, and
support is steadfast, and to my brothers, Benjamin and Christopher, for being hilarious geniuses.
Thank you to my dear canine companion, Calvin, for bringing me such joy and getting me
outside no matter what the weather. And finally, thank you to my honey, Benjamin Dalziel,
whose keen mind, generous spirit, and love was the background to the creation of this document.
vi
TABLE OF CONTENTS
BIOGRAPHICAL SKETCH ................................................................................................................................ iii DEDICATION ........................................................................................................................................................ iv ACKNOWLEDGEMENTS .................................................................................................................................... v LIST OF FIGURES .............................................................................................................................................. vii LIST OF TABLES .................................................................................................................................................. ix CONTENTS OF APPENDIX A ............................................................................................................................ x CONTENTS OF APPENDIX B ............................................................................................................................ xi Chapter 1: Introduction ....................................................................................................................................... 1 Chapter 2: Factors associated with the risk of acute malnutrition among children aged 6-36 months in households targeted by an emergency cash transfer program ............................................................. 24
Background/Introduction ....................................................................................................................................................... 25 Methods ........................................................................................................................................................................................ 28 Results ........................................................................................................................................................................................... 36 Discussion .................................................................................................................................................................................... 46
Chapter 3: The impact of an emergency cash transfer program on child dietary practices and weight gain during a food crisis: Results of a quasi-experimental longitudinal study in Niger ........ 54
Background/Introduction ....................................................................................................................................................... 55 Methods ........................................................................................................................................................................................ 59 Results ........................................................................................................................................................................................... 66 Discussion .................................................................................................................................................................................... 82
Chapter 4: Stigma and its role in limiting access to treatment for child acute malnutrition ............. 89 Background/Introduction ....................................................................................................................................................... 90 Methods ........................................................................................................................................................................................ 93 Results ........................................................................................................................................................................................ 101 Discussion ................................................................................................................................................................................. 118
Chapter 5: Discussion ...................................................................................................................................... 124 APPENDIX A ..................................................................................................................................................... 135 APPENDIX B ...................................................................................................................................................... 148 References ........................................................................................................................................................... 179
vii
LIST OF FIGURES 1.1 How a conditional emergency cash transfer program can impact child growth ........9 1.2 Conceptualizing stigma and its consequences for health ...........................................16 2.1 Flow diagram of beneficiaries and study participants in Save the Children’s emergency
cash transfer program in Maradi, Niger .....................................................................38 2.2 Acute malnutrition-free survival at specified levels of wealth category, baseline WHZ,
health status, and medical expenditures among participants in a study of Save the Children’s emergency cash transfer program in Maradi, Niger ................................45
3.1 Intervention and study timeline for Concern Worldwide’s emergency cash transfer
program in Tahoua, Niger ..........................................................................................67 3.2 Flow diagram of beneficiaries and study participants in an evaluation of Concern
Worldwide’s emergency cash transfer program in Tahoua, Niger ............................68 3.3 The predicted weight of participants in an evaluation of Concern Worldwide’s emergency
cash transfer program in Tahoua, Niger, across time and by treatment group ..........76 3.4 Predicted vs. observed change in weight-for-height Z scores from initial to endline
measurements of participants in an evaluation of Concern Worldwide’s emergency cash transfer program in Tahoua, Niger .............................................................................78
3.5 The prevalence of acute malnutrition among participants in an evaluation of Concern
Worldwide’s emergency cash transfer program in Tahoua, Niger, according to mid-upper-arm circumference and weight-for-height Z scores at initial and endline measurements .............................................................................................................80
3.6 The probability of acute malnutrition among participants in an evaluation of Concern
Worldwide’s emergency cash transfer program in Tahoua, Niger, across time and by study arm ....................................................................................................................81
4.1 Barriers to accessing health services for children among participants in a survey of access
barriers in Marsabit County, Kenya ...........................................................................105 4.2 The ten most commonly reported barriers to accessing child health services, as reported
by participants with children of normal nutritional status, with moderate acute malnutrition, and with severe acute malnutrition ......................................................107
viii
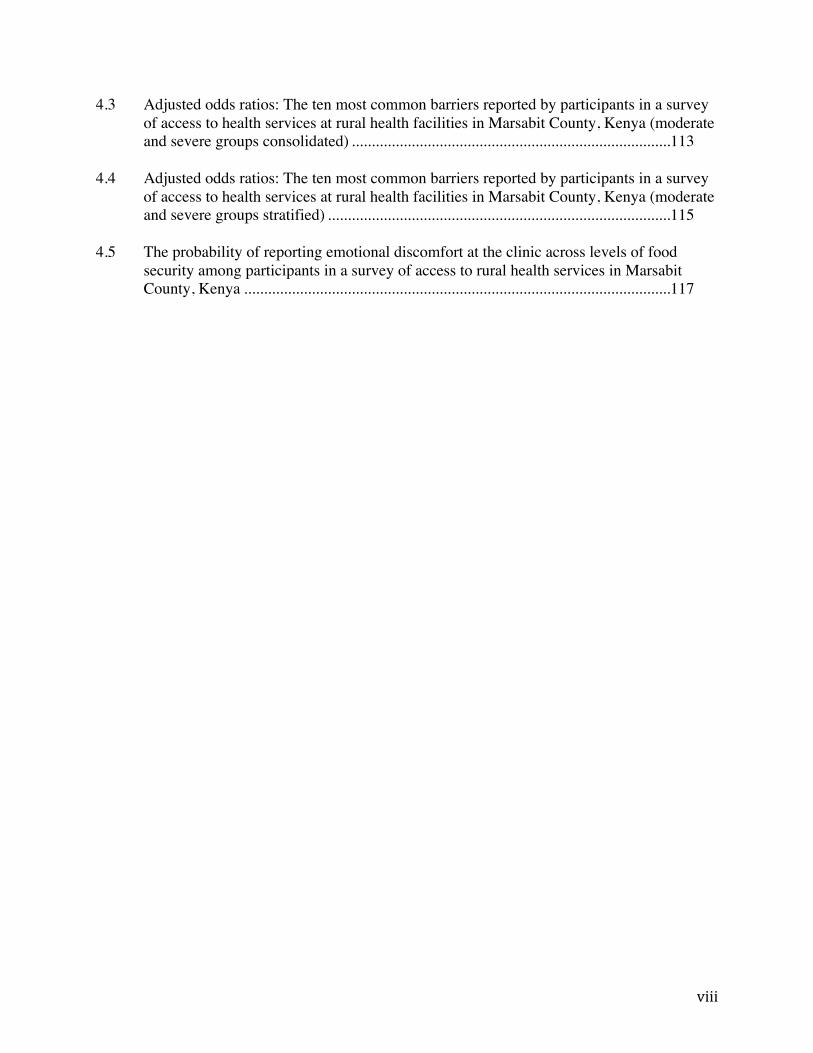
4.3 Adjusted odds ratios: The ten most common barriers reported by participants in a survey of access to health services at rural health facilities in Marsabit County, Kenya (moderate and severe groups consolidated) ................................................................................113
4.4 Adjusted odds ratios: The ten most common barriers reported by participants in a survey
of access to health services at rural health facilities in Marsabit County, Kenya (moderate and severe groups stratified) ......................................................................................115
4.5 The probability of reporting emotional discomfort at the clinic across levels of food
security among participants in a survey of access to rural health services in Marsabit County, Kenya ...........................................................................................................117
ix
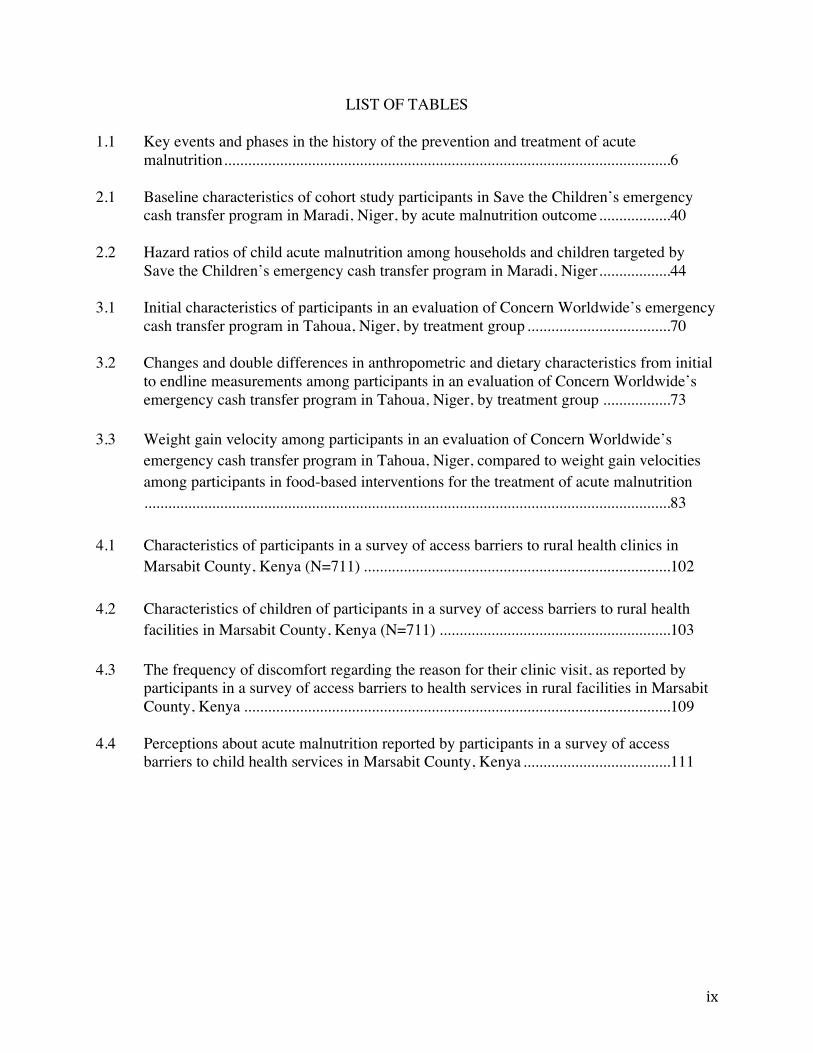
LIST OF TABLES 1.1 Key events and phases in the history of the prevention and treatment of acute
malnutrition ................................................................................................................6 2.1 Baseline characteristics of cohort study participants in Save the Children’s emergency
cash transfer program in Maradi, Niger, by acute malnutrition outcome ..................40 2.2 Hazard ratios of child acute malnutrition among households and children targeted by
Save the Children’s emergency cash transfer program in Maradi, Niger ..................44 3.1 Initial characteristics of participants in an evaluation of Concern Worldwide’s emergency
cash transfer program in Tahoua, Niger, by treatment group ....................................70 3.2 Changes and double differences in anthropometric and dietary characteristics from initial
to endline measurements among participants in an evaluation of Concern Worldwide’s emergency cash transfer program in Tahoua, Niger, by treatment group .................73
3.3 Weight gain velocity among participants in an evaluation of Concern Worldwide’s
emergency cash transfer program in Tahoua, Niger, compared to weight gain velocities among participants in food-based interventions for the treatment of acute malnutrition....................................................................................................................................83
4.1 Characteristics of participants in a survey of access barriers to rural health clinics in
Marsabit County, Kenya (N=711) .............................................................................102 4.2 Characteristics of children of participants in a survey of access barriers to rural health
facilities in Marsabit County, Kenya (N=711) ..........................................................103 4.3 The frequency of discomfort regarding the reason for their clinic visit, as reported by
participants in a survey of access barriers to health services in rural facilities in Marsabit County, Kenya ...........................................................................................................109
4.4 Perceptions about acute malnutrition reported by participants in a survey of access
barriers to child health services in Marsabit County, Kenya .....................................111
x
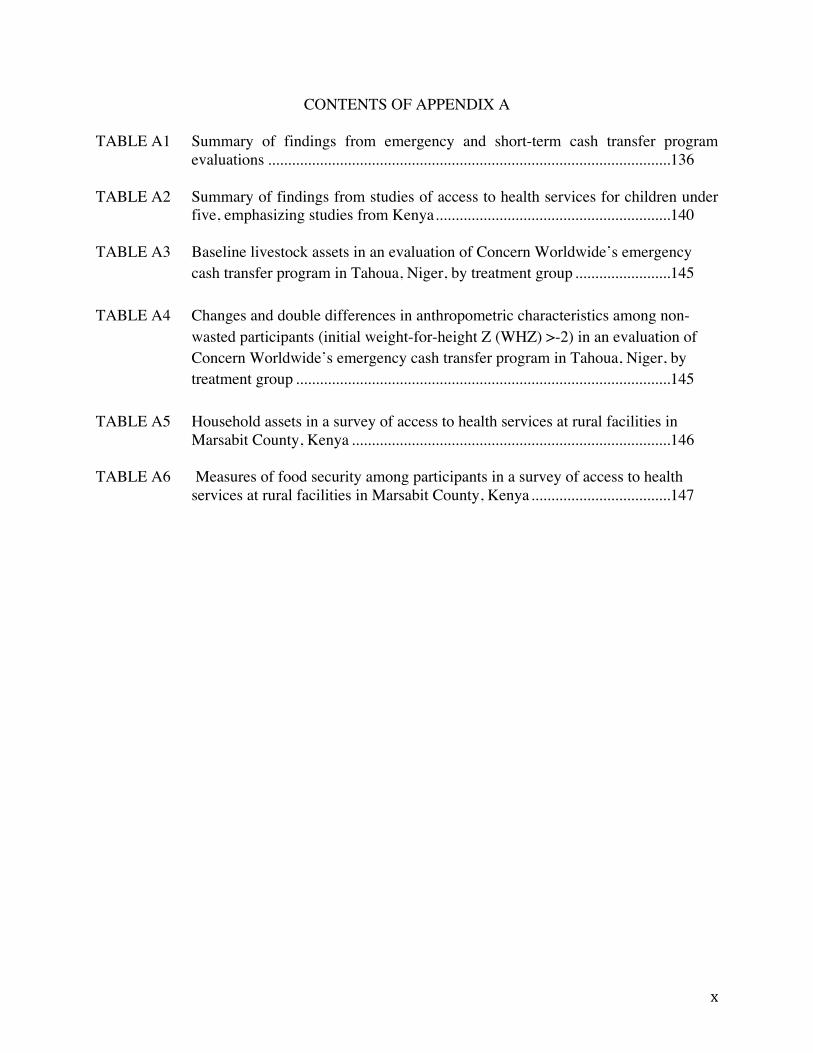
CONTENTS OF APPENDIX A
TABLE A1 Summary of findings from emergency and short-term cash transfer program evaluations .....................................................................................................136
TABLE A2 Summary of findings from studies of access to health services for children under
five, emphasizing studies from Kenya ...........................................................140 TABLE A3 Baseline livestock assets in an evaluation of Concern Worldwide’s emergency
cash transfer program in Tahoua, Niger, by treatment group ........................145 TABLE A4 Changes and double differences in anthropometric characteristics among non-
wasted participants (initial weight-for-height Z (WHZ) >-2) in an evaluation of Concern Worldwide’s emergency cash transfer program in Tahoua, Niger, by treatment group ..............................................................................................145
TABLE A5 Household assets in a survey of access to health services at rural facilities in
Marsabit County, Kenya ................................................................................146 TABLE A6 Measures of food security among participants in a survey of access to health
services at rural facilities in Marsabit County, Kenya ...................................147
xi
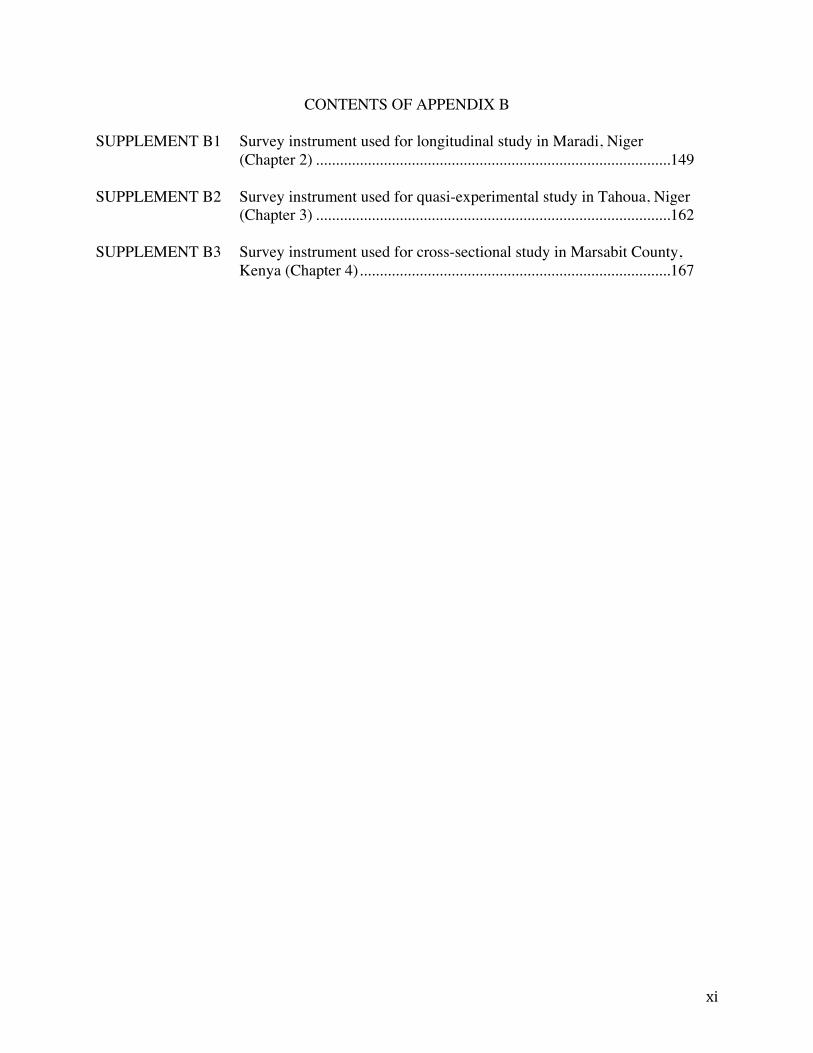
CONTENTS OF APPENDIX B
SUPPLEMENT B1 Survey instrument used for longitudinal study in Maradi, Niger (Chapter 2) .........................................................................................149
SUPPLEMENT B2 Survey instrument used for quasi-experimental study in Tahoua, Niger
(Chapter 3) .........................................................................................162
SUPPLEMENT B3 Survey instrument used for cross-sectional study in Marsabit County, Kenya (Chapter 4) ..............................................................................167
1
Chapter 1: Introduction
Significance
Recently termed the “everyday emergency”, acute malnutrition affects 50-70 million
children each year, results in the deaths of over one million, and is a significant public
health problem in both emergency and non-emergency settings (1,2). Despite the
widespread adoption and integration of an efficacious treatment (CMAM) into national
health systems, the global burden of acute malnutrition only declined by 11% between
1990 and 2011 (2). Efforts to improve treatment efficacy, integrate and promote
prevention across multiple sectors, prioritize acute malnutrition on national and global
agendas, and expand program coverage are all necessary for reaching a meaningful and
sustainable decline in the burden of acute malnutrition. The research reported in this
dissertation makes two significant contributions to programmatic and theoretical
understandings of how acute malnutrition may be prevented and treated: it describes the
remarkable capacity that emergency CTPs can play in the prevention of acute
malnutrition in humanitarian settings, and it reveals that the stigmatization of acute
malnutrition may be a relevant factor limiting the access and coverage of CMAM in the
context of routine health programming.
2
Background Conventional models for the prevention and treatment of acute malnutrition Acute malnutrition occurs as a result of infection, disease, and/or restricted dietary intake,
which lead to reduced appetite, limited nutrient absorption, the loss of nutrients through
diarrhea or vomiting, and subsequent wasting (3). Although the condition is typically
viewed as a feature of rapid-onset emergency settings, half of the overall burden of cases
are estimated to occur in chronic non-emergency contexts (2,4). Each year,
approximately 51.5 million children experience moderate acute malnutrition (MAM) and
18.7 million experience severe acute malnutrition (SAM)1; roughly 11% of children
under the age of 5 are affected annually (1).
Conventional approaches for preventing and treating acute malnutrition are primarily
food-based and consist of referral to supplementary (for MAM) or therapeutic (for SAM)
feeding programs, with the intent to promote weight gain and return affected children to a
healthy growth trajectory (4-6). Typically, both supplementary and therapeutic programs
are delivered as part of routine child health and nutrition services through Ministry of
Health platforms and are jointly referred to as the Community-based Management of
Acute Malnutrition (CMAM). In emergency settings, such as following a natural
disaster, in conflict zones, or in cases of severe famine, feeding programs are temporarily
scaled-up or initiated in partnership with international humanitarian organizations (7).
1 MAM is defined as a weight-‐for-‐height Z-‐score (WHZ) < -‐2 and ≥-‐3, or a mid-‐upper arm circumference (MUAC) <115 and ≥125mm. SAM is the more severe condition, defined by a WHZ <-‐3, MUAC <115mm, or the presence of bilateral pitting edema.
3
Whereas previous models for SAM treatment relied on inpatient care, CMAM is operated
almost exclusively on an outpatient basis, thanks to the advent, effectiveness, and
proliferation of non-perishable and ready-to-eat foods for treatment (RUFs) (6).
Although calls for decentralizing acute malnutrition treatment away from hospitals came
as early as the 1970s, CMAM didn’t replace inpatient care as the dominant model until
the mid 2000s (8-10). Since then, CMAM has lead to remarkable achievements in the
coverage, efficacy, and cost-effectiveness of treatment for acute malnutrition (11-15).
Cure rates of acutely malnourished children who receive prompt CMAM care are
estimated to be as high as 80% (15).
Yet even in light of CMAM’s achievements over the last decade, supplementary and
therapeutic feeding programs are criticized for the inadequate nutritional composition of
supplementary food staples and their reliance on internationally sourced supplementary
foods and RUFs (5,6,16). They are also subject to perpetuating a ‘food first’ bias, among
beneficiaries and implementers alike, which overlooks the relative importance of
morbidity and the health environment (2,17). Simultaneously, CMAM coverage often
fails to meet international standards for humanitarian action, which require at least 50%
of eligible children to be covered in rural areas (15,18). Recent work by the Coverage
Monitoring Network estimated the global coverage2 of SAM treatment to be less than
2 Coverage is the ratio of the number of individuals receiving treatment relative to the number of individuals eligible for treatment. In situations where the prevalence of a condition is unknown, or where screening for the condition and/or referral for treatment is poor, coverage is difficult, if not impossible, to estimate.
4
15% (15), and studies of supplementary feeding programs have consistently reported
MAM treatment drop-out rates as high as 80% (19).
Emergent approaches for the prevention and treatment of acute malnutrition
The vast majority of current acute malnutrition research involves the development of new
feeding protocols. Examples include experimentation with the composition of RUFs
(milk, whey, peanut butter, etc.) (20-22), the intensity of intervention delivery, the
efficacy of RUF relative to flour-based interventions (23,24), the use of RUFs for
prevention in addition to treatment among at-risk populations (25-28), and the feasibility
of local RUF production (29).
While there is no doubt of the necessity of food-based interventions for the prevention
and treatment of acute malnutrition, there is increasing interest in the feasibility and
effectiveness of non-food complements or alternatives. The importance of
multidisciplinary approaches to child health and nutrition has long been recognized, but
integrated efforts have only recently been linked directly to acute malnutrition (2). For
instance, the use of antibiotics in conjunction with RUF for the treatment of SAM in
Malawi was associated with faster weight gain, quicker recovery rates, and lower
mortality (30). In Bangladesh, psychosocial stimulation provided alongside routine
inpatient care and outpatient follow-up resulted in improved child development and
growth (31). And in Niger, Myanmar, and the Philippines, cash transfer programs have
been used to curb food insecurity and the incidence of acute malnutrition during
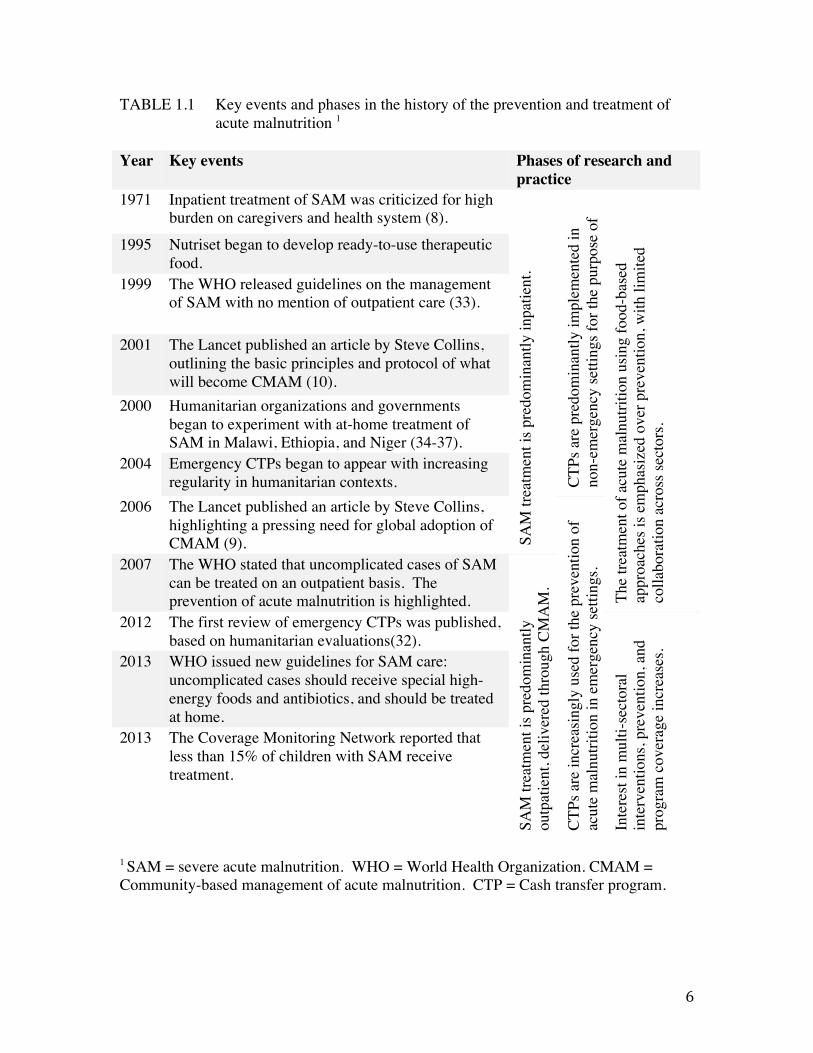
humanitarian crises (32). In Table 1.1, we present a chronology of events in the history

5
of acute malnutrition research and practice, highlighting both conventional and emergent
approaches.
6
TABLE 1.1 Key events and phases in the history of the prevention and treatment of acute malnutrition 1
1 SAM = severe acute malnutrition. WHO = World Health Organization. CMAM = Community-based management of acute malnutrition. CTP = Cash transfer program.
Year Key events Phases of research and practice
1971 Inpatient treatment of SAM was criticized for high burden on caregivers and health system (8).
SAM
trea
tmen
t is p
redo
min
antly
inpa
tient
.
CTPs
are
pre
dom
inan
tly im
plem
ente
d in
no
n-em
erge
ncy
setti
ngs f
or th
e pu
rpos
e of
po
verty
redu
ctio
n.
The
treat
men
t of a
cute
mal
nutri
tion
usin
g fo
od-b
ased
ap
proa
ches
is e
mph
asiz
ed o
ver p
reve
ntio
n, w
ith li
mite
d co
llabo
ratio
n ac
ross
sect
ors.
1995 Nutriset began to develop ready-to-use therapeutic food.
1999 The WHO released guidelines on the management of SAM with no mention of outpatient care (33).
2001 The Lancet published an article by Steve Collins, outlining the basic principles and protocol of what will become CMAM (10).
2000 Humanitarian organizations and governments began to experiment with at-home treatment of SAM in Malawi, Ethiopia, and Niger (34-37).
2004 Emergency CTPs began to appear with increasing regularity in humanitarian contexts.
2006 The Lancet published an article by Steve Collins, highlighting a pressing need for global adoption of CMAM (9).
CTPs
are
incr
easin
gly
used
for t
he p
reve
ntio
n of
ac
ute
mal
nutri
tion
in e
mer
genc
y se
tting
s. 2007 The WHO stated that uncomplicated cases of SAM
can be treated on an outpatient basis. The prevention of acute malnutrition is highlighted.
SAM
trea
tmen
t is p
redo
min
antly
ou
tpat
ient
, del
iver
ed th
roug
h CM
AM
.
2012 The first review of emergency CTPs was published, based on humanitarian evaluations(32).
Inte
rest
in m
ulti-
sect
oral
in
terv
entio
ns, p
reve
ntio
n, a
nd
prog
ram
cov
erag
e in
crea
ses.
2013 WHO issued new guidelines for SAM care:
uncomplicated cases should receive special high-energy foods and antibiotics, and should be treated at home.
2013
The Coverage Monitoring Network reported that less than 15% of children with SAM receive treatment.
7
Emergency cash transfer programs: an emerging tool for preventing acute malnutrition
Cash transfer programs (CTPs) are a compelling example of an intervention with new
applications in the prevention of acute malnutrition. A brainchild of the socio-economic
field, CTPs have been implemented in long-term, non-emergency settings for decades as
a means of investing in human capital to promote measurable and sustainable poverty
reduction (38). Emergency CTPs have become increasingly common tools in a range of
humanitarian crises, implemented in response to social and political conflicts (Sudan),
natural disasters (Myanmar), and recurring seasonal effects (Niger), with the common
objective of protecting child health and nutrition during periods of disrupted access to
food, water, shelter, and/or basic services (32). The underlying assumption in most
emergency CTPs is that a meaningful amount of the transfer will be spent on food, which
is presumed to translate into improved child dietary intake and subsequent reductions in
the rate of acute malnutrition for the duration of the crisis (32). This assumption prevails
despite the proliferation of evidence that increases in income are not sufficient to
influence child nutritional status (39-41).
Some insight into whether and how emergency CTPs may impact child nutrition can be
gained from non-emergency CTPs, for which conceptual frameworks for program impact
are fairly well developed (Figure 1.1) (42). Non-emergency programs have been
associated with favorable child nutrition outcomes in several Latin American countries,
including reductions in anemia (Mexico), low birth weight (Mexico), underweight (Brazil
and Nicaragua), and stunting (Mexico, Nicaragua, Brazil) (43-45). They are consistently
associated with improved uptake of health services (46-48), immunization coverage (49),
8
and dietary diversity (38). However, a recent meta-analysis of sixteen long-term CTPs
found their weighted average impact on child stunting to be effectively zero (50), and
there is no evidence of reliable impact on micronutrient status (51,52). Programs with
unclear participant guidelines, small transfers, or poor adherence have limited or no
impact on any outcome measure (38,53).
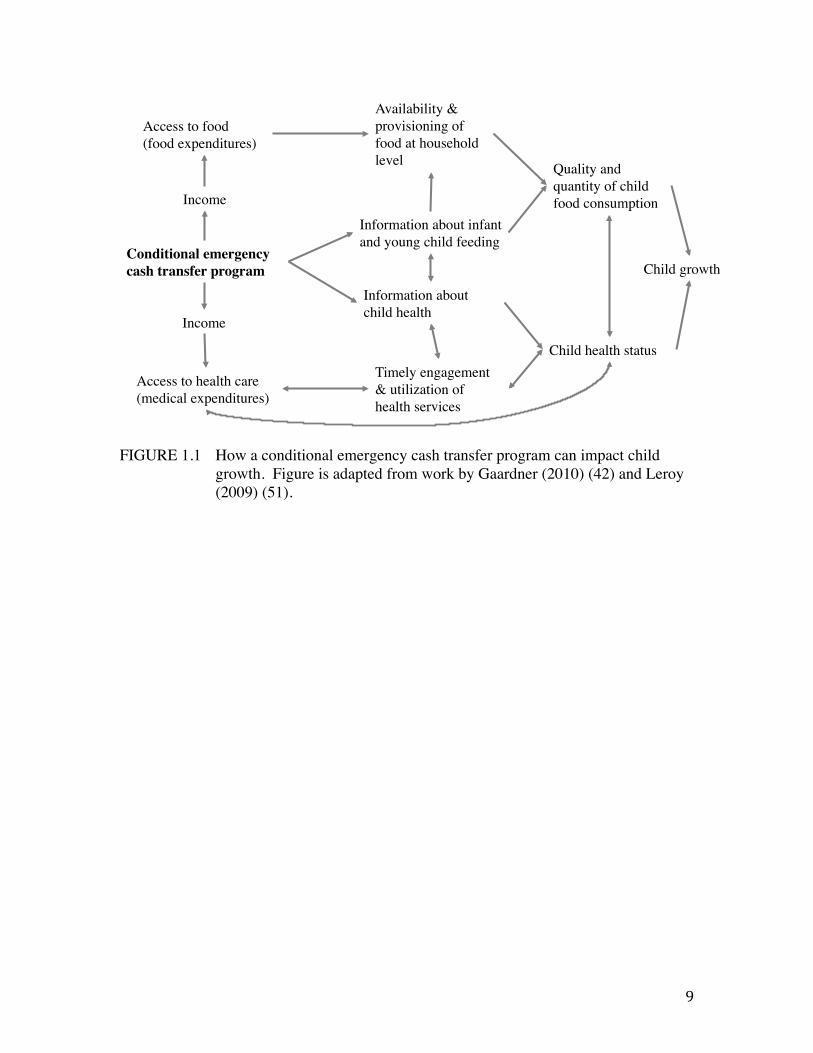
9
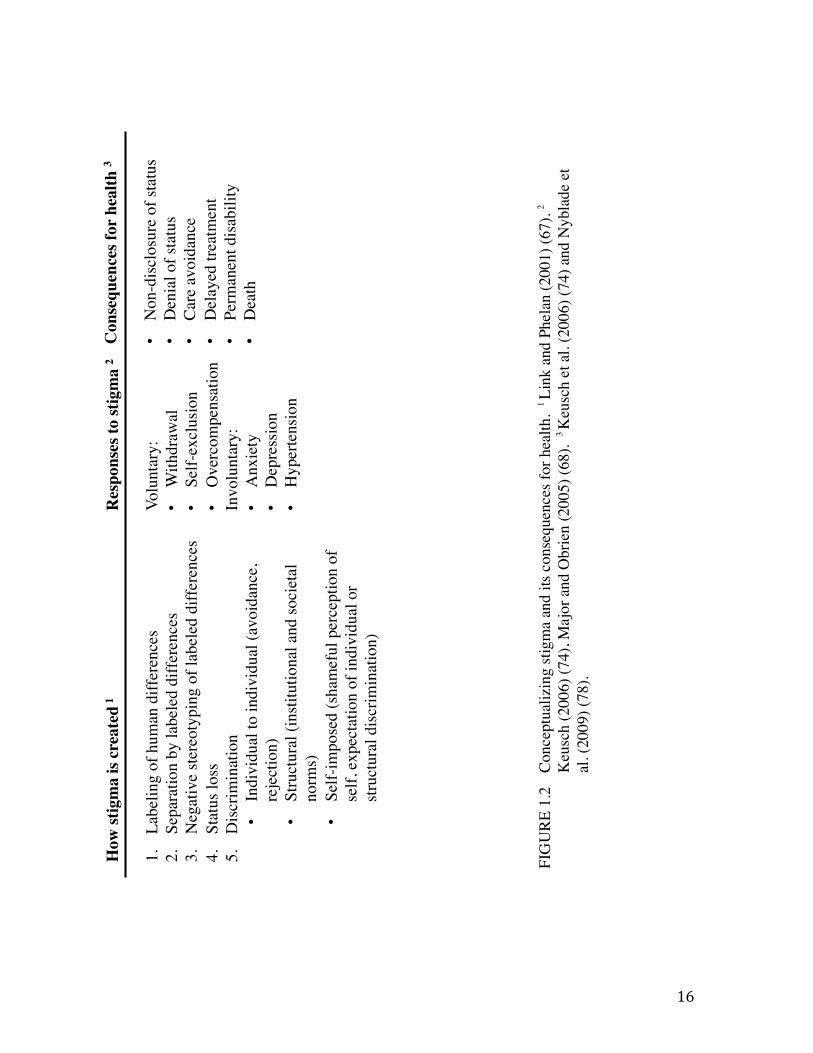
FIGURE 1.1 How a conditional emergency cash transfer program can impact child growth. Figure is adapted from work by Gaardner (2010) (42) and Leroy (2009) (51).
Conditional emergency cash transfer program! Child growth!
Information about infant and young child feeding!
Child health status!
Income!
Information about child health!
Access to health care !(medical expenditures)!
Access to food !(food expenditures)!
Availability & provisioning of food at household level! Quality and
quantity of child food consumption!
Timely engagement & utilization of health services!
Income!
10
The impact of non-emergency CTPs on child health and nutrition outcomes is mixed and
difficult to estimate, likely due to confounding by differences in program design, transfer
amount and frequency, and context (54). The generalizability to emergency CTPs is
additionally limited by the vastly different objectives, timeframes, and implementation
constraints faced by CTPs operating in humanitarian crisis contexts. Whereas non-
emergency programs are structured with the long-term goal of poverty alleviation,
emergency programs address an immediate need for an abbreviated period of time.
Furthermore, the availability and quality of evidence regarding the impact of emergency
CTPs is limited by a number of logistic and ethical considerations. First, due to the
unpredictable and urgent nature of the context in which emergency cash transfer
programs are most relevant, implementing organizations may sacrifice strategic
monitoring and evaluation methods in favor of rapid program execution (7). Second, in
circumstances where the need for assistance is high, it is typically considered unethical to
deny program benefits to eligible populations, limiting organizational capacity to assess
program impact using concurrent controls. And third, the pressure on implementing
agencies and donors to produce and report positive program results for crisis-affected
communities cannot be overlooked as a potential source of bias in the publication of
emergency CTP evaluations, which currently comprise the bulk of available evidence.
Turning to the available literature on emergency CTP impact, a recent review of internal
humanitarian agency evaluations indicated an improvement in child diet quality and
nutritional status (wasting) across a range of crisis types in Myanmar, Niger, Somalia,
11
and South Sudan (32). One study of an emergency CTP in Niger determined that
beneficiaries of the program made gains in child weight-for-height Z scores (WHZ), mid-
upper arm circumference (MUAC), and dietary diversity, as well as improved household
indicators of wealth and food security; the study did not have a comparison group so
improvements could not be attributed to the intervention (55). Recent work by the
International Food Policy Research Institute (IFPRI) offered the first glimpse at rigorous
evaluation; through the use of a randomized design in Niger and Ecuador to compare
transfer modalities—cash transfer, in-kind, and food vouchers—they found food baskets
resulted in larger gains in household dietary diversity and food security status than cash
transfers, but did not report impacts on child-specific indicators (56,57). A summary of
recent outcomes from emergency CTPs and short-term non-emergency CTPs is presented
in Appendix A (Table A1).
Expansion of coverage for existing approaches to the treatment of acute malnutrition
Expanding the arsenal of interventions is just one tactic for addressing the burden of
acute malnutrition; an additional tactic is the expansion of CMAM access and coverage.
As found with many maternal and child survival services, CMAM access and coverage
are thought to be limiting factors of program effectiveness and impact (58,59). Poor
coverage of and access to acute malnutrition treatment programs is a challenge in spite of
the increases in coverage that should be afforded by the CMAM approach (15,60).
Nonetheless, most studies of acute malnutrition have paid little attention to coverage,
focusing instead on documenting medical outcomes such as weight gain, survival,
12
recovery, and relapse (7).
Review of the extensive body of literature on the coverage of child health services in
low-income settings highlights the relevance of women’s time and financial constraints,
in addition to a lack of awareness of treatment options and eligibility, as difficult
obstacles to overcome when seeking care (61). A table summarizing the findings of this
literature can be found in Appendix A (Table A2). Research specific to CMAM access
and coverage consists of one published study spanning six Sub-Saharan African countries
and a three-part series of reports produced by the Coverage Monitoring Network. In a
review of CMAM programs in Niger, Ethiopia, North and South Sudan, Malawi, and the
Democratic Republic of the Congo in the mid 2000s, the fear of rejection, not
recognizing the child’s condition as malnutrition, lack of confidence in the program,
relapse, and distance to the site of program were the most common reasons for not
utilizing treatment services (60).
The Coverage Monitoring Network, a nonprofit organization that began monitoring the
global coverage of CMAM since 2012, recently produced a three-part series summarizing
global access issues related to SAM treatment over the last two years (15,62,63). They
collaborated with CMAM implementers in 21 countries to survey caregivers of children
with untreated SAM regarding barriers to accessing care. Their main findings—that the
primary treatment barriers were a lack of knowledge of malnutrition, lack of knowledge
13
about CMAM, high opportunity costs, and distance to site—are consistent with
knowledge about access barriers for other child health services (62).
Stigma as a barrier to access and coverage of CMAM
The stigmatization of health conditions has been documented in several contexts and is a
potentially relevant and unidentified barrier to CMAM access. Erving Goffman’s
seminal essay in 1963 described stigma as the relationship between a dehumanizing,
“deeply discrediting” attribute and a stereotype (64). The subsequent decades of stigma
research were characterized by the use and application of socio-cognitive perspectives,
emphasizing individuals’ perceptions about stigma and the consequences of these
perceptions in social interactions (65). Contemporary conceptualizations of stigma
incorporate a more complex consideration of the dynamic social, economic, and political
contexts and processes that both produce and intensify discrimination (66).
Link and Phelan (67) offer a comprehensive framework for conceptualizing stigma that
includes both the socio-cognitive and structural aspects of stigma. They describe stigma
as the convergence of labeling, stereotyping, separation, status loss, and discrimination in
the context of a situation with a clear power differential (67,68). Thus, for stigmatization
to occur, (1) individuals must distinguish differences between each other and label those
differences, (2) the labeled differences must be linked to a set of undesirable
characteristics or negative stereotypes, (3), the labeled people or groups must be
categorized as separate, forming a sense of “us” versus “them”, and (4) status loss and
14
discrimination must ensue at the expense of the labeled group (67). Discrimination may
be individual, in which a person takes overt discriminatory action against another;
structural, in which social or institutional norms perpetuate inequalities; and/or self-
imposed, in which an individual devalues themselves and expects stereotyping and
discrimination to occur (67,68).
Self-imposed discrimination, also called identity threat, has dominated stigma research
for the last decade (68). Steele and Aronson first proposed the theory of identity threat in
1995 under the name “stereotype threat”, proposing that members of stigmatized groups
experience “situationally based fear that one will be judged on the basis of [negative]
stereotypes” (68,69). This concept is similar to the theory of “stigma consciousness”, in
which members of a stigmatized group anticipate a stereotype and expect discrimination
(70). Overt discrimination does not necessarily take place in the case of self-imposed
discrimination—rather, self-identifying as a member of a stigmatized group, devaluing
oneself, and the expectation of discrimination are the key components of this form of
discrimination.
A key aspect of the current conceptualization of stigma is the role of power, which
enables a community “to move from individual level perceptions to collectively identify
an undesirable attribute, construct stereotypes, and ultimately, to act on the negative
stereotype by discriminating against the stigmatized” (65). Link and Phelan (66,67)
explain that for stigma to result in discrimination, the stigmatized group must be at the
lower end of a power differential. Although labeling, stereotyping, and separation also
15
take place against groups in power, status loss and discrimination do not occur because
the lower-status groups lack the cultural, economic, and/or political power to influence
status or enact discriminatory measures of consequence.
16
How
stig
ma
is cr
eate
d 1!
! 1.
Labe
ling
of h
uman
diff
eren
ces!
2.
Sepa
ratio
n by
labe
led
diffe
renc
es !
3.
Neg
ativ
e ste
reot
ypin
g of
labe
led
diffe
renc
es !
4.
Stat
us lo
ss !
5.
Disc
rimin
atio
n!•
Indi
vidu
al to
indi
vidu
al (a
void
ance
, re
ject
ion)
!•
Stru
ctur
al (i
nstit
utio
nal a
nd so
ciet
al
norm
s)!
• Se
lf-im
pose
d (s
ham
eful
per
cept
ion
of
self,
exp
ecta
tion
of in
divi
dual
or
struc
tura
l disc
rimin
atio
n)!
Res
pons
es to
stig
ma
2 !! Vo
lunt
ary:
!•
With
draw
al !
• Se
lf-ex
clus
ion !
• O
verc
ompe
nsat
ion !
Invo
lunt
ary:
!•
Anx
iety
!•
Dep
ress
ion !
• H
yper
tens
ion !
!
Con
sequ
ence
s for
hea
lth 3 !
! • N
on-d
isclo
sure
of s
tatu
s !•
Den
ial o
f sta
tus !
• Ca
re a
void
ance
!•
Del
ayed
trea
tmen
t !•
Perm
anen
t disa
bilit
y !
• D
eath
!! !
FIG
URE
1.2
Co
ncep
tual
izin
g st
igm
a an
d its
con
sequ
ence
s for
hea
lth.
1 Li
nk a
nd P
hela
n (2
001)
(67)
. 2
Keu
sch
(200
6) (7
4), M
ajor
and
Obr
ien
(200
5) (6
8).
3 K
eusc
h et
al.
(200
6) (7
4) a
nd N
ybla
de e
t al
. (20
09) (
78).
17
For well known stigmatized health conditions, such as HIV/AIDS, tuberculosis, and
epilepsy, stigma has proven a formidable barrier to accessing medical treatment (65,71-
73). Individuals with stigmatized conditions may invoke a number of voluntary and
involuntary coping strategies; the former include denial of their health status, delayed
care-seeking, avoidance of care, and in severe cases, permanent disability or death
(Figure 1.2) (74). Involuntary responses to stigma include depression, anxiety, and stress
(68,75).
Stigma has been documented in association with acute malnutrition in a number of
settings. In Pakistan in the late 1980s, women expressed the belief that child wasting
meant that the mother had behaved immorally and was being punished by evil spirits;
women whose children were wasted described not leaving the house due to concerns over
judgment (76). In Tanzania, stigma associated with poverty was tightly associated with
child malnutrition and invoked feelings of shame and exclusion from the health system
(77). Stigma and insecurity were detected in a few instances as noted in the Coverage
Monitoring Network reports described previously (60,62). And, lastly, during the
author’s service as a Peace Corps volunteer in Niger, women with children with untreated
SAM expressed reluctance to seek CMAM due to feelings of shame about the child’s
condition.
18
Context
Chapters 2 and 3: Studies of emergency CTPs in Niger
The national Government of Niger declared an impending food crisis in May 2012, based
on drought and famine early warning system projections of poor crop and fodder
production due to insufficient rainfall. High food prices were seen as a key contributing
factor to the crisis (79). Similar circumstances in Niger in 2004-2005 and 2008-2009 had
proven devastating, with several million people believed to be affected by crop failure,
the inability to afford market-sourced foods, severe food security, and perilously high
levels of child acute malnutrition and mortality (80-82). These events led to international
calls for enhanced governmental and humanitarian agency response to threats of famine
in the country and region (83).
Save the Children and Concern Worldwide are two international nonprofit humanitarian
agencies with long histories of providing child health and nutrition support in emergency
settings around the world. In 2012, they each implemented emergency CTPs in separate
regions of Niger in response to the government’s declaration of a food crisis.
Chapter 4: Assessment of access barriers in Kenya
Approximately 291,000 people inhabit Marsabit County, Kenya; most residents are of
Borana or Gabra ethnicity and practice pastoralism or agro-pastoralism (84). The region
is subject to recurrent droughts and chronic food insecurity, and conflict between the
dominate ethnic groups over livestock, land, and water rights is frequent (85). Marsabit
19
County has few roads and limited infrastructure for education, communication, and
health services.
In 2012, Concern Worldwide began a USAID Child Survival Grant-funded project to
reduce maternal, infant, and child morbidity and mortality among women and children in
Marsabit County, Kenya. Increased access to maternal and child health services was a
primary objective of the project, yet Concern Worldwide and its Ministry of Health
partners lacked current, context-specific information about access barriers in Marsabit
County. This situation provided an opportunity to research both the universal access
barriers faced by beneficiaries of the child survival program as well as those barriers that
may be unique to CMAM beneficiaries, with particular attention to the role of stigma.
Innovation
Chapters 2 and 3
In their budding application as tools in emergency settings, CTPs show promising yet
poorly evidenced impact for enhancing child health and nutrition status. The high cost3
and the increasing frequency of emergency CTP use raise important questions about their
effectiveness and cost-effectiveness, and demands more rigorous evaluation than what
currently exists. To date, few studies of emergency CTPs have had the resources or data
3 To get a sense of cost: the CTP program described in Chapter 2 provided transfers worth 390 USD each to 2,736 households, for a total of 1,076, 040 USD in a 6-‐month period. The program in Chapter 3 administered transfers worth 250 USD to 6,497 households over a 3-‐month period, for a total of 1,624,350 USD. Administrative, implementation, or evaluation costs are not included in these totals.
20
to test assumptions about how or whether emergency CTPs might work. The research for
this dissertation begins to fill this gap by contributing findings from two novel studies of
emergency CTPs implemented by international nonprofit humanitarian agencies in Niger.
In the Maradi region, Save the Children collaborated with the Emergency Nutrition
Network (England), an international nonprofit specializing in intervention evaluation, to
design and implement a thorough monitoring and evaluation protocol among a random
subsample of beneficiaries. This protocol involved the most extensive data collection to
take place for an emergency CTP to date, including detailed collection of food and
medical expenditures for children, overall household expenditures, child diet, health, and
anthropometric indicators, and a host of caregiver and household characteristics. These
data are novel in that they provide the first opportunity for a critical analysis of the
factors associated with the development of acute malnutrition in the context of an
emergency setting. An analysis of these data is reported in Chapter 2.
In the Tahoua region, Concern Worldwide similarly upgraded their approach to CTP
evaluation, in this case collecting data on non-enrolled households in addition to a subset
of program beneficiaries. To our knowledge, this is the only study to make use of a true
control group in the evaluation of an emergency CTP, thus making a significant
contribution to our understanding of whether and how such programs impact child
nutrition. The circumstances that made the use of a concurrent control possible and
ethical, as well as an analysis of the data collected, are described in Chapter 3.
21
The findings of Chapters 2 and 3 contribute new knowledge of the capacity of emergency
CTPs to influence child diet and nutrition outcomes, as well as a better understanding of
their role alongside other tactical nutrition and food security programs.
Chapter 4
While there are ample studies that look at barriers to health service utilization for single
health conditions (pre-natal services, diarrhea, pneumonia, malaria, etc.), there are none
that take a comprehensive or comparative view of multiple disease states or services.
Therefore, it is unknown whether the many barriers identified are specific to disease
states, their respective treatment demands, or simply reflective of general barriers to
access in the context studied. Furthermore, the relationship between stigma and acute
malnutrition has not been systematically investigated as a potential barrier to accessing
CMAM since CMAM became a prominent intervention in child nutrition and health
services.
No single mechanism can be universally applied to make child health and nutrition
programs such as CMAM more wide reaching: context-specific solutions are required
that address the unique barriers to acceptable and sustainable coverage rates (86).
Without strong evidence for context-specific, demand-side access barriers, efforts to
increase coverage are unlikely to succeed (87). The research in Chapter 4 challenges
existing health service implementers and theorists to take into account the different
obstacles that caregivers face depending on the specific condition of their child by
22
providing a comprehensive understanding of access barriers for CMAM compared with
other child health services.
Summary of dissertation
The overall goals of this research were to (1) examine the role of one emergent, non-food
intervention, the emergency cash transfer program, in the prevention of acute
malnutrition, and (2) to identify and describe unique barriers associated with accessing
the treatment of acute malnutrition, with particular attention to stigma.
We examine the role of food and diet-related factors and health-related factors in the
development of acute malnutrition, using data from a longitudinal cohort study of 453
children aged 6-36 months in households receiving an unconditional emergency CTP in
Maradi, Niger (Chapter 2). The program, designed by the Emergency Nutrition Network
and implemented by Save the Children, was expected to reduce risk by increasing food
availability to beneficiary children. The cohort data did not allow a test of this
expectation as there was no comparison group, but they did provide an opportunity to see
if the association between acute malnutrition and food/diet related factors was diminished
in the presence of the CTP.
We also present an assessment of the impact of Concern Worldwide’s conditional
emergency CTP in Tahoua, Niger, on the growth and diet of 212 beneficiary children
aged 6-24 months (Chapter 3). The study design included a comparison group of 212
non-beneficiary children, which allowed us to estimate the portion of weight and WHZ
23
gain attributable to the intervention. We consider the importance of the conditional terms
of this program, which emphasized child feeding and care practices.
The focus of Chapter 4 is the potential role of stigma in limiting access to treatment for
acute malnutrition for children in Marsabit County, Kenya. We used survey data from
interviews with 711 women at eighteen rural health facilities, each of whom had a child
aged 6-59 months. Children were either of normal nutritional status (n=189), had MAM
(n=159), or had SAM (n=163), allowing us to identify access barriers that were universal
across the group and those that were unique to caregivers of children with acute
malnutrition.
The fifth and final chapter includes a consideration of the consistency of findings
between our studies of emergency CTPs—including discussion of the programmatic and
methodological differences that explain the seemingly divergent findings, and a
discussion of the limitations that such programs may face in addressing child morbidity.
We also explore the current imbalance of research in the field of acute malnutrition,
which favors the development of new product and protocol development over expanded
access and coverage of existing interventions.
24
Chapter 2: Factors associated with the risk of acute
malnutrition among children aged 6-36 months in households
targeted by an emergency cash transfer program
Authors
Jessica Bliss, Nathaniel Jensen, Brian Thiede, Jeremy Shoham, Carmel Dolan, Victoria
Sibson, and Bridget Fenn
Abstract
Emergency cash transfer programs (CTPs) are promising nutrition-sensitive interventions
for the prevention of acute malnutrition. Identifying how the expenditure of cash
transfers relates to child nutrition status is a necessary step for informed program design
and targeting. We investigated the relationship between cash transfer expenditures and
acute malnutrition in children aged 6-36 months through an observational cohort study of
420 households enrolled in a six-month unconditional emergency CTP in Niger. A Cox
proportional hazards model was used to estimate the risk of acute malnutrition while
adjusting for relevant child, household, and community characteristics. Seventy-four
children (18% of the cohort) developed acute malnutrition. The risk was 1.79 times
higher among ill children than healthy children (HR: 1.79; 95%CI: 1.10, 2.92; P<0.05),
nearly 3 times higher among children in the poorest households than those in wealthier
households (HR: 2.98; 95%CI: 1.86, 4.78; P<0.001), and 2.85 times lower with each unit
25
increase in baseline weight-for-height Z score (HR: 0.35; 95%CI: 0.23, 0.53; P<0.001).
Among recipients of this CTP, food expenditures and diet-related factors did not appear
to have a protective effect against the risk of acute malnutrition. The significance of
wealth and health-related factors suggests that a potential role of emergency CTPs is to
enable medical access for ill children. The timing of emergency CTPs is an important
factor in reaching at risk children, but even timeliness may not compensate for persistent
poverty and undernutrition.
Background/Introduction
Despite a renewed global focus on improving child health and nutrition, acute
malnutrition affects at least 52 million children annually (1). It impairs immune function,
reduces appetite, increases metabolic rate and nutrient needs, and heightens vulnerability
to infection and disease (3). Children with moderate or severe acute malnutrition have
two- to nine-fold greater odds of dying from pneumonia, diarrhea, or malaria than
children without acute malnutrition. Ultimately, wasting is responsible for 875,000 child
deaths each year (1,9).
The determinants of child undernutrition vary with context, and require flexible and
variable approaches for effective prevention and treatment. Conventional approaches to
preventing and treating acute malnutrition typically address immediate food-based causes
through referral to blanket and targeted supplementary or therapeutic feeding programs,
with the objective of promoting weight gain and returning affected children to a healthy
26
growth trajectory (1,4). While food-based approaches remain at the core of programs for
treating acute malnutrition, cash and voucher-based programs are increasingly being
considered as viable preventive options. Cash transfer programs (CTPs), in which cash is
distributed to vulnerable households, have emerged as nutrition-sensitive options to
address the underlying determinants of undernutrition (52,88).
Differences in CTP design, implementation, transfer amount and frequency,
conditionality, and setting make evaluation of the impact(s) of CTPs difficult;
consequently, observed effects on child nutrition and health outcomes are mixed (52,54).
Most evidence of CTP impact comes from programs implemented over a prolonged
period of time—usually several years—in politically and environmentally stable settings,
often in Latin American countries. In these settings, CTPs have been associated with
lower rates of child mortality, low birth weight, and anemia (Mexico), diarrhea
(Colombia and Mexico), and stunting (Brazil, Colombia, Mexico, and Nicaragua), and
they are consistently associated with increased utilization of health services (46,54).
However, a recent meta-analysis of sixteen programs found their weighted average
impact on child stunting to be essentially zero, and concluded that no evidence for an
impact on acute malnutrition is currently available (50).
The use of CTPs in emergency settings is growing, particularly in African countries.
Emergency settings are characterized by substantial logistic challenges, an immediate
need to prevent human suffering and save lives, and the decision to seek humanitarian
assistance (7). The available evidence for CTPs in such settings is limited and relies
27
heavily on routine program evaluations by implementing nonprofit agencies. These
evaluations indicate an association with reductions in the prevalence of acute
malnutrition in several contexts (Myanmar, Niger, Somalia, and South Sudan) (32). In
both stable and emergency settings, CTPs have shown consistent associations with
improved dietary quality and increased food expenditures (32,38,52). One recent study
by the International Food Policy Research Institute (IFPRI) offers the most rigorous
evidence to date: their findings from a randomized study of cash and in-kind transfers in
Niger show that while CTPs were more cost-effective to implement, recipients had less
diverse diets and poorer household food security outcomes than recipients of food baskets
(57).
High quality evidence and empirical understanding of how emergency CTPs are utilized,
how they compare to other modalities of providing humanitarian assistance, and how
they might influence child nutrition outcomes are urgently needed (49,56,89). This
longitudinal study examined the association of food and health-related expenditures on
children’s risk of acute malnutrition, and estimates the effects of other potentially
relevant child, household, and community characteristics among households targeted by
an emergency CTP. A pre-post analysis of moderating factors within the causal
framework for undernutrition from the same program has been published elsewhere (55).
28
Methods
Setting
Niger’s population of 16 million is largely reliant on rain-fed agriculture and experiences
extreme food insecurity on an annual basis. Most rural households in the study region of
Maradi are supported through a combination of subsistence farming, unskilled manual
labor, livestock husbandry, and the selling of commodity items such as firewood,
charcoal, or small goods. The prevalences of stunting and wasting among children under
five years of age in Maradi are 54% and 19%, respectively; this is higher than the
national rates (44% and 18%) (90). At 166 deaths per 1,000 live births, child mortality in
Maradi is lower than the national rate of 198 deaths per 1,000 live births (90). Acute
malnutrition is most prevalent during an annual period of food insecurity, the rainy “lean
season”, between June and October.
Intervention
In May 2012, Save the Children (hereafter “Save”) implemented a six-month
unconditional, emergency CTP in the Maradi region of Niger in response to the
Government of Niger’s declaration of an impending food crisis. Program objectives
were to improve household food security, prevent the sale of household assets, and
reduce the incidence of child wasting. Eligible households were those classified as either
“poor” or “poorest” according to the Household Economy Approach (HEA) (91). The
HEA defines wealth groups according to locally defined thresholds of land and livestock
ownership and household size. In the study context, the “poorest” households had
29
approximately seven household members and owned less than one hectare of land, no
cattle, and no more than two goats and four hens. “Poor” households, in contrast, had
approximately eight household members and owned approximately 1.5 hectares of land,
no cattle, and no more than three goats and eight hens (92).
A total of 2,736 households in 21 villages were enrolled in the program and received six
monthly cash transfers from April to September 2012. Save staff distributed the
transfers at public distribution sites. The transfer amount started at 20,000 West African
Francs (CFA) for each of the first two months of the program and 30,000 CFA for each
of the subsequent four months, for a total value of 160,000 CFA (296 USD using July
2012 exchange rates (44,93)). The total was equivalent to approximately 76% of the
Gross National Income (GNI) per capita in Niger in 2012 (210,810 CFA, or 390 USD)
(32,94). The median total weekly household expenditures (the sum of food, medical,
and other expenditures) among the study sample at baseline were 2,100 CFA (inter-
quartile range: 1,450-3,350), or approximately 11% of the starting transfer amount.
Educational sessions did not accompany the intervention. All participants had access to
the same medical and nutritional services that existed prior to the study, which would
have included supplementary and therapeutic feeding programs for qualifying
individuals. Such programs are integrated into routine Ministry of Health services.
30
Study design and eligibility
The Emergency Nutrition Network (ENN), a UK-based research and information-sharing
humanitarian organization, designed and implemented a six-month longitudinal cohort
study of children in Save CTP beneficiary households. Households were randomly
selected from the Save list of CTP beneficiaries, and one eligible child per household was
selected as the target child for the study. Children were eligible if they were 6-36 months
of age and did not have acute malnutrition, defined as a weight-for-height Z-score (WHZ)
<-2 using the World Health Organization (WHO) standards for child growth (95), a mid-
upper-arm circumference (MUAC) <125mm, or edema, in April 2012. Eligibility did
not discount participation in other health or livelihood programs. In households with
more than 1 eligible child, all eligible children’s names were written on folded pieces of
paper and one was randomly selected as the target child.
Planned sample size
The sample size for this study was designed for a different purpose than the analysis
presented here, making ours a secondary data analysis. Post-hoc power calculations
appropriate to Cox proportional hazards models are provided in the results section. The
study’s sample size was calculated to detect a 25% decrease in the prevalence of acute
malnutrition relative to the prevalence during the previous year’s lean season (26% in
August 2011). Power was set at 80% with 95% two-sided confidence intervals.
Correlation of repeated measures was estimated at 0.6; a Spearman’s rank correlation
coefficient of 0.015 was used. The minimum sample size after adjusting for clustering
(n=21) and 5% attrition was 460 child-household pairs.
31
Data collection
Data on child diet, health and anthropometric status, and household expenditures were
collected at the homes of study participants for six consecutive months, from April
(baseline) to September (endline) 2012. Data on household composition, education,
income, and assets were collected only at baseline and endline. Interviews with thirty-
four female beneficiaries, seventeen with an acutely malnourished child and seventeen
with a non-acutely malnourished child, were conducted and recorded to collect
qualitative data on program delivery and uptake. All data were collected in the Hausa
language in the week prior to the cash transfer distributions by ten teams of three
enumerators each (one team leader and two individuals to measure and record data). A
copy of the survey tool is available in Appendix B (Supplement B1).
Any target child diagnosed with acute malnutrition (a “case”) at any survey round was
referred to treatment services. Their household remained a beneficiary of the CTP, but
no further data was collected from the target child or the household until the endline
survey.
Model variables and measurement
All variables are continuous unless otherwise noted. Child anthropometric measurements
were made using standard techniques, applying Standardized Monitoring & Assessment
of Relief & Transitions (SMART) guidelines (96). The Emergency Nutrition Assessment
(ENA) software was used to test both inter- and intra- measurer reliability during training
and refresher training (59,97,98). Weight was recorded to a precision of 0.1kg using an
electronic baby/toddler scale (Tanita BD-590, USA). Length of less than 87cm was
32
measured to a precision of 1mm using a baby mat (SECA S210, UK); height of children
≥ 87 cm was measured using a plastic stadiometer (Leicester, Child Growth Foundation,
UK). A tape was used to measure MUAC on the left arm to a precision of 0.1 cm. The
presence of bilateral pitting edema was recorded. Moyo4 weight-for-height charts were
used to assess and interpret a child’s weight-for-height according to the 2006 WHO
growth standards (95). Age was determined by asking to see a birth certificate or by
asking the mother directly or, if not known, it was estimated using a local events
calendar. Exact dates of birth were known for 281 children in the study (62%).
Child dietary diversity was assessed by summing the total number of WHO food groups
consumed within the last 24 hours (grains/tubers, fruits and vegetables rich in vitamin A,
legumes/nuts, animal flesh foods, eggs, dairy, and other fruits/vegetables) (99,100). Child
meal frequency was the number of snacks or meals fed to the child within the last 24
hours. Breastfeeding status was assessed by asking whether the child had received breast
milk in the preceding day (0, no breast milk fed; 1, breast milk was fed). Current
consumption of supplementary or therapeutic foods by the target child was also
documented (0, no supplement; 1, received supplement).
Child illness was defined as the occurrence of any of the following five symptoms or
diseases within the previous two weeks as observed by the mother: diarrhea, cough,
fever, malaria, or measles (0, healthy; 1, recently ill). Maternal mental health was
assessed using the Self-Reporting Questionnaire, which scores mental health from 0 to
4 Moyo charts are named for the nutrition center in Blantyre, Malawi, where the chart was developed.
33
19, where 0 is no symptoms and 19 is all elicited symptoms of poor mental health
(19,101).
Expenditures on food, medical, or other expenses were estimated by participants for the
previous one week, and are expressed in units of 100 CFA (approximately 19 cents using
July 2012 exchange rates (62,93)). Estimates were for expenditures related to the target
child only. “Other” expenses included the cost of materials such as clothing, cloth, soap,
or any non-food, non-medical expense incurred for the target child.
Household size was the number of family members currently living in the household.
Education referred to the presence of any individual in the household with formal
(primary or secondary) education (0, no formal education; 1, formal education).
Participants estimated the time to the nearest health facility in minutes. Discrete
categories of time to health facilities did not appear in the data, so the variable was left
continuous and log-transformed for modeling. Protected water sources were covered
wells or pumps, while unprotected sources were open wells or bodies of water (0,
protected; 1, unprotected). Household food insecurity was assessed using a shortened
validated version of the Household Food Insecurity Access Scale (HFIAS) (102). The
scale was dichotomized for analysis (0, no indicators of household food insecurity; 1, at
least 1 indicator of food insecurity). We categorized household wealth using the HEA
system as described in intervention section above (0, “poor”; 1, “poorest).
34
Informed consent and approval
Study participants gave verbal and written informed consent at each month of data
collection and were free to leave the study at any point. Study procedures were in
accordance with Save’s routine program monitoring and evaluation protocols. Any target
child found to have acute malnutrition was referred to treatment and removed from the
study; the household remained a beneficiary of the CTP. This study was approved by the
Niger Ministry of Health.
Statistical Methods
Data were double entered into EpiInfo Version 7 (103) by two data-entry clerks on the
day after data collection and analyzed using the STATA statistical software package
version 12 (104). Anthropometric indicators of the attained growth standards were
calculated using the WHO macro for STATA (105). A quality check of the
anthropometric data using the ENA plausibility software declared the data to be of
“good” quality (98).
We used a continuous-time Cox proportional hazards model to estimate the risk of acute
malnutrition based on fixed and time-variant variables, using month as the underlying
time variable. Cox proportional hazards models estimate the effect of covariates on the
likelihood of an event (becoming acutely malnourished in this case) relative to a common
underlying risk function; it is the appropriate modeling approach for right-censored data
with time-dependent covariates (106).
35
Model construction
Our binary outcome variable was the diagnosis of acute malnutrition. We began model
construction by selecting explanatory variables with theoretical significance to child
undernutrition as identified by the UNICEF framework (107). The initial model included
sixteen explanatory variables representing the immediate, underlying, and basic causes of
undernutrition. We then used a backward elimination approach to remove variables that
did not reach marginal statistical significance (P<0.10). We planned a priori to include
an interaction term between medical expenditures and child health status to examine
whether the effect of child health status on acute malnutrition risk varied with the level of
medical investment.
The results of the hazard analysis are expressed in terms of hazard ratios (HR). For
categorical predictors, HRs represent the relative risk of becoming acutely malnourished
in the category of interest compared with children in the reference category. For
continuous predictors, the HR is the relative risk of acute malnutrition associated with a
one-unit increase in the predictor. The exact marginal method was used to account for
ties due to discrete time units.
We provide baseline descriptive statistics for all independent variables. We also report
significance tests comparing mean differences for normally distributed variables (t-tests),
equality of medians for non-normally distributed variables (Wilcoxon rank-sum tests),
and frequencies for categorical variables (Pearson’s Chi-squared tests) at baseline
between those children who eventually developed acute malnutrition and those who did
36
not. Survival curves are provided for select outcomes using the Cox hazard model
estimates. Values in the text are HRs with 95% confidence intervals (CIs), means ±
standard deviation (SD), or frequency and percentage, as appropriate. Significance was
assessed at the P<0.05 level.
Exclusions
An analysis of changes in height between surveys suggested that in some households,
children other than the target child may have been measured and/or height measurement
errors exceeded plausible limits. We identified these individuals as those whose height
reduced between two consecutive surveys and/or those whose height increased at a pace
greater than 2.5 cm between two consecutive surveys, while making allowances for
measurement error (±2cm). This limit to linear growth has been used elsewhere (108).
These criteria resulted in the exclusion of data for 33 children. Data for 420 children were
retained. There is no evidence that excluded children were more or less likely to develop
acute malnutrition than those retained (Pearson χ2=0.0067, P=0.94).
Results
Adherence to the CTP was 100%: all 453 original participating households received six
cash transfers. Among households retained for data analysis (n=420), adherence to the
survey and anthropometric measurement was 99% (n=414): three households declined
participation in the survey in select months, and three were unable to be contacted for all
six surveys. Data for these households were included in analysis when available. Data
37
for two households were right-censored due to death of the target child. Post-hoc power
analysis indicate that the study sample size (n=420) provided >80% power to detect each
of the effects estimated by our Cox Proportional Hazard model (alpha 0.05, two-sided).
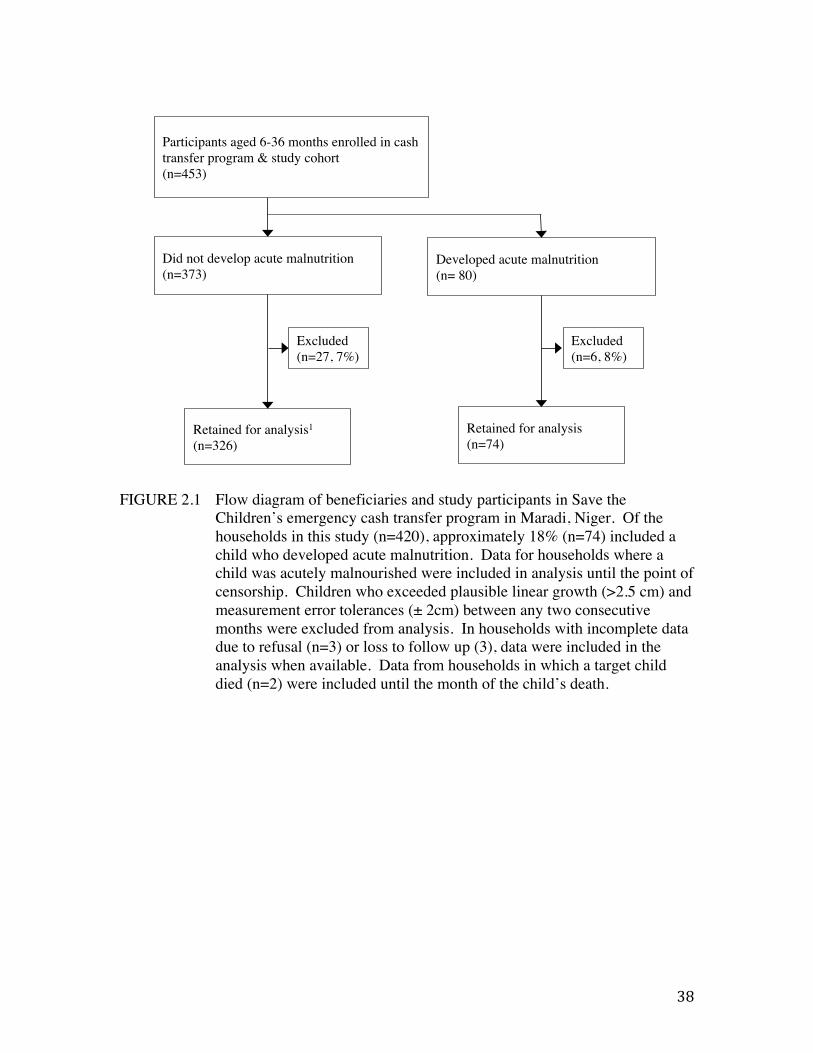
Figure 2.1 depicts a flow diagram of study participants. Seventy-four children (18%)
became acutely malnourished (cases) over the course of the study; 58 of these were
moderately malnourished (14%) and 16 severely malnourished (4%). Thirty-four of the
cases were indicated by WHZ alone, four by MUAC alone, 31 by both MUAC and WHZ,
and five by edema.
38
FIGURE 2.1 Flow diagram of beneficiaries and study participants in Save the
Children’s emergency cash transfer program in Maradi, Niger. Of the households in this study (n=420), approximately 18% (n=74) included a child who developed acute malnutrition. Data for households where a child was acutely malnourished were included in analysis until the point of censorship. Children who exceeded plausible linear growth (>2.5 cm) and measurement error tolerances (± 2cm) between any two consecutive months were excluded from analysis. In households with incomplete data due to refusal (n=3) or loss to follow up (3), data were included in the analysis when available. Data from households in which a target child died (n=2) were included until the month of the child’s death.
Participants aged 6-36 months enrolled in cash transfer program & study cohort !(n=453) !
Retained for analysis1 !(n=326)!
Excluded!(n=27, 7%)!
Retained for analysis!(n=74)!
Did not develop acute malnutrition !(n=373) !
Developed acute malnutrition !(n= 80) !
Excluded !(n=6, 8%)!
39
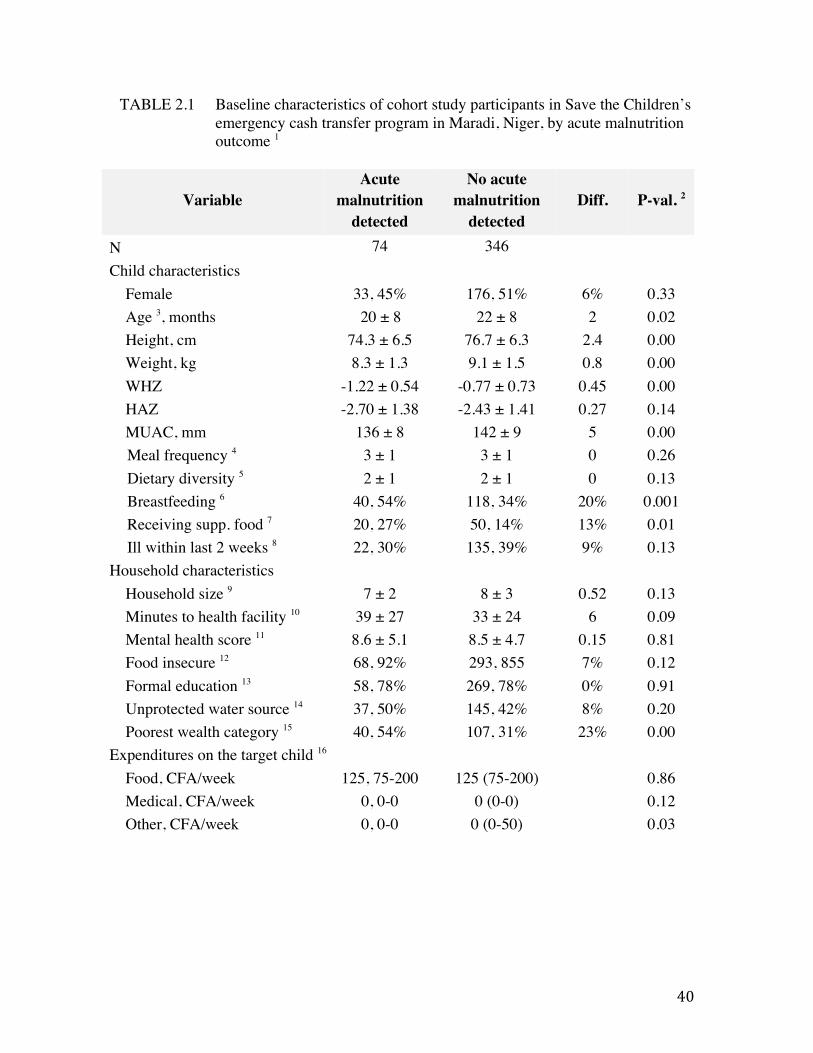
Moderately and severely malnourished children did not differ significantly by any of the
baseline variables measured (results not shown). There were 950 reports of child illness,
with between 33% (n=138) and 53% (n=222) of participants reporting an ill child in a
given month.
The baseline characteristics of participants are presented by acute malnutrition outcome
in Table 2.1. The mean baseline age, WHZ, and MUAC of cases were lower by a
magnitude of 2 months, 0.45Z and 5mm, respectively (P<0.05). Case households
reported slightly but significantly less general spending (non-medical, non-food) on the
target child (P<0.05), and a larger proportion of case households were in the lowest
wealth category (23% difference) (P<0.001). There were no significant differences
between case and non-case households in terms of dietary diversity, meal frequency,
recent childhood illness, household size, food insecurity, reported weekly spending on
food or medical costs, education level, mothers’ health, time to nearest health facility, or
the use of protected water sources at baseline.
40
TABLE 2.1 Baseline characteristics of cohort study participants in Save the Children’s emergency cash transfer program in Maradi, Niger, by acute malnutrition outcome 1
Variable Acute
malnutrition detected
No acute malnutrition
detected Diff. P-val. 2
N 74 346 Child characteristics
Female 33, 45% 176, 51% 6% 0.33 Age 3, months 20 ± 8 22 ± 8 2 0.02 Height, cm 74.3 ± 6.5 76.7 ± 6.3 2.4 0.00 Weight, kg 8.3 ± 1.3 9.1 ± 1.5 0.8 0.00 WHZ -1.22 ± 0.54 -0.77 ± 0.73 0.45 0.00 HAZ -2.70 ± 1.38 -2.43 ± 1.41 0.27 0.14 MUAC, mm 136 ± 8 142 ± 9 5 0.00 Meal frequency 4 3 ± 1 3 ± 1 0 0.26 Dietary diversity 5 2 ± 1 2 ± 1 0 0.13 Breastfeeding 6 40, 54% 118, 34% 20% 0.001 Receiving supp. food 7 20, 27% 50, 14% 13% 0.01 Ill within last 2 weeks 8 22, 30% 135, 39% 9% 0.13
Household characteristics Household size 9 7 ± 2 8 ± 3 0.52 0.13 Minutes to health facility 10 39 ± 27 33 ± 24 6 0.09 Mental health score 11 8.6 ± 5.1 8.5 ± 4.7 0.15 0.81 Food insecure 12 68, 92% 293, 855 7% 0.12 Formal education 13 58, 78% 269, 78% 0% 0.91 Unprotected water source 14 37, 50% 145, 42% 8% 0.20 Poorest wealth category 15 40, 54% 107, 31% 23% 0.00
Expenditures on the target child 16 Food, CFA/week 125, 75-200 125 (75-200) 0.86 Medical, CFA/week 0, 0-0 0 (0-0) 0.12 Other, CFA/week 0, 0-0 0 (0-50) 0.03
41
1 N=420. Values are mean ± SD; n, percentage, or median (IQR) as appropriate. Acute malnutrition was measured as WHZ<-2, MUAC<125cm, or bilateral pitting edema. All children were free of acute malnutrition at baseline. 2 P values are based on T-tests for continuous and normally distributed variables, chi-squared tests for categorical variables, or Wilcoxon Rank-sum tests for non-parametrically distributed variables. 3 Age was determined by asking to see a birth certificate or by asking the mother directly or, if not known, it was estimated using a local events calendar. 4 The number of snacks and meals consumed by the child in the last 24 hours. 5 The total number of WHO food groups consumed by the child within the last 24 hours (grains/tubers, fruits and vegetables rich in vitamin A, legumes/nuts, animal flesh foods, eggs, dairy, and other fruits/vegetables). 6 Whether the child consumed breast milk in the previous day (0, no; 1, yes). 7 Current consumption of supplementary or therapeutic foods by the target child (0, no supplement; 1, receiving supplement). 8 Diarrhea, cough, fever, malaria, or measles as observed by the mother during the previous two weeks (0, healthy; 1, recently ill). 9 Number of family members currently living in the household. 10 Time to the nearest health facility was estimated by mothers.11 Maternal mental health was assessed using the Self-Reporting Questionnaire. 12 Food insecurity was assessed using a shortened validated version of the Household Food Insecurity Access Scale (0, no indicators of food insecurity; 1, at least one of 3 indicators of food insecurity). 13 Presence of a formally educated individual in the household (0, no; 1, yes). 14 Uncovered water sources included open wells or open source (0, no; 1, yes). 15 Households occupied one of two wealth categories according to local standards using the Household Economy Approach (0, poor; 1, poorest). 16 CFA = West African franc. At the time of the study, 1 USD = 540 CFA.
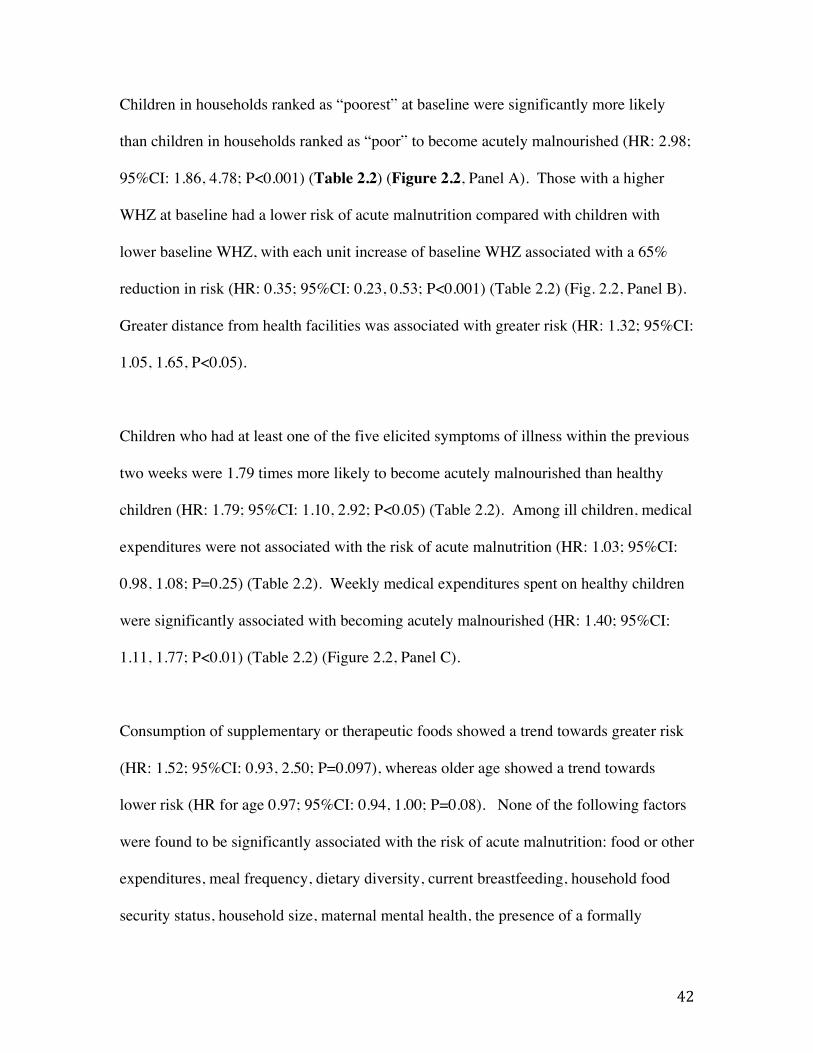
42
Children in households ranked as “poorest” at baseline were significantly more likely
than children in households ranked as “poor” to become acutely malnourished (HR: 2.98;
95%CI: 1.86, 4.78; P<0.001) (Table 2.2) (Figure 2.2, Panel A). Those with a higher
WHZ at baseline had a lower risk of acute malnutrition compared with children with
lower baseline WHZ, with each unit increase of baseline WHZ associated with a 65%
reduction in risk (HR: 0.35; 95%CI: 0.23, 0.53; P<0.001) (Table 2.2) (Fig. 2.2, Panel B).
Greater distance from health facilities was associated with greater risk (HR: 1.32; 95%CI:
1.05, 1.65, P<0.05).
Children who had at least one of the five elicited symptoms of illness within the previous
two weeks were 1.79 times more likely to become acutely malnourished than healthy
children (HR: 1.79; 95%CI: 1.10, 2.92; P<0.05) (Table 2.2). Among ill children, medical
expenditures were not associated with the risk of acute malnutrition (HR: 1.03; 95%CI:
0.98, 1.08; P=0.25) (Table 2.2). Weekly medical expenditures spent on healthy children
were significantly associated with becoming acutely malnourished (HR: 1.40; 95%CI:
1.11, 1.77; P<0.01) (Table 2.2) (Figure 2.2, Panel C).
Consumption of supplementary or therapeutic foods showed a trend towards greater risk
(HR: 1.52; 95%CI: 0.93, 2.50; P=0.097), whereas older age showed a trend towards
lower risk (HR for age 0.97; 95%CI: 0.94, 1.00; P=0.08). None of the following factors
were found to be significantly associated with the risk of acute malnutrition: food or other
expenditures, meal frequency, dietary diversity, current breastfeeding, household food
security status, household size, maternal mental health, the presence of a formally
43
educated household member, or the use of protected water sources. An interaction
between baseline WHZ and child age was not significant (results not shown).
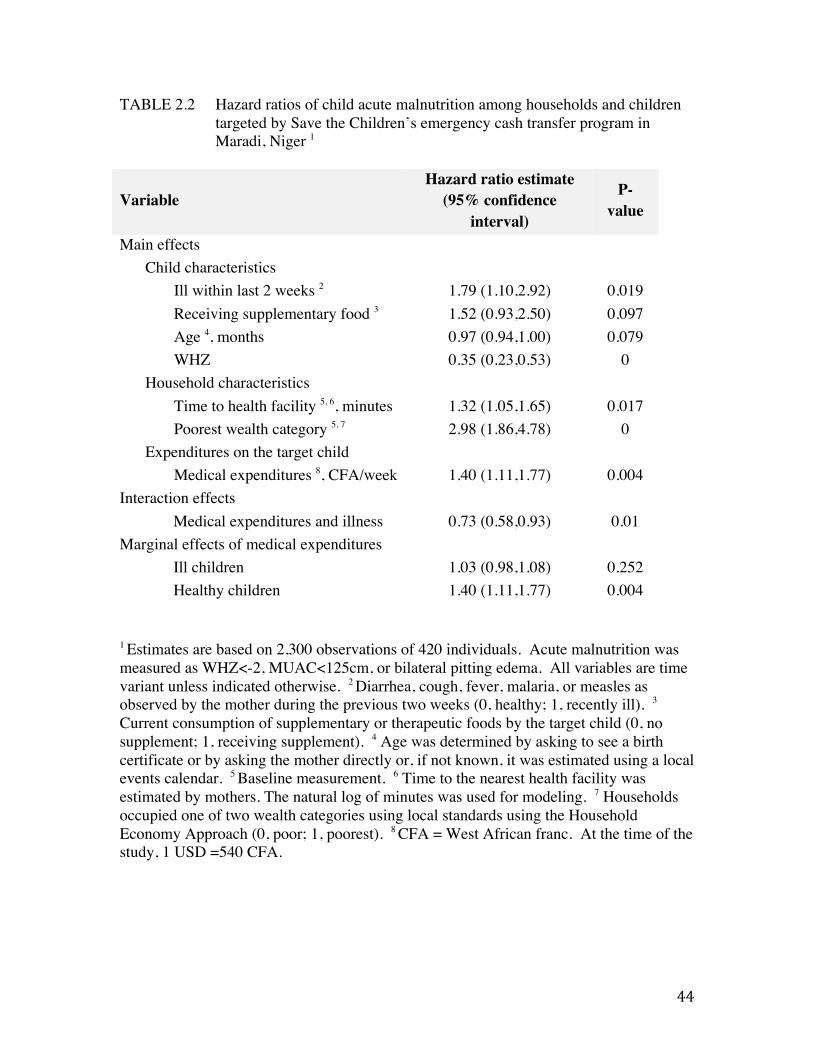
44
TABLE 2.2 Hazard ratios of child acute malnutrition among households and children targeted by Save the Children’s emergency cash transfer program in Maradi, Niger 1
Variable Hazard ratio estimate
(95% confidence interval)
P-value
Main effects Child characteristics
Ill within last 2 weeks 2 1.79 (1.10,2.92) 0.019 Receiving supplementary food 3 1.52 (0.93,2.50) 0.097 Age 4, months 0.97 (0.94,1.00) 0.079 WHZ 0.35 (0.23,0.53) 0
Household characteristics Time to health facility 5, 6, minutes 1.32 (1.05,1.65) 0.017 Poorest wealth category 5, 7 2.98 (1.86,4.78) 0
Expenditures on the target child Medical expenditures 8, CFA/week 1.40 (1.11,1.77) 0.004
Interaction effects Medical expenditures and illness 0.73 (0.58,0.93) 0.01
Marginal effects of medical expenditures Ill children 1.03 (0.98,1.08) 0.252 Healthy children 1.40 (1.11,1.77) 0.004
1 Estimates are based on 2,300 observations of 420 individuals. Acute malnutrition was measured as WHZ<-2, MUAC<125cm, or bilateral pitting edema. All variables are time variant unless indicated otherwise. 2 Diarrhea, cough, fever, malaria, or measles as observed by the mother during the previous two weeks (0, healthy; 1, recently ill). 3
Current consumption of supplementary or therapeutic foods by the target child (0, no supplement; 1, receiving supplement). 4 Age was determined by asking to see a birth certificate or by asking the mother directly or, if not known, it was estimated using a local events calendar. 5 Baseline measurement. 6 Time to the nearest health facility was estimated by mothers. The natural log of minutes was used for modeling. 7 Households occupied one of two wealth categories using local standards using the Household Economy Approach (0, poor; 1, poorest). 8 CFA = West African franc. At the time of the study, 1 USD =540 CFA.
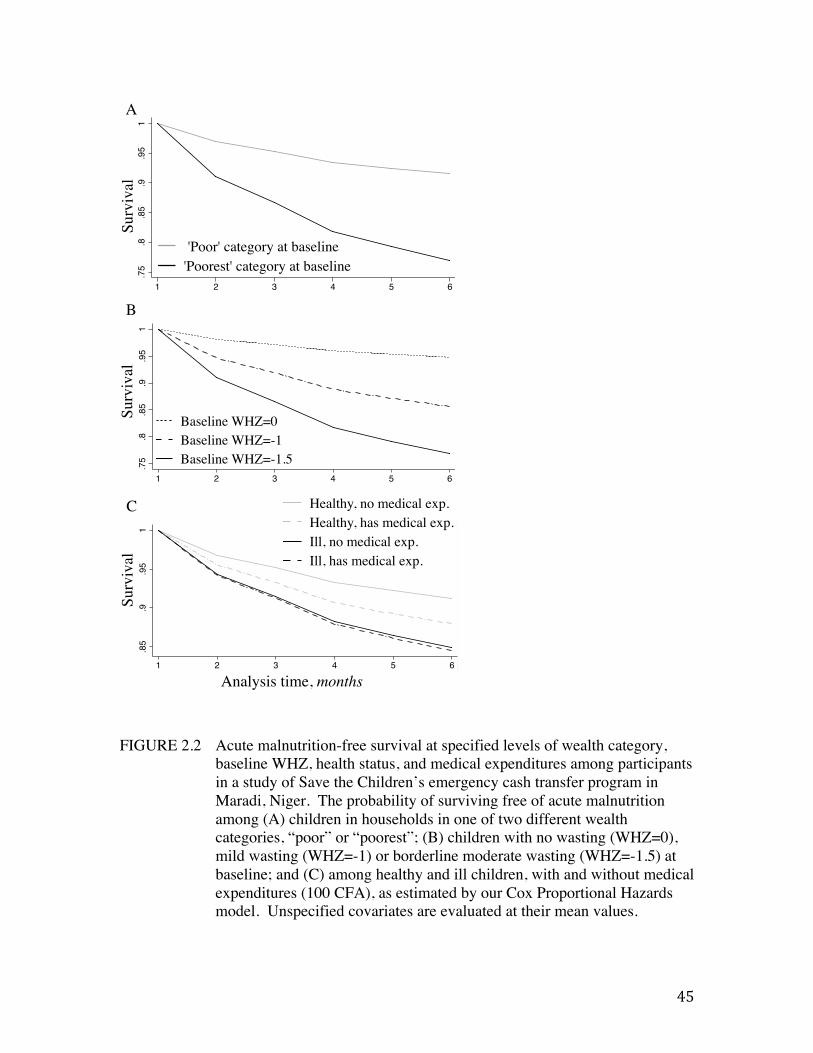
45
FIGURE 2.2 Acute malnutrition-free survival at specified levels of wealth category,
baseline WHZ, health status, and medical expenditures among participants in a study of Save the Children’s emergency cash transfer program in Maradi, Niger. The probability of surviving free of acute malnutrition among (A) children in households in one of two different wealth categories, “poor” or “poorest”; (B) children with no wasting (WHZ=0), mild wasting (WHZ=-1) or borderline moderate wasting (WHZ=-1.5) at baseline; and (C) among healthy and ill children, with and without medical expenditures (100 CFA), as estimated by our Cox Proportional Hazards model. Unspecified covariates are evaluated at their mean values.
.75
.8.8
5.9
.95
1Pr
obab
ility
of s
urvi
ving
with
out a
cute
mal
nutri
tion
1 2 3 4 5 6Analysis Time
Baseline WHZ=0Baseline WHZ=-1Baseline WHZ=-1.5
.75
.8.8
5.9
.95
1Pr
obab
ility
of s
urvi
ving
with
out a
cute
mal
nutri
tion
1 2 3 4 5 6Analysis Time
'Poor' category at baseline'Poorest' category at baseline
.85
.9.9
51
Surv
ival
1 2 3 4 5 6Analysis Time
Healthy, no medical exp.Healthy, has medical exp.Ill, no medical exp.Ill, has medical exp.
Analysis time, months!
Surv
ival!
Surv
ival!
Surv
ival!
A!
B!
C!
.85
.9.9
51
Surv
ival
1 2 3 4 5 6Analysis Time
Healthy, no medical exp.Healthy, has medical exp.Ill, no medical exp.Ill, has medical exp.
.75
.8.8
5.9
.95
1Pr
obab
ility
of s
urvi
ving
with
out a
cute
mal
nutri
tion
1 2 3 4 5 6Analysis Time
'Poor' category at baseline'Poorest' category at baseline
.75
.8.8
5.9
.95
1Pr
obab
ility
of s
urvi
ving
with
out a
cute
mal
nutri
tion
1 2 3 4 5 6Analysis Time
Baseline WHZ=0Baseline WHZ=-1Baseline WHZ=-1.5
46
In the qualitative interviews, most respondents reported returning home following
transfer distributions and handing their household’s transfer directly to their husband.
Further investigation of the data on medical expenditures revealed that the majority of
households spent no money on medical costs: of the 950 reports of child illness, only 300
were accompanied by reports of medical expenditures. An additional 43 reports of child
medical expenditures were unaccompanied by reports of recent child illness and are
presumed to represent either preventive medical spending or un-elicited cases of child
illness.
Discussion
Among vulnerable households targeted by this 6-month emergency CTP, food
expenditures for children and other diet-related factors were not found to be associated
with the risk of acute malnutrition. Rather, household poverty, baseline wasting, and
child illness were significantly associated with high risk.
The relationship between food expenditures, diet, and child nutritional status
Our findings draw attention to a prevailing paradigm regarding the role of emergency
CTPs, which equates increased income with increased expenditures on food, and
ultimately, improved child nutritional status (32). Similar thinking perpetuates in
nutrition research and policy, which tend to focus on the dietary causes of undernutrition
and retain a strong ‘food first’ bias (4,17). This paradigm exists despite extensive
47
evidence from income-generation and poverty reduction interventions which
demonstrates that increased income and/or food expenditures are insufficient to influence
child growth, especially when households remain below or near the poverty line (109).
Even in food-secure or well-off households, children may not have adequate diets due
variation in infant and child feeding practices, household coping strategies in which poor
and wealthy households reduce food intake during food shortages, and intra-household
food and resource allocation (110).
Expenditures on food, and the extent to which they influence child diet and nutritional
status, have been found in several contexts to rely on the interaction of income and
gender. A study of Malawian and Kenyan households found that in poor households in
which women controlled income, children had higher caloric intake and better nutritional
status than in wealthier households where income was controlled by men (40). Similarly,
in the Ivory Coast, raising women’s share of income was associated with increased
allocation of household expenditure to food (111). In the present study, although transfers
were distributed to women, qualitative interviews with program beneficiaries revealed
that the majority of women gave the transfers to their husbands as soon as they returned
home from distribution sites. This implies that women had limited control over the
transfer income, and may not have been in a position to direct its spending towards child
diet or health.
Turning to the available evidence on CTPs in Sub-Saharan Africa to situate our diet and
expenditure-related findings, we see that our results are consistent with work from Niger
48
and South Africa. In Niger, IFPRI found that cash transfers may be less effective
promoters of diet quality where markets are poorly functioning, food prices are unstable,
and/or beneficiaries favor bulk grain purchases over diet diversification (57). All of these
constraints are likely to occur in our study population, and may have constrained the
program’s potential to influence child nutritional status through diet-related factors. In a
non-emergency South African context, a study comparing private transfers (remittances,
or transfers sent home from family members) to public transfers (such as pensions) found
that private transfers significantly impacted household expenditure patterns on food and
clothing, whereas public transfers did not (112). Seeing as remittances are a critical
source of household income in Niger (113), it is possible that a similar dynamic exists
between spending of remittances and emergency cash transfers in the Nigerien context as
well.
The relationship of medical expenditures, child health, and child nutritional status
The ‘food first’ bias neglects the causative role of disease and the importance of access to
medical care, factors that our analysis showed to be more indicative of acute malnutrition
risk than food and diet-related factors. Illness was frequent in our study population and
was associated with a high risk of acute malnutrition; this risk did not vary significantly
with medical spending. Early informative work from Southwestern Kenya found that
even in the presence of a successful food insecurity intervention, in which household
income and food expenditures increased, child growth only improved in the presence of
substantial improvements in the health environment (41).
49
Evidence from development literature suggests a positive association between income
and medical spending. In a study of 30 African countries, 10% increases in gross per
capita income or per capita foreign aid income were each associated with modest (1%
and 0.18%, respectively) increases in health expenditures (114). Willingness and ability
to pay for healthcare services was highest among rural households in the Central African
Republic, despite their lower income relative to urban households (115). Yet one study
from Jamaica found that while female decision makers were more likely to allocate a
budget to child and family food and goods, they were less likely to spend money on
health. Women in the Jamaican context prioritized free sources of health care outside of
the mainstream health system (116).
Again turning to CTP-specific evidence, we see that in the recent randomized study of
cash and in-kind transfers in Niger there was no difference in medical spending between
study arms; no measure of child illness were reported to assess differences in frequency
and no conditional terms were tied to health service utilization (57). Yet improving
health service access by alleviating financial barriers is a realistic emergency CTP
objective with precedence in non-emergency conditional programs, particularly those that
promote awareness of how and when to pursue care (42,46). A recent evaluation of a
non-emergency, unconditional CTP in Malawi found child illness was less frequent
among children in households receiving transfers (117,118). The authors of the Malawi
study attributed the difference to increased food consumption and medical spending
among transfer households, but did not provide adequate methodological detail assess the
quality of these data.
50
Although basic health services for children under the age of five are supposed to be free
in public Nigerien clinics (119), households often have to pay for services and drugs, and
frequently purchase drugs from itinerant medicine vendors, (110). Purchasing power is a
necessary component of medical spending that an emergency CTP is equipped to address,
but financial accessibility alone is not sufficient to guarantee health service utilization or
desired child health and nutrition outcomes. Utilization of health services in Niger is
sensitive to distance as well as price (120); a recent study identified 1·88 greater odds of
complete vaccination by the age of one among children in households <60 minutes from
a health facility (121). This is consistent with our finding that those living further from
health facilities had a greater risk of acute malnutrition. Many components of health
service access—proximity, availability of staff and resources, quality of staff-patient
interactions—are similarly beyond the scope of an emergency CTP (61).
The significance of baseline wealth and anthropometric status
The significance of pre-intervention child anthropometric status and household wealth in
our results suggest that the CTP in question may have come too late to help the most
vulnerable children in the sample. It is reasonable to infer that an emergency CTP alone
cannot offset the major physiological vulnerabilities associated with extreme and chronic
poverty. Further research about the optimal timing and appropriate value of emergency
CTPs would help inform future program design (52). Commitment and investment in
nutrition-specific and nutrition-sensitive interventions, including agriculture, public
health initiatives including water and sanitation, and social protection schemes with
capacity for seasonal surges in resources and programming, may be more effective
51
approaches for increasing resilience to shocks and promoting sustained prevention of
undernutrition and poverty (88,122).
Further insight into the Nigerien context, including social perceptions of child
malnutrition and caregiver decision-making around healthcare utilization, is gained from
two studies by Hampshire et al, conducted following the food crisis in 2005. Uptake of
child health services was very low; children with commonplace illnesses (diarrhea, fever,
or respiratory infection) were seldom taken for treatment; among children with more
serious or chronic conditions, the condition was often considered an intrinsic quality of
the child (110). The authors determine that while the intent of humanitarian interventions
is to save lives, the behaviors and decisions made by households and caregivers in
emergency-prone contexts is risk-adverse and often detrimental to child health.
Constrained decision-making abilities and the need for long-term livelihood preservation
resulted in a “failure to invest in growth-faltering children” (82,110). It is certainly
reasonable to expect that similar circumstances informed beneficiary decision-making in
the context of our study and the 2012 food crisis.
Limitations
This analysis relied on recalled expenditure data, which may have been recalled
differentially for food and medical expenses. Given the communal nature of food
preparation and consumption in Niger, estimating food expenditures for one child was
likely to introduce bias. Medical expenditures may have been easier to recall, as they
were discrete events with more obvious ties to one individual. We do not expect that
52
food or medical expenditure recall errors varied systematically, and we posit that the
short recall period (2 weeks) limited the extent of recall errors (123). Expenditure is
difficult to measure accurately, and the lack of significant findings in this study should
not diminish their importance in promoting positive child health outcomes.
We also see limitations in our definition of child illness. Our survey tool was restricted
to five acute conditions and neglected to capture many common or chronic conditions or
symptoms (such as vomiting, anemia, helminth infection, micronutrient deficiency, or
HIV/AIDS), which would have necessitated medical costs and been associated with
higher risk of acute malnutrition but were not elicited by study enumerators. As a result,
we suspect that some individuals were misclassified as healthy, leading to conflation of
the impact of the influences of medical expenditures and undocumented child illness. In
these cases, medical expenditures were tantamount to a second variable capturing un-
queried illnesses and their associated risk of acute malnutrition.
Although higher maternal education and knowledge has been associated with improved
child nutrition outcomes in previous studies, our data did not contain enough variation to
assess this relationship. Finally, although a pre-post analysis of this data reveals that
participants showed substantial improvements in anthropometric outcomes, the
attributable impact of the CTP cannot be estimated in the absence of a control group (55).
53
Conclusions
This study provides evidence regarding the use of an unconditional CTP in an emergency
setting in Niger. Several health related factors—medical expenditures, child illness,
baseline wasting, and poverty—were associated with a high risk of the development of
acute malnutrition. Food and diet-related factors—food expenditures, meal frequency,
dietary diversity, and household food insecurity—were conversely not associated with
the risk of acute malnutrition. These findings highlight the importance of the health-
related determinants of child undernutrition, and suggest that a potential role of
emergency CTPs may be to enable and promote health service access where services
exist. They also indicate a need for more sustained poverty reduction and undernutrition
prevention activities in concert with well-timed and strategic use of emergency
interventions. Future study involving the use of a comparison group and conditional
terms that promote child health and nutrition would be an appropriate way to determine
how and whether the incidence of acute malnutrition is reduced in the presence of
emergency CTPs.
54
Chapter 3: The impact of an emergency cash transfer program
on child dietary practices and weight gain during a food crisis:
Results of a quasi-experimental longitudinal study in Niger
Authors
Jessica Bliss, Kate Golden, Chaibou Saidou, Leila Bourahla, Rebecca Stoltzfus, and
David Pelletier
Abstract
Assessment of the impact of emergency cash transfer programs on child nutritional status
has been difficult to achieve due to the considerable logistic and ethical constraints that
characterize humanitarian settings. Here we present the findings from a quasi-
experimental longitudinal study of a 4-month conditional emergency cash transfer
program implemented by Concern Worldwide during a food crisis in Tahoua, Niger, in
2012, in which the use of a concurrent control group permits estimation of the program’s
impact on child diet and weight gain. Program beneficiaries received 3 transfers totaling
approximately 65% of Niger’s gross national per capita income; mothers attended
mandatory sessions on child and infant feeding and care practices. Data from 212
vulnerable households and children targeted by the intervention were compared with 212
similarly vulnerable control households and children from the same 21 villages. We used

55
multilevel mixed effects regression to estimate weight and weight-for-height Z score gain
over time. Children in intervention households gained 1.22 kg more weight on average
than those in control households over the 2-month duration of study (P<0.001). The
weight gain velocity among intervention children (3.79 ± 3.8 g/kg/day) was comparable
to results reported by studies of CSB interventions in similar contexts. WHZ gains
associated with the intervention were 1.49 Z on average (P<0.001), and the prevalence of
acute malnutrition declined from 40% to <5% among intervention children while
remaining approximately 20% among controls. We conclude that emergency cash
transfer programs have tremendous capacity for promoting child weight gain in the
context of a food crisis, and we suggest that the use of strategic conditional terms is likely
a key feature for achieving this result.
Background/Introduction
Emergency cash transfer programs (CTPs) are intended to provide immediate relief to
crisis-affected households and communities by helping them acquire the goods and
services necessary to sustain themselves until the crisis is resolved. They have been
implemented in response to social and political conflicts (Sudan), natural disasters
(Myanmar), and recurring seasonal effects (Niger), with the common objective of
protecting child health and nutrition during periods of disrupted access to food, water,
shelter, and/or basic services (32). During such periods, affected households are often
unable to derive income, may incur unanticipated or uncovered expenses, and frequently
experience food shortages, resulting in increased vulnerability of children to poor diets
56
and poor health (4). Child acute malnutrition, the deterioration of muscle and fat tissue
due to inadequate dietary intake and/or illness, is a potentially life-threatening condition
and a focus of humanitarian interventions in crisis-affected communities (4).
Despite the increasing popularity of emergency cash transfer programs as tools during
crises, there is surprisingly little evidence available regarding their impact on child
nutrition. Due to the unpredictable and urgent nature of the context in which emergency
cash transfer programs are most relevant, implementing organizations may sacrifice
strategic monitoring and evaluation methods in favor of rapid program execution (7).
Similarly, in circumstances where the need for assistance is high, it would be unethical to
deny program benefits to eligible populations, which further limits organizational
capacity to assess program impact using concurrent controls.
For the logistic and ethical reasons outlined above, most evidence regarding emergency
CTP impact is in the form of humanitarian agencies’ internal evaluations and yields
limited insight into whether the programs resulted in measurable, significant impact or
how this impact was achieved. Furthermore, given the strong desire of implementing
humanitarian agencies and donors to demonstrate positive program impact, a bias
towards reporting positive results in evaluations is highly likely. The available evidence
indicates a positive effect of emergency CTPs on child diet quality and nutritional status
(wasting) across a range of crisis types in Myanmar, Niger, Somalia, and South Sudan
(32). A recent study of an emergency CTP in Niger determined that beneficiaries of the
program made gains in child weight-for-height Z scores (WHZ), mid-upper arm
57
circumference (MUAC), and dietary diversity, as well as improved household indicators
of wealth and food security; the study did not have a comparison group so improvements
could not be attributed to the intervention (55). Recent work by the International Food
Policy Research Institute (IFPRI) offers the first glimpse at rigorous evaluation through
the use of a randomized design in Niger and Ecuador (56,57). Cash, food baskets, and
food vouchers were randomly distributed to communities in order to evaluate the
modalities’ potential impact on diet and food security across. In Niger, cash transfer
recipient households had less diverse diets and lower food security indicators than those
receiving food baskets (57). The IFPRI studies did not include child nutrition or child
diet outcomes, and no measures of acute malnutrition were reported.
Further insight into how emergency CTPs may impact child nutrition can be gained from
studies of non-emergency CTPs, for which the quality of evidence is generally stronger
and conceptual frameworks for program impact are well developed (42,51). Non-
emergency programs have shown mixed effects for child nutrition: reductions in stunting,
anemia, and underweight have been reported in Mexico and Nicaragua (43,45), yet a
recent review of 16 programs in 10 countries found no consistent effect on child nutrition
status (50). Findings do show a consistent association with improved uptake of
preventive health services (46).
Although the structure and objectives of non-emergency and emergency CTPs are quite
different—the former are typically operated over a period of years with a long-term goal
of reducing poverty, whereas the latter are operated over a period of months with the
58
immediate goal of bridging crisis—program impact pathways for each can be
conceptualized similarly. For instance, in a conditional CTP, in which beneficiaries must
comply with terms set by the program (i.e. attending educational sessions on health,
enrolling children in school, keeping vaccination status up to date, etc.), the conditional
terms could be hypothesized as a mechanisms to positively impact health, regardless of
whether the program was implemented in an emergency context or not. In a non-
conditional program, conversely, the cash itself would be the only mechanism generating
impact. Figure 1.1, adapted from work by Gaardner (2010) and Leroy (2009) pertaining
to non-emergency programs, depicts a conceptual framework for how an emergency CTP
may impact child growth (42,51).
The study presented here is the result of a unique opportunity seized by a humanitarian
organization, Concern Worldwide (hereafter Concern), during the planning and
implementation of an emergency CTP in Tahoua, Niger, during a food crisis in 2012.
Concern’s targeting scheme yielded natural experiment in which to compare beneficiary
households to similar households not receiving the intervention. To our knowledge, this
is the only known study of an emergency CTP that included the use of a concurrent
control group to estimate the impact on child health and nutrition outcomes. Specifically,
the study sought to estimate the impact of an emergency CTP on the diet and weight gain
of children aged 6-24 months, and to assess the potential for such programs to prevent
acute malnutrition.
59
Methods
Context of the emergency CTP
The national Government of Niger declared an impending food crisis in May 2012, based
on drought and famine early warning system projections of poor crop and fodder
production due to insufficient rainfall. High food prices were seen as a key contributing
factor to the crisis (79). Similar circumstances in Niger in 2005-2006 and 2008-2009 had
proven devastating, with several million people believed to be affected by crop failure,
the inability to afford market-sourced foods, and severe food security (80,81). These
events led to international calls for enhanced governmental and humanitarian agency
response to threats of famine in the country and region (83).
Concern’s emergency CTP intervention: Targeting and design
In response to the crisis announced in 2012, Concern implemented a conditional
emergency CTP in Niger’s Tahoua region. The program targeted 81 villages that had
exhibited chronic vulnerability to food insecurity between 2005 and 2011, as determined
by federal and Concern assessments of fodder and food production, asset ownership, and
previous exposure to drought, pestilence, and human and animal epidemics.
Not all of the households in the 81 villages targeted were enrolled in the emergency CTP.
The Household Economy Approach (HEA) was used to assign each household to one of
four socio-economic groups, based on household size, land and livestock ownership, and
household assets (91). This approach has been used by other humanitarian organizations
in Niger previously (92). All of the lowest-ranking households (HEA category “D”) were
60
enrolled in the intervention, totaling 5,286 households. Surplus funding for the
intervention allowed enrollment of an additional 1,211 households, which were selected
from the second-lowest ranking household (HEA category “C”). These additional
beneficiaries were selected by village committees based on vulnerability criteria relative
to the average category “C” household, including the number of people able to work,
whether the household was male or female-headed, the presence of disability within the
family, marital status (monogamous or polygamous), average income, source of income,
and type of dwelling. The emergency CTP enrolled a total of 6,497 households.
Each intervention household received a total of 125,000 CFA (approximately 250 USD)
split across three distribution periods between July and September 2012. The cash
transfers were given to mothers of each household, in order to increase the likelihood that
the money would be spent to benefit child health and nutrition (44). The value of the
total transfer amount was equivalent to 65% of the gross national income per capita in
Niger in 2012 (94).
The condition for receiving each transfer was for household mothers to attend health and
education sessions held prior to the cash transfer distributions. Sessions delivered
messages about optimal infant and young child feeding (the importance of feeding
colostrum after birth and infant and young child feeding for children 6-8, 9-11, and 12-24
months olds), hand washing, and the use and mixing of oral rehydration salts. They also
included cooking demonstrations of how to prepare and integrate protein-rich foods and
vegetable purees into meals for children.
61
Additional concurrent programs
In addition to the emergency CTP, two additional programs were being implemented in
the Tahoua region. First, services for the community-based management of acute
malnutrition (CMAM) were available at all of the 17 major health facilities. This
included therapeutic care for severe acute malnutrition and targeted supplementary
feeding for moderate acute malnutrition. One month prior to the first cash distribution
(June 2012), Concern distributed seeds and fertilisers to the same 81 villages selected for
the CTP. Village committees distributed 10 kg bundles of millet seeds and fertiliser to
individual households that were considered vulnerable and had access to land.
Design of the emergency CTP evaluation
Concurrent to the emergency CTP intervention, Concern designed and implemented a
non-randomized study with two treatment groups to investigate the impact of the program
on child nutrition outcomes. Of the 81 beneficiary villages, 21 were purposively selected
for the study for their accessibility. In each selected village, an exhaustive sampling
approach was taken to enroll all eligible households. Households were eligible for the
cash treatment group (“cash group”) if they (1) were enrolled in Concern’s emergency
CTP program, (2) occupied HEA category “C”, and (3) had a child aged 6-23 months of
age. The child could not be wasted (MUAC<125mm) or have any elicited symptoms of
disease (diarrhea, fever, or cough). Households were eligible for the comparison group if
they (1) were not enrolled in the emergency CTP, (2) occupied HEA category “C”, and
(3) had a child aged 6-23 months of age. Comparison group children could not be wasted
62
(MUAC<125mm) or have any of the symptoms listed above. Children identified during
study enrollment were the individuals for whom all data were collected. MUAC was the
sole indicator used to assess wasting/acute malnutrition status.
Data collection procedures
Data were collected on child and household characteristics by six teams of two trained
Concern enumerators at the homes of study participants at three times: once shortly after
the start of the intervention (“Initial”) and subsequently in one-month increments
(“Midpoint” and “Endline”). Surveys were written in French and administered in the
Hausa language. A copy of the survey tool is available in Appendix B (Supplement B2).
Anthropometric measurements were made using standard techniques according to the
Standardized Monitoring and Assessment of Relief and Transitions (SMART) guidelines
(96). Weight was recorded in kilograms using an electronic scale. Length of children
<87 cm long was measured using a baby mat, and height of children ≥ 87 cm tall was
measured using a stadiometer. Standard MUAC tapes were used to measure mid-upper
arm circumference. Age was either determined by birth certificate or mother’s
estimation. Any child who was found to be acutely malnourished (MUAC<125 mm)
during the study was referred to the nearest CMAM treatment site.
The number of meals and snacks consumed by the target child within the last 24 hours
constituted meal frequency. Consumption of any of the 7 World Health Organization
(WHO) infant and young child food groups within the last 24 hours was recorded (grains,
63
legumes, fruits or vegetables rich in vitamin A, eggs, animal flesh foods, dairy, other
fruits and vegetables) (100). Children who had breastfed within the last 24 hours were
recorded as breastfeeding. Elicited symptoms of child illness included diarrhea, cough,
difficulty breathing, or fever in the last two weeks as observed by the mother. Current
enrollment in therapeutic or supplementary feeding programs was recorded. Vaccination
history (measles and Penta 3) and vitamin A supplementation were determined by
reviewing the child’s health card. If no card was available, enumerators asked mothers if
the child had been vaccinated or supplemented. Mothers provided information about
ethnicity, marital status, and the number of cattle, goats, sheep, poultry, camels and
hectares of land owned by the household.
Sample size calculation
The sample size for this study was calculated to detect a difference of 0.5 g/kg/day in
weight gain velocity between the treatment groups, adjusting for design effect using a
factor of 1.5 (chosen using SMART survey guidelines (96)). The target sample size was
213 individuals per group.
Informed consent and ethical approval
Verbal and written informed consent was sought at each survey for each participant. This
study was found to be exempt from review by Cornell University’s IRB (protocol ID#
1302003601). Concern collected all of the data for this study as part of their routine
program monitoring and evaluation activities.
64
Analytic methods
Data were assembled in Microsoft Excel and analyzed in STATA (104). Anthropometric
indicators were calculated using the WHO macro for STATA (105). We used the WHO
standards for infant and child feeding practices and growth (95,100). We used Principle
Components Analysis (PCA) to extract one component (the first) to summarize
household livestock assets from the types and number of livestock owned initially. The
first component capture 39% of the variance in livestock ownership data; goats and cattle
were the most heavily loaded (Appendix A, Table A3).
Descriptive statistics (means, medians, frequencies) were calculated and plotted for
mother, child, and household characteristics as appropriate. A linear regression model
was used to predict change in WHZ from initial to endline measures, adjusting for child
age, sex, treatment group, baseline WHZ, breastfeeding status, recent illness, Penta
vaccination status, enrollment in supplementary feeding programs, and initial household
livestock and land ownership.
Multilevel mixed-effects linear regression was used to estimate the effect of the cash
transfer program on weight over time, clustering by village and treating individuals as
random effects to account for random variation in individual growth. An interaction term
between study arm and time permitted us to estimate this effect for each time increment.
The model was adjusted for child sex, age, receipt of therapeutic or supplementary foods,
and initial household livestock and land ownership.
65
A multilevel mixed-effects logistic model was used to estimate the odds of developing
acute malnutrition (WHZ<-2 or MUAC<125mm), treating individuals as random effects
and adjusting for child age, sex breastfeeding status, illness, enrollment in a
supplementary feeding program and initial household livestock and land ownership.
Values are reported as mean ± standard deviation, or as frequency (%) as appropriate.
The threshold for statistical significance was P<0.05.
Criteria for excluding data
We identified outlying anthropometric measurements as WHZ, HAZ, or WAZ scores ± 4
Z beyond the respective median scores for the sample. Outlying Z scores and their
component anthropometric measurements (height and/or weight) were excluded from
analysis. We defined implausible linear growth as gains exceeding 7 cm or losses
exceeding 2 cm over the study period. The positive limit (gain of 7 cm) is the sum of our
threshold for allowable measurement error (2 cm) plus the maximum plausible linear
growth over a two-month period (5 cm). The negative limit (loss of 2 cm) is again our
allowable measurement error. This approach to identifying implausible linear growth has
been used elsewhere (108).
66
Results
Figure 3.1 depicts the intervention and study timeline, and Figure 3.2 shows participant
flow. Of the 212 households recruited for the cash group, observations of WHZ, HAZ,
and/or height were excluded for 101 children due to outlying or implausible height
measurements, leaving 111 children with complete height, WHZ, and HAZ data. Of the
214 households recruited for the comparison group, observations of WHZ, HAZ, and/or
height were excluded for 85 children and two households were excluded due to an error
in protocol, leaving 127 children with complete height WHZ, and HAZ data. Weight
measurements and all other non-anthropometric data were retained for all children and
households (n=424).
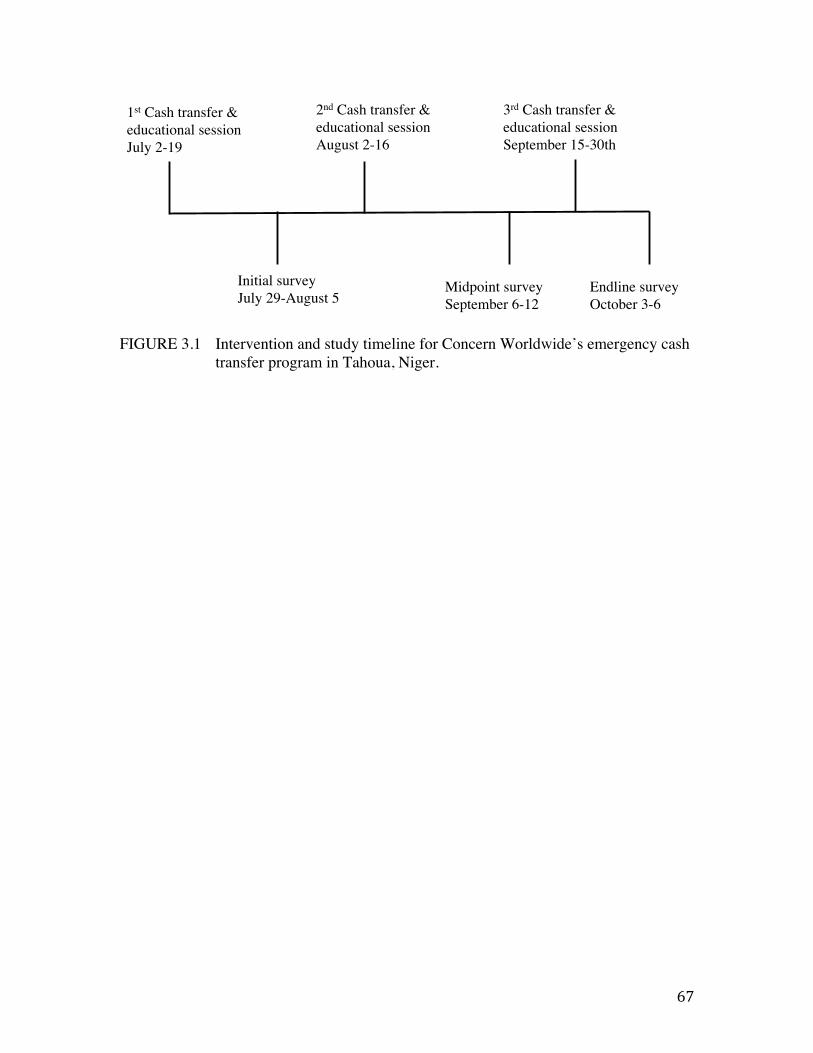
67
FIGURE 3.1 Intervention and study timeline for Concern Worldwide’s emergency cash transfer program in Tahoua, Niger.
Initial survey!July 29-August 5 !
Midpoint survey!September 6-12 !
Endline survey!October 3-6 !
1st Cash transfer & educational session !July 2-19 !
2nd Cash transfer & educational session!August 2-16 !
3rd Cash transfer & educational session!September 15-30th!
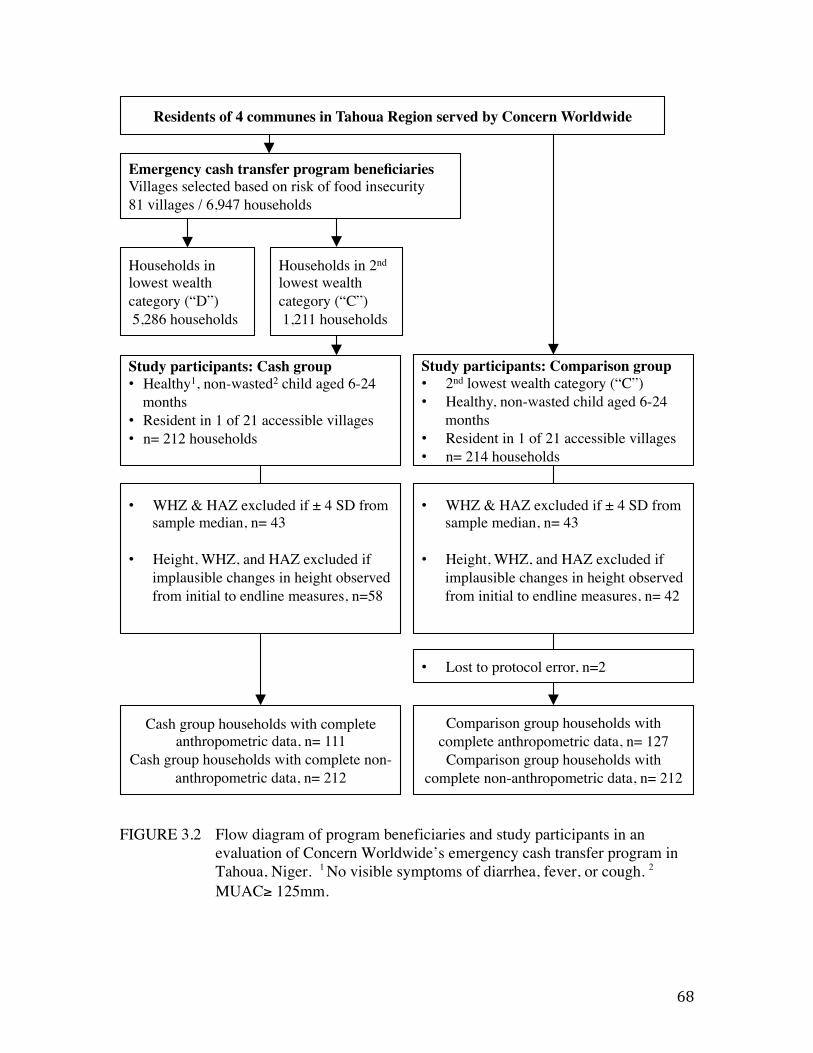
68
FIGURE 3.2 Flow diagram of program beneficiaries and study participants in an evaluation of Concern Worldwide’s emergency cash transfer program in Tahoua, Niger. 1 No visible symptoms of diarrhea, fever, or cough. 2
MUAC≥ 125mm.
!Comparison group households with
complete anthropometric data, n= 127!Comparison group households with
complete non-anthropometric data, n= 212!!
• Lost to protocol error, n=2!
Households in lowest wealth category (“D”)! 5,286 households!
Households in 2nd lowest wealth category (“C”)! 1,211 households!
Study participants: Comparison group!• 2nd lowest wealth category (“C”)!• Healthy, non-wasted child aged 6-24
months!• Resident in 1 of 21 accessible villages!• n= 214 households!
Residents of 4 communes in Tahoua Region served by Concern Worldwide !
Study participants: Cash group!• Healthy1, non-wasted2 child aged 6-24
months !• Resident in 1 of 21 accessible villages!• n= 212 households!!
Emergency cash transfer program beneficiaries!Villages selected based on risk of food insecurity!81 villages / 6,947 households!
Cash group households with complete anthropometric data, n= 111!
Cash group households with complete non-anthropometric data, n= 212!
• WHZ & HAZ excluded if ± 4 SD from sample median, n= 43!
!• Height, WHZ, and HAZ excluded if
implausible changes in height observed from initial to endline measures, n=58!
!
• WHZ & HAZ excluded if ± 4 SD from sample median, n= 43!
!• Height, WHZ, and HAZ excluded if
implausible changes in height observed from initial to endline measures, n= 42!
!
69
Program adherence
Program records showed that 98% of the cash group attended all of the educational
sessions, and that all cash group households received the full amount of the cash
transfers.
Power
Post-hoc power analyses indicated that after excluding data, this study had 82% power to
detect the observed mean differences in weight between the cash and comparison groups
at the initial time point, and 100% power to detect differences observed at endline (α =
0.05, 2-sided test). For WHZ, initial and endline power were 87% and 100%
respectively. The descriptive and analytic results of this study remain consistent with and
without the excluded data.
Descriptive results: Initial measurements
The study sample was similar across treatment groups in mean age, age distribution, and
sex at the initial measurement (Table 3.1). The average age of the children in the sample
was 13 months, with most participants falling in the 13-24 month age category.
Approximately half of the participants were female.
Despite similarities in age and sex, participants in the cash group were 0.3 kg lighter on
average, with mean WHZ scores 0.37 Z lower than their comparison group counterparts
(P<0.001). Average heights and HAZ scores were similar between the groups.
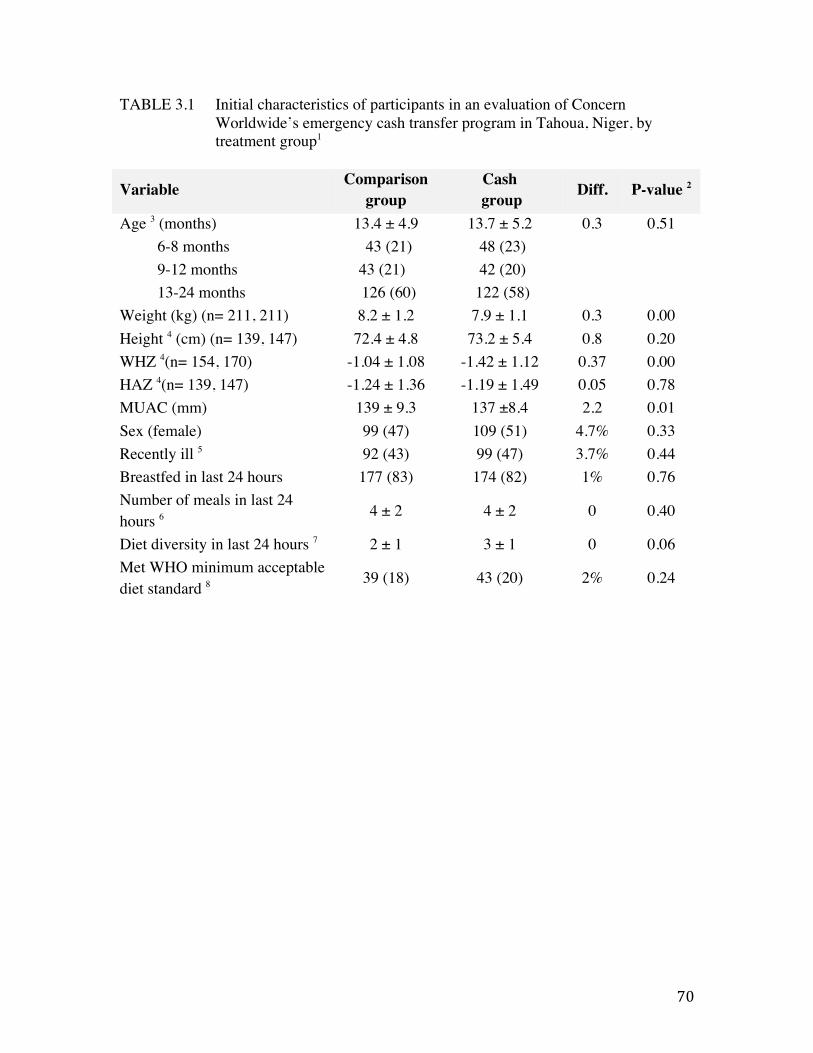
70
TABLE 3.1 Initial characteristics of participants in an evaluation of Concern Worldwide’s emergency cash transfer program in Tahoua, Niger, by treatment group1
Variable Comparison group
Cash group Diff. P-value 2
Age 3 (months) 13.4 ± 4.9 13.7 ± 5.2 0.3 0.51 6-8 months 43 (21) 48 (23) 9-12 months 43 (21) 42 (20) 13-24 months 126 (60) 122 (58)
Weight (kg) (n= 211, 211) 8.2 ± 1.2 7.9 ± 1.1 0.3 0.00 Height 4 (cm) (n= 139, 147) 72.4 ± 4.8 73.2 ± 5.4 0.8 0.20 WHZ 4(n= 154, 170) -1.04 ± 1.08 -1.42 ± 1.12 0.37 0.00 HAZ 4(n= 139, 147) -1.24 ± 1.36 -1.19 ± 1.49 0.05 0.78 MUAC (mm) 139 ± 9.3 137 ±8.4 2.2 0.01 Sex (female) 99 (47) 109 (51) 4.7% 0.33 Recently ill 5 92 (43) 99 (47) 3.7% 0.44 Breastfed in last 24 hours 177 (83) 174 (82) 1% 0.76 Number of meals in last 24 hours 6 4 ± 2 4 ± 2 0 0.40
Diet diversity in last 24 hours 7 2 ± 1 3 ± 1 0 0.06 Met WHO minimum acceptable diet standard 8 39 (18) 43 (20) 2% 0.24
71
1 Values are mean ± standard deviation or n(%) as appropriate. The total number of observations used to calculate means and frequencies in each group is 212 unless otherwise indicated. In such cases, the number of observations for each group is noted in parentheses following the indicator, with the comparison group sample size preceding the cash group. 2 P-values are reported for t-tests comparing means of continuous variables or Chi-squared tests comparing frequencies of categorical variables. 3 Age was determined by looking at birth certificates when available (n=181) or estimated by mothers. 4 Height data and Z scores using height data (HAZ, WHZ) for children whose linear growth exceeded plausible limits over the 2-month period of study were excluded from analysis. For this reason, the number of observations for anthropometric indicators varies. Criteria for plausibility are described in the methods section of this paper. 5
Mothers reported whether the child had diarrhea, fever, difficulty breathing, cough, or any other illness in the last 2 weeks. 6 Meals included any time the child had been fed, not including breast milk feeding. 7 Diet diversity is the number of food groups consumed according to the World Health Organization guidelines for infant and child feeding, which considers 7 groups (grains, legumes, fruits and vegetables rich in Vitamin A, eggs, animal flesh foods, dairy, and other fruits or vegetables). 8 The World Health Organization minimum acceptable diet standard for infant and young child feeding accounts for age-appropriate breastfeeding, meal frequency, and dietary diversity.
72
Dietary indicators suggest that participants in both groups had similar diets initially. The
prevalence of breastfeeding in the last 24 hours was approximately 80%, and meal
frequency averaged 4 meals per day. Dietary diversity was low, and only 20% of
participants in either group met age-appropriate WHO minimum acceptable diet
standards (Table 3.1).
Illness was common, with at least 40% of children reported as being ill within the
previous 2 weeks. The frequency of seeking treatment for ill children within 24 hours of
the onset of symptoms was significantly higher in the cash group (n=63, 63%) than in the
comparison group (n=42, 46%) (P< 0.05). The distribution of illness types (diarrhea,
fever, cough, difficulty breathing) did not differ between the treatment groups (Table
3.1).
Descriptive results: Endline measurements
By endline, participants in the cash group gained 1.27 kg more on average than those in
the comparison group (P<0.001) (Table 3.2). This was the equivalent to a 2.48 g/kg/day
greater weight gain velocity among intervention children (P<0.001) (Table 3.2). Children
in the cash group gained more on average than comparison children across all ages
observed in the study, with the greatest weight gain observed in older children (12-24
months). Intervention children aged 12-24 months at the start of the study gained 2.06 kg
on average, compared to comparison group children of the same age who gained 0.29 kg
on average (P<0.001) (Table 3.2).
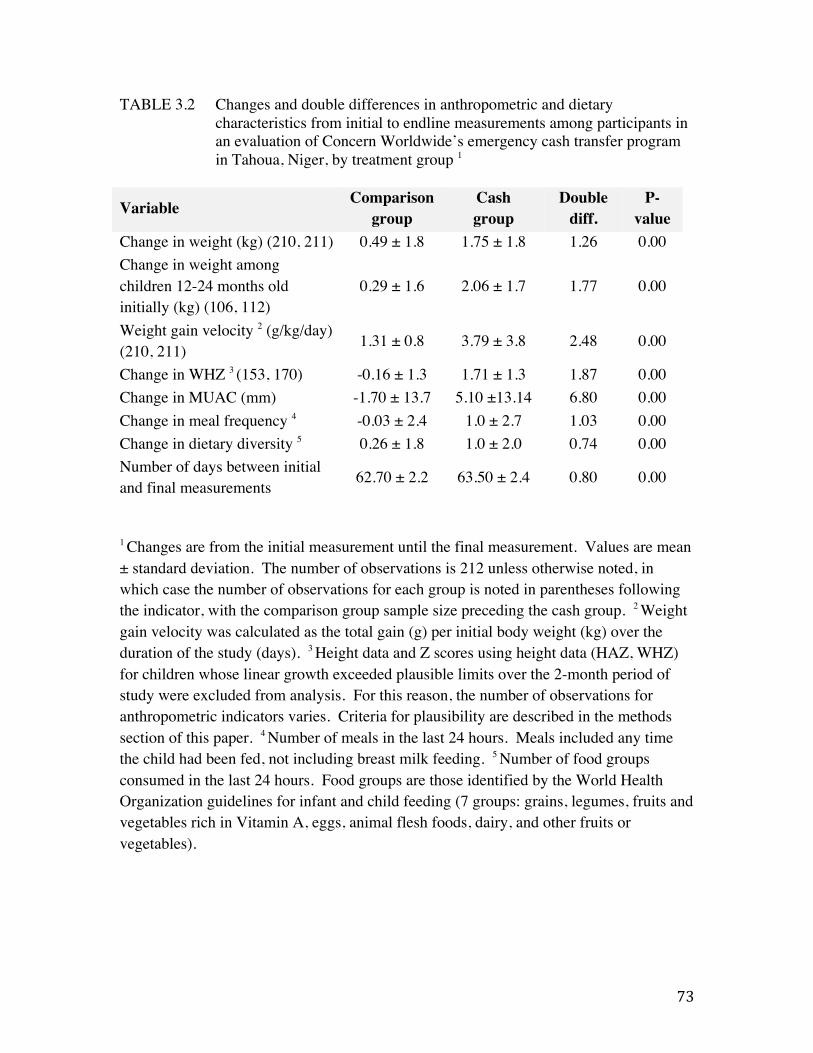
73
TABLE 3.2 Changes and double differences in anthropometric and dietary characteristics from initial to endline measurements among participants in an evaluation of Concern Worldwide’s emergency cash transfer program in Tahoua, Niger, by treatment group 1
Variable Comparison group
Cash group
Double diff.
P-value
Change in weight (kg) (210, 211) 0.49 ± 1.8 1.75 ± 1.8 1.26 0.00 Change in weight among children 12-24 months old initially (kg) (106, 112)
0.29 ± 1.6 2.06 ± 1.7 1.77 0.00
Weight gain velocity 2 (g/kg/day) (210, 211) 1.31 ± 0.8 3.79 ± 3.8 2.48 0.00
Change in WHZ 3 (153, 170) -0.16 ± 1.3 1.71 ± 1.3 1.87 0.00 Change in MUAC (mm) -1.70 ± 13.7 5.10 ±13.14 6.80 0.00 Change in meal frequency 4 -0.03 ± 2.4 1.0 ± 2.7 1.03 0.00 Change in dietary diversity 5 0.26 ± 1.8 1.0 ± 2.0 0.74 0.00 Number of days between initial and final measurements 62.70 ± 2.2 63.50 ± 2.4 0.80 0.00
1 Changes are from the initial measurement until the final measurement. Values are mean ± standard deviation. The number of observations is 212 unless otherwise noted, in which case the number of observations for each group is noted in parentheses following the indicator, with the comparison group sample size preceding the cash group. 2 Weight gain velocity was calculated as the total gain (g) per initial body weight (kg) over the duration of the study (days). 3 Height data and Z scores using height data (HAZ, WHZ) for children whose linear growth exceeded plausible limits over the 2-month period of study were excluded from analysis. For this reason, the number of observations for anthropometric indicators varies. Criteria for plausibility are described in the methods section of this paper. 4 Number of meals in the last 24 hours. Meals included any time the child had been fed, not including breast milk feeding. 5 Number of food groups consumed in the last 24 hours. Food groups are those identified by the World Health Organization guidelines for infant and child feeding (7 groups: grains, legumes, fruits and vegetables rich in Vitamin A, eggs, animal flesh foods, dairy, and other fruits or vegetables).
74
The observed mean change in WHZ in the cash group was a gain of 1.71 Z, whereas
children in the comparison group saw an average decline of -0.16 Z. The net difference
in WHZ change was 1.86 Z (P<0.001). Changes in MUAC followed suit, with
intervention children gaining 6.8 mm more on average than comparison children
(P<0.001) (Table 3.2).
Mean meal frequency and dietary diversity increased by modest but significantly higher
increments in the cash group relative to the comparison group (P<0.001) (Table 3.2).
The percentage of children meeting WHO minimum acceptable diet standards rose from
20% to 48% among intervention children, and declined from 18% to 16% among those in
the comparison group.
The rate of illness was higher at endline in both groups, with approximately 60% of
children reportedly ill within the previous 2 weeks. Prompt (<24 hour) treatment for ill
children was sought more frequently in the cash group (=94, 73%) than in the comparison
group (n=81, 59%) (P<0.05).
Model results
Our regression models allowed us to estimate the extent to which the improvements in
weight and WHZ observed in the cash group can be attributed to the intervention. The
effect of the intervention on weight varied with time, as indicated by our adjusted mixed
effects multilevel linear regression model (Wald chi2 848.25, P<0.001). The intervention
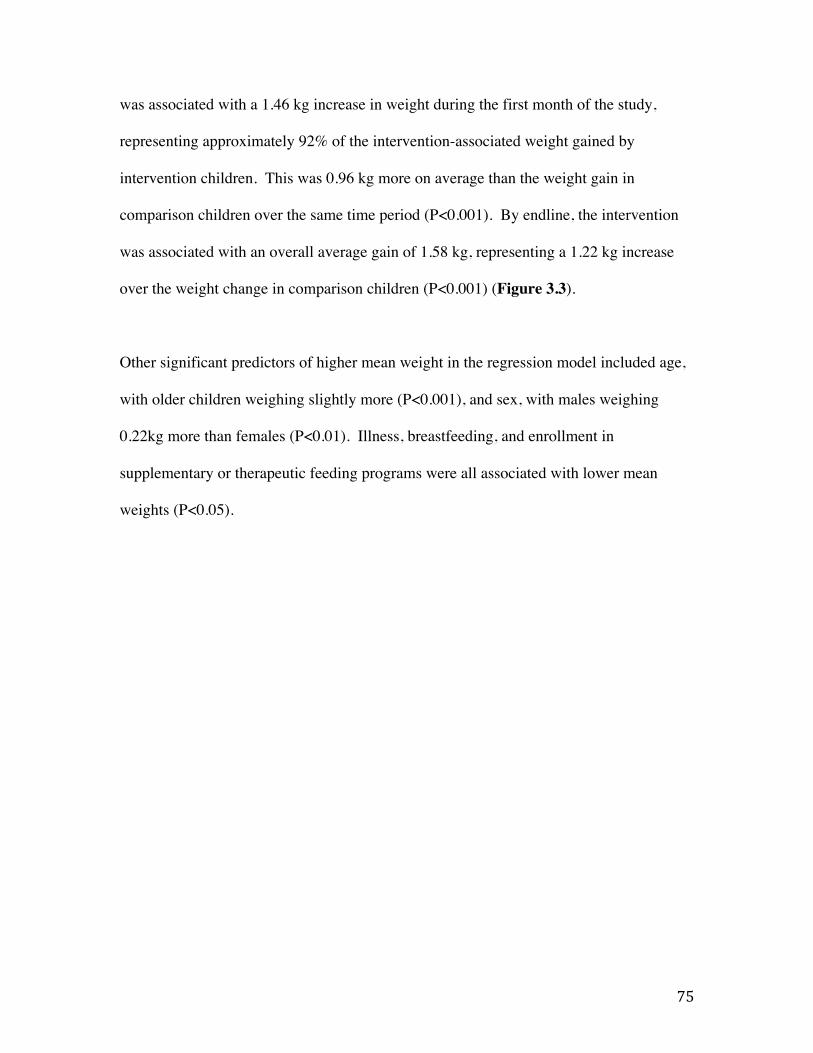
75
was associated with a 1.46 kg increase in weight during the first month of the study,
representing approximately 92% of the intervention-associated weight gained by
intervention children. This was 0.96 kg more on average than the weight gain in
comparison children over the same time period (P<0.001). By endline, the intervention
was associated with an overall average gain of 1.58 kg, representing a 1.22 kg increase
over the weight change in comparison children (P<0.001) (Figure 3.3).
Other significant predictors of higher mean weight in the regression model included age,
with older children weighing slightly more (P<0.001), and sex, with males weighing
0.22kg more than females (P<0.01). Illness, breastfeeding, and enrollment in
supplementary or therapeutic feeding programs were all associated with lower mean
weights (P<0.05).
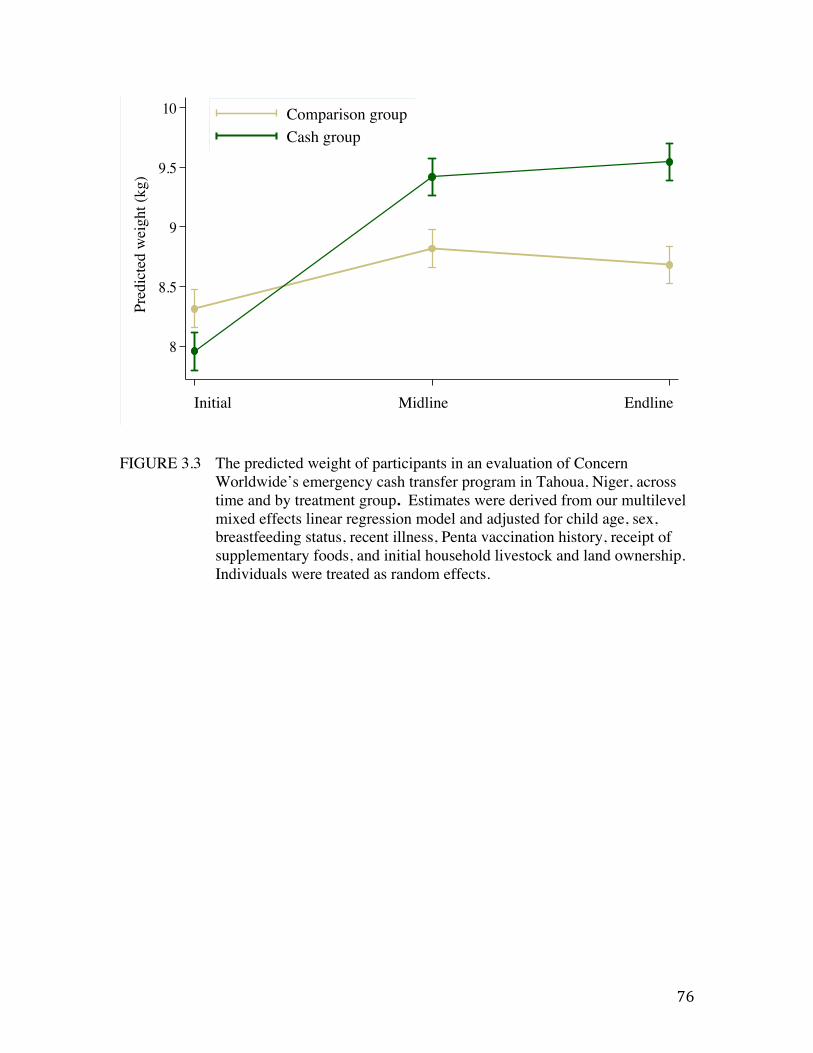
76
FIGURE 3.3 The predicted weight of participants in an evaluation of Concern Worldwide’s emergency cash transfer program in Tahoua, Niger, across time and by treatment group. Estimates were derived from our multilevel mixed effects linear regression model and adjusted for child age, sex, breastfeeding status, recent illness, Penta vaccination history, receipt of supplementary foods, and initial household livestock and land ownership. Individuals were treated as random effects.
8
8.5
9
9.5
10
Pred
icte
d W
eigh
t (kg
)
1 2 3Time
Comparison groupIntervention group
Predictive Margins of Cash#MonthOrder with 95% CIs
Initial!!
Midline!!
Endline!
Pred
icte
d w
eigh
t (kg
) !
8
8.5
9
9.5
10
Pred
icte
d W
eigh
t (kg
)
1 2 3
Comparison groupCash group
Predictive Margins of Cash#MonthOrder with 95% CIs
77
Our linear regression model estimated an overall increase of 1.49 WHZ associated with
the intervention, adjusting for multiple covariates (P<0.001) (adjusted R2 0.71, P<0.001).
Predicted values of WHZ change were highly consistent with those observed in the data
(Figure 3.4). Other significant predictors of WHZ change were age, with each month of
age associated with a 0.02 increase (P<0.05); baseline WHZ, with a unit increase
associated with a 0.89 lower change in endline WHZ (P<0.001), and illness, which was
associated with 0.20 lower change in WHZ on average (P<0.001).
78
FIGURE 3.4 Predicted vs. observed change in weight-for-height Z scores from initial to endline measurements of participants in an evaluation of Concern Worldwide’s emergency cash transfer program in Tahoua, Niger. Estimates were derived from our linear regression model and were adjusted for child age, sex, breastfeeding status, recent illness, Penta vaccination history, receipt of supplementary foods, and household livestock and land ownership.
-4
-2
0
2
4Pr
edic
ted
chan
ge in
WH
Z ( i
nitia
l to
endl
ine
)
-4 -2 0 2 4 6Observed change in WHZ (intial to endline)
Comparison groupIntervention group
Observed change in WHZ (initial to endline) !!
Pred
icte
d ch
ange
in W
HZ
(initi
al to
end
line)
!
-4
-2
0
2
4
Pred
icte
d ch
ange
in W
HZ
( ini
tial t
o en
dlin
e )
-4 -2 0 2 4 6Observed change in WHZ (intial to endline)
Comparison groupCash group
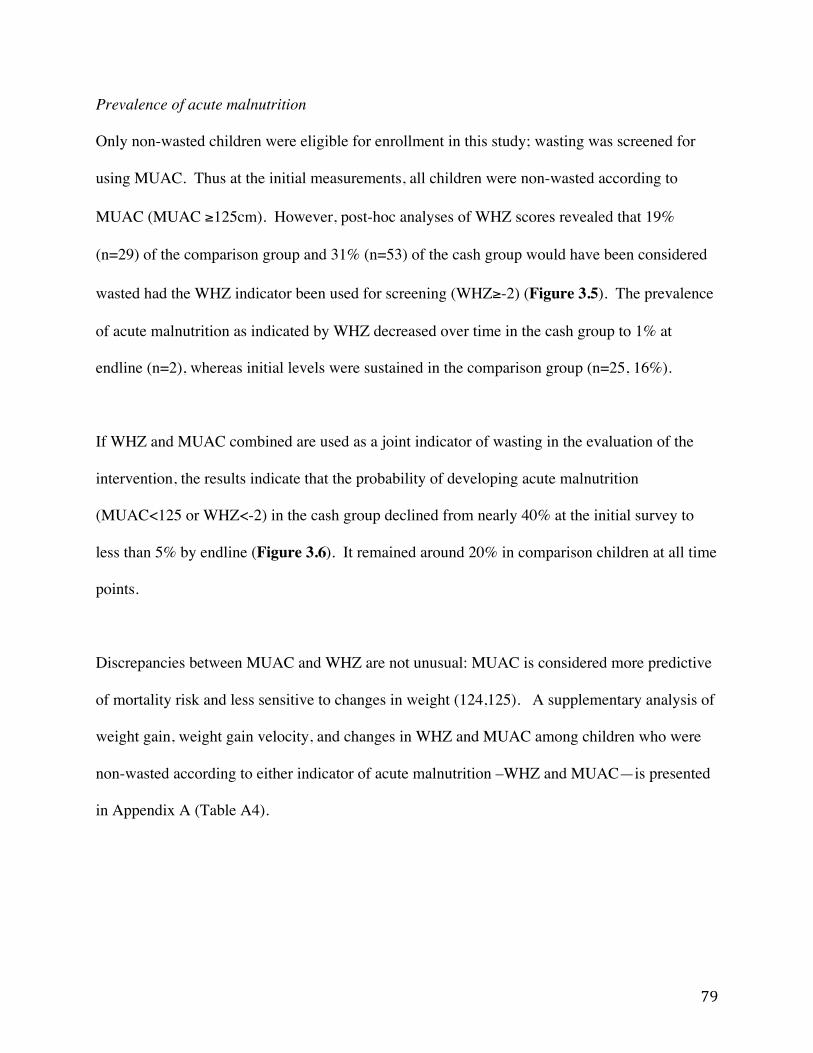
79
Prevalence of acute malnutrition
Only non-wasted children were eligible for enrollment in this study; wasting was screened for
using MUAC. Thus at the initial measurements, all children were non-wasted according to
MUAC (MUAC ≥125cm). However, post-hoc analyses of WHZ scores revealed that 19%
(n=29) of the comparison group and 31% (n=53) of the cash group would have been considered
wasted had the WHZ indicator been used for screening (WHZ≥-2) (Figure 3.5). The prevalence
of acute malnutrition as indicated by WHZ decreased over time in the cash group to 1% at
endline (n=2), whereas initial levels were sustained in the comparison group (n=25, 16%).
If WHZ and MUAC combined are used as a joint indicator of wasting in the evaluation of the
intervention, the results indicate that the probability of developing acute malnutrition
(MUAC<125 or WHZ<-2) in the cash group declined from nearly 40% at the initial survey to
less than 5% by endline (Figure 3.6). It remained around 20% in comparison children at all time
points.
Discrepancies between MUAC and WHZ are not unusual: MUAC is considered more predictive
of mortality risk and less sensitive to changes in weight (124,125). A supplementary analysis of
weight gain, weight gain velocity, and changes in WHZ and MUAC among children who were
non-wasted according to either indicator of acute malnutrition –WHZ and MUAC—is presented
in Appendix A (Table A4).
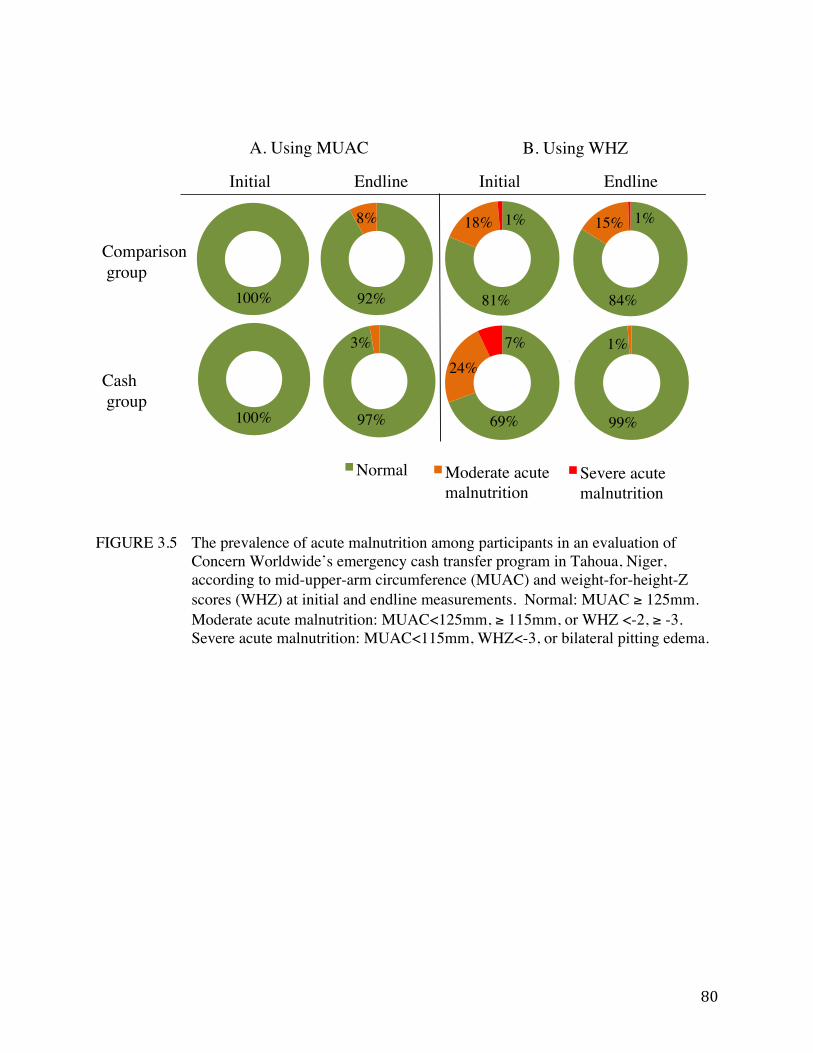
80
FIGURE 3.5 The prevalence of acute malnutrition among participants in an evaluation of Concern Worldwide’s emergency cash transfer program in Tahoua, Niger, according to mid-upper-arm circumference (MUAC) and weight-for-height-Z scores (WHZ) at initial and endline measurements. Normal: MUAC ≥ 125mm. Moderate acute malnutrition: MUAC<125mm, ≥ 115mm, or WHZ <-2, ≥ -3. Severe acute malnutrition: MUAC<115mm, WHZ<-3, or bilateral pitting edema.
Comparison group!
Intervention group!
Initial! Endline!
Normal !
Normal !
Normal !
Moderate acute malnutrition!
Normal !
Moderate acute malnutrition!
Initial! Endline!
Normal !
Moderate acute malnutrition!Severe acute malnutrition!
Normal !
Moderate acute malnutrition!Severe acute malnutrition!
Normal !
Moderate acute malnutrition!Severe acute malnutrition!
Normal !
Moderate acute malnutrition!Severe acute malnutrition!
Comparison! group!
Cash! group!
Initial ! ! !Endline ! ! !Initial ! ! !Endline!
81%!
18%!1%!
Normal !
Moderate acute malnutrition!Severe acute malnutrition!
81%!
18%!1%!
Normal !
Moderate acute malnutrition!Severe acute malnutrition!
81%!
18%!1%!
Normal !
Moderate acute malnutrition!Severe acute malnutrition!
A. Using MUAC! B. Using WHZ!
100%!
100%!
92%!
97%!
81%! 84%!
69%! 99%!
8%!
3%!
18%! 1%! 15%! 1%!
24%!7%! 1%!
81
FIGURE 3.6 The probability of acute malnutrition (weight-for-height Z score <-2) among
participants in an evaluation of Concern Worldwide’s emergency cash transfer program in Tahoua, Niger, across time and by treatment group. Probabilities were generated using our multilevel mixed effects logistic regression model and were adjusted for child age, sex, breastfeeding status, receipt of supplementary foods, and household livestock and land ownership. Individuals were treated as random effects.
0
.1
.2
.3
.4
Prob
abili
ty o
f hav
ing
acut
e m
alnu
tritio
n
1 2 3
Comparison groupIntervention group
Predictive Margins of Cash#MonthOrder with 95% CIs
Initial!!
Midline!!
Endline!Prob
abili
ty o
f hav
ing
acut
e m
alnu
tritio
n (W
HZ<
-2) !
8
8.5
9
9.5
10
Pred
icte
d W
eigh
t (kg
)
1 2 3
Comparison groupCash group
Predictive Margins of Cash#MonthOrder with 95% CIs
82
Discussion
This study used a quasi-experimental design to examine the impact of a short-term emergency
CTP on child diet and nutrition outcomes in the context of a food crisis in Niger. Our findings
show that emergency CTPs have the capacity for rapid impact on child ponderal growth—in the
program studied here, dietary indicators improved, weight gain accelerated at a rate high enough
for participants to reach median WHO growth standards for WHZ, and the prevalence of acute
malnutrition in the cash group radically declined. Although limitations in the design and
execution of the study make a precise estimation of the impact impossible, the findings
nonetheless make a substantial contribution to our understanding of whether and how emergency
cash transfer programs can prevent acute malnutrition.
Biologic plausibility
Studies of conventional food-based interventions for treating acute malnutrition provide a useful
reference with which to consider the ponderal growth observed in this study. Weight gain
velocities among children with MAM were 3.1 g/kg/day on a fortified corn-soy blend flour in
Malawi (24), and as high as 5.67 g/kg/day among children with MAM consuming ready-to-use
therapeutic foods in Niger (23) (Table 3.3). Among severely malnourished children with
complications receiving inpatient care, weight gain <5g/kg/day is considered ‘poor’, and
>10g/kg/day is considered ‘good’ (126).
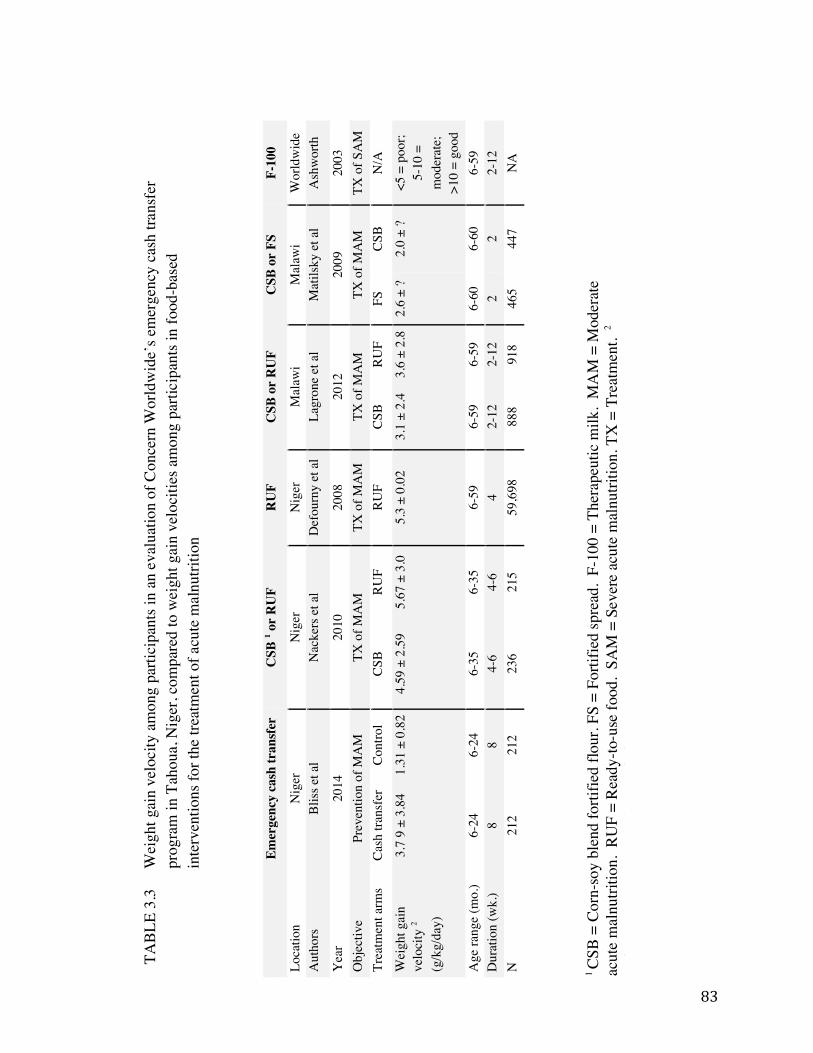
83
Emer
genc
y ca
sh tr
ansf
er
CSB
1 or
RU
F
RU
F C
SB o
r R
UF
CSB
or
FS
F-10
0
Loca
tion
Nig
er
Nig
er
Nig
er
Mal
awi
Mal
awi
Wor
ldw
ide
Aut
hors
Bl
iss e
t al
Nac
kers
et a
l D
efou
rny
et a
l La
gron
e et
al
Mat
ilsky
et a
l A
shw
orth
Yea
r 20
14
2010
20
08
2012
20
09
2003
O
bjec
tive
Prev
entio
n of
MA
M
TX o
f MA
M
TX o
f MA
M
TX o
f MA
M
TX o
f MA
M
TX o
f SA
M
Trea
tmen
t arm
s Ca
sh tr
ansf
er
Cont
rol
CSB
RUF
RUF
CSB
RUF
FS
CSB
N/A
Wei
ght g
ain
velo
city
2
(g/k
g/da
y)
3.7
9 ±
3.84
1.
31 ±
0.8
2 4.
59 ±
2.5
9 5.
67 ±
3.0
5.
3 ±
0.02
3.
1 ±
2.4
3.6
± 2.
8 2.
6 ±
? 2.
0 ±
? <5
= p
oor;
5-10
=
mod
erat
e;
>10
= go
od
Age
rang
e (m
o.)
6-24
6-
24
6-35
6-
35
6-59
6-
59
6-59
6-
60
6-60
6-
59
Dur
atio
n (w
k.)
8
8
4-6
4-
6
4
2-12
2-
12
2
2
2-12
N
21
2 21
2 23
6 21
5 59
,698
88
8 91
8 46
5 44
7 N
A
!TABL
E 3.
3
Wei
ght g
ain
velo
city
am
ong
parti
cipa
nts i
n an
eva
luat
ion
of C
once
rn W
orld
wid
e’s e
mer
genc
y ca
sh tr
ansf
er
prog
ram
in T
ahou
a, N
iger
, com
pare
d to
wei
ght g
ain
velo
citie
s am
ong
parti
cipa
nts i
n fo
od-b
ased
in
terv
entio
ns fo
r the
trea
tmen
t of a
cute
mal
nutri
tion
1 CS
B =
Cor
n-so
y bl
end
forti
fied
flour
. FS
= Fo
rtifie
d sp
read
. F-
100
= Th
erap
eutic
milk
. M
AM
= M
oder
ate
acut
e m
alnu
tritio
n. R
UF
= R
eady
-to-u
se fo
od.
SAM
= S
ever
e ac
ute
mal
nutri
tion.
TX
= T
reat
men
t. 2
Val
ues a
re m
eans
± st
anda
rd d
evia
tions
.
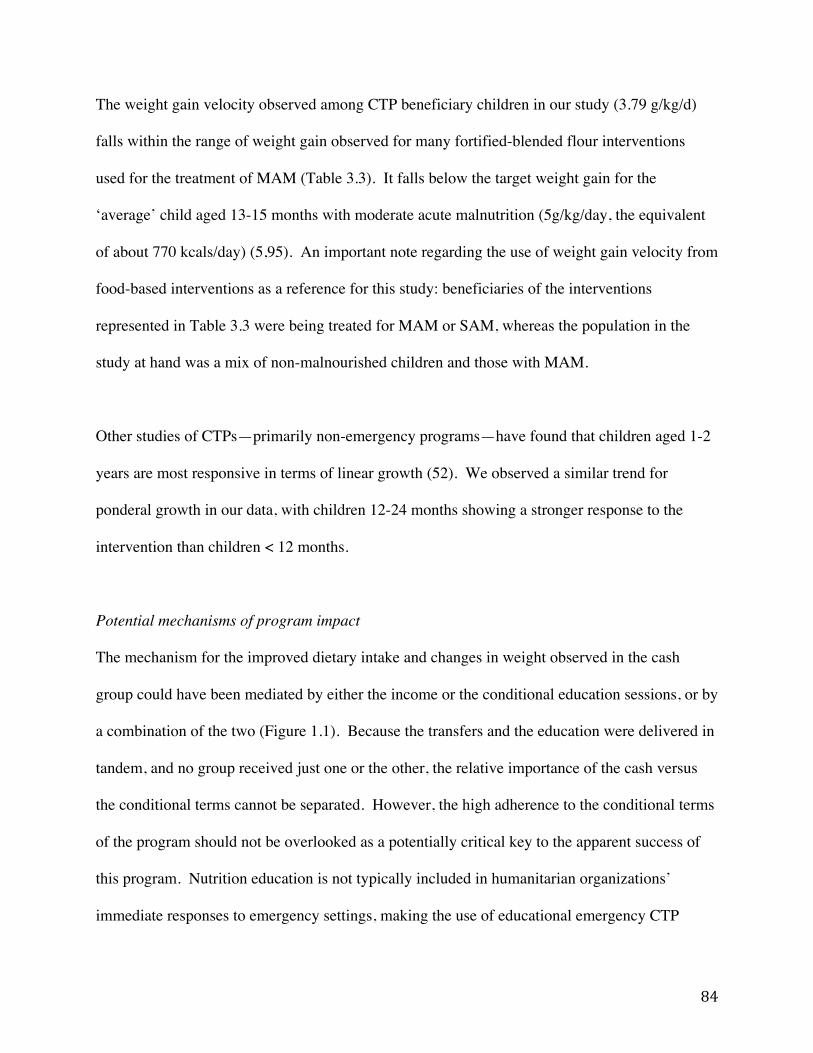
84
The weight gain velocity observed among CTP beneficiary children in our study (3.79 g/kg/d)
falls within the range of weight gain observed for many fortified-blended flour interventions
used for the treatment of MAM (Table 3.3). It falls below the target weight gain for the
‘average’ child aged 13-15 months with moderate acute malnutrition (5g/kg/day, the equivalent
of about 770 kcals/day) (5,95). An important note regarding the use of weight gain velocity from
food-based interventions as a reference for this study: beneficiaries of the interventions
represented in Table 3.3 were being treated for MAM or SAM, whereas the population in the
study at hand was a mix of non-malnourished children and those with MAM.
Other studies of CTPs—primarily non-emergency programs—have found that children aged 1-2
years are most responsive in terms of linear growth (52). We observed a similar trend for
ponderal growth in our data, with children 12-24 months showing a stronger response to the
intervention than children < 12 months.
Potential mechanisms of program impact
The mechanism for the improved dietary intake and changes in weight observed in the cash
group could have been mediated by either the income or the conditional education sessions, or by
a combination of the two (Figure 1.1). Because the transfers and the education were delivered in
tandem, and no group received just one or the other, the relative importance of the cash versus
the conditional terms cannot be separated. However, the high adherence to the conditional terms
of the program should not be overlooked as a potentially critical key to the apparent success of
this program. Nutrition education is not typically included in humanitarian organizations’
immediate responses to emergency settings, making the use of educational emergency CTP
85
conditions novel. Our data do not allow us to test the value of the conditional terms; evidence
from non-emergency CTPs and behavior change interventions supports the hypothesis that the
sessions could have led to positive changes in child feeding and care practices (51,127).
The value of the cash transfer was high relative to the GNI per capita of beneficiaries. We know
from studies of long-term, non-emergency CTPs that the value of transfers is a determinant of
whether beneficiaries adhere to conditions, and ultimately, whether the program has an impact.
In the well-documented non-emergency CTP in Mexico, Progresa, transfers equaled 20-30% of
monthly household income, an amount that was perceived to be high by beneficiaries and one
likely reason for the program’s success in improving child linear growth and anemia rates (43).
Conversely, a program in Honduras distributed transfers equivalent to less than 4% of monthly
household income, a factor considered relevant to the program’s lack of impact on child growth
(51). In both examples, the relative size of the transfer likely influenced how able and how
motivated beneficiaries were to make changes to their food purchasing and provisioning
behaviors. Additional findings from Progresa showed that transfers influenced women’s interest
and ability to negotiate better healthcare, empowering them to demand services for themselves
and their children (44).
Limitations
We expect that sample selected for the cash group differed systematically from the comparison
group in ways other than the intervention itself, but we are unable to probe the extent of the
difference with the available data. Households in the cash group were assigned to receive the
intervention due to their greater vulnerability to food insecurity relative to the households in the
86
comparison group at baseline based on a number of indicators. This decision was made by local
authorities and based on objective measures of vulnerability as described in the methods section.
Systematic differences between the treatment groups are not apparent in the household and
dietary data collected initially, with the important exception that children in the intervention arm
did have poorer nutritional status than those in the comparison group. While unmeasured
systematic differences between treatment groups are undesirable characteristics of this study, we
note that the program did appropriately target more vulnerable households as per their
organizational objectives. We posit that given the direction of the difference in mean weight and
WHZ in the treatment groups (with the cash group being more wasted initially and attaining
median Z scores on average by endline), the gains in nutritional status in the intervention group
can be plausibly attributed to the intervention.
An additional limitation of this study is that the first data collection period occurred after the
cash transfer intervention had begun. Thus, the actual status of both treatment groups prior to the
intervention is unknown, and a precise estimate of the effect of the program on child diet and/or
growth is difficult to achieve. Given the first limitation described above, the lagged timing of the
initial survey likely produced an underestimate of the effect of the intervention.
As mentioned in the description of the intervention, a seed and fertilizer program was also
implemented in the same region and similar time period as the emergency cash transfer program.
Concern estimates that more households in the cash group than the comparison group would
have been beneficiaries of the agriculture services, but participation was not documented.
87
Important to note is that given the timing of the seed and fertilizer distribution and the time
needed to grow and harvest a millet crop, it is unlikely that the agriculture services contributed to
the weight gain in the intervention group. Nonetheless, it is conceivable that this study’s
findings may be due to one or more of the interventions delivered (cash, education, and
agriculture), but it is not possible to assess this given the study’s design.
Finally, as this was a non-blinded study, the possibility of bias cannot be excluded. We
attempted to limit the extent of recorder bias by using conservative cutoff criteria to identify
outlying anthropometric measures as well as implausible changes in linear growth.
Conclusions
Three lines of convergent evidence support the conclusion that Concern’s emergency CTP had a
positive impact on child growth. First, the observed weight gain in the cash group is within the
range observed from food-based interventions done in similar contexts and significantly greater
than that seen in the comparison group. Second, the observed improvements child growth are
consistent with, and partially explained by, the improvements in meal frequency and dietary
diversity. These latter behavior changes, in turn, are consistent with the high value of the
transfer (65% of GNI per capita for Niger in 2012) and the high rate of adherence to conditional
education sessions on infant and child feeding. Third, the most important design weaknesses (the
timing of the baseline survey and the non-randomized design) both are likely to produce
conservative estimates of the effect size. Although these design weaknesses limit our ability to
make a precise estimate of the impact of the program, they strengthen our conclusion that this
prevention-oriented CTP made a meaningful difference in the growth of vulnerable children. We
88
conclude that emergency cash transfer programs have tremendous capacity for promoting child
weight gain in the context of a food crisis, and we suggest that the use of strategic conditional
terms is likely a key feature for achieving this result.
89
Chapter 4: Stigma and its role in limiting access to treatment for
child acute malnutrition
Authors
Jessica Bliss, Rebecca Stoltzfus, and David Pelletier
Abstract
Acute malnutrition, “the every day emergency”, affects millions of children each year, yet the
coverage of life-saving treatment through the Community-based Management of Acute
Malnutrition (CMAM) is estimated to be below 15%. The factors most commonly documented
as barriers to maternal and child health services—women’s time constraints, distance, and lack
of awareness about the program or eligibility—are likely to limit CMAM coverage as well.
Suspecting undocumented factors may also be at play, we investigated the potential role of
stigma as a unique barrier to accessing care for acutely malnourished children. Caregivers of
children of normal status (n=289), moderate acute malnutrition (n=259), and severe acute
malnutrition (n=163) participated in this facility-based study across eighteen rural health
facilities in Marsabit County, Kenya. We used multilevel mixed effects logistic regression to
estimate the odds of reporting shame or emotional discomfort as a barrier to accessing
healthcare. We found that the most common barriers to accessing child health care were indeed
those known to be universally problematic: women’s time and labor constraints constituted the
top five most frequently reported barriers regardless of child acute malnutrition status.
90
Emotional discomfort with their purpose for attending the facility was reported by 40% (n=65)
of women with severely acutely malnourished children, 28 % (n=71) of women with moderately
acutely malnourished children, and 19%(n=54) of women with children of normal status
(P<0.001). The odds of reporting shame as a barrier were 3.78 times higher in among women
with acutely malnourished children relative to women with sick children of normal nutritional
status (CI: 1.55-9.18, P<0.05). Acute malnutrition-associated stigma in this population appeared
to be distinct from stigma associated with food insecurity or poverty. We conclude that acute
malnutrition-associated stigma is an under-recognized barrier to accessing CMAM that may be
constraining program coverage. There is an urgent need to understand the sources of acute
malnutrition-associated stigma and adopt effective means of de-stigmatization.
Background/Introduction
Acute malnutrition affects approximately 11% of children under the age of five each year, or
approximately 52 million individuals (1). The condition occurs as a result of infection, disease,
and/or restricted dietary intake, and is associated with increased risk of morbidity and mortality.
Cases of acute malnutrition may be classified as moderate (MAM) or severe (SAM), and are
determined by the use of mid-upper arm circumference (MUAC), weight-for-height Z scores
(WHZ), or the presence of bilateral pitting edema5. Community-based management of acute
malnutrition (CMAM), a treatment protocol that began in 2001 and was adopted globally by
2006, is viewed as a highly efficacious approach to treating acute malnutrition (9). However, of
5 MAM is defined as a weight-‐for-‐height Z-‐score (WHZ) < -‐2 and ≥-‐3, or a mid-‐upper arm circumference (MUAC) <115 and ≥125mm. SAM is the more severe condition, defined by a WHZ <-‐3, MUAC <115mm, or the presence of bilateral pitting edema.
91
the total number of children eligible for CMAM each year, less than 15% are estimated to
receive treatment (15). The discrepancy in coverage is thought largely to reflect poor access to
existing programs rather than the absence of treatment options (3,62).
Prior studies of health service access in resource-poor settings report that a range of
geographical, social, infrastructural, financial, and personal factors influence access to treatment
for common childhood illnesses (61,87) (Table 1.2). Barriers to the treatment of childhood
malaria and diarrhea have been extensively researched in Kenya, and highlight women’s
financial and time constraints and lack of awareness of treatment options as major obstacles to
seeking care (128-132). Studies of barriers to CMAM include one review of SAM treatment
programs across six African countries (the Democratic Republic of the Congo, Ethiopia, Malawi,
Niger, and North and South Sudan), which identified fear of rejection, not recognizing the
child’s condition as malnutrition, lack of confidence in the program, relapse, and distance to the
site of program as the most common factors (60). A more recent evaluation of SAM treatment
access across 21 countries found the primary barriers to be a lack of knowledge of malnutrition,
lack of knowledge about CMAM, high opportunity costs, and distance to site—all of which are
consistent with pre-existing knowledge about access barriers for other child health services (62).
Field observations by the first author during Peace Corps service in Niger, West Africa, in 2008
and 2009 suggested that the shame of with having an acutely malnourished child discouraged
some caregivers from seeking timely treatment, even when caregivers were aware of CMAM
services and such services were available. There is dated evidence showing an association
between stigma and acute malnutrition in two other contexts: in a study from Pakistan from the
92
early 1990s, mothers of children with severe wasting reported hiding their children due to shame
and fear of judgment associated with the condition, which was thought to be caused by
malevolent spirits (76). In Tanzania at around the same time, stigma associated with poverty
was nearly inextricable from that linked to child malnutrition, and was perpetuated through
structural violence within the healthcare system (77).
Conceptualizing stigma and its consequences for health
Contemporary conceptualizations of stigma consider the dynamic social, economic, and political
contexts and processes that produce and intensify discrimination, expanding on Erving
Goffman’s pivotal early work defining stigma as the “deeply discrediting” association between
an attribute and a stereotype (64,66). Discrimination may be individual, in which a person takes
overt discriminatory action against another; structural, in which social or institutional norms
perpetuate inequalities; and/or self-imposed, in which members of stigmatized groups experience
“situationally based fear that one will be judged on the basis of [negative] stereotypes” (67-69).
This concept has also been referred to as “stereotype threat”(69), “identity threat” (68), and
“stigma consciousness” (70).
Stigma is well documented for many health conditions, with mental illness being the focus of
work prior to the 1990s and HIV/AIDS stigma dominating the research through the present day
(65,133). In 2006, the NIH Fogarty International Center’s Stigma and Global Health Research
Program requested further research about the burden of stigma, its causes, and the development
of effective interventions to curb it (74). Recent work has documented stigma in connection to
tuberculosis, epilepsy, obesity, and obstetric fistula (72,73,134,135). Although the stereotypes
93
associated with different health conditions vary, many of the consequences of having a
stigmatized health condition are foreseeable in regards to decision-making about prevention,
care, and treatment. Common consequences for health and care include anxiety, stress, non-
disclosure about one’s health status, care avoidance, and potential permanent disability or even
death (74,75,78) (Figure 1.2).
The relationship between stigma and acute malnutrition has not been systematically investigated
since CMAM became a prominent intervention in child nutrition and health services. We
proposed to bridge this gap by collecting empirical evidence on the presence of acute
malnutrition-associated stigma in the context of a rural health facility-based survey that
identified access barriers for multiple childhood conditions in Kenya. We hypothesized that
caregivers of children with acute malnutrition experience feelings of shame, embarrassment, or
discomfort around accessing CMAM, in addition to the universal challenges known to limit
access to child health services. We also hypothesized that stigma is a contributing factor in the
poor coverage of CMAM programs.
Methods
Study setting
Marsabit County, Kenya, covers approximately 26,000 square miles and is divided into six
administrative divisions. It is a geographically remote and arid region in North Kenya, home to
approximately 290,000 people and subject to drought and food insecurity. Nomadic pastoralism
is the dominant livelihood, and is practiced by the dominant ethnic groups in the region: the
94
Borana, the Gabra, the Rendille, and the Burji. The Borana and Gabra share a common
language, the Borana language, which is widely spoken across the region. Political and ethnic
tension, primarily between the Borana and Gabra groups, dates back for decades, originating in
disputes over land and livestock ownership and water use (85). Violent clashes over grazing
land and civil disputes in the town of Moyale, on the border of Marsabit County and Ethiopia,
were ongoing throughout 2013 and during the time of this study (136,137).
Rates of wasting (>12%) and stunting (>27%) among children under 5 in Marsabit County are
among the highest in the country (138).
Selection of study districts
This study was conducted in three districts of Marsabit County. Districts were selected if
Concern Worldwide (Kenya office) supported their child health and nutrition programming and
if they had active CMAM participants in June of 2013.
Selection of health facilities
Eighteen health facilities were randomly selected for participation in this study as sites for data
collection, six from each study district. We randomly selected three from above and below the
50th percentile of CMAM admissions6 according to June 2013 records for each district. We used
this stratification approach to ensure even representation of population densities and to include
facilities with a range of potential accessibility issues.
6 CMAM admission rates are recorded by clinic staff on a weekly basis and uploaded monthly by district health management teams to Kenya’s open-access Health Information System (139).
95
Selection of study participants
Eligible participants were adult women (≥18 years) who accompanied a child aged 6-59 mos. at
a study facility between August and September 2013 and gave informed consent to participate in
the study. Women accompanying children <6 mos. were not included, as CMAM protocol for
children of this age was not established at the time of the study.
From the pool of eligible women, study participants were systematically and purposively
selected into one of three study subgroups based on their child’s mid-upper arm circumference
(MUAC). Women whose children had severe acute malnutrition (SAM, MUAC<115mm) were
eligible for the SAM group. Those whose children had moderate acute malnutrition (MAM,
MUAC<125mm, ≥115mm) were eligible for the MAM group, and those with children with a
normal MUAC (MUAC ≥125mm) were eligible for the Normal group. Group selection was
based on MUAC only and did not discriminate between other indicators of child health or
nutrition status or the purpose of the clinic visit (women in any of the three groups could have
been present for a well child visit, treatment for illness, etc.).
Target sample size
The minimum target sample size for this study was 144 individuals per group, or 432 individuals
total. This target was calculated to detect a 20% difference in the frequency of a unique access
barrier between any two subgroups with 80% power, alpha 0.05, and 95% confidence. The
sample size was adjusted to account for correlation among individuals from a single facility on a
single day by using a design effect factor of 0.05. We did not have prior data with which to
estimate the design effect; our chosen value of 0.05 value reflects our assumption that
96
participants at the same facility were only 5% more likely to have correlating values than
participants selected at random.
Sampling strategy
We designed our sampling strategy knowing that it might exceed the target sample size. Due to
uncertainty around CMAM admissions caseloads during the study time period, we needed to
design a strategy that would reach the target sample size but not over-sample the early weeks of
the study. We also expected admissions at some facilities to be lower than in others, in which
case low-admissions facilities would need a longer period of time to reach their target sample
size. To attain sampling breadth across time as well as ensure that the target sample would be
reached at each clinic, we chose to operate the study for a pre-specified period of time (five
weeks) regardless of whether the overall target sample size had already been reached.
Four women were recruited per group (SAM, MAM, Normal) per facility per day for four “study
days” spread across six weeks (August- September 2013). Study days were pre-selected by
health facility staff to coincide with CMAM activities. On each of the four study days at each
study facility, every second eligible woman was systematically selected for the MAM and the
Normal groups, beginning with the first eligible woman for each group and continuing with
every other woman until four women in each group had been selected. This approach was used
to limit oversampling of participants early in the day and to reduce the burden on enumerators.
As a result of the limited number of women eligible for the SAM group, every eligible woman
for that group was selected on each study day.
97
Data collection procedures
Enumerators were community health workers working under the supervision of one designated
study nurse at each study clinic. Enumerators and study nurses were selected based on the their
prior experience with data collection, a positive work record, their designation as the primary
individuals working at the health facilities selected for the study, and written and spoken
proficiency in English and Borana. The survey took approximately 40 minutes and was
administered at study facilities after participants had completed their clinic visits. A copy of the
survey tool is available in Appendix B (Supplement B3).
The survey consisted of 40 closed or open-ended questions, presented in the English or Borana
languages, as preferred by the mother. All questions were originally written in English,
translated to Borana by a professional translator, and then back translated to English during
enumerator training before the survey was finalized. The survey was pilot tested by enumerators
among patients and families at the Marsabit County Hospital, allowing for corrections and
adjustments to question wording and order prior to finalization.
Child MUAC, weight, and height were obtained from the child’s health card, using the
measurements recorded by the study nurse during their clinic visit that day. MUAC was
assessed using a standard MUAC tape on the left arm. Length of children less than 87cm long
was measured using a baby mat. Height of children greater than 87cm was measured using a
wooden or plastic stadiometer. Child age was recorded from the child’s health card (n=595,
84%) or estimated by the 116 mothers (n=16%) whose child did not have a health card. Mothers
reported their own age and marital status (married monogamous, married polygamous, single,
98
separated, divorced, widowed); their formal education level (none, primary, secondary, higher);
ethnicity; the residential status of their household (resident, refugee, visitor); the number of
people living in their household and the number under the age of 5 years; and the primary source
of income in their household. Food security was assessed using a condensed version of the
Household Food Insecurity Access Scale (102) that queried whether any of the following five
events occurred within the previous four weeks: inability to eat healthy and nutritious foods,
worry about running out of food, not having any food to eat in the household, going to sleep at
night hungry due to lack of food, and going a day and night without eating anything due to lack
of food. We asked participants about the presence or absence of 17 household items to assess
non-agricultural assets (lantern, cart, hoe or axe, clock or watch, radio, television, car battery,
electricity, generator, tape player, bicycle, cell phone, tin roof, latrine, running water, and
mosquito net), in addition to recording the number and type of livestock owned by the
household. Participants reported their primary reason for being at the clinic on that day, whether
their child was ill, any symptoms they noticed in their child, and questions about care-seeking
behavior including choice of provider and typical time-to-care.
Open-ended questions about access: Participants were asked to freely list any barriers,
challenges, or obstacles that they had faced, either in the past or on the day of the study, in
accessing health care for a child. They were then asked to pick what they considered the three
most important issues. A pre-specified list of responses was available to the enumerators to aid
in data collection, but this list was not made available or indicated to participants. The list
included pre-coded responses for “shame” and “embarrassment” using the Borana terms fokifade
amale cherfad in the event that participants used this language to describe their own experience.
99
Responses were recorded “1” if listed as one of the three most important issues, and “0”
otherwise. Responses that were not pre-specified were written separately and coded by JRB
later.
Direct questions about stigma: We also sought to ask participants directly about the concept of
stigma as a barrier, regardless of whether they had freely listed it as a barrier. Whereas initial
versions of the survey used the word “shame”, consensus among survey staff was that using the
term in direct questions could alienate or insult participants and should be changed to
“discomfort”. Thus all participants were asked about their level of comfort with their purpose at
the clinic that day. This question was worded to elicit emotional discomfort rather than physical
discomfort; enumerators were given additional prompts such as “worried” and “unhappy” to
assist if the question was not received as intended. The Borana term used for discomfort was
dansa indagau. To get a sense of social norms and perceptions of acute malnutrition, we also
asked whether participants would expect women whose children were wasted to feel
uncomfortable coming to the clinic, and reasons why this might be the case. Answers were pre-
coded; unique responses were noted by enumerators and coded post-hoc by JRB later.
Ethical approval
The Cornell University Institutional Review Board for Human Participants granted ethical
approval for this study (protocol #1306003948). In Kenya, approval was granted by the Nairobi
Nutrition Information Working Group and the Marsabit County Ministry of Health.
100
Analytic methods
Data were assembled and analyzed using STATA 12 (104). Descriptive statistics (means,
medians, frequencies) were calculated for the caregiver, child, and household characteristics as
appropriate. We used Principle Components Analysis (PCA) and extracted the first component
to summarize household asset-based wealth from the 17 non-agricultural asset variables
collected. The first component captured 22% of the variability in asset ownership; the following
nine variables were the most heavily loaded: clock, radio, television, electricity, tape player,
motorcycle, phone, tin roof, and latrine (Appendix A, Table A5). We also used PCA and
extracted the first component to summarize food security status from the five food security
variables collected (see data collection section, above). The first component for food security
captured 57% of the variability in the data; worrying about food availability and the lack of food
in the household were the most heavily loaded (Appendix A, Table A6).
We used multilevel mixed-effects logistic regression to estimate the odds of reporting a barrier
given the acute malnutrition status of the child, using the responses to our open-ended questions
about access barriers. The ten most commonly reported barriers were used as binary outcome
variables in ten separate models, each adjusted for the same set of covariates. We chose 12
covariates that we expected to be potentially confounding because of their association with both
exposure (acute malnutrition) and outcome (reporting discomfort, shame, or embarrassment), as
well as covariates that we expected to be significant predictors of at least one of the 10 outcome
barriers. Covariates included study group (dummy coding for MAM and SAM using Normal as
the reference), child age (months) and sex (male=0, female=1), maternal age (years), marital
101
status (single, separated, divorced, or widowed=0, married=1) and education (0=no formal
education, 1=any formal education), household distance from the clinic (minutes), food security
status, and wealth, district, and facility caseload (low=0, high=1). Health facility was treated as
a random effect. The threshold for statistical significance was P<0.05.
We also used multilevel mixed-effects logistic regression to identify factors significantly
associated with feeling discomfort at the health facility. Here, we began with the same set of 12
covariates described above and used stepwise elimination to remove non-significant covariates,
using P<0.10 as the threshold for significance.
Results
Descriptive statistics
Descriptive statistics of the study participants (N=711) are presented in Table 4.1. Most
participants were married Borana residents aged 22-30 with no formal education, living in
households with 4-7 individuals, including 1-2 children under the age of 5. Table 4.2 presents
descriptive data on the children of study participants. The sample was 45% female (n=315), with
a median age of 21 months and a median MUAC of 124 mm.
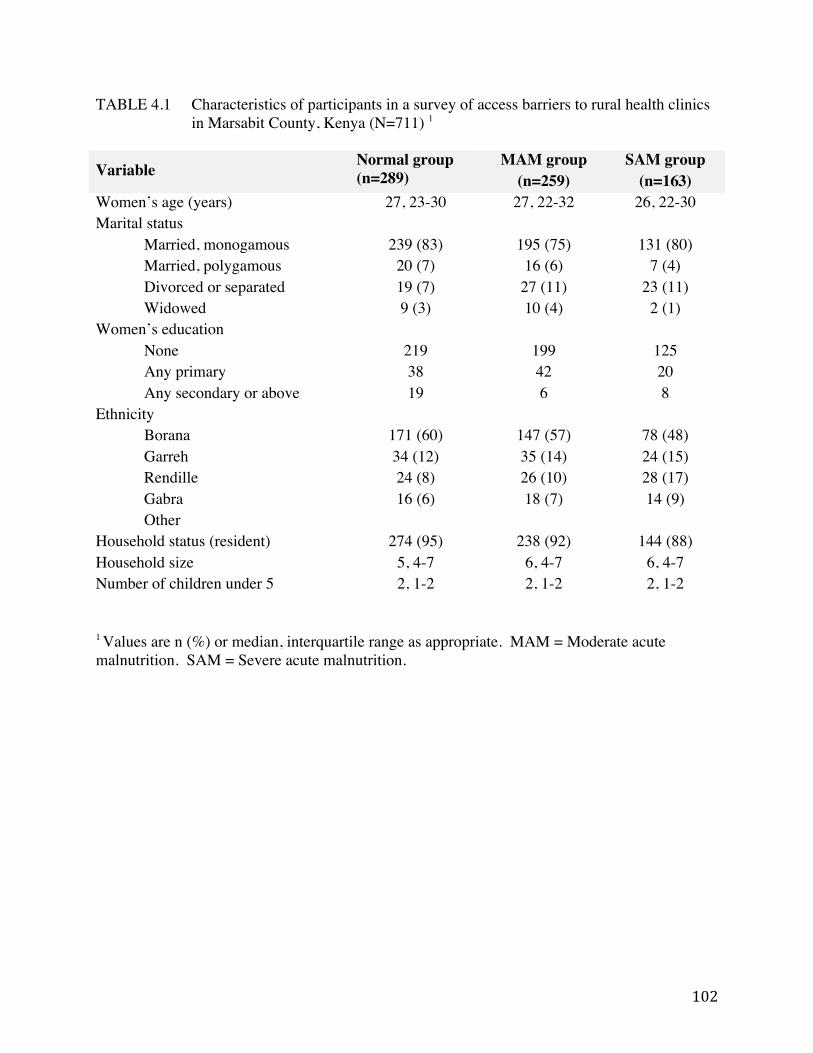
102
TABLE 4.1 Characteristics of participants in a survey of access barriers to rural health clinics in Marsabit County, Kenya (N=711) 1
Variable Normal group (n=289)
MAM group (n=259)
SAM group (n=163)
Women’s age (years) 27, 23-30 27, 22-32 26, 22-30 Marital status
Married, monogamous 239 (83) 195 (75) 131 (80) Married, polygamous 20 (7) 16 (6) 7 (4) Divorced or separated 19 (7) 27 (11) 23 (11) Widowed 9 (3) 10 (4) 2 (1)
Women’s education None 219 199 125 Any primary 38 42 20 Any secondary or above 19 6 8
Ethnicity Borana 171 (60) 147 (57) 78 (48) Garreh 34 (12) 35 (14) 24 (15) Rendille 24 (8) 26 (10) 28 (17) Gabra 16 (6) 18 (7) 14 (9) Other
Household status (resident) 274 (95) 238 (92) 144 (88) Household size 5, 4-7 6, 4-7 6, 4-7 Number of children under 5 2, 1-2 2, 1-2 2, 1-2
1 Values are n (%) or median, interquartile range as appropriate. MAM = Moderate acute malnutrition. SAM = Severe acute malnutrition.
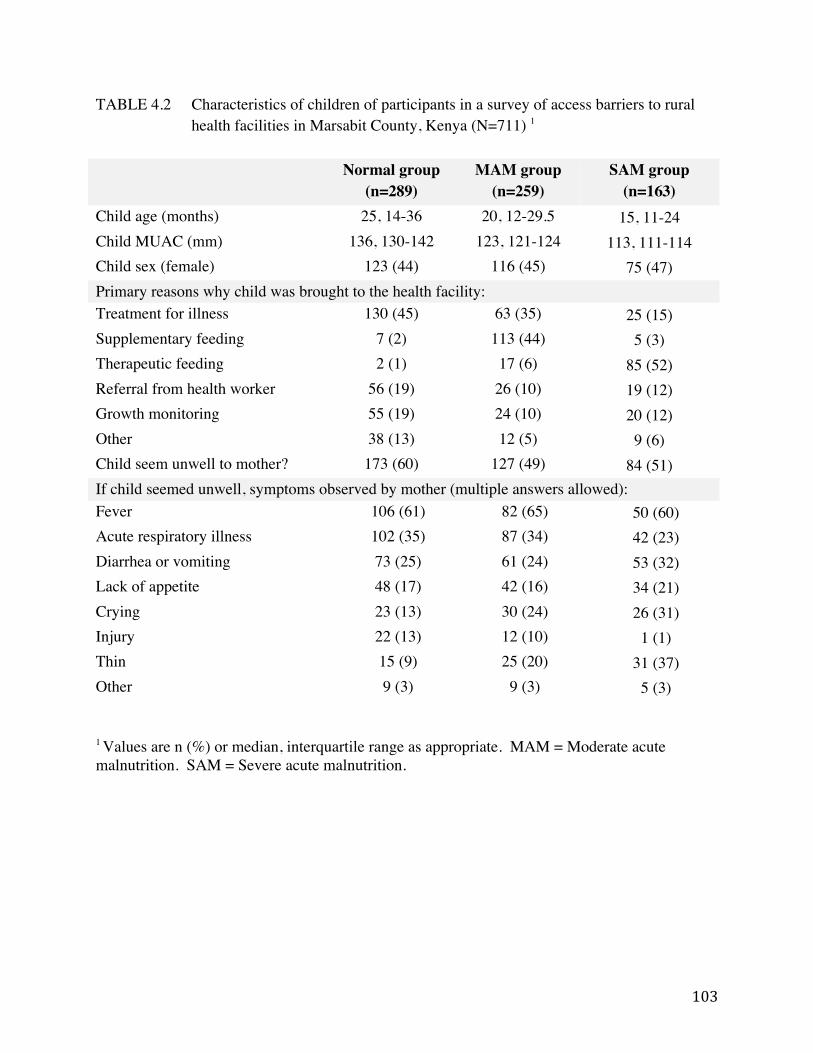
103
TABLE 4.2 Characteristics of children of participants in a survey of access barriers to rural health facilities in Marsabit County, Kenya (N=711) 1
Normal group (n=289)
MAM group (n=259)
SAM group (n=163)
Child age (months) 25, 14-36 20, 12-29.5 15, 11-24 Child MUAC (mm) 136, 130-142 123, 121-124 113, 111-114 Child sex (female) 123 (44) 116 (45) 75 (47) Primary reasons why child was brought to the health facility: Treatment for illness 130 (45) 63 (35) 25 (15) Supplementary feeding 7 (2) 113 (44) 5 (3) Therapeutic feeding 2 (1) 17 (6) 85 (52) Referral from health worker 56 (19) 26 (10) 19 (12) Growth monitoring 55 (19) 24 (10) 20 (12) Other 38 (13) 12 (5) 9 (6) Child seem unwell to mother? 173 (60) 127 (49) 84 (51) If child seemed unwell, symptoms observed by mother (multiple answers allowed): Fever 106 (61) 82 (65) 50 (60) Acute respiratory illness 102 (35) 87 (34) 42 (23) Diarrhea or vomiting 73 (25) 61 (24) 53 (32) Lack of appetite 48 (17) 42 (16) 34 (21) Crying 23 (13) 30 (24) 26 (31) Injury 22 (13) 12 (10) 1 (1) Thin 15 (9) 25 (20) 31 (37) Other 9 (3) 9 (3) 5 (3)
1 Values are n (%) or median, interquartile range as appropriate. MAM = Moderate acute malnutrition. SAM = Severe acute malnutrition.
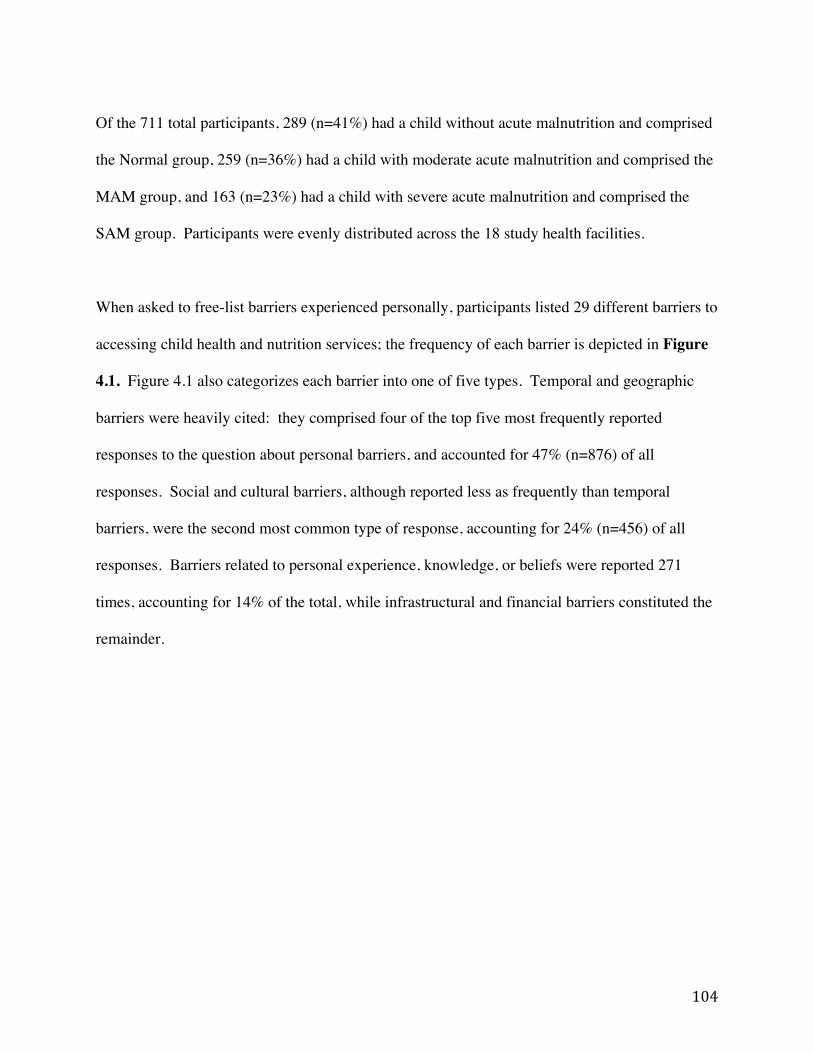
104
Of the 711 total participants, 289 (n=41%) had a child without acute malnutrition and comprised
the Normal group, 259 (n=36%) had a child with moderate acute malnutrition and comprised the
MAM group, and 163 (n=23%) had a child with severe acute malnutrition and comprised the
SAM group. Participants were evenly distributed across the 18 study health facilities.
When asked to free-list barriers experienced personally, participants listed 29 different barriers to
accessing child health and nutrition services; the frequency of each barrier is depicted in Figure
4.1. Figure 4.1 also categorizes each barrier into one of five types. Temporal and geographic
barriers were heavily cited: they comprised four of the top five most frequently reported
responses to the question about personal barriers, and accounted for 47% (n=876) of all
responses. Social and cultural barriers, although reported less as frequently than temporal
barriers, were the second most common type of response, accounting for 24% (n=456) of all
responses. Barriers related to personal experience, knowledge, or beliefs were reported 271
times, accounting for 14% of the total, while infrastructural and financial barriers constituted the
remainder.
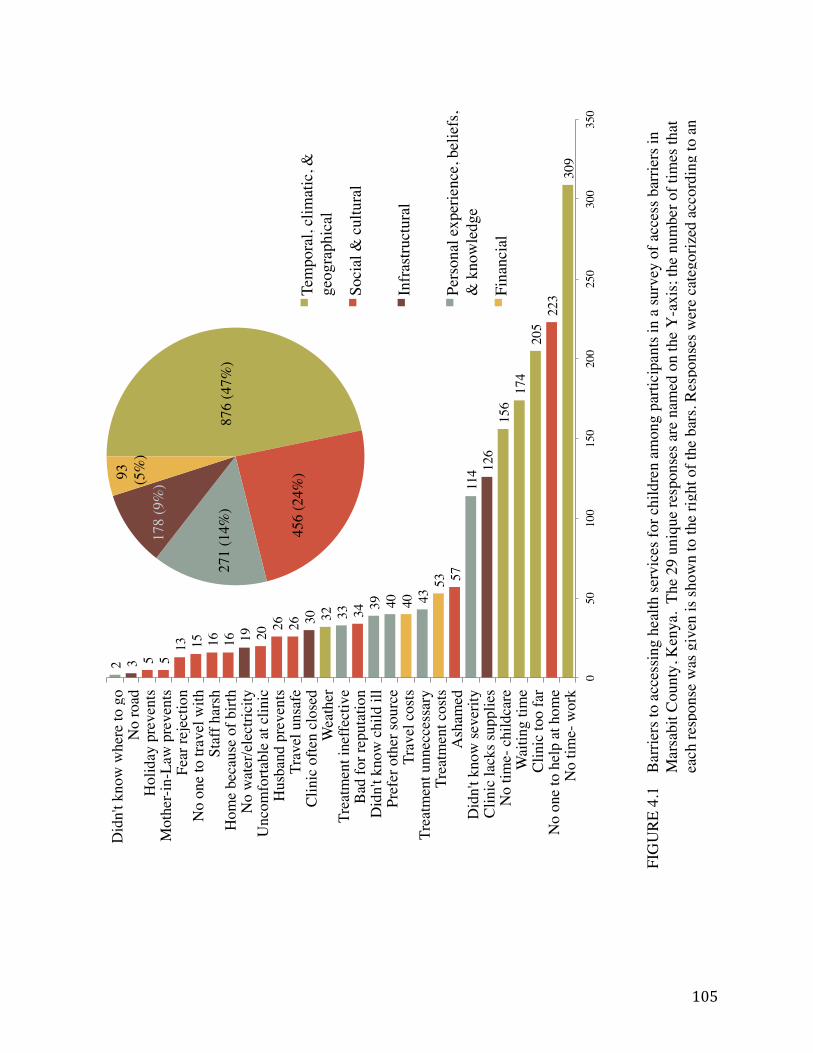
105
309!
223!
205!
174!
156!
126!
114!
57!
53!
43!
40!
40!
39!
34!
33!
32!
30!
26!
26!
20!
19!
16!
16!
15!
13!
5!5!3!2!
0!50!
100!
150!
200!
250!
300!
350!
No
time-
wor
k!N
o on
e to
hel
p at
hom
e!C
linic
too
far!
Wai
ting
time!
No
time-
chi
ldca
re!
Clin
ic la
cks s
uppl
ies!
Did
n't k
now
seve
rity!
Ash
amed!
Trea
tmen
t cos
ts!
Trea
tmen
t unn
ecce
ssar
y!Tr
avel
cos
ts!
Pref
er o
ther
sour
ce!
Did
n't k
now
chi
ld il
l!B
ad fo
r rep
utat
ion!
Trea
tmen
t ine
ffect
ive!
Wea
ther!
Clin
ic o
ften
clos
ed!
Trav
el u
nsaf
e!H
usba
nd p
reve
nts!
Unc
omfo
rtabl
e at
clin
ic!
No
wat
er/e
lect
ricity!
Hom
e be
caus
e of
birt
h!St
aff h
arsh!
No
one
to tr
avel
with!
Fear
reje
ctio
n!M
othe
r-in-
Law
pre
vent
s!H
olid
ay p
reve
nts!
No
road!
Did
n't k
now
whe
re to
go!
702
(37%
)!
456
(24%
)!
271
(14%
)!
352
(19%
)!
93!
(5%
)!Te
mpo
ral,
clim
atic
, &
geog
raph
ical!
Soci
al &
cul
tura
l!
Infr
astru
ctur
al!
Pers
onal
exp
erie
nce,
bel
iefs
, &
kno
wle
dge!
Fina
ncia
l!
876
(47%
)!
456
(24%
)!
271
(14%
)!
178
(9%
)!
93!
(5%
)!Te
mpo
ral,
clim
atic
, &
geog
raph
ical!
Soci
al &
cul
tura
l!
Pers
onal
exp
erie
nce,
bel
iefs
, &
kno
wle
dge!
Infr
astru
ctur
al!
Fina
ncia
l!
FIG
URE
4.1
Ba
rrier
s to
acce
ssin
g he
alth
serv
ices
for c
hild
ren
amon
g pa
rtici
pant
s in
a su
rvey
of a
cces
s bar
riers
in
Mar
sabi
t Cou
nty,
Ken
ya.
The
29 u
niqu
e re
spon
ses a
re n
amed
on
the
Y-a
xis;
the
num
ber o
f tim
es th
at
each
resp
onse
was
giv
en is
show
n to
the
right
of t
he b
ars.
Res
pons
es w
ere
cate
goriz
ed a
ccor
ding
to a
n
106
Freely-listed responses mentioning shyness, embarrassment, or shame (fokifade amale cherfad )
were reported as barriers 57 times, frequently enough to be the 9th most common barrier cited
overall but still only comprising 3% of all responses. When we stratified barrier results by study
group, the frequency of shame was highest within the SAM group (n=22, 14%), followed by the
MAM group (n= 25, 10%). It was not one of the top ten most frequently reported barriers within
the Normal group (n=10, 3%). The frequency of the ten most commonly listed barriers in each
study group is depicted in Figure 4.2.
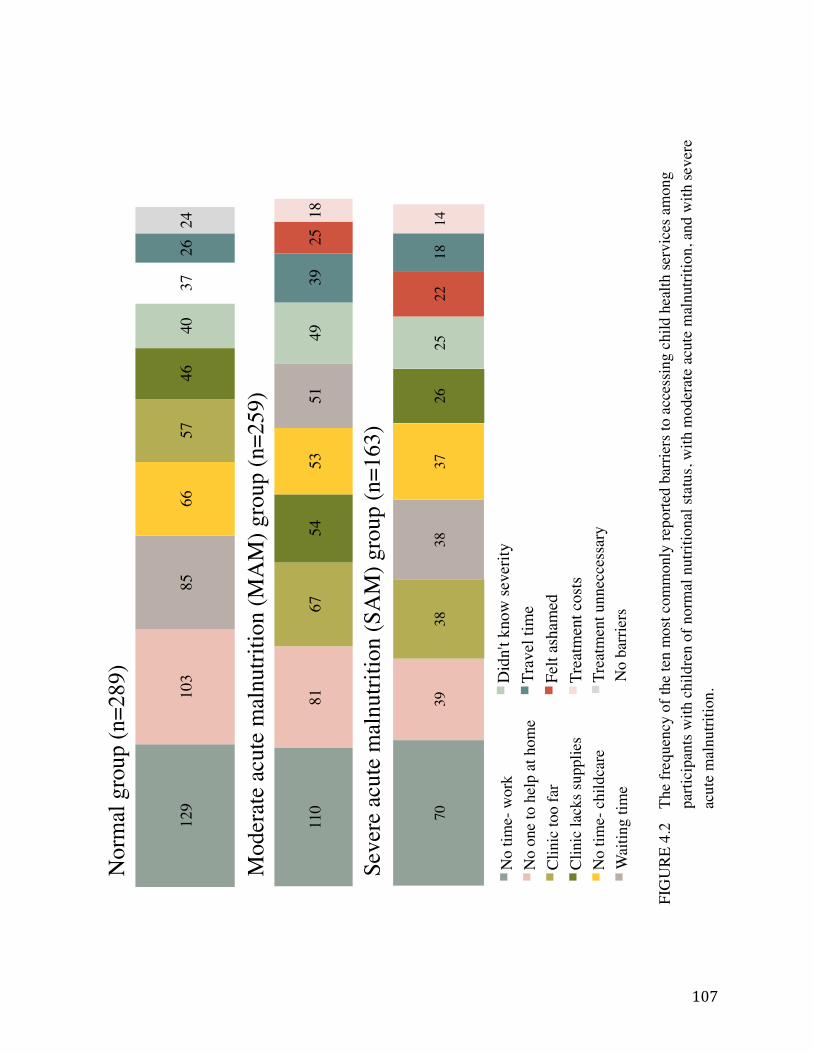
107
70!
39!
38!
38!
37!
26!
25!
22!
18!
14!
No
time-
wor
k!N
o on
e to
hel
p at
hom
e!C
linic
too
far!
Wai
ting
time!
No
time-
chi
ldca
re!
Clin
ic la
cks s
uppl
ies!
Did
n't k
now
seve
rity!
Felt
asha
med!
Trav
el ti
me!
Trea
tmen
t cos
ts!
110!
81!
67!
54!
53!
51!
49!
39!
25!1
8!
No
time-
wor
k!N
o on
e to
hel
p at
hom
e!C
linic
too
far!
Clin
ic la
cks s
uppl
ies!
No
time-
chi
ldca
re!
Wai
ting
time!
Did
n't k
now
seve
rity!
Trav
el ti
me!
Felt
asha
med!
Trea
tmen
t cos
ts!
129!
103!
85!
66!
57!
46!
40!
37!
26!
24!
No
time-
wor
k!N
o on
e to
hel
p at
hom
e!W
aitin
g tim
e!N
o tim
e- c
hild
care!
Clin
ic to
o fa
r!C
linic
lack
s sup
plie
s!D
idn'
t kno
w se
verit
y!N
o ba
rrie
rs!
Trav
el ti
me!
Trea
tmen
t unn
ecce
ssar
y!
Nor
mal
gro
up (n
=289
)!
Mod
erat
e ac
ute
mal
nutri
tion
(MA
M) g
roup
(n=2
59)!
Seve
re a
cute
mal
nutri
tion
(SA
M) g
roup
(n=1
63)!
110!
81!
67!
54!
53!
51!
49!
39!
25!1
8!
No
time-
wor
k!N
o on
e to
hel
p at
hom
e!C
linic
too
far!
Clin
ic la
cks s
uppl
ies!
No
time-
chi
ldca
re!
Wai
ting
time!
Did
n't k
now
seve
rity!
Trav
el ti
me!
Felt
asha
med!
Trea
tmen
t cos
ts!
129!
103!
85!
66!
57!
46!
40!
37!
26!
24!
No
time-
wor
k!N
o on
e to
hel
p at
hom
e!W
aitin
g tim
e!N
o tim
e- c
hild
care!
Clin
ic to
o fa
r!C
linic
lack
s sup
plie
s!D
idn'
t kno
w se
verit
y!N
o ba
rrie
rs!
Trav
el ti
me!
Trea
tmen
t unn
ecce
ssar
y!
129!
103!
85!
66!
57!
46!
40!
37!
26!
24!
No
time-
wor
k!N
o on
e to
hel
p at
hom
e!W
aitin
g tim
e!N
o tim
e- c
hild
care!
Clin
ic to
o fa
r!C
linic
lack
s sup
plie
s!D
idn'
t kno
w se
verit
y!N
o ba
rrie
rs!
Trav
el ti
me!
Trea
tmen
t unn
ecce
ssar
y!
FIG
URE
4.2
Th
e fre
quen
cy o
f the
ten
mos
t com
mon
ly re
porte
d ba
rrier
s to
acce
ssin
g ch
ild h
ealth
serv
ices
am
ong
parti
cipa
nts w
ith c
hild
ren
of n
orm
al n
utrit
iona
l sta
tus,
with
mod
erat
e ac
ute
mal
nutri
tion,
and
with
seve
re
acut
e m
alnu
tritio
n.
108
When asked directly, forty-percent (n=65) of women in the SAM group responded that they
were uncomfortable with their purpose attending the clinic on that day; the frequency of this
response was lower in the MAM group (n=71, 28%) and lowest in the Normal group (n=54,
19%) (P<0.001) (Table 4.3). Three quarters of the total sample (n=526) reported that they
would expect women with acutely malnourished children to experience more discomfort
attending a clinic with their child when compared to other women. This expectation was
distributed evenly across the study subgroups (P=0.55) (Table 4.3).
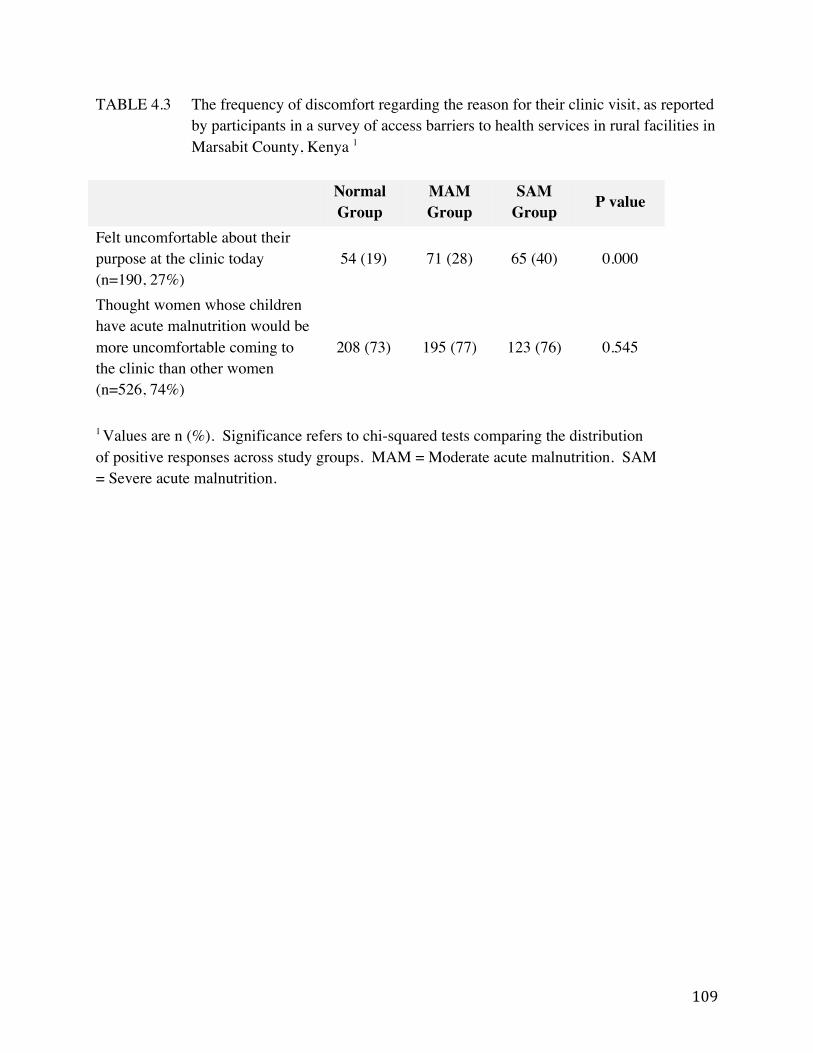
109
TABLE 4.3 The frequency of discomfort regarding the reason for their clinic visit, as reported by participants in a survey of access barriers to health services in rural facilities in Marsabit County, Kenya 1
Normal Group
MAM Group
SAM Group P value
Felt uncomfortable about their purpose at the clinic today (n=190, 27%)
54 (19) 71 (28) 65 (40) 0.000
Thought women whose children have acute malnutrition would be more uncomfortable coming to the clinic than other women (n=526, 74%)
208 (73) 195 (77) 123 (76) 0.545
1 Values are n (%). Significance refers to chi-squared tests comparing the distribution of positive responses across study groups. MAM = Moderate acute malnutrition. SAM = Severe acute malnutrition.
110
Participants offered a number of reasons why discomfort or shame might occur (or be expected
to occur) among women attending a clinic with acutely malnourished children. Having a child
with moderate or severe acute malnutrition was perceived to indicate negative characteristics
about the child’s mother and household. Approximately 60% of respondents mentioned that
having an acutely malnourished child would invite the perception that the mother did not take
proper care of her child, either in terms of food or other basic provisions (Table 4.4). Indicators
of food insecurity occurred at consistently higher rates among participants in the SAM group
(Appendix A, Table A6).
111
TABLE 4.4 Perceptions about acute malnutrition reported by participants in a survey of access barriers to child health services in Marsabit County, Kenya 1
Do women whose children have acute malnutrition feel less comfortable coming to a clinic than other women? (n=711)
Yes 526 (75) Why do they feel more uncomfortable? (n=536)
Perceived that the mother doesn’t take proper care of her child 328 (63)
Household perceived to not have enough food 317 (61)
Perceived that mother cannot provide basic things for her child 297 (57)
The mother is embarrassed or ashamed 182 (35)
Perceived that the child has a very severe condition 162 (31)
Perceived that the household is poor 120 (23) 1 Values are n (%). MAM = Moderate acute malnutrition. SAM = Severe acute malnutrition.
112
Multivariate regression results
Shame as a barrier, freely listed
Our first mixed effects regression model estimated the odds of reporting shame given the acute
malnutrition status of the child in the SAM and MAM groups (consolidated), adjusting for child
age and sex, maternal age, marital status, and education, household size, distance from the clinic,
food security status, wealth, district, and clinic caseload. Of the top ten most frequently reported
barriers in this study, shame was the only barrier that women with acutely malnourished children
were significantly more likely to report. Women in either the SAM or the MAM group had a
3.78 times higher odds of reporting shame relative to the Normal group (CI: 1.55-9.18, P<0.05)
(Figure 4.3).
113
FIGURE 4.3 The odds of reporting one of the10 most common barriers in a survey of access to
health services at rural health facilities in Marsabit County, Kenya, (moderate and severe groups consolidated and compared to the normal group). Odds ratios of significant findings (P<0.05) are noted on the figure, and were estimated using a multilevel mixed effects logistic regression model that adjusted for child age and sex, maternal age, marital status and education, household size, distance from the clinic, food security status, and wealth, district, and facility caseload. Health facility was treated as a random effect.
.64
.39
3.77
1 5 10 12Adjusted odds ratios (Reference: Normal group)
95% Confidence intervalWomen with children with acute malnutrition(MAM or SAM groups)
Cost of treatment!
Travel time!
Severity unknown!Clinic lacks supplies!
No time- childcare!
Clinic too far!
Waiting time!
No help at home!No time-work!
Felt ashamed!
Adjusted odds ratios (Reference: Normal group)!
.64
.39
3.77
1 5 10 12Adjusted odds ratios (Reference: Normal group)
95% Confidence intervalWomen with children with acute malnutrition(MAM or SAM groups)
114
When we separated the subgroups and calculated the adjusted estimates of reporting shame in
each group as a barrier relative to the Normal group, we saw that the pattern held. The odds of
reporting shame as a barrier were highest in the SAM group (OR: 7.88, CI: 2.62-23.73,
P<0.001), followed by the MAM group (OR: 2.84, CI: 1.10-7.47 P<0.05) (Figure 4.4).
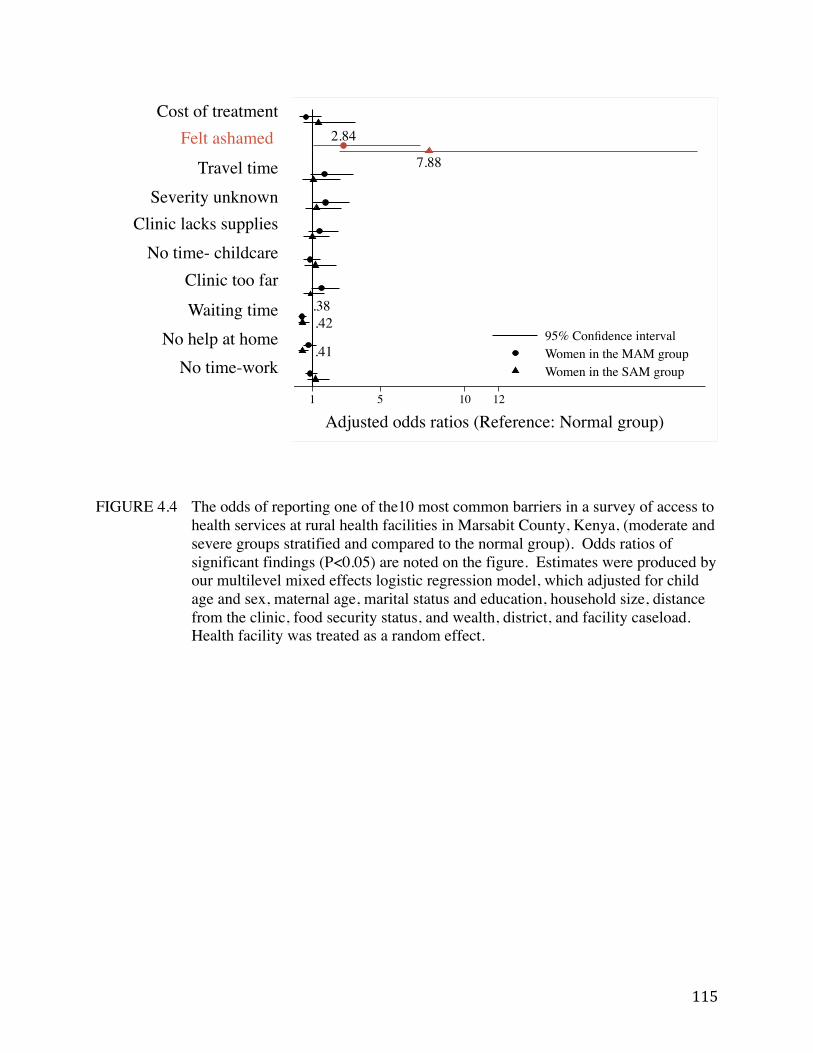
115
FIGURE 4.4 The odds of reporting one of the10 most common barriers in a survey of access to health services at rural health facilities in Marsabit County, Kenya, (moderate and severe groups stratified and compared to the normal group). Odds ratios of significant findings (P<0.05) are noted on the figure. Estimates were produced by our multilevel mixed effects logistic regression model, which adjusted for child age and sex, maternal age, marital status and education, household size, distance from the clinic, food security status, and wealth, district, and facility caseload. Health facility was treated as a random effect.
Cost of treatment!
Travel time!Severity unknown!
Clinic lacks supplies!No time- childcare!
Clinic too far!
Waiting time!No help at home!
No time-work!
Felt ashamed!
.41
.42.38
7.88
2.84
1 5 10 12Adjusted odds ratios (Reference: Normal group)
95% Confidence intervalWomen in the MAM groupWomen in the SAM group
Adjusted odds ratios (Reference: Normal group)!
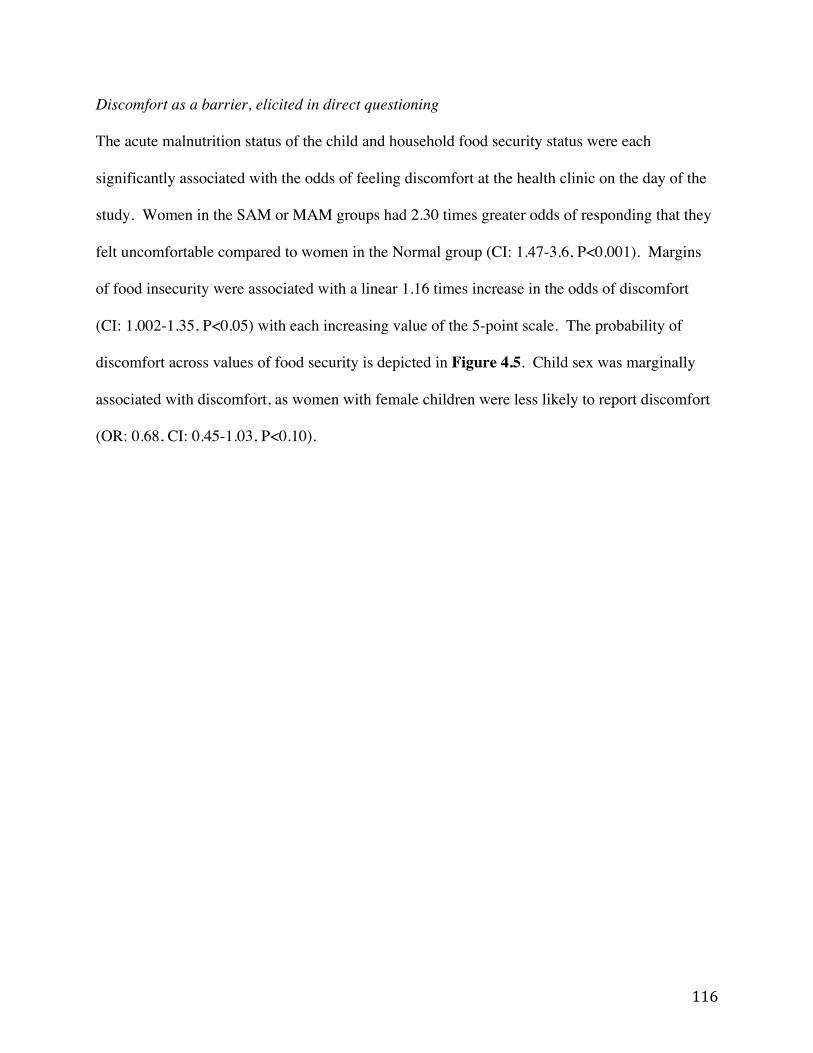
116
Discomfort as a barrier, elicited in direct questioning
The acute malnutrition status of the child and household food security status were each
significantly associated with the odds of feeling discomfort at the health clinic on the day of the
study. Women in the SAM or MAM groups had 2.30 times greater odds of responding that they
felt uncomfortable compared to women in the Normal group (CI: 1.47-3.6, P<0.001). Margins
of food insecurity were associated with a linear 1.16 times increase in the odds of discomfort
(CI: 1.002-1.35, P<0.05) with each increasing value of the 5-point scale. The probability of
discomfort across values of food security is depicted in Figure 4.5. Child sex was marginally
associated with discomfort, as women with female children were less likely to report discomfort
(OR: 0.68, CI: 0.45-1.03, P<0.10).
117
FIGURE 4.5 The predicted probability of reporting emotional discomfort at the clinic across levels of food security among participants in a survey of access to rural health services in Marsabit County, Kenya. Negative values represent food security and positive values represent increasing levels of food insecurity. Probabilities are adjusted for child sex and household food security status. Health facility was treated as a random effect. MAM = Moderate acute malnutrition. SAM = Severe acute malnutrition.
.1
.2
.3
.4
.5Pr
edic
ted
prob
abili
ty o
f dis
com
fort
-2 -1 0 1 2 3Component scores for food security
Women with children in the 'normal' groupWomen with children with acute malnutrition (MAM or SAM groups)
.1
.2
.3
.4
.5
Pred
icte
d pr
obab
ility
of d
isco
mfo
rt
-2 -1 0 1 2 3Component scores for food security
Women with non-wasted children (Normal group)Women with children with acute malnutrition (MAM or SAM groups)
Pred
icte
d pr
obab
ility
of d
isco
mfo
rt!
Component scores for food security!
118
Discussion
This study systematically investigated whether stigma associated with acute malnutrition
constrains access to CMAM. By asking participants with and without acutely malnourished
children about their experiences in accessing care, we were able to identify those barriers that are
universal across child health conditions and those that are unique to a single condition or service.
Our findings support the two hypotheses posed earlier, that acute malnutrition is a stigmatized
condition and that stigma is one factor limiting utilization of CMAM.
We used three approaches to triangulate the association between stigma and acute malnutrition:
we asked open-ended questions about participants’ past and current experience accessing a
clinic, direct questions about their own comfort level on the day of the survey, and direct
questions about general expectations and perceptions surrounding the condition. Each approach
yielded consistent findings: most access barriers were universal, regardless of the child’s
nutritional status or reason for being at the clinic.
Shame was the only barrier uniquely reported by women whose children had acute malnutrition,
and the majority of participants perceived acute malnutrition as a condition that would elicit
emotional discomfort when seeking care. Our findings support the hypothesis that caregivers of
children with acute malnutrition experience stigmatization, as revealed in the feelings of shame,
embarrassment, and discomfort reported in the process of accessing treatment.
119
Sources of stigma among stigmatized health conditions
The existing literature on health-related stigma yields insight into sources of negative
stereotyping that may be relevant to understanding the stigmatization of acute malnutrition.
Shame associated with child malnutrition in Tanzania was inseparable from that of hunger and
food insecurity; this was largely a result of structural discrimination perpetuated by decades of
political and economic policies that prevented households from escaping poverty (77).
Similarly, poverty and its constraints were believed to fuel HIV/AIDS stigma in Zambia (141).
Recent qualitative work from Zimbabwe showed something different: HIV/AIDS-related stigma
was distinct from poverty-related stigma among both HIV-affected and HIV-unaffected children
(142). In Pakistan, the belief that child wasting was caused by spirits punishing the mother’s
immoral behavior was found as the predominant source of stigma (76). Punitive witchcraft has
been documented as a perceived cause of poor health, namely epilepsy, and its consequential
stigmatization in Kenya and across Sub-Saharan Africa (73,143).
Wasting is a highly visible trait that was tightly associated with HIV/AIDS during the early years
of the HIV/AIDS epidemic prior to the availability of antiretroviral therapies, and continues to
prompt the labeling of individuals as infected with the virus (144). A recent study of HIV/AIDS
related stigma in Swaziland, Namibia, Kenya, Nigeria, Burkina Faso and Senegal found Kenyan
narratives about HIV/AIDS to be among the most polarized and moralistic (145). This is
consistent with recent findings from Kenya showing that HIV/AIDS related stigma contributes to
women’s refusal of HIV testing (71).
120
The above examples are useful for generating hypotheses about the sources of stigma associated
with acute malnutrition that we found in our study. One hypothesis is that acute malnutrition-
associated stigma is driven by the stigma of poverty and food insecurity, as shown in Tanzania
and Zambia (77,141). Yet in our data, household food insecurity and acute malnutrition were
independent and significant predictors of discomfort in the clinic setting, intimating that stigma
associated with acute malnutrition may be distinct from that associated with food insecurity; this
finding seems consistent with the recent finding in Zimbabwe that HIV/AIDS stigma is distinct
from poverty stigma (142). A second hypothesis is that “stigma by association”, or stigma
associated with HIV/AIDS infection, occurs among caregivers of visibly wasted children; this
phenomenon has been documented for tuberculosis (72). A third hypothesis, as seen among
mothers of wasted children in Pakistan and in communities that stigmatize epilepsy, is the
presence of a belief system that views the condition as a form supernatural or spiritual
punishment (73,76).
De-stigmatization efforts
Most stigma reduction interventions are primarily informed by socio-cognitive
conceptualizations of stigma, and are thus limited to advocacy-based strategies to increase
empathy and tolerance among the general public (e.g. via media or political campaigns, health
worker training) or to reduce fear among high-risk groups (i.e. via support groups) (65,66,146).
Although contemporary conceptualizations of stigma recognize the broader structural and
cultural processes that perpetuate stigma, such dynamics have not been targeted by most
interventions (65). A recent review of structural stigma is likely to generate interest in creating
effective multi-level de-stigmatization strategies (75). The high incidence and severe
121
consequences of untreated SAM add urgency to the need for greater attention to acute
malnutrition-related stigma.
Limitations
The extent to which stigma is a barrier among any of the subgroups in this study is likely
underestimated for several reasons. First, by nature, shame or discomfort may be difficult for a
person to discuss or admit, which may have prevented some participants from listing it or
responding positively when asked directly. Second, health workers are known to be sources of
discrimination or judgment in many settings, which may have informed participants’ choice of
responses in this study (78,147). We emphasized the necessity of sensitive and respectful data
collection during enumerator training to minimize this limitation, but our efforts may not have
been adequate to put participants at ease or to offset caution learned from past negative
experiences. Third, women for whom stigma was an especially strong barrier would be
underrepresented in this facility-based study because they are unlikely to seek care. The facility-
based aspect of this study means that it is not representative of the community at-large, and is
only generalizable to women who accessed care. Fourth, our tool for measuring stigma did not
attempt to separate the constructs of shame and guilt, two distinct psychological concepts that
our research did not fully distinguish (148).
By using MUAC to categorize our MAM and SAM groups, we applied a relatively stringent
definition for SAM. There are known discrepancies between the use of MUAC and WHZ as
indicators, with MUAC being more predictive of mortality risk and less sensitive to weight or
122
body- mass index (125). The potential effect of classification differences on this study’s results
is unknown.
Conclusions
In addition to the many universal barriers faced by caregivers in accessing healthcare for
children, most notably time and workload constraints of mothers, access to CMAM is
additionally constrained by stigma associated with acute malnutrition. Shame and discomfort at
health clinics were reported more frequently among mothers of children with moderate or severe
acute malnutrition compared to those with children of normal status, and a majority of all
participants perceived acute malnutrition as an indication of poor maternal or household
provisioning.
If the experience of decades of HIV/AIDS research is indicative, we might expect efforts to
address the stigmatization of acute malnutrition to have low priority (65). Yet in order to
achieve maximum coverage of potentially life-saving CMAM programs, thoughtful
consideration of barriers unique to CMAM must be made among researchers and programmers
alike (62). Given the groundwork laid for conceptualizing stigma and its consequences for
health outcomes (149), the existing precedents for effective de-stigmatization programs (146),
and the capacity of child health and nutrition programs to influence caregiver behavior and
improve coverage (63,88), many of the key requirements exist for successfully integrating de-
stigmatizing interventions into existing platforms. Such efforts could be strengthened by
research to identify the sources of stigma associated with acute malnutrition, along with
123
formative work to determine which approaches and targets for de-stigmatization efforts may be
most appropriate and effective.
124
Chapter 5: Discussion
Summary
Global efforts to reduce the burden of acute malnutrition through supplementary and therapeutic
feeding programs are increasingly accompanied by a range of strategies from disciplines other
than nutrition, including development economics, medicine, and psychology. Simultaneously,
efforts to improve access and coverage to the existing, conventional approaches to acute
malnutrition are ongoing. This dissertation contributes to the study of acute malnutrition in two
ways: first, it offers insight into whether and how emergency cash transfer programs (CTPs) are
effective at preventing acute malnutrition during food crises; second, it documents stigma as a
barrier to accessing treatment for acute malnutrition in routine health system settings. The
findings are relevant and actionable, and will be of interest across the disciplines of emergency
nutrition, humanitarian response, and development studies.
We presented a longitudinal analysis of risk factors associated with acute malnutrition risk
among 453 children and households targeted by an emergency CTP in Maradi, Niger, during the
2012 food crisis (Chapter 2). We found that child dietary factors (meal frequency, dietary
diversity, household food security, and food expenditures) were not significantly associated with
the subsequent risk of acute malnutrition. Health and wealth-related factors had a larger and
significant effect on risk, and we determined that the CTP alone was insufficient to offset the risk
associated with illness or poverty.
125
Using a quasi-experimental study design, we evaluated the impact of a second emergency CTP
on child health and diet, this time in Tahoua, Niger, also during the 2012 food crisis (Chapter 3).
We observed substantial increases in weight and WHZ among program beneficiaries. The use of
a comparison group and concurrent data on child diets allowed us to attribute the child growth to
the intervention, with the qualifications as noted in Chapter 3, given that the diets and weights of
non-beneficiaries remained unchanged for the duration of the study.
In a cross-sectional analysis of healthcare access barriers in Marsabit, Kenya, we investigated the
role of stigma as a unique barrier to caregivers of children with acute malnutrition (Chapter 4).
Shame and emotional discomfort at health clinics were reported most frequently among mothers
of children with moderate or severe acute malnutrition relative to those with children of normal
status, and a majority (75%) of all participants perceived acute malnutrition as an indication of
poor maternal or household provisioning.
Synthesis
In this section we explore the possible reasons for the apparent divergence in outcomes between
the two emergency CTPs in Niger, as presented in Chapters 2 and 3. We also consider the
limitations of emergency CTPs as preventive tools for acute malnutrition, with particular
attention to their ability (or lack thereof) to affect the health environment. Then we reflect on the
importance of access and coverage to the success of Community-Based Management of Acute
Malnutrition (CMAM) for the treatment of acute malnutrition in light of the current emphasis on
126
product development. To conclude, we offer suggestions for future research in the area of acute
malnutrition prevention and treatment.
Consistency of emergency CTP outcomes
Although the outcomes of the Save the Children (“Save”) and Concern Worldwide (“Concern”)
emergency CTPs presented in Chapters 2 and 3 may appear divergent at first, consideration of
the methodological differences (and similarities) between the two programs shows them to be
consistent with each other and with the recent work of others. The programs were comparable in
many ways: they occurred in neighboring regions within the same country (Niger) and among
the same ethnic group (the Hausa people); they were implemented in the same year (2012) and
over approximately the same time period (May- October and July-October); they used similar
targeting criteria (locally-defined HEA wealth categories) and distributed a similar amount of
cash (250-296 USD); and, finally, they shared the goal of preventing acute malnutrition.
For all of the reasons listed above, one might expect the Save and Concern programs to have
yielded similar impact. Programmatic and methodological differences lend insight into why they
appear to have divergent results and what may be responsible for differences that did occur.
First, Save’s emergency CTP was an unconditional program (Chapter 2), whereas Concern’s was
conditioned on education sessions delivered parallel to the transfer distributions (Chapter 3).
Second, Save’s program was examined using a cohort study, whereas Concern’s utilized a quasi-
experimental study with a control group. The implications of these differences are presented
below.
127
Programmatic differences: the role of conditional terms
As described in Chapter 3, the impact of the conditional education sessions as promoters of child
feeding and care practices among beneficiaries of Concern’s emergency CTP cannot be
untangled from the impact of the cash itself. Nor should the importance of the sessions be
overlooked; the strategic timing of their delivery—in the hour previous to cash distributions—
and the resulting high adherence rate (99%) are both strong evidence that the messages were
transmitted effectively. As the key defining feature between the Save and Concern programs, it
seems likely that if there were a difference in impact it would likely be attributable to the
difference in conditional status that ensured the delivery of nutrition education messages.
Systematic reviews of behavior change (BC) interventions have repeatedly demonstrated the
potential for improving child dietary practices and nutritional status (9,150). Whether the
duration of the cash intervention (4 months), the number of conditional sessions (3), or the
quality and content of the sessions provided by Concern’s emergency CTP were sufficient to
yield the diet and growth changes observed is a reasonable question. In a recent review of 29
complementary feeding BC interventions, some with intense delivery platforms (daily sessions
for 2-week periods) and others with just one session, the authors determined BC interventions to
be “powerful” intervention strategies, despite being unable to determine whether length or
intensity of the delivery platform was associated with greater impact (127). Thus it is plausible
that even a small number of BC sessions of the type delivered through Concern’s program could
be effective.
128
Methodological differences: the use of cohort vs. experimental design
The study designs used to collect evaluate Save’s and Concern’s emergency CTPs lent
themselves to different research questions. For Save’s program (Chapter 2), we were able to
explore the relevance of food and illness pathways by testing for associations between diet and
health-related factors and our outcome of interest. As a cohort study with no comparison group,
the data did not permit us to estimate the impact of the program through either pathway, but we
were able to highlight the relative importance of child health status as a factor associated with
subsequent malnutrition among children in beneficiary households. In contrast, for Concern’s
program (Chapter 3), which leveraged the availability of a comparison group, we were able to
estimate impact and test the relevance of both pathways, leading to the conclusion that the
program’s impact was mediated through diet.
Neither Save’s nor Concern’s programs included food distribution as part of the CTP
intervention, but the assumption underlying both programs was that the cash would increase food
expenditures, thereby improving children’s access to food and reducing their risk of acute
malnutrition during the 2012 food crisis. Similar assumptions underlie many non-emergency
programs as well (51). Only the quasi-experimental evaluation methods used for Concern’s
program allow us to explore the assumption. However, the lack of association found between
dietary-related variables and the risk of acute malnutrition among beneficiaries of Save’s
program cannot be taken as an indication that there wasn’t also an impact child diet and weight.
In a related study using the same dataset, researchers showed that indicators of food security
improved over time in the cohort households (55).
129
It is conceivable—and even likely, given the evidence from other studies—that beneficiaries of
Save’s emergency CTP did in fact experience meaningful increases in food expenditures, dietary
indicators, and/or weight gain relative to non-beneficiaries (32). We do not rule out the
likelihood that the overall risk of acute malnutrition was indeed lower among children in the
cohort relative to non-beneficiaries. However, without a comparison group, we were unable to
document such a result.
Emergency CTPs and child morbidity
Child illness was significantly associated with poor child growth outcomes in both of the
emergency CTPs described in this dissertation, and we saw no evidence to indicate that either
program reduced the frequency of illness. In Chapter 2, we concluded that an important role of
emergency CTPs is (or should be) to enable access to medical care, given the prominent role that
illness played in putting children at risk of acute malnutrition despite being targeted by Save’s
program. This conclusion was supported in Chapter 3, where Concern’s program appears to
have led to more frequent and prompt care-seeking behavior among beneficiaries of the CTP.
A likely reality is that the ability of emergency CTPs to have a substantial impact on child
growth is constrained by underlying rates of child morbidity as well as limitations in health care
access and quality. Even a program that successfully improves child diet is likely to hit a ceiling
in terms of impact on growth unless morbidity is also addressed. The relative importance of the
health environment was well documented in early work by Kennedy et al in Kenya (41), where
130
an agricultural and food-security intervention drastically increased beneficiary income and food
expenditures but had no observable impact on child growth; any improvements in growth were
associated with improvements in water and sanitation. More recently, interest in the role of co-
infection in children with acute malnutrition has increased, and is being explored through trials
that incorporate antibiotic treatment alongside RUTF (30,151). Even within the world of RUTF
product development and testing, there is discourse about the appropriateness of promoting food-
based interventions when health and sanitation conditions remain inadequate (152).
It would be naïve to posit that an intervention as temporary as an emergency CTP could result in
a substantial improvements to the health environment via changes to water, sanitation, or health
service infrastructure. While long term CTPs frequently include health systems strengthening
components (38,47), emergency programs do not operate on a time scale suitable to such goals,
nor do health systems or the health environment necessarily factor into the ‘immediate relief’
focus of humanitarian settings (4). However, our findings indicate that a potentially important
and unsung role of emergency CTPs is to enable medical care for ill children where services
exist, as well as to promote prompt care-seeking for ill children through the use of strategic
conditional terms.
131
Prioritizing access and coverage of CMAM
Access and the 3/97 gap
As described in the introduction to this dissertation (Chapter 1), researchers from food science,
psychology, medicine, child development, public health, and others are contributing resources
towards achieving the most efficacious, cost-effective, and sustainable approach for the
treatment of acute malnutrition. Most of this research revolves around product development and
testing of RUF composition and new treatment protocols. Efforts to reduce the burden of acute
malnutrition fall neatly into what Leroy and Habicht termed the “3/97” gap (153)—the
observation that the vast majority of child health research and funding is dedicated to the
development of new technologies, despite the evidence that child mortality could be reduced by
60% by scaling up currently available technologies (154).
Access is a prime example of an issue currently situated in the “3%” of the 3/97 gap: a small
portion of current research is dedicated to understanding how to improve the coverage of the
existing strategies for maternal and child health services. This imbalance persists despite the
widely accepted knowledge that even the most efficacious and novel interventions are likely to
fail unless vulnerable populations achieve access to health services (58,155). Convincing policy-
makers, program implementers, researchers, and funders to prioritize coverage, when increasing
efficacy remains so tantalizing, has proven to be challenging (59,156). Doing so for a program
that professes to be “community-based”, which implies high levels of access, may be especially
problematic and counterintuitive.
132
The irony of a community-based intervention with poor coverage
CMAM access offers a particularly compelling and ironic case to consider: by all accounts, the
design of CMAM meets expectations about what an “accessible” program should look like.
Eligible children can receive treatment on an outpatient basis, mothers or caregivers can
administer the treatment themselves, treatment is free, and the program has been integrated into
public health systems across the globe. Optimizing coverage was precisely what Steve Collins
had in mind when describing the motivations originally behind the program (9,10). Based on the
standards for scaling-up child survival programs touted over the last decade, CMAM should be
one of the most highly accessed programs around (155). So why, then, is coverage so low?
This dissertation and other related work on the topic of coverage of CMAM have begun to
document and consider the extent of the problem, with the emerging consensus being that
CMAM coverage is probably no better than that of other child health or nutrition services,
despite the intent behind its design (15,60,62,63). In fact, our findings raise the possibility that
the stigmatization of acute malnutrition constrains CMAM coverage beyond that of programs or
conditions where stigma is not an issue. Using the RE-AIM framework and language to situate
our findings from in Kenya, we propose that CMAM has limited reach due to the many
formidable barriers that occur universally for maternal and child health services, foremost
women’s time and labor constraints. Furthermore, the stigmatization of acute malnutrition
contributes to the constrained adoption of CMAM (59).
133
In other words, all else equal, it’s possible that coverage of CMAM is more difficult to achieve
than other child health services due to the stigmatization of acute malnutrition.
It is conceivable that increased awareness and appreciation of acute malnutrition-associated
stigma among policymakers and implementers could motivate improvements to CMAM
coverage. Whereas the more common barriers to maternal and child health services can seem
insurmountable, and therefore unappealing as policy or program targets, de-stigmatization may
be relatively actionable. As detailed in our discussion of de-stigmatizing acute malnutrition in
Kenya (Chapter 4), some of the key requirements for integrating de-stigmatization efforts into
existing platforms already exist. It remains to be seen whether CMAM coverage, including the
role of stigma, will gain priority among the many other tactics being used to address the burden
of child acute malnutrition.
Concluding remarks
There remains a need for more rigorous evaluation of emergency CTPs and their impact on child
health and nutrition. Opportunities to leverage the use of comparison or control groups, as was
achieved by Concern in 2012, should be sought to aid in the quantification of program impact.
Doing so will help to substantiate and justify the continued proliferation of CTPs in humanitarian
settings. Study designs that allow an assessment of the relative contribution of cash and
conditional terms in emergency CTPs would further illuminate the mechanisms by which these
programs yield a meaningful effect.
134
The extent to which stigma prevents acutely malnourished children from getting treatment would
be better understood through community-based studies with caregivers not accessing treatment.
Qualitative work could elucidate sources and consequences of stigma with greater nuance and
depth, and more sophisticated survey tools should be constructed to reflect contemporary
conceptualizations of stigma. Whether stigma is in fact a widespread or formidable barrier to
accessing care has yet to be established and requires more attention.
To conclude, the prevention and treatment of child acute malnutrition will both benefit from a
more holistic approach to program design and evaluation. This dissertation demonstrated how
integrating food, health, and care components into emergency cash transfer programming is
fundamental to preventing acute malnutrition in the context of a food crisis. It also identified
stigma as an important barrier to accessing treatment in a routine healthcare setting. With
continued collaboration across disciplines and more emphasis on strengthening the coverage of
existing programs, the burden of child acute malnutrition stands the greatest chance of decline.

135
APPENDIX A
136
TABLE A1. Summary of findings from emergency and short-term cash transfer program evaluations
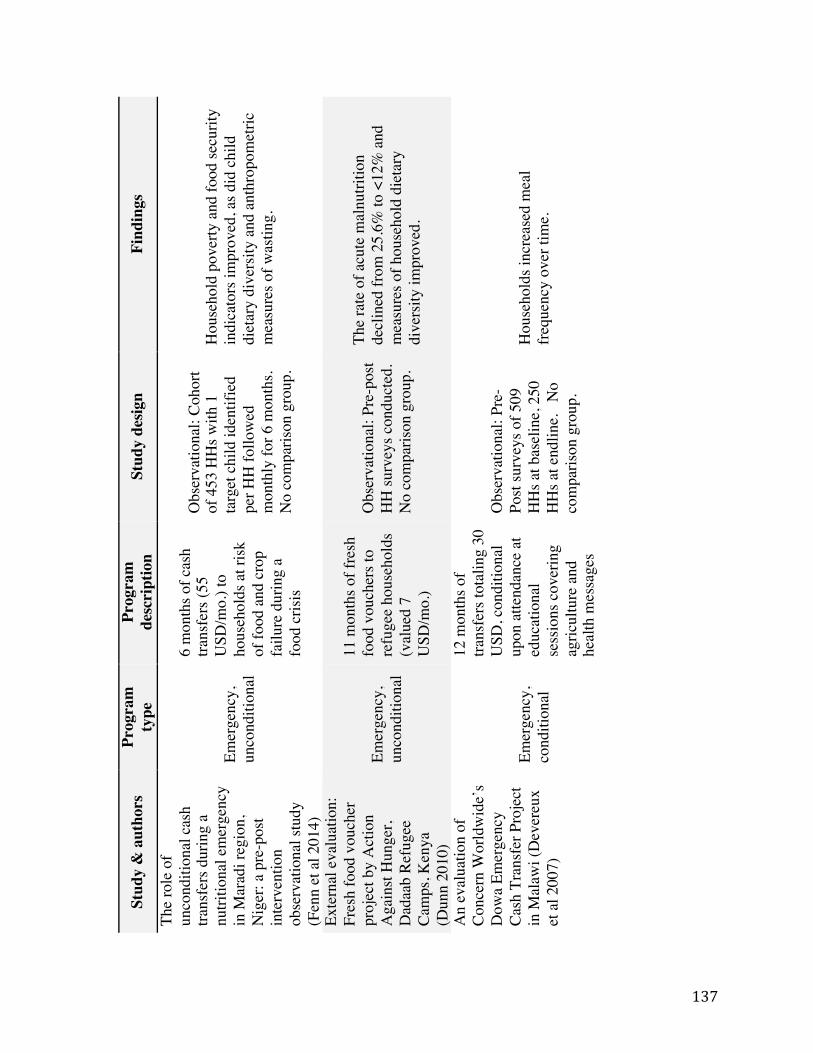
137
TABL
E A
1
Sum
mar
y of
find
ings
from
em
erge
ncy
and
shor
t-ter
m c
ash
trans
fer
prog
ram
eva
luat
ions
! !St
udy
& a
utho
rs
Prog
ram
ty
pe
Prog
ram
de
scri
ptio
n St
udy
desig
n Fi
ndin
gs
The
role
of
unco
nditi
onal
cas
h tra
nsfe
rs d
urin
g a
nutri
tiona
l em
erge
ncy
in M
arad
i reg
ion,
N
iger
: a p
re-p
ost
inte
rven
tion
obse
rvat
iona
l stu
dy
(Fen
n et
al 2
014)
Emer
genc
y,
unco
nditi
onal
6 m
onth
s of c
ash
trans
fers
(55
USD
/mo.
) to
hous
ehol
ds a
t risk
of
food
and
cro
p fa
ilure
dur
ing
a fo
od c
risis
Obs
erva
tiona
l: Co
hort
of 4
53 H
Hs w
ith 1
ta
rget
chi
ld id
entif
ied
per H
H fo
llow
ed
mon
thly
for 6
mon
ths.
No
com
paris
on g
roup
.
Hou
seho
ld p
over
ty a
nd fo
od se
curit
y in
dica
tors
impr
oved
, as d
id c
hild
di
etar
y di
vers
ity a
nd a
nthr
opom
etric
m
easu
res o
f was
ting.
Exte
rnal
eva
luat
ion:
Fr
esh
food
vou
cher
pr
ojec
t by
Act
ion
Aga
inst
Hun
ger,
Dad
aab
Refu
gee
Cam
ps, K
enya
(D
unn
2010
)
Emer
genc
y,
unco
nditi
onal
11 m
onth
s of f
resh
fo
od v
ouch
ers t
o re
fuge
e ho
useh
olds
(v
alue
d 7
USD
/mo.
)
Obs
erva
tiona
l: Pr
e-po
st H
H su
rvey
s con
duct
ed.
No
com
paris
on g
roup
.
The
rate
of a
cute
mal
nutri
tion
decl
ined
from
25.
6% to
<12
% a
nd
mea
sure
s of h
ouse
hold
die
tary
di
vers
ity im
prov
ed.
An
eval
uatio
n of
Co
ncer
n W
orld
wid
e’s
Dow
a Em
erge
ncy
Cash
Tra
nsfe
r Pro
ject
in
Mal
awi (
Dev
ereu
x et
al 2
007)
Emer
genc
y,
cond
ition
al
12 m
onth
s of
trans
fers
tota
ling
30
USD
, con
ditio
nal
upon
atte
ndan
ce a
t ed
ucat
iona
l se
ssio
ns c
over
ing
agric
ultu
re a
nd
heal
th m
essa
ges
Obs
erva
tiona
l: Pr
e-
Post
surv
eys o
f 509
H
Hs a
t bas
elin
e, 2
50
HH
s at e
ndlin
e.
No
com
paris
on g
roup
.
Hou
seho
lds i
ncre
ased
mea
l fre
quen
cy o
ver t
ime.
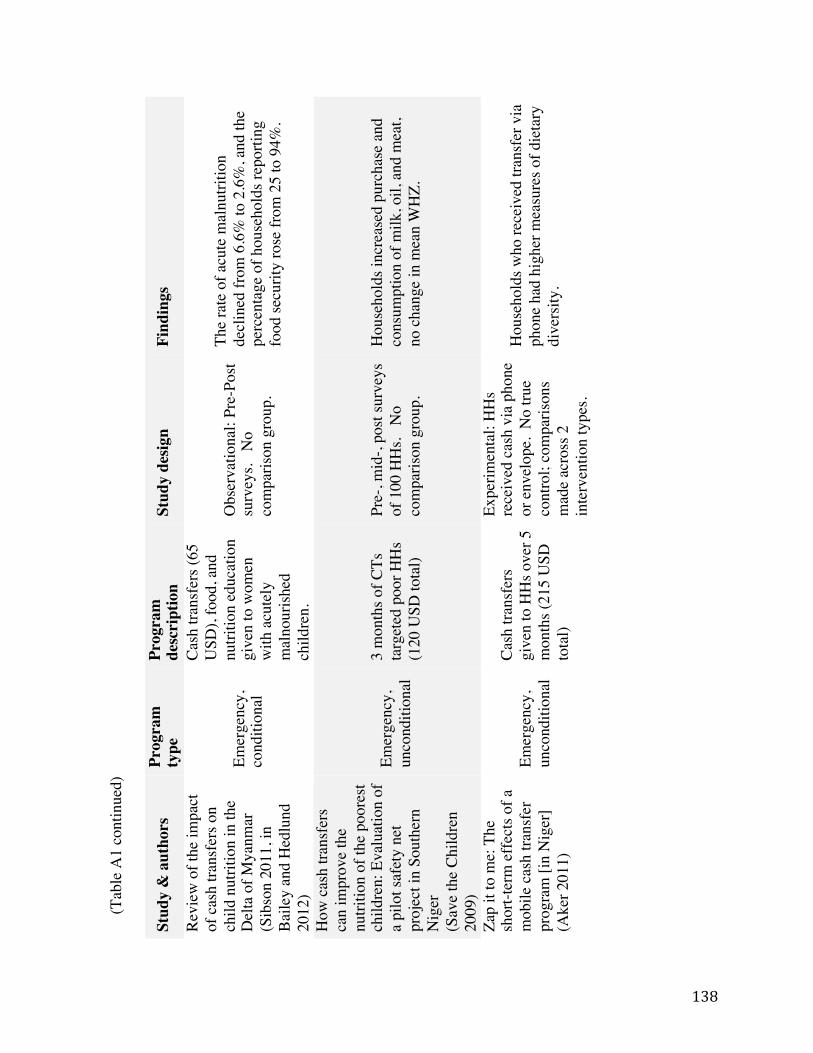
138
(Tab
le A
1 co
ntin
ued)
! !
Stud
y &
aut
hors
Pr
ogra
m
type
Pr
ogra
m
desc
ript
ion
Stud
y de
sign
Find
ings
Revi
ew o
f the
impa
ct
of c
ash
trans
fers
on
child
nut
ritio
n in
the
Del
ta o
f Mya
nmar
(S
ibso
n 20
11, i
n Ba
iley
and
Hed
lund
20
12)
Emer
genc
y,
cond
ition
al
Cash
tran
sfer
s (65
U
SD),
food
, and
nu
tritio
n ed
ucat
ion
give
n to
wom
en
with
acu
tely
m
alno
urish
ed
child
ren.
Obs
erva
tiona
l: Pr
e-Po
st su
rvey
s. N
o co
mpa
rison
gro
up.
The
rate
of a
cute
mal
nutri
tion
decl
ined
from
6.6
% to
2.6
%, a
nd th
e pe
rcen
tage
of h
ouse
hold
s rep
ortin
g fo
od se
curit
y ro
se fr
om 2
5 to
94%
.
How
cas
h tra
nsfe
rs
can
impr
ove
the
nutri
tion
of th
e po
ores
t ch
ildre
n: E
valu
atio
n of
a
pilo
t saf
ety
net
proj
ect i
n So
uthe
rn
Nig
er
(Sav
e th
e Ch
ildre
n 20
09)
Emer
genc
y,
unco
nditi
onal
3 m
onth
s of C
Ts
targ
eted
poo
r HH
s (1
20 U
SD to
tal)
Pre-
, mid
-, po
st su
rvey
s of
100
HH
s. N
o co
mpa
rison
gro
up.
Hou
seho
lds i
ncre
ased
pur
chas
e an
d co
nsum
ptio
n of
milk
, oil,
and
mea
t, no
cha
nge
in m
ean
WH
Z.
Zap
it to
me:
The
sh
ort-t
erm
effe
cts o
f a
mob
ile c
ash
trans
fer
prog
ram
[in
Nig
er]
(Ake
r 201
1)
Emer
genc
y,
unco
nditi
onal
Cash
tran
sfer
s gi
ven
to H
Hs o
ver 5
m
onth
s (21
5 U
SD
tota
l)
Expe
rimen
tal:
HH
s re
ceiv
ed c
ash
via
phon
e or
env
elop
e. N
o tru
e co
ntro
l; co
mpa
rison
s m
ade
acro
ss 2
in
terv
entio
n ty
pes.
Hou
seho
lds w
ho re
ceiv
ed tr
ansf
er v
ia
phon
e ha
d hi
gher
mea
sure
s of d
ieta
ry
dive
rsity
.
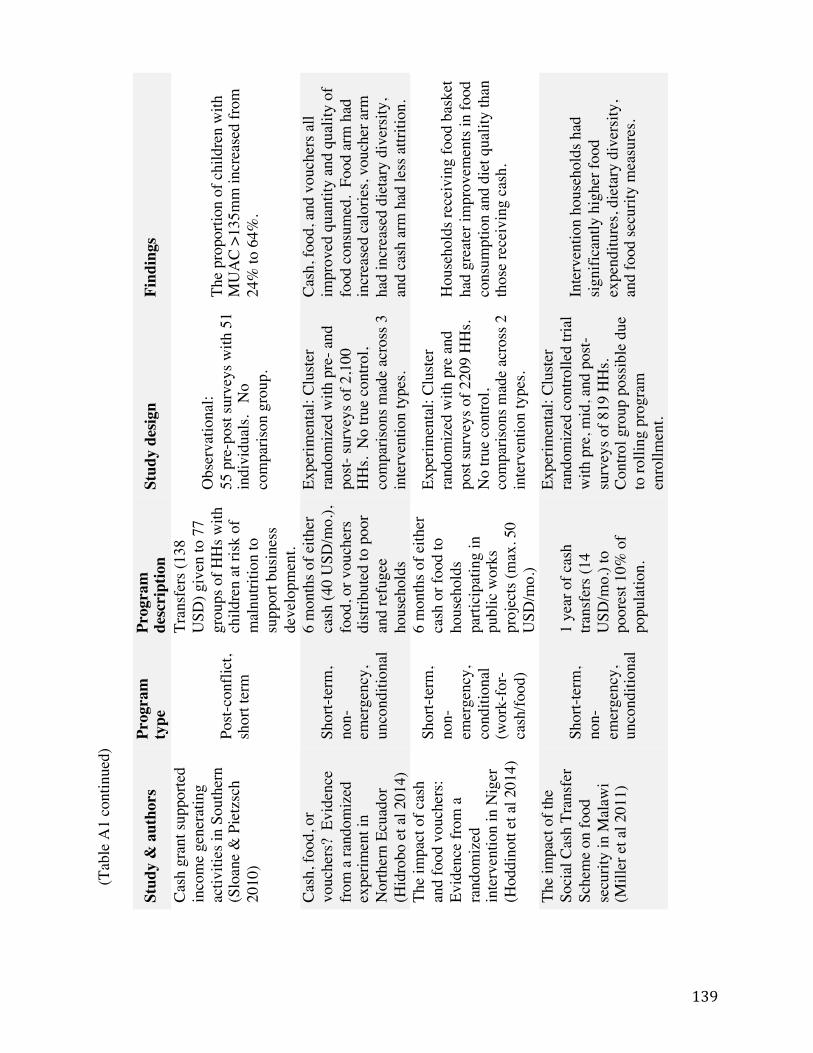
139
(Tab
le A
1 co
ntin
ued)
! !
Stud
y &
aut
hors
Pr
ogra
m
type
Pr
ogra
m
desc
ript
ion
Stud
y de
sign
Find
ings
Cash
gra
nt su
ppor
ted
inco
me
gene
ratin
g ac
tiviti
es in
Sou
ther
n
(Slo
ane
& P
ietz
sch
2010
) Po
st-co
nflic
t, sh
ort t
erm
Tran
sfer
s (13
8 U
SD) g
iven
to 7
7 gr
oups
of H
Hs w
ith
child
ren
at ri
sk o
f m
alnu
tritio
n to
su
ppor
t bus
ines
s de
velo
pmen
t.
Obs
erva
tiona
l: 55
pre
-pos
t sur
veys
with
51
indi
vidu
als.
No
com
paris
on g
roup
.
The
prop
ortio
n of
chi
ldre
n w
ith
MU
AC
>135
mm
incr
ease
d fro
m
24%
to 6
4%.
Cash
, foo
d, o
r vo
uche
rs?
Evi
denc
e fro
m a
rand
omiz
ed
expe
rimen
t in
Nor
ther
n Ec
uado
r (H
idro
bo e
t al 2
014)
Shor
t-ter
m,
non-
emer
genc
y,
unco
nditi
onal
6 m
onth
s of e
ither
ca
sh (4
0 U
SD/m
o.),
food
, or v
ouch
ers
distr
ibut
ed to
poo
r an
d re
fuge
e ho
useh
olds
Expe
rimen
tal:
Clus
ter
rand
omiz
ed w
ith p
re- a
nd
post-
surv
eys o
f 2,1
00
HH
s. N
o tru
e co
ntro
l, co
mpa
rison
s mad
e ac
ross
3
inte
rven
tion
type
s.
Cash
, foo
d, a
nd v
ouch
ers a
ll im
prov
ed q
uant
ity a
nd q
ualit
y of
fo
od c
onsu
med
. Fo
od a
rm h
ad
incr
ease
d ca
lorie
s, vo
uche
r arm
ha
d in
crea
sed
diet
ary
dive
rsity
, an
d ca
sh a
rm h
ad le
ss a
ttriti
on.
The
impa
ct o
f cas
h an
d fo
od v
ouch
ers:
Evid
ence
from
a
rand
omiz
ed
inte
rven
tion
in N
iger
(H
oddi
nott
et a
l 201
4)
Shor
t-ter
m,
non-
emer
genc
y,
cond
ition
al
(wor
k-fo
r-ca
sh/fo
od)
6 m
onth
s of e
ither
ca
sh o
r foo
d to
ho
useh
olds
pa
rtici
patin
g in
pu
blic
wor
ks
proj
ects
(max
. 50
USD
/mo.
)
Expe
rimen
tal:
Clus
ter
rand
omiz
ed w
ith p
re a
nd
post
surv
eys o
f 220
9 H
Hs.
N
o tru
e co
ntro
l, co
mpa
rison
s mad
e ac
ross
2
inte
rven
tion
type
s.
Hou
seho
lds r
ecei
ving
food
bas
ket
had
grea
ter i
mpr
ovem
ents
in fo
od
cons
umpt
ion
and
diet
qua
lity
than
th
ose
rece
ivin
g ca
sh.
The
impa
ct o
f the
So
cial
Cas
h Tr
ansf
er
Sche
me
on fo
od
secu
rity
in M
alaw
i (M
iller
et a
l 201
1)
Shor
t-ter
m,
non-
emer
genc
y,
unco
nditi
onal
1 ye
ar o
f cas
h tra
nsfe
rs (1
4 U
SD/m
o.) t
o po
ores
t 10%
of
popu
latio
n.
Expe
rimen
tal:
Clus
ter
rand
omiz
ed c
ontro
lled
trial
w
ith p
re, m
id, a
nd p
ost-
surv
eys o
f 819
HH
s. Co
ntro
l gro
up p
ossib
le d
ue
to ro
lling
pro
gram
en
rollm
ent.
Inte
rven
tion
hous
ehol
ds h
ad
signi
fican
tly h
ighe
r foo
d ex
pend
iture
s, di
etar
y di
vers
ity,
and
food
secu
rity
mea
sure
s.
140
TABLE A2. Summary of findings from studies of access to health services for children under five, emphasizing studies from Kenya
141
TABLE A2 Summary of findings from studies of access to health services for children under five, emphasizing studies from Kenya
Study title and authors
Country and condition
Study design Findings
Improving access to health care for malaria in Africa: a review of literature on what attracts patients. (Kizito et al 2012)
African continent/ Malaria
Review of 97 papers to identify provider characteristics attractive to people seeking malaria treatment in Africa. No comparison group.
-Low cost, proximity, provider-caregiver interactions, timeliness of services, and belief in curative power of treatment all indicative of treatment seeking.
Use of curative care for fever, acute respiratory illness, and diarrhea among children in rural DRC. (Dissertation excerpt- Kwilu 2010)
Democratic Republic of Congo/ Diarrhea
Descriptive cross-sectional analysis of World Bank household survey (n=5,860) . No comparison group.
-Lower cost of care was associated with increased odds of seeking treatment. -Hospital use was lowest among poorest households.
Determinants of coverage in community-based therapeutic care programmes: towards a joint quantitative and qualitative analysis. (Guerrero et al 2010)
DRC, Ethiopia, Malawi, Niger, and N&S Sudan/ SAM
Descriptive, retrospective cross-sectional analysis of qualitative and quantitative survey data (n=1,696). No comparison group.
-Multiple factors cited with poor coverage, including previous rejection, lack of awareness of condition, lack of trust in program, distance to program, and shame.
Barriers to prompt and effective malaria treatment among the poorest population in Kenya. (Chuma et al 2010)
Kenya/ Malaria
Descriptive cross-sectional survey of mothers (n=708), FGD (n=24), semi-structured interviews w/health workers (n=34), patient exit interviews (n=359). No comparison group.
- Affordability (treatment costs) and awareness (of seriousness of illness) were main barriers found via quantitative analysis. - Qualitative analysis revealed that acceptability (provide-patient relationship) and availability (facility hours) were also significant factors.
!
142
(Table A2 continued) Study title and authors
Country and condition
Study design Findings
Factors associated with utilization of community health workers in improving access to malaria treatment among children in Kenya. (Kisia et al 2013)
Kenya/ Malaria
Descriptive two-stage cross-sectional household survey (n=1,187 and 1,374) in 113 villages with community health workers (CHWs). No comparison group.
-Remote location was a barrier to clinic-based services. -Higher rates of prompt and effective treatment were observed when CHWs were the source of care sought, especially among poorest households in small villages.
Who is to blame? Perspectives of caregivers on barriers to accessing healthcare for under-fives in Butere District, Western Kenya. (Opwora et al 2011)
Kenya/ General services
Descriptive cross-sectional exit survey of hospital patients (n=397), FGDs in community (n=45). No comparison group.
-Lack of money for transport and fees, long waiting times, and past poor experiences were all cited as barriers to access. -Traditional healing sources sought prior to western sources.
Factors associated with appropriate diarrhea case management in hospitalized children under five in Nyanza Province, Kenya. (Masters thesis- Weaver 2010)
Kenya/ Diarrhea
Descriptive cross-sectional exit interviews with mothers (n=122). No comparison group.
-Fear that child will die, confidence in ability to prepare ORS, and advice from multiple people to use ORS all improved odds of ORS use.
Ecological and cultural barriers to treatment of childhood diarrhea in riverine areas of Ondo State, Nigeria. (Iun and Oke 2000).
Nigeria/ Diarrhea
Descriptive cross-sectional survey of mothers (n=308), in-depth interviews with key informants (n=42). No comparison group.
- Lack of awareness of ORS and lack of experience with ORS prevented use of ORS therapy. - Preferences for herbal remedies and the presence of drug peddlers contributed to under-use of ORS.
!
143
(Table A2 continued) !Study title and authors
Country and condition
Study design Findings
Health system weaknesses constrain access to PMTCT and maternal HIV services in South Africa: a qualitative enquiry. (Sprague et al 2011).
South Africa/ HIV
Descriptive cross-sectional study consisting of in-depth interviews with HIV-positive female patients (n=83), female caregivers of HIV-positive children (n=32), and key informants (n=38). No comparison group.
-Psychosocial concerns, including fear of positive test results, fear of partner’s response, and stigma cited as “individual” barriers to access. -Poor or judgmental attitudes of health workers led to testing refusals.
Access to antiretroviral therapy for adults and children with HIV infection in developing counties: Horizons Studies, 2002-2008. (Sarna et al 2010)
Global/ HIV
Review of ART studies from 11 programs in Asia and sub-Saharan Africa. No comparison group.
-Lack of awareness about where to access HIV testing and treatment services for children, stigma, and costs all cited as barriers to seeking care for child HIV.
If you build it, will they come? Kenya healthy start pediatric HIV study: a diagnostic study investigating barriers to HIV treatment and care among children. (Kiragu et al 2008).
Kenya/ HIV
Descriptive cross-sectional survey of 1,182 individuals within 15k of HIV treatment facilities, key informant interviews (n=97). No comparison group.
-Cost was the primary access barrier to pediatric treatment of HIV. -Misconceptions about HIV, fear, and the belief that children with HIV are “lost causes” also cited as substantial barriers.
!
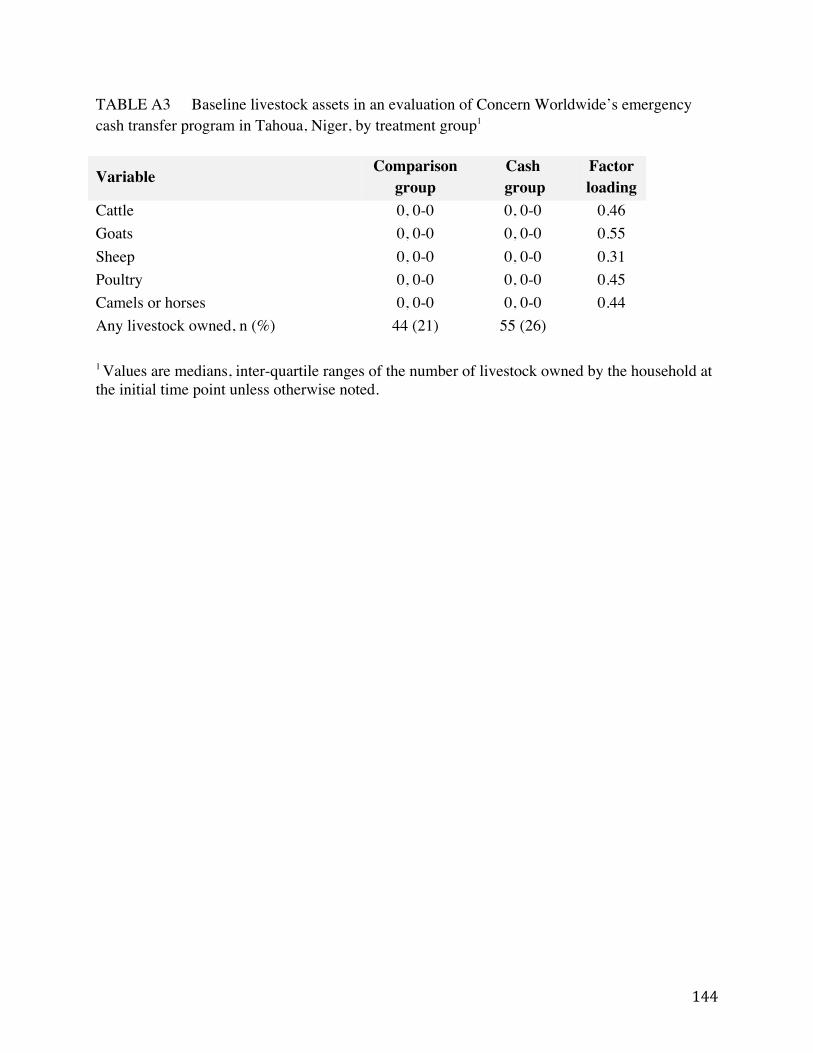
144
TABLE A3 Baseline livestock assets in an evaluation of Concern Worldwide’s emergency cash transfer program in Tahoua, Niger, by treatment group1
Variable Comparison group
Cash group
Factor loading
Cattle 0, 0-0 0, 0-0 0.46 Goats 0, 0-0 0, 0-0 0.55 Sheep 0, 0-0 0, 0-0 0.31 Poultry 0, 0-0 0, 0-0 0.45 Camels or horses 0, 0-0 0, 0-0 0.44 Any livestock owned, n (%) 44 (21) 55 (26) 1 Values are medians, inter-quartile ranges of the number of livestock owned by the household at the initial time point unless otherwise noted.
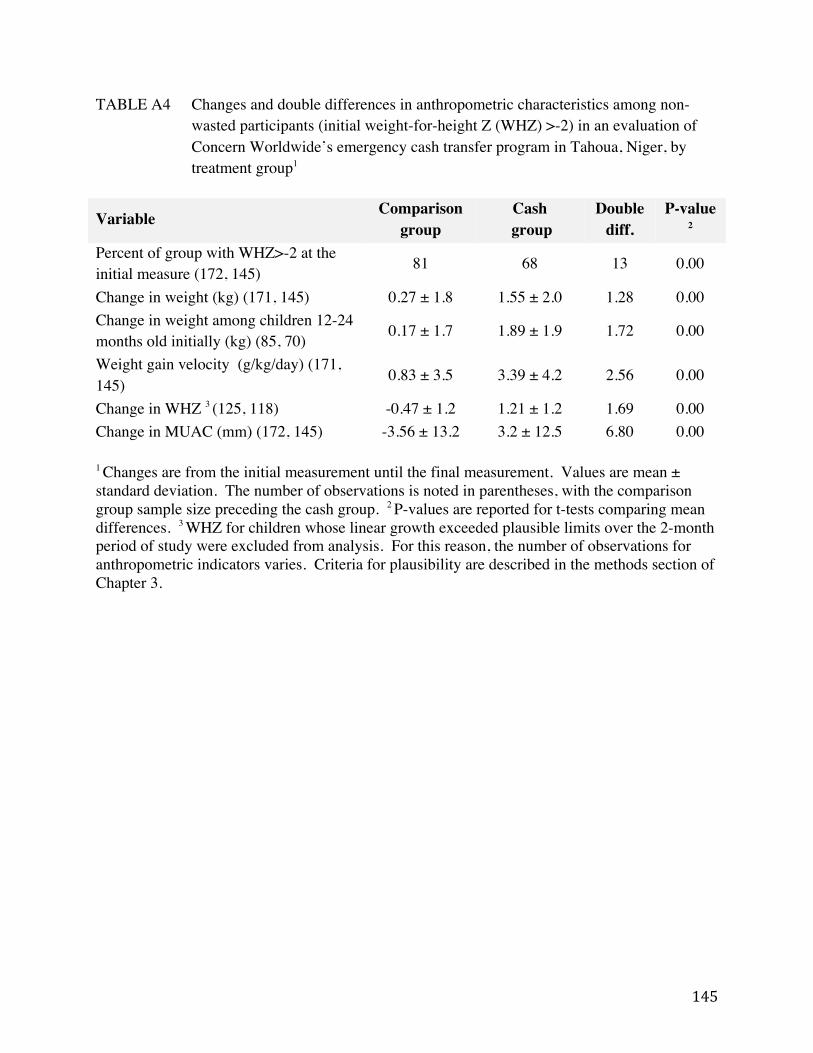
145
TABLE A4 Changes and double differences in anthropometric characteristics among non-wasted participants (initial weight-for-height Z (WHZ) >-2) in an evaluation of Concern Worldwide’s emergency cash transfer program in Tahoua, Niger, by treatment group1
Variable Comparison group
Cash group
Double diff.
P-value 2
Percent of group with WHZ>-2 at the initial measure (172, 145) 81 68 13 0.00
Change in weight (kg) (171, 145) 0.27 ± 1.8 1.55 ± 2.0 1.28 0.00 Change in weight among children 12-24 months old initially (kg) (85, 70) 0.17 ± 1.7 1.89 ± 1.9 1.72 0.00
Weight gain velocity (g/kg/day) (171, 145) 0.83 ± 3.5 3.39 ± 4.2 2.56 0.00
Change in WHZ 3 (125, 118) -0.47 ± 1.2 1.21 ± 1.2 1.69 0.00 Change in MUAC (mm) (172, 145) -3.56 ± 13.2 3.2 ± 12.5 6.80 0.00 1 Changes are from the initial measurement until the final measurement. Values are mean ± standard deviation. The number of observations is noted in parentheses, with the comparison group sample size preceding the cash group. 2 P-values are reported for t-tests comparing mean differences. 3 WHZ for children whose linear growth exceeded plausible limits over the 2-month period of study were excluded from analysis. For this reason, the number of observations for anthropometric indicators varies. Criteria for plausibility are described in the methods section of Chapter 3.
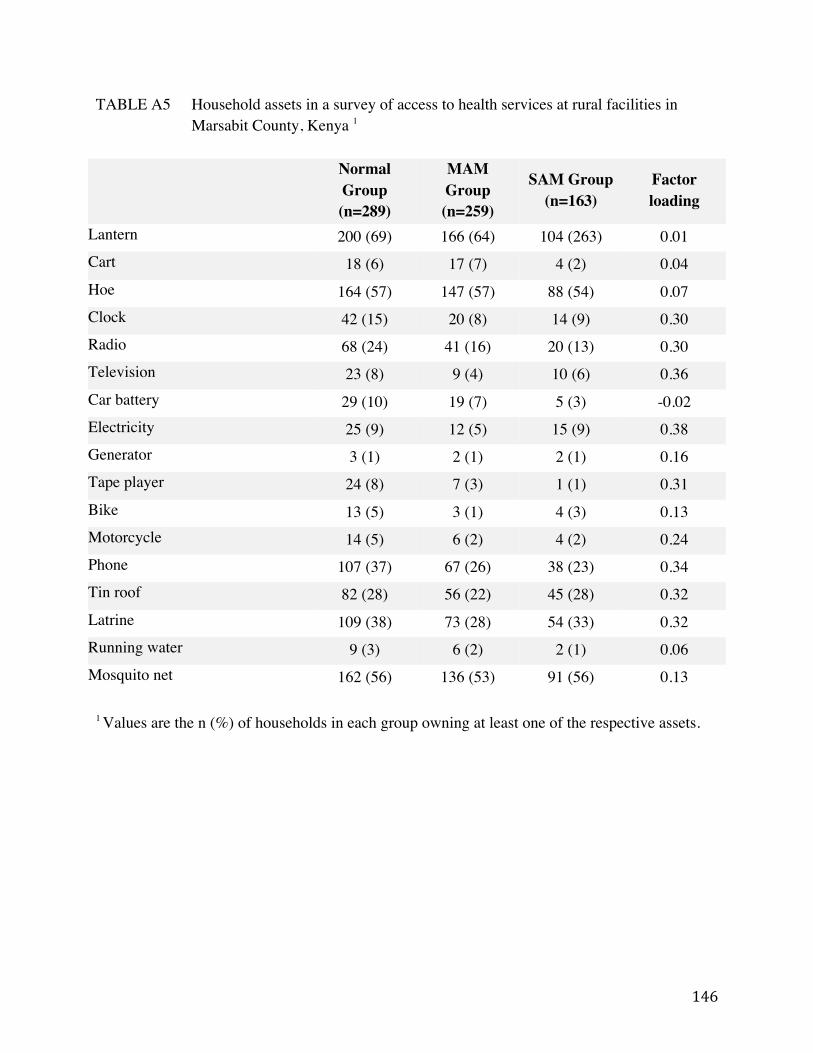
146
TABLE A5 Household assets in a survey of access to health services at rural facilities in Marsabit County, Kenya 1
Normal
Group (n=289)
MAM Group (n=259)
SAM Group (n=163)
Factor loading
Lantern 200 (69) 166 (64) 104 (263) 0.01 Cart 18 (6) 17 (7) 4 (2) 0.04 Hoe 164 (57) 147 (57) 88 (54) 0.07 Clock 42 (15) 20 (8) 14 (9) 0.30 Radio 68 (24) 41 (16) 20 (13) 0.30 Television 23 (8) 9 (4) 10 (6) 0.36 Car battery 29 (10) 19 (7) 5 (3) -0.02 Electricity 25 (9) 12 (5) 15 (9) 0.38 Generator 3 (1) 2 (1) 2 (1) 0.16 Tape player 24 (8) 7 (3) 1 (1) 0.31 Bike 13 (5) 3 (1) 4 (3) 0.13 Motorcycle 14 (5) 6 (2) 4 (2) 0.24 Phone 107 (37) 67 (26) 38 (23) 0.34 Tin roof 82 (28) 56 (22) 45 (28) 0.32 Latrine 109 (38) 73 (28) 54 (33) 0.32 Running water 9 (3) 6 (2) 2 (1) 0.06 Mosquito net 162 (56) 136 (53) 91 (56) 0.13 1 Values are the n (%) of households in each group owning at least one of the respective assets.
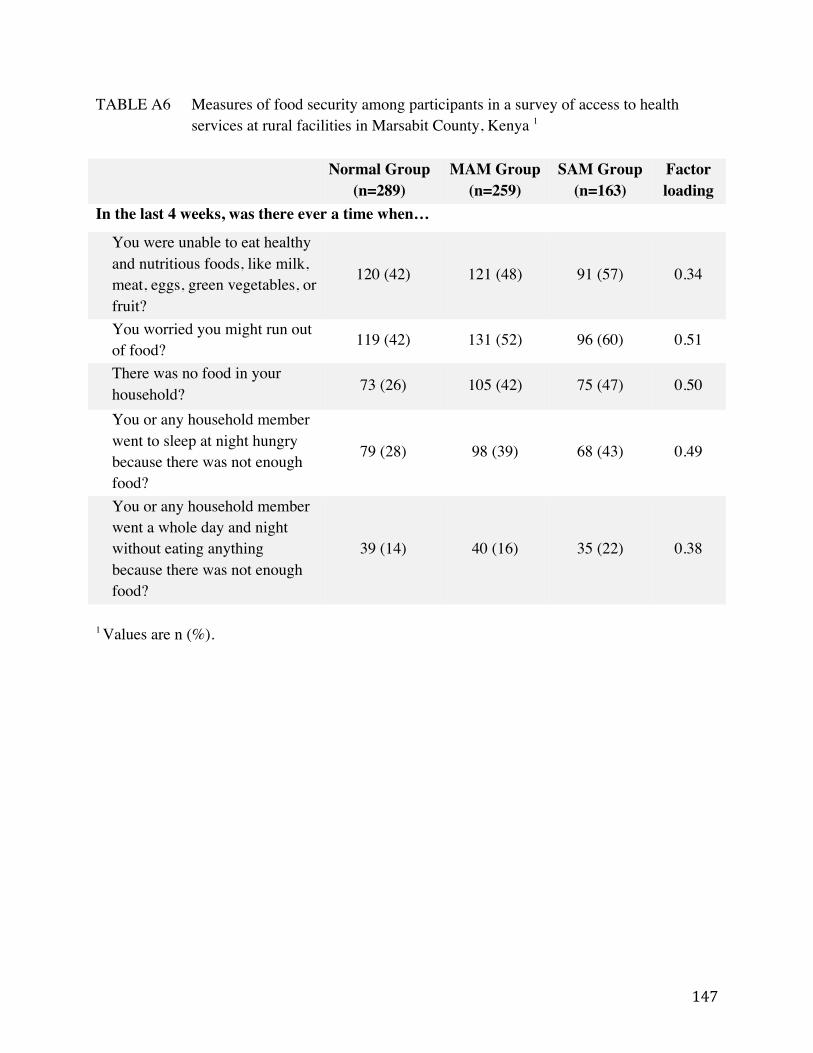
147
TABLE A6 Measures of food security among participants in a survey of access to health services at rural facilities in Marsabit County, Kenya 1
Normal Group (n=289)
MAM Group (n=259)
SAM Group (n=163)
Factor loading
In the last 4 weeks, was there ever a time when…
You were unable to eat healthy and nutritious foods, like milk, meat, eggs, green vegetables, or fruit?
120 (42) 121 (48) 91 (57) 0.34
You worried you might run out of food? 119 (42) 131 (52) 96 (60) 0.51
There was no food in your household? 73 (26) 105 (42) 75 (47) 0.50
You or any household member went to sleep at night hungry because there was not enough food?
79 (28) 98 (39) 68 (43) 0.49
You or any household member went a whole day and night without eating anything because there was not enough food?
39 (14) 40 (16) 35 (22) 0.38
1 Values are n (%).

148
APPENDIX B
149
SUPPLEMENT B1 Survey instrument used for longitudinal study in Maradi, Niger (Chapter 2)

150
MMS STUDY - HOUSEHOLD QUESTIONNAIRE BASELINE
(COMPLETE ONE QUESTIONNAIRE PER CARER OF [NAME] IN HH)
FILL IN AS MUCH AS POSSIBLE BEFORE VISITING HH Date : _____/_______/___________DD/MM/YYYY
[DATE]
Team number: [_____] [TNUM]
Commune NAME: _____________________________________________
[COMNAM]
Commune number: [_____]
[COMNUM]
Village NAME: _____________________________________________
[CLNAM] Village Number: [_____] [CLNUM]
Head of HH name _____________________________________________
[HHNAM] HH number: [______] [HHNUM]
CHILD ID# [_________]
Contact Number:
How many years has this family lived in this village? [_______]
Interviewed by:
Data entry by:_______________________ Data checked / double entered by:___________________
Who is answering the questions? CODE BOX 1 [_______]
SECTION 1: HOUSEHOLD DEMOGRAPHY RECORD INFORMATION FOR EACH FAMILY MEMBER. FIRST THE HEAD OF THE HOUSEHOLD FOLLOWED BY PRIMARY CARER AND THEN THE SELECTED CHILD THEN THE OTHER FAMILY MEMBERS IN ORDER OF AGE - ONLY INCLUDE PEOPLE WHO ARE CURRENT HH MEMBERS – NOT VISITORS OR FAMILY MEMBERS LIVING AWAY PERMANENTLY. ALSO RECORD DETAILS FOR ANYONE WHO DIED IN THE HOUSEHOLD IN THE LAST 3 MONTHS AND FOLLOWING MONTHS 1 A B C D E F G
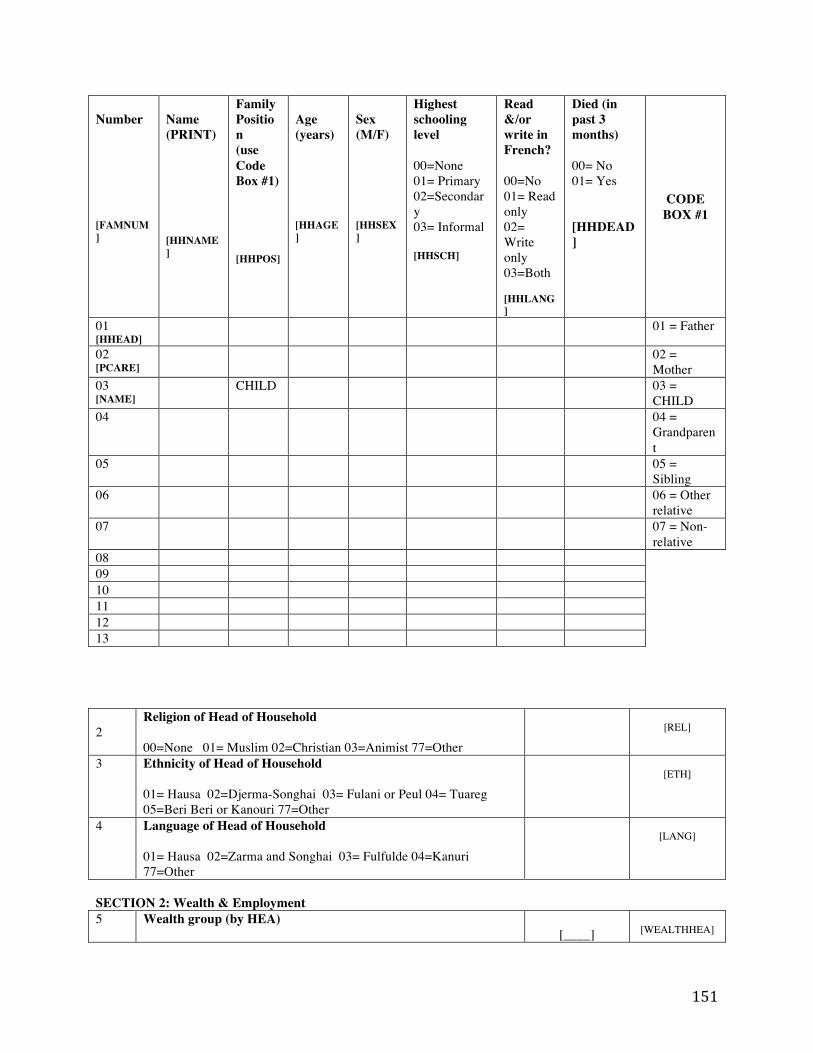
151
Number [FAMNUM]
Name (PRINT) [HHNAME]
Family Position (use Code Box #1) [HHPOS]
Age (years) [HHAGE]
Sex (M/F) [HHSEX]
Highest schooling level 00=None 01= Primary 02=Secondary 03= Informal [HHSCH]
Read &/or write in French? 00=No 01= Read only 02= Write only 03=Both [HHLANG]
Died (in past 3 months) 00= No 01= Yes [HHDEAD]
CODE BOX #1
01 [HHEAD]
01 = Father
02 [PCARE]
02 = Mother
03 [NAME]
CHILD 03 = CHILD
04 04 = Grandparent
05 05 = Sibling
06 06 = Other relative
07 07 = Non-relative
08 09 10 11 12 13 2
Religion of Head of Household 00=None 01= Muslim 02=Christian 03=Animist 77=Other
[REL]
3 Ethnicity of Head of Household 01= Hausa 02=Djerma-Songhai 03= Fulani or Peul 04= Tuareg 05=Beri Beri or Kanouri 77=Other
[ETH]
4 Language of Head of Household 01= Hausa 02=Zarma and Songhai 03= Fulfulde 04=Kanuri 77=Other
[LANG]
SECTION 2: Wealth & Employment 5 Wealth group (by HEA)
[____]
[WEALTHHEA]
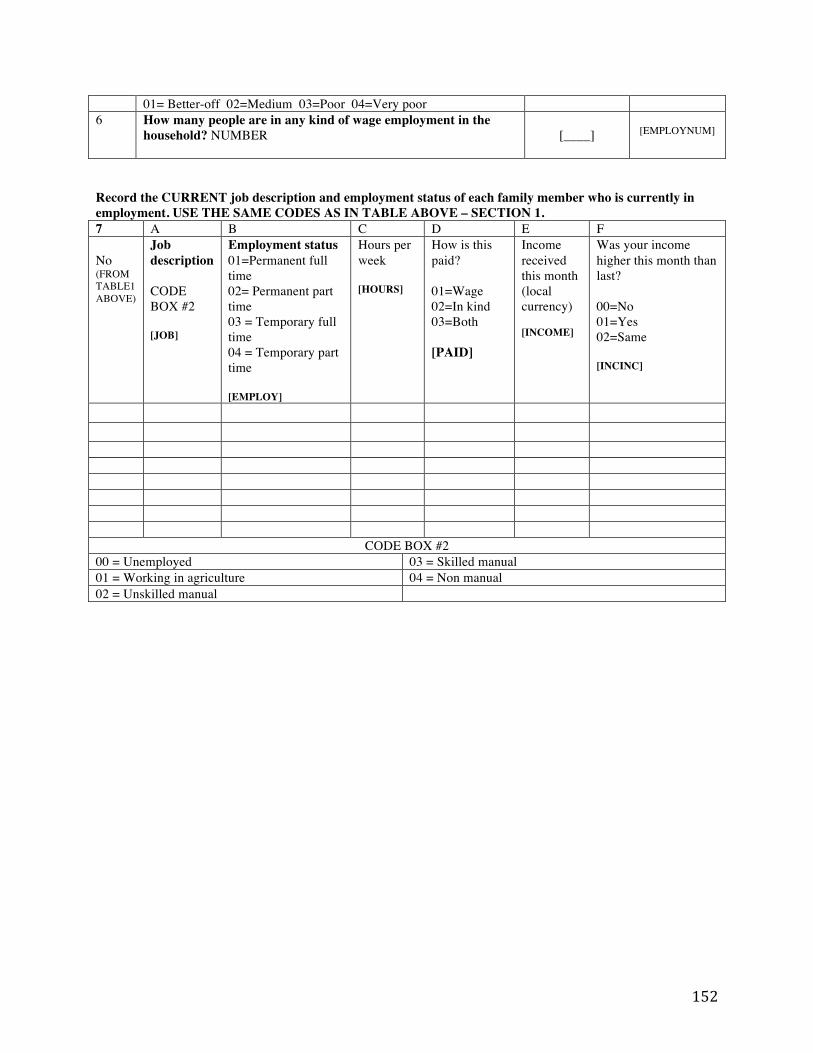
152
01= Better-off 02=Medium 03=Poor 04=Very poor 6 How many people are in any kind of wage employment in the
household? NUMBER
[____]
[EMPLOYNUM]
Record the CURRENT job description and employment status of each family member who is currently in employment. USE THE SAME CODES AS IN TABLE ABOVE – SECTION 1. 7 A B C D E F No (FROM TABLE1 ABOVE)
Job description CODE BOX #2 [JOB]
Employment status 01=Permanent full time 02= Permanent part time 03 = Temporary full time 04 = Temporary part time [EMPLOY]
Hours per week [HOURS]
How is this paid? 01=Wage 02=In kind 03=Both [PAID]
Income received this month (local currency) [INCOME]
Was your income higher this month than last? 00=No 01=Yes 02=Same [INCINC]
CODE BOX #2 00 = Unemployed 03 = Skilled manual 01 = Working in agriculture 04 = Non manual 02 = Unskilled manual
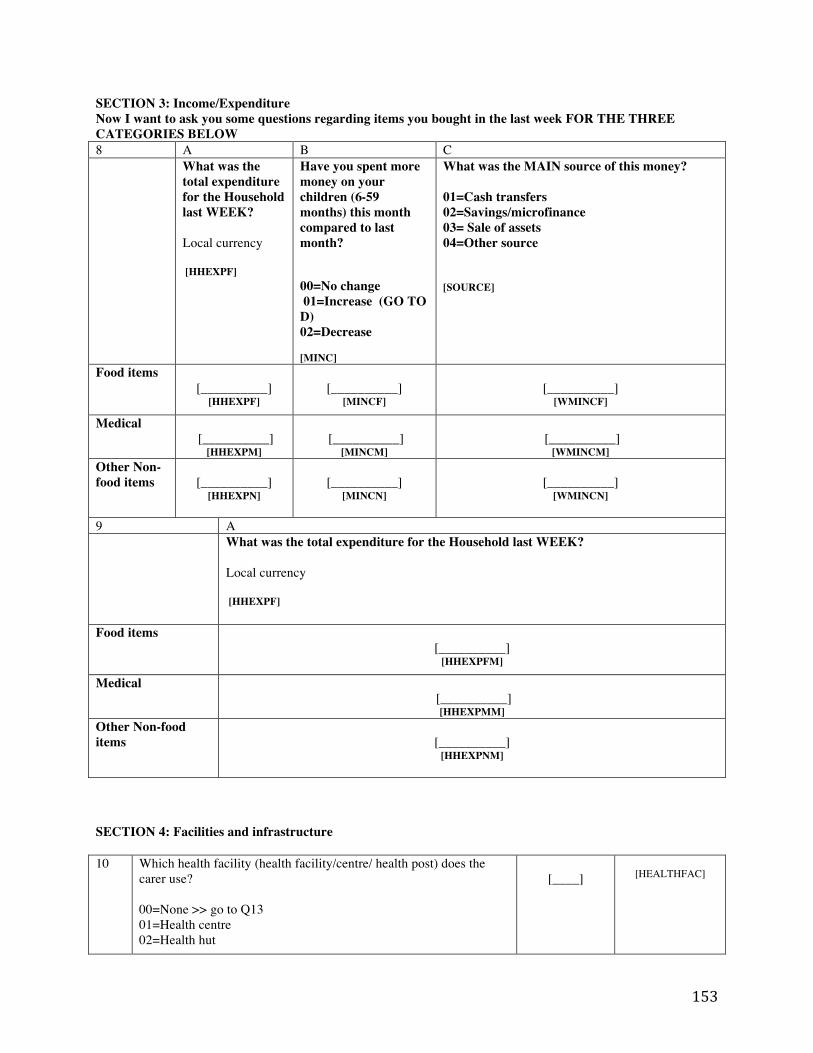
153
SECTION 3: Income/Expenditure Now I want to ask you some questions regarding items you bought in the last week FOR THE THREE CATEGORIES BELOW 8 A B C
What was the total expenditure for the Household last WEEK? Local currency [HHEXPF]
Have you spent more money on your children (6-59 months) this month compared to last month? 00=No change 01=Increase (GO TO D) 02=Decrease [MINC]
What was the MAIN source of this money? 01=Cash transfers 02=Savings/microfinance 03= Sale of assets 04=Other source [SOURCE]
Food items [__________]
[HHEXPF]
[__________]
[MINCF]
[__________]
[WMINCF]
Medical [__________]
[HHEXPM]
[__________]
[MINCM]
[__________]
[WMINCM] Other Non-food items
[__________]
[HHEXPN]
[__________]
[MINCN]
[__________]
[WMINCN]
9 A
What was the total expenditure for the Household last WEEK? Local currency [HHEXPF]
Food items [__________]
[HHEXPFM]
Medical [__________]
[HHEXPMM] Other Non-food items
[__________]
[HHEXPNM]
SECTION 4: Facilities and infrastructure 10 Which health facility (health facility/centre/ health post) does the
carer use? 00=None >> go to Q13 01=Health centre 02=Health hut
[____]
[HEALTHFAC]
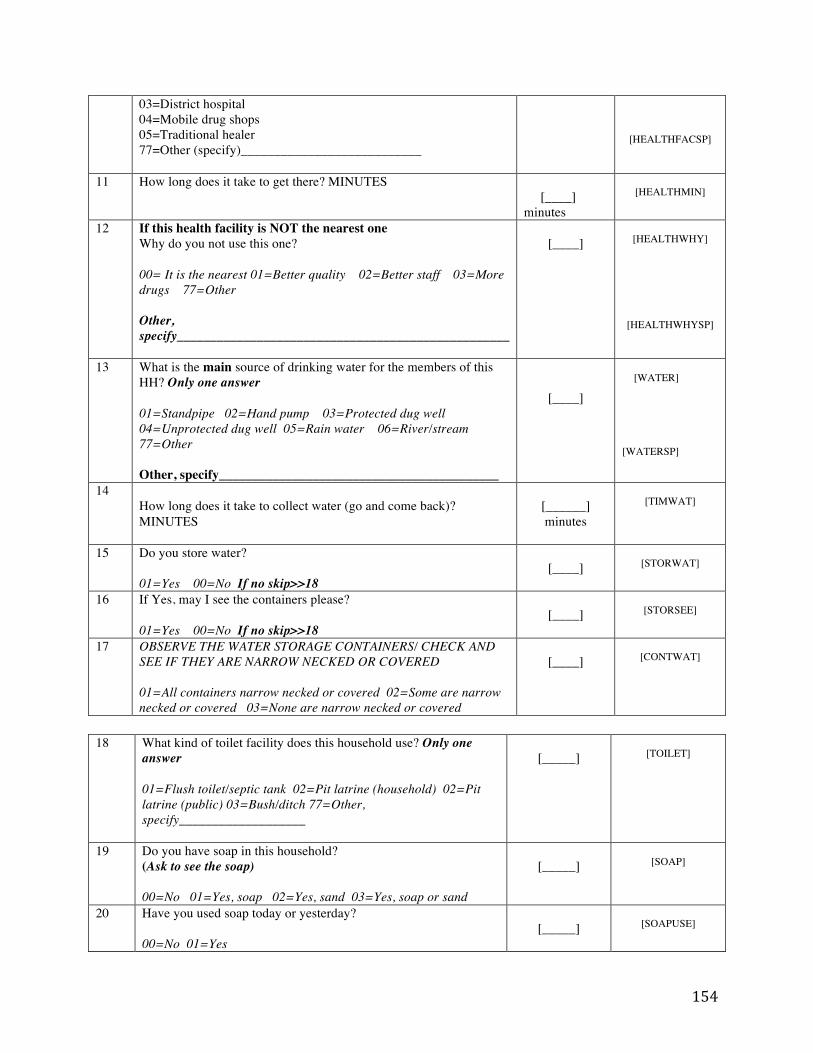
154
03=District hospital 04=Mobile drug shops 05=Traditional healer 77=Other (specify)___________________________
[HEALTHFACSP]
11 How long does it take to get there? MINUTES
[____] minutes
[HEALTHMIN]
12 If this health facility is NOT the nearest one Why do you not use this one? 00= It is the nearest 01=Better quality 02=Better staff 03=More drugs 77=Other Other, specify__________________________________________________
[____]
[HEALTHWHY]
[HEALTHWHYSP]
13 What is the main source of drinking water for the members of this HH? Only one answer 01=Standpipe 02=Hand pump 03=Protected dug well 04=Unprotected dug well 05=Rain water 06=River/stream 77=Other Other, specify__________________________________________
[____]
[WATER]
[WATERSP]
14 How long does it take to collect water (go and come back)? MINUTES
[______] minutes
[TIMWAT]
15 Do you store water? 01=Yes 00=No If no skip>>18
[____]
[STORWAT]
16 If Yes, may I see the containers please? 01=Yes 00=No If no skip>>18
[____]
[STORSEE]
17 OBSERVE THE WATER STORAGE CONTAINERS/ CHECK AND SEE IF THEY ARE NARROW NECKED OR COVERED 01=All containers narrow necked or covered 02=Some are narrow necked or covered 03=None are narrow necked or covered
[____]
[CONTWAT]
18 What kind of toilet facility does this household use? Only one
answer 01=Flush toilet/septic tank 02=Pit latrine (household) 02=Pit latrine (public) 03=Bush/ditch 77=Other, specify___________________
[_____]
[TOILET]
19 Do you have soap in this household? (Ask to see the soap) 00=No 01=Yes, soap 02=Yes, sand 03=Yes, soap or sand
[_____]
[SOAP]
20 Have you used soap today or yesterday? 00=No 01=Yes
[_____]
[SOAPUSE]
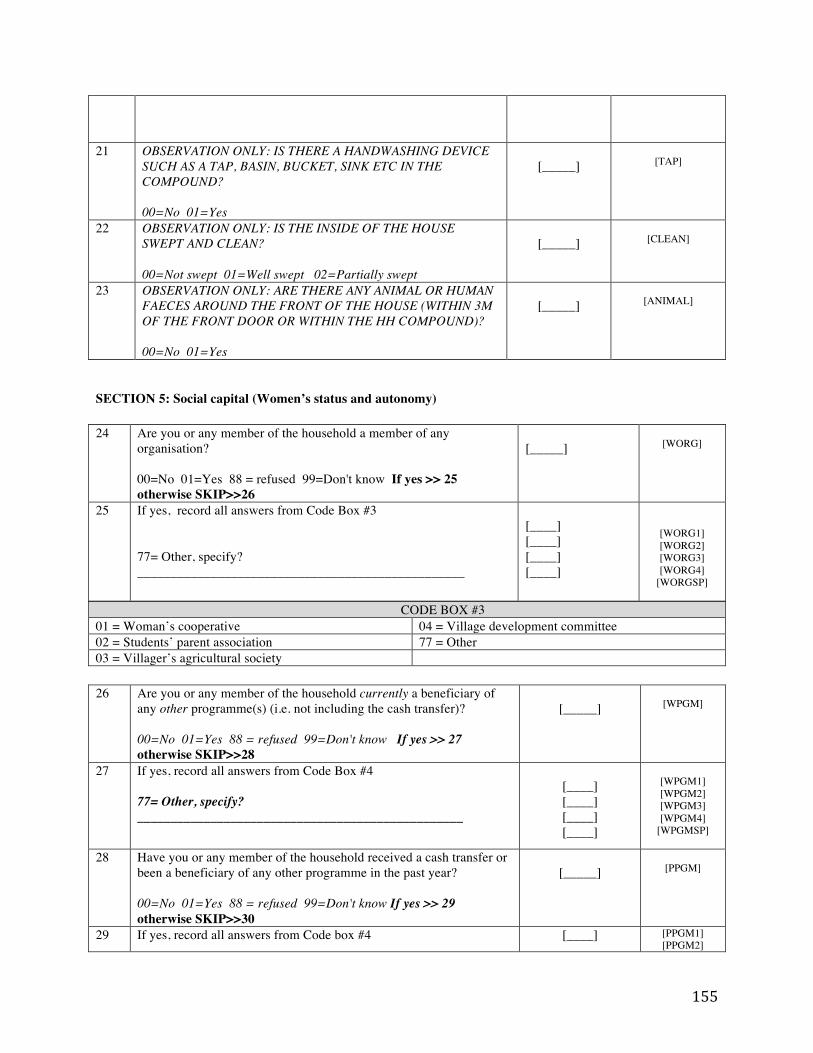
155
21 OBSERVATION ONLY: IS THERE A HANDWASHING DEVICE SUCH AS A TAP, BASIN, BUCKET, SINK ETC IN THE COMPOUND? 00=No 01=Yes
[_____]
[TAP]
22 OBSERVATION ONLY: IS THE INSIDE OF THE HOUSE SWEPT AND CLEAN? 00=Not swept 01=Well swept 02=Partially swept
[_____]
[CLEAN]
23 OBSERVATION ONLY: ARE THERE ANY ANIMAL OR HUMAN FAECES AROUND THE FRONT OF THE HOUSE (WITHIN 3M OF THE FRONT DOOR OR WITHIN THE HH COMPOUND)? 00=No 01=Yes
[_____]
[ANIMAL]
SECTION 5: Social capital (Women’s status and autonomy) 24 Are you or any member of the household a member of any
organisation? 00=No 01=Yes 88 = refused 99=Don't know If yes >> 25 otherwise SKIP>>26
[_____]
[WORG]
25 If yes, record all answers from Code Box #3 77= Other, specify? _________________________________________________
[____] [____] [____] [____]
[WORG1] [WORG2] [WORG3] [WORG4]
[WORGSP]
CODE BOX #3 01 = Woman’s cooperative 04 = Village development committee 02 = Students’ parent association 77 = Other 03 = Villager’s agricultural society 26 Are you or any member of the household currently a beneficiary of
any other programme(s) (i.e. not including the cash transfer)? 00=No 01=Yes 88 = refused 99=Don't know If yes >> 27 otherwise SKIP>>28
[_____]
[WPGM]
27 If yes, record all answers from Code Box #4 77= Other, specify? _________________________________________________
[____] [____] [____] [____]
[WPGM1] [WPGM2] [WPGM3] [WPGM4]
[WPGMSP]
28 Have you or any member of the household received a cash transfer or been a beneficiary of any other programme in the past year? 00=No 01=Yes 88 = refused 99=Don't know If yes >> 29 otherwise SKIP>>30
[_____]
[PPGM]
29 If yes, record all answers from Code box #4 [____] [PPGM1] [PPGM2]
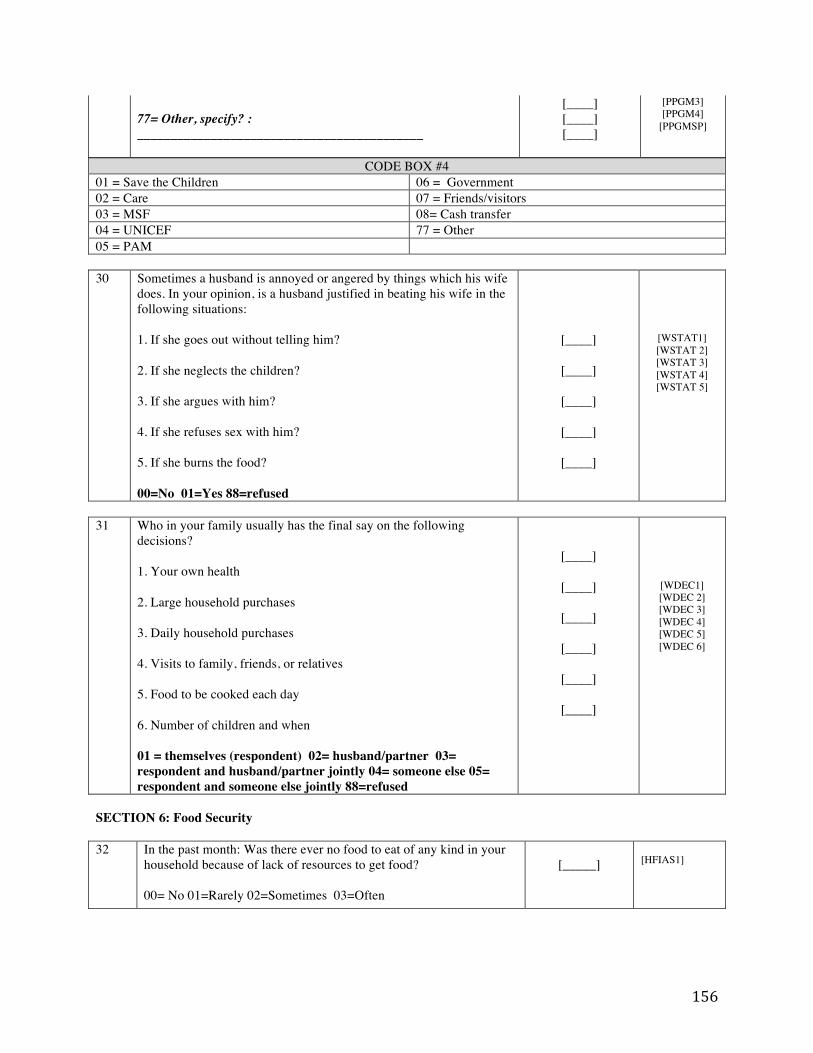
156
77= Other, specify? : ___________________________________________
[____] [____] [____]
[PPGM3] [PPGM4]
[PPGMSP]
CODE BOX #4 01 = Save the Children 06 = Government 02 = Care 07 = Friends/visitors 03 = MSF 08= Cash transfer 04 = UNICEF 77 = Other 05 = PAM 30 Sometimes a husband is annoyed or angered by things which his wife
does. In your opinion, is a husband justified in beating his wife in the following situations: 1. If she goes out without telling him? 2. If she neglects the children? 3. If she argues with him? 4. If she refuses sex with him? 5. If she burns the food? 00=No 01=Yes 88=refused
[____]
[____]
[____]
[____]
[____]
[WSTAT1] [WSTAT 2] [WSTAT 3] [WSTAT 4] [WSTAT 5]
31 Who in your family usually has the final say on the following
decisions? 1. Your own health 2. Large household purchases 3. Daily household purchases 4. Visits to family, friends, or relatives 5. Food to be cooked each day 6. Number of children and when 01 = themselves (respondent) 02= husband/partner 03= respondent and husband/partner jointly 04= someone else 05= respondent and someone else jointly 88=refused
[____]
[____]
[____]
[____]
[____]
[____]
[WDEC1] [WDEC 2] [WDEC 3] [WDEC 4] [WDEC 5] [WDEC 6]
SECTION 6: Food Security 32 In the past month: Was there ever no food to eat of any kind in your
household because of lack of resources to get food? 00= No 01=Rarely 02=Sometimes 03=Often
[_____]
[HFIAS1]
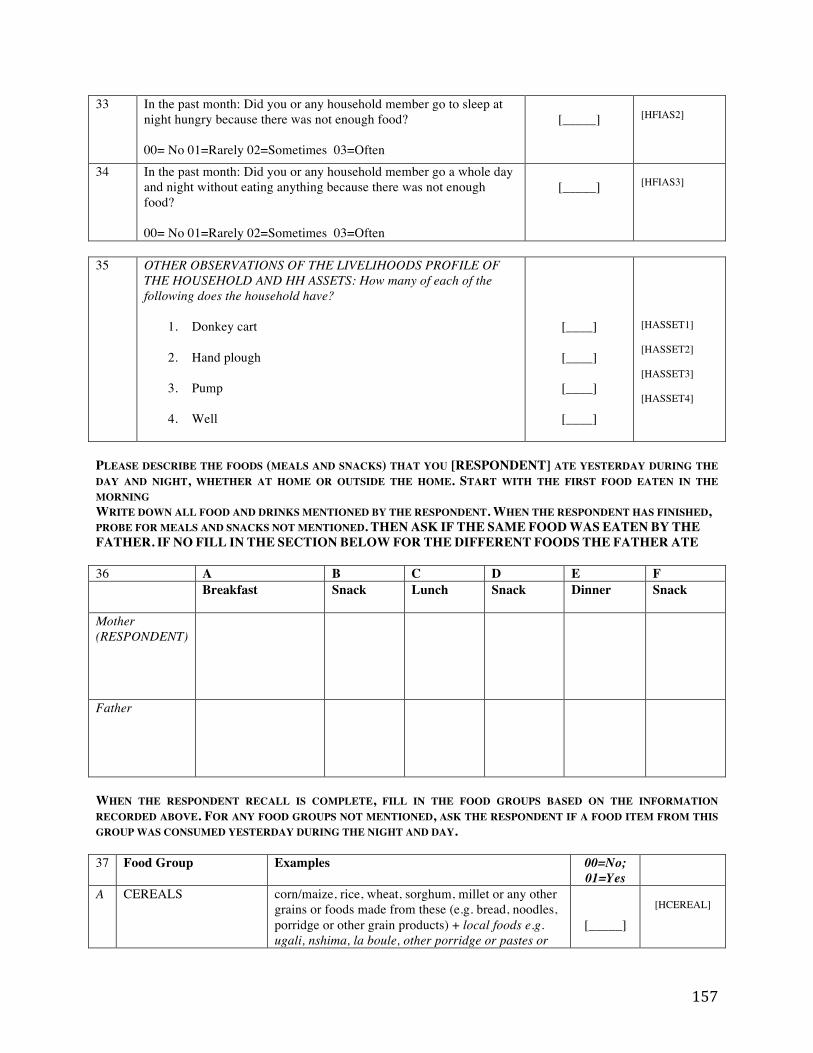
157
33 In the past month: Did you or any household member go to sleep at night hungry because there was not enough food? 00= No 01=Rarely 02=Sometimes 03=Often
[_____]
[HFIAS2]
34 In the past month: Did you or any household member go a whole day and night without eating anything because there was not enough food? 00= No 01=Rarely 02=Sometimes 03=Often
[_____]
[HFIAS3]
35 OTHER OBSERVATIONS OF THE LIVELIHOODS PROFILE OF
THE HOUSEHOLD AND HH ASSETS: How many of each of the following does the household have?
1. Donkey cart
2. Hand plough
3. Pump
4. Well
[____]
[____]
[____]
[____]
[HASSET1] [HASSET2] [HASSET3] [HASSET4]
PLEASE DESCRIBE THE FOODS (MEALS AND SNACKS) THAT YOU [RESPONDENT] ATE YESTERDAY DURING THE DAY AND NIGHT, WHETHER AT HOME OR OUTSIDE THE HOME. START WITH THE FIRST FOOD EATEN IN THE MORNING WRITE DOWN ALL FOOD AND DRINKS MENTIONED BY THE RESPONDENT. WHEN THE RESPONDENT HAS FINISHED, PROBE FOR MEALS AND SNACKS NOT MENTIONED. THEN ASK IF THE SAME FOOD WAS EATEN BY THE FATHER. IF NO FILL IN THE SECTION BELOW FOR THE DIFFERENT FOODS THE FATHER ATE 36 A B C D E F Breakfast Snack Lunch
Snack Dinner Snack
Mother (RESPONDENT)
Father
WHEN THE RESPONDENT RECALL IS COMPLETE, FILL IN THE FOOD GROUPS BASED ON THE INFORMATION RECORDED ABOVE. FOR ANY FOOD GROUPS NOT MENTIONED, ASK THE RESPONDENT IF A FOOD ITEM FROM THIS GROUP WAS CONSUMED YESTERDAY DURING THE NIGHT AND DAY. 37 Food Group Examples 00=No;
01=Yes
A CEREALS corn/maize, rice, wheat, sorghum, millet or any other grains or foods made from these (e.g. bread, noodles, porridge or other grain products) + local foods e.g. ugali, nshima, la boule, other porridge or pastes or
[_____]
[HCEREAL]
158
other locally available grains B VITAMIN A RICH
VEGETABLES AND TUBERS
carrots, squash, or sweet potatoes that are orange inside + other locally available vitamin-A rich vegetables (e.g. red sweet pepper)
[_____]
[HVITAVEG]
C WHITE TUBERS AND ROOTS
white potatoes, white yams, white cassava, or other foods made from roots (e.g. garin rojo) [_____]
[HTUBER]
D DARK GREEN LEAFY VEGETABLES
dark green/leafy vegetables, including wild ones + locally available vitamin-A rich leaves e.g. amaranth, cassava leaves, spinach, moringa etc., baobab
[_____]
[HDARKGN]
E OTHER VEGETABLES tomato, onion, eggplant, cabbage, including wild vegetables, okra
[_____]
[HOTHVEG]
F VITAMIN A RICH FRUITS
ripe mangoes, ripe papaya, + other locally available vitamin A-rich fruits
[_____]
[HVITAFRU]
G OTHER FRUITS other fruits, bananas, orange, pineapple, including wild fruits
[_____]
[HOTHFRU]
H ORGAN MEAT (IRONRICH)
liver, kidney, heart or other organ meats or blood-based foods [_____]
[HIRONMEAT]
I FLESH MEATS beef, lamb, goat, wild game, chicken, duck, guinea hen, guinea fowl, or other birds
[_____]
[HFLESH]
J EGGS chicken, duck, guinea hen or any other egg [_____]
[HEGGS]
K FISH fresh or dried fish [_____]
[HFISH]
L LEGUMES, NUTS AND SEEDS
beans, peas, lentils, ground nuts or other nuts, seeds or foods made from these
[_____]
[HLEGUMES]
M MILK AND MILK PRODUCTS
milk, cheese, yogurt or other milk products, powdered milk
[_____]
[HMILK]
N OILS AND FATS oil, fats, butter or margarine added to food or used for cooking
[_____]
[HOIL]
O SWEETS sugar, honey, sweetened soda or juice, sugary foods such as chocolates, candies, biscuits and cakes
[_____]
[HSWEET]
P SPICES, CONDIMENTS, BEVERAGES
Spices (black pepper, salt), condiments, coffee, tea, alcoholic beverages OR local examples [_____]
[HSPICE]
SECTION 7: Mother’s health 40 In the past month: Have you been suffering from any illness that has
caused you to rest more than usual? 00= No 01= Yes, but not too bad 02=Yes, much more
[_____]
[WHEALTH]
PLEASE ANSWER YES OR NO TO THE FOLLOWING QUESTIONS – CIRCLE YES OR NO 41
38 Did you or anyone in your household eat anything (meal or snack) OUTSIDE of the home yesterday? 00= No 01=Yes
[_____]
[HCONOUT]
39 During mealtime who in the family gets to eat first? 01= Father/males 02=Mother/females 03=Children 04=All adults first 05=Children first 06=Eat together
[_____]
[HHFDDIST]
159
1 Do you often have headaches?
YES NO
2 Is your appetite poor?
YES NO
3 Do you sleep badly?
YES NO
4 Are you easily frightened?
YES NO
5 Do your hands shake? YES NO
6 Do you feel nervous, tense or worried? YES NO
7 Is your digestion poor? YES NO
8 Do you have trouble thinking clearly? YES NO
9 Do you feel unhappy? YES NO
10 Do you cry more than usual? YES NO
11 Do you find it difficult to enjoy your daily activities? YES NO
12 Do you find it difficult to make decisions? YES NO
13 Do you find it difficult to carry out your daily work/chores properly? YES NO
14 Are you unable to play a useful part in life? YES NO
15 Have you lost interest in things? YES NO
16 Has the thought of ending your life been on your mind? YES NO
17 Do you feel tired all the time? YES NO
18 Do you have uncomfortable feelings in your stomach? YES NO
19 When you start to work do you get tired quickly?
YES NO
SCORE [ ] [SDQ20] SECTION 8: Child Protection and Education 42
Are there any children who have left the household since September 2011? 00=No 01=Yes 99=Don’t know If yes >> 43 otherwise SKIP>>45
[ ]
[CHLEAVE]
43 Why did they leave? Please record the main reason. 01=Not enough food in the house 02=Needed to contribute to the household income 03=Family breakdown 77=Other (specify)____________________
[ ]
[CHLEAVEW]
160
44 What did they do? Please record the main option. 01=Domestic work 02=Street work/petty trading 03=Marriage 77=Other(specify)_____________ 99=Don’t know
[ ]
[CHLEAVEDO]
45 What are the children who have not left home doing
during the day? Please record the main activity including the no.of hours spent doing it per day: 01=School / no. of hours 02=Domestic work / no. of hours 03=Play / no. of hours 04=Look after siblings / younger children / no. of hours 05=Herding animals / no. of hours 06=Helping parents with other income generating activities / no. of hours 77=Other (specify)_____________________
Activity Hr/day [____]
[____]
[CHHOME]
46
How many children in the household are attending school this year?
1. Boys
2. Girls
[____]
[____]
[CHSCH1]
[CHSCH2]
47 How many children have been attending school since the beginning of September 2011, and are still attending?
1. Boys
2. Girls
[____]
[____]
[CHSCHYR1]
[CHSCHYR2]
48 Are there any children who have left school? 00=No 01=Yes If yes >>49 otherwise SKIP>>50
[____]
[CHQUITSC]
49 Why did they leave school ? 01= Cost of education 02=The need for children to work 03=To take care of younger siblings 77=Other (specify)__________________________
[____]
[CHQUITSCW]
50 Are there any children in the household who have been admitted to
the nutritional rehabilitation centre in the last 3 months? 00=No 01=Yes
[_____]
[CCMAM]
161
SECTION 9: Coping mechanisms 51 Have you had to sell any household assets during the past month?
00=No 01=Yes If yes >>52 otherwise SKIP>>54
[_____]
[ASSET]
52 If yes, why was this? RECORD ALL THAT APPLY
01 = Repay debts 02 = Festivals 03 = Funeral 04 = Illness 05 = Extra food 06 = Livestock drugs/vet bills 07 = Water for animals 08 = Community obligations 09 = Taxes 10 =Transport 11 = To buy phone credit 77 =Other, specify___________________________
[_____] [_____] [_____] [_____] [_____] [_____] [_____] [_____] [_____] [_____]
[ASSET1] [ASSET2] [ASSET3] [ASSET4] [ASSET5] [ASSET6] [ASSET7] [ASSET8] [ASSET9]
[ASSET10] [ASSET11]
[ASSETOTH]
[ASSETOTHSP]
53 Specify what asset you have sold (e.g. land..)________________________
[ASSETSP]
54 Est-ce qu’il y a des membres du foyer qui sont partis en exode au
cours du dernier mois? Are there any household members who have left on exode (i.e. migration for labour) in the past month? 00=No 01=Yes If yes >>55 otherwise SKIP>>56
[_____]
[HEXODE]
55 How many people left on exode?
[_____] [HEXODENO]
56 Do you have any debts? 00=No 01=Yes If yes >>57 otherwise SKIP>>58
[____]
[HDEBT]
57 How much debt do you have? Nature : ________ kg Cash : _______ FCF
[_____] KG
[_____] FCF
[HDEBT1]
[HDEBT2]
58 Have you mortgaged any land over the last 3 months? 00=No 01=Yes
[____]
[HMORTG]
SUPERVISOR NAME_______________________________ SUPERVISOR SIGNATURE______________________ DATE_______/_________/__________DD/MM/YYYY
162
SUPPLEMENT B2 Survey instrument used for quasi-experimental study in Tahoua, Niger (Chapter 3)
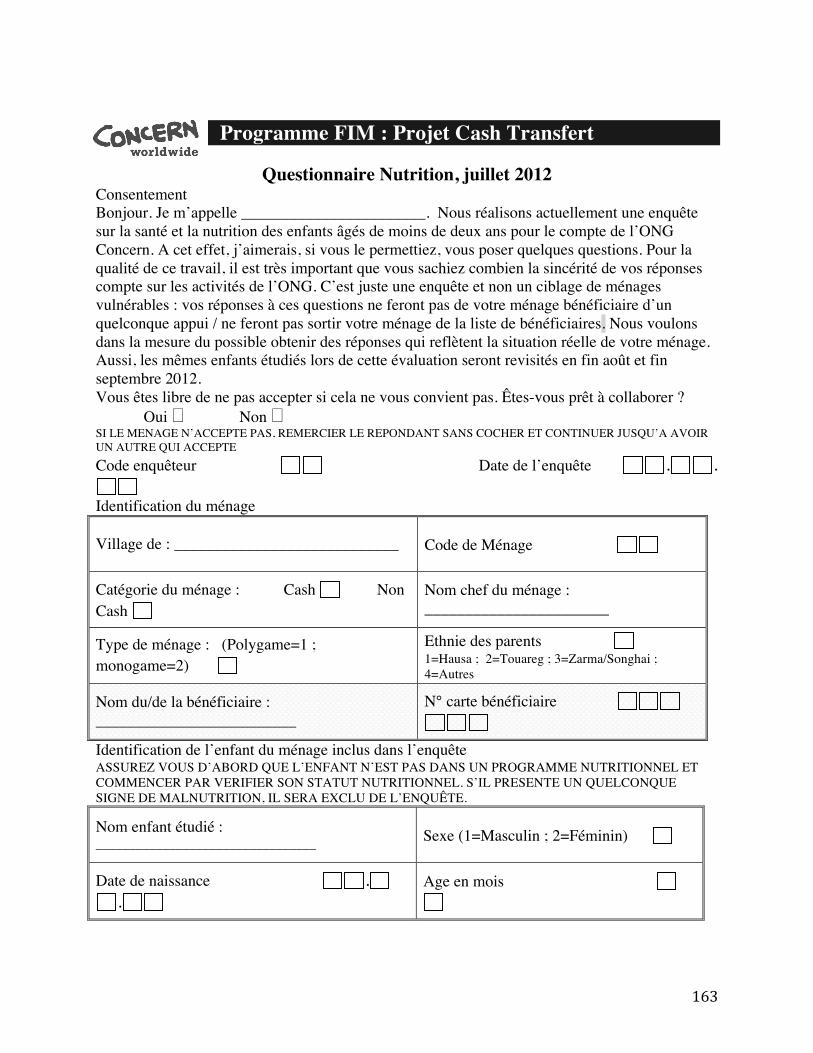
163
Programme FIM : Projet Cash Transfert
Questionnaire Nutrition, juillet 2012 Consentement Bonjour. Je m’appelle _______________________. Nous réalisons actuellement une enquête sur la santé et la nutrition des enfants âgés de moins de deux ans pour le compte de l’ONG Concern. A cet effet, j’aimerais, si vous le permettiez, vous poser quelques questions. Pour la qualité de ce travail, il est très important que vous sachiez combien la sincérité de vos réponses compte sur les activités de l’ONG. C’est juste une enquête et non un ciblage de ménages vulnérables : vos réponses à ces questions ne feront pas de votre ménage bénéficiaire d’un quelconque appui / ne feront pas sortir votre ménage de la liste de bénéficiaires. Nous voulons dans la mesure du possible obtenir des réponses qui reflètent la situation réelle de votre ménage. Aussi, les mêmes enfants étudiés lors de cette évaluation seront revisités en fin août et fin septembre 2012. Vous êtes libre de ne pas accepter si cela ne vous convient pas. Êtes-vous prêt à collaborer ? Oui ! Non ! SI LE MENAGE N’ACCEPTE PAS, REMERCIER LE REPONDANT SANS COCHER ET CONTINUER JUSQU’A AVOIR UN AUTRE QUI ACCEPTE Code enquêteur Date de l’enquête . .
Identification du ménage
Village de : ____________________________ Code de Ménage
Catégorie du ménage : Cash Non Cash
Nom chef du ménage : _______________________
Type de ménage : (Polygame=1 ; monogame=2)
Ethnie des parents 1=Hausa ; 2=Touareg ; 3=Zarma/Songhai ; 4=Autres
Nom du/de la bénéficiaire : _________________________
N° carte bénéficiaire
Identification de l’enfant du ménage inclus dans l’enquête ASSUREZ VOUS D’ABORD QUE L’ENFANT N’EST PAS DANS UN PROGRAMME NUTRITIONNEL ET COMMENCER PAR VERIFIER SON STATUT NUTRITIONNEL. S’IL PRESENTE UN QUELCONQUE SIGNE DE MALNUTRITION, IL SERA EXCLU DE L’ENQUÊTE.
Nom enfant étudié : _________________________________ Sexe (1=Masculin ; 2=Féminin)
Date de naissance ..
Age en mois
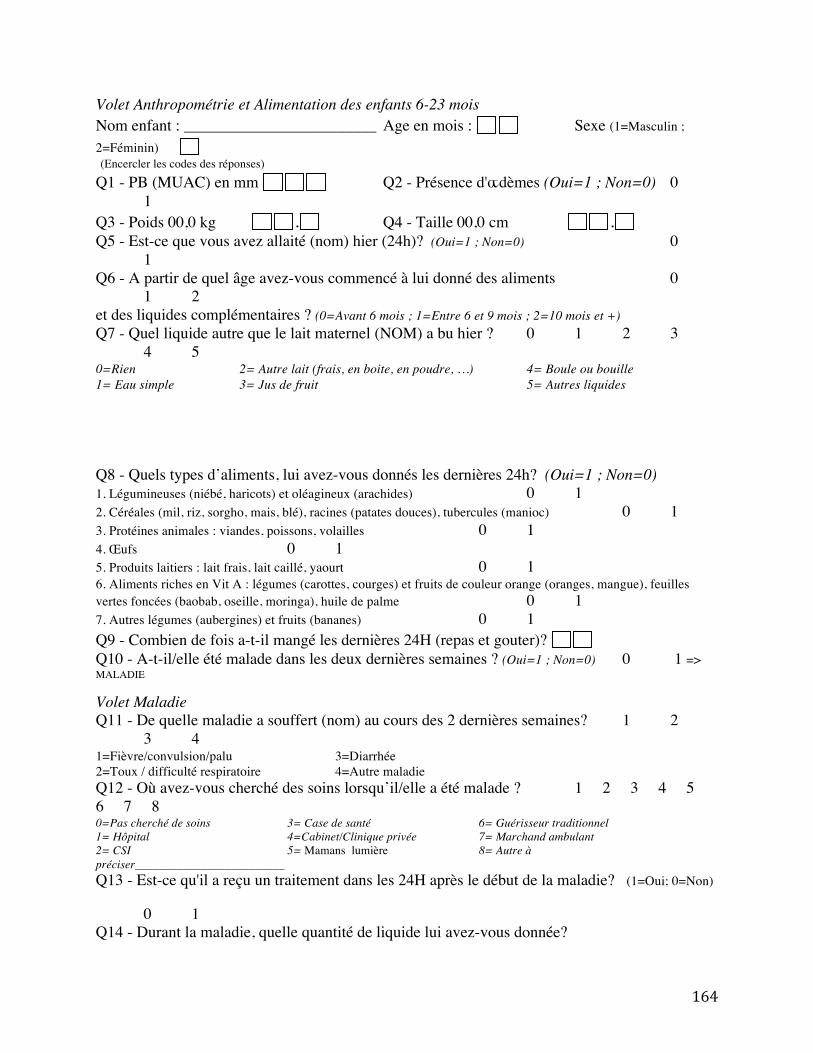
164
Volet Anthropométrie et Alimentation des enfants 6-23 mois
Nom enfant : ________________________ Age en mois : Sexe (1=Masculin ; 2=Féminin) (Encercler les codes des réponses) Q1 - PB (MUAC) en mm Q2 - Présence d'œdèmes (Oui=1 ; Non=0) 0 1 Q3 - Poids 00,0 kg . Q4 - Taille 00,0 cm . Q5 - Est-ce que vous avez allaité (nom) hier (24h)? (Oui=1 ; Non=0) 0 1 Q6 - A partir de quel âge avez-vous commencé à lui donné des aliments 0 1 2 et des liquides complémentaires ? (0=Avant 6 mois ; 1=Entre 6 et 9 mois ; 2=10 mois et +) Q7 - Quel liquide autre que le lait maternel (NOM) a bu hier ? 0 1 2 3 4 5 0=Rien 2= Autre lait (frais, en boite, en poudre, …) 4= Boule ou bouille 1= Eau simple 3= Jus de fruit 5= Autres liquides Q8 - Quels types d’aliments, lui avez-vous donnés les dernières 24h? (Oui=1 ; Non=0) 1. Légumineuses (niébé, haricots) et oléagineux (arachides) 0 1 2. Céréales (mil, riz, sorgho, mais, blé), racines (patates douces), tubercules (manioc) 0 1 3. Protéines animales : viandes, poissons, volailles 0 1 4. Œufs 0 1 5. Produits laitiers : lait frais, lait caillé, yaourt 0 1 6. Aliments riches en Vit A : légumes (carottes, courges) et fruits de couleur orange (oranges, mangue), feuilles vertes foncées (baobab, oseille, moringa), huile de palme 0 1 7. Autres légumes (aubergines) et fruits (bananes) 0 1 Q9 - Combien de fois a-t-il mangé les dernières 24H (repas et gouter)? Q10 - A-t-il/elle été malade dans les deux dernières semaines ? (Oui=1 ; Non=0) 0 1 => MALADIE Volet Maladie Q11 - De quelle maladie a souffert (nom) au cours des 2 dernières semaines? 1 2 3 4 1=Fièvre/convulsion/palu 3=Diarrhée 2=Toux / difficulté respiratoire 4=Autre maladie Q12 - Où avez-vous cherché des soins lorsqu’il/elle a été malade ? 1 2 3 4 5 6 7 8 0=Pas cherché de soins 3= Case de santé 6= Guérisseur traditionnel 1= Hôpital 4=Cabinet/Clinique privée 7= Marchand ambulant 2= CSI 5= Mamans lumière 8= Autre à préciser_________________________ Q13 - Est-ce qu'il a reçu un traitement dans les 24H après le début de la maladie? (1=Oui; 0=Non) 0 1 Q14 - Durant la maladie, quelle quantité de liquide lui avez-vous donnée?
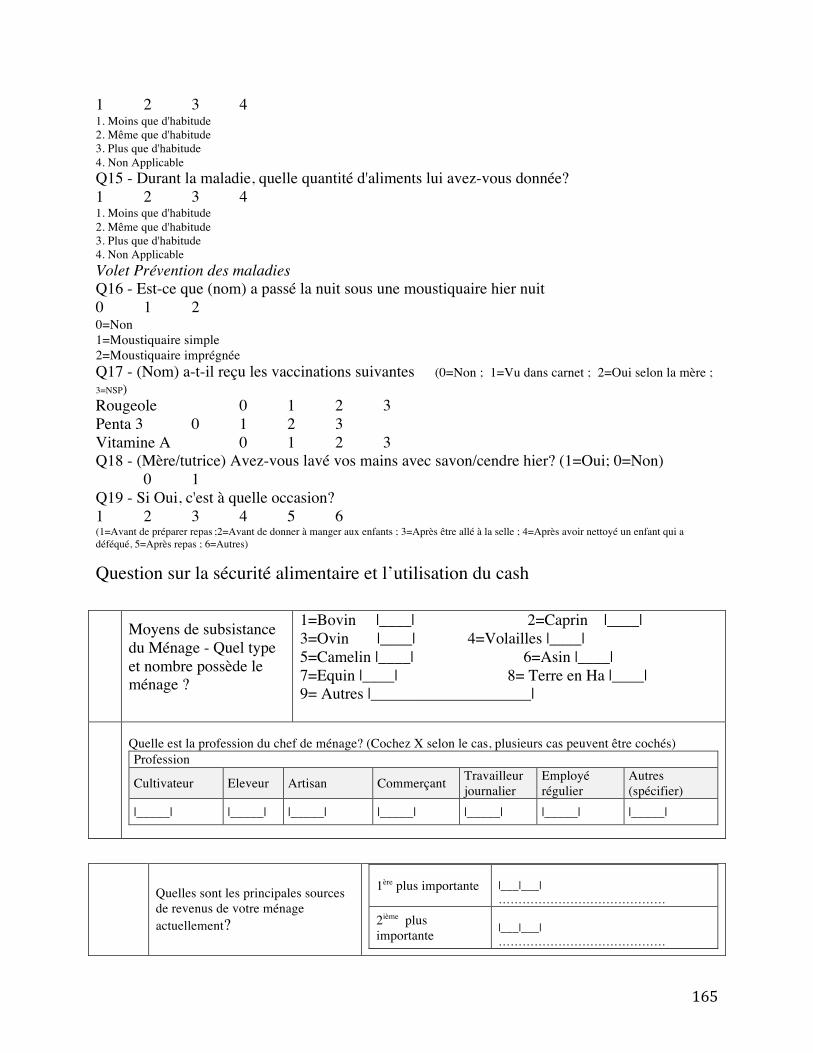
165
1 2 3 4 1. Moins que d'habitude 2. Même que d'habitude 3. Plus que d'habitude 4. Non Applicable Q15 - Durant la maladie, quelle quantité d'aliments lui avez-vous donnée? 1 2 3 4 1. Moins que d'habitude 2. Même que d'habitude 3. Plus que d'habitude 4. Non Applicable Volet Prévention des maladies Q16 - Est-ce que (nom) a passé la nuit sous une moustiquaire hier nuit 0 1 2 0=Non 1=Moustiquaire simple 2=Moustiquaire imprégnée Q17 - (Nom) a-t-il reçu les vaccinations suivantes (0=Non ; 1=Vu dans carnet ; 2=Oui selon la mère ; 3=NSP)
Rougeole 0 1 2 3 Penta 3 0 1 2 3 Vitamine A 0 1 2 3 Q18 - (Mère/tutrice) Avez-vous lavé vos mains avec savon/cendre hier? (1=Oui; 0=Non) 0 1 Q19 - Si Oui, c'est à quelle occasion? 1 2 3 4 5 6 (1=Avant de préparer repas ;2=Avant de donner à manger aux enfants ; 3=Après être allé à la selle ; 4=Après avoir nettoyé un enfant qui a déféqué, 5=Après repas ; 6=Autres)
Question sur la sécurité alimentaire et l’utilisation du cash
Moyens de subsistance du Ménage - Quel type et nombre possède le ménage ?
1=Bovin |____| 2=Caprin |____| 3=Ovin |____| 4=Volailles |____| 5=Camelin |____| 6=Asin |____| 7=Equin |____| 8= Terre en Ha |____| 9= Autres |____________________|
Quelle est la profession du chef de ménage? (Cochez X selon le cas, plusieurs cas peuvent être cochés) Profession
Cultivateur Eleveur Artisan Commerçant Travailleur journalier
Employé régulier
Autres (spécifier)
|_____| |_____| |_____| |_____| |_____| |_____| |_____|
Quelles sont les principales sources de revenus de votre ménage actuellement?
1ère plus importante |___|___| ……………………………………
2ième plus importante
|___|___| ……………………………………
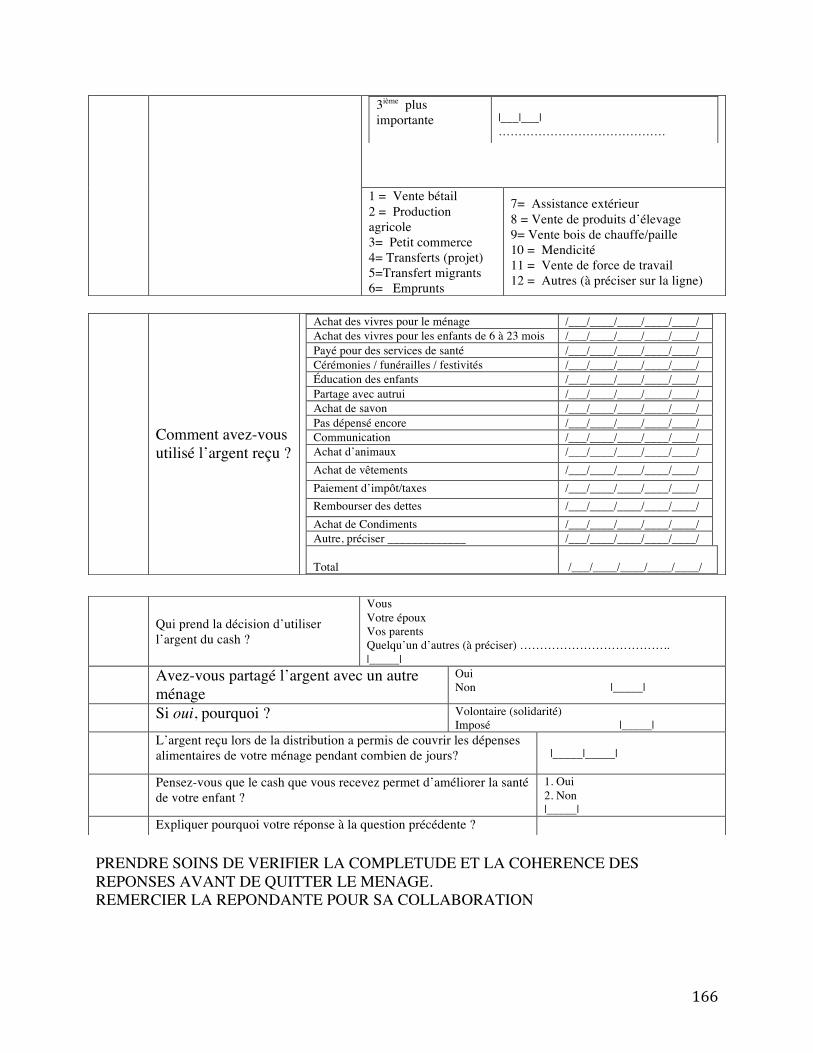
166
PRENDRE SOINS DE VERIFIER LA COMPLETUDE ET LA COHERENCE DES REPONSES AVANT DE QUITTER LE MENAGE. REMERCIER LA REPONDANTE POUR SA COLLABORATION
3ième plus importante
|___|___| ……………………………………
1 = Vente bétail 2 = Production agricole 3= Petit commerce 4= Transferts (projet) 5=Transfert migrants 6= Emprunts
7= Assistance extérieur 8 = Vente de produits d’élevage 9= Vente bois de chauffe/paille 10 = Mendicité 11 = Vente de force de travail 12 = Autres (à préciser sur la ligne)
Comment avez-vous utilisé l’argent reçu ?
Achat des vivres pour le ménage /___/____/____/____/____/ Achat des vivres pour les enfants de 6 à 23 mois /___/____/____/____/____/ Payé pour des services de santé /___/____/____/____/____/ Cérémonies / funérailles / festivités /___/____/____/____/____/ Éducation des enfants /___/____/____/____/____/ Partage avec autrui /___/____/____/____/____/ Achat de savon /___/____/____/____/____/ Pas dépensé encore /___/____/____/____/____/ Communication /___/____/____/____/____/ Achat d’animaux /___/____/____/____/____/ Achat de vêtements /___/____/____/____/____/ Paiement d’impôt/taxes /___/____/____/____/____/ Rembourser des dettes /___/____/____/____/____/ Achat de Condiments /___/____/____/____/____/ Autre, préciser _____________ /___/____/____/____/____/ Total
/___/____/____/____/____/
Qui prend la décision d’utiliser l’argent du cash ?
Vous Votre époux Vos parents Quelqu’un d’autres (à préciser) ……………………………….. |_____|
Avez-vous partagé l’argent avec un autre ménage
Oui Non |_____|
Si oui, pourquoi ? Volontaire (solidarité) Imposé |_____|
L’argent reçu lors de la distribution a permis de couvrir les dépenses alimentaires de votre ménage pendant combien de jours?
|_____|_____|
Pensez-vous que le cash que vous recevez permet d’améliorer la santé de votre enfant ?
1. Oui 2. Non |_____|
Expliquer pourquoi votre réponse à la question précédente ?

167
SUPPLEMENT B3 Survey instrument used for cross-sectional study in Marsabit County, Kenya (Chapter 4)
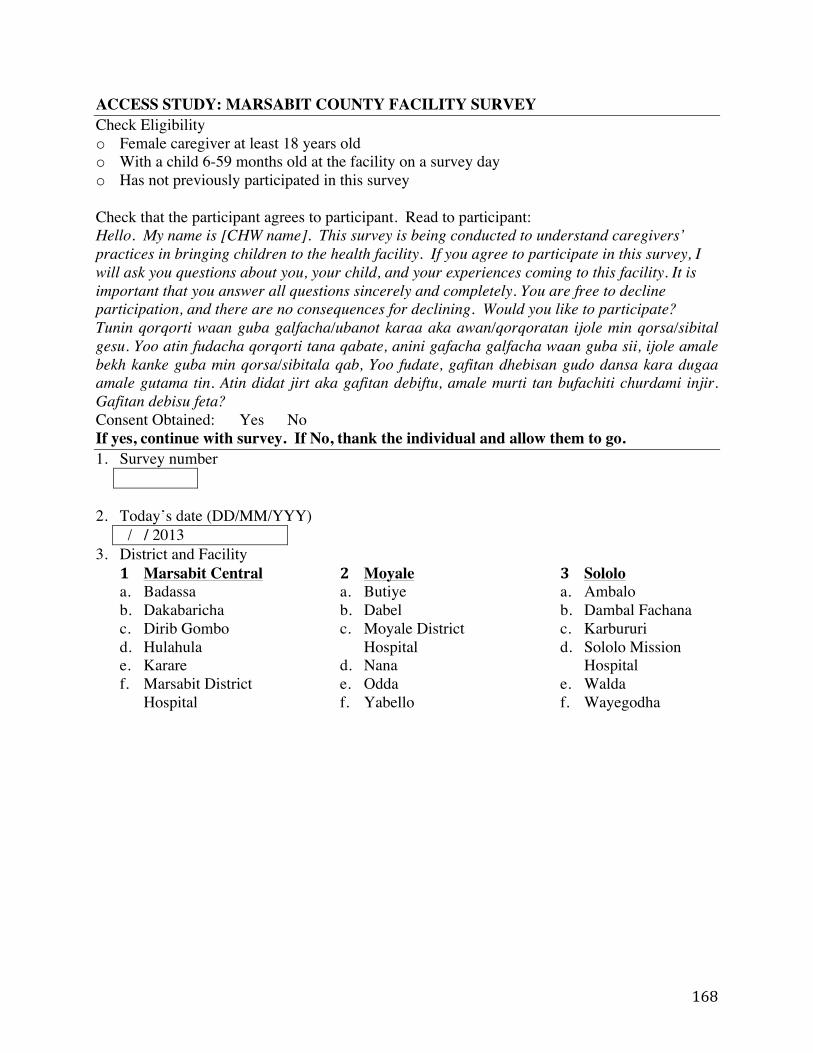
168
ACCESS STUDY: MARSABIT COUNTY FACILITY SURVEY Check Eligibility o Female caregiver at least 18 years old o With a child 6-59 months old at the facility on a survey day o Has not previously participated in this survey Check that the participant agrees to participant. Read to participant: Hello. My name is [CHW name]. This survey is being conducted to understand caregivers’ practices in bringing children to the health facility. If you agree to participate in this survey, I will ask you questions about you, your child, and your experiences coming to this facility. It is important that you answer all questions sincerely and completely. You are free to decline participation, and there are no consequences for declining. Would you like to participate? Tunin qorqorti waan guba galfacha/ubanot karaa aka awan/qorqoratan ijole min qorsa/sibital gesu. Yoo atin fudacha qorqorti tana qabate, anini gafacha galfacha waan guba sii, ijole amale bekh kanke guba min qorsa/sibitala qab, Yoo fudate, gafitan dhebisan gudo dansa kara dugaa amale gutama tin. Atin didat jirt aka gafitan debiftu, amale murti tan bufachiti churdami injir. Gafitan debisu feta? Consent Obtained: Yes No If yes, continue with survey. If No, thank the individual and allow them to go. 1. Survey number
2. Today’s date (DD/MM/YYY) / / 2013
3. District and Facility 1 Marsabit Central a. Badassa b. Dakabaricha c. Dirib Gombo d. Hulahula e. Karare f. Marsabit District
Hospital
2 Moyale a. Butiye b. Dabel c. Moyale District
Hospital d. Nana e. Odda f. Yabello
3 Sololo a. Ambalo b. Dambal Fachana c. Karbururi d. Sololo Mission
Hospital e. Walda f. Wayegodha
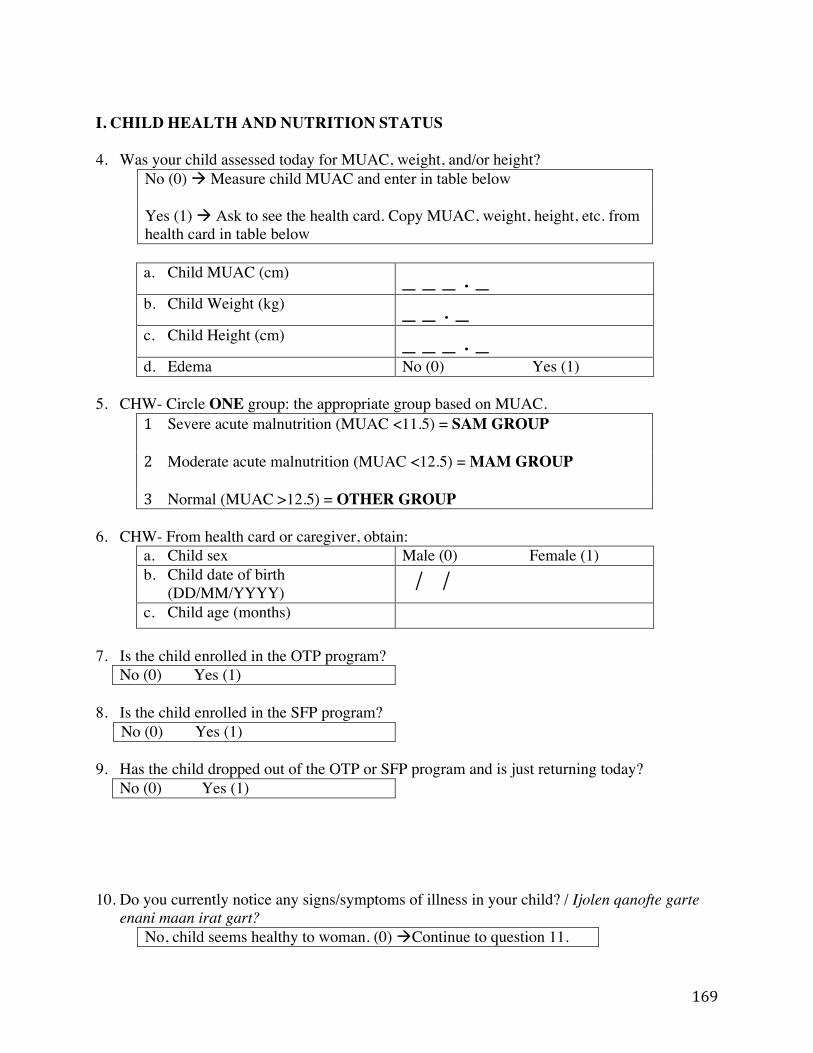
169
I. CHILD HEALTH AND NUTRITION STATUS 4. Was your child assessed today for MUAC, weight, and/or height?
No (0) ! Measure child MUAC and enter in table below Yes (1) ! Ask to see the health card. Copy MUAC, weight, height, etc. from health card in table below
a. Child MUAC (cm) _ _ _ . _ b. Child Weight (kg) _ _ . _ c. Child Height (cm) _ _ _ . _ d. Edema No (0) Yes (1)
5. CHW- Circle ONE group: the appropriate group based on MUAC.
1 Severe acute malnutrition (MUAC <11.5) = SAM GROUP
2 Moderate acute malnutrition (MUAC <12.5) = MAM GROUP
3 Normal (MUAC >12.5) = OTHER GROUP
6. CHW- From health card or caregiver, obtain: a. Child sex Male (0) Female (1) b. Child date of birth
(DD/MM/YYYY) / / c. Child age (months)
7. Is the child enrolled in the OTP program?
No (0) Yes (1)
8. Is the child enrolled in the SFP program? No (0) Yes (1)
9. Has the child dropped out of the OTP or SFP program and is just returning today?
No (0) Yes (1)
10. Do you currently notice any signs/symptoms of illness in your child? / Ijolen qanofte garte enani maan irat gart?
No, child seems healthy to woman. (0) !Continue to question 11.
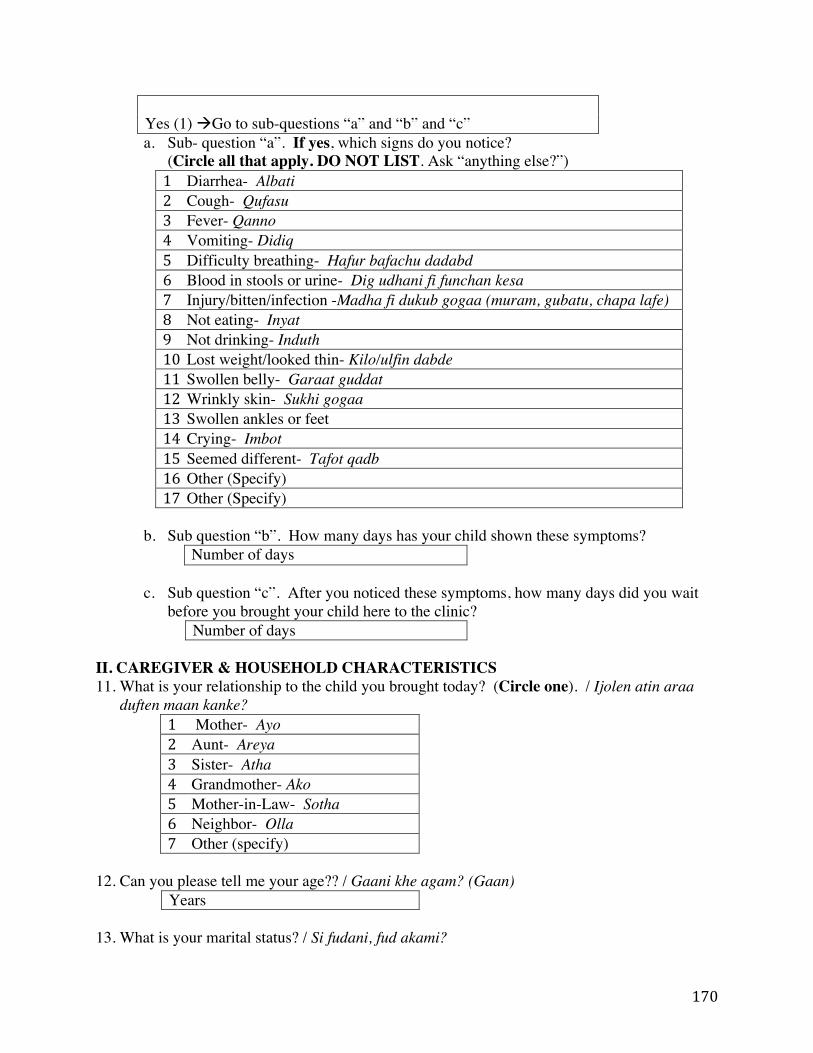
170
Yes (1) !Go to sub-questions “a” and “b” and “c” a. Sub- question “a”. If yes, which signs do you notice?
(Circle all that apply. DO NOT LIST. Ask “anything else?”) 1 Diarrhea- Albati 2 Cough- Qufasu 3 Fever- Qanno 4 Vomiting- Didiq 5 Difficulty breathing- Hafur bafachu dadabd 6 Blood in stools or urine- Dig udhani fi funchan kesa 7 Injury/bitten/infection -Madha fi dukub gogaa (muram, gubatu, chapa lafe) 8 Not eating- Inyat 9 Not drinking- Induth 10 Lost weight/looked thin- Kilo/ulfin dabde 11 Swollen belly- Garaat guddat 12 Wrinkly skin- Sukhi gogaa 13 Swollen ankles or feet 14 Crying- Imbot 15 Seemed different- Tafot qadb 16 Other (Specify) 17 Other (Specify)
b. Sub question “b”. How many days has your child shown these symptoms?
Number of days
c. Sub question “c”. After you noticed these symptoms, how many days did you wait before you brought your child here to the clinic?
Number of days II. CAREGIVER & HOUSEHOLD CHARACTERISTICS 11. What is your relationship to the child you brought today? (Circle one). / Ijolen atin araa
duften maan kanke? 1 Mother- Ayo 2 Aunt- Areya 3 Sister- Atha 4 Grandmother- Ako 5 Mother-in-Law- Sotha 6 Neighbor- Olla 7 Other (specify)
12. Can you please tell me your age?? / Gaani khe agam? (Gaan)
Years 13. What is your marital status? / Si fudani, fud akami?
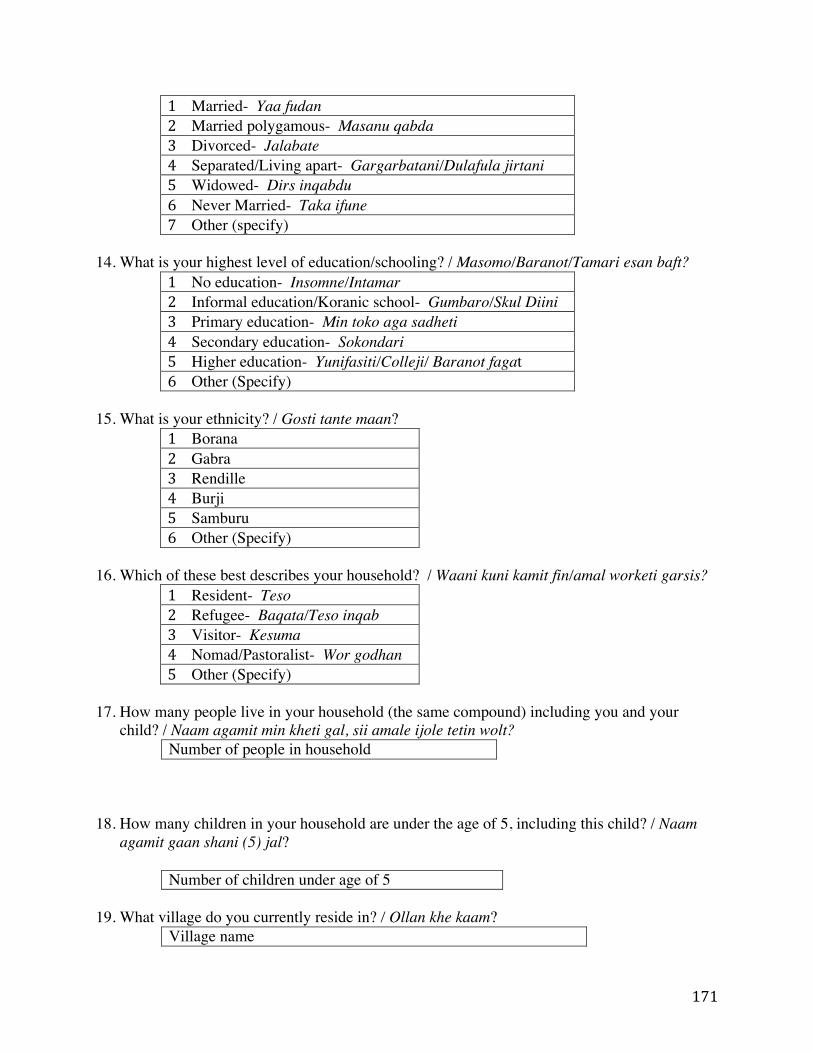
171
1 Married- Yaa fudan 2 Married polygamous- Masanu qabda 3 Divorced- Jalabate 4 Separated/Living apart- Gargarbatani/Dulafula jirtani 5 Widowed- Dirs inqabdu 6 Never Married- Taka ifune 7 Other (specify)
14. What is your highest level of education/schooling? / Masomo/Baranot/Tamari esan baft?
1 No education- Insomne/Intamar 2 Informal education/Koranic school- Gumbaro/Skul Diini 3 Primary education- Min toko aga sadheti 4 Secondary education- Sokondari 5 Higher education- Yunifasiti/Colleji/ Baranot fagat 6 Other (Specify)
15. What is your ethnicity? / Gosti tante maan?
1 Borana 2 Gabra 3 Rendille 4 Burji 5 Samburu 6 Other (Specify)
16. Which of these best describes your household? / Waani kuni kamit fin/amal worketi garsis?
1 Resident- Teso 2 Refugee- Baqata/Teso inqab 3 Visitor- Kesuma 4 Nomad/Pastoralist- Wor godhan 5 Other (Specify)
17. How many people live in your household (the same compound) including you and your
child? / Naam agamit min kheti gal, sii amale ijole tetin wolt? Number of people in household
18. How many children in your household are under the age of 5, including this child? / Naam agamit gaan shani (5) jal?
Number of children under age of 5
19. What village do you currently reside in? / Ollan khe kaam? Village name
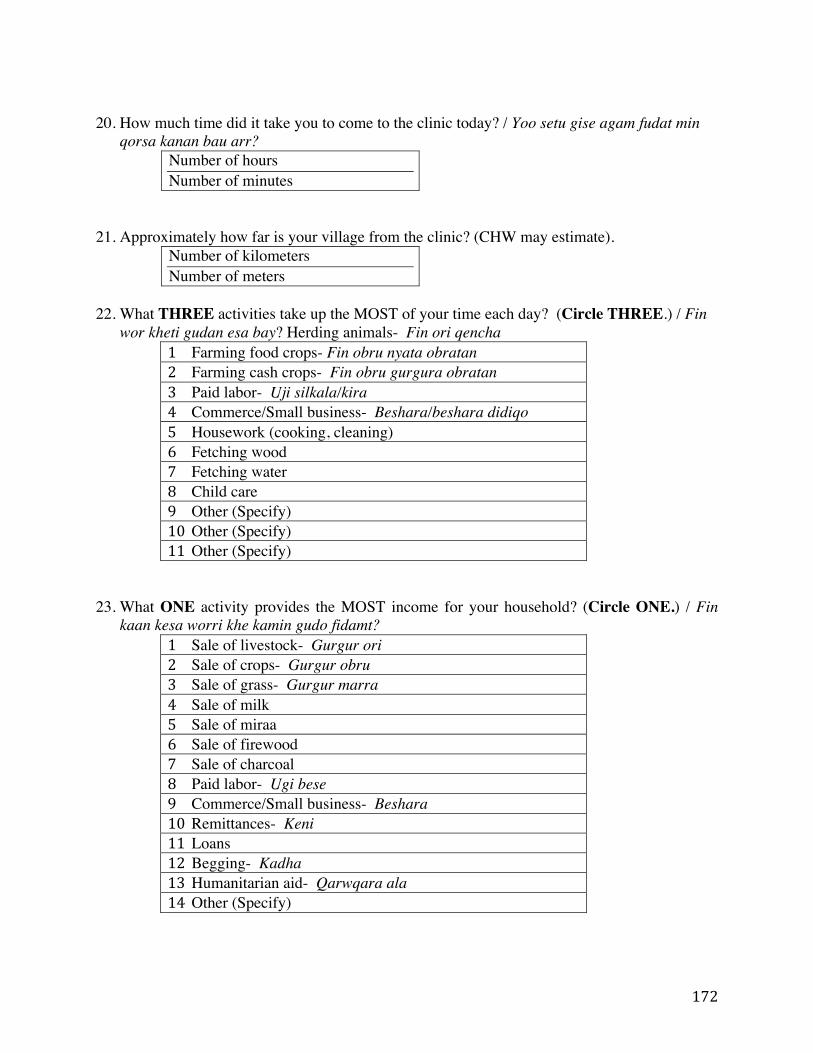
172
20. How much time did it take you to come to the clinic today? / Yoo setu gise agam fudat min
qorsa kanan bau arr? Number of hours Number of minutes
21. Approximately how far is your village from the clinic? (CHW may estimate). Number of kilometers Number of meters
22. What THREE activities take up the MOST of your time each day? (Circle THREE.) / Fin
wor kheti gudan esa bay? Herding animals- Fin ori qencha 1 Farming food crops- Fin obru nyata obratan 2 Farming cash crops- Fin obru gurgura obratan 3 Paid labor- Uji silkala/kira 4 Commerce/Small business- Beshara/beshara didiqo 5 Housework (cooking, cleaning) 6 Fetching wood 7 Fetching water 8 Child care 9 Other (Specify) 10 Other (Specify) 11 Other (Specify)
23. What ONE activity provides the MOST income for your household? (Circle ONE.) / Fin
kaan kesa worri khe kamin gudo fidamt? 1 Sale of livestock- Gurgur ori 2 Sale of crops- Gurgur obru 3 Sale of grass- Gurgur marra 4 Sale of milk 5 Sale of miraa 6 Sale of firewood 7 Sale of charcoal 8 Paid labor- Ugi bese 9 Commerce/Small business- Beshara 10 Remittances- Keni 11 Loans 12 Begging- Kadha 13 Humanitarian aid- Qarwqara ala 14 Other (Specify)
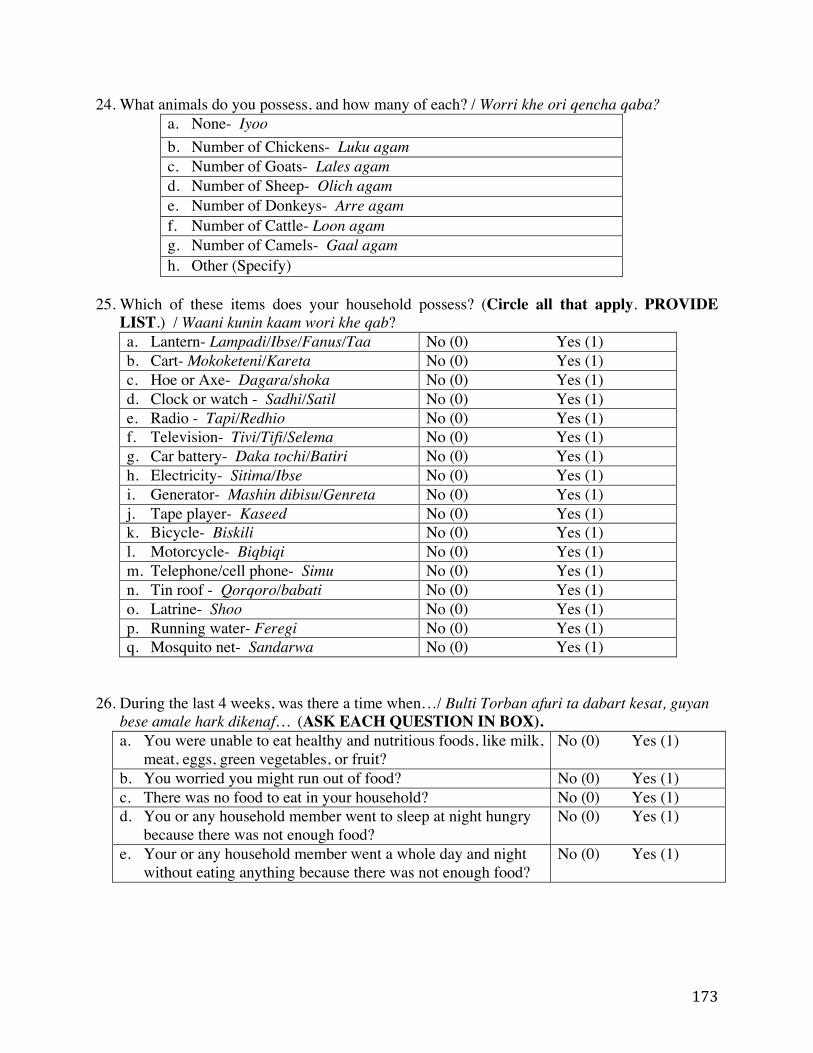
173
24. What animals do you possess, and how many of each? / Worri khe ori qencha qaba? a. None- Iyoo b. Number of Chickens- Luku agam c. Number of Goats- Lales agam d. Number of Sheep- Olich agam e. Number of Donkeys- Arre agam f. Number of Cattle- Loon agam g. Number of Camels- Gaal agam h. Other (Specify)
25. Which of these items does your household possess? (Circle all that apply. PROVIDE
LIST.) / Waani kunin kaam wori khe qab? a. Lantern- Lampadi/Ibse/Fanus/Taa No (0) Yes (1) b. Cart- Mokoketeni/Kareta No (0) Yes (1) c. Hoe or Axe- Dagara/shoka No (0) Yes (1) d. Clock or watch - Sadhi/Satil No (0) Yes (1) e. Radio - Tapi/Redhio No (0) Yes (1) f. Television- Tivi/Tifi/Selema No (0) Yes (1) g. Car battery- Daka tochi/Batiri No (0) Yes (1) h. Electricity- Sitima/Ibse No (0) Yes (1) i. Generator- Mashin dibisu/Genreta No (0) Yes (1) j. Tape player- Kaseed No (0) Yes (1) k. Bicycle- Biskili No (0) Yes (1) l. Motorcycle- Biqbiqi No (0) Yes (1) m. Telephone/cell phone- Simu No (0) Yes (1) n. Tin roof - Qorqoro/babati No (0) Yes (1) o. Latrine- Shoo No (0) Yes (1) p. Running water- Feregi No (0) Yes (1) q. Mosquito net- Sandarwa No (0) Yes (1)
26. During the last 4 weeks, was there a time when…/ Bulti Torban afuri ta dabart kesat, guyan
bese amale hark dikenaf… (ASK EACH QUESTION IN BOX). a. You were unable to eat healthy and nutritious foods, like milk,
meat, eggs, green vegetables, or fruit? No (0) Yes (1)
b. You worried you might run out of food? No (0) Yes (1) c. There was no food to eat in your household? No (0) Yes (1) d. You or any household member went to sleep at night hungry
because there was not enough food? No (0) Yes (1)
e. Your or any household member went a whole day and night without eating anything because there was not enough food?
No (0) Yes (1)
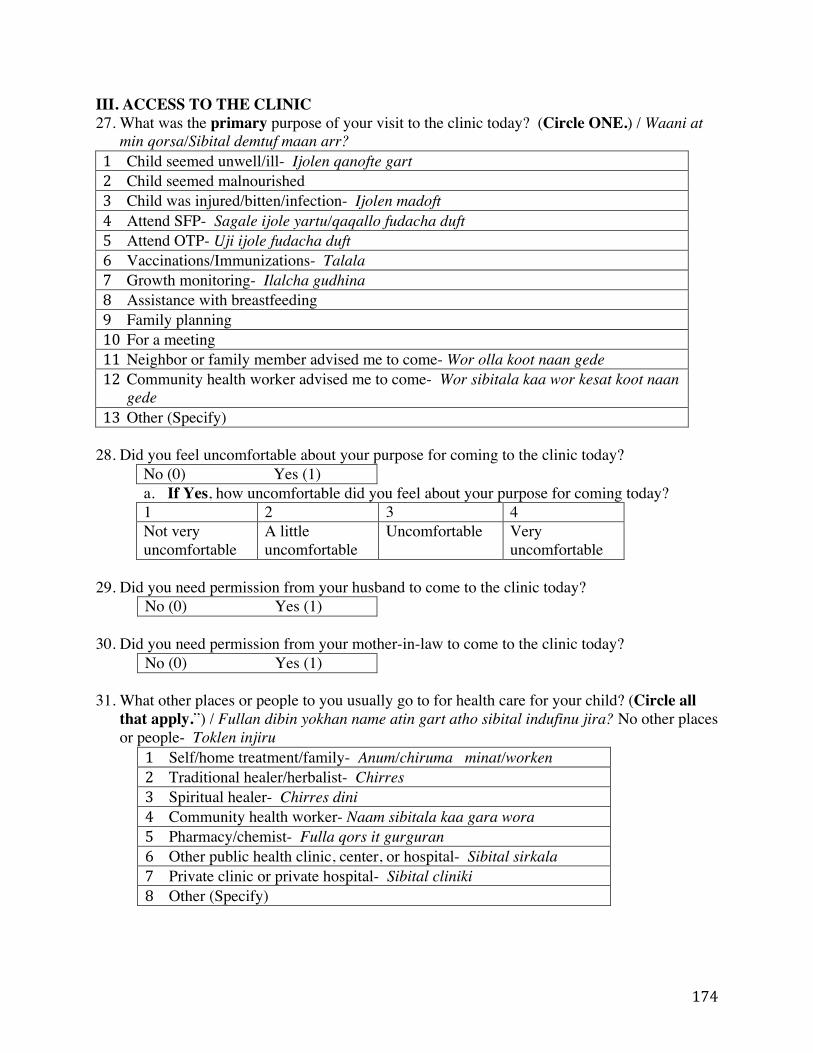
174
III. ACCESS TO THE CLINIC 27. What was the primary purpose of your visit to the clinic today? (Circle ONE.) / Waani at
min qorsa/Sibital demtuf maan arr? 1 Child seemed unwell/ill- Ijolen qanofte gart 2 Child seemed malnourished 3 Child was injured/bitten/infection- Ijolen madoft 4 Attend SFP- Sagale ijole yartu/qaqallo fudacha duft 5 Attend OTP- Uji ijole fudacha duft 6 Vaccinations/Immunizations- Talala 7 Growth monitoring- Ilalcha gudhina 8 Assistance with breastfeeding 9 Family planning 10 For a meeting 11 Neighbor or family member advised me to come- Wor olla koot naan gede 12 Community health worker advised me to come- Wor sibitala kaa wor kesat koot naan
gede 13 Other (Specify)
28. Did you feel uncomfortable about your purpose for coming to the clinic today?
No (0) Yes (1) a. If Yes, how uncomfortable did you feel about your purpose for coming today? 1 2 3 4 Not very uncomfortable
A little uncomfortable
Uncomfortable Very uncomfortable
29. Did you need permission from your husband to come to the clinic today?
No (0) Yes (1) 30. Did you need permission from your mother-in-law to come to the clinic today?
No (0) Yes (1) 31. What other places or people to you usually go to for health care for your child? (Circle all
that apply.”) / Fullan dibin yokhan name atin gart atho sibital indufinu jira? No other places or people- Toklen injiru
1 Self/home treatment/family- Anum/chiruma minat/worken 2 Traditional healer/herbalist- Chirres 3 Spiritual healer- Chirres dini 4 Community health worker- Naam sibitala kaa gara wora 5 Pharmacy/chemist- Fulla qors it gurguran 6 Other public health clinic, center, or hospital- Sibital sirkala 7 Private clinic or private hospital- Sibital cliniki 8 Other (Specify)
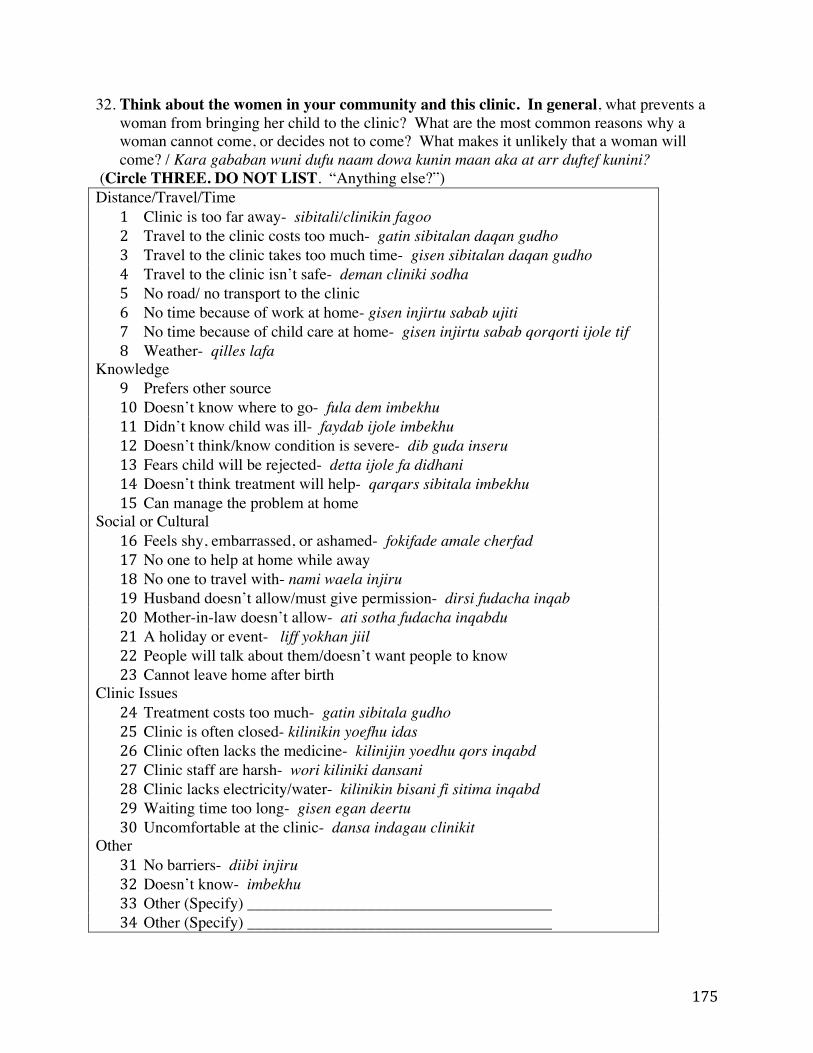
175
32. Think about the women in your community and this clinic. In general, what prevents a woman from bringing her child to the clinic? What are the most common reasons why a woman cannot come, or decides not to come? What makes it unlikely that a woman will come? / Kara gababan wuni dufu naam dowa kunin maan aka at arr duftef kunini?
(Circle THREE. DO NOT LIST. “Anything else?”) Distance/Travel/Time
1 Clinic is too far away- sibitali/clinikin fagoo 2 Travel to the clinic costs too much- gatin sibitalan daqan gudho 3 Travel to the clinic takes too much time- gisen sibitalan daqan gudho 4 Travel to the clinic isn’t safe- deman cliniki sodha 5 No road/ no transport to the clinic 6 No time because of work at home- gisen injirtu sabab ujiti 7 No time because of child care at home- gisen injirtu sabab qorqorti ijole tif 8 Weather- qilles lafa
Knowledge 9 Prefers other source 10 Doesn’t know where to go- fula dem imbekhu 11 Didn’t know child was ill- faydab ijole imbekhu 12 Doesn’t think/know condition is severe- dib guda inseru 13 Fears child will be rejected- detta ijole fa didhani 14 Doesn’t think treatment will help- qarqars sibitala imbekhu 15 Can manage the problem at home
Social or Cultural 16 Feels shy, embarrassed, or ashamed- fokifade amale cherfad 17 No one to help at home while away 18 No one to travel with- nami waela injiru 19 Husband doesn’t allow/must give permission- dirsi fudacha inqab 20 Mother-in-law doesn’t allow- ati sotha fudacha inqabdu 21 A holiday or event- liff yokhan jiil 22 People will talk about them/doesn’t want people to know 23 Cannot leave home after birth
Clinic Issues 24 Treatment costs too much- gatin sibitala gudho 25 Clinic is often closed- kilinikin yoefhu idas 26 Clinic often lacks the medicine- kilinijin yoedhu qors inqabd 27 Clinic staff are harsh- wori kiliniki dansani 28 Clinic lacks electricity/water- kilinikin bisani fi sitima inqabd 29 Waiting time too long- gisen egan deertu 30 Uncomfortable at the clinic- dansa indagau clinikit
Other 31 No barriers- diibi injiru 32 Doesn’t know- imbekhu 33 Other (Specify) ______________________________________ 34 Other (Specify) ______________________________________
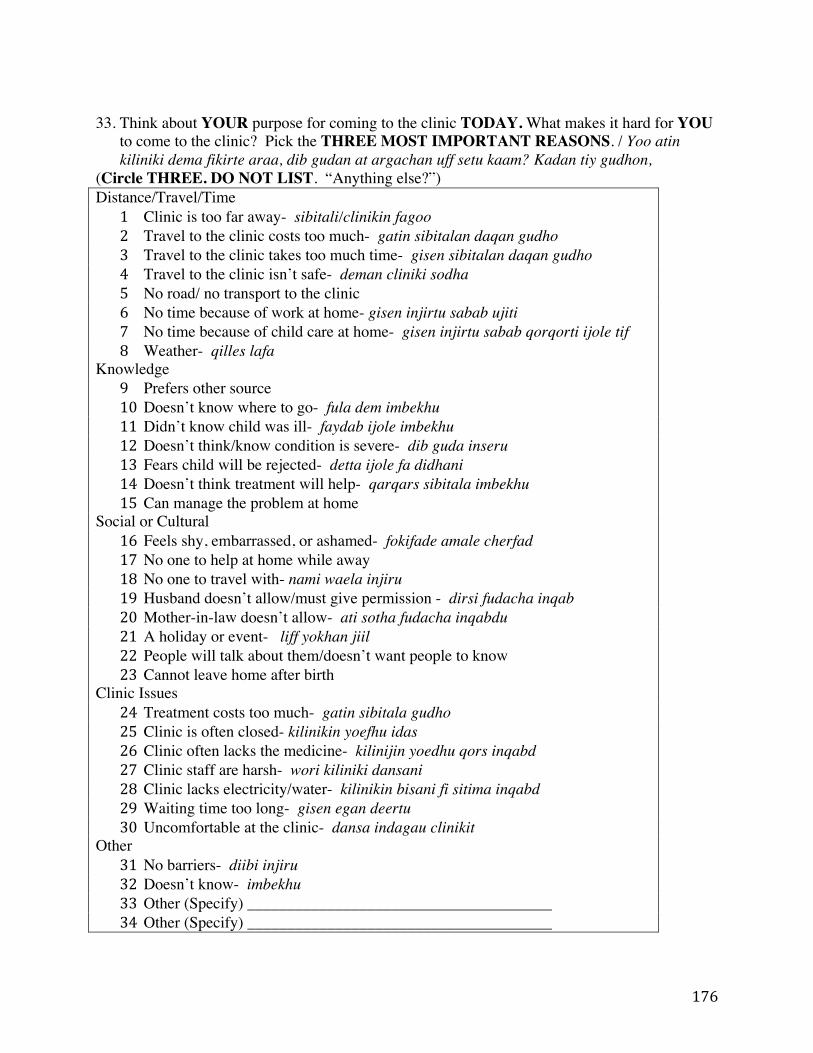
176
33. Think about YOUR purpose for coming to the clinic TODAY. What makes it hard for YOU
to come to the clinic? Pick the THREE MOST IMPORTANT REASONS. / Yoo atin kiliniki dema fikirte araa, dib gudan at argachan uff setu kaam? Kadan tiy gudhon,
(Circle THREE. DO NOT LIST. “Anything else?”) Distance/Travel/Time
1 Clinic is too far away- sibitali/clinikin fagoo 2 Travel to the clinic costs too much- gatin sibitalan daqan gudho 3 Travel to the clinic takes too much time- gisen sibitalan daqan gudho 4 Travel to the clinic isn’t safe- deman cliniki sodha 5 No road/ no transport to the clinic 6 No time because of work at home- gisen injirtu sabab ujiti 7 No time because of child care at home- gisen injirtu sabab qorqorti ijole tif 8 Weather- qilles lafa
Knowledge 9 Prefers other source 10 Doesn’t know where to go- fula dem imbekhu 11 Didn’t know child was ill- faydab ijole imbekhu 12 Doesn’t think/know condition is severe- dib guda inseru 13 Fears child will be rejected- detta ijole fa didhani 14 Doesn’t think treatment will help- qarqars sibitala imbekhu 15 Can manage the problem at home
Social or Cultural 16 Feels shy, embarrassed, or ashamed- fokifade amale cherfad 17 No one to help at home while away 18 No one to travel with- nami waela injiru 19 Husband doesn’t allow/must give permission - dirsi fudacha inqab 20 Mother-in-law doesn’t allow- ati sotha fudacha inqabdu 21 A holiday or event- liff yokhan jiil 22 People will talk about them/doesn’t want people to know 23 Cannot leave home after birth
Clinic Issues 24 Treatment costs too much- gatin sibitala gudho 25 Clinic is often closed- kilinikin yoefhu idas 26 Clinic often lacks the medicine- kilinijin yoedhu qors inqabd 27 Clinic staff are harsh- wori kiliniki dansani 28 Clinic lacks electricity/water- kilinikin bisani fi sitima inqabd 29 Waiting time too long- gisen egan deertu 30 Uncomfortable at the clinic- dansa indagau clinikit
Other 31 No barriers- diibi injiru 32 Doesn’t know- imbekhu 33 Other (Specify) ______________________________________ 34 Other (Specify) ______________________________________
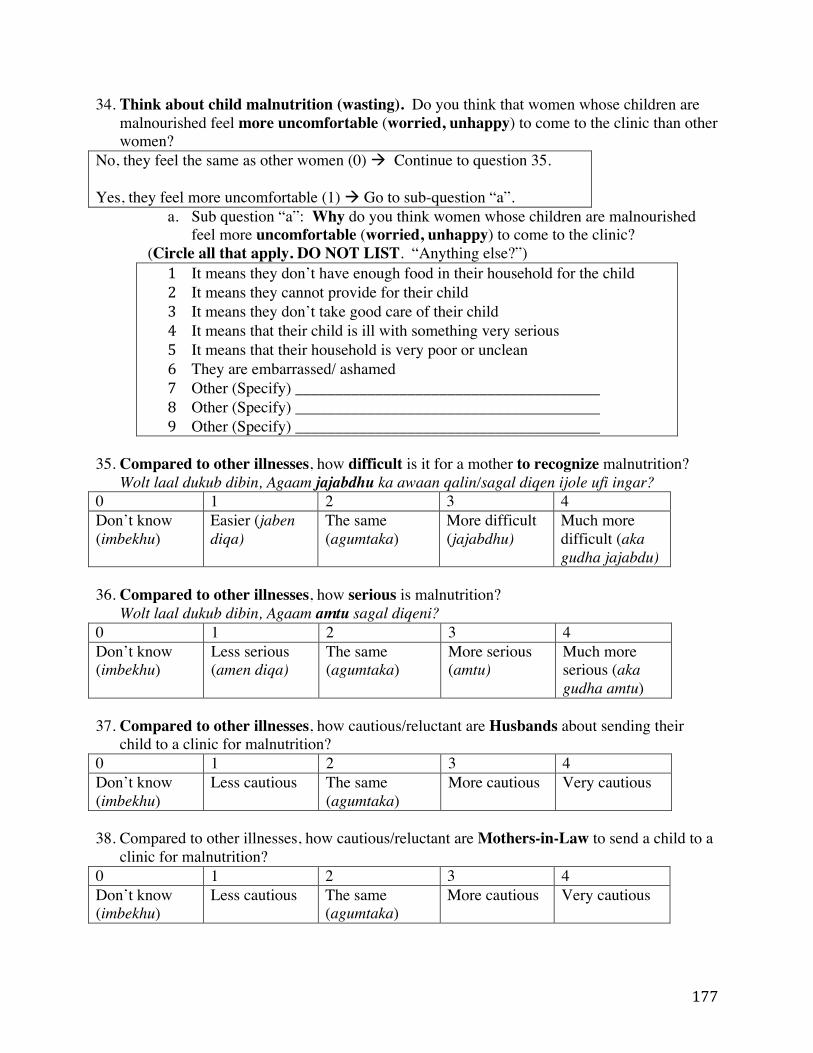
177
34. Think about child malnutrition (wasting). Do you think that women whose children are malnourished feel more uncomfortable (worried, unhappy) to come to the clinic than other women?
No, they feel the same as other women (0) ! Continue to question 35. Yes, they feel more uncomfortable (1) ! Go to sub-question “a”.
a. Sub question “a”: Why do you think women whose children are malnourished feel more uncomfortable (worried, unhappy) to come to the clinic?
(Circle all that apply. DO NOT LIST. “Anything else?”) 1 It means they don’t have enough food in their household for the child 2 It means they cannot provide for their child 3 It means they don’t take good care of their child 4 It means that their child is ill with something very serious 5 It means that their household is very poor or unclean 6 They are embarrassed/ ashamed 7 Other (Specify) ______________________________________ 8 Other (Specify) ______________________________________ 9 Other (Specify) ______________________________________
35. Compared to other illnesses, how difficult is it for a mother to recognize malnutrition?
Wolt laal dukub dibin, Agaam jajabdhu ka awaan qalin/sagal diqen ijole ufi ingar? 0 1 2 3 4 Don’t know (imbekhu)
Easier (jaben diqa)
The same (agumtaka)
More difficult (jajabdhu)
Much more difficult (aka gudha jajabdu)
36. Compared to other illnesses, how serious is malnutrition?
Wolt laal dukub dibin, Agaam amtu sagal diqeni? 0 1 2 3 4 Don’t know (imbekhu)
Less serious (amen diqa)
The same (agumtaka)
More serious (amtu)
Much more serious (aka gudha amtu)
37. Compared to other illnesses, how cautious/reluctant are Husbands about sending their
child to a clinic for malnutrition? 0 1 2 3 4 Don’t know (imbekhu)
Less cautious The same (agumtaka)
More cautious Very cautious
38. Compared to other illnesses, how cautious/reluctant are Mothers-in-Law to send a child to a
clinic for malnutrition? 0 1 2 3 4 Don’t know (imbekhu)
Less cautious The same (agumtaka)
More cautious Very cautious
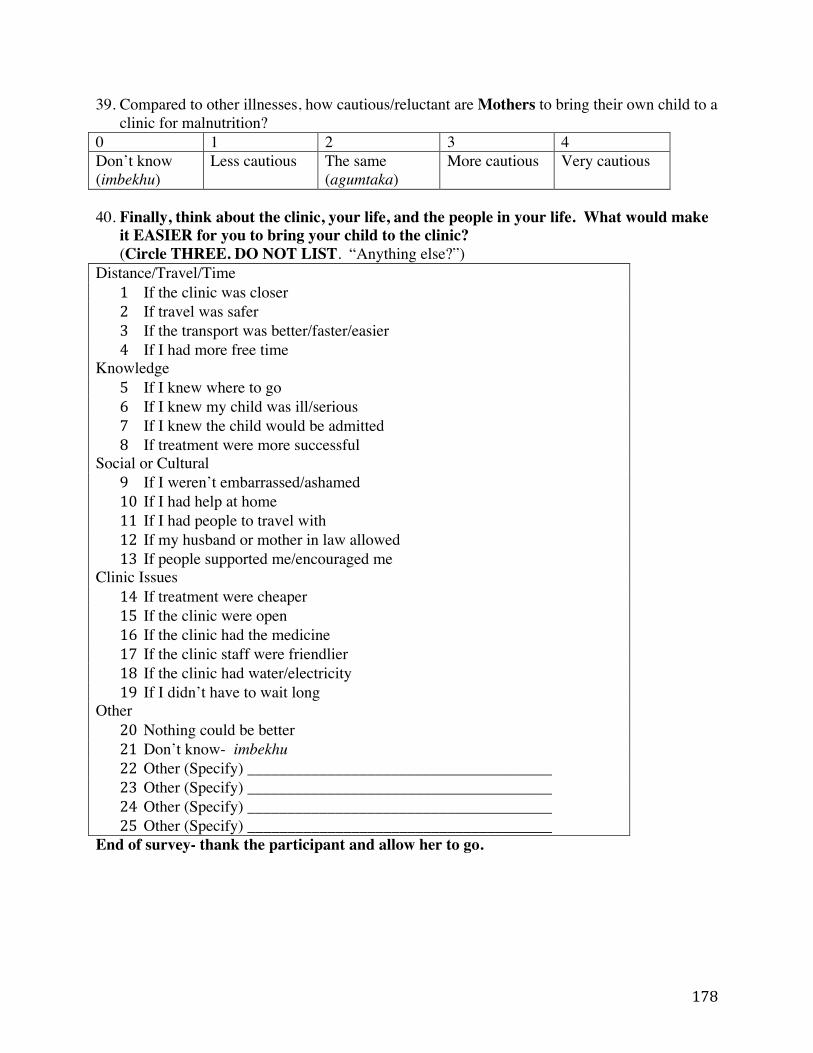
178
39. Compared to other illnesses, how cautious/reluctant are Mothers to bring their own child to a clinic for malnutrition?
0 1 2 3 4 Don’t know (imbekhu)
Less cautious The same (agumtaka)
More cautious Very cautious
40. Finally, think about the clinic, your life, and the people in your life. What would make
it EASIER for you to bring your child to the clinic? (Circle THREE. DO NOT LIST. “Anything else?”)
Distance/Travel/Time 1 If the clinic was closer 2 If travel was safer 3 If the transport was better/faster/easier 4 If I had more free time
Knowledge 5 If I knew where to go 6 If I knew my child was ill/serious 7 If I knew the child would be admitted 8 If treatment were more successful
Social or Cultural 9 If I weren’t embarrassed/ashamed 10 If I had help at home 11 If I had people to travel with 12 If my husband or mother in law allowed 13 If people supported me/encouraged me
Clinic Issues 14 If treatment were cheaper 15 If the clinic were open 16 If the clinic had the medicine 17 If the clinic staff were friendlier 18 If the clinic had water/electricity 19 If I didn’t have to wait long
Other 20 Nothing could be better 21 Don’t know- imbekhu 22 Other (Specify) ______________________________________ 23 Other (Specify) ______________________________________ 24 Other (Specify) ______________________________________ 25 Other (Specify) ______________________________________
End of survey- thank the participant and allow her to go.
179
References 1. Black RE, Victora CG, Walker SP, Bhutta ZA, Christian P, deOnis M, Ezzati M,
Grantham-McGregor S, Katz J, et al. Maternal and child undernutrition and overweight in low-income and middle-income countries. The Lancet. Elsevier Ltd; 2013;382:427–51.
2. Hobbs B, Bush A. Acute malnutrition: An everyday emergency. Generation Nutrition; 2014 Apr pp. 1–32.
3. Brown KH, Nyirandutyle DH, Jungichann S. Management of acute malnutrition in resource-poor settings. Nature Reviews: Endocrinology. 2009;5:597–603.
4. Young H, Borrel A, Holland D, Salama P. Public nutrition in complex emergencies. The Lancet. Elsevier; 2004;364:1899–909.
5. de Pee S, Bloem M. Current and potential role of specially formulated foods and food supplements for preventing malnutrition among 6- to 23- month-old children and for treating moderate malnutrition among 6- to 59-month-old children. Food and Nutrition Bulletin. 2009;30:S434–63.
6. Chaparro CM, Dewey KG. Use of lipid-based nutrient supplements (LNS) to improve the nutrient adequacy of general food distribution rations for vulnerable sub-groups in emergency settings. Maternal & Child Nutrition. 2010;6:1–69.
7. Hall A, Blankson B, Shoham J. The impact and effectiveness of emergency nutrition and Nutrition related interventions: a review of published evidence 2004–2010. Oxford, UK: Emergency Nutrition Network; 2011.
8. Cook R. Is hospital the place for the treatment of malnourished children? Journal of Tropical Pediatrics. Oxford Univ Press; 1971;17:15–25.
9. Bhutta ZA, Ahmed T, Black RE, Cousens S, Dewey K, Giugliani E, Haider BA, Kirkwood B, Morris SS, Sachdev H. Effective international action against undernutrition: why has it proven so difficult and what can be done to accelerate progress? The Lancet. Elsevier; 2005;368:1992–2000.
10. Collins S. Changing the way we address severe malnutrition during famine. The Lancet. 2001;358:498–501.
11. Bachmann MO. Cost–effectiveness of community-based treatment of severe acute malnutrition in children. Expert Rev Pharmacoeconomics Outcomes Res. 2010;10:605–12.
12. Wilford R, Golden K, Walker DG. Cost-effectiveness of community-based management of acute malnutrition in Malawi. Health Policy and Planning. 2012;27:127–37.
180
13. Tekeste A, Wondafrash M, Azene G, Deribe K. Cost effectiveness of community-based and in-patient therapeutic feeding programs to treat severe acute malnutrition in Ethiopia. Cost Effectiveness and Resource Allocation. BioMed Central Ltd; 2012;10:4.
14. Puett C, Coates J, Alderman H, Sadler K. Quality of care for severe acute malnutrition delivered by community health workers in southern Bangladesh. Maternal & Child Nutrition. 2012;9:130–42.
15. Guerrero S, Rogers E. Access for all: Is community-based treatment of severe acute malnutrition (SAM) at scale capable of meeting global needs? Coverage Monitoring Network. London; 2013;1:1–13.
16. Webb P, Rogers B, Rosenberg I, Schlossman N, Wanke C, Bagriansky J, Sadler K, Johnson Q, Tilahun J, et al. Delivering improved nutrition. Boston: Tufts University; 2011 Apr pp. 1–56.
17. Pelletier DL, Deneke K, Kidane Y, Haile B, Negussie F. The food-first bias and nutrition policy: lessons from Ethiopia. Food Policy. Elsevier; 1995;20:279–98.
18. The Sphere Project, editor. Humanitarian Charter and Minimum Standards in Humanitarian Response [Internet]. The Sphere Project; [cited 2014 May 8]. Available from: http://www.sphereproject.org/handbook/
19. Navarro-Colorado C, Mason F, Shoham J. Measuring the effectiveness of Supplementary Feeding Programs in emergencies. Humanitarian Practice Network, Overseas Development Institute; 2008 Sep pp. 1–32. Report No.: 63.
20. Oakley E, Reinking J, Sandige H, Trehan I, Kennedy G, Maleta K, Manary M. A Ready-To-Use Therapeutic Food Containing 10% Milk Is Less Effective Than One with 25% Milk in the Treatment of Severely Malnourished Children. Journal of Nutrition. 2010;140:2248–52.
21. Bahwere P, Banda T, Sadler K, Nyirenda G, Owino V, Shaba B, Dibari F, Collins S. Effectiveness of milk whey protein-based ready-to-use therapeutic food in treatment of severe acute malnutrition in Malawian under-5 children: a randomised, double-blind, controlled non-inferiority clinical trial. Maternal & Child Nutrition. 2014;10:436–51.
22. Owino VO, Irena AH, Dibari F, Collins S. Development and acceptability of a novel milk-free soybean-maize-sorghum ready-to-use therapeutic food (SMS-RUTF) based on industrial extrusion cooking process. Maternal & Child Nutrition. 2014;10:126–34.
23. Nackers F, Broillet F, Oumarou D, Djibo A, Gaboulaud V, Guerin PJ, Rusch B, Grais RF, Captier V. Effectiveness of ready-to-use therapeutic food compared to a corn/soy-blend-based pre-mix for the treatment of childhood moderate acute malnutrition in Niger. Journal of Tropical Pediatrics. 2010;56:407–13.
24. LaGrone LN, Trehan I, Meuli GJ, Wang RJ, Thakwalakwa C, Maleta K, Manary MJ. A novel fortified blended flour, corn-soy blend “plus-plus,” is not inferior to lipid-based
181
ready-to-use supplementary foods for the treatment of moderate acute malnutrition in Malawian children. American Journal of Clinical Nutrition. 2011;95:212–9.
25. Patel MP, Sandige HL, Ndekha M, Briend A. Supplemental feeding with ready-to-use therapeutic food in Malawian children at risk of malnutrition. Journal of Health. 2011.
26. Isanaka S, Nombela N, Djibo A, Poupard M, Van Beckhoven D, Gaboulaud V, Guerin PJ, Grais RF. Effect of preventive supplementation with ready-to-use therapeutic food on the nutritional status, mortality, and morbidity of children aged 6 to 60 months in Niger. Journal of the American Medical Association. Am Med Assoc; 2009;301:277–85.
27. Imdad A, Sadiq K, Bhutta ZA. Evidence-based prevention of childhood malnutrition. Current Opinion in Clinical Nutrition and Metabolic Care. 2011;14:276–85.
28. Talley L. Prevention of Acute Malnutrition During the Lean Season:Comparison of a Lipid-Based Nutrient Supplement and an Improved Dry Ration, South Darfur,Sudan. A Quasi-Experimental Study. Journal of Nutritional Disorders and Therapy. 2012;02.
29. Nga TT, Nguyen M, Mathisen R, Hoa DT, Minh NH, Berger J, Wieringa FT. Acceptability and impact on anthropometry of a locally developed ready-to-use therapeutic food in pre-school children in Vietnam. Nutrition Journal. 2013;12:120.
30. Trehan I, Goldbach HS, LaGrone LN, Meuli GJ, Wang RJ, Maleta KM, Manary MJ. Antibiotics as Part of the Management of Severe Acute Malnutrition. New England Journal of Medicine. 2013;368:425–35.
31. Nahar B, Hamadani JD, Ahmed T, Tofail F, Rahman A, Huda SN, Grantham-McGregor M. Effects of psychosocial stimulation on growth and development of severely malnourished children in a nutrition unit in Bangladesh. European Journal of Clinical Nutrition. 2009;63:725–31.
32. Bailey S, Hedlund K. The impact of cash transfers on nutrition in emergency and transitional contexts. London: Humanitarian Policy Group, Overseas Development Institute; 2012. 52 p.
33. World Health Organization. MANAGEMENT OF SEVERE MALNUTRITION:A MANUAL FOR PHYSICIANS AND OTHER SENIOR HEALTH WORKERS. World Health Organization. Geneva: World Health Organization; 1999 Jun pp. 1–68.
34. Chaiken MS, Deconinck H, Degefie T. The promise of a community-based approach to managing severe malnutrition: A case study from Ethiopia. Food and Nutrition Bulletin. Nevin Scrimshaw International Nutrition Foundation; 2006;27:95–104.
35. Ciliberto MA, Sandige H, Ndekha MJ, Ashorn P, Briend A, Ciliberto HM, Manary MJ. Comparison of home-based therapy with ready-to-use therapeutic food with standard therapy in the treatment of malnourished Malawian children: a controlled, clinical effectiveness trial. The American journal of clinical nutrition. Am Soc Nutrition; 2005;81:864–70.
182
36. Defourny I, Seroux G, Abdelkader I, Harczi G. Management of moderate acute malnutrition with RUTF in Niger. Field Exchange. 2007;31:1–3.
37. Ashworth A. Efficacy and effectiveness of community-based treatment of severe malnutrition. FOOD AND NUTRITION BULLETIN-UNITED NATIONS …. 2006.
38. Bassett L. Can conditional cash transfer programs play a greater role in reducing child undernutrition? World Bank Social Policy Discussion Paper. 2008;835:1–84.
39. Schuftan C. Malnutrition and income: Are we being misled? (A dissenting view about a confusing literature). Ecology of Food and Nutrition. 1998;37:101–21.
40. Kennedy E, Peters P. Household food security and child nutrition: the interaction of income and gender of household head. World Development. Elsevier; 1992;20:1077–85.
41. Kennedy E, R O. Health and nutrition effects of sugar cane production in south-western Kenya. Food and Nutrition Bulletin. 1990;12:261–7.
42. Gaarder MM, Glassman A, Todd JE. Conditional cash transfers and health: unpacking the causal chain. Journal of Development Effectiveness. 2010;2:6–50.
43. Rivera J, Sotres-Alvarez D, Habicht JP, Shamah T, Villalpando S. Impact of the Mexican Program for Education, Health, and Nutrition (Progresa) on Rates of Growth and Anemiain Infants and Young Children. Journal of the American Medical Association. 2004;291:1–8.
44. Barber SL, Gertler PJ. Empowering women: how Mexico's conditional cash transfer programme raised prenatal care quality and birth weight. Journal of Development Effectiveness. 2010;2:51–73.
45. Maluccio JA, Flores R. Impact evaluation of a conditional cash transfer program: The Nicaraguan Red de Proteccion Social. International Food Policy Research Institute. International Food Policy Research Institute; 2004 Sep pp. 1–89. Report No.: 184.
46. Lagarde M, Haines A, Palmer N. Conditional Cash Transfers for Improving Uptake of Health Interventions in Low- and Middle-Income Countries: A Systematic Review. Journal of the American Medical Association. 2007;298:1900.
47. Morris SS, Flores R, Olinto P, Medina JM. Monetary incentives in primary health care and effects on use and coverage of preventive health care interventions in rural Honduras: cluster randomised trial. The Lancet. 2004;364:2030–7.
48. Adato M, Roopnaraine T, Becker E. Understanding use of health services in conditional cash transfer programs: Insight from qualitative research in Latin America and Turkey. Social Science & Medicine. Elsevier Ltd; 2011;72:1921–9.
49. Bassani DG, Arora P, Wazny K, Gaffey MF, Lenters L, Bhutta ZA. Financial incentives and coverage of child health interventions: a systematic review and meta-analysis. BMC
183
Public Health. BioMed Central Ltd; 2013;13:S30.
50. Gitter SR, Manley J, Slavchevska V. How Effective are Cash Transfer Programs at Improving Nutritional Status? Towson University Department of Economics; 2010. Report No.: 2010-18.
51. Leroy JL, Ruel M, Verhofstadt E. The impact of conditional cash transfer programmes on child nutrition: a review of evidence using a programme theory framework. Journal of Development Effectiveness. 2009;1:103–29.
52. Alderman H. Can Transfer Programs be Made More Nutrition Sensitive? International Food Policy Research Institute. International Food Policy Research Institute; 2014 Apr. Report No.: DP 01342.
53. Morris SS, Olinto P, Flores R, Nilson EAF, Figueiró AC. Conditional cash transfers are associated with a small reduction in the rate of weight gain of preschool children in northeast Brazil. Journal of Nutrition. 2004;134:2336–41.
54. Fiszbein A, Schady NR, Ferreira FH. Conditional cash transfers: reducing present and future poverty. Washington DC: The International Bank for Reconstruction and Development/The World Bank; 2009.
55. Fenn B, Noura G, Sibson V, Dolan C, Shoham J. The role of unconditional cash transfers during a nutritional emergency in Maradi region, Niger: a pre–post intervention observational study. PHN. 2014;:1–9.
56. Hidrobo M, Hoddinott J, Peterman A, Margolies A, Moreira V. Cash, Food, or Vouchers? Evidence from a randomized experiment in Northern Ecuador. International Food Policy Research Institute. International Food Policy Research Institute; 2012 Apr. Report No.: DP 01234.
57. Hoddinott J, Sandstrom S, Upton J. The Impact of Cash and Food Transfers: Evidence from a randomized intervention in Niger. International Food Policy Research Institute. International Food Policy Research Institute; 2014 Apr pp. 1–32. Report No.: DP 01341.
58. Requejo J, Bryce J. Countdown to 2015 Decade Report (2000-2010): Taking stock of maternal, newborn, and child survival. Requejo J, editor. World Health Organization; 2010 May pp. 1–56.
59. Glasgow RE, Vogt TM, Boles SM. Evaluating the public health impact of health promotion interventions: the RE-AIM framework. AMerican Journal of Public Health. 1999;89:1322–7.
60. Guerrero S, Myatt M, Collins S. Determinants of coverage in Community- based Therapeutic Care programmes: towards a joint quantitative and qualitative analysis. Disasters. 2010;34:571–85.
61. Streatfield PK, Koehlmoos TP, Alam N, Mridha MK. Mainstreaming nutrition in
184
maternal, newborn and child health: barriers to seeking services from existing maternal, newborn, child health programmes. Maternal & Child Nutrition. Wiley Online Library; 2008;4:237–55.
62. Guerrero S, Rogers E. Access for all: What factors influence access to community-based treatment of severe acute malnutrition? Coverage Monitoring Network. London; 2013;2:1–13.
63. Guerrero S, Ellie. Access for all: What can community-based SAM treatment learn from other public health interventions to improve access and coverage? Coverage Monitoring Network. London; 2014;3:1–11.
64. Goffman E. Stigma: Notes on the management of spoiled identity. Simon and Schuster, Inc; 2009.
65. Mahajan AP, Sayles JN, Patel VA, Remien RH, Sawires SR, Ortiz DJ, Szekeres G, Coates TJ. Stigma in the HIV/AIDS epidemic: a review of the literature and recommendations for the way forward. AIDS. 2008;22:S57–S65.
66. Parker R, Aggleton P. HIV and AIDS-related stigma and discrimination: a conceptual framework and implications for action. Social Science & Medicine. 2003;57:13–24.
67. Link BG, Phelan JC. Conceptualizing stigma. Annual review of Sociology. JSTOR; 2001;27:363–85.
68. Major B, O'Brien LT. The Social Psychology of Stigma. Annual Review of Psychology. 2005;56:393–421.
69. Steele CM. A threat in the air: How stereotypes shape intellectual identity and performance. American Psychologist. 1997;52:613–29.
70. Pinel EC. Stigma consciousness: The psychological legacy of social stereotypes. Journal of Personality and Social Psychology. American Psychological Association; 1999;76:114–28.
71. Turan JM, Bukusi EA, Onono M, Holzemer WL, Miller S, Cohen CR. HIV/AIDS Stigma and Refusal of HIV Testing Among Pregnant Women in Rural Kenya: Results from the MAMAS Study. AIDS Behav. 2010;15:1111–20.
72. Coreil J, Mayard G, Simpson KM, Lauzardo M, Zhu Y, Weiss M. Social Science & Medicine. Social Science & Medicine. Elsevier Ltd; 2010;71:1409–17.
73. Baskind R, Birbeck GL. Epilepsy-associated stigma in sub-Saharan Africa: The social landscape of a disease. Epilepsy & Behavior. 2005;7:68–73.
74. Keusch G, Wilentz J, Kleinman A. Stigma and global health: developing a research agenda. The Lancet. 2006;367:525–7.
185
75. Hatzenbuehler ML, Link BG. Social Science & Medicine. Social Science & Medicine. Elsevier Ltd; 2014;103:1–6.
76. Mull D. Traditional perceptions of marasmus in Pakistan. Social Science & Medicine. 1991;32:175–91.
77. Howard M, Millard A. Hunger and shame: Child malnutrition and poverty on Mount Kilimanjaro. Routledge; 1997.
78. Nyblade L, Stangl A, Weiss E, Ashburn K. Combating HIV stigma in health care settings: what works? Journal of the International AIDS Society. BioMed Central Ltd; 2009;12:15.
79. Eilerts G. Niger 2011–12: A Crisis of Prices? World Bank Knowledge and Learning Forum. United States Agency for International Development; 2012 pp. 1–21. Report No.: 1.
80. Aker JC. Droughts, Grain Markets and Food Crisis in Niger. Social Science Research Network. Social Science Research Network; 2008 pp. 1–47. Report No.: 1.
81. Trench P, Rowley J, Diarra M. Beyond any drought: root causes of chronic vulnerability in the Sahel. Food and Agricultural Organization (FAO); 2007.
82. Hampshire K, Panter-Brick C, Kilpatrick K, Casiday RE. Saving lives, preserving livelihoods: Understanding risk, decision-making and child health in a food crisis. Social Science & Medicine. Elsevier Ltd; 2009;68:758–65.
83. Clay E. The Niger food crisis: How has this happened? What should be done to prevent a recurrence. Overseas Development Institute September. Overseas Development Insitute; 2005 pp. 1–4. Report No.: 48.
84. Kenya National Bureau of Statistics. Marsabit District Multiple Indicator Cluster Survey 2008. Nairobi: Kenya National Bureau of Statistics; 2009 Jun.
85. Swift J, Ivo P, editors. Pastoralist Communication Initiative Archives [Internet]. [cited 2014 Jun 3]. Available from: http://www.pastoralists.org/category/archive/
86. Bryce J, Arnold F, Blanc A, Hancioglu A, Newby H, Requejo J, Wardlaw T, the CHERG Working Group on Improving Coverage Measurement. Measuring Coverage in MNCH: New Findings, New Strategies, and Recommendations for Action. Chappell L, editor. PLoS Med. 2013;10:e1001423.
87. Ensor T. Overcoming barriers to health service access: influencing the demand side. Health Policy and Planning. 2004;19:69–79.
88. Ruel MT, Alderman H. Nutrition-sensitive interventions and programmes: how can they help to accelerate progress in improving maternal and child nutrition? The Lancet. Elsevier Ltd; 2013;382:1–16.
186
89. Bhutta ZA, Das JK, Rizvi A, Gaffey MF, Walker N, Horton S, Webb P, Lartey A, Black RE. Evidence-based interventions for improvement of maternal and child nutrition: what can be done and at what cost? The Lancet. Elsevier Ltd; 2013;382:1–26.
90. Niger: Enquête Démographique et de Santé et à Indicateurs Multiples 2012. Demographic Health Survey; 2012 Jan pp. 1–24.
91. Boudreau T. The Practitioner's Guide to the Household Economy Approach. Regional Hunger and Vulnerability Program; 2007 Sep pp. 1–401.
92. Understanding Household Economy in Rural Niger. London: Save the Children; 2009 Oct pp. 1–108.
93. Online Currency Converter [Internet]. [cited 2013 Jul 24]. Available from: http://www.freecurrencyrates.com/exchange-rate-history/USD-XOF/2012
94. The World Bank, editor. Gross National Income per capita [Internet]. The World Bank; [cited 2014 Jan 24]. Available from: http://data.worldbank.org/indicator/NY.GNP.PCAP.CD/countries
95. World Health Organization. WHO Multicentre Growth Reference Study Group. WHO Child Growth Standards: Length/height-for-age, weight-for-age, weight-for-length, weight-for-height and body mass index-for-age: Methods and development. World Health Organization; 2006 Apr.
96. Golden M, Brennan M, Brennan R, Kaiser R, Mone C, Nathan R, Robinson C, Woodruff B, Seaman J, Erhardt J. Measuring Mortality, Nutritional Status, and Food Security in Crisis Situations: SMART Methodology. UNHCR, USAID, US Department of State, WFP, WHO; 2006 Aug pp. 1–129.
97. Shengelia B, Tandon A, Adams OB, Murray CJL. Access, utilization, quality, and effective coverage: An integrated conceptual framework and measurement strategy. Social Science & Medicine. 2005;61:97–109.
98. Erhardt J, Gross R. Emergency Nutrition Assessment software (ENA) [Internet]. Nutrisurvey. Available from: http://www.nutrisurvey.de/ena/ena.html
99. Guerrero S, Rogers E. ACCESS FOR ALL. Coverage Monitoring Network. 2014;:1–11.
100. World Health Organization. Indicators for assessing infant and young child feeding practices: Measurement. Geneva: World Health Organization; 2010.
101. Beusenberg M, Orley JH. A user's guide to the self reporting questionnaire (SRQ). Division of Mental Health, World Health Organization. Geneva: Geneva: World Health Organization; 1994.
102. Swindale A, Bilinsky P. Household Dietary Diversity Score (HDDS) for Measurement of Household Food Access: Indicator Guide. 2nd ed. Washington, DC: Food and
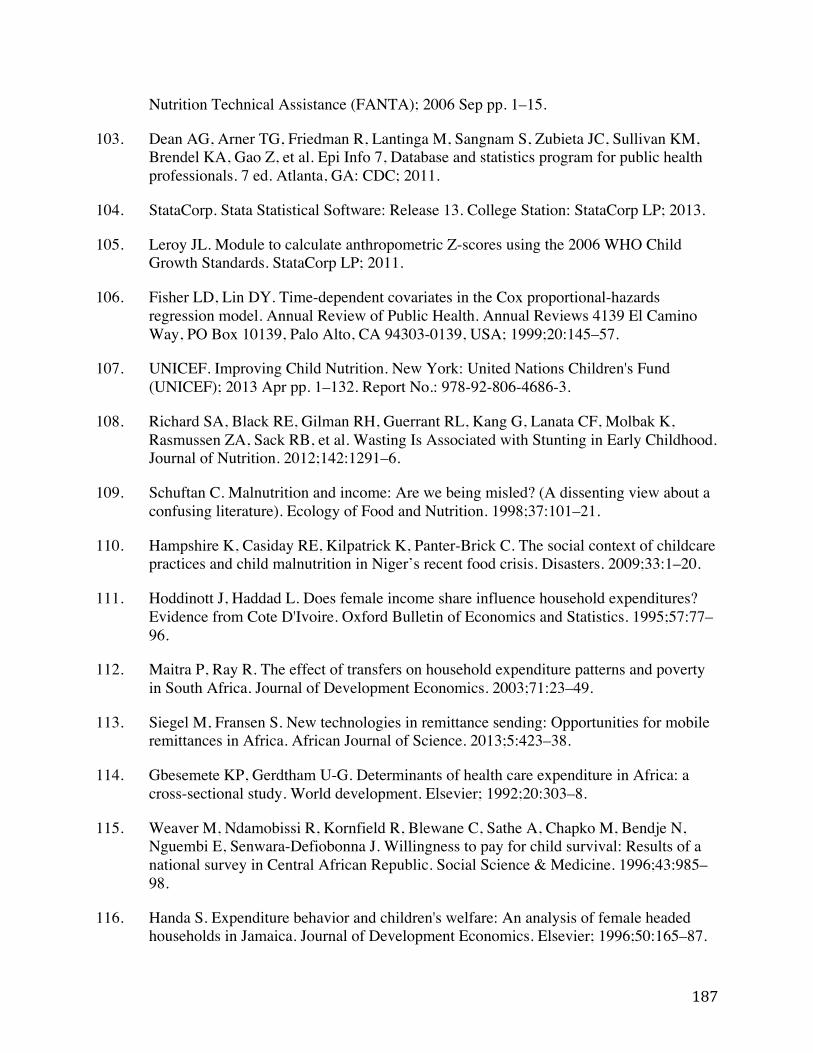
187
Nutrition Technical Assistance (FANTA); 2006 Sep pp. 1–15.
103. Dean AG, Arner TG, Friedman R, Lantinga M, Sangnam S, Zubieta JC, Sullivan KM, Brendel KA, Gao Z, et al. Epi Info 7, Database and statistics program for public health professionals. 7 ed. Atlanta, GA: CDC; 2011.
104. StataCorp. Stata Statistical Software: Release 13. College Station: StataCorp LP; 2013.
105. Leroy JL. Module to calculate anthropometric Z-scores using the 2006 WHO Child Growth Standards. StataCorp LP; 2011.
106. Fisher LD, Lin DY. Time-dependent covariates in the Cox proportional-hazards regression model. Annual Review of Public Health. Annual Reviews 4139 El Camino Way, PO Box 10139, Palo Alto, CA 94303-0139, USA; 1999;20:145–57.
107. UNICEF. Improving Child Nutrition. New York: United Nations Children's Fund (UNICEF); 2013 Apr pp. 1–132. Report No.: 978-92-806-4686-3.
108. Richard SA, Black RE, Gilman RH, Guerrant RL, Kang G, Lanata CF, Molbak K, Rasmussen ZA, Sack RB, et al. Wasting Is Associated with Stunting in Early Childhood. Journal of Nutrition. 2012;142:1291–6.
109. Schuftan C. Malnutrition and income: Are we being misled? (A dissenting view about a confusing literature). Ecology of Food and Nutrition. 1998;37:101–21.
110. Hampshire K, Casiday RE, Kilpatrick K, Panter-Brick C. The social context of childcare practices and child malnutrition in Niger’s recent food crisis. Disasters. 2009;33:1–20.
111. Hoddinott J, Haddad L. Does female income share influence household expenditures? Evidence from Cote D'Ivoire. Oxford Bulletin of Economics and Statistics. 1995;57:77–96.
112. Maitra P, Ray R. The effect of transfers on household expenditure patterns and poverty in South Africa. Journal of Development Economics. 2003;71:23–49.
113. Siegel M, Fransen S. New technologies in remittance sending: Opportunities for mobile remittances in Africa. African Journal of Science. 2013;5:423–38.
114. Gbesemete KP, Gerdtham U-G. Determinants of health care expenditure in Africa: a cross-sectional study. World development. Elsevier; 1992;20:303–8.
115. Weaver M, Ndamobissi R, Kornfield R, Blewane C, Sathe A, Chapko M, Bendje N, Nguembi E, Senwara-Defiobonna J. Willingness to pay for child survival: Results of a national survey in Central African Republic. Social Science & Medicine. 1996;43:985–98.
116. Handa S. Expenditure behavior and children's welfare: An analysis of female headed households in Jamaica. Journal of Development Economics. Elsevier; 1996;50:165–87.
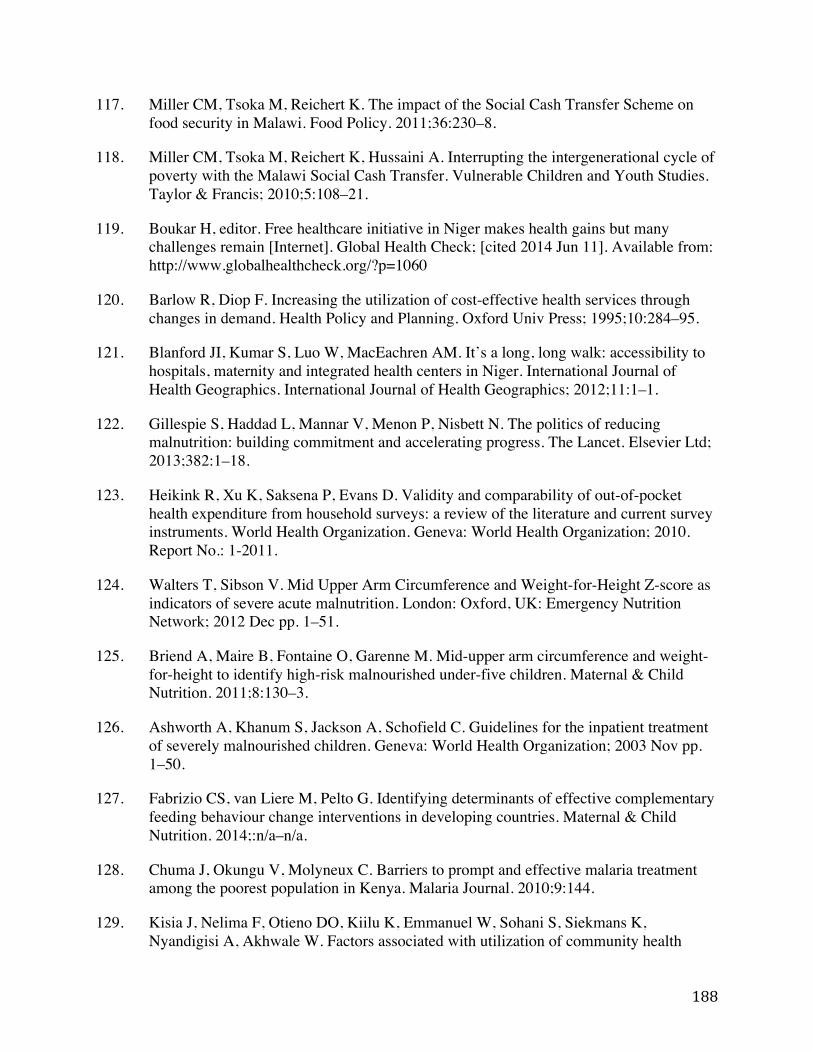
188
117. Miller CM, Tsoka M, Reichert K. The impact of the Social Cash Transfer Scheme on food security in Malawi. Food Policy. 2011;36:230–8.
118. Miller CM, Tsoka M, Reichert K, Hussaini A. Interrupting the intergenerational cycle of poverty with the Malawi Social Cash Transfer. Vulnerable Children and Youth Studies. Taylor & Francis; 2010;5:108–21.
119. Boukar H, editor. Free healthcare initiative in Niger makes health gains but many challenges remain [Internet]. Global Health Check; [cited 2014 Jun 11]. Available from: http://www.globalhealthcheck.org/?p=1060
120. Barlow R, Diop F. Increasing the utilization of cost-effective health services through changes in demand. Health Policy and Planning. Oxford Univ Press; 1995;10:284–95.
121. Blanford JI, Kumar S, Luo W, MacEachren AM. It’s a long, long walk: accessibility to hospitals, maternity and integrated health centers in Niger. International Journal of Health Geographics. International Journal of Health Geographics; 2012;11:1–1.
122. Gillespie S, Haddad L, Mannar V, Menon P, Nisbett N. The politics of reducing malnutrition: building commitment and accelerating progress. The Lancet. Elsevier Ltd; 2013;382:1–18.
123. Heikink R, Xu K, Saksena P, Evans D. Validity and comparability of out-of-pocket health expenditure from household surveys: a review of the literature and current survey instruments. World Health Organization. Geneva: World Health Organization; 2010. Report No.: 1-2011.
124. Walters T, Sibson V. Mid Upper Arm Circumference and Weight-for-Height Z-score as indicators of severe acute malnutrition. London: Oxford, UK: Emergency Nutrition Network; 2012 Dec pp. 1–51.
125. Briend A, Maire B, Fontaine O, Garenne M. Mid-upper arm circumference and weight-for-height to identify high-risk malnourished under-five children. Maternal & Child Nutrition. 2011;8:130–3.
126. Ashworth A, Khanum S, Jackson A, Schofield C. Guidelines for the inpatient treatment of severely malnourished children. Geneva: World Health Organization; 2003 Nov pp. 1–50.
127. Fabrizio CS, van Liere M, Pelto G. Identifying determinants of effective complementary feeding behaviour change interventions in developing countries. Maternal & Child Nutrition. 2014;:n/a–n/a.
128. Chuma J, Okungu V, Molyneux C. Barriers to prompt and effective malaria treatment among the poorest population in Kenya. Malaria Journal. 2010;9:144.
129. Kisia J, Nelima F, Otieno DO, Kiilu K, Emmanuel W, Sohani S, Siekmans K, Nyandigisi A, Akhwale W. Factors associated with utilization of community health
189
workers in improving access to malaria treatment among children in Kenya. Malaria Journal. Malaria Journal; 2012;11:1–1.
130. Kizito J, Kayendeke M, Nabirye C, Staedke SG, Chandler CI. Improving access to health care for malaria in Africa: a review of literature on what attracts patients. Malaria Journal. 2012;11:55.
131. Opwora AS, Laving AM, Nyabola LO, Olenja JM. Who is to blame? Perspectives of caregivers on barriers to accessing healthcare for the under-fives in Butere District, Western Kenya. BMC Public Health. BioMed Central Ltd; 2011;11:272.
132. Weaver A. Factors associated with appropriate diarrhea case management in hospitalized children under 5 in Nyanza Province, Kenya. Ram P, editor. [Buffalo]: State University of New York; 2010. pp. 1–43.
133. Rüsch N, Angermeyer MC, Corrigan PW. Mental illness stigma: Concepts, consequences, and initiatives to reduce stigma. European Psychiatry. 2005;20:529–39.
134. Mak WWS, Mo PKH, Cheung RYM, Woo J, Cheung FM, Lee D. Comparative stigma of HIV/AIDS, SARS, and Tuberculosis in Hong Kong. Social Science & Medicine. 2006;63:1912–22.
135. Khisa AM, Nyamongo IK. Still living with fistula: an exploratory study of the experience of women with obstetric fistula following corrective surgery in West Pokot, Kenya. RHM. Reproductive Health Matters; 2012;20:59–66.
136. Jazeera Al, editor. Ethnic clashes in Kenya leave dozens dead [Internet]. Al Jazeera; [cited 2014 Jun 3]. Available from: http://www.aljazeera.com/news/africa/2013/12/ethnic-clashes-kenya-leave-dozens-dead-201312841942552182.html
137. Kenya Humanitarian Response, editor. Conflict Assessment Report: Moyale [Internet]. Humanitarian Response; [cited 2014 Jun 3]. Available from: https://kenya.humanitarianresponse.info/sites/kenya.humanitarianresponse.info/files/assessments/MOYALE%20CONFLICT%20ASSESSMENT%20REPORT%20Sept%202013.pdf
138. Wambua F. Marsabit County SMART Nutrition Survey. Food for the Hungry, Concern Worldwide, World Vision, and the Kenyan Ministry of Health; 2013 Dec pp. 1–50.
139. Kenya Ministry of Health, editor. Kenya Health Information System [Internet]. [cited 2014 Jun 3]. Available from: https://hiskenya.org/dhis-web-commons/security/login.action
140. Barton PL. Understanding the US Health Service System. 4 ed. Health Administration Press; 2010. 32 p.
141. Bond V. Stigma when there is no other option: understanding how poverty fuels
190
discrimination toward people living with HIV in Zambia. AIDS. 2006.
142. Campbell C, Skovdal M, Mupambireyi Z, Madanhire C, Robertson L, Nyamukapa CA, Gregson S. Can AIDS stigma be reduced to poverty stigma? Exploring Zimbabwean children's representations of poverty and AIDS. Child Care Health Dev. 2011;38:732–42.
143. Sharkawy GE, Newton C, Hartley S. Attitudes and practices of families and health care personnel toward children with epilepsy in Kilifi, Kenya. Epilepsy & Behavior. 2006;8:201–12.
144. Duffy L. Suffering, shame, and silence: The stigma of HIV/AIDS. Journal of the Association of Nurses in AIDS Care. 2005;16:13–20.
145. Winskell K, Hill E, Obyerodhyambo O. Comparing HIV-related symbolic stigma in six African countries: social representations in young people's narratives. Social Science & Medicine. 2011.
146. Carr D, Eckhaus T, Brady L, Watts C, Zimmerman C, Nyblade L. Scaling up the response to HIV stigma and discrimination. Washington D.C. International Center for Research on Women [ICRW] 2010; 2010. Report No.: 1.
147. Reis C, Heisler M, Amowitz LL, Moreland RS, Mafeni JO, Anyamele C, Iacopino V. Discriminatory Attitudes and Practices by Health Workers toward Patients with HIV/AIDS in Nigeria. PLoS Med. Public Library of Science; 2005;2:e246.
148. Tangney JP, Dearing RL. Shame and Guilt. The Guilford Press; 2002.
149. Earnshaw VA, Chaudoir SR. From Conceptualizing to Measuring HIV Stigma: A Review of HIV Stigma Mechanism Measures. AIDS Behavior. 2009;13:1160–77.
150. Caulfield LE, Huffman SL, Piwoz EG. Interventions to impove intake of complementary foods by infants 6 to 12 months of age in developing countries: Impact on growth and on the prevalence of malnutrition and potential contribution to child survival. Nevin Scrimshaw International Nutrition Foundation; 1999;20:183–200.
151. Kerac M, Bunn J, Seal A, Thindwa M, Tomkins A, Sadler K, Bahwere P, Collins S. Probiotics and prebiotics for severe acute malnutrition (PRONUT study): a double-blind efficacy randomised controlled trial in Malawi. Lancet. 2009;374:136–44.
152. Hendricks KM. Ready-to-use therapeutic food for prevention of childhood undernutrition. Nutrition Reviews. 2010;68:429–35.
153. Leroy JL, Habicht JP, Pelto G, Bertozzi SM. Current Priorities in Health Research Funding and Lack of Impact on the Number of Child Deaths per Year. AMerican Journal of Public Health. 2007;97:219–23.
154. Jones G, Steketee RW, Black RE, Bhutta ZA, Morris SS. How many child deaths can we
191
prevent this year? The Lancet. Elsevier; 2003;362:65–71.
155. Bryce J, Arifeen el S, Pariyo G, Lanata CF, Gwatkin D, Habicht JP. Reducing child mortality: can public health deliver? The Lancet. Elsevier; 2003;362:159–64.
156. Morris SS, Cogill B, Uauy R. Effective international action against undernutrition: why has it proven so difficult and what can be done to accelerate progress? The Lancet. Elsevier; 2008;371:608–21.