lesotho cash & voucher market study
TRANSCRIPT
i
Lesotho Cash & Voucher Market
Study Findings Report
Armstrong Associates Consulting (Pty) Ltd
ii
Acknowledgments
A study of this nature requires the collaboration of many different stakeholders, including members
of households and communities who face chronic food security. The Research Team would like to
thank Imadeldin Osman Salih, Rui Possolo and Bile Khalif for selecting Armstrong Associates Consulting
to carry out the study and for the valuable guidance they provided at all stages of the process. The
content of the study is mostly the result of the generous contribution of time and information by the
traders across the districts where the fieldwork took place. Of equal importance is the contribution
of the many community members who participated in focus groups and gave freely of their time to
share their experiences and observations. The burden for the Research Team was made lighter by an
excellent team of Research Assistants and Data Entry Clerks. We thank them all for their
professionalism and commitment. Finally, as the study leader, I offer warm recognition of the
contributions of my colleagues, Russell Armstrong and Thabelo Khoboko.
Thuso Green, Study Leader Armstrong Associates Consulting Maseru, Lesotho November 2011

iii
Executive Summary
Lesotho continues to face food-insecurity as a result of recent unpredictable and devastating changes
in regional climatic patterns. This situation has been exacerbated by ongoing regional and global
economic shocks. Consequently, the Lesotho Vulnerability Assessment Committee estimated that in
2011 as many as 582, 000 Basotho would face high levels of food insecurity. Current estimates of food
insecure individuals by the Food and Agricultural Organization stand at 514, 000. With a population
of 1, 876, 633 this means that 27.4% of the population are food insecure; many are in need of
emergency food assistance.
Food security in Lesotho has been a critical development priority during the past decade. During this
time, both locally and globally, the World Food Programme (WFP) and its strategic partners have been
investigating and piloting different approaches to food security interventions. Specifically, WFP has
sought to transition away from emergency food relief to more sustainable and longer-term
interventions that build resilience at community and country levels towards gradually restoring the
ability of Basotho to achieve and maintain adequate food security.
As part of its recently revised country assistance strategy, WFP Country Office Lesotho has chosen as
a priority the investigation of opportunities for changing its food assistance modalities in order to
achieve this longer term impact. One such opportunity involves the current process of investigating
the appropriateness and feasibility of cash transfer or food voucher programmes in order to more
effectively mitigate and ultimately resolve Lesotho’s ongoing food insecurity challenges. In
recognition that the use cash transfers or vouchers are not universally applicable in every context,
WFP Lesotho has begun an assessment of the suitability of these alternative food assistance
modalities. The process was initiated in April, 2011, with a high-level cash/voucher feasibility study,
conducted under the guidance of the WFP Regional Office in Pretoria. Amongst the recommendations
that were made by the study group was the need to undertake a more in depth market analysis in
order to assess how local food markets would respond to an increase in the purchasing power of food
insecure households. It was also recommended that the results of the study be used to explore the
feasibility and cost-effectiveness of WFP’s current and proposed approaches to food assistance. In
this regard, WFP Lesotho contracted Armstrong Associates Consulting, based in Maseru to undertake
the food market analysis.

iv
The study and the analysis were guided by the following main questions:
Are markets operational and physically accessible by targeted households?
Is appropriate food available in sufficient quantities and at reasonable prices?
Are food markets sufficiently integrated so that food will flow to deficit/target zones?
Will traders respond adequately to any increase in effective demand based on their storage
capacities, supply sources, required quality and preference of customers, and access to credit,
amongst other factors?
Is it likely or unlikely that cash/vouchers will contribute to an unintended rise in the purchase
prices for food basket items?
In view of the results of a rapid assessment on the feasibility of a cash or voucher programme for
Lesotho, WFP also requested that the study address issues of cost-effectiveness given that the earlier
assessment had shown a substantial differences in cost that would negatively affect any decision to
move away from direct food assistance.
The market analysis was conducted with two main components: a macro-level food market analysis
using existing data banks, document reviews, and key informant interviews; and, a traders’ survey
carried out in the four districts where WFP currently focuses most of its food assistance (Maseru,
Berea, Mokhotlong and Thaba Tseka). The traders’ survey involved 120 shop owners or retailers
selected using a purposive sampling approach and interviewed by research assistants using a standard
questionnaire. Primary and secondary data collected within the two study components was then
triangulated to provide a multi-dimensional perspective on the food market in Lesotho and, more
specifically, to estimate the different effects that might arise within this market should the current
direct food assistance modality be changed to either a cash, voucher or combined approach.
The findings of the study showed the following:
Food markets in Lesotho are dominated by imports from the neighbouring Republic of South
Africa (RSA). Except at the household level, in the form of subsistence farming, almost no food is
produced from farm gate to retail in Lesotho;

v
Food markets in Lesotho are accessible, integrated and operational. They are also likely to be able
to absorb any increases in volume due increased demand from the availability of cash within
impoverished, food insecure households;
Because of integration and competitiveness, there are unlikely to be any perverse incentives as a
result of a cash transfer or food voucher scheme. However, prices would still need to be closely
monitored as the data gives no absolute assurance against such trends on a local scale;
Although the regional food supply is current stable and adequate to address current levels of need,
regional and global events have a significant influence on price patterns. The purchasing power
of households in Lesotho, particularly those at the lower ranks of the socio-economic scale, is
fragile. Even small price increases can have significant negative effect on household food security;
The banking and financial services system in Lesotho is not accessible, particularly in remote or
mountainous regions. Because of this few consumer or retails routinely make use of such financial
services. Experience from other social cash transfer programmes in Lesotho show that cash
delivery and processing costs can add substantially to administrative and overhead costs.
Opportunities are arising for the use of cell phone networks for the cash transfer or voucher
redemption process. However, these are unlikely to be fully developed and useable within the
short term.
Finally, issues of market size and scale make cash or food voucher schemes more expensive than
direct food assistance, at least in the short to medium term. This is largely because the retailers
and wholesalers within the food market do not operate collectively and there cannot source food
items at the scale of WFP where significant price discounts are possible.
While cash or voucher programmes implemented by WFP elsewhere around the global have had the
aim of strengthening the food production and marketing capacities, this aim may not be feasible or
realistic in Lesotho. Most commodities sold in the country are imported from RSA. White maize, the
main staple food for the Basotho, could never, at least in the immediate future, be produced at a level
to supply the market at price competitive to what could be imported from RSA whether one is the
considering milling, wholesale or retail stage of value chain.
As it is currently organized, traders and purchasers within the Lesotho food market could never
individually or within small groups match the WFP procurement costs given the quantities that it can
procure at any one time and its ability to negotiate discounts. With such a substantial difference in
costs, changing from direct food assistance to a cash or voucher modality cannot rely on cost-
effectiveness alone. This change must be part of a longer term strategy to stabilize household food

vi
security and to reduce levels of poverty to the extent that local production of food expands and local
economies begin to provide sustainable livelihoods for poor, food insecure households.
vii
Table of Contents
List of Figures and Tables ............................................................................................................. x
List of Abbreviations ................................................................................................................... xi
1.0 Background & Context .......................................................................................................... 1
1.1 Introduction ............................................................................................................................ 1
1.2 WFP and Cash Transfer/Food Voucher Modalities ................................................................. 2
1.3 Experience with Food Assistance through Cash Transfers in Lesotho .................................... 3
1.4 Role of Markets in the Implementation of Cash Transfer/Food Voucher Programmes ......... 5
1.5 Methodological Considerations in Conducting a Market Analysis .......................................... 7
1.6 Need for a Market Study in Lesotho........................................................................................ 8
1.7 Purpose and Objectives for the Study ..................................................................................... 8
1.8 Study Implementation ............................................................................................................. 9
2.0 Methodology ..................................................................................................................... 10
2.1 Study Design .......................................................................................................................... 10
2.2 Sample Design ....................................................................................................................... 10
2.3 Sampling Process ................................................................................................................... 10
2.3.1 Sampling of Traders ............................................................................................... 11
2.3.2 Sampling of Beneficiaries and Non-Beneficiaries ................................................... 11
2.4 Instrumentation ..................................................................................................................... 12
2.5 Recruitment and Training of Research Assistants ................................................................. 12
2.6 Study Pilot .............................................................................................................................. 12
2.7 Secondary Data Sources ........................................................................................................ 12
2.8 Data Collection and Data Management Procedures ............................................................. 13
2.9 Data Entry and Analysis ......................................................................................................... 13
3.0 Findings .............................................................................................................................. 14
3.1 Food Security in Lesotho ....................................................................................................... 14
3.2 Local Food Market Characteristics ........................................................................................ 14

viii
3.2.1 Policy environment ................................................................................................. 15
3.2.2 Market Structure .................................................................................................... 15
3.2.3 Price trends ............................................................................................................. 17
3.2.4 Market Trends and Food Security ................................................................................ 18
3.3 Trader Survey ........................................................................................................................ 20
3.3.1 General Trader Characteristics ............................................................................... 20
3.3.2 Macro Food Availability ......................................................................................... 23
3.3.3 Most Important Food Commodities ....................................................................... 25
3.3.4 Volumes and flows of most traded consumables .................................................. 28
3.3.5 Sources of the three most important consumables traded .................................... 30
3.3.6 Constraints and Response Capacity ...................................................................... 31
3.3.7 Business Trading Practices ..................................................................................... 31
3.4 Food Basket Cost Effectiveness .............................................................................................. 34
3.5 Community Perspectives ........................................................................................................ 35
3.5.1 Household allocation of resources and financial decision making ........................ 35
3.5.2 Household access to local markets ........................................................................ 37
3.5.3 Household financial status and access to banking systems ................................... 37
3.5.4 General Observations ............................................................................................ 38
4.0 Discussion .......................................................................................................................... 40
4.1 Are markets operational and physically accessible by targeted households? ...................... 40
4.2. Is appropriate food available in sufficient quantities and at reasonable prices? ................. 40
4.3 Are food markets sufficiently integrated so that food will flow to deficit/target zones? ..... 40
4.4 Will traders respond adequately to any increase in effective demand based on their storage
capacities, supply sources, required quality and preference of customers, access to credit, etc?
41
4.5 Is it unlikely that cash/vouchers will contribute to rising purchase prices? ......................... 41
4.6 Why is food purchase through the local market more expensive compared to WFP
procurement? .......................................................................................................................... 41
5.0 Conclusions ........................................................................................................................ 42

ix
6.0 References ......................................................................................................................... 44
Appendix A Lesotho: A Socio-economic Country Context ........................................................ 46
Appendix B Terms of Reference ............................................................................................. 49
Appendix C WFP Lesotho Food Basket Items .......................................................................... 52
Appendix D Trader Questionnaire .......................................................................................... 53
Appendix E Focus Group Discussion Guide ............................................................................. 58
APPENDIX F Availability of WFP Food Basket Items .................................................................. 59

x
List of Figures and Tables
Figure 3.1 Southern Africa Maize Market Map
Figure 3.2 South African Raw Material Maize Prices
Figure 3.3 Share of global imports in total domestic utilization of cereals
Figure 3.4 Photo of trader being interviewed in a small rural shop
Figure 3.5 Retail outlet ownership
Figure 3.6 Type of trading activities
Figure 3.7 Type of trading by different shop types
Figure 3.8 Availability of expanded WFP food basket items
Figure 3.9 Prices of food items in urban vs. rural zones
Figure 3.10 Projected price changes of essential food basket items
Figure 3.11 Consumables most frequently identified amongst the three most important food
items traded
Figure 3.12 Most important consumables reported by wholesale entities
Figure 3.13 Most important consumables reported by supermarket entities
Figure 3.14 Most important consumables reported by small shop entities
Figure 3.15 Number of customers to whom the three most important consumables were sold in
the past month
Figure 3.16 Changes in the number of customers compared to the same period last year
Figure 3.17 Changes in the sales volume compared to the same period last year
Figure 3.18 Number of weeks traders report keeping their stock between purchase and sale
Figure 3.19 Proportion of traders providing credit to customers by shop function
Figure 3.20 Record-keeping of transaction costs by traders
Figure 3.21 Cost comparison of WFP vs. local retail purchase of key food items
Table 3.1 Classification of shops by type and districts
Table 3.2 Classification of retail outlet and ethnic ownership

xi WFP Cash & Voucher Market Study – Final Report November 2011
List of Abbreviations
ART Anti-retroviral Treatment /Therapy
CGP Child Grant Programme
FAO Food and Agricultural Organization
FEWS NET Famine Early Warning System Network
GDP Cross Domestic Product
GOL Government of Lesotho
LVAC Lesotho Vulnerability Assessment Committee
MOHSW Ministry of Health and Social Welfare
RSA Republic of South Africa
SACU Southern African Customs Union
SADC Southern African Development Community
SPSS Statistical Programme for Social Sciences
UNDP United Nations Development Programme
UNICEF United Nation Children’s Fund
USAID United States Agency for International Development
WFP World Food Programme

1 WFP Cash & Voucher Market Study – Final Report November 2011
1.0 Background & Context
1.1 Introduction
The Kingdom of Lesotho, located in the eastern part of Southern Africa, is a land-locked country completely
surrounded by the Republic of South Africa (RSA). The Kingdom covers an area of 30,350 km2 and has a
population of 1,876,633 million.1 The population growth rate declined between 1996 and 2006, from 1.5%
to 0.08%.2 Lesotho currently has the lowest growth rate in the southern African region. The impact of the
HIV epidemic is a major factor in the decline in population growth. The life expectancy for the Basotho is
currently 41 years.3 58% of the population is under the age of 19. 51% of the population is female; 23% of
the population lives in urban areas clustered along the borders with RSA. The remaining 77% of the
population lives in rural and remote mountainous areas.4
Food security in Lesotho has been a critical development priority during the past decade as a result of changes
in geo-political arrangements, ongoing economic shocks at the regional and global level, and, more recently,
unpredictable and devastating changes in regional climatic patterns. During this time, both locally and
globally, the World Food Programme (WFP) and its strategic partners have been investigating and piloting
different approaches to food security interventions. Specifically, WFP has sought to transition away from
emergency food relief to more sustainable and longer-term interventions that build resilience at community
and country levels towards gradually restoring the ability of Basotho to achieve and maintain adequate food
security.
As part of its recently revised country assistance strategy, WFP Lesotho has chosen as a priority the
investigation of opportunities for changing its food assistance modalities in order to achieve this longer term
impact. One such opportunity involves the current process of investigating the appropriateness and
feasibility of cash transfer or food voucher programmes in order to more effectively mitigate and ultimately
resolve Lesotho’s ongoing food insecurity challenges. One of the required decision tools for the investigation
is a comprehensive food market analysis. In this regard, WFP Lesotho contracted Armstrong Associates
Consulting, based in Maseru, to undertake the food market analysis and to provide market-related advice in
terms of the most effective food assistance response (food baskets, cash, vouchers or a combination) in order
to achieve its long term goal of stable and sustainable food security for the country.
1 GOL. 2009. Lesotho 2006 Population and Housing Census. Maseru, LS: MOFDP/BOS. 2 Ibid. 3 MOHSW and ICF Macro. 2010. 2009 Lesotho Demographic and Health Survey. Maseru, LS: MOHSW. 4 A more comprehensive discussion on the socio-economic context of Lesotho is included in Appendix A.
2
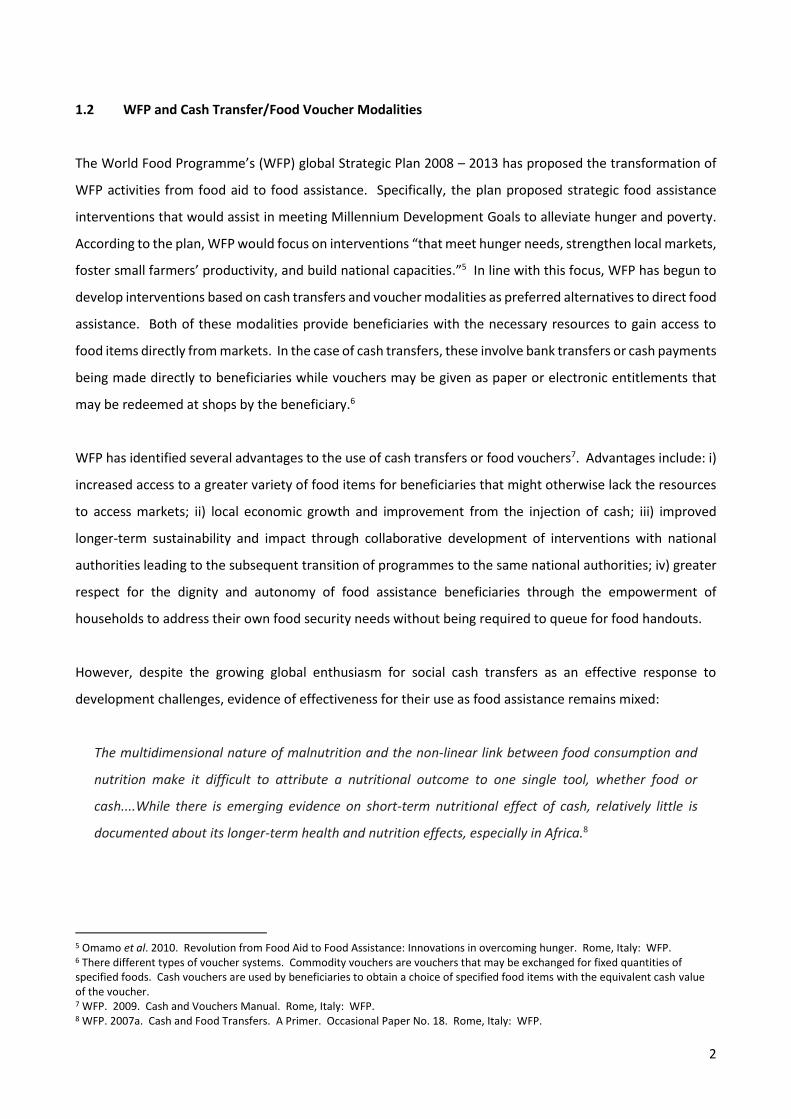
1.2 WFP and Cash Transfer/Food Voucher Modalities
The World Food Programme’s (WFP) global Strategic Plan 2008 – 2013 has proposed the transformation of
WFP activities from food aid to food assistance. Specifically, the plan proposed strategic food assistance
interventions that would assist in meeting Millennium Development Goals to alleviate hunger and poverty.
According to the plan, WFP would focus on interventions “that meet hunger needs, strengthen local markets,
foster small farmers’ productivity, and build national capacities.”5 In line with this focus, WFP has begun to
develop interventions based on cash transfers and voucher modalities as preferred alternatives to direct food
assistance. Both of these modalities provide beneficiaries with the necessary resources to gain access to
food items directly from markets. In the case of cash transfers, these involve bank transfers or cash payments
being made directly to beneficiaries while vouchers may be given as paper or electronic entitlements that
may be redeemed at shops by the beneficiary.6
WFP has identified several advantages to the use of cash transfers or food vouchers7. Advantages include: i)
increased access to a greater variety of food items for beneficiaries that might otherwise lack the resources
to access markets; ii) local economic growth and improvement from the injection of cash; iii) improved
longer-term sustainability and impact through collaborative development of interventions with national
authorities leading to the subsequent transition of programmes to the same national authorities; iv) greater
respect for the dignity and autonomy of food assistance beneficiaries through the empowerment of
households to address their own food security needs without being required to queue for food handouts.
However, despite the growing global enthusiasm for social cash transfers as an effective response to
development challenges, evidence of effectiveness for their use as food assistance remains mixed:
The multidimensional nature of malnutrition and the non-linear link between food consumption and
nutrition make it difficult to attribute a nutritional outcome to one single tool, whether food or
cash....While there is emerging evidence on short-term nutritional effect of cash, relatively little is
documented about its longer-term health and nutrition effects, especially in Africa.8
5 Omamo et al. 2010. Revolution from Food Aid to Food Assistance: Innovations in overcoming hunger. Rome, Italy: WFP. 6 There different types of voucher systems. Commodity vouchers are vouchers that may be exchanged for fixed quantities of specified foods. Cash vouchers are used by beneficiaries to obtain a choice of specified food items with the equivalent cash value of the voucher. 7 WFP. 2009. Cash and Vouchers Manual. Rome, Italy: WFP. 8 WFP. 2007a. Cash and Food Transfers. A Primer. Occasional Paper No. 18. Rome, Italy: WFP.

3
While different types of social cash transfer and voucher programmes are becoming widespread within social
and economic development approaches, their success is not universal, but is instead context dependent.9
For example, the cash transfer approach requires functional, integrated and accessible food markets so that
beneficiaries can purchase need food items from local markets. Cash transfers as the modality for food
assistance function in certain types of country contexts while direct food assistance is most effective in
others. A note of caution is evident in the ongoing global dialogue on what form of food assistance to
prioritize.
A key message is that appropriateness cannot be predetermined since programme objectives, the
economics of food consumption, market analysis, costs effectiveness and efficiency, capacity
requirements and beneficiary preferences all play a role in determining the most appropriate option or
combinations of options.10
For this reason a careful assessment of the context for each proposed intervention must be made to inform
the decision-making process about the suitability of cash transfers, voucher systems or other modalities for
the provision of food assistance.
Best practice experience in cash/voucher programme development has allowed WFP to propose seven key
issues to be addressed in order to determine whether country context favours the use of cash or voucher
modalities.11 These are: i) market size and functionality (i.e., whether the number of traders is adequate); ii)
food availability (i.e., whether food commodities are available on local markets); iii) geographic accessibility
of markets (i.e., whether food vulnerable households have easy access to markets); iv) inflation trends (i.e.,
whether consumer price indices are stable); v) long-term price stability for staple foods; vi) accessibility and
use of financial systems and service providers (i.e. where or how cash can be distributed, and the availability
of credit for traders for market expansion); vii) and, general stability and security within the country.
Therefore, the choice of food assistance provision must be made within the country level programme
environment in order to achieve sustainable change in food security status and to avoid unintended negative
consequences.
1.3 Experience with Food Assistance through Cash Transfers in Lesotho
The use of cash transfers by aid agencies has been limited in Lesotho. During the 2007/2008 drought crisis,
World Vision Lesotho implemented a temporary cash transfer project as an emergency food assistance
9 WFP. 2009. Cash and Vouchers Manual. Rome, Italy: WFP. 10 Ibid. 11 Ibid.

4
intervention. Approximately, 41,200 beneficiaries in the Maseru and Mohale’s Hoek districts received
unconditional monthly payments to augment household food supply that was drastically reduced by
interruption in subsistence farming practices caused by drought-induced crop damage. Two evaluation
studies were conducted, one on the overall efficacy of the programme and the other exploring the impact of
cash transfers on gender equity.
The first evaluation found that there was no significant increase in non-food, non-essential expenditures
(alcohol and cigarettes) within households. Most households used a “whole-wage system” to allocate and
manage the additional cash. This involved a discussion with the entire household of how to prioritize the use
of the transfer. As a result, in descending order, the cash transfer was used for food, educational needs,
personal hygiene and health needs.12 The overall evaluation found that 94% of cash recipients used almost
all their money on purchasing food. This trend is also reflected in the findings of Continuous Multi-Purpose
Household Survey which show that most households in Lesotho expend the majority of their financial
resources towards the purchasing of consumables to meet their daily needs..13
The second evaluation found with respect to gender equity that while gender conflicts in households were
common during times of crisis, such as food shortages, the cash transfer itself did not intensify these but
rather helped to mitigate them.
The overarching finding regarding gender relations and cash transfers is that gender conflicts within
households are reduced when more resources are coming into the household, and that cash reduces
gender conflict more than food.14
The second precedent involving the use of cash transfers in Lesotho has been the unconditional social cash
transfer scheme called the Lesotho Child Grant Programme (CGP). The scheme, which targets destitute
households caring for children, has been developed by the Government of Lesotho (GOL) and the United
Nations Children’s Agency (UNICEF) with support from the European Union. Eligible households receive a
quarterly grant worth LSL360 (USD50). Household selection, eligibility assessment and monitoring is done
initially through Village Assistance Committees with the help of CGP enumerators. As of September 2011,
the CGP was supporting approximately 9,000 households caring for 27,000 children in the four districts in
Lesotho where the programme currently operates.15 A recent assessment of the programme showed that
12Devereux S & Mhlanga M. 2008. Cash Transfers in Lesotho: An Evaluation of World Vision’s Cash and Food Transfers Pilot Project. Brighton, UK: Institute of Development Studies. 13 GOL. 2010. Continuous Multi-purpose Household Survey (4th Quarter, October 2010). Maseru, LS: Bureau of Statistics. 14 Slater R &Mphale M. 2008. Cash transfers, gender and generational relations: evidence from a pilot project in Lesotho. London, UK: Overseas Development Institute. 15 Pre-public-release data from UNICEF Lesotho country office. Used by permission.

5
spending of the benefit was almost exclusively targeted towards children’s educational needs, food, health
care needs and personal hygiene. In the majority of recipient households, women were the designated
beneficiaries and held the upper hand in household decision-making on how the money would be spent.16
Until December 2010, through WFP, eligible households also received supplementary food assistance in the
form of food baskets. Since then, however, this assistance has been phased out. A baseline survey to anchor
a comprehensive impact assessment in 2012 is currently being conducted. It is not clear how the phasing
out of food baskets will affect decision-making and prioritization of the benefit amongst beneficiary
households.
Both programmes, the World Vision cash transfer pilot and the CGP, have encountered similar challenges.
The reliance on a separate cash distribution system has proved cumbersome and costly. However, an
alternative is not easy to identify as numerous beneficiary households cannot physically access or do not
utilize banking or other financial services systems (i.e., Lesotho Post Bank). All of the funds have been spent
on consumables with none of the benefit used for savings or for investment in productive assets such as
livestock or farming inputs. This is likely a result of the difference between the amount of the benefit that is
received and the critical nature of the household needs that the transfer is meant to mitigate.17
1.4 Role of Markets in the Implementation of Cash Transfer/Food Voucher Programmes
As WFP’s global experience of cash transfer programmes has grown in recent years, so too has its
understanding of the critical importance of markets and market functionality in the choice of when and how
to implement such programmes. Two recent examples serve to demonstrate this. Voucher systems were
introduced in Burkino Faso and the Occupied Palestinian Territory in 2009. Some of the market challenges
that were identified in these interventions were that: i) many traders did not sell all the products in the food
basket; ii) WFP restricted food items to local foods rather than focusing on essential food products; iii) traders
required financial capacity to maintain sufficient stocks of food items to respond to beneficiary needs; iv)
traders required sufficient storage capacity to respond to additional demand from voucher beneficiaries. In
Burkino Faso, in post-distribution monitoring, shopkeepers reported that although the introduction of the
voucher system had improved their trading situation, the fluctuating prices of commodities were a concern,
in particular the price of maize, as vouchers were redeemed at fixed values. An important aspect contributing
to the success of the programme in the Occupied Palestinian Territory was that the supply chain of
wholesalers and retailers was fully integrated leading to an appropriate level of control over supply-
influenced price pressures.
16 Oxford Policy Management. 2011. A Rapid Assessment of the Lesotho Child Grants Programme. Maseru, LS: UNICEF. Cited by permission. 17 Ibid.

6
Given the potential barriers and enablers regarding the characteristics and functioning food markets,
understanding local, regional and global markets has become essential in the decision-making process
regarding what type of food assistance intervention to implement.
Food markets are the principal means through which billions of people try to assure their food security.
It is therefore essential that cash and food programmes are carefully designed without distorting price
signals and incentives.18
All types of food assistance have impacts on markets whether positive or negative. Undertaking a market
analysis is now a critical component within food security assessments and decisions on appropriate
responses, particular those involving cash transfers. It is critically important to consider all stakeholder
interests in order to avoid bringing about unintended ‘harms’ to food security at household levels,
livelihoods, markets, trading practices, or government policy.
Cash-based responses and other in-kind distributions are increasingly used as an alternative to food aid
to meet emergency requirements, while a wide range of safety net interventions are being promoted
as part of social protection and disaster risk reduction activities. Choosing the appropriate intervention
means understanding which intervention is likely to have the maximum benefit for the affected
population, with the minimum harm to unaffected actors, such as producers, traders and unaffected
consumers. A particular kind of market analysis is central to this kind of calculation.19
As a result, through WFP and its many global partners and stakeholders, a number of tools and approaches
are being developed and brought forward to ensure that whatever action is taken optimizes positive impacts
on local markets and market flows. In addition to cash transfers or demand side actions, these interventions
can also include market or supply side actions to address interruptions in market functionality caused by
natural disasters, for example, or other inhibitors such as lack of operational capacity or national and regional
trade restrictions.
18 WFP. 2007c. Market Analysis Tool—How to Conduct a Traders Survey? Rome, IT: WFP. 19 Regional Hunger and Vulnerability Programme (RHVP). 2007. The Practitioners’ Guide to the Household Economy Approach. London, UK: The Food Economy Group and Save the Children.

7
1.5 Methodological Considerations in Conducting a Market Analysis
There is a growing literature on the different strengths and weakness of market analysis methodologies.
Regionally, in southern Africa, consensus has been reached on the following list of essential components
for market analysis:20
an understanding of the national policy environment (many constraints are government related and can
only be addressed through government action);
a food supply (value) chain analysis to identify the key markets and market actors for different
geographic areas, and transaction costs, margins and bottlenecks;
an analysis of prices – both nominal and real prices – including trends, seasonal fluctuations, forecasts,
comparison of local prices with import party prices (IPP), and a determination of what is driving food
prices – whether simply general inflation (in line with the consumer price index, CPI) or other factors
(such as wage rates for example);
an analysis of market integration and market functioning including food flows (especially the market
reliability element and whether to use the mean or some other standard to compare markets);
a trader survey to collect data on prices, traded volumes, stocks and traders’ perceptions/ forecasts
using a mixture of open-ended and closed questions.
Similarly a number of tools have been developed or identified with respect to the different components.
These include stakeholder analysis, supply chain analysis, market mapping, market integration analysis, and
standardized questionnaires for interviewing traders. Primers explaining basic macro- and micro-economic
analysis and indicator calculations, such as elasticities, have also been made available.
There are challenges, however, that arise in relation to different situations within which a market analysis is
conducted. Time is usually the main constraint with respect to emergency food assistance responses. A
market analysis is more effective and meaningful if undertaken when markets are actually functional as
opposed to when they are disrupted by natural disaster or internal or inter-country conflict. Market
dynamics are complex and difficult to identify and comprehend without extensive data gathering and
analysis. Available budgets and time allocations usually prohibit the use of random sampling in trader
surveys, for example, or extensive secondary data gathering and analysis from country level, regional and
global databases on market behaviours, commodity flows or trading practices. Finally, effective market
analysis demands specific skills that have not always been prioritized in the training and development
programmes for development professionals conducting emergency food security analysis. Regardless, a
20 WFP. 2007d. Technical Meeting Report: Food Security and Markets. Subiaco, Italy 10-12 January 2007. Rome, IT: WFP.

8
market analysis is now a widely regarded critical component of such assessments and even though, for
various reasons, they may not always be conducted with the highest standard of methodological rigour, they
nevertheless can generate critically important information for the larger analysis of appropriate and effective
food assistance responses.
1.6 Need for a Market Study in Lesotho
In recognition that the use cash transfers or vouchers are not universally applicable in every context, WFP
Lesotho has begun an assessment of the suitability of these alternative food assistance modalities. The
process was initiated in April, 2011, with a high-level cash/voucher feasibility study, conducted under the
guidance of the WFP Regional Office in Pretoria. Amongst the recommendations that were made by the
study group was the need to undertake a more in depth market analysis in order to assess how local food
markets would respond to an increase in the purchasing power of food insecure households. It was also
recommended that the results of the study be used to explore the feasibility and cost-effectiveness of WFP’s
current and proposed approaches to food assistance.
1.7 Purpose and Objectives for the Study
The purpose of the market analysis was to inform WFP Lesotho in its decision-making on whether local food
commodities identified for a nutritious food basket were available and sustainable in the local food market.
In addition, there was a need to understand whether the local food market have the potential to respond
effectively to an increased demand for the food basket items as a result of the shift away from direct food
assistance to a cash or voucher based intervention (see Attachment A for the Terms of Reference and
Attachment B for the food basket contents).
The specific objectives for the study were best articulated using the following questions from WFP guidance
documents on the purpose of a market analysis:21
Are markets operational and physically accessible by targeted households?
Is appropriate food available in sufficient quantities and at reasonable prices?
Are food markets sufficiently integrated so that food will flow to deficit/target zones?
Will traders respond adequately to any increase in effective demand based on their storage capacities,
supply sources, required quality and preference of customers, and access to credit, amongst other
factors?
21 WFP 2007c, op. cit. note 18.

9
Is it likely or unlikely that cash/vouchers will contribute to an unintended rise in the purchase prices
for food basket items?
It was also anticipated by WFP that the study would assist to determine the cost-effectiveness of the food
basket and to assess the supply lines for the food basket items in order to explain why the local market is
expensive compared to WFP procurement methods (as pointed in out in the rapid assessment).
1.8 Study Implementation
The study was conducted by an independent research team from Armstrong Associates Consulting (Pty) Ltd.
The team was comprised of a Study Leader (T. Green), a Data Collection and Analysis Manager (T. Khoboko),
and a Research Advisor (R. Armstrong). Technical guidance during the development of the study was
provided by WFP Lesotho and the WFP Regional Office in Pretoria. The study was conducted between August
and September, 2011. As stipulated by WFP, the study was conducted in the four districts of Maseru, Berea,
Mokhotlong and Thaba Tseka where WFP’s food assistance programmes currently operate.

10 WFP Cash & Voucher Market Study – Final Report November 2011
2.0 Methodology
The study was designed and implemented according to the specifications of WFP Lesotho and the wealth of
best-practice advice that is emerging with respect to the necessity for market analysis in the development of
effective and sustainable food assistance strategies.
2.1 Study Design
The study was designed with two components: primary data was collected through a traders’ survey using a
standardized WFP questionnaire, and through focus groups comprised of individuals from both WFP-assisted
and non-assisted households; subsequently an overall market analysis was conducted using both primary
and secondary data (sourced from the GOL, key informants, and regional and international databases).
2.2 Sample Design
For the sample design for the trader survey and focus groups, WFP Lesotho stipulated that data be collected
in each of its four intervention districts. It was also stipulated that, where feasible, the choice of data
collection sites should coincide with existing WFP food distribution points. Through the literature review,
and as a result additional consultation with WFP Lesotho, additional desirable sample characteristics were
identified; characteristics that influence market dynamics. These included ensuring that that the composition
of the sample included at least two of the country’s four ecological zones (lowlands, foothills, mountainous
region, or Senqu Valley), as well as certain practical characteristics likely to influence both respondent
perspectives and analytical findings. 22 These latter characteristics included data collection sites that were
either: rural or urban, close to or distant from main transportation arteries, and, finally, close to or distant
from existing cash points (banks, bank ATMs in shops, or Lesotho Post Bank outlets). Finally, WFP stipulated
that community level focus groups include both current food assistance beneficiaries and non-beneficiaries,
particularly those from food insecure households in the latter case.
2.3 Sampling Process
Given the stipulations on sample characteristics in the choice of traders to be interviewed, and in the
composition of the community focus groups, a non-random, purposive sampling strategy was used. Sites for
data collection within each district were pre-selected using both the list of WFP distribution sites as well as
the additional sample criteria concerning ecological zones and other relevant considerations. In the Maseru
22 The fourth ecological zone, Senqu Valley, was not relevant since none of the country’s southern districts were included in the study.

11
district there were no identifiable WFP distribution sites and therefore data collection was conducted using
the other sample parameters as described above.
2.3.1 Sampling of Traders
Upon arrival at each data collection site, the data collectors were advised to use additional parameters for
the selection of shops and traders to approach. These parameters were adapted from the WFP Market
Analysis Tool. As most traders in Lesotho trade out of shops, not market places, selection of traders was
guided by type of shop or enterprise as well as length of time in operation as follows:
Enterprise (i.e., type of shop: wholesale, retail, etc.);
Size of enterprise (i.e., supermarket, small store, wholesale warehouse);
Ownership (e.g. Basotho owned, non-Basotho owned); and,
Length of time in operation (only enterprises in operation for one year or greater were included).
The selection of traders also took into account chain stores (Pep, Metro, for example) that are known to be
popular. Where possible, in villages that were visited, local residents were asked to help identify the most
frequented or popular shops. Since information was not available about the distribution of shops and their
characteristics prior to data collection, data collectors were instructed to visit as many shops as possible
bearing in mind the different desired characteristics for inclusion in the sample.
2.3.2 Sampling of Beneficiaries and Non-Beneficiaries
Individual participants in the community focus group discussions were recruited in two ways. For current
beneficiaries of WFP food assistance programmes, focus groups were convened at food distribution sites
(primarily health centres) on food distribution days. With assistance from health centre staff, beneficiaries
were informed about the study and invited to volunteer to participate in a focus group discussion. For non-
beneficiaries, village chiefs were approached to help convene individuals from food insecure households not
receiving WFP food assistance. To the greatest extent possible, beneficiary and non-beneficiary focus groups
were convened in each location where data collection took place. In all cases, members of the data collection
team informed potential participants about the importance of voluntary participation and informed consent.
This included assurances regarding confidentiality and anonymity.

12
2.4 Instrumentation
Both a trader questionnaire and a focus group discussion guide were utilized for primary data collection. The
trader questionnaire (Attachment B) was adapted from the model questionnaire in the WFP Market Analysis
Tool.23 The focus group discussion guide (Attachment C) was developed specifically for the study using
examples and best practice advice from the literature review.
2.5 Recruitment and Training of Research Assistants
Eight research assistants were recruited and trained by the Data Manager to assist with data collection. The
research assistants all had previous experience in survey research using administered questionnaires and
focus group discussion guides. All underwent a comprehensive training programme using a training manual
developed specifically for the study.
2.6 Study Pilot
The sampling process, instrumentation, and data collection procedures were tested in a pilot process that
took place over one day at Borokhoaneng, Ha Matala and Ha Abia in the Maseru district. During the day,
sampling procedures and data collection tools were assessed for feasibility and relevance. In addition, the
data collection skills of the research assistants were carefully observed. Following the pilot, minor changes
were made to the questionnaires to improve clarity and flow, and some additional training on data collection
procedures was conducted.
2.7 Secondary Data Sources
Data for the completion of the overall market analysis was collected in two ways. Firstly, statistical
information was sourced from the Bureau of Statistics, Central Lesotho Bank, relevant government ministries
(Trade; Agriculture, Food Security and Disaster Management; Financed and Development Planning; Health
and Social Welfare); regional and global data banks (USAID, SADC, WFP, FAO, UNDP); and from international
NGOs and bilateral and multi-lateral agencies operating in Lesotho. Additionally, relevant key informants
were identified and interviewed using the study objectives as an interview guide.
23 WFP 2007c, op. cit. note 18.

13
2.8 Data Collection and Data Management Procedures
Primary data collection, through the traders’ survey and community focus groups, was carried out by
Research Assistants working in two teams of four. Within each team, one member was designated as the
supervisor to ensure adherence to sampling and data collection procedures. Two members of the research
team (T. Green, T. Khoboko) supervised the data collection and conducted random audit of questionnaires
and focus group discussion notes to ensure consistency and completion of data collection instruments.
Secondary data collection and key informant interviews were conducted by the Study Leader and Research
Advisor. Original sources of statistical data were carefully recorded and all analysis procedures were
documented. Key informant interview notes were reviewed following each interview and, to the greatest
extent possible, validated by either the Study Leader or Research Advisor.
2.9 Data Entry and Analysis
As data collection involved different types of data from different sources, a mixed methods approach for data
entry and analysis was employed. Data from the traders’ questionnaire was entered and analysed using the
Statistical Programme for Social Sciences (SPSS). Data quality was assured by the Data Manager through
random spot checks during data entry and through data cleaning after data entry was complete. Survey
data was analysed using frequency tables and cross-tabulations. Secondary data on the different aspects of
market dynamics was analysed according to standard macro- and micro-economic techniques, including
market flows, supply chain analysis, value chain analysis and price elasticities. Finally, to create a multi-
dimensional view of market dynamics, the study used an iterative process of triangulation.

14
3.0 Findings
3.1 Food Security in Lesotho
Approximately, 77% of households in Lesotho depend on subsistence agricultural production as their main
source of food. Food security trends are monitored on a continuous basis by the Lesotho Vulnerability
Assessment Committee (LVAC). Between December 2010 and February 2011, unusually heavy rains had
negative impacts on crop yields. The rainfall for the period was the highest on record since 1933. It was
projected at the time that maize production would decline by 60% and sorghum by 80% due to crop
damage.24 The LVAC estimated that by June 2011, 582,000 households would face high levels of food
insecurity with many of these households requiring emergency food assistance.25 The negative effects of
chronic food insecurity are most apparent on children’s health and development. 20% of all children are
considered underweight for age and 13% of the population is considered to be under nourished.26 The
prevalence of growth retardation or stunting has not declined significantly over the past decade. Currently,
it ranges from 30% to 50% across the different districts of the country.27
3.2 Local Food Market Characteristics
Lesotho’s agricultural sector has been extensively studied in the recent past, both from a production and
from a marketing perspective. While approximately 60% of the country’s population depends on agriculture
as a source of livelihoods, the sector’s overall contribution to the national GDP is very small. In 2006 this
share was 15%.28 More recently, this share has declined to approximately 7%.29 Agricultural production in
the country is almost exclusive at the small scale, subsistence level. Farmers rely on rains for crop production
and, consequently, agricultural production is very sensitive to changes in weather patterns. Drought is the
most frequent cause of low agricultural output (with the exception of heavy rains in 2010/2011).
Lesotho’s food market is dominated by imports from RSA. While the country’s main agricultural products
include maize, sorghum, wheat and livestock, maize accounts for over 70% of agricultural production. Maize
constitutes approximately 80% of daily diet, particularly in rural and impoverished settings. In high yield
years, local maize production contributes a maximum of 30% to the country’s total needs. In 2006, it was
24WFP. 2011. Southern African Regional Food Security Update: Lesotho. June 2011. Rome, IT: WFP. 25WFP. 2011. Lesotho Food Security Quarterly Monitoring Bulletin March 2011. Rome, IT: WFP. 26MOHSW and ICF Macro 2010. 2009 Lesotho Demographic and Health Survey. Maseru, LS: MOHSW. 27 Ibid. 28 FAO. 2006. Food Aid, Food Production and Food Markets in Lesotho. Rome/Lusaka: FAO. The study is the latest comprehensive analysis of Lesotho’s food market. It is included here as the substantive findings are highly unlikely to have changed significantly to the present time. 29 MAFSDM. 2010. Discussion Paper for the Lesotho National Agricultural Forum. June 2-4, 2010. Maseru, LS: MAFSDM.

15
estimated that approximately 95% of maize grain used for commercial milling in Lesotho was imported from
RSA.30
3.2.1 Policy environment
Lesotho’s food markets have been liberalized (i.e. released from extensive government control) since the
mid-1990s. There is currently minimal public sector intervention in local food markets. However, the country
continues to experience chronic food shortages, largely driven by poverty and low productivity agriculture.
Achieving adequate food security for the country’s population remains a critical development challenge. In
order to guide multi-sectoral efforts to address food security challenges, the GOL has developed the Lesotho
Food Security Policy and Strategic Guidelines, a National Action Plan on Food Security and Food Aid
Guidelines. In addition, the GOL and its Development Partners have convened together to review the current
state of the agricultural sector with a view to significantly boosting agricultural production.31 As part of the
review, significant note was taken with respect to the new Land Act. This legislation introduced significant
changes to land administration and land ownership. These changes are expected to have substantial, positive
influence across all sectors, including agriculture.
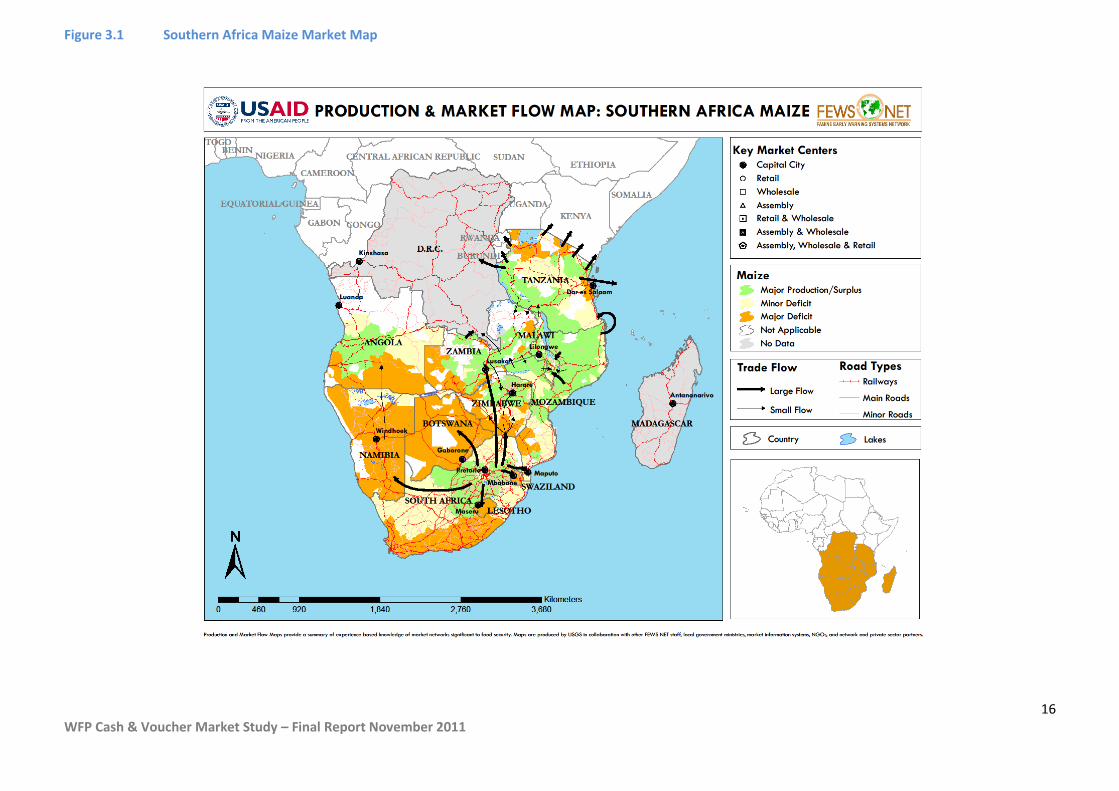
3.2.2 Market Structure
This section looks at the food market structure in Lesotho from the perspective of maize production. This is
the only staple food that has any significant local production in addition to imports. The milled maize meal
market structure in Lesotho is oligarchic. It is dominated by two companies, Lesotho Flour Mills (co-owned
by Seaboard International and the GOL) with a 40% market share and Lesotho Milling Company with a 30%
market share. As noted above, more than 90% of maize grain that is milled at these companies is imported
from RSA. Locally milled maize is estimated to be double the cost of imported milled maize due to the fact
that RSA annual yields are at least four times larger than even ideal harvest yields in Lesotho. RSA dominates
the regional maize markets particularly with respect to the amount of maize that is exported to its SADC
neighbours as shown in the market map at Figure 3.1 below. As for other food products included in this
study, traders source goods from wholesalers, other traders or make their own trips to RSA to purchase stock.
30 FAO 2006, op. cit. note 28. 31 MAFSDM 2010, op. cit. note 29.
16 WFP Cash & Voucher Market Study – Final Report November 2011
Figure 3.1 Southern Africa Maize Market Map

17 WFP Cash & Voucher Market Study – Final Report November 2011
3.2.3 Price trends
Given the high proportion of imports within the country’s food markets, price trends are dominated by
influences from RSA and, to a much lesser extent, trends in regional and global markets. As noted previously,
during the 2010/2011 planting season much of the maize yield in Lesotho was destroyed by unseasonal heavy
rains resulting in almost complete reliance on imported maize from RSA32. However, the global supply and
demand pressures on South African maize, in addition to the global economic shocks have resulted in soaring
local prices. In January 2011, the raw material price per metric ton of maize was ZAR1,317. Current prices
for October 2011 are ZAR2,358 , which is higher than 2008 peak price of ZAR2,200 (30th June 2008) at the
onset of the global economic troubles. A year ago (October 2010) the price of white maize was ZAR1,312.
Price fluctuations, which are illustrated in Figure 3.2 below, are in part due to the fact that maize prices in
RSA are no longer controlled by the wheat boards but instead maize is now traded as a commodity on the
open markets.
Figure 3.2 South African Raw Maize Prices (ZAR)33
The blue points in Figure 3.2 indicate prices as recorded by SAFEX. The red points indicate anticipated prices according to Lesotho Flour Mills. 34
Price trends of cereal products in Lesotho are tracked on a monthly basis by the Bureau of Statistics. Inflation
continues to have an upward pressure on prices, both locally and in RSA. Cereal prices for the region are
influenced by trends in commodity trading on the SAFEX. It has been noted that fluctuations in the global
supply of cereals, particularly maize, have continuously resulted in upward pressure on trading values. In
32 Food Agricultural Organization (2011). Crop Prospects and Food Situation No.3 October 2011. http://www.fao.org/docrep/014/al980e/al980e00.pdf 33 Adapted from http://www.jse.co.za/Products/Commodity-Derivatives-Market/Commodity-Derivatives-Market-Product-Detail.aspx?CntItem=c6e42a2d-21b2-48d6-a96b-67d93ddd1d09. 34 Interview conducted with Lesotho Flour Mills Chief Executive Officer – Mr Ron Mills 19th October 2011.
1301
1597
18862091
1820
1368
1582
1067
1317
1672
2358
2239
1839
South African Raw Material White Maize Prices

18
this current year, however, trading values have stabilized and are not expected to cause significant erosion
in purchasing power at all stages in the maize value change, from farm-gate to local retail to households.
At this time in Lesotho, households are almost exclusively dependent on markets for their daily food supply.
The predominant local influence on market prices is seasonality. As noted below, prices increase the further
in time away from harvest with the leanest period being just before winter harvest and spring planting.
Figure 3.3 illustrates the expectation that, in 2012, Lesotho will continue to exhibit a dependency on imported
maize (and other cereals) at a higher rate than in 2011. Therefore, continually high maize prices mean that
it will become increasingly more expensive to assure food security for Lesotho.
Figure 3.3 Share of imports in total domestic utilization of cereals35
3.2.4 Market Trends and Food Security
The impact of regional and global market trends on the food supply in southern Africa is monitored on a
continuous basis by the Famine Early Warning System Network (FEWS NET). While currently, on the regional
level, the food security situation is stable, important sub-trends are continuing to have a significant negative
impact on impoverished households. Changes in climatic conditions are magnified by unsustainable practices
in livestock management and farming which contribute to soil erosion and low vegetation quality. The lack
35 Adapted from FAO (2011). Food and Agricultural Organization (2011). Crop Prospects and Food Situation No.3 October
2011. http://www.fao.org/docrep/014/al980e/al980e00.pdf. The bar representing Lesotho has been highlighted by the
red outline.
19
of irrigation systems to increase utilization of arable land stands in contradiction to Lesotho’s exports of fresh
water to neighbouring RSA.36 The widespread use of wood as cooking fuel has contributed to high rates of
deforestation, particularly in the rural and remote regions of the country. Sixty percent of rural households
and 44% of all households use wood as their primary cooking fuel. In 2009, for example, 56% of households
in urban areas and 94% of households in rural areas were without electricity. Only 16% of the population
used electricity in the home (a significant increase, nevertheless, from 7% in 2004).37
Food consumption is also characterized along ecological zones in Lesotho. Although households in urban
areas consume more purchased foods than households in rural areas, relative to the household expenditure,
rural households are spending more of their available money (82%) on food than urban households (78.1%).
While rural households are seemingly spending more on food, it is important to note that these households
have less disposal income than urban households. Therefore, the meagre financial resources that exist are
largely spent on purchasing food. It is therefore not surprising then that with respect to food aid, twice as
much food aid is consumed in rural households than in urban regions.38
While the food supply is stable in the region at the moment, “a combination of high food prices, delayed/or
inadequate assistance to affected households, and late onset of the 2011/12 rainy season could exacerbate
current conditions.”39 Although for most parts of the region most households will remain food secure in the
period up to December 2011, threats such as rising food prices, undersupplied markets, and delayed onset
of rains which can lead to reduction in casual labour demand and income earning opportunities, will
increasingly compromise food security.
36 FAO. 2011. Strengthening Capacity of Climate Change Adaptation in Agriculture: Experience and Lessons from Lesotho. Rome, IT: FAO. 37 MOHSW and ICF Macro 2010, op. cit. note 26. 38GOL. 2010. Continuous Multi-purpose Household Survey 4th Quarter (October). Maseru, LS: MOFD/BOS. 39 FEWS NET. 2011. Southern Africa Food Security Outlook Update October 2011. Available: www.fews.net

20 WFP Cash & Voucher Market Study – Final Report November 2011
3.3 Trader Survey
The trader questionnaire was administered to 120 traders in the four target districts: Berea (n=31), Maseru
(n=27), Mokhotlong (n=29) and Thaba-Tseka (n=33). The interviews were conducted with either the shop
owners or the managers; shop owners were interviewed in 45% of the cases and managers in 55% of the
cases. All of the traders had been in operation for at least one year with 33.3% of the traders having been
operational for 1-3 years and 66.7% for more than 3 years.
3.3.1 General Trader Characteristics
Traders classified their trading outlets as either
wholesale, supermarkets or small shops. This
classification was based on the traders own
definition of the enterprise. The majority of the
interviews were conducted in small shops. A total
of n=5, n=36, and n=78 traders classified their
businesses as wholesales, supermarkets and small
shops respectively. Refer to Table 3.1 below. In
Berea and Mokhotlong, no wholesale enterprises
were identified for interview. In each district, the
majority of participants were either owners or
managers of small shops.
Table 3.1 Classification of shops by type and districts
Berea Maseru Mokhotlong Thaba-Tseka Total
Wholesale 0 3 0 2 5
Supermarket 10 10 8 9 37
Small shop 21 14 21 22 78
Total 31 27 29 33 120
The type of retail outlet by ethnic ownership is shown in Table 3.2 below. Overall, 91% (n=78) of all retail
outlets owned by Basotho were small shops, whereas all outlets owned by Chinese were either supermarkets
(n=22) or wholesale outlets (n=4). Indian and South African ownership was mainly of supermarkets;
European ownership included both supermarkets and wholesale outlets.
Figure 3.4 Photo of a trader being interviewed in a small rural shop in Semonkong, Maseru District
21
Table 3.2 Classification of retail outlet and ethnic ownership
Basotho Ownership
Indian Ownership
Chinese Ownership
European Ownership
South African Ownership
Wholesale 0 0 4 1 0 Supermarket 8 2 22 3 1 Small shop 78 0 0 0 0 Total 86 2 26 4 1
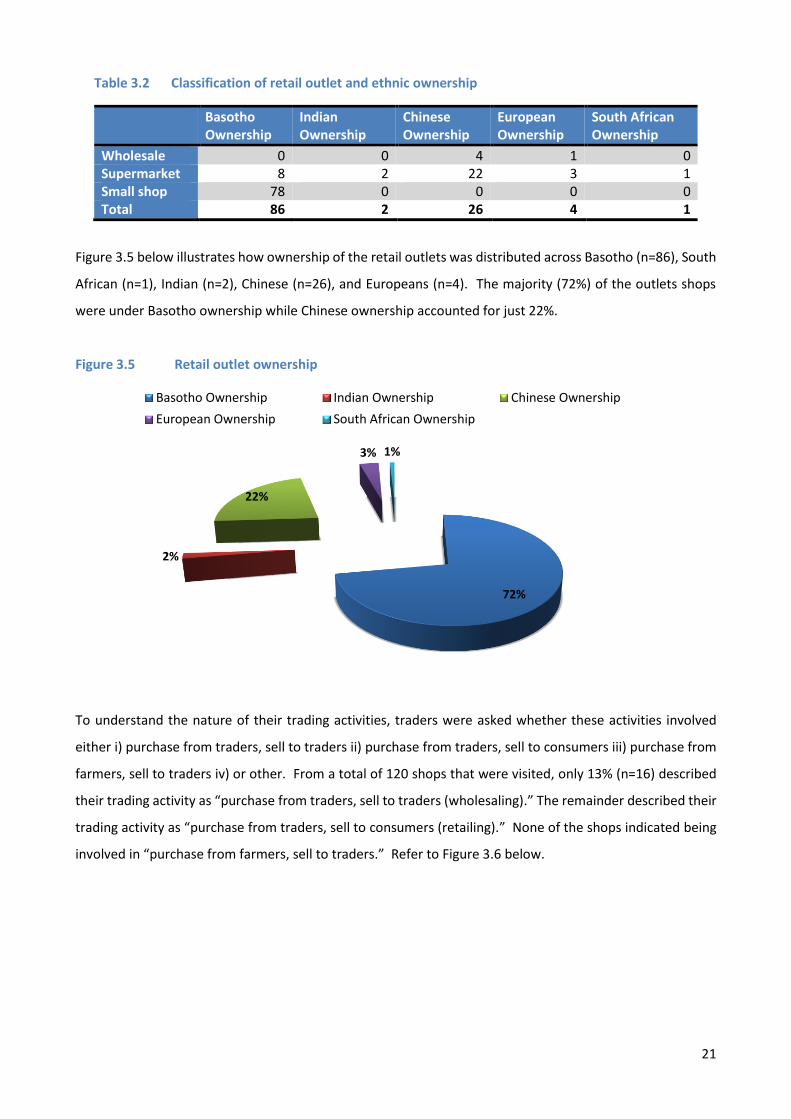
Figure 3.5 below illustrates how ownership of the retail outlets was distributed across Basotho (n=86), South
African (n=1), Indian (n=2), Chinese (n=26), and Europeans (n=4). The majority (72%) of the outlets shops
were under Basotho ownership while Chinese ownership accounted for just 22%.
Figure 3.5 Retail outlet ownership
To understand the nature of their trading activities, traders were asked whether these activities involved
either i) purchase from traders, sell to traders ii) purchase from traders, sell to consumers iii) purchase from
farmers, sell to traders iv) or other. From a total of 120 shops that were visited, only 13% (n=16) described
their trading activity as “purchase from traders, sell to traders (wholesaling).” The remainder described their
trading activity as “purchase from traders, sell to consumers (retailing).” None of the shops indicated being
involved in “purchase from farmers, sell to traders.” Refer to Figure 3.6 below.
72%
2%
22%
3% 1%
Basotho Ownership Indian Ownership Chinese Ownership
European Ownership South African Ownership

22
As shown in Figure 3.7(A), below, of the traders reporting wholesaling activity, 5 were wholesale outlets, 10
were supermarkets, while 1 was a small shop. As shown in Figure 3.7(B), retailing activity was reported by 27
supermarkets and 77 small shops. Dual trading activities, involving both wholesaling and retailing, was
reported by 3 wholesalers, 8 supermarkets, and 1 shop trader. Two observations drawn from the above are
that, while only 5 traders had classified their shops as wholesale outlets, 16 traders described ‘wholesaling’
(i.e., purchase from traders, sell to traders) as their trading activity; furthermore, 10% of all traders were
involved in dual trading (i.e., sold to both traders and consumers).
Figure 3.7 Type of trading by different shop-types
A B
n=5
n=10
n=1
Distribution of wholesale trading activity amongst different shop-types
Wholesale
Supermarket
Small shop
n=27
n=77
Distribution of retail trading activity amongst different shop-types
Supermarket
Small shop
Figure 3.6 Type of trading activities
n=16
n=104
In what type of trading activity are you involved?
Purchase from traders, sell to traders (wholesailing)
Purchase from traders, sell to consumers (retailing)

23 WFP Cash & Voucher Market Study – Final Report November 2011
3.3.2 Macro Food Availability
Data was gathered from traders and shops to determine the availability of food items from the expanded
WFP food basket in local markets. Figure 3.8 below illustrates the availability of the food items that were
reported to be either currently available or normally traded by at least 80% of all the traders. A complete list
of the twenty-nine food items with details of their availability is attached in Appendix F.
Figure 3.8 Availability of expanded WFP food basket items
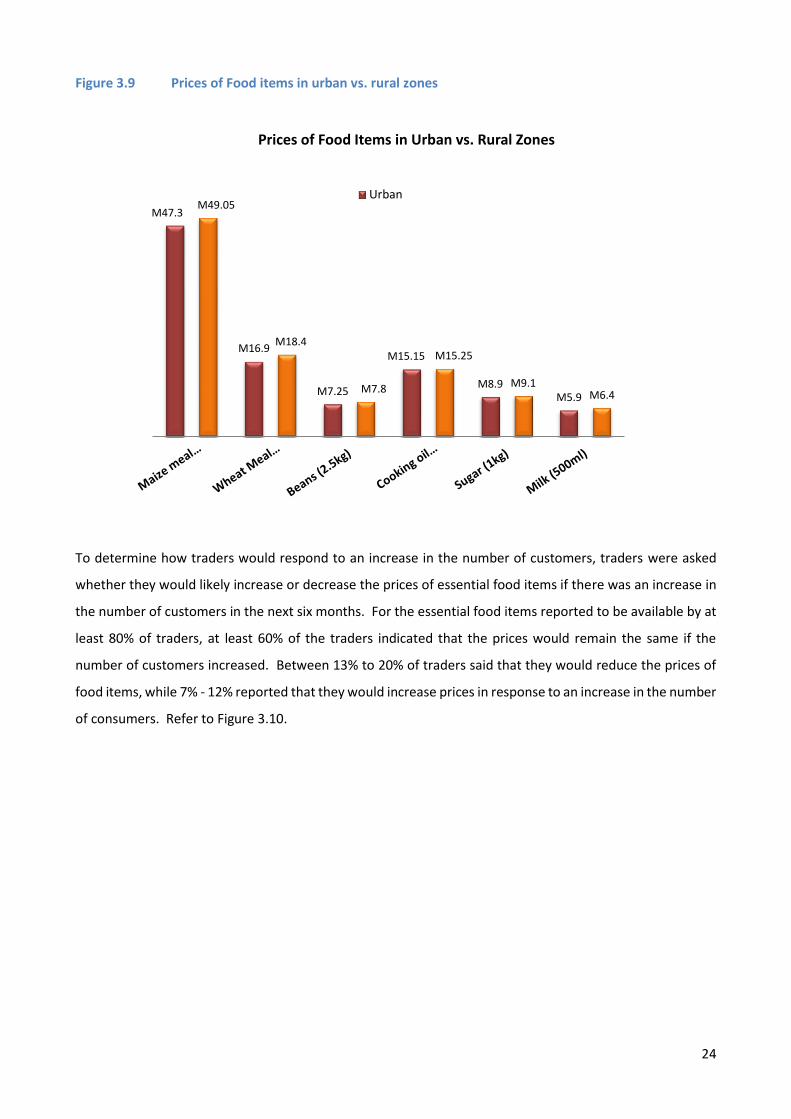
In order to examine prices and price variations of six of the food basket items (i.e., maize meal, wheat, beans,
cooking oil, sugar and milk), data were analysed to determine price variability between urban and rural zones.
Figure 3.9 illustrates the prices differences. This information is presented in greater detail in Appendix F
where price data for the six food items are compared according districts, by location of the shop in urban
versus rural zones, and by proximity to main transportation routes.
0
20
40
60
80
100
120Item currently available in the shop
Pro
po
rtio
n o
f tr
ade
rs(%
)
Availability of Food Items
24
Figure 3.9 Prices of Food items in urban vs. rural zones
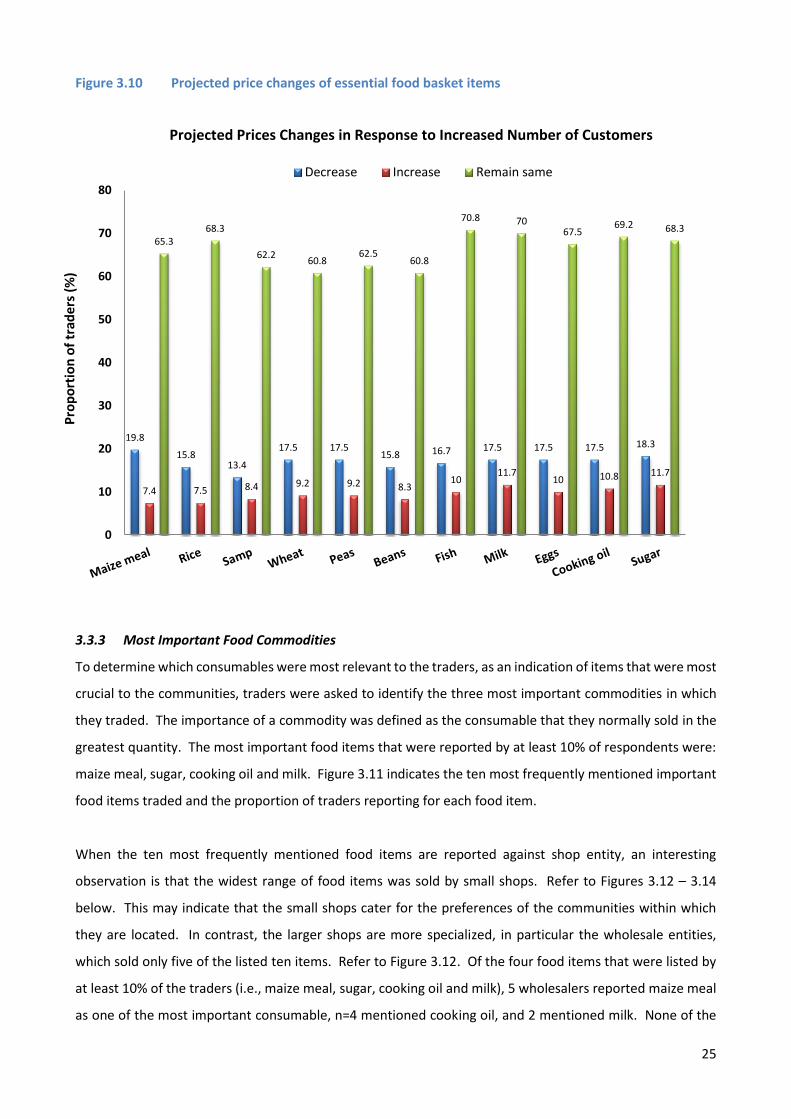
To determine how traders would respond to an increase in the number of customers, traders were asked
whether they would likely increase or decrease the prices of essential food items if there was an increase in
the number of customers in the next six months. For the essential food items reported to be available by at
least 80% of traders, at least 60% of the traders indicated that the prices would remain the same if the
number of customers increased. Between 13% to 20% of traders said that they would reduce the prices of
food items, while 7% - 12% reported that they would increase prices in response to an increase in the number
of consumers. Refer to Figure 3.10.
M47.3
M16.9
M7.25
M15.15
M8.9M5.9
M49.05
M18.4
M7.8
M15.25
M9.1M6.4
Prices of Food Items in Urban vs. Rural Zones
Urban
25
Figure 3.10 Projected price changes of essential food basket items
3.3.3 Most Important Food Commodities
To determine which consumables were most relevant to the traders, as an indication of items that were most
crucial to the communities, traders were asked to identify the three most important commodities in which
they traded. The importance of a commodity was defined as the consumable that they normally sold in the
greatest quantity. The most important food items that were reported by at least 10% of respondents were:
maize meal, sugar, cooking oil and milk. Figure 3.11 indicates the ten most frequently mentioned important
food items traded and the proportion of traders reporting for each food item.
When the ten most frequently mentioned food items are reported against shop entity, an interesting
observation is that the widest range of food items was sold by small shops. Refer to Figures 3.12 – 3.14
below. This may indicate that the small shops cater for the preferences of the communities within which
they are located. In contrast, the larger shops are more specialized, in particular the wholesale entities,
which sold only five of the listed ten items. Refer to Figure 3.12. Of the four food items that were listed by
at least 10% of the traders (i.e., maize meal, sugar, cooking oil and milk), 5 wholesalers reported maize meal
as one of the most important consumable, n=4 mentioned cooking oil, and 2 mentioned milk. None of the
19.8
15.813.4
17.5 17.515.8 16.7 17.5 17.5 17.5 18.3
7.4 7.5 8.4 9.2 9.2 8.310
11.710 10.8 11.7
65.368.3
62.260.8
62.560.8
70.8 7067.5
69.2 68.3
0
10
20
30
40
50
60
70
80
Decrease Increase Remain same
Pro
po
rtio
n o
f tr
ader
s(%
)
Projected Prices Changes in Response to Increased Number of Customers

26
wholesale traders mentioned sugar. This is in contrast with supermarket and small shop traders, 45.9% and
53.8% of whom mentioned sugar as one of the three most important food items sold. In addition to sugar,
maize meal, cooking oil and milk was also reported by 78.3%, 59.4% and 18.9% of supermarket traders
respectively. Small shop traders also mentioned maize meal (39.7%), cooking oil (42.3%) and milk (46.1%).
Refer to Figures 3.13 and 3.14.
Figure 3.11 Consumables most frequently identified amongst the three most important food items traded
Figure 3.12 Most important consumables reported by wholesale entities
18.1%16.4% 16.4%
12.5%
8.1%5.6%
4.4% 3.6% 3.1% 2.2%
Ten consumables most frequently identified amongst the three-most important food items traded
5
4
2
1
1
Items reported as most important consumables by Wholesale Entities
Maize meal
Cooking oil
Milk
Meat/Chicken
Beans

27
Figure 3.13 Most important consumables reported by supermarket entities
Figure 3.14 Most important consumables reported by small shop entities
29
2217
7
5
4
7
5 3
Items reported as most important consumables by Supermarket Entities
Maize meal
Cooking oil
Sugar
Milk
Eggs
Cabbage
Wheatmeal
Meat/Chicken
Beans
31
33
4236
24
20
12
65
4
Items reported as most important consumables by Small Shop Entities
Maize meal
Cooking oil
Sugar
Milk
Eggs
Fish
Cabbage
Wheatmeal
Meat/Chicken
Beans

28
3.3.4 Volumes and flows of most traded consumables
To determine the flow of consumables (i.e., sales of essential food items), traders were asked to estimate
their customer base over the past month for the three most important food items that they had reported
and to discuss changes in sales volumes over the past month compared to the same time last year. In
reporting trade of the three most important items of the past month, 6% of traders had sold to fewer than
10 customers, 41% served between 10 and 70 customers, 28% to more than 70 but less than 140 customers,
while 25% sold to more than 140 customers. Refer to Figure 3.15 below.
Figure 3.15 Number of customers to whom the three most important consumables were sold in the past month
As noted previously, most retail entities were either small shops or supermarkets (see Table 3.1). On a
monthly basis, for the three most important consumable items, most shops had served between 10 and 70
or between 70 and 140 customers purchasing these items. One quarter of the shops or supermarkets had
served more than 140 customers.
Traders were asked whether the number of customers had increased or decreased compared to the same
period in the previous year. In general, close to half of all traders (47.5%) indicated that the numbers of
customers who bought the most traded food items were higher than those of last year. A third (31%) said
that the figures were lower and 21% said that the figures were the same. Refer to Figure 3.16 below.
6%
41%
28%
25%
Less than 10 More than 10 less than 70
More than 70, less than 140 More than 140

29
Figure 3.16 Changes in the number of customers compared to the same period last year
Although a change in customers may reflect a reciprocal change in sales volumes, it is possible that other
factors influenced volumes. Therefore, traders were also asked to compare the volume of sales in the past
month with the same period last year. Over half of all traders (55.5%) indicated that sales had increased
during the last month while only one fifth 21% noted that there had not been any change and 23% said they
had decreased. Refer to Figure 3.17 below.
Figure 3.17 Changes in sales volume compared to the same period last year
To understand the reasons that may account for the changes in sales volumes, traders were asked to suggest
the single-most important reason for the change. In the case of those who noted that sales had increased in
the past year, the two main reasons that were given for the increase in sales were, more demand from
47.5%
30.8%
20.8%
Higher Lower Same level
Change in the number of customers compared to the same period last year
56.0%
23.0% 21.0%
Higher Lower Same level
Changes in sales volume compared to the same period last year

30
customers in the district/area (36.1% of responses) and worse harvest than last year (23.6% of responses).
In the case of those indicating that sales had decreased, the main reasons that were given were less demand
from the local area (48% of responses) and increased competition (12.9% of responses). When these who
had indicated that sales volumes were lower than last year were asked to indicate when they expected a
recovery to occur, a large proportion (42.3%) indicated that they expected recovery within the next 6 months
to one year. About one fifth (23.0%) said they expected recovery within three months and a much smaller
number (7.7%) said within one month.
3.3.5 Sources of the three most important consumables traded
To understand the dynamics of markets, traders were first questioned on the sources of most of their stock
and then on the sources for their three most important consumables. With respect to the source of the
majority of their stock, 36.7% of traders purchased most of their stock from local wholesales, 31.7%
purchased stock from other wholesalers in Lesotho, while 29.1% of traders purchased most of their stock
from local supermarkets. 8% of traders purchased most of their stock from elsewhere in RSA.
In the case of the three most traded commodities, the majority of traders (64.7%) reported their source as
traders within the district, 31.9% sourced their consumables from traders in other districts, while 9.2%
purchased their stock from traders in RSA. Other sources that were mentioned were farmers within the
district (2.5%) and farmers outside the district (2.5%). There was no difference between the sources this year
and sources during the same period in the previous year. This is in line with the fact that when traders were
asked if they thought that the source of the most important food items will change in the next six months,
91% said that they did not anticipate any change. In cases where changes were expected, it was reported
that this would occur as a result of changes of supply from the farmers in their districts. In response to the
question on how they transport goods to their shops, over half (58.3%) of the traders indicated that they use
their own transport while a third (31.7%) indicated that they use hired transport. A small proportion (5%)
indicated that the goods are delivered by the seller and a similar proportion noted that they either use their
own transport or have the goods delivered.
Traders were also asked to compare their current stock levels to their stock levels during the same period in
the previous year. The largest proportion of traders indicated that they were much higher (43.2%). Almost
equal proportions of traders indicated that they were either at the same level (20.3%) or much lower (21.2%).
As for the remainder, 11% of traders said their stocks were somewhat higher than the previous year and
4.2% indicated they were somewhat lower. These findings correspond with the abovementioned trends in
sales volumes with most traders (56%) reporting higher volumes of sales and 23% reporting lower sales
figures when compared with the same period last year. Therefore, most traders are stocking more this year

31
because they are selling more. This also accounts for the majority of traders reporting that they keep their
stock for two weeks or less between purchase and sale. Refer to Figure 3.18 below.
Figure 3.18 Number of weeks traders report keeping their stock between purchase and sale
3.3.6 Constraints and Response Capacity
When respondents were asked whether they have constraints to increase their stock level, 42.9% indicated
that they do have constraints. Respondents who indicated that they have constraints were asked to give the
three most important reasons. Multiple response analysis revealed that in 30.3% of cases, lack of own capital
was one of the most significant. In other cases, 15.2% of respondents mentioned competition pressures
while 7.6% mentioned lack of transport. Lack of sufficient demand and theft were both mentioned in 6.1%
of cases.
3.3.7 Business Trading Practices
3.3.7.1 Credit
To better understand the business trading practices and the relationship between traders and consumers,
traders were asked whether they provide credit to their consumers. 71% of traders indicated that they
provided credit to consumers. In assessing the proportion of customers receiving credit from traders, 20%
of the traders indicated that 10% of the customers were given credit in the previous month, 13% of traders
provided credit to 20% of all customers, while a similar proportion (13%) of traders indicated that 50% of
their customers were given credit in the previous month. From a total of eighty-five traders who gave credit
3634.5
11.2 11.2
0 0.9 1.7 2.6
0 0.9
1 2 3 4 5 6 7 8 9 10
Length of Time Traders Keep Stock
Weeks
Pro
po
rtio
no
f tr
ader
s (%
)

32
to customer, 73% were small shop owners, 24% were supermarket traders while less than 1% (i.e. n=3) were
wholesale traders. Refer to Figure 3.19 below. It was discussed above in Section 3.3.1 that all small shops
were Basotho-owned, therefore the greatest proportion of shops giving credit were Basotho-owned.
Figure 3.19 Proportion of traders providing credit to customers by shop function
When asked whether there had been any change in the number of people who have been requesting credit,
44% of traders indicated that there had been fewer people who asked for credit in the previous month than
for a similar period one year ago. A similar number (44%) indicated that there had been more people asking
for credit compared to the same period last year, while 11% said that there was no change.
3.3.7.2 Transaction Costs
Respondents were asked to indicate whether they kept records of transaction costs. The data indicates that
with the exception of transport, losses, tax-related information and financial expenses, most traders do not
keep records of transaction costs. Refer to Figure 3.20 below. This may be a reflection of the nature of
trading where traders largely just buy and sell and are not involved in other stages of goods production, such
as harvesting or manufacturing.
<1%
24%
73%
Proportion of traders providing credit to customers
Wholesale
Supermarket
Small shop
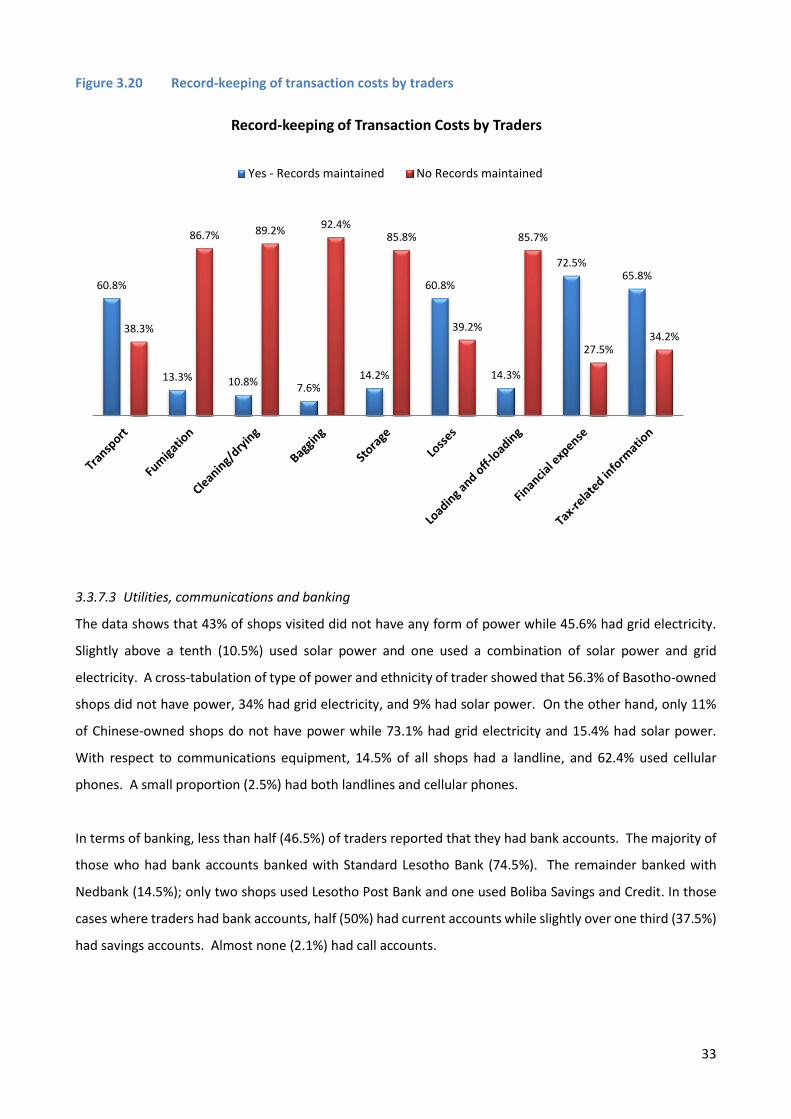
33
Figure 3.20 Record-keeping of transaction costs by traders
3.3.7.3 Utilities, communications and banking
The data shows that 43% of shops visited did not have any form of power while 45.6% had grid electricity.
Slightly above a tenth (10.5%) used solar power and one used a combination of solar power and grid
electricity. A cross-tabulation of type of power and ethnicity of trader showed that 56.3% of Basotho-owned
shops did not have power, 34% had grid electricity, and 9% had solar power. On the other hand, only 11%
of Chinese-owned shops do not have power while 73.1% had grid electricity and 15.4% had solar power.
With respect to communications equipment, 14.5% of all shops had a landline, and 62.4% used cellular
phones. A small proportion (2.5%) had both landlines and cellular phones.
In terms of banking, less than half (46.5%) of traders reported that they had bank accounts. The majority of
those who had bank accounts banked with Standard Lesotho Bank (74.5%). The remainder banked with
Nedbank (14.5%); only two shops used Lesotho Post Bank and one used Boliba Savings and Credit. In those
cases where traders had bank accounts, half (50%) had current accounts while slightly over one third (37.5%)
had savings accounts. Almost none (2.1%) had call accounts.
60.8%
13.3% 10.8%7.6%
14.2%
60.8%
14.3%
72.5%65.8%
38.3%
86.7% 89.2%92.4%
85.8%
39.2%
85.7%
27.5%34.2%
Record-keeping of Transaction Costs by Traders
Yes - Records maintained No Records maintained

34
A cross tabulation of banking patterns with ethnicity of owner revealed that all Indian, European or South
African traders had bank accounts, 59.6% of Basotho traders also had bank accounts and only 29% Chinese
traders had bank accounts. It is important to note that there was no correlation between location of the
shop whether or not the trader had a bank account. Even traders in the most remote areas (such as
Tlhanyaku and Ha Janteu in Mokhotlong, Tiping in Mantsonyane, and Bobete in Thaba Tseka) reported having
bank accounts.
3.4 Food Basket Cost Effectiveness
The question on the expense to be incurred if the food assistance modalities should be converted to cash or
voucher systems was raised when the preliminary feasibility study was conducted in April 2011. It was
estimated that WFP would incur a 48% increase in the amount spent. To determine the extent to which food
items might be more expensive, procurement data was collected from WFP (i.e., prices for current food
basket items) and this was used to compare the cost of procurement at local retail prices reported by traders
in the study. The procurement data from WFP includes the cost of purchase plus the cost of transport; the
cost was expressed as the dollar (USD) cost per metric tonne. To arrive at the same cost, data from traders
for four food items (maize, beans, vegetable oil and sugar) was converted to dollar cost per metric tonne.
Figure 3.14 illustrates the comparison. The most expensive food item would be vegetable oil for which the
local retail purchase cost is USD2620, 100% more expensive than the WFP procurement prices. Contrary to
expectation, the local retail cost was not always greater than the WFP procurement cost. For example, the
local retail purchase cost for beans was USD402, compared with WFP procurement cost of USD958.
Figure 3.21 Cost Comparison of WFP vs. Local Retail Purchase of Key Food Items
USD392
USD958
USD1309
USD954
USD505.67USD402.06
USD2620.23
USD1172.68
Maize Beans Vegetable oil Sugar
Cost Comparison of WFP vs. Local Purchase of Key Food Items
WFP Local Retail Cost

35
3.5 Community Perspectives
This section is based on focus group discussions that were conducted in each of the districts based on the
focus group discussion guides.
3.5.1 Household allocation of resources and financial decision making
Question 1: What are the five main food items that you purchase normally and most often?
The main food items that were mentioned as being regularly purchased by respondents are the following:
Maize meal, wheat meal, beans, peas, sugar, tea, salt, milk, meat, cooking oil, vegetables, canned fish and
eggs. Items such as milk and sorghum meal (which is used to make porridge – lesheleshele) are bought to
meet the nutritional needs of babies and children when funds permit. It was observed that in many cases
people have accesses to maize meal but lack resources for food items that are used as accompaniments.
Question 2: Have there been any factors which have altered the type of products that you have purchased
and the timing?
The main factor that has influenced the purchasing behaviour of respondents has been insufficient funds due
to high unemployment in the communities. A second factor influence the purchasing behaviour is health
problems within the family resulting in most of the available funds being used to meet these demands.
Question 3: How would your purchasing behaviour change if you received more money? What would be
your priority spending areas (i.e., what would be the first three things that you spend the money on)?
What would you spend remaining funds on?
When asked what are the most important items that they would buy if they got money, respondents
mentioned the following: Maize meal, oil/fat, samp, wheat meal, sugar, paraffin and candles. The food items
that were regularly mentioned as accompaniments are the following, beans, green vegetables, milk, eggs,
potatoes and tomato.
Responding to what they would do with the remainder of the money after buying the essential stuff,
respondents noted the following:
Save or bank the extra money so that I can replenish;
Keep the money to be able to access medical help;
Buy soap to be to wash (clothes and self) to be able to keep clean;
Pay school fees for children at school;

36
Buy uniforms for children; and,
Buy vaseline, paraffin, matches and soup.
In the case where respondents noted that they save or bank the money, it was emphasized that it is better
to bank the money since it is difficult to save money at home as it easily gets used.
Question 4: Who makes the decisions about how money is spent in the household?
Responding to the question of who makes decision in the family, especially the use of money, it was noted
that in the case where the wife and husband still live together decisions were jointly made. It was pointed
out that although decisions are made jointly, there are some matters that are better decided upon by either
men or women. For example women decide on what to do on household matters while men decide on issues
related to livestock and fields.
In some focus groups there were a number of older men and women who indicated that they did not have
spouses and thus made decisions alone. Some of these looked after grandchildren of diseased children and
relatives. In some case it was noted that where married children still live with the family, a priority list is
made. In some cases respondents noted that the money is kept by women although the decisions may be
made jointly by the couple. t was noted that men are more prone to abuse the money compared to women.
When men need money they then have to ask for it from their wives. In one case a woman indicated that
when she has been given money to keep by the husband she can’t even use the money for emergencies if he
is not available to discuss the matter. This is in the case of major items and not minor one such as buying
paraffin or candles.
Question 5: If assistance was to include money, would you prefer it to be all money or a mix of food and
money?
In the majority of cases respondents noted that they would prefer a mixture of food and money if they got
assistance. Asked what their preference would be if they were to be assisted, the majority noted that they
would prefer a combination of food and money. A few noted that they would prefer food as they would
abuse money. It was noted that the money would be saved to buy other food stuffs and also address other
household needs such as paraffin, matches and clothes. In one case the individual noted that they would
prefer to have food and money in that they would use the money to start a small business that would
generate profit which would be used to improve household income and reduce dependency. In the case of
cash, some noted that if they are given cash alone it would not work as there are too many things that require
cash and all the money would go to these commitments and none would buy food or that the food bought
would not be enough to last for a month.

37
3.5.2 Household access to local markets
Question 1: Where do you purchase your essential food items? Is that the shop you prefer to purchase
food and why?
It was noted that in most cases people prefer to shop supermarkets at the district headquarters or larger
settlements as the local shops were very expensive and people largely used them for smaller purchases. It
was also mentioned that the local shops tend to run out of stock of some essential items. Some of the older
people noted that they have to ask other people to help shop at distant places as they were not able to travel
far. Respondents noted that they buy food and other items at different shops or supermarkets. They
indicated that the choice of where to buy is based on the price. In one case a respondent noted that he
purchased goods at a Chinese supermarket that seem to be stocking fresh goods as he is afraid of purchasing
expired goods. This he said is because some food items in Chinese supermarkets and shops do not have
expiry date stickers.
Since most supermarkets and shops of Chinese and Indians do not offer credit, people have or show no
allegiance to these shops. Some respondents noted that they show or have allegiance to Basotho shops that
give them credit. In Thaba Tseka and Mokhotlong, a number of respondents noted that they are able to buy
beans and lentils from individuals but that this was limited to a short period after harvest. Respondents
indicated prices of these items from locals are lower than those of shops and supermarkets.
Question 2: How far is the nearest food purchase market from your homes?
Distance to town or a larger settlement is a challenge for those who stay in the rural areas where the roads
are bad.
Question 3: Do you have access to credit at the place that you normally buy food?
In most cases it was noted that the supermarkets and bigger shops that people prefer to go to because they
are cheaper than the smaller shops do not give credit. It was specifically noted that most of the purchases
are done at Chinese and Indian shops and that no credit is extended at such establishments. In a few cases it
was noted that the smaller Basotho owned shops at the village level were likely to give credit but that one
has to be well known by the shop owner to be able to get credit. In the case where credit is given, it is for
small items such as salt, paraffin, matches, etc. It was noted that while at the village level one was likely to
get credit, at the town level this was not possible.
3.5.3 Household financial status and access to banking systems
Question 1: What are your sources of income?
In response to source of income, some noted that they get money from piece work while the elderly ones

38
noted that it is not easy for them to work anymore. Some of the respondents indicated that they rely on their
children and relative to give them money. Some noted that they do a variety of jobs such as mending shoes,
weeding fields, working in gardens, collecting water for people, washing clothes, looking after animals for a
fee, selling wood, domestic help, selling food at the market place, sale of traditional beer (joala ba Sesotho),
etc.
Some noted that from the money they get from piece work or from other sources they buy or make items
such a potato crisps, sweets, fat cakes and biscuits for sale. In one case the respondent noted that they raise
pigs and then sell piglets as a means of income generation. In case of one respondent, the source of income
was sales of food to people working at the garment factories but the business failed. Some households
reported that their income comes from sale of livestock, especially sheep. A number of respondents
indicated that due to their old age they were no more able to work to make ends meet. They rely mainly on
handouts.
Question 2: How do you receive money? If participants do not mention bank or post office accounts, ask
for the reasons why?
Responding to the issue of how they get money from their relatives who are far away or other sources such
as pension payouts, some noted that they have their own accounts at local banks and are able to use ATMs.
Some noted that they use accounts of friends or relatives to receive money. Others noted that they use the
post office. Others noted that if family members give them money, it is brought to them physically and may
at times be given to other people who are traveling to the village to bring. Some respondents noted that
they used to have bank books that they had opened with the post office but that these were closed or just
abandoned. A couple of respondents who are ex-miners indicated that they used to find TEBA a useful means
to remitting to their families. In a few cases respondents noted that Taxis drivers are asked to help take
money to relatives. Some of the elderly who receive pensions noted that they do not have bank accounts
but have to go to a place where they receive their pay physically. In some case those who get a pension give
their cellphone numbers and are given messages to go collect their money.
Question 3: Do you have a bank account?
When some were asked why they do not have bank accounts, they indicated that it was because they were
told that they would need to have about M150 to be able to open an account at Standard Lesotho bank.
Others noted that the problem with bank accounts is that when it is not active for more than 3 months it gets
closed. They noted that bank accounts are for people with regular income.
3.5.4 General Observations
The following observations can be made from the focus group discussions:
39
Many people indicated that they buy from Chinese shops;
Most people indicated that the bigger shops and supermarkets are much cheaper than the village shops
and cafes;
In those cases where there is easy access to the town centre, people prefer to go shop in town and not
in the village;
Even people close to towns do not seem to be keen to have bank accounts. It is clear then that it is not
about proximity but other factors, especially access to regular income. The fact that people say that they
need to have M150 to open an account is seen as a barrier to opening bank accounts;
In some cases it was noted that passports were needed to open bank accounts and many people do not
have passports;
In the case of those who indicated that they have bank accounts, a large number of those who bank with
Standard Lesotho Bank;
The road infrastructure has improved people’s access to towns and this allows most people to purchase
food at the cheaper supermarkets in towns. There are few cases where people reported walking long
distances to towns where here are no shops;
The general trend is that the shops do not offer credit any more, especially the supermarkets and Chinese
shops. The smaller Basotho owned shops in villages are the ones where people reported that they still
get credit;
There was a number of respondents in Mokhotlong and Thaba Tseka who indicated that their main
source of income was sale of livestock and crops, especially beans; and,
Male respondents in most cases prefer to have only cash while female respondents prefer a mixture of
cash and food.
Asked what food items they would purchase if they had some extra cash, respondents mentioned only basic
items and did not include fancy food items such as cheese, butter, margarine, and the like.

40
4.0 Discussion
The discussion in this section of the report has been organized according to the six key questions regarding
markets and cash or voucher food assistance programmes that served as the study objectives.
4.1 Are markets operational and physically accessible by targeted households?
The different types of shop entities (i.e., wholesale, supermarket and small shops) were present in all the
districts, were located in all geographical regions (lowlands and mountain areas) and were accessible to
communities even in the remote areas thus suggesting that markets are accessible to communities. Further
evidence of accessibility, was the fact that the majority of the entities specialised exclusively in retailing
activity (i.e., purchase from trader, sell to consumer), meaning that they cater for the needs of households
(refer to Fig. 3.3). In addition, all traders had been in business for at least one year, thus indicating that
markets are operational. Further evidence of accessibility and functionality is reflected by the fact that nearly
half of the traders reported that there had been an increase in the number of customers and sales volumes
when compared in the same period in the previous year (refer to Figures 3.13 and 3.14).
Households’ accessibility to markets was further confirmed by the results of focus group discussions that
indicated that in the majority of cases people have access to shops or cafes within walking distance from
their homes. Improved road infrastructure that has allowed taxis to operate between towns and remote
areas, has resulted in rural households also having access to shops in the urban centres where they perceive
prices to be cheaper.
4.2. Is appropriate food available in sufficient quantities and at reasonable prices?
Many of the key food items identified by WFP CO Lesotho to be appropriate for a nutritional diet were
available and traded by at least 80% of the traders (refer to Figure 3.5). These key food items included maize
meal, rice, samp, wheat, peas, beans, fish, milk, eggs, cooking oil and sugar. Interestingly, carriers of the
most diverse food items were the small shop keepers (refer to Figure 3.11). The price of food varies little
between urban and rural zones indicating that the prices were not inflated and were therefore reasonable.
The data also indicate that the shops visited are generally well stocked. This was true for even those shops
in rural areas although the stock levels varied based on, largely, the type of ownership of the trading
establishment.
4.3 Are food markets sufficiently integrated so that food will flow to deficit/target zones?
The price data presented above suggests that markets are integrated and competitive. The prices of goods
do not only vary very little between regions (spatial difference) but in some cases, prices in the rural areas

41
seem to be better than in the urban areas. The general picture is that there are no constraints to the
functioning of markets.
4.4 Will traders respond adequately to any increase in effective demand based on their storage
capacities, supply sources, required quality and preference of customers, access to credit, etc?
The results show that more than half of traders indicated that they would be able to respond if demand were
to increase by 25% or more as a result of new purchase modalities. The results show that most of the traders
restock frequently and that there are no problems of storage. There are no problems with supply as most of
the stock is available from wholesalers in the districts, in Maseru and from RSA. Therefore, supply is not a
constraint at all. Transport has been noted as one of the constraints by some of the traders, especially
Basotho traders. This implies that their ability to respond will be largely influenced by access to transport.
4.5 Is it unlikely that cash/vouchers will contribute to rising purchase prices?
Results from the trader’s survey also show that the majority of respondents do not anticipate an increase in
food commodities as a result of increased demand. Traders were asked whether they were likely to increase
the price of food items if they had an increase in the number of customers. For the key food items reported
to be available by at least 80% of traders, at least 60% indicated that the prices would remain the same if the
number of customers increased (refer to Figure 3.7). Based on this finding and on the fact that consumables
are readily available and traded in the study areas and Lesotho in general, it is unlikely that a cash/voucher
system would contribute to rising purchase prices.
4.6 Why is food purchase through the local market more expensive compared to WFP procurement?
Results from the trader’s survey position locally bought food items as almost 50% higher than current
procurement prices for the same items. There can be many reasons for this. The first is likely an issue of
scale. The Lesotho food market is very small compared to many of its southern African neighbours.
Wholesalers and traders operate with similarly small quantities of food items. They operate relatively
independent of each other so there is little possibility of obtaining economies of scale if, for example, there
were to be joint purchasing by retailers from wholesalers or from flour mills themselves. As it is currently
organized, traders and purchasers within the Lesotho food market could never individually or within small
groups match the WFP procurement costs given the quantities that it can procure at any one time and its
ability to negotiate discounts. With such a substantial difference in costs, changing from direct food
assistance to a cash or voucher modality cannot rely on cost-effectiveness alone. This change must be part
of a longer term strategy to stabilize household food security and to reduce levels of poverty to the extent
that local production of food expands and local economies begin to provide livelihoods for poor households.

42 WFP Cash & Voucher Market Study – Final Report November 2011
5.0 Conclusions
With respect to the main questions to be considered by the market analysis, it is clear that both buyers and
sellers within the country’s food market have the capacity to adapt to a shift from direct food assistance to
a cash or voucher programme. Much of the data to support this was, however, prospective in the sense that
respondents stated what they would do should the change occur. It goes without saying that some type of
monitoring system would be required to ensure that no perverse incentives arise either for traders or
households to frustrate the over aim of cash transfer modalities.
While cash or voucher programmes implemented by WFP elsewhere around the global have had the aim of
strengthening the food production and marketing capacities, this aim may not be feasible or realistic in
Lesotho. Most commodities sold in the country are imported from RSA. White maize, the main staple food
for the Basotho, could never, at least in the immediate future, be produced at a level to supply the market
at price competitive to what could be imported from RSA whether one is the considering milling, wholesale
or retail stage of value chain.
Despite the challenging nature of the country’s geography, what the study has shown it that there are shops
or cafes with at least some food for sale in almost every region. Many of these are within walking distance
to households. All of these stock on a routine basis most of the food items identified by WFP as potential
components of its food basket. In addition, the prices of food items are not only considered to be reasonable
by traders or consumers alike. They also reasonable but vary very little between areas, especially between
urban and rural settings. There can be no guarantee against price fixing should WFP change its food
assistance modalities. However, what the study has shown about the integration and competitiveness of the
food market means that the risk of such consequences is small and can be controlled by the market itself for
the most part. Should WFP choose to implement a cash component within its country assistance strategy, it
will still be necessary to develop ways of monitoring food prices closely to ensure that traders do not inflate
prices as a result of the heightened demand.
One major challenge to be addressed as part of further feasibility analysis efforts will be how to deal with the
fact that a large number of both traders and consumers do not have access to or do not use banking facilities.
Lesotho has a very poorly developed financial services sector. Access to these services is very poor outside
of urban settings. For this reason, amongst others, neither traders nor consumers routinely rely on banks for
cash management or credit purposes. Although under the Millennium Challenge Account project it is
envisaged that about 2,000 point of sale terminals will be installed across the country to address this gap, it
43
will be 2 or 3 years before this expanded system becomes fully operational. Under the CGP, it was found
that cash management procedures, including processes for cash delivery to beneficiaries, can add
significantly to administrative costs and can erode the value-for-money of the intervention. WFP should take
cognisance of this and benefit from the experience of its UN partners locally and globally. Currently, cell
phone-based technologies are being piloted in the country as a method of remote banking and cash
management. While there is no substantive evidence yet, such newer technologies have at least some
potential to facilitate cost-effective implementation of the WFP programme and other current or future
social cash transfer interventions.

44
6.0 References
Devereux S & Mhlanga M. 2008. Cash Transfers in Lesotho: An Evaluation of World Vision’s Cash and Food Transfers Pilot Project. Brighton, UK: Institute of Development Studies.
FAO. 2011. Strengthening Capacity of Climate Change Adaptation in Agriculture: Experience and Lessons from Lesotho. Rome, Italy: FAO. GOL. 2009. Lesotho 2006 Population and Housing Census. Maseru, LS: MOFDP/BOS. GOL. 2010. Addendum to the Background Paper to the Budget Speech. Maseru, LS: MOFDP. GOL. 2010. Continuous Multi-purpose Household Survey 4th Quarter (October). Maseru, LS: MOFD/BOS. Management Care Development International (MCDI). 2007. GOL-CHAL Hospital and Health Centre Certification and Accreditation: Summary Report. MOHSW. 2010. Annual Joint Review Report 2009/10 FY. Maseru, LS: MOHSW/HPSU. MOHSW and ICF Macro. 2010. 2009 Lesotho Demographic and Health Survey. Maseru, LS: MOHSW. MOHSW. 2011. Annual Joint Review Report 2010/11 FY. Maseru, LS: MOHSW NAC and UNAIDS. 2011. National HIV and AIDS Estimates for Lesotho 2011. Maseru, LS: MOHSW. Omamo et al. 2010. Revolution from Food Aid to Food Assistance: Innovations in Overcoming Hunger. Rome, Italy: WFP. Oxford Policy Management. 2011. A Rapid Assessment of the Lesotho Child Grants Programme. Maseru, LS: UNICEF. Cited by permission. Regional Hunger and Vulnerability Programme (RHVP). 2007. The Practitioners’ Guide to the Household Economy Approach. London, UK: The Food Economy Group and Save the Children. Slater R &Mphale M. 2008. Cash transfers, gender and generational relations: evidence from a pilot project in Lesotho. London, UK: Overseas Development Institute. Special Initiative for Cash and Voucher Programming (SICVP). 2007. The Use of Cash/Vouchers in Response to Vulnerability and Food Insecurity: Case Study Review and Analysis. Rome, Italy: WFP. UNDP. 2010. Lesotho Millennium Development Goals Report 2010. Maseru, LS: UNDP UNICEF. 2011. Child Poverty in Lesotho (DRAFT). Maseru, LS: MOHSW USAID. 2009. Commodity Market Maps and Price Bulletins: Tools for Food Security Analysis and Reporting. FEWS NET Markets Guidance, No 4 (July). USAID and Famine Early Warning Systems Network (FEWS NET). 2011. Southern Africa Price Bulletin (July). WFP. 2006. Markets and Emergency Needs Assessment. Cairo Workshop. Rome, Italy: WFP. WFP. 2007a. Cash and Food Transfers. A Primer. Occasional Paper No. 18. Rome, Italy: WFP.

45
WFP. 2007b. Malawi: Assessment of appropriateness and feasibility of cash response options. Lilongwe, Malawi: WFP. WFP. 2007c. Market Analysis Tool: How to Conduct a Trader Survey? Rome, Italy: WFP. WFP. 2007d. Technical Meeting Report: Food Security and Markets. Subiaco, Italy 10-12 January 2007. Rome, IT: WFP. WFP. 2007e. Technical Meeting Report: Partnerships in Market Analysis for Food Security. Rome, Italy: WFP. WFP. 2009. Cash and Vouchers Manual. Rome, Italy: WFP. WFP. 2011a. Food Market and Trader Assessment. Post‐Nargis Affected Areas: Ayeyarwady and Yangon Divisions Myanmar. Yangon, Myanmar: WFP. WFP. 2011b. Lesotho Food Security Quarterly Monitoring Bulletin March 2011. Rome, IT: WFP. WFP. 2011c. Southern African Regional Food Security Update: Lesotho. June 2011. Rome, IT: WFP. WFP. 2011d. Update on Implementation of WFP’s Policy on Vouchers and Cash Transfers: Informal consultation. Meeting Report. Rome, Italy: WFP. WFP. 2011e. Urban Market Assessment in The Gambia: A feasibility study on cash and vouchers. Banjul, Gambia: WFP. WFP. 2011f. WFP Lesotho Cash and Voucher Feasibility Rapid Assessment. Maseru, LS: WFP. WFP and Michigan State University. 2005. Desk Review: Emergency Needs Assessments and the Impact of Food Aid on Local Markets. Rome, Italy: WFP. WFP and Michigan State University. 2006. Market Profiles and Emergency Needs Assessments: A summary of methodological challenges. Rome, Italy: WFP.
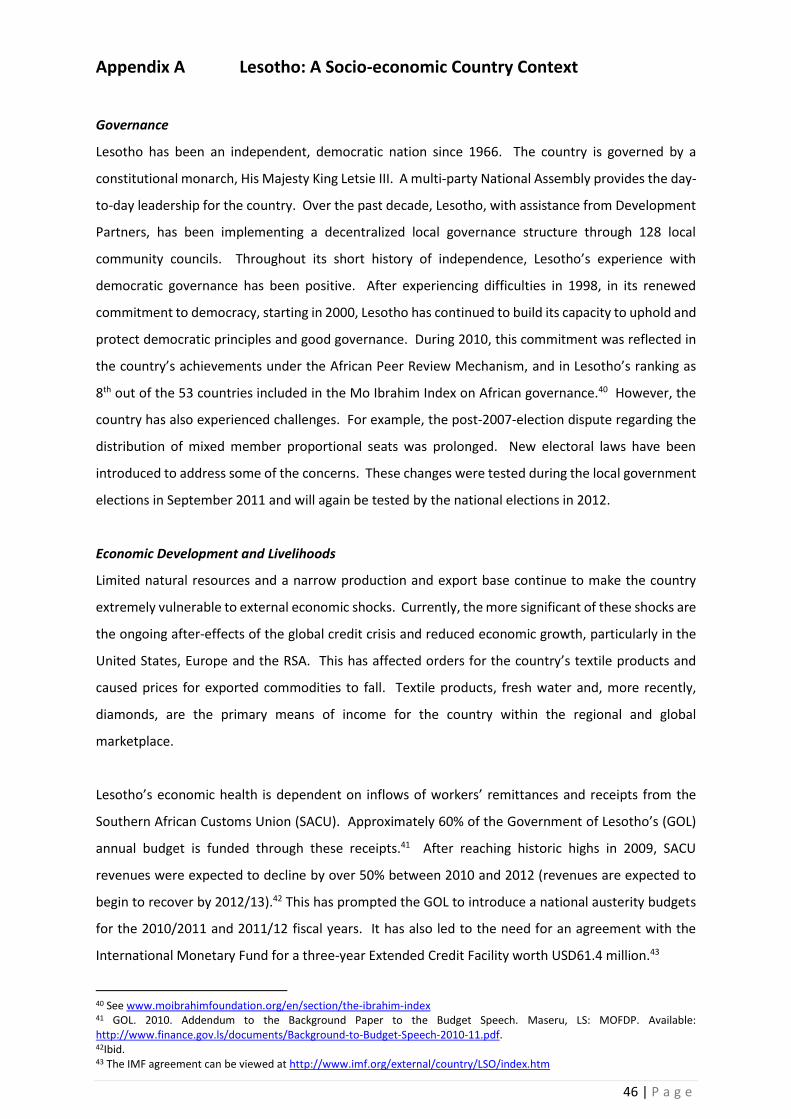
46 | P a g e
Appendix A Lesotho: A Socio-economic Country Context
Governance
Lesotho has been an independent, democratic nation since 1966. The country is governed by a
constitutional monarch, His Majesty King Letsie III. A multi-party National Assembly provides the day-
to-day leadership for the country. Over the past decade, Lesotho, with assistance from Development
Partners, has been implementing a decentralized local governance structure through 128 local
community councils. Throughout its short history of independence, Lesotho’s experience with
democratic governance has been positive. After experiencing difficulties in 1998, in its renewed
commitment to democracy, starting in 2000, Lesotho has continued to build its capacity to uphold and
protect democratic principles and good governance. During 2010, this commitment was reflected in
the country’s achievements under the African Peer Review Mechanism, and in Lesotho’s ranking as
8th out of the 53 countries included in the Mo Ibrahim Index on African governance.40 However, the
country has also experienced challenges. For example, the post-2007-election dispute regarding the
distribution of mixed member proportional seats was prolonged. New electoral laws have been
introduced to address some of the concerns. These changes were tested during the local government
elections in September 2011 and will again be tested by the national elections in 2012.
Economic Development and Livelihoods
Limited natural resources and a narrow production and export base continue to make the country
extremely vulnerable to external economic shocks. Currently, the more significant of these shocks are
the ongoing after-effects of the global credit crisis and reduced economic growth, particularly in the
United States, Europe and the RSA. This has affected orders for the country’s textile products and
caused prices for exported commodities to fall. Textile products, fresh water and, more recently,
diamonds, are the primary means of income for the country within the regional and global
marketplace.
Lesotho’s economic health is dependent on inflows of workers’ remittances and receipts from the
Southern African Customs Union (SACU). Approximately 60% of the Government of Lesotho’s (GOL)
annual budget is funded through these receipts.41 After reaching historic highs in 2009, SACU
revenues were expected to decline by over 50% between 2010 and 2012 (revenues are expected to
begin to recover by 2012/13).42 This has prompted the GOL to introduce a national austerity budgets
for the 2010/2011 and 2011/12 fiscal years. It has also led to the need for an agreement with the
International Monetary Fund for a three-year Extended Credit Facility worth USD61.4 million.43
40 See www.moibrahimfoundation.org/en/section/the-ibrahim-index 41 GOL. 2010. Addendum to the Background Paper to the Budget Speech. Maseru, LS: MOFDP. Available: http://www.finance.gov.ls/documents/Background-to-Budget-Speech-2010-11.pdf. 42Ibid. 43 The IMF agreement can be viewed at http://www.imf.org/external/country/LSO/index.htm

47 | P a g e
The country’s official unemployment rate is 19.2%. The definition of what constitutes employment is
expansive. It includes, “all persons who work for pay or profit, or had a job but were not currently at
work for various reasons, or were unpaid family workers who assist in the operation of either a farm
or family business usually run by the household head for at least a third of normal working hours.”
Overall, only 17.7% of men and 11.7% of women ages 15 to 64 have salaried employment. For women,
this ranges from 10% in rural areas to 24% in urban areas. For men the range is 16% to 26% in rural
and urban areas respectively. Approximately 31% of all women ‘work’ as homemakers or housewives.
Forty-three-point-two percent of the population lives on less than USD 1.25 per day; 68 % lives on less
than USD 2 per day.44 In a recently completed study on child poverty in Lesotho, it was estimated that
the richest 10% of the population held 40% of the country’s wealth, while the poorest 10% held only
1%.45 An estimated 500,000 children under the age of 18 years were considered to be living in poverty,
with 25% of this group being children under the age of 5 years.
Health and Social Development
The adult (ages 15 to 49 years) HIV prevalence rate in Lesotho has stabilized at 23.0%.46 In 2010, there
were an estimated 282,532 adults and children living with HIV, of which 50,494 or 18% were children
and adolescents below the age of 19 years. Fifty-five percent of this group was female. The HIV
epidemic in Lesotho has a very significant gender dimension. Overall, 60% of HIV-positive adults and
children are female. In the age groups 15 to 24 years, and 25 to 29 years, over 70% are female.
Persistently high HIV prevalence in the 25 to 30 year age group indicates ongoing transmission of the
virus. Social and behavioural change interventions to prevent HIV transmission have had limited
effect. In 2009, only 51% of males and 38% of females had used condoms during their most recent
high risk sexual encounter.
With respect to the provision of anti-retroviral treatment (ART), at the end of 2010, 75,793 (58%) of
the 115,000 HIV-positive adults (15 to 49 years) in need of ART were on active treatment.47 At the
same time, of the estimated 37,266 HIV-positive children 14 years and below, approximately 23,000
were in need of ART of which 4,902 or 21% were on active treatment. Results released in 2009 from
the 2006 population census showed that the number of orphaned children had risen 41% to
approximately 221,000 since the previous census in 1996.48 Estimates developed by the Ministry of
Health and Social Welfare (MOHSW) in 2010 showed that of all orphans, approximately 25% had lost
44 Ibid. 45 UNICEF. 2011. Child Poverty in Lesotho (DRAFT). Maseru, LS: MOHSW. 46NAC and UNAIDS. 2011. National HIV and AIDS Estimates for Lesotho 2011. Maseru, LS: MOHSW; see also MOHSW and ICF Macro 2010, op. cit. note 2. Both studies found an HIV prevalence of 23%. All other data in the paragraph originates from these sources. 47 MOHSW. 2011. Annual Joint Review Report 2010/11 FY. Maseru, LS: MOHSW 48 GOL. 2009, op. cit. note 1.
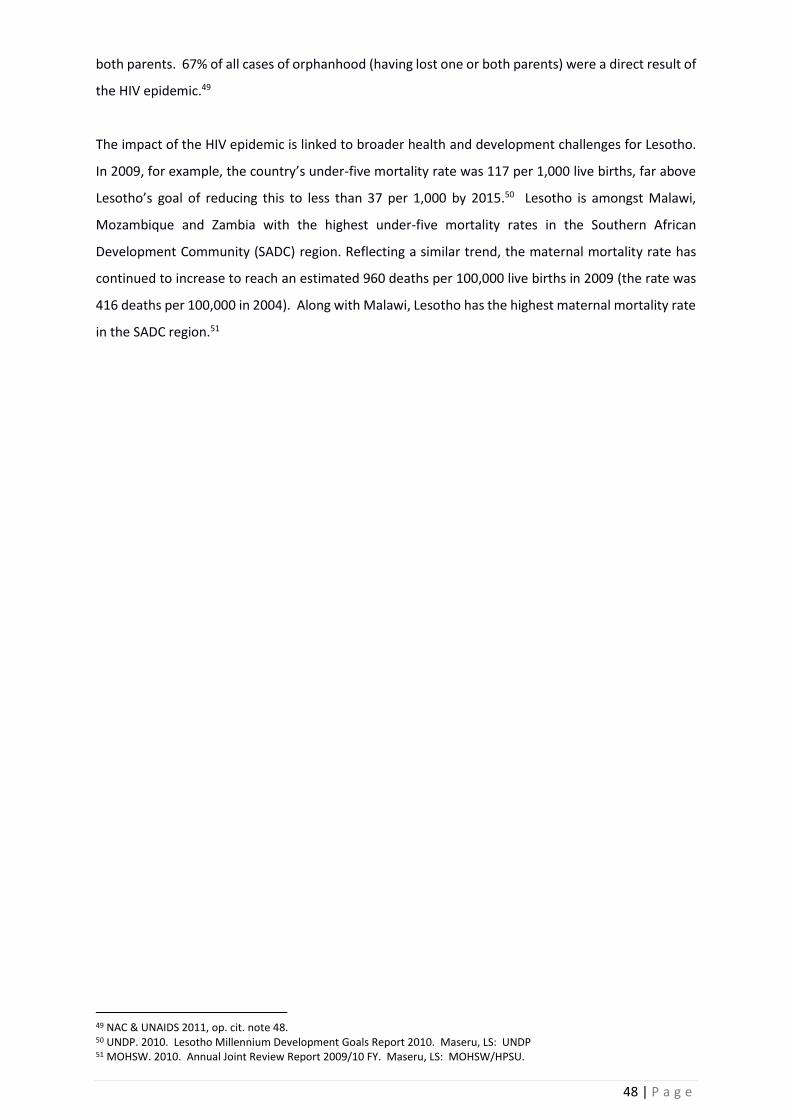
48 | P a g e
both parents. 67% of all cases of orphanhood (having lost one or both parents) were a direct result of
the HIV epidemic.49
The impact of the HIV epidemic is linked to broader health and development challenges for Lesotho.
In 2009, for example, the country’s under-five mortality rate was 117 per 1,000 live births, far above
Lesotho’s goal of reducing this to less than 37 per 1,000 by 2015.50 Lesotho is amongst Malawi,
Mozambique and Zambia with the highest under-five mortality rates in the Southern African
Development Community (SADC) region. Reflecting a similar trend, the maternal mortality rate has
continued to increase to reach an estimated 960 deaths per 100,000 live births in 2009 (the rate was
416 deaths per 100,000 in 2004). Along with Malawi, Lesotho has the highest maternal mortality rate
in the SADC region.51
49 NAC & UNAIDS 2011, op. cit. note 48. 50 UNDP. 2010. Lesotho Millennium Development Goals Report 2010. Maseru, LS: UNDP 51 MOHSW. 2010. Annual Joint Review Report 2009/10 FY. Maseru, LS: MOHSW/HPSU.

49 | P a g e
Appendix B Terms of Reference
Technical support to assess the feasibility of introducing C/V based programming, focusing
mainly on market analysis in potential interventions areas
1.0 Purpose
The main purpose of this exercise is to undertake the market analysis to inform decision making on
whether locally produced food commodities identified for a nutritious food basket are available in the
market and whether the markets have the potential to respond to increased demand.
2.0 Background
Lesotho produces less than 30% of its cereal requirements indicating high reliance on imports. Prices
of main cereals and fuel are heavily influenced by South African Markets. The effect of high prices was
illustrated by the 2008 Urban Vulnerability Study (WFP and the Disaster Management Authority),
which was carried out at the time when prices increased drastically. Vulnerable households such as
those hosting chronically ill members, orphans and vulnerable children were found to be highly food
insecure as they relied almost entirely on purchases. Overall, 13% (60,000 people) of urban population
was food insecure. On the other hand, rural livelihoods are deteriorating as crop production,
remittances, casual labour opportunities are declining.
The situation in Lesotho is complex since almost 54% of the population lives in poverty; 23% of adults
are HIV positive; 39% and 47% of children under five years suffer from chronic malnutrition and
anaemia respectively (Lesotho Demographic Health Survey 2009); and there are more than 180,000
orphans. Every other year, the number of people identified with food insecurity increases. In 2010/11,
200,000 people were food insecure, half the number estimated the previous year. However, in
2011/12 there is high likelihood that this number will increase significantly, based on the government-
led rapid assessment on the impact of the heavy rains, which showed that field operations reduced
due to water logging, poor germination and pests. This information is supported by the recent Post
Disaster Needs Assessment by World Bank and UN (2011) which indicated poor crop production this
year. Although it is expected that food will still be available in the markets, many people lack the
means to purchase it.
Given that 70% of food required is imported, supported by a very reliable source of food in RSA, WFP
proposes to explore cash and voucher approaches for nutrition programming. Markets can be used as
an effective modality to transfer food to hungry people. Thus, the market analysis will enhance the
knowledge base in the country office on the possibility of using cash/voucher modalities for nutrition
programmes. Lesotho is a suitable country in which to implement a cash/voucher modality as an
alternative to direct food deliveries and this initiative will boost the local business.

50 | P a g e
3.0 Approach and Methodology
A team of the Regional Senior Advisor for New Assistance Modalities, Mr. Mads Lofvall and Cash and
Voucher Programme Officer, Mr. Trygve Siira undertook a mission to Lesotho in April to assist the
country office to start thinking about the process of changing input modality from food to
cash/voucher in its nutrition programming.
The mission discovered that the cost implication of using cash/voucher in the context of Lesotho are
high owing to the fact that WFP would still want to maintain corn soya blend for its beneficiaries in
the nutrition programme. However, the mission recommended that through the German Grant, the
Country Office should study different cost-effective measures of implementing cash/voucher
modalities. It is in this context that the CO intends to explore all the possibilities of using cash/voucher
by i) designing a nutritious and cost-effective food basket that is easily available in the market,
preferably locally produced foods; ii) engaging a national consultant to undertake the market analysis
based on the indentified food basket and iii) undertaking a feasibility study of changing from food to
cash/voucher modalities.
Therefore the following procedure will be followed:
WFP nutritionist will design a locally produced food basket that will provide adequate
nutrients to patients as it is the case with WFP traditional food basket.
A qualified local consultant will be engaged to conduct market survey in order to determine
the cost-effectiveness of the food basket.
The consultant will assess the supply lines for the traditional commodities to explain why the local market is expensive compared with WFP provided commodities.
The proposed market study will assess market capacities, the potential for markets to respond effectively to a shift away from food to cash/voucher based interventions.
Study areas:
The study will be conducted in four districts out of which three are WFP operational districts; Thaba-
Tseka and Mokhotlong in the mountain region and Berea in the lowlands. The fourth district will be
Maseru.
Specific activities would include:
1. Reviewing and summarizing existing secondary data
2. Developing methodologies and tools for data collection and analysis (taking into account
WFP’s corporate guidance on cash and voucher programmes)
3. Carrying out primary data collection as planned
4. Drafting the market analysis report 5. Presenting key findings to WFP and stakeholders (and incorporating their feedback into the
final report)
6. Preparation of a final report

51 | P a g e
4.0 Expected outputs
A report informing decision making on the cost-effective food basket that is easily found in the local
markets and whether these have the capacity to sustain cash/voucher project for WFP programme.
5.0 Timeframe
This exercise is expected to take 2 months or 40 days, starting in June 2011 and the final report should
be available no later than August 2011.
6.0 Supervision
The consultant will work in close collaboration with the WFP country office, under the overall
supervision of the Head of Programme.

52 | P a g e
Appendix C WFP Lesotho Food Basket Items
1. Starch
Maize, rice, sorghum, wheat, potatoes, sweet potatoes,
2. Protein
Pulses: peas, beans, lentils
Animal products: Bbef, mutton, lamb chicken, turkey, offal, fish, milk, eggs
3. Vegetables (moroho) and fruits
a)Vegetables: cabbage, spinach, carrots, pumpkin (leaves and fruit) beetroot,
radish (leaves and roots), seruoe, leshaabe, moeetse-oa-pere, theepe, qheela,
leharasoana, tenane.
b) Fruits: peaches, apples, oranges, bananas, pear, pineapple, mango
4. Fats and oils
Fats: hydrogenated fats, margarine, butter
Oils: Vegetable cooking oils.
5. Sugars and sweeteners
Sugar, honey, Syrup
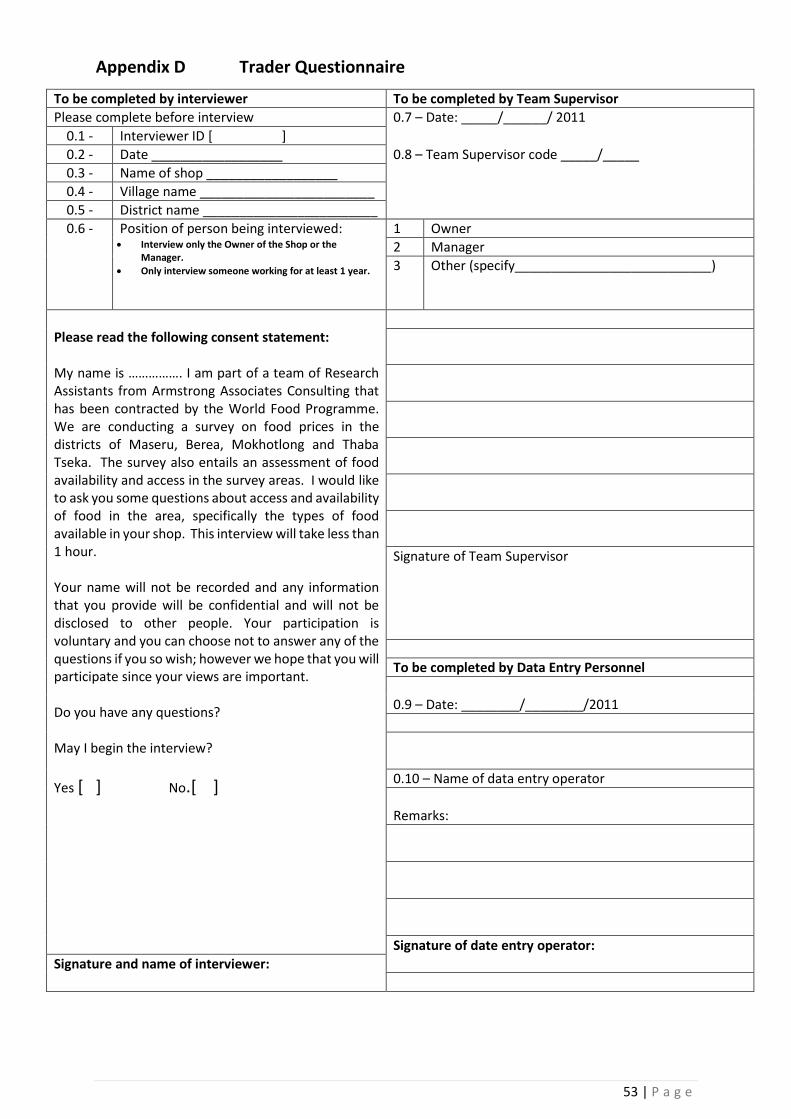
53 | P a g e
Appendix D Trader Questionnaire
To be completed by interviewer To be completed by Team Supervisor
Please complete before interview 0.7 – Date: _____/______/ 2011
0.1 - Interviewer ID [ ]
0.2 - Date __________________ 0.8 – Team Supervisor code _____/_____
0.3 - Name of shop __________________
0.4 - Village name ________________________
0.5 - District name ________________________
0.6 - Position of person being interviewed: Interview only the Owner of the Shop or the
Manager.
Only interview someone working for at least 1 year.
1 Owner
2 Manager
3 Other (specify___________________________)
Please read the following consent statement: My name is ……………. I am part of a team of Research Assistants from Armstrong Associates Consulting that has been contracted by the World Food Programme. We are conducting a survey on food prices in the districts of Maseru, Berea, Mokhotlong and Thaba Tseka. The survey also entails an assessment of food availability and access in the survey areas. I would like to ask you some questions about access and availability of food in the area, specifically the types of food available in your shop. This interview will take less than 1 hour. Your name will not be recorded and any information that you provide will be confidential and will not be disclosed to other people. Your participation is voluntary and you can choose not to answer any of the questions if you so wish; however we hope that you will participate since your views are important. Do you have any questions? May I begin the interview?
Yes [ ] No.[ ]
Signature of Team Supervisor
To be completed by Data Entry Personnel
0.9 – Date: ________/________/2011
0.10 – Name of data entry operator
Remarks:
Signature of date entry operator:
Signature and name of interviewer:

54 | P a g e
Section 1: General characteristics of the trader
1.1 When did you start your trading business?
[Circle only one. If the business has been operating for less than one
year, stop the interview]
1 Less than one years ago 2 Between 1 -3 years ago 3 More than 3 years ago
99 No answer
1.2
Which of the following would you classify your shop as?
RA: Read out list.
[Circle only one]
1 Wholesaler
2 Supermarket
3 Small shop
1.3
What is the ethnicity/nationality of the owner of the owner of the
shop?
[Circle only one. For other describe below]
Other_______________________________________
1 Chinese 2 Indian 3 Mosotho 4 Other
1.4
In what type of trading activities are you involved? [circle all the numbers that apply]
Other_______________________________________
1 Purchase from traders, sell to traders (=wholesaling) 2 Purchase from traders, sell to consumers (=retailing) 3 Purchase from farmers, sell to traders ( =collecting) 4 Other (specify: )
99 No answer 1.5 Where do you buy most of your stock?
[circle all the numbers that apply]
Other_______________________________________
1 Local wholesale 2 Other wholesale in Lesotho 3 Local supermarket 5 Place in RSA ( ) 6 Other
99 No answer
Section 2: Credit and stock safety
2.1 Do you provide credit to some of your customers?
[circle one of the numbers]
1 = Yes 2 =No Go to Q2.3
99 = no answer
2.2
If yes to 2.1, what proportion of the total number of your customers were
those receiving credit during the past month?
Credit % of Sales 88=Not
applicable
99 = no
answer
2.3
Have there been any changes in the number of people who have been
requesting credit compared to the same period last year?
[circle one of the numbers]
1 Yes, less people
2 Yes, more people
3 No, same number of people
99 No answer
2.4 How many weeks do you usually keep your commodity between purchases
and sales?
Weeks
99 No answer
Section 3: Prices and transaction costs
3.1 Do you keep records of the following costs?
Cost item 1= Yes 2 = No 99= No answer
Transport
Fumigation
Cleaning/drying
Bagging
Storage
Losses
Loading and Off-loading
Financial expenses (e.g. auditing and accounting expenses)
Informal and formal taxes
Section 4: Utilities, infrastructure, banking and licensing
\
4.1 Type of power supply to the shop 1. None 2.
Generator
2. Grid electricity 3. Solar 4. Solar & grid 99. No
answer 4.2 Type of communication at the shop 1. None 2. Landline 3. Cell 4. Cell & landline 99. No
answer 4.3 Do you have bank account for this business 1. Yes 2. No Go to Section 5 99. No
answer 4.4 If there is an account, where is bank? 1. Nedbank 2. Standard LS
Bank
3. Post Bank 4.FNB 99. No
answer 5. Other Bank. Describe:
99. No answer 4.6 Type of bank account 1. None 2. Cheque 3. Savings 4. Call 5. Not Known 99. No
answer
I am now going to ask you questions about availability and prices of specific food items. Move to Section 5 on the next page.
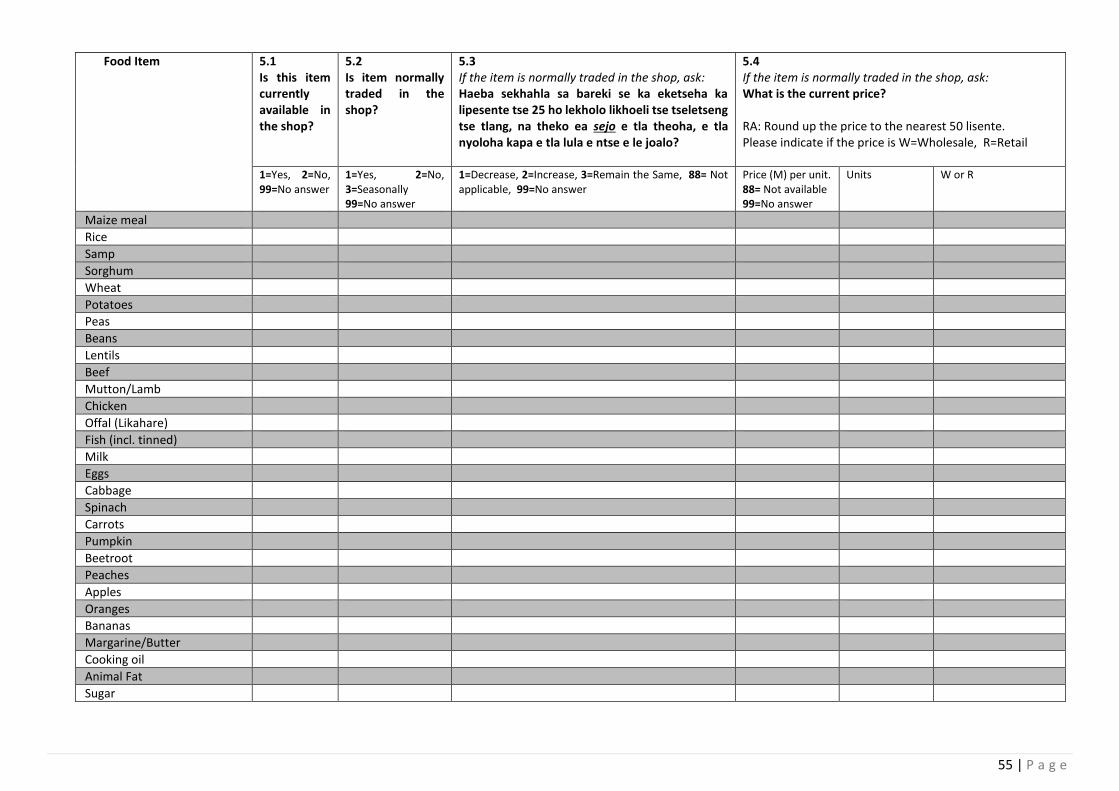
55 | P a g e
Food Item 5.1 Is this item currently available in the shop?
5.2 Is item normally traded in the shop?
5.3 If the item is normally traded in the shop, ask: Haeba sekhahla sa bareki se ka eketseha ka lipesente tse 25 ho lekholo likhoeli tse tseletseng tse tlang, na theko ea sejo e tla theoha, e tla nyoloha kapa e tla lula e ntse e le joalo?
5.4 If the item is normally traded in the shop, ask: What is the current price?
RA: Round up the price to the nearest 50 lisente. Please indicate if the price is W=Wholesale, R=Retail
1=Yes, 2=No, 99=No answer
1=Yes, 2=No, 3=Seasonally 99=No answer
1=Decrease, 2=Increase, 3=Remain the Same, 88= Not applicable, 99=No answer
Price (M) per unit. 88= Not available 99=No answer
Units W or R
Maize meal
Rice
Samp
Sorghum
Wheat
Potatoes
Peas
Beans
Lentils
Beef
Mutton/Lamb
Chicken
Offal (Likahare)
Fish (incl. tinned)
Milk
Eggs
Cabbage
Spinach
Carrots
Pumpkin
Beetroot
Peaches
Apples
Oranges
Bananas
Margarine/Butter
Cooking oil
Animal Fat
Sugar

56 | P a g e
Section 5 Continued
5.6 Please indicate the three most important – in terms of quantity – commodities traded normally by you?
Write commodity below
1:for the most important commodity _______________________________________________________________________
2: for the second most important commodity y________________________________________________________________
3:for the third most important commodity] ___________________________________________________________________
5.7 How do you transport the goods to your shop?
[circle all that apply]
1 Own transport
2 Hired transport
3 Delivered by seller
4 Combination of both
99 No answer
Section 6: Volumes and flows. RA: “The questions below relate to three food items that you have just mentioned.
6.1
Please estimate the number of customers to whom you have sold
these items to during the past month
[circle one of the numbers]
1 Less than 10 2 More than 10 less than 70 3 More than 70, less than 140 4 More than 140
99 No answer
6.2 Please indicate if this number is higher, lower or the same level
compared to the same period last year.
[circle one of the numbers]
1 Higher 2 Lower 3 Same level
99 No answer
6.3
Please indicate if your sales during the last month of the food items
has increased, decreased or stayed the same level compared to the
same period last year.
[circle one of the numbers]
1 Increased 4 No change 5 Decreased
99 No answer 88 Not Applicable (if 2.3 =no change or no answer)
6.4
If sales volumes are higher or lower, please provide the most
important reasons for this change.
[circle all the numbers that apply]
Other: _______________________________________________
____________________________________________________
1 Better local harvest than last year influenced sales 2 Worse local harvest than last year influenced sales 3 More institutional procurement 4 Less institutional procurement 5 More effective demand from other districts/areas 6 Less effective demand from other districts/areas 7 More supply coming from other districts/areas 8 Less supply coming from other districts /areas 9 More demand from customers in the district /area
10 Less demand from customers in the district /area 11 Higher profit margins 12 Lower profit margins 13 Less capital/credit available for trade 14 More capital/credit available for trade 15 Increased risk 16 Lower risk 17 Other 99 No answer 88 Not Applicable
6.5
If the sales volumes are lower than during the same period last
year, please indicate when the trader expects that sales will
recover to normal level. [circle one of the numbers]
1 Within one month 2 Within 3 months 3 Within 6 months to one year 4 Longer than one year or never
99 No answer
6.6
What are currently your most important sources for your three
most important food items?
[circle all the numbers that apply]
Other:________________________________________________
1 Farmers within the district 2 Farmers outside the district 3 Traders within the district 4 Traders inn other districts within the country 5 Traders in RSA 6 Other
99 No Answer
6.7
What were your most important sources for the three most
important food items during the same period last year (where did
the trader buy the commodity)?
[circle all the numbers that apply]
Other:________________________________________________
1 Farmers within the district 2 Farmers outside the district 3 Traders within the district 4 Traders inn other districts within the country 5 Traders in RSA 6 Other
99 No Answer 88 Not applicable

57 | P a g e
6.8
If the most important source(s) of the three most important commodities
have changes,
Please provide the 3 most important reasons for this change?
[circle all the numbers that apply]
1 Better local harvest than last year influenced sales 2 Worse local harvest than last year influenced sales 3 More institutional procurement 4 Less institutional procurement 5 More effective demand from other districts/abroad 6 Less effective demand from other districts/ abroad 7 More supply coming from other districts/ abroad 8 Less supply coming from other districts / abroad 9 More demand from customers
10 Less demand from customers 11 Higher profit margins 12 Lower profit margins 13 Less capital/credit available for trade on the part of the shop owner 14 More capital/credit available for trade 15 Increased risk in trading (e.g. thefts, bad weather etc) 16 Lower risk 17 Other (Specify ) 99 No answer
6.9
Do you think the most important sources of the 3 commodities will change
during the coming six months, compared to the current source?
If so, to what source? For example, the source of maize supply might change
seasonally.
[circle all the numbers that apply]
1 No change of the most important source 2 Yes, to farmers within the district/region 3 Yes, to farmers outside the district 4 Yes, to traders within the district 5 Yes, to traders in other districts 6 Yes, to traders in RSA 7 Yes, to other sources (specify )
99 No answer
6.10
Could you please provide an indication of your stock levels now (of the
three most important food items) compared to the same period last year.
[circle one of the numbers]
1 More or less the same level 2 My stock level is much higher 3 My stock level is somewhat higher 4 My stock level is much lower 5 My stock level is somewhat lower
99 No answer
RA: “I am going to continue to ask you about the three most important food items that you trade in. .
Section 7: Constraints and response Capacity
7.1 Do you have constraints to increase the amount you sell? 1 Yes [Go to 7.2]
2 No [End Interview]
99 No answer
7.2
What are the three most important constraints preventing you from increasing the amount of stock that you sell (of the 3 most important food items)? Other: _____________________________________________ ___________________________________________________
1 Lack of own capital 2 Lack of credit/ credit is expensive 3 Low or varying quality of produce (supply)
4 Low irregular quantity of produce (supply) including trade restrictions 5 Lack means of transport 6 Poor road infrastructure/ transport cost too high 7 High insecurity
8 Lack of storage 9 Low profit margin (low sales price, high purchase price)
10 Lack of demand 11 Competitors would not allow me to grow so much 12 Government would not allow me, taxes too high 13 Too much food assistance in the area 14 Theft 15 Other 99 No answer
Thank you for participating in this survey. Do you have any questions for me at this stage?
RA Specific remarks about the interview

58 | P a g e
Appendix E Focus Group Discussion Guide
Focus Group Discussion Topic Guideline
While focus group discussions are shaped more by group interactions and are not aimed at providing an in-
depth analysis of the habits of community, it is important that topics and issues are discussed systematically.
To ensure uniformity and that questions are open-ended and not leading, a topic guide with specific themes
and questions is currently being developed. The topic guide is organized around three themes: Household
allocation of resources and financial decision making; household access to local markets; household financial
status and access to banking systems.
Theme 1: Household allocation of resources and financial decision making
What are the five main food items that you purchase normally and most often?
Have there been any factors which have altered the type of products that you have purchased and the
timing?
How would your purchase behaviour change if you received more money? What would be your priority
spending areas (i.e., what would be the first three things that you spend the money on)? What would
you spend remaining funds on?
Who makes the decisions about how money is spent in the household?
If assistance was to include money, would you prefer it to be all money or a mix of food and money?
Theme 2: Household access to local markets
3 Where do you purchase your essential food items? Is that the shop you prefer to purchase food and
why?
4 How far is the nearest food purchase market from your homes?
5 How do you travel there?
6 Have there been any factors which have resulted in the lack of physical access to the market/shop?
7 Do you have access to credit at the place that you normally buy food?
Theme 3: Household financial status and access to banking systems
8 What are your sources of income?
9 How do you receive money? If participants do not mention bank or post office accounts, ask for the
reasons why?
10 Do you have a bank account?
11 How far is the nearest banking facility?
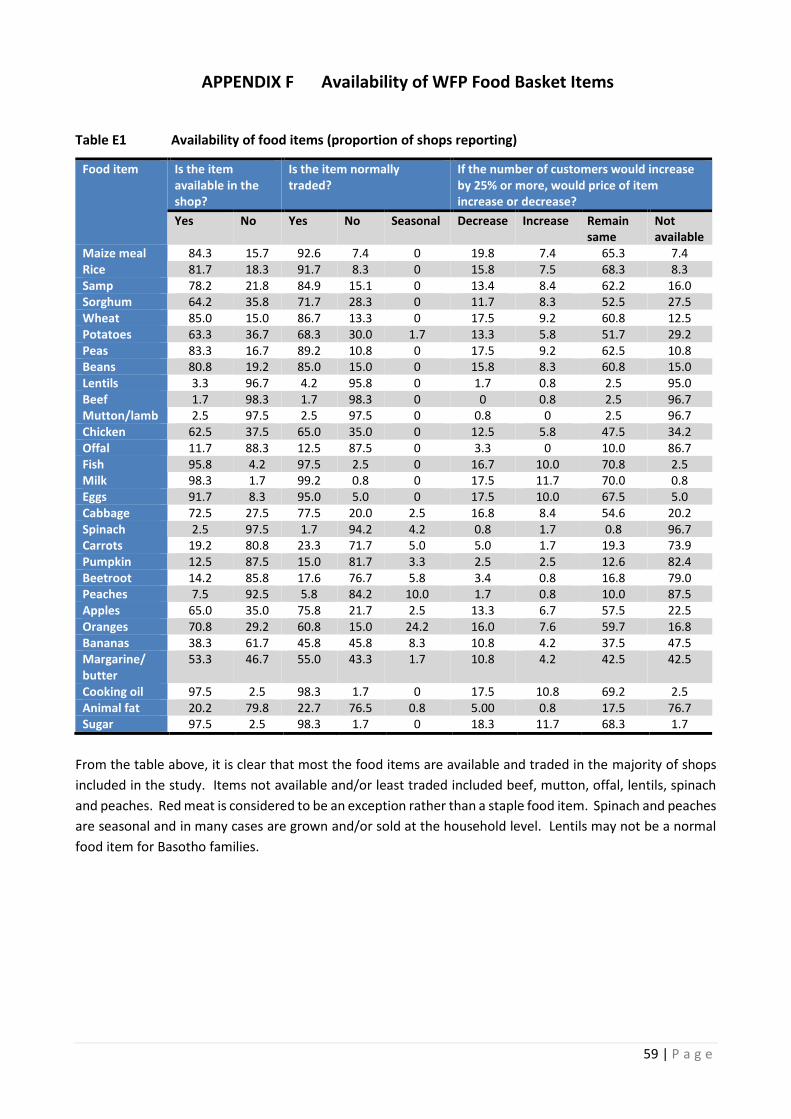
59 | P a g e
APPENDIX F Availability of WFP Food Basket Items
Table E1 Availability of food items (proportion of shops reporting)
Food item Is the item available in the shop?
Is the item normally traded?
If the number of customers would increase by 25% or more, would price of item increase or decrease?
Yes No Yes No Seasonal Decrease Increase Remain same
Not available
Maize meal 84.3 15.7 92.6 7.4 0 19.8 7.4 65.3 7.4 Rice 81.7 18.3 91.7 8.3 0 15.8 7.5 68.3 8.3 Samp 78.2 21.8 84.9 15.1 0 13.4 8.4 62.2 16.0 Sorghum 64.2 35.8 71.7 28.3 0 11.7 8.3 52.5 27.5 Wheat 85.0 15.0 86.7 13.3 0 17.5 9.2 60.8 12.5 Potatoes 63.3 36.7 68.3 30.0 1.7 13.3 5.8 51.7 29.2 Peas 83.3 16.7 89.2 10.8 0 17.5 9.2 62.5 10.8 Beans 80.8 19.2 85.0 15.0 0 15.8 8.3 60.8 15.0 Lentils 3.3 96.7 4.2 95.8 0 1.7 0.8 2.5 95.0 Beef 1.7 98.3 1.7 98.3 0 0 0.8 2.5 96.7 Mutton/lamb 2.5 97.5 2.5 97.5 0 0.8 0 2.5 96.7 Chicken 62.5 37.5 65.0 35.0 0 12.5 5.8 47.5 34.2 Offal 11.7 88.3 12.5 87.5 0 3.3 0 10.0 86.7 Fish 95.8 4.2 97.5 2.5 0 16.7 10.0 70.8 2.5 Milk 98.3 1.7 99.2 0.8 0 17.5 11.7 70.0 0.8 Eggs 91.7 8.3 95.0 5.0 0 17.5 10.0 67.5 5.0 Cabbage 72.5 27.5 77.5 20.0 2.5 16.8 8.4 54.6 20.2 Spinach 2.5 97.5 1.7 94.2 4.2 0.8 1.7 0.8 96.7 Carrots 19.2 80.8 23.3 71.7 5.0 5.0 1.7 19.3 73.9 Pumpkin 12.5 87.5 15.0 81.7 3.3 2.5 2.5 12.6 82.4 Beetroot 14.2 85.8 17.6 76.7 5.8 3.4 0.8 16.8 79.0 Peaches 7.5 92.5 5.8 84.2 10.0 1.7 0.8 10.0 87.5 Apples 65.0 35.0 75.8 21.7 2.5 13.3 6.7 57.5 22.5 Oranges 70.8 29.2 60.8 15.0 24.2 16.0 7.6 59.7 16.8 Bananas 38.3 61.7 45.8 45.8 8.3 10.8 4.2 37.5 47.5 Margarine/ butter
53.3 46.7 55.0 43.3 1.7 10.8 4.2 42.5 42.5
Cooking oil 97.5 2.5 98.3 1.7 0 17.5 10.8 69.2 2.5 Animal fat 20.2 79.8 22.7 76.5 0.8 5.00 0.8 17.5 76.7 Sugar 97.5 2.5 98.3 1.7 0 18.3 11.7 68.3 1.7
From the table above, it is clear that most the food items are available and traded in the majority of shops
included in the study. Items not available and/or least traded included beef, mutton, offal, lentils, spinach
and peaches. Red meat is considered to be an exception rather than a staple food item. Spinach and peaches
are seasonal and in many cases are grown and/or sold at the household level. Lentils may not be a normal
food item for Basotho families.
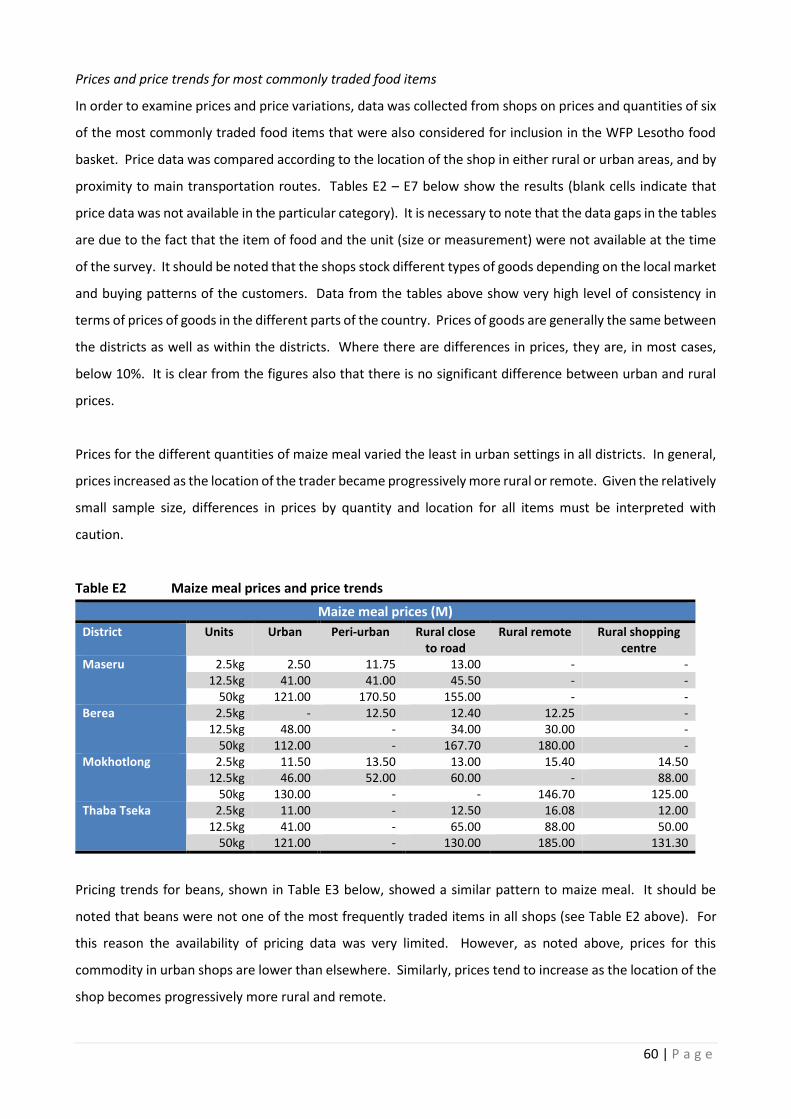
60 | P a g e
Prices and price trends for most commonly traded food items
In order to examine prices and price variations, data was collected from shops on prices and quantities of six
of the most commonly traded food items that were also considered for inclusion in the WFP Lesotho food
basket. Price data was compared according to the location of the shop in either rural or urban areas, and by
proximity to main transportation routes. Tables E2 – E7 below show the results (blank cells indicate that
price data was not available in the particular category). It is necessary to note that the data gaps in the tables
are due to the fact that the item of food and the unit (size or measurement) were not available at the time
of the survey. It should be noted that the shops stock different types of goods depending on the local market
and buying patterns of the customers. Data from the tables above show very high level of consistency in
terms of prices of goods in the different parts of the country. Prices of goods are generally the same between
the districts as well as within the districts. Where there are differences in prices, they are, in most cases,
below 10%. It is clear from the figures also that there is no significant difference between urban and rural
prices.
Prices for the different quantities of maize meal varied the least in urban settings in all districts. In general,
prices increased as the location of the trader became progressively more rural or remote. Given the relatively
small sample size, differences in prices by quantity and location for all items must be interpreted with
caution.
Table E2 Maize meal prices and price trends
Maize meal prices (M)
District Units Urban Peri-urban Rural close to road
Rural remote Rural shopping centre
Maseru 2.5kg 2.50 11.75 13.00 - - 12.5kg 41.00 41.00 45.50 - -
50kg 121.00 170.50 155.00 - - Berea 2.5kg - 12.50 12.40 12.25 -
12.5kg 48.00 - 34.00 30.00 - 50kg 112.00 - 167.70 180.00 -
Mokhotlong 2.5kg 11.50 13.50 13.00 15.40 14.50 12.5kg 46.00 52.00 60.00 - 88.00
50kg 130.00 - - 146.70 125.00 Thaba Tseka 2.5kg 11.00 - 12.50 16.08 12.00
12.5kg 41.00 - 65.00 88.00 50.00 50kg 121.00 - 130.00 185.00 131.30
Pricing trends for beans, shown in Table E3 below, showed a similar pattern to maize meal. It should be
noted that beans were not one of the most frequently traded items in all shops (see Table E2 above). For
this reason the availability of pricing data was very limited. However, as noted above, prices for this
commodity in urban shops are lower than elsewhere. Similarly, prices tend to increase as the location of the
shop becomes progressively more rural and remote.
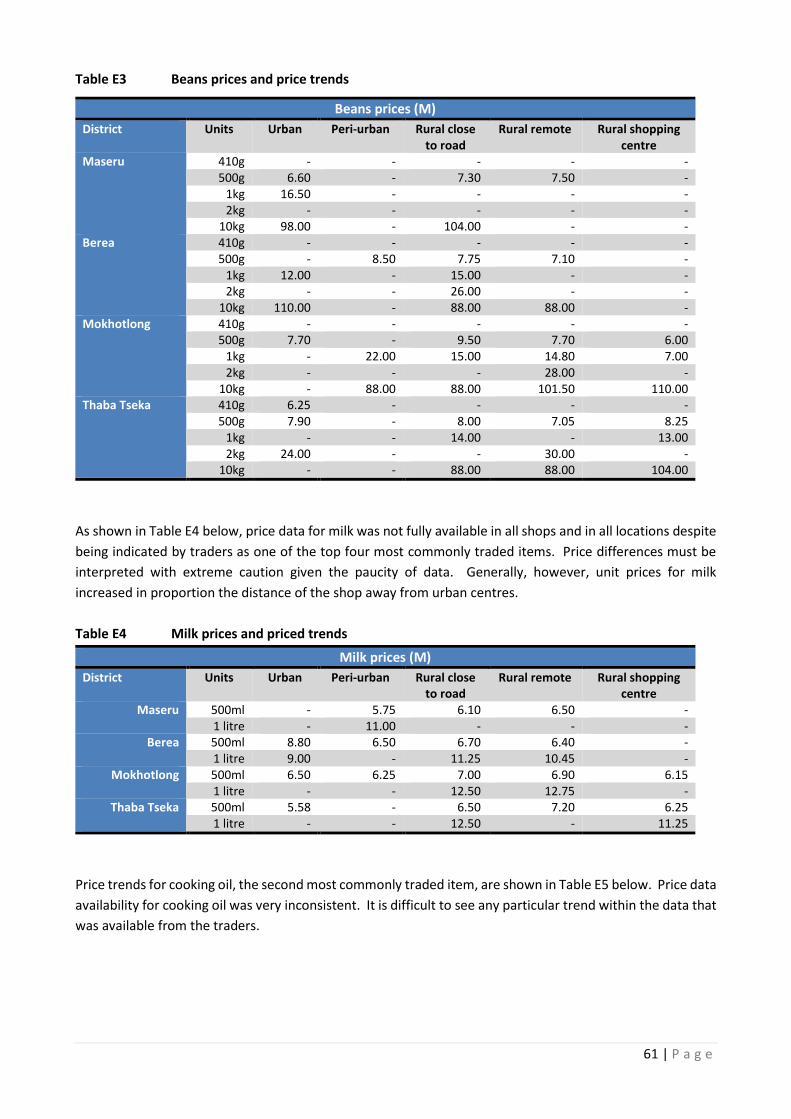
61 | P a g e
Table E3 Beans prices and price trends
Beans prices (M)
District Units Urban Peri-urban Rural close to road
Rural remote Rural shopping centre
Maseru 410g - - - - - 500g 6.60 - 7.30 7.50 -
1kg 16.50 - - - - 2kg - - - - -
10kg 98.00 - 104.00 - - Berea 410g - - - - -
500g - 8.50 7.75 7.10 - 1kg 12.00 - 15.00 - - 2kg - - 26.00 - -
10kg 110.00 - 88.00 88.00 - Mokhotlong 410g - - - - -
500g 7.70 - 9.50 7.70 6.00 1kg - 22.00 15.00 14.80 7.00 2kg - - - 28.00 -
10kg - 88.00 88.00 101.50 110.00 Thaba Tseka 410g 6.25 - - - -
500g 7.90 - 8.00 7.05 8.25 1kg - - 14.00 - 13.00 2kg 24.00 - - 30.00 -
10kg - - 88.00 88.00 104.00
As shown in Table E4 below, price data for milk was not fully available in all shops and in all locations despite
being indicated by traders as one of the top four most commonly traded items. Price differences must be
interpreted with extreme caution given the paucity of data. Generally, however, unit prices for milk
increased in proportion the distance of the shop away from urban centres.
Table E4 Milk prices and priced trends
Milk prices (M)
District Units Urban Peri-urban Rural close to road
Rural remote Rural shopping centre
Maseru 500ml - 5.75 6.10 6.50 - 1 litre - 11.00 - - -
Berea 500ml 8.80 6.50 6.70 6.40 - 1 litre 9.00 - 11.25 10.45 -
Mokhotlong 500ml 6.50 6.25 7.00 6.90 6.15 1 litre - - 12.50 12.75 -
Thaba Tseka
500ml 5.58 - 6.50 7.20 6.25 1 litre - - 12.50 - 11.25
Price trends for cooking oil, the second most commonly traded item, are shown in Table E5 below. Price data
availability for cooking oil was very inconsistent. It is difficult to see any particular trend within the data that
was available from the traders.

62 | P a g e
Table E5 Cooking oil prices and price trends
Cooking oil prices (M)
District Units Urban Peri-urban Rural close to road
Rural remote Rural shopping centre
Maseru 375 ml - 7.75 7.80 - - 500ml 9.00 8.50 - - - 750ml - 14.60 15.25 15.00 - 2 litres 35.50 - 29.00 - -
Berea 375 ml - 9.0 8.5 7.95 - 500ml 9.0 - 12.00 10.00 -
750 ml - - 15.10 14.00 - 2 litres - - 33.40 30.00 -
Mokhotlong 375ml 8.25 8.50 8.50 8.60 - 500ml - - 13.50 13.00 - 750ml 15.90 14.50 8.75 15.15 15.20 2 litres - - 38.00 - -
Thaba Tseka
375 ml 7.50 - 7.50 9.10 8.25 500ml - - - - 5.00 750ml 17.30 - 16.25 15.70 14.80 2 litres 29.50 - - 40.00 30.00
Price trends for sugar are shown in Table E6 below. Again, price data availability for sugar was very
inconsistent and therefore it is difficult to see any particular trend by district or shop location.
Table E6 Sugar prices and price trends
Sugar Prices (M)
District Units Urban Peri-urban Rural close to road
Rural remote Rural shopping centre
Maseru 500g - 5.00 5.00 - - 1 kg 8.50 8.50 8.90 9.00 - 2 kg - - 22.50 - -
2.5 kg 23.00 - - - - Berea 500g - 5.00 5.25 - -
1 kg 8.50 - 9.00 8.85 - 2 kg - - - 22.00 -
Mokhotlong 500g 5.40 - 5.25 5.00 5.40 1 kg 9.20 9.25 - 9.70 9.50 2 kg 21.00 - - 22.5 -
Thaba Tseka
500g - - 5.20 5.70 5.00 1 kg 9.15 - 11.00 9.75 8.40 2 kg 18.00 - - 24.00 20.00
Finally, price trends for wheat meal are shown in Table E7 below. Within the available data, wheat meal
prices appear to be consistent across quantities and shop locations.

63 | P a g e
Table E7 Wheat meal prices and price trends
Wheat meal Prices (M)
District Units Urban Peri-urban Rural close to road
Rural remote Rural shopping centre
1 kg - 8.00 6.50 - - Maseru 2.5 kg - - 17.50 - -
5 kg - 33.50 34.00 - - 12.5 kg 70.00 65.00 70.00 - -
25 kg 103.00 130.00 140.00 - - Berea 1 kg - - 7.00 - -
2.5 kg - - 17.50 17.00 - 5 kg 30.00 - - 16.50 -
12.5 kg - - - 65.00 - 25 kg - 136.00 125.00 -
Mokhotlong 1 kg - - - - - 2.5 kg 18.00 12.50 18.75 18.20 19.00
5 kg - - - 35.00 - 12.5 kg 74.00 66.00 - - 70.00
25 kg - - - 160.00 - Thaba Tseka
1 kg - - - 8.00 - 2.5 kg 15.80 - 18.50 19.70 17.50
5 kg - - 27.00 - 20.00 12.5 kg 71.50 - 70.00 - 69.00
25 kg 139.00 - - - -