dry powder inhalers: mechanistic evaluation of lactose formulations containing salbutamol sulphate
TRANSCRIPT
Ds
Wa
b
c
d
a
ARRAA
KICSPASSCA
1
dWiiaitdfiie
0d
International Journal of Pharmaceutics 423 (2012) 184– 194
Contents lists available at SciVerse ScienceDirect
International Journal of Pharmaceutics
journa l h omepa g e: www.elsev ier .com/ locate / i jpharm
ry powder inhalers: Mechanistic evaluation of lactose formulations containingalbutamol sulphate
aseem Kaialya,b, Martyn Ticehurstc, Ali Nokhodchia,d,∗
Chemistry and Drug Delivery Group, Medway School of Pharmacy, University of Kent, ME4 4TB Kent, UKPharmaceutics and Pharmaceutical Technology Department, University of Damascus, SyriaPharmaceutical Sciences, PharmaTherapeutics, Pfizer, Sandwich, Kent CT13 9NJ, UKDrug Applied Research Center and Faculty of Pharmacy, Tabriz University of Medical Sciences, Tabriz, Iran
r t i c l e i n f o
rticle history:eceived 27 September 2011eceived in revised form 2 December 2011ccepted 4 December 2011vailable online 17 December 2011
eywords:nhalationommercial lactosealbutamol sulphateulmonary deliveryerolizer®
hapeurface roughnessontent uniformitydhesion
a b s t r a c t
The purpose of this study was to evaluate the relationships between physicochemical properties andaerosolisation performance of different grades of lactose. In order to get a wide range of physicochem-ical properties, various grades of lactose namely Flowlac® 100 (FLO), Lactopress anhydrous® 250 (LAC),Cellactose® 80 (CEL), Tablettose® 80 (TAB), and Granulac® 200 (GRA) were used. The different lactose gradeswere carefully sieved to separate 63–90 �m particle size fractions and then characterised in terms of size,shape, density, flowability, and solid state. Formulations were prepared by blending each lactose withsalbutamol sulphate (SS) at ratio of 67.5:1 (w/w), and then evaluated in terms of SS content uniformity,lactose–SS adhesion properties, and in vitro aerosolisation performance delivered from the Aerolizer®.Sieved lactose grades showed similar particle size distributions (PSDs) and good flow properties but dif-ferent particle shape, particle surface texture, and particle solid state. Content uniformity assessmentsindicated that lactose particles with rougher surface produced improved SS homogeneity within DPIformulation powders. Lactose–SS adhesion assessments indicated that lactose particles with more elon-gated shape and the rougher surface showed smaller adhesion force between lactose and salbutamolsulphate. Lactose powders with higher bulk density and higher tap density produced smaller emission
(EM) and higher drug loss (DL) of SS. In vitro aerosolisation for various lactose grades followed the fol-lowing rank order in terms of deposition performance: GRA > TAB > LAC ≈ CEL > FLO. Linear relationshipswere established showing that in order to maximize SS delivery to lower airway regions, lactose particleswith more elongated shape, more irregular shape, and rougher surface are preferred. Therefore, consid-erable improvement in DPI performance can be achieved by careful selection of grade of lactose included within DPI formulations.. Introduction
The respiratory tract is an attractive delivery route, with globalrug delivery market size about 30% (Kaparissides et al., 2006).hen considering pulmonary drug delivery, major advantages
nclude avoiding the harsh conditions of the gastro intestinal, non-nvasive route of administration, fast drug absorption and action,nd local treatment of specific diseases (Wall, 1995). Dry powdernhalers (DPIs) are increasing in popularity for lung delivery dueo their propellant free formulations and potentially rapid productevelopment, making DPIs the most promising inhaler type for theuture (Todo et al., 2001). With DPIs, the inhalable drug fraction
s dependent on the inhaler device (Dalby et al., 1996), patientnhalation effort (Chan, 2006), and formulation properties (Kaialyt al., 2011a).∗ Corresponding author. Tel.: +44 1634 202947; fax: +44 1634 883927.E-mail address: [email protected] (A. Nokhodchi).
378-5173/$ – see front matter © 2011 Elsevier B.V. All rights reserved.oi:10.1016/j.ijpharm.2011.12.018
© 2011 Elsevier B.V. All rights reserved.
Carrier-drug based formulations are most commonly developedfor delivery with DPIs (Telko and Hickey, 2005). Potential carriersfor carrier-drug DPI formulations are somewhat limited becausethey have to meet strict toxicological standards. Carrier selectionwithin DPI formulation is critical as carrier type has major effecton the DPI performance and an apparently minor change in car-rier physicochemical properties could have a considerable effect ofdrug aerosolisation behaviour (Nokhodchi et al., 2011). Carrier par-ticles should be selected based on their physicochemical propertiessuch as size and morphology (Kaialy et al., 2011a), hygroscopicity(Harjunen et al., 2003), surface roughness (Kaialy et al., 2011b), andsurface energy (Buckton, 1997).
Lactose is the most commonly used carrier in DPI formulationsfor pharmaceutical, physicochemical, and historical reasons. Forexample, lactose has both well documented stability and safetyprofiles (long track history of use in pharmaceutical formula-
tions), can be produced by different manufacturing processeswith predetermined properties, has high stability, low cost, andgives good flow properties (Smyth and Hickey, 2005). Lactose
al of P
eeaadlsttatfdphm5cc
pedeDdHpesmifsEtutaflslfgcbomnu(atfcm
2
2
Ca
W. Kaialy et al. / International Journ
xists in different forms including �-lactose monohydrate (Friest al., 1971), �-lactose anhydrous (Platteau et al., 2005), �-lactosenhydrous (Hirotsu and Shimada, 1974), amorphous lactose (Roosnd Karel, 1992), and anhydrous crystals with � and � lactose inifferent molar of ratios (Lefebvre et al., 2005). Different forms of
actose have different physical properties and different chemicaltabilities. �-Lactose monohydrate is the natural, most stable, andhe most commonly used DPI excipient (Nickerson, 1974) dueo its less hygroscopic properties (Zeng et al., 2007). �-Lactosenhydrous is unstable (hygroscopic) (Briggner et al., 1994), difficulto obtain, and difficult to handle. �-Lactose is a stable anhydrousorm, and has no tendency to form any hydrate phase. Sprayried lactose usually contains a mixture of �-lactose monohydratearticles and amorphous lactose. Molecular compounds of lactoseave specific lattices resulting from association of �-lactoseonohydrate and �-lactose with a hydrogen bonding. Lactose
�/3� and lactose 3�/2� are the most common forms of molecularompounds of lactose (Drapier-Beche et al., 1999); yet, other formsan be formed depending on the operating techniques.
In literature, several reports showed that lactose aerosolisationerformance was dependent on its physical prosperities. Differ-nt polymorphs of lactose produced dissimilar DPI performanceue to their different physical and chemical properties (Trainit al., 2008). The formation of needle shaped lactose enhancedPI performance (Larhrib et al., 2003) and has improved aero-ynamic performance to penetrate deeper into the lung airways.igher respirable drug fraction is generally obtained when finearticles are mixed with lactose coarse carrier particles (Kaialyt al., 2011c). More irregular shaped lactose particles with rougherurface produced enhanced DPI performance compared to com-ercial lactose product (Kaialy et al., 2011b,c). Electrostatic charge
s believed to have considerable influence on drug detachmentrom carrier particles (Staniforth, 1996) and hence particle depo-ition on airway regions (Bailey et al., 1998; Hashish et al., 1998;lajnaf et al., 2006). Interestingly, Chow et al. (2008) proved thathe dynamic charge of lactose in influenced by the repeated inhalerse and increase with increasing relative humidity and aerosoliza-ion flow rate. A large number of lactose grades are commerciallyvailable with a wide range of physical properties. This gives theormulator a broad scope for the selection of the most suitableactose material for a particular application. Although there is aubstantial amount of scientific literature describing the role ofactose on DPI formulation performance there are only a hand-ul of publications comparing the differences between commercialrades in depth and none of them, to best of our knowledge,ompared different grades with similar particle size. Also, it iselieved that this is the first study showing the DPI performancef Cellactose® (spray-dried product composed of 75% �-lactoseonohydrate and 25% cellulose dry matter and designed origi-
ally for direct tableting). In the present paper, the influence ofsing different lactose grades [Flowlac® 100 (FLO), Granulac® 200GRA), Tablettose® 80 (TAB), Cellactose® 80 (CEL), and Lactopressnhydrous® 250 (LAC)] on inhalation properties of SS was inves-igated. By comparing these different lactose products, it will giveormulators better understanding of the role of lactose physico-hemical properties and DPI performance with readily obtainableaterials.
. Materials and methods
.1. Materials
Flowlac® 100 (FLO) (spray dried �-lactose monohydrate),ellactose® 80 (CEL) (spray dried: 75% �-lactose monohydratend 25% cellulose), Tablettose® 80 (TAB) (agglomerated �-lactose
harmaceutics 423 (2012) 184– 194 185
monohydrate), and Granulac® 200 (GRA) (milled �-lactose mono-hydrate) were supplied from Meggle Group, Wasserburg, Germany.Lactopress anhydrous® 250 (LAC) (anhydrous �-lactose) was pur-chased from IMCD UK Limted. Micronised salbutamol sulphate (SS)(D50% = 1.8 ± 0.3 �m, Kaialy et al., 2010a) was obtained from LBBohle, Germany.
2.2. Sieving
All lactose powders were sieved to separate the 63–90 �m par-ticle size (as precedent in the literature). Each lactose productpowder was poured onto the top of 90 �m sieve (Retsch® GmbHTest Sieve, Germany) which was placed above another 63 �m sieve,and then the mechanical sieve shaker was operated for 30 min.After that, each 63–90 lactose particle size fraction was collected,placed on top of the 63 �m sieve, and subjected to air depressionsieving (Copley Scientific, UK) at a gas volume flow that generates anegative pressure of 4 kPa for 15 min. After the sieving process wascomplete, the particles retained on the 63 �m sieve were collectedand stored in sealed glass vials until required for further investi-gation. All experiments described below were carried out on the63–90 �m particle size fractions.
2.3. Particle size distribution analysis
Particle size analysis was conducted using a Sympatec(Clausthal-Zellerfeld, Germany) laser diffraction particle size anal-yser as described in details previously (Kaialy et al., 2010b).Approximately 200–300 mg of the sample was dispersed in acetoneand filled in cuvette. A test reference measurement was performedwith the HELOS sensor using WINDOX software followed by a stan-dard measurement. The particle size measurement was carried outunder stirring condition during the experiment.
2.4. Image analysis optical microscopy
Quantitative particle shape analysis was performed usinga computerized morphometric image analyzing system (LeicaDMLA Microscope; Leica Microsystems Wetzlar GmbH, Wetzlar,Germany; Leica Q Win Standard Analyzing Software). For eachlactose sample, a small amount of powder (about 20 mg) wasdispersed on a microscope slide. The microscope slide was thenmanually tapped to remove accumulated powder until thin powderdust was homogenously scattered over the slide. For each lactosesample, minimum 350 particles were detected randomly from dif-ferent positions and measured. Particle shape was assessed usingseveral parameters including elongation ratio (ER) (Eq. (1)), flat-ness ratio (FR) (Eq. (2)), simplified shape factor (eR) (Eq. (3)), andsurface factor (Fsurface) (Eq. (4)) (Kaialy et al., 2012; Kuo et al., 1998;Podczeck et al., 1999; Zeng et al., 2000):
ER = lengthbreadth
(1)
FR = lengthbreadth
(2)
eR = perimeterconvex
perimeter−
√1 −
(breadthlength
)2
(3)
Fsurface = Fshape × (1 + ER)2
� × ER(4)
where length is the maximum Feret diameter, breadth is the min-
imum Feret diameter (maximum and minimum Feret diameterswere calculated from 16 Calliper measurements at 6◦ intervalsaround the particle), thickness is the Calliper diameter in the 90◦direction, perimeter is the estimated perimeter of particle with
1 al of P
cm
2
m(saaut
2
Seaaloat
2
d4mtoa
2
ui
2
ldtau1d(u
C
p
(ew
86 W. Kaialy et al. / International Journ
ompensation for corners, and perimeterconvex is perimeter of theinimum convex boundary circumscribing the particle.
.5. Scanning electron microscope (SEM)
Electron micrographs of all lactose samples and lactose–SS for-ulations were obtained using a scanning electron microscope
Philips XL 20, Eindhoven, Netherlands) operating at 15 kV. Thepecimens were mounted on a metal stub with double-sideddhesive tape and coated under vacuum with gold in an argontmosphere prior to observation. Different magnifications weresed to observe the surface topography of different lactose par-icles.
.6. Differential scanning calorimetry (DSC)
A differential scanning calorimeter (DSC7, Mettler Toledo,witzerland) was used to characterise crystalline nature of differ-nt lactose samples. The equipment was calibrated using indiumnd zinc. Samples weighing between 4 mg and 5 mg were crimpednd sealed nonhermetically in aluminium DSC pans with pin-holeids. Each sample was heated from 25 ◦C to 300 ◦C at a scanning ratef 10 ◦C/min. A purge gas of nitrogen was passed over the pans with
flow rate of 50 mL/min. Different enthalpies were calculated byhe software (Mettler, Switzerland).
.7. Fourier transform infrared (FT-IR) spectroscopy
FT-IR were taken by FT-IR instrument (Perkin Elmer, USA) forifferent lactose samples at scanning range between 450 cm−1 and000 cm−1. Each sample (several milligrams) was placed in theiddle of the sample stage and a force applied (50 bar) using the
op of the arm of the sample stage. After obtaining sharp peaksf appropriate intensity, the spectra acquired were the results ofveraging four scans at 1 cm−1.
.8. True density measurements
The true density of all lactose samples was measured using anltrapycnometer 1000 (Quantachrom, USA) using helium gas at an
nput gas pressure of 19 psi and an equilibrium time of 1 min.
.9. Powder flow characterisation
Carr’s index (CI) and angle of repose (˛) were measured for allactose powders as an indication of powder flowability. Each pow-er was filled into a 5 mL measuring cylinder and after recordinghe volume (bulk volume) the cylinder was tapped 100 times undermbient conditions (20 ◦C, 50% RH) and the new volume (tap vol-me) was recorded. The preliminary results showed that the use of00 taps was sufficient to attain the minimum volume of the pow-er bed. Then, bulk density (Db), tap density (Dt), Carr’s Index (CI, Eq.5)), and porosity (Eq. (6)) for each lactose sample was calculatedsing the following equations (Kaialy et al., 2011a):
I =(
Dt − Db
Db
)× 100 (5)
orosity =(
1 − Db
Dtrue
)× 100 (6)
Angle of repose was measured by the method adapted fromKaialy et al., 2011a). In brief, a pile was built by dropping 1 g ofach through a 75 mm flask on a flat surface. Angle of repose (�)as calculated using the following equation (where h is the height
harmaceutics 423 (2012) 184– 194
of the powder cone, and D the diameter of the base of the formedpowder pile).
tan ˛ = 2h
D(7)
2.10. Preparing carrier-drug formulations
SS was mixed separately with different sieved (63–90 �m)lactose powders in a ratio of (SS:lactose) 1:67.5 w/w (which isin accordance with the ratio used in commercial VentolinTM
RotacapsTM (GSK)). This blending was carried out in cylindrical alu-minium container (6.5 cm × 8 cm) using a Turbula® mixer (WillyA. Bachofen AG, Maschinenfabrik, Basel, Switzerland) at standardmixing conditions (100 rpm mixing speed and 30 min mixing time)for the preparation of all formulations. A total of 5 formulationswith FLO, LAC, CEL, TAB, and GRA were prepared at constant con-ditions. After the blending process was complete, all formulationswere stored in tightly sealed glass vials at least 24 h prior to anyinvestigation.
2.11. Dose uniformity assessment
After preparing all formulations, drug content uniformity ineach formulation was tested by taking a minimum of five randomlyselected aliquots of sampled powder from different positions of for-mulation powder bed for assay of SS content. Each aliquot weighs33 ± 1.5 mg corresponding to 481 ± 22 �g unit dose. Each samplewas then dissolved in 100 mL distilled water contained in a volu-metric flask and the amount of the active drug (SS) was determinedusing high performance liquid chromatography (HPLC) method asdescribed elsewhere (Kaialy et al., 2010a). Average drug contentfor each formulation was expressed as the percentage of nominalSS unite dose (% uniformity, 481 ± 22 �g). The degree of SS contenthomogeneity within all formulations was expressed using coeffi-cient of variation (% CV).
2.12. Evaluation of lactose–SS adhesion
Air depression sieving was employed to assess lactose–SS adhe-sion forces within formulations. A 45 �m sieve (Retsch® GmbhTestSieve, Germany) was employed and the air jet sieving machine(Copley Scientific, Nottingham, UK) was operated at a gas vol-ume flow that generates a negative pressure of 4 kPa. Accuratelyweight quantity of 1 g of each formulation was placed on top of the45 �m sieve and minimum three samples (33 ± 1.5 mg correspond-ing to a unit SS dose: 481 ± 22 �g) were removed from differentareas of each formulation after different functional sieving times(5 s, 10 s, 30 s, and 3 min). SS content in each formulation samplewas quantified using HPLC and expressed as a percentage to theunite SS dose (481 �g). Adhesion assessments were conducted inan air-conditioned laboratory where the ambient temperature andrelative humidity (RH) were 22 ◦C and 50%, respectively.
2.13. In vitro deposition study
After blending, each formulation was filled manually into hardgelatine capsules (size 3) with 33 ± 1.5 mg such that each capsulecontained 481 ± 22 �g of SS. After filling, in order to allow anycharge-relaxation to occur, capsules were stored in sealed glassvials for at least 24 h prior to any investigation. Deposition profilesof all formulations were assessed in vitro using Aerolizer® inhaler
device and Multi Stage Liquid Impinger (MSLI) equipped with a USPinduction port (IP) (Copley Scientific, Nottingham, UK). Pharma-copoeial deposition experiments were performed at flow rate thatcorresponds to a pressure drop of 4 kPa across the device (92 L/min),
al of Pharmaceutics 423 (2012) 184– 194 187
aos4tpo(a(2
oartaal(
E
ar
2
mestM
3
3
otfw((caoifit(sp(hw
3
ncs
Fig. 1. Percent cumulative undersize particle size distribution, volume mean diam-eter (VMD), volume specific surface area (SSAv), and span for different 63–90 �msieved lactose products: Flowlac® 100 (FLO), Lactopress anhydrous® 250 (LAC),
® ® ®
W. Kaialy et al. / International Journ
s described in details elsewhere (Kaialy et al., 2010a). At flow ratef 92 L/min, MSLI effective cut-off diameters becomes as follows:tage 1 = 10.50 �m, stage 2 = 5.49 �m, stage 3 = 2.5 �m, and stage
= 1.37 �m. Each deposition experiment involved the aerosolisa-ion of ten capsules and was repeated at least three times. Severalarameters were employed to characterise the deposition profilesf the formulations under investigation including recovered doseRD), emitted dose (ED), recovery (RE), emission (EM), mass medianerodynamic diameter (MMAD), and geometric standard deviationGSD) which were calculated as described previously (Kaialy et al.,010a).
Drug loss (DL) was defined as the percent ratio of amountsf SS remained in capsule shells plus I + M (inhaler + mouthpiecedapror) to the RD. Impaction loss (IL) was defined as the percentatio of amounts of SS deposited on the IP plus MSLI stage 1 tohe RD. Fine particle dose (FPD) (defined as amounts of SS witherodynamic diameter ≤5.5 �m) was calculated as the sum of SSmounts deposited on MSLI stage 3 + stage 4 + filter. FPF was calcu-ated as the percent ratio of FPD to RD. Effective inhalation indexEI) (Kaialy et al., 2011a) were calculated by Eq. (8):
I = (EM × FPF)1/2 (8)
All aerosol deposition experiments were performed in anir-conditioned laboratory where the ambient temperature andelative humidity (RH) were 22 ◦C and 50% respectively.
.14. Statistical analysis
One way analysis of variance (ANOVA) was applied to compareean results in this study, with P values less than 0.05 being consid-
red as indicative of significant difference. Where ANOVA indicatedignificant difference, Tukey’s HSD post hoc test was applied. Mul-iple regression and correlation analysis were conducted using
icrosoft Excel software (UK, 2007).
. Results and discussion
.1. Particle size measurements
In order to remove the influence of particle size and focusn other physical properties, only 63–90 �m sieved lactose par-icles were used in these studies. Particle size distribution (PSD)or all lactose powders were measured and shown in Fig. 1 alongith volume mean diameter (VMD), volume specific surface area
SSAv), and span. All sieved lactose powders showed similar VMDsfrom 81.6 ± 2.6 �m to 84.9 ± 1.3 �m, P > 0.05) and ≤1% fine parti-les < 10 �m. This indicates that the sieving process was efficientnd able to remove fine lactose particles adhering to the surfacef larger lactose particles of all powders. Also, this is importantn terms of limiting the effect of lactose particle size and lactosenes (<10 �m) on DPI performance. Regardless of lactose productype, the majority of lactose particles were between 52.6 ± 3.6 �mD10%) and 117.8 ± 3.5 �m (D90%) in diameter. Nevertheless, specificurface area (SSAv) and span between different lactose sam-les varied significantly (Fig. 1). FLO exhibited the lowest SSAv
0.09 ± 0.02 m2/cm3) and lowest span (0.72 ± 0.01) whereas theighest SSAv (0.15 ± 0.02 m2/cm3) and span (0.87 ± 0.09) valuesere seen with GRA (Fig. 1).
.2. Particle shape characterisation
The shape of all lactose grades was quantitatively assessed usingumber of different shape descriptors based on image analysis opti-al microscopy including elongation ratio/flatness ratio (ER/FR),implified shape factor (eR), and surface factor (Fsurface) which are
Cellactose 80 (CEL), Tablettose 80 (TAB), and Granulac 200 (GRA) (mean ± SD,n ≥ 3). (•) cumulative undersize particle size distribution for salbutamol sulphate(SS).
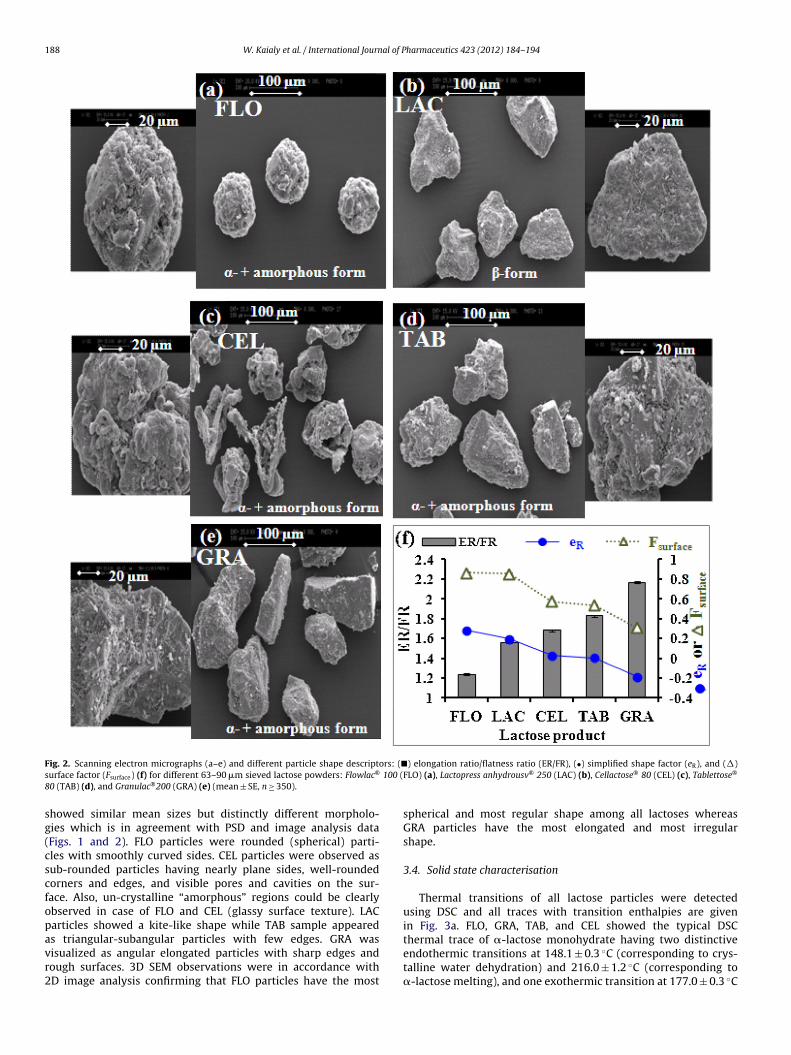
all displayed in Fig. 2. ER and FR are first order shape parameterswhich are considered the fundamental descriptors of particle shape(Kuo et al., 1998). Spheres and perfect cubes have ER and FR of1.0. Higher ER is indicative of more elongated and/or more irregu-lar shape whereas higher FR is indicative of more flattened shape.Higher ER/FR is indicative of more elongated/less flattened particleshape. eR is a second order particle shape descriptor refers to par-ticle shape irregularity (Podczeck and Newton, 1994). eR can havevalues from −1 to 1 and smaller eR values indicate greater shapeirregularity and/or rougher particle surface. Fsurface is a third ordershape descriptor refers only to particle surface roughness. Cubicalparticles with typical smooth surface are expected to have a Fsurfaceof 1 and particles with smaller Fsurface have rougher surface. Shapefactors between different lactose carrier particles varied consider-ably as seen in Fig. 2. Differences in carrier particle shape mighthave considerable effect on DPI performance (Kaialy et al., 2011a,2012).
Among all lactoses, FLO showed the lowest ER/FR (1.24 ± 0.01),the highest eR (0.28 ± 0.01), and the highest Fsurface (0.86 ± 0.01)(Fig. 2) indicating that FLO particles have the least elongatedand most regular shape and smoothest surface texture (closer tospheres with smoother surface). On the other hand, GRA showedthe highest ER/FR (2.17 ± 0.01), the smallest eR (−0.20 ± 0.00), andthe smallest Fsurface (0.31 ± 0.00) (Fig. 2) indicating that GRA parti-cles have the most elongated and most irregular shape and roughestsurface topography.
Particle shape assessment using 2D image analysis is depen-dent on particle orientation and contact area with other particleswhich might affect the accuracy of the technique. Therefore, shapeof all lactose particles was qualitatively explored using 3D scanningelectron microscope (SEM) in the following section.
3.3. Scanning electron microscope (SEM) for different lactoses
SEM micrographs of different lactose particles are shownin Fig. 2. It can be observed that different lactose particles
188 W. Kaialy et al. / International Journal of Pharmaceutics 423 (2012) 184– 194
F rs: (�s 100 (8
sg(cscfopavr2
ig. 2. Scanning electron micrographs (a–e) and different particle shape descriptourface factor (Fsurface) (f) for different 63–90 �m sieved lactose powders: Flowlac®
0 (TAB) (d), and Granulac®200 (GRA) (e) (mean ± SE, n ≥ 350).
howed similar mean sizes but distinctly different morpholo-ies which is in agreement with PSD and image analysis dataFigs. 1 and 2). FLO particles were rounded (spherical) parti-les with smoothly curved sides. CEL particles were observed asub-rounded particles having nearly plane sides, well-roundedorners and edges, and visible pores and cavities on the sur-ace. Also, un-crystalline “amorphous” regions could be clearlybserved in case of FLO and CEL (glassy surface texture). LACarticles showed a kite-like shape while TAB sample appeared
s triangular-subangular particles with few edges. GRA wasisualized as angular elongated particles with sharp edges andough surfaces. 3D SEM observations were in accordance withD image analysis confirming that FLO particles have the most) elongation ratio/flatness ratio (ER/FR), (•) simplified shape factor (eR), and (�)FLO) (a), Lactopress anhydrousv® 250 (LAC) (b), Cellactose® 80 (CEL) (c), Tablettose®
spherical and most regular shape among all lactoses whereasGRA particles have the most elongated and most irregularshape.
3.4. Solid state characterisation
Thermal transitions of all lactose particles were detectedusing DSC and all traces with transition enthalpies are givenin Fig. 3a. FLO, GRA, TAB, and CEL showed the typical DSC
thermal trace of �-lactose monohydrate having two distinctiveendothermic transitions at 148.1 ± 0.3 ◦C (corresponding to crys-talline water dehydration) and 216.0 ± 1.2 ◦C (corresponding to�-lactose melting), and one exothermic transition at 177.0 ± 0.3 ◦C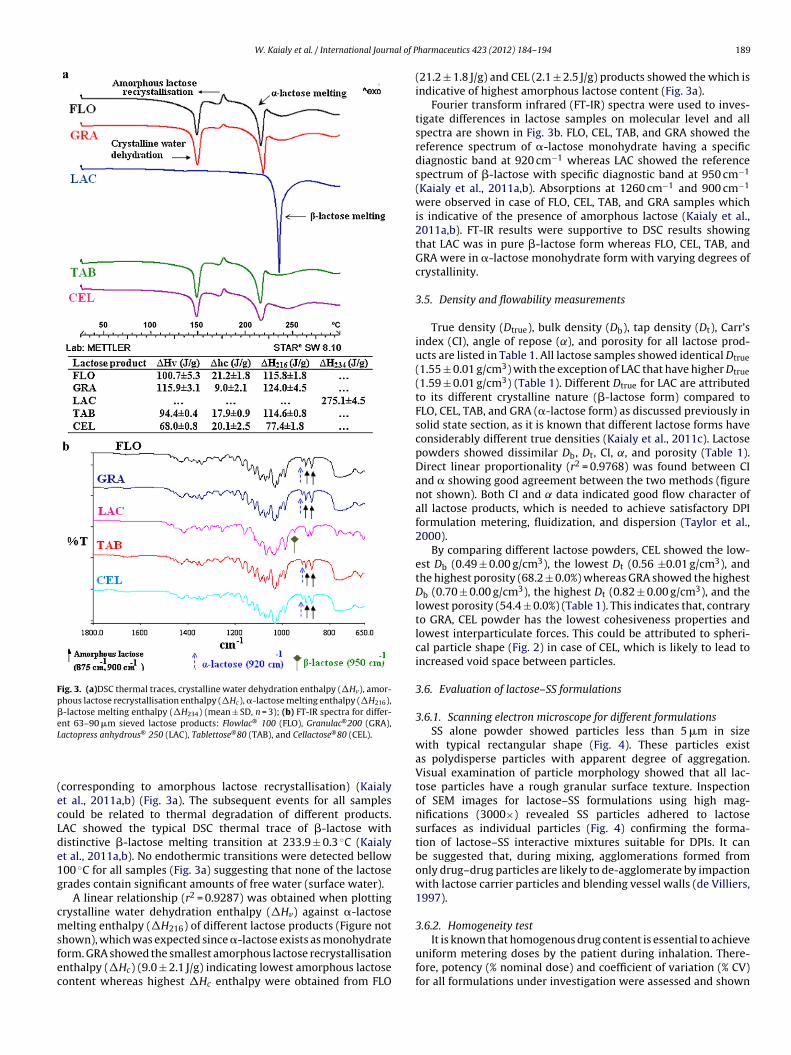
W. Kaialy et al. / International Journal of P
Fig. 3. (a)DSC thermal traces, crystalline water dehydration enthalpy (�Hv), amor-phous lactose recrystallisation enthalpy (�Hc), �-lactose melting enthalpy (�H216),�-lactose melting enthalpy (�H234) (mean ± SD, n = 3); (b) FT-IR spectra for differ-ent 63–90 �m sieved lactose products: Flowlac® 100 (FLO), Granulac®200 (GRA),L
(ecLde1g
cmsfec
It is known that homogenous drug content is essential to achieve
actopress anhydrous® 250 (LAC), Tablettose®80 (TAB), and Cellactose®80 (CEL).
corresponding to amorphous lactose recrystallisation) (Kaialyt al., 2011a,b) (Fig. 3a). The subsequent events for all samplesould be related to thermal degradation of different products.AC showed the typical DSC thermal trace of �-lactose withistinctive �-lactose melting transition at 233.9 ± 0.3 ◦C (Kaialyt al., 2011a,b). No endothermic transitions were detected bellow00 ◦C for all samples (Fig. 3a) suggesting that none of the lactoserades contain significant amounts of free water (surface water).
A linear relationship (r2 = 0.9287) was obtained when plottingrystalline water dehydration enthalpy (�Hv) against �-lactoseelting enthalpy (�H216) of different lactose products (Figure not
hown), which was expected since �-lactose exists as monohydrate
orm. GRA showed the smallest amorphous lactose recrystallisationnthalpy (�Hc) (9.0 ± 2.1 J/g) indicating lowest amorphous lactoseontent whereas highest �Hc enthalpy were obtained from FLOharmaceutics 423 (2012) 184– 194 189
(21.2 ± 1.8 J/g) and CEL (2.1 ± 2.5 J/g) products showed the which isindicative of highest amorphous lactose content (Fig. 3a).
Fourier transform infrared (FT-IR) spectra were used to inves-tigate differences in lactose samples on molecular level and allspectra are shown in Fig. 3b. FLO, CEL, TAB, and GRA showed thereference spectrum of �-lactose monohydrate having a specificdiagnostic band at 920 cm−1 whereas LAC showed the referencespectrum of �-lactose with specific diagnostic band at 950 cm−1
(Kaialy et al., 2011a,b). Absorptions at 1260 cm−1 and 900 cm−1
were observed in case of FLO, CEL, TAB, and GRA samples whichis indicative of the presence of amorphous lactose (Kaialy et al.,2011a,b). FT-IR results were supportive to DSC results showingthat LAC was in pure �-lactose form whereas FLO, CEL, TAB, andGRA were in �-lactose monohydrate form with varying degrees ofcrystallinity.
3.5. Density and flowability measurements
True density (Dtrue), bulk density (Db), tap density (Dt), Carr’sindex (CI), angle of repose (˛), and porosity for all lactose prod-ucts are listed in Table 1. All lactose samples showed identical Dtrue
(1.55 ± 0.01 g/cm3) with the exception of LAC that have higher Dtrue
(1.59 ± 0.01 g/cm3) (Table 1). Different Dtrue for LAC are attributedto its different crystalline nature (�-lactose form) compared toFLO, CEL, TAB, and GRA (�-lactose form) as discussed previously insolid state section, as it is known that different lactose forms haveconsiderably different true densities (Kaialy et al., 2011c). Lactosepowders showed dissimilar Db, Dt, CI, ˛, and porosity (Table 1).Direct linear proportionality (r2 = 0.9768) was found between CIand � showing good agreement between the two methods (figurenot shown). Both CI and ̨ data indicated good flow character ofall lactose products, which is needed to achieve satisfactory DPIformulation metering, fluidization, and dispersion (Taylor et al.,2000).
By comparing different lactose powders, CEL showed the low-est Db (0.49 ± 0.00 g/cm3), the lowest Dt (0.56 ±0.01 g/cm3), andthe highest porosity (68.2 ± 0.0%) whereas GRA showed the highestDb (0.70 ± 0.00 g/cm3), the highest Dt (0.82 ± 0.00 g/cm3), and thelowest porosity (54.4 ± 0.0%) (Table 1). This indicates that, contraryto GRA, CEL powder has the lowest cohesiveness properties andlowest interparticulate forces. This could be attributed to spheri-cal particle shape (Fig. 2) in case of CEL, which is likely to lead toincreased void space between particles.
3.6. Evaluation of lactose–SS formulations
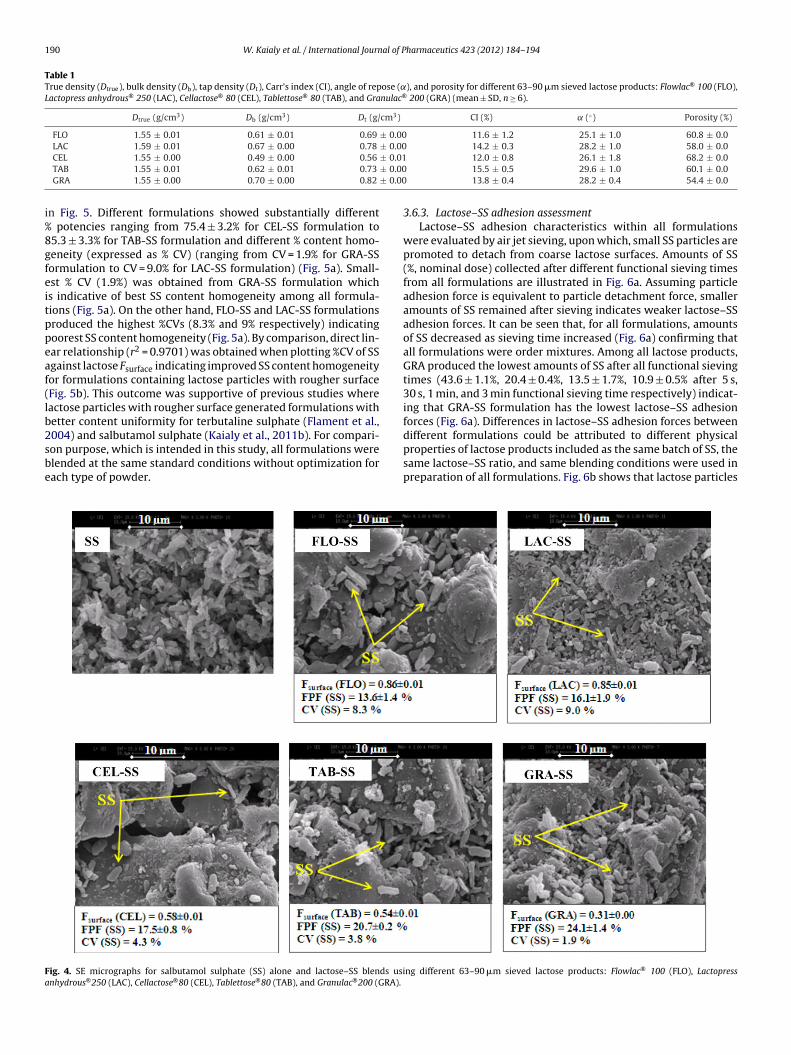
3.6.1. Scanning electron microscope for different formulationsSS alone powder showed particles less than 5 �m in size
with typical rectangular shape (Fig. 4). These particles existas polydisperse particles with apparent degree of aggregation.Visual examination of particle morphology showed that all lac-tose particles have a rough granular surface texture. Inspectionof SEM images for lactose–SS formulations using high mag-nifications (3000×) revealed SS particles adhered to lactosesurfaces as individual particles (Fig. 4) confirming the forma-tion of lactose–SS interactive mixtures suitable for DPIs. It canbe suggested that, during mixing, agglomerations formed fromonly drug–drug particles are likely to de-agglomerate by impactionwith lactose carrier particles and blending vessel walls (de Villiers,1997).
3.6.2. Homogeneity test
uniform metering doses by the patient during inhalation. There-fore, potency (% nominal dose) and coefficient of variation (% CV)for all formulations under investigation were assessed and shown
190 W. Kaialy et al. / International Journal of Pharmaceutics 423 (2012) 184– 194
Table 1True density (Dtrue), bulk density (Db), tap density (Dt), Carr’s index (CI), angle of repose (˛), and porosity for different 63–90 �m sieved lactose products: Flowlac® 100 (FLO),Lactopress anhydrous® 250 (LAC), Cellactose® 80 (CEL), Tablettose® 80 (TAB), and Granulac® 200 (GRA) (mean ± SD, n ≥ 6).
Dtrue (g/cm3) Db (g/cm3) Dt (g/cm3) CI (%) ̨ (◦) Porosity (%)
FLO 1.55 ± 0.01 0.61 ± 0.01 0.69 ± 0.00 11.6 ± 1.2 25.1 ± 1.0 60.8 ± 0.0LAC 1.59 ± 0.01 0.67 ± 0.00 0.78 ± 0.00 14.2 ± 0.3 28.2 ± 1.0 58.0 ± 0.0
± 0.01± 0.00± 0.00
i%8gfeitppeaf(lb2sbe
Fa
CEL 1.55 ± 0.00 0.49 ± 0.00 0.56
TAB 1.55 ± 0.01 0.62 ± 0.01 0.73
GRA 1.55 ± 0.00 0.70 ± 0.00 0.82
n Fig. 5. Different formulations showed substantially different potencies ranging from 75.4 ± 3.2% for CEL-SS formulation to5.3 ± 3.3% for TAB-SS formulation and different % content homo-eneity (expressed as % CV) (ranging from CV = 1.9% for GRA-SSormulation to CV = 9.0% for LAC-SS formulation) (Fig. 5a). Small-st % CV (1.9%) was obtained from GRA-SS formulation whichs indicative of best SS content homogeneity among all formula-ions (Fig. 5a). On the other hand, FLO-SS and LAC-SS formulationsroduced the highest %CVs (8.3% and 9% respectively) indicatingoorest SS content homogeneity (Fig. 5a). By comparison, direct lin-ar relationship (r2 = 0.9701) was obtained when plotting %CV of SSgainst lactose Fsurface indicating improved SS content homogeneityor formulations containing lactose particles with rougher surfaceFig. 5b). This outcome was supportive of previous studies whereactose particles with rougher surface generated formulations withetter content uniformity for terbutaline sulphate (Flament et al.,
004) and salbutamol sulphate (Kaialy et al., 2011b). For compari-on purpose, which is intended in this study, all formulations werelended at the same standard conditions without optimization forach type of powder.ig. 4. SE micrographs for salbutamol sulphate (SS) alone and lactose–SS blends usinhydrous®250 (LAC), Cellactose®80 (CEL), Tablettose®80 (TAB), and Granulac®200 (GRA).
12.0 ± 0.8 26.1 ± 1.8 68.2 ± 0.0 15.5 ± 0.5 29.6 ± 1.0 60.1 ± 0.0 13.8 ± 0.4 28.2 ± 0.4 54.4 ± 0.0
3.6.3. Lactose–SS adhesion assessmentLactose–SS adhesion characteristics within all formulations
were evaluated by air jet sieving, upon which, small SS particles arepromoted to detach from coarse lactose surfaces. Amounts of SS(%, nominal dose) collected after different functional sieving timesfrom all formulations are illustrated in Fig. 6a. Assuming particleadhesion force is equivalent to particle detachment force, smalleramounts of SS remained after sieving indicates weaker lactose–SSadhesion forces. It can be seen that, for all formulations, amountsof SS decreased as sieving time increased (Fig. 6a) confirming thatall formulations were order mixtures. Among all lactose products,GRA produced the lowest amounts of SS after all functional sievingtimes (43.6 ± 1.1%, 20.4 ± 0.4%, 13.5 ± 1.7%, 10.9 ± 0.5% after 5 s,30 s, 1 min, and 3 min functional sieving time respectively) indicat-ing that GRA-SS formulation has the lowest lactose–SS adhesionforces (Fig. 6a). Differences in lactose–SS adhesion forces between
different formulations could be attributed to different physicalproperties of lactose products included as the same batch of SS, thesame lactose–SS ratio, and same blending conditions were used inpreparation of all formulations. Fig. 6b shows that lactose particlesng different 63–90 �m sieved lactose products: Flowlac® 100 (FLO), Lactopress

W. Kaialy et al. / International Journal of Pharmaceutics 423 (2012) 184– 194 191
Fig. 5. (a) Percent uniformity (mean ± SD, n ≥ 5) and (♦) coefficient of variation (%CV) of salbutamol sulphate (SS) content; (b) (�) relationship between % CV of SS andsurface factor (Fsurface) of lactose (mean ± SE, n ≥ 350) obtained from formulationsc ®
p2
w(4cl
3
Surv6ch(dddafiSosetGdwa
Fig. 6. (a) Remained salbutamol sulphate (SS) (%, 481 �g) (mean ± SD, n ≥ 3) aftersubjecting different lactose–SS blends to different functional sieving times; (b) %remained SS after 5 s or 30 s sieving time in relation to surface factor (Fsurface) andelongation ratio/flatness ratio (ER/FR) of different lactose particles: Flowlac® 100(FLO), Lactopress anhydrous® 250 (LAC), Cellactose® 80 (CEL), Tablettose® 80 (TAB),
®
ontaining different 63–90 �m sieved lactose products: Flowlac 100 (FLO), Lacto-ress anhydrous® 250 (LAC), Cellactose® 80 (CEL), Tablettose® 80 (TAB), and Granulac®
00 (GRA).
ith rougher surface (smaller Fsurface) and more elongated shapehigher ER/FR) produced smaller amounts of SS remained on5 �m sieve indicating smaller lactose–SS adhesion forces. Thisould be ascribed to decreased lactose–SS contact area in case ofactose particles with more elongated shape and rougher surface.
.6.4. In vitro deposition testMass distribution and aerodynamic particle size distribution of
S obtained from formulations containing different lactose prod-cts are shown in Fig. 7a and b.It can be seen amounts of SSemained in capsule shells and I + M from different formulationsaried considerably (the highest amounts were produced by GRA:.9 ± 0.3% (Fig. 7a)). In fact, it can be assumed that drug parti-les separate from carrier particles even within the capsules andence deposit on capsule walls. Amounts of SS deposited on throatIP) were not influenced considerably (P > 0.05, 2.6 ± 0.9%) by usingifferent lactose products. All formulations produced maximaleposition of SS on MSLI stage 1 (Fig. 7a). By comparison, GRA pro-uced the lowest deposition of SS on MSLI stage 1 (48.8 ± 0.3%)nd the highest deposition of SS on MSLI stage 4 (16.2 ± 0.8%) andlter (4.1 ± 0.5%) whereas FLO produced the highest deposition ofS on MSLI stage 1 (77.9 ± 1.9%) and the lowest deposition of SSn MSLI stage 4 (5.6 ± 0.7%) and filter (1.3 ± 0.3%) (Fig. 7a). Fig. 7bhows that the cumulative amounts of SS with aerodynamic diam-ter ≤10.5 �m, ≤5.5 �m, and ≤2.5 �m were dependent on lactoseype product included in each formulation by the following order:
RA > TAB > LAC ≈ CEL > FLO. These results point out that GRA pro-uced the highest amounts of SS deposited on lower airway regionshereas FLO produced the smallest amounts. Generally and forsthma therapy, optimal drug delivery requires that higher amount
and Granulac 200 (GRA).
of drug delivered to the lung (which is the target organ) and reducedthe amount of non-respirable (systemic drug) and consequentlyadverse effects (Crompton, 2006).
Various formulations containing different lactose productsproduced similar (P > 0.05) RD (384.0 ± 36.8 �g), similar ED(349.5 ± 33.9 �g), and similar RE (79.8 ± 7.6%) of SS upon aerosoli-sation (Table 2). The constant weigh of all metered doses(33 ± 1.5 mg), high number of capsules used during actuation foreach formulation (n = 10), and the formation of ordered mixturesof all formulations (Fig. 4) might be responsible for low variationsbetween RD, ED, and RE between all formulations.
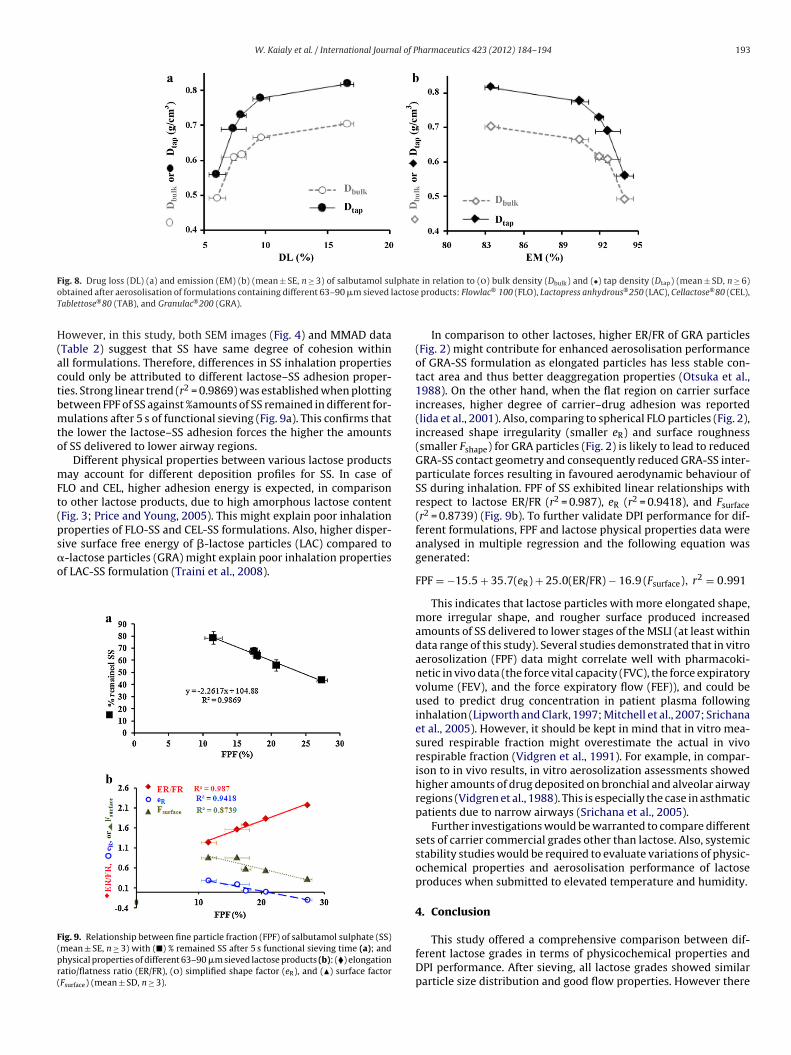
Different formulations produced substantially different DL(drug loss) and EM (emission) of SS (Table 2). By comparison, lac-tose powders with higher Db and higher Dtap produced higher DL(Fig. 8a) and smaller EM (Fig. 8b) of SS upon inhalation. This indi-cates that powder cohesiveness of lactose products with higher Dband higher Dt could not be totally overcome during inhalation lead-ing to the formation of aggregates remaining in the capsules andinhaler device.
IL (impaction loss) of SS varied from 52.4 ± 0.0% for GRA-SS for-mulation to 79.8 ± 1.6% for FLO-SS formulation (Table 2). IL couldbe related to amounts of SS which is still adhered to carrier sur-faces after aerosolisation. These amounts are expected to deposit
on the upper airway regions and eventually swallowed where theybecome systemically absorbed (Gupta and Hickey, 1991).
192 W. Kaialy et al. / International Journal of Pharmaceutics 423 (2012) 184– 194
Fig. 7. Amounts of salbutamol sulphate (%, recovered dose) deposited on capsules, inhaler with mouthpiece adaptor (I + M), throat, and different MSLI stages (a); and amountso .5 �mf (FLOG stand
11t
(aarfFaw
TR(b2
f salbutamol sulphate (%, recovered dose) (mean ± SE, n ≥ 3) less than 10.5 �m, 5ormulations containing different 63–90 �m sieved lactose products: Flowlac® 100ranulac® 200 (GRA). MMAD: mass median aerodynamic diameter; GSD: geometric
EI (ranging from 32.6 ± 3.7% to 47.8 ± 1.1%), DS (ranging from2.4 ± 2.5% to 32.8 ± 2.1%) and FPD (ranging from 44.8 ± 9.0 �g to06.0 ± 3.2 �g) were shown to follow a similar rank order accordingo lactose product as follows: GRA > TAB > CEL ≈ LAC > FLO (Table 2).
All formulations produced similar (P > 0.05) MMAD2.6 ± 0.2 �m) and GSD (2.2 ± 0.1) of SS which indicate thatll SS particles are theoretically expected to deposit on lowerirway regions giving raise to FPF of 100%. Nevertheless, FPFanged from 11.5 ± 2.5% for FLO-SS formulation to 27.4 ± 1.5%
or GRA-SS formulation (Table 2). Increased FPF variability forLO-SS and LAC-SS formulations (Table 2) could be partiallyttributed to reduced drug content homogeneity (higher % CV)ithin these formulations (Fig. 5). Low FPF (11.5 ± 2.4%) despiteable 2ecovered dose (RD), emitted dose (ED), recovery (RE), emission (EM), mass median aerFPD), fine particle dose (FPF), impaction loss (IL), drug loss (DL), dispersibility (DS), andlends containing different 63–90 �m sieved lactose powders: Flowlac® 100 (FLO), Lactop00 (GRA) (mean ± SE, n ≥ 3).
RD (�g) ED (�g) RE (%) DL (%) EM (%) IL (%)
FLO 389.0 ± 4.5 360.2 ± 1.3 80.9 ± 0.9 7.4 ± 1.4 92.6 ± 1.4 79.8 ± 1.6LAC 402.5 ± 42.0 363.8 ± 38.5 83.7 ± 8.7 9.6 ± 1.3 90.4 ± 1.3 71.9 ± 5.5CEL 342.2 ± 30.1 321.7 ± 32.4 71.2 ± 6.3 6.1 ± 1.3 93.9 ± 1.3 74.7 ± 2.6TAB 403.4 ± 27.1 371.0 ± 26.4 83.9 ± 5.6 8.1 ± 0.7 91.9 ± 0.7 69.4 ± 1.2GRA 386.7 ± 9.4 322.7 ± 10.8 80.4 ± 2.0 16.6 ± 0.8 83.4 ± 0.8 52.4 ± 0.0
, 2.5 �m, and 1.37 �m aerodynamic diameter (b) obtained after aerosolisation of), Lactopress anhydrous® 250 (LAC), Cellactose® 80 (CEL), Tablettose® 80 (TAB), andard deviation.
high EM (92.6 ± 1.4%) in case of FLO-SS formulation indicates thatSS dispersed well from the capsules and inhaler device but couldnot detach easily from FLO surfaces during inhalation.
In theory, FPF refers to the percentage fraction of the drugwhich will be locally pharmacologically active in the lung (Dunbaret al., 1998). Higher FPF indicates higher amounts of SS would beexpected to be delivered to lower airway regions where SS recep-tors are mainly located (Labiris and Dolovich, 2003).
Based on this, it can be concluded that FLO carrier produced
the poorest aerosolisation performance of SS whereas best DPIaerosolisation of SS was obtained in case of GRA carrier. In theory,improved performance of a DPI formulation could be attributedto either less drug–drug cohesion or less carrier–drug adhesion.odynaic diameter (MMAD), geometric standard deviation (GSD), fine particle dose effective inhalation index (EI) of salbutamol sulphare obtained from formulationress anhydrous® 250 (LAC), Cellactose® 80 (CEL), Tablettose® 80 (TAB), and Granulac®
DS (%) EI (%) FPD (�g) MMAD (�m) GSD FPF (%)
12.4 ± 2.5 32.6 ± 3.7 44.8 ± 9.0 2.8 ± 0.1 2.2 ± 0.1 11.5 ± 2.4 17.8 ± 4.4 37.9 ± 4.8 63.8 ± 12.7 2.7 ± 0.1 2.2 ± 0.0 16.1 ± 3.9 18.6 ± 1.8 40.5 ± 1.6 59.6 ± 4.0 2.6 ± 0.2 2.2 ± 0.1 17.5 ± 1.5 22.5 ± 0.5 43.6 ± 0.2 83.5 ± 4.6 2.6 ± 0.1 2.2 ± 0.0 20.7 ± 0.3
32.8 ± 2.1 47.8 ± 1.1 106.0 ± 3.2 2.4 ± 0.6 2.3 ± 0.1 27.4 ± 1.5
W. Kaialy et al. / International Journal of Pharmaceutics 423 (2012) 184– 194 193
F lphateo actoseT
H(actbmto
mFt(ps�o
F(pr(
ig. 8. Drug loss (DL) (a) and emission (EM) (b) (mean ± SE, n ≥ 3) of salbutamol subtained after aerosolisation of formulations containing different 63–90 �m sieved lablettose®80 (TAB), and Granulac®200 (GRA).
owever, in this study, both SEM images (Fig. 4) and MMAD dataTable 2) suggest that SS have same degree of cohesion withinll formulations. Therefore, differences in SS inhalation propertiesould only be attributed to different lactose–SS adhesion proper-ies. Strong linear trend (r2 = 0.9869) was established when plottingetween FPF of SS against %amounts of SS remained in different for-ulations after 5 s of functional sieving (Fig. 9a). This confirms that
he lower the lactose–SS adhesion forces the higher the amountsf SS delivered to lower airway regions.
Different physical properties between various lactose productsay account for different deposition profiles for SS. In case of
LO and CEL, higher adhesion energy is expected, in comparisono other lactose products, due to high amorphous lactose contentFig. 3; Price and Young, 2005). This might explain poor inhalationroperties of FLO-SS and CEL-SS formulations. Also, higher disper-
ive surface free energy of �-lactose particles (LAC) compared to-lactose particles (GRA) might explain poor inhalation propertiesf LAC-SS formulation (Traini et al., 2008).ig. 9. Relationship between fine particle fraction (FPF) of salbutamol sulphate (SS)mean ± SE, n ≥ 3) with (�) % remained SS after 5 s functional sieving time (a); andhysical properties of different 63–90 �m sieved lactose products (b): (�) elongationatio/flatness ratio (ER/FR), (о) simplified shape factor (eR), and (�) surface factorFsurface) (mean ± SD, n ≥ 3).
in relation to (о) bulk density (Dbulk) and (•) tap density (Dtap) (mean ± SD, n ≥ 6) products: Flowlac® 100 (FLO), Lactopress anhydrous®250 (LAC), Cellactose®80 (CEL),
In comparison to other lactoses, higher ER/FR of GRA particles(Fig. 2) might contribute for enhanced aerosolisation performanceof GRA-SS formulation as elongated particles has less stable con-tact area and thus better deaggregation properties (Otsuka et al.,1988). On the other hand, when the flat region on carrier surfaceincreases, higher degree of carrier–drug adhesion was reported(Iida et al., 2001). Also, comparing to spherical FLO particles (Fig. 2),increased shape irregularity (smaller eR) and surface roughness(smaller Fshape) for GRA particles (Fig. 2) is likely to lead to reducedGRA-SS contact geometry and consequently reduced GRA-SS inter-particulate forces resulting in favoured aerodynamic behaviour ofSS during inhalation. FPF of SS exhibited linear relationships withrespect to lactose ER/FR (r2 = 0.987), eR (r2 = 0.9418), and Fsurface(r2 = 0.8739) (Fig. 9b). To further validate DPI performance for dif-ferent formulations, FPF and lactose physical properties data wereanalysed in multiple regression and the following equation wasgenerated:
FPF = −15.5 + 35.7(eR) + 25.0(ER/FR) − 16.9 (Fsurface), r2 = 0.991
This indicates that lactose particles with more elongated shape,more irregular shape, and rougher surface produced increasedamounts of SS delivered to lower stages of the MSLI (at least withindata range of this study). Several studies demonstrated that in vitroaerosolization (FPF) data might correlate well with pharmacoki-netic in vivo data (the force vital capacity (FVC), the force expiratoryvolume (FEV), and the force expiratory flow (FEF)), and could beused to predict drug concentration in patient plasma followinginhalation (Lipworth and Clark, 1997; Mitchell et al., 2007; Srichanaet al., 2005). However, it should be kept in mind that in vitro mea-sured respirable fraction might overestimate the actual in vivorespirable fraction (Vidgren et al., 1991). For example, in compar-ison to in vivo results, in vitro aerosolization assessments showedhigher amounts of drug deposited on bronchial and alveolar airwayregions (Vidgren et al., 1988). This is especially the case in asthmaticpatients due to narrow airways (Srichana et al., 2005).
Further investigations would be warranted to compare differentsets of carrier commercial grades other than lactose. Also, systemicstability studies would be required to evaluate variations of physic-ochemical properties and aerosolisation performance of lactoseproduces when submitted to elevated temperature and humidity.
4. Conclusion
This study offered a comprehensive comparison between dif-ferent lactose grades in terms of physicochemical properties andDPI performance. After sieving, all lactose grades showed similarparticle size distribution and good flow properties. However there
1 al of P
wotT2olaladsoc
A
opt
R
B
B
B
C
C
C
D
d
D
D
E
F
F
G
H
H
H
I
K
K
K
94 W. Kaialy et al. / International Journ
ere substantial differences between the lactose grades in termsf their physicochemical properties and the performance of salbu-amol sulphate DPI products prepared using the different grades.his study pointed out that the use of milled lactose (Granulac®
00) would be advantageous for pulmonary drug delivery of SS thanther lactose products under investigation. This was explained asactose particles with more elongated shape, more irregular shape,nd rougher surface produced increased amounts of SS delivered toower stages of the MSLI (at least within data range of this study). Inddition lower amorphous content observed lead to improved SSelivered to lower stages of the MSLI. The results from this detailedtudy demonstrate that a good understanding of lactose propertiesver and above PSD is necessary to make the correct selection andontrol of lactose grades for pulmonary drug delivery.
cknowledgements
Waseem Kaialy would like to thank Mr. Ian Slipper (Universityf Greenwich) and Dr. Ewa Kolosionek (University of Kent) for helprovided with SEM images and image optical microscopy, respec-ively.
eferences
ailey, A.G., Hashish, A.H., Williams, T.J., 1998. Drug delivery by inhalation of chargedparticles. J. Elect. 44, 3–10.
riggner, L.E., Buckton, G., Bystrom, K., Darcy, P., 1994. The use of isothermalmicrocalorimetry in the study of changes in crystallinity induced during theprocessing of powders. Int. J. Pharm. 105, 125–135.
uckton, G., 1997. Characterization of small changes in the physical properties ofpowders of significance for dry powder inhaler formulations. Adv. Drug Deliv.25, 17–27.
han, H.K., 2006. Dry powder aerosol delivery systems: current and future researchdirections. J. Aerosol. Med. 19, 21–27.
how, K.T., Zhu, K., Tan, R.B.H., Heng, P.W.S., 2008. Investigation of electrostaticbehavior of a lactose carrier for dry powder inhalers. Pharm. Res. 25 (12),2822–2834.
rompton, G., 2006. A brief history of inhaled asthma therapy over the last fiftyyears. Prim. Care Respir. J. 15, 326–331.
alby, R.N., Tiano, S.L., Hickey, A.J., 1996. Medical devices for the delivery of thera-peutic aerosols to the lungs. Lung Biol. Health Dis. 94, 441–473.
e Villiers, M.M., 1997. Description of the kinetics of the deagglomeration of drugparticle agglomerates during powder mixing. Int. J. Pharm. 151, 1–6.
rapier-Beche, N., Fanni, J., Parmentier, M., 1999. Physical and chemical propertiesof molecular compounds of lactose. J. Dairy Sci. 82, 2558–2563.
unbar, C.A., Hickey, A.J., Holzner, P., 1998. Dispersion and characterization of phar-maceutical dry powder aerosols. Kona 16, 7–45.
lajnaf, A., Carter, P., Rowley, G., 2006. Electrostatic characterisation of inhaledpowders: effect of contact surface and relative humidity. Eur. J. Pharm. Sci. 29,375–384.
lament, M.P., Leterme, P., Gayot, A., 2004. The influence of carrier roughness onadhesion, content uniformity and the in vitro deposition of terbutaline sulphatefrom dry powder inhalers. Int. J. Pharm. 275, 201–209.
ries, D.C., Rao, S.T., Sundaralingam, M., 1971. Structural chemistry of carbo-hydrates III. crystal and molecular structure of 4-O-�-d-galactopyranosyl-�-d-glucopyranose monohydrate(�-lactose monohydrate). Acta Cryst. B 27,994–1005.
upta, P.K., Hickey, A.J., 1991. Contemporary approaches in aerosolized drug deliv-ery to the lung. J. Control. Release 17, 127–147.
ashish, A.H., Fleming, J.S., Conway, J., Halson, P., Moore, E., Williams, T.J., Bailey, A.G.,Nassim, M., Holgate, S.T., 1998. Lung deposition of particles by airway genera-tion in healthy subjects: three-dimensional radionuclide imaging and numericalmodel prediction. J. Aerosol Sci. 29, 205–215.
arjunen, P., Lankinen, T., Salonen, H., Lehto, V.P., Jarvinen, K., 2003. Effects of car-riers and storage of formulation on the lung deposition of a hydrophobic andhydrophilic drug from a DPI. Int. J. Pharm. 263, 151–163.
irotsu, K., Shimada, A., 1974. The crystal and molecular structure of �-lactose. Bull.Chem. Soc. Jpn. 47, 1872–1879.
ida, K., Hayakawa, Y., Okamoto, H., Danjo k. Leuenberger, H., 2001. Evaluation of flowproperties of dry powder inhalation of salbutamol sulfate with lactose carrier.Chem. Pharm. Bull. 49, 1326–1330.
aialy, W., Momin, M.N., Ticehurst, M.D., Murphy, J., Nokhodchi, A., 2010b. Engi-neered mannitol as an alternative carrier to enhance deep lung penetration ofsalbutamol sulphate from dry powder inhaler. Colloids Surf. B Biointerfaces 79,345–356.
aialy, W., Martin, G.P., Ticehurst, M.D., Momin, M.N., Nokhodchi, A., 2010a. Theenhanced aerosol performance of salbutamol from dry powders containing engi-neered mannitol as excipient. Int. J. Pharm. 392, 178–188.
aialy, W., Alhalaweh, A., Velaga, S.P., Nokhodchi, A., 2011a. Effect of carrier particleshape dry powder inhaler performance. Int. J. Pharm. 421, 12–23.
harmaceutics 423 (2012) 184– 194
Kaialy, W., Martin, G.P., Ticehurst, M.D., Royall, P., Mohammad, M.A., Murphy, J.,Nokhodchi, A., 2011b. Characterisation and deposition studies of recrystallisedlactose from binary mixtures of ethanol/butanol for improved drug deliveryfrom dry powder inhalers. AAPS J. 13, 30–43.
Kaialy, W., Ticehurst, M.D., Murphy, J., Nokhodchi, A., 2011c. Improved aerosoliza-tion performance of salbutamol sulfate formulated with lactose crystallizedfrom binary mixtures of ethanol—acetone. J. Pharm. Sci. 100, 2665–2684.
Kaialy, W., Martin, G.P., Larhrib, H., Ticehurst, M.D., Kolosionek, E., Nokhodchi, A.,2012. The influence of physical properties and morphology of crystallised lactoseon delivery of salbutamol sulphate from dry powder inhalers. Colloid Surf. B 89,29–39.
Kaparissides, C., Alexandridou, S., Kotti, K., Chaitidou, S., 2006. Recent advances innovel drug delivery systems. J. Nanotechnol. Online 2, 1–11.
Kuo, C.Y., Rollings, R.S., Lynch, L.N., 1998. Morphological study of coarse aggregatesusing image analysis. J. Mater. Civ. Eng. 10, 135–143.
Mitchell, J., Newman, S., Chan, H.K., 2007. In vitro and in vivo aspects of cascadeimpactor tests and inhaler performance: a review. AAPS Pharm. Sci. Tech. 2007;8 (4).
Labiris, N.R., Dolovich, M.B., 2003. Pulmonary drug delivery part I: physiologicalfactors affecting therapeutic effectiveness of aerosolized medications. Br. J. Clin.Pharmacol. 56, 588–599.
Larhrib, H., Martin, G.P., Prime, D., Marriott, C., 2003. Characterisation and deposi-tion studies of engineered lactose crystals with potential for use as a carrier foraerosolised salbutamol sulfate from dry powder inhalers. Eur. J. Pharm. Sci. 19,211–221.
Lipworth, B.J., Clark, D.J., 1997. Effects of airway calibre on lung delivery of nebulisedsalbutamol. Thorax 52, 1036–1039.
Lefebvre, J., Willart, J.F., Caron, V., Lefort, R., Affouard, F., Danede, F., 2005. Structuredetermination of the 1/1/mixed lactose by X-ray powder diffraction. Acta Cryst.B 61, 455–463.
Nickerson, T.A., 1974. In: Webb, B.H., Johnson, A.H., Alford, J.A. (Eds.), Lactose. Fun-damentals of Dairy Chemistr, 2nd ed. AVI Publishing Co., Westport, CT, pp.273–324.
Nokhodchi, A., Kaialy, W., Ticehurst, M.D., 2011. The influence of particle physico-chemical properties on delivery of drugs by dry powder inhalers to the lung. In:Popescu, M.A. (Ed.), Drug Delivery Book. Nova Science Publishers, Hauppauge,NY, pp. 1–50.
Otsuka, A., Iida, K., Danjo, K., Sunada, H., 1988. Measurement of the adhesive forcebetween particles of powdered materials and a glass substrate by means of theimpact separation method III: effect of particle shape and surface asperity. Chem.Pharm. Bull. 36, 741–749.
Platteau, C., Lefebvre, J., Affouard, F., Willart, J.F., Derollez, P., Mallet, F., 2005. Struc-ture determination of the stable anhydrous phase [alpha] lactose from X-raypowder diffraction. Acta Cryst. B 61, 185–191.
Podczeck, F., Newton, J.M., 1994. A shape factor to characterize the quality ofspheroids. J. Pharm. Pharmacol. 46, 82–85.
Podczeck, F., Rahman, S.R., Newton, J.M., 1999. Evaluation of a standardised pro-cedure to assess the shape of pellets using image analysis. Int. J. Pharm. 192,123–138.
Price, R., Young, P.M., 2005. On the physical transformations of processed pharma-ceutical solids. Micron 36, 519–524.
Roos, Y., Karel, M.A., 1992. Crystallization of amorphous lactose. J. Food Sci. 57,775–777.
Smyth, H.D.C., Hickey, A.J., 2005. Carriers in drug powder delivery: implications forinhalation system design. Am. J. Drug Deliv. 3, 117–132.
Srichana, T., Suedee, R., Muanpanarai, D., Tanmanee, N., 2005. The study of in vitro–invivo correlation: pharmacokinetics and pharmacodynamics of Albuterol drypowder inhalers. J. Pharm. Sci. 94, 220–230.
Staniforth, J.N., 1996. Improvements in dry powder inhaler performance: surfacepassivation effects. In: Drug Delivery to the Lungs VII. The Aerosol Society, BristolLondon.
Taylor, M.K., Ginsburg, J., Hickey, A.J., Gheyas, F., 2000. Composite method to quan-tify powder flow as a screening method in early tablet or capsule formulationdevelopment. AAPS Pharm. Sci. Tech. 1, 20–30.
Telko, M.J., Hickey, A.J., 2005. Dry powder inhaler formulation. Respir. Care 50,1209–1227.
Todo, H., Okamoto, H., Iida, K., Danjo, K., 2001. Effect of additives on insulin absorp-tion from intratracheally administered dry powders in rats. Int. J. Pharm. 220,101–110.
Traini, D., Young, P.M., Thielmann, F., Acharya, M., 2008. The influence of lactosepseudopolymorphic form on salbutamol sulfate–lactose interactions in DPI for-mulations. Drug Dev. Ind. Pharm. 34, 992–1001.
Vidgren, P., Silvasti, M., Vidgren, M., Paronen, P., Tukiainen, H., Lehti, H., 1991. In vitroinhalation behaviour and therapeutic response of salbutamol particles admin-istered from two metered dose aerosols. Pharmazie 46, 41–43.
Vidgren, P., Kärkkäinen, A., Karjalainen, P., Nuutinen, J., Paronen, P., 1988. In vitroand in vivo deposition of drug particles inhaled from pressurized aerosol anddry powder inhaler. Drug Dev. Ind. Pharm. 14, 2649–2665.
Wall, D.A., 1995. Pulmonary absorption of peptides and proteins. Drug Deliv. 2,1–20.
Zeng, X.M., Martina, G.P., Marriott, C., Pritchard, J., 2000. The influence of car-
rier morphology on drug delivery by dry powder inhalers. Int. J. Pharm. 200,93–106.Zeng, X.M., MacRitchie, H.B., Marriott, C., Martin, G.P., 2007. Humidity-inducedchanges of the aerodynamic properties of dry powder aerosol formulationscontaining different carriers. Int. J. Pharm. 333, 45–55.