the modelling of caking in bulk lactose
TRANSCRIPT

Copyright is owned by the Author of the thesis. Permission is given for a copy to be downloaded by an individual for the purpose of research and private study only. The thesis may not be reproduced elsewhere without the permission of the Author.
Massey Unive. s, j Palmerslon North
Turilea
THE MODELLING OF CAKING IN BULK LACTOSE
A thesis presented paI1ial fulfilment of the requirements for the degree of Doctor of Philosophy in Process and Environmental Technology at Massey University
John Bronlund
B. Tech (Hons)
1997
1
THE MODELLING OF CAKING IN BULK LACTOSE
I give permission for my thesis to be made available to readers in Massey University Library under conditions determined by the Librarian.
2 I agree that my thesis, or a copy, may be sent to another institution under conditions determined by the Librarian.
3 I agree that my thesis may be copied for Library use.
Signed �j�.
Date 2200 October 1997
The copyright of this thesis belongs to the author. Readers must sib'll their name in the space below to show that they recognise this. They are asked to add their permanent address.
Name and Address Date
ABSTRACT
Caking during storage is a serious problem for manufacturers of bulk lactose. This study \vas carried out to investigate the causes of caking and identify solutions as to how such problems can be eliminated.
The mechanisms for caking in crystalline lactose powders were identified . Liquid bridging between adjacent particles was shown to occur in high relative humidity environments (>80% RH) These liquid bridges could form crystalline solid bridges if the material was subsequently dried out. The potential mechanism of amorphous lactose flo\\ and bridging in conditions where the glass transition temperature is exceeded was shmvn to be insignificant in predominantly crystalline lactose powders «5% amorphous lactose) The presence of amorphous lactose is still important as the amorphous matrix acts as a sink of moisture, which can be released upon crystallisation . This increases the moisture available in the system which can contribute to caking by the liquid bridging mechanism. Both of these mechanisms involve changes in the local temperature and moisture conditions within the bulk powder. Such changes were known to be caused by moisture migration under the influence of a temperature gradient .
A model which describes the transport of moisture in one dimension as a result of temperature gradients was developed and validated . The microscopic scale processes of liquid bridging and amorphous lactose moisture relations were included into this model . The model predictions agreed well with experimental trials for completely crystalline lactose powders . Comparison of model predictions for the case where amorphous lactose was present on the surface of the particles showed some inadequacies exist in the modeL These were the rate of amorphous lactose crystallisation and the assumption of instantaneous equilibrium between the crystallising amorphous matrix and the air present in the interstices of the bulk l actose.
Using the model it was shown that for expected storage conditions, the product should be stored with a water activity below 0.57 a.v if no amorphous lactose is present and below 0 .25 �\! i f i t is present. If these prescribed limits are met then the goal of producing caking free l actose powders can be achieved .
111
ACKNOWLEDGEMENTS
I always used wonder why research into industrial problems satisfies the requirements for a Doctorate in Philosophy.
Then I found a definition for Philosophy;
Philosophy, is like a blilld mall, in a dark 1'00111, 100kil1� for a Mack callhal iSIl 'I there.
Then I realised that this was the ideal qualificat ion for this kind of research.
When it comes to lactose caking, I have been that blind man in the dark room. This is not to say that I didn't get any help during my search for the alleged black cat Indeed there have been many people who have helped and encouraged me along the way.
Tony Paterson, my principal supervisor, has spent many hours over the last few years helping me ponder the riddles of what is lactose. My other supervisors, Dr Richard Archer, Dr Dong Chen and Professor Ray Winger were also of great help, particularly at the two ends of the whole exercise. Dr Jim Hargreaves's initial work into lactose has also been invaluable to this work Also thanks to Aaron O'Donnell for all his work in searching for the same lactose cat.
John Alger, Bruce Collins and Don McLean have aided me in the design and manufacture of many cat searching devices. Thank you all very much.
I would like to thank Ma and Pa Bronlund, my family and mends who have listened and encouraged me to complete this thesis. This was mostly in the form of questions like
"Is your thesis finished yet John')".The people responsible for asking such questions know who they are and many will be hearing similar questions from me in the near future. Special thanks to Jules, Kath, Dave, Kim, Lynley, Stacey, Mike, Clint, Ross, Silvia and Inge.
Thanks to Marcel Gesterkamp, Stephen Kellam, David Hall, and John Thomas at (or once with) The Lactose Company of New Zealand at Kaponga for all their valuable assistance and financial backing for this project.
Most thanks of all goes to Susie, without whose love and support, none of this would have been possible. With this thing now complete we can breath a combined sigh of relief.
At the end of this work there was still 110 sign of the Black Cat, but I didfind a small hard deposit of a white powdery substance in one corner.
'
'" " ?" , �. , . . . . .
v
TABLE OF CONTENTS ABSTRACT . . . . . . . . . . . . . • . . . . . . . . . . . . . . . . • . . . . . . . . . . . . . . . . . . . • . . 1/1
ACKNOWLEDGEMENTS . . . . . . . . . . • . . . . . . . . . . . . • . . • . . . . . . . . . . . . . . . .. V
TABLE OF CONTENTS . . . . . . . . . . . . . . . . . . . . . . . . . . . . . . . . . • . . . . . . . . .. VII
LIST OF FIGURES . . . . . . . . . . . . . . . . . . . . • . . . . • . • . . • . . . . . . . • . . . . • • . • XII
LIST OF TABLES . . . . . . . . • . . . . . . . . • . . . • . . . . . • . . • . . . . . . • . . . . . • . • . XVII
CHAPTER 1
PROJECT OVERVIEW
1.1 PROBLEM DEFINITION . . . . . . . . . . . . . . . . . . . . . . . . . . . . . . . . . . . . . . . 1 . 1
1 . 2 PROPOSE D CAKING M E CHANISMS . . . . . . . . . . . . . . . . . . . . . . . . . . . . . . 1.2
1 .2.1 HUMIDITY CAKING . . . . . . . . . . . . . . . . . . . . . . . . . . . . . . . . . . . . . . . . . . . . . . . . . . . . 1 .2 1.2.2 AMORPHOUS LACTOSE CAKING . . . . . . . . . . . . . . . . . . . . . . . . . . . . . . . . . . . . . . . . . . 1 .2
1.3 MOISTURE M IG RATION . . . . .. . . . . . . . . .... . . . . . . . . . . . .. . . . . .. . . 1.2
1.4 OVERALL PROJECT AIMS . . . . . . . . . . . . . . . . . . . . . . . . . . . . . . . . . . . . . 1 . 3
CHAPTER 2
PHYSICAL PROPERTIES OF LACTOSE
2.1 LACTOSE CHEMISTRY . . . . . . . . . . . . . . . . . . . . . . . .. . . . . . . . . . . . . . . 2 . 1
VII
2.2 LACTOSE FORMS . . . . . . . . . . . . . . . . . . . . . . . . . . . . . . . . . . . . . . . . . . 2.1
2.2 . 1 CRYSTALLINE LACTOSE . . . . . . . . . . . . . . . . . . . . . . . . . . . . . . . . . . . . . . . . . . . . . . . . 2 . 1 2 .2 .2 AMORPHOUS LACTOSE . . . . . . . . . . . . . . . . . . . . . . . . . . . . . . . . . . . . . . . . . . . .. . . . 2 .3 2.2.3 PARTIALLY AMORPHOUS LACTOSE . . . . . . . . . . . . . . . . . . . . . . . . . . . . . . . . . . . . . . . . 2 .3
2.3 CHARACTERISATION OF LACTOSE POWDERS . . . . . . . . . . . . . . . . . . . . . . 2 .5
2.3.1 PARTICLE SIZE DISTRIBUTION . . . . . . . . . . . . . . . . . . . . . . . . . . . . . . . . . . . .. . . . . . . . 2 .5 2 .3 .2 DENSITY . . . . . . . . . . . . . . . . . . . . . . . . . . . . . . . . . . . . . . . . . . . . . . . . . . . . . . . . . . . 2.5
2 .3 .2.1 Particle Density . , . . . . . . . . . . . . . . . . . . . . . . . . . . . . . . . . . . . . . . . . . .. . . . 2 .5 2 .3 .2.2 Bulk Density, Tapped Density and Porosity . . . . . . . . . . . . . . . . . . . . . . .. . . . 2.6
2.4 THERMAL PROPERTIES . . . . . . . . . . . . . . . . . . . . . . . . . . . . . . . . . . . . . . 2 .7
2.4. 1 SPECIFIC HEAT CAPACITY . . . . . . . . . . . . . . . . . . . . . . . . . . . . . . . . . . . . . .. . . . . . . . 2.7 2.4.2 EFFECTIVE THERMAL CONDUCTIVITY . . . . . . . . . . . . . . . . . . . . . . . . . . . . . . . . . . . . . . 2 .7
2.4.2. 1 Experimental Measurement of Effective Thermal Conductivity . . . . . . . . . . . . 2.7 2.4 .2.1.1 Measurement by the Infinite Cylinder Method . . . . . . . . . . . . . . . . . . . . . . . 2. 9 2.4.2. 1 . 2 Measurement by the Guarded Hot Plate Method . . . . . . . . . . . . . . . . . . . . 2. 1 2
2.4.2.2 Summary of Lactose Thermal Conductivity Measurements . . . . . . . . . . . . . . 2 . 1 3
2.5 PROPERTIES OF LACTOSE SOLUTIONS . . . . . . . . . . . . . . . . . . . . . . . . . . 2 . 1 3
2.5. 1 SOLUBILITY . . . . . . . . . . . . . . . . . . . . . . . . . . . . . . . . . . . . . . .. . . . . . . . . . . . . . . . . 2 . 1 3 2.5.2 SURFACE TENSION . . . . . . . . . . . . . . . . . . . . ... . . . . . . . . . . . . . . . . . . . . . ... . . . 2 . 1 4
2.6 CLOSURE .............................................. . 2.1 5
CHAPTER 3 MOISTURE RELATIONS IN LACTOSE
3.1 I NTRO D UCTION ...... .......................... . ........... 3.1
3.2 THE DEGREE OF BINDING OF MOISTURE IN LACTOSE . .. 3.1 3.2.1 CHEMICALLY BOUND MOISTURE . . . . . . . . . . . . . . . . . . . . . .. . ................. 3.1
3.2.2 PHYSICALLY ADSORBED MOISTURE . . . . . . . . . . . . . . . . . . . . . . . 3.2 3.2.3 BOUND AND FREE MOISTURE USED IN THIS WORK . . .. . ....... .. . . .. . . 3.3
3.3 MOISTURE SORPTION ISOTHERMS . . . .. . . .. . . . . . . . . . . . . ... . .. . .. 3 . 3 3.3.1 PUBLISHED LACTOSE ISOTHERM DATA ..................................... 3.4
3.3.1.1 Crystalline Lactose ....... . .. . . .. . .. .. . .......... . ... . .. . . .. . .. . 3.4
3.3.1.2 Amorphous, Spray-dried and Freeze-dried Lactose .. , . . . . . . . . . . . . . .. 3.5 3.3.2 EXPERIMENTAL MEASUREMENT OF LACTOSE ISOTHERM DATA ... ... .. .. . . . . . . 3.6 3.3.3 ex-LACTOSE MONOHYDRATE . . . . . . . . . . . . . . . . . . . . . . . . . . . . . . . . 3 .7 3.3.4 (3-LACTOSE . . . . . . . . . . . . . . . . . . . . . . . . . . . . . . . . 3.14 3.3.5 AMORPHOUS LACTOSE . ... . . . . . . ..... . . . .. . . . . . . ... . . .. . . 3.16 3.3.6 MIXTURES OF CRYSTALLINE AND AMORPHOUS LACTOSE ....................... 3.18
3.4 RATES OF M OISTURE SORPTION ON TO LACTOSE . . ...... .. . . ...... 3.20
3 .4 . 1 SORPTION ON TO ex-LACTOSE MONOHYDRATE . . .. ... . . . .. . .. ...... .. ... ..... 3. 21 3 . 4.2 SORPTION ON TO AMORPHOUS LACTOSE .. . . .. . . . . . . . ...... . .... . .. . .. . ... 3.22 3.4.3 SORPTION ON TO MIXTURES OF CRYSTALLINE AND AMORPHOUS LACTOSE .......... 3.28
VlIl
3.5 M OISTURE CONTENT DETERMINATION .. . . . . . . . . . . . . . . . . . . . . . . . .. 3.3 1
3.6 WATER ACTIVITY M EASUREMENT . . . . .. . .. . .. . . . . . . . . . . . . . . . . . . 3.3 3
3.7 PROPERTIES OF AMORPHOUS LACTOSE . . . . . . . . . . . .. . . . . . . . . . . . . 3.3 4
3. 7.1 GLASS TRANSITION TEMPERATURE . . . . . . . . . . . . . . . . . . . . . . . . . . . . . . . . . . . . . . . 3 .34 3. 7.2 VISCOSITY OF AMORPHOUS LACTOSE . . .. . . . . . . .. . . . . . . . . . . . . . . . . . . .. . . . . . 3.3 6 3. 7.3 QUANTIFICATION OF AMORPHOUS LACTOSE IN LACTOSE POWDERS ....... ..... .. . . 3 .37 3. 7.4 CRYSTALLISATION OF AMORPHOUS LACTOSE . . . . .. . . . . . . . .. . . . . . . . . . . . . .. . . . 3.38
3.7.4.1 Product of Amorphous Lactose Crystal l isation . . . . . . ... . . . . . . . . . . . . . . . 3.38 3.7.4.2 Crystal lisation Kinetics . . . . . . . . . . . . . . . . . . . . . . . .......... .. 3.41
3. 7.4.2. 1 Polymer Crystallisation Kinetics. . . . . . . . . . . ............... 3.4 1 3.7. 4. 2. 2 Prediction of Crystallisation Rate in Amorphous Lactose . . . . .. . . . .. 3.43
3 74221 Sorption-desorption phenomena . . . . . . . ........... 3.4 6
.) 74.2.2.2 P to a-lactose conversion . . . . . . . ....... 3.4 7
3 742.23 Crystallisation rate. . . . . . . . . . . . . . . ...... 3.4 9
3.8 EFFECTIVE MOISTURE DIFFUSIVITY IN A PACKED BED OF LACTOSE .. . . . . 3.54
3.9 CLOSURE . . . . . . . . . . . ... . . . . . . . .. . . . . . . . . . . . . . . . . . . . . . .. . 3.55
CHAPTER 4
M OD ELLING HEAT AND M OISTURE TRANSPORT IN BULK LACTOSE
4. 1 I NTRODUCTION . . . . . . . . . . . ... . . . . . . . . . . . . . . ... . . . . . . . . ..... 4 . 1
4.2 FORMULATION OF TRANSPORT M ODEL . . . . ... . . . . . . . . . . . . . . . . . . . . 4 . 1
4.2 . 1 CONCEPTUAL MODEL . . . . . . . . . . . . . . . . . . .. . . .. . .. . . .. .. . . . . . . .. . . . . . . . . . 4 . 1 4.2.2 ASSUMPTIONS . . . . . . . . . . . . . . . . . . . . . . . . . . . . . . . . . . . . . . . . . . . . . . . . . . . . . . . 4.2 4 .2.3 VALIDITY OF ASSUMPTIONS . . . . . ... . . . . .. . . . . . .. . . . . . . . . . . . . . . . . . . . . . . . . 4.2
4 .2 .3. 1 Local Thermal Equi l ibrium . . . .. . . . . . . .. . . . . . . . . . . . . . . . . . . . . . . . . . . . 4 .2 4 .2 .3.2 Local Moisture Equi l ibrium . . . . . . . . . . . . . . . . . . . . .. . . . . . . . . . . . .. . . . . . 4 .3 4 .2 .3 .3 Negl ig ible Convection . . . . . . . . . . . . . . . . . . . . . . . . . .. . . . . . .. . . . . . . . . . 4 .4 4.2.3.4 Negligible Heat a nd Moisture Transport Due to Changes i n Air Density . . . . . . 4.4 4 .2 .3 .5 Mode of Moisture Movement .. . . .. . . . . . . . . . . . .. . . . . . . . . . . . . .. . . . . . 4 .5 4 .2.3.6 Other Assumptions Made . .. . . . . . . . . . .. . . . . . . . . . . . .. . . . . . . . .. . . . . . 4 .5
4.2.4 MATHEMATICAL FORMULATION . . .. . . . . . . . . . . . . . . . . . . .. . .. . . . . . . . . . . .. . . . . 4. 6
4.3 NUMERICAL SOLUTION OF TRANSPORT MODEL . . . . . . . . . . . .. . . . . . . . . 4. 6
4.3. 1 SELECTION OF NUMERICAL SOLUTION METHOD .. . .. . . . . . . . . . . . .. . . . . . . . . . . .. . 4 . 6 4 .3.2 NUMERICAL SOLUTION . . . . . . . . . . . . . . . . .. . . . . . . . . . .. . . . .. . . .. . . . . . . . . . .. 4 .7
4.4 MATHS CHECKING . . . . . . . . . . . . . . . . . . . . . . . . . . . . . . . . . . . . . . . . . . 4.8
4.4 . 1 CHECKS AGAINST PREVIOUSLY VALIDATED SOLUTIONS . . . . . . . . . . . . . . . . . . . . . . . . . 4 .8 4.4.2 NUMERICAL ERROR CHECKING . . . . .. . . .. . . . . . . .. . . .. . . . . ... . . . ... . . .. . . . . 4.9 4.4.3 MATHS CHECKING SUMMARY . . . . . . . . . . . . . . . . . . . . . . . .. . . . . . . . . . . . . . . . . . . . 4 .9
4.5 MATHEMATICAL M ODEL EVALUATION . . . . . . . . . . . . . . . . . . . . . . . . . . . 4 . 10
4 .5 . 1 MODEL PREDICTIONS . . . . . . .. . . . . . . . . .. .. . . . ... . . . . . . . . . . . . . . . . . . . . . . . 4 . 1 0 4.5. 1 . 1 Temperature . . . . . . . . . . . . . . . . . . . . . .. . . . . . . . . . . . . . . . . . . . . . . . . . . 4.1 0
< ••• •••• , • • • ,
lX
4.5.1.2 Water Vapour Concentration ... ...... .... .... ... .. ........... . .. . 4.11 4.5.1.3 Absolute Humidity . . . . . . . . . . . . . . . . . . . . . . . . . . . . . . . . . . . . . . . . . . . . . 4 . 11
4.5.1.4 Relative Humidity . .. ... .. ... ....... .. ...... ............. .. ... . 4.12 4.5.1.5 Moisture Content ......... ........ . .... .. . ........ . . ..... ...... 4.13
4.5.2 HEAT LOSSES DUE TO THERMAL EXPANSION ............................... 4.14 4.5.3 EXPERIMENTAL DATA COLLECTION ....................................... 4.14
4.5.3.1 Experimenta l Apparatus Design .... . . .. . .... ............ ... .. . . . .. 4.14 4.5.3.2 Experimental Data Col lection . . . . . . . . . . . . . . . . . . . . . . . . . . . . . . . . . . . . . 4. 16
4.5.4 MODEL PREDICTION ACCURACY ......................................... 4.19 4.5.4.1 Temperature Prediction Accuracy ..................... .. . .. .... .. . 4.19 4.5.4.2 Surface Relative Humid ity Pred iction Accuracy . . . . . . . . . . . . . . . . . . . . . . . 4. 20
4.6 CLOSURE ............... . . ....... . ... .... .. ............. 4. 27
CHAPTER 5
CAKING MECHANISMS
5.1 INTRODUCTION . ............ ........ ....................... 5. 1
5.2 CAKING MECHANISM OVERVIEW ... .... ............. . .. . . . . . . . . 5. 1
5.2.1 HUMIDITY CAKING ........... ...... ................ .. .. ..... .. . . . ..... 5.2
5.2.2 AMORPHOUS SUGAR RE-CRYSTALLISATION ................. ... .. .... . .... . . 5.3
5.2.3 ALTERNATIVE MECHANISMS .. .... ........ . ... .. .... ........ ...... .. . .... 5.4
5.2.4 EFFECT OF PRESSURE AND CRYSTAL CONTACT AREA .......................... 5.4
5.3 CAKING MECHANISMS UNDER CONSIDERATION IN THIS WORK ..... ..... 5 . 5
5.4 CAKING STRENGTH MEASUREMENT . . .. . . . ... . . . . . . . . . . ... . . . . . . 5.6
5.4 . 1 CAKING STRENGTH REQUIREMENTS FOR THIS WORK .. . . ............ ...... ..... 5.7
5.4.2 AVAILABLE STRENGTH MEASUREMENT METHODS ... . .... ..... .. .. . .... . ...... 5.7
5.4.2.1 Tensile Strength ... . ..... .... . . ........ . .. . . ... ............... 5.7
5.4.2.2 Shear Strength and Cohesion Tests . . . . . . . . . . . . . . . . . . . . . . . ..... 5.8
5.4.2.3 Compaction and Compressibility Measurements ..... ......... .. . . . . ... 5.8
5.4.2.4 Other Methods . ........... . . ....... . .. .. ... ............... . .... 5.9
5.4.3 METHOD DEVELOPMENT ......... . . . . .............. ..... ... . . . .... 5.9
5.4.4 METHOD PERFORMANCE . . . . . . . . . . . . . . . . . . . . . . . . . . . . . . . . . . . . . . . . .. . .. 5.10
5.5 CAKING BY LIQUID BRIDGING AND SUBSEQUENT DRYING . . ...... . . . . 5. 12 5.5.1 MECHANISM OVERVIEW . . . . . . . . . . . . . . . . . . . . . . . . . . . . . . . . . . . . . 5.12
5.5.2 LIQUID BRIDGING . . . . . . . . . . . . . . . . . . . . . . . . . . . . . . . . . . . . . . . . . . . . . . . 5.12
5.5.3 SOLID BRIDGING .. . ......... . . . . .. . . ..... . ... . ... ....... . .. ... . . 5.16
5.5.4 SUMMARY OF THE LIQUID BRIDGING AND DRYING CAKING MECHANISM . . ...... . .. . 5.17
5.6 CAKING DUE TO AMORPHOUS LACTOSE FLOW AND CRYSTALLISATION . .. 5. 18 5.6.1 MECHANISM OVERVIEW ....... . .. .. . .. ... ... . . ....... . ............. ... 5.18
5.6.2 RUBBER BRIDGING AND STICKING . . . ... . ..... . .. . . ....... ....... ...... . .. 5.19
5.6.3 RELATIVE RATES OF AMORPHOUS FLOW AND CRYSTALLISATION . ......... ... . .. .. 5.20
5.6.3.1 Sticking of Thin Layers of Amorphous Lactose ............ ... ......... 5.2 1
5.6.4 RELEVANCE OF AMORPHOUS LACTOSE TO CAKING IN BULK LACTOSE . . . . . . . . . . . .. 5.2 4
5.7 CLOSURE............................................... 5. 24
x
CHAPTER 6
PREDICTION OF CAKING IN BULK LACTOSE
6.1 INTRODUCTION .. ' . . . . . . . . . . . . . . . . . . . . . . . . . . ...... . .. 6.1
6 . 2 CAKING IN PURELY CRYSTALLINE LACTOSE POWDERS . . . . . . . . . . . . . . . 6. 1
6.2.1 OVERVIEW OF CAKING IN CRYSTALLINE LACTOSE . . . . . . . ... . . . . .. . . . . . . . . . . . . . . 6.1
6.2.2 INCLUSION OF STRENGTH PREDICTION INTO THE TRANSPORT MODEL . . . . . . . .. . . . . . . 6.1
6.2.3 EXPERIMENTAL DATA COLLECTION . .. . . . . . . . . . . . . . . . . . . . . . ... . . . ... . . ..... 6.3
6.2.4 EVALUATION OF CAKING STRENGTH PREDICTIONS . . . . . . . . . . . . . . ....... 6.5
6.2.5 INVESTIGATIONS OF CONDITIONS REQUIRED FOR LUMPING IN BULK LACTOSE. . . . .. .. 6.6
6.2.6 AVOIDANCE OF LUMPING IN PURELY CRYSTALLINE LACTOSE . . . . 6.10
6 .3 CAKING IN FRESHLY MILLED OR DRIED LACTOSE CONTAINING AMORPHOUS
LACTOSE . . . . . . . . . . . . . . . . . . . « « « • • • • • • • • • • • • • • • • • • • • • • • • • 6.10 6.3.1 OVERVIEW OF REQUIREMENTS FOR AMORPHOUS LACTOSE RELATED CAKING ........ 6.10
6.3.2 MODIFICATIONS TO THE TRANSPORT MODEL TO INCLUDE THE EFFECTS OF AMORPHOUS LACTOSE . . . . . . . . . . . . . . . . . . . . . . . . . . . . . . . . . . . . . . . . . . . . . . . . . . . . . . . . . 6.11
6.3.3 THE EFFECT OF AMORPHOUS LACTOSE MOISTURE BINDING CAPACITY ON MOISTURE
MIGRATION .. . . . .. . . . . . . . . . . . . . .. . . . . . .. . .. . . . .. . . . .. . . . . . . . . . . . . . . 6.12
6.3.4 PREDICTIONS OF MOISTURE TRANSPORT WITH AMORPHOUS LACTOSE CRYSTALLISATION 6.13
6.3.4.1 Crystallisation to Anhydrous Lactose Product . . . . . . . . . . . . . . .. . . .. . . . . . 6.13
6.3.4.2 Crystallisation to a-Lactose MonO-hydrate . . . . . . . . . . .. . ............. 6.15
6.3.5 EXPERIMENTAL VALIDATION . . . . . .. . .. . . . .. . . . . . . . . . . . . . . . . . . . . . . . . . . . . . 6.16
6.3.6 MODEL PREDICTION ACCURACY . . . . . . . . . . . . . . . . . . . . . . . . . . . . . . . .. . ...... 6.2 1
6.3.7 AVOIDANCE OF AMORPHOUS LACTOSE RELATED CAKING IN BULK LACTOSE . . . . . . . . . . 6.2 4
6 .4 CLOSURE « « • • • • • • • • • • • • • • • • • • • • • • • • • • • • • • • • • • • • • • • • • • • • • 6 .25
CHAPTER 7
CONCLUSIONS AND SUGGESTIONS FOR FUTURE WORK
7 . 1 CONCLUSiONS . . . . . . . . . . . . . . . . . . . . . . . . . . . . . . . . . . . . . . . . . . . . . 7 . 1
7 .2 SUGGESTED FUTURE RESEARCH . . . . . . . . . . . . . . . . . . . . . . . . . . . . . . . 7 .2
REFERENCES . . . . . . . . . . . . . . . . . . . . . . . . . . . . . . . . . . . . . . . . . . . . . . . . . . 8 . 1
ApPENDIX A-1 NOMENCLATURE . . . . . . . . . . . . . . . . . . . . . . . . . . . . . . . . . . A 1 . 1
ApPENDIX A-2 PSYCHROMETRIC PROPERTIES OF AIR . . . . . . . . . . .. . . . . . . A2. 1
ApPENDIX A-3 TRANSPORT MODEL FORMULATION . . . . . . . . . . . . . . . . . . . . A3 . 1
ApPENDIX A-4 FINITE DIFFERENCE ApPROXIMATIONS . . . . . . . . . . . . . . . . . . A4. 1
ApPENDIX A-5 PROGRAM SOURCE CODE A5. 1
Xl
Figure 2.1
Figure 2.2
Figure 2.3
Figure 2 . 4
Figure 2 .5
Figure 2.6
Figure 2.7
Figure 2.8
Figure 2.9
Figure 2.10
Figure 3.1
Figure 3.2
Figure 3.3
Figure 3.4
Figure 3.5
Figure 3.6
Figure 3.7
Figure 3. 8
Figure 3.9
Figure 3.10
Figure 3.11
Figure 3.12
Figure 3 . 13
Figure 3. 14
Figure 3.15
Figure 3.1 6
LIST OF FIGURES
a-Lactose chemical structure. 2.1 Muta-rotation between lactose forms 2.1 Electron micrograph of a-lactose monohydrate at 2000x magnification 2 .3 Electron micrograph of p-Iactose at 2000x magnification 2.3 Electron micrograph ofsllperlab lactose at 100x magnification . 2.3 Particle size distributions of lactose powders. 2.5 Typical heating curve for an infinite cylinder full of bulk lactose 2. 10 Semi-log plot of lactose cylinder heating time temperature history 2.10 Solubil ity of lactose as a function of temperature 2 14 Surface tension of saturated solutions of lactose 2 IS
Literature isotherm data for a-lactose monohydrate 3.5 Summary of amorphous lactose isotherm data from the literature 3.6 Moisture sorption isotherm of a-lactose monohydrate. 3.8 Third stage sorption isotherm model predictions for a-lactose monohydrate . . . . . . . . . . . . . . . 3. ] 0 Moisture content versus capi llary radius for special dense a-lactose monohydrate . . . . . . . . . . . . . . . . . . . . . . . . . . . . . . . . . . . . . 3. 1 3 Capillary condensation isotherm for a-lactose monohydrate ... .. . 3.14
Observed weight change of p-lactose after storage above saturated salt solutions for 1 month .. .. ......... . . . . . . . . . . . . .. 3. 16 Moisture sorption isotherm for amorphous lactose . . . . .. . . .. . . . 3.18 Effect of small amounts of amorphous lactose on the sorption i sotherm of a-lactose samples as predicted from the additive isotherm model 3.19 Sorption isotherm of supertab lactose .. . . . .. . .... . .... .... " 3. 19 Sorption rates measurement apparatus . . . . . .. .. ......... . .. . 3.20
Rates of sorption of moisture on to crystalline lactose . . . . . . . . . .. 3.21 Comparison of observed moisture content with that predicted from bulk air relative humidity ........ . .... . ...... ...... . . 3.22 Rate of moisture sorption on to spray dried amorphous lactose subjected to a step change in relative humidity from 0 to 43.5% RH 3.23 Comparison of experimental sorption rates with analytical solution . 3.25 Comparison of moisture diffusivity of some foods as a function of moisture content . . . . .... ... . .. . .. . . ..... . ... . . ...... . '. 3.26
Figure 3.17 Predicted rates of moisture sorption into varying thicknesses of amorphous lactose . . ...... . . . . ... . . . . . . .... . .... . . . . .. . 3. 3 0
Figure 3.18 Comparison of drying techniques for the measurement of moisture content in a-lactose monohydrate .. .. . .... . . . . . . . . . 3.3 1
Figure 3.19 Glass transition temperature of amorphous lactose as a function of moisture content . . . . . . . . . . . . . . . . . . . . . . . . . . . . . . . . . . . . . .. 3.35
xiii

Figure 3.20
Figure 3.21
Figure 3.22
Figure 3.23
Figure 3.24
Figure 3.25
Figure 3.2 6
Figure 3.27
Figure 3.28
Figure 3.29
Figure 3 . 30
Figure 3 . 31
Figure 4.1
Figure 4.2
Figure 4.3
Figure 4.4
Figure 4.5
Figure 4.6
Figure 4. 7
Figure 4.8
Figure 4.9
Figure 4.10
Figure 4.11
Figure 4.1 2
Figure 4.13
Figure 4 .1 4
Figure 4 . 1 5
Figure 4.1 6
Figure 4.1 7
Figure 4.1 8
Figure 4.1 9
Figure 4.20
Figure 4.21
Figure 4.22
Figure 4.23
Figure 4.24
XIV
Dependence of viscosity on temperature above glass transition temperature predicted by the WLF equation . . . . . . . . . . . . . . . .. . 3.36
Isothermal DSC plot for amorphous lactose at 65°C and 0.22 �v ... 3 . 4 5
DSC plot showing desorption of water of crystallisation from crystallisation product. . . . . . . . . . . . . . . . . . . . . . . . . . . . . . . . . .. 3.45 Comparison of moisture sorption results for amorphous lactose from Niediek (1982) and isotherm determined from this work at 20°C. . . 3.4 6 Conversion of P to a-lactose monohydrate as indicated by moisture uptake for P and supertab lactose . . . . . . . . . . . . . . . . . . . . . . . . .. 3.47 Predicted conversion from P to a-lactose after one month . . . . . . .. 3.48
Moisture content change in amorphous lactose during crystallisation 3.50 Crystallinity as a function of time during amorphous lactose crystallisation ..... ................................. 3.50
Avrami plot for amorphous lactose crystallisation . . . . . . . . . . . . .. 3.51 Prediction of crystallisation progress using Avrami equation . . .... 3.52 Comparison of crystallisation times between this work and the literature . . . . . .. ............................. 3.52 Avrami model predictions of time to reach 90% crystallinity . . 3. 53
Conceptual model for heat and moisture transport in bulk lactose . .. 4.1
Temperature time profile for the heating of a IOOmm slab ........ 4 . 10 Temperature profile through lactose slab. . . . . . . . . . . . 4.11
Water vapour concentration time profile within the slab 4.11
Humidity time profile for lactose slab .............. 4 .12 Relative humid it y profile development through the lactose slab 4 .13 Moisture content profile development through the lactose slab 4. 13 Transport model validation experimental rig 4.16 Ex peri menta l tem peratu re p rofiles for a 78 mm lactose slab 4.17 Experimental surface relative humidity proflle for a 78mm slab 4 18 Ex perime nta l temp erature profiles tor a 100mm lactose slab 4 18 Ex pe rim enta l surface relative humidity profile for 100mm slab 4 .19 Predictions for 78mm slab tem pe ratur e profiles. 4 .20 78 mm slab surface relative humidity profile predictions 4 .21 Effect of poros ity on surface relative humidity predictions. 4 .21 Effect of diffusivity on surface relative humidity predictions 4 .22 Effect of initial temperature on surface relative humidity predictions 4 . 23 Effect of initial water activity on surface relative humidity predictions 4 .23 Effect of slab thickness on surface relative humidity predictions 4 .24 Sorption isotherm model fitting limits 4 24 Effect of cha ngin g isotherm shape on surface relative humidity predictions . . . . . . . . . . . . . . . . . . 4 .25 Best attempt at surface relative h um idi ty predi ctions . 4.26 Model predictions for 100mm slab experimental temperature profiles 4 .26 Model predictions for 1 00mm slab ex perim ental surface relative humidity profiles. 4 .27
Figure 5. 1
Figure 5.2
Figure 5.3
Figure 5 .4
Figure 5 . 5
Figure 5.6
Figure 5. 7
Figure 5. 8
Figure 5.9
Figure 5.10
Figure 5. 11
Figure 5.12
Figure 5.13
Figure 5.14
Figure 6.1
Figure 6 . 2
Figure 6.3
Figure 6.4
Figure 6.5
Figure 6 . 6
Figure 6.7
Figure 6 . 8
Figure 6.9
Figure 6.1 0
Figure 6.1 1
Figure 6.1 2
Humidity caking mechanism . . . . . . . . . . . .. . ... .
Amorphous related caking mechanism ' . . . . ... . . . . . . . .. . Strength measurement apparatus. ' , , , . ..... , .. . .. . . . . . ,
Typical force distance profiles for lactose samples using multi pin penetrometry method Powder strength after one day equilibration time ..... .
Powder strength after ten days equilibration time .......... .
Powder strength after fifty days equilibration ....... .
Powder strength after one day as a function of moisture content Solid bridge strength as a function of equilibrium relative humidity prior to drying Comparison of solid bridge strength to originating liquid bridge strength Comparison of sticking and crystallisation times in amorphous lactose Additive isotherm method for quantification of amorphous lactose content of freshly milled lactose sample. Freshly milled lactose strength compared with purely crystalline powder strength stored over saturated salt solutions for one week Strength of fi'eshly milled lactose compared 'with strength of crystalline lactose stored for fifty days over saturated salt solutions .
Typical strength development in a 100mm lactose slab subjected to
5.5
5.6 5.10
5.11 5.13 5.13 5.14 5.15
5.17
5.17
5.20
5.22
5.22
5.23
a 20°C temperature gradient ........... " 6.2 Typical strength profile through lactose slab at steady state when a 20°C gradient has been applied .......................... " 6.3 Experimentally measured steady state strength profiles through lactose slabs with applied temperature gradients for approximately one day. . . . . . . . . . . . . . . . ........ .................. 6.4 Predicted and experimentally measured strength profiles for lactose slab experiments . . . . . . . . . . . . . . . . . . . . . . . . . . . . . . . . . . . . . . .. 6.5 Strength profile for slabs of increasing thickness as a function of the fractional position into the surface ...................... " 6.6 Effect of initial product water activity on cold surface strength and relative humidity ...................................... " 6.7 Typical relative humidity profile for the cooling of a lactose slab from one side . . . . . . . . . . . . . . . . > • • • • • • • • • • • • • • • • • • • • • 6.8 Maximum strength as a function of initial water activity ...... > • • • 6.8 Temperature profile through lactose slab cooled evenly from both sides .... . ..... . .. . . . . . . . ............. . ... . . . ....... .. 6.9
Strength profile through slab cooled evenly from both sides .. . ... . 6.9
Comparison of moisture migration rates for increasing amorphous lactose fractions . ... . ..... . . . . .. . . ...... > • • • • • • • • • • • • • • • • • • • • 6.12 Predictions of moisture transport with crystallisation for powder containing 2.5% amorphous lactose at 2 0°C after subjection to 20°C temperature gradient . . . . . . . . . . . . . . . . . . . . . . . . . . . . . . . . . . .. 6. 14
xv
Figure 6.13 Moisture migration in a lactose slab starting at a water activity of 0.25 3.w showing no signs amorphous lactose crystallisation .. . . . 6. 14
Figure 6.14 Moisture migration with amorphous lactose crystallisation to a-lactose monohydrate . . . . . . . . . . . . . . . . . . . . . . . . . . . . . . . . . . 6.15
Figure 6.15 Steady state amorphous lactose fraction profile through the lactose slab . . . . . . . . . . . . . . . . . . . . . . . . . . . . . . . . . . . . . . . . . . . 6 . 16
Figure 6.16 Hammer mill arrangement . . . . . . . . . . . . . . . . . . . . . . . . . . . . . . . . 6 . 16 Figure 6.17 Method used to raise water activity of lactose slab . . . . . . . . . . . . . 6 . 17 Figure 6.18 Schematic of rig used to provide constant RH air . . . . . . . . . . . . . . 6 . 18 Figure 6.19 Experimental temperature profiles for 78 mm lactose slab
containing 4.5% amorphous lactose . . . . . . . . . . . .. . . . .. . . . . . . 6. 19 Figure 6.2 0 Experimental surface relative humidity profiles for a 78 mm lactose
slab with 4.5% amorphous lactose initially present . . . . . . . . 6.19 Figure 6.21 Two-point isotherm results for lactose samples taken before and
after the slab experiment . . . . . . . . . . . . . . . . . . . . . . . . . . . . . . . . . 6 . 20 Figure 6.22 Comparison of experimental and predicted temperature profiles
with amorphous lactose present . . . . . . . . . . . . . . . . . . . . . . . . . . . 6 . 21 Figure 6.23 Comparison of experimental and predicted surface relative
humidity profiles with amorphous lactose present . . . . . . . . . . . . . . 6 . 22 Figure 6.24 Comparison of predictions for crystallisation to a-lactose
monohydrate with 20 and 5 0 nodes . . . . . . . . . . . . . . . . . . . . . . . . . 6 . 24
XVI
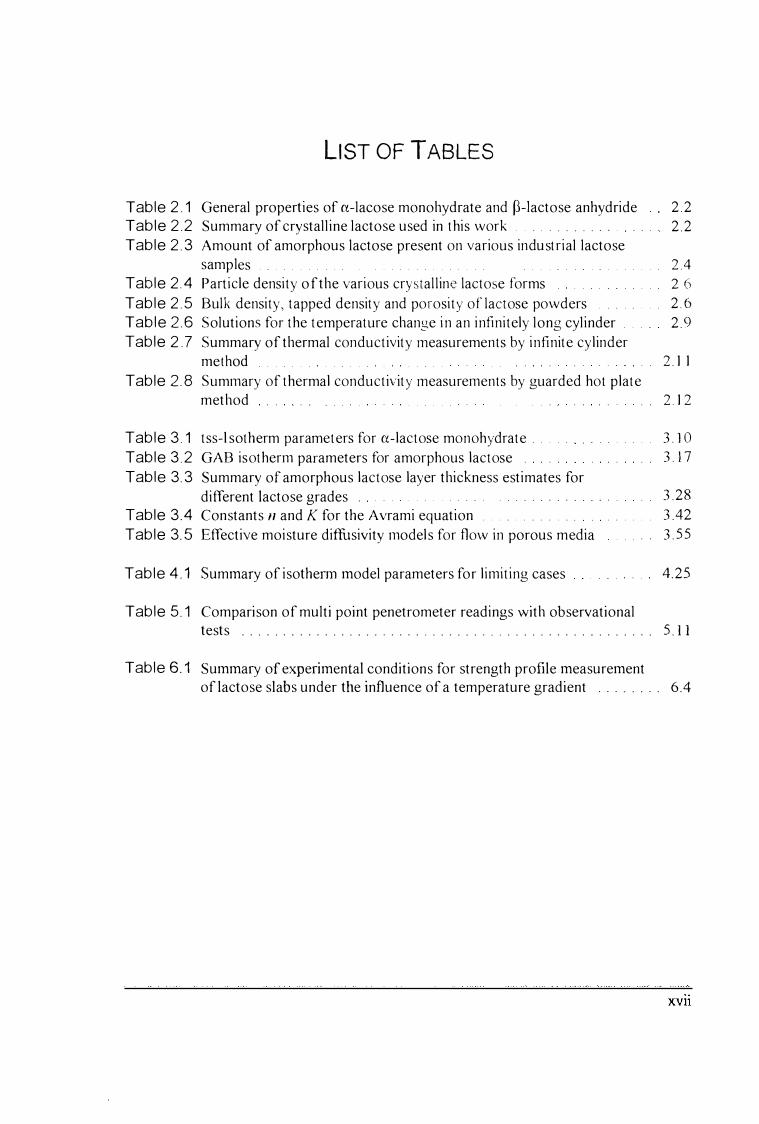
LIST OF TABLES
Table 2 . 1 General properties of a-lacose monohydrate and p-Iactose anhydride " 2.2 Table 2 . 2 Summary of crystalline lactose used in this work . . . . . . . 2.2 Table 2 . 3 Amount of amorphous lactose present on various industrial lactose
samples 2.4 Table 2 . 4 Particle density of the various crystalline lactose forms 2 6
Table 2.5 Bulk density, tapped density and porosity of lactose powders 2.6
Table 2.6 Solutions for the temperature change in an infinitely long cylinder 2 9 Table 2.7 Summary of thermal conductivity measurements by infinite cylinder
method 2. 1 1 Table 2.8 Summary of thermal conductivity measurements by guarded hot plate
method 2. 1 2
Table 3.1 tss- l sotherm parameters for a-lactose monohydrate. 3.10
Table 3.2 GAB isotherm parameters for amorphous lactose 3.17
Table 3 . 3 Summary of amorphous lactose layer thickness estimates for
different lactose grades . . . . . . . . . . . . . . 3.28
Table 3 . 4 Constants 11 and K for the Avrami equation 3.42
Table 3.5 Effective moisture diffusivity models for flow in porous media 3.55
Table 4.1 Summary of isothenn model parameters for limiting cases 4.25
Table 5. 1 Comparison of multi point penetrometer readings with observational tests . . . . . . . . . . . . . . . . . . . . . . . . . . . . . . . . . . . . . . . . . . . . . . . . . . 5.11
Table 6.1 Summary of experimental conditions for strength profile measurement of lactose slabs under the influence of a temperature gradient . . . . . . . . 6.4
xvn
CHAPTER 1
PROJECT OVERVIEW
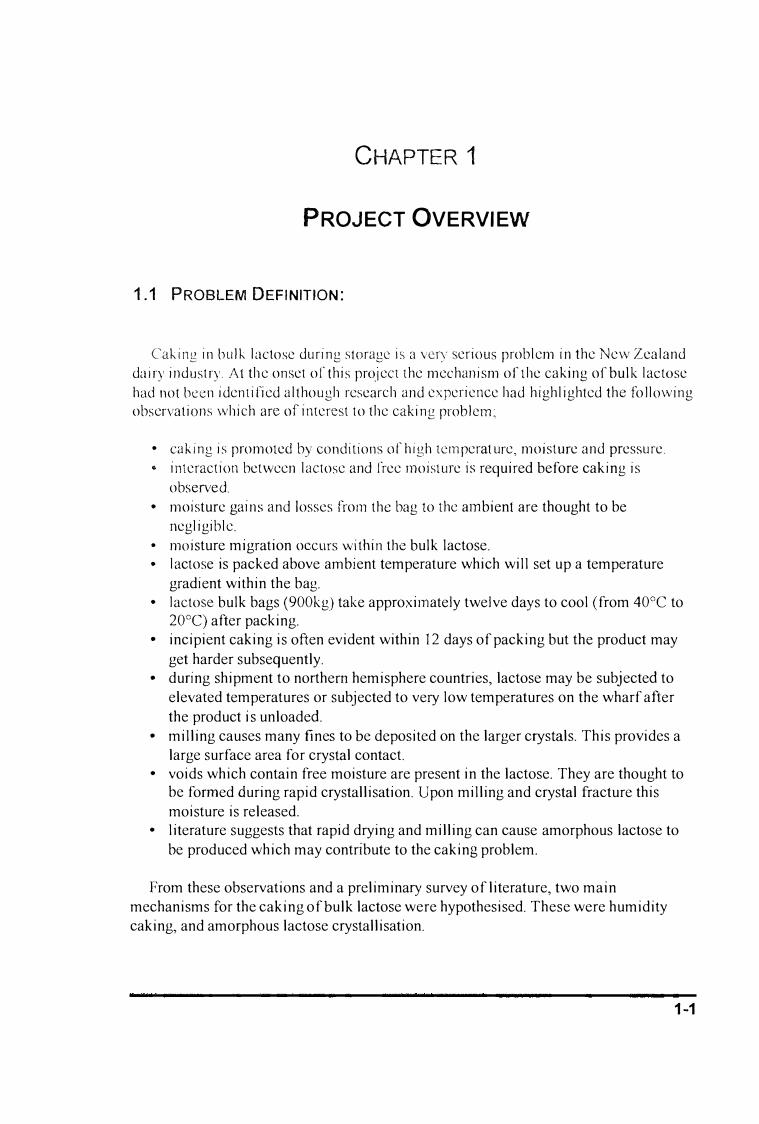
1.1 PROBLEM DEFINITION:
Caking in bulk lactose during storage is a vcry serious problem in the New Zealand dairy industry A1 the onset of this project the mechanism of the caking of bulk lactose had not been identified although research and experience had highlighted the following observations which arc of interest to the cak i ng problem;
• caking is promoted by conditions of high tem perature , moisture and pressure .
" interaction between lactose and free Inoisture is required before caking is observed .
• moisture gains and losses from the bag to the ambient are thought to be negligible.
• moisture migration occurs within the bulk lactose. • lactose is packed above ambient temperature which will set up a temperature
gradient within the bag. • lactose bulk bags (900kg) take approximately twelve days to cool (from 40°C to
20°C) after packing. • incipient caking is often evident within 12 days of packing but the product may
get harder subsequently. • during shipment to northern hemisphere countries, lactose may be subjected to
elevated temperatures or subjected to very low temperatures on the wharf after the product is unloaded.
• milling causes many fines to be deposited on the larger crystals. This provides a large surface area for crystal contact.
• voids which contain free moisture are present in the lactose. They are thought to be formed during rapid crystallisation. Upon milling and crystal fracture this moisture is released.
• literature suggests that rapid drying and milling can cause amorphous lactose to be produced which may contribute to the caking problem.
From these observations and a preliminary survey of literature, two main mechanisms for the caking of bulk lactose were hypothesised. These were humidity caking, and amorphous lactose crystallisation.
'75l''i'5S$'j'" If:WflW1@pmrnr r "r -=' 7W . OM%''tP W n M"'9M1S¥'M1!WU11ilN" 'wsw« PW'SMJi@ti em 'WWWimnssm .. TUf'MN_W r
1 -1
1.2 PROPOSED CAKING MECHANISMS:
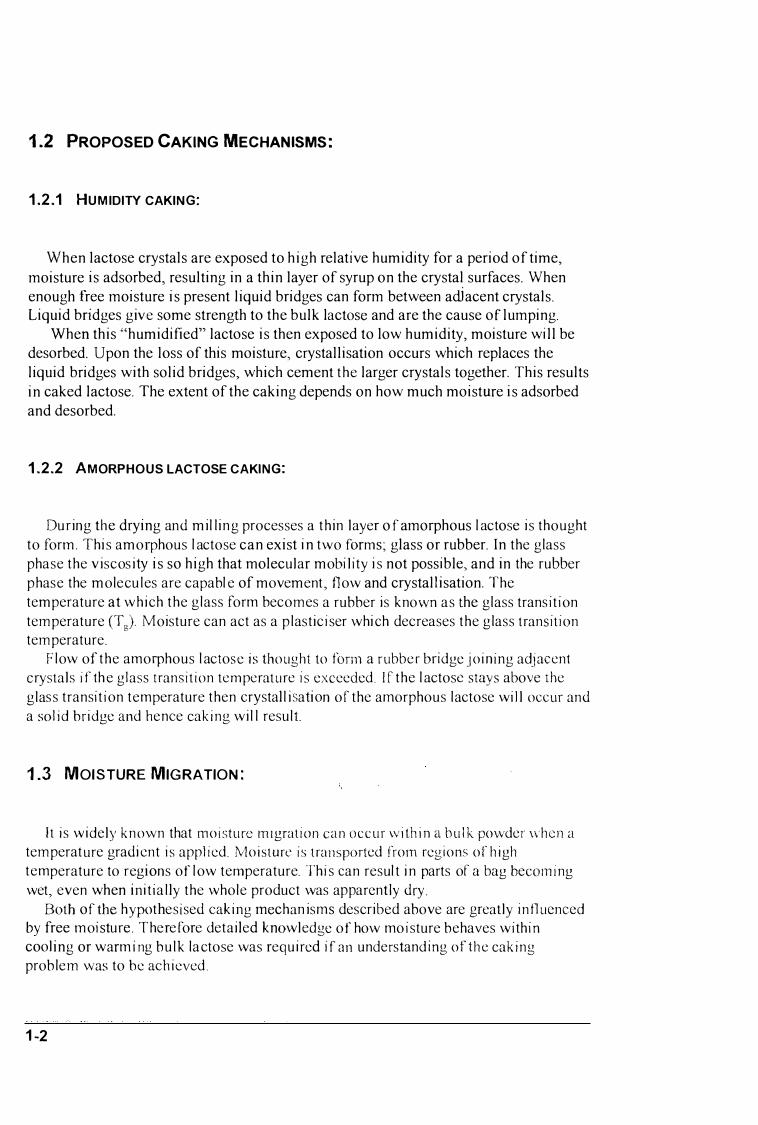
1 .2.1 HUMIDITY CAKING:
When lactose crystals are exposed to high relative humidity for a period of time, moisture is adsorbed, resulting in a thin layer of syrup on the crystal surfaces. When enough free moisture is present liquid bridges can form between adjacent crystals. Liquid bridges give some strenb>th to the bulk lactose and are the cause of lumping.
When this "humidified" lactose is then exposed to low humidity, moisture will be desorbed. Upon the loss of this moisture, crystallisation occurs which replaces the liquid bridges with solid bridges, which cement the larger crystals together. This results in caked lactose. The extent of the caking depends on how much moisture is adsorbed and desorbed.
1.2.2 AMORPHOUS LACTOSE CAKING:
During the drying and mil l i n g processes a th in layer of amorphous l actose i s thought to form. Thi s amorphous l actose can exist in two forms; glass or rubber. In the glass phase the v iscosity is so high that molecular mobility i s not possible, and in the rubber phase the molecu l es are capabl e of movement, flow and crystallisation. The temperature at which the g lass form becomes a rubber is known as the glass transition temperature (T')' Moisture can act as a p lasticiser whi ch decreases the g lass transition o
temperature. Flow of the amorphous l actose is thought to form a rubber bridge joining adjacent
crystals if th e glass transition temperature is exceeded. I f the l actose stays above the
glass transition temperature then crystall i sation of the amorphous l actose will occur and
a solid bridge and hence caking wi l l result
1.3 MOISTURE MIGRATION:
It is wid ely known that moisture migration can occur within a hulk powder when a
temperature gradient is applied . Moisture is transported from regions of high
temperature to regions of l ow temperature. This can resul t i n parts of a bag becom ing
wet, even when initia lly the whole product was apparently dry.
Both of the hypothesised caking mechan isms described above are greatly influenced by free moisture . There fore detailed knowledge of how moisture behaves within cooling or warming bulk lactose was required if an understanding of the caking
problem was to be achieved.
1-2
1.4 OVERALL PROJECT AIMS:
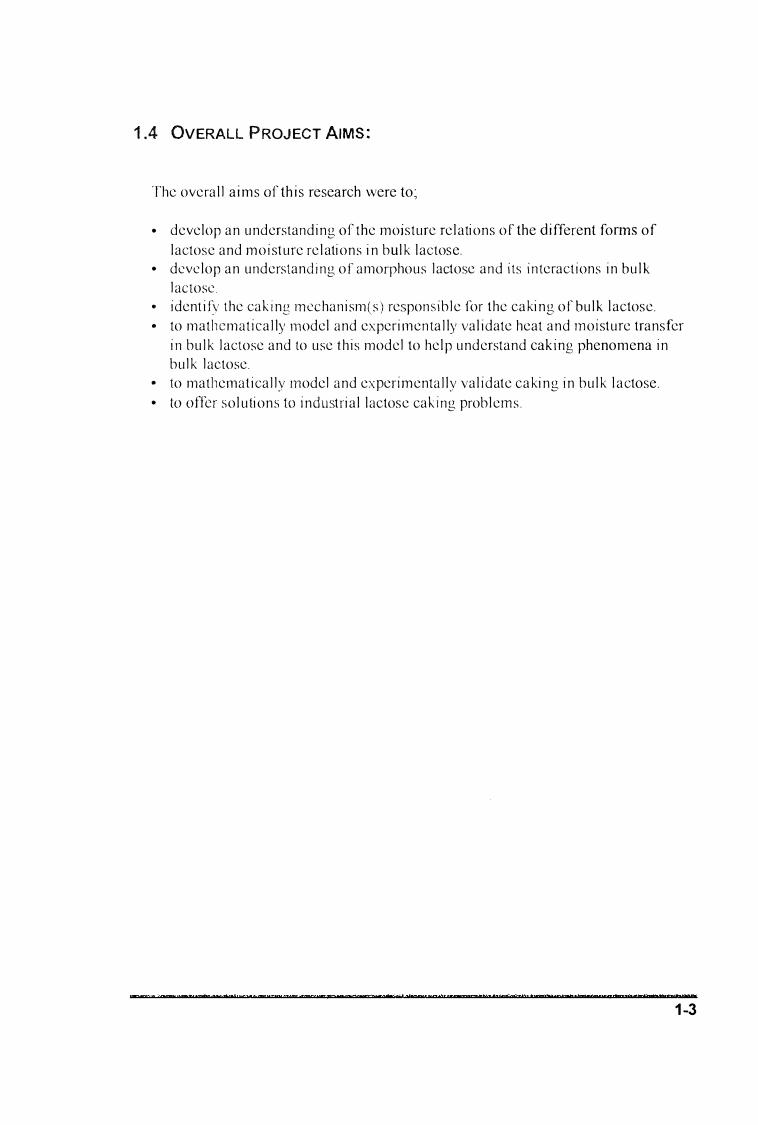
The overall aims of this research were to;
• develop an understanding of the moisture relations o f the different fonns of lactose and moisture relations in bulk lactose.
• develop an understanding of amorphous lactose and its interactions in bulk lactose.
.. ident it\, the caking mechanism(s) responsible for the caking of bulk lactose. " to mathematically model and exper imentally val idate heat and moisture transfer
in bulk lactose and to use th is model to help understand caking phenomena in bulk lactose.
" to mathemat ically model and experimentally validate caking in bulk lactose.
• to offer solutions to industrial lactose caking problems.
;; mZ'WWiS')$W;'?!"Y'QU:t'fW'WV"'i'ff"W'W w"wwrwww
1-3
CHAPTER 2
PHYSICAL PROPERTIES OF LACTOSE
2.1 LACTOSE CHEMISTRY
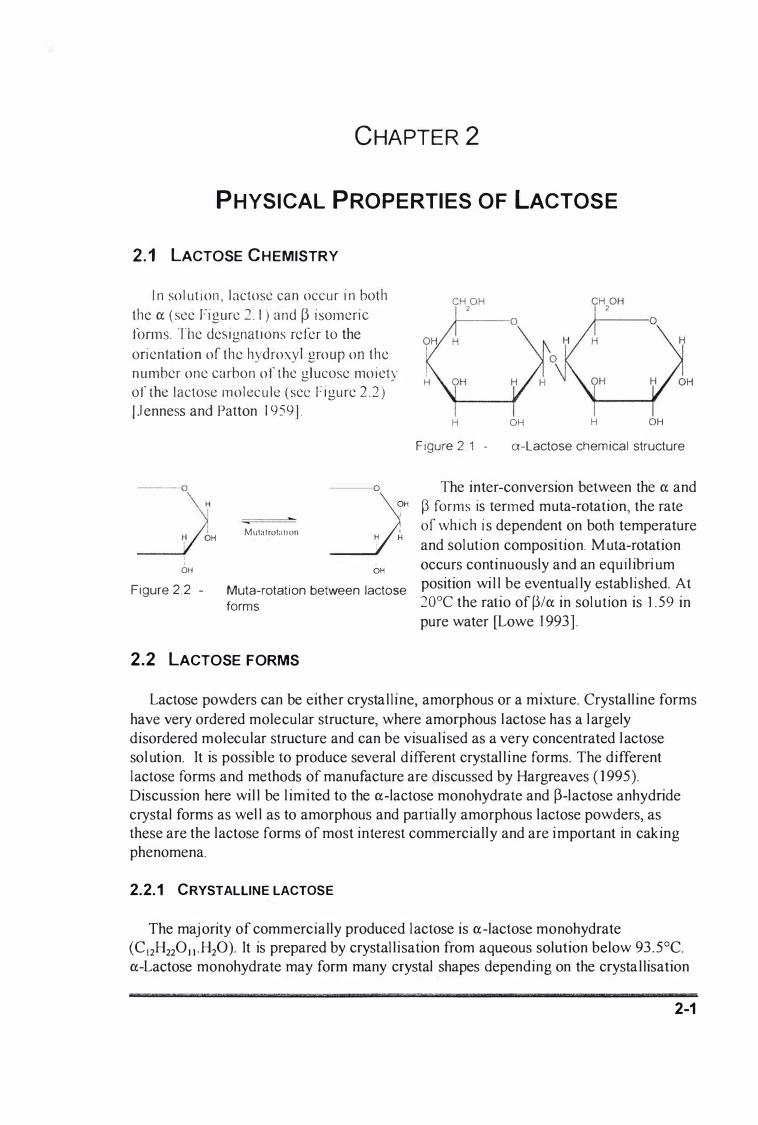
In solutioll, lnctose can occur in both
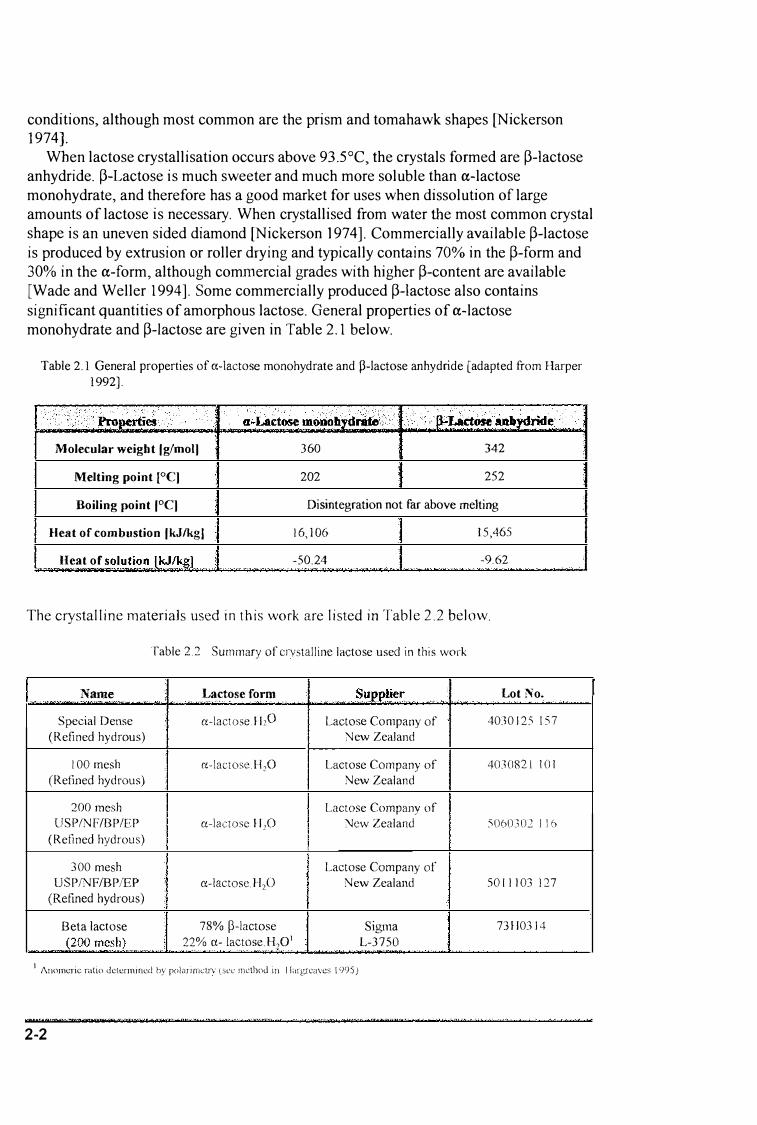
the a (see Figure 2. I) and � isomeric fOnllS. The designations refer to the orientation of the hydroxyl group on the number one carbon of the glucose moiety of the lactose molecule (see Figure 2.2) [Jenness and Patton] 959]
i OH
Figure 2.2 -
�o �" H H i
Mut.:llrolatJon
OH
Muta-rotation between lactose
forms
2.2 LACTOSE FORMS
CH OH 2
)----0
H OH H OH
Figure 21 - a-Lactose chemical structure
The inter-conversion between the a and � forms is termed muta-rotation, the rate of which i s dependent on both temperature and solution composition. Muta-rotation occurs continuously and an equi l ibri um position wi l l be eventual ly establ ished. At 20°C the ratio of �/a in solution is 1.59 in pure water [Lowe 1993].
Lactose powders can be either crystal l ine, amorphous or a mixture. Crystall ine forms have very ordered molecular structure, where amorphous lactose has a largely disordered molecular structure and can be visual ised as a very concentrated lactose sol ution. It is possible to produce several different crystal l ine forms. The different lactose forms and methods of manufacture are discussed by Hargreaves (I 995). Discussion here wil l be l imited to the a-lactose monohydrate and �-lactose anhydride crystal forms as wel l as to amorphous and partial ly amorphous lactose powders, as these are the lactose forms of most interest commercial ly and are important in caking phenomena.
2.2.1 CRYSTALLINE LACTOSE
The majority of commercially produced lactose is a-lactose monohydrate (CI2H2201l.H20). It is prepared by crystal l isation from aqueous solution below 93.5°C. a-Lactose monohydrate may form many crystal shapes depending on the crysta l lisation wrrzmrmn msr:: yo,
2-1
conditions, although most common are the prism and tomahawk shapes [Nickerson 1974].
When lactose crystallisation occurs above 93.5°C, the crystals formed are p-Iactose anhydride. p-Lactose is much sweeter and much more soluble than a-lactose monohydrate, and therefore has a good market for uses when dissolution of large amounts of lactose is necessary. When crystallised from water the most common crystal shape is an uneven sided diamond [Nickerson 1974]. Commercially available p-lactose is produced by extrusion or roller drying and typically contains 70% in the p-form and 30% in the a-form, although commercial grades with higher p-content are available [Wade and Weller 1994]. Some commercially produced p-Iactose also contains significant quantities of amorphous lactose. General properties of a-lactose monohydrate and p-Iactose are given in Table 2.1 below.
Table 2.1 General properties of a-lactose monohydrate and p-Iactose anhydride [adapted from Harper 1992].
Molecular weigbt Iglmol] 360 342
Melting point [DC] 202 252 Boiling point IDC] Disintegration not far above melting
Heat of combustion IkJIkg) 16,106 15,465
Heat of soluti�n .LkJlk,g} -50.24 -9.62
The crystalline materials used in this work are listed in Table 2.2 below.
LH Name .. "
Special Dense (Refined hydrous)
100 mesh (Refined hydrous)
200 mesh USP/NFIBP/EP
(Refined hydrous)
300 mesh USPINFIBPfEP
(Refined hydrous)
Beta lactose .(�OOme�h)
Table 2.2 Summary of crystalline lactose used in this work
Lactose form �' -,' ,., ,. -'-.-�. "" ,
a-lactoseHp
fi-lactoseHp
a-lactose H)O
a-lactose H20
78% p-lactose 22% a-Iactose.HoOl
" � � .-,
� .
., -", .S�peJier .. ,.""
Lactose Company of :"Jew Zealand
Lactose Company of New Zealand
Lactose Company of \Jew Zealand
Lactose Company of New Zealand
Sigma L-3750 "
1 Anomer!c ratio uetermined hy polilJJmctrv (sec method in Ilargxcaws 1(95)
2-2
Lot No . "
4030125 ]57
4030821 101
5060301 116
5011J03 127
73H0314
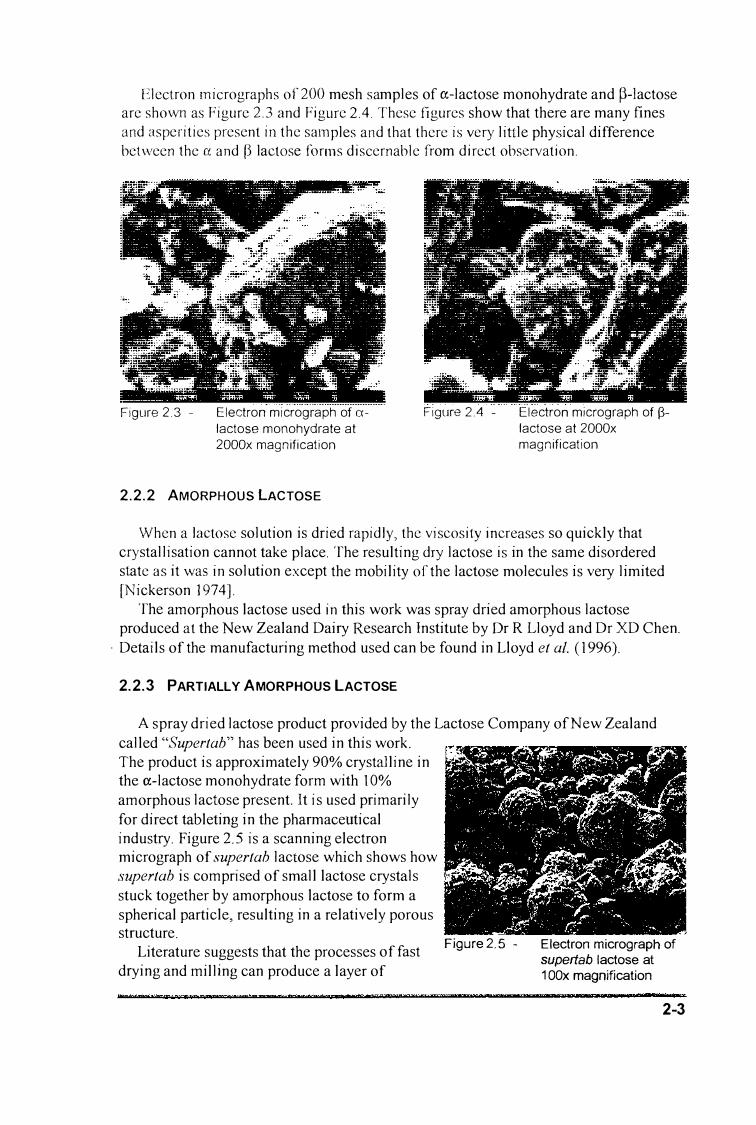
Electron micrographs of200 mesh samples of a-lactose monohydrate and �-Jactose are shown as Figure 2.3 and Figure 2.4. These figures show that there are many fines and asperities present in the samples and that there is very little physical difference between the Ct, and (3 lactose forms discernable from direct observation.
Figure 2.3 Electron micrograph of (;(lactose monohydrate at
2000x magnification
Figure 24 - Electron micrograph of (3-
lactose at 2000x magnification
2.2.2 AMORPHOUS LACTOSE
When a lactose solution is dried rapidly, the viscosity increases so quickly that crystallisation cannot take place. The resulting dry lactose is in the same disordered state as it was in solution except the mobility of the lactose molecules is very limited [Nickerson] 974].
The amorphous lactose used in this work was spray dried amorphous lactose produced at the New Zealand Dairy Research Institute by Dr R Lloyd and Dr XD Chen .
. Details of the manufacturing method used can be found in Lloyd et al. (1996).
2.2.3 PARTIALLY AMORPHOUS LACTOSE
A spray dried lactose product provided by the Lactose Company of New Zealand called "Supertab" has been used in this work. The product is approximately 90% crystalline in the a-lactose monohydrate form with 1 0% amorphous lactose present. It is used primarily for direct tableting in the pharmaceutical industry. Figure 2.5 is a scanning electron micrograph of supertab lactose which shows how supertab is comprised of small lactose crystals stuck together by amorphous lactose to form a spherical particle, resulting in a relatively porous structure.
Literature suggests that the processes of fast drying and milling can produce a layer of
Figure 2.5 - Electron micrograph of supertab lactose at 100x magnification
Wt'mmvww-wwwmtn omwxmm 7!i"'tl'M'""WN8'iBl' mrue". mm v roww'?wn xnr'Wwvv =
2-3
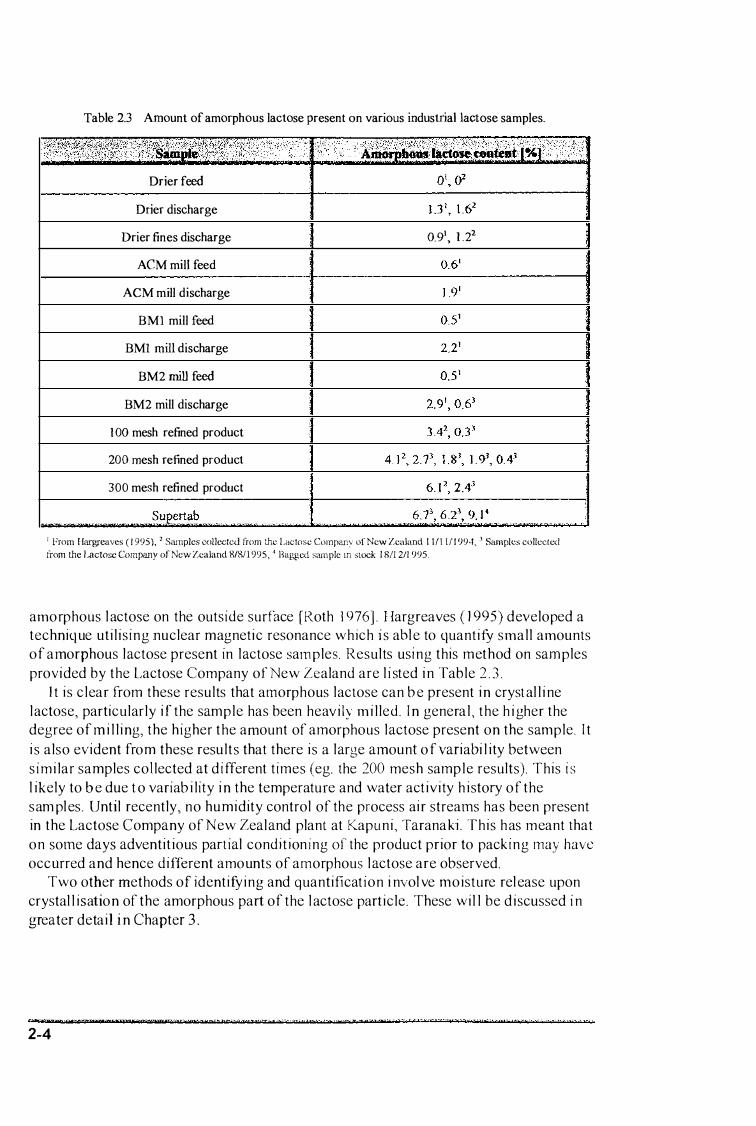
Table 2.3 Amount of amorphous lactose present on various industrial lactose samples.
Drier feed
Drier discharge
Drier fines discharge 0.9\ 1 .22
ACM mill feed
ACM mill discharge
BMI mill feed
BMI mill discharge
BM2 mill feed
BM2 mill discharge
1 00 mesh refined product
200 mesh refined product
300 mesh refined product
I From Hargreaves ( 1 995), 2 Samples coUcctcct from the Lactose Company of New Zealand I I / [ I f l 994, .J Samples collected from the Lactose Company of New Zealand 8/&1 1 995, ' Ilagged sample m slock I 811 21l 995.
amorphous l actose on the outside surface [Roth 1 976] . Hargreaves ( 1 995) developed a techniq ue uti l i s ing nuclear magnetic resonance which i s abl e to quantity smal l amounts of amorphous lactose present in lactose sam ples. Results usi ng this method on sam ples provided by the Lactose Company or New Zealand are l i sted i n Table 2 . 3 .
I t is c lear from these results that amorphous lactose can b e present in cryst al l i ne l actose, particularly i f the sample has been heavi ly m i l led. I n genera l , the h i gher the degree of m i l l ing, the higher the amount of amorphous lactose present on the sample. I t
i s also evident from these results that there is a large amount o f variabi l ity between s imi lar samples collected at d ifferent t imes (eg. the 200 mesh sample results). This i s l ikely to b e due t o variab i lity i n the temperature and water activity h istory o f the sam pl es. Until recently, no humidity control of the process air streams has been present in the Lactose Company of New Zeal and plant at Kapuni, Taranaki . This h as meant that on some days adventitious part ial condit ioning of the product prior to pack ing may have
occurred and hence different amounts of amorphous l actose are observed. Two other methods of identifying and quantification i nvol ve moisture rel ease upon
crystal l isation of the amorphous part of the l actose particle. These wi l l be discussed i n greater detail i n Chapter 3 .
%¥m roxmv .
2-4

2.3 CHARACTERISATION OF LACTOSE POWDERS
2.3. 1 PARTICLE SIZE DISTRIBUTION
The particle size distributions of the lactose powders i nvestigated in this work are summarised i n Table 2 .3 . The analysis of the typical samples of special dense, 1 00, 200, 300 mesh and supertab lactose powders were measured by the Lactose Company of New Zealand using a Coulter LS 1 00 particle size analyser. The particle size distribution of beta lactose was determi ned by Malvern l aser scattering particle size analyser by the New Zealand Dairy Board, Product Evaluation Centre, Mt Eden, Auckland.
01 C II) II) tU Q. C o t5 � LL
20 -+------'---L-+---+--+-:.+--t-+ ,-- - --J-.-.+---+�
1 0 J ____ --L-.�t---+-:;t 100 mesh
o t··_n---l '- I 10 100
Particle size [ J-l m]
Figure 2.6 - Particle size d istributions of lactose powders.
2.3.2 DENSITY
2. 3 . 2 . 1 PARTICLE DENSITY
1 000
Berlin e( al. ( 1 97 ] ) measured the particle density of the three major crystall ine lactose forms pycnometrical ly, by helium displacement. Weast and Astle ( 1 979) reported the particle density of the a-lactose monohydrate and p-Iactose forms although the measurement method was not given. Burna ( 1 96 5 ) reported values for the density of lactose as measured by centrifugation in carbon tetrachloride l iquid paraffin solutions and by air pycnometry. Herrington ( 1 934) also pub l ished the densities of anhydrous alactose and p-Iactose. These results are summarised in Table 2.4 below.
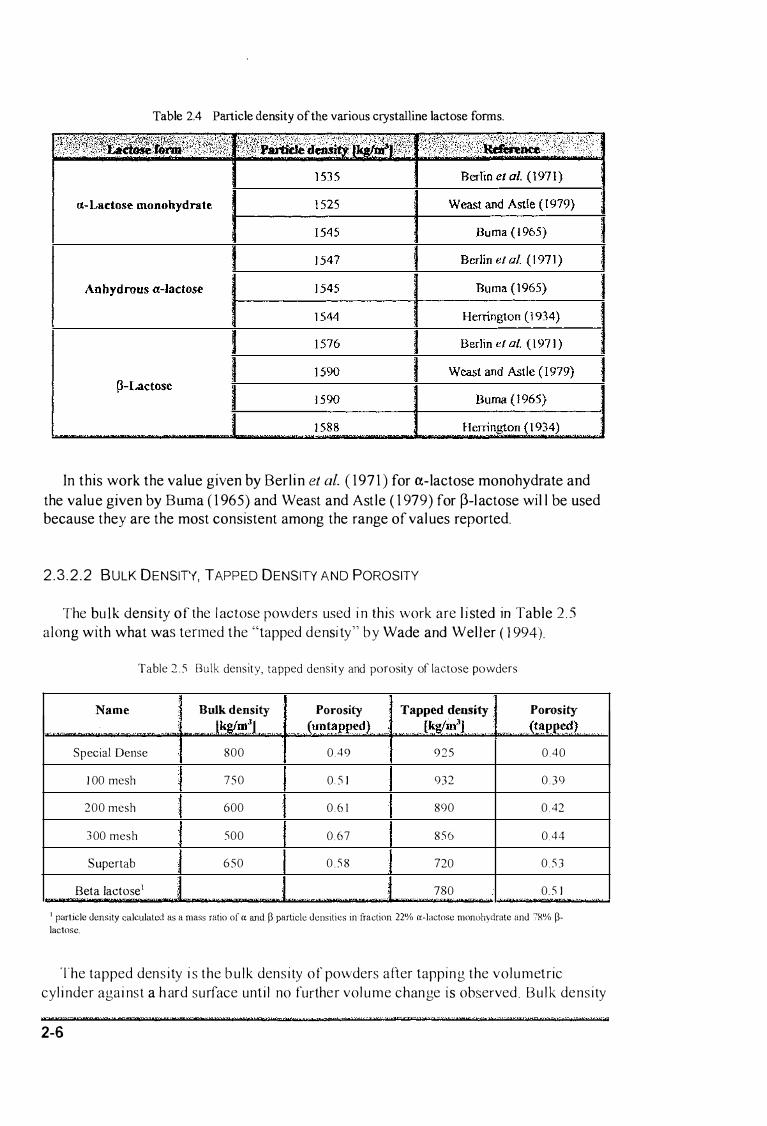
Table 2.4 Particle density of the various crystalline lactose forms.
In this work the value given by Berlin et al. ( 197 1 ) for a-lactose monohydrate and the value given by Burna ( 1 965) and Weast and Astle ( 1 979) for �-lactose wil l be used because they are the most consistent among the range of values reported.
2 . 3 . 2 . 2 BULK DENSITY, TAPPED DENSITY AND POROSITY
The bu lk densi ty of the l actose powders used i n this work are l i sted in Table 2 . 5 a long with what was termed the "tapped densi ty " b y Wade and Wel l er ( 1 994).
. , - .,
Table 2 . 5 Bulk density, tapped density and porosity of lactose powders
, ,
Name Bulk density Porosity Tapped density .
J���l _(lInta�pe�l . (kg(m3J Special Dense 800 0 4 f) f) 2 5
1 00 mesh 7 5 0 0 . 5 1 932
200 mesh 600 0 . 6 1 890
3 00 mesh 500 0 . 6 7 8 5 6
Supertab .• 6 5 0 0 . 5 8 720
Beta lactose1 780
Porosity
. (t1:lPp�)_ . . 0 4 0
0 . 39
0 42
044
0 . 5 3
0. 5 1 "'
I partjcle density calculakd as a mass ratio of a and � particle densities in fraction 22% a-lactose monohydrate and 7K% �lactosc.
The tapped dens ity i s the b u l k densi ty of powders after tapping the volumetric cyl i nder agai nst a h ard surface unti l no further vol ume change is observed. Bu lk density
2-6
i s the density of the powder without any compaction appl ied to the sample. It can be seen from the data that for the finer powders up to 40% reduction i n volume can occur by compaction of the powder.
In a packed bag the b u l k density wi l l approach the tapped density figures l i sted here due to the compacti o n action of the wei ght of other bags in a pal le t or due to the l arge weight of l actose contained i n a 900kg bulk bag.
2.4 THERMAL PROPERTIES
2.4. 1 S PECIFIC H EAT C APACITY
The specifi c h eat capacity of sol id a-l actose monohydrate is given by J en ness and Patton ( 1 959) as 1 2 5 2 J/kg°C . The speci fic heat capacity of p-l actose is given by J en ness and Patton ( J 959) as 1 1 93 J/kg°C.
2.4.2 E FFECTIVE THERMAL CONDUCTIVITY
The most s i m pl e way of m odel l i ng the transport of heat through bulk l actose is to treat the l actose a ir m i xture as an effecti ve medium . An effective m edium i s where the two phase system of air and sol id particles is approxi m ated as being one phase with effective physical properti es . For this reason, the etTective thennal conductivity of bulk l actose was required. This can be approached i n two ways. The fi rst approach i s to model the effective thermal conductivity as a function of lhe sol i d l actose thermal conductivi ty and the porosity of the powder.
There have been m any models pub l ished i n the l iterature aimed at achieving this. Shrotriya et al. ( 1 99 1 ) described a model which can be used to predict the thermal d iffusivity of a porous medium. Nimick and Leith ( 1 992) provide a model for prediction of the effective thermal conductivity of an effective medium. Deng et al. ( 1 992) provide a m odel for the case where the sol id phase is a mixture of two different granular materials . A detail ed analysis of thermal conductivity in porous media is given by Bauer ( 1 993), discussing the validity of assumptions of pore type and size d i stribution. Bauer offers a general approach for prediction of thermal conductivity of porous media.
The secon d approach is to d irectly measure the effective thermal conductivity experimenta l ly. In thi s study direct measurement was employed due to the unavai l abi l i ty of sol id l actose thermal conductivity data.
2.4. 2. 1 EXPERIMENTAL M EASUREMENT OF EFFECTIVE THERMAL CONDUCTIVITY
Measurement techniques for the determination of the effective thermal conductivity of porous materia ls can be categorised i nto three groups. These are steady state, quasisteady state and transient methods. In general, steady state methods such as the guarded hot p l ate method are unsuitab l e for food materials because of long temperature equil ibration times and moisture migration in the sample (Sweat 1 9 86). In spite of this,
several researchers have used steady state methods to determine the thermal '_'I' W t remwtt1'7&l!PtWms wwmmn we 'vnrmn"'7"Wt?' wnewrewemw 'we mv mwwv.rtT!t: ..
2-7
conductivity of porous media. MacCarthy and Fabre ( 1989) measured the effective thermal conductivity of different grades of sucrose using a guarded hot plate. The results ranged from 0.094W/mK for icing sugar, to 0. 164 W/mK for medium grade sucrose. Pham and Willix ( 1989) and Willix and Lovatt ( 1 995) used a guarded hot plate method to measure the thermal conductivity of various foodstuffs including lactose powder. The inclusion of lactose powder in their work was made at my request and will be discussed in greater detail below.
Murakami and Okos ( 1989) suggested the use of the temperature history method for experimental determination of the thermal diffusivity of fine porous materials or powders. It is also evident from the literature that transient methods have been widely used for the determination of thermal transport properties in food and porous materials.
The measurement of thermal conductivity from the time taken for heat dissipation has been used by a number of researchers. Thome ( 1989) describes a method where
heating is applied to foodstuffs through a small thermistor. The same thermistor is then used to record the rate of heat dissipation. This i s then used to estimate the thermal diffusivity. The results were reproducible although further evaluation of the method was required. Nimick and Leith ( 1992) measured the effective thermal conductivity of fused silica powder using an adaption of the needle probe technique. This used a thin heating probe inserted into the bulk powder. Power was applied to the thermal probe for ninety seconds and the external surface temperature of the heater was recorded as a function of time. This was used to calculate the effective thermal conductivity of the powder.
Kent et al. ( 1 984) compared the use of five transient heating methods for the determination of the thermal conductivity and diffusivity of various food samples, i ncluding whole milk pOWder. Three used methods based on the heated probe with cylindrical symmetry. The other two methods used symmetry about a central plane.
Shrotriya et al. ( 1 99 1 ) and Deng el at. ( 1 992) both used a parallel wire method for measuring the thermal conductivity of a porous media. These used two thermocouples positioned at some radial distance from a heating wire. The resulting temperature profile was used to calculate the effective thernlal conductivity .
Voudouris and Hayakawa ( 1 994) mathematically analysed the suitabil ity of the point source probe for simultaneous determination of thermal conductivity and diffusivity of foods. They concluded that results were in good agreement with published values of thermal conductivity but the method was best suited to products with high thermal diffusivity.
Scotter and Horne ( ] 985) used a transient method based around the heating profile of an in finite cyli nder to measure the thermal diffusivity of soil. From this the effective thermal conductivity was calculated.
Two experimental methods for determining the effective thermal conduct ivi ty of
bulk lactose were carried out. These are the transient heating or cooling rates of an infinite cylinder filled with lactose using the method given by Scotter and Horne ( 1 985) and a guarded hot plate method [Willix and Lovatt ( 1995)].
mm r vwe'wJw''PcMxwan Wl5t"¥ve;:a vrmor ''Wl',U7PR'l''Ni'if1W'0l$:)''f!M$OOlZiG ''W:t1WPmp-", SlPPlfW' n%ctti1t W3m W WWlfA t"i W"19�;17' e3'?' 'Own 'W!�'"m)n1"'''1*'M'OOMlin) D'r) rw w
2-8
2. 4. 2. 1 . 1 MEASUREMENT B Y THE INFINITE CYLINDER METHOD
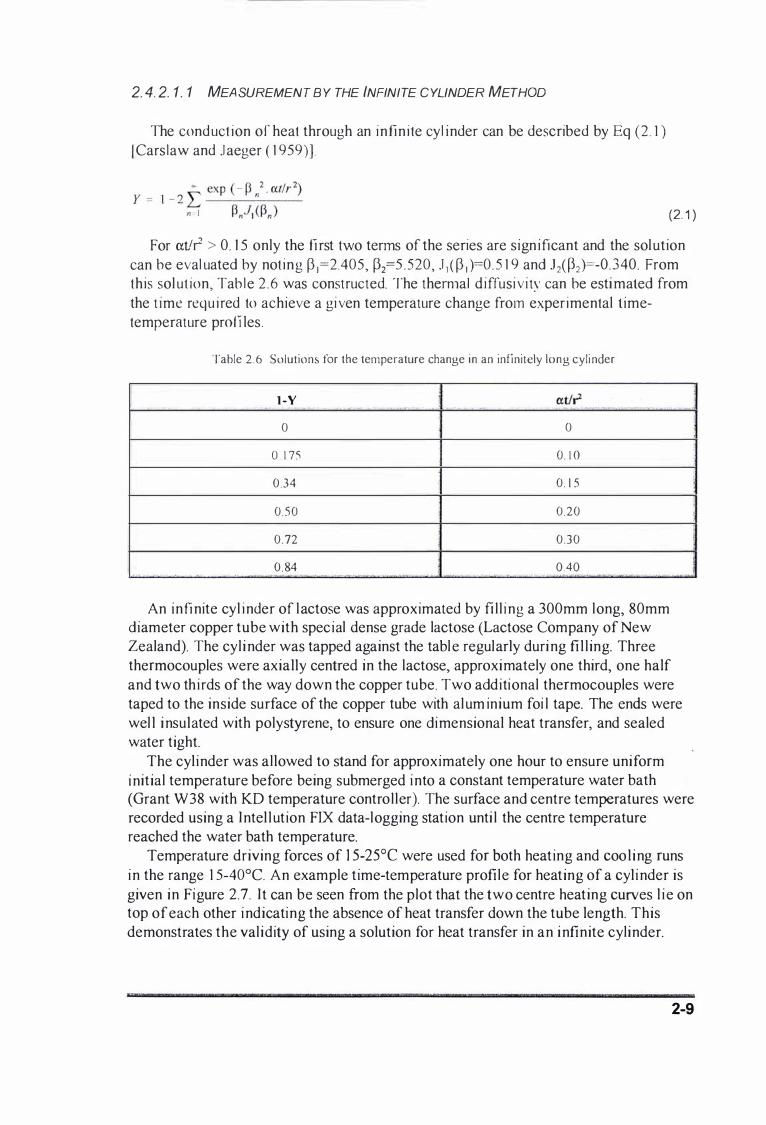
The conduct ion of heat through an infini te cyl inder can be described by Eq (2 . 1 )
[Carslaw and .I aeger ( 1 959») .
(2. 1 )
For atJr > 0. 1 5 only the first two tenns of the series are significant and the solution can be eval uated by not ing p ]=2.405, P2=5 . 520, J ) ( p ) )=0. 5 1 9 and .J2(P2)=-0.340. From this sol ut ion, Table 2 .6 was constructed. The them1al diffusivity can be estimated from the time requ i red to achieve a given temperature change from experimental timetemperature profi les.
Table 2.6 Solutions for the temperature change in an infinitely long cyli nder
l -Y atli'-° °
° 1 75 0. 1 0
0 .34 0 . 1 5
0 .50 0 .20
0 . 72 0 .30
0 . 84 OAO
An infinite cyl inder of lactose was approximated by fi l l ing a 300mm long, 80mm diameter copper tube with special dense grade lactose (Lactose Company of New Zealand). The cyl inder was tapped against the table regularly during fi l l ing. Three thermocouples were axially centred in the lactose, approximately one third, one half and two thirds of the way down the copper tube. Two additional thermocouples were taped to the inside surface of the copper tube with alum inium foi l tape. The ends were wel l insulated with polystyrene, to ensure one dimensional heat transfer, and sealed water tight.
The cyl inder was allowed to stand for approximately one hour to ensure uniform initial temperature before being submerged into a constant temperature water bath (Grant W38 with KD temperature control ler). The surface and centre temperatures were recorded using a Intel l ution FIX data-logging station unti l the centre temperature reached the water bath temperature.
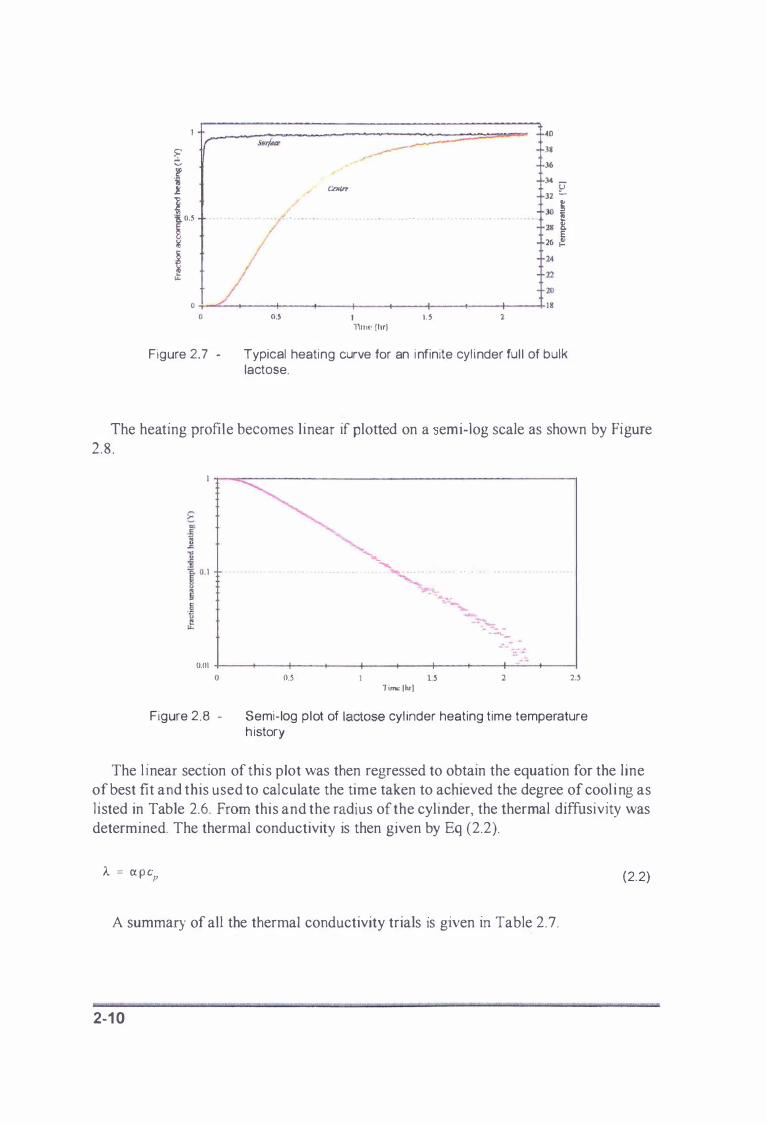
Temperature driving forces of 1 5-25°C were used for both heating and cool ing runs in the range 1 5-40°C. An example time-temperature profile for heating of a cyl inder is given in Figure 2.7. I t can be seen from the plot that the two centre heating curves l i e on top of each other indicating the absence of heat transfer down the tube length. This demonstrates the val idity of using a solution for heat transfer in an infinite cylinder.
GX·
2-9
[ .� � t.S e :6
� .l:
0 0
. . .
,tflfr/JltX /�
�HIn
. . . / .
O.S '1rne Ihrl
. . " .
1 .5
. .
2
40
38 36
34 _ � 32 -
30 � I 2l! E 26 f!.
24 22
20 1 8
Figure 2.7 - Typical heating curve for an i nfinite cyl inder ful l of bulk lactose.
The heating profi le becomes l inear if plotted on a em i-log scale as shown by Figure 2 . 8 .
"'" -..-...... ..... . . . . . . . . . . . . . . .
� ...... . - ::"� .
"'-:1...-
0.01 +---+---+---+---+---+---+---+--+---+----i o O.S 2 2.S
Time Ihr]
Figure 2.8 - Semi-log plot of lactose cyl inder heating time temperature h istory
The l inear section of thi s plot was then regressed to obtain the equation for the line of best fit and this used to calculate the time taken to achieved the degree of cooli ng as l isted in Table 2.6. From this and the radius of the cylinder, the thermal diffusivity was determined. The thermal conductivity is then given by Eq (2.2).
A = a p e p
A summary of all the thermal conductivity trials is given in Table 2.7.
2-1 0
(2.2)
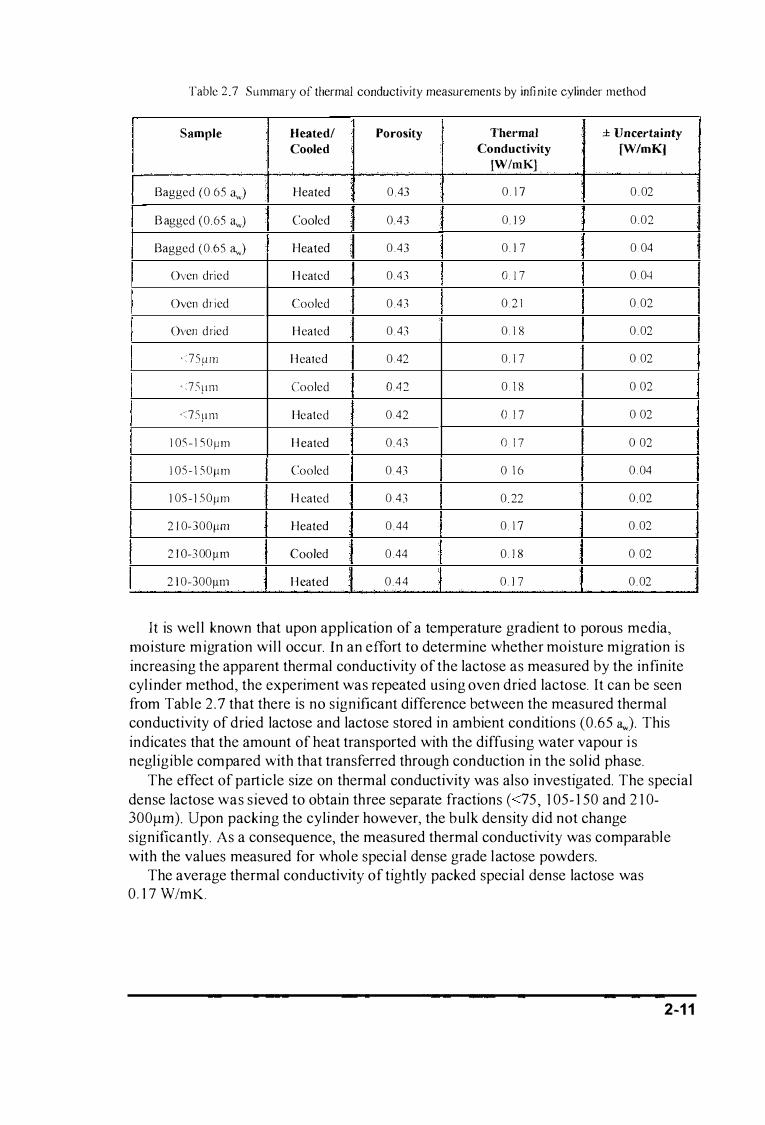
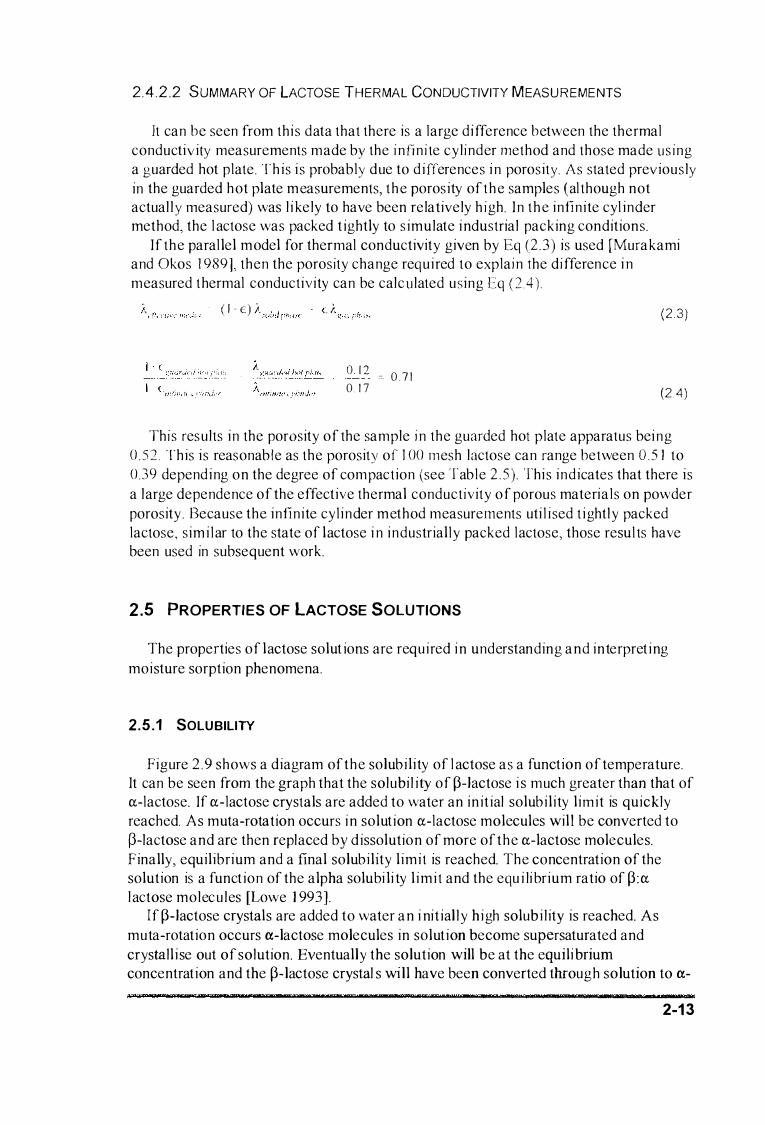
Table 2 7 Summary of thermal conductivity measurements by infinite cylinder method
I
Sample Heated! ; Porosity Thermal ± Uncertainty , Cooled
" Conductivity [W/mK)
IW/mKl , '"
Bagged (0 65 <1w) Heated 0 . 43 0 1 7 0 , 02
, B agged (0 65 <1w) Cooled ! 0.43 0. 1 9 0,02
, Bagged (0 .65 <1w) Heated 0 .43 0 . 1 7 0 04
Oven dried H eated 0 . 4 3 0 . 1 7 0 04
Oven dried Cooled 0 .43 0 . 2 1 0 02 ,
Oven d ried H eated 0 . 43 0 . 1 8 0 . 02
· : 7 5 p m H eated 0 . 42 0 . 1 7 0 02
· :75 r 1m Cooled 042 0. 1 8 0 02
<75[1 m Heated 0 .42 o l 7 0 02
1 0'i - l 'i O p m H eated 0 . 4 3 o 1 7 0 02
1 0S - l SOpm Cooled 0 . 43 0 ] 6 0 . 04
1 0S - 1 50pm H eated 0 . 43 0 22 0 02
2 1 0-300pm Heated 0 . 44 0 17 { 0 . 02
; 2 J O-3 00 11 III Cooled 0 . 44 0. 1 8 0 02
2 1 0-300�lIll H eated ,
0 . 4 4 0 . 1 7 0 . 02
It is wel l known that upon application of a temperature gradient to porous media, moisture migration wil l occur, In an effort to determine whether moisture mif:,'Tation is increasing the apparent thermal conductivity of the lactose as measured by the infinite cyl inder method, the experiment was repeated using oven dried lactose, It can be seen from Table 2 .7 that there is no significant difference between the measured thermal conductivity of dried lactose and lactose stored in ambient conditions (0.65 <1w). This indicates that the amount of heat transported with the diffusing water vapour is negligible compared with that transferred through conduction in the sol id phase.
The effect of particle size on thermal conductivity was also investigated. The special dense lactose was sieved to obtain three separate fractions « 75 , 1 05- 1 50 and 2 1 0-300/lm). Upon packing the cylinder however, the bulk density did not change significantly. As a consequence, the measured thermal conductivity was comparable with the values measured for whol e special dense grade lactose powders.
The average thermal conductivity of tightly packed special dense lactose was 0. 1 7 W/mK.
1'U1" v ' we w 1WM"'¢'" r .1 tnr n ' t '=w'@m tt rzm ry "Wn
2-1 1

2.4. 2. 1 .2 MEASUREMENT B Y THE GUARDED HOT PLA TE METHOD
Willix and Lovatt ( 1 995) at the Meat Industry Research Institute of New Zealand included 1 00 and 200 mesh lactose powders (supplied by the Lactose Company of New Zealand) in their study of the thermal properties of foodstuffs. The guarded hot plate used a 200mm by 200mm measuring area. The lactose was poured into the apparatus in a free flowing manner to a depth of 20mm and levelled using a stainless steel straight edge. Adclitional lactose was then added and re-Ievelled with the straight edge sitting on two 0.65mm thick alum inium strips. This made the powder surface slightly proud of the surface to ensure good plate product contact. This treatment allowed some product compaction although the porosity of the product is l ikely to have remained high (Wil l ix 1 996).
Full details of the construction of the guarded hot plate apparatus used in this work are given by Pham and Wil l ix ( 1 989) . Further details of the l actose loading method are given in Will ix and Lovatt ( 1 995).
The results of the experiments carried out by Willix and Lovatt ( 1 995) are summarised in Table 2 .8 .
Table 2.8 Summary o f thermal conductivity measurements b y guarded hot plate method
1 :/>{>\ . \ :·� � S�fu;f�'!;. ;;W;yA1 ,/.i·�; • . \; · •. ···T��erat.it{l�tl�i:;;lIl ·, :tK��;��d���i��rWl� .. : :
1 00 mesh - 3 9 . 0 0 . 1 1 2
- 1 7 . 3 0 . 1 1 8
- 1 7. 4 0. 1 1 6
-9 .6 0 . 1 1 9
-9 6 0 . 1 1 8
2 6 0 . 1 07
2 7 0 1 03
] 6 . 3 0. 1 04
1 6 3 0 . 1 1 3
25 1 0 . 1 20
3 5 . 9 0 . 1 24
3 6 0 0 . 1 23
2 00 mesh -29.0 0 . 095
1 7 0 0. 097
2-1 2
2.4 .2 .2 SUMMARY OF LACTOSE THERMAL CONDUCTIVITY MEASUREME NTS
It can be seen from this data that there is a large difference between the thermal conductivity measurements made by the i n fini te cyl inder method and those made using a guarded hot plate. This is probably due to d i fferences i n porosity. As stated previously in the guarded hot plate measurements, the porosity of the samples (al though not actual l y measured) was l i kely to have been relatively high. In the infinite cyl inder method, the l actose was packed t ightly to simulate i ndustrial packing conditions.
If the paral lel m odel for thermal conductivity given by Eq (2 . 3 ) is used [Murakami and Okos 1 9891, then the porosity change required to explai n the difference i n measured thermal conductivity can be calculated using Eq ( 2 4 ).
( I - c) (2 .3)
o 12 �. 0 . 7 1
0 . 1 7 (24)
This results in the porosity of the sample i n the guarded hot plate apparatus bei ng 0 . 5 2 . This is reasonable as the porosity o f 1 00 mesh lactose can range between O.S J to 0.39 depending on the degree of compaction (see Table 2 . 5 ). This ind icates that there is a l arge dependence of the effective thermal conductivity of porous materials on powder porosity . Because the infinite cyl inder method measurements uti l ised t ightl y packed lactose, sim i l ar to the state of l actose i n industrial ly packed lactose, those resul ts have been used in subsequent work.
2.5 PROPERTIES OF LACTOSE SOLUTIONS
The properties of l actose solut ions are required i n understanding and interpreting moisture sorption phenomena.
2.5.1 SOLUBILITY
Figure 2 . 9 shows a diagram of the solubi l i ty of l actose as a function of temperature. It can be seen from the graph that the solubi l ity of p-Iactose i s much greater than that of a-lactose. If a-lactose crystals are added to water an init ial solubi l i ty l imit is quickly reached. As muta-rotation occurs i n solution a-lactose molecules will be converted to p-lactose and are then replaced by d issolution of more of the a-lactose molecules. Finally, equil ibrium and a final solubility l imi t is reached. The concentration of the solution is a function of the alpha solubi li ty l i m i t and the equ i li brium ratio of p:a l actose molecules [Lowe 1 993].
If p-Iactose crystals are added to water an i nit ial l y h igh solub i l ity is reached. As muta-rotation occurs a-lactose molecules in solution become supersaturated and crystall i se out of solution. Eventually the solution will be at the equili brium concentration and the p-lactose crystal s wil l have been converted through solution to a-
WXtwftWW w "Mf1W ...
2-1 3
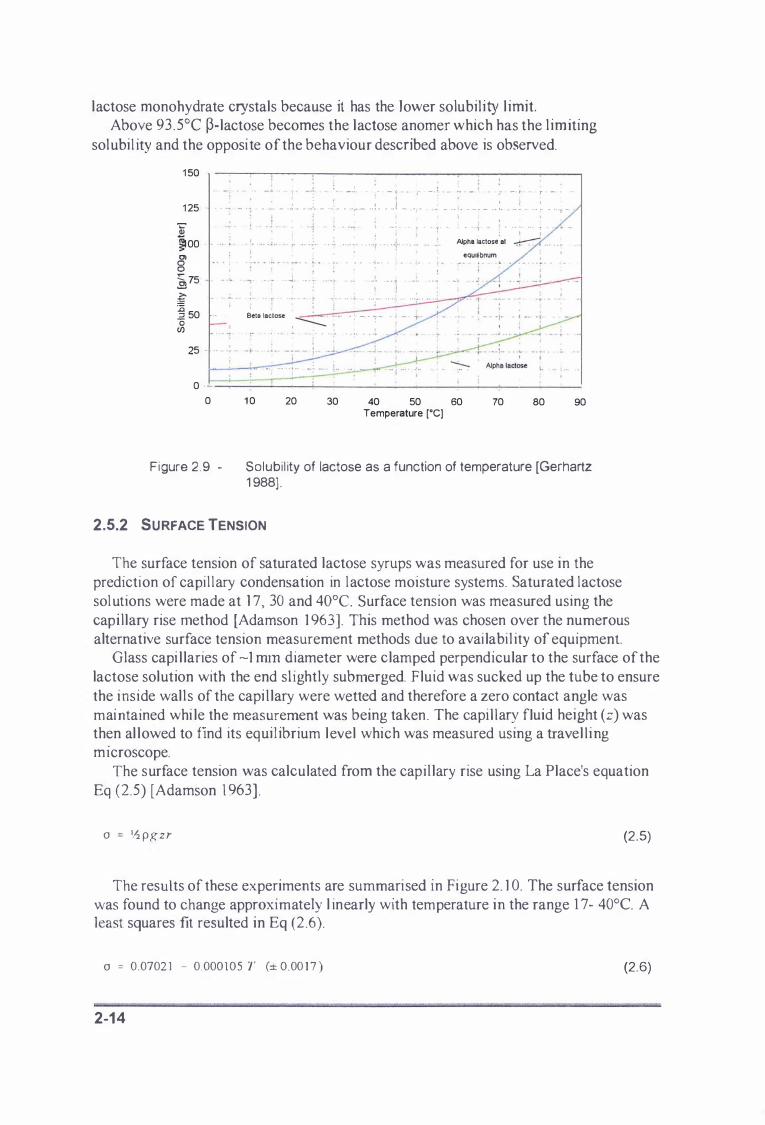
lactose monohydrate crystals because it has the lower solubil ity l imit. Above 93 . 5°C p-lactose becomes the lactose anomer whjch has the l imiting
sol ubi l ity and the opposite of the behaviour described above is observed.
1 50 . ----��--�--------�------��----�--__. ,
1 25 .
"C' Q) joo 0> 8 ' .
--: � : ' - ! t" • - • I
.- � • � - • .'
- .� _ . .: • • .• :- _ . • : • • .. r- - •. : • • .• I _ . . -: .. .. . . .. . - . : . .. � - - . ; . . " -� .... : . .
-
; /'" .. . � .. . . . � . . .. . .. . . .. � . - . . + . .
I , • . _ . . ! _ . . � . . • . .
' : . • . y " ' . _ e _ .. , 1 . I , Alpha lacloso al � . __ _ _ .. .
equilibrium
�75 - 0 • • .;,. • - r - - - ... � . . - . � " 'r - , , - _ . ' - 1 . ... . . . _ I
� :g 50 .o (/J
..
. ; . . . . :- ",_ • e . .. . " ','0. _ . " , ' ••. �._ • • __ . �'y-B�la la�I�' �l'
. -_-
.. �. � . �-
.l. 25 - . ,. .- , - .
J. _. _ - , _.
0
0 1 0 20 30 40 50 60 70 80 90 Temperature [0C]
Figure 2 .9 - Solubi l ity of lactose as a function of temperature [Gerhartz 1 988) .
2.5.2 SURFACE TENSION
The surface tension of saturated lactose syrups was measured for use in the prediction of capi l lary condensation in l actose moisture systems. Saturated lactose sol utions were made at 1 7) 30 and 40°C. Surface tension was measured using the capillary rise method [Adamson 1 963] . This method was chosen over the numerous alternative surface tension measurement methods due to avai labi l ity of equipment.
Glass capi l laries of -1 rum diameter were clamped perpendicular to the surface of the lactose solution with the end slightly submerged. Fluid was sucked up the tube to ensure the i nside wal l s of the capi llary were wetted and therefore a zero contact angle was mai ntained whi le the measurement was being taken. The capil lary fluid height (z) was then al lowed to find its equi l ibrium l evel which was measured using a travel l ing mIcroscope.
The surface tension was calculated from the capillary rise using La Place's equation Eq (2.5) [Adamson 1 963] .
a = IJi pgzr (2 .5)
The results of these experiments are summarised in Figure 2. ] O. The surface tension was found to change approximately l inearly with temperature in the range 1 7- 40°C. A least squares fit resulted in Eq (2 .6).
a = 0.0702 1 - 0 .000105 T (± 0 .00 1 7 ) (2.6)
2-14

The increase in the sol ubility of lactose with temperature is thought to be partly responsible for the decrease in surface tension with increasing temperature.
0.070.,.-----------------------,
0.069
� � 0.06� .� � tl � 0.067
en
0.066
0.065 +-----!----I------+-----+----+---' 1 5 20 25 30 Temp<.nlurc lOCI 35
Figure 2. 1 0 - Surface tension of saturated solutions of lactose
2.6 CLOSURE
40
The lactose powders used in this work have been characterised in terms of bulk properties, surface structure and particle size distribution. General properties of lactose have been summarised from literature or experimentally determined where l iterature data was unavai lable or incomplete. Thi s is not an exhaustive compi lation of lactose properties but rather a l i st of those properties that describe the materials used i n this work and that are i mportant in the understanding and model l i ng of lactose caking phenomena.
One key group of properties which is of central importance in the understanding of caking phenomena was not discussed in this chapter. That group can be broadly described as moisture re lations in solid phase lactose and because of its importance i s the focus of the next chapter.
2·1 5

CHAPTER 3
MOISTURE RELATIONS I N LACTOSE
3 . 1 INTRODUCTION
A detailed knowledge of the relationships and interactions between moisture and the various lactose forms is essential to the understanding of caking phenomena. This includes understanding the differences between bound and free moisture, knowledge of the moisture sorption i sotherm and sorption kinetics of lactose and the ability to accurately measure moisture content and water activity of lactose samples.
3.2 THE DEGREE OF BINDING OF MOISTURE IN LACTOSE
Water in powders can exist in many forms and can be classified according to degree of binding to the powder or its functionality. In addition, the functionality of the water can be described in terms of a single particle or as water in bulk powder [Kawamura 1 99 1 ] . Broadly, moisture can be thought of as being chemically bound or physically adsorbed to a crystal .
3.2.1 C HEMICALLY BOUND MOISTURE
C hemically bound water i s normally called crystal water or water of crystallisation. In a-lactose monohydrate, one water molecule i s present for every molecule of alactose. This is further distinguished as being lattice water as it i s required in the crystal lattice to maintain the integrity of the crystal structure. The lattice water can be removed by dehydration at 1 20°C [Stecher 1 968] and can be seen as a single endotherm between 1 2 0- 1 4 0°C by differential scanning calorimetry [Biliaderis 1 990] . The heat of desorption of lattice water in a-lactose mondhydrate is 5 1 .46 kJ/mol of water removed [Berlin et al. 1 97 1 ] .
Burna ( 1 965) measured the density of a-lactose crystals before and after dehydration of the lattice water (5%w/w) by centrifugation in carbon tetra-chloride liquid paraffin solutions. He showed that the densities were indistinguishable in magnitude ( 1 545 kg/m3). This indicates that substantial changes in the crystal lattice occurred upon desiccation .
B erlin et at ( 1 97 1 ) explained the hydration phenomenon of ex-lactose based on a mechanism put forward by Ladd and Lee ( 1 965) and Ladd and Lee ( 1969). The anhydrous structure is first expanded and gaseous water molecules are accommodated so
" " ' - Y ' · " , ,
3-1

that the resulting crystal structure is equivalent to that of t he hydrate . In a second stage, the expanded lattice-water interaction occurs which may be stabilised through covalent bonding, hydrogen bonding or ion-dipole interaction energy. In <x-lactose, hydrogen bonding formation is the most likely mode of interaction between the lactose and water.
p-Lactose does not have a hydrated crystalline form. This can be explained in terms of the hydration mechanism described above if it is considered that p-Iactose has a higher melting point and higher density than <x-lactose. This indicates a more compact crystal structure and requires a greater expenditure of enthalpy for expansion of the anhydrous crystal lattice than that required for <x-lactose. This means it is energetically unfavourable for the formation of a hydrated crystalline p-Iactose form.
3.2.2 PHYSICALLY ADSORBED MOISTURE
Adsorbed moisture is present on specific sites on the particle surface to form a monolayer and as subsequent additional layers. The water molecules can be attached to the crystal surfaces by van der Waals forces or hydrogen bonding. A delay in the removal of water as well as an increase in the heat of vaporisation calculated from the dehydration endotherm of a differential scanning calorimetry run, have been considered as an indication of stronger binding of water to a substance. Biliaderis ( 1 990) suggests caution in these interpretations due to difficulties in interpolation of the baseline in estimating the heat of desorption and the fact that the process of moisture removal is very dependant on the mass transfer conditions .
Other methods by which the degree of binding of adsorbed moisture can be established are determination of unfrozen water, nuclear magnetic resonance, dielectric properties and measurement of vapour pressure [Karel 1 975] .
Unfreezable water is identified by comparing a differential thermal analysis plot with the known total water content of a food. The water unaccountable from the heat of fusion of the ice is then termed unfreezable water because it is evidently 'bound' by interaction with other food components. Franks ( 1 99 1 ) argues that there are at least three reasons why such an analysis is incorrect . Firstly the i ce melt ing endotherm is not equal to the l atent heat of fusion of pure water as it contains a contribution from the heat of di lution of the concentrated solution into which the ice is melt ing. Secondly the area of the endotherm is incorrectly computed as no allowance is made to glass transition which must precede any melting. Thirdly freezing is nearly always incomplete as total freezing can only occur in systems where components other than water undergo complete eutectic crystall i sation.
Proton magnetic resonance (NMR) i s used routinely to determine the state of water in foods Duckworth ( 1 972) demonstrated using NMR that not all water present in foods
is capable of acting as a solvent Monolayer water does not act as a solvent nor does an additional fraction of water. He showed that each solute had a specific water activity at which it went into solution and that the presence of other insoluble components did not alter this value. For sucrose, this water act ivity was 0 .82 . This type of water has been termed non-solvent water. There have been no reports of the water activity where adsorbed moisture can act as a solvent for lactose systems.
The degree of binding of water to proteins, polymers and foods can be determined by dielectric measurements although quantification using this method is difficult [Karel 1 975] .
3-2
Karel ( 1 975) suggests that the most successful method for studying properties of water involves preparation of sorption i sotherms. The BET monolayer obtained from these i sotherms is said to be strongly bound to specific sites on the surface of the particle. Such sites could be hydroxyl groups of polysaccharides or simple sugars, carbonyl and amino groups of proteins and others on which water can be bonded by hydrogen bonding, ion-dipole bonds or by other strong interactions. In lactose the monolayer water is l ikely to be hydrogen bonded to hydroxyl groups to the crystal surface.
It must be remembered, however, when using such an analysis that the BET isotherm equation describes physical adsorption of a vapour to a surface. Only when the equation i s applied to i sotherm data for such a system is interpretation of the B ET monolayer value meaningful . Numerous occurrences of the application of the B ET or GAB i sotherms for systems when adsorption to the surface i s coupled with diffusion from the surface into the product are found in the literature. This is not consistent with the mechanistic basis of the i sotherm equation and therefore interpretation of the i sotherm equation constants is inappropriate.
3.2.3 BOUND AND FREE M OISTURE USED IN THIS WORK
It can be seen from this discussion that there are numerous interpretations made about how strongly bound water is in a particular food system. It is also evident that there is still some debate in the literature as to the validity of some of these interpretations. For the purposes of this work therefore, definitions of the concepts of bound and free moisture were made.
It is clear that when using an isotherm equation of mechanistic origin, some consideration of the function and degree of binding of water in the system must be made. In practical terms however, water that can be removed by placing lactose in a dry environment at moderate temperature is what is important in caking phenomena. For this reason water which can be removed by desiccation over phosphorous pentoxide over several weeks was termed «free moisture". Using this definition, lattice or crystal water in a-lactose monohydrate is not included as it is not removed until high temperature ( 1 2 0°C) is applied . Crystal water was termed "bound moisture". Monolayer moisture i s termed free moisture using this definition.
3.3 MOISTURE SORPTION ISOTHERMS
The most commonly used and most effective physical method of assessing the state of water in food i s measurement of water vapour i n equilibrium with a given moisture content i n solid at a constant temperature. The almost universally accepted convention i s the use of the relative vapour pressure and it 's designation as water activity Eq(3 . 1 ) (Karel 1 989] .
3-3
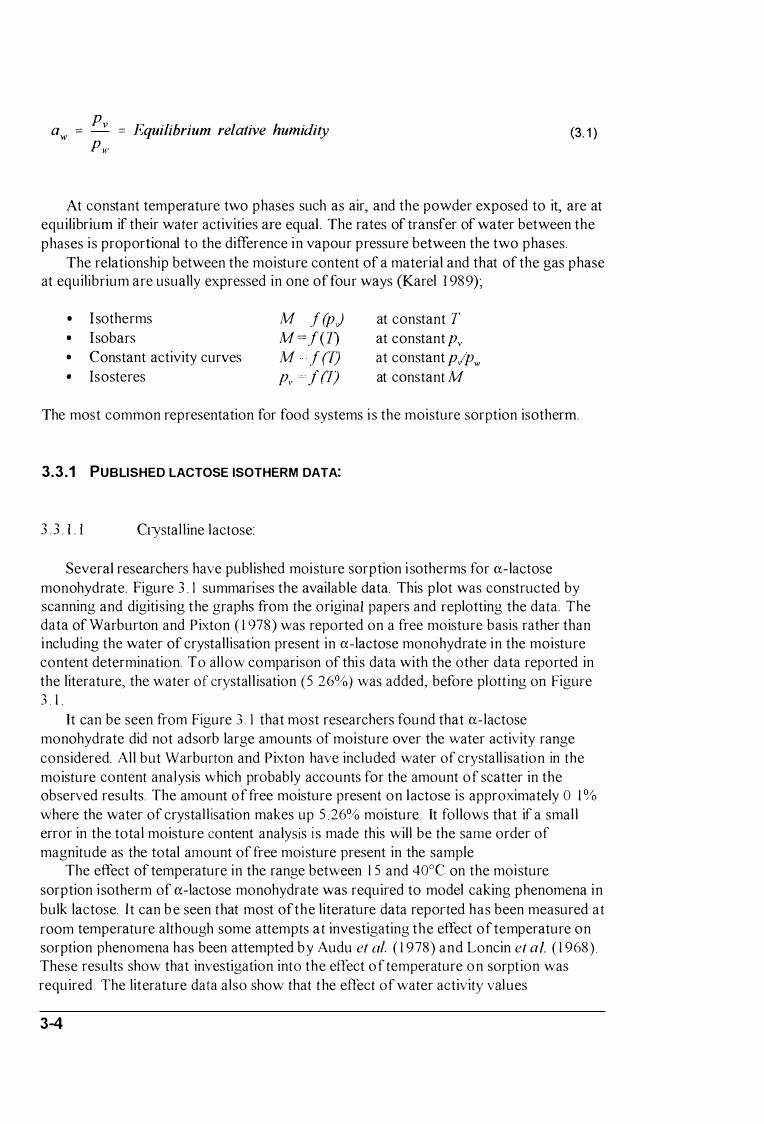
aw = Pv = Equilibrium relative humidity Pw
( 3.1)
At constant temperature two phases such as air, and the powder exposed to it, are at equilibrium if their water activities are equal . The rates of transfer of water between the phases i s proportional to the difference in vapour pressure between the two phases.
The relationship between the moisture content of a material and that of the gas phase at equilibrium are usually expressed in one of four ways (Karel 1 9 89);
• I sotherms M f(pJ at constant T • Isobars M = f(1) at constant PI' • Constant activity curves M f(T) at constant piPw • Isosteres PI' ··�·f(7) at constant M
The most common representation for food systems i s the moisture sorption isotherm .
3.3.1 PUBLISHED LACTOSE ISOTHERM DATA:
3 . 3 . 1 . 1 Ciystalline lactose:
Several researchers have published moisture sorption i sotherms for a-lactose monohydrate . Figure 3 . 1 summarises the available data. This plot was constructed by scanning and digiti sing the graphs from the original papers and replotting the data. The data of Warburton and Pixton (197 8) was reported on a free moisture basis rather than including the water of crystallisation present in a-lactose monohydrate in the moisture content determination. To allow comparison of thi s data with the other data reported in the literature, the water of crystal l isation (5 26%) was added, before plott ing on Figure 3 .1.
It can be seen from Figure 3 . I that most researchers found that a-lactose monohydrate did not adsorb large amounts of moisture over the water activity range considered. All but Warburton and Pixton have included water of crystallisation in the moisture content analysis which probably accounts for the amount of scatter in the observed results. The amount of free moisture present on lactose is approximately 0 1% where the water of crystallisation makes up 5 26% moisture . It follows that if a small error in the total moisture content analysis i s made this will be the same order of magnitude as the total amount of free moisture present in the sample
The effect of temperature in the range between 15 and 40°C on the moisture sorption i sotherm of a-lactose monohydrate was required to model caking phenomena in bulk lactose. It can be seen that most of the literature data reported has been measured at room temperature although some attempts at investigating the effect of temperature on sorption phenomena has been attempted by Audu et at. (197 8) and Loncin et at. (196 8) . These results show that investigation into the effect of temperature on sorption was required. The literature data also show that the effect of water activity values
3-4
approaching one has not been investigated. It was expected that the water activity of lactose at a cold surface in a bag would approach unity and therefore the available data were not adequate for the accurate modelling of caking in bulk lactose. Because of this it was decided to determine moisture sorption isotherms experimentally, as part ofthis work.
3 . 3 . 1 . 2
8.0% Q) (J) 0 7.5% U ro � 7.0%
-0 CJ)
0, 6.5% ....... ..... c Q) 6 .0% ..... c 0 ()
5.5% Q) L... ::J �
..... (J) 5.0% '0 �
4.5%
o
�> . 4
0.2
&
• 'J ' y
0.4 0 .6 Water activity
&
..
V ..J.--" < �
0.8
• LinKo et al. ( 1 981) (edsortJ 25°C) " Llnko et.1 (1981) (desorb 25°C) . !ludu et at (30,SO,80°C)
• Loneln at al (1968) (80°C) X WarbUrton & PIl<ton (1978) (25"C) - Pr1tzakl-Stegmenn (1988) (25"C)
Figure 3 . 1 - Literature isotherm data for a-lactose monohydrate .
Amorphous, spray-dried and freeze-dried lactose:
Moisture sorption isotherm data for amorphous lactose have been published by numerous researchers. These data are summarised in Figure 3 .2.
In most cases the isotherms show a step change in moisture content at about 0 .4-O .6<lw' This decrease in moisture content is due to the crystallisation of amorphous lactose and the subsequent release of moisture. The available data show a great deal of scatter and do not show the effect of temperature on the sorption isotherm. Hargreaves ( 1 995) also indicated that differences in glass transition temperature of amorphous lactose formed by spray drying and freeze drying can occur, For these reasons the moisture sorption isotherm for spray dried amorphous lactose was experimentally determined,

1 4% ,
Iil ----l- •
B3 • . "'-r. • 1m
.,.. ... <
V "
o 0.2
IE
IE . �
• •
...
< , ,.. '" >
0.4 0.6
Water activity
� •
..
83
IE "
0.8
Figure 3 . 2 - Summary of amorphous lactose isotherm data from the l iterature.
3.3.2 EXPERIMENTAL MEASUREMENT OF LACTOSE ISOTHERM DATA:
Because previously published a-lactose isotherm data are of poor quality and does not encompass the full water activity range important in lactose caking problems, experimental data was generated. The effect of temperature on the sorption isotherm of
a-lactose was also investigated in the ranges of 1 5-40°C because this had not been published in the literature and was required for this work .
The sorption isotherms of p-Iactose were also measured because the product of amorphous lactose crystallisation at water activities below 0. 5 5 � is reported to be p-lactose anhydride [Vuataz 1 988] . Spray-dried amorphous lactose isotherms were measured to quantify the effect of temperature on sorption behaviour in the range 1 5-40°C .
Methods for obtaining moisture sorption isotherms for foods have been described by many researchers including Stitt ( 1 958), Taylor ( 1 96 1 ) and Smith et al. ( 1 98 1 ). Many of theses methods have been reviewed by Gal ( 1 975). In general the methods utilise one of three basic approaches.
3-6
• measurements of moisture content of samples in vacuum desiccators containing saturated salt solutions at atmospheric pressure, which give a certain relative humidity. Various authors have outlined which saturated salt solutions are required to maintain a given relative vapour pressure, [fuchardson and Malthus 1 955 , Rockland 1 960, Karel 1 975 and Greenspan 1 977].
• measurement of the vapour pressure of air in equilibrium with a food at a given moisture content, with a sensitive manometlic system. [Taylor 1 96 1 ] .
• inverse gas chromatography where a column packed with the food powder as the stationary phase in gas chromatography. This technique allows investigation of
low water activity levels of up to one order of magnitude less than the other two techniques [ Smith e/ al. 1 98 1 ] .
The first measurement approach was used in this work . Crystalline samples were left in ambient conditions (25°C, 75-90% RH), for approximately one month before the isotherm measurement This Vvas done to ensure that no amorphous lactose was present in the samples. Amorphous lactose samples were removed from vacuum sealed foil bags.
The sorption i sotherms were determined using the static gravimetric method. Air tight plastic jars, containing saturated salt solutions placed inside temperature controlled rooms, were used to provide constant relative humidity and temperature environments. Stainless steel stands were used to hold the samples above the salt solutions. The values given by Greenspan ( 1 977) were used for the equilibrium relative humidity of the saturated salt solutions.
Ten gram samples of lactose were placed inside the sealed plastic jars and allowed to equilibrate. The samples were covered air tight during weighing to ensure no weight gains or losses occurred . Care was taken to observe the onset of any mould growth in the samples placed in high relative humidity environments which might effect the results. The samples were weighed periodically over three months until constant weight was reached. Samples were returned to the sealed containers immediately after weighing.
Initial moisture contents for the samples were determined by desiccation over phosphorous pentoxide for three months . The isotherms were then determined from the weight change from the initial sample. In this way desorption occurred below the starting product water activity (0. 75�J and adsorption above this value.
3.3.3 a -LACTOSE MONOHYDRATE:
The saturated salt solutions used in the determination of a-lactose monohydrate were;
LiCl 1 1 % MgCl2 3 3% Mg(N03) 54% NaC! 75% (NH)2S04 8 1 % KCI 87% KN03 94% K2S04 97%
These salts were chosen to concentrate on the high water activity end of the isotherms. The low water activity end was known to be reasonably level. Anular grade chemicals and distilled water were used for all salt solutions.
The raw data for all isotherms measured for a-lactose monohydrate are shown in Figure 3 . 3. The isotherm data shows that very little change in moisture content occurred in the lower water activity region « 0. 85) for a large change in water activity. Only at water activities above 0 .85 is appreciable free moisture present. The moisture content increases exponentially above this point and approaches an asymptote at a water activity of one.
3-7
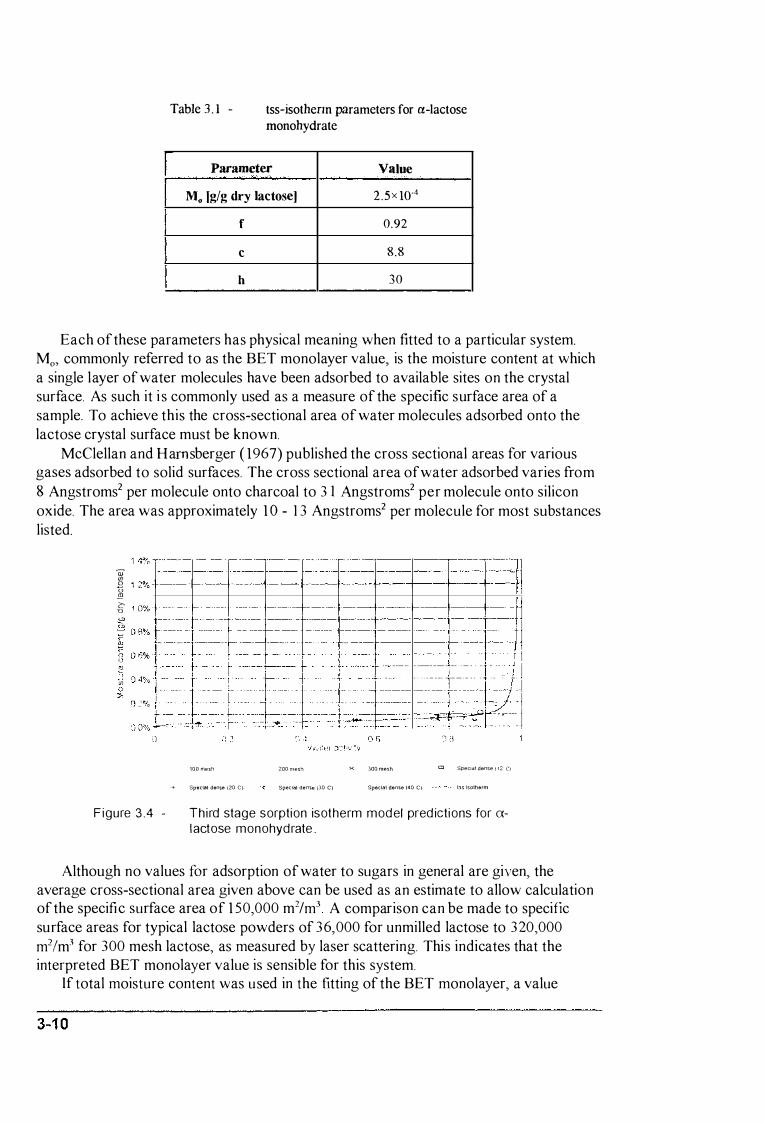
Table 3 . 1 - tss-isothenn parameters for a-lactose monohydrate
L Parameter Value M" [gig dry lactose] 2 .Sx lO·4
f 0.92
c 8.8
h 30
Each of these parameters has physical meaning when fitted to a particular system. Mo> commonly referred to as the BET monolayer value, is the moisture content at which a single layer of water molecules have been adsorbed to available sites on the crystal surface. As such it i s commonly used as a measure of the specific surface area of a sample. To achieve this the cross-sectional area of water molecules adsorbed onto the lactose crystal surface must be known.
McClellan and Hamsberger ( 1967) published the cross sectional areas for various gases adsorbed to solid surfaces. The cross sectional area of water adsorbed varies from 8 Angstroms2 per molecule onto charcoal to 3 1 Angstroms2 per molecule onto silicon oxide. The area was approximately 1 ° - 1 3 Angstroms2 per molecule for most substances listed.
(j) 2 1 2% +---4_---�--�----�--4_---4_--_+--- � ---+--� o i2 � 1 0% �---�---+---�--_+----1----�--4_--�--_+---+
100 mesn
-+ Special dense (20 C)
8
zoo mesh x 300 mssh G.:J Specl,,!! danse ( 12 C)
SpeCial deme (:'0 C) Special dense (40 C) tss Isotherm
Figure 3.4 - Third stage sorption isotherm model predictions for (Xlactose monohydrate.
Although no values for adsorption of water to sugars in general are given, the average cross-sectional area given above can be used as an estimate to allow calculation of the specific surface area of 1 5 0, 0 0 0 m2/m3 A comparison can be made to specific surface areas for typical lactose powders of 36, 0 0 0 for unmilled lactose to 3 20, 0 0 0 m2/m3 for 3 0 0 mesh lactose, as measured by laser scattering. This indicates that the interpreted BET monolayer value is sensible for this system.
If total moisture content was used in the fitting of the BET monolayer, a value
equivalent to a specific surface area 200 times greater than predicted above, would result This would then require the visualisation of lactose as a highly porous particle, which it is not Tills i l lustrates that care is required when using isotherm equations with a theoretical basis
The constant c, which is present in both the GAB and BET isotherms, is a constant dependant on the bonding energy of the sorbent onto the solid surface Brunauer et al. ( 1 938 ) shows that Eq (3 . 5) applies;
rEI /01) C � e RT (3.5)
That i s, the difference in bonding energy between the monolayer adsorbed molecules and the molecules adsorbed on subsequent layers (EI - l�'L) is approximately equal to Hl ' ln(c) In the case of the model fitted here, (E/ - Er) = 5 . 30 kJ/mo! . The latent heat of evaporation of water (FI.) � 45 kJ/mo! . This means the monolayer water is approximately 1 0% more strongly bound than free moisture. This again seems a sensible result
The GAB constant /is a constant which is dependent on the energy of bonding of the second to ninth layers of adsorbed molecules on the surface. Anderson ( 1 946) shows that the energy of bonding of these layers is equal, given by Eq (3 .6) .
/ � e ( 1,': _" "/. '
NT (3 . 6)
If/= 1 then the GAB model simplifies to the BET model . If/>1 then this results in infinite sorption at a value of water activity less than 1 which is physically unsound. It follows therefore that/ � 1 . This means that the energy of bonding of the second to the ninth layers is less than the latent heat of vaporisation of free moisture. Anderson ( 1 946) explains tills by showing that because / < 1 , the entropy of adsorption in the second to ninth layers is more negative than the entropy of vaporisation. This means that these layers are more ordered than pure liquid phase.
Chirife el al. ( 1 992) showed that there is perhaps a correlation in the values of f in the GAB isotherm and the type of adsorbent. Proteins showed a narrow range of/values from between 0 .82 - 0. 88 while starchy based materials showed/values in the range 0. 7 - 0.77. The/value estimated in tills work i s 0 .92, which means the energy of bonding of the water molecules adsorbed in the second to ninth layers is equal to approximately 44 . 8 kllmol . Tills is 0. 5% lower than the latent heat of vaporisation of pure water and indicates that the water molecules on the second and subsequent layers are relatively unstructured.
The fourth parameter in the tss isotherm (h) is a parameter which describes the number of water layers that need to be present, before the moisture can behave as free moisture [Timmermann 1 989] . Because the moisture in lactose does not exhibit free behaviour until a water activity of higher than 0 . 85 is achieved, it makes sense that the value of h for this system is large (ie. 30) . An estimate of h can be made by considering the space that an individual water molecule takes up. By approximating the water molecule as being spherical , Eq (3 . 7) was formulated to allow the diameter to be calculated .
. . . -... .. .. - ..... ·.n·.... . .... ..... . .... . . , ... "t ............. . . •••••• ,. , • •• _ . ...... .... . ....... . . , ... · ••• ·7.H ••• � ....... .. n . ... . z ......... n ... '.... . . . . . . . ..... ... . . . . . .. _ . . ....... . . ......... .. , ., ............. .... .
3-1 1
( 3.7)
For water at 20°C Eq (3 . 7) gives the diameter of a water molecule as being 0 .39 run. The thickness of the water layer on the outer surface of the crystal can be calculated from Eq (3 . 8) if a uniform monolithic layer is assumed.
Mps ( 3 .8)
At a water activity of 0 . 85 this calculates out to be 5 to 43 J.1m thick for the range of specific surface areas measured for lactose (36,000 to 320,000 m2/m3). This gives a range of values for h of 1 3 to 1 1 0. This analysis suggests that the fitted value of 30 is sensible.
It can be seen that in the fitting of the tss i sotherm, care has been taken to observe that the physical basis for the isotherm was appropriate for the system under consideration and that the physical constants resulting from the model fitting are sensible.
A second, fundamentally derived model, which can be applied to the crystalline lactose system was given by Zsigmondy ( 1 9 1 1 ), who used the concept of capillary condensation to describe the exponential increase in moisture content as the water activity approaches unity. Capillary condensation is the process where direct condensation can occur, due to surface tension effects, in the capillaries formed by the contact points between particles. In the capillary, the pressure is less than atmospheric pressure. This results in the saturated vapour pressure above the liquid surface being less (at the same temperature) than in the vapour pressure in the bulk air. If the pressure is lowered enough to cause the vapour pressure to be greater than the saturated partial pressure above the capillary surface, then condensation will occur, even if the bulk air relative humidity is below 1 00%. The water vapour pressure at which capillary condensation will occur is dependant on the capillary radius and is given by the Kelvin equation Eq (3 . 9) [Adamson 1 963] .
lorose "0
a = P v = e rkll ( T ' 2 7'> 1 5) w (3 . 9)
When capillary size reaches molecular dimensions the Kelvin equation no longer applies and is, therefore, only suitable for water activity values greater than 0 . 8 .
By using the Kelvin equation, the capillary radius (r) was calculated from the water activity for the isotherm data collected for special dense ex-lactose monohydrate. A plot of moisture adsorbed versus capillary radius was then plotted (Figure 3 . 5) . As all data used in this analysis was for the same size distribution, the geometry and packing characteristics should be similar between samples. This should result in the capillary radius versus moisture content plot being independent of temperature. It can be seen from Figure 3 . 5 that no dependance on temperature was observed in the range investigated.
3-1 2
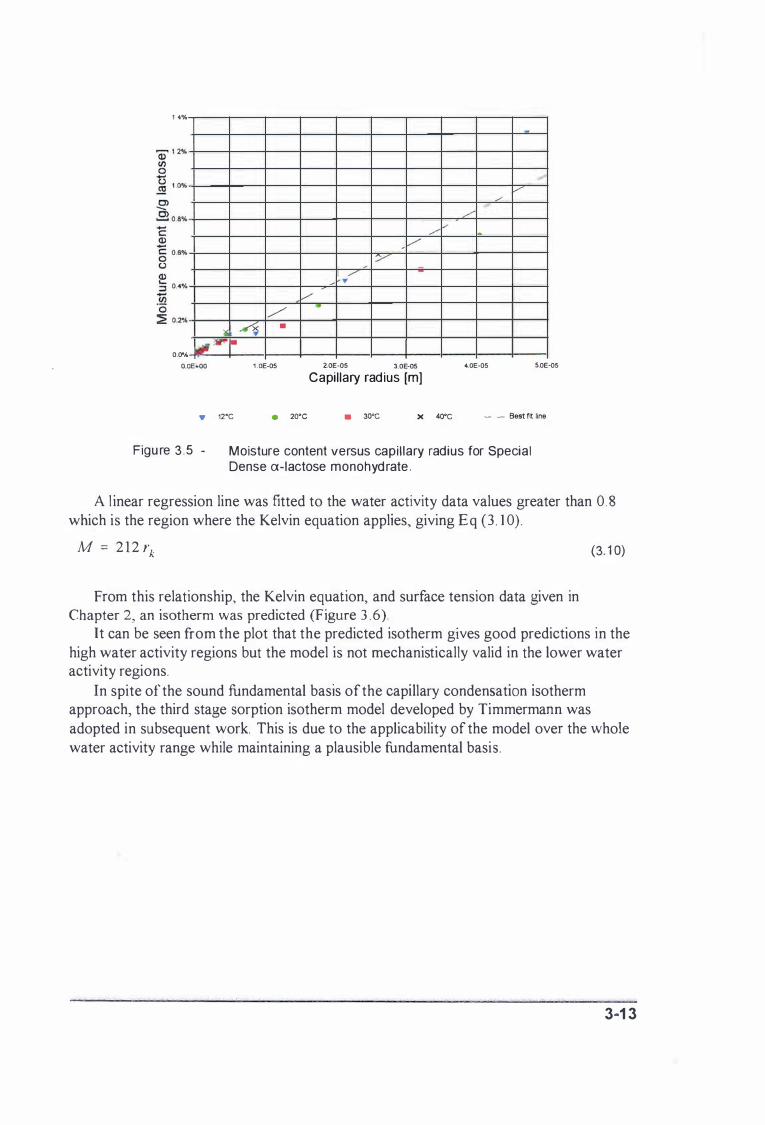
1 4%
/ � --i •
,,#:r' 0.0-'"
o.OE+oO
I'll 1 .0E-05
,/ -
V y
,,/
2.0E-05 3.0E-05
Capillary rad ius [m]
/'
f/ L ;' /"
L ;'
'.OE-05 5.0E-05
� 12'C • 20'C • 30'C X 40'C _ _ Best fit line
Figu re 3.5 - Moisture content versus capi l lary radius for Special Dense a-lactose monohydrate .
A l inear regression line was fitted to the water activity data values greater than 0 .8 which is the region where the Kelvin equation applies, giving Eq (3 . 1 0) .
M = 212 rk (3_ 1 0)
From this relationship, the Kelvin equation, and surface tension data given in Chapter 2, an isotherm was predicted (Figure 3 .6).
It can be seen from the plot that the predicted isotherm gives good predictions in the high water activity regions but the model is not mechanistically valid in the lower water activity regions.
In spite of the sound fundamental basis of the capillary condensation isotherm approach, the third stage sorption isotherm model developed by Timmermann was adopted in subsequent work. This is due to the applicability of the model over the whole water activity range while maintaining a plausible fundamental basis.
3-1 3
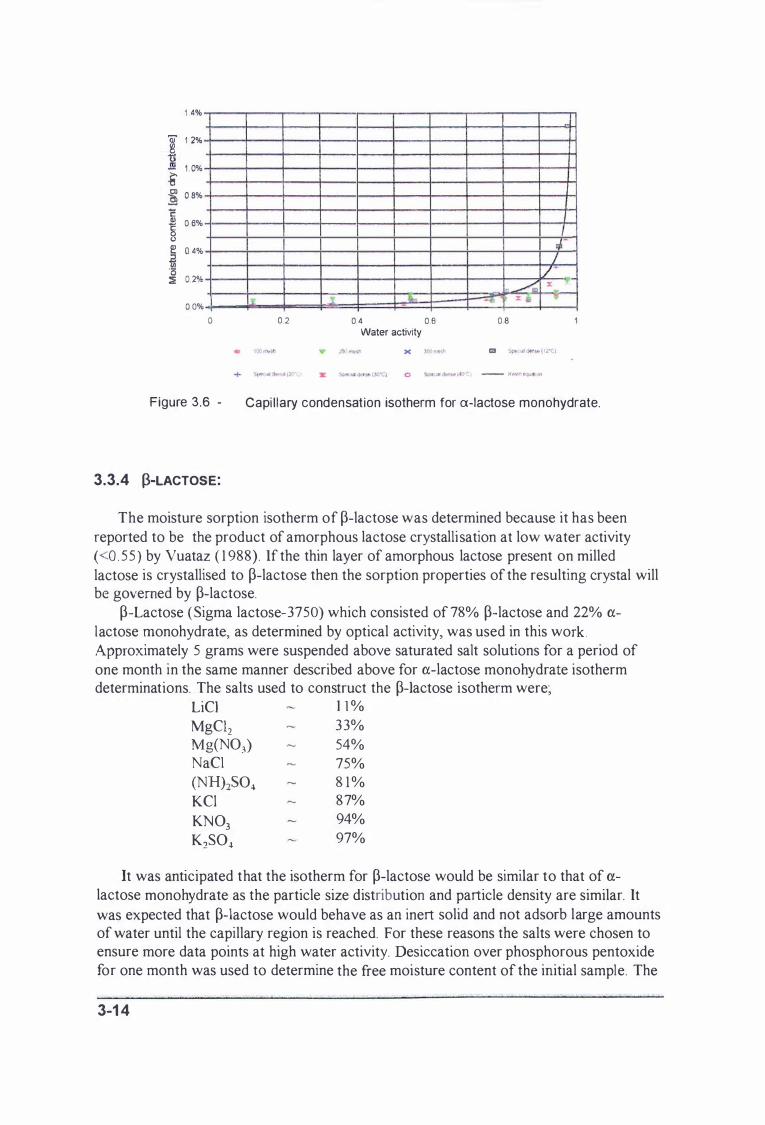
1 .4% 1 1 2% tl .£!! 1 . 0% :e ]l 0 8% � 0 6% 0 0 2: �
0 4% '0 :iE 0,2%
0 0% IJ. o 0.2 '- L
0 4 0.6 Water activity
....
0.8
I dJ' 7 1/ ./;;; x
x i
Figure 3.6 - Capi l lary condensation isotherm for a-lactose monohydrate.
3.3.4 �-LACTOSE:
The moisture sorption isotherm of p-Iactose was determined because it has been reported to be the product of amorphous lactose crystallisation at low water activity « 0 . 55) by Vuataz ( 1 988). Jf the thin layer of amorphous lactose present on milled lactose is crystallised to p-Iactose then the sorption properties of the resulting crystal will be governed by p-lactose.
p-Lactose ( Sigma lactose-3750) which consisted of 78% p-lactose and 22% alactose monohydrate, as determined by optical activity, was used in this work . Approximately 5 grams were suspended above saturated salt solutions for a period of one month in the same manner described above for a-lactose monohydrate isotherm determinations. The salts used to construct the p-Iactose isotherm were;
LiCI 1 1 % MgC12 33% Mg(N03) 54% NaCI 75% (NH)2S04 8 1 % KCI 87% KN03 94% K2S04 97%
It was anticipated that the isotherm for p-lactose would be similar to that of (1-lactose monohydrate as the particle size distribution and particle density are similar. It was expected that p-lactose would behave as an inert solid and not adsorb large amounts of water until the capillary region is reached. For these reasons the salts were chosen to ensure more data points at high water activity. Desiccation over phosphorous pentoxide for one month was used to determine the free moisture content of the initial sample. The
3-1 4
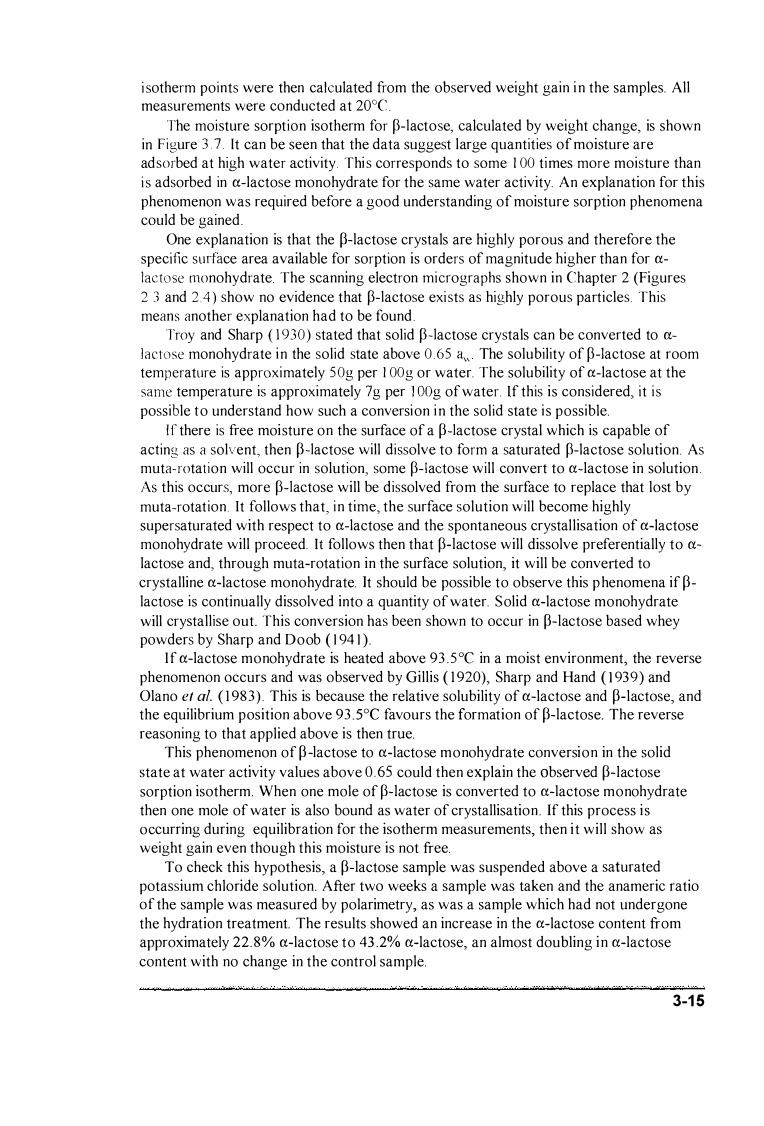
i sotherm points were then calculated from the observed weight gain i n the samples. All measurements were conducted at 20°C .
The moisture sorption isotherm for p-Iactose, calculated by weight change, is shown in Figure 3 . 7 . It can be seen that the data suggest large quantities of moisture are adsorbed at high water activity Thi s corresponds to some 1 00 times more moisture than i s adsorbed in a-lactose monohydrate for the same water activity. An explanation for this phenomenon was required before a good understanding of moisture sorption phenomena could be gained.
One explanation is that the p-Iactose crystals are highly porous and therefore the specific surface area available for sorption is orders of magnitude higher than for alactose monohydrate The scanning electron micrographs shown in Chapter 2 (Figures 2 3 and 24) show no evidence that p-Iactose exi sts as highly porous particles . This means another explanation had to be found .
Troy and Sharp ( 1 930) stated that solid p-Iactose crystals can be converted to alactose monohydrate in the solid state above 0 .65 3..., The solubility of p-Jactose at room temperature is approximately 50g per 1 00g or water. The solubility of a-lactose at the same temperature is approximately 7g per WOg of water. If this is considered, it i s possible to understand how such a conversion in the solid state i s possible.
If there is free moisture on the surface of a p-Iactose crystal which is capable of acting as a solvent, then p-Iactose will dissolve to form a saturated p-lactose solution. As muta-rotation will occur in solution, some p-Iactose will convert to a-lactose in solution . As this occurs, more p-Iactose will be dissolved from the surface to replace that lost by muta-rotation. It follows that, in time, the surface solution will become highly supersaturated with respect to a-lactose and the spontaneous crystallisation of a-lactose monohydrate will proceed. It follows then that p-Iactose will dissolve preferentially to alactose and, through muta-rotation in the surface solution, it will be converted to crystalline a-lactose monohydrate. It should be possible to observe this phenomena if plactose is continually dissolved into a quantity of water. Solid a-lactose monohydrate will crystallise out. This conversion has been shown to occur in p-Iactose based whey powders by Sharp and Doob ( 1 94 1 ) .
If a-lactose monohydrate is heated above 93 . 5 °C in a moist environment, the reverse phenomenon occurs and was observed by Gillis ( 1 920), Sharp and Hand ( 1 939) and Olano et at. ( 1 983) . This is because the relative solubility of a-lactose and p-lactose, and the equilibrium position above 93 .s°C favours the formation of p-Iactose. The reverse reasoning to that applied above is then true.
This phenomenon of p -Iactose to a-lactose monohydrate conversion in the solid state at water activity values above 0 . 65 could then explain the observed p-Iactose sorption isotherm. When one mole of p-Iactose is converted to a-lactose monohydrate then one mole of water is also bound as water of crystallisation. If this process i s occurring during equilibration for the isotherm measurements, then i t will show as weight gain even though this moisture is not free.
To check this hypothesis, a p-Iactose sample was suspended above a saturated potassium chloride solution. After two weeks a sample was taken and the anameric ratio of the sample was measured by polarimetry, as was a sample which had not undergone the hydration treatment. The results showed an increase in the a-lactose content from approximately 22.8% a-lactose to 43 .2% a-lactose, an almost doubling in a-lactose content with no change in the control sample.
3-1 5
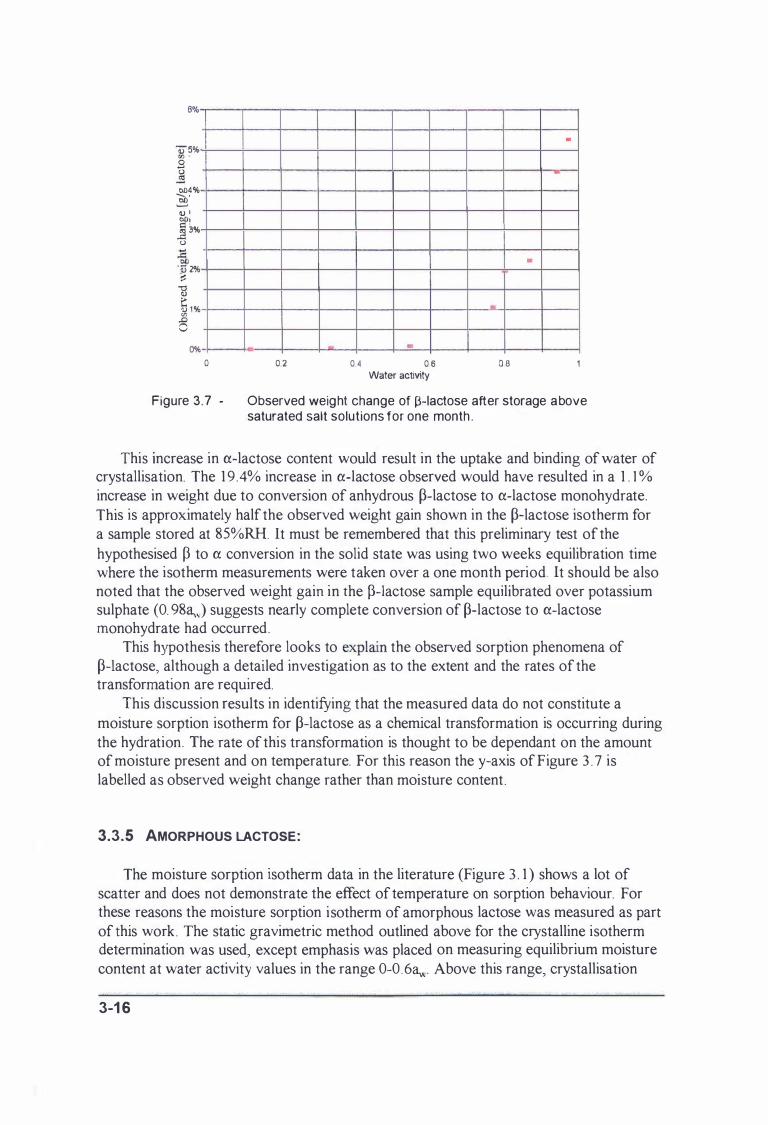
6%
1)5% <n '
] 0Jl4% �t CU i gfl ] 3% u
� Q) 2% ::: -0 cu 1: 1;l 1% .0 o
..
a 0 2 •
0.4 0.6 Water activity
.
•
-
0.8
Figure 3 .7 · Observed weight change of 13-lactose after storage above saturated salt solutions for one month .
This increase in a-lactose content would result in the uptake and binding of water of crystallisation. The 1 9 .4% increase in a-lactose observed would have resulted in a 1 . 1 % increase in weight due to conversion of anhydrous p-Iactose to a-lactose monohydrate, This is approximately half the observed weight gain shown in the p-Iactose isotherm for a sample stored at 85%RH. It must be remembered that this preliminary test of the hypothesised P to a conversion in the solid state was using two weeks equilibration time where the isotherm measurements were taken over a one month period. It should be also noted that the observed weight gain in the p-Iactose sample equilibrated over potassium sulphate (0. 98� . .) suggests nearly complete conversion of p-lactose to a-lactose monohydrate had occurred.
This hypothesis therefore looks to explain the observed sorption phenomena of p-Iactose, although a detailed investigation as to the extent and the rates of the transformation are required.
This discussion results in identifying that the measured data do not constitute a moisture sorption isotherm for p-lactose as a chemical transformation is occurring during the hydration. The rate of this transformation is thought to be dependant on the amount of moisture present and on temperature. For this reason the y-axis of Figure 3 . 7 is labelled as observed weight change rather than moisture content .
3.3.5 AMORPHOUS LACTOSE:
The moisture sorption isotherm data in the literature (Figure 3 . 1 ) shows a lot of scatter and does not demonstrate the effect of temperature on sorption behaviour. For these reasons the moisture sorption isotherm of amorphous lactose was measured as part of this work. The static gravimetric method outlined above for the crystalline isotherm determination was used, except emphasis was placed on measuring equilibrium moisture content at water activity values in the range 0-0.6a".". Above this range, crystallisation
3-1 6

occurs, and therefore isotherm data is not meaningful. The salt solutions used were; LiCI 1 1 % KCH2COO 23% MgCI2 3 3% K2C03 43% Mg(N03) 54%
The raw results for the isotherm are shown in Figure 3 . 8 along with data collected by Jouppila and Roos ( 1 993 ) . The results do not shown any significant influence of temperature on the isotherm shape in the range investigated ( 1 5-40°C) . Because the driving force for crystallisation increases with temperature, the maximum water activity at which a reading could be taken, reduced with temperature. This meant that at a water activity of o. 54�v only the sample equilibrated at 1 2°C was achieved .
Jouppila and Roos ( 1 993 ) fitted the GAB isotherm (3 . 1 1 ) to their isotherm data and it is also plotted on Figure 3 . 8 . It can be seen that there is little difference between the data collected by Jouppila and Roos and that collected in thi s work . The GAB constants were adjusted to improve the fit to the spray dried amorphous lactose isotherm data after removing the three experimental outlying data points. Table 3 .2 summarises the GAB model parameters fitted in this study along with those specified by Jouppila and Roos ( 1 993) .
M = (3. 1 1 ) ( l -fa".) [ 1 +(c - l )faJ
Table 3 . 2 GAB-isotheml parameters for amorphous lactose.
Parameter This work
Mo [gig dry lactose] 0.0488 0.049 1
f 1 . 1 6 l . l 8
c 3 .23 4.33
If these constants are interpreted as having physical meaning, it is evident that the GAB model is not consistent with the mechanistic basis of the i sotherm model . A GAB constantfofgreater than unity, as shown in Table 3 . 2, suggests that an asymptote will occur at a water activity less than one, which is a physical impossibility. The BET monolayer value is very high, which suggests a very large internal surface area and therefore the particle must be seen as a very porous particle. The time taken for absorption of moisture into the particle, shown in the following section however, suggests that diffusion is the mode of moisture uptake into the internal water sorption
.. . ... .... .. ... . . c- . " •... ,. . .. ,.n ., ....... . . .. . , . . " '" • H' s ... . ...... . . . � ',h. " ................ ...... . h . .... . .. ...... .... _ .• · . .. ... ...... .
3-1 7
- - -----
sites and physical adsorption of water vapour occurs only on the outer particle surface. Because the GAB model describes absorption of a water vapour on to a surface and not a diffusion governed sorption process, it is not mechanistically applicable to amorphous lactose. The GAB model, with the fitted constants summarised in Table 3 .2, will be used in this work for convenience, although it is stressed that no physical meaning can be attributed to any of the fitted parameters.
1 2%
2% ) V 0%
o
il !I/ /; II .
VI II 'l //� / /
//
0.2 0.4 0 .6 Water activity
12'C
•
20'C )( 30'C
3S'C
+
Joupplla and Roos ( 1994) 124'C]
GAB model lJoupplia and Roos ( 1994») -GAB model fitted -
0 .8
Figure 3 .8 - Moisture sorption isotherm for amorphous lactose
3.3.6 MIXTURES OF CRYSTALLINE AND AMORPHOUS LACTOSE:
Because of the large moisture holding capacity of amorphous lactose, the effect of even small amounts of amorphous lactose is significant, in terms of increasing the free moisture available for spoilage and caking problems. In the water activity region where amorphous lactose is likely to be present (0-0 .5) the amount of moisture adsorbed onto the crystalline surface is small .
The amorphous lactose layer, thought to be present on the outside of the particle, can absorb moisture throughout the whole amorphous mass. In this case the sorption isothenns for the individual components can be assumed to be additive on a mass basis. This will result in the isotherms shown in Figure 3 . 9.
3-1 8
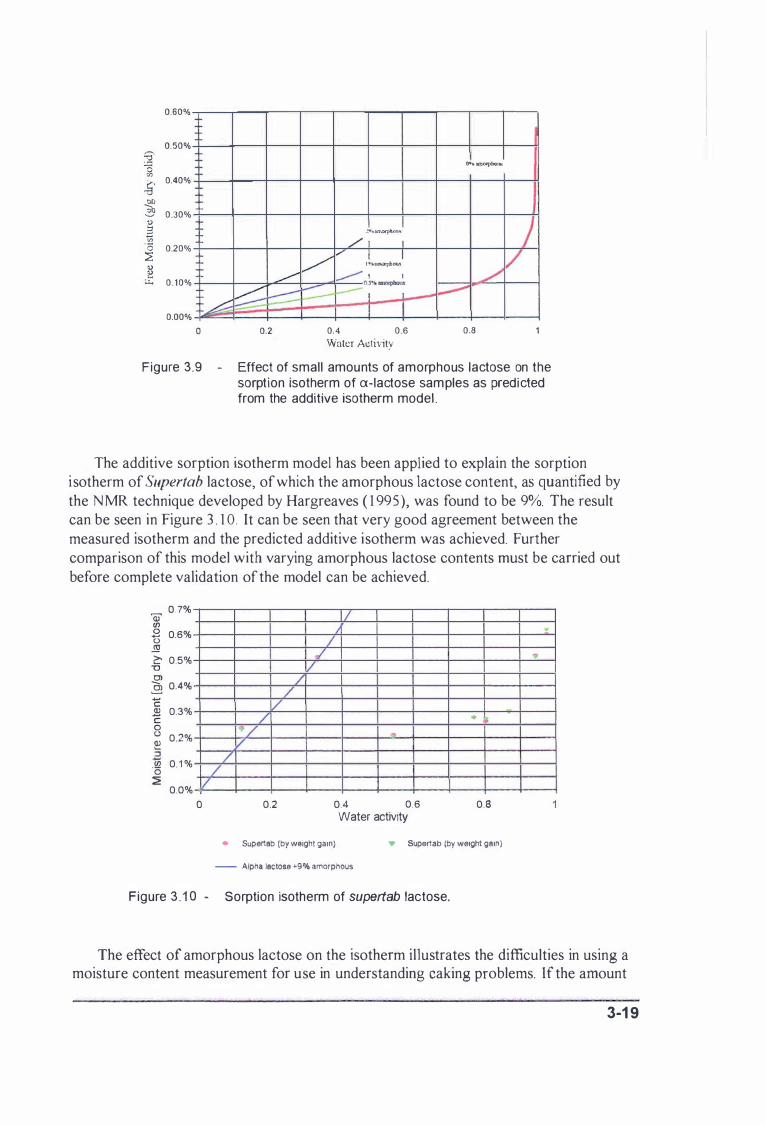
0.60%
0.50%
� (3 en
� 0.40%
� .;:!J 0.30% 1) E en ' 13 0.20% ::E " " .... t..t.. 0 . 1 0% ./" � ;::::::::: �
0.00%
o 0.2
V �
l'ho;lUoOfllbOUIl
/ 1 I .t..maph�.1
V-. ' I O. " 'II llUlOIphCl1W
f-- I l
0.4 0.6 Water At:tivity
O't'. amocphQll5
J ./ /
-..---
0.8
Figure 3.9 - Effect of small amounts of amorphous lactose on the sorption isotherm of a-lactose samples as predicted from the additive isotherm model .
The additive sorption isotherm model has been applied to explain the sorption isotherm of Supertab lactose, of which the amorphous lactose content, as quantified by the N MR technique developed by Hargreaves ( 1 995), was found to be 9%. The result can be seen in Figure 3 . 1 0 . It can be seen that very good agreement between the measured isotherm and the predicted additive isotherm was achieved. Further comparison of this model with varying amorphous lactose contents must be carried out before complete validation of the model can be achieved.
0. 7% W en U 0.6%
.!l1 2:' 0.5%
'0 OJ :g 0.4%
C 2 0.3% c 0 u 0.2% Q) :5 � 0. 1 % 0 :;i!
0.0% / o
/ L
/ /
1 "'/ V
/ /
0.2
/ I ./
l!
'"
0.4 0.6 Water activity
...
0.8
• Supertab (by weight gaIn) ... Supertab (by weIght gaIn)
- Alpha lactose +9% amorphous
Figure 3 . 1 0 - Sorption isotherm of supertab lactose.
T
..,
The effect of amorphous lactose on the isotherm illustrates the difficulties in using a moisture content measurement for use in understanding caking problems. lf the amount
3-1 9

of amorphous lactose is unknown, then the moisture content measurement does not explain how resistant the product is to caking.
3.4 RATES OF MOISTURE SORPTION ON TO LACTOSE:
The rate of sorption of moisture on to both crystalline and partially crystalline lactose is necessary for the mathematical modelling of moisture transport in bulk lactose. Knowledge of the sorption rates will also improve the understanding of lactose drying, conditioning and caking phenomena. To achieve such an understanding, the rates of moisture sorption onto purely crystalline lactose and spray dried amorphous lactose were determined experimentally.
A Mettler AE200 analytical balance equipped with an RS232 interface connected to a 3 86 IBM compatible computer was used to data-log the change in weight of a lactose sample when applied to a step change in ambient relative humidity. The sample was surrounded by a 1 litre plastic bottle which had the bottom removed. Attached around the base of this surround was 5mm plastic tubing with holes drilled at regular intervals providing a manifold for air distribution around the sample. The top of the surround had a 1 5mm opening to allow air to escape. Air supplied from a Hycal water vapour generator was introduced into the chamber. Relative humidity and temperature of the air inside the chamber were also recorded using a Grant Squirrel data logger series 1 000. This set up can be seen in Figure 3 . 1 1 .
balance
exhaust
surround
--- .. ,-' --.
humidified air 7
Figure 3 , 1 1 - Sorption rate measurement apparatus
RH/temperature probe
air distribution manifold
The dew point generator was switched on to allow the chamber to reach a steady state condition. The sample was placed into the apparatus in an aluminium moisture dish as a thin layer of up to 3mm deep. In this way a step change was applied to the sample. The balance reading was data-logged along with the chamber relative humidity and temperature.
3-20
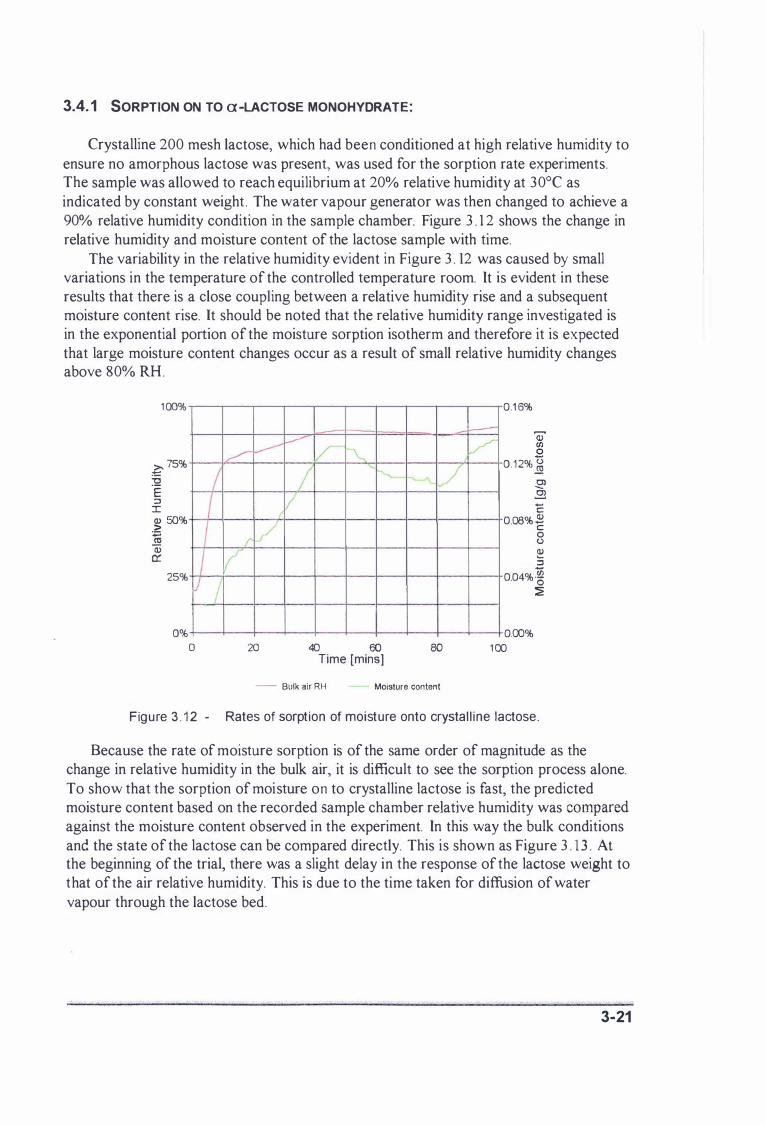
3.4. 1 SORPTION ON TO a-LACTOSE MONOHYDRATE:
Crystalline 200 mesh lactose, which had been conditioned at high relative humidity to ensure no amorphous lactose was present, was used for the sorption rate experiments. The sample was allowed to reach equilibrium at 20% relative humidity at 30°C as indicated by constant weight . The water vapour generator was then changed to achieve a 90% relative humidity condition in the sample chamber. Figure 3 . 1 2 shows the change in relative humidity and moisture content of the lactose sample with time.
The variability in the relative humidity evident in Figure 3 . 12 was caused by small variations in the temperature of the controlled temperature room. It is evident in these results that there is a close coupling between a relative humidity rise and a subsequent moisture content rise. It should be noted that the relative humidity range investigated is in the exponential portion of the moisture sorption isotherm and therefore it is expected that large moisture content changes occur as a result of small relative humidity changes above 80% RH.
1 00%
� 75% :!2 E ::l I Q) 50% .2! !§ Q) c::
I 1 I I 25% ) I 0%
o
� �
( J/ �
20
V / -/ V
40 60 Time [mins]
"- iv/
80
- Bulk air RH Moisture content
f-------VI
0.1 6%
(j) til o
0 . 1 2% � � 2l C 0.08% 2 c o (.) � ::l
0.04%� �
0.00% 1 00
Figure 3 . 1 2 - Rates of sorption of moisture onto crystal l ine lactose .
Because the rate of moisture sorption is of the same order of magnitude as the change in relative humidity in the bulk air, it is difficult to see the sorption process alone. To show that the sorption of moisture on to crystalline lactose is fast, the predicted moisture content based on the recorded sample chamber relative humidity was compared against the moisture content observed in the experiment. In this way the bulk conditions and the state of the lactose can be compared directly. This is shown as Figure 3 . 1 3 . At the beginning of the trial, there was a slight delay in the response of the lactose weight to that of the air relative humidity. This is due to the time taken for diffusion of water vapour through the lactose bed.
3-21
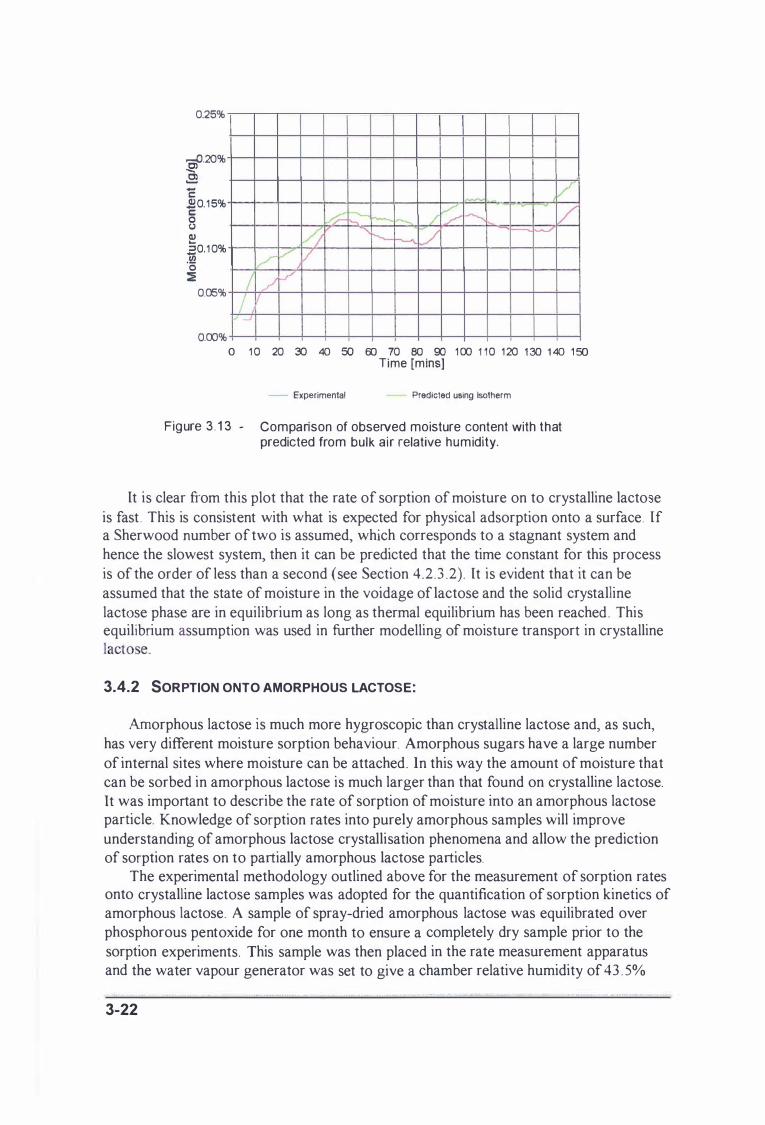
0.25%
�.20% � .52l 1: $0. 15% c: o (J Q) ,a0. 1 0% .ra o
� 0.05%
0.00%
� . V .� -� v V � t-� ""'-. / .�
/f. "-� � /' ,/ /
/ ,/ V / -.J
I
o 1 0 20 30 40 50 00 70 80 90 1 00 1 10 120 1 30 1 40 1 50 Time [mins]
- Experimental Predicted using Isotherm
Figure 3 . 1 3 - Comparison of observed moisture content with that predicted from bulk air relative h�midity.
It is clear from this plot that the rate of sorption of moisture on to crystalline lacto e is fast . This is consistent with what is expected for physical adsorption onto a surface. If a Sherwood number of two is assumed, which corresponds to a stagnant system and hence the slowest system, then it can be predicted that the time constant for this process is of the order of less than a second (see Section 4 .2 .3 .2) . It is evident that it can be assumed that the state of moisture in the voidage of lactose and the solid crystalline lactose phase are in equilibrium as long as thermal equilibrium has been reached . This equilibrium assumption was used in further modelling of moisture transport in crystalline lactose.
3.4.2 SORPTION ONTO AMORPHOUS LACTOSE:
Amorphous lactose is much more hygroscopic than crystalline lactose and, as such, has very different moisture sorption behaviour. Amorphous sugars have a large number of internal sites where moisture can be attached. In this way the amount of moisture that can be sorbed in amorphous lactose is much larger than that found on crystalline lactose. It was important to describe the rate of sorption of moisture into an amorphous lactose particle. Knowledge of sorption rates into purely amorphous samples will improve understanding of amorphous lactose crystallisation phenomena and allow the prediction of sorption rates on to partially amorphous lactose particles.
The experimental methodology outlined above for the measurement of sorption rates onto crystalline lactose samples was adopted for the quantification of sorption kinetics of amorphous lactose. A sample of spray-dried amorphous lactose was equilibrated over phosphorous pent oxide for one month to ensure a completely dry sample prior to the sorption experiments. This sample was then placed in the rate measurement apparatus and the water vapour generator was set to give a chamber relative humidity of 43 . 5%
3-22

RH at 30°C. The weight of the sample was then logged and the moisture content change with time was calculated. The change in moisture content of the amorphous sample can be seen in Figure 3 . 14 .
(j) U) o
0.08
� 0 .06
� -0 � Cl
C 0 .04 Q) -c o o � .3 0.02 U) '0 �
o
f II
o
. .-' v /
I I
I
5
----
1 0 Time [hr]
1 5
-
20
Figure 3 . 1 4 - Rate of moisture sorption onto spray dried amorphous lactose subjected to a step change in relative humidity from a to 43.5% RH .
Because the time for sorption i s much greater than that for pure adsorption on to a surface (see Section 3 .4. 1 ) it is clear that this is not the controlling mechanism for the moisture sorption process on to amorphous lactose. Several researchers interpret the high BET monolayer value obtained from amorphous glass isotherms as indicating large internal surface areas, suggesting a highly porous structure (Berlin et at. 1 973, Niediek and Babernics 1 979 and Flink 1 983) . In the case of amorphous lactose however, it is clear that diffusion into the surface is the mode of moisture absorption into the particle. Adsorption of moisture is occurs only to the outer surface.
The rate of moisture gain shown in Figure 3 . 14 is the result of two competing rates. Firstly, diffusion of water vapour must occur from the bulk air into the thin lactose bed. Secondly the water vapour is absorbed into the amorphous lactose particles. In order to estimate the diffusivity of moisture in the amorphous lactose particle it was therefore required to somehow differentiate between these two rate processes.
The rate of sorption into the spherical amorphous lactose particles can be approximated as a reversible first order approach to an equilibrium moisture content .
d� = D '(� - � ) = D I(y C - 0
dt eq
where � is the mass average concentration of absorbed moisture in the amorphous particle, �.q is the moisture concentration in equilibrium with the air moisture
. a ' ).
(3. 1 2)
3-23
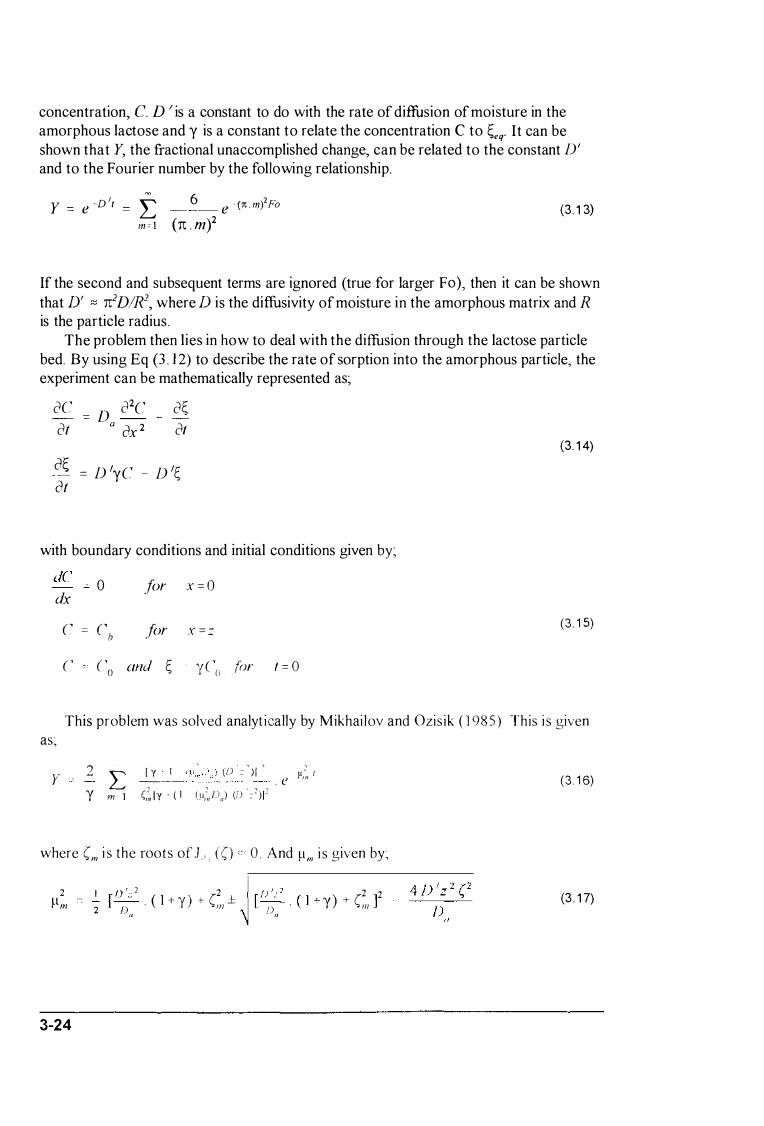
concentration, C. D I is a constant to do with the rate of diffusion of moisture in the amorphous lactose and y is a constant to relate the concentration C to �eq. It can be shown that Y, the fractional unaccomplished change, can be related to the constant D' and to the Fourier number by the following relationship.
y �D lt e L 6 e - (Tt _ miFo m e l (TC . m)2 (3. 1 3)
If the second and subsequent terms are ignored (true for larger F 0), then it can be shown that D' � TC2DIR2, where D is the diffusivity of moisture in the amorphous matrix and R is the particle radius.
The problem then lies in how to deal with the diffusion through the lactose particle bed. By using Eq (3 . 1 2) to describe the rate of sorption into the amorphous particle, the experiment can be mathematically represented as;
2C D 22C 2� 2t a ax 2 2t
(3. 1 4) a�
= D lyC at D /�
with boundary conditions and initial conditions given by;
de 0 for x = O dx
C = C for X = 7 (3 . 1 5) h
C Co and � - y eo for 1 = 0
This problem was solved analyt ically by Mikhai lov and Ozis ik ( 1 985) This i s given as;
2 [ y I (0 � ' ) I ' ,
y L }ll�1 I --- - . e (,�i Iy
, (I) '�2) 12 Y m 1 ' ( 1 ( ,li�i L\)
where (m i s the roots of J, «() 0 And !lm i s given by;
2 !lm
3-24
I [ f) !:: 2 . ( 1 + y ) + (2 ± 2 D //I
"
[D !;: 2 . ( 1 + ) + (2 ]2 I ) Y III • . a
(3 . 1 6)
(3 . 1 7)
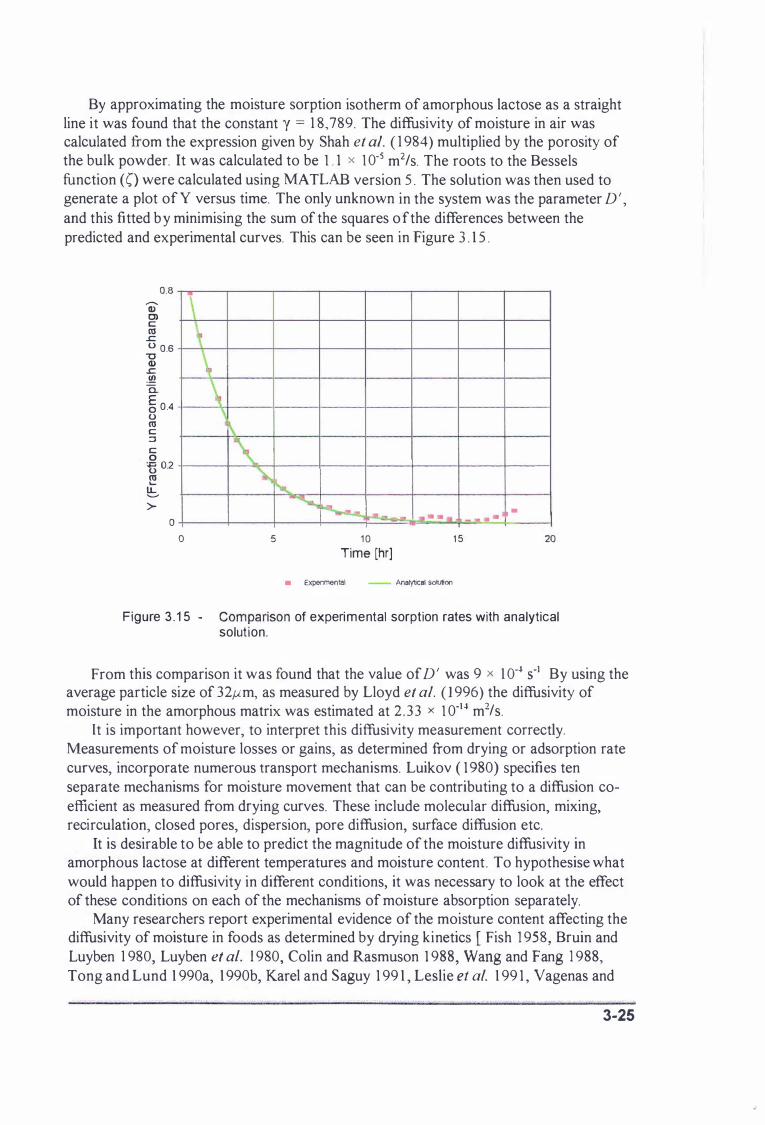
By approximating the moisture sorption isotherm of amorphous lactose as a straight line it was found that the constant y = 1 8,789. The diffusivity of moisture in air was calculated from the expression given by Shah et al. ( 1 984) multiplied by the porosity of the bulk powder. It was calculated to be 1 . 1 x 1 0-5 m2/s. The roots to the Bessels function (0 were calculated using MATLAB version 5 . The solution was then used to generate a plot of Y versus time. The only unknown in the system was the parameter D' , and this fitted b y minimising the sum of the squares o f the differences between the predicted and experimental curves. This can be seen in Figure 3 . 1 5 .
0.8 Q) C> C tU .t:: 0 0.6 "0 (J) .t:: .!!! a. E 0 0.4 o tU C :::l C o 1:5 0.2 tU .... !S >-
o
\ \ \ � \
o
1\ "\. '\.. �
5
� � .
1 0
Time [hr]
• Expenmental
-. - - . . . -
1 5 20
Analytical solUtion
Figure 3 . 1 5 - Comparison of experimental sorption rates with analytical solut ion.
From this comparison it was found that the value of D' was 9 x 1 O-� S-l By using the average particle size of 32,um, as measured by Lloyd et al. ( 1 996) the diffusivity of moisture in the amorphous matrix was estimated at 2 . 33 x 1 0-14 m2/s.
It is important however, to interpret this diffusivity measurement correctly. Measurements of moisture losses or gains, as determined from drying or adsorption rate curves, incorporate numerous transport mechanisms. Luikov ( 1 980) specifies ten separate mechanisms for moisture movement that can be contributing to a diffusion coefficient as measured from drying curves. These include molecular diffusion, mixing, recirculation, closed pores, dispersion, pore diffusion, surface diffusion etc.
It is desirable to be able to predict the magnitude of the moisture diffusivity in amorphous lactose at different temperatures and moisture content . To hypothesise what would happen to diffusivity in different conditions, it was necessary to look at the effect of these conditions on each of the mechanisms of moisture absorption separately.
Many researchers report experimental evidence of the moisture content affecting the diffusivity of moisture in foods as determined by drying kinetics [ Fish 1 958, Bruin and Luyben 1 980, Luyben et al. 1 980, Colin and Rasmuson 1 988, Wang and Fang 1 988, Tong and Lund 1 990a, 1 990b, Karel and Saguy 1 99 1 , Leslie et al. 1 99 1 , Vagenas and
' I
3-25
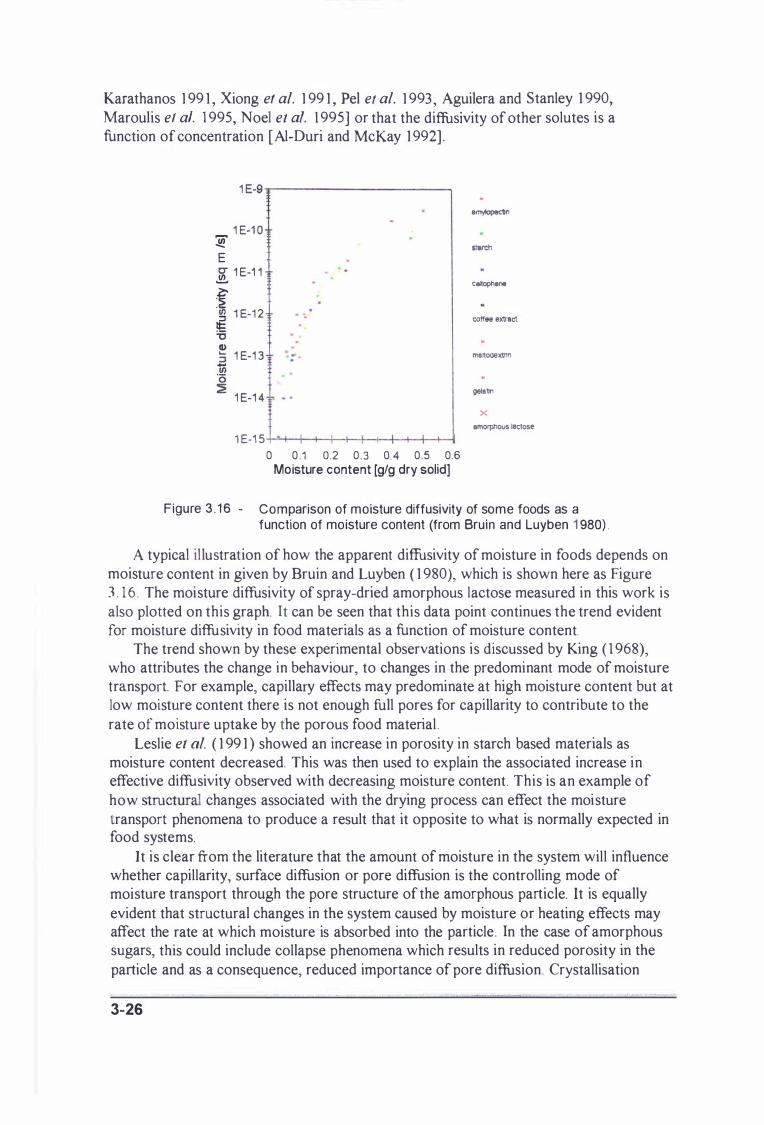
Karathanos 1 99 1 , Xiong et al. 1 99 1 , Pel et al. 1 993 , Aguilera and Stanley 1 990, Maroulis et at. 1 995, Noel et al. 1 995] or that the diffusivity of other solutes is a function of concentration [Al-Duri and McKay 1 992] .
1 E-9 -r----------...,
1 E-1 0 � E 0' 1 E-1 1 .!E.
f rJ) 1 E-1 2 tE :0 Q) :5 1 E-1 3 iii '0 :2 1 E-1 4
: -
1 E -1 5 +-"-- +--+--+--+--1--+-+--+--+--+--+--1 o 0 .1 0.2 0.3 0 .4 0 .5 0.6
Moisture content [gIg dry solid]
amylopectin
s1arch
cellophane
coif •• extract
m.nodex1nn
gel.on X
amorphous lactose
Figure 3 . 1 6 - Comparison of moisture diffusivity of some foods as a function of moisture content (from Bruin and Luyben 1 980) .
A typical illustration of how the apparent diffusivity of moisture in foods depends on moisture content in given by Bruin and Luyben ( 1 980), which is shown here as Figure 3 . 1 6 . The moisture diffusivity of spray-dried amorphous lactose measured in this work is also ploued on this graph. It can be seen that this data point continues the trend evident for moisture diffusivity in food materials as a function of moisture content.
The trend shown by these experimental observations is discussed by King ( 1 968), who attributes the change in behaviour, to changes in the predominant mode of moisture transport. For example, capillary effects may predominate at high moisture content but at low moisture content there is not enough full pores for capillarity to contribute to the rate of moisture uptake by the porous food material .
Leslie et at. ( 1 99 1 ) showed an increase in porosity in starch based materials as moisture content decreased. This was then used to explain the associated increase in effective diffusivity observed with decreasing moisture content. This is an example of how structural changes associated with the drying process can effect the moisture transport phenomena to produce a result that it opposite to what is normally expected in food systems.
It is clear from the literature that the amount of moisture in the system will influence whether capillarity, surface diffusion or pore diffusion is the controlling mode of moisture transport through the pore structure of the amorphous particle. It is equally evident that structural changes in the system caused by moisture or heating effects may affect the rate at which moisture is absorbed into the particle. In the case of amorphous sugars, this could include collapse phenomena which results in reduced porosity in the particle and as a consequence, reduced importance of pore diffusion. Crystallisation
3-26
phenomena may also be occurring within the amorphous matrix, which may release more moisture into the system and hence effect the absorption rate.
The effect of temperature on moisture diffusivity in porous media is often modelled using the Arrhenius relationship [Madamba et a1. 1 996, Tong and Lund 1 990a,b, Karel and Saguy 1 99 1 ] or by a modified Arrhenius relationship incorporating a factor accounting for the degree of binding of moisture in the system [Xiong et a1. 1 99 1 ] . The main reason for the increase in moisture absorption rates at higher temperature is the increased moisture holding capacity of hot air. In this way more moisture can be transported by the mechanism of pore diffusion.
The "solid" regions of the porous amorphous particle are regions of supersaturated sugar solution in either the glass or rubbery states. As such, molecular diffusion into these regions is molecular diffusion of water into a highly viscous concentrated l iquid. The Stokes-Einstein equation has been developed from the hydrodynamical theory for moisture diffusivity in liquids [Welty el al. 1 984] and can be used to relate the diffusivity to the vi scosity of the liquid (see Eq (3 1 8))
j) K ( /+273 1 5 )
6 n r ll (3 . 1 8)
Many other equations of this nature can be found in the literature to describe t he
relationship between di ffusivity, temperature and viscosity [Welty e/ a1. 1 984, Reid e/ a1. 1 987, Sinnott 1 989, Bird et al. 1 960]. If such relationships are applicable to highly
concentrated solutions around the glass transition temperature, then diffusivity should be proportional to free volume. Vrentas and Duda ( 1 979) suggest that the best models for prediction of molecular diffusivity in polymer solutions are those based on free volume considerations.
Because the WLF model has been shown to describe the change in viscosity with temperature and moisture content around the glass transition temperature of sugar solutions it may be argued that the WLF model can be used to describe the change in moisture diffusivity. Karel and Saguy ( 1 99 1 ) take this approach to allow the prediction of shelf life in food systems.
Le Meste et al. ( 1 99 1 ) and Noel et al. ( 1 995) argue that this is not the case and that viscosity and diffusivity are relatively decoupled properties. This is based largely around comparison of the magnitude of the change in viscosity between a dilute sugar solution and a solution near its glass transition temperature, when compared to the change in moisture diffusivity. A 12 log cycle change in viscosity gives only a 4 log cycle change in diffusivity. It should be pointed out however that the sugar solution near the glass transition temperature is likely to be porous and that the molecular diffusion processes under consideration may be several orders of magnitude less than the distances used in calculation of the effective diffusivity from drying kinetics.
To summarise this discu ssion it i s suggested that direct comparison of apparent diffusivity values with dilute solution moisture diffusivity data using the Stokes-Einstein equation is not sensible as the Stokes-Einstein equation applies only for the molecular diffusion mode of moisture transport. Unless the distance for diffusion by this mode is quantified, accurate molecular diffusivity data cannot be achieved from drying studies.
It seems, from a brief revue of the literature, that the factors effecting the overall rate
3-27
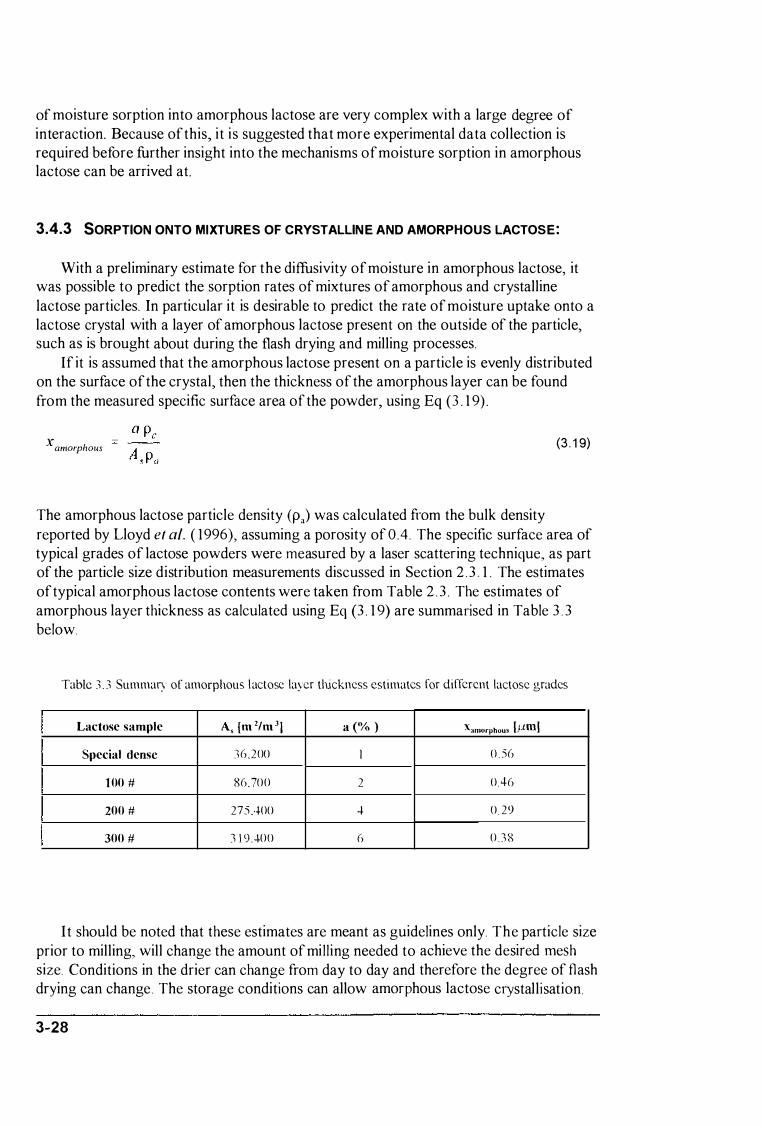
of moisture sorption into amorphous lactose are very complex with a large degree of interaction. Because of this, it is suggested that more experimental data collection is required before further insight into the mechanisms of moisture sorption in amorphous lactose can be arrived at.
3.4.3 SORPTION ONTO MIXTURES OF CRYSTALLINE AND AMORPHOUS LACTOSE:
With a preliminary estimate for the diffusivity of moisture in amorphous lactose, it was possible to predict the sorption rates of mixtures of amorphous and crystalline lactose particles. In particular it is desirable to predict the rate of moisture uptake onto a lactose crystal with a layer of amorphous lactose present on the outside of the particle, such as is brought about during the flash drying and milling processes.
If it is assumed that the amorphous lactose present on a particle is evenly distributed on the surface of the crystal, then the thickness of the amorphous layer can be found from the measured specific surface area of the powder, using Eq (3 . 1 9) .
Xamorphous (3 . 1 9)
The amorphous lactose particle density (pJ was calculated from the bulk density reported by Lloyd et al. ( 1996), assuming a porosity of 0.4 . The specific surface area of typical grades of lactose powders were measured by a laser scattering technique, as part of the particle size distribution measurements discussed in Section 2 . 3 . 1 . The estimates of typical amorphous lactose contents were taken from Table 2 . 3 . The estimates of amorphous layer thickness as calculated using Eq (3 . 1 9) are summarised in Table 3 . 3 below.
Table 3 . 3 Summary of amorphous lactose layer thickness estimates for different lactose grades
I Lactose sample As (m 2/m 3j a (% ) xanwrl'hou, [j.im! Special dense 36.200 I 0 . 56
1 00 # 86.700 2 046 200 # 275 ...1-00 4 0 29 300 # 3 1 9.400 6 0 .38
It should be noted that these estimates are meant as guidelines only. The particle size prior to milling, will change the amount of milling needed to achieve the desired mesh size. Conditions in the drier can change from day to day and therefore the degree of flash drying can change. The storage conditions can allow amorphous lactose crystallisation.
3-28
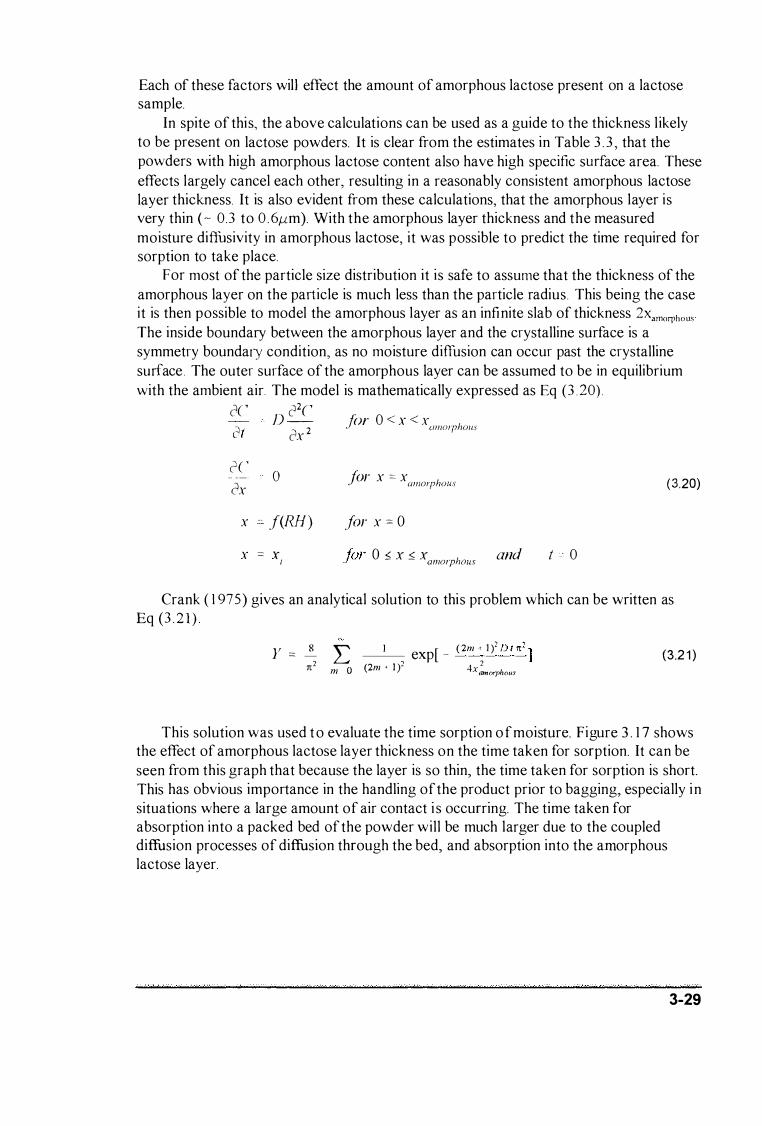
Each of these factors will effect the amount of amorphous lactose present on a lactose sample.
In spite of this, the above calculations can be used as a guide to the thickness l ikely to be present on lactose powders. It is clear from the estimates in Table 3 . 3 , that the powders with high amorphous lactose content also have high specific sUlface area. These effects largely cancel each other, resulting in a reasonably consistent amorphous lactose layer thickness. It is also evident from these calculations, that the amorphous layer is very thin ( � 0.3 to 0 . 6/1m). With the amorphous layer thickness and the measured moisture diffusivity in amorphous lactose, it was possible to predict the time required for sorption to take place.
For most of the particle size distribution it is safe to assume that the thickness of the amorphous layer on the pat1icle is much less than the particle radius. This being the case it is then possible to model the amorphous layer as an infinite slab of thickness 2Xamorphous'
The inside boundary between the amorphous layer and the crystalline surface is a symmetry boundary condition, as no moisture diffusion can occur past the crystalline surface. The outer surface of the amorphous layer can be assumed to be in equilibrium with the ambient air. The model is mathematically expressed as Eq (3 20) .
2(' (12(' f) -
21
2(' 2x
2x 2
o
x f(RH) x == X I
fi)r 0 < x < x (/1II0lphollS
for x == x . UIIIOIphous
for x :::: 0
for 0 :'!, x :'!, x Gnd .I' (/J)JOIphous
(3.20)
t 0
Crank ( 1 975) gives an analytical solution to this problem which can be written as Eq (3 . 2 1 ) .
y == g L I exp[ Jl2 m 0 (2m ' Ii
( 2m + 1 )2 D I Jl2 ] 2 4 x amorphous (3.2 1 )
This solution was used t o evaluate the time sorption o f moisture. Figure 3 . 1 7 shows the effect of amorphous lactose layer thickness on the time taken for sorption. It can be seen from this graph that because the layer is so thin, the time taken for sorption is short. This has obvious importance in the handling of the product prior to bagging, especially in situations where a large amount of air contact i s occurring. The time taken for absorption into a packed bed of the powder will be much larger due to the coupled diffusion processes of diffusion through the bed, and absorption into the amorphous lactose layer.
3-29

Q) C) c: <U i3 0.8 "C Q) .s::. en 'a 0.6 E o u u :g 0 4 � c: o
+=l � 0.2 ...
LL '-" >-
o
\ 1\ \
\ \ \ '" \ '\ \ I\.
""-o 5
, "'" I--.. --I--
1 0 1 5 Time [s]
20
thickness = 0.46 um - 0.56um - 0.29 um
Figure 3 . 1 7 - Predicted rates of moisture sorption into varying thicknesses of amorphous lactose.
25
It must be remembered however, that when amorphous lactose surfaces are placed in conditions of high ambient humidity, crystallisation phenomena are also occurring which may release moisture and effect the sorption rates. In this case, the sorption rate will appear slower than predicted, depending on how fast the crystallisation rate is. This is because the outer surface of the amorphous layer will reach high moisture contents much faster than further into the amorphous layer. This may cause crystallisation and hence the expected steady state moisture content is reduced due to the depletion of the amorphous lactose present . Because the diffusivity of moisture in amorphous lactose is controlling the rate of adsorption, it appears that the rate of sorption is slower than predicted using the model developed above. The time taken until the rate of crystallisation overtakes the rate of sorption is however still expected to be similar to that predicted by the sorption model above.
The model used above for the prediction of sorption rates in mixed amorphous and crystalline particles is not yet validated. Sorption rates for samples with varying amorphous lactose contents are needed to achieve this. The diffusivity of moisture in amorphous lactose used in the construction of Figure 3 . 1 7 is that measured in this work. As such, the effect of temperature and moisture content has not been included, due to unavailability of data. If diffusivity is a function of temperature and moisture content, then the analytical solution u sed above is not applicable, as constant properties are not observed. If this is true then a numerical solution to the problem is required.
3-30

3.5 MOISTURE CONTENT DETERMINATION
There are two main reasons to measure the moisture content of lactose samples. The first is to satisfy product specifications. The specification will state what moisture content determination method is to be used and what results are acceptable. The second and most important reason is to give information on what is occurring in lactose. Hopefully this information can be related to quality problems like caking and mould growth, and solutions to reducing quality problems can be identified . As stated previously it is 'free" surface moisture, not "bound" crystal water that contributes to caking related phenomena. With this in mind, this section will discuss the merits and demerits of the common methods of moisture determination.
Moisture content measurement in ex-lactose monohydrate is difficult. This is because of the different characteristics of the two types of moisture present in the powder, that is "bound" and "free" moisture. The differences between these types of moisture have been highlighted above. The difficulties arise because of the "bound" water of crystallisation comprising 5% (gig dry solid) is two orders of magnitude greater than the "free" moisture we are interested in, which comprises about 0 .05% (gig dry solid).
The most widely accepted method for "free moisture" in food science research is vacuum desiccation over phosphorous pentoxide for at least one month. Phosphorous pentoxide maintains an absolute humidity of 0 . 0 1 93 mg water per kg of dry air and is therefore an excellent desiccator [Grayson 1 979] . It will remove only free moisture as no extra energy is applied to the sample to overcome the activation energy required to break the relatively strong bonds holding the water of crystallisation within the lattice structure. This method was used in construction of the sorption isotherms presented in this report.
Due to the long time requirements, this method is not applicable for routine industry based measurements and another quicker method must be identified.
Oven at 1 200C
Oven at 1 00 'C 0 Own at 80 �
Vaouum oven at 60"C
0% 1 % 2% 3% 4% 5% Moisturu outent (gls dry soild)
,.
6%
Figure 3 . 1 8 - Comparison of drying techn iques for the measurement of moisture content i n a-lactose monohydrate . Comparison included oven drying at 80, 1 00 and 1 20°C for 2 hours , 60°C at 700 mm Hg vacuum for 3 h rs and desiccation over phosphorus pentoxide for 2 weeks.
3-31
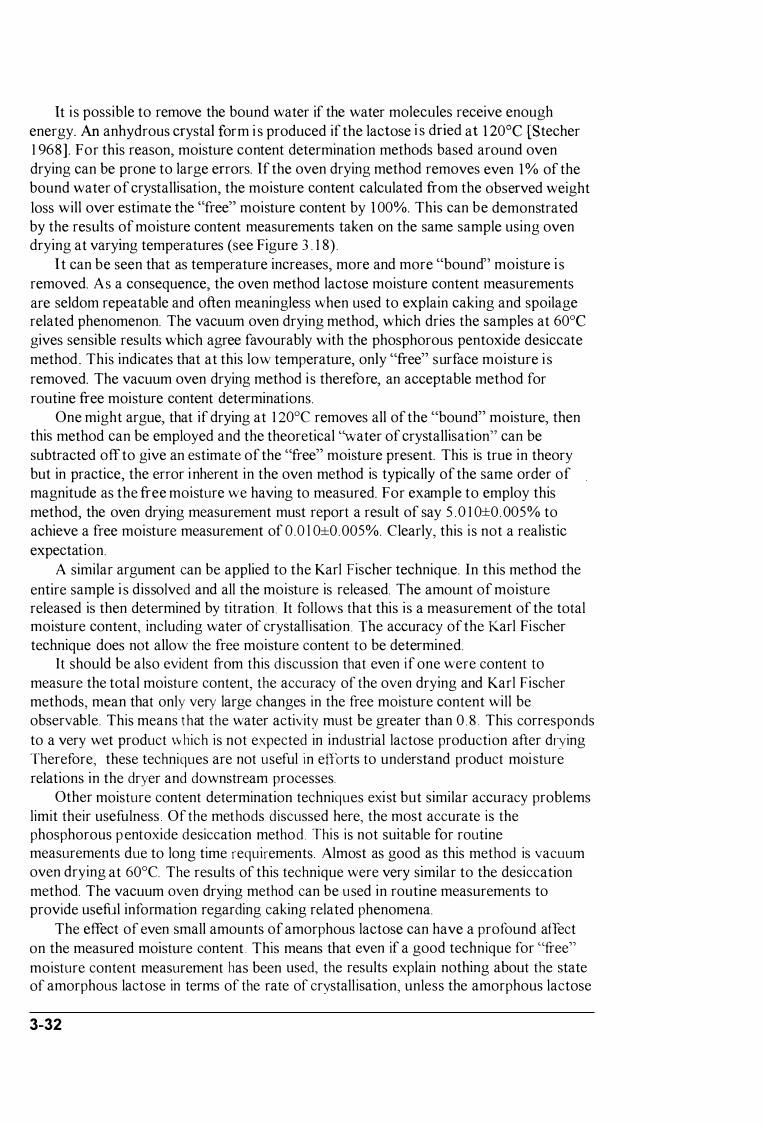
It i s possible to remove the bound water if the water molecules receive enough energy. An anhydrous crystal form i s produced if the lactose i s dried at 1 20°C [Stecher 1 968] . For this reason, moisture content determination methods based around oven drying can be prone to large errors. If the oven drying method removes even 1 % of the bound water of crystallisation, the moisture content calculated from the observed weight loss will over estimate the "free" moisture content by 1 00%. This can be demonstrated by the results of moisture content measurements taken on the same sample using oven drying at varying temperatures (see Figure 3 . 1 8) .
I t can be seen that as temperature increases, more and more "bound" moisture i s removed. As a consequence, the oven method lactose moisture content measurements are seldom repeatable and often meaningless when used to explain caking and spoilage related phenomenon. The vacuum oven drying method, which dries the samples at 60°C gives sensible results which agree favourably with the phosphorous pentoxide desiccate method. This indicates that at this low temperature, only "free" surface moisture i s removed. The vacuum oven drying method is therefore, an acceptable method for routine free moisture content determinations.
One might argue, that if drying at 1 20°C removes all of the "bound" moisture, then this method can be employed and the theoretical "water of crystallisation" can be subtracted off to give an estimate of the "free" moisture present. This is true in theory but in practice, the error inherent in the oven method is typically of the same order of magnitude as the free moisture we having to measured. For example to employ this method, the oven drying measurement must report a result of say 5 .0 1 O±0.005% to achieve a free moisture measurement of O .O l O±0.005%. Clearly, this is not a realistic expectation.
A similar argument can be applied to the Karl Fischer technique. In this method the entire sample i s dissolved and all the moisture is released. The amount of moisture released is then determined by titration. It follows that this is a measurement of the total moisture content, including water of crystall isation. The accuracy of the Karl Fischer technique does not allow the free moisture content to be determined.
It should be also evident from this discussion that even if one were content to measure the total moisture content, the accuracy of the oven drying and Karl Fischer methods, mean that only very large changes in the free moisture content will be observable. This means that the water activity must be greater than 0 . 8 . This corresponds to a very wet product \vhich is not expected in industrial lactose production after dlying Therefore, these techniques are not useful in efforts to understand product moisture relations in the dryer and downstream processes.
Other moisture content determination techniques exist but similar accuracy problems limit their usefulness Of the methods discussed here, the most accurate is the phosphorous pentoxide desiccation method. This is not suitable for routine measurements due to long time requirements Almost as good as this method is vacuum oven drying at 60°C. The results of this technique were very similar to the desiccation method. The vacuum oven drying method can be used in routine measurements to provide useful information regarding caking related phenomena.
The effect of even small amounts of amorphous lactose can have a profound affect on the measured moisture content . This means that even if a good technique for "free" moisture content measurement has been used, the results explain nothing about the state of amorphous lactose in terms of the rate of crystall isation, unless the amorphous lactose
3-32
content i s also known. This i s a difficult property to measure and at present only an NMR technique is available [Hargreaves 1 995] . Moisture content measurements for samples which contain amorphous lactose therefore provide very little information which can be related to spoilage or caking problems in bulk product.
An alternative measurement which is of use for such considerations is water activity.
3.6 WATER ACTIVITY MEASUREMENT
The shape of the sorption i sotherm for crystalline lactose (Figure 3 . 3 ) shows that water activity measurements are much more sensitive than moisture content measurements. The low slope of the i sotherm at low water activity values means that while a moisture content measurement on a batch of samples may show only small differences of 0 .0 1 %, the samples in the batch may have water activities which may vary by up to 0 1 . The moisture content can be predicted from the water activity reading using the sorption isotherm for the product being measured .
The sorption behaviour of amorphous lactose means that if the pure amorphous lactose isotherm is known, the water activity of the whole product will allow the estimation of the moisture content of the amorphous fraction without knowledge of how much amorphous lactose is present. This is useful, as from this information the glass transition temperature can be calculated and it can be shown whether the amorphous lactose is in a condition where crystallisation will occur or not . If amorphous lactose crystall isation is occurring, the rate of crystall isation can also be estimated. This analysis can not be achieved with a moisture content measurement of a lactose sample alone.
It fol lows from this discussion that the method of choice for identifYing the state of moisture relations in lactose powders is by measurement of water activity and not by moisture content.
A review of the different techniques for measurement of water activity has been conducted by Troller ( 1983) . This discusses various methods including bi-thermal equilibration, vapour pressure manometer, hair hygrometer, isopiestic hygrometry, electrical hygrometers, psychometry, dew point measurement and freezing point depression. The equilibration time, reliability, cost and maintenance requirements of each instrument are compared.
As discussed previously, water activity i s the relative humidity of air which is in both thermal and moisture equilibrium with the product of which the water activity is being measured. There are many methods available for measurement of the p sychrometric properties of air so it follows that water activity can be best measured by allowing the product to come to equilibrium with some air and then measure the relative humidity of this air. This is the basis of most water activity measurement devices.
In electronic water activity meters, equilibration times of down to five minutes are reported. This would make such meters suitable for routine laboratory analyses. The problem is however, that five minutes is not likely to be sufficient time for equilibrium to be reached. In a sealed vessel containing a SOmm deep bed with a stagnant head space above it, three hours are needed before a steady state relative humidity is achieved. For these reasons careful assessment must be made before purchase of a water activity meter. I f long equilibration times are required for accurate water activity measurement, the number of analyses that can be achieved using one water activity meter would be only a
3-33
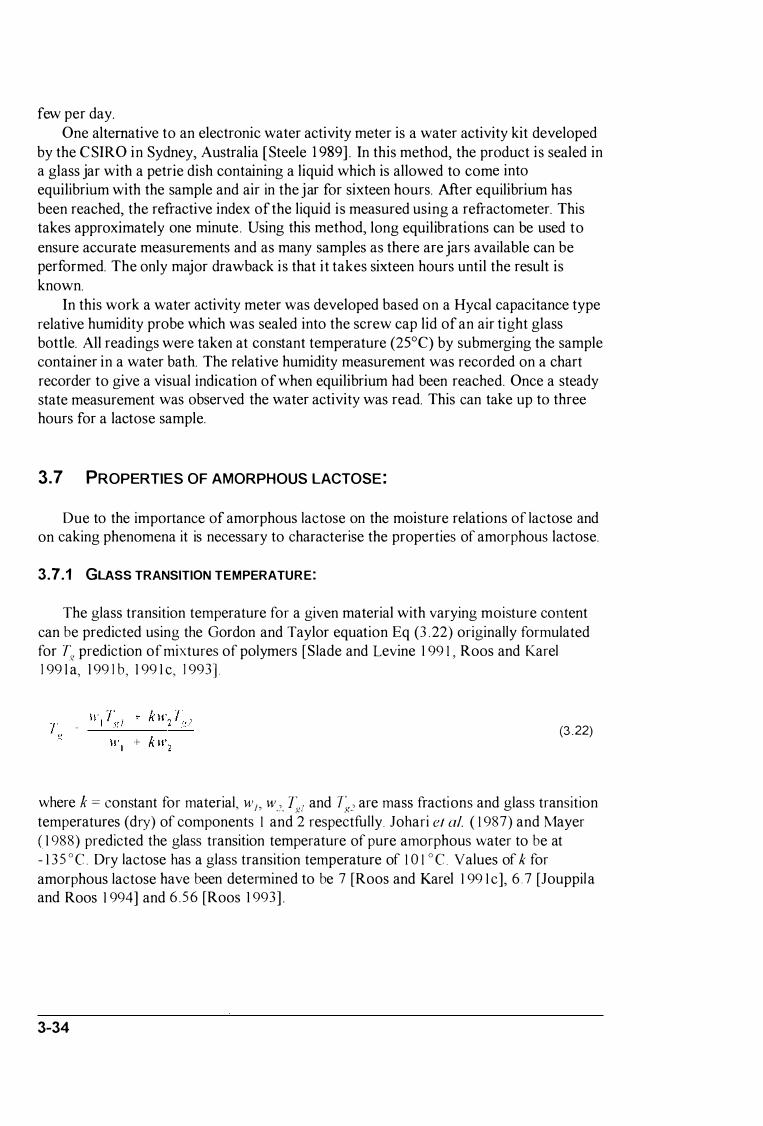
few per day. One alternative to an electronic water activity meter is a water activity kit developed
by the CSIRO in Sydney, Australia [Steele 1 989] . In this method, the product is sealed in a glass jar with a petrie dish containing a liquid which is allowed to come into equilibrium with the sample and air in the jar for sixteen hours. After equilibrium has been reached, the refractive index of the liquid is measured using a refractometer. This takes approximately one minute . Using this method, long equilibrations can be used to ensure accurate measurements and as many samples as there are jars available can be performed. The only major drawback is that it takes sixteen hours until the result is known.
In this work a water activity meter was developed based on a Hycal capacitance type relative humidity probe which was sealed into the screw cap lid of an air tight glass bottle. All readings were taken at constant temperature (2S0C) by submerging the sample container in a water bath. The relative humidity measurement was recorded on a chart recorder to give a visual indication of when equilibrium had been reached. Once a steady state measurement was observed the water activity was read. This can take up to three hours for a lactose sample.
3.7 PROPERTIES OF AMORPHOUS LACTOSE:
Due to the importance of amorphous lactose on the moisture relations of lactose and on caking phenomena it is necessary to characterise the properties of amorphous lactose.
3.7.1 GLASS TRANSITION TEMPERATURE:
The glass transition temperature for a given material with varying moisture content can be predicted using the Gordon and Taylor equation Eq (3 .22) originally formulated for T� prediction of mixtures of polymers [Slade and Levine 1 99 1 , Roos and Karel 1 99 1 a, 1 99 1 b, 1 99 1 c, 1 993]
(3.22)
where k = constant for material, WI' w.'. T�I and T�.' are mass fractions and glass transition temperatures (dry) of components 1 and 2 respectfully. Johari e/ al. ( 1 987) and Mayer ( 1 988) predicted the glass transition temperature of pure amorphous water to be at - 1 3 5 0 C . Dry lactose has a glass transition temperature of 1 0 1 0 C . Values of k for amorphous lactose have been determined to be 7 [Roos and Karel 1 99 1 c], 6 . 7 [Jouppila and Roos 1 994] and 6 . 56 [Roos 1 993] .
3-34
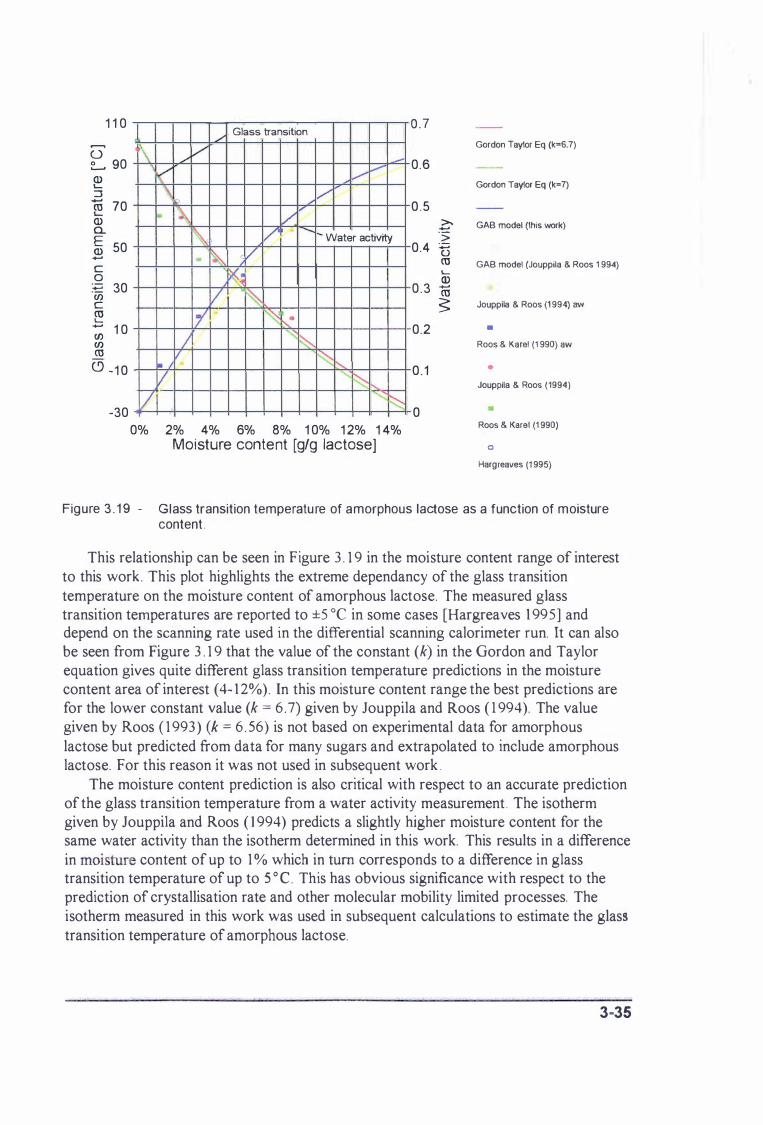
1 1 0
,......., o � 90 Q) � ::J ro 70 � Q) 0... � 50 ..... c o
:2 30 en c ro � -; 1 0 en ro (9 - 1 0
-30
/' Glass transition
�\ /V ..-� ,/ ,/" '\ V
,. .� V \" V -...... r- Water activity . � ,/
�� V � Ii � ';:-.... I " � V � I- �
V � 7 "'" � 0% 2% 4% 6% 8% 1 0% 1 2% 1 4%
Moisture content [gIg lactose]
0 .7
Gordon T aytor Eq (k=6.7)
0.6
Gordon Taylor Eq (k=7)
0 .5 >. GAB model (this work) .....
0.4 :� ..... 0 ro GAB model (Jouppila & Roos 1 994) �
0 .3 Q) ....... ro 5: Jouppila & Roos (1 994) aw
0.2 •
Roos & Karel (1 990) aw
0 . 1 •
Jouppila & Roos (1994)
0 Roos & Karel (1 990)
0
Hargreaves (1 995)
Figure 3 . 1 9 - Glass transition temperature of amorphous lactose as a function of moisture content .
This relationship can be seen in Figure 3 . 1 9 in the moisture content range of interest to this work. This plot highlights the extreme dependancy of the glass transition temperature on the moisture content of amorphous lactose. The measured glass transition temperatures are reported to ±5 °C in some cases [Hargreaves 1 995] and depend on the scanning rate used in the differential scanning calorimeter run. It can also be seen from Figure 3 . 1 9 that the value of the constant (k) in the Gordon and Taylor equation gives quite different glass transition temperature predictions in the moisture content area of interest (4- 1 2%). In this moisture content range the best predictions are for the lower constant value (k = 6 .7) given by Jouppila and Roos ( 1 994). The value given by Roos ( 1 993) (k = 6 . 56) is not based on experimental data for amorphous lactose but predicted from data for many sugars and extrapolated to include amorphous lactose. For this reason it was not used in subsequent work .
The moisture content prediction is also critical with respect to an accurate prediction of the glass transition temperature from a water activity measurement . The isotherm given by Jouppila and Roos ( 1 994) predicts a slightly higher moisture content for the same water activity than the isotherm determined in this work. This results in a difference in moisture content of up to 1 % which in tum corresponds to a difference in glass transition temperature of up to S o C . This has obvious significance with respect to the prediction of crystallisation rate and other molecular mobility limited processes. The isotherm measured in this work was used in subsequent calculations to estimate the glass transition temperature of amorphous lactose.
3·35

3.7.2 VISCOSITY OF AMORPHOUS LACTOSE:
The viscosity of amorphous lactose is important when considering the bridging of amorphous lactose between adjacent particles forming sticky agglomerates. The WLF or Williams-Landel-Ferry equation relates relaxation time of mechanical properties to the temperature above the glass transition temperature ( Tg) [Williams et al. 1 955 ] . Viscosity is a property which is governed by the relaxation of the amorphous structure. The equation is given by Eq (3.23) .
10g.2l. =
11g C1 ( T - Tg)
C2 + ( T - Tg) (3 .23)
Williams ef at. ( 1 95 5) reported average constants (el and C2) to be 1 7 .44 and 5 1 .6 respectively and to apply for many materials. Soesanto and Williams ( 1 98 1 ) found these universal constants to be adequate to describe the temperature dependence of viscosity of sugar solutions at temperatures above the glass transition temperature. Williams et at. ( 1 955) state however that the universal constants should only be used as a last resort for describing relat ionships where no reliable data are available from any other source. Because no viscosity data for amorphous lactose exists above the glass transition temperature and because the universal constants were shown to be adequate for sucrose solutions [ Soesanto and Williams 1 98 1 ] these values will be used in this work . From (3 .23) and the universal constants Figure 3 .20 was constructed.
3-36
1 2 1\ \, '" 1 0
"" ""
"" "� "" 4 ......... ............... r---.-..
------------
2
--o
o 20 40 60 80 1 00
Figure 3 .20 - Dependence of viscosity on temperature above g lass transit ion temperature predicted by the WLF equation .
3.7.3 QUANTIFICATION OF AMORPHOUS LACTOSE IN LACTOSE POWDERS
Some method of quantification of the amount of amorphous lactose present in lactose powders was required, in order to model the moisture movement and caking phenomena in bulk lactose. Three methods of quantitying low levels of amorphous lactose have been reported in the literature. Hargreaves ( 1 995) developed a low resolution nuclear magnetic resonance method. This i s expensive to carry out as specialist equipment and operators are required. Hargreaves also showed that polarimetry can be used, if some equilibrium ratio of a and p lactose is assumed. The background levels of p-lactose, in the crystalline lactose portion are also needed. Buckton and Darcy ( 1 995) developed a method which used very accurate gas adsorption equipment. A dry lactose sample was made to undergo crystallisation at 90% RH where it was expected that the product of crystallisation would be a-lactose monohydrate . The sample was then subjected to dry conditions again . The weight increase in the sample was assumed to be due to an increase in water of crystallisation associated with the newly formed a-lactose monohydrate crystal.
Two new methods of identifying and quantitying the amount of amorphous lactose in a predominately crystalline lactose sample were hypothesised as part of this work and further developed in other projects [O'Donnell ( 1 997), Paterson et at. ( 1 997)) .
The first method uses the additive i sotherm developed for mixtures of crystalline and amorphous lactose samples ( see Section 3 . 3 .6) . Samples of the powder to be tested were placed in desiccators kept, at 0 and 3 3% RH using phosphorous pentoxide and a saturated solution of magnesium chloride. The moisture content was evaluated from the weight changes after two weeks equilibration time and the amorphous lactose content was determined using the additive isotherm Eq (3 .24).
Nf = M + a M Jlux/1Ire Cf),sta/lme . amorphous (3.24)
where the moisture contents of the crystalline and amorphous phases were evaluated using the moisture sorption isotherm equations of each phase at 0 . 33 a.v (Eq' s (3 . 2) to (3 .4) and (3 . 1 1 )) .
The second method makes use of the moisture release that occurs during crystallisation. A sample of lactose was sealed into a 20 ml Kimex tube with a Hycal dew point probe attached, so the water activity of the product could be measured. The initial water activity was recorded and then the sample was heated, in a water bath to 90°C, to cause any amorphous lactose on the sample to crystallise. This was indicated by a increase in the measured headspace relative humidity. The sample was cooled back to ambient temperature and the final water activity of the sample recorded. An increase in water activity of the sample was taken to indicate the presence of amorphous lactose. If an assumption on the product of crystallisation i s made, an estimate of the quantity of amorphous lactose present can be made. Paterson et at. ( 1 997) and 0 'Donnell ( 1 997) showed that the predictions made by assuming either, complete crystallisation to an anhydrous product, or complete crystallisation to a hydrous product, fell either side of the amorphous content of the samples as measured by the additive i sotherm method, polarimetry and NMR. Because of this, the method was used, only as a test for the presence of amorphous lactose in a sample, as a result could be obtained within a few hours.
3-37

3.7.4 CRYSTALLISATION OF AMORPHOUS LACTOSE:
3 . 7.4. 1 Product of amorphous lactose crystallisation:
The work of Vuataz ( 1 988), studying the role of water activity and temperature in lactose crystall isation has been widely used in discussion of the crystallisation product of amorphous lactose. Very little direct investigation of the crystallisation product has followed, in spite of the significance of this in interpreting and establishing the mechanisms for amorphous lactose crystall isation kinetics.
Vuataz ( 1 988) measured the rate of sorption of moisture in spray-dried milk powders and observed moisture loss, due to amorphous lactose crystallisation, at humidities greater than 39. 1 % RH at 25°C. The product was determined using near infra red spectroscopy. For water activity values of 0 .391 and 0.493 , the crystallisation product was shown to be p-Iactose. At a water activity of 0 .572, the product was alactose monohydrate. It should be noted that the near infra red spectra are difficult to interpret and this method has not been used in any subsequent work.
Vuataz ( 1 988) continued the investigation by crystallising spray dried milk samples at 80°C and 98°C. He concluded that at 0 .55 a.v and 80°C a phase change from amorphous lactose to p-Iactose occurred after about three minutes followed by conversion to a-lactose monohydrate after about sixteen minutes. At the same water activity but at 98°C, amorphous lactose first crystallises to a-lactose monohydrate in one minute but then converts to p-Iactose after about sixteen minutes. At higher water activity (0. 58 aJ a-lactose monohydrate crystallisation occurs at low temperature and Plactose crystallisation occurs at high temperature (>93 .5°C).
There are many other observations of amorphous lactose crystallisation in the literature although not all researchers have directly investigated the crystallisation product.
Herrington ( 1 934) observed amorphous lactose crystallisation in humidified environments by measuring the weight change of an amorphous lactose sample placed in high humidity environment. No effort to measure or control the level of relative humidity in the balance chamber was taken, but the results show that when the maximum amount of moisture adsorbed was high, the crystallisation time was reduced and a-lactose monohydrate was the crystallisation product. In runs where the maximum amount of moisture was not as high, crystallisation times become longer and a mixture of a-lactose and p-Iactose were produced.
Sharp and Doob ( 1 94 1 ) suggest the product of crystallisation in whey powders is the crystal form that is previously present in the powder. That is, if the powder has predominantly crystalline p-Iactose in the solid phase, the amorphous lactose will crystallise to the p-form If a-lactose is present in the crystall ine fraction, then the amorphous lactose will crystallise to the a-form. These conclusions were drawn from measured changes in the anameric ratio with temperature at constant relative humidity. Upon investigation of the data it is difficult to see the justification for such a conclusion. The small changes in a-lactose content could be explained by experimental uncertainty. The data of Sharp and Doob do however show strong evidence that crystalline p-lactose will convert to a-lactose monohydrate if placed in environments of above 65% relative humidity, as first stated by Troy and Sharp ( \ 930) .
Sharp ( 1 93 8) developed a seeding test to detect the presence of a a-lactose
3-38
crystalline surface or a p-lactose surface. The method involved making a slightly supersaturated solution of lactose at temperature above and below 93 . 5°C . Seed crystals were then added to the lactose solutions. If the seed crystals are p-Iactose then growth would be observed in the supersaturated solution above 93 . 5°C but not in the solution below 93 . 5°C . The reverse observation was found to be true for a-lactose crystal seeds. Sharp ( 1 938) then used this technique to test the crystalline form present on the surface of industrially produced a-lactose monohydrate crystals. Surprisingly, these crystals tested positive for the presence of p-lactose. When the same crystals were moistened with a small amount of water before being added to the seeding test, they indicated no Plactose present. The small amount of water added was enough to dissolve the crystalline p-Iactose present on the a-lactose crystal surface. The presence of p-Iactose on the crystal surface was explained by the crystall isation of p-Iactose from a small amount of amorphous present on the surface due to rapid drying. Sharps' observation indicates that amorphous lactose can crystallise to p-Iactose even when the main crystalline form present in the sample is a-lactose monohydrate. This observation disagrees with the conclusions given by Sharp and Doob ( 1 94 1 ) . Sharp ( 1 938) found that tests on spraydried milk powders which have caked due to amorphous lactose moisture adsorption and crystallisation usually showed the presence of p-Iactose.
Bushi l l el al. ( 1 965) report that amorphous lactose obtained by freeze and spraydrying lactose solutions crystall ises as a mixture of a-lactose monohydrate and p-lactose when exposed to air of a fairly wide range of humidities. Under similar conditions the amorphous lactose present in spray-dried milk powders crystallise to a-lactose monohydrate although it can crystallise to an anhydrous molecular compound consisting of a-lactose and p-Iactose in a molar ratio of 5 : 3 . This was identified using x-ray diffraction techniques. Jouppila et al. ( 1 997) have recently reported the existence of this product in spray dried milk powder.
Berlin et al. ( 1 968) measured the moisture sorption isotherm for freeze-dried lactose at 24.5°C . This shows crystallisation of the amorphous lactose occurred above 0 .375 3..". The crystallisation product has a total moisture content of 1 % for 0 . 375 <lw to 0 .85 3..V7 indicating the formation of p-lactose or a mixture of a-lactose and p-Iactose.
Warburton and Pixton ( 1 978) showed a similar observation when they measured the change in weight of lactose glasses at different relative humidities. The results show crystallisation occurred at 0.45 � and an anhydrous product was produced. Their results also show the expected rise in weight which would result from the conversion of Plactose to a-lactose monohydrate at high water activity.
Linko et al. ( 1 982) measured the isotherm of amorphous lactose by dehydrating over phosphorous pentoxide then hydrating to a water activity of 0.9 and measuring moisture content by weight change and water activity using a relative humidity probe. The accuracy of the isotherm is questionable as no note of the equilibration time for the water activity measurement is given, and more sorption, followed by crystallisation and moisture release is expected at high water activity. It is unlikely equilibrium was reached in this experiment and therefore, what was measured as water activity can not be called water activity by definition. The result is interesting however, as the second desorption isotherm curve shows evidence of crystallisation, as indicated by a drop in the moisture content of the sample. The product moisture content, as measured by weight gain, i s below the water of crystallisation content of pure a-lactose monohydrate ( '" 5 . 26% w/w). This suggests that some p-lactose was formed due to the crystallisation of
. . . . .. . .. . . . . . ... . .. . . . . . h . . . . .. ' . , . . . . . . . . .. .. . .. .. . . . ... . . . . . .. ; ......... . . , • • •.• • • • • • •• • • •• " . . . .. . . . , . .. . . . � . . . . . . * •. •.• • • � • •• • • • • • � .. ....... .. .. . . . . -. ..... S< . . . . . ...... .... . . .. . . .. . . . ....... . . . .. . . ... , . . . .. . . .. ... . . � . .. .. . .. . 3-39
amorphous lactose. Niediek ( 1 982) measured the rate of sorption of moisture onto amorphous lactose
with a sensitive balance. At 600e and at a relative humidity of 46.8%, the lactose adsorbed a maximum of 4 .6% moisture before crystallisation occurred in one- two hours. The resulting moisture content, as measured by weight change, was 0.8% which suggests the formation of p-lactose. At 300e and 50% relative humidity the maximum moisture content reached was 1 0% and crystallisation occurred within ten hours. The crystallised product had a moisture content of 3 . 5%, indicating a mixture of the a- and p-lactose forms.
Wursch et at. ( 1 984) looked at crystallisation of spray-dried milk powders with a moisture content of 3 . 1 4% stored at different temperatures. No change was observed in moisture content, lactose content or anameric ratio after 60 days for those samples stored at 45°C. At higher temperature significant lactose losses occurred, caused by extensive Maillard reaction reaching 2 1 % lost after two months at 60°C. Lactose crystallisation accompanied the lactose losses by Maillard reaction. A reduction in alactose content and an increase in p-lactose was observed. This result was confirmed by x-ray diffraction. It was also shown that the rate of crystallisation to p-lactose at 600e increased with increasing moisture content. At 6. 1 % moisture content, lactose started to crystallise to the p-anameric form but after two days a-lactose monohydrate was formed progressively. Wursch e/ at. ( 1 984) suggested protein in milk powders may be important in favouring p-Iactose crystallisation.
Saito ( 1 985) reported that crystallisation to p-Iactose proceeded very slowly in whole milk powder at 37°e, when humidity was low enough to inhibit the crystallisation of a-lactose monohydrate. X-ray diffraction analysis confirmed that p-lactose alone, was in the crystalline state in whole milk powder stored at 37°e for 5 months at an relative humidity of less than 20%.
Labrousse et at. ( 1 992) investigated collapse and crystall isation in amorphous lactose matrix and showed that crystallisation of lactose in a lactose-gelatin matrix occurred rapidly above 52% relative humidity at 25°e as indicated by moisture loss. The final equilibrium moisture contents of those samples which crystallised ranges from about 1 to 2 . 5%. This indicates that complete crystal lisation of amorphous lactose to a-lactose monohydrate did not occur, even when placed in relative humidity environments of up to 85%.
Jouppila and Roos ( 1 994) measured the sorption isotherm of amorphous lactose by weight change and found that no measurements for water activity values above 0 . 55 �\ were possible because crystallisation at 24°e occurred before equilibrium moisture content was achieved . The moisture contents of the crystall ised samples were approximately 2% at 0 .66 �v and < 1 % at O. 76 �v. This indicated the product of crystallisation in these samples was p-Iactose or a mixture of the a-lactose and p-Iactose forms.
If the amorphous lactose structure is considered, it is evident that both a-lactose and p-lactose are highly supersaturated. If the mobility of the molecules are high enough, they should both spontaneously nucleate and crystallisation will proceed. In the case of p-lactose, there is nothing to stop this occurring if the molecules are able to move and arrange themselves into the ordered crystal lattice structure. a-Lactose monohydrate crystals, however, require lattice water to keep the structure stable. This is only possible if there is enough water present in the amorphous matrix.
3-40

Walstra and Jenness ( 1 984) report that it is possible to produce a stable (S) anhydrous a-lactose crystal form by crystallisation from a supersaturated solution of lactose in ethanol . It is conceivable that such a product could be formed during the crystallisation of amorphous lactose at low water activity. In both ethanol solutions and dry amorphous lactose there is not enough moisture present to support the formation of a-lactose monohydrate crystals. The stable (S) a-lactose will dissolve preferentially to alactose monohydrate and therefore in high water activity conditions, it is l ikely that it will be conveI1ed into the hydrous form, in much the same way that p-lactose has been shown to do.
A general mechanism of the amorphous crystallisation phenomena, that fits most of the observat ions reported in the l iterature can be hypothesi sed. Either p-lactose or (S) alactose anhydride crystal forms will form during the crystall isation of amorphous lactose at low water act ivity « 0 . 55 ) . At high water activity, there is enough water present to form a-lactose monohydrate crystals . If a crystallisation experiment is carried out at high water activity (>0 55), then until the product reaches that high water activity, the product may be partially crystallising to form an anhydrous product . As moisture is released during this process, or further absorption takes place, the crystall isation to alactose monohydrate may proceed. Tn conditions of high water activity, the solid state conversion of the anhydrous to the hydrous forms will also occur. The final product, will therefore be, a mixture of the anhydrous and hydrous lactose forms in different proportions depending on the conditions of the experiment .
3 .7. 4 .2 Crystallisation kinetics:
A kinetic model for the crystallisation of amorphous lactose was required for the modelling of caiUng phenomena in bulk lactose. Since the application of glass transition related relaxation phenomena to food systems, there have been many efforts to use models originally developed for polymer systems to describe phenomena in food systems. The glass transition temperature has been used to describe collapse [To and Flink 1 978a,b,c, Tsourouflis et at. 1 976], sticking (Wallack and King 1 988), crystall isation [Roos and Karel 1 992] and caking [Aguilera et at. 1 995, Peleg 1 993] of amorphous sugar systems. Because these models were originally developed for polymer systems, it is useful to begin with the polymer science literature.
3. 7. 4. 2. 1 POL YMER CRYSTALLISA TlON KINETICS
The progress of crystallisation is dependant on the formation of stable nuclei and the ability of molecules to move about and build on these nuclei . When a molten polymer is cooled below its melting point to a constant temperature, the rate of crystallisation is at first slow. The rate then accelerates to a maximum and then slows again as it approaches equilibrium. The rate of crystallisation is therefore sigmoid in shape as a function of time.
Avrami ( 1 939, 1 94 1 ) developed Eq (3 .25) to describe this phenomena which has become known throughout the polymer science field as the Avrami equation.
Yet) = 1 - e -KI n (3.25)
• • , • • •• • • , . . .. . .. .. .... . . . �., . . . . . . .. " . . . . . . . . , . . . . . . . . . . . . . __ . . ...... . . . . . . .. .. .. .. . .. .. . .... . . . . . . .. . .. . . . ... , . . . .. . . . . .. . ... . . . . . . � . . . . . .. . . .. . . . . . . ..... �· •• • • • • • • •••• � .· ... H· • • • � • •• • ,
3-41
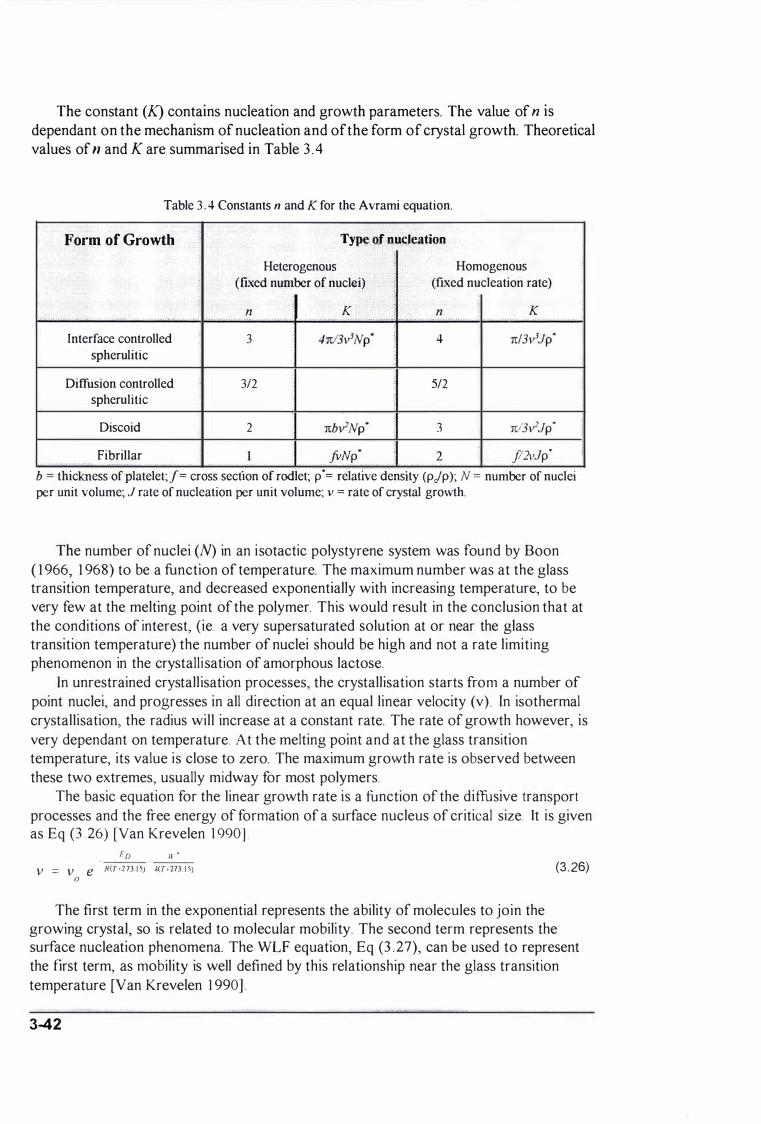
The constant (K) contains nucleation and growth parameters. The value of n is dependant on the mechanism of nucleation and of the form of crystal growth. Theoretical values of n and K are summarised in Table 3 .4
Table 3 . 4 Constants n and K for the Avrami equation. ,
Form of Growth
Interface controlled spherulitic
Diffusion controlled spherulitic
Discoid
Fibrillar - -- . . . . . . . . , .
Type of nucleatioD Heterogenous
(fixed number of nuclei) "
n K
3
3/2
2
. . fvNp· .. ,
Homogenous (fixed nucleation rate)
n K
4
5/2
3
2 p2vJp' b = thickness of platelet;J= cross sectIon of rodIet; p.= relatIve densIty (pjp)� N = number of nuclei per unit volume; J rate of nucleation per unit volume; v = rate of crystal growth.
The number of nuclei (N) in an isotactic polystyrene system was found by Boon ( 1 966, 1 968) to be a function of temperature. The maximum number was at the glass transition temperature, and decreased exponentially with increasing temperature, to be very few at the melting point of the polymer. This would result in the conclusion that at the conditions of interest, (ie. a very supersaturated solution at or near the glass transition temperature) the number of nuclei should be high and not a rate limiting phenomenon in the crystall i sation of amorphous lactose.
In unrestrained crystallisation processes, the crystallisation starts from a number of point nuclei, and progresses in all direction at an equal linear velocity (v) In isothermal crystallisation, the radius will increase at a constant rate. The rate of growth however, is very dependant on temperature. At the melting point and at the glass transition temperature, its value is close to zero. The maximum growth rate is observed between these two extremes, usually midway for most polymers.
The basic equation for the linear growth rate is a function of the diffusive transport processes and the free energy of formation of a surface nucleus of critical size. It is given as Eq (3 26) [Van Krevelen 1 990J
ED IV " V = V e R(T . 27315) k(T . 273 1 5)
o (3. 26)
The first term in the exponential represents the ability of molecules to join the growing crystal, so is related to molecular mobility. The second term represents the surface nucleation phenomena. The WLF equation, Eq (3 .27), can be used to represent the first term, as mobility is well defined by this relationship near the glass transition temperature [Van Krevelen 1 990J
3-42
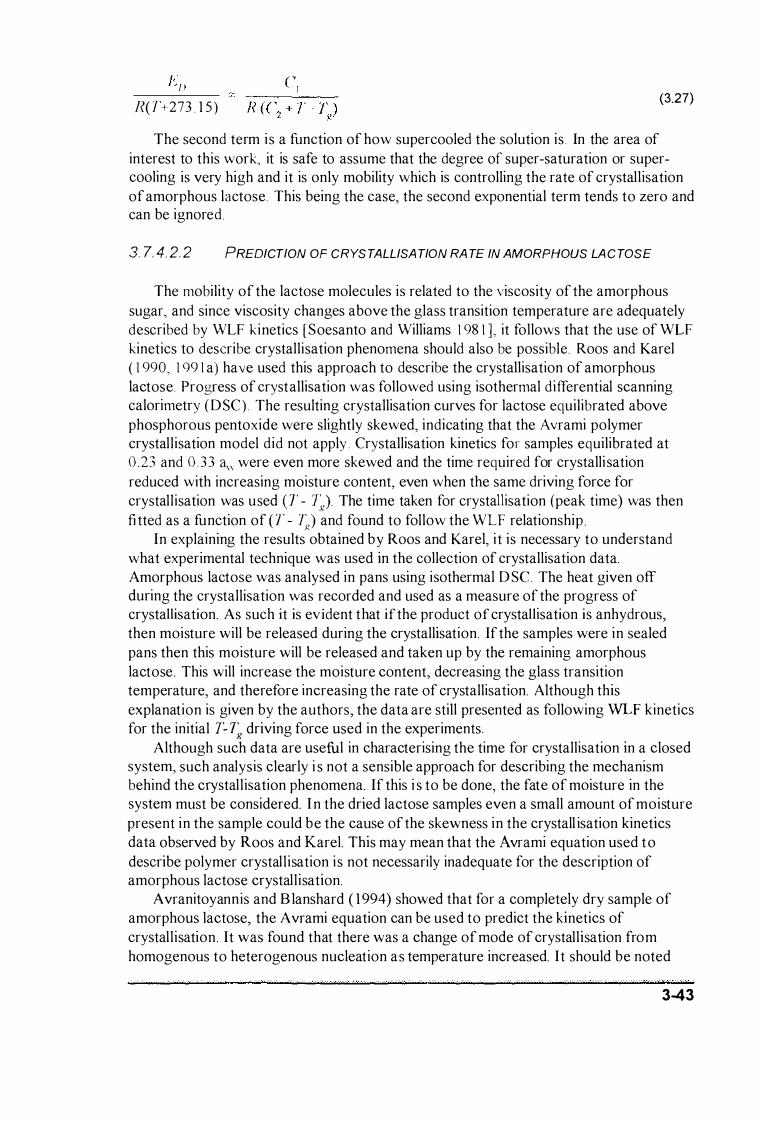
C I (3.27)
I\( T+273 1 5 )
The second term is a function of how supercooled the solution is . In the area of interest to this work, it is safe to assume that the degree of super-saturation or supercooling is very high and it is only mobility which is controlling the rate of crystallisation of amorphous lactose. This being the case, the second exponential term tends to zero and can be ignored.
3. 7. 4. 2. 2 PREDICTION OF CRYSTALLISATION RA TE IN AMORPHOUS LACTOSE
The mobility of the lactose molecules is related to the viscosity of the amorphous sugar, and since viscosity changes above the glass transition temperature are adequately described by WLF kinetics [Soesanto and Williams 1 98 1 ] , it follows that the use of WLF kinetics to describe crystallisation phenomena should also be possible. Roos and Karel ( 1 990, 1 qq 1 a) have used this approach to describe the crystallisation of amorphous lactose. Progress of crystallisation was followed using isothermal differential scanning calorimetry (DSC) . The resulting crystallisation curves for lactose equilibrated above phosphorous pentoxide were slightly skewed, indicating that the A vrami polymer crystallisation model did not apply . Crystallisation kinetics for samples equilibrated at 0 23 and 0 . 33 3., were even more skewed and the time required for crystalli sation reduced with increasing moisture content, even when the same driving force for crystallisation was used ( 1' - 1�). The time taken for crystallisation (peak time) was then fitted as a function of ( T - 7�) and found to follow the WLF relationship .
In explaining the results obtained by Roos and Karel, i t is necessary to understand what experimental technique was used in the collection of crystallisation data. Amorphous lactose was analysed in pans using isothermal D SC The heat given off during the crystallisation was recorded and used as a measure of the progress of crystallisation. As such it is evident that if the product of crystallisation is anhydrous, then moisture will be released during the crystallisation. If the samples were in sealed pans then this moisture will be released and taken up by the remaining amorphous lactose. This will increase the moisture content, decreasing the glass transition temperature, and therefore increasing the rate of crystallisation. Although this explanation is given by the authors, the data are still presented as following WLF kinetics for the initial T-7� driving force used in the experiments,
Although such data are useful in characterising the time for crystallisation in a closed system, such analysis clearly i s not a sensible approach for describing the mechanism behind the crystallisation phenomena. If this i s to be done, the fate of moisture in the system must be considered. I n the dried lactose samples even a small amount of moisture present in the sample could be the cause of the skewness in the crystall isation kinetics data observed by Roos and Karel. This may mean that the Avrami equation used to describe polymer crystall isation i s not necessarily inadequate for the description of amorphous lactose crystallisation.
A vranitoyannis and B lanshard ( 1 994) showed that for a completely dry sample of amorphous lactose, the Avrami equation can be used to predict the kinetics of crystallisation. It was found that there was a change of mode of crystallisation from homogenous to heterogenous nucleation as temperature increased. It should be noted
3-43
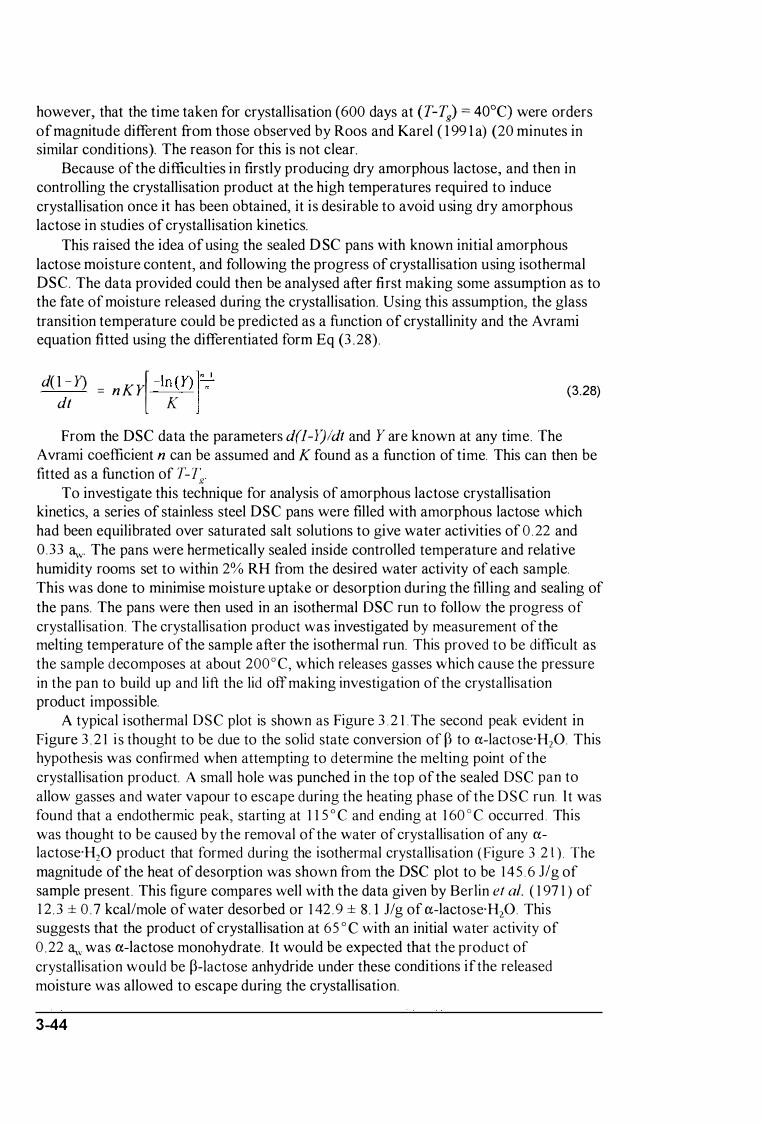
however, that the time taken for crystallisation (600 days at (T-Tg) = 40°C) were orders of magnitude different from those observed by Roos and Karel ( 1 99 1 a) (20 minutes in similar conditions). The reason for this is not clear.
Because of the difficulties in firstly producing dry amorphous lactose, and then in controlling the crystallisation product at the high temperatures required to induce crystallisation once it has been obtained, it is desirable to avoid using dry amorphous lactose in studies of crystallisation kinetics.
This raised the idea of using the sealed D SC pans with known initial amorphous lactose moisture content, and following the progress of crystallisation using isothermal DSC. The data provided could then be analysed after first making some assumption as to the fate of moisture released during the crystallisation. Using this assumption, the glass transition temperature could be predicted as a function of crystallinity and the A vrami equation fitted using the differentiated form Eq (3 .28) .
d( 1 - Y) = n K Y[ -In (Y) ln�1
dt K
From the DSC data the parameters d(l-Y)/dt and Y are known at any time. The
(3.28)
A vrami coefficient n can be assumed and K found as a function of time. This can then be fitted as a function of T-l�.
To investigate this technique for analysis of amorphous lactose crystallisation kinetics, a series of stainless steel DSC pans were filled with amorphous lactose which had been equilibrated over saturated salt solutions to give water activities of 0 .22 and 0 .33 <lw. The pans were hermetically sealed inside controlled temperature and relative humidity rooms set to within 2% RH from the desired water activity of each sample. This was done to minimise moisture uptake or desorption during the filling and sealing of the pans. The pans were then used in an isothermal DSC run to follow the progress of crystallisation. The crystallisation product was investigated by measurement of the melting temperature of the sample after the isothermal run. This proved to be difficult as the sample decomposes at about 200° C, which releases gasses which cause the pressure in the pan to build up and lift the lid off making investigation of the crystallisation product impossible.
A typical i sothermal DSC plot is shown as Figure 3 . 2 1 . The second peak evident in Figure 3 . 2 1 i s thought to be due to the solid state conversion of P to a-lactase-H20. This hypothesis was confirmed when attempting to determine the melting point of the crystallisation product. A small hole was punched in the top of the sealed DSC pan to allow gasses and water vapour to escape during the heating phase of the DSC run. It was found that a endothermic peak, starting at 1 1 5 ° C and ending at 1 60 ° C occurred . This was thought to be caused by the removal of the water of crystallisation of any alactose-H20 product that formed during the isothermal crystallisation (Figure 3 2 1 ) . The magnitude of the heat of desorption was shown from the DSC plot to be 145 .6 Jig of sample present . This figure compares well with the data given by Berlin et al. ( 1 97 1 ) of 1 2 . 3 ± 0 . 7 kcallmole of water desorbed or 1 42 .9 ± 8. 1 Jig of a-lactose-H20 . This suggests that the product of crystallisation at 65 ° C with an initial water activity of 0.22 <lw was a-lactose monohydrate. It would be expected that the product of crystallisation would be p-lactose anhydride under these conditions if the released moisture was allowed to escape during the crystallisation.
3 -44
8
7
""" r-. / \ I -----' \ / \ /
J 2 /
/ I
1/ o
o 25 50 75 1 00 Time [min)
Figure 3 .21 - Isothermal DSC plot for amorphous lactose at 65 "C and 0.22 aw.
This suggests that the analysis of isothermal DSC plots is very difficult because several phenomena are important and can occur simultaneously during the experiment. Each of these phenomena are important in predicting caking phenomena. They are;
o sorption/desorption � p to a-lactose conversion 6) crystallisation
Because of the importance of each of these phenomena they are discussed in more detail below.
40
35
�o E i2s .2 u.
r 1 5
10
5 100
l...---" 120
f\. 11 / \ / / /
1 / j
/ l� V \ 140 Temperature ["C] 160
Figure 3 .22 · DSC plot showing desorption of water of crystall isation from crysta l l isation product.
180
3-45
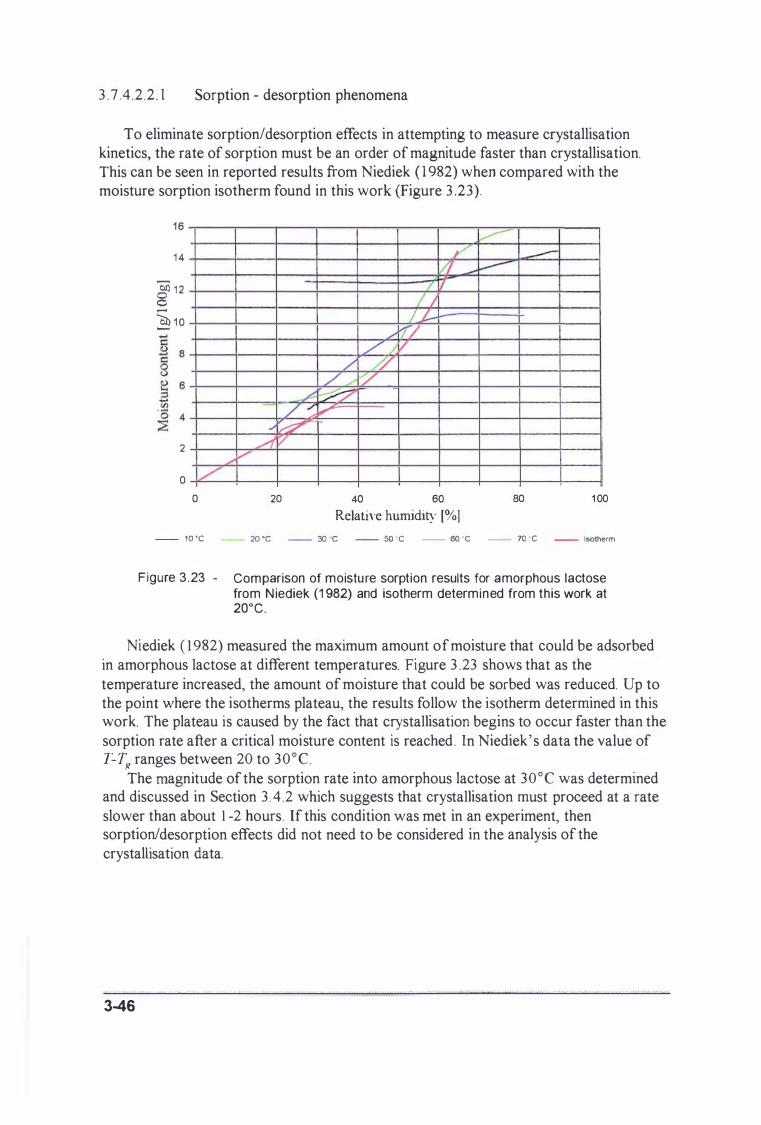
3 .7 .4 .2 .2 . 1 Sorption - desorption phenomena
To eliminate sorption/desorption effects in attempting to measure crystallisation kinetics, the rate of sorption must be an order of magnitude faster than crystallisation. This can be seen in reported results from Niediek ( 1 982) when compared with the moisture sorption isotherm found in this work (Figure 3 .23) .
16 1 4
� 12 o ..... � 10
2
o /' o
- 10 'C
r / ./ -' �
A ? ...... v
20
/' VI _ / 1/
Ii /J--./r/ ./� /
/ // // � -7;7
fII"
40 60 Relative humidity [%1
� ------
80 100
- 2O 'C - 30 C - 50 'C - OO 'C - 70 ·C - Isotherm
Figure 3 .23 - Comparison of moisture sorption results for amorphous lactose from N iediek (1 982) and isotherm determined from this work at 20°C.
Niediek ( 1 982) measured the maximum amount of moisture that could be adsorbed in amorphous lactose at different temperatures. Figure 3 .23 shows that as the temperature increased, the amount of moisture that could be sorbed was reduced. Up to the point where the isotherms plateau, the results follow the isotherm determined in this work. The plateau is caused by the fact that crystallisation begins to occur faster than the sorption rate after a critical moisture content is reached. In Niediek' s data the value of T-Tg ranges between 20 to 30°C .
The magnitude of the sorption rate into amorphous lactose at 30°C was determined and discussed in Section 3 . 4 .2 which suggests that crystallisation must proceed at a rate slower than about 1 -2 hours. If this condition was met in an experiment, then sorption/desorption effects did not need to be considered in the analysis of the crystallisation data.
3-46
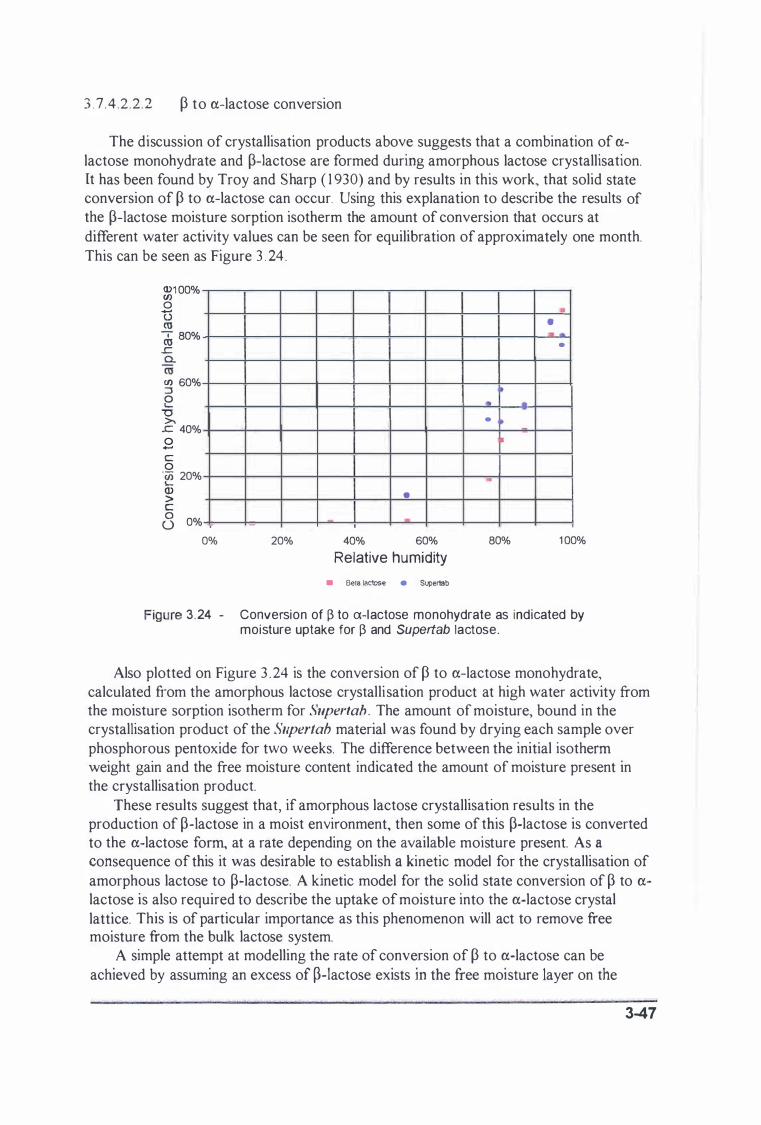
3 .7 .4 .2 .2 .2 P to a-lactose conversion
The discussion of crystallisation products above suggests that a combination of alactose monohydrate and p-Iactose are formed during amorphous lactose crystallisation. It has been found by Troy and Sharp ( 1 930) and by results in this work, that solid state conversion of P to a-lactose can occur. Using this explanation to describe the results of the p-Iactose moisture sorption isotherm the amount of conversion that occurs at different water activity values can be seen for equilibration of approximately one month. This can be seen as Figure 3 . 24 .
0)1 00% (/) o ...... o (U d, 80% ..c 0. (/) 60% :::l o � "0 >-..c 40% o ...... c o 'w 20% � Q) > c <3 0%
0% 20%
• • -
•
• • •
•
..
40% 60% 80% 1 00% Relative humidity
• Beta lactose • Supertab
Figure 3 .24 - Conversion of !3 to a-lactose monohydrate as indicated by moisture uptake for !3 and Supertab lactose .
Also plotted on Figure 3 . 24 is the conversion of P to a-lactose monohydrate, calculated from the amorphous lactose crystallisation product at high water activity from the moisture sorption isotherm for Supertab . The amount of moisture, bound in the crystallisation product of the SlIpertab material was found by drying each sample over phosphorous pentoxide for two weeks. The difference between the initial isotherm weight gain and the free moisture content indicated the amount of moisture present in the crystallisation product.
These results suggest that, if amorphous lactose crystallisation results in the production of p-Iactose in a moist environment, then some of this palactose is converted to the a-lactose form, at a rate depending on the available moisture present. As a consequence of this it was desirable to establish a kinetic model for the crystallisation of amorphous lactose to p�lactose. A kinetic model for the solid state conversion of p to alactose is also required to describe the uptake of moisture into the a-lactose crystal lattice. This is of particular importance as this phenomenon will act to remove free moisture from the bulk lactose system.
A simple attempt at modelling the rate of conversion of P to a-lactose can be achieved by assuming an excess of p-Iactose exists in the free moisture layer on the
3-47
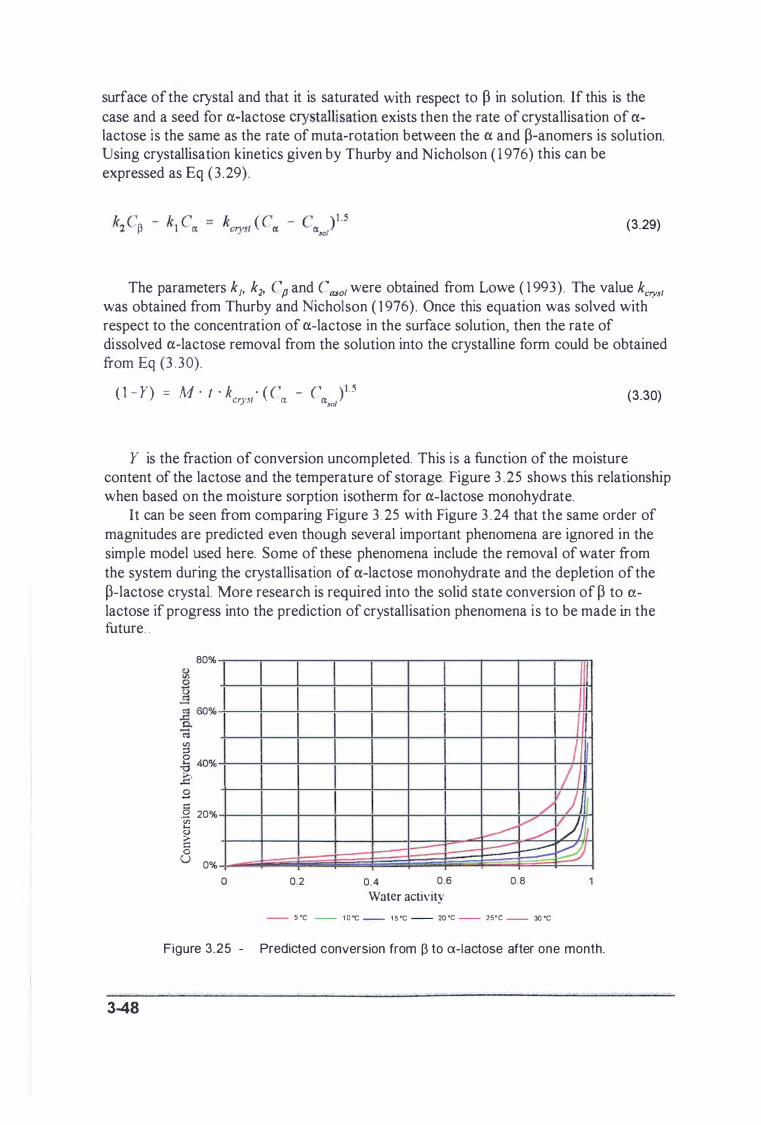
surface of the crystal and that it is saturated with respect to P in solution. If this is the case and a seed for ex-lactose crystallisation exists then the rate of crystallisation of exlactose is the same as the rate of muta-rotation between the ex and p-anomers is solution. U sing crystallisation kinetics given by Thurby and Nicholson ( 1 976) this can be expressed as Eq (3 .29) .
(3.29)
The parameters kJ> k2J Cp and Casal were obtained from Lowe ( 1 993) . The value kcrys/ was obtained from Thurby and Nicholson ( 1 976) . Once this equation was solved with respect to the concentration of ex-lactose in the surface solution, then the rate of dissolved ex-lactose removal from the solution into the crystalline form could be obtained from Eq (3 . 30).
( I - Y) ::: M ' t ' k ' (C - C )1 .5 crYSI 0: 0:'0/ (3.30)
Y is the fraction of conversion uncompleted. This i s a function of the moisture content of the lactose and the temperature of storage. Figure 3 .25 shows this relationship when based on the moisture sorption isotherm for ex-lactose monohydrate.
It can be seen from comparing Figure 3 .25 with Figure 3 .24 that the same order of magnitudes are predicted even though several important phenomena are ignored in the simple model used here. Some of these phenomena include the removal of water from the system during the crystallisation of ex-lactose monohydrate and the depletion of the p-lactose crystal. More research is required into the solid state conversion of p to exlactose if progress into the prediction of crystallisation phenomena is to be made in the future . .
3-48
80%
s:: .8 20% Vl .... (l) 6 o
U 0%
a 0.2 0.4 0.6
Water activity
/ � V ........... I----l---:::::
0.8
- s 'C - 1 0 -C _ 1 S 'C - w ·c - 2S'C - 3Q 'C
I / ) v� �
Figure 3.25 - Predicted conversion from f3 to a-lactose after one month.

To ensure the solid state p- to a-lactose conversion did not interfere with the crystallisation phenomena, crystallisation experiments targeted low water activity environments, where the rate of p- to a-lactose conversion is negligible, due to the deficiency in available water.
3 7 4. 2 . 2 . 3 Crystallisation rate
To evaluate the rate of crystallisation, an experiment which removed the secondary effects of unknown crystalli sation product, sorption rates and the conversion of p to ctlactose was designed . For these reasons, the crystallisation rate at 3 0 ° C and relative humidity environments of around 45% were investigated. Under these conditions the adsorption time was expected to be of the order of one day and the crystallisation time approximately one month. The crystallisation product was expected to be p-lactose, and the rate of solid state conversion to a-lactose monohydrate was expected to be negligible Lower temperature or relative humidity would result in extended crystallisation times and make experimental measurement impracticaL
The progress of crystallisation can be followed by recording the weight change with respect to time, for a dried sample subjected to these conditions. To achieve this, samples of amorphous lactose which had been equilibrated over phosphorous pentoxide for four weeks, were placed on to the sorption rate measurement device outlined in section 3 4 above . The chamber relative humidity was then changed to the required value using the dew point generator. The sample weight was data-logged every thirty minutes for a period of approximately one month. These data were expressed as the change in moisture content and can be seen in Figure 3 . 26 which shows the results for two samples subjected to 45% RH and 43 . 5% RH at 3 0 ° C for approximately one month.
It can be seen from 3 .26 that the product of crystallisation is anhydrous as the final moisture content is approximately 0%. This confirms the hypothesis that, under the conditions of the experiment, p-lactose or stable anhydrous a-lactose crystallisation products were produced.
The sample placed in higher relative humidity has a slightly faster rate of crystallisation, but both experiments show curves of similar shape. The initial adsorption can be seen to take approximately one day . When this is compared to the gradual decrease in moisture content with time over the next 25 days, it validates the assumption that in the range of conditions investigated, sorption phenomena are much faster than crystallisation.
349
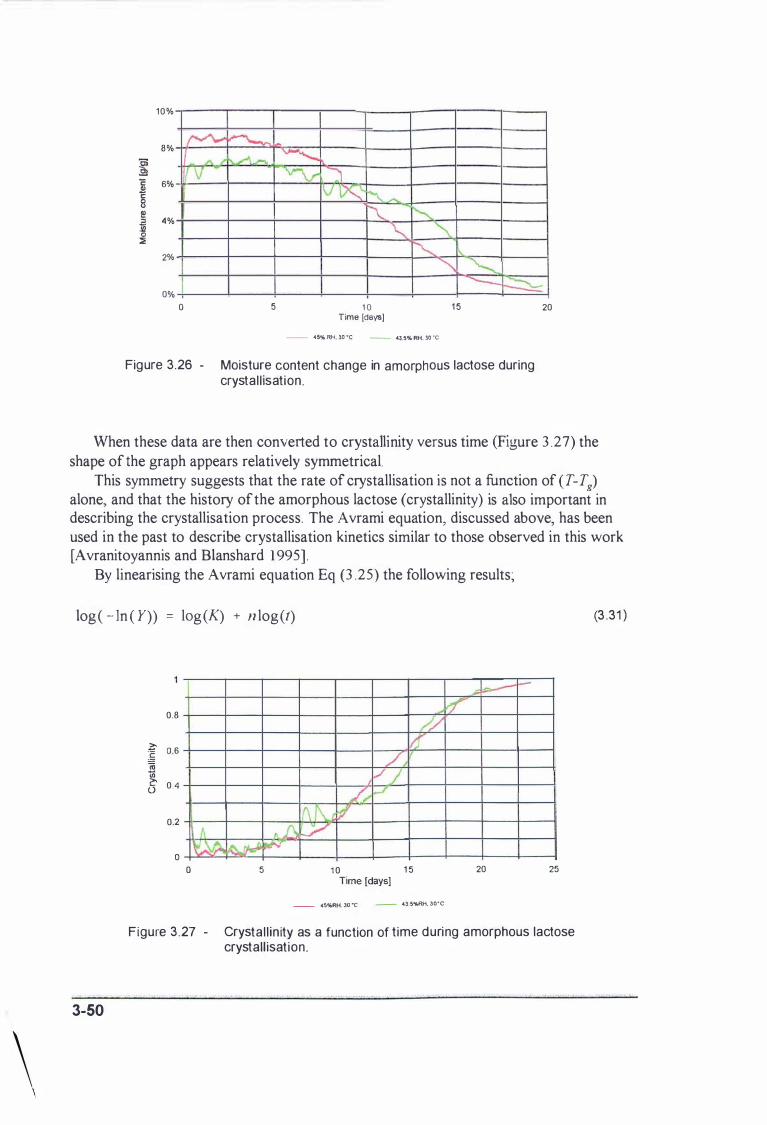
\
10%
8% � � � .9 'E 6% �
A / ..A....-. v 8 f£ ::l 4% i 0 ::;
2%
0% o 5
� "\r -:J IV�
k � '" � � '" � �
1 0 Time [days) - 45% RH, 30 ec _ 43.6% RH. 30 �c
1 5
, -.............: I-� 20
Figure 3.26 - Moisture content change in amorphous lactose during crystal l isation.
When these data are then converted to crystallinity versus time (Figure 3 .27) the shape of the graph appears relatively symmetrical.
This symmetry suggests that the rate of crystallisation is not a function of (T-Tg) alone, and that the history ofthe amorphous lactose (crystallinity) is also important in describing the crystallisation process. The Avrami equation, discussed above, has been used in the past to describe crystallisation kinetics similar to those observed in this work [Avranitoyannis and Blanshard 1 995] .
By linearising the Avrami equation Eq (3 .25) the following results;
loge - In ( Y)) = 10g(A) + n log(t)
3-50
0.8
z- 0.6 § iii en � 0.4 0
0.2 � \o'.�
o o
b' // � / V I � � 1(\ f\u I?
IL� V II\. � �
5 1 0 1 5 Time [days]
_ 45%RH. 30 �c _ 4J.5'!I.RH. 30'C
� js...--�
20 25
Figure 3 .27 - Crystal l in ity as a function of time during amorphous lactose crystall isation.
(3 .31 )
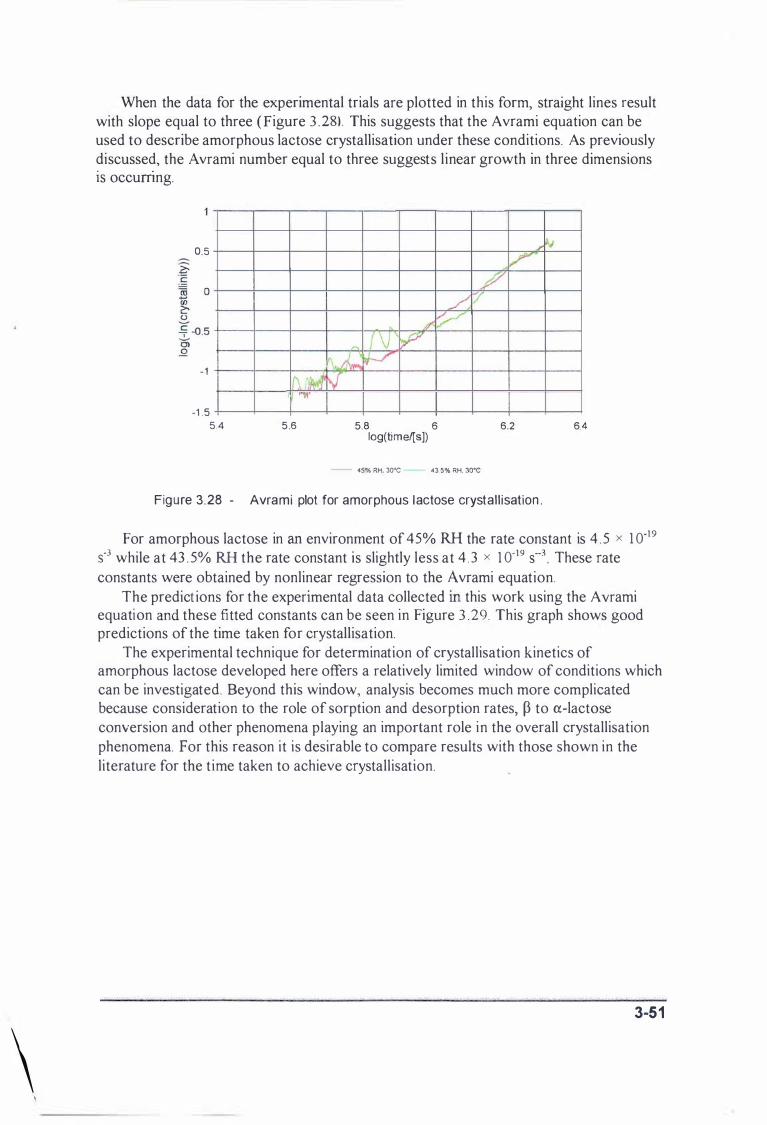
\ \
When the data for the experimental trials are plotted in this form, straight lines result with slope equal to three (Figure 3 .281. This suggests that the Avrami equation can be used to describe amorphous lactose crystallisation under these conditions. As previously discussed, the A vrami number equal to three suggests linear growth in three dimensions . . IS occumng.
0.5
-1 11\ ,I'MJ , .".
-1 .5 5A 5 .6
L /-V
1':1 ['l V r� � N
5.8 6 log(time/[s])
V L V
6.2
- 45% RH. 30'C 43.5% RH. 30'C
Figure 3 .28 - Avrami plot for amorphous lactose crystal l isation .
�
6A
For amorphous lactose in an environment of 45% RH the rate constant is 4 . 5 x 1 0-19
S-3 while at 43 . 5% RH the rate constant is slightly less at 4 . 3 x 1 0-19 S--3 These rate constants were obtained by nonlinear regression to the Avrami equation.
The predict ions for the experimental data collected in this work using the Avrami equation and these fitted constants can be seen in Figure 3 .29. This graph shows good predictions of the time taken for crystallisation.
The experimental technique for determination of crystallisation kinetics of amorphous lactose developed here offers a relatively limited window of conditions which can be investigated. Beyond this window, analysis becomes much more complicated because consideration to the role of sorption and desorption rates, p to a-lactose conversion and other phenomena playing an important role in the overall crystallisation phenomena. For this reason it is desirable to compare results with those shown in the literature for the time taken to achieve crystallisation.
3-51
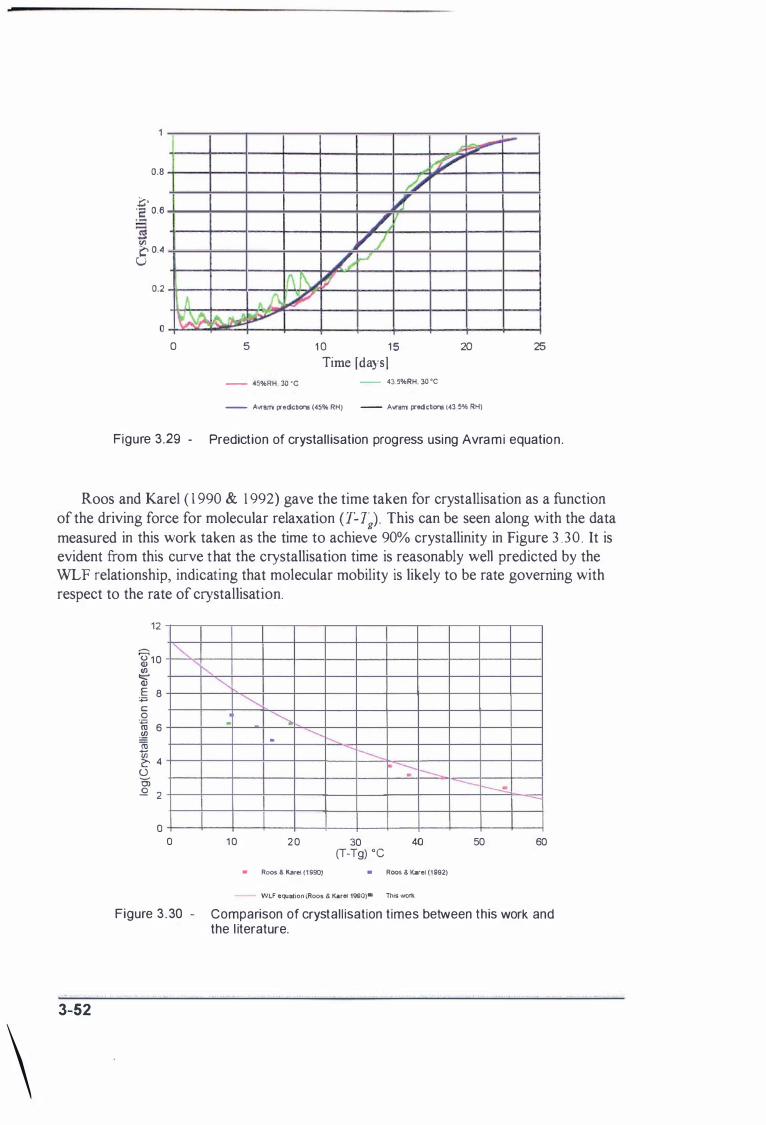
\
0.8 .0 'c; 0.6 � � 0.4 U
0.2
o A y.� �
o
�� �
fL� '.bP" 5
# ',!' � '/ h � f\� � �
1 0 1 5 Time [days]
- �5%RH. 3() ·C - 43.5%RH. 3() ·C
20
- A'lfM'l preclctions (45% RH) - A",.rrI preclc!ons (43 5% RH)
�
25
Figure 3.29 - Prediction of crystall isation progress using Avrami equation .
Roos and Karel ( 1 990 & 1 992) gave the time taken for crystallisation as a function of the driving force for molecular relaxation (T-Tg) . This can be seen along with the data measured in this work taken as the time to achieve 90% crystallinity in Figure 3 . 30 . It is evident from this curve that the crystallisation time is reasonably well predicted by the WLF relationship, indicating that molecular mobility is likely to be rate governing with respect to the rate of crystallisation.
3-52
12
:rl 10
� E 8 +' c o iii 6 Jg ]§ � 4 o OJ ..Q 2
o
� i".
o
""" �
. � ............. . .......
---......,. �.--:----
10 20 30 (T-Tg) DC 40
• RoDS & Karel (1990) • Roo. & Karel (' 992)
- WLF eQUatIon (Roos & Karel 1990)-= This work
---i� -
50 60
Figure 3 .30 - Comparison of crystall isation times between this work and the l iterature.
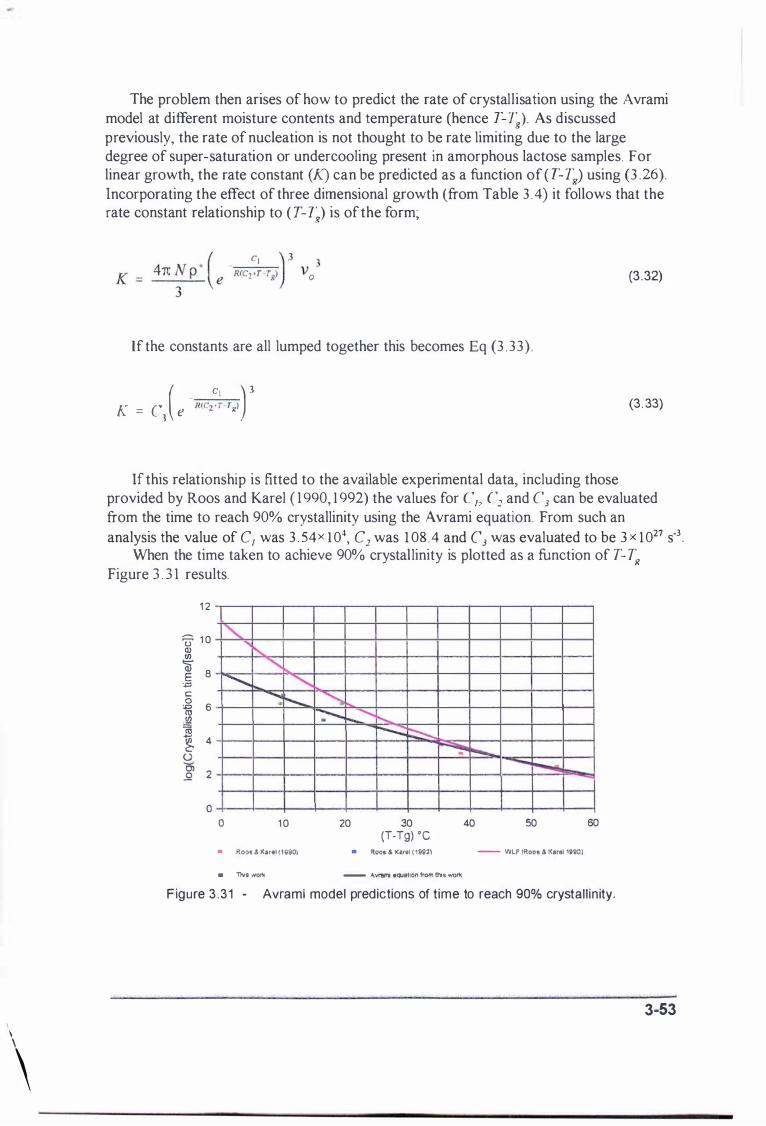
\
\
\
The problem then arises of how to predict the rate of crystallisation using the A vrami model at different moisture contents and temperature (hence T-7�). As discussed previously, the rate of nucleation is not thought to be rate limiting due to the large degree of super-saturation or undercooling present in amorphous lactose samples. For linear growth, the rate constant (K) can be predicted as a function of ( T- Tg) using (3 .26). Incorporating the effect of three dimensional growth (from Table 3 .4) it follows that the rate constant relationship to ( T-l�) is of the form;
If the constants are all lumped together this becomes Eq (3 . 33) .
( C ) 3 K = C\ e Ii(C2 '� Tgl
(3 .32)
(3 . 33)
If this relationship is fitted to the available experimental data, including those provided by Roos and Karel ( 1 990, 1 992) the values for C" ('2 and C3 can be evaluated from the time to reach 90% crystallinity using the Avrami equation. From such an analysis the value of C} was 3 . 54x l 0�, C] was 1 08 .4 and CJ was evaluated to be 3 x 1027 S-3
When the time taken to achieve 90% crystallinity is plotted as a function of T- Tg Figure 3 . 3 1 results.
1 2
� 1 0 Q) Vl � 8 :p c � 6 11 ro � 4 () � 2
o
, r--....
'" ............. "
-:: '-
o 1 0
• Roos & Karel (1990)
• This 'NOric
� � _ ............ ........
20
--..:: ::::--.....
30 (T-Tg) ·C
• Roas & Karei {199:2)
� ........ -........... -
40 50
- WLF IRoos ll Kerel l;gOl
- "'�ni e()Jation from this wont
60
Figure 3 .3 1 - Avrami model predictions Of time to reach 90% crystal l in ity.
3·53

This curve looks to give better fit to the crystallisation times for the high T-Tg region of the curve than does the simple WLF model using the universal constants and also offers the advantage that the actual rate of crystallisation can be predicted as a function of time. It is apparent that more crystalli sation data is required for the intermediary T-Tg region. This experiment could be achieved by equilibrating lactose samples above salts solutions at low temperature and then increasing temperature to give the desired T-Tg. In this way the effect of adsorption kinetics can be nullified.
The final model used in subsequent work is Eq (3 .28), where 11 3 and Eq (3 . 3 3 ) where C] = 3 . 54 x 1 04, C2 1 08 .4, C3 = 3 x 1 027 S-3 and R=8 . 3 1 4. Additional consideration to the rate of conversion of the p-Iactose form to a-lactose monohydrate is required due to the associated moisture uptake and hence, removal from the free moisture pool in the bulk lactose system. Similarly the rate of uptake of moisture into the amorphous lactose layer present on industrial lactose powders requires consideration in order to give accurate crystallisation predictions.
3.8 EFFECTIVE MOISTURE DIFFUSIVITY IN A PACKED BED OF LACTOSE:
The diffusivity of moisture in air can be estimated with the following correlation (Shah et al. 1 984);
D = 1 .7255 x lO-7 (T + 273 . 1 5) 2 .552 x lO-5 (3. 34)
The diffusivity of moisture through a bulk porous media is less than for air due to the reduced area available for the transport of the vapour and the effects of constrictivity (0) and tortuosity (1:2) in the media. For this reason an " effective" moisture diffusivity is defined. Collin and Rasmuson ( 1 988) summarise a number of correlations used to predict effective diffusivity in soi ls and other unsaturated porous materials . The simplest of correlation ignores the effects of tortuosity and constrictivity or the partial fi lling of the pores with moisture and is written as;
(3 . 35)
This estimate represents the maximum moisture diffusivity possible in the bulk porous media. Collin and Rasmuson ( 1 988) concluded that the most suitable correlat ion for prediction of moisture ditfusivity in soils was that derived by Millington and Shearer ( 1 97 1 ) . A summary table of the estimated effective diffusivity of lactose is given as Table 3 . 5 below
Due to the homogeneity of lactose the effective moisture ditTusivity in bulk lactose is likely to be in the higher end of the range predicted by these correlations. As a first approximation the simplest estimation of effective moisture diffusivity was used with a porosity (E) of 04
3-54

\
T bl 3 5 a e -
Model
S i mp le approx i mat ions
Currie ( 1 96 1 )
Van Brake and Heel1jcs ( 1 974)
Mi l l ington and Shearer ( 1 97 1 )
3.9 C LOSURE :
Effi ( t d'ffu ' t " ec lYe mOls ure I SIVH Y mo
Equation
E .!)
(Ol'r: ) E O -S) f)
(o ! 1:: ) E ( I - ,,,,' )� /)
E ( I -S) j) �-----
1:,! b + 9 72 ,')'
j) ( I _,\')2 I E ( I -S) ff
I 0 67 /hr E 0 . +
d I fi f1 e s or ow III porous me la
oh2 D�ff (m2/s)
- 1 04 x 1 0-5
0.5 5 . 1 8 x 1 0-6
I 1 . 04 X 1 0-5
0.5 5 . 1 7 x 1 0-6
1 1 . 03 x 1 0-5
0 . 5 5 1 5 x 1 0-()
J J 02 x 1 0-5
- 7 .57 x 1 0-6
The overall moisture relations of lactose are central to the caking of lactose powders and have been discussed in depth in this chapter. Moisture sorption isotherms, sorption kinetics and amorphous lactose crystallisation have been highlighted within the chapter as being especially important in subsequent chapters.
Equations have been formulated to allow adequate mathematical description of these phenomena i n the modelling of moisture movement and caking in bulk lactose . The modell ing of moisture movement in bulk lactose due to a temperature gradient is the subject of the next chapter .
3-55
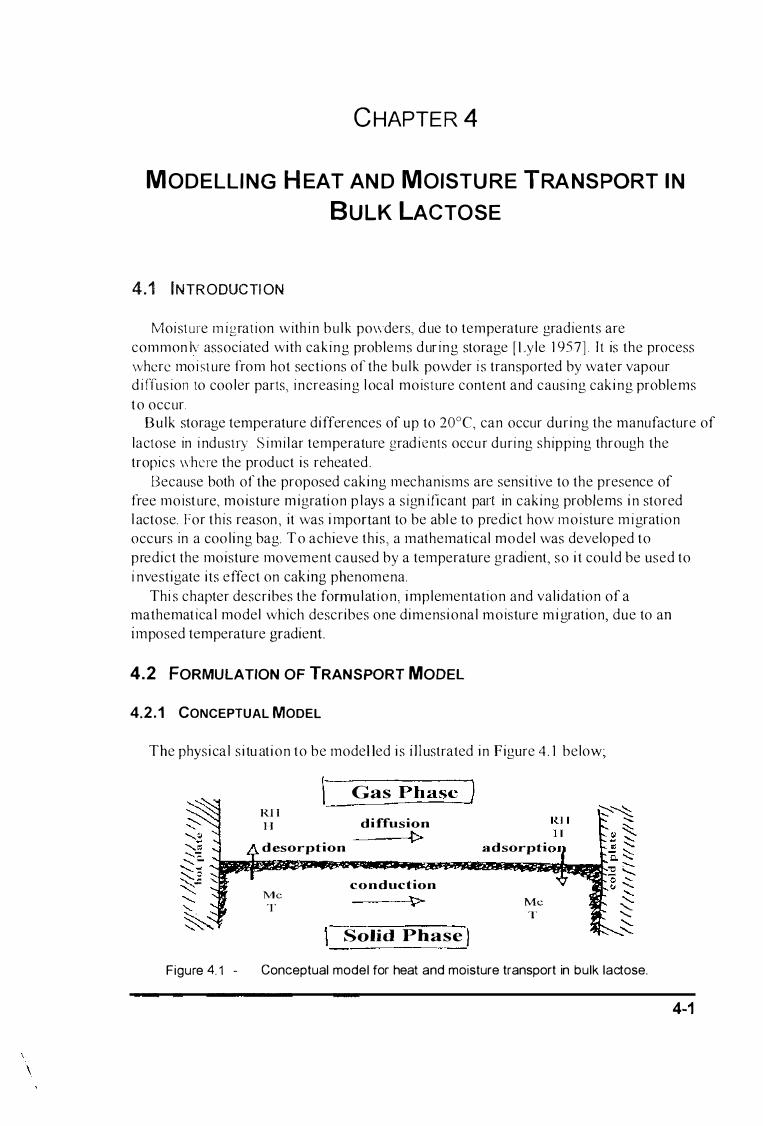
CHAPTER 4
MODELLING HEAT AND MOISTURE TRANSPORT IN
BULK LACTOSE
4.1 INTRODUCTION
Moi st ure m i gration with i n b u l k powders, d ue to temperature gradients are common Iv associ ated with caki n g problems d ur i n g storage p _yle 1 95 7] . It is the process vvhcrc moi st ure from hot sections of the b u l k powder i s transported by water vapour d i ffus ion to cooler parts, i n creasi n g l ocal moisture content and causing caking problems
to occur. B u l k storage temperature differences of up to 20oe, can occur during the manufacture of
lactose in i nd ustry S i m i l ar temperature grad i ents occur d uri ng shipping through the
tropics where the prod uct is reheated ,
Because both of the proposed caking mechanisms are sensitive to the presence of free moist ure, moisture m igration p l ays a s ign i ficant part in caking problems i n stored l actose, For th is reason , it was i mportant to be abl e to predict how moi sture m i gration occurs in a cooling bag, To achieve this, a mathematical model was developed to predict the moisture movement caused by a temperature gradient, so i t cou l d be used to
i nvestigate its effect on caking phenomena,
Thi s chapter describes the formu l ation, implementation and val idation of a mathemat ical model which describes one dimensional moisture m i gration, due to an imposed temperature b:rradient
4.2 FORMULATION OF TRANSPORT MODEL
4.2 . 1 CONCEPTUAL MODEL
The physical situ ation to be modelled is illustrated in Figure 4 . 1 below;
t Gas Phase] lU I �� diffusion ...... II � d esorption .(> adsorpti �
� :--... -......
conduction � Me 'J?- Me ::::: T ........ T '-
\ Solid Phase I �
Figure 4. 1 - Conceptual model for heat and moisture transport in bulk lactose.
w uen me , �, mxewsaemW$'V'wrmrn mwma '??mrw
4-1
\
The physical basis of the model can be summarised as; • one dimensional heat and moisture transport through a packed bed of lactose. • initially the lactose has a constant moisture content throughout the bed. • a temperature gradient is appl ied across the bed. • the solid and gaseous phases are considered as continua with interaction over
adjacent interfaces. • moisture diffusivity and thermal conductivity are treated as effective properties
of the porous matrix
4.2.2 ASSUMPTIONS
The main assumptions made for the model are; • all moisture transfer occurs by diffusion in the gas phase. • all phases are in local thermal equi l ibrium. • all phases are i n local moisture equilibrium. • the gas phase can be considered as ideal . • al l free moisture is present at the lactose crystal surface. • the void volume is completely mixed. • heat and moisture transport by convection is negligible. • no gravitational effects are present. • the voidage volume change with increasing moisture content i s negl igible. • enthalpy and moisture transport due to air expansion with temperature i s
negl igible. • heat of crystal l isation and dissol ution is negl igible. • crysta l surface dissolution occurs instantaneous ly .
4.2.3 VALIDITY OF ASSUMPTIONS
4 . 2 . 3 . 1 LOCAL THERMAL EQUIL IBR IUM
The val id i ty of th i s assumption was proven by calcu lat ing the t ime constant for the process of convecti ve heat transfer from the part ic le surface to the pore a ir phase . By ignoring diffus ion of moisture, and assuming negl ig ih le heat i s translCrred in the gas phase, a heat balance in the gas phase was wri tten as;
ch g E. V p . {J at
( J - E). V . h . ! ! ' - ! 'I � c \
By making the approximation;
dT C . Pa dl
1 )
(4 2)
and assum i ng cpm Pa and he arc constant in the tem perature range of i nterest and tak i ng Lap lace transforms of Eq (4. 1 ) g ives;
4-2
\
T,(s) + 1: . 7{O) Hs ) c (4.3) t . S + 1
\vhere the t ime constant (1:) is given by;
(4 .4)
Lq ( 4 . 3 ) i s of the form typical or a fi rst order process. J f standard l actose properties arc used and a surface h eat transfer coefficient (he) of 3W/m2°C (for stagnant air) [McCabe and S m i th 1 984] the first order t i m e constant (t) is of the order of l ess than a second Therefore the assumption of local themlal equi l i bri um is valid as the model is run for periods of over 1 0 hours.
4 2 . 3 2 LOCAL MOISTU RE EQ U I LIBR I U M
I n a simi lar m an ner t o above, t h e val i d ity o f t h e assumption of local moisture eq u i l ibri um was shown by calculat i ng the magni tude of the first order time constant of the sorption process. A mass balance on the solid phase was written as;
(4. 5)
By assumi ng the moisture sorption isotherm is linear (true for the water activity range 0 . 1 - 0 . 8), and using the value for saturated vapour pressure obtained from the literature (25 °C) [Cooper and Le Fevre ] 969], the following expression was derived;
(4.6)
Subst i tuting Eq (4.6) into Eq (4. 5 ) and by assuming kg and Ps are independent of temperature, and taking laplace transfonns gives;
M(s) J\(s) + 1: . M(O) t . S + 1 (4.7)
Equation (4.7) is of the typical fonn for a first order system. The first order time constant (1:) for the system is given by Eq (4. 8).
- w -
4-3
Ps (4.8)
If standard lactose properties are used and a surface mass transfer coefficient (kg) of 1 . 8 x 1 0-6 s/m (from Sherwood number (Nsh) of 2 for negli gible flow past a particle of average size, McCabe and Smith 1 984) the first order time constant ('r) is of the order of l ess than a second. This shows that the sorption process occurs very quickly and the assumption that local moisture equil ibrium between the solid and the gas phases is valid.
4 . 2 . 3 . 3 N EGLIGIBLE CONVECTION
Natural convection can be neglected if the Rayleigh number is l ess than 4n:2 (Bear and Bachmat, 1 99 1 ).
Pa.g.a .K.L. !J. T A. 1l
(4 .9)
If convection is unimportant i n the worst case situation that occurs in i ndustry, then convection wil l not play an active role i n the transport of moisture and heat in the simpl ified one dimensional case. The worst case scenario consists of lactose powder, recently packaged into a I m' cubic bulk bag placed in a store room.
The properties for l actose i n thi s s ituation are: Ct 1 /298 K ( liT)
j1 1 . 8 x 1 0.5 Pa.s Ll T ,- 20cC ( i m mediately after bagging)
r I m (dimension of a bulk bag) K 1 . 9 8 x 1 0'7 m2 (Hodges 1 992)
This gave N/?a = 0.05, which i s m uch l ess than the cri tical Rayleigh number (4rrC) and therefore natural convect ion is not sign i ficant in the transport of heat and moisture i n bulk l actose under the types o f conditions under consideration.
4 . 2 . 3 .4 N EGLIGIBLE H EAT AND MOISTUR E TRANSPORT DUE To CHANGES I N AIR
DENSITY
Upon heating a node of fixed volume, the air density wil l decrease and air wi l l flow out of that fixed volume carrying heat and moisture with it. Because of this, a heat and moisture transport term due to a ir expansion and contraction with changing temperature should be incl uded i n the model. It was assumed that the amount of heat and moisture transported in this way was negl igible. Having made this assumption, rather than making a further assumption that air density was constant i n the temperature range of
4-4
\

\,
i nterest ( 1 5 - 40°C), i t was desirable to al low it to change with temperature. As a result ,
i f a i r dens i ty i s al l owed to change and no effort m ade to account for the a ir that expands over the boundaries of the n ode of fixed vol ume, then moisture and dry air balances over the whole system wi l l resul t in a net l oss of a ir and moisture. Some heat wil l be associaled with the air l ost from the system and therefore a total heat balance over the system wi l l a l so show a discrepancy. Quantification of the amount of moisture and heat l ost from the system was required to show how s ignificant this effect was.
The dri v i ng force for moisture diffusion in the porous system was expressed as a water vapour concent ration (kg water vapour! m; dry air) and absolute humidity was back calcu lated from water vapour concentrat ion. Thi s means the only way the total amount or m oi sture in a node of fixed volume coul d change was by the processes model l ed (d i ffusion and condensat ion) For t h i s reason no mo i st ure was overlooked by the model and the tota l mo isture in the system i s accounted for. The balance equat i on J()f moisture in the system was \vri tten i n temlS of a moisture concentrat ion (kg water vapour/ m3 a i r ) and on ly dry a i r was l ost .
The e ffect of t hermal expansion at heated parts of a porous slab and contraction at parts of the s lab undergo ing coo l i ng, wi l l promote extra moisture movement in the direct ion of the temperature gradient (hot to cold).
Quan t i fi cat ion of the s ign i fi cance of heat l osses and gains in dry air to the system by thermal expansion and con tract ion was most eas i ly ach ieved by check i ng the eiTeel of the assumpt ion tha t they are negl ig ib le , after a working simulation was compl eted. Once the model was form u lated, and numerical l y solved, a runni ng total o f the dry a i r lost, a long with the heat l o st with this air, was made using a s imple dry air m ass balance at each t ime step. Thi s heat loss term was then be compared with the total heat entering over the boundaries. The results of this test are discussed in Section 4 . 5 . 2 .
4 . 2 . 3 . 5 MODE OF MOISTURE MOVEMENT:
Other modes by which moisture transfer in the lactose bed can occur are surface diffusion, capi l lary action and ditIusion through the lactose particles themsel ves. The structure of the l actose crystal is very ordered and contai ns few spaces in the crystalline matri x where free moisture can be present. Because of this, diffusion through the partic le is not significant.
Because the free moisture in the lactose system exists on the surface of the crystal partic les, a thin fi lm of saturated lactose syrup i s present. This fi lm is likely to be concentrated at contact points between adjacent particles due to surface tension forces. It can be seen from the moisture sorption isotherm that the amount of free moisture present in atmospheres of l ess than 95% relative humidity is very small, consisting of only a few mono-layers thick. It was concl uded that flow of moisture by surface diffusion wou l d be insignificant.
4 . 2 . 3 . 6 OTHER ASSUMPTIONS MADE
All other assumptions made are reasonable assumptions necessary to enable a s imple model formulation.
c "F -
4-5

4.2.4 MATHEMATICAL FORMULATION
Details of the mathematical fonnulation of the conceptual model described above can be found in Appendix A3 . The mathematical model is summarised as transport equations (4. 1 0) and (4. 1 1 ),
2Q
21 for t> O and O <x<L
for t>O, and O <x<L
with initial conditions given by (4. 1 2) and (4 . 1 3),
T=f(T ) fior all x at t '" 0 Initial
for all x at t '" 0
and boundary condit ions given by (4. 1 4) and (4. 1 5 ).
he ( T 7� ) '" 0 for t > 0 at x =0 0 , r
o fhr t > 0 at x o . r
(4 . 1 0)
(4. 1 1 )
(4. 1 2)
(4. 1 3)
(4. 1 4)
( 4 1 5)
A l gebraic equations describ i ng the psychometric properties o f ai r and water are
l i sted i n Appendix A-2 . System i nput val ues and equations descr ibing lactose properties and moisture rel at ions of l actose arc di scussed and l i sted in Chapters 2 and 3.
4.3 NUMERICAL SOLUTION OF TRANSPORT MODEL
4.3.1 SELECTION OF NUMERICAL SOLUTION METHOD
The model summarised i n Secti on 4 . 2 .4, shows the solution o f two coupled part ial differential equations was required. One equation describes the transport of heat and the other the transport of moisture t hrough the l actose s lab. Some algebrai c equations used in the model arc non l i near. The complexity of the model makes the analyt ica l solution
d i fficul t and, with the advent of i nexpensive comput ing fac i l i t ies, the m odel was best solved numerical ly.
\ \
The most common methods available for the n umerical solution of partial d ifferential equatio ns are;
• E:xpl ic it fi nite difference schemes • Impl ic i t fin i te difference schemes (eg. Lee's or Crank-Nicholson) • Fin i te elements methods
Each of these methods have advantages and di sadvantages. The explicit fin i te difference scheme i s the easiest method to i mplement as the predi ct ions of the dependent variables are made based on known values. If changes i n the dependent variable are occurrin g q uickly, this method can lead to i nstabil ity problems and an
impl ic i t fin i te di fference scheme should be used. In an i m pl icit scheme the predictions of the dependent variable is based not only on known val ues but a lso future values of the dependent variable. This resu l ts i n a series oreq uations which m ust be solved
s imultaneously. When deal ing with a coupled system a sparse matrix results, which i s
usual l y sol ved i teratively . I n the case where the system behaves non-linearly, solution o f s imu l taneous equat ions i n this manner i s d ifficult .
Fin i te element methods are more difficult to i mplement and most often an exist ing package i s used . Thi s method i s especial ly' usefu l for solution of problems where the geometry of the system i s i rregu lar.
In the case of solution of the transport model , formulated in Section 4 .2 .4 above,
changes occur relat ively slowly. Total equilibrat ion for a 1 00mm s lab of lactose with a
20"C temperature gradient appl ied to it i s i n the order of 1 2 hours. Thi s suggests that the extra complexi ty involved i n i mplementing an implicit scheme, over a more s i mple explicit scheme was not warranted. The non-l i nearity i nherent i n the system, m akes
implementation of an implicit scheme difficult i n any case. Because the system is of regular geometry and changes occur relatively slowly, the
finite e lements method offers n o real advantages over the explicit fin i te d ifference scheme. For these reasons the explic it fin ite d ifference scheme was used to sol ve the transport model.
4.3.2 NUMERICAL SOLUTION
The equations representing the lactose slab were solved using an explicit finite d ifference scheme . The lactose slab was divided into several nodes where the content of each node was considered uniform. By discretising the continuous system in this way, a series of equations which describe transport of heat and moisture between adjacent nodes were derived.
The part ial d ifferentia l equations were approximated using the expanded Taylor series and these equations, together with the boundary conditions, initial conditions and algebraic equations, which characterise the system, were solved in a Borland C++
program. The formulation of the finite difference equations for the system can be found in
much greater detail in Appendix A4 .
The program was written using object orientated programming techniques. Obj ect
orientated programming offers many advantages over conventional "top down" programming. The first and most important of these advantages is that by treating each item in the real world as a separate subject, the program is more c losely representing
'YWWfern n 3WWWWMWffi",lli''llI'fMtz wet 7 )$ r nwnm IT 7XZW'SWiP"N'Y! m
4-7

the actual situation. By treating each node as a separate object which interacts with neighbouring nodes or boundaries, the lactose slab is simulated more closely. Other advantages include easier debugging, more control over what can affect an object, easily understood code, code reuse and greater flexibil ity.
One example of the flexibil ity given by object orientated programming could be if the system was changed so it also contained a heating source in the centre of the slab. With an object orientated program all that would be required is the inclusion of an extra heating term in the equation describing heat transfer in the centre node. As nothing else has changed in the system no other changes are required. With top down programming a lot of rewriting and restructuring would normally be required.
A copy of the source code for the program is included with this thesis as Appendix AS.
4.4 MA THS CHECKING
4.4.1 CHECKS AGAINST P REVIOUSLY VALIDATED SOLUTIONS
After a model has been implemented in a numerical solution, checks must be made to ensure that what h as been implemented numerically is what was actual ly formulated. This i s done by comparison against an exi sting sol ut ion which h as already been validated. Due to the complexi ty of the transport model formulated here, a d irect comparison l ike thi s could not be made. Tf the model was simpl ified by turning off
moisture or heat transport, then individual parts ofthe model could be checked separately.
Moi sture transport was switched off by making the b inary moisture ditTus iv i ty of water vapour in air equa l to zero. As di ffusi on i s the only method by whi ch moisture i s transported in the mode l , on ly heat transfer by conduct ion wi l l occur. Th i s reduced the
transport model to the s imple one d i mensional heat transfer by conduct ion in an i n fi ni te s lab case. I f the surface h eat t ransfer cocificients were set very h igh then the temperature h istory of the s lab could be pred i cted using the Fourier solution for heat
conductIOn in an i n fi n i te s l ab . The pred icti ons by this method were compared to the transport model predict ions for the case of a l OOmm l actose s lab of in i t ia l ly uni form
temperature (20°C), heated on both s i des by a step change on the surface to 40°C. During a s imulation of over eight hours, the maximum difference in any nodes between
the two models was O . 06°C. This shows the heat conduction part of the transport model is a reasonable representation o f t he actual syste m .
A s i m i l ar comparison was performed against a previously val idated finite difference model for heat conduction i n an infin i te s lab with convection occurring at the s lab boundaries, (RADS, Corne l i us 1 99 1 ). The same s i tuat ion described above was
s imulated with both surface heat transfer co-efficients set to 1 0W/m2K. The maximum difference observed d uring an e igh t hour s imulat ion was O.045°C at the centre of the s lab, and O. 1 4°C at the s lab surfaces. This showed the term describing convection at the l actose s l ab sur faces, h ad been correctly implemented in the transport mode l .
I n much the same way as the heat transport portion was checked above, the moisture
transport part of the transport model was also to have been checked. In practise

\
however, th is was difficu l t. With an analytical sol ut ion, the moisture concentration changes by ddfus ion only. With the transport mode l , the water vapour concentration changes also because of the equ i l ibri um rel ationshi p between the gas phase and sol id phase viith i n a particular node. Therefore, thi s condensation/evaporation process was di sabled before a comparison with the analytical sol ution was made.
To d i sabl e the evaporation/condensati on process required reformulation and could not be done by simp ly changing system input data. To reformulated the model for the purpose of check ing the models mathematical correctness defeats the whole purpose of the check . For this reason no compari son against ex ist ing models was carried out for the moisturc transport portion of thc transport mode l , and th is was compared d i rect ly aga inst experi menta l resul ts .
4.4.2 NUMERICAL ERROR C H ECKING
The fundamenta l pri ncipl e which f<mns the fi n i te di fference n umerical scheme, used i n t h i s work 10 solve the coup l ed heat and moisture transport equat ion, is the d i screti sat ion of both time and space, by cutting the continua of time and space i nto a series o f t ime-steps and nodes, over which the properties o C the material arc averaged. As the t i me-step approaches zero and the number of n odes approaches i n fi ni ty, the real cont i nua are more c lose ly m ode l l ed . This has the effect of rapid ly i ncreas ing s imu lation time and i ntroduces rounding errors which accumulate in the calcu l ated resul ts . Some trade otT i s therefore required so n umerical errors are at acceptabl e l evels and s imu lat ion t imes are al so sens ib le .
A series of simulations were run using typical values for system inp uts. The timestep i n these runs was changed from 1 second to 1 0 seconds and the number of nodes in a total slab thickness of 1 00 mm was changed i n the range 5 to 20 nodes. The temperature and relative humidity predictions for nodes at 0, 20, 40, 60, 80, and 1 00 m m were compared. For these positions the maximum temperature and relative humidity difference compared with the run with 20 nodes and a 1 second time step were compared for each time-step. From these results it was shown that the error in using only 5 nodes lead to differences i n predictions of up to 20% RH than that predicted using 20 nodes. The effect of time-step had less influence on predictions. This analys is showed that 20 nodes and a 5 second time-step was required to achieve accurate predi ctions. The s imulation time for these settings is of the order of 2 minutes per hour of real time simulated. This was acceptable for the investigation of caking carried out in further work.
4.4.3 M ATHS CHEC KING S U MMARY
The model describing the transport of heat and moisture through a slab of bulk lactose developed in this work was show'll to give accurate predictions when compared against existing solutions. This indicated that the implementation of the formulated model was performed correctly.
Checks on the level of numerical errors accumulating i n the solution of the model indicated that a minimum of twenty nodes and time steps of less than five seconds are required to obtain accurate predictions .
. '
4-9
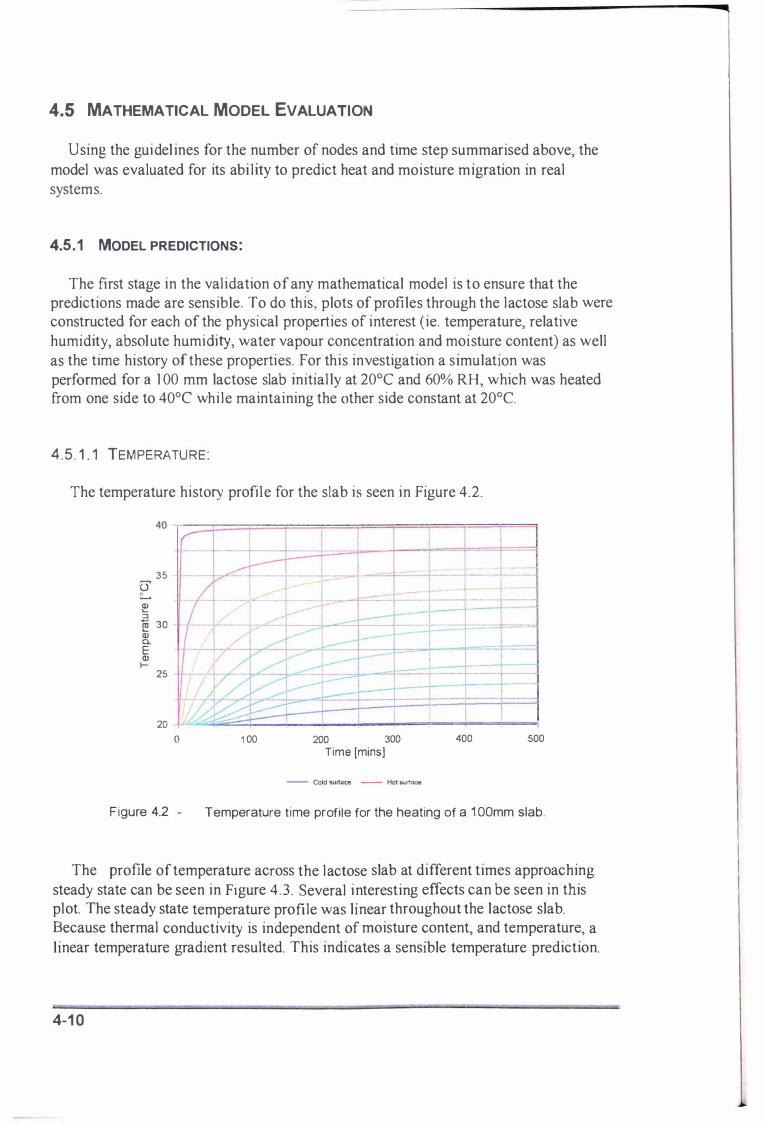
4.5 MATHEMATICAL MODEL EVALUATION
U sing the gui del ines for the number of nodes and time step summarised above, the
model was evaluated for its abi l ity to predict heat and moisture migration in real systems.
4.5. 1 MODEL PREDICTIONS:
The first stage in the val idation of any mathematical model is to ensure that the predictions made are sensible. To do this, plots of profiles through the lactose slab were constructed for each of the physical properties of interest (ie. temperature, relative humidity, absol ute humidity, water vapour concentration and moisture content) as well as the time history of these properties. For this investigation a simulation was petformed for a ] 00 mm lactose slab injtial ly at 20°C and 60% RH, which was heated from one side to 40°C whi le maintaining the other side constant at 20°e.
4 . 5 . 1 . 1 TEM PERATURE:
The temperature history profile for the slab is seen in Figure 4.2 .
� � :::J
35
ro 30 -... <V c.. E <V f-
25 -
20
o 1 00 200 300 Time [minsj
- Cold surface - Hoi �urroce
400 500
Figure 4.2 - Temperature t ime profi le for the heating of a 1 00mm slab.
The profile of temperature across the lactose slab at different times approaching steady state can be seen in Figure 4 .3 . Several interesting effects can be seen in this plot. The steady state temperature profile was linear throughout the lactose slab. Because thermal conductivity is independent of moisture content, and temperature, a l inear temperature gradient resulted. This indicates a sensible temperature prediction.
4-1 0
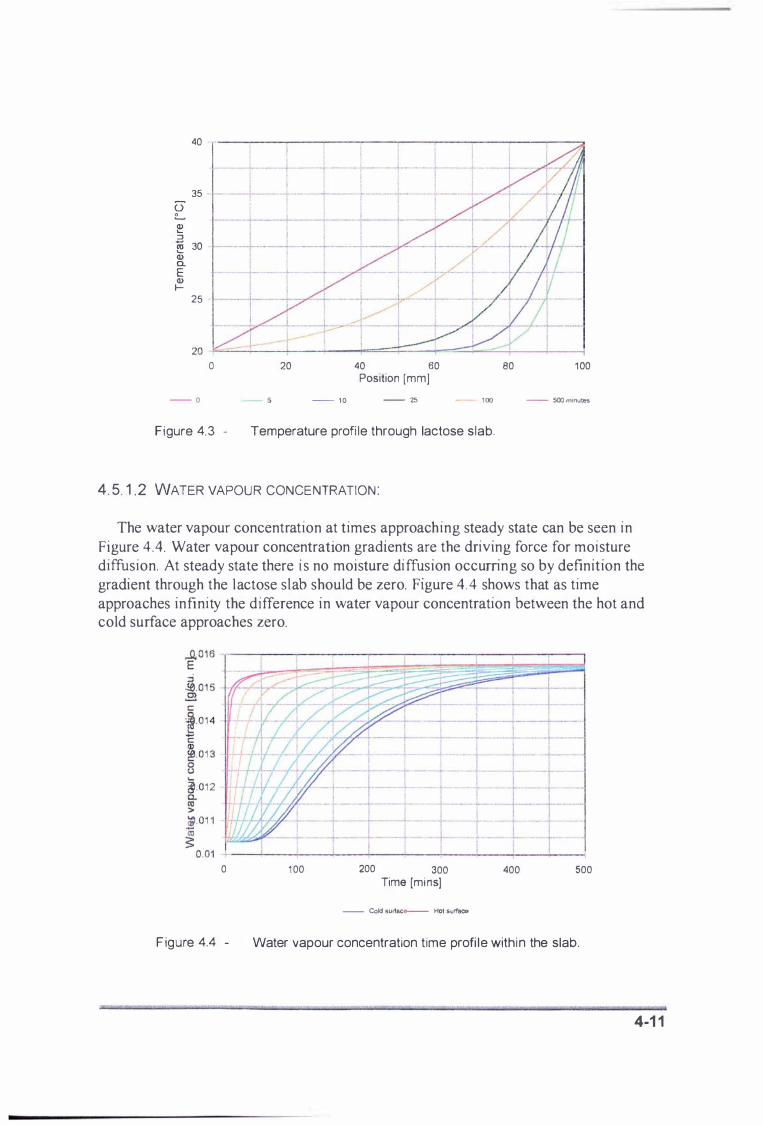
40
35
0' L � :l iii 30 'Q) a. E Q) f-
25 .
o
- 0
20 40 60 80 100 Position [mm]
- 1 0 - 25 - - 1 00 - 5(X) mmutes
Figure 4.3 - Temperature profi le through lactose slab.
4. 5 . 1 . 2 WATER VAPOU R CONCENTRATION :
The water vapour concentration at times approaching steady state can be seen in Figure 4.4. Water vapour concentration gradients are the driving force for moisture diffusion. At steady state there i s no moisture di ffusion occurring so by definition the gradient through the l actose slab should be zero. Figure 4 .4 shows that as time approaches infinity the difference in water vapour concentration between the hot and cold surface approaches zero.
o 100 200 300 Time [mins]
- Cold surtace- Hot surf3ce
400 500
F igure 4.4 - Water vapour concentration time profi le within the slab.
4-1 1

It can be seen from Figure 4.4, that the steady state water vapour concentration increases from the initial val ue. In this simulation the average slab temperature was i ncreased. This resulted in a net increase in the amount of moisture present in the voidage volume due to the extra moisture holding capacity of the warmer air. This indicates that sensible predictions for the change in void space moisture content were achieved using the model .
4 . 5 . 1 . 3 ABSOLUTE HUMI DITY:
Figure 4.5 shows the profi le of absolute humidity in the lactose slab. It can be seen from this plot that the steady-state condition resulted in a slight difference in humidity across the slab. This difference i s the result of the temperature gradient and its effect on air density in the voidage. The result given i n Figure 4.5 was therefore, what was expected.
0 .015 -,--,----.----.----,----r---,---,---:----:------,
0 .014 ·iii 0.01 3 i!'
"0 OJ 0 .012 a. Z' 0.01 1 '5 'E :::J 0.01 - ' I
0. 008 o 1 00 200 300
Time [mins]
- Cok:l 6urmcc - Hoi s.urtace
Figure 4.5 - Humidity time profile for the lactose slab.
4 . 5 . 1 .4 RELATIVE HUMIDITY:
400 500
Figure 4.6 shows the relative humidity profile through the lactose slab. It can be seen that immedi ately after the temperature gradient is applied the hot side relative humidity drops. The relative humidity front then moves through the lactose slab until steady state is reached. The steady state relative humidity profile is nearly an i nverse relationship to temperature. The slight nonlinearity was due to the nonlinear relationship of saturated vapour with temperature.
4-12

Q) 60% > § Q) 50% 0::
40%
- 0
o
- 5
20
- 10
40 60 Position [mm]
- 25
80 1 00
-- 100 - 500 minutes
Figure 4.6 - Relative humidity profi le development though the lactose slab.
4 . 5 . 1 . 5 MOISTURE CONTENT
Figure 4 .7 shows the moisture content of the lactose profi l e at different times approaching steady state in the lactose slab. It can be seen that a front of moisture moves through the lactose slab. At steady state, the moisture content profile approaches the shape of the sorption isotherm. This is because of the near l inearity of the RH profile and the observed i ndependence of sorption behaviour with temperature.
0 1 4% , ---�---r------------�--�--�------�---.
Q) - t-·· ---L--r- ---L-�---+ -- �.- -- - L -- j--� 0. 1 2% - - - - -i----+-- - i--- l ··--t-----··--· � - - -J---.!!! - -- t·--l ·------r---------I----- ----L - 1. ---1..---� 0. 1 0% .---.---�-- --t-- ---1----�--f----t---l-··-i----t---� - - I--- -r--- - -+ -+--T --�-- ---+. --.- - -----1------· � 0.08% -·- --o-- -+---t- --,-�.--. t --- -- ·--�--I- -� 0.06% ---��-r--=t-.=--��::-.=X=-�-�- -.1"- .-,- --� ---I .� 0. 04% -- - ----f�=;l-� 1'- -+- -:2 - - -.- L . , .- - I -- --r
0.02% · -----'------'-----------'------'-----'--------"--+----'
- 0
o 20 40 60 80 1 00 Position [mm]
- 5 - 10 - 25 - 100
Figure 4 .7 - Moisture content profi le development through the lactose slab.
4-1 3

4.5.2 HEAT LOSSES DUE TO THERMAL EXPANSION:
Because air density was allowed to change as a function of temperature, without the inclusion of a transport term for that thermal expansion in the model, inconsistencies occurred. If a node of lactose underwent heating, a net loss of dry air resulted. If the node was cooled, a net gain of dry air resulted. The dry air gained and lost from the system contains heats and therefore a total heat balance did not work. Quantification of the significance of these heat losses and gains was required, to assess whether these effects were si6Jfiificant.
The amount of heat lost at time step (n) with changing temperature in a node due to air expansion is given by Eq. (4. 16)
n [Heat lostL = c.Y L Pn - Pn 1 1 1� I 0
A negati ve heat loss indicates the gain of heat associated with cooling.
(4.16)
To assess whether this heat loss was significant it was compared it to the amount of h eat flowing through the node. This can be expressed as Eq (4. 17)
n
Total heat .flow " L ! On - On J I (4.17) o
A measure of the s ign i ficance o f heat losses was given by the accumulated Heat losses/Tota l h eat flow i n each node. This calculation was performed for a 1 00 mm s lab o f lactose i n i ti a l l y at 20"C which had one boundary, step changed to 40°C while the other was kept at 20cC In it ial water acti vi ty was 0.67 and thermal conductivity was 0. 1 75 W/m K The rat io of heat l osses to heat flow was at a m axim um of 0 .03<;0 througho ut the whole s lab . This showed that the assumption that negl i gible heat is
transferred by thcm1al expans i on , i s val id, and that the m ass lost i s a lso negl i gi b l e.
4.5.3 EXPERIMENTAL DATA COLL ECTION
The true test of val i d i tv of a model is its performance aga inst rea l i ty . To val i date the
transport model one d i mensional heat and mo i sture transport data was requ i red. The thermal con ducti v i ty of l actose i s only h a l f an order of magn i tude greater than that of any i nsu lat ion materia l ava i l ab l e . There fore a great deal of care and consi derat i on was taken in the des i gn of the exper i m ental apparatus to ensure the col l ect ion of good, one d i mensional heat and mois ture t ransport data.
4 . 5 . 3 . 1 EXPERIM ENTAL APPARATUS DESIGN
The greatest d i fficu l ty in the collection of one dimensi onal heat and mass transport d ata i s ensuri ng the transport i s o n l y i n one d i mens ion . Th is prob lem i s more pronounced by the fact that the t herma l cond uc tivity of l actose is onl y about five ti m es the therma l conduct iv ity of polystyrene . C l e l and et a/. ( 1 994) have shown, from finite
4-14
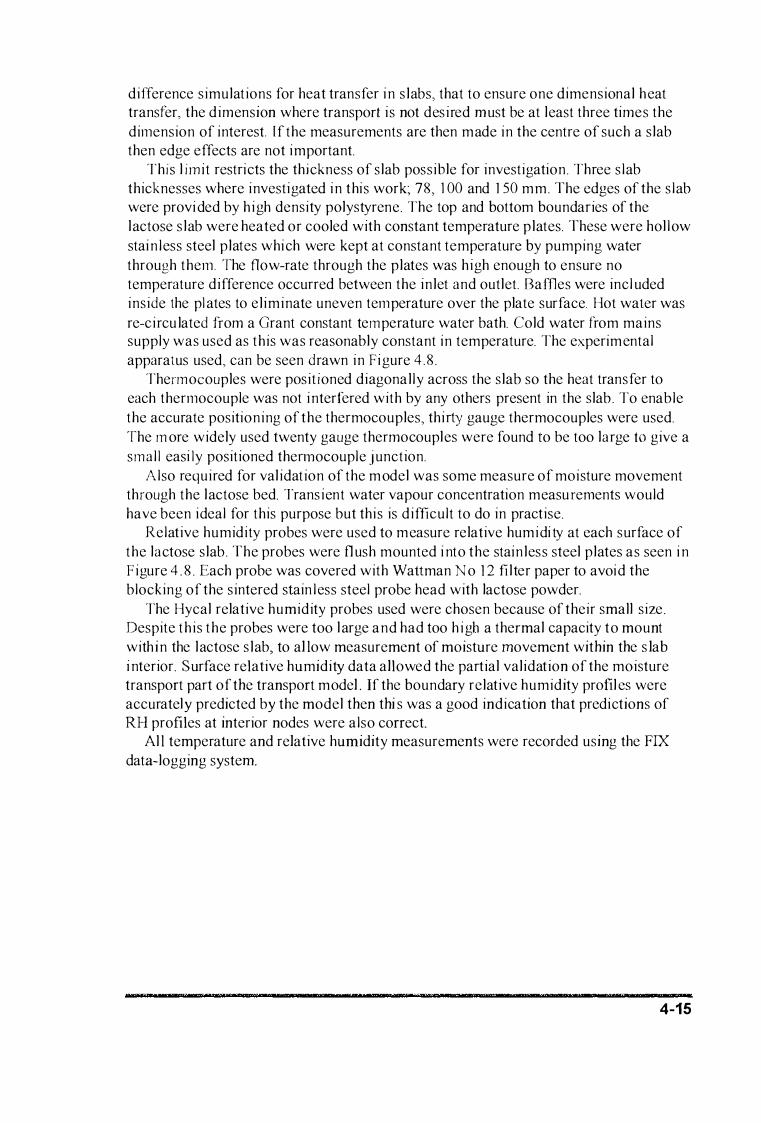
difference simulations for heat transfer in s labs, that to ensure one dimensional heat transfer, the d imension where transport i s not desired must be at least three times the
dimension of interest. [f the measurements are then made in the centre of such a slab then edge effects are not important.
This l imit restricts the thickness of slab possible for investigation. Three s lab
thicknesses where investigated in this work; 78, 1 00 and 1 50 mm. The edges of the s lab were provi ded by h igh density polystyrene. The top and bottom boundaries of the
lactose s lab were heated or cooled with constant temperature plates. These were hol low
stain less steel plates which were kept at constant temperature by pumping water
through them. The flow-rate through the plates was high enough to ensure no
temperature difference occurred between the inlet and outlet. Baffles were incl uded
inside the pl ates to e l iminate uneven temperature over the plate surface. Hot waier was
re-circu lated from a Grant constant temperature water bath. Cold water from mains supply was used as this was reasonably constant in temperature. The experimental
apparatus used, can be seen drawn in Figure 4 .8 .
Thermocouples were positioned diagonal ly across the slab so the heat transfer to
each thermocouple was not interfered with by any others present in the slab. To enable
the accurate positioning of the thermocouples, thirty gauge thermocouples were used.
The m ore widely used twenty gauge thermocouples were found to be too large 10 give a
smal l easi ly positioned themlocouple j unction.
Also required for val idation of the m odel was some measure of moisture movement through the lactose bed. Transient water vapour concentration measurements would
have been ideal for this purpose but this is difficult to do in practise. Relative humidity probes were used to measure relative humidi ty at each surface of
the lactose slab. The probes were fl ush mounted i nto the stain less steel plates as seen i n
Figure 4 . 8 . Each probe was covered with Wattman N o 1 2 fi l ter paper to avoid the
blocking of the sintered stain less steel probe head with lactose powder.
The Hycal relative humidity probes used were chosen because of their small size . Despite this the probes were too l arge and had too h igh a thermal capacity to mount
with in the lactose s lab, to allow measurement of moisture movement within the s lab
i nterior. Surface relative humidity data allowed the partial val idation of the moisture transport part ofthe transport model. If the boundary relative humidity profil es were
accurately predicted by the model then thi s was a good indication that predictions of RH profiles at interior nodes were also correct.
All temperature and relative humidity measurements were recorded using the FIX data-logging system.
'St7'fW'T - - 'We =< .. = ' M
4-15
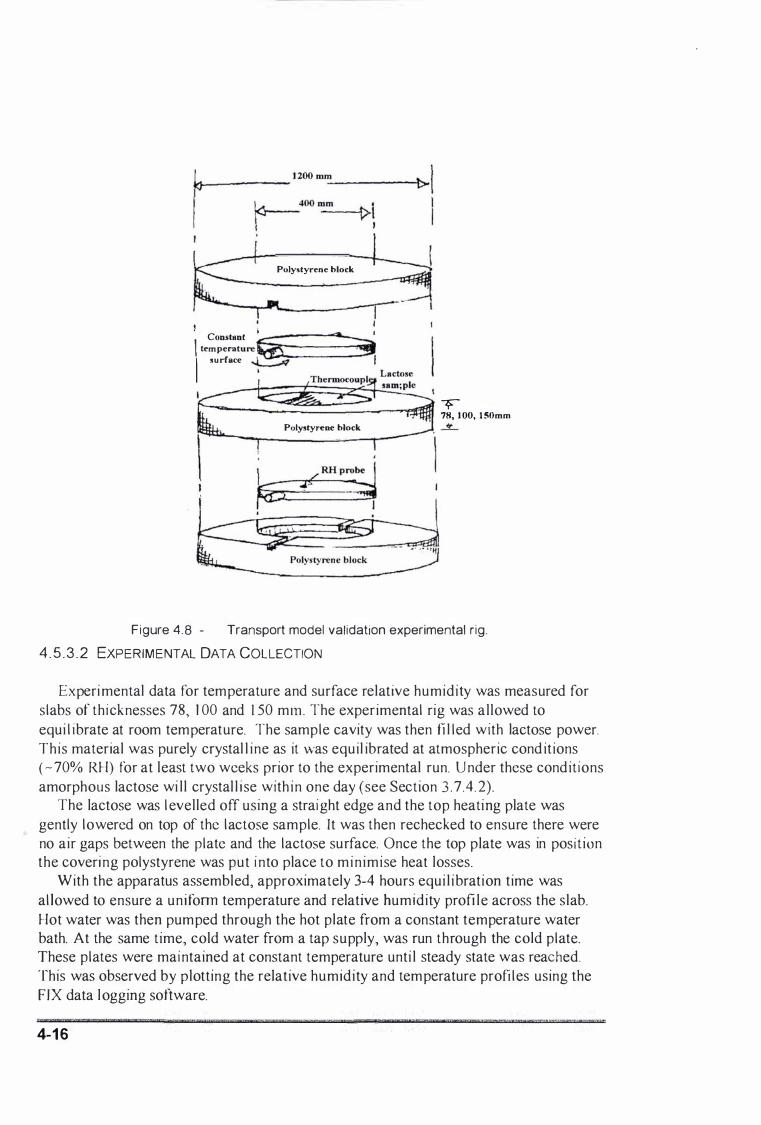
. .
Poly.tyrcnc block
. Constant · __ ---a.... '
I temper .. ture� 3 I surface � I
�---=::::�:::��:=:��""'l'!lI'#flJ �OO, 1 50mm Polystyrene block �
Figure 4.8 - Transport model val idation experimental r ig.
4 . 5 . 3 . 2 EXPERIM ENTAL DATA COLLECTION
Experimental data for temperature and surface relative humidity was measured for slabs of thicknesses 78, 1 00 and 1 50 mm. The experimental rig was al lowed to equi l ibrate at room temperature. The sample cavity was then fi l led with lactose power. This material was purely crystal l ine as it was equil ibrated at atmospheric cond itions ( - 70% RH) for at least two weeks prior to the experimental run. Under these conditions amorphous lactose wi l l crystal l i se with in one day (see Section 3 .7 .4 . 2).
The lactose was l evelled off using a straight edge and the top heating plate was gently lowered on top of the lactose sample. It was then rechecked to ensure there were no air gaps between the plate and the lactose surface. Once the top plate was in position the covering polystyrene was put i nto place to minimise heat losses.
With the apparatus assembled, approximately 3-4 hours equi l ibration time was al lowed to ensure a unifonn temperature and relative humidity profi le across the slab. Hot water was then pumped through the hot plate from a constant temperature water bath. At the same time, cold water from a tap supply, was run through the cold plate. These plates were maintained at constant temperature unti l steady state was reached. This was observed by plotting the relative humidity and temperature profi l es using the Frx data logging software.
re::c=nnvrm"lmnecroo·'tMQr,.m=arrrn WN"mzn:-sXPO·. ,. n=e.lCl1P,·'ttreQ'ttsn<,n=rr=OYT'Z'VDD'''''WZ''S '%S'm=tJnsrmu'Z'A"')'OiXY'n
4-1 6
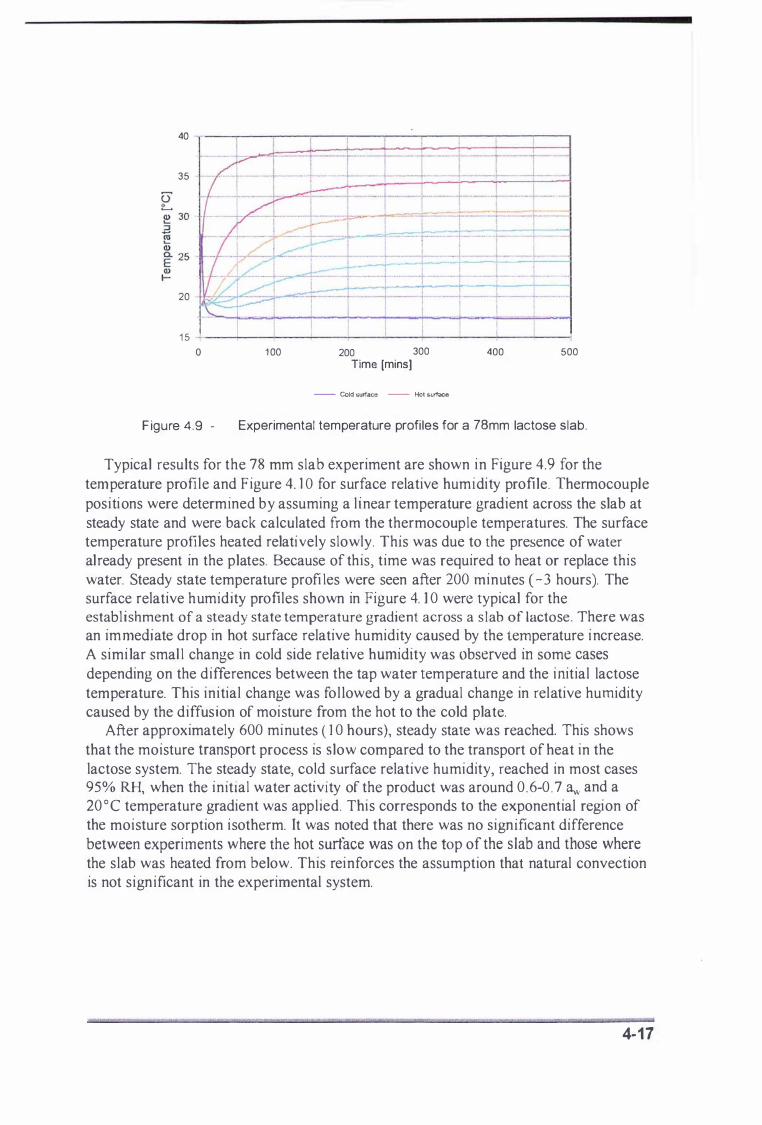
40
35
20 , -r-_. _ _ .-I 1 5 +---+---�--+-------�--�--�--�--�--�
o 1 00 200 300 Time [minsl
- Cold surface - Hot surfaco
400 500
F igure 4.9 - Experimental temperature profi les for a 78mm lactose slab.
Typical results for the 78 mm slab experiment are shown in Figure 4.9 for the temperature profile and Figure 4. 1 0 for surface relative humidity profile. Thermocouple positi ons were determined by assuming a l inear temperature gradient across the slab at steady state and were back calculated from the thermocouple temperatures. The surface temperature profiles heated relati vely slowly. This was due to the presence of water
already present in the plates. Because of this, time was required to heat or replace this water. Steady state temperature profi les were seen after 200 minutes ( - 3 hours). The surface relative humidity profiles shown in Figure 4. ] 0 were typical for the establishment of a steady state temperature gradient across a s lab of lactose . There was an im meruate drop in hot surface relative humidity caused by the temperature i ncrease. A simi lar smal l change in cold side relative humidity was observed in some cases depending on the differences between the tap water temperature and the initial lactose temperature. This initial change was fol lowed by a gradual change in relative humidity caused by the diffusion of moisture from the hot to the cold plate.
After approximately 600 minutes ( 1 0 hours), steady state was reached. This shows that the moisture transport process is slow compared to the transport of heat in the lactose system. The steady state, cold surface relative humidity, reached in most cases 95% RH, when the initial water activity of the product was around 0 .6�0 .7 aw and a 20 °C temperature gradient was applied. This corresponds to the exponential region of the moisture sorption isotherm. It was noted that there was no significant difference between experiments where the hot surface was on the top of the slab and those where the slab was heated from below. This reinforces the assumption that natural convection is not significant in the experimental system.
4· 1 7
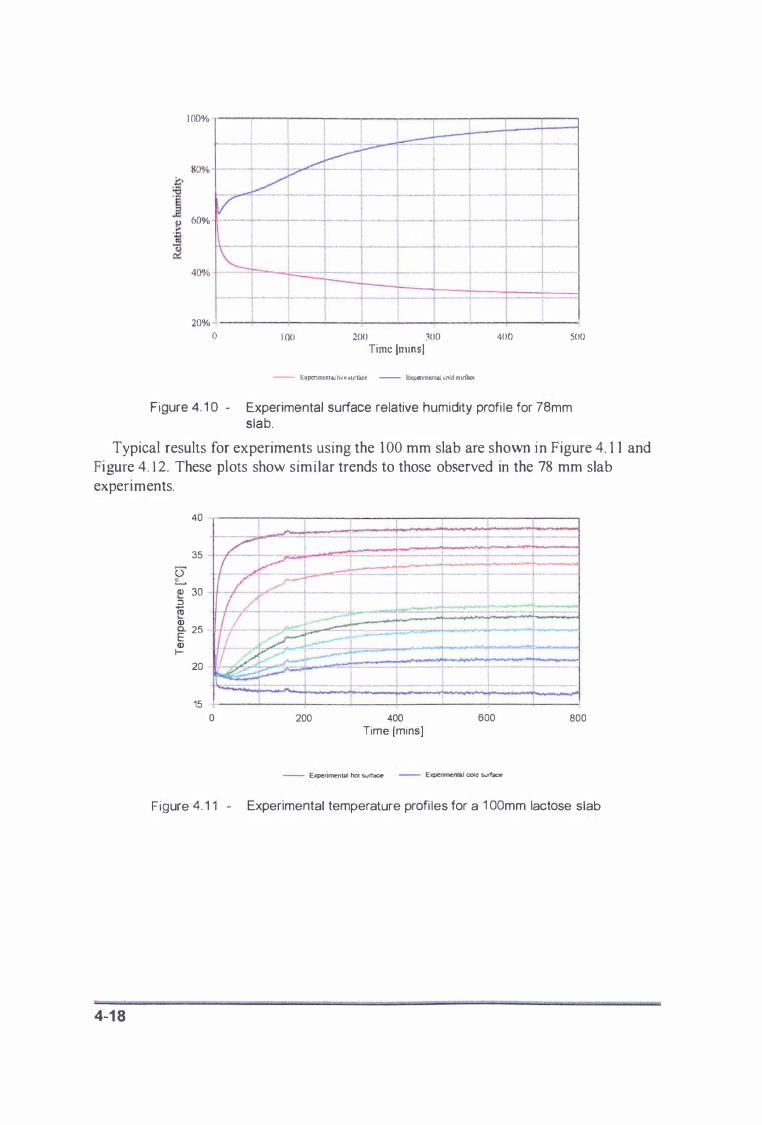
J OO% ---�----�--�---�--�--�---r---r--�--�
60%
40% -
20% o 1 00 200 300
Time [ruins] - HXPC!1JnC"nlaJ he'! ""rim - Rxponme:nhtl Cf\Jd 51uiaoe
400 SOO
Figure 4. 1 0 - Experimental surface relative humidity profi le for 78mm slab.
Typical results for experiments using the 1 00 mm slab are shown in Figure 4. 1 1 and Figure 4. 1 2 . These plots show simi lar trends to those observed in the 78 mm slab experiments.
4-1 8
40
35
� 30 .a � CD a. 25 E CD
I-20
15 �--�----�----�--�--------------�--� o 200 400
Time [mins] 600
- Experimental hoi surh:soe - Expcrimenta.l cold sut1'aoe
800
Figure 4. 1 1 - Experimental temperature profi les for a 1 00mm lactose slab
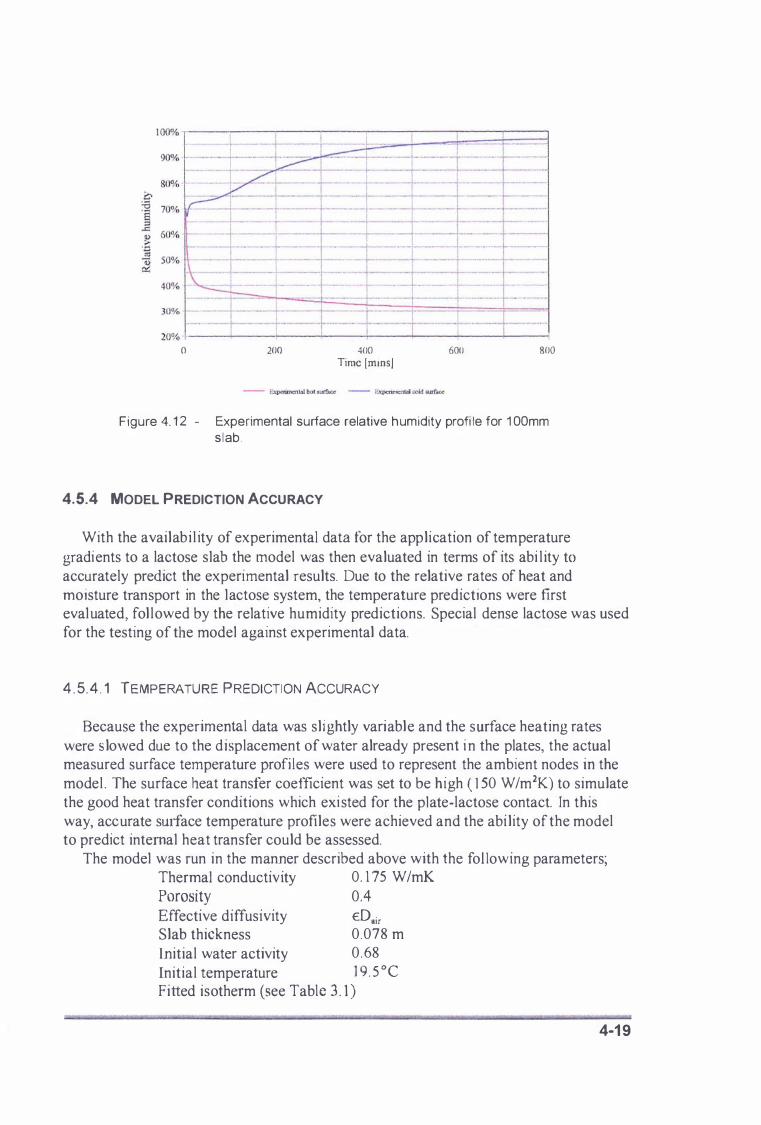
o 200 400 Time [minsl
600 800
Figure 4. 1 2 - Experimental surface relative humidity profi le for 1 00mm slab.
4.5.4 MODEL PREDICTION ACCURACY
With the availabi l ity of experimental data for the application of temperature gradients to a lactose slab the model was then evaluated in terms of its abi l ity to accurately predict the experimental results. Due to the relative rates of heat and moisture transport in the lactose system, the temperature predictions were first eval uated, fol lowed by the relative humidity predictions. Special dense lactose was used for the testing of the model against experimental data.
4 . 5 . 4 . 1 TEMPERATURE PREDICTION ACCURACY
Because the experimental data was sli ghtly variable and the surface heating rates were s lowed due to the displacement of water already present i n the plates, the actual measured surface temperature profi les were used to represent the ambient nodes in the model . The surface heat transfer coefficient was set to be high ( 1 50 W/m2K) to simulate the good heat transfer conditions which exi sted for the plate-lactose contact. In this way, accurate sUlface temperature profiles were achieved and the abi lity of the model to predict internal heat transfer could be assessed.
The model was run in the manner described above with the fol lowing parameters; Thermal conductivity 0. 1 75 W/mK Porosity 0.4
Effective diffusivity €Dair Slab thickness 0.078 m Initial water activity 0 .68 Initial temperature 1 9 . 5 °C Fitted isotherm (see Table 3 . 1 )
4·1 9
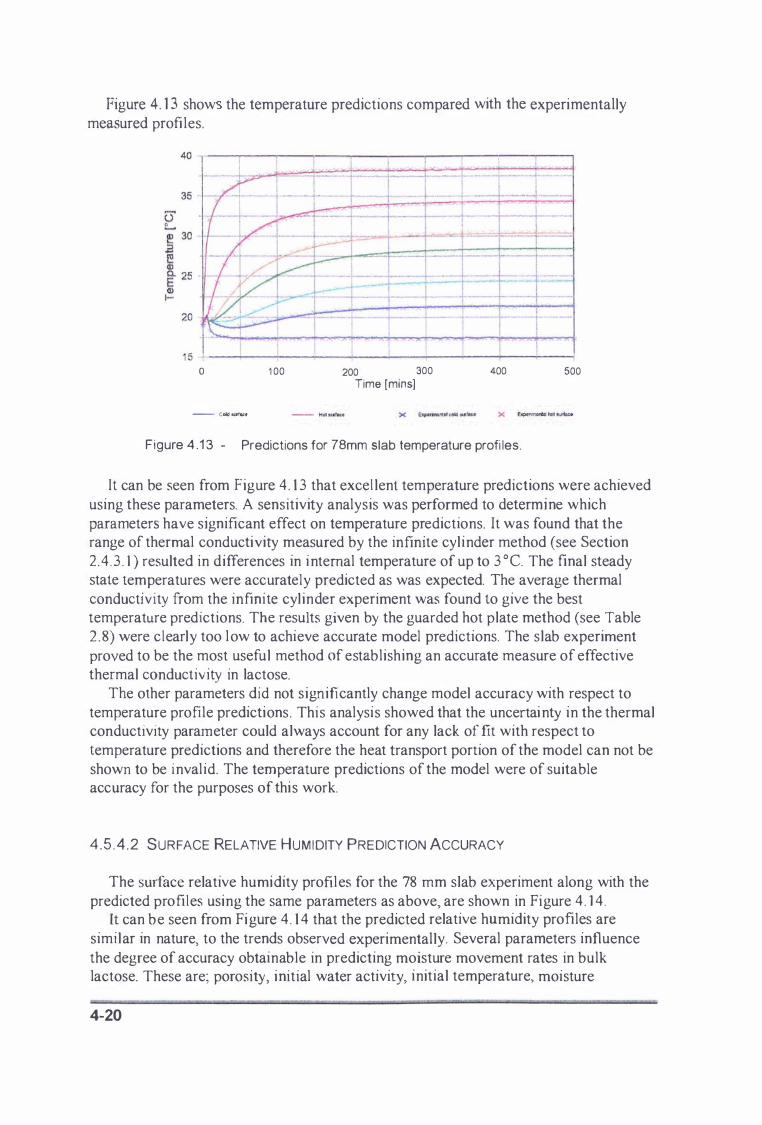
Figure 4 . 1 3 show the temperature predictions compared with the experimentally measured profi les.
o 1 00
- c ... _
200 300 Time [mins)
400
Figure 4.13 - Predictions for 78mm slab temperature profi les.
500
It can be seen from Figure 4 . 1 3 that excel lent temperature predictions were achieved using these parameters. A sensitivity analysis was performed to determine which parameters have significant effect on temperature predictions. It was found that the range of thermal conductivity measured by the infinite cyl inder method (see Section 2 .4 .3 . 1 ) resulted in differences in internal temperature of up to 3 ° e. The final steady state temperatures were accurately predicted as was expected. The average thermal conductivity from the infinite cyl inder experiment was found to give the best temperature predictions. The results given by the guarded hot plate method (see Table 2 . 8) were clearly too l ow to achieve accurate model predictions. The slab experiment proved to be the most useful method of establishing an accurate measure of effective thermal conductivity in lactose.
The other parameters did not significantly change model accuracy with respect to temperature profile predictions. This analysis showed that the uncertai nty in the thermal conductivity parameter could always account for any lack of fit with respect to temperature predictions and therefore the heat transport portion of the model can not be shown to be inval id. The temperature predictions of the model were of suitable accuracy for the purposes of thi s work.
4 . 5 . 4 . 2 SURFACE RELATIVE HUMIDITY PREDICTION ACCURACY
The surface relative humidity profil es for the 78 mm slab experiment along with the predicted profiles using the same parameters as above, are shown in Figure 4 . ] 4 .
It can be seen from Fi gure 4 . 1 4 that the predicted relative humidity profiles are similar in nature, to the trends observed experimentally. Several parameters influence the degree of accuracy obtainable in predicting moisture movement rates in bulk lactose. These are; porosity, initial water activity, initial temperature, moisture
4-20
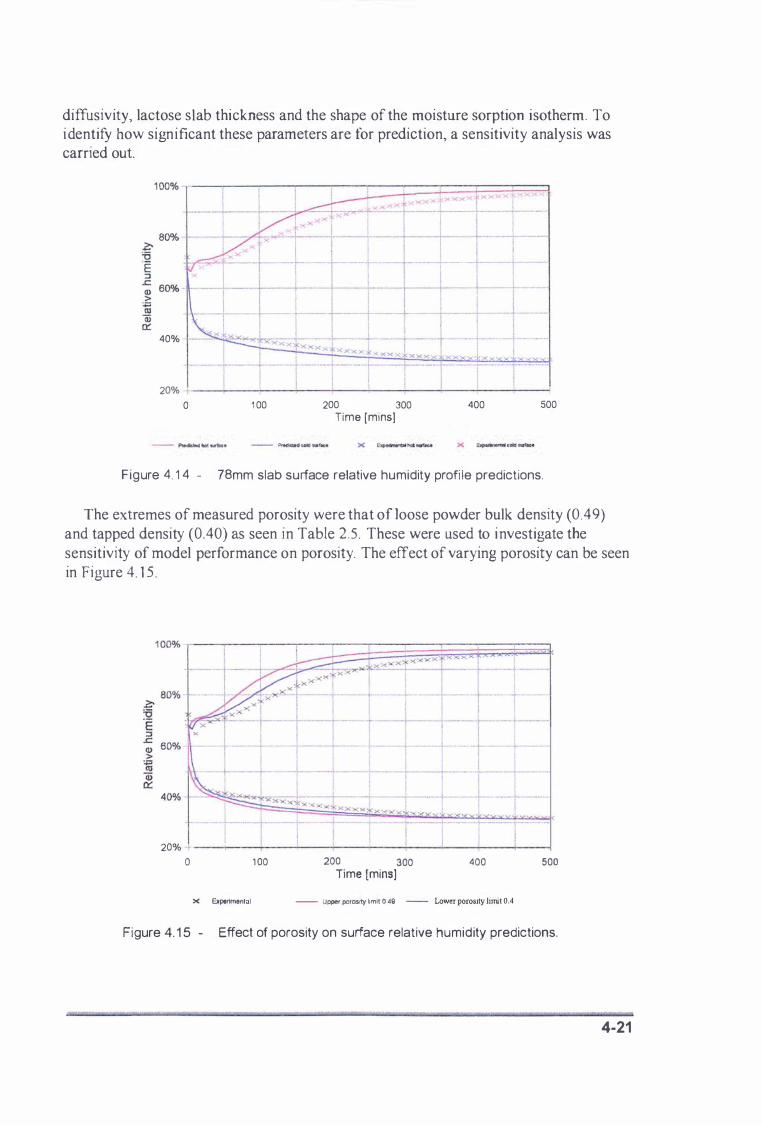
diffusivity, lactose slab thickness and the shape of the moisture sorption isotherm. To i dentify how significant these parameters are for prediction, a sensitivity analysis was carried out
40%
20% ----4----�--�--4---�--�--�----�--�--� o 1 00 200 300
Time [mins] 400 500
Figure 4. 1 4 - 78mm slab surface relative humidity profi le predictions.
The extremes of measured porosity were that of loose powder bulk density (0 .49) and tapped density (0.40) as seen in Table 2.5 . These were used to i nvestigate tbe
sensitivity of model performance on porosity. The effect of varying porosity can be seen in Figure 4. 1 5.
20%
o 1 00
)( Expenmental
200 300 Time [mins] 400
I -L + -_L _ ...
I
500
- Uppe< p<l,OSIty limrt 0 4g - Lower porositylimit O.4
Figure 4. 1 5 - Effect of porosity on surface relative humidity predictions.
4-21

This shows that the major effect of increasing porosity is to increase the rate of moisture migration. This is due to the simple model for effective moisture diffusivity in the porous matrix Eq (3 .27). The results of the simulation were therefore expected however the prediction using the minimum porosity l imit (0.40) did not accurately predict the experimental results . Porosity on its own does not account for the lack of fit of the model.
The results of the porosity analysis indicated that the rate of moisture movement is predicted to be faster than experimental ly observed and therefore an i nvestigation into the sensitivity of the moisture diffusivity parameter on model performance was undertaken. To do this the extreme estimates of diffusivity models discussed in Section 3 . 8 were used. This involved the use of the simple model for diffusivity given by Eq
(4. ] 8)
f) 'fJ''';� = ( ;,) E D a;, (4. 1 8)
where 0/1;2 is a parameter involving the tortuosity and constrictivity of the diffusion path and can range from 0. 5 to 1 .0 . Figure 4. 1 6 shows the prediction of surface relative humidity using 0/1;2 of 0 . 5 and 1 . 0 for comparison.
1 00% -, --,--,--,---,---.,---.,..--.,..--..,.---..,.-----,
- -1·- J . --r-t· I - -t--80% - - - -�--T----�-t--·
f 6O% X�.�-=_,�_ · I -t-.+r-+=�h +� ! --1 -I-I ! -- t I·�- --t--�I -40% - -- ><""'" xxx xxx ., --- - _ .
. -.- --t -----t x x..::: x_xx:: _._ ----- --20% -�-�----+-_4-�-�-�-�-�-�
o 1 00
x Experimental
200 300 Time [mins]
400
- LOINe! ditrusMty limit - Upper difJu:srvity limit
500
Figure 4. 1 6 - Effect of d iffusivity on surface relative humidity predict ions.
This shows that the adj ustment of the diffusivity parameter could allow very good cold surface predictions to be achieved. The hot surface relative humidity profile was not as well predicted however. The reason for the rapid drop in relative humidity on the hot side is the increase in temperature. This is then fol lowed by the gradual diffusion of moisture toward the cold surface_ It fol lows therefore that the magnitude of this temperature increase could have been influential on how accurate the hot surface relative humidity predictions were.
To assess this, an analysis on the sensitivity of the model on initial temperature was undertaken. Figure 4 . 1 7 shows predictions with initial temperature of 1 9 and 2 0 ° C. It
4-22
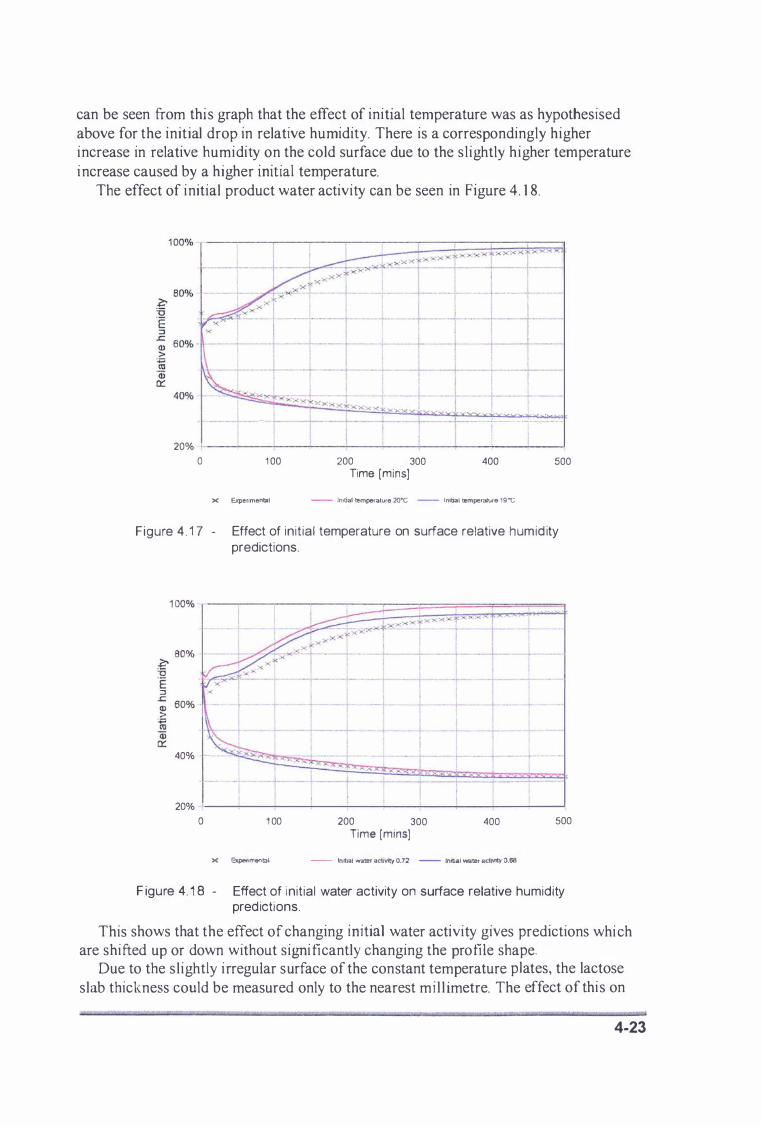
can be seen from thi s graph that the effect of initial temperature was as hypothesised above for the initial drop in relative humidity. There is a correspondingly higher increase in relative humidity on the cold surface due to the sl ightly higher temperature
increase caused by a higher initial temperature. The effect of initial product water activity can be seen in Figure 4. 1 8.
- r -r --t�:�>( I· ><--=-··t-- · · _-t-- --�I·---f--· -· ' 20% [ . I o 1 00
x Experimental
200 300 Time [mins]
400
- Imtial temperalurc w-c - Initial tempemture 19�
500
Figure 4. 1 7 · Effect of in it ial temperature on surface relative humid ity predictions.
40% --
20%
o
- -r i--
1 00
x ExpMlmentol
I --t----t - I . _.t-. 1 __ _
I . ,-i
4- •
200 300 Time [mins]
- - r
400
- Initlal w:amr actIVity O.72 - Inmal watBr RctJvrty O.68
-r
1
500
F igure 4. 1 8 · Effect of i n it ial water activity on surface relative humidity pred ictions.
This shows that the effect of changing initial water activity gives predictions whi ch are shifted up or down without sif,'11ificantly changing the profile shape.
Due to the sl ightly irregular surface of the constant temperature plates, the lactose
slab thickness could be measured only to the nearest m i l l imetre. The effect of this on
4-23
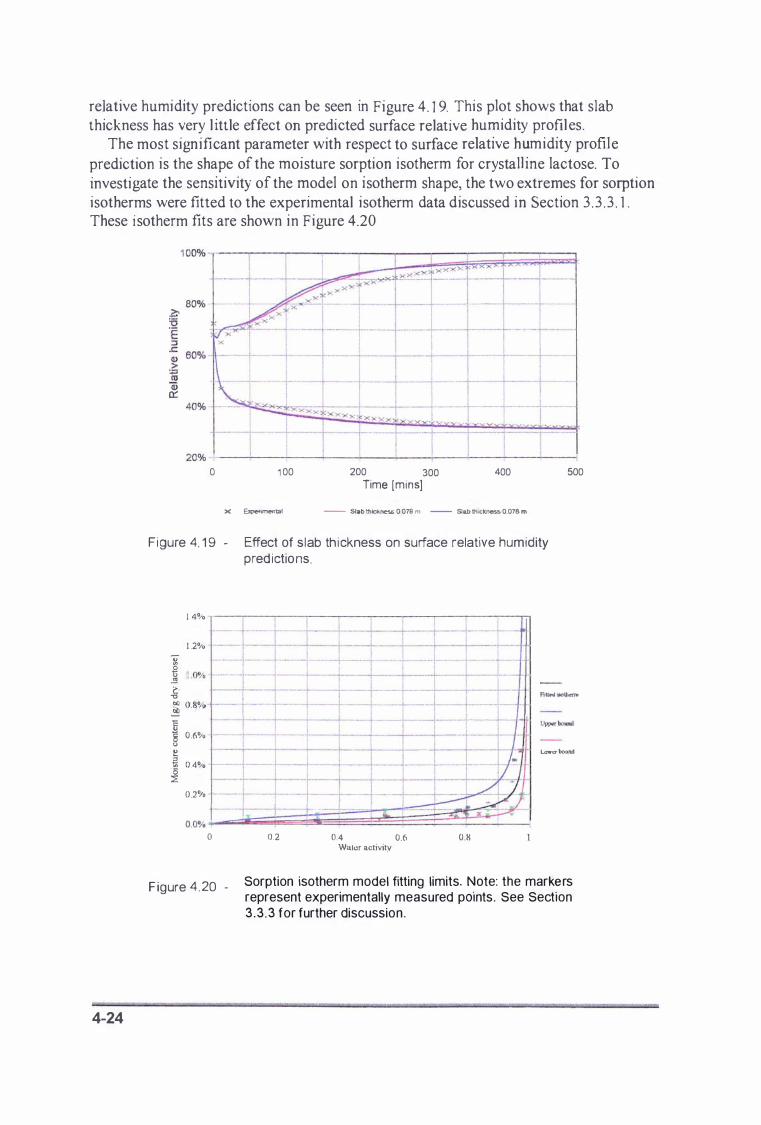
relative humidity predictions can be seen in Figure 4. ] 9. This plot shows that slab thickness has very l ittle effect on predicted surface relative humidity profil es.
The most significant parameter with respect to surface relative humidity profile
prediction is the shape of the moisture sorption isotherm for crystalline lactose. To investigate the sensitivity of the model on isotherm shape, the two extremes for sorption isotherms were fitted to the experimental isotherm data discussed in Section 3 . 3 . 3 . 1 . These isotherm fits are shown in Figure 4.20
4-24
o 1 00
x experimental
200 300 Time [mins]
400
- Slab thK::kness 0 079 m - Slab thiCkness 0.078 m
Figure 4. 1 9 - Effect of slab th ickness on surface relative humidity pred ictions
1 .4% .,--r-----,--,-----,--....,.---r--.,----r----..,-"
500
1 2% -- l=-t--- .�+= - --1= �f-I 1 .0% .-·��r��-l=� - ·-i- ·:=-��� =-_. ---=t---�t�· -c ---1---·- ---- ---1--- --"1---� 0 . 8%----l -. _.1-__ --- --/----- - ----- Fiued ulothcrm
i ---t----H--- .-+--- .--- -.--- -8 0.6% - -r-.t----=J= -,- --.j 0.4% - ---t=l. - - - -�+= _. - --
::E --- --- --- ---1----0.2% - - .-- -- �-=t� _ _ -
O. O%l::.:T�������;;t�$�E��B�j o 0 .2 0.4 0.6 0.8
Water activity
l..owcr OOund
F igure 4 .20 - Sorption isotherm model fitting limits. �ote: the mark�rs represent experimentally measured pOints. See Section 3 .3 .3 for further discussion.
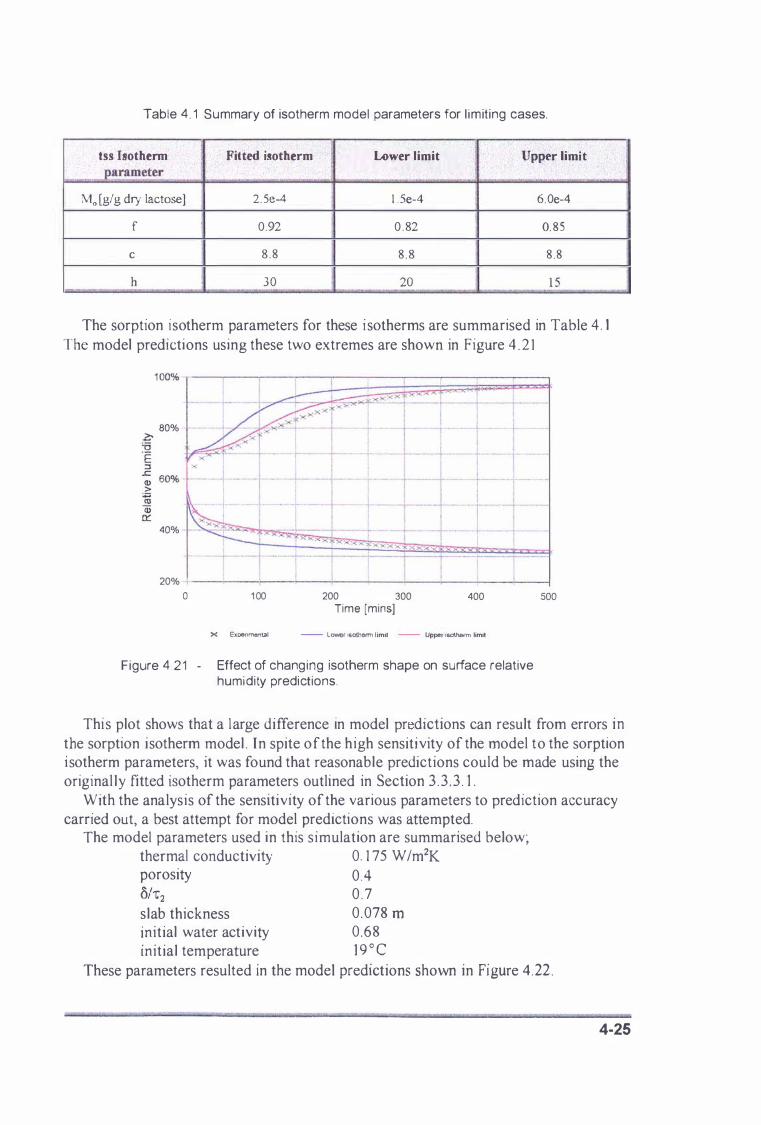
Table 4 . 1 Summary of isotherm model parameters for l im iting cases.
tss Isotherm Fitted isotherm Lower limit Upper limit . �arllmeter ,
,
Mo [gig dry lactose] 2. Se-4 1 . 5e-4 6.0e-4
f 0.92 0 . 82 0. 85
c 8 .8 8 .8 8 .8
h 30 20 1 5 . .
The sorption isotherm parameters for these i sotherms are summarised in Table 4 . 1 The model predictions using these two extremes are shown in Figure 4 . 2 1
80%
40%
20% o 1 00
X EX08rtmen\il1
- "T " -T . __ .-
t -_ l I
200 300 400 Time (mins]
- Lower Isotherm limit - Upper Isotherm limit
Figure 4 .2 1 - Effect of chang ing isotherm shape on surface relative humidity predictions.
500
Thi s plot shows that a large difference in model pr dictions can result from errors in the sorption isotherm model . In spite of the high sensitivity of the model to the sorption i sotherm parameters, it was found that reasonable predictions could be made using the original ly fitted isotherm parameters outlined in Section 3 . 3 . 3 . 1 .
With the analysis of the sensitivity of the various parameters to prediction accuracy carried out, a best attempt for model predi.ctions was attempted.
The model parameters used in this s imulation are summarised below; thermal conductivity 0. 1 75 W/m2K porosity 0 .4
O/�2 0 . 7 slab thickness 0. 078 m initial water activity 0.68 initial temperature 1 9 ° C
These parameters resulted in the model predictions shown in Figure 4 . 22 .
4-25
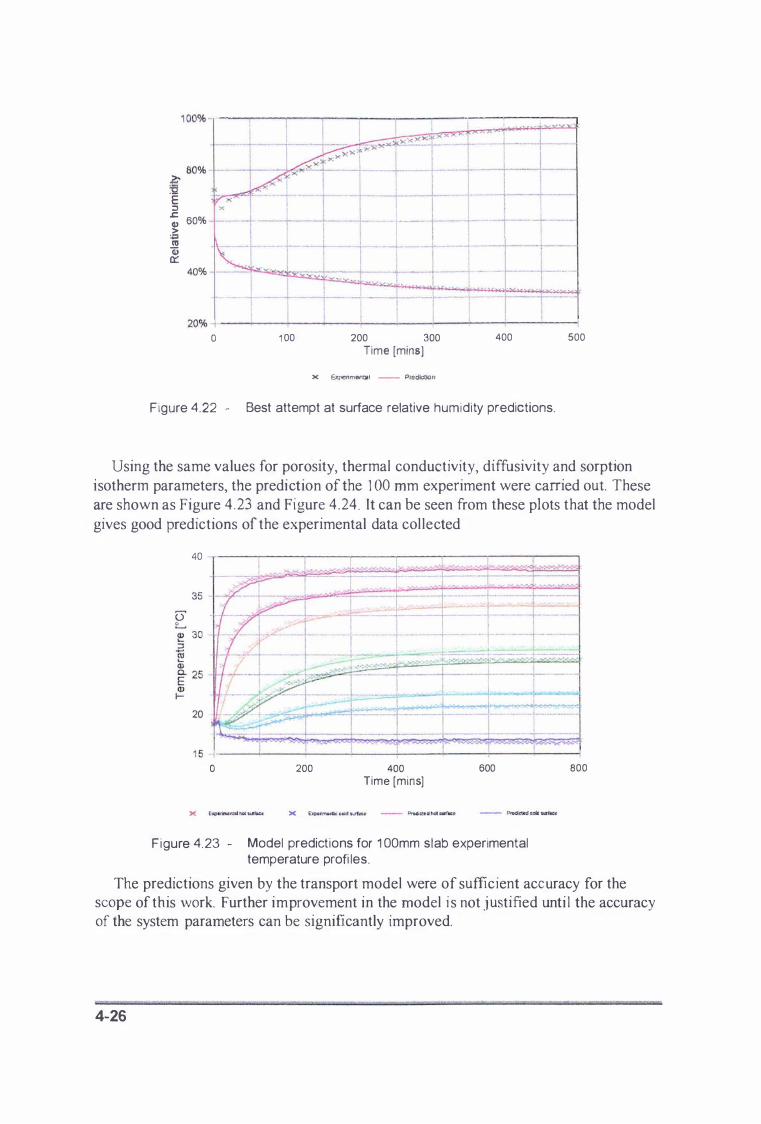
1 00% -... ----,----r--.....,--r----r-, ----,.--..... -,--...,..---I )(� ��x
.� --_. --1" ' ---r-- -I-,---L-- ---r----- I ---i 60% --'1---- ---+--- - " - --t-- - -1- ---& ' . - --- '''--i''-'' --1
40%
-+ 1 - -.- - -t-- - . ---- -- - - .
II I ! I 20% �; ---+----4---�--�--�--�'--�--�' -�-� o 1 00 200 300
Time [mins)
x Expenmemal - Prodlctioo
400
Figure 4.22 - Best attempt at surface relative humidity predictions.
500
Using the same values for porosity, thermal conductivity, diffusivity and sorption isotherm parameters, the prediction of the 1 00 rom experiment were carried out These are shown as Figure 4 . 23 and Figure 4 . 24 . It can be seen from these plots that the model gives good predictions of the experimental data col lected
40 T---'---'--�--'---'---'--�---'
20
1 5 _ ___ -L __ �--�-��-_+--�--�-� o 200 400
Time [mins] 600
Figure 4.23 - Model predict ions for 1 00mm slab experimental temperature profi les_
800
The predictions given by the transport model were of sufficient accuracy for the scope of this work. Further improvement in the model i s not justified unti l the accuracy of the system parameters can be significantly improved.
4-26
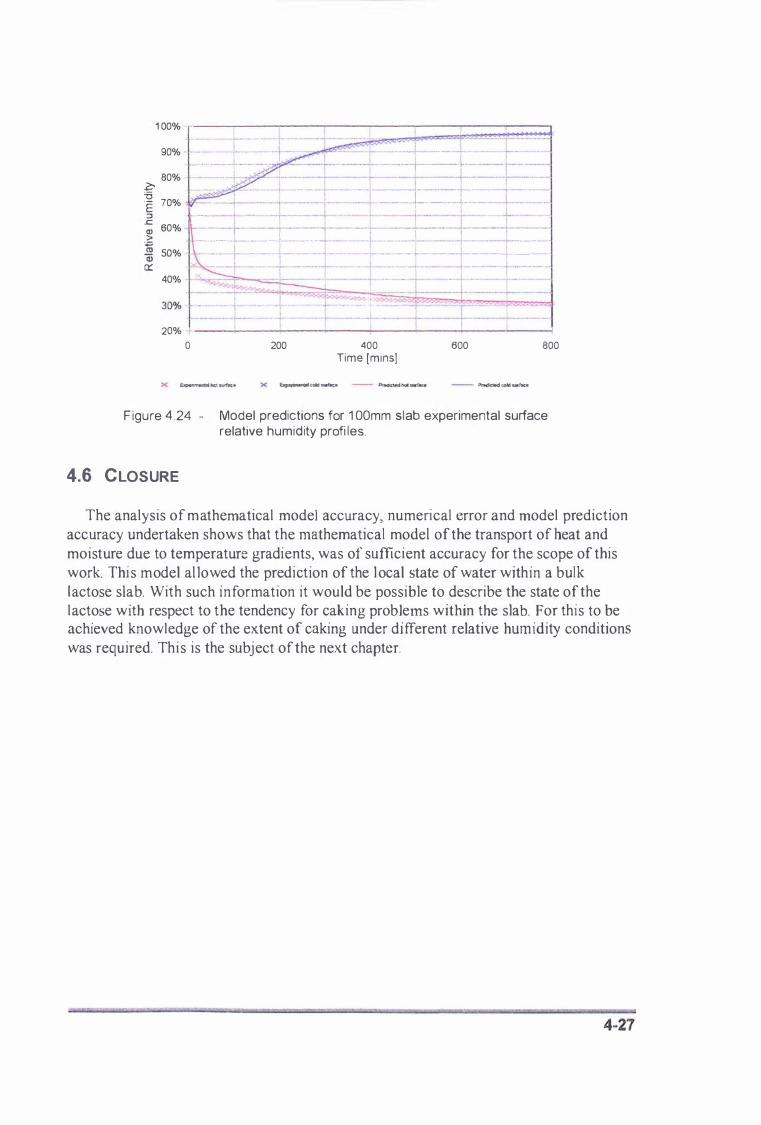
1 00% I I 1 I I I •
90% - �= --r=-- ·�·-F -�-� .. �.= t=.L - . - .-.--1- .. -- -. - .'=�--- -- -�-.-.-----�-- ---
--.----. �--.. - -- - - - ---' - --1--'--- � .. . . -.--�- '--" -
80% - - . +- ...,._._-_ .. __ ... .. - -· ---... ··-----I-· ... ·--�-·-·· -x: _ I I " � .. - -. " - - " -!' - -·· t · . -+ .- --... -.- .-.- + . . -- ---t -- .- -
'E 70% -- ---t-_ .. -- t"---.. ----·t- -- � -·---· �--·----t--·- --- .-_. _. E - - --'0- - ' 1---- '-+ . �-- -l-'-'--'-- 'I '- " .. . -...... . .. Q) 60% - -f- '---r--l---- --.L '--- 1 ----- 1------:------.� . - ... '--.-. .-. L- ' ... .. -t-.- I -_. - - , -1 -_.- - t-· -- .-� 50% ' .. -- +- - - I - --1-- - � - - - f. -.- - -1 --- '--'-0:: .. -- - 1----- ... T ..... --"-1-- - -- 1-- -- _ .. - ------. .. ----. �-.---- .
40% �""'� - I-- I T -- - ;- -- -- - -
30% . ����-=.L�� ��=���_: ��!"'==�-:,:==-.--- --:--20% ' _--�I----------�--�----�----�--�--�
o 200 400 Time [mins]
600 800
Figure 4 .24 - Model predictions for 1 00mm slab experimental surface relative humidity profi les.
4.6 CLOSURE
The analysis of m athematical model accuracy, numerical error and model prediction accuracy undertaken shows that the mathematical model of the transport of heat and moisture due to temperature gradients, was of sufficient accuracy for the scope of this work. Thi s model al lowed the prediction of the l ocal state of water within a bulk lactose slab. With such information it would be possible to describe the state of the lactose with respect to the tendency for caking problems within the slab. For this to be achieved knowledge of the extent of caking under different relative humidity conditions was required. This is the subject of the next chapter.
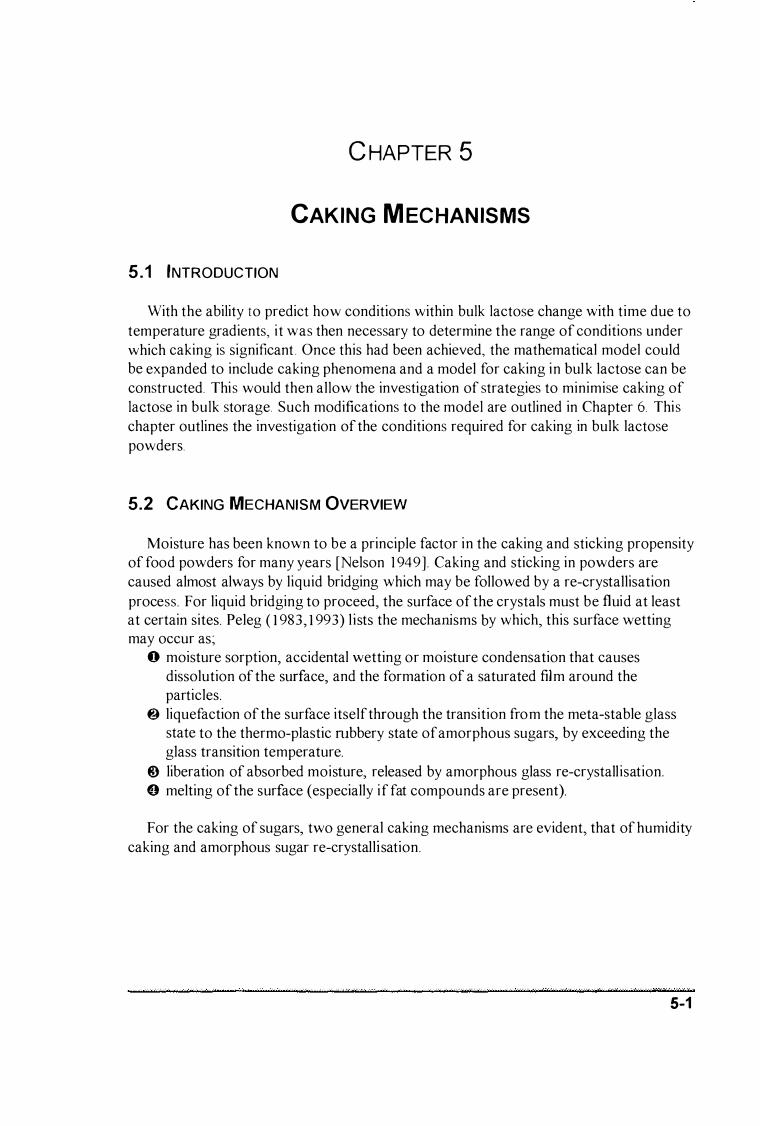
CHAPTER 5
CAKING MECHANISMS
5 . 1 INTRODUCTION
With the ability to predict how conditions within bulk lactose change with time due to temperature gradients, it was then necessary to determine the range of conditions under which caking is significant . Once this had been achieved, the mathematical model could be expanded to include caking phenomena and a model for caking in bulk lactose can be constructed. This would then allow the investigation of strategies to minimise caking of lactose in bulk storage. Such modifications to the model are outlined in Chapter 6. This chapter outlines the investigation of the conditions required for caking in bulk lactose powders.
5.2 CAKING MECHANISM OVERVIEW
Moisture has been known to be a principle factor in the caking and sticking propensity of food powders for many years [Nelson 1 949] . Caking and sticking in powders are caused almost always by liquid bridging which may be followed by a re-crystallisation process. For liquid bridging to proceed, the surface of the crystals must be fluid at least at certain sites. Peleg ( 1 983, 1 993) l ists the mechanisms by which, this surface wetting may occur as�
o moisture sorption, accidental wetting or moisture condensation that causes dissolution of the surface, and the formation of a saturated film around the particles.
@:) liquefaction of the surface itself through the transition from the meta-stable glass state to the thermo-plastic rubbery state of amorphous sugars, by exceeding the glass transition temperature.
@) liberation of absorbed moisture, released by amorphous glass re-crystall isation. 6 melting of the surface (especially if fat compounds are present).
For the caking of sugars, two general caking mechanisms are evident, that of humidity caking and amorphous sugar re-crystallisation.
5-1
5.2.1 HUMIDITY CAKING
Many authors have hypothesised the caking mechanism in sugars [Moss et al. 1 93 3 , Nelson 1 949, Meade 1 963, McGinnis 1 97 1 , Pancoast and Junk 1 980, Nicol 1 99 1 ] , onion powder [Peleg and Mannheim 1 969, 1 977], and fertilisers [Hardesty and Kumagai 1 952, Kumagai and Hardesty 1 956, Whynes and Dee 1 957, Anonymous 1 990a, Rutland 1 99 1 ] . A detailed review of the earlier investigations into the caking of sucrose was carried out by Bagster ( 1 970a, 1 970b).
The basic mechanism presented by these researchers has been termed "Humidity Caking", and was summarised by Nelson ( 1 949) as;
"Powders, when exposed to conditions of high relative humidity will absorb moisture. A powder, will at equilibrium, give an equilibrium relative humidity, dependent on its moisture content. There exists what has been termed the critical relative humidity for adsorption to take place. This is the relative humidity at which pure sugar crystals change from a theoretically moisture free condition to a dissolved or liquid condition. For sucrose this value has been observed as being approximately 85%."
The moisture content of sucrose is typically between 0 .02-0.06% (dry weight) [McGinnis 1 97 1 ] . Nelson ( 1 949) suggests that moisture contents above 0 .06% lead to caking problems. Anonymous ( 1 990b) suggested that for storage of sucrose, the equilibrium relative humidity should be kept below 65%, to avoid caking.
Bagster ( 1 970a) suggested that most of the moisture stays at the surface in the case of a sucrose crystal . Solutes at the surface may then be dissolved to form a saturated solution. Irani et al. ( 1 959) stated that caking propensity is directly dependant on the solubility of the material being caked. This would indicate an increase in caking strength with increasing temperature due to the increasing solubility with temperature.
It has been experimentally observed [Rumpf 1 975, Schubert 1 984] that where particles possess free liquid films on the surface, liquid bridges will form between adjacent particles as surface tension forces cause flow to occur toward the contact regions of two or more particles. Scoville and Peleg ( 1 98 1 ) determined that liquid bridges are sufficient to alter the bulk properties of food powders. Nelson ( 1 949) however stresses that caking does not occur until this moist sugar has lost excess moisture and the syrup film at the fused points of contact has re-crystallised to the crystal surface, causing the cementing together of adjacent particles.
Peleg and Mannheim ( 1 969) observed that caking tendency of onion powders increased with temperature in the range 1 5-3 5 0 c . They attributed the observation of shrinkage on caking to the inter-particle attraction caused by liquid bridging. These forces result in the formation of a closer matrix and hence shrinkage. It should be pointed out that these observations can be also explained by the amorphous glass recrystallisation caking mechanism.
From the observations of Peleg and Mannheim ( 1 977) and Scoville and Peleg ( 1 98 1 ) it is clear that the physical properties of cohesion and bulk density are mainly attributed to the particle surface properties of the powder. This means flow-ability loss and caking will start even when the particle interior is relatively dry. Inter-particle cohesion in crystalline materials can develop with very minor, sometimes difficult to detect, changes in moisture content. The bulk properties of bulk density and compressibility, may be more sensitive indicators of such changes [Moreyra and Peleg 1 98 1 ) .
5-2
5.2.2 AMORPHOUS SUGAR RE-CRYSTALLISATION
Stickiness or cohesion in powders is a problem in the storage of amorphous sugar containing food powders [Downton et at. 1 982, Wallack and King 1 988, Noel et at. 1 990, Roos and Karel 1 993] . The characteristic sticky point of a particular material has been defined as "the temperature at which the force required to stir a food powder increases sharply" [Lazar et at. 1 956] . Stickiness usually results in caking above the sticky point [ Roos and Karel 1 993 ] .
The sticky point o f a powder and caking tendency are moisture dependent phenomena [Notter el al 1 958] . Peleg and Mannheim ( I 973) indicated a relationship between caking and the cohesion of powdered sucrose. Moreyra and Peleg ( 1 98 1 ) have conducted an investigation of the effect of water activity on the bulk properties of a number of powders including powdered sucrose. Their results have showed that the behaviour of sucrose changes markedly at 0 .6 a.v' Flink ( I 983 ) points out that this observation could be due to transitions in the structure of the surface of the powder, first with collapse and then re-crystallisation of a thin layer of amorphous material formed during the mi lling process. Roos and Karel ( I 99 1 a) observed that for a sucrose/fructose (7 ] ) mixture, the sticky point was close to the temperature corresponding to the end of glass transition.
Roos and Karel ( 1 993) attributed the stickiness phenomena to glass transition. Above l� increasing mobility may result in stickiness. Wallack and King ( 1 988) used liquid bridge formation kinetics to determine the critical viscosity for stickiness. It was found to be around 1 06_ 1 08 Pa. s . Roos and Karel ( 1 993) demonstrated that the viscosity for stickiness is equivalent to the viscosity of amorphous sugars at r-Tg value of 1 0-20 °e .
Various additives, often of high molecular weight, have been used to combat stickiness in spray drying and in powders. When high molecular weight additives such as gums, proteins, or malto-dextrin are used as drying aids, they serve to increase the viscosity at a given moisture content and can raise viscosity sufficiently to avoid stickiness [Downton et at. 1 982] . This could be the result of increasing the glass transition temperature of the mixture, or the additives could act as a moisture sink which means much more moisture is required to achieve a high water activity.
Downton et al ( I 982) described the mechanism for the stickiness phenomenon. Moistening the particle surface reduces the viscosity. If two surfaces come into contact, they may or may not stick together, depending on whether sufficient liquid flow can occur to build a bridge between the particles that is strong enough to resist subsequent mechanical deformation. By dimensional analysis or simplistic energy balance Eq.(5 . 1 ) was formulated.
k 1a f d (5 . 1 )
where k I i s a dimensionless proportionality constant, a i s surface tension driving force, t is contact time, 1] is viscosity and d is distance over which flow must occur.
Peleg ( 1 993) derived Eq . (5 .2) for the temperature/moisture relationship of stickiness, collapse and glass transition.
5-3

T- T In ___
T
T - T o T
(5.2)
where T is Temperature, To is characteristic temperature corresponding to zero moisture content, Tr is reference temperature, M is moisture content (dry basis) and k " is a constant. This is again evidence that stickiness, glass transition and caking are all attributed to the same phenomenon.
5.2.3 ALTERNATIVE MECHANISMS
Alternative mechanisms for caking of fertiliser caking include plastic deformation [Anonymous 1 990a, Rutland 1 99 1 ] and the formation of double salts [Anonymous 1 990a]. Double salt formation occurs during storage of fertilisers when chemical reactions between different salts do not reach completion in the granulation process. The end result of these exothermic reactions can be extensive re-crystallisation, increased temperature and severe caking. Plastic deformation caking occurs in fertiliser storage when high pressure is applied.
5.2.4 EFFECT OF PRESSURE AND CRYST AL CONTACT AREA
Flow-ability and caking is affected by the number of points of contact between crystals [Anonymous 1 990b]. The number of points of contact i s affected by�
• pressure • crystal size (the smaller the crystal size the greater the number of points of contact) • coefficient of variation (as this increases, the number of contact points will increase
as fine particles will fill the interstices between the larger crystals) . Lyle ( 1 956) and Pancoast and Junk ( 1 980) also indicated the importance of face to
face contact in the caking of sucrose Pressure influences the severity of caking in that the greater the compression, the closer the contact between the crystals will become. This will result in a greater number of contact points and hence more adhesion between adjacent crystals [Bagster 1 970b] . Nelson ( 1 949) indicated that not only did pressure increase the number of points of contact between crystal faces, but makes more certain the fusing of any syrup film on the crystals
Bagster ( 1 970b) states that smaller particles have a greater surface area per unit of bulk volume. Because of this there is more water associated with a bag of fine crystals at a given equilibrium relative humidity than for larger crystals . There is also evidence to suggest that the time to reach equilibrium in conditioning granulated sugar was less for finer particle sizes.
Irani et at. ( 1 959) stated that the effect of extremely high pressures at points of contact can locally raise solubility of the material so that the resulting saturated solution may crystallise, upon flow to neighbouring positions, where pressure is lower.
5-4
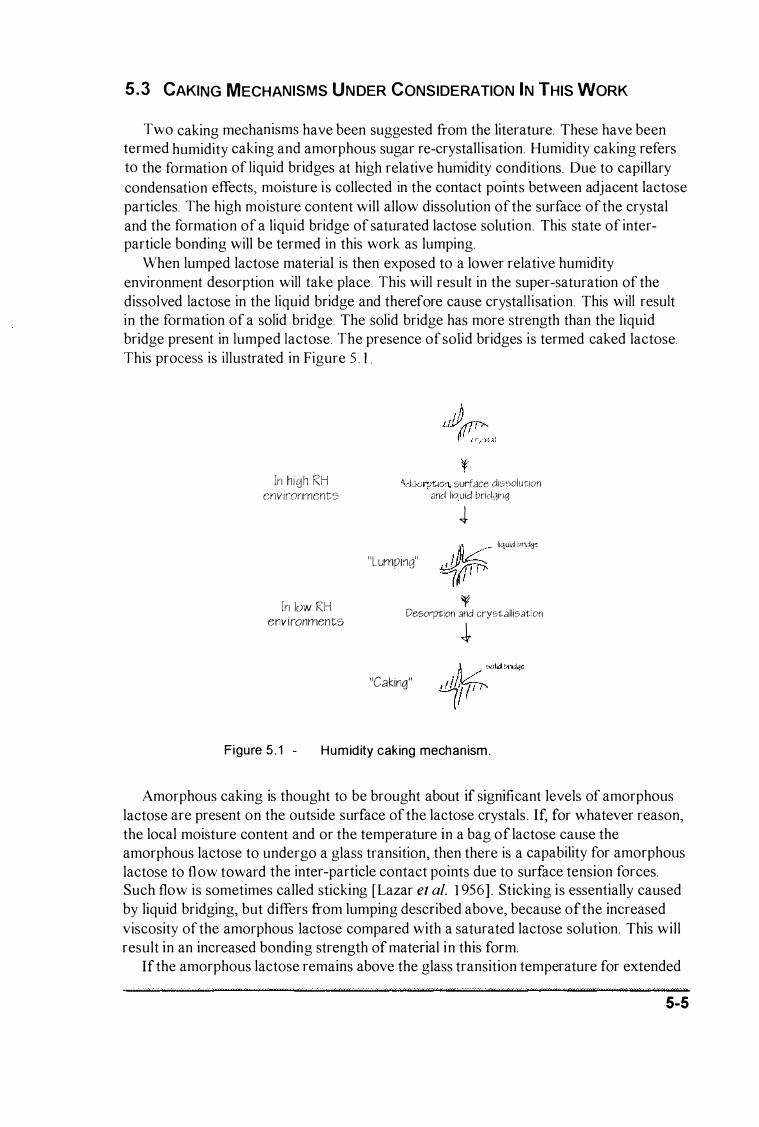
5.3 CAKING MECHANISMS UNDER CONSIDERATION IN THIS WORK
Two caking mechanisms have been suggested from the literature. These have been termed humidity caking and amorphous sugar re-crystall isation. Humidity caking refers to the formation of liquid bridges at high relative humidity conditions. Due to capillary condensation effects, moisture i s collected in the contact points between adjacent lactose particles. The high moisture content will allow dissolution of the surface of the crystal and the formation of a liquid bridge of saturated lactose solution. This state of interparticle bonding will be termed in this work as lumping.
When lumped lactose material is then exposed to a lower relative humidity environment desorption will take place. This will result in the super-saturation of the dissolved lactose in the liquid bridge and therefore cause crystall isation. This will result in the formation of a solid bridge. The solid bridge has more strength than the liquid bridge present in lumped lactose. The presence of solid bridges is termed caked lactose. This process is illustrated in Figure 5 . 1 .
In h igh RH environments
In low RH environments
""";" mnnn surfdce dissolution and liquid bridCjinCj
J �/J��I liquid Im,Jgc
"Lumping" �.� f
Desorpt:ion .and cryst.allis.at;on
� "Caking"
Figure 5 . 1 - Humid ity caking mechanism .
Amorphous caking is thought to be brought about if significant levels of amorphous lactose are present on the outside surface of the lactose crystals . If, for whatever reason, the local moisture content and or the temperature in a bag of lactose cause the amorphous lactose to undergo a glass transition, then there is a capability for amorphous lactose to flow toward the inter-particle contact points due to surface tension forces. Such flow is sometimes called sticking [Lazar et al. 1 956] . Sticking is essentially caused by liquid bridging, but differs from lumping described above, because of the increased viscosity of the amorphous lactose compared with a saturated lactose solution. This will result in an increased bonding strength of material in this form.
If the amorphous lactose remains above the glass transition temperature for extended j'1''''7,··,h
5-5
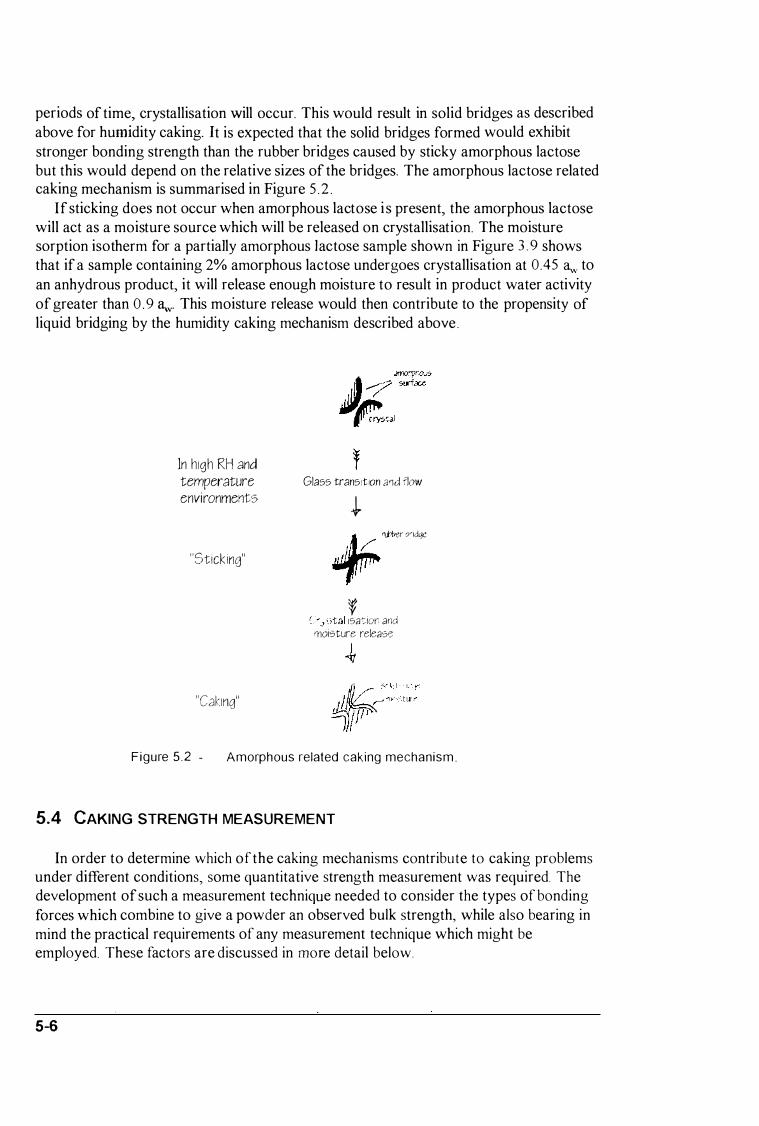
periods of time, crystallisation will occur. This would result in solid bridges as described above for humidity caking. It is expected that the solid bridges formed would exhibit stronger bonding strength than the rubber bridges caused by sticky amorphous lactose but this would depend on the relative sizes of the bridges. The amorphous lactose related caking mechanism is summarised in Figure 5 . 2 .
If sticking does not occur when amorphous lactose i s present, the amorphous lactose will act as a moisture source which will be released on crystallisation. The moisture sorption isotherm for a partially amorphous lactose sample shown in Figure 3 . 9 shows that if a sample containing 2% amorphous lactose undergoes crystallisation at 0 .45 � to an anhydrous product, it will release enough moisture to result in product water activity of greater than 0 .9 �. This moisture release would then contribute to the propensity of liquid bridging by the humidity caking mechanism described above .
In h igh RH and temperature environments
"Stick ing"
"Caking"
Glass transition a'1d flow
�
.. ""'' ''''''
� . . Isa".;lo� ana moisture release
Figure 5.2 - Amorphous related caking mechanism .
5.4 CAKING STRENGTH MEASUREMENT
In order to determine which of the caking mechanisms contribute to caking problems under different conditions, some quantitative strength measurement was required. The development of such a measurement technique needed to consider the types of bonding forces which combine to give a powder an observed bulk strength, while also bearing in mind the practical requirements of any measurement technique which might be employed. These factors are discussed in more detail below.
5-6

5.4.1 CAKIN G STRENGTH REQUIREMENTS FOR THIS WORK
The strength of caked or lumped lactose powder i s caused by either liquid bridges or solid crystalline bridges. The major difference between the humidity caking and amorphous lactose related caking mechanisms i s the viscosity of the liquid bridges and the likely size of the resultant crystalline bridges. In either case, some form of bridges are the major reason for the increased strength of lumped or caked bulk powder.
A liquid bridge has strength due to the presence of capillary forces. These are made up of surface tension forces and the force due to differences in pressure inside and outside the liquid bridge [Schubert 1 984] . Such forces are best measured as the tensile strength of the product. Schubert ( 1 975) defines tensile strength as the 'unidirectional maximum tensile force per unit of the plane cross-sectional area of the bulk material at right angles to the direction of the tension when a locally constant, purely tensile stress prevails in the fracture cross-section of the material regarded as a continuum' .
As such, the method of characterising the relative strength of product in different conditions needed to be able to measure the strength of the liquid bridges or solid bridges inherent in the bulk media. The technique decided upon, also needed to meet the requirement of being suitable for use in measuring the strength of material packed into the experimental temperature gradient rig described in Section 4 . 5 . 3 . 1 . This allowed the application of a temperature gradient to a packed lactose bed and the characterisation of the resulting strength profiles throughout the bed, due to moisture migration.
Any technique which required the removal of the product from the experimental rig would cause the disturbance of the liquid bridges giving the sample strent,>th and therefore was not suited to this purpose. The technique also needed to be suitable for the strength determination of small samples which were equilibrated in desiccators at varying conditions.
5.4.2 AVAILABLE STRENGTH M EASUREMENT M ETHODS
Numerous methods can be found for the detennination of the bulk strength of particulate materials. These can be characterised into several main categories including, tensile strength, shear strength, crushing strength and other miscellaneous measurement methods.
5 . 4. 2 . 1 TENSILE STRENGTH
Tensile strength measurements have been made by Schubert ( 1 975), Schubert et al. ( 1 975) and Pietsch et al. ( 1 969) for finely divided solids. The advantage of tensile strength measurement is the availability of theoretical relationships between tensile strength and the various kinds of binding mechanisms which have been developed by Rumpf ( 1 96 1 ), Schubert ( 1 975) and Pietsch et al. ( 1 969).
Kawashima ( 1 99 1 ) summarises several other researchers tensile strength measurement devices as does Schubert ( 1975) . Hasegawa et al. ( 1 985) detail two commercially available tension testers. Most methods involve the measurement of strength when the powder is pulled apart. For example the split table method makes use of a horizontal
5-7
platform on to which the powder is packed. Part of the platform is movable and is pulled from the remaining part, causing a breakage in the powder. The force required to separate the two portions is used as a measure of the tensile strength.
Each of the tension force methods are relatively simple, established techniques, however they were not suitable to testing in situ in the experimental temperature gradient ng.
5.4. 2.2 SHEAR STRENGTH AN D COHESION TESTS
Shear strength measurements are often used as measures of cohesion or flow-ability in powder systems. Jenike ( 1 970) developed a shear cell which uses a split ring system into which the powder is packed. A loading force is applied to the top of the cell and the strength required to drag the top ring over the bottom ring is measured. Similarly an annular shear cell has also been developed [Walker 1 967] which allows the accurate measurement of shear forces at low normal stresses. For the purpose of measurement of food powders, the annular shear cell is preferred, particularly for low strength powders such as soup mix and onion powders [Schubert 1 987] . The annular shear cell is a complicated and expensive device however and simpler methods are often preferred by many researchers.
In spite of this, there are a number of researchers who have used shear measurements and many testers are commercially available. These include Nash et al. ( 1 965) who use a method similar to the Jenike tester for investigating the effectiveness of antiagglomerating agents in finely ground powders. Plinke et al. ( 1 994) used the method of Peschl ( 1 989) which is a rotational split level shear tester for measurement of shear strength in limestone. They found that the method agreed well with the more widely accepted Jenike and Gebhard techniques. Scoville and Peleg ( 1 98 1 ), Moreyra and Peleg ( 1 98 1 ) and Hollenbach et al. ( l 982) used a Jenike and Johanson flow factor tester to characterise the flow-ability of selected food powders. Hasegawa et al. ( 1 985) review the operation of three commercially avai lable shear strength testers for use in characterising powder beds.
The basic operation of any shear cell testers, effectively excludes the method for use in this work. All methods require one plane to be dragged across another plane of powder materia1 . While such a setup is possible in small scale equilibrated samples, it i s not easily achieved i n the experimental temperature gradient rig, without the physical disruption of the system.
5.4.2.3 COMPACTION AND COMPRESSIBILITY MEASUREMENTS
Many researchers have used compression tests as a measure of the strength of particulate materials [Whynes and Dee 1 957, Moreyra and Peleg 1 98 1 , Scoville and Peleg 1 98 1 , Hollenbach et al. 1 982, 1 983 , Abdel-Ghani et al. 1 99 1 , Riepma et al. 1 992 and Morishma et at. 1 993] . Each method is essentially a measurement of the crushing stren!:,>th of a standardised pellet or sample. While such measurements are common and the availability of instruments such as an Instron universal testing machine are high, the action of the method is to measure a combination of forces including shear, tension,
5-8
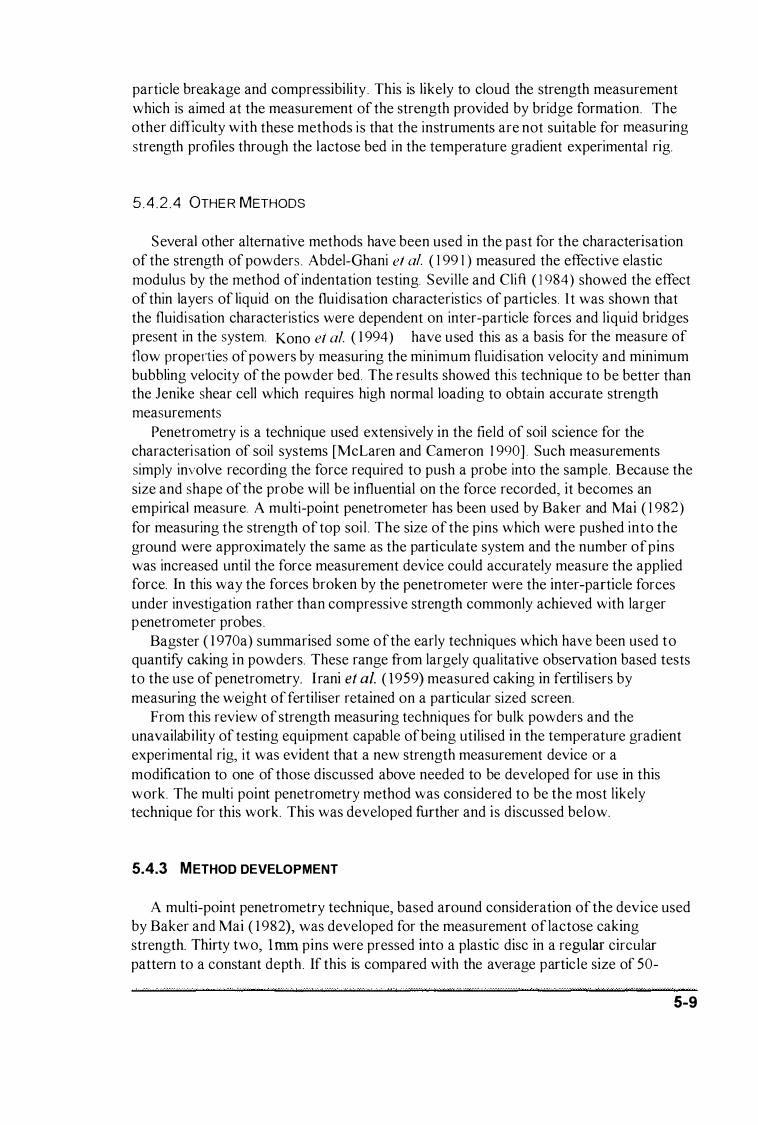
particle breakage and compressibility . This is likely to cloud the strength measurement which is aimed at the measurement of the strength provided by bridge formation. The other difficulty with these methods is that the instruments are not suitable for measuring strength profiles through the lactose bed in the temperature gradient experimental rig.
5 . 4 . 2 . 4 OTHE R METHODS
Several other alternative methods have been used in the past for the characterisation of the strength of powders . Abdel-Ghani e( al. ( 1 99 1 ) measured the effective elastic modulus by the method of indentation testing. Seville and Clift ( ] 984) showed the effect of thin layers of liquid on the fluidisation characteristics of particles. I t was shown that the fluidisation characteristics were dependent on inter-particle forces and liquid bridges present in the system. Kono et al. ( 1 994) have used this as a basis for the measure of flow propel1ies of powers by measuring the minimum fluidisation velocity and minimum bubbling velocity of the powder bed. The results showed this technique to be better than the Jenike shear ceII which requires high normal loading to obtain accurate strength measurements
Penetrometry is a technique used extensively in the field of soil science for the characterisation of soil systems [McLaren and Cameron 1 990] . Such measurements simply involve recording the force required to push a probe into the sample. Because the size and shape of the probe will be influential on the force recorded, it becomes an empirical measure. A multi-point penetrometer has been used by Baker and Mai ( 1 982) for measuring the strength of top soi l . The size of the pins which were pushed into the ground were approximately the same as the particulate system and the number of pins was increased until the force measurement device could accurately measure the applied force. In this way the forces broken by the penetrometer were the inter-particle forces under investigation rather than compressive strength commonly achieved with larger penetrometer probes .
Bagster ( 1 970a) summarised some of the early techniques which have been used to quantifY caking in powders. These range from largely qualitative observation based tests to the use of penetrometry. I rani et al. ( 1959) measured caking in fertil isers by measuring the weight of fertiliser retained on a particular sized screen.
From this review of strength measuring techniques for bulk powders and the unavailability of testing equipment capable of being utilised in the temperature gradient experimental rig, it was evident that a new strength measurement device or a modification to one of those discussed above needed to be developed for use in this work. The multi point penetrometry method was considered to be the most likely technique for this work. This was developed further and is discussed below.
5.4.3 METHOD DEVELOPMENT
A multi-point penetrometry technique, based around consideration of the device used by Baker and Mai ( 1 982), was developed for the measurement of lactose caking strength. Thirty two, I mm pins were pressed into a plastic disc in a regular circular pattern to a constant depth. If this is compared with the average particle size of 50-
5-9
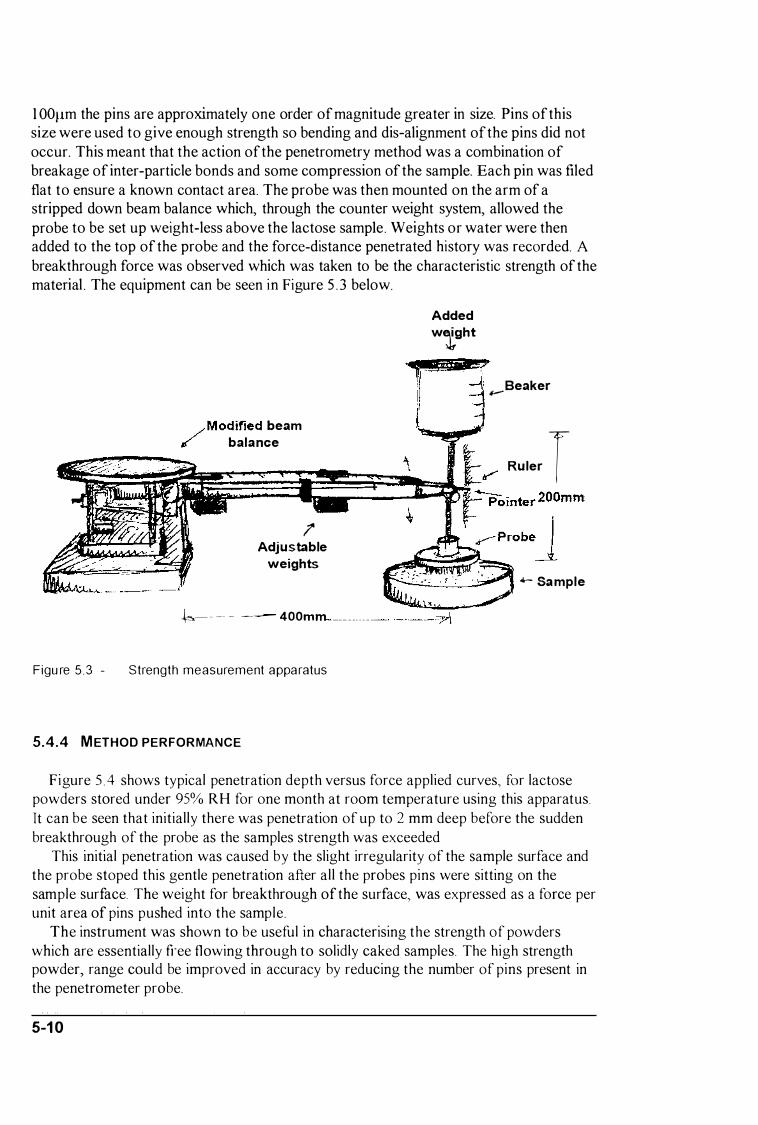
l OOllm the pins are approximately one order of magnitude greater in size. Pins of this size were used to give enough strength so bending and dis-alignment of the pins did not occur. This meant that the action of the penetrometry method was a combination of breakage of inter-particle bonds and some compression of the sample. Each pin was filed flat to ensure a known contact area. The probe was then mounted on the arm of a stripped down beam balance which, through the counter weight system, allowed the probe to be set up weight-less above the lactose sample . Weights or water were then added to the top of the probe and the force-distance penetrated history was recorded. A breakthrough force was observed which was taken to be the characteristic strength of the material . The equipment can be seen in Figure 5 . 3 below.
/Modified beam
;(' balance
;c Adjustable
weights
�-� -- - --- 400mm
Figu re 5.3 - Strength measurement appa ratus
5.4.4 M ETHOD PERFORMANCE
Added
wj!.9ht
---7"\
...-Beaker
Ru ler T
........ Sa mple
Figure 5 .4 shows typical penetration depth versus force applied curves, tl)r lactose powders stored under 95% RH for one month at room temperature using this apparatus. It can be seen that initially there was penetration of up to 2 mm deep before the sudden breakthrough of the probe as the samples strength was exceeded
This initial penetration was caused by the slight irregularity of the sample surface and the probe stoped this gentle penetration after all the probes pins were sitting on the sample surface. The weight for breakthrough of the surface, was expressed as a force per unit area of pins pushed into the sample.
The instrument was shown to be useful in characterising the strength of powders which are essentially free flowing through to solidly caked samples. The high strength powder, range could be improved in accuracy by reducing the number of pins present in the penetrometer probe.
5-1 0

1 2,-------------------------------------------�
E ..s
1 0
"0 8 rQ) � Qi 6 c: Q) 0. Q) u 4 c ro t5 o 2
., . •
• •
�:",.---O __ ��� __ rl.��--;_--+_--�--�_4--�--� o 200 400 600 800
Force applied per unit area [kPaj
+ SpecIal Den3a .. 100 mesh • 2OO me'" • 3OO mesl-i
1 000
Figure 5 .4 - Typical force distance profi les for lactose samples using multi pin penetrometry method.
In order to give some meaning to the strength measurements given by the penetrometer method, qualitative observational tests on the strength of the samples were also undertaken. From these tests, the following comparisons, were made.
Table 5 . 1 Comparison of multi point penetrometer readings with observational tests.
I Strength [kPal Observation
0 Free [lowing with no obvious strength
50 Lumps form which have very little strength and cannot be pickcd up without disintegration. Surface powders easily
100 Can just pick up lumps but are broken very easily. Powders easily. :
200 Can pick up lumps and break into two. Still easily crushed and powdered.
400 Can pick up hunps and snap into parts. Has reasonable strength but
still powders easily
800+ Strongly lumped material which can be broken but is difficult to crush. Powders easily.
This shows that lactose samples with strength measurements of less than 200 kPa. are either free flowing or will become so with minimal mechanical input . Samples with strengths ranging from 200 • 600 kPa. have intermediate strength, while samples with greater than 600 kPa. have large strength and are not easily crushed. Industrial caking problems were estimated to have strength of the greater than 400 kPa range of this scale.
:" .
5.5 CAKING BY LIQUID BRIDGING AND SUBSEQUENT DRYING
This section aims at investigating the mechanism sometimes referred to as humidity caking caused by the formation of and subsequent drying of liquid bridges in the powder. This was achieved by identifYing which relative humidity conditions caused increased powder strength and what effect drying had on the caking strength.
5.5.1 M ECHANISM OVERVIEW
The liquid bridging and subsequent drying mechanism was outlined in Figure 5 . 1 above. It involves the adsorption by capillary condensation of large amounts of moisture in high relative humidity conditions. Surface tension forces cause the formation of interparticle liquid bridges which give the particle system strength and cause what is known as lumping in the bulk powder. Over a period of approximately three hours [Hodges et al. 1 993] dissolution of the surface takes place due to the high moisture content. This results in the liquid bridge being comprised of a saturated solution of lactose. Solute effects are likely to increase liquid viscosity and slightly reduce surface tension from that of pure water (see Section 2 . 5 .2) .
If the liquid bridge is then dried out, due to the desorption of water in low relative humidity environments, the concentration of lactose in the liquid bridge will increase until super saturation occurs and crystallisation will proceed. This will result in the formation of a crystalline bridge which will be smaller in size than the liquid bridge originally present. The strength of this crystalline bridge per unit area will greatly exceed that of the l iquid bridge.
5.5.2 LIQUID BRIDGING
The strength of liquid bridges was assessed for lactose samples under varying relative humidity conditions at room temperature ( 1 8 D C). Plastic petri dishes of 75 mm diameter were packed 5 mm high with lactose powders. The samples were conditioned at ambient conditions to ensure no amorphous lactose was present The top surface was levelled off using a straight edge to provide a flat surface from which the strength could be measured using the multi-point penetrometry method discussed above.
These samples were equilibrated in desiccators containing the following saturated solutions;
Potassium acetate Sodium bromide Sodium chloride Ammonium sulphate Potassium chloride Potassium nitrate Potassium sulphate
� 23 % RH � 60 % RH � 76 % RH � 82 % RH � 86 % RH � 95 % RH � 98 % RH
Samples were removed from the controlled relative humidity environments after one day, ten days and fifty days of equilibration time and the strength determined using the
5-1 2

multi-point penetrometry method . Figure 5 . 5 shows the strength profile of lactose powders equilibrated for one day. This clearly shows the development of strength only under high relative humidity conditions.
160
1 40 co Q.. � 1 20 til OJ ro 1 00
..... C ::J 80 ----OJ () '-.2 60 -"0 .� 40 0. Q. « 20 f-
0 20%
Figure 5.5 -
40% 60% Relative humidity
Special Dense + 100# & 200#
...
•
• -80%
• 300#
Powder strength after one day equil ibration t ime.
.•
•
•
1 00%
In this high relative humidity region, the material is weakly lumped, but could be picked up by hand (see Table 5 . 1) . Although the strength of the lumped lactose in high relative humidity environments after one day is not great, these results are an indication of the region of water activity where lumping problems are likely to occur. This region of greater than 0 .85 Clw corresponds to the region where capillary condensation can occur, in the pore size distribution which occurs in lactose samples. This is also an indication of the relative humidity conditions which are capable of forming a stable liquid bridge [Hamby et at. 1 996] .
200,---------------------------------------�
'iii �150 m ro "'" c �100 .E "0 <D li 50 -a. « •
....
•
....
•
..
-O �.-�----�----�--� •• ----+---· ���-�----�
60% Relative humidity
• Specie! Dense + 1001 .... 2001
80%
Figure 5.6 - Powder strength after ten days equi l ibration time.
100%
5-1 3
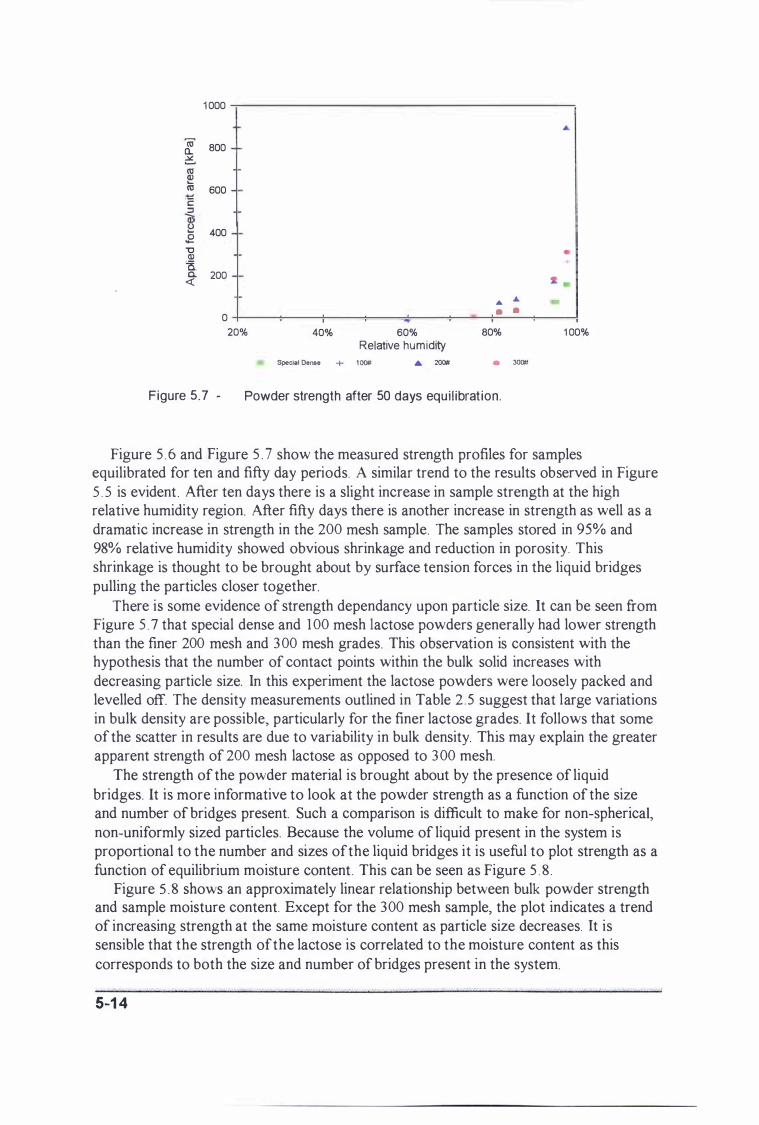
1 000
ro 800 CL 6 <Il � <Il 600 � C ::J ""-Q.) � 400 .E
"'0 . !E a. 0. 200 «
0 20% 40% 60%
Relative humidity
Special Dense + 1 00# .... 200#
-.... .01.. • •
80%
• 300t1
Figure 5.7 - Powder strength after 50 days equi l ibration.
•
t .
1 00%
Figure 5 . 6 and Figure 5 . 7 show the measured strength profiles for samples equilibrated for ten and fifty day periods. A similar trend to the results observed in Figure 5 . 5 is evident . After ten days there is a slight increase in sample strength at the high relative humidity region. After fifty days there is another increase in strength as well as a dramatic increase in strength in the 200 mesh sample. The samples stored in 95% and 98% relative humidity showed obvious shrinkage and reduction in porosity. This shrinkage is thought to be brought about by surface tension forces in the liquid bridges pulling the particles closer together.
There is some evidence of strength dependancy upon particle size. It can be seen from Figure 5 . 7 that special dense and 1 00 mesh lactose powders generally had lower strength than the finer 200 mesh and 300 mesh grades. This observation is consistent with the hypothesis that the number of contact points within the bulk solid increases with decreasing particle size. ln this experiment the lactose powders were loosely packed and levelled off. The density measurements outlined in Table 2 .5 suggest that large variations in bulk density are possible, particularly for the finer lactose grades. It follows that some of the scatter in results are due to variability in bulk density. This may explain the greater apparent strength of 200 mesh lactose as opposed to 300 mesh.
The strength of the powder material is brought about by the presence of liquid bridges. It is more informative to look at the powder strength as a function of the size and number of bridges present. Such a comparison is difficult to make for non-spherical, non-uniformly sized particles. Because the volume of liquid present in the system is proportional to the number and sizes of the liquid bridges it is useful to plot strength as a function of equilibrium moisture content . This can be seen as Figure 5 . 8 .
Figure 5 . 8 shows an approximately linear relationship between bulk powder strength and sample moisture content. Except for the 300 mesh sample, the plot indicates a trend of increasing strength at the same moisture content as particle size decreases. It is sensible that the strength of the lactose is correlated to the moisture content as this corresponds to both the size and number of bridges present in the system.
5-1 4
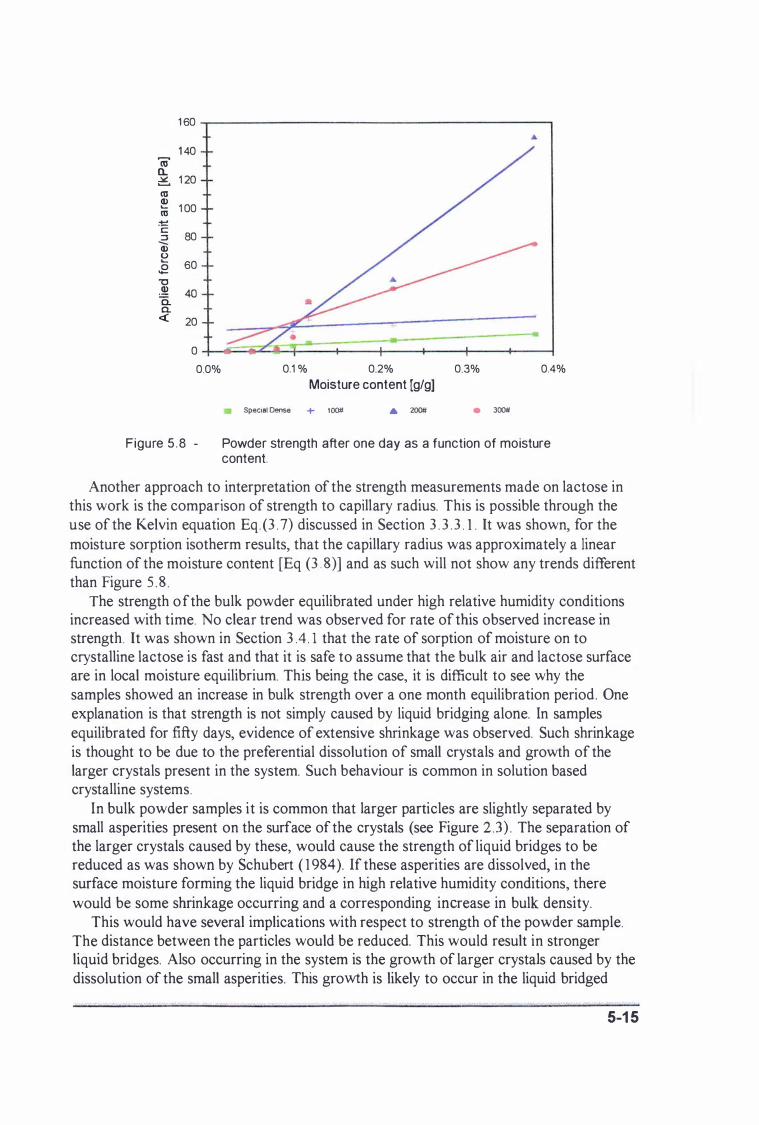
1 60
1 40 ro 0.. i£ 1 20 <U (J) 1 00 .... <U
.-·c 80 ::l --(J) 0 .... 60 .g
-0 .� 40 a. a.. q: 20
0 0.0% 0.1 % 0.2% 0.3% 0.4%
Moisture content [gig] Special Dense + 100# ... 200# • 300#
Figure 5 . 8 - Powder strength after one day as a function of moisture content.
Another approach to interpretation of the strength measurements made on lactose in this work is the comparison of strength to capillary radius. This is possible through the use of the Kelvin equation Eq. (3 . 7) discussed in Section 3 . 3 . 3 . 1 . It was shown, for the moisture sorption isotherm results, that the capillary radius was approximately a linear function of the moisture content [Eq (3 . 8)] and as such will not show any trends different than Figure 5 .8 .
The strength of the bulk powder equilibrated under high relative humidity conditions increased with time. No clear trend was observed for rate of this observed increase in strength. It was shown in Section 3 .4 . 1 that the rate of sorption of moisture on to crystalline lactose is fast and that it is safe to assume that the bulk air and lactose surface are in local moisture equilibrium. This being the case, it is difficult to see why the samples showed an increase in bulk strength over a one month equilibration period. One explanation is that strength is not simply caused by liquid bridging alone. In samples equilibrated for fifty days, evidence of extensive shrinkage was observed. Such shrinkage is thought to be due to the preferential dissolution of small crystals and growth of the larger crystals present in the system. Such behaviour is common in solution based crystalline systems.
In bulk powder samples it is common that larger particles are slightly separated by small asperities present on the surface of the crystals (see Figure 2 .3) . The separation of the larger crystals caused by these, would cause the strength of liquid bridges to be reduced as was shown by Schubert ( 1 984). If these asperities are dissolved, in the surface moisture forming the liquid bridge in high relative humidity conditions, there would be some shrinkage occurring and a corresponding increase in bulk density.
This would have several implications with respect to strength of the powder sample. The distance between the particles would be reduced. This would result in stronger liquid bridges. Also occurring in the system is the growth of larger crystals caused by the dissolution of the small asperities. This growth is likely to occur in the liquid bridged
5-1 5

area due to the concentration of surface moisture to the contact points by surface tension forces. This may result in the formation of partial crystalline bridges. Because the samples in the experiment were not controlled at constant temperature, some growth may have occurred in the bridge area due to the cyclic heating and cooling of the sample because of the variable ambient storage temperature.
It follows from this discussion that the increased strength is thought to be due to the reduction in inter-particle distance caused by the dissolution of small asperities and the production of small crystalline bridges formed due to temperature fluctuations and preferential large crystal growth. This mechanism for increased strength can explain the measured strength of 200 mesh lactose after fifty days equilibration time (see Figure 5 . 7) .
Although the irregularity of geometry and particle size coupled with variability in bulk density, depending on how tightly the particles are packed, make a generic mechanistically based strength prediction method difficult, a basic conclusion can be reached from the results discussed. High relative humidity conditions (>90% RH) or alternatively moisture contents above 0 .4% must be reached before strong lumping wil l occur. For further work, a simple average linear correlation between lactose moisture content and bulk powder strength will be used to predict the extent of lumping due to liquid bridging after one days equilibration time. This can be expressed as Eq.(5 . 3 )
Strength [kPa. ] = 1 5900 x M (5 .3)
5.5.3 SOLID BRIDGING
The drying of liquid bridges formed from saturated lactose solutions will cause the super-saturation and eventual crystall i sation of the lactose surface solution. This will result in the formation of solid crystalline bridges. It is difficult to predict the strength of such a crystall ine bridge. It is l ikely to be a function of the size of the original l iquid bridge and of the concentration of the lactose solution. The concentration will be the solubi lity of lactose and therefore a function of temperature (see Figure 2 9)
To assess the strength of solid crystall ine bridges, samples were equilibrated over saturated salt solutions for fIfty days. The strength of the l iquid bridges present in these samples were measured using the multi-point penetrometry method. These samples were then allowed to dry out in ambient air ( - 70%RH) for a period of seven days. Once dried out, the samples were measured for strength using the same technique as used above
Figure 5 . 9 shows the results of strength measurements as a function of the relative humidity conditions first equi l ibrated at This plot shows samples which had high strength in the lumped form also gave high strength measurements once dried. The strength of the dried material generally had the same or greater strength than the originating liquid bridged material . This can be seen in Figure 5 . 1 0 .
These results indicate that material in the lumped state will retain the same strength or greater strength once dried out. This shows that despite the much smaller bridges present in the solid form, the increased strength of these bridges compensates. To avoid the occurrence of caked product by this mechanism, it is necessary to avoid the onset of lumping. Investigation into how to achieve this goal is the focus of the next chapter.
5-1 6
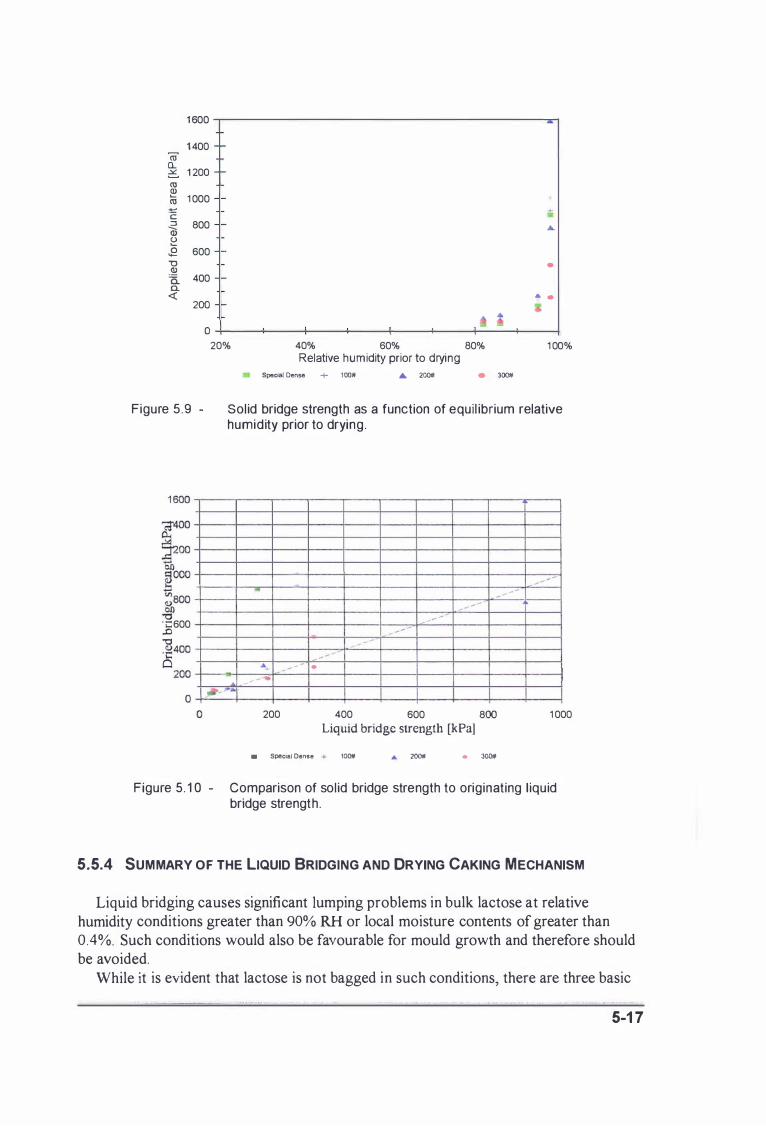
1 600 -
1 400 ro a.. � 1 200 (1J Q) ro 1 000
-·c =s 800 --Q) � 0 600 -.....
-0 . 5!:! 400 a. •
0.. « ... . 200 t- • O
20% 40% 60% 80% 1 00% Relative humidity prior to drying
Special Dense + 1 00n • 200II • 300#
Figure 5.9 - Solid bridge strength as a function of equi l ibrium relative humidity prior to drying .
1600.----.---.---.----,---,---,----.---.---..--,
�OO�---r---+--�----�--+---�---r---+--�r-� �00�---r---+---4----�--+---�---r---+--�r-�
�OOO �---r---r---+---+----�--�----r---r---+-�-���� b .,.._-�800 �--_r--_+--_4----�--+_--�--_r--����--.r---� -- --
·;:: 600 --I----t----t---__j----t_--+---:;,...j-"'----+---t----r--� � �
'0 .�400�---r---+---4---=�--+----r---+---+----r-l-e .� � .
200 ���--��_�--�---r---+----j----t---+----r--� �� 200 400 600 800
Liquid bridge strength [kPa]
.. Special Dense + 100# • 200# • 300#
1 000
Figure 5. 1 0 - Comparison of sol id bridge strength to originating l iquid bridge strength.
5.5.4 SUMMARY OF THE LIQUID BRIDGING AND DRYING CAKING MECHANISM
Liquid bridging causes significant lumping problems in bulk lactose at relative humidity conditions greater than 90% RH or local moisture contents of greater than 0 .4%. Such conditions would also be favourable for mould growth and therefore should be avoided.
While it is evident that lactose is not bagged in such conditions, there are three basic
5-1 7

mechanisms by which high relative humidity conditions may subsequently exist in the bag. These are;
o moisture infiltration from ambient due to inadequate packaging. @ redistribution of moisture within the bag raising the local moisture content due to
temperature gradients.
� the release of moisture due to amorphous lactose crystallisation. Moisture infiltration from ambient is not of principle concern here as work has been
undertaken by Lactose New Zealand to minimise this effect . The moisture transport
model and the experiments used in validation of this model have clearly shown that such conditions are possible due to the temperature gradients expected in industrial product storage and shipping if the moisture content of the lactose at packing is too high. The release of moisture due to amorphous lactose crystallisation is the focus of the next section of this work.
If the conditions required for lumping of lactose do occur, then the strength provided
by the liquid bridges has been shown to be retained or increased once the liquid bridges are dried out and solid crystalline bridges form. The strength of the liquid bridge is also l ikely to increase with increasing temperature due to the increase in solubility associated with that temperature increase. This is due to the greater amount of crystallisation which would result from the subsequent drying of a liquid bridge of higher lactose concentration.
5.6 CAKING DUE TO AMORPHOUS LACTOSE FLOW AND CRYSTALLISATION
This section investigates the mechanism of viscous flow of amorphous lactose above its glass transition temperature. This results in the formation of viscous liquid bridges which could be followed by crystall isation to give a caked product.
5.6. 1 M ECHANISM OVERVIEW
The amorphous lactose flow followed by crystall isation mechanism is summarised in Figure 5 .2 above. It involves the presence of a thin layer of amorphous lactose on the outer surface of the crystalline lactose particles. Such layers have been identified to have been present on milled and quickly dried sugars [Roth 1 976, Hargreaves 1 995] and have been discussed in more detail in Section 2 . 2 . 3 .
Due to moisture sorption or temperature rise i n the amorphous layer, the glass transition temperature is exceeded . This results in the rapid reduction in viscosity allowing both viscous flow due to surface tension forces and crystall isation to proceed This is a two step process somewhat similar to that described by the mechanism of caking by liquid bridging and subsequent drying. The first stage of viscous flow is termed sticking and the second stage of crystallisation results in the formation of caked product . The major differences between the two hypothesised mechanisms is the mode in which the lactose crystal surface becomes capable offlow and the lack of reliance on subsequent drying to produce a solid bridge in the case of amorphous lactose crystall isation. Crystallisation is also likely to result in a subsequent increase in free moisture which would be available for moisture migration (see Section 3 . 7 . 3 . 1 )
5-1 8

5.6.2 RUBBER BRIDGING AND STICKING
Downton et at. ( 1 982) described the mechanism of sticking in hygroscopic amorphous powders. The driving force for the formation of bridges between adjacent particles is due to maintaining a minimum surface enerf,YJ' and is governed by the surface tension of the amorphous material present. The rate at which the bridges are formed is governed by the viscosity of the material. Downton et at. ( 1 982) showed experimentally for a sucrose-fructose mixture, that the critical viscosity for sticking in a short time i s in the range 1 06_ 1 08 Pa. s . This work was extended by Wallack and King ( 1 988) to cover coffee extract and a mixture of malto-dextrin, sucrose and fructose. Results for these substances also fell in the critical viscosity range found by Downton et al. ( 1 982). Wallack and King ( 1 988) utilised the Frenkel model Eq . (5 .4) for interpretation of experimental observations.
(5.4)
where rb is the bridge radius. The Frenkel model is based on the formation of a liquid bridge by a coalescence process, driven by surface energy causing viscous flow. This model has been used as the basis for many attempts to describe agglomeration and sintering phenomena [Rosenzweig and Narkis 1 98 1 , Ristic and Dragojevic-Nesic 1 987 and Wallack and King 1 988] .
The size of the inter-particle bridge required for sticking is an important parameter if the Frenkel equation is to be of use. Wallack and King ( 1 988) measured this through the use of scanning electron microscopy. They found that a reasonable representation from sticking coffee extract particles was r/R equal to 0 . 1 . This result can be used to predict the time for sticking to occur at any viscosity.
It is common for researchers into sticking and agglomeration of food powders to determine experimentally what has become known as the sticking temperature of a powder. The first such experiment as performed by Lazar et al. ( 1 956). This involved the gradual heating of the sample in a test tube which is closed to the atmosphere and containing a stirrer. The stirrer was then turned by hand and the temperature at which the force required to turn the stirrer dramatically increased was recorded as the sticking temperature. Modifications to this technique and another similar method used by Tsourflis et al. ( 1 976), have been used by many researchers to characterise the sticking temperatures of various food powders [Downton et al. 1 98 1 , Wallack and King 1 98 8, Chuy and Labuza 1 994) .
Some researchers have made a link between sticking temperature and the glass transition temperature. For example, Roos and Karel ( 1 993) demonstrated that sticking occurs at 1 0-20 0 C above the glass transition temperature. Chuy and Labuza ( 1 994) found that such measurements depended upon the sample heating rate. In hindsight it becomes obvious that sticking temperature is essentially a meaningless measure of sticking unless the heating rate is also stated. In the extreme case of an infinitely slow heating rate, the sticking temperature would correspond to the glass transition temperature. The sticking phenomenon is a dynamic process, just as amorphous crystallisation is, and because of this time dependancy, it cannot be characterised
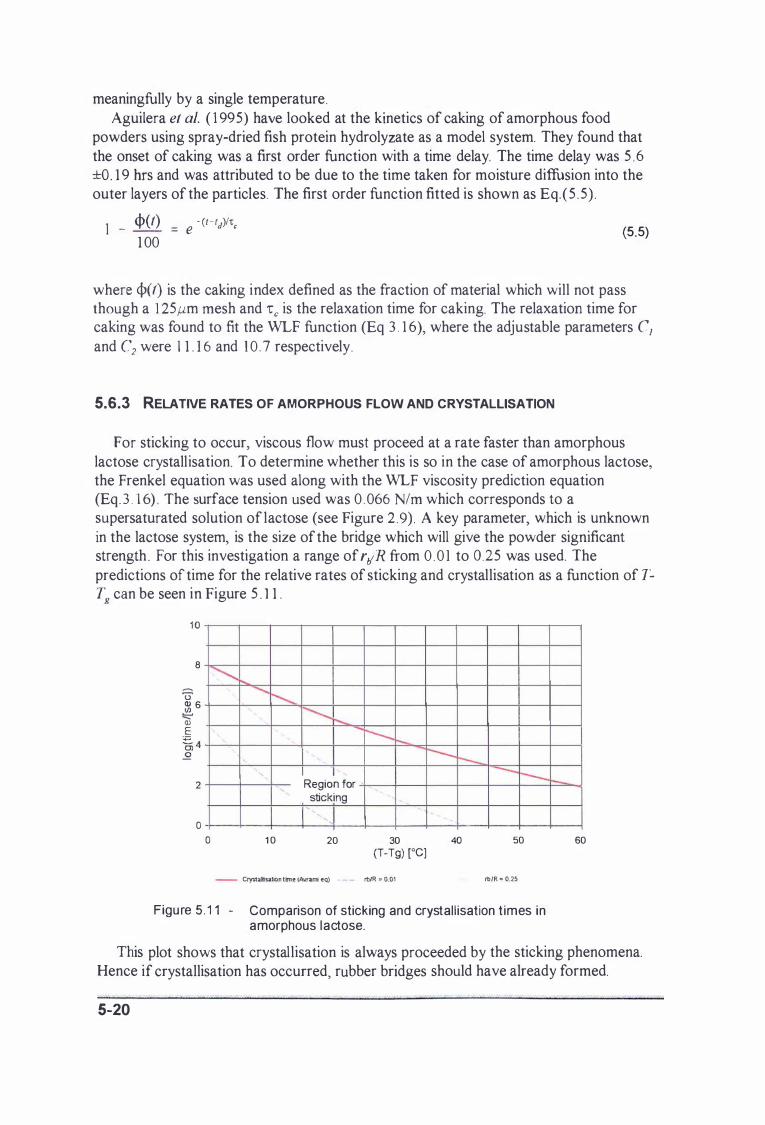
meaningfully by a single temperature . Aguilera et a/. ( 1 995) have looked at the kinetics of caking of amorphous food
powders using spray-dried fish protein hydrolyzate as a model system. They found that the onset of caking was a first order function with a time delay. The time delay was 5 .6 ±O. 1 9 hrs and was attributed to be due to the time taken for moisture diffusion into the outer layers of the particles. The first order function fitted is shown as Eq.( 5 . 5) .
1 - <p(t) = e - (t-td)/t. 1 00
( 5.5 )
where cI>(t) is the caking index defined as the fraction of material which will not pass though a 1 25,um mesh and 'rc is the relaxation time for caking. The relaxation time for caking was found to fit the WLF function (Eq 3 . 1 6), where the adjustable parameters C} and C 2 were 1 1 . 1 6 and 1 0 . 7 respectively .
5.6.3 RELATNE RATES OF AMORPHOUS FLOW AND CRYSTALLISATION
.For sticking to occur, viscous flow must proceed at a rate faster than amorphous lactose crystallisation. To determine whether this is so in the case of amorphous lactose, the Frenkel equation was used along with the WLF viscosity prediction equation (Eq. 3 . 1 6) . The surface tension used was 0 . 066 N/m which corresponds to a supersaturated solution of lactose (see Figure 2 . 9) . A key parameter, which is unknown in the lactose system, is the size of the bridge which will give the powder significant strength. For this investigation a range of r/R from 0 . 0 1 to 0 .25 was used. The predictions of time for the relative rates of sticking and crystallisation as a function of TTg can be seen in Figure 5 . 1 1 .
1 0
8
� � 6 "==' Q) E �4 o
2
o
.............. i--. ......... ............
"-
"
o 1 0
I'-----........
Region for sticking
, '. "�
20
I--r-----
30 40 (T-T9) [0C]
- Crystiilltisation time (A\'rami eq) - -- rblR • 0.01
--r--
50
rb/R = 0.25
Figure 5 . 1 1 - Comparison of sticking and crystall isation t imes in amorphous lactose.
-
60
This plot shows that crystallisation is always proceeded by the sticking phenomena. Hence if crystallisation has occurred, rubber bridges should have already formed.
5-20
5.6. 3 . 1 STICKING OF THIN LAYERS OF AMORPHOUS LACTOSE
Sticking phenomena occur in spray or freeze-dried food powders such as lactose based infant powders [Chuy and Labuza 1 994], coffee extract [Wallack and King 1 988] and mixed sugar powders [Downton et a/. 1 982, Wallack and King 1 988] . In these powders there are large quantities of amorphous sugar present. The question then arises that if there is a thin surface layer of amorphous lactose only, as is present in milled lactose, does sticking still play a significant role in caking?
Roth ( 1 976) answered this question for the case of freshly milled icing sugar. Samples that had re-crystallised at 3 5% RH did not show any traces of solidification. He suggests that the amorphous surface layers (less than 1 00A thick) are too thin to be in position to connect touching parts with a solid body bridge of sufficient strength during crystallisation. He went on to suggest that re-crystallisation lead indirectly to caking by releasing moisture to a point whereby the liquid bridging mechanism could proceed. In samples where significant strength was observed and shrinkage occurred it was shown that the shrinkage observed amounted to a reduction in contact area thickness of 1 000A. This corresponded to about ten times the thickness of amorphous surface layer present. This suggested that surface d issolution and liquid bridging were the major cause of caking in icing sugar in high relative humidity conditions.
To test to see if this is also the case for freshly milled lactose, an experiment was conducted which aimed at measuring the strength of lactose samples with amorphous lactose present after one week's exposure to environments of varying relative humidity. If sticking can occur with thin layers of amorphous lactose, then significant strength should be observed at intermediate relative humidity. If not, then results similar to those observed and reported in Section 5 .4 for liquid bridged samples would be observed and high strength will result only above 90% RH.
Samples of coarse lactose were milled for five minutes in a Janke and Kunkel Analysenmuhle (Al O) pin mill holding approximately 50 grams of lactose. Cooling water was used to ensure the milled lactose did not heat up during the milling process. The freshly milled sample was then transferred into petri dishes in the manner stated for the liquid bridging experiments (see Section 5 . 5 . 2) . Samples were then equilibrated for one week above saturated salt solutions at 20°e. Samples were also equilibrated over phosphorous pent oxide and magnesium chloride to allow an estimation of amorphous lactose content using the combined sorption isotherm method (see Section 3 . 3 . 6) . The salt solutions used were;
lithium chloride - 1 1 % RH potassium acetate magnesium chloride potassium carbonate magnesium nitrate sodium chloride
- 22% RH - 3 3% RH - 43% RH - 54% RH - 76% RH
potassium chloride - 87% RH After one weeks equilibration time, the samples stored for moisture isotherm
determination were weighed and the moisture isotherm was calculated using the dried sample (P20S) and the sample equilibrated over magnesium chloride (0 . 33 <lw). Under these conditions the rate of amorphous lactose crystalli sation is negligible. The amorphous lactose content was determined using the additive isotherm method (see
5-21

Section 3 . 3 . 6). This analysis showed that 4% amorphous lactose was produced in the milling process. These results can be seen in Figure 5 , 1 2 .
(jj' � 0.30',l, � � 0,25% " :§ 0.20''(' j 0,1 5% 8 0 , 10% � -ffl 0,05% '(5 � 0,00%
.
-0,05% °
L /
".-
-----,..,-./'"
0,1
,..,-,..,-v
0.2 Water activity
,./""
- Flted isothenn (4� amorphous) • EJ:penmer.11 dlta
0,3
./" V .-r-
•
0.4
Figure 5. 1 2 - Additive isotherm method for quantification of amorphous lactose content of freshly mi l led lactose sample.
After one week's equilibration time, the remaining samples were tested for strength using the multi-point penetrometry method . Figure 5 . 1 3 shows the results compared with the strength of liquid bridged purely crystalline lactose material after ten days equilibration time (from Section 5 . 5 .2) .
200 ,---------------------------------------�
0% 20%
+ ", ••
•
•
.a. • •
.a. x •
400'0 60% 80% 1 00% Relative humidity
Figure 5. 1 3 - Freshly mi l led lactose strength compared with purely crystall ine powder strength stored over saturated salt sol utions for one week.
This graph demonstrates that there is some extra strength in the freshly milled lactose samples compared with the conditioned powders. In the week's equilibration time, the samples equilibrated above 0,45 11w crystallised and thereby released moisture, The samples below this value were all below the glass transition temperature, It is difficult
5-22

therefore to explain why the low water activity samples showed greater strength than the conditioned lactose samples. One possible explanation is that fast adsorption of moisture to the surface of the amorphous layer could have occurred during transfer ofthe powder to the petri dishes. This could have enabled sticking of the particles before storage above the salt solutions.
Because the glass transition temperature was not exceeded in these samples the amorphous lactose surface would not have been capable oftlow, and therefore amorphous bridging should not have occurred. If amorphous lactose flow and crystallisation, did occur in the samples containing 4% amorphous lactose, it would have been expected to see a dramatic increase in strength at approximately 0 . 5 a..v' No such change was observed.
It should be noted that even though the amorphous lactose containing samples showed greater strength than the crystalline samples, the strength measured was not high. No sample showed any signs of bulk powder strength. There was no signs of lumping or caking in the samples. This can be seen more clearly if the results are plotted with the measured strengths of lactose samples equilibrated for fifty days as shown in Figure 5 . 1 4 .
ro Q.. � (1J � (1J
:!: c ::J ....... Q) � .E
" . � Q. a. «
1 000
800
600 -
400
200
0
l-
0% 20%
SpecIal Dense + 100#
)(
40% 60% Relative humidity
• 200II 300#
... .. x , "I .
80%
•
•
1 00%
)( FresHy mlled
Figure 5 . 14 - Strength of freshly milled lactose compared with strength of crystal l ine lactose stored for fifty days over saturated salt solutions.
It is clear from this graph and Table 5 . 1 which shows a qualitative description of the scale of the multi-point penetrometry method, that no significant strength occurred due
to amorphous lactose flow in conditions above the glass transition temperature. This finding is consistent with that reported for freshly milled icing sugar by Roth ( 1 976).
This suggests that the role of amorphous lactose in the occurrence of caking in bulk lactose is due to increasing the moisture holding capacity of the powder and the subsequent release of this moisture if crystallisation proceeds. Roth ( 1 976) also concluded that amorphous sucrose influences caking phenomena in icing sugar by this mechanism. This may be due to the amorphous sugar layer being too thin for flow to occur toward the inter-particle contact points.
5-23
5.6.4 RELEVANCE OF AMORPHOUS LACTOSE TO CAKING IN BULK LACTOSE
It has been shown that there was a small increase in strength due to the presence of amorphous lactose. This extra strength was not significant with respect to lump formation or obvious signs of caking. If these strength measurements are compared with samples exhibiting even weak lumps, they become insignificant. This suggests that amorphous l actose flow does not contribute to caking in bulk lactose in the low amorphous lactose content range.
Amorphous lactose is important, because of its moisture binding ability and the possible release of this moisture if conditions are favourable for crystallisation. This wil l cause high local moisture contents which result in lumping by liquid bridge formation as described in Section 5 . 5 . This moisture will be free for diffusion into other regions of the bulk lactose.
5.1 CLOSURE
This work has showed that the main cause of caking is due to the formation of interparticle crystalline bridges. Such bridges give the powder significant strength. These crystalline bridges occur though the formation of liquid bridges which have intermediate strength. Over time, the strength of these bridges increase dramatically. The mechanism for this is not clear although it is thought to be due to the dissolution of small interparticle asperities al lowing shrinkage of the bulk powder. This will also result in closer liquid bridges and possibly the formation of crystalline bridges due to the growth of larger crystals in the region of the liquid bridge. This mechanism is a function of the geometry and packing of the particles and is too complex to allow accurate modelling Such model ling was not required to achieve the purpose of this work.
The one day liquid bridge strength, although not high, is an indicator of the flIture formation of caked product if high water activity conditions are maintained . As a general rule, product with a water activity greater than 0 .9 <lv, is at high risk .
Amorphous lactose is important with respect to moisture binding and release during crystallisation and therefore was be included in the transport model to allow i nvestigation into possible ways to avoid caking in industrial applications. The next chapter outlines the inclusion of these caking mechanisms into the overall transport model
5-24

CHAPTER 6
PREDICTION OF CAKING IN BULK LACTOSE
6 . 1 INTRODUCTION
Chapter 4 outlined the development of the transport model describing the migration of moisture as a result of an imposed temperature gradient . With this model, good predictions for temperature and surface relative humidity profiles were achieved. Chapter 5 outlined experimental results characterising the conditions at which the mechanisms of caking by either liquid bridging or amorphous lactose flow can occur.
This chapter summarises the work in which the transport model and the conditions required for caking were coupled together. In this way, an overall model describing caking caused by temperature gradients was achieved. This is discussed at first with respect to purely crystal line lactose powders and then extended to the case where amorphous lactose is present.
6.2 CAKING IN PURELY CRYSTALLINE LACTOSE POWDERS
6.2.1 OVERVIEW OF CAKING IN CRYSTALLINE LACTOSE
Caking in crystalline lactose with no amorphous lactose present, occurs through the formation of liquid bridges. This was discussed in detail in Section 5 . 5 above. After one day, powder samples subj ected to high relative humidity conditions (>85 %RH) showed significant strength using the multi-point penetrometer measurement method. Further equilibration for up to fifty days resulted in increased strength.
I t was shown in the transport model validation experiments that such conditions could be achieved locally in product with a water activity of greater than 0 .6 <lw when a 20 0 ell OOmm temperature gradient was applied for 1 3 hours. This section outlines the prediction of bulk strength profiles through a lactose slab when a temperature gradient is applied.
6.2.2 I NCLUSION O F STRENGTH PREDICTION INTO THE TRANSPO RT MODEL
The transport model describing moisture migration due to temperature gradients, developed in Chapter 4, was modified to include the prediction of bulk powder strength. As discussed in Section 5 . 5 .2, it is evident that bulk powder strength is a function of the
6-1

moisture content and geometry of the powder system. The strength measurement using the multi-point penetrometry apparatus for samples equilibrated in varying relative humidity conditions for one day, showed strength to be an approximately linear function of moisture content .
As the storage time increased, the measured powder strength also increased. No clear trend was observed for the rate of strength increase although this is thought to be due to the dissolution of small asperities in the powder allowing the shrinkage of the bulk powder and a corresponding reduction in inter-particle separation distance with the possible formation of small crystalline bridges. Such behaviour is dependent on the packing properties of the powder and particle size distribution. Increased pressure due to bag stacking might also be an important parameter in this phenomena. Such considerations are beyond the scope of this work although in spite of these phenomena, it can be seen that the one day strength profiles were due to liquid bridging, and lumping was observed. Even though these samples showed relatively weak strength (40-50 kPa. ), the one day strength measurements can be used as an indication of serious caking problems, especially if the conditions causing the liquid bridges are maintained for long periods of time.
To allow the prediction of lumped lactose strength in the transport model, the simple correlation between liquid bridge strength and moisture content outlined in Section 5 . 5 .2 was used. This equation was shown as Eq(S . 3 ) in the previous chapter and represents an a generalised strength relationship for all lactose powder grades. With this relationship included as part of the transport model, the strength profile within the slab was able to be predicted . The time taken for the development of significant bulk powder strength was also able to be assessed .
A typical profile for the onset of liquid bridging due to the migration of moisture from the hot surface to the cold region under a temperature gradient is shown in F igure 6. l .
60
50
'iii' 40 CL 2S t 30 c Q) ;:,
(J) 20
1 0
o
V / � r--
�� :::---- -l'
o 200 400
/
-----:/
/
600 800 Time [mins]
'-
- Co4d �urfotet - Hot swface
--- -
f- --
1 000 1 200 1400
Figure 6 . 1 - Typical strength development in a 1 00 mm lactose slab subjected to a 20° C temperature gradient.
Because the strength of the powder was modelled as a function of the lactose moisture content, it can be misleading to interpret the flattening out of the surface relative humidity profile as the reaching of steady state conditions. At high water activity
6-2
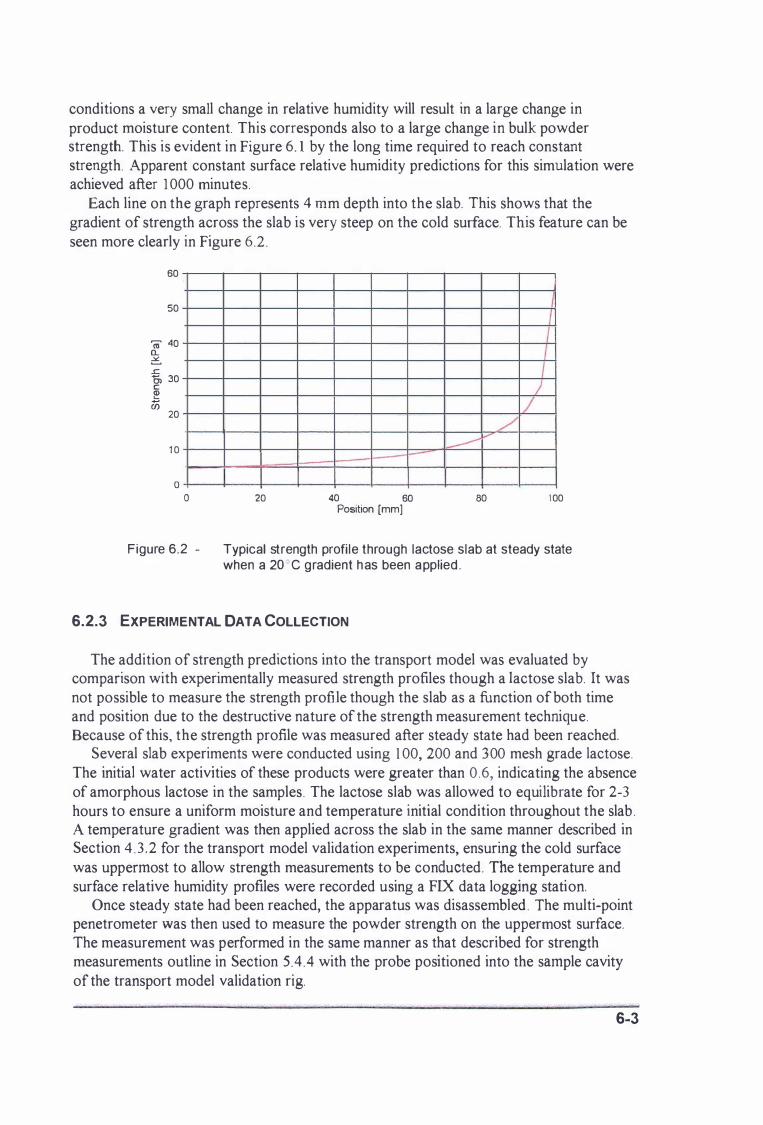
conditions a very small change in relative humidity will result in a large change in product moisture content. This corresponds also to a large change in bulk powder strength. This is evident in Figure 6. 1 by the long time required to reach constant strength. Apparent constant surface relative humidity predictions for this simulation were achieved after 1 000 minutes.
Each line on the graph represents 4 mm depth into the slab. This shows that the gradient of strength across the slab is very steep on the cold surface. This feature can be seen more clearly in Figure 6.2 .
60
50
ro 40 a.. � ..c 0> 30 c � (j)
20
1 0
o o 20
t---
40 60 Position [mm]
1 1 1 I L L
L � V
80 1 00
Figure 6.2 - Typical strength profi le through lactose slab at steady state when a 20 C gradient has been applied .
6.2.3 EXPERIMENTAL DATA COLLECTION
The addition of strength predictions into the transport model was evaluated by comparison with experimentally measured strength profiles though a lactose slab. It was not possible to measure the strength profile though the slab as a function of both time and position due to the destructive nature of the strength measurement technique. Because of this, the strength profile was measured after steady state had been reached.
Several slab experiments were conducted using 1 00, 200 and 300 mesh grade lactose. The initial water activities of these products were greater than 0 .6, indicating the absence of amorphous lactose in the samples. The lactose slab was allowed to equilibrate for 2-3 hours to ensure a uniform moisture and temperature initial condition throughout the slab . A temperature gradient was then applied across the slab in the same manner described in Section 4 . 3 . 2 for the transport model validation experiments, ensuring the cold surface was uppermost to allow strength measurements to be conducted. The temperature and surface relative humidity profiles were recorded using a FIX data logging station.
Once steady state had been reached, the apparatus was disassembled. The multi-point penetrometer was then used to measure the powder strength on the uppermost surface. The measurement was performed in the same manner as that described for strength measurements outline in Section 5.4 .4 with the probe positioned into the sample cavity of the transport model validation rig.
6-3
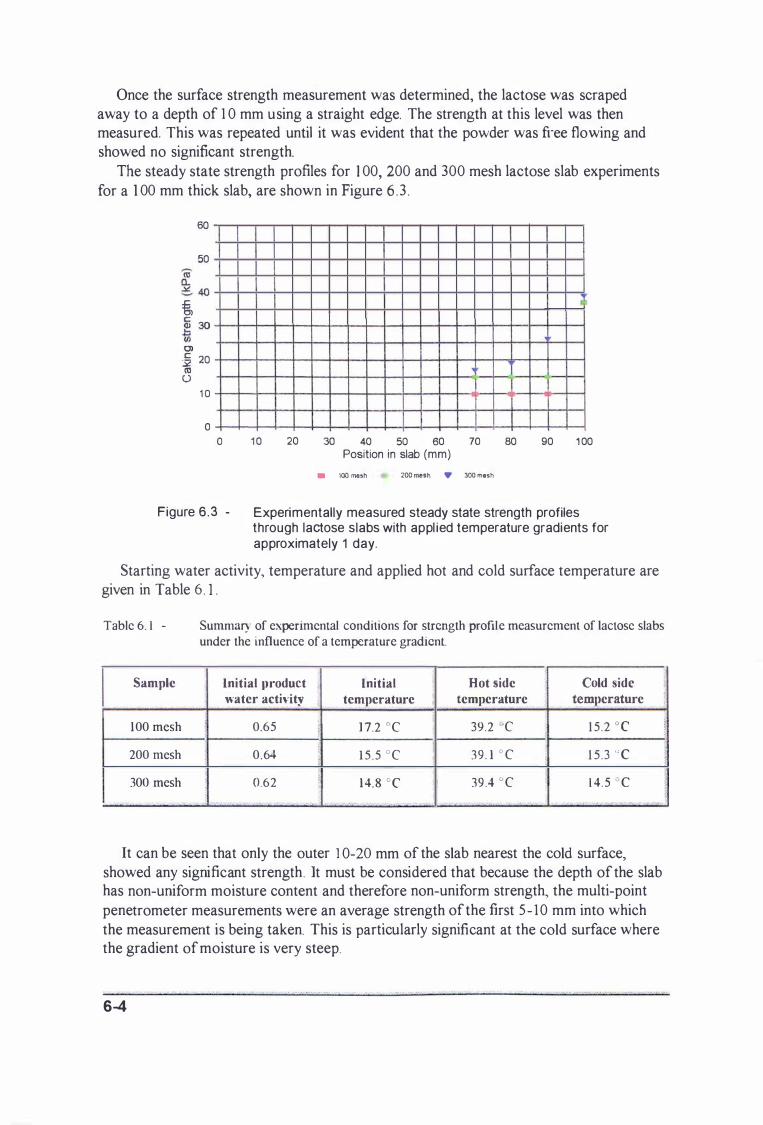
Once the surface strength measurement was determined, the lactose was scraped away to a depth of 1 0 mm using a straight edge. The strength at this level was then measured. This was repeated until it was evident that the powder was free flowing and showed no significant strength.
The steady state strength profiles for 1 00, 200 and 300 mesh lactose slab experiments for a 1 00 mm thick slab, are shown in Figure 6 . 3 .
60
50
� � 30 1ii Ol � 20 (Il ()
1 0
o o 1 0
I
� � � � 00 ro 00 00 1 00 Position in slab (mm)
• 100 mesh 200 mesh .. 300 mesh
Figure 6.3 - Experimentally measured steady state strength profiles through lactose slabs with appl ied temperature gradients for approximately 1 day.
Starting water activity, temperature and applied hot and cold surface temperature are given in Table 6 . 1 .
Table 6. 1 -
I Sample
100 mesh
200 mesh
300 mesh
Summary of experimental conditions for strength profile measurement of lactose slabs under the influence of a temperature gradient.
Initial IU'oduct Initial water activlt�' temperature
0.65 , 1 7.2 °C
0.64 i 1 5 .5 °C
0.62 ; 14.8 °C
. . - ' .' ,
Hot side temperature
39.2 C
\ 39. 1 ° C
39 .4 °C
Cold side temllerature
1 5 .2 °C
1 5 .3 " c 1 4. 5 ° C
" . · ' r . . .. .
i ;
It can be seen that only the outer 1 0-20 mm of the slab nearest the cold surface, showed any significant strength. It must be considered that because the depth of the slab has non-uniform moisture content and therefore non-uniform strength, the multi-point penetrometer measurements were an average strength of the first 5 - 10 mm into which the measurement is being taken. This is particularly significant at the cold surface where the gradient of moisture is very steep.
" j "
6-4
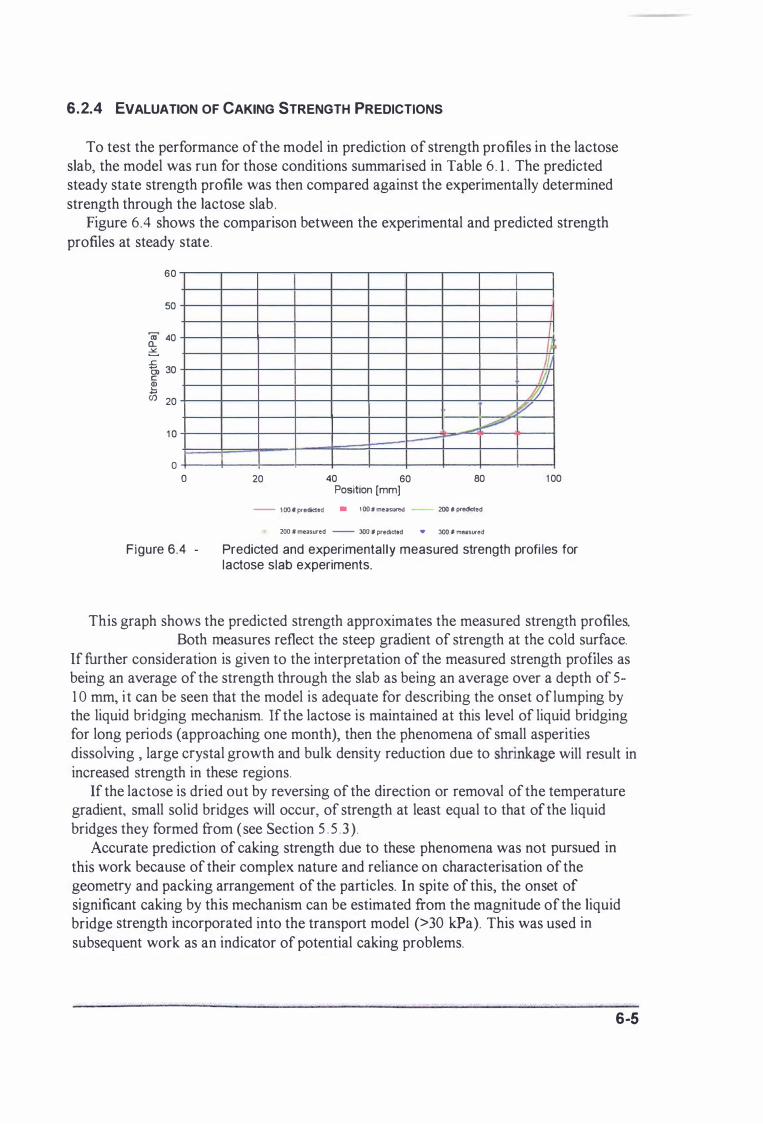
6.2.4 EVALUATION OF CAKING STRENGTH PREDICTIONS
To test the performance of the model in prediction of strength profiles in the lactose slab, the model was run for those conditions summarised in Table 6 . 1 . The predicted steady state strength profile was then compared against the experimentally determined strength through the lactose slab .
Figure 6.4 shows the comparison between the experimental and predicted strength profiles at steady state.
60
50
8!. 40
� £ 0, 30 c � (/) 20
1 0
o
o 20 40 60 Position [mm]
....,� -
80
- 1 00 ' predide<l • 1 00 ,. measured 200 ' predicted
200 fI measured - laO ' predicted .. 300 , measured
//. 1'/ �
1 00
Figure 6.4 - Predicted and experimental ly measured strength profi les for lactose slab experiments.
This graph shows the predicted strength approximates the measured strength profiles. Both measures reflect the steep gradient of strength at the cold surface.
If further consideration is given to the interpretation of the measured strength profiles as being an average of the strength through the slab as being an average over a depth of 5-1 0 mm, it can be seen that the model is adequate for describing the onset of lumping by the liquid bridging mechanism. If the lactose is maintained at this level of liquid bridging for long periods (approaching one month), then the phenomena of small asperities dissolving , large crystal growth and bulk density reduction due to shrinkage will result in increased strength in these regions.
If the lactose is dried out by reversing of the direction or removal of the temperature gradient, small solid bridges will occur, of strength at least equal to that of the liquid bridges they formed from (see Section 5 . 5 . 3 ).
Accurate prediction of caking strength due to these phenomena was not pursued in
this work because of their complex nature and reliance on characterisation of the geometry and packing arrangement of the particles. In spite of this, the onset of significant caking by this mechanism can be estimated from the magnitude of the liquid bridge strength incorporated into the transport model (>30 kPa). This was used in
subsequent work as an indicator of potential caking problems.
6-5

6.2.5 INVESTIGATIONS OF CONDITIONS REQUIRED FOR LUMPING IN BULK LACTOSE
With the ability to predict the onset of significant strength in purely crystalline lactose, due to moisture migration caused by temperature gradients, an investigation into the bagging and storage conditions which cause caking was carried out. The effect of slab thickness was investigated by running the model at three different slab thicknesses ( 1 00, 200 and 500 mm). The other parameters in the model were maintained constant between simulations. The parameters used were;
slab thickness initial temperature initial water activity cold surface temperature hot surface temperature
1 00, 200 and 500 mm 20 ° C
All other parameters were those determined i n Section 4 . 5 .4 .2 for the best estimates obtained in the transport model validation. Figure 6 .5 shows the predictions of strength profile for these simulations at steady state conditions.
70
60
� 50 (1l 0.. -=s 40 � c
{, " � 30
(f) 7 20
1 0
o o 0.2 0.4 0.6 Fractional distance [XfL]
�
0.8
- 1 00 mm slab - 200 mm slab - 500 mm slab
./ ./
Figure 6.5 - Strength profi le for slabs of increasing thickness as a function of the fractional position into the surface.
Figure 6 . 5 shows that the slab thickness does not significantly alter the shape of the steady state profile through the lactose slab . The increasing thickness does however, result in a correspondingly larger region in the slab where significant lumping caused by liquid bridging occurs. Figure 6 . 5 shows that the region with significant strength is at a fractional distance of approximately 0 .96 . This corresponds to a region 4 mm wide in the 1 00 mm slab, 8 mm in the 200 mm slab and 20 mm wide in the 500 mm slab. Because of the much larger distance over which the moisture migration must occur, the time taken to reach this steady state condition increases proportionally with the slab thickness.
The initial water activity of the product is an important parameter with respect to caking phenomena. Water activity is essentially an indirect measure of moisture and
" - . -, .' �. . . . . • • 'y' Y' "
6-6
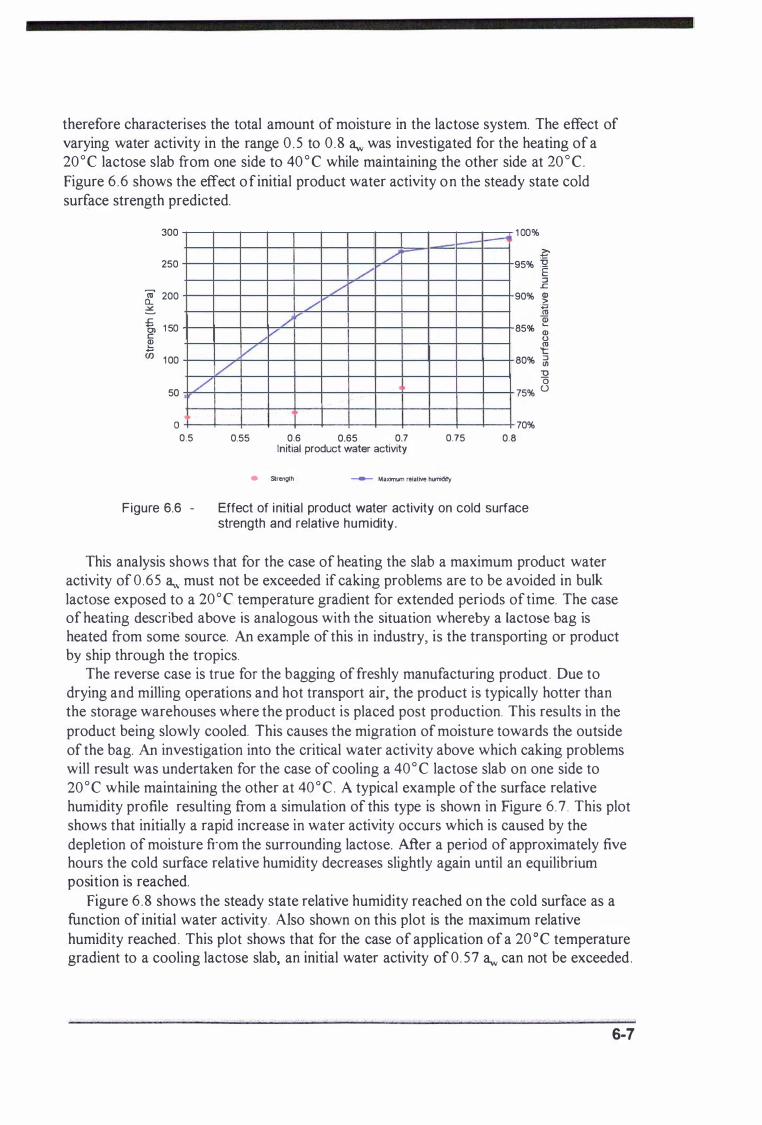
therefore characterises the total amount of moisture in the lactose system. The effect of varying water activity in the range 0 . 5 to 0 . 8 3w was investigated for the heating of a 20 0e lactose slab from one side to 40 0 e while maintaining the other side at 20 ° e . Figure 6 .6 shows the effect of initial product water activity on the steady state cold surface strength predicted.
300
250
ro 200 a... 2S t 1 50 c � (f) 1 00
50
o
/"
0.5
/' /"
0.55
,/
/� /'
./ /'
/'
0.6 0.65 0.7 Initial product water activity
-
0.75
• Strength --- Maxinum relative hUfl"lidity
--1 1 00%
� 95% �
::J £. 90% �
1ii (j) 85°A, �
o �
80% iil "0 (5
75% 0
70%
0.8
Figure 6.6 - Effect of initial product water activity on cold surface strength and relative humidity .
This analysis shows that for the case of heating the slab a maximum product water activity of 0 .65 3w must not be exceeded if caking problems are to be avoided in bulk. lactose exposed to a 20 0 e temperature gradient for extended periods oftime. The case of heating described above is analogous with the situation whereby a lactose bag is heated from some source. An example of this in industry, is the transporting or product by ship through the tropics.
The reverse case is true for the bagging of freshly manufacturing product . Due to drying and milling operations and hot transport air, the product is typically hotter than the storage warehouses where the product is placed post production. This results in the product being slowly cooled. This causes the migration of moisture towards the outside of the bag. An investigation into the critical water activity above which caking problems will result was undertaken for the case of cooling a 40 0 e lactose slab on one side to 20 0e while maintaining the other at 40 ° e . A typical example of the surface relative humidity profile resulting from a simulation of this type is shown in Figure 6. 7 . This plot shows that initially a rapid increase in water activity occurs which is caused by the depletion of moisture from the surrounding lactose. After a period of approximately five hours the cold surface relative humidity decreases slightly again until an equilibrium position is reached.
Figure 6 . 8 shows the steady state relative humidity reached on the cold surface as a function of initial water activity. Also shown on this plot is the maximum relative humidity reached. This plot shows that for the case of application of a 20 ° e temperature gradient to a cooling lactose slab, an initial water activity 0[ 0 . 57 3w can not be exceeded.
6-7
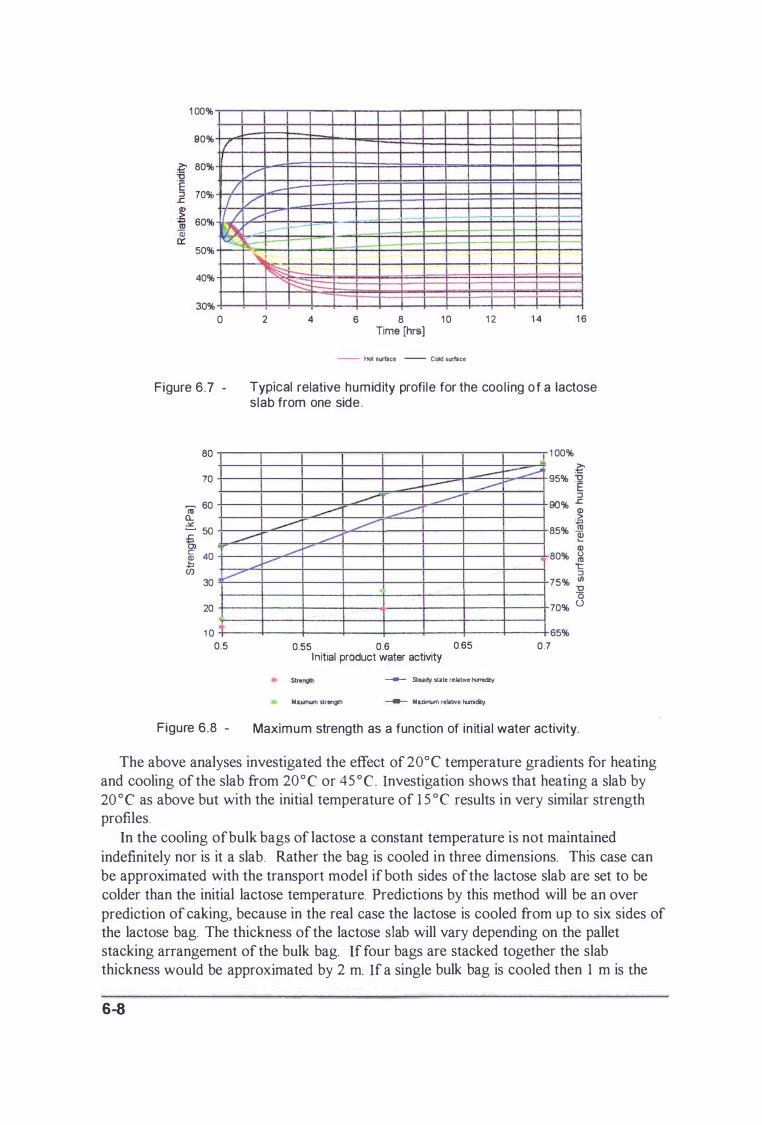
1 00%
90% f � 80% "0 'E :J 70% .s:: Q) � 60% (II Q) 0::
/ I / :� � 50%
40%
30%
o
Figure 6.7 -
80
70
tv 60 !l. .:.t.
/' --V
./' -----
� _"�
�-�
2 4 6 8 1 0 Time [hrs] - Hot swel - Cold slrltce
1 2 1 4 1 6
Typical relative humidity profi le for the cool ing o f a lactose slab from one side .
-� -- --
-- � --- ---
------� --
1 00%
� 95% :Q
E :J
90% .s:: � ." � 50 t ,....---- ."....--- 85% .ll1 �
..--c: � 40
V Cf) 30
20
1 0 0.5
...----.-'"
0.55 0.6 0.65 Initial product water activity ___ Study state relatHe hurnt<fity
Maxitrun strength ___ Mmnum relative tunlcMy
Q) 80% � 't: :J
0.7
75% � '0
70% 0
65%
Figure 6.8 - Maximum strength as a function of in itia l water activity.
The above analyses investigated the effect of 20°C temperature gradients for heating and cooling of the slab from 20°C or 45 °C . Investigation shows that heating a slab by 20 ° C as above but with the initial temperature of 1 5 ° C results in very similar strength profiles.
In the cooling of bulk bags of lactose a constant temperature is not maintained indefinitely nor is it a slab. Rather the bag is cooled in three dimensions. This case can be approximated with the transport model ifboth sides of the lactose slab are set to be colder than the initial lactose temperature. Predictions by this method will be an over prediction of caking, because in the real case the lactose is cooled from up to six sides of the lactose bag. The thickness of the lactose slab will vary depending on the pallet stacking arrangement of the bulk bag. If four bags are stacked together the slab thickness would be approximated by 2 m. If a single bulk bag is cooled then 1 m is the
6-8
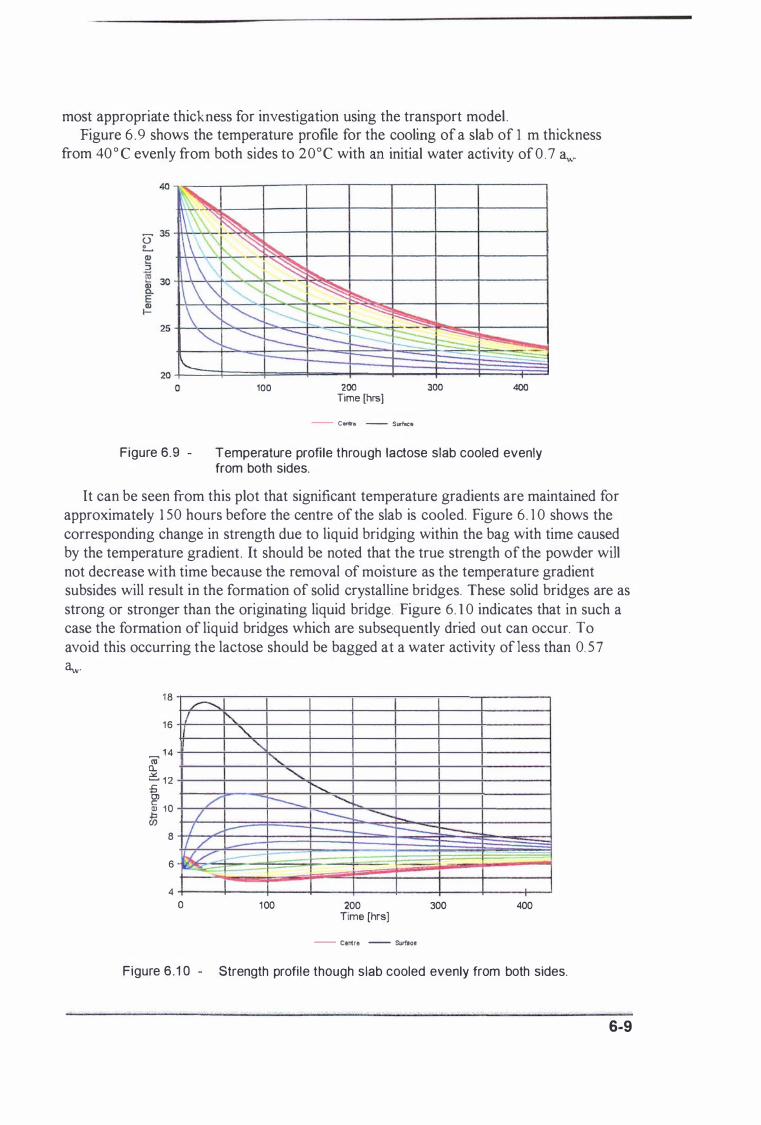
most appropriate thickness for investigation using the transport model . Figure 6 .9 shows the temperature profile for the cooling of a slab of 1 m thickness
from 40 D e evenly from both sides to 20De with an initial water activity of 0 .7 a".,.
� ,�--�----,----,----,----,----,----,------,
100 200 Time [hrs] - c_. - StA'fac.
300 400
Figure 6.9 - Temperature profile through lactose slab cooled evenly from both sides.
It can be seen from this plot that significant temperature gradients are maintained for approximately 1 50 hours before the centre of the slab is cooled. Figure 6. 1 0 shows the corresponding change in strength due to liquid bridging within the bag with time caused by the temperature gradient. It should be noted that the true strength of the powder will not decrease with time because the removal of moisture as the temperature gradient subsides will result in the formation of solid crystalline bridges. These solid bridges are as strong or stronger than the originating liquid bridge. Figure 6. 1 0 indicates that in such a case the formation of liquid bridges which are subsequently dried out can occur. To avoid this occurring the lactose should be bagged at a water activity of less than 0. 57
Clw· 1 8
1 6
1 4 ro n. � � 1 2 B, c � 10
8
6
4
/""-... I
L / /
1/ / �
a
� "-
"" 1""-"" ........... r----.. ........... =--- ---� -- -r---::: t::---
---
100 200 300 400 Time [hrs] - C&ntre - sumc.
Figure 6 . 1 0 - Strength profi le though slab cooled evenly from both sides.
6-9
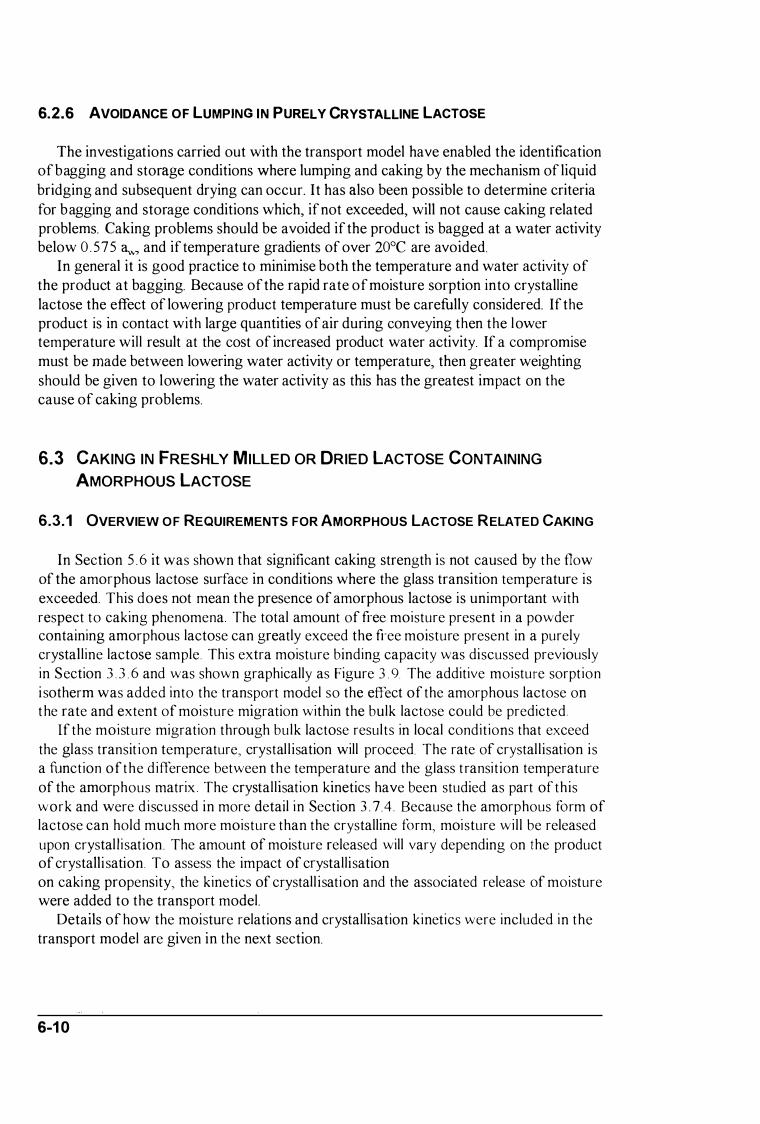
6.2.6 AVOIDANCE OF LUMPING IN PURELY CRYSTALLINE LACTOSE
The investigations carried out with the transport model have enabled the identification of bagging and storage conditions where lumping and caking by the mechanism of liquid bridging and subsequent drying can occur. It has also been possible to determine criteria for bagging and storage conditions which, if not exceeded, will not cause caking related problems. Caking problems should be avoided if the product is bagged at a water activity below 0 . 575 <lv.� and if temperature gradients of over 20°C are avoided.
In general it is good practice to minimise both the temperature and water activity of the product at bagging. Because of the rapid rate of moisture sorption into crystalline lactose the effect of lowering product temperature must be carefully considered. If the product is in contact with large quantities of air during conveying then the lower temperature will result at the cost of increased product water activity. If a compromise must be made between lowering water activity or temperature, then greater weighting should be given to lowering the water activity as this has the greatest impact on the cause of caking problems.
6.3 CAKING IN FRESHLY MILLED OR DRIED LACTOSE CONTAINING
AMORPHOUS LACTOSE
6.3.1 OVERVIEW O F REQUIREMENTS FOR AMORPHOUS LACTOSE RELATED CAKING
In Section 5 . 6 it was shown that significant caking strength is not caused by the flow of the amorphous lactose surface in conditions where the glass transition temperature is exceeded. This does not mean the presence of amorphous lactose is unimportant with respect to caking phenomena The total amount of free moisture present in a powder containing amorphous lactose can greatly exceed the free moisture present in a purely crystalline lactose sample. This extra moisture binding capacity was discussed previously in Section J . J . 6 and was shown graphically as Figure J . 9. The additive moisture sorption i sotherm was added into the transport model so the effect of the amorphous lactose on the rate and extent of moisture migration within the bulk lactose could be predicted.
If the moisture migration through bulk lactose results in local conditions that exceed the glass transit ion temperature, crystall isation will proceed. The rate of crystallisation is a function of the difference between the temperature and the glass transition temperature of the amorphous matrix The crystallisation kinetics have been studied as part of this work and were d iscussed in more detail in Section 3 . 7 .4 . Because the amorphous form of lactose can hold much more moisture than the crystalline form, moisture will be released upon crystalli sation. The amount of moisture released will vary depending on the product of crystalli sation. To assess the impact of crystalli sation on caking propensity, the kinetics of crystall isation and the associated release of moisture were added to the transport model.
Details of how the moisture relations and crystallisation kinetics were included in the transport model are given in the next section.
6-1 0

6.3.2 MODIFICATIONS TO THE TRANSPORT MODEL TO INCLUDE THE EFFECTS OF
AMORPHOUS LACTOSE
In the range of amorphous lactose fractions present on freshly milled or dried crystall ine a-lactose mono-hydrate produced commercially (0-6%), the thickness of the amorphous lactose surface layer was calculated to be between 0 to 0 6J-1m The time for sorption has been estimated at up to 20 to 30 seconds (see Section 3 . 4 . 3 ) As the time scale is small compared to that for moisture migration and heat conduction in the bulk lactose, the assumption of instantaneous moisture adsorption is valid for powders containing small amounts of amorphous l actose on the surface
The local moisture content of the combined crystalline and amorphous particle was determined using the additive moisture sorption isotherm developed in Section 3 . 3 . 6 . This can be summarised as Eq (6. 1 ) .
A1 ::: M , a M I OTsl{]f/1JlC UJl)orp lOllS (6 . 1 )
where MCn 'iU!!In<' and �m/OrJiholls are the moisture contents of the purely crystal line and amorphous lactose fractions given by Eqs (3 .2-3 .4) and Eq ( 3 . 9) respectively and a represents the amorphous lactose fraction The transport model describes the change in the total amount of tree moisture contained at any position in the l actose slab (see Eq 4 1 1 ) . The distribution of this moisture between the solid and gaseous phases was obtained iteratively using Eq (6 . 1 ) above.
The differentiated form of the Avrami equation (Eq 3 .28) was used to describe the rate of crystall isation in the amorphous component of the lactose particle. The A vrami equation rate constant (K), is a function of ( T - l�) and is given by Eq ( 3 . 32) . The parameters used were C] = 3 . 54x 1 0-1, C:: = 1 08 .4, Cj = 3 x 1 027 and n=3 . The equation was then solved at each time step using simple Euler numerical integration at each node of the l actose slab. The initial crystallinity of the amorphous layer was set to a small number ( 1 0.16) to allow the onset of crystall isation once favourable conditions were achieved.
As the crystallinity of the amorphous layer increases, the amount of amorphous lactose and hence the moisture binding capacity of the combined particle is reduced. The amount of moisture released depends on the crystallisation product This i s discussed in detail in Section 3 .7 .4 . 1 . For the modelling of amorphous lactose crystallisation in a lactose slab under the influence of a temperature gradient, both extremes were considered. Simulations were performed assuming an anhydrous p-Iactose product as well as simulations assuming a-lactose mono-hydrate as the product of crystallisation. In both cases i t was assumed that the moisture released was uninhibited and was redistributed evenly between the solid and gaseous phases.
6-1 1

6.3.3 THE EFFECT OF AMORPHOUS LACTOSE MOISTURE BINDING CAPACITY ON
MOISTURE MIGRATION
Figure 6 . 1 1 shows predictions of the effect of changing amounts of amorphous lactose on the rate of moisture migration.
/ 1/
I / I // J� /
1 5"to -
1 0% f.,.---o 5
/" f--
/ / /'"
/
-r---r-
1 0
----
1 5 20 Time [hr ]
I Cold Suface
Hot surface
25
- a % emorptl0u5 2 5% amorphous - 5 % amorphous
30
Figure 6 . 1 1 - Comparison of moisture migration rates for increasing amorphous lactose fractions.
5
In each case the starting water activity of the lactose slab was set to 0.25 �v and the temperature was initially 20°e. One sUiface was maintained at 200e and a step change to 400e was applied to the other surface. These conditions were chosen so that no position in the slab ever reached conditions conducive to significant amorphous lactose crystallisation.
It can be seen from Figure 6 . 1 1 that the steady state water activity on both hot and cold surfaces are similar between simulations for varying amounts of amorphous lactose present. The rate that these steady state conditions are reached is notably different however. The increased binding capacity of the amorphous lactose slows the rate that steady state is reached. This is because more moisture must be transported to achieve a given change in surface water activity if amorphous lactose is present. This is a function of the shape of the combined crystalline and amorphous lactose moisture sorption isotherm.
It is evident from these results that the rate of moisture migration though a lactose slab under the influence of a temperature gradient is markedly effected by the amount of amorphous lactose present. It may be possible to exploit this behaviour and use it as the basis for a amorphous lactose fraction measurement method. To use the model to quantity the amount of amorphous lactose present, the moisture sorption isotherm data for both crystalline and amorphous lactose would have to be more accurately determined. Another approach might be to calibrate the technique against known lactose
6-1 2

samples. This method might offer advantages over the other techniques such as shorter measurement times than the additive isotherm method, cheaper than NMR and avoidance of crystallisation phenomena which are not known well enough to allow quantification of amorphous lactose using the controlled crystallisation method. Further research on the feasibility of this method is left for subsequent investigations.
6.3.4 PREDICTIONS OF MOISTURE TRANSPORT WITH AMORPHOUS LACTOSE CRYSTALLISATION
As discussed above, the prediction of crystallisation phenomena in the lactose slab will depend on the product of crystallisation. If p-Iactose is formed, then all of the moisture associated with the amorphous fraction will be made available when crystallisation proceeds. If a-lactose mono-hydrate is formed, then large amounts of moisture will be bound as water of crystallisation (5% w/w) and therefore the total amount of free moisture in the system will be reduced. It is l ikely that some combination of these two extremes occurs in practise depending on the conditions of crystallisation. A more detailed discussion on crystallisation product was given in Section 3 . 7 .4 . 1 . The mechanism of solid state conversion of p-Iactose to the a-lactose mono-hydrate crystal form was outlined in Section 3 . 7 . 4 . 2 . 2 2, and is likely to be significant at high water activity conditions.
The modelling of amorphous crystallisation in the bulk lactose slab described in this work was limited to the case of the formation of either a-lactose mono-hydrate or Plactose product . No subsequent conversion of the P to a crystal forms was included into the model . While these assumptions over simplified the real phenomena occurring in the lactose slab, they represent the extremes of what can occur. In this way they were used to offer insight into how amorphous lactose contributes to caking in bulk lactose.
6.3 .4. 1 C RYSTALLISATION TO AN HYDROUS LACTOSE PRODUCT
The model was run for the case where all the moisture contained within the crystall ising amorphous lactose was released into the surrounding bulk of the lactose powder. The amount of moisture contained within each node was calculated as described in Chapter 4. The difference was that the distribution of moisture between the solid and gaseous phases could change as crystallisation processed. The new crystallinity of the amorphous layer was calculated using the A vrami equation and the fraction of amorphous lactose remaining was used to calculate the new moisture sorption isotherm using the additive isotherm model . This was used to determine how the moisture contained in the node was distributed between the solid and gaseous phases.
Figure 6. 1 2 shows predictions of what occurs in the lactose slab for a starting water activity of 0 . 3 5 Clw and with 2 .5% amorphous lactose present on the surface of the lactose crystal. It can be seen from this figure that for the first 1 6 hours the relative humidity profiles are similar to that predicted from simulations where crystall isation did not occur. When the cold surface relative humidity reached 55%, crystallisation began to proceed. The model predicted a rapid release of moisture which caused a snowball effect to occur. This released moisture was then able to diffuse back through the slab causing more amorphous lactose to crystalli se. Once all of the amorphous lactose had
6-1 3

crystallised, moisture migration occurred in the then completely crystalline lactose bed until a new equilibrium was reached. It is clear from Figure 6. 1 2 that the overall water activity of the resulting product is much greater than the average starting water activity.
Figure 6. 1 3 shows the prediction of relative humidity for a simulation using the same conditions as above but with a starting water activity of 0 .25 aw. This plot shows crystallisation did not occur in the time frame studied as the water activity did not reach a high enough level. The steady state cold side water activity of 0 .45 a..v shown would be expected to crystallise in approximately 36 days. This would mean that crystall isation could still occur in an industrial product bagged at 0 .25 aw during storage and transport if the temperature gradient is maintained for extended periods of time. It is unlikely that temperature gradients would be maintained for this length of time.
6-1 4
1 0Cj'�
80'� �. '0 ] 60er, Cold !.'Iw-r.f;lCC -� 'l' 40'10 " �
� � 1- _
�[;- -.'CC'
200/0 I' HOI- &uri'sc<:
0% (1 10
lx-r '3K� --
- -l "--- -
'- I I r'�1
r- - I - '" -+-r---� �I'-....... I I
I ))
1 5 20 Time [hrsl
----
25
r.::::-r--t:::-.
30 35
Figure 6 . 1 2 - Prediction of moisture transport with crystall isation for powder contain ing 2.5% amorphous lactose at 20·C after subjection to a 20·C temperature grad ient.
0 45
0.4 Cold fiurlace -....--
.?;-. 0 35 ,/ --'0 .� 0 3 ..c " .C 0 25 '"
OJ oe: 0 2
/. v -""./ W i-
--r �. 1- -+- 1 I --..... i-- I I I -0. 1 5
HO'L 5urlblCe
0. 1 I I o 1 0
I
-
I
1 5 20 Time [hrs]
--
25 30 35
Figure 6 . 1 3 - Moisture migration in a lactose slab start ing at a water activity of 0.25 aw showing no signs of amorphous lactose crystal lisation.
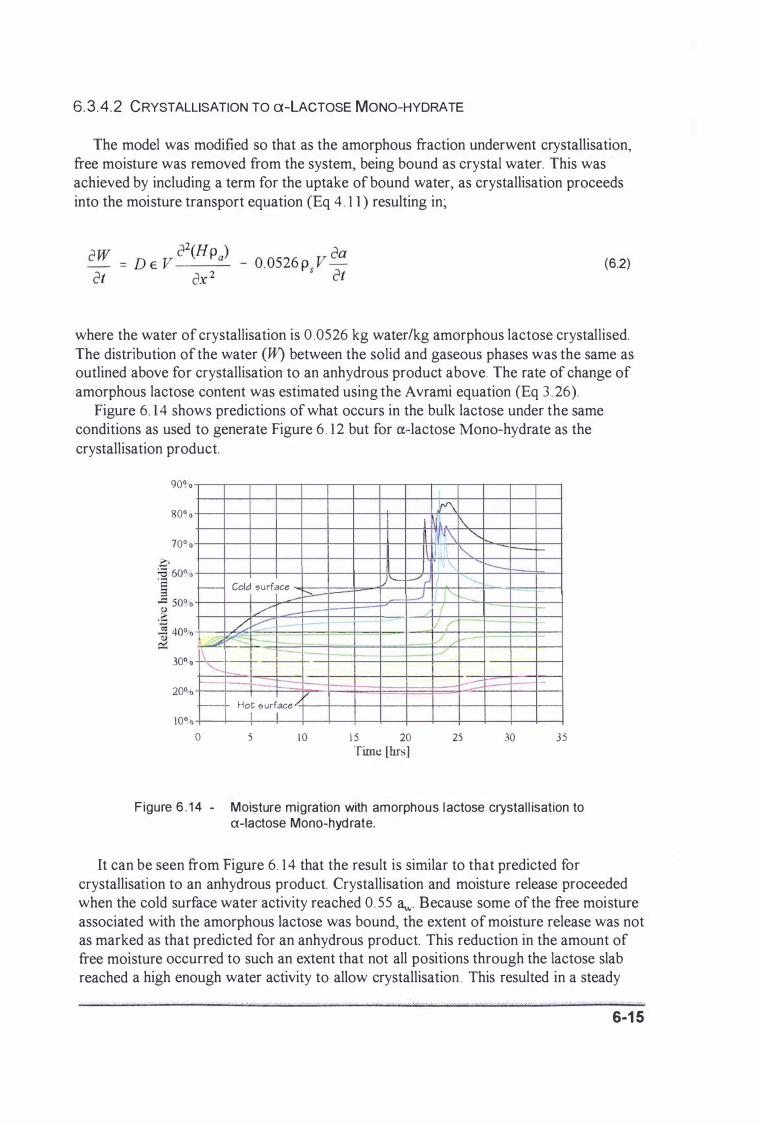
6. 3.4 .2 CRYSTALLISATION TO a-LACTOSE MONO-HYDRATE
The model was modified so that as the amorphous fraction underwent crystallisation, free moisture was removed from the system, being bound as crystal water. This was achieved by including a term for the uptake of bound water, as crystallisation proceeds into the moisture transport equation (Eq 4 . 1 1 ) resulting in;
(6.2)
where the water of crystallisation is 0 .0526 kg water/kg amorphous lactose crystallised. The distribution of the water (W) between the solid and gaseous phases was the same as outlined above for crystallisation to an anhydrous product above. The rate of change of amorphous lactose content was estimated using the Avrami equation CEq 3 . 26).
Figure 6. 14 shows predictions of what occurs in the bulk lactose under the same conditions as used to generate Figure 6 . 1 2 but for a-lactose Mono-hydrate as the crystallisation product.
90%
80%
70%
f--- Cold 5urface --� /' � v -
;;tt; ---- -I---30% �I I -
r-.--r I 20% - Hot 5urface 10% I I
o 5 10
'------'r � -
1 5 20 Time [hrs]
rv\ \. :1\\ '-..
�\ "'" t----1\ --'-, 1'-. '-... (
li t V / ./
�
25 30 35
Figure 6 . 1 4 - Moisture migration with amorphous lactose crystal l isation to a-lactose MonO-hydrate.
It can be seen from Figure 6. 1 4 that the result is similar to that predicted for crystallisation to an anhydrous product. Crystallisation and moisture release proceeded when the cold surface water activity reached 0. 55 ilv". Because some of the free moisture associated with the amorphous lactose was bound, the extent of moisture release was not as marked as that predicted for an anhydrous product. This reduction in the amount of free moisture occurred to such an extent that not all positions through the lactose slab reached a high enough water activity to allow crystallisation. This resulted in a steady
, • • . . tT . ! •• ,
6-1 5
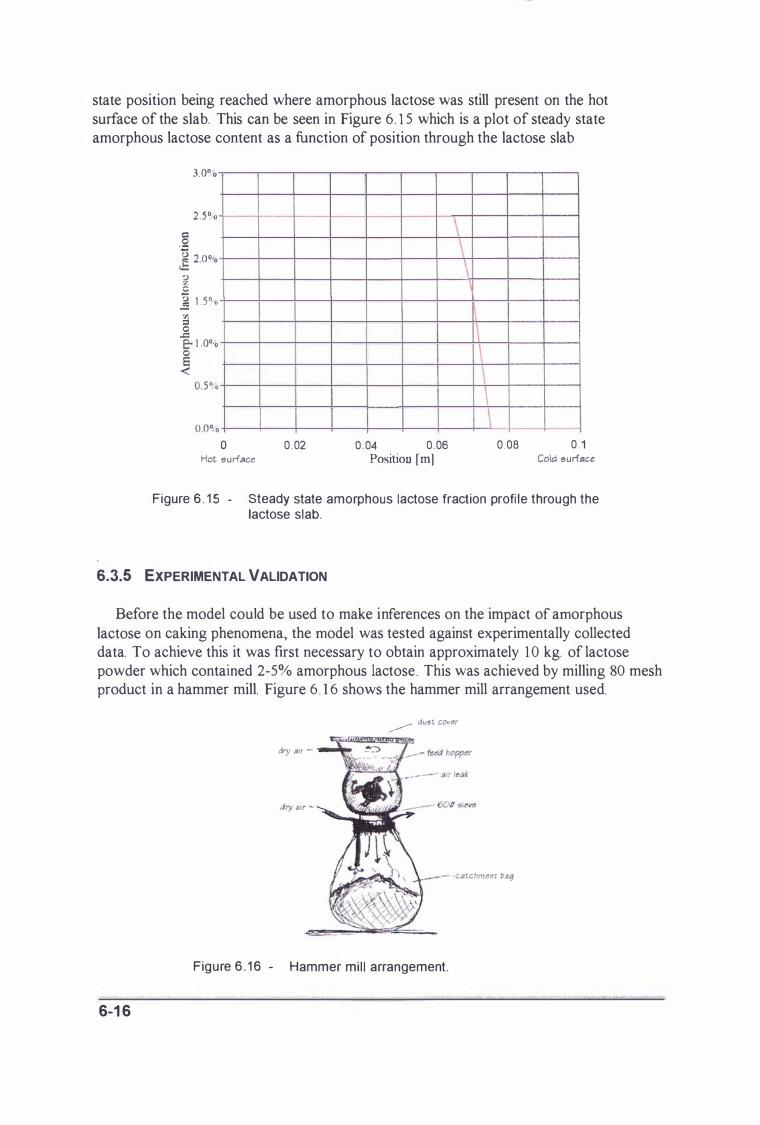
state position being reached where amorphous lactose was still present on the hot surface of the slab. This can be seen in Figure 6. 1 5 which is a plot of steady state amorphous lactose content as a function of position through the lactose slab
3.0°,<>
2.5°'0
§ '.c � 2.0% <.l::
'l) :r. C ] 1 .5°/0 Vl ] e- l .0% !
0.5° 0
0.0% o
Hot 9urfacc 0 .02 0 .04 0 .06
Position [m]
\ \ \
1\ \ \ \ \
0.08 0 . 1 Cold 9urfacc
Figure 6 . 1 5 - Steady state amorphous lactose fraction profi le through the lactose slab.
6.3.5 EXPERIMENTAL VALIDATION
Before the model could be used to make inferences on the impact of amorphous lactose on caking phenomena, the model was tested against experimentally collected data. To achieve this it was first necessary to obtain approximately 1 0 kg. of lactose powder which contained 2-5% amorphous lactose . This was achieved by milling 80 mesh product in a hammer mill. Figure 6 . 1 6 shows the hammer mill arrangement used.
6-1 6
�.----- du�t cover
dry alr -
- . catchment /1"9
Figure 6 . 1 6 - Hammer mi l l arrangement.
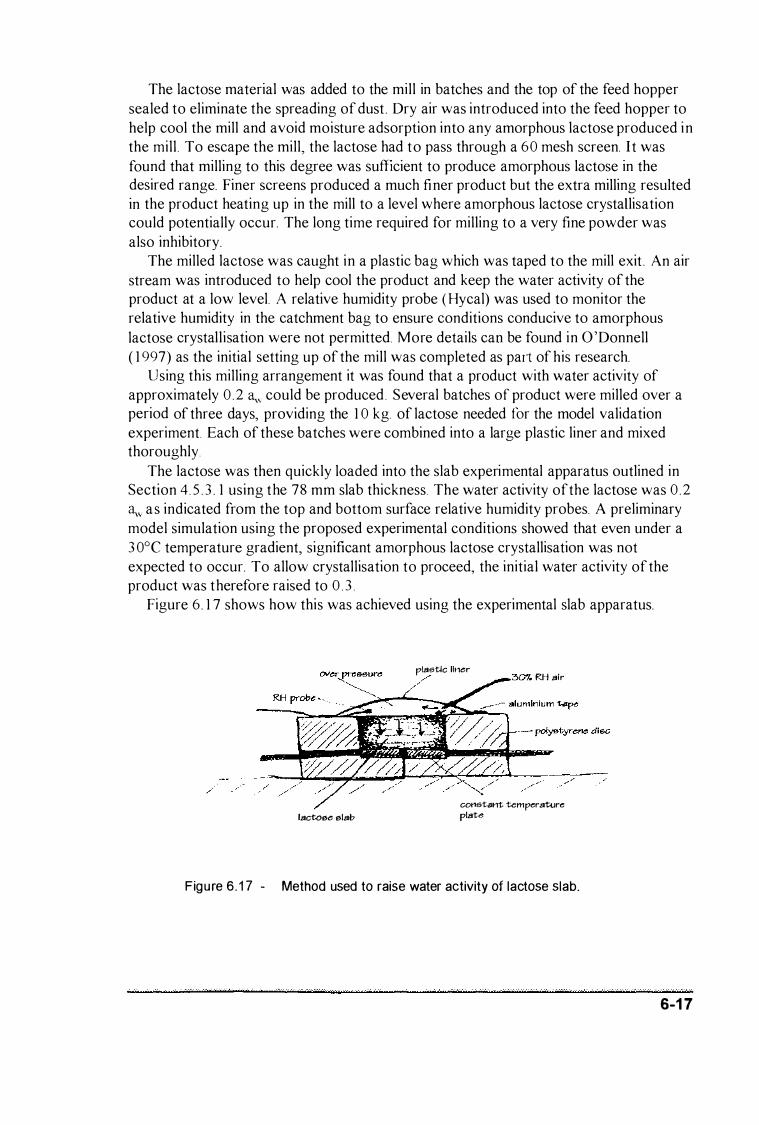
The lactose material was added to the mill in batches and the top of the feed hopper sealed to eliminate the spreading of dust . Dry air was introduced into the feed hopper to help cool the mill and avoid moisture adsorption into any amorphous lactose produced in the mill. To escape the mill, the lactose had to pass through a 60 mesh screen. I t was found that milling to this degree was sufficient to produce amorphous lactose in the desired range. Finer screens produced a much finer product but the extra milling resulted in the product heating up in the mill to a level where amorphous lactose crystallisation could potentially occur. The long time required for milling to a very fine powder was also inhibitory.
The milled lactose was caught in a plastic bag which was taped to the mill exit . An air stream was introduced to help cool the product and keep the water activity of the product at a low level. A relative humidity probe (Hycal) was used to monitor the relative humidity in the catchment bag to ensure conditions conducive to amorphous lactose crystallisation were not permitted. More details can be found in O'Donnell ( 1 997) as the initial setting up of the mill was completed as part of his research.
Using this milling arrangement it was found that a product with water activity of approximately 0 .2 <l..., could be produced. Several batches of product were milled over a period of three days, providing the 1 0 kg. of lactose needed for the model validation experiment. Each of these batches were combined into a large plastic liner and mixed thoroughly.
The lactose was then quickly loaded into the slab experimental apparatus outlined in Section 4. 5 . 3 . 1 using the 78 mm slab thickness. The water activity of the lactose was 0 .2 <l...v as indicated from the top and bottom surface relative humidity probes. A preliminary model simulation using the proposed experimental conditions showed that even under a 3 0°C temperature gradient, significant amorphous lactose crystallisation was not expected to occur. To allow crystallisation to proceed, the initial water activity of the product was therefore raised to 0 . 3 .
Figure 6 . 1 7 shows how this was achieved using the experimental slab apparatus.
lactoee elab
pla€lUc Iil1er RH alr
COI1€ltal1t: t:emp<:ra"torc plat:e
Figure 6. 1 7 - Method used to raise water activity of lactose slab.
6-1 7
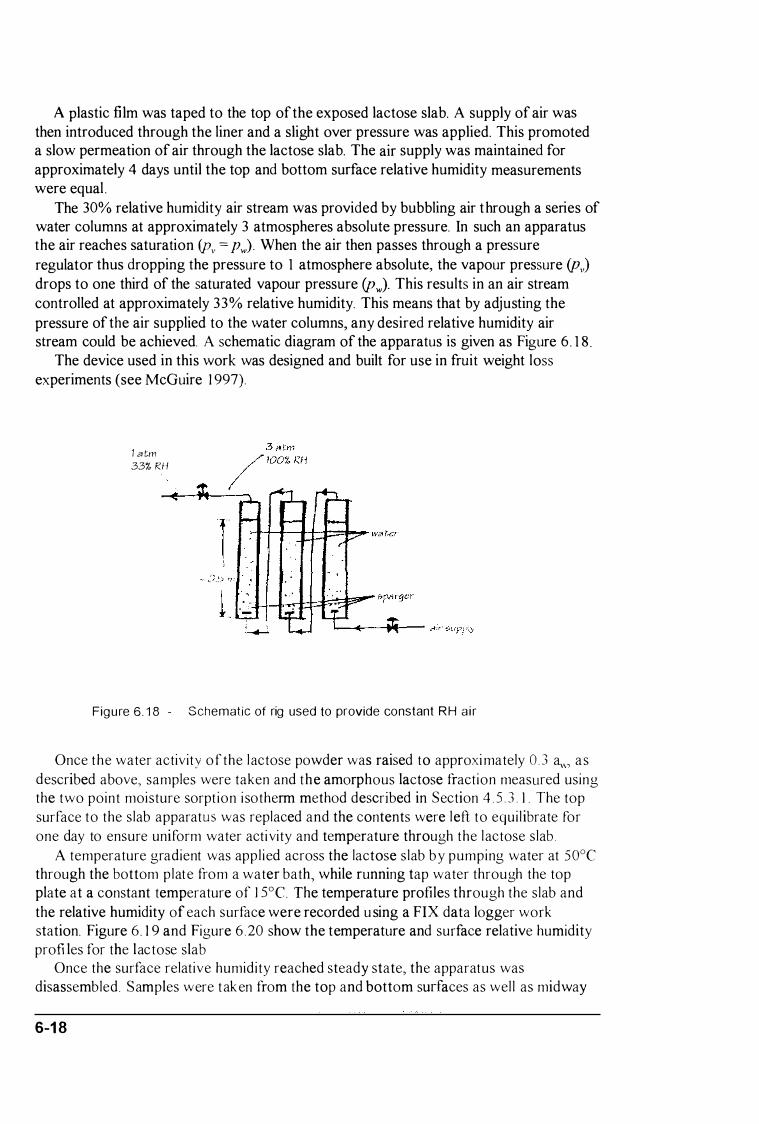
A plastic film was taped to the top of the exposed lactose slab. A supply of air was then introduced through the liner and a slight over pressure was applied. This promoted a slow permeation of air through the lactose slab. The air supply was maintained for approximately 4 days until the top and bottom surface relative humidity measurements were equal .
The 30% relative humidity air stream was provided by bubbling air through a series of water columns at approximately 3 atmospheres absolute pressure. In such an apparatus the air reaches saturation (Pv = Pw)' When the air then passes through a pressure regulator thus dropping the pressure to 1 atmosphere absolute, the vapour pressure (PJ drops to one third of the saturated vapour pressure (PJ. This results in an air stream controlled at approximately 33% relative humidity. This means that by adjusting the pressure of the air supplied to the water columns, any desired relative humidity air stream could be achieved. A schematic diagram of the apparatus is given as Figure 6 . 1 8 .
The device used in this work was designed and built for use in fruit weight loss experiments (see McGuire 1 997).
1 a tm 33% Rli
Figure 6.18 - Schematic of rig used to provide constant R H a i r
Once the water activity of the lactose powder was raised to approximately 0 . 3 a", as described above, samples were taken and the amorphous lactose fraction measured using the two point moisture sorpt ion i sotherm method described in Section 4 . S . 3 . 1 . The top surface to the slab apparatus was replaced and the contents were lett to equil ibrate for one day to ensure uniform water activity and temperature through the lactose slab .
A temperature gradient was appl ied across the lactose slab by pumping water at s ooe through the bottom plate from a water bath, while running tap water through the top plate at a constant temperature of I soc. The temperature profiles through the slab and the relative humidity of each surface were recorded u sing a FIX data logger work station. Figure 6 . 1 9 and Figure 6 .20 show the temperature and surface relative humidity profiles for the lactose slab
Once the surface relative humidity reached steady state, the apparatus was disassembled. Samples were taken from the top and bottom surfaces as wel l as midway
6-1 8
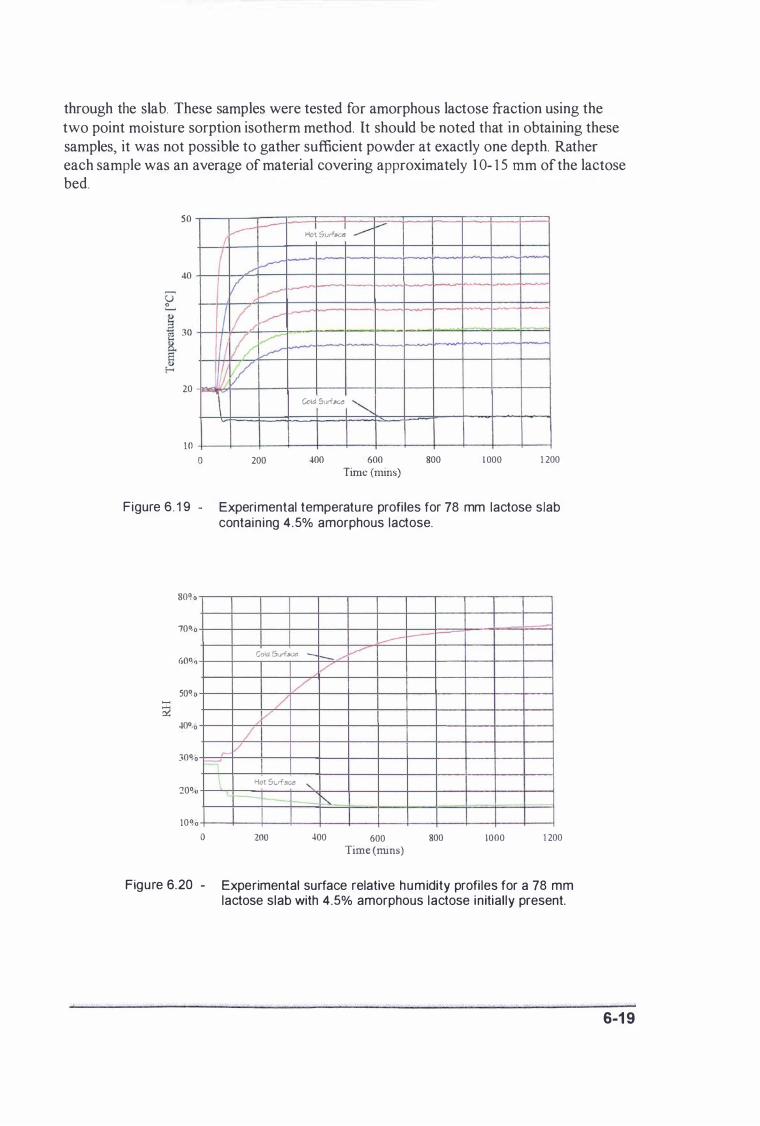
through the slab. These samples were tested for amorphous lactose fraction using the two point moisture sorption isotherm method. It should be noted that in obtaining these samples, it was not possible to gather sufficient powder at exactly one depth. Rather each sample was an average of material covering approximately 1 0- 1 5 mm of the lactose bed.
50
(l-----
/ ./ .-r"
II � 40
711 �
1 11// V L.r-' 20 �V 10
a 200
I I .............. .,..-Hot Surf Be<:
Cola SlIrf.e<: �
400 600 Time (mins)
-
--
800 1000 1 200
Figure 6 . 1 9 - Experimental temperature profi les for 78 mm lactose slab contain ing 4.5% amorphous lactose.
80�'0
700'0
GO�o
50% �
40°/0
30°'0
20�0
10�0 a
-----Cold 5lltf8Ce _ /l.---'"" V
./ / l7
/ V r-==-' I Hot Surf.e<: "-, 1---1- 1 "
200 400 600 Time (mins)
-
800 1000 1 200
Figure 6.20 - Experimental surface relative humidity profi les for a 78 mm lactose slab with 4.5% amorphous lactose initial ly present.
6-1 9

The two point moisture sorption isotherms for these samples are shown as Figure 6.2 1 . These measurements show that 4 . 5% amorphous lactose was present on the lactose prior to commencement of the experiment . There was good agreement between replicates for these samples.
0.4%
4i' U) .s � 0 . 3% 2:--0 � OJ ":E0.2% � 8 e ,a 0. 1 % U) '0 :2
0.0% o
,-c
0 . 1 0 .2 0.3 Water activity
..:c.
•
-"
•
-Q L
"!:'i-
I I 4.5% �morph ue
- 3.5';' �morphoue
- 1 .5% �morphoue J I
I- 0.5% �morphoue
0 .4
• Before experiment ., Cold su1ece X Hot smece
Centre of slab - CI)'SIB.ne isofhenn 0 C!)istalne da'" points
0 .5
Figure 6 .21 - Two-point isotherm results for lactose samples taken before and after the slab experiment.
After the experiment, the amount of amorphous lactose present at the cold surface was reduced. This is demonstrated by the fact that the amount of free moisture that could be held by the lactose at 0 .33 � was much lower than that observed for the lactose samples analysed prior to the experiment . The moisture content measured at this water activity is slightly higher than the isotherm value for purely crystalline lactose also shown on the plot . This can be explained in two ways. There is some scatter in the purely crystalline isotherm data. This scatter could include the isotherm points measured for these samples. Alternatively, the apparent difference in moisture content could be due to the fact that the samples were taken as an average of the material present in the first l O-1 5 mm of the lactose surface. It is possible that some of the powder at lower depths still contained small amounts of amorphous lactose even if the top surface was completely crystalline. Either way, the results clearly show that there was amorphous lactose present before the experiment which was absent after the experiment was completed. This result is reinforced by the fact the cold surface relative humidity reached 73% at which amorphous lactose is most unlikely to be stable.
The hot surface amorphous lactose content measurements show that 3 . 5% amorphous lactose is present after the experiment was completed. It is unlikely that any crystallisation occurred in the conditions that thi s surface experienced. The glass transition temperature for amorphous lactose at a water activity of 0 .2 a..v is 55°C as given from Figure 3 . 1 9 . This means that the glass transition temperature was never exceeded and so crystallisation should never have occurred at this surface. Using Figure 3 . 3 1 and Figure 3 . 1 9 it was calculated that for crystallisation to occur in the time frame
6-20
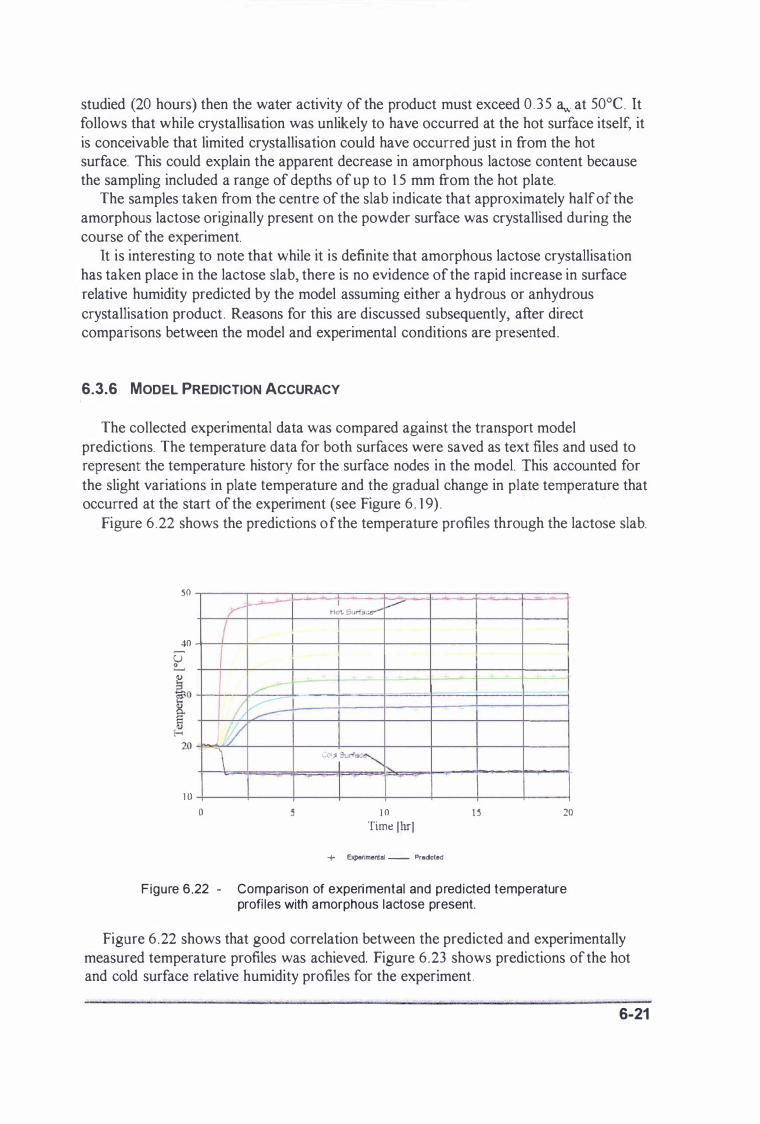
studied (20 hours) then the water activity of the product must exceed 0 . 3 5 Clw at 50°C . It follows that while crystallisation was unlikely to have occurred at the hot surface itself, it
is conceivable that limited crystallisation could have occurred just in from the hot surface. This could explain the apparent decrease in amorphous lactose content because the sampling included a range of depths of up to 1 5 mm from the hot plate.
The samples taken from the centre of the slab indicate that approximately half of the amorphous lactose originally present on the powder surface was crystallised during the course of the experiment.
It is interesting to note that while it is definite that amorphous lactose crystallisation has taken place in the lactose slab, there is no evidence of the rapid increase in surface relative humidity predicted by the model assuming either a hydrous or anhydrous
crystallisation product . Reasons for this are discussed subsequently, after direct comparisons between the model and experimental conditions are presented .
6.3.6 MODEL PREDICTION ACCURACY
The collected experimental data was compared against the transport model predictions. The temperature data for both surfaces were saved as text files and used to represent the temperature history for the surface nodes in the model. This accounted for
the slight variations in plate temperature and the gradual change in plate temperature that occurred at the start of the experiment (see Figure 6 . 1 9) .
Figure 6 .22 shows the predictions o f the temperature profiles through the lactose slab.
50 r-/ I
I 40 U �
r--/ � /
J O o
I H ot. 511ri.C<)""" V
Colo I;;Url9C�
� �
-
1 0 Time Ibrl
+ Experimental _ Predoted
I
1 5 20
Figure 6 .22 - Comparison of experimental and predicted temperature profi les with amorphous lactose present.
Figure 6 .22 shows that good correlation between the predicted and experimentally measured temperature profiles was achieved. Figure 6 .23 shows predictions of the hot and cold surface relative humidity profiles for the experiment .
6-21
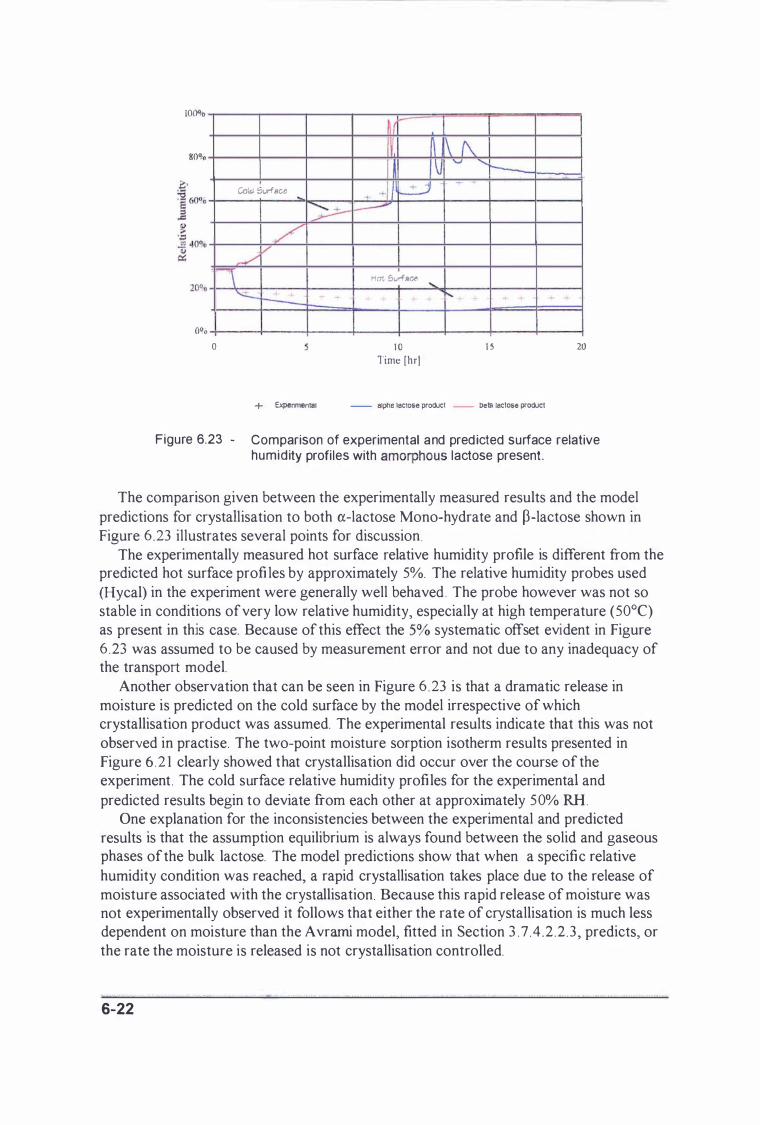
100%
80%
0·' ,0
Cold Suri8cO
/ ,.L ./
-\ � r--:-
o
�
- .
� I� + .,
• j ......;...-J �
Hat Surf.!lce ......
1 0 Time [hT]
1\ f\ '>oJ
�
� �
........ r---
1 5
+ Experimental - alpha lactose product - betll iaciose product
-
20
Figure 6,23 - Comparison of experimental and pred icted surface relative humidity profi les with amorphous lactose present
The comparison given between the experimentally measured results and the model predictions for crystallisation to both a-lactose Mono-hydrate and p-Iactose shown in Figure 6 .23 illustrates several points for discussion.
The experimentally measured hot surface relative humidity profile is different from the predicted hot surface profiles by approximately 5%. The relative humidity probes used (Hycal) in the experiment were generally well behaved. The probe however was not so stable in conditions of very low relative humidity, especially at high temperature (50°C) as present in this case. Because of this effect the 5% systematic offset evident in Figure 6 .23 was assumed to be caused by measurement error and not due to any inadequacy of the transport model.
Another observation that can be seen in Figure 6 .23 is that a dramatic release in moisture is predicted on the cold surface by the model irrespective of which crystallisation product was assumed. The experimental results indicate that this was not observed in practise. The two-point moisture sorption isotherm results presented in Figure 6 .2 1 clearly showed that crystallisation did occur over the course of the experiment . The cold surface relative humidity profiles for the experimental and predicted results begin to deviate from each other at approximately 50% RH .
One explanation for the inconsistencies between the experimental and predicted results is that the assumption equilibrium is always found between the solid and gaseous phases of the bulk lactose. The model predictions show that when a specific relative humidity condition was reached, a rapid crystallisation takes place due to the release of moisture associated with the crystallisation Because this rapid release of moisture was not experimentally observed it follows that either the rate of crystallisation is much less dependent on moisture than the Avrarni model, fitted in Section 3 .7 .4 .2 .2 .3 , predicts, or the rate the moisture is released is not crystallisation controlled.
's '
6-22
There is some evidence from the work carried out by 0 'Donnell ( 1 997) and Cressey ( 1 997) that the product of amorphous lactose crystallisation is difficult to dry. This suggests a fine porous structure which might trap moisture within it. It is not difficult to explain how such a structure could form as a result of crystallisation. Amorphous lactose exists as a unstructured matrix of lactose molecules. This matrix is very super saturated with respect to both a and P lactose and therefore there is a strong driving force for spontaneous nucleation and crystal growth. In conditions where the glass transition temperature is not exceeded, the high viscosity and hence low mobility of the lactose molecules prevent crystallisation taking place. When conditions change to allow movement of the lactose to form nuclei and for growth to occur, the matrix collapses and crystallisation takes place. Because the degree of super-saturation of lactose in the amorphous matrix is so high, it is likely that numerous point nuclei form and these nuclei grow and run into each other. Because the density of amorphous matrix (758 kg/m') i s much lower than the crystalline form ( 1 53 5 kg/m3) the amount of space required for the crystal foml is much lower than for the amorphous matrix. It follows that the structure resulting from the crystallisation has large pockets which can entrap moisture.
If a such a surface structure is formed on the surface of the particle due to the amorphous lactose crystall isation then it could limit the rate that moisture can escape the particle into the void spaces of the bulk powder where it is available for diffUsion to other parts of the slab. In the experimental measurement of amorphous lactose crystallisation rate outlined in Section 3 . 7.4 .2 .2 .3 , the rate of crystallisation was slow (20 days) compared to the rate that such moisture release through the resulting crystalline structure. The crystallisation rate experiment therefore can be consistent with the above explanation.
For this explanation to be valid, crystallisation must proceed at a water activity corresponding to the point at which the experimental and predicted cold surface relative humidity profiles deviate (�50% RH). This indicates that crystallisation occurred at a significant rate at a lower water activity than is predicted using the A vrami model with the constants fitted in this work. The predicted water activity for crystallisation to occur within the time frame of this work was 0 . 57 8.w. This demonstrates a need for further investigation into the kinetics of amorphous lactose crystallisation. At faster crystallisation rates it i s likely that consideration must be given to the rate that moisture can escape the crystall ising structure.
The oscillating increase of cold surface relative humidity upon crystallisation, particularly evident for the a-lactose Mono-hydrate product, suggests an alternative explanation for the apparent lack of fit of the model. This oscillation is caused by the surface node reaching conditions conducive to crystallisation and subsequent release of moisture. This moisture then is free to diffuse back to the second node until this is able to crystallise. This process i s then repeated onwards through the lactose slab until all of the nodes have crystalli sed or not enough moisture is available. In the real situation the concept of the discrete element that the node represents is not applicable and the oscillatory relative humidity fluctuations do not occur. This suggests that the simulation requires more nodes to accurately model the crystallisation phenomena compared for the prediction of moisture migration through the lactose slab.
The model was therefore run assuming a a-lactose mono-hydrate crystallisation product using 50 nodes instead of the regular 20 and the comparisons can be seen i n Figure 6 .24 . It was found that a lower time step (0.5 s ) was required to make the
6-23
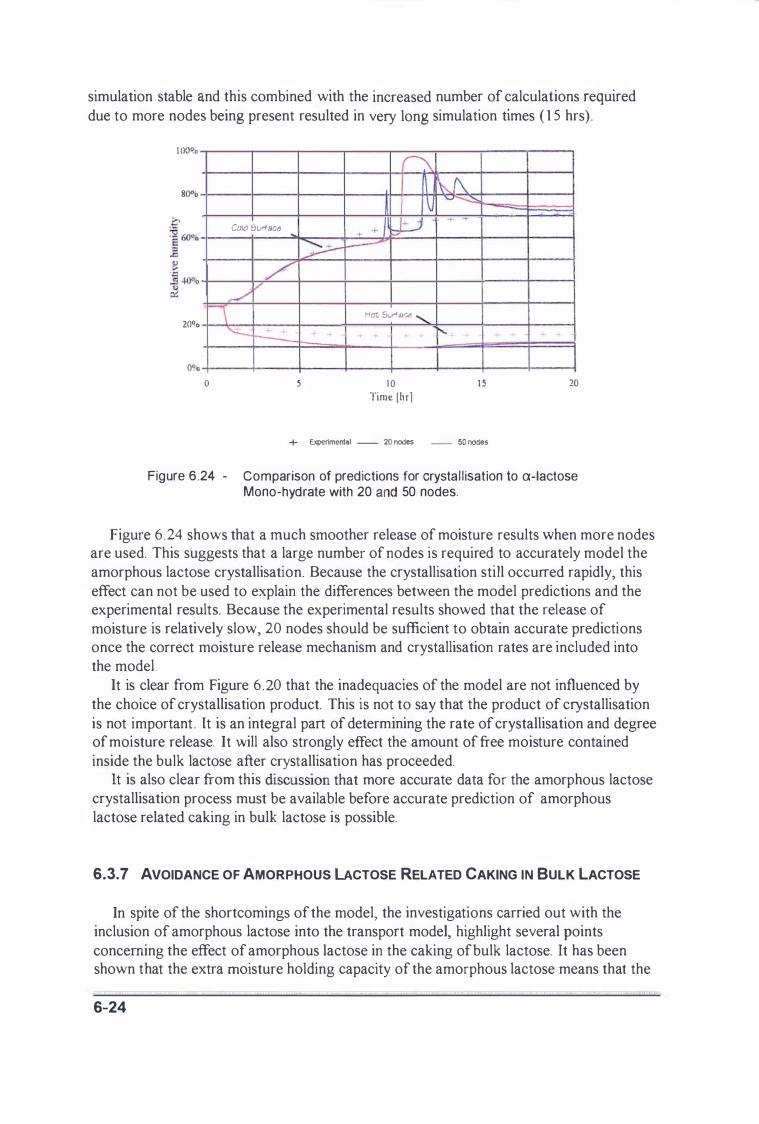
simulation stable and this combined with the increased number of calculations required due to more nodes being present resulted in very long simulation times ( 1 5 hrs) .
] (lO�o
80%
20%
1.\ n r-0\ � ...... �
. ..,.. Colo SuriSG<l + � + "::::J--'
,/ n '---
o
...
>--:----
/" v Hat. SurillG<l .........
� + r--.
5 1 0 Time [hr]
1 5
+ Experiment.1 - 20 nodes - 50 nodes
20
Figure 6.24 � Comparison of predictions for crysta l l isation to a�lactose Mono�hydrate with 20 and 50 nodes.
Figure 6.24 shows that a much smoother release of moisture results when more nodes are used. This suggests that a large number of nodes is required to accurately model the amorphous lactose crystallisation. Because the crystallisation still occurred rapidly, this effect can not be used to explain the differences between the model predictions and the experimental results. Because the experimental results showed that the release of moisture is relatively slow, 20 nodes should be sufficient to obtain accurate predictions once the correct moisture release mechanism and crystallisation rates are included into the model .
It is clear from Figure 6 .20 that the inadequacies of the model are not influenced by the choice of crystallisation product. This is not to say that the product of crystallisation is not important . It is an integral part of determining the rate of crystallisation and degree of moisture release. It will also strongly effect the amount of free moisture contained inside the bulk lactose after crystallisation has proceeded.
It is also clear from this discussion that more accurate data for the amorphous lactose crystallisation process must be available before accurate prediction of amorphous lactose related caking in bulk lactose is possible.
6.3.7 AVOIDANCE OF AMORPHOUS LACTOSE RELATED CAKING IN BULK LACTOSE
In spite of the shortcomings of the model, the investigations carried out with the inclusion of amorphous lactose into the transport model, highlight several points concerning the effect of amorphous lactose in the caking of bulk lactose. It has been shown that the extra moisture holding capacity of the amorphous lactose means that the
6-24
total amount of free moisture contained within a bag is higher than that for completely crystalline lactose at the same water activity. Secondly this extra moisture holding capacity acts as a buffer and slows the rate of migration of moisture under the influence of a temperature gradient This is of industrial importance as it means that the time required to achieve conditions conducive to amorphous lactose crystallisation at a particular local position within the slab, will increase with increasing amorphous lactose content. As the moisture migration is driven by a temperature gradient driving force, this means that bulk lactose with large amounts of amorphous lactose (�> 3%) are less l ikely to crystallise under the influence of swinging temperature gradients than powders with low levels of amorphous lactose (-D. 5-3%).
The transport model has shown that more research must be undertaken into the amorphous lactose crystal lisation phenomena. This includes the kinetics of crystallisation, the rate moisture is released from the resulting crystalline structure and the product of crystallisation. Until better understanding of these phenomena are available it is not possible to accurately model caking in bulk lactose powders when amorphous lactose is present and crystallisation occurs.
The amorphous lactose crystallisation rate experiments (Section 3 . 7 .4 2 2.3) have shown that the time required for crystallisation at a water activity of 0.43 5 is of the order of 20 days. This suggests that the rate of crystallisation at lower water activities is very slow. It is therefore possible to prescribe a maximum water activity level that must not be exceeded to ensure that the extent of amorphous lactose crystallisation will be negligible. If it is considered that this maximum water activity will exist only as long as the maximum temperature gradient to which the bag is exposed to is maintained, then it can be seen that a upper limit of 0.4 � i s sensible until a better estimate can be obtained once complete understanding of the crystallisation process is avai lable.
Figure 6. 1 3 indicates that a maximum water activity of O. 4 � is achieved on the cold surface of a lactose slab when a 20De temperature gradient is applied to product with an initial water activity of 0 .25 �. This suggests that if lactose powders are packed at a water activity below 0 .25 � in the industrial production of lactose powders, then amorphous lactose crystallisation will not occur under expected storage conditions.
6.4 CLOSURE
This section of the work covered the inclusion of the microscopic scale processes that are contributory to caking phenomena (liquid bridging, amorphous lactose crystallisation) into the overall transport model . This has highlighted several areas where more research is needed to provide complete understanding of the causes of caking especially concerning the transitions of amorphous lactose in the bulk powder. These include the rate of crystallisation, the rate of moisture release from the crystallising amorphous structure and the product of crystallisation.
The resulting models have allowed the assessment of appropriate guidelines for product water activity upon packing in industrial lactose production. A maximum water activity of 0 . 575 a.v i s suggested for the case where no amorphous lactose is present, while a maximum of 0 .25 a.v i s suggested when amorphous lactose is present in small amounts.
This suggests two possible courses of action to avoid caking in industrial situations.
6-25
The first is to bag at a water activity of 0.25 3w or lower. This will eliminate the possibility of any amorphous lactose present in the powder reaching conditions where crystallisation can occur, and allowing moisture to be released to facilitate liquid bridging and subsequent caking.
The second option is to ensure there is no amorphous lactose present in the powder when it is bagged. This relaxes the maximum water activity requirement from 0.25 to 0 . 575 3w at the time of packing. This could be achieved by the inclusion of a conditioning step into the manufacturing process, downstream of the milling operations. Such conditioning could be achieved by contacting the powder with an elevated relative humidity air stream to encourage amorphous lactose crystallisation. This would then be followed by a drying step to ensure a final product water activity of less than 0. 575 3w. The technical feasibility of such an conditioning operation was the subject of another research study by O'Donnell ( 1 997).
6-26
CHAPTER 7
CONCLUSIONS AND SUGGESTIONS FOR FUTURE
WORK
7 . 1 CONCLUSIONS
This work has identified the mechanisms for lumping and caking in bulk lactose and the conditions under which these mechani sms occur. Liquid bridge formation was found to give lactose powders significant strength if the powder is subjected to conditions above 0 . 8 5 a" If these conditions are maintained fOf long periods of time (up to one month) then shrinkage and increased powder strength result This is thought to be due to the di ssolution of small asperities in the porous matrix, enabling adjacent particles to pack closer together. If the powder is subsequently dried, then crystalline bridges of greater strength than the originating liquid bridges result .
The mechanism of amorphous lactose flow in conditions above the glass transition temperature, has been shown to be insignificant with respect to caking in bulk crystalline lactose when the level of amorphous lactose is < 5%. Amorphous lactose is important, acting as a moisture sink . If conditions are favourable, crystallisation will OCCUf, resulting in the release of moisture which contributes to caking by the liquid bridging mechanism. The effect of applied pressure on caking was not investigated
A model which describes the transport of moisture in one dimension as a result of temperature gradients was developed and validated . The microscopic scale processes of liquid bridging and amorphous lactose moisture relations were included into this model. The model agreed well with experimental trials for the case where the lactose powder was completely crystalline. Comparison of the model predictions with experimental trials for the case when amorphous lactose was present showed that some inadequacies of the model exist These are to do with the rate of crystall isation, the rate that moisture i s released from the crystallising amorphous matrix and the product of amorphous lactose crystallisation.
In spite of the inability to accurately model crystallisation of the amorphous matrix, it was possible to prescribe limits, which, if not exceeded will allow the production of caking free lactose powder. It was shown that under expected ambient conditions the product should be stored with a water activity below 0 .57 a.v ifno amorphous lactose is present and below 0.25 a.v if it i s present
These figures show that if no amorphous lactose is present in the packed samples, then the critical water activity limit is not as strict as for when it is present. This offers two alternative process philosophies which can be followed to achieve the goal of producing caking free lactose. These are to bag the product at low water activity, or to remove the amorphous lactose prior to packing. The conditioning of lactose is the subject of continuing research from this work.
7-1
7.2 SUGGESTED FUTURE RESEARCH
This work has highlighted several areas which require further research before a complete understanding of caking in bulk lactose can be achieved. These are listed below�
• Improved amorphous lactose crystallisation kinetics. • Investigation into the products of amorphous lactose crystallisation. • Investigation into structural changes during amorphous lactose crystallisation and
the influence of the resulting structure on the rate of moisture release. • The rate of the solid state conversion of P to ex-lactose mono-hydrate. • The feasibility of conditioning of lactose to eliminate amorphous lactose prior to
packing.
7-2
REFERENCES
Abdel-Ghan i M . , Petri J .G . , Sevi l le J . P.K . , Clift R. and Adams MJ . ( 1 99 ] ). Mechanical properties of cohesive particulate sol i ds. Powder Techno!. , 65, 1 1 3- 1 23 .
Adamson A.W. ( 1 963). Physical chemistry of surfaces. John Wiley and Son, New York.
Agui lera J .M . and Stanley D.W. ( 1 990). M icrostructural principles of food processing and engineering. El sevier Applied Science, London.
Agui lera 1 .M. , del Val l e J .M. and Karel M . ( 1 995). Caking phenomena in amorphous food powders. Trends food Sci. Techno!. , 6, 1 49- 1 55 .
AI-Duri B . and McKay G. ( 1 992) . Pore diffusion: Dependence of the effective diffusivity on the initial sorbate concentration in single and mu1tisolute batch adsorption systems. J. Chern. Tech. Biotechno!. , 55, 245-250.
Anderson R.B . ( 1 946). Modifications of the Brunauer, Emmett and Teller equation. J. Am Chern. Soc. , 68, 686-69 1 .
Anonymous ( 1 990a) . The latest in fertil izer cake prevention. Nitrogen, 1 87, 20-27.
Anonymous ( 1 990b). Sugar storage in concrete silos. Int. Sugar Jnl. , 92, 7- 1 5 .
ASHRAE ( 1 993). ASHRAE Handbook. Fundamentals 1993. American Society of Heating, Refigeration and Air-conditioning Engineers Inc. , Atlanta.
Audu T.O.K. , Loncin M. and Weisser H. ( 1 978). Sorption isotherms of sugars. Lebensm. Wiss. u. Techno!. , 1 1 , 3 1 -34.
Avrami M. ( 1 94 1 ). J. Chern. Phys. , 9, 1 77.
Avrami M. ( 1 939). J. Chern. Phys. , 7, 1 1 03 .
_mwrvssmm -
8-1

Avranitoyannis I. and Blanshard J.M.V. ( 1 994). Rates of crystall ization of dried lactose-sucrose mixtures. 1. Food Sci. , 59, 1 97-205 .
Bagster D. F. ( 1 970a). Cause, prevention and measurement of the caking of refined
sugar - a review. Part I. Int. Sugar inl. , 72, 263-267.
Bagster D. F. ( 1 970b). Cause, prevention and measurement of the caking of refined
sugar - a review. Part II. Int. Sugar inl. , 72, 298-302.
Baker e.J. and Mai 1 . ( 1 982). Physical effects of direct dri lling equipment on undisturbed soils and techniques for measuring soil compaction in the vicinity of dri l led grooves. NZ. J. Agr. Res. , 25 ( 1 ) 43-49.
Bauer T.H. ( 1 993). A general analytical approach toward the thermal conductivity of porous media. Int. 1. Heat & Mass Transfer, 36, 4 1 8 1 -4 1 9 1 .
Bear l and Bachmat Y . ( 1 99 1 ). Introduction to modell ing of transport phenomena
in porous media. Kluwer Academic Publishers, Dordrecht. .
Berlin E. , Anderson B.A and Pal lansch M.l ( 1 968). Comparison of water vapour
sorption by milk powder components. 1. Dairy Sci. , 5 1 , 1 9 1 2- 1 9 1 5 .
Berl in E . , Ki l man P . G . , Anderson B.A and Pal lansch M . l ( 1 97 1 ). Calorimetric measurement of the heat of desorption of water vapour from amorphous and crysta l l ine lactose. 7hermochim. A cta. , 2, 1 43 - 1 52.
Berl in E . , Anderson B.A and Pal lansch M.l ( 1 973 ) . Effect of hydration and crystal form on the surface area of lactose. 1. Dairy Sci. , 55, 1 396- 1 399.
B i l iaderis e.G. ( 1 990). Thermal analysis of food carbohydrates. I n lherrnaf analysis ojjhods. (Harwal kar V . R. and Ma c.Y . Eds). E lsevier Appl ied Science. New
York. 1 68-220.
Bird R . B . , Stewart W. E. and Lightfoot E.N. ( 1 960). Transport phenomena. John Wi ley and Sons. , New York . .
Boon J . ( 1 966 ). PhD dissertation, Del ft University, N etherlands.
Boon J . , Chal la G. and Van Krevelen D. W. ( \ 968) . .J. Fufymer Sci. A 2. , 6,
1 79 1 , 1 83 5 .
Bruin S. and Luyben K. C.A M. ( 1 980) . Drying o f food materials : A review o f recent devel opments. In Advances in drying, Vol /. (Muj umda A S . Eds). Hemisphere Publ ishing, New York. ] 5 5-2 1 5 .
Brunauer S . , Emmett P. H . and Tel ler E. ( 1 938). Adsorption of gases in m ultimolecular layers . .J. Am. Chem. ,-�'oc. , 60, 309-3 1 9 .
8-2
Buckton G. and Darcy P. ( 1 995). The use of gravimetric studies to assess the degree of crystal l inity of predom inantly crystal l ine powders. Int. 1. Pharm. , 1 23, 265-27 1 .
Buma T. .I . ( 1 965). The true density of spray mi lk powders and of certain constituents. Neth. Milk Dairy 1. , 1 9, 249.
Bush i l l lH. , Wright W.B. , Ful l er CH.F. and Sell A. V. ( 1 965). The crystal l i sation of lactose with particular reference to i ts occurrence in mi lk powder, 1. Sci.
Food Agric. , 1 6, 622 .
Carslaw H .S . and Jaeger J .C ( 1 959). Conduction of heat in sol ids. Oxford University Press. London . .
Chiri fe 1 , Timmermann E.O., Iglesias H.A and Soquet R . ( 1 992). Some features of the parameter k of the GAB equation as appl ied to sorption isotherms of selected food materials. 1. Food 8ng. , 1 5, 75-82.
Chuy L. E. and Labuza T.P. ( 1 994) . Caking and stickiness of dairy based food powders as related to glass transition . .J. Food Sci. , 59, 43-46.
Cleland 0..1 . , Cleland AC and Jones R .S . ( 1 994). Col lection of accurate experimental data for testing the performance of simple methods for food freezing time prediction. 1. l' ood Proc. Eng. , 1 7, 93-1 1 7 .
Col l in M. and Rasmuson A ( 1 988). A comparison of gas diffusivity models for unsaturated porous media. Soil Sci. Am . .J. , 52, 1 5 59- 1 565.
Cooper J .G. and Le Fever E.N. ( 1 969). Thermophysical properties of water substance. Edward Arnold Ltd., London . .
Cornerlius M. ( 1 99 1 ). RADS Refrigeration analysis design and simulation package. Release 3 . 1 . Massey University, Palmerston North . .
Crank 1. ( 1 975). The mathematics of diffusion. Oxford University Press. , London . .
Currie lA. ( 1 96 1 ). Gaseous diffusion in porous media. Part 3 . Wet granular material s. Br. 1. Appl. Phys. , 12, 275-2 8 1 .
Oe Boer lH. ( 1 953) . The dynamical character of adsorption. Clarendon Press, Oxford . .
Oeng Y., Fedler C.B. and Gregory 1.M. ( 1 992). Predictions of thermal characteristics for mixed porous media. J. Mat. Civil Eng. , 4, 1 85 - 1 95 .
Downton G.B., Flores-Luna 1.L. and King C1. ( 1 982). Mechanism of stickiness in hygroscopic, amorphous powders. Ind Eng. Chern. Fund, 21 , 447-45 1 .
8-3
Cressy H. ( 1 997). Investigation into the relationship between structure and moisture relations in crvstal line a-l actose: monohvnr::ltp nrmlnpn;: MII C::C::p" T Tniuprc::itu
Duckworth R.B. ( 1 972). The properties of water around the surfaces of food colloids. Proc. 1nst. Food Sci. Technol. (UK). , 5, 60.
F ish B.P. ( 1 95 8) . Diffusion and thermodynamics of water in potato starch gel . In Fundamental aspects of the dehydration of foodstuffs. (Society of Chemical Industry. Eds). Metchim and Son Ltd. London. 1 43-1 57.
Fl ink 1M. ( 1 983). Structure and structure transitions in dried carbohydrate materials. In PhYSical properties offoodv. (Peleg M. and Bagley E. Eds). A VI Pub l ishing, Connecticut. .
Franks F. ( 1 99 1 ). Hydration phenomena: an update and implications for the food processing industry. In Water relationships infood. (Levine H. and Slade L. Eds). Plenum Press. New York. 1 - 1 9.
Gal . ( 1 975). Recent advances i n techniques for the determination of sorption isotherms. In Water relations in/oods. (Duckworth R.B. Eds). Academic Press, London. .
Gekas V. ( 1 992). Transport phenomena of foods and biological materials. CRC Press, Boca Raton . .
Gerhartz W. ( 1 988). Ul lmann' s encylopedia of industrial chemistry. VCH. Verlagsgesell schaft, Weinheim,
G i l l i s 1 . ( 1 920). Nouvel les recherches sur Ie sucre de lait. Rec. trav. chim. Pays-Bas. , 39, 8 8- 1 25 .
G rayson M. ( 1 979). Kirk-Othmer Encylopedia o f chem ical technology 3rd Edition. John Wiley and Sons, New York. 1 1 6- 1 2 3 .
Greenspan L. ( 1 977). Humidity fi xed points o f bi nary saturated aqueous solutions. J I?es. Nal. Bur. Stand. Sect. A. , 8 1 A, 89-96.
Guggenhei m E.A ( 1 966). Appl ications of stati stical mechanics. Clarendon Press, Oxford . .
Hardesty J .O. and Kumagai R . ( 1 952 ) . Factors infl uencing the efficiency of flow
conditioners. A gr. ('hem. , 7, 3 8-39, 1 1 5 .
Hargreaves 1 . ( 1 995). Characterisation of l actose in the l iquid and sol id state using nuclear magnetic resonance and other methods. PhD Thesis, Massey University, Palmerston North.
Hamby N . , Hawkins A E. Opal insk I . ( 1 996). Measurement of the adhesional force between i ndividual particles with moisture present. I . - a review. Chem I�ng R. 74 (A6) 605-6 1 5 .
8-4
H arper W.J . ( 1 992). Lactose and lactose derivatives. In Whey and lactose processing. (Zadow lG. Ed). Elsevier Applied Science. Essex. England. 3 1 7-360.
Hasegawa M . , Saito K . , Hong K. , Tom iyasu H. and Watanabe K. ( 1 985) . Measurement and uti l ization of dynamic properties of powder beds. Bulk Solids Handling, 5, 64 J -645 .
Herrington B.L. ( J 934). Some physico-chemical properties of lactose. I . The spontaneous crystal l i sation of supersaturated solutions of lactose. 1. Dairy
Sci. , 1 7, 50 1 -5 1 8 .
Hodges G . E. Lowe E . K. and Paterson A . H . ( 1 993). A mathematical model of lactose dissol ution . Chern I�'ng .J. 53 (2) 825-B33 .
Hodges G . ( 1 992 ) . Lactose in bulk bags, study of moisture migration and caking mechan isms. Lactose Company of New Zealand. , Hawera, New Zealand.
Hol lenbach A . M . , Peleg M . and Rufner R. ( 1 983). Interparticle surface affinity and bulk properties of conditioned powders. Powder Techno!. , 35, 5 1 -62.
Hollenbach A . M . , Peleg M. and Rufner R. ( 1 982). Effect of four anticaking agents on the characteristics of ground sugar. 1. Food Sci. , 47, 53 8-544.
I rani R . R . , Cal l i s C.F. and Lin T. ( 1 959). How to select flow conditioning and anti caking agents. lnd Eng. Chem. , 51 , J 285- 1 288.
J enike A.W. ( 1 970). Storage and flow a/solids. Bull etin No 1 23 of the Utah Engineering Experiment Station. Utah.
Jenness R. and Patton S. ( 1 959) . Pri nciples of dairy chemistry. Chapman and Hal l , London.
Johari G.P . , Hal lbrucker A. and Mayer E. ( J 987). The glass transition of hyperquenched water. Nature, 330, 552-553.
Jouppi la K . and Roos YH. ( 1 993). Glass transitions and physical state of dehydrated milk products. In Proceedings a/the sixth International Congress on Engineering and Food ( Eds). Elsevier, Tokyo . .
Jouppi la K . and Roos Y H. ( 1 994). Water sorption and time-dependent phenomena of mi lk powders. 1. Dairy Sci. , 77, 1 798- 1 808.
Jouppil a K . , Kansikas J . and Roos YH. ( 1 997). Glass transitions, water plasticization and l actose crystall isation in mi lk powder. Submitted to 1. Dairy Sci.
8-5
Karel M. and Saguy I. ( 1 99 1 ). Effects of water on diffusion in food systems. In Water relationships in foods. (Levine H. and Slade L. Eds). P lenium Press, New York. 1 57- 1 73.
Karel M. ( 1 975). Water activity and food preservation. In Principles offood science: Part 11, Physical principles offood preservation. (Karel M., Fennema O.R. and Lund D.B. Eds). Marcel Dekker Inc., New York. 237-263.
Kawamura M. ( 1 99 1 ). Moisture. In Powder technology handbook. (Linoya K, Gotoh K and Higashitani K. Eds). Marcel Dekker Inc. , New York. 1 83- 1 92.
Kawashima Y. ( 1 99 1 ). Adhesion and cohesion of powder. In Powder technology handbook. (Linoya K , Gotoh K. and Higashitani K Eds). Marcel Dekker Inc., New York. 99- 1 1 5 .
Kent M. , Christianson K , van Haneghem I.A., Holtz E., Morley M.J . , Nesvadba P. and Poulsen KP. ( 1 984). Cost 90 col laborative measurements of thermal properties of foods. J. Food Eng. , 3, 1 1 7- ] 50.
King C.J. (] 968). Rates of moisture sorption and desorption in porous, dried foodstuffs. Food Technol. , 22, 509-5 1 5 .
Kono H.O. Aksoy E. and l tani Y . ( 1 994). Measurement and application of the rheological parameters of aerated fin powders - a novel characterisation approach to powder flow properties. Powder Tech. , 89, 1 77- 1 88.
K umagai R. and Hardesty J .0. ( 1 956). Relative effecti veness of granule coati ng
agents. Agr. Food Chern. , 4, 1 32- 1 35 .
Labrousse S . , Roos Y. and Karel M. ( 1 992). Co l l apse and crysta l l i sation i n
amorphous matrices w i th encapsu l ated compounds . Sciences j)es Aliments. ,
1 2, 757-769.
Labuza T.P . ( 1 968). Sorption phenomena in foods. Food techno/. , 22, 1 5-24.
Ladd M . F.C. and Lee W. H. ( 1 965) . The thermodynamics of crysta l l i ne hydrates . .J. Phys. Chern. , 69, 1 840- 1 843 .
Ladd M. F.C. an d Lee W . H . ( 1 969 ) Studies on crysta l l i ne hydrates . .J. J )!zys. ( ·hem. , 73, 2033-2035.
Lazar M . E. , Brown AH., Sm ith G.S. , Wong F.F . and L indqu ist F .E. ( 1 956).
8-6
Experimental production of tomato powder by spraydrying. Food Techno!. ,
1 0, 1 29- 1 37.
LeMeste M . , Voi l ley A and Colas B . ( 1 99 1 ). I nfluence of water on the mobil ity of smal l molecules dispersed in a polymeric system. In Water relationships in food. (Levine H . and Slade L. Eds) . Plenum Press. New York. 1 23 - 1 3 8.
Lesl ie R.B. , Cari l lo P J . , Chung T. Y. , Gi lbert S . G . , Hayakawa K , Marousis S . , Saravacos G . D . and Solberg M . ( 1 99 1 ). Water diffusivity in starch-based systems.
Linko P . , Plooari T. , Harj u M . and Heikonen M . ( 1 98 1 ) . Water sorption properties and the effect of moisture on structure of dried m i l k products. j,ebensm. Wi",s. u. techno!. , 1 5, 26-30.
Lloyd R .l , Chen X.D. and Hargreaves 1 . 8 . ( 1 996). Glass transition and caking of spray-dried l actose. Inf . .J. Food Sci. Tech. , 3 1 , 305-3 1 1 .
Loncin M . , Bimbenet J.I . and Lenges .I. ( 1 968). Influence of the act ivi ty of water on the spo i lage of foodstuffs . .J. Food Feclmol. , 3, 1 3 1 - 1 42 .
Lowe EX. ( 1 993) . The dissolution of alpha l actose monohydrate : a mathematical model for predict ing dissolution t imes. Masterate Thesis, Massey University, Palmerston North.
Luikov A V ( 1 980). H eat and mass transfer. MIR Pub l ishers , Moscow.
Luyben K C . A M . , Ol ieman 1 .1 . and Bruin S. ( 1 980). Concentration dependent diffusion co-efficients derived from experimental drying curves. In Drying '80. Volume 2: Proceedings a/the second internationa! -\ymposium. (Muj umdar A S. Eds). Hemisphere Publishing Corporation. Washington. 233-243.
Lyle O. ( 1 957). Technology for sugar refinery workers. Chapman Hall . London . .
MacCarthy D.A and Fabre N. ( 1 989). Thermal conductivity of sucrose. I n Food Properties and computer-aided engineering of food processing systems. (Singh R.P. and Medina AG. Eds). Kluwer Academic Publishers. 1 05 - 1 1 1 .
Madamba P. S . , Driscoll R.H. and B uckle K A ( 1 996). The thin-layer drying characteristics of garlic s lices. J Food Eng. , 29, 75-97.
Maroulis Z . B . , Kiranoudis c.T. and Marinos-Kouris D. ( 1 995). Heat and masstransfer modell ing in air drying of foods. J Food Eng. , 26, 1 1 3 - 1 30.
Mayer E . ( 1 988). Hyperquenching of water and dil ute aqueous solutions i nto their glassy states: an approach to cryo-fixation. Cryoletters, 9, 66-77.
McCabe W.L. and Smith lC. ( 1 984) . Unit operations in chemical engineering. McGraw Hil l , New York.
8-7
McClellan A L. and Hansberger H.F. ( 1 967). Cross-sectional areas of molecules adsorbed on solid surfaces J. Colloid Interface SCi. , 23, 577-599.
McGinnis RA ( 1 97 1 ). Beet sugar technology. Beet Sugar Development Foundation, Colorado . .
McGuire K . ( 1 997). Personal communication. Dept Plant Science, M assey University, Palmerston North.
M cLaren RG. and Cameron K.c. ( 1 990). Soil science: An introduction to the properties and management of New Zealand Soils. Oxford University Press, Auckland . .
M eade G.P. ( 1 963). Cane sugar handbook. Wiley and Sons Inc . , New York. .
M i khailov M . D. and Ozisik M.N. ( J 985). Unified analysis and solutions of heat and mass diffusion. John Wiley and Sons Ltd., New York. .
Mi l l ington RJ. and Shearer R.c. ( 1 97 1 ). Diffusion in aggregated porous media. Soil Sci. , 1 1 1 , 372-378.
Moreyra R. and Peleg M. ( 1 98 1 ) . Effect of equ i l ibrium water activity on the bulk properties of selected food powders. J. Food Sci. , 46, 1 9 1 8- 1 922.
Morishima K., Kawashima Y., Kawashima Y., Takeuchi H., N i wa T. and Hino T. ( 1 993) M icrometric characteristics and agglomerat ion m echanisms in the spherical crysta l l ization of buci l lamine by the spherical agglomeration and the emulsion solvent diffusion methods. Powder 'techno!. , 76, 57-64.
Moss H . Y . , Schi lb T. W. and Warn i ng W . G . ( 1 933) . Tricalci um phosphate as a
cak i ng inhibitor i n salt and sugar. Ind. I�'ng Chem. , 25, 1 42- 1 47.
M urakam i E.G . and Okos M . R . ( 1 989 ) . Measurement and prediction of thermal
propert ies of foods. In Food properties and computer-aided engineering of j()()d processing " ystems. ( Si ngh R. P. and Med i na A . G. Eds). Kl uwer
Academ ic Publ i shers . 3-4 8 .
Nash J . H . , Le i ter G . G . and J ohnson A . P , ( 1 96 5 ). Effects of anti agglomerant agents
on phys i cal propert ies of Jl ne l y d i vided sol i ds . Ind f>'ng Chem. Fund , 4, 1 40- 1 45 .
Niediek E.A. and Babemics L . ( 1 979) . Aroma sorption properties of amorphous sucrose and lactose. Gordian, 2, 35-44.
Niediek E .A . ( 1 982). Di fferences i n propert ies between the crystal l ine and
amorphous forms of lactose. Zeilschriji l,ebenssmittef- l 'echnol.
Verfrenstichnik, 33, 1 73 - 1 85 .
8-8
N elson TJ. ( 1 949) . Hygroscopicity of sugar and other factors affecting retention of quality. Food Techno!. , 3, 347-35 1 .
N i chol W. M . ( 1 990). The carbohydrate - sucrose. In Handbook of sweeteners. ( M arie
S . and P iggot lG. Eds). B lackie and Son Ltd., Glasgow . .
N ickerson T.A ( 1 974) . In Fundamentals of dairy chemistry. (Webb B.H. , Johnson
AH. and Alford l A Eds). A VI Pub l ish ing, Connecticut. .
N i mick F .B . and Leith lG. ( 1 992) . A model for thermal conductivity of granul ar
porous media . .J. Heat Transjer, 1 1 4, 505-508.
Noel T. R . , Parker R . and R ing S . G . ( 1 995) . Ki netic processes in h ighly viscous, aq ueous carbohydrate l i q uids. In Food macromolecules and colloids. ( Di ck inson E. and Lorient D. Eds) . The Royal Society of Chemi stry. 543-5 5 1 .
N otter G . K . , Taylor D.H. and Downes N . J . ( 1 959) . Orange j uice powder -factors
affecting storage stabil ity. Food Techno!. , 1 2, ] 1 3- 1 1 8 .
O'Donnel l A ( 1 997). Conditioning of l actose powders. Masterate Thesis, Massey Universi ty, Palmerston North.
Olano A , Corzo N . and Matinez-Castro I. ( 1 983). Studies on beta-lactose
crystal l isation . Milchwissenschafi. , 38, 47 1 -474.
Pancoast H M . and J unk W.R ( 1 980). Handbook of sugars. A VI P ub l i shers I nc. ,
Connecticut.
Paterson AH.J . , Bronlund J.E. and O'Donnell A ( 1 997). Amorphous lactose determination in lactose powders by absorption. In CHEMECA 97. CHEMECA, Rotorua.
Pel L. , Ketelaar AA, Adan o.CG. and Vanwel l AA ( 1 993). Determination of moisture diffusivity i n porous media using scanning neutron radiography. Int J Heat & Mass Transfer, 36 1 26 1 - 1 267.
Peleg M. ( 1 983). Physical characterisation of food powders. In Physical properties
offoods. (Peleg M. and Bagley E.B. Eds). A VI Publishing. Westport, Connecticut 293-324.
PeJeg M. ( 1 992). On the use of the WLF model in polymers and foods. Crit. Rev. Food Sci. Nutrition. , 32, 59-66.
Peleg M. ( 1 993). Glass transitions and the physical stability of food powders. In Glass transitions infoods. (Blanshard 1M.V. and Lil l iford PJ. Eds). Nottingham University Press, Nottingham. 435-45 1 .
8-9

Peleg M. and Mannheim C.R. ( 1 969). Caking of onion powder. Powder TechnoZ. , 4, 1 57- 1 60.
Peleg M. and Mannheim C.R. ( 1 977). The mechanism of caking of powdered onion. J. Food Proc. Pres. , 1 , 3- 1 1 .
Perry H.P. and Green D . W. ( 1 984). Perry's Chemical engineering handbook. 6th Edition. McGraw Hi l l , Singapore . .
Pesch I I .A. S.Z. ( 1989). Equipment for the measurement of mechanical properties of bulk materials. Powder Handling & Processing. , 1 , 73-8 1 .
Pham Q.T. and Wil lix J . ( 1 989). Thermal conductivity of fresh lamb meat, ofTals and fat in the range -40 to +30 °C: Measurements and correlations. J. Food Sci. , 54, 508-5 1 5 .
Pietsch W., Hoffman E . and Rumpf H. ( 1 969). Tensi le strength of moist agglomerates. lnd. Eng. Chern. Fund. , 8, 58-62.
Pl inke M.A.E. , Lithe D. and Loffler F. ( 1 994). Cohesion in granular materials. Bulk Solids Handling, 1 4, 1 0 1 - 1 06.
Pritzwald-Stegmann B.F. ( 1 986). Lactose and some of its derivatives. J. Soc. Dairy Tech. , 39, 9 1 -97.
Reid R . C , Prausnitz J . M. and Sherwood T. K . ( 1 987). The properties of gases and l iq uids McGraw H i l l , New York . .
Richardson G . M. and Malthus R . S . ( 1 95 5 ) . Salts for static control of humidity at
relati vely low levels . .J. App. ( 'hem. , 5, 557-567.
Ri epma K. A . , Dekker B .G . and Lerk C F. ( 1 992 ) . The effect of moisture sorption on the strenbrth and internal surface area of l actose tablets. Int . .J. Ph arm. , 87, 1 49- 1 59.
R i stic M . M . an d Draj ojevic-Nesic M . J. ( 1 987) A new approach for the descri ption of the i n itial -stage k inet ics during amorphous materials sintering. Powder Techno/. , 49 \ 89- \ 90.
Rockland L.B. ( 1 960). Saturated saIt sol utions for static control of relative humidity between 5 ° and 40°C Anal. Chern. , 32, 1 375- 1 376.
Roos Y. ( 1 993). Melting and glass transitions of low molecular weight carbohydrates. Carbohydr. Res. , 238, 39-48.
8-1 0
Roos Y . and Karel M . ( 1 990). Differential scanning calorimetry study of phase transitions affecting the quality of dehydrated materials. Biotechno!. Prog. , 6, 1 59- 1 63 .
Roos Y. and Karel M. ( 1 99 1 a). Plasticizing effect of water on thermal behaviour and crystal l isation of amorphous food models. J. Food Sci. , 56, 38-43 .
Roos Y . and Karel M. ( 1 99 1 b). Applying state diagrams to food processing and development. Food Techno!. , 45, 66-7 ] , 1 07.
Roos Y. and Karel M. ( 1 99 1 c) . Amorphous state and delayed ice formation in sucrose systems. Int . .J. Food Sci. Tech. , 26, 553-566
Roos Y. and Karel M. ( 1 992). Crystal l isation of amorphous lactose . .J. Food SCi. , 57, 775-777.
Roos Y. and Karel M . ( 1 993). Effects of glass transitions on dynamic phenomena is sugar containing food systems. In Glass transitions in foods. (Blanshard J .M .V. and Li l l iford PJ . Eds). Nottingham University Press, Nottingham. 207-222.
Rosenzweig N. and Narkis M. ( 1 98 1 ). Sintering rheology of amorphous polymers. })olym. �·ng. SCi. , 21 , 1 1 67- 1 1 70.
Roth D. ( 1 976). Amorphous icing sugar produced during crushing and recrystall isation as the cause of agglomeration and procedures for its avoidance. (in German) PhD thesis, University of Karlsruhe, Karlsruhe.
Rumpf H. ( 1 96 1 ). In Agglomeration. (Knepper W. Eds). Chapman and Hal l , London . .
Rumpf H. ( 1 975). Particle Technology. Carl Hanser Verlag. Munich.
Rutland D.W. ( 1 99 1 ). Fertil izer caking: mechanisms, influential factors, and methods of prevention. F ert. Res. , 30, 99- 1 1 4.
Saito Z. ( 1 985). Particle structure in spray dried whole milk and in instant skim milk powder as related to lactose crystal l isation. Food Microstructure, 4, 333-340.
Schubert H ( 1 975). Tensile strength of agglomerates. Powder Techno!. , 1 1 , 1 07- ] 19 .
Schubert H , Herrmann W. and RumpfH. ( 1 975). Deformation behaviour of agglomerates under tensi le stress. Powder Technol. , 1 1 , 1 2 1 - 1 3 1 .
Schubert H ( 1 987). Food particle technology Part I : Properties of particles and particulate food systems. J. Food Eng. , 6, 1 -32.
8-1 1
Schubert H. ( 19 84). Capillary forces - modeling and application i n particle technology. Powder Technol. , 37, 1 05- 1 1 6.
Scotter D.R. and Horne D.l ( 1 985). The effect of drainage on soil temperatures under pasture. J. Soil Sci. , 36, 3 1 9-327.
Scoville E. and Peleg M. ( 1 98 ] ). Evaluation of the effects of l iquid bridges on the bulk properties of model powders. J. Food Sci. , 46, 1 74- 1 77.
Sevi l le J . P .K. and Clift R. ( 1 9 84). The effect of thin layers on fl uidisation characteristics. Powder Technol. , 37, 1 1 7- ] 29.
Shah D.l . , Ramsey l W. and Wang M. ( 1 984). An experimental determination of the heat and mass transfer coefficients in moist unsaturated soils. Int. J. Heat & Mass Transfer, 27, 1 075- 1 085 .
Sharp P. F. ( 1 93 8). Seeding test for crystal line beta lactose. J. Dairy Sci. , 21, 445-449.
Sharp P. F. and Doob H. ( 1 94 1 ). Quantitative determination of alpha and beta lactose in dried milk and dried whey. J. Dairy Sci. , 24, 5 89.
Sharp P. F. and Hand D.B. ( 1 939). U . S . Patents 2 . 1 82 .6 1 8 and 2 . 1 82 .6 1 9.
Shrotriya A.K. , Verma L .S . , Singh R . and Chaudhary D.R. ( 1 99 ] ). Thermal di ffusion through moist porous systems at different temperatures. 1. Energy Heat Mass Transfer, 1 3, 77-85.
Sinnott R . ( 1 983 ). Chemi cal Engi neering Vol 6, An introducti on to chemical enbrineeri ng design. Pergamon Press, Oxford.
Slade L. and Levi ne H. ( 1 99 1 ) . Beyond water activity: recent advances based on an
alternative approach to the assessment of food qual ity and safety. eRe ('rit. Rev. Food ,)'ci. Nutr. , 30, 1 1 5-360.
Sm ith D.S . , Mannheim C H. and G i lbert S.G. ( 1 98 1 ) . Water sorption isotherms of sucrose and gl ucose by inverse gas chromatography. J. Food Sci. , 46, 1 05 1 -1 053 .
Soesanto T . and Wi l l iams M . C ( 1 98 1 ) . Vol umetric interpretation of viscosi ty for concentrated and dilute sugar sol utions. J. Phys. Chem. , 85, 3338-334 1 .
Stecher P.G . ( 1 968). The Merck Index . , Merck and Co. Inc., Rathway, New Jersey.
Steele B. ( 1 989). Is the water in your food too active ? CSTRO Food Research, Sydney.
8-1 2
Stitt F. ( 1 958). Moisture equil ibrium and the determination of water content of dehydrated foods. In Fundamental aspects of the dehydration offoodstuffs· (Society of Chemical Industry. Eds). Metchim and Son Ltd. London. 67-87.
Sweat y .E. ( 1 986). Them1al properties of foods. In Engineering properties offood'l.
(Rao M.A. and Rizvi S .S .H . Eds). Marcel Dekker Inc . , New York. 49-87.
Taylor AA ( 1 96 1 ) . Determination of moisture equil ibria in dehydrated foods. Food Techno!. , 1 5, 536-540.
Thorne S. ( 1 989). Local measurement of thermal diffusivity of foodstuffs. In Food properties and computer-aided engineering offood processing systems.
(Singh R .P . and Medina A G . Eds). Kl uwer Academic Publ i shers. 1 ] 3 - 1 1 6.
Thurby .I .A and Nickerson T.A ( 1 976). Crystall isation kinetics of alpha lactose . .J. Food '''·ci. , 4 1 , 38-42 .
Timmermann E.O. ( 1 989). A BET l ike three sorption stage isotherm . .J. Chern. Soc. , Faraday Trans . ./. , 85, 1 63 1 - 1 645.
Timmemlann E.O. and Chirife 1 . ( 1 99 1 ). The physical state of water sorbed at high activities in starch in terms of the GAB sorption equation . .J. Food Eng , 1 3, 1 7 1 - 1 79.
To E.c. and Flink J.M. ( 1 978a). Col lapse, a structural transition in freeze dried carbohydrates - 1. an evaluation of analytical methods. J. Food Techno!. , 1 3, 55 1 -565 .
To E.c. and Fl ink 1 .M. ( 1 978b). Col lapse, a structural transition in freeze dried carbohydrates - I I . effect of solute composition. J. Food Techno!. , 13, 567-5 8 1 .
To E .c. and Fl ink 1 .M. ( 1 978c). Col lapse, a structural transition in freeze dried carbohydrates - I I I. Prerequisite of recrystal 1 isation. J. Food Technol. , 13, 583-594.
Tong C.H. and Lund D.B. ( 1 990). Effective moisture difTusivity in porous materials as a function of temperature and moisture content. Biotechno!. Prog. , 6, 67-75 .
Tong C.H. and Lund D.B. ( 1 990). Effective moisture difTusivity in porous materials as a function of temperature and moisture content. In Engineering and Food Volume I. PhYSical properties and process contro!' (Spiess W.E.L. and Schubert H. Eds). Elsevier Applied Science, London. 482-492.
Troller 1. ( 1 983) . Methods to measure water activity. J. Food Protection, 46, 1 29-1 34.
8-13
Troy H.e. and Sharp P.F. ( 1930). Alpha and Beta lactose in some milk products. J. Dairy SCi. , 13, 1 40- 1 57.
Tsourouflis S. , Flink 1 M. and Karel M. ( 1 976). Loss of structure in freeze-dried carbohydrate solutions: Effects of temperature, moisture content and composition. J. Sci. Food Agric. , 27, 509-5 1 9.
Vagenas G.K. and Karathanos V. T. ( 1 99 1 ). Prediction of moisture diffusivity in granular materials, with special applications to foods. Biotechnol. Prog. , 7, 4 1 9-426.
Van Brake 1 . and Heertjes P.M. ( 1 974). Analysis of diffusion in micro-porous media in terms of a porosity, a tortuosity and a contrictivity factor. Int. J. Heat & Mass Transfer, 17, 1 093- 1 1 03
Van Krevelen D.W. ( 1 990). Properties of polymers. Elsevier Applied Science. Amsterdam.
Voudouris N. and Hayakawa K. ( 1 994). Simultaneous determination of thermal conductivity and diffusivity of foods using a point heat source probe: a theoretical analysis. Lebensm. Wiss. u. Techno!. , 27, 522-532.
Vrentas 1 . S. and D uda J .L. ( 1 979). Molecular diffusion in polymer sol utions. A . f.
Ch. H. J. , 25, 1 -24.
Vuataz G. ( 1 988). Preservation of skim-mi l k powders: role of water activity and temperature i n lactose crystall ization and lysine l oss. In Food preservation by moisture content. (Seow e.c. Eds). Elsevier Applied Science. New York . .
Wade A. and Weller P .l ( 1 994). Handbook of pharmaceutical excipi ents. American
Pharmaceutical Association, Washi ngton . .
Walker D .M. ( 1 967). A basis for bunker desihTJ1. Fowder Techno!. , 1 , 228-23 6 .
Wal lack D.A. and King C.J . ( 1 988) . Sticking and agglomeration of hygroscopic, amorphous carbohydrate and food powders. Biotechno!. Prog , 4, 3 1 -35 .
Walstra P . and J enness R. ( 1 984). Dai ry chemistry and physics. Wi ley. New York . .
Wang B .x. and Fang Z. H. ( 1 988). Water absorption and measurement of the mass
d iffusivity in porous media. Int. J. Heat & Mass Transfer, 31 , 25 1 -257.
Warburton S. and Pixton S. W. ( 1 978). The moisture relations of spray dried
skimmed m i l k. J. Stored Prod. Res. , 1 4, 1 43- 1 58 .
8-1 4

Weast RC. and Astle M.l ( 1 979). CRC handbook of chemistry and physics. CRC Press, Cleveland, Ohio.
Welty J . G . , Wicks C.E. and Wilson R . E. ( 1 984). Fundamental of momentum, heat and mass transfer. J ohn Wi ley and Sons . , New York . .
Whynes A.L. and Dee T.P. ( 1 957). The caking of granular fertil izers: an
investigation on a l aboratory scale. J. Sci. Food Agric. , 8, 5 77-59 1 .
Wi l l iams M . L. , Landel R F. and Ferry J . D. ( 1 955) . The temperature dependence of
relaxation mechanisms in amorphous polymers and other glass forming l iq uids . .J. Am. Chern. Soc. , 77, 3 70 1 -3707.
W i l l ix J. ( 1 996). Personal communication. Meat I ndustry Research Institute of N ew
Zealand. Hamil ton.
Wi l l ix J . and Lovatt S.J . ( 1 997). Further thermal conductivity val ues of foods
measured by a guarded hot plate. Submitted for pub l ication to .J. Food I!-·ng.
W ursch P. , Rosset 1 . , Kol l reutter B. and Klein A . ( 1 984). Crystal l ization of Beta
lactose under elevated storage temperature in spray-dried mi lk powder.
MilchwissenschaJt, 39, 5 79-582.
Xiong S. , Narismhan G . and Okos M . R . ( 1 99 1 ) . Effect of composition and pore structure on b inding energy and effective diffusivity of moisture in porous food. J. Food Eng. , 1 5, 1 87-208.
Zsigrnondy R ( 1 9 1 1 ). Uber die struktur des gels der kieselsaure. Theorie der ententwasserung. Z A norg. Chern. , 7 1 , 356.
'.,mm c:eWI m Nff"·'mr 75C7
8-15
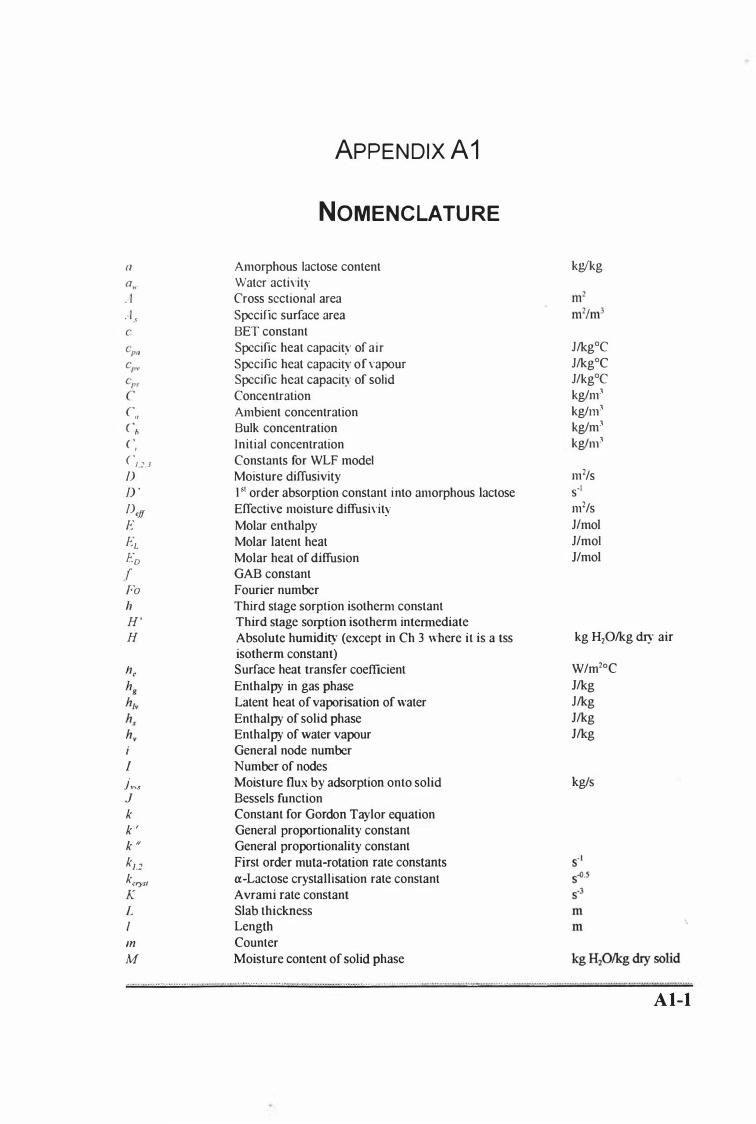
n
. 1 A , c
('" ('b r. ( 'J.�.3 f) D ' f)'ff E EL ED f Fa h H ' H
I jV\S J k k ' k if kJ.2 kcrys' K L I In
M
ApPENDlx A1
NOMENCLATU RE
Amorphous lactose content Water activity Cross sectional area
Specific surface area
BET constant
Specific heat capacity of air
Specific heat capacity of yapour Specific heat capacity of solid
Concentration
Ambient concentration Bulk concentration
Initial concentration
Constants for WLF model Moisture diffusivity
L SI order absorption constant into amorphous lactose
Effective moisture diffusiyity
Molar enthalpy
Molar latent heat
Molar heat of diffusion GAB constant
Fourier number
Third stage sorption isotherm constant Third stage sorption isotherm intermediate Absolute humidity (except in Ch 3 where it is a tss isotherm constant) Surface heat transfer coefficient
Enthalpy in gas phase
Latent heat of vaporisation of water
Enthalpy of solid phase Enthalpy of water vapour General node number Number of nodes
Moisture flux by adsorption onto solid Bessels function Constant for Gordon Taylor equation General proportionality constant General proportionality constant First order muta-rotation rate constants
a-Lactose crystallisation rate constant
Avrami rate constant Slab thickness Length
Counter
Moisture content of solid phase
kglkg
l/kgOC
l/kgOC l/kgOC
kg/m3
kg/1ll3
kg/m3
kg/1ll3
m2/s
S·1 m2/s
llmol
llmol
J/mol
kg Hp/kg dry air
W/m20C
J/kg l/kg J/kg J/kg
kg/s
... .. ... " ....... . . -• ., •.•.• � . . �� ........ ......... . . . . ,', ...... .. . . . . . . ....... '" ......... ' •. " ... . · �.·.,.,n·.· ••. . -•.••• ' ....... ,' . • • _ . __ . . . . . . . ...... '" •. •.• ' ......... "H-'_,_)'" ,' • • • ' ....... ','" "" • • _._ .·jo:n· ... · j."'.·. , . ....... ............ · ............ . ·.·H ..... ' ........... · ........ "'.' ... ·•·•· .................. ..... .,
A l-l
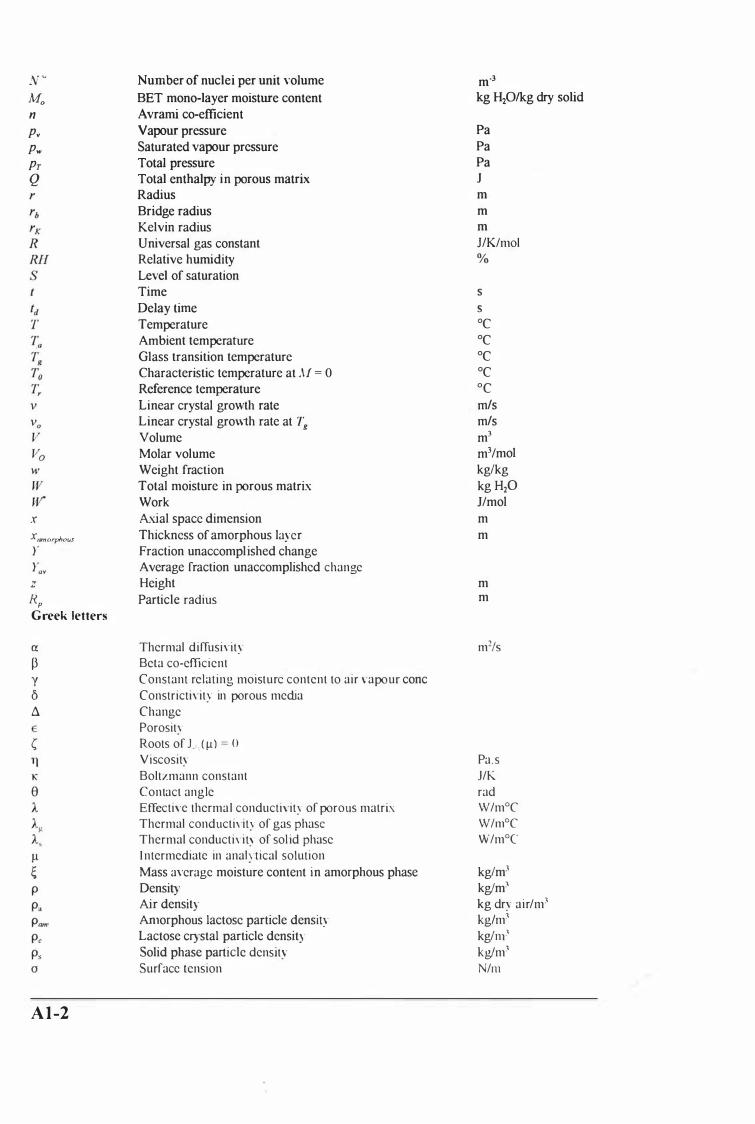
N " Mo n P. Pw Pr Q
x
X lunorpnous y
z
Rp Greek letters
IX
P y o Ll
A l -2
Number of nuclei per unit volume
BET mono-layer moisture content Avrami co-efficient
Vapour pressure Saturated vapour pressure Total pressure Total enthalpy in porous matrix Radius Bridge radius Kelvin radius Universal gas constant Relative humidity Level of saturation Time
Delay time Temperature Ambient temperature Glass transition temperature Characteristic temperature at AI = 0 Reference temperature
Linear crystal growth rate Linear crystal growth rate at Tg Volume Molar volume Weight fraction Total moisture in porous matrix Work A�al space dimension Thickness of amorphous layer Fraction unaccomplished change Average fraction unaccomplished change Height Particle radius
Thermal diffusiyity Beta co-efficient Constant relating moisturc content to air yapour conc Constrictiyity in porous media Change Porosity Roots of J ( Il) = ( ) Viscosity Boltzmann constant Contact angle Effecti,'e thermal conductivity of porous matrix Thermal conductiyity of gas phase Thermal conductiyity of sol id phase I ntermediate in anah1ical solution Mass average moisture content in amorphous phase Density Air density Amorphous lactose particle density Lactose crystal particle density Solid phase particle density Surface tension
m,3
kg H20lkg dry solid
Pa Pa Pa J m m m JIK/mol %
s
S DC DC DC DC DC
m/s
m/s
m3
m3/mol kglkg kg H20
J/mol m m
m m
Pa.s J/K rad W/mDC W/mDC W/mDC
kglm3 kglm3 kg dry air/m) kglm3 kglnr'
kglm3 N/m

Tortuosity in porous media Relaxation time for caking Caking index
s
, . . . -....... ' '' . .. . . . ... ' ' .. , . .... ... .... ... . ., . . ... ... .. . .. , ", .,
Al-3

ApPENDlx A2
PSYCH ROMETRIC PROPERTI ES OF AIR
Using O �C as a datum for entha lpy the fol l owing rel at ions have been used (ASHRAE 1 993 );
A2. 1 DRY AIR ENTHALPY (J/kg d ry a i r)
h -= c r a po
A2.2 WATER VAPOUR ENTHALPY (J/kg water vapou r)
A2.3 DRY AIR DENSITY (kg dry a i r/m3) 273 . ] 5
Po = 22.4 (273 . 1 5 + n ( -] +!i) 29 ] 8
A2.4 VAPOUR PRESSURE (Pa)
29HPT Pv = 1 8 + 29H
A2.5 SATURATED WATER VAPOUR PRESSURE (Pa)
Pw = e 23 .4795 _ 3990 . 56
T + 233 .833
A2.6 SURFACE VAPOUR PRESSURE (Pa)
(A2. 1 )
(A2.2)
(A2.3)
(A2.4)
(A2.S)
(A2.6)
A2-1
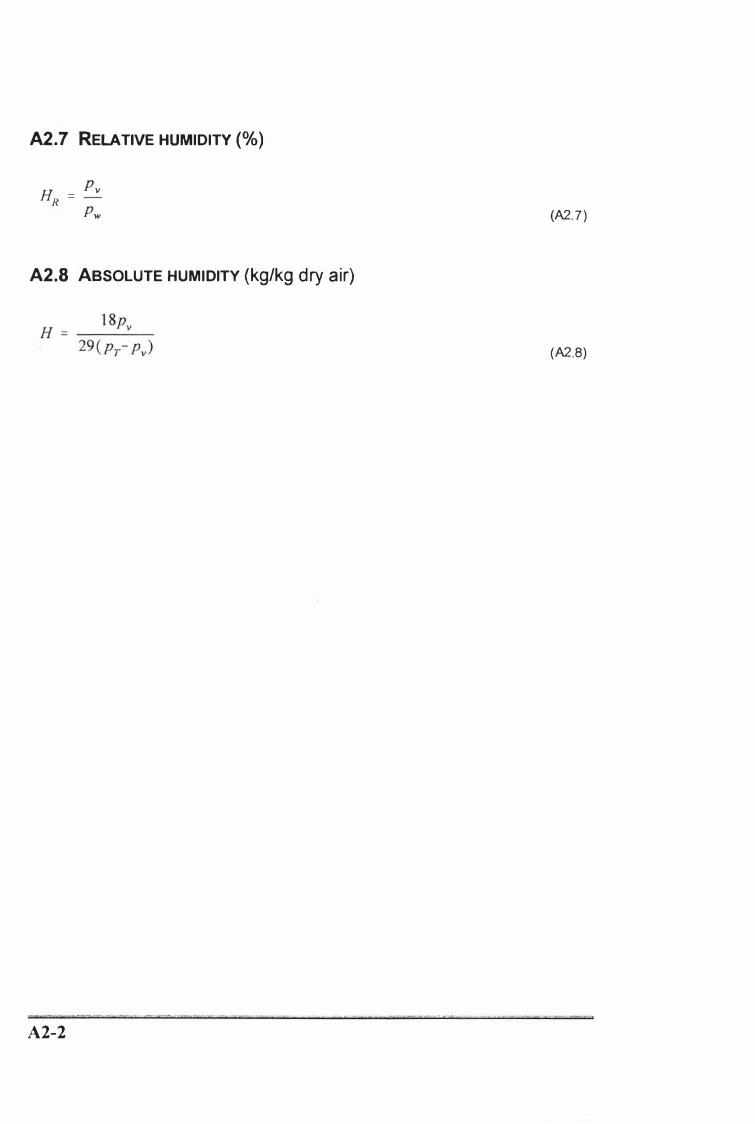
A2.7 RELATIVE HUMIDITY (0/0)
H = Pv R
Pw (A2.7 )
A2.8 ABSOLUTE HUMIDITY (kg/kg d ry air)
(A2.8)
. r , • �'S _I,." .... Z71" -:t!'c'Y. '?<-•• ,,' • '���) nrlo'kd'Ci" '.'?"'---"X" ''lSGW''''
A2-2

ApPENDlx A3
TRANSPORT MODEL FORMULATION
A3.1 ENTHALPY CONSERVATION EQUATIONS:
A3. 1 . 1 E NTHALPY BALANCE I N THE GAS PHASE
An enthalpy balance in the gas phase of the porous lactose matrix can be written as;
r Hale 0/ accunlu/mion 1 of hCai ill .'la, phase
[ Role of inflow of heal 1 [ Rale of out/ow of heal 1 [ Role of inflow of heal hy in diffiJsed vapour in diffused vapour I conduclion in gas phase
[ ROle or ou!/low oj" heal hy 1 r Rate of outflow of heal 1 conduclion in gas phase l in condensing vapour
When converted into equation form this gives;
A3. 1 .2 ENTHALPY BALANCE IN THE SOLID PHASE
(A3 . 1 )
(A3.2)
An enthalpy balance in the solid phase of the porous lactose matrix can be written as;
[ Rate of accumulation ] = [ Rate of inflow of heat ] _ [Rate of out/ow of heal ] + [Rate of inflow of heal ] of heal in solid phase by conduction by conduction in condensing vapour
When converted into equation form this gives;
a[\.( l -E)Y .psl = [A . ( l -E)A. aT] _ [A . ( l -E)A. aT] + . .h at s ax s ax J v's Iv -� .�
(A3.3)
(A3.4)
A3-1
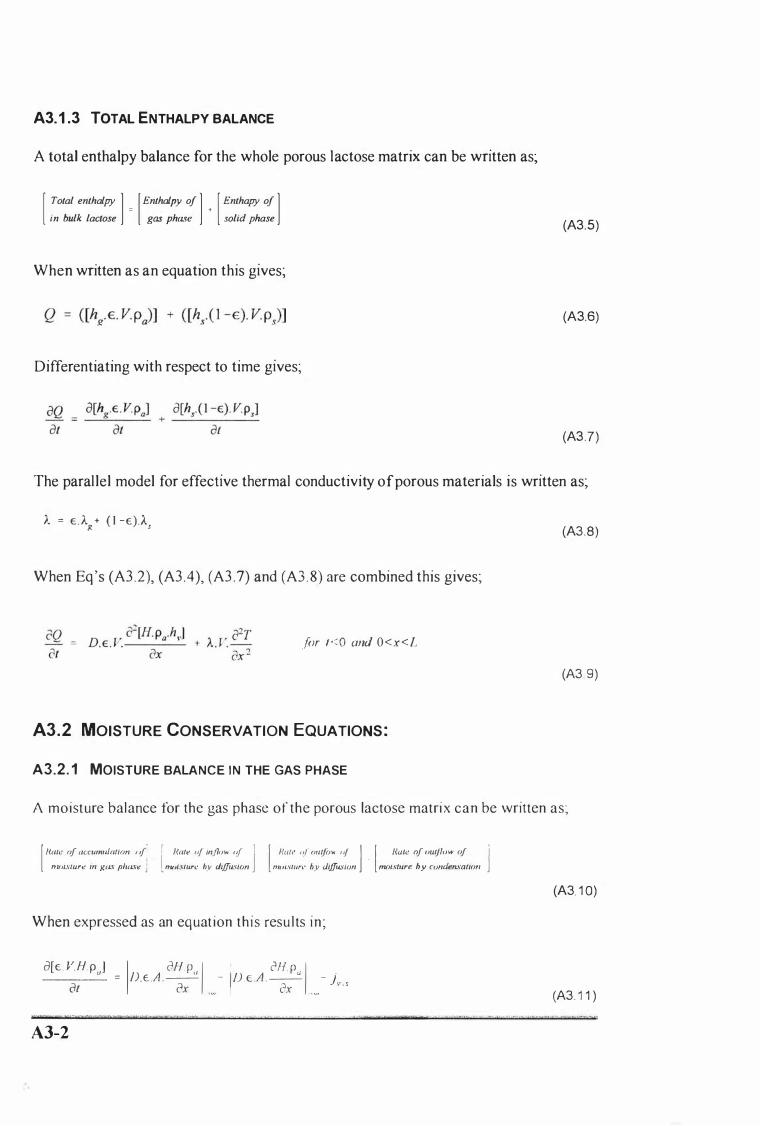
A3.1 .3 TOTAL ENTHALPY BALANCE
A total enthalpy balance for the whole porous lactose matrix can be written as;
[ Total enthalpy ] = [EnthalPY of ] � [ Enthapy of ] in bulk lactose gas phase solid phase
(A3.S)
When written as an equation this gives;
(A3.6)
Differentiating with respect to time gives;
(A3.7)
The paral lel model for effective thermal conductivity of porous materials is written as;
A = E .A,\( + ( I -E) .A,
When Eq's (A3 .2), (A3 .4), (A3 .7) and (A3 . 8) are combined this gives;
for 1<0 and O<x<l-
A3.2 MOISTURE CONSERVATION EQUATIONS :
A3.2. 1 MOISTURE BALANCE I N THE GAS PHASE
(A3.8)
(A3 9)
A moist ure balance for the gas phase of the porous lactose matri x can be written as;
[ I<a/e of accum,,/alion ,i [ /((1/" of influ .. 0/ ]1 [ Ral" of o"tjow 0/ j [ /lule of outjl" ... of 1 nUJislure in gus phuse J moislUrc hy di,ffusion nlOI.Wurc by diffusion moisture by cVndefL\'oliofl
When expressed as an eq uat ion th is resu l ts in ;
a[EVHpJ _ I aHp" 1 - ; _ 2H pu 1 - ' ---- - /) EA . -- IlJ EA . -- } at ax ' w ' ax . , ,"
v . s
)" . x - - ? "9 "[W'n»!t-� ·w,.···,· "WOC'O 'n'," " '7�J - .- • � - "P� .. , . ,
A3-2
(A3. 1 0)
(A3. 1 1 )
. • X"'s Off W?f '?5X''''-,-Z. " " ·:: .. ·r'!� '. . -PI,! . �, - )';) a 1Wz .,'. j)n.-IE ,...-••.• ' ..
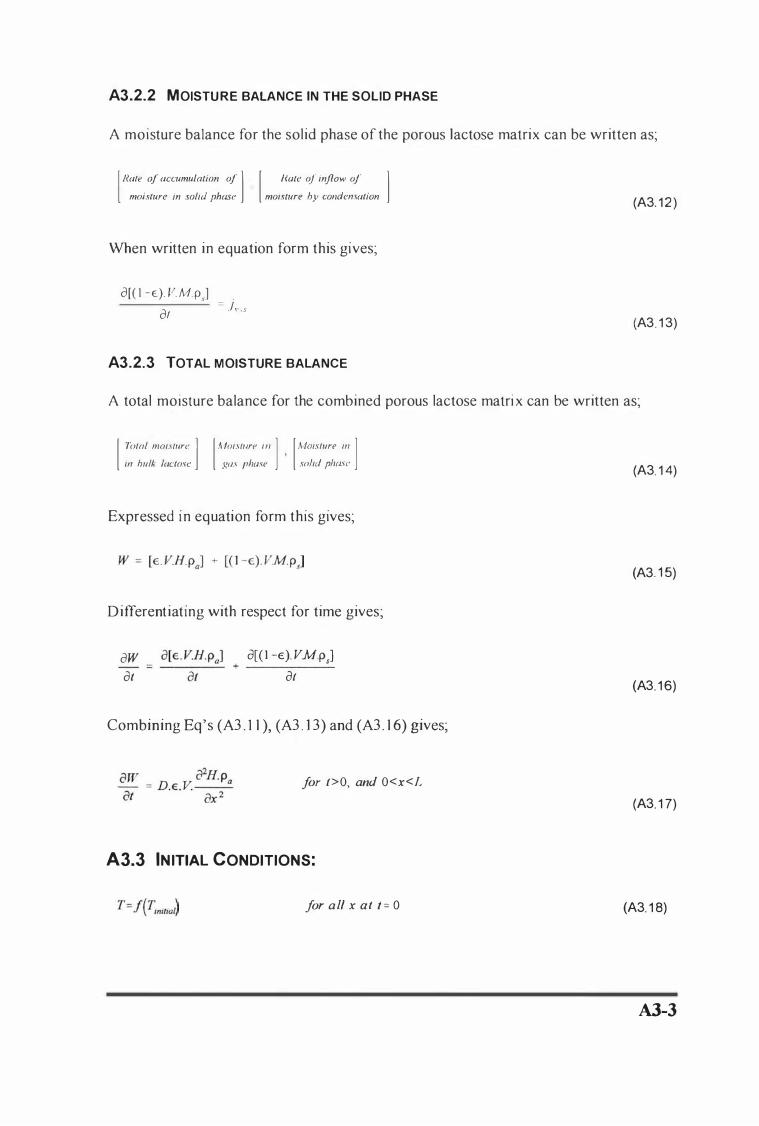
A3.2.2 MOISTU RE BALANCE IN THE SOLID PHASE
A moisture balance for the solid phase of the porous lactose matrix can be written as;
[Rale 0/ accumulalion 0/ 1 [ I(ale 0/ inflow 0/ 1 moisture in solid phase moisltJre by condensation
When written in equation form this gives;
a[( l - E)V MPJ = .i, . . , at
A3.2.3 TOTAL MOISTURE BALANCE
(A3. 1 2 )
(A3. 1 3)
A total moisture balance for the combined porous lactose matri x can be written as;
[ 7(llal moistllre 1 [ Moistllre ill 1 [MOisture in 1 in hulk lactose gas ph(J.�e I solid plum-
Expressed i n equation form this gives;
Differentiating with respect for time gives;
aw at
a[( l -€)Y M.p.] + -----
at
Combining Eq 's (A3 . 1 1 ), (A3 . I 3) and (A3 . 1 6) gives;
for t>O, and O<x<L
A3.3 IN ITIAL CONDITIONS:
for all x at t = 0
(A3. 1 4)
(A3. 1 5)
(A3. 1 6)
(A3. 1 7)
(A3. 1 8)
AJ-3
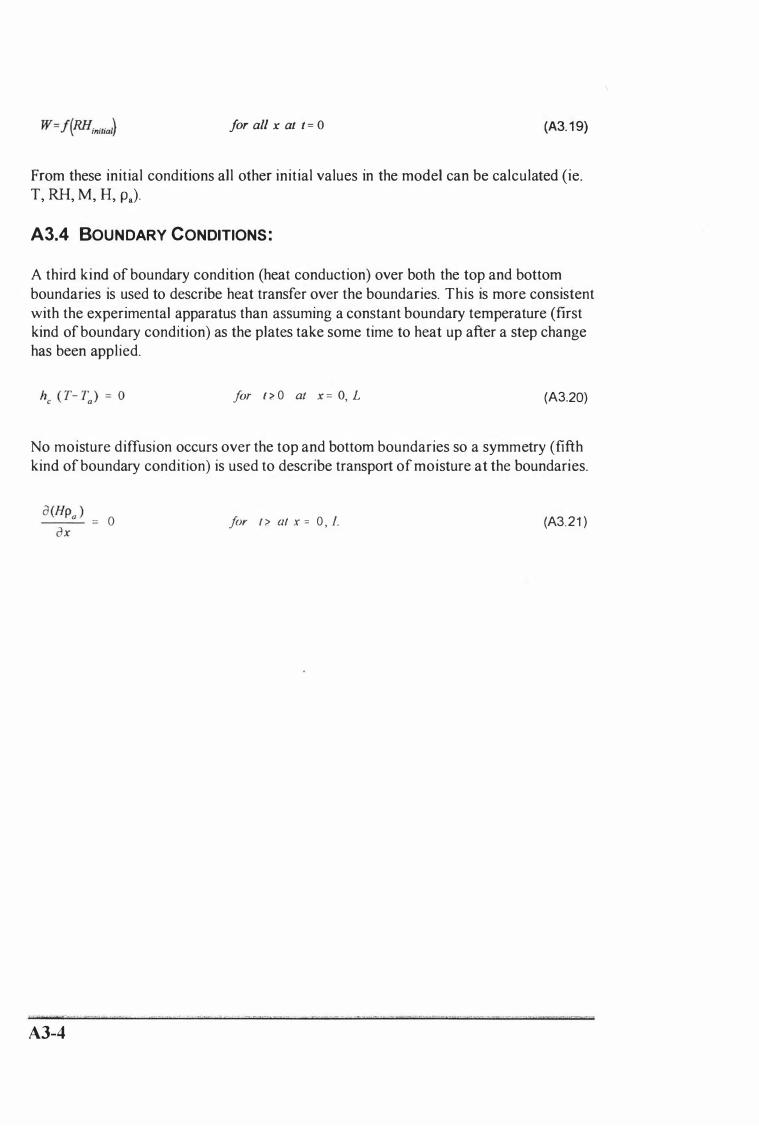
for all x at t = 0 (A3. 1 9)
From these initial conditions al l other initial values in the model can be calculated (ie. T, RH, M, H, Pa).
A3.4 BOUNDARY CONDITIONS :
A third kind of boundary condition (heat conduction) over both the top and bottom boundaries is used to describe heat transfer over the boundaries. This is more consistent with the experimental apparatus than assuming a constant boundary temperature (first kind of boundary condition) as the plates take some time to heat up after a step change has been applied.
for t '2 0 at x = 0, L (A3.20)
No moisture diffusion occurs over the top and bottom boundaries so a symmetry (fifth kind of boundary condition) is used to describe transport of moisture at the boundaries.
o for t >. at x = 0 , L (A3.21 )
'" -t GC'�t" • -• . - -. ' ,'- r"G2Cr?i2� . ' c� -r"c- . ""2 O 'C ' m'w-p" CC:Q>�!-C"'''·''''cT)m,·tF'-''''Tt ""GTS -V7 �37
A3-4
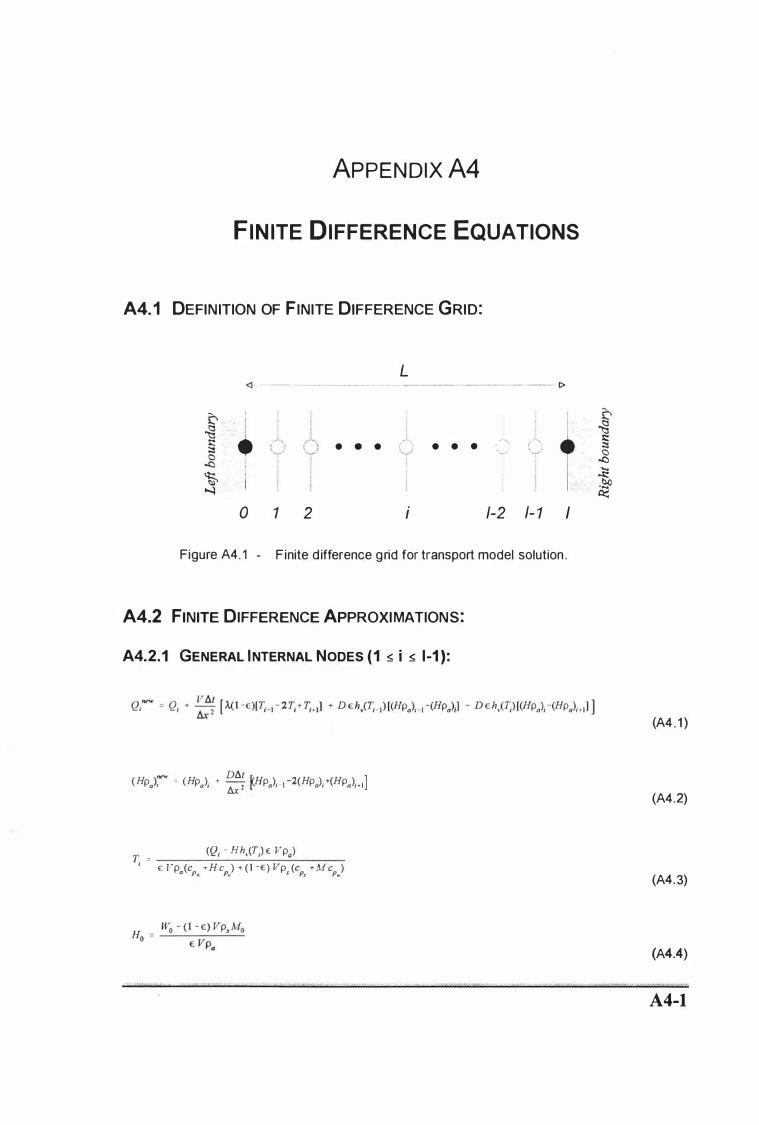
ApPENDlx A4
FIN ITE DIFFERENCE EQUATIONS
A4. 1 DEFINITION OF FINITE DIFFERENCE GRID:
L <l -- - --------- .- t>
� I
t � I J, . ...:... ... () s::
i ( I • • • t .... • • • ' -, r--'.
;:s �, \----- '-./ \� <::> , ..C) ,
� I)) "4 0 1 2 i /-2 /- 1 I
Figure A4. 1 - F inite d ifference grid for transport model solution .
A4.2 FINITE DIFFERENCE ApPROXIMATIONS:
A4.2.1 GENERAL INTERNAL NODES (1 :<> i :<> 1-1 ) :
( H )� = ( H ) + D6.t flH ) -2(H ) +(H ) 1 Pa , Pa ; !:J,x 2 I' Pa H Pa i Pa ;.)
T. = (Q; - H h,(T,) E V po) , E Fp (c + H C ) + ( \ -E) Vp (C + M c ) a Pa PII S PI Pw
� � s:: �
<::> ..0 .... ..s:: .� et:::
(A4 . 1 )
(A4.2)
(A4.3)
(A4.4)
. . . • ... "" "".,�" ,'''' "" ' ''''' '''' ,�, ," ., .. t." ,,,! 1" '"'''' '''' ' ' r"" c' , · .. · . ... "'''''''''''''''V''� . . • • , ., ,. " .• , .• �" " , . , .• , .•••.•.• -•. ,,. .••.•. , •• " r" ..... ,_,_.,.', ,", '''�''' '''
A4-1
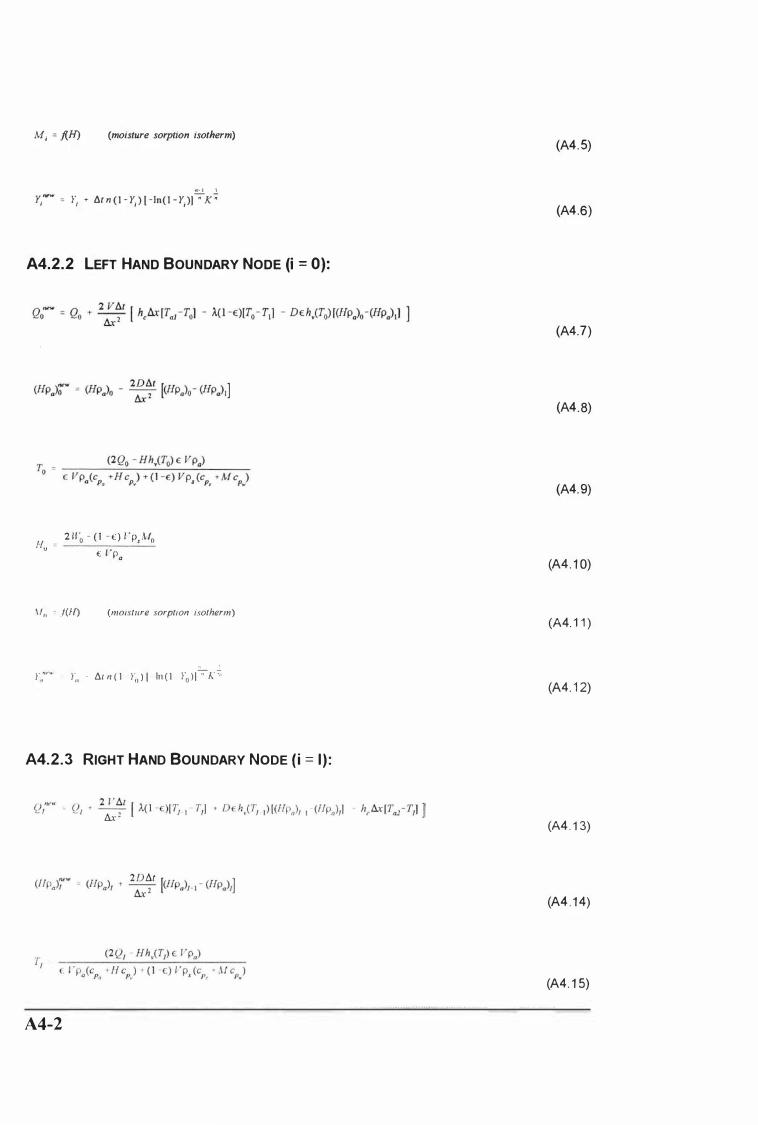
M, = f(H) (moisture sorption isotherm)
!:.!. 2.. Y,'''w = Y, '" M n (l - Y, ) [ -!n(l - Y' )I " K "
A4.2.2 LEFT HAND BOUNDARY NODE (i = 0):
2 11 " - ( I - E) Vp AI H = 0 , 0 u
€ VP.
.\/" = f(H) (moisture sorption isotherm)
.::....: ..!. Y,;"" Y,, ' �l n ( 1 Yo ) 1 In ( 1 Yo l l " K "
A4.2.3 RIGHT HAND BOUNDARY NODE ( i = I ) :
A4-2
(A4.S)
(A4.6)
(A4.7)
(A4.8)
(A4.9)
(A4. 1 0)
(A4. 1 1 )
(A4. 1 2)
(A4. 1 3)
(A4 . 1 4)
(A4. 1 S)
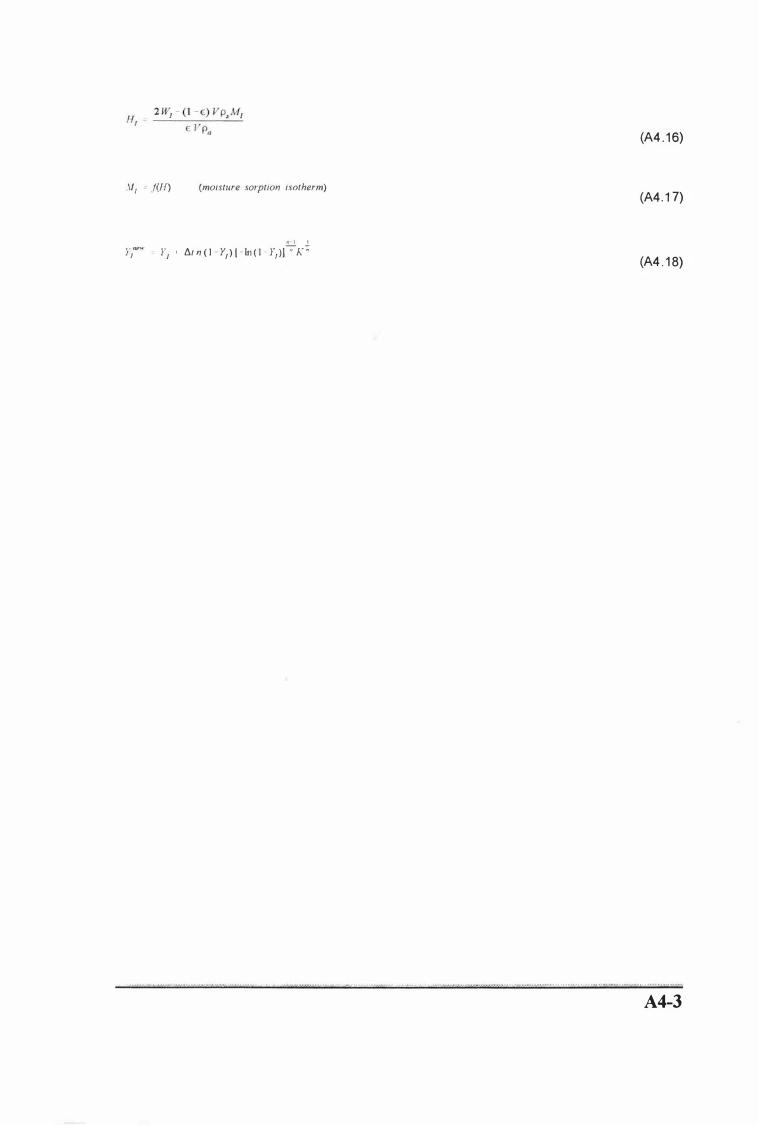
.If! - f(H) (moisture sO/plion isotherm)
� .!. r/,,'w Y! I l1t n ( 1 - Y,) [ - In ( 1 - Y,ll " K "
. · . . • ,. ,s . . • , . • ,s . '", . · • . .•.• s. '" " ',······· · "s " " 'C" " " . . . . .. cw· ....
(A4 . 1 6)
(A4. 1 7)
(A4 . 1 8)
. , ' , . . . . . . ... , .. 'tt" ' . 'M·s· .... . . " . . , .�. '"'.' ' .• s • •• ,. . . . · , ' • • • , • • . • • , . . . . �""� 'S " � 's,"' t"' . ,",,� 's"'" "'j
A4-3
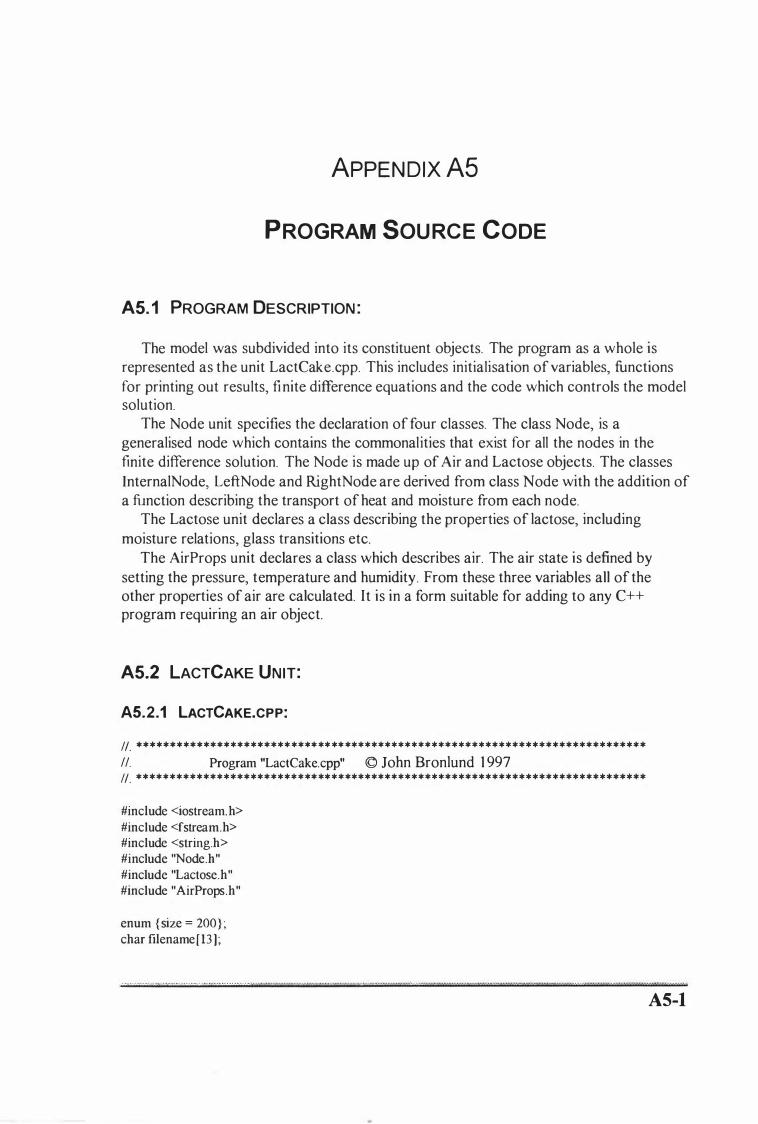
ApPENDlx A5
PROGRAM SOU RCE CODE
A5. 1 PROGRAM DESCRIPTION :
The model was subdivided into its constituent objects. The program as a whole is represented as the unit LactCake.cpp. This includes initialisation of variables, functions for printing out results, finite difference equations and the code which controls the model solution.
The Node unit specifies the declaration of four classes. The class Node, is a generalised node which contains the commonalities that exjst for all the nodes in the finite difference solution. The Node is made up of Air and Lactose objects. The classes InternalNode, LeftNode and RightNode are derived from class Node with the addition of a function describing the transport of heat and moisture from each node.
The Lactose unit declares a class describing the properties of lactose, including moisture relations, glass transitions etc.
The AirProps unit declares a class which describes air. The air state is defined by setting the pressure, temperature and humidity. From these three variables all of the other properties of air are calculated. It is in a form suitable for adding to any C++ program requiring an air object.
A5.2 LACTCAKE UNIT:
AS.2.1 LACTCAKE.CPP:
H. * * * * * * * * * * * * * * * * * * * * * * * * * ** ** ** ** * * * * * * * * * * * * * * * * * * * * * * * * * * * * * * * * * * * * * * * * * * *
II. Program "LactCake.cpp" © John Bronlund 1 997 H. * * * * * * * * * * * * * * * * * * * * * * * * * ** ** * * ** * * * * * * * * * * * * * * * * * * * * * * * * * * * * * * * * * * * * * * * * * * *
#include <iostream.h> #incIude <fstream.h> #incIude <strillg.h> #incIude "Node.h" #incIude "Lactose.h" #incIude "AirProps.h"
enum {size = 200} ; char filename[13] ;
' " .u., . • . , .. • '.� . ... .. . .. . . .. . . . .. . �' • . _ • •. . . . . . • . • � ...... ... ,. .", •. _ ..... . , .h·' �',. .. , ... h.', .'<-H •••••• • • •• ·h·.· . ........ ',." .. . . .. _ .... ....... ... . .. .. . u" ur" .. '-;, ... 0,0 ' z ... ·. · .•.. tt" ••• • •• u • . , .�" ....... ?' .... .,. •.. • -.............. { ... ''''"- -' ' ..... • , .' .• '
A5-1
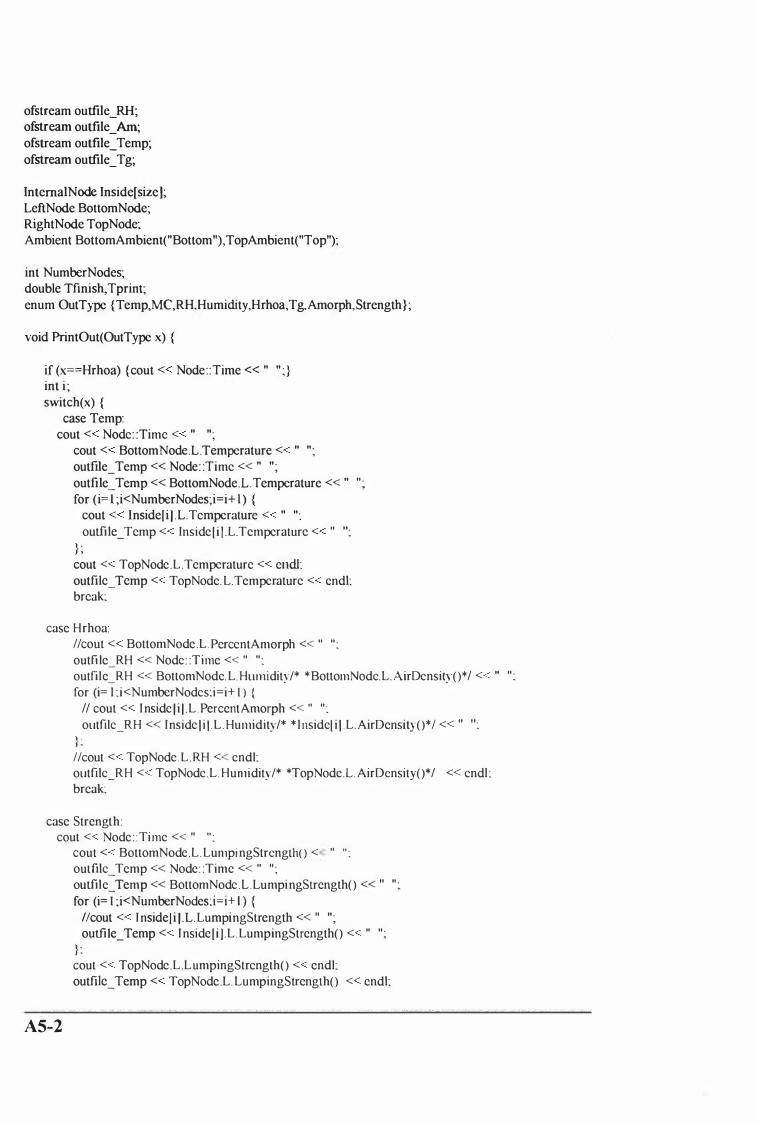
of stream outfile _ RH; of stream outfile _Am; of stream outfile _Temp;
of stream outfile _ T g;
InternalNode Inside[ size]; LeftNode BottomNode; RightNode TopNode; Ambient BottomAmbient(" Bottom "), TopAmbient("Top");
int NumberNodes; double Tfinish,Tprint;
enum OutType {Temp,MC,RH,Humidity ,Hrhoa, T g.Amorph,Strength} ;
void PrintOut(OutType x) {
if (x==Hrhoa) {cout « Node: :Time « " " ; } int i ; switch(x) {
case Temp: cout « Node : :Time « " " .
cout « BottomNode.L.Temperature « " ". outfile_Temp « Node: :Time « II " ; outfile_Temp « BottomNode.L.Temperature « II II . for (i= l ;i<NumberNodes;i=i+ l ) {
cout « Insidel ilL.Temperature « " ": outfi le_ Temp « Inside [ i ] .L.Temperature « " I I .
} ; cout « TopNode .L .Tempcrature « emil: outfile_ Temp « TopNode. L.Temperature « endl: break:
case Hrhoa: Ilcout « BottomNode.L. PerccntAmorph « II II . outfile_RH « Nodc: :Time « " " : outfile_RH « BottomNode. L. HlIlllidity/* * BottolllNodc. L. AirDcnsityO*1 « " II . for (i= 1 : i<NumberNodcs:i=i+ I ) {
II cout « I nsidc f i l . L . PercentAmorph « " " : olitfilc_RH « Insidc l i l . L . HlIlllidity/* * l nsidc[ i l L . AirDensityO*I « II I I .
} : Ilcout « TopNode. L .RH « cndl: olitfilc_RH « TopNodc .L . Hulllidity/* *TopNodc.L. AirDensityO*1 « cndl : break:
case Strength: cout « Node : :Time « II " .
A5-2
cout « BottomNode.L . Lull1pi ngStrenglhO « " " .
outfilc_Temp « Node: :Time « II " ; outfile_Temp « BottomNodc .L .LumpingStrengthO « II II .
for (i= I ;i<NumberNodes: i= i+ I ) { Ilcout « I nsidel i } .L . LumpingStrength « " "; outfile_Temp « I nside [ i } .L . LumpingStrengthO « II II .
L cout « TopNode.L .LlImpingStrcngthO « endl: outfile_Temp « TopNode.L. LlImpingStrengthO « endl;
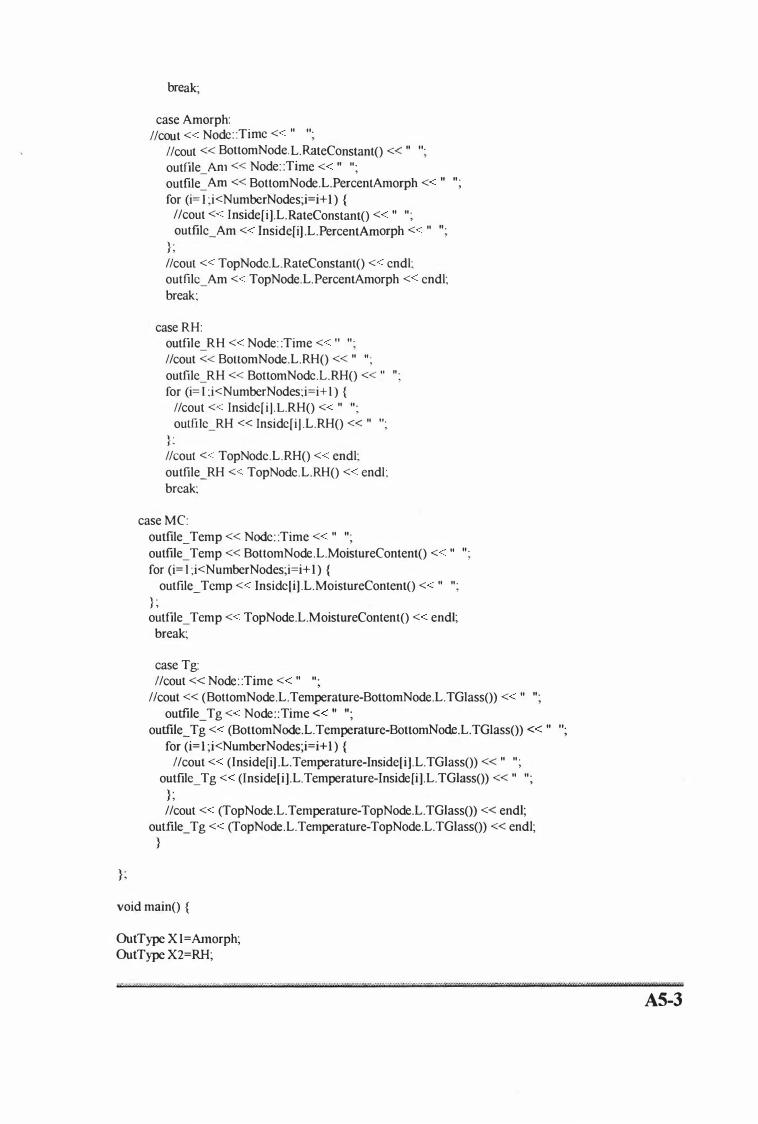
} ;
break;
case Amorph: Ilcout « Node: :Time « " II.
Ilcout « BottomNode.L.RateConstantO « II II.
outfile_Am « Node: :Time « II " ; outfile_Am « BottomNode.L.PercentAmorph « II II .
for (i= 1 ;i<NumberNodes;i=i+ 1 ) { //cout « Inside[i].L.RateConstantO « " " ; outfile_Am « Inside[i] .L.PercentAmorph « " II .
} ; /Icoul « TopNode.L.RateConstantO « cnd!; outfile_Am « TopNode.L.PercentAmorph « end!; break;
case RH: outfile RH « Node: :Time « I I II .
I/cout « BouomNode.L.RHO « " II .
outfilc_RH « BottomNodc.L.RHO « II II .
for (i= I ;i<NumberNodes;i=i+ 1 ) { I/cout « Inside[i ] . L.RHO « " " ; outfilc_RH « Insidc[i] .L.RHO « " I I .
} : Ilcoul « TopNodc.L.RHO « end!; outfile_RH « TopNode.L.RHO « cnd!; break;
case MC: outfile_Temp « Node: :Time « " II .
outfile_Temp « BottomNode.L.MoistureContentO « " II .
for (i= l ;i<NumberNodes;i=i+ I ) { out file_Temp « Insidc[i] .L.MoistureContentO « " ";
} ; outfile_Tcmp « TopNode.L.MoistureContentO « end!;
break;
case Tg: I/cout « Node: :Time « " II .
licout « (BottomNode.L.Temperature-BottomNode.L.TGlass()) « " II .
outfile_Tg « Node: :Time « II " ; outfile�Tg « (BottomNode.L.Temperature-BottomNode.L.TGlass()) « II II.
for (i= 1 ;i<NumberNodes;i=i+ 1 ) { I/cout « (lnside[i] .L.Temperature-Inside[i).L.TGlass()) « " " ;
outfilc_Tg « (Inside[i].L.Temperature-Inside[i].L.TGlass()) « " " ; } ; //cout « (TopNode.L.Temperature-TopNode.L.TGlass()) « endl;
outfile_Tg « (TopNode.L.Temperature-TopNode.L.TGlass()) « end!; }
void mainO {
OutType X I=Amorph; OutType X2=RH;
S' •• ' ....... .................. -., .- -, .. , • . . � .• - ........... ,'.-. t •• •• .. " • • 'k' , ",.'" . ••••.• " .......... '.� .. ', ...... ' .......... ," "" •. " -, H', , .... ,�., .-....... -,', t· .. tiz···· .... ·• '····Z"'··· .. :; .... .,..· ·"·-.. sn,. .. "·'. • .... !''5e .. ·•·•·• -'":i .. ' " r ·-,.,.�·······""'········'·· .. ·':itzQ ... r·�"··3�:i' .. ,
AS-3
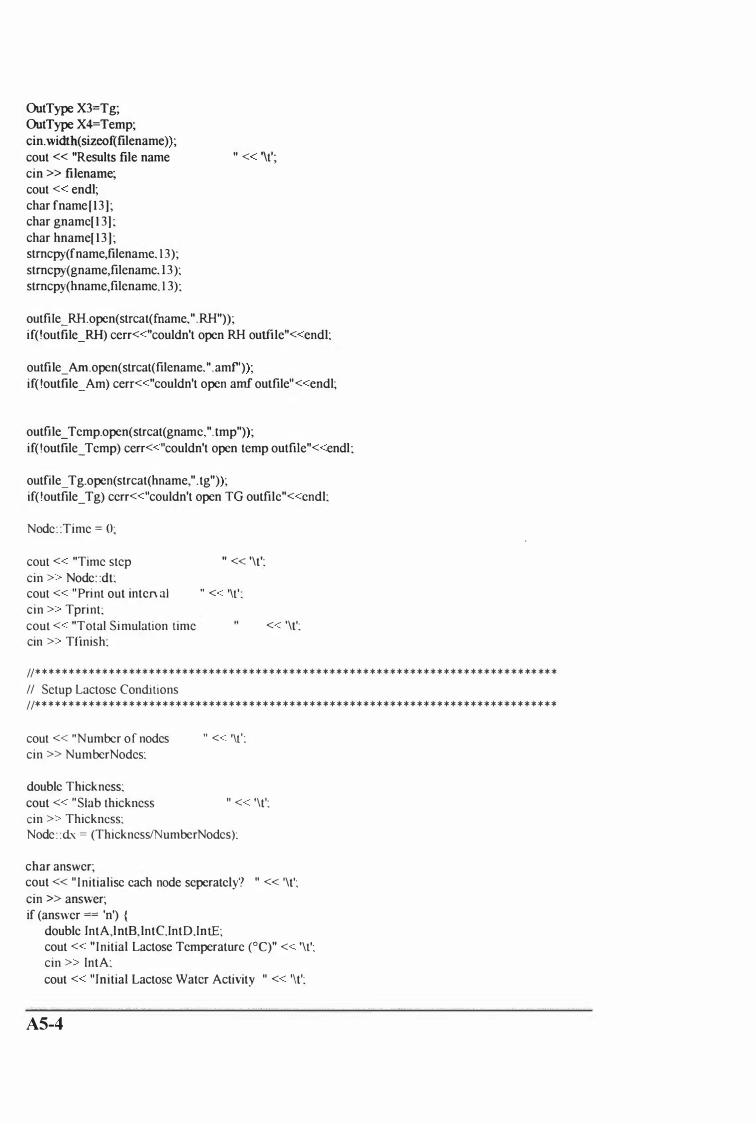
OutType X3=Tg; OutType X4=Temp; cin.width(sizeof(filename» ; cout < < "Results file name cin > > filename; cout « endl; char fname[ 13 ] ; char gname[ 1 3] ; char hname[ 1 3 ] ; stmcpy(fname,filename. 1 3 ); stmcpy(gname,filename, 1 3); stmcpy(hname,filename. 1 3);
" « '\t';
outfi Ie _ RH. open( strcat( fname, II • RH "» ; if(!outfile_RH) cerr« "couldn't open RH outfile"« endl;
outfile _ Am. open( strcat( filename, II . amf'» ; if( !outfile_ Am) cerr« "couldn't open arnf outfile" « endl;
outfile _ Temp.open(strcat(gname,". Imp"» ; if( !outfile_ Temp) cerr« "couldn't open temp outfue"« endl;
outfile _ Tg.open(strcat(hname," .tg"» ; if( !outfile_ Tg) cerr« "couldn't open TG outfile"« endl:
Node : :Time = 0;
cout « "Time step " « '\t': cin » Node: :dt: cout « "Print out inten al " « '\t' : cin » Tprint: cout « "Total Simulation time « '\t': cin » Tfinish:
11********************************************************************** * * * ** ** * II Setup Lactose Conditions 11** * * * * * * * * ** * * * **************** * * * * *******************************************
cout « "Number of nodes cin » NumberNodes:
double Thickness: cout « "Slab thickness cin » Thickness:
" « '\t ' :
" « '\t':
Node : :d-.; = (ThickncsslNumberNodcs);
char answer; cout « " Initialise each node seperately? " « '\t'; cin » answer; if (answer == 'n') {
double IntA,lntB,lntC.IntD,IntE; cout « " Initial Lactose Temperature (0C)" « '\t'; cin » IntA: cout « "Initial Lactose Water Activity " « '\t':
AS-4
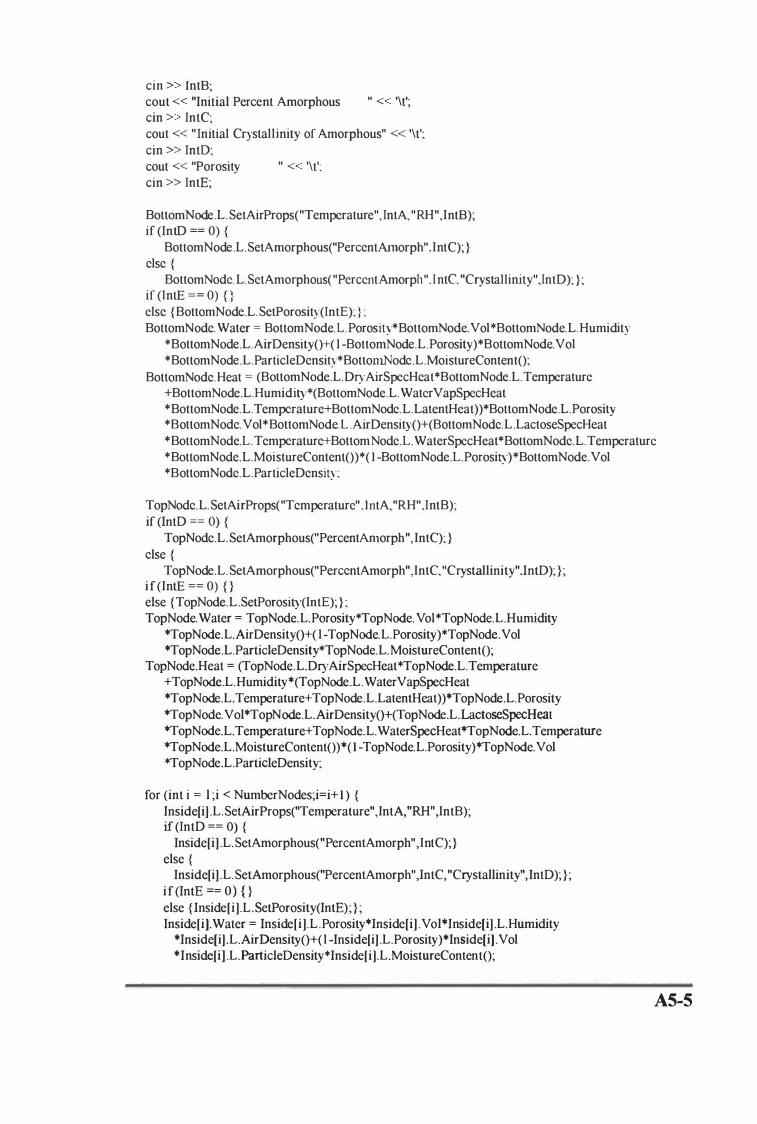
cin » lntE; cout « "Initial Percent Amorphous " « '\t'; cin » IntC; cout « " Initial Crystallinity of Amorphous" « '\t'; cin » IntO; cout « "Porosity cin » IntE;
" « '\t':
BottomNode.L. SetAirProps("Temperature", IntA, "RH" ,lntE); if (IntD == 0) {
BottomNode.L. SetAmorphous("PercentAmorph" ,lntC); } else {
BottomNodc. L. SetAmorphous("PercentAmorph". I nte. "Crystallinity", IntD); } ; if (lntE == 0) { } else {BottomNode.L. SetPorosity(IntE): } : BottomNode. Water = BottomNode. L. Porosity* BottomNode. Vol *BottomNode. L. Humidity
*BottomNode.L. AirDensityO+( I -BottomNode.L. Porosity)*BottornNode. Vol *BottomNode.L.ParticleDensity*BottomNode.L.MoistureContent();
BottomNode.Heat = (BottomNode.L.DryAirSpecHeat*BottomNode.L.Temperature +BottomNode.L.Humidity*(BottomNode.L.WaterVapSpecHeat *BottomNode.L.Temperature+BottomNode.L.LatentHeat))*BottomNode.L.Porosity *BottomNode. Vol *BottomNode. L . AirDensityO+(BottornNode.L.LactoseSpecHeat *BottomNode.L. Temperature+Bottom Node.L. WaterSpecHeat*BottomNode.L. Temperature *BottomNode.L.MoistureContentO )*( I -BottornNode.L.Porosity) * BottomNode. Vol *BottomNode.L.ParticleDensit)·:
TopNode. L. SetAirProps("Temperature" . IntA, "RH" ,IntB); if (IntD == 0) {
TopNode.L. SetAmorphous("PercentAmorph" , lntC); } clse {
TopNode.L. SetAmorphous("PerccntAmorph" ,lntC, "Crystallinity",IntD); } ; if (lntE = = 0) { } else {TopNode.L.SetPorosity(lntE); } ; TopNode. Water = TopNode.L.Porosity*TopNode. Vol * TopNode. L. Humidity
*TopNode.L.AirDensity()+( 1 -TopNode.L.Porosity)*TopNode. Vol *TopNode.L.ParticleDensity*TopNode. L. MoistureContentO;
TopNode.Heat = (TopNode. L. Dry AirSpecHeat*TopNode.L. Temperature + TopNode.L.Humidity*(TopNode.L. WaterVapSpecHeat *TopNode.L.Temperature+TopNode.L.LatentHeat))*TopNode.L.Porosity *TopNode. Vol*TopNode.L. AirDensity()+(TopNode.L.LactoseSpecHeat *TopNode.L. Temperature+ TopNode.L. WaterSpecHeat*TopNode.L. Temperature *TopNode.L.MoistureContentO )*( 1 -TopNode.L.Porosity)*TopNode. Vol *TopNode.L.PartieleDensity;
for (int i = l ;i < NumberNodes;i=i+ 1 ) { Inside[i] .L. SetAirProps("Temperature" ,lntA, "RH" ,lntB); if (IntD == 0) {
Inside[i] .L. SetAmorphous("PercentAmorph" ,lntC); } else {
Inside[i] .L. SetAmorphous("PercentAmorph" ,lntC, "Crystallinity" , IntD); } ; if (IntE == 0) { } else {lnside[i].L.SetPorosity(IntE); } ; Inside[i].Water = Inside[i] .L.Porosity*lnside[i] .Vol*Inside[i] .L.Humidity
*lnside[i] .L.AirDensity()+( l -Inside[i] .L.Porosity)*Inside[i] . Vol *lnside[i} .L.ParticleDensity*lnside[i].L.MoistureContentO;
........ -....... ·w········ ·· .. ··· · · ... ··· ·······z·······""·'··'''''···" .. , ......... , , . 0" . ............. , . . . ••• ' •• ' ..... , •••.• , ............. " ......... .... . .......... ................... ,. .•.•. � ............... -•.•.• ••.•.• � .......... , •.•.• ':' •.• ' ••.• " .•.•.• ' ... .,., .•. , .•.• ' ....... � .................. .. . ... .. .. . ........ ... . .
A5-5
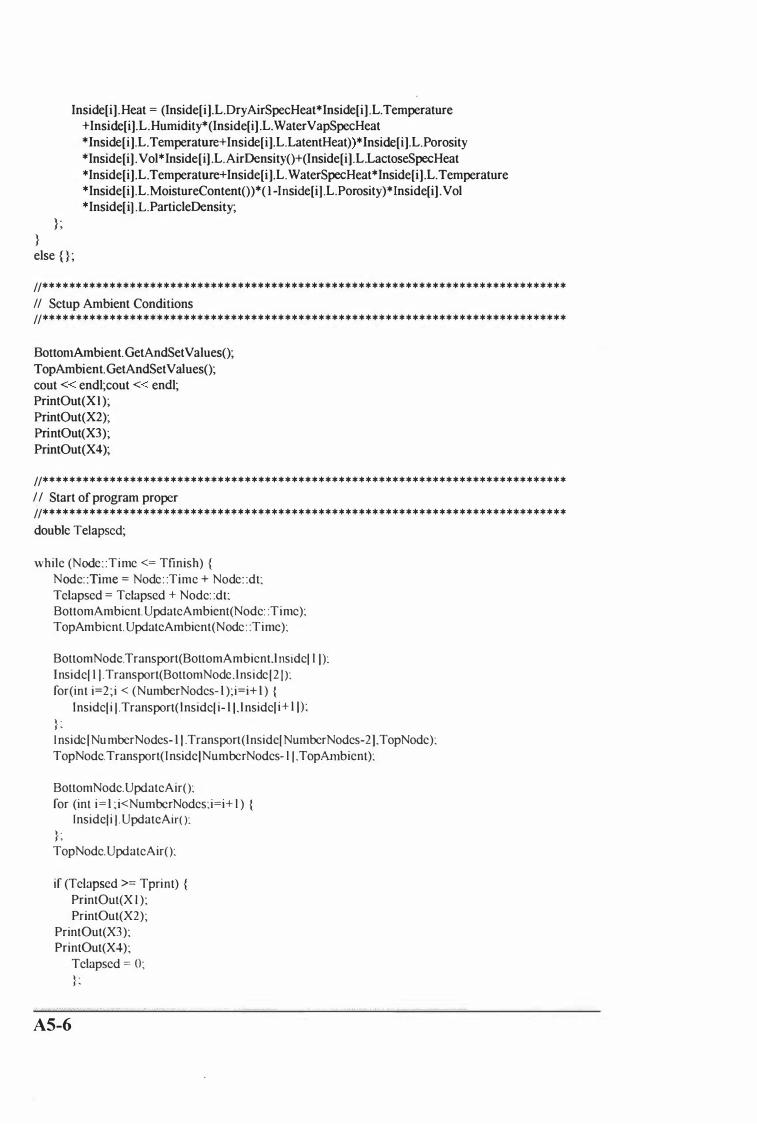
} ; }
Inside[i] .Heat = (lnside[i).L.DryAirSpecHeat*Inside[i) .L.Temperature +Inside[i] .L.Humidity*(Inside[i] .L. WaterVapSpecHeat *Inside[i].L.Temperature+Inside[i].L.LatentHeat» *Inside[i].L.Porosity *Inside[i] . Vol * Inside [i ) .L.AirDensityO+(Inside[i) .L.LactoseSpecHeat *Inside[i] .L. Temperature+ Inside [ i).L. WaterSpecHeat*Inside[i] .L. Temperature *Inside[i) .L.MoistureContentO )*( 1 -Inside[ i] .L.Porosity)*Inside[i] . Vol *Inside[ i) .L.ParticleDensity;
else { } ; V****** ************************************************************************
I I Setup Ambient Conditions V******************************************************************************
BottomAmbient.GetAndSetValuesO; TopAmbient. GetAndSet ValuesO; cout « endl;cout « emil; PrintOut(Xl ); PrintOut(X2); PrintOut(X3) ; PrintOut(X4);
V******************************************************************************
II Start of program proper V******************************************************************************
double Telapsed;
while (Node: :Time <= Tfinish) { Node: :Time = Node: :Time + Node: :dt: Telapsed = TeJapsed + Node: :dt: BottomAmbient. UpdateAmbient(Nodc: :Time): TopAmbient. UpdateAmbient(Node : :Time):
BottomNode.Transport(BottomAmbient.lnsidel l D: Inside[ J ] . Transport(BottomNode.lnside [2 D: for(int i=2 ;i < (NumberNodes- l );i=i+ l ) {
Inside[ i 1 . Transport( lnside[ i- l l . lnsidel i+ J D:
} ; I nside lNumberNodes- l j . Transport(lnsidc[ NumberNodes-2], TopNodc): TopNode. Transport(lnsideINumberNodcs- l l . TopAmbicnt):
BottomNode. UpdateAirO: for (int i= l ;i<NumberNodcs:i=i+ l ) {
Insidel i I . UpdateAirO: , . { , TopNode. UpdateAirO:
if (TeJapsed >= Tprint) { PrintOut(X I ); PrintOut(X2);
PrintOut(X3 ); PrintOut(X4 );
Telapsed = 0;
} ;
AS-6

} ; PrintOut(X l ); PrintOut(X2 ); } :
A5.3 NODE UNIT:
A5.3.1 NODE. H :
#ifndef Node H #dcfine Nodc H
#include <iostream.h>
#include <stdl ib.h>
#includc "Lactosc.h"
#includc "AirProps.h"
enum Boolean {Yes. No } :
class Ambient { public
char labell l O I :
Boolean ConstantTemperaturc: double Temperature; double TcmpArray[ 400 1 :
double Timelnten·aL
double htc;
friend iostrcam; friend [stream;
Ambient(char* nm); ,"oid SetAmbient(double temp,double h); void GetAndSetValuesO; void UpdateAmbient(double t); } :
class Node {
public:
Lactose L; static double Time; static double dt; static double dx; double Heat; double Water; double Vol; double Tempnew,EffMCnew; NodeO; void SetNode(char inA[],double ina,char inB[],double inb,char inC[],double inc,
char inD[] = "None",double ind = 42,char inE[] = "None",double ine = 42); void GetAndSetValuesO; void UpdateAirO;
. . . . . .•• . . . . . . . . . . - •• -� • .• y .•.• -. . , ,", ."" ., ....... ""H''',?''''''S'7' ...... -., • ·'·'�"···'·'j't· ,-, •. � .. ..... . .... . . . ' •• .. ' ..... "�.' •• -, �. ' ••.• .,..' '-.;; ••• •.• ' ... " .. " ........ -... "'.-...... '.' ... '.-. , ... . ', ."� .' ... ,.."" .... ' .............. '.-.'.'." .•.•. "'. " .................... ".., •. ".',.,.,.,-•• ' •.• ' ... "'. ""·'·r·· ..... ···'·'·'···'·· ... ·· ..
AS-7
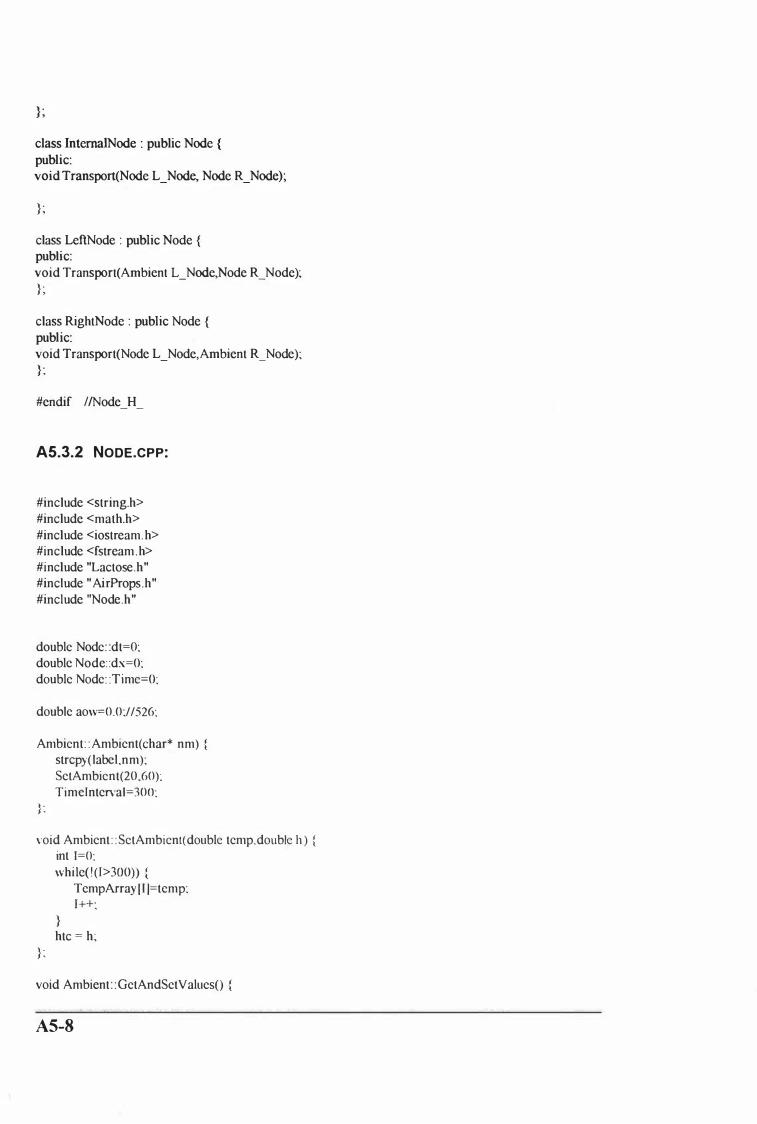
} ; class IntemalNode : public Node { public: void Transport(Node L_Node, Node R_Node);
} ;
class LeftNode : public Node { public: void Transport(Ambient L_Node,Node R_Node);
} ;
class RightNode : public Node { public: void Transport(Node L_Node,Ambient R_Node);
} ;
#endif I/Node H
AS.3.2 NODE.CPP:
#include <string.h> #include <math.h> #include <iostream. h> #include <fstream.h> #include "Lactose.h" #include "AirProps.h" #include "Node.h"
double Node: :dt=O: double Node: :dx=O: double Node: :Timc=O:
double aow=0.0;//526:
Ambicnt: : Ambient(ehar* nm) { strcpy( label,nm): SetAmbicnt(20,60): Timeintervai=300:
} : void Ambient : : SctAmbicnt( double temp. double h ) {
int 1=0:
} ;
while( ! ( I> 3(0» { TempArray I I I=temp: 1++;
} hte = h;
void Ambient : :GetAndSetValuesO {
AS-8

double IntA,IntB; char answer;
cout « "Use constant temperature for " « label « " (yin)?" « '\t'; cin » answcr: if (answer == 'n') {
char filename[ 1 3 J ; cout « "Enter temperature history filename "; cin » filename;
ifstream infile(filename); int 1=0;
while( ! infile.eof() ) { infile » TempArrayl l l 1++:
} infile.closeO:
cout « "Entcr time intcrval for file" « filename:
cin » Timclnterval; cout « "Enter heat transfer coefficient I I .
cin » htc:
else { cout « label « " Boundary Temperature (0C) " « '\t'; cin » I ntA:
cout « label « " Boundary HTC " « '\t':
cin » IntB:
SetAmbient(IntA,IntB);
}
void Ambient : :UpdateAmbient(double t) { double fract:
} ;
double Int; fract = modf«tffimeInterval),&Int);
int I=(int)Int; Temperature = TempArray[I]+(TempArray[I+ 1 ] -TempArray[I])*fractffimeInterval;
Node : :NodeO { Vol = l e-5; Water = 0;
Heat = 0;
} ; void Node: :GetAndSetValuesO {
double IntA,IntB; cout « "Initial Lactose Temperature (OC)" « '\t'; cin » IntA; cout « "Initial Lactose Water Activity " « '\t'; cin » IntB; L. SetAirProps("Temperature" ,1ntA, "RH" ,1ntB); cout « "Initial Percent Amorphous " « '\t'; cin » IntA; cout « "Initial Crystallinity of Amorphous" « '\t'; cin » lntB; if (lntB ==0) {L.SetAmorphous("PercentAmorph",1ntA);}
•• , •••••• '.' •••••• '�" ' . ....... ,"- •• , ," .'.� ....... ........ ,. •••• ' ... -.' ......... ........ ,.,. •••• 0', .-.c· ... '.-.·.,.,,·, •.•.• ,.'. "" •• '" ..• '.'.-•...•..• ", .•• � ••..... �c ..•• • '-- .... ...... ,", ,", .'.' • .,. ..................... ,", .... �."' .. ' • •• ·-·"'·'''e'''·''''1!"'·' •.•.•.•.••.• , • . -c-.�'.".-r ........... •.•• ········.,.··'···'c··'·· .. ·'·'···· .. r
A5-9
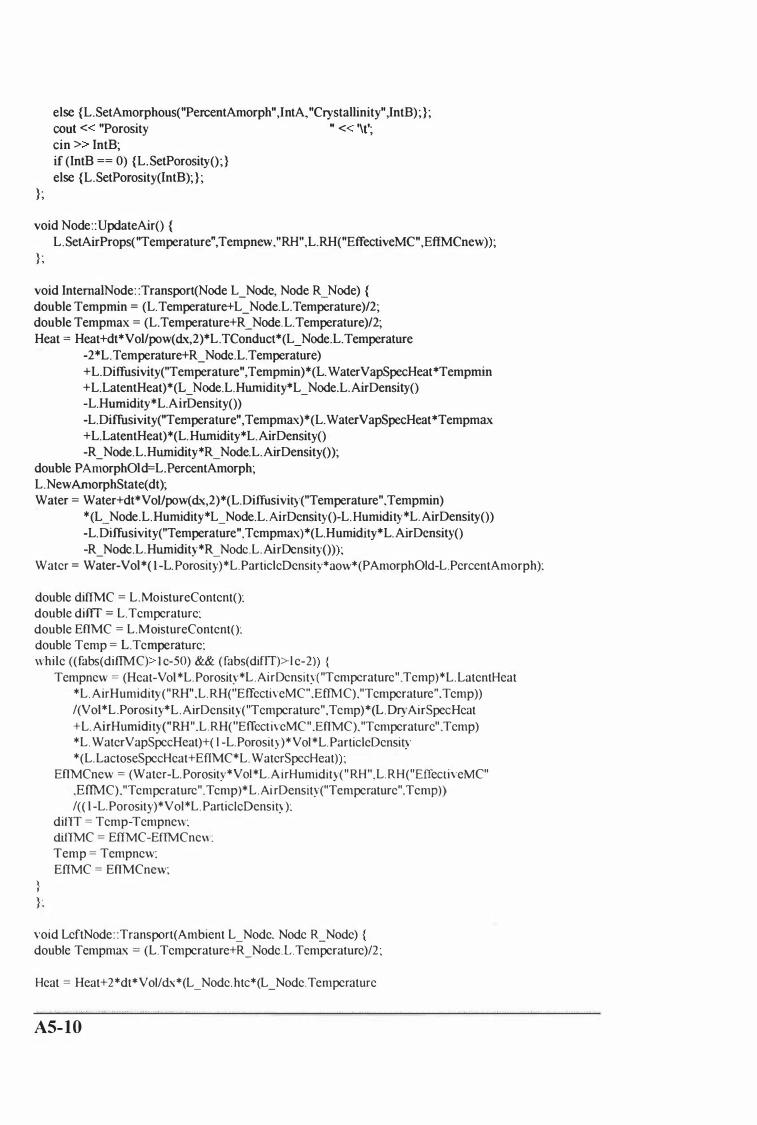
};
else {L.SetAmorphous("PercentAmorph" ,1ntA, "Crystallinity" ,1ntB);} ; cout « "Porosity " « '\t'; cin » IntB; if (IntB == 0) {L.Setporosity();} else {L.Setporosity(lntB);} ;
void Node::UpdateAirO { L.SetAirProps("Temperature",Tempnew,"RH",L.RH("EffectiveMC",EffMCnew» ;
} ;
void InternaINode: :Transport(Node L_Node, Node R_Node) { double Temprnin = (L.Temperature+L_Node.L.Temperature)/2; double Tempmax = (L.Temperature+R_Node.L.Temperature)/2; Heat = Heat+dt*Vol/pow( dx,2)*L. TConduct*(L _Node.L. Temperature
-2*L.Temperature+R_Node.L.Temperature) +L.DifIusivity("Temperature", Tempmin)*(L. WaterVapSpecHeat*Temprnin +L.LatentHeat)*(L _ Node.L.Hurnidity*L _ Node.L.AirDensityO -L.Hurnidity*L.AirDensityO) -L.Diffusivity("Temperature", Tempmax)*(L. WaterVapSpecHeat*Tempmax +L.LatentHeat)*(L.Hurnidity*L.AirDensityO -R _ Node.L.Hurnidity*R _Node. L.AirDensity());
double P AmorphOld=L. PercentAmorph; L.NewAmorphState(dt); Water = Water+dt*VoUpow( dX,2)*(L.Diffusivity("Temperature", Temprnin)
*(L _ Node.L. Hurnidity*L _ Node.L. AirDensityO-L.Hurnidity*L . AirDensityO) -L.Diffusivity("Temperature",Tempmax)*(L.Humidity*L.AirDensityO -R _ Node.L.Hurnidity*R _ Node.L. AirDensityO» ;
Water = Water-Vol *( 1 -L. Porosity) *L. ParticleDensity*aow*(P AmorphOld-L.PercentAmorph):
double diflMC = L.MoistureContentO: double diff[ = L.Temperature; double EflMC = L.MoistureContentO: double Temp = L.Temperature; while «fabs(diflMC» I e-50) && ( fabs(ditJT» l e-2» {
} } :
Tempnew = (Heat-Vol*L.Porosity*L .AirDcnsity( "Tempcrature".Temp)*L.LatentHeat *L. AirHumidity("RHtI ,L.RH(tlEffectiveMC",EfIMC)."Temperature".Temp)) I(Vol *L.Porosity*L. AirDensity("Temperature", Temp )*(L .Dry AirSpecHeat +L. AirHumidity(tlRH".L . RH(tlEITectiveMC" . EflMC), "Temperature" .Temp) *L. WaterVapSpecHeat)+( l -L.Porosity)*Vol *L. ParticIeDensity *(L. LactoseSpecHeat+EfIMC*L. WaterSpccHeat» ;
EflMCnew = (Water-L.Porosity*Vol*L.AirHumidity( "RHtI,L.RH("EfTecliveMC" .EffMC),"Temperature".Temp)*L.Ai rDensity("Temperature".Temp» 1« l -L.Porosity)*Vol *L. ParticIeDensity):
diITT = Temp-Tempnew: diITMC = EflMC-EftMCne\\: Temp = Tempnew: EffMC = EflMCnew;
void LeftNode: :Transport(Ambient L_Node. Node R_Node) { double Tempmax = (L.Temperature+R_Node.L.Tcmperature)/2 ;
Heat = Heat+2*dt*Vol/dx*(L_Node.htc*(L_Node.Temperature
AS-lO

-L. Temperature)-L.TConductldx*(L.Temperature-R_Node. L. Temperature) -L.Diffusivity("Temperature",Tempmax)Jdx*(L. WaterVapSpecHeat*Tempmax + L. LatentHeat) * (L.Humidi ty* L. AirDel1si tyO -R _Node.L.Humidity*R _Node. L. AirDensityO» ;
double PAmorphOld==L. Percel1tAmorph; L.NewAmorphState(dt); Water == Water+ 2 *dt*Vol!pow( dx,2)*( -L.Diffusivity("Temperature", Tempmax)
* (L. Humidity*L. AirDel1sityO-R_Node.L.Humidity*R_Node.L.AirDensityO) ); Water == Water-Vol *( I -L.Porosity)*L.ParticleDensity*aow*(p AmorphOld-L.Percel1tAmorph);
double diflMC == L.MoistureCol1tentO: double diffT == L.Temperature; double EffMC == L.MoistureCol1tentO: double Temp == L.Temperature: while «fabs(diftMC» I c-50) && (fabs(difIT» I c-2» {
Tcmpncw = (Heat-Vol*L.Porosity*L.AirDensity("Temperature", Temp)*L.Latel1tHeat *L. AirHumidity("RH",L.RH("EffectiyeMC".EfIMC),"Temperature",Temp» J(Vol*L.Porosity*L.AirDensity("Temperature",Temp)*(L.DryAirSpecHeat +L. AirHumidity("RH".L.RH("EffectiyeMC",EfIMC),"Temperature".Temp) *L. WaterVapSpecHeat)+( I -L.Porosity)*Vol *L.ParticleDensity *(L.LactoscSpecHeat+EffMC*L.WaterSpecHeat» ;
EflMCnew = (Water-L. Porosity*Vol*L.AirHumidity("RH",L.RH("EffectiveMC" .EffMC). "Temperature".Temp)*L. AirDel1sity("Temperature".Temp» J« I -L.Porosity)*Vol*L. ParticleDensity):
diffT = Temp-Tempnew; diffMC = EfIMC-EffMCnew; Temp = Tempnew; EffMC = EffMCncw;
void RightNode: :Transport(Node L_Node,Ambient R_Node) { double Tempmil1 == (L.Temperature+L_Node.L.Temperature)/2; Heat = Heat+2*dt*Vol!dx*(-R_Node.htc*(L.Temperature-R_Node.Temperature)
+L. TConductldx*(L_Node. L. Temperature-L. Temperature) +L.Diffusivity("Temperature", Tempmin)Jdx*(L. WaterVapSpecHeat*Tempmin +L.LatentHeat)*(L _ Node. L. Humidity*L _ Node. L. AirDensityO-L. Humidity*L. AirDensityO » ;
double P AmorphOld=L.PercentAmorph; L.NewAmorphState(dt); Water = Water+2*dt*Vol!pow(dx,2)*(L.Diffusivity("Temperature",Tempmin)
*(L_Node.L.Humidity*L_Node.L.AirDensityO-L.Hurnidity*L.AirDensityO» ; Water = Water-Vol*( I -L.Porosity)*L.ParticleDensity*aow*(p AmorphOld-L.PercentAmorph);
double diffMC == L.MoistureContentO; double difIT = L.Temperature; double EtIMC == L.MoistureContentO; double Temp = L.Temperature; while «fabs(difIMC» I e-50) && (fabs(difIT» I e-2» {
Templ1ew == (Heat-VoI*L.Porosity*L.AirDensity("Temperature", Temp)*L.LatentHeat *L. AirHumidity("RH",L.RH("EffectiveMC" ,EflMC), "Temperature" , Temp» J(Vol *L.Porosity*L.AirDensity("Temperature", Temp )*(L.Dry AirSpecHeat +L. AirHumidity("RH" ,L.RH("EffectiveMC" ,EflMC), "Temperature" , Temp) *L. WaterVapSpecHeat)+( l -L.Porosity)*Vol *L.ParticieDensity *(L.LactoseSpecHeat+EtIMC*L. WaterSpecHeat» ;
EtIMCnew == (Water-L.Porosity*Vol *L. AirHumidity("RH" ,L.RH("EffectiveMC"
' ..... ,� • ••• ', ••• ""� ••• ' • •.•... � ...•• " ", " . •• . , .•.• ,', • ····z' ," 0,. •. ".-."'!" -' •• , ' <it •.•.• • • 'U' •••.• ' •.•.•.•• ,' .', • • . , .• -- " " •.•.•. :;,.; . ... � .••.•. , .......... ' •.•. ".' .... ·'P·r"'·· .. ·· , ., .... -, ........ "'. ?n.' .... ., ........ · .. ·,.'·· .. 1·11"·" ·-···· ..... '.' •.• '.' ..... '".-.'. , .. ·.;·······'··t .. ·W'3'·�":i'
AS-I I
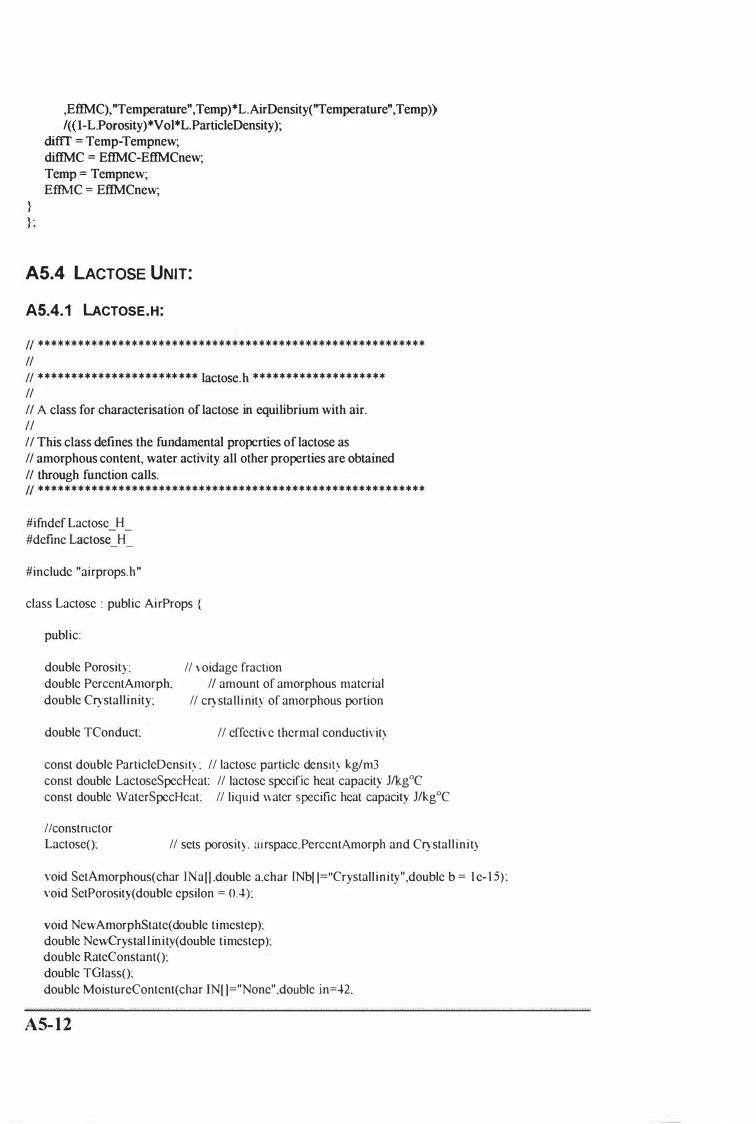
} } ;
,EfIMC), "Temperature", Temp) *L. AirDensity("Temperature" ,Temp» 1« I-L.Porosity)*Vol*L.ParticleDensity);
difIT = Temp-Tempnew; difIMC = EfIMC-EfIMCnew; Temp = Tempnew; EfIMC = EfIMCnew;
AS.4 LACTOSE UNIT:
AS.4. 1 LACTOSE.H:
V **********************************************************
II II ********************* *** lactose.h ******************** II II A class for characterisation of lactose in equilibrium with air. II II This class defines the fundamental properties of lactose as II amorphous content, water activity all other properties are obtained
II through function calls. V **********************************************************
#ifndef Lactose H #define Lactose H
#include "airprops.h"
class Lactose : public AirProps {
public:
double Porosity: double PercentA.Illorph: double Crystall inity:
double TConduct:
II \ oidage fraction I I amount of amorphous material
II crystallinity of amorphous portion
II effective thermal conductivity
const double ParticleDensity : II lactose particlc density kg/m3 const double LactoseSpecHcat: II lactose specific heat capacity J/kgOC const double WaterSpecHeat: II liqujd water specific heat capacity J/kgOC
Ilconstmctor LactoseO: II sets porosity. ai rspacc.PercentAmorph and Crystallinity
void SetAmorphous( char INa[ ] .double a.char [Nb[ 1="Crystall inity" ,double b = 1 e- I S) ; void SetPorosity(double epsilon = 0.4):
void NewAmorphState(double timestep): double NewCrystal l inity(double timestep); double RateConstantO: double TGlassO: double MoistureContent(char IN[ ]="None",double in=.J.2,
AS- 1 2
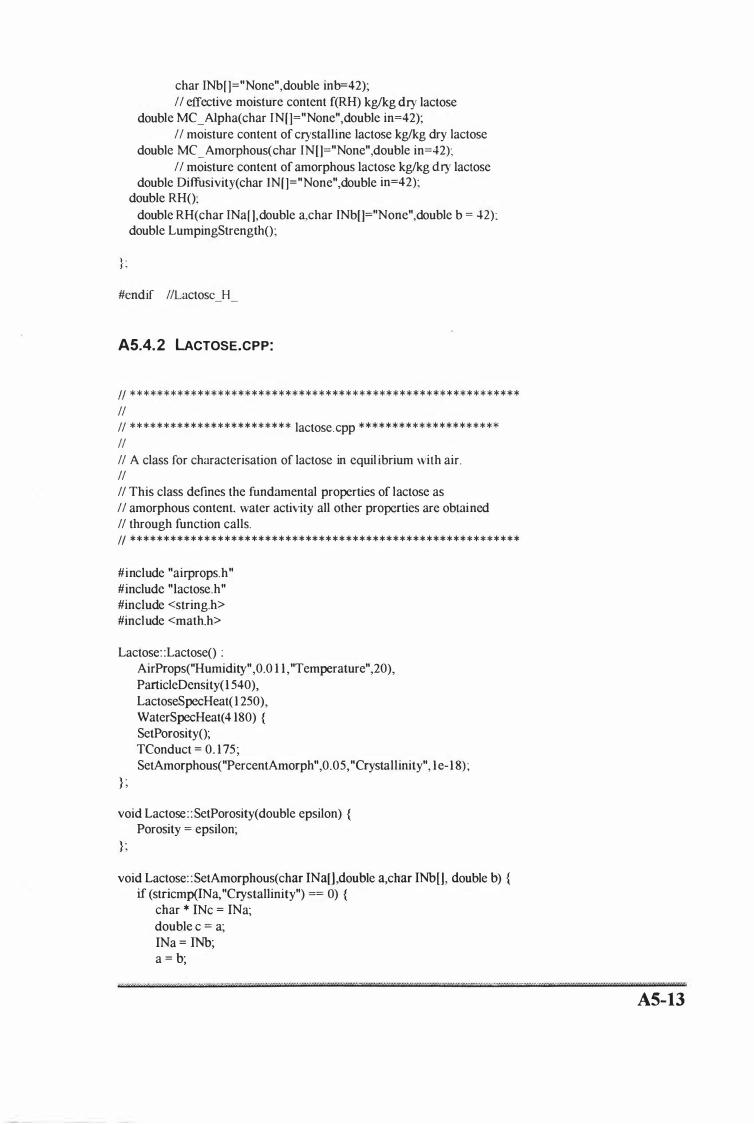
) . f ,
char INb(]="None",double inb=42); II effective moisture content f(RH) kg/kg dry lactose
double MC_AJpha(char IN[]="None",double in=42); II moisture content of crystalline lactose kg/kg dry lactose
double MC _ Amorphous( char IN[]="None" ,double in=42); II moisture content of amorphous lactose kg/kg dry lactose
double Diffusivity(char IN[]="None",double in=42); double RHO;
double RH(char INa(],double a,char INb[]="None",double b = 42); double LumpingStrengthO;
#cndif IILactosc H
AS.4.2 LACTOSE.CPP:
11 ********************************************************** II II ************************ lactose.cpp ********************* II II A class for characterisation of lactose in equilibrium with air. II II This class defines the fundamental properties of lactose as II amorphous content. water activity all other properties are obtained I I through function calls. H **********************************************************
#include "airprops.h" #include "Iactose.h" #include <string.h> #include <math.h>
Lactose: :LactoseO :
} ;
AirProps("Humidity" ,0.0 1 1 , "Temperature" ,20), ParticleDensity( 1 540), LactoseSpecHeat( 1 250), WaterSpecHeat( 4 180) { SetPorosityO; TConduct = 0. 175 ; SetAmorphous("PercentAmorph" , 0.05, "Crystallinity" , 1 e- 1 8) ;
void Lactose : :SetPorosity(double epsilon) { Porosity = epsilon;
} ;
void Lactose: :SetAmorphous(char INa[],double a,char INb[], double b) { if (stricmp(INa, "Crystallinity") == 0) {
char * INc = INa; double c = a; INa = INb; a = b;
,., ...... . , .'.' ...... " "" �.' ••• �. , •••. ,.-•• "..:; •.•.• '-"''''''' ....... ....... ' •• '.,.. ............... ,-.-.", •• ·•· ... "j.·"'i.·.· ... 'Zw ," • • 'n' ... .,.e .. ··TI .. ?·· ... •· .. • .-........... -......... ', •.• ' ......... ' ...... . . ............... ..... " .. " • •• -• • -• . ,. .................... ,.,. ...................... ,,······"' .. ·• ......... :i··;jo·· ... ·'··,.n·,.-·'·'·,..
A5-I3

} ;
}
INb = INc; b = c; ,
if (stricmp(INa, "PercentAmorph") == 0) { PercentAmorph = a;
} if (stricmp(INb, "Crystallinity") == 0) {
Crystallinity = b; }
void Lactose: :NewAmorphState(double timestep) { if « I -Crystallinity» O) {
}
PercentAmorph = PercentAmorph/( I -Crystallinity)*( I -NewCrystallinity(timestep » ; Crystallinity = NewCrystallinity(timestep);
else Crystallinity= I ; } ;
double Lactose: :NewCrystallinity(double timestep) { const double Avrami_m = 3 ;
double dummy_Cry; if « PercentAmorph > 0) && (RateConstantO > 0) && (Crystallinity < I » {
dummy_Cry = Crystallinity+timestep* A vrami _m *( I -Crystallinity)* pow« -Iog( I -Crystallinity» ,(Avrami _ m- I )/ Avrami _ m)* pow(RateConstantO,( I I Avram( m»:
else { dummy_Cry = Crystal linity; }
i f (dummLCry > I ) { dummLCry = l : } return dummy_Cry;
double Lactose : : RateConstantO { const double Anami = 3 :
const double C I = 35.43; const double C2 = 1 08.38: const double C3 = 1e27: double K: if (Temperature > TGlass()) {
K=C1 *pow(e.\p( -C 1 /(8, 3 14e-3 *(C2+ Temperature-TGlass()))),Avrami):
else { K = o: } : return K:
double Laclose: :TGlassO { const double T g I = 10 l : consl double Tg2 = - 1 35 : const double K = 6,7; return « I -MC_Amorphous())*Tgl +K*MC_AmorphousO*Tg2)/
« I -MC _ Amorphous())+K *MC _ Amorphous()):
AS- 1 4
double Lactose : :MoistureContent(char INa[],double ina,char INb[],double inb) {
, . ( ,
i f (stricmp(INa,"None") = = 0 ) { INa = "RH"; ina = RHO ;
if (stricmp(INb, "None") == 0) { inb = PercentAmorph;
} retum MC _ Alpha(INa,ina)+MC _ Amorphous(INa,ina)*inb;
double Lactose: :MC_Alpha(char IN[],double in) { const double Ymtss = 2 .5e-4;
, . I ,
const double ctss = 8.8; const double ktss = 0.92; const double htss = 30;
if (stricmp(IN."None") == 0) { IN = "RH": in = RHO:
double HH = 1 +( l -ktss)/ktss*exp(htss*log(ktss* in))/( I -in); double HHH = I +(HH- I )/HH*( l -ktss*in)/( l -in)*(htss+( I -htss)*in); return Ymtss*ctss*k1ss*in*HH*HHHI« l -ktss*in)*( 1+( ctss*lffi-l )*ktss*in));
double Lactose: :MC_Amorphous(char IN[],double in) {
\ . J ,
const double YmGAB = 0.0488; //0.048; const double cGAB = 3 .23; 112; const double kGAB = 1 . 1 59; //1 .25;
if (stricmp(IN, "None") == 0) { IN = "RH"; in = RHO;
} return YmGAB*cGAB*kGAB*inl« l -kGAB*in)*( l+(cGAB- l )*kGAB*in));
double Lactose: :Diffusivity(char IN[],double in) {
} ;
if (stricmp(IN, "None") == 0) { IN = "Temperature" ; in = Temperature;
}
return 1 *Porosity*(O.OO 1 7255*(in+273. 1 5)-0.2552)/1 0000;
double Lactose: :RHO { return AirProps: :RHO;
} ;
double Lactose: :RH(char INa[],double a,char INb[],double b){
' •••.••••••• ', ", ".-•. •• ' •• • • .•• . ••• T?' " .-. ;, •• ' ••.•.•.•. ,." .......... , .•.• " ' • • • ••••• " '·0 • • ··r ....... , . .-....... "r . u ......... ,", 'h" " .............. . ' .......... ' ..... " ............ -............. 0";' ••.•.•.• •• • • , , •• 'P'" ., .... '.0. "0 .-............ "0"" Ot.,.. ,..·.·.,.' ... ·.·.·.(.' ... :;ti'& .. ·• "0 ...
AS-IS
\ . J ,
if «stricmp(INa, "EffectiveMC") == 0) II (stricmp(INb, "EffectiveMC")==O» {
}
if « stricmp(1Nb, "EffectiveMC") == 0» {
char * INc = INb;
}
double c; c = b; INb = INa; b = a; INa = INc;
a = c;
if « stricmp(INb,"Nolle")==O» { INb = IPercelltAmorph"; b = PercentAmorph;
}
if « stricmp(INa,IEffectiveMC") == 0) && (stricmp(INb,IPercentAmorph")==O» { double Try I =0, Try2= I ,MCalc= l ,aw;
}
while (fabs(MCalc-a» Ie- I S) {
}
aw=(Try 1 + Try2)/2; MCalc = MoistureContent(IRH",aw,INb,b); if «MCalc-a)<O) {Tryl = aw; } else {Try2 = aw; }
return aw;
else return AirProps : :RH(INa,a,INh,b);
double Lactose: :LumpingStrengthO { return 15929.44 7*MoistureContentO;
AS.S AIRPROPS UNIT:
AS.S.1 AIRPROPS.H:
V******************************* ******************************************
II 11***** ***** ************* AirProps. H ***** ******************************* **
II II A class for characterisation of air properties at atmospheric pressure. II I I This class defines the fundamental properties of air as Temperature. II Pressure and Absolute humidity. All other properties are obtained I I through function calls. 11 ********************************* ***************************************
#iflldef AirProps _ H_ #define AirProps_H_
class AirProps {
public:
A5- 1 6
double Temperature; 11 °C double Humidity; II kglkg dry air const double Pressure; II = 1 0 1 300 Pa const double DryAirSpecHeat; II = 1006 J/kgOC const double WaterVapSpecHeat II = 1 875 J/kgOC const double GasConstant; 11 = 8.4 1 3 J/moloC const double LatentHeat; 11 = 2.5e6 J/kg
AirProps(char[] ,double,char[],double); II Class AirProps constructor void SetAirProps(char ina[] , double aa, char inb[ ], double bb);
II Sets the Temperature and Humidity
double AirTemperature(char INal ],double a, char INbrJ="None",double b=42): double AirHumidity(char lNa f l .double a,char INb[ ]="None".double b=42): double AirDensityO: II Dry air density kglm3
double AirDensity(char lNAf] ,double A,char INB[J="None".double B=42): double VapPressureO; II Vapour Pressure (pa) from Humidity
double VapPressure(char INAI ],double A,char INB[ ]="None",double B=42): double SatVapPressureO; II Saturated Vapour Pressure (Pa) from AirTemp
double SatVapPressure(char INAn.double A,char INB [ ]="None",double B=42); double RHO: II RH from Humidity and AirTemp double RH(char INA_RH [ l,double A_RH ,char INB_RH[]="None",double B_RH =42 ) : double AirEnthalpyO: II Air Enthalpy J/kg dry air double AirEnthalpy(char INAf l ,double A,char INB[]="None".double B=42 ) :
AS.S.2 AIRPROPS.CPP:
11 **********************************************************
II II ************************** AirProps.cpp ********************
II II A class for characterisation of air properties at atmospheric pressure. II II This class defines the fundamental properties of air as Temperature, II Pressure and Absolute humidity. All other properties are obtained II through function calls. � **********************************************************
#include <string.h> #include <math.h> #include "Airprops.h"
� **********************************************************
II
II AirProps Constructor II � ** ********************************************************
AirProps: :AirProps(char INAl], double A, char INBl], double B) : Pressure( 1013e2), II Pa DryAirSpecHeat(1006), II J/kgOC
••• -•• ,-:10' •...... 't .•.• . • •· .. ·., .. ·'····:i�··.,Z-';i .. •·• ,", .', ••.. ,',. S"' "1'" -. ,··-···w········ "" .'.""., U', ,", '",. '"' ,', ·c· .. -" , ......... """ .. ........ -... ,-"-' .......... ··· ... ·-·N .. ····'.--·,'·-··- · .. '·{ .... •·•·•·• ... ·.·h .... D···-·· .... ·,,· ', ..... . ',.-. 'i;'., ..... ', ."t-, 0" •• '"f ·'·,·= .. ·· .. · ... 1 .. ,..·· .. •
AS-I7
} ;
WaterVapSpecHeat( 1875), GasConstant(8. 4 1 3), LatentHeat(2.5e6) {
SetAirProps(INA,A,INB,B);
II J/kgOC II NmlmoloC II J/kg
void AirProps: :SetAirProps(char inan , double aa. char inb[], double bb) {
} ;
Temperature = AirTemperature(ina,aa, inb,bb); Humidity = AirHumidity(ina,aa, inb,bb) ;
V **********************************************************
II II II
Air Humidity Functions
V **********************************************************
double AirProps : :AirHumidity(char INa[l, double a, char INb[] ,double b) {
double dummyH;
11******************* Sorting code ***********************
II. rearranges arguments so "Humidity" is last if it is present. if (stricmp(lNa."Temperature") == 0) {
char * INc = INb; double c: c = b: INb = INa: b = a: INa = INc: a = c:
II. sets INb to "Temperature" if second argument is not given if (stricmp(INb."None") == 0) {
lNb = "Temperature": b = Temperature:
II. checks i f INb = "Humidity" and changes it so I Na = "Humidity if (stricmp(lNb."Humidity" ) == 0) {
INa = INb: a = b;
11******************* Calculation code ***********************
II. Hwnidity
AS- I 8
if (stricmp(INa, "Humidity") == 0) { dunmlyH = a;
II. RH and Temperature if « stricmp(lNa,"RH") = = 0) && (stricmp(INb,"Temperature") == 0» {
dummyH = 1 8.0*a*exp(23 .4795-3990.56/(b+233 .833» 1(29. O*(Pressure-a *exp(23. 4 795-3990. 56/(b+ 233 .833» » ;
II. AirDensity and Temperature i f «stricmp(INa,"AirDensity") == 0) && (stricmp(INb."Temperature") = = 0» {
dummyH = 1 8 0*(273 1 5/(224*(273 . 1 5+b)*a)-1 129.0):
II. Air Enthalpy and Temperature i f « stricmp( lNa. "AirEnthalpy") == 0) && (stricmp(INb,"Temperature") == 0» {
dUl11myH = (a-DryAirSpecHeat*b)/(WaterVapSpecHeat*b+LatentHeat);
return dwnmyH;
11 **********************************************************
II II Temperature Functions II v **********************************************************
double AirProps: :AirTemperature(char INa[],double a,char INb[J , double b) {
double dun1l11yTemp;
11******************* Sorting code ***********************
II. rearranges argUTIlents so "Humidity" is last if i t i s present. if (stricmp(INa, "Hwnidity") ==0) {
char * INc = INb; double c; c = b; INb = INa; b = a; INa = INc; a = c;
II. sets INb to "Hwnidity" if second argUTIlent is not given if (stricmp(INb, "None") == 0) {
INb = "Hwnidity"; b = Humidity;
}
A5-19
II. checks if INb = "Temperature" and changes it so INa = "Temperature" if (stricmp(INb, "Temperature") == 0) {
INa = INb; a = b;
}
11******************* Calculation code ***********************
II. Temperature if (stricmp(INa,"Temperature") == 0)
durnmyTemp = a;
}
II .RH and Humidity imputed from user else if « stricmp(INa, "RH") == 0) && (stricmp(INb,"Humiditylt) == 0» {
durnmyTemp = 3990.S6/(23 .479S-log(29*b*Pressure/( 1 8+29*b)/a» -233.833;
}
II. AirEnthalpy and Humidity from user else if «stricmp(INa,ltAirEnthalpylt) == 0) && (stricmp(INb,ltHumiditylt) == 0» {
durnmyTemp = (a-b*LatentHeat)/(DryAirSpecHeat+b*WaterVapSpecHeat);
}
II. AirDensity and Humidity from user else if «stricmp(INa,ltAirDensitylt) == 0) && (stricmp(INb,ltHumiditylt) = = 0» {
dummyTemp = (273 . I S/(a*22.4*( l129.0+b/1 8.0)))-273. 1 5 :
}
II. room for more functions here
return dummyTemp;
1/ **********************************************************
II II AirDcnsity Functions II 1/ **********************************************************
double AirProps: : AirDcnsilyO { return 1 I(22 .4*(273 . 1 5+Temperature)*( 1 I29.0+Humidity/ 1 8.0)1273 . I S ) :
}:
double AirProps: : AirDcnsity(char lNAn.double A.char lNB f l .double B) {
} ;
double Humidity_int = AirHumidity(lNA.A. INB.B): double Temperature_int = AirTempcrature( \NA.AJNB.B); return 1 /(22.4*(273 . I S+Temperaturejnt)*( 1 /29.0+Humidityjntl 1 8.0)/273 . 1 S) :
1/ **************************************** ****************** II II Vapour Pressure FLllctions II
A5-20
11 **********************************************************
double AirProps: : VapPressureO { retum 29*Humidity*Pressure/( 1 8+ 29*Humidity);
double AirProps: : VapPressure( char INA[ ] ,double A,char INB[ ],double B) { double Humidity)nt = AirHumidity(INA,A,INB,B);
\ . J ,
return 29*Humidity)nt*Pressure/( 1 8+29*Hurnidity_int);
V * *********************************************************
II II Saturated Vapour Pressure Functions II 11 **********************************************************
double AirProps: : SatVapPrcssurcO { \ . J .
return exp(23 .4 795-3990.56/(Temperature+ 233.833»:
double AirProps: : SatVapPressure(char INA[ ] .double A,char INB[ ],double B) { double Temperaturc_int = AirTemperature(lNA,A,INB,B); return exp(23 .4 795-3990.56/(Temperature _ int+ 233 .833» ;
} :
V **********************************************************
II II Relative Humidity Functions II V **********************************************************
double AirProps: :RHO { return VapPressureO/Sat VapPressureO;
} ;
double AirProps: :RH(char INA_RH[],double A_RH,char INB_RH[],double B_RH) { return VapPressure(IN A _ RH,A _ RH,INB _ RH,B _ RH)
ISat VapPressure(INA _ RH,A _ RH,INB _ RH,B _ RH);
} ;
V **********************************************************
II II Air Enthalpy Functions II 11 **********************************************************
double AirProps : :AirEnthalpyO {
} ;
return Dry AirSpecHeat *Temperature+Humidity *(WaterVapSpecHeat*Temperature+LatentHeat);
double AirProps: :AirEnthalpy(char INA[],double A,char INB[],double B) {
• •.•• • , . , , . , • • • • - . . . .. .. . .. ..... ' •••• • • • •• • •• •• • •••.•. •.• ". � .. '.'. , ••.• • , .. . . .. .. . ........ ' •• •••• • • r •.• , .••.• ' . .. .. . . . . . . .. .......... . ' ... . .... ... ·.·« ••.•. •.• ' • • ' .... · ... ·.....,.·.· ..... · • • · • • '.·.r ...... . . . .. . ' •• • • • '.' ...... ""· • • · • • ,.· • • ·•· . .... ·•·•·•· •• '.· •• b.· ••.•.••.•.• • " ...... , .. . .... . ...... "
A5-21
} ;
double Temperature_int = AirTemperature(INA,A,INB,B); double Humidity _int = AirHumidity(INA,A,INB,B);
return Dry AirSpecHeat*Temperature _int+Humidity _int * (WaterVapSpecHeat*Temperature_int+LatentHeat);
. >, . . . A5-22