diet-induced obese mice are leptin insufficient after weight reduction
TRANSCRIPT
1702 VOLUME 17 NUMBER 9 | sEptEMBER 2009 | www.obesityjournal.org
articles nature publishing group
integrative Physiology
IntroductIonDespite attempts to increase awareness of the deleterious health consequences associated with obesity, there continues to be a significant increase in the obese population worldwide (1). High-fat (HF) content in many western diets is a major contributor to human obesity, leading to multiple problems such as hyperglycemia, hyperinsulinemia, and hyperleptine-mia, as well as glucose intolerance and insulin resistance (2). The majority of people who lose weight rapidly rebound to their prediet body weight and adiposity if proper diet and exercise are not maintained (3). The physiological responses to weight loss include increased food consumption (4–6), enhancement in metabolic efficiency (4), and reduction in resting and nonresting energy expenditure (3,7,8). However, the cellular mechanisms underlying limitation in weight loss are not fully understood.
Rodents that were fed an HF diet, analogous to western diets in terms of fat content and caloric density, develop an obesity syndrome similar to the metabolic syndrome in
humans. Like humans, rodents on an HF diet have a general-ized expansion in the size of white adipose tissue (WAT) due to both hypertrophy of preexisting adipocytes and hyperpla-sia by adipogenesis from the preadipocyte population in the stromal tissue (9). In response to weight loss induced by food restriction, the lipid content of adipocytes is readily reduced, yet the increased number of adipocytes is difficult to reverse (9). HF diet–induced obese (DIO) mice lose weight after being switched to a low-fat diet but rarely reach the same lean state as age-matched mice that are never exposed to an HF diet. We hypothesized that the retained excess adipos-ity was due to an increase in adipocytes induced by the HF diet (10) and would not be easily reversed by diet interven-tion. Although adiposity is defended at a high level, reduced adiposity suggested that certain metabolic changes caused by an HF diet could be reversed. To investigate this hypoth-esis, we examined the metabolic effects of a low-fat diet on DIO mice and the histological and molecular alterations in adipose tissue.
Diet-induced Obese Mice Are Leptin Insufficient After Weight ReductionHaifei Shi1, Shailaja Akunuru2, John C. Bierman2, Karen M. Hodge2, M. Chrissy Mitchell2, Michelle T. Foster1, Randy J. Seeley1 and Ofer Reizes2,3
Behavioral therapies aimed at reducing excess body fat result in limited fat loss after dieting. To understand the causes for maintenance of adiposity, high-fat (HF) diet–induced obese (DIO) mice were switched to a low-fat chow diet, and the effects of chow on histological and molecular alterations of adipose tissue and metabolic parameters were examined. DIO mice reduced and stabilized their body weights after being switched to chow (HF-chow), but retained a greater amount of adiposity than chow-fed mice. Reduction in adipocyte volume, not number, caused a decrease in fat mass. HF-chow mice showed normalized circulating insulin and leptin levels, improved glucose tolerance, and reduced inflammatory status in white adipose tissue (WAT). Circulating leptin levels corrected for fat mass were lower in HF-chow mice. Leptin administration was used to test whether reduced leptin level of HF-chow mice inhibited further fat loss. Leptin treatment led to an additional reduction in adiposity. Finally, HF-HF mice had lower mRNA levels of β3-adrenergic receptor (β3-AR) in epididymal WAT (EWAT) compared to chow-fed mice, and diet change led to an increase in the WAT β3-AR mRNA levels that were similar to the levels of chow-fed mice, suggesting an elevation in sympathetic activation of WAT during diet switch relative to HF-HF mice leading to the reduced leptin level and proinflammatory cytokine content. In summary, HF-chow mice were resistant to further fat loss due to leptin insufficiency. Diet alteration from HF to low fat improved metabolic state of DIO mice, although their adiposity was defended at a higher level.
Obesity (2009) 17, 1702–1709. doi:10.1038/oby.2009.106
1Obesity Research Center, Department of Psychiatry, University of Cincinnati, Cincinnati, Ohio, USA; 2Metabolism Biology, Health Care Research Center, Procter & Gamble Pharmaceuticals, Inc., Mason, Ohio, USA; 3Department of Cell Biology, Lerner Research Institute, Cleveland Clinic Foundation, Cleveland, Ohio, USA. Correspondence: Randy J. Seeley ([email protected]) or Ofer Reizes ([email protected])
Received 24 November 2008; accepted 14 March 2009; published online 16 April 2009. doi:10.1038/oby.2009.106

obesity | VOLUME 17 NUMBER 9 | sEptEMBER 2009 1703
articlesintegrative Physiology
Methods And ProceduresAnimalsTwo cohorts of adult male C57Bl/6J mice obtained from the Jackson Laboratory (Bar Harbor, ME) were individually housed in micro- isolator cages in pathogen-free, temperature- and humidity- controlled rooms with a 12/12 light/dark cycle. Mice were provided with ad libitum access to pelleted rodent chow (Harlan Teklad, Madison, WI, rodent diet 8604; 12% fat; 3.10 kcal/g) or an HF diet (Research Diets, New Brunswick, NJ, D12451; 45% fat; 4.73 kcal/g) and water unless otherwise noted. HF diet–fed mice that gained over 15 g of body weight after 10 weeks of HF diet feeding were divided into two body weight– and body fat–matched groups and were then either maintained on HF diet (HF-HF) or switched to chow (HF-chow) for another 2 weeks. The 2-week time point was chosen based on our previous unpublished studies showing stabilized body weights and improvement in metabolic profile after a 2-week diet switch; thus, it was important to know what metabolic and molecular events have occurred at this time point. Age-matched chow-fed mice were kept for controls. Quantitative nuclear magnetic resonance from Echo Medical Systems (Houston, TX) was used to determine body composition of the mice as previously described (11). All animal experi-ments were approved by the University of Cincinnati and the Procter & Gamble Institutional Animal Care and Use Committees.
First cohortThree groups of mice from the first cohort (HF-HF, HF-chow, Chow; n = 10 per group) were used to monitor body weight and body fat, and to evaluate metabolic profile, histology, and gene expression of adipose tissue.
Intraperitoneal glucose tolerance test. Mice were fasted for 4 h and intraperitoneal glucose tolerance test was performed during the light phase. All blood samples were obtained from the tip of the tail vein. Following a baseline (0 min) blood sample withdraw, 0.75 g/kg body weight of 20% D-glucose (Sigma-Aldrich, St Louis, MO) was injected and the concentration of glucose was measured on duplicate samples at 15, 30, 45, 60, 120, and 180 min using One Touch Basic glucometers and One Touch glucose test strips (LifeScan, Milpitas, CA).
Assays for leptin and insulin. All mice were killed by intraperitoneal administration of Fatal-Plus (100 mg/kg; Vortech Pharmaceuticals, Dearborn, MI) at the end of the light phase, and cardiac blood samples were collected with cardiac puncture. Blood samples were centrifuged and plasma was stored at −20 °C until assay. The concentrations of leptin and insulin were measured using 125I RIA kits (Linco Research, St Charles, MO). The coefficients of variation within and between leptin assays are 3 and 4%, and the coefficients of variation within and between insulin assays are 5 and 7%. The sensitivity for leptin assay is 0.5 ng/ml and for insulin assay is 3 pmol/l.
Adipose tissue and liver histology. The epididymal WAT (EWAT) pads were dissected and fixed in neutral buffered 10% formalin, embed-ded in paraffin, sectioned, and stained with hematoxylin and eosin. Microscopic images were digitized from 20 sections across each EWAT depot for assessment of adipocyte cellularity. The size of adipocytes was quantified from the images using a program developed to digitize the cross-sectional area of the cells in a given field. Adipocyte number was
derived by dividing the EWAT volume (calculated by multiplying the EWAT mass by 0.92 cm3/g, the approximate density of adipose tissue) by the adipocyte volume. The cell number analysis using this histo-logical method was validated by comparing it to the osmium tetroxide fixation method of Hirsch and Gallian (12). Livers were dissected and fixed in 10% neutral buffered formalin and then 30% sucrose solution before being embedded. Liver sections were stained for lipid with Oil Red O to estimate the extent of lipid accumulation.
Quantitative PCR analyses of gene expression of adipose tissues. Monocyte chemoattractant protein-1 (MCP-1), a macrophage-specific marker CD68, and β3-adrenergic receptor (β3-AR) gene expressions were measured in EWAT. β3-AR and uncoupling protein-1 gene expressions were measured in the interscapular brown adipose tissues (IBATs). Briefly, RNA was isolated from EWAT or IBAT using TRI Reagent (MRC, Cin-cinnati, OH). Following DNase treatment (Ambion, Austin, TX), cDNA was synthesized using an iScript kit (Bio-Rad, Hercules, CA). L32 was used as an endogenous control to indicate relative quantification of gene expression from every sample. The sequences of selected primers were from GenBank, and the primers were selected using Primer3 web-based primer design (http://frodo.wi.mit.edu/cgi-bin/primer3/primer3_www.cgi; Table 1). Quantitative PCR was performed using a Bio-Rad iCycler and the iQ SYBR Green Supermix (Bio-Rad) with 2-step amplification at 95 °C for 10 s and annealing temperature of 61.2 °C (L32, MCP-1, β3-AR, and uncoupling protein-1) or 64.3 °C (CD68) for 30 s for 40 cycles. The difference of threshold cycle (ΔCT) between control gene L32 and inter-ested gene was calculated. For relative quantification, the ΔCT was aver-aged for the HF-HF group and was then subtracted from the ΔCT of each HF-chow sample to calculate the approximate fold difference (Applied Biosystems manufacturer’s instructions).
table 1 oligonucleotides used for quantitative rt-Pcr amplifications
Target gene Accession no. Sequence
MCP-1 J04467 Forward primer: 5′-CCCAATGAGTAGGCTGGAGA-3′ Reverse primer: 5′-TCTGGACCCATTCCTTCTTG-3′
CD68 P31996 Forward primer: 5′-TTCTGCTGTGGAAATGCAAG-3′ Reverse primer: 5′-AGAGGGGCTGGTAGGTTGAT-3′
β3-AR X72862 Forward primer: 5′-TCGACATGTTCCTCCACAAA-3′ Reverse primer: 5′-GATGGTCCAAGATGGTGCTT-3′
UCP-1 U63418 Forward primer: 5′-GGGCCCTTGTAAACAACAAA-3′ Reverse primer: 5′-GTCGGTCCTTCCTTGGTGTA-3′
β3-AR, β3-adrenergic receptor; CD68, CD68 molecule, a macrophage-specific marker; MCP-1, monocyte chemoattractant protein-1; RT, reverse transcriptase; UCP-1, uncoupling protein-1.
table 2 Body weight, body fat, and concentrations of plasma leptin and insulin of chow-fed, hF-chow, and hF-hF mice
Diet BW (g) Total fat (g)Leptin (ng/ml)
Leptin/body fat (ng/ml/g)
Insulin (ng/ml)
Insulin/body fat (ng/ml/g)
Chow 28.50 ± 0.24 2.68 ± 0.15 8.02 ± 1.68 2.77 ± 0.52 2.66 ± 1.16 0.91 ± 0.37
HF-chow 33.30 ± 0.90* 5.28 ± 0.59* 7.14 ± 1.39 1.55 ± 0.22* 2.64 ± 0.94 0.43 ± 0.11
HF-HF 40.88 ± 0.94*,† 13.46 ± 0.51*,† 25.57 ± 0.40* 1.92 ± 0.06 13.29 ± 0.48* 1.00 ± 0.05
BW, body weight.*P < 0.05 comparing to chow mice. †P < 0.05 comparing to HF-chow mice. n = 10.

1704 VOLUME 17 NUMBER 9 | sEptEMBER 2009 | www.obesityjournal.org
articlesintegrative Physiology
second cohortData from the first cohort demonstrated that leptin levels of HF-chow and chow mice were identical, although HF-chow mice contained sig-nificantly greater adiposity; the leptin level was lower in the HF-chow mice when corrected for the total adiposity (Table 2). It is possible that the suppressed leptin level of HF-chow mice leads to resistance in fur-ther body fat loss. In this cohort, we tested whether HF-chow mice were leptin sensitive and whether administration of exogenous leptin would lead to further reduction in body weight and fat.
Leptin sensitivity test. HF-HF and HF-chow mice were divided into three groups that were matched with body weight and body fat (n = 10 per group). All mice were injected intraperitoneally twice daily with either phosphate-buffered saline (PBS) or leptin (10 or 20 mg/kg; R&D Systems, Milwaukee, WI) for 7 days based on a published paradigm (13). Leptin injection of 10 mg/kg is effec-tive in decreasing food intake in chow-fed and 4-day HF diet–fed mice, but not in 16-day HF diet–fed mice (13). Dose-dependent responses in the current 10-week HF DIO mice may exist; thus, a higher dose of leptin (20 mg/kg) was also used. Injections were performed immediately prior to the onset of dark period and 6 h afterward. Body weight and food intake of the mice were monitored daily. On the eighth day, mice were injected with PBS or leptin
before the onset of darkness; then all mice were killed and concen-trations of circulating leptin levels were measured using the same method as mentioned above.
statistical analysisData were expressed as mean ± s.e.m. Comparisons between multiple groups were made using one-way or two-way ANOVA when appro-priate. Post hoc tests of individual groups were made using Tukey’s tests (SigmaStat 3.1; Jandel Scientific, San Rafael, CA). Significance was set at P < 0.05.
resultsFirst cohortHF-chow mice maintained excess adiposity. Two weeks after their diet switch, HF-chow mice showed a significant reduction in body weight and body fat. HF-HF mice weighed an average of over 40 g and had over 30% body fat, whereas HF-chow mice weighed an average of 33 g and had approximately 15% body fat. Chow-fed mice weighed <30 g and had less than 10% body fat on average. Total adiposity of HF-chow mice was 50% less
HF-HF
HF-cho
wCho
w
HF-HF
HF-cho
wCho
w
HF-HF
HF-cho
wCho
w
HF-HF
HF-cho
wCho
w
Bod
y fa
t (%
)
**†
35
a b
c d
e
f
302520151050 0.0
0.5
1.0
1.5
2.0
2.5
EW
AT m
ass
(g)
*
* †* †
0
1.0 × 10⁵
2.0 × 10⁵
0
1.0 × 10⁷
2.0 × 10⁷
**
Cel
l vol
ume
(µm
3 )
**
** * †
Cel
l num
ber
* †* †
HF-HF HF-chow
7.0 × 10⁶
6.0 × 10⁶
5.0 × 10⁶
4.0 × 10⁶
3.0 × 10⁶
1.0
× 10
6
2.0
× 10
6
3.0
× 10
6
4.0
× 10
6
5.0
× 10
60
Osmium tetroxide fixation method
His
tolo
gica
l ana
lysi
s
Figure 1 HF-chow mice lost weight but retained excess body adiposity compared to chow-fed mice. HF-chow mice had reduced fat cell size but not fat cell number. (a) Body fat percentage, (b) epididymal white adipose tissue (EWAT) mass, (c) fat cell volume, and (d) fat cell number of HF-HF, HF-chow, and chow-fed mice. (e) Representative images of EWAT of HF-HF and HF-chow mice. (f) Linear regression of cellularity between histologically prepared and osmium tetroxide fixed samples. *P < 0.05 comparing to HF-HF mice. †P < 0.05 comparing to HF-chow mice. Bar = 100 µm.
obesity | VOLUME 17 NUMBER 9 | sEptEMBER 2009 1705
articlesintegrative Physiology
than that of HF-HF mice; however, adiposity of HF-chow mice was twice that of chow-fed mice (Figure 1a and Table 2). Total body fat and body fat % were all significantly different among three groups (Figure 1a and Table 2).
EWAT mass of HF-chow mice was analogously reduced, being significantly less than that of HF-HF mice but greater than that of chow-fed mice (Figure 1b). The cell number anal-ysis using the histological method was validated by compar-ing it to the osmium tetroxide fixation method of Hirsch and Gallian (12). There was a significant correlation between two methods (R2 = 0.620, P = 0.036; Figure 1f). HF-HF mice had enlarged and increased number of adipocytes comparing to chow-fed mice. Diet switch in HF-chow mice did not change the number of fat cells but decreased fat cell size by 1/3, pro-portionally to the decrease in EWAT mass (Figure 1c–e). The sizes of adipocytes of HF-chow mice and chow-fed mice were not significantly different, yet the number of adipocytes of HF-chow mice was approximately twice that of the chow-fed group (Figure 1c,d). Therefore, diet switch from HF to chow reduced adipocyte volume with no apparent changes in adi-pocyte number of EWAT.
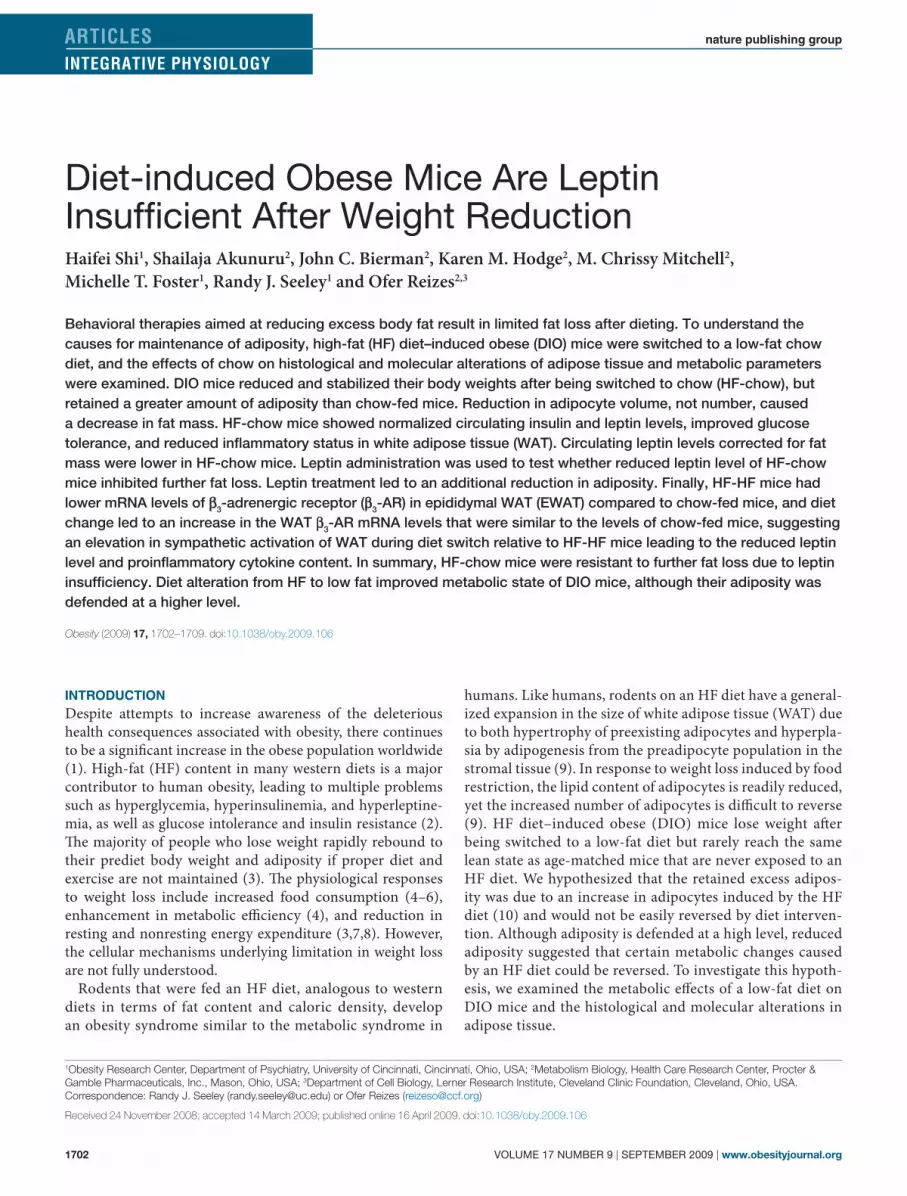
HF-chow mice improved steatotic livers and metabolic profile. The livers of HF-HF mice were steatotic as assessed by Oil Red O staining in liver sections. In contrast, after the DIO mice had been switched to chow for as little as 2 weeks, the steatosis decreased and histology of livers was indistinguishable between HF-chow and chow-fed mice (Figure 2a–c). The rapid reversal in steatosis may be indicative of changes in other metabolic end points; therefore, we analyzed the levels of leptin and insulin in
the serum. Circulating leptin and insulin levels were significantly reduced in HF-chow mice compared to HF-HF mice, and these levels were equivalent in HF-chow and chow-fed mice, despite the greater adiposity of HF-chow mice (Table 2). In addition, when the concentrations of circulating leptin and insulin were corrected for the total amount of body fat, leptin level, but not insulin level, of HF-chow mice was significantly lower than that of chow-fed mice (Table 2).
Intraperitoneal glucose tolerance test was performed in HF-HF, HF-chow, and chow-fed mice to test whether the normalized circulating insulin level and improved hepatic steatosis led to improved glucose tolerance in the HF-chow mice. Although HF-HF mice showed high baseline glucose level (229 ± 7 mg/dl) and poor glucose tolerance, HF-chow mice showed normal baseline glucose level (HF-chow: 180 ± 8 mg/dl; chow: 170 ± 7 mg/dl) and normal glucose tolerance indistinguishable from chow-fed mice, with lowered glucose levels comparing to HF-HF mice at all time points during intraperitoneal glucose tolerance test (Figure 2d). Therefore, despite maintaining a higher level of adiposity, HF-chow mice had similar metabolic profiles and glucose tolerance compared to chow-fed mice.
HF-chow mice have reduced macrophage markers in EWAT. The improved glucose tolerance in HF-chow mice could be due to improved inflammatory status and reduced macrophage con-tent in adipose tissue. Using quantitative PCR analysis, there was a 70% decrease in transcript level of the chemoattractant MCP-1 and the macrophage-specific marker CD68 in EWAT of HF-chow mice compared to that of HF-HF mice (Table 3). In addition, the EWAT mRNA levels of MCP-1 and CD68 were not different between HF-chow and chow-fed mice. This likely indicates that HF-chow mice had improved inflammatory status and reduced macrophage infiltration in adipose tissue, which was normalized to the same levels as chow-fed lean mice.
β3-AR expression is increased in EWAT but decreased in IBAT in HF-chow mice. The finding that circulating leptin is reduced when corrected for total body fat content suggests that leptin secretion is inhibited. Inhibition of leptin secretion (14–16) and proinflammatory cytokine production suggests possible sympathetic activation in the WAT (17). Diet switch from HF to chow increased β3-AR expression in EWAT but decreased
0 30 60 90 120 150 180
150
200
250
300
350
400
450
500
550
600
650
700
a b
d
c
Time (min)
***
*
HF-HFHF-chowChow
Glu
cose
(m
g/dl
)
*
*
**
Figure 2 HF-chow mice improved steatotic livers and glucose tolerance. HF-HF mice had fatty liver that was recovered in HF-chow diet-induced obese mice. (a) Liver histological analysis of HF-HF, (b) HF-chow, and (c) chow-fed mice using Oil Red O staining. (d) HF-HF mice had impaired glucose tolerance whereas HF-chow mice had normal glucose tolerance similar as chow-fed mice. *P < 0.05 comparing to HF-HF mice.
table 3 Percentages of eWAt and IBAt gene expression of hF-hF, hF-chow, and chow-fed mice
% change HF-HF HF-chow Chow
EWAT MCP-1 100.00 ± 15.27 32.92 ± 7.16* 26.28 ± 4.56*
EWAT CD68 100.00 ± 27.12 34.64 ± 12.83* 45.32 ± 8.29*
EWAT β3-AR 100.00 ± 18.76 232.09 ± 50.23* 338.19 ± 79.70*
IBAT β3–AR 100.00 ± 8.94 50.76 ± 8.69* 66.96 ± 12.83
IBAT UCP-1 100.00 ± 8.36 50.25 ± 10.13* 30.09 ± 2.52*
β3-AR, β3-adrenergic receptor; CD68, CD68 molecule, a macrophage-specific marker; EWAT, epididymal white adipose tissue; IBAT, interscapular brown adipose tissue; MCP-1, monocyte chemoattractant protein-1; UCP-1, uncoupling protein-1.*P < 0.05 comparing to HF-HF mice. There is no difference between HF-chow and chow-fed mice.
1706 VOLUME 17 NUMBER 9 | sEptEMBER 2009 | www.obesityjournal.org
articlesintegrative Physiology
in IBAT relative to the HF-HF mice (Table 3). In addition, the mRNA levels of β3-AR and uncoupling protein-1 of IBAT were equivalently reduced in HF-chow mice and were com-parable to the mRNA levels of chow-fed mice (Table 3). There was no difference in β3-AR expression between HF-chow and chow-fed mice. The lowered levels of both β3-AR and uncou-pling protein-1 mRNA in IBAT and the increased β3-AR expression in EWAT relative to HF-HF mice but similar to chow-fed mice suggest that HF-chow mice might maintain a lower sympathetic activation in IBAT but an elevated sym-pathetic drive to EWAT than HF-HF mice did, and HF-chow mice had similar sympathetic drive in IBAT and EWAT as chow-fed lean mice.
second cohortLeptin is secreted in direct proportion to body adiposity—as adipose tissue increases so does the circulating level of leptin (18). The data from the first cohort suggest this may not
be the case. HF-chow mice have greater amount of adipose tis-sue than chow-fed mice, yet they have similar circulating leptin levels (Table 2). When the concentration of circulating leptin is corrected for adiposity, the HF-chow mice have a lower lep-tin level than that of chow-fed mice (Table 2), suggesting that a leptin insufficient state exists in HF-chow mice. The suppressed leptin level may resist further body fat loss in HF-chow mice. Therefore, we tested the effects of exogenous leptin administra-tion in HF-chow mice using a second cohort.
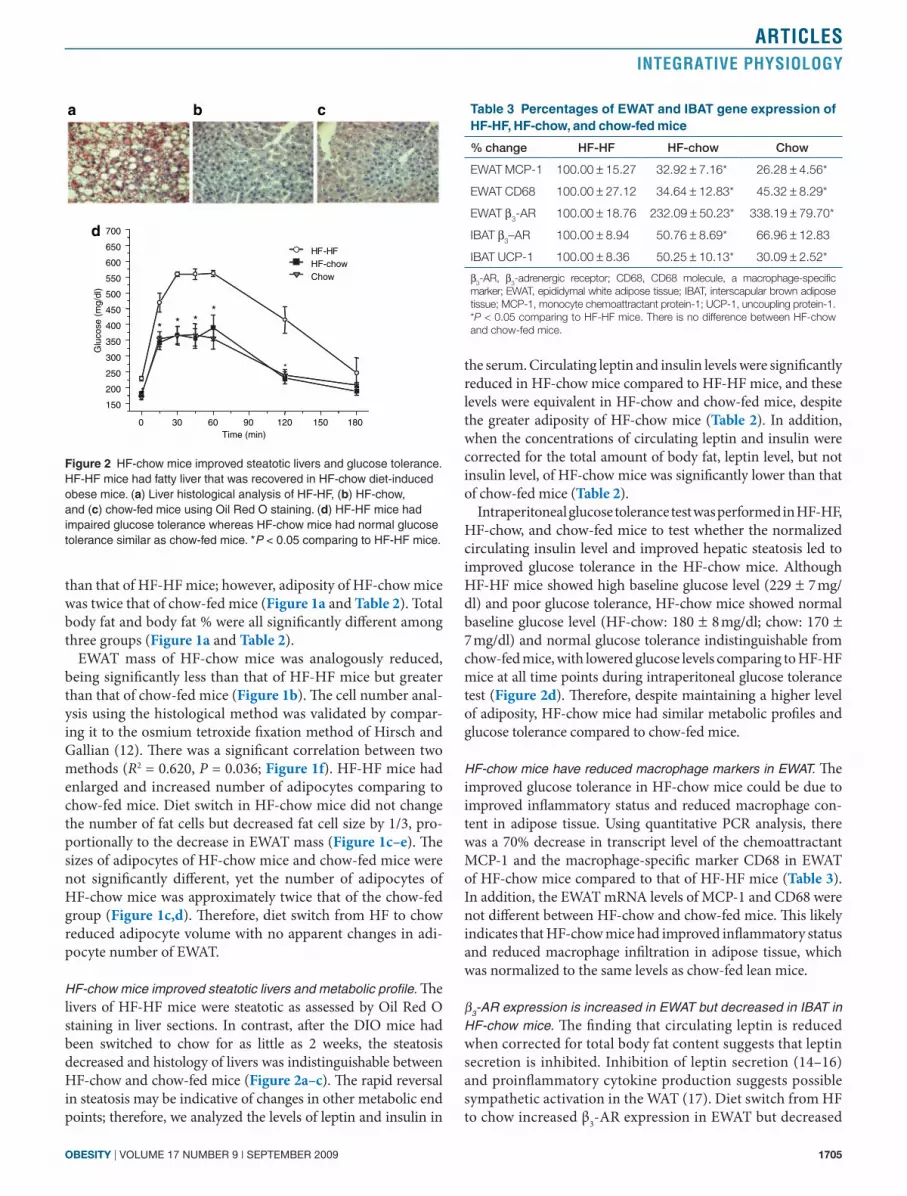
Body weights of HF-HF and HF-chow mice before leptin treatment. HF DIO mice were switched to the chow diet and body weight monitored for 7 weeks prior to leptin injection. During the initial week, the body weights of the HF-HF and HF-chow mice were significantly more than chow-fed control mice. By the end of the second week, the body weights of HF-chow and chow-fed mice were no longer significantly different (Figure 3a). Importantly, total fat tissue mass of the HF-chow mice was sig-nificantly different from the HF-HF and chow-fed mice (HF-HF mice: 15.81 ± 0.48 g; HF-chow mice: 7.19 ± 0.38 g; Chow mice: 2.41 ± 0.21 g). HF-HF mice but not HF-chow mice weighed significantly greater than chow-fed mice between week 2 and week 7. There was no further weight decrease in HF-chow mice from 2–7 weeks suggesting that the body weight of HF-chow mice stabilized 2 weeks after the diet switch (Figure 3a).
Circulating leptin levels of treated mice. Consistent with data from the first cohort, HF-chow mice had similar circulating leptin level as chow-fed mice and significantly lower leptin level than HF-HF mice (Figure 3b). HF-chow mice treated with the high dose of leptin (20 mg/kg) had increased circulating leptin levels that are comparable to the PBS-treated HF-HF mice (Figure 3b).
HF-chow mice were leptin sensitive. Consistent with previous reports, we confirmed that DIO mice are leptin resistant (13). HF-HF mice treated with 10 or 20 mg/kg leptin showed no reduction in food intake or body weight compared to PBS-treated HF-HF mice (Figure 3c,d). Food intake of the PBS-treated HF-chow mice was greater than that of PBS-treated chow-fed mice (Figure 3e). Treatment of HF-chow mice with 10 or 20 mg/ kg leptin led to a reduction in food intake, comparable to the food intake of chow-fed mice (Figure 3e). Leptin-treated HF-chow mice also reduced their body weights, though not to the level of chow-fed mice (Figure 3f). Thus, unlike HF-HF mice, HF-chow mice were sensitive to exogenous leptin administration.
Leptin-treated HF-chow mice further decreased body fat and adipocyte number. All HF-chow mice showed a reduction in adiposity during the treatment period (Figure 4a). Impor-tantly, the reduction in body weight was dose dependent, and with increasing concentration of leptin, there was a more pronounced decrease in body fat. Both the 10 and 20 mg/kg leptin-treated HF-chow mice showed a significantly greater reduction in body fat than PBS-treated HF-chow
Chow P
BS
HF-HF P
BS
HF-cho
w PBS
0
10
20
30
Lept
in (
ng/m
l)
** *
†
HF-HF 2
0 m
g/kg
lept
in
HF-cho
w 20
mg/
kg
leptin
0 1 2 3 4 5 6 7Time (days)
0
5
10
15
20 HF-HF PBSHF-HF 10 mg/kg leptinHF-HF 20 mg/kg leptin
0 1 2 3 4 5 6 7Time (days)
Cum
ulat
ive
food
inta
ke (
g)
0 1 2 3 4 5 6 7Time (days)
38
40
42
44
46
48HF-HF PBSHF-HF 10 mg/kg leptinHF-HF 20 mg/kg leptin
Bod
y w
eigh
t (g)
0
5
10
15
20
25
30
Chow PBSHF-chow PBSHF-chow 10 mg/kg leptinHF-chow 20 mg/kgleptin
**
**
*
Cum
ulat
ive
food
inta
ke (
g)
0 1 2 3 4 5 6 7Time (days)
Chow PBSHF-chow PBSHF-chow 10 mg/kg leptinHF-chow 20 mg/kg leptin
27
29
31
33
35
37
25
Bod
y w
eigh
t (g)
0 1 2 3 4 5 6 725
30
35
40
45
50
55
60a b
c d
e f
HF-HFHF-chowChow
* *
Week
Bod
y w
eigh
t (g)
* * * * * *† †
Figure 3 HF-chow but not HF-HF mice were leptin sensitive. (a) Body weight curves after diet switch and before leptin administration. *P < 0.05 HF-HF mice comparing to chow-fed mice. †P < 0.05 HF-chow mice comparing to chow-fed mice. (b) Plasma leptin levels following leptin treatment. *P < 0.05 comparing to chow-fed PBS mice. †P < 0.05 comparing to HF-HF PBS mice. (c) Food intake and (d) body weight of vehicle (PBS)- or leptin-treated HF-HF mice. (e) Food intake and (f) body weight of vehicle (PBS)- or leptin-treated HF-chow mice and PBS-treated chow-fed mice. *P < 0.05 comparing to chow-fed mice. PBS, phosphate-buffered saline.

obesity | VOLUME 17 NUMBER 9 | sEptEMBER 2009 1707
articlesintegrative Physiology
mice (Figure 4a). Leptin treatment of 20 mg/kg also led to a significant decrease in EWAT mass, but it did not reach the level of chow-fed mice (Figure 4b). EWAT adipocyte sizes of all groups were similar (Figure 4c); however, adipocyte number was significantly reduced in the 20 mg/ kg leptin-treated mice and was similar to that of the chow-fed mice (Figure 4d). Therefore, leptin treatment of HF-chow mice leads to a further decrease in fat mass by reducing the num-ber of adipocytes.
dIscussIonHF diet feeding in mice leads to an increase in adiposity due to hypertrophy and hyperplasia of adipocytes. The mice develop an obesity syndrome that includes hyperleptinemia, hyper-insulinemia, and impaired glucose tolerance. HF DIO mice switched to a low-fat diet lose body weight and adiposity, and exhibited improved metabolic profile, normal glucose toler-ance, and increased leptin sensitivity. Surprisingly, HF-chow mice retained the increased adipocytes accumulated dur-ing the HF feeding, which limited their overall weight loss. Concomitant with the weight reduction was decreases in the content of macrophage and proinflammatory factors in WAT. In addition, the level of the β3-AR mRNA was elevated in WAT relative to HF-HF mice suggesting an increase in sympathetic tone following the diet change, which was similar to the level of lean control mice.
Leptin is produced principally by white adipocytes and secreted in proportion to the amount of body fat (19). Leptin levels are also influenced by meal consumption and short-term swings in energy balance such as fasting or overfeeding; and we recently reported that circulating levels of male mice dynamically changed during caloric restriction and refeed-ing (11). Interestingly, circulating leptin levels in chow-fed and HF-chow mice were nearly identical despite greater body adiposity in HF-chow mice. When corrected for body fat, the leptin/adiposity ratio of HF-chow mice was signifi-cantly lower than that of chow-fed mice. This indicates that HF-chow mice are in a state of leptin insufficiency, leading to greater food intake of PBS-treated HF-chow mice compared to PBS-treated chow-fed mice and maintenance of greater adiposity in HF-chow mice (Figure 3e). The leptin insuffi-ciency of HF-chow mice can be overcome by exogenous lep-tin. Treatment of HF-chow mice led to a further reduction in fat by decreasing the number of adipocytes, in marked contrast to the reduction of adipocyte size by just the low-fat diet. Therefore, reduced leptin level underlies the resistance of further body fat reduction in HF-chow mice. Injections of leptin corrected the leptin insufficient state in HF-chow mice and led to further body fat reduction. Leptin plays impor-tant roles in the regulation of energy balance and inflamma-tion (20). In the current study, adipose gene expression was not measured in leptin-treated animals because changes of
−4
−3
−2
−1
0
Fat
cha
nge
(g)
*
HF-chow
PBS
HF-chow
10 m
g/kg
leptin
HF-chow
20 m
g/kg
leptin
*†
a
0
1.0 × 10⁵
2.0 × 10⁵
Cel
l vol
ume
(µm
3 )
HF-chow
PBS
HF-chow
10 m
g/kg
leptin
HF-chow
20 m
g/kg
leptin Chow P
BS
c
0
1.0 × 10⁷
2.0 × 10⁷
* *
Cel
l num
ber
HF-chow
PBS
HF-chow
10 m
g/kg
leptin
HF-chow
20 m
g/kg
leptin Chow P
BS
d
HF-chow
PBS
HF-chow
10 m
g/kg
leptin
HF-chow
20 m
g/kg
leptin Chow P
BS0.0
0.4
0.8
1.2
1.6
EW
AT
mas
s (g
)
*
*†
b
Figure 4 HF-chow mice had decreased total body fat, epididymal white adipose tissue (EWAT) mass, and fat cell number after leptin treatment. (a) Body fat change, (b) EWAT mass, (c) fat cell size, and (d) fat cell number of vehicle (PBS)- or leptin-treated HF-chow mice. *P < 0.05 comparing to PBS-treated HF-chow mice. †P < 0.05 comparing to 10 mg/kg leptin-treated HF-chow mice. PBS, phosphate-buffered saline.
1708 VOLUME 17 NUMBER 9 | sEptEMBER 2009 | www.obesityjournal.org
articlesintegrative Physiology
gene expression in adipose tissue are secondary to the loss of body fat and change of adipocyte cellularity after 7-day leptin treatment.
DIO mice have impaired glucose tolerance and are leptin resistant. Both conditions are resolved after reducing weight in DIO mice using a low-fat diet. Reduction in fat cell con-tent is associated with improvements in metabolic parameters including glucose tolerance. Indeed, one of the consequences of treatment with the antidiabetic thiazolidinediones is an increase in number of small adipocytes, suggesting reduced adipocyte size contributes to the improvement in insulin sensitivity (21). Therefore, weight loss that induces a reduc-tion in adipocyte size would cause the most improvement in the inflammatory status and glucose handling in the obese mice. Our findings are consistent with other observations that enlarged adipocytes are strongly correlated with obesity-related inflammation (22). Reduction in fat content leads to a regain in glucose tolerance and leptin sensitivity (23). In contrast, increased fat cell number following HF diet-induced obesity is not easily reduced. In related studies, long-term diet restriction and exercise training decrease fat cell volume without a significant change in fat cell number in human (24) and rats (25). Leptin treatment, however, decreases fat cell numbers in rats (26) and in mice from the current study. This is not surprising, as leptin has been shown to induce adipocyte apoptosis in vivo (27) and inhibit maturation of preadipocytes in vitro 3T3-L1 adipocytes (28).
We focused on EWAT because it is the adipose tissue with the most existing data in the literature and more importantly because it had the highest levels of expression of inflamma-tion-related genes such as MCP-1 and CD68 in HF DIO mice (29). In addition, EWAT contains less connective tissue than subcutaneous inguinal WAT and fewer blood vessels than perirenal or mesenteric WAT, assuring accuracy in analysis of cellularity and gene expressions. EWAT also has the distinction of having a large influence on glucose tolerance. For example, surgical removal of EWAT caused the largest improvements in glucose tolerance when compared with surgical removal of equal amounts from varying fat depots (30).
The current study suggests that sympathetic activity in EWAT of HF-chow mice was elevated 2 weeks after switch to chow relative to the HF-HF mice and was normalized to the lean controls, as evidenced by an increase of β3-AR gene expres-sion compared to HF-HF mice that was returned to the level of chow-fed lean mice. β3-AR, the primary postsynaptic sym-pathetic adrenoceptor subtype in rodent WAT, is an important sympathetically related receptor in the control of adiposity (31). β3-AR gene expression in WAT is significantly greater in HF-chow mice relative to HF-HF mice and is similar to lean mice. Although it might be expected that the diet switch–induced increase in sympathetic drive on adipose tissues would downregulate β3-ARs or promote postreceptor desen-sitization (32), the β3-AR has been reported to be regulated primarily at the transcriptional level and its expression associ-ated with increased norepinephrine level (33). This contrasts with the β1- and β2-ARs that are desensitized after sustained
stimulation (33). The greater β3-AR mRNA level in WAT of HF-chow mice compared to HF-HF mice from the current study is consistent with the increase in sympathetic stimulation observed previously in DIO rats that were switched to chow diet assessed by norepinephrine level and norepinephrine turnover rate in WAT (34). In contrast to the putative sympa-thetic stimulation in WAT, sympathetic activity in the brown adipose tissue was lower in HF-chow and lean mice relative to HF-HF mice—in all likelihood—due to a decrease in diet-induced thermogenesis (35). Direct measurement requires an assay of norepinephrine turnover rates in individual tissues. Although we did not directly measure sympathetic activation, the correlation between sympathetic activity and β3-AR gene expression is well established in many physiological models. For example, sympathetic drive to WAT is activated during fasting and suppressed during refeeding, and β3-AR mRNA level in WAT correspondingly increases during fasting and decreases during refeeding (36).
Levin and colleagues reported a general increase in sym-pathetic activity in DIO Sprague–Dawley rats after switching to regular chow from HF diet (34). They found a significant increase of sympathetic activity in brown fat. This was accom-panied by a slight but nonsignificant increase of sympathetic activity in epididymal white fat 3 days after DIO rats were switched to chow (34). Although those observations are not consistent with the current data, the variation may be due to the different time points when sympathetic activity was assessed. In Levin’s study, adipose tissues were harvested 3 days after the diet was switched from HF to chow. At this early time point, the animals are losing weight, so it is not surprising that they have high sympathetic activity in the brown fat. In contrast, by 2 weeks, our findings indicate that the DIO mice reached a new stable body weight and a concomitant decrease in sympathetic innervation of brown fat.
Leptin secretion is inhibited by conditions that promote increased sympathetic drive on WAT (37) and these changes do not necessarily reflect adjustments in adiposity. Sympathetic activation with adrenergic agonists, in particular those specific for the β3-AR, inhibit ob gene expression and leptin secretion in vitro (38–40) and in vivo in mice (41,42), rats (43), and humans (44). The suppressed leptin levels in the HF-chow mice may initiate hypothalamic changes that resist further weight loss by biasing the animal toward greater food intake and/or decreased energy expenditure. For example, Enriori et al. recently demonstrated altered leptin sensitivity of pro-opiomelanocortin and neuropeptide Y/agouti-related peptide neurons in the arcuate nucleus of the hypothalamus in HF DIO mice (23).
Our data support the concept that DIO mice resist weight loss due to defense of adipose tissue and more notably the con-servation of fat cell number in adipose tissue. We suggest that it is the leptin insufficient state that leads to a drive to defend the excess fat cells accumulated during the weight gain phase on an HF diet. Although adiposity is defended at a high level, reduced adiposity caused by diet switch from HF to low fat improved metabolic profiles.
obesity | VOLUME 17 NUMBER 9 | sEptEMBER 2009 1709
articlesintegrative Physiology
AcknoWledgMentsWe thank Jennifer Waldrop for her comments on this manuscript and procter & Gamble for their generous gift of leptin.
dIsclosures.A., J.C.B., and K.M.H. are procter & Gamble stock shareholders. J.C.B. and K.M.H. are current procter & Gamble employees.
© 2009 The Obesity Society
reFerences1. Yach D, Stuckler D, Brownell KD. Epidemiologic and economic
consequences of the global epidemics of obesity and diabetes. Nat Med 2006;12:62–66.
2. Lazar MA. How obesity causes diabetes: not a tall tale. Science 2005;307:373–375.
3. Levin BE. Why some of us get fat and what we can do about it. J Physiol (Lond) 2007;583:425–430.
4. MacLean PS, Higgins JA, Johnson GC et al. Enhanced metabolic efficiency contributes to weight regain after weight loss in obesity-prone rats. Am J Physiol Regul Integr Comp Physiol 2004;287:R1306–R1315.
5. Cornier MA, Grunwald GK, Johnson SL, Bessesen DH. Effects of short-term overfeeding on hunger, satiety, and energy intake in thin and reduced-obese individuals. Appetite 2004;43:253–259.
6. Doucet E, Imbeault P, St-Pierre S et al. Appetite after weight loss by energy restriction and a low-fat diet-exercise follow-up. Int J Obes Relat Metab Disord 2000;24:906–914.
7. Leibel RL, Rosenbaum M, Hirsch J. Changes in energy expenditure resulting from altered body weight. N Engl J Med 1995;332:621–628.
8. Ravussin E, Burnand B, Schutz Y, Jéquier E. Energy expenditure before and during energy restriction in obese patients. Am J Clin Nutr 1985;41:753–759.
9. Hausman DB, DiGirolamo M, Bartness TJ, Hausman GJ, Martin RJ. The biology of white adipocyte proliferation. Obes Rev 2001;2:239–254.
10. Faust IM, Johnson PR, Stern JS, Hirsch J. Diet-induced adipocyte number increase in adult rats: a new model of obesity. Am J Physiol 1978;235:E279–E286.
11. Shi H, Strader AD, Woods SC, Seeley RJ. Sexually dimorphic responses to fat loss after caloric restriction or surgical lipectomy. Am J Physiol Endocrinol Metab 2007;293:E316–E326.
12. Hirsch J, Gallian E. Methods for the determination of adipose cell size in man and animals. J Lipid Res 1968;9:110–119.
13. Van Heek M, Compton DS, France CF et al. Diet-induced obese mice develop peripheral, but not central, resistance to leptin. J Clin Invest 1997;99:385–390.
14. Trayhurn P, Duncan JS, Rayner DV. Acute cold-induced suppression of ob (obese) gene expression in white adipose tissue of mice: mediation by the sympathetic system. Biochem J 1995;311(Pt 3):729–733.
15. Gettys TW, Harkness PJ, Watson PM. The β3-adrenergic receptor inhibits insulin-stimulated leptin secretion from isolated rat adipocytes. Endocrinology 1996;137:4054–4057.
16. Ricci MR, Lee MJ, Russell CD et al. Isoproterenol decreases leptin release from rat and human adipose tissue through posttranscriptional mechanisms. Am J Physiol Endocrinol Metab 2005;288:E798–E804.
17. Calcagni E, Elenkov I. Stress system activity, innate and T helper cytokines, and susceptibility to immune-related diseases. Ann N Y Acad Sci 2006;1069:62–76.
18. Benoit SC, Clegg DJ, Seeley RJ, Woods SC. Insulin and leptin as adiposity signals. Recent Prog Horm Res 2004;59:267–285.
19. Lönnqvist F, Arner P, Nordfors L, Schalling M. Overexpression of the obese (ob) gene in adipose tissue of human obese subjects. Nat Med 1995;1:950–953.
20. Lago R, Gómez R, Lago F, Gómez-Reino J, Gualillo O. Leptin beyond body weight regulation—current concepts concerning its role in immune function and inflammation. Cell Immunol 2008;252:139–145.
21. Boden G, Cheung P, Mozzoli M, Fried SK. Effect of thiazolidinediones on glucose and fatty acid metabolism in patients with type 2 diabetes. Metab Clin Exp 2003;52:753–759.
22. Greenberg AS, Obin MS. Obesity and the role of adipose tissue in inflammation and metabolism. Am J Clin Nutr 2006;83:461S–465S.
23. Enriori PJ, Evans AE, Sinnayah P et al. Diet-induced obesity causes severe but reversible leptin resistance in arcuate melanocortin neurons. Cell Metab 2007;5:181–194.
24. Tremblay A, Després JP, Bouchard C. The effects of exercise-training on energy balance and adipose tissue morphology and metabolism. Sports Med 1985;2:223–233.
25. Bailey JW, Barker RL, Beauchene RE. Age-related changes in rat adipose tissue cellularity are altered by dietary restriction and exercise. J Nutr 1993;123:52–58.
26. Chen G, Koyama K, Yuan X et al. Disappearance of body fat in normal rats induced by adenovirus-mediated leptin gene therapy. Proc Natl Acad Sci U S A 1996;93:14795–14799.
27. Qian H, Azain MJ, Compton MM et al. Brain administration of leptin causes deletion of adipocytes by apoptosis. Endocrinology 1998;139:791–794.
28. Ambati S, Kim HK, Yang JY et al. Effects of leptin on apoptosis and adipogenesis in 3T3-L1 adipocytes. Biochem Pharmacol 2007;73:378–384.
29. Xu H, Barnes GT, Yang Q et al. Chronic inflammation in fat plays a crucial role in the development of obesity-related insulin resistance. J Clin Invest 2003;112:1821–1830.
30. Shi H, Strader AD, Woods SC, Seeley RJ. The effect of fat removal on glucose tolerance is depot specific in male and female mice. Am J Physiol Endocrinol Metab 2007;293:E1012–E1020.
31. Tavernier G, Galitzky J, Valet P et al. Molecular mechanisms underlying regional variations of catecholamine-induced lipolysis in rat adipocytes. Am J Physiol 1995;268:E1135–E1142.
32. Harden TK. Agonist-induced desensitization of the β-adrenergic receptor-linked adenylate cyclase. Pharmacol Rev 1983;35:5–32.
33. Carpéné C, Galitzky J, Collon P et al. Desensitization of β1 and β2, but not β3, adrenoceptor-mediated lipolytic responses of adipocytes after long-term norepinephrine infusion. J Pharmacol Exp Ther 1993;265:237–247.
34. Levin BE, Triscari J, Sullivan AC. Altered sympathetic activity during development of diet-induced obesity in rat. Am J Physiol 1983;244:R347–R355.
35. Lowell BB, Bachman ES. β-adrenergic receptors, diet-induced thermogenesis, and obesity. J Biol Chem 2003;278:29385–29388.
36. Bertile F, Criscuolo F, Oudart H, Le Maho Y, Raclot T. Differences in the expression of lipolytic-related genes in rat white adipose tissues. Biochem Biophys Res Commun 2003;307:540–546.
37. Rayner DV, Trayhurn P. Regulation of leptin production: sympathetic nervous system interactions. J Mol Med 2001;79:8–20.
38. Deng C, Moinat M, Curtis L et al. Effects of β-adrenoceptor subtype stimulation on obese gene messenger ribonucleic acid and on leptin secretion in mouse brown adipocytes differentiated in culture. Endocrinology 1997;138:548–552.
39. Mitchell SE, Rees WD, Hardie LJ et al. Ob gene expression and secretion of leptin following differentiation of rat preadipocytes to adipocytes in primary culture. Biochem Biophys Res Commun 1997;230:360–364.
40. Hardie LJ, Guilhot N, Trayhurn P. Regulation of leptin production in cultured mature white adipocytes. Horm Metab Res 1996;28:685–689.
41. Trayhurn P, Duncan JS, Rayner DV, Hardie LJ. Rapid inhibition of ob gene expression and circulating leptin levels in lean mice by the β3-adrenoceptor agonists BRL 35135A and ZD2079. Biochem Biophys Res Commun 1996;228:605–610.
42. Mantzoros CS, Qu D, Frederich RC et al. Activation of β3 adrenergic receptors suppresses leptin expression and mediates a leptin-independent inhibition of food intake in mice. Diabetes 1996;45:909–914.
43. Moinat M, Deng C, Muzzin P et al. Modulation of obese gene expression in rat brown and white adipose tissues. FEBS Lett 1995;373:131–134.
44. Pinkney JH, Coppack SW, Mohamed-Ali V. Effect of isoprenaline on plasma leptin and lipolysis in humans. Clin Endocrinol (Oxf) 1998;48:407–411.