prostate cancer cell proliferation and angiogenesis in different obese mice models: prostate cancer...
TRANSCRIPT
ORIG INAL ART ICLE
Prostate cancer cell proliferation and angiogenesis in differentobese mice models
Andreia M. Ribeiro*, Sara Andrade*, Filipa Pinho*, J. Duarte Monteiro*, Madalena Costa*,
Carlos Lopes�, Artur P. Aguas* and Mariana P. Monteiro*
*Department of Anatomy and UMIB (Unit for Multidisciplinary Biomedical Research) of ICBAS and�Department of Pathology and
Immunology of ICBAS
In the last century, obesity has taken epidemic proportions
at most western populations (Hedley et al. 2004; Ogden
et al. 2006; James 2008). The rising prevalence of obesity
and overweight has been attributed to the increase of caloric
consumption, in particular of high fat diets, together with
the sedentary lifestyle of population (Crespo et al. 2001;
INTERNATIONAL
JOURNAL OF
EXPERIMENTAL
PATHOLOGY
Received for publication:
9 March 2010
Accepted for publication:
2 June 2010
Correspondence:
Mariana P. Monteiro
ICBAS, Abel Salazar Institute for the
Biomedical Sciences
University of Porto
Largo Prof. Abel Salazar
4099-003 Porto
Portugal
Tel.: 00351222062205
Fax: 00351222062232
E-mail: [email protected]
Summary
Obesity has been associated with increased incidence and aggressiveness of prostate
cancer. Although controversial, several studies suggest that leptin could influence
tumour cell growth and proliferation. The main goal of this study was to assess cel-
lular growth of prostate adenocarcinoma cells in obese mice with different endoge-
nous hormonal environments in what relates to leptin circulating levels and
sensitivity. Four groups of mice (n = 6 ⁄ group) were used, namely obese mice with
congenital non-functioning leptin receptor OBR (db ⁄ db), obese mice with congenital
leptin deficiency (ob ⁄ ob), mice with diet induced obesity (DIO) and normal weight
C57BL ⁄ 6J mice (control). All groups of mice were injected subcutaneously with
3.0 · 105 RM1 cells ⁄ 500 ll PBS (murine prostate carcinoma androgen insensitive
cells) and tumour growth and angiogenesis were evaluated 14 days after inoculation.
The tumours induced in ob ⁄ ob and DIO mice were significantly larger (P < 0.001)
while those induced in db ⁄ db mice were significantly smaller (P = 0.047), when com-
pared with controls. Morphometric analysis revealed that mitotic index and Ki-67
positive nuclear density, both cell proliferation markers, were also significantly lower
in the tumours of db ⁄ db mice (P < 0.001) when compared to controls. An inverse
correlation was observed between leptin plasma levels and tumour weight
(r = )0.642, P < 0.001), mitotic index (r = )0.646, P < 0.01) and Ki-67 positive
nuclear density (r = )0.795, P < 0.001). These results suggest that high leptin con-
centrations are not favourable to RM1 cell growth and proliferation. On the con-
trary, high plasma leptin levels were associated with less cellular proliferation and
angiogenesis in vivo.
Keywords
leptin, morphometry, obesity, OBR, prostate cancer, RM1 cells
Int. J. Exp. Path. (2010), 91, 374–386
doi: 10.1111/j.1365-2613.2010.00726.x
374� 2010 The Authors
Journal compilation � 2010 Blackwell Publishing Ltd
Calle & Kaaks 2004; Stubbs & Lee 2004). Obesity is a
major public health problem as it is associated with
increased risk for several co-morbid conditions such as
hypertension, type 2 diabetes, cardiovascular disease and
some types of cancer like colon, breast, and prostate among
others (Calle & Kaaks 2004). Since the 1970s, epidemiologi-
cal studies have disclosed the possible association between
increased adiposity and increased incidence of colon (Schoen
et al. 1999; Calle & Kaaks 2004; Pischon et al. 2006; Gio-
vannucci & Michaud 2007), breast (Calle & Kaaks 2004;
Majed et al. 2007), kidney (Asal et al. 1988; Calle & Kaaks
2004; Luo et al. 2007), oesophagus (Brown et al. 1995;
Vaughan et al. 1995; Calle & Kaaks 2004; Veugelers et al.
2006) and endometrial (Calle & Kaaks 2004; Chia et al.
2007) cancers, in addition to an unfavourable prognosis and
increased death rate from cancer (Calle & Kaaks 2004).
In opposite to what was thought for many years, the adi-
pose tissue is not a passive deposit of triglycerides, it is an
active tissue with many biological and endocrine functions
(Trayhurn & Beattie 2001; Kershaw & Flier 2004; Ronti
et al. 2006). It was after the discovery of leptin, the first
hormone secreted by the adipocyte to be identified in 1994
that the adipose tissue was formally accepted and recognized
as a new endocrine organ (Zhang et al. 1994). Besides leptin
other hormones and factors like IL-6, TNFa and VEGF have
also been found to be secreted by the adipose tissue in pro-
portion to the tissue mass and have been related to the risk
of development of some types of cancer, such as prostate
cancer (Mistry et al. 2007). While some other factors, like
adiponectin, seem to have a protective role in carcinogenesis
(Goktas et al. 2005; Bub et al. 2006; Mistry et al. 2006).
Leptin is a protein, codified by the ob gene, with 16 kDa
containing 167 aminoacids, it is secreted predominantly by
the adipocytes of the subcutaneous adipose tissue and in
most individuals circulates in plasma levels that are propor-
tional to the adipose tissue mass as well as the nutritional
state of the individual (Frederich et al. 1995; Boden et al.
1996; Haque & Garg 2004). Leptin acts at the hypothala-
mus where it regulates body weight and energy balance
(Zhang et al. 1994). Leptin is also considered a mitogenic,
anti-apoptotic (Hoda & Popken 2008) and angiogenic medi-
ator (Ambrosini et al. 2002), because by acting on one of its
transmembrane receptor (Tartaglia et al. 1995), OBRb,
which is the long isoform, also activates many genes
involved in cellular proliferation such as c-fos, c-jun, junB,
egr-1 and socs3 and angiogenesis regulation, like VEGF fac-
tor (Fruhbeck 2006).
The association between prostate cancer and obesity is a
controversial issue since the results obtained by different
studies have been contradictory (Giovannucci et al. 2003).
Obesity seems to be a risk factor for the development of
aggressive prostate tumours and increased mortality
although low grade prostate tumours are also increased in
obesity (Freedland et al. 2006, 2008; Ribeiro et al. 2006;
Mistry et al. 2007). Increased leptin, insulin and IGF-1
plasma levels observed in obesity are potential mediators
which may promote latent prostate cancer progression to an
aggressive state (Amling 2004; Ribeiro et al. 2006; Mistry
et al. 2007).
Since there is a controversial association of obesity and
prostate cancer and on the role of leptin on cellular prolifer-
ation, angiogenesis, and in tumour development, our aim
was to assess in vivo the degree of prostate cancer cell pro-
liferation and angiogenesis in different strains of obese mice,
namely in leptin deficient mice (ob ⁄ ob), leptin resistant and
diabetic mice (db ⁄ db) and in mice with diet induced obesity.
Materials and methods
RM-1 murine prostate cancer cells
RM-1 cells are a murine androgen insensitive prostate cancer
cell line, which was gently offered by T Thompson (MD
Anderson Cancer Center, Houston, TX, USA) for this study
(Baley et al. 1995). The cells were grown at 25 cm2 flasks
in Dulbecco’s Modified Essential Medium (DMEM – Invitro-
gen, New York, NY, USA) with high glucose (4500 mg ⁄ l),50 mM EPES buffer solution (Invitrogen), sodium bicar-
bonate (Sigma, St Louis, MO, USA), Penicillin–Streptomycin
100 U ⁄ ml (Invitrogen) and Nystatine 100 U ⁄ ml (Sigma) in a
incubator (Function Line – Heraeus Instruments, Hanau, Ger-
many) which maintained constant humid atmosphere with
5% CO2 at 37 �C. The cells were separated (passaged) every
time they became confluent using trypsin 0.25% (Invitrogen).
Mycoplasm test was performed in the cell culture medium,
without any antibiotics, to exclude contamination. Cellular
viability was evaluated using the trypan blue (Sigma) test and
a viability superior to 90% was considered satisfactory.
RM1 Cellular characterization
Immunocytochemistry. A sample of RM1 cells in suspen-
sion, obtained at 17th passage, was analysed to check the
presence or absence of leptin receptor OBRb (long form).
After performing a 50 ll cytospin (Cytospin 3 – Shandon,
Cheshire, UK) of the cell suspension on poly-l-lysine (Sigma)
microscope slides, the cellular preparation was fixed with
10% formaldehyde. Cells were pepsin digested (0.1%) at
HCl 0.01 N (pH 2.25) for 10 min and after this the endo-
genous peroxidase was blocked by adding H2O2 0.3% and
Prostate cancer proliferation in obese mice 375
� 2010 The Authors
Journal compilation � 2010 Blackwell Publishing Ltd, International Journal of Experimental Pathology, 91, 374–386
incubating for 5 min. The preparation was first incubated
with the primary antibody OBR 12-A (Alpha Diagnostics
International, San Antonio, TX, USA) 1:100 BSA 1% over-
night at 4 �C and then with the secondary antibody (pig
antibody anti-rabbit, DaKoCytomation, Glostrup, Denmark)
1:100 BSA 1% for 1 h. At the end of this time period the
preparation was incubated with avidin–biotin complex
(ABC, DaKoCytomation) for 30 min and after this the
immune reaction was revealed using diaminobenzidine
(DAB, DaKoCytomation) during 7 min.
Internal negative control was obtained by omitting the pri-
mary antibody (OBR 12-A) and external positive and nega-
tive controls were obtained by performing the same technique
in mice peritoneal exudate obtained 5 h after intra-peritoneal
injection of 1.5 mL casein 10% in C57BL ⁄ 6J mice.
Normal mice prostate histological study. Native prostate of
normal weight C57BL ⁄ 6J adult male mice were collected
and processed for routine histological analysis after being
fixed in a paraformaldehyde and picric acid 14% solution.
Microscopy slides with tumour sections were incubated in a
pepsin solution (0.1%) HCl 0.01 N pH 2.25 during 45 min
at 37 �C for antigen retrieval. Endogenous peroxidase block-
ade was performed by peroxide hydrogen 0.3% incubation
for 5 min. Unspecific bindings were eliminated by incubation
during 5 min with Protein Block (Novolink Polymer Detec-
tion System, Newcastle, UK). Slides were incubated over-
night with primary antibody OBR 12-A (Alpha Diagnostics
International) 1:100 BSA 1% at 4 �C. After this time were
washed with PBS and incubated with Post Primary Block
(Novolink Polymer Detection System) during 30 min and
then with Polymer (Novolink Polymer Detection System)
during another 30 min and the immune reaction was
revealed with DAB.
Internal negative control was done as described above
except for the omission of the primary antibody.
In vivo studies
Animals. Normal weight C54BL ⁄ 6J (control), ob ⁄ ob,
db ⁄ db and C54BL ⁄ 6J male mice with diet induced obesity
(DIO) were purchased to a certified commercial breeder
(Charles River Laboratories, Barcelona, Spain) and main-
tained in standard animal house conditions, temperature
21 ± 1 �C and constant humidity, 12 h controlled photope-
riod (7—19 h) with unrestricted assess to regular rat chow
(SAFE – Scientific Animal Food & Engineering) and tap
water, except for DIO mice that were fed from weaning
with hypercaloric diet (45% fat, Charles River). All proce-
dures were approved by the local Ethics Board for Animal
Research and followed the European Union laws on animal
protection (86 ⁄ 609 ⁄ EC).
RM1 cellular growth dose–response curve in normal weight
mice C57BL ⁄ 6J. To evaluate RM1 cell growth in vivo seven
groups of normal weight mice C57BL ⁄ 6J (n = 6 mice ⁄ group)
were inoculated subcutaneously with a suspension of RM1
cells in seven different concentrations: 1.5 · 105, 3.0 · 105,
6.0 · 105, 7.5 · 105, 9.0 · 105, 1.2 · 106 e 1.8 · 106
cells ⁄ 500 ll PBS. Tumour growth and development was then
followed-up and monitored for 14 days after inoculation. At
the end of the experiment mice were sacrificed by 99% CO2
atmosphere exposition, blood was collected by cardiac punc-
ture and plasma was separated and kept at )20 �C for later
hormone assays. The induced tumours were collected,
weighed and processed for histological analysis.
RM1 cellular growth in obese mice. To access RM1 cell
growth in obese mice, ob ⁄ ob mice (n = 6), db ⁄ db mice
(n = 6), DIO mice (n = 6) and normal weight C57BL ⁄ 6J
mice (n = 6) (control) were subcutaneously inoculated with
a suspension of RM1 at a concentration of 3.0 · 105
cells ⁄ 500 ll in PBS that was chosen from the dose-response
curve performed in normal weight mice. All the experimen-
tal procedures were similar to the ones described above. At
the end of the experimental period besides the tumour, epi-
didymal fat was also collected and weighed, while plasma
was collected to perform the hormone assays.
Tumours histological analysis
Ki-67 Immunohistochemistry. Tumour cellular proliferation
was evaluated with the aid of Ki-67 nuclear antigen immu-
nohistochemistry which is expressed during cellular cycle at
G1, S, G2 and M phases.
Tumour sections were placed on poly-l-lysine covered
microscopy slides. Microwaves were used for antigen retrie-
val by emerging the slides in tampon citrate solution 0.01 M
(pH 6.0) and exposure to microwave oven at 900 W for
20 min. Endogenous peroxidase was neutralized using hydro-
gen peroxide (LabVision) and unspecific bindings were
blocked with ultra block serum (LabVision, Fremont, CA,
USA), then slides were incubated, for 60 min, with the
primary antibody Ki67 (Novocastra, NCL-L-Ki67-MM1,
Newcastle, UK) (1:30) at 25 �C, followed by the biotinylated
secondary antibody Goat-Antipolyvalent (Labvision) incuba-
tion for 15 min at room temperature. The immune reaction
was then marked by an enzymatic polyvalent complex Strep-
tavidin HRP (Labvision) and revelled by adding DAB sub-
strate (Diaminobenzidine tetrahydrochloride, Sigma).
376 A. M. Ribeiro et al.
� 2010 The Authors
Journal compilation � 2010 Blackwell Publishing Ltd, International Journal of Experimental Pathology, 91, 374–386
Internal negative control was obtained by omission of the
primary antibody and by the observation of unstained mus-
cular cells.
Caveolin immunohistochemistry. Angiogenesis was evalu-
ated with the aid of anti-caveolin immunohistochemistry per-
formed on the tumour sections. The technique was similar to
the one described for Ki-67 immunohistochemistry except for
the primary antibody used that in this case was anti-caveolin
antibody (BD Biosciences, San Jose, CA, USA) 1:400.
Internal negative control was obtained by omission of the
primary anti-body and absence of staining in mice pancre-
atic glandular cells was used as external negative control.
For each antibody, samples were processed the same day
and simultaneously to decrease inter-assay variability.
Morphometric analysis
Morphometric analysis was done in 10 digital pictures per
slide of 10 high magnification fields (400·, 10· ocular 40·objective) corresponding to an area of 4567.8 lm2 ⁄ picture
selected by peripheral scanning of the tumour section and
avoiding the central area of necrosis. Nuclei and cells in mito-
sis stained by Ki-67 and vascular vessels stained by caveolin
immune reaction were counted in each picture with the aid of
a specifically calibrated computer software acopulated to the
microscope digital camera (Leica Qwin, Leica Microsystems,
Wetzlar, Germany).
Hormone assays
Leptin, insulin and IGF-1 plasma levels were determined
using commercial ELISA kits (EZML-82K, EZRML-13K,
Linco Research and RMEE25R, BioVendor, respectively)
according to the manufacturer instructions.
Statistical analysis of the results
Means, standard error of the mean (SEM), normality and
homogeneity of variances were calculated for each group.
Differences between means were analysed by anova test
with LSD post-hoc correction or Kruskal–Wallis test as
appropriate. For correlation studies Pearson and Spearman
tests were used. P < 0.05 was considered statistical signifi-
cant. All statistically analyses were done using windows spss
software (version 16).
Results
RM1 cellular characterization
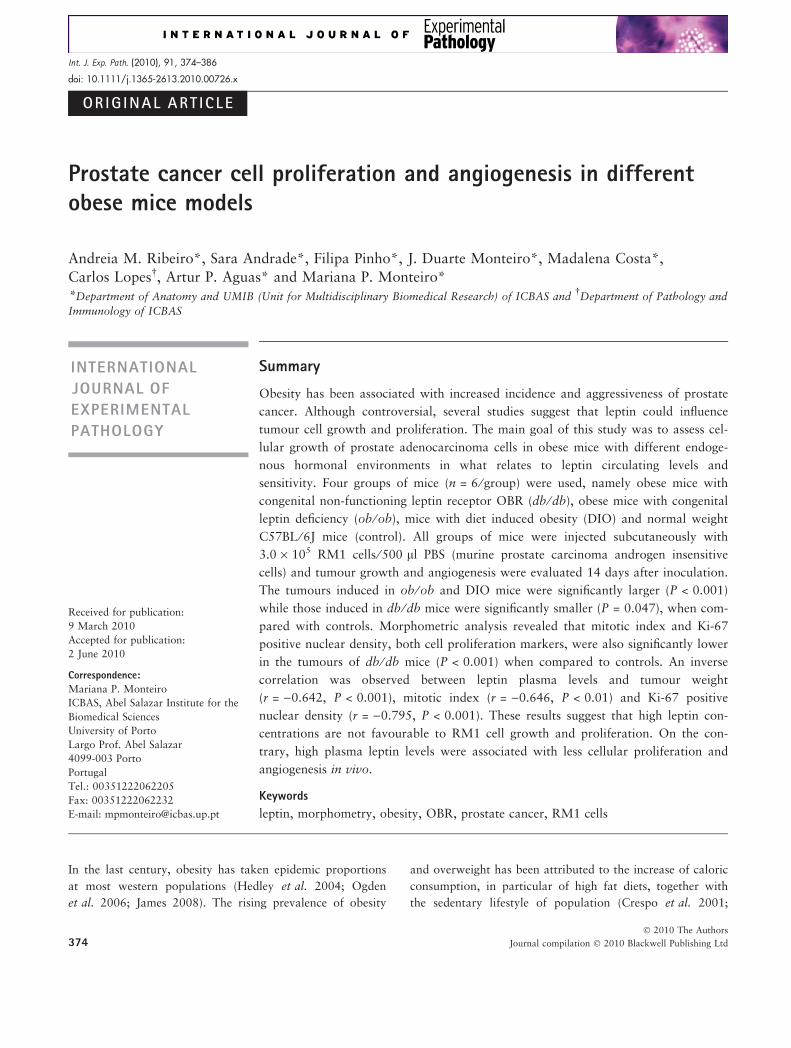
Immunocytochemistry. RM1 cells stained positive for
OBRb using the specific antibody OBR 12-A, as demon-
strated by the brown coloration of the RM1 cells on the cell
periphery (Figure 1a) which supports the OBRb presence at
this prostate cancer cellular line. Antibody specificity was
further tested by performing the same immunocytochemistry
(a) (b)
(c) (d)
100 µm 100 µm
Figure 1 RM1 cells (a) show a brown
coloration on the membrane of the cell
which corresponds to the location of
the leptin receptors after ObR immuno-
cytochemistry. Mice peritoneal exudates
(b) with macrophages marked positively
for ObR (brown coloration) and neu-
trophils (unstained) that were used as
controls (100·). Immunohistochemistry
for ObR of normal C57BL ⁄ 6J mice
prostate (400·) showing the epithelial
prostate cells positively stained (c) and
negative control (d).
Prostate cancer proliferation in obese mice 377
� 2010 The Authors
Journal compilation � 2010 Blackwell Publishing Ltd, International Journal of Experimental Pathology, 91, 374–386
study on a sample of peritoneal exudates, which permitted
to verify that macrophages stained positively whereas neu-
trophils did not stain for OBRb (Figure 1b), as anticipated
since OBRb is known to be expressed by macrophages but
not by neutrophils (O’Rourke et al. 2001; Bruno et al.
2005). Mice native prostate glandular epithelium also
stained positive on the OBRb immunohistochemistry study
(Figure 1c, d).
In vivo studies
Dose–response curve in normal weight C57BL ⁄ 6J mice.
Tumour growth 14 days after dorsal subcutaneous inocula-
tion of different concentrations of RM1 cells (1.5 · 105,
3.0 · 105, 6.0 · 105, 7.5 · 105, 9.0 · 105, 1.2 · 106 and
1.8 · 106 cells in 500 ll of PBS) in C57BL ⁄ 6J mice was pro-
portional to the concentration of the inoculums’. The
3.0 · 105 cells ⁄ 500 ll PBS concentration was chosen as the
ideal one to be used in the obese mice study because
tumours obtained after inoculation of this cellular suspen-
sion concentration since these were large enough to allow
morphological analysis, presented the smaller dimension var-
iability (SE = 0.242), a small area of central necrosis and
high mitotic density (data not known).
RM1 cells growth in obese mice. RM1 cells (3.0 · 105
cells ⁄ 500 ll PBS) where inoculated in obese ob ⁄ ob mice,
db ⁄ db mice, DIO mice and normal weight C57BL ⁄ 6J mice
(control). Animals mean body weight was significantly
higher in the obese ob ⁄ ob (57.5 ± 0.99 g) and in obese
diabetic db ⁄ db mice (43.0 ± 1.69 g) when compared with
DIO (30.2 ± 1.47 g) and control mice (31.7 ± 0.66 g)
(P < 0.001) (Table 1). Epididymal fat weight for 100 g of
body weight, used as a surrogate marker of fatty body
content, was significantly higher at all three groups of
obese mice ob ⁄ ob (4.59 ± 0.26 g), db ⁄ db (4.70 ± 0.08 g)
and DIO (2.29 ± 0.03 g) when compared with control
(1.19 ± 0.09 g); (P < 0.001, P < 0.001, P < 0.01, respec-
tively) (Table 1).
The tumour weight 14 days after inoculation was signifi-
cantly higher in ob ⁄ ob (2.82 ± 0.46 g) and DIO
(2.78 ± 0.19 g) mice (P < 0.001) while db ⁄ db mice displayed
significantly smaller tumours (0.16 ± 0.069 g) (P < 0.05)
when compared to control mice (1.00 ± 0.24 g) tumours
(Table 1).
Morphometric studies
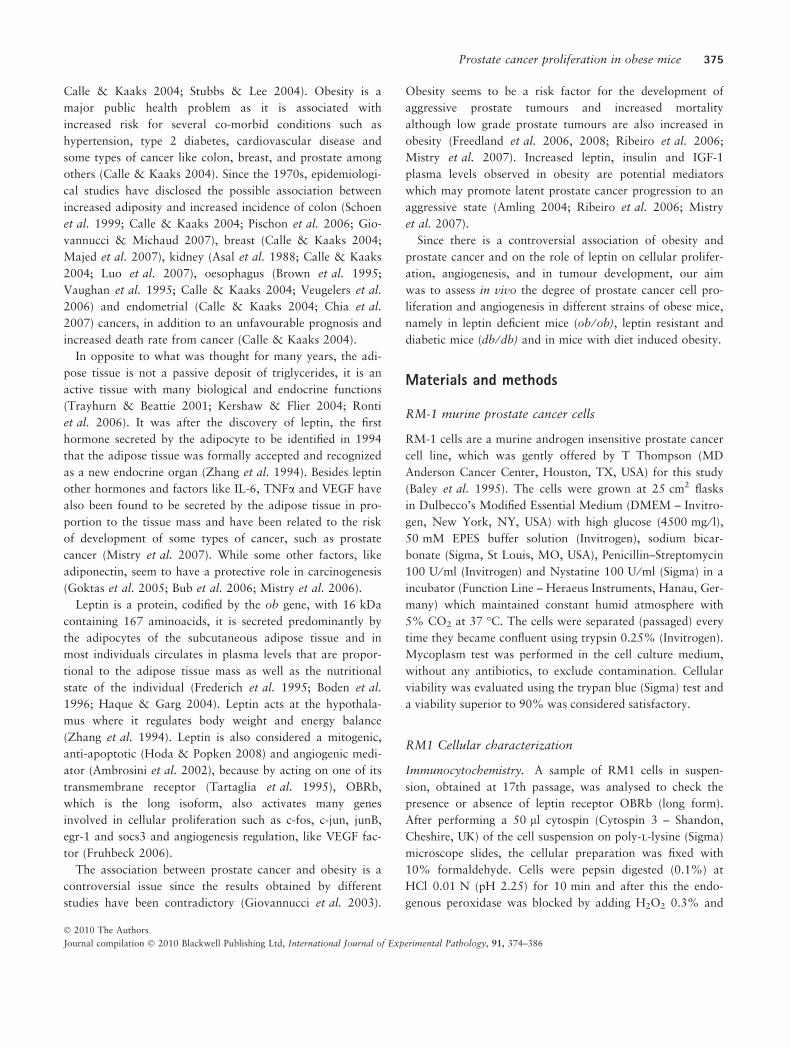
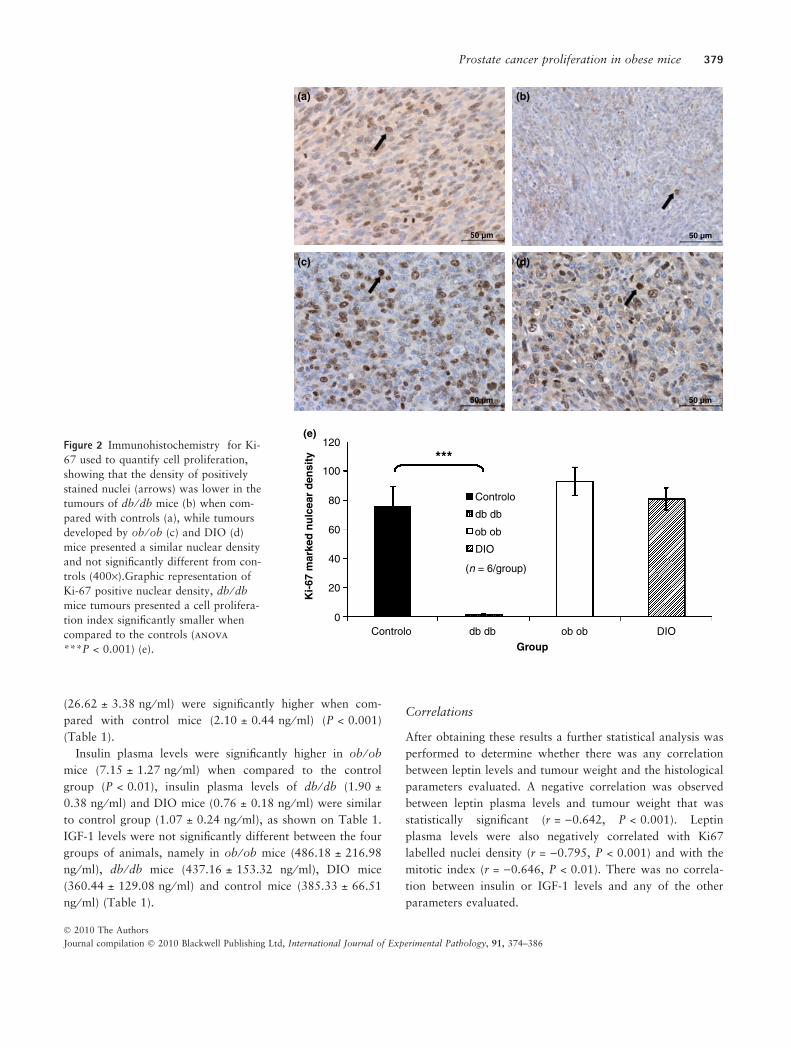
Tumour cell proliferation as accessed by counting ki-67
positive nuclei density was higher in the ob ⁄ ob and DIO
mice and lower in the db ⁄ db mice when compared with con-
trols (Figure 2a–d), although only the difference between
db ⁄ db mice and control has been statistically significant
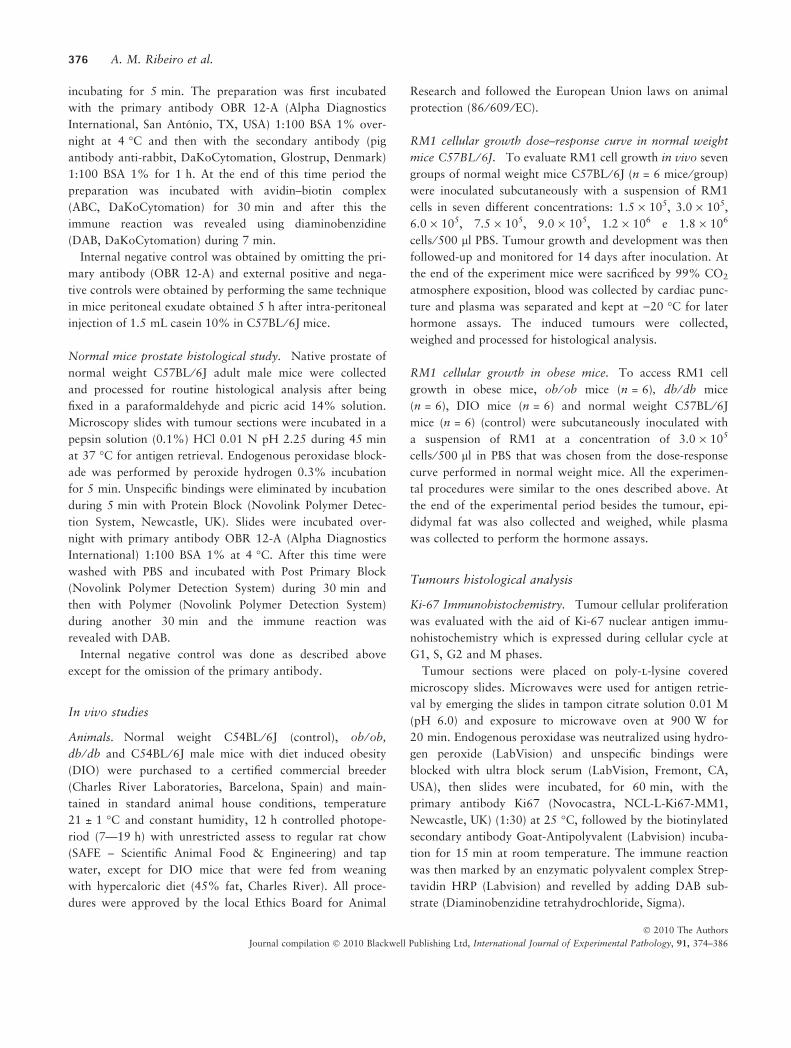
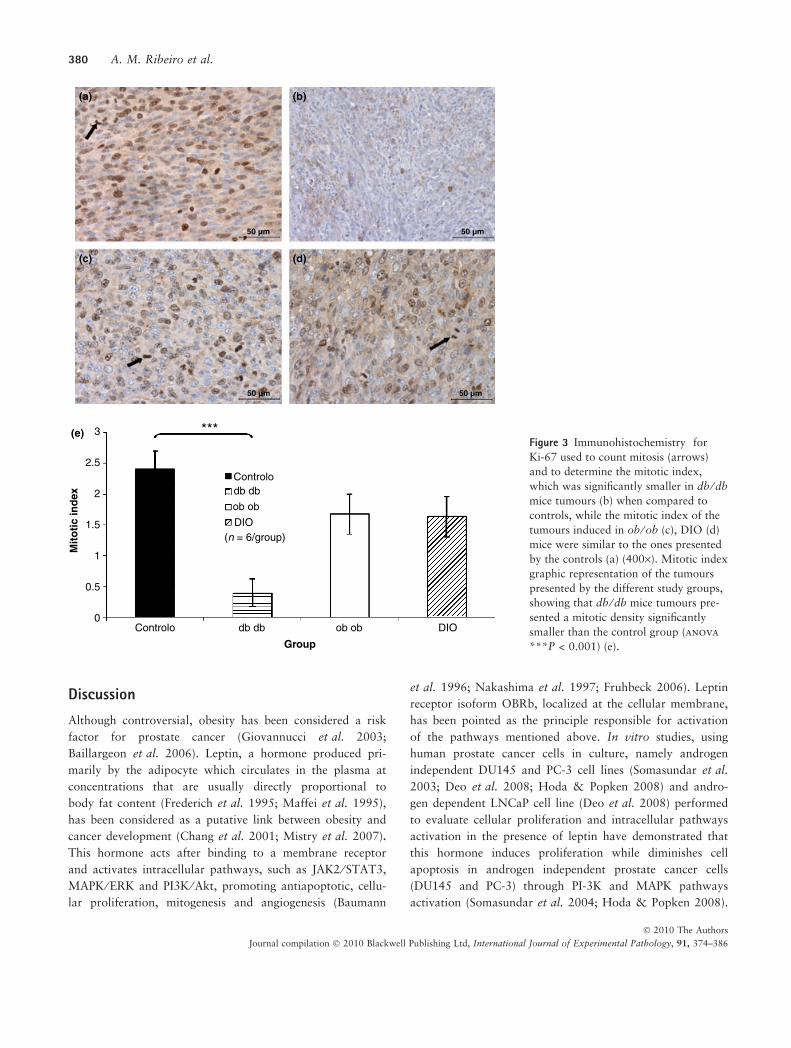
(P < 0.001) as shown on Figure 2e. The mitotic index deter-
mined by mitosis counting on the same slides stained with
anti-Ki67 to allow a better visualization of mitotic nuclei
was also significantly lower in the db ⁄ db mice tumours
when compared to tumours of control mice group
(P < 0.001) (Figure 3a–e).
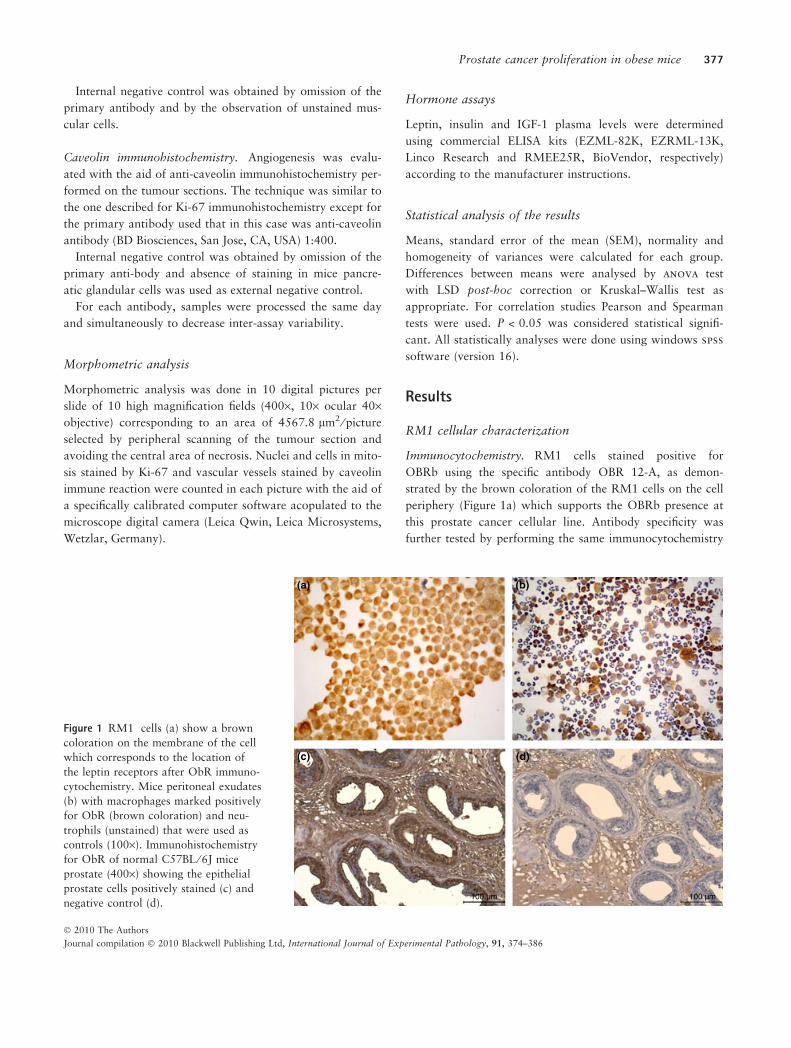
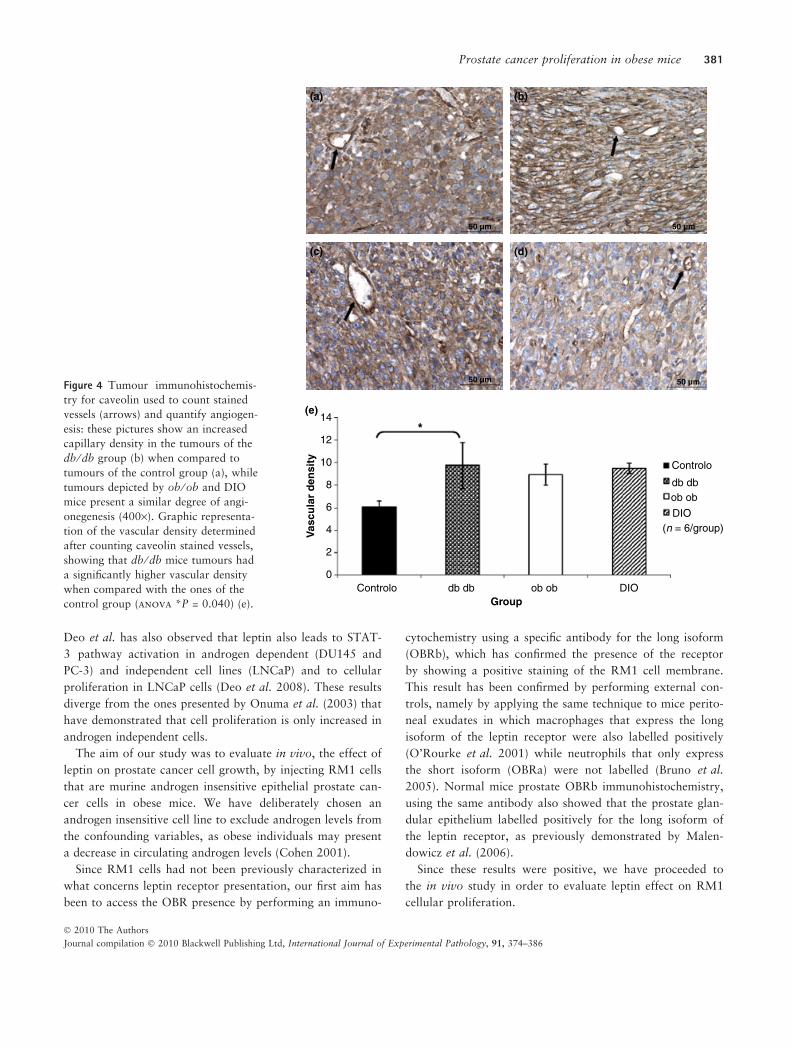
Vascular density was significantly higher in tumours of
db ⁄ db mice (P < 0.05) while vascular density of tumours of
ob ⁄ ob and DIO mice was not statistically different from
controls as it can be observed in Figure 4.
Hormonal plasma levels. Leptin plasma levels of ob ⁄ ob
mice were undetectable while those of db ⁄ db mice
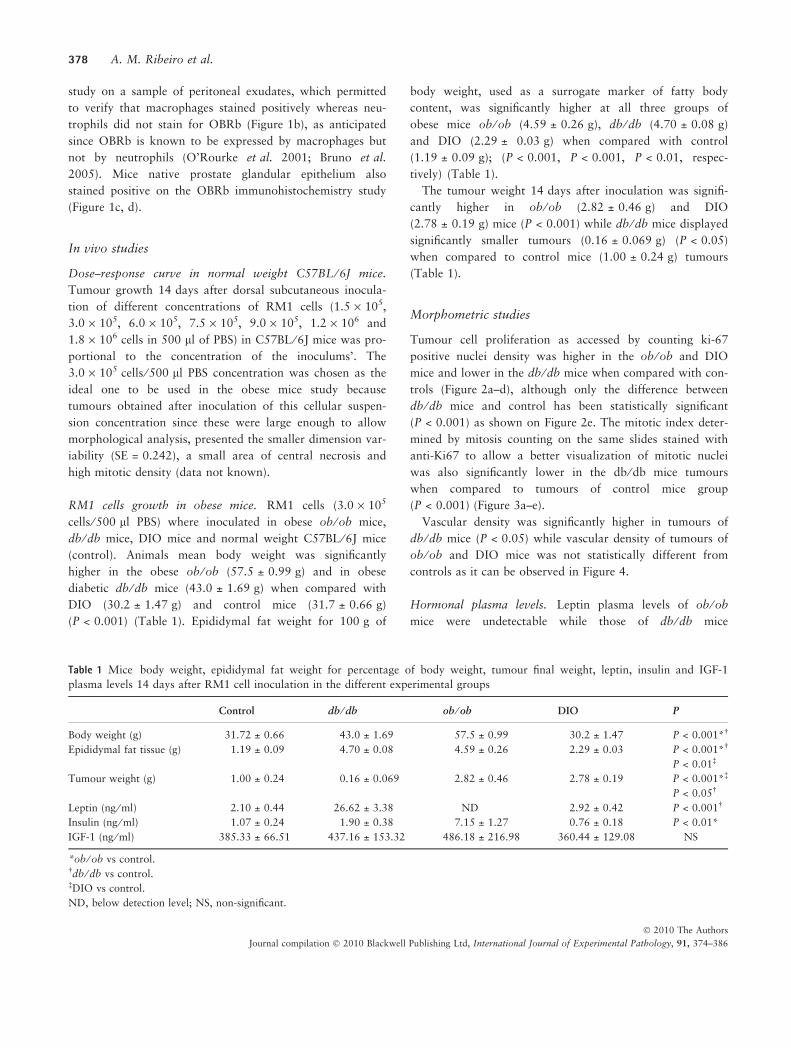
Table 1 Mice body weight, epididymal fat weight for percentage of body weight, tumour final weight, leptin, insulin and IGF-1
plasma levels 14 days after RM1 cell inoculation in the different experimental groups
Control db ⁄ db ob ⁄ ob DIO P
Body weight (g) 31.72 ± 0.66 43.0 ± 1.69 57.5 ± 0.99 30.2 ± 1.47 P < 0.001*�
Epididymal fat tissue (g) 1.19 ± 0.09 4.70 ± 0.08 4.59 ± 0.26 2.29 ± 0.03 P < 0.001*�
P < 0.01�
Tumour weight (g) 1.00 ± 0.24 0.16 ± 0.069 2.82 ± 0.46 2.78 ± 0.19 P < 0.001*�
P < 0.05�
Leptin (ng ⁄ ml) 2.10 ± 0.44 26.62 ± 3.38 ND 2.92 ± 0.42 P < 0.001�
Insulin (ng ⁄ ml) 1.07 ± 0.24 1.90 ± 0.38 7.15 ± 1.27 0.76 ± 0.18 P < 0.01*
IGF-1 (ng ⁄ ml) 385.33 ± 66.51 437.16 ± 153.32 486.18 ± 216.98 360.44 ± 129.08 NS
*ob ⁄ ob vs control.�db ⁄ db vs control.�DIO vs control.
ND, below detection level; NS, non-significant.
378 A. M. Ribeiro et al.
� 2010 The Authors
Journal compilation � 2010 Blackwell Publishing Ltd, International Journal of Experimental Pathology, 91, 374–386
(26.62 ± 3.38 ng ⁄ ml) were significantly higher when com-
pared with control mice (2.10 ± 0.44 ng ⁄ ml) (P < 0.001)
(Table 1).
Insulin plasma levels were significantly higher in ob ⁄ ob
mice (7.15 ± 1.27 ng ⁄ ml) when compared to the control
group (P < 0.01), insulin plasma levels of db ⁄ db (1.90 ±
0.38 ng ⁄ ml) and DIO mice (0.76 ± 0.18 ng ⁄ ml) were similar
to control group (1.07 ± 0.24 ng ⁄ ml), as shown on Table 1.
IGF-1 levels were not significantly different between the four
groups of animals, namely in ob ⁄ ob mice (486.18 ± 216.98
ng ⁄ ml), db ⁄ db mice (437.16 ± 153.32 ng ⁄ ml), DIO mice
(360.44 ± 129.08 ng ⁄ ml) and control mice (385.33 ± 66.51
ng ⁄ ml) (Table 1).
Correlations
After obtaining these results a further statistical analysis was
performed to determine whether there was any correlation
between leptin levels and tumour weight and the histological
parameters evaluated. A negative correlation was observed
between leptin plasma levels and tumour weight that was
statistically significant (r = )0.642, P < 0.001). Leptin
plasma levels were also negatively correlated with Ki67
labelled nuclei density (r = )0.795, P < 0.001) and with the
mitotic index (r = )0.646, P < 0.01). There was no correla-
tion between insulin or IGF-1 levels and any of the other
parameters evaluated.
(a) (b)
(c) (d)
(e)
***
Group
50 µm
Ki-
67 m
arke
d n
ulc
ear
den
sity
Controlo
Controlo
120
100
80
60
40
20
0db db
db db
ob ob
ob ob
DIO
(n = 6/group)
DIO
50 µm
50 µm50 µm
Figure 2 Immunohistochemistry for Ki-
67 used to quantify cell proliferation,
showing that the density of positively
stained nuclei (arrows) was lower in the
tumours of db ⁄ db mice (b) when com-
pared with controls (a), while tumours
developed by ob ⁄ ob (c) and DIO (d)
mice presented a similar nuclear density
and not significantly different from con-
trols (400·).Graphic representation of
Ki-67 positive nuclear density, db ⁄ db
mice tumours presented a cell prolifera-
tion index significantly smaller when
compared to the controls (anova
***P < 0.001) (e).
Prostate cancer proliferation in obese mice 379
� 2010 The Authors
Journal compilation � 2010 Blackwell Publishing Ltd, International Journal of Experimental Pathology, 91, 374–386
Discussion
Although controversial, obesity has been considered a risk
factor for prostate cancer (Giovannucci et al. 2003;
Baillargeon et al. 2006). Leptin, a hormone produced pri-
marily by the adipocyte which circulates in the plasma at
concentrations that are usually directly proportional to
body fat content (Frederich et al. 1995; Maffei et al. 1995),
has been considered as a putative link between obesity and
cancer development (Chang et al. 2001; Mistry et al. 2007).
This hormone acts after binding to a membrane receptor
and activates intracellular pathways, such as JAK2 ⁄ STAT3,
MAPK ⁄ ERK and PI3K ⁄ Akt, promoting antiapoptotic, cellu-
lar proliferation, mitogenesis and angiogenesis (Baumann
et al. 1996; Nakashima et al. 1997; Fruhbeck 2006). Leptin
receptor isoform OBRb, localized at the cellular membrane,
has been pointed as the principle responsible for activation
of the pathways mentioned above. In vitro studies, using
human prostate cancer cells in culture, namely androgen
independent DU145 and PC-3 cell lines (Somasundar et al.
2003; Deo et al. 2008; Hoda & Popken 2008) and andro-
gen dependent LNCaP cell line (Deo et al. 2008) performed
to evaluate cellular proliferation and intracellular pathways
activation in the presence of leptin have demonstrated that
this hormone induces proliferation while diminishes cell
apoptosis in androgen independent prostate cancer cells
(DU145 and PC-3) through PI-3K and MAPK pathways
activation (Somasundar et al. 2004; Hoda & Popken 2008).
(a) (b)
(c) (d)
(e) 3
2.5
2
1.5
1
0.5
0
Mit
oti
c in
dex
***
Controlo
Controlo
db db
db db
ob ob
ob ob
(n = 6/group)DIO
DIO
Group
50 µm 50 µm
50 µm 50 µm
Figure 3 Immunohistochemistry for
Ki-67 used to count mitosis (arrows)
and to determine the mitotic index,
which was significantly smaller in db ⁄ db
mice tumours (b) when compared to
controls, while the mitotic index of the
tumours induced in ob ⁄ ob (c), DIO (d)
mice were similar to the ones presented
by the controls (a) (400·). Mitotic index
graphic representation of the tumours
presented by the different study groups,
showing that db ⁄ db mice tumours pre-
sented a mitotic density significantly
smaller than the control group (anova
***P < 0.001) (e).
380 A. M. Ribeiro et al.
� 2010 The Authors
Journal compilation � 2010 Blackwell Publishing Ltd, International Journal of Experimental Pathology, 91, 374–386
Deo et al. has also observed that leptin also leads to STAT-
3 pathway activation in androgen dependent (DU145 and
PC-3) and independent cell lines (LNCaP) and to cellular
proliferation in LNCaP cells (Deo et al. 2008). These results
diverge from the ones presented by Onuma et al. (2003) that
have demonstrated that cell proliferation is only increased in
androgen independent cells.
The aim of our study was to evaluate in vivo, the effect of
leptin on prostate cancer cell growth, by injecting RM1 cells
that are murine androgen insensitive epithelial prostate can-
cer cells in obese mice. We have deliberately chosen an
androgen insensitive cell line to exclude androgen levels from
the confounding variables, as obese individuals may present
a decrease in circulating androgen levels (Cohen 2001).
Since RM1 cells had not been previously characterized in
what concerns leptin receptor presentation, our first aim has
been to access the OBR presence by performing an immuno-
cytochemistry using a specific antibody for the long isoform
(OBRb), which has confirmed the presence of the receptor
by showing a positive staining of the RM1 cell membrane.
This result has been confirmed by performing external con-
trols, namely by applying the same technique to mice perito-
neal exudates in which macrophages that express the long
isoform of the leptin receptor were also labelled positively
(O’Rourke et al. 2001) while neutrophils that only express
the short isoform (OBRa) were not labelled (Bruno et al.
2005). Normal mice prostate OBRb immunohistochemistry,
using the same antibody also showed that the prostate glan-
dular epithelium labelled positively for the long isoform of
the leptin receptor, as previously demonstrated by Malen-
dowicz et al. (2006).
Since these results were positive, we have proceeded to
the in vivo study in order to evaluate leptin effect on RM1
cellular proliferation.
(a) (b)
(c) (d)
(e)
Controlo
db dbob ob
(n = 6/group)DIO
Controlo db db ob ob DIOGroup
14
12
10
8
6
4
2
0
Vas
cula
r d
ensi
ty
*
50 µm
50 µm 50 µm
50 µm
Figure 4 Tumour immunohistochemis-
try for caveolin used to count stained
vessels (arrows) and quantify angiogen-
esis: these pictures show an increased
capillary density in the tumours of the
db ⁄ db group (b) when compared to
tumours of the control group (a), while
tumours depicted by ob ⁄ ob and DIO
mice present a similar degree of angi-
onegenesis (400·). Graphic representa-
tion of the vascular density determined
after counting caveolin stained vessels,
showing that db ⁄ db mice tumours had
a significantly higher vascular density
when compared with the ones of the
control group (anova *P = 0.040) (e).
Prostate cancer proliferation in obese mice 381
� 2010 The Authors
Journal compilation � 2010 Blackwell Publishing Ltd, International Journal of Experimental Pathology, 91, 374–386
The RM1 cells were inoculated subcutaneously in the dor-
sal region of normal weight C57BL ⁄ 6J mice at seven differ-
ent cell concentrations and were followed up for 14 days in
order to determine the most appropriate concentration to be
used in the subsequent studies. Tumours obtained were anal-
ysed in what concerns mitotic index, area of necrosis and
intra-group variability. Our results were similar to the
results obtained by Voeks et al. (2002) that reported that
RM1 cells, when inoculated subcutaneously, present a fast
growth, conducting to high grade tumours 10 Gleason score
(5+5), since cells present a high abnormality grade and are
poorly differentiated (McNeal & Gleason 1991). After
tumour histological analysis, we have chosen the 3.0 · 105
cells ⁄ 500 ll PBS cell concentration since tumours obtained
after the inoculation of this concentration presented a small
intra-group variability, a high mitotic index and a necro-
sis area practically inexistent and thus allowing the develop-
ment of tumours at ideal conditions for morphologic
analysis.
To evaluate RM1 cell growth in obese animals with dif-
ferent endogenous environments with regards to leptin sensi-
tivity and leptin levels, the cells were inoculated in obese
mice ob ⁄ ob with congenital leptin deficiency due to a muta-
tion that inactivates the leptin gene ob (Zhang et al. 1994);
in obese db ⁄ db mice, diabetic and hiperleptinemic in result
of congenital leptin resistance due to a spontaneous muta-
tion on the gene of the leptin receptor db (Chua et al.
1996); in C57BL ⁄ 6J with diet induced obesity (DIO) by
feeding with hypercaloric and hyperlipidic diet (45% fat)
started after weaning and thus inducing fat mass gain and
increased leptin levels in animals with functional leptin
receptors; and in normal weight C57BL ⁄ 6J mice that were
used as controls.
As expected, db ⁄ db and ob ⁄ ob mice presented body
weights significantly higher when compared with control
mice, while DIO mice weight was not statistically different
from the control group. Nevertheless, when relative body
composition was evaluated, DIO mice presented an
increased epididymal fat percentage, a surrogate marker of
visceral fat content (Monteiro et al. 2006), when compared
with the control group, so in spite of DIO mice having the
same body weight body as controls these mice have an
increased fat mass. Likewise, as expected, leptin plasma lev-
els were undetectable in ob ⁄ ob mice and were significantly
higher in db ⁄ db mice when compared with control mice.
DIO mice also presented higher leptin plasma levels than
control mice but this difference was not statistically signifi-
cant.
After RM1 cell inoculation, leptin deficient mice (ob ⁄ ob)
developed significantly larger tumours than control mice,
while leptin resistant mice (db ⁄ db) presented significantly
smaller tumours when compared with control mice. This is
the opposite to what was expected if leptin worked as a
tumour growth factor as some authors have proposed
(Chang et al. 2001; Somasundar et al. 2003, 2004; Mistry
et al. 2008). Chang et al. has evaluated the association of
leptin plasma levels with tumour volume at total prostatec-
tomy in patients and has verified that after stratification for
age, testosterone levels, body weight and body mass index,
individuals with higher leptin levels presented a superior risk
of developing larger tumours (Chang et al. 2001). While
some other authors by conducting in vitro studies have veri-
fied that PC3 and DU145 cells (Somasundar 2003, 2004;
Hoda & Popken 2008), both androgen independent human
prostate cancer cell lines, presented increased cellular prolif-
eration when cultivated in the presence of leptin. On the
contrary, some other authors, like Stattin et al. (2003) in an
epidemiologic study did not find any significant relationship
between leptin plasma levels and risk of tumour develop-
ment, while Hsing et al. (2001) which evaluated cellular
growth of PC3 and DU145 cells in the presence of leptin
also could not find any statistically significant association.
In our study, DIO mice developed tumours of similar size
to those observed in ob ⁄ ob mice and significantly larger than
the ones presented by the control group despite leptin
plasma levels not being significantly higher. After morpho-
metric analysis to evaluate the mitotic index and tumour cell
proliferation, we have verified that leptin deficient ob ⁄ ob
mice presented higher cellular proliferation indexes when
compared to hyperleptinemic db ⁄ db mice, which presented
tumours with a low cellular proliferation index, suggesting
that leptin may act as a cellular proliferation repressor. A
negative correlation statistically significant was also observed
between leptin plasma levels and cellular proliferation and
mitotic index of induced RM1 tumours.
Although vascular density of all obese mice tumours was
higher than the observed in the tumours of controls, with
the exception of the db ⁄ db mice group this failed to reach
statistical significance, nevertheless we cannot exclude that
the small sample size could be one of the reasons for not
finding a significant difference. We were unable to find any
correlation between leptin plasma levels and angiogenesis
degree.
Contrary to our results, Sierra-Honigmann et al. have
studied HUVECs cells (human umbilical vein endothelial
cells) growth in the presence of leptin, after having verified
that the cells presented the OBRb receptor by immunocyto-
chemistry and that the receptor was functional by analysing
OBRb tyrosine phosforilation and by determining STAT3
levels by SDS-PAGE and immunobloting. To determine
382 A. M. Ribeiro et al.
� 2010 The Authors
Journal compilation � 2010 Blackwell Publishing Ltd, International Journal of Experimental Pathology, 91, 374–386
whether leptin had any effect on angiogenesis in vitro, cellu-
lar migration evaluation through a porous membrane in
response to leptin was evaluated. The authors demonstrated
that HUVECs cells formed tubules similar to capillaries in a
three-dimensional collagen gel in the presence of leptin. The
same effect was demonstrated in in vivo studies, namely in
rats rendered hyperleptinemic after implantation of a poly-
mer with leptin solution in the rats cornea and in leptin
resistant OBR deficient rats (fa ⁄ fa Zucker rats), In these ani-
mal models a vigorous angiogenic response was observed in
leptin implanted rats, while the same was absent in fa ⁄ faleptin resistant rats, thus in favour of a positive effect of lep-
tin in angiogenesis (Sierra-Honigmann et al. 1998). Boulou-
mie et al. have demonstrated the expression of the OBR
receptor by RT-PCR in the same cell line and have also
observed that leptin acted as a pro-angiogenic factor, in vitro
and in vivo (Bouloumie et al. 1998).
In our study, since the results obtained after immunocyto-
chemistry for the long isoform of the leptin receptors sup-
ported the presence of OBRb in RM1 cells, and leptin levels
were negatively correlated with tumour size, these results
suggest that leptin is not a tumour growth factor for RM1
cells in vivo, and could even function as RM1 proliferation
inhibitor. To further clarify the role of the OBR receptor in
RM1 cell proliferation activated by leptin it would be perti-
nent to evaluate cellular growth in the presence of leptin in
vitro and to study the intracellular pathways of signal acti-
vation like MAPK, STAT3 and PI3-K similarly to what has
been done with other cell lines (Deo et al. 2008; Hoda &
Popken 2008).
Our results are in agreement with the results obtained by
Hsing et al. (2001) and Stattin et al. (2003) that have not
found any statistically significant association between leptin
plasma levels and risk of prostate cancer development in
clinical studies. The same authors in turn attribute the risk
association to other circulating factors, namely insulin and
IGF-1, which are frequently increased in the obese state
(Hsing et al. 2001), nevertheless we also could not find any
association between IGF-1 levels and tumour growth in our
study.
Hoda and Popken (2008) in in vitro studies using two
androgen independent human prostate cancer cell lines,
DU145 and PC-3, grown in the presence of leptin have dem-
onstrated that leptin promotes cellular proliferation and
inhibits apoptosis, while Deo et al. (2008) that studied the
same two cellular lines mentioned above and also the
LNCaP androgen independent cell line, has verified that lep-
tin only enhanced the cellular growth in the last one.
Nunez et al. to dissociate the effect of obesity in carcino-
genesis from other hormones that are frequently increased in
obesity, studied breast and skin cancer development in ‘Fat-
less A-ZIP ⁄ F-1’ lipodistrophic transgenic mice, which is an
animal model with practically inexistent white adipose tissue
and low leptin levels, but presenting insulin resistance and
increased insulin levels. Fatless mice develop more breast
and skin tumours than wild mice suggesting that insulin,
IGF-1 and IL-6 which levels are elevated in these mice as
result of insulin resistance and pro-inflammatory state might
be the principal link factors between obesity and cancer
(Nunez et al. 2006). Ablamunits et al. (2006) to study leptin
and adipose tissue effects on tumour development have also
induced skin cancer in ob ⁄ ob and A-ZIP ⁄ F-1 mice and veri-
fied that leptin deficient mice when compared to control
mice did not present augmented carcinogenesis while lipodi-
strophic and leptin deficient mice presented higher carcino-
genesis suggesting adipose tissue could function has
protector factor for tumour development.
In our study, and as expected, ob ⁄ ob mice, which are
hyperphagic, obese and insulin resistant, presented plasma
insulin levels significantly higher than control mice while
db ⁄ db mice, which have a similar phenotype to ob ⁄ ob mice,
but besides presenting insulin resistance are diabetic due to
pancreatic beta cell insufficiency, present insulin plasma lev-
els not significantly different from control mice. In spite of
these differences in insulin levels we also could not find any
association between insulin and tumour growth in our cur-
rent study.
Cox et al. (2009) has demonstrated the presence of insulin
receptors in human prostate primary tumours suggesting
that hyperinsulinemia associated to obesity could have an
adverse effect in this carcinoma development. Insulin binds
to its receptor and activates several intracellular pathways
RAS ⁄ RAF ⁄ MEK ⁄ ERK which stimulate mitogenesis and Akt
by PI-3K phosphorilation that inhibit apoptosis and promote
carcinogenesis (Frasca et al. 2008). Insulin also acts at the
autonomous nervous system, in hyperinsulinemic conditions,
insulin promotes sympathetic nervous system activation
which in turn stimulates catecolamines production which
could have a trophic effect in tumour cells by decreasing
apoptosis (Nandeesha 2008). Leitzmann et al. in a prospec-
tive epidemiologic study followed up a cohort of 33 088
men, aged between 55 and 74 years during 8.9 years and
has verified an inverse relation between diabetes and pros-
tate cancer development risk, total risk (non-aggressive and
aggressive forms) and non-aggressive risk, which suggests
that diabetes could act as a protector for initial prostate can-
cer states (Leitzmann et al. 2008).
To our knowledge the presence of insulin receptors in
RM1 cells has not been assessed it would be pertinent in
future studies, to explore this signalling pathway, namely by
Prostate cancer proliferation in obese mice 383
� 2010 The Authors
Journal compilation � 2010 Blackwell Publishing Ltd, International Journal of Experimental Pathology, 91, 374–386
verifying whether the cells express the insulin receptor and
by determining the role of insulin in in vitro and in vivo
cellular proliferation. Also, we could not find any associa-
tion between insulin levels and any of the parameters evalu-
ated in this study.
Obesity is a pathological state characterized by altered cir-
culating levels of several hormones, growth factors and cyto-
kines with potential influence on cellular proliferation, thus
from the results obtained in our study we cannot exclude
that other factors such as adiponectin (Goktas et al. 2005;
Lihn et al. 2005; Mistry et al. 2006; Michalakis et al. 2007)
or IL-6 (Fried et al. 1998; Stienstra et al. 2007) could be
involved on tumour cell proliferation. These factors and
pathways were not evaluated in this study.
Our results could also be due to the fact that the chosen
animal models diverge not only in leptin levels but also in
other circulating factors, such as insulin among others previ-
ously mentioned, with a potential to interfere on tumour
growth. In future studies it would be important to repeat
this study using normal weight mice rendered hyperleptine-
mic by exogenous leptin administration to allow the evalua-
tion of the leptin role on tumour cell proliferation
independently of other factors which are also altered in
obesity. Testosterone levels could also potentially interact
with leptin levels and lead to different patterns of tumour
growth in this animal model, as we know that obese animals
have lower androgen levels than lean controls it would be
important to further characterize whereas testosterone levels
are able to modulate the response to leptin regarding tumour
growth and angiogenesis. However, the RM1 cells used in
this study are androgen insensitive and not suitable to study
such interaction which would require the use of an androgen
dependent murine prostate cell line, namely TRAMP cells.
In conclusion, in our research work performed to evaluate
the influence of obesity and leptin on prostate cancer cell
growth and angiogenesis in vivo, we verified that androgen
insensitive murine prostate cancer RM1 cells when inocu-
lated in obese hyperleptinemic db ⁄ db mice induced the
development of small tumours with a low proliferation
index and angiogenesis while in obese leptin deficient ob ⁄ ob
mice induced larger tumours with high cell proliferation
index when compared to control mice, suggesting that high
leptin levels are not favourable to this androgen insensitive
prostate cancer cell line and that the hormone will rather
limit the growth of this type of prostate tumours.
Acknowledgement
We thank Prof. Thompson for kindly providing the RM1
cells that made this work possible; Rui Medeiros, Ricardo
Ribeiro and Susana Carrilho for support with cell culture
and experimental work; and Carlos Gouveia for technical
support with immunohistochemistry. UMIB is funded by
grants from FCT (POCTI ⁄ FEDER), Portugal.
References
Ablamunits V., Cohen Y., Braazee I.B., Gaetz H.P., Vinson C.,
Klebanov S. (2006) Susceptibility to induced and spontaneous
carcinogenesis is increased in fatless A-ZIP ⁄ F-1 but not in
obese ob ⁄ ob mice. Cancer Res. 66, 8897–8902.
Ambrosini G., Nath A.K., Sierra-Honigmann M.R., Flores-
Riveros J. (2002) Transcriptional activation of the human
leptin gene in response to hypoxia. Involvement of hypoxia-
inducible factor 1. J. Biol. Chem. 277, 34601–34609.
Amling C.L. (2004) The association between obesity and the
progression of prostate and renal cell carcinoma. Urol.
Oncol. 22, 478–484.
Asal N.R., Risser D.R., Kadamani S., Geyer J.R., Lee E.T.,
Cherng N. (1988) Risk factors in renal cell carcinoma: I.
Methodology, demographics, tobacco, beverage use, and
obesity. Cancer Detect. Prev. 11, 359–377.
Baillargeon J., Platz E.A., Rose D.P. et al. (2006) Obesity, adipo-
kines, and prostate cancer in a prospective population-based
study. Cancer Epidemiol. Biomarkers Prev. 15, 1331–1335.
Baley P.A., Yoshida K., Sehgal I., Thompson T.Cl. (1995)
Progression to androgen insensitivity in a novel in vitro
mouse model for prostate cancer. J. Steroid Biochem. Mol.
Biol. 52, 403–413.
Baumann H., Morella K.K., White D.W. (1996) The full-length
leptin receptor has signaling capabilities of interleukin 6-type
cytokine receptors. Proc. Natl Acad. Sci. USA 93, 8374–
8378.
Boden G., Chen X., Mozzoli M., Ryan I. (1996) Effect of
fasting on serum leptin in normal human subjects. J. Clin.
Endocrinol. Metab. 81, 3419–3423.
Bouloumie A., Drexler H.C., Busse R. (1998) Leptin, the prod-
uct of Ob gene, promotes angiogenesis. Circ. Res. 83, 1059–
1066.
Brown L.M., Swanson C.A., Gridley G. et al. (1995) Adenocar-
cinoma of the esophagus: role of obesity and diet. J. Natl
Cancer Inst. 87, 104–109.
Bruno A., Conus S., Simon H.U. (2005) Apoptotic pathways are
inhibited by leptin receptor activation in neutrophils. J.
Immunol. 174, 8090–8096.
Bub J.D., Miyazaki T., Iwamoto Y. (2006) Adiponectin as a
growth inhibitor in prostate cancer cells. Biochem. Biophys.
Res. Commun. 340, 1158–1166.
Calle E.E. & Kaaks R. (2004) Overweight, obesity and cancer:
epidemiological evidence and proposed mechanisms. Nat.
Rev. Cancer 4, 579–591.
384 A. M. Ribeiro et al.
� 2010 The Authors
Journal compilation � 2010 Blackwell Publishing Ltd, International Journal of Experimental Pathology, 91, 374–386
Chang S., Hursting S.D., Contois J.H. (2001) Leptin and pros-
tate cancer. Prostate 46, 62–67.
Chia V.M., Newcomb P.A., Trentham-Dietz A., Hampton J.M.
(2007) Obesity, diabetes, and other factors in relation to
survival after endometrial cancer diagnosis. Int. J. Gynecol.
Cancer 17, 441–446.
Chua Jr S.C., Chung W.K., Wu-Peng X.S. et al. (1996) Pheno-
types of mouse diabetes and rat fatty due to mutations in the
OB (leptin) receptor. Science 271, 994–996.
Cohen P.G. (2001) Aromatase, adiposity, aging and disease.
The hypogonadal-metabolic-atherogenic-disease and aging
connection. Med. Hypotheses 56, 702–708.
Cox M.E., Gleave M.E., Zakikhani M. et al. (2009) Insulin
receptor expression by human prostate cancers. Prostate 69,
33–40.
Crespo C.J., Smit E., Troiano R.P., Bartlett S.J., Macera C.A.,
Andersen R.E. (2001) Television watching, energy intake, and
obesity in US children: results from the third National Health
and Nutrition Examination Survey, 1988–1994. Arch. Pedi-
atr. Adolesc. Med. 155, 360–365.
Deo D.D., Rao A.P., Bose S.S. et al. (2008) Differential effects of
leptin on the invasive potential of androgen-dependent and -
independent prostate carcinoma cells. J. Biomed. Biotechnol.
2008, 163902.
Frasca F., Pandini G., Sciacca L. et al. (2008) The role of insulin
receptors and IGF-I receptors in cancer and other diseases.
Arch. Physiol. Biochem. 114, 23–37.
Frederich R.C., Hamann A., Anderson S., Lollmann B.,
Lowell B.B., Flier J.S. (1995) Leptin levels reflect body lipid
content in mice: evidence for diet-induced resistance to leptin
action. Nat. Med. 1, 1311–1314.
Frederich R.C., Lollmann B., Hamann A. et al. (1995) Expres-
sion of ob mRNA and its encoded protein in rodents. Impact
of nutrition and obesity. J. Clin. Invest. 96, 1658–1663.
Freedland S.J., Giovannucci E., Platz E.A. (2006) Are findings
from studies of obesity and prostate cancer really in conflict?
Cancer Causes Control 17, 5–9.
Freedland S.J., Wen J., Wuerstle M. (2008) Obesity is a signifi-
cant risk factor for prostate cancer at the time of biopsy.
Urology 72, 1102–1105.
Fried S.K., Bunkin D.A., Greenberg A.S. (1998) Omental and
subcutaneous adipose tissues of obese subjects release inter-
leukin-6: depot difference and regulation by glucocorticoid. J.
Clin. Endocrinol. Metab. 83, 847–850.
Fruhbeck G. (2006) Intracellular signalling pathways activated
by leptin. Biochem. J. 393, 7–20.
Giovannucci E. & Michaud D. (2007) The role of obesity and
related metabolic disturbances in cancers of the colon, pros-
tate, and pancreas. Gastroenterology 132, 2208–2225.
Giovannucci E., Rimm E.B., Liu Y. et al. (2003) Body mass
index and risk of prostate cancer in U.S. health professionals.
J. Natl Cancer Inst. 95, 1240–1244.
Goktas S., Yilmaz M.I., Caglar K., Sonmez A., Kilia S., Bedir S.
(2005) Prostate cancer and adiponectin. Urology 65, 1168–
1172.
Haque W.A. & Garg A. (2004) Adipocyte biology and adipo-
cytokines. Clin. Lab. Med. 24, 217–234.
Hedley A.A., Ogden C.L., Johnson C.L., Carroll M.D., Curtin
L.R., Flegal K.M. (2004) Prevalence of overweight and obes-
ity among US children, adolescents, and adults, 1999–2002.
JAMA 291, 2847–2850.
Hoda M.R. & Popken G. (2008) Mitogenic and anti-apoptotic
actions of adipocyte-derived hormone leptin in prostate can-
cer cells. BJU Int. 102, 383–388.
Hsing A.W., Chua Jr S., Gao Y.T. et al. (2001) Prostate cancer
risk and serum levels of insulin and leptin: a population-based
study. J. Natl Cancer Inst. 93, 783–789.
James W.P. (2008) WHO recognition of the global obesity epi-
demic. Int. J. Obes. (Lond) 32(Suppl 7), S120–S126.
Kershaw E.E. & Flier J.S. (2004) Adipose tissue as an endocrine
organ. J. Clin. Endocrinol. Metab. 89, 2548–2556.
Leitzmann M.F., Ahn J., Albanes D. et al. (2008) Diabetes mell-
itus and prostate cancer risk in the Prostate, Lung, Colorectal,
and Ovarian Cancer Screening Trial. Cancer Causes Control
19, 1267–1276.
Lihn A.S., Pedersen S.B., Richelsen B. (2005) Adiponectin: action,
regulation and association to insulin sensitivity. Obes. Rev. 6,
13–21.
Luo J., Margolis K.L., Adami H.O., Lopez A.M., Lessin L.,
Ye W. (2007) Body size, weight cycling, and risk of renal cell
carcinoma among postmenopausal women: the Women’s
Health Initiative (United States). Am. J. Epidemiol. 166, 752–
759.
Maffei M., Halaas J., Ravussin E. et al. (1995) Leptin levels in
human and rodent: measurement of plasma leptin and ob
RNA in obese and weight-reduced subjects. Nat. Med. 1,
1155–1161.
Majed B., Moreau T., Senouci K., Salmon R.J., Fourquet A., Asse-
lain B. (2008) Is obesity an independent prognosis factor in
woman breast cancer? Breast Cancer Res. Treat. 111, 329–342.
Malendowicz W., Rucinski M., Macchi C. et al. (2006) Leptin
and leptin receptors in the prostate and seminal vesicles of
the adult rat. Int. J. Mol. Med. 18, 615–618.
McNeal J.E. & Gleason D.F. (1991) Gleason’s classification of
prostatic adenocarcinomas. Ann. Pathol. 11, 163–168.
Michalakis K., Williams C.J., Mitsiades N. et al. (2007) Serum
adiponectin concentrations and tissue expression of adiponec-
tin receptors are reduced in patients with prostate cancer: a
case control study. Cancer Epidemiol. Biomarkers Prev. 16,
308–313.
Mistry T., Digby J.E., Chen J., Desai K.M., Randeva H.S.
(2006) The regulation of adiponectin receptors in human
prostate cancer cell lines. Biochem. Biophys. Res. Commun.
348, 832–838.
Prostate cancer proliferation in obese mice 385
� 2010 The Authors
Journal compilation � 2010 Blackwell Publishing Ltd, International Journal of Experimental Pathology, 91, 374–386
Mistry T., Digby J.E., Desai K.M., Randeva H.S. (2007) Obes-
ity and prostate cancer: a role for adipokines. Eur. Urol. 52,
46–53.
Mistry T., Digby J.E., , Desai K.M., Randeva H.S. (2008) Lep-
tin and adiponectin interact in the regulation of prostate can-
cer cell growth via modulation of p53 and bcl-2 expression.
BJU Int. 101, 1317–1322.
Monteiro M.P., Monteiro J.D., Aguas A.P., Cardoso M.H.
(2006) Rats submitted to gastric banding are leaner and show
distinctive feeding patterns. Obes. Surg. 16, 597–602.
Nakashima K., Narazaki M., Taga T. (1997) Overlapping and
distinct signals through leptin receptor (OB-R) and a closely
related cytokine signal transducer, gp130. FEBS Lett. 401,
49–52.
Nandeesha H. (2009) Insulin: a novel agent in the pathogenesis
of prostate cancer. Int. Urol. Nephrol. 41, 267–272.
Nunez N.P., Oh W.J., Rosenberg J. et al. (2006) Accelerated
tumor formation in a fatless mouse with type 2 diabetes and
inflammation. Cancer Res. 66, 5469–5476.
Ogden C.L., Carroll M.D., Curtin L.R., McDowell M.A.,
Tabak C.J., Flegal K.M. (2006) Prevalence of overweight and
obesity in the United States, 1999–2004. JAMA 295, 1549–
1555.
Onuma M., Bub J.D., Rummel T.L., Iwamoto Y. (2003) Pros-
tate cancer cell-adipocyte interaction: leptin mediates andro-
gen-independent prostate cancer cell proliferation through
c-Jun NH2-terminal kinase. J. Biol. Chem. 278, 42660–
42667.
O’Rourke L., Yeaman S.J., Shepherd P.R. et al. (2001) Insulin
and leptin acutely regulate cholesterol ester metabolism in
macrophages by novel signaling pathways. Diabetes 50, 955–
961.
Pischon T., Lahmann P.H., Boeing H. et al. (2006) Body size
and risk of colon and rectal cancer in the European Prospec-
tive Investigation Into Cancer and Nutrition (EPIC). J. Natl
Cancer Inst. 98, 920–931.
Ribeiro R., Lopes C., Medeiros R. (2006) The link between
obesity and prostate cancer: the leptin pathway and therapeu-
tic perspectives. Prostate Cancer Prostatic. Dis. 9, 19–24.
Ronti T., Lupattelli G., Mannarino E. (2006) The endocrine
function of adipose tissue: an update. Clin. Endocrinol. (Oxf)
64, 355–365.
Schoen R.E., Tangen C.M., Kuller L.H. et al. (1999) Increased
blood glucose and insulin, body size, and incident colorectal
cancer. J. Natl Cancer Inst. 91, 1147–1154.
Sierra-Honigmann M.R., Nath A.K., Murakami C. et al. (1998)
Biological action of leptin as an angiogenic factor. Science
281, 1683–1686.
Somasundar P., Yu A.K., Vona-Davis L., McFadden D.W.
(2003) Differential effects of leptin on cancer in vitro. J. Surg.
Res. 113, 50–55.
Somasundar P., Frankenberry K.A., Skinner H. et al. (2004)
Prostate cancer cell proliferation is influenced by leptin. J.
Surg. Res. 118, 71–82.
Stattin P., Kaaks R., Johansson R. et al. (2003) Plasma leptin is
not associated with prostate cancer risk. Cancer Epidemiol.
Biomarkers Prev. 12, 474–475.
Stienstra R., Duval C., Muller M., Kersten S. (2007) PPARs,
Obesity, and Inflammation. PPAR Res. 2007, 95974.
Stubbs C.O. & Lee A.J. (2004) The obesity epidemic: both
energy intake and physical activity contribute. Med. J. Aust.
181, 489–491.
Tartaglia L.A., Dembski M., Weng X. et al. (1995) Identifica-
tion and expression cloning of a leptin receptor, OB-R. Cell
83, 1263–1271.
Trayhurn P. & Beattie J.H. (2001) Physiological role of adipose
tissue: white adipose tissue as an endocrine and secretory
organ. Proc. Nutr. Soc. 60, 329–339.
Vaughan T.L., Davis S., Kristal A., Thomas D.B. (1995) Obes-
ity, alcohol, and tobacco as risk factors for cancers of the
esophagus and gastric cardia: adenocarcinoma versus squa-
mous cell carcinoma. Cancer Epidemiol. Biomarkers Prev. 4,
85–92.
Veugelers P.J., Porter G.A., Guernsey D.L., Casson A.G. (2006)
Obesity and lifestyle risk factors for gastroesophageal reflux
disease, Barrett esophagus and esophageal adenocarcinoma.
Dis. Esophagus 19, 321–328.
Voeks D.J., Martiniello-Wilks R., Russel P.J. (2002) Derivation
of MPR and TRAMP models of prostate cancer and prostate
cancer metastasis for evaluation of therapeutic strategies.
Urol. Oncol. 7, 111–118.
Zhang Y., Proenca R., Maffei M., Barone M., Leopold L.,
Friedman J.M. (1994) Positional cloning of the mouse obese
gene and its human homologue. Nature 372, 425–432.
386 A. M. Ribeiro et al.
� 2010 The Authors
Journal compilation � 2010 Blackwell Publishing Ltd, International Journal of Experimental Pathology, 91, 374–386