development and evaluation of an improved quantitative 90y bremsstrahlung spect method
TRANSCRIPT

Development and evaluation of an improved quantitative 90Ybremsstrahlung SPECT method
Xing Ronga) and Yong DuDepartment of Radiology, Johns Hopkins University, Baltimore, Maryland 21287-0859
Michael LjungbergDepartment of Medical Radiation Physics, Clinical Sciences, Lund, Lund University, SE-221 85 Lund, Sweden
Erwann RaultFormerly with Department of Electronics and Information Systems, MEDISIP,Ghent University-IBBT-IBiTech, De Pintelaan 185 block B, B-9000 Ghent, Belgium
Stefaan VandenbergheDepartment of Electronics and Information Systems, MEDISIP, Ghent University-IBBT-IBiTech,De Pintelaan 185 block B, B-9000 Ghent, Belgium
Eric C. FreyDepartment of Radiology, Johns Hopkins University, Baltimore, Maryland 21287-0859
(Received 10 November 2011; revised 14 March 2012; accepted for publication 14 March 2012;
published 11 April 2012)
Purpose: Yttrium-90 (90Y) is one of the most commonly used radionuclides in targeted radionuclide
therapy (TRT). Since it decays with essentially no gamma photon emissions, surrogate radionuclides
(e.g., 111In) or imaging agents (e.g., 99mTc MAA) are typically used for treatment planning. It would,
however, be useful to image 90Y directly in order to confirm that the distributions measured with
these other radionuclides or agents are the same as for the 90Y labeled agents. As a result, there has
been a great deal of interest in quantitative imaging of 90Y bremsstrahlung photons using single pho-
ton emission computed tomography (SPECT) imaging. The continuous and broad energy distribution
of bremsstrahlung photons, however, imposes substantial challenges on accurate quantification of the
activity distribution. The aim of this work was to develop and evaluate an improved quantitative 90Y
bremsstrahlung SPECT reconstruction method appropriate for these imaging applications.
Methods: Accurate modeling of image degrading factors such as object attenuation and scatter and
the collimator-detector response is essential to obtain quantitatively accurate images. All of the image
degrading factors are energy dependent. Thus, the authors separated the modeling of the bremsstrah-
lung photons into multiple categories and energy ranges. To improve the accuracy, the authors used a
bremsstrahlung energy spectrum previously estimated from experimental measurements and incorpo-
rated a model of the distance between 90Y decay location and bremsstrahlung emission location into
the SIMIND code used to generate the response functions and kernels used in the model. This improved
Monte Carlo bremsstrahlung simulation was validated by comparison to experimentally measured
projection data of a 90Y line source. The authors validated the accuracy of the forward projection
model for photons in the various categories and energy ranges using the validated Monte Carlo (MC)
simulation method. The forward projection model was incorporated into an iterative ordered subsets-
expectation maximization (OS-EM) reconstruction code to allow for quantitative SPECT reconstruc-
tion. The resulting code was validated using both a physical phantom experiment with spherical
objects in a warm background and a realistic anatomical phantom simulation. In the physical phantom
study, the authors evaluated the method in terms of quantitative accuracy of activity estimates in the
spheres; in the simulation study, the authors evaluated the accuracy and precision of activity estimates
from various organs and compared them to results from a previously proposed method.
Results: The authors demonstrated excellent agreement between the experimental measurement
and Monte Carlo simulation. In the XCAT phantom simulation, the proposed method achieved
much better accuracy in the modeling (error in photon counts was �1.1%) compared to a previ-
ously proposed method (errors were more than 20 %); the quantitative accuracy of activity esti-
mates was excellent for all organs (errors were from �1.6% to 11.9%) and comparable to
previously published results for 131I using the same collimator.
Conclusions: The proposed 90Y bremsstrahlung SPECT reconstruction method provided very
accurate estimates of organ activities, with accuracies approaching those previously observed for131I. The method may be useful in verifying organ doses for targeted radionuclide therapy using 90Y.
VC 2012 American Association of Physicists in Medicine. [http://dx.doi.org/10.1118/1.3700174]
Key words: Yttrium-90 bremsstrahlung, quantitative SPECT, model-based compensation, Monte
Carlo simulation, targeted radionuclide therapy
2346 Med. Phys. 39 (5), May 2012 0094-2405/2012/39(5)/2346/13/$30.00 VC 2012 Am. Assoc. Phys. Med. 2346

I. INTRODUCTION
Targeted radionuclide therapy (TRT) is an established treat-
ment for certain cancers due to its ability to locally and
selectively deposit a toxic dose of radiation to cancerous
cells.1 As an essentially pure b-particle emitter, Yttrium-90
(90Y) is one of the most commonly used radionuclides in
TRT and has found commercial application in 90Y Zevalin
radioimmunotherapy of indolent B-cell lymphoma and 90Y
microsphere brachytherapy of hepatic malignancies. Due to
variability in the delivery of the therapeutic agents to tumors
and normal organs, it is often necessary or desirable to per-
form patient specific treatment planning; a key part of this
treatment planning is estimating the distribution of 90Y at
multiple time points.2 To this end, pretherapy imaging of a
planning dose obtained using either a surrogate radionuclide
(e.g., 111In for Zevalin) or imaging agent (e.g., 99mTc MAA
for 90Y microspheres brachytherapy) is often performed.3,4
However, due to differences in distribution of the imaging
agents or variations in uptake over time, this imaging may
not exactly reflect the distribution of 90Y during the therapy.
Thus, post-therapy dosimetry based on quantitative imaging
of the 90Y distribution may be useful to provide dose confir-
mation or allow implementation of more rational dose frac-
tionation protocols.5
Although 90Y decay does not result in gamma ray emis-
sions, it does produce bremsstrahlung photons. While these
bremsstrahlung photons have been imaged in the past using
conventional single photon emission computed tomography
(SPECT) reconstruction methods,6 the quality of the images
has been relatively poor. This is because the bremsstrahlung
photon energy spectrum is continuous and extends to ener-
gies up to 2.3 MeV. The continuous nature means that
energy-based scatter rejection is not effective, and thus, there
will be substantial numbers of scattered photons in any
energy window. The presence of significant numbers of
high-energy photons means that septal penetration and scat-
ter, as well as partial deposition in and backscatter behind
the crystal, will further degrade image quality and quantita-
tive accuracy.
Recently, Minarik et al.7 demonstrated the feasibility of
quantitative 90Y bremsstrahlung SPECT imaging by model-
ing the scatter using effective source scatter estimation
(ESSE) method8 and the collimator-detector response (CDR)
using a precalculated CDR table obtained from Monte Carlo
(MC) simulation. These models were incorporated into an
implementation of the ordered subsets-expectation maximi-
zation (OS-EM) algorithm.9,10 This reconstruction method
modeled all the image degrading factors including attenua-
tion, scatter and the full CDR (including septal penetration
and scatter) using a single energy range (we refer to their
method as the single energy range method in the remainder
of this paper). More details about the implications of this
will become apparent below.
Further, Minarik et al.7 used the SIMIND MC program11 to
simulate 90Y bremsstrahlung imaging and generate the scat-
ter kernels and CDR table used in the modeling of image
degrading factors. The SIMIND code simulated the emission of
bremsstrahlung photons directly by sampling an energy
spectrum obtained from simulations using the MCNPX MC
program.12 As will be shown in more detail below, several
of the major MC simulation codes including MCNPX seem to
underestimate the abundance of high-energy bremsstrahlung
photons.13 Also, the bremsstrahlung emission distance, i.e.,
the distance between the 90Y decay location and the brems-
strahlung photon emission location, was not modeled.
Together these factors may have limited the accuracy of the
MC simulation.
In fact, in the validation of the SIMIND simulation of
bremsstrahlung imaging, Minarik et al. reported a mismatch
between the simulated and experimentally measured projec-
tion data: SIMIND underestimated the full width at half maxi-
mum (FWHM) and full width at tenth maximum (FWTM) of
the line spread function compared to experimentally meas-
ured data. This discrepancy may have resulted in reduced
accuracy of the scatter kernels and CDR table. In addition,
modeling the image degrading factors using a single energy
range has limitations due to the continuous and broad energy
distribution of bremsstrahlung photons and the energy de-
pendence of the various factors. As a result, the quantitative
accuracy of the proposed method might not have been as
good as possible.
The aim of this work was to develop and evaluate an
improved quantitative 90Y bremsstrahlung SPECT method to
improve the quantitative accuracy of activity estimates for tar-
geted radionuclide therapy dosimetry applications. Since one
factor potentially limiting the accuracy was the method used
to generate the CDR tables and scatter kernels, we first
improved the accuracy of the SIMIND MC simulation by incor-
porating an improved bremsstrahlung emission energy spec-
trum and a model of the distance between the 90Y decay and
bremsstrahlung emission locations. Second, we improved the
accuracy of modeling object scatter, attenuation, and the CDR
through the use of multiple energy ranges to model better
the energy dependence of these effects. We evaluated the
improvements in the MC code, the forward model of the
image formation process, and the quantitative accuracy of
the reconstructed images using a combination of physical
phantom experiments and realistic MC simulations.
II. MATERIALS AND METHODS
II.A. Improvement in quantitative 90Y bremsstrahlungSPECT method
II.A.1. Improvement in SIMIND simulation ofbremsstrahlung imaging
Rault et al. developed a fast simulation method13 to simu-
late the emission of 90Y bremsstrahlung photons using the
GEANT4 application for emission tomography (GATE) MC simu-
lation code.14 Instead of time-consuming simulation of
b-particles, the emission of bremsstrahlung photons was simu-
lated directly based on a precalculated bremsstrahlung energy
spectrum and probability density functions (PDFs) of the
bremsstrahlung emission distance generated using GATE. They
computed these PDFs as a function of the bremsstrahlung
2347 Rong et al.: Development and evaluation of an improved quantitative 90Y bremsstrahlung SPECT method 2347
Medical Physics, Vol. 39, No. 5, May 2012

energy in 20 keV steps between 0 and 2 MeV. However, even
when taking into account this distance effect, they reported a
mismatch between simulated and measured point spread func-
tions. They attributed this to errors in the bremsstrahlung
energy spectrum generated using GATE and, as a result, used a
measured energy spectrum corrected for the detector energy
response, including Compton scatter in the detector, obtained
with a high-purity germanium (HPGe) detector. Using this
energy spectrum to sample energies of the bremsstrahlung
photons and the PDFs for the corresponding energies to sam-
ple the bremsstrahlung emission distance, they reported a sub-
stantial improvement in agreement between the simulation
and the measurement.
However, even with these improvements, the GATE code is
computationally inefficient when simulating voxelized phan-
toms such as XCAT phantom,15 a widely used digital phan-
tom that provides a realistic model of human anatomy. In
contrast, as a MC program dedicated to simulating scintilla-
tion camera imaging, SIMIND is much faster and computation-
ally more efficient. As a result, we have incorporated similar
improvements into SIMIND in order to facilitate evaluation of
our proposed method and rapid generation of the requisite
CDR tables and scatter kernels.
Figure 1 shows a comparison of the corrected experimental
energy spectrum from Rault et al. and one simulated using
MCNPX. Note that MCNPX substantially underestimated the
abundance of photons with energies higher than 500 keV.
Similar underestimation has been observed with other MC
codes including GATE.13 This underestimation has important
consequences for simulation of bremsstrahlung imaging
because down-scatter (photons with energies above a particu-
lar energy window that are scattered and detected in that win-
dow) and collimator-detector interactions (septal penetration
and scatter, partial deposition in the crystal, as well as the
backscatter from structures behind the crystal) can result in
high-energy photons contributing to projection data in lower
energy windows. As a result, we used the bremsstrahlung
energy spectrum estimated by Rault et al. as an improved
emission energy spectrum in the SIMIND simulation. In addition
to bremsstrahlung photons, 90Y also emits low-abundance
prompt gamma photons (1.76 MeV, 7.8� 10�5 cps/Bq). For
completeness, we incorporated the prompt gamma photons
into this spectrum; this combination is referred to as the
improved spectrum in the remainder of this paper. In particu-
lar, energies of emitted photons were sampled from this
improved spectrum instead of the energy spectrum generated
using MCNPX as used in the original work by Minarik et al.
We also incorporated the effects of bremsstrahlung emis-
sion distance into SIMIND using a method similar to Rault
et al. We used GATE to simulate the emission of b-particles
from a 90Y point source in water, the interaction of emitted
b-particles with the water, and the generation of bremsstrah-
lung photons. Bremsstrahlung emission distance histograms
were estimated as a function of bremsstrahlung photon
energy. We generated histograms in energy ranges with
varying widths. At lower energies, we used finer energy
spacing because of both the higher abundance of emitted
photons and more rapid changes in the distance histograms
for lower bremsstrahlung energies. We used 20, 50, 100, and
200 keV energy intervals for bremsstrahlung photons with
energies in the ranges of 0–300, 300–500, 500–1000 and
1000–2000 keV, respectively. Sample distance histograms
are shown in Fig. 2.
We incorporated these two improvements into the SIMIND
simulation of 90Y bremsstrahlung imaging as follows. First,
the 90Y decay location was sampled within the source vol-
ume with a probability proportional to the activity concentra-
tion. The photon energy was then sampled from the
improved spectrum. The bremsstrahlung emission distance
was then sampled from the distance histogram corresponding
to the emitted photon’s energy. Then, the direction from the90Y decay location to the bremsstrahlung emission location
FIG. 1. Energy spectra (50–2000 keV, 10 keV interval) of 90Y bremsstrah-
lung photons in water simulated using MCNPX (solid line) and estimated from
experimental measurement by Rault et al. (dashed line).
FIG. 2. Sample distance histograms (bin width was 0.1 mm) displayed for
four different energies.
2348 Rong et al.: Development and evaluation of an improved quantitative 90Y bremsstrahlung SPECT method 2348
Medical Physics, Vol. 39, No. 5, May 2012

was sampled isotropically, and the bremsstrahlung emission
location was calculated. Finally, the photon was emitted iso-
tropically from this location, and then propagated through
the object and collimator-detector system using the standard
radiation transport methods implemented in SIMIND.
II.A.2. Multirange method to improve modeling ofbremsstrahlung photon image formation
In addition to improving the scatter kernels and CDR
tables by improving the SIMIND bremsstrahlung simulation,
we have also developed an improved method to model the
image formation process. This is essential since the accuracy
of the reconstructed images obtained with iterative recon-
struction methods is closely tied to the accuracy of the image
formation process modeled in the projector.
II.A.2.a. Single energy range (SER) method and its
limitations. Modeling the image formation process requires
modeling attenuation and scatter of the photons in the patient
as well as interactions with the collimator-detector system.
In the SER method, Minarik et al. modeled attenuation, scat-
ter, and the CDR as constant over the whole energy range.
Since all of these image degrading effects are energy de-
pendent, modeling them as constant over the very broad
energy range results in limited modeling accuracy.
Limitations in attenuation modeling. Attenuation of pho-
tons in the patient is modeled in the SER method using a sin-
gle effective attenuation coefficient computed based on the
bremsstrahlung emission energy spectrum inside the acquisi-
tion energy window. This approximation is less accurate as
the width of the energy window increases due to beam
hardening.
Limitations in scatter modeling. Both the proposed and
SER methods use ESSE to model scatter in the patient. The
ESSE method models propagation of photons from their
point of origin until their last scatter location in the body,
and includes the interactions in the detector but not the colli-
mator. Logically one can divide scatter measured in an
energy window into direct- and down-scatter. Both designa-
tions refer to photons scattered in the patient and detected in
the energy window of interest. Direct-scatter refers in partic-
ular to the photons with emission energies inside the win-
dow, and down-scatter refers to photons with emission
energies above the window. In ESSE, scatter is modeled by
computing an effective scatter source using a pair of scatter
kernels estimated from MC simulation. These kernels are
estimated by MC simulation of a point source with a given
emission energy spectrum in the center of a water slab. Pho-
tons are propagated through the collimator-detector system
until detected. The first kernel represents the average proba-
bility that a photon has its last scatter interaction before
detection in the energy window of interest at each voxel in
the slab. The second kernel represents the average attenua-
tion coefficient of scattered photons after their last scatter
event in corresponding voxels. These kernels are used to
model scattering in the object via spatially invariant convo-
lution. A correction is included to account for the change
in energy after scatter that is based on a Taylor Series
expansion; this expansion is truncated and is most accurate
when the change in energy after scattering is small. In the
SER method direct- and down-scatter are treated together.
Since the energy window used is relatively large and since
the energy range of down-scattered photons is even larger,
the accuracy of the scatter modeling is limited.
Limitations in CDR modeling. Both scattered and unscat-
tered photons are propagated through the collimator-detector
system using CDR tables estimated using MC simulations of
a point source in air.16 Since the CDR is a function of
energy, the accuracy of the CDR table will depend on how
closely the actual energy spectrum of photons incident on
the collimator matches the spectrum used in the generation
of the CDR table. In the SER method, a single CDR table
calculated using the bremsstrahlung emission energy spec-
trum is used for unscattered and direct- and down-scattered
photons. However, due to beam hardening and object scat-
tering, the energy spectrum of these photons is object de-
pendent and, in general, very different from the emission
energy spectrum.
Sine all of these image degrading effects are energy de-
pendent, it is critical to account for the changes in the energy
spectrum in modeling bremsstrahlung photon image forma-
tion. The SER method, however, does not account for the
changes in the energy spectrum since it treats all different
kinds of photons together. To overcome its limitations, we
proposed the multiple energy range (MER) method.
II.A.2.b. MER method. In the SER method, Minarik et al.
used a 105–195 keV acquisition window based on considera-
tions about the fraction of primary versus other photons. In
the MER method, we selected a 100–500 keV acquisition
window based on the trade-off between several factors. First,
the overall abundance of bremsstrahlung photons with ener-
gies higher than 50 keV is only about 2% in water. Thus, for
applications such as 90Y radioimmunotherapy where the
injected activity is modest, there would be relatively few pho-
tons emitted. This argues for using as wide an energy window
as possible. We selected 100 keV as a lower bound since the
fraction of multiple scatter increases dramatically at lower
energies and the ESSE scatter model has relatively poor per-
formance for photons with high scatter orders. We selected
500 keV as an upper bound since higher energy photons result
in much larger amounts of collimator penetration and scatter,
which are also difficult to model accurately and could increase
the bias in the activity estimates. We should note that the
above energy window was not formally optimized and doing
so will be the subject of future work.
Figure 3 shows the MER method schematically. In this
context, “multiple energy range” does not refer to the use of
multiple acquisition energy windows; on the contrary, a sin-
gle acquisition window was used (100–500 keV). Instead, it
refers to the separate treatment of photons in various energy
ranges and in various logical categories during the modeling
process. In particular, we separated photons into eight cate-
gories based on energy and logical category. Primary pho-
tons (i.e., photons not scattered in the body) were separated
into four categories according to their emission energies:
0–250, 250–500, 500–1000, and 1000–2000 keV. Scattered
2349 Rong et al.: Development and evaluation of an improved quantitative 90Y bremsstrahlung SPECT method 2349
Medical Physics, Vol. 39, No. 5, May 2012
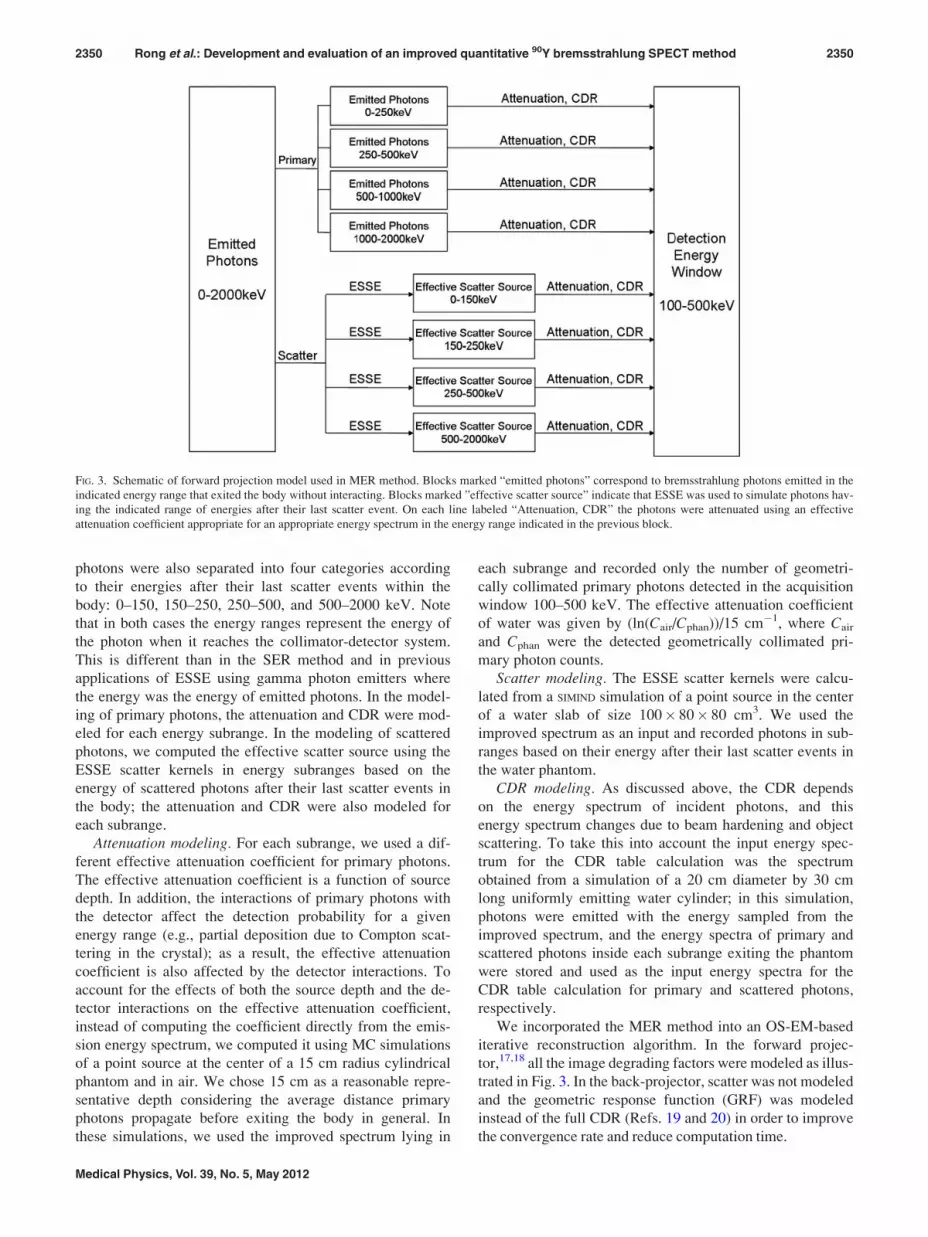
photons were also separated into four categories according
to their energies after their last scatter events within the
body: 0–150, 150–250, 250–500, and 500–2000 keV. Note
that in both cases the energy ranges represent the energy of
the photon when it reaches the collimator-detector system.
This is different than in the SER method and in previous
applications of ESSE using gamma photon emitters where
the energy was the energy of emitted photons. In the model-
ing of primary photons, the attenuation and CDR were mod-
eled for each energy subrange. In the modeling of scattered
photons, we computed the effective scatter source using the
ESSE scatter kernels in energy subranges based on the
energy of scattered photons after their last scatter events in
the body; the attenuation and CDR were also modeled for
each subrange.
Attenuation modeling. For each subrange, we used a dif-
ferent effective attenuation coefficient for primary photons.
The effective attenuation coefficient is a function of source
depth. In addition, the interactions of primary photons with
the detector affect the detection probability for a given
energy range (e.g., partial deposition due to Compton scat-
tering in the crystal); as a result, the effective attenuation
coefficient is also affected by the detector interactions. To
account for the effects of both the source depth and the de-
tector interactions on the effective attenuation coefficient,
instead of computing the coefficient directly from the emis-
sion energy spectrum, we computed it using MC simulations
of a point source at the center of a 15 cm radius cylindrical
phantom and in air. We chose 15 cm as a reasonable repre-
sentative depth considering the average distance primary
photons propagate before exiting the body in general. In
these simulations, we used the improved spectrum lying in
each subrange and recorded only the number of geometri-
cally collimated primary photons detected in the acquisition
window 100–500 keV. The effective attenuation coefficient
of water was given by (ln(Cair/Cphan))/15 cm�1, where Cair
and Cphan were the detected geometrically collimated pri-
mary photon counts.
Scatter modeling. The ESSE scatter kernels were calcu-
lated from a SIMIND simulation of a point source in the center
of a water slab of size 100� 80� 80 cm3. We used the
improved spectrum as an input and recorded photons in sub-
ranges based on their energy after their last scatter events in
the water phantom.
CDR modeling. As discussed above, the CDR depends
on the energy spectrum of incident photons, and this
energy spectrum changes due to beam hardening and object
scattering. To take this into account the input energy spec-
trum for the CDR table calculation was the spectrum
obtained from a simulation of a 20 cm diameter by 30 cm
long uniformly emitting water cylinder; in this simulation,
photons were emitted with the energy sampled from the
improved spectrum, and the energy spectra of primary and
scattered photons inside each subrange exiting the phantom
were stored and used as the input energy spectra for the
CDR table calculation for primary and scattered photons,
respectively.
We incorporated the MER method into an OS-EM-based
iterative reconstruction algorithm. In the forward projec-
tor,17,18 all the image degrading factors were modeled as illus-
trated in Fig. 3. In the back-projector, scatter was not modeled
and the geometric response function (GRF) was modeled
instead of the full CDR (Refs. 19 and 20) in order to improve
the convergence rate and reduce computation time.
FIG. 3. Schematic of forward projection model used in MER method. Blocks marked “emitted photons” correspond to bremsstrahlung photons emitted in the
indicated energy range that exited the body without interacting. Blocks marked ”effective scatter source” indicate that ESSE was used to simulate photons hav-
ing the indicated range of energies after their last scatter event. On each line labeled “Attenuation, CDR” the photons were attenuated using an effective
attenuation coefficient appropriate for an appropriate energy spectrum in the energy range indicated in the previous block.
2350 Rong et al.: Development and evaluation of an improved quantitative 90Y bremsstrahlung SPECT method 2350
Medical Physics, Vol. 39, No. 5, May 2012

II.B. Validation of improved SIMIND simulation of 90Ybremsstrahlung imaging
A comparison between experimental measurements and
corresponding simulations was performed using the custom
designed rod phantom shown in Fig. 4 in order to validate
the improved simulation of 90Y bremsstrahlung imaging.
The rod phantom had an inner diameter of 0.34 cm, and an
outer diameter of 2.54 cm, and was filled with a solution of90Y up to a length of 10 cm. These dimensions were chosen
such that the distance from the outer boundary of the com-
partment containing the 90Y solution to the outer boundary
of the phantom was 1.1 cm, which is the maximum range of90Y b-particles in water. In this way, nearly all b-particles
were stopped, but the attenuation of the bremsstrahlung pho-
tons was still relatively small. The phantom was imaged
using a dual-camera Philips Precedence SPECT/CT system
with a high-energy general-purpose (HEGP) collimator. The
crystal thickness was 9.525 mm and the acquisition energy
window used was 100–500 keV. The distance between the
center of the line source and the camera face was 15.8 cm.
The projection image at each view had 128� 128 pixels and
the pixel size was 4.664 mm. Background counts were meas-
ured and subtracted from the phantom projections. Simula-
tions were conducted with the same system geometry and
imaging parameters as in the measurement using the
improved SIMIND, GATE, and standard SIMIND (using the emis-
sion energy spectrum from MCNPX and no bremsstrahlung
emission distance model) codes. The compartment behind
the crystal was modeled as a slab made of SiO2 with density
of 2.6 g/cm3 and thickness of 6 cm. We modeled a Gaussian
energy resolution with a FWHM of 9.5% at 140 keV and an
intrinsic spatial resolution of 3.4 mm, both with an energy
dependence of 1=ffiffiffi
Ep
, where E represents the deposited
energy. In the GATE simulation, the emission and propagation
of both b-particles and bremsstrahlung photons were simu-
lated. Profiles through the phantom projections averaged over
ten consecutive rows of pixels in the middle of the line source
were compared between the measurement and the simulations.
II.C. Evaluation of the MER method
Both physical phantom and simulated XCAT phantom
experiments were conducted to evaluate the performance of
the MER method. The physical phantom experiment pro-
vides the benchmark in accuracy of modeling of the physics
and camera; the XCAT phantom study provides more realistic
modeling of patient anatomy, eliminates errors in measure-
ment of activity and in definition of object volumes-of-inter-
est (VOIs), and facilitates estimation of precision. In the
physical phantom experiment, we evaluated the quantitative
accuracy of activity estimates from the MER and SER
methods; in the XCAT phantom simulation, we compared
the MER method to the SER method in terms of the errors in
projection modeling and activity estimates. In both cases we
also included a comparison to the results from OS-EM with
attenuation compensation alone to provide a basis for com-
paring to what one might obtain with typical commercial
software. All the following simulations were conducted
using the improved version of SIMIND.
II.C.1. Physical phantom experiment
An elliptical phantom with three spheres of different sizes
was used in the experimental evaluation (see Fig. 5). The ac-
tivity was uniformly distributed in each compartment. To
minimize the adsorption of 90Y on the walls of the phantom
we used a buffer solution containing ethylenediaminetetraace-
tate (EDTA).21 For large and medium spheres, the sphere-to-
background activity concentration ratio was about 10:1; for
the small sphere, the ratio was about 20:1. The activity in
each compartment was measured using a Capintec dose cali-
brator with a dial setting of 55 and a readout scale factor of
10, as suggested by Zimmerman et al.,22 and using the same
type of syringes with the same solution volume and with the
syringe at the same position in the dose calibrator. The total
activities in the background, large, medium, and small spheres
were 1657.7, 121.9, 27.4, and 5.9 MBq, respectively. The
imaging system, collimator and acquisition window were the
same as used in the rod phantom experiment. Projections
were acquired at 128 views over 360� in a 128� 128 matrix
with a pixel size of 4.664 mm. The imaging time was 45 s per
projection view. CT images were acquired in connection with
the SPECT measurements for use in attenuation and scatter
compensation. The manufacturer’s software was used to
rescale the CT images to represent the attenuation at 100 keV
and to register the CT images with the SPECT images.
Nonuniformity correction was performed using intrinsic
FIG. 4. Custom designed rod phantom used as a line source for MC simula-
tion validation and sensitivity measurements.
FIG. 5. Elliptical phantom used in physical phantom experiments showing
three spheres of different sizes.
2351 Rong et al.: Development and evaluation of an improved quantitative 90Y bremsstrahlung SPECT method 2351
Medical Physics, Vol. 39, No. 5, May 2012

flood-field images acquired for both detectors using the 90Y
rod source phantom.
The images were reconstructed with up to 400 iterations of
16 subsets per iteration using the OS-EM algorithm with
attenuation compensation alone (representing what could be
achieved with typical commercial software), the MER and the
SER methods. The dimensions of the reconstructed images
were 128� 128� 128 and the voxel size was 4.664 mm. For
the MER method, the CT images were rescaled to generate
the attenuation map for each energy subrange such that
attenuation coefficient for water in this map was equal to the
effective attenuation coefficient, calculated as described
above, for the corresponding energy subrange.
Although we directly measured the activity in each
sphere, knowledge of the sphere volume was useful in defin-
ing VOIs for activity quantification. We used an electronic
balance with a precision of 1 mg to measure the masses of
individual spheres when they were dry and were full of solu-
tion. Then, we calculated the difference of the masses and
divided by the density of water to give the volume of each
sphere. The resulting volumes were 89.610, 19.009, and
2.004 cm3, respectively. The corresponding inner diameters
were 5.5, 3.3, and 1.5 cm, respectively. The VOIs for the
three spheres were defined based on the SPECT image so
that the volumes in the VOIs were consistent with the meas-
ured volumes.
After reconstruction, the voxel values in the SPECT
image were in units of geometrically collimated primary
photons per voxel. To convert the sum of voxel values inside
the VOIs to activity we needed a measure of camera system
sensitivity (in cps/MBq) for geometrically collimated
primary photons. The rod phantom (Fig. 4) filled with 90Y
solution having an activity of 263 MBq was imaged from
one view for 5 min to measure the sensitivity. Since it is not
possible to directly measure the number of geometrically
collimated primary photons from the image, a corresponding
simulation was conducted using SIMIND. The ratio of the total
counts in the measured data to that in the simulated data was
calculated in an ROI covering the center of the phantom.
This ratio was then multiplied by the sensitivity for geomet-
rically collimated primary photons obtained from the SIMIND
simulation to determine the camera system sensitivity, which
was 1.20 cps/MBq.
II.C.2. XCAT phantom experiment
An XCAT phantom with a 90Y activity distribution based
on patient 111In Zevalin data was used to evaluate the MER
method. We simulated the same dual-camera SPECT system
as in the physical phantom experiment, a 30 min total acqui-
sition time, and a total activity of 2960 MBq, a total activity
representative of what might be used in a myeloablative ther-
apy regimen. Data were simulated at 128 projection views
over 360� and the matrix size for each projection view was
128� 128 with a pixel size of 4.664 mm. Both 100–500 and
105–195 keV acquisition windows were simulated. We
simulated a total of 1012 photon emissions using the variance
reduction techniques available in SIMIND (including perpetual
propagation, forced detection, and delta tracking in the colli-
mator) to generate low-noise projection data. The noise in
the resulting projections was very low (negligible compared
to a realistic noise level) and not Poisson distributed due to
the variance reduction. To allow studying the effects of
noise, we scaled the projections to a realistic mean count
level based on the activity and acquisition duration and then
simulated 50 Poisson noise realizations using a pseudoran-
dom number generator.
To verify the modeling accuracy for the image degrading
factors obtained using the MER method, projections for each
of the eight photon categories were estimated separately
using the true activity distribution as an input; the resulting
projections were compared to corresponding ones generated
with SIMIND. We also compared the modeling accuracy from
the MER method to that from the SER method.
The images were reconstructed with up to 200 iterations
of 16 subsets per iteration using the OS-EM algorithm with
attenuation compensation alone, the MER, and the SER
methods. A uniform activity distribution was used as the ini-
tial estimate in all cases. The dimension of the reconstructed
images was 128� 128� 128 and the voxel size was 4.664
mm. For the MER method, the effective mass attenuation
coefficients were estimated for water in the four primary
photon energy subranges and for bone in the 250–500 keV
subrange using SIMIND simulations. The attenuation map for
the 250–500 keV subrange was generated by multiplying the
mass density map produced by the XCAT phantom code by
the effective mass attenuation coefficient for 250–500 keV
for either bone or water depending on whether the density
value exceeded 1.2 g/cm3. For the other energy subranges
the attenuation maps were calculated by multiplying the
attenuation map for the 250–500 keV subrange by the ratio
of the effective attenuation coefficient for water in the sub-
range to that for 250–500 keV.
The total activities in the individual organs were esti-
mated from the reconstructed images and the true organ
VOIs. Note that the blood vessels were simulated with dif-
ferent activities than the other organs in the XCAT phantom
used in this study. However, when quantifying activities the
regions corresponding to blood vessels inside each organ
were included in the VOI of that organ since in practice it
would be difficult or impossible to obtain accurate VOIs for
the blood vessels. For images reconstructed from data with-
out added Poisson noise, the percent errors in activity esti-
mates for the individual organs were calculated based on the
true organ activities. For data with added Poisson noise,
mean and standard deviation (s.d.) of percent errors in organ
activity estimates, and percent root mean squared error (per-
cent RMSE) of organ activity estimates were calculated over
50 Poisson noise realizations. The percent errors in activity
estimates were calculated as:
Percent error¼ðEstimated�TrueÞ=True� 100%
Percent RMSE¼
ffiffiffiffiffiffiffiffiffiffiffiffiffiffiffiffiffiffiffiffiffiffiffiffiffiffiffiffiffiffiffiffiffiffiffiffiffiffiffiffiffiffiffiffiffiffiffiffiffiffiffiffiffi
1
50
X
50
i¼1
ðEstimatedi�TrueÞ2v
u
u
t =True�100%
2352 Rong et al.: Development and evaluation of an improved quantitative 90Y bremsstrahlung SPECT method 2352
Medical Physics, Vol. 39, No. 5, May 2012
III. RESULTS
III.A. Validation of improved SIMIND simulation
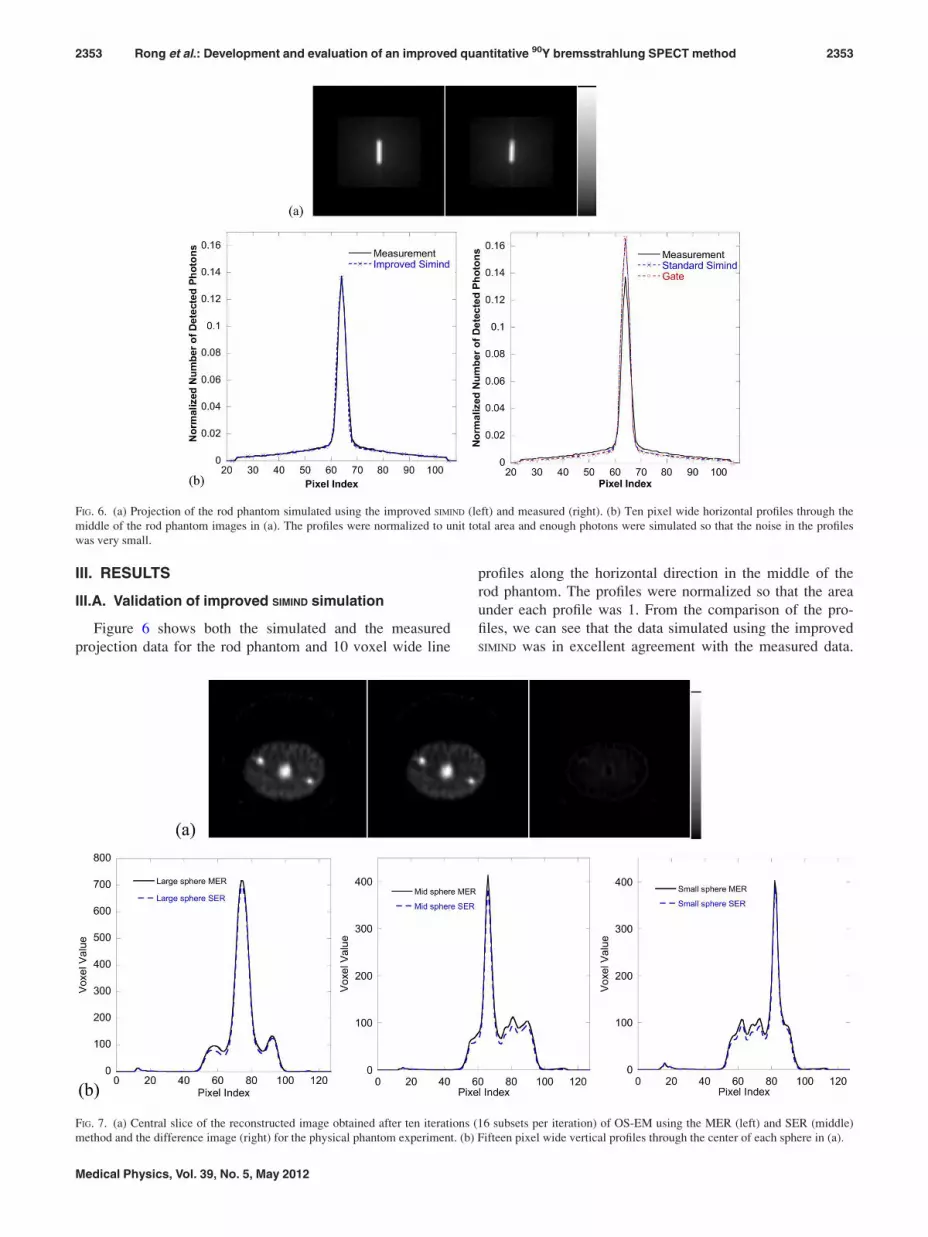
Figure 6 shows both the simulated and the measured
projection data for the rod phantom and 10 voxel wide line
profiles along the horizontal direction in the middle of the
rod phantom. The profiles were normalized so that the area
under each profile was 1. From the comparison of the pro-
files, we can see that the data simulated using the improved
SIMIND was in excellent agreement with the measured data.
FIG. 6. (a) Projection of the rod phantom simulated using the improved SIMIND (left) and measured (right). (b) Ten pixel wide horizontal profiles through the
middle of the rod phantom images in (a). The profiles were normalized to unit total area and enough photons were simulated so that the noise in the profiles
was very small.
FIG. 7. (a) Central slice of the reconstructed image obtained after ten iterations (16 subsets per iteration) of OS-EM using the MER (left) and SER (middle)
method and the difference image (right) for the physical phantom experiment. (b) Fifteen pixel wide vertical profiles through the center of each sphere in (a).
2353 Rong et al.: Development and evaluation of an improved quantitative 90Y bremsstrahlung SPECT method 2353
Medical Physics, Vol. 39, No. 5, May 2012

The data simulated with both the standard SIMIND and GATE
codes agreed well with each other but did not agree well
with the measured data. In particular, they had a sharper
peak and reduced tails. One explanation of this is underesti-
mation of high-energy photon abundance by the b-particle
simulations in MCNPX and GATE. This explanation is consistent
with similar observations by Rault et al.: “This underestima-
tion could be attributed to either an incorrect 90Y beta spec-
trum or deficiencies in the sampling of the high-energy
portion of the bremsstrahlung photon energy spectrum in the
GEANT4 code.”13
III.B. Physical phantom experiment
Figure 7(a) shows the central slice of the reconstructed
phantom image obtained using the MER and SER meth-
ods and the difference image. Figure 7(b) shows the fif-
teen pixel wide vertical profiles through the center of each
sphere in (a). It demonstrates the good image quality that
can be obtained. In particular, the three spheres are clearly
visualized. Figure 8 shows the percent errors in the activ-
ity estimates for the spheres as a function of iteration
number for the MER method, and Table I gives the values
of the percent errors after 400 iterations for the MER and
SER methods and attenuation compensation alone. From
these we see that the MER method achieved the best
quantitative accuracy among the three methods. As will
be shown in the following XCAT phantom experiment,
for realistic human anatomy, the improvement in quantita-
tive accuracy achieved by the MER method compared to
the SER method was greater than that for the relatively
simple and clinically unrealistic structure of the physical
phantom.
III.C. XCAT phantom simulation
III.C.1. Modeling accuracy for the image degradingfactors
Table II shows the errors in estimates of the total projec-
tion counts for each photon category with the MER method.
Table III shows a comparison of errors in the estimated total
counts for the MER method using the 100–500 keV window
and the SER method using both the 100–500 and 105–195
keV windows. Note that the error from the MER method was
very small, and the SER method substantially overestimated
the total counts, with the error, as expected, being somewhat
better for the narrow energy window than the wide one. Fig-
ure 9 shows projection images and profiles through them for
the MC simulated images and images estimated using the
MER and SER methods. This confirms that the MER method
substantially improved the modeling accuracy.
III.C.2. Quantitative accuracy and precision of organactivity estimates
Figure 10(a) shows coronal slices of the attenuation map,
activity distribution and images reconstructed using the
MER and SER methods and attenuation compensation alone.
Note the substantial improvement in image quality compared
to attenuation compensation alone. Figure 10(b) shows verti-
cal profiles through the center of the liver in the images
reconstructed using the MER and SER methods. From the
profiles, we can see that the SER method underestimated the
activity compared to the results from the MER method.
Table IV shows the percent errors in organ activity esti-
mates for the data without added noise after 200 iterations of
16 subsets per iteration for the MER and SER methods and
for attenuation compensation alone. These data demonstrate
the vast improvement in accuracy obtained using the SER or
MER methods compared to standard reconstruction. They
FIG. 8. Percent errors in activity estimates as a function of the number of
OS-EM iterations (16 subsets per iteration) for each of the three spheres
using the MER method. Percent error¼ (Estimated Activity�True Activ-
ity)/True Activity� 100%.
TABLE I. Percent errors in activity estimatesa from physical phantom
experiment.
Large sphere
(%)
Medium sphere
(%)
Small sphere
(%)
MER �7.0 �9.7 �10.2
SER �9.4 �12.3 �12.8
Attenuation compensation 90.6 27.0 �39.8
aAfter 400 iterations of 16 subsets per iteration.
TABLE II. Errors in photon counts for various photon categories obtained using the MER method.
Category Primary 0–250 Primary 250–500 Primary 500–1 k Primary 1–2 k Scatter 0–150 Scatter 150–250 Scatter 250–500 Scatter 500–2 k Total
Errora (%) 0.00 0.01 0.22 �0.25 0.26 �0.16 �0.16 �1.03 �1.10
aError¼ (Estimated counts�Simulated counts)/total simulated counts� 100%.
2354 Rong et al.: Development and evaluation of an improved quantitative 90Y bremsstrahlung SPECT method 2354
Medical Physics, Vol. 39, No. 5, May 2012

also demonstrate the improvement in accuracy provided by
MER compared to SER.
Figure 11 shows plots of the percent error and RMSE of
the liver activity estimates obtained using the various meth-
ods and energy windows as a function of the iteration num-
ber from the ensemble of noisy projection data. For all the
methods, the accuracy improved with iteration and the preci-
sion (indicated by the error bars) worsened. The RMSE data
indicate that 50 iterations are sufficient to achieve near-
optimal results. Similar observations were made for the other
organs. Based on this, we used 50 iterations in the precision
evaluation presented below.
Table V shows the mean and standard deviation of the
percent errors in the organ activity estimates for the SER and
MER methods estimated from the ensemble of noisy projec-
tion data. These data confirm the improvement in accuracy
provided by the MER method. They also demonstrate that
both methods and, for the SER method, both energy win-
dows provided similar precision.
IV. DISCUSSION
As discussed above, a major motivation for the MER
method and an explanation for the improved modeling accu-
racy is its improved modeling of beam hardening and the
effect it has on modeling the energy spectrum of photons
exiting the body and the CDR. To illustrate this, we gener-
ated the energy spectra of primary photons incident on the
collimator after passing through 0, 5, and 20 cm of water.
The results are shown in Fig. 12. Note the substantial differ-
ence in the relative number of photons at low and high ener-
gies. Since the SER method assumes the same incident
energy spectrum for all depths, it is clear that errors in the
modeling of various effects will result. In the MER method
the change in energy spectrum as a function of source depth
is reduced by the use of multiple energy ranges in the model-
ing. This is a major reason that the MER method achieved
such a substantial reduction in modeling error and resulting
improved accuracy of the reconstructed images.
As noted above, with the MER method the error in the
total counts was as small as 1.1%. The agreement in count
TABLE III. Percent errors in total counts for various modeling methods and
energy windows.
Method MER 100–500 keV SER 100–500 keV SER 105–195 keV
Errora (%) �1.1 23.2 21.4
aError¼ (Estimated counts�Simulated counts)/Simulated counts� 100%.
FIG. 9. (a) Anterior projection view estimated using the MER method (left), MC simulated (middle), and the difference image (right) all shown on the same
gray scale; (b) Profiles through projections at the position indicated by lines in (a) of MC simulated images and images estimated using the MER and SER
methods for the 100–500 and 105–195 keV energy windows, as indicated in the legend.
2355 Rong et al.: Development and evaluation of an improved quantitative 90Y bremsstrahlung SPECT method 2355
Medical Physics, Vol. 39, No. 5, May 2012

FIG. 10. (a) Sample coronal slices of (left to right) the attenuation map, activity distribution, images reconstructed using the MER method and attenuation
compensation alone from data with noise corresponding to 2960 MBq total activity and 30 min imaging time, and images reconstructed using the MER and
SER 100–500 keV from data without added noise and the difference image. The reconstructed images were obtained using ten iterations with 16 subsets per
iteration and the third and fourth images were filtered using a 3D Butterworth postreconstruction filter with order 8 and cutoff 0.11 pixels�1. (b) Vertical pro-
files through the center of the liver in the fifth and sixth images in (a).
TABLE IV. Percent errors in organ activity estimatesa for data w/o added noise.
Lung (%) Spleen (%) Kidneys (%) Liver (%) Heart (%)
MER 100–500 keV 11.9 �5.9 �3.2 �1.6 �2.4
SER 100–500 keV �27.0 �11.3 �29.6 �15.3 �8.8
SER 105–195 keV �21.1 �9.1 �25.5 �12.8 �7.1
attenuation compensation 324.4 121.5 400.9 254.1 133.8
aAfter 200 iterations of 16 subsets per iteration.
FIG. 11. Mean and standard deviation of percent errors (left) and percent RMSE (right) of the activity estimates for the liver from 50 Poisson noise realizations
as a function of the number of OS-EM iterations (16 subsets per iteration) for the MER method and SER method using data acquired in the energy windows
indicated in the legend. The error bars in the left figure represent the standard deviations.
2356 Rong et al.: Development and evaluation of an improved quantitative 90Y bremsstrahlung SPECT method 2356
Medical Physics, Vol. 39, No. 5, May 2012

distributions in the estimated and MC simulated projections
was also very good. However, the errors in organ activity
estimates were larger than the modeling errors. We believe
that the residual errors result from partial volume effects due
to the inability to completely recover the image resolution.23
The data on the order of the relative errors in the organ activ-
ity estimates confirm this. From Table IV, we can see that
the activities of the liver, heart, kidneys and spleen were
underestimated, with larger errors being seen in smaller
organs. This is consistent with the residual errors being due
to spill-out of activity. The overestimation of lung activity is
also consistent with this: the lung activity was overestimated
due to spill-in from surrounding organs since it was in close
proximity to organs, such as the heart and liver, that had
much higher relative activities. For the SER method, how-
ever, the modeling errors for image degrading factors seem
to have been a more important factor limiting the accuracy
in activity estimates than partial volume effects.
To give a frame of reference for the accuracy of the
reconstructed images, we compared the quantitative accu-
racy for 90Y to results of a previous simulation study for 131I
using the same collimator. The reconstructions for that study
included compensation for all image degrading factors
including down-scatter from high-energy photons.24 Despite
the fact that there were differences in organ uptake and
organ volumes between the two studies, the accuracies
achieved for quantitative 90Y bremsstrahlung SPECT were
comparable to those for quantitative 131I SPECT. For exam-
ple, for the heart and liver, respectively, the errors for 90Y vs131I were �2.4% vs �4.4% and �1.6% vs �3.2%. The sit-
uation for the lungs is more complicated (the errors were
11.9% for 90Y vs �4.7% for 131I) since the errors for the
lungs resulted from both spill-in of activity from the liver
and heart and spill-out of activity from the lungs. For the90Y study, surrounding organs such as the heart and liver
had larger activity concentrations relative to the lungs than
for the 131I study (e.g., the heart-to-lungs activity concentra-
tion ratios were 8.6 for 90Y vs 3.1 for 131I). Thus, the amount
of spill-in would be greater for 90Y, explaining the overesti-
mation of the lung activity. In any event, the errors for 90Y
using the MER method were comparable to those for 131I
with full compensation, especially compared to the errors
obtained using the SER method or attenuation compensation
alone.
The CPU times per iteration for the MER and SER meth-
ods on a single core of an Intel Xeon E5410 (2.33 GHz)
CPU running Linux were 45.6 and 9.3 min, respectively. No
special effort was made to optimize the code nor was it par-
allelized. In the current code, the computations for each
energy range are performed independently, resulting in some
redundant calculations that could be removed. Further, these
calculations could be readily parallelized to take essentially
the same time as the SER method. However, since ten itera-
tions were sufficient to achieve near-optimum performance
(see Fig. 11), even with the current code the computation
time may not be a major impediment to clinical translation
of the MER method.
V. CONCLUSIONS
In this work, we have developed an improved quantitative90Y bremsstrahlung SPECT reconstruction method. The
method is based on more accurate modeling of the various
image degrading factors. Improvements in the model
included enhancements to the SIMIND bremsstrahlung simula-
tion that was used to estimate scatter kernels and collimator-
detector response tables used in the method, as well as better
modeling of the energy dependence of these effects through
the use of multiple energy ranges. The SIMIND bremsstrahlung
simulation was improved by incorporating both an improved
emission energy spectrum and a model of the distance
between 90Y decay location and bremsstrahlung photon
emission location. The reconstruction method was evaluated
using both a physical phantom experiment and an XCAT
phantom simulation. The evaluation experiments showed
TABLE V. Mean and standard deviation of percent errors in organ activity estimatesa for simulated noisy data.
Lung (%) Spleen (%) Kidneys (%) Liver (%) Heart (%)
MER 100–500 keV (10.26 2.1) (�11.96 2.3) (�6.46 5.0) (�4.56 0.7) (�5.86 0.9)
SER 100–500 keV (�28.06 1.9) (�18.96 2.2) (�33.46 4.4) (�19.06 0.6) (�12.86 0.8)
SER 105–195 keV (�22.06 1.9) (�17.26 2.5) (�28.86 4.8) (�16.86 0.8) (�11.56 1.6)
a(Mean6 s.d.) from 50 Poisson noise realizations after 50 iterations of 16 subsets per iteration.
FIG. 12. SIMIND simulated 90Y bremsstrahlung energy spectrum of primary
photons after passing through 0, 5, and 20 cm of water, respectively. The
spectra were normalized to have the same total area over the energy range
80–1500 keV.
2357 Rong et al.: Development and evaluation of an improved quantitative 90Y bremsstrahlung SPECT method 2357
Medical Physics, Vol. 39, No. 5, May 2012

more accurate modeling of the image formation process than
previous methods as well as a resulting improvement in the
accuracy of organ activity estimates obtained from recon-
structed images. The accuracy of the resulting organ activity
estimates were similar to those previously obtained with 131I
using the same collimator-detector system and a similar
phantom and activity distribution.
ACKNOWLEDGMENT
This work was supported by Public Health Service Grant
No. R01-CA109234. The content of this work is solely the
responsibility of the authors and does not necessarily repre-
sent the official view of the PHS or its various institutes.
a)Author to whom correspondence should be addressed. Electronic mail:
[email protected]. Stigbrand, J. Carlsson, G. P. Adams, D. Eriksson, K. Riklund, L.
Johansson, F. Y. Frejd, M. d. Jong, S. M. Verwijnen, M. d. Visser, D. J.
Kwekkeboom, R. Valkema, E. P. Krenning, V. Tolmachev, G. Sgouros,
D. Josten, and R. H. Larsen, Targeted Radionuclide Tumor Therapy
(Springer ScienceþBusiness Media, New York, 2008).2G. Sgouros, E. Frey, R. Wahl, B. He, A. Prideaux, and R. Hobbs, “Three-
dimensional imaging-based radiobiological dosimetry,” Semin. Nucl.
Med. 38, 321–334 (2008).3W. A. Dezarn, J. T. Cessna, L. A. DeWerd, W. Z. Feng, V. L. Gates, J.
Halama, A. S. Kennedy, S. Nag, M. Sarfaraz, V. Sehgal, R. Selwyn, M. G.
Stabin, B. R. Thomadsen, L. E. Williams, and R. Salem, “Recommendations
of the American Association of Physicists inMedicine on dosimetry, imaging,
and quality assurance procedures for (90)Y microsphere brachytherapy in the
treatment of hepaticmalignancies,” Med. Phys. 38, 4824–4845 (2011).4S. Nag, A. Kennedy, R. Salem, R. Murthy, A. J. McEwan, C. Nutting, A.
Benson, J. Espat, J. I. Bilbao, R. A. Sharma, J. P. Thomas, and D. Cold-
well, “Recommendations for radioembolization of hepatic malignancies
using yttrium-90 microsphere brachytherapy: A consensus panel report
from the Radioembolization Brachytherapy Oncology Consortium,” Int. J.
Radiat. Oncol. 68, 13–23 (2007).5A. Al-Nahhas, N. Tehranipour, R. Canelo, G. Stamp, K. Woo, P. Tait, and
P. Gishen, “Concordant F-18FDG PET and Y-90 bremsstrahlung scans
depict selective delivery of Y-90-microspheres to liver tumors: Confirma-
tion with histopathology,” Clin. Nucl. Med. 32, 371–374 (2007).6R. Mansberg, N. Sorensen, V. Mansberg, and H. V. D. Wall, “Yttrium-90
bremsstrahlung SPECT/CT scan demonstrating areas of tracer/tumor
uptake,” Eur. J. Nucl. Med. Mol. Imaging 34, 1887 (2007).7D. Minarik, K. Sjogreen Gleisner, and M. Ljungberg, “Evaluation of quan-
titative (90) Y SPECT based on experimental phantom studies,” Phys.
Med. Biol. 53, 5689–5703 (2008).8E. C. Frey and B. M. W. Tsui, “A new method for modeling the spatially-
variant, object-dependent scatter response function in SPECT,” IEEE
Nuclear Science Symposium, Vol. 2 (IEEE, Anaheim, CA, 1996), pp.
1082–1086.9K. Lange and R. Carson, “EM reconstruction algorithms for emission and
transmission tomography,” J. Comput. Assist. Tomogr. 8, 306–316 (1984).
10H. M. Hudson and R. S. Larkin, “Accelerated image-reconstruction using
ordered subsets of projection data,” IEEE Trans. Med. Imaging 13,
601–609 (1994).11M. Ljungberg and S.-E. Strand, “A Monte Carlo program for the simula-
tion of scintillation camera characteristics,” Comput. Methods Programs
Biomed. 29, 257–272 (1989).12J. S. Hendricks, MCNPX (Los Alamos National Laboratory, Los Alamos,
2005).13E. Rault, S. Staelens, R. Van Holen, J. De Beenhouwer, and S. Vanden-
berghe, “Fast simulation of yttrium-90 bremsstrahlung photons with
GATE,” Med. Phys. 37, 2943–2950 (2010).14C. Morel, S. Jan, G. Santin, D. Strul, S. Staelens, K. Assie, D. Autret,
S. Avner, R. Barbier, M. Bardies, P. M. Bloomfield, D. Brasse, V. Breton,
P. Bruyndonckx, I. Buvat, A. F. Chatziioannou, Y. Choi, Y. H. Chung,
C. Comtat, D. Donnarieix, L. Ferrer, S. J. Glick, C. J. Groiselle, D. Guez,
P. F. Honore, S. Kerhoas-Cavata, A. S. Kirov, V. Kohli, M. Koole,
M. Krieguer, D. J. van der Laan, F. Lamare, G. Largeron, C. Lartizien,
D. Lazaro, M. C. Maas, L. Maigne, F. Mayet, F. Melot, C. Merheb,
E. Pennacchio, J. Perez, U. Pietrzyk, F. R. Rannou, M. Rey, D. R. Schaart,
C. R. Schmidtlein, L. Simon, T. Y. Song, J. M. Vieira, D. Visvikis, R. V.
de Walle, and E. Wieers, “GATE: A simulation toolkit for PET and
SPECT,” Phys. Med. Biol. 49, 4543–4561 (2004).15W. P. Segars, G. Sturgeon, S. Mendonca, J. Grimes, and B. M. W. Tsui,
“4D XCAT phantom for multimodality imaging research,” Med. Phys. 37,
4902–4915 (2010).16W. T. Wang, E. C. Frey, B. M. W. Tsui, C. Tocharoenchai, and W. H.
Baird, “Parameterization of Pb c-ray contamination in simultaneous Tl-
201 and Tc-99m dual-isotope imaging,” IEEE Trans. Nucl. Sci. 49,
680–692 (2002).17G. L. Zeng, Y. L. Hsieh, and G. T. Gullberg, “A Rotating and warping
projector backprojector for fan-beam and cone-beam iterative algorithm,”
IEEE Trans. Nucl. Sci. 41, 2807–2811 (1994).18E. C. Frey, Z. W. Ju, and B. M. W. Tsui, “A fast projector-backprojector
pair modeling the asymmetric, spatially varying scatter response function
for scatter compensation in SPECT imaging,” IEEE Trans. Nucl. Sci. 40,
1192–1197 (1993).19C. Kamphuis, F. J. Beekman, P. P. van Rijk, and M. A. Viergever, “Dual
matrix ordered subsets reconstruction for accelerated 3D scatter compen-
sation in single-photon emission tomography,” Eur. J. Nucl. Med. 25,
8–18 (1998).20G. L. Zeng and G. T. Gullberg, “Unmatched projector/backprojector pairs
in an iterative reconstruction algorithm,” IEEE Trans. Med. Imaging 19,
548–555 (2000).21M.-A. Park, A. Mahmood, R. E. Zimmerman, N. Limpa-Amara, G. M.
Makrigiorgos, and S. C. Moore, “Adsorption of metallic radionuclides on
plastic phantom walls,” Med. Phys. 35, 1606–1610 (2008).22B. E. Zimmerman, J. T. Cessna, and M. A. Millican, “Experimental deter-
mination of calibration settings for plastic syringes containing solutions of
Y-90 using commercial radionuclide calibrators,” Appl. Radiat. Isot. 60,
511–517 (2004).23Y. Du, B. M. W. Tsui, and E. C. Frey, “Partial volume effect compensa-
tion for quantitative brain SPECT imaging,” IEEE Trans. Med. Imaging
24, 969–976 (2005).24N. Song, Y. Du, B. He, and E. C. Frey, “Development and evaluation of a
model-based downscatter compensation method for quantitative I-131
SPECT,” Med. Phys. 38, 3193–3204 (2011).
2358 Rong et al.: Development and evaluation of an improved quantitative 90Y bremsstrahlung SPECT method 2358
Medical Physics, Vol. 39, No. 5, May 2012