efficacy and toxicity related to treatment of hepatocellular carcinoma with 90y-sir spheres:...
TRANSCRIPT

Efficacy and Toxicity Related to Treatmentof Hepatocellular Carcinoma with 90Y-SIRSpheres: Radiobiologic Considerations
Lidia Strigari1, Rosa Sciuto2, Sandra Rea2, Livio Carpanese3, Giuseppe Pizzi3, Antonella Soriani1, Giuseppe Iaccarino1,Marcello Benassi1, Giuseppe Maria Ettorre4, and Carlo Ludovico Maini2
1Laboratory of Medical Physics and Expert Systems, Regina Elena National Cancer Institute, Rome, Italy; 2Department of NuclearMedicine, Regina Elena National Cancer Institute, Rome, Italy; 3Department of Radiology, Regina Elena National CancerInstitute, Rome, Italy; and 4Department of General Surgery and Liver Transplantation, Azienda Ospedaliera San Camillo-Forlanini, Rome, Italy
Radioactive 90Y-selective internal radiation (SIR) sphere therapyis increasingly used for the treatment of nonresectable hepato-cellular carcinoma (HCC). However, the maximum delivereddose is limited by severe injury to the nontarget tissue, includingliver parenchyma. Our study aimed to implement radiobiologicmodels for both tumor control probability (TCP) and normal-tissue complication probability (NTCP) to describe more effec-tively local response and the liver toxicity rate, respectively.Methods: Patients with documented HCC, adequate bonemarrow parameters, and regular hepatic and pulmonary func-tion were eligible for the study. Patients who had pulmonaryshunt greater than 20% of 99mTc-labeled macroaggregatedalbumin or any uncorrectable delivery to the gastrointestinaltract, reverse blood flow out of the liver, or complete portal veinthrombosis were excluded. Patients received a planned activityof the 90Y-SIR spheres, determined using the empiric body sur-face area method. The dose distribution was determined usingposttreatment (3-dimensional) activity distribution and MonteCarlo dose voxel kernel calculations, and the mean doses tohealthy liver and tumor were calculated for each patient. Re-sponse was defined according to Response Evaluation Criteriain Solid Tumors (RECIST) and recommendations of the Euro-pean Association for the Study of the Liver (EASL). Criteria wereused to assess possible liver toxicities. The parameters of TCPand NTCP models were established by direct maximization ofthe likelihood. Results: Seventy-three patients were treated.With an average dose of 110 Gy to the tumor, complete orpartial response was observed in 74% and 55% of patientsaccording to the EASL guideline and RECIST, respectively,and the predicted TCPs were 73% and 55%, respectively. Witha median liver dose of 36 Gy (range, 6–78 Gy), the $grade 2(G2), $grade 3 (G3), and $grade 4 (G4) liver toxicities wereobserved in 32% (23/73), 21% (15/73), and 11% (8/73) ofpatients, respectively. The parameters describing the $G2 livertoxicity data using the NTCP model were a tolerance dose ofthe whole organ leading to a 50% complication probability of 52
Gy (95% confidence interval, 44–61 Gy) and a slope of NTCPversus dose of 0.28 (95% confidence interval, 0.18–0.60), as-suming n 5 1. Conclusion: The radiobiologic approach, basedon patient-specific dosimetry, could improve the 90Y-micro-sphere therapeutic approach of HCC, maintaining an accept-able liver toxicity.
Key Words: hepatocellular carcinoma; 90Y; intrahepatic arterialtherapy
J Nucl Med 2010; 51:1377–1385DOI: 10.2967/jnumed.110.075861
Hepatocellular carcinoma (HCC) is a malignant epithe-lial tumor arising from parenchymatous liver cells (1). Pa-tients with localized HCC (involvement of a single lobe andabsence of vascular invasion or extrahepatic disease) aregenerally evaluated for the potentially curative therapeuticoptions of either partial hepatectomy or orthotopic livertransplantation. In contrast, more than 50% of patientsunderwent palliation of symptoms with external-beam ra-diotherapy (EBRT), and only 20% experienced significanttumor shrinkage (2).
These data suggest that HCC is radioresistant. However,the delivered dose is limited by severe injury to the sur-rounding tissue, including the liver parenchyma and duo-denum (3–5). Given the limited efficacy of nonsurgicaltreatment, several techniques have been proposed to delivertargeted tumor radiation by means of radiopharmaceuticalsfor HCC treatment. In particular, radioactive 90Y-micro-sphere therapy is increasingly used, and specific recom-mendations have been published (6).
Recently, some authors have applied radiobiologic prin-ciples to evaluate the biologic effect induced by therapies,with different time distributions of radiation. In particular,the linear-quadratic model has been extended to radionuclidetherapy, including the biologic effective dose (BED) concept,which represents the dose producing the same biologic effect
Received Feb. 8, 2010; revision accepted Jun. 10, 2010.For correspondence or reprints contact: Lidia Strigari, Laboratory of
Medical Physics and Expert Systems, Regina Elena National CancerInstitute, Via E. Chianesi, 53, 00144 Rome, Italy.E-mail: [email protected] ª 2010 by the Society of Nuclear Medicine, Inc.
EFFICACY AND TOXICITY AFTER 90Y SPHERES • Strigari et al. 1377
by on September 8, 2016. For personal use only. jnm.snmjournals.org Downloaded from

obtained under different irradiation conditions (7–9). Theaim of this study was to apply 2 radiobiologic models, basedon dosimetric and clinical data from a retrospective study, toadequately predict the clinical results on efficacy and toxicityof 90Y-selective internal radiation (SIR) sphere (SIRT Med-ical Limited; www.sirtex.com) treatment in HCC.On the basis of posttreatment 3-dimensional activity
distribution and Monte Carlo dose voxel kernel calcula-tions, the dose distribution was used to calculate the meandose to healthy liver and tumor in each patient.Moreover, radiobiologic models for both tumor control
probability (TCP) and normal-tissue complication proba-bility (NTCP) were implemented to interpret the localresponse and liver toxicity rate in our cohort.
MATERIALS AND METHODS
Inclusion CriteriaAll patients were selected according to strict inclusion and
exclusion criteria and were asked to give informed consent.Eligible patients were older than 18 y, with measurable unresect-able disease predominately involving the liver, adequate bonemarrow (granulocytes . 1,500/mL; platelets . 60,000/mL), hep-atic (total bilirubin # 2.0 mg/dL) serum glutamic oxaloacetictransaminase or serum glutamic pyruvic transaminase or alkalinephosphatase less than 5 times the upper limit of normal, pulmo-nary function (forced expiratory volume in 1 s . 1 L), and nocontraindications to angiography and selective visceral catheter-ization.
Absolute contraindications included pulmonary shunt greaterthan 20% of 99mTc-labeled macroaggregated albumin (99mTc-MAA)or any uncorrectable delivery to the gastrointestinal tract, reverseblood flow out of the liver, or complete portal vein thrombosis.
Radioactive Material90Y is a pure b-emitter, which decays to stable 90Zr, with an
average energy of 0.94 MeVand a half-life of 2.67 d (64.2 h). It isproduced by neutron bombardment of 89Y in a commercial reac-tor, yielding 90Y b-radiation, with a mean tissue penetration of 2.5mm and a maximum range of 1.1 cm. 90Y that had been perma-nently embedded within resin structures (SIR spheres) was usedfor patients with the approval of the Food and Drug Administra-tion. Each resin sphere has a diameter of 32 6 10 mm, causingterminal arterioles within the tumor to be permanently embolized.A standard dose of 90Y resin microspheres is 2 GBq, containingapproximately 50 million microspheres (range, 40–80 million),with an activity per microsphere estimated to be 50 Bq. A max-imum of 0.4% of administered 90Y activity is free from the resinspheres according to the SIR spheres manual (10).
Administered Activity and DosimetryThe administered activity of the 90Y-SIR spheres was deter-
mined using the body surface area (BSA) empiric method givenin the user’s manual (10):
AðGBqÞ 5 ðBSA� 0:2Þ1Vtumor=Vliver; Eq. 1
where Vtumor and Vliver are the volume of tumor and total liver,respectively, and BSA (m2) is calculated as 0.20247 · height(m)0.725 · weight (kg)0.425.
This activity was used to treat the entire liver in 35 patients. Alobar approach was used in 38 of 73 patients. The right lobe wastreated in 35 patients and the left in 3 patients. The activity wascalculated considering the lobe volume in Eq. 1. The total deliv-ered activity was reduced by 20% and 40% in patients with lungshunt between 10% and 15% or 15% and 20%, respectively.Accordingly, the dose was applied intraarterially on the treatmentdate, usually 10–14 d after obtaining the screening arteriography,either to the entire liver or to a single lobe.
Hepatic AngiographyAn angiogram was obtained to assess hepatic vasculature,
determine the appropriate catheter position for treatment, andidentify any collateral vessels that would result in inadvertentmicrosphere deposition to the gastrointestinal tract. To preventnontarget embolization, the gastroduodenal and right gastricarteries were prophylactically embolized in all patients. Emboli-zation of vessels to create flow redistribution was not performed inany patient (i.e., embolization of accessory right or accessory lefthepatic arteries to redistribute flow).
ImagingAll 73 patients were evaluated via chest, abdomen, and pelvic
CT scans to detect extrahepatic metastases and to determine livertumor location, size, and number. All scans were obtained with3-mm slices.
After embolization of collateral vessels, 99mTc-MAA scans(anterior or posterior planar scans of lungs and abdomen andSPECT acquisition of abdomen) were obtained (within 30 minafter embolization) to detect any unobserved gastrointestinal flowand estimate the percentage of injected activity that may shunt tothe lungs. Therefore, pretherapy imaging was used to determinethe liver–lung shunt.
Posttherapy (bremsstrahlung 90Y-microspheres) planar andtomographic images were obtained to study the radioactivity dis-tribution within 6 h after 90Y injection. The SPECT scan wasacquired using a triple-head g-camera (Irix; Philips) equippedwith a standard medium-energy general-purpose collimator. Awide window (from 55 to 245 keV) was used; 120 frames of 25s were acquired using an elliptic orbit in a 128 · 128 image matrixwith a magnification of 1.42.
Image Fusion, Image Quantification, and DosimetryTransaxial, coronal, and sagittal slices were reoriented with
respect to the canthomeatal plane and reconstructed by an iterativemethod.
CT and SPECT images were registered and fused using adedicated software program (Syntegra; Philips). A typical activitydistribution using 99mTc-MAA and posttherapy bremsstrahlungmicrosphere images after hepatic embolization are shown in Fig-ures 1A and 1C, respectively. Typical target regions of interest(ROIs) (tumor and liver) delineated on an axial CT slice are shownin Figure 1B.
Attenuation correction was performed using an ellipse determi-nation (based on an automated threshold of about 10% maximumcount), with a constant linear attenuation coefficient of 0.11 cm21
using the Chang method. No scatter correction was performed.The patient–lesion calibration factor was obtained by determin-
ing the ratio between the net administered activity (i.e., the dif-ference between the activity—transferred in the V vial—to bedelivered and the residual activity after the angiographic proce-dure, taking into account the physical decay) and total counts of
1378 THE JOURNAL OF NUCLEAR MEDICINE • Vol. 51 • No. 9 • September 2010
by on September 8, 2016. For personal use only. jnm.snmjournals.org Downloaded from

all voxels included in the total liver ROI after background sub-traction. The absorbed dose was obtained using in-house softwareby the convolution of the activity matrix from SPECT bremsstrah-lung images and the dose voxel kernel value precalculated in waterby Monte Carlo simulation, as described elsewhere (11). Weobserved 1, 2, 3, and more lesions in patients 21, 8, 6, and 38,respectively, and in each patient the tumor was identified by thelargest lesion. Tumor and normal-liver ROIs were manuallydelineated by a radiologist or nuclear medicine physician (Fig. 1).The in-house software, developed using assembler language andinstalled on a high-performance personal computer, allowed us tocalculate the dose volume histograms (DVHs), from which themean dose to lesion and normal liver was obtained for each patient.
The time–activity curves for the source organs (liver and, in thecase of a shunt, lungs, gastroduodenal tract, etc.) were supposed todecrease because of the physical decay only. The mean dose tolungs was calculated assuming a uniform microsphere distribution.
The tumor–to–normal-liver activity ratio (TNR) was calculatedas:
TNR 5total tumor counts
total hepatic counts� total tumor counts: Eq. 2
Tumor ResponseResponse was defined according to Response Evaluation Criteria
in Solid Tumors (RECIST) (12) and recommendations of the Euro-pean Association for the Study of the Liver (EASL) (13), usingWorld Health Organization criteria and taking into account tumornecrosis recognized by nonenhanced areas (Table 1).
Generally, CT may require 4–8 mo to reveal full response after90Y-SIR therapy (14); thus, only patients with an adequate minimumfollow-up were included in this analysis.
ToxicityPatients were followed closely until all acute toxicities were
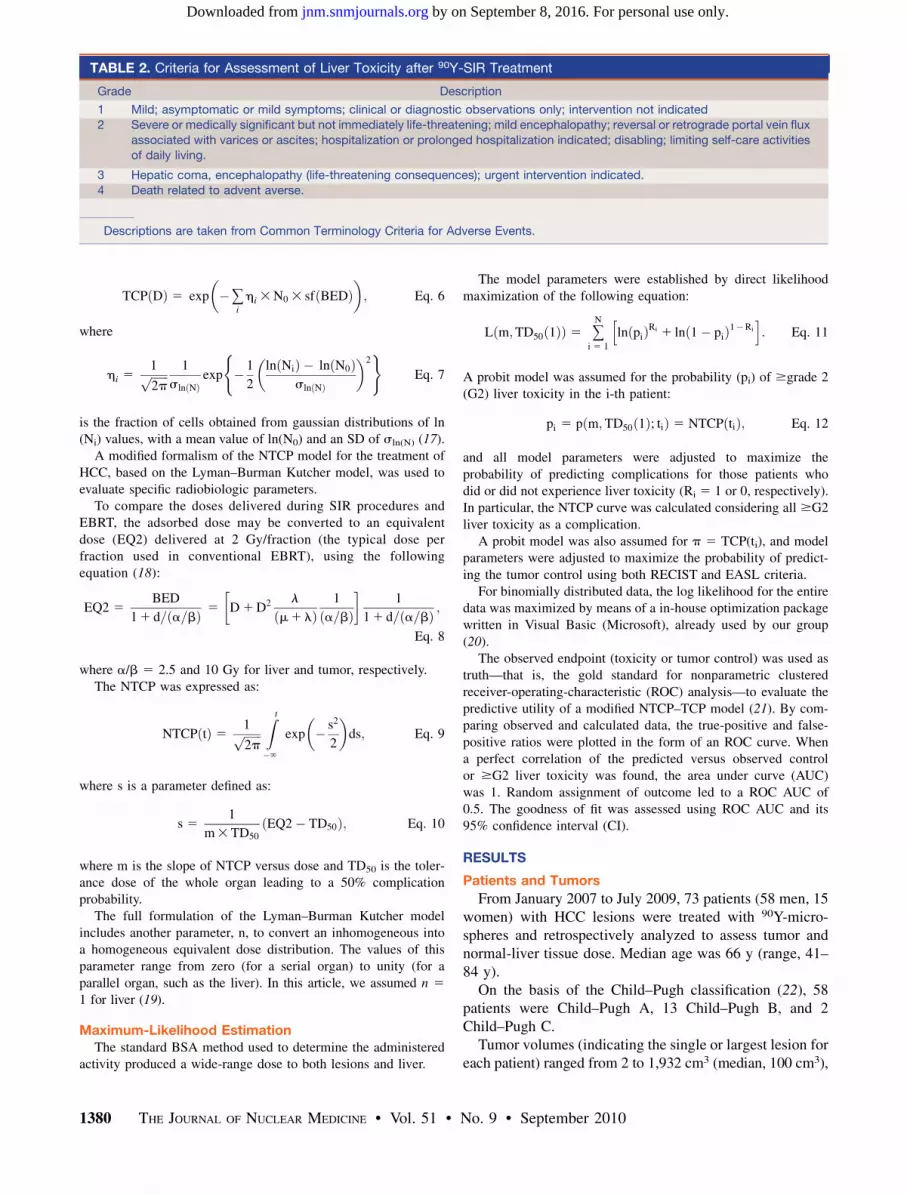
resolved, or at least every 2 wk for 6 wk, then monthly for 3 mo toobserve the possible radiation hepatitis or other toxicities. TheCommon Terminology Criteria for Adverse Events (version 4;
National Cancer Institute, Cancer Therapy Evaluation Program)were used as appropriate, according to the severity of the livertoxicity (Table 2).
Radiobiologic ModelsThe radiobiologic models, based on the linear-quadratic model,
have been largely used to describe the surviving fraction (sf) ofcells in the tissue exposed to a total radiation dose D. Recently,these models have been applied to systemic therapy (9).
The BED delivered to target and liver was calculated asfollows:
BED 5 D1D2 l
m1lð Þ1
a=b; Eq. 3
where D is expressed in Gy, a and b are tissue-specific parametersrelated to cell radiosensitivity (expressed in Gy21 and Gy22,respectively), m is a parameter incorporating the repair of suble-thal radiation damage and m 5 ln(2)/T1/2,rep (expressed as h21) isthe repair half-time of sublethal damage, and l is the biologicallyeffective decay constant l 5 ln(2)/T1/2,phys (expressed as h21).The a-to-b ratio was equal to 10 and 2.5 Gy for tumor and normalliver, respectively (15).The T1/2,rep was 1.5 and 2.5 h for tumor andnormal liver, respectively (16).
The sf can be written as follows:
sf 5 3exp � a3BED½ �f g: Eq. 4
The TCP, using the linear-quadratic model incorporatingPoisson’s law, can be written as:
TCP Dð Þ 5 exp �N0 3 sf BEDð Þ½ �; Eq. 5
where N0 is the initial number of clonogenic cells.To take into account the inhomogeneity in the population
sensitivity and density of clonogenic cells, the TCP can be writtenas follows:
FIGURE 1. Typical activity distributionafter hepatic embolization using 99mTc-MAA (A) and posttherapy bremsstrah-lung 90Y-microsphere images (C) fusedwith CT images (B). Typical target ROIs(tumor and liver) are delineated on axialCT slice (B).
TABLE 1. Criteria for Assessment of Response to 90Y-Microsphere Treatment
Criteria
Response EASL RECIST
Complete Disappearance of lesion or total necrosis Disappearance of lesion
Partial $50% decrease or $30% necrosis $30% decreaseStable disease ,50% decrease or ,25% increase ,30% decrease or ,20% increase
Progressive disease $25% increase or appearance of new lesions $20% increase or appearance of new lesions
EFFICACY AND TOXICITY AFTER 90Y SPHERES • Strigari et al. 1379
by on September 8, 2016. For personal use only. jnm.snmjournals.org Downloaded from
TCP Dð Þ 5 exp �+i
hi 3N0 3 sf BEDð Þ� �
; Eq. 6
where
hi 51ffiffiffiffiffiffi2p
p 1
sln Nð Þexp � 1
2
ln Nið Þ � ln N0ð Þsln Nð Þ
� �2( )
Eq. 7
is the fraction of cells obtained from gaussian distributions of ln(Ni) values, with a mean value of ln(N0) and an SD of sln(N) (17).
A modified formalism of the NTCP model for the treatment ofHCC, based on the Lyman–Burman Kutcher model, was used toevaluate specific radiobiologic parameters.
To compare the doses delivered during SIR procedures andEBRT, the adsorbed dose may be converted to an equivalentdose (EQ2) delivered at 2 Gy/fraction (the typical dose perfraction used in conventional EBRT), using the followingequation (18):
EQ2 5BED
11 d= a=bð Þ 5 D1D2 l
m1 lð Þ1
a=bð Þ� �
1
11 d= a=bð Þ ;Eq. 8
where a/b 5 2.5 and 10 Gy for liver and tumor, respectively.The NTCP was expressed as:
NTCP tð Þ 5 1ffiffiffiffiffiffi2p
pZ t
�‘
exp � s2
2
� �ds; Eq. 9
where s is a parameter defined as:
s 51
m3TD50EQ2� TD50ð Þ; Eq. 10
where m is the slope of NTCP versus dose and TD50 is the toler-ance dose of the whole organ leading to a 50% complicationprobability.
The full formulation of the Lyman–Burman Kutcher modelincludes another parameter, n, to convert an inhomogeneous intoa homogeneous equivalent dose distribution. The values of thisparameter range from zero (for a serial organ) to unity (for aparallel organ, such as the liver). In this article, we assumed n 51 for liver (19).
Maximum-Likelihood EstimationThe standard BSA method used to determine the administered
activity produced a wide-range dose to both lesions and liver.
The model parameters were established by direct likelihoodmaximization of the following equation:
L m;TD50 1ð Þð Þ 5 +N
i 5 1
ln pið ÞRi 1 ln 1� pið Þ1�Ri
h i: Eq. 11
A probit model was assumed for the probability (pi) of $grade 2(G2) liver toxicity in the i-th patient:
pi 5 p m;TD50 1ð Þ; tið Þ 5 NTCP tið Þ; Eq. 12
and all model parameters were adjusted to maximize theprobability of predicting complications for those patients whodid or did not experience liver toxicity (Ri 5 1 or 0, respectively).In particular, the NTCP curve was calculated considering all $G2liver toxicity as a complication.
A probit model was also assumed for p 5 TCP(ti), and modelparameters were adjusted to maximize the probability of predict-ing the tumor control using both RECIST and EASL criteria.
For binomially distributed data, the log likelihood for the entiredata was maximized by means of a in-house optimization packagewritten in Visual Basic (Microsoft), already used by our group(20).
The observed endpoint (toxicity or tumor control) was used astruth—that is, the gold standard for nonparametric clusteredreceiver-operating-characteristic (ROC) analysis—to evaluate thepredictive utility of a modified NTCP–TCP model (21). By com-paring observed and calculated data, the true-positive and false-positive ratios were plotted in the form of an ROC curve. Whena perfect correlation of the predicted versus observed controlor $G2 liver toxicity was found, the area under curve (AUC)was 1. Random assignment of outcome led to a ROC AUC of0.5. The goodness of fit was assessed using ROC AUC and its95% confidence interval (CI).
RESULTS
Patients and Tumors
From January 2007 to July 2009, 73 patients (58 men, 15women) with HCC lesions were treated with 90Y-micro-spheres and retrospectively analyzed to assess tumor andnormal-liver tissue dose. Median age was 66 y (range, 41–84 y).
On the basis of the Child–Pugh classification (22), 58patients were Child–Pugh A, 13 Child–Pugh B, and 2Child–Pugh C.
Tumor volumes (indicating the single or largest lesion foreach patient) ranged from 2 to 1,932 cm3 (median, 100 cm3),
TABLE 2. Criteria for Assessment of Liver Toxicity after 90Y-SIR Treatment
Grade Description
1 Mild; asymptomatic or mild symptoms; clinical or diagnostic observations only; intervention not indicated
2 Severe or medically significant but not immediately life-threatening; mild encephalopathy; reversal or retrograde portal vein flux
associated with varices or ascites; hospitalization or prolonged hospitalization indicated; disabling; limiting self-care activitiesof daily living.
3 Hepatic coma, encephalopathy (life-threatening consequences); urgent intervention indicated.
4 Death related to advent averse.
Descriptions are taken from Common Terminology Criteria for Adverse Events.
1380 THE JOURNAL OF NUCLEAR MEDICINE • Vol. 51 • No. 9 • September 2010
by on September 8, 2016. For personal use only. jnm.snmjournals.org Downloaded from

whereas the liver volumes ranged from 360 to 3,816 cm3
(median, 1,783 cm3).Administered activities calculated using the standard
BSA method ranged from 1.00 to 2.26 GBq, with a medianof 1.73 GBq (Table 3).
Image Analysis99mTc-MAA SPECT images of the abdomen after pre-
therapeutic embolization were sufficiently predictive of the90Y-SIR sphere distribution in more than 80% of patients.Moreover, before SIR treatment a further embolization wasperformed to avoid any flow redistribution during the timebetween the 2 embolization procedures. However, this topicdeserves a separate paper.
Tumor Control and Toxicity
Complete response (CR), partial response (PR), stabledisease, and progressive disease (PD) were seen in 1% (1/73), 53% (39/73), 43% (31/73), and 3% (2/73), respec-tively, using RECIST. According to the EASL guidelines,CR, PR, stable disease, and PD were seen in 26% (19/73),51% (37/73), 20% (15/73), and 3% (2/73), respectively.With a median liver dose of 36 Gy (range, 6–78 Gy) and
an EQ2 of 33 Gy (3–90 Gy), $G2 liver toxicity wasobserved in 31% (23/73), $grade 3 (G3) liver toxicity in21% (15/73), and $grade 4 (G4) liver toxicity in 11% (8/73) of the patients. With a median lung dose of 5 Gy (range,1–15 Gy), no lung toxicity was observed. Gastroduodenalulcers developed in 1 patient. No hematologic toxicity wasobserved in our cohort of patients.
Dosimetry and Radiobiologic Model
Analysis of the bremsstrahlung images of the 73 patientsprovided a median TNR of 2.7 (1.7–6.0). Median absorbeddoses per unit activity were 18 (3–50) Gy/GBq to the non-tumor liver and 60 (13–251) Gy/GBq to the tumor.CR, PR, stable disease, and PD were observed in 19, 37,
15, and 2 patients, respectively, using the EASL guidelines,and according to RECIST, CR, PR, stable disease, and PDwere found in 1, 39, 31, and 2 patients, respectively (Fig. 2).CT scans of a patient before therapy and 5 mo after
therapy are shown in Figure 3, together with the dose dis-tribution and the DVH of total liver and target. In thispatient, a PR (according to RECIST) and CR (accordingto the EASL guidelines) were registered, whereas no $G2liver toxicity was observed.
The mean and median doses necessary to obtain CRusing the EASL guidelines were 150 and 111 Gy, re-spectively, and the mean and median doses needed to obtainCR or PR were 110 and 97 Gy, respectively. For CR and PRusing RECIST, the mean and median doses were 122 and99 Gy, respectively.
The dose versus response type for the EASL guideline orRECIST is reported in Figure 4, and the calculated TCPs interms of CR or PR are reported in Figure 5.
TCP curves were obtained from gaussian distributions ofln(N) values—the first (more radioresistant) with ana-value of 0.001/Gy, a mean value of ln(N0) equal to 23,and an SD (sln(N)) of 18, and the second (less radioresist-ant) with an a-value of 0.005/Gy, an ln(N0) of 6.9, and ansln(N) of 6.2. The fit of the tumor control, based on RECISTand EASL criteria, indicates that 2 populations having 60%and 40% more radioresistant cells, respectively, wereobserved in our cohort.
Assuming all $G2 liver toxicity as a complication after90Y sphere treatment of HCC, the observed and predictedliver toxicity rate versus the mean BED to the liver wascalculated and plotted in Figure 6, with a 95% CI. Theparameters resulting from fittings to clinical toxicity datawere a TD50 of 52 Gy (95% CI, 44–61 Gy) and an m of0.28 (95% CI, 0.18–0.60), assuming n 5 1. In Equation 3,
TABLE 3. 0th (Minimum), 25th, 50th (Median), 75th, and 100th (Maximum) Percentiles of Dosimetric Data
Parameter Percentile
0 25 50 75 100
Injected activity (GBq) 1.0 1.5 1.7 1.9 2.3Tumor–to–normal-tissue ratio 1.7 2.6 2.7 3.3 6.0
Lung shunt (%) 2% 5% 5% 10% 19%
Mean dose to liver/injected activity (Gy/GBq) 3.2 13.4 18.4 28.1 50.0
Mean dose to tumor/injected activity (Gy/GBq) 13.1 38.0 60.0 87.6 251.4Mean dose to lungs/injected activity (Gy/GBq) 0.9 2.5 2.6 5.0 9.9
FIGURE 2. Tumor response observed in our patientsaccording to EASL guideline and RECIST.
EFFICACY AND TOXICITY AFTER 90Y SPHERES • Strigari et al. 1381
by on September 8, 2016. For personal use only. jnm.snmjournals.org Downloaded from

the tolerance BED of the whole organ leading to a 50%complication probability (BED50) was 93 Gy (95% CI,79–110 Gy).The predicted and observed toxicity in our group was
34%, and the AUC of the NTCP model was 0.612 (95% CI,0.466–0.759). The predicted TCPs were 73% and 55%, andthe AUCs of TCP models were 0.513 (95% CI, 0.340–0.685) and 0.594 (95% CI, 0.437–0.711) for RECIST andEASL criteria, respectively.
DISCUSSION
Selecting an appropriate treatment strategy for patientswith HCC depends on careful tumor staging and assessmentof the underlying liver disease.Moreover, bremsstrahlung image quantification is still
under evaluation. Recent publications have shown thepossibility of using these images for dosimetry but afternontrivial important or significant calibration proceduresand image corrections (23).Because of the administration of 90Y-SIR treatment, spe-
cific calibrator factors have been carried out for eachpatient to calculate the activity in each voxel of attenua-tion-corrected SPECT images, based on the net admin-istered activity. The absorbed dose was obtained usingin-house software through the convolution of the activitymatrix from SPECT bremsstrahlung images and the dosevoxel kernel estimation (11). DVHs were calculated fromthe liver and lesion ROIs delineated on CT images to obtainthe mean dose. Dosimetric and clinical data were interpo-lated by TCP–NTCP models. In patients with HCC, thegoal of all locoregional therapies (ablation or chemoembo-lization) is to obtain necrosis of the tumor, regardless of the
shrinkage of the lesion. Even if an extensive tumor necrosisis achieved, this may not accompany a reduction in thedimension.
Regarding toxicity, substantial data are available on theacute and late side effects of 90Y-SIR spheres in HCCpatients. Symptoms including fatigue, nausea, and abdo-minal pain are quite common for patients undergoing90Y-SIR sphere therapy, who experience mild postemboli-
FIGURE 3. Pretherapy (A) and 5-moposttherapy (B) CT scan of patient PRaccording to RECIST and CR accordingto EASL. (B) Evident necrosis withreduced peripheral enhancement isobserved in place of HCC lesion(between V and VIII segments). Dosedistribution (C) is shown over prether-apy CT scan. DVH of total liver and tar-get is reported in D. Grade 1 (G1) livertoxicity was observed.
FIGURE 4. Lesion mean dose vs. tumor response typeaccording to EASL guideline and RECIST. In box-and-whisker plot, central box represents values from lower toupper quartile (25th to 75th percentile). Middle line repre-sents median. Vertical line extends from minimum to max-imum value, excluding outside (circle) values, which aredisplayed as separate points. Outside values are valueslarger than upper quartile plus 1.5 times interquartile range.
1382 THE JOURNAL OF NUCLEAR MEDICINE • Vol. 51 • No. 9 • September 2010
by on September 8, 2016. For personal use only. jnm.snmjournals.org Downloaded from

zation syndrome on the day of treatment and for up to 3 dthereafter.Radioembolization to nontarget organs can also cause
other acute damage, resulting in gastrointestinal ulceration,pancreatitis, and radiation pneumonitis. The incidence ofradiation effects could be minimized if meticulous angio-graphic techniques and dosimetry are used (24). Strictadherence to accepted limits on radiation dose (,30 Gy)to the lung prevents this complication (25). No lung toxicitywas observed in our patients. Despite careful evaluationbefore treatment and attempts to reduce SIR sphere expo-sure, gastroduodenal ulcers did develop in 1 patient.
A long-term sequela of 90Y treatment may be radiation-induced liver disease (26–29). When the whole liver isexposed to external-beam radiation at a mean radiationdose of more than 40 Gy, more than 50% of patientsdevelop liver dysfunction (30). Many other researchershave also reported tolerance doses for individual organsand 90Y-SIR sphere therapy, but data concerning late livertoxicity are scarce. In particular, dose escalation in 10patients showed that up to 138 Gy to the nontumorous liverby SIR treatment did not cause clinical radiation hepatitis(31). Moreover, 70 Gy by SIR treatment to the nontumo-rous part of the liver is tolerable in cirrhosis (32). Biopsiesin 4 patients receiving up to 75 Gy by SIR treatmentshowed a minimal histologic effect in the healthy liver(31). When the normal-liver dose was estimated separately,the maximum average dose was 75 Gy, with up to 147 Gydelivered to the tumor (33). From their study of a dogmodel, Wollner et al. (34) estimated that the human livercan easily tolerate 100 Gy. Assuming all $G2 liver toxicityas a complication after 90Y-SIR spheres treatment of HCC,and n 5 1, the estimated parameters of the NTCP curvewere a BED50 of 93 Gy and an m of 0.28. The value of theestimated BED50 is higher than the 72 Gy reported for lateeffect—that is, liver failure—by Emami et al. (30).Although factors other than dose distribution may be sig-nificant, this apparent discrepancy could be reconciled ifthe distribution of microspheres was more macroscopicallynonuniform (33) because of the vasculature of the majorvessels. Moreover, the fact that toxicity occurred within 4–6mo after treatment in our series might be due to the high–dose-rate effect generated by SIR treatment, probablybecause the dose to liver is delivered in a shorter time(about 10 d) than in EBRT, producing early or prematurevascular damage.
Moreover, our results are higher than those of Dawsonet al. (19), who found a TD50 of 39.8 Gy (BED50 5 64Gy), an m of 0.12, and an n of 0.97 for primary liver tumorstreated at a dose fraction of 1.5 Gy. Furthermore, ourparameters are lower in terms of BED50 but similar interms of m and n to those obtained by Xu et al. (35) forprimary liver patients with Child–Pugh A cirrhosis treatedat a dose fraction of 4.6 Gy (TD50 5 40.5 Gy, BED50 5115 Gy, m 5 0.28, and n 5 1.1). This difference might bebecause 21% (15/73) of our patients had pretreatmentChild–Pugh B or C cirrhosis. From a radiobiologic pointof view, these differences could be further explained by thefact that in the typical dose distribution delivered using90Y-SIR spheres the higher doses were received in smallervolumes, increasing the probability of cross-firing with apossible loss of biologic effect.
Regarding tumor control, the mean dose to the tumormay be predictive of final therapy outcome (i.e., cure) butmay not be the best predictor of tumor response. Likewise,the average dose seems to be more adequate for parallelorgans, such as the liver, capable of maintaining functionwhen a limited part of an organ receives a higher dose.
FIGURE 5. Tumor control probability vs. tumor mean doseaccording to EASL criteria and RECIST. Solid and dottedcurves represent TCP for more (TCPh) or less (TCPl) radiore-sistant tumors, respectively, in our study. Upper (TCPtot,EASL)and lower (TCPtot,RECIST) dashed curves represent weightedsum of above population to describe tumor responseaccording to EASL and RECIST, respectively. ¤ and s rep-resent experimental data. Gray area indicate no lesionsreceived dose lower than about 20 Gy. DT 5 tumor dose.
FIGURE 6. Normal-tissue complication probability of livertoxicity (solid line) vs. liver BED. Dashed line represents 95%CI. Vertical bars represent SD (caused by number of data ineach group that created each point). Exp 5 experimentaldata.
EFFICACY AND TOXICITY AFTER 90Y SPHERES • Strigari et al. 1383
by on September 8, 2016. For personal use only. jnm.snmjournals.org Downloaded from

Doses to the tumor higher than 110–120 Gy are able toobtain PR or CR (according to both criteria) in at least50% of patients. All the values discussed above were higherthan 100 Gy, which is the recommended target-absorbeddose for nonresectable HCC (36).However, tumor response varies according to the criteria
applied. In fact, according to the EASL guidelines orRECIST, a significant difference in the CR or PR wasregistered (i.e., in 74% or 55% of patients, respectively,using an average dose of 110 Gy). This difference couldbe because RECIST evaluates only 1-dimensional tumormeasurements and disregards the extent of the necrosis,which is the objective of all locoregional therapy used forHCC, including ablation and intraarterial procedures suchas chemoembolization. Considering that a multivariateanalysis of survival clearly demonstrated that the completetumor necrosis was associated with significantly bettersurvival (odds ratio, 1.83; 95% CI, 1.1–3.1; P 5 0.020)(37), the use of combined (size and necrosis) criteria mightlead to a more accurate assessment of response to 90Yradioembolization than criteria based on size alone (38).Recently, Coldwell et al. (39) introduced the response
based on 18F-FDG PET—which demonstrated a highdegree of response, compared with RECIST (CR or PR91% vs. 47%), and appears to be well demonstrated bythe survival of the patients in their series.In our series, the CR or PR based on RECISTwas similar
to that reported by Coldwell et al. (39), whereas that basedon the EASL guidelines was 77% for intermediate valueswith respect to the RECIST and 18F-FDG PET criteria.Consequently, 18F-FDG PET is expected to improve theassessment of tumor response. However, our study wasbased on CT/MR images and RECIST and EASL criteria,before the installation of 2 PET/CT devices at our institute.Moreover, the behavior of the TCP curves suggests that
the role of the inhomogeneity should be investigated, andDVH might be a valid method to assess the inhomogeneityof dose distribution; however, more advanced mathematicmodels still need to be applied (40,41). In addition,although the availability of a map of dose distributionallows correlations at the voxel level to be performed, theshrinkage of the tumor and the healthy remodeling of theliver could make a conclusive correlation more difficult.The use of a more simplified model based on mean dose
could provide robust results when the target dose distribu-tion is sufficiently homogeneous and the liver can beconsidered a parallel organ (i.e., the liver failure probabilityincreases with the liver mean dose). Assuming the samedosage to both tumor and liver, the BED for liver is higherthan that for tumor. However, the angiographic approach,limiting liver involvement, decreases the mean dose to thehealthy liver. Moreover, on the basis of these preliminaryfindings the TCP and NTCP models permit the outcome tobe predicted and the activity giving the highest therapeuticgain to be calculated. When the expected NTCP of the liveris higher than the acceptable cutoff (generally 20%–30%),
the use of a superselective approach or the possibility ofmulticycle treatments (15) should be carefully evaluated.
CONCLUSION
90Y-SIR sphere therapy is a complex procedure thatrequires multidisciplinary management for safety and suc-cess. Our results support that a radiobiologic approach,based on patient-specific dosimetry, is a feasible and effec-tive method to increase treatment efficacy sparing normal-tissue 90Y therapy.
According to the NTCP–TCP model, new clinical proto-cols should be designed to improve the risk–benefit bal-ance. Additional data on a larger cohort are required toimprove the outcome prediction.
ACKNOWLEDGMENT
We thank Paula Franke for the English revision of themanuscript.
REFERENCES
1. Rocken C, Carll-McGrath S. Pathology and pathogenesis of hepatocellular
carcinoma. Dig Dis. 2001;19:269–278.
2. Di Bisceglie AM, Rustgi VK, Hoofnagle JH, Dusheiko GM, Lotze MT. NIH
conference: hepatocellular cancer. Ann Intern Med. 1988;108:390–401.
3. Lin DY, Lin SM, Liaw YF. Non-surgical treatment of hepatocellular carcinoma.
J Gastroenterol Hepatol. 1997;12:S319–S328.
4. Cheng JC, Wud JK, Huanga CM, et al. Radiation-induced liver disease after
radiotherapy for hepatocellular carcinoma: clinical manifestation and dosimetric
description. Radiother Oncol. 2002;63:41–45.
5. Seong J, Park HS, Han KH, et al. Local radiotherapy for unresectable
hepatocellular carcinoma patients who failed with arterial chemoembolization.
Int J Radiat Oncol Biol Phys. 2000;47:1331–1335.
6. Kennedy A, Nag S, Salem R, et al. Recommendations for radioembolization of
hepatic malignancies using yttrium-90 microsphere brachyterapy: a consensus
panel report from the radioembolization brachytheraphy oncology consortium.
Int J Radiat Oncol Biol Phys. 2007;68:13–23.
7. Dale RG. Dose-rate effects in targeted radiotherapy. Phys Med Biol. 1996;
41:1871–1884.
8. Dale R, Carabe-Fernandez A. The radiobiology of conventional radiotherapy and
its application to radionuclide therapy. Cancer Biother Radiopharm. 2005;20:
47–51.
9. Strigari L, D’Andrea M, Maini CL, et al. Biological optimization of
heterogeneous dose distributions in radionuclide direct therapy. Med Phys.
2006;33:1857–1866.
10. Sirtex Medical Limited. SIR-Spheres Training Program, Physicians and Institu-
tions. Available at: http://www.sirtex.com/files/TRN-US-0320for20US1.pdf. Ac-
cessed August 3, 2010.
11. Strigari L, Menghi E, D’Andrea M, et al. Monte Carlo dose voxel kernel
calculations of beta-emitting and Auger-emitting radionuclides for internal
dosimetry: a comparison between EGSnrcMP and EGS4. Med Phys. 2006;33:
3383–3389.
12. Therasse P, Arbuck SG, Eisenhauer EA, et al. New guidelines to evaluate the
response to treatment in solid tumors. European Organization for Research and
Treatment of Cancer, National Cancer Institute of the United States, National
Cancer Institute of Canada. J Natl Cancer Inst. 2000;92:205–216.
13. Bruix J, Sherman M, Llovet JM, et al. Clinical management of hepatocellular
carcinoma: conclusions of the Barcelona-2000 EASL-conference. European
Association for the Study of the Liver. J Hepatol. 2001;35:421–430.
14. Jakobs T. Radiologic follow-up of patients treated with SIRT. Paper presented
at: Liver-Directed Radiotherapy with Microspheres: A Clinical Symposium;
February 11–12, 2006; Barcelona, Spain.
15. Cremonesi M, Ferrari M, Bartolomei M, et al. Radioembolization with 90Y-
microspheres: dosimetric and radiobiological investigation for multi-cycle
treatments. Eur J Nucl Med Mol Imaging. 2008;35:2088–2096.
1384 THE JOURNAL OF NUCLEAR MEDICINE • Vol. 51 • No. 9 • September 2010
by on September 8, 2016. For personal use only. jnm.snmjournals.org Downloaded from

16. Krishnan S, Lin EH, Gunn GB, et al. Conformal radiotherapy of the dominant
liver metastasis: a viable strategy for treatment of unresectable chemotherapy
refractory colorectal cancer liver metastases. Am J Clin Oncol. 2006;29:562–567.
17. Strigari L, D’Andrea M, Abate A, Benassi M. A heterogeneous dose distribution
in simultaneous integrated boost: the role of the clonogenic cell density on the
tumor control probability. Phys Med Biol. 2008;53:5257–5273.
18. Withers HR, Thames HD Jr, Peters LJ. A new isoeffect curve for change in dose
per fraction. Radiother Oncol. 1983;1:187–191.
19. Dawson LA, Normolle D, Balter JM, et al. Analysis of radiation-induced liver
disease using the Lyman NTCP model. Int J Radiat Oncol Biol Phys. 2002;
53:810–821.
20. Strigari L, Arcangeli G, Arcangeli S, Benassi M. A mathematical model for
evaluating the incidence of acute rectal toxicity during conventional or hypo-
fractionated radiotherapy courses for prostate cancer. Int J Radiat Oncol Biol
Phys. 2009;73:1454–1460.
21. Obuchowski NA. Nonparametric analysis of clustered ROC curve data.
Biometrics. 1997;53:567–578.
22. Child CG, Turcotte JG. Surgery and portal hypertension. In: Child CG, ed. The
Liver and Portal Hypertension. Philadelphia, PA: Saunders; 1964:50–64.
23. Minarik D, Sjogreen Gleisner K, Ljungberg M. Evaluation of quantitative 90Y-
SPECTbasedonexperimental phantomstudies.PhysMedBiol.2008;53:5689–5703.
24. Rhee TK, Omary RA, Gates V, et al. The effect of catheter directed CT
angiography on yttrium-90 radioembolization treatment of hepatocellular
carcinoma. J Vasc Interv Radiol. 2005;16:1085–1091.
25. Leung TW, Lau WY, Ho SK, et al. Radiation pneumonitis after selective internal
radiation treatment with intra-arterial 90yttrium-microspheres for inoperable
hepatic tumors. Int J Radiat Oncol Biol Phys. 1995;33:919–924.
26. Goin JE, Salem R, Carr BI, et al. Treatment of unresectable hepatocellular
carcinoma with intrahepatic yttrium 90 microspheres: factors associated with
liver toxicities. J Vasc Interv Radiol. 2005;16:205–213.
27. Thamboo T, Tan KB, Wang SC, et al. Extra-hepatic embolisation of Y-90
microspheres from selective internal radiation therapy (SIRT) of the liver.
Pathology. 2003;35:351–353.
28. Ho S, Lau WY, Leung TW, et al. Partition model for estimating radiation doses
from yttrium-90 microspheres in treating hepatic tumours. Eur J Nucl Med.
1996;23:947–952.
29. Ingold J, Reed G, Kaplan H, Bagshaw MA. Radiation hepatitis. AJR.
1965;93:200–208.
30. Emami B, Lyman J, Brown A, et al. Tolerance of normal tissue to therapeutic
irradiation. Int J Radiat Oncol Biol Phys. 1991;21:109–122.
31. Gray B, Burton MA, Kelleher DK, et al. Selective internal radiation (SIR)
therapy for treatment of liver metastases: measurement of response rate.
J Surg Oncol. 1989;42:192–196.
32. Lau WY, Leung WT, Ho S, et al. Treatment of inoperative hepatocellular
carcinoma with intra-arterial yttrium-90 microspheres: a phase 1 and 2 study.
Br J Cancer. 1994;70:994–999.
33. Burton MA, Gray BN, Klemp PF, Kelleher DK, Hardy N. Selective internal
radiation therapy: distribution of radiation in the liver. Eur J Cancer Clin
Oncol. 1989;25:1487–1491.
34. Wollner I, Knutsen C, Smith P, et al. Effects of hepatic arterial yttrium-90 glass
microspheres in dogs. Cancer. 1988;61:1336–1344.
35. Xu ZY, Liang SX, Zhu JRD, et al. Prediction of radiation induced liver disease
by Lyman normal-tissue complication probability model in three-dimensional
conformation radiation therapy for primary liver carcinoma. Int J Radiat
Oncol Biol Phys. 2006;65:189–195.
36. Dancey JE, Shepherd FA, Paul K, et al. Treatment of nonresectable
hepatocellular carcinoma with intrahepatic 90Y-microspheres. J Nucl Med.
2000;41:1673–1681.
37. Sala M, Llovet JM, Vilana R, et al. Initial response to percutaneous ablation
predicts survival in patients with hepatocellular carcinoma. Hepatology.
2004;40:1352–1360.
38. Keppke AL, Salem R, Reddy D, et al. Imaging of hepatocellular carcinoma after
treatment with yttrium-90 microspheres. AJR. 2007;188:768–775.
39. Coldwell DM, Kennedy AS, Nutting CW. Use of yttrium-90 microspheres in the
treatment of unresectable hepatic metastases from breast cancer. Int J Radiat
Oncol Biol Phys. 2007;69:800–804.
40. Kutcher GJ, Burman C. Calculation of complication probability factors for non-
uniform norma1tissue irradiation: the effective volume method. Int J Radiat
Oncol Biol Phys. 1989;16:1623–1630.
41. Lyman JT, Wolbarst AB. Optimization of radiation therapy IV: a dose-volume
histogram reduction algorithm. Int J Radiat Oncol Biol Phys. 1989;17:433–
436.
EFFICACY AND TOXICITY AFTER 90Y SPHERES • Strigari et al. 1385
by on September 8, 2016. For personal use only. jnm.snmjournals.org Downloaded from

Doi: 10.2967/jnumed.110.075861Published online: August 18, 2010.
2010;51:1377-1385.J Nucl Med. Marcello Benassi, Giuseppe Maria Ettorre and Carlo Ludovico MainiLidia Strigari, Rosa Sciuto, Sandra Rea, Livio Carpanese, Giuseppe Pizzi, Antonella Soriani, Giuseppe Iaccarino, Y-SIR Spheres: Radiobiologic Considerations
90Efficacy and Toxicity Related to Treatment of Hepatocellular Carcinoma with
http://jnm.snmjournals.org/content/51/9/1377This article and updated information are available at:
http://jnm.snmjournals.org/site/subscriptions/online.xhtml
Information about subscriptions to JNM can be found at:
http://jnm.snmjournals.org/site/misc/permission.xhtmlInformation about reproducing figures, tables, or other portions of this article can be found online at:
(Print ISSN: 0161-5505, Online ISSN: 2159-662X)1850 Samuel Morse Drive, Reston, VA 20190.SNMMI | Society of Nuclear Medicine and Molecular Imaging
is published monthly.The Journal of Nuclear Medicine
© Copyright 2010 SNMMI; all rights reserved.
by on September 8, 2016. For personal use only. jnm.snmjournals.org Downloaded from