radioembolization and the dynamic role of 90y pet/ct
TRANSCRIPT
IN CANCER IMAGING AND DIAGNOSISlogo
Radioembolization and the dynamic role of 90Y PET/CT
Alexander S Pasciak, Austin C Bourgeois, J. Mark McKinney, Ted T Chang, Dustin R Osborne, Shelley N Acuff and Yong CBradley
Journal Name: Frontiers in Oncology
ISSN: 2234-943X
Article type: Review Article
Received on: 23 Jan 2014
Accepted on: 12 Feb 2014
Provisional PDF published on: 12 Feb 2014
Frontiers website link: www.frontiersin.org
Citation: Pasciak AS, Bourgeois AC, Mckinney JM, Chang TT, Osborne DR,Acuff SN and Bradley YC(2014) Radioembolization and the dynamicrole of 90Y PET/CT. Front. Oncol. 4:38.doi:10.3389/fonc.2014.00038
Article URL: /Journal/Abstract.aspx?s=1236&name=cancer%20imaging%20and%20diagnosis&ART_DOI=10.3389/fonc.2014.00038
(If clicking on the link doesn't work, try copying and pasting it into your browser.)
Copyright statement: © 2014 Pasciak, Bourgeois, Mckinney, Chang, Osborne, Acuff andBradley. This is an open-access article distributed under the termsof the Creative Commons Attribution License (CC BY). The use,distribution or reproduction in other forums is permitted,provided the original author(s) or licensor are credited and thatthe original publication in this journal is cited, in accordance withaccepted academic practice. No use, distribution or reproductionis permitted which does not comply with these terms.
This Provisional PDF corresponds to the article as it appeared upon acceptance, after rigorous
peer-review. Fully formatted PDF and full text (HTML) versions will be made available soon.

Abstract Before the advent of tomographic imaging, it was postulated that decay of 90Y to the 0+ excited state of 90Zr may result in emission of a positron-‐electron pair. While the branching ratio for pair production is small (~32x10-‐6), PET has been successfully used to image 90Y in numerous recent patient and phantom studies. 90Y PET imaging has been performed on a variety of PET/CT systems, with and without time-‐of-‐flight (TOF) and/or resolution recovery capabilities as well as on both BGO and L(Y)SO based scanners. On all systems, resolution and contrast superior to bremsstrahlung SPECT has been reported. The intrinsic radioactivity present in L(Y)SO-‐based PET scanners is a potential limitation associated with accurate quantification of 90Y. However, intrinsic radioactivity has been shown to have a negligible effect at the high activity concentrations common in 90Y radioembolization. Accurate quantification is possible on a variety of PET scanner models, with or without TOF, although TOF improves accuracy at lower activity concentrations. Quantitative 90Y PET images can be transformed into 3D maps of absorbed dose based on the premise that the 90Y activity distribution does not change after infusion. This transformation has been accomplished in several ways, although the most common is with the use of 3D dose point-‐kernel convolution. From a clinical standpoint, 90Y PET provides a superior post-‐infusion evaluation of treatment technical success owing to its improved resolution. Absorbed dose maps generated from quantitative PET data can be used to predict treatment efficacy and manage patient follow-‐up. For patients who receive multiple treatments, this information can also be used to provide patient-‐specific treatment planning for successive therapies, potentially improving response. The broad utilization of 90Y PET has the potential to provide a wealth of dose-‐response information, which may lead to development of improved radioembolization treatment-‐planning models in the future.
Introduction Yttrium-‐90 (90Y) has many properties that make it an ideal radionuclide for targeted internal therapy. It is one of a handful of radionuclides that is considered to be a pure β-‐ emitter, emitting no gamma rays at any appreciable yield following decay. 90Y also releases a higher energy electron than other pure β-‐ emitters that have been used in internal therapy, with a maximum and average energy of 2.28 and 0.934 MeV, respectively. While 90Y has found broad utility in targeted internal therapies ranging from radioimmunotherapy for non-‐hodgkins lymphoma to radioembolization for hepatic malignancy, it is radioembolization that benefits most from the relatively high energy of the 90Y β-‐ emission. The range of the maximum energy 90Y β-‐ particle is 11 mm in tissue, while its average energy β-‐ has a range slightly less than 4 mm. The penetration depth of the high-‐energy 90Y β-‐ particle is a key component of this radionuclide’s success in radioembolization, allowing for high dose deposition into the tissues between embolized capillaries. As a pure β-‐ emitter, 90Y radioembolization has the advantage of a negligible radiation burden to both non-‐embolized portions of the liver and extra-‐hepatic tissues. Further, patients can be released shortly after treatment with minimal precautions due to both the lack of appreciable gamma emissions and the lack of free 90Y, which may be transferred to others by exposure to body fluid. Unfortunately, these benefits come at a cost, as conventional direct imaging of this radionuclide is not possible. The standard-‐of-‐care post-‐treatment imaging of 90Y radioembolization is indirect imaging using bremsstrahlung SPECT with a wide energy window. Despite its common use, this method presents a number of drawbacks. Namely, the image quality produced by 90Y bremsstrahlung SPECT is lower than that produced from conventional SPECT imaging radiotracers. Quantification of bremsstrahlung SPECT images also requires specialized techniques (Kappadath, 2010; Walrand et al., 2011; Elschot et al., 2013a), making it impractical in the typical clinical setting. Recently, PET has been identified as a new method of directly visualizing the activity distribution of 90Y radioembolization. Imaging is based on a minor decay branch of 90Y resulting in the generation of annihilation photons. Physics Behind 90Y and Emission of Annihilation Photons In 1955 Johnson (Johnson et al., 1955) and Ford (Ford, 1955) independently found evidence of a 0+ first excited state in 90Zr, albeit in different ways. Ford(Ford, 1955) predicted this state theoretically, while Johnson et al(Johnson et al., 1955) measured the positron emission resulting from the de-‐excitation of this state experimentally using a magnetic spectrometer. Decay of 90Y to the first excited state of 90Zr 0+ occurs rarely, but will result in subsequent de-‐excitation of 90Zr with several different possible emissions. A monopole transition of 90Zr 0+ -‐> 0+ occurs by either

the emission of a monoenergetic 1.75 MeV conversion electron or, because the energy of the 90Zr 0+ excited state exceeds 1.022 MeV, by internal pair production (Evans, 1982; Moore et al., 1967). Unlike typical excited states, in a 0+ -‐> 0+ monopole transition the emission of a gamma ray is absolutely forbidden (Evans, 1982). Following publication of Johnson’s findings (Johnson et al., 1955), Greenberg (Greenberg and Deutsch, 1956) used a magnetically focused coincidence detector to accurately describe the ratio for positron emission of several β-‐ radionuclides that were traditionally considered to be pure β-‐ emitters. Greenberg determined the branching ratio for positron emission of 90Y to be 36 +/-‐ 0.9 x 10-‐6. More recently, Selwyn et al(Selwyn et al., 2007) was able to experimentally determine of the 90Y branching ratio for positron emission with more accuracy than previous reports. A high purity coaxial germanium detector was used along with Monte Carlo modeling to identify the annihilation peak, and subtract out both the bremsstrahlung and environmental background(Selwyn et al., 2007) . Selwyn identified the probability of positron emission per decay of 90Y to be 31.86 +/-‐0.47 x 10-‐6 (Selwyn et al., 2007). A more detailed explanation of the physics of positron emission resulting from the 90Zr 0+ -‐> 0+ transition is given by D’Arienzo (D’Arienzo, 2013). First Images While the presence of a 90Zr 0+ excited state and resultant minor branch for positron emission following decay of 90Y has been known for over half of a century, coincidence imaging has been performed only in the past few years. In 2004, Nickles et al (Nickles et al., 2004) performed a quantitative measurement of annihilation photons emitted from a 90Y source using a sodium-‐iodide scintillation detector pair operating in fast coincidence. The small branching ratio of 90Y was measured with high precision with a trues:randoms ratio of 1000:1. Nickles also obtained some of the first phantom images with a micro-‐Derenzo phantom filled with a 50 MBq/mL 90Y activity concentration on a Concorde microPET scanner. The scanner’s excellent resolution easily resolved phantom objects as small as 1.6 mm in size. While the true-‐coincidence count rate measured by Nickles was low, he proposed that 90Y coincidence imaging may prove clinically useful due to the possibility of accurate post-‐infusion quantification (Nickles et al., 2004). In 2009, Lhommel et al (Lhommel et al., 2009) performed one of the first post-‐infusion clinical 90Y PET/CT scans. Images were acquired using a Phillips Gemini Time of Flight (TOF) system. A 2.5 mm thick copper ring was fabricated and placed over the detectors to decrease the count rate from lower energy bremsstrahlung and prevent detector saturation. Qualitative comparison with bremsstrahlung

SPECT showed superior resolution and a microsphere distribution that closely matched areas of high metabolic uptake seen on 18FDG PET/CT imaging. Following these two preliminary reports describing the possible viability of 90Y PET/CT imaging, multiple authors have presented results from both patient and phantom imaging obtained on many different scanner types. Table 1 summarizes the PET/CT systems used in selected phantom studies from the literature. References in Table 1: (Lhommel et al., 2010), (Werner et al., 2009), (van Elmbt et al., 2011), (Willowson et al., 2012), (Bagni et al., 2012), (D’Arienzo et al., 2012), (Elschot et al., 2013b),(Kao et al., 2013a) Confounding Factors 90Y is a poor PET radiotracer when compared to those routinely used for diagnostic purposes. Aside from the low true-‐coincidence count rate due to the small branching ratio for positron emission, several other factors may contribute to the difficulty of 90Y PET imaging. These factors can be broken into two broad categories: those associated with the low true-‐coincidence rate and those associated with the high singles rate due to bremsstrahlung X-‐rays. These issues are introduced here and discussed through the remainder of this article. The low true-‐coincidence rate The low true-‐coincidence rate in 90Y PET imaging results in long scan-‐times and noisy images, which are expected challenges given the low branching ratio for 90Y positron emission (Nickles et al., 2004). Additionally, there are also several less obvious challenges associated with the low true-‐coincidence rate. Modern PET/CT scanners use detectors composed primarily of either cerium-‐doped lutetium yttrium orthosilicate (LYSO) or cerium-‐doped lutetium orthosilicate (LSO). L(Y)SO has become the scintillator of choice for state-‐of-‐the-‐art PET systems, especially as TOF becomes standardized due to both a superior energy resolution to bismuth-‐gemanate (BGO) and a light emission decay rate which is nearly an order of magnitude faster. Both LSO and LYSO contain lutetium which, based on natural isotopic abundance contains 2.59% 176Lu (Lhommel et al., 2010). 176Lu beta decays with a long half-‐life, emitting several prompt gamma rays, one of which has an energy of 401 keV. This 401 keV gamma ray falls within the typical PET energy window resulting in the introduction of a low background randoms rate. The typical true-‐coincidence count rates associated with conventional PET radiotracers are orders of magnitude higher than that created by the presence of natural 176Lu, thus allowing this intrinsic radioactivity to be effectively ignored. Unfortunately, this may not be the case for 90Y PET imaging and this intrinsic activity could have implications affecting both the accuracy of quantification and image quality. Bremsstrahlung X-‐rays

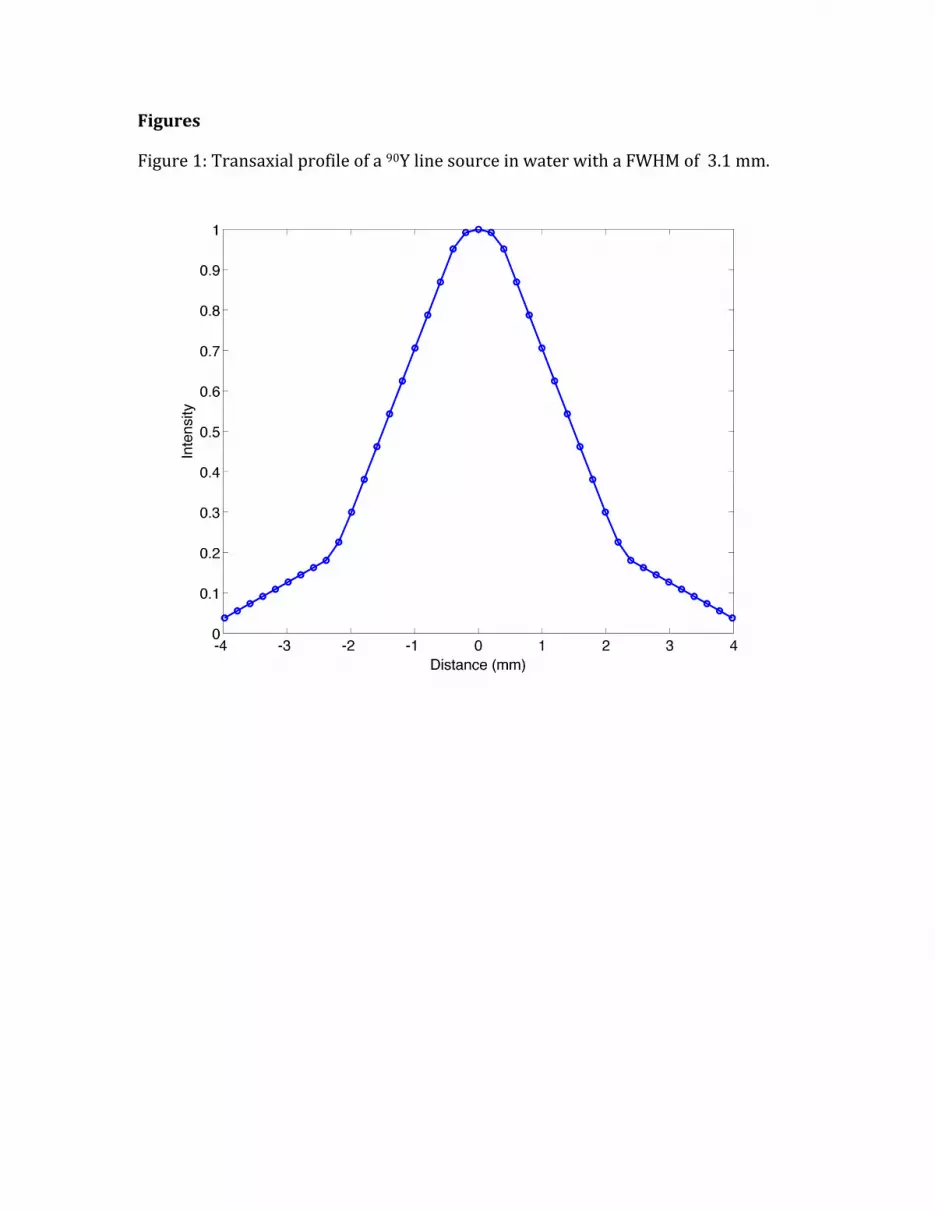
The infused 90Y dosage in radioembolization can range anywhere from 1 GBq to 4 GBq, and all of this activity can easily be within the axial field of view (FOV) of a single PET bed position. Since every decay of 90Y emits a high-‐energy β-‐, a large fluence of bremsstrahlung X-‐rays can be produced. In fact, in 90Y PET imaging the singles count rate from bremsstrahlung exceeds the true-‐coincidence count rate by a large margin. The 90Y bremsstrahlung energy spectrum is broad (Stabin et al., 1994) and produces the highest photon yield at energies below 20 keV. Fortunately, the majority of these low-‐energy photons are likely to be significantly attenuated by the patient. The spectrum of released photons is relatively constant from 20-‐500 keV, at which point the yield drops appreciably up to its maximum of 2.28 MeV(Stabin et al., 1994). One potential issue associated with this high fluence of bremsstrahlung photons is the possibility of detector saturation. Detector saturation due to the high singles rate from bremsstrahlung X-‐rays was initially thought to be a major barrier associated with 90Y PET/CT. One of the first reports of successful clinical 90Y PET/CT imaging (Lhommel et al., 2009) was performed with a custom fabricated 2.5 mm thick copper ring designed to reduce the singles rate due to bremsstrahlung from a patient dosage of only 1.3 GBq. Detector saturation at the dosages used in radioembolization has the potential to degrade image quality substantially and limit the quantitative accuracy of 90Y PET—a major component of its utility. Image Quality The first reported clinical 90Y PET/CT scan (Lhommel et al., 2009) qualitatively demonstrated superior resolution to bremsstrahlung SPECT. Multiple authors have since published additional examples showing that 90Y PET produces superior image quality when compared to alternative methods of imaging 90Y such as Bremmstrahlung SPECT or indirect imaging with 99mTc MAA SPECT (Gates et al., 2010; Kao et al., 2011; Gupta et al., 2012; Bagni et al., 2012; D’Arienzo et al., 2012; Kao et al., 2012; Elschot et al., 2013b; Carlier et al., 2013; Kao et al., 2013b; Padia et al., 2013). Resolution Resolution has been evaluated by a number of authors on many PET/CT systems. For 90Y PET the full-‐width at half-‐maximum (FWHM) has been reported to be anywhere between 5.0 mm (D’Arienzo et al., 2012) and 10.6 mm (van Elmbt et al., 2011). Table 1 details the resolution reported in recent publications. It should be noted that the method used to evaluate resolution has varied from author to author, and this explains some of the inconsistencies seen. For example, Bagni (Bagni et al., 2012) and D’Arienzo (D’Arienzo et al., 2012) both evaluated resolution on a GE Discovery ST and obtained a FWHM of 6.5 mm and 5.0 mm, respectively. We have evaluated the resolution of a Siemens Biograph mCT Flow (Siemens Medical Solutions USA, Inc., Knoxville, TN) using a 0.4 mm inner-‐diameter line source

charged with 90Y in a cylindrical water scatter phantom. The line source was positioned at isocenter. Reconstruction was performed using a 10 cm FOV (zoom of 8), a 512x512 PET reconstruction matrix, 1 iteration and 21 subsets with point spread function resolution recovery (RR) and time-‐of-‐flight (TOF). Under these conditions, the axial FWHM on this scanner was measured to be 3.1 mm. An axial profile of the line source from this acquisition is shown in Figure 1. Contrast Van Elmbt et al (van Elmbt et al., 2011) presented a detailed phantom analysis of 90Y PET contrast using a custom built phantom. Van Elmbt compared both the hot and cold contrast of varying size hot-‐spheres when filled with standard clinical activity concentrations in the spheres and background as a function of scanner type. A LYSO scanner (Phillips Gemini TF, with and without TOF), a GSO scanner (Phillips Gemini power 16) and a BGO scanner (Siemens ECAT Exact HR+) were all compared. Contrast was measured for effective scan times of 12, 24, 36 and 48 minutes on each scanner. The LYSO-‐based system with TOF produced the best hot contrast, regardless of scan time and/or sphere diameter. Results were somewhat different for cold contrast, where the intrinsic radioactivity of 176Lu adds to cold-‐sphere background and reduces nominal contrast when TOF was not used. The use of TOF compensated for some of this lost cold-‐sphere contrast, improving LYSO scanner performance. The BGO scanner was a poor performer, with a 40% loss of contrast for all sphere sizes and scan times, when both hot and cold spheres were analyzed(van Elmbt et al., 2011). However, D’Arienzo (D’Arienzo et al., 2012) was successful at using a BGO based system to obtain contrast recovery exceeding 0.5 for 18mm or larger spheres. D’Arienzo’s findings are similar to other publications where LSO and LYSO based scanners were used (Willowson et al., 2012; Werner et al., 2010; Elschot et al., 2013b). Direct comparisons between 90Y PET/CT and Bremsstrahlung SPECT using identical scan time and similar reconstruction parameters have also been performed. Elschot (Elschot et al., 2013b) reported contrast recovery to be significantly higher for phantom hot spheres of all sizes using PET/CT on a Siemens mCT with TOF and RR when compared with a Siemens Symbia T16 with RR. In many cases the contrast recovery produced using PET/CT exceeded bremsstrahlung SPECT by a factor of 3 or more. However, the 90Y PET images had significantly more noise. In order to compare 90Y PET and bremsstrahlung SPECT images with similar noise characteristics, reconstruction parameters of 1 iteration with a 15 mm Gaussian filter were applied to the PET data, producing similar noise to the bremsstrahlung SPECT. In this case, 90Y PET still produced superior contrast (Elschot et al., 2013b). Elschot’s quantitative comparison of contrast recovery between PET and bremsstrahlung SPECT is in agreement with published patient results (Kao et al., 2011; Gupta et al., 2012; Bagni et al., 2012; D’Arienzo et al., 2012; Kao et al., 2012; Carlier et al., 2013; Kao et al., 2013b; Padia et al., 2013) which demonstrate this qualitatively.
Van Elmbt et al (van Elmbt et al., 2011) analyzed PET/CT scans of a phantom filled either 90Y or 18F and found that the scatter fractions were nearly identical. Despite this finding, contrast recovery with 18F is still superior to 90Y (van Elmbt et al., 2011; Willowson et al., 2012; Carlier et al., 2013; Elschot et al., 2013b). A clear, detailed analysis of this phenomenon is currently not present in the 90Y PET literature, however there are several plausible explanations. The first can be attributed to the effect of high image noise on OSEM image reconstruction. Traditional OSEM reconstruction algorithms have an inherent non-‐negativity constraint, which may introduce a positive bias in low-‐count portions of the image. This same issue is present in dynamic PET where individual frames have high noise and special reconstruction methods are used to improve quantification and contrast recovery (Verhaeghe and Reader, 2010; Rahmim et al., 2012). Another potential explanation for loss of contrast recovery is the possibility of pair-‐production events in the PET detector blocks from bremsstrahlung photons that exceed 1.022 MeV. Van Elmbt (van Elmbt et al., 2011) suggested that these true-‐coincidence events may affect the ends of the profile tails of the rebinned sinograms. These pair-‐production events may have an impact on the scaling of the scattered sinogram to the emission sonogram and may impact randoms correction. Both of these phenomenon require future exploration as they relate to 90Y PET. Noise 90Y PET/CT images are inherently noisy due to the small positron emission branching fraction of 90Y. Long clinical scan times of up to 45 minutes have been used to compensate for low true-‐coincidence rates in an effort to improve image quality(Chang et al., 2013). However, other authors have obtained acceptable image quality with scan times as short as 20 minutes (Gates et al., 2010). Further, while image quality may not be acceptable for clinical interpretation, dosimetry can be performed with scan times as low as 15 minutes (Goedicke et al., 2013). The appearance of noise in clinical 90Y imaging is often worse in the non-‐target hepatic paranchyma where the 90Y activity concentration is lower, as illustrated in Figure 2. Although this low-‐level, clustered non-‐target activity is often attributed to quantum mottle, evidence suggests that this may represent a true physiologic phenomenon that can be visualized with PET/CT due to its high spatial resolution. Kennedy (Kennedy et al., 2004) first observed clustering of microspheres in the pathologic analysis of four explanted livers following radioembolization. More recently, Walrand (Walrand et al., 2013) has provided simulation data supporting Kennedy’s findings using a virtual arterial tree model to simulate asymmetrical microsphere distribution. Quantification Linearity

Following Lhommel’s (Lhommel et al., 2009) first report of successful clinical 90Y PET/CT imaging with the use of a 2.5 mm thick copper attenuating ring to prevent detector saturation, it was thought that saturation might be the most significant factor preventing accurate quantification of 90Y using PET/CT. However, since this initial report, numerous authors have presented results verifying count-‐rate linearity at the high activity levels common in radioembolization. Detector saturation and non-‐linearity at clinical activities does not occur in PET systems that use detector blocks composed of LSO (Willowson et al., 2012), LYSO, or GSO (van Elmbt et al., 2011) due to their fast response time. Further, Lhommel followed up his initial report with a publication detailing count-‐rate linearity up to an activity of 2.2 GBq on the same scanner where a copper attenuator was initially used (Lhommel et al., 2010). On the far end of the spectrum, Willowson (Willowson et al., 2012) found excellent linearity up to an activity of 4.7 GBq on a Siemens Biograph mCT . The limited geometric efficiency of PET due to solid angle is a major contributor to the lack of detector saturation. However, although bremsstrahlung SPECT has a higher geometric efficiency than PET, the poor efficiency of its collimator prevents saturation(van Elmbt et al., 2011). While a number of authors have found no evidence of detector saturation on LSO, LYSO and GSO scanners, there is some controversy regarding saturation on BGO scanners. Van Elmbt (van Elmbt et al., 2011) found evidence of non-‐linearity at activities greater than 1.2 GBq on a Siemens Exact HR+ BGO PET system. Similarly Walrand (Walrand et al., 2010) found detector saturation on a BGO system at activities above 1.5 GBq. Van Elmbt concluded that BGO based scanners are not suitable for 90Y quantification, not due just to count-‐rate linearity issues but also the resultant 40% loss of hot contrast at clinical activity concentrations(van Elmbt et al., 2011). However, it should be noted that the scanner used by van Elmbt (van Elmbt et al., 2011) was antiquated (Table 1) and newer BGO systems have shown to produce better results. Bagni (Bagni et al., 2012) found no evidence of saturation on a GE Discovery ST BGO PET system up to a total activity of 2.0 GBq. Similarly, D’Arienzo was able to obtain quantifiable images using a GE Discovery ST BGO scanner accurate to within 7.62% (D’Arienzo et al., 2012). Bagni and D’Arienzo’s results suggest that some BGO detector systems may be acceptable for imaging many radioembolization procedures. Table 1 details the maximum activity where count-‐rate linearity was found in several recent phantom studies, stratified by scanner type. Intrinsic Radioactivity The effect of intrinsic 176Lu radioactivity has been evaluated by assessing count-‐rate linearity and quantification accuracy at low total activity within the field of view. Goedicke (Goedicke et al., 2013) found reasonable count-‐rate linearity on an LYSO based system at total activities from 200 to 55 MBq (<16% error), suggesting that

176Lu provides a definite but not overwhelming contribution. Kao (Kao et al., 2013a) performed 15 phantom scans using available source vials with activities ranging from 3.5 MBq to 3.2 GBq placed in an acrylic scattering phantom. Across all imaged activities, the mean relative error in 90Y PET quantification was 1.38% while vial activities exceeding 400 MBq had a mean error of only 0.29%. However, these analyses may not have been clinically realistic as they were performed using a decaying 90Y source vial with a very small volume, preventing evaluation of activity concentration. While the total activity within the FOV was low, the activity concentration still may have been quite high. Carlier focused on identifying the minimum detectable activity concentration (MDA) of 90Y PET/CT (Carlier et al., 2013). The MDA for a 10 mm hot-‐sphere in a 40:1 hot-‐sphere to background activity concentration was found to be approximately 1 MBq/mL with TOF and 3 MBq/mL without TOF. Spheres larger than 17mm were detected at the lowest activity concentration imaged, 0.49 MBq/mL. Similarly, Willowson (Willowson et al., 2012) found accurate quantification of large spheres and total activity within the FOV at activity concentrations as low as 0.380 MBq/mL. A study by Kao (Kao et al., 2013a) further corroborated these findings. While accurate quantification at activity concentrations common in 90Y radioembolization have been reported, one author designed a protocol specifically to quantify and subtract the signal resulting from intrinsic 176Lu activity(Fourkal et al., 2013). Using a 2-‐step process, patients received a PET/CT scan both before and after the infusion of 90Y using the same acquisition protocol. The pre-‐treatment scan served as a measurement of the background contribution from intrinsic 176Lu activity, allowing for later background subtraction. Data from an example patient presented showed an average pre-‐treatment activity concentration in the liver to be 29.6 Bq/ml, resulting from intrinsic 176Lu activity on a Siemens Biograph 16 Truepoint PET/CT system. Interestingly, the average background found was significantly less than the typical tumor activity concentration in radioembolization, which is often greater than 2 MBq/mL. This likely explains why other authors were able to obtain quantifiable results without the use of background subtraction. Reconstruction Several publications have investigated optimal ordered-‐subset expectation maximization (OSEM) reconstruction parameters for quantifying 90Y PET/CT. An in-‐depth analysis by Willowson et al(Willowson et al., 2012) examined the effect of reconstruction parameters on quantitative accuracy as a function of both hot-‐sphere size and activity concentration using the IEC NEMA Body Phantom. This phantom was initially imaged with a hot-‐sphere activity concentration of 3.9 MBq/mL and a background concentration of 0.47 MBq/mL. It was then serially imaged at multiple time points down to hot-‐sphere and background concentrations of 0.380 MBq/mL and 0.037 MBq/mL, respectively. Regardless of activity concentration or hot-‐sphere size, reconstruction parameters of 1 iteration and 21 subsets with TOF and RR provided the most accurate quantification on a Siemens Biograph mCT. Carlier

(Carlier et al., 2013) also performed a similar analysis and corroborated the conclusion that 1 iteration provides the most accurate quantification. It is likely that optimal reconstruction techniques are scanner dependent as both Willowson and Carlier performed their analysis on Siemens Biograph mCT systems, while D’Arienzo found 2 iterations to be optimal on a GE Discovery ST system(D’Arienzo et al., 2012). Goedicke (Goedicke et al., 2013) used a Phillips Gemini TF 16 system and found that the number of reconstruction subsets had a dominant effect on quantitative accuracy in both hot and cold regions, concluding that 2 iterations and 60 subsets was optimal. However, Goedicke noted that large numbers of subsets had the effect of increased noise clustering, perhaps negatively effecting uniformity or producing reconstruction-‐related artifacts. There is overwhelming evidence in the literature to suggest that 90Y PET is a quantifiable with a reasonable degree of accuracy. In all reported instances, neither detector saturation nor intrinsic 176Lu radioactivity substantially affected accurate quantification at activity concentrations common in radioembolization on modern scanners using LSO or LYSO detectors. Careful selection of reconstruction parameters can increase quantitative accuracy, however, the best choice will depend on the scanner and reconstruction software. 90Y PET/CT Dosimetry The complexity of techniques for radioembolization treatment-‐planning and post-‐infusion dosimetry has grown significantly in the past 10 years. Beginning with the MIRD schema for 90Y hepatic radioembolization (Gulec et al., 2006), there has been an effort to estimate the dose to the tumor independently from the dose to the normal hepatic parenchyma. From compartmentalized models (Ho et al., 1996), (Gulec et al., 2006), research in radioembolization has moved in the direction of 3-‐dimensional (3D) absorbed dose maps, which can be utilized for analysis of dose-‐volume histograms (DVH) and comparison of tumor absorbed dose with known tumoricidal thresholds. Image-‐based dosimetry for radioembolization has been performed in 3D using dose-‐point-‐kernel (DPK) convolution, with or without the use of 90Y PET/CT. Both Kennedy (Kennedy et al., 2011) and Dieudonne (Dieudonne et al., 2011) have used 3D SPECT data following infusion of 99mTc MAA translated into absorbed dose maps using DPK convolution. A number of authors have used DPK convolution as a tool to compute absorbed dose in patient and phantom studies using post-‐infusion imaging with 90Y PET/CT (Lhommel et al., 2010; D’Arienzo et al., 2012; Chang et al., 2013; Fourkal et al., 2013; Elschot et al., 2013b; D’Arienzo et al., 2013). In several cases, DPKs were used from published literature such as reported by Strigari (Strigari et al., 2006) or Laconelli (Lanconelli et al., 2012). However, because the DPK voxel size must match the PET acquisition matrix voxel size, DPKs were often calculated for specific scenarios using Monte Carlo radiation transport codes. Many Monte Carlo codes have been used in the 90Y PET literature for this purpose

including EGSnrc (Kawrakow, 2000; Kennedy et al., 2011), MCNP-‐X (McKinney et al., 2006; Elschot et al., 2013b) and FLUKA (Ballarini et al., 2007; Fourkal et al., 2013). Unlike other forms of targeted internal radionuclide therapy, radioembolization has the benefit of negligible biological removal following infusion. On that premise, absorbed dose following 90Y radioembolization can be calculated by 3D convolution of the 3D activity concentration matrix with the β-‐ DPK for 90Y. Equation 1 below describes this process:
D x, y, z( ) = 1λA⊗DPK( ) x, y, z( )
=1λ
A x ', y ', z '( )x '∑
y '∑
z '∑ ∗DPK x − x ', y− y ', z− z '( ) (1)
Whereλ is the decay constant of 90Y, A represents the 3 dimensional activity concentration voxel space and DPK is the computed dose point kernel per disintegration of 90Y. In the reports cited above, the activity concentration matrix was taken from 90Y PET/CT data. DPK convolution can be performed in a clinical setting using software such as the popular FDA approved MIDose code by DOSIsoft (Dosisoft, Cachan, France). One alternative technique to DPK convolution that has been used in several 90Y PET publications is a method whereby energy from 90Y β-‐ decay is deposited locally, within each voxel and no convolution is used. While this method may initially appear to be less accurate than DPK convolution, one must consider that the activity concentration matrix determined by PET/CT is not precisely A in Equation 1, but rather A convolved with the point-‐spread-‐function (PSF) of the PET/CT system. On this premise, both Kao et al (Kao et al., 2013a) and Bourgeois et al (Bourgeois et al., 2014) have performed 3D dosimetry without using DPK convolution, under the assumption that the PSF of the PET/CT system approximates the 90Y β-‐ dose-‐point kernel. Kao et al (Kao et al., 2013a) presented justification for his technique in an included appendix, while Bourgeois (Bourgeois et al., 2014) cited a prior publication which validated this method for SPECT (Pasciak and Erwin, 2009). Clinical Utility of Post-‐Treatment 90Y PET/CT Imaging 90Y PET/CT imaging following radioembolization serves in two primary clinical roles: 1) Evaluating technical success and 2) Predicting treatment efficacy. Evaluation of Technical Success

Successful radioembolization requires microsphere delivery within the target hepatic lobe and/or lesions selected for therapy. Although the primary goal of radioembolization is straightforward in principle, numerous procedural and physiologic factors contribute to, and potentially confound technical success. These include patient factors such as variable arterial hemodynamics and tumor vascularity, as well as technical factors such as catheter position, total particulate load delivered, and rate of microsphere delivery. Technical success with 90Y trans-‐arterial hepatic embolization has traditionally been assumed by successful infusion of 90Y into the target artery and bremsstrahlung SPECT demonstrating activity in the region of the targeted hepatic lobe. However, accurate confirmation of pre-‐treatment radiation planning intentions was not possible using conventional bremsstrahlung SPECT, as illustrated in Figure 3. Figure 3(a) shows the pre-‐treatment hepatic protocol CT obtained on a patient with metastatic cholangiocarcinoma in the left lobe. The neoplasm is characterized by central necrosis surrounded by peripheral contrast-‐enhancing viable tumor. The left hepatic arteriogram in Figure 3(b) confirms infusion of SIRTeX SIR-‐Sphere® radioembolization into the target artery. Finally, the post-‐treatment bremsstrahlung SPECT in Figure 3(c) demonstrates diffuse activity in the region of the left lobe hepatic neoplasm. However, due to the limited resolution of bremsstrahlung SPECT, a detailed comparison with pre-‐treatment imaging was not possible. The post-‐treatment 90Y PET/CT in Figure 3(d) demonstrates more detailed information with multifocal areas of maximum activity corresponding to the peripheral viable tumor seen on the pre-‐treatment hepatic CT. Lack of technical success can also be identified using 90Y PET/CT with high specificity. Historically, lack of technical success would not be apparent until delayed conventional imaging and clinical follow-‐up determine poor success in tumor management. Identification of technical failure on 90Y PET/CT imaging gives the opportunity for treating physicians to consider additional therapies before discovering clinical failure weeks to months later. Alternative or supplemental therapies such as trans-‐arterial drug eluting bead embolization or percutaneous thermal ablation may be considered in a timely manner. Figure 4 illustrates an example of technical failure as compared to pre-‐treatment radioembolization therapy planning intent. Figure 4(a) is a pre-‐treatment 18FDG PET/CT with conspicuous tumor activity in the left hepatic lobe. Technical success was initially inferred from successful infusion of the SIRTeX SIR-‐Sphere® radioembolization dosage into the left hepatic artery, and presence of left lobe activity on the post-‐treatment 90Y bremsstrahlung SPECT scan. However, the 90Y PET/CT following radioembolization demonstrated lack of significant uptake in the region of most active tumor (Figure 4b). A detailed description of 90Y PET/CT diagnostic reporting, including many more examples has been presented by (Kao et al., 2013b). Many other reports have recently presented results and example cases comparing bremsstrahlung SPECT post-‐treatment images with 90Y PET/CT images, illustrating qualitatively superior resolution and contrast with 90Y PET/CT(Gates et al., 2010;
Lhommel et al., 2009; Kao et al., 2011; Carlier et al., 2013; Gupta et al., 2012; Kao et al., 2012; Padia et al., 2013). Quantitative Prediction of Treatment Efficacy 90Y PET/CT equips treating physicians with precise information regarding the heterogeneity of microsphere distribution within a lesion and the absorbed radiation dose to each part of the lesion. These factors could be helpful in predicting treatment response or the need for early triage to alternative or adjuvant therapy. Several authors have used 90Y PET based dosimetry to predict treatment response in patients receiving radioembolization (D’Arienzo et al., 2012; Chang et al., 2013; D’Arienzo et al., 2013; Kao et al., 2013a; Bourgeois et al., 2014). However, while there are standardized and accepted methods for generating 3D absorbed dose maps from 90Y PET/CT data, there is no standardization of the dose metric used to predict treatment response in radioembolization patients. Chang (Chang et al., 2013), Bourgeois (Bourgeois et al., 2014) and D’Arienzo (D’Arienzo et al., 2013) all used the average absorbed dose to the lesion (Davg). In an article by Bourgeois (Bourgeois et al., 2014), Davg was selected to coincide with one of the largest published patient studies detailing radiobiologic toxicity of SIRTeX SIR-‐Sphere® radioembolization in hepatocellular carcinoma (HCC) (Strigari et al., 2010). Alternatively, Kao (Kao et al., 2013a) used D70 and V100 values for tumor analysis, where D70 and V100 are the minimum absorbed dose delivered to 70% of the tumor volume and V100 is the percentage of tumor volume exceeding 100 Gy. Kao (Kao et al., 2013a) outlines several applicable external beam radiotherapy standards which could be applied to 90Y radioembolization. The missing component for the accurate prediction of treatment efficacy using 90Y PET/CT following radioembolization is a detailed compendium of radiobiologic toxicities. The ideal minimum requirements for such a database would include dose-‐response data that is stratified by the type of radioembolization used (i.e., SIRTeX SIR-‐Spheres® or BTG ThereSpheres®) and the type of tumor being treated. However, no such database currently exists. Strigari has published (Strigari et al., 2010) an excellent database compiled from 73 patients treated for HCC with SIRTeX SIR-‐Spheres® and her data remains one of the most complete offerings in the current literature. However, because 90Y PET/CT can provide quantitative post-‐treatment imaging, it is likely that more dose-‐response data will be available in the near future. As these data become available, clinicians who choose to use it along with post-‐treatment Y90 PET to predict treatment efficacy or modify treatments (as described in the next section) must be particularly cautious that the referenced dose-‐response data is appropriate for the clinical case. For instance, application of Strigari’s dose-‐response data (Strigari et al., 2010) to the clinical decision making process for a patient treated with BTG ThereSpheres® would be contraindicated. While 90Y PET can quantify absorbed dose from SIRTeX SIR-‐Spheres® or BTG ThereSpheres® with equal accuracy, due to the activity per microsphere as well as

the number of microspheres used, the dose-‐response relationship between the two products is significantly different. 90Y PET/CT Imaging as a Tool for Improving Treatment In addition to confirmation of technical success and prediction of treatment efficacy, 90Y PET/CT imaging has the potential to prospectively improve therapy. Recent reports explore two mechanisms by which 90Y PET/CT can be used to directly tailor treatment planning for radioembolization. The current advanced method of 90Y treatment planning involves use of 99mTc MAA as a microsphere surrogate. The partition model (Ho et al., 1996) is used clinically as a radioembolization treatment-‐planning tool at many sites based on the measurement of T/N on 99mTc MAA SPECT imaging. However, factors including differences in catheter position, embolic load, particle size, injection technique, free 99mTc and physiologic changes occurring between MAA and radioembolization procedures may affect the accuracy of MAA as a microsphere surrogate. Knesaurek (Knesaurek et al., 2010) suggested that these factors explained varying agreement found between the hepatic distribution of MAA and radioembolization in a 20 patient study. Wondergem (Wondergem et al., 2013) also reported poor correlation between MAA and 90Y distribution. However, Kao (Kao et al., 2013a) found good agreement between dosimetry based on 99mTc MAA and 90Y PET. While debate on the effectiveness of MAA as a radioembolization surrogate still exists, several recent reports have incorporated 90Y PET/CT into treatment-‐planning algorithms to optimize therapy without relying on 99mTc MAA SPECT imaging. Chang et al (Chang et al., 2013), presented a report where a patient received two separate SIRTeX SIR-‐Sphere® radioembolization treatments for cholangiocarcinoma metastases in the right and left hepatic lobes. The SIRTeX body surface area (BSA) treatment-‐planning model was used for the treatment of the right hepatic lobe lesion. Following the first treatment, 90Y PET indicated that the absorbed dose to the right lobe tumor was less than 70 Gy with a T/N measuring just 2.5:1. Subsequent radioembolization of a lesion in the left hepatic lobe was performed with treatment-‐planning based on the partition model (Ho et al., 1996) and the T/N measured from the 90Y PET/CT of the right lobe. Another 90Y PET/CT performed after the left lobe treatment indicated a tumor-‐absorbed dose of 110 Gy. Follow up imaging demonstrated no response in the right lobe lesion and complete response in the left lobe (Chang et al., 2013). While debate exists on the effectiveness of MAA as a radioembolization surrogate, one can conclude that Chang’s method (Chang et al., 2013) did eliminate some uncertainties in that it did not rely on MAA. However, Chang applied measurements from focal disease in one lobe to treat focal disease in another lobe, which has unproven validity (Chang et al., 2013). A subsequent report by Bourgeois (Bourgeois et al., 2014) described results from a patient with hepatocellular

carcinoma (HCC) who underwent a novel dual-‐infusion, single-‐day radioembolization protocol using SIRTeX SIR-‐Spheres®. An initial 90Y infusion was performed using a conventional treatment-‐planning model, followed by 90Y PET/CT. A 3D absorbed dose map was generated from 90Y PET, which allowed for quantification of a tumor-‐absorbed dose of 53.2 Gy. A simple arithmetic proportion was then applied to determine the necessary additional 90Y dosage required to achieve a total tumor absorbed dose of 120 Gy, corresponding to published recommendations for HCC (Strigari et al., 2010). The additional dosage was delivered in the same day, with comparable catheter placement and resulted in a robust treatment response (Bourgeois et al., 2014). The benefit to Bourgeois’ protocol was that it provided patient-‐specific radioembolization treatment planning, however, the complexity of the protocol may limit clinical use. There may be utility in adapting Bourgeois’ protocol (Bourgeois et al., 2014) as part of a multi-‐cycle fractionated radioembolization treatment method, previously discussed by Cremonesi et al (Cremonesi et al., 2008). This would allow patient specific treatment-‐planning to be combined with increased sparing of normal liver parenchyma, increased dose to the tumor and may be a potential future application of 90Y PET/CT. Improving 90Y PET/CT Imaging Multiple authors have found excellent quantification, resolution and contrast recovery in 90Y PET/CT phantom studies. However, there is still potential for improving both quantitative accuracy and image quality in 90Y PET/CT. As previously discussed, contrast recovery for 90Y PET is less than 18F PET. Because the scatter fractions have been found to be nearly identical(van Elmbt et al., 2011) for 18F and 90Y, it is likely that the differences in contrast recovery may be attributed to the effects of image noise on conventional reconstruction algorithms. Standard clinical OSEM reconstruction algorithms contain an inherent non-‐negativity constraint, which is appropriate for conventional radiotracers where image noise is low. However, this non-‐negativity constraint can contribute to a positive bias in 90Y PET images, particularly in the low-‐count background resulting in a decrease in contrast recovery. A similar issue has been found in dynamic PET, where short duration frames contribute to high image noise resulting in a positive bias when conventional OSEM is used (Verhaeghe and Reader, 2010). NEG-‐ML (Nuyts et al., 2002) and AB-‐EM (Byrne, 1999) are two reconstruction algorithms without non-‐negativity constraints that have been used to address this issue in dynamic PET. Verhaeghe and Reader (Verhaeghe and Reader, 2010) have compared both algorithms, and while either improves quantification accuracy in dynamic PET compared to conventional OSEM, AB-‐EM produced the best results. Application of these techniques to 90Y PET may, therefore, provide a benefit. However, widespread use will likely require direct support from PET/CT manufacturers.

Another area where 90Y quantification can be improved is with application of gated acquisition protocols. Several studies have shown a quantitative improvement with gated 18FDG PET. Lupi et al(Lupi et al., 2009) performed non-‐gated and gated PET/CT studies in 22 patients with lung carcinoma. Gating resulted in a maximum average increase of 77% in the SUV of measured lesions. Werner et al(Werner et al., 2009) evaluated the effect of respiratory gating during 18FDG PET/CT on estimation of lesion size and SUV in 18 patients with pulmonary nodules and found a 22% maximum average increase in SUV, as well as a decrease in nodule volume by 44.5%. Gating has also shown to be useful for 18FDG PET/CT imaging of liver metastases, mirroring results from chest studies with statistically significant increases in SUV with the use of a respiratory gated protocol(Suenaga et al., 2013). However, traditional phase based gating used in PET is based on principles applied to cardiac gating, where a temporal description of motion is useful for diagnosis. The PET dataset is divided into multiple temporal bins with the phase of the breathing cycle. This process results in a significant decrease in the number of counts contributing to each image or bin, increasing image noise. Due to the low true-‐coincidence count rate associated with 90Y PET, phased-‐based gating is not a viable option since the resulting images would be too noisy to be quantitatively or diagnostically useful. Amplitude based gating is an alternative to phase-‐based gating first described in 4D-‐CT by Rietzel (Rietzel et al., 2005) and further refined to account for motion by Wink (Wink et al., 2006). This method uses amplitude information rather than temporal information to sort the reconstructed data. Amplitude-‐based methods were applied to PET/CT imaging by Wang (Wang et al., 2007), who described the performance of this type of algorithm in controlled phantom studies. This gating method is useful in PET/CT imaging as it retains more counts than phase-‐based gating with the trade off of a loss of a temporal description of motion. A method of amplitude-‐based gating, known as optimal respiratory gating, was developed in 2010 by Hamill et al. and patented in 2011 (Siemens Medical Solutions Usa, Inc., 2011). This method uses an upper and lower threshold pair correlated to a measured respiratory signal to create an optimally gated static PET image that corresponds to the phase of the respiratory cycle where motion is at a minimum. In recent work, the authors of this manuscript have performed 90Y PET/CT scans with continuous bed motion acquisition techniques (Flow•Motion) in conjunction with optimal respiratory gating (HD•Chest) using a Siemens Biograph mCT Flow (Siemens Medical Solutions USA, Inc., Knoxville, TN). Initial results show decreases in visualized tumor volume and increases in 90Y activity concentration with the use of optimal respiratory gating techniques. Figures 5(a) and 5(b) qualitatively illustrate the difference between an acquisition performed on a Siemens Biograph mCT Flow with TOF and RR, with and without HD•Chest. Using automatic contouring with the same threshold, visual tumor volume decreased by 33% when optimal respiratory gating is used, along with increases in average and maximum activity concentration. Scan times on the order of 25 minutes produce acceptable image quality, even with the gated protocol (Figure 5b).

Conclusion 90Y PET/CT is a tool that has the potential to contribute significantly toward improving radioembolization in the future. Accurate quantification of activity concentration has been demonstrated on a variety of PET/CT systems, with or without TOF. Further, methods are available to transform 90Y PET image sets into 3D absorbed dose maps in the setting of a traditional clinical workflow. In fact, many institutions with a modern PET/CT system are currently fully equipped to perform post-‐treatment 90Y PET/CT scans and generate absorbed dose maps. Not only will post-‐treatment 90Y PET/CT allow treating physicians to more appropriately manage the care of their patients, increasing utilization of 90Y PET has the potential to provide a wealth of dose-‐response information. This information may lead to the development of improved radioembolization treatment-‐planning models in the future.
Figures
Figure 1: Transaxial profile of a 90Y line source in water with a FWHM of 3.1 mm.

Figure 2: 90Y PET/CT following radioembolization. Note the non-‐uniformity present in the hepatic paranchyma (arrow).

Figure 3(a): Pre-‐treatment contrast enhanced CT imaging of metastatic cholangiocarcinoma in the left hepatic lobe. Areas of increased vascularity (arrow) are seen surrounding areas of necrosis.
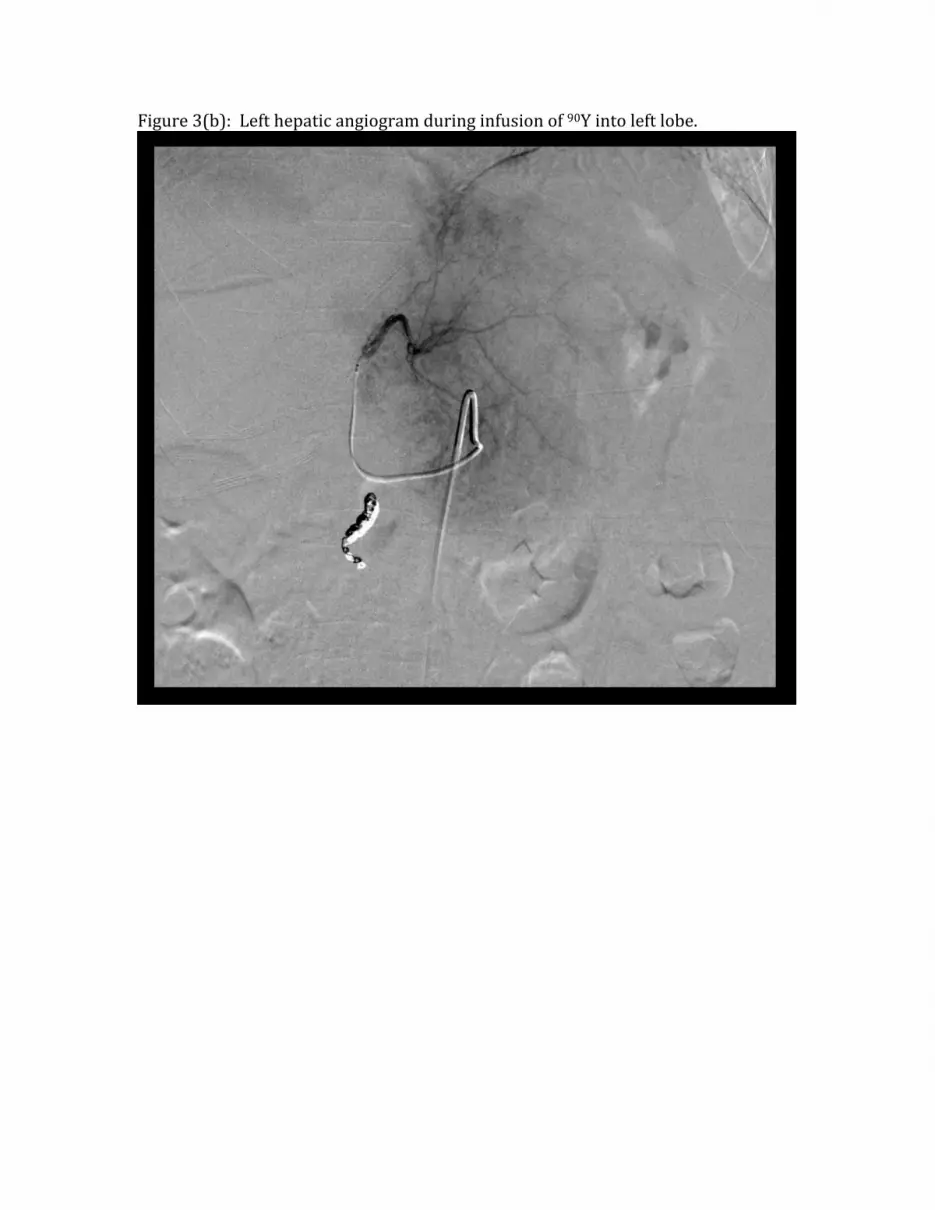
Figure 3(b): Left hepatic angiogram during infusion of 90Y into left lobe.

Figure 3(c): Bremsstrahlung SPECT following radioembolization demonstrates diffuse activity in the region of the left lobe hepatic neoplasm.
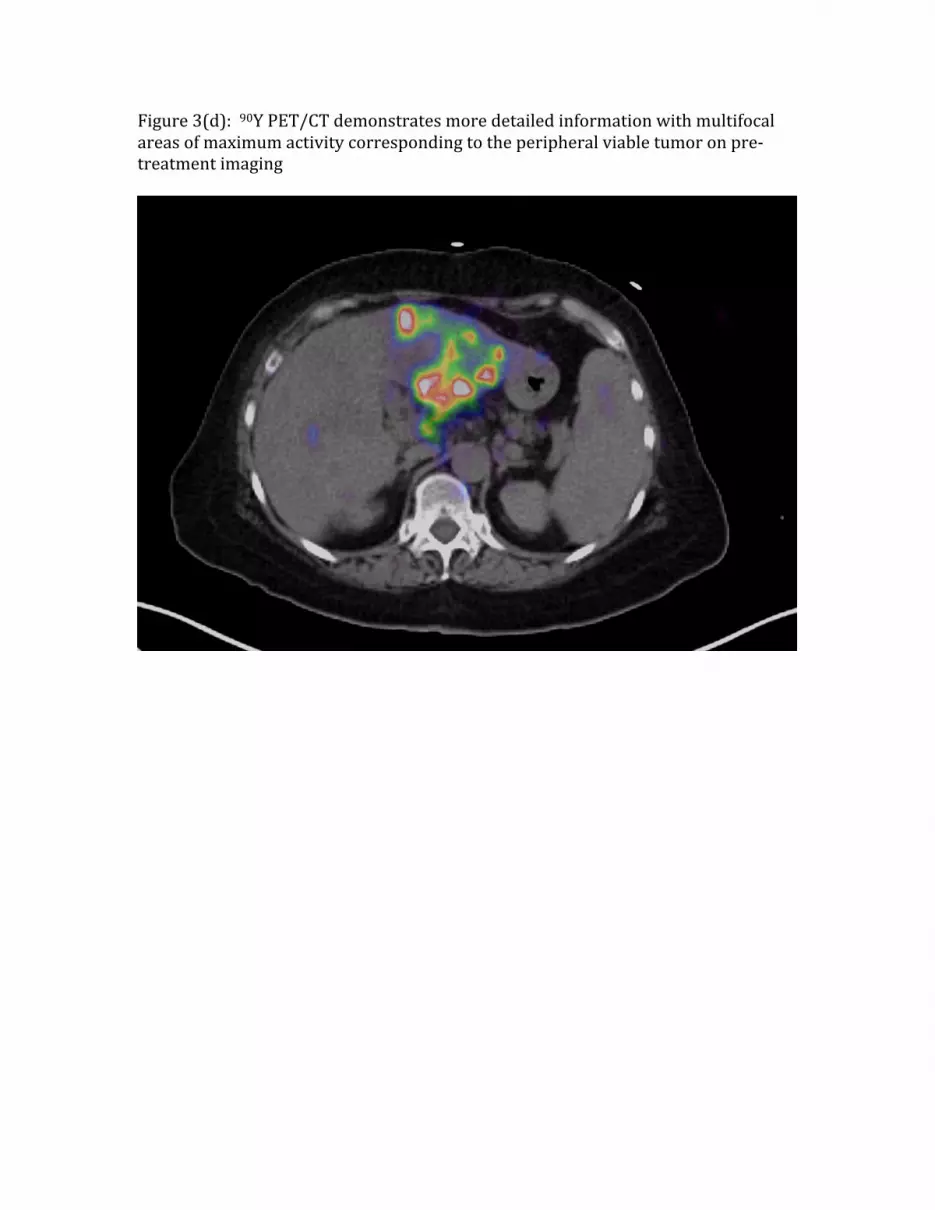
Figure 3(d): 90Y PET/CT demonstrates more detailed information with multifocal areas of maximum activity corresponding to the peripheral viable tumor on pre-‐treatment imaging
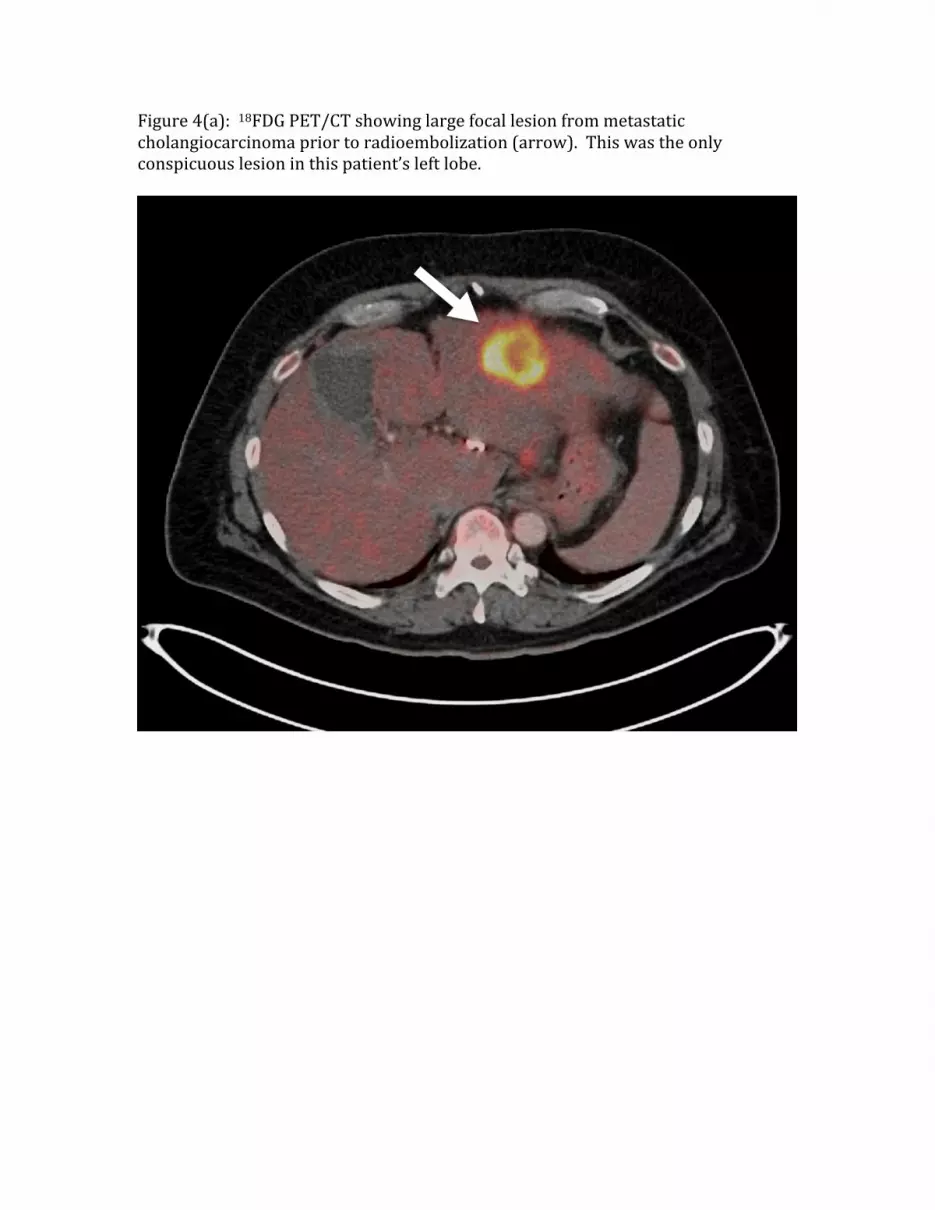
Figure 4(a): 18FDG PET/CT showing large focal lesion from metastatic cholangiocarcinoma prior to radioembolization (arrow). This was the only conspicuous lesion in this patient’s left lobe.

Figure 4(b): 90Y PET/CT following radioembolization. Poor tumor uptake can be seen (T/N less than 1) with the majority of the dosage distributing to non-‐target areas of the left lobe.

Figure 5(a): 90Y PET of a patient with HCC. Scan performed on Siemens Biograph mCT Flow with TOF and RR. A continuous bed speed of 0.2 mm/sec, 1 iteration and 21 subsets were used for reconstruction. The contour (red) was performed by an automatic segmentation tool with the lower threshold set to an absorbed dose of 100 Gy.

Figure 5(b): 90Y PET of a patient with HCC. Scan performed on Siemens Biograph mCT Flow with TOF, RR and optimal respiratory gating (HD•Chest). A continuous bed speed of 0.2 mm/sec, 1 iteration and 21 subsets were used for reconstruction. The contour (red) was performed by an automatic segmentation tool with the lower threshold set to an absorbed dose of 100 Gy.
References Bagni, O., D’Arienzo, M., Chiaramida, P., Chiacchiararelli, L., Cannas, P., D’Agostini, A.,
Cianni, R., Salvatori, R., and Scopinaro, F. (2012). 90Y-‐PET for the assessment of microsphere biodistribution after selective internal radiotherapy. Nuclear Medicine Communications 33, 198–204.
Ballarini, Battistoni, Brugger, Campanella, Carboni, Cerutti, Empl, Fasso, Ferrari, Gadioli, et al. (2007). The physics of the FLUKA code: Recent developments. Adv Space Res 40, 11–11.
Bourgeois, A. C., Chang, T. T., Bradley, Y. C., Acuff, S. N., and Pasciak, A. S. (2014). Intra-‐procedural 90Y PET/CT for treatment optimization of 90Y radioembolization. J Vasc Interv Radiol 25, 271–275.
Byrne, C. (1999). Iterative algorithms for deblurring and deconvolution with constraints. Inverse Problems 14, 1455–1467.
Carlier, T., Eugène, T., Bodet-‐Milin, C., Garin, E., Ansquer, C., Rousseau, C., Ferrer, L., Barbet, J., Schoenahl, F., and Kraeber-‐Bodéré, F. (2013). Assessment of acquisition protocols for routine imaging of Y-‐90 using PET/CT. EJNMMI Research 3, 11.
Chang, T. T., Bourgeois, A. C., Balius, A. M., and Pasciak, A. S. (2013). Treatment Modification of Yttrium-‐90 Radioembolization Based on Quantitative Positron Emission Tomography/CT Imaging. Journal of vascular and … 24, 333–337.
Cremonesi, M., Ferrari, M., Bartolomei, M., Orsi, F., Bonomo, G., Aricò, D., Mallia, A., Cicco, C., Pedroli, G., and Paganelli, G. (2008). Radioembolisation with 90Y-‐microspheres: dosimetric and radiobiological investigation for multi-‐cycle treatment. Eur J Nucl Med Mol Imaging 35, 2088–2096.
Dieudonne, A., Garin, E., Laffont, S., Rolland, Y., Lebtahi, R., Leguludec, D., and Gardin, I. (2011). Clinical Feasibility of Fast 3-‐Dimensional Dosimetry of the Liver for Treatment Planning of Hepatocellular Carcinoma with 90Y-‐Microspheres. Journal of Nuclear Medicine 52, 1930–1937.
D’Arienzo, M. (2013). Emission of β+ Particles Via Internal Pair Production in the 0+ – 0+ Transition of 90Zr: Historical Background and Current Applications in Nuclear Medicine Imaging. Atoms 1, 2–12.
D’Arienzo, M., Chiaramida, P., Chiacchiararelli, L., Coniglio, A., Cianni, R., Salvatori, R., Ruzza, A., Scopinaro, F., and Bagni, O. (2012). 90Y PET-‐based dosimetry after selective internal radiotherapy treatments. Nuclear Medicine Communications 33, 633–640.

D’Arienzo, M., Filippi, L., Chiaramida, P., Chiacchiararelli, L., Cianni, R., Salvatori, R., Scopinaro, F., and Bagni, O. (2013). Absorbed dose to lesion and clinical outcome after liver radioembolization with (90)Y microspheres: a case report of PET-‐based dosimetry. Ann Nucl Med 27, 676.
Elschot, M., Lam, M. G. E. H., van den Bosch, M. A. A. J., Viergever, M. A., and de Jong, H. W. A. M. (2013a). Quantitative Monte Carlo-‐Based 90Y SPECT Reconstruction. Journal of Nuclear Medicine 54, 1557–1563.
Elschot, M., Vermolen, B. J., Lam, M. G. E. H., de Keizer, B., van den Bosch, M. A. A. J., and de Jong, H. W. A. M. (2013b). Quantitative Comparison of PET and Bremsstrahlung SPECT for Imaging the In Vivo Yttrium-‐90 Microsphere Distribution after Liver Radioembolization. PLoS ONE 8, e55742–e55742.
Evans, R. D. (1982). The Atomic Nucleus. 14 ed. Malabar: Krieger Publishing Company.
Ford, K. W. (1955). Predicted 0+ level in Zr90. Physical Review 98, 1516–1517.
Fourkal, E., Veltchev, I., Lin, M., Koren, S., Meyer, J., Doss, M., and Yu, J. Q. (2013). 3D inpatient dose reconstruction from the PET-‐CT imaging of 90Y microspheres for metastatic cancer to the liver: Feasibility study. Med Phys 40, 081702–081702–10.
Gates, V. L., Esmail, A. A. H., Marshall, K., Spies, S., and Salem, R. (2010). Internal Pair Production of 90Y Permits Hepatic Localization of Microspheres Using Routine PET: Proof of Concept. Journal of Nuclear Medicine 52, 72–76.
Goedicke, A. A., Berker, Y. Y., Verburg, F. A. F., Behrendt, F. F. F., Winz, O. O., and Mottaghy, F. M. F. (2013). Study-‐Parameter Impact in Quantitative 90-‐Yttrium PET Imaging for Radioembolization Treatment Monitoring and Dosimetry. IEEE Trans Med Imaging 32, 485–492.
Greenberg, J., and Deutsch, M. (1956). Positrons from the Decay of P32 and Y90. Physical Review 102, 415–421.
Gulec, S. A. S., Mesoloras, G. G., and Stabin, M. M. (2006). Dosimetric techniques in 90Y-‐microsphere therapy of liver cancer: The MIRD equations for dose calculations. Journal of Nuclear Medicine 47, 1209–1211.
Gupta, A. A., Gill, A. A., Shrikanthan, S. S., and Srinivas, S. S. (2012). Nontargeted Y-‐90 microsphere radioembolization to duodenum visualized on Y-‐90 PET/CT and Bremsstrahlung SPECT/CT. Clin Nucl Med 37, 98–99.
Ho, S., Lau, W. Y., Leung, T. W., Chan, M., Ngar, Y. K., Johnson, P. J., and Li, A. K. (1996). Partition model for estimating radiation doses from yttrium-‐90 microspheres in treating hepatic tumours. Eur J Nucl Med 23, 947–952.
Johnson, O. E., Johnson, R. G., and Langer, L. M. (1955). Evidence for a 0+ first excited state in Zr90. Physical Review 98, 1517–1518.
Kao, Y. H., Steinberg, J. D., Tay, Y.-‐S., Lim, G. K., Yan, J., Townsend, D. W., Budgeon, C. A., Boucek, J. A., Francis, R. J., Cheo, T. S., et al. (2013a). Post-‐radioembolization yttrium-‐90 PET/CT -‐ part 2: dose-‐response and tumor predictive dosimetry for resin microspheres. EJNMMI Research 3, 1–1.
Kao, Y. H., Steinberg, J. D., Tay, Y.-‐S., Lim, G. K., Yan, J., Townsend, D. W., Takano, A., Burgmans, M. C., Irani, F. G., Teo, T. K., et al. (2013b). Post-‐radioembolization yttrium-‐90 PET/CT -‐ part 1: diagnostic reporting. EJNMMI Research 3, 1–1.
Kao, Y. H., Tan, E. H., Lim, K. Y., Ng, C. E., and Goh, S. W. (2012). Yttrium-‐90 internal pair production imaging using first generation PET/CT provides high-‐resolution images for qualitative diagnostic purposes. British Journal of Radiology 85, 1018–1019.
Kao, Y. H., Tan, E. H., Ng, C. E., and Goh, S. W. (2011). Yttrium-‐90 Time-‐of-‐Flight PET/CT Is Superior to Bremsstrahlung SPECT/CT for Postradioembolization Imaging of Microsphere Biodistribution. Clin Nucl Med 36, e186–e187.
Kappadath, S. C. (2010). SU-‐GG-‐I-‐163: A Scatter Correction Algorithm for Quantitative Yttrium-‐90 SPECT Imaging. in.
Kawrakow, I. (2000). Accurate condensed history Monte Carlo simulation of electron transport. I. EGSnrc, the new EGS4 version. Med Phys 27, 485–498.
Kennedy, A. S. A., Nutting, C. C., Coldwell, D. D., Gaiser, J. J., and Drachenberg, C. C. (2004). Pathologic response and microdosimetry of ^9^0Y microspheres in man: Review of four explanted whole livers. Int J Radiat Oncol Biol Phys 60, 12–12.
Kennedy, A., Dezarn, W., and Weiss, A. (2011). Patient specific 3D image-‐based radiation dose estimates for 90Y microsphere hepatic radioembolization in metastatic tumors. J Nucl Med Radiat Ther 2, 1–8.
Knesaurek, K., Machac, J., Muzinic, M., DaCosta, M., Zhang, Z., and Heiba, S. (2010). Quantitative comparison of yttrium-‐90 (90Y)-‐Microspheres and Technetium-‐99m (99mTc)-‐Macroaggregated Albumin SPECT Images for Planning 90Y Therapy of Liver Cancer. Technology in Cancer Research and Treatment 9, 253–261.
Lanconelli, N., Pacilio, M., Meo, Lo, S., Botta, F., Di Dia, A., Aroche, A. T., Pérez, M. A. C., and Cremonesi, M. (2012). A free database of radionuclide voxel S values for the dosimetry of nonuniform activity distributions. Phys Med Biol 57, 517–533.
Lhommel, R. R., van Elmbt, L. L., Goffette, P. P., Van den Eynde, M. M., Jamar, F. F.,

Pauwels, S. S., and Walrand, S. S. (2010). Feasibility of 90Y TOF PET-‐based dosimetry in liver metastasis therapy using SIR-‐Spheres. Eur J Nucl Med Mol Imaging 37, 1654–1662.
Lhommel, R., Goffette, P., Eynde, M., Jamar, F., Pauwels, S., Bilbao, J. I., and Walrand, S. (2009). Yttrium-‐90 TOF PET scan demonstrates high-‐resolution biodistribution after liver SIRT. Eur J Nucl Med Mol Imaging 36, 1696–1696.
Lupi, A. A., Zaroccolo, M. M., Salgarello, M. M., Malfatti, V. V., and Zanco, P. P. (2009). The effect of 18F-‐FDG-‐PET/CT respiratory gating on detected metabolic activity in lung lesions. Ann Nucl Med 23, 191–196.
McKinney, G. W., Durkee, J. W., and Hendricks, J. S. (2006). MCNPX overview. in.
Moore, C. F., Zaidi, S. A., and Kent, J. J. (1967). Single-‐Particle States Built on the Second 0+ State in 90Zr. Physical Review Letters.
Nickles, R. J., Roberts, A. D., Nye, J. A., Converse, A. K., Barnhart, T. E., Avila-‐Rodriguez, M. A., Sundaresan, R., Dick, D. W., Hammas, R. J., and Thomadsen, B. R. (2004). Assaying and PET imaging of ytrrium-‐90: 1≫34ppm>0. Ieee Nuclear Science Symposium Conference. Proceedings 6, 3412–3416.
Nuyts, J., Stroobants, S., Dupont, P., Vleugels, S., Flamen, P., and Mortelmans, L. (2002). Reducing loss of image quality because of the attenuation artifact in uncorrected PET whole-‐body images. Journal of Nuclear Medicine 43, 1054–1062.
Padia, S. A., Alessio, A., Kwan, S. W., Lewis, D. H., Vaidya, S., and Minoshima, S. (2013). Comparison of Positron Emission Tomography and Bremsstrahlung Imaging to Detect Particle Distribution in Patients Undergoing Yttrium-‐90 Radioembolization for Large Hepatocellular Carcinomas or Associated Portal Vein Thrombosis. Journal of vascular and … 24, 1147–1153.
Pasciak, A. S., and Erwin, W. D. (2009). Effect of voxel size and computation method on Tc-‐99m MAA SPECT/CT-‐based dose estimation for Y-‐90 microsphere therapy. IEEE Trans Med Imaging 28, 1754–1758.
Rahmim, A., Zhou, Y., Tang, J., Lu, L., Sossi, V., and Wong, D. F. (2012). Direct 4D parametric imaging for linearized models of reversibly binding PET tracers using generalized AB-‐EM reconstruction. Phys Med Biol 57, 733–755.
Rietzel, E., Pan, T., and Chen, G. T. Y. (2005). Four-‐dimensional computed tomography: image formation and clinical protocol. Med Phys 32, 874–889.
Selwyn, R. G., Nickles, R. J., Thomadsen, B. R., DeWerd, L. A., and Micka, J. A. (2007). A new internal pair production branching ratio of 90Y: The development of a non-‐destructive assay for 90Y and 90Sr. Applied Radiation and Isotopes 65, 318–327.
Siemens Medical Solutions Usa, Inc. (2011). Optimal Respiratory Gating In Medical Imaging.
Stabin, M. G., Eckerman, K. F., Ryman, J. C., and Williams, L. E. (1994). Bremsstrahlung radiation dose in yttrium-‐90 therapy applications. Journal of Nuclear Medicine 35, 1377–1380.
Strigari, L., Menghi, E., D’Andrea, M., and Benassi, M. (2006). Monte Carlo dose voxel kernel calculations of beta-‐emitting and Auger-‐emitting radionuclides for internal dosimetry: A comparison between EGSnrcMP and EGS4. Med Phys 33, 3383.
Strigari, L., Sciuto, R., Rea, S., Carpanese, L., Pizzi, G., Soriani, A., Iaccarino, G., Benassi, M., Ettorre, G. M., and Maini, C. L. (2010). Efficacy and toxicity related to treatment of hepatocellular carcinoma with 90Y-‐SIR spheres: radiobiologic considerations. Journal of nuclear medicine : official publication, Society of Nuclear Medicine 51, 1377–1385.
Suenaga, Y., Kitajima, K., Aoki, H., Okunaga, T., Kono, A., Matsumoto, I., Fukumoto, T., Tanaka, K., and Sugimura, K. (2013). Respiratory-‐gated ¹⁸F-‐FDG PET/CT for the diagnosis of liver metastasis. Eur J Radiol 82, 1696–1701.
van Elmbt, L. L., Vandenberghe, S. S., Walrand, S. S., Pauwels, S. S., and Jamar, F. F. (2011). Comparison of yttrium-‐90 quantitative imaging by TOF and non-‐TOF PET in a phantom of liver selective internal radiotherapy. Phys Med Biol 56, 6759–6777.
Verhaeghe, J. J., and Reader, A. J. A. (2010). AB-‐OSEM reconstruction for improved Patlak kinetic parameter estimation: a simulation study. Phys Med Biol 55, 6739–6757.
Walrand, S., Hesse, M., Chiesa, C., Lhommel, R., and Jamar, F. (2013). The Low Hepatic Toxicity per Gray of 90Y Glass Microspheres Is Linked to Their Transport in the Arterial Tree Favoring a Nonuniform Trapping as Observed in Posttherapy PET Imaging. Journal of Nuclear Medicine.
Walrand, S., Hesse, M., Demonceau, G., Pauwels, S., and Jamar, F. (2011). Yttrium-‐90-‐labeled microsphere tracking during liver selective internal radiotherapy by bremsstrahlung pinhole SPECT: feasibility study and evaluation in an abdominal phantom. EJNMMI Research 1, 32–32.
Walrand, S., Jamar, F., van Elmbt, L., Lhommel, R., Bekonde, E. B., and Pauwels, S. (2010). 4-‐Step Renal Dosimetry Dependent on Cortex Geometry Applied to 90Y Peptide Receptor Radiotherapy: Evaluation Using a Fillable Kidney Phantom Imaged by 90Y PET. Journal of Nuclear Medicine 51, 1969–1973.
Wang, J., Byrne, J., Franquiz, J., and McGoron, A. (2007). Evaluation of amplitude-‐

based sorting algorithm to reduce lung tumor blurring in PET images using 4D NCAT phantom. Comput Methods Programs Biomed 87, 112–122.
Werner, M. K. M., Parker, J. A. J., Kolodny, G. M. G., English, J. R. J., and Palmer, M. R. M. (2009). Respiratory gating enhances imaging of pulmonary nodules and measurement of tracer uptake in FDG PET/CT. AJR Am J Roentgenol 193, 1640–1645.
Werner, M. K., Brechtel, K., Beyer, T., Dittmann, H., Pfannenberg, C., and Kupferschläger, J. (2010). PET/CT for the assessment and quantification of (90)Y biodistribution after selective internal radiotherapy (SIRT) of liver metastases. Eur J Nucl Med Mol Imaging 37, 407–408.
Willowson, K., Forwood, N., Jakoby, B. W., Smith, A. M., and Bailey, D. L. (2012). Quantitative 90Y image reconstruction in PET. Med Phys 39, 7153.
Wink, N. N., Panknin, C. C., and Solberg, T. D. T. (2006). Phase versus amplitude sorting of 4D-‐CT data. J Appl Clin Med Phys 7, 77–85.
Wondergem, M., Smits, M. L. J., Elschot, M., de Jong, H. W. A. M., Verkooijen, H. M., van den Bosch, M. A. A. J., Nijsen, J. F. W., and Lam, M. G. E. H. (2013). 99mTc-‐Macroaggregated Albumin Poorly Predicts the Intrahepatic Distribution of 90Y Resin Microspheres in Hepatic Radioembolization. Journal of Nuclear Medicine 54, 1294–1301.