gated spect myocardial perfusion imaging in ... - estudo geral
TRANSCRIPT
Gated SPECT myocardial perfusion
imaging in patients with end stage renal
disease - comparison with clinical data
Maria Margarida Vidigal Ferreira Robalo
FMUC - Faculty of Medicine, University of Coimbra, Portugal

1
SUMMARY
Abbreviations …………………………………………………………………………. 2
Abstract ………………………………………………………………….................... 3
Resumo …………………………………………………………………..................... 5
Introduction …………………………………………………………………………… 7
Material and Methods …………………………………………………………………. 8
A. Patient population …………………………………………………………….. 8
B. Protocol ………………………………………………………………………. 9
C. Interpretation of images ………………………………………………………. 9
D. Statistical analysis …………………………………………………………….. 10
Results ………………………………………………………………………………… 11
Discussion ……………………………………………………………….................... 20
Conclusions …………………………………………………………………………… 24
Acknowledgements …………………………………………………………………… 25
References ………………………………………………………………...................... 26
2
ABBREVIATIONS
CAD: coronary artery disease
CKD: chronic kidney disease
DM: diabetes mellitus
ECG: electrocardiogram / electrocardiographic
ESRD: end-stage renal disease
HTN: hypertension
LV: left ventricle
LVEF: left ventricular ejection fraction
RS: reversible score
SD: standard deviation
SPECT-MPI: single-photon emission computed tomography myocardial perfusion imaging
SRS: summed rest score
SSS: summed stress score
3
ABSTRACT
Background: The patients with end stage renal disease (ESRD) represent a particularly
challenging population as coronary artery disease (CAD) remains a leading cause of
mortality, limiting the long term success of renal transplantation. Thus cardiovascular risk
stratification is essential in the pre-transplant screening and may be performed non-invasively
by modalities including single-photon emission computed tomography myocardial perfusion
imaging (SPECT-MPI). The goal of this study was to evaluate the prevalence of changes in
the SPECT-MPI and its relationship with cardiovascular risk factors, clinical manifestations
of ischemia, electrocardiographic pattern and heart rate response to adenosine in patients with
ESRD.
Methods: We included 112 cases of consecutive patients with ESRD on dialysis, who were
referred to our institution between October 2011 and April 2013, to perform SPECT-MPI for
pre-operative risk stratification before renal transplant. Data was collected, including gender,
age, the presence of risk factors for atherosclerosis (diabetes (DM), hypertension (HTN),
dyslipidemia and smoking habits), rest heart rate, presence of previous angina and baseline
ECG pattern. Gated SPECT-MPI was performed according to the protocol stress followed by
rest images with Tc 99m-tetrafosmin. A 17 segment score system was used to semi-quantify
the perfusion defects. A LVEF ≤ 45% was considered abnormal. Emory Toolbox Software
was used for phase analysis and a standard deviation (SD) ≥ 43º was considered significant
for mechanical dyssynchrony.
Results: The mean age was 51.8 10.8 and the majority of patients were male. Myocardial
perfusion abnormalities were presented in 22.3%. The QRS width (OR = 1.0, P value <
0.005) and the rest heart rate (OR = 1.1, P value < 0.05) were independent predictors of an
abnormal perfusion. An LVEF ≤ 45% was present in 13.4 % of the patients. The evidence of
an ECG suggestive of myocardial hypertrophy (OR = 8.2, P value < 0.05), the baseline QRS
4
width (OR = 1.0, P value < 0.05) and the reference to previous angina (OR = 5.4, P value <
0.05) were independent predictors of a LVEF ≤ 45%. Left ventricular dyssynchrony was
observed in 16.1% of the studied population. The age (OR = 0.9, P value < 0.05) and the SRS
(OR = 1.3, P value < 0.001) were independent predictors of mechanical dyssynchrony.
Conclusions: An abnormal gated SPECT-MPI in this group of patients was not associated
with the presence of cardiovascular risk factors. The changes on the ECG pattern were
predictors of an abnormal perfusion and along with the electrocardiographical evidence of
myocardial hypertrophy were also predictors of an impaired left ventricle function, with no
relationship between them and the presence of mechanical dyssynchrony. The low frequency
of perfusion abnormalities found in gated SPECT-MPI, which was also very heterogeneous in
what concerns to age, justifies further studies to define the optimal population, protocol and
image acquisition of gated SPECT-MPI when evaluating patients with ESRD.
Key words: end stage renal disease • coronary artery disease • cardiovascular risk factors •
myocardial perfusion imaging • ECG • left ventricular ejection fraction • ventricular
dyssynchrony.

5
RESUMO
Introdução: Os doentes com doença renal terminal (DRT) representam uma população
particularmente desafiante dado que a doença arterial coronária (DAC) continua a ser uma das
principais causas de morte nesta população, o que limita o sucesso a longo prazo do
transplante renal. Deste modo, a estratificação do risco cardiovascular é fundamental na
seleção de doentes para transplante e pode ser realizada de forma não invasiva pela CPM. O
objetivo deste estudo foi avaliar a prevalência de alterações na cintigrafia de perfusão do
miocárdio (CPM) e a sua relação com fatores de risco cardiovascular, manifestações clínicas
de isquémia, padrão electrocardiográfico (ECG) e frequência cardíaca após a administração
de adenosina em pacientes com DRT.
Métodos: Foram incluídos 112 doentes consecutivos com DRT em diálise, que foram
encaminhados para a nossa instituição entre Outubro de 2011 e Abril de 2013, para realizar
CPM, de forma a estratificar o risco cardiovascular pré-operatório do transplante renal. Os
dados colhidos incluíram o género, a idade, a presença de fatores de risco para aterosclerose
(diabetes mellitus, hipertensão arterial, dislipidémia e tabagismo), a frequência cardíaca em
repouso, a presença de angina prévia e o padrão eletrocardiográfico basal. A CPM foi
realizada de acordo com o protocolo de esforço seguido pela obtenção de imagens em
repouso, com o uso de Tc 99m-tetrafosmina. Um sistema de pontuação de 17 segmentos foi
usado para semi-quantificar os defeitos de perfusão miocárdica. Uma FEVE ≤ 45% foi
considerada anormal. O histograma de fase foi obtido pelo Emory Toolbox Software e um
desvio padrão (SD) ≥ 43º foi considerado significativo para dessincronia mecânica.
Resultados: A idade média foi de 51.8 ± 10.8 anos e a maioria dos pacientes eram do género
masculino. Alterações da perfusão miocárdica estavam presentes em 22.3% dos pacientes. A
duração do intervalo QRS (OR = 1.0, P < 0.005) e a frequência cardíaca em repouso (OR =
6
1.1, P < 0.05) foram preditores independentes de uma perfusão anormal. Uma FEVE ≤ 45 %
estava presente em 13.4% dos doentes. A evidência de um ECG sugestivo de hipertrofia do
miocárdio (OR = 8.2, P < 0.05), a duração do intervalo QRS (OR = 1.0, P < 0.05 ) e a
referência a história prévia de angina (OR = 5.4, P < 0.05 ) foram preditores independentes de
uma FEVE ≤ 45%. A dessincronia ventricular esquerda foi observada em 16.1% da população
estudada. A idade (OR = 0.9, P < 0.05) e o SRS (OR = 1.3, P < 0.001) foram preditores
independentes de dessincronia mecânica.
Conclusões: As alterações da perfusão do miocárdio não tiveram qualquer relação com a
presença de fatores de risco cardiovascular. As alterações no padrão de ECG foram preditoras
de uma perfusão anormal e, juntamente com a evidência eletrocardiográfica de hipertrofia
miocárdica, foram preditoras de uma função ventricular esquerda diminuída, sem relação com
a presença de dessincronia mecânica. A baixa prevalência de defeitos de perfusão encontrada,
que foi, de igual modo, muito heterogénea no que concerne a idade, justifica a necessidade
premente de realizar mais estudos, de forma a definir o melhor protocolo e processo de
aquisição de imagens mais adequado na CPM, bem como a população ideal a ser submetida a
este exame, no que respeita à avaliação de pacientes com DRT em lista de espera para
transplante renal.
Palavras-chave: doença renal terminal • doença arterial coronária • fatores de risco
cardiovascular • cintigrafia de perfusão do miocárdio • ECG • fração de ejeção do ventrículo
esquerdo • dessincronia ventricular.
7
INTRODUCTION
Cardiovascular disease is the leading cause of morbidity and mortality in patients with
chronic kidney disease (CKD), particularly in those with end stage renal disease (ESRD) [1-6]
,
where 45% of the overall mortality is attributed to cardiovascular causes [2, 7]
. In fact, the
incremental risk of cardiovascular disease in those with CKD, compared to the age- and sex-
matched general population, ranges from 10- to 20-fold, depending on the stage, being CKD
an independent risk factor for coronary artery disease (CAD) [1, 8-10]
. Therefore, the increased
prevalence of vascular disease in CKD patients derives from both traditional and non-
traditional (CKD-related) risk factors. The first ones include hypertension (HTN), diabetes
(DM) and dyslipidemia. The CKD-related risk factors include anemia, hyperphosphatemia,
hyperparathyroidism and generalized inflammation [1, 3, 9, 11, 12]
.
Patients with ESRD, with an indication for renal replacement therapy, represent a
particularly challenging population as CAD remains a leading cause of mortality, limiting the
long term success of renal transplantation. This procedure improves both survival and quality
of life in this subgroup of patients. However, concerning the intense utilization of resources
and the limited availability of donors, it is vital to offer this therapy to individuals most likely
to achieve long-term benefit [1, 4]
. Thus, cardiovascular risk stratification is essential in the
pre-transplant screening, helping to identify individuals that may require a more aggressive
evaluation and treatment. Moreover, it helps to detect existing cardiac conditions amenable to
risk modification, and to exclude individuals with such short life expectancy that
transplantation would not yield acceptable benefit from the allograft [6, 8, 9, 11, 13-21]
.
Among other techniques, testing for CAD may be performed non-invasively by
modalities including single-photon emission computed tomography myocardial perfusion
imaging (SPECT-MPI). It has been shown that these tests have prognostic value for mortality
8
but imperfect sensitivity and specificity for detecting angiographically-defined CAD in
patients with renal failure [1, 4-6, 11, 13-15, 17, 21-24]
. However, encouraging results have been
already reported [25-27]
, suggesting that this subject requires further evaluation.
Nevertheless, SPECT-MPI is a powerful tool to diagnose CAD, identifying patients at
high and low clinical risk, and aid in their treatment. It predicts adverse cardiovascular
outcomes in CKD patients with known or suspected CAD, due to the provided data such as
left ventricular (LV) function, myocardial perfusion defects and, likewise, the existence of
ventricular dyssynchrony [7, 8, 16, 20, 22, 28-30]
.
With this study, we intend to evaluate the prevalence of changes in the SPECT-MPI
and its relationship with cardiovascular risk factors, clinical manifestations of ischemia,
electrocardiographic pattern and heart rate response to adenosine in patients with ESRD.
MATERIAL AND METHODS
A. Patient population
The study population was selected from a database of all patients with ESRD on
dialysis, who were referred to our institution to perform SPECT-MPI for pre-operative risk
stratification before renal transplant. From October, 1st of 2011, to April, 30th of 2013, 125
SPECT-MPI were performed in these patients.
In brief, demographic and clinical data was possible to collect from 112 cases,
including gender, age, the presence of risk factors for atherosclerosis (diabetes (DM),
hypertension (HTN), dyslipidemia and smoking habits), presence of previous angina and
ischemic basal ECG as well as reference to an ECG suggestive of myocardial hypertrophy or
bundle branch block, rest heart rate and baseline QRS width. Due to the presence of
arrhythmia, gated SPECT was not possible to perform in 13 patients.
9
B. Protocol
Gated SPECT-MPI was obtained at stress followed by rest with Tc-99m tetrafosmin.
For stress images patients were injected with 370 to 555 MBq (10 to 15 mCi) of Tc-
99m tetrafosmin during adenosine protocol. Adenosine was infused at a dose of 140
μg/Kg/min during 4 minutes and the tracer was injected at the end of the second minute. ST
deviation during adenosine and heart rate after vasodilation were recorded for analysis.
Rest images were acquired by injecting 740 to 1110 MBq (20 to 30 mCi) of the tracer,
3 hours later if an abnormality (in perfusion and/or ventricular function) was noticed in stress
images. The injected dose was calculated according to the weight of the patient.
Images were acquired 30 to 45 minutes after the injection of the tracer. They were
performed by a hybrid system SPECT-CT, with a dual-head gama camera (BrightView XCT),
using a stop and shoot acquisition, with 64 projections per study and a 180o arc, from right
anterior to left anterior oblique. A single low-dose CT (computed tomography) scan (helical,
120 KeV, 1mA with 1.9 pitch) was acquired before stress and rest acquisitions for attenuation
correction.
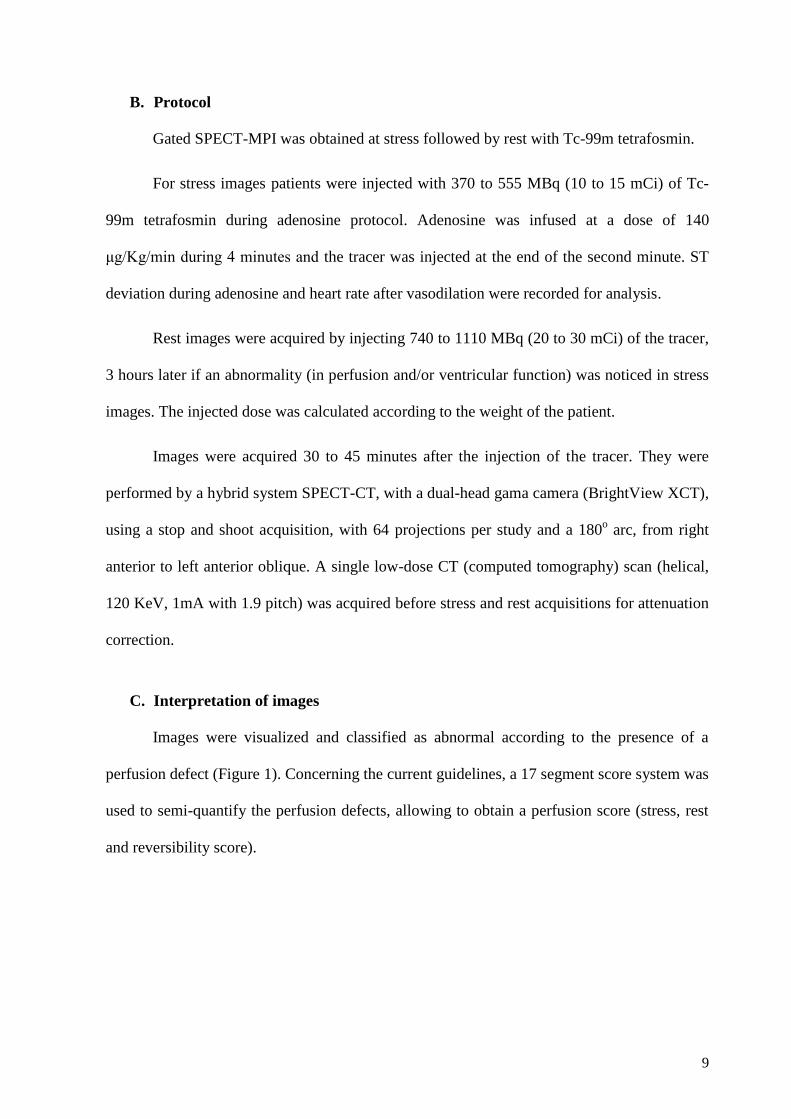
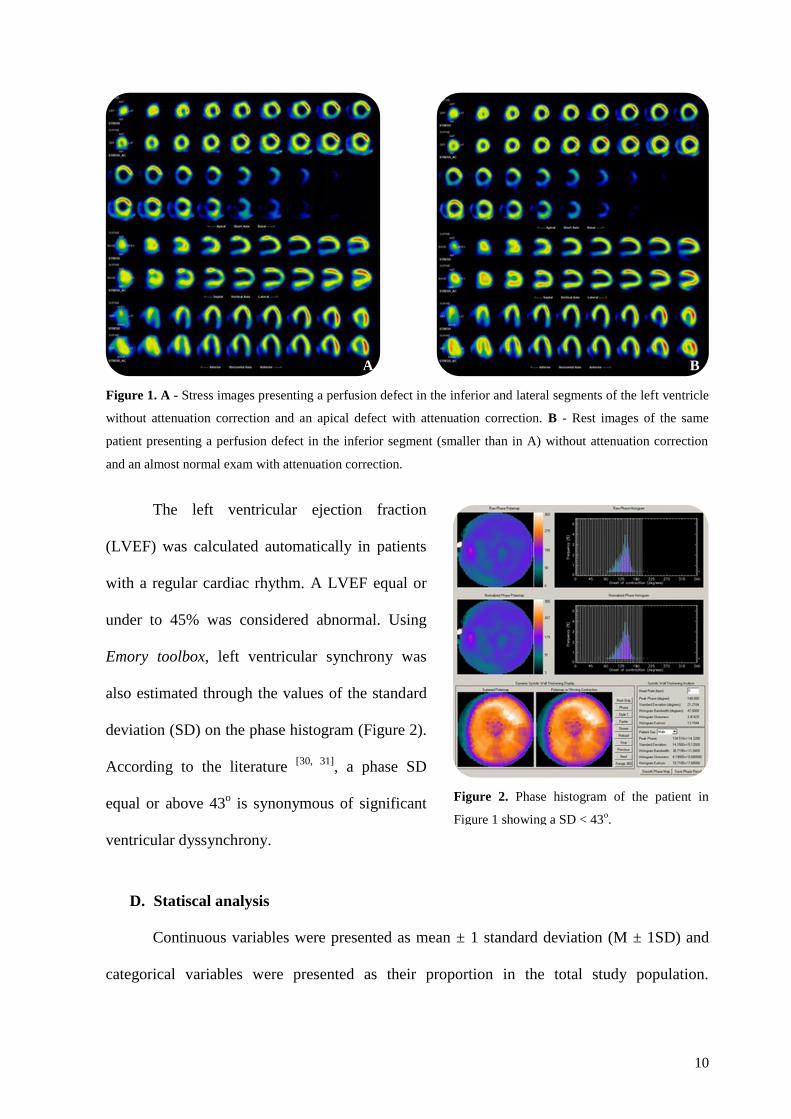
C. Interpretation of images
Images were visualized and classified as abnormal according to the presence of a
perfusion defect (Figure 1). Concerning the current guidelines, a 17 segment score system was
used to semi-quantify the perfusion defects, allowing to obtain a perfusion score (stress, rest
and reversibility score).
10
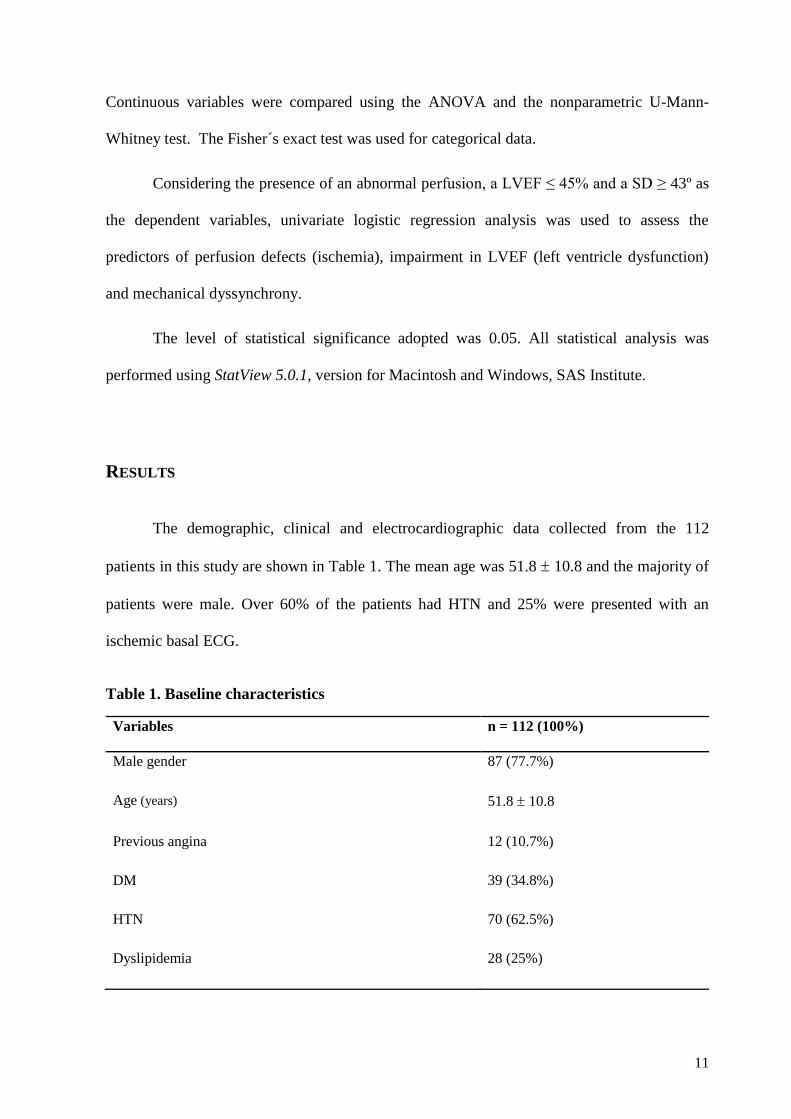
The left ventricular ejection fraction
(LVEF) was calculated automatically in patients
with a regular cardiac rhythm. A LVEF equal or
under to 45% was considered abnormal. Using
Emory toolbox, left ventricular synchrony was
also estimated through the values of the standard
deviation (SD) on the phase histogram (Figure 2).
According to the literature [30, 31]
, a phase SD
equal or above 43o is synonymous of significant
ventricular dyssynchrony.
D. Statiscal analysis
Continuous variables were presented as mean ± 1 standard deviation (M ± 1SD) and
categorical variables were presented as their proportion in the total study population.
A B
Figure 1. A - Stress images presenting a perfusion defect in the inferior and lateral segments of the left ventricle
without attenuation correction and an apical defect with attenuation correction. B - Rest images of the same
patient presenting a perfusion defect in the inferior segment (smaller than in A) without attenuation correction
and an almost normal exam with attenuation correction.
Figure 2. Phase histogram of the patient in
Figure 1 showing a SD < 43o.
11
Continuous variables were compared using the ANOVA and the nonparametric U-Mann-
Whitney test. The Fisher´s exact test was used for categorical data.
Considering the presence of an abnormal perfusion, a LVEF ≤ 45% and a SD ≥ 43º as
the dependent variables, univariate logistic regression analysis was used to assess the
predictors of perfusion defects (ischemia), impairment in LVEF (left ventricle dysfunction)
and mechanical dyssynchrony.
The level of statistical significance adopted was 0.05. All statistical analysis was
performed using StatView 5.0.1, version for Macintosh and Windows, SAS Institute.
RESULTS
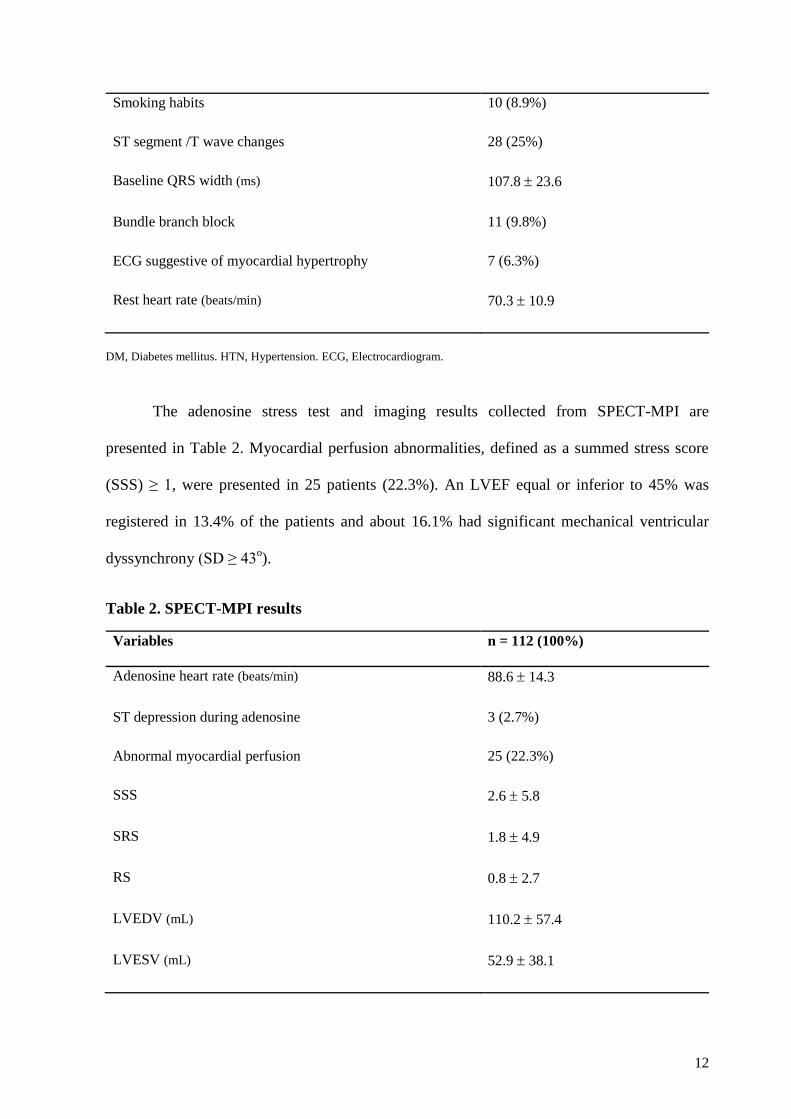
The demographic, clinical and electrocardiographic data collected from the 112
patients in this study are shown in Table 1. The mean age was 51.8 10.8 and the majority of
patients were male. Over 60% of the patients had HTN and 25% were presented with an
ischemic basal ECG.
Table 1. Baseline characteristics
Variables n = 112 (100%)
Male gender 87 (77.7%)
Age (years) 51.8 10.8
Previous angina 12 (10.7%)
DM 39 (34.8%)
HTN 70 (62.5%)
Dyslipidemia 28 (25%)
12
Smoking habits 10 (8.9%)
ST segment /T wave changes 28 (25%)
Baseline QRS width (ms) 107.8 23.6
Bundle branch block 11 (9.8%)
ECG suggestive of myocardial hypertrophy 7 (6.3%)
Rest heart rate (beats/min) 70.3 10.9
DM, Diabetes mellitus. HTN, Hypertension. ECG, Electrocardiogram.
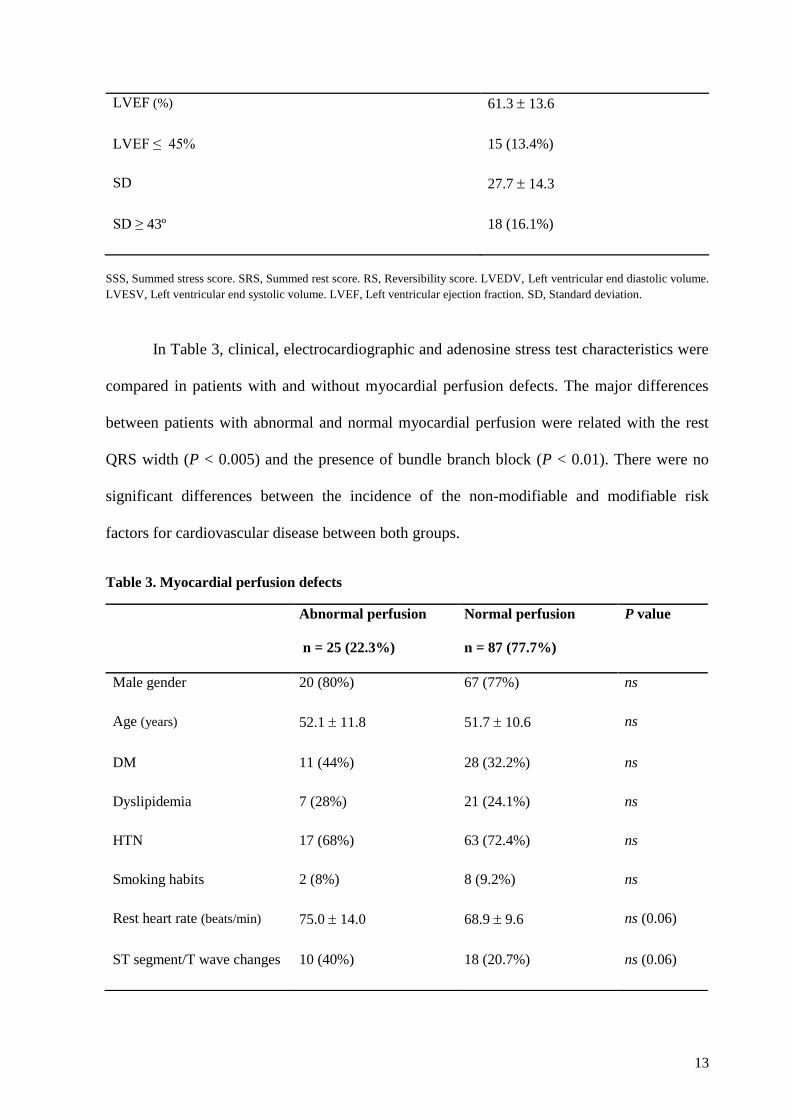
The adenosine stress test and imaging results collected from SPECT-MPI are
presented in Table 2. Myocardial perfusion abnormalities, defined as a summed stress score
(SSS) ≥ 1, were presented in 25 patients (22.3%). An LVEF equal or inferior to 45% was
registered in 13.4% of the patients and about 16.1% had significant mechanical ventricular
dyssynchrony (SD ≥ 43o).
Table 2. SPECT-MPI results
Variables n = 112 (100%)
Adenosine heart rate (beats/min) 88.6 14.3
ST depression during adenosine 3 (2.7%)
Abnormal myocardial perfusion 25 (22.3%)
SSS 2.6 5.8
SRS 1.8 4.9
RS 0.8 2.7
LVEDV (mL) 110.2 57.4
LVESV (mL) 52.9 38.1
13
LVEF (%) 61.3 13.6
LVEF ≤ 45% 15 (13.4%)
SD 27.7 14.3
SD ≥ 43º 18 (16.1%)
SSS, Summed stress score. SRS, Summed rest score. RS, Reversibility score. LVEDV, Left ventricular end diastolic volume.
LVESV, Left ventricular end systolic volume. LVEF, Left ventricular ejection fraction. SD, Standard deviation.
In Table 3, clinical, electrocardiographic and adenosine stress test characteristics were
compared in patients with and without myocardial perfusion defects. The major differences
between patients with abnormal and normal myocardial perfusion were related with the rest
QRS width (P < 0.005) and the presence of bundle branch block (P < 0.01). There were no
significant differences between the incidence of the non-modifiable and modifiable risk
factors for cardiovascular disease between both groups.
Table 3. Myocardial perfusion defects
Abnormal perfusion
n = 25 (22.3%)
Normal perfusion
n = 87 (77.7%)
P value
Male gender 20 (80%) 67 (77%) ns
Age (years) 52.1 11.8 51.7 10.6 ns
DM 11 (44%) 28 (32.2%) ns
Dyslipidemia 7 (28%) 21 (24.1%) ns
HTN 17 (68%) 63 (72.4%) ns
Smoking habits 2 (8%) 8 (9.2%) ns
Rest heart rate (beats/min) 75.0 14.0 68.9 9.6 ns (0.06)
ST segment/T wave changes 10 (40%) 18 (20.7%) ns (0.06)
14
DM, Diabetes mellitus. HTN, Hypertension. ECG, Electrocardiogram.
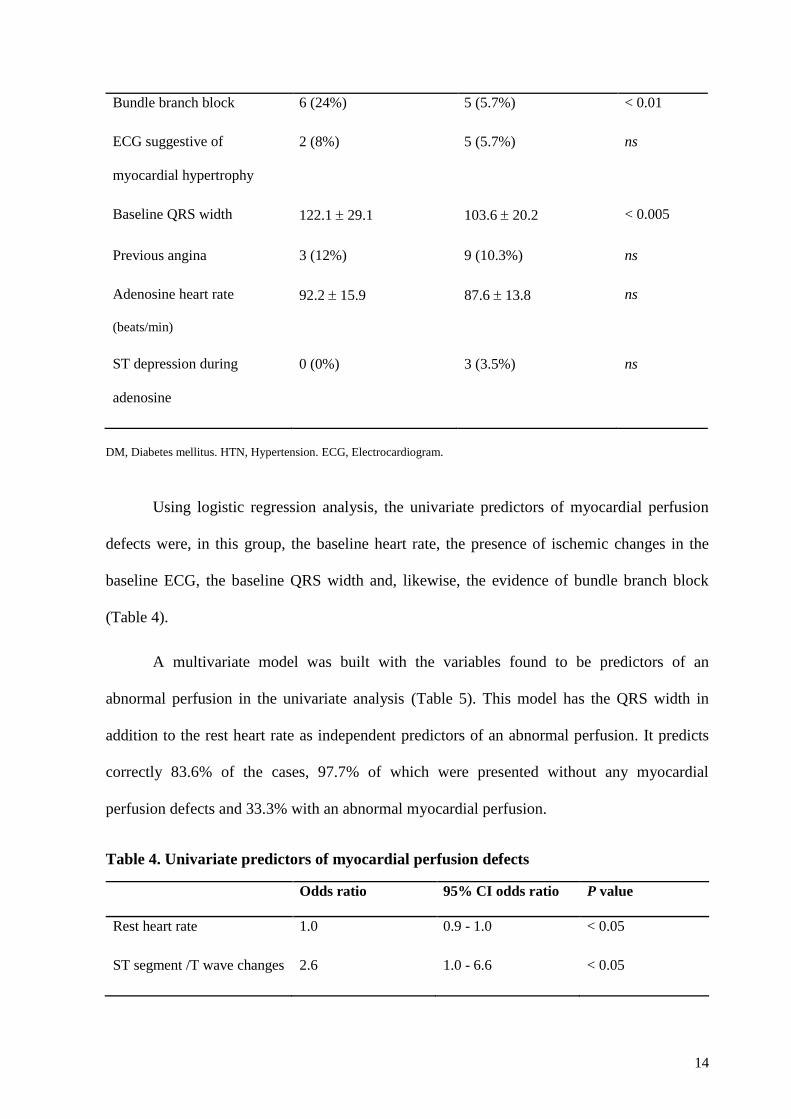
Using logistic regression analysis, the univariate predictors of myocardial perfusion
defects were, in this group, the baseline heart rate, the presence of ischemic changes in the
baseline ECG, the baseline QRS width and, likewise, the evidence of bundle branch block
(Table 4).
A multivariate model was built with the variables found to be predictors of an
abnormal perfusion in the univariate analysis (Table 5). This model has the QRS width in
addition to the rest heart rate as independent predictors of an abnormal perfusion. It predicts
correctly 83.6% of the cases, 97.7% of which were presented without any myocardial
perfusion defects and 33.3% with an abnormal myocardial perfusion.
Table 4. Univariate predictors of myocardial perfusion defects
Odds ratio 95% CI odds ratio P value
Rest heart rate 1.0 0.9 - 1.0 < 0.05
ST segment /T wave changes 2.6 1.0 - 6.6 < 0.05
Bundle branch block 6 (24%) 5 (5.7%) < 0.01
ECG suggestive of
myocardial hypertrophy
2 (8%) 5 (5.7%) ns
Baseline QRS width 122.1 29.1 103.6 20.2 < 0.005
Previous angina 3 (12%) 9 (10.3%) ns
Adenosine heart rate
(beats/min)
92.2 15.9 87.6 13.8 ns
ST depression during
adenosine
0 (0%) 3 (3.5%) ns
15
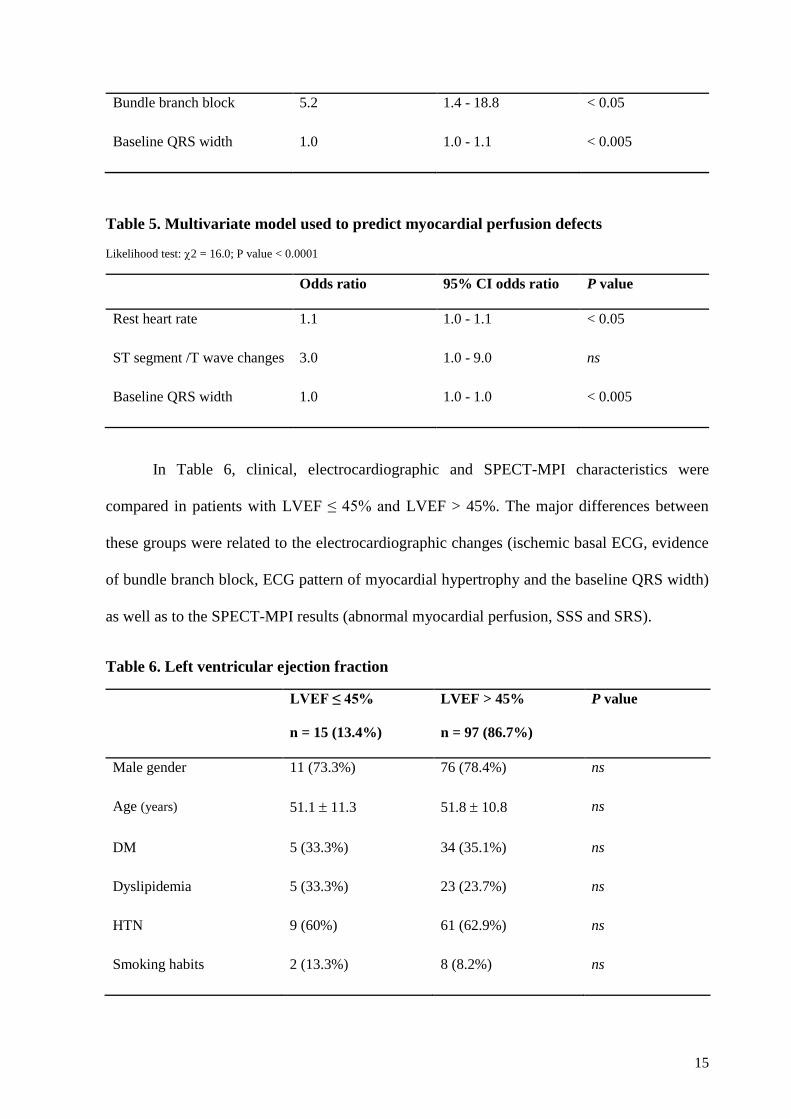
Bundle branch block 5.2 1.4 - 18.8 < 0.05
Baseline QRS width 1.0 1.0 - 1.1 < 0.005
Table 5. Multivariate model used to predict myocardial perfusion defects
Likelihood test: 2 = 16.0; P value < 0.0001
Odds ratio 95% CI odds ratio P value
Rest heart rate 1.1 1.0 - 1.1 < 0.05
ST segment /T wave changes 3.0 1.0 - 9.0 ns
Baseline QRS width 1.0 1.0 - 1.0 < 0.005
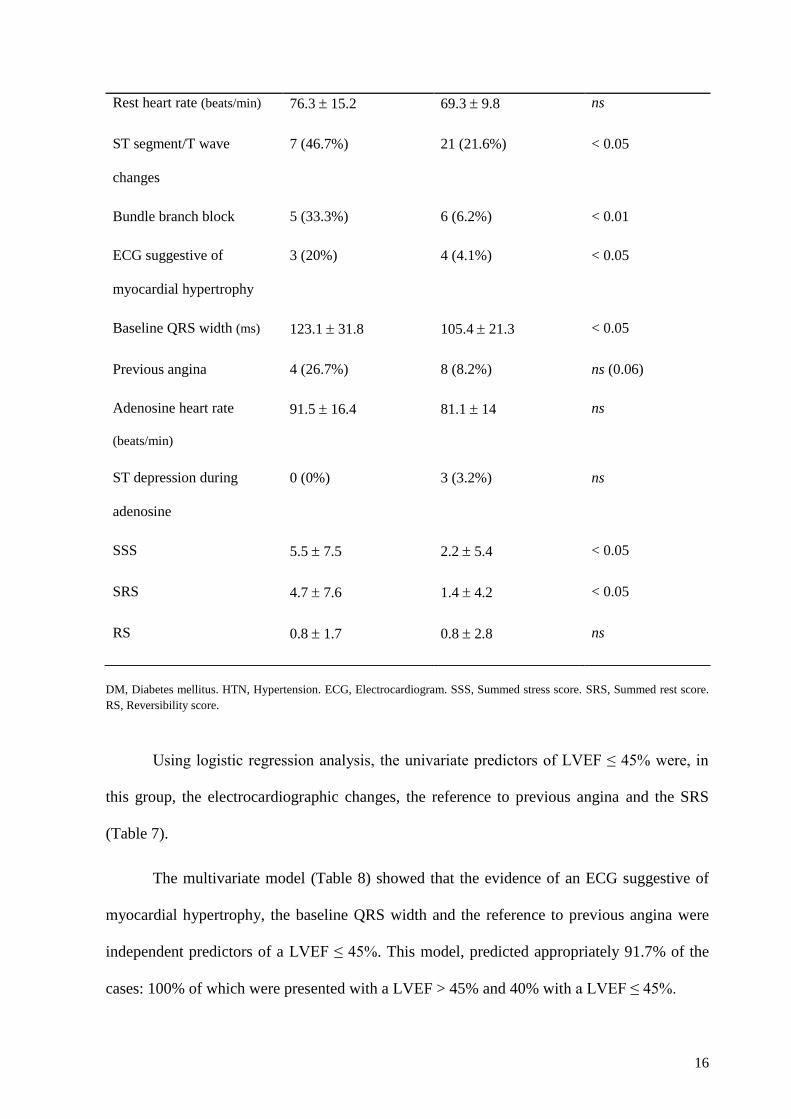
In Table 6, clinical, electrocardiographic and SPECT-MPI characteristics were
compared in patients with LVEF ≤ 45% and LVEF > 45%. The major differences between
these groups were related to the electrocardiographic changes (ischemic basal ECG, evidence
of bundle branch block, ECG pattern of myocardial hypertrophy and the baseline QRS width)
as well as to the SPECT-MPI results (abnormal myocardial perfusion, SSS and SRS).
Table 6. Left ventricular ejection fraction
LVEF ≤ 45%
n = 15 (13.4%)
LVEF > 45%
n = 97 (86.7%)
P value
Male gender 11 (73.3%) 76 (78.4%) ns
Age (years) 51.1 11.3 51.8 10.8 ns
DM 5 (33.3%) 34 (35.1%) ns
Dyslipidemia 5 (33.3%) 23 (23.7%) ns
HTN 9 (60%) 61 (62.9%) ns
Smoking habits 2 (13.3%) 8 (8.2%) ns
16
DM, Diabetes mellitus. HTN, Hypertension. ECG, Electrocardiogram. SSS, Summed stress score. SRS, Summed rest score.
RS, Reversibility score.
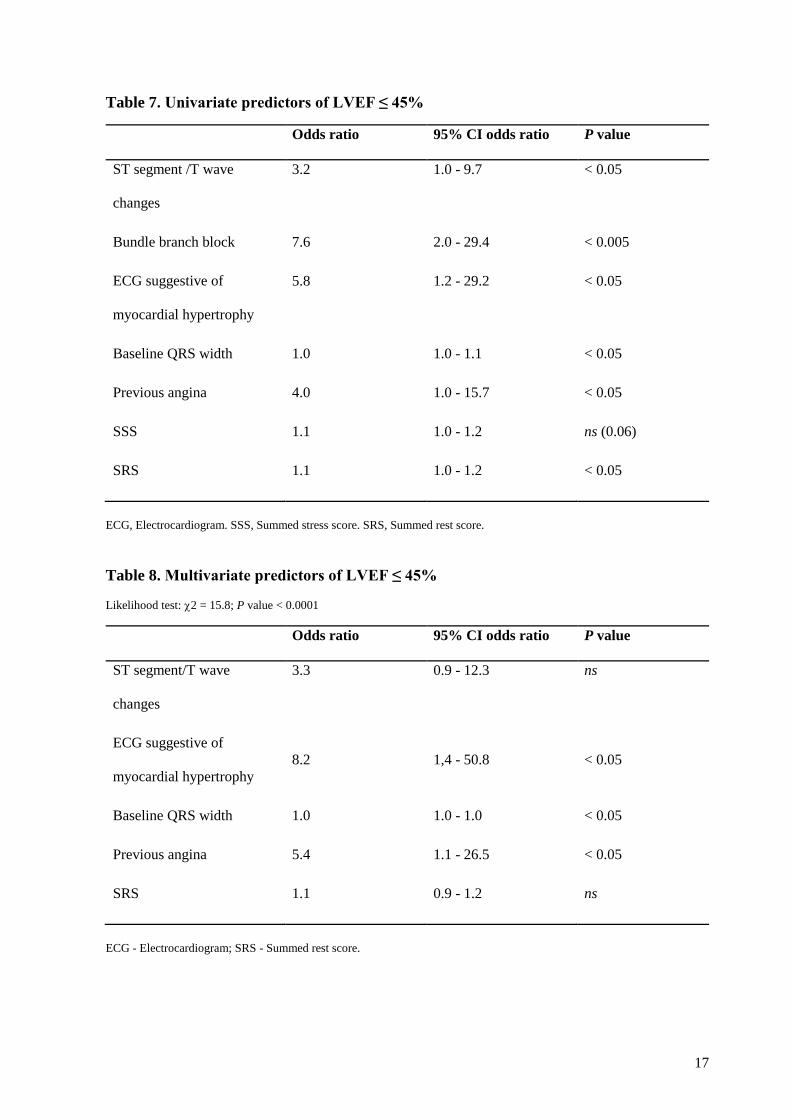
Using logistic regression analysis, the univariate predictors of LVEF ≤ 45% were, in
this group, the electrocardiographic changes, the reference to previous angina and the SRS
(Table 7).
The multivariate model (Table 8) showed that the evidence of an ECG suggestive of
myocardial hypertrophy, the baseline QRS width and the reference to previous angina were
independent predictors of a LVEF ≤ 45%. This model, predicted appropriately 91.7% of the
cases: 100% of which were presented with a LVEF > 45% and 40% with a LVEF ≤ 45%.
Rest heart rate (beats/min) 76.3 15.2 69.3 9.8 ns
ST segment/T wave
changes
7 (46.7%) 21 (21.6%) < 0.05
Bundle branch block 5 (33.3%) 6 (6.2%) < 0.01
ECG suggestive of
myocardial hypertrophy
3 (20%) 4 (4.1%) < 0.05
Baseline QRS width (ms) 123.1 31.8 105.4 21.3 < 0.05
Previous angina 4 (26.7%) 8 (8.2%) ns (0.06)
Adenosine heart rate
(beats/min)
91.5 16.4 81.1 14 ns
ST depression during
adenosine
0 (0%) 3 (3.2%) ns
SSS 5.5 7.5 2.2 5.4 < 0.05
SRS 4.7 7.6 1.4 4.2 < 0.05
RS 0.8 1.7 0.8 2.8 ns
17
Table 7. Univariate predictors of LVEF ≤ 45%
Odds ratio 95% CI odds ratio P value
ST segment /T wave
changes
3.2 1.0 - 9.7 < 0.05
Bundle branch block 7.6 2.0 - 29.4 < 0.005
ECG suggestive of
myocardial hypertrophy
5.8 1.2 - 29.2 < 0.05
Baseline QRS width 1.0 1.0 - 1.1 < 0.05
Previous angina 4.0 1.0 - 15.7 < 0.05
SSS 1.1 1.0 - 1.2 ns (0.06)
SRS 1.1 1.0 - 1.2 < 0.05
ECG, Electrocardiogram. SSS, Summed stress score. SRS, Summed rest score.
Table 8. Multivariate predictors of LVEF ≤ 45%
Likelihood test: 2 = 15.8; P value < 0.0001
Odds ratio 95% CI odds ratio P value
ST segment/T wave
changes
3.3 0.9 - 12.3 ns
ECG suggestive of
myocardial hypertrophy
8.2 1,4 - 50.8 < 0.05
Baseline QRS width 1.0 1.0 - 1.0 < 0.05
Previous angina 5.4 1.1 - 26.5 < 0.05
SRS 1.1 0.9 - 1.2 ns
ECG - Electrocardiogram; SRS - Summed rest score.
18
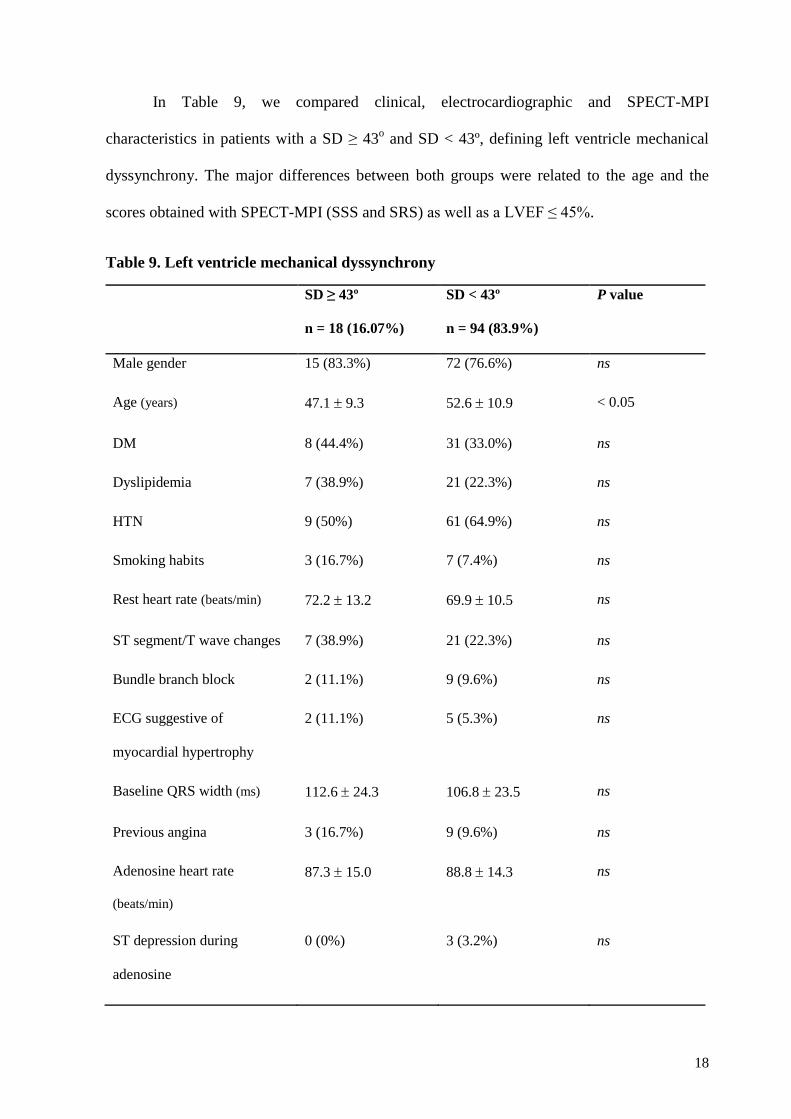
In Table 9, we compared clinical, electrocardiographic and SPECT-MPI
characteristics in patients with a SD ≥ 43o and SD < 43º, defining left ventricle mechanical
dyssynchrony. The major differences between both groups were related to the age and the
scores obtained with SPECT-MPI (SSS and SRS) as well as a LVEF ≤ 45%.
Table 9. Left ventricle mechanical dyssynchrony
SD ≥ 43º
n = 18 (16.07%)
SD < 43º
n = 94 (83.9%)
P value
Male gender 15 (83.3%) 72 (76.6%) ns
Age (years) 47.1 9.3 52.6 10.9 < 0.05
DM 8 (44.4%) 31 (33.0%) ns
Dyslipidemia 7 (38.9%) 21 (22.3%) ns
HTN 9 (50%) 61 (64.9%) ns
Smoking habits 3 (16.7%) 7 (7.4%) ns
Rest heart rate (beats/min) 72.2 13.2 69.9 10.5 ns
ST segment/T wave changes 7 (38.9%) 21 (22.3%) ns
Bundle branch block 2 (11.1%) 9 (9.6%) ns
ECG suggestive of
myocardial hypertrophy
2 (11.1%) 5 (5.3%) ns
Baseline QRS width (ms) 112.6 24.3 106.8 23.5 ns
Previous angina 3 (16.7%) 9 (9.6%) ns
Adenosine heart rate
(beats/min)
87.3 15.0 88.8 14.3 ns
ST depression during
adenosine
0 (0%) 3 (3.2%) ns
19
DM - Diabetes mellitus; HTN - Hypertension; ECG, Electrocardiogram. SSS, Summed stress score. SRS, Summed rest score.
RS, Reversibility score.
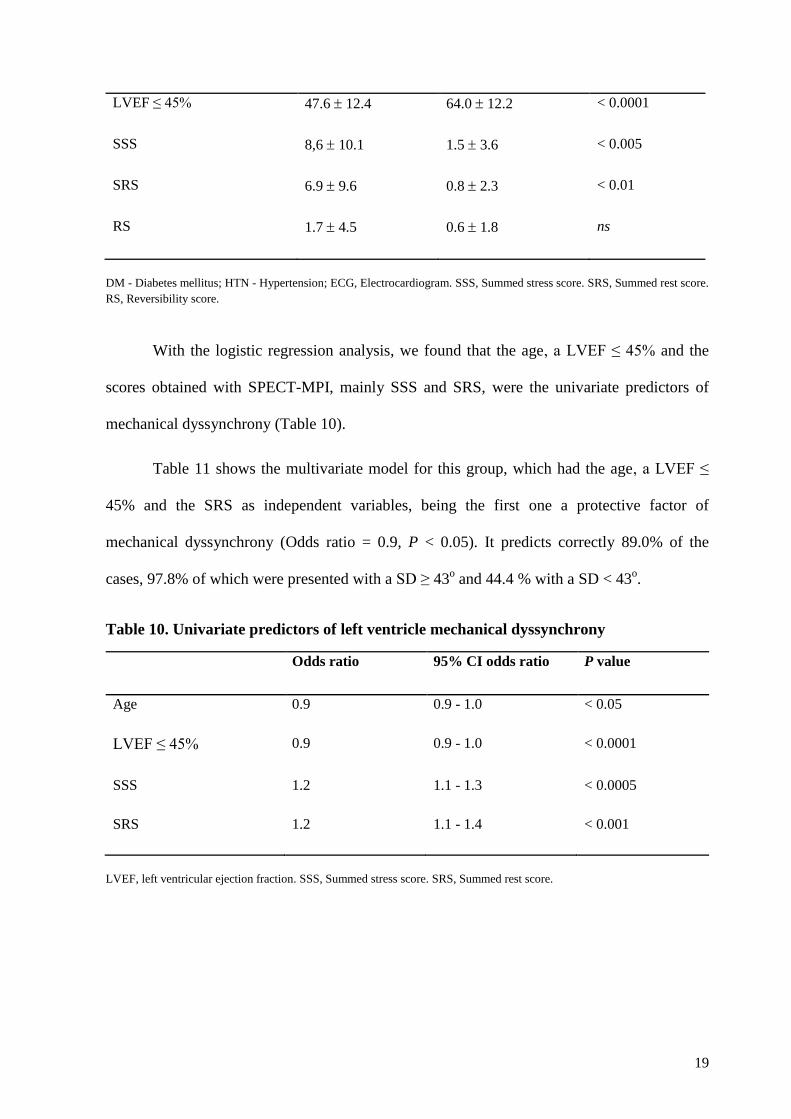
With the logistic regression analysis, we found that the age, a LVEF ≤ 45% and the
scores obtained with SPECT-MPI, mainly SSS and SRS, were the univariate predictors of
mechanical dyssynchrony (Table 10).
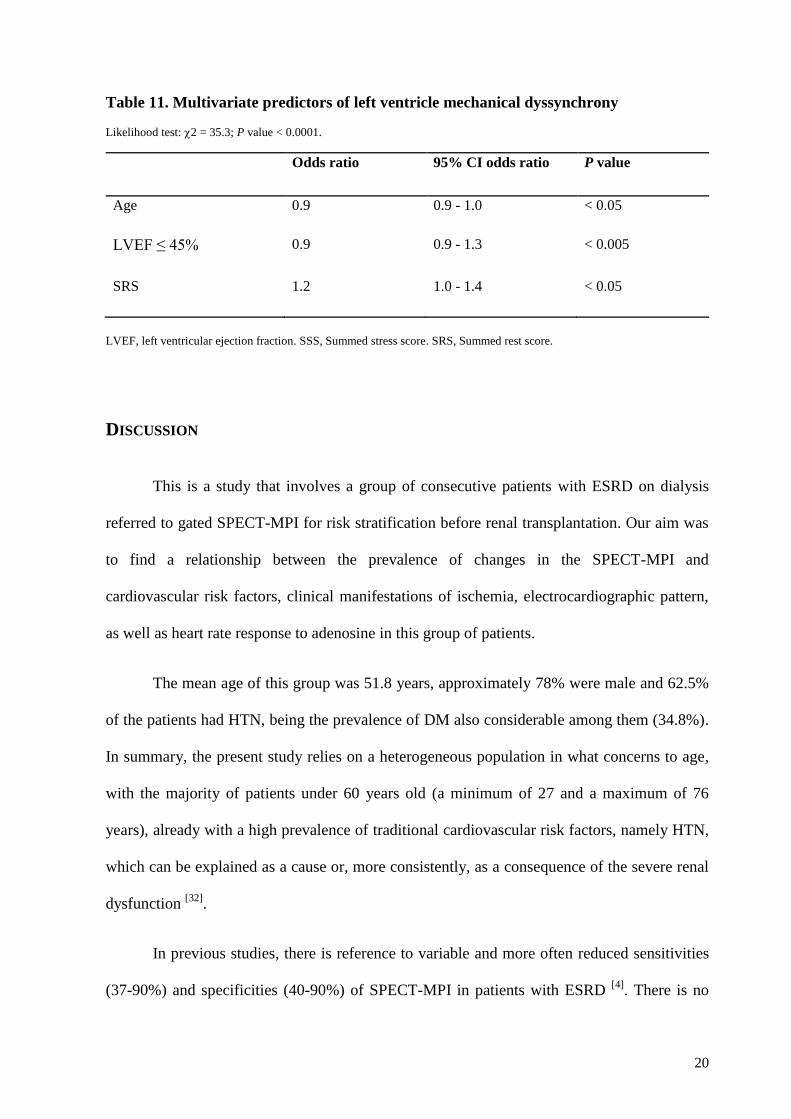
Table 11 shows the multivariate model for this group, which had the age, a LVEF ≤
45% and the SRS as independent variables, being the first one a protective factor of
mechanical dyssynchrony (Odds ratio = 0.9, P < 0.05). It predicts correctly 89.0% of the
cases, 97.8% of which were presented with a SD ≥ 43o and 44.4 % with a SD < 43
o.
Table 10. Univariate predictors of left ventricle mechanical dyssynchrony
Odds ratio 95% CI odds ratio P value
Age 0.9 0.9 - 1.0 < 0.05
LVEF ≤ 45% 0.9 0.9 - 1.0 < 0.0001
SSS 1.2 1.1 - 1.3 < 0.0005
SRS 1.2 1.1 - 1.4 < 0.001
LVEF, left ventricular ejection fraction. SSS, Summed stress score. SRS, Summed rest score.
LVEF ≤ 45% 47.6 12.4 64.0 12.2 < 0.0001
SSS 8,6 10.1 1.5 3.6 < 0.005
SRS 6.9 9.6 0.8 2.3 < 0.01
RS 1.7 4.5 0.6 1.8 ns
20
Table 11. Multivariate predictors of left ventricle mechanical dyssynchrony
Likelihood test: 2 = 35.3; P value < 0.0001.
Odds ratio 95% CI odds ratio P value
Age 0.9 0.9 - 1.0 < 0.05
LVEF ≤ 45% 0.9 0.9 - 1.3 < 0.005
SRS 1.2 1.0 - 1.4 < 0.05
LVEF, left ventricular ejection fraction. SSS, Summed stress score. SRS, Summed rest score.
DISCUSSION
This is a study that involves a group of consecutive patients with ESRD on dialysis
referred to gated SPECT-MPI for risk stratification before renal transplantation. Our aim was
to find a relationship between the prevalence of changes in the SPECT-MPI and
cardiovascular risk factors, clinical manifestations of ischemia, electrocardiographic pattern,
as well as heart rate response to adenosine in this group of patients.
The mean age of this group was 51.8 years, approximately 78% were male and 62.5%
of the patients had HTN, being the prevalence of DM also considerable among them (34.8%).
In summary, the present study relies on a heterogeneous population in what concerns to age,
with the majority of patients under 60 years old (a minimum of 27 and a maximum of 76
years), already with a high prevalence of traditional cardiovascular risk factors, namely HTN,
which can be explained as a cause or, more consistently, as a consequence of the severe renal
dysfunction [32]
.
In previous studies, there is reference to variable and more often reduced sensitivities
(37-90%) and specificities (40-90%) of SPECT-MPI in patients with ESRD [4]
. There is no
21
definitive explanation to this fact, but it has been speculated that it could be related to the
increased circulating levels of adenosine in some patients with CKD, a reduced coronary flow
reserve or even the presence of left ventricular hypertrophy [16]
. Moreover, we could not
discard the possibility that diverse values are obtained with different protocols in the
acquisition of the images with the gated SPECT-MPI. Attenuation correction seems to
improve the specificity of the test according to Mathur et al. [33]
. In this study, a low
prevalence of perfusion abnormalities had been found (n = 25, 22.3%), which could always
raise the question of sensitivity and the doubt related with a negative test [1, 4]
.
Univariate and multivariate logistic regression analysis were performed and we found
that in these patients the independent predictors of myocardial perfusion defects were the
QRS width (OR = 1.0, P value < 0.005) and the rest heart rate (OR = 1.1, P value < 0.05).
Regarding the cardiovascular risk factors analyzed, although the sample of patients with an
abnormal perfusion is reduced, the presence of DM is higher in this group (n = 11, 44%)
comparatively to the patients with a normal perfusion (n = 28, 32.2%), even though it was not
statistically significant. HTN appears with an identical prevalence in both groups with an
abnormal and normal perfusion, consistent with the high prevalence in the overall population,
being this factor, as mentioned, a possible cause or effect of the CKD [32]
. An increased
baseline heart rate is a well known marker of disease, particularly in situations of metabolic or
hemodynamic stress [34, 35]
. Therefore, it was expected to be more elevated in the patients with
perfusion defects, with an almost significant statistical difference (P value < 0.06). Similar
results were found comparing the presence of an ischemic ECG in these groups, being more
prevalent in the group with an abnormal perfusion (P value < 0.06). The presence of
variations in the baseline QRS width, mainly the presence of bundle branch block, was the
characteristic that showed a more significant statistical difference between the groups with an
abnormal and normal perfusion. In fact, perfusion defects are known to be a common cause of
22
changes in the cardiac electrical conduction. Nonetheless, the bundle branch block, namely
the left bundle branch block, is frequently associated with anteroseptal perfusion defects that
are not always an expression of CAD but have a definite prognostic value [36-38]
.
Concerning the LVEF, only 15 patients showed a LVEF ≤ 45% (13.4%). However, in
spite of the small sample, it was evident the higher prevalence of ECG changes in this group:
ischemic pattern (P value < 0.05), variations in baseline QRS width and bundle branch block
(P value < 0.05 and < 0.01, respectively) as well as evidence of myocardial hypertrophy (P
value < 0.05). Univariate and multivariate logistic regression analysis were performed and it
was found that regarding these variables the independent predictors of a LVEF ≤ 45% were
the QRS width (OR = 1.0, P value < 0.05) and an ECG suggestive of myocardial hypertrophy
(OR = 8.2, P value < 0.05). The ECG alterations, particularly the increased duration of the
QRS interval and the presence of a bundle branch block pattern, could lead to changes in the
ventricular synchrony, causing a diminished LVEF [39]
. On the other hand, an ischemic ECG
could be associated to the presence of established ischemia, which is likewise a cause of
contractility changes and reduced LVEF. The evidence of left ventricular hypertrophy, most
likely related to volume overload in patients with advanced CKD, with an undoubtable
relationship with HTN, could thus be a consequence of the disease or a preexisting condition
[40, 41], and lead to ventricular dyssynchrony. A clinical history of previous angina was more
prevalent in the patients with a LVEF ≤ 45% and was an independent predictor of this feature
(OR = 5.4, P value < 0.05) as a clinical manifestation of ischemia that could lead to an
impaired left ventricle function. Its influence in ventricular function and not in perfusion
abnormalities could make us suspect of false negative results of perfusion or even small
vessels disease. As we expected, this group of patients revealed increased values on the
SPECT-MPI scores (SSS and SRS) with a significant statistical difference in comparison to
those with a normal left ventricle function.
23
The presence of mechanical ventricular dyssynchrony, defined as a SD ≥ 43o, seemed
to be influenced by an abnormal perfusion, with the SPECT-MPI scores increased in this
group of individuals, with a significant statistical difference. This was also observed in several
other studies [7, 30, 42-45]
. The age was also an independent predictor of mechanical
dyssynchrony (OR = 0.9, P value < 0.05). Surprisingly, it was more prevalent at a younger
age. As expected, there was a clear relationship between mechanical dyssynchrony and a
LVEF ≤ 45% (OR = 0.9; P value < 0.0001). Furthermore, it is important to note that in this
group of patients the presence of a mechanical ventricular dyssynchrony had no significant
relationship with the baseline QRS width, although a wider QRS is seen in these individuals.
As stated by previous studies, mechanical dyssynchrony could be identified in patients with a
normal QRS width [43]
and it is more prevalent in the presence of ESRD, even in the absence
of electrical dyssynchrony and abnormal LV perfusion [42]
. This higher prevalence happens in
CKD patients already prior to dialysis treatment and is associated with left ventricle
hypertrophy, left ventricular dysfunction and load conditions, which underlines the relevance
of volume status for mechanical dyssynchrony in this group of patients [46-48]
.
This investigation was a single-center retrospective study that included only patients
on the waiting list for kidney transplantation, with no reference to the time interval between
the beginning of the CKD or the occurrence of the last session of hemodialysis and the
performance of the exam. In addition, gated SPECT-MPI was not repeated unless clinically
warranted, limiting our ability to follow the progression of the disease. Likewise, it was not
possible to have access to the coronary angiography performed in the patients with positive
results on the SPECT-MPI until the end of this study. Moreover, the observations could not
be extended to the post-transplant period, since most of these patients are still waiting for
surgery.
24
CONCLUSIONS
In this study it was found that an abnormal gated SPECT-MPI in ESRD patients, with
perfusion defects, impaired LVEF and/or evidence of mechanical dyssynchrony were not
associated with the presence of the most common risk factors for atherosclerotic disease
(gender, age, DM, dyslipidemia, HTN and smoking habits).
A history of angina and an increased rest heart rate were higher in patients with
perfusion defects, lower EF and mechanical dyssynchrony, although the rest heart rate was the
only predictor of perfusion abnormalities and the history of angina predictor of a LVEF ≤
45%. The changes on the ECG pattern, namely the presence of variations in the baseline QRS
width, including the bundle branch block, were associated with an abnormal perfusion. These
variations along with the electrocardiographical evidence of myocardial hypertrophy were
also predictors of an impaired left ventricle function. Mechanical dyssynchrony was
associated to younger patients with a lower LVEF and higher perfusion scores.
To clarify the low prevalence of perfusion abnormalities and also some surprising
findings, such as the influence of angina in ventricular function and not in perfusion
abnormalities, further studies are necessary. In our point of view, it is essential to define a
homogeneous protocol when evaluating patients with ESRD on the waiting list for
transplantation.

25
AKNOWLEDGMENTS
First, I thank to Professor Lino Gonçalves and Dr. Maria João Cunha for their
suggestions and revision of this work.
I am also grateful to Professor Maria João Ferreira for her guidance. Her enthusiasm
and deep knowledge on the subject were essential for my learning and for this work’s
execution.
26
REFERENCES
1. Enkiri, S.A., et al., Coronary angiography is a better predictor of mortality than
noninvasive testing in patients evaluated for renal transplantation. Catheter Cardiovasc
Interv, 2010. 76(6): p. 795-801.
2. Hage, F.G., et al., The scope of coronary heart disease in patients with chronic kidney
disease. J Am Coll Cardiol, 2009. 53(23): p. 2129-40.
3. Karthikeyan, V. and K. Ananthasubramaniam, Coronary risk assessment and
management options in chronic kidney disease patients prior to kidney transplantation.
Curr Cardiol Rev, 2009. 5(3): p. 177-86.
4. Lentine, K.L., et al., Cardiovascular risk assessment among potential kidney transplant
candidates: approaches and controversies. Am J Kidney Dis, 2010. 55(1): p. 152-67.
5. Hase, H., et al., Prognostic value of stress myocardial perfusion imaging using
adenosine triphosphate at the beginning of haemodialysis treatment in patients with
end-stage renal disease. Nephrol Dial Transplant, 2004. 19(5): p. 1161-7.
6. Yoda, S., et al., Risk stratification of cardiovascular events in patients at all stages of
chronic kidney disease using myocardial perfusion SPECT. J Cardiol, 2012. 60(5): p.
377-82.
7. AlJaroudi, W., et al., Impact of left ventricular dyssynchrony by phase analysis on
cardiovascular outcomes in patients with end-stage renal disease. J Nucl Cardiol,
2010. 17(6): p. 1058-64.
8. Al-Mallah, M.H., et al., Incremental prognostic value of myocardial perfusion imaging
in patients referred to stress single-photon emission computed tomography with renal
dysfunction. Circ Cardiovasc Imaging, 2009. 2(6): p. 429-36.
27
9. Beller, G.A., Chronic kidney disease and risk for coronary events: value of myocardial
perfusion imaging. J Nucl Cardiol, 2010. 17(5): p. 759-60.
10. Ronco, C., et al., Cardiorenal syndrome. J Am Coll Cardiol, 2008. 52(19): p. 1527-39.
11. McCullough, P.A. and H. Assad, Diagnosis of cardiovascular disease in patients with
chronic kidney disease. Blood Purif, 2012. 33(1-3): p. 112-8.
12. McCullough, P.A., et al., Cardiovascular disease in chronic kidney disease: data from
the Kidney Early Evaluation Program (KEEP). Curr Diab Rep, 2011. 11(1): p. 47-55.
13. Berman, D.S., et al., SPECT/PET myocardial perfusion imaging versus coronary CT
angiography in patients with known or suspected CAD. Q J Nucl Med Mol Imaging,
2011. 54(2): p. 177-200.
14. De Vriese, A.S., et al., Should we screen for coronary artery disease in asymptomatic
chronic dialysis patients? Kidney Int, 2012. 81(2): p. 143-51.
15. Delos Santos, R.B., et al., Cardiac evaluation prior to kidney transplantation. Semin
Dial, 2010. 23(3): p. 324-9.
16. Galvao De Lima, J.J., et al., The role of myocardial scintigraphy in the assessment of
cardiovascular risk in patients with end-stage chronic kidney disease on the waiting
list for renal transplantation. Nephrol Dial Transplant, 2012. 27(7): p. 2979-84.
17. Hatta, T., S. Nishimura, and T. Nishimura, Prognostic risk stratification of myocardial
ischaemia evaluated by gated myocardial perfusion SPECT in patients with chronic
kidney disease. Eur J Nucl Med Mol Imaging, 2009. 36(11): p. 1835-41.
18. Kasiske, B.L., M.A. Malik, and C.A. Herzog, Risk-stratified screening for ischemic
heart disease in kidney transplant candidates. Transplantation, 2005. 80(6): p. 815-20.
19. Rucker, D. and M. Tonelli, Cardiovascular risk and management in chronic kidney
disease. Nat Rev Nephrol, 2009. 5(5): p. 287-96.
28
20. Venkataraman, R., et al., Role of myocardial perfusion imaging in patients with end-
stage renal disease undergoing coronary angiography. Am J Cardiol, 2008. 102(11): p.
1451-6.
21. Yoshinaga, K., Cardiovascular event risk assessment using myocardial perfusion
imaging with a view to wide clinical application. Circ J, 2011. 75(10): p. 2318-9.
22. Bart, B.A., et al., Comparison of dobutamine stress echocardiography, dobutamine
SPECT, and adenosine SPECT myocardial perfusion imaging in patients with end-
stage renal disease. J Nucl Cardiol, 2009. 16(4): p. 507-15.
23. Hakeem, A., et al., Predictive value of myocardial perfusion single-photon emission
computed tomography and the impact of renal function on cardiac death. Circulation,
2008. 118(24): p. 2540-9.
24. Schmidt, A., et al., Informational contribution of noninvasive screening tests for
coronary artery disease in patients on chronic renal replacement therapy. Am J Kidney
Dis, 2001. 37(1): p. 56-63.
25. Patel, A.D., et al., Prognostic value of myocardial perfusion imaging in predicting
outcome after renal transplantation. Am J Cardiol, 2003. 92(2): p. 146-51.
26. Rabbat, C.G., et al., Prognostic value of myocardial perfusion studies in patients with
end-stage renal disease assessed for kidney or kidney-pancreas transplantation: a
meta-analysis. J Am Soc Nephrol, 2003. 14(2): p. 431-9.
27. Wang, L.W., et al., Cardiac testing for coronary artery disease in potential kidney
transplant recipients: a systematic review of test accuracy studies. Am J Kidney Dis,
2011. 57(3): p. 476-87.
29
28. Bialostozky, D., et al., Myocardial perfusion and ventricular function assessed by
SPECT and Gated-SPECT in end-stage renal disease patients before and after renal
transplant. Arch Med Res, 2007. 38(2): p. 227-33.
29. Chen, J., et al., Left-ventricular systolic and diastolic dyssynchrony as assessed by
multi-harmonic phase analysis of gated SPECT myocardial perfusion imaging in
patients with end-stage renal disease and normal LVEF. J Nucl Cardiol, 2011. 18(2):
p. 299-308.
30. Vidigal Ferreira, M.J., et al., Left ventricular mechanical dyssynchrony in patients
with impaired left ventricular function undergoing gated SPECT myocardial perfusion
imaging. Rev Port Cardiol, 2013. 32(5): p. 387-94.
31. Chen, J., et al., Onset of left ventricular mechanical contraction as determined by
phase analysis of ECG-gated myocardial perfusion SPECT imaging: development of a
diagnostic tool for assessment of cardiac mechanical dyssynchrony. J Nucl Cardiol,
2005. 12(6): p. 687-95.
32. Kamper, A.L., E.B. Pedersen, and S. Strandgaard, [Hypertension and renal disease].
Ugeskr Laeger, 2009. 171(25): p. 2109-13.
33. Mathur, S., et al., Clinical value of stress-only Tc-99m SPECT imaging: importance of
attenuation correction. J Nucl Cardiol, 2013. 20(1): p. 27-37.
34. Beddhu, S., et al., Associations of resting heart rate with insulin resistance,
cardiovascular events and mortality in chronic kidney disease. Nephrol Dial
Transplant, 2009. 24(8): p. 2482-8.
35. Uematsu, M., et al., Association between heart rate at rest and myocardial perfusion in
patients with acute myocardial infarction undergoing cardiac rehabilitation - a pilot
study. Arch Med Sci, 2012. 8(4): p. 622-30.
30
36. Afzal, M.S., et al., Gated spect myocardial perfusion scintigraphy for identifying
septal perfusion artifacts in left bundle branch block. J Coll Physicians Surg Pak,
2006. 16(8): p. 504-8.
37. Fallahi, B., et al., High accuracy of myocardial perfusion imaging in patients with left
bundle branch block: comparison of four interpretation approaches. Hell J Nucl Med,
2009. 12(2): p. 132-7.
38. Soares, A., et al., Prognostic value of normal myocardial perfusion scintigraphy in
patients with chest pain and left bundle branch block. Rev Port Cardiol, 2002. 21(11):
p. 1241-55.
39. Yamamoto, A., et al., Relationship between left ventricular function and wall motion
synchrony in heart failure assessed by ECG-gated myocardial perfusion SPECT. Ann
Nucl Med, 2008. 22(9): p. 751-9.
40. Paoletti, E., Left ventricular hypertrophy and progression of chronic kidney disease. J
Nephrol, 2012. 25(6): p. 847-50.
41. Tomilina, N.A., et al., [Risk factors and pathogenetic mechanisms of left ventricular
hypertrophy in progressive chronic kidney disease and after transplantation of the
kidney]. Ter Arkh, 2007. 79(6): p. 34-40.
42. AlJaroudi, W., et al., Left ventricular mechanical dyssynchrony by phase analysis of
gated single photon emission computed tomography in end-stage renal disease. Am J
Cardiol, 2010. 106(7): p. 1042-7.
43. Cho, G.Y., et al., Electrical and mechanical dyssynchrony for prediction of cardiac
events in patients with systolic heart failure. Heart, 2011. 96(13): p. 1029-32.
31
44. Samad, Z., et al., Prevalence and predictors of mechanical dyssynchrony as defined by
phase analysis in patients with left ventricular dysfunction undergoing gated SPECT
myocardial perfusion imaging. J Nucl Cardiol, 2011. 18(1): p. 24-30.
45. Chen, J., et al., SPECT myocardial perfusion imaging for the assessment of left
ventricular mechanical dyssynchrony. J Nucl Cardiol, 2011. 18(4): p. 685-94.
46. Hayashi, S.Y., et al., Left ventricular mechanical dyssynchrony in patients with
different stages of chronic kidney disease and the effects of hemodialysis. Hemodial
Int, 2013. 17(3): p. 346-58.
47. Kim, J.K., et al., Cardiac risk assessment by gated single-photon emission computed
tomography in asymptomatic end-stage renal disease patients at the start of dialysis. J
Nucl Cardiol, 2012. 19(3): p. 438-47.
48. Murata, T., et al., Role of haemodialytic therapy on left ventricular mechanical
dyssynchrony in patients with end-stage renal disease quantified by speckle-tracking
strain imaging. Nephrol Dial Transplant, 2011. 26(5): p. 1655-61.