quantitative analysis of 90 y bremsstrahlung spect-ct images for application to 3d patient-specific...
TRANSCRIPT

CANCER BIOTHERAPY & RADIOPHARMACEUTICALSVolume 24, Number 1, 2009© Mary Ann Liebert, Inc.DOI: 10.1089/cbr.2008.0543
Quantitative Analysis of 90Y Bremsstrahlung SPECT-CTImages for Application to 3D Patient-Specific Dosimetry
Cinzia Fabbri,1 Graziella Sarti,1 Marta Cremonesi,2 Mahila Ferrari,2 Amalia Di Dia,2
Monica Agostini,3 Francesca Botta,2 and Giovanni Paganelli2
Abstract
Aim: The aim of this study was to evaluate the accuracy of the activity quantification of single-photon emis-sion computed tomography/computed tomography (SPECT-CT) 90Y-Bremsstrahlung images and to validatethe S-voxel method.Methods: An anthropomorphic torso phantom with radioactive inserts (90Y) was acquired by SPECT-CT. Con-stant calibration factors (cps/MBq) for the quantification were evaluated, considering different volume, shape,position inside the phantom, activity concentration and background, and distance from detectors. S-voxel val-ues (EGSnrc) were implemented in MATLAB R0086 USA software. Dose comparisons between S-voxel and theconventional Medical Internal Radiation Dose method were repeated in a group of 11 patients administeredwith 90Y-DOTATATE.Results: Using the appropriate calibration factors to recover the volume variability, the error about the mea-surement repeatability and the activity variation was within 4%. The variability of activity quantification, de-pending on the position in the phantom, detector distance, and background, was �10%, �5%, and �10%, re-spectively. The absorbed-dose values calculated by OLINDA were in agreement with the mean dose valuesobtained by the S-voxel method (difference, �10%).Conclusions: The results confirm that, with the hybrid SPECT-CT system, quantitative analysis of SPECT 90Y-Bremsstrahlung images and the generation of three-dmensional dose distributions are feasible. The improvedanalysis of Bremsstrahlung images could have a notable clinical impact, allowing to address the dosimetric ver-ification to patients during the course of therapy.
Key words: SPECT-CT, voxel dosimetry, Bremsstrahlung image quantification, 90Y-radionuclide therapy, dose-volume histogram (DVH)
145
Introduction
The characteristics of 90Y, suitable for therapy, are de-moted by the lack of �-emission, which imposes alter-
native methods to image 90Y-conjugates and to evaluatebiodistribution. Usually, analogs labeled with 111In or 86Yhave been used to mimic therapy,1,2 with some inevitabledrawbacks. The chemical characteristics of 111In confers a be-havior similar, but not identical, to the molecules labeled
with 90Y. The positron emitter, 86Y, offers the high resolu-tion of positron emission tomography (PET), but its shorthalf-life (14.7 hours), scarce availability, and interference ofhigh-energy gamma rays reduce the feasibility and accuracyof the data collection for dosimetry.3
Until recently, the quality of Bremsstrahlung images ac-quired by nuclear medicine equipment allowed for an ap-proximated verification of biodistribution, but dissuadedfrom quantitative evaluations in the routine. The new-gen-
1Division of Medical Physics, Bufalini Hospital, Cesena, Italy.2Division of Nuclear Medicine, European Institute of Oncology, Milano, Italy.3Division of Nuclear Medicine, Bufalini Hospital, Cesena, Italy.
Address correspondence to: Graziella Sarti; Division of Medical Physics, Bufalini Hospital, Ghirotti 286, Cesena 47023, Italy; Tel.:0547352681; Fax: 0547302754E-mail: [email protected]
eration single-photon emission computed tomography–com-puted tomography (SPECT-CT) systems have implementedadvanced software for acquisition and reconstruction. Theinformation associated with images have been consistentlyand continuously improved. Scintigraphic scans obtained inpatients treated with 90Y-conjugates have shown a new po-tentiality of Bremsstrahlung images. This led our group toexplore more, in detail, the data obtainable from 90Y-imag-ing and the possibility of performing dosimetry directly dur-ing therapy. The feasibility of a patient-specific three-di-mensional (3D) dosimetry based on Bremsstrahlung SPECT,combined with the density distribution obtained by CT,could be of special interest for clinical applications, consid-ering the organ/tumor geometric variability (i.e., size, shape,and location), with improved information, as compared withthe conventional Medical Internal Radiation Dose (MIRD)method.4,5
The aim of this study was to evaluate the accuracy of theactivity quantification of SPECT-CT 90Y-Bremsstrahlung im-ages and to validate a 3D method (S-voxel)6 for absorbed-dose calculations in patients. Three main steps were consid-ered for the investigation with phantoms: 1) analysis ofBremsstrahlung SPECT images coregistered with CT; 2) gen-eration of 3D activity distribution maps; and 3) conversioninto 3D dose-distribution maps, using the S-voxel valuesspecifically calculated for 90Y and the voxel dimension used.Subsequently, this method was applied to evaluate dosime-try in patients administered with 90Y peptide receptor ra-dionuclide therapy (90Y-PRRT). The results were also com-pared with the conventional MIRD scheme.
Methods
Image acquisition and reconstruction
The SPECT-CT hybrid system, Symbia-T2 (Siemens, Mu-nich, Germany), was used for acquisition. This equipmentcombines a dual-detector (NaI(Tl), 3/8 in thick) variable-an-gle gamma-camera with a dual-slice spiral CT. Acquisitionparameters were set as follows: 36–204-keV [80 (55%) and170 (20%) keV] energy window; medium-energy (generalpurpose; MEGP) collimators; 128 � 128 matrix (4.8-mm cu-bical voxel); 64 projections (40 s/step).7
The full width at half maximum resulted in 19 mm for aline source in air at a distance of 10 cm from the detectorwith static acquisition and 30 mm for a line source in a cylin-drical plexiglas phantom (diameter, 20 cm), with a radius ofrotation 23 cm in the same acquisition and reconstructionconditions as clinical images. The capillary was made of apolyvinyl chloride (PVC) material; the thickness of the wallswas equal to 0.5 mm and its length was equal to 15 cm.
Low-dose CT was acquired (130 kV, 80 mAs) for attenua-tion correction. SPECT and CT images were coregistered andreconstructed with the ordered set expectation maximum(OSEM) 3D fast algorithm, with correction for attenuationand for 3D response of the collimator. The conversion of theCT to an mu-map was done within e.soft®, where the mu-map was scaled to the central value of the window with a“broad-beam correction factor.” The 3D response of the col-
FABBRI ET AL.146
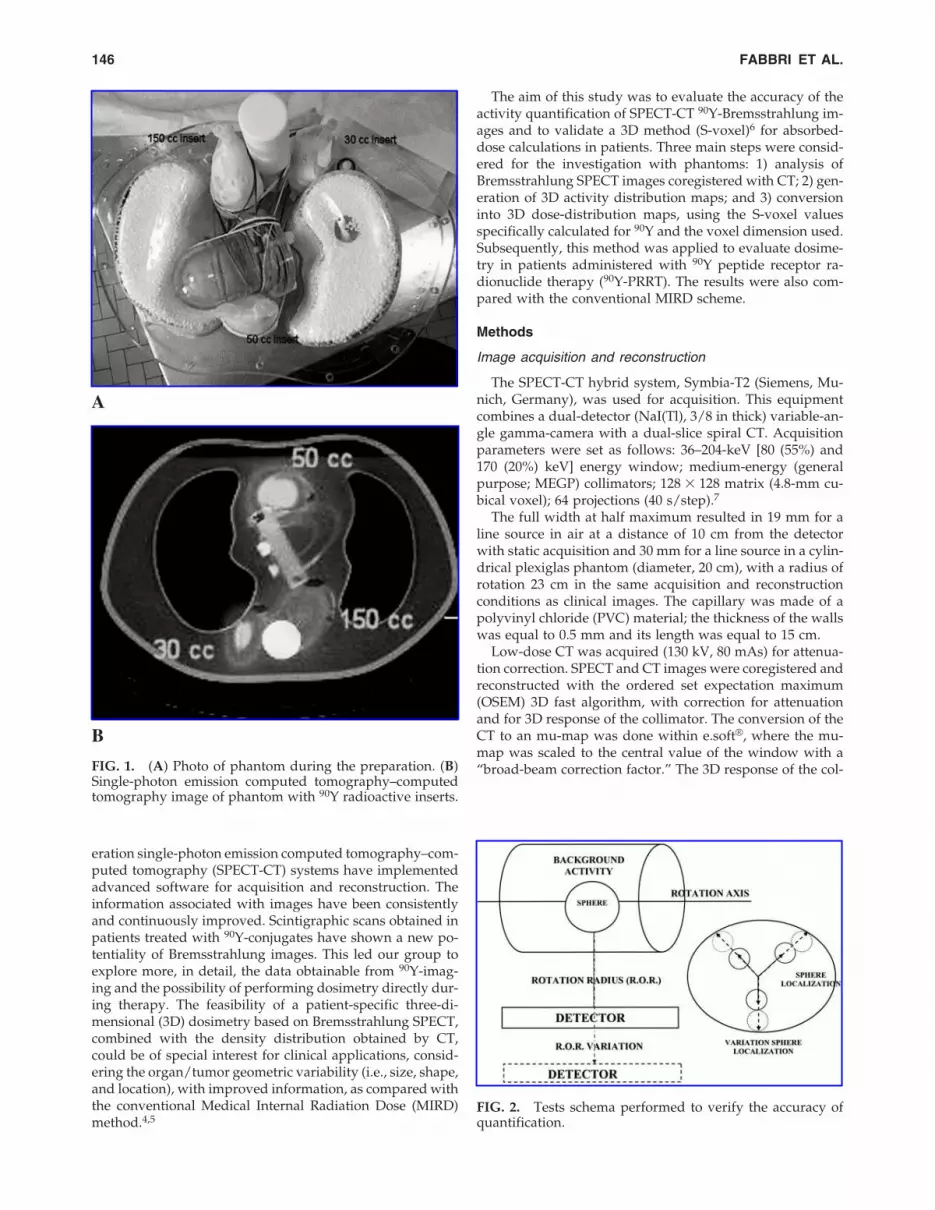
FIG. 1. (A) Photo of phantom during the preparation. (B)Single-photon emission computed tomography–computedtomography image of phantom with 90Y radioactive inserts.
A
B
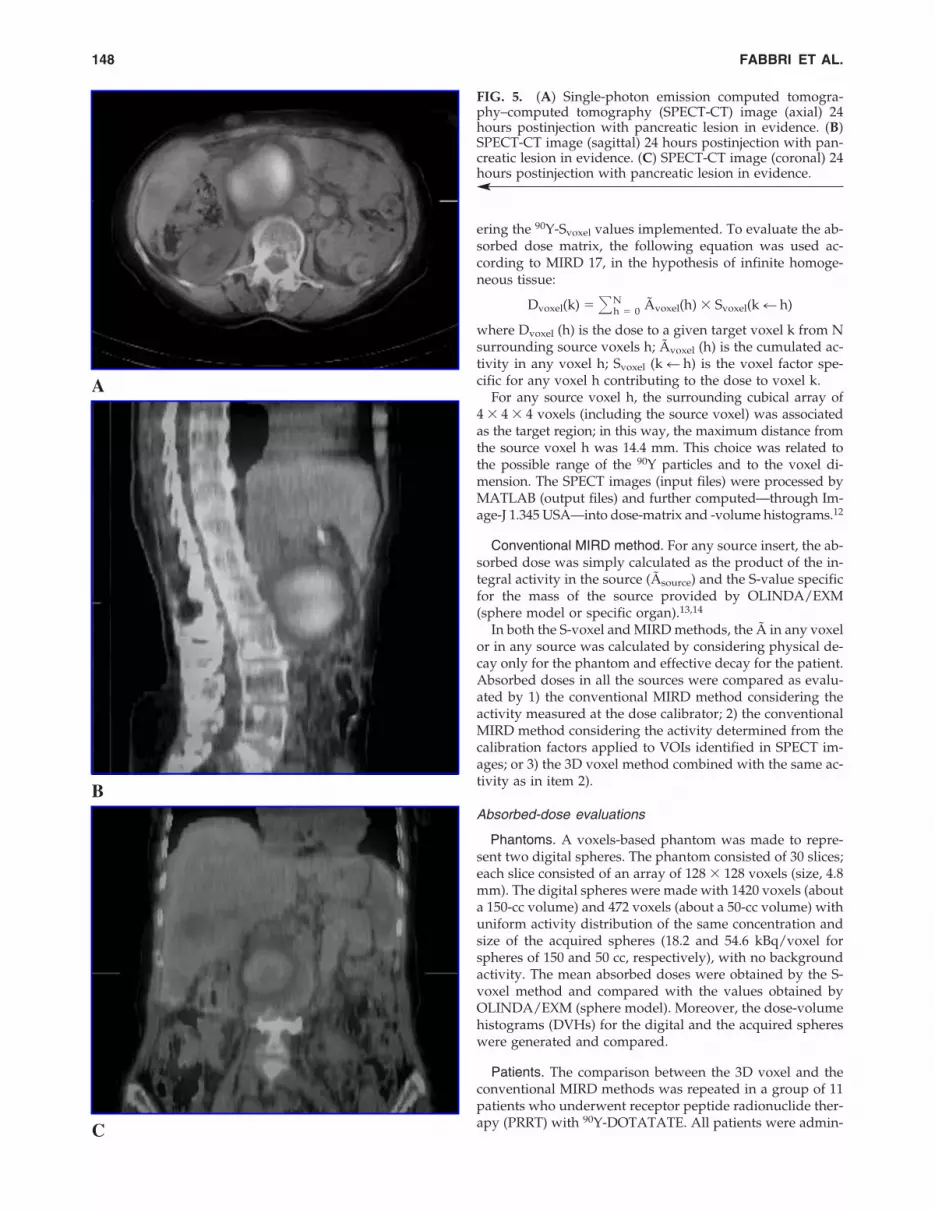
FIG. 2. Tests schema performed to verify the accuracy ofquantification.

limator modeled the blurring of the collimator without in-troducing corrections for the scatter and the septal penetra-tion. Volumes of interest (VOIs) were selected, by isocontorthreshold, on the SPECT images and confirmed on the CTimages. The total and average counts, the volume, and theCT Hounsfield number of any VOI were readily providedby software (Volumetric Analysis, Siemens).
Calibration of 90Y-Bremsstrahlung images: Phantom studies
The Data Spectrum (Data Spectrum Corporation) anthro-pomorphic torso phantom was used to quantify 90Y-Bremsstrahlung images. Besides the lungs, liver, spine, andcardiac inserts of the phantom, some spherical-ellipsoidalsources (8, 15, 30, 50, 100, 150, 250, and 350 cc) were addedto simulate kidneys and tumors of different sizes (Fig. 1Aand 1B). The spherical-ellipsoidal inserts and the liver werefilled with known activities of 90Y (20–400 MBq), with activ-ity concentration ranging from 0.08 to 31 MBq/cc. First, thetorso phantom was filled with water without radioactivity(S/B ratio of infinity) and then filled with increasing activ-
ity (S/B ratios in the range of 2–10, similar to clinical condi-tions). Calibration factors of the sources (cps/MBq) wereevaluated, considering the possible dependence from pa-rameters such as volume, shape, position inside the phan-tom, activity concentration, background, and distance fromdetectors (Fig. 2). Acquisitions were repeated in order toevaluate the accuracy of activity quantification.8,9 The posi-tion dependence was studied by moving the radioactive in-sert in different positions inside the phantom. The depen-dence from the rotation distance radius (ROR) was studiedby increasing the distance of the heads from the phantomfrom 2.5 to 8 cm.
Algorithm for activity to dose conversion
3D voxel method. Svoxel values specific for 90Y and voxelsize of 4.8 � 4.8 � 4.8 mm were calculated by the MonteCarlo code, EGSnrc10,11 (University of Bologna, Physics De-partment in Bologna, Italy). An appropriate algorithm forMATLAB software was developed to convert a 3D voxel ac-tivity map (input file, dicom format) into the correspondentdose distribution (output file, dicom format) while consid-
90Y SPECT-CT IMAGES ANALYSIS FOR 3D DOSIMETRY 147
FIG. 3. 90Y activity quantification in an abdominal phan-tom: Volume-dependence study.
FIG. 4. 90Y S-values within 3 mm, 6-mm voxels from MIRD17, and within 4.8 mm calculated by EGSnrc. MIRD, Med-ical Internal Radiation Dose.
TABLE 1. ABSORBED DOSES IN SPHERICAL SOURCES
Absorbed dose (Gy) Difference %
Source (1) (2) (3)a (2) versus (1) (3) versus (2)volume CF MIRD, MIRD, 3D voxel, CF versus 3D voxel versus(cc) cps/MBq measured activity CF CF measured activity MIRD
8 0.41 1527 (253 MBq) 1739 —b �14 —b
15 0.54 754 (253 MBq) 697 —b �8 —b
30 0.77 299 (197 MBq) 241 266 (�71)a �19 1050 0.98 182 (197 MBq) 187 198 (�46)a 3 6150 1.33 62 (197 MBq) 58 58 (�16)a �6 0
aThe mean � value standard deviation is reported to include the dose-distribution variability of all sphere voxels.bBecause of the little dimensions of the spherical sources and low resolution of the system, dose-distribution analysis was not meaningful.Absorbed doses in spherical sources (30, 50, and 150 cc, filled with 197 MBq; 8 and 15 cc filled with 253 MBq) were evaluated by 1) the con-
ventional MIRD method, considering the actual activity; 2) the conventional MIRD method considering the activity derived from single-photon emission computed tomography calibration (CF specific for the source volume) and counts in volumes of interest; and 3) the 3D voxelmethod considering the activity as in item 2). Sources were considered to follow physical decay only.
CF, calibration factor; MIRD, Medical Internal Radiation Dose; 3D, three dimensional.
ering the 90Y-Svoxel values implemented. To evaluate the ab-sorbed dose matrix, the following equation was used ac-cording to MIRD 17, in the hypothesis of infinite homoge-neous tissue:
Dvoxel(k) � �a
a
Nh � 0 Ãvoxel(h) � Svoxel(k � h)
where Dvoxel (h) is the dose to a given target voxel k from Nsurrounding source voxels h; Ãvoxel (h) is the cumulated ac-tivity in any voxel h; Svoxel (k � h) is the voxel factor spe-cific for any voxel h contributing to the dose to voxel k.
For any source voxel h, the surrounding cubical array of4 � 4 � 4 voxels (including the source voxel) was associatedas the target region; in this way, the maximum distance fromthe source voxel h was 14.4 mm. This choice was related tothe possible range of the 90Y particles and to the voxel di-mension. The SPECT images (input files) were processed byMATLAB (output files) and further computed—through Im-age-J 1.345 USA—into dose-matrix and -volume histograms.12
Conventional MIRD method. For any source insert, the ab-sorbed dose was simply calculated as the product of the in-tegral activity in the source (Ãsource) and the S-value specificfor the mass of the source provided by OLINDA/EXM(sphere model or specific organ).13,14
In both the S-voxel and MIRD methods, the à in any voxelor in any source was calculated by considering physical de-cay only for the phantom and effective decay for the patient.Absorbed doses in all the sources were compared as evalu-ated by 1) the conventional MIRD method considering theactivity measured at the dose calibrator; 2) the conventionalMIRD method considering the activity determined from thecalibration factors applied to VOIs identified in SPECT im-ages; or 3) the 3D voxel method combined with the same ac-tivity as in item 2).
Absorbed-dose evaluations
Phantoms. A voxels-based phantom was made to repre-sent two digital spheres. The phantom consisted of 30 slices;each slice consisted of an array of 128 � 128 voxels (size, 4.8mm). The digital spheres were made with 1420 voxels (abouta 150-cc volume) and 472 voxels (about a 50-cc volume) withuniform activity distribution of the same concentration andsize of the acquired spheres (18.2 and 54.6 kBq/voxel forspheres of 150 and 50 cc, respectively), with no backgroundactivity. The mean absorbed doses were obtained by the S-voxel method and compared with the values obtained byOLINDA/EXM (sphere model). Moreover, the dose-volumehistograms (DVHs) for the digital and the acquired sphereswere generated and compared.
Patients. The comparison between the 3D voxel and theconventional MIRD methods was repeated in a group of 11patients who underwent receptor peptide radionuclide ther-apy (PRRT) with 90Y-DOTATATE. All patients were admin-
FABBRI ET AL.148
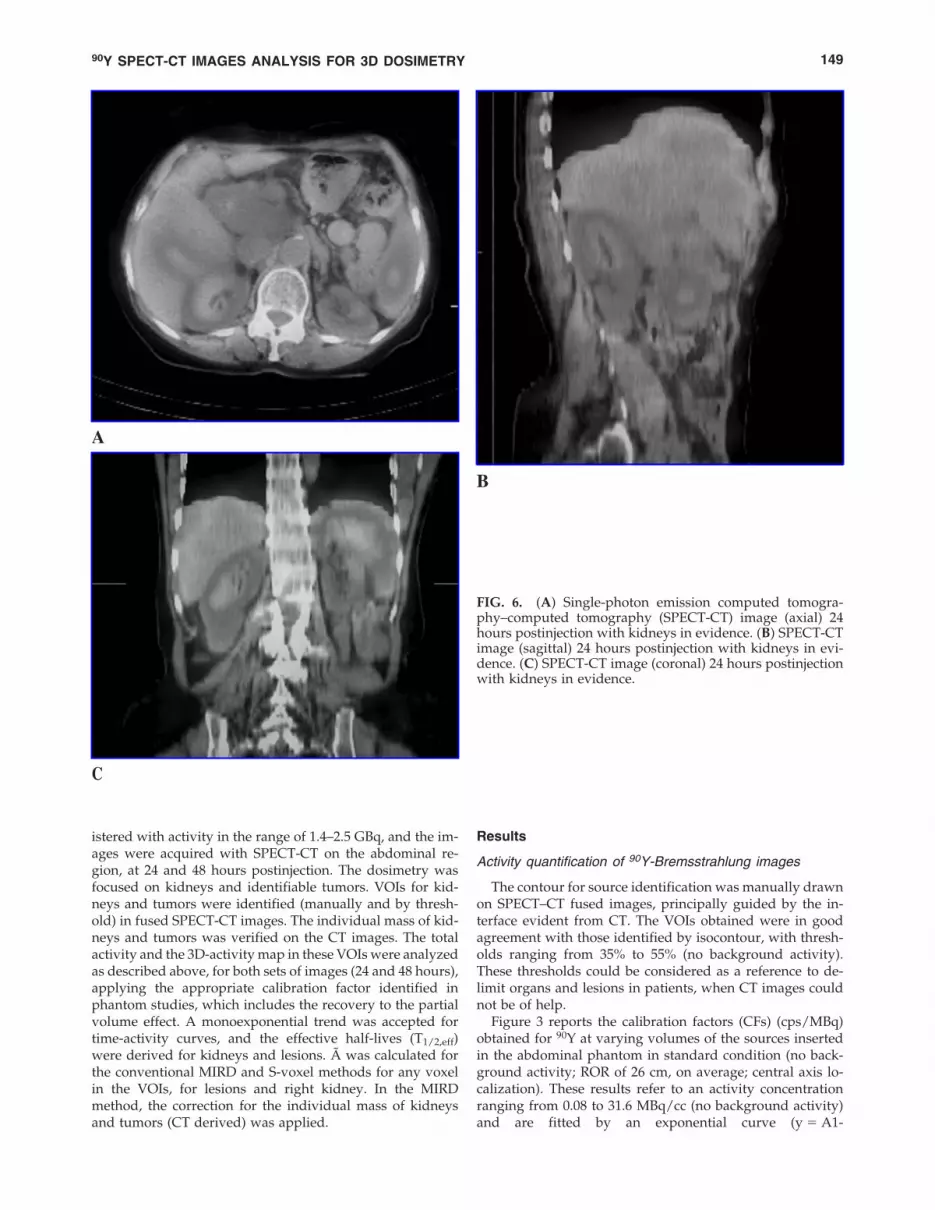
FIG. 5. (A) Single-photon emission computed tomogra-phy–computed tomography (SPECT-CT) image (axial) 24hours postinjection with pancreatic lesion in evidence. (B)SPECT-CT image (sagittal) 24 hours postinjection with pan-creatic lesion in evidence. (C) SPECT-CT image (coronal) 24hours postinjection with pancreatic lesion in evidence.
A
C
B
Results
Activity quantification of 90Y-Bremsstrahlung images
The contour for source identification was manually drawnon SPECT–CT fused images, principally guided by the in-terface evident from CT. The VOIs obtained were in goodagreement with those identified by isocontour, with thresh-olds ranging from 35% to 55% (no background activity).These thresholds could be considered as a reference to de-limit organs and lesions in patients, when CT images couldnot be of help.
Figure 3 reports the calibration factors (CFs) (cps/MBq)obtained for 90Y at varying volumes of the sources insertedin the abdominal phantom in standard condition (no back-ground activity; ROR of 26 cm, on average; central axis lo-calization). These results refer to an activity concentrationranging from 0.08 to 31.6 MBq/cc (no background activity)and are fitted by an exponential curve (y � A1-
90Y SPECT-CT IMAGES ANALYSIS FOR 3D DOSIMETRY 149
istered with activity in the range of 1.4–2.5 GBq, and the im-ages were acquired with SPECT-CT on the abdominal re-gion, at 24 and 48 hours postinjection. The dosimetry wasfocused on kidneys and identifiable tumors. VOIs for kid-neys and tumors were identified (manually and by thresh-old) in fused SPECT-CT images. The individual mass of kid-neys and tumors was verified on the CT images. The totalactivity and the 3D-activity map in these VOIs were analyzedas described above, for both sets of images (24 and 48 hours),applying the appropriate calibration factor identified inphantom studies, which includes the recovery to the partialvolume effect. A monoexponential trend was accepted fortime-activity curves, and the effective half-lives (T1/2,eff)were derived for kidneys and lesions. Ã was calculated forthe conventional MIRD and S-voxel methods for any voxelin the VOIs, for lesions and right kidney. In the MIRDmethod, the correction for the individual mass of kidneysand tumors (CT derived) was applied.
A
B
C
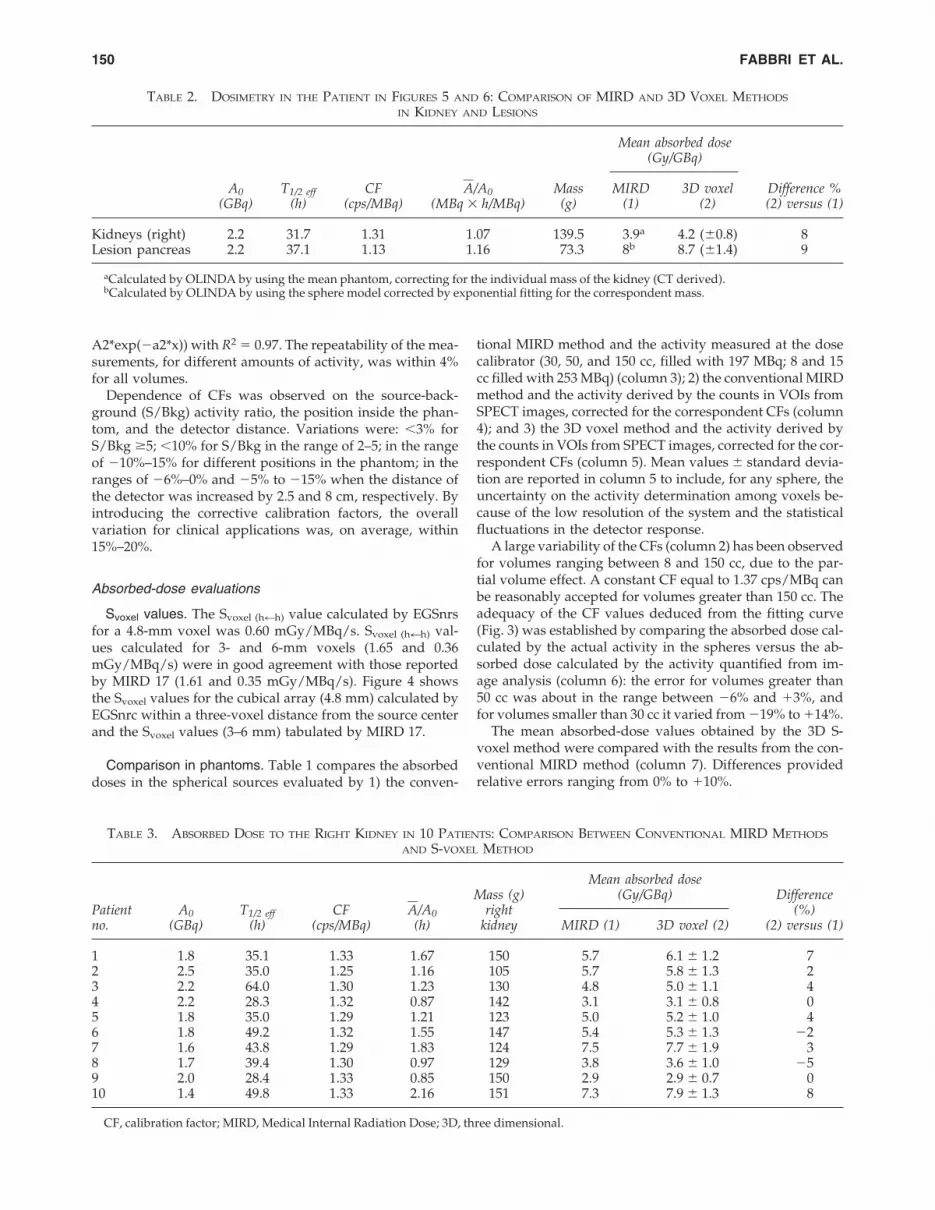
FIG. 6. (A) Single-photon emission computed tomogra-phy–computed tomography (SPECT-CT) image (axial) 24hours postinjection with kidneys in evidence. (B) SPECT-CTimage (sagittal) 24 hours postinjection with kidneys in evi-dence. (C) SPECT-CT image (coronal) 24 hours postinjectionwith kidneys in evidence.
A2*exp(�a2*x)) with R2 � 0.97. The repeatability of the mea-surements, for different amounts of activity, was within 4%for all volumes.
Dependence of CFs was observed on the source-back-ground (S/Bkg) activity ratio, the position inside the phan-tom, and the detector distance. Variations were: �3% forS/Bkg �5; �10% for S/Bkg in the range of 2–5; in the rangeof �10%–15% for different positions in the phantom; in theranges of �6%–0% and �5% to �15% when the distance ofthe detector was increased by 2.5 and 8 cm, respectively. Byintroducing the corrective calibration factors, the overallvariation for clinical applications was, on average, within15%–20%.
Absorbed-dose evaluations
Svoxel values. The Svoxel (h�h) value calculated by EGSnrsfor a 4.8-mm voxel was 0.60 mGy/MBq/s. Svoxel (h�h) val-ues calculated for 3- and 6-mm voxels (1.65 and 0.36mGy/MBq/s) were in good agreement with those reportedby MIRD 17 (1.61 and 0.35 mGy/MBq/s). Figure 4 showsthe Svoxel values for the cubical array (4.8 mm) calculated byEGSnrc within a three-voxel distance from the source centerand the Svoxel values (3–6 mm) tabulated by MIRD 17.
Comparison in phantoms. Table 1 compares the absorbeddoses in the spherical sources evaluated by 1) the conven-
FABBRI ET AL.150
tional MIRD method and the activity measured at the dosecalibrator (30, 50, and 150 cc, filled with 197 MBq; 8 and 15cc filled with 253 MBq) (column 3); 2) the conventional MIRDmethod and the activity derived by the counts in VOIs fromSPECT images, corrected for the correspondent CFs (column4); and 3) the 3D voxel method and the activity derived bythe counts in VOIs from SPECT images, corrected for the cor-respondent CFs (column 5). Mean values � standard devia-tion are reported in column 5 to include, for any sphere, theuncertainty on the activity determination among voxels be-cause of the low resolution of the system and the statisticalfluctuations in the detector response.
A large variability of the CFs (column 2) has been observedfor volumes ranging between 8 and 150 cc, due to the par-tial volume effect. A constant CF equal to 1.37 cps/MBq canbe reasonably accepted for volumes greater than 150 cc. Theadequacy of the CF values deduced from the fitting curve(Fig. 3) was established by comparing the absorbed dose cal-culated by the actual activity in the spheres versus the ab-sorbed dose calculated by the activity quantified from im-age analysis (column 6): the error for volumes greater than50 cc was about in the range between �6% and �3%, andfor volumes smaller than 30 cc it varied from �19% to �14%.
The mean absorbed-dose values obtained by the 3D S-voxel method were compared with the results from the con-ventional MIRD method (column 7). Differences providedrelative errors ranging from 0% to �10%.
TABLE 2. DOSIMETRY IN THE PATIENT IN FIGURES 5 AND 6: COMPARISON OF MIRD AND 3D VOXEL METHODS
IN KIDNEY AND LESIONS
Mean absorbed dose(Gy/GBq)
A0 T1/2 eff CF A�/A0 Mass MIRD 3D voxel Difference %(GBq) (h) (cps/MBq) (MBq � h/MBq) (g) (1) (2) (2) versus (1)
Kidneys (right) 2.2 31.7 1.31 1.07 139.5 3.9a 4.2 (�0.8) 8Lesion pancreas 2.2 37.1 1.13 1.16 73.3 8b 8.7 (�1.4) 9
aCalculated by OLINDA by using the mean phantom, correcting for the individual mass of the kidney (CT derived).bCalculated by OLINDA by using the sphere model corrected by exponential fitting for the correspondent mass.
TABLE 3. ABSORBED DOSE TO THE RIGHT KIDNEY IN 10 PATIENTS: COMPARISON BETWEEN CONVENTIONAL MIRD METHODS
AND S-VOXEL METHOD
Mass (g)Mean absorbed dose
DifferencePatient A0 T1/2 eff CF A�/A0 right
(Gy/GBq)(%)
no. (GBq) (h) (cps/MBq) (h) kidney MIRD (1) 3D voxel (2) (2) versus (1)
1 1.8 35.1 1.33 1.67 150 5.7 6.1 � 1.2 72 2.5 35.0 1.25 1.16 105 5.7 5.8 � 1.3 23 2.2 64.0 1.30 1.23 130 4.8 5.0 � 1.1 44 2.2 28.3 1.32 0.87 142 3.1 3.1 � 0.8 05 1.8 35.0 1.29 1.21 123 5.0 5.2 � 1.0 46 1.8 49.2 1.32 1.55 147 5.4 5.3 � 1.3 �27 1.6 43.8 1.29 1.83 124 7.5 7.7 � 1.9 38 1.7 39.4 1.30 0.97 129 3.8 3.6 � 1.0 �59 2.0 28.4 1.33 0.85 150 2.9 2.9 � 0.7 010 1.4 49.8 1.33 2.16 151 7.3 7.9 � 1.3 8
CF, calibration factor; MIRD, Medical Internal Radiation Dose; 3D, three dimensional.

Comparison in patients. Figures 5 and 6 show the post-therapy SPECT-CT 90Y-Bremsstrahlung images acquired ina patient (patient 11) at 24 hours after the administration of2.2 GBq of 90Y-DOTATATE, with a pancreatic lesion (Fig.5A–5C) and the kidneys (Fig. 6A–6C) in evidence. The ab-sorbed doses evaluated in the right kidney (as a mean value)and in the pancreatic lesion detected in this patient are re-ported (see Table 2), comparing the results from the MIRDand the 3D voxel methods. The absorbed-dose values for theright kidney and the lesion calculated by Olinda/EXM werein agreement with the mean dose values obtained by the S-voxel method (difference of �8% and �9%, respectively).Table 3 presents the mean absorbed dose to the right kidneyevaluated in 10 patients. Differences between the MIRD andS-voxel methods ranged between �5% and �8%, with kid-ney masses in the range of 100–150 g.
A few examples of integral DVHs derived from the imageanalysis are shown in Figure 7A for the digital and the ac-quired spheres of 50 and 150 cc and in Figure 7B for the rightkidney and lesion of patient 11. The dose distribution of theSPECT-acquired sphere spread out in values that rangewider than the dose distribution of the digital sphere. TheDVHs relative to the patient showed a clear separation be-tween the kidney and lesion dose distribution.
Discussion
90Y-PRRT started in our center a few years ago with a mul-ticenter collaboration. Therapy is planned after an indicationhas been proven by a diagnostic scan in one of the centersinvolved. In the course of time, the need of verifying thebiodistribution during the course of therapy, even shiftingto 90Y-Bremstrahlung images, has been pointed out. Theavailability of the new-generation SPECT-CT hybrid systemhas favored a multiple set of SPECT-CT of the abdominal re-gion versus planar scintigraphies, to potentially observe thekinetics and the activity distribution within the organs re-ceiving most of the administered activity, including the crit-ical organs—the kidneys. As a routine procedure, two ac-quisitions (at 24 and 48 hours) were planned for anytreatment with 90Y-DOTATOC or 90Y-DOTATATE.
The quality of the images obtained resulted as unexpect-edly fulfilling, as compared to the usual Bremsstrahlung fea-tures, and identified the assessment of quantitative 90Y-imag-ing for 3D dosimetry as a possible goal. The first step was adetailed calibration study with phantoms in order to evalu-ate the response of the system and the influence of some pa-rameters (e.g., source activity, volume, position, detector dis-tance, background, and so forth). The results confirmed that,using appropriate energy windows, attenuation, and 3D re-sponse of the collimator correction, the fused SPECT-CT im-ages processed by the system offer a more than acceptablequantitative accuracy in clinical cases for dosimetric pur-poses.
The results shown were obtained by introducing specificvolume-compensating coefficient CFs. The appropriate de-termination of these factors is most important, especially forthe small source volumes. In fact, the calibration curve (Fig.3) shows relevant dependence of the sensitivity from volume(CFs vary from 0.4 up to 1.3 cps/MBq for sources of from 8to 150 cc).
The error about the measurement repeatability and the ac-tivity variation was within 4% for a phantom activity range(0.5–10 mCi) that covered clinical applications. The featuresof the equipment guarantee also a good alignment and fu-sion of SPECT and CT images. The software for image anal-ysis eases the identification of VOIs associated with organsand tumors—with the guide of CT as well as with a count-ing threshold tool. All these characteristics increase the re-producibility of the results.
The following step was to set up a more ample 3D dosi-metric evaluation method based on voxel-activity distribu-tion analysis. The comparison of the results (see Table 1) con-firmed the adequacy of the correction factors and of thealgorithm used for the S-voxel method, as absolute differ-ences were within 10%.
Of course, the performance of the system withBremsstrahlung images is worse than for a gamma-emitter,such as 111In, and the accuracy of a 3D dosimetric evalua-tion is undoubtedly lower than what is achievable by 111Inor 86Y derivatives through SPECT-CT or PET-CT. In fact,there are some inevitable drawbacks: Spatial resolution and
90Y SPECT-CT IMAGES ANALYSIS FOR 3D DOSIMETRY 151
AB
FIG. 7. (A) Integral dose-volume histogram (DVH) of acquired sphere and digital sphere. (B) Integral DVH of pancreaticlesion and kidney shown in Figures 5A–5C and 6A–6C.

sensitivity are lower, and small volumes are especially af-fected by the partial volume effect. These issues undoubt-edly impact on the absorbed-dose distributions, while meanvalues were similar. The quantitative analysis with the pro-posed S-voxel method was able to generate dose-matrix and-volume histograms, which provide information limited bythe low spatial resolution of the system. Moreover, the S-val-ues were calculated in the hypothesis of infinite homoge-neous tissue, with density equal to 1 g/cm3, so the valuescould not be used for tissues with very different density (e.g.,lung and bone) and for air to soft-tissue and for bone to soft-tissue interfaces.15–17
Despite the limitations reported above, the consistent im-provement on Bremsstrahlung images make them suitablefor dosimetric evaluations. The method applied to patientshas proven to be feasible, reproducible, and even less time-consuming than planar dosimetry. The commitment of pre-dictive dosimetry, onerous for the patients and for the De-partment, is not essential in the case of multiple-cycletherapies such as PRRT: The data needed to personalize andoptimize treatments (e.g., cumulative IA, time intervalamong cycles, and so forth) can perfectly be derived on theoccasion of the first therapeutic administration. Dosimetrybecomes feasible at all cycles with minor/acceptable time im-pact, allowing to identify possible variations of the biodis-tribution among cycles (as observed in PRRT with 177Lu-DOTATATE18). Based on subsequent results, patients canpotentially benefit from a rearrangement of the treatment.Moreover, the statistical enrichment in the field of radionu-clide therapy is crucial for the analysis19 of dose-effect cor-relations. Further developments could include the compari-son, in the same patient, of 90Y-Bremsstrahlung versus 111In-or 86Y-SPECT/PET-CT images. The study of the dose distri-butions, as compared to the evaluated mean absorbed doses,could be deepened in order to assess the ability ofBremsstrahlung images to identify details on different ac-tivity concentrations in suborgans or tumors.
The application of the proposed method allows to addressdiagnostic examinations to patient recruitment and to restrictample dosimetry evaluation only to treated patients, beforeor during therapy, directly using the therapeutical radionu-clide. This could represent the most convenient choice inmany centers, avoiding the need of a surrogate to mimic ther-apy or the difficulties of 86Y quantification.
Conclusions
This study shows the improvement of 90Y-Bremsstrahlungimages acquired and reconstructed by hybrid SPECT-CT sys-tems, which provide better information on distribution andbiokinetics of pure beta-emitter radiopharmaceuticals. Ap-plying adequate CFs, 3D patient-specific dosimetry is feasi-ble with acceptable accuracy on each therapy cycle. TheDVHs, even though limited from low spatial resolution, al-lowed us to verify the dose distribution in the target and inthe critical organs. This represents contribution-enrichingdosimetry and toxicity information, which is essential in ra-dionuclide therapy, especially in patients with risk factors.
Acknowledgments
The authors are thankful to Nico Lanconelli of the PhysicsDepartment of the University of Bologna for the calculation
of the Svoxel values, which were not available in the litera-ture and were necessary for the computation of this work.The authors are also grateful the radiochemist, MicheleMusto, for all his help and assistance.
Disclosure Statement
No competing financial interests exist.
References
1. Cremonesi M, Ferrari M, Bodei L, et al. G. Dosimetry in pep-tide radionuclide receptor therapy: a review. J Nucl Med2006;47:1467.
2. Barone R, Chazot FB, Valkema R, et al. Patient-specificdosimetry in predicting renal toxicity with 90Y-DOTATOC:Relevance of kidney volume and dose rate in finding a dose-effect relationship. J Nucl Med 2005;46:99S.
3. Walrand S, Jamar F, Mathieu I, et al. Quantitation in PETusing isotopes emitting prompt single gammas: applicationto yttrium-86. Eur J Nucl Med Mol Imaging 2003;30:354.
4. Snyder WS, Ford MR, Warner G, et al. MIRD Pamphlet No.11: “S” Absorbed dose unit cumulated activity for selectedradionuclides and organs. New York: Society of NuclearMedicine, 1975.
5. Siegel JA, Thomas SR, Stubbs JB, et al. MIRD Pamphlet No.16: Techniques for quantitative radiopharmaceutical biodis-tribution data acquisition and analysis for use in human ra-diation dose estimates. J Nucl Med 1999;40:37S.
6. Bolch WE, Bouchet LG, Robertson JS, et al. MIRD PamphletNo. 17: The dosimetry of nonuniform activity distribu-tions—radionuclide S-values at the voxel level. J Nucl Med1999;40:11S.
7. Shen S, De Nardo GL, Yuan A, et al. Planar gamma-cameraimaging and quantitation of Yttrium-90 Bremsstrahlung. JNucl Med 1994;35:1381.
8. Dewaraja YK, Wilderman SJ, Ljungberg M, et al. Accuratedosimetry in 131I radionuclide therapy using patient-spe-cific, 3-dimensional methods for SPECT reconstruction andabsorbed dose calculation. J Nucl Med 2005;46:840.
9. Ljungberg M, Sjogreen K, Liu X, et al. A 3-dimensional ab-sorbed-dose calculation method based on quantitativeSPECT for radionuclide therapy: Evaluation for 131I usingMonte Carlo simulation. J Nucl Med 2002;43:1101.
10. Rogers DWO, Kawrakow I, Seuntjens JP, et al. NRC usercodes for EGSnrc. Technical Report Pirs-702 (rev B). NationalResearch Council of Canada, 2005.
11. Kawrakow I, Mainegra-Hing E, Rogers DWO. EGSnrcMP:The multiplatform environment for EGSnrc. Technical Re-port Pirs–877. National Research Council of Canada, 2006.
12. Ljungberg M, Frey E, Sjogreen K, et al. 3D absorbed-dosecalculations based on SPECT: Evalutation for 111-In/90-Ytherapy using Monte Carlo simulations. Cancer Biother Ra-diopharm 2003;18:99.
13. Stabin MG, Sparks RB, Crowe E. OLINDA/EXM: the sec-ond-generation personal computer software for internaldose assessment in nuclear medicine. J Nucl Med 2005;46:1023.
14. Bouchet LG, Bolch WE, Blanco HP, et al. MIRD PamphletNo. 19: Absorbed fractions and radionuclide S-values for sixage-dependent multiregion models of the kidney. J NuclMed 2003;44:1113.
15. Mckay E. A software tool for specifying voxel models fordosimetry estimation. Cancer Biother Radiopharm 2003;18:379.
FABBRI ET AL.152

16. Chiavassa S, Bardies M, Guiraud-Vitaux F, et al. CEDIPE: A personalized dosimetric tool associating voxel-basedmodels with MCNPX. Cancer Biother Radiopharm 2005;20:325.
17. Petoussi-Henss N, Zankl M, Nosske D. Estimation of patientdose from radiopharmaceuticals using voxel models. Can-cer Biother Radiopharm 2005;20:103.
18. Valkema R, Pauwels SA, Kvols LK, et al. Long-term follow-up of renal function after peptide receptor radiation therapywith 90Y-DOTA0,Tyr3-octreotide and 177Lu-DOTA0, Tyr3-octreotate. J Nucl Med 2005;46:83S.
19. Strigari L, D’Andrea M, Ludovico C, et al. Biological opti-mization of heterogeneus dose distributions in systemic ra-diotherapy. Med Phys 2006;33:1857.
90Y SPECT-CT IMAGES ANALYSIS FOR 3D DOSIMETRY 153
