development and application of advanced proteomic ... - core
TRANSCRIPT
DEVELOPMENT AND APPLICATION OF ADVANCED
PROTEOMIC TECHNIQUES FOR HIGH-
THROUGHPUT IDENTIFICATION OF PROTEINS
HU YI (B.Sc.)
NATIONAL UNIVERSITY OF SINGAPORE
2006
DEVELOPMENT AND APPLICATION OF ADVANCED
PROTEOMIC TECHNIQUES FOR HIGH-
THROUGHPUT IDENTIFICATION OF PROTEINS
HU YI (B.Sc.)
A THESIS SUBMITTED
FOR THE DEGREE OF DOCTOR OF PHILOSOPHY
DEPARTMENT OF BIOLOGICAL SCIENCES
NATIONAL UNIVERSITY OF SINGAPORE
2006

i
Acknowledgements
I am especially indebted to my supervisor, Dr. Yao Shao Qin, for his invaluable
guidance and consistent support since I joined the lab. All the credit must go to him
for his critical opinions and edification in my research work.
I am full of gratitude to Grace, who has taught me basic experimental skills with
wonted patience. Her generous support and encouragement were throughout my stay
in the lab.
My grateful thanks are also due to A/P Yang Daiwen, Dr. Lu Yixin and Dr. Zhu Qing,
who have kindly written the letters of recommendation for me.
I would thank all the past and current members in Dr. Yao’s lab for fostering a
comfortable working environment. I wish them all the best in the years to come.
Special thanks to all my friends in Singapore- Lu Yi, Wu Heng, Hong Bing, Li Mo,
Portia, Siew Lai, Bernie, Srinivasa Rao, Luo Min, Xiao Xing, Zhuo Lei, Dong Lai
and others, who have been spicing up my life with great joys over the last four years.
Finally, I must thank my parents and sister for providing unwavering support
whenever I need it.
ii
Table of Contents
Page
Acknowledgements i
Table of Contents ii
Summary viii
List of Publications x
List of Tables xi
List of Figures xii
List of Abbreviations xiv
Chapter 1 Introduction 1
1.1 Impact of proteomics in the post-genomic era 2
1.1.1 Genomics and functional genomics 2
1.1.2 Proteomics 4
1.2 Gel-based proteomics 7
1.2.1 Two-dimensional gel electrophoresis (2-DE) 7
1.2.2 Multiplexed proteomics (MP) 10
1.2.3 Differential gel electrophoresis (DIGE) in quantitative proteomics 13
1.3 Isotope-based proteomics 14
1.3.1 Metabolic labeling by the radioisotopes 15
1.3.2 Isotope-coded affinity tag (ICAT) 19
1.4 Mass spectrometry (MS)-based protein identification and
quantitation 21
1.5 Emerging techniques for protein activity-based profiling and
microarray-based protein characterization 27
iii
Page
1.5.1 Activity-based protein profiling 27
1.5.2 Microarray-based protein characterization 28
1.6 Yeast and yeast proteome 31
1.7 Objectives 32
Chapter 2 Proteome analysis of Saccharomyces
cerevisiae under metal stress by two-dimensional
differential gel electrophoresis (2-D DIGE) 36
2.1 Introduction 36
2.2 Objectives 38
2.3 Results 40
2.3.1 Metal survival test 40
2.3.2 Comparison of protein profiles of DIGE images with silver-stained
images 42
2.3.3 Expression profiling of yeast proteome with different metals 46
2.3.4 Quantitative thresholds of significant changes in protein expression 48
2.3.5 Quantitative and qualitative analysis of individual spots across
fifteen DIGE gels 50
2.4 Discussion 57
2.4.1 An overview of DIGE and its limitations in proteomic applications 57
2.4.2 The putative functions of identified proteins in cellular defense
pathways 61
2.4.3 Complexity of cellular mechanisms for metal homeostasis in yeast 64
iv
Page
2.5 Conclusions and future directions 65
Chapter 3 Identification of protein-protein
interactions using 2-D DIGE 68
3.1 Introduction 68
3.1.1 Yeast two-hybrid (Y2H) system 68
3.1.2 MS-based identification of protein-protein interactions 70
3.2 Objectives 71
3.3 Results 73
3.3.1 Purification of a yeast caspase-like protein (YCA1) 73
3.3.2 Identification of YCA1-binding proteins in yeast 74
3.3.3 Verification of identified protein-protein interactions 76
3.4 Discussion 81
3.4.1 Apoptosis in yeast 81
3.4.2 In silico validation of protein-protein interactions 85
3.5 Future directions 87
Chapter 4 Activity-based high-throughput screening
of enzymes by using a DNA microarray 89
4.1 Introduction and objectives 89
4.1.1 Protein display technologies 91
4.1.2 Activity-based protein profiling 92
v
Page
4.2 Results 93
4.2.1 In vitro selection of functional protein by ribosome display 93
4.2.2 In vitro selection of enzyme based on the catalytic activity 96
4.2.3 Identification of a subclass of enzymes from a DNA library via
Expression Display 100
4.3 Discussion 105
4.3.1 Comparison of ribosome display with other protein display
technologies 105
4.3.2 In vitro selection of functional proteins 107
4.3.3 Application of DNA microarrays as decoding tools in functional
proteomics 108
4.4 Conclusions and future directions 109
Chapter 5 High-throughput screening of functional
proteins from a phage display library 112
5.1 Introduction 112
5.2 Objective 113
5.3 Results and discussion 114
5.3.1 In vitro screening of functional proteins under standard selection
conditions 114
5.3.2 In vitro screening of functional proteins under modified selection
conditions 118
5.4 Conclusions and future directions 122
vi
Page
Chapter 6 Concluding remarks 124
6.1 Conclusions and critiques 124
6.2 Future directions 126
Chapter 7 Materials and methods 127
7.1 Common materials and methods 127
7.1.1 Bacteria strains and culture media 127
7.1.2 Yeast strains and culture media 127
7.1.3 DNA sample preparation and analysis 128
7.1.3.1 DNA extraction and polymerase chain reaction (PCR) 128
7.1.3.2 DNA cloning and sequencing 129
7.1.4 Protein sample preparation and analysis 130
7.1.4.1 Protein expression and purification 130
7.1.4.2 1-D, 2-D gel electrophoresis and silver staining 131
7.1.4.3 Protein identification by MALDI-TOF MS 133
7.1.4.4 Western blotting 134
7.2 Proteome analysis of Saccharomyces cerevisiae under metal stress
by 2-D DIGE 134
7.2.1 Dye synthesis 134
7.2.2 Yeast culture and metal treatments 135
7.2.3 Sample preparation, protein labeling and 2-D DIGE 135
7.3 Identification of protein-protein interactions using 2-D DIGE 136
7.3.1 Extraction and purification of the yeast metacaspase 136
vii
Page
7.3.2 Protein pull-down assay 137
7.3.3 Analysis of identified protein-protein interactions on BIACORE® 137
7.4 Expression Display 138
7.4.1 Probe synthesis 138
7.4.2 DNA construction 138
7.4.3 In vitro transcription and translation 140
7.4.4 In vitro selection 140
7.4.5 Reverse transcription- Polymerase chain reaction (RT-PCR) 141
7.4.6 Slide preparation and microarray processing 141
7.4.7 Verification of protein labeling with the probe 143
7.4.8 Inhibition assay 143
7.5 High-throughput screening of functional proteins from a phage
display library 144
7.5.1 Phage-displayed human cDNA library 144
7.5.2 Phage propagation 144
7.5.3 In vitro selection 145
7.5.4 Plaque assay 145
7.5.5 Probe and streptavidin binding assays for individual phage clones 146
7.5.6 Identification of selected phage clones 146
Bibliography 147
Appendices i-xxix
viii
Summary
As an emerging field in the post-genomic era, proteomics has witnessed a rapid
development in the last decade and beyond. However, to date, no proteomic
techniques can perfectly address all the issues in this field. In this study, we sought to
develop and apply advanced proteomic techniques from three different aspects for
high-throughput identification of enzymes and their associated proteins in yeast
proteome (catalomics). Firstly, to validate the high-throughput capacity of differential
gel electrophoresis (DIGE), the yeast proteome upon exposure to fifteen kinds of
metal salts was interrogated in a parallel and quantitative fashion (quantitative
proteomics). Yeast proteins (mainly enzymes) with significantly altered expression
levels have been identified, which not only provided the first clues on how yeast cells
respond to the sudden influx of exogenous metals on a proteome-wide scale, but also
presented the mutuality between multiple cellular defense mechanisms against metal
stress in yeast. Potentially, DIGE-based proteome profiling can be applied for large-
scale identification of not only enzymes, but also enzyme substrates in a proteome.
Secondly, to improve the quality of protein-protein interaction data, a new strategy for
the elimination of false positives has been developed, where a control sample was
prepared in parallel with a protein pull-down assay to pinpoint nonspecifically bound
proteins (interactomics). With the aid of DIGE, subtraction of those nonspecifically
bound proteins led to a rigorous identification of yeast metacaspase-binding proteins
from yeast proteome. Results showed that although nonspecific protein binding were
rather strong under the mild washing conditions, which are typically required for the
purification of unstable protein complexes, binding partners of yeast metacaspase
could still be ascertained with a high confidence. This may pave the way for a
rigorous identification of enzyme substrates and regulatory proteins in a high-
ix
throughput manner. Thirdly, to expedite the activity-based protein identification, a
novel strategy (i.e. Expression Display) has been developed in this study, whereby
proteins with particular enzymatic activity could be selected and subsequently
identified from a DNA library (functional proteomics). By taking advantage of the
activity-based chemical probe, we have shown, for the first time, multiple enzymes
belonging to the same class could be fished out as ribosome-displayed complexes
from a DNA library, followed by facile identification of the enzyme-encoding genes
with the decoding DNA microarray. We envision that Expression Display will be
potentially applicable for high-throughput characterization of proteins from any well-
known or unknown organisms and therefore facilitate the study in functional
proteomics. In the following endeavors, we sought to fish out enzyme-encoding genes
by the chemical probe from a human brain cDNA library using phage display. Based
on our results, the selection conditions need to be further refined so as to specifically
select desired genes from a genome-scale library.
In conclusion, advanced proteomic techniques have been successfully developed and
exploited in this study in attempts to identify yeast enzymes and their associated
proteins on a proteome-scale. These techniques showed significant advantages over
conventional methods and will thus facilitate the high-throughput identification of
proteins in proteomics.
x
List of Publications
Hu, Y., Wang, G., Chen, G.Y.J., Fu, X. & Yao, S.Q. Proteome analysis of Saccharomyces cerevisiae under metal stress by two-dimensional differential gel electrophoresis. Electrophoresis 24, 1458-1470 (2003).
Hu, Y., Huang, X., Chen, G.Y.J. & Yao, S.Q. Recent advances in gel-based proteome profiling techniques. Mol. Biotechnol. 28, 63-76 (2004).
Lue, R.Y., Chen, G.Y.J., Hu, Y., Zhu, Q. & Yao, S.Q. Versatile protein biotinylation strategies for potential high-throughput proteomics. J. Am. Chem. Soc. 126, 1055-1062 (2004).
Hu, Y., Chen, G.Y.J. & Yao, S.Q. Activity-based high throughput screening of enzymes using DNA microarray. Angew. Chem. Int. Ed. Engl. 44, 1048-1053 (2005).
Hu, Y., Uttamchandani, M. & Yao, S.Q. Microarray: a versatile platform for high-throughput functional proteomics. Comb. Chem. High Throughput Screen. 9, 203-212 (2006).

xi
List of Tables Page
Table 2.1 Proteins related to metal stress in yeast. 55
Table 5.1 Phage clones selected from human brain cDNA library (batch
A). 118
Table 5.2 Phage clones selected from human brain cDNA library (batch
B, round 4). 121
Table 7.1 Protocol of silver staining. 133
xii
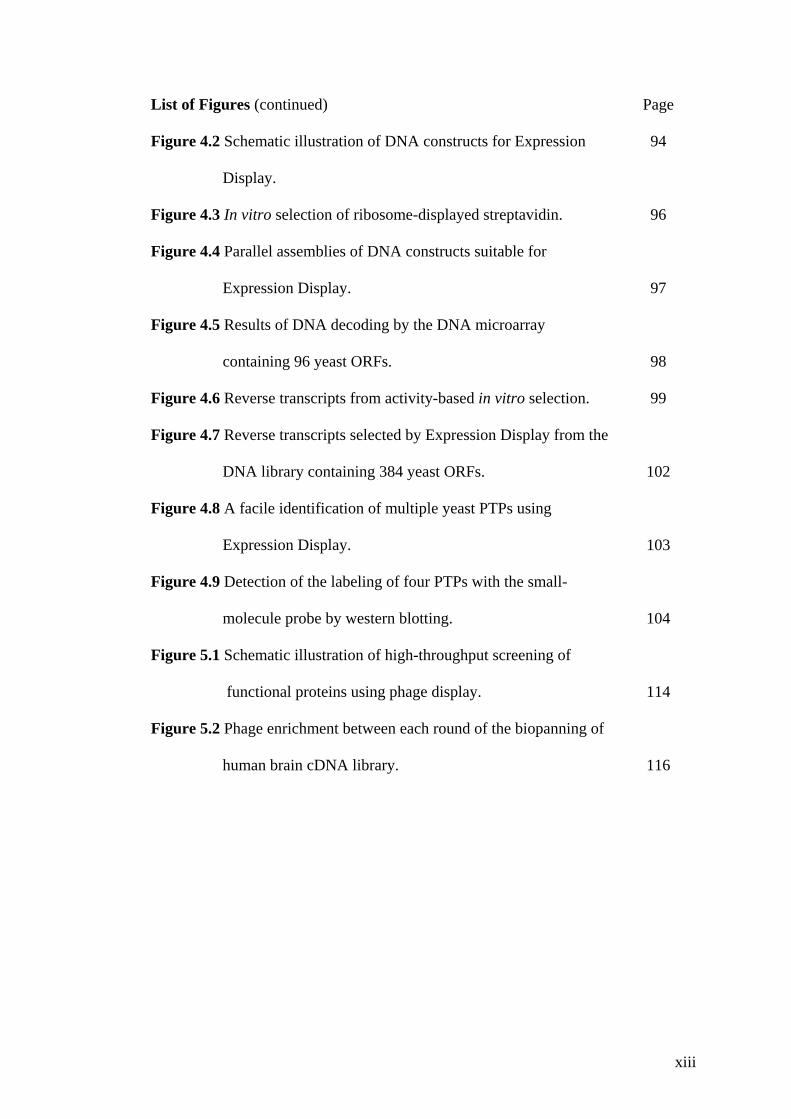
List of Figures Page
Figure 1.1 The diagram of studying three major entities in a biological
system. 6
Figure 1.2 Schematic illustration of DifExpo. 18
Figure 2.1 Methodology of proteome analysis by DIGE. 39
Figure 2.2 Quantitative analysis of metal stress in Saccharomyces
cerevisiae. 41
Figure 2.3 Comparison of protein patterns on DIGE images. 44
Figure 2.4 Comparison of protein patterns of DIGE images with the
pattern of silver-stained image. 45
Figure 2.5 Reproducibility of 2-D DIGE gels. 45
Figure 2.6 Protein map of Saccharomyces cerevisiae and 3D profiles of
SOD1 present in fifteen gels. 52
Figure 3.1 Schematic illustration of subtractive proteomics for the
identification of protein-protein interactions. 72
Figure 3.2 Western blots of YCA1-GST and GST using anti-GST. 74
Figure 3.3 2-D images of the proteins from pull-down assays. 76
Figure 3.4 Verification of identified protein-protein interactions by the
in vitro protein binding assays. 78
Figure 3.5 Sensorgrams of identified protein-protein interactions on
BIACORE®. 80
Figure 3.6 Sequence alignments of YNR064Cp, BAC56745p and
Nma111p. 83
Figure 4.1 Schematic illustration of Expression Display. 90
xiii
List of Figures (continued) Page
Figure 4.2 Schematic illustration of DNA constructs for Expression
Display.
94
Figure 4.3 In vitro selection of ribosome-displayed streptavidin. 96
Figure 4.4 Parallel assemblies of DNA constructs suitable for
Expression Display. 97
Figure 4.5 Results of DNA decoding by the DNA microarray
containing 96 yeast ORFs. 98
Figure 4.6 Reverse transcripts from activity-based in vitro selection. 99
Figure 4.7 Reverse transcripts selected by Expression Display from the
DNA library containing 384 yeast ORFs. 102
Figure 4.8 A facile identification of multiple yeast PTPs using
Expression Display. 103
Figure 4.9 Detection of the labeling of four PTPs with the small-
molecule probe by western blotting. 104
Figure 5.1 Schematic illustration of high-throughput screening of
functional proteins using phage display. 114
Figure 5.2 Phage enrichment between each round of the biopanning of
human brain cDNA library. 116
xiv
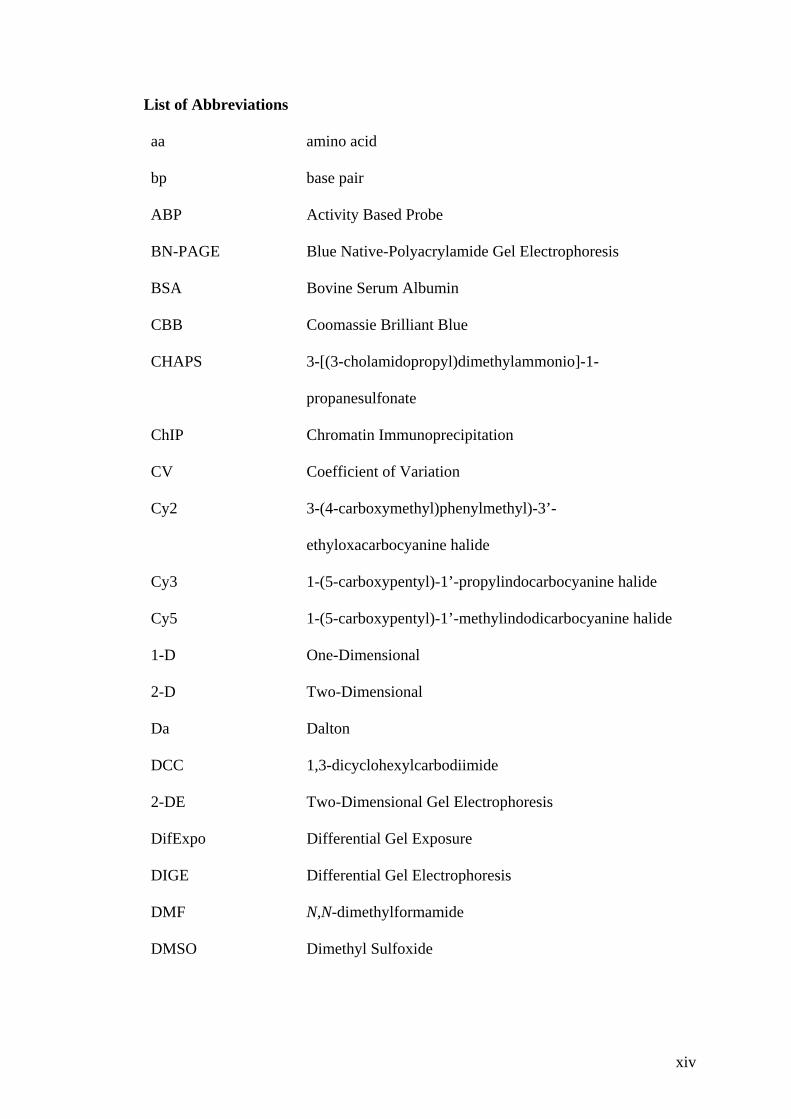
List of Abbreviations aa amino acid
bp base pair
ABP Activity Based Probe
BN-PAGE Blue Native-Polyacrylamide Gel Electrophoresis
BSA Bovine Serum Albumin
CBB Coomassie Brilliant Blue
CHAPS 3-[(3-cholamidopropyl)dimethylammonio]-1-
propanesulfonate
ChIP Chromatin Immunoprecipitation
CV Coefficient of Variation
Cy2 3-(4-carboxymethyl)phenylmethyl)-3’-
ethyloxacarbocyanine halide
Cy3 1-(5-carboxypentyl)-1’-propylindocarbocyanine halide
Cy5 1-(5-carboxypentyl)-1’-methylindodicarbocyanine halide
1-D One-Dimensional
2-D Two-Dimensional
Da Dalton
DCC 1,3-dicyclohexylcarbodiimide
2-DE Two-Dimensional Gel Electrophoresis
DifExpo Differential Gel Exposure
DIGE Differential Gel Electrophoresis
DMF N,N-dimethylformamide
DMSO Dimethyl Sulfoxide
xv
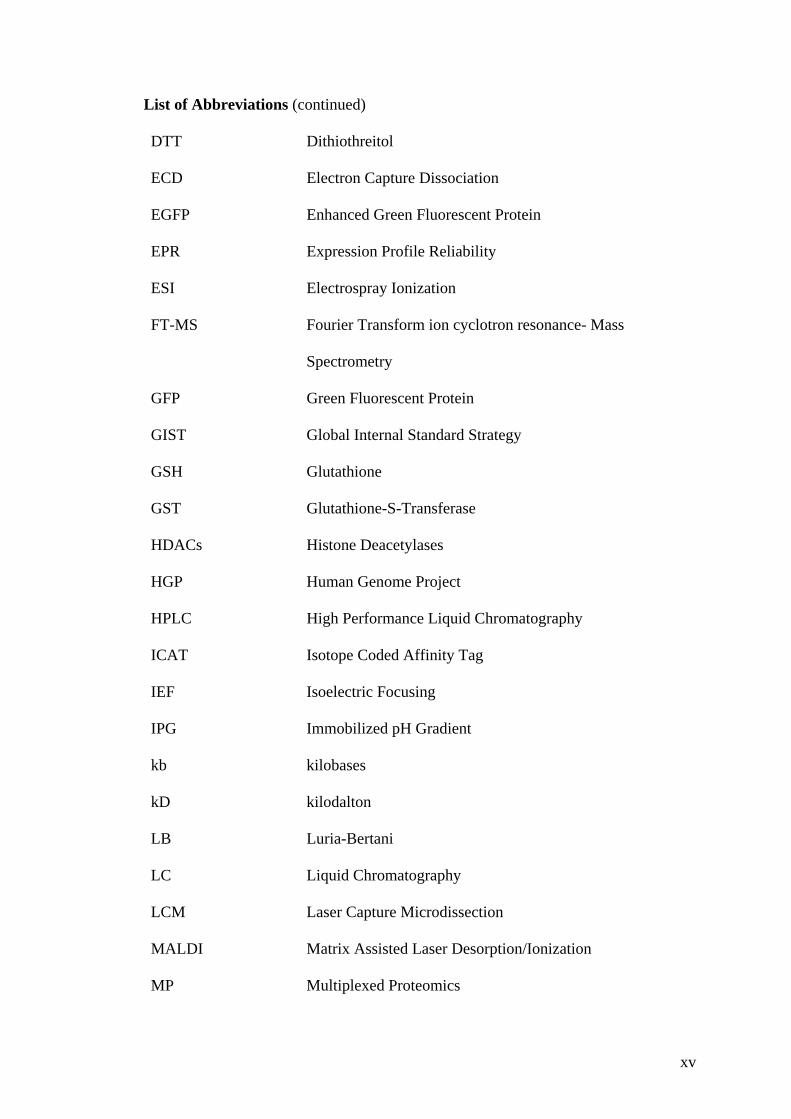
List of Abbreviations (continued) DTT Dithiothreitol
ECD Electron Capture Dissociation
EGFP Enhanced Green Fluorescent Protein
EPR Expression Profile Reliability
ESI Electrospray Ionization
FT-MS Fourier Transform ion cyclotron resonance- Mass
Spectrometry
GFP Green Fluorescent Protein
GIST Global Internal Standard Strategy
GSH Glutathione
GST Glutathione-S-Transferase
HDACs Histone Deacetylases
HGP Human Genome Project
HPLC High Performance Liquid Chromatography
ICAT Isotope Coded Affinity Tag
IEF Isoelectric Focusing
IPG Immobilized pH Gradient
kb kilobases
kD kilodalton
LB Luria-Bertani
LC Liquid Chromatography
LCM Laser Capture Microdissection
MALDI Matrix Assisted Laser Desorption/Ionization
MP Multiplexed Proteomics
xvi
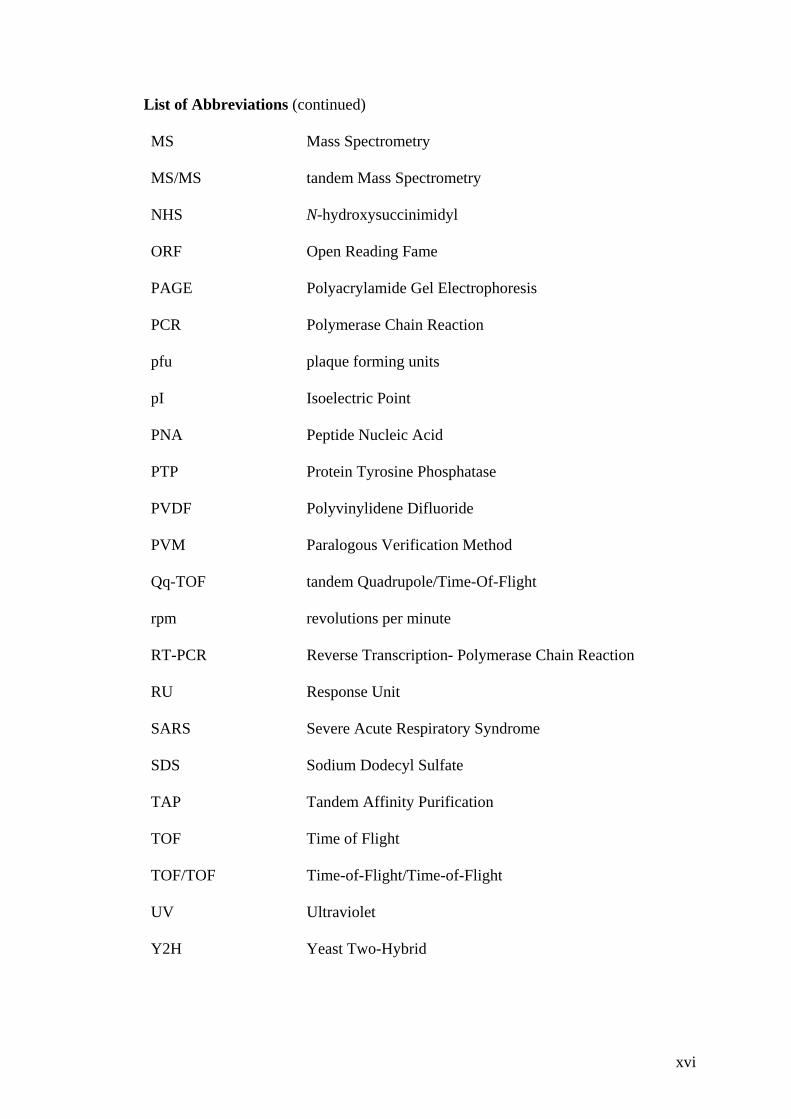
List of Abbreviations (continued) MS Mass Spectrometry
MS/MS tandem Mass Spectrometry
NHS N-hydroxysuccinimidyl
ORF Open Reading Fame
PAGE Polyacrylamide Gel Electrophoresis
PCR Polymerase Chain Reaction
pfu plaque forming units
pI Isoelectric Point
PNA Peptide Nucleic Acid
PTP Protein Tyrosine Phosphatase
PVDF Polyvinylidene Difluoride
PVM Paralogous Verification Method
Qq-TOF tandem Quadrupole/Time-Of-Flight
rpm revolutions per minute
RT-PCR Reverse Transcription- Polymerase Chain Reaction
RU Response Unit
SARS Severe Acute Respiratory Syndrome
SDS Sodium Dodecyl Sulfate
TAP Tandem Affinity Purification
TOF Time of Flight
TOF/TOF Time-of-Flight/Time-of-Flight
UV Ultraviolet
Y2H Yeast Two-Hybrid
1
Chapter 1 Introduction The complete sequence of the human genome (Lander et al., 2001; Venter et al.,
2001), in addition to the larger framework of other model organisms such as the
bacterium Haemophilus influenzae (Fleischmann et al., 1995), the budding yeast
Saccharomyces cerevisiae (Goffeau et al., 1996), the nematode Caenorhabditis
elegans (C. elegans sequencing consortium, 1998), the plant Arabidopsis thaliana
(Arabidopsis Genome Initiative, 2000), the fruitfly Drosophila melanogaster (Adams
et al., 2000), two subspecies of rice Oryza sativa L. ssp. japonica (Goff et al., 2002)
and Oryza sativa L. ssp. indica (Yu et al., 2002), the pufferfish Fugu rubripes
(Aparicio et al., 2002), the mouse (Waterston et al., 2002), the severe acute
respiratory syndrome (SARS)-associated coronavirus (Marra et al., 2003), the
laboratory rat Rattus norvegicus (Gibbs et al., 2004), Mimivirus (Raoult et al., 2004),
the chicken Gallus gallus (Hillier et al., 2004), the protozoan pathogen Trypanosoma
cruzi (El-Sayed et al., 2005) and the chimpanzee Pan troglodytes (Chimpanzee
Sequencing and Analysis Consortium, 2005), heralded the dawn of the post-genomic
era. These genomic studies have established a firm foundation for modern biological
investigations to unveil the blueprint of life. However, unlike the relatively
unchanging genome, the constellation of all proteins in the proteome is dynamic and it
is the study of protein expression and functions that will elucidate the molecular basis
of health and disease. Currently, rather than the characterization of individual proteins,
scientific endeavors have shifted towards high-throughput approaches that facilitate
large-scale analysis of proteins, i.e. proteomics (Pandey and Mann, 2000; Tyers and
Mann, 2003). Therefore, the advancement of proteomics relies largely on the
development of state-of-the-art proteomics techniques. The following discussion will
2
mainly focus on the impact of proteomics in the post-genomic era and the
development of up-to-date techniques employed in this field.
1.1 Impact of proteomics in the post-genomic era
Proteomics, extrapolated from genomics, aims to characterize the repertoire of gene
products encoded by the entire genome of an organism (Fields, 2001). With an
elaborate depiction of proteins, proteomics is an efficacious means of unraveling gene
expression and functions, thereby holding the promise to significantly impact our
understanding of the cellular processes and disease states (Hanash, 2003). In this
regard, proteomics is a further step from genomics and its descendant - functional
genomics. To highlight the significance of proteomics in this post-genomic era, the
mutuality between genomics, including functional genomics, and proteomics will be
reviewed in the following sections.
1.1.1 Genomics and functional genomics
Genomics, firstly coined by Thomas H. Roderick in 1986, was a term introduced to
define the study of the complete set of genetic information of an organism (Mckusick,
1997), which encompasses mapping, sequencing and analysis of the whole genome of
an organism. The significance of genomics was highlighted by the initiation of the
Human Genome Project (HGP) in 1985 with the aim of decoding the entire human
sequence (Watson and Cook-Deegan, 1991). After more than a decade of strenuous
efforts, the draft of the human genome sequence was accomplished in 2001 (Lander et
al., 2001; Venter et al., 2001). The complete sequence of the human genome has
provided an enormous amount of data to be further analyzed. However, the question
3
of how to elucidate all the gene functions from the overgrowing sequence data
remains elusive. To address this issue, a new branch was brought up in the genomic
studies, i.e. functional genomics (Hieter and Boguski, 1997).
The objective of the initial phase of genomics was to determine the complete DNA
sequence. However, the study of genome-wide function by using information
generated from genetic mapping was also desired. This functional analysis of gene
products, termed functional genomics, includes the large-scale characterization of
genes and their derivatives (Eisenberg et al., 2000). As a high-throughput tool in
functional genomics, DNA microarrays have been widely exploited in profiling gene
expression at the transcriptional level (Lockhart and Winzeler, 2000). To date, DNA
microarray experiments have provided unprecedented amounts of genome-wide data
on gene expression patterns. DNA microarray technology allows mRNA abundance
from different cellular states to be displayed and compared on a genome-wide scale,
thereby providing information of gene expression levels and accordingly the first
clues about disease-related genes. In addition, with the concept of “guilt-by-
association”, unknown open reading frames (ORF) can be annotated by clustering
genes with similar expression patterns from DNA microarray data in that those genes
in the same cluster are assumed to be functionally related (Chu et al., 1998). However,
we should be aware that there are intrinsic limitations of the study of gene functions at
the transcriptional level. Generally, characterization of gene products in a
sophisticated biological network is inevitably complicated by a bewildering number
of gene products from a single gene as a result of alternative splicing and post-
translational modifications. Moreover, there is mounting evidence showing that the
data of mRNA abundance gathered from DNA microarray, thus far, do not correlate
well with the protein expression level (Pandey and Mann, 2000). It has been reported
4
that variation between certain protein abundance and the corresponding mRNA
transcription level could be as high as 30 folds in yeast (Gygi and Rochon et al.,
1999). This poor correlation between mRNA levels and protein abundance is an
obstacle to predicting protein expression levels from DNA microarray data (Tian et
al., 2004). Since proteins play more direct roles in the biological machinery than
nucleic acids do, direct information of protein expression level and protein activity
will be more important for a comprehensive understanding of cellular processes. As
diverse entities inside the cells, proteins are key structural scaffolds, signal
transducers, functional executors, reaction catalysts and major drug targets (Hanash,
2003). With the aid of DNA sequence information, the elucidation of cellular
functions of proteins is facilitated by large-scale protein profiling, i.e. proteomics. The
significance of proteomics will be highlighted in the following sections.
1.1.2 Proteomics
Proteomics is a promising field in the post-genomic era with the aim of defining gene
products encoded by the whole genome, partly because it is an arduous task to predict
gene functions directly from the gene sequences. In contrast to traditional biological
paradigm, one ORF defined from genomic sequence may not necessarily connote only
one protein (Pandey and Mann, 2000). It is possible that certain DNA sequences do
not encode any proteins due to the gene redundancy and the presence of non-coding
RNAs (Eddy, 2001). Conversely, one ORF is also likely to encode more than one
protein due to the RNA splicing and even protein splicing at the translational level
(Black, 2000; Paulus, 2000; Casci, 2001). Consequently, the conventional genomic
studies will not be able to directly contribute to our understanding of protein activity
and function. In the post-genomic era, proteomic studies complement the information
5
acquired from genomics and functional genomics, thereby expanding our knowledge
of cellular processes at the proteome level.
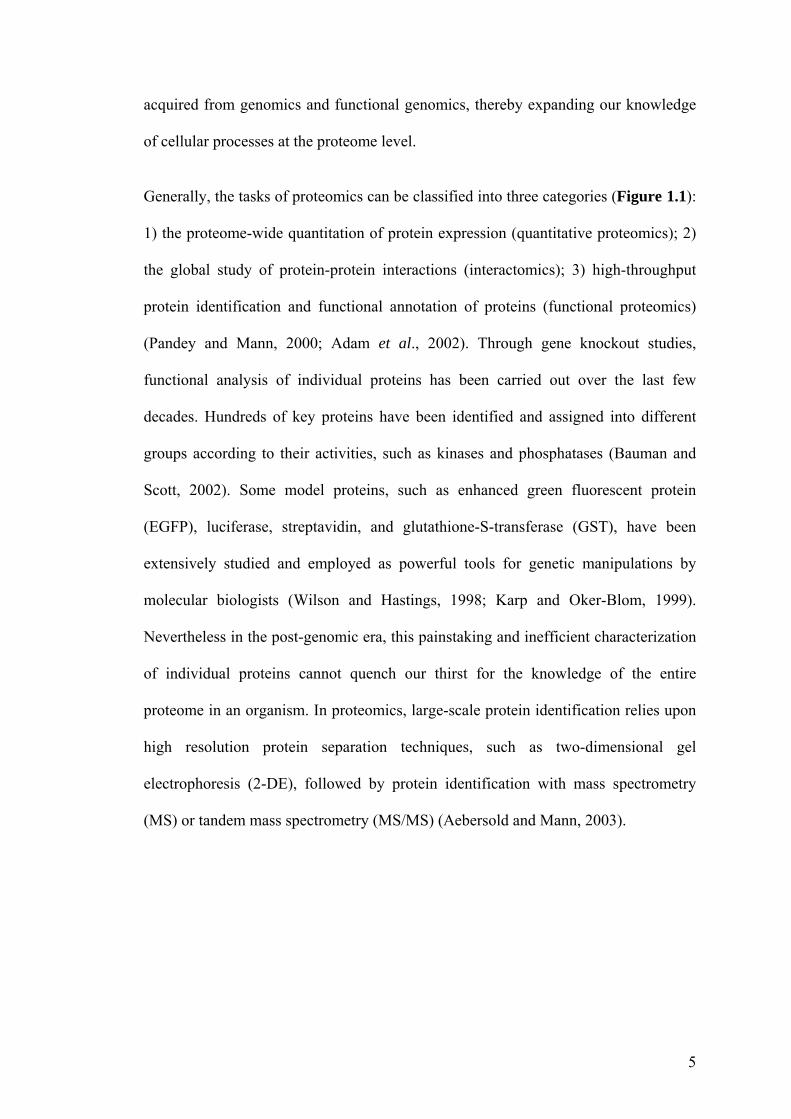
Generally, the tasks of proteomics can be classified into three categories (Figure 1.1):
1) the proteome-wide quantitation of protein expression (quantitative proteomics); 2)
the global study of protein-protein interactions (interactomics); 3) high-throughput
protein identification and functional annotation of proteins (functional proteomics)
(Pandey and Mann, 2000; Adam et al., 2002). Through gene knockout studies,
functional analysis of individual proteins has been carried out over the last few
decades. Hundreds of key proteins have been identified and assigned into different
groups according to their activities, such as kinases and phosphatases (Bauman and
Scott, 2002). Some model proteins, such as enhanced green fluorescent protein
(EGFP), luciferase, streptavidin, and glutathione-S-transferase (GST), have been
extensively studied and employed as powerful tools for genetic manipulations by
molecular biologists (Wilson and Hastings, 1998; Karp and Oker-Blom, 1999).
Nevertheless in the post-genomic era, this painstaking and inefficient characterization
of individual proteins cannot quench our thirst for the knowledge of the entire
proteome in an organism. In proteomics, large-scale protein identification relies upon
high resolution protein separation techniques, such as two-dimensional gel
electrophoresis (2-DE), followed by protein identification with mass spectrometry
(MS) or tandem mass spectrometry (MS/MS) (Aebersold and Mann, 2003).
6
Figure 1.1 The diagram of studying three major entities in a biological system (adapted from Patterson and Aebersold, 2003). Following the endeavors in genomics and functional genomics, the main tasks of proteomics encompass: 1) a proteome-wide quantitation of protein expression (quantitative proteomics); 2) a global study of protein-protein interactions (interactomics); 3) high-throughput protein identification and functional annotation of proteins (functional proteomics).
Global quantitation of protein expression is routinely achieved by the quantitation of
spot intensity in 2-DE-based protein profiling (Aebersold and Mann, 2003). Although
it is typically difficult to absolutely quantify protein abundance by 2-DE, this method
is still useful for the comparison of protein expression levels between different
proteomes. A second aspect of proteomics is the study of protein-protein interactions
in a high-throughput fashion. In general, proteins are not functionally independent and
they are always implicated in complex cellular pathways inside cells. In signaling
pathways, certain proteins are key executors acting as monkey wrenches to switch
on/off the downstream proteins and thus determine whether particular cellular process
will proceed or be terminated (Pawson and Nash, 2000). This kind of protein
activation or inhibition typically takes place via protein-protein interactions. Hence,
mapping protein-protein interactions will lead to a better understanding of protein
functions as well as cellular processes. To this end, several techniques have been
utilized to identify protein-protein interactions, including the yeast two-hybrid (Y2H)
system and protein chips (Piehler, 2005). Thirdly, the activity of proteins (especially
7
enzymes), can also be determined on a proteome-scale by using activity based probe
(ABP) (Huang et al., 2003). These chemical molecules can recognize and covalently
tether proteins with desired activities, followed by separation through either sodium
dodecyl sulfate (SDS)-polyacrylamide gel electrophoresis (PAGE) or 2-DE (Adam et
al., 2002). With these techniques available, proteomic studies have been greatly
accelerated in the past decade and beyond. To help understand the significance of
developing proteomic techniques in the proteomic studies, several state-of-the-art
techniques employed in gel-based proteomics, isotope-based proteomics, MS-based
proteomics, as well as emerging techniques for protein activity-based profiling and
large-scale protein characterization in microarray formats, will be scrutinized in the
following sections.
1.2 Gel-based proteomics
The past decade has witnessed a rapid development of proteomic techniques for high-
throughput protein identification and characterization (Aebersold and Mann, 2003; Hu
et al., 2004). Among these techniques, 2-DE is a routine tool for large-scale protein
separation. Up to 10000 proteins can be resolved in one single gel and subsequently
identified by MS (Poland et al., 2003).
1.2.1 Two-dimensional gel electrophoresis (2-DE)
O’Farrell (1975) and Klose (1975) first demonstrated large-scale protein separation by
2-DE. In their works, proteins were separated by isoelectric focusing (IEF) in the first
dimension, followed by separation on SDS-PAGE according to the molecular weight
of the protein in the second dimension. E. coli, a simple model organism, was chosen
8
in O’Farrell’s work and more than 1000 proteins from E. coli were resolved in a two-
dimensional (2-D) gel. More recently, Gygi et al. (2000) worked on the yeast
proteome and resolved more than 1500 proteins in 2-D gels with the aid of a narrow
range immobilized pH gradient (IPG) strip. Based on their work, it was found that
proteins encoded by the same gene would actually migrate to different spots due to
protein post-translational modifications. Moreover, proteins encoded by different
genes could comigrate to the same spot, which further complicates protein
identification and quantitation after separation in 2-D gels. On the other hand,
although high resolution 2-DE can allow about 1000 proteins to be separated in a
single gel, these proteins are only a small fraction of a complex proteome. Therefore
improvement in the separation power of 2-DE is a crucial issue in proteomics. Poland
et al. (2003) have attempted to profile a more complete proteome by using up to 100
cm long immobilized pH gradient gels. The long gel strips were then cut into small
pieces, followed by the second dimensional separation on SDS-PAGE. This collage of
different 2-D gels enabled more proteins in a proteome to be displayed on one
“integrated” gel, thereby providing a more complete proteome map. 2-DE can also be
used to quantitate protein expression in a global fashion. Anderson et al. (1984) and
Rabilloud et al. (1994) have differentiated protein expression levels between different
cell lines by using the quantitative data from 2-DE. In such a manner, cell lines could
be easily distinguished at the translational level, thereby providing more pertinent
information for the study of human diseases.
Despite the extensive applications of 2-DE in proteomics, most studies to date have
focused on soluble and high-abundance proteins in the proteome. It is well-known
that hydrophobic and low-abundance proteins are difficult to be analyzed by 2-DE-
based techniques. This renders the analysis of all the proteins in a proteome en masse
9
impractical (Gygi et al., 2000). Several methods have been reported to address these
problems (Molloy, 2000; Santoni et al., 2000). Among them, blue native-
polyacrylamide gel electrophoresis (BN-PAGE) has been exploited for membrane
protein profiling on 2-DE (Devreese et al., 2002). In BN-PAGE, the introduction of
Coomassie dyes causes a charge shift on hydrophobic proteins, resulting in increased
solubility of membrane proteins. Another method reported by Lehner et al. (2003) is
that detergent-based extraction of membrane proteins from the complex proteome
enabled the analysis of membrane fraction in 2-D gels. Besides detergent-based
extraction, four other kinds of protein extraction methods were also evaluated,
including centrifugal protein extraction, whole-cell protein extraction, SDS-based
total protein extraction and sequential protein extraction. Both the detergent-based
extraction and sequential protein extraction were verified to be suitable methods for
membrane proteins extraction in 2-DE. In addition, visualization of low-abundance
proteins on a 2-D gel has also been achieved by zooming in a narrow pH range (Gygi
et al., 2000), or with the aid of prefractionation of the complex proteome by reversed-
phase high performance liquid chromatography (HPLC) (Van Den Bergh et al., 2003;
Shen et al., 2004). However, these methods compromised the integrity of the
proteome to a certain extent and therefore the study of all the proteins in a proteome
en masse remains an uphill task.
The application of conventional 2-DE in quantitative proteomics has been largely
hampered by its poor reproducibility, which is typically caused by the discrepancy of
protein absorbed by the IEF strips, protein transfer from IEF to PAGE gels and
inhomogeneities of the gel composition and pH gradients (Van den Bergh and
Arckens, 2004). Any subtle changes in experimental conditions may also render the
quantities of two aliquots of proteins analyzed in separate 2-D gels unequal, making it
10
difficult to ascertain the proteins with indubitably altered expression level and
quantify them on the gels. As a result, the gel images from even the same protein
samples are hardly superimposable and it is thus difficult to distinguish between
system variation and changes in the proteome arising from biological perturbations.
This poor reproducibility thus necessitates the running of replicate gels for the same
protein sample to generate an electronic “averaged” gel. Apart from being a tedious
process, the accuracy of this method is still a controversial issue. In particular, when
quantitation of protein expression by 2-DE is required, more attention must be
centered on this issue since the amount of proteins transferred from the first
dimension to the second dimension is usually inconstant. Consequently, the difference
in spot intensity may be virtually ascribed to the discrepancy of protein transfer
between two dimensions rather than real differences between the proteomes.
1.2.2 Multiplexed proteomics (MP)
Proteins can be separated by 2-DE on a large scale, whereas the visualization of low-
abundance proteins on 2-D gels remains challenging. Protein visualization in a
polyacrylamide gel normally requires post-separation staining (Patton, 2002). Among
numerous methods, Coomassie Brilliant Blue (CBB) and silver staining are the
common tools in routine gel staining due to the relatively low cost and easy
manipulation (Fazekas De St. Groth et al., 1963; Blum et al., 1987; Rabilloud et al.,
1988). However the application of both methods is restricted by their poor sensitivity
and narrow linearity. Typically CBB can detect proteins of more than one microgram,
while silver staining necessitates at least a few nanograms of proteins. Moreover, the
linear dynamic range of both CBB and silver staining is limited to about 10- fold
range (Hu et al., 2004). To partially address these problems, a fluorescence-based
11
post-separation gel staining method was developed by taking advantages of a panel of
fluorescent protein dyes. Using the MP platform, two samples can be first stained
with the dyes specific to unique protein attributes and subsequently stained with a
common protein dye to visualize all the proteins. Overlaid gel images offer not only a
facile quantitation of the gene expression level across samples, but also the
information of protein functions and post-translational modifications (Patton and
Beechem, 2002). Patton and his colleagues have successfully applied this MP
platform to detect glycoproteins via a periodic acid Schiff’s reaction (Steinberg et al.,
2001), and in-gel β-glucuronidase activity using a fluorogenic enzyme substrate
(Kemper et al., 2001). It has also been shown that penicillin binding proteins could be
detected by fluorescent analogs of penicillin V, together with total proteins
visualization with SYPRO Ruby staining (Gee et al., 2001). A more recent example
was to examine protein phosphorylation status in the proteome using the Pro-Q
Diamond fluorescent dye, which has a higher affinity for phosphoserine,
phosphothreonine and phosphotyrosine proteins (Steinberg et al., 2003). Furthermore,
the MP platform has also shown its potential in combination with other proteomic
techniques, such as solution-phase IEF (Schulenberg and Patton, 2004).
Compared to conventional gel-staining methods, MP offers several obvious
advantages in protein detection. Since proteins are visualized by fluorescent dyes, MP
approach has a greater sensitivity and much broader dynamic range than CBB and
silver staining. The SYPRO Ruby dye was reported to be as sensitive as silver
staining for protein detection (Lopez et al., 2000). Pro-Q Emerald 300 dye is capable
of detecting as little as a single nanogram of glycoprotein and 2-4 ng of
lipopolysaccharides (Steinberg et al., 2001). As for the detection linearity, the
dynamic range of SYPRO Ruby was nearly five orders of magnitude, which is about
12
700 times broader than that of silver staining. Another advantage is that a combination
of fluorescent dyes can be used in the same gel, either sequentially or concurrently, to
unveil the overall protein profile and also to group the proteins into distinct
subproteomes based on their properties. This enables rigorous protein quantitation and
facile identification of particular subclasses of proteins, remarkably improving the
accuracy and throughput of protein analysis in polyacrylamide gel. Furthermore, the
MP approach typically makes use of non-covalent binding of fluorophores to the
proteins. As a consequence, this method is generally nondestructive and compatible
with MS-based protein identification. It also sidesteps the problems in pre-separation
fluorescent labeling of the proteins, where protein solubility and isoelectric point may
be significantly altered (Hu et al., 2004).
Although MP provides greater sensitivity and a broader linear dynamic range than
conventional gel staining methods, it still does not obviate the limitation of
conventional 2-DE. Two gels processed by MP method are typically not
superimposable since the protein separation still relies on conventional 2-DE. This
intrinsic drawback of 2-DE thus hampers the application of MP in high-throughput
protein quantitation. Furthermore, MP is only applicable for the detection of certain
protein post-translational modifications due to the limited availability of fluorescent
dyes. In future, more fluorescent dyes need to be developed in order to accommodate
the diversity of protein modifications in a proteome.
13
1.2.3 Differential gel electrophoresis (DIGE) in quantitative proteomics
To date, a majority of quantitative analyses of protein expression have relied on
conventional 2-DE, which, when coupled with advanced mass spectrometers, has
allowed the rapid quantitation and identification of thousands of proteins
simultaneously (Gorg et al., 2004). Through monitoring the fluorescence of native or
modified protein residues, direct protein quantitation on the gel, albeit conceptually
simple, may produce significant variations because of different residue composition
between proteins (Kazmin et al., 2002; Sluszny and Yeung, 2004). Alternatively,
quantitation of proteins on a gel is typically achieved by post-separation protein
staining, such as CBB and silver staining (Plowman et al., 2000). These methods,
however, do not fulfill the requirement of quantitative proteomics, due to limited
detection sensitivity and poor linearity. To address these problems, fluorescent protein
staining dyes have been developed for protein quantitation in polyacrylamide gels
(Nishihara and Champion, 2002). These fluorescent dyes can usually be integrated
with other proteomics platforms for global characterization of protein expression as
well as protein post-translational modifications (Patton, 2002).
Although fluorescent staining of proteins in gels offers great sensitivity and a broad
dynamic range, their application in quantitative proteomics is still hampered by the
poor reproducibility of 2-DE. To address this problem, a relatively new technique (i.e.
DIGE) was developed by Unlu et al. (1997), whereby two protein samples can be
labeled with two structurally similar cyanine dyes, respectively, and co-separated in
the same gel. Since two fluorescent molecules, 1-(5-carboxypentyl)-1’-
propylindocarbocyanine halide (Cy3) and 1-(5-carboxypentyl)-1’-
methylindodicarbocyanine halide (Cy5), have similar mass and charge, identical
14
protein in two samples still migrates as one spot in the same gel without significant
shift. Therefore, protein quantitation is easily achieved by simply comparing the
intensity difference of the fluorophore covalently tethered to the proteins. Compared
to conventional 2-DE methods, DIGE has its intrinsic advantages. Since two samples
can be resolved in the same gel, DIGE circumvents the necessity of a reference gel,
making it a powerful tool for potential high-throughput analysis of multiple biological
samples simultaneously. In addition, with the detection of as little as about one
hundred picograms of a single protein, DIGE offers greater sensitivity and a broader
linear dynamic range, rivaling the fluorescent staining of 2-D gels (Patton, 2002).
In this study, we will employ 2-D DIGE for high-throughput analysis of the yeast
proteome upon metal treatment so as to identify the yeast proteins implicated in metal
detoxification pathways.
1.3 Isotope-based proteomics
Sensitive and variable protein labeling techniques are capable of large-scale protein
characterizations. Other than fluorescent molecules, radioisotopes pave an alternative
way for protein labeling and facilitate the subsequent protein quantitation and
identification. Albeit biohazardous, the incorporation of radioisotopes into a protein
is presumably one of the least destructive means to proteins, providing a flexible tool
for sensitive and quantitative protein analysis in multiplexing experiments. The
following section will give a detailed description of metabolic isotope labeling and
isotope coded affinity tag (ICAT).
15
1.3.1 Metabolic labeling by the radioisotopes
During the last decade, metabolic incorporation of radioisotopes into biological
systems has been an important tool for the exploration of cellular processes (Kelleher,
2004; Wiechert and Noh, 2005) and drug development (Perkins and Frier, 2004). In
this post-genomic era, metabolic labeling of proteins could also be utilized to identify
and quantitate proteins in living organisms. Several research groups have made use of
metabolic labeling strategies to examine yeast protein expression upon different
exogenous stimuli (Maillet et al., 1996; Godon et al., 1998; Vido et al., 2001; Bro et
al., 2003). In their studies, the use of multiple isotopes, i.e. 35S, 3H or 14C, has allowed
sensitive detection of proteins without post-separation staining, and also a facile
comparison of the disturbed proteome with its cognate untreated proteome on the
same gel. In this manner, Labarre and his colleagues have successfully constructed a
reference 2-DE map of the yeast proteome with more than four hundred proteins
identified. Unlike the conjugation of fluorescent molecules with proteins, the
introduction of isotopes in a protein does not significantly alter the isoelectric point
(pI) and molecular weight of proteins. As a consequence, same proteins from different
samples can migrate as identical bands or spots on the PAGE gels, rendering protein
matching and quantitation rather straightforward. While the treated and untreated cells
were labeled by diverse isotopes and mixed before lysis, the undisturbed sample
worked as an internal standard to eliminate artifacts caused by experimental variations
(Godon et al., 1998). As a result, this internal standard provides an effective means
for rigorous protein quantitation on the gel, thereby facilitating an accurate reflection
of protein expression levels in the organism. Proteins of interest could be
subsequently identified either through a comparison to the reference 2-D gel, or by
16
MS analysis. The combination of these studies substantially shows the potential of the
stable radioisotope labeling of the proteins in large-scale proteomic analysis.
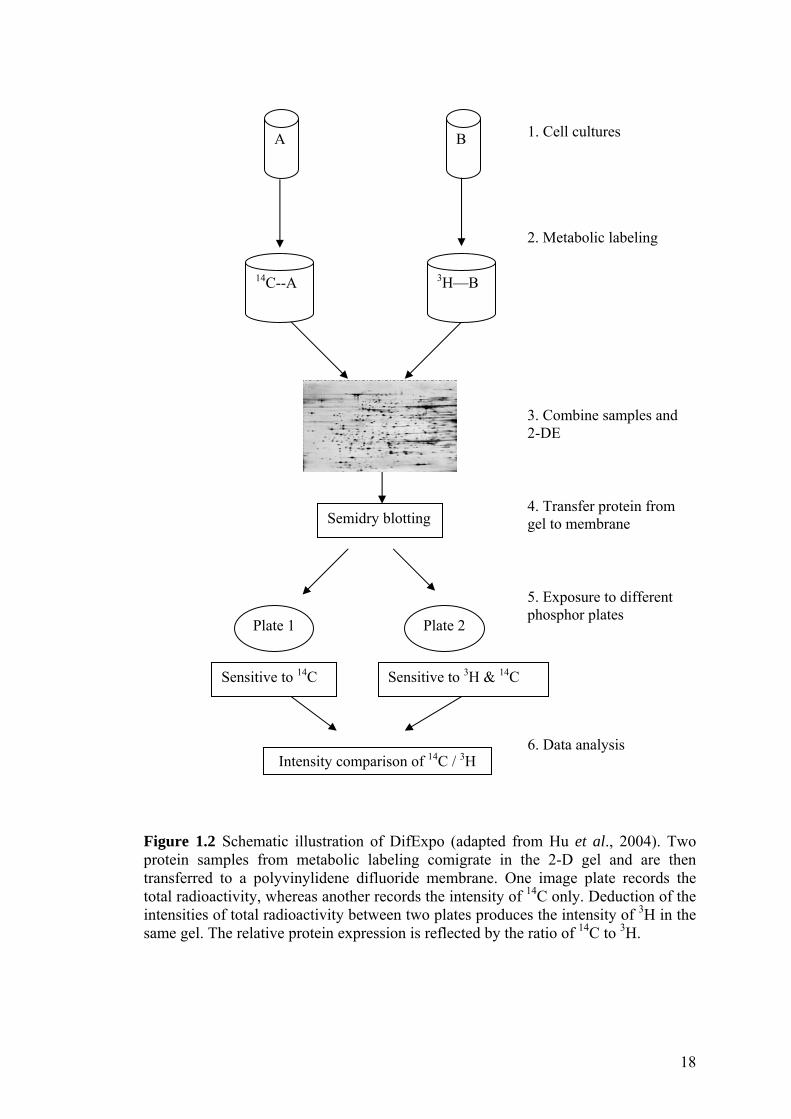
Similar to the strategy described above, another method, known as differential gel
exposure (DifExpo), takes advantage of two unique imaging plates, which have
overlapping detection capacity (Monribot-Espagne and Boucherie, 2002). Through
metabolic labeling, 14C-leucine and 3H-leucine were incorporated into two yeast
proteomes, respectively, during cell growth (Figure 1.2). Then these two pools of
cells were mixed and lysed to liberate the radioisotope-labeled proteins, which were
subject to protein separation in 2-D gels. As mentioned above, since radioisotope
labeling of proteins would not interfere with protein migration in 2-D gel, co-
migration of the same proteins from two different samples renders two images
superimposable. The proteins in the 2-D gel were then transferred onto a
polyvinylidene difluoride (PVDF) membrane and exposed successively to two distinct
imaging plates. One imaging plate could record only the radioactivity of 14C, while
another plate, sensitive to both 14C and 3H, records the total radioactivity on the gels.
Subtraction of the 14C intensity value from that of total radioactivity generates the
value of 3H signal on the same gel. Comparison of these two values, i.e. the 3H/14C
ratio, actually represents the relative protein abundance between the yeast proteomes.
As a metabolic labeling strategy, DifExpo allows real-time and rigorous probing of
protein synthesis upon biological perturbations, such as diauxic shift (Monribot-
Espagne and Boucherie, 2002).
Additionally, a handful of advanced strategies have been developed with the
combination of metabolic labeling and MS-based protein identification and
quantitation. One study was to identify and quantify isotope-labeled yeast proteins by
17
MS (Jiang and English, 2002). Yeast leucine auxotrophs were grown in the media
containing either natural leucine (H10-Leu) or deuterated leucine (D10-Leu) and
combined prior to cell lysis. The extracted proteins were resolved in 2-D gels,
followed by excision of protein spots from the gels and analyzed by MS. Through
validation trials, metabolic incorporation of isotope-labeled leucine into yeast proteins
was concluded to be quantitative based on the evidence that intensities of the peptide
peaks were proportional to the percentage of isotopes used in the culture media. As a
result, the D10 / H10 –Leu ratios indeed reflect the relative protein expression level in
yeast proteome. As such, metabolic labeling could also be utilized to survey protein
post-translational modifications. Oda et al. (1999) have successfully quantified the
changes in protein phosphorylation level through MS-based peptide quantitation.
From the mass spectra, peak intensity ratios of isotopically labeled phosphorylated
peptides to nonlabeled unphosphorylated peptides were calculated to indicate the
relative protein phosphorylation level.
18
Figure 1.2 Schematic illustration of DifExpo (adapted from Hu et al., 2004). Two protein samples from metabolic labeling comigrate in the 2-D gel and are then transferred to a polyvinylidene difluoride membrane. One image plate records the total radioactivity, whereas another records the intensity of 14C only. Deduction of the intensities of total radioactivity between two plates produces the intensity of 3H in the same gel. The relative protein expression is reflected by the ratio of 14C to 3H.
14C--A
1. Cell cultures
2. Metabolic labeling
3. Combine samples and 2-DE
Semidry blotting
Plate 1 Plate 2
Sensitive to 14C Sensitive to 3H & 14C
Intensity comparison of 14C / 3H
5. Exposure to different phosphor plates
4. Transfer protein from gel to membrane
6. Data analysis
3H—B
BA
19
In a more recent study, rather than nonspecific isotopic labeling of proteins, Ong et al.
(2004) have metabolically incorporated isotopes exclusively into protein modification
sites using a synthetic stable isotope analog of methyl group, 13CD3. As a result, any
proteins undergoing methylation could be identified and quantified on the mass
spectra. Furthermore, an intriguing metabolic labeling strategy applied to the living
multicellular organisms has been demonstrated by Krijgsveld et al. (2003).
Caenorhabditis elegans and Drosophila melanogaster, either wild-type or mutant,
were quantitatively labeled by feeding them on 15N -labeled Escherichia coli and
yeast, respectively. After protein extraction and separation in 2-D gel, proteins of
interest were identified and quantified by MS. The altered protein expression level,
resulting from genetic manipulation, was examined through the analysis of the 15N /
14N ratio. This strategy therefore provides simple but reliable metabolic labeling of
multicellular eukaryotes for proteomic studies. Additionally, metabolic labeling could
also be applied for temporal analysis and signaling events and mapping entire
signaling networks that govern the cell differentiation (Blagoev et al., 2004;
Kratchmarova et al., 2005).
Albeit fairly successful, isotope-based metabolic labeling is unsuitable for dissection
of human proteome as radioisotopes are biohazards (Yeargin and Haas, 1995).
1.3.2 Isotope-coded affinity tag (ICAT)
In addition to in vivo metabolic labeling, proteins can be labeled with stable isotopes
in vitro via isotope-coded affinity tags (Gygi and Rist et al., 1999). This kind of tags
has a warhead which can tether the tags to proteins, while a deuterated or
nondeuterated linker works as a reporter for the detection of labeled peptides. ICAT is
20
generally utilized together with gel-free separation techniques, such as liquid
chromatography (LC)-MS/MS (Zhou and Ranish et al., 2002; Jiang et al., 2005). In
such strategy, two protein samples were first labeled with two light or heavy ICAT
reagents, respectively, and then mixed together. Without the separation in the gel,
proteins were trypsin-digested and filtered through an avidin column. While unlabeled
peptides were washed away, the ICAT-labeled peptides were retained on the avidin
column due to the biotin moiety on the tags, and subsequently eluted by formic acid.
Upon chromatographic separation, the biotinylated peptides were readily sequenced
by MS/MS and quantified based on the peak intensity of each peptide. By using ICAT,
Dunkley and colleagues (2004) have successfully identified membrane proteins from
different organelles. Besides LC-MS/MS, ICAT is also compatible with standard 2-
DE for quantitative protein profiling (Smolka et al., 2002; Froment et al., 2005).
Basically, two differentially ICAT-labeled protein samples could be combined and
separated in the same 2-D gel, followed by spot excision, trypsin digestion and MS
analysis. Through the signal comparison of the peptides labeled with two different
isotopes, the relative protein expression level between samples could be determined.
Nevertheless, both gel-free and gel-based ICAT methods have their inherent
weaknesses. As the reactive group of the tags specifically targets the sulfhydryl group
of cysteine residues in a protein, ICAT can only be used to label proteins containing
free cysteine residues. However, it has been reported that as high as 15% of proteins
in some bacteria do not have any cysteine residues (Patton, 2002). In eukaryotes, only
10-20% of the peptides from digested proteomes have more than one cysteine residue,
rendering ICAT incapable of quantifying as much as 80% of the peptides from
eukaryotic proteome. Several methods, grouped as global internal standard strategy
(GIST), have been introduced to universally label the peptides without dependence on
21
cysteine residue (Hamdan and Righetti, 2002). These techniques generally rely on
chemical reagents, such as N-acetoxysuccinimide (Ji et al., 2000) and succinic
anhydride (Wang and Regnier, 2001), to acylate trypsin-digested peptides.
Resembling ICAT, these methods employed light and heavy acylation reagents to
label two protein samples, respectively, and the isotope ratios of labeled peptides
present the relative protein abundance between samples. Another issue is about
chromatographic isotope effects with ICAT. Due to the limited chromatographic
resolution of the isotopically labeled peptides, the elution of deuterated peptide was
found to be earlier than that of nondeuterated peptides (Zhang et al., 2001), thereby
generating a discernible variation in isotope ratios between mass spectra taken at
different points during the elution. As a result, quantitation of peptides from a single
mass spectrum will not be accurate and more data must be combined in order to
provide a relative measurement of peptide quantity, which thus greatly complicates
the data analysis. Further efforts are needed to minimize this chromatographic isotope
effect, like using ICAT reagent with carbon isotopes instead of deuterium (Zhang and
Regnier, 2002). On the other hand, for the 2-DE-based ICAT, conjugation of ICAT
reagents with proteins might decrease the protein solubility to some extent and thus
compromise the electrophoretic mobility of proteins in 2-D gel. Albeit far from
perfect, ICAT is a practical tool for quantitative proteomic analysis.
1.4 Mass spectrometry (MS)-based protein identification and quantitation
To date, one of the most common schemes in proteomic study is that proteins are
either separated by one-dimensional (1-D) or 2-D gel electrophoresis, followed by
CBB or silver staining. Proteins of interest are then excised and subject to trypsin
digestion. While other schemes employ gel-free chromatographic techniques to
22
separate the tryptic peptides, both strategies converge at a common end point, i.e.
mass spectrometric analysis of proteins (Rappsilber and Mann, 2002).
Literally, MS is one of the analytical techniques measuring the inherent mass property
of the molecules. As a venerable technique, MS has evidenced its wide applications in
biological sciences for decades (Banoub et al., 2005; Tost and Gut, 2005),
encompassing the analysis of nucleosides (Biemann and McCloskey, 1962) and
metabolites (Hammar et al., 1968; Lehmann et al., 1976), as well as the quantitative
detection of drugs and trace metals in biological samples (Cho et al., 1973;
Achenback et al., 1979). However, it was not until the late 1980s that MS was
revitalized to find its increasingly significant roles in protein characterization by the
development of two fundamental ionization methods, electrospray ionization (ESI)
and matrix assisted laser desorption/ionization (MALDI) (Mann et al., 2001). Two
Nobel laureates in chemistry (2002), John Fenn and Koichi Tanaka, have made
substantial contributions to the development of ESI-MS and MALDI-MS,
respectively (Fenn et al., 1989; Tanaka, 2003).
By and large, there are two prevailing MS-based methods for protein identification,
i.e. peptide mass fingerprinting and peptide sequencing (Aebersold and Goodlett,
2001). The basic principle underlying peptide mass fingerprinting is to match the
experimental peptide masses with the theoretically predicted peptide masses in the
protein databases (Henzel et al., 1993; James et al., 1993; Pappin et al., 1993). This
peptide prediction is based on the sequence specific tryptic proteolysis at the C-
terminal residues lysine or arginine. Unknown protein can be assigned to a known
protein in the database with a sufficient number of peptides overlapping. MALDI-MS
has been widely used to identify proteins via peptide mass fingerprinting, rather than

23
measurement of the mass of intact protein. This is because proteins will be
fragmented to some extent in MALDI-MS, resulting in obscure protein masses and
low sensitivity in the detection of intact proteins. Through the automation of MALDI-
MS procedure, high-throughput protein identification has been achieved (Jensen et al.,
1997; Berndt et al., 1999). Hundreds of proteins can be simultaneously excised from
the gels, trypsin digested, analyzed by MS and the acquired mass spectra are
automatically used for database searching. To date, however, it would be difficult to
mix and co-crystallize the chromatographic eluant automatically with matrix
substance on the sample plate. Other than peptide mass fingerprinting, the peptide
sequence can also be read out by mass spectrometer (Mann and Wilm, 1994).
Traditionally, protein sequencing relied on stepwise cleavage of the amide bonds,
such as Edman degradation (Samy et al., 1983). This amino-terminal protein
sequencing, however, excludes large proteins with more than 50 amino acids (aa) and
any modified proteins without a free amine at N-terminus. The emergence of ESI-
MS/MS in 1990s revolutionized the sequence analysis of proteins with much higher
sensitivity and throughput (Loo et al., 1990). The sequencing mass spectrometer
generally consists of two mass analyzers separated by a collision cell where peptide
ions are fragmented via collision with inert gas (Hunt et al., 1986). Currently, triple
quadrupole, tandem quadrupole/time-of-flight (Qq-TOF), time-of-flight/ time-of-
flight (TOF/TOF) and quadrupole/ion-trap mass spectrometers are mainstream
instruments for protein sequencing. These sequencing tools, when coupled with
chromatographic techniques, render the identification of proteins in a mixture feasible
in that peptide sequence from mass spectra can be more accurately assigned to the
protein sequence in the databases (Eng et al., 1994). A variety of algorithms have
been worked out to facilitate the database searching using MS/MS spectra (Sadygov
24
et al., 2004), yet there is still room for improvement in order to accommodate aberrant
analyte fragmentation and eliminate the false positive.
Not only protein primary sequence, but also protein post-translational modifications
could be characterized by mass spectrometer. Protein post-translational modifications
are reversible chemical processes responsible for protein activity, localization and
turnover. As a protein identification tool, MS also plays an important role in site-
specific recognition of the modifications on the proteins, such as protein
phosphorylation, methylation, glycosylation and ubiquitination and sumoylation
(Mann and Jensen, 2003; Peng et al., 2003; Boisvert et al., 2003; Vertegaal et al.,
2004). At the early stage, in order to reduce the peptide complexity, the tryptic
peptides with interested modifications were enriched, prior to MS analysis, through
affinity chromatography (Nuwaysir and Stults, 1993). This is presumably due to the
detection limitation of MS at that time. With technical improvement, either gel-
separated or affinity-purified proteins with interested modifications could be directly
sequenced by mass spectrometer (Betts et al., 1997; Kirkpatrick et al., 2005). On the
mass spectra, the peptides with modification were distinguished from unmodified
peptides by a mass shift with great sensitivity and broad dynamic range. It has been
reported that as little as subpicomole of protein was sufficient for mapping protein
modifications (Neubauer and Mann, 1999). Furthermore, with the aid of isotopical
labeling, MS could not only identify but also quantify the protein phosphorylation and
methylation (Oda, et al., 1999; Stemmann et al., 2001; Ong et al., 2004). However,
one of the challenges in most MS-based mapping of protein post-translational
modifications is that labile modifications on the proteins may be lost during peptide
fragmentation in MS/MS. As a result, it is not feasible to determine the location of
these modifications on the proteins through mass spectra. To address this problem, a
25
relatively new instrument, Fourier transform ion cyclotron resonance-mass
spectrometry (FT-MS), when coupled with electron capture dissociation (ECD),
shows its great potential for delicate mapping of protein post-translational
modification (Kelleher et al., 1999). This is because several labile protein
modifications proved to be intact throughout ECD process, leading to unambiguous
localization of these labile modifications on the protein. As such, Kjeldsen et al.
(2003) have presented a complete map of post-translational modifications on bovine
milk protein.
A third achievement made in MS-based proteomics is the sketch of protein-protein
interaction network of an organism. Protein-protein interaction usually modulates the
dynamics of protein functions within a multiprotein complex, such as spliceosome
(Neubauer et al., 1997). With the availability of proteomic techniques, the delineation
of protein-protein interaction network on an organelle- or even organism-wide scale
becomes feasible (Ashman et al., 2001). Following co-purification of proteins and
their interaction partners, they can be identified by either MS or MS/MS. In such a
manner, Gavin et al. (2002) and Ho et al. 2002 have independently reported large-
scale identification of the yeast protein-protein interaction using tandem affinity
purification (TAP) and immunopurification, respectively. According to the data
available in literature, some 80,000 protein-protein interactions in yeast have been
identified, depicting a comprehensive network of protein-protein interaction in yeast.
Among these protein-protein interactions, however, only about three percent of them
were corroborated by more than one method (von Mering et al., 2002). Other than
data complementation between methods, this lack of overlapping is presumably
ascribed to a significant number of false positives generated in high-throughput
screening. To alleviate this problem, a control sample containing nonspecific binding
26
proteins could be prepared in parallel with the purification of protein complex.
Through the comparison between samples, real protein binding partners could be
distinguished from those nonspecifically bound proteins (Blagoev et al., 2003; Ranish
et al., 2003).
In addition to protein identification, MS has a long history of quantitative analysis in
biomedical research (Lehmann and Schulten, 1978; Heck and Krijgsveld, 2004). As
mention above, with the aid of isotopical labeling, MS has been extensively used to
interrogate the protein abundance between samples (Turecek, 2002). This is based on
the assumption that the height of the peaks on the mass spectra objectifies quantities
of the substance in the sample. However, one caveat to this method is that among
tryptic peptides, MALDI - time of flight (TOF) is more sensitive in the detection of
arginine-containing peptides than that of lysine-containing peptide, concluding from
the observation that the peak of arginine-containing peptide is typically 4 to 18 fold
more intense than that of lysine-containing peptide on the mass spectra (Krause et al.,
1999). This bias towards arginine-containing peptides may complicate the
identification and absolute quantitation of proteins by MS. To address this problem,
Hale et al. (2000) resorted to the conversion of the C-terminal lysine of tryptic peptide
into a more basic homoarginine residue through the guanidination reaction, which
greatly increases the detection of lysine-containing peptides by MS. In a derivative
procedure, Cagney and Emili (2002) have made use of lysine guanidination to
quantify the lysine-containing peptides by ESI-MS. Similar to ICAT (vide ut supra),
one sample was treated with a guanidination reagent, O-methylisourea, while another
sample was untreated. The signal intensity ratios of unmodified and modified peptides
provide relative protein abundance between samples.

27
Currently, as MS data can only be used to match “known” proteins in the databases,
the availability of more protein sequences derived from ever-growing DNA sequence
information is thus crucial to boost the success of MS in protein identification. While
de novo peptide sequencing by MS/MS provides an alternative for protein
identification, it is mainly used to identify new proteins due to technical complexity
and relatively low throughput.
1.5 Emerging techniques for protein activity-based profiling and microarray-
based protein characterization
Besides the routine protein identification and quantitation mentioned above, protein
activity-based profiling and microarray-based protein characterization are burgeoning
fields in proteomics.
1.5.1 Activity-based protein profiling
In contrast to other housekeeping proteins, enzymes are one of the most important
classes of proteins which are implicated in virtually every aspect of intracellular
processes. Aberrant activation or dysfunction of many enzymes, such as kinases,
phosphatases and proteases, will lead to a variety of diseases (Bauman and Scott,
2002). Conventionally, the studies of enzymes have been conducted by painstaking
screening and characterization of individual enzymes (Martzen et al., 1999). In the
proteomic era, although a number of proteomic approaches can examine the relative
abundance of proteins in a proteome, one of the remaining challenges today in
proteomics is to fathom the activity of proteins, especially enzymes, which are
typically vital in organisms, not only by their relative abundance, but more
28
importantly by their relative enzymatic activities (Baruch et al., 2004). In the last few
years, our laboratory and other research groups have independently developed a series
of activity-based approaches to study enzymes on a proteome-wide scale, i.e.
catalomics (Hu et al., 2006). In these approaches, ABPs were harnessed to
specifically target enzymes either in vitro or in vivo based on the inherent enzymatic
activity (Speers et al., 2003; Ovaa et al., 2003; Saghatelian and Cravatt, 2005).
Basically, ABPs are small chemical molecules with reporting tags, which can
covalently label enzymes according to their inherent enzymatic activities (Huang et
al., 2003; Jessani and Cravatt, 2004). The labeled enzymes can be separated from a
proteome by 1-D or 2-D gel electrophoresis and identified by MS. In a recent study,
Blum et al. (2005) have successfully applied enzyme-specific ABPs for the in vivo
imaging of protease activity. By designing the probes with different reactive warheads,
several classes of enzymes could be selectively targeted and subsequently visualized
over other proteins from a complex proteome, thereby providing subproteomic
profiles based on the enzymatic activities (Liau et al., 2003; Zhu et al., 2003; Wang
and Yao, 2003; Zhu et al., 2004; Chan et al., 2004). However, these activity-based
protein profilings are mainly based on electrophoretic and other chromatographic
separation methods (Liu et al., 1999; Adam et al., 2004; Jessani et al., 2005), and thus
require MS for individual protein identification, which makes them less than ideal for
high-throughput protein analysis.
1.5.2 Microarray-based protein characterization
Over the past few years, microarray has catapulted into the limelight as a versatile
platform for proteomic studies (Hu et al., 2006). Based on the entities immobilized on
the glass slide, microarray can be classified into five categories: DNA microarray,
29
small-molecule microarray, peptide microarray, protein microarray and cell array
(Chen et al., 2003). Herein, I will mainly discuss the application of DNA and protein
microarray in proteomics.
DNA microarray is a self-addressable miniature array of DNA fragments immobilized
on the glass slide. When DNA or RNA samples are fluorescently labeled and
hybridized onto the DNA microarray, both the identity and quantity of each DNA or
RNA fragment in the sample can be readily unveiled with the aid of a fluorescence
scanner (Schena et al., 1995). Since tens of thousands of DNA fragments can be
spotted with high density on the array, information of the whole genome of an
organism can be virtually procured in a single experiment, making it an ideal tool for
high-throughput exploration.
Conventionally, DNA microarray has been mainly exploited for profiling global gene
expression at the transcriptional level (Lockhart and Winzeler, 2000). However, a
self-addressable DNA microarray can also be used to decode DNA fragments in a
complex sample. By combining DNA microarray technology with chromatin
immunoprecipitation (ChIP), Ren et al. (2000) and Iyer et al. (2001) had successfully
determined the genome-wide location of DNA-binding proteins, such as
transcriptional factors. In their studies, DNA fragments enriched by
immunoprecipitation were assumed to be protein-binding sequences, which could be
subsequently decoded by the DNA microarray on an organism-wide scale. In this
study, we will present one of the first examples where DNA microarray can be
integrated with high-throughput screening of enzymes (Hu et al., 2006).
Protein microarray is an emerging tool for the studies of protein functions and
protein-protein interactions on a large scale. By immobilizing most of proteins from a
30
proteome onto a coin-size glass slide, high-throughput identification of proteins which
bind to the protein of interest can be readily achieved. As such, Zhu et al. (2001) have
fabricated a yeast proteome microarray containing 5800 yeast proteins and then used
it to identify all the calmodulin- and phospholipid-interacting proteins in yeast
proteome. Moreover, membrane protein-protein interactions, which are difficult to be
analyzed by Y2H, can also be interrogated by fabricating membrane protein
microarrays (Fang et al., 2002; Fang et al., 2006). In addition to protein-protein
interaction, large-scale characterization of protein activities and functions has also
been achieved in a high-throughput manner (LaBaer and Ramachandran, 2005;
Merkel et al., 2005; Ptacek et al., 2005).
Albeit promising, the application of protein microarray for the dissection of a
proteome still faces several challenges. First, protein-protein interactions detected in
protein microarrays are only known to be taking place outside the cells. It is not clear
whether these in vitro protein binding assays can really recapitulate the protein-
protein interactions taking place inside the cells. Secondly, site-specific
immobilization which can maintain native protein conformation is normally required
to generate a functional protein microarray (Cha et al., 2005). To this end, however, it
typically entails the laborious cloning, expression and purification of individual
proteins before being spotted on the surface of microarray slide (Lesaicherre et al.,
2002; Lue et al., 2004; Yeo et al., 2004). A third issue is about the shelf-life of protein
microarray. To date, it remains unaddressed how to fabricate a protein microarray
allowing long-term preservation of protein activities.
31
1.6 Yeast and yeast proteome
In this study, we will use yeast as a model organism and mainly dissect yeast
proteome using advanced proteomic techniques. Herein current progress in the studies
of yeast genome and proteome will be briefly reviewed.
Yeast is a unicellular fungus, encompassing three model organisms, the budding yeast
Saccharomyces cerevisiae, the fission yeast Schizosaccharomyces pombe, and
Candida albicans (Herrero et al., 2003). To date, the most well-known and widely
studied yeasts are the related strains of Saccharomyces cerevisiae, which have also
long been used in the beverage industry for the fermentation of corn to produce
alcohol.
The budding yeast Saccharomyces cerevisiae is an ideal paradigmatic eukaryote for
modern biological research (Botstein et al., 1997; Kolkman et al., 2005). As early as
1996, the entire genome sequence of Saccharomyces cerevisiae was published
(Goffeau et al., 1996). It has a compact genome in which 70% of DNAs are protein
coding sequences, encoding some 6,000 genes with about 1 gene per 2 kilobases (kb)
of DNA sequence. Unlike other higher eukaryotes, only approximately 4% of yeast
genes contain introns, thereby simplifying the procedure of expression and
identification of yeast genes (Costanzo et al., 2000). In addition, the budding yeast
has been greatly facilitating gene cloning and functional studies since it can be easily
cultured in the research laboratory and is amenable to various genetical manipulations,
such as DNA recombination and gene disruption (Giaever et al., 2002). More
importantly, Saccharomyces cerevisiae is an informative experimental model for the
functional dissection of human genes and disease-related studies (Bork et al., 2004;
Mager and Winderickx, 2005). Almost half of the genes implicated in human diseases
32
have their counterparts in yeast (Bassett et al., 1996). Therefore, advances in yeast
genomics and proteomics will pave the way for a better understanding of cellular
processes in human cells (Kumar and Snyder, 2001). Besides yeast genome, the yeast
proteome has also been well-studied (Futcher et al., 1999). Not only has the standard
yeast 2-D gel map with about 400 protein spots been identified, a yeast proteome
database which compiles all the data from over 8,000 research reports is also available
to provide comprehensive information of yeast proteome (Perrot et al., 1999; Hodges
et al., 1999). In addition, several large-scale screening projects have provided a
wealth of information about the yeast protein-protein interaction network since 2000
(Uetz et al., 2000; Ito et al., 2001; Gavin et al., 2002; Ho et al., 2002). More recently,
Kumar et al. (2002) and Huh et al. (2003) have independently determined individual
yeast protein localization on a proteome-wide scale by using immunolabeling and
green fluorescent protein (GFP) tagging, respectively. Albeit being well studied, with
new cellular mechanism (like yeast apoptosis) being identified in yeast, yeast
proteome still needs to be further dissected upon various biological perturbations
(Masse and Arguin, 2005; Longo et al., 2005). Moreover, since there are to date a
large number of yeast proteins whose functions remain unknown, activity-based
profiling of yeast proteins on a large scale will be necessary for a better understanding
of yeast enzymes (Saghatelian and Cravatt, 2005).
1.7 Objectives
In this study, we are mainly interested in developing and applying advanced
proteomic techniques for high-throughput characterization of yeast enzymes on a
proteome-wide scale (i.e. catalomics) from three different aspects (Figure 1.1): 1)
quantitation of protein expression in yeast upon metal stimuli (quantitative
33
proteomics), which will lead to high-throughput identification of a large number of
yeast enzymes involved in metal detoxification pathways; 2) identification of yeast
enzyme (metacaspase)-interacting proteins (interactomics), which may be involved in
yeast apoptosis; 3) identification of yeast enzymes in an activity-dependent manner
(functional proteomics).
Firstly, to partly address the problem in quantitative proteomics, a relatively new
technique (i.e. DIGE) has been validated as a powerful tool in high-throughput protein
profiling and rigorous protein quantitation. Changes in yeast proteome upon exposure
to fifteen kinds of exogenous metal stimuli were examined by DIGE. This, to our
knowledge, represents the first example to explore the high-throughput capability of
DIGE and correlate variation in the yeast proteome with its response to different
exogenous stimuli. Secondly, to improve the data quality in MS-based identification
of protein-protein interactions, a new method to eliminate the nonspecific selections
has been developed in this study. With the aid of DIGE, a control sample was
prepared in parallel with the pull-down experiment and used to indicate the
nonspecific binding. Subtraction of the nonspecific binding was believed to provide
more rigorous protein-protein data in interactomics. Thirdly, to expedite the
functional characterization of proteins in ABP-based functional proteomics, a new
approach, termed Expression Display, has been developed in this study. By taking
advantages of ribosome display, small-molecule probe and DNA microarray, enzymes
were fished out from the library based on their inherent enzymatic activities, followed
by facile protein identification through the hybridization of protein-coding DNA
fragments onto a decoding DNA microarray. A yeast DNA library containing 384
yeast ORFs was used to validate the strategy of Expression Display. In the following
34
endeavors, we sought to screen a phage-displayed library containing all the human
cDNAs using a similar strategy.
The development and application of advanced proteomic techniques mentioned above
may have a significant impact on the proteomic studies from various aspects. Firstly,
the simultaneous profiling of fifteen disturbed yeast proteomes by DIGE validates it
as a powerful tool for the high-throughput identification of proteins. This comparison
between disturbed yeast proteomes should also provide a first clue on the mutuality
between different cellular defense mechanisms in eukaryotes and thus foster a better
understanding of cellular responses to various metal stimuli. Potentially, DIGE-based
expression profiling can be used to identify enzyme substrates on a proteome-wide
scale by comparing the proteome profiles before and after the enzymatic reaction. We
envision that not only the protease substrates, but also the substrates of kinases and
phosphatases can be easily identified in such a manner. Secondly, the new strategy
introduced for high-throughput identification of protein-protein interactions mainly
addresses one of the biggest challenges in interactomics, i.e. nonspecificity. By
introduction of a control sample in pull-down assay, high-quality data of protein-
protein interactions can be provided. This strategy will be potentially applicable for
high-throughput identification of all the enzyme-interacting proteins in a proteome,
including enzyme substrates and regulatory proteins. Thirdly, the development of
Expression Display should be of great significance in high-throughput functional
characterization of protein activities from any known or unknown organisms in that it
circumvents the tedious procedures in MS-based protein identification and also helps
to eliminate the bias against low-abundance proteins in current proteomic studies.
Therefore this novel technique should complement other proteomic techniques
currently employed in protein functional profiling. With more chemical tools being

35
developed in catalomics, Expression Display will find wider applications for the
characterization and classification of all the enzymes in a proteome. Finally, the
further application of Expression Display in the screening of human cDNA library
will facilitate the functional annotation of human proteins in a high-throughput
manner.
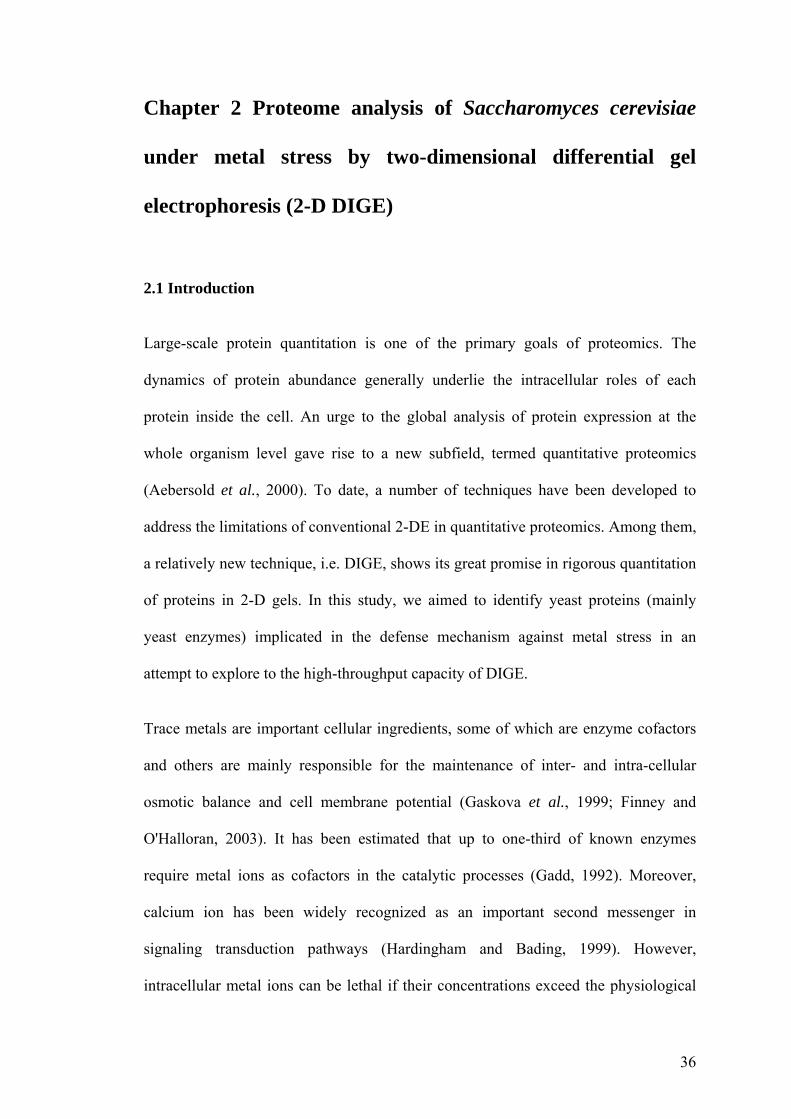
36
Chapter 2 Proteome analysis of Saccharomyces cerevisiae
under metal stress by two-dimensional differential gel
electrophoresis (2-D DIGE)
2.1 Introduction
Large-scale protein quantitation is one of the primary goals of proteomics. The
dynamics of protein abundance generally underlie the intracellular roles of each
protein inside the cell. An urge to the global analysis of protein expression at the
whole organism level gave rise to a new subfield, termed quantitative proteomics
(Aebersold et al., 2000). To date, a number of techniques have been developed to
address the limitations of conventional 2-DE in quantitative proteomics. Among them,
a relatively new technique, i.e. DIGE, shows its great promise in rigorous quantitation
of proteins in 2-D gels. In this study, we aimed to identify yeast proteins (mainly
yeast enzymes) implicated in the defense mechanism against metal stress in an
attempt to explore to the high-throughput capacity of DIGE.
Trace metals are important cellular ingredients, some of which are enzyme cofactors
and others are mainly responsible for the maintenance of inter- and intra-cellular
osmotic balance and cell membrane potential (Gaskova et al., 1999; Finney and
O'Halloran, 2003). It has been estimated that up to one-third of known enzymes
require metal ions as cofactors in the catalytic processes (Gadd, 1992). Moreover,
calcium ion has been widely recognized as an important second messenger in
signaling transduction pathways (Hardingham and Bading, 1999). However,
intracellular metal ions can be lethal if their concentrations exceed the physiological
37
tolerance of cells, which presents a serious threat to human health (Crossgrove and
Zheng, 2004). The metal toxicity encompasses denaturation of proteins, replacement
of cognate metals binding to the proteins, blocking of enzyme active sites and
perturbation of redox equilibrium inside cells (Blackwell et al., 1998). The question
about how cells respond to exogenous metal disturbance has been asked over a
century and several model systems have been proposed to elucidate the defense
mechanisms in prokaryotic and eukaryotic cells. Prokaryotes, for instance, typically
use efflux pumps to export excess metal ions outside the cells (Silver and Phung,
1996). Higher organisms, on the other hand, generally have several more elaborate
ion transportation and sequestration pathways (Kaplan and O'Halloran, 1996). One
well-known mechanism employs a tripeptide, glutathione (GSH), which has a low
redox potential and high concentration (up to 10 mM) in yeast cells (Penninckx, 2002).
GSH can be conjugated with free transition metal ions to form the organic GSH
complex, which can be selectively recognized and secreted outside the cells by
specific protein transporters (Li et al., 1997). Another sequestration mechanism relies
on a family of cysteine-rich proteins, i.e. metallothioneins, which function as
sacrificial scavengers to maintain low levels of free ions by tightly regulated metal
chelation (Fischer and Davie, 1998). The adequate sulfur ligands present in
metallothioneins can effectively bind to free metal ions and shield them from
biological milieu.
However, most studies in the pre-proteomics period have been restricted at the
transcriptional level, where the mRNA levels in wild type strain and the knock-out
mutant were compared after metal treatments (Ghosh et al., 1999). As such,
individual genes or gene products implicated in metal resistance were identified. More
recently, with the development of DNA microarray technology, high-throughput
38
methods for the global analysis of gene expression have been used to explore the
cellular response to metal stimuli (Bouton et al., 2001). The examination of metal
induced changes in mRNA abundance by DNA microarray provides a global view on
cellular response to these biological disturbances. However, few reports have
addressed how cells respond to the external stimuli at the translational level, whereby
up- or down-regulation of specific clusters of proteins can be chalked up in response
to the sudden influx of exogenous metals. Since proteins play more direct roles in
biological pathways (as mentioned in chapter 1), a global proteome profile of protein
expression, followed by high-throughput identification of proteins, will thus provide a
more direct functional description of cellular response to biological perturbations at
the translational level. This should be helpful to numerate components involved in
different cellular pathways and eventually facilitate our understanding of a biological
system at the proteomic level.
2.2 Objectives
DIGE had been successfully utilized to identify the difference in protein expression
between healthy and diseased cells (Gharbi et al., 2002; Zhou and Li et al., 2002). In
those experiments, however, only one or two kinds of protein samples were studied at
one time. We sought to further evaluate the capacity of DIGE as a high-throughput
proteomic tool for the global analysis of protein expression in yeast (Figure 2.1). The
budding yeast Saccharomyces cerevisiae was chosen as the model organism, and its
proteome profiles were examined upon fifteen kinds of metal treatments. In each
DIGE gel, an undisturbed yeast sample, as an internal standard, was run together with
a metal-perturbed sample in each 2-D gel. Upon co-separation and image analysis,
spots corresponding to differentially expressed proteins (mainly enzymes) were
39
readily matched and quantified. Theoretically and practically, only fifteen gels were
required for the analysis of the same number of protein samples by 2-D DIGE.
Protein Sample A Protein Sample B (Control) (Metal-treated)
N N
O
ON
O
O
I
NN
O
ON
O
O
I
Labeling Labeling /Quench /Quench Mix 2-D Gel Scan Cy3 image Cy5 image
Qualitative Quantitative Analysis Analysis (MS) (ProgenesisTM)
Figure 2.1 Methodology of proteome analysis by DIGE.
NHS-Cy3 NHS-Cy5
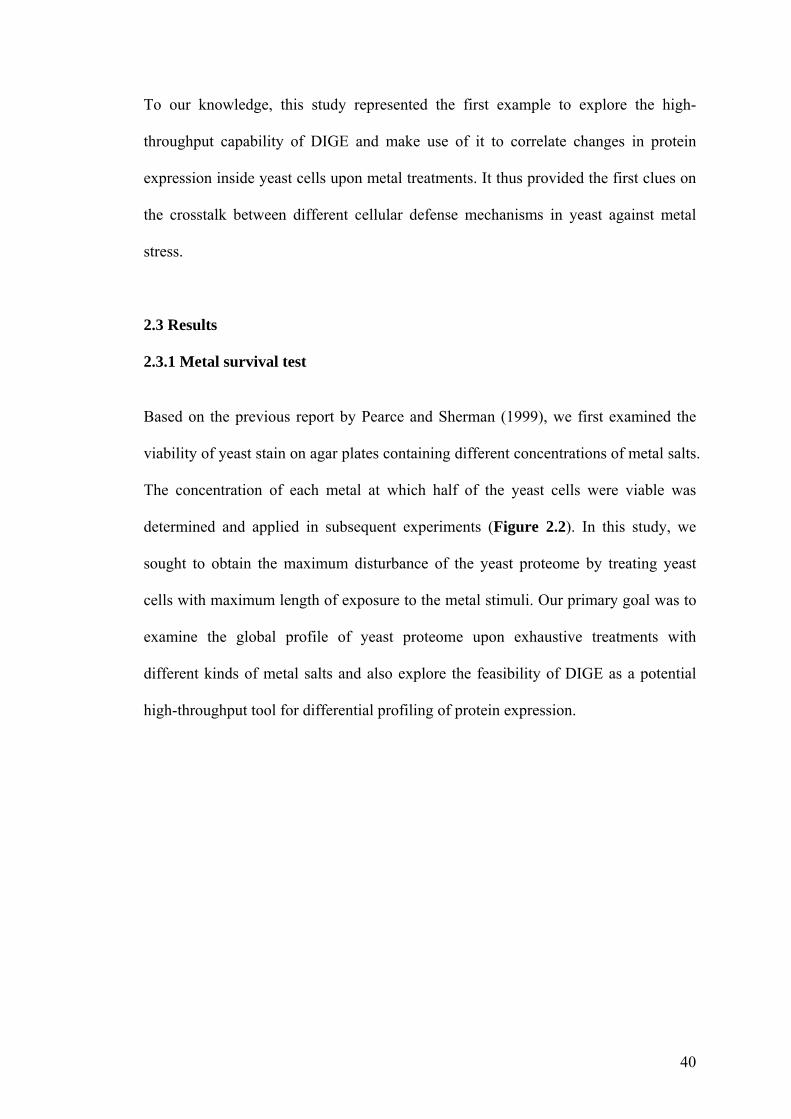
40
To our knowledge, this study represented the first example to explore the high-
throughput capability of DIGE and make use of it to correlate changes in protein
expression inside yeast cells upon metal treatments. It thus provided the first clues on
the crosstalk between different cellular defense mechanisms in yeast against metal
stress.
2.3 Results
2.3.1 Metal survival test
Based on the previous report by Pearce and Sherman (1999), we first examined the
viability of yeast stain on agar plates containing different concentrations of metal salts.
The concentration of each metal at which half of the yeast cells were viable was
determined and applied in subsequent experiments (Figure 2.2). In this study, we
sought to obtain the maximum disturbance of the yeast proteome by treating yeast
cells with maximum length of exposure to the metal stimuli. Our primary goal was to
examine the global profile of yeast proteome upon exhaustive treatments with
different kinds of metal salts and also explore the feasibility of DIGE as a potential
high-throughput tool for differential profiling of protein expression.
41
a)
b)
Figure 2.2 Quantitative analysis of metal stress in Saccharomyces cerevisiae. (a) Tabular results of the quantitative analysis. CV: coefficient of variation between the metal treatments and the normal condition of the spot volumes. The spot volumes were normalized by the total spot volume of the gel. The fold differences were based on the normalized spot volumes. Ratio is the number of down-regulated proteins over that of up-regulated proteins (CV > 50%). Metals were classified roughly based on this ratio: A (< 0.85); B (0.85-1.15); C (> 1.15). (b) Graphical representation of up- and down-regulation effects on yeast proteome by different metals. Series 1, CV > 100% and down-regulation; Series 2, CV > 100% and up-regulation; Series 3, CV > 50% and down-regulation; Series 4, CV > 50% and up-regulation.
CV > 100% CV > 50% Group Metal Concentration Salts (mM) (LD50)
Down- Fold Up- Fold Ratio
Regulation Differences Regulation Differences Down- Fold Up- Fold Ratio1
Regulation Differences Regulation Differences
A
B
C
Copper sulfate 1 Calcium chloride 200 Cadmium chloride 0.025 Cobalt chloride 1.2 Chromium chloride 8 Silver nitrate 0.4 Lithium chloride 40 Manganese chloride 2 Zinc chloride 4 Magnesium chloride 150 Potassium chloride 600 Sodium chloride 400 Nickel chloride 2 Rubidium chloride 5 Ferric chloride 8
147 >6.0 175 >5.9 0.84 131 >5.9 160 >5.9 0.81 139 >6.0 173 >5.9 0.80 95 >6.0 160 >5.9 0.59 190 >6.0 209 >5.9 0.91 126 >5.9 220 >5.9 0.57 86 >5.9 192 >6.0 0.45 123 >6.0 206 >5.9 0.60 145 >6.0 247 >5.9 0.59 155 >6.0 165 >6.0 0.94 241 >5.9 186 >6.0 1.29 158 >5.9 143 >5.9 1.10 154 >5.9 149 >6.0 1.03 218 >5.9 170 >5.9 1.28 291 >6.0 194 >5.9 1.50
242 >2.2 299 >2.1 0.81 238 >2.1 289 >2.1 0.82 322 >2.1 365 >2.1 0.88 243 >2.1 389 >2.1 0.62 326 >2.1 369 >2.1 0.88 263 >2.2 379 >2.2 0.69 207 >2.1 345 >2.1 0.60 235 >2.1 354 >2.1 0.66 268 >2.1 423 >2.2 0.64 277 >2.1 302 >2.1 0.92 349 >2.2 335 >2.1 1.04 285 >2.1 303 >2.1 0.94 286 >2.1 305 >2.1 0.94
362 >2.1 316 >2.1 1.15 428 >2.1 341 >2.1 1.26
Num
ber of spots
42
2.3.2 Comparison of protein profiles of DIGE images with silver-stained images
Since there were different protein staining/labeling methods used in this study, it was
imperative to examine whether there were significant variations between gels
visualized by different methods: i.e. Cy3-labeled fluorescent gels, Cy5-labeled
fluorescent gels, and silver-stained gels. Firstly, two aliquots of the same untreated
control sample were labeled by Cy3 and Cy5, respectively, and then resolved in the
same 2-D gel. Figure 2.3 shows two fluorescent images of one protein sample labeled
with Cy3 and Cy5, separately, on the same gel. By visual inspection, Cy3 and Cy5
images on the same gel were superimposable in that all the spots showed up as yellow
spots (Figure 2.3c), suggesting that the protein labeling by Cy3 and Cy5 will not
cause significant spot shift in 2-D gel. This highlights the merit of DIGE that two
images on the same gel can be more rigorously compared since it circumvents the gel-
to-gel variation.
Similarly, we then compared the images of fluorescent gels and silver-stained gels.
Two aliquots of the protein sample were either fluorescently labeled or unlabeled and
then resolved in two separate 2-D gels. The 2-D gel containing the unlabeled protein
sample was stained by silver-staining. Figure 2.4 presents the Cy3 gel image, Cy5 gel
image and silver-stained gel image of the same protein sample. The image pattern of
fluorescently labeled sample was rather different from that of the unlabeled one. This
may be partly due to mass shift of the spots on 2-D gel caused by the binding of
fluorescent molecules to the proteins. However, with the aid of the image analysis
software ProgenesisTM, fluorescent image and silver-stained image could be well
correlated as conventional 2-DE, where different gels are compared and averaged by
using image analysis software with specified parameters. Results showed that there
43
were more proteins detected in fluorescent image than silver-stained image (Figure
2.4), indicating that fluorescent labeling is more sensitive than silver-staining.
Nevertheless, results also showed that a few spots on the silver-stained gel were
absent on the DIGE gels. This may be explained by the reaction mechanism of
fluorescent labeling. In DIGE, the fluorescent molecules can only react with the
amine group of lysine residues on the proteins. As a consequence, proteins without
lysine residues cannot be labeled and visualized on the DIGE gel. On the other hand,
the different content of lysine residues in proteins can also complicate the labeling
effects. In DIGE, proteins with low lysine content may be hypo-labeled, whereas
proteins with high lysine content may be hyper-labeled. Therefore, although DIGE
may be more sensitive than conventional staining methods, DIGE still cannot detect
all the proteins resolved in 2-D gel. In terms of the sensitivity of DIGE, our
conclusion that DIGE is more sensitive than other staining methods, including silver
staining, is consistent with the observation by Gharbi et al. (2002), although other
researchers have argued that fluorescent labeling is virtually as sensitive as silver-
staining based on their experimental results (Patton, 2002). This discrepancy may be
ascribed to different silver-staining methods and distinct properties of protein samples
used in respective studies.
We next compared the fluorescent images of metal-treated and untreated control
samples (Figure 2.4a, b). Results showed that most proteins in Cy3 and Cy5 images
could be well matched. This is not surprising because most of the proteins should be
identical in two samples and identical protein spots can match each other on the same
gel based on the principle of DIGE. However, results also indicated that a few spots in
the low-molecular-weight region were not matched between two fluorescent images.
This is presumably because the mass shift arising from protein labeling may be more
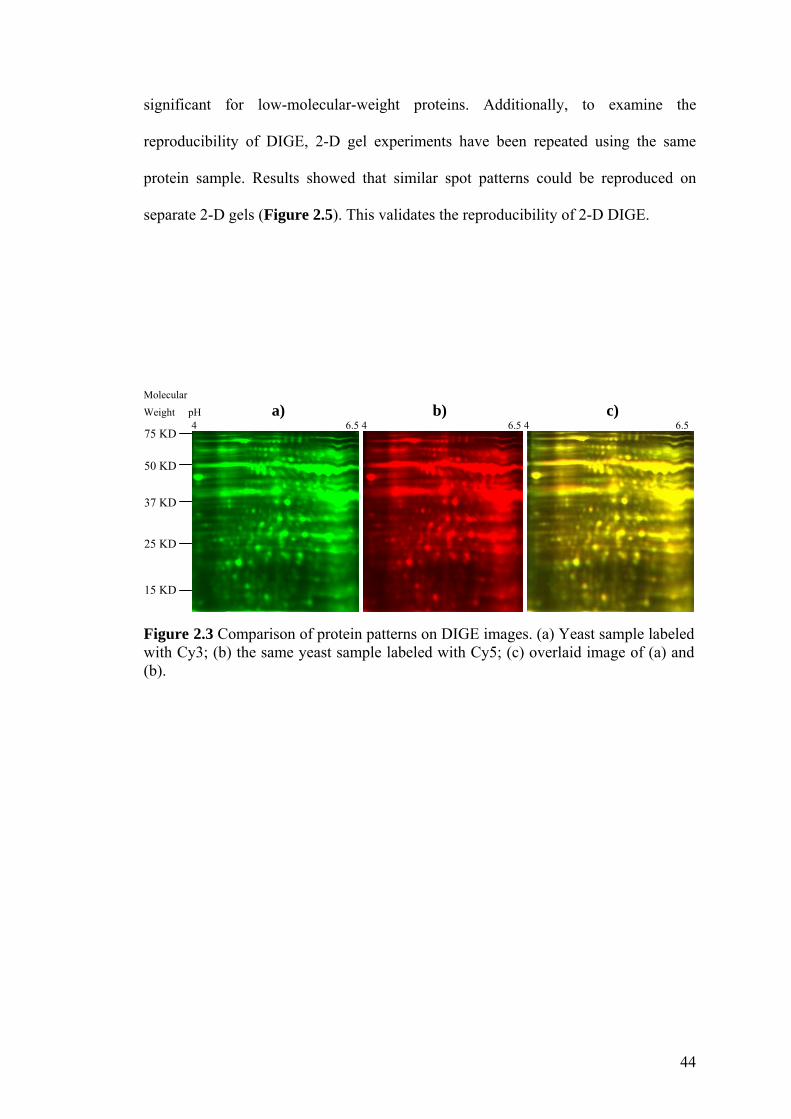
44
significant for low-molecular-weight proteins. Additionally, to examine the
reproducibility of DIGE, 2-D gel experiments have been repeated using the same
protein sample. Results showed that similar spot patterns could be reproduced on
separate 2-D gels (Figure 2.5). This validates the reproducibility of 2-D DIGE.
Molecular Weight pH a) b) c) 4 6.5 4 6.5 4 6.5
Figure 2.3 Comparison of protein patterns on DIGE images. (a) Yeast sample labeled with Cy3; (b) the same yeast sample labeled with Cy5; (c) overlaid image of (a) and (b).
75 KD
50 KD
37 KD
25 KD
15 KD
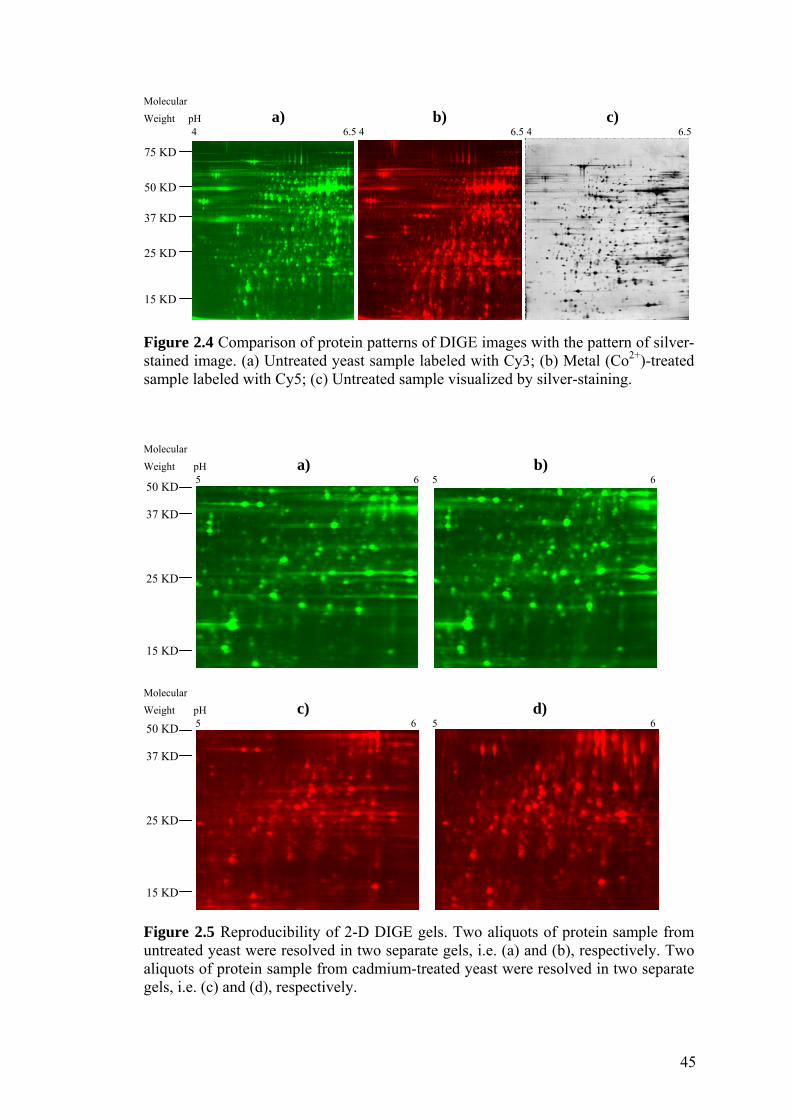
45
Molecular Weight pH a) b) c) 4 6.5 4 6.5 4 6.5
Figure 2.4 Comparison of protein patterns of DIGE images with the pattern of silver-stained image. (a) Untreated yeast sample labeled with Cy3; (b) Metal (Co2+)-treated sample labeled with Cy5; (c) Untreated sample visualized by silver-staining. Molecular
Weight pH a) b) 5 6 5 6
Molecular Weight pH c) d) 5 6 5 6
Figure 2.5 Reproducibility of 2-D DIGE gels. Two aliquots of protein sample from untreated yeast were resolved in two separate gels, i.e. (a) and (b), respectively. Two aliquots of protein sample from cadmium-treated yeast were resolved in two separate gels, i.e. (c) and (d), respectively.
50 KD 37 KD
25 KD
15 KD
50 KD 37 KD
25 KD
15 KD
75 KD
50 KD
37 KD
25 KD
15 KD
46
2.3.3 Expression profiling of yeast proteome with different metals
As mentioned above, metals are generally essential cellular components but toxic at
high concentration to the living organism. An elevated concentration of metal ions
may cause serious human disease (Crossgrove and Zheng, 2004). Previous studies of
organisms under metal stress had typically been limited to a small number of proteins
which are involved in metal detoxification (Li et al., 1997; Fischer and Davie, 1998).
A global profile of protein expression pattern from an organism upon exposure to
exogenous metal salts will, therefore, impose a significant impact on our
understanding of the cellular defense mechanism at the translational level. Yeast is a
simple eukaryotic organism with both its genome and proteome well characterized.
We expected that the information of the metal stress on yeast will potentially be
instructive to the study of other higher organisms.
In this study, we used the combination of Cy3 and Cy5 in all our 2-D DIGE gels.
Generally, DIGE can employ three kinds of spectrally resolvable and mass/charge-
matched fluorescent molecules, i.e. 3-(4-carboxymethyl)phenylmethyl)-3’-
ethyloxacarbocyanine halide (Cy2), Cy3 and Cy5, to label three different protein
samples. However, earlier work had shown that the combination of Cy3 and Cy5
labeling was the least variable one among all three possible dye combinations (Tonge
et al., 2001). For the comparison across different DIGE gels, all the untreated yeast
protein samples were labeled with Cy3 and metal- treated samples were labeled with
Cy5 in each DIGE gel. In order to minimize other external effects (temperature,
medium, etc.) on yeast proteome, each metal-treated yeast culture was grown in
parallel with an untreated yeast culture. Therefore, fifteen untreated control yeast
cultures were grown and analyzed, together with fifteen kinds of metal-treated yeast
47
cultures. In each gel, approximately a thousand of protein spots were visible, about
20% of which saw significant changes in their expression levels upon the ionic stress
(Figure 2.2). This is not out of our expectation, considering that exhaustive metal
treatments were purposely conducted on yeast cells so as to maximize the changes to
be recorded under our experimental conditions. According to the changes in
expression level, there were roughly two groups of proteins in yeast proteome coping
with metal toxicity. One group of proteins saw their expression changed only upon the
treatment of one or a few metal ions, indicating that these proteins may be designated
in the biochemical pathways essential for particular metal detoxification in yeast. For
another group of proteins, their expression levels were altered when subjected to most
of the metal treatments, suggesting that these proteins may be implicated in the
general cellular defense mechanism in yeast. From the results of quantitative analysis
of protein expression, fifteen metals were divided into three groups, A, B and C,
based on their overall up-/down-regulation effects on the proteins. In group A, the
majority of members are heavy metals including Cu2+,Co2+, Cd2+, Cr3+, Ag+ and Mn2+.
These metals, together with Ca2+, Zn2+ and Li+, saw more protein being up-regulated.
Group B metals, while comprising of most essential metals including Mg2+, K+, Na+
and Ni2+, had similar protein regulation effects on the yeast proteome in terms of the
number of proteins being up-regulated or down-regulated. Another two metals tested
in our experiments, Fe3+ and Rb+, were placed in group C. These two metals rendered
more proteins down-regulated.
There are several reasons accounting for distinct effects of different metal stimuli on
yeast proteome. It has been shown that high concentrations of free metal ions would
cause cell damage (Xavier et al., 2002). To avoid it, proteins which are implicated in
the cellular defense mechanisms to combat metal toxicity, such as GSH and
48
metallothioneins, would be induced to sequester metals so as to reduce the amount of
free metal ions inside the cells (Fischer and Davie, 1998; Penninckx, 2002). In group
A, most members are transition metals which have been reported to be toxic to yeast
cells (Pearce and Sherman, 1999). Therefore, certain proteins responding to these
metal treatments might be directly involved in the metal detoxification, such as
antioxidant proteins. The expression of other proteins, on the other hand, might be
altered by metal disturbance as a result of DNA/RNA and protein damage. All group
B metals, except for nickel, have not been documented that they are toxic to yeast
cells. In this study, the changes in yeast protein expression upon exposure to these
metals are presumably ascribed to the growth inhibition effect of excess metal ions on
yeast cells. This growth inhibition effect is also statistically evident for the metals in
group C, including Rb+ and Fe3+. In this group, more down-regulation effects of
protein expression were observed, implying that either yeast is highly tolerant to these
metal treatments or there are no efficient biochemical pathways in yeast to remove
excess Rb+ and Fe3+.
2.3.4 Quantitative thresholds of significant changes in protein expression
In most previous reports, the quantitative analyses in DIGE were carried out
according to the fold differences in the ratios of normalized spot volumes (Gharbi et
al., 2002; Zhou and Li et al., 2002). An intrinsic drawback of this method is that the
threshold for the analysis of high-molecular-weight proteins was typically different
from that of low-molecular-weight proteins (Tonge et al., 2001). As a result,
demarcation of the normalized spot volume according to protein molecular weight
was inevitable in order to determine a threshold of significant changes in protein
expression. This demarcation, however, was liable to produce variables due to distinct
49
scales of the spot volumes applied in different studies (Tonge et al., 2001). To address
this problem, we sought to use the coefficient of variation (CV) in our quantitative
analyses of protein expression. As a statistical term, CV represents the standard
deviation of the samples expressed as a percentage of the sample mean, which is thus
independent of the scales of the normalized spot volumes. Therefore, CV provides an
accurate measurement of variations between samples.
Although the combination of Cy3 and Cy5 used in this study for the protein labeling
generates the least variation than other dye combinations, the slight difference in
fluorescence and cross-over effects between Cy3 and Cy5 still impede a direct
comparison of Cy3 and Cy5 images on the same gel (Patton, 2002), in that two
images from the same protein sample labeled with Cy3 and Cy5, respectively, would
still show slight difference in terms of normalized spot volumes. By taking this
variation into account, we sought to generate a statistical standard deviation for our
experimental data and determine a CV threshold of the spot volumes to distinguish
the differences in protein expression arising from experimental variation from those
caused by the biological perturbations. To this end, two aliquots of the control sample
were labeled with Cy3 and Cy5, respectively, mixed and separated in the same 2-D
gel. After image scanning, the quantitative data of each protein spot in the same
sample were collected by the software Progenesis™. Based on these data, we
determined that the CV threshold of 95% of confidence was approximate 50%, which
was equivalent to a 2.1-fold difference in protein expression, and the CV threshold of
99% of confidence was 100%, which was equivalent to a 5.7-fold difference in
protein expression (Figure 2.2). Under our experimental conditions, over 200 proteins
saw their expression levels altered by five-fold, whereas up to 700 proteins had more
than two-fold changes in expression levels (Figure 2.2).
50
2.3.5 Quantitative and qualitative analysis of individual spots across fifteen
DIGE gels
As one of the primary goals in this study, validation of DIGE as a powerful tool for
potential high-throughput proteome analysis was conducted by using only one
undisturbed control sample as an internal reference to run along with each metal-
treated yeast sample in the same 2-D gel. The fifteen images of the control sample
(Cy3 channels) in fifteen gels were used to match the spots of the same proteins in
different metal-treated samples (Cy5 channels). By simple visualization, the fifteen
Cy3 images from the same control yeast sample in fifteen 2-D gels showed that more
than 80% of all the proteins detected could be readily matched across fifteen 2-D gels.
Further adjustments of the spots, either manually or with the aid of the software, were
able to match nearly all the spots in different gels. These results clearly demonstrated
the advantages of DIGE over conventional 2-DE in that a sample employed as an
internal reference in DIGE can be used for the comparison of protein spots between
gels. Therefore, we envision that DIGE will find wide applications in potential high-
throughput proteomic studies.
In order to further identify proteins that had undergone significant induction or
repression upon metal stimuli, spots were manually excised from the gels and trypsin-
digested, followed by peptide fingerprinting using MALDI-TOF mass spectrometer.
In this study, we mainly chose those proteins that observed expression changes upon
most metal treatments. Among these proteins, some low-abundance proteins eluded
the identification by MS, due to technical limitations. In all, about a hundred proteins
were analyzed by MS and more than fifty yeast proteins were unambiguously
identified by MS. These identified proteins were divided into several groups
51
according to their known biological functions (Figure 2.6 and Table 2.1), such as
proteins with antioxidant properties, heat shock proteins, etc.
From MS results, it showed that a majority of the identified proteins with significantly
altered expression levels were yeast enzymes, suggesting that enzymes may play
important roles in yeast defense mechanism against metal stress. Among five enzymes
with antioxidant properties, four enzymes saw their expression level down-regulated
upon most of the metal treatments, indicating yeast cells had undergone oxidative
stress. Of particular interest to us is the protein, Cu/Zn superoxide dismutase (SOD1),
which has been well known as an anti-stress enzyme with important roles in copper
and zinc detoxification pathways (Culotta et al., 1995; Wei et al., 2001). Other than
copper and zinc, however, SOD1 was also induced upon exposure to almost every
metal ion examined in this study (Figure 2.6). Treatments with most metals in group
A resulted in over two-fold up-regulation effects on SOD1, whereas the CV of Ag+
was less than the quantitative threshold for significant changes in protein expression
we had determined as described above. In this group, a transition metal, i.e.
manganese, did not show much induction effect on SOD1 expression. This is
presumably because another protein, superoxide dismutase 2 (SOD2), is present
within the mitochondrial matrix and responsible for protecting the cells from
manganese toxicity in yeast (O'Brien et al., 2004).
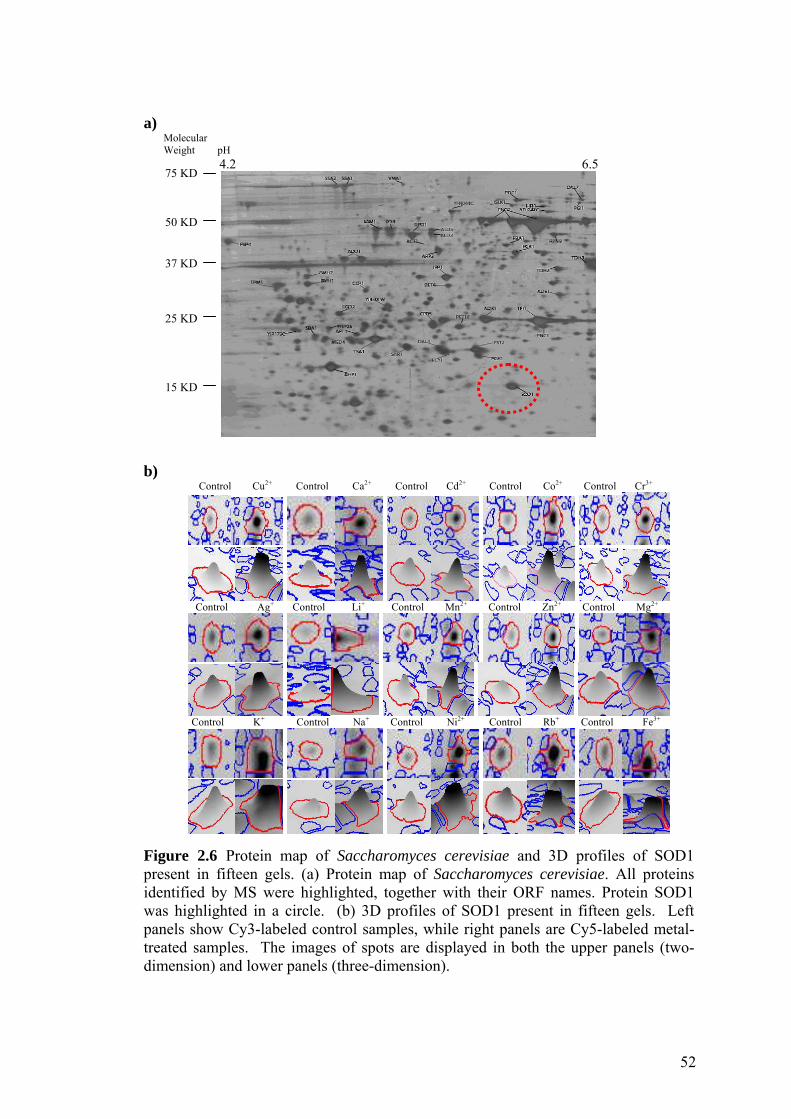
52
a) Molecular Weight pH 4.2 6.5
b) Control Cu2+ Control Ca2+ Control Cd2+ Control Co2+ Control Cr3+
Control Ag+ Control Li+ Control Mn2+ Control Zn2+ Control Mg2+
Control K+ Control Na+ Control Ni2+ Control Rb+ Control Fe3+
Figure 2.6 Protein map of Saccharomyces cerevisiae and 3D profiles of SOD1 present in fifteen gels. (a) Protein map of Saccharomyces cerevisiae. All proteins identified by MS were highlighted, together with their ORF names. Protein SOD1 was highlighted in a circle. (b) 3D profiles of SOD1 present in fifteen gels. Left panels show Cy3-labeled control samples, while right panels are Cy5-labeled metal-treated samples. The images of spots are displayed in both the upper panels (two-dimension) and lower panels (three-dimension).
75 KD
50 KD 37 KD 25 KD 15 KD
53
Interestingly, in contrast to previous observation that SOD1 was not induced by
cadmium treatment (Vido et al., 2001), the CV of Cd2+ in our experiment data was de
facto higher than 100%, representing a 6.5-fold change in SOD1 expression. This
discrepancy may be explained by the different exposure time of yeast to Cd2+ between
two experiments. In the work carried out by Vido and co-workers, exponentially
growing yeast cells were disturbed by Cd2+ only for 15 minutes to 1 hour (Vido et al.,
2001). In our experiments, however, the yeast proteome was exhaustively perturbed
by Cd2+ before harvest. We may, therefore, suppose that SOD1 may be still
implicated in the detoxification of heavy metals including cadmium, although the
induction effect on SOD1 expression was not detectable at the initial stage of
cadmium treatment. As the cells were exposed to prolonged treatment by cadmium,
SOD1 could be adequately induced to remove the excess Cd2+. Recent study has
further verified the function of SOD1 in cadmium detoxification by examining the
metal stress on yeast cells lacking SOD1 (Adamis et al., 2004). In group B, all the
metals, except for magnesium, could significantly induce SOD1 expression. The CVs
of Rb+ and Fe3+ (two metals in group C) were 105% and 77%, respectively. This
relatively lower induction effect of Fe3+ on SOD1 expression is presumably because
there is lack of an effective transportation system to export the Fe3+ outside the yeast
cells (Kaplan and O'Halloran, 1996). Among all fifteen metals examined in this study,
the CVs of Cu2+, Cd2+, Cr3+, Zn2+, Ni2+ and Rb+ (most of which are transition metals)
were higher than 100%, corresponding to more than 6.4-fold changes in SOD1
expression. From these results, we suggest that SOD1 may play a vital role in cellular
defense mechanism coping with metal toxicity at the translational level, which is
consistent with other reports (Culotta et al., 1995; Sumner et al., 2005). Strikingly, a
so-called “non-toxic” metal, i.e. Zn2+, had the highest up-regulation effect on SOD1
54
expression. This finding corroborated the significant role of SOD1 in zinc
homeostasis, besides its antioxidant property (Wei et al., 2001).
In addition to antioxidant proteins, a majority of identified heat shock and chaperone
proteins were down-regulated by most of the metal treatments, indicating that a
critical balance of metal content is required for the protein folding processes. The
expression of most proteins implicated in the carbohydrate metabolism processes
were also repressed, which underlines the inhibition effects of high-dosage metal ions
on yeast cell growth. As for proteins implicated in DNA/protein synthesis and
transcriptional regulation, some proteins were up-regulated while others were down-
regulated, further evincing the complexity of the cellular defense mechanism against
metal stress in yeast.
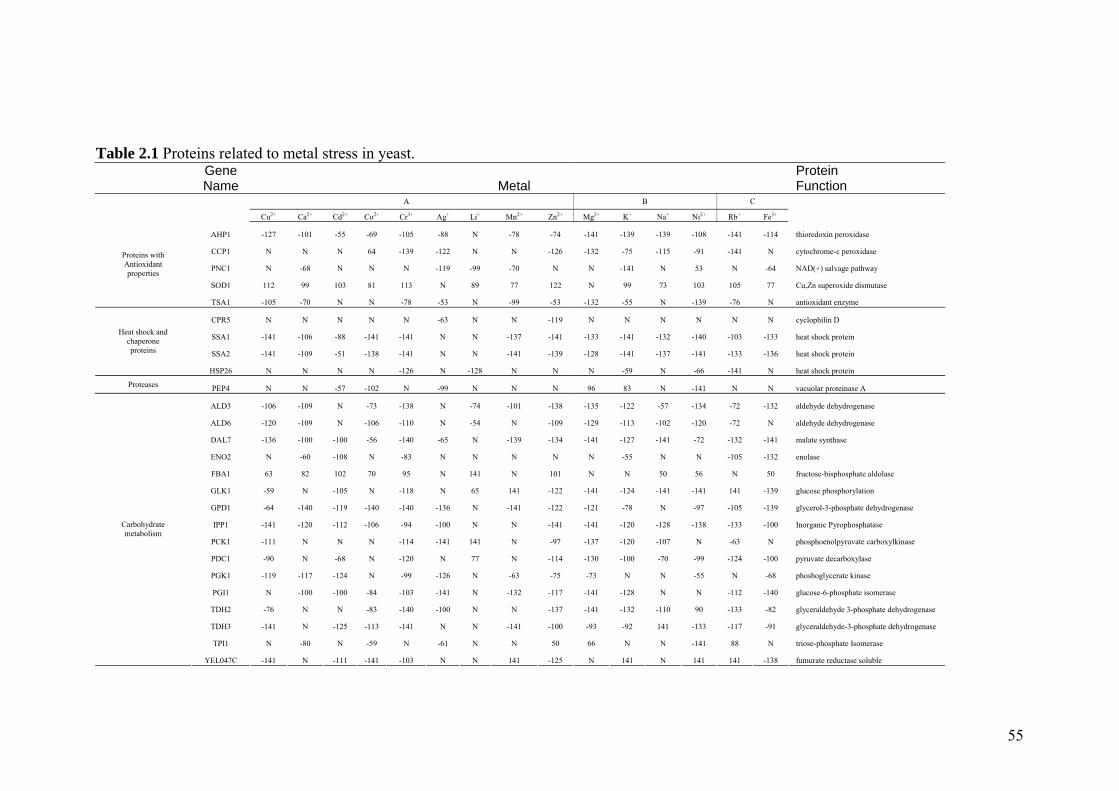
55
Table 2.1 Proteins related to metal stress in yeast.
Gene Name Metal
Protein Function
A B C
Cu2+ Ca2+ Cd2+ Co2+ Cr3+ Ag+ Li+ Mn2+ Zn2+ Mg2+ K+ Na+ Ni2+ Rb+ Fe3+
AHP1 -127 -101 -55 -69 -105 -88 N -78 -74 -141 -139 -139 -108 -141 -114 thioredoxin peroxidase
CCP1 N N N 64 -139 -122 N N -126 -132 -75 -115 -91 -141 N cytochrome-c peroxidase
PNC1 N -68 N N N -119 -99 -70 N N -141 N 53 N -64 NAD(+) salvage pathway
SOD1 112 99 103 81 113 N 89 77 122 N 99 73 103 105 77 Cu,Zn superoxide dismutase
Proteins with Antioxidant properties
TSA1 -105 -70 N N -78 -53 N -99 -53 -132 -55 N -139 -76 N antioxidant enzyme
CPR5 N N N N N -63 N N -119 N N N N N N cyclophilin D
SSA1 -141 -106 -88 -141 -141 N N -137 -141 -133 -141 -132 -140 -103 -133 heat shock protein
SSA2 -141 -109 -51 -138 -141 N N -141 -139 -128 -141 -137 -141 -133 -136 heat shock protein
Heat shock and chaperone proteins
HSP26 N N N N -126 N -128 N N N -59 N -66 -141 N heat shock protein
Proteases PEP4 N N -57 -102 N -99 N N N 96 83 N -141 N N vacuolar proteinase A
ALD3 -106 -109 N -73 -138 N -74 -101 -138 -135 -122 -57 -134 -72 -132 aldehyde dehydrogenase
ALD6 -120 -109 N -106 -110 N -54 N -109 -129 -113 -102 -120 -72 N aldehyde dehydrogenase
DAL7 -136 -100 -100 -56 -140 -65 N -139 -134 -141 -127 -141 -72 -132 -141 malate synthase
ENO2 N -60 -108 N -83 N N N N N -55 N N -105 -132 enolase
FBA1 63 82 102 70 95 N 141 N 101 N N 50 56 N 50 fructose-bisphosphate aldolase
GLK1 -59 N -105 N -118 N 65 141 -122 -141 -124 -141 -141 141 -139 glucose phosphorylation
GPD1 -64 -140 -119 -140 -140 -136 N -141 -122 -121 -78 N -97 -105 -139 glycerol-3-phosphate dehydrogenase
IPP1 -141 -120 -112 -106 -94 -100 N N -141 -141 -120 -128 -138 -133 -100 Inorganic Pyrophosphatase
PCK1 -111 N N N -114 -141 141 N -97 -137 -120 -107 N -63 N phosphoenolpyruvate carboxylkinase
PDC1 -90 N -68 N -120 N 77 N -114 -130 -100 -70 -99 -124 -100 pyruvate decarboxylase
PGK1 -119 -117 -124 N -99 -126 N -63 -75 -73 N N -55 N -68 phoshoglycerate kinase
PGI1 N -100 -100 -84 -103 -141 N -132 -117 -141 -128 N N -112 -140 glucose-6-phosphate isomerase
TDH2 -76 N N -83 -140 -100 N N -137 -141 -132 -110 90 -133 -82 glyceraldehyde 3-phosphate dehydrogenase
TDH3 -141 N -125 -113 -141 N N -141 -100 -93 -92 141 -133 -117 -91 glyceraldehyde-3-phosphate dehydrogenase
TPI1 N -80 N -59 N -61 N N 50 66 N N -141 88 N triose-phosphate Isomerase
Carbohydrate metabolism
YEL047C -141 N -111 -141 -103 N N 141 -125 N 141 N 141 141 -138 fumurate reductase soluble
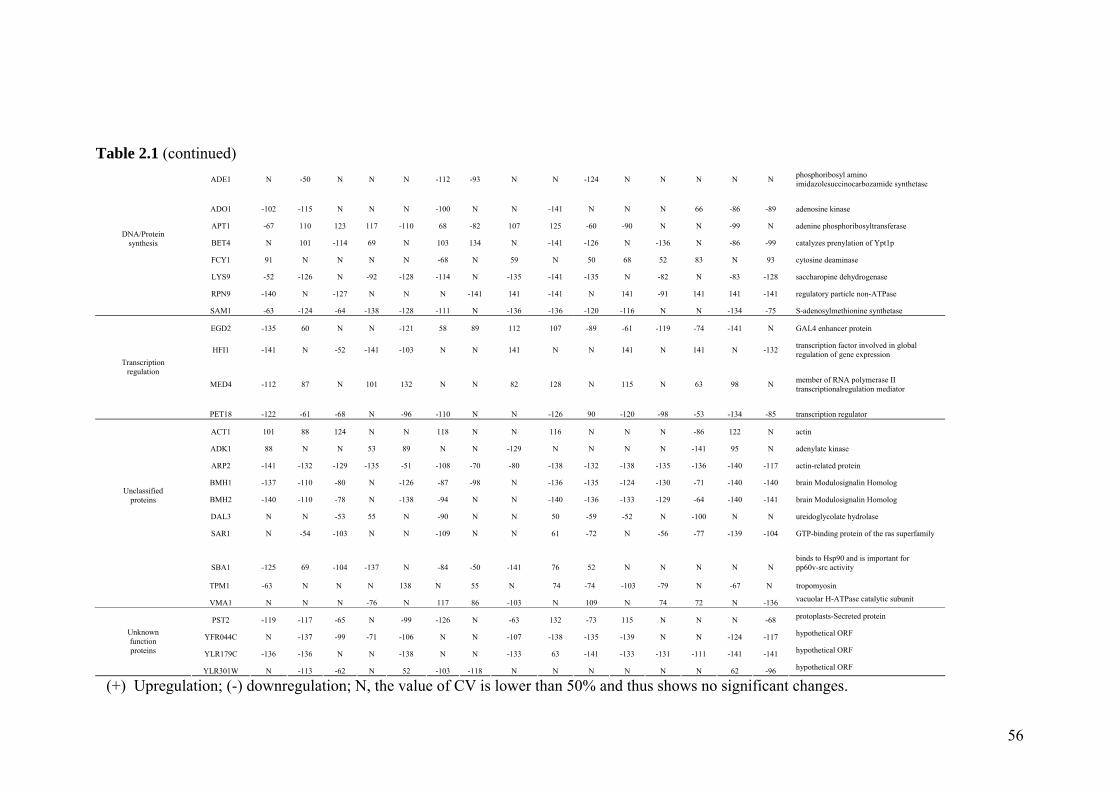
56
Table 2.1 (continued) ADE1 N -50 N N N -112 -93 N N -124 N N N N N phosphoribosyl amino
imidazolesuccinocarbozamide synthetase
ADO1 -102 -115 N N N -100 N N -141 N N N 66 -86 -89 adenosine kinase
APT1 -67 110 123 117 -110 68 -82 107 125 -60 -90 N N -99 N adenine phosphoribosyltransferase
BET4 N 101 -114 69 N 103 134 N -141 -126 N -136 N -86 -99 catalyzes prenylation of Ypt1p
FCY1 91 N N N N -68 N 59 N 50 68 52 83 N 93 cytosine deaminase
LYS9 -52 -126 N -92 -128 -114 N -135 -141 -135 N -82 N -83 -128 saccharopine dehydrogenase
RPN9 -140 N -127 N N N -141 141 -141 N 141 -91 141 141 -141 regulatory particle non-ATPase
DNA/Protein synthesis
SAM1 -63 -124 -64 -138 -128 -111 N -136 -136 -120 -116 N N -134 -75 S-adenosylmethionine synthetase
EGD2 -135 60 N N -121 58 89 112 107 -89 -61 -119 -74 -141 N GAL4 enhancer protein
HFI1 -141 N -52 -141 -103 N N 141 N N 141 N 141 N -132 transcription factor involved in global regulation of gene expression
MED4 -112 87 N 101 132 N N 82 128 N 115 N 63 98 N member of RNA polymerase II transcriptionalregulation mediator
Transcription regulation
PET18 -122 -61 -68 N -96 -110 N N -126 90 -120 -98 -53 -134 -85 transcription regulator
ACT1 101 88 124 N N 118 N N 116 N N N -86 122 N actin
ADK1 88 N N 53 89 N N -129 N N N N -141 95 N adenylate kinase
ARP2 -141 -132 -129 -135 -51 -108 -70 -80 -138 -132 -138 -135 -136 -140 -117 actin-related protein
BMH1 -137 -110 -80 N -126 -87 -98 N -136 -135 -124 -130 -71 -140 -140 brain Modulosignalin Homolog
BMH2 -140 -110 -78 N -138 -94 N N -140 -136 -133 -129 -64 -140 -141 brain Modulosignalin Homolog
DAL3 N N -53 55 N -90 N N 50 -59 -52 N -100 N N ureidoglycolate hydrolase
SAR1 N -54 -103 N N -109 N N 61 -72 N -56 -77 -139 -104 GTP-binding protein of the ras superfamily
Unclassified proteins
SBA1 -125 69 -104 -137 N -84 -50 -141 76 52 N N N N N binds to Hsp90 and is important for pp60v-src activity
TPM1 -63 N N N 138 N 55 N 74 -74 -103 -79 N -67 N tropomyosin
VMA1 N N N -76 N 117 86 -103 N 109 N 74 72 N -136 vacuolar H-ATPase catalytic subunit
PST2 -119 -117 -65 N -99 -126 N -63 132 -73 115 N N N -68 protoplasts-Secreted protein
YFR044C N -137 -99 -71 -106 N N -107 -138 -135 -139 N N -124 -117 hypothetical ORF
YLR179C -136 -136 N N -138 N N -133 63 -141 -133 -131 -111 -141 -141 hypothetical ORF
Unknown function proteins
YLR301W N -113 -62 N 52 -103 -118 N N N N N N 62 -96 hypothetical ORF
(+) Upregulation; (-) downregulation; N, the value of CV is lower than 50% and thus shows no significant changes.
57
2.4 Discussion
2.4.1 An overview of DIGE and its limitations in proteomic applications
Building on conventional 2-DE methods, DIGE made further advances by adding a
reference dimension for rigorous quantitation of relative protein expression level.
Besides yeast, DIGE has been successfully applied to other model organisms, such as
mouse (Tonge et al., 2001), human (Zhou et al., 2002), bacteria (Yan et al., 2002), cat
(Van den Bergh et al., 2003), rat (Sakai et al., 2003), and maize (Casati et al., 2005).
In these studies, DIGE has shown considerable advantages over conventional 2-DE in
a number of proteomic applications (Hu et al., 2004). As presented in this study, a
salient feature of DIGE is the introduction of an internal standard in each 2-D gel,
allowing simultaneous analysis of a batch of protein samples in a limited number of
gels. Since each 2-D DIGE gel shares a common internal standard, the protein profiles
across different gels could also be easily correlated and compared. More importantly,
this in-gel ratio measurement with an internal standard as a reference is more accurate
than absolute measurement of spot volumes. When the significant role of internal
standard was established in DIGE, a following issue was to determine a protein
sample which can be used as the internal control. In this study, an aliquot of untreated
yeast cells was cultured in parallel with all the metal-treated yeast cells, so as to
minimize other external effects (temperature, medium, etc.) on yeast proteome.
Nevertheless, it is sometimes difficult to procure a control sample identical to the
sample before being biologically disturbed. For instance, human proteome varies
substantially not only between individuals, but also within individuals. Moreover, it is
to date practically and ethically infeasible to clone a human being for scientific
research. In these cases, the control sample could be prepared by combining equal
58
amount of each sample to be analyzed. Therefore, this control sample has averaged
protein content of all the samples and can be used to determine the relative protein
expression level in each sample. By using a pooled internal standard, Seike et al.
(2004) have recently profiled the proteome of 30 human cell lines in a high-
throughput fashion. Similar to our work, they used a two-dye system in which the
control sample was labeled with Cy3 and co-separated with each Cy5-labeled protein
sample in the 2-D gels.
In addition to two-dye system, other researchers have taken advantages of a triple-
color system with the introduction of a pooled protein sample labeled with Cy2.
Gharbi et al. (2002) first demonstrated the use of triple-color gels for the quantitation
of time-course protein expression in the cells treated with particular growth factor,
where a Cy2-labeled sample was used as an internal control resolved together with
Cy3 and Cy5-labeled protein samples in the same 2-D gel. Alban et al. (2003) further
explored this triple-color system in quantitative analysis through “artificial” protein
samples in which bacterial lysate was spiked with different amount of purified
proteins. However, there is mounting evidence suggesting that this triple-color system
would produce more variables than two-dye system do using Cy3 and Cy5 (Tonge et
al., 2001; Karp and Lilley, 2005). This variation is presumably because of the
difference between the chemical properties of Cy2 and Cy3/Cy5. Compared to Cy3
and Cy5, Cy2 is a weaker fluorophore and the fluorescent signal of Cy2 is closer to
the background (Karp and Lilley, 2005). As a result, the Cy2 signal might be more
easily blurred by the system noise and therefore caution must be exercised in
analyzing the data from triple-color system.
59
As an emerging technology, DIGE has shown decent compatibility with other
advanced techniques. First of all, it is compatible with MS, enabling the downstream
protein identification. Secondly, Zhou et al. (2002) and Lee et al. (2003) have
successfully coupled DIGE with laser capture microdissection (LCM) to profile
different cell populations. Moreover, through the enrichment of intracellular
organelles, profiling of subcellular proteome could also be achieved by DIGE (Lehr et
al., 2005). In other examples, Van den Bergh et al. (2003) and Qin et al. (2005) have
found that prefractionation of complex proteome by reversed-phase HPLC prior to
DIGE allows for successful detection and characterization of low abundance proteins.
Other than low-abundance proteins, membrane proteins which were also excluded
from conventional 2-DE experiments have been successfully identified from the
Escherichia coli proteome by 2-D DIGE (Yan et al., 2002). All these evidence clearly
demonstrated that DIGE is a powerful tool for high-throughput quantitation of protein
expression and also provides opportunities to detect and quantify low-abundance
proteins and the proteins with unique properties.
Notwithstanding its great promise, DIGE has inherent drawbacks. In DIGE, the
hydrophobic fluorescent molecules are used to label the proteins by reacting with
surface-exposed lysine residues. The addition of fluorescent dyes on proteins can
decrease protein solubility and may thus precipitate the proteins, to some extent,
before gel electrophoresis (Unlu et al., 1997). Furthermore, since the efficiency of
protein labeling is dependent on the lysine content of proteins, certain proteins with
high lysine content will be hyper-labeled while other proteins will be hypo-labeled by
the fluorescent dyes, thereby complicating the subsequent quantitative analysis. To
partially alleviate these problems, minimal labeling is generally applied in DIGE. The
labeling reaction was typically optimized such that only 1-5% of lysine residues in a
60
given protein were labeled (Unlu et al., 1997; Shaw et al., 2003). However, the
minimal labeling compromises the detection sensitivity of DIGE. On the other hand,
due to the covalent linkage of Cy3 or Cy5 to the proteins, which adds approximately
500 daltons (Da) each to the protein mass, there was a slight migration difference
between labeled protein and the bulk of unlabeled protein in 2-D gel. As a
consequence, protein spots observed in the fluorescent image cannot be directly
excised from post-stained 2-D gel. In our group, we usually post-stained the 2-D
DIGE gels with silver-staining or SyproRubyTM before spot excision. In an alternative
strategy, Shaw et al. (2003) have developed a new batch of DIGE Cy3 and Cy5 dyes,
which labeled free cysteine residues of proteins through saturation labeling. The
saturation labeling offers greater sensitivity than the conventional DIGE method
(Marouga et al., 2005). However, the biggest problem with saturation labeling is the
decreased solubility of labeled proteins due to the hydrophobicity of the fluorophores
as mentioned above. As much as 25% of the total proteins would be precipitated upon
saturation labeling, which could be even worse for high-molecular-weight proteins
with higher cysteine content (Shaw et al., 2003). Furthermore, since this saturation
labeling can only label proteins with free cysteines, certain proteins with low cysteine
content may not be labeled with these fluorescent dyes, thereby constraining its
applicability in proteomics. To address this problem, Chan et al. (2005) recently
sought to combine the cysteine labeling with lysine labeling to profile the proteome of
epithelial cells exposed to oxidative stress. As expected, the combination of two
labeling methods has presented a more complete list of identified proteins in the
proteome, suggesting that proteins lack either cysteine or lysine residues can be
studied with the combined labeling methods.
61
Another problem in DIGE is the preferential labeling of proteins by different
fluorescent dyes. A basic assumption in DIGE is that all the fluorescent dyes can label
proteins with approximately the same efficiency. However, it has been found that this
assumption may not hold true. Under same conditions, the fluorescent intensity of
Cy5-labeled protein might be slightly higher than that of the same protein labeled
with Cy3 (Karp and Lilley, 2005). In addition, the crossover effect between Cy3 and
Cy5 dyes on the same protein has also been observed (Patton, 2002). In our study, we
addressed these problems by resorting to a statistical threshold to differentiate bona
fide changes in protein expression from the system variations. When the data with
high confident level are required, this threshold is typically high, which will probably
mask those real subtle changes in protein expression. These subtle changes, however,
might be more critical to elucidate a perturbed biochemical pathway.
2.4.2 The putative functions of identified proteins in cellular defense pathways
In Table 2.1, the identified proteins encompass antioxidant proteins, heat shock
proteins, transcription factors, etc. Some of the proteins have been individually
characterized and designated in metal detoxification pathways. One enzyme (AHP1),
for instance, has been shown that it might be implicated in manganese transportation
from the cytosol to mitochondria in yeast (Farcasanu et al., 1999). In our study, AHP1
saw a lower expression level in the metal-treated sample than that in the untreated
control sample. This is presumably because AHP1 can chelate the free manganese ion
and then co-transfer into the mitochondria, whereas most proteins in the mitochondria
fraction were not resolved in 2-D gel under the conditions applied in our 2-DE
experiments. This presumption is supported by the observation that while yeast AHP1
was normally in the cytosol, this protein would be mainly located in mitochondria
62
upon biological perturbations (Farcasanu et al., 1999). Akin to AHP1, TSA1 is
another thioredoxin peroxidase ubiquitous in yeast cells to reduce hydroperoxides
(Grant, 2001). AHP1 and TSA1, together with glutathione and thioredoxin systems,
can not only efficiently maintain the redox homeostasis in yeast cells, but also
efficaciously pull the cells through stress conditions (Grant, 2001). A third enzyme
with antioxidant property, CCP1, is a metalloprotein that has an iron binding center
(Bonagura et al., 2003). In this study, while CCP1 was significantly repressed by
other metal treatments, its expression was not attenuated by Fe3+, implying that CCP1
is likely to be involved in iron chelation or transportation in yeast (Kaplan and
O'Halloran, 1996). The fourth protein with antioxidant property, PNC1, is a longevity
protein taking charge of the yeast lifespan. It has been documented that
overexpression of PNC1 could extend the lifespan of yeast stains under low-intensity
stress (Anderson et al., 2003). However, most of metal treatments examined in our
study, except for Ni2+, had either down-regulation or insignificant effects on PNC1
expression. We thus speculated that certain exhaustive metal treatments, in contrast to
low-intensity stress, might shorten the yeast lifespan by suppressing PNC1 expression.
Among other proteins being induced by metal stress, two enzymes, FBA1 and TPI1,
are typically involved in glycolysis pathway and both can catalyze the conversion of
glyceraldehyde-3-phosphate to dihydroxyacetone phosphate. It has been reported that
FBA1 and TPI1 could be post-translationally modified with GSH, which prevented
them from further destructive oxidation under stress conditions (Shenton and Grant,
2003). However, our results showed that while most of metal treatments could to
some extent induce FBA1 expression, the expression of TPI1 was attenuated by
several kinds of metal treatments. These findings suggest that there might be an
elaborate mechanism, which currently eludes our understanding, to differentiate the
63
cellular functions of FBA1 and TPI1 in yeast cells. Another two enzymes, PEP4 and
RPN9, are mainly involved in yeast protein degradation. PEP4 can help to degrade
some stable proteins in response to an elevated metal concentration in yeast
(Swaminathan and Sunnerhagen, 2005). As for RPN9, of particular interest to us was
the observation that the yeast cells lacking RPN9 became more resistant to hydrogen
peroxide treatment (Inai and Nishikimi, 2002). This observation is consistent with our
results where the expression level of RPN9 was much lower in the yeast cells upon
six kinds of metal treatments than that in the control yeast cells. On the other hand
however, four metal ions, i.e. Mn2+, K+, Ni2+ and Rb+, could still elicit a significant
overexpression of RPN9. The different effects of metal treatments on RPN9
expression further suggest that there might be several defense mechanisms in yeast
against metal stress. A fifth protein, HFI1, is a transcription factor implicated in
global regulation of gene expression. HFI1 has been linked to the cellular defense
mechanism by the evidence that HFI1 could maintain the integrity of yeast
chromosome and mitochondrial genome under stress conditions (Koltovaya et al.,
2003). In addition, another enzyme (VMA1) has found its important roles in
regulating intracellular Ca2+ homeostasis in yeast cells (Ohya et al., 1991). It has
been shown that proper expression of VMA1, a functional subunit of vacuolar
ATPase, was important for the ATPase activity, while the abolishment of this ATPase
activity resulting from VMA1 deficiency rendered the yeast cells sensitive to Ca2+
(Ohya et al., 1991). Taken together, all these proteins (mainly enzymes) could be to
some extent induced by various metal treatments, although we also noticed some
down-regulation effects of metal stress on these proteins. These two sides of a coin
imply the complexity of the cellular defense mechanism in yeast.
64
2.4.3 Complexity of cellular mechanisms for metal homeostasis in yeast
In prokaryotes and eukaryotes, there are a number of defense mechanisms known to
evade cell damage resulting from over-abundant metal ions and reactive oxygen
species (Temple et al., 2005; Masse and Arguin, 2005). Some antioxidant enzymes,
for instance, can catalyze the disproportion of superoxide anion to hydrogen peroxide
and oxygen in yeast (O'Brien et al., 2004). In this study, we found that some metals
belonging to the same group could have different effects on the same protein, as
exemplified by the difference in their expression levels (up- & down-regulation).
SOD1, for instance, could be induced by most of the metals in group A, including
Cu2+, Zn2+ and Cr3+, which is consistent with others’ reports (Culotta et al., 1995; Wei
et al., 2001; Sumner et al., 2005). However, SOD1 was not found to be significantly
induced upon the manganese treatment. We postulated that SOD1 may not be actively
involved in the defense mechanism against manganese perturbation, whereas another
enzyme, SOD2, complements SOD1’s function in such a way that it can effectively
sequester the excess manganese and cadmium ions inside the yeast cells (Vido et al.,
2001; O'Brien et al., 2004). Therefore our results, together with other recent
literatures, strongly suggest that both SOD1 and SOD2 have not only overlapped but
also distinct functions in yeast defense mechanism to remove excess metal ions.
It should be pointed out that, since many other proteins undergoing metal-dependent
expression changes were not identified by MS in this study, the data in Figure 2.2 and
Table 2.1 may not completely depict the outcome of yeast proteome upon metal
treatments. In addition to SOD1 and SOD2, both GSH and metallothioneins also play
vital roles in metal detoxification in yeast, as mentioned above. The relationship
between GSH, SOD1/SOD2 and metallothioneins has been illuminated by cumulative
65
advances in the studies of yeast mutant strains. Tamai et al. (1993) have shown that
the yeast or monkey metallothioneins could assume the duty of SOD1 in SOD1
deletion yeast stains under stress conditions. More recently, Adamis et al. (2004) have
found that the expression levels of two proteins were elevated in the yeast cells
lacking SOD1/SOD2 upon cadmium treatment. One protein is the metallothionein and
another is a protein which constitutes a vacuolar glutathione conjugate pump. Since
these two proteins were known to be able to protect the yeast cells against cadmium, it
thus indicated that both metallothioneins and GSH mediated metal transport could be
complementary pathways to effectively remove excess metal ions from yeast mutant
cells lacking SOD1/SOD2. However, it still remains elusive how these proteins
interplay with each other in the wild-type yeast strains for the maintenance of metal
homeostasis inside the cells. It is envisaged that the overlapping mechanisms in
eukaryotes against metal stress will be further understood using advanced proteomic
tools, as explored in this study.
2.5 Conclusions and future directions
Taken together, we have successfully employed DIGE for a global profiling of the
yeast proteome in response to fifteen kinds of metal stimuli. A total of fifteen 2-D gels
were sufficient to illustrate the cellular effects of fifteen kinds of metal treatments on
yeast at the translational level, in contrast to at least 30-75 2-D gels required in the
conventional 2-DE to provide equivalent information on yeast proteome. This, to our
knowledge, presented the first example whereby DIGE was exploited for the analysis
of protein expression in a high-throughput fashion. Also for the first time, the cellular
response of yeast to different types of exogenous metal ions has been systematically
examined at the translational level, resulting in the identification of a large number of
66
yeast enzymes which may be involved in defense mechanism against metal stress.
This work thus provides the clues on how yeast cells respond to a variety of metal
stimuli at the translational level, as well as the distinct effects of various metals on
those detoxification proteins, leading to a better understanding of biochemical
pathways in yeast to combat metal toxicity. We envisage that the study of metal stress
on yeast will be potentially useful for the unveiling of conserved metal detoxification
mechanism from yeast to human.
As a relatively new technique, DIGE has certain potential issues that remain
unexplored. As a method of protein pre-separation labeling, DIGE is theoretically
compatible with those methods using post-separation staining of proteins, such as MP.
One example has recently borne out the feasibility of combining DIGE with the use of
fluorescent post-staining dyes specific to phosphorylated proteins (Stasyk et al., 2005),
allowing a concomitant profiling of the proteome and phosphoproteome of an
organism. The characterization of protein post-translational modifications, together
with protein expression level, is of particular importance for proteome profiling in
that both the protein modifications and protein expression level (enzymes in particular)
can determine the fate of cells in bewildering milieu. There is no doubt that DIGE will
continue to play an important role in tackling these enigmatic issues in a larger
framework. For instance, all the intracellular substrates of a particular protease could
be readily singled out from a proteome by canvassing the proteome profiles before
and after protease treatment (Bredemeyer et al., 2004). The “missing” proteins after
the protease treatment were then identified as the protease substrates. This strategy is
potentially applicable for the characterization of other enzymes such as kinases and
phosphatases, in that DIGE can be combined with MP platform whereby post-staining
fluorescent dyes are able to tell the addition or removal of the phosphate from the
67
proteins. In another perspective, the entire signaling pathway could also be
specifically profiled and subsequently interrogated using DIGE so as to determine a
majority of components involved in this particular biochemical pathway (Sitek et al.,
2005), in contrast to the characterization of individual proteins in conventional
methods.
With respect to the metal stress, the cellular defense mechanisms are probably more
complex than what we thought before. For instance, the toxicity of one metal ion to
the cells could even be alleviated or deteriorated by another metal ion (Blackwell et
al., 1998). On the other hand, the proteins with anti-stress properties are presumably
involved in the cellular defense upon several, but not all, stress conditions, as
illustrated in previous work and our study (Park et al., 1998). Therefore, future
endeavor to elucidate stress response may boil down to two directions. One direction
is to interpret the mutuality of different mechanisms for metal homeostasis inside the
cells. Another direction is to study the unique functions of several key anti-stress
proteins, such as SOD1 and SOD2, upon other biological perturbations. All these
studies are believed to be further facilitating a better understanding of cellular defense
mechanism and metal homeostasis in eukaryotes.
68
Chapter 3 Identification of protein-protein interactions
using 2-D DIGE
3.1 Introduction
Besides the quantitation of protein expression (chapter 2), a global mapping of
protein-protein interactions on a proteome-wide scale is another fundamental task in
proteomics. Since the importance of protein-protein interactions in regulating cellular
processes has been stressed in chapter 1, I will herein mainly discuss the problems in
current techniques used for the identification of protein-protein interactions, including
Y2H and MS-based methods.
3.1.1 Yeast two-hybrid (Y2H) system
The Y2H system was first developed by Fields and Song (1989) in an attempt to
detect protein-protein interactions inside yeast cells. In Y2H, a yeast transcriptional
factor (GAL4) is split into two functional domains, i.e. DNA-binding domain and
activation domain, which are fused to two proteins of interest (bait and prey proteins),
respectively. Upon co-expression of bait and prey fusion proteins in yeast, the
interaction between bait and prey proteins can bring two domains of GAL4 together,
leading to the reconstitution of a functional GAL4 protein which can subsequently
turn on the expression of reporter genes. Several reporter genes, such as LEU2 and
HIS3, are usually used together with lacZ gene to monitor the protein-protein
interactions. LEU2 and HIS3 allow the selection based on the cell growth on selective
plates lacking leucine or histidine, respectively. Meanwhile, the expression of lacZ
gene can be detected by colorimetric assays.
69
As an in vivo screening system, Y2H is amenable to large-scale studies of protein-
protein interactions. Several large-scale Y2H screening projects have provided a
comprehensive analysis of protein-protein interactions in different organisms,
including budding yeast (Uetz et al., 2000), Caenorhabditis elegans (Li et al., 2004),
drosophila (Formstecher et al., 2005) and human (Stelzl et al., 2005; Rual et al.,
2005). Albeit fairly powerful, Y2H has its intrinsic drawbacks. Firstly, Y2H tends to
generate a relatively large number of false-positives and false-negatives, resulting in
little overlapping between the databases from two independent Y2H screenings of the
yeast interactome (Uetz et al., 2000; Ito et al., 2001). Furthermore, the data sets
obtained from Y2H screenings are also poorly overlapped with the data sets generated
by other screening methods (Li et al., 2004). Secondly, many proteins with unique
properties will be excluded from Y2H screening. For instance, proteins with
hydrophobic transmembrane domains cannot be studied in Y2H system. This is
because the detectable protein-protein interactions in Y2H have to take place in the
nucleus, which results in its inability to analyze the proteins that cannot go into the
nucleus. Other proteins, such as transcription factors and toxic proteins, must also be
excluded from Y2H screening in that transcription factors may turn on the reporter
gene expression independent of any protein-protein interactions (generating false
positives) and on the other hand the toxic proteins may kill the host cells (generating
false negatives). Thirdly, although Y2H is an in vivo screening system, a lack of
physiologically relevant context will become an important issue when the proteins
from other organisms are expressed in yeast. Since protein-protein interactions are
highly regulated cellular processes, this lack of pertinent physiological environment
raises a question whether these identified “positive” interactions (as well as
“negative” interactions) by Y2H are also real in the organism which they are from.
70
To partly address above issues in Y2H, a number of other techniques resembling Y2H
have been developed to identify protein-protein interactions by using different protein
trap systems. Currently, split-ubiquitin system (Johnsson and Varshavsky, 1994), Ras
recruitment system (Broder et al., 1998) and G protein-based system (Ehrhard et al.,
2000) can be harnessed to study the integral membrane protein-protein interactions.
Eyckerman et al. (2001) and Wehrman et al. (2002) have independently developed
two novel systems to determine the protein-protein interactions inside mammalian
cells by making use of specific protein phosphorylation and β-lactamase
complementation assays, respectively. More recently, the simultaneous visualization
of protein-protein interactions in living cells has been achieved by Hu and Kerppola
(2003) with the aid of in vivo complementation of multiple fluorescent proteins. These
methods, together with Y2H, are very useful tools in the elucidation of protein-protein
interaction network inside the cell. However, all these in vivo methods may not be
ideal for high-throughput analysis of interactome due to the laborious cloning
procedure and their inapplicability to a large number of proteins with unique
properties.
3.1.2 MS-based identification of protein-protein interactions
Basically, the strategies of MS-based identification of protein-protein interactions
combine different protein isolation methods with subsequent MS-based protein
identification. Several MS-compatible protein isolation methods have been mentioned
in chapter 1, such as TAP and immunoprecipitation. The inherent drawback of TAP is
that both the DNA cloning and protein purification are very tedious, as compared with
other methods currently used for the isolation of protein complexes. With respect to
immunoprecipitation, it is similar to the protein purification methods using single
71
affinity tag, such as GST (Martzen et al., 1999). A common issue in TAP and
immunoprecipitation is about the balance between the purity and integrity of isolated
protein complex (Ashman et al., 2001). To purify the protein complex, intensive
washing is generally required to remove nonspecifically bound proteins arising from
adsorption to the affinity resin and tube surface. Nevertheless, this kind of stringent
washing conditions tends to dissociate delicate protein complexes which may be more
important for the modulation of signaling transduction inside the cells. As a
consequence, these methods, although conceptually simple, may not be ideal for the
study of weak protein-protein interactions since it will introduce a high proportion of
nonspecifically bound proteins under mild purification conditions.
3.2 Objectives
To alleviate the problem in purification of protein complexes, Blagoev et al. (2003)
and Ranish et al. (2003) have independently developed two similar strategies in which
a control sample was introduced to help distinguish “real” target associated proteins
from a large number of nonspecifically bound proteins. The control sample could be
proteins from noninduced cells to study signaling-dependent interactions (Blagoev et
al., 2003), or from a parallel protein purification assay where the protein complex of
interest was not specifically enriched by the ligand (Ranish et al., 2003). In their
studies, however, protein samples were differentially labeled with stable isotopes for
the protein quantitation and comparison. As mentioned in chapter 1, isotope labeling
has its intrinsic drawbacks in the proteomic applications and may not be applicable
for the dissection of a complex human proteome. To circumvent this problem, we
chose DIGE as a tool for the subtraction of nonspecifically bound proteins through the
comparison between the purified protein sample and a control sample resolved in the
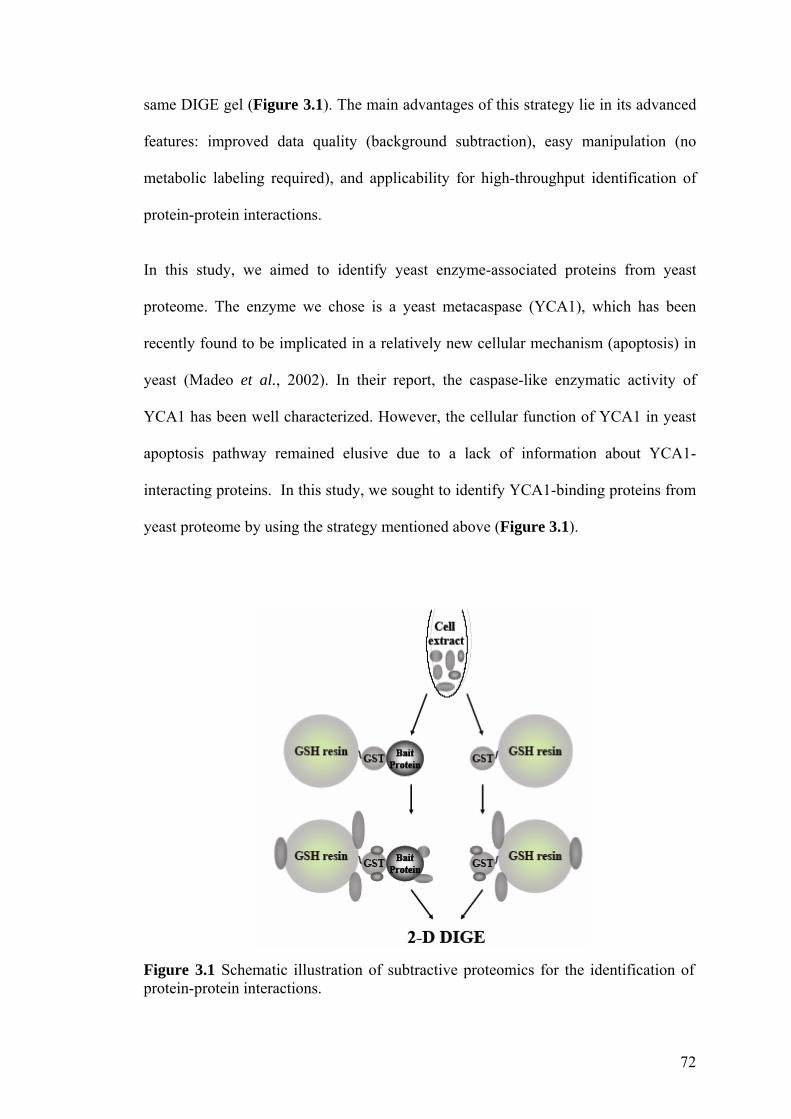
72
same DIGE gel (Figure 3.1). The main advantages of this strategy lie in its advanced
features: improved data quality (background subtraction), easy manipulation (no
metabolic labeling required), and applicability for high-throughput identification of
protein-protein interactions.
In this study, we aimed to identify yeast enzyme-associated proteins from yeast
proteome. The enzyme we chose is a yeast metacaspase (YCA1), which has been
recently found to be implicated in a relatively new cellular mechanism (apoptosis) in
yeast (Madeo et al., 2002). In their report, the caspase-like enzymatic activity of
YCA1 has been well characterized. However, the cellular function of YCA1 in yeast
apoptosis pathway remained elusive due to a lack of information about YCA1-
interacting proteins. In this study, we sought to identify YCA1-binding proteins from
yeast proteome by using the strategy mentioned above (Figure 3.1).
Figure 3.1 Schematic illustration of subtractive proteomics for the identification of protein-protein interactions.
73
3.3 Results
3.3.1 Purification of a yeast caspase-like protein (YCA1)
To identify the YCA1-binding proteins, the GST-fused YCA1 was overexpressed and
purified from yeast ExClonesTM using GSH sepharose. It was found that direct
overexpression and purification of GST-fusion proteins from the commercial stock of
yeast ExClonesTM would generate, in addition to GST-fusion protein, a very high
portion of free GST which could not be separated from GST-fusion protein by the
GSH sepharose. In this case, the expression of free GST may significantly overrun the
expression of GST-fusion protein, thereby complicating the following pull-down
experiments. To alleviate this problem, the yeast ExClonesTM which encodes YCA1
was streaked for single colonies on the SD-Ura drop-out agar plates. Five yeast
colonies were randomly picked from the plate and re-inoculated into SD-Ura liquid
media. The expression levels of YCA1-GST fusion protein in these five clones were
evaluated by western blotting with anti-GST. Results showed that the ratios of
expressed YCA1-GST to free GST were different in these randomly picked yeast
clones (Figure 3.2). Since clone 2 had a relatively higher expression level of YCA1-
GST, it was chosen to express the yeast metacaspase YCA1 for the subsequent pull-
down experiments.
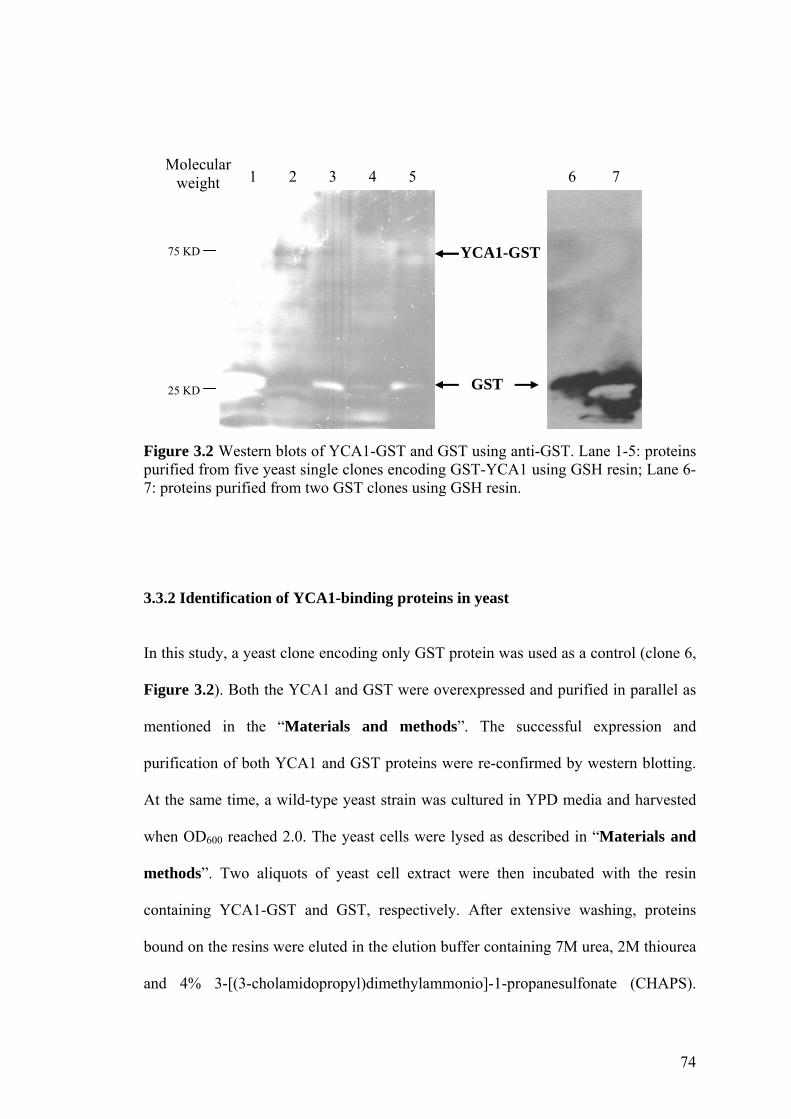
74
Figure 3.2 Western blots of YCA1-GST and GST using anti-GST. Lane 1-5: proteins purified from five yeast single clones encoding GST-YCA1 using GSH resin; Lane 6-7: proteins purified from two GST clones using GSH resin.
3.3.2 Identification of YCA1-binding proteins in yeast
In this study, a yeast clone encoding only GST protein was used as a control (clone 6,
Figure 3.2). Both the YCA1 and GST were overexpressed and purified in parallel as
mentioned in the “Materials and methods”. The successful expression and
purification of both YCA1 and GST proteins were re-confirmed by western blotting.
At the same time, a wild-type yeast strain was cultured in YPD media and harvested
when OD600 reached 2.0. The yeast cells were lysed as described in “Materials and
methods”. Two aliquots of yeast cell extract were then incubated with the resin
containing YCA1-GST and GST, respectively. After extensive washing, proteins
bound on the resins were eluted in the elution buffer containing 7M urea, 2M thiourea
and 4% 3-[(3-cholamidopropyl)dimethylammonio]-1-propanesulfonate (CHAPS).
GST
YCA1-GST
Molecular weight 1 2 3 4 5 6 7
75 KD
25 KD
75
Subsequently, the proteins eluted from the resin containing YCA1-GST fusion protein
were labeled with Cy5 and proteins eluted from GST control were labeled with Cy3.
The labeled proteins were then mixed and subject to protein separation by 2-D DIGE.
In 2-D DIGE gels, results showed that while most of proteins could be found in both
Cy3 and Cy5 images, several proteins found in Cy5 channel (red) were absent in Cy3
channel (green) (Figure 3.3). According to the experimental design, the only
difference between two protein samples in the same 2-D gel was the presence or
absence of the bait protein (YCA1) in the pull-down assays. Without the bait protein,
the proteins isolated from the control assay include those proteins bound
nonspecifically to GST, GSH resin and the tube surface. On the other hand, since the
bait protein can capture its prey proteins, the isolated proteins from this pull-down
assay will include the prey proteins in addition to those nonspecifically bound
proteins. Therefore, the red spots in 2-D gel which were only present in Cy5 channel
should represent the real prey proteins interacting with YCA1.
Following protein separation by 2-D DIGE, seven red spots were excised from the 2-
D gel, trypsin digested and subject to MS analysis (Appendix 2). Three proteins were
identified, i.e. spot 3 (YNR064Cp), spot 4 (YLR194Cp) and spot 5 (CAA49192, an
unnamed protein) which has the molecular weight and pI well matched to the spot
location in the 2-D gel (Figure 3.3). The rest of protein spots were not identified due
to an insufficient amount of proteins sent for MS analysis and the keratin
contamination during sample processing. More protein samples need to be collected
from pull-down assays to identify the rest of protein spots in future.
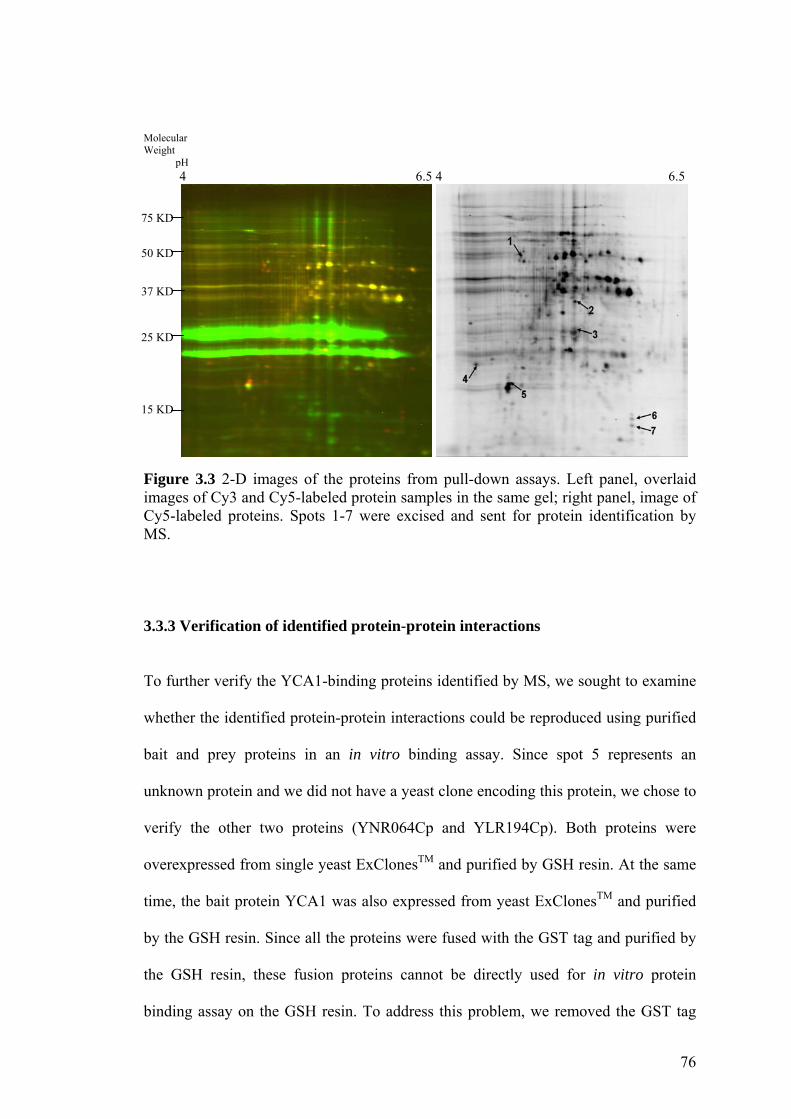
76
Molecular Weight pH 4 6.5 4 6.5
Figure 3.3 2-D images of the proteins from pull-down assays. Left panel, overlaid images of Cy3 and Cy5-labeled protein samples in the same gel; right panel, image of Cy5-labeled proteins. Spots 1-7 were excised and sent for protein identification by MS.
3.3.3 Verification of identified protein-protein interactions
To further verify the YCA1-binding proteins identified by MS, we sought to examine
whether the identified protein-protein interactions could be reproduced using purified
bait and prey proteins in an in vitro binding assay. Since spot 5 represents an
unknown protein and we did not have a yeast clone encoding this protein, we chose to
verify the other two proteins (YNR064Cp and YLR194Cp). Both proteins were
overexpressed from single yeast ExClonesTM and purified by GSH resin. At the same
time, the bait protein YCA1 was also expressed from yeast ExClonesTM and purified
by the GSH resin. Since all the proteins were fused with the GST tag and purified by
the GSH resin, these fusion proteins cannot be directly used for in vitro protein
binding assay on the GSH resin. To address this problem, we removed the GST tag
75 KD
50 KD
37 KD
25 KD
15 KD
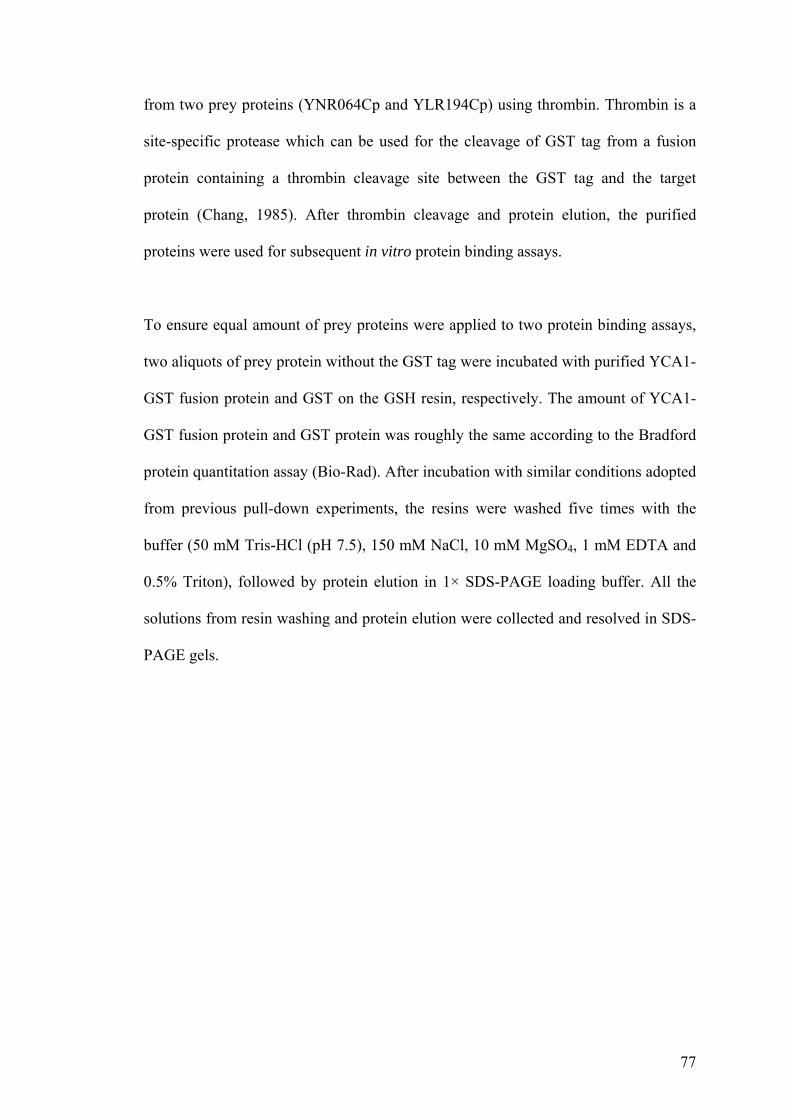
77
from two prey proteins (YNR064Cp and YLR194Cp) using thrombin. Thrombin is a
site-specific protease which can be used for the cleavage of GST tag from a fusion
protein containing a thrombin cleavage site between the GST tag and the target
protein (Chang, 1985). After thrombin cleavage and protein elution, the purified
proteins were used for subsequent in vitro protein binding assays.
To ensure equal amount of prey proteins were applied to two protein binding assays,
two aliquots of prey protein without the GST tag were incubated with purified YCA1-
GST fusion protein and GST on the GSH resin, respectively. The amount of YCA1-
GST fusion protein and GST protein was roughly the same according to the Bradford
protein quantitation assay (Bio-Rad). After incubation with similar conditions adopted
from previous pull-down experiments, the resins were washed five times with the
buffer (50 mM Tris-HCl (pH 7.5), 150 mM NaCl, 10 mM MgSO4, 1 mM EDTA and
0.5% Triton), followed by protein elution in 1× SDS-PAGE loading buffer. All the
solutions from resin washing and protein elution were collected and resolved in SDS-
PAGE gels.
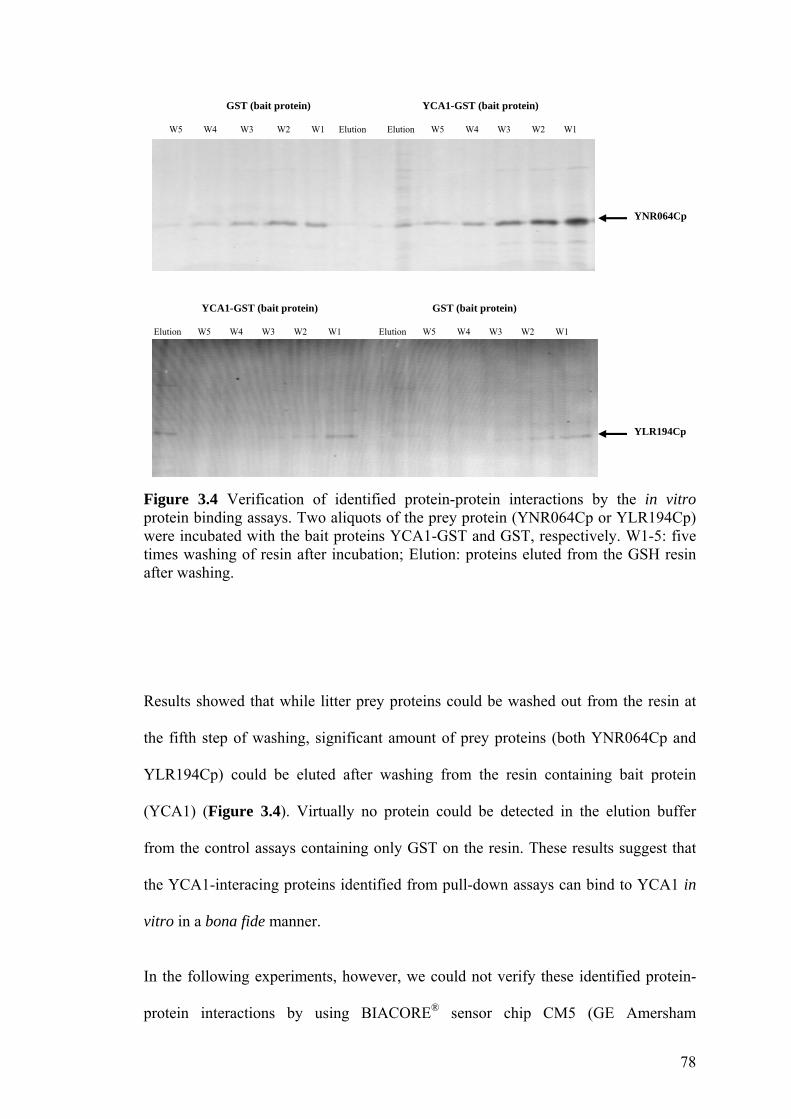
78
Figure 3.4 Verification of identified protein-protein interactions by the in vitro protein binding assays. Two aliquots of the prey protein (YNR064Cp or YLR194Cp) were incubated with the bait proteins YCA1-GST and GST, respectively. W1-5: five times washing of resin after incubation; Elution: proteins eluted from the GSH resin after washing.
Results showed that while litter prey proteins could be washed out from the resin at
the fifth step of washing, significant amount of prey proteins (both YNR064Cp and
YLR194Cp) could be eluted after washing from the resin containing bait protein
(YCA1) (Figure 3.4). Virtually no protein could be detected in the elution buffer
from the control assays containing only GST on the resin. These results suggest that
the YCA1-interacing proteins identified from pull-down assays can bind to YCA1 in
vitro in a bona fide manner.
In the following experiments, however, we could not verify these identified protein-
protein interactions by using BIACORE® sensor chip CM5 (GE Amersham
GST (bait protein) YCA1-GST (bait protein)
W5 W4 W3 W2 W1 Elution Elution W5 W4 W3 W2 W1
YCA1-GST (bait protein) GST (bait protein) Elution W5 W4 W3 W2 W1 Elution W5 W4 W3 W2 W1
YNR064Cp
YLR194Cp

79
Biosciences) (Huang et al., 2001; Uttamchandani et al., 2004). Based on the
sensorgrams, results showed that there was no significant difference (<20 response
units (RU)) between the binding affinity of prey proteins (both YNR064Cp and
YLR194Cp) for YCA1 and that for GST (Figure 3.5). This is presumably because
these interactions are very weak with relatively high off-rate. Other interaction
analysis systems with more sensitive and robust detection methods are thus needed to
further verify these protein-protein interactions in future.
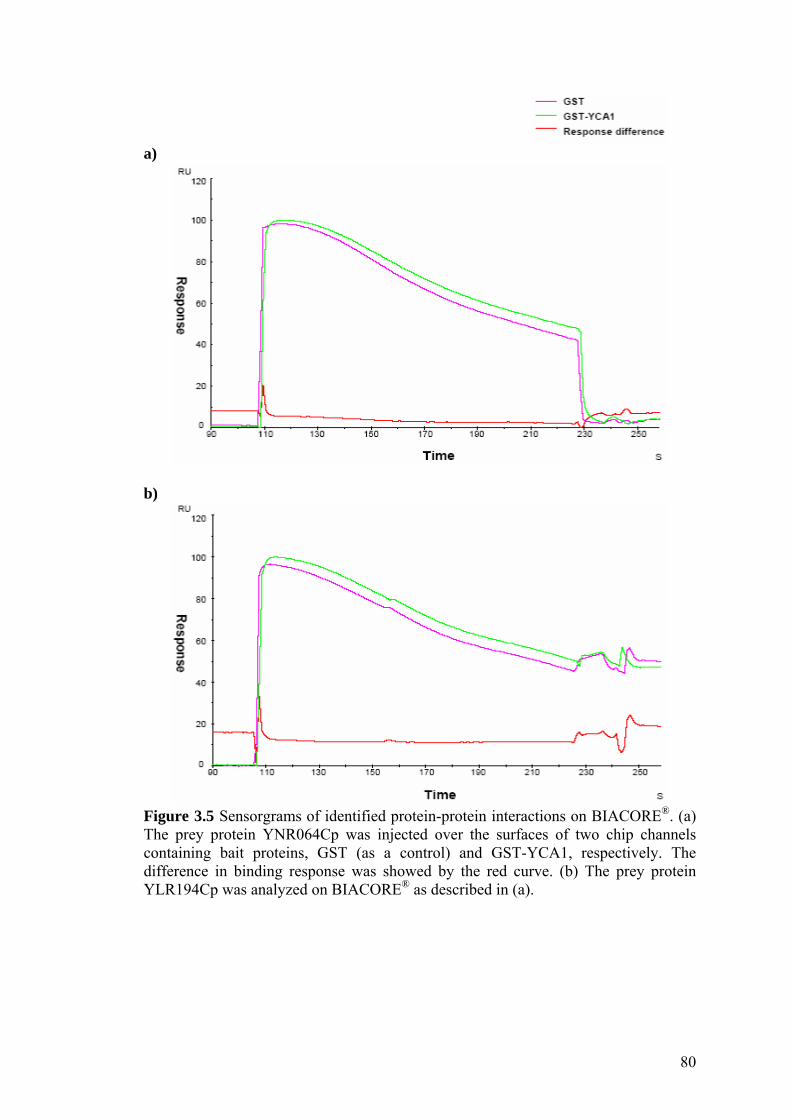
80
a)
b)
Figure 3.5 Sensorgrams of identified protein-protein interactions on BIACORE®. (a) The prey protein YNR064Cp was injected over the surfaces of two chip channels containing bait proteins, GST (as a control) and GST-YCA1, respectively. The difference in binding response was showed by the red curve. (b) The prey protein YLR194Cp was analyzed on BIACORE® as described in (a).
81
3.4 Discussion
3.4.1 Apoptosis in yeast
In multicellular organisms, apoptosis (known as programmed cell death) plays crucial
roles in development, reproduction and defense mechanism by removing damaged or
simply dispensable cells (Jin and Reed, 2002). As a suicide program, apoptosis does
not seem to be beneficial for an organism consisting of only one cell. Nevertheless,
recent reports have showed that cell death with apoptosis-like features can also take
place in prokaryotic and unicellular eukaryotic cells, including yeast (Yarmolinsky,
1995; Uren et al., 2000). To account for this discrepancy, it was suggested that the
suicide of individual cells would be important for the survival of other cells within a
population of unicellular organisms upon severe oxidative damage (Frohlich and
Madeo, 2000). Therefore, this altruistic behavior could be beneficial to the
preservation of cell population under harsh conditions. In yeast, apoptosis can be
induced by hydrogen peroxide, acetic acid, ageing and other reagents (Ludovico et al.,
2001; Madeo et al., 2004).
From two large-scale Y2H screening projects, there are all together seven yeast
proteins identified as YCA1-interacting proteins, including PET111p, SRO77p (Uetz
et al., 2000) and JSN1p, YAK1p, KRE11p, SRB4p and TFB1p (Ito et al., 2001).
Nevertheless, none of these proteins were found in both data sets. Except for YAK1p
and SRO77p, most proteins identified from Y2H are known to be involved in
transcription/translation machinery and therefore they are more likely to be false
positives from Y2H screening, rather than real metacaspase-interacting proteins,
according to the caveats in Y2H as discussed above. Regarding another two proteins
(YAK1p and SRO77p), YAK1p is a protein kinase which controls cell growth in
82
response to glucose availability (Moriya et al., 2001). However, no evidence so far
shows that YAK1p is directly involved in yeast apoptosis. As for SRO77p, although
one of its homolog (SRO7p) was found to be implicated in apoptosis-like cell death
under NaCl stress (Wadskog et al., 2004), the physiological role of SRO77p in yeast
apoptosis remains unknown.
Besides SRO7p, a yeast proteasomal substrate (Stm1p) and a serine protease
(Nma111p) may also be implicated in yeast apoptosis. It has been reported that the
overexpression of Stm1p or Nma111p could enhance apoptosis-like cell death and on
the other hand, the yeast cells which lack either Stm1p or Nma111p do not show
apoptotic hallmarks after the induction of yeast apoptosis by hydrogen peroxide (Ligr
et al., 2001; Fahrenkrog et al., 2004). In this study, we have identified a yeast protein
(YNR064Cp) which can bind to yeast metacaspase YCA1 in vitro. YNR064Cp is a
yeast epoxide hydrolase and may have an important role in detoxification of epoxides
(Elfstrom and Widersten, 2005). According to a yeast genome/proteome database
(http://www.yeastgenome.org), YNR064Cp has a structural homolog (BAC56745p)
which is a serine hydrolase in janthinobacterium. Since another yeast protease
(Nma111p) has also been found to be implicated in apoptosis, we further examined
the sequence similarity between YNR064Cp, BAC56745p and Nma111p using the
software T-COFFEE. Result showed that YNR064Cp and BAC56745p do not have
significant sequence similarity to Nma111p (Figure 3.6). The relationship between
YNR064Cp, Nma111p and YCA1 and their regulatory roles in yeast apoptosis thus
need to be further investigated.
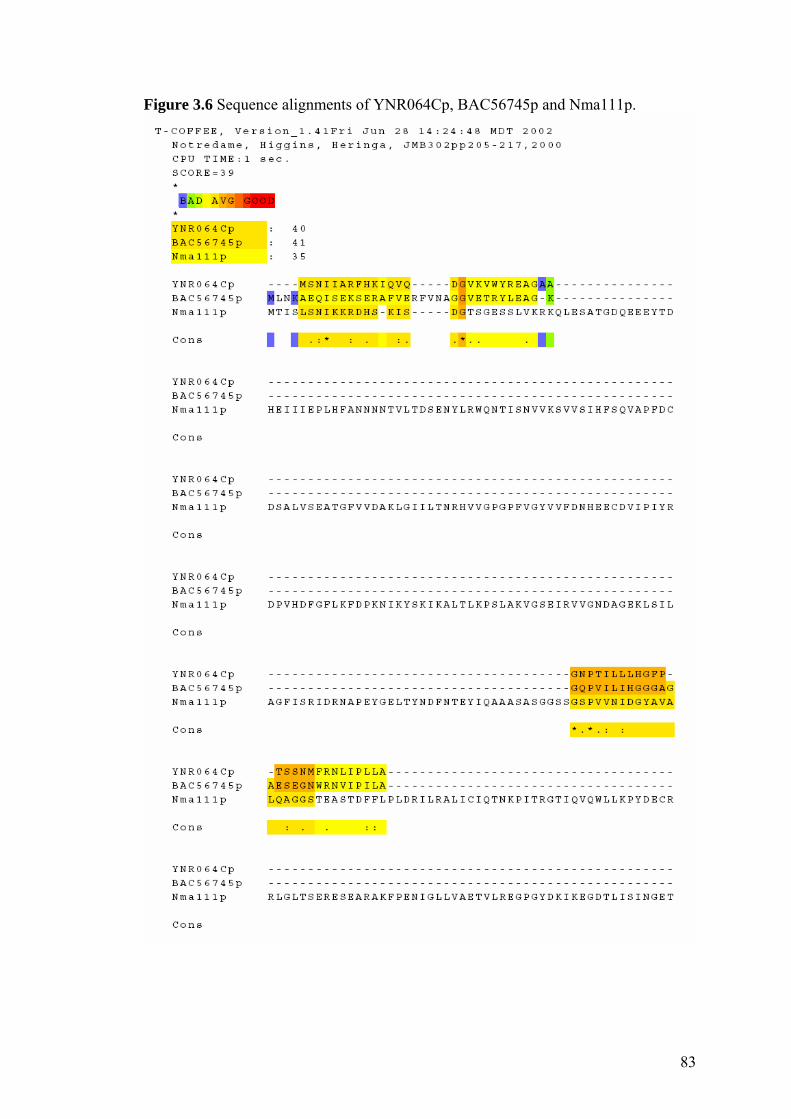
83
Figure 3.6 Sequence alignments of YNR064Cp, BAC56745p and Nma111p.
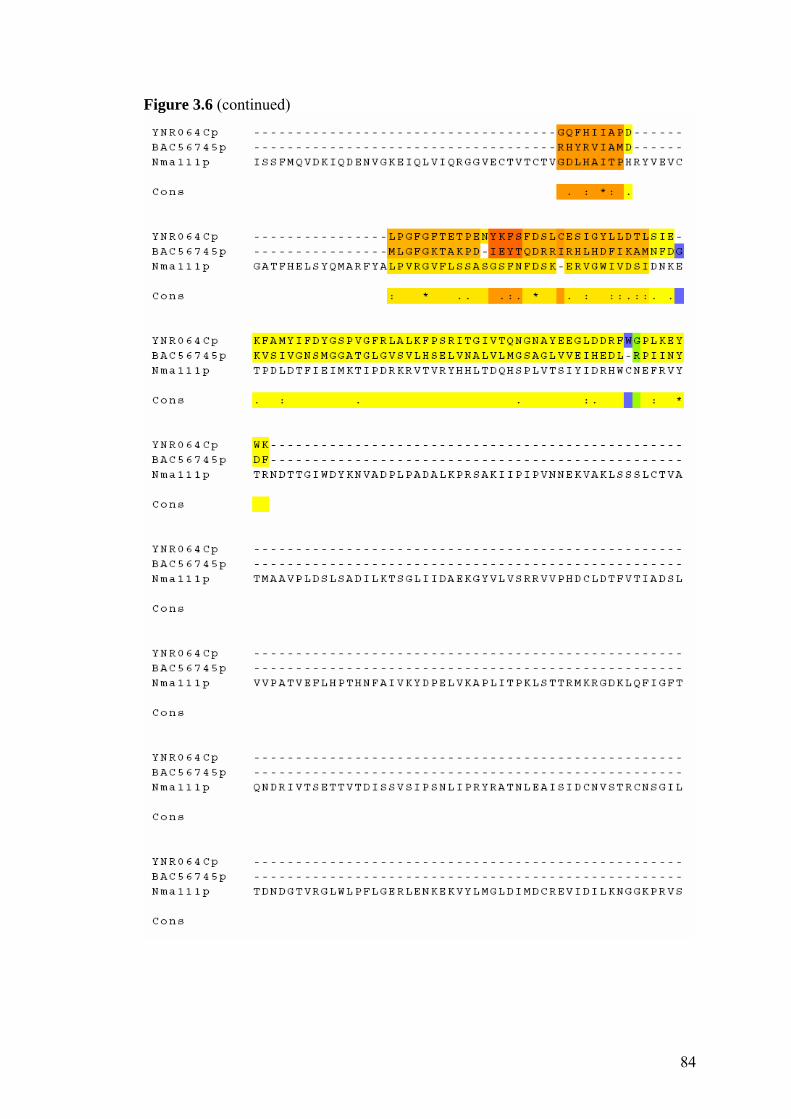
84
Figure 3.6 (continued)
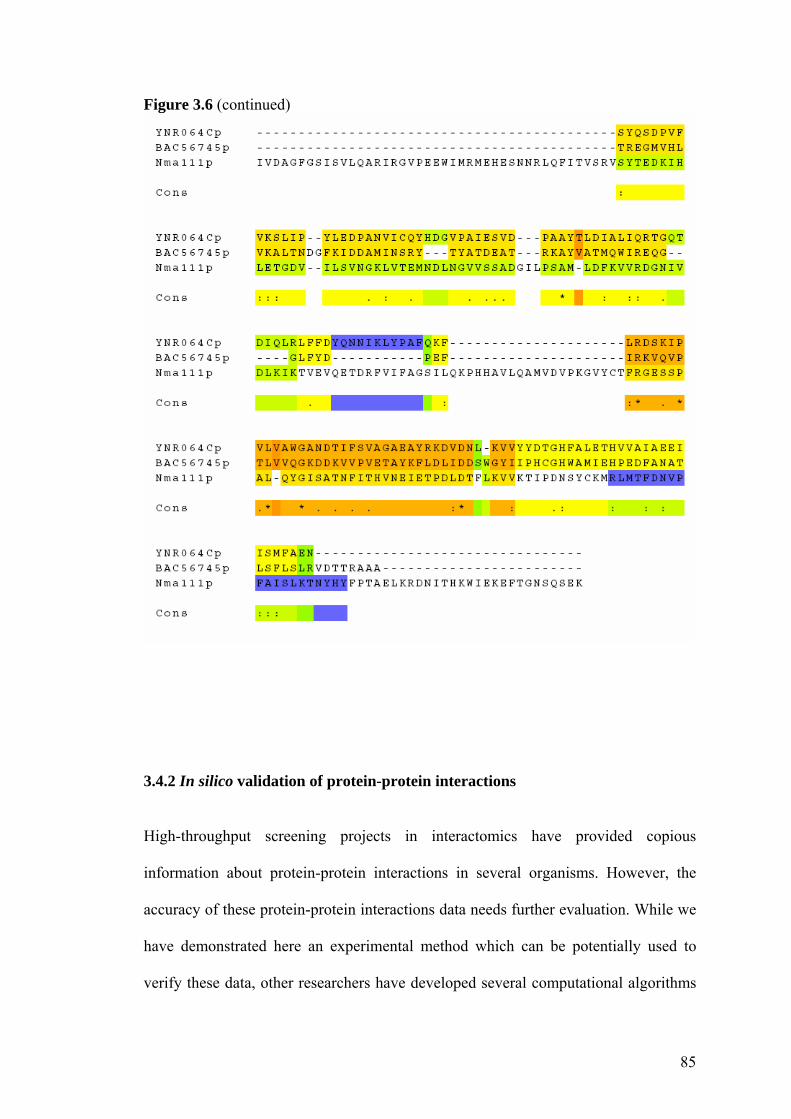
85
Figure 3.6 (continued)
3.4.2 In silico validation of protein-protein interactions
High-throughput screening projects in interactomics have provided copious
information about protein-protein interactions in several organisms. However, the
accuracy of these protein-protein interactions data needs further evaluation. While we
have demonstrated here an experimental method which can be potentially used to
verify these data, other researchers have developed several computational algorithms
86
to predict and assess the biological relevance of protein-protein interactions generated
from high-throughput screenings.
A common strategy to assess the data from high-throughput screenings is to compare
them with other available data sets. Deane et al. (2002) reported two methods for the
computational data assessment, including expression profile reliability (EPR) index
and paralogous verification method (PVM). EPR index examines the biologically
relevant fraction of protein-protein interaction by comparing the expression levels of
proteins, whose interactions were found in high-throughput screenings, with the
expression levels of proteins whose interactions were identified by other methods.
The principal assumption underlying PVM is that the interactions are likely to be real
if both interaction partners have their paralogs that also interact. By using these two
methods, the authors estimated that approximately half of the interactions are reliable
in their test set containing over 8000 yeast protein interactions (Deane et al., 2002). In
a recent endeavor, Bader et al. (2004) developed a statistic model for the validation of
protein-protein interactions identified from high-throughput screenings based on
screening statistics and network topology. The basic assumption in this confidence
measurement is that nonspecific interactions are typically technique-dependent or
database-specific, leading to a lower overlapping between proteomic databases. By
integrating genetic and proteomic data sets, the researchers have determined a
confidence score to every protein-protein interaction (Bader et al., 2004). Overall,
these in silico validation of protein-protein interactions are greatly facilitating a
system-level understanding of protein complexes in the relevant biological network.
However, real protein-protein interactions still need to be experimentally verified by
the methods like what we have demonstrated above.
87
3.5 Future directions
In this study, a general strategy has been introduced to pull down yeast metacaspase-
binding proteins. Since this metacaspase is a crucial executor in yeast apoptosis, the
study of apoptosis-dependent interactions between metacaspase and other proteins
will be an important following step towards a comprehensive understanding of yeast
apoptosis pathway. We have tried to fish out the metacaspase-interacting proteins
from H2O2-treated yeast cells cultured in minimal media (since the overexpression of
metacaspase from yeast ExClonesTM must be carried out in minimal media). However,
we could not see a significant difference between the proteins isolated from H2O2-
treated cells and those from untreated cells. This might be because the expression
level of most proteins in minimal media is low and therefore the difference in protein
expression upon exposure to H2O2 is not detectable under our experimental conditions.
Moreover, the signal-dependent protein-protein interactions are typically transient and
very weak. Therefore, the experiment conditions must be further refined to pull down
such unstable protein complexes.
Potentially, our strategy will be applicable for large-scale identification of enzyme-
associated proteins, including not only enzyme substrates but also enzyme regulatory
proteins (Tan et al., 2005). This will complement future studies mentioned in chapter
2, where enzyme substrates can be identified on a proteome-wide scale. We thus
envisage that our studies will potentially accelerate the data mining in catalomics,
where high-throughput characterization of enzymes is required.
A third direction of the study of protein-protein interaction is to identify small-
molecule modulator of protein complexes. As we know, protein-protein interactions
are dynamic and highly regulated processes inside the cells. The modulation of
88
protein-protein interactions will be an important means of turning on/off particular
signal transduction pathways. In this regard, the identification of small-molecule
modulators of protein complexes could help to unveil various cellular processes and
eventually lead to therapeutics for human diseases (Gestwicki et al., 2004). Early
report suggested that protein pull-down assays could also be applied for the study of
proteins undergoing ligand-dependent protein-protein interactions, where a
subpopulation of calcium-dependent protein complexes from rat brain extract had
been characterized in a high-throughput manner (Nelson et al., 2002). Based on their
work, our strategy (with the introduction of a control sample) demonstrated in this
study can also be potentially applied for a rigorous identification of small-molecule
modulators which can either enhance or perturb protein-protein interactions.
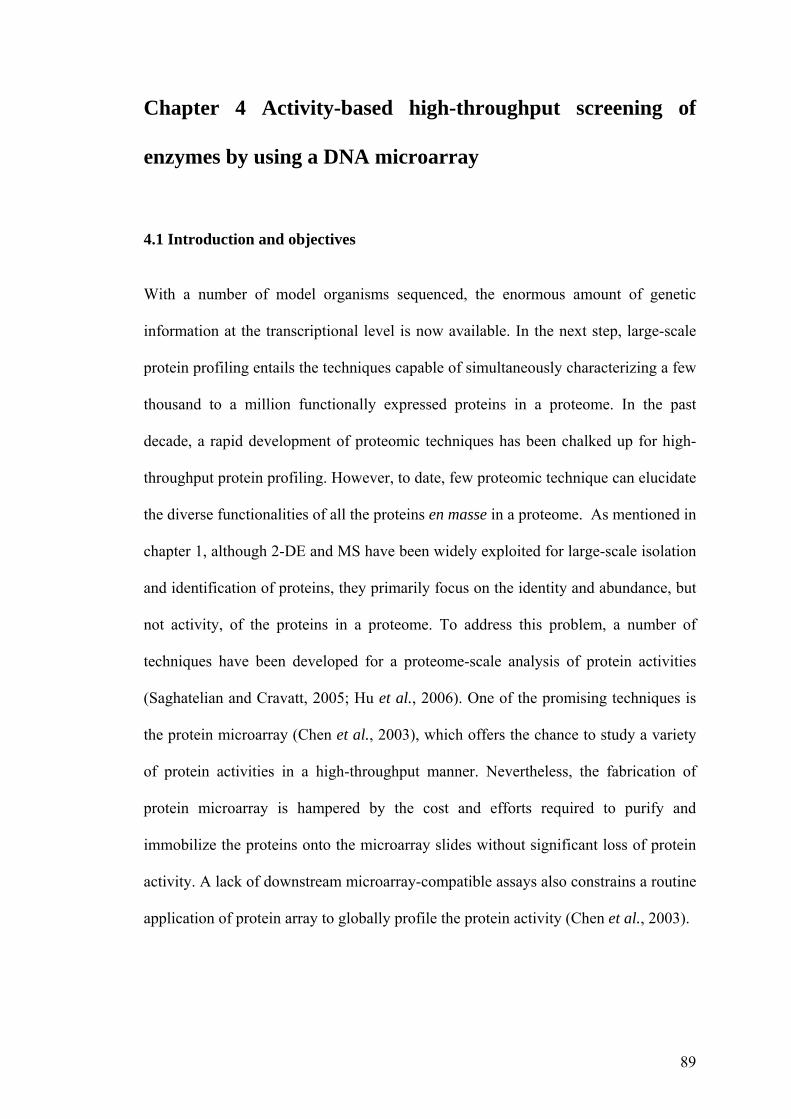
89
Chapter 4 Activity-based high-throughput screening of
enzymes by using a DNA microarray
4.1 Introduction and objectives
With a number of model organisms sequenced, the enormous amount of genetic
information at the transcriptional level is now available. In the next step, large-scale
protein profiling entails the techniques capable of simultaneously characterizing a few
thousand to a million functionally expressed proteins in a proteome. In the past
decade, a rapid development of proteomic techniques has been chalked up for high-
throughput protein profiling. However, to date, few proteomic technique can elucidate
the diverse functionalities of all the proteins en masse in a proteome. As mentioned in
chapter 1, although 2-DE and MS have been widely exploited for large-scale isolation
and identification of proteins, they primarily focus on the identity and abundance, but
not activity, of the proteins in a proteome. To address this problem, a number of
techniques have been developed for a proteome-scale analysis of protein activities
(Saghatelian and Cravatt, 2005; Hu et al., 2006). One of the promising techniques is
the protein microarray (Chen et al., 2003), which offers the chance to study a variety
of protein activities in a high-throughput manner. Nevertheless, the fabrication of
protein microarray is hampered by the cost and efforts required to purify and
immobilize the proteins onto the microarray slides without significant loss of protein
activity. A lack of downstream microarray-compatible assays also constrains a routine
application of protein array to globally profile the protein activity (Chen et al., 2003).
90
Figure 4.1 Schematic illustration of Expression Display. (a) Schematic representation of Expression Display. (b) The structure of the activity-based probe.
To address these issues, our strategy, coined “Expression Display”, resorts to
expressing proteins with physical linkage to their cognate mRNA in a single mixture
from a DNA pool (Figure 4.1). Upon activity-based protein selection by a small-
molecule probe, the selected mRNAs were subsequently decoded by a spatially
addressable DNA microarray. In this study, we were mainly interested in high-
throughput identification of yeast enzymes using Expression Display. To our
knowledge, our work presented the first example where high-throughput identification
of proteins with a particular enzymatic activity has been achieved through DNA
91
microarray decoding. Herein, the techniques employed in Expression Display will be
briefly reviewed.
4.1.1 Protein display technologies
Since the invention of phage display in 1985 (Smith, 1985), a number of novel protein
display technologies have been developed in the last decade. For instance, ribosome
display (Mattheakis et al., 1994; Hanes and Pluckthun, 1997), mRNA display
(Roberts and Szostak, 1997) and tRNA display (Merryman et al., 2002) can
noncovalently or covalently link the protein to its encoding mRNA in vitro with the
aid of ribosome, puromycin and a modified tRNA, respectively. By taking advantages
of two kinds of DNA binding proteins, both plasmid display (Speight et al., 2001) and
CIS display (Odegrip et al., 2004) can also specifically tether the nascent peptide to
its encoding DNA template. Additionally, yeast surface display and virus display,
which resemble phage display, can present the peptides or proteins on the surface of
yeast and virus capsid, respectively (Boder and Wittrup, 1997; Muller et al., 2003). A
salient feature of these technologies is that genetic code of each protein, i.e. genotype,
is physically linked to its phenotype and the selected genotype-phenotype complexes
can be re-generated for further rounds of selection. As such, protein display
technologies have been widely used in the last few years for in vitro selection of
peptides or proteins from diverse combinatorial libraries, as well as in vitro protein
evolution to generate proteins with desired properties.
Although protein display technologies are primarily used to the evolution of proteins
with novel functions, they have also been successfully modified in recent years to
express the entire constellation of proteins encoded by the cDNAs of an organism (Li,
92
2000; Leemhuis et al., 2005). These display technologies, which allow a facile
generation of a large pool of functional proteins and rapid genetic decoding, are
particularly useful for large-scale analysis of protein functions. Ribosome display, for
instance, allows the in vitro protein expression in a cell-free translation system and at
the same time the proteins are tethered to their own encoding mRNAs (Hanes and
Pluckthun, 1997). In ribosome display, the ribosome stalls at the end of the mRNA
without a stop codon and the nascent peptide still dangles from the ribosome after in
vitro translation. The resulting ternary complex, i.e. mRNA-ribosome-protein, is
stable at low temperature and high concentration of magnesium ions to undergo in
vitro protein selection. After selection, the mRNA can be released from the ternary
complex by increasing the temperature and removing the magnesium ions, followed
by reverse transcription of the purified mRNA. The recovered cDNA can be directly
decoded or further used for iterative protein selection. To date, ribosome display has
been widely used for affinity selection of proteins, such as antibody and hydrophobic
proteins (Hanes et al., 1998; Matsuura and Pluckthun, 2003). However, functional
study of proteins using ribosome display remained less explored. Herein, we showed
that proteins, when properly expressed from a pool of DNA samples as mRNA-
protein conjugates, could be used for the activity-based screening of enzymes in a
high-throughput manner.
4.1.2 Activity-based protein profiling
To circumvent tedious protein identification by MS, we sought to develop a novel
strategy for activity-based protein profiling. Of most of ABPs developed so far, a sine
qua non is their capabilities to covalently tether the enzymes such that the resulting
adducts can sustain denaturing conditions in subsequent 1-D or 2-D gel separation.
93
This property of ABPs, on the other hand, can indeed be useful to specifically enrich
the proteins of interest when biotin, instead of the fluorescent tag, is conjugated with
the reactive warhead to generate a biotinylated small-molecule probe (Huang et al.,
2003). In our group, a fluorescent ABP specific to protein tyrosine phosphatases (PTP)
had been previously synthesized and well characterized as a PTP probe (Zhu et al.,
2003). Herein, we sought to use a modified PTP probe, in which the fluorescent tag
was usurped by a biotin moiety, to select the PTPs from a ribosome-displayed protein
library.
4.2 Results:
4.2.1 In vitro selection of functional protein by ribosome display
To date, ribosome display has shown to be a powerful tool for in vitro selection of
antibodies (He and Khan, 2005). However, activity-based selection of other functional
proteins using ribosome display remained less explored. In this study, we first sought
to examine the feasibility of applying ribosome display for the in vitro selection
independent of antigen-antibody interaction by using streptavidin. Streptavidin is a
protein produced by Streptomyces avidinii with a strong affinity for biotin (Kd ≈10-15
M) (Sano and Cantor, 1990). This high binding affinity for biotin and biotinylated
molecules has made streptavidin an important player in protein purification and
immobilization (Chames et al., 2002). In this study, we used streptavidin as a model
protein for the in vitro selection.
94
Figure 4.2 Schematic illustration of DNA constructs for Expression Display. The genes (cerulean) were tethered by a spacer fragment (grey) via restriction enzyme (EcoR I or Sap I) digestion/ligation. Elements for in vitro expression include T7 promoter (in red) and ribosome binding site (in yellow) upstream the genes. Two stem-loops (in green) were introduced at 5’ and 3’ end, respectively. DNA constructs could be amplified with primers Y-T7B and Spacer-R.
Before the in vitro expression and selection, DNA fragment encoding streptavidin
protein was constructed in a ribosome display cassette (Figure 4.2). The stop codon
in the streptavidin gene was first removed by sequence-specific polymerase chain
reaction (PCR) with a reverse primer annealing to the sequence upstream of the stop
codon. The removal of stop codon is necessary for ribosome display since the
presence of stop codon can elicit the dissociation of mRNA and nascent polypeptide
from the ribosome and consequently bypass the formation of mRNA-ribosome-
protein complex during in vitro protein synthesis. Besides gene sequence, there are
five accessorial sequences, including a T7 promoter, 5’-stem-loop, a ribosome
binding site, a spacer and 3’-stem-loop from 5’ end to 3’ end of the ribosome display
cassette (Figure 4.2). The T7 promoter can be specifically recognized by T7 RNA
polymerase so as to initiate the transcription of DNA to mRNA. At mRNA level, the
stem-loops at both 5’ and 3’ ends of DNA cassette help to stabilize the mRNA against
RNase and thus extend its half-life during in vitro selection. As for protein translation,
a prokaryotic ribosome binding sequence (Shine-Dalgarno sequence) is the
recognition site for the initiation of protein biosynthesis in bacterial cell extract. Upon
protein translation, an unstructured C-terminal spacer fragment was synthesized
95
together with nascent protein of interest to ensure efficient display of the protein on
the ribosome. This spacer fragment provides a spatial portion between the synthesized
protein and ribosome, which is believed to facilitate a proper protein folding on
ribosome (Hanes and Pluckthun, 1997). The ribosome display cassette for streptavidin
gene was constructed completely in vitro without any DNA cloning and
transformation. In the same manner, we constructed another gene, EGFP, as a
negative control for in vitro selection.
We first expressed streptavidin construct as ribosome-displayed streptavidin ternary
complex, followed by incubation with iminobiotin and amylose resin, respectively.
Results showed that only the streptavidin gene selected by iminobiotin could be
recovered by reverse transcription- polymerase chain reaction (RT-PCR) (Figure
4.3a). Since streptavidin protein can only be captured by iminobiotin, but not amylose
resin, results validated that the recovery of streptavidin gene was ascribed to the
interaction between a functional streptavidin and biotin, rather than nonspecific
binding of streptavidin protein to the surface of resin or solid support. Subsequently,
we combined equal amount of streptavidin and EGFP DNA constructs, followed by in
vitro expression and incubation with iminobiotin. Results showed that streptavidin
gene could be successfully selected via biotin-streptavidin interaction in the presence
of EGFP (Figure 4.3 b), whereas the EGFP gene could not be recovered through the
selection with iminobiotin. The identity of reverse transcript from in vitro selection
was confirmed by DNA sequencing.
96
a) 1 2 b) 1 2 3 4 c) 1 2
Figure 4.3 In vitro selection of ribosome-displayed streptavidin. (a) Streptavidin gene was constructed and subject to the selection. Lane 1: reverse transcript after in vitro selection with iminobiotin; Lane 2: negative control, selection with amylose resin. (b) Equal amount of streptavidin and EGFP constructs were combined and then subject to the selection with iminobiotin. Lane 1: gene recovered from in vitro selection; Lane 2: spacer sequence after the selection; Lane3: positive control, only streptavidin gene was subject to the selection; Lane 4: PCR amplification of reverse transcript from in vitro selection using EGFP sequence-specific primers. (c) Streptavidin construct was combined with 100-fold EGFP construct and then subject to in vitro selection. Lane 1: reverse transcript after in vitro selection with iminobiotin; Lane 2: negative control, selection without iminobiotin.
When we increased the selection pressure by mixing streptavidin and EGFP
constructs with a ratio of 1:100, the mRNA corresponding to streptavidin could be
still exclusively recovered upon the selection with iminobiotin, thereby further
corroborating the successful application of ribosome display for the in vitro selection
of functional protein (Figure 4.3 c).
4.2.2 In vitro selection of enzyme based on the catalytic activity
We next tested whether ribosome-displayed yeast PTPs could be selected in the
presence of other proteins by using the activity-based small-molecule probe. PTPs are
a class of enzymes which can hydrolyze phosphoester bonds at tyrosine residues of
their substrates. While working antagonistically with protein tyrosine kinases, PTPs
modulate the phosphorylation status of proteins and their functions thereof in
response to various cellular signals (Tonks and Neel, 2001; Wang et al., 2003). For a
library screening of proteins based on enzymatic activity, we randomly isolated the
400 base pairs
(bp)
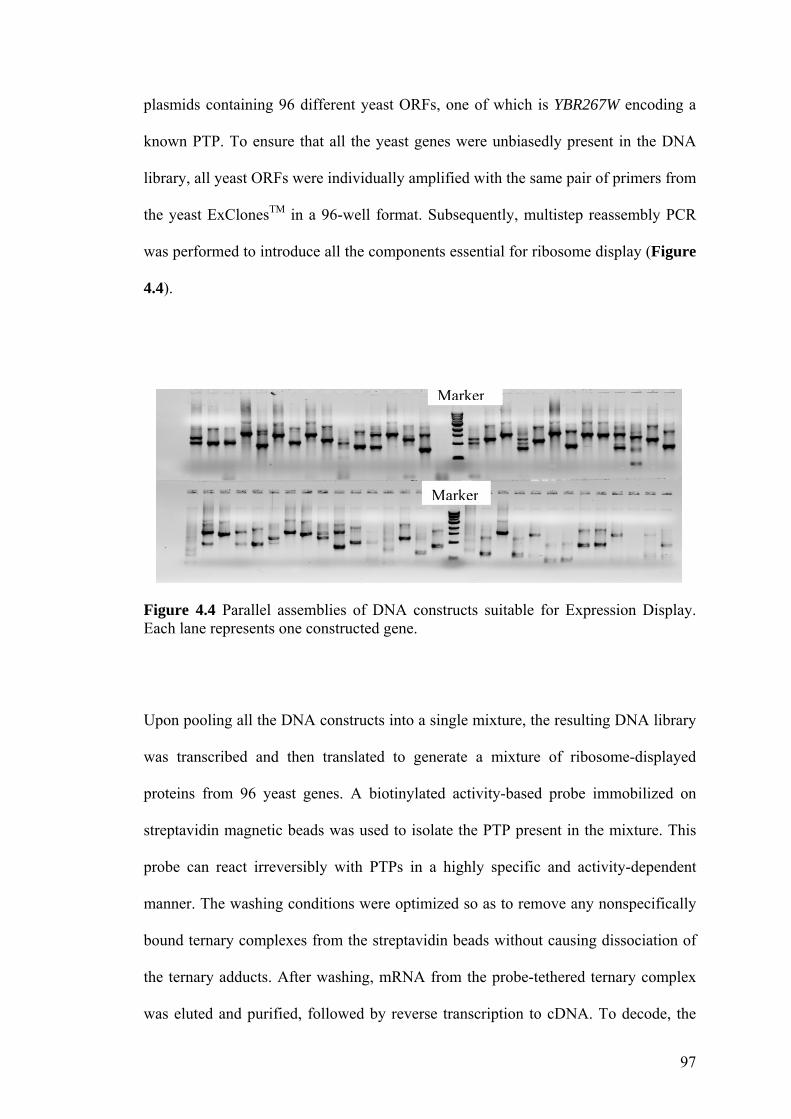
97
plasmids containing 96 different yeast ORFs, one of which is YBR267W encoding a
known PTP. To ensure that all the yeast genes were unbiasedly present in the DNA
library, all yeast ORFs were individually amplified with the same pair of primers from
the yeast ExClonesTM in a 96-well format. Subsequently, multistep reassembly PCR
was performed to introduce all the components essential for ribosome display (Figure
4.4).
Figure 4.4 Parallel assemblies of DNA constructs suitable for Expression Display. Each lane represents one constructed gene.
Upon pooling all the DNA constructs into a single mixture, the resulting DNA library
was transcribed and then translated to generate a mixture of ribosome-displayed
proteins from 96 yeast genes. A biotinylated activity-based probe immobilized on
streptavidin magnetic beads was used to isolate the PTP present in the mixture. This
probe can react irreversibly with PTPs in a highly specific and activity-dependent
manner. The washing conditions were optimized so as to remove any nonspecifically
bound ternary complexes from the streptavidin beads without causing dissociation of
the ternary adducts. After washing, mRNA from the probe-tethered ternary complex
was eluted and purified, followed by reverse transcription to cDNA. To decode, the
Marker
Marker
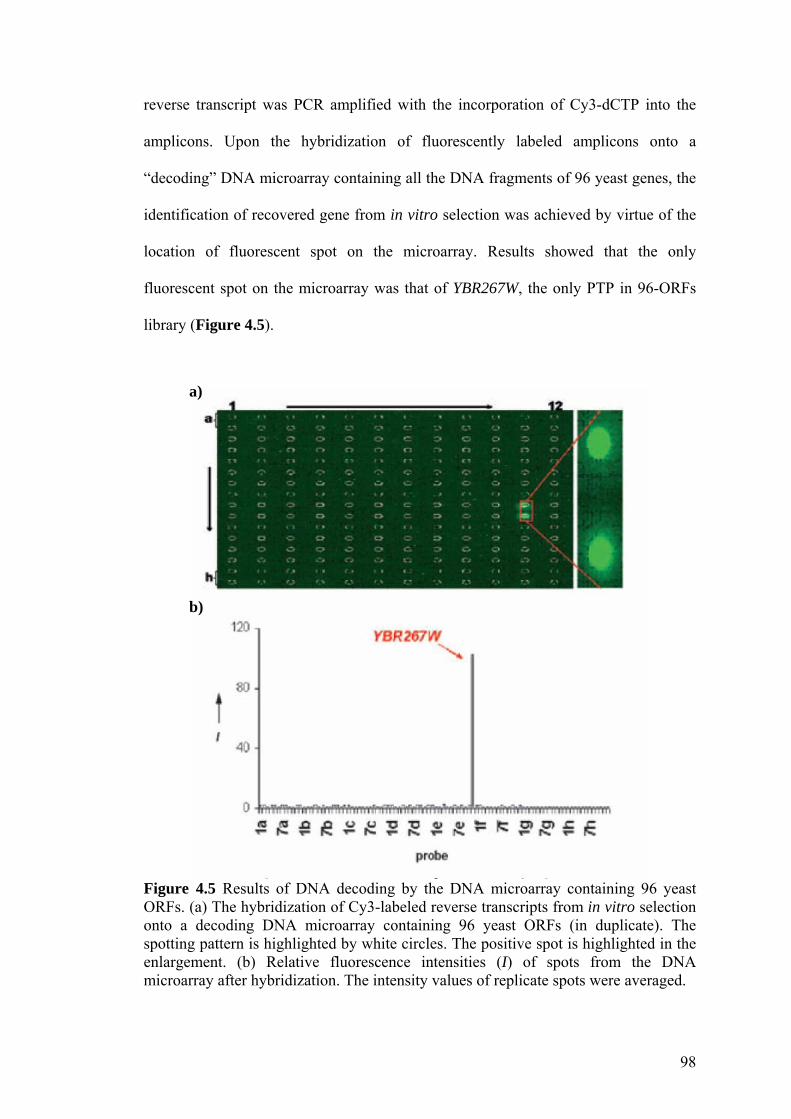
98
reverse transcript was PCR amplified with the incorporation of Cy3-dCTP into the
amplicons. Upon the hybridization of fluorescently labeled amplicons onto a
“decoding” DNA microarray containing all the DNA fragments of 96 yeast genes, the
identification of recovered gene from in vitro selection was achieved by virtue of the
location of fluorescent spot on the microarray. Results showed that the only
fluorescent spot on the microarray was that of YBR267W, the only PTP in 96-ORFs
library (Figure 4.5).
Figure 4.5 Results of DNA decoding by the DNA microarray containing 96 yeast ORFs. (a) The hybridization of Cy3-labeled reverse transcripts from in vitro selection onto a decoding DNA microarray containing 96 yeast ORFs (in duplicate). The spotting pattern is highlighted by white circles. The positive spot is highlighted in the enlargement. (b) Relative fluorescence intensities (I) of spots from the DNA microarray after hybridization. The intensity values of replicate spots were averaged.
a)
b)
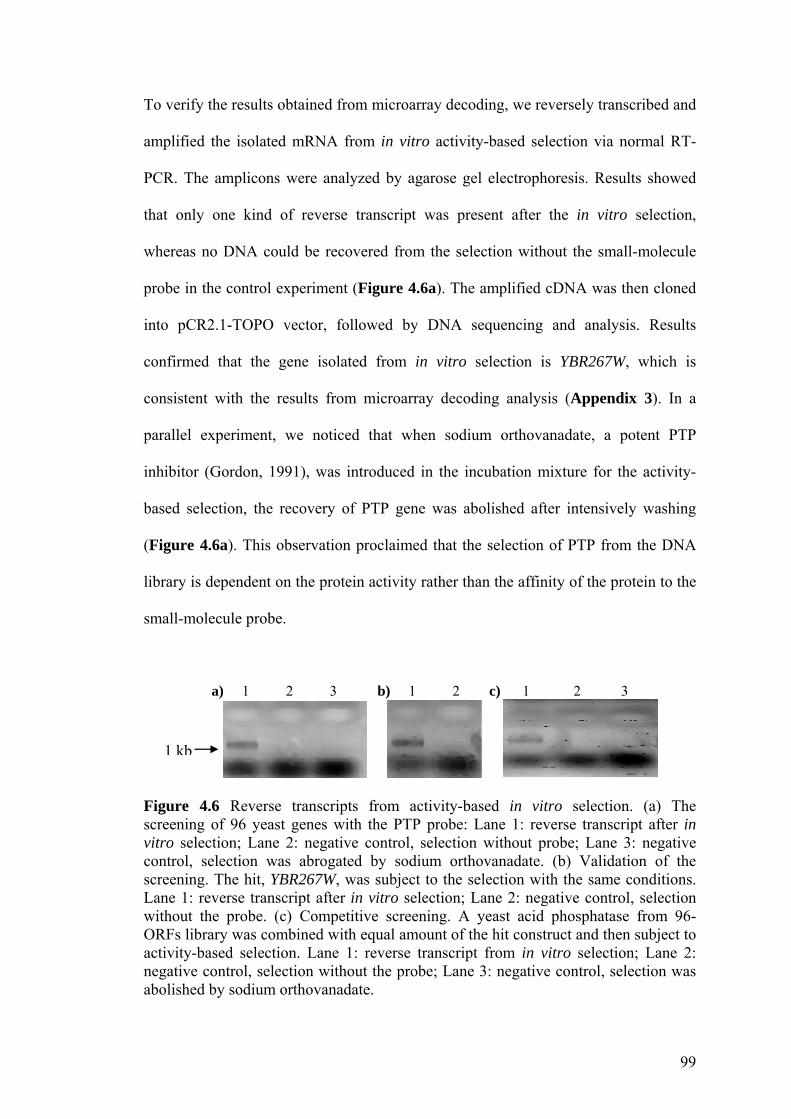
99
To verify the results obtained from microarray decoding, we reversely transcribed and
amplified the isolated mRNA from in vitro activity-based selection via normal RT-
PCR. The amplicons were analyzed by agarose gel electrophoresis. Results showed
that only one kind of reverse transcript was present after the in vitro selection,
whereas no DNA could be recovered from the selection without the small-molecule
probe in the control experiment (Figure 4.6a). The amplified cDNA was then cloned
into pCR2.1-TOPO vector, followed by DNA sequencing and analysis. Results
confirmed that the gene isolated from in vitro selection is YBR267W, which is
consistent with the results from microarray decoding analysis (Appendix 3). In a
parallel experiment, we noticed that when sodium orthovanadate, a potent PTP
inhibitor (Gordon, 1991), was introduced in the incubation mixture for the activity-
based selection, the recovery of PTP gene was abolished after intensively washing
(Figure 4.6a). This observation proclaimed that the selection of PTP from the DNA
library is dependent on the protein activity rather than the affinity of the protein to the
small-molecule probe.
a) 1 2 3 b) 1 2 c) 1 2 3
Figure 4.6 Reverse transcripts from activity-based in vitro selection. (a) The screening of 96 yeast genes with the PTP probe: Lane 1: reverse transcript after in vitro selection; Lane 2: negative control, selection without probe; Lane 3: negative control, selection was abrogated by sodium orthovanadate. (b) Validation of the screening. The hit, YBR267W, was subject to the selection with the same conditions. Lane 1: reverse transcript after in vitro selection; Lane 2: negative control, selection without the probe. (c) Competitive screening. A yeast acid phosphatase from 96-ORFs library was combined with equal amount of the hit construct and then subject to activity-based selection. Lane 1: reverse transcript from in vitro selection; Lane 2: negative control, selection without the probe; Lane 3: negative control, selection was abolished by sodium orthovanadate.
1 kb
100
To confirm that YBR267W could be de facto selected via Expression Display, we used
this identified “positive” hit alone for the activity-based selection with the same PTP
probe. As mentioned above, the selection by the streptavidin magnetic beads without
the biotinylated probe was used as a negative control. Results corroborated that
YBR267W could be recovered only in positive trial (Figure 4.6b).
As other types of phosphatases may compete with the PTPs in Expression Display, we
evaluated the specificity of the selection when an acid phosphatase (YAR071W) was
combined with the identified hit with equal DNA input. After in vitro expression, the
ternary complexes of were incubated with PTP probe as described above. Results
showed that YBR267W could be fished out in the presence of competitive phosphatase.
Additionally, no DNA was recovered in the negative control and inhibition trial
(Figure 4.6c), thereby verifying the specificity of the probe to PTP in Expression
Display. Taken together, all these lines of evidence validated our strategy whereby
enzymes expressed from a DNA library using ribosome display could be
preferentially selected on the basis of their enzymatic activity with the aid of a
suitable small-molecule probe. The recovered DNA can be either identified by DNA
cloning and sequencing or DNA decoding with a self-addressable DNA microarray.
4.2.3 Identification of a subclass of enzymes from a DNA library via Expression
Display
To assess whether Expression Display could be used for a facile identification of
enzymes in a class-specific fashion, we applied our strategy to the screening of a
DNA library containing 384 yeast ORFs. As usual, all the ORFs were individually
PCR-amplified and assembled before pooling to ensure equal representation of each
101
gene in the library. Upon in vitro transcription and translation, the mixture containing
the ribosome-displayed proteins was subject to activity-based selection, in a single
reaction, using the same small-molecule probe. Selection conditions were optimized
so as to rule out the nonspecific selection. Reverse transcripts would be identified as
“positives” only when no reverse transcripts could be fished out in the control trial,
where sodium orthovanadate was introduced to abolish the selection by the PTP probe.
From our results, we noticed that both the incubation time and the presence of bovine
serum albumin (BSA) are important for an enzyme-specific in vitro selection (Figure
4.7). When the incubation time was as short as 30 minutes, no genes could be
recovered under the selection conditions applied in this study. This is presumably
because the incubation time may not be long enough for the protein maturation. In
this study, all the proteins were expressed in vitro and immediately proceeded to the
incubation with the probe. As we know, in vitro expressed proteins typically take up
to a couple of hours to completely mature as functional proteins. When the
incubation time is too short, the proteins are not functional to be captured by the
activity-based probe. On the other hand, the ribosome-displayed complex tends to fall
apart and mRNA is prone to RNA degradation when the incubation is too long (4
hours), resulting in a significant portion of contaminant RNA which may mask the
specificity of the selection. With respect to BSA, it can not only block the
nonspecific binding of the ternary complexes to streptavidin and the tube surface, but
also quench the highly reactive probe intermediate upon phosphate hydrolysis and
thus prevent the nonspecific protein labeling with the probe.
102
Figure 4.7 Reverse transcripts selected by Expression Display from the DNA library containing 384 yeast ORFs. After in vitro transcription and translation, the product was incubated with or without BSA, activity-based probe and sodium orthovanadate for different time as indicated in the upper panel.
To identify the genes selected from Expression Display, we spotted all 384 yeast
ORFs in duplicate onto the polylysine glass slides as a decoding DNA microarray.
The eluted mRNAs from activity-based selection were reversely transcribed and
amplified with the incorporation of Cy3-dCTP into the amplicons. The resulting
fluorescently labeled cDNAs were then hybridized onto the decoding microarray.
Following DNA hybridization and extensive washing, the slides were scanned by the
fluorescent scanner. Upon fluorescence normalization, the spots with significant
fluorescent intensities over the background were identified (Figure 4.8). Results
showed that these “positive” spots correspond to the genes encoding four PTPs in the
library. The identities of these genes were further confirmed by DNA sequencing, as
mentioned above (Appendix 4).
BSA + + + + + + + + – –
Na3VO4 – + – + + – – – – +
Incubationtime
Probe + + + + + + + – + +
4 hrs 30 min 2 hrs 2 hrs 2 hrs
Marker
103
Figure 4.8 A facile identification of multiple yeast PTPs using Expression Display. (a) The hybridization of Cy3-labeled reverse transcripts from in vitro selection onto a decoding DNA microarray containing 384 yeast ORFs (in duplicate). The spotting pattern is highlighted by white circles. The positive spots are highlighted in the enlargements. Four positives were identified as A: YFR028C, B: YDL230W, C: YPR073C, and D: YBR267W, corresponding to four PTPs in the cDNA library. (b) Relative fluorescence intensities (I) of spots from the DNA microarray after hybridization. The intensity values of replicate spots were averaged. Four PTPs are labeled (A–D). (c) Comparison of relative fluorescence intensities of the four PTPs (red) to those of other phosphatases in the cDNA library, including eight Ser/Thr phosphatases (cyan), two dl-glycerol phosphatases (green), one exopolyphosphatase (yellow), one inorganic pyrophosphatase (pink), three acid phosphatases (dark blue), and three phosphatase homologues (light blue).
104
By western blotting, we sought to further validate the enzymatic activities of the
corresponding “positive” proteins identified from Expression Display. These four
yeast PTPs, i.e. YBR267W, YDL230W, YFR028C, and YPR073C, were expressed as
GST fusion proteins from yeast ExClonesTM and purified by GSH resin. The labeling
reaction between the small-molecule probe and the PTPs was described in the section
“Materials and methods”. The anti-biotin antibody was used to detect the formation
of probe-protein adducts resolved in SDS-PAGE gels. Results corroborated the
successful labeling of the individually purified proteins with the probe in gel-based
experiments (Figure 4.9). In parallel control experiments, the inhibition effects of
sodium orthovanadate on the protein labeling reactions were consistent with what we
observed in Expression Display.
Figure 4.9 Detection of the labeling of four PTPs with the small-molecule probe by western blotting. The proteins were expressed and purified as GST fusion proteins, and then incubated with the probe (with or without the PTP inhibitor, sodium orthovanadate), followed by detection with anti-biotin antibody. 200 µM of sodium orthovanadate was used to inhibit the labeling reaction.
YBR267W YDL230W YFR028C YPR073C (45 kilodalton (kD)) (38 kD) (61 kD) (18 kD)
105
4.3 Discussion
4.3.1 Comparison of ribosome display with other protein display technologies
As mentioned above, there are several protein display technologies which have been
developed and widely used in protein selection and in vitro evolution. Compared to
other display technologies which require DNA cloning, transformation and in vivo
protein expression, completely in vitro-based methods, including ribosome display,
mRNA display, tRNA display and CIS display, have an intrinsic advantage in that the
complexity of the library generated in vitro will not be fettered by transformation
efficiency (yeast, 107 – 108 cells/µg DNA; bacteria, 109 – 1010 cells/µg DNA)
(Amstutz et al., 2001).
In this study, we chose ribosome display rather than other in vitro protein display
technologies (like tRNA display and mRNA display) for protein expression and
encoding, as it is relatively simpler to generate a large number of mRNA-ribosome-
protein complexes for the library screening. In tRNA display, a bifunctional tRNA
bridges the protein and its encoding mRNA (Merryman et al., 2002). As reported, the
wybutine base in yeast tRNAphe could be crosslinked to the mRNA containing a Phe
codon and a stable amide bond between tRNA and synthetic protein was achieved
through the substitution of 3’-terminal adenosine of tRNAphe with 3’-amino-3’-
deoxyadenosine. Albeit successful in short peptide enrichment, tRNA display may not
be currently suitable for the screening of a library of proteins, considering that
tRNAphe might be preferentially crosslinked to the mRNA with a high content of Phe
codons and therefore cause aberrant conjugation of proteins to other encoding
mRNAs. This miscoding renders the decoding of isolated proteins difficult. As for
mRNA display, it distinguishes itself from ribosome display by the covalent linkage
106
between the mRNA and encoded protein via puromycin, whereas the linkages in the
ternary complex from ribosome display are non-covalent. This feature of mRNA
display makes it feasible to immobilize the mRNA-displayed proteins in a
corresponding DNA microarray to generate a functional protein array (Weng et al.,
2002; Jung and Stephanopoulos, 2004). Both mRNA display and ribosome display
could be applied to in vitro selection and evolution of proteins with similar successes
(Lipovsek and Pluckthun, 2004). Nevertheless, mRNA display requires a few more
steps to generate mRNA-protein conjugates when compared with ribosome display.
Moreover, the low efficiency of ligating puromycin-attached oligonucleotides to
mRNA and subsequent purification of ligation products will significantly reduce the
yield of mRNA-protein conjugates in mRNA display. Therefore, ribosome display
would be preferred when a covalent linkage between mRNA and its encoded protein
is not essential for the in vitro selection.
Among current in vitro display methods, both ribosome display, mRNA display and
tRNA display face a common problem that RNA is unstable and prone to nuclease
degradation. To address this issue, Odegrip et al. (2004) recently developed the CIS
display whereby a library of the proteins of interest are fused to a DNA replication
initiator protein (RepA) and then in vitro expressed. The RepA protein has a high-
fidelity cis-activity to bind exclusively to the template DNA from which it has been
expressed, resulting in the conjugation of protein with its encoding DNA. With
increased robustness, CIS display has the potential to find a wide application in
protein selection, evolution and microarray fabrication. However, an issue of concern
is about the size of the fusion protein (RepA is 33 kDa, another cis-acting protein P2A
is 86 kDa) employed in CIS display. These relatively large protein tags may make it
difficult to in vitro express the proteins with proper protein folding.
107
4.3.2 In vitro selection of functional proteins
Conventionally, a majority of studies on the in vitro characterization of protein
functions and enzymatic activity has been achieved by in vitro compartmentalization
whereby the protein and its encoding DNA, together with the protein substrate, were
encapsulated in the same compartment (Griffiths and Tawfik, 2000). However, in
vitro compartmentalization has its intrinsic drawback. Since the expressed protein is
not physically linked to its encoding DNA, the presence of other proteins from in
vitro transcription and translation mixture may interfere with the protein assays taking
place in each compartment and in turn complicate the results obtained from in vitro
selection.
Protein display technologies circumvent this problem by allowing flexible
manipulations of the in vitro assays (Amstutz et al., 2002; Cesaro-Tadic et al., 2003).
In our study, the endogenous phosphatases and other proteins in the in vitro
transcription and translation mixture would not affect the outcome of in vitro selection.
This is because only mRNA, rather than protein, will be decoded upon the selection.
The binding of other non-ribosome-displayed proteins to the probe will not be
reflected by the decoding of reverse transcripts. This also explains why we could use
high concentration of BSA to block nonspecific binding and quench the reactive
probe intermediate during the in vitro selection. Alternatively, it would be also
feasible to purify the ternary complexes from the in vitro expression mixture before
conducting particular protein assays when an affinity tag is introduced in each
expressed protein (Matsuura and Pluckthun, 2003; Hosse et al., 2006).
108
With more chemical tools being developed in catalomics, in vitro protein selection,
when coupled with protein display technologies, will find wider applications in
activity-based protein classification and functional annotation of proteins.
4.3.3 Application of DNA microarrays as decoding tools in functional proteomics
In additional to global profiling of gene expression, DNA microarray is an emerging
decoding tool in functional proteomics and chemical biology (Lovrinovic and
Niemeyer, 2005). As mentioned above, genome-wide determination of protein-
binding sequences can be readily achieved by ChIP-on-chip. In a related work, Robyr
et al. (2002) sought to depict the genome-wide map of enzymatic activity of yeast
histone deacetylases (HDACs). HDACs are a group of enzymes which regulate DNA
transcription by deacetylating histone proteins. In their work, the DNA fragments
from both HDACs mutant and wide-type yeast cells were simultaneously enriched by
ChIP with specific antibodies against selected acetylated lysines of histone. The
enriched DNA fragments were then combined and hybridized onto the microarray
containing about 6700 intergenic regions of yeast genome. The difference in
fluorescence between two samples indicated where histones were deacetylated by the
HDACs of interest, thereby providing a comprehensive map of HDACs activity in
yeast.
With versatile chemical tools, Winssinger and co-workers have utilized either
fluorescent or fluorogenic chemical molecules, which were encoded by peptide
nucleic acid (PNA), to probe the proteolytic activities in different crude cell extracts
(Winssinger et al., 2004; Harris et al., 2004). Upon the in vitro screening, the selected
probes which indicated the enzymatic activities were decoded through the
109
hybridization of PNA onto the corresponding DNA microarray. Other recent
examples include the screening of encoded self-assembling chemical libraries
(Melkko et al., 2004), discovery of novel bond-forming reactions (Kanan et al., 2004),
screening of phage-displayed small molecules (Yin et al., 2004), etc.
Together with our work, these exciting applications of DNA microarray in functional
proteomics will continue to accelerate the elucidation of protein activity and function
on a proteome-wide scale.
4.4 Conclusions and future directions
Herein we have demonstrated that Expression Display could be used for high-
throughput screening and identification of proteins on the basis of their enzymatic
activities. By taking advantage of the activity-based chemical probe, we have shown,
for the first time, multiple enzymes belonging to the same class could be fished out as
ribosome-displayed complexes from a DNA library, followed by facile identification
with the decoding DNA microarray. In our experiments, all genes were individually
constructed before pooling into a single DNA library in order to ensure the library
diversity and equal presentation of each gene in the library. Other DNA libraries,
either commercially available or constructed using standard cloning techniques,
should be equally applicable for Expression Display.
Overall, our strategy is novel in a number of ways when compared with other existing
proteomic techniques. Firstly, our strategy distinguishes itself from the
electrophoretic/chromatographic protein profiling methods by allowing a high-
throughput identification of enzymes without the need of MS. As we know, the
protein identification by MS is generally time-consuming with low throughput, which
110
hampers large-scale protein analysis. On the other hand, considering the expression
levels of most enzymes are relatively low in contrast to those of the housekeeping
proteins in a proteome, the standard 2-DE is not ideal for the separation and analysis
of those low-abundance proteins. Secondly, by circumventing tedious procedure of
cloning, expression and purification of each protein, out strategy could express and
characterize hundreds to thousands of proteins in one single mixture, thereby
facilitating protein characterization on a large scale. Thirdly, by utilizing RT-PCR for
the amplification of isolated genes and subsequently using DNA microarray for
decoding, our strategy provides a very sensitive detection method. The detection limit
of Expression Display needs to be further addressed. Taken together, we envision that
Expression Display will be potentially applicable for a high-throughput
characterization of proteins from any known or unknown organisms and therefore
facilitate the study in functional proteomics.
In future, some interesting issues need to be further addressed. The first issue is about
the stability of mRNA-ribosome-protein complexes. In most of the applications of
ribosome display so far, all the in vitro experiments following the formation of ternary
complex must be carried out at low temperature (4 oC) so as to avoid the dissociation
of mRNA and protein from the ribosome. This requirement of maintaining low
temperature during in vitro selection renders Expression Display inapplicable for the
protein assays which must be conducted at room (or higher) temperature. To alleviate
this problem, a modified ribosome display system has been described whereby the
resultant mRNA-ribosome-protein complexes could be stable at room temperature
(Zhou and Fujita et al., 2002). In this system, through the introduction of the ricin A
chain to inactivate eukaryotic ribosome, the release of mRNA and nascent protein
from ribosome was inhibited, resulting in the formation of a stable ribosome-
111
displayed complex. However, since the inactivation of ribosomes by ricin is very
efficient (about 1500 ribosomes per minute), it needs to be further addressed whether
the ricin can also inactivate the adjacent ribosomes which are in the process of
translating other mRNAs. If this inactivation by ricin is not selective, it will generate a
large number of truncated proteins as a result of rapid inhibition of in vitro protein
synthesis by ricin. In this sense, only when it is confirmed that ricin can selectively
inactivate the ribosome with which it has been translated, this modified system can be
further applied for the in vitro selection of functional proteins which typically entails
the expression of full-length proteins.
A second issue is about the removal of stop codon from gene before being ribosome-
displayed. Although it is widely believed that stop codon can recruit the release
factors to dissociate the mRNA and nascent protein from ribosome and consequently
the removal of stop codon is necessary in ribosome display, it has been shown that
selection of the gene with a stop codon using ribosome display was still feasible
(Sawata and Taira, 2003). To date, however, the mechanism of the formation of
ribosome-displayed complexes in the presence of stop codon remains elusive. Future
elucidation of this mechanism will help to answer whether the removal of stop codon
is really necessary for the efficient display of proteins on the ribosomes. This issue
will be of particular importance when a mixture of mRNA extracted from cells needs
to be constructed for Expression Display since the removal of the stop codon from
each gene will be very tedious.
112
Chapter 5 High-throughput screening of functional proteins
from a phage display library
5.1 Introduction
As reported in the chapter 4, we had successfully carried out an activity-based
screening of the ribosome-displayed yeast protein library in a high-throughput manner.
Instead of the 384-membered protein library which had been screened in chapter 4,
we next sought to examine the feasibility of screening the protein library on a
proteome-wide scale. In this study, we chose to screen a commercially available
phage-displayed human brain cDNA library using PTP probe.
Phage display was first invented in 1985 by George P. Smith, who inserted foreign
DNA fragments into filamentous phage gene III so as to display the foreign proteins
on the surface of virion (Smith, 1985). By virtue of the genotype-phenotype linkage,
phage display allows rapid protein “amplification” between each round of selections
and provides an efficient means for the facile identification of enriched proteins,
whereby encoding DNA fragments, rather than proteins themselves, will be
sequenced after the selection. In the past two decades, phage display has been widely
exploited for the screening of protein-binding molecules (including protein-protein
interactions), protein engineering and cell-specific targeting (Kehoe and Kay, 2005).
The most common application of phage display is to produce affinity peptides or
proteins that bind to a target of interest. This target can be a small molecule, a
macromolecule or a protein itself (Videlock et al., 2004; McKenzie et al., 2004). By
using a phage-displayed cDNA library, Zozulya and co-workers (1999) have globally
characterized the protein-protein interactions in particular signaling pathways for the
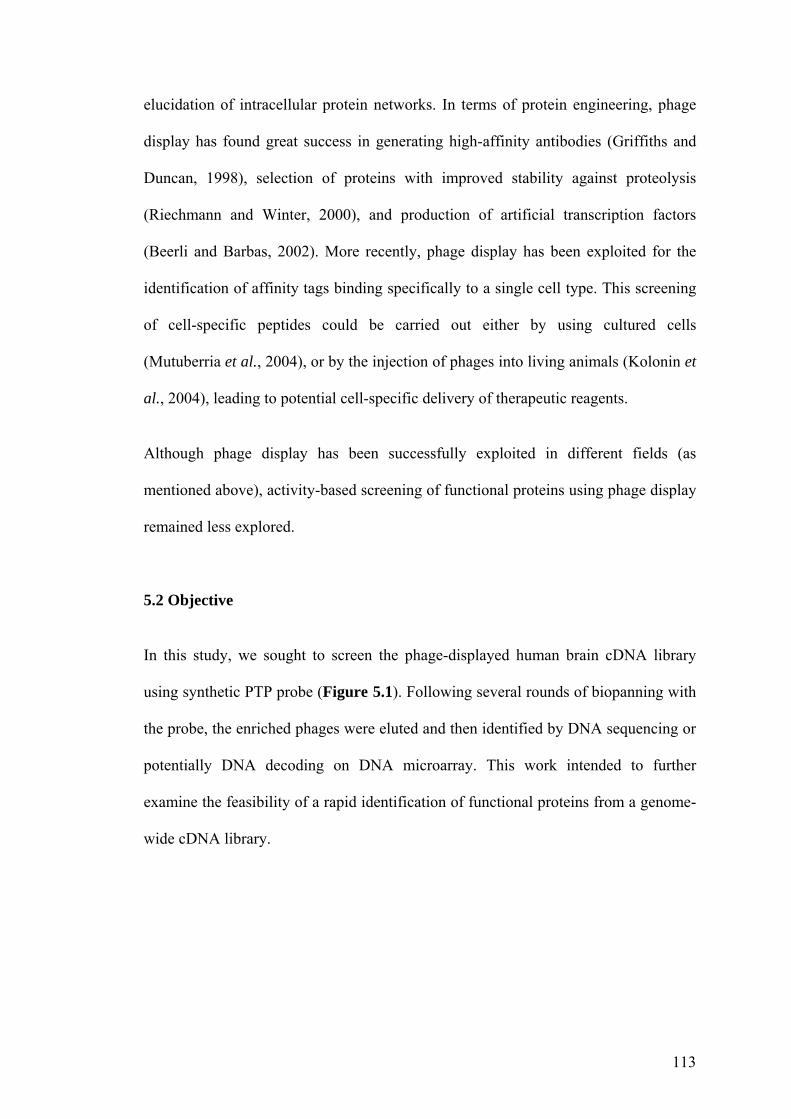
113
elucidation of intracellular protein networks. In terms of protein engineering, phage
display has found great success in generating high-affinity antibodies (Griffiths and
Duncan, 1998), selection of proteins with improved stability against proteolysis
(Riechmann and Winter, 2000), and production of artificial transcription factors
(Beerli and Barbas, 2002). More recently, phage display has been exploited for the
identification of affinity tags binding specifically to a single cell type. This screening
of cell-specific peptides could be carried out either by using cultured cells
(Mutuberria et al., 2004), or by the injection of phages into living animals (Kolonin et
al., 2004), leading to potential cell-specific delivery of therapeutic reagents.
Although phage display has been successfully exploited in different fields (as
mentioned above), activity-based screening of functional proteins using phage display
remained less explored.
5.2 Objective
In this study, we sought to screen the phage-displayed human brain cDNA library
using synthetic PTP probe (Figure 5.1). Following several rounds of biopanning with
the probe, the enriched phages were eluted and then identified by DNA sequencing or
potentially DNA decoding on DNA microarray. This work intended to further
examine the feasibility of a rapid identification of functional proteins from a genome-
wide cDNA library.
114
Figure 5.1 Schematic illustration of high-throughput screening of functional proteins using phage display.
5.3 Results and discussion
5.3.1 In vitro screening of functional proteins under standard selection conditions
In this study, we sought to utilize the same chemical probe used in chapter 4 to fish
out the phosphatases from phage-displayed human brain cDNA library (Figure 5.1).
As discussed in chapter 4, the selection condition is critical for in vitro selection of the
proteins of interest. In the first trial (batch A), we followed the selection conditions
similar to those described in chapter 4.
Following phage propagation, we first incubated the fresh phage lysate containing
human brain cDNA library with streptavidin beads (Promega) to remove streptavidin-
115
binding phages. Afterwards, the phage lysate was incubated with the PTP probe,
together with 10 mg/ml BSA, at 4 oC for 2 hours. After the incubation, the
streptavidin beads were washed five times with phage washing buffer. The phage
washing buffer was prepared as described in previous reports where phage-displayed
proteins were selected with high binding affinity for the target ligand (Videlock et al.,
2004; McKenzie et al., 2004). Following extensive washing, an aliquot of the bound
phages was used for phage titering and the rest of phages were propagated for the next
round of the biopanning. In this study, the bound phages after selection were directly
amplified by the addition of mid-log host bacteria cells since it is hardly possible to
elute the phages which were covalently tethered to the probe. It has been reported that
displayed proteins bound on the solid support do not interfere with the infectivity of
the bound phages (Mikawa et al., 1996).
In light of the purpose of in vitro selection, the biopanning should be stopped when no
further increment in the number of recovered phages is observed. In this trial (batch
A), we stopped the selection in the fourth round since no further enrichment of phages
between round 3 and round 4 of the biopanning was observed based on the results of
phage titering (Figure 5.2a). The phage lysate after the third round of biopanning was
diluted and plated by the plaque assay. Individual plaques were randomly picked for
PCR amplification of the cDNA inserts. The phage clones containing a proper cDNA
insert (>300bp) were identified by DNA sequencing.
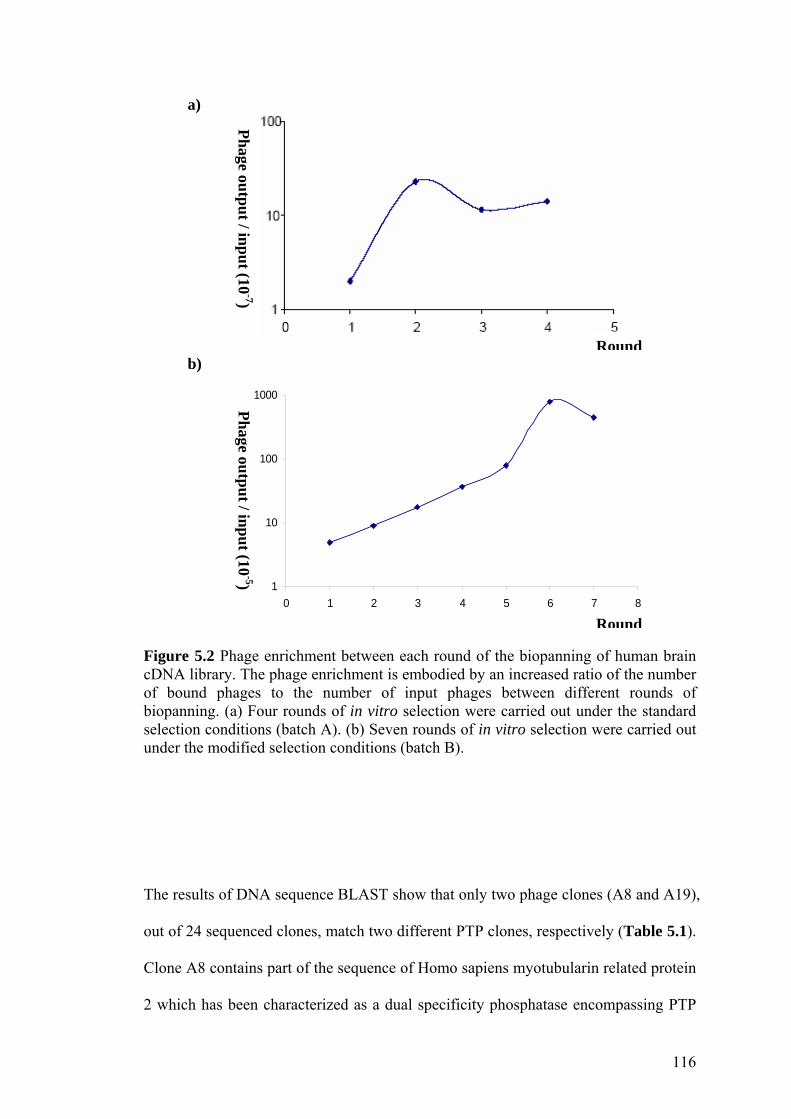
116
a)
b)
1
10
100
1000
0 1 2 3 4 5 6 7 8
Figure 5.2 Phage enrichment between each round of the biopanning of human brain cDNA library. The phage enrichment is embodied by an increased ratio of the number of bound phages to the number of input phages between different rounds of biopanning. (a) Four rounds of in vitro selection were carried out under the standard selection conditions (batch A). (b) Seven rounds of in vitro selection were carried out under the modified selection conditions (batch B).
The results of DNA sequence BLAST show that only two phage clones (A8 and A19),
out of 24 sequenced clones, match two different PTP clones, respectively (Table 5.1).
Clone A8 contains part of the sequence of Homo sapiens myotubularin related protein
2 which has been characterized as a dual specificity phosphatase encompassing PTP
Phage output / input (10-7)
Phage output / input (10-5)
Round
Round
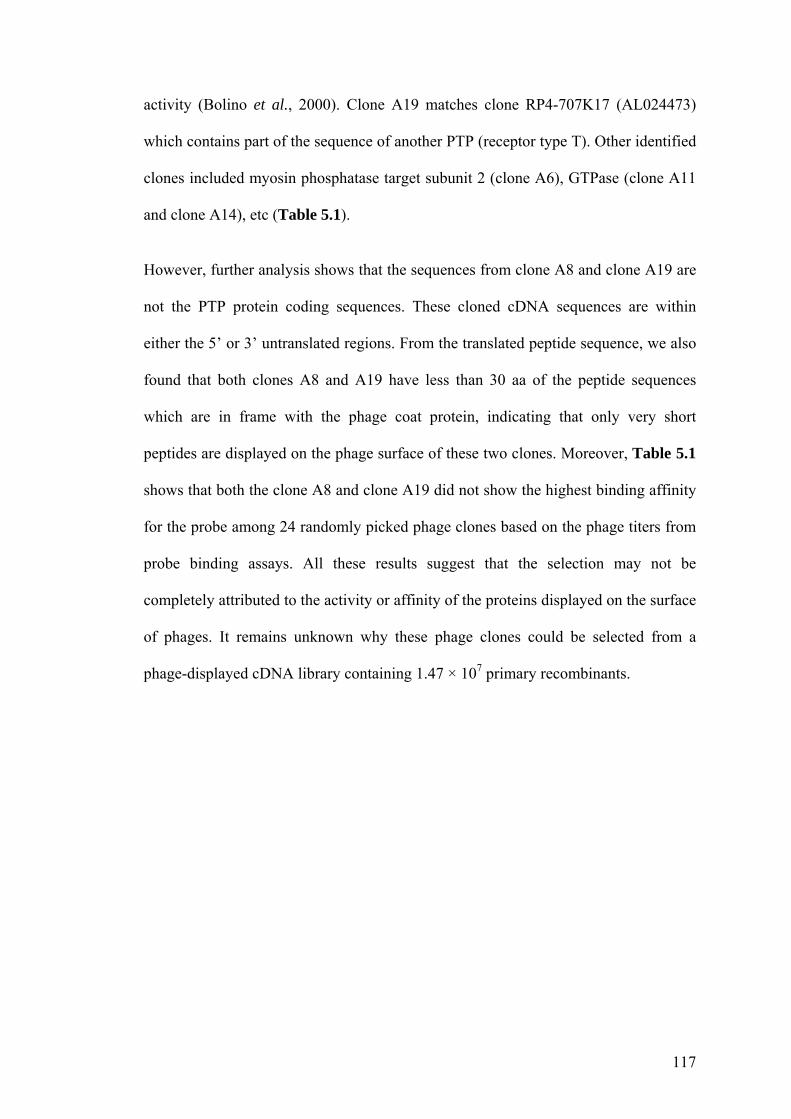
117
activity (Bolino et al., 2000). Clone A19 matches clone RP4-707K17 (AL024473)
which contains part of the sequence of another PTP (receptor type T). Other identified
clones included myosin phosphatase target subunit 2 (clone A6), GTPase (clone A11
and clone A14), etc (Table 5.1).
However, further analysis shows that the sequences from clone A8 and clone A19 are
not the PTP protein coding sequences. These cloned cDNA sequences are within
either the 5’ or 3’ untranslated regions. From the translated peptide sequence, we also
found that both clones A8 and A19 have less than 30 aa of the peptide sequences
which are in frame with the phage coat protein, indicating that only very short
peptides are displayed on the phage surface of these two clones. Moreover, Table 5.1
shows that both the clone A8 and clone A19 did not show the highest binding affinity
for the probe among 24 randomly picked phage clones based on the phage titers from
probe binding assays. All these results suggest that the selection may not be
completely attributed to the activity or affinity of the proteins displayed on the surface
of phages. It remains unknown why these phage clones could be selected from a
phage-displayed cDNA library containing 1.47 × 10⁷ primary recombinants.
118
Table 5.1 Phage clones selected from human brain cDNA library (batch A). The phages binding to the probe were titered by the plaque assays. All the sequenced phage clones were ranked according to their probe binding titers.
Phage clone
Titer of phages binding to the probe (pfu/ml)
Sequence match Clone description
A1 4.8 × 10⁷ AL137059 clone RP11-125I23 on chromosome 13 A2 2.45 × 10⁷ AL929472 clone RP11-109P14 on chromosome 1 A3 1.8 × 10⁷ NM_001017 ribosomal protein S13 A4 1.7 × 10⁷ NM_016588 neuritin 1 A5 1.22 × 10⁷ AC012622 clone CTD-2072F21 on chromosome 5 A6 9.6 × 10⁶ AF324892 myosin phosphatase target subunit 2 A7 3.6 × 10⁶ AC018508 clone RP11-123L21 on chromosome 10 A8 3.3 ×10⁶ NM_201278 myotubularin related protein 2 A9 3.3 ×10⁶ AC012618 clone CTD-2666L21 on chromosome 19
A10 2.25 × 10⁶ AC016635 clone RP11-313I12 on chromosome 5 A11 1.5 × 10⁶ AY032844 GTPase A12 1.05 × 10⁶ BC010448 KIAA1191 protein A13 106 BC035932 small EDRK-rich factor A14 9 × 10⁵ AY032844 GTPase A15 3.6 ×10⁵ NM_003081 synaptosomal-associated protein A16 2.5 × 10⁵ AF317228 spindlin 1 A17 2.5 × 10⁵ NM_020066 formin 2 A18 1.8 × 10⁵ AL359085 clone RP11-113J24 on chromosome 13
A19 1.4 × 10⁵ AL024473 clone RP4-707K17 Contains part of the PTPRT gene for protein tyrosine phosphatase receptor type T
A20 105 NM_199478 proteolipid protein 1 A21 105 AK127500 clone BRTHA3014920 A22 8 × 10⁴ AP001419 clone RP1-24K9 on chromosome 21 A23 3 × 104 X52104 p68 protein
A24 103 BC002750 open reading frame 10 on chromosome 11
5.3.2 In vitro screening of functional proteins under modified selection conditions
In the following endeavor, we further modified the selection conditions in an attempt
to improve the selection specificity. During the incubation of phage-displayed
proteins with the probe, three metal ions, including 1 mM Mn2+, 1 mM Ni2+ and 1 mM
119
Mg2+, were added into the incubation buffer. It has been reported that these three
divalent metal ions could, to some extent, enhance the activity of the phosphatases
purified from human brain (Cheng et al., 2000; Cheng et al., 2001). Since the
covalent binding of the proteins to the probe relies on the phosphatase activity, we
presumed that the addition of the metal ions will facilitate the specific trapping of
phage-displayed phosphatases by the probe. For the same reason, we changed the
incubation temperature to 30 oC for 1 hour to enhance the protein activity. With
respect to the washing conditions, we chose to use a detergent (1% SDS), instead of
the normal phage washing buffer, to remove noncovalently bound phages. In contrast
to other phage display systems, T7 phages are stable to a broad range of buffers
including 5 M sodium chloride, 4 M urea, 2 M guanidine-HCl, 100 mM dithiothreitol
(DTT) and 1% SDS (T7Select® system manual).
In this trial (batch B), we first empirically stopped the in vitro selection for clone
identification at the fourth round of the biopanning, although the bound phages were
still being enriched at this point (Figure 5.2b). This is because three or four rounds of
the biopanning are typically sufficient for a successful affinity- or activity-based
protein screening based on previous reports and our experience. The phage sample
after the fourth round of the biopanning was diluted and plated by the plaque assay.
As usual, individual plaques were randomly picked for PCR amplification of the
cDNA inserts. The phage clones containing a proper cDNA insert (>300bp) were
identified by DNA sequencing. The results of sequence BLAST show that no PTP is
present among 15 identified phage clones (Table 5.2). However, three clones (B3, B9
and B15) have part of the sequences matched to the clones containing PTP genes.
Clone B3 matches part of sequence of clone RP11-490F3 (AL360020) which contains
the gene for PTP9Q22. Clone B9 matches part of sequence of clone RP11-397F23
120
(AL162733) which contains the gene for the PTP (non-receptor type 3). Clone B15
matches part of sequence of clone RP11-316H11 (AL645859) which contains the
gene for PTP (receptor type U). Phage binding assays showed that the affinity of three
clones for the probe was approximately 150-250 times higher than the affinity for the
streptavidin beads (Table 5.2). However, further sequence analysis indicates that the
DNA sequences from clone B3, B9 and B15 are not the PTP protein coding sequences.
Besides three clones mentioned above, of particular interest are the clones (B1, B7
and B10) which encode myelin basic protein (Appendix 7). According to the
translated peptide sequences, clone B1 and clone B7 have about 48 aa and 169 aa,
respectively, in frame with the phage coat protein, whereas clone B10 has less than 10
aa in frame. In the following rounds of biopanning (round 5-7, Figure 5.2b), we
found that this myelin basic protein was highly enriched. By DNA sequencing, we
have identified 16 randomly picked phage clones from the sixth round of the
biopanning. Out of the 16 sequenced clones, 12 clones contain the coding sequence of
myelin basic protein.
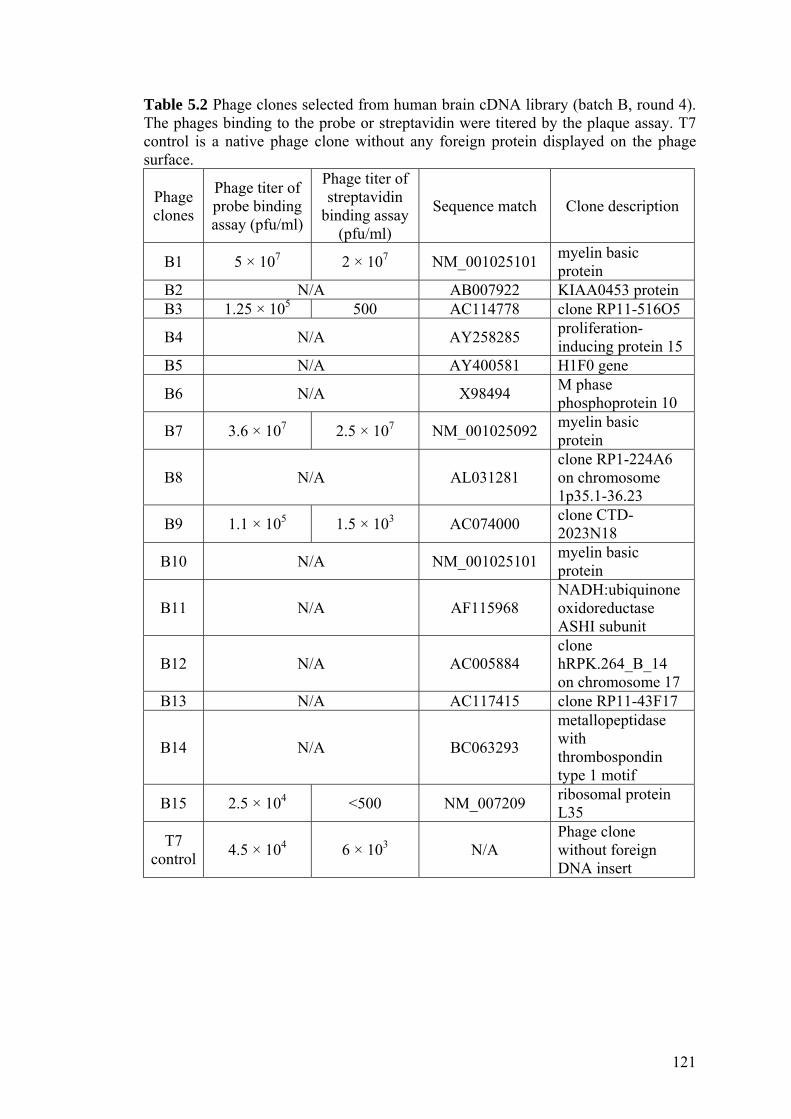
121
Table 5.2 Phage clones selected from human brain cDNA library (batch B, round 4). The phages binding to the probe or streptavidin were titered by the plaque assay. T7 control is a native phage clone without any foreign protein displayed on the phage surface.
Phage clones
Phage titer of probe binding assay (pfu/ml)
Phage titer of streptavidin
binding assay (pfu/ml)
Sequence match Clone description
B1 5 × 10⁷ 2 × 10⁷ NM_001025101 myelin basic protein
B2 N/A AB007922 KIAA0453 protein B3 1.25 × 10⁵ 500 AC114778 clone RP11-516O5
B4 N/A AY258285 proliferation-inducing protein 15
B5 N/A AY400581 H1F0 gene
B6 N/A X98494 M phase phosphoprotein 10
B7 3.6 × 10⁷ 2.5 × 10⁷ NM_001025092 myelin basic protein
B8 N/A AL031281 clone RP1-224A6 on chromosome 1p35.1-36.23
B9 1.1 × 10⁵ 1.5 × 10³ AC074000 clone CTD-2023N18
B10 N/A NM_001025101 myelin basic protein
B11 N/A AF115968 NADH:ubiquinone oxidoreductase ASHI subunit
B12 N/A AC005884 clone hRPK.264_B_14 on chromosome 17
B13 N/A AC117415 clone RP11-43F17
B14 N/A BC063293
metallopeptidase with thrombospondin type 1 motif
B15 2.5 × 10⁴ <500 NM_007209 ribosomal protein L35
T7 control 4.5 × 10⁴ 6 × 10³ N/A
Phage clone without foreign DNA insert
122
Based on the results we obtained, there may be two main reasons why myelin basic
protein could be selectively enriched during the biopanning by the phosphatase probe.
Firstly, myelin basic protein is a universal substrate of protein kinases and
phosphatases with multiple phosphorylation/dephosphorylation sites. It has thus been
widely used to assay the activity of PTPs, protein serine/threonine phosphatases and
the protein phosphatases with dual specificity (MacKintosh, 1993; Tonks, 1993). As a
phosphatase substrate, myelin basic protein might be pulled down together with its
associated phosphatases reacting with the probe. Secondly, the results of probe and
streptavidin binding assays showed that myelin basic protein had a very high binding
affinity for the streptavidin, regardless of the presence or absence of the probe (Table
5.2). Since the probe was bound to the streptavidin beads during the biopanning, this
high affinity of myelin basic protein for streptavidin presumably increases the chance
of forming a covalent bond between myelin basic protein and the intermediate of
probe upon phosphate hydrolysis by the PTPs. As such, myelin basic protein might be
enriched after rounds of biopanning.
5.4 Conclusions and future directions
In this study, we sought to fish out functional proteins by the chemical probe from a
human brain cDNA library containing over 107 primary recombinants. However, we
did not find any phage-displayed proteins with considerable PTP activity after several
rounds of the biopanning. Based on our results, the clones which match part of PTP
gene sequence do not contain the PTP protein coding sequences. On the other hand,
one of highly enriched protein, myelin basic protein is actually a universal
phosphatase substrate with a very high binding affinity for streptavidin.
123
In future endeavors, we may ameliorate this phage display-based protein screening
system from two aspects. For the cDNA library screened in this study, the first strand
of cDNA was primed with random primers. As a consequence, most of the cloned
cDNAs in the library may not encode full-length proteins. Although it is possible to
fish out some peptides/proteins with certain protein domains of interest from such
randomly primed cDNA libraries (Videlock et al., 2004; McKenzie et al., 2004), it
seems that the selection of functional proteins with enzymatic activity will be difficult
based on our results obtained in this study. To alleviate this problem, we can use
oligo(dT) priming to clone the cDNA library with full-length genes. This may help to
ensure the activity of proteins displayed on phage coat. The second aspect is to
distinguish those nonspecifically enriched phages from the phages containing the
proteins of interest. Similar to the strategy demonstrated in chapter 3, we may
introduce a control sample which can pinpoint nonspecifically enriched phage clones
during biopanning. The subtraction of these nonspecifically bound clones from final
data sets of the biopanning will lead to a rigorous identification of the proteins with
particular enzymatic activity.
124
Chapter 6 Concluding remarks
6.1 Conclusions and critiques In this study, we have developed and further explored the capacity of advanced
proteomics techniques for high-throughput identification of proteins (mainly the
enzymes and their associated proteins in yeast proteome). To address the problems
faced in high-throughput quantitation of proteins, DIGE was exploited to profile the
yeast proteome upon exposure to exogenous metal stimuli. Proteins with significantly
altered expression levels were quantified simultaneously in DIGE gels and
subsequently identified by MALDI. The identification of up- or down-regulated
proteins in 2-D DIGE gels using MALDI will lead to elucidation of the defense
mechanisms in yeast since these proteins are assumed to be the main executors of the
cellular response to metal disturbance. Our results also showed that DIGE has certain
advantages over conventional 2-DE in that DIGE offered greater sensitivity and a
broader linear dynamic range. However, DIGE also has its intrinsic limitations in
proteomic applications. The fluorescent labeling relies on the covalent linkage of Cy3
or Cy5 dyes to the proteins, which may cause a slight shift between labeled and
unlabeled protein spots in 2-D DIGE gels. Although no significant shift was found in
the pI dimension, the shift of the protein spots in the second dimension has hindered a
straightforward spot excision from the 2-D DIGE gel and subsequent protein
identification. In this study, the solution for this problem was to prepare a reference
gel, where proteins were unlabeled and thus could be directly identified by MALDI.
This reference gel was used to correlate the protein spots across different 2-D DIGE
gels. As such, all the proteins on DIGE gels were readily identified based on the
125
reference gel without further spot excision from each 2-D DIGE gels. Nevertheless, it
is still challenging to apply this method to identify some low-molecular-weight
proteins since the spot shift of these proteins may be more significant in 2-D gel,
rendering the correlation of labeled and unlabeled proteins difficult.
Next, we demonstrated a new strategy for the rigorous identification of protein-
protein interactions. When both the purified protein complexes and nonspecifically
bound proteins (control sample) were resolved in the same 2-D DIGE gel, the
contaminating proteins could be readily identified by comparison of two images of 2-
D DIGE. The subtraction of contaminating proteins after the purification of protein
complexes led to a more rigorous identification of the protein-protein interactions on a
proteome-wide scale.
Thirdly, a novel strategy, named Expression Display, was developed to expedite
activity-based protein identification in a high-throughput fashion. Genes coding for
the proteins with desired enzymatic activities were successfully singled out from a
DNA library with the aid of a small-molecule probe. This strategy will be of great
help in simultaneous functional dissection of genes and gene products from an
organism. In the following experiments, we sought to select the active proteins from a
human brain cDNA library using phage display. Results showed that when the DNA
library was larger, it became more difficult to control the specificity of the in vitro
selection. This may be because when more proteins were expressed from an enlarged
DNA library, the contaminating proteins can more significantly interfere with the
specific binding of the target proteins to the probe during the biopanning. This
problem poses a particular challenge for applying the strategy of in vitro selection to
screen a genome-wide DNA library encompassing thousands of genes.
126
6.2 Future directions
Although the frontier of proteomics has been constantly pushed forward by the
development of the state-of-the-art proteomic techniques, no techniques to date can
address all the issues in proteomics. Future endeavors in developing and applying
advanced proteomic techniques should still be focused on three main tasks of
proteomics (Figure 1.1). Firstly, both the gel-based and gel-free protein quantitation
methods are promising for the identification of disease-related biomarkers, including
enzymes, which can eventually contribute to the therapeutics for human diseases.
Secondly, following several high-throughput screening projects, a large set of
identified protein-protein interactions needs to be further verified not only in silico,
but more importantly by the experiments. Thirdly, the functional annotation of all the
proteins in a proteome is probably the most formidable task in proteomics. The
exploration of protein activity, as well as protein post-translational modifications, will
lead to a better understanding of protein functions in a complex biological system.
Nevertheless, how to characterize the activities of different classes of proteins and
identify protein post-translational modifications in a high-throughput manner remain
to be big challenges ahead.
In future, the integration of genomics and proteomics data (including catalomics)
fostered in system biology will eventually lead to a more comprehensive view of any
biological system at the molecular level (Hohmann, 2005; Kirschner, 2005).
127
Chapter 7 Materials and methods
7.1 Common materials and methods
7.1.1 Bacteria strains and culture media
Bacteria TOP10 cells (Invitrogen) were cultured at 37 oC in Luria-Bertani (LB) broth
(Bio Basic) containing 10 g/l tryptone, 5 g/l yeast extract and 10 g/l NaCl. TOP10
cells were used for the preparation of competent cells.
Bacteria BLT5403 (Novagen) is the host strain of T7 phage. For the phage
propagation, BLT5403 cells were cultured in LB broth (pH 7.5) with 50 µg/ml
carbenicillin or ampicillin at 37 oC until log phase. For the plaque assay, BLT5403
cells were inoculated into M9LB medium, containing 5 ml 20× M9 salts (20 g/l
NH4Cl, 60 g/l KH2PO4, 120 g/l Na2HPO4·7H2O), 2 ml 20% glucose, 0.1 ml 1 M
MgSO4 and 100 ml LB broth, and then cultured at 37 oC until OD600 reached 1.0.
7.1.2 Yeast strains and culture media
The budding yeast strain BY4741 (MATa his3delta1 leu2delta0 met15delta0
ura3delta0; Brachmann et al., 1998) was purchased from ATCC (Cat. Number:
201388). Yeast cells were cultured in YPD broth (Bio Basic), containing 2% tryptone,
2% glucose and 1% yeast extract, with shaking at 30 oC.
A complete set of yeast ExClonesTM was purchased from Invitrogen. Each yeast clone
contains a plasmid encoding a different full-length yeast ORF fused to the GST tag.
The expression of GST-fusion protein is under the control of Pcup1 promoter. Yeast
ExCloneTM was cultured in SD-Ura liquid medium or on agar plate at 30 oC. For
128
protein overexpression, yeast ExCloneTM was inoculated into SD-Ura-Leu medium
and then induced by copper. Upon growth selection in the culture medium lacking
leucine, the yeast plasmid is maintained at high copy number to provide sufficient
gene product for cell survival (Gietz and Sugino, 1988).
7.1.3 DNA sample preparation and analysis
7.1.3.1 DNA extraction and polymerase chain reaction (PCR)
Plasmid DNA extraction from bacteria cells, DNA gel extraction and purification of
PCR products were carried out by using QIAprep Miniprep kit, QIAquick gel
extraction kit and QIAquick PCR purification kit (Qiagen), respectively.
Isolation of plasmid DNA from yeast ExClonesTM was performed as previously
described with certain modifications (Robzyk and Kassir, 1992). In brief, 5 ml
overnight yeast culture was harvested by centrifuging at 4000 revolutions per minute
(rpm) for 10 minutes, followed by re-suspension in 100 µl STET buffer containing
8% sucrose, 50 mM Tris (pH 8.0), 50 mM EDTA and 5% Triton X-100. With the
addition of about a small spoon of acid-washed glass beads (Sigma), the yeast cells
were lysed by a mixer mill (Retsch) (30 /second, 10 minutes twice, at 4 °C). After
spinning, the supernatant was transferred to a fresh tube containing 500 µl of 7.5 M
ammonium acetate and then incubated at -20 °C for 1 hour. Following incubation and
centrifugation, the supernatant was combined with 200 µl of ice cold ethanol to
precipitate DNA at room temperature for about 30 minutes. Precipitated DNA was
then collected after centrifugation, 70% ethanol washing and re-suspension in 20 µl
water. The isolated yeast plasmid DNA can be used for DNA transformation or PCR
amplification with the primers: ExClone-YF (5’-
129
GCGGCGGCCATATGGAATTCCAGCTGACCACC -3’) and ExClone-YR (5’-
GGCGGCTGCTCTTCCGCATCCCCGGGAATTGCCATGCCA-3’).
DNA amplification by PCR was carried out in T1 thermocycler (Biometra) or peltier
thermal cycler (MJ research) using Taq DNA polymerase (Promega) or HotStar Taq
DNA polymerase (Qiagen). dNTPs were obtained from New England Biolabs (NEB).
7.1.3.2 DNA cloning and sequencing
By TA cloning, the PCR amplicons could be cloned into pCR2.1-TOPO vector from
TOPO TA cloning kit (Invitrogen) according to vendor’s recommendation. For DNA
transformation, the competent cells were prepared as follows. 0.2 ml of overnight
TOP10 cell culture was inoculated into 20 ml SOB broth (pH 7.0) containing 20 g/l
tryptone, 5 g/l yeast extract, 0.5 g/l NaCl, 2.44 g/l MgSO4 and 0.186 g/l KCl. The
TOP10 cells were cultured at 37 oC until OD550 reached 0.5, followed by incubation
on ice for 15 minutes and centrifugation at 4000 rpm for 15 minutes. The cell pellet
was re-suspended in 10 ml of Tfb1 buffer containing 2.94 g/l potassium acetate, 12.1
g/l RbCl, 1.47 g/l CaCl2, 10 g/l MnCl2 and 150 ml/l glycerol. After incubation on ice
for 15 minutes and centrifugation (4000 rpm, 15 min), the cell pellet was again
suspended in 1 ml of Tfb2 buffer containing 2.1 g/l MOPS, 11 g/l CaCl2, 1.21 g/l
RbCl and 150 ml/l glycerol. Aliquots of the solution were immediately frozen in
liquid nitrogen and then stored at -80 oC.
DNA sequencing was performed in 20 µl PCR reaction containing 4 µl reaction
premix (Applied Biosystems), 2 µl 5 × sequencing buffer, 3.2 pmol primer and 200-
500 ng plasmid DNA or linear DNA templates for 25 cycles of 30 seconds at 96 °C,
15 seconds at 50°C and 4 minutes at 60°C. Reaction products were precipitated in a
130
solution containing 3 µl 3 M sodium acetate (pH 4.6), 62.5 µl ethanol and 14.5 µl
water at room temperature for 30 minutes. After washing with 150 µl of 70% ethanol,
DNA pellet was suspended in 12 µl Hi Di formamide and then sequenced by ABI
3100 sequencer (Applied Biosystems).
7.1.4 Protein sample preparation and analysis
7.1.4.1 Protein expression and purification
Expression and isolation of GST-fusion proteins from yeast ExClonesTM were
performed as described (Martzen et al., 1999). Briefly, yeast ExClonesTM were
inoculated into SD-Ura liquid medium, grown overnight, re-inoculated into SD-Ura-
Leu and grown to absorbance at 600nm of 0.8. The yeast cells were then induced with
0.5mM copper sulfate for 2 hours before harvest. Subsequently, cells were lysed in
the buffer containing 50 mM Tris-HCl (pH 7.5), 150 mM NaCl, 10 mM MgSO4, 1
mM EDTA, 0.5% Triton, 10 µg/ml leupeptin and 1 µg/ml pepstatin with acid-washed
glass beads (Sigma) by the mixer mill (Retsch) (30 /second, 10 minutes twice, at 4
°C). The GST-fusion proteins were purified by GSH sepharose (GE Amersham
Biosciences) according to vendor’s recommendation. Briefly, GSH resin was washed
three times with 1× PBS buffer (8 g/l NaCl, 0.2 g/l KCl, 1.44 g/l Na2HPO4·7H2O, 0.24
g/l KH2PO4, pH 7.4). After washing, the GSH resin was sedimentated by
centrifugation (500 g, 10 min), followed by incubation with the cell extract containing
GST-fusion proteins (4 °C, 2 h).
131
7.1.4.2 1-D, 2-D gel electrophoresis and silver staining
To analyze proteins by SDS-PAGE, proteins were boiling for 5-10 minutes in 1×
SDS-PAGE loading buffer containing 50 mM Tris (pH 6.8), 100 mM DTT, 2% SDS,
10% glycerol and 0.1% bromophenol blue. Subsequently, the proteins were separated
in 12% SDS-PAGE gel.
All 2-D DIGE experiments were performed on an Ettan IPGphor™ isoelectric
focusing and Ettan DALT™ gel system using standard protocols recommended by the
vendor (Ettan DIGE user manual). All the equipment and gel strips were purchased
from GE Amersham Bioscience (Cleveland, OH, USA), unless otherwise mentioned.
Protein concentration was determined using Bradford protein assay (Bio-Rad) with
the protocol recommended by the vendor (Bradford, 1976). Equal amount of Cy3- and
Cy5-labeled samples were mixed together with rehydration buffer and then transfered
to a rehydration tray. The final concentration of rehydration buffer was 8 M urea, 2%
CHAPS, 1% IPG buffer, 4 mg/ml DTT with trace amount of bromophenol blue. An
immobilized pH gradient strip (pH 4-7, 7cm or 18 cm) was then placed on top of the
sample. The sample should be evenly distributed along the gel strip without any
bubbles in beteewn. The strip was overlaid with 1-2 ml mineral oil to avoid the
sample evaporation, and then passively rehydrated for 1 hour, followed by 12 hours of
active rehydration (20 oC, 50V). The active rehydration can facilitate the absorbance
of large proteins by the gel. The total voltage-hour in IEF was 32 kVh, or higher when
the voltage can hardly reach 8,000V. The gel strip after focusing can be held at 500V
for a few hours without significant protein diffusion in the gel. After IEF, the strip
was rinsed with Milli-Q water to remove the oil on the strip surface and then the strip
can either proceed to the second dimension electrophoresis or be frozen at -80 oC if
132
necessary. Before being applied to a 12% SDS-PAGE gel, the strip was equilibrated
in the equilibration buffer I (6 M urea, 2% SDS, 0.375 M Tris (pH 8.8), 20% Glycerol,
130 mM DTT) for 15 minutes and then in equilibration buffer II (6 M urea, 2% SDS,
0.375 M Tris (pH 8.8), 20% Glycerol, 135 mM iodoacetamide) for another 15
minutes, followed rinsing with SDS running buffer (25 mM Tris (pH 8.3), 192 mM
glycine, 0.1% SDS) for a few seconds. Subsequently, the gel strip was placed on top
of the resolving gel without any bubbles in between and then overlaid with agarose
sealing solution (1% agarose and a few grains of bromophenol blue in SDS running
buffer). SDS-PAGE gel electrophoresis was carried out in Ettan DALT™ gel system
at 2.5 W/gel for 30 minutes in order to transfer the proteins from gel strip into the
polyacrylamide gel, and then 17 W/gel until the dye front was 1 mm away from the
bottom of the gel. After gel electrophoresis, the gel images were obtained using a
Typhoon™ 9200 fluorescence gel scanner (GE Amersham Bioscience). A 580-nm
band-pass filter, which transmits light between 565 nm and 595 nm and has a
transmission peak centered at 580 nm, was used for the collection of Cy3 images. A
670 band-pass filter, which transmits lights between 655 nm and 685 nm and has a
transmission peak centered at 670 nm, was used for the collection of Cy5 images.
Protein spots on 2-D gels were matched and quantitatively analyzed with the software
Progenesis™ (GE Amersham Bioscience). According to the manual of Progenesis™,
each spot volume is the sum of pixel intensities within the spot, which was
normalized with the total spot volume of the gel. For comparison, all values of fold
difference were based on normalized spot volumes.
The method of silver staining was adapted from the protocol reported by Blum et al.
(1987) (Table 7.1). All the reagents were prepared just before use.
133
Table 7.1 Protocol of silver staining.
Reagents Concentration Operation Time 1 Methanol
& Acetic acid
50% (v/v) 10% (v/v)
Fixation 30 min or overnight
2 Methanol
50% (v/v) Incubation 15 min
3 Milli-Q water
Washing (5×) 5 min
4 Sodium thiosulfate
0.2 g/l Incubation 1 min
5 Milli-Q water
Washing (2×) 1 min
6 Silver nitrate, chilled to 4 ◦C before use
2 g/l Incubation 25 min
7 Milli-Q water Washing (2×)
1 min
8 Sodium carbonate anhydrous & 37% Formaldehyde
30 g/l 250 ul/l
Development (2-3×)
3-5 min Max 10 min
9 EDTA
14 g/l Stop 10 min
10 Milli-Q water Washing (2×) 1 min
7.1.4.3 Protein identification by MALDI-TOF MS
Protein spots of interest were excised manually from polyacrylamide gel and ground
into small pieces before being transferred to a PCR tube. The protocol (Appendix 1)
of in-gel tryptic digestion of silver-stained proteins was adapted from the protocol
described by Shevchenko et al. (1996). Briefly, the ground gel pieces were destained
in 50 mM ammonium bicarbonate and 50% (v/v) acetonitrile until they become white
and opaque, which were then dried thoroughly in a vacuum centrifuge. The 2-D gels
which had been equilibrated in two equilibration buffers between the first and second
dimensional gel electrophoresis required no further protein reduction / alkylation and
could directly proceed to tryptic digestion in 50 mM ammonium bicarbonate solution
containing 12.5 ng/µl of trypsin for 12-15 hours at 37 oC. After protein digestion, the
134
tryptic peptides were extracted first in 20 mM ammonium bicarbonate and then in the
solution containing 5% (v/v) formic acid and 50% acetonitrile. A MALDI-TOF mass
spectrometer (Voyager-DE STR™; Applied Biosystems) was used to obtain the
corresponding mass spectra of tryptic peptides by the delayed-extraction reflection
mode. The mass fingerprints of the peptides were used for protein identification by
searching the NCBI database using Mascot™ search engine (Perkins et al., 1999).
7.1.4.4 Western blotting
Proteins were resolved in 12% SDS-PAGE gel as described above (section 2.3.2), and
then transferred to PVDF membrane by SemiPhor semi-Dry transfer unit (GE
Amersham Biosciences) for 1 hour (or longer for high-molecular-weight proteins) at
45 mA. After blocking in milk, PVDF membrane was incubated with proper antibody,
followed by the detection with ECL plus western blotting detection kit (GE
Amersham Biosciences) according to vendor’s recommendation.
7.2 Proteome analysis of Saccharomyces cerevisiae under metal stress by 2-D
DIGE
7.2.1 Dye synthesis
Both Cy3 N-hydroxysuccinimidyl (NHS) ester and Cy5 NHS ester were synthesized
as previously described (Unlu et al., 1997; Korbel et al., 2001; Liau et al., 2003).
Briefly, Cy3 (0.44 g, 0.76 mmol) was dissolved in 5 ml N,N-dimethylformamide
(DMF), followed by addition of NHS (106 mg, 0.92 mmol) and 1,3-
dicyclohexylcarbodiimide (DCC; 190 mg, 0.92 mmol). The reaction mixture was
stirred for 12 hours at room temperature. The product, Cy3 NHS ester, was purified
135
with flash column to give a red solid; yield: 0.42 g (83%). Cy5 (0.22 g, 0.37 mmol)
was dissolved in 3 ml DMF, followed by addition of NHS (52 mg, 0.45 mmol) and
DCC (93 mg, 0.45 mmol). The reaction mixture was stirred for 12 hours at room
temperature. The product, Cy5 NHS ester, was purified with flash column to give a
blue solid; yield: 0.17 g (66%). The dyes were dissolved in dimethyl sulfoxide
(DMSO) as 10 mM stock solutions and kept at -20 oC.
7.2.2 Yeast culture and metal treatments
As mentioned above, the yeast strain BY4741 was cultured in YPD media until mid-
log phase (OD600 = 0.8) and aliquots of the culture were treated with different
concentrations of metal salts (Figure 2.2). All the metal salts were autoclaved before
use.
Survival tests were conducted by taking aliquots of untreated mid-log phase (OD600 =
0.4) yeast culture and then spotting them onto the YPD agar plates containing
different concentration gradients of metal salts based on previous work (Pearce and
Sherman, 1999). Plates were incubated for 3-5 days at 30 oC.
7.2.3 Sample preparation, protein labeling and 2-D DIGE
Based on the results of survival tests, a working concentration for each metal salt was
determined (Figure 2.2). Autoclaved metal slats with proper concentrations were
added to the aliquots of mid-log phase (OD600 = 0.4) culture. The metal-treated yeast
cultures were further grown until log phase with continuous agitation at 30 oC. Yeast
cells were harvested by centrifugation at 4,000 rpm for 15 minutes and lysed by
sonication in the sample buffer containing 7 M urea, 2 M thiourea, 4% CHAPS and
136
protease inhibitor cocktail (Pierce). Supernatants were collected after
ultracentrifugation at 75,000 rpm for 1 hour at 4 oC. 5 mM Tris·HCl was used to
adjust the pH to 8.0-9.0. The final concentration of Tris in the sample was estimated
to be 2-3 mM. The optimal ratio of dye to protein was experimentally determined to
be about 200 pmol dyes to 50 µg proteins, so as to ensure that only 1-2% of lysines on
the proteins were labeled (Unlu et al., 1997). The untreated protein sample was
labeled with Cy3, as an internal control across different gels, while metal-treated
samples were labeled with Cy5, for 30 minutes on ice, followed by dye quenching
with 1.5 µM of hydroxylamine. Cy3- and Cy5-labeled samples were then combined
with 300 µl rehydration buffer.
Separation of labeled proteins by 2-D DIGE was performed as described above. An
unlabeled control sample was resolved in a 2-D gel as the reference gel for the
subsequent protein identification. All the 2-D gels were analyzed by the software
Progenesis™ (GE Amersham Bioscience). For the quantitative comparison, spot
volume was normalized with the total spot volume of the gel.
7.3 Identification of protein-protein interactions using 2-D DIGE
7.3.1 Extraction and purification of the yeast metacaspase
The yeast ExClonesTM were streaked on the SD-Ura drop-out agar plates and grown at
30 oC for 3-5 days. Single colonies were re-inoculated into SD-Ura liquid medium.
The expression and purification of GST-fusion proteins were performed as mentioned
above. Purified GST-fusion protein was resolved in SDS-PAGE gel and detected by
western blotting using anti-GST antibody (GE Amersham Biosciences).
137
For the protein extraction from wild-type yeast strain, yeast cells were cultured in
YPD medium and lysed in the buffer containing 50 mM Tris-HCl (pH 7.5), 150 mM
NaCl, 10 mM MgSO4, 1 mM EDTA, 0.5% Triton, 10 µg/ml leupeptin and 1 µg/ml
pepstatin with acid-washed glass beads (Sigma) by the mixer mill (Retsch) (30
/second, 10 minutes twice, at 4 °C). Fresh yeast proteins were prepared before use.
The removal of GST tag from GST-fusion protein was achieved by on-resin thrombin
cleavage. 19 µl 1×PBS buffer was combined with the GSH resin containing purified
GST-fusion protein. The cleavage was carried out by 0.01 unit thrombin (GE
Amersham Biosciences) at 22 oC for 16 hours. The purified proteins were
subsequently used for in vitro protein binding assays.
7.3.2 Protein pull-down assay
Two aliquots of fresh yeast cell lysate were incubated with the GSH resin containing
YCA1-GST and GST, respectively, at 4 °C for 6 hours. The resins were then washed
three times with the buffer containing 50 mM Tris-HCl (pH 7.5), 150 mM NaCl, 10
mM MgSO4, 1 mM EDTA and 0.5% Triton. After extensive washing, proteins bound
on the resin were eluted in the buffer containing 7M urea, 2M thiourea and 4%
CHAPS. The eluted protein samples from two resins were used for subsequent 2-D
DIGE experiments. Proteins isolated from the resin containing the bait protein were
labeled with Cy5, and proteins isolated from the control assay were labeled with Cy3.
7.3.3 Analysis of identified protein-protein interactions on BIACORE®
The analysis of protein-protein interactions was performed on a BIACORE® X system
(Biacore AB, Uppsala, Sweden) as previously described (Huang et al., 2001;
138
Uttamchandani et al., 2004). Briefly, anti-GST was first immobilized on a
BIACORE® sensor chip CM5, followed by the immobilization of GST and GST-
YCA1 on the surfaces of two chip channels, respectively. GST channel was used as a
control. The prey protein in the buffer (10 mM HEPES, 150 mM NaCl, 3.4 mM
EDTA, 0.05% P20, pH 7.4) was then injected over the sensor chip. Sensorgrams were
collected and analyzed by BIAevaluationTM software.
7.4 Expression Display
7.4.1 Probe synthesis
The small-molecule probe for PTPs was synthesized as previously described with a
modification that Cy3 moiety was replaced by biotin (Zhu et al., 2003).
7.4.2 DNA construction
The construction of all the genes used in this study was based on Figure 4.2.
Streptavidin gene was amplified from the plasmid constructed in our lab with primers:
STA-F (5’-
GCCGCCCATATGGACTACAAAGACGTCTCGATTACGGCCAGCGCTTCGGC
A-3’) and STA-R (5’- TTGAGGGAATTCGCCGCCCAGCCACTGGGTGTTGAT-
3’). EGFP gene was amplified from the plasmid constructed in our lab with primers:
EGFP-F (5’- ATGGACTACAAAGACATGGTGAGCAAGGGCGAGGAG-3’) and
EGFP-R (5’-TTGAGGGAATTCGCCGCCCTTGTACAGCTCGTCCATGCC-3’).
Spacer was amplified from amino acids 211-299 of gene III of filamentous phage
M13mp19 with Spacer-F (5’- GGCGGCGAATTCCCTCAACCTCCTGT-3’) and
Spacer-R (5’- CCGCACACCAGTAAGGTGTGCGGTATCACCAGTAGCACC-3’).
139
The amplified DNA fragments were ligated with spacer as following: both genes and
spacer were digested by EcoR I (NEB) at 37°C for 1 hour and subsequently ligated by
T4 ligase (NEB) overnight at 16°C. The ligation products were amplified with
primers SDA (5’-
AGACCACAACGGTTTCCCTCTAGAAATAATTTTGTTTAACTTTAAGAAGGA
GATATATCCATGGACTACAAAGA-3’) and Spacer-R, followed by amplification
with primers Y-T7B and Spacer-R.
The DNA plasmids containing different yeast ORFs were isolated from yeast
ExClonesTM (Invitrogen). Yeast ORFs were then amplified with the following primers:
ExClone-YF (5’-GCGGCGGCCATATGGAATTCCAGCTGACCACC -3’) and
ExClone-YR (5’-GGCGGCTGCTCTTCCGCATCCCCGGGAATTGCCATGCCA-
3’). For yeast ORFs construction, spacer was amplified with primers: Y-spacer-F (5’-
GGGGATGCGGAAGAGCAGCCGCCCCCTCAACCTCCTGTCAAT-3’) and
Spacer-R (5’- CCGCACACCAGTAAGGTGTGCGGTATCACCAGTAGCACC-3’).
The amplicons were ligated with spacer as following: both genes and spacer were
digested by Sap I (NEB) at 37°C for 2 hours and subsequently ligated by T4 ligase
(NEB) overnight at 16°C. The ligated DNA fragments were amplified by Y-SDA (5’-
AGACCACAACGGTTTCCCTCTAGAAATAATTTTGTTTAACTTTAAGAAGGA
GATATATCCATGGAATTCCAGCTGACCACC-3’) and Spacer-R, followed by
amplification with primers Y-T7B (5’-
ATACGAAATTAATACGACTCACTATAGGGAGACCACAACGG-3’) and
Spacer-R. All the DNA constructs were re-amplified with the primers Y-T7B and
Spacer-R when necessary.
140
7.4.3 In vitro transcription and translation
According to the requirement of each experiment, DNA constructs were pooled
proportionally to obtain a master mixture. 1-6 µg DNA constructs were transcribed
with the RiboMAXTM large scale RNA production system T7 (Promega) for 4 hours
at 37°C. Then mRNAs were purified by an RNeasy mini kit (Qiagen). Transcripts
were translated in vitro in an E.coli rapid translation system 100 (Roche) with the
addition of 10 mM magnesium acetate, 5.6 µM anti-ssrA (5’-
TTAAGCTGCTAAAGCGTAGTTTTCGTCGTTTGCGACTA-3’) and 0.5 µl 40
U/µl rRNasin (Promega). Translation was performed in a 35 µl solution for 7 minutes
at 37°C. After translation, the reaction mixture was immediately transferred to an ice-
cold tube with 220 µl binding buffer containing 50 mM Tris-acetate (pH 7.5), 150
mM NaCl, 50 mM magnesium acetate, 0.1% (v/v) Tween 20, 0.1 mg/ml BSA and 2
mg/ml heparin.
7.4.4 In vitro selection
The small-molecule probe (50 µl, 300µM) for PTPs was incubated with 50 µl
streptavidin MagneSphere paramagnetic particles (Promega) for 30 minutes at room
temperature with gentle shaking. The streptavidin beads were then washed three times
with 1×PBS to remove excess of probes. Then the translation mixture together with
the binding buffer was incubated with the probe for 2 hours on ice. For the selection
of streptavidin gene, 20 µl iminobiotin (Pierce) was incubated with translation
mixture for 1 hour on ice. After incubation, the agarose or magnetic beads were
washed four times with washing buffer containing 50 mM Tris-acetate (pH 7.5), 150
mM NaCl, 50 mM magnesium acetate and 0.1% (v/v) Tween 20. Following DNase
141
(Promega) treatment (30 minutes at room temperature), mRNAs were released from
ternary complexes by the elution buffer containing 50 mM Tris-acetate (pH 7.5), 150
mM NaCl and 20 mM EDTA. The eluted mRNAs were purified by RNeasy mini kit.
7.4.5 Reverse transcription- Polymerase chain reaction (RT-PCR)
Reverse transcription was performed using AMV reverse transcriptase (Promega)
with primer Spacer-R according to the supplier’s recommendation. PCR was
performed using Taq polymerase (Promega) in the presence of 5% (v/v) DMSO (5
minutes at 95°C, followed by 25 cycles 30 seconds at 95°C, 30 seconds at 50 °C and
2.5 minutes at 72°C, with a final 10 minutes extension at 72°C). PCR products were
analyzed by agarose gel electrophoresis. For fluorescent labeling of RT-PCR product,
Cy3-dCTP (GE Amersham Biosciences) was incorporated into PCR products
according to the supplier’s recommendation. The fluorescent DNAs were
subsequently used as probes for DNA microarray hybridization.
7.4.6 Slide preparation and microarray processing
All the DNA slides were prepared according to the on-line protocols
(http://www.microarrays.org/protocols.html). 30 glass slides were washed for 2 hours
with stirring in the washing solution containing 33.3 g NaOH, 200 ml ethanol and 134
ml Milli-Q water. All the slides were then rinsed at least ten times with Milli-Q water.
Subsequently, the slides were incubated for 30 minutes with stirring in poly-lysine
solution containing 34.2 ml 1×PBS, 58.7 ml poly-lysine and 250 ml Milli-Q water,
followed by rinsing with Milli-Q water at least ten times. The slides were spun at 500
rpm until dry.
142
All the DNA templates used for fabricating the DNA microarrays were amplified in
96-well formats with primers ExClone-YF and ExClone-YR from the yeast plasmids
containing the corresponding yeast ORFs. Yeast ORFs were spotted in duplicate onto
75×25 mm poly-lysine coated glass slides using a CHIPWRITERTM arrayer (Virtek),
followed by incubation in a humid chamber overnight at room temperature. After
ultraviolet (UV) crosslinking with energy of 550 mJ, the DNA slides were re-hydrated
in 100 ml 0.5× SSC at 42 °C for 1-5 minutes until full hydration was achieved.
Subsequently, all the slides were dried within 1-2 seconds in the 150 °C oven and then
transferred to blocking solution containing 5.5 g succinic anhydride, 335 ml 1-methyl-
2-pyrrolidinone and 15 ml 1M sodium borate at pH 8.0 for 15 minutes. The slides
were boiled in Milli-Q water for about 1 minute and then transferred to 95% ethanol,
followed by spinning at 500 rpm until dry.
For DNA hybridization, DNA probes were the reverse transcripts (amplified with
primers ExClone-YF and ExClone-YR) from in vitro selection incorporated with
Cy3-dCTP. 10 µl Cy-3 labeled DNA was mixed with 1.9 µl 20× SSC, 0.5 µl 1M
HEPES at pH 7.0, and 0.5 µl 10% SDS, which was then applied to DNA slides and
incubated in a hybridization chamber with a humid environment at 60 °C for 2-4
hours or at 42 °C overnight.
After DNA hybridization, the slides were washed in washing solution I containing 10
ml 20× SSC, 1 ml 10% SDS and 340 ml Milli-Q water, followed by washing solution
II containing 1 ml 20× SSC and 350 ml Milli-Q water. Then the slides were spun at
500 rpm until dry and analyzed by ArrayWoRx scanner (Applied Precision). The slide
images were shown in Figure 4.5 and Figure 4.8, with spotting patterns highlighted
by white circles, and positive hits zoomed for better visualization. Spots were
143
identified as “positive hits” if their fluorescence intensities were at least 2 times
higher than the average background values defined by the data analysis software that
was equipped with the scanner. The signal intensities of duplicate spots were
averaged for each ORF, and reported in Figure 4.5, Figure 4.8, appendix 5 and 6.
7.4.7 Verification of protein labeling with the probe
Purified proteins were labeled with the small-molecule probe following the incubation
conditions of in vitro selection. Labeling reactions were stopped by boiling for 5-10
minutes in 1× SDS-PAGE loading buffer and then resolved in SDS-PAGE gel.
Protein labeling was detected by western blotting with horseradish peroxidase-
conjugated anti-biotin antibody (NEB).
7.4.8 Inhibition assay
To achieve maximal inhibition of PTPs, sodium orthovanadate was activated as
previously described (Gordon, 1991). Briefly, 200 mM solution of sodium
orthovanadate was adjusted to pH 10.0 and then boiled until it became colorless. This
process was repeated until the pH stabilized at 10.0. The activation of sodium
orthovanadate is to depolymerize the vanadate, which converts it into a more potent
PTP inhibitor. After activation, sodium orthovanadate was added into the reaction
mixture to a final concentration of 200 µM. The incubation conditions of inhibition
experiments were exactly the same as the conditions applied in the labeling reactions
without sodium orthovanadate.
144
7.5 High-throughput screening of functional proteins from a phage display
library
7.5.1 Phage-displayed human cDNA library
T7Select® human brain cDNA library containing 1.47 × 10⁷ primary recombinants
was purchased from Novagen. In the library construction, the first strand of cDNA
was primed with random primers and cDNA fragments were size-fractionated to
remove short fragments (<300 bp) before being cloned at the C-terminus of the T7
gene 10 major capsid protein. The size range of cDNA inserts has been confirmed to
be from 300 bp to greater than 3 kbp by PCR analysis and the size limit of the
proteins on phage capsid was estimated to be 1200 aa (T7Select® system manual).
The average copy number of proteins displayed on each phage was approximately 5
to 15 copies.
7.5.2 Phage propagation
The host bacteria strain (BLT5403, Novagen) was cultured in the LB media (pH 7.5)
at 37 oC until the OD600 reached 0.5-1.0. Subsequently, the bacteria cells were infected
by phages with a ratio of 100-1000 cells per phage. A substantial excess of bacteria
cells will help to prevent rapid lysis of the host cells during the phage propagation.
Phage propagation was stopped when cell lysis was observed (a visible reduction in
the culture OD and accumulation of cell debris strand) and phages were then
harvested by spinning at 4000 rpm for 15 min. The propagated phages were
immediately used for in vitro selection assays.
145
7.5.3 In vitro selection
1 ml of fresh phage lysate was incubated with 4.5 nmol small-molecule probe
immobilized on streptavidin MagneSphere paramagnetic particles (Promega) in the
buffer containing 10 mg/ml BSA at 4 oC or 30 oC. Following incubation, the magnetic
beads were washed either by the phage washing buffer containing 10 mM Tris (pH
7.0), 150 mM NaCl and 0.05% Tween-20, or by 1% SDS. After extensive washing, a
small portion of the phages bound on the magnetic beads were used for phage titering.
The rest of the bound phages were propagated through the infection of log phase
BLT5403 cells and then used for the next round of selection.
7.5.4 Plaque assay
The plaque assay was used to determine the number of phages in the samples after in
vitro selection. In plaque assay, phage infection will produce clear areas (plaques) in
the lawn of bacteria on the agar plate. In this study, we followed the procedures of
plaque assay described in T7Select® system manual. Briefly, phages were diluted in
series in LB media and then combined with BLT5403 (OD600=1.0) and top agarose,
followed by plating on LB/ampicillin agar plates. The top agarose contains 10 g/l
tryptone, 5 g/l yeast extract, 5 g/l NaCl and 6 g/l agarose. After incubation at 37 oC for
3-4 h or overnight at room temperature, the number of plaques was counted and used
to calculate the phage titer. The phage titer is described in plaque forming units (pfu)
per unit volume. To minimize the variation, phage titer was calculated from the
diluted samples which produced about 20-200 plaques on the plates.
146
7.5.5 Probe and streptavidin binding assays for individual phage clones
Individual plaques were inoculated into log phase BLT5403 cells to obtain the phage
lysate of single phage clone. The fresh phage lysate was then incubated with the
small-molecule probe following the conditions same as those applied in the in vitro
selection assays. The number of bound phages was titered by the plaque assays. For
the comparison of phage titers, the binding assays of different phage clones selected
from the same batch of biopanning were carried out in parallel. When both the probe
and streptavidin binding titers of the same phage clone were examined, two aliquots
of the phage lysate were incubated with the streptavidin beads without the probe and
the probe immobilized on the streptavidin beads, respectively.
7.5.6 Identification of selected phage clones
For PCR screening, 1-2 µl crude phage lysate of individual phage clone was boiled in
10 µl dH2O for 10 min, followed by PCR amplification of cDNA insert using the
primers: T7SelectUP 5′- GGAGCTGTCGTATTCCAGTC -3′ and T7SelectDOWN
5′- AACCCCTCAAGACCCGTTTA -3′. The PCR thermal cycling (25 cycles)
includes denaturation at 95 oC for 30 seconds, annealing at 58 oC for 30 seconds and
extension at 72 oC for 2 minutes. The PCR amplicons were analyzed by agarose gel
electrophoresis. DNA sequencing was performed with the primer T7SelectUP as
described above.
147
Bibliography: Achenback, C., Ziskoven, R., Koehler, F., Bahr, U. & Schulten, H.R. Quantitative trace analysis of thallium in biological material. Angew. Chem. Int. Ed. 18, 882-883 (1979). Adam, G.C., Burbaum, J., Kozarich, J.W., Patricelli, M.P. & Cravatt, B.F. Mapping enzyme active sites in complex proteomes. J. Am. Chem. Soc. 126, 1363-1368 (2004). Adam, G.C., Sorensen, E.J. & Cravatt, B.F. Chemical strategies for functional proteomics. Mol. Cell. Proteomics 1, 781-790 (2002). Adamis, P.D., Gomes, D.S., Pereira, M.D., Freire de Mesquita, J., Pinto, M.L., Panek, A.D. & Eleutherio, E.C. The effect of superoxide dismutase deficiency on cadmium stress. J. Biochem. Mol. Toxicol. 18, 12-17 (2004). Adams, M.D., Celniker, S.E., Holt, R.A., Evans, C.A., Gocayne, J.D., Amanatides, P.G., Scherer, S.E., Li, P.W., Hoskins, R.A., Galle, R.F. et al. The genome sequence of Drosophila melanogaster. Science 287, 2185-2195 (2000). Aebersold, R. & Goodlett, D.R. Mass spectrometry in proteomics. Chem. Rev. 101, 269-295 (2001). Aebersold, R. & Mann, M. Mass spectrometry-based proteomics. Nature 422, 198-207 (2003). Aebersold, R., Rist, B. & Gygi, S.P. Quantitative proteome analysis: methods and applications. Ann. N. Y. Acad. Sci. 919, 33-47 (2000). Alban, A., David, S.O., Bjorkesten, L., Andersson, C., Sloge, E., Lewis, S. & Currie, I. A novel experimental design for comparative two-dimensional gel analysis: two-dimensional difference gel electrophoresis incorporating a pooled internal standard. Proteomics 3, 36-44 (2003). Amstutz, P., Forrer, P., Zahnd, C. & Pluckthun, A. In vitro display technologies: novel developments and applications. Curr. Opin. Biotechnol. 12, 400-405 (2001). Amstutz, P., Pelletier, J.N., Guggisberg, A., Jermutus, L., Cesaro-Tadic, S., Zahnd, C. & Pluckthun, A. In vitro selection for catalytic activity with ribosome display. J. Am. Chem. Soc. 124, 9396-9403 (2002). Anderson, N.L., Hofmann, J.P., Gemmell, A., & Taylor, J. Global approaches to quantitative analysis of gene-expression patterns observed by use of two-dimensional gel electrophoresis. Clin. Chem. 30, 2031-2036 (1984). Anderson, R.M., Bitterman, K.J., Wood, J.G., Medvedik, O. & Sinclair, D.A. Nicotinamide and PNC1 govern lifespan extension by calorie restriction in Saccharomyces cerevisiae. Nature 423, 181-185 (2003).
148
Aparicio, S., Chapman, J., Stupka, E., Putnam, N., Chia, J.M., Dehal, P., Christoffels, A., Rash, S., Hoon, S., Smit, A. et al. Whole-genome shotgun assembly and analysis of the genome of Fugu rubripes. Science 297, 1301-1310 (2002). Arabidopsis Genome Initiative: Analysis of the genome sequence of the flowering plant Arabidopsis thaliana. Nature 408, 796-815 (2000). Ashman, K., Moran, M.F., Sicheri, F., Pawson, T. & Tyers, M. Cell signalling - the proteomics of it all. Sci. STKE 103:PE33 (2001). Bader, J.S., Chaudhuri, A., Rothberg, J.M. & Chant, J. Gaining confidence in high-throughput protein interaction networks. Nat. Biotechnol. 22, 78-85 (2004). Banoub, J.H., Newton, R.P., Esmans, E., Ewing, D.F. & Mackenzie, G. Recent developments in mass spectrometry for the characterization of nucleosides, nucleotides, oligonucleotides, and nucleic acids. Chem. Rev. 105, 1869-1915 (2005). Baruch, A., Jeffery, D.A. & Bogyo, M. Enzyme activity--it's all about image. Trends Cell Biol. 14, 29-35 (2004). Bassett, D.E. Jr., Boguski, M.S. & Hieter, P. Yeast genes and human disease. Nature 379, 589-590 (1996). Bauman, A.L. & Scott, J.D. Kinase- and phosphatase-anchoring proteins: harnessing the dynamic duo. Nat. Cell Biol. 4, E203-E206 (2002). Beerli, R.R. & Barbas, C.F. 3rd. Engineering polydactyl zinc-finger transcription factors. Nat. Biotechnol. 20, 135-141 (2002). Berndt, P., Hobohm, U. & Langen, H. Reliable automatic protein identification from matrix-assisted laser desorption/ionization mass spectrometric peptide fingerprints. Electrophoresis 20, 3521-3526 (1999). Betts, J.C., Blackstock, W.P., Ward, M.A. & Anderton, B.H. Identification of phosphorylation sites on neurofilament proteins by nanoelectrospray mass spectrometry. J. Biol. Chem. 272, 12922-12927 (1997). Biemann, K. & McCloskey, J. A. Application of Mass Spectrometry to Structure Problems.1 VI. Nucleosides2. J. Am. Chem. Soc. 84, 2005-2007 (1962). Black, D.L. Protein diversity from alternative splicing: a challenge for bioinformatics and post-genome biology. Cell 103, 367-370 (2000). Blackwell, K.J., Tobin, J.M. & Avery, S.V. Manganese toxicity towards Saccharomyces cerevisiae: dependence on intracellular and extracellular magnesium concentrations. Appl. Microbiol. Biotechnol. 49, 751−757 (1998). Blagoev, B., Kratchmarova, I., Ong, S.E., Nielsen, M., Foster, L.J. & Mann, M. A proteomics strategy to elucidate functional protein-protein interactions applied to EGF signaling. Nat. Biotechnol. 21, 315-318 (2003).
149
Blagoev, B., Ong, S.E., Kratchmarova, I. & Mann, M. Temporal analysis of phosphotyrosine-dependent signaling networks by quantitative proteomics. Nat. Biotechnol. 22, 1139-1145 (2004). Blum, H., Beier, H. & Gross, H.J. Improved silver staining of plant proteins, RNA and DNA in polyacrylamide gels. Electrophoresis 8, 93-99 (1987). Boder, E.T. & Wittrup, K.D. Yeast surface display for screening combinatorial polypeptide libraries. Nat. Biotechnol. 15, 553-557 (1997). Boisvert, F.M., Cote, J., Boulanger, M.C. & Richard, S. A Proteomic Analysis of Arginine-methylated Protein Complexes. Mol. Cell. Proteomics 2, 1319-1330 (2003). Bolino, A., Muglia, M., Conforti, F.L., LeGuern, E., Salih, M.A., Georgiou, D.M., Christodoulou, K., Hausmanowa-Petrusewicz, I., Mandich, P., Schenone, A., Gambardella, A., Bono, F., Quattrone, A., Devoto, M. & Monaco, A.P. Charcot-Marie-Tooth type 4B is caused by mutations in the gene encoding myotubularin-related protein-2. Nat. Genet. 25, 17-19 (2000). Bonagura, C.A., Bhaskar, B., Shimizu, H., Li, H., Sundaramoorthy, M., McRee, D.E., Goodin, D.B. & Poulos, T.L. High-resolution crystal structures and spectroscopy of native and compound I cytochrome c peroxidase. Biochemistry 42, 5600-5608 (2003). Bork, P., Jensen, L.J., von Mering, C., Ramani, A.K., Lee, I. & Marcotte, E.M. Protein interaction networks from yeast to human. Curr. Opin. Struct. Biol. 14, 292-299 (2004). Botstein, D., Chervitz, S.A. & Cherry, J.M. Yeast as a model organism. Science 277, 1259-1260 (1997). Bouton, C.M., Hossain, M.A., Frelin, L.P., Laterra, J. & Pevsner, J. Microarray analysis of differential gene expression in lead-exposed astrocytes. Toxicol. Appl. Pharmacol. 176, 34-53 (2001). Brachmann, C.B., Davies, A., Cost, G.J., Caputo, E., Li, J., Hieter, P. & Boeke, J.D. Designer deletion strains derived from Saccharomyces cerevisiae S288C: a useful set of strains and plasmids for PCR-mediated gene disruption and other applications. Yeast 14, 115-132 (1998). Bradford, M.M. A rapid and sensitive method for the quantitation of microgram quantities of protein utilizing the principle of protein-dye binding. Anal. Biochem. 72, 248-254 (1976). Bredemeyer, A.J., Lewis, R.M., Malone, J.P., Davis, A.E., Gross, J., Townsend, R.R. & Ley, T.J. A proteomic approach for the discovery of protease substrates. Proc. Natl. Acad. Sci. USA 101, 11785-11790. (2004). Bro, C., Regenberg, B., Lagniel, G., Labarre, J., Montero-Lomeli, M. & Nielsen, J. Transcriptional, proteomic, and metabolic responses to lithium in galactose-grown yeast cells. J. Biol. Chem. 278, 32141-32149 (2003).
150
Broder, Y.C., Katz, S. & Aronheim, A. The ras recruitment system, a novel approach to the study of protein-protein interactions. Curr. Biol. 8, 1121-1124 (1998). Cagney, G. & Emili, A. De novo peptide sequencing and quantitative profiling of complex protein mixtures using mass-coded abundance tagging. Nat. Biotechnol. 20, 163-170 (2002). Casati, P., Zhang, X., Burlingame, A.L. & Walbot, V. Analysis of leaf proteome after UV-B irradiation in maize lines differing in sensitivity. Mol. Cell. Proteomics 4, 1673-1685 (2005). Casci, T. RNA splicing. Chance findings. Nat. Rev. Genet. 2, 162 (2001). C. elegans sequencing consortium: Genome sequence of the nematode C. elegans: a platform for investigating biology. Science 282, 2012-2018 (1998). Cesaro-Tadic, S., Lagos, D., Honegger, A., Rickard, J.H., Partridge, L.J., Blackburn, G.M. & Pluckthun, A. Turnover-based in vitro selection and evolution of biocatalysts from a fully synthetic antibody library. Nat. Biotechnol. 21, 679-685 (2003). Cha, T., Guo, A. & Zhu, X.Y. Enzymatic activity on a chip: the critical role of protein orientation. Proteomics 5, 416-419 (2005). Chames, P., Hoogenboom, H.R., Henderikx, P. Selection of antibodies against biotinylated antigens. Methods Mol. Biol. 178, 147-157 (2002). Chan, E.W., Chattopadhaya, S., Panicker, R.C., Huang, X. & Yao, S.Q. Developing photoactive affinity probes for proteomic profiling: hydroxamate-based probes for metalloproteases. J. Am. Chem. Soc. 126, 14435-14446 (2004). Chan, H.L., Gharbi, S., Gaffney, P.R., Cramer, R., Waterfield, M.D. & Timms, J.F. Proteomic analysis of redox- and ErbB2-dependent changes in mammary luminal epithelial cells using cysteine- and lysine-labelling two-dimensional difference gel electrophoresis. Proteomics 5, 2908-2926 (2005). Chang, J.Y. Thrombin specificity. Requirement for apolar amino acids adjacent to the thrombin cleavage site of polypeptide substrate. Eur. J. Biochem. 151, 217-224 (1985). Chen, G.Y.J., Uttamchandani, M., Lue, R.Y., Lesaicherrea, M.L. & Yao, S.Q. Array-based technologies and their applications in proteomics. Curr. Top. Med. Chem. 3, 705-724 (2003). Cheng, L.Y., Wang, J.Z., Gong, C.X., Pei, J.J., Zaidi, T., Grundke-Iqbal, I. & Iqbal, K. Multiple forms of phosphatase from human brain: isolation and partial characterization of affi-gel blue binding phosphatases. Neurochem. Res. 25, 107-120 (2000).
151
Cheng, L.Y., Wang, J.Z., Gong, C.X., Pei, J.J., Zaidi, T., Grundke-Iqbal, I. & Iqbal, K. Multiple forms of phosphatase from human brain: isolation and partial characterization of affi-gel blue nonbinding phosphatase activities. Neurochem. Res. 26, 425-438 (2001). Chimpanzee Sequencing and Analysis Consortium. Initial sequence of the chimpanzee genome and comparison with the human genome. Nature 437, 69-87 (2005). Cho, A.K., Lindeke, B., Hodshon, B.J. & Jenden, D.J. Deuterium substituted amphetamine as an internal standard in a gas chromatographic-mass spectrometric (GC-MS) assay for amphetamine. Anal. Chem. 45, 570-574 (1973). Chu, S., DeRisi, J., Eisen, M., Mulholland, J., Botstein, D., Brown, P.O. & Herskowitz, I. The transcriptional program of sporulation in budding yeast. Science 282, 699-705 (1998). Costanzo, M.C., Hogan, J.D., Cusick, M.E., Davis, B.P., Fancher, A.M., Hodges, P.E., Kondu, P., Lengieza, C., Lew-Smith, J.E., Lingner, C., Roberg-Perez, K.J., Tillberg, M., Brooks, J.E. & Garrels, J.I. The yeast proteome database (YPD) and Caenorhabditis elegans proteome database (WormPD): comprehensive resources for the organization and comparison of model organism protein information. Nucleic Acids Res. 28, 73-76 (2000). Crossgrove, J. & Zheng, W. Manganese toxicity upon overexposure. NMR Biomed. 17, 544-553 (2004). Culotta, V.C., Joh, H.D., Lin, S.J., Slekar, K.H. & Strain, J. A physiological role for Saccharomyces cerevisiae copper/zinc superoxide dismutase in copper buffering. J. Biol. Chem. 270, 29991-29997 (1995). Deane, C.M., Salwinski, L., Xenarios, I. & Eisenberg, D. Protein interactions: two methods for assessment of the reliability of high throughput observations. Mol. Cell. Proteomics 1, 349-356 (2002). Devreese, B., Vanrobaeys, F., Smet, J., Van Beeumen, J. & Van Coster, R. Mass spectrometric identification of mitochondrial oxidative phosphorylation subunits separated by two-dimensional blue-native polyacrylamide gel electrophoresis. Electrophoresis 23, 2525-2533 (2002). Dunkley, T.P., Watson, R., Griffin, J.L., Dupree, P. & Lilley, K.S. Localization of organelle proteins by isotope tagging (LOPIT). Mol. Cell. Proteomics 3, 1128-1134 (2004). Eddy, S.R. Non-coding RNA genes and the modern RNA world. Nat. Rev. Genet. 2, 919-929 (2001). Ehrhard, K.N., Jacoby, J.J., Fu, X.Y., Jahn, R. & Dohlman, H.G. Use of G-protein fusions to monitor integral membrane protein-protein interactions in yeast. Nat. Biotechnol. 18, 1075-1079 (2000).
152
Eisenberg, D., Marcotte, E.M., Xenarios, I. & Yeates, T.O. Protein function in the post-genomic era. Nature 405, 823-826 (2000). Elfstrom, L.T. & Widersten, M. The Saccharomyces cerevisiae ORF YNR064c protein has characteristics of an 'orphaned' epoxide hydrolase. Biochim. Biophys. Acta 1748, 213-221 (2005). El-Sayed, N.M., Myler, P.J., Bartholomeu, D.C., Nilsson, D., Aggarwal, G., Tran, A.N., Ghedin, E., Worthey, E.A., Delcher, A.L., Blandin, G. et al. The genome sequence of Trypanosoma cruzi, etiologic agent of Chagas disease. Science 309, 409-415 (2005). Eng, J. K., McCormack, A.L. & Yates, J.R. 3rd. An approach to correlate tandem mass spectral data of peptides with amino acid sequences in a protein database. J. Am. Soc. Mass Spectrom. 5, 976-989 (1994). Eyckerman, S., Verhee, A., der Heyden, J.V., Lemmens, I., Ostade, X.V., Vandekerckhove, J. & Tavernier, J. Design and application of a cytokine-receptor-based interaction trap. Nat. Cell Biol. 3, 1114-1119 (2001). Fahrenkrog, B., Sauder, U. & Aebi, U. The S. cerevisiae HtrA-like protein Nma111p is a nuclear serine protease that mediates yeast apoptosis. J. Cell Sci. 117, 115-126 (2004). Fang, Y., Frutos, A.G. & Lahiri, J. Membrane protein microarrays. J. Am. Chem. Soc. 124, 2394-2395 (2002). Fang, Y., Peng, J., Ferrie, A.M. & Burkhalter, R.S. Air-stable g protein-coupled receptor microarrays and ligand binding characteristics. Anal. Chem. 78, 149-155 (2006). Farcasanu, I.C., Hirata, D., Tsuchiya, E., Mizuta, K. & Miyakawa, T. Involvement of thioredoxin peroxidase type II (Ahp1p) of Saccharomyces cerevisiae in Mn2+ homeostasis. Biosci. Biotechnol. Biochem. 63, 1871-1881 (1999). Fazekas De St. Groth, S., Webster, R. G. & Datyner, A. Two new staining procedures for quantitative estimation of proteins on electrophoretic strips. Biochim. Biophys. Acta 71, 377-391 (1963). Fenn, J.B., Mann, M., Meng, C.K., Wong, S.F. & Whitehouse, C.M. Electrospray ionization for mass spectrometry of large biomolecules. Science 246, 64-71 (1989). Fields, S. Proteomics. Proteomics in genomeland. Science 291, 1221-1224 (2001). Fields, S. & Song, O. A novel genetic system to detect protein-protein interactions. Nature 340, 245-246 (1989). Finney, L.A. & O'Halloran, T.V. Transition metal speciation in the cell: insights from the chemistry of metal ion receptors. Science 300, 931-936 (2003).
153
Fischer, E.H. & Davie, E.W. Recent excitement regarding metallothionein. Proc. Natl. Acad. Sci. USA 95, 3333-3334 (1998). Fleischmann, R.D., Adams, M.D., White, O., Clayton, R.A., Kirkness, E.F., Kerlavage, A.R., Bult, C.J., Tomb, J.F., Dougherty, B.A., Merrick, J.M. et al. Whole-genome random sequencing and assembly of Haemophilus influenzae Rd. Science 269, 496-512 (1995). Formstecher, E., Aresta, S., Collura, V., Hamburger, A., Meil, A., Trehin, A., Reverdy, C., Betin, V., Maire, S., Brun, C. et al. Protein interaction mapping: a Drosophila case study. Genome Res. 15, 376-384 (2005). Frohlich, K.U. & Madeo, F. Apoptosis in yeast--a monocellular organism exhibits altruistic behaviour. FEBS Lett. 473, 6-9 (2000). Froment, C., Uttenweiler-Joseph, S., Bousquet-Dubouch, M.P., Matondo, M., Borges, J.P., Esmenjaud, C., Lacroix, C., Monsarrat, B. & Burlet-Schiltz, O. A quantitative proteomic approach using two-dimensional gel electrophoresis and isotope-coded affinity tag labeling for studying human 20S proteasome heterogeneity. Proteomics 5, 2351-2363 (2005). Futcher, B., Latter, G.I., Monardo, P., McLaughlin, C.S. & Garrels, J.I. A sampling of the yeast proteome. Mol. Cell. Biol. 19, 7357-7368 (1999). Gadd, G.M. Metals and microorganisms: a problem of definition. FEMS Microbiol. Lett. 100, 197-203 (1992). Gaskova, D., Brodska, B., Holoubek, A. & Sigler, K. Factors and processes involved in membrane potential build-up in yeast: diS-C3(3) assay. Int. J. Biochem. Cell Biol. 31, 575-584 (1999). Gavin, A. C., Bosche, M., Krause, R., Grandi, P., Marzioch, M., Bauer, A., Schultz, J., Rick, J.M., Michon, A.M., Cruciat, C.M. et al. Functional organization of the yeast proteome by systematic analysis of protein complexes. Nature 415, 141-147 (2002). Gee, K.R., Kang, H.C., Meier, T.I., Zhao, G. & Blaszcak, L.C. Fluorescent Bocillins: synthesis and application in the detection of penicillin-binding proteins. Electrophoresis 22, 960-965 (2001). Gestwicki, J.E., Crabtree, G.R. & Graef, I.A. Harnessing chaperones to generate small-molecule inhibitors of amyloid beta aggregation. Science 306, 865-869 (2004). Gharbi, S., Gaffney, P., Yang, A., Zvelebil, M.J., Cramer, R., Waterfield, M.D. & Timms, J.F. Evaluation of two-dimensional differential gel electrophoresis for proteomic expression analysis of a model breast cancer cell system. Mol. Cell. Proteomics 1, 91-98 (2002). Ghosh, M., Shen, J. & Rosen, B.P. Pathways of As(III) detoxification in Saccharomyces cerevisiae. Proc. Natl. Acad. Sci. USA 96, 5001-5006 (1999).
154
Giaever, G., Chu, A.M., Ni, L., Connelly, C., Riles, L., Veronneau, S., Dow, S., Lucau-Danila, A., Anderson, K., Andre, B. et al. Functional profiling of the Saccharomyces cerevisiae genome. Nature 418, 387-391 (2002). Gibbs, R.A., Weinstock, G.M., Metzker, M.L., Muzny, D.M., Sodergren, E.J., Scherer, S., Scott, G., Steffen, D., Worley, K.C., Burch, P.E. et al. Genome sequence of the Brown Norway rat yields insights into mammalian evolution. Nature 428, 493-521 (2004). Gietz, R.D. & Sugino, A. New yeast-Escherichia coli shuttle vectors constructed with in vitro mutagenized yeast genes lacking six-base pair restriction sites. Gene 74, 527-534 (1988). Godon, C., Lagniel, G., Lee, J., Buhler, J.M., Kieffer, S., Perrot, M., Boucherie, H., Toledano, M.B. & Labarre, J. The H2O2 stimulon in Saccharomyces cerevisiae. J. Biol. Chem. 273, 22480-22489 (1998). Goff, S.A., Ricke, D., Lan, T.H., Presting, G., Wang, R., Dunn, M., Glazebrook, J., Sessions, A., Oeller, P., Varma, H. et al. A draft sequence of the rice genome (Oryza sativa L. ssp. japonica). Science 296, 92-100 (2002). Goffeau, A., Barrell, B.G., Bussey, H., Davis, R.W., Dujon, B., Feldmann, H., Galibert, F., Hoheisel, J.D., Jacq, C., Johnston, M., Louis, E.J., Mewes, H.W., Murakami, Y., Philippsen, P., Tettelin, H. & Oliver, S.G. Life with 6000 genes. Science 274, 546, 563-567 (1996). Gordon, J.A. Use of vanadate as protein-phosphotyrosine phosphatase inhibitor. Methods Enzymol. 201, 477-482 (1991). Gorg, A., Weiss, W. & Dunn, M.J. Current two-dimensional electrophoresis technology for proteomics. Proteomics 4, 3665-3685 (2004). Grant, C.M. Role of the glutathione/glutaredoxin and thioredoxin systems in yeast growth and response to stress conditions. Mol. Microbiol. 39, 533-541 (2001). Griffiths, A.D. & Duncan, A.R. Strategies for selection of antibodies by phage display. Curr. Opin. Biotechnol. 9, 102-108 (1998). Griffiths, A.D. & Tawfik, D.S. Man-made enzymes--from design to in vitro compartmentalisation. Curr. Opin. Biotechnol. 11, 338-353 (2000). Gygi, S.P., Corthals, G.L., Zhang, Y., Rochon, Y. & Aebersold, R. Evaluation of two-dimensional gel electrophoresis-based proteome analysis technology. Proc. Natl. Acad. Sci. USA 97, 9390-9395 (2000). Gygi, S.P., Rist, B., Gerber, S.A., Turecek, F., Gelb, M.H. & Aebersold, R. Quantitative analysis of complex protein mixtures using isotope-coded affinity tags. Nat. Biotechnol. 17, 994-999 (1999).
155
Gygi, S.P., Rochon, Y., Franza, B.R. & Aebersold, R. Correlation between protein and mRNA abundance in yeast. Mol. Cell Biol. 19, 1720-1730 (1999). Hardingham, G.E. & Bading, H. Calcium as a versatile second messenger in the control of gene expression. Microsc. Res. Tech. 46, 348-355 (1999). Hale, J.E., Butler, J.P., Knierman, M.D. & Becker, G.W. Increased sensitivity of tryptic peptide detection by MALDI-TOF mass spectrometry is achieved by conversion of lysine to homoarginine. Anal. Biochem. 287, 110-117 (2000). Hamdan, M. & Righetti, P.G. Modern strategies for protein quantification in proteome analysis: advantages and limitations. Mass Spectrom. Rev. 21, 287-302 (2002). Hammar, C.G., Hanin, I., Holmstedt, B., Kitz, R.J., Jenden, D.J. & Karlen, B. Identification of acetylcholine in fresh rat brain by combined gas chromatography-mass spectrometry. Nature 220, 915-917 (1968). Hanash, S. Disease proteomics. Nature 422, 226-232 (2003). Hanes, J., Jermutus, L., Weber-Bornhauser, S., Bosshard, H.R. & Pluckthun, A. Ribosome display efficiently selects and evolves high-affinity antibodies in vitro from immune libraries. Proc. Natl. Acad. Sci. USA 95, 14130-14135 (1998). Hanes, J. & Pluckthun, A. In vitro selection and evolution of functional proteins by using ribosome display. Proc. Natl. Acad. Sci. USA 94, 4937-4942 (1997). Harris, J., Mason, D.E., Li, J., Burdick, K.W., Backes, B.J., Chen, T., Shipway, A., Van Heeke, G., Gough, L., Ghaemmaghami, A., Shakib, F., Debaene, F. & Winssinger, N. Activity profile of dust mite allergen extract using substrate libraries and functional proteomic microarrays. Chem. Biol. 11, 1361-1372 (2004). He, M. & Khan, F. Ribosome display: next-generation display technologies for production of antibodies in vitro. Expert Rev. Proteomics 2, 421-430 (2005). Heck, A.J. & Krijgsveld, J. Mass spectrometry-based quantitative proteomics. Expert Rev. Proteomics 1, 317-326 (2004). Henzel, W.J., Billeci, T.M., Stults, J.T., Wong, S.C., Grimley, C. & Watanabe, C. Identifying proteins from two-dimensional gels by molecular mass searching of peptide fragments in protein sequence databases. Proc. Natl. Acad. Sci. USA 90, 5011-5015 (1993). Herrero, E., de la Torre, M.A. & Valentin, E. Comparative genomics of yeast species: new insights into their biology. Int. Microbiol. 6, 183-190 (2003). Hieter, P. & Boguski, M. Functional genomics: it's all how you read it. Science 278, 601-602 (1997).
156
Hillier, L.W., Miller, W., Birney, E., Warren, W., Hardison, R.C., Ponting, C.P., Bork, P., Burt, D.W., Groenen, M.A., Delany, M.E. et al. Sequence and comparative analysis of the chicken genome provide unique perspectives on vertebrate evolution. Nature 432, 695-716 (2004). Ho, Y., Gruhler, A., Heilbut, A., Bader, G.D., Moore, L., Adams, S.L., Millar, A., Taylor, P., Bennett, K., Boutilier, K. et al. Systematic identification of protein complexes in Saccharomyces cerevisiae by mass spectrometry. Nature 415, 180-183 (2002). Hodges, P.E., McKee, A.H., Davis, B.P., Payne, W.E. & Garrels, J.I. The Yeast Proteome Database (YPD): a model for the organization and presentation of genome-wide functional data. Nucleic Acids Res. 27, 69-73 (1999). Hohmann, S. The Yeast Systems Biology Network: mating communities. Curr. Opin. Biotechnol. 16, 356-360 (2005). Hosse, R.J., Rothe, A. & Power, B.E. A new generation of protein display scaffolds for molecular recognition. Protein Sci. 15, 14-27 (2006). Hu, C.D. & Kerppola, T.K. Simultaneous visualization of multiple protein interactions in living cells using multicolor fluorescence complementation analysis. Nat. Biotechnol. 21, 539-545 (2003). Hu, Y., Huang, X., Chen, G.Y.J. & Yao, S.Q. Recent advances in gel-based proteome profiling techniques. Mol. Biotechnol. 28, 63-76 (2004). Hu, Y., Uttamchandani, M. & Yao, S.Q. Microarray: a versatile platform for high-throughput functional proteomics. Comb. Chem. High Throughput Screen. 9, 203-212 (2006). Huang, M., Lai, W.P., Wong, M.S. & Yang, M. Effect of receptor phosphorylation on the binding between IRS-1 and IGF-1R as revealed by surface plasmon resonance biosensor. FEBS Lett. 505, 31-36 (2001). Huang, X., Tan, E.L.P., Chen, G.Y.J. & Yao, S.Q. Enzyme-targeting small molecule probes for proteomics applications. Appl. Genomics Proteomics 2, 225-239 (2003). Huh, W.K., Falvo, J.V., Gerke, L.C., Carroll, A.S., Howson, R.W., Weissman, J.S. & O'Shea, E.K. Global analysis of protein localization in budding yeast. Nature 425, 686-691 (2003). Hunt, D.F., Yates, J.R. 3rd, Shabanowitz, J., Winston, S. & Hauer, C.R. Protein sequencing by tandem mass spectrometry. Proc. Natl. Acad. Sci. USA 83, 6233-6237 (1986). Inai, Y. & Nishikimi, M. Increased degradation of oxidized proteins in yeast defective in 26 S proteasome assembly. Arch. Biochem. Biophys. 404, 279-284 (2002).
157
Ito, T., Chiba, T., Ozawa, R., Yoshida, M., Hattori, M. & Sakaki, Y. A comprehensive two-hybrid analysis to explore the yeast protein interactome. Proc. Natl. Acad. Sci. USA 98, 4569-4574 (2001). Iyer, V.R., Horak, C.E., Scafe, C.S., Botstein, D., Snyder, M. & Brown, P.O. Genomic binding sites of the yeast cell-cycle transcription factors SBF and MBF. Nature 409, 533-538 (2001). James, P., Quadroni, M., Carafoli, E. & Gonnet, G. Protein identification by mass profile fingerprinting. Biochem. Biophys. Res. Commun. 195, 58-64 (1993). Jensen, O.N., Mortensen, P., Vorm, O. & Mann, M. Automation of matrix-assisted laser desorption/ionization mass spectrometry using fuzzy logic feedback control. Anal. Chem. 69, 1706-1714 (1997). Jessani, N. & Cravatt, B.F. The development and application of methods for activity-based protein profiling. Curr. Opin. Chem. Biol. 8, 54-59 (2004). Jessani, N., Young, J.A., Diaz, S.L., Patricelli, M.P., Varki, A. & Cravatt, B.F. Class assignment of sequence-unrelated members of enzyme superfamilies by activity-based protein profiling. Angew. Chem. Int. Ed. 44, 2400-2403 (2005). Ji, J., Chakraborty, A., Geng, M., Zhang, X., Amini, A., Bina, M. & Regnier, F. Strategy for qualitative and quantitative analysis in proteomics based on signature peptides. J. Chromatogr. B Biomed. Sci. Appl. 745, 197-210 (2000). Jiang, H. & English, A.M. Quantitative analysis of the yeast proteome by incorporation of isotopically labeled leucine. J. Proteome Res. 1, 345-350 (2002). Jiang, X.S., Dai, J., Sheng, Q.H., Zhang, L., Xia, Q.C., Wu, J.R. & Zeng, R. A comparative proteomic strategy for subcellular proteome research: ICAT approach coupled with bioinformatics prediction to ascertain rat liver mitochondrial proteins and indication of mitochondrial localization for catalase. Mol. Cell. Proteomics 4, 12-34 (2005). Jin, C. & Reed, J.C. Yeast and apoptosis. Nat. Rev. Mol. Cell Biol. 3, 453-459 (2002). Johnsson, N. & Varshavsky, A. Split ubiquitin as a sensor of protein interactions in vivo. Proc. Natl. Acad. Sci. USA 91, 10340-10344 (1994). Jung, G.Y. & Stephanopoulos, G. A functional protein chip for pathway optimization and in vitro metabolic engineering. Science 304, 428-431 (2004). Kanan, M.W., Rozenman, M.M., Sakurai, K., Snyder, T.M. & Liu, D.R. Reaction discovery enabled by DNA-templated synthesis and in vitro selection. Nature 431, 545-549 (2004). Kaplan, J. & O'Halloran, T.V. Iron metabolism in eukaryotes: Mars and Venus at it again. Science 271, 1510-1512 (1996).
158
Karp, M. & Oker-Blom, C. A streptavidin-luciferase fusion protein: comparisons and applications. Biomol. Eng. 16, 101-104 (1999). Karp, N.A. & Lilley, K. S. Maximising sensitivity for detecting changes in protein expression: Experimental design using minimal CyDyes. Proteomics 5, 3105-3115 (2005). Kazmin, D., Edwards, R.A., Turner, R.J., Larson, E. & Starkey, J. Visualization of proteins in acrylamide gels using ultraviolet illumination. Anal. Biochem. 301, 91-96 (2002). Kehoe, J.W. & Kay, B.K. Filamentous phage display in the new millennium. Chem. Rev. 105, 4056-4072 (2005). Kelleher, J. K. Probing metabolic pathways with isotopic tracers: insights from mammalian metabolic physiology. Metab. Eng. 6, 1-5 (2004). Kelleher, N.L., Zubarev, R.A., Bush, K., Furie, B., Furie, B.C., McLafferty, F.W. & Walsh, C.T. Localization of labile posttranslational modifications by electron capture dissociation: the case of gamma-carboxyglutamic acid. Anal. Chem. 71, 4250-4253 (1999). Kemper, C., Steinberg, T.H., Jones, L. & Patton, W.F. Simultaneous, two-color fluorescence detection of total protein profiles and beta-glucuronidase activity in polyacrylamide gel. Electrophoresis 22, 970-976 (2001). Kirkpatrick, D.S., Weldon, S.F., Tsaprailis, G., Liebler, D.C. & Gandolfi, A.J. Proteomic identification of ubiquitinated proteins from human cells expressing His-tagged ubiquitin. Proteomics 5, 2104-2111 (2005). Kirschner, M.W. The meaning of systems biology. Cell 121, 503-504 (2005). Kjeldsen, F., Haselmann, K.F., Budnik, B.A., Sorensen, E.S. & Zubarev, R.A. Complete characterization of posttranslational modification sites in the bovine milk protein PP3 by tandem mass spectrometry with electron capture dissociation as the last stage. Anal. Chem. 75, 2355-2361 (2003). Klose, J. Protein mapping by combined isoelectric focusing and electrophoresis of mouse tissues. A novel approach to testing for induced point mutations in mammals. Humangenetik 26, 231-243 (1975). Kolkman, A., Slijper, M. & Heck, A.J. Development and application of proteomics technologies in Saccharomyces cerevisiae. Trends Biotechnol. 23, 598-604 (2005). Kolonin, M.G., Saha, P.K., Chan, L., Pasqualini, R. & Arap, W. Reversal of obesity by targeted ablation of adipose tissue. Nat. Med. 10, 625-632 (2004). Koltovaya, N.A., Guerasimova, A.S., Tchekhouta, I.A. & Devin, A.B. NET1 and HFI1 genes of yeast mediate both chromosome maintenance and mitochondrial rho(-) mutagenesis. Yeast 20, 955-971 (2003).
159
Korbel, G.A. Lalic, G. & Shair, M.D. Reaction microarrays: a method for rapidly determining the enantiomeric excess of thousands of samples. J. Am. Chem. Soc. 123, 361-362 (2001). Kratchmarova, I., Blagoev, B., Haack-Sorensen, M., Kassem, M. & Mann, M. Mechanism of divergent growth factor effects in mesenchymal stem cell differentiation. Science 308, 1472-1477 (2005). Krause, E., Wenschuh, H. & Jungblut, P.R. The dominance of arginine-containing peptides in MALDI-derived tryptic mass fingerprints of proteins. Anal. Chem. 71, 4160-4165 (1999). Krijgsveld, J., Ketting, R.F., Mahmoudi, T., Johansen, J., Artal-Sanz, M., Verrijzer, C.P., Plasterk, R.H. & Heck, A.J. Metabolic labeling of C. elegans and D. melanogaster for quantitative proteomics. Nat. Biotechnol. 21, 927-931 (2003). Kumar, A., Agarwal, S., Heyman, J.A., Matson, S., Heidtman, M., Piccirillo, S., Umansky, L., Drawid, A., Jansen, R., Liu, Y., Cheung, K.H., Miller, P., Gerstein, M., Roeder, G.S. & Snyder, M. Subcellular localization of the yeast proteome. Genes Dev. 16, 707-719 (2002). Kumar, A. & Snyder, M. Emerging technologies in yeast genomics. Nat. Rev. Genet. 2, 302-312 (2001). LaBaer, J. & Ramachandran, N. Protein microarrays as tools for functional proteomics. Curr. Opin. Chem. Biol. 9, 14-19 (2005). Lander, E.S., Linton, L.M., Birren, B., Nusbaum, C., Zody, M.C., Baldwin, J., Devon, K., Dewar, K., Doyle, M., FitzHugh, W. et al. Initial sequencing and analysis of the human genome. Nature 409, 860-921 (2001). Lee, J.R., Baxter, T.M., Yamaguchi, H., Wang, T.C., Goldenring, J.R. & Anderson, M.G. Differential protein analysis of spasomolytic polypeptide expressing metaplasia using laser capture microdissection and two-dimensional difference gel electrophoresis. Appl. Immunohistochem. Mol. Morphol. 11, 188-193 (2003). Leemhuis, H., Stein, V., Griffiths, A.D. & Hollfelder, F. New genotype-phenotype linkages for directed evolution of functional proteins. Curr. Opin. Struct. Biol. 15, 472-478 (2005). Lehmann, W.D., Beckey, H.D. & Schulten, H.R. Qualitative and quantitative analyses of bansyl derivatives of dopamine and some of its metabolites in urine samples by electron impact and field desorption mass spectrometry. Anal. Chem. 48, 1572-1575 (1976). Lehmann, W.D. & Schulten, H.R. Quantitative mass spectrometry in biochemistry and medicine. Angew. Chem. Int. Ed. 17, 221-238 (1978). Lehner, I., Niehof, M. & Borlak, J. An optimized method for the isolation and identification of membrane proteins. Electrophoresis 24, 1795-1808 (2003).
160
Lehr, S., Kotzka, J., Avci, H., Knebel, B., Muller, S., Hanisch, F.G., Jacob, S., Haak, C., Susanto, F. & Muller-Wieland, D. Effect of sterol regulatory element binding protein-1a on the mitochondrial protein pattern in human liver cells detected by 2D-DIGE. Biochemistry 44, 5117-5128 (2005). Lesaicherre, M.L., Lue, R.Y., Chen, G.Y.J., Zhu, Q. & Yao, S.Q. Intein-mediated biotinylation of proteins and its application in a protein microarray. J. Am. Chem. Soc. 124, 8768-8769 (2002). Li, M. Applications of display technology in protein analysis. Nat. Biotechnol. 18, 1251-1256 (2000). Li, S., Armstrong, C.M., Bertin, N., Ge, H., Milstein, S., Boxem, M., Vidalain, P.O., Han, J.D., Chesneau, A., Hao, T. et al. A map of the interactome network of the metazoan C. elegans. Science 303, 540-543 (2004). Li, Z.S., Lu, Y.P., Zhen, R.G., Szczypka, M., Thiele, D.J. & Rea, P.A. A new pathway for vacuolar cadmium sequestration in Saccharomyces cerevisiae: YCF1-catalyzed transport of bis(glutathionato)cadmium. Proc. Natl. Acad. Sci. USA 94, 42-47 (1997). Liau, M.L., Panicker, R.C. & Yao, S.Q. Design and synthesis of an affinity probe that targets caspases in proteomic experiments. Tetrahedron Lett. 44, 1043-1046 (2003). Ligr, M., Velten, I., Frohlich, E., Madeo, F., Ledig, M., Frohlich, K.U., Wolf, D.H. & Hilt, W. The proteasomal substrate Stm1 participates in apoptosis-like cell death in yeast. Mol. Biol. Cell 12, 2422-2432 (2001). Lipovsek, D. & Pluckthun, A. In-vitro protein evolution by ribosome display and mRNA display. J. Immunol. Methods 290, 51-67 (2004). Liu, Y., Patricelli, M.P. & Cravatt, B.F. Activity-based protein profiling: the serine hydrolases. Proc. Natl. Acad. Sci. USA 96, 14694-14699 (1999). Lockhart, D.J. & Winzeler, E.A. Genomics, gene expression and DNA arrays. Nature 405, 827-836 (2000). Longo, V.D., Mitteldorf, J. & Skulachev, V.P. Opinion: programmed and altruistic ageing. Nat. Rev. Genet. 6, 866-872 (2005). Loo, J.A., Edmonds, C.G. & Smith, R.D. Primary sequence information from intact proteins by electrospray ionization tandem mass spectrometry. Science 248, 201-204 (1990). Lopez, M.F., Berggren, K., Chernokalskaya, E., Lazarev, A., Robinson, M. & Patton, W.F. A comparison of silver stain and SYPRO Ruby Protein Gel Stain with respect to protein detection in two-dimensional gels and identification by peptide mass profiling. Electrophoresis 21, 3673-3683 (2000).
161
Lovrinovic, M. & Niemeyer, C.M. DNA microarrays as decoding tools in combinatorial chemistry and chemical biology. Angew. Chem. Int. Ed. 44, 3179-3183 (2005). Ludovico, P., Sousa, M.J., Silva, M.T., Leao, C. & Corte-Real, M. Saccharomyces cerevisiae commits to a programmed cell death process in response to acetic acid. Microbiology 147, 2409-2415 (2001). Lue, R.Y., Chen, G.Y.J., Hu, Y., Zhu, Q. & Yao, S.Q. Versatile protein biotinylation strategies for potential high-throughput proteomics. J. Am. Chem. Soc. 126, 1055-1062 (2004). MacKintosh, C. Assay and Purification of Protein (Serine/Threonine) Phosphatases in Protein Phosphorylation: A Practical Approach. Eds. Hardie, D.G., IRL Press, 197–230 (1993). Madeo, F., Herker, E., Maldener, C., Wissing, S., Lachelt, S., Herlan, M., Fehr, M., Lauber, K., Sigrist, S.J., Wesselborg, S. & Frohlich, K.U. A caspase-related protease regulates apoptosis in yeast. Mol. Cell 9, 911-917 (2002). Madeo, F., Herker, E., Wissing, S., Jungwirth, H., Eisenberg, T. & Frohlich, K.U. Apoptosis in yeast. Curr. Opin. Microbiol. 7, 655-660 (2004). Mager, W.H. & Winderickx, J. Yeast as a model for medical and medicinal research. Trends Pharmacol. Sci. 26, 265-273 (2005). Maillet, I., Lagniel, G., Perrot, M., Boucherie, H. & Labarre, J. Rapid identification of yeast proteins on two-dimensional gels. J. Biol. Chem. 271, 10263-10270 (1996). Mann, M., Hendrickson, R.C. & Pandey, A. Analysis of proteins and proteomes by mass spectrometry. Annu. Rev. Biochem.70, 437-473 (2001). Mann, M. & Jensen, O.N. Proteomic analysis of post-translational modifications. Nat. Biotechnol. 21, 255-261 (2003). Mann, M. & Wilm, M. Error-tolerant identification of peptides in sequence databases by peptide sequence tags. Anal. Chem. 66, 4390-4399 (1994). Marouga, R., David, S. & Hawkins, E. The development of the DIGE system: 2D fluorescence difference gel analysis technology. Anal. Bioanal. Chem. 382, 669-678 (2005). Marra, M.A., Jones, S.J., Astell, C.R., Holt, R.A., Brooks-Wilson, A., Butterfield, Y.S., Khattra, J., Asano, J.K., Barber, S.A., Chan, S.Y. et al. The Genome sequence of the SARS-associated coronavirus. Science 300, 1399-1404 (2003). Martzen, M.R., McCraith, S.M., Spinelli, S.L., Torres, F.M., Fields, S., Grayhack, E.J. & Phizicky, E.M. A biochemical genomics approach for identifying genes by the activity of their products. Science 286, 1153-1155 (1999).
162
Masse, E. & Arguin, M. Ironing out the problem: new mechanisms of iron homeostasis. Trends Biochem. Sci. 30, 462-468 (2005). Matsuura, T. & Pluckthun, A. Selection based on the folding properties of proteins with ribosome display. FEBS Lett. 539, 24-28 (2003). Mattheakis, L.C., Bhatt, R.R. & Dower, W.J. An in vitro polysome display system for identifying ligands from very large peptide libraries. Proc. Natl. Acad. Sci. USA 91, 9022-9026 (1994). McKenzie, K.M., Videlock, E.J., Splittgerber, U. & Austin, D.J. Simultaneous Identification of Multiple Protein Targets by Using Complementary-DNA Phage Display and a Natural-Product-Mimetic Probe. Angew. Chem. Int. Ed. 43, 4052-4055 (2004). Mckusick, V.A. Genomics: structural and functional studies of genomes. Genomics 45, 244-249 (1997). Melkko, S., Scheuermann, J., Dumelin, C.E. & Neri, D. Encoded self-assembling chemical libraries. Nat. Biotechnol. 22, 568-574 (2004). Merkel, J.S., Michaud, G.A., Salcius, M., Schweitzer, B. & Predki, P.F. Functional protein microarrays: just how functional are they? Curr. Opin. Biotechnol. 16, 447-452 (2005). Merryman, C., Weinstein, E., Wnuk, S.F. & Bartel, D.P. A bifunctional tRNA for in vitro selection. Chem. Biol. 9, 741-746 (2002). Mikawa, Y.G., Maruyama, I.N. & Brenner, S. Surface display of proteins on bacteriophage lambda heads. J. Mol. Biol. 262, 21-30 (1996). Molloy, M. P. Two-dimensional electrophoresis of membrane proteins using immobilized pH gradients. Anal Biochem. 280, 1-10 (2000). Monribot-Espagne, C. & Boucherie, H. Differential gel exposure, a new methodology for the two-dimensional comparison of protein samples. Proteomics 2, 229-240 (2002). Moriya, H., Shimizu-Yoshida, Y., Omori, A., Iwashita, S., Katoh, M. & Sakai, A. Yak1p, a DYRK family kinase, translocates to the nucleus and phosphorylates yeast Pop2p in response to a glucose signal. Genes Dev. 15, 1217-1228 (2001). Muller, O.J., Kaul, F., Weitzman, M.D., Pasqualini, R., Arap, W., Kleinschmidt, J.A. & Trepel, M. Random peptide libraries displayed on adeno-associated virus to select for targeted gene therapy vectors. Nat. Biotechnol. 21, 1040-1046 (2003). Mutuberria, R., Satijn, S., Huijbers, A., Van Der Linden, E., Lichtenbeld, H., Chames, P., Arends, J.W. & Hoogenboom, H.R. Isolation of human antibodies to tumor-associated endothelial cell markers by in vitro human endothelial cell selection with phage display libraries. J. Immunol. Methods 287, 31-47 (2004).
163
Nelson, T.J., Backlund, P.S. Jr., Yergey, A.L. & Alkon, D.L. Isolation of protein subpopulations undergoing protein-protein interactions. Mol. Cell. Proteomics 1, 253-259 (2002). Neubauer, G., Gottschalk, A., Fabrizio, P., Seraphin, B., Luhrmann, R. & Mann, M. Identification of the proteins of the yeast U1 small nuclear ribonucleoprotein complex by mass spectrometry. Proc. Natl. Acad. Sci. USA 94, 385-390 (1997). Neubauer, G. & Mann, M. Mapping of phosphorylation sites of gel-isolated proteins by nanoelectrospray tandem mass spectrometry: potentials and limitations. Anal. Chem. 71, 235-242 (1999). Nishihara, J.C. & Champion, K.M. Quantitative evaluation of proteins in one- and two-dimensional polyacrylamide gels using a fluorescent stain. Electrophoresis 23, 2203-2215 (2002). Nuwaysir, L.M. & Stults, J.T. Electrospray ionization mass spectrometry of phosphopeptides isolated by on-line immobilized metal-ion affinity chromatography. J. Am. Soc. Mass Spectrom. 4, 662-669 (1993). O'Brien, K.M., Dirmeier, R., Engle, M. & Poyton, R.O. Mitochondrial protein oxidation in yeast mutants lacking manganese-(MnSOD) or copper- and zinc-containing superoxide dismutase (CuZnSOD): evidence that MnSOD and CuZnSOD have both unique and overlapping functions in protecting mitochondrial proteins from oxidative damage. J. Biol. Chem. 279, 51817-51827 (2004). Oda, Y., Huang, K., Cross, F.R., Cowburn, D. & Chait, B.T. Accurate quantitation of protein expression and site-specific phosphorylation. Proc. Natl. Acad. Sci. USA 96, 6591-6596 (1999). Odegrip, R., Coomber, D., Eldridge, B., Hederer, R., Kuhlman, P.A., Ullman, C., FitzGerald, K. & McGregor, D. CIS display: In vitro selection of peptides from libraries of protein-DNA complexes. Proc. Natl. Acad. Sci. USA 101, 2806-2810 (2004). O'Farrell, P. H. High resolution two-dimensional electrophoresis of proteins. J. Biol. Chem. 250, 4007-4021 (1975). Ohya, Y., Umemoto, N., Tanida, I., Ohta, A., Iida, H. & Anraku, Y. Calcium-sensitive cls mutants of Saccharomyces cerevisiae showing a Pet- phenotype are ascribable to defects of vacuolar membrane H(+)-ATPase activity. J. Biol. Chem. 266, 13971-13977 (1991). Ong, S.E., Mittler, G. & Mann, M. Identifying and quantifying in vivo methylation sites by heavy methyl SILAC. Nat. Methods 1, 119-126 (2004). Ovaa, H., van Swieten, P.F., Kessler, B.M., Leeuwenburgh, M.A., Fiebiger, E., van den Nieuwendijk, A.M., Galardy, P.J., van der Marel, G.A., Ploegh, H.L. & Overkleeft, H.S. Chemistry in living cells: detection of active proteasomes by a two-step labeling strategy. Angew. Chem. Int. Ed. 42, 3626-3629 (2003).
164
Pandey, A. & Mann, M. Proteomics to study genes and genomes. Nature 405, 837 - 846 (2000). Pappin, D.J., Hojrup, P. & Bleasby, A.J. Rapid identification of proteins by peptide-mass fingerprinting. Curr. Biol. 3, 327-332 (1993). Park, J.I., Grant, C.M., Davies, M.J. & Dawes, I.W. The cytoplasmic Cu,Zn superoxide dismutase of saccharomyces cerevisiae is required for resistance to freeze-thaw stress. Generation of free radicals during freezing and thawing. J. Biol. Chem. 273, 22921-22928 (1998). Patterson, S.D. & Aebersold, R.H. Proteomics: the first decade and beyond. Nat. Genet. 33, Suppl: 311-323 (2003). Patton, W. F. A thousand points of light: the application of fluorescence detection technologies to two-dimensional gel electrophoresis and proteomics. Electrophoresis 21, 1123-1144 (2000). Patton, W.F. Detection technologies in proteome analysis. J. Chromatogr. B Analyt. Technol. Biomed. Life Sci. 771, 3-31 (2002). Patton, W.F. & Beechem, J.M. Rainbow's end: the quest for multiplexed fluorescence quantitative analysis in proteomics. Curr. Opin. Chem. Biol. 6, 63-69 (2002). Paulus, H. Protein splicing and related forms of protein autoprocessing. Annu. Rev. Biochem. 69, 447-496 (2000). Pawson, T. & Nash, P. Protein-protein interactions define specificity in signal transduction. Genes Dev. 14, 1027-1047 (2000). Pearce, D.A. & Sherman, F. Toxicity of copper, cobalt, and nickel salts is dependent on histidine metabolism in the yeast Saccharomyces cerevisiae. J. Bacteriol. 181, 4774-4779 (1999). Peng, J., Schwartz, D., Elias, J.E., Thoreen, C.C., Cheng, D., Marsischky, G., Roelofs, J., Finley, D. & Gygi, S.P. A proteomics approach to understanding protein ubiquitination. Nat. Biotechnol. 21, 921-926 (2003). Penninckx, M.J. An overview on glutathione in Saccharomyces versus non-conventional yeasts. FEMS Yeast Res. 2, 295-305 (2002). Perkins, A.C. & Frier, M. Radionuclide imaging in drug development. Curr. Pharm. Des. 10, 2907-2921 (2004). Perkins, D.N., Pappin, D.J., Creasy, D.M. & Cottrell, J.S. Probability-based protein identification by searching sequence databases using mass spectrometry data. Electrophoresis 20, 3551-3567 (1999).
165
Perrot, M., Sagliocco, F., Mini, T., Monribot, C., Schneider, U., Shevchenko, A., Mann, M., Jeno, P. & Boucherie, H. Two-dimensional gel protein database of Saccharomyces cerevisiae (update 1999). Electrophoresis 20, 2280-2298 (1999). Piehler, J. New methodologies for measuring protein interactions in vivo and in vitro. Curr. Opin. Struct. Biol. 15, 4-14 (2005). Plowman, J.E., Bryson, W.G. & Jordan, T.W. Application of proteomics for determining protein markers for wool quality traits. Electrophoresis 21, 1899-1906 (2000). Poland, J., Cahill, M.A. & Sinha, P. Isoelectric focusing in long immobilized pH gradient gels to improve protein separation in proteomic analysis. Electrophoresis 24, 1271-1275 (2003). Ptacek, J., Devgan, G., Michaud, G., Zhu, H., Zhu, X., Fasolo, J., Guo, H., Jona, G., Breitkreutz, A., Sopko, R. et al. Global analysis of protein phosphorylation in yeast. Nature 438, 679-684 (2005). Qin, S., Ferdinand, A.S., Richie, J.P., O'Leary, M.P., Mok, S.C. & Liu, B.C. Chromatofocusing fractionation and two-dimensional difference gel electrophoresis for low abundance serum proteins. Proteomics 5, 3183-3192 (2005). Rabilloud, T. Carpentier, G. & Tarroux, P. Improvement and simplification of low-background silver staining of proteins by using sodium dithionite. Electrophoresis 9, 288-291 (1988). Rabilloud, T., Vincens, P., Asselineau, D., Pennetier, J.L., Darmon, M. & Tarroux, P. Computer analysis of two-dimensional electrophoresis gels as a tool in cell biology: study of the protein expression of human keratinocytes from normal to tumor cells. Cell Mol. Biol. 40, 17-27 (1994). Ranish, J.A., Yi, E.C., Leslie, D.M., Purvine, S.O., Goodlett, D.R., Eng, J. & Aebersold, R. The study of macromolecular complexes by quantitative proteomics. Nat. Genet. 33, 349-355 (2003). Raoult, D., Audic, S., Robert, C., Abergel, C., Renesto, P., Ogata, H., La Scola, B., Suzan, M. & Claverie, J.M. The 1.2-megabase genome sequence of Mimivirus. Science 306, 1344-1350 (2004). Rappsilber, J. & Mann, M. Is mass spectrometry ready for proteome-wide protein expression analysis? Genome Biol. 3, COMMENT2008 (2002). Ren, B., Robert, F., Wyrick, J.J., Aparicio, O., Jennings, E.G., Simon, I., Zeitlinger, J., Schreiber, J., Hannett, N., Kanin, E., Volkert, T.L., Wilson, C.J., Bell, S.P. & Young, R.A. Genome-wide location and function of DNA binding proteins. Science 290, 2306-2309 (2000).
166
Riechmann, L. & Winter, G. Novel folded protein domains generated by combinatorial shuffling of polypeptide segments. Proc. Natl. Acad. Sci. USA 97, 10068-10073 (2000). Roberts, R.W. & Szostak, J.W. RNA-peptide fusions for the in vitro selection of peptides and proteins. Proc. Natl. Acad. Sci. USA 94, 12297-12302 (1997). Robyr, D., Suka, Y., Xenarios, I., Kurdistani, S.K., Wang, A., Suka, N. & Grunstein, M. Microarray deacetylation maps determine genome-wide functions for yeast histone deacetylases. Cell 109, 437-446 (2002). Robzyk, K. & Kassir, Y. A simple and highly efficient procedure for rescuing autonomous plasmids from yeast. Nucleic Acids Res. 20, 3790 (1992). Rual, J.F., Venkatesan, K., Hao, T., Hirozane-Kishikawa, T., Dricot, A., Li, N., Berriz, G.F., Gibbons, F.D., Dreze, M., Ayivi-Guedehoussou, N. et al. Towards a proteome-scale map of the human protein-protein interaction network. Nature 437, 1173-1178 (2005). Sadygov, R.G., Cociorva, D. & Yates, J.R. 3rd. Large-scale database searching using tandem mass spectra: looking up the answer in the back of the book. Nat. Methods. 1, 195-202 (2004). Saghatelian, A. & Cravatt, B.F. Global strategies to integrate the proteome and metabolome. Curr. Opin. Chem. Biol. 9, 62-68 (2005). Sakai, J., Ishikawa, H., Kojima, S., Satoh, H., Yamamoto, S. & Kanaoka, M. Proteomic analysis of rat heart in ischemia and ischemia-reperfusion using fluorescence two-dimensional difference gel electrophoresis. Proteomics 3, 1318-1324 (2003). Samy, T.S., Hahm, K.S., Modest, E.J., Lampman, G.W., Keutmann, H.T., Umezawa, H., Herlihy, W.C., Gibson, B.W., Carr, S.A. & Biemann, K. Primary structure of macromomycin, an antitumor antibiotic protein. J. Biol. Chem. 258, 183-191 (1983). Sano, T. & Cantor, C.R. Expression of a cloned streptavidin gene in Escherichia coli. Proc. Natl. Acad. Sci. USA 87, 142-146 (1990). Santoni, V., Molloy, M. & Rabilloud, T. Membrane proteins and proteomics: un amour impossible? Electrophoresis 21, 1054-1070 (2000). Sawata, S.Y. & Taira, K. Modified peptide selection in vitro by introduction of a protein-RNA interaction. Protein Eng. 16, 1115-1124 (2003). Schena, M., Shalon, D., Davis, R.W. & Brown, P.O. Quantitative monitoring of gene expression patterns with a complementary DNA microarray. Science 270, 467-470 (1995).
167
Schulenberg, B. & Patton, W. F. Combining microscale solution-phase isoelectric focusing with Multiplexed Proteomics dye staining to analyze protein post-translational modifications. Electrophoresis 25, 2539-2544 (2004). Seike, M., Kondo, T., Fujii, K., Yamada, T., Gemma, A., Kudoh, S. & Hirohashi, S. Proteomic signature of human cancer cells. Proteomics 4, 2776-2788 (2004). Shaw, J., Rowlinson, R., Nickson, J., Stone, T., Sweet, A., Williams, K. & Tonge, R. Evaluation of saturation labelling two-dimensional difference gel electrophoresis fluorescent dyes. Proteomics 3, 1181-1195 (2003). Shen, Y., Jacobs, J.M., Camp, D.G. 2nd, Fang, R., Moore, R.J., Smith, R.D., Xiao, W., Davis, R.W. & Tompkins, R.G. Ultra-high-efficiency strong cation exchange LC/RPLC/MS/MS for high dynamic range characterization of the human plasma proteome. Anal. Chem. 76, 1134-1144 (2004). Shenton, D. & Grant, C.M. Protein S-thiolation targets glycolysis and protein synthesis in response to oxidative stress in the yeast Saccharomyces cerevisiae. Biochem. J. 374, 513-519 (2003). Shevchenko, A., Wilm, M., Vorm, O. & Mann, M. Mass spectrometric sequencing of proteins from silver-stained polyacrylamide gels. Anal. Chem. 68, 850-858 (1996). Silver, S. & Phung, L.T. Bacterial heavy metal resistance: new surprises. Annu. Rev. Microbiol. 50, 753-789 (1996). Sitek, B., Apostolov, O., Stuhler, K., Pfeiffer, K., Meyer, H.E., Eggert, A. & Schramm, A. Identification of dynamic proteome changes upon ligand activation of Trk-receptors using two-dimensional fluorescence difference gel electrophoresis and mass spectrometry. Mol. Cell. Proteomics 4, 291-299 (2005). Sluszny, C. & Yeung, E.S. One- and two-dimensional miniaturized electrophoresis of proteins with native fluorescence detection. Anal. Chem. 76, 1359-1365 (2004). Smith, G.P. Filamentous fusion phage: novel expression vectors that display cloned antigens on the virion surface. Science 228, 1315-1317 (1985). Smolka, M., Zhou, H. & Aebersold, R. Quantitative protein profiling using two-dimensional gel electrophoresis, isotope-coded affinity tag labeling, and mass spectrometry. Mol. Cell Proteomics. 1, 19-29 (2002). Speers, A.E., Adam, G.C. & Cravatt, B.F. Activity-based protein profiling in vivo using a copper(i)-catalyzed azide-alkyne [3 + 2] cycloaddition. J. Am. Chem. Soc. 125, 4686-4687 (2003). Speight, R.E., Hart, D.J., Sutherland, J.D. & Blackburn, J.M. A new plasmid display technology for the in vitro selection of functional phenotype-genotype linked proteins. Chem. Biol. 8, 951-965 (2001).
168
Stasyk, T., Morandell, S., Bakry, R., Feuerstein, I., Huck, C.W., Stecher, G., Bonn, G.K. & Huber, L.A. Quantitative detection of phosphoproteins by combination of two-dimensional difference gel electrophoresis and phosphospecific fluorescent staining. Electrophoresis 26, 2850-2854 (2005). Steinberg, T.H., Pretty On Top, K., Berggren, K.N., Kemper, C., Jones, L., Diwu, Z., Haugland, R.P. & Patton, W.F. Rapid and simple single nanogram detection of glycoproteins in polyacrylamide gels and on electroblots. Proteomics 1, 841-855 (2001). Steinberg, T.H., Agnew, B.J., Gee, K.R., Leung, W.Y., Goodman, T., Schulenberg, B., Hendrickson, J., Beechem, J.M., Haugland, R.P. & Patton, W.F. Global quantitative phosphoprotein analysis using Multiplexed Proteomics technology. Proteomics 3, 1128-1144 (2003). Stelzl, U., Worm, U., Lalowski, M., Haenig, C., Brembeck, F.H., Goehler, H., Stroedicke, M., Zenkner, M., Schoenherr, A., Koeppen, S. et al. A human protein-protein interaction network: a resource for annotating the proteome. Cell 122, 957-968 (2005). Stemmann, O., Zou, H., Gerber, S.A., Gygi, S.P. & Kirschner, M.W. Dual inhibition of sister chromatid separation at metaphase. Cell 107,715-726 (2001). Sumner, E.R., Shanmuganathan, A., Sideri, T.C., Willetts, S.A., Houghton, J.E. & Avery, S.V. Oxidative protein damage causes chromium toxicity in yeast. Microbiology 151, 1939-1948 (2005). Swaminathan, S. & Sunnerhagen, P. Degradation of Saccharomyces cervisiae Rck2 upon exposure of cells to high levels of zinc is dependent on Pep4. Mol. Genet. Genomics 273, 433-439 (2005). Tamai, K.T., Gralla, E.B., Ellerby, L.M., Valentine, J.S. & Thiele, D.J. Yeast and mammalian metallothioneins functionally substitute for yeast copper-zinc superoxide dismutase. Proc. Natl. Acad. Sci. USA 90, 8013-8017 (1993). Tan, E.L., Panicker, R.C., Chen, G.Y.J. & Yao, S.Q. A proteomic strategy for the identification of caspase-associating proteins. Chem. Commun. 596-598 (2005). Tanaka, K. The origin of macromolecule ionization by laser irradiation (Nobel lecture). Angew. Chem. Int. Ed. 42, 3860-3870 (2003). Temple, M.D., Perrone, G.G. & Dawes, I.W. Complex cellular responses to reactive oxygen species. Trends Cell Biol. 15, 319-326 (2005). Tian, Q., Stepaniants, S.B., Mao, M., Weng, L., Feetham, M.C., Doyle, M.J., Yi, E.C., Dai, H., Thorsson, V., Eng, J. et al. Integrated genomic and proteomic analyses of gene expression in Mammalian cells. Mol. Cell. Proteomics 3, 960-969 (2004).
169
Tonge, R., Shaw, J., Middleton, B., Rowlinson, R., Rayner, S., Young, J., Pognan, F., Hawkins, E., Currie, I. & Davison, M. Validation and development of fluorescence two-dimensional differential gel electrophoresis proteomics technology. Proteomics 1,377-396 (2001). Tonks, N.K. Characterization of Protein (Tyrosine) Phosphatases in Protein Phosphorylation: A Practical Approach. Eds. Hardie, D.G., IRL Press, 231–252 (1993). Tonks, N.K. & Neel, B.G. Combinatorial control of the specificity of protein tyrosine phosphatases. Curr. Opin. Cell Biol. 13, 182-195 (2001). Tost, J. & Gut, I.G. Genotyping single nucleotide polymorphisms by MALDI mass spectrometry in clinical applications. Clin. Biochem. 38, 335-350 (2005). Turecek, F. Mass spectrometry in coupling with affinity capture-release and isotope-coded affinity tags for quantitative protein analysis. J. Mass Spectrom. 37, 1-14 (2002). Tyers, M. & Mann, M. From genomics to proteomics. Nature 422, 193 - 197 (2003). Uetz, P., Giot, L., Cagney, G., Mansfield, T.A., Judson, R.S., Knight, J.R., Lockshon, D., Narayan, V., Srinivasan, M., Pochart, P. et al. A comprehensive analysis of protein-protein interactions in Saccharomyces cerevisiae. Nature 403, 623-627 (2000). Unlu, M., Morgan, M.E. & Minden, J.S. Difference gel electrophoresis: a single gel method for detecting changes in protein extracts. Electrophoresis 18, 2071-2077 (1997). Uren, A.G., O'Rourke, K., Aravind, L.A., Pisabarro, M.T., Seshagiri, S., Koonin, E.V. & Dixit, V.M. Identification of paracaspases and metacaspases: two ancient families of caspase-like proteins, one of which plays a key role in MALT lymphoma. Mol. Cell 6, 961-967 (2000). Uttamchandani, M., Walsh, D.P., Khersonsky, S.M., Huang, X., Yao, S.Q. & Chang, Y.T. Microarrays of tagged combinatorial triazine libraries in the discovery of small-molecule ligands of human IgG. J. Comb. Chem. 6, 862-868 (2004). Van den Bergh, G. & Arckens, L. Fluorescent two-dimensional difference gel electrophoresis unveils the potential of gel-based proteomics. Curr. Opin. Biotechnol. 15, 38-43 (2004). Van den Bergh, G., Clerens, S., Vandesande, F. & Arckens, L. Reversed-phase high-performance liquid chromatography prefractionation prior to two-dimensional difference gel electrophoresis and mass spectrometry identifies new differentially expressed proteins between striate cortex of kitten and adult cat. Electrophoresis 24, 1471-1481 (2003).
170
Venter, J.C., Adams, M.D., Myers, E.W., Li, P.W., Mural, R.J., Sutton, G.G., Smith, H.O., Yandell, M., Evans, C.A., Holt, R.A. et al. The sequence of the human genome. Science 291, 1304-1351 (2001). Vertegaal, A.C., Ogg, S.C., Jaffray, E., Rodriguez, M.S., Hay, R.T., Andersen, J.S., Mann, M. & Lamond, A.I. A proteomic study of SUMO-2 target proteins. J. Biol. Chem. 279, 33791-33798 (2004). Videlock, E.J., Chung, V.K., Mohan, M.A., Strok, T.M. & Austin, D.J. Two-dimensional diversity: screening human cDNA phage display libraries with a random diversity probe for the display cloning of phosphotyrosine binding domains. J. Am. Chem. Soc. 126, 3730-3731 (2004). Vido, K., Spector, D., Lagniel, G., Lopez, S., Toledano, M.B. & Labarre, J. A proteome analysis of the cadmium response in Saccharomyces cerevisiae. J. Biol. Chem. 276, 8469-8474 (2001). von Mering, C., Krause, R., Snel, B., Cornell, M., Oliver, S.G., Fields, S. & Bork, P. Comparative assessment of large-scale data sets of protein-protein interactions. Nature 417, 399-403 (2002). Wadskog, I., Maldener, C., Proksch, A., Madeo, F. & Adler, L. Yeast lacking the SRO7/SOP1-encoded tumor suppressor homologue show increased susceptibility to apoptosis-like cell death on exposure to NaCl stress. Mol. Biol. Cell 15, 1436-1444 (2004). Wang, G. & Yao, S.Q. Combinatorial synthesis of a small-molecule library based on the vinyl sulfone scaffold. Org. Lett. 5, 4437-4440 (2003). Wang, S. & Regnier, F.E. Proteomics based on selecting and quantifying cysteine containing peptides by covalent chromatography. J. Chromatogr. A 924, 345-357 (2001). Wang, W.Q., Sun, J.P. & Zhang, Z.Y. An overview of the protein tyrosine phosphatase superfamily. Curr. Top. Med. Chem. 3, 739-748 (2003). Waterston, R.H., Lindblad-Toh, K., Birney, E., Rogers, J., Abril, J.F., Agarwal, P., Agarwala, R., Ainscough, R., Alexandersson, M., An, P. et al. Initial sequencing and comparative analysis of the mouse genome. Nature 420, 520-562 (2002). Watson, J.D. & Cook-Deegan, R.M. Origins of the Human Genome Project. FASEB J. 5, 8-11 (1991). Wehrman, T., Kleaveland, B., Her, J.H., Balint, R.F. & Blau, H.M. Protein-protein interactions monitored in mammalian cells via complementation of beta -lactamase enzyme fragments. Proc. Natl. Acad. Sci. USA 99, 3469-3474 (2002). Wei, J.P., Srinivasan, C., Han, H., Valentine, J.S. & Gralla, E.B. Evidence for a novel role of copper-zinc superoxide dismutase in zinc metabolism. J. Biol. Chem. 276, 44798-44803 (2001).
171
Weng, S., Gu, K., Hammond, P.W., Lohse, P., Rise, C., Wagner, R.W., Wright, M.C. & Kuimelis, R.G. Generating addressable protein microarrays with PROfusion covalent mRNA-protein fusion technology. Proteomics 2, 48-57 (2002). Wiechert, W. & Noh, K. From stationary to instationary metabolic flux analysis. Adv. Biochem. Eng. Biotechnol. 92, 145-172 (2005). Winssinger, N., Damoiseaux, R., Tully, D.C., Geierstanger, B.H., Burdick, K. & Harris, J.L. PNA-encoded protease substrate microarrays. Chem. Biol. 11, 1351-1360 (2004). Wilson, T. & Hastings, J.W. Bioluminescence. Annu. Rev. Cell Dev. Biol. 14, 197-230 (1998). Xavier, S., Yamada, K., Samuni, A.M., Samuni, A., DeGraff, W., Krishna, M.C. & Mitchell, J.B. Differential protection by nitroxides and hydroxylamines to radiation-induced and metal ion-catalyzed oxidative damage. Biochim. Biophys. Acta 1573, 109-120 (2002). Yan, J.X., Devenish, A.T., Wait, R., Stone, T., Lewis, S. & Fowler, S. Fluorescence two-dimensional difference gel electrophoresis and mass spectrometry based proteomic analysis of Escherichia coli. Proteomics 2, 1682-1698 (2002). Yarmolinsky, M.B. Programmed cell death in bacterial populations. Science 267, 836-837 (1995). Yeargin, J. & Haas, M. Elevated levels of wild-type p53 induced by radiolabeling of cells leads to apoptosis or sustained growth arrest. Curr. Biol. 5, 423-431 (1995). Yeo, D.S., Panicker, R.C., Tan, L.P. & Yao, S.Q. Strategies for immobilization of biomolecules in a microarray. Comb. Chem. High Throughput Screen. 7, 213-221 (2004). Yin, J., Liu, F., Schinke, M., Daly, C. & Walsh, C.T. Phagemid encoded small molecules for high throughput screening of chemical libraries. J. Am. Chem. Soc. 126, 13570-13571 (2004). Yu, J., Hu, S., Wang, J., Wong, G.K., Li, S., Liu, B., Deng, Y., Dai, L., Zhou, Y., Zhang, X. et al. A draft sequence of the rice genome (Oryza sativa L. ssp. indica). Science 296, 79-92 (2002). Zhang, R. & Regnier, F. E. Minimizing resolution of isotopically coded peptides in comparative proteomics. J. Proteome Res. 1, 139-147 (2002). Zhang, R., Sioma, C.S., Wang, S. & Regnier, F.E. Fractionation of isotopically labeled peptides in quantitative proteomics. Anal. Chem. 73, 5142-5149 (2001).
172
Zhou, G., Li, H., DeCamp, D., Chen, S., Shu, H., Gong, Y., Flaig, M., Gillespie, J.W., Hu, N., Taylor, P.R., Emmert-Buck, M.R., Liotta, L.A., Petricoin, E.F. 3rd & Zhao, Y. 2D differential in-gel electrophoresis for the identification of esophageal scans cell cancer-specific protein markers. Mol. Cell. Proteomics 1, 117-124 (2002). Zhou, H., Ranish, J.A., Watts, J.D. & Aebersold, R. Quantitative proteome analysis by solid-phase isotope tagging and mass spectrometry. Nat. Biotechnol. 20, 512-515 (2002). Zhou, J. M., Fujita, S., Warashina, M., Baba, T. & Taira, K. A novel strategy by the action of ricin that connects phenotype and genotype without loss of the diversity of libraries. J. Am. Chem. Soc. 124, 538-543 (2002). Zhu, H., Bilgin, M., Bangham, R., Hall, D., Casamayor, A., Bertone, P., Lan, N., Jansen, R., Bidlingmaier, S., Houfek, T., Mitchell, T., Miller, P., Dean, R.A., Gerstein, M. & Snyder, M. Global analysis of protein activities using proteome chips. Science 293, 2101-2105 (2001). Zhu, Q., Girish, A., Chattopadhaya, S. & Yao, S.Q. Developing novel activity-based fluorescent probes that target different classes of proteases. Chem. Commun. 1512-1513 (2004). Zhu, Q., Huang, X., Chen, G.Y.J. & Yao, S.Q. Activity-based fluorescent probes that targets phosphatases. Tetrahedron Lett. 44, 2669-2672 (2003). Zozulya, S., Lioubin, M., Hill, R.J., Abram, C. & Gishizky, M.L. Mapping signal transduction pathways by phage display. Nat. Biotechnol. 17, 1193-1198 (1999).
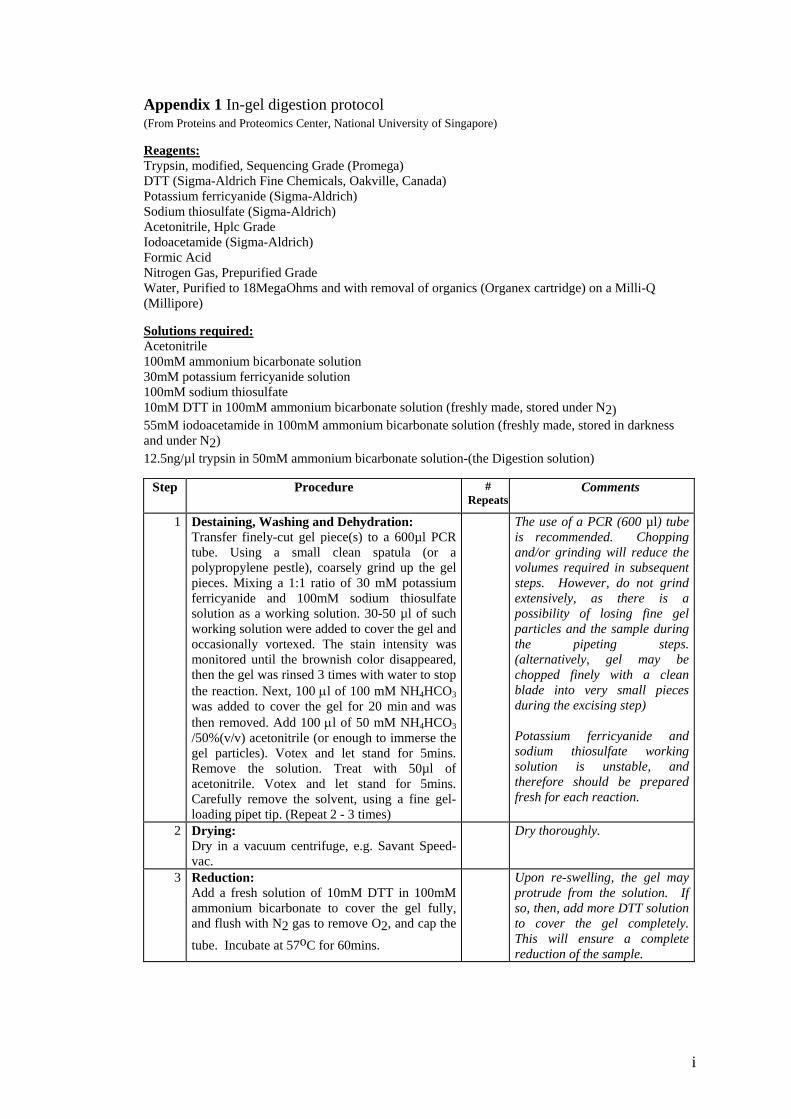
i
Appendix 1 In-gel digestion protocol
(From Proteins and Proteomics Center, National University of Singapore) Reagents: Trypsin, modified, Sequencing Grade (Promega) DTT (Sigma-Aldrich Fine Chemicals, Oakville, Canada) Potassium ferricyanide (Sigma-Aldrich) Sodium thiosulfate (Sigma-Aldrich) Acetonitrile, Hplc Grade Iodoacetamide (Sigma-Aldrich) Formic Acid Nitrogen Gas, Prepurified Grade Water, Purified to 18MegaOhms and with removal of organics (Organex cartridge) on a Milli-Q (Millipore) Solutions required: Acetonitrile 100mM ammonium bicarbonate solution 30mM potassium ferricyanide solution 100mM sodium thiosulfate 10mM DTT in 100mM ammonium bicarbonate solution (freshly made, stored under N2) 55mM iodoacetamide in 100mM ammonium bicarbonate solution (freshly made, stored in darkness and under N2) 12.5ng/µl trypsin in 50mM ammonium bicarbonate solution-(the Digestion solution)
Step Procedure # Repeats
Comments
1 Destaining, Washing and Dehydration: Transfer finely-cut gel piece(s) to a 600µl PCR tube. Using a small clean spatula (or a polypropylene pestle), coarsely grind up the gel pieces. Mixing a 1:1 ratio of 30 mM potassium ferricyanide and 100mM sodium thiosulfate solution as a working solution. 30-50 µl of such working solution were added to cover the gel and occasionally vortexed. The stain intensity was monitored until the brownish color disappeared, then the gel was rinsed 3 times with water to stop the reaction. Next, 100 µl of 100 mM NH4HCO3 was added to cover the gel for 20 min and was then removed. Add 100 µl of 50 mM NH4HCO3 /50%(v/v) acetonitrile (or enough to immerse the gel particles). Votex and let stand for 5mins. Remove the solution. Treat with 50µl of acetonitrile. Votex and let stand for 5mins. Carefully remove the solvent, using a fine gel-loading pipet tip. (Repeat 2 - 3 times)
The use of a PCR (600 µl) tube is recommended. Chopping and/or grinding will reduce the volumes required in subsequent steps. However, do not grind extensively, as there is a possibility of losing fine gel particles and the sample during the pipeting steps. (alternatively, gel may be chopped finely with a clean blade into very small pieces during the excising step) Potassium ferricyanide and sodium thiosulfate working solution is unstable, and therefore should be prepared fresh for each reaction.
2 Drying: Dry in a vacuum centrifuge, e.g. Savant Speed-vac.
Dry thoroughly.
3 Reduction: Add a fresh solution of 10mM DTT in 100mM ammonium bicarbonate to cover the gel fully, and flush with N2 gas to remove O2, and cap the
tube. Incubate at 57oC for 60mins.
Upon re-swelling, the gel may protrude from the solution. If so, then, add more DTT solution to cover the gel completely. This will ensure a complete reduction of the sample.
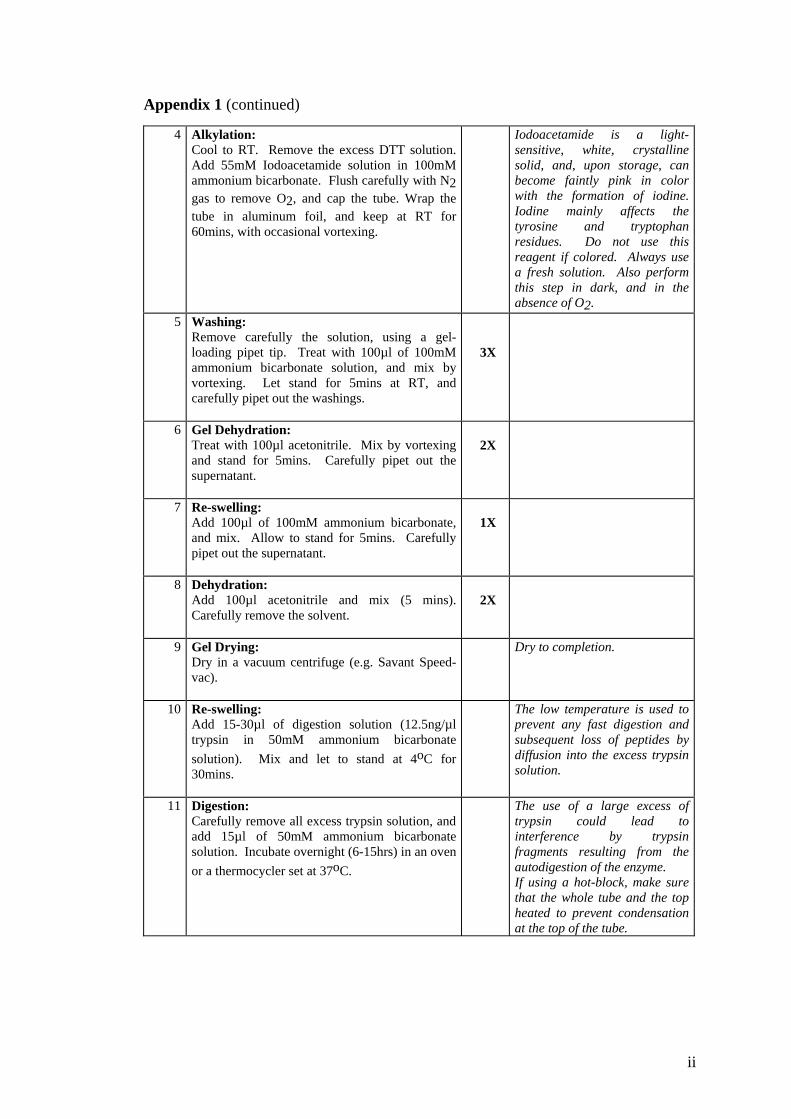
ii
Appendix 1 (continued)
4 Alkylation: Cool to RT. Remove the excess DTT solution. Add 55mM Iodoacetamide solution in 100mM ammonium bicarbonate. Flush carefully with N2 gas to remove O2, and cap the tube. Wrap the tube in aluminum foil, and keep at RT for 60mins, with occasional vortexing.
Iodoacetamide is a light-sensitive, white, crystalline solid, and, upon storage, can become faintly pink in color with the formation of iodine. Iodine mainly affects the tyrosine and tryptophan residues. Do not use this reagent if colored. Always use a fresh solution. Also perform this step in dark, and in the absence of O2.
5 Washing: Remove carefully the solution, using a gel-loading pipet tip. Treat with 100µl of 100mM ammonium bicarbonate solution, and mix by vortexing. Let stand for 5mins at RT, and carefully pipet out the washings.
3X
6 Gel Dehydration: Treat with 100µl acetonitrile. Mix by vortexing and stand for 5mins. Carefully pipet out the supernatant.
2X
7 Re-swelling: Add 100µl of 100mM ammonium bicarbonate, and mix. Allow to stand for 5mins. Carefully pipet out the supernatant.
1X
8 Dehydration: Add 100µl acetonitrile and mix (5 mins). Carefully remove the solvent.
2X
9 Gel Drying: Dry in a vacuum centrifuge (e.g. Savant Speed-vac).
Dry to completion.
10 Re-swelling: Add 15-30µl of digestion solution (12.5ng/µl trypsin in 50mM ammonium bicarbonate solution). Mix and let to stand at 4oC for 30mins.
The low temperature is used to prevent any fast digestion and subsequent loss of peptides by diffusion into the excess trypsin solution.
11 Digestion: Carefully remove all excess trypsin solution, and add 15µl of 50mM ammonium bicarbonate solution. Incubate overnight (6-15hrs) in an oven or a thermocycler set at 37oC.
The use of a large excess of trypsin could lead to interference by trypsin fragments resulting from the autodigestion of the enzyme. If using a hot-block, make sure that the whole tube and the top heated to prevent condensation at the top of the tube.
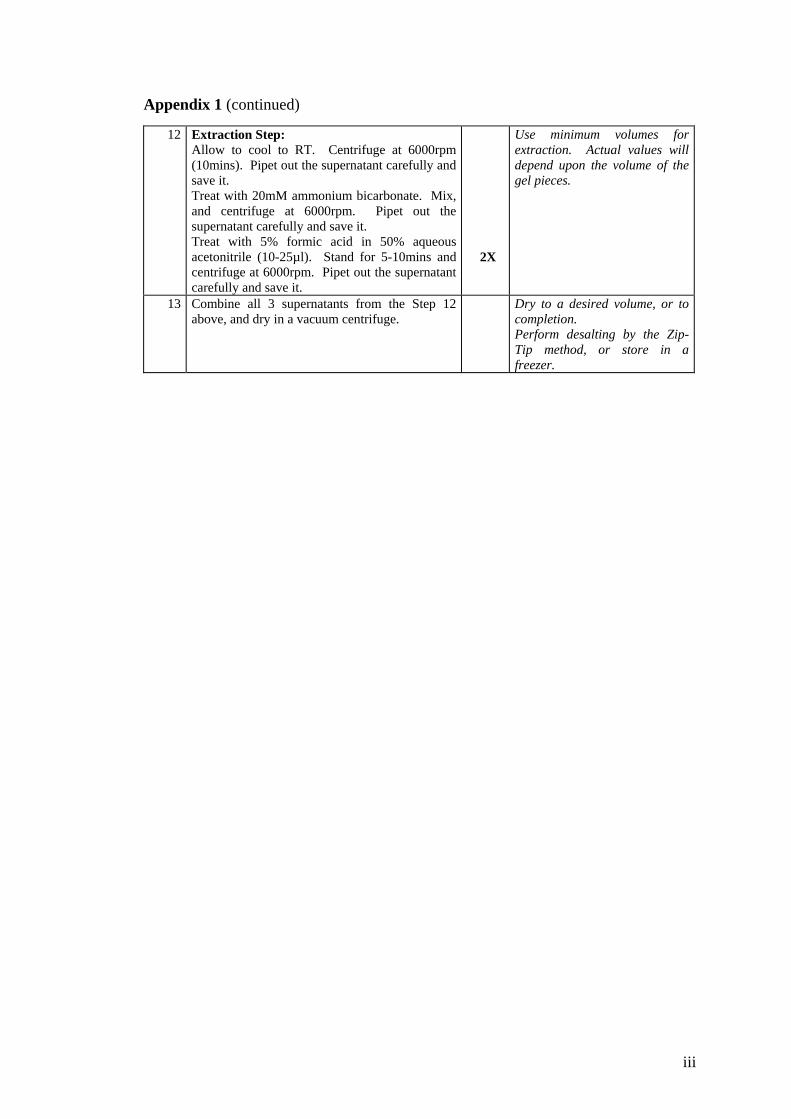
iii
Appendix 1 (continued)
12 Extraction Step: Allow to cool to RT. Centrifuge at 6000rpm (10mins). Pipet out the supernatant carefully and save it. Treat with 20mM ammonium bicarbonate. Mix, and centrifuge at 6000rpm. Pipet out the supernatant carefully and save it. Treat with 5% formic acid in 50% aqueous acetonitrile (10-25µl). Stand for 5-10mins and centrifuge at 6000rpm. Pipet out the supernatant carefully and save it.
2X
Use minimum volumes for extraction. Actual values will depend upon the volume of the gel pieces.
13 Combine all 3 supernatants from the Step 12 above, and dry in a vacuum centrifuge.
Dry to a desired volume, or to completion. Perform desalting by the Zip-Tip method, or store in a freezer.
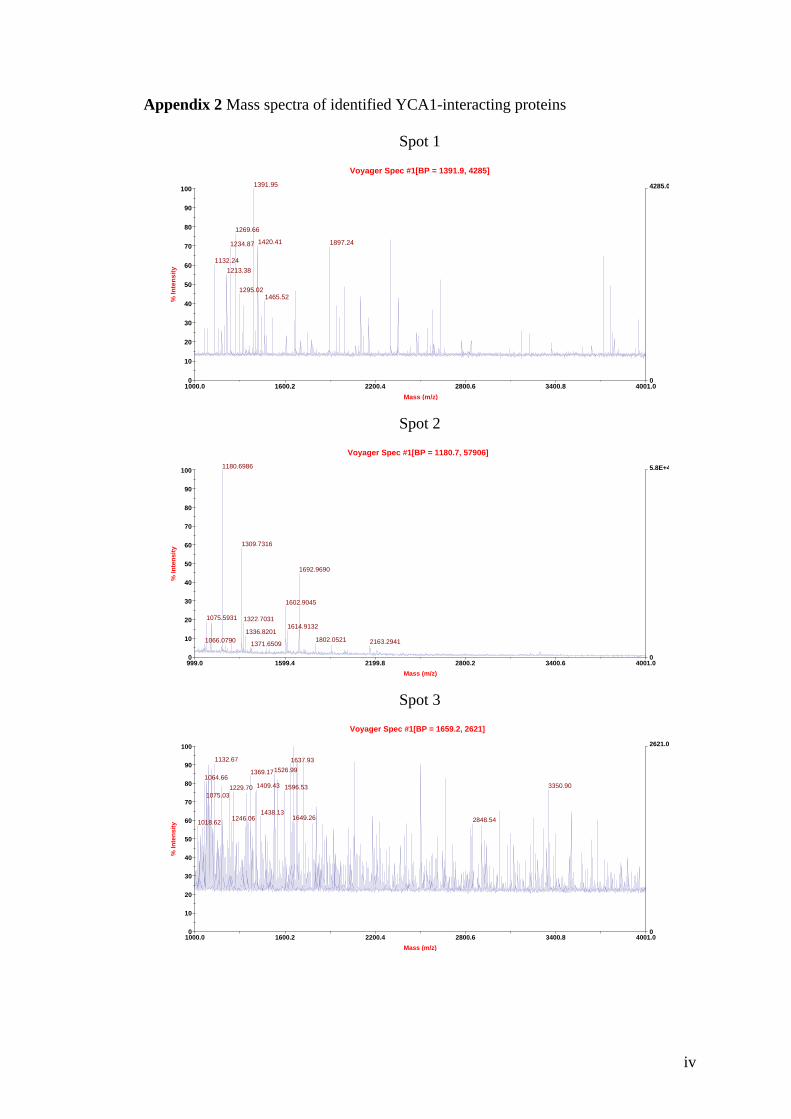
iv
Appendix 2 Mass spectra of identified YCA1-interacting proteins
Spot 1
Spot 2
Spot 3
1000.0 1600.2 2200.4 2800.6 3400.8 4001.0Mass (m/z)
0
2621.0
0
10
20
30
40
50
60
70
80
90
100
% In
tens
ity
Voyager Spec #1[BP = 1659.2, 2621]
1132.67 1637.931526.991369.17
1064.661409.43 3350.901596.531229.70
1075.03
1438.131649.261246.06 2848.541018.62
999.0 1599.4 2199.8 2800.2 3400.6 4001.0Mass (m/z)
0
5.8E+4
0
10
20
30
40
50
60
70
80
90
100
% In
tens
ity
Voyager Spec #1[BP = 1180.7, 57906]1180.6986
1309.7316
1692.9690
1602.9045
1075.5931 1322.70311614.9132
1336.82011802.05211066.0790 2163.29411371.6509
1000.0 1600.2 2200.4 2800.6 3400.8 4001.0Mass (m/z)
0
4285.0
0
10
20
30
40
50
60
70
80
90
100
% In
tens
ityVoyager Spec #1[BP = 1391.9, 4285]
1391.95
1269.66
1420.41 1897.241234.87
1132.241213.38
1295.021465.52
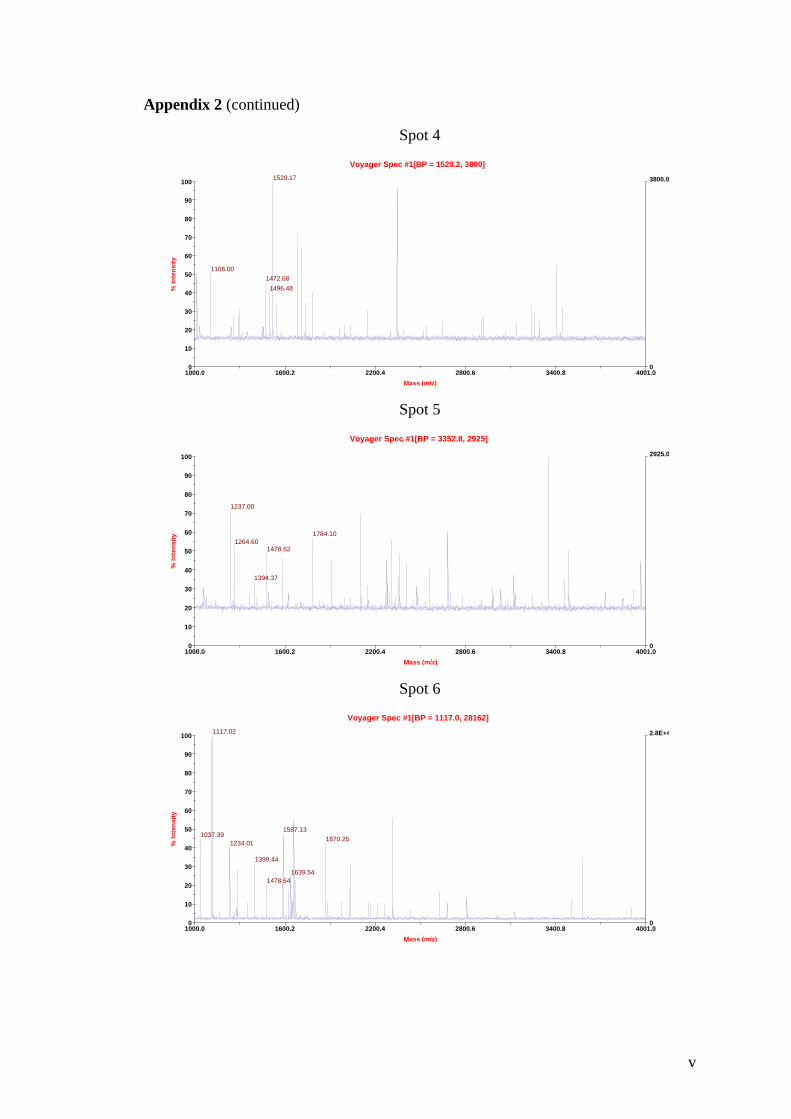
v
Appendix 2 (continued)
Spot 4
Spot 5
Spot 6
1000.0 1600.2 2200.4 2800.6 3400.8 4001.0Mass (m/z)
0
2.8E+4
0
10
20
30
40
50
60
70
80
90
100
% In
tens
ity
Voyager Spec #1[BP = 1117.0, 28162]1117.02
1587.131037.39 1870.251234.01
1399.44
1639.541478.64
1000.0 1600.2 2200.4 2800.6 3400.8 4001.0Mass (m/z)
0
2925.0
0
10
20
30
40
50
60
70
80
90
100
% In
tens
ity
Voyager Spec #1[BP = 3352.8, 2925]
1237.00
1784.101264.60
1478.62
1394.37
1000.0 1600.2 2200.4 2800.6 3400.8 4001.0Mass (m/z)
0
3800.0
0
10
20
30
40
50
60
70
80
90
100%
Inte
nsity
Voyager Spec #1[BP = 1520.2, 3800]1520.17
1106.001472.68
1496.48
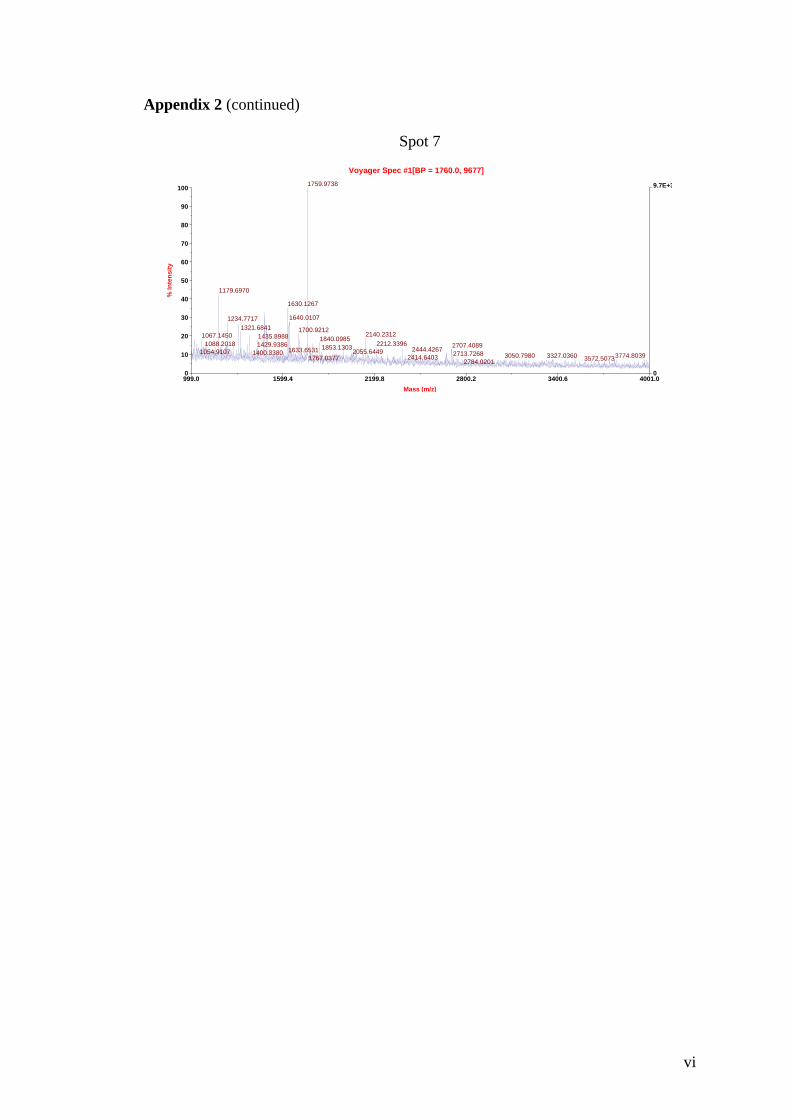
vi
Appendix 2 (continued)
Spot 7
999.0 1599.4 2199.8 2800.2 3400.6 4001.0Mass (m/z)
0
9.7E+3
0
10
20
30
40
50
60
70
80
90
100
% In
tens
ityVoyager Spec #1[BP = 1760.0, 9677]
1759.9738
1179.6970
1630.1267
1640.01071234.77171321.6841 1700.9212
2140.23121067.1450 1435.8988 1840.09852212.33961088.2018 1429.9386 2707.40891853.1303 2444.42671633.6531 2055.64491054.9107 1400.3380 2713.7268 3050.7980 3774.80393327.03602414.64031767.0377 3572.50732784.0201

vii
Appendix 3 Sequence of the gene selected from the DNA library containing 96 yeast ORFs YBR267W
viii
Appendix 4 Sequences of the genes selected from the DNA library containing 96 yeast ORFs YPR073C
ix
Appendix 4 (continued) YFR028C
x
Appendix 4 (continued) YBR267W
xi
Appendix 4 (continued) YPR073C
xii
Appendix 4 (continued) YDL230W NCATTTATTGGGTAAATTCAAGTTCATACAGAATCAAGAAGACGGCAGANGAAGGGAAGCTACAAACGGAACGGTGAATTCACGATGGTCGTTGGGGGTCAGCATAGAACCTCGTAACGATAGCTAGAAACAGATACGTTAACATTATGCCGTATGAGAGGAACCGCGTTCATTTGAAGACTCTATCCGGGAATGATTACATTAATGCCTCGTATGTCAAAGTGAACGTGCCAGGGCAGANCATCGAACCGGGCTACTATATTGCTACTCAAGGTCCCACGCGTAAAACTTGGGATCAGTTTTGGCAAATGTGCTATCACAATTGTCCTTTANACAATATTGTCATTGTGATGGTCACGCCTCTGGTAGAATACAATAGGGAGAAGTGCTACCAGTACTGGCCTCGCGGTGGTGTANACNATACGGTTANAAATAGCATCAAAATGGGAAAGTCCGGGGCGGCGCCAATGATATGACTCAATTTCCCTCTGATTTGNAAATAGAGTTTTGTTANCGTACATAGGGTGAAGGANTATTATACGGTCACCGATTTCAAANTCCACCCCCNNCGGGACCCTTCTTGNANGGACCTGTNCAAAACTGTTTCCCCACTTTTTACTTCGAACCTTTTGGAAAGAATATGCACANCCCNGAGGGAGNTAGTCCCCATTAANGGGAATTTNGGCCCTCCCCTNCCACNNCNTTGAATTTCNNCGGGNAACCCCNTNTNNNNTANCGTGTTCCCCCAGGCGGGGGCNAAAAAGGGGAACTTNTNTTNCCTTNAACNCNCCNNGGCNGANCCTNGGNTTTTAAAAANATTCCGAAGGGTCANNGCTTTCANCANGGNNTCAANAGNGATTCACCGGNNTTTNTNAANAAANTCGTTTTNTTTCNCCCCNAAAAGNAANGGGTTNAANAANGATCTTNCTTCTTTCCCANGCCNNAGTTTNAANTTTCTCGNCCNGNTGTGGNNTCCCNGGCNNAAAANACCCNGANGNGCNCNTTGNAGNGTTGCTTTCGTNG YPR073C GCGGCATGGGAATTCCCGNCNTATGNGGGAGNGANCCNTNGATTGGGTAACCTCTGTAGATCACCAATGGCGGAAGCCATTTTCAAACATGAAGTCGAAAAGGCTAATCTAGAAAATCGATTCAACAAGATTGATTCATTTGGCACTTCTAATTATCATGTGGGGGAAAGCCCTGATCATCGTACAGTGTCCATTTGTAAGCAACATGGCGTCAAGATTAATCATAAAGGGAAACAAATAAAGACCAAACACTTCGATGAATATGACTATATAATCGGTATGGATGAATCCAACATTAATAACCTAAAAAAAATACAACCTGAAGGTTCTAAAGCTAAAGTTTGCCTTTTTGGTGATTGGAATACTAATGATGGCACTGTGCAGACCATTATTGAAGATCCTTGGTATGGTGACATACAAGATTTCGAGTACAACTTCAAACAAATCACCTATTTCTCCAAACAGTTTTTAAAAAAAGAGTTATGGCANGGCAATTCCCGGGGATGCGGAANACCNCCCCCCANNNNNNNNNNNNNGNNNNNNNNNNNNNNNNNNNNNNN YBR267W CTGTCTCCNCGAGGGNTNNCTCCCTGACCTGGCCATNCCCTNTTTGNCAGAAAATGAGGAGAACAAGGAAAAGGAAGAACCTAAGAAGGAGGAGCCTGAACAGTTGACCGAGGAAGAAATGGCGGAAAGAGTAATGCAAGAAAAGCTACGCAACAGAGTCANATATTCCACTGGAACAATGTCTATTTTGTGAGCACAATANNCACTTCAAAGATGTTGAAGAAAACCTGGATCACATGTTTNGGACCCACGGGTTTTATATCCCAGAACAGAAATATCTNGTCGACAAGATCGGCTTGGTAAAATACATGTCGGAGAAGATTGGTCTTGGGAACATTTGTATTGTTTGTAATTACCAGGGGAGAACGTTGACCGCTGTNAGACAGCACATGTTGGCAAAGAGACACTGTAAAATTCCCTACGAAAGCGAGGATGAAAGGTTGGAGATATCTNAATTCTACGATTTTACAAGCTCATACGCAAACTTTAATAGCAACACANCACCAGACAACGAAGATGACTGGGAAGACGTGGGCAGCGACGAACCCGGAAGCGACNACGAAAATCTGCCCCANGAGTNCTTNTATAACGNTGGGTTTTGGNGCTGCANCTNCCCGNNGGNCATCAAAGTTGGCCNACGGTCCCTTGCAAAGATCCTACNAGCAAGACTTTAAGCCCGGGGGGNNTCNTGACCGAAGGCCANGGNNCCCTNGGTCCCTGCAAAAACAAATTCNTTNTTTCCCGCCTTCGNAAAAAGGGGGNGCAACTCCCNCCGNGTTTNGNAAACNGANNGGTNCCCNNANAAAGGNNTANAAANANGNNCCAATTNCCCAAACCCACCCCCNTCCGGNACCCGTTTTNGGNGGGGGNGGCNTTNCCCGGGNAGGNGGAAAACCCCCCCANNNTGNTCCTCTNTTTNCGGNGTNTNTTTNTNTCTNNTTGNNNGNNNNNNNCTNNTTNNCNNTNCTCGNCTGNGNGNNNNNTNTTTTNNNGNGNGNCCCTCTNGTNGCGCNCNNNTNGNGNNNCNCNGNNTANGNNNNCAGNNTNAGTNCTCNCCGNCCNCNCCNNCAGNNNNCNCC
xiii
Appendix 4 (continued) YBR267W CCGTCGAGANGGAAAGNCTNCCTGNCCTGGCNCTNCNCNNNNNGNNAGGAAAGATGAGNNGNACAAGGAAAAGGGAGAACCTAAGAAGGAGGAGCCTGAACAGTTGACCGAGGAAGAAATGGCGGAAAGAGNAATGCAAGAAAAGCTACNCAACAGAGTCGATATTCCACTGGAACAATGTCTATTTTGTGAGCACAATAAGCACTTCAAAGATGTTGAAGAAAAGCTGGAACACATGTTTAGGACCCACGGGTTTTATATCCCAGAACAGAAATATCTAGTCGACGAGATCGGCTTGGTAAAATACATGTCGGAGAAGATTGGTCTTGGGAACATTTGTATTGTTTGTAATTACCAGGGGAGAACGTTGACCGCTGTAAGACAGCACATGTTGGCAAAGAGACACTGTAAAATTCCCTACGAAAGCGAGGATGAAAGGTTGGAGATATCTGAATTCTACGATTTTACAAGCTCATACGCAAACTTTAATAGCAACNCANCACCAGACAACGAAGATGACTGGGAAGACGTGGGCAGCGACNAANCCGGAAGCGACGACAAANATCTGCCACAAGAGTACTTATATAACGATGGTATAGAGCTGCATCTACCGACAGGCATCAAAGNTGGCCNCAGGTCCTTGCAAGATNNTACANGCAAGACTNAAGNCCCGGGGTGATACTGACCGANGGCCAGGTTCCCTGGTCNCTGCAAANNCAAATCTTTTTTTCCTGCCTTCNAAAAAAGGGGGNNCAACCCCACCGNGTGTTGGGCAANCTGANAGGTTCNANAAAAAAGGCNCATAAAAAANNCCAGTTTCTCANACCCCCNCNNAAAAACCANTTNGNGGGGGTGGNATNCNGGGGATNNNAANCCCCCNANNNNNNNNNNNNNNNGNNNNNNNNNNNNNNNNNNNNNNNNNNNTNNNNNNTN YDL230W ATTTATTGGGTAAATTCAAGTTCATACAGAATCAAGAAGACGGCAGATTAAGGGAAGCTACAAACGGAACGGTGAATTCACGATGGTCGTTGGGGGTCAGCATAGAACCTCGTAACGATGCTAGAAACAGATACGTTAACATTATGCCGTATGAGAGGAACCGCGTTCATTTGAAGACTCTATCCGGGAATGATTACATTAATGCCTCGTATGTCAGAGTGAACGTGCCAGGGCAGAGCATCGAACCGGGCTACTATATTGCTACTCAAGGTCCCACGCGTAAAACTTGGGATCAGTTTTGGCAAATGTGCTATCACAATTGTCCTTTAGACAATATTGTCATTGTGATGGTCACNCCTCTGGTAGAATACAATAGGGAGAAGTGCTACCAGTACTGGCCTCGCGGTGGTGTAGACGATACGGTTAGAATAGCATCAAAATGGGAAAGTCCGGGCGGCGCCAATGATATGACTCAATTTCCCTCTGATTTGAAAATAGAGTTTGTTAACGTACATAAGGTGAAGGACTATTATACGGTCACCGATATCAAACTCACACCCACGGACCCTCTTGTAGGACCTGTCAAAACTGTTCACCACTTTTACTTCGACCTTTGGAAAGATATGAANGAGCCCAGAGGAAGTAGTNCCCATANTGGAATTNTGCCCTCCCTCCCCCAGCTTGNATTCCCGCGGGANCCCATTNTCGTAACTGTTCCCCAGGGGGGGCAAAANGGGGACTTTCNTGCCCTAAACNTCCAGGGGGANCCTNGGATTTNAAAATTNACAAACGGTCAGGNTTCANNGGGCTCAAAAGAATANNCCGGGANTNNTCNANAATTNNTTNNTTNCCCCCAAAAAAAANGTTNAAAAAGATNTTCTNTTTTCCCGGGNCAAANTNANNNTTCNGAAAAGGGGGNNTCNGGGGGGNAAANCCCNANNNNNNNNNNCNAAANTNNNTTCNAANNNNGAANNNNNNANANANCCCTNNCCNCCGC

xiv
Appendix 5 DNA library containing 96 yeast ORFs
xv
Appendix 5 (continued)
xvi
Appendix 5 (continued)
xvii
Appendix 6 DNA library containing 384 yeast ORFs
xviii
Appendix 6 (continued)
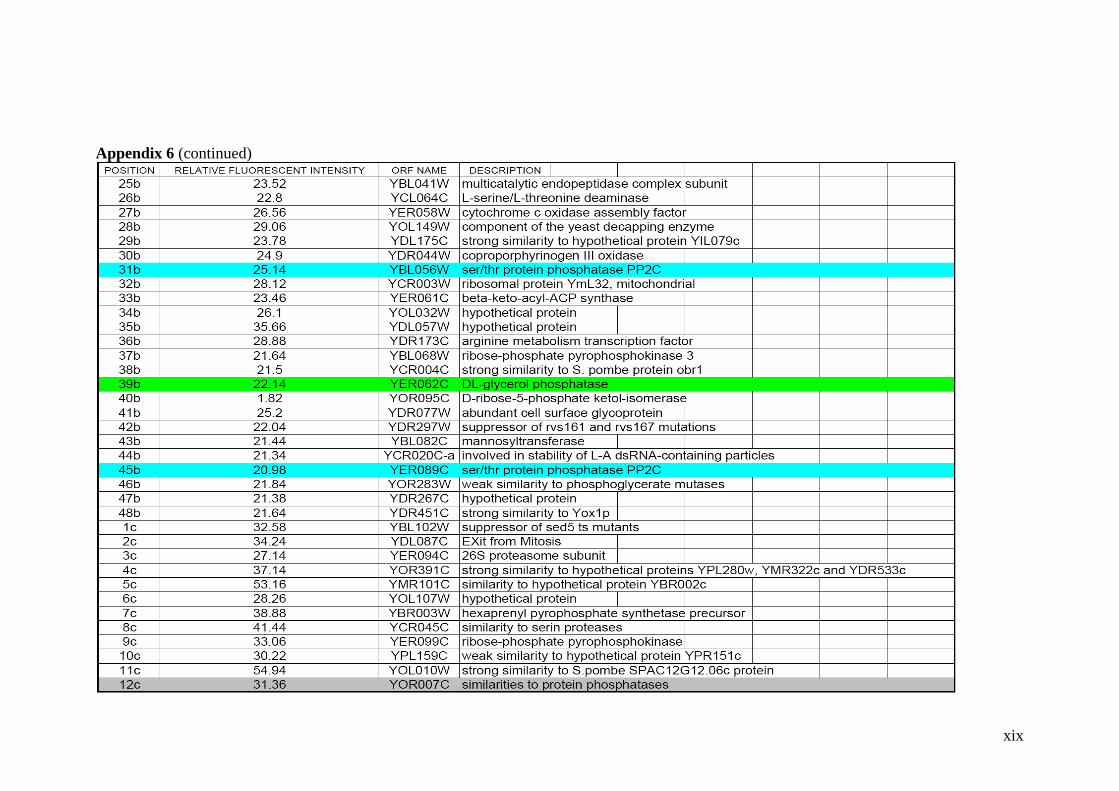
xix
Appendix 6 (continued)
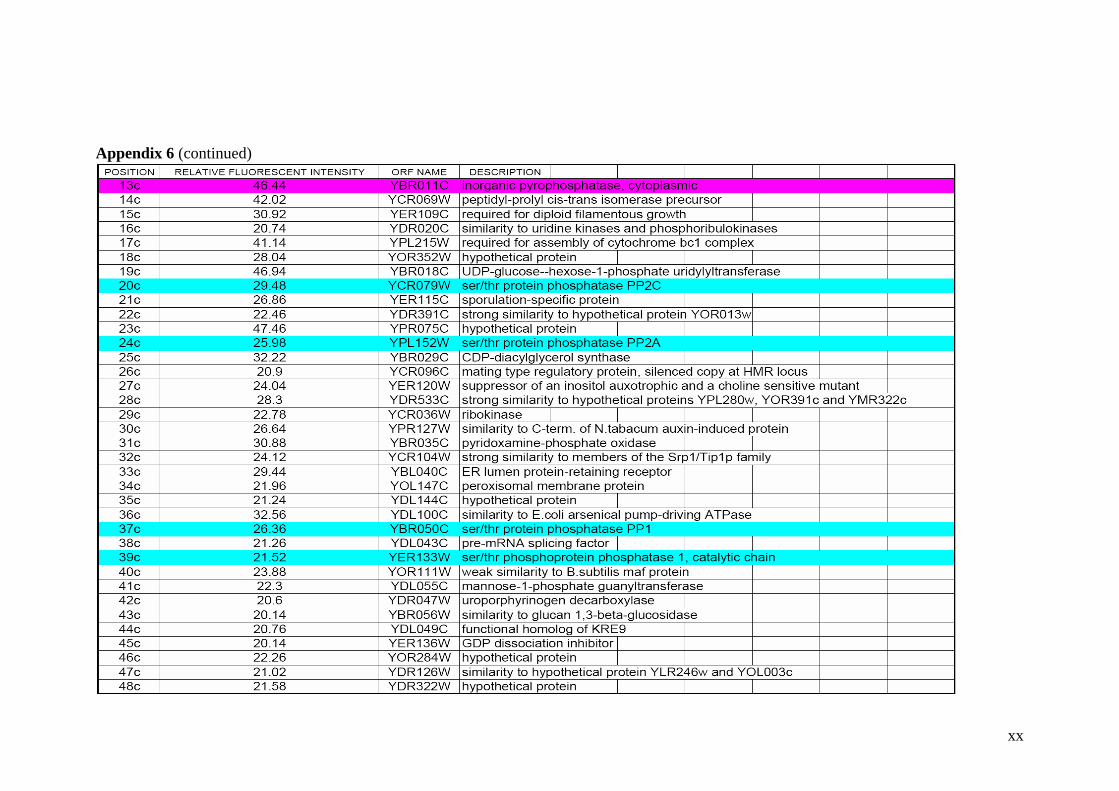
xx
Appendix 6 (continued)
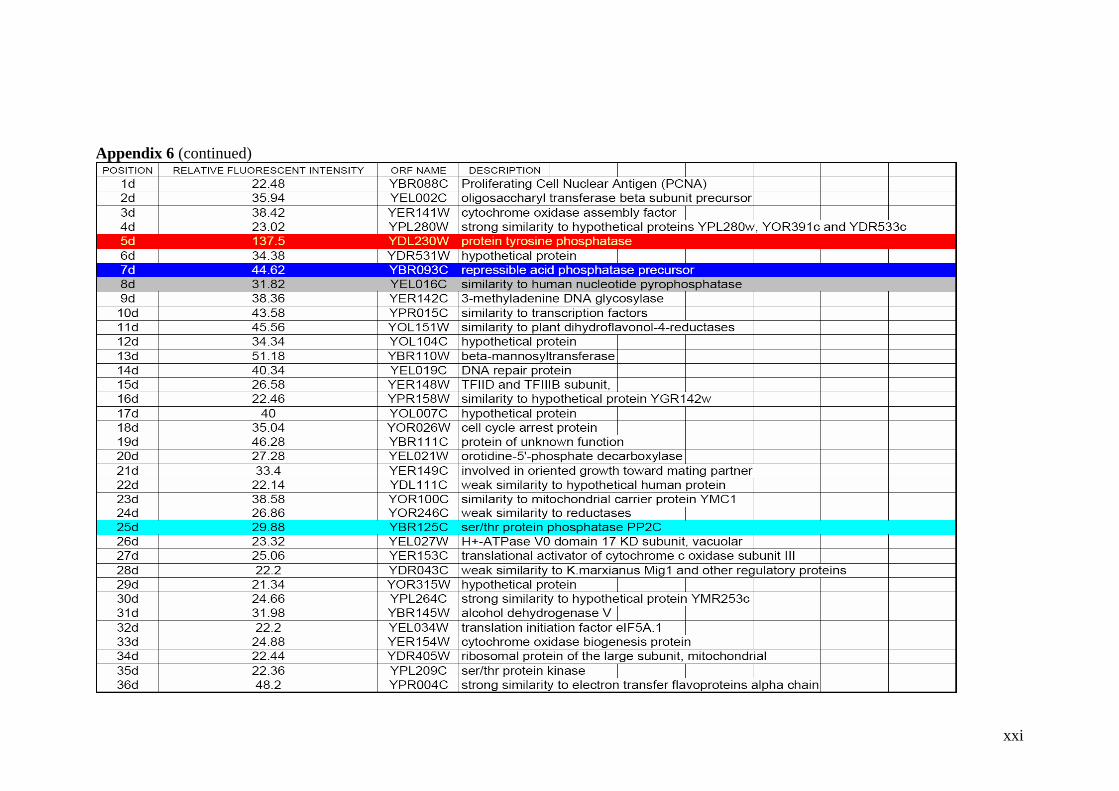
xxi
Appendix 6 (continued)
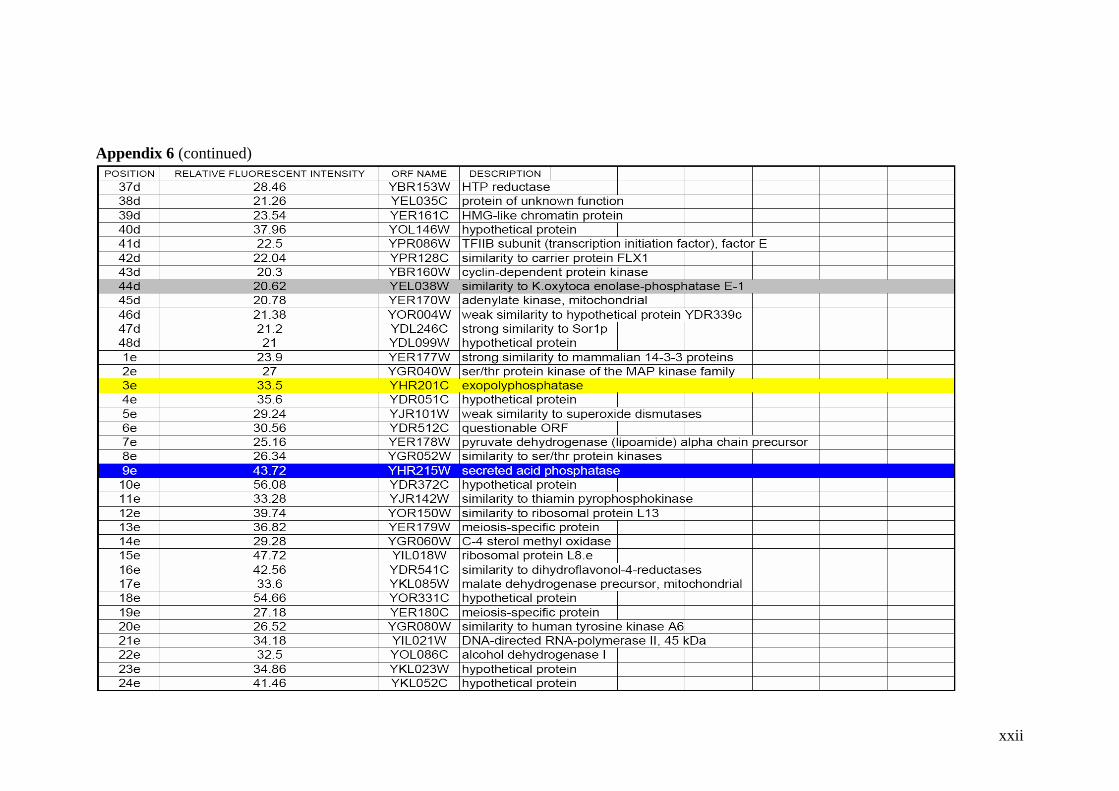
xxii
Appendix 6 (continued)
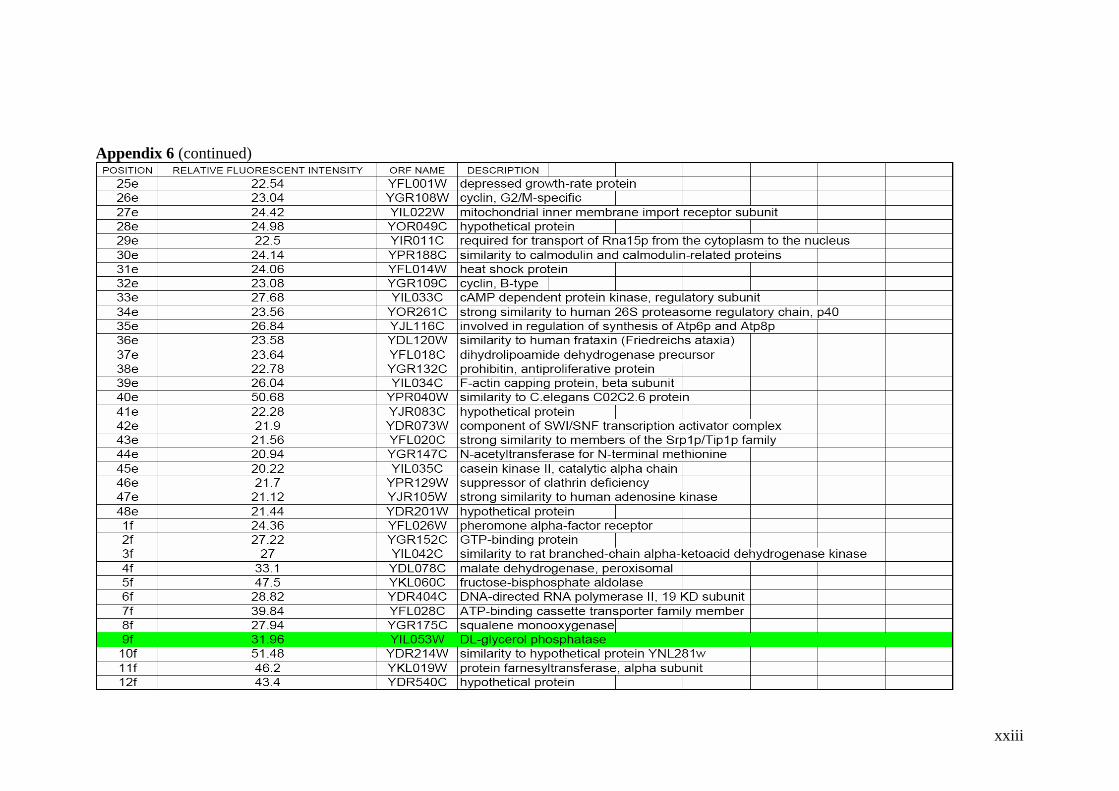
xxiii
Appendix 6 (continued)
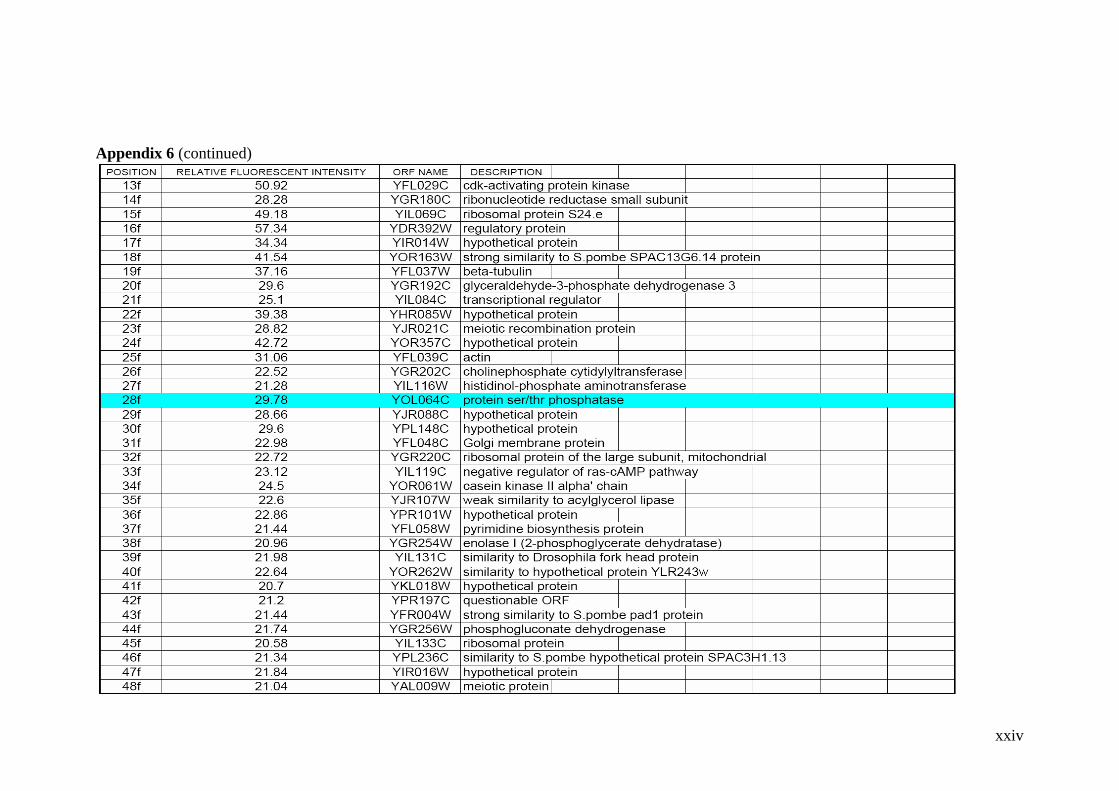
xxiv
Appendix 6 (continued)
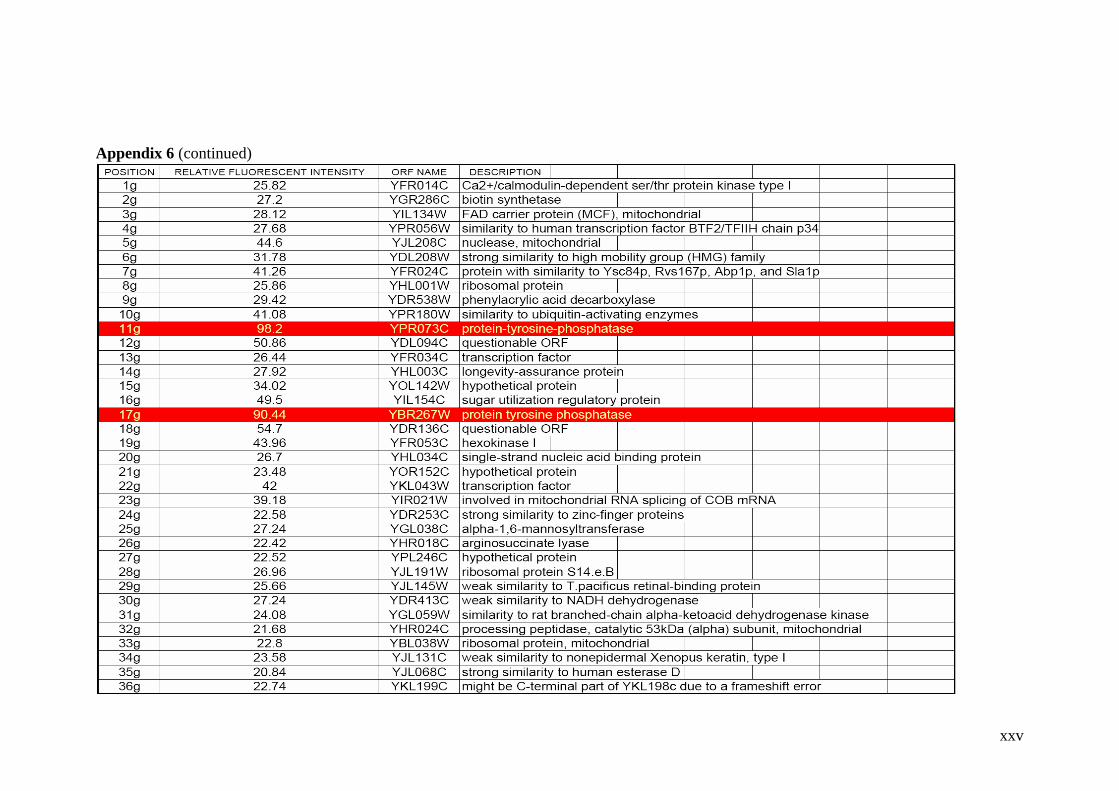
xxv
Appendix 6 (continued)
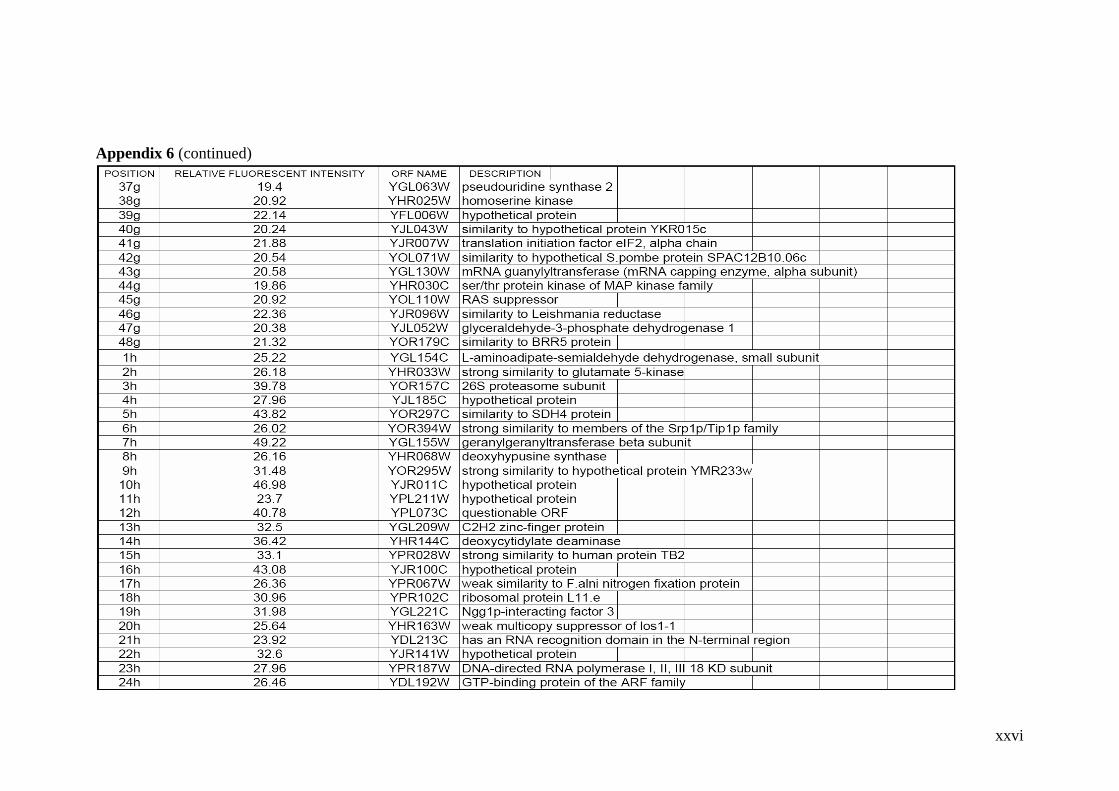
xxvi
Appendix 6 (continued)
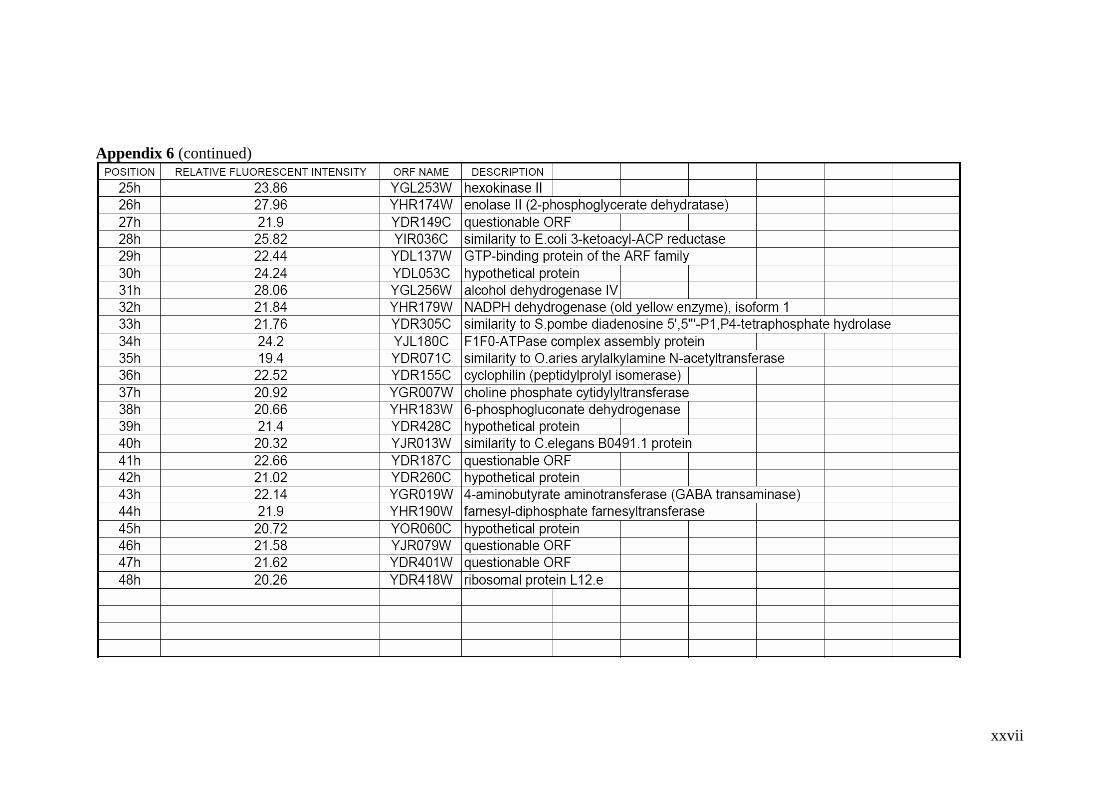
xxvii
Appendix 6 (continued)
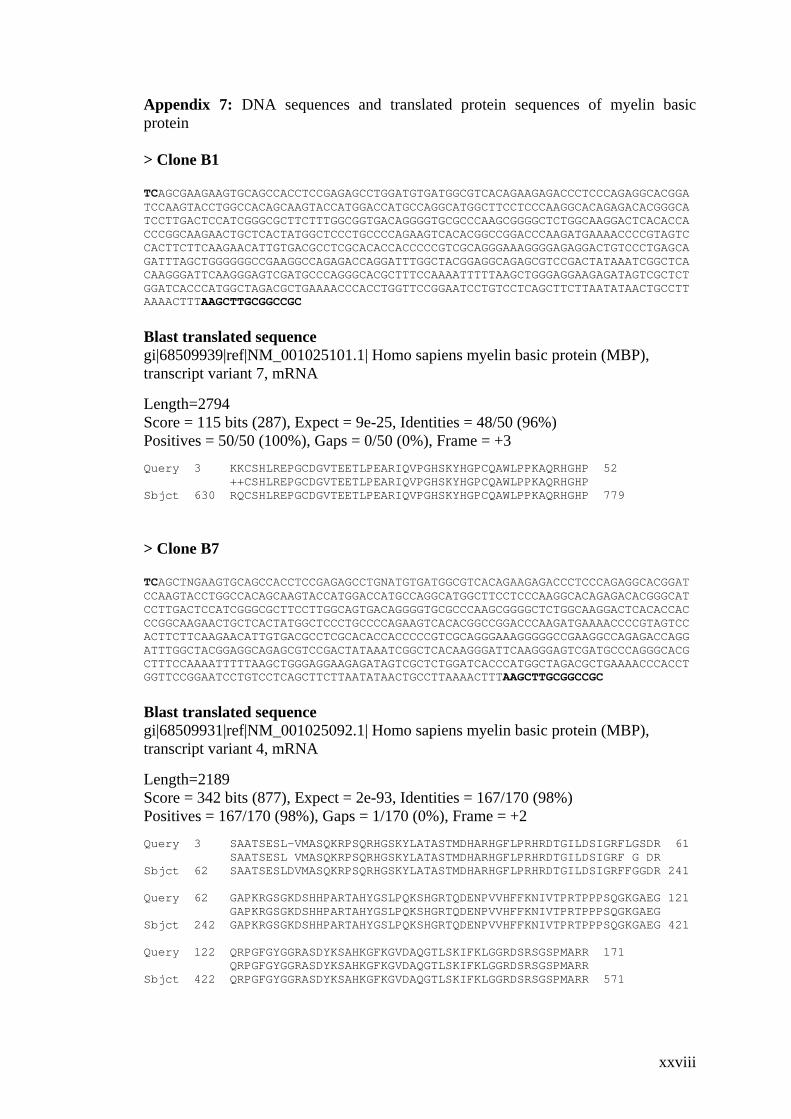
xxviii
Appendix 7: DNA sequences and translated protein sequences of myelin basic protein > Clone B1 TCAGCGAAGAAGTGCAGCCACCTCCGAGAGCCTGGATGTGATGGCGTCACAGAAGAGACCCTCCCAGAGGCACGGATCCAAGTACCTGGCCACAGCAAGTACCATGGACCATGCCAGGCATGGCTTCCTCCCAAGGCACAGAGACACGGGCATCCTTGACTCCATCGGGCGCTTCTTTGGCGGTGACAGGGGTGCGCCCAAGCGGGGCTCTGGCAAGGACTCACACCACCCGGCAAGAACTGCTCACTATGGCTCCCTGCCCCAGAAGTCACACGGCCGGACCCAAGATGAAAACCCCGTAGTCCACTTCTTCAAGAACATTGTGACGCCTCGCACACCACCCCCGTCGCAGGGAAAGGGGAGAGGACTGTCCCTGAGCAGATTTAGCTGGGGGGCCGAAGGCCAGAGACCAGGATTTGGCTACGGAGGCAGAGCGTCCGACTATAAATCGGCTCACAAGGGATTCAAGGGAGTCGATGCCCAGGGCACGCTTTCCAAAATTTTTAAGCTGGGAGGAAGAGATAGTCGCTCTGGATCACCCATGGCTAGACGCTGAAAACCCACCTGGTTCCGGAATCCTGTCCTCAGCTTCTTAATATAACTGCCTTAAAACTTTAAGCTTGCGGCCGC
Blast translated sequence gi|68509939|ref|NM_001025101.1| Homo sapiens myelin basic protein (MBP), transcript variant 7, mRNA Length=2794 Score = 115 bits (287), Expect = 9e-25, Identities = 48/50 (96%) Positives = 50/50 (100%), Gaps = 0/50 (0%), Frame = +3 Query 3 KKCSHLREPGCDGVTEETLPEARIQVPGHSKYHGPCQAWLPPKAQRHGHP 52 ++CSHLREPGCDGVTEETLPEARIQVPGHSKYHGPCQAWLPPKAQRHGHP Sbjct 630 RQCSHLREPGCDGVTEETLPEARIQVPGHSKYHGPCQAWLPPKAQRHGHP 779
> Clone B7 TCAGCTNGAAGTGCAGCCACCTCCGAGAGCCTGNATGTGATGGCGTCACAGAAGAGACCCTCCCAGAGGCACGGATCCAAGTACCTGGCCACAGCAAGTACCATGGACCATGCCAGGCATGGCTTCCTCCCAAGGCACAGAGACACGGGCATCCTTGACTCCATCGGGCGCTTCCTTGGCAGTGACAGGGGTGCGCCCAAGCGGGGCTCTGGCAAGGACTCACACCACCCGGCAAGAACTGCTCACTATGGCTCCCTGCCCCAGAAGTCACACGGCCGGACCCAAGATGAAAACCCCGTAGTCCACTTCTTCAAGAACATTGTGACGCCTCGCACACCACCCCCGTCGCAGGGAAAGGGGGCCGAAGGCCAGAGACCAGGATTTGGCTACGGAGGCAGAGCGTCCGACTATAAATCGGCTCACAAGGGATTCAAGGGAGTCGATGCCCAGGGCACGCTTTCCAAAATTTTTAAGCTGGGAGGAAGAGATAGTCGCTCTGGATCACCCATGGCTAGACGCTGAAAACCCACCTGGTTCCGGAATCCTGTCCTCAGCTTCTTAATATAACTGCCTTAAAACTTTAAGCTTGCGGCCGC
Blast translated sequence gi|68509931|ref|NM_001025092.1| Homo sapiens myelin basic protein (MBP), transcript variant 4, mRNA Length=2189 Score = 342 bits (877), Expect = 2e-93, Identities = 167/170 (98%) Positives = 167/170 (98%), Gaps = 1/170 (0%), Frame = +2 Query 3 SAATSESL-VMASQKRPSQRHGSKYLATASTMDHARHGFLPRHRDTGILDSIGRFLGSDR 61 SAATSESL VMASQKRPSQRHGSKYLATASTMDHARHGFLPRHRDTGILDSIGRF G DR Sbjct 62 SAATSESLDVMASQKRPSQRHGSKYLATASTMDHARHGFLPRHRDTGILDSIGRFFGGDR 241 Query 62 GAPKRGSGKDSHHPARTAHYGSLPQKSHGRTQDENPVVHFFKNIVTPRTPPPSQGKGAEG 121 GAPKRGSGKDSHHPARTAHYGSLPQKSHGRTQDENPVVHFFKNIVTPRTPPPSQGKGAEG Sbjct 242 GAPKRGSGKDSHHPARTAHYGSLPQKSHGRTQDENPVVHFFKNIVTPRTPPPSQGKGAEG 421 Query 122 QRPGFGYGGRASDYKSAHKGFKGVDAQGTLSKIFKLGGRDSRSGSPMARR 171 QRPGFGYGGRASDYKSAHKGFKGVDAQGTLSKIFKLGGRDSRSGSPMARR Sbjct 422 QRPGFGYGGRASDYKSAHKGFKGVDAQGTLSKIFKLGGRDSRSGSPMARR 571
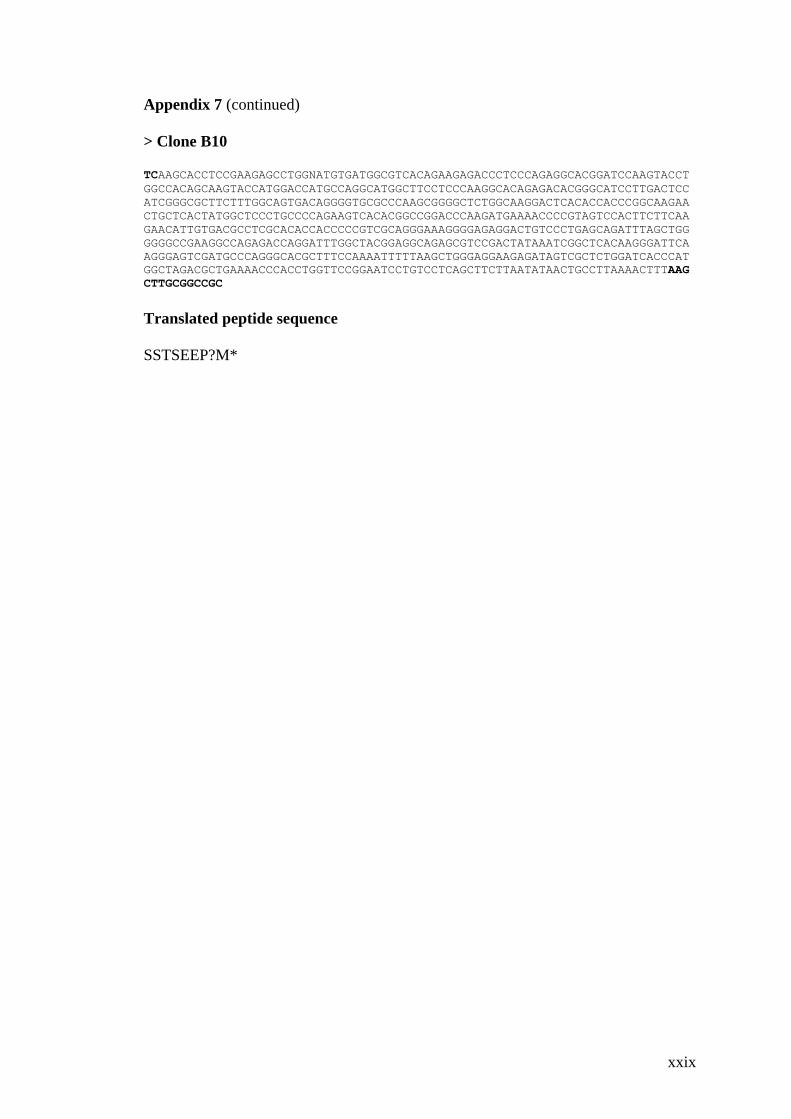
xxix
Appendix 7 (continued) > Clone B10 TCAAGCACCTCCGAAGAGCCTGGNATGTGATGGCGTCACAGAAGAGACCCTCCCAGAGGCACGGATCCAAGTACCTGGCCACAGCAAGTACCATGGACCATGCCAGGCATGGCTTCCTCCCAAGGCACAGAGACACGGGCATCCTTGACTCCATCGGGCGCTTCTTTGGCAGTGACAGGGGTGCGCCCAAGCGGGGCTCTGGCAAGGACTCACACCACCCGGCAAGAACTGCTCACTATGGCTCCCTGCCCCAGAAGTCACACGGCCGGACCCAAGATGAAAACCCCGTAGTCCACTTCTTCAAGAACATTGTGACGCCTCGCACACCACCCCCGTCGCAGGGAAAGGGGAGAGGACTGTCCCTGAGCAGATTTAGCTGGGGGGCCGAAGGCCAGAGACCAGGATTTGGCTACGGAGGCAGAGCGTCCGACTATAAATCGGCTCACAAGGGATTCAAGGGAGTCGATGCCCAGGGCACGCTTTCCAAAATTTTTAAGCTGGGAGGAAGAGATAGTCGCTCTGGATCACCCATGGCTAGACGCTGAAAACCCACCTGGTTCCGGAATCCTGTCCTCAGCTTCTTAATATAACTGCCTTAAAACTTTAAGCTTGCGGCCGC
Translated peptide sequence
SSTSEEP?M*