proteomic profiling of cancer biomarkers
TRANSCRIPT

Hungyi Shau
was trained as a cancer
immunologist with interest in
tumour biology, gene medicine
and cancer biomarkers.
G. Scott Chandler
is involved in the development
and preclinical testing of breast
cancer vaccine therapy.
Julian P. Whitelegge
was trained in biochemistry and
molecular biology. His research
interest is proteomics of
membrane proteins.
Jeffrey A. Gornbein
has been a key designer in the
planning and analysis of cancer
studies of Revlon/UCLA Breast
Cancer Center. His research
interests are clinical trial
design, repeated measure
analysis and statistical
discrimination methods.
Kym F. Faull
has worked and published on
CG/MS of biogenic amines and
related compounds, and on
FAB, electrospray and MALDI
of peptides, proteins and other
biomolecules.
Helena R. Chang
is a surgical oncologist and
immunologist focused on
developing early breast cancer
detection methods and breast
cancer vaccine therapy.
Keywords: analysisalgorithm, biomarkers, cancerdiagnosis, matrix assistedlaser desorption (MALDI),proteomics, surface-enhancedlaser desorption/ionisation(SELDI)
Helena R. Chang,
Director and Professor,
Revlon/UCLA Breast Center 200
UCLA David Geffen Medical Plaza,
Suite B265-1,
Los Angeles, CA 90095-7028, USA
E-mail: [email protected]
Additional Paper
Proteomic profiling ofcancer biomarkersHungyi Shau, G. Scott Chandler, Julian P. Whitelegge, Jeffrey A. Gornbein,Kym F. Faull and Helena R. ChangDate received (in revised form): 17th March 2003
AbstractEarly detection and correct diagnosis are essential for effective treatment of cancer and patient
survival. Complete sequencing of the human genome, and the genomes of other species,
provides valuable tools for discerning the genetic abnormalities in cancer. However,
differences between cancerous and normal cells reflect more than variations in genetic
sequences and abundance of transcribed RNA. Many cancer biomarkers are manifestation of
differences in post-transcriptional splicing and/or post-translational modifications. Thus,
proteomic tools are being increasingly utilised in the post-genomic era for discovery of new
cancer biomarkers. In this paper we will provide an overview of the biomarker discovery
process from the proteomic profiling point of view, with emphasis given to the principles that
are involved in the process, including the protein identification strategies, and how surface
enhanced laser desorption ionisation mass spectrometry fits into the picture. The aim is to
provide a resource for the experimental practitioner seeking awareness of the analytical tools
that are now available in contemporary cancer research.
INTRODUCTIONCancer claims a half million lives each
year in the USA. Surgery, radiotherapy
and chemotherapy are effective treatments
for most localised early cancers. Because
there can be significant differences in
survival rates between local and advanced
disease, detection of cancer at an early
stage can be life saving in many cases. For
example, five-year survival rates for
localised breast or ovarian cancers (Stages
I–II) can exceed 80 per cent whereas the
five-year survival rates for advanced breast
or ovarian cancers (Stages III–IV) can be
as low as 20 per cent.1,2 The conventional
methods for detecting cancer include
assessment of symptomatic complaints of
patients, findings of the physical
examination, imaging abnormalities and
various laboratory tests. Although these
are the gold standards of today’s medicine,
many cancers are found in the advanced
stage where the current treatment is
frequently ineffective in halting the
disease. Biomarkers that are characteristic
of cancer growth may allow cancer
discovery at an earlier stage than our
current practice.
Many new technologies are being
introduced to identify biomarkers
associated with cancer. These
technologies may mark the beginning of a
new era in cancer screening and diagnosis.
The ultimate goal of biomarker discovery
is to be able to establish a panel of
biomarkers with sufficient and reliable
predictive value for diagnosing a specific
type of cancer.
One of the most promising of the new
biomarker discovery strategies involves
proteomic profiling by mass spectrometry.
This development has been made possible
through recent advances in mass
spectrometry of biopolymers which were
acknowledged by the 2002 Nobel
committee with the recognition of the
& HENRY STEWART PUBLICATIONS 1467-9550. BRIEF INGS IN FUNCTIONAL GENOMICS AND PROTEOMICS . VOL 2. NO 2. 147–158. JULY 2003 1 4 7
by guest on October 17, 2015
http://bfg.oxfordjournals.org/D
ownloaded from

discovery of electrospray ionisation (ESI)
mass spectrometry3,4 and for the discovery
of soft laser desorption (SLD) ionisation,5
which led to the development of matrix-
assisted laser desorption ionisation
(MALDI).6 Proteomic profiling for cancer
detection and diagnosis began to emerge
after the development of convenient
methods for displaying a wide range of
proteins in convenient one- and
two-dimensional formats. Most notable in
this regard was the development of
isoelectric point focusing in one
dimension followed by polyacrylamide
gel electrophoresis (PAGE) for molecular
weight filtering in the second dimension7
and visualisation of the display with
protein dyes (Coomaasie Blue, elemental
silver, SyproRubyTM, etc). ESI and
MALDI mass spectrometry became
important in this process as the preferred
methods for identifying the displayed
proteins (see below).
SELDI – surface-enhanced laser
desorption ionisation mass spectrometry8,9
– is an acronym coined to describe an
extension of theMALDI process that is
currently receiving careful scrutiny
because it combines in a convenient one-
step process a method for both protein
isolation from biological samples and
presentation of the isolated proteins for
laser-induced mass spectrometric analysis.
SELDI has several advantages including
elimination of the requirement for off-line
protein isolation (such as PAGE and liquid
chromatography) and sample transfer and
manipulation, and it is potentially
compatible with automation, a necessary
requirement for any high-throughput
process.
Any biomarker profiling strategy
requires the application of appropriate
statistical methods for making
comparisons between complex data sets
and for assigning reasonable probabilities
that any one profile is in some way
abnormal. So the development of the
proteomic profiling strategy for disease
biomarker recognition involves the
merger of technologies from widely
disparate disciplines including physical
chemistry, engineering, biochemistry and
statistics.
CURRENT CANCERBIOMARKERSAttempts to develop new and improved
biomarker screenings for cancer have
focused on all levels of biochemistry
including the gene, RNA, protein and
metabolites, extending early attempts in
other disease detections. Early efforts
included one by Linus Pauling and
associates to profile metabolites in urine
and other body fluids using gas
chromatography and combined gas
chromatography-mass spectrometry.10,11
Today, metabolite screening strategies for
cancer detection are all but abandoned. At
the nucleic acid level, karyotyping was
one of the early approaches to detect the
Philadelphia chromosome as a marker for
the bcl-abl gene abnormality in chronic
myeloid leukaemia. Fluorescence in situ
hybridisation and real time polymerase
chain reaction have been developed to
detect amplification and overexpression of
genes. At the protein level,
immunohistological staining and
fluorescence-activated cell sorting are
techniques that use antibodies for
detection of specific cancer biomarkers.
However, all these techniques are time
consuming and, with the exception of
metabolite profiling, represent single
marker-based approaches.
The inability to unequivocally screen
for cancer is due, in part, to the fact that
most of the cancer biomarkers currently
used are also expressed by normal cells.
These are considered cancer markers
because they are produced at the wrong
time of one’s life, in excessive amounts
and/or in an altered conformation (ie in
incorrectly spliced or post-translationally
modified forms).
Unfortunately, most of these markers
have not been useful as independent
methods for the screening or diagnosis of
cancer. However, they still play an
important role in the diagnostic process
and the overall management of the
disease. Most markers are used in patients
Most markers are usedin patients withestablished cancers forthe purpose ofmonitoring response totherapy or insurveillance forrecurrence of disease
SELDI is promising indetecting cancer-related biomarkers
SELDI’s advantagesinclude elimination ofoff-line proteinisolation, sampletransfer andmanipulation
The limited use ofbiomarkers in cancerscreening is due, in part,to the fact that most ofthe cancer biomarkerscurrently used are alsoexpressed by normalcells
1 4 8 & HENRY STEWART PUBLICATIONS 1467-9550. BRIEF INGS IN FUNCTIONAL GENOMICS AND PROTEOMICS . VOL 2. NO 2. 147–158. JULY 2003
Shau et al.
by guest on October 17, 2015
http://bfg.oxfordjournals.org/D
ownloaded from
with established cancers for the purpose of
monitoring response to therapy or in
surveillance for recurrence of disease.
Recently, advances in cancer
immunobiology have resulted in the
development of immunotherapeutic
agents directed at certain cancer
biomarkers which has resulted in some
very significant, but limited, new cancer
vaccine therapies. Some of the more
common cancer biomarkers currently
used with an impact on clinical practice
are described below.
Carcinoembryonic antigen (CEA) is an
example of a molecule expressed at the
wrong time because it is normally
expressed in significant amounts only
during embryonic life. In adults, CEA is
only expressed in small amounts in the
large intestine. Elevated levels of CEA are
frequently associated with an advanced
stage of colon cancer, but may also be
expressed in other epithelial-derived
tumours such as pancreas, stomach and
breast.12 These levels may also be elevated
in some benign conditions.
Consequently, CEA has not been useful
in screening or diagnosis. However, once
elevated, CEA is very useful in
monitoring response to therapy. It is also
useful in the surveillance for recurrence,
particularly metastatic disease.13
Prostate specific antigen (PSA) is an
example of a molecule expressed in
abnormally elevated amounts. Because
PSA is unique to the prostate gland,
elevated levels may indicate cancer of the
prostate, but because PSA may also be
elevated in benign states, it cannot be
used as a sole criterion for screening.
Therefore, PSA should be used in
conjunction with digital rectal
examination in order to screen for
prostate cancer.14 CA 125 is also expressed
in abnormally elevated amounts and has
been important in the management of
ovarian cancer. The use of CA 125 may
be much more effective in identifying
patients at high risk for ovarian cancer
when elevated CA 125 levels are
combined with findings on transvaginal
ultrasound.14 Like CEA, elevated PSA
and CA 125 levels are also being used in
the surveillance and monitoring of
patients for recurrence of disease.15–17
Her2/neu, a growth factor receptor of
normal cells, is an example of a molecule
expressed in an excessive amount, in
certain subsets of cancers, notably breast
and ovarian. Infrequently, Her2/neu gene
amplification with overexpression of
protein represents an aggressive form of
breast cancer. Although Her2/neu is not
useful as a screening biomarker for breast
cancer, Her2/neu overexpression is
prognostically valuable because it
indicates the presence of a more
aggressive form of breast cancer and helps
to identify patients with a more
unfavourable prognosis. Recent advances
in vaccine research have resulted in the
development of anti-Her2/neu receptor
antibodies for target specific treatment of
breast cancer.18
CD44 is an example of a molecule with
incorrect splicing. CD44 is a cell surface
protein and certain lymphoma and
leukaemia cells express the CD44v6
variant whose exon conformation differs
from that of normal lymphocytes.19,20
Because incorrect splicing results in
expression of an abnormal protein, such a
molecule may prove to be a target for
immunotherapeutic agents in addition to
playing a diagnostic role. In cases of non-
Hodkin’s lymphomas, another type of cell
surface protein known as CD20 provides
such an immunological target on these
malignant cells. Development of specific
monoclonal antibodies directed against
these malignant, CD20-expressing cells
has played a significant role in elimination
of these lymphoma cells.21
An example of a cancer biomarker
resulting from post-translational
modifications is mucin (MUC1), also
known as CA 15-3 and CA 27-29.
MUC1 is a high molecular weight
glycoprotein having oligosaccharides
attached to the 20 amino acid repeats of
apomucin protein backbone by O-
glycosidic linkages.22 Breast and
pancreatic cancers are associated with
high surface expression of the MUC1
Her2/neuoverexpression isprognostically valuablebecause it indicates thepresence of a moreaggressive form ofbreast cancer and helpsto identify patients witha more unfavourableprognosis
Like CEA, elevated PSAand CA 125 levels arebeing used in thesurveillance andmonitoring of patientsfor recurrence ofdisease
CD20 is a biomarkerand immunologicaltarget for Non-Hodgkin’s Lymphoma
& HENRY STEWART PUBLICATIONS 1467-9550. BRIEF INGS IN FUNCTIONAL GENOMICS AND PROTEOMICS . VOL 2. NO 2. 147–158. JULY 2003 1 4 9
Proteomic profiling of cancer biomarkers
by guest on October 17, 2015
http://bfg.oxfordjournals.org/D
ownloaded from

molecules that are improperly
glycosylated and antigenically different
from the normal cells.23,24 Measuring
MUC1 mucin levels does not have an
accepted role in screening or diagnosis,
but monitoring levels has been used for
surveillance in patients with advanced
disease.25 The use of MUC1-specific
vaccines has become a topic of great
interest as efforts are underway to design
and develop cancer vaccine therapy
against MUC1-expressing tumours.23,24,26
LikeMUC1, other biomarker and
therapeutic target candidates are being
discovered and tested. One area of
research which shows particular promise is
that of matrix metalloproteinases (MMPs).
Significant advances have been made in
understanding the role of MMPs in cancer
development and metastasis. These
molecules are believed to play an
important role in tumour invasion,
angiogenesis and metastasis.27 MMPs have
been detected in tumour tissues of
multiple types and endogenous tissue
inhibitors of metalloproteinases (TIMPs)
have also been identified. Owing to the
nature of theMMP’s role in tumour
invasion, propagation and spread, levels of
MMPs and TIMPs may provide a marker
for the presence of certain cancers and the
associated aggressiveness or prognosis.27,28
Although these levels may prove useful in
detecting cancer or determining prognosis,
their use is not currently accepted as
standard practice. Furthermore, clinical
trials usingMMP inhibitors have shown
mixed results and further design,
development and testing will be necessary
before these agents can be fully evaluated
and applied clinically.27,28
Tumour markers may be useful tools in
the fight against cancer, but the limitations
of their use must be understood.
Specifically, a given tumour marker may
be elevated in persons without a specific
malignancy (false positive) while some
tumour markers may not be elevated in all
patients with a given cancer (false
negative). In order to improve the
predictive value for tumour markers, their
measurements can be combined or used
with other diagnostic tests. As described
previously, examples of these combined
screening methods include the use of PSA
and digital rectal exam in prostate cancer;
the use of CA 125 and pelvic ultrasound in
ovarian cancer; and measurement of both
AFP and hCG in testicular cancer.While
the majority of tumour markers are used as
Monitoring MUC1mucin levels by CA 27-29 and CA 15-3 havebeen used forsurveillance in patientswith advanced breastcancer
In order to improve thepredictive value fortumour markers, theresults should beinterpreted inconjunction with otherdiagnostic tests
MMPs and TIMPs arecandidate markers forcertain cancers and mayreflect aggressivenessand poor prognosis
Table 1: Common tumour biomarkers and clinical uses
Cancerbiomarker
Cancer typea Clinical applicationb Therapeutic application Reference
AFP Liver Screening, diagnosis, prognosis,surveillance
N/A Johnson29
AFP/hCG Germ cell Diagnosis, prognosis, surveillance N/A Labdenne and Heikinheimo 30
CA 15-3CA 27-29
Breast Surveillance Anti-MUC1 vaccines (experimental) He et al., 26 Duffy, 25 Finn et al. 23
CA 19-9 Pancreatic Diagnosis, surveillance N/A Riker and Bartlett 31
CA 125 Ovarian Screening, diagnosis, surveillance N/A Menon and Jacobs, 32 Rosenthal andJacobs15
CD20 Non-Hodgkinlymphoma
Diagnosis, prognosis, surveillance Anti-CD20 antibodies (rituximab) Press et al. 21
CEA Colon Prognosis, surveillance Anti-CEA vaccines (experimental) Macdonald, 13 Berinstein 33
ER/PR Breast Prognosis Estrogen antagonists (tamoxifen)/aromatase inhibitors(anastrazole)
Duffy 25
Her2/neu Breast Prognosis Anti-Her2/neu antibodies(trastuzumab)
Pegram and Slamon 18
PSA Prostate Screening, diagnosis, prognosis,surveillance
N/A Small and Roach,17 Smith et al. 16
aMost common cancer/biomarker pairing.bScreening/diagnostic role limited.AFP, alpha-fetoprotein; CEA, carcinoembryonic antigen; ER/PR, oestrogen receptor/progesterone receptor; hCG, human chorionic gonadotropin; Her2/neu, human epidermal growth factor receptor 2/neuroblastoma antigen; PSA, prostate specific antigen.
1 5 0 & HENRY STEWART PUBLICATIONS 1467-9550. BRIEF INGS IN FUNCTIONAL GENOMICS AND PROTEOMICS . VOL 2. NO 2. 147–158. JULY 2003
Shau et al.
by guest on October 17, 2015
http://bfg.oxfordjournals.org/D
ownloaded from

surveillance tools to monitor clinical
response and the recurrence or spread of
disease in patients following cancer
diagnosis and treatment, efforts to find
tumour markers effective in the diagnosis
of cancer continue to evolve. Table 1 lists
common cancer biomarkers and their
clinical uses.
Mircroarray and gene profilingWith the advent of complete human
genome sequences, profiling cancer genes
with DNA microarrays has been pursued
vigorously. Gene profiling has not only
been successfully applied to cancer
diagnosis, but has also been used to sort
out subtypes of the cancers with different
phenotype.34,35 With its potential to
separate normal condition from a cancer
condition and cancers of different
biologies, DNA microarray may play an
important role in cancer diagnosis and
predicting prognosis in the future.
However, the current technology of
DNA profiling does not always reflect the
post-transcriptional modification such as
splicing and does not distinguish post-
translational modifications of the protein
products. Thus, besides direct enzyme
assays, other high-throughput
technologies in proteomic analysis may
bridge gaps in addition to validating the
gene findings in cancer detection.
PROTEOMICS ANDBIOMARKERSSince cellular behaviour is influenced by a
large number of possiblemolecules, normal
growth and differentiation dependon the
presence of appropriate proteins in the right
context. Through signal transduction
cascades and transcriptional networks,
alterations of one protein can affect a large
number of cellular pathways and result in
global effects on cell behaviour.Regulation
of translation and post-transcriptional
modification clearly play significant roles.
For instance,while loss ofBRCA1 gene
expression is often the cause of breast
cancer, post-translational phosphorylation
at vital sites is also essential for its tumour-
suppressing function.Thus, analysing
protein post-translational differences can
be informative. Since abnormal growth and
de-differentiation are hallmarks of
malignancy, it is reasonable to speculate
that cancer cells express a different
repertoire of proteins comparedwith their
‘normal’ counterparts. It is also likely that
other biological differences, such as tumour
sensitivity or resistance to chemotherapy,
are also reflected by the activity of discrete
but unique sets of proteins.These
differences can bemanifested not only
qualitatively but also quantitatively. These
protein profile changes are tightly coupled
with clonal expansion of particular cancer
cells. Tumour classifications based on the
protein profiles therefore should bemore
predictive of outcome andprovide a better
guidance for appropriate treatment.
Finally, defining biomarkers that are
involved in the tumour response to
chemotherapymay provide strategic
insight for the development of novel
therapeutic agents.
Mass spectrometry is one of many
available methods that can be used for
biomarker screening. Both ESI and
MALDI can be used in this process
although MALDI may have an advantage
because the spectra are simpler and thus
more complex mixtures can be tolerated.
One advantage of mass spectrometry is
that it can also be used for chemical
identification of the biomarkers once they
are recognised.
Mass spectrometry of proteinsThe discovery of ESI and MALDI mass
spectrometry for peptides, proteins and
other macromolecules has been
revolutionary, providing easy
measurements of molecular weight with
unprecedented accuracy. Measurement
accuracy for larger proteins typically falls
into the range 1–0.001 per cent of the
molecular weight, depending upon the
method used, while measurements of
smaller peptides can achieve 0.0001 per
cent (or 1 ppm) accuracy. Important
applications of these techniques have been
for protein identification (the so-called
mass tag or peptide mass fingerprinting,
Since abnormal growthand de-differentiationare hallmarks ofmalignancy, it isreasonable to speculatethat cancer cellsexpress a differentrepertoire of proteins
The current technologyof DNA profiling doesnot always reflect thepost-transcriptionalmodification and doesnot distinguish post-translationalmodifications of theprotein products
One of massspectrometry’sadvantages inbiomarker screening isthat it can also be usedto identify thebiomarkers once theyare recognised
& HENRY STEWART PUBLICATIONS 1467-9550. BRIEF INGS IN FUNCTIONAL GENOMICS AND PROTEOMICS . VOL 2. NO 2. 147–158. JULY 2003 1 5 1
Proteomic profiling of cancer biomarkers
by guest on October 17, 2015
http://bfg.oxfordjournals.org/D
ownloaded from

and sequence tag protein identification
strategies). Another important application,
particularly relevant in the current
context, is for making protein displays.
SLD and MALDIBecause the dominant ions generated
under SLD and MALDI conditions are
singly charged, the technique is most
often used in combination with a time-
of-flight (TOF) analyser to extend the
m/z range to 100,000 Da and beyond.5,6
A dramatic improvement in the technique
resulted from the discovery that a UV
absorbing matrix which co-crystallised
with the analyte increased the efficiency
of ionisation.5 Thus MALDI (or MALDI-
TOF) has become widely used for protein
and peptide measurements. Solutions of
the sample and matrix are co-spotted on a
surface. The matrix is in sufficient
concentration to crystallise, and in so
doing is thought to trap some of the
analyte within the crystal lattice. The
dried spot is then inserted into the mass
spectrometer and irradiated with laser
energy. The laser pulse ablates a plume of
material from the sample surface. In this
plume conditions exist which permit ion
formation to occur, and proteins and
peptides emerge typically carrying a single
charge (a proton). The m/z values of the
ions are determined in the mass analyser
attached to the ion source.
SELDIThe idea of covalently modifying a
surface to enhance ionisation by atom and
ion bombardment and laser ablation
originated in the 1980s and possibly even
earlier. However, this approach did not
blossom until the chemistry for covalently
attaching functional groups to a metal
surface was developed and perfected.8
Today this chemistry is marketed as a
SELDI and ProteinChip1 array
technology for proteomics and biomarker
discovery by Ciphergen Biosystems,
Fremont, California.9 As already stated,
SELDI is an acronym coined to describe
an extension of the MALDI process. The
surface used in SELDI is covalently
modified with one of a number of
functionalities to impart specific
properties to the surface (ProteinChips1).
The available surfaces include anion and
cation exchange (for selectively retaining
negatively and positively charged
proteins, respectively), metal affinity (for
capturing His-tagged recombinantly
expressed proteins, for example), reverse
phase (immobilised hydrophobic surface)
and normal phase (immobilised
hydrophilic surface). The functionalised
surfaces are used to capture specific classes
of analytes and concentrate them from
impure extracts. The surfaces can then be
washed to remove non-absorbed
components, and following the addition
of an appropriate matrix, the surfaces are
then subjected to laser desorption mass
spectrometry. There is no evidence to
indicate that the ionisation processes
taking place during SELDI from a
ProteinChip1 surface are any different
from those taking place from a MALDI
surface, and it seems that the adsorption of
analytes to the immobilised surfaces does
not hinder the ionisation process during
laser desorption. The advantage provided
by the ProteinChip1 surface can be
attributed to the ability to selectively
capture classes of proteins from complex
biological matrices thus eliminating the
need for off-line sample purification,
manipulation and transfer.
SELDI has an advantage in cancer
research where the quantity of the
available specimen may be a limiting
factor. Using crude preparations in sub-
microlitre volumes containing less than a
picomole of analyte, SELDI can produce
information on specific components such
as molecular mass, surface affinity and pI.
Thus the technique can be used to
capture and partially purify a specific
component or group of components from
a complex mixture, and simultaneously
provide a convenient display of the
captured components. At the same time
the technique yields information about
the components that can be used for their
off-line should that be necessary. This
information may eliminate most of the
The surface used inSELDI is covalentlymodified with one of anumber offunctionalities to impartspecific properties tothe surface(ProteinChips1)
1 5 2 & HENRY STEWART PUBLICATIONS 1467-9550. BRIEF INGS IN FUNCTIONAL GENOMICS AND PROTEOMICS . VOL 2. NO 2. 147–158. JULY 2003
Shau et al.
by guest on October 17, 2015
http://bfg.oxfordjournals.org/D
ownloaded from
preliminary work involved in
identification and characterisation by
traditional methods. One drawback of
many screening procedures is that the
most abundant molecules in the
specimens may overshadow the subtle
signals of interest. SELDI, however, may
overcome this problem by selectively
eliminating abundant molecules using
differences in surface affinity. Although
intact protein molecular mass alone can
rarely be used to identify proteins, the
screening strategy does not depend upon
the identification of the signals that
discriminate between subjects or groups
of subjects. However, the questions that
arise from the screening strategy
concerning the actual identification of the
proteins of interest, will require extension
of the SELDI technique to embrace either
the mass or sequence tag experiments.
Despite the promise of the technique,
the published work using SELDI for
biomarker discovery, and the information
available from the manufacturer, is lacking
in some important specifications. There is
no information available on the dynamic
range and capacity of the ProteinChips1
for protein capture, or for the percentage
recovery of proteins of interest from
complex samples. It will be necessary for
this type of data to be made available
before the technique can be confidently
used in a routine clinical setting which
demands reliability and accuracy for
unambiguous interpretation of results.
STATISTICAL METHODSWhen using protein profiles to
discriminate/classify between cancer and
non-cancer groups, the number of m/z
‘variables’ greatly exceeds the number of
samples, so classical discriminant or cluster
analysis methods cannot be used directly.
There are also specific problems including
profile standardisation, ‘baseline removal’
and the definition of ‘noise’.
Discrimination/classificationwhen cancer groups are knownRepeated measure ANOVA
Classic repeated measure analysis of
variance (ANOVA) is used to compare
mean protein profiles when group
membership (cancer/no cancer) is
known. This method does not require
finding individual peaks in each sample
and takes into account correlations
between multiple profiles from the same
patient and between adjacent values in the
profile. It assumes there is a ‘true’
underlying mean profile for each group
and individual profiles are composed of
the underlying mean profile plus within
patient and between patient error.
Peak consolidation and alignment
As outlined by Adam et al.36 individual
peaks are found for each sample where a
‘true peak’ is any peak value larger than a
given ‘noise’. Peaks from all samples in a
group are combined and ‘aligned’ where
two adjacent peaks whose intensities differ
by less than a specified percentage (the
authors say , 0.18 per cent) are
consolidated. Then mean comparisons are
made as in ANOVA.
Uniform Maximum Separability Analysis
(UMSA)
This is a recent method developed by
Zhang et al.37 UMSA is similar to
principal component analysis (PCA) as it
takes linear combinations of the molecular
weight ‘variables’ and creates a smaller
number of components. Unlike PCA, the
UMSA components are designed such
that the mean difference for any
component between cancer and non-
cancer (or across cancer/non-cancer
groups) is maximised rather than
maximising the variance of each
component as in PCA. In this regard
UMSA is similar to linear discriminant
analysis. As with PCA, UMSA reduces
high dimensions to low dimensions. If
UMSA is successful, the most important
part of the information contained in the
original variables can be visualised.
UMSA identifies molecular weight
markers that ‘load’ heavily on the first few
components (particularly the first
component) as providing the best
discrimination. After ‘markers’ have been
Rules for classificationare more difficult toobtain when the truecancer status isunknown
& HENRY STEWART PUBLICATIONS 1467-9550. BRIEF INGS IN FUNCTIONAL GENOMICS AND PROTEOMICS . VOL 2. NO 2. 147–158. JULY 2003 1 5 3
Proteomic profiling of cancer biomarkers
by guest on October 17, 2015
http://bfg.oxfordjournals.org/D
ownloaded from
identified using any of the above, a
decision rule for predicting cancer or
non-cancer groups is needed. Since the
number of variables is now manageable,
classical methods such as logistic
regression or classification tree (CART)38
analysis may be used. In addition, the data
can be broken up into training and
validation sets for validation.
‘Genetic’ algorithm
In addition to the methods above, the so-
called ‘genetic’ algorithm was developed
by the Correlogic group and the NIH
using cluster analysis.39 A training data set
is obtained and molecular weight variables
are initially arbitrarily placed in one of
1,500 ‘logical chromosomes’, each
composed of a fixed number of molecular
weight variables. For each, a Euclidian
distance-based cluster analysis using the
variables in the chromosome creates
cancer or non-cancer clusters depending
on the majority of samples that are one
type or the other. The proportion of
samples correctly classified
(‘homogeneity’) is a measure of the
‘fitness’ of the chromosome. Those with
poor ‘fitness’ are eliminated with higher
probability than those with good fitness.
Random ‘crossovers’ (exchange of
molecular weight variables) are also made
among the remaining chromosomes and
fitness of each new ‘generation’ of logical
chromosomes are evaluated iteratively
until a final logical chromosome (set of
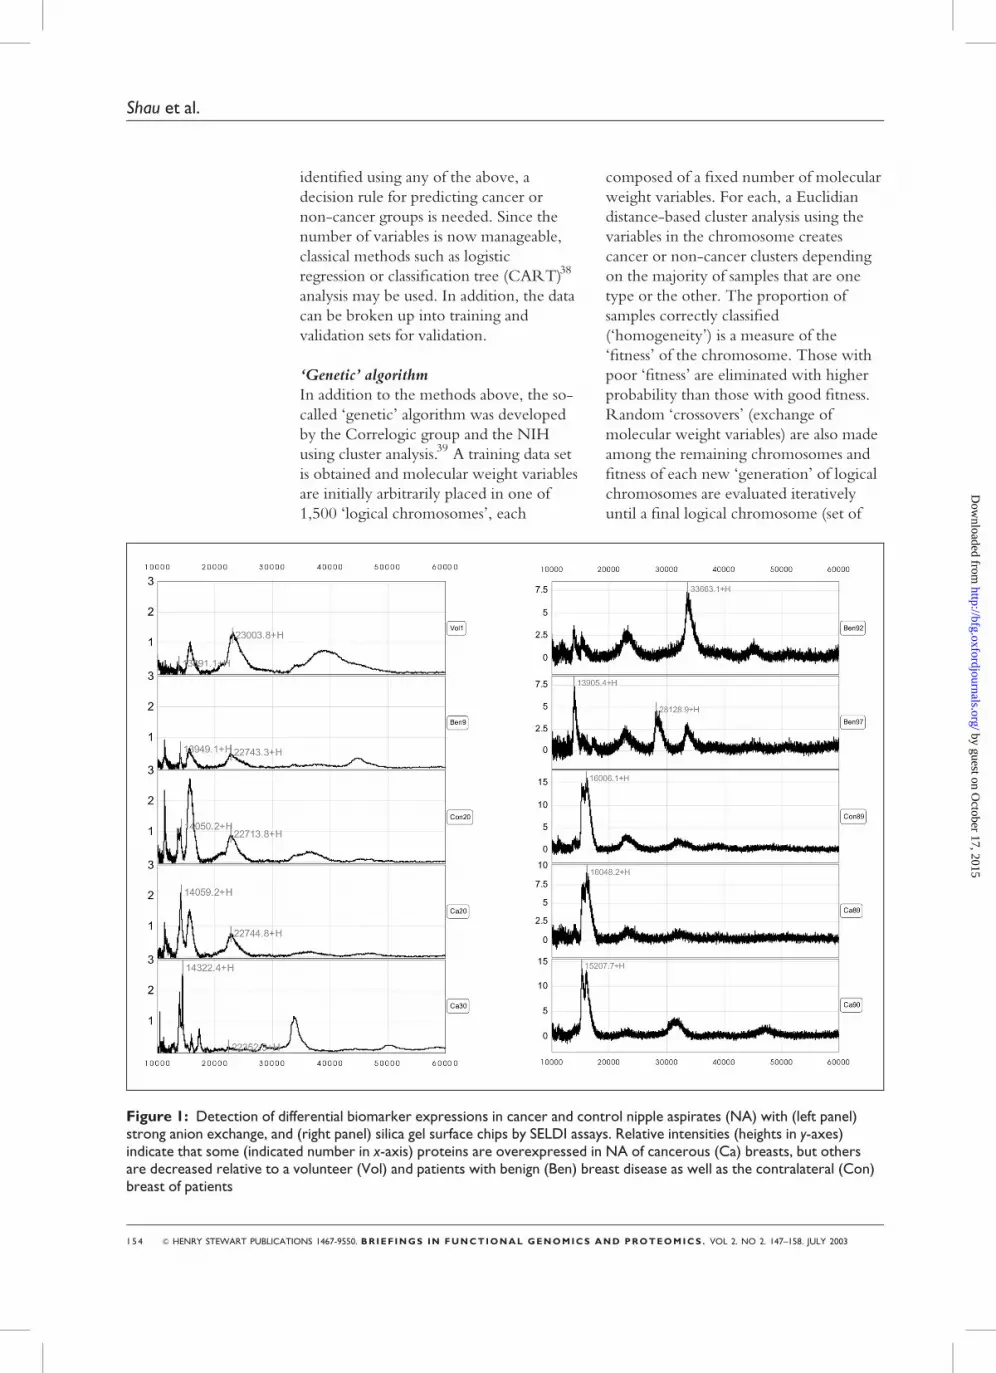
Figure 1: Detection of differential biomarker expressions in cancer and control nipple aspirates (NA) with (left panel)strong anion exchange, and (right panel) silica gel surface chips by SELDI assays. Relative intensities (heights in y-axes)indicate that some (indicated number in x-axis) proteins are overexpressed in NA of cancerous (Ca) breasts, but othersare decreased relative to a volunteer (Vol) and patients with benign (Ben) breast disease as well as the contralateral (Con)breast of patients
1 5 4 & HENRY STEWART PUBLICATIONS 1467-9550. BRIEF INGS IN FUNCTIONAL GENOMICS AND PROTEOMICS . VOL 2. NO 2. 147–158. JULY 2003
Shau et al.
by guest on October 17, 2015
http://bfg.oxfordjournals.org/D
ownloaded from

SELDI can be used todiscover biomarkers ofvarious cancers withoutprior knowledge aboutthem or the need forpurification
SELDI protein spectrafrom cancerous nippleaspirates are distinctfrom those of non-cancerous nippleaspirates
markers) is generated whose clusters best
separate the cancer from the non-cancer
samples. These markers are validated on a
separate data set.
Classification when cancer groups are not
known
The problem is much more difficult when
one is not certain how many groups exist
a priori. One approach is to tentatively
classify samples into groups, apply UMSA
procedures and then examine the low
dimensional plots. More formally,
hierarchical or k-means cluster analysis
methods37 can be applied using the
UMSA components. Validation of the
results is made using bootstrap
(resampling) methods.
SELDI AND PROTEOMICPROFILINGBecause of the advantages afforded by
SELDI, NCI has sponsored an Early
Detection Research Network to utilise
SELDI as a major tool for biomarker
searching and screening.40 SELDI is able
to screen proteins across wide range of
molecular weights (MW) without prior
knowledge of their biological or
biochemical characteristics. This unique
feature has enabled investigators to
compare the qualitative and quantitative
difference for each individual protein.
We are one of the early groups to
embark on SELDI for discovery of breast
cancer-related biomarkers. Our
examination of nipple aspirates and
comparison of their SELDI protein
spectra allows us to distinguish cancerous
nipple aspirate profiles from that of non-
cancerous nipple aspirates (Figure 1).
From SELDI-TOF we have found several
protein peaks that are specifically present
in cancerous nipple aspirates. On the
other hand, several protein peaks are
more abundant in non-cancerous nipple
aspirates. We are currently identifying
those potential breast cancer-associated
biomarkers as well as those that are down-
regulated in breast cancer. Similarly,
comparison between extracts of cancerous
breast biopsies with normal counterparts
of the same patient by SELDI-TOF
shows differences in their protein profiles
(Figure 2).
This technology resulted in detection
of new candidate markers in the
prostate,41–44 ovarian,45,46 pancreatic47 and
Figure 2: Massspectrometry profile ofprotein extracts frompaired cancerous (BrCa)and normal breast (NBr)specimens of the samepatient. X-axis indicatesthe molecular mass indaltons, y-axis indicatesthe relative intensity ofthe peak signals
& HENRY STEWART PUBLICATIONS 1467-9550. BRIEF INGS IN FUNCTIONAL GENOMICS AND PROTEOMICS . VOL 2. NO 2. 147–158. JULY 2003 1 5 5
Proteomic profiling of cancer biomarkers
by guest on October 17, 2015
http://bfg.oxfordjournals.org/D
ownloaded from
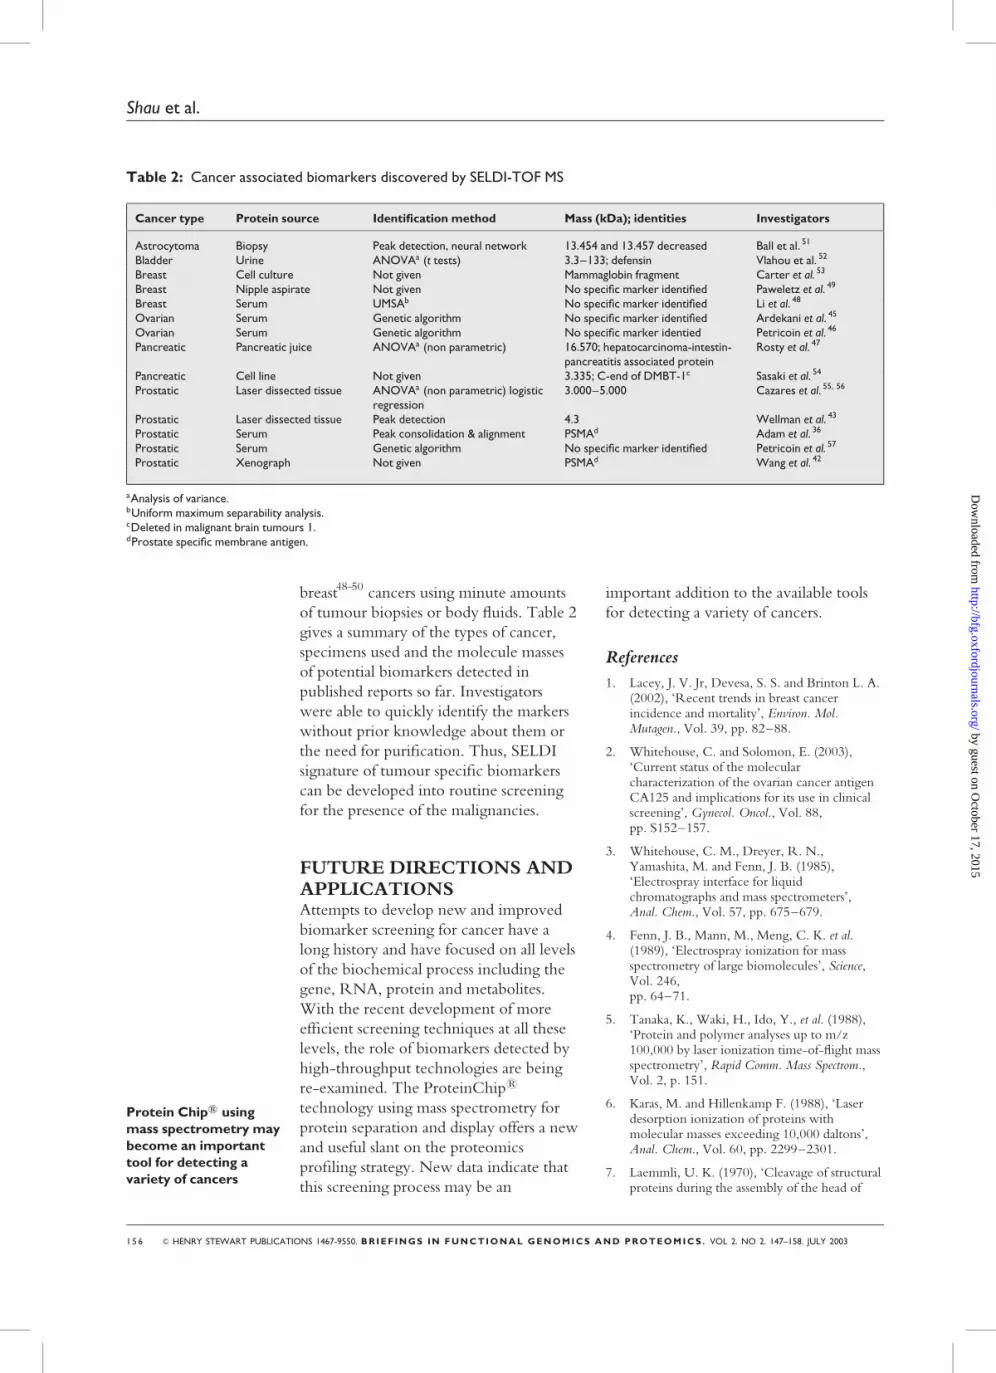
breast48–50 cancers using minute amounts
of tumour biopsies or body fluids. Table 2
gives a summary of the types of cancer,
specimens used and the molecule masses
of potential biomarkers detected in
published reports so far. Investigators
were able to quickly identify the markers
without prior knowledge about them or
the need for purification. Thus, SELDI
signature of tumour specific biomarkers
can be developed into routine screening
for the presence of the malignancies.
FUTURE DIRECTIONS ANDAPPLICATIONSAttempts to develop new and improved
biomarker screening for cancer have a
long history and have focused on all levels
of the biochemical process including the
gene, RNA, protein and metabolites.
With the recent development of more
efficient screening techniques at all these
levels, the role of biomarkers detected by
high-throughput technologies are being
re-examined. The ProteinChip1
technology using mass spectrometry for
protein separation and display offers a new
and useful slant on the proteomics
profiling strategy. New data indicate that
this screening process may be an
important addition to the available tools
for detecting a variety of cancers.
References
1. Lacey, J. V. Jr, Devesa, S. S. and Brinton L. A.(2002), ‘Recent trends in breast cancerincidence and mortality’, Environ. Mol.Mutagen., Vol. 39, pp. 82–88.
2. Whitehouse, C. and Solomon, E. (2003),‘Current status of the molecularcharacterization of the ovarian cancer antigenCA125 and implications for its use in clinicalscreening’, Gynecol. Oncol., Vol. 88,pp. S152–157.
3. Whitehouse, C. M., Dreyer, R. N.,Yamashita, M. and Fenn, J. B. (1985),‘Electrospray interface for liquidchromatographs and mass spectrometers’,Anal. Chem., Vol. 57, pp. 675–679.
4. Fenn, J. B., Mann, M., Meng, C. K. et al.(1989), ‘Electrospray ionization for massspectrometry of large biomolecules’, Science,Vol. 246,pp. 64–71.
5. Tanaka, K., Waki, H., Ido, Y., et al. (1988),‘Protein and polymer analyses up to m/z100,000 by laser ionization time-of-flight massspectrometry’, Rapid Comm. Mass Spectrom.,Vol. 2, p. 151.
6. Karas, M. and Hillenkamp F. (1988), ‘Laserdesorption ionization of proteins withmolecular masses exceeding 10,000 daltons’,Anal. Chem., Vol. 60, pp. 2299–2301.
7. Laemmli, U. K. (1970), ‘Cleavage of structuralproteins during the assembly of the head of
Protein Chip1 usingmass spectrometry maybecome an importanttool for detecting avariety of cancers
Table 2: Cancer associated biomarkers discovered by SELDI-TOF MS
Cancer type Protein source Identification method Mass (kDa); identities Investigators
Astrocytoma Biopsy Peak detection, neural network 13.454 and 13.457 decreased Ball et al. 51
Bladder Urine ANOVAa (t tests) 3.3–133; defensin Vlahou et al. 52
Breast Cell culture Not given Mammaglobin fragment Carter et al. 53
Breast Nipple aspirate Not given No specific marker identified Paweletz et al. 49
Breast Serum UMSAb No specific marker identified Li et al. 48
Ovarian Serum Genetic algorithm No specific marker identified Ardekani et al. 45
Ovarian Serum Genetic algorithm No specific marker identied Petricoin et al. 46
Pancreatic Pancreatic juice ANOVAa (non parametric) 16.570; hepatocarcinoma-intestin-pancreatitis associated protein
Rosty et al. 47
Pancreatic Cell line Not given 3.335; C-end of DMBT-1c Sasaki et al. 54
Prostatic Laser dissected tissue ANOVAa (non parametric) logisticregression
3.000–5.000 Cazares et al. 55, 56
Prostatic Laser dissected tissue Peak detection 4.3 Wellman et al. 43
Prostatic Serum Peak consolidation & alignment PSMAd Adam et al. 36
Prostatic Serum Genetic algorithm No specific marker identified Petricoin et al. 57
Prostatic Xenograph Not given PSMAd Wang et al. 42
aAnalysis of variance.bUniform maximum separability analysis.cDeleted in malignant brain tumours 1.dProstate specific membrane antigen.
1 5 6 & HENRY STEWART PUBLICATIONS 1467-9550. BRIEF INGS IN FUNCTIONAL GENOMICS AND PROTEOMICS . VOL 2. NO 2. 147–158. JULY 2003
Shau et al.
by guest on October 17, 2015
http://bfg.oxfordjournals.org/D
ownloaded from
bacteriophage T4’, Nature, Vol. 227,pp. 680–685.
8. Hutchens, T. W., Nelson, R. W. and Yip,T. T. (1991), ‘Evaluation of peptide/metal ioninteractions by UV laser desorption time-of-flight mass spectrometry’, J. Mol. Recognit.,Vol. 4, pp. 151–153.
9. Weinberger, S. R., Dalmasso, E. A. and Fung,E. T. (2002), ‘Current achievements usingProteinChip Array technology’, Current Opin.Chem. Biol., Vol. 6, pp. 86–91.
10. Pauling, L., Robinson, A. B., Teranishi, R.and Cary, P. (1971), ‘Quantitative analysis ofurine vapor and breath by gas–liquid partitionchromatography’, Proc. Natl Acad. Sci. USA,Vol. 68, pp. 2374–2376.
11. Matsumoto, K. E., Partridge, D. H.,Robinson, A. B. et al. (1973), ‘Theidentification of volatile compounds in humanurine’, J. Chromatogr., Vol. 85, pp. 31–34.
12. Posner, M. R. and Mayer, R. J. (1994), ‘Theuse of serologic tumor markers ingastrointestinal malignancies’, Hematol. Oncol.Clin. North Am., Vol. 8, pp. 533–553.
13. Macdonald, J. S. (1999), ‘Carcinoembryonicantigen screening: pros and cons’, Semin.Oncol., Vol. 26, pp. 556–560.
14. Duffy, M. J. (2001), ‘Clinical uses of tumormarkers: a critical review’, Crit. Rev. Clin. Lab.Sci., Vol. 38, pp. 225–262.
15. Rosenthal, A. N. and Jacobs, I. J. (1998), ‘Therole of CA 125 in screening for ovariancancer’, Int. J. Biol. Markers, Vol. 13,pp. 216–220.
16. Smith, R. A., Cokkinides, V. and Eyre, H. J.(2003), ‘American Cancer Society guidelinesfor the early detection of cancer, 2003’, CACancer J. Clin., Vol. 53, pp. 27–43.
17. Small, E. J. and Roach, M. (20020, ‘3rdprostate-specific antigen in prostate cancer: Acase study in the development of a tumormarker to monitor recurrence and assessresponse’, Semin. Oncol., Vol. 29,pp. 264–273.
18. Pegram, M. and Slamon, D. (2000),‘Biological rationale for HER2/neu (c-erbB2)as a target for monoclonal antibody therapy’,Semin. Oncol., Vol. 27, pp. 13–19.
19. Liang, X., Smoller, B. R. and Golitz, L. E.(2002), ‘Expression of CD44 and CD44v6 inprimary cutaneous CD30 positive T-celllymphoproliferative disorders’, J. Cutan.Pathol., Vol. 29, pp. 459–464.
20. Akisik, E., Bavbek, S. and Dalay, N. (2002),‘CD44 variant exons in leukemia andlymphoma’, Pathol. Oncol. Res., Vol. 8,pp. 36–40.
21. Press, O. W., Leonard, J. P., Coiffier, B. et al.(2001), ‘Immunotherapy of Non-Hodgkin’slymphomas. Hematology’, American Society
Hematology Education Program, Washington,DC, pp. 221–240.
22. Yonezawa, S. and Sato, E. (1997), ‘Expressionof mucin antigens in human cancers and itsrelationship with malignancy potential’, Pathol.Int., Vol. 47, pp. 813–830.
23. Finn, O. J., Jerome, K. R., Henderson, R. A.et al. (1995), ‘MUC-1 epithelial tumor mucin-based immunity and cancer vaccines’, Immunol.Rev., Vol. 145, pp. 61–89.
24. Gendler, S. J. (2001), ‘MUC1, the renaissancemolecule’, J. Mammary Gland Biol. Neoplasia,Vol. 6, pp. 339–353.
25. Duffy, M. J. (2001), ‘Biochemical markers inbreast cancer: Which ones are clinicallyuseful?’, Clin. Biochem., Vol. 34, pp. 347–352.
26. He, J., Shen, D. and O’Donnell, M. A. andChang, H. R. (2002), ‘Induction of MUC1-specific cellular immunity by a recombinantBCG expressing human MUC1 and secretingIL2’, Int. J. Oncol., Vol. 20, pp. 1305–1311.
27. Zucker, S., Cao, J. and Chen, W. T. (2000),‘Critical appraisal of the use of matrixmetalloproteinase inhibitors in cancertreatment’, Oncogene, Vol. 19, pp. 6642–6650.
28. Baker, A. H., Edwards, D. R. and Murphy, G.(2002), ‘Metalloproteinase inhibitors:Biological actions and therapeuticopportunities’, J. Cell. Sci., Vol. 115,pp. 3719–3727.
29. Johnson, P. J. (2001), ‘The role of serumalpha-fetoprotein estimation in the diagnosisand management of hepatocellular carcinoma’,Clin. Liver Dis., Vol. 5, pp. 145–159.
30. Labdenne, P. and Heikinheimo, M. (2002),‘Clinical use of tumor markers in childhoodmalignancies’, Ann. Med., Vol. 34,pp. 316–323.
31. Riker, A. and Bartlett, D. (1999),‘Pancreaticoduodenectomy for chronicpancreatitis: A case report and literaturereview’, Hepatogastroenterology, Vol. 46,pp. 2005–2010.
32. Menon, U. and Jacobs, I. J. (2000), ‘Recentdevelopments in ovarian cancer screening’,Current Opin. Obstet. Gynecol., Vol. 12,pp. 39–42.
33. Berinstein, N. L. (2002), ‘Carcinoembryonicantigen as a target for therapeutic anticancervaccines: a review’, J. Clin. Oncol., Vol. 20,pp. 2197–2207.
34. Gordon, G. J., Jensen, R. V., Hsiao, L. L. et al.(2002), ‘Translation of microarray data intoclinically relevant cancer diagnostic tests usinggene expression ratios in lung cancer andmesothelioma’, Cancer Res., Vol. 62,pp. 4963–4967.
35. Perou, C. M., Jeffrey S. S., van de Rijn, M.et al. (1999), ‘Distinctive gene expressionpatterns in human mammary epithelial cells
& HENRY STEWART PUBLICATIONS 1467-9550. BRIEF INGS IN FUNCTIONAL GENOMICS AND PROTEOMICS . VOL 2. NO 2. 147–158. JULY 2003 1 5 7
Proteomic profiling of cancer biomarkers
by guest on October 17, 2015
http://bfg.oxfordjournals.org/D
ownloaded from

and breast cancers’, Proc. Natl Acad. Sci. USA,Vol. 96, pp. 9212–9217.
36. Adam, B. L., Qu, Y., Davis, J. W. et al. (2002),‘Serum protein fingerprinting coupled with apattern-matching algorithm distinguishesprostate cancer from benign prostatehyperplasia and healthy men’, Cancer Res.,Vol. 62, pp. 3609–3614.
37. Zhang, Z., Page, G. and Zhang, H. (2001)‘Applying classification separability analysis tomicroarray data’, in Lin, S. M. and Johnson, K.J., Eds, ‘Methods of Microarray Data Analysis’,Kluwer Academic Publishers, Norwell, MA,pp. 125–136.
38. Breiman, L., Friedman, J., Olshen, R. andStone, C. (1984) ‘Classification and RegressionTrees’, Wadsworth International Group,Belmont, CA.
39. URL: http://clinicalproteomics.steem.com/proteome-detail.php
40. Verma, M., Wright, G. L. Jr, Hanash, S. M.et al. (2001), ‘Proteomic approaches within theNCI early detection research network for thediscovery and identification of cancerbiomarkers’, Ann. NY Acad. Sci., Vol. 945,pp. 103–115.
41. Ahram, M., Best, C. J., Flaig, M. J. et al.(2002), ‘Proteomic analysis of human prostatecancer’, Mol. Carcinog., Vol. 33, pp. 9–15.
42. Wang, S., Diamond, D. L., Hass, G. M. et al.(2001), ‘Identification of prostate specificmembrane antigen (PSMA) as the target ofmonoclonal antibody 107-1A4 by proteinchip;array, surface-enhanced laser desorption/ionization (SELDI) technology’, Int. J. Cancer,Vol. 92, pp. 871–876.
43. Wellmann, A., Wollscheid, V., Lu, H. et al.(2002), ‘Analysis of microdissected prostatetissue with ProteinChip(R) arrays – a way tonew insights into carcinogenesis and todiagnostic tools’, Int. J. Mol. Med., Vol. 9,pp. 341–347.
44. Wright, G. L. J., Cazares, L. H., Leung, S. M.et al. (2000), ‘ProteinChip Surface EnhancedLaser Desorption/Ionization (SELDI) massspectrometry: A novel protein biochiptechnology for detection of prostate cancerbiomarkers in complex protein mixtures’,Prostate Cancer Prostatic Dis., Vol. 2,pp. 264–276.
45. Ardekani, A. M., Liotta, L. A. and Petricoin,E. F. 3rd (2002), ‘Clinical potential ofproteomics in the diagnosis of ovarian cancer’,Expert Rev. Mol. Diagn., Vol. 2, pp. 312–320.
46. Petricoin, E. F., Ardekani, A. M., Hitt, B. A.et al. (2002), ‘Use of proteomic patterns inserum to identify ovarian cancer’, Lancet,Vol. 359, pp. 572–577.
47. Rosty, C., Christa, L., Kuzdzal, S. et al. (2002),‘Identification of hepatocarcinoma–intestine–pancreas/pancreatitis-associated protein I as a
biomarker for pancreatic ductaladenocarcinoma by protein biochiptechnology’, Cancer Res., Vol. 62, pp. 1868–1875.
48. Li, J., Zhang, Z., Rosenzweig, J. et al. (2002),‘Proteomics and bioinformatics approaches foridentification of serum biomarkers to detectbreast cancer’, Clin. Chem., Vol. 48,pp. 1296–1304.
49. Paweletz, C. P., Trock, B., Pennanen, M. et al.(2001), ‘Proteomic patterns of nipple aspiratefluids obtained by SELDI-TOF: Potential fornew biomarkers to aid in the diagnosis ofbreast cancer’, Dis. Markers, Vol. 17,pp. 301–307.
50. Wulfkuhle, J. D., McLean, K. C., Paweletz,C. P. et al. (2001), ‘New approaches toproteomic analysis of breast cancer’, Proteomics,Vol. 1, pp. 1205–1215.
51. Ball, G., Mian, S., Holding, F. et al. (2002),‘An integrated approach utilizing artificialneural networks and SELDI mass spectrometryfor the classification of human tumours andrapid identification of potential biomarkers’,Bioinformatics, Vol. 18, pp. 395–404.
52. Vlahou, A., Schellhammer, P. F., Mendrinos,S. et al. (2001), ‘Development of a novelproteomic approach for the detection oftransitional cell carcinoma of the bladder inurine’, Am. J. Pathol., Vol. 158,pp. 1491–1502.
53. Carter, D., Douglass, J. F., Cornellison, C. D.et al. (2002), ‘Purification and characterizationof the mammaglobin/lipophilin B complex, apromising diagnostic marker for breast cancer’,Biochemistry, Vol. 41, pp. 6714–6722.
54. Sasaki, K., Sato, K., Akiyama, Y. et al. (2002),‘Peptidomics-based approach reveals thesecretion of the 29-residue COOH-terminalfragment of the putative tumor suppressorprotein DMBT1 from pancreaticadenocarcinoma cell lines’, Cancer Res.,Vol. 62, pp. 4894–4898.
55. Cazares, L. H., Adam, B. L., Ward, M. D.et al. (2002), ‘Normal, benign, preneoplastic,and malignant prostate cells have distinctprotein expression profiles resolved by surfaceenhanced laser desorption/ionization massspectrometry’, Clin. Cancer Res., Vol. 8, pp.2541–2552.
56. Cazares, L. H., Gong, L., Nasim, S. et al.(1999),’ Surface enhanced laser desorption/ionization (SELDI) mass spectroscopy for thediscovery of prostate cancer signature proteinsin laser capture microdissected cells’,Proceedings of the 4th IBC InternationalConference on Functional Proteomics’, SanDiego, California, 1st–3rd December.
57. Petricoin, E. F. 3rd, Ornstein, D. K.,Paweletz, C. P. et al. (2002), ‘Serum proteomicpatterns for detection of prostate cancer’,J. Natl Cancer Inst., Vol. 94, pp. 1576–1578.
1 5 8 & HENRY STEWART PUBLICATIONS 1467-9550. BRIEF INGS IN FUNCTIONAL GENOMICS AND PROTEOMICS . VOL 2. NO 2. 147–158. JULY 2003
Shau et al.
by guest on October 17, 2015
http://bfg.oxfordjournals.org/D
ownloaded from