advanced fuel cycle cost basis - core
TRANSCRIPT

The INL is a U.S. Department of Energy National Laboratory operated by Battelle Energy Alliance
INL/EXT-07-12107 Rev. 1
Advanced Fuel Cycle Cost Basis
D. E. Shropshire K. A. Williams W. B. Boore J. D. Smith B. W. Dixon M. Dunzik-Gougar R. D. Adams D. Gombert E. Schneider
March 2008

INL/EXT-07-12107 Rev. 1
Advanced Fuel Cycle Cost Basis
D. E. Shropshire1
K. A. Williams2
W. B. Boore3
J. D. Smith4
B. W. Dixon1
M. Dunzik-Gougar1
R. D. Adams1
D. Gombert1
E. Schneider51Idaho National Laboratory 2Oak Ridge National Laboratory 3Washington Savannah River Company 4Sandia National Laboratory 5University of Texas-Austin
March 2008
Idaho National Laboratory Idaho Falls, Idaho 83415
Prepared for the U.S. Department of Energy Office of Nuclear Energy
Under DOE Idaho Operations Office Contract DE-AC07-05ID14517

DISCLAIMER This information was prepared as an account of work sponsored by an agency of the U.S. Government. Neither the U.S. Government nor any agency thereof, nor any of their employees, makes any warranty, expressed or implied, or assumes any legal liability or responsibility for the accuracy, completeness, or usefulness, of any information, apparatus, product, or process disclosed, or represents that its use would not infringe privately owned rights. References herein to any specific commercial product, process, or service by trade name, trade mark, manufacturer, or otherwise, does not necessarily constitute or imply its endorsement, recommendation, or favoring by the U.S. Government or any agency thereof. The views and opinions of authors expressed herein do not necessarily state or reflect those of the U.S. Government or any agency thereof.

INL/EXT-07-12107 (March 2008) Advanced Fuel Cycle Cost Basis iii
ABSTRACT
This report, commissioned by the U.S. Department of Energy (DOE), provides a comprehensive set of cost data supporting a cost analysis for the relative economic comparison of options for use in the Advanced Fuel Cycle Initiative (AFCI) Program. The report describes the AFCI cost basis development process, reference information on AFCI cost modules, a procedure for estimating fuel cycle costs, economic evaluation guidelines, and a discussion on the integration of cost data into economic computer models. This report contains reference cost data for 25 cost modules—23 fuel cycle cost modules and 2 reactor modules. The cost modules were developed in the areas of natural uranium mining and milling, conversion, enrichment, depleted uranium disposition, fuel fabrication, interim spent fuel storage, reprocessing, waste conditioning, spent nuclear fuel (SNF) packaging, long-term monitored retrievable storage, near surface disposal of low-level waste (LLW), geologic repository and other disposal concepts, and transportation processes for nuclear fuel, LLW, SNF, transuranic, and high-level waste.

INL/EXT-07-12107 (March 2008) Advanced Fuel Cycle Cost Basis iv

INL/EXT-07-12107 (March 2008) Advanced Fuel Cycle Cost Basis v
SUMMARY This report, commissioned by the U.S. Department of Energy (DOE),
provides a comprehensive set of cost data supporting an ongoing, credible, technical cost analysis basis for use in the Advanced Fuel Cycle Initiative (AFCI) Program. System analysts will use this report to evaluate the impacts and benefits of a wide range of AFCI and Generation IV deployment options. The objectives underlying this report are to (1) understand the issues and opportunities for keeping nuclear power an economically competitive option, (2) evaluate the elements dominating nuclear fuel cycle costs, and (3) develop the tools to evaluate the economics of creative solutions to make the nuclear fuel cycle even more cost competitive.
The intended use of the cost data is for the relative economic comparison of options rather than for determination of total fuel cycle costs with great accuracy. Each element of cost has a probabilistic range of accuracy, and when the costs are coupled together into a total fuel cycle system estimate, the uncertainty range is additive. This information is being used in studies to evaluate costs of fuel cycle options. Fuel cycle costs are an important part of the comprehensive evaluation, which also includes measures of sustainability, proliferation resistance, adaptability to different energy futures, and waste management impacts (e.g., heat load impacts on the repository). These evaluations will result in the identification of cost drivers within the fuel cycle where development may be focused to reduce the costs within the system.
This report describes the AFCI cost basis development process, reference information on AFCI cost modules, a procedure for estimating fuel cycle costs, economic evaluation guidelines, and a discussion on the integration of cost data into economic computer models. This report contains reference cost data for 25 cost modules—23 fuel cycle cost modules and 2 reactor modules. The cost modules were developed in the areas of natural uranium mining and milling, conversion, enrichment, depleted uranium disposition, fuel fabrication, interim spent fuel storage, reprocessing, high-level waste conditioning, spent nuclear fuel packaging, long-term monitored retrievable storage, near surface disposal of low-level waste, geologic repository and other disposal concepts, and transportation processes for nuclear fuel, low-level waste, spent nuclear fuel, transuranic, and high-level waste. The AFCI cost developers are closely coordinating with the Generation IV Economic Modeling Working Group (EMWG) and have adopted many of the EMWG estimating structures, assumptions, and estimating processes.
This report is based on data collected from historical reports and expert knowledge of past and current fuel cycle facilities and processing requirements. The reference data have been placed into a cost collection database, screened, normalized for U.S. facilities, and summarized for this report. The fuel cycle requirements for future generation nuclear reactors are also being assessed and will be included in the cost basis as the technology matures. The cost basis information will be updated annually to keep pace with advances in the technology development studies.

INL/EXT-07-12107 (March 2008) Advanced Fuel Cycle Cost Basis vi
INL/EXT-07-12107 (March 2008) Advanced Fuel Cycle Cost Basis vii
ACKNOWLEDGMENTS
The authors acknowledge the efforts of those who contributed to the report: Economic Modeling Working Group (EMWG) members including Kent Williams, Geoffrey Rothwell, and Evelyne Bertel; Idaho National Laboratory’s (INL’s) David Ostby and Roger Henry (Spent Fuel Treatment Facility), Steve Piet, Jake Jacobson and Buck West (VISION model development), Sharon (Jess) Chandler from Georgia Institute of Technology supporting an INL Fellowship/Internship; Sandia National Laboratory’s Charles Morrow and Len Malczynski (cost database); Oak Ridge National Laboratory’s Sydney Ball (gas-cooled reactor data), David Williams (gas-cooled reactor data), Brian Cowell (MOX fuels), Sean Terrill, John Gunning (fast reactor fuels literature search), and Robert Hightower (DUF6); Westinghouse Savannah River Company’s David McGuire; Argonne National Laboratory’s Ed Hoffman (working meeting participation); Los Alamos National Laboratory’s Chuck Bathke and Erich Schneider (review of NFCSim capabilities); and Chaim Braun’s development of the Economics of Private Sector vs. Regulated Nuclear Fuel Cycle Facilities completed under Contract No. 00038009 to Bechtel BWXT Idaho, LLC. We also appreciate the review comments provided by James Laidler from Argonne National Laboratory, David Hebditch of Burns and Roe, and from TechSource Incorporated.

INL/EXT-07-12107 (March 2008) Advanced Fuel Cycle Cost Basis viii

INL/EXT-07-12107 (March 2008) Advanced Fuel Cycle Cost Basis ix
PREFACE
The December 2007 release of the AFC Cost Basis report contains a number of important updates and improvements. Module content and costs data have been further improved through use the use of new resources and information derived from approximately 150 new references. The What-It-Takes (WIT) tables have been updated with additional cost breakdowns and details reflecting the cost analyst’s current expectations. Cost frequency distribution figures have been added to each module to illustrate the most likely cost bounds and probabilities for each module. The most significant module changes in this revision are in the front-end (A, B, C) modules, reprocessing (F) modules, and the reactor (R) modules. The front-end modules have been extensively updated by the University of Texas-Austin by taking a fresh look at the recent run-up in uranium and enrichment prices. New analysis was performed to evaluate long term uranium price trends and the availability of secondary supplies. With reprocessing, additional details have been added by Burns and Roe on the cost factors driving plant design, scaling of facilities, capital costs and throughput from various reprocessing plant design studies and facilities. Reactor costs were refined to show a breakdown of capital (under various discount rate assumptions), operations and maintenance, and D&D costs. Light water reactor capital costs were updated in response to the increases seen across of all types of power plants due to rising prices from key industries (e.g., steel, concrete, and copper), international competition for these materials, and tight capacity within the supply chain (as suggested by the Electric Power Research Institute). Several new references were added in the fast reactor module, where estimates now reflect an 11% capital cost premium for fast reactors when compared to thermal reactors. Since the initial external release of this document in April 2007 the document has been provided to the nuclear industry, universities, and international collaborators with the intent to gain further feedback and input to improve the document. A paper “A Documented Resource for Nuclear Fuel Cycle Cost Information” was presented at the June American Nuclear Society meeting in Boston, MA on June 25, 2007, to advertise the purpose, background, basis, and links to obtain the report from OSTI and Idaho National Laboratory.

INL/EXT-07-12107 (March 2008) Advanced Fuel Cycle Cost Basis x

INL/EXT-07-12107 (March 2008) Advanced Fuel Cycle Cost Basis xi
CONTENTS
ABSTRACT................................................................................................................................................. iii
SUMMARY.................................................................................................................................................. v
ACKNOWLEDGMENTS ..........................................................................................................................vii
PREFACE.................................................................................................................................................... ix
ACRONYMS.............................................................................................................................................. xv
NOMENCLATURE .................................................................................................................................xvii
1. INTRODUCTION.............................................................................................................................. 1 1.1 Background .............................................................................................................................. 2 1.2 Related Program Interfaces and Related Key Evaluations....................................................... 2 1.3 Annual AFCI Cost Basis.......................................................................................................... 3 1.4 Cost Module Description ......................................................................................................... 3 1.5 Structure of the Report ............................................................................................................. 5
2. AFCI COST BASIS DEVELOPMENT PROCESS........................................................................... 6 2.1 Process Description.................................................................................................................. 6 2.2 Fuel Cycle Data Collection ...................................................................................................... 7 2.3 Cost Data Normalization.......................................................................................................... 7
2.3.1 Government versus Private Facility Ownership ......................................................... 7 2.3.2 Technology Readiness Level (Program/Project R&D Status) .................................... 7 2.3.3 Code of Accounts/Work Breakdown Structure........................................................... 7 2.3.4 Common Currency ($U.S.) ....................................................................................... 10 2.3.5 Common Year (Current Year Basis)......................................................................... 10 2.3.6 Differences in Cost Estimating Methodologies (Top Down vs. Bottom Up) ........... 10
2.4 Cost Data Verification ........................................................................................................... 11 2.5 Data Gap Analysis ................................................................................................................. 11 2.6 Cost Data Documentation ...................................................................................................... 12 2.7 AFCI Cost Database............................................................................................................... 14
3. FUEL CYCLE REFERENCE COST MODULES........................................................................... 15
4. STRATEGY COSTING PROCEDURE .......................................................................................... 19 4.1 Process Description................................................................................................................ 19 4.2 Define Scenarios .................................................................................................................... 20 4.3 Define Parameters .................................................................................................................. 20 4.4 Cost Module Coupling ........................................................................................................... 20 4.5 Cost Module Scaling.............................................................................................................. 20 4.6 Handling of Credits for U, Pu, and Other Materials .............................................................. 21 4.7 Develop Total Fuel Cycle Costs ............................................................................................ 21

INL/EXT-07-12107 (March 2008) Advanced Fuel Cycle Cost Basis xii
4.8 Develop Total Cost of Electricity Costs................................................................................. 22 4.9 Economics of Private Sector vs. Regulated Nuclear Fuel Cycle Facilities........................... 22
5. ECONOMIC EVALUATION GUIDELINES ................................................................................. 23
6. ECONOMIC COMPUTER MODELS............................................................................................. 24 6.1 Integration of Cost Modules into Cost Models ...................................................................... 24 6.2 Computer Software and Simulations ..................................................................................... 24
6.2.1 NFCSim .................................................................................................................... 24 6.2.2 Dynamic Model of Nuclear Development (DYMOND)........................................... 25 6.2.3 Harvard Spreadsheets................................................................................................ 25 6.2.4 Generation IV Economic Modeling Working Group Levelized Cost of
Electricity Model....................................................................................................... 25 6.2.5 Total System Model .................................................................................................. 25 6.2.6 VISION.ECON ......................................................................................................... 26
6.3 Model Performance Evaluation and Verification Activities .................................................. 26
7. CONCLUSIONS AND RECOMMENDATIONS........................................................................... 28 7.1 Creation of a Credible Reference AFCI Cost Basis ............................................................... 28 7.2 Path Forward .......................................................................................................................... 29
8. REFERENCES................................................................................................................................. 30
Appendix A—Code-of-Accounts Dictionary for Estimating Costs of Facilities........................................ 31 Modules: A—Uranium Mining and Milling .............................................................................................................A-1 B—Conversion ......................................................................................................................................... B-1 C1—Enrichment ..................................................................................................................................... C1-1 C2—Highly Enriched Uranium Blend-down ......................................................................................... C2-1 D1 Series—Fabrication of Contact-handled Fuels (Summary and Modules D1-1 through D1-9).........D1-1 E1—Wet Storage of Spent Nuclear Fuel ................................................................................................ E1-1 E2—Dry Storage of Spent Nuclear Fuel................................................................................................. E2-1 E3—Recycled Product Storage............................................................................................................... E3-1 F1—Spent Nuclear Fuel Aqueous Reprocessing Facility (Cost Module F1) ..........................................F1-1 F2/D2—Electrochemical Reprocessing and Remote Fuel Fabrication..............................................F2/D2-1 G Series—Waste Conditioning, Storage, and Packaging (Modules G1 through G5)...............................G-1 I—Long-term Monitored Retrievable Storage............................................................................................I-1 J—Near Surface Disposal .......................................................................................................................... J-1 K1—Depleted Uranium Conversion and Disposition.............................................................................K1-1 K2—Aqueously Reprocessed Uranium Conversion, Disposition, and Possible Recycle ......................K2-1 K3—Electrochemically Reprocessed Uranium Conversion, Disposition, and Possible Recycle...........K3-1 L—Geologic Repository........................................................................................................................... L-1 M Series—Alternative Disposal Concepts (Modules M1 through M3) .................................................. M-1 O Series—Transportation Processes (Modules 01, 02, and Annex OX) ..................................................O-1

INL/EXT-07-12107 (March 2008) Advanced Fuel Cycle Cost Basis xiii
R1—Thermal Reactors ........................................................................................................................... R1-1 R2—Fast Reactors .................................................................................................................................. R2-1
FIGURES
Temporal relationship of RD&D, deployment, and standard plant costs. ................................................xxii Figure 1-1. AFCI cost flow sheet.................................................................................................................. 4 Figure 2-1. AFCI cost basis development process........................................................................................ 6 Figure 2-2. AFCI cost database. ................................................................................................................. 14 Figure 4-1. AFCI strategy costing procedure.............................................................................................. 19 Figure 4-2. Example of linked cost modules. ............................................................................................. 21
TABLES Table 2-1. Example of a WIT table............................................................................................................. 13 Table 3-1. Fuel cycle cost module general descriptions. ............................................................................ 16

INL/EXT-07-12107 (March 2008) Advanced Fuel Cycle Cost Basis xiv

INL/EXT-07-12107 (March 2008) Advanced Fuel Cycle Cost Basis xv
ACRONYMS AFC advanced fuel cycle
AFCI Advanced Fuel Cycle Initiative
CANDU Canada deuterium uranium
COA code of accounts
D&D decontamination and decommissioning
DOE U.S. Department of Energy
DYMOND Dynamic Model of Nuclear Development
EMWG Economic Modeling Working Group
FOAK First-of-a-Kind
GNEP Global Nuclear Energy Partnership
GTCC Greater-than-Class-C (low-level waste)
HLW high-level waste
HVAC heating, ventilating, and air conditioning
IDC Interest during construction
INL Idaho National Laboratory
LLW low-level waste
LUEC Levelized Unit of Electricity Cost
LWR light water reactor
MTHM metric ton of heavy metal
NOAK Nth-of-a-Kind
NRC Nuclear Regulatory Commission
O&M Operations and Maintenance
OCRWM Office of Civilian Radioactive Waste Management
R&D research and development
RD&D research, development, and demonstration
SNF spent nuclear fuel
SNL Sandia National Laboratories
TCIC Total Capital Investment Cost
TCOE Total Cost of Electricity
TOC Total Overnight Cost
VHTR Very High Temperature Reactor

INL/EXT-07-12107 (March 2008) Advanced Fuel Cycle Cost Basis xvi
VISION Verifiable Fuel Cycle Simulation
WIT What-It-Takes

INL/EXT-07-12107 (March 2008) Advanced Fuel Cycle Cost Basis xvii
NOMENCLATURE
The following definitions established the common terminology used to develop fuel cycle cost estimates. These terms were developed by the Generation IV Economic Modeling Working Group and, in some cases, have been modified to describe fuel cycle costs. It is understood that some of these terms will not be used or become applicable until much later in the system development and deployment cycle.
Base cost. The base construction cost is the most likely plant construction cost based on the direct and indirect costs only. This cost is lower than the total capital cost because cost elements such as contingency and interest are not included. The direct costs are those costs directly associated on an item-by-item basis with the equipment and structures that comprise the complete production plant, fuel cycle facility, equipment fabrication factory, or end-use plant. The indirect costs are expenses for services applicable to all portions of the physical plant. These include field indirect costs, design services, engineering services, architectural engineer home office engineering and design services, field office engineering and services, and construction management services. Process equipment manufacturer home office engineering and services are included in separate accounts. Owner’s costs, such as commissioning, are added to the base costs prior to the application of the contingency allowance.
Common plant facilities. Common plant facilities are those systems, structures, and components that provide common support to the operation at a new plant site. They include such facilities as administration buildings, general warehouse, water supply, general fire systems, energy distribution, cooling water intakes, cooling towers, and civil and engineering offices. These common plant facilities can be sized to share with other production units added subsequently.
Constant money. Constant money cost is the cost of an item, measured in money that has a general purchasing power as of some reference date, e.g., January 1, 2001. Because inflation is associated with the erosion of the purchasing power of money, constant money analysis factors out inflation. In the Advanced Fuel Cycle Initiative (AFCI) economic analyses carried out using the present guidelines, only constant money costs will be considered.
Construction module. A construction module is a free standing, transportable preassembly of a major portion of the plant, or a system or sub-system of the unit. A construction module may be a preassembly of a single system or portion thereof, or may contain elements of all the systems that exist in a given location in the plant. A construction module may contain parts of the building structure. A construction module might be assembled in a factory, shipped to the plant site, and installed in the plant (perhaps after minor assembly and/or linking). The direct costs for modules should contain their share of the manufacturing costs, including the fair burden of the cost of operating the factory where they are manufactured. If not, the factory-related costs must be accounted for elsewhere. An example would be groups of gas centrifuges for uranium enrichment shipped as production units from a centrifuge machine manufacturing facility.
Contingency. Contingency is an adder to account for uncertainty in the cost estimate Contingency includes an Allowance For Indeterminates and should be related to the level of design, degree of technological advance, and the quality/reliability level of given components. Contingency does not include any allowance for potential changes from external factors, such as changing government regulations, major design changes or project scope changes, catastrophic events (force majeure), labor strikes, extreme weather conditions, varying site conditions, or project funding (financial) limitations. Contingencies can be also applied to the interest during construction (IDC) and the capacity factor to account for uncertainty in the reactor design/construction schedule and reactor performance, respectively.
Deployment costs. Costs of developing a standard facility design and licensing it. These are considered part of First-of-a-Kind (FOAK) costs and are distinct from research and development costs.

INL/EXT-07-12107 (March 2008) Advanced Fuel Cycle Cost Basis xviii
Direct cost. All costs that are traceable to construction of permanent plant, but excluding support services such as field indirect costs, construction supervision, and other indirect costs (see also Base cost).
Discount rate. In the context of the present guidelines, discount rate will be taken as equal to the real cost of money. This cost will, in turn, depend on the market risk, deployment risk, financing scheme, and other external factors.
Economic life. The number of years of commercial operation over which capital costs are recovered. This value is needed to calculate a fixed charge rate or capital recovery factor. The economic life is usually fixed at the number of years of commercial operation allowed by the regulator.
Escalation rate. The rate of cost change. This rate can be greater than or less than the general inflation rate, as measured by the Gross Domestic Product Implicit Price Deflator. For Advanced Fuel Cycle Initiative cost estimation, it will be assumed to be zero, unless otherwise justified.
Equipment. Equipment for production facilities includes all manufactured items ordered and delivered to a site, and used in construction. Such items may be procured on a design and build contract from qualified vendors, wherein design responsibility belongs to the seller (vendor) or is maintained by the buyer or purchasing agent on a “build-to-print” basis. To facilitate bottom-down estimating techniques, only major process related equipment costs will be categorized as equipment cost. Nonprocess related equipment such as heating, ventilating, and air conditioning (HVAC), plumbing, lifting or maintenance equipment, or large pipe and valves is to be classified as material costs.
Equipment module. An equipment module is a prepackaged and site delivered (skid-mounted, factory-assembled) package that includes (but is not limited to) equipment, piping, instrumentation, controls, structural components, and electrical items. Module types include Box Modules, Equipment Modules, Structural Modules, Connection Modules, Electrical Modules, Control System Modules, and Dressed Equipment Modules. These Modules are applicable to both the Main Process and Balance of Plant, including support buildings.
Factory (manufacturing facility) first-of-a-kind costs. These First-of-a-Kind (FOAK) costs include the development of manufacturing specifications, factory equipment, facilities, startup, tooling, and setup of factories that are used for manufacturing specific equipment for the fuel cycle system. These costs can be minimized if existing facilities are used for module production. These facilities might not be dedicated to, or even principally used for this application (e.g., a shipyard or any other factory that already builds modules for other industries or units). For a new modular production facility, the new equipment module fabrication factory might be considered a FOAK cost and included in module prices. If these costs are to be spread over a production run (or total Number of Plants), then the cost should be estimated on that basis, and the number of plants or production needed to recover the factory costs defined. The module prices are in the unit/plant costs and, as such, the price should be amortized into the unit product cost over some number of modular facilities produced over its projected lifetime. The capital cost of the modules must amortize the module factory capital costs plus the normal annual production (operating) costs for the factory. For a preexisting factory, it is assumed that the price of the modules includes a fair share of any factory operating and capital recovery costs (overheads).
First commercial plant costs. The first commercial plant is the first standard plant of a particular type that is sold to an entity for the purpose of commercial production of fuel and/or other fuel cycle related products or services. The costs include all engineering, equipment, construction, testing, tooling, and project management costs, as well as any other costs that are repetitive in nature. Any costs unique to the first commercial plant, which will not be incurred for subsequent plants of the identical design, will be identified and broken out separately as FOAK plant costs. The “learning” process for this first plant will reflect its first commercial plant status and not be the average over a larger number of later plants.

INL/EXT-07-12107 (March 2008) Advanced Fuel Cycle Cost Basis xix
First-of-a-kind plant costs. The First-of-a-Kind (FOAK) costs are those necessary to put a first commercial plant in place that will not be incurred for subsequent plants. Design and design certification costs are examples of such costs. Refer to the figure on temporal relationship of research, development, and demonstration (RD&D); deployment; and standard plant costs at the end of nomenclature section.
Force account. Construction Labor Force account involves the direct hiring and supervision of craft labor to perform a construction activity by a prime contractor, as opposed to the prime contractor hiring a subcontractor to perform these functions.
Indirect cost. All costs that are not directly identifiable with a specific permanent plant, such as field indirect, construction supervision, design services, and PM/CM services (see Base cost).
Industrial grade construction. Industrial grade construction means construction practices that conform to generally accepted commercial requirements such as those required for fossil-fired plant or general chemical plant construction. Industrial grade construction could be used for nonnuclear parts of fuel cycle facilities, such as a zirconium tube factory in a light water reactor fuel fabrication facility. A module factory could also use industrial grade construction for the production of some modules. See also definition of nuclear grade construction.
Inflation rate. The rate of change in the general price level as measured by the Gross Domestic Product Implicit Price Deflator. The inflation rate is assumed to be zero in constant money based studies.
Interest during construction. Interest during construction (IDC) is the interest accrued for up-front cost financing, i.e., it is accrued to the end of construction and plant startup. This report assumes that once the plant is in commercial operation, the IDC plus the total overnight costs are “rolled-over” to a long-term loan or financing structure.
Levelized unit of electricity (LUEC) cost. The levelized cost of electricity generation, expressed in $U.S./MWh or mills per net kWh. For the standard plant, it includes costs associated with nongeneric licensing, capital investment, operation and maintenance of the energy plant, owner’s costs, ongoing refurbishment, fuel, waste disposal, and decommissioning the plant at the end of life, and may include revenue offsets due to by-product production. Typically, the four components of levelized unit of electricity cost (LUEC) reported are: the capital component (recovery of capital cost over economic life), the production or nonfuel operating and maintenance component, the fuel component, and the decontamination and decommissioning component. Normally, this cost does not have research and development or demonstration (prototype) cost embedded in it. If the FOAK plant were a commercial plant, it would have some FOAK costs, such as generic design and design certification, recovered in the LUEC. The remaining recoverable costs would be standard plant costs. When multiple reactors (and types) are evaluated in a fuel cycle scenario, then the composite unit cost is referred to as the total cost of electricity (TCOE).
Materials. Materials include field-purchased (site material) and/or bulk commodity items, such as lumber, concrete, structural steel, and plumbing items. All piping is a materials item, as are all wire, cable, and raceways, including those in building service power systems. Also included is nonprocess related equipment such as HVAC, cranes, hoists, doors, plumbing, sewage treatment, etc. To facilitate bottom-down estimating techniques, only process-related equipment is categorized as equipment cost.
Module. See Construction Module and Equipment Module.
Multi-unit plant. A plant consisting of more than one production unit.
Nominal dollars. Nominal dollar cost is the cost for an item measured in as-spent dollars and includes inflation. Nominal dollars are sometimes referred to as “current” dollars, “year of expenditure” dollars, or “as spent” dollars.

INL/EXT-07-12107 (March 2008) Advanced Fuel Cycle Cost Basis xx
Nominal cost of money. The nominal cost of money is the percentage rate used in calculations involving the time value of money containing an inflation component. It explicitly provides for part of the return on an investment to keep up with inflation.
Nth-of-a-kind plant cost. The nth-of-a-kind (NOAK) plant cost is the cost of the nth-of-a-kind or equilibrium commercial plant of identical design to the FOAK plant. NOAK plant cost includes all engineering, equipment, construction, testing, tooling, and project management, as well as any other costs that are repetitive in nature and would be incurred if an identical plant was built. The NOAK plant cost reflects the beneficial cost experience of prior plants. The EMWG currently defines the NOAK plant as the next plant after 8.0 GWe of capacity have been built.2 However, some U.S. nuclear analysts suggest that the NOAK plant may be achieved earlier, e.g., closer to four power plants. Refer to the figure on temporal relationship of RD&D, deployment, and standard plant costs at the end of nomenclature section.
Nuclear-safety grade. Nuclear-safety grade construction means construction practices that satisfy the Quality Assurance and other requirements of national licensing. Both reactor and fuel cycle facilities will require some nuclear-grade construction.
Overnight cost. The (total) overnight cost is the base construction cost plus applicable owner’s, contingency, and first core costs. It is referred to as an overnight cost in the sense that time value costs (IDC) are not included, i.e., the cost is as if the plant were constructed “overnight” with no accrual of interest. Total overnight cost is expressed as a constant dollar amount in reference year dollars (overnight cost = total capital investment cost – IDC). Commissioning costs are included in the overnight cost for this study, which is not usually the case for conventional facility estimates. This expanded definition is used to reflect the fact that an owner is likely to need to finance the start-up cost in addition to the design and construction costs. Allowing all “up-front” costs to be combined into one lump sum term prior to calculation of the IDC simplifies the algorithms used to calculate the LUEC.
Prototype-of-a-kind. Costs specific to any prototype plant. These include prototype-specific design, development, licensing, construction, and testing, as well as operation of the prototype to support the demonstration of the system or concept (this prototype may assist, but does not meet or satisfy standard plant design certification). These costs are separate from FOAK and are not amortized within the LUEC.
Research, development, and demonstration costs. Costs associated with material, component, system, process, and possibly even fuel development and testing performed specifically for the particular advanced concept. These costs are often borne by governments or by industry consortia, and may be recovered depending on national norms and practices. In the present guidelines, RD&D costs are not distributed into the LUEC; however, their sum for each system is an important figure of merit for AFCI decision makers.
Real cost of money. The real cost of money (r) is the percentage rate used in calculations involving the time value of money when the inflation component has been removed (constant money calculations). Calculations using the real cost of money assume that the money maintains a constant value in terms of purchasing power, and, thus, no return on investment is needed to cover inflation.
Reference plant costs. These costs are the basis for estimating costs in the absence of a fully worked up or proven cost for a commercial unit (i.e., a surrogate basis for estimating total plant cost and cost differences). The reference plant is not part of the overall project, but rather a benchmark from which to begin costing the real planned facilities. Obtaining this information may incur some costs. See Chapter 4 of the Generation IV Cost Estimating Guidelines for information on the process for top-down cost estimation using reference plant costs.

INL/EXT-07-12107 (March 2008) Advanced Fuel Cycle Cost Basis xxi
Single-unit plant. A stand-alone commercial production plant consisting of a single unit and all necessary common plant facilities is referred to as a single-unit plant or unit. This is the smallest unit of production capacity normally sold to a customer, such as a uranium enricher or fabricator.
Specific cost. Total cost divided by the net capacity (such as net MTHM) of the plant.
Standard plant design costs. Costs associated with the engineering and engineering support functions for the design of the standard plant. These are a FOAK cost for the first commercial standard plant. These do not include the site-specific engineering costs that are associated with all standard plants.
Standard production plant licensing costs. Costs associated with licensing-related activities performed to establish that the design of the standard plant is adequate for obtaining a license. In the United States, it includes the design and analysis of prototype tests necessary for certification, coordination with the Nuclear Regulatory Commission, and preparation of documents required for certification of the standard plant design. These are a FOAK cost for the first commercial standard plant. These do not include the site-specific engineering costs that are associated with all standard plants.
Technology development costs. See research, development, and demonstration costs.
Total Cost of Electricity. The total cost of electricity (TCOE) is represented by the composite costs from an alternative consisting of multiple reactors (and potentially types of reactors), expressed in $U.S./MWh or mills per net kWh. These costs include the individual reactor LUEC and fuel cycle costs. The TCOE can be decomposed into composite contributions from the reactor (thermal and fast) capital component (recovery of capital cost over economic life), operating and maintenance component, fuel component, and the decontamination and decommissioning component. This cost does not represent life-cycle costs which would also include research and development and demonstration (prototype) costs.
Transition period. The period from the start of the construction of the FOAK to the start of construction of the NOAK plant.
Transition period plant-specific capital costs. The capital costs for the transition plants (such as the second and third of a kind). These costs exclude any FOAK costs and include costs for manufacturing of factory equipment, site construction, site-specific engineering, and home office construction support. The transition in costs from FOAK to NOAK and the beneficial cost effects of serial manufacturing and construction should be documented.
Unit. See single-unit plant.
Total Capital Investment Cost. The total capital investment cost is an all-inclusive plant capital cost (or lump-sum up-front cost) developed for the purpose of calculating the plant LUEC ($/production unit), or that of a factory-fabricated module or equipment item (such as $/module). This cost is the base construction cost plus contingency, escalation (zero for these studies, unless justified), IDC, owner’s cost (including owner’s start-up cost), and commissioning (nonowner startup cost, such as that spent by process equipment manufacturer or architectural engineer). Because constant dollar costing will be used in these studies, escalation and inflation are not included.
The following figure shows the relationship in time between some of the cost categories defined above as well as which costs are included in the cost of product. It should be noted that the horizontal and vertical scales of the graph are illustrative only and not scaled to real time and expenditures.

xxii IN
L/EXT-07-12107 (D
ecember 2007)
A
dvanced Fuel Cycle C
ost Basis
TRUEFOAK Costs
(generic des &lic.)
** ** *******
Lump *********Sum Standard FC plant Second standard ******
Expen- portion of first commercial FC plant ******diture commercial FC plant (2OAK) > learning >
(FOAK) Nth standard($M) commercial
Prototype (these cost categories FC plant(Arbitrary (Demo) recur in subsequent (NOAK)
Scale) Fuel Cycle Facil plants)
Fuel Cycle R&D (POAK)
Phase >> < Deployment >
RD&D phase costs generally not included in cost ofproduct
>>>> TIME (Arbitrary Scale) >>>>
<Research, Dev't, & Demonstration> Fully Commercialized Production FC Technology
Temporal relationship of RD&D, deployment, and standard plant costs.

INL/EXT-07-12107 (March 2008) Advanced Fuel Cycle Cost Basis 1
Advanced Fuel Cycle Cost Basis 1. INTRODUCTION
This report builds on work performed over the past 4 years by the Advanced Fuel Cycle Initiative (AFCI) Program to develop cost-estimating processes and establish a uniform structure for the collection of fuel cycle cost data. This report describes the advanced fuel cycle (AFC) cost basis development process, and provides reference information for AFC cost modules, a fuel cycle strategy costing procedure, economic evaluation guidelines, and integration of the cost data into economic computer models, and finally conclusions and recommendations. The report does not include an evaluation of the future costs of or technical challenges for other potential future (non-nuclear) electricity generation alternatives. It also does not deal with non-cost (e.g., sustainability, societal, environmental, non-proliferation) issues. However, these important factors should be considered when evaluating the competitiveness and benefits of nuclear energy.
A significant body of cost data has been collected and organized; however, the report is a continuous “work in progress” where some elements of the overall life-cycle cost for a given fuel cycle step may be incomplete, but new cost data is constantly being added to the database from new sources. Some of the cost and technology information derived from older reference sources are dated, but are included for completeness and will be updated as new data becomes available. This external release of the AFC Cost Basis report is intended to allow a wider distribution of the cost information, help identify new cost data sources, and facilitate closer collaboration, both domestically and internationally, with industry and universities. These costs are being reviewed by international experts from the International Generation IV Reactor Systems Economic Modeling Working Group (EMWG) and the Organization for Economic Cooperation and Development/Nuclear Energy Agency (OECD/NEA) that have prepared similar studies. The reconciliation of any differences will be reported in a future report update.
There are some general assumptions and caveats of which users of the AFC cost data should be aware. The costs are presented in current-year (2007) dollars, but are assumed to represent longer-term (10–20 year) market conditions, long-term contracts, and mature commercial technologies. The authors recognize that uranium and enrichment spot prices have recently exceeded the high-cost range provided in this cost basis. These price trends continue to be evaluated and the cost ranges in the report may continue to be revised as appropriate in future updates. The projected costs for recycling facilities and fast reactor projected costs are based on Nth-of-a-kind facilities. Special attention should be directed towards including the costs for recycled product storage, conditioning, and disposition of all waste streams.
The cost data, especially the unit cost data such as the cost per kilogram of heavy metal, may be readily input to cost models to perform engineering cost studies on both open and closed fuel cycles. Users are cautioned that their models may provide different answers and resulting conclusions due to different assumptions on the fuel cycle configuration, mass flows, time delays, cost escalation, technology performance, learning effects, market growth, and other user-defined parameters. Assumptions should be clearly documented and sensitivity analyses performed to evaluate the impacts resulting from the various assumptions.
Any comments are welcomed on the data or text in this study, especially any new data that has not been publicly available or is the result of recent new analyses outside of the Department of Energy. Comments may be provided to David Shropshire at [email protected] or by calling (208) 526-6800.

INL/EXT-07-12107 (March 2008) Advanced Fuel Cycle Cost Basis 2
1.1 Background The AFCI’s definition of fuel cycle costs is consistent with the Generation IV EMWG’s definition of
nuclear fuel cycle costs, stated as “the costs of uranium supply, conversion, and enrichment; fuel fabrication; transport; intermediate storage and final disposal of spent fuel (for the direct disposal option). For the reprocessing option, the costs also include those for spent nuclear fuel (SNF) reprocessing associated with waste management, along with storage and final disposal of high-level radioactive waste, as well as any credits realized through the sale and use of uranium, plutonium, heavy water, or other materials.”1 The AFCI definition also extends into advanced or innovative fuel cycles that may require additional cost elements related to fuel recycling (e.g., recycled product storage, reprocessing variations) and alternative disposal concepts (e.g., deep bore hole).
Current AFCI cost analysis includes an extensive evaluation of the fuel cycle costs and also includes reactor costs to fully understand the interdependency relationships between the fuel cycle and the reactor technology. The EMWG describes the total costs as the levelized unit of electricity cost (LUEC), which is the unit of most interest to utility decision makers. The LUEC “is composed of four main contributors to its total: a capital component (which includes up-front cost of financing and amortization over the economic life); an Operations and Maintenance component; fuel cycle component (fuel reloads); and a decontamination and decommissioning (D&D) component. The component costs and the total are generally expressed in constant money per unit of electricity/energy produced (e.g., $/kWh).”1
Several weaknesses of past fuel cycle economic analysis are identified and addressed in this report:
1. A fundamental weakness was the lack of a consistent and comprehensive documented source of fuel cycle cost data. With this report, we have established a documented reference cost basis with a structure and processes for continued improvement of the cost data.
2. Current design bases and requirements for critical AFCI operations (e.g., separations, fuel refabrication, waste forms) are lacking. Improving the design cost basis will shadow the development of fuel cycle technology and facility designs prepared by the AFCI Program. Cost information consistent with the cost structure and processes identified in this report will be obtained through economic integration with the fuels and separation working groups, engineering alternative studies (e.g., Consolidated Fuel Treatment Center), and through industry engagement.
3. Verified estimating models to support fuel cycle cost analysis are lacking. In FY 2005, the requirements for a verifiable fuel cycle cost model were established. The selection of a modeling platform and development of an initial dynamic model to support systems economic analyses were completed in FY 2006. In FY 2007, the dynamic model was used to perform dynamic analysis on a range of fuel cycle cases and the results were compared to static (equilibrium) modeling results.
4. Previous cost studies failed to provide a complete economic accounting of all the fuel cycle costs (e.g., D&D costs, refurbishment, and waste forms were omitted) in the overall life-cycle costs of a facility. Such “partial” studies can result in misleading conclusions. This work will continue to be expanded to encompass all relevant aspects of the nuclear fuel cycle and related cost elements. Internal AFCI review of the module cost data, external reviewers of this report, and input from report users will be used to help identify areas of omission or discontinuity in our estimate basis.
1.2 Related Program Interfaces and Related Key Evaluations The economic benefits of the AFCI accrue in-part from cost savings in high-level waste (HLW)
disposal. Therefore, AFCI economic analysis must be carefully coordinated with the U.S. Department of Energy (DOE) Office of Civilian Radioactive Waste Management (OCRWM). The OCRWM program has an ongoing effort that annually updates the Total System Life-cycle Cost estimate for the repository

INL/EXT-07-12107 (March 2008) Advanced Fuel Cycle Cost Basis 3
program. AFCI economic analysis should draw from and coordinate with the Total System Life-cycle Cost analysis and ultimately be reviewed by knowledgeable OCRWM personnel. In FY 2005, the AFCI Program began working with the OCRWM Program to develop a joint understanding of the impact of advanced fuel cycles on both the need for and cost of future repository capacity in the United States.
The AFCI Economic Analysis activity has developed a close working relationship with the Generation IV EMWG. For this report, we defined a consistent fuel cycle code of accounts (COA) structure, a cost basis development process, and a set of cost estimating terminology. The AFCI Economic Analysis activity has received feedback from the EMWG on key AFCI economic deliverables. Some reactor cost data has been received from the EMWG to support total nuclear system cost calculations. The AFCI and Generation IV groups jointly held sessions on the economics of closed fuel cycles and the economics of fast reactors at the June 2007 ANS conference in Boston, MA. The two groups created and presented 15 papers, which helped to get more information into the public domain and facilitated discussion, information sharing, and enhanced collaboration between the groups.
The AFCI Economic Analysis Working Group previously interacted with the AFCI separations and fuels working groups. Under the Global Nuclear Energy Partnership, the working groups have been reorganized into Campaigns in which the EMWG is currently participating. The Economic team supports technical working group reviews and analysis, and identifies ways to reduce the costs and uncertainty of recycle processes. Through this involvement we gain access the latest design and cost data for input to the cost database and use in AFCI system studies.
1.3 Annual AFCI Cost Basis As stated previously, the AFCI Program has established the foundation for cost estimates with a
greater level of confidence and completeness, and provided the framework for incremental process improvements. The AFCI Program has been collecting cost references and has expanded the fuel cycle cost data for over 4 years. The intended use of the cost data is relative economic comparison of options rather than for determination of total fuel cycle costs with great accuracy. As technology development progresses and detailed engineering designs are completed, cost estimate accuracy will be further improved. The cost report will be periodically updated to include the latest technology and design information and to support the improvement of processes and tools used to perform fuel cycle cost analysis.
In the future, the report will be updated with cost data based on U.S. information as well as experience gained in developed and developing nuclear countries. The analysis may be extended to foreign applications as an evolution in the cost development activity.
1.4 Cost Module Description Each type of fuel cycle facility or activity is referred to as a cost module. A cost module provides
a specific fuel cycle function that is separate from but dependent on other fuel cycle activities (e.g., the enrichment module is influenced by the enrichment required by the fuel manufactured in the fuel fabrication module). The cost modules are assembled in various ways to create different fuel cycle scenarios, as illustrated in the AFCI Cost Flow Sheet in Figure 1-1.
The flow sheet includes 25 fuel cycle modules with interface lines that show the flow paths through the fuel cycle from the initial Module A, Mining and Milling, through various open and closed fuel cycle paths that terminate with Modules J, L, and M that provide the function of waste disposition. The interfaces between the functional Modules A through M (associated with facilities) are provided by the transportation process, Module O.

INL/EXT-07-12107 (March 2008) Advanced Fuel Cycle Cost Basis 4
Figure 1-1. AFCI cost flow sheet.

INL/EXT-07-12107 (March 2008) Advanced Fuel Cycle Cost Basis 5
1.5 Structure of the Report A list of definitions that provide a common set of terminology for describing fuel cycle costing
activities is included in the nomenclature section at the beginning of the report.
Section 1 of this report contains the background, program interfaces, description of the annual report cost activities, description of cost modules and example of fuel cycle paths.
Section 2 describes the cost development process used to develop the fuel cycle costs. The process includes data collection methodology, cost data normalization, verification, data gap analysis, and cost data documentation, and a description of the AFCI cost database. A COA dictionary for estimating costs of fuel cycle facilities is provided in Appendix A. A common cost table that summarizes the module cost data, called the AFCI What-It-Takes (WIT), is described.
Section 3 describes the organization of the reference cost modules into front-end, back-end, and recycle groups. A general description of the twenty cost modules is provided.
Section 4 provides a procedure for costing fuel cycle options using the cost modules in this report.
Section 5 includes guidelines for comparing alternatives using qualitative and quantitative techniques.
Section 6 describes the use and integration of the cost data into cost models. A description of fuel cycle models that could be used for cost analysis is provided.
Section 7 summarizes the conclusions and recommendations resulting from the development of the report.
Section 8 provides general (nonmodule specific) report references.
The appendix provides additional fuel cycle cost details on the code-of-accounts.
Attachment 1 is broken into separate tabbed sections for 25 cost modules. Fuel cycle modules are included in tabs A through O, as listed in Section 3. Baseline cost information for different types of reactors/transmutation options are included under tab R. Each of the module sections contains cost documentation based on the module outline described in Section 2. The AFCI WIT table is used to summarize the module fuel cycle cost data in a consistent manner.

INL/EXT-07-12107 (March 2008) Advanced Fuel Cycle Cost Basis 6
2. AFCI COST BASIS DEVELOPMENT PROCESS The goal of the AFCI Cost Basis Development Process shown in Figure 2-1 is to establish a credible
cost basis and to create a reference source for fuel cycle unit costs. Cost data will be evaluated on discrete fuel cycle activities, called cost modules, which represent the various front-end fuel cycle, back-end fuel cycle, waste disposition, and transportation functions. This task does not include the “bottoms up” development of cost estimates from a design basis. Instead, the cost basis for each module is derived from existing cost reference sources and studies.
2.1 Process Description The AFCI cost basis development includes cost data collection, cost normalization, data verification,
and gap analysis. Data gaps are recommended to DOE as the subjects for future engineering cost studies. For example, specific recommendations were made on additional cost study needs based on the review of the Spent Fuel Treatment Facility Scoping Study in FY 2005. The data from the engineering studies are used to improve the cost basis. The synthesized data developed are being input to the VISION (Verifiable Fuel Cycle Simulation) model for use in quantitative analysis (such as the calculation of the Total Cost of Electricity), or may be used as qualified static input data for scenario evaluations and development of fuel cycle strategies.
Cost Basis Development Process
Collect Cost Data for each
Fuel Cycle Module
Normalize Data
Verify Data
AFC Engineering Cost Studies
Data Gap Identification
Start
AFC Cost Basis Report
VISION Model
StaticCost
Analysis
DynamicCost
Analysis
Fuel Cycle Strategy and Scenario Evaluations
AFC Cost Report
Database
Access
Figure 2-1. AFCI cost basis development process.

INL/EXT-07-12107 (March 2008) Advanced Fuel Cycle Cost Basis 7
2.2 Fuel Cycle Data Collection Data were collected for 23 fuel cycle modules and 2 reactor modules. The cost data were analyzed
and evaluated on a common basis. The complete list of modules is included in Section 3.
The data collection methodology identifies the data sources and selection for use. The source of the cost information is identified, including data generated and maintained/updated by the AFCI program, and those taken from data gathering and modeling efforts of other organizations (e.g., OECD/International Atomic Energy Agency “Red Book”).
2.3 Cost Data Normalization Fuel cycle cost data were normalized to establish uniform baseline costs and assumptions. The
characteristic attributes of the cost data were identified for each module. The following sections describe the unique characteristics that are important to understanding the costs.
2.3.1 Government versus Private Facility Ownership
Ownership affects the methodology by which unit costs are calculated and also affects the categorization of costs. The treatment of risk, especially as it is represented in the assumed discount rate, is also different for government projects as opposed to private commercial projects. Some aspects of the fuel cycle, such as geologic disposal, are typically considered to occur in government facilities while others, such as enrichment, are typically considered to occur in private facilities. To provide both consistency and flexibility, the differences due to ownership are made explicit so that the fuel cycle module (e.g., separations facility) can be estimated for either type of ownership. The reference cost data for each module will identify the ownership basis of the cost estimate. Further discussion on the economics of private sector versus regulated nuclear fuel cycle facilities is included in Reference 2.
2.3.2 Technology Readiness Level (Program/Project R&D Status)
The technology readiness level often affects the detail level of the information needed for cost estimating and also the extent to which contingency must be applied to cover risk in project costs. For this cost basis, the technology readiness is categorized into three classes: Research & Development (R&D) — possible, Pilot — feasible, Commercial — viable. Subsequent to the development of the initial classification, a basis will be developed for relating technology readiness to contingency for purposes of developing cost estimates and associated confidence ranges. The EMWG is developing approaches for handling contingency in nuclear energy systems.1
2.3.3 Code of Accounts/Work Breakdown Structure
The COA and associated dictionary provide a means for consistently placing cost information in explicitly defined “bins” or categories that are common to most projects and their life cycles. Having uniformity in the definition of the COA allows useful comparison of process alternatives or competing technologies and provides some insight at the subsystem level. The work breakdown structure that eventually evolves from the COA structure can be used for management of the project, such as in subcontracting work packages and tracking costs.
The front-end modules (i.e., natural uranium mining and milling, conversion, enrichment, and fuel fabrication) are typically commercial operations where COA and work breakdown structure cost information is typically not available due to sensitivity over the competitive nature of the information.

INL/EXT-07-12107 (March 2008) Advanced Fuel Cycle Cost Basis 8
The life-cycle costs can basically be divided into costs that are recovered in the price of a product and those which are not. These (nonrecovered) costs may be paid by the government or through public/private consortia. This would be consistent with what has been done for the Generation IV Reactor Systems program in their draft guidelines. The following level “0” account provides a structure for these costs. The cost categories in bold typeface are the “single digit” COA titles. The “two digit” accounts “roll up” by summing to the “one-digit” value.
0 – Early Life-Cycle Costs Not Normally Recovered in the Price of the Plant Product or Service Sold
0.1 – Planning Costs
0.2 – Research and Development Costs
0.3 – Prototype or Pilot Plant Costs
0.4 – Generic Licensing Costs
The recoverable life-cycle costs can be placed in a more familiar and structured COA typical of nuclear production facilities. The COA structure has been derived by modifying the COA proposed for Generation IV Reactor Systems, and also described in detail in that set of draft guidelines.1 “Capitalized” costs are those “up-front” (time wise) costs that must be financed, and for which costs are recovered in the price charged for facility product over the amortization life of the project. Annualized costs can be represented as the recurring cash sums needed to sustain a constant level of annual production exclusive of the “mortgage.” The following summarizes the proposed COA for recoverable fuel cycle facility costs. If all cost data obtained can be placed in such appropriate “bins,” useful comparisons of cost data and technological economic potential can be greatly enhanced.
1 – Capitalized Preconstruction Costs
11 – Land and Land Rights 12 – Site Permits 13 – Plant Licensing (including National Environmental Policy Act) 14 – Plant Permits 15 – Plant Studies (e.g., preliminary safety studies and hazards analysis) 16 – Plant Reports (formal documents) 17 – Other Preconstruction Costs 18 – Other Preconstruction Costs 19 – Contingency: Preconstruction Costs
2 – Capitalized Direct Costs
21 – Structures and Improvements 22 – Process Equipment 23 – Equipment 24 – Electrical Equipment 25 – Heat Addition/Rejection System 26 – Miscellaneous Equipment 27 – Special Materials (such as high unit cost nuclear materials) 28 – Simulator 29 – Contingency: Direct Costs
Total Directs = 1 + 2

INL/EXT-07-12107 (March 2008) Advanced Fuel Cycle Cost Basis 9
3 – Capitalized Support Services
31 – Field Indirect Costs 32 – Construction Supervision 33 – Commissioning and Start-up Costs 34 – Demonstration Test Run Field Cost 35 – Design Services Offsite (offsite might be “home-office” of architectural engineer designer) 36 – PM/CM Services Offsite (Project manager/construction manager) 37 – Design Services Onsite 38 – PM/CM Services Onsite 39 – Contingency: Support Services
Base Construction Cost = 1 + 2 + 3
4 – Capitalized Operations (Mostly plant owner costs prior to commercial operation)
41 – Staff Recruitment and Training 42 – Staff Housing 43 – Staff Salary Related Costs 44 – Other Owner Capitalized Costs 49 – Contingency: Operations Costs
5 – Capitalized Supplementary Costs
51 – Shipping and Transportation Costs 52 – Spare Parts 53 – Taxes 54 – Insurance = 58 – Decommissioning Costs (if not covered by escrow fund) 59 – Contingency: Supplementary Costs
Total Overnight Cost (TOC) = 1 + 2 + 3 + 4 + 5
6 – Capitalized Financial Costs
61 – Escalation (not used for constant dollar analysis) 62 – Fees (noninterest fees paid to financial institutions) 63 – Interest during Construction (IDC) 69 – Contingency: Financial Costs
Capital Investment Cost (TCIC) = 1 + 2 + 3 + 4 + 5 + 6
7 – Annualized Operations and Maintenance (O&M) Cost
71 – Operations and Maintenance Staff 72 – Management Staff 73 – Salary Related Costs (benefits, Federal Insurance Contribution Act, etc.) 74 – Operations Chemicals (feedstock) and Lubricants. 75 – Spare Parts 76 – Utilities, Supplies, Miscellaneous Consumables 77 – Capital Plant Upgrades (not including financing costs) 78 – Taxes, Insurance, Regulation (Nuclear Regulatory Commission [NRC] inspections) 79 – Contingency: Annualized O&M Costs

INL/EXT-07-12107 (March 2008) Advanced Fuel Cycle Cost Basis 10
9 – Annualized Financial Costs
91 – Escalation (not used for constant dollar analysis) 92 – Fees (noninterest financial costs during operations) 93 – Cost of Money (financing of large replacement capital items or upgrades: interest) 94 – Annual contribution to the D&D Escrow Fund 99 – Contingency: Annualized Financial Costs
Total Project Life-Cycle Cost = Nonrecovered costs (R&D, etc.) + TCIC + Yr of Plant Ops * (7 + 9)
The COA dictionary for estimating costs of fuel cycle facilities in Appendix A provides additional explanations of the content for each of these cost elements. Throughout this cost structure, the government or private enterprise may fund some costs. The ownership definition must be explicitly defined for each module.
2.3.4 Common Currency ($U.S.)
The U.S. dollar is the most common monetary standard for nuclear facility cost estimating and is easily convertible into other currencies. Consideration should be given to the years in which the project costs were incurred (e.g., 1970 vs. 2000). The equivalent monetary exchange rates applicable at that point in time may be significantly different than present day exchange rates. In some cases the base currency unit has also changed, for example the French franc is now converted to the European Monetary Union (Euro). Many Web-based calculators are available to perform the conversion calculations.a
2.3.5 Common Year (Current Year Basis)
A reference year for constant dollar costing and use of discount/escalation factors was chosen. The Generation IV EMWG is revising their Cost Estimating Guidelines report in 2007 and is expected to update the base year from FY 2001 to FY 2007. The AFCI Program has chosen to use 2007 dollars. Escalation factors were chosen from the Defense and General Construction Escalation indices3 for construction costs and the U.S. Dept. of Labor4 statistics for escalation of operations costs.
2.3.6 Differences in Cost Estimating Methodologies (Top Down vs. Bottom Up)
Both “top-down” and “bottom-up” methodologies can be used for cost estimating. The former is usually used for systems that are not well defined, but for which scaling data from other projects can be used. Bottom-up cost estimating is used for well-defined projects for which material balances, flow sheets, process floor layouts, and detailed drawings are available for “engineering take-off” type cost estimating. Cost estimating groups in Architect Engineer firms usually use the latter technique. There are also differing techniques for calculating cost estimating figures of merit such as unit cost of product and discounted life-cycle cost. The techniques used also depend on the level of cost estimating and project schedule data available. Reference cost information will be evaluated to determine which method was used to develop the costs.
a. Web-based currency conversion calculator is available at http://www.x-rates.com/calculator.html; http://www.france-pub.com/currency.html provides a calculator to convert from older French currency bank notes franc(s) to other currency.

INL/EXT-07-12107 (March 2008) Advanced Fuel Cycle Cost Basis 11
2.4 Cost Data Verification Cost data verification will consist of performing the following three assessments:
• Definition of data quality based on credibility measures
• Identification of cost estimate limitations and applicability (often technology driven)
• Evaluation of cost data sensitivity, technical cost discriminators (cost drivers), and uncertainty bounds.
The data quality will be defined and categorized based on credibility measures. The measures used to evaluate each data source are based on the degree of detail and rigor of the analysis, use of a consistent basis and approach, and whether data were independently reviewed. Each source will be categorized into one of the following five quality levels.
1. Independently-reviewed detailed assessments using a common basis and consistent approach
2. Detailed assessments using a common basis and consistent approach
3. Scoping assessments using a common basis and consistent approach
4. Engineering judgment of program specialists
5. Potentially biased or conflicting assessments collected from independent sources that do not use a common basis or consistent approach.
Cost estimate limitations and applicability will be determined for each data source/study. The data will be analyzed to determine on what restrictions and assumptions that the estimate was based, omissions from the estimate, unique circumstances, etc. An estimate of the range of applicability of the data will also be developed, indicating bounds in scaling or other parameters beyond which the estimate is not deemed credible.
The cost estimates will be analyzed to understand their sensitivity and uncertainty bounds within the range of applicability. If sufficient cost details are available, then sensitivity modeling may be performed with spreadsheets to determine the sensitivity of the estimates to different estimating assumptions. High sensitivity items that make a sufficient contribution to the overall module cost will be identified and assigned sufficiently wide uncertainty bounds to be a major contributor to the uncertainty of the full module cost estimate.
2.5 Data Gap Analysis A set of criteria is used to determine when additional engineering cost trade-off studies are needed.
The criteria highlight those cost areas with large data gaps, potential for high costs, restrictive assumptions, etc. Pareto analysis is used to identify the largest cost drivers, and to evaluate the limitations of the cost data (technology readiness, data quality). Emphasis is placed on improving the consistency of high sensitivity cost uncertainties within the range of applicability, as well as expanding the range of applicability as needed to fully support AFCI program objectives.
Through the previous analysis, data gaps were identified for aqueous reprocessing, electrochemical reprocessing, hot fuel fabrication, and waste conditioning. In FY 2005, we recognized gaps in understanding the uncertainties associated with various financing schemes (i.e., private versus government financing) and subsequently performed further data gap analysis in FY 2006. In FY 2007, additional analysis is being performed to help fill gaps associated with (1) estimating the costs for first-of-a-kind to nth-of-a-kind facilities, long-term uranium supplies, and secondary resources; (2) understanding international fuel (enrichment, fabrication) market structures, global fuel cycle

INL/EXT-07-12107 (March 2008) Advanced Fuel Cycle Cost Basis 12
resources, and potential supplies; and (3) understanding the competitive influences between nuclear and competing energy sources on a national and international bases.
2.6 Cost Data Documentation Each cost module is documented with specific information derived from the data collection,
normalization, verification, and gap analysis activities. The report structure for this report includes some, or all, of the following data sections, as applicable, for each module.
1. Module (see Section 3 for listing of modules)
1.1 Basic Information⎯includes the overall narrative descriptive information, e.g., the facility purpose, design requirements, history.
1.2 Define Functional & Operational Description⎯describes the primary functions and flows of the facility as well as provides a functional block diagram that describes the inflows/outflows.
1.3 Pictures/Schematics⎯describes layout of the facility, includes pictures, schematics, etc.
1.4 Module Interface Definition⎯describes interdependencies such as with site infrastructure services, dependencies on other modules (e.g., packaging and transportation), secondary waste flows.
1.5 Module Scaling Factors⎯describes special attributes and/or associated scaling factors, including appropriate constraints. This section will also detail the manner in which to apply the associated modifying factors to adjust the cost estimate.
1.6 Cost Bases, Assumptions, and Data Sources⎯includes the specific bases for design estimates, data sources for key technical reports, and reviews performed by secondary parties.
1.6.1 The reference cost data for each module will identify the ownership basis as government, private facility, or some combination of the two.
1.6.2 The reference cost data will be identified as generated from top down, bottom up, or “actuals.”
1.7 Limitations of Cost Data⎯addresses the credibility and limitations of the cost data. Information may include reported and observed data gaps, estimate details (planning level vs. detailed), safety/environmental/regulatory conditions unique to country of origin, site-specific cost factors due to labor unions, and other limitations.
1.7.1 The technology readiness will be categorized as R&D – possible, Pilot – feasible, or Commercial – viable.
1.7.2 The data quality will be categorized as one of the five quality levels listed in Section 2.4 (i.e., independently reviewed & detailed with consistent approach, detailed assessment with common basis, scoping assessments with common basis/approach, engineering judgment, independent sources without a common basis).

INL/EXT-07-12107 (March 2008) Advanced Fuel Cycle Cost Basis 13
1.8 Cost Summaries⎯compiles the cost data that have been placed in the module sections. These data are normalized (CY 2006) and in the standard COA breakdown for comparison purposes. Data may be presented as graphical cost projections based on parametric scaling analysis of cost vs. capacity or other cost measures.
1.8.1 The cost breakdowns of reported life-cycle costs and unit costs with their associated operating and financial assumptions are presented. Major cost discriminators are identified and separately reported (e.g., contact-handled and remote-handled costs).
1.8.2 The most relevant cost references are used to provide a facility cost breakdown at the one digit level (e.g., 0, 1, 2, 3) using AFCI standard COA (see Appendix A).
1.8.3 The reference costs are escalated to CY 2007 U.S. dollars.
1.8.4 A reference capacity (e.g., throughput rate, package size, storage capacity) is defined for each module.
1.8.5 The cost summary information is placed in a WIT table (see example Table 2-1) that shows reference cost basis (constant year $U.S.); the reference cost basis contingency (if known); the cost analyst’s judgment of the potential upsides (low end of cost range) and downsides (high end of the cost range) based on references and qualitative factors, and selected nominal costs (judgment of the expected costs based on the references, contingency factors, upsides, and downsides). These costs are subject to change and are updated as additional reference information is collected and evaluated, and as a result of sensitivity and uncertainty analysis.
1.8.6 The WIT results are further projected into an estimated cost frequency distribution that represents the uncertainty of the data for modeling purposes. The module probability distributions are primarily triangular, with the exception of modules B and C, which use a uniform distribution. Explanations for the choice of distribution are included in the cost summaries.
Table 2-1. Example of a WIT table. What-It-Takes (WIT) Table
Reference Cost(s) based on reference
capacity (normalized costs in
CY$ and $U.S.) Reference cost
contingency (Low Cost)
Upsides (High Cost) Downsides
(Nominal Cost) Selected Values
e.g., $100/MTHM based on capacity of 2,000 ton/yr
e.g., +/- 10% e.g., $90/MTHM e.g., $150/MTHM e.g., $120/MTHM
(Further breakdowns and assessments of costs may be provided by code of account element or by listing those items that have the highest costs impacts)
(Based on the stated reference contingency percentage)
Rationale (Explanations such as technology improvements, improved economies of scale, changes in estimating assumptions that are more cost favorable)
Rationale (Explanations such as increased regulatory requirements, worst-case economic conditions, estimate limitations)
Rationale (Cost analyst’s overall assessment of the most likely cost based on current conditions)

INL/EXT-07-12107 (March 2008) Advanced Fuel Cycle Cost Basis 14
1.9 Sensitivity and Uncertainty Analysis⎯describes the analysis performed and explains conclusions. The results of these analyses will be summarized in the cost module documentation, and references to more detailed uncertainty analysis reports will be provided.
1.9.1 Evaluations to consider the potential cost implications on variations to the functional design requirements of the reference facility. For example, a separations facility is designed to separate three main product streams. An analysis may be performed to determine the costs for separation of only two product streams.
1.9.2 Evaluations to determine the impacts on costs due to advances in technologies, changing economies of scale and economies of production due to increasing nuclear energy demands, and changes in facility ownership (private vs. government).
1.10 References⎯lists the most relevant references that form the primary basis for the module costs. Additional (more general) data sources may also be listed in a bibliography section.
2.7 AFCI Cost Database The AFCI cost collection database, illustrated in Figure 2-2, stores raw cost data, reference reports,
and citations (i.e., cost derivations from the reference documents) resulting from the cost review process. The raw cost data undergo the steps defined in the cost bases development process discussed in Section 2. The complete reference documents are accessible through queries of the Sandia National Laboratories (SNL) Web FileShare server.b Password protocols are used to control access for maintenance and read/write capabilities versus view and download-only access. Cited module reference cost data identified in this report are stored on an Access database file. The Access database contains hot links to the associated reports, which currently reside on the SNL Web FileShare server.
Cost analysts use the database and FileShare to perform queries to find references, download specific reports available in the open literature, and review cost data for a specific reference. The cost data user is not allowed to add or modify records in the AFCI Cost Citation Collection database. Open (publicly available) reports may be provided upon written request to David Shropshire at [email protected].
AFCI Cost Collection Database
Cost Basis Development
Process
AFCI Cost Basis Report
SNL WebFileShare
Screened Estimating Data for Cost Modules
"Read-only"
Raw Data,References,and Citations
Input
Analysts' Data Edits/Updates
CitedReferenceData
AFCI CostReferences/
Queries
AFCI Cost Report
Database
Access to CompleteAFCI Cost Database
CD
AccessDatabase
StorageUpdates
Figure 2-2. AFCI cost database.
b. The data server is in the process of being transferred to the INL. The cost database will be accessible through the INL based Document Management System in FY 2008.

INL/EXT-07-12107 (March 2008) Advanced Fuel Cycle Cost Basis 15
3. FUEL CYCLE REFERENCE COST MODULES The fuel cycle has been broken down into functional elements called cost modules as described in
Section 1.5. This section provides a general description and categorization of these cost modules—details on each of the modules are provided in the tabbed sections in Attachment 1. Table 3-1 summarizes information on the 30c fuel cycle cost modules. The following paragraphs describe some discriminating characteristics of these modules that impact the type (and quantity) of cost data available for this report.
1. The front-end fuel cycle modules (A, B, C1 and K1) are generally related to commodity types of services provided by commercial sources. The costs for these types of operations are often market driven and may be obtained from many sources both domestically and internationally. These modules will not be detailed with facility COA breakdown information, but are based on market related unit costs (e.g., $U.S./kg UF6). Module C2, which deals with light water reactor (LWR) fuel derived from the blend-down of highly enriched uranium from military sources, was added because such blended material (and continuing to 2013 under arrangements with Russia) is currently providing a significant portion of U.S. LWR fuel. UF6 received from blend-down operations substitutes for fuel cycle operations in Modules A, B, C1, and K1. Module D1, Fuel Fabrication-Unirradiated, is available from a limited number of sources and some detailed cost data are available at a facility level.
2. Reactor/transmutation baseline cost data are provided in Modules R1 and R2 (including thermal reactors and fast reactors). The SNF wet and dry storage (Modules E1 and E2) is generally located at reactor sites. Wet storage costs (E1) are generally assumed to be a portion of the reactor capital and operations costs and are not typically added on top of reactor costs. The storage costs are based on commercial cost data associated with the reactor construction and operation. Incremental dry storage pads may be added at a reactor site to support extended fuel storage requirements. The reactor operator may have added dry storage pads some time after reactor construction.
3. The back-end fuel cycle modules (G2, I, L and M) are the responsibility of the government as provided by the Nuclear Waste Policy Act.d The government funds these functions and the services would be provided by government contractors.e Only a limited number of these types of facilities would be built due to their high cost and political sensitivity.
4. The recycle modules (F1, F2/D2, E3, K2, K3, G1, G3, G4, G5, and J) are associated with fuel reprocessing and may be provided by some combination of government and private sources. Cost data are generally derived from international and domestic sources with various ownership arrangements. Wastes designated for low-level waste (LLW) disposal in Module J may be associated with depleted uranium, recycled LLW from reprocessing, or from fuel cycle and reactor facility maintenance and operations.
5. The transportation modules (O1 and O2) support the costs for transport of new fuel, recycled fuel, and shipment of SNF, HLW, and LLW. Transportation of raw fuel to the reactor is a commercial cost to the reactor owner/utility. SNF transportation from the reactor to interim storage and the repository is the responsibility of the government. HLW and LLW transportation resulting from recycling could be provided by some combination of government and private sources.
c. Of the 30 modules, some have been combined or deleted netting 25 currently used modules. d. Information on the Nuclear Waste Policy Act can be found at http://www.ocrwm.doe.gov/ymp/about/nwpa.shtml. e. Long-term retrievable storage could potentially be funded through a private venture (e.g., Skull Valley).

INL/EXT-07-12107 (March 2008) Advanced Fuel Cycle Cost Basis 16
Table 3-1. Fuel cycle cost module general descriptions. Cost Module Module Name General Description
A Natural Uranium Mining and Milling
Includes the factors involved in extraction of uranium from the earth through production of uranium concentrate in the form of U3O8, commonly known as “yellow cake.”
B Conversion Takes the mined U3O8 concentrate, further purifies it, and converts it to a UF6 solid in cylinders for feed to a uranium enrichment plant.
C1 Enrichment (Isotopic Separation)
Uses the UF6 solid in cylinders to enrich the % of U-235 from 0.711 mass% to the 3–5% typical of the enrichment used for LWR fuel fabrication, or higher for typical VHTR fuels.
C2 Highly Enriched Uranium Blend-Down
U.S. and Russian government-owned highly enriched uranium (blended down as a secondary supply to meet demand for low-enriched uranium.
D1 (D1-1 through D1-9 submodules)
Fabrication of Contact–Handled Fuels
Uses chemical, ceramic/metallurgical, and mechanical steps to take enriched UF6 and convert it to finished fuel assemblies.
D2 Fuel Fabrication of Remote-handled (Metal) Fuels and Targets
This module has been combined with Module F2 to create Module F2/D2.
E1 Wet Storage of SNF Pool storage (at reactor) of SNF from existing commercial reactor operations.
E2 Dry Storage of SNF Dry storage (at reactor) of SNF coming from reactor wet storage; includes handling costs involved with transfer from wet to dry storage.
E3 Recycled Product Storage Storage of the actinide by-products produced from the reprocessing of thermal reactor and fast reactor fuels. Would typically be required to support blending needs.
F1 SNF Aqueous Reprocessing Facility
Separation of SNF elemental components using aqueous process to support recycling of fissile materials. Includes cost of receipt of SNF through end-product production.
F2 Reprocessing—Electrochemical
This module has been combined with Module D2 to create Module F2/D2.
F2/D2 Electrochemical Reprocessing and Remote Fuel Fabrication
Separation of SNF elemental components using an electrochemical process to support recycling of fissile materials. Includes cost of receipt of SNF through end-product production. Uses chemical, ceramic/metallurgical, and mechanical steps to convert fissile material from the back-end fuel cycle to finished fuel assemblies.
G1 HLW Conditioning, Storage, and Packaging
Stabilizes the waste, provides interim storage of the treated waste, and packages the HLW in preparation for transport to a HLW repository.

Table 3-1. (continued).
INL/EXT-07-12107 (March 2008) Advanced Fuel Cycle Cost Basis 17
Cost Module Module Name General Description
G2 SNF Conditioning, Storage, and Packaging
Removes the fuel from wet or dry storage, performs inspection as required, dry, package, seal, leak-check, and prepare the SNF package for shipping to a HLW repository.
G3 LLW Conditioning, Storage, and Packaging
Conditions and packages miscellaneous LLW for disposal in a NRC-licensed near surface landfill.
G4 GTCC Conditioning, Storage, and Packaging
Conditions and packages GTCC LLW for long-term storage for qualification for near surface disposal or direct to GTCC disposal.
G5 TRU Conditioning, Storage, and Packaging
Conditions the waste, certification, interim storage, and packaging of transuranic wastes in preparation for transport to an acceptable disposal facility/repository.
H (no longer used)
SNF Packaging for Transport and Disposal
[Cost data transferred entirely to Module O1]
I Long-Term Monitored Retrievable Storage
Long-term storage of SNF/HLW until shipped to a geologic repository.
J Near Surface Disposal Engineered or trench disposal of LLW, including waste and fill placement and monitoring.
K1 Depleted Uranium Conversion and Disposition
Conversion and disposal of depleted UF6. In some scenarios, this material is later withdrawn to use in breeder fast reactors.
K2 Reprocessed Uranium Disposition-Aqueous
Conversion of burned uranium resulting from aqueous reprocessing such as PUREX or UREX (LWR spent fuels)
K3 Reprocessed Uranium Disposition-Electrochemical
Conversion and purification of burned uranium resulting from electrochemical reprocessing of LWR spent fuels. Uranium-metal will contain multiple contaminants, including transuranics.
L Geologic Repository Cost from inception through closure for repository operations. Based on OCRWM data and projected cost estimates.
M Alternative Disposal Concepts
Speculative costs for SNF/HLW disposal alternatives to a deep geologic repository, such as deep bore hole, and others.
N (no longer used)
Nuclear Fuel Transportation (Contact and remote handled)
[Cost data transferred to Module O1 and O2]
O1 Transportation of Radioactive Materials
Transportation cost of recycled irradiated fuel and SNF/HLW per relative unit includes handling costs not already included in interim storage costs. Includes cost of required operations to condition and package the SNF for shipment to the repository, interim storage, or to a reprocessing facility.
O2 Transport of Nuclear Fuel and Low-Level Radioactive Materials
Transportation cost for new fuel, unirradiated materials, and LLW per relative unit, includes handling costs not already included in interim storage costs.

Table 3-1. (continued).
INL/EXT-07-12107 (March 2008) Advanced Fuel Cycle Cost Basis 18
Cost Module Module Name General Description
R1 Thermal Reactors Capital, operations and maintenance, and D&D costs for generic thermal reactors in the U.S.
R2 Fast Reactors Capital, operations and maintenance, and D&D costs for fast reactors in the U.S.
Additional cost modules have been defined to distinguish cost differences between modules with different technologies, radioactive environments, and regulatory requirements. The following modules have been split to accommodate these differences and provide additional cost distinction:
• Module C, Enrichment, was divided into traditional enrichment (Module C1) produced by gaseous diffusion or centrifuge and highly enriched uranium blend down (Module C2).
• Module D1, Fabrication of Contact-Handled Fuel, includes unirradiated fuel. Fabrication of recycled (remote-handled) fuel is discussed in Module F2/D2. There are ten types of fuel that were evaluated for this report. Fuel fabrication submodules were developed to support both different fabrication technologies and fuel applications (i.e., fuels for fast reactors, heavy water reactors, and gas-cooled reactors).
• Module D2, Fuel Fabrication of Remote-handled Fuel/Targets, was combined with Module F2.
• Module E, Interim SNF Storage, was divided into costs for reactor wet storage (Module E1), reactor dry storage (Module E2), and a special module (Module E3) for recycled product storage of actinide products produced from the reprocessing of thermal reactor and fast reactor fuels.
• Module F, Reprocessing, was divided into modules for aqueous reprocessing (Module F1) and electrochemical reprocessing (Module F2). Module F2 has been combined with Module D2 to create a new Module F2/D2. Modules F2 and D2 were combined into this module because they are considered to be one integrated facility, making it difficult to separate the costs.
• Module G, Waste Conditioning, was divided into modules for HLW conditioning, storage, and packaging; SNF packaging (G2); LLW conditioning (G3); Greater-than-Class-C (GTCC)-LLW conditioning (G4); and transuranic waste conditioning (G5).
• Module K, Uranium Conversion, Storage, and Disposition, was further divided into depleted uranium derived from enrichment (K1) and burned uranium (BU) resulting from reprocessing. The burned uranium was further designed based on the type of reprocessing, where BU from aqueous reprocessing (K2) was evaluated separate from BU from electrochemical processing (K3).
• Module O, Transportation, costs were segregated primarily on the type of transport package. Transportation of low radioactive materials in O1 uses a Type-A package to support unirradiated fuel, LLW, and contact handled transuranic wastes. Transportation in Type-B package materials (O2) supports SNF/HLW and remote-handled transuranic wastes.
The cost modules were developed using a consistent structure to provide consistency in data collection, normalization, verification, and documentation. However, the content for each of the modules may vary due to characteristics described above and the availability of the data in the public domain. Attachment 1 contains sections for each of the AFC cost modules listed in Table 3-1.

INL/EXT-07-12107 (March 2008) Advanced Fuel Cycle Cost Basis 19
4. STRATEGY COSTING PROCEDURE The goal of the AFCI strategy costing procedure, shown in Figure 4-1, is to use the data from the
AFCI cost database to support various AFCI cost analyses.5,6
4.1 Process Description The AFCI strategy costing procedure includes defining the scenario and key parameters, selectively
linking and scaling the cost modules, and selecting data from the AFCI Cost Basis to develop complete fuel cycle costs. The fuel cycle costs may be combined with selected reference reactor cost data (Module R or other data sources) to develop total nuclear system costs (or converted into TCOE). The fuel cycle/total nuclear system costs can additionally consider facility ownership options (e.g., regulated, private-sector, government owned, or government/private). The fuel cycle costs and total nuclear system costs can be used to support quantitative cost analysis for fuel cycle and scenario analysis. These processes may be performed manually or through the assistance of a computer model.
Start
Define Scenario
Define Parameters
Link Cost Modules
Scale Cost Modules
Develop Fuel Cycle Costs
Estimate Fuel Cycle Credits
Select reference
reactor cost data
Develop Total Nuclear
System Costs
Select Data from AFCI Cost
Basis
Quantitative Cost Analysis for Fuel Cycle and Scenario Analysis
Optional
Optional
Evaluate Facility
Ownership Options
Optional
Figure 4-1. AFCI strategy costing procedure.

INL/EXT-07-12107 (March 2008) Advanced Fuel Cycle Cost Basis 20
4.2 Define Scenarios General strategies (once-through, thermal recycle, thermal/fast recycle, etc.) lead to scenarios that
include various options for transmutation, separation, and HLW disposition. An example would be the selection of a once-through fuel cycle with ceramic UO2 fuel, in an existing light water reactor, with separation of U, Pu/Np/Am/Cm/Sr/Cs, where Tc/I/residuals go to geologic disposal. The selection of a scenario is needed to identify the applicable cost modules. The front-end modules (mining and milling, conversion, enrichment, and fabrication) for most once-through options may be the same. However, the specific parameters may differ depending on the objectives of the scenario (e.g., analysis of high burn-up fuels, percent loading, and enrichment).
Scenarios can focus on a specific part of the fuel cycle, such as used fuel recycling options. Potential scenarios include: fuel cycles to optimize repository space, various reprocessing deployment schedules, selective/total retrieval of fuel for recycle, use of long-term storage, or combinations of these options.
4.3 Define Parameters After a scenario is developed, additional module parameters are chosen; for example: facility start-up
dates, enrichment percent, mass flow rates, storage durations, HLW packaging details, transportation distances, private/government financing arrangements, etc. Integrated functional flow models (mass balance simulations, etc.) may be used to assist in the identification of some parameters and to ensure consistency. The definition of the parameters allows the user to select the most appropriate module data to fit the scenario. The available parameter choices will differ for each module, so the user will need to refer to the specific module section (e.g., Table D1-4 of Module D1-1, WIT costs for pressurized and boiling water reactors) in this report. The nomenclature section at the beginning of this report provides standard definitions for cost estimating terms and parameters that are commonly used in economic analysis.
4.4 Cost Module Coupling Modules are chosen by linking the front-end modules and the back-end modules to a reactor.
Additionally, transportation modules are selected to provide the linkage between the fuel cycle facility modules. There are numerous options for combining the modules to build an integrated fuel cycle system. Figure 4-2 shows a simple example of linked cost modules for a once-through fuel cycle scenario. Further refinement of the module parameters may be necessary based on the specific module interface requirements. The interface requirements are provided for each module in this report. More complex fuel cycle systems may also be developed that include recycle modules. In the case of recycled materials, particular attention must be paid to the recycle material flows to ensure that the facility capacities are sized to adequately support the new and recycled flows. In these cases, a computer model may be required to evaluate the dynamic flows between the modules (refer to Section 6).
4.5 Cost Module Scaling Modules may have cost data that can be scaled to a range of capacities. The user may adjust the
size/throughput rate of the reference modules, and then determine the associated scaling of costs versus size for their scenario using parametric methods. Data on module scaling are provided (as available) in Section 5 of each of the modules in the cost basis report. The user is advised that scaling is limited to a range of applicability around the reference module capacity; extension of the scaling beyond these bounds may be invalid and is not advised. Because of the large uncertainties involved in scaling costs, this task can become highly detailed and complex.

INL/EXT-07-12107 (March 2008) Advanced Fuel Cycle Cost Basis 21
Transportation Modules
Natural Uranium Mining & Milling
[Module A ]
Conversion[Module B ]
Enrichment[Module C1 ]
Fuel Fabrication
(CH)[Module D1 ]
ThermalReactor
[Module R1 ]
Enriched (EUF6)U3O8 Natural UF6
UOx
SNF
BackEndFacilityModules
SNF
SNF
Front End Facility Modules Interim Storage(Wet)
[Module E1 ]InterimStorage
(Dry)[Module E2 ]
HLW & SNFConditioning, Storage, and Packaging
[Module G2 ]
Geologic Repository
[Module L ]
TransportationProcesses for
High-Level Radioactive Materials
[Module O1 ]
TransportationProcesses for
Low-Level Radioactive
Materials[Module O2 ]
Figure 4-2. Example of linked cost modules.
4.6 Handling of Credits for U, Pu, and Other Materials In some recycle scenarios, recovered fuel may be sent back to a reactor for reuse. There may be an
implied value for this fuel that can be counted as a credit in the fuel cycle cost calculations. This value may be accounted for simply by requiring less new fuel during refueling. In other cases, the materials may take on a commodity value, based on the equivalent cost of the fuels that they are replacing. The user is referred to the applicable front-end cost modules to determine the value of recycled materials.
4.7 Develop Total Fuel Cycle Costs After the scenario has been defined, applicable modules selected and scaled, and modules linked then
a total fuel cycle cost may be derived. The cost estimate is composed of a compilation of cost data that have been normalized, scaled for mass flows, extended based on quantities of production and years of operation. An economic analysis has been performed that provides a cost comparison of four fuel cycles that represent applications of the once through fuel cycle, thermal/fast recycling, fast reactor recycling, and recycling in thermal reactors.7 The module cost data was selected from the AFC Cost Basis report and additional sources that were available at the time of the assessment.

INL/EXT-07-12107 (March 2008) Advanced Fuel Cycle Cost Basis 22
4.8 Develop Total Cost of Electricity Costs The total cost of electricity (TCOE) can be developed for a fuel cycle scenario by adding the total fuel
cycle contribution or component (in $/MWh) to the other cost components (reactor capital, reactor operating and maintenance, reactor D&D). Baseline cost data for different reactor types is necessary to support development of TCOE. The baseline cost data for current generation light water reactors and fast reactors are provided in Modules R1 and R2. The reader may also seek additional reactor cost data sources (e.g., EMWG). These data are provided for estimate completeness and to account for the interdependencies between the reactor technology and the fuel cycle. The user is advised to use a range of reactor costs to evaluate the sensitivity of the total TCOE to the reactor/fuel cycle concept.
4.9 Economics of Private Sector vs. Regulated Nuclear Fuel Cycle Facilities
With the expected high costs and significant risks involved in constructing new nuclear facilities, including nuclear reactors and fuel recycle facilities (i.e., reprocessing, refabrication, and HLW form), consideration should be given to the economics of various facility ownership options. These options include government funding, regulated funding, private funding, and combinations of public and private funding options. These different funding approaches may significantly impact the costs of fuel cycle services. As part of the overall quantitative analysis of the fuel cycle, the assessment of the economics based on the ownership of the fuel cycle facilities was conducted. A sensitivity analysis of the fuel cycle facility ownership options was also prepared, evaluating a range of options from fully government owned to fully private owned were evaluated using DPL (Decision Programming Language 6.0), which can systematically optimize outcomes based on user-defined criteria (e.g., lowest life-cycle cost, lowest unit cost). The analysis was presented at ICONE14 in December 2006 in Miami, Florida.2

INL/EXT-07-12107 (March 2008) Advanced Fuel Cycle Cost Basis 23
5. ECONOMIC EVALUATION GUIDELINES This section provides guidelines for comparing alternatives on a consistent basis. There are two
approaches, qualitative analysis and quantitative analysis. Qualitative analysis has been used in analyses such as the DOE AFCI Comparison Report.8 Quantitative analysis will be used in the broad system studies to evaluate system scenarios to identify economic drivers and refine scenario evaluations. Because of the large uncertainties in the designs and costs for many of the fuel cycle cost elements, the qualitative method is being used to provide economic analysis data external to the DOE. Quantitative analysis is the primary application internal to the AFCI Program for system assessment.
Qualitative analysis is used when system cost information is unavailable (no current or relevant cost basis, or uncertainties so large that differences derived from system comparisons are unsupportable). The evaluations use factual system data with economic consequences. The cost comparisons consider sources of additional costs and potential areas for cost savings as compared to the current demonstrated technology (e.g., reduced uranium consumption, fewer waste packages required, reduced transportation, increased amount of waste to be dispositioned).
For example, the economics of separation has implications in many areas across the fuel cycle; however, we can expect that separation costs will be driven by the type of spent fuel, number of recycles, type of operation, separation process and facility requirements, recycled elements, and in-process waste storage. Each of these qualitative parameters is evaluated in order to derive a relative comparison for the separation economics across the various systems. As design information becomes available, the qualitative comparisons will be replaced with actual cost estimates and their associated assumptions.
Quantitative analysis numerically evaluates and compares various fuel cycle systems. The fuel cycle cost data contain a high degree of uncertainty. Understanding the range of cost uncertainty associated with each of the concepts is important for determining if a significant cost difference exists between systems. When the process described in this report is used, the data can be used to understand the relative cost differences between systems. There are two types of quantitative analysis that can be performed, which are described as follows:
• Scenario optimization⎯hold most factors (modules) constant while varying the parameters of a limited number of interrelated modules to determine the most cost-effective technology combination for a particular fuel cycle strategy.
• Strategy/scenario comparison⎯compare two different integrated concepts for purposes of determining an economic “score” as part of metric application for program down-selects.

INL/EXT-07-12107 (March 2008) Advanced Fuel Cycle Cost Basis 24
6. ECONOMIC COMPUTER MODELS
6.1 Integration of Cost Modules into Cost Models The cost information included in this report may be used in conjunction with computer models to
provide quantitative analysis of fuel cycle options. The costing procedure described in Section 4 is directly relevant to the use of cost data in the cost models. It is strongly recommended that the user become experienced with manually using the cost data in scenario studies before incorporating the data in a cost model. Manual checks on modeling results are recommended for verification.
Cost models can be wonderful time saving analysis tools, but may also provide misleading answers. Wrong conclusions will result from a number of sources:
1. Cost data were not intended for use in the type of scenario.
2. Bounding capacities of the reference facility were exceeded.
3. Module capacities and mass flows were not properly calculated to account for recycling, blending, maximum versus operating capacities, etc.
4. Cost module uncertainties bounds were not considered.
5. Misunderstanding of ownership (private versus government) and associated treatment of interest charges for capital, taxes, etc.
6. Inadequate account taken of the technology maturity and R&D funds needed.
7. Hidden/implicit assumptions
8. Impacts on processing efficiency resulting from future technologies.
6.2 Computer Software and Simulations Several fuel cycle models have been developed that produce mass flows through the fuel cycle based
on various fuel cycle scenarios. Some of the fuel cycle models that could be adapted for use with the AFCI cost data are described in the following sections.
6.2.1 NFCSim
NFCSim Version 3.0 is a JAVA-based model developed by Los Alamos National Laboratory that tracks the flow of nuclear materials at charge level (isotopic level) throughout the nuclear fuel cycle. The object-oriented model reenacts the history (i.e., simulates the operation with the historical variation in burnup and availability) of the U.S. reactor fleet, which includes 104 operating and 14 decommissioned reactors, to obtain an estimate of the associated SNF generated by these reactors. The class structure of the model includes facility classes for the complete fuel cycle, including reactor and accelerator driven systems. The model is coupled to ORIGEN and can produce detailed isotopic flows resulting from irradiation in a reactor or decay while in storage. NFCSim includes a costing model using input unit cost data. The calculation of annual costs is assessed for the year in which the service is rendered. Pre and postoperational costs (e.g., initial core loading) are included in the mortgage and D&D escrow account, respectively. Costs for storage can be assessed on a $/kg/yr or $/kg basis. Costs and revenues with a time component (e.g., O&M and electrical production) are apportioned according to the fraction of a year for which they apply.9

INL/EXT-07-12107 (March 2008) Advanced Fuel Cycle Cost Basis 25
6.2.2 Dynamic Model of Nuclear Development (DYMOND)
DYMOND Version 1.0 and DANESS (not reviewed) are system dynamics models developed by Argonne National Laboratory to perform 100-year global nuclear energy scenarios. The DYMOND model was further developed in FY 2005 by modelers at Argonne and the Idaho National Laboratory to perform fuel cycle systems analysis. The Stella/iThink models provide a summary level simulation of SNF for the U.S. reactor fleet. These types of models support continuous, nonlinear feedback systems. The modeling environment is adaptable to various reactor systems but is less sophisticated than object-oriented tools. The model handles radioactive decay at a summary level, parametrically estimating rates for key isotopes. Unit cost data may be incorporated into the model to determine the total costs resulting from mining, conversion, enrichment, storage, fuel fabrication, recycling, disposal, and power production.
6.2.3 Harvard Spreadsheets
The economic models used in the 2003 Harvard economic study, The Economics of Reprocessing vs. Direct Disposal of Spent Nuclear Fuel, 10 are available as spreadsheets.11 The spreadsheet models are self-documenting. There are two spreadsheets, one for LWR and one for fast reactors. Either can be used to estimate the LUEC (in $/MWh) based on key user-input parameters such as U ore price ($/kg), mixed-oxide (MOX) or fast reactor fuel fabrication cost ($/kg), geological disposal cost ($/kg), separation cost ($/kg).
6.2.4 Generation IV Economic Modeling Working Group Levelized Cost of Electricity Model
The International Generation IV EMWG has an EXCEL-based model called G4 ECONS that considers open fuel cycles and equilibrium closed fuel cycles. The intent of the model is to allow comparison of all six Generation IV concepts and their variants. The financial model is very simple, since the intent is comparison of technologies and not financing or deployment options. The fuel cycle portion of the model inputs unit costs in much the same form that they are given in this report. The fuel cycle component cost for all of the major parts of the fuel cycle is then calculated in mills/kWh ($/MWh), $/kg heavy metal (HM), and $/yr. In order to keep the model—which must also consider capital, O&M, and decommissioning costs—simple, fuel cycle lag and lead times and losses are ignored. So far, the EMWG model has been used for a range of nuclear system analysis, including Japanese Sodium Fast Reactors under study by the Generation IV technology groups.
The first purpose of the highly-transparent and simple G4-ECONS formulation for fuel cycle modeling is to allow comparison of vastly different reactor and fuel cycle technologies being developed by many international partners; secondly, not enough information on the timing of technology deployment and financing is available to allow the use of more sophisticated models. No allowance is made for interest charges due to lag time or lead time in purchase of services, as is done in more sophisticated business models used by utilities.
6.2.5 Total System Model
A model has been developed by Bechtel SAIC for the Yucca Mountain Project. The objective of the Total System Model is to evaluate alternative approaches for OCRWM disposal. The model encompasses the back-end of the fuel cycle and provides discrete event simulation of waste packages from the 104 U.S. reactors to final disposition at the HLW repository. The model was developed in SimCad and is designed to evaluate life-cycle costs, total project cost, and funding requirements. The model was developed based on a once-through fuel cycle and does not currently support recycling alternatives.12

INL/EXT-07-12107 (March 2008) Advanced Fuel Cycle Cost Basis 26
6.2.6 VISION.ECON
The existing fuel cycle models, previously discussed in this section, were not developed specifically to support comprehensive dynamic analysis of fuel cycle costs. A verifiable fuel cycle simulation (VISION) model is being developed to support the requirements defined in Section 6.3. This model will be used to perform fuel cycle analysis and serve as a verification tool for cost comparison with results generated by NFCSim, DYMOND/DANESS, Harvard, Total System Model, or other fuel cycle cost models (e.g., EMWG, NERAC). An economic submodel has been developed in conjunction with VISION called VISION.ECON. This model will use the cost data from this report to analyze various fuel cycle alternatives. Results from the dynamic VISON.ECON are compared to the G4 ECONS model for verification purposes and to help in understand the impacts from modeling under dynamic conditions.
VISION is the AFCI nuclear fuel cycle systems code.13 The VISION model is the successor to the DYMOND model, the Dynamic Model of Nuclear Development.14 VISION, which is run on the commercial software PowerSim STUDIO,15 is a dynamic stock and flow model that tracks the mass of materials through the entire nuclear fuel cycle. VISION tracks the isotopic mass-flows of uranium, plutonium, minor actinides, and fission products throughout the fuel cycle and accounts for the decay of those isotopes. The current VISION model focuses on the U.S. reactor fleet, with planned expansion to handle the international power fleet in the future.
VISION.ECON was created as a submodel of VISION to provide economic analysis of nuclear fuel cycle cases. The submodel produces cost distributions for relative economic comparisons rather than absolute value cost estimates. VISION.ECON extends the modeling capability beyond static equilibrium analysis tools by providing insight to dynamic modeling impacts to cost over time. The tool currently includes the functionality to evaluate cost and system uncertainties. Model output showing the total cost uncertainties of a case are generated within VISION.ECON in a post processing mode using a modified Monte Carlo method. Cost and system uncertainties can be used to identify the variables within the model that have the largest impact on the cost for each case.
6.3 Model Performance Evaluation and Verification Activities The objective of VISION is to serve as a broad systems analysis and study tool applicable to AFCI
and Generation IV reactor development studies. The model simulates the fuel cycle from cradle to grave, from mining of raw materials to disposition of waste after electricity generation. A software requirements specification16 was developed to define the objective, scope, and key assumptions of VISION. In addition, expectations and requirements were developed for model variables (flow model, cost model), analysis of estimates or measures, general model architecture elements, hardware/software, constraints, and use cases. Software quality will be ensured through design requirements (e.g., code transparency), quality documentation (e.g., user manuals), and performance testing (e.g., independent verification and review). The model uses nonproprietary, off-the-shelf commercial software; has an open architecture; and is readily usable by fuel cycle practitioners and technical experts; and supports communication of analysis and results to less technical audiences. The graphical user interface provides an intuitive understanding of the model functionality and the capability to trace though the causes of system behavior to identify the key variables driving the behavior within the system. The cost submodule under development in VISION will support simulations using probabilistic algorithms to account for module cost uncertainties.
The model and/or its documentation will explicitly state key assumptions, including what is and is not included in each sector of the model. Good examples include how inflation, escalation, and interest charges on capital are treated—especially given that some parts of the fuel cycle are commercial (power plants), some are government, and some might be either/or. Another key issue is how geological disposal costs are treated, i.e., as a single government-set fee (mills/kWh) or projected repository capital + operating costs amortized over an amount of disposed HLW.

INL/EXT-07-12107 (March 2008) Advanced Fuel Cycle Cost Basis 27
AFCI systems cost analysis would preferably be performed using multiple models as a check on estimating assumptions, modeling algorithms, and data integrity. This type of verification will be particularly important for results supporting recommendations for the need for a second repository.
Based on the software requirements specification, a software platform evaluation17 was developed to evaluate potential software platforms on which to construct a simulation model. The evaluation compared software in three classes of platforms (programming languages, business applications, and system simulation models). Each platform’s capabilities were compared to each of the VISION requirements. Key considerations included: the amount of lab experience with the software; number of requirements supported without platform modification; total software and development costs; need for additional interface tools; ability to support sensitivity analysis, optimization, units checking, multi-dimensional arrays; and the inclusion of an equation editor. The software platform evaluation resulted in the choice of the PowerSim Studio application. PowerSim provides the functionality to allow economics to be run as a separate submodule based on the flows in the core of the model. Output charts were developed to support economic analysis requirements. Future functionality will include feedback of economic data into the main model to provide dynamic influences to facility schedules, capacities, and other modeling parameters.

INL/EXT-07-12107 (March 2008) Advanced Fuel Cycle Cost Basis 28
7. CONCLUSIONS AND RECOMMENDATIONS The AFCI Economic Analysis team has established the processes and structure to support the
collection of fuel cycle cost data. The cost data were drawn from over 200 reference reports, reviewed and summarized, normalized for consistency, verified through cost sensitivity analysis, input to models for evaluation of various fuel cycle scenarios, and applied toward new approaches for communicating fuel cycle economics.
7.1 Creation of a Credible Reference AFCI Cost Basis The Advanced Fuel Cycle Cost Basis report, commissioned by DOE, provides a comprehensive set of
cost data supporting an on-going, credible, technical cost basis for use on the AFCI Program. System analysts will use this report to evaluate the impacts and benefits of a wide range of AFCI and Generation IV deployment options. The report is meant to aid analysts in (1) understanding the issues and opportunities for keeping nuclear power an economically competitive option, (2) evaluating the elements dominating nuclear fuel cycle costs, and (3) developing the tools to evaluate the economics of creative solutions to make the nuclear fuel cycle even more cost competitive.
The intended use of the cost data is for the relative economic comparison of options rather than for determination of total fuel cycle costs with great accuracy. Each element of cost has a probabilistic range of accuracy and, when the costs are coupled together into a total fuel cycle system estimate, the uncertainty range is additive. The cost data are being used in studies to evaluate costs of fuel cycle options. Fuel cycle costs are an important part of the comprehensive evaluation that also includes measures of sustainability, proliferation resistance, adaptability to different energy futures, and waste management impacts (e.g., heat load impacts on the repository). These evaluations will result in the identification of cost drivers within the fuel cycle where development may be focused to reduce the costs within the system.
This report describes the AFCI cost basis development process, reference information on AFCI cost modules, a procedure for estimating fuel cycle costs, economic evaluation guidelines, and a discussion on the integration of cost data into economic computer models. This report contains reference cost data for nineteen fuel cycle cost modules. The cost modules were developed in the areas of natural uranium mining and milling, conversion, enrichment, depleted uranium disposition, fuel fabrication, interim spent fuel storage, reprocessing, HLW conditioning, SNF packaging, long-term monitored retrievable storage, near-surface disposal of LLW, geologic repository and other disposal concepts, and transportation processes for nuclear fuel, LLW, SNF, and HLW. The AFCI cost developers are closely coordinating with the Generation IV EMWG and have adopted many of the EMWG estimating structures, assumptions, and estimating processes.
This report is based on data collected from historical reports and expert knowledge of past and current fuel cycle facilities and processing requirements. The reference data have been placed into a cost collection database, screened, normalized for U.S. facilities, and summarized for this report. The fuel cycle requirements for future generation nuclear reactors are also being assessed and will be included in the cost basis as the technology matures. The cost basis information will be updated periodically with advancements in the knowledge gained in the technology development studies.
This report establishes fuel cycle modules with “What it takes” values and a plausible cost distribution for a particular service, operation, or material. In most cases a cost or prices is given and does not include any taxes, carrying charges, or other overheads sometimes applied to such items by utility accounting systems. For example, some utilities may add refueling service overheads or significant carrying charges to the front end costs for UO2 fuel. This may result in open cycle fuel cycle front-end

INL/EXT-07-12107 (March 2008) Advanced Fuel Cycle Cost Basis 29
costs of 10 mills/kwh or higher. The constituent unit costs given are intended to be used in a simple, but highly transparent, “value added” model such as the Generation IV G4-ECONS reactor economics code. This model moves through the steps of the fuel cycle, multiplying all of the annual flows times the unit costs for each module or “box” and summing the annual costs. The grand total annual cost is then divided by the annual electricity production in kilowatt hours per year to obtain the fuel cycle contribution to the overall levelized unit electricity cost (LUEC). (Reactor-related components of the LUEC are discussed in Modules R-1 and R-2.)
7.2 Path Forward This report will continue to be updated in future years based on the input from technical reviews;
updated cost information; advances in the knowledge gained in the technology development studies; information collected through integration with AFCI, Generation IV, and GNEP studies. Additional cost sensitivity and uncertainty analysis will be performed to expand the knowledge base. Additional studies are underway to predict the costs for commercial application of fuel cycle facilities and fast reactors, understand the international market dynamics on the front-end of the fuel cycle (uranium), understand the economic implications of supplier-user system economics, and establish a basis for costing international facilities. The economic study can also be expanded to touch on new areas such as the costs of small nuclear power reactors, the economic impacts from meeting nonproliferation objectives, and studies on the utilization of the repository.
The AFCI Economic Analysis Working Group has integrated cost data into the AFCI VISION.ECON dynamic cost model, while continuing to use the Generation IV ECONS reactor economics code for static analysis and for cost verification purposes. Systems integration modeling of economic performance will be performed in conjunction with the Modeling and Simulation activity. Refined appreciation for the application of the cost data will be gained through support of AFCI reports and technical options analysis.
All reference fuel cycle cost data and source documentation will continue to be placed in the AFCI Cost Collection database. The fuel cycle requirements for future generation nuclear reactors will also be assessed with the help of the EMWG and included in the cost basis as this technology matures.

INL/EXT-07-12107 (March 2008) Advanced Fuel Cycle Cost Basis 30
8. REFERENCES 1. Generation IV Economic Modeling Working Group (EMWG), Cost Estimating Guidelines for
Generation IV Nuclear Energy Systems, Rev. 1.04, May 2005.
2. J. Chandler and D. Shropshire, “Financing Strategies for a Nuclear Fuel Cycle Facility,” ICONE14-89255, 14th International Conference on Nuclear Engineering, July 17−20, 2006, Miami, Florida.
3. Defense and General Construction Escalation Indices based on an average of the Engineering News Record Construction Cost Index and Building Cost Index, http://enr.construction.com/features/coneco/subs/recentindexes.asp.
4. U.S. Department of Labor, Bureau of Labor Statistics, Consumer Price Index-Urban Wage Earners, years 1970-2004, http://www.bls.gov/cpi/home.htm.
5. D. E. Shropshire, INEEL, to Kathy McCarthy, INEEL, Letter report, “Transmittal of Top-Down Strategy for Communicating Economic Benefits,” CCN 48562, INEEL, March 12, 2004.
6. D. E. Shropshire, INEEL, to Kathy McCarthy, INEEL, Letter report, “Systematic Process for Performing Advanced Fuel Cycle Economic Analysis,” CCN 49284, INEEL, April 15, 2004.
7. D. E. Shropshire et al., Advanced Fuel Cycle Economic Sensitivity Analysis, INL/EXT-06-11947, December 2006.
8. U.S. Department of Energy, Office of Nuclear Energy, Advanced Fuel Cycle Initiative (AFCI) Comparison Report, FY 2006 Update, July 2006.
9. C. G. Bathke et al., Advanced Nuclear Fuel Cycle Systems Analyses for FY 2002, LA-UR-02-6674, Los Alamos National Laboratory.
10. M. Bunn, S. Fetter, et al., The Economics of Reprocessing vs. Direct Disposal of Spent Nuclear Fuel, DE-FG26-99FT4028, Belfer Center for Science and International Affairs, John F. Kennedy School of Government, Harvard University, 2003. http://www.puaf.umd.edu/Fetter/2003-Bunn-repro.pdf, webpage accessesed August 24, 2007.
11. http://www.puaf.umd.edu/Fettr/programs/COE-LWR.xls.
12. D. E. Shropshire, INL, to Kathy McCarthy, INL, “Total System Model Implementation Plan” Rev. 0, Bechtel SAIC Company, LLC, under contact number DE-AC28-01RW12101, December 2003.
13. Report to Congress on Advanced Fuel Cycle Initiative: “Advanced Fuel Cycle Initiative: Objectives, Approach, and Technology Summary,” U. S. Department of Energy, Office of Nuclear Energy, Science, and Technology, May 2005.
14. A. M. Yacout, et al., “Dynamic Analysis of the AFCI Scenarios,” PHYSOR 2004, Chicago, Illinois, April 25–29, 2004.
15. PowerSim Software, http://www.powersim.com.
16. AFCI Economic Benefits and Systems Analysis Team, Software Requirements Specification Verifiable Fuel Cycle Simulation (VISION) Model, INEEL/EXT-05-02643, Rev. 1, 2005.
17. J. Jacobson, W. West, D. Shropshire, Software Platform Evaluation Verifiable Fuel Cycle Simulation (VISION) Model, INL/EXT-06-01076, Rev. 0, 2005.

INL/EXT-07-12107 (March 2008) Advanced Fuel Cycle Cost Basis 31
Appendix A
Code-of-Accounts Dictionary for Estimating Costs of Fuel Cycle Facilities

INL/EXT-07-12107 (March 2008) Advanced Fuel Cycle Cost Basis 32

INL/EXT-07-12107 (March 2008) Advanced Fuel Cycle Cost Basis 33
Appendix A Code-of-Accounts Dictionary for Estimating Costs
of Fuel Cycle Facilities The life cycle of any nuclear fuel cycle system, including those considered by AFCI, includes
expenditures over many years for such major categories as research, development, and demonstration (RD&D), commercial design, construction, commissioning, operations, and decommissioning. The ability to further subdivide these cost categories into activities at lower levels gives further insight into the technical and business issues associated with each concept. If subdivisions can be made in a common manner for all concepts, relevant comparisons can be achieved. This may be accomplished by using a uniform code of accounts (COA) system. For many years the standard COA for nuclear power plant construction and design costs was the Engineering Economic Data Base, which was derived from an older nuclear utilities COA. Similar COAs were used for support facilities to these power plants, such as fuel fabrication facilities.
The International Atomic Energy Agency has developed its own account system that subsumes the Engineering Economic Data Base for capital costs and develops additional codes for operation and maintenance, fuel cycle services, and other parts of a reactor system life cycle. The International Atomic Energy Agency account system for nuclear power plants has been modified to accommodate more generic production facilities, such as those required for the nuclear fuel cycle It is sometimes referred to at as the “two-digit” level representation, i.e., costs are rolled-up at the level of major subsystems. It can be used to organize a cost estimate prepared using either a bottom-up or top-down approach to estimating. For fuel cycle RD&D costs it will be necessary for the AFCI working groups to create their own hybrid cost accounting system.
The following “dictionary” defines the possible contents of each cost account. Note that for a given facility, each account may not necessarily contain all of the items that appear in the list.
0 – Early Life-Cycle Costs Not Normally Recovered in the Price of the Plant Product or Service Sold:
0.1 – Planning Costs—Initial concept definition, road mapping, feasibility analysis, proposal preparation and marketing, patent applications.
0.2 – Research and Development Costs—Bench scale development, basic science parameters, materials development, irradiation studies, post-irradiation examination of fuels, experiment safety approvals, publication preparation.
0.3 – Prototype or Pilot Plant Costs—Prototype scale equipment development, pilot plant flow sheet development and layout, design engineering, permits and approvals, safety reviews, feedstock certification, pilot plant construction and startup, pilot plant operations, analytical chemistry, data analysis, waste characterization, report preparation, pilot plant deactivation, pilot plant D&D.
0.4 – Generic licensing costs—NRC certification of generic technology.

INL/EXT-07-12107 (March 2008) Advanced Fuel Cycle Cost Basis 34
Costs Normally Recovered in the Price of the Product or Service Sold
1 – Capitalized Preconstruction Costs
11 – Land and Land Rights—Cost of land purchase or long-term lease.
12 – Site Permits—Cost of obtaining permits that allow use of site and preparation of site (e.g., for tree cutting, drainage, wetlands relocation, runoff mitigation, excavation).
13 – Plant Licenses (including NEPA)—Cost of NRC document submittal preparation, cost of NRC review if applicant must cover such costs, costs for similar DOE-related activities if plant is government-owned.
14 – Plant Permits—Cost of obtaining permits required for plant construction (electrical, plumbing, construction waste disposition, etc.).
15 – Plant Studies—Cost of special plants studies such as Preliminary Safety Analysis Report, Safety Analysis Report, safeguards and security plan, constructability analysis.
16 – Plant Reports—Cost of submitting plant design documents for regulatory and management review.
17 – Other Preconstruction Costs—Other preconstruction costs specific to project that are not covered above.
18 – Other Preconstruction Costs—Continuation of category 17 if needed.
19 – Contingency: Preconstruction Costs—Allowance to reflect uncertainty and risk for above activities. A level of cost confidence should be specified along with this monetary value.
2 – Capitalized Direct Costs
21 – Structures and Improvements—Labor-hours and materials (commodities such as brick, rebar, concrete, permanent scaffolding, etc) used to construct civil structures for the main process and auxiliary buildings. Site preparation and grading are also included.
22 – Process Equipment—Costs of purchasing major process equipment items and the labor-hours needed to install them. The price paid for the items should include any equipment and vendor engineering or services required plus any transportation costs. Major process equipment items would include dissolvers, gas centrifuges, gloveboxes, sintering furnaces, chemical reactors, remote manipulators, separation columns, and large pumps.
23 – Auxiliary Equipment—Costs of process piping, pipe hangers, small pumps, vacuum pumps, valves, conventional heat exchangers, etc. which support the larger process items in Account 22. Installation labor-hours should be included.
24 – Electrical Equipment—Costs include the plant switchyard equipment, transformers, cables, switchboxes, and controllers. Installation man-hours for such equipment should be included.
25 – Heat Addition/Rejection System—Cost of any systems which supply or reject heat to or from the overall process. This could include cooling water systems, cooling towers, a steam plant, large heat exchangers not in the main process flow sheet, electrical heaters. Plant heating, ventilating, and air conditioning (HVAC) can be included here. Labor-hours for installation should be included.

INL/EXT-07-12107 (March 2008) Advanced Fuel Cycle Cost Basis 35
26 – Miscellaneous Equipment—Costs include maintenance capital items, process controllers and sensors, control room displays and computers, special safety or radiation control equipment, in-plant transport vehicles, scales, etc.
27 – Special Materials (such as high unit cost nuclear materials)—Cost of initial inventories of special nuclear or nonnuclear materials needed before commercial operation. Examples might be depleted U for cold startup tests, special radiation shielding materials, precious metals or special catalysts, etc.
28 – Simulator—Cost of purchasing plant simulator used to train plant operators. Costs should include vendor’s engineering and testing support.
29 – Contingency on Capitalized Direct Costs (Accounts 21–28)—Allowance to reflect uncertainty and risk for equipment/commodity costs and the man-hours required to construct and install. A level of cost confidence should be specified along with this monetary value.
Total Directs = 1 + 2
3 – Capitalized Support Services
31 – Field Indirect Costs—Costs include temporary buildings and trailers, major construction equipment rentals (cranes), food and sanitary facilities for construction workers, vehicle-related costs, site security and worker badging, preparation of construction staging areas, worker housing allowance and per diems, safety equipment.
32 – Construction Supervision—Costs of craft supervision by the project constructor staff (man-hours).
33 – Commissioning and Startup Costs—Cost of procedure development and documentation, operational readiness review, testing and certifying of installed equipment, integration of equipment into process, cold startup. Costs are mostly incurred by architectural engineer and equipment suppliers. Owner’s costs are in (4) below.
34 – Demonstration Test Run—Costs of first “hot” startup run.
35 – Design Services Offsite (offsite might be “home office” of architectural engineer designer)—Cost of preconceptual, conceptual, preliminary, and final design and preparation of all drawings and final design documentation in the form of formal design reports.
36 – PM/CM Services Offsite (Project manager/construction manager)—Cost of scheduling, cost tracking, procurement planning, and other management activities conducted at the home offices of the architectural engineer and construction manager.
37 – Design Services Onsite—Cost of design and engineering services provided by architectural engineer on the site. Most of this cost is for labor-hours of engineering support provided during the construction process and actual implementation of the final design on the plant site.
38 – PM/CM Services Onsite—Cost of construction related services onsite, such as craft payroll services, quality assurance and work inspection, safety enforcement, and craft hiring.
39 – Contingency on Capitalized Support Services—Allowance to reflect uncertainty and risk for above activities. A level of cost confidence should be specified along with this monetary value.
Base Construction Cost (BCC) = 1 + 2 + 3

INL/EXT-07-12107 (March 2008) Advanced Fuel Cycle Cost Basis 36
4 – Capitalized Operations (mostly plant owner costs prior to commercial operation)
41 – Staff Recruitment and Training—Costs to hire and train the employees of the company that will operate the process.
42 – Staff Housing—Costs of housing the operational staff in a foreign or remote location. Not needed for most U.S. plants.
43 – Staff Salary Related Costs—Fully burdened staffing costs paid by plant owner/operator for operations prior to commercial production.
44 – Other Owner Capitalized Costs—Cost for plant owner/operators’ activities or purchases not covered above.
49 – Contingency on Capitalized Operations Costs—Allowance to reflect uncertainty and risk for above activities. A level of cost confidence should be specified along with this monetary value.
5 – Capitalized Supplementary Costs
51 – Shipping and Transportation Costs—Cost of personnel travel and transportation of materials and/or equipment if not included in price.
52 – Spare Parts—Cost of spare pumps, piping, gloveboxes, and other major equipment items purchased before commercial operation and kept in reserve for possible use during plant operations.
53 – Taxes—Some owners may wish to keep sales taxes, value-added taxes, and property taxes in a separate category. Sales taxes during construction can be quite large.
54 – Insurance—Costs of insurance to cover vehicle accidents, construction accidents, fire and theft losses, and minor process accidents. Federal Price-Anderson coverage for nuclear facilities should cover damages arising from a more serious process accident.
58 – Decommissioning Costs (if not covered by escrow fund)—This is the amount in the reference year’s dollars which must be set aside to cover D&D of the plant at its end of life. Payments are usually made via an escrow fund during operations. Sinking fund calculation is used to estimate the annual payments to this fund.
59 – Contingency on Supplementary Costs—Allowance to reflect uncertainty and risk for above activities. A level of cost confidence should be specified along with this monetary value.
Total Overnight Cost (TOC) = 1 + 2 + 3 + 4 + 5

INL/EXT-07-12107 (March 2008) Advanced Fuel Cycle Cost Basis 37
6 – Capitalized Financial Costs
61 – Escalation (not used for constant dollar analysis)—Inflation related costs.
62 – Fees (noninterest fees paid to financial institutions)—These costs would be for any financing fees not considered interest.
63 – Interest During Construction (IDC)—This is the actual interest paid on the “construction loan.” The revenues generated during operations must recover this cost plus the “overnight” cost.
69 – Contingency on Financial Costs—A contingency can be assigned to the financial costs to cover the effect of schedule slippage during construction. Since “time is money,” the IDC increases when the schedule exceeds the baseline schedule.
Capital Investment Cost (TCIC) = 1 + 2 + 3 + 4 + 5 + 6
7 – Annualized O & M Cost
71 – Operations and Maintenance Staff—These costs include the base annual salaries for all nonmanagement plant employees plus the costs of any subcontracted personnel on or off site. The account can be further broken down into categories such as chemical operators, computer technicians, radiological control technician staff, engineers, maintenance mechanics, instrument technicians, accountants ($ and nuclear materials), clerks, clerical staff, personnel, and public relations, etc.
72 – Management Staff—These costs include the base salaries of the onsite management staff plus any management staff assigned to the project at the home office.
73 – Salary Related Costs (benefits, FICA, etc.)—These costs include payroll taxes such as FICA and Medicare, employee pension and benefits costs, and general and administrative (G&A) costs.
74 – Operations Chemicals (feedstocks) and Maintenance Materials—These costs include the costs of the chemicals or substances required for feedstocks, any special subcontracted services required to process them, and miscellaneous chemicals such as resins, packings, lubricants, solvents, process gases, special clothing, cleaning materials needed to sustain operations.
75 – Spare Parts—This cost is for spare parts purchased during the span of commercial operations.
76 – Utilities, Supplies, Miscellaneous Consumables—These costs are for electricity, natural gas (for heat), process and potable water, compressed air, steam (if purchased rather than produced in-house), oil, gasoline, and communications services.
77 – Capital Plant Upgrades (not including financing costs)—These costs are for major process equipment items that must be replaced during the operational life of the plant. For tax and accounting purposes they are treated as capital items; however, for cost estimating purposes their costs can be spread over the operational life of the plant for levelization. Capital upgrade costs are sometimes calculated as a percent of plant overnight cost expended per year.
78 – Taxes, Insurance, Regulation (NRC inspections)—These costs include sales taxes for items purchased during operations, property taxes, insurance premiums for noncatastrophic

INL/EXT-07-12107 (March 2008) Advanced Fuel Cycle Cost Basis 38
accidents, any Price-Anderson premiums if required, NRC inspections, OSHA inspections, and any local/state government regulatory or licensing fees.
79 – Contingency on Annualized O & M Costs—Allowance to reflect uncertainty and risk for above activities. A level of cost confidence should be specified along with this monetary value.
8 – (N/A—reserved placeholder)
9 – Annualized Financial Costs
91 – Escalation (not used for constant dollar analysis).
92 – Fees (noninterest financial costs during operations)—Such costs would include any banking fees actually paid. In some accounting systems, interest can be imputed for product and feedstock inventories and working capital.
93 – Cost of Money—This cost category can cover the financing of large replacement capital items or upgrades, e.g., interest. This total can be levelized over the operational years along with costs under Account 77.
94 – Annual Contribution to the D&D Escrow Fund—The amount (in reference year constant $) estimated for D&D should be treated using a sinking fund calculation such that the estimated amount is available after the last year of plant operation. The annual payments to the fund are kept in this account. If this account is used, Cost Account 58 should be zeroed.
99 – Contingency on Annualized Financial Costs—Allowance to reflect uncertainty and risk for above activities. A level of cost confidence should be specified along with this monetary value.

INL/EXT-07-12107 (March 2008) Advanced Fuel Cycle Cost Basis
MODULES A Uranium Mining and Milling
B Conversion
C1 Enrichment
C2 Highly Enriched Uranium Blend-down
D1 Series Fabrication of Contact-handled Fuels (Modules D1-1 through D1-9)
E1 Wet Storage of Spent Nuclear Fuel
E2 Dry Storage of Spent Nuclear Fuel
E3 Recycled Product Storage
F1 Spent Nuclear Fuel Aqueous Reprocessing Facility
F2/D2 Electrochemical Reprocessing and Remote Fuel Fabrication
G Series Waste Conditioning, Storage, and Packaging (Modules G1 through G5)
I Long-term Monitored Retrievable Storage
J Near Surface Disposal
K1 Depleted Uranium Conversion and Disposition
K2 Aqueously Reprocessed Uranium Conversion, Disposition, and Possible Recycle
K3 Electrochemically Reprocessed Uranium Conversion, Disposition, and Possible Recycle
L Geologic Repository
M Series Alternative Disposal Concepts (Modules M1 through M3)
O Series Transportation Processes (Modules 01, 02, and Annex OX)
R1 Thermal Reactors
R2 Fast Reactors

INL/EXT-07-12107 (March 2008) Advanced Fuel Cycle Cost Basis

INL/EXT-07-12107 (March 2008) Advanced Fuel Cycle Cost Basis A-1
Module A
Uranium Mining and Milling

INL/EXT-07-12107 (March 2008) Advanced Fuel Cycle Cost Basis A-2

INL/EXT-07-12107 (March 2008) Advanced Fuel Cycle Cost Basis A-3
Module A Uranium Mining and Milling
A-1. BASIC INFORMATION The authors recognize that uranium and enrichment spot prices have recently exceeded the high-cost
range provided in this cost basis. These price trends continue to be evaluated and the cost ranges in the report may continue to be revised as appropriate in future updates. The cost basis reflects reasonable expectations about uranium and enrichment long-term contract prices applicable to reactors with long operating lives, rather than reflecting market spikes as experienced in the 1970s and observed in the spot market U3O8 prices circa 2007.
This module covers the factors involving extraction of uranium from the earth through production of uranium concentrate in the form of U3O8, commonly known as “yellow cake.” Supply of uranium for use in the commercial nuclear industry in the United States is obtained from both domestic and foreign supplies. Uranium is somewhat unique among fuel resources in that nontraditional or secondary supply currently provides a significant portion of uranium requirements. The sources of uranium for any given year’s demand are classified as originating from primary supplies representing newly extracted and processed uranium from the earth’s surface or from secondary supplies such as existing inventories of natural or low-enriched uranium (LEU), highly enriched uranium (HEU), mixed oxide fuel (MOX), reprocessed uranium (RepU), and reenrichment of depleted uranium (tails). In general, the difference between the demand for uranium to produce new fuel and that supplied by secondary sources results in the market demand for newly extracted uranium from mining of the earth’s surface.
Availability of supply is evaluated using the accepted systematic convention of reporting reserves as established by a joint Organization for Economic Cooperation and Development/Nuclear Energy Agency-International Atomic Energy Agency (OECD/NEA-IAEA) expert group and as adapted by U.S. Department of Energy-Energy Information Administration (DOE-EIA). The various categories of reserves indicate both the confidence level that given amounts of reserves will exist as well as the difficulty in making that uranium available for use. These indications are expressed in an estimated cost to reclaim and utilize the reserves with reasonably established methods. Adequacy of the market to supply uranium and appropriateness of pricing are influenced by many factors including overall demand, secondary supplies, primary supplies, lead time for discovery and production, cost of extraction, and such factors as captured markets. Extensive analyses of such factors are performed regularly and published in a biennial report by OECD/NEA-IAEA known as the Red Book1 and annually by DOE-EIA in the Uranium Industry Annual.2 IAEA recently published an Analysis of Uranium Supply to 2050,3 evaluating uranium supply to three distinct uranium demand cases. These ranged from a “Low” uranium demand case, reflecting a low energy demand growth and a phaseout of nuclear power by 2100, to a “High” demand case, reflecting high economic growth with significant development of nuclear power. A “Middle” demand case, which was also defined, is mainly driven by sustained development of nuclear power worldwide, including the demand in developing countries. Such analysis permits the estimated reserves to be evaluated relative to adequacy of supply, expectations of relative pricing, and projections of ability to make the resources available for utilization in a timely manner.
Two unit systems for quantifying uranium masses are in widespread use in literature. These are pounds of U3O8 (lb U3O8) and kilograms of U (kg U), where 1 kg U = 2.60 lb U3O8. In the figures and tables accompanying this module, the units used by individual source documents are generally preserved.

INL/EXT-07-12107 (March 2008) Advanced Fuel Cycle Cost Basis A-4
A-2. DEFINE FUNCTIONAL AND OPERATIONAL DESCRIPTION
A-2.1 Mining and Milling Uranium is widely distributed throughout the crust of the earth. The ability to extract the uranium in a
practical and cost-effective manner depends on the relative grade of the ore to be mined (i.e., the percentage of uranium in the ore body), the type of formation in which it resides, and the location. Uranium, on average, is more prevalent in the earth’s crust than such economically important metals as silver and tungsten (Table A-1); it is a constituent of most rocks and even of the sea. Table A-2 shows some typical concentrations in ppm (parts per million).
Table A-1. Crustal abundance (grams/tonne) of selected elements. Element Grams/tonne
Gold 0.004 Silver 0.07 Tungsten 1.5 Molybdenum 1.5 Uranium 2.8 Thorium 7 Lead 13 Copper 55 Zinc 70
Iron 50,000
Table A-2. Typical concentrations (uranium parts per million).
Substance Uranium Concentration
(ppm) High-grade ore⎯2% U 20,000 Low-grade ore⎯0.1% U 1,000 Granite 4 Sedimentary rock 2 Earth’s continental crust (av) 2.8 Seawater 0.003
An ore body is, by definition, an occurrence of mineralization from which the metal is economically
recoverable. It is therefore relative to both costs of extraction and market prices. At present, neither the oceans nor any granites are ore bodies, but conceivably either could become so if prices were to rise sufficiently.4
The cost of meeting environmental requirements is also a major factor in the attractiveness of the ore body. Although there are varied means of extracting the uranium to “yellow cake,” only two basic approaches will be discussed here, conventional mining (surface pit or deep) and in situ leaching, as depicted in Figure A-1. The quantity of ore required to produce a tonne of uranium will depend on the average grade of the ore. Typically amounts from 10–1000 tonnes of ore are processed to produce a single tonne of uranium (e.g., ore grade 10% to 0.1% U), although in certain circumstances lower-grade ore

INL/EXT-07-12107 (March 2008) Advanced Fuel Cycle Cost Basis A-5
bodies are being tapped. The Olympic Dam mine in Southern Australia, for instance, holds the largest-currently known ore body in the world—greater than 1 million tonnes of yellow cake. The average grade of Olympic Dam ore is only 0.04% U, but the ore is rich in copper (1.1%) and gold.5 The presence of iron, copper, and gold in this and other breccia complex deposits allow profitable U mining at lower market prices than would otherwise be the case.
Mining techniques, as depicted below, will thus be impacted by the difficulty in reaching the ore, the grade, and the amount of secondary waste to be generated.
A-2.2 In situ Leaching With the in situ leaching technology (Figure A-2), a leaching liquid (e.g., ammonium-carbonate or
sulfuric acid) is pumped through drill-holes into underground uranium deposits. The solution dissolves and mobilizes the deposit, and the uranium bearing liquid is pumped out from below. The solution is further processed through a series of ion exchange resins or solvent extraction processes and eventually precipitated, dewatered, and yellow cake is produced. The yellow cake is packaged in 55-gallon steel drums for shipment to the conversion plant. The process recovers the leachate, which is adjusted and recycled back into the injection wells. Very little secondary waste is formed. This technology can only be used for uranium deposits located in an aquifer in permeable rock, confined between nonpermeable rock.
The advantages of in situ leaching are: (a) elimination of stockpiling and hauling of ore; (b) elimination of the crushing, grinding, and other milling operation; (c) elimination of large scale excavations; (d) reduction of risks to miners because they do not have to work underground; and (e) a very small portion of the radioactivity (~5%) of the ore reaches the surface. Disadvantages include (a) risk of leaching liquid excursions beyond the uranium deposit and subsequent contamination of ground water, (b) production of some amounts of waste sludge and waste water when recovering the leaching liquid, (c) impossibility of restoring natural conditions in the leaching zone after finishing the leaching operation, and (d) a low recovery rate of approximately 50% is considered optimum.6,7
A-2.3 Open Pit and Underground Mining Historically most uranium ore has been mined in open pit or underground mines. The uranium
content of the ore is often between only 0.1% and 0.2%. Therefore, large amounts of ore have to be mined to acquire uranium. Waste rock is produced during open pit mining when overburden is removed and during underground mining when driving tunnels through non-ore zones. Piles of so-called waste rock often contain elevated concentrations of radioisotopes compared to normal rock. They are typically returned to the pit and covered with overburden. Other waste piles consist of ore with too low of a grade for processing. The transition between waste rock and ore depends on technical and economic feasibility.
The uranium bearing ore must be stockpiled and subsequently hauled to the uranium mill (Figure A-3) where it is processed and concentrated into yellow cake. A uranium mill is a chemical plant designed to extract uranium from ore. It is usually located near the mines to limit transportation. The ore has to be crushed and ground into a fine powder and then roasted to remove most of the organic matter. In most cases, sulfuric acid is used as the leaching agent, but alkaline leaching is also used. As the leaching agent not only extracts uranium from the ore, but also several other constituents like molybdenum, vanadium, selenium, iron, lead, and arsenic, the uranium must be separated out of the leaching solution. This procedure may be an ion exchange or solvent extraction type of process. The uranium is eventually precipitated out and washed, centrifuged, and dried; and the yellow cake is placed in 55-gallon steel drums for shipment to the conversion plant. In some cases, uranium has been removed from low-grade ore by heap leaching. This may be done if the uranium content is too low for the ore to be economically processed in a uranium mill. The leaching liquid (often sulfuric acid) is introduced on the top of the pile

INL/EXT-07-12107 (March 2008) Advanced Fuel Cycle Cost Basis A-6
and percolates down until it reaches a liner below the pile, where it is caught and pumped to a processing plant.
Waste from the uranium mill is released to a tailings pond where it forms sludge. The tailing ponds receive nearly all the radium and other decay products of the original ore. The amount of sludge produced is nearly the same as that of the ore milled. At a grade of 0.1% uranium, 99.9% of the material is left over. Apart from the portion of the uranium removed, the sludge contains all the constituents of the ore including heavy metals and other contaminants, such as arsenic, as well as chemical reagents used during the milling process. As a result, such tailings require control to safeguard the surrounding environment from radioactive contamination or unwanted radiation exposure. Control of the tailings falls under the Uranium Mill Tailings Radiation Control Act and U.S. Environmental Protection Agency standards.
Advantages of open pit or deep mining are usually centered on a higher recovery of the uranium ore, or, in the case of underground mining, very little surface disturbance. Obvious disadvantages include the large amount of secondary waste that is generated—the 60 million tonne Olympic Dam tailings pile, for example, presently covers over 500 hectares—as well as a much larger exposure of operating personnel to radiation and potential contamination. Deep mining has the added risk of cave-ins, subsidence, and dealing with radon gas generation during mining operations.
A-3. PICTURES/SCHEMATICS
Figure A-1. Nuclear fuel production chain for light water reactors.6

INL/EXT-07-12107 (March 2008) Advanced Fuel Cycle Cost Basis A-7
Figure A-2. Typical in situ leaching operation.6
Figure A-3. Typical uranium mill.8
A-4. MODULE INTERFACE DEFINITION The product of Module A is greatly influenced by the requirements for Module D1, Fuel Fabrication,
which defines overall demand. However, relative to specific demand, there are other factors outside of the defined modules that have influence on this module. The requirements for Module D1 can be made up from uranium originating from mining with subsequent conversion and enrichment, or from a number of secondary sources including but not limited to inventory reduction, HEU blend down to LEU and RepU. Module A should, therefore, be directly linked to Modules B and C with the potential for planned inventory buildup by the suppliers.

INL/EXT-07-12107 (March 2008) Advanced Fuel Cycle Cost Basis A-8
A-4.1 Module Scaling Factors Scaling factors are not specifically applicable. Size and cost of establishing a new mine will depend
on many factors and are not generally scalable unless conditions would be nearly identical to another mining opportunity including type of mining method, location, and type of ore body, thickness of seam, etc.
A-4.2 Cost Bases, Assumptions, and Data Sources The cost basis for uranium depends on a number of factors impacting supply and demand.
Availability, at a given cost, drives the specific supply to meet demand for new product. This demand is also impacted by secondary sources of uranium already existing in many forms in the overall fuel cycle. The following discussions highlight the key factors relative to the actual supply and demand for newly produced uranium.
A-4.3 Definition of Uranium Reserves The definitions of the conventional resource categories as established by the IAEA are as follows:
Reasonably Assured Resources (RAR) refer to uranium that occurs in known mineral deposits of delineated size, grade, and configuration such that the quantities that could be recovered within the given production cost ranges with currently proven mining and processing technology can be specified. Estimates of tonnage and grade are based on specific sample data and measurements of the deposits and on knowledge of deposit characteristics. RAR have a high assurance of existence.
Estimated Additional Resources Category I (EAR-I) refers to uranium in addition to RAR that is inferred to occur, mostly on the basis of direct geological evidence, in extensions of well explored deposits or in deposits in which geological continuity has been established but where specific data, including measurements of the deposits and knowledge of the deposits’ characteristics, are considered to be inadequate to classify the resource as RAR. Estimates of tonnage, grade, and cost of further delineation and recovery are based on such sampling as is available and on knowledge of the deposit characteristics as determined in the best known parts of the deposit or in similar deposits. Less reliance can be placed on the estimates in this category than on those for RAR.
Estimated Additional Resources Category II (EAR-II) refers to uranium in addition to EAR-I that is expected to occur in deposits for which the evidence is mainly indirect and which are believed to exist in well defined geological trends or areas of mineralization with known deposits. Estimates of tonnage, grade, and cost of discovery, delineation, and recovery are based primarily on knowledge of deposit characteristics in known deposits within the respective trends or areas and on such sampling, geological, geophysical, or geochemical evidence as may be available. Less reliance can be placed on the estimates in this category than on those for EAR-I.
Speculative Resources refer to uranium, in addition to EAR-II, that is thought to exist, mostly on the basis of indirect evidence and geological extrapolations, in deposits discoverable with existing exploration techniques. The location of deposits envisaged in this category could generally be specified only as being somewhere within a given region or geological trend. As the term implies, the existence and size of such resources are speculative.
Unconventional Resources are considered very low-grade resources, which are now not economic or from which uranium is only recoverable as a minor by-product, (e.g., phosphates, monazite, coal, lignite, and black shale).

INL/EXT-07-12107 (March 2008) Advanced Fuel Cycle Cost Basis A-9
The IAEA in its biennial Red Book1 also uses the convention of Known Conventional Resources that consist of RAR and EAR-I, recoverable at a cost of less than $130/kgU (<$50/lb U3O8) USD. Undiscovered Conventional Resources consists of EAR-II and Speculative resources (SR).
Special note on U.S. reserves: The U.S. does not report EAR-I and EAR-II quantities separately, but rather combines and reports them as EAR-II only. IAEA also uses the following cost categories for uranium resources.
<$40/kgU (<$15.38/lb U3O8) <$80/kgU (<$30.77/lb U3O8) <$130/kgU (<$50.00/lb U3O8)
Thus the combination of implied resource availability and cost defines the expectations for recovered reserves within a given price expectation.
A-4.4 World Reserves of Uranium The IAEA Red Book 2005 estimated world reserves as shown in Table A-3.1
Table A-3. Known World Uranium Resources (1000 tU). Cost Category
Resource Category $0–40/kgU $40–80/kgU $0–80/kgU $80–130/kgU $0–130/kgU Reasonably Assured Resources 1947.383 696 2,643 653 3,297 Inferred Resources 798.997 362 1,161 285 1,446 Total Identified Resources 2,746 1,058 3,804 938 4,743 Prognosticated Resources — — 1,687 — 2,468
2,862 Speculative Resources (SR) — — — — *2,286
Total Undiscovered Resources — — 1,687 — 7,615 All Conventional Resources 2,746 — 5,491 — 12,358 aUnconventional Resources**
- From Phosphates 22,000 - Seawater
— — — —
4,000,000 “t” is metric tonne. * Cost range unassigned ** Phosphate recovery has been estimated at USD 60–100/kgU including capital investment, and seawater extraction has been estimated in the order of USD 300/kgU a. 2003 data. Not all countries report separate figures for the two lowest cost categories. The figures are adjusted to account for mining and milling losses.
Table A-4 shows that the world reserves of uranium are dominated by foreign supply.

INL/EXT-07-12107 (March 2008) Advanced Fuel Cycle Cost Basis A-10
Table A-4. Known recoverable resources of uranium.a Country Tonnes U Percentage of World
Australia 1,074,000 28% Kazakhstan 606,658 16% Canada 443,800 12% Namibia 262,912 7% South Africa 248,752 7% Brazil 231,300 6% Russian Fed. 172,402 5% USA 102,000 3% Uzbekistan 90,764 2%
World Total 3,804,381 a. Reasonably Assured Resources plus Inferred Resources to U.S.$80/kgU, 1/1/05,
from OECD NEA & IAEA, Uranium 2005: Resources, Production and Demand.
The World Nuclear Association (WNA)9 interprets these data to imply that “the world’s present measured resources of uranium in the lower-cost category (3.5 MT) and used only in conventional reactors, are enough to last for some 50 years. This represents a higher level of assured resources than is normal for most minerals. Further exploration and higher prices will certainly, on the basis of present geological knowledge, yield further resources as present ones are used up.”
Most of what is known about the existence of uranium reserves is the result of a single cycle of exploration-discovery-production that was driven in large part by peak prices for uranium in the late 1970s. Little exploration has occurred since the early 1980s. That initial cycle provided enough uranium to last for over three decades. Figure A-4 depicts the work of K. S. Deffeyes and I. D. MacGregor, which was published in the late 1970s and depicts their evaluation of the abundance of uranium in the earth’s crust.
Figure A-4 depicts many of the recognized source materials from which uranium can be recovered. As with other metals and energy sources, such as oil and gas, focused exploration could be expected to expand known resources as has been the case for most commodities. WNA further states that “a doubling of price from present levels could be expected to create about a tenfold increase in measured resources, over time.”8
This WNA statement may be inferred from Figure A-4 with the aid of a simplifying assumption. If one assumes that, to first order, the cost of extracting and purifying a unit mass of ore is independent of grade, then the cost of producing a kilogram of uranium would be inversely proportional to the ore grade. Looking at the region of Figure A-4 labeled “Current Mines,” one sees that a reduction of an order of magnitude in ore grade would lead to a three order of magnitude increase in the availability of uranium at that lower ore grade. For example, referring to Figure A-4 one sees that 105 tonnes of uranium are estimated to exist in deposits having grade 10,000 ppm or higher. Moving to ores one order of magnitude less rich, 1,000 ppm, the estimated availability increases by three orders of magnitude to 108 tonnes. Hence, if the production cost is indeed inversely proportional to grade, and no other factors affecting the price are considered, the ore grade distribution of uranium deposits does indeed imply that a doubling of price would increase the economically extractable amount of uranium by about a factor of ten. Other forecasters have applied somewhat different assumptions and interpretations of Figure A-4 to arrive at slightly different conclusions.10 It must be noted that these estimates do not take into account that factors discussed below that have seen most mineral prices decline over the past century.

INL/EXT-07-12107 (March 2008) Advanced Fuel Cycle Cost Basis A-11
Deffeyes 1978, 1980
Distribution of Uranium in the Earth
Figure A-4. Distribution of uranium in the earth.11
Without constraint by cost, the total conventional resources reported by IAEA-NEA (Known Conservative Resources with Undiscovered Conventional Resources) represent 14.4 million tonnes, which is over a 200-year supply at today’s rate of consumption by light water reactors. If unconventional resources, such as phosphate deposits (22 MT) and seawater (up to 4000 MT), which would cost two to six times the present market price to extract, are considered, the supply becomes essentially unbounded. Uranium extraction as a by-product of phosphate mining, where tailings contain 50 – 200 ppm U, has historically been achieved with costs ranging from $22 – 54 per lb U3O8.12 Higher prices for supply will drive further exploration. As exploration expands, more geologic knowledge is gained of existing or new deposits and typically new technologies developed to cost effectively utilize the resource. The recent history of the Athabasca Basin in Canada suggests that the largest proportion of future resources will be as deposits discovered in the advanced phases of exploration. It is clear that a combination of mineral exploration and development of technology advances will need to generate economical resources at least as fast as they are being consumed.
Details on the U.S. uranium reserves by state are provided in Table A-5 with geographical locations shown in Figures A-5 and A-6. The U.S. potential uranium resources by forward-cost category and resource region are included in Table A-6. The U.S. uranium mine production and number of mines and sources for the period of 1993−2002 is provided in Table A-7.

INL/EXT-07-12107 (March 2008) Advanced Fuel Cycle Cost Basis A-12
Table A-5. U.S. reserves of forward-cost uranium by state (December 31, 2003).2 $30 per pound $50 per pound
State(s)
Ore (million
tons)
Gradea (percent U3O8)
U3O8 (million pounds)
Ore (million
tons)
Gradea (percent U3O8)
U3O8 (million pounds)
Wyoming 41 0.129 106 238 0.076 363 New Mexico 15 0.280 84 102 0.167 341 Arizona, Colorado, Utah
8 0.281 45 45 0.138 123
Texas 4 0.077 6 18 0.063 23 Otherb 6 0.199 24 21 0.094 40 Total 74 0.178 265 424 0.105 890 a. Weighted average percent U3O8 per tonne of ore. b. Includes California, Idaho, Nebraska, Nevada, North Dakota, Oregon, South Dakota, and Washington. Notes: Uranium reserves that could be recovered as a by-product of phosphate and copper mining are not included in this table. Reserves values in forward-cost categories are cumulative; that is, the quantity at each level of forward cost includes all reserves at the lower costs. Totals may not equal sum of components because of independent rounding. Sources: Estimated by Energy Information Administration, Office of Coal, Nuclear, Electric and Alternate Fuels, based on industry conferences; U.S. Department of Energy, Grand Junction Office, files; and Energy Information Administration, Form EIA-858, “Uranium Industry Annual Survey,” Schedule A, Uranium Raw Material Activities (1984-2002) and Form EIA-851A, “Domestic Uranium Production Report,” (2003).
Figure A-5. Major U.S. uranium reserve areas.

INL/EXT-07-12107 (March 2008) Advanced Fuel Cycle Cost Basis A-13
Figure A-6. Uranium resource regions of the U.S.
Table A-6. U.S. potential uranium resources by forward-cost category and resource region (million pounds U3O8).
Forward-Cost Category $30 per pound $50 per pound $100 per pound
Resource Region EARa SRb EARa SRb EARa SRb Colorado Plateau 1,330 480 1,900 770 2,540 1,210 Wyoming Basins 160 80 340 160 660 250 Coastal Plain 370 130 490 180 600 230 Northern Rockies 30 110 60 200 170 300 Colorado and Southern Rockies 140 90 180 140 220 190 Basin and Range 50 90 160 170 390 320 Other Regionsc 110 330 180 610 270 990
Total 2,180 1,310 3,310 2,230 4,850 3,480 a. EAR = Estimated Additional Resources. b. SR = Speculative Resources. c. Includes Appalachian Highlands, Great Plains, Pacific Coast and Sierra Nevada, Central Lowlands, and Columbia
Plateau regions, and Alaska. Notes: Values shown are the mean values for the distribution of estimates for each forward-cost category, rounded to the nearest 10 million pounds U3O8. Estimates of uranium that could be recovered as a by-product of other commodities are not included. Resource values in forward-cost categories are cumulative; that is, the quantity at each level of forward cost includes all resources at the lower cost in that category. Sources: Prepared by the Energy Information Administration, Office of Coal, Nuclear, Electric and Alternate Fuels, based on uranium resources data developed under DOE National Uranium Resource Evaluation (NURE) program and the USGS Uranium Resource Assessment project, using methodology described in Uranium Resource Assessment by the Geological Survey: Methodology and Plan to Update the National Resource Base, U.S. Geological Survey Circular 994 (1987).

INL/EXT-07-12107 (March 2008) Advanced Fuel Cycle Cost Basis A-14
Table A-7. U.S. uranium mine production and number of mines and sources, 1993−2006. Mining Method 1993 1994 1995 1996 1997 1998 1999 2000 2001 2002 2003 2004 2005 2006
Underground (metric tonnes U) 0 0 0 W W W W W 0 0 W W W W
Open Pit (metric tonnes U) 0 0 0 0 0 0 0 0 0 0 0 0 0 0
In situ Leaching (metric tonnes U) W 942 1,297 1,684 1,571 1,431 1,473 1,152 W W W W 1,031 1,638
Othera (metric tonnes U) 789 30 60 125 241 408 276 49 W W W W W W
Total Mine Production (metric tonnes U) 789 972 1,357 1,810 1,812 1,840 1,750 1,201 1,018 925 E846 961 1,171 1,804
Number of Mines Operated Underground 0 0 0 1 1 4 3 1 0 0 1 2 4 5 Open Pit 0 0 0 0 0 0 0 0 0 0 0 0 0 0 In situ Leaching 5 5 5 6 7 6 6 4 3 3 2 3 4 5 Other Sourcesb 7 7 7 6 6 5 5 5 4 3 1 1 2 1 Total Mines and Sources
12 12 12 13 14 15 14 10 7 6 4 6 10 11
a. For 1993, the “Other” includes production from in situ leach mines and uranium-bearing water from mine workings and restoration. For 1994 and 1995, “Other” includes production from uranium-bearing water from mine workings and restoration. For 1996 through 2000, “Other” includes production from underground mines and uranium-bearing water from mine workings and restoration.
b. “Other Sources” includes, in various years, heap leach, mine water, mill site cleanup and mill tailings, well field restoration, and low-grade stockpiles as sources of uranium.
W=Data withheld to avoid disclosure. The data are included in the total for “Other” through 2000. E=Estimate to avoid disclosure of individual company data. Notes: Totals may not equal sum of components because of independent rounding. Table does not include by-product production and sources. Sources: Energy Information Administration: 19932001-Uranium Industry Annual 2001 (May 2002). 2002-Form EIA-858, “Uranium Industry Annual Survey;” Schedule A: Uranium Raw Material Activities; Energy Information Administration: Form EIA-851A, "Domestic Uranium Production Report" (2003-2005)
Because the supply of newly generated uranium is controlled by the world market and dominated by foreign supply, the future price for U.S. supply would expect to meet that world market price. IAEA-NEA in its analysis of uranium supply evaluated cumulative supply and demand for uranium to 2050.3 The study considered the reality of reducing existing inventories, the infusion of prior weapons HEU into the market, as well as other significant secondary supply market impacts. Three demand cases were evaluated (low, middle, high) and covered scenarios from phaseout of nuclear power in 2100 in the low case to high economic growth and significant development of nuclear power in the high case. The middle was simply the mid-point of the two cases. Cumulative uranium requirements ranged from 3,390 to 7,577 MTU. Production from high confidence RAR was projected to be adequate in the low demand case. Deficits arise when considering use of low cost supplies to meet the middle and high cases. The study, therefore, estimated the year in which uranium from higher cost production could be justified. Table A-8 is a summary of the IAEA-NEA projections.
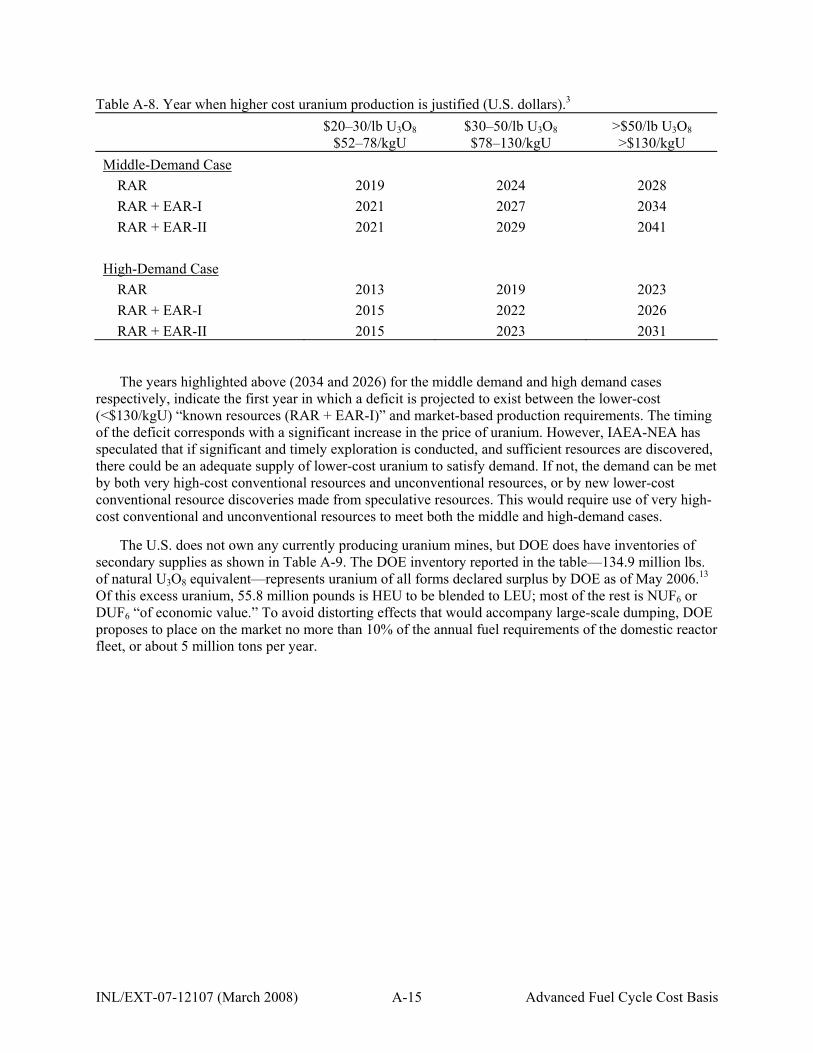
INL/EXT-07-12107 (March 2008) Advanced Fuel Cycle Cost Basis A-15
Table A-8. Year when higher cost uranium production is justified (U.S. dollars).3
$20–30/lb U3O8
$52–78/kgU $30–50/lb U3O8 $78–130/kgU
>$50/lb U3O8 >$130/kgU
Middle-Demand Case RAR 2019 2024 2028 RAR + EAR-I 2021 2027 2034 RAR + EAR-II 2021 2029 2041
High-Demand Case
RAR 2013 2019 2023 RAR + EAR-I 2015 2022 2026 RAR + EAR-II 2015 2023 2031
The years highlighted above (2034 and 2026) for the middle demand and high demand cases respectively, indicate the first year in which a deficit is projected to exist between the lower-cost (<$130/kgU) “known resources (RAR + EAR-I)” and market-based production requirements. The timing of the deficit corresponds with a significant increase in the price of uranium. However, IAEA-NEA has speculated that if significant and timely exploration is conducted, and sufficient resources are discovered, there could be an adequate supply of lower-cost uranium to satisfy demand. If not, the demand can be met by both very high-cost conventional resources and unconventional resources, or by new lower-cost conventional resource discoveries made from speculative resources. This would require use of very high-cost conventional and unconventional resources to meet both the middle and high-demand cases.
The U.S. does not own any currently producing uranium mines, but DOE does have inventories of secondary supplies as shown in Table A-9. The DOE inventory reported in the table—134.9 million lbs. of natural U3O8 equivalent—represents uranium of all forms declared surplus by DOE as of May 2006.13 Of this excess uranium, 55.8 million pounds is HEU to be blended to LEU; most of the rest is NUF6 or DUF6 “of economic value.” To avoid distorting effects that would accompany large-scale dumping, DOE proposes to place on the market no more than 10% of the annual fuel requirements of the domestic reactor fleet, or about 5 million tons per year.

INL/EXT-07-12107 (March 2008) Advanced Fuel Cycle Cost Basis A-16
Table A-9. Inventories of natural and enriched uranium as of end of year, 1998−2005 (thousand pounds natural U3O8 equivalent).
Inventories at the End of the Year Type of Uranium Inventory 1998 1999 2000 2001 2002 2003 2004 2005P Owners and Operators of U.S. Civilian Nuclear Power Reactors Inventories
65,758 58,250 54,804 55,636 53,461 45,639 57,665 64,811
Natural Uranium 42,051 44,761 35,952 34,433 31,029 22,674 27,889 45,445 Enriched Uranium a,d 23,708 13,488 18,851 21,204 22,432 22,965 29,766 19,366 U.S. Supplier Inventories b 70,732 68,848 56,455 48,147 48,653 39,850 37,544 28,959 Natural Uranium 35,030 29,468 12,616 9,192 W W W W Enriched Uranium a,d 35,702 39,380 43,839 38,955 W W W W Total Commercial Inventories
136,491 127,097 111,258 103,783 102,114 85,489 95,209 93,770
DOE-owned Inventories c 24,454 53,054 53,054 53,054 51,789 N/A N/A 134,900 a. Includes amounts reported as inventories of enriched UF6 at enrichment suppliers (1998–2001). b. Includes inventories owned by the 1998 privatized USEC, Inc. (United States Enrichment Corporation). c. DOE-owned inventories reported by the U.S. Department of Energy. Variations during this period largely reflect changes in DOE
classification of excess materials, rather than disbursement or acquisition of uranium. d. Enriched UF6 and fabricated fuel not inserted into a reactor (2002–2005). P = Preliminary data. Final 2004 inventory data reported in the 2005 survey. W = Data withheld to avoid disclosure. Note: Totals may not equal sum of components because of independent rounding. Source unless otherwise noted: Energy Information Administration, Form EIA-858, “Uranium Industry Annual Survey;” Energy Information Administration, Form EIA-858 "Uranium Marketing Annual Survey" (2003–2006).
A-4.5 Market Price for Uranium The market price (and essentially the effective cost to the utilities) is driven by a number of key
factors as follows:
Uranium Demand. Demand must consider the amount of nuclear fuel to be delivered over a given period. Relative to the nuclear market, demand is driven by the projections for economic growth driving need for power as well as the role of nuclear power in meeting the demand. Such demand can be driven by other than electricity such as a significant growth in hydrogen demand or major desalination programs. Of course, the most significant factor is the projected growth in developing nations, which will greatly influence the worldwide demand for energy. Because of such a broad range of uncertainties, demand is normally considered over a wide range of demand scenarios. Current worldwide demand requires about 68,000 MT of uranium from mines or the equivalent from stockpiles.
Supply Factors. Supply can be considered in terms of primary and secondary supplies. In the next several decades, supply will continue to be strongly influenced by the use of secondary supplies. At the beginning of this century, 42% of the worldwide demand was met by use of secondary supplies creating a buyers market and reducing the economic attractiveness of exploring for and developing new primary supplies. However, such supplies are being reduced and are under a scenario of growth of nuclear power, the gap between overall demand and that provided by secondary supply will grow, creating a stronger demand for primary supplies in the longer term.

INL/EXT-07-12107 (March 2008) Advanced Fuel Cycle Cost Basis A-17
A-4.6 Secondary Supplies Existing Inventories. Inventories of natural uranium and LEU are currently owned by uranium
suppliers, United States Enrichment Corporation (USEC), utilities, and DOE. Other nations, especially Russia, also have significant inventories. Depending on short-term needs and opportunity for profit, such inventories are released into the market place (at or near market price).
Highly Enriched Uranium (HEU). Following the cold war, the United States and Russia declared large quantities of HEU and plutonium as surplus for national defense purposes (see Module C2 for details and implementation of the agreement). While other nations such as China, France, and the United Kingdom have similar materials, the market impact is basically dominated and controlled by agreement between the U.S. and Russia, who are believed to hold over 95% of the HEU stocks dedicated to nuclear weapons. In 1993, an agreement was made with Russia that 500 tonnes of Russian HEU would be converted to roughly 150,000 tonnes of LEU over a 20-year period to be used in the U.S. market. Such an amount represents roughly 50% of the U.S. utilities requirements during this period. Basically, USEC exchanges natural uranium for down-blended LEU, effectively contracting Russia (Tenex) for the cost of enrichment. The LEU is sold through USEC and a consortium of three Western companies (Cameco, Cogema, and RWE Nukem). The equivalent natural uranium feed is returned to the Russians, who can sell it or return it to Russia. In the U.S., DOE programs plan to down-blend an additional 145 tonnes of HEU for commercialization.
MOX Use. Although not currently used by the U.S. market, the world demand for uranium is influenced by the amount of plutonium/uranium MOX fuel that is to be used as the energy content of the plutonium replaces the demand for natural uranium. Use of MOX represents less than 4% of the overall equivalent uranium demand. Should U.S. policy be revised to encourage MOX use in the U.S., there would be a small but significant impact as MOX use is increased. The agreement between the U.S. and Russia to disposition surplus plutonium from the weapons programs at this point is not large enough to produce any significant impact in the overall demand.
RepU. Reprocessed uranium can be used as a direct substitution for newly generated uranium in fuel fabrication. As with MOX, the acceptance of RepU will be driven by cost with RepU use increasing as the market price for natural uranium increases. Should MOX use be initiated in the U.S., a potential large source of RepU could be available to meet supply. As an example, approximately 0.94 kg of RepU having about 0.9 w/o 235U content could be recovered from reprocessing one kilogram of current U.S. irradiated fuel. If this RepU were enriched—compensating for 236U by enriching to say 5% versus about 4.2% for present-day PWR LEU fuel—with tails taken to 0.2 w/o 235U, it could produce 0.15 kg of fuel worth approximately equivalent to that of PWR LEU fuel. Such a U.S. source has not been considered in any supply or cost projections to this point because reprocessing is not within current U.S. policy, and the U.S. is decades away from implementation. Reactor operation will also impact the economics as deeper burn fuels have less value relative to remaining fissile uranium content. Nonetheless, if nuclear fuel reprocessing does become a reality, primary uranium prices remain high, and suitable enrichment capacity is available, a policy of sustained single recycle of RepU could reduce domestic primary uranium demand by 15% or more.
Depleted Uranium (DU). In the enrichment process for nuclear fuel for each kilogram of enriched uranium produced, an average of 8 kg of depleted uranium (enrichment tails) is also produced. Some reenrichment of tails is being used in Russia to recover fissile uranium because a surplus of low cost enrichment capacity currently exists, but it is not a significant factor versus total world demand. In general, the existence of low cost uranium, as well as the added cost for reenrichment, results in DU not being considered to have value as a uranium supply at this time. Because stable storage of the tails is possible, emergence of lower-cost enrichment technologies could result in DU becoming a valuable energy source in the future. However, most projections take no credit for such entry into the market place.

INL/EXT-07-12107 (March 2008) Advanced Fuel Cycle Cost Basis A-18
Other uses to be considered are for HEU or MOX dilution and future fast reactor core blankets. Again, such use is not expected to have any impact on market price. Most studies also assume that tails will remain at 0.3% throughout the demand period, but evolution of technology and uranium pricing could result in driving the tails to lower value trading off the additional cost of separative work units versus the cost of newly mined uranium.
Stockpiles of DU, in the form of uranium hexafluoride (UF6), have been accumulating since the beginning of the nuclear age and the U.S. currently holds 708,189 tonnes of UF6 in storage sites at Peducah, Kentucky and Portsmouth, Ohio. These inventories are far from homogenous and the conditions under which they would become attractive alternatives to mined natural uranium depend on many factors.
The decision of whether to mine fresh uranium, or exploit alternative sources, is largely a matter of which offers the cheaper supply. Depleted uranium stockpiles have a highly variable 235U composition (Table A-10) and will often require additional enrichment beyond what is needed for manufacturing LWR fuel from natural uranium. Because of this, the price of using DU will depend on the costs of enrichment, DU cylinder transport from storage to the enrichment plant, UF6 tails storage, deconversion of UF6 tails to U3O8, and its subsequent disposal.
The table shows the amount of depleted uranium in UF6 from in the US as a function of 235U assay. The UF6 is stored in 58890 cylinders at Paducah, Kentucky and Portsmouth, Ohio. In total there are 708,189 million tonnes of UF6 in the U.S. One MT = 109 kg.
The U.S. Department of Energy currently plans to deconvert stockpiled UF6 to U3O8 for stable storage until final disposal at a cost of $2.80 /kg UF6.
a A limited number of uses for DU exist beyond reenrichment. Depleted uranium can make an ideal matrix for down blending highly enriched uranium from dismantled nuclear weapons and its use for fast reactor blanket material has also been explored.14,15 However, with the exception of shielding applications for spent fuel storage casks, the amount of material required to meet potential needs is small compared to the current supply. This disparity is likely to grow with time, especially if demand for nuclear power increases. Alternatives for DU disposition are discussed in greater detail in Module K.
Table A-10. Assay distribution of US depleted uranium.16 Assay Range (% 235U) # Cylinders MT UF6
0.1250–0.1649 20 149 0.1650–0.2149 16,036 174,137 0.2150–0.2649 15,290 192,883 0.2650–0.3149 10,749 135,056 0.3150–0.3649 12,165 151,952 0.3650–0.4149 1,939 23,989 0.4150–0.4649 861 10,535 0.4650–0.5149 47 425 0.5150–0.5649 97 1,163 0.5650–0.6149 20 94 0.6150–0.6649 31 227 0.6650–0.7149 1,634 17,580
a. Cost estimate based on communication with Uranium Disposition Services, LLC.

INL/EXT-07-12107 (March 2008) Advanced Fuel Cycle Cost Basis A-19
Reduction of Tails Assay. Although not a supply source, the DU tails assay bears mentioning as it is the sole short-term method of introducing demand elasticity available to utilities. Prior to 2000, the prevailing DU tails assay was 0.3 w/o 235U. As the price of uranium has increased, the front-end cost-minimizing tails assay has decreased to perhaps 0.2 w/o 235U. To place this into context, for production of 4.2% enriched fuel the reduction of tails assay from 0.3 to 0.2 w/o would decrease natural uranium requirements by 18%. Hence, its market-driven adjustment can lead to economies of primary uranium consumption similar to those listed above for the various secondary supply sources.
A-4.7 Primary Supplies Newly mined and processed uranium has been divided into four categories for purposes of world
uranium supply projection by the IAEA-NEA.
1. Commonwealth of Independent States, the former Soviet Union
2. National programs
3. Chinese production
4. Market-based production.
The first three are generally perceived as captured production for “in-house” utilization and, therefore, do not have a significant impact on the world market except as avoiding import of world market based supplies. As any of the first three categories develop cost-effective production capacity exceeding demand, they could begin to impact the market price.
Market-based production is simply the difference between the overall demand minus the secondary supplies and the first three primary supplies. As can been seen in Table A-11, the primary producers of uranium are Canada, Australia, Niger, Namibia, and the Commonwealth of Independent States of Russia and Kazakhstan.
The reference data have been collected from actual bottoms-up feedback from industry along with specific country reporting of supply and demand. More recently, data have begun to be withheld as a more competitive market emerges.

INL/EXT-07-12107 (March 2008) Advanced Fuel Cycle Cost Basis A-20
Table A-11. Uranium production figures, 1995−2005. Country/Area 1995 1996 1997 1998 1999 2000 2001 2002 2003 2004 2005
Argentina 65 16 30 7 4 0 0 0 0 0 0Armenia NA NA NA NA NA NA NA NA NA NA NA Australia 1,712 4,975 5,488 4,894 5,984 7,579 7,720 6,854 7,573 8,982 8,980Belgium 25 28 27 15 0 0 0 0 0 0 0Brazil 106 0 0 0 0 11 56 272 230 300 340Bulgaria 0 0 0 0 0 0 0 0 0 0 0Canada 10,473 11,706 12,031 10,922 8,214 10,683 12,522 11,607 10,455 11,597 11,800China 500 560 570 590 700 700 700 730 730 730 730Czech Rep 600 604 603 610 612 507 456 465 452 412 320Finland 0 0 0 0 0 0 0 0 0 0 0France 1,016 930 572 452 416 296 184 18 9 6 3Gabon 652 568 470 725 0 0 0 0 0 0 0Germany 35 39 28 30 29 28 27 221 150 77 80Hungary 210 200 200 10 10 10 10 10 4 4 4India 155 207 207 207 207 207 230 230 230 230 230Japan 0 0 0 0 0 0 0 0 0 0 0Kazakhstan 1630 1210 1090 1270 1560 1870 2114 2822 3327 3719 4175Korea, S NA NA NA NA NA NA NA NA NA NA NA Lithuania NA NA NA NA NA NA NA NA NA NA NA Mexico 0 0 0 0 0 0 0 0 0 0 0Namibia 2016 2447 2905 2780 2690 2715 2239 2333 2037 3039 3000Netherlands NA NA NA NA NA NA NA NA NA NA NA Niger 2974 3329 3487 3714 2907 2914 2919 3080 3157 3245 3400Pakistan 23 23 23 23 23 23 46 38 40 40 40Portugal 18 15 17 19 10 14 4 0 0 Romania 120 105 107 132 89 86 85 90 90 90 90Russia 2160 2605 2580 2530 2610 2760 3090 2850 3073 3280 3275Slovakia NA NA NA NA NA NA NA NA NA NA NA Slovenia 0 0 0 0 0 0 0 0 0 0 0South Africa 1421 1436 1100 965 927 798 878 824 763 747 848Spain 255 255 255 255 255 255 30 37 0 0 0Sweden 0 0 0 0 0 0 0 0 0 0 0Switzerland NA NA NA NA NA NA NA NA NA NA NA UK NA NA NA NA NA NA NA NA NA NA NA Ukraine 1000 1000 1000 1000 1000 1005 750 800 800 800 800United States 2324 2432 2170 1810 1773 1522 1015 902 769 878 835Uzbekistan 1644 1459 1764 1926 2159 2028 1945 1859 1603 2087 2300
Total 31134 36149 36724 34886 32179 36011 37020 36042 35492 40263 41250 NA = not applicable Source: Redbooks, 1995–2005

INL/EXT-07-12107 (March 2008) Advanced Fuel Cycle Cost Basis A-21
A-5. LIMITATIONS OF COST DATA Much of the data is based on speculation and intuitive evaluation of geologic data and speculation
relative to the movement of future power markets versus demand. Many factors including actual cost of recovery, market timing versus production of newly mined uranium, and future regulatory impacts (both positive and negative) will affect the credibility of the information. The data best represent a “speculative supply” to an uncertain demand.
The mining industry is relatively mature but will expand and utilize new techniques as dictated by ability to make profit versus a competitive market.
Most of the data used for analyses have received detailed evaluation and are as good as any speculative approach can be applying engineering judgment.
A-6. COST SUMMARIES The actual price paid for uranium is a combination of long-term contract prices and “spot market”
procurements. While spot market prices are tracked and published and in general the indicators are very close to one another, they do not necessarily indicate the appropriate price to reflect the average uranium sale on the longer-term contracts. Any slight variation of demand or supply has a significant effect on the spot price. The reasons for this are that spot prices represent a snapshot of market conditions at the publication date when quantities are fairly low, trade is somewhat sporadic, and inventory sales may not reflect production cost at all. In terms of quantity, the spot market procurements only represent roughly one-tenth of the demand. The spot market can be viewed as speculative in nature and is driven by short-term impacts rather than real supply/demand interaction. Following the trends of the spot market does provide some insight into market factors as can be seen in Figure A-7.
Constant 2006 U.S. Dollars versus Current U.S. Dollars Spot U3O8 Prices
Figure A-7. U3O8 spot prices.17

INL/EXT-07-12107 (March 2008) Advanced Fuel Cycle Cost Basis A-22
The pricing in the 1990s was dominated by the influx of LEU from down-blend of Russian HEU and reduction of commercial uranium inventories. As part of the privatization of USEC in 1997, the U.S. government provided them with ~70 million pounds of yellow cake, which USEC used to ensure some return for investors. The combination of these three factors reduced the need for newly mined uranium and drove the spot market down. A flood in the largest mine in Canada sparked the sharp upturn in spot market prices in 2003. The mine is now back in production, but the market has yet to respond. Other unforeseeable events have also curtailed primary supply: a 2001 fire at Australia’s Olympic Dam mine reduced production through 2003, weather events substantially curtailed production at mines in Australia and Canada in 2006, and lower than expected ore grades affected production at McClean Lake in Canada in 2006.
Developments on the secondary side of the supply picture also contributed to the upward pressure on prices. In November of 2003, Tenex, citing unfavorable agreement terms, announced that beginning in 2004 that natural uranium from the HEU to LEU arrangement would be returned to Russia and thus would not be available for the Western market. Although this impasse was resolved and LEU deliveries were not interrupted, in 2006 the Russian government indicated that a second HEU deal would not be pursued once the current arrangement expires in 2013. This future loss of up to 9000 tU/year of supply (natural uranium equivalent) sparked a concern about the longer-term supply of newly mined uranium to replace this important source. It is also anticipated that the significant utility and producer inventory drawdowns are complete and the market price will once again begin to respond in relation to a more stable demand including growth scenarios.
The uranium price has increased more than five-fold since January, 2005 (Figure A-8). Market factors are combining with the supply-side effects discussed above to contribute to the ongoing price increase. For example, the activities of hedge funds and speculative investors since 2004 have added substantially—at least 12 million pounds of U3O8—to the demand side of the uranium market.18 In addition, the long-term contract volume has increased significantly from its historical average as utilities have hastened to secure supplies as hedges against further price increases.
Ux U3O8 Prices
Figure A-8. U3O8 spot prices in current dollars, January 2005–May 2007.17

INL/EXT-07-12107 (March 2008) Advanced Fuel Cycle Cost Basis A-23
These developments on the demand side have in fact spurred growth in supply with several uranium mines being reopened in the U.S. for the first time in nearly a decade. Moreover, a large body of quantitative and anecdotal evidence points to a strong worldwide resurgence in uranium prospecting activities. The U.S. Energy Information Administration reports that domestic uranium exploration and development expenditures increased from an average of $5M/year during the 1999–2001 time period to $18.1M in 2005 and $40.1M in 2006. Large exploration expenditure increases are also being seen in Canada and Kazakhstan; the Redbook indicates worldwide exploration expenditures of about $400M in 2005. Given that historically each $3 of exploration expenditures has led to the production of 1-pound U3O8,
19 the current supply tightness may be expected to ease.
It is important to note that it takes some time for a successful prospecting claim to become an operational mine. For mines that opened in 1999–2001, the elapsed time between discovery and commencement of mining was 20 years.21 On the other hand, the corresponding time interval for mines that opened between 1970 and 1980 was under 10 years. While an increased regulatory burden and local public opposition may account for a component of this increase, it is likely that the unfavorable economics—from a seller’s perspective—of the uranium business accounted for many discoveries remaining untapped through the 1990s. Therefore, it is reasonable to claim 10 years as a realistic prospecting-to-production time delay.
Although it is not possible to predict with confidence when, if ever, today’s elevated uranium prices might drop, industry expectations and actions can serve as a useful barometer. In a February 2007, presentation, for example, Exelon Nuclear President Christopher Crane said that “(Exelon believes) recent price increases are not sustainable and the market will correct… we do believe the market will turn before we have to buy significant quantities in 2011 to 2013.” Likewise, a June, 2007 report issued by Lehman Brothers20 forecasted the spot price to peak at $160 - $170 per lb U3O8 in 2009. The Lehman Brothers report predicted a subsequent decline in prices over the following five years to a probable level of about $60 per lb.
The statement by the Exelon president notwithstanding, volumes of uranium contracted by utilities continue to be heavy, at least through 2006. Table A-12 shows that the volume of new contracts secured by reactor owners and operators has not declined even as the price of uranium has risen. However, it is important to note that market prices, especially the spot price, do not always reflect the actual cost of uranium to utilities. While the details of contract terms are confidential, Energy Information Administration (EIA) data makes clear that utilities are paying considerably less for uranium than market prices would imply.
Table A-12. U.S. reactor owner and operator multi-year contract volume (thousand lb U3O8) by date of contract initiation.
Year of Contract Initiation Minimum Volume Contracted for
Delivery Maximum Volume Contracted
for Delivery 2001 49,245 76,158 2002 20,004 29,231 2003 > 33,141a > 36,072a 2004 > 52,038a > 58,207a 2005 > 47,259a > 48,821a 2006 81,466 90,422
a. Some data was withheld by EIA to avoid disclosure of sensitive contractual information. Source: US Energy Information Administration, “Uranium Industry Annual,” 2001-02, and “Uranium Marketing Annual
Report,” 2003-2006.

INL/EXT-07-12107 (March 2008) Advanced Fuel Cycle Cost Basis A-24
Table A-13 reveals that, even in 2006 – a year where the average spot market price was around $40/kg U3O8 – the cost of uranium to utilities averaged less than half of that value. Pricing mechanisms play a role here, but even so spot market prices do affect a significant portion of uranium that is delivered under contract. For instance, Cameco reveals some information on its Web siteb regarding pricing mechanisms utilized by its contractual agreements. Of Cameco’s contracts, 60% are at least partially tied to the spot market price at delivery time, while 40% are fixed, base-escalated or negotiated annually. This figure may be changing with time, though; Table A-13 shows that utilities have responded to higher prices by moving away from contracts that are tied to spot market prices.
Table A-13. US utility annual spot and contract-specified price (dollars unadjusted for inflation) and volume (thousand lb U3O8) of delivered uranium. Spot Market PricingA Contract Specified Pricing Volume Price Volume Price 2000 16,740 8.73 28,563 12.65 2001 17,742 8.42 28,453 11.61 2002 18,591 9.57 25,063 11.15 2003 20,098 10.54 26,755 11.00 2004 14,923 13.77 37,691 12.13 2005 13,615 14.65 42,114 14.42 2006 9,523 18.04 41,164 18.18 a. Spot-market pricing includes contracts with pricing mechanisms tied to spot market prices at time of delivery. Source: US Energy Information Administration, “Uranium Industry Annual,” 2001-02, and “Uranium Marketing Annual
Report,” 2003-2006.
It is important to differentiate short-term pressures from the longer-term picture with which this review is chiefly concerned. More recent trends anticipating a renaissance in nuclear energy have not only spurred new interests in uranium supply, but also introduced new factors into the market not seen in the recent past. A growing number of environmental groups have begun to openly recognize the benefit of nuclear power relative to potential global warming, which results from the related greenhouse gas release from alternative energy supplies. The absolute magnitude of potential energy growth worldwide has also been recognized and society is seeing a clearer vision of the need to provide cleaner, more efficient energy sources. The political arena is filled with activity in support of the need for a substantial growth in nuclear power. In the U.S., administration programs, such as Nuclear Power 2010, have been established to help encourage commitment to and construction of the first new reactors to be built in the U.S. in nearly 30 years. Utilities across the U.S. have begun to float press releases about future reactors and locations. New relationships are being built among the nations using nuclear power. The U.S. and India have recently announced joint cooperation for the civilian nuclear energy field. In March of 2006, DOE announced a new Global Nuclear Energy Partnership venture whose objective is to support safe, nonproliferable growth of nuclear energy throughout the world. With new reactors being built throughout the world, companies look to secure their longer-term supplies with nearly three times the activity in this term market versus the last 10 years. As a result of all this interest, investors and hedge funds have become quite active in the uranium market. Such investors represented over 25% of the sport market in 2005. The net result in increased purchases, both speculative and long-term contracts, resulted in a steep increase in price, which directly increases interest in the supply field.
b. http://www.cameco.com/

INL/EXT-07-12107 (March 2008) Advanced Fuel Cycle Cost Basis A-25
A-6.1 Natural Uranium Production Cost and Price The pricing market is far from disciplined or mature; companies and countries have chosen not to
share any long-term contract pricing information. As a result, many of the indices stopped reporting uranium prices in 2002, and some have even withdrawn previously published data. Using published data such as spot market prices to form conclusions for the future does not appear to have a solid basis.
Estimates of future pricing often ignore uranium resource replacement via new exploration. As a result, long-term supply-demand analyses tend to have a pessimistic bias (i.e., toward scarcity and higher prices) that typically will not reflect reality. New exploration cycles may drive up uranium prices in the short term. However, this exploration should be expected to add uranium resources to the world inventory. To the extent that some of these resources may be of higher quality and involve lower operating cost than resources previously identified, this will tend to mitigate price increases. This is precisely what has happened in Canada, as the low-cost discoveries in the Athabasca Basin have displaced higher-cost production from many other regions, lowering the cost curve and contributing to lower prices. Secondary uranium supplies, to the extent that they can be considered as a very low-cost mine, have simply extended this price trend. Likewise, existing estimates generally neglect advances in extraction technologies and other factors affecting productivity per mineworker. For instance, in 1980 combined employment in the U.S., Canadian, and Australian uranium extraction industries was 26,520 persons; in 2005 employment stood at 1824 individuals.21 The corresponding annual production figures are 25,511 tU in 1980 and 21,615 tU in 2005. Hence, to a first approximation, productivity stood at 0.96 tU/person/year in 1980 and 11.85 tU/person/year in 2005. Evidently, labor inputs to uranium mining have decreased significantly.
The following summary reflects current information that appears valid for use in economic modeling for Advanced Fuel Cycle Initiative fuel cycle analyses.
Specific Exploration, Mining, and Milling Cost Data. Such data have not been supplied because the U.S. had only three operating in situ leach operations at the end of 2002, and they were all foreign ownership. Such data are not believed useful relative to uncertainties in future supply and degree of difficulty to use such resources. The huge uranium reserves of Canada’s Athabasca Basin were discovered for about U.S.$70/kg (2003 dollars, including unsuccessful exploration). It has been suggested that finding costs for uranium can be estimated as low as 2% of the spot price. On the high side, extrapolation of past exploration costs suggests costs as high as $1.80/kg (2005 U.S. dollars). In any case, it is small fraction of the cost to produce the yellow cake product.
Supply and Demand Data. The data available through the DOE-EIA, the IAEA, and OECD/NEA have a reasonable degree of consistency relative to reserves, supply, and demand data. Most other references use that data.
Uranium Price Data. Ux Consulting and NUEXCO have Web sites that maintain “real-time” published values for spot market pricing.
Future Price Evaluation. No published sources were discovered with predictions of future uranium price. The IAEA-NEA study, Uranium Supply to 2050, provides the best source of speculative data relative to likely price ranges for newly produced uranium versus a broad range of demand scenarios.3 Such data could be plotted and assumed to have linear growth to provide a speculative cost value for a dynamic model. Studies by Massachusetts Institute of Technology and Harvard used uranium values ranging from $30−$50/kgU ($11.53−$19.20/lb U3O8). Based on the reserves listed and the influence of secondary supplies, it would appear that uranium prices would fall well within the projections of the IAEA.

INL/EXT-07-12107 (March 2008) Advanced Fuel Cycle Cost Basis A-26
However, the excitement over potential growth certainly has sparked a short-term growth in the price of uranium with the spot pricing reaching over $335/kgU ($130/lb U3O8) by June 2007. An energetic growth in nuclear power could create a temporary lag in supply driving prices up, but that would spark more interest in supply, again bringing high prices to a reasonable market level. The reasonable market level will be influenced by policy, actual growth in nuclear power capacity, and both the timing as well as the relative cost of producing new supplies.
It is necessary to choose a distribution that can reasonably be expected to depict the likely average uranium price over the next century. Forecasts are rarely attempted over such extended periods for any mineral, and market-driven uranium price data itself has only a 40-year history. Indeed, many of the concerns discussed in preceding subsections of this report are applicable to short and medium-term prices and will have little if any bearing on long-term price trends. Nonetheless, given that uranium is a mineral with ore deposit phenomenology similar to that of other minerals and that the abundance of uranium in the earth’s crust is not exceptionally low or very high as compared to other minerals of economic importance, it is reasonable to draw an analogy between the price evolutions of uranium and other minerals.
The United States Geological Survey maintains a database22 of commodity prices tabulated in constant year 2005 dollars. For many minerals the data extends back to the year 1900. Many of the price histories show a gradual decline in price—regardless of the level of mining—punctuated by occasional upward and downward excursions. Some of the minerals show an upward price trend over the past century.
It is assumed that the price of uranium over the next century will continue to evolve in a manner that is not exceptional when compared to that of the USGS-tracked minerals over the past century. Therefore, to create a distribution that describes the probable average uranium price over the 21st century, the following procedure was developed.
Thirty-five minerals were selected. Those commodities in the USGS database that were omitted (e.g., peat, wood, helium and cement) were clearly not analogous to uranium and other minerals. For each mineral, the time series data was regressed onto the function:
P = C * eMt
where
P = price (2005 dollars per tonne)
t = year
C and M = regression coefficients.
The data series and regression results for four minerals are depicted in Figure A-9. A similar analysis of historical USGS data has recently been published.23
The coefficient M is interpreted as a price growth rate with respect to time. Minerals with negative M-values have experienced declining prices; for those with positive M-values, the price has increased over the past century. Table A-14 gives the M-values obtained for all 35 minerals. The M-coefficients for six of the minerals were positive, while 29 were negative.

INL/EXT-07-12107 (March 2008) Advanced Fuel Cycle Cost Basis A-27
Figure A-9. 100-year price trends for four minerals.
Table A-14. Regression M-coefficients for 35 minerals.
The distribution of M-values was then itself subjected to statistical analysis. A normal distribution was assumed and the mean and standard deviation of the distribution were calculated. Table A-15 shows that the mean value was negative: -0.0118. This implies a decrease in average mineral prices with time.c c. This phenomenon is well-known: witness the famous 1980 wager between the economist Julian Simon and Stanford biologist Paul Ehrlich. Simon and Ehrlich wagered $1000 against the price of a basket of five commodities chosen by Ehrlich, an early proponent of scarcity theory. Ehrlich ‘bought’ the basket in 1980, and Simon agreed to purchase the basket from Ehrlich in 1990 regardless of its price. The price of the basket fell considerably and Simon made a profit of $570.07 from the wager.
Aluminum Antimony Arsenic Bauxite Beryllium Bismuth Boron Bromine-0.0204 0.0014 -0.0087 -0.0074 -0.0186 -0.0210 -0.0015 -0.0283
Cadmium Chromium Cobalt Copper Germanium Gypsum Indium Iodine-0.0243 0.0077 -0.0049 -0.0064 -0.0212 0.0041 -0.0407 -0.0153
Iron Ore Lead Lithium Magnesium Manganese Mercury Molybdenum Nickel0.0029 -0.0052 -0.0254 -0.0232 0.0033 -0.0124 -0.0075 -0.0043
Platinum Pumice Rhenium Silver Tantalum Thorium Tin Titanium-0.0046 -0.0139 -0.0499 -0.0013 -0.0059 -0.0046 0.0013 -0.0395
Tungsten Vanadium Zinc-0.0019 -0.0121 -0.0038

INL/EXT-07-12107 (March 2008) Advanced Fuel Cycle Cost Basis A-28
The standard deviation was computed to be 0.0136, which implies about a 20% probability that the M-value for any given mineral will in fact be positive. The 95% confidence interval for M—computed by calculating the interval falling within two standard deviations of the mean—is thus found to be (-0.0390, +0.0153).
Table A-15. Statistical distribution of the 35 M-coefficients. Most Negative Rhenium, -0.0499 Most Positive Chromium, 0.0077 Mean -0.0118 Standard Deviation 0.0136 Two Standard Deviation Confidence Interval (-0.0390, +0.0153)
Accepting that future uranium price trends should not diverge from the experience of the past century,
the mean M-value and its confidence interval can be used to make a very approximate projection of uranium price evolution over this century. To do so, one must first select a starting point for the uranium price that roughly corresponds to a long-term average value. This was chosen to be $100/kgU ($40/lb U3O8) which corresponds closely to the historical average uranium price over the past 50 years (viz. Figure A-7). Although contract prices at the time of delivery have historically averaged somewhat less than $100/kgU, Table A-13 indicates that a convergence between prices paid by utilities under a variety of pricing mechanisms is taking place. Likewise, recent estimates20,24,d of marginal production costs and prices indicate that $40/lb U3O8 is a reasonable estimate of the equilibrium price in the medium term. Beginning from this price in 2005, then, price evolutions corresponding to the mean and upper and lower confidence interval boundary M-values were computed and plotted. A time-averaged uranium price for this century was computed for each of the three evolutions. The results are shown in Figure A-10.
0
50
100
150
200
250
300
350
2005 2015 2025 2035 2045 2055 2065 2075Year
Pric
e [$
/ kg
U]
M = -0.0390 (2 SD below Mean)
M = -0.0118 (Mean)
M = +0.0153 (2 SD Above Mean)
21st Century Average =$25/kgU
21st Century Average = $60/kgU
21st Century Average = $240/kgU
Figure A-10. Upper bound, most probable, and lower bound uranium price forecasts obtained from USGS data.
d. This discussion, based upon a study of mine production costs conducted by International Nuclear, Inc., indicates that at production levels corresponding to expected demand in 2015, marginal production costs should be around $20/lbU3O8.

INL/EXT-07-12107 (March 2008) Advanced Fuel Cycle Cost Basis A-29
Therefore, a price distribution having lower, most likely, and upper values of $25, $60, and $240/kgU was obtained. A logical alternate upper bound would be set by the cost of uranium extraction from seawater; however, since that cost has not been credibly estimated at less than $300/kgU,25 the upper bound of $240/kgU was allowed to stand. Although the true shape of the distribution derived here is lognormal, for reasons of simplicity a triangular distribution with vertices at $25, $60, and $240 is recommended.e
It is recognized that a case for the “exceptionalism” of uranium may be made in view of its lack of natural substitutes. This case is difficult to refute or confirm in the absence of more detailed study of the role played by substitution in other mineral commodity prices. In any case, the observation made above—that the price of a basket of minerals declines with time—remains true if the independent variable is changed from time to the cumulative quantity of that mineral extracted from the ground.23 In other words, a significant increase in extraction rates does not cause an irreversible price increase. Therefore, the price projection derived above is expected, to first order, to be applicable for both lower and higher nuclear growth scenarios.
Other similarities and differences between uranium and many other minerals may be briefly summarized. As mentioned above, the overall abundance of uranium is middling in comparison to that of other minerals. Certain types of uranium are also abundant in minerals like silver, copper, gold, and iron, making co-extraction of these minerals worthwhile. Examples include hematite-granite complex deposits such as Olympic Dam, uranium-vanadium deposits such as found on the Colorado Plateau, and solution breccia pipe-type deposits which can additionally contain economically viable zinc and lead sulfides. The in-situ leaching technique, predominantly used for the extraction of uranium from sandstone roll-front deposits, has thus far played a considerably more significant role in the uranium extraction industry than for most other minerals. It has grown to account for about 20% of world uranium production and 80% in the U.S. but is not used at all for the vast majority of minerals depicted in Table A-14. Most uranium mining is still carried out using open-pit and underground approaches, however, so advances in these areas would continue to benefit the uranium industry as well as the broader mining sector. In general, leaving in-situ leaching aside, the concentration factor at which uranium extraction is economically feasible is consistent with that of other minerals. The concentration factor is defined as the ore grade of an economically viable deposit divided by the average grade in the earth’s crust. For uranium, taking 500 ppm to be a viable concentration, the concentration factor is (500/2.8) = 180. Other common minerals have concentration factor thresholds bracketing this value: gold, 2,500; iron, 10; mercury, 10,000; lead, 2,500; copper, 100.26
The module cost information is summarized in the What-It-Takes (WIT) cost summary in Table A-16. The summary shows the reference cost basis (constant year U.S. dollars), the reference basis cost contingency (if known), the cost analyst’s judgment of the potential upsides (low end of cost range) and downsides (high end of cost range) based on references and qualitative factors, and selected nominal costs (judgment of the expected costs based on the references, contingency factors, upsides, and downsides). These costs are subject to change and are updated as additional reference information is collected and evaluated, and as a result of sensitivity and uncertainty analysis. Refer to Section 2.6 in the main section of this report for additional details on the cost estimation approach used to construct the WIT table.
The triangular distribution based on the costs in the WIT table is shown in Figure A-11. Note that the mean cost associated with this skewed distribution is $108/kgU. See Section A-6.1 for explanation. e. It is recognized that this methodology for projecting uranium price trends differs from the approach taken in for other Modules of this document where existing literature was sufficient to formulate an estimate. To confirm that our approach is reasonable, we have undertaken a peer review process that includes a consultation with fuel cycle experts at the Nuclear Energy Institute and publication and presentation in professional society venues. Regardless, given a system as complex as the uranium market we recognize the impossibility of true high-fidelity forecasting of long-term behavior.

INL/EXT-07-12107 (March 2008) Advanced Fuel Cycle Cost Basis A-30
Table A-16. Cost summary table. What-It-Takes (WIT) Table
Reference Cost(s) Based on Reference
Capacity
Reference Cost Contingency
(+/- %) Upsides
(Low Cost) Downsides (High Cost)
Selected Values (Nominal Cost)
$50−300/kgU NA $25/kgU $240/kgUf $60/kgU Reflects near-term (next 10−15 years)
Module A Uranium Mining & MillingEstimated Cost Frequency Distribution
$/kgU (U3O8)
Freq
uenc
y
Low Nominal Mean High
$25 $60 $133 $240
Figure A-11. Uranium mining & milling estimated cost frequency distribution.
A-7. RESULTS FROM SENSITIVITY AND UNCERTAINTY ANALYSIS Uranium Cost Sensitivity. The cost of uranium represents about 20% of the cost of fuel. A doubling
of the ore price has little sensitivity in terms of the total fuel cycle cost. The sensitivity from a $150/kgU increase in price is in the range of ~1 mil/kWh relative to the cost of electricity.
Implication of expanding use of secondary sources of uranium and growth in price of natural uranium can become the driver for enhancements and capacity growth for new enrichment technologies and consideration for expanded use of existing tails and reprocessed uranium. With laser enrichment, or if the present high prices are sustained, even depleted uranium could be considered for cost-effective supply.
f. The authors recognize that uranium and enrichment spot prices have recently exceeded the high-cost range provided in this cost basis. These price trends continue to be evaluated and the cost ranges in the report may continue to be revised as appropriate in future updates. The cost basis reflects reasonable expectations about uranium and enrichment long-term contract prices applicable to reactors with long operating lives, rather than reflecting market spikes as experienced in the 1970s and observed in the spot market U3O8 prices circa 2007.

INL/EXT-07-12107 (March 2008) Advanced Fuel Cycle Cost Basis A-31
A-8. REFERENCES 1. OECD Nuclear Energy Agency, Uranium 2005: Resources, Production and Demand (also known as
The Red Book), OECD/NEA-IAEA: Paris 2006.
2. U.S. Department of Energy, Energy Information Administration, Uranium Industry Annual⎯2005, Office of Coal, Nuclear, Electric and Alternate Fuels, U.S. Department of Energy, http://www.eia.doe.gov/fuelnuclear.htm, Web page accessed June 18, 2007.
3. International Energy Agency, Analysis of Uranium Supply to 2050, http://www-pub.iaea.org/MTCD/publications/PDF/Pub1104_scr.pdf, Web page accessed June 18, 2007.
4. Uranium Information Centre, “Supply of Uranium,” Nuclear Issues Briefing Paper #75, www.uic.com.au/nip75.htm, Web page accessed November 30, 2005.
5. Global InfoMine, Inc., “Olympic Dam MineSite Feature,” http://olympicdam.infomine.com, November 15, 2005, Web page accessed April 29, 2007.
6. Peter Diehl and Am Schwedenteich, World Information Service on Energy, Uranium Project Web Site general information, www.wise-uranium.org, December 22, 2005, Web page accessed January 25, 2006.
7. R. Cochran and N. Tsoulfanidis, The Nuclear Fuel Cycle: Analysis and Management, 2nd Edition, American Nuclear Society, 1999.
8. Environmental Protection Agency, “Extraction and Benefication of Ores and Minerals: Volume 5, Uranium,” EPA 530-R-94-032, 1995.
9. World Nuclear Association, Information, and Issue Brief, “Supply of Uranium,” September 2005, www.world-nuclear.org/info/inf75.htm, Web page accessed November 30, 2005.
10. E. A. Schneider, “A Survey of Uranium Supply Curve Estimates,” in Trans. Am. Nucl. Soc., 92, San Diego, CA, June 2005.
11. K. S. Deffeyes and I. D. MacGregor, “World Uranium Resources,” Scientific American, 242, 66-76, January 1980.
12. Wise Uranium Project, “Recovery of Uranium from Phosphates,” http://www.wise-uranium.org/purec.html, Web page accessed July 13, 2007.
13. United States Department of Energy, “Proposed Long-Term Uranium Sales Strategy,” DOE Offices of Nuclear Energy, Environmental Management and Defense Nuclear Nonproliferation, http://www.ne.doe.gov/pdfFiles/proposedDoeLtUraniumSalesStrategyIndustryPresentationAug%204th2006.pdf, August 4, 2006, Web page accessed May 15, 2007.
14. P. Diehl, Re-enrichment of West European depleted urnanium tails in Russia. WISE Uranium Project, 2004.
15. T. J. Hertzler and D. D. Nishimoto, Depleted Uranium Management Alternatives. Idaho National Engineering Laboratory, Idaho Falls, ID. EGG-MS-11416, 1994.
16. United States Department of Energy, “UF6 Cylinder Information Database,” updated December 2006.
17. The Ux Consulting Company, LLC, http://www.uxc.com, Web page accessed July 19, 2007.
18. J. Steyn, “Will Supply Suffice?” Nuclear Engineering International, September 2006.

INL/EXT-07-12107 (March 2008) Advanced Fuel Cycle Cost Basis A-32
19. T. Pool, 2005 Global Uranium Symposium, in Steyn, 2006.
20. Lehman Brothers, Inc., “Uranium Price Outlook,” 2007 Edition, cited in Nuclear Fuel Cycle Monitor, June, 2007.
21. OECD Nuclear Energy Agency, Forty Years of Uranium Resources, Production and Demand in Perspective: the Redbook Retrospective, OECD/NEA: Paris, 2006.
22. T. Kelly et al., Historical Statistics for Mineral and Material Commodities in the United States, USGS Data Series 140, http://minerals.usgs.gov/ds/2005/140/, 2007, Web page accessed May 15, 2007.
23. E. Schneider and W. Sailor, “Nuclear Fission,” Science and Global Security 14, 183–211, December 2006.
24. Uranium Information Centre, “Uranium Markets,” Nuclear Issues Briefing Paper 36, March 2007, http://www.uic.com.au/nip36.htm, Web page accessed May 15, 2007.
25. United States Department of Energy, “Generation IV Roadmap: Report of the Fuel Cycle Crosscut Group,” U.S. DOE Report, March 2002.
26. W. R. Griffits, U.S. Geological Survey Professional Paper 820, 1973.

INL/EXT-07-12107 (March 2008) Advanced Fuel Cycle Cost Basis B-1
Module B
Conversion

INL/EXT-07-12107 (March 2008) Advanced Fuel Cycle Cost Basis B-2

INL/EXT-07-12107 (March 2008) Advanced Fuel Cycle Cost Basis B-3
Module B
Conversion
B-1. BASIC INFORMATION Module B discusses the step in the nuclear fuel cycle where the mined U3O8 concentrate is further
purified and converted to a uranium hexafluoride (UF6) solid in cylinders for feed to a uranium enrichment plant.1 It involves receipt of feed stock, chemical operations, and shipment of cylinders.
Conversion of the U3O8 yellow cake to UF6 is driven basically by the need for purified uranium to enrich for fuel fabrication. The current U.S. annual demand for conversion is approximately 22,000 MTU. Worldwide, the demand for conversion is approximately 64,500 MTU per year, excluding Pakistan, India, and China. The major suppliers of conversion capability are BNFL (United Kingdom), Cameco (Canada), Comurhex (France), ConverDyn (U.S.), and Minatom (Russia). The Russian capacity is utilized internally and not available for export at this time.
The U.S. capacity resides in only one facility, Honeywell Specialty Chemicals, located in Metropolis, Illinois. The nominal 14,000 MTU/yr capacity is marketed by ConverDyn, a joint venture of Honeywell International and General Atomics. Because the U.S. demand of approximately 22,000 MTU/yr exceeds supply, the U.S. uses both domestic and foreign sources of conversion services. This facility has been in service since 1959. A second conversion facility, the Sequoyah Fuels Corporation plant, was operated by General Atomics and located in Gore, Oklahoma. However, following numerous safety and environmental challenges, it was shut down in 1992 and is now undergoing decommissioning.
The cost of conversion represents only approximately 4% of the overall cost of fuel manufacture and is representative of a competitive market relative to cost of operations. Conversion cost is typically reported in U.S. dollars/kgU in the UF6 product and includes related transportation costs to the enrichment plant.
B-2. DEFINE FUNCTIONAL AND OPERATIONAL DESCRIPTION Following formation of the U3O8 “yellow cake” at the mill, the uranium must be further purified and
enriched as necessary for use as a reactor fuel. The chemical and physical form of the conversion product depends on the subsequent use of the product. If enrichment is not required, the yellow cake can be processed directly to UO2 for fuel fabrication. In the more common case, enrichment of the 235U is desired, and the yellow cake is converted to a purified UF6 gas suitable for subsequent enrichment operations. The “conversion” to UF6 is achieved using either a wet or dry chemical process.
The basic steps of a dry process are as follows. The yellow cake is ground into a fine powder and fed into a fluidized bed reactor at 1,000–1,200°F where it is reduced by hydrogen and emerges as uranium dioxide (UO2). The crude UO2 is passed through two successive hydrofluorination fluidized bed reactors, where interaction occurs with anhydrous hydrogen fluoride (HF) at a temperature of 900–1,000°F. Uranium tetrafluoride (UF4), a green salt, is formed which is a nonvolatile solid with a very high melting point. The UF4 is treated at high temperatures with fluorine gas to form UF6 gas. Volatile impurities are removed at several steps in this process, leaving a uranium product that is at least 99.95% pure (see Figure B-1).

INL/EXT-07-12107 (March 2008) Advanced Fuel Cycle Cost Basis B-4
Figure B-1. Simplified flow chart of the dry hydrofluorination process to convert U3O8 to UF6.
The basic steps of a wet process are similar to the dry process, but the yellow cake is initially dissolved in nitric acid and goes through a solvent extraction process to remove impurities. The extraction is followed by the hydrogen-reducing furnace as well as the hydrofluorination and the fluorination steps to again produce a very pure UF6 gas (see Figure B-2).
With both processes, the UF6 gas is distilled to remove the light fraction gases, pressurized, and cooled into a liquid. In the liquid state, it is drained into 14-ton mild steel cylinders where it solidifies after cooling for approximately 5 days. The UF6 is a solid at room temperatures, which makes it easy to handle and ship. At a slightly elevated temperature above the triple point (~147°F), it becomes a gas, which makes it ideal for current enrichment technologies. As future enrichment technologies develop, the needed chemical and physical form of the conversion product could change. 2 Physical losses are small (<0.5%).

INL/EXT-07-12107 (March 2008) Advanced Fuel Cycle Cost Basis B-5
Figure B-2. Flow chart of the wet solvent extraction-fluorination process to convert U3O8 to UF6.
B-3. PICTURES/SCHEMATICS Cameco is an integrated uranium fuel supplier with fuel services facilities (conversion and fuel
fabrication) at Port Hope, located in Ontario, Canada. (The company’s Port Hope conversion services plants chemically change the form of the [UO3] to either uranium hexafluoride [UF6] or uranium dioxide [UO2]). During 2006, Cameco became a nuclear fuel manufacturer by acquiring Zircatec Precision Industries, Inc. (Zircatec) in Port Hope. Zircatec manufactures fuel bundles for use in Canada deuterium uranium (CANDU) reactors. Pictures of the conversion facility are shown in Figures B-3 and B-4. A loaded UF6 cylinder is shown in Figure B-5.

INL/EXT-07-12107 (March 2008) Advanced Fuel Cycle Cost Basis B-6
Figure B-3. Port Hope Conversion and Fuel Fabrication Plant (Cameco) in Ontario, Canada.
Figure B-4. Port Hope conversion facility.
Figure B-5. Loaded UF6 cylinder at Port Hope.
B-4. MODULE INTERFACE DEFINITION The need for conversion services is highly dependent on Modules A, C1, C2, D1, F2/D2, and K,
which essentially define the supply and demand relationship. Raw uranium pricing impacts the source uranium cost of conversion. The availability of mixed oxide, reprocessed uranium, and/or blend down of highly enriched uranium (HEU) impacts demand for enrichment services from UF6. Timing of fuel fabrication also impacts the need for conversion services. In addition to real time feed and product needs,

INL/EXT-07-12107 (March 2008) Advanced Fuel Cycle Cost Basis B-7
decisions relative to inventory levels along the front-end of the fuel cycle will have impact on this conversion module.
The key dependencies on supply and demand as impact costs are discussed in the following subsections.
B-4.1 Supply and Demand The United States has only one operating plant for uranium conversion services. The plant,
Honeywell Specialty Chemicals is located in Metropolis, Illinois, across the Ohio River from the Paducah, Kentucky, enrichment plant. It is owned by Honeywell International Corporation, based in Minneapolis, Minnesota. ConverDyn, a general partnership created by affiliates of Honeywell and General Atomics, markets the UF6 conversion services, a key step in the nuclear fuel cycle, to the worldwide electric utility industry.3 An upgrade completed in 2001 increased the nominal capacity of the facility from 12,700 MTU per year to its present level of 14,000 MTU per year. It uses the dry fluoride volatility process described above. On May 15, 2007, ConverDyn received a license from the U.S. Nuclear Regulatory Commission to continue operating the Metropolis Works through 2017.
Table B-1 shows the worldwide commercial-scale capacity as reported by The Ux Consulting Company, LLC for UF6 product,3 The information is current because no new capacity has been added in the last 5 years. ConverDyn appears to be considering adding capacity at Metropolis Works; Jim Graham, ConverDyn’s president and CEO was quoted in 2004 as saying that the company was considering adding 5,000 MTU/year of capacity around 2010.4 However, given that the company has issued no official statements to this effect, it must be assumed that such a move, at most, is still in the planning stages.
Table B-1. World conversion nameplate capacity.a
Company (Country)
Nameplate Capacity Million kgU
(as of December 31, 2000) BNFL (UK) 6.0 Cameco (Canada) 12.5* CNNC (China) 1.0 Comurhex (France) 14.0 ConverDyn (USA) 14.0 IPEN (Brazil) 0.1 Minatom (Russia) 22.0 Total 69.6 *Additional Cameco capacity includes 2,800 tonnes per year of UO2 and 2,000 tonnes as metal. a. Updated September 20, 2005. Frequency: Annually.
The Russian conversion plants are tightly integrated to their enrichment plants and do not export their
product on the Western market. On February 9, 2001, BNFL announced their intent to halt UF6 production in 2006 and had ceased marketing of UF6 conversion services. However, in March 2005, a 10-year agreement was reached between Cameco and BNFL to acquire uranium conversion services at a base quantity of 5 million kg of uranium (UO3) to UF6 per year for the duration of the contract. Discounting Russia, the world demand is essentially filled by the U.S., French, and Canadian plants. While the capacity of these Western suppliers is adequate in the short term, there is obviously uncertainty

INL/EXT-07-12107 (March 2008) Advanced Fuel Cycle Cost Basis B-8
about future adequacy when the primary uranium supply begins to increase as is suggested by projected growth in nuclear power.2
Obviously new conversion capability will be required although there has not been a new commercial facility for UF6 production built since 1984. That has been because the availability of secondary supplies of uranium, such as HEU blend-down and mixed oxide, has filled the difference between supply and demand for uranium to produce reactor fuel. Unlike facilities in Russia, the U.S. conversion facilities did not have the capability to convert HEU metal or oxide into UF6. The U.S. converts the HEU into uranyl nitrate hexahydrate (UNH) with the blended UNH going to fuel fabricators where it is converted to uranium oxide powder. Whether there will be new capacity built or expansion of existing capacities will be driven by market analysis. However, there does not appear to be a new technology in the horizon that will have a significant impact on the cost of conversion, and thus, new capacity is a matter of providing supply to meet the market demand.
Plans for new conversion plants in France, Kazakhstan, and Australia have been announced. In May 2007, AREVA declared the launch of a 15,000 MTU facility, Comurhex II, to be built at Malvesi, the site of its existing 14,500 MTU plant. Comurhex II, slated to open in 2012 at a cost of $820M, could be increased in capacity to up to 21,000 MTU/year if demand increases.5 It is unclear if or when Comurhex’s existing facility would be retired. Also in May 2007, Cameco and the Kazakh state-owned nuclear fuel corporation, Kazatomprom, signed a memorandum of understanding to study the feasibility of constructing a conversion plant at or near the site of the Inkai mine. This proposed facility, like the Inkai mine itself, would be a joint venture between the two firms.6 No concrete information as to the potential capacity of this facility was available. Discussions in Australia regarding construction of conversion as well as enrichment capacity have not, as of July 2007, moved past the study phase. A report prepared by the firm Nuclear Fuel Australia Ltd. (NFAL) envisaged a conversion facility supplying UF6 to a co-located 3 million SWU/year enrichment plant. Construction was proposed to begin in 2010 with the plants becoming operational in 2015. NFAL estimated the costs of these facilities at $420M (U.S.) for the conversion plant and $1.68B for the enrichment facility.7
Figure B-6 indicates the relationship of the various types of equivalent UF6 supply relative to the projected source. The graph implies growth in capacity in those areas of the world where demand is expected to grow the most. Note that Figure B-6 does not reflect the very recent developments described above; if all of these came to fruition and no existing capacity were retired, a considerable oversupply of conversion services could exist over the medium term.

INL/EXT-07-12107 (March 2008) Advanced Fuel Cycle Cost Basis B-9
Figure B-6. Conversion capacities and production forecasts as projected by Energy Resources International.8
B-5. MODULE SCALING FACTORS Scale-up is not an issue for application of mature technology. Additional capacity can be added via
expansion of existing facilities or new capacity. Location relative to enrichers within a continent is of importance because shipping UF6 overseas adds cost, requires additional time, and thus more in-pipeline inventory.
B-6. COST BASES, ASSUMPTIONS, AND DATA SOURCES
B-6.1 Conversion Pricing and Forecasts Over the past 15 years, the long-term, U.S. spot, and European spot prices for conversion services
(UF6) have converged as the market has been dominated by excess primary supply. Reductions in inventories, introduction of HEU, as well as use of mixed oxide fuels and reprocessed uranium reduced the need for conversion services and created a very competitive market. Utility buyers took advantage of the opportunity and prices were driven well below the historical trends. The current well-publicized spot market provides some indication of the relative stability of the conversion pricing. Presently, the spot and term prices are close and are expected to again return to values in the $6–8/kgU range as was experienced up to the mid-1990s (see Figures B-7 and B-8). It should be noted that, in contrast to natural uranium and SWU, most conversion price indices, including that depicted in Figure B-7, reflect both spot and base-escalated long-term contract prices.
The strong drop from 1997 through 2000 reflected the influx of Russian HEU into the Western market through USEC, creating an oversupply of UF6. The increase beginning in 2003 reflects a number of factors, chiefly the need to increase supply from natural uranium as utility and producer UF6 stockpiles have been largely drawn down. In addition, a significant supply interruption took place at the Metropolis Works. This facility was forced offline by process leaks and was offline for most of the period September 2003–April 2004. More than a year followed before the plant was again operating at nearly full capacity. Also in November 2003, Techsnabexport (Tenex) announced that it would no longer sell

INL/EXT-07-12107 (March 2008) Advanced Fuel Cycle Cost Basis B-10
Figure B-7. Ux conversion spot prices.9
Figure B-8. Ux UF6 spot values.9
its excess UF6 resulting from the U.S.-Russian agreement to down blend HEU to LEU. Beginning in 2008, the excess will be returned to Russia to meet internal demand. This will create a need to replace that availability from additional conversion services. This will likely help to maintain current elevated conversion prices until the market supply and demand become more closely matched. On the other hand, a substantial portion of the DOE-held surplus uranium inventory—30,500 of 52,000 MTU— is already in hexafluoride form. If DOE moves forward on releasing this inventory to the market at a rate of about 2 MTU/year, some of the pressure on suppliers may be relieved. In any case, the conversion services market today reflects substantially lower prices than was the case 25 years ago, only about 1/3 of the mid-1970s prices in real terms.

INL/EXT-07-12107 (March 2008) Advanced Fuel Cycle Cost Basis B-11
Recent studies by Harvard University, Massachusetts Institute of Technology, and CEA-NEA suggest a range of $4–8/kgU is reasonable for evaluation of conversion services.10,11,12 This is based on the adequacy of secondary supplies for uranium and an expected leveling of inventory management. The chart in Figure B-7 shows the Spot Market Price for UF6, which reflects the average U3O8 price plus a spread of $4–10 for conversion. HEU down blend by the U.S. and Russia, making HEU available for commercial use. This availability, along with the release of DOE-held UF6, will play a role in UF6 price evolution. Agreements between the countries control and limit the amount to be placed in to the supply chain. DOE has stated that it will not release UF6 in amounts greater than 10% of annual domestic demand, so the dramatic drop in price experienced in the late 1990s should be avoided. The recent upturn in price reflects mainly the increase in uranium pricing versus a significant impact from conversion services.
B-6.2 Assumptions Should the demand for natural uranium begin to grow quickly, the price for conversion could increase
in the short term. However, as uranium and UF6 prices go up, the use of more separative work units to drive to a lower enrichment tail becomes a check and balance on longer-term price growth. Also as the uranium price goes up, the attractiveness of reprocessed uranium for reenrichment increases⎯again, a check on conversion prices.
B-7. LIMITATIONS OF COST DATA Real time costs are not reported for Russia and the other Commonwealth of Independent States
countries. Most countries are beginning to take a proprietary view of long-term contract costs with reporting becoming less prevalent. Modelers and forecasters must view the total uranium supply picture and use the spot market trends as the feedback tool. Real time costs are relatively low initially, which represents typically less than 4% of the fuel cost. Short-term fluctuations should have little to no impact on the overall fuel cycle costs.
B-7.1 Cost Summaries The module cost information is summarized in the What-It-Takes (WIT) cost summary in Table B-2.
The summary shows the reference cost basis (constant year U.S. dollars), the reference basis cost contingency (if known), the cost analyst’s judgment of the potential upsides (low end of cost range) and downsides (high end of cost range) based on references and qualitative factors, and selected nominal costs (judgment of the expected costs based on the references, contingency factors, upsides, and downsides). These costs are subject to change and are updated as additional reference information is collected and evaluated, and as a result of sensitivity and uncertainty analysis. Refer to Section 2.6 in the main section of this report for additional details on the cost estimation approach used to construct the WIT table. The triangular distribution based on the costs in the WIT table is shown in Figure B-9.
This distribution is uniform, with every price between the lower and upper limits being forecast as equally likely to occur (see Figure B-9). See Section B-8 for discussion.

INL/EXT-07-12107 (March 2008) Advanced Fuel Cycle Cost Basis B-12
Table B-2. Cost summary table.
What-It-Takes (WIT) Table
Reference Cost(s) Based on Reference
Capacity
Reference Cost Contingency
(+/- %) Upsides
(Low Cost) Downsides (High Cost)
Selected Values (Nominal Cost)
$8/kgU as UF6 +/- $2 $5/kgU as UF6 $15/kgU as UF6 $10/kgU as UF6
Reflects a competitive and mature market at a world capacity of ~58,000 MTU/yr
Upside potential exists only when capacity exceeds supply. This is not expected in the long term.
A rapid growth in nuclear reactors would spawn growth for additional conversion capacity. The extent to which capacity growth lags demand could drive interim pricing for conversion much higher.
Selected value is judgment vs. current 2007 pricing during a time of much market excitement, but no maturity.
Module B ConversionEstimated Cost Frequency Distribution
$/kgU (UF6)
Freq
uenc
y
Low Nominal/Mean High
$5 $10 $15
Figure B-9. Conversion estimated cost frequency distribution.
B-8. RESULTS FROM SENSITIVITY AND UNCERTAINTY ANALYSIS Prior studies have highlighted the relative insensitivity of conversion cost to the overall fuel cycle as
the conversion cost represents generally less than 4% of the fuel cost. The impact of doubling the price impacts the cost by only a few percent.

INL/EXT-07-12107 (March 2008) Advanced Fuel Cycle Cost Basis B-13
Figure B-10 is a histogram of monthly conversion prices on the spot market as reported by Ux Consulting, LLC. This data has been adjusted for inflation using the CPI and extends back to January 1981. It shows that prices have varied considerably, from a low of around $2.50/kgU in 1983 and again in 2000 to a high of nearly $13/kgU in 2005. This trend of variability, with prices varying by a factor of three or more over the time period for which data is available, is not atypical of market-driven prices for front-end services. Given the historically wide variation in conversion prices, then, a rectangular rather than triangular distribution is chosen for the cost distribution proposed in this module.
Figure B-10. Histogram of monthly conversion spot price.
B-9. BIBLIOGRAPHY Cochran, R., and N. Tsoulfanidis, “The Nuclear Fuel Cycle: Analysis and Management,” American
Nuclear Society, 1990.
Graham, J., “If It’s Not One Thing, It’s Another⎯Overcoming Adversity in Conversion,” World Nuclear Association Annual Symposium, London, England, September 8−10, 2004.
OECD Nuclear Energy Agency and International Atomic Energy Agency, Uranium 2003: Resources, Production and Demand (also known as the Red Book), OECD/NEA-IAEA: Paris, 2003.
U.S. Department of Energy, Energy Information Administration, Uranium Industry Annual⎯2002, May 2003.
Varley, G. “Uncertainties in the Future Conversion Market,” The Uranium Institute Twenty Second Annual International Symposium 1997, http://www.world-nuclear.org/sym/1997/varley.htm, Web page accessed December 14, 2005.

INL/EXT-07-12107 (March 2008) Advanced Fuel Cycle Cost Basis B-14
B-10. REFERENCES 1. P. Canaux, “UF6 Conversion: Ordeal or New Deal?” The Uranium Institute Twenty Second Annual
International Symposium, 1997, www.world-nuclear.org/sym/1997/varley.htm, Web page accessed December 14, 2005.
2. G. Varley, “Uncertainties in the Future Conversion Market,” The Uranium Institute Twenty Second Annual International Symposium, 1997, http://www.world-nuclear.org/sym/1997/varley.htm, Web page accessed December 14, 2005.
3. The Ux Consulting Company, LLC, www.uxc.com, July 2005, Web page accessed May 16, 2007.
4. Nuclear Energy Institute, “Achieving a Stable Fuel Supply,” in Nuclear Policy Outlook newsletter, Third Quarter 2004, http://www.nei.org/documents/Outlook_3Q2004.pdf, Webpage visited May 16, 2007.
5. “New Conversion Plant to be Built in France,” World Nuclear News, May 22, 2007.
6. “Cameco May Build Kazakhstan Uranium Facility,” Mining Weekly, May 29, 2007.
7. “Commercial Enrichment Study for Australian Government,” World Nuclear News, June 14, 2007.
8. Energy Resources International, 2006 Nuclear Fuel Supply and Price Report, cited in United States Department of Energy, “Proposed Long-Term Uranium Sales Strategy,” DOE Offices of Nuclear Energy, Environmental Management and Defense Nuclear Nonproliferation, http://www.ne.doe.gov/pdfFiles/proposedDoeLtUraniumSalesStrategyIndustryPresentationAug%204th2006.pdf, August 4, 2006, Web page accessed May 15, 2007.
9. Ux Consulting Company, LLC, http://www.uxc.com.
10. Organization for Economic Cooperation and Development/Nuclear Energy Agency, “The Economics of the Nuclear Fuel Cycle,” 1994, http://www.nea.fr/html/ndd/reports/efc/, Web page accessed May 16, 2006.
11. M. Bunn, et al., The Economics of Reprocessing vs. Direct Disposal of Spent Nuclear Fuel, Cambridge, Mass, Project on Managing the Atom, http://bcsia.ksg.harvard.edu/, Harvard University, December 2003, Web page accessed July 5, 2007.
12. J. Deutch, et al., “The Future of Nuclear Power: An Interdisciplinary MIT Study,” Massachusetts Institute of Technology, Belfer Center for Science and International Affairs Science, Technology, and Public Policy Program, 2003, p. 146, Ch. 5, and Appendixes.

INL/EXT-07-12107 (March 2008) Advanced Fuel Cycle Cost Basis C1-1
Module C1
Enrichment

INL/EXT-07-12107 (March 2008) Advanced Fuel Cycle Cost Basis C1-2

INL/EXT-07-12107 (March 2008) Advanced Fuel Cycle Cost Basis C1-3
Module C1 Enrichment
C1-1. BASIC INFORMATION The authors recognize that uranium and enrichment spot prices have recently exceeded the high-cost
range provided in this cost basis. These price trends are being evaluated and the cost ranges in the report will be revised as appropriate in future updates. The cost basis reflects reasonable expectations about uranium and enrichment long-term contract prices applicable to reactors with long operating lives, rather than reflecting market spikes as experienced in the 1970s and observed in the spot market U3O8 prices circa 2005.
Module C1 discusses the step in the nuclear fuel cycle where the UF6 solid in cylinders from the conversion plant is processed to enrich the percentage of U-235 from 0.711% to the 3–5% typical of the enrichment used for light water reactor nuclear fuel fabrication. It involves receipt of UF6 feed stock in 12.5-ton cylinders, enrichment operations, formation of enriched UF6 solid, and shipment of 2.3-ton cylinders to fuel fabricators.
The degree of enrichment is driven by the specific reactor requirements (pressurized or boiling water reactors) to meet desired burnup as well as other factors such as use of mixed oxide fuel or reprocessed uranium. The product from the enrichment plant is called low-enriched uranium (LEU) if the enrichment is less than or equal to 20% U-235. At present, licensing constraints restrict the enrichment of LEU for civilian reactors to 5%. The product is highly enriched uranium (HEU) if the enrichment is greater than 20%. HEU was produced in support of nuclear weapons programs and is currently used in some research reactors. During the enrichment process, the U-235 in the UF6 is enriched from its natural state of 0.711% to the desired end state (3−5%). The by-product of the enrichment process is a large quantity of depleted uranium whose U-235 content is less than 0.711%. This material is known as the enrichment “tails” and typically has an assay in the range of 0.25 to 0.35% U-235. Such material is stable and is currently stored at the enrichment sites for future use because it does have a significant fissile material loading.
The basic enrichment market deals with supply of LEU. LEU can be supplied to the fuel manufacturer as a product of an enrichment process or by virtue of “down-blending” HEU with natural uranium or LEU. The overall demand can be satisfied by either or both of these methods. See Module C2 for details of HEU supply from military stockpile reductions.
The current U.S. annual demand for LEU is approximately 21,500 tU. Worldwide, the demand for LEU is approximately 66,700 tU per year. The capacity of enrichment plants is measured in terms of “separative work units” (SWU or kg SWU). A SWU represents a quantity of separative work performed to enrich a given amount of uranium by a certain amount. It is a function of the amount of uranium processed, the degree to which it is enriched, as well as the level of depletion of the remaining tails. It is proportional to the amount of work required to move the gaseous uranium through the separation cascade. As an example, 3.8 SWUs are required to produce 1 kg of uranium enriched to 3% U-235 if the plant is operated to a tails assay of 0.25% or 5.0 SWUs are required if the plant is operated to a tails assay of 0.15%. With the lower tails assay, more SWUs are required; however, only 5.1 kg of natural uranium feedstock are required versus 6.0 kg for the higher assay. Therefore, SWU demand is established by the utilities looking at all aspects of the fuel cycle to determine how to best meet the reactor burn requirements. About 100–120 thousand SWUs are required to enrich the annual fuel loading for a typical 1,000 MWe light water reactor.

INL/EXT-07-12107 (March 2008) Advanced Fuel Cycle Cost Basis C1-4
The current worldwide enrichment requirements are about 39,000 million SWUs of which the U.S. demand is approximately 11,800 million SWUs. Although there are 21 enrichment facilities in operation, the world supply is dominated by four companies.
1. Eurodiff (France)
2. Minatom (Russia)
3. Urenco (Germany, Netherlands, United Kingdom)
4. United States Enrichment Corporation (USEC) in the U.S.
The current world enrichment nameplate capacity is about 49.25 million SWUs. Thus an overcapacity exists. The current U.S. capacity of 11.3 million SWUs exists in one facility at Paducah, Kentucky. A second unit located in Portsmouth, Ohio, with an additional capacity of 7.4 million SWUs was placed in cold standby in March 2001.
The cost of enrichment represents ~30–40% of the overall cost of fuel manufacture. Enrichment services are highly competitive due to overcapacity and availability of LEU from blend-down of HEU (see Module C2). Enrichment cost is typically reported in $U.S./SWU and includes related transportation costs to the fuel fabrication plant.
C1-2. DEFINE FUNCTIONAL AND OPERATIONAL DESCRIPTION Globally, uranium is enriched on a commercial scale by one of two methods: gaseous diffusion and
gas centrifugation. All operating uranium enrichment plants use UF6 as feed (historically, uranium tetrachloride was used in some electromagnetic separation processes). The processes depend on the physical properties of the molecules, specifically the 1% difference in mass, to separate the isotopes of U-235 and U-238. The use of UF6 is preferred because fluorine has only one stable isotope, and thus, the difference in processing is entirely due to the properties of the uranium isotopes. There are other methods such as laser isotopic enrichment and aerodynamic enrichment using separation nozzles and/or vortex tubes, but these are not commercially viable at this time. Worldwide gaseous diffusion (mainly in the U.S. and France) currently represents about 40% of capacity, with more recent facilities using the more cost-effective gas centrifuge process. The gaseous diffusion plants have been durable and reliable, but are nearing the end of their design life with the focus on advanced centrifuge technology to replace this aging capacity. Table C1-1 shows that, with the retirement of diffusion-based facilities in France and the United States over the next decade, gas centrifuge plants will dominate the next generation of enrichment capacity.
Table C1-1. SWU or SWU equivalent market share by supply source.1 Supply Source 2007 2017
Diffusion 25% 0 Centrifuge 65% 96% HEU Downblenda 10% 4%
a. SWU equivalent: derived from amount and enrichment of LEU produced via HEU downblending.
Both gaseous diffusion and gas centrifugation begin with receipt of 12.5-t cylinders of solid UF6
under a slight vacuum. The UF6, when heated above 135°F, becomes a gas and is the ideal feed for the two main commercial scale processes, which are described below.

INL/EXT-07-12107 (March 2008) Advanced Fuel Cycle Cost Basis C1-5
Gaseous Diffusion: The gaseous diffusion process has been highly developed and used to produce both HEU and commercial reactor-grade LEU. The U.S. first employed gaseous diffusion during World War II and expanded its capacity after the war to produce HEU. Since the late 1960s, the U.S. facilities have been used primarily to produce commercial LEU, with the last remaining HEU capacity being shut down in 1992. China and France currently have operating diffusion plants. Russia’s enrichment facilities have been converted from diffusion to centrifuge technology. Britain’s diffusion facility was shut down and dismantled.2
The gaseous-diffusion process depends on the separation effect arising from the difference in rate of molecular effusion of the UF6 isotopes through a thin barrier (i.e., the flow of gas through small holes). The frequency at which the different species pass through the tiny hole in the barrier is proportional to the speed of the molecule and inversely proportional to the square root of the molecular weight. On the average, lighter gas molecules travel faster than heavier gas molecules and, consequently, tend to collide more often with the porous barrier material. Therefore, lighter molecules are more likely to enter the barrier pores than are heavier molecules. For UF6, the difference in velocities between molecules containing U-235 and U-238 is small (0.4%). Consequently, the amount of separation achieved by a single stage of gaseous diffusion is small. Therefore, this process must be repeated in approximately 1,400 stages in a single cascade to achieve even LEU assays of 2.5 to 5%. The higher the desired enrichment, the more stages and recycle are required to get the desired product.
UF6 is a solid at room temperature but becomes a gas when heated above 135°F. The solid UF6 is heated to form a gas, and the gaseous diffusion enrichment process begins. The process separates the lighter U-235 isotopes from the heavier U-238. The gas is forced by a compressor through a diffusion cell consisting of a porous membrane with microscopic openings. Because the U-235 atoms are lighter, they have a slightly higher probability of reaching and passing through the membrane. As the gas moves, the two isotopes are separated, increasing the U-235 concentration and decreasing the concentration of U-238. Approximately 50% of the feed material passes through the membrane and is pumped off as lightly enriched product. The remaining material flows past the membrane, containing less U-235 and thus is slightly depleted. Passing through the membrane causes a pressure drop. After each stage, the gas must be depressurized, and the heat of compression must be removed (see Figures C1-1 and C1-2).
Figure C1-1. Gaseous diffusion stage.

INL/EXT-07-12107 (March 2008) Advanced Fuel Cycle Cost Basis C1-6
Figure C1-2. Gas must be depressurized, and the heat of compression must be removed.
Figure C1-3 shows a typical gaseous diffusion cascade for enriching and stripping.
Figure C1-3. Gaseous diffusion cascade for enriching and stripping.
Diffusion equipment tends to be large and consumes significant amounts of energy. The main components of a single gaseous-diffusion stage are (1) a large cylindrical vessel, called a diffuser or converter, that contains the barrier; (2) a compressor used to compress the gas to the pressures needed for flow through the barrier; (3) an electric motor to drive the compressor; (4) a heat exchanger to remove the

INL/EXT-07-12107 (March 2008) Advanced Fuel Cycle Cost Basis C1-7
heat of compression; and (5) piping and valves for stage and interstage connections and process control. The entire system must be essentially leak free, and the compressors require special seals to prevent both out-leakage of UF6 and in-leakage of air. In addition to the stage equipment, auxiliary facilities for a gaseous-diffusion plant include a large electrical power distribution system, cooling towers to dissipate the waste process heat, a fluorination facility, a steam plant, a barrier production plant, and a plant to produce dry air and nitrogen. The process is energy intensive requiring over 2,500 kWh/SWU. A gas diffusion plant uses approximately 4% of the energy that can be generated with its enriched uranium.
At the end of the process, the enriched UF6 gas is withdrawn from the pipelines and condensed back into a liquid that is poured into containers. The UF6 is then allowed to cool and solidify in 2.3-t cylinders before it is transported to fuel fabrication facilities where it is turned into fuel assemblies for nuclear power reactors.
Gas Centrifuge: The gas centrifuge uranium enrichment process uses a large number of rotating cylinders in a sequence. These sequences of centrifuge machines, called trains, are interconnected to form cascades. Gaseous UF6 is fed into a cylindrical rotor that spins at high speed inside an evacuated casing. Because the rotor spins very rapidly, centrifugal force results in the gas occupying only a thin layer next to the rotor wall, with the gas moving at approximately the speed of the wall. The centripetal forces induced by the circular motion of the gases (about a million times the gravitational force on the gas) also causes the heavier 238UF6 molecules to tend to move closer to the outer wall than the lighter 235UF6 molecules, thus partially separating the uranium isotopes. This separation is increased by a relatively slow axial countercurrent flow of gas within the centrifuge that concentrates enriched gas at one end and depleted gas at the other. UF6 depleted of U-235 flows upward adjacent to the rotor wall, while the UF6 enriched in U-235 flows downward closer to the axis. The two gas streams are continuously removed through small pipes. The separative capacity of a single centrifuge increases with the length and radius of the rotor and the rotor wall speed. Consequently, centrifuges containing long, high-speed rotors are the goal of centrifuge development programs.
The primary constraint upon further enhancement of the separation factor achievable in a single centrifuge unit is imposed by the rotor material. Specifically, the maximum tangential velocity of the rotor is limited by the square root of its yield strength to density ratio. Therefore, strong lightweight materials such as aluminum and titanium are favored. The length of a centrifuge unit is often constrained by the need to avoid exciting a destructive resonant oscillation.
Although the capacity of a single centrifuge is much smaller than that of a single diffusion stage, its capability to separate isotopes is much greater. Centrifuge stages normally consist of a large number of centrifuges in parallel. Such stages are then arranged in cascade similarly to those for diffusion. Although the separation factors obtainable from a centrifuge are large compared to gaseous diffusion, several cascade stages are still required to produce even LEU material. In the centrifuge process, however, the number of stages in a series may only be 10 to 20, instead of a thousand or more for diffusion. As was the case for the diffusion cascade, the stream that is slightly enriched in U-235 is withdrawn and fed into the next higher stage, while the slightly depleted stream is recycled back into the next lower stage. Eventually, enriched and depleted uranium are drawn from the cascade at the desired assay. Significantly more U-235 enrichment can be obtained from a single unit gas centrifuge than from a single unit gaseous diffusion barrier. Each cascade is capable of producing the desired separation. Many cascades must be run in parallel to gain the desired throughput. However, this lends flexibility to the operation and supports ease of modular growth. This is in stark contrast to a diffusion plant where the many stages must run in one cascade to obtain the final product.1
The end of the process is basically the same as the gaseous diffusion process; the enriched UF6 gas condensed into a liquid that is poured into containers before being transported to fuel fabrication facilities.

INL/EXT-07-12107 (March 2008) Advanced Fuel Cycle Cost Basis C1-8
Figures C1-4 and C1-5 show schematics of typical gas centrifuges used for U-235 enrichment.
Figure C1-4. Gas centrifuge.

INL/EXT-07-12107 (March 2008) Advanced Fuel Cycle Cost Basis C1-9
Figure C1-5. A schematic showing the Zippe centrifuge.
One of the key components of a gas centrifuge enrichment plant is the power supply (frequency converter) for the gas centrifuge machines. The power supply must accept alternating current (ac) input at the 50 or 60-Hz line frequency available from the electric power grid and provide an ac output at a much higher frequency (typically 600 Hz or more). The high-frequency output is fed to the high-speed gas centrifuge drive motors—the speed of an ac motor is proportional to the frequency of the supplied current. The centrifuge power supplies must operate at high efficiency, provide low harmonic distortion, and provide precise control of the output frequency.
The casing not only maintains a vacuum but must also contain the rapidly spinning components in the event of a failure. If the shrapnel from a single centrifuge failure is not contained, a “domino effect” may result and destroy adjacent centrifuges. A single casing may enclose one or several rotors.
A notable feature of the gas centrifuge process is that the plant capacity can be expanded on a modular basis. Capacity can be increased according to market demand. This leads to substantial economic advantages and allows advanced technology to be installed in each increment of capacity. Because of the development of almost friction-free bearings, the electrical consumption of a modern gas centrifuge facility is much less than that of a gaseous diffusion plant requiring as little as 50 kWh/kg SWU (roughly 2% of the diffusion requirement).
Other Enrichment Processes: Several other enrichment technologies have been considered or are under further development. None of these are currently being considered for commercial application at this time.

INL/EXT-07-12107 (March 2008) Advanced Fuel Cycle Cost Basis C1-10
Laser Isotopic Separation: The Atomic Vapor Laser Isotopic Separation process (AVLIS) and the similar French process SILVA were extensively studied in the 1990s by the U.S., France, and Japan. These processes have not proven to be commercially viable in the short term, and the U.S. and France have stopped development efforts.
USEC secured exclusive worldwide rights to the commercial use of the SILEX laser-based technology for enriching uranium in 1997, working in partnership with SILEX Systems LTD., in Australia. After funding it for six years, USEC announced its withdrawl from the SILEX project in 2003, despite continuing positive results. SILEX and General Electric Company signed an exclusive Commercialization and License Agreement for the SILEX Uranium Enrichment Technology in 2006.3 If successfully deployed, SILEX, a molecular laser separation process using UF6, would selectively separate U-235 in a manner that requires lower power consumption, lower capital cost, and lower tails assay. Similar to gas centrifuges, SILEX could be implemented in a modular manner. The SILEX process is currently being evaluated in a significant scale engineering prototype facility.
If process efficiency and economics are verified, the next stage would be to construct and operate a pilot plant facility. Indeed, on May 22, 2006 GE and Silex Systems announced plans to move forward on a test loop at the GE Global Nuclear Fuel—Americas site in Wilmington, North Carolina. On October 11 of the same year, GE informed the Nuclear Regulatory Commission of its plans to file an operating license application for a SILEX facility in the U.S. While the partnership has not yet issued a timeline for developments beyond the test loop, on October 2, Peter Wells, GE Nuclear’s marketing manager, estimated that a commercial-scale facility might come online in 2011 or 2012.4 The use of such technology makes use of reprocessed uranium and further enrichment of existing enrichment tails much more attractive than with current technology.
Other Separation Technologies: Numerous chemical, ion exchange, electromagnetic, aerodynamic and plasma separations processes have been investigated, but none are being seriously considered at this time for large scale commercial enrichment application.
C1-3. PICTURES/SCHEMATICS Large commercial enrichment plants are in operation in France, Germany, Netherlands, United
Kingdom, U.S., and Russia, with smaller plants elsewhere. The following picture shown in Figure C1-6 is the EURODIF’s Tricastin gaseous diffusion enrichment plant in France. Note the four reactors in the foreground which supply 3000 MWe of power to the enrichment facility and the large production facilities beyond the cooling towers.
Figure C1-7 shows the USEC Gaseous Diffusion Building in Paducah, Kentucky.
Figures C1-8, C1-9, and C1-10 show the URENCO gas centrifuge enrichment plant at Gronau, Germany.

INL/EXT-07-12107 (March 2008) Advanced Fuel Cycle Cost Basis C1-11
Figure C1-6. George Besse Gaseous Diffusion Enrichment Plant.
Figure C1-7. United States Enrichment Corporation Gaseous Diffusion Production Building.

INL/EXT-07-12107 (March 2008) Advanced Fuel Cycle Cost Basis C1-12
Figure C1-8. Separation Hall with centrifuges at the Gronau Enrichment Plant, Germany.
Figure C1-9. Top view of a bank of centrifuges at a URENCO gas centrifuge plant.

INL/EXT-07-12107 (March 2008) Advanced Fuel Cycle Cost Basis C1-13
Figure C1-10. Enriched UF6 product container being loaded into an overpack for shipment.
C1-4. MODULE INTERFACE DEFINITION The need for enrichment services is highly dependent on Modules A, C2, D1, D2, and K. Raw
uranium pricing impacts the source uranium cost of conversion. The availability of mixed oxide, reprocessed uranium, and/or blend down of highly enriched uranium impacts the demand for enrichment services from UF6. Timing of fuel fabrication also impacts the need for conversion services. In addition to real time feed and product needs, decisions relative to inventory levels along the front-end of the fuel cycle will have impact on this enrichment module.
The key cost dependencies on supply and demand are discussed in the following section.
C1-4.1 Supply and Demand
C1-4.1.1 Supply
Although there are 21 enrichment facilities in operation, four companies dominate the world enrichment supply; Eurodiff (France), Minatom (Russia), Urenco (Germany, Netherlands, United Kingdom) and USEC (U.S.). The current world enrichment nameplate capacity is about 49 million SWU. Actual production capability is estimated to be closer to 40 million SWU/yr. The world supply is dominated by Russia with approximately 40% of the world capacity.
Table C1-2 implies a worldwide capacity of ~49 million SWU, most sources evaluate the reasonable and reliable capacity to be closer to 40 million SWU/yr.
The U.S. has only one operating plant for uranium enrichment. USEC, Inc. is the only producer of enrichment services in the U.S. USEC leases production facilities from the United States Department of Energy at Paducah, Kentucky, and Portsmouth, Ohio, (also referred to as Piketon, Ohio). The current capacity at Paducah is 11.3 thousand SWU with a license to enrich uranium up to 5.5% U-235. The second unit located in Portsmouth, Ohio, with an additional capacity of 7.4 million SWU per year was placed in cold standby in March 2001 and cold shutdown in September 2005. A date for the initiation of final D&D activities at Portsmouth has not yet been identified.

INL/EXT-07-12107 (March 2008) Advanced Fuel Cycle Cost Basis C1-14
Table C1-2. World enrichment nameplate capacity.
Company (Country)
Nameplate Capacity Million SWU
(as of Dec 31, 2001) Technology
CNNC (China) 1.0 Gaseous Diffusion & Centrifuge Eurodif (France) 10.8 Gaseous Diffusion JNC (Japan) 0.9 Centrifuge Minatom (Russia) 20.0 Centrifuge Urenco (Germany) Urenco (Netherlands) Urenco (UK)
5.25 Centrifuge
USEC (USA) 11.3 Gaseous Diffusion
Total 49.25
Gaseous diffusion plants cost much more than gas centrifuges to operate with costs near $100/SWU versus close to $70/SWU for centrifuges. To remain competitive, by 2013 ERODIF plans to phase out their gaseous diffusion plant at Tricastin by replacing it with the gas centrifuge plant, George Besse II, capable of 7.5 million SWU. In the U.S., both Louisiana Energy Services and USEC have submitted license applications to the Nuclear Regulatory Commission for gas centrifuge plants. In 2005, Louisiana Energy Services announced plans to begin construction of a National Enrichment Facility (NEF) in New Mexico with a capacity of 3 million SWU (1 million SWU by 2009 expanding to 3 million SWU by 2013) This facility received a construction license from the NRC in June, 2006 and ground was broken in October of that year. USEC planned to begin construction in 2007 on the American Centrifuge Plant (ACP) in Portsmouth, Ohio with an initial capacity of 3.5 million SWU expandable to 7.0 million SWU. A Lead Cascade facility at Portsmouth will pilot the USEC centrifuges without producing product. Originally billed at $1.7B the ACP’s cost has recently been updated to $2.3B. The increase comes as a result of higher commodity prices for construction materials (both facility and cascade) and because of a one year construction delay resulting from poor test results on cascade equipment. Future cost increases are possible as the current estimate of $2.3B is based on an aggressive construction schedule. Because of the increased cost, USEC does not currently have sufficient funds beyond FY 2007 for ACP and is in the process of looking for investors or some other cash stream to keep the project on schedule.a
See Module C2 relative to supply from downblend of HEU.
C1-4.1.2 Demand
The current U.S. demand for SWUs is approximately 11.8 million SWU and begins to reduce after 2010, reflecting a general reduction in nuclear power in the U.S. In 2003, roughly 14% of the U.S. demand for SWU was provided by USEC with 86% originating from foreign enrichment plants—largely Russian LEU from blend-down (see Figure C1-11).
a. USEC’s 2006 SEC K-10 filing.

INL/EXT-07-12107 (March 2008) Advanced Fuel Cycle Cost Basis C1-15
Figure C1-11. Purchases of enrichment services by owners and operators of U.S. civilian nuclear power reactors by origin country and delivery year, 2003-2006.5
Jean-Jacques Gautrot, Areva’s director for international operations and marketing, presented the following demand breakdown in Figure C1-12 for a steadily growing market of roughly 0.5% growth per year.6 Much of the growth, as might be expected, is in Asia. Gautrot goes further to show the current supply breakdown in Figure C1-13.
Figure C1-12. The harmonious market of uranium enrichment services: two decades of world requirements assuming an average growth rate of 0.5% per year.

INL/EXT-07-12107 (March 2008) Advanced Fuel Cycle Cost Basis C1-16
Figure C1-13. Current supply breakdown of the market.
This figure implies that the Americas, dominated by the U.S., require about 30% of the total demand. Russia’s three plants at Seversk, Zelenogorsk, and Novouralsk satisfy nearly 45% of the U.S. demand and almost 30% of the world demand. Thus from a supply standpoint, Russia has a major impact on the world market. It is also interesting to note that USEC is filling nearly 50% of the growing Asia market.
C1-4.1.3 World Nuclear Association 2001 Enrichment Requirements Forecasts
Ux Consulting (UxC) offers three scenarios for mid-term demand for SWUs in Figure C1-14, reporting on data from the World Nuclear Association. Existing capacity easily handles the lower case. The middle case is within the nameplate worldwide capacity, values over 40 million SWU imply improved performance, and capacity above that is experienced in recent history. Clearly the high scenario requires additional new SWU capacity.
There is a very key interaction between Cost Module A and C1. Figure C1-15 depicts the relationship between raw uranium requirements and the enrichment tails assay. Simply stated, if more U-235 is separated (i.e., lower tails assay) per unit of feed, then less feed (i.e., natural uranium) is needed.

INL/EXT-07-12107 (March 2008) Advanced Fuel Cycle Cost Basis C1-17
Figure C1-14. Mid-term demand for separative work unit.7
Figure C1-15. Relationship between raw uranium requirements and the enrichment tails assay.

INL/EXT-07-12107 (March 2008) Advanced Fuel Cycle Cost Basis C1-18
As an example of this coupling, the optimal tails enrichment as a function of uranium-to-SWU price ratio ($/kgU as UF6 per $/SWU) has been calculated by Thomas Neff of MIT.8 His results are shown in Figure C1-16. From 2002 through late 2006, as uranium prices increased at a greater rate than SWU prices, the optimal tails enrichment dropped from about 0.35% to 0.22%. Utilities’ shift to lower tails fractions should, over time, serve to reduce primary uranium prices, with attendant upward pressure on SWU prices that would accompany higher demand. This effect is evidently too small to stem the rise in uranium prices. At the time Neff prepared his figure, the U in UF6:SWU price ratio was about 1.0; as of May, 2007 it reached 2.2 as the U in UF6 price rose from $134 (August, 2006) to $305 (May 18, 2007), while the SWU price rose only slightly, from $130/SWU to $138/SWU.
At a UF6:SWU price ratio of 2.2, the optimal tails enrichment would be 0.15%. Information regarding recent enrichment contracts and volumes is difficult to obtain; however inherent lead times ensure that tails enrichments are not yet this low. Nonetheless, over the medium term and subject to SWU supply constraints, this elasticity of demand ensures that:
1. Uranium and SWU prices will have a positive correlation
2. Upward (or downward) price pressure within one of these industries will be mitigated to an extent.
Figure C1-16. Optimal tails as a function of ratio of uranium to SWU price.
In summary, if the price of UF6 increases, while the price per SWU remains stable, there reaches a point where it is more cost effective to pay for more separation (i.e., more SWU) and reduce the natural uranium demand. The impact of this relationship provides for other cost optimization scenarios in addition to tails assay adjustment. These scenarios are as follows.
1. In the case that the price of uranium goes up and excess SWU capacity exists, enrichers (especially more cost effective processors) could use the unused SWU to enrich the existing richer tails and thus provide a new source of uranium.
2. If laser isotope enrichment becomes a commercial reality, then the door is open for utilization of reprocessed uranium as feedstock for enrichment in addition to the existing tails.

INL/EXT-07-12107 (March 2008) Advanced Fuel Cycle Cost Basis C1-19
The reality of the supply-demand discussion is that is it a very dynamic and extremely competitive market. Key interactive factors include:
• Tails assay versus natural uranium price and supply.
• Commercialized HEU to LEU availability (both Russian and U.S.) and timing (blend-down can occur with natural uranium, LEU, enrichment tails, and/or reprocessed uranium) (see Module C2).
• Further reductions in nuclear stockpiles and government inventories of uranium in all forms (see Module C2).
• Openness of emerging enrichment suppliers especially from currently restricted markets (because of past dumping practices, several countries and the Commonwealth of Independent States are not permitted to enter the competitive market or are currently heavily taxed to do so).
• Cost versus reliability and flexibility (reliability is critically important).
• Demand for higher enrichment because of deeper burn reactor operations or to support use of mixed oxide fuel (and to address the higher enrichment needs of the Next Generation Nuclear Plants).
• Continued integration of fuel cycle companies to integrate all aspects of the fuel cycle up through fuel fabrication.
• Enriched uranium product procurement versus utility procurement of natural uranium, conversion, and enrichment services (changes price structure due to avoidance of carrying costs from uranium purchase to fuel delivery).
• Much of the existing infrastructure is getting quite old. New facilities, while capital intensive, will be more cost effective, reliable, capable of modular expansion, and have more flexibility in products.
These factors should all work to keep the price of SWU fairly stable with moderate price increases to support new supply balanced by an overall production cost decrease as electricity-hungry diffusion plants are retired in favor of centrifuge facilities.
C1-5. MODULE SCALING FACTORS New additions to supply are planned. In cases like the U.S. and France, the new facilities will permit
the more costly gaseous diffusion plants to be replaced by the more efficient gas centrifuge plants. The gas centrifuge technology is relatively mature with ongoing work to improve efficiency even further. Costs are reasonably well understood and capacity can easily be added in a cost-effective modular basis. Therefore, scale-up is not a process or cost concern for this technology. A general cost per SWU can be expected to apply over the range anticipated for future growth.
C1-5.1 Cost Bases, Assumptions, and Data Sources
C1-5.1.1 Enrichment Pricing and Forecasts
Although spot market pricing is published, most enrichment services are tied to longer contracts where reliability is more important than price. However, the pricing of Russian SWU was driven by the HEU agreement between the U.S. and Russia, and agreement was made to follow market pricing (see Module C2). The restricted market jumped to about $108/SWU as a result of the decision by USEC to place the capacity of the Portsmouth Gaseous Diffusion plant in cold standby in March 2001. The spot market price for SWU is shown in Figure C1-17.

INL/EXT-07-12107 (March 2008) Advanced Fuel Cycle Cost Basis C1-20
Figure C1-17. Spot market price for SWU.9
Recent studies by Harvard University, Massachusetts Institute of Technology, and CEA-Nuclear Energy Agency suggest a range of $80–130/SWU is reasonable for evaluation of enrichment services, and most economic comparisons use a value of ~$105–110/SWU. Although Figure C1-17 shows the spot market price for SWU, very little SWU is purchased on the spot market reflecting a stronger need for reliable longer term committed supply. The most significant factor is the impact of weapons reduction by the U.S. and Russia, making HEU (effectively the Russian SWU) available for commercial use (see Module C2). Longer term contract prices are not published. However, roughly 50% of the U.S. SWU demand is being filled via Russian SWU through 2013. Further reductions are expected in the nuclear stockpiles making additional HEU and plutonium available for the market. It is, therefore, reasonable to assume that some convergence of the markets could occur but that the range suggested above is reasonable for SWU service.
Russian SWUs have also had a significant effect upon European markets. Since the mid-1990s, Russia has been making available between 2.5 million and 4.0 million SWU per year to AREVA, Urenco and others. As shown in Figure C1-17, these SWUs have consistently changed hands at lower than world market prices. Under the AREVA and Urenco contracts, over 100,000 tonnes of depleted uranium tails have been upgraded to natural uranium assay.10 In late 2006, Minatom announced that contracts for this work would not be renewed once the current program is complete. It is likely that Russia perceives greater economic advantage in making this capacity available on the unrestricted world market.
It is possible that some of the SWU capacity liberated by the lapsing of the Russian – European tails reenrichment contracts may be deployed to enrich reprocessed uranium that was recovered from Japanese SNF but still located in France and the UK. These uranium stocks, amounting to 6,400 tonnes, would be enriched in Russia as part of a larger deal involving natural uranium extraction and enrichment from mines in Kazakhstan in which Japanese companies hold a stake. The Japanese newspaper Yomiuri Shimbun reported that the negotiations are in their “final stage,”11 but no particulars regarding the terms of the deal are yet available.
At this point, sufficient evaluation has been completed to address ongoing research and development expenses and new capital cost. They can assume to be unimportant to a cost model because the market will drive the price, and companies with large research and development efforts must plan to recover those expenses without obtaining a premium for their services.

INL/EXT-07-12107 (March 2008) Advanced Fuel Cycle Cost Basis C1-21
Prices for reenrichment of depleted uranium hexafluoride would be the same as prices for identical services involving natural uranium. The situation for reprocessed uranium (RU) is more complex. Although commercial RU enrichment is not presently taking place (subject to change in the near term in view of the Russian-Japanese negotiations), the U.S., Russia and France have enriched RU in significant quantities within their facilities. The U.S. does not hold large stocks of RU at present.
The most recent major study of RU enrichment in the U.S. took place in 1993.12 Given the availability of RU stocks, the option has received more frequent attention in Europe (a Russian study13 was issued in 2006). Given that the latter report is proprietary, the conclusions presented below are drawn from the earlier U.S. study. The Department of Energy (DOE) is presently obligated to accept RU for enrichment, provided the source uranium was originally enriched in a DOE facility and it meets certain purity standards. DOE reserves the right to apply an additional “service charge,” which has historically been nominal—up to $10 per kilogram of RU feed or about a 10% surcharge per SWU when the separative work is computed according to the traditional two-component formula. The service charge is in fact based upon the additional separative work requirements to enrich RU feed to a specified U-235 content given the presence of U-236. Indeed, to ensure that the tails from the RU enrichment process can be stored and disposed in the same manner as traditional depleted uranium (DU), it is advantageous to pursue one of the following:
• Blending of RU feedstock with natural uranium (NU) to decrease the U-232 and U-236 concentrations. This strategy offers the further advantage of reducing the level of over-enrichment required to compensate for the negative effect of U-236 on the neutron economy of a reactor.
• Blending of RU with HEU or alternatively LEU having greater than 5% enrichment. This option would obviate the need to pass any RU through an enrichment cascade, but like RU use as a diluent in MOX or fast reactor fuel it may not be sufficient to balance the rate at which RU is recycled with the rate at which it is produced.
• Employment of a secondary cascade to produce a second tails stream that is highly concentrated in U-232. This small amount of material would require some decades of storage before becoming disposable in the same fashion as traditional DU.
In any case, since there is no indication that Russia imposes more than a nominal surcharge for enrichment services involving RU and since the DOE charge is also nominal, the SWU price estimates given in this section would also be valid for RU, given that the RU meets purity standards and that the separative work for the multicomponent stream is calculated according to the methodology given in Reference 12. If the simpler two-component (U-235 and U-238) equation is used to calculate the SWU, a 10% surcharge should be assessed to the SWU cost as a first approximation.
Decontamination and Decommissioning (D&D) is the area in which enrichment of RU would be expected to most impact costs. A great deal of uncertainty surrounds the correlation between RU enrichment and D&D costs for the three U.S. enrichment facilities. The Uranium Enrichment Decontamination and Decommissioning Fund was established by the 1992 Energy Policy Act. This fund was to be paid into between 1992 and 2007 by government appropriations and utilities, with the utility portion reflecting previous purchase of SWU from government-owned facilities. In addition to D&D costs, the fund is also intended to defray remedial cleanup activities, waste management, plant surveillance and maintenance, and reimbursement to active uranium and thorium processing facilities to defray their own decontamination and cleanup costs. Therefore, it is difficult to identify from the fund balance that portion of the costs that are organic to RU enrichment.
The most substantial additional expenses that adhere to RU enrichment are therefore purification and tails disposal (see Module K). Effective removal of fission products, especially Tc-99, is necessary prior to enrichment or disposal. Both of these issues are also complicated by the presence of the isotope U-232.

INL/EXT-07-12107 (March 2008) Advanced Fuel Cycle Cost Basis C1-22
Although U-232 (T1/2 = 68.9 yr) is present in RU at levels of a few parts per 107 atoms, Th-228 and other daughters in its chain that undergo particularly energetic decays lead this parent isotope to be the dominant contributor to the RU dose field. Given that these daughters are removed from the uranium stream at the time of separation, it is advantageous to enrich RU as quickly as possible to avoid a costly secondary purification step. Indeed, the dose rate from RU immediately following its separation is very nearly the same as that of NU. One year after separation, the RU dose rate increases to almost ten times that of NU and its decay power exhibits an even more substantial increase; the radiation field from RU peaks about 10 years after separation. Therefore, it seems essential to enrich the RU within a few months of its separation.
If quick re-enrichment is not possible, or if the original separation process does not sufficiently extract certain fission products and actinides, additional “polishing” of the RU would be required. A number of polishing processes have been proposed. While PUREX or a similar aqueous process could be employed, given the low contaminant concentrations, other methods offering considerably less complexity and expense can be pursued. One of these is fluoride volatility purification; high-purity separation of uranium fluorides from fluorides of many fission products and actinides. Uranium fluorides become volatile at significantly lower temperatures than other fluoride compounds; none of the noble metal fluorides become gaseous at a temperature within 30 K of the UF6 boiling point. Indeed, this purification process is already employed at the Metropolis Works and other U fluorination facilities, and the cost of purifying RU in this fashion would be similar to the cost of conversion.
C1-5.2 Assumptions Should the demand for natural uranium begin to grow quickly, the price for enrichment could
increase in the short term as capacity is added. The price of enrichment services will also be responsive to short term relatively rapid increases in uranium pricing as has been the case since 2004. As uranium prices increase, the desire to reduce the tails concentration also increases, thus creating a more rapid change in the demand for SWUs. While this is self-correcting in the longer term, it has demonstrated an increase in the volatility of SWU pricing. However, there is no apparent driver other than a rapid increase in demand that should drive up the relatively stable price of SWU, and shortfall can be accommodated with the release of more HEU to produce enriched uranium product without enrichment. The addition of new capacity from gas centrifuges in the U.S. should also have a stabilizing effect on future cost as more than 75% of current U.S. need is being met through foreign support. The new SWU capacity in the U.S. will be replacing the gaseous diffusion technology with the more cost-effective centrifuge technology. However, the U.S. industry will need to recoup the large capital expenses to obtain the newer and more cost-effective technology.
C1-6. LIMITATIONS OF COST DATA There are obviously many factors with impact on the enrichment demand. See Section C1-4 for
details. Real time costs are not reported because of the highly competitive nature of the tight supply-demand scenario, which at this point is nearly balanced.
Modelers and forecasters must view the total uranium supply picture and consider the closer relationship between the price of natural uranium and enrichment as utilities try to optimize the total front-end of the fuel cycle. While enrichment currently represents between 30 and 40% of the cost of fuel, short-term fluctuations should have only a moderate impact on the overall fuel cycle costs. When a closed fuel cycle is considered, its impact will be dwarfed by the reprocessing and fuel fabrication expenses.
As centrifuge technology replaces diffusion, assuming long-term supply-demand equilibrium with open markets, its lower production costs should translate into lower SWU prices. A dramatic drop in SWU prices is not expected for two reasons. First, since centrifuge plants are modular, producers can

INL/EXT-07-12107 (March 2008) Advanced Fuel Cycle Cost Basis C1-23
expand capacity incrementally and relatively quickly, avoiding creation of a persistent supply glut. Second, the SWU market is not fully competitive in the sense that enrichers do not offer fully flexible contract terms. For example, the cost-minimizing process of tails enrichment optimization, while easy to carry out in paper, is not generally an option in present-day contracts which stipulate a fixed tails assay for their duration.
C1-7. COST SUMMARIES The module cost information is summarized in the What-It-Takes (WIT) cost summary in
Table C1-3. The summary shows the reference cost basis (constant year $U.S.), the reference basis cost contingency (if known), the cost analyst’s judgment of the potential upsides (low end of cost range) and downsides (high end of cost range) based on references and qualitative factors, and selected nominal costs (judgment of the expected costs based on the references, contingency factors, upsides, and downsides). These costs are subject to change and are updated as additional reference information is collected and evaluated, and as a result of sensitivity and uncertainty analysis. Refer to Section 2.6 in the main section of this report for additional details on the cost estimation approach used to construct the WIT table.
The uniform distribution based on the costs in the WIT table is shown in Figure C1-18.
Table C1-3. Cost summary table. What-It-Takes (WIT) Table
Reference Cost(s) Based on Reference
Capacity
Reference Cost
Contingency (+/- %)
Upsides (Low Cost)
Downsides (High Cost)
Selected Values (Nominal Cost)
$105/SWU +/- $25 $80/SWU $130/SWUb $105/SWU Reflects a competitive and mature market where current world demand and supply are nearly matched
Upside potential exists only when capacity exceeds supply. This is not expected in the medium term. In the long term, this reflects the lower production costs for centrifuge technology.
Should demand for uranium increase rapidly, capacity would also have to increase driving some short-term increase in price.
Reflects the relatively stable price for the 1990-2005 time period.
b. The authors recognize that uranium and enrichment spot prices have recently exceeded the high-cost range provided in this cost basis. These price trends are being evaluated and the cost ranges in the report will be revised as appropriate in future updates. The cost basis reflects reasonable expectations about uranium and enrichment long-term contract prices applicable to reactors with long operating lives, rather than reflecting market spikes as experienced in the 1970s and observed in the spot market U3O8 prices circa 2005.

INL/EXT-07-12107 (March 2008) Advanced Fuel Cycle Cost Basis C1-24
Module C1 EnrichmentEstimated Cost Frequency Distribution
$/SWU
Freq
uenc
y
Low Nominal/Mean High
$80 $105 $130
Figure C1-18. Enrichment estimated cost frequency distribution.
C1-8. RESULTS FROM SENSITIVITY AND UNCERTAINTY ANALYSIS SWU is a service and as such is subject to volatility not seen in largely noncompetitive back end
processes such as reprocessing and repository disposal. It is important to reflect this volatility in the proposed long-term price distribution, so that uncertainties in future SWU prices are properly captured. Figure C1-19 is a histogram of the inflation-adjusted quarterly average SWU price shown in Figure C1-20.
Figure C1-19. Histogram of quarterly SWU prices, 1972-2006.

INL/EXT-07-12107 (March 2008) Advanced Fuel Cycle Cost Basis C1-25
0
20
40
60
80
100
120
140
160
1972 1977 1982 1987 1992 1997 2002 2007Year
SWU
Spo
t Pric
e [2
006
$/SW
U]
Figure C1-20. Historical SWU price (UxC spot post-1986), adjusted for inflation.
Table C1-4 summarizes the statistical parameters of the historical SWU price along with those of two proposed future price distributions. Both of these have lower and upper bounds of $80 and $130 per SWU. One proposed distribution is triangular, like those employed to describe costs associated with many other modules; it is also symmetric, with the likeliest price chosen to be $105 per SWU. The second option is a uniform distribution, with all prices between $80 and $130 being equally likely. The triangular distribution shows a smaller variance than does the historical SWU price data; the uniform distribution matches well in this area.
Therefore, the uniform distribution, with its implication that low and elevated SWU prices are equally likely even over the long term, appears more able to replicate uncertainties in this price. It is adopted as the reference distribution for this module.
Table C1-4. Statistics of historical quarterly SWU price distribution versus proposed distribution.
Historical ($/SWU) $80-130 ($/SWU)
Triangular Symmetric Proposed: $80-130 ($/SWU) Uniform
Mean 113 105 105 Median 116 105 105 Standard Deviation 14.9 9.8 14.9
We forecast a lower price limit of $80/SWU over the medium- to long-term. This projection is
supported by Rothwell’s14 formulation of the year 2015 SWU spot market supply curve. Figure C1-21 depicts an estimate of the situation in 2015, with the heavy black line representing the supply curve. The thin blue box represents the contribution of electricity purchase to the production cost; the areas of the pink and orange boxes represent the profits forecast for the Russian and Urenco facilities, respectively. Steps in the curve represent individual facilities: all facilities planned to be operational by 2015 are included and minimal demand growth prior to 2015 is assumed. By 2015, all world capacity will utilize centrifuges, so that plants in Russia as well as new capacity in the U.S. and France each appear as steps in the supply curve.

INL/EXT-07-12107 (March 2008) Advanced Fuel Cycle Cost Basis C1-26
$0
$30
$60
$90
$120
$150
0 10 20 30 40 50
M SW U/ye ar
$/SW
U
2 0 1 5
R us s ian Π (Profit) Ure nco Π (Profit)
Indus try Ele c
Figure C1-21. Supply Curve for the SWU Spot Market, 2015 Projection.
The plateaus in the curve represent production costs for each facility. At a demand of ca. 42 MSWU/year, the production cost for the marginal plant – the cost of producing one additional SWU at the most expensive plant to operate – is about $75/kgU. Making the assumption of equilibrium, so that price equals marginal production cost, one arrives at a SWU price very close to the lower estimate presented here. It is important to note that the SWU market will evidently be very tight in 2015, so that a supply disruption or unexpected increase in demand could easily push prices significantly higher.
C1-9. BIBLIOGRAPHY Bunn, M. et al., The Economics of Reprocessing vs. Direct Disposal of Spent Nuclear Fuel, Cambridge,
Massachusetts, Project on Managing the Atom, Harvard University, DE-FG26-99FT4028, December 2003, pp. 19, 55-57; also on Web: http://http://bcsia.ksg.harvard.edu/.
Cochran, R., and N. Tsoulfanidis, “The Nuclear Fuel Cycle: Analysis and Management,” American Nuclear Society, 1990.
Federation of American Scientists, Special Weapons Primer, http://www.fas.org/nuke/intro/nuke/uranium.htm, 2004.
Massachusetts Institute of Technology, “The Future of Nuclear Power,” 2003.
OECD Nuclear Energy Agency and International Atomic Energy Agency, Uranium 2003: Resources, Production and Demand (also known as the Red Book), OECD/NEA-IAEA: Paris, 2003.
OECD/NEA, The Economics of the Nuclear Fuel Cycle, 1994.
RWE NUKEM, Inc., Market Report Online, http://www.nukemonline.com/, subscription, May 2002. The Ux Consulting Company, LLC, www.uxc.com, July 2005
Uranium Information Centre Ltd, “Uranium Enrichment,” Nuclear Issues Briefing Paper 33, Melbourne, June 2003, http://www.uic.com.au/nip33.htm, accessed December 14, 2005.
U.S. Department of Energy, Energy Information Administration, Uranium Industry Annual⎯2002, May 2003.

INL/EXT-07-12107 (March 2008) Advanced Fuel Cycle Cost Basis C1-27
U.S. Department of Energy, Office of Nuclear Energy, Report on the Effect the Low-Enriched Uranium Delivered Under the HEU Agreement Between the Government of the Unites States and the Government of the Russian Federation has on the Domestic Uranium Mining, Conversion, and Enrichment Industries and the Operation of the Gaseous Diffusion Plant, www.ne.doe.gov/reports/, Annual Reports 1999–2004.
C1-10. REFERENCES 1. World Nuclear Association, Information Brief #28: Enrichment, April 2007, http://www.world-
nuclear.org/info/inf28.html, Web page accessed May 12, 2007.
2. Federation of American Scientists, “Special Weapons Primer,” 2004, http://www.fas.org/nuke/intro/nuke/uranium.htm, updated June 24, 2000, Web page accessed January 26, 2006.
3. SILEX Systems, LTD, http://www.silex.com.au/s02_company_history/content.html. Web page visited April 24, 2007.
4. “GE, Silex get US Okay to Proceed with Enrichment Technology Deal,” Nuclear Fuel Newsletter, October 9, 2006.
5. US Energy Information Administration, Uranium Marketing Annual Report 2007, May 16, 2007, http://www.eia.doe.gov/cneaf/nuclear/umar/, Web page accessed May 18, 2007.
6. J.-J. Gautrot, “The Harmonious Market for Uranium Enrichment Services,” World Nuclear Association Annual Symposium, London, England, September 4−6, 2002.
7. UXC Weekly, UXC Web site, http://uxc.com/review/uxc_Prices.aspx, Web page accessed May 10, 2006, 15−38.
8. T. Neff, “Dynamic Relationships Between Uranium and SWU Prices: A New Equilibrium,” presentation at the World Nuclear Association 2006 Annual Symposium, September, 2006, http://www.world-nuclear.org/sym/2006/neff.htm, Web page accessed May 18, 2007.
9. The Ux Consulting Company, LLC, www.uxc.com, Web page accessed July 19, 2007.
10. R. Neely and J. Combs, “Diffusion Fades Away,” Nuclear Engineering International, September, 2006.
11. Reported in “Japan Seeks Enrichment Partner,” World Nuclear News, February 23, 2007, http://www.world-nuclear-news.org/wasteRecycling/230207Japan_seeks_enrichment_partner.shtml, Web page accessed May 20, 2007.
12. G. Michaels and T. Welch, “Evaluation of Disposition Options for Reprocessed Uranium,” Oak Ridge National Laboratory Report ORNL/TM-12326, 1993.
13. “Direct Enrichment of Reprocessed Uranium at Siberian Chemical Combine,” International Business Relations Corporation (IBR) Report, proprietary, 2006.
14. G. Rothwell, “Cost and Market Structures in International Nuclear Fuel Cycles,” Trans. Am. Nucl. Soc., 96, Boston MA, June 2007.

INL/EXT-07-12107 (March 2008) Advanced Fuel Cycle Cost Basis C1-28

INL/EXT-07-12107 (March 2008) Advanced Fuel Cycle Cost Basis C2-1
Module C2
Highly Enriched Uranium Blend-down

INL/EXT-07-12107 (March 2008) Advanced Fuel Cycle Cost Basis C2-2

INL/EXT-07-12107 (March 2008) Advanced Fuel Cycle Cost Basis C2-3
Module C2 Highly Enriched Uranium Blend-down
C2-1. BASIC INFORMATION Module C2 discusses the use of U.S. and Russian government-owned highly enriched uranium (HEU)
blended down as a secondary supply to meet demand for low-enriched uranium (LEU). The introduction of such government weapons-origin LEU has a direct impact on the uranium supply chain by reducing the need for newly mined uranium, conversion capability, and enrichment services. This impact was anticipated, and the two governments agreed to control such addition into the LEU supply so as to have minimal impact on the industry.
After the end of the Cold War, nonproliferation considerations made it imperative that safe and economical means be found to disposition stockpiles of surplus HEU from the U.S. and Russian weapons complexes. Because of the quick dissolution of the Soviet Union, the security of HEU in Russia became the paramount issue. In the mid-1990s, a program was initiated under which the west would receive and purchase LEUF6 from Russia. LEUF6 is made by blending converted Russian HEU with Russian slightly enriched uranium. This bilateral U.S.-Russian “Megatons to Megawatts” program agreed to the blend-down of 500 MTU of Russian HEU with Russia receiving market value for the separative work units (SWUs) and natural uranium feed content for the LEU produced.
The U.S. private corporation United States Enrichment Corporation (USEC) acts as the U.S. agent for enrichment sales to U.S. utility customers, and Techsnabexport (known as TENEX) acts as Russia’s executive agent for sales to USEC. The U.S. agreed to purchase over a 20-year period (1994–2013), 500 metric tons (MT) of HEU (90% U-235) from Russian weapons down blended to LEU6 (4.5% U-235). The HEU is down blended in facilities at Seversk, Zelenogorsk, and Novouralsk. USEC receives the equivalent of about 30 MT/yr of HEU in the form of LEU6 derived from blend-down of Russian HEU for sale and distribution to the U.S. utility market. In return for the LEU procured from Russia at an agreed upon market price, USEC returns to TENEX natural uranium as uranium hexafluoride (UF6). This is equivalent to the natural uranium and conversion service that was incorporated into the down-blended HEU, effectively only procuring the enrichment services SWUs contained in the LEU. USEC uses the UF6 to supply utility customers in the U.S. This secondary supply of LEU, therefore, effectively represents about 5.5 million SWU annually to the U.S. market. In 2006, the 870 MT of LEU delivered to the U.S. from this program supplied approximately 40% of the nuclear power used in the U.S. and approximately 10% of overall U.S. electricity production.
The UF6 that is received by TENEX is marketed through an HEU Feed Deal Agreement to a consortium of Cameco, COGEMA (AREVA), and RWE NUKEM. The remaining UF6 that is not purchased can be returned to Russia and placed in an inventory monitored by the U.S. Department of Energy (DOE). Each year TENEX is permitted to withdraw 7,000 lb from the approximately 44 MT of monitored inventory for use in further downblending or delivery into existing contracts in Russia and the former Soviet-bloc states.
In July, 2006, the Russian Federal Atomic Energy Agency announced that Megatons to Megawatts would not be renewed past its 2013 expiration date. While it is possible that Russian downblending activities will continue, it appears that Russia views direct control over the marketing of the LEU product to be advantageous. Although this development was not unexpected, it is now certain that domestic utilities will need to look elsewhere to secure the 40-50% of their annual requirements that are currently being served by Megatons to Megawatts.
Figure C2-1 is a schematic of the U.S.–Russian Megatons to Megawatts program.

INL/EXT-07-12107 (March 2008) Advanced Fuel Cycle Cost Basis C2-4
Figure C2-1. Megatons to Megawatts Program.1
The U.S. has its own version of the Megatons to Megawatts Program declaring an excess of 174.3 tons of HEU from the weapons program. This HEU has a U-235 content from 50 to 90+% with various amounts of impurities. Some of this material was of sufficient quality to be down blended at USEC’s Portsmouth Plant (14.2 MT HEU) with additional downblending in progress at BWX Technologies in Lynchburg, Virgina (46.6 MT HEU). These two downblending campaigns were completed in July 1998 and September 2006, respectively. Some of the U.S. Government “off-spec” HEU (reprocessed HEU with U-236 and slight fission product/transuranic contamination) has been processed and blended down under the BLEU (Blended Low Enriched Uranium) program. The material (~39 MT HEU) is decontaminated at the Savannah River Site in Aiken, South Carolina, and shipped to Nuclear Fuel Services in Ervin, Tennessee, for blend-down to LEU for use in Tennessee Valley Authority reactors. The approximately 120 MT HEU remaining in DOE inventory represents a reserve of about 21,000 MT of natural uranium equivalent, roughly one year’s supply for the domestic reactor fleet at current consumption rates.
The down-blended LEU has purposely not been made available for sale in the U.S. to avoid a significant negative impact on the uranium supply and conversion vendors (see Section C2-9). The U.S. is currently evaluating direct sale of HEU for blend-down to LEU by U.S. vendors. DOE will continue to control the entry of the HEU to LEU into the market. In fact, the probable DOE strategy calls for its sales from all sources to not exceed 10% of the annual domestic requirements, i.e., about 2000 MT natural uranium equivalent per year. While the bulk of DOE sales over the next decade are expected to come from downblended HEU, off-spec and otherwise, the HEU represents only a minority of DOE’s total reserve of about 52,000 MT natural uranium equivalent. The remainder of the DOE inventory is in the form of UF6; while most of this is unenriched natural uranium, part (9000 MT natural uranium equivalent) is termed “depleted uranium of economic value.” The assays in this stockpile are variable but never less than 0.4% U-235.

INL/EXT-07-12107 (March 2008) Advanced Fuel Cycle Cost Basis C2-5
C2-2. FUNCTIONAL AND OPERATIONAL DESCRIPTION Russian HEU to LEU⎯The product received by USEC is EUF6 in small UF6 cylinders of 4 to 5%
U-235 content shipped from St. Petersburg, Russia, to a U.S. port and eventually DOE’s Portsmouth site, which is leased by USEC. At Portsmouth, it can be further blended to the light water reactor utility’s exact U-235 assays before shipment to a fuel fabricator. Under USEC’s arrangement it is receiving only SWU from Russia, not uranium. USEC is obliged to return the uranium content of the EUF6 to Russia. Typically the USEC sells Russian LEU to their customers and returns to the Russians natural uranium that those customers gave USEC to enrich.a
The conversion of Russian nuclear weapons takes place at several locations. It begins with the removal of the warheads and their HEU metal components from strategic and tactical nuclear missiles. The HEU warhead components are machined into metal shavings. The shavings are then heated and converted to an HEU oxide, and any contaminants are chemically removed. The HEU oxide is converted to highly enriched UF6, a compound that becomes a gas when heated. The highly enriched UF6 is introduced into a gaseous process stream. There, it mixes with other material and is diluted to less than 5% concentration of the fissionable U-235 isotope. The now low-enriched UF6 fuel is checked to ensure the product meets commercial specifications and is then transferred to 2.5-ton steel cylinders. The uranium fuel is enclosed in shipping containers and sent to a collection point in St. Petersburg. USEC takes possession of the fuel containers in St. Petersburg and they are shipped to USEC’s facilities in the U.S. (originally the Portsmouth plant but now the Paducah plant). The LEU is tested again to ensure that it meets appropriate commercial and customer specifications. If necessary, the enrichment level of the uranium fuel can be further adjusted to meet utility customers’ needs. Based on customer instructions, USEC ships the LEU fuel to fabricators (Global Nuclear Fuel, Framatome, or Westinghouse), who convert the LEU into uranium oxide pellets and fabricate them into fuel assemblies. The assemblies are then shipped to USEC utility customers as a source of fuel for their nuclear reactors.
U.S. HEU to LEU⎯Unlike conversion facilities in the Russian Federation, U.S. facilities must convert HEU metal into uranyl nitrate hexahydrate (UNH). The blended UNH product is delivered to fuel fabricators where it can be further converted to uranium oxide powder and pelletized for use in fuel rods. At the Savannah River Site, off-specification material from weapons production was dissolved and processed through H Canyon (a large chemical fuel reprocessing plant) to remove impurities, blended with natural uranium supplied by industry, and shipped as a UNH solution to Nuclear Fuel Services in Erwin, Tennessee. Nuclear Fuel Services will convert HEU metal and unirradiated uranium-aluminum alloy into uranyl nitrate solutions as well. The UNH solutions from Savannah River Site and Nuclear Fuel Services will be converted by Nuclear Fuel Services to LEU oxide powder. The oxide will be shipped to Richland, Washington, where it will be prepared and pressed into fuel pellets and built into fuel assemblies by Framatome Advanced Nuclear Products to be used in Tennessee Valley Authority reactors.
C2-3. SCHEMATIC OF PROCESS Figures C2-2 and C2-3 show simplified flow diagrams for the Russian and U.S. processes ‘currently’
being deployed to blend down excess weapons HEU material to LEU for use in commercial reactors.
a. USECs 2006 K-10 SEC filing.

INL/EXT-07-12107 (March 2008) Advanced Fuel Cycle Cost Basis C2-6
Figure C2-2. Russian HEU to LEU blend process.

INL/EXT-07-12107 (March 2008) Advanced Fuel Cycle Cost Basis C2-7
Figure C2-3. Generic U.S. off-specification HEU to LEU blend process.

INL/EXT-07-12107 (March 2008) Advanced Fuel Cycle Cost Basis C2-8
C2-4. MODULE INTERFACE DEFINITIONS HEU blending essentially is an alternative to the steps of mining and milling, U3O8 to UF6
conversion, and uranium enrichment. The EUF6 product is provided directly to the fuel fabricator (basically the same product as from Module C1).
C2-5. MODULE SCALING FACTORS Scaling factors do not apply to this model. Twenty-five to 30 MTU of HEU are blended annually.
C2-6. COST BASES, ASSUMPTIONS, AND DATA SOURCES Cost and Pricing. USEC and TENEX are actually paid as they are supplying commercial enrichment
and natural feed services. The Russians charge an enrichment price in the low range of commercial enrichment prices. The buyer must provide the natural uranium content and value associated with the LEU. This can be done by a payment or actually providing Russia with U3O8 or NatUF6. “Flag Swaps” on uranium possession between nations can also be used to avoid transportation costs.
The actual cost of the blending operations is not known. The western value of EUF6 at commercial ore, conversion, and enrichment sources is around $800 to 1,100/kgU. The costs of enrichment to HEU are sunk costs to Russia, which were realized decades ago. Ninety percent of U-235 HEU is worth $35,000/kgU at western commercial ore and SWU prices, but there is no legitimate market for this today. It is estimated that the cost of conversion and blending in Russia is a small fraction of what they realize from their sales. All operations, including tails enrichment, HEU oxidation and fluorination, and blending, probably cost Russia less than $100 per kg of LEU sold. For purposes of modeling the impacts of HEU blend-down, the impact is only one of supply. The actual market price will be kept reasonably close to (and slightly below) the market price for EUF6, which originated from natural uranium.
C2-7. LIMITATIONS OF COST DATA No actual Russian or U.S. cost data are available. Modelers and forecasters can make the assumption
that the cost impact from current or future HEU to LEU blend-down will follow the general market trends with the effective cost of Russian SWUs being close to the open market SWU cost. Neither market penetration nor HEU/LEU cost contracts are expected to do anything to make a dramatic impact on the basic supply demand chain.
C2-8. COST SUMMARIES Because the basis for this program is government driven, the politics of HEU reduction becomes a
more important factor than economics. See Section C1-8 in Module C1 for cost summaries relative to market driven SWUs and assume this program will have some parity to those assumptions.
It can be assumed that the equivalent of 30 MT of HEU will continue to enter the market through the end of the current agreement (2013). The U.S. entry into the LEU market will be gradual and controlled so as to have minimal impact on the uranium supply market. It can be further suggested that because the U.S. and Russia have considerably more HEU in the stockpiles, the Russian agreement for HEU purchase and accompanying U.S. reduction as well could continue for at least another decade. The impact is only to minimize the squeeze on producing newly mined uranium over the next two decades should growth in nuclear power become more prevalent.

INL/EXT-07-12107 (March 2008) Advanced Fuel Cycle Cost Basis C2-9
C2-9. SENSITIVITY AND UNCERTAINTY ANALYSES Figure C2-4 is a conceptual illustration of the effect of sales of blended-down HEU, or any other
government-held uranium inventory, on the market. The blue curve shows the price-supply relationship for primary uranium from mines. The dark red curve is the demand curve; some elasticity is afforded by the ability of utilities, over the medium term, to adjust the enrichment of tails, so the curve is not vertical. If no secondary supply sources exist, point 1 is the market clearing point.
Quantity [kg U]
Pric
e [$
/kg
U] Tails Fraction
= 0.1%
0.3%
0.4%
1. Market Cleared,No Gov’t Sales
Gov’t Sales
2. New MarketClearing State
Supply
Demand
0.2%
3. Amount of PrimaryU Supplied
Quantity [kg U]
Pric
e [$
/kg
U] Tails Fraction
= 0.1%
0.3%
0.4%
1. Market Cleared,No Gov’t Sales
Gov’t Sales
2. New MarketClearing State
Supply
Demand
0.2%
3. Amount of PrimaryU Supplied
Figure C2-4. Effect of down blended HEU sales on the uranium market.
If government decides to place some uranium on the market, both the price and quantity supplied will change. This secondary uranium may come from government stockpiles as well as HEU blend-down; in fact, the secondary source of uranium could be in private hands, for example utility or producer inventories. Regardless of the source, the secondary uranium has the dual effect of reducing the amount of primary uranium supplied and reducing the market price. In the figure, the quantity of secondary uranium placed on the market is represented by the line connecting points 2 and 3. The secondary uranium essentially shifts the supply curve to the right by this amount, so that point 2 becomes the new market clearing state and point 3 is the amount of uranium supplied by mines. Since the uranium price has decreased, utilities choose to consume less SWU in exchange for more uranium so that the optimal tails enrichment increases.
A situation like the one shown in the figure existed through the 1990s as utilities consumed uranium from stockpiles while down-blended HEU and other varieties of secondary uranium appeared on the market as well. This situation is somewhat analogous to dumping situations that occur from time to time in commodity markets, and its effect of suppressing primary supply over time is well known. Indeed, it is for this reason that DOE has constrained itself to sell only limited quantities of its surplus uranium over the next decade.

INL/EXT-07-12107 (March 2008) Advanced Fuel Cycle Cost Basis C2-10
C2-10. BIBLIOGRAPHY Bunn, M., “Blending Down HEU: National Security and Market Competition Perspectives,” Presentation
to World Nuclear Fuel Market 2003, Boston, Massachusetts, June 2003.
Bunn, M., Reducing Excess Stockpiles: U.S. Highly Enriched Uranium Disposition, NTI Web site, http://www.nti.org/e_research/cnwm/reducing/heudispose.asp, last updated March 3, 2003, accessed December 14, 2005.
ISIS, Chapter VIII, “Military and Excess Stocks of Highly Enriched Uranium (HEU) in Acknowledged Nuclear Weapons States,” in Global Fissile Material Inventories, Institute for Science and International Security, Revised June 25, 2004; http://www.isis-online.org.
NTI, “Russia: Overview of the U.S.-Russian HEU Agreement,” http://www.nti.org/db/nisprofs/russia/fissmat/heudeal/heudeal.htm, last updated February 26, 1999.
Nuclear Fuel Services, NFS News, www.nuclearfuelservices, NFS News, Web site accessed March 1, 2006, July 2005.
Nuclear News, “Companies Amend Deal for U from Old Weapons,” August 2004.
Tousley, Dean, “U.S. Highly Enriched Uranium (HEU) Disposition—Overview,” NEI Nuclear Fuel Supply Forum, January 26, 2005.
United States Enrichment Corporation Web site, “Megatons to Megawatts,” www.usec.com.
U.S. Department of Energy, “Megatons to Megawatts: Turning Russian Nuclear Warheads into Fuel: Step by Step,” viewgraph.
U.S. Department of Energy, Office of Nuclear Energy, Report on the Effect the Low-Enriched Uranium Delivered Under the HEU Agreement Between the Government of the Unites States and the Government of the Russian Federation has on the Domestic Uranium Mining, Conversion, and Enrichment Industries and the Operation of the Gaseous Diffusion Plant, www.ne.doe.gov/reports/, Annual Reports 1999–2004.
U.S. Department of Energy, “Proposed Long-Term Uranium Sales Strategy,” DOE Offices of Nuclear Energy, Environmental Management and Defense Nuclear Nonproliferation, http://www.ne.doe.gov/pdfFiles/proposedDoeLtUraniumSalesStrategyIndustryPresentationAug%204th2006.pdf, August 4, 2006, webpage visited May 15, 2007.
World Nuclear Association, WNA Trade Briefing, “The U.S.-Russia HEU Agreement,” August 1999.
C2-11. REFERENCES 1. United States Enrichment Corporation (USEC),
www.usec.com/v2001_02/content/Megatons/MegatonstoMegawattsSnapshot.pdf, Web site accessed July 6, 2007.

INL/EXT-07-12107 (March 2008) Advanced Fuel Cycle Cost Basis D1-1
Module Series D1
Fabrication of Contact-handled Fuels (Summary for Modules D1-1 through D1-9)

INL/EXT-07-12107 (March 2008) Advanced Fuel Cycle Cost Basis D1-2

INL/EXT-07-12107 (March 2008) Advanced Fuel Cycle Cost Basis D1-3
Module Series D1
Fabrication of Contact-handled Fuels
INTRODUCTION Fuel fabrication represents the set of chemical, ceramic/metallurgical, and mechanical steps that take
a basic chemical form of the fissile material (such as enriched UF6 product from an enrichment plant or other fissile chemical forms from a reprocessing plant) and convert it to finished fuel assemblies and associated hardware ready for insertion into the reactor as either first cores or reloads. The nature of these facilities and operations is affected by the following factors:
1. Type of reactor system (Module R) into which the fuel will be charged and its associated peak temperatures, fuel heat transfer considerations, reactor moderator/coolant chemistry, fuel fissile enrichment (% U-235, fissile plutonium and other actinide isotopes, or U-233 in the diluent fuel materials), and desired fuel burnup. Fissile isotope enrichment level is important because it defines the batch sizes and equipment sizes that can be accommodated in a fuel fabrication plant that is safe from a nuclear criticality standpoint. The choice of the fuel fissile material also affects the facility design from a safety and environmental standpoint, because some elements, such as plutonium and other higher actinides, present a significant radiotoxicity hazard. As noted below, the nature of the radioactivity of the elements within the fuel will determine whether fuel is “contact-handled” and will be covered in this D1-series of modules or is “remote-handled” and will be covered in the F2/D2 module. The nature of the fuel-handling environment has a very strong effect on fuel fabrication design and ultimately fuel fabrication unit costs. Nonproliferation is another factor that is also becoming increasingly important in assessment of fuel types. The “attractiveness level” to a potential proliferator will depend on the fuel’s radiological and isotopic properties and its physical form. As closed fuel cycles are considered, the compatibility of the fuel form with the associated spent fuel reprocessing scheme (Modules F1 and F2/D2) must also be considered. The fact that new fuel might be refabricated from reprocessing plant “products” is another economic consideration, since “avoided costs” for other fuel cycle steps come into play.
Fabricated fuel assemblies take many different physical forms. Every September, Nuclear Engineering International (Ref 0-a) publishes diagrams and design data for fuel assemblies required by most of the world’s commercial reactors, i.e., pressurized water reactors (PWRs), Voda-Vodyanoi Energetichesky Reaktors (VVERs; Russian pressurized water reactors), boiling water reactors (BWRs), and heavy water reactors (HWRs).
2. The regulatory and quality assurance requirements for the fuel as stated in the fuel specification, i.e., American Society for Testing and Materials (ASTM) International “specs” for enriched uranium oxide (EUO2) and light-water reactor (LWR)-mixed oxide (MOX) fuel. These specifications define the morphology, mechanical properties, and allowed impurity levels in the fuel. The intent is to minimize the probability of fuel failure or leakage of fission products into the reactor coolant/moderator. Whatever matrix or containment in which the base fuel form resides, such as a pellet or particle, must be able to confine fission product noble gases and other volatile radionuclides over the duration of irradiation exposure. This means that any fuel types used by electrical utilities must have undergone a rigorous fuel qualification process, which is likely to include the irradiation and postirradiation examination of test fuel ampoules and lead test assemblies.
3. The fuel form must be capable of safe and secure transport and storage both as unirradiated fuel and as spent fuel. The integrity of the cladding or fuel matrix must be maintained at all times.

INL/EXT-07-12107 (March 2008) Advanced Fuel Cycle Cost Basis D1-4
The following assumptions are made for the cost analysis for Module D1:
1. Nine types of fuel will be considered: (1) ceramic UO2 LWR fuel in the form of clad pellets (Section D1-1), (2) ceramic MOX (UO2/PuO2) LWR fuel in the form of clad pellets (Section D1 2), (3) gas-cooled reactor fuel in the form of coated particles in a graphite matrix (Section D1-3), (4) ceramic pellet fuel for use in sodium-cooled fast reactors (Section D1-4), (5) ceramic vibrocompacted fuel for use in sodium-cooled fast reactors (Section D1-5), (6) metallic and alloyed fuels for use in sodium-cooled fast reactors (Section D1-6), (7) natural or slightly enriched clad pellet fuels for use in heavy-water moderated CANDU type reactors (Section D1-7), (8) fuels involving the use of thorium as a fertile material, including “seed-blanket” concepts (Section D1-8), and (9) “advanced fuels,” which will include dispersion and inert matrix fuels (Section D1-9). Each of these fuels will be treated in the subsequent writeups as if it were a separate module. The subsection numbering for D1 will subdivide each fuel’s section into the same ten topics (N.1 through N.10; N=1 through 9 depending on fuel type) as if it were a stand-alone module.
2. For this Module D1, all nine fuel types are assumed to be contact-handled. This means that the radioactivity level of the fresh, unirradiated fuel is low enough that the rods and fuel assemblies can be safely handled outside of hot cells. (Gloveboxes may be required, however.) This would mean that the fuel handled is likely to be uranium, plutonium, or plutonium with small amounts of neptunium. This is in contrast with the fuels discussed in Module F2/D2 that originate from a non-PUREX recycling (reprocessing) process and are not separated to the extent that they can be contact handled. These fuels are likely to contain significant amounts of higher actinides, such as americium and curium, and may also include some unseparated fission products such as elements from the lanthanide series. Some of these remote-handled fuels will need to be refabricated in a hot-cell immediately adjacent to a electrochemical reprocessing step and involve inherently simple metallurgical operations such as direct injection-casting of fuel rods. These Module F2/D2 fuels are likely to be metal alloy fuels such as those envisioned for the General Electric/Materials and Fuels Complexa Integrated Fuel Recycle fuel cycle. Fuel materials, such as oxides, arising from an aqueous reprocessing process, such as UREX 1-a, where higher actinides and small amounts of lanthanides are not separated out, also would require remote refabrication. Because of the integral nature of reprocessing and refabrication for this technology, the F2 and D2 modules are combined.
3. Transportation costs from the fuel fabricator to the reactor are included as part of the fabrication cost. For fuels that can be contact-handled, these costs are generally quite small compared to the manufacturing costs.
4. For enriched uranium fuels, the feed material to the fabrication plant is assumed to be either virgin or aqueously reprocessed UF6 from enrichment plants or blending facilities. For natural uranium-fueled or thorium-fueled reactors, the feed material is assumed to be a clean “nuclear-grade” oxide from a mill or processor. No fluorine-related steps are required. For MOX fuels (both LWR and foreign reactor) the feed material is assumed to be clean PuO2 or (Pu, Np)O2 powder from an aqueous reprocessing plant or from a facility capable of preparing clean PuO2 from weapons program feedstocks. “Virgin” uranium or thorium fuel materials are those that are not derived from previous irradiation and reprocessing. Enriched uranium prepared from natural (ore-derived) uranium feed is one such material.
5. The level of technical readiness or deployment varies tremendously by the type of fuel considered. The production of LWR fuels is a highly mature private industry, while other fuel types are still in the bench scale or pilot plant development stage of an overall fuel process qualification program.
a. Beginning February 1, 2005, the name of the Idaho National Engineering and Environmental Laboratory (INEEL) was changed to Idaho National Laboratory (INL). Argonne National Laboratory-West (ANL-W) was renamed the Materials and Fuels Complex (MFC).

INL/EXT-07-12107 (March 2008) Advanced Fuel Cycle Cost Basis D1-5
A cost summary is provided below for each of the nine types of fuel (see Table D1-1). Note that no single reference had up-to-date and “apples-to-apples” comparisons for the costs of fabricating different fuel types. The only documents (Refs 0-b and 0-c) found that presented a uniform costing methodology for all fuel types were prepared nearly 30 years ago by ORNL for the International Nuclear Fuel Cycle Evaluation (INFCE) effort. The data therein may be useful to consider on a comparative basis; merely updating the costs therein for general inflation from 1979 to 2007 would not cover all the cost-affecting changes in the regulatory, security, and financial environment surrounding new nuclear projects in the U.S.
Table D1-1. Cost summary table.
What-It-Takes (WIT) Table (updated to 2007 constant $)
Reference Cost(s) Based on Reference
Capacity
Reference Cost Contingency
(+/- %) (Low Cost)
Upsides (High Cost) Downsides
(Nominal Cost) Selected Values
D1-1 LWR UO2 Fuel Fab
Only unit fuel costs available: $240/kgU for PWR $290/kgU for BWR
Not available $200/kgU for PWR
$250/kgU for BWR
$220/kgU for PWR REPU
$275/kgU for BWR REPU
20% or less increase if higher enrichment (>5% U-235), higher burnup fuels produced
$300 for PWR
$350 for BWR
$400/kgU for PWR REPU
$450/kgU for BWR REPU
$240/kgU for PWR $290/kgU for BWR, for today’s LWR fuel designs
$290/kgU for PWR REPU, and $350/kgU for BWR REPU
D1-2 LWR MOX Fuel Fabrication
“Overnight” capital cost for 120 MTHM/yr plant: $1,200 M Unit cost from private plant of above capacity with guaranteed market and guaranteed loan: $1,500/kgHM
Not available Larger plant size (additional lines) or multishift operation should bring down unit cost
Unit Cost=$2000/kgHM
Use of “dirty” MOX with oxides of higher actinides (curium, neptunium, etc) will drive up capital, operating, and unit costs and perhaps, depending on concentrations, require remote handling.
Unit Cost=$4000/kgHM
Stay with reference cost for “normal” MOX: Cap=$2.5B for 120 MT/yr; Unit=$3,200/kgHM
D1-3 Gas-Cooled Reactor particle Fuels
No good data on plant capital costs; Today’s 8–19.9% U-235 unit fab cost probably $25,000/kgU
Not available Development of a reliable, highly automated TRISO process in a central large facility:
$7500/kgU
Quality or process development difficulties. Use of PuO2 kernels
$30,000/kgU
If automated process is successful: $10,000/kgU

Table D1-1. (continued).
INL/EXT-07-12107 (March 2008) Advanced Fuel Cycle Cost Basis D1-6
What-It-Takes (WIT) Table (updated to 2007 constant $)
Reference Cost(s) Based on Reference
Capacity
Reference Cost Contingency
(+/- %) (Low Cost)
Upsides (High Cost) Downsides
(Nominal Cost) Selected Values
D1-4 Ceramic Pelletized Fast Reactor Fuel
No good data on plant capital costs: Reference unit cost: $2,300/kgHM from centralized, private 50 MT/yr facility with loan and market guarantee
Not available $3,200/kgHM
Blanket: $350/kgU
Many of same factors affecting SRS-MFFF would affect this cost. (see Module D1-1) $6,000/kgHM
Blanket: $700/kgU
Core (driver fuel): $4,000/kgHM
Blanket: $500/kgU
D1-5 Ceramic Vibrocompacted Fast Reactor Fuel
No data available No data available Could be cheaper process than pelletization (fewer steps)
Difficulties in development/automation
$3,600/kgHM if VIPAC assumed 10% cheaper than pellet fast reactor MOX
D1-6 Metallic or Alloyed Fast Reactor Fuel
See Section D.2 for remote handled. No data available on fab part of recycle process only.
No data available No data No data See F2/D2
D1-7 CANDU Fuel
No fab plant capital cost data available. Unit cost= $135/kgU
No data available None identified
$110/kgU
Use of enrichments over 1% U-235
$150/kgU
Use reference value of $135/kgU
D1-8 Thorium-based Fuels
(U,Th)O2 pellet fuel No data $800/kgHM in Russia (HM is U+Th). Includes SWU component in uranium cost.
Longer fuel life than for LEUO2
$3,000/kgHM
Higher fuel production costs due to need for 19.95% EU and HVAC modifications
$1,600/kgHM in West

Table D1-1. (continued).
INL/EXT-07-12107 (March 2008) Advanced Fuel Cycle Cost Basis D1-7
What-It-Takes (WIT) Table (updated to 2007 constant $)
Reference Cost(s) Based on Reference
Capacity
Reference Cost Contingency
(+/- %) (Low Cost)
Upsides (High Cost) Downsides
(Nominal Cost) Selected Values
Pu-Zr metal fuel for RTPI Pu-disposition application (in tandem with (U,Th)O2 blanket)
No data High annual consumption of surplus plutonium in LWR
Having both metal seed and pellet oxide blankets make very complicated and expensive fuel. Long and expensive fuel qualification program needed
$27,000/kg metal (U.S. or Russia) for Pu-Zr driver [seed] fuel
D1-9 “Advanced” Fuels (No cost data available)
BWR=boiling water reactor EU=enriched uranium HVAC=heating, ventilation, and air conditioning LEU=low-enriched uranium
LWR=light water reactor MOX=mixed oxide PWR=pressurized water reactor RTPI=Radkowsky Thorium-Plutonium Incinerator

INL/EXT-07-12107 (March 2008) Advanced Fuel Cycle Cost Basis D1-8

INL/EXT-07-12107 (March 2008) Advanced Fuel Cycle Cost Basis D1-9
Module D1-1
LWR UO2 Fuel Fabrication

INL/EXT-07-12107 (March 2008) Advanced Fuel Cycle Cost Basis D1-10

INL/EXT-07-12107 (March 2008) Advanced Fuel Cycle Cost Basis D1-11
Module D1-1
LWR UO2 Fuel Fabrication
D1-1.1. BASIC INFORMATION Fuel Form. Low-enriched uranium (LEU) light water reactor (LWR) fuel for both pressurized water
reactors (PWRs) and boiling water reactors (BWRs) is in the form of ceramic enriched UO2 (EUO2) sintered pellets stacked inside long (up to 14 ft, depending on the reactor size and manufacturer), sealed Zircalloy (or other Zirconium-based alloys such as Zirlo, E-110, M-5, etc.) tubes. A Western fuel assembly consists of a square (n × n) array of these tubes separated by spacers and held in place via clips and springs. Most of the hardware holding the tubes is also made of Zircalloy or a similar zirconium alloy. The upward flowing water (PWR) or steam/water mixture (BWR) removes the nuclear-generated heat by contacting the outside surface of the Zircalloy tubes enclosing the pellets. Before sealing, the tubes are pressurized to counteract the reactor coolant’s external pressure on the cladding. The tubes are also designed to handle the pressure of any fission product gases generated during fuel irradiation.
D1-1.2. FUNCTIONAL AND OPERATIONAL DESCRIPTION Status of the Industry. Production of such LWR fuel assemblies is a highly mature industry and is
totally privatized in the U.S. Because of the need to specifically tailor the fuel to the reactor, most of the companies manufacturing LWR assemblies are also affiliated with the ones that design the nuclear steam supply system for the reactor using the fuel. Table D1-1-1 lists the LWR fuel fabricators in the U.S. and the capacities in terms of MTU/yr for their facilities. This is a highly competitive nuclear business, and because of recent worldwide oversupply1 and general consolidation2 of the nuclear business, the number of plants in the U.S. has dropped to four. This over-supply situation, however, is ending, with the onset of the “Nuclear Renaissance.” LWR fuel fabrication business is highly international, and there are at least eight countries outside of the U.S. that have LWR fuel fabrication plants. Some of these foreign companies are considering significant expansion of their business.3,4,5 Some of these foreign companies sell fuel to U.S. utility customers; however, this requires that the fuel production process and the fuel itself be certified by the U.S. Nuclear Regulatory Commission (NRC) just as it would be for a domestic fabricator. Figure D1-1-1 shows a BWR and a PWR fuel assembly manufactured by Global Nuclear Fuel Americas and AREVA NP, respectively.
Table D1-1-1. LWR fuel fabrication capacity in the U.S.
Plant Owner Location Capacity in
MTU/yr Fuel Type AREVA NP Lynchburg, Virginia 600 PWR (fuel assembly
only, no pellet production)
AREVA NP (formerly Siemens)
Richland, Washington 900 Mainly BWR, some PWR
Global Nuclear Fuel Americas, LLC ( GE Energy, Toshiba, Hitachi)
Wilmington, North Carolina 1,100 Mainly BWR
Westinghouse Nuclear Fuel
West Columbia, South Carolina 1,150 PWR, some VVER

INL/EXT-07-12107 (March 2008) Advanced Fuel Cycle Cost Basis D1-12
Fuel fabrication is a highly “campaigned” business, i.e., the production of the UO2 powder and subsequent steps are designed to meet the utility customer’s enrichment needs and the utility’s reload schedule. Each campaign may take several weeks, with time required between campaigns to retool for the next utility’s requirements.
D1-1.3. PICTURES AND SCHEMATICS Fuel Fabrication Process. Figure D1-1-2 shows the basic steps in
the generic LWR fuel fabrication process. The process shown is an environmentally preferable and predominant “dry” process in which there are no aqueous steps in the main process. (There may be some aqueous or “wet” steps in the scrap recycle/recovery lines for such plants, however). Most U.S. manufacturers have migrated toward the dry process and have already qualified LEUO2 fuel prepared in this way.
The first step in the process is a chemical one, “EUF6 to EUO2 conversion.” It is basically the same as the DUF6 to DU3O8 process described in Module K1, except in this case the fuel is enriched in U-235, and the typical plant EU throughput quantities (400 to 1,500 MTU/yr) are three to four orders-of-magnitude smaller than those in the proposed plants for converting enrichment plant waste or “tails” UF6 depleted in U-235. Because the enrichment levels for EUO2 are typically from 2 to 5% U-235, there are some criticality considerations in processing LWR fuel, and batch sizes must be limited. Quality assurance considerations
are also important at every step. The EUO2 powder from the first step must meet a very high purity and morphology specification (ASTM fuel spec) to be used in LWR fuel. The specified low impurity levels and particle size/flowability requirements ensure that the UO2 will not attack the fuel cladding in the reactor and that the EUO2 powder will sinter into a strong and stable pellet. For this reason, the cost per kgU for this first EUF6 to enriched oxide conversion step is at least an order of magnitude higher than the $3–8/kgU required to convert depleted UF6 as discussed in Module K1. This conversion or “powder preparation” cost is eventually rolled into the overall fabrication $/kgU cost/price of the fuel assembly. The second step involves adjustment of the powder U-235 enrichment to meet the customer’s requirement. This is done by blending it with small amount of preexisting enriched blendstock. A binder and flowability enhancer may also be blended with the EUO2 powder to assist the pellet production steps, which are pressing the “green” pellet; sintering it to a homogeneous, hard ceramic structure; and grinding and finishing it such that it meets dimensional specifications; and loads easily into the Zircalloy tubes. Pellet inspection and loading into tubes is an automated process requiring limited human interaction. Once the tubes are loaded, they are pressurized and welded shut. The washed tubes are then transported to the fuel bundle assembly room where the structural or “skeleton” hardware is added. This operation is semiautomated and requires careful inspection and handling so that the tubes are not damaged and are inserted in the correct array positions. Among the major operations costs involved in the above steps are manufacturing and support personnel and the purchase or onsite manufacturing of Zircalloy tubes and assembly parts. As NRC-licensed fuel cycle facilities under 10 CFR 70, LWR fuel fabrication facilities are also subject to regulatory costs such as inspections. The above recurring operations costs, however, can be partially offset by the sale of hydrogen fluoride (HF) from the UF6 to UO2 conversion step if a buyer of very slightly uranium-contaminated HF can be found. Finished fuel assemblies are hung vertically for storage prior to shipping to light water nuclear power plants (Module R1).
Figure D1-1-1. BWR and PWR fuel assemblies.

INL/EXT-07-12107 (March 2008) Advanced Fuel Cycle Cost Basis D1-13
Figure D1-1-2. Generic LWR fuel fabrication process.
D1-1.4. MODULE INTERFACE DEFINITION Front-end interface. The EUF6 is received from the enrichment plant in 2.5 MTU “30B” type
cylinders. These criticality-safe cylinders must be “overpacked” during transportation from the enricher or blender in a certified container. The chemical toxicity hazard associated with fluorine product (gaseous HF) release in a transportation accident is far more serious than the small radioactivity level associated with the uranium product UO2F2 (solid particles). (Released UF6 reacts with the moisture in the air to form HF and UO2F2.)
Back-end interface. When ready for transportation, the finished fuel is loaded in special shock-absorbing packages, which are then enclosed in wooden crates. Commercial carriers usually transport these packages on flat bed trucks to the LWR plant sites. The ceramic UO2 form in sealed tubes is a very safe form for transportation, and the external radiation hazard is quite low.
D1-1.5. MODULE SCALING FACTORS Scaling factors are not relevant for this step. Additional LWR fuel fabrication capacity could be
added by reopening existing shutdown lines, constructing new additional lines, or by operating existing lines on more than one shift. New capacity would probably be added at an existing site. A recent ANS paper by Rothwell5 discusses the scaling issue.
D1-1.6. COST BASES, ASSUMPTIONS, AND DATA SOURCES Unlike uranium ore, natural U3O8 to UF6 conversion, and enrichment prices, LEU fabrication prices
(and costs) are unpublished and considered proprietary information. This is partly because each fuel fabrication batch is custom-suited to the utility’s core design, and its price is separately negotiated. There are some nuclear consulting firms like NAC International and TradeTech that legally obtain data on such matters from users, which is then made available in “sanitized” report form6 to utilities and other parties at a price too high for this project to use. It has been possible; however, to calculate approximate LEU fabrication pricing over many initial and reload fuel batches. Table D1-1-2 shows ranges and reference values for four data sources for LWR fuel fabrication. The price is expressed in $/kg heavy metal or $/kgHM and normally includes the cost of converting the EUF6 to EUO2. Because the only fissile material

INL/EXT-07-12107 (March 2008) Advanced Fuel Cycle Cost Basis D1-14
Table D1-1-2. LEU fuel fabrication prices in $/kgHM ($/kgU).
Study/Yr/Ref # Low Value Medium or
Reference Value High Value
Energy Resources International(ERI)/2007/7
207 (PWR in U.S.) 276 (BWR in U.S.)
NECDB/1988/8 170 200a 280
NEA-OECD/1994/7 200 275 350
J. James & K. Williams/1999/9 180 (PWR)
Harvard (Bunn et al.)/2003/10 150 250b 350
MIT/2003/11 275
Delene, Williams, et al./2000/12 200 270 300
a. Higher burnup fuel would add $20/kgU to this cost.
b. Bunn suggests that the cost (as opposed to price) is on the order of $200/kgU based on data of Varley and Collier.13 Bunn also suggests low, medium, and high penalties of $5, $15, and $25 per kgU, respectively, for handling reprocessed LEU in the fabrication plant. NEA-OECD = Nuclear Energy Agency-Organization for Economic Cooperation and Development MIT = Massachusetts Institute of Technology References 14, 15, and 16 present similar ranges to above, i.e., $200 to $300/kgU
c. ERI reports European prices to be 30% higher than U.S.; East Asian prices 60% higher than U.S.
is uranium, $/kgHM is the same as $/kgU in this case. These prices are for unirradiated or “virgin” LEU, and not LEU that arises from spent fuel reprocessing. (A price penalty of 5 to 10% of the unirradiated LEU fuel cost is assessed to cover the additional safety and radiation-related costs of handling reprocessed uranium and its trace fission products and higher actinides. This has been done mainly in Europe where reprocessing of spent LWR fuel is commonplace. The use of reprocessed uranium (REPU) is discussed in more detail at the end of this section). The real prices for LEU fabrication have been decreasing slightly over the last 15 years. This has been due mainly to overcapacity, higher fuel burnup, increased automation, and the use of now fully amortized plants. Because the nuclear fuel market is now beginning to tighten, fuel fabrication costs are likely to rise. Other factors that may drive fuel fabrication prices up are:
1. As longer fuel cycles and extended burnup of LEU fuels are required for economic reasons,17 the performance requirements for cladding and fuel integrity will become more stringent. The fabricator’s research and development and other costs to allow high burnup will be passed along to the fuel buyer. Perspectives on LWR fuel development are presented in an article by Gunnar and Junkrans.18
2. Higher burnups may require LEU fuels of enrichments greater than the 5% maximum U-235 assay now used as the NRC-licensing basis for LEU fuel fabrication facilities. Retrofitting and relicensing costs will have to be passed along to utility customers. The intent is that higher burnups will eventually result in a low “mills/kWh” fuel component for the overall electricity generation cost. This reduction will be the result of the fact that less enriched uranium fuel will be required per kWh generated. Reference 19 discusses the effect of higher burnup on overall “front-end” UO2 costs and nuclear design parameters. Reference 20 discusses how the choice of higher burnup fuel would affect the fuel steps (modules) downstream of the reactor.

INL/EXT-07-12107 (March 2008) Advanced Fuel Cycle Cost Basis D1-15
In general, BWR fuel fabrication prices are somewhat higher than PWR prices because of the greater complexity of the former fuel assemblies. Foreign fuel fabrication prices are higher than in the U.S. In 1994, the Organization for Economic Cooperation and Development price range, which in addition to U.S. data contains foreign data, was higher than any of the other ranges in Table D1-1-3. For future U.S. studies and nonreprocessed fuel enrichments less than 5% U-235, the following reference values are suggested by the author: $220/kgU for PWR assemblies and $270/kgU for BWR assemblies. For reprocessed LWR UO2, a penalty of at least $20/kgU should be added to the price. It will be seen below, and that reprocessed uranium from higher burnup UO2 spent fuel is more difficult to recycle, reenrich, and refabricate.
Table D1-1-3. Cost summary table for contact-handled fuel fabrication.
What-It-Takes (WIT) Table (2007 constant $)
Reference Cost(s) Based on Reference
Capacity
Reference Cost Contingency
(+/- %) (Low Cost)
Upsides (High Cost) Downsides
(Nominal Cost) Selected Values
$240/kgU for PWR $290/kgU for BWR
N/A $200/kgU for PWR
$250/kgU for BWR
$220/kgU for PWR REPU
$275/kgU for BWR REPU
$300 for PWR
$350 for BWR
$400/kgU for PWR REPU
$450/kgU for BWR REPU
$240/kgU for PWR
$290/kgU for BWR
$290/kgU for PWR REPU
$350/kgU for BWR REPU
Only unit fuel costs available:
Not available None likely, this mature industry already very competitive
20% or less increase in unit cost if higher enrichment (>5% U-235), higher burnup fuels produced
Based on today’s LWR fuel designs
D1-1.7. LIMITATIONS OF COST DATA Identification of Gaps in Cost Information. The data above are for today’s LWR fuel market. Some
changes are envisioned for the future, however. It is likely that fuel enrichments over 5% associated with higher burnups will eventually become commonplace. In order to understand how the LEU fabrication price will be affected, the following cost studies should be made.
1. The determinable costs of advanced higher burnup fuel research and development must be calculated and amortized over some number of reloads. This includes the ongoing research on new alloys, improved cladding, better process automation, etc.
2. The cost of modifying and relicensing existing fuel fabrication plants to handle the higher enrichments must be determined. These costs must also be recovered in the new, higher price. New enrichment plants will be needed in the U.S. to produce these higher LEU U-235 assays. Two such new enrichment plants are planned for the U.S., and both are likely to request the production of U-235 assays greater than 5% as part of their licensing basis.
3. No information was available on the costs of constructing or operating new LEU fabrication plants. Such historical information would be proprietary in a highly competitive industry. It is likely that if new U.S. production capacity is needed, it will be added by reopening existing lines, constructing

INL/EXT-07-12107 (March 2008) Advanced Fuel Cycle Cost Basis D1-16
additional process lines, or going to additional shift operations at existing facilities. An educated guess is that a new fabrication line of 200 to 300 MTHM/yr capacity would cost over $100 million in an existing building. This value is based on analysis of data in reports that consider the use of LEU fabrication plants for the production of thorium oxide fuel.21,22,23
Technical Readiness. LWR pelletized fuel fabrication falls in the technical readiness category of “viable and fully commercial.” Two variations on pellet LWR fuel that are in the R&D stages are annular fuel24 and ceramic-clad fuel.25
D1-1.8. COST SUMMARIES The module cost information is summarized in the What-It-Takes (WIT) cost summary in
Table D1-1-3. The summary shows the reference cost basis (constant year $U.S.), the reference basis cost contingency (if known), the cost analyst’s judgment of the potential upsides (low end of cost range) and downsides (high end of cost range) based on references and qualitative factors, and selected nominal costs (judgment of the expected costs based on the references, contingency factors, upsides, and downsides). These costs are subject to change and are updated as additional reference information is collected and evaluated, and as a result of sensitivity and uncertainty analysis. Refer to Section 2.6 in the main section of this report for additional details on the cost estimation approach used to construct the WIT table.
The triangular distribution based on the costs in the WIT Table is shown in Figures D1-1-3 and D1-1-4.
Module D1-1.1 LWR UO2 Fuel Fabrication (PWR)Estimated Cost Frequency Distribution
$/kgU
Freq
uenc
y
Low Nominal Mean High
$200 $240 $247 $300
Figure D1-1-3. LWR UO2 fuel fabrication (PWR) estimated cost frequency distribution.

INL/EXT-07-12107 (March 2008) Advanced Fuel Cycle Cost Basis D1-17
Module D1-1.2 LWR UO2 Fuel Fabrication (BWR)Estimated Cost Frequency Distribution
$/kgU
Freq
uenc
y
Low Nominal Mean High
$250 $290 $297 $350
Figure D1-1-4. LWR UO2 fuel fabrication (BWR) estimated cost frequency distribution.
D1-1.9. RESULTS FROM SENSITIVITY AND UNCERTAINTY ANALYSES
Because of the high readiness level of this fuel fabrication technology, no studies were performed. Fuel fabricators have likely done such studies; however, they are likely to be proprietary.
D1-1.10. SPECIAL TOPIC: LEUO2 FABRICATED FROM REPROCESSED URANIUM
LEU in the form of uranyl nitrate hexahydrate (UNH) is one of the by-products of PUREX or UREX reprocessing of LWR fuels (Module F1) in addition to high-level waste and separated higher actinides such as plutonium. Like plutonium, the uranium has some value if it can be reused as reprocessed uranium fuel or REPU. (94%+ of the mass of spent LWR fuel is still in the form of uranium for which the U-235 isotopic content is significantly reduced from that prior to irradiation. Over 50,000 MTU of uranium already exist in U.S. legacy spent fuel.) If this reprocessed uranium is not reenriched and refabricated, it must be safely stored and dispositioned. Storage and disposition options for reprocessed uranium are covered in Modules K2 and K3. Also like plutonium solution to MOX fuel preparation, there are cost-incurring process steps that must be taken on the route from reprocessing plant uranium by-product (UNH) to LWR reprocessed/re-enriched/refabricated UO2 fuel. (The costs of these steps must be assessed against any monetary “credits” for the virgin LEUO2 assemblies displaced by reprocessed uranium, just as MOX preparation costs are assessed against “credits” for the virgin LEUO2 assemblies displaced by plutonium-derived MOX.)
The uranium is essentially what is left when the 2–5% U-235 “virgin” unirradiated LEUO2 pellet fuel has burned down to unfissioned uranium enrichment levels of 0.5–1.2 % U-235. This unburned uranium constitutes about 94+% of the heavy metal mass of a spent fuel assembly. (The remaining HM-derived masses are fission products and minor actinides such as plutonium, neptunium, americium, and curium.) Unfortunately undesirable uranium isotopes, such as U-236, a neutron absorber, and U-232, an isotope with a very strong gamma-emitting daughter, have been generated in the reprocessed uranium by irradiation, and their percentages increase with reactor fuel burnup. U-232 has the undesirable aspect of producing radioactivity that increases with time. Its decay chain includes the radioisotopes lead-212,

INL/EXT-07-12107 (March 2008) Advanced Fuel Cycle Cost Basis D1-18
bismuth-212, and thallium-208; the latter is especially notable for its 2.615 MeV hard gamma emission. Gamma activity of the freshly separated reprocessed uranium increases for about a decade because of the accumulation of these decay products and then slowly decreases. The associated radiation increases the risks of (and costs of) handling reprocessed uranium vis-à-vis “virgin” uranium in the conversion, reenrichment, and refabrication steps. The natural nonfissile isotope U-234 is also enhanced in reprocessed uranium above its level in virgin LEU fuel by the fact that it does not fission, whereas its adjacent U-235 isotopic species does. U-234 has a short enough half-life (245,000 years) that it becomes a problem for long-term waste disposal somewhat like other actinides. These and other issues are treated in greater detail in Reference 26.
PUREX-derived reprocessed uranium has been successfully used in commercial reactors; however, steps are needed to prepare it for reactor use. First, the UNH or other stored product form, such as U3O8, must be converted to UF6. This is usually done at the reprocessing or enrichment plant site and is anticipated to cost significantly more than the $4–7/kgU for natural U3O8 to UF6 conversion. The presence of radiotoxic minor isotopes and criticality issues associated with possible higher than natural enrichments probably means that the conversion cost is more on the order of $10 to $20/kgU. The second step is reenrichment to a U-235 level capable of use in the same reactor that burns the “virgin” LEUO2. Because of the U-236 and U-234 content, a higher U-235 level than for virgin LEU is needed to compensate for the U-236 “poisoning” effect. Because of the difficulty of handling the more radioactive reprocessed UF6, the enrichment cost is anticipated to be higher than for virgin EUF6 enrichment plant feed. A 20–30% penalty on the price of separative work unit (SWU) is probably warranted. The last step is fuel fabrication from the LEUF6 enrichment plant product. If not blended with other LEUF6 or passed through an additional enrichment step, the U-232 and U-236 content of this material will be even higher than for the enrichment plant reprocessed UF6 feed. This is because the gaseous diffusion and centrifuge enrichment processes tend to push these undesirable isotopes into the product. The fabrication plant must now minimize personnel radiation exposures and use more automated handling of the process steps. Additional shielding may be required. For these reasons, the cost of reprocessed UO2 fuel fabrication is expected to be at least several percent higher than for virgin LEUO2 fuel. In Reference 10, penalties of up to $20/kgU are suggested. Reference 26 indicates that as reactor burnups for LWR fuel increase, the reprocessed uranium derived from reprocessing thereof will have increasingly undesirable isotopic content, thus refabrication costs could go even higher.
Reference 26 also considers storage and disposal options for the reprocessed uranium. UNH or any oxides produced may not qualify as low-level waste because of the minor isotopes and any residual fission products therein. Costs for uranium storage are also covered in References 26 and 27 and are discussed in Modules K2 and K3.
Reprocessed uranium reconversion, reenrichment, and refabrication for the production of reprocessed UO2 fuel are now under way in Europe and with the high price of U3O8 today, expansion of this REPU capability is planned.28,29 Figure D1-1-5 shows the scheme used in Russia at the Siberian Chemical Combine (Seversk/Tomsk) to take stored French reprocessed uranium (produced at LaHague and stored at Pierrelatte), remove the undesirable daughter products, convert the oxides to UF6, and reenrich this clean material to low U-232 enhanced U-235 product in two centrifuge cascades for ultimate refabrication. The processes and economics are described in Reference 30. Russian cost estimates in this reference indicate that this scheme should produce finished reprocessed UO2 fuel at prices competitive with virgin LEUO2 fuel, especially as uranium ore (U3O8) prices continue to rise.

INL/EXT-07-12107 (March 2008) Advanced Fuel Cycle Cost Basis D1-19
Figure D1-1-5. French-Russian scheme for reprocessed uranium recycle.
AREVA has recently announced plans31 to build their own 1,000-MTU/yr reprocessed uranium oxide to reprocessed UF6 conversion plant next to their proposed centrifuge plant at Pierrelatte. This announcement seems to indicate that rising uranium ore costs and large quantities of stored reprocessed U3O8 are making deployment of this scheme in France economically attractive.
As the U.S. deploys the more versatile centrifuge enrichment technology and reconsiders LWR fuel reprocessing, such a scheme may ultimately prove economical for the even larger amounts of unburned uranium now remaining in the U.S. The U.S. is presently gaining some experience in the use of reprocessed-material fuels via Project BLEU. In this program, Tennessee Valley Authority is burning LWR fuels produced by the blending of reprocessed production reactor highly enriched uranium with lower assay blendstocks. Reference 32 describes this U.S. Department of Energy (DOE)-National Nuclear Security Administration (NNSA) supported program in more detail.

INL/EXT-07-12107 (March 2008) Advanced Fuel Cycle Cost Basis D1-20

INL/EXT-07-12107 (March 2008) Advanced Fuel Cycle Cost Basis D1-21
Module D1-2
LWR MOX Fuel Fabrication

INL/EXT-07-12107 (March 2008) Advanced Fuel Cycle Cost Basis D1-22

INL/EXT-07-12107 (March 2008) Advanced Fuel Cycle Cost Basis D1-23
Module D1-2
LWR MOX Fuel Fabrication
D1-2.1. BASIC INFORMATION Fuel Form. An LWR MOX fuel assembly and its array of pellet-loaded rods appear identical to a
LEU O2 thermal LWR fuel assembly. In fact in the European reactors that burn MOX fuel, the two types of assemblies reside together in the reactor, with 1/3 MOX: 2/3 LEUO2 being a typical fuel assembly loading ratio. Even the ceramic MOX pellets within the rods appear nearly identical to their ceramic LEUO2 counterparts. It is because of the radiotoxicity of plutonium; however, that vastly different types of plants are needed to fabricate MOX fuel. This is true even though 95+% of the MOX material flowing through the fabrication plant is the depleted, natural, or slightly enriched U-235 assay UO2 diluent that is blended with the 10% or less (by mass) of PuO2 powder to form the MOX pellet process feed. Most of the world’s MOX fuel is presently fed to PWRs.
Status of Industry. European industries, such as Cogema, Belgonucleaire, and Siemens, have been successfully fabricating MOX, and European utilities in France, Switzerland, and Belgium have been successfully burning it for over a decade. The PuO2 in all of this European MOX arises from the reprocessing of spent LEUO2 thermal reactor fuel at facilities such as LaHague in France and THORP in the United Kingdom. The Japanese will soon begin use of MOX in their reactors as part of their “Pluthermal Fuels” program. The British are also now producing limited MOX33 at their SMP (Sellafield MOX Plant) located near their THORP reprocessing plant.
Up to 1978, the U.S. was on the verge of using MOX as part of a closed LWR fuel cycle. A MOX fabrication plant design had already been prepared for a MOX plant at Anderson, South Carolina, with PuO2 to come from a nearly completed fuel reprocessing plant at Barnwell, South Carolina. All this was halted by the Presidential edict of Jimmy Carter putting an end to plutonium recycle because of nonproliferation concerns with spent fuel recycling. In 1993, after the end of the Cold War, the U.S. began to start investigating the use of MOX fuel derived from surplus weapons-grade plutonium. Reports by the National Academy of Sciences34 and others35,36 documented the technical and economic feasibility of utilizing existing U.S. utility LWRs to burn partial cores of weapons-derived MOX fuel. In 1996, a Record of Decision was issued by DOE to pursue the MOX reactor option as one of two methods to disposition plutonium. In 1997, a procurement action was started to find a corporate entity willing to design, construct, and operate a government-owned MOX Fuel Fabrication Facility (MFFF) at the Savannah River Site (SRS). In early 1999, the consortium Duke, Cogema, Stone, and Webster was chosen for this purpose and was chosen to also burn the MOX fuel in Duke Energy’s two reactors, McGuire and Catawba, just north and south respectively of Charlotte, North Carolina. The design of this plant is now over 95% complete with NRC construction approval and groundbreaking projected for August 2007.37 The plant will process 70 to 100 MTHM per year for over 10 years. The intent is to disposition 34 MT of weapons-grade plutonium over this campaign and possibly some other less-pure government plutonium scrap. (Prior to 2007 a similar “build-to-print” LWR-MOX plant, also based on French MELOX technology, was being designed for a parallel Russian program at Tomsk [Seversk] in Siberia. The MOX was to be burned in VVER-type reactors. Liability, funding and technology transfer concerns have prevented this project from moving at the speed of the U.S. MOX project. It now appears that the Russian Pu-disposition program may utilize weapons-derived fast reactor MOX in BN-type fast reactors for their Pu-disposition program.38) Figure D1-2-1 shows a flowsheet for the generic reactor-based plutonium disposition programs.

INL/EXT-07-12107 (March 2008) Advanced Fuel Cycle Cost Basis D1-24
Figure D1-2-1. Generic reactor-based option for weapons plutonium-disposition.35
Present DOE/National Nuclear Security Administration plans are to limit the U.S. plant (SRS-MFFF) to weapons plutonium-disposition activities only, even if the plant life is limited to 10 to 12 years of operations. Up until recently, U.S. policy has been to discourage plutonium recycle and the construction of commercial facilities, such as MOX or reprocessing plants. As of the time of this writing (July 2007), the U.S. Congress is investigating the possibility of transferring the SRS-MFFF to the DOE Office of Nuclear Energy.
D1-2.2. FUNCTIONAL AND OPERATIONAL DESCRIPTION MOX Fuel Fabrication Process. The steps involved the fabrication of MOX fuel are basically the
same as those for LEU fuel assembly production except that most of the front and middle steps must be enclosed in gloveboxes to protect the workers and public from exposure to radiotoxic plutonium compounds. The radioactivity level in a MOX plant is also somewhat higher than for UO2 because of the spontaneous neutrons, beta, and gamma radiation emanating from plutonium isotopes and their daughter radionuclides. Some radiation also comes from (alpha, n) reactions where PuO2 is in contact with low atomic weight materials. Fire protection considerations are also important with electrochemical plutonium compounds, and process areas within the process building must be capable of isolation. There is also a security consideration arising from the fact that MOX has a proliferation or terrorist attractiveness level much higher than for LEUO2. This is because plutonium could be readily chemically separated from the uranium in the MOX and has great value as a fissile material for a nuclear weapon. This fact requires that the stringent Materials, Protection, Control, and Accounting (MPC&A) and safeguards be implemented and that the process building itself be extremely robust and resistant to attack or intrusion. The avoidance of nuclear criticality is also more of a consideration for MOX due to the smaller critical mass of Pu-239 as compared to U-235. All these considerations contribute to the very high capital and operating costs for MOX as compared to LEU. However, economics must be evaluated on the whole nuclear fuel cycle, where for commercial MOX use, reduced ore, conversion, and SWU costs and waste disposal cost savings due to reprocessing in tandem with MOX use become evident. For weapons MOX use, the cost savings arise from not requiring perpetual government storage and guarding of plutonium and the fact that other plutonium-disposition methods, such as immobilization, are likely to increase costs and encounter technical difficulties. MOX is essentially made available to the utility at a unit cost somewhat below that for LEUO2 fuel assemblies in order to provide an incentive to electric utility, in this case Duke Energy, participation.

INL/EXT-07-12107 (March 2008) Advanced Fuel Cycle Cost Basis D1-25
D1-2.3. PICTURES/SCHEMATICS Figure D1-2-2 shows the generic MOX production process for either commercial (Pu-239 isotopic
content less than 94%) or weapons-derived (Pu-239 content 94% or greater) MOX. The feedstocks PuO2 and DUO2 are blended into a 20 to 30% plutonium “master-mix,” which is then later blended with more DUO2 to the desired fissile content of 4 to 9% plutonium in heavy metal. Because of criticality concerns, all early processing operations are in small batches of a few kilograms Pu each. Final blended MOX batches may be 100 kg MOX or more. The pellet pressing, sintering, grinding/finishing, and inspection operations are nearly identical to their LEU counterparts except for the difficulty of handling somewhat smaller batches and the need for glovebox operations. Once the pellets are loaded into the Zircalloy tubes and the tubes are welded and cleaned, the decontaminated rods can be contact handled.
The bundle assembly area is very similar to that of the LEU plant. Because of the higher radiation arising from decay of the americium-241 plutonium decay daughter, it is necessary to limit worker exposure times to MOX fuel assemblies.
D1-2.4. MODULE INTERFACE DEFINITION Front-end Interfaces. For commercial MOX as done in Europe, the starting materials are reactor
grade PuO2 powder arising from aqueous PUREX-type reprocessing such as is done at LaHague or THORP. The reactor-qualified powder so produced is stored in special cans in protected areas at the reprocessing plant. (Costs related to MOX are assumed to start with shipping of this powder in special double-walled cans and special “safe and secure” trucks to the MOX fabrication plant). The diluent natural, depleted, or slightly enriched UO2 powder, which is part of the MOX mix, must also be reactor-spec grade and is usually purchased from or manufactured by uranium converters with aqueous processing equipment, although some dry-process UO2 powder is being qualified for MOX use. (Slightly enriched [0.0071 < U-235 assay (mass fraction) <0.015 ] uranium diluent would be likely to be reprocessed uranium oxide, most likely recovered in the same facility as the plutonium oxide. Module K2 discusses issues associated with reprocessed uranium.) This UO2 material can be shipped by normal commercial trucks in sealed drums. The front end steps for the U.S. and Russian plutonium-disposition projects are more complex. The metal plutonium pits and any other weapons-grade legacy plutonium forms from the DOE complex must be converted to clean reactor spec PuO2. For the U.S. program, a Pit Disassembly and Conversion Facility (PDCF) is planned at SRS to oxidize the impure plutonium metal to impure PuO2. This “pit-derived” impure PuO2 plus other legacy impure PuO2 is then stripped of its gallium, americium, uranium, halide, and other impurities in an aqueous-polishing front end step: i.e., an MFFF- aqueous polish (AP building) addition to the overall SRS-MFFF MP (MOX Process building). From this AP point onward, the commercial and disposition flowsheets are basically the same, with the back-end of the SRS-MFFF (called the MFFF-MP) being very similar to the French MELOX plant at Marcoule. The SRS-MFFF plans to use DUO2 as the diluent, thus reducing the U-235 content and maximizing the Pu-239 content of the fissile part of the MOX fuel. This reactor grade DUO2 must be manufactured by a conversion plant starting with clean legacy DUF6 in cylinders located at one of the U.S. gaseous diffusion enrichment plant sites. Shaw-AREVA MOX Services, the new DOE/National Nuclear Security Administration plutonium disposition contractor, is responsible for implementing this conversion step and has subcontracted Framatome-ANP to use a specially modified (for DU use) wet conversion line at their Richland, Washington LEU fuel fabrication plant or to arrange for another DU-processor to handle this step. The cost of this uranium conversion step will be included in the SRS-MFFF operations costs and is likely to cost in the tens of dollars per kgU, the actual unit cost depending on the batch sizes and quality of the UO2 powder required. Framatome has already prepared cost proposals to Duke, Cogema, and Stone and Webster for this operation; however, DOE’s ultimate choice of the DUO2 provider will depend heavily on economics.

D1-26
INL/EX
T-07-12107 (March 2008)
A
dvanced Fuel Cycle C
ost Basis
Figure D1-2-2. Generic MOX fuel process flow diagram (Diagram courtesy DOE-AFCI Fuels Working group).

INL/EXT-07-12107 (March 2008) Advanced Fuel Cycle Cost Basis D1-27
Back-end Interfaces. Storage and shipping of the MOX assemblies to the reactor is included in the cost. Special safe and secure transport vehicles are needed for this purpose. For the U.S., plutonium-disposition program the DOE/National Nuclear Security Administration will provide this service. Transportation probably adds about $120/kgHM to the overall cost of MOX (see Module Reference 14).
Transuranic and low-level waste from the MOX fabrication plant must also be handled. For the U.S. disposition program, waste will be processed and packaged by modified existing SRS waste facilities plus a possible new facility. Because the plutonium arises from the weapons program, transuranic waste containers can be sent to the DOE/National Nuclear Security Administration’s Waste Isolation Pilot Plant (WIPP) geologic disposal site in New Mexico. For future commercial MOX facilities in the U.S., use of the Waste Isolation Pilot Plant may not be possible. MOX production wastes would have to be jointly considered along with reprocessing wastes and a viable disposal option studied and implemented. The J, L, M. and I Modules discuss some possible disposal methods.
D1-2.5. MODULE SCALING FACTORS Scaling rules are similar to those for LWR fuel production, since the fuel manufacturing is performed
in parallel process lines. The line size is limited by the fact that many of the process steps are batch operations with batch size limited by criticality concerns. Capacity additions to a plant would likely be realized by adding shifts or adding a new line in an existing building. As will be seen in the cost discussion, very high fixed costs are associated with any plutonium-handling facility, regardless of size. The ratio of these fixed costs to total life-cycle cost, however, falls as more capacity is added; thus, economies of scale are possible. Rothwell discusses economy-of-scale issues in a recent ANS presentation.5
D1-2.6. COST BASES, ASSUMPTIONS, AND DATA SOURCES Cost and Pricing of LWR MOX Fuel Fabrication. Most of the MOX fuel fabrication cost data
available are for existing facilities in Europe. In the Harvard report, Bunn, et al.14 performed a very complete survey of life-cycle cost information. Table D1-2-1 summarizes this information along with the Section D1 author’s analysis of the U.S. SRS-MFFF projected life-cycle costs.
No data were available for the French MELOX or the Belgonuclaire facilities. Data for the U.S. plant had to be partitioned by the author to remove the aqueous polishing costs. Capital (sunk design costs plus projected construction) costs of $4.8 billion (FY 2007$) now include the additional design/construction scopes of strengthening the building to meet post-September 11 security requirements, the aqueous front-end processing facility, technology transfer costs, numerous HVAC and fire protection design improvements, commodity escalation, and anticipated facility startup. The U.S. MOX facility has also suffered schedule delays due to attempts to allow the Russian MOX plutonium-disposition to “catch-up” so that schedule parallelism can be established. (The Russian LWR MOX facility of similar capacity was to be located at the Siberian Chemical Combine near Seversk [Tomsk]. Its capital cost was estimated at least $2.8 billion before it was canceled by the Russian government.)
From Table D1-2-1, it is difficult to notice any capital cost scaling relationship. According to Stoll,39 however, there is such a relationship for unit costs, which include capital and operating components, as shown in Figure D1-2-3. Because the fixed safety, security, and other infrastructure costs associated with both the capital and operating costs are so high, the unit costs climb rapidly as throughput decreases. Therefore in order for MOX to be more competitive, large throughput plants should be built.

INL/EXT-07-12107 (March 2008) Advanced Fuel Cycle Cost Basis D1-28
Table D1-2-1. Available data on MOX fuel fabrication plants.
Plant Owner Location Capacity
(MTHM/yr) Financing Capital Cost (2003$M)
Operating Costs
(2003$M) Ref
SMP BNFL Sellafield UK 120 Private & Gov’t
750 50 Bunn et al.14
Hanau-2 Siemens Hanau, Germany
120 Private 750 Not avail Bunn et al.14
Rokkasho
(under constr)
JNC Rokkasho-mura, Japan
130 Private & Gov’t
1,000 Not avail Bunn et al.14
SRS-MFFF
(under constr)
DOE/NNSA Aiken, So Carolina U.S.
70–100 Gov’t 1,200 not incl aqueous polish (AP)
70 not incl AP
Williamsa
(2003 Data)
SRS-MFFF
(under constr)
DOE/NNSA Aiken, So. Carolina U.S.
70–100 Gov’t 3,500–4,000 incl AP
Revised data not available
2006 estimate in trade press18
a. K. A. Williams, ORNL, calculated estimate based on FMDP program documentation.
Figure D1-2-3. MOX unit cost as a function of throughput.39

INL/EXT-07-12107 (March 2008) Advanced Fuel Cycle Cost Basis D1-29
Table D1-2-2 shows the range of unit production costs for LWR MOX fuel gleaned from the literature. The range is very large and is influenced by market and political factors in addition to pure engineering economics. Nearly all the numbers shown are for European experience. As with LEU fabrication, there is no price list for MOX fabrication. A major variable in the calculation of unit cost is the method of financing and ownership of the MOX facility. Bunn et al.14 performed financing calculations for a 100-MTHM/yr MOX plant with a 30-year operating life, a $750-million overnight capital cost, and a $56-million/yr operating cost. Under government financing, at a low discount rate, a unit cost (or price since return on investment is included) of $1,010/kgHM results (not including transportation) from his calculation. For private ownership and financing with a guaranteed market and rate of return, a unit cost of $1,460/kgU results. For the highest discount rate associated with high-risk financing and private ownership, a unit cost of $2,140/kgHM results. In a document prepared at the onset of the plutonium-disposition program for DOE-MD, Williams36 found basically the same result: that government financing of MOX is much less expensive than private financing. Most of this difference is attributable to the very large carrying charges or interest associated with construction financing and plant amortization.
Table D1-2-2. Unit fabrication costs for LWR MOX fuels.
Reference/Date Fabrication Cost in $/kgHM (“then year $”) L=low; M=medium or reference; H=high
Bunn et al., 200314 (L/M/H) 700/1,500/2,300
NEA/OECD, 19947 (L/M/H) 800/1,100/1,400
Delene et al., 200016 (L/M/H) 2,000/3,200/4,000
Williams36 (M) ~700 (operations only, aqueous polish of feed excluded)
NEA, 200040 (L/M/H) 1,000/1,250/1,500
In summary, MOX fabrication costs and pricing are very assumption-driven. In all cases, MOX is more expensive than LEU, a point constantly mentioned by all plutonium fuel cycle opponents. One must remember, however, that use of MOX is economically advantageous to other parts of the fuel cycle, and that the socioeconomic benefits, such as reduced repository space per kWh generated, of fuel recycling are not fully reflected. The plutonium-disposition program has been also criticized for “subsidizing” Duke Energy in the form of selling MOX fuel to them at a discount relative to LEU. One must also remember, though, that the reactor-based disposition program is really a waste disposal program in addition to its function of providing an incremental power production cost benefit to a particular utility. Any extra costs that the government pays are lower than the alternative methods of plutonium disposition such as perpetual plutonium storage/surveillance (at a few $/gram plutonium/yr) or immobilization with its highly uncertain performance and cost uncertainties. Unlike reactor burning, immobilization also does not change the isotopics of the Pu, thus leaving in a “weapons-usable” U-239 isotopic concentration.41
D1-2.7. LIMITATIONS OF COST DATA Technical Readiness. In Europe, LWR MOX is a mature technology, and costs can be readily
calculated or derived. In Japan and the U.S., LWR MOX is a new technology experiencing first-of-a-kind plant cost growth due to regulatory and international political delays, litigation, scope changes, and special requirements (in the U.S.) for weapons program-derived feeds. Once hot startup problems, which are nearly always encountered in a process of this type, are resolved, the costs should be more representative of a mature commercial technology.

INL/EXT-07-12107 (March 2008) Advanced Fuel Cycle Cost Basis D1-30
Identification of Gaps in Cost Information for future fuel cycles. Some of the fuel cycles to be studied in Advanced Fuel Cycle Initiative program assume the use of MOX fuel with higher actinides in the fuel, i.e., actinides such as neptunium, curium, and americium in addition to the plutonium. (Such fuels would be the result of new proliferation-resistant reprocessing schemes such as UREX.) These additional constituents and their associated higher radioactivity will impose significant safety and operational burdens on a MOX plant (hence the name “dirty” MOX is sometimes applied). The cost effects of these new requirements, such as a requirement for remote-handling, need to be studied, and the effects of additional automation of the MOX fuel fabrication process need to be considered (to reduce worker exposures). The cost effects of multiple thermal MOX recycle also need to be considered as well as benefits to the back end of the fuel cycle. The December 2006 AFC Economic Sensitivity Analysis Report (INL/EXT-06-11947) provides an initial analysis of the thermal actinide recycle.
D1-2.8. COST SUMMARIES The module cost information is summarized in the What-It-Takes (WIT) cost summary in
Table D1-2-3. The summary shows the reference cost basis (constant year $U.S.), the reference basis cost contingency (if known), the cost analyst’s judgment of the potential upsides (low end of cost range) and downsides (high end of cost range) based on references and qualitative factors, and selected nominal costs (judgment of the expected costs based on the references, contingency factors, upsides, and downsides). These costs are subject to change and are updated as additional reference information is collected and evaluated, and as a result of sensitivity and uncertainty analysis. Refer to Section 2.6 in the main section of this report for additional details on the cost estimation approach used to construct the WIT table.
Table D1-2-3. Cost summary table for commercial LWR MOX fuel.
What-It-Takes (WIT) Table (2007 constant $) Reference Cost(s)
Based on Reference Capacity
Reference Cost Contingency
(+/- %) (Low Cost)
Upsides (High Cost) Downsides
(Nominal Cost) Selected Values
“Overnight” capital cost for 120 MTHM/ yr commercial MOX plant in U.S.: $2.5B (Value increased from 2005 value of $1.2B due to recent noted experience with U.S. SRS-MFFF)
N/A Collocation with LWR spent fuel reprocessing plant could reduce cost
Political and institutional risk will be high for any first U.S. commercial LWR MOX project
Cap=$2.5B for 120 MT/yr; Unit=$3,200/kgHM (private facility with full cost recovery and all operations and D&D costs.)
Unit cost from private plant of above capacity with guaranteed market and guaranteed loan: $3,200/kgHM
Not available Larger plant size (additional lines) or multishift operation should bring down unit cost Unit=$2,000/kgHM
Use of “dirty” or multiply-recycled MOX with oxides of higher actinides (Cm, Np, etc) will drive up capital, operating, and unit costs even if remote handling is not required Unit=$4,000/kgHM
Stay with reference cost for “normal” MOX: Unit=$3,200/kgHM

INL/EXT-07-12107 (March 2008) Advanced Fuel Cycle Cost Basis D1-31
The triangular distribution based on the costs in the WIT Table is shown in Figure D1-2-4.
Module D1-2 LWR MOX Fuel FabricationEstimated Cost Frequency Distribution
$/kgHM
Freq
uenc
y Low Mean Nominal High
$2000 $3067 $3200 $4000
Figure D1-2-4. LWR MOX fuel fabrication estimated cost frequency distribution.

INL/EXT-07-12107 (March 2008) Advanced Fuel Cycle Cost Basis D1-32

INL/EXT-07-12107 (March 2008) Advanced Fuel Cycle Cost Basis D1-33
Module D1-3
Gas-Cooled Reactor Fuels

INL/EXT-07-12107 (March 2008) Advanced Fuel Cycle Cost Basis D1-34

INL/EXT-07-12107 (March 2008) Advanced Fuel Cycle Cost Basis D1-35
Module D1-3
Gas-Cooled Reactor Fuels D1-3.1. BASIC INFORMATION
Fuel Form. The high temperatures envisioned for today’s gas-cooled reactor (GCR) designs offer the cost advantages of higher thermodynamic efficiency; however, they also put very stringent demands on the fuel. The fact that the moderator, carbon in the form of graphite, is a solid, and the coolant is a gas, helium, also affects the design of the fuel. The fuel form for GCRs is also supposed to be the first line of “defense in depth” as far as safety is concerned, with the fuel form itself actually described as part of the over all “containment” philosophy. The volatile fission products are contained by the fuel particle design, and the possibility of a “meltdown” in the classical sense is eliminated through inherent safety features.
There are two major fuel forms now envisioned for GCRs:
1. The prismatic concept in which a fuel assembly or “block” is in the shape of a hexagonal cylinder with holes drilled for flow of the gas coolant. These hexagonal blocks are stacked and arrayed inside of a machined graphite core. Each prismatic block has smaller graphite right circular cylinders or “compacts” imbedded in other vertical holes in the block. These compacts contain the fuel particles. This is the concept that has been developed over many years by General Atomics (GA) as the Modular High-Temperature Gas-cooled Reactor (MHTGR) and more recently the direct cycle Gas Turbine-Modular Helium Reactor (GT-MHR).
2. The other fuel “assembly” form is that of a billiard-ball sized graphite sphere or “pebble” with the fuel particles imbedded within. This concept was developed and demonstrated in Germany and is now being vigorously pursued in China, Japan, and South Africa. The latter nation plans to build a demonstration plant called the Pebble Bed Modular Reactor (PBMR). If successful, this plant concept will be marketed worldwide by South Africa. (ESKOM is the South African utility that ordered the PBMR demo module.) China recently announced plans to deploy the PBMR concept.
D1-3.2. FUNCTIONAL AND OPERATIONAL DESCRIPTION Two GCR Fuel Concepts. Both GCR fuel concepts, however, have a common fuel production
technology. The fissile material, enriched uranium or plutonium, in the form of an oxide (UO2 or PuO2) or other ceramic forms (e.g., UCO), exists as tiny 200 to >500 micron spheres or “kernels,” which are coated with layers of mechanically tough and highly refractory coatings of porous carbon, silicon carbide, and electrochemical carbon. The resulting sphere, which measures less than 1 mm in diameter, is called a TRISO coated fuel particle and is in essence a tiny pressure vessel. Thousands of these particles are then imbedded in a graphite matrix that forms the “pebble” or the cylindrical “compacts.” The latter are inserted in a prismatic hexagonal block. For both concepts, the fuel enrichments (U-235) are considerably above the 3 to 5% U-235 for today’s LWRs. In fact, early MHTGR designs utilized highly enriched uranium at >90% U-235. For nonproliferation reasons, all GCR designs have backed off to LEU enrichments in the range 8 to 19.9% U-235. The fuel for these two concepts is often referred to as “particle fuel” as opposed to pellet, vipac, or cast fuel for other reactor concepts. GA includes some “fertile” natural uranium TRISO particles in their design and in the past has incorporated thorium in the form of thoria (ThO2 ) fertile particles.
Figure D1-3-1 shows the basic fuel concept for the GA GT-MHR concept. Figure D1-3-2 shows a similar diagram for the “pebble bed” concept. Figure D1-3-3 shows the makeup of the basic TRISO particle. All GCR concepts discussed for future deployment have some variant of the particle fuel concept.

INL/EXT-07-12107 (March 2008) Advanced Fuel Cycle Cost Basis D1-36
Figure D1-3-1. Prismatic concept utilizing particle fuel (General Atomics).
Figure D1-3-2. Pebble concept utilizing particle fuel.42
Figure D1-3-3. Illustration of a TRISO fuel particle concept.42

INL/EXT-07-12107 (March 2008) Advanced Fuel Cycle Cost Basis D1-37
Status of Industry. Unlike for LWR fuel, no large-scale GCR fuel manufacturing capability exists in the U.S. (or in the world for that matter). Because there is no fleet of electricity producing GCRs of a current design, this fact is not surprising. (The United Kingdom has an aging fleet of lower-temperature CO2-cooled advanced GCRs that are not candidates for further deployment.) All the world’s existing high-temperature GCR projects had their fuel produced in pilot scale facilities. A commercial MHTGR was operated for several years at Fort St. Vrain, Colorado. Its fuel was produced in a pilot scale facility operated by GA at Sorrento Valley, California. Pebble bed fuel pilot lines in China and proposed for South Africa at Pelindaba are based on German PBMR technology, which was formerly located at Karlsruhe. Nuclear Fuel Industries in Japan has a 0.4 MTU/yr coated-particle fuel line at Tokai-Mura, which was completed in 1992. NUKEM/HOBEG of Germany had a line at Hanau from 1960−1968 that was capable of manufacturing 200,000 fuel blocks per year. It is now being decommissioned. Cost information on these pilot facilities is either not available or is considered proprietary.
If GCR technology is to be deployed for large-scale electricity generation, a large-scale particle fuel production facility will need to be built to support the fleet of modular reactors. No company has yet initiated such a project and will not until the proposed demonstration GCR modules utilizing pilot-plant-produced fuel prove to be technically and economically viable. (To support a prototype high-temperature GCR, such as the proposed U.S. Next Generation Nuclear Plant [NGNP], a pilot-scale fuel fabrication line will be required.) The U.S. companies Nuclear Fuel Services of Erwin, Tennessee, and BWXT Technologies and AREVA-NP of Lynchburg, Virginia, have all shown some interest in pursuing this technology. GA Technologies of San Diego, California, has decided to pursue only the reactor part of this fuel cycle.
In terms of heavy metal or uranium throughput, commercial particle fuel production facilities are likely to be smaller than LWR facilities, but this is partially because the U-235 enrichment of this fuel is at least twice that of LWR fuel and less “heavy metal” (combined fertile and fissile) is required per kilowatt of electricity produced. In an LWR fuel assembly, most of the “weight” is UO2 in the form of pellets. However, for GCR fuel, much of the fuel assembly weight will be machined or formed graphite. The fissile mass is dispersed within defined locations within the graphite.
From 1988–1992, DOE embarked on a program to design and construct tritium production reactors for military purposes. The original Record of Decision was to build eight 350 MWth modules at the Idaho National Laboratory (INL).b These steam cycle MHTGR modules were to use 93.5% U-235 weapons-grade highly enriched uranium in its fuel. The fuel design was the TRISO/prismatic block concept. To support this operation, a 3 MTU/yr onsite fuel fabrication plant was proposed, and a preconceptual design was prepared in 1990 by Fluor-Daniel Corporation based on GA process concepts. This plant was to be government (DOE Defense Programs)-owned and financed and operated by the INL prime government contractor. Cost information from this report will be discussed in a section below.
GA has proposed the GT-MHR as a plutonium-dispositioning reactor both in the U.S. and Russia. (The same particle fuel concept can be used with PuO2 or other plutonium compound ceramic kernels.) GA is engaged in a joint program to eventually construct a plutonium GT-MHR in Russia; however, very limited information on the fuel fabrication facility that would be needed has been presented. The GT-MHR uranium burner is also being NRC-certified for future U.S. deployment; however, no plans or cost information for a supporting fuel fabrication facility have come forth. Some GA cost information can be gleaned from conference papers, and some of this is discussed below.
b. Beginning February 1, 2005, the name of the Idaho National Engineering and Environmental Laboratory (INEEL) was changed to Idaho National Laboratory (INL).

INL/EXT-07-12107 (March 2008) Advanced Fuel Cycle Cost Basis D1-38
The South African utility ESKOM plans a small (maximum 13 MTU/yr) fuel production facility to support their first-of-a-kind demonstration module. Again, very limited cost information on this proposed facility is available.
There is, however, considerable developmental work taking place in the area of TRISO fuels. Two of the International Generation IV reactor concepts involve high temperatures (required for nuclear hydrogen production) and gas-coolants as well as some space reactor concepts. DOE is also considering the construction of a NGNP at INL that will be a demonstration GCR for hydrogen production. AREVA-NP, BWXT, GA, Nexia (formerly BNFL), and national laboratories such as INL and Oak Ridge National Laboratory all have research and development interests in this type of fuel. Any economic analyses performed on GCR fuel manufacturing, however, have not been made public.
GCR Fuel Fabrication Process. There is no single process for all particle fuels, and many of the processes are proprietary. They all have some basic similar element; however, and these will be briefly mentioned. Figure D1-3-4 shows a generic TRISO fuel fabrication process being considered by the Advanced Fuel Cycle Initiative (AFCI) Fuels Working Group. Production of the ceramic UO2 or UCO kernel is a crucial step in the process. In order to get uniform spheres, a sol-gel or similar fluidization process must be used to render liquid spheres into hard solid spheres. This means that a liquid solution such a uranyl nitrate hexahydrate (UNH) must be produced from the UF6. This is a relatively simple step, since many of the older LWR fuel “wet” or aqueous fuel fabrication processes required the same step on their front end. Uniform UNH solution drops of the desired size are formed and then contacted with ammonia to form gel-spheres (gel-precipitation process). These gel-spheres are washed with water, dried to a low-density form, calcined to a medium-density form, and then sintered to a high-density microsphere “kernel.” Fission-product-retentive ceramic coatings are applied to the kernel by chemical vapor deposition in a fluidized-bed furnace. The coated particles are mixed with various carbonaceous materials and formed into either cylindrical compacts or spherical pebbles. For the GT-MHR, the compacts are inserted into predrilled hexagonal blocks of graphite. Each pebble or compact will have thousands of such TRISO particles imbedded within. The requirement for quality control and TRISO particles in a reactor core, the defective particle fraction must be kept very low, especially for modern vented confinement reactor designs in order to meet the licensing requirements for low onsite and offsite doses/releases.
Bench and pilot scale work is under way in several nations on variants of this process. The problems of scaleup and automation are just now being seriously considered. The economic viability of this reactor/fuel system will depend heavily on how successful these efforts are.

D1-39
INL/EX
T-07-12107 (March 2008)
A
dvanced Fuel Cycle C
ost Basis
D1-3.3. PROCESS DESCRIPTION
Figure D1-3-4. TRISO MOX fuel process flow diagram (Figure courtesy of DOE-AFCI Fuels Working group).

INL/EXT-07-12107 (March 2008) Advanced Fuel Cycle Cost Basis D1-40
D1-3.4. MODULE INTERFACE DEFINITION Front-end interface. Because the fuel enrichment level is 8 to 19.9% U-235, the likely feed material
to a fabrication facility will be EUF6 coming from a new centrifuge enrichment plant or from blended U.S. or Russian EUF6 derived from surplus HEU.
Back-end interface. Irradiated blocks and pebbles are the fuel forms that exit a GCR fuel fabrication facility. Special transport packages will need to be designed to safely move and protect this type of fuel. The spent fuel handling and disposal steps are technically different than for LWR fuels. The bibliography includes three publications dealing with waste characterization and repository issues associated with this fuel type. Most MHR reactor and fuel concepts are designed for open cycles. Reprocessing of this type of fuel presents many processing and waste-related difficulties compared to that for LWR or fast reactor fuels, especially in head-end operations. The Generation IV Roadmap (see Bibliography for reference) for gas-cooled systems discusses research and development issues with reprocessing and other aspects of this technology.
D1-3.5. MODULE SCALING FACTORS No scaling factors or other scaling information was found in the literature. Because batch sizes are
limited by criticality concerns, any capacity additions to an already-existing production scale facility (none exists now) will be accomplished by adding new process lines or the use of multiple shifts. The size of an optimal automated TRISO particle fabrication line is still to be determined.
D1-3.6. COST BASES, ASSUMPTIONS, AND DATA SOURCES Cost and Pricing of GCR Fuel Fabrication. The fabrication cost of GCR fuel is most useful if it
can be expressed in $/kgU or $/kgHM and not include the ore, natural U3O8 to UF6, and enrichment components. In the literature, it is hardly ever expressed in this fab-only way, so in the cases below the fab-only unit cost had to be calculated by the author. Four different literature sources are analyzed below.
Proposed New Production Reactor Fuel Fabrication Facility43 In FY 2003 dollars, this 3 MTU/yr fuel fabrication plant, based on a Fluor-Daniel study, would have cost $355M and have annual operating costs of $22.6 million/yr. This operations cost does not include the ore, conversion, SWU, or UF6 to UO3 or UNH conversion needed to supply feed material (UO2 or UCO) to the plant. If this New Production Reactor-support plant is amortized over 30 yr at a 4% real discount rate, a unit fabrication cost of nearly $40,000 per kgU or $49,000/hexagonal fuel block results. The fabrication of fuel at this price would account for 11 mills/kWh for a steam cycle 135-MWe MHTGR operating on a 1-year cycle at an 80% capacity factor. The proliferation, security, and criticality issues associating with dealing with weapons-grade (> 90% U-235) highly enriched uranium contribute significantly to these high costs. In later commercial designs, such as the GT-MHR, GA designers have reduced the fuel enrichment to below 20% U-235 and increased the fuel burnup, thermodynamic efficiency, and electrical capacity of the reactor, which will drive down the per kWh unit cost.
GA Study on production of Spherical Targets for Fusion Energy.44 This report attempts to predict the cost of producing tiny spherical D-T targets for inertial confinement fusion based on past and projected costs of producing TRISO microspheres for GCRs. A graph in this document demonstrates how the cost per particle (fabrication only) for TRISO fuel has decreased from 20 cents/particle for 1960s bench scale fuel to a projected cost of less than 0.001 cents per TRISO particle for future fuel in an automated plant.

INL/EXT-07-12107 (March 2008) Advanced Fuel Cycle Cost Basis D1-41
Each MHTGR or GT-MHR block (fuel assembly) has over 10 million of these particles. For the more current direct cycle 300 MWe GT-MHR reactor, both 19.8% U-235 and natural uranium particles will be used. Using the above costs per particle (midrange values) the fuel costs are calculated in Table D1-3-1 as follows: (note: ore, SWU, graphite, conversion from UF6, etc., add $5,900/kgU to the stand-alone particle fabrication cost).
Table D1-3-1. Fabrication costs as a function of TRISO particle cost.
Particle Cost (U.S. cents)
Fab Cost per Block(particle fab only)
Fab Cost ($/kgU)
(particle fab only)
Fab Cost per Block
(incl ore, SWU, conv)
Fab Cost ($/kgU)
(incl ore, SWU, etc.)
20 $2,540,000 $573,000 $2,560,000 $579,000
1 127,000 28,700 147,000 34,700
0.1 12,700 2,870 33,000 8,850
0.003 382 860 20,700 6,070
Today’s cost is likely between the $33,000 and $147,000 per block. GA would like to force
fabrication costs down to around $12,000/block (particle preparation and graphite steps, but no ore or SWU cost are in this goal). A block contains around 4 kg of uranium, with over 75% of particles consisting of 19% U-235, and <25% of particles containing natural uranium.
1993 Gas-Cooled Reactor Associates Commercialization Study.45 This report deals mostly with MHTGR construction costs. However, it does have some fuel cycle information. It states that the goal of the fuel development/qualification program is to get the cost of an MHTGR fuel assembly or “block” down to ~$12,000 in 1993 dollars. This would be ~$16,000 per block in today’s dollars. It did not state if this includes only fabrication or includes all materials/services such as ore, SWUs, etc. If each block contains ~4 kg of uranium, the goal cost per kgU is therefore around $4,000/kgU. This means that the Gas-Cooled Reactor Associates goal cost probably does not include ore or SWU, because these combined items alone would likely contribute nearly $6,000/kgU to the overall fuel cost. If GA can drive the overall cost ($6,000 + $4,000) to $10,000/kg of enriched uranium for a finished fuel assembly, they will meet the target. Realization of the target fuel cost above would result in a fuel cycle component of the power generation cost of around 9 mills/kWh.
University Design Project Study for Pebble Bed Reactor.42 The concept described is called the Modular Pebble Bed Reactor (MPBR) as opposed to the Eskom/BNFL PBMR. The plant designed and evaluated is a 10-reactor module facility totaling 1,100 MWe. It was developed jointly in 1998 by Massachusetts Institute of Technology (Andy Kadak and students) and INL. It was also part of a University of Cincinnati/Ohio State Design Course for which the documentation was made available on the Internet. The capital cost data are at the two-digit energy economic database code-of-accounts level only. All the costs are in 1992 constant dollars. The data from this study were input by this section’s author to the Power Generation Cost model, G4-ECONS, being developed by the Generation IV Economics Working Group. In this model, the costs were all increased by a factor of 1.275 to take them to today’s constant dollars using a construction index similar to the Handy-Whitman Utility Construction Index.
The reactor core for each PMBR module consists of 360,000 round pebbles with 7 g (expressed as uranium) of 8% U-235 enriched UO2 in each. The UO2 is encapsulated in 11,000 TRISO-coated microspheres within each billiard-ball-sized pebble. For the Generation IV Economics Working Group

INL/EXT-07-12107 (March 2008) Advanced Fuel Cycle Cost Basis D1-42
model, each pebble is assumed to be a “fuel assembly.” An annual reload consists of 120,000 pebbles per module. The design project authors assume each pebble costs $22 in 1992 dollars including all front-end fuel cycle steps. The author of this section assumes that this has risen to $28 in today’s dollars. This yields a fabrication cost of ~$1,700/kgHM or per kgU if all other front-end fuel cycle costs (ore, SWUs, etc.) are set at today’s values. This cost, in the opinion of the analyst for this report, is unrealistically low given the complexity of GCR fuel fabrication.
Facility Cost Projections. The author of this report located some fuel fabrication facility cost projections for both the South African PBMR46,47,48 and GA GT-MHR49 concepts. Both of these costs were for fuel fab facilities to be located outside the U.S., either in South Africa or Russia. The GT-MHR data were for a plant producing PuO2 TRISO fuel for use in the joint U.S.-RF Plutonium Disposition Program. Table D1-3-2 shows the fissile loading, throughput, and cost projections for each of these facilities. Based on experience in the U.S. with other nuclear facilities, these cost projections would likely be considerably higher for similar facilities to be located in the U.S.
ESKOM of South Africa recently (May 2005) announced the award of a $20 million design and construction contract for a 270,000 sphere (fuel assembly) per year pilot plant to support their PBMR project. If this plant operated for 10 years and the capital cost is distributed over the uranium processed (7g U per pebble), the capital component of the unit cost comes to ~$1,000/year. The operating cost anticipated for this pilot plant was not given. As PBMR orders come in, South Africa will add additional production capacity to this pilot facility.50
Because of the need for gloveboxes and more nuclear safety controls for plutonium fuels, the costs associated with the use of plutonium TRISO fuels are likely to be an order of magnitude higher than for 19.8% U-235 LEU TRISO on a per kilogram (heavy metal) basis.
Table D1-3-2. Data for projected ESKOM and GA TRISO fuel fabrication facilities.
ESKOM Pebble-Bed Modular Reactor (PBMR)for Uranium
Fuel: GA Modular Helium Reactor (GT-MHR) U or Pu burner
for Uranium or Plutonium fuel as noted:
TRISO Particles per Cylindrical compact 4230TRISO Particles per Sphere (Pebble) ~15000 Compacts in Full Core of one 286MWe GT-MHR module 3102120Spheres in Full Core of one 117MWe module ~360000 Average enrichment of U in initial core 10.31%New Spheres introduced annually per module ~122000 Total U mass of initial core for one GT-MHR module (MTU) 4681Grams of U in one sphere 9 Average 235 enrichment of U in annual GT-MHR reload 15.46%Ave U-235 Enrichment of TRISO fuel 8.0% Total U mass of annual MHTGR reload for 1 module (MTU) 2262
Total Pu mass of initial core for one GT-MHR module (MTPu) 634Uranium loading of full core (MTU) for 1 module 3.24 Total Pu mass of annual reload for one GT-MHR module (MTPu) 262
Make-up Uranium required per year to fuel one module (MTU) 1.10Projected Yr 2000 US$ cost in Russia (Seversk) for Pu-TRISO FFF supporting 4 GT-MHR modules (Nth of kind plant) [$M] 126Annual throughput of Pu-TRISO FFF [kg Pu/yr] 1048
Proposed prod'n capacity of initial ESKOM fuel fab plant based 12.6 Annual operations cost for Pu-TRISO FFF in Russia ($M/yr) 28.4 on 1.4 million spheres/yr (MTU/yr) Capital cost per unit of capacity ($/kgPu/yr) 120229Estimated capital cost of ESKOM fuel plant based on 23 Operations cost per kgPu processed [$/kgPu] 27099
nth-of-kind cost of $2M/reactor supported ($M)Unit cost using 10 year amortization at 4% annual discount rate (in $/kgPu) [in Russia] 41922
Capital cost per unit of capacity ($/kgU/yr) 1825Projected Fuel cycle contribution to electricity cost 13
ESKOM Projected Fuel cycle contribution to 16.7 mills/kwh 4.0 (mills/kwh) from nth of a kind Pu-burning plantelectricity cost (South African conditions; nth of a kind)
[Information from IAEA-TECDOC-1198 (Feb 2001)] [Information from General Atomics Reports]

INL/EXT-07-12107 (March 2008) Advanced Fuel Cycle Cost Basis D1-43
D1-3.7. LIMITATIONS OF COST DATA Identification of Gaps in Cost Information for Future Fuel Cycles. The gaps in the economic
information for this type of fuel are very wide and deep, especially given the fact that PBMRs and GT-MHRs are being seriously considered for deployment as electricity producers and even hydrogen producers. It may be that the private developers of these concepts are keeping such information proprietary. In any case, it would be in DOE’s best interest to initiate a study that would at least consider the economic and cost issues associated with scaleup and automation of at least some of the various TRISO particle fuel flowsheets now under development. It would also be useful to understand the cost issues associated with the radiochemical and radiotoxicity amelioration design fixes required to adapt TRISO fuel production flowsheets to plutonium particle fuel production or actinide burning. The joint U.S./Russian GT-MHR program could also greatly benefit from such an analysis.
Readiness level. This fuel fabrication technology reached the pilot plant level of deployment in the U.S. for the production of Fort St. Vrain MHTGR fuel at Sorrento Valley near San Diego, California. Presently, that facility has been shuttered, and any U.S. work in progress is now at the “bench scale.”
D1-3.8. COST SUMMARY The module cost information is summarized in the What-It-Takes (WIT) cost summary in
Table D1-3-3. The summary shows the reference cost basis (constant year $U.S.), the reference basis cost contingency (if known), the cost analyst’s judgment of the potential upsides (low end of cost range) and downsides (high end of cost range) based on references and qualitative factors, and selected nominal costs (judgment of the expected costs based on the references, contingency factors, upsides, and downsides). These costs are subject to change and are updated as additional reference information is collected and evaluated, and as a result of sensitivity and uncertainty analysis. Refer to Section 2.6 in the main section of this report for additional details on the cost estimation approach used to construct the WIT table.
The triangular distribution based on the costs in the WIT Table is shown in Figure D1-3-5. The distribution is skewed toward the low cost because the nominal cost reflects past experience with making TRISO fuel; however, the outlying high cost reflects a very high uncertainty in deploying a large-scale, automated facility for manufacturing of TRISO particle fuel.
Table D1-3-3. Cost summary table for GCR TRISO fuel.
What-It-Takes (WIT) Table
Reference Cost(s) Based on Reference
Capacity
Reference Cost Contingency
(+/- %) (Low Cost)
Upsides (High Cost) Downsides
(Nominal Cost)Selected Values
Today’s 8–19.9% U-235 unit fab cost probably ~$25,000/kgU
N/A $7,500/kgU $30,000/kgU $10,000/kgU
No highly reliable data on plant capital costs;
Not available Development of a reliable, highly automated TRISO process in a central large facility
Quality or process development difficulties. Use of PuO2 kernels
If automated process is successful:

INL/EXT-07-12107 (March 2008) Advanced Fuel Cycle Cost Basis D1-44
Module D1-3 Gas Cooled Reactor Particle FuelsEstimated Cost Frequency Distribution
$/kgU
Freq
uenc
y
Low Nominal Mean High
$7500 $10000 $15833 $30000
Figure D1-3-5. Gas cooled reactor particle fuels estimated cost frequency distribution.
D1-3.9. RESULTS FROM SENSITIVITY AND UNCERTAINTY ANALYSES
Insufficient base process cost data exist for such studies to begin. References 44 and 45 have some limited sensitivity study data.
D1-3.10. BIBLIOGRAPHY Forsberg, C. W. (ORNL), “Advanced High-Temperature Reactor Spent-fuel Characteristics and
Repository Impacts,” Paper prepared for the 2006 International High-Level Waste Management Conference (ANS), Las Vegas, Nevada, April 30–May 4, 2006.
Fuls, W. F, et al., “The Interim Fuel Storage Facility of the PBMR,” Paper from the 2nd International Topical Meeting on High Temperature Reactor Technology, Beijing, China, September 22−24, 2004.
Generation IV Roadmap, R&D Scope Report for Gas-Cooled Reactor Systems, GIF-004-00, December 2002.
Owen, Paul E., Waste Characteristics of Spent Nuclear Fuel from a Pebble Bed Reactor; MS Thesis in Nuclear Engineering, Massachusetts Institute of Technology, June 1999.

INL/EXT-07-12107 (March 2008) Advanced Fuel Cycle Cost Basis D1-45
Module D1-4
Ceramic Pelletized Fast Reactor Fuel

INL/EXT-07-12107 (March 2008) Advanced Fuel Cycle Cost Basis D1-46

INL/EXT-07-12107 (March 2008) Advanced Fuel Cycle Cost Basis D1-47
Module D1-4
Ceramic Pelletized Fast Reactor Fuel
D1-4.1. BASIC INFORMATION Fuel Form. Ceramic fueled fast reactors can operate on either highly enriched uranium fuel (such
as the BN-600 in Russia) or plutonium-based MOX fuels (such as the French Phenix reactors and the cancelled U.S. Clinch River Breeder Reactor). For electricity production “breeder” fast reactors, the ceramic material of choice has been either enriched UO2 or MOX (Pu,U)O2, which can be contact-handled during fabrication if the minor actinide (neptunium, americium, curium) content is sufficiently low. For “burner” fast reactors, where significant amounts of the minor actinides arising from LWR reprocessing or from the fast reactor’s own fuel cycle are to be recycled within the driver fuel, remote-handling during fabrication will be required because of the radiation level associated with mainly americium and curium and any trace fission products carried over from fast reactor fuel reprocessing. These fuel types will be addressed in Module F2/D2, where reprocessing and remote refabrication are considered as integral processes. Because of the use of higher fissile content, typically 15% or higher U-235 or plutonium in heavy metal, the amount of fissile material per unit volume in the driver fuel is a factor of four or more higher than for LWR fuels. c
For a given power level the fuel assemblies and the reactor core are smaller in mass and volume than for an equivalent power LWR. Ceramic fast reactor fuel assemblies are typically less than 3 m long including axial blankets and end pieces, hexagonal in shape, and with much thinner fuel rods. The cladding is stainless steel instead of Zircalloy for reasons of better chemical resistance to the liquid sodium coolant. Table D1-4-1 compares example LWR (thermal) and fast reactor fuel assemblies:
Figure D1-4-1 shows a French ceramic fast reactor fuel assembly from their Superphenix fast reactor, which is typical of this type of fuel assembly.
Ceramic fuels other than oxides have also been considered, with uranium or plutonium nitrides and carbides receiving the most research and development attention in the U.S.
D1-4.2. FUNCTIONAL AND OPERATIONAL DESCRIPTION Similarity to LWR MOX. The functions and operations in a fast reactor fuel plant based on pellet
technology are similar to those in an LWR MOX plant. The higher fissile content of fast reactor fuel, however, requires more stringent security and criticality avoidance measures. The previous existence of a developing fast reactor industry in Europe, Japan, and Russia shows that such facilities are technologically viable.
c. Fast reactors may have as many as three types of fuel rods within the core: drivers, blankets, and targets. Drivers constitute the fissile materials that account for most of the energy production and in which the fissile content falls with continuing irradiation (“burning”). Blanket fuel consists of fertile material, such as DUO2 or THO2, which will be partially converted via neutron absorption to new fissile material (“breeding”), such as Pu-239 or U-233, which can be recovered by reprocessing and refabricated into new fuel. Targets contain radionuclides, such as higher actinides or fission products, which are converted by neutron irradiation to other nuclides with shorter lives; this “burning” process is sometimes called burnout, transmutation, or destruction. These spent targets can subsequently be more efficiently and safely emplaced in a geologic repository.

INL/EXT-07-12107 (March 2008) Advanced Fuel Cycle Cost Basis D1-48
Table D1-4-1. Comparison of fast and thermal pellet fuel.

INL/EXT-07-12107 (March 2008) Advanced Fuel Cycle Cost Basis D1-49
Figure D1-4-1. Superphenix fuel assembly diagram. (CEA)
Status of Industry. Slowdowns or cancellations of fast reactor programs have put production of ceramic fast reactor fuel worldwide at a near standstill. Belgium, France, Germany, and Japan all have fabrication plants that are now shutdown or inactive. Russia still produces mostly highly enriched uranium (HEU) and some (U,Pu)O2 MOX fuel for their BN-600 Reactor located at Beloyarsk. When the U.S. was about to construct the Clinch River Breeder Reactor, plans were being drawn up to construct a U.S.fast fuel fabrication facility. The ceramic fast reactor fuel production that has taken place in the U.S. has been on a small scale in national laboratory or reactor vendor development facilities, and most of this was in the 1960s and 1970s. Unless interest is revived in closed fuel cycles and particularly one that uses ceramic rather than metallic fast reactor fuel (Module F2/D2), near-term prospects are dim for the deployment of such fast reactor fabrication capacity in the U.S. As the Generation IV and Global Nuclear Energy Partnership programs progress, however, interest may be revived. (Global Nuclear Energy Partnership “burner” fast reactor concepts are more likely to require the types of remote-handled, higher-actinide laden fuels discussed in Module F2/D2, however the first cores are likely to be U,Pu only.)
Both Russia and Japan plan to keep the fast reactor option open, with electricity generation and “breeding” being the predominant missions rather than actinide burning. Japan is about to restart their experimental MONJU sodium-cooled reactor. The Russian Federation plans to construct an 800-MWe unit at Beloyarsk near its existing BN-600 unit and has even proposed a 1,800-MWe design. The Russian Federation has also indicated interest in using BN-type reactors to disposition surplus plutonium from their military programs. A small fuel fabrication facility at Mayak named “Paket” could be restarted to

INL/EXT-07-12107 (March 2008) Advanced Fuel Cycle Cost Basis D1-50
provide early pellet-based fuel assemblies. The Japanese also have limited capability to produce pellet MOX fuel at their Tokai Works. Costs for production at these facilities are not known. India is constructing a fast reactor, however no information on the fuel source is available.
D1-4.3. SCHEMATIC OF PROCESS For fast reactor-MOX pellet fuel, the schematic would be very similar to the process diagram shown
in Subsection D1-4.2 on LWR MOX fuels, except there would be one less blending step. Figure D1-4-2 shows the fabrication process for the ceramic nitride fuel being examined by the AFCI Fuels Working Group for Generation IV fast reactor applications. Most of the steps are similar to those for oxide fuel.
Fast Reactor Pellet Fuel Fabrication Process. For medium enriched uranium (>10% U-235 or <20% U-235 or highly enriched uranium), ceramic fuel the process would be much the same as for LEU fuel production. Because of the security and criticality concerns, batch sizes would be very limited in size. For MOX ceramic fast reactor fuel, the process is much the same as for thermal MOX (Section D1-2). Again, the batch sizes handled would have to be much smaller. Both plants would likely have to purchase or fabricate their own stainless steel fuel assembly parts such as grids and spacers.
D1-4.4. MODULE INTERFACE DEFINITIONS For the fast reactor MOX plant the starting material for driver fuel would likely be clean, reactor-
grade PuO2 powder from the reprocessing plant or PuO2 storage. (For contact handling some neptunium and/or very small amounts of americium can be present with the plutonium.) For the EUO2 driver fabrication plant, the starting material is likely to be EUF6. Blanket UO2 fuel could be produced in a conventional industrial facility with very low security and radiation protection requirements, i.e., no gloveboxes or criticality alarms. Transportation of finished fast reactor MOX driver fuel will, of course, need special casks for added security and radiochemical safety reasons. Other interfaces are similar to those for LWR MOX.
MOX driver fuel and DUO2 blanket fuel are best matched to aqueous reprocessing at the back end of the fast reactor closed fuel cycle. The Japanese have already begun planning such a plant to reprocess spent fuel and blankets from their Japanese Sodium-cooled Fast Reactor (1,500 MWe; JSFR) concept. Note that spent fast reactor fuel is likely to require development of a new type of storage/shipping cask.

D1-51
INL/EX
T-07-12107 (March 2008)
A
dvanced Fuel Cycle C
ost Basis
Figure D1-4-2. Fabrication process for mixed nitride fuels. (Figure courtesy of DOE-AFCI Fuels Working group)

INL/EXT-07-12107 (March 2008) Advanced Fuel Cycle Cost Basis D1-52
D1-4.5. MODULE SCALING FACTORS The same considerations apply in this area as for LWR MOX fuel (see Subsection D1-2.4). In terms
of heavy metal throughput, the reference fast reactor MOX plant will be much smaller for the same amount of fissile nuclide (plutonium) processed.
D1-4.6. COST BASES, ASSUMPTIONS, AND DATA SOURCES Cost and Pricing of Fast Reactor Fuel Fabrication. Fixed costs for a fast reactor ceramic fuel
fabrication plant are likely to be similar to those for an LWR MOX fabrication facility. These costs are distributed over a smaller heavy metal throughput, however, because less of the heavy metal is diluent and more is fissile. One would expect that the cost per kgHM for ceramic fast reactor fuel would be higher than for LWR MOX and that the plant heavy metal throughputs would be smaller. Table D1-4-2 shows projected costs for fast reactor (sodium-cooled LMR) ceramic MOX [(U,Pu)O2] fuel from various sources. Some of the cases below have fabrication costs for MOX fuel that contain minor actinides such as neptunium, americium, and curium, which make the radioactivity hazard associated with fabricating fuel somewhat more serious. Fast reactors have two types of fuel in their cores: the fissile “driver” core with high fissile content, and the fertile blanket, with natural or depleted uranium oxide or other ceramic forms. Fabricating blanket fuel should cost no more than fabricating LEU fuel, because criticality and radiotoxicity are minor or nonexistent concerns.
The sizing of ceramic fast reactor fuel fabrication plants is uncertain, because it is not known how many fast reactors utilizing pellet fuel might eventually be used. The only scaling data found were from the 1988 Oak Ridge National Laboratory Nuclear Energy Cost Data Base, which references data from the late 1970s Nonproliferation Alternative Systems Assessment Program (NASAP) that looked at many fuel cycles. A table from the Nuclear Energy Cost Data Base is reproduced here (Table D1-4-3) to show some plant capacity and capital cost data. All costs are in 1987 dollars. A multiplication factor of 1.8 would bring them to 2007 dollars.
Table D1-4-2. Unit fabrication costs for various fast reactor fuels.
Reference/Date Fuel (Contact-handled unless otherwise noted)
Fab Cost in $/kgHM (“then year $”)
Ref51/2002 MOX with minor actinides (ceramic pellet)
Core [driver] (M) 2,600
Ref 14/2003 MOX (ceramic pellet) Core (L/M/H) 700/1,500/2,300 Blanket 150/250/350
Ref 7/1994 MOX with minor actinides (ceramic pellet. Reference did not specify whether facility was totally remote-handling.)
Core (L/M/H) 1,400/2,600/5,000
Ref 12/1988 MOX (ceramic pellet) Core (L/H) 1,900/2,250 Blanket (M) 430
Ref 15/2000 ALMR metal fuel (for comparison, remote handling assumed)
Core (L/M/H) 4,600/5,150/7,700
Ref52/2005 MOX from equilibrium breeding cycle (JSFR data)
Core (M) 1537 revised in 2006 to 1,675
Ref 18/2001 Fast Reactor MOX Core (L/M/H) 1,000/1,500/2,000 Ref 53/2006 Fast Reactor MOX Core (L/M/H) 1,100/1,650/2,200

INL/EXT-07-12107 (March 2008) Advanced Fuel Cycle Cost Basis D1-53
Table D1-4-3. Fast Reactor (LMR) recycle costs from 1988 Oak Ridge National Laboratory NECDB study.
The Japan Atomic Energy Agency (JAEA)54 has projected a capital cost of approximately $750 million for a 200-MTHM/yr pellet MOX fabrication facility needed to support JSFRs. The updated unit cost of $1,675/kgHM in Reference 52 of Table D1-4-3 is calculated based on amortization of this capital cost and the addition of operations and maintenance and decommissioning levelized costs.

INL/EXT-07-12107 (March 2008) Advanced Fuel Cycle Cost Basis D1-54
D1-4.7. LIMITATIONS OF COST DATA Technology Readiness Level. Fast reactor MOX or enriched uranium pellet fuel production
technology in the U.S. could reasonably progress quickly to the pilot plant stage; however, changing requirements would link FR MOX progress to that for LWR MOX. Considerable fuel qualification would be required before industrial scale implementation in the U.S.
Identification of Gaps in Cost Information. If the benefits and risks of closed fuel cycles vis-à-vis open cycles are to be well understood, the fabrication costs for fuels arising from closed cycles must be better understood. Unfortunately, there is little U.S. experience in operating large scale facilities, and what work has been done to date is mostly on LWR or thermal MOX. The most recent fast reactor cost studies have been for plants preparing metal fuel, with the feeds coming from an adjacent dedicated fuel reprocessing facility on the reactor site, i.e., the GE/MFCd Integral Fast Reactor cycle (discussed in Module F2/D2). Therefore, they add little to the database for ceramic fast reactor fuels. It is also difficult to separate fabrication costs from reprocessing costs for such studies involving collocated integrated facilities.
It is likely that fast reactor ceramic (such as liquid metal reactor MOX) fuel fabrication plants will need to be tied in closely or be part of a reprocessing complex for fabrication unit costs to decrease. This collocation allows fixed costs for considerations, such as security and radiochemical hazard protection, to be distributed over more fuel cycle operations. Some preconceptual designs for collocated facilities need to be prepared by an architect-engineering firm in order for this assumption to be validated. The only other studies that might have very limited use are Russian design/cost studies on small fast reactor pelletized fuel facilities to support the burning of 17–25% fissile MOX fuels in the BN-600 reactor to support the joint U.S./Russian Federation weapons plutonium disposition program.
To increase the proliferation resistance of closed fuel cycles, the idea of not separating plutonium from other transuranic actinides in the reprocessing plant has been advanced. The UREX 1a reprocessing concept is one such process. This means that the fast reactor fuel that would be refabricated from this material would contain neptunium, americium, and perhaps other actinide oxides in the MOX. Sometimes referred to as “dirty” MOX, this material would impose special and more stringent requirements on the fuel fabrication facility from the standpoints of personnel radiation exposure, heat management, criticality, and materials accountability. The resulting plants would more appropriately fall under Module F2/D2 (remote handling). These additional costs of more automated or remote handling are not known; however, if a “dirty MOX” economic study is done for thermal reactor fuel, such as (Pu,Np)O2 or for higher actinide LWR targets, the results will have similar impacts on fast reactor MOX plants.
D1-4.8. COST SUMMARIES The module cost information is summarized in the What-It-Takes (WIT) cost summary in
Table D1-4-4. The summary shows the reference cost basis (constant year $U.S.), the reference basis cost contingency (if known), the cost analyst’s judgment of the potential upsides (low end of cost range) and downsides (high end of cost range) based on references and qualitative factors, and selected nominal costs (judgment of the expected costs based on the references, contingency factors, upsides, and downsides). These costs are subject to change and are updated as additional reference information is collected and evaluated, and as a result of sensitivity and uncertainty analysis. Refer to Section 2.6 in the main section of this report for additional details on the cost estimation approach used to construct the WIT table.
d. Beginning February 1, 2005, the name of the Idaho National Engineering and Environmental Laboratory (INEEL) was changed to Idaho National Laboratory (INL). Argonne National Laboratory-West was renamed the Materials and Fuels Complex (MFC).

INL/EXT-07-12107 (March 2008) Advanced Fuel Cycle Cost Basis D1-55
Table D1-4-4. Cost summary table for Fast Reactor Pelletized Ceramic fuels.
What-It-Takes (WIT) Table (2007 constant $)
Reference Cost(s) Based on Reference
Capacity (Low Cost)
Upsides (High Cost) Downsides
(Nominal Cost) Selected Values
$2,300/kgHM from centralized, private 50-MT/yr facil with loan and market guarantee
$3,200/kgHM
Blanket: $350/kgU
Many of same factors affecting SRS-MFFF would affect this cost. (see Module D1-1) $6,000/kgHM
Blanket: $700/kgU
Core: $4,000/kgHM Blanket: $500/kgU
No reliable and validated data on plant capital costs
Same as for LWR MOX; use of enriched uranium in 15 to 25% U-235 range would be cheaper than plutonium use.
Same as for LWR MOX Stay with reference value
The triangular distribution based on the costs in the WIT Table is shown in Figure D1-4-3. The
distribution is skewed toward the low cost because there is European and Japanese industrial experience, although at a small scale, with this type of fuel.
Module D1-4 Ceramic Pellet Fast Reactor FuelEstimated Cost Frequency Distribution
$/kgHM
Freq
uenc
y
Low Nominal Mean High
$3200 $4000 $4400 $6000
Figure D1-4-3. Ceramic Pellet Fast Reactor Fuel Estimated Cost Frequency Distribution.
D1-4.9. RESULTS FROM SENSITIVITY AND UNCERTAINTY STUDIES
No such studies were found in the literature or were performed by the author for this fuel type.

INL/EXT-07-12107 (March 2008) Advanced Fuel Cycle Cost Basis D1-56

INL/EXT-07-12107 (March 2008) Advanced Fuel Cycle Cost Basis D1-57
Module D1-5
Ceramic Vibrocompacted Fast Reactor Fuel

INL/EXT-07-12107 (March 2008) Advanced Fuel Cycle Cost Basis D1-58

INL/EXT-07-12107 (March 2008) Advanced Fuel Cycle Cost Basis D1-59
Module D1-5
Ceramic Vibrocompacted Fast Reactor Fuel
D1-5.1. BASIC INFORMATION Current Status. A vibrocompacted or VIPAC fast reactor fuel assembly appears identical to a
pelletized ceramic fuel assembly on the outside. The fuel rods, however, initially contain vibrationally compacted, dense ceramic granulate instead of stacked pellets. (Some metallic powder may be added to the oxide mix to improve the fuel performance characteristics.) As the VIPAC fuel is irradiated, the reactor heat sinters the granulate into what is essentially a long pellet. The technical and cost advantage of this type of fuel is elimination of the costly pressing, sintering, and pellet grinding/finishing steps in the usual MOX fuel fabrication process. This process was investigated on a bench scale in the U.S. several decades ago, and some fuel was irradiated in the Saxton test reactor. There is still considerable interest in this process for fast reactor MOX in Russia and in Japan. The Japanese have funded some Russian MOX vibro-fabrication work at RIAR (or NIIAR) in Dimitrovgrad, and some test rods have been irradiated in the BN-600 at Beloyarsk.55 Figure D1-5-1 describes the purported advantages of vibropack technology as presented by RIAR. This technology is likely to play a role in the joint U.S./R.F. plutonium disposition program.
There are several variations of VIPAC technology. Early techniques focused on granulate produced by crushing sintered ceramic pellets. More recent work outside Russia has focused on use of sintered gel-spheres, and the associated technology is known as Sphere-Pac in reference to the resulting spherical feed. The East German – Russian variant promoted vigorously by NIIAR uses a crushed glassy granulate resulting from electrochemical deposition of UO2 or (U,Pu)O2 out of the molten salt solution.
VIPAC fuel fabrication is often paired with electrochemical fuel reprocessing (Module F2/D2 type process, but with ceramic rather than cast-metal fuel) in proposed fuel cycles because of the nature of the processes as explained below. One such fuel cycle is for the STAR-H2 reactor (The Secure Transportable Autonomous Reactor for Hydrogen [Electricity and Potable Water] Production). This is one of the metal-cooled reactor concepts being studied under the Generation IV program by Argonne National Laboratory56 and would use a U,Pu-nitride fuel.
D1-5.2. FUNCTIONAL AND OPERATIONAL DESCRIPTION Vibrocompaction equipment (sieve-sizing, feeding, shaking) replaces pellet fabrication equipment for
this type fuel. Feed powder preparation, however, may be somewhat more complex for vibrocompaction than for pelletization. The feed powder is usually in the form of tiny irregular shards rather than round or nearly-round particles. The oxide powder would actually be produced from a electrochemical process where oxide crystals are interspersed with other salts on an electrode. These other salts must be separated or washed away before the irregularly-shaped shard-powder is sieved and prepared for vibrational compacting into fuel rods.
D1-5.3. PICTURES/SCHEMATICS Figure D1-5-2 shows a conceptualized view of the VIPAC process. In the diagram, three particle
sizes are chosen. Some processes, such as the Russian RIAR one, have five particle sizes. The particles are not actually round, however, and exist as irregular shards that can be sized by sieving.
Figure D1-5-3 shows the overall VIPAC process as practiced at RIAR and how it meshes with their electrochemical reprocessing technology.

D1-60
INL/EX
T-07-12107 (March 2008)
A
dvanced Fuel Cycle C
ost Basis
Fuel rods containing granulated fuel are fabricated using a standard vibropacking procedure (in glove-boxes or hot cells) have been used at RIAR for about 20 years.
The main advantages of the vibropack technology and fuel rods with vibropack fuel are as follows:
• Simplicity and reliability of the production process due to a smaller amount of process and control operations facilitating automation and remote control
• Granulate of homogeneous composition can be used as well as in the form of mechanical mixture
• Lower (as compared with a pellet stack) thermal-mechanical impact of vibropack fuel on the cladding
• Weakened requirements to the inner diameter of fuel rod claddings.
Fuel column is a mechanical mixture of (U, Pu)O2 granulate and uranium powder, having a function of getter and is added to a fuel weighted portion at the stage of agitation before pouring. Getter addition for regulation of the fuel oxygen potential and elimination of process impurities effect allowed for complete solution of the problem of chemical interaction of vibropack oxide fuel and cladding. The process provides for a 100% fuel column quality control including distribution of plutonium and density along the fuel column length. The uniform getter distribution is ensured by the technology.
A number of studies were performed to verify the performance of fuel rods with vibropack oxide fuel including the optimization of the fabrication and control technology as well as the performance of all required reactor tests (SM, BOR-60, BN-350, BN-600) and post-irradiation material science examinations. Based on the testing results performed in the SM, BOR-60 and BN-350 reactors the basic parameters of fuel rod design for the BOR-60 and BN-600 reactors were optimized as well as the technological processes for production and control with consideration of remotely controlled operation.
Due to the fuel rod design optimization the world record burnup of 30% was achieved in the BOR-60 reactor.
Figure D1-5-1. RIAR (Federal State Unitary Enterprise “State Scientific Center of Russian Federation–Research Institute of Atomic Reactors.” Vibropacking technology description and advantages.

INL/EXT-07-12107 (March 2008) Advanced Fuel Cycle Cost Basis D1-61
Figure D1-5-2. Conceptualized view of VIPAC. (Figure provided by ORNL)
Figure D1-5-3. The VIPAC process and its relation to pyrochemical reprocessing technology. (Figure provided by RIAR)
D1-5.4. MODULE INTERFACE The feed MOX mixture fed to the vibrator/tube-filler must have a very well-defined particle size
distribution (enabled by sieving) and particle shape characteristics (small shards or crystals). The powder characteristics of material coming from electrochemical reprocessing techniques are better suited for VIPAC; however, it is still quite possible to fix the morphology of aqueous precipitation-derived MOX powders.

INL/EXT-07-12107 (March 2008) Advanced Fuel Cycle Cost Basis D1-62
VIPAC feasibility has been examined for LWR fuels including UO2. A DOE-NERI report suggests that spheroidal powder could be vibropacked into annular cladding as one of several fuel options, which would allow higher power density and extended burnup with their beneficial economic consequences.57 The higher fabrication costs for annular fuel are predicted to be overcome by the lower mills/kWh fuel cycle cost component of the cost of electricity resulting from the use of less fuel. No detailed cases with cost numbers were presented in the report.
D1-5.5. MODULE SCALING FACTORS No data were available. Any scaling would be similar to fast reactor pelletized fuel facilities.
D1-5.6. COST BASES, ASSUMPTIONS, AND DATA SOURCES No direct unit cost information was found for Western or Japanese vibropacked fast reactor fuels;
however, it is known that the Japanese considered VIPAC in their feasibility study58 for commercialization of fast reactor fuel cycle systems. All that can be said is that proponents have roughly estimated that VIPAC unit costs should be 20% lower than for pelletized fuel unit costs. This estimate probably does not include all the additional research and development, fuel qualification, and process qualification costs that would be involved with this type of fuel.
In 1998, Russian engineers prepared a cost estimate for converting and operating the BN-600 Fast Reactor to a partial MOX core of vibropacked fuel as part of the joint U.S./RF Plutonium Disposition Program.59 Their estimate concluded that a BN-600 VIPAC fuel assembly could be produced for less than $100,000 per unit. Because each fuel assembly contains approximately 28.7 kg of heavy metal (MOX with >20% PuO2 ), a unit cost of ~$3,500/kgHM could be calculated for production from the pilot-plant sized facility that would need to be operated to supply these assemblies. Because this is a pilot scale facility number, it would be expected that a large fuel fabrication plant of this type could produce fuel at a lower cost. Converting the above Russian number to the U.S. wage and industrial conditions, however, would elevate the cost.
An OECD report14 gives unit cost projections for advanced fast reactor fabrication and reprocessing steps in an integrated (one building) facility. For the fabrication step, which involved gelatione and vibrocompaction, the following unit costs are given:
Present (2001): $4,900/kgHM
Future: $1,600/kgHM
These data are based on Japanese sources such as ICONE 8 papers.
D1-5.7. LIMITATIONS OF COST DATA The Russian Federation is likely to have some limited cost data. However, it may be difficult to
convert it to U.S. dollar equivalents for deployment in the West. The Russian VIPAC process is still at the bench scale level of development. Yet, funding from and cooperative work with Japan may allow some larger scale fabrication to be done. Via the Generation IV Economic Modeling Working Group (EMWG) JAEA may make available in the near future some cost projections on VIPAC fuel fabrication, which was part of one of the four fuel-cycle scenarios studied as part of their fast reactor analysis.58
e. Gelation rather than electrochemistry produces “rounder” particles which can be vibrationally compacted. Such a process is sometimes called “spherepak.”

INL/EXT-07-12107 (March 2008) Advanced Fuel Cycle Cost Basis D1-63
D1-5.8. COST SUMMARIES The module cost information is summarized in the What-It-Takes (WIT) cost summary in
Table D1-5-1. The summary shows the reference cost basis (constant year $U.S.), the reference basis cost contingency (if known), the cost analyst’s judgment of the potential upsides (low end of cost range) and downsides (high end of cost range) based on references and qualitative factors, and selected nominal costs (judgment of the expected costs based on the references, contingency factors, upsides, and downsides). These costs are subject to change and are updated as additional reference information is collected and evaluated, and as a result of sensitivity and uncertainty analysis. Refer to Section 2.6 in the main section of this report for additional details on the cost estimation approach used to construct the WIT table.
Table D1-5-1. WIT cost summary table.
What-It-Takes (WIT) Table
Reference Cost(s) Based on Reference
Capacity
Reference Cost Contingency
(+/- %) (Low Cost)
Upsides (High Cost) Downsides
(Nominal Cost)Selected Values
Plant capital cost: No data available
N/A N/A
Unit production cost: no validated data available
No data available Could be cheaper process than pelletization (fewer steps)
Difficulties in development/ automation
$3,600/kgHM if VIPAC assumed 10% cheaper than pellet fast reactor MOX
D1-5.9. RESULTS FROM SENSITIVITY AND UNCERTAINTY ANALYSIS
None available.

INL/EXT-07-12107 (March 2008) Advanced Fuel Cycle Cost Basis D1-64

INL/EXT-07-12107 (March 2008) Advanced Fuel Cycle Cost Basis D1-65
Module D1-6
Metallic or Alloyed Fast Reactor Fuel

INL/EXT-07-12107 (March 2008) Advanced Fuel Cycle Cost Basis D1-66

INL/EXT-07-12107 (March 2008) Advanced Fuel Cycle Cost Basis D1-67
Module D1-6
Metallic or Alloyed Fast Reactor Fuel
D1-6.1. BASIC INFORMATION Current Status. Metallic fast reactor fuel, such as is produced by casting operations, is generally
part of refabrication schemes associated with on reactor-site closed fuel cycles where the reprocessed and refabricated fuel must be handled in hot cells, with the higher actinides allowed to remain in the fuel for partial destruction in the next irradiation cycle. No cost information was found on metallic fuels not arising from a reprocessing plant or a transmutation/separation facility, although that does not mean that such schemes do not exist. (Some Pu-based metallic fuel for the now-closed Hanford FFTF (Fast Fuel Test Facility) was prepared without high concentrations of higher actinides [Np,Am,Cm].) Generally the higher actinide metals are alloyed with uranium and another heat-resistant metal such as zirconium. The INL MFC Integral Fast Reactor fuel cycle is one such cycle. The processes and costs associated with these remotely refabricated fuels are discussed in Module F2/D2. Unfortunately no data on separated reprocessing and refabrication costs were found. As noted above small amounts (a few hundred kilograms) of sodium-bonded metal fuel were fabricated for the now-deactivated FFTF reactor at Hanford.60 Government-owned plutonium was used for this fuel. No costs for its manufacture have been found by the author.
Metallic or alloyed fuels have been extensively used in (nonelectricity) production and research applications where high temperature is not needed, but high fast or thermal neutron fluxes exist. Much of this fuel, which is mostly uranium alloyed or mixed with aluminum or molybdenum, or even silicides, is produced by pressing or extrusion type metallurgical operations. Because this fuel is usually 19% or greater in fissile content and is made in relatively small quantities, the unit costs for fabrication are usually high (i.e., a few thousand dollars to tens of 1,000s of $ per kgHM). Dispersion type fuels, such as those proposed by the AFCI Fuels Working Group, for the Generation IV Gas-cooled Fast Reactors, are discussed in Section D1-9.
D1-6.2. FUNCTIONAL AND OPERATIONAL DESCRIPTION See Modules D1-9, F2/D2.
D1-6.3. PICTURES AND SCHEMATICS See Modules D1-9, F2/D2.
D1-6.4. MODULE INTERFACE DEFINITION See Modules D1-9, F2/D2.
D1-6.5. MODULE SCALING FACTORS No data available.
D1-6.6. COST BASES, ASSUMPTIONS, AND DATA SOURCES See Modules D1-9, F2/D2.

INL/EXT-07-12107 (March 2008) Advanced Fuel Cycle Cost Basis D1-68
D1-6.7. LIMITATIONS OF COST DATA See Modules D1-9, F2/D2.
D1-6.8. COST SUMMARIES See Modules D1-9, F2/D2.
D1-6.9. RESULTS FROM SENSITIVITY AND UNCERTAINTY ANALYSES
None available.

INL/EXT-07-12107 (March 2008) Advanced Fuel Cycle Cost Basis D1-69
Module D1-7
CANDU Fuel

INL/EXT-07-12107 (March 2008) Advanced Fuel Cycle Cost Basis D1-70

INL/EXT-07-12107 (March 2008) Advanced Fuel Cycle Cost Basis D1-71
Module D1-7
CANDU Fuel
D1-7.1. BASIC INFORMATION Current Status. Because the advanced CANDU ACR-700 heavy-water reactor design was recently
undergoing Nuclear Regulatory Commission (NRC) certification in the U.S. and is being offered for sale on the international market, it is useful to briefly consider the projected manufacturing cost for its fuel and that of its other CANDU cousins. CANDU fuel is fabricated in Canada at firms such as Zircatec LTD. Present generation CANDU fuel is not made from enriched uranium, hence no UF6/enrichment steps are needed in the front-end fuel cycle. The “spec-powder” oxide feed required by Zircatec for pelletization can be prepared in a facility adjacent to the mill (natural UO2 can be used for fuel in a water reactor with a heavy water moderator/coolant). The newer-type ACR-700 fuel, however, will be slightly enriched uranium at around 2% U-235. Its fuel assembly and the older NATUO2 fuel assemblies, however, do not at all look like an LEU LWR fuel assembly. The fuel assemblies are much shorter but still use stacked UO2 pellets.
D1-7.2. FUNCTIONAL AND OPERATIONAL DESCRIPTION Basic Plant Configuration. A CANDU fuel bundle (assembly) still uses pelletized ceramic UO2
fuel; so, most of the pellet and rod loading manufacturing process steps are the same as for LWR fuel. Because the fuel bundle is an order of magnitude shorter and lighter than LWR fuel, the steps at the end of the manufacturing process are somewhat simpler. However, one should note that the quality control costs are higher per kilogram of heavy metal because each closure weld applies to much less heavy metal than for LWR fuel. Batch size control and criticality concerns are minimal to nonexistent in CANDU fuel fabrication plants as compared to LEU PWR and BWR fuel fabrication plants.
CANDU reactors can also be operated on plutonium-bearing MOX fuel. Atomic Energy of Canada Limited has irradiated some weapons-derived MOX fuel in their experimental heavy-water reactor at Chalk River, Ontario. This PARALLEX MOX project with Russia and the U.S. is part of the joint U.S./Russian Federation Plutonium Disposition Program. A plant that would produce production quantities of CANDU MOX fuel would be nearly identical to fuel fabrication plants producing PWR or BWR MOX fuel, except that the resulting final fuel assembly form would be much smaller and would appear the same as UO2 CANDU fuel.
D1-7.3. PICTURES/SCHEMATICS Figure D1-7-1 shows the ACR-700 assembly, which resides in the reactor horizontally rather than
vertically. Each of the parallel tubes is filled with ceramic oxide pellets. The assemblies are fed continuously to the pressure-tube type reactor while it is running rather than in reload batches during shutdowns (per the LWR). Figure D1-7-2 from ACR data submitted to the USNRC61 shows this operation.

INL/EXT-07-12107 (March 2008) Advanced Fuel Cycle Cost Basis D1-72
Figure D1-7-1. The ACR-700 CANDU fuel assembly. (Figure courtesy AECL)
Figure D1-7-2. Horizontal on-line refueling for the ACR-700 CANDU reactor. (Figure courtesy AECL)
D1-7.4. MODULE INTERFACE DEFINITION Front end Interfaces. A CANDU fuel fabrication plant preparing slightly enriched UO2 ACR-700
fuel will require enriched UF6 conversion (UF6 to UO2) before the pellet preparation steps. For present generation CANDU reactor fuel, which is natural uranium, reactor grade sinterable UO2 powder can be prepared as a final milling step rather than as a front-end step in the fuel fabrication plant. NATUO2 CANDU fuel bundles are shipped in conventional cartons to the reactor sites. Criticality safety is not a concern. The ACR-700 EUO2 fuel may require a certified shipping package as does LWR fuel in the U.S.
Back-end Interfaces. CANDU reactors have larger cores than LWRs for the same power capacity. Volume-wise, there will be more spent fuel that needs to be stored and ultimately disposed by geologic repository emplacement.

INL/EXT-07-12107 (March 2008) Advanced Fuel Cycle Cost Basis D1-73
D1-7.5. MODULE SCALING FACTORS The same observations on fabrication plant scaling apply for this type fuel as for LWR fuel
(Subsection D1-1).
D1-7.6. COST BASES, ASSUMPTIONS, AND DATA SOURCES Assuming that the manufacturing/fabrication process for this slightly enriched uranium fuel assembly
is the same as for past CANDU NATU assemblies, the unit cost should be similar. If the 1991 NATU value from the NEA/OECD fuel cycle study17 is escalated to 2007 constant dollars, a fabrication cost of $~100/kgU results. To this should be added a conversion cost for slightly enriched EUF6 to ceramic-grade UO2 powder, a step that is not needed for natural uranium CANDU fuels. The author of this report assumes that $30/kgU cost would be appropriate, for a total cost of $130/kgU. This is smaller than for LWR fuel; however, the CANDU fuel assembly/bundle is simpler by design.
Fabrication costs for CANDU MOX fuels would be expected to be in the lower end of the ranges for LWR MOX fuel as presented in Section D1-3.
D1-7.7. LIMITATIONS OF COST DATA The reliability of the cost data is good, since CANDU fuel production is a fully commercialized
operation.
D1-7.8. COST SUMMARIES The module cost information is summarized in the What-It-Takes (WIT) cost summary in
Table D1-7-1. The summary shows the reference cost basis (constant year $U.S.), the reference basis cost contingency (if known), the cost analyst’s judgment of the potential upsides (low end of cost range) and downsides (high end of cost range) based on references and qualitative factors, and selected nominal costs (judgment of the expected costs based on the references, contingency factors, upsides, and downsides). These costs are subject to change and are updated as additional reference information is collected and evaluated, and as a result of sensitivity and uncertainty analysis. Refer to Section 2.6 in the main section of this report for additional details on the cost estimation approach used to construct the WIT table.
Table D1-7-1. Cost summary table for CANDU ACR-700 fuel.
What-It-Takes (WIT) Table
Reference Cost(s) Based on Reference
Capacity (Low Cost)
Upsides (High Cost) Downsides
(Nominal Cost) Selected Values
Unit cost=$130/kgU $110/kgHM $150/kgHM $135/kgHM
No fab plant capital cost data available.
None identified Use of enrichments over 1% U-235
Use reference value
The triangular distribution based on the costs in the WIT Table is shown in Figure D1-7-3. The
distribution is not heavily skewed since there is considerable industrial cost experience with CANDU fuel.

INL/EXT-07-12107 (March 2008) Advanced Fuel Cycle Cost Basis D1-74
Module D1-7 CANDU FuelEstimated Cost Frequency Distribution
$/kgHM
Freq
uenc
y
Low Mean Nominal High
$110 $132 $135 $150
Figure D1-7-3. CANDU fuel estimated cost frequency distribution.
D1-7.9. RESULTS FROM SENSITIVITY AND UNCERTAINTY ANALYSIS
No data were found or generated.
D1-7.10. SPECIAL TOPIC: DUPIC: THE DIRECT USE OF SPENT PWR FUEL IN CANDU REACTORS
After irradiation, PWR fuel still has a high enough fissile content that it could be further irradiated in CANDU reactors. The problem is that the fuel forms are different. South Korea has both PWRs and CANDUs and has been part of a cooperative program with the U.S. and Canada to see if irradiated PWR fuel could be declad, crushed, reoxidized, and remade into CANDU pellets without separation of the nonvolatile transuranic or fission-product components. Doing so would solve the PWR spent fuel problem for Korea and allow use of a tandem PWR/CANDU fuel cycle. Figure D1-7-4 shows the benefits and challenges of this scheme as envisioned by the Korean Atomic Energy Research Institute (KAERI).
This type of fuel would have to be remotely handled all the way through its production process (see Figure D1-7-5) and through its insertion in the CANDU reactor. With continuous fuel loading machines, however, such shielded and automated loading may be feasible. Choi, et al.62 of KAERI have performed a conceptual design and cost study for a CANDU DUPIC fuel plant capable of manufacturing 400 MT/yr of fuel. For a 40-year plant and a 5% discount rate, the unit cost of CANDU DUPIC fuel production is calculated to be $616/kgHM. Although much higher than for UO2 CANDU fuel, this cost is counteracted by the much lower back-end fuel cycle costs for the PWRs. There are also greatly reduced uranium costs for the CANDU reactors.
Using relatively pure uranium oxide recovered from LWR reprocessing is also an option. Such REPU could have 0.7 to 1.2 % U-235 and could be obtained from future U.S. reprocessing operations. Use of this material would avoid expenditure for the purchase of new uranium ore. Basically the costs involved would be conversion of the reprocessing product (UNH or an oxide) into a sinterable UO2 powder grade and fabrication into pellets and assemblies. Initial indications for high natural uranium prices (~$100/lb U3O8) are that the upfront cost for the CANDU open cycle could be cut in half.63

INL/EXT-07-12107 (March 2008) Advanced Fuel Cycle Cost Basis D1-75
Figure D1-7-4. Benefits and challenges of turning PWR fuel into CANDU fuel. (Figure courtesy KAERI)
Figure D1-7-5. Process steps for DUPIC CANDU fuel fabrication. (KAERI)

INL/EXT-07-12107 (March 2008) Advanced Fuel Cycle Cost Basis D1-76

INL/EXT-07-12107 (March 2008) Advanced Fuel Cycle Cost Basis D1-77
Module D1-8
Thorium-based Fuels

INL/EXT-07-12107 (March 2008) Advanced Fuel Cycle Cost Basis D1-78

INL/EXT-07-12107 (March 2008) Advanced Fuel Cycle Cost Basis D1-79
Module D1-8
Thorium-based Fuels
D1-8.1. BASIC INFORMATION Current Status. For sustainability (U-conservation) and nonproliferation reasons the use of
thorium/U-233 LWR fuels has recently received considerable attention64,65,66,67,68,69 and some DOE research and development funding (as part of NERI, INPRO, and the Russian plutonium disposition programs). A U.S. company, Thorium Power (now part of Novastar), is working on one such concept, called the Radkowsky Thorium-Plutonium Incinerator (RTPI) with the Kurchatov Institute in Moscow, Russia. The intent is to develop a two-part hybrid [ceramic (U,Th)O2 blanket, metal Pu-Zr alloy seed driver] fuel assembly that could deeply burn enriched uranium or plutonium without producing additional higher actinides. The use of a plutonium driver is not necessary if the mission is to only produce electricity and not to disposition plutonium. Pelletized UO2/ThO2 MOX fuel can be used in lieu of low-enriched UO2. The UO2 mixed with the ThO2 must be at a U-235 content (19.95% U-235 to still qualify as LEU) considerably above that of LEU fuel (2 to 5% U-235). The U-233 that is formed or “bred” by neutron irradiation of thoruim helps to sustain the life of the nuclear fuel such that residence times of as long as 9 years are deemed possible (if cladding can be developed with such a long life). Such long residence times mean higher fuel burnup or utilization and less consumption of nuclear fuel. Thus there is a reduction in the fuel cycle component of the busbar levelized cost of electricity from a reactor. Most thorium-related fuel development work to date in the U.S. has been on LWR and gas-cooled reactor fuels. This section will deal mainly with possible LWR applications, mainly U.S. and Russian PWRs (VVERs).
World thorium resources are estimated to be three times those of uranium, and that several nations, such as Brazil, Australia, Norway, and India, have significant indigenous thorium sources.
D1-8.2. FUNCTIONAL AND OPERATIONAL DESCRIPTION For a reactor using only UO2-ThO2 (U-Th MOX) pellets, the fuel fabrication facility would be very
similar to a low-enriched UO2 facility such as that at West Columbia, South Carolina (BNFL/Westinghouse). Figure D1-8-1 shows the major process steps. The major differences would be at the front end of the plant, where a UO2/THO2 blending step would be needed. Prior to this, some purification/conversion of the original thorium feed form, such as a nitrate, would be required. The uranium conversion step (UF6 to UO2) would have a major difference from that in an LEU plant, however. The higher U-235 enrichment (19.95% U-235) would require special criticality control and smaller batch sizes prior to blending with ThO2. Pellets of this type have been successfully produced on a small scale and irradiated in commercial reactors.
For a reactor using the RTPI concept, such as for plutonium disposition, essentially two fuel plants are needed. The plant described in the paragraph above would provide the “blanket” fuel in which a high conversion of Th to U-233 would take place, and the fission of bred U-233 would augment the fission of U-235 from the uranium component. Within each fuel assembly there would also be a driver fuel that would consist of long, thin, trefoil rods of plutonium metal alloyed with zirconium. Most of the neutrons for fission would be produced in the driver. Figure D1-8-2 shows how each RTPI fuel assembly would have driver rods surrounded by rods containing blanket (U,Th)O2 pellets. The driver fuel plant would contain complex chemical and metallurgical operations that must be performed in a glovebox environment, such as exists for production of (U,Pu)O2 MOX fuel. None of the proposed operations, which include conversion, reduction, pressing, and extrusion of plutonium compounds or alloys, have

D1-80
INL/EX
T-07-12107 (March 2008)
A
dvanced Fuel Cycle C
ost Basis
Figure D1-8-1. Fuel fabrication facility process schematics for a thorium concept utilizing both a blanket (U, ThO2) pelletized fuel and a metallic Pu-Zr driver fuel (RTPI concept proposed for Russian Pu-disposition).[ORNL figure]

INL/EXT-07-12107 (March 2008) Advanced Fuel Cycle Cost Basis D1-81
∅ 8.40
∅ 6.87
∅ 1.2
∅ 7 03.
Figure D1-8-2. RTPI blanket/driver fuel envisioned for plutonium-disposition (dimensions are in millimeters). [ORNL figure]
been performed in a large-scale commercial facility. Figure D1-8-1 shows the steps required for the driver fuel production for a plant envisioned to support possible Russian VVER-PWR disposition of 38 MT of Russian Federation plutonium over ~16 years. Compared to a proposed similar weapons plutonium-disposition scheme using French MOX (U,Pu) technology (Module D1-2) in Russia, the RTPI scheme appears considerably more complex.
D1-8.3. PICTURES AND SCHEMATICS The top part of Figure D1-8-2 shows an RTPI mockup hexagonal fuel assembly for a Russian
VVER-1000 PWR. The two-part assembly (blanket and driver separable) has the metal-alloy, twisted, trefoil drivers in the middle surrounded by tubes of blanket pelletized ceramic fuel. A cross section of a driver rod is shown bottom left. A cross section of an annular blanket pellet is shown bottom right.

INL/EXT-07-12107 (March 2008) Advanced Fuel Cycle Cost Basis D1-82
D1-8.4. MODULE INTERFACE DEFINITION Front-end interfaces. Thorium is three times as abundant in the earth’s crust as uranium; hence there
is plenty of thorium ore available for use. Like uranium, the thorium ore must be mined and milled. The thorium compound produced at the mill, such as an oxide or a nitrate, must be chemically purified to produce a reactor-grade thoria powder. The uranium is likely to be received as enriched UO2 produced from a new enrichment facility or blended from weapons-highly enriched uranium stockpiles. For the RTPI plutonium-disposition concept, the plutonium is envisioned to come from nuclear weapons as impure metal or as impure PuO2 from other military facilities. This plutonium must be chemically purified before it is reduced to metal and alloyed with zirconium. Front-end process conversion steps involving aqueous chemistry are required. Over 10 years of fuel qualification would be required for the RTPI concept before it could be commercially implemented.
Back-end interfaces. These thorium fuel cycles are envisioned to achieve high burnups and be operated on a once-through basis. The spent fuel is likely to be more radiotoxic than normal low-enriched UO2 spent fuel. The driver and blanket spent fuel for the RTPI application will be separable. Casks for transportation and final geologic disposal would need to be developed.
Thorium-based spent fuels present special problems if they are reprocessed for recovery of U-233 and minimization of wastes. Along with U-233, small amounts of the isotope U-232 are produced. This relatively short-lived uranium radioisotope has decay daughters, such as thallium-208, which produce very potent gamma radiation. If the U-233 fuel refabrication operations are not performed quickly after reprocessing (which strips out the U-232 daughters but not the U-232 itself), U-232 daughters will build back up and present a significant radiological hazard in the fuel fabrication facility. The required shielding and handling procedures, perhaps even totally remote fabrication, will very significantly increase the unit cost of U-233 fuel refabrication.
D1-8.5. MODULE SCALING FACTORS No documented data were available. For (U,Th)O2 blanket ceramic pellet fuel the plant scaling laws
would be similar to those for LWR UO2. The Pu-Zr driver fuel would probably scale similarly to metal fast reactor fuel facilities.
D1-8.6. COST BASES, ASSUMPTIONS, AND DATA SOURCES The Kurchatov Institute and Thorium Power Corporation have produced analyses claiming that their
thorium fuel cycles are at least 20% cheaper than the conventional UO2 fuel cycle on a mills/kWh basis (fuel component of the cost of electricity). The favorable economics are based on the high burnup and long residence time of the fuel assembly, with U-233 being continually produced and burned. Residence times up to 9 years are projected. Unfortunately, a fuel rod cladding that lasts this long has not been developed. If it were, it would benefit not only (U,Th)O2 fuel but also any UO2 fuel, thus the cost advantage over UO2 may be illusory. As far as unit production (fabrication only) costs for (U,Th)O2, a detailed analysis by Lahoda23 indicates that they would be no more than 50% greater than those for low-enriched UO2 LWR fuel (Section D1). Such fuel could be produced in a low-enriched UO2 fuel line with some heating, ventilating, and air-conditioning (HVAC) and front-end modifications. A license amendment and significant building and procedure modifications would be needed to handle the 19.95% U-235 UO2 component. Because of higher U-235 content, the total front-end fuel cycle cost (ores, conversion, enrichment, and fabrication) of the (U,Th)O2 assembly, which is 13% uranium and 87% thorium, would be at least 60% higher than for low-enriched UO2 fuel ($784/kgHM versus $476/kgHM). Lower Russian unit costs for these front-end fuel cycle steps are assumed.70 The SWU component alone for 19.95% U-235 is $5,000 to 6,000/kgU in the West.

INL/EXT-07-12107 (March 2008) Advanced Fuel Cycle Cost Basis D1-83
The unit fabrication costs for the twisted, trefoil Pu-Zr alloy driver70 fuel are projected by Oak Ridge National Laboratory to be much higher than those projected by Kurchatov Institute. In terms of unit cost per unit of metal (plutonium + zirconium for fuel which is 15% plutonium) a value of $27,000/kg metal was calculated by Oak Ridge National Laboratory. This is several times higher than unit costs for either fast reactor MOX or cast metallic fuel. The high cost is based on the Oak Ridge National Laboratory analysis of the various chemical and metallurgical operations involved in extruded trefoil rod production under glovebox conditions. These high plutonium-handling costs are validated by U.S. cost experience with plutonium and its compounds and alloys in its weapons complex.
D1-8.7. LIMITATIONS OF COST DATA Technical Readiness Status: Planning for bench scale development is under way in Russia. A pilot
plant for RTPI fuel would be at least 5 years away, and a large scale fabrication plant at least 12 years distant. If only (U,Th)O2 or (Pu,Th)O2 pellet fuel were to be used, these deployment times would be considerably shorter. India, in fact, has shown interest in using such fuel because of the large amount of indigenous thorium and has performed some successful irradiation experiments.
D1-8.8. COST SUMMARIES The module cost information is summarized in the What-It-Takes (WIT) cost summary in
Table D1-8-1. The summary shows the reference cost basis (constant year $U.S.), the reference basis cost contingency (if known), the cost analyst’s judgment of the potential upsides (low end of cost range) and downsides (high end of cost range) based on references and qualitative factors, and selected nominal costs (judgment of the expected costs based on the references, contingency factors, upsides, and downsides). These costs are subject to change and are updated as additional reference information is collected and evaluated, and as a result of sensitivity and uncertainty analysis. Refer to Section 2.6 in the main section of this report for additional details on the cost estimation approach used to construct the WIT table.
Table D1-8-1. Cost summary table for LWR thorium-based RTPI fuel now under development in Russia.
What-It-Takes (WIT) Table (2007 constant $)
Reference Cost(s) Based on Reference
Capacity (Low Cost)
Upsides (High Cost) Downsides
(Nominal Cost) Selected Values
(U,Th)O2 pellet fuel $800/kgHM in Russia (HM is U+Th). Includes SWU component in uranium cost.
Longer fuel life than for LEUO2
$3,000/kgHM
Higher fuel production costs due to need for 19.95% EU and HVAC modifications
$1,600/kgHM in West
Pu-Zr metal fuel for RTPI Pu-disposition application [in tandem with (U,Th)O2 blanket]
High annual consumption of surplus Pu in LWR
Having both metal seed and oxide blankets makes very complicated and expensive fuel. Very long, expensive fuel qual program needed.
$27,000/kg metal (U.S. or Russia)
If ThO2 only pellets and rods were to be produced in the U.S. for “blankets” in LWRs, the
fabrication-only cost would be on the order of $400/kgHM. However, reprocessing the blanket pellets to obtain fissile U-233 and its refabrication into U-233/U-238 LEU fuel assemblies would incur very significant costs and is not being seriously considered in the U.S.

INL/EXT-07-12107 (March 2008) Advanced Fuel Cycle Cost Basis D1-84
D1-8.9. RESULTS FROM UNCERTAINTY ANALYSES None available.
D1-8.10. OTHER THORIUM UTILIZATION NOTES Thorium can also be used as a fertile material in fuel cycles other than those in water reactors. It has
actually been used in TRISO-type fuels for gas-cooled reactors in both the U.S. (Fort St. Vrain) and Germany (THTR). The durability and long life of TRISO fuels makes the thorium to U-233 conversion feature beneficial for high fissile burnup. The additional economic impact of using thoria in addition to 8 to 20% U-235 UO2 in TRISO fuel production is relatively low. HTGR applications are also discussed in Reference 71. Thorium oxide blankets on fast reactors (such as liquid metal fast breeder reactors) are also of interest, and fast reactors in India may in fact use plutonium driver fuel and some ThO2 blanket.

INL/EXT-07-12107 (March 2008) Advanced Fuel Cycle Cost Basis D1-85
Module D1-9
Inert Matrix and Other Advanced Fuels

INL/EXT-07-12107 (March 2008) Advanced Fuel Cycle Cost Basis D1-86

INL/EXT-07-12107 (March 2008) Advanced Fuel Cycle Cost Basis D1-87
Module D1-9
Inert Matrix and Other Advanced Fuels
D1-9.1. BASIC INFORMATION Background and Current Status. Inert Matrix Fuels (IMFs) are those in which there are no or
minimal fertile radioisotopes, such as U-238 or Th-232, that are transmuted to higher actinides. The advantages of such fuel are as follows:
• The generation of long-lived higher actinides which contribute to repository heat-loading is minimized.
• High fissile destruction fractions are attainable because no new fissile material is generated from fertile constituents. This can be an advantage for some open cycle concepts.
• Because the initial fissile fraction or percentage of the overall fuel mass must be high, the reactor volume and fuel mass per kilowatt thermal can be reduced. This is advantageous for small modular reactor and space reactor concepts. The associated high neutron fluxes can also effectively burn out any actinides introduced in the core, such as in fast reactor burner concepts.
The inert (diluent) materials in such fuels may be oxides of metals with low neutron absorption cross sections or metallic alloying constituents such as zirconium.
Advanced Fuels are those special fuel types envisioned for some of the Generation IV Reactor Systems concepts such as the Gas-cooled Fast Reactor (GFR) and not included in Modules D1-1 through D1-8. Dispersion fuel, where ceramic fuel particles are dispersed in a metal or ceramic matrix, is one such example of an advanced fuel.
It is too early to know definitively whether these two types of fuel would be fabricated in contact-handling (D1) or remote handling (D2) facilities. The reactor concepts and fuel cycle are still being defined as part of the Generation IV Program Fuels of these two types have been produced as “specialty fuels” for use in research reactors or other special reactor applications. The manufacturing of these fuels is a batch operation with considerable human contact handling. Some such fuels have been used in (nonelectricity) production and research applications where high temperature is not needed, but high fast or thermal neutron fluxes exist. Much of this “specialty-type” fuel is produced by pressing or extrusion type metallurgical operations. Because this fuel is usually 19% or greater in fissile content and is made in relatively small quantities, the unit costs for fabrication are usually high (i.e., a several thousand to tens of 1,000s of dollars per kgHM).
D1-9.2. FUNCTIONAL AND OPERATIONAL DESCRIPTION No data were available on processes for the large scale production of such fuels. As Generation IV
research and development continues, such manufacturing processes will be further defined.
D1-9.3. PICTURES AND SCHEMATICS Figure D1-9-1 shows two types of IMF fuel pellets produced by a fuels research and development
program.72
The two IMF pellets (solid solution and macro-dispersed) are shown at the beginning of life before irradiation in the frame of the OTTO project. The pellet on the left is a representative pellet made of

INL/EXT-07-12107 (March 2008) Advanced Fuel Cycle Cost Basis D1-88
ErxYyPuzZr1-x-y-zO2-(x+y)/2 material. The pellet on the right is a composite material pellet. Visible microspheres made of ErxYyPuzZr1-x-y-zO2-(x+y)/2 are partially popping out of the pellet’s white surface, which is made of MgAl2O4 spinel.
Figure D1-9-2 shows the types of dispersion fuel being considered by the Generation IV Gas-cooled Fast Reactor Program.
D1-9.4. MODULE INTERFACE DEFINITION There is not yet enough fuel cycle definition to describe these interfaces.
Figure D1-9-1. Solid solution and macro-dispersed inert matrix fuel pellets.
Figure D1-9-2. Dispersion fuel concepts.73

INL/EXT-07-12107 (March 2008) Advanced Fuel Cycle Cost Basis D1-89
D1-9.5. MODULE SCALING FACTORS No data available.
D1-9.6. COST BASES, ASSUMPTIONS, AND DATA SOURCES No cost data on these fuel types were found. For contact-handled IMF or Advanced Fuel, the cost
data in Sections D1-3 (Gas-cooled Reactors) and Section D1-6 (Metallic and Alloyed Fuels) might provide some idea of unit costs for production quantities. For remote-handled IMF or Advanced Fuels, the comments in Section F2/D2 should apply.
D1-9.7. LIMITATIONS OF COST DATA There is not enough cost data available to define cost limitations
D1-9.8. COST SUMMARIES For these fuels a considerable fraction of the fuel mass (not including clad or assembly hardware)
will not be a diluent heavy metal (HM) such as uranium. The figure of merit used should be $/kg base fuel metal. Because of the high fissile content of such fuels, the cost is expected to range from several thousand to tens of thousands $/kg, depending on quantities produced and the manufacturing environment.
D1-9.9. RESULTS FROM SENSITIVITY AND UNCERTAINTY ANALYSES
None available.
D1-10 REFERENCES (For all D1 Modules) References for all of the D1 Modules appear in this section. The boxed headings group them by fuel type in the same manner as the text. Note that some references are proprietary, copyrighted trade press newsletters, official government documents marked “official use only” or “applied technology,” or reports prepared by consulting firms with limitations on their release.
INTRODUCTION
0a. “Fuel Design Data”; Nuclear Engineering International; September 2006
0b. Olsen, A.R, Judkins, R.R, Carter, W.L., and Delene, J.G; “Fuel Cycle Cost Studies – Fabrication, Reprocessing, and Refabrication of LWR, SSCR, HWR, LMFBR, and HTGR Fuels”; ORNL/TM-6522; Oak Ridge National Laboratory; March 1979
0c. Judkins, R.R. and Olsen, A.R.; Nuclear Fuel Fabrication and Refabrication Cost Estimation Methodology; ORNL/TM-6640; Oak Ridge National Laboratory; November 1979
MODULE D1-1 LWR UO2 FUEL
1. G. Varley, “Perspectives on Consolidation in the Nuclear Industry,” Nuclear Energy, 2002,
Vol. 41, No 4, August, pp. 259–264.

INL/EXT-07-12107 (March 2008) Advanced Fuel Cycle Cost Basis D1-90
2. Kidd, Steve; “Fabrication: Is it different?”; Nuclear Engineering International (web version);
August 31, 2005; www.neimagazine.com/story.asp?sc=2030109.
3. Hans-Uwe Siebert; “AREVA Secures Fuel Assembly Manufacturing of the Future; Conference paper from “Building the Nuclear Future:Challenges and Opportunities; 2006.
4. Gizitdinov, N.; “Kazakhstan Aims to Be Biggest Nuclear-Fuel Producer (Update 1)”; www.bloomberg.com; July 11, 2007.
5. Rothwell, G. and Braun, C.; “Cost and Market Structures in International Nuclear Fuel Cycles”; presentation at ANS Annual Meeting; June 25-28; Boston MA.
6. NAC Worldwide Consulting, “LWR Fabrication Plant Data,” Focus Journal of Nuclear Commerce, Issue 68; Vol 2; 2004 (proprietary data). [This document has a restricted distribution, may be proprietary, or both; and is not publicly releasable.]
7. “U Market: ERI expects Drop in Price”; Platt’s Nuclear Fuel; page 20; July 2, 2007.
8. J. G. Delene, K. A. Williams, B. H. Shapiro, Nuclear Energy Cost Data Base: A Reference Data Base for Nuclear and Coal-fired Powerplant Power Generation Cost Analysis, ORNL, DOE/NE-0095, September 1988.
9. J. James and K. A. Williams, “Overview of Fuel Cycle for DOE Chicago Operations Office,” MOX Procurement Group, Powerpoint presentation by, ORNL, February 24, 1999. [This document has a restricted distribution, may be proprietary, or both; and is not publicly releasable.]
10. M. Bunn, et al., The Economics of Reprocessing vs. Direct Disposal of Spent Nuclear Fuel, Cambridge, Massachusetts, Project on Managing the Atom, Harvard University, DE-http://www.house.gov/science/hearings/energy05/july%2012/Fetter%20Bunn-reprocessing%20economics.pdf, accessed 20 December 2003.
11. John Deutch, et al., The Future of Nuclear Power: An Interdisciplinary MIT Study, Massachusetts Institute of Technology, 2003, Belfer Center for Science and International Affairs Science, Technology, and Public Policy Program, full text publication available at http://www.web.mit.edu/nuclearpower/, Web site accessed December 14, 2005, no date.
12. J. G. Delene, J. Sheffield, K. A. Williams, et al., An Assessment of the Economics of Future Electric Power Generation Options and the Implications for Fusion, Rev. 1, ORNL/TM-1999/243/R1, January 2000.
13. G. Varley and D. Collier, Fuel Cycle Cost Data, Atlanta: NAC Worldwide Consulting, October 1999. [This document has a restricted distribution, may be proprietary, or both; and is not publicly releasable.]
14. Nuclear Energy Agency/OECD, “Trends in the Nuclear Fuel Cycle: Economic, Environmental and Social Aspects,” Paris: OECD, www1.oecd.org/publications/ e-book/6602011e.pdf, accessed December 20, 2005.

INL/EXT-07-12107 (March 2008) Advanced Fuel Cycle Cost Basis D1-91
15. OECD Nuclear Energy Agency (NEA), Projected Costs of Generating Electricity: 2005 Update,
Paris: OECD, 2005, out of print, PDF available.
16. G. S. Tolley and D. W. Jones, codirectors, The Economic Future of Nuclear Power: A Study Conducted at The University of Chicago, August 2004, http://www.house.gov/science/hearings/energy05/july%2012/Chicago%20Nuclear%20Economics%20Summary.pdf, accessed December 20, 2005.
17. OECD Nuclear Energy Agency (NEA) and International Atomic Energy Agency (IAEA) The Economics of the Nuclear Fuel Cycle, 1994, http://www.nea.fr/html/ndd/reports/efc/, accessed December 20, 2005.
18. V. Gunnar and S. Junkrans, “Perspectives on LWR Fuel Development,” The Uranium Institute Twenty Third International Symposium, 1998, www.world-nuclear.org/sym/1998/vester.html, PDF, accessed December 20, 2005.
19. Gregg, R and Worrall, A.; “Effect of Highly Enriched/Highly Burnt OU2 Fuels on Fuel Cycle Costs, Radiotoxicity, and Nuclear Design Parameters”; Nuclear Technology (ANS); Vol 151; August 2005.
20. Gingold, J. and Goldstein, L.; “The Seven Percent Solution: A Contrarian View”; paper delivered at NEI Fuel Cycle 2002 Conference; Chicago IL; April 14–17.
21. W. H. Hermes, et al., Thorium Nitrate Material Inventory Definition Report, ORNL/TM-2000/163, June 2001, Official Use Only, p. E-14. [This document has a restricted distribution, may be proprietary, or both; and is not publicly releasable.]
22. W. H. Hermes, et al., Executive Summary Report for the Thorium Nitrate Stockpile Stewardship and Disposition Project, ORNL/TM-2001/14, June 2001, Official Use Only, p. 9-9. [This document has a restricted distribution, may be proprietary, or both; and is not publicly releasable.]
23. E. J. Lahoda, “Costs for Manufacturing Thorium-Uranium Dioxide Fuels for Light Water Reactors,” Nuclear Technology, American Nuclear Society, Vol. 147, July 2004, pp 102–112.
24. “MIT Promises More Efficient Nuke Plants”; News item on Yahoo Finance Message Board for USEC Inc (symbol USU); April 24, 2007.
25. “New LWR fuel might double burnup, cut waste in half, Westinghouse says”; Platt’s Nuclear Fuel; June 4, 2007.
26. G. E. Michaels and T. D. Welch, Evaluation of Disposition Options for Reprocessed Uranium, ORNL/TM-12326, February 1993.
27. B. B. Spencer, et al., Spent Fuel Treatment Engineered Product Storage: Preferred Concepts for Uranium Disposition, ORNL/TM-2005/20, July 2005, Applied Technology & Official Use Only. [This document has a restricted distribution, may be proprietary, or both; and is not publicly releasable.]
28. “TVEL lands first UK fuel contract”; Platt’s Nuclear Fuel; page 19; June 18, 2007.

INL/EXT-07-12107 (March 2008) Advanced Fuel Cycle Cost Basis D1-92
29. “AREVA launches Comurhex II project, studies new REPU facility”; Platt’s Nuclear Fuel;
pages 1,6,7 and 8; June 4, 2007.
30. Direct Enrichment of Reprocessed Uranium at Siberian Chemical Combine, International Business Relations Corporation (IBR), Moscow, 2006, Proprietary Report. [This document has a restricted distribution, may be proprietary, or both; and is not publicly releasable.]
31. AREVA, AREVA’s Chemistry Business Unit Has Plans For a New Conversion Plant Dedicated to the Conversion of Reprocessed Uranium, Platt’s Nuclear News Flashes, June 13, 2006.
32. NEI Recognizes BLEU Project with Top Industry Practices Award, Nuclear Fuel Services Inc. Press Release, Erwin, Tennessee, USA, May 30, 2006.
MODULE D1-2 LWR MOX FUEL 33. “The UK’s Sellafield Mixed-oxide Plant, or SMP, will only ever achieve a third of its design
output of 120 MTHM/yr …”; Platt’s Nuclear News Flashes; March 3, 2007.
34. Management and Disposition of Plutonium: Reactor-related Options, National Academy of Sciences, Washington, D.C.: National Academy Press, 1995.
35. FMDP Reactor Alternative Summary Report: Vol 1—Existing Reactor-related Alternative, Oak Ridge National Laboratory, ORNL/TM-13275/V1, October 7, 1996.
36. K. A. Williams, Life Cycle Costs for the Domestic Reactor-based Plutonium Disposition Option, ORNL/TM-1999-257, Oak Ridge National Laboratory, October 1999.
37. “U.S. Energy Department to Move Forward on MOX,” NTI Global Security Newswire; Nuclear Threat Initiative; www.nti.org; April 16, 2007.
38. “Russia, US could take decisive step in plutonium disposition program,” Platt’s Nuclear Fuel; pages 1 and 5; May 21, 2007.
39. W. Stoll, Lessons Learned at the Karlsruhe and Hanau Plants for Future MOX Technology Developments, IIU, Inc., Germany (prepared for ORNL), IIU/MD-001, December 2002.
40. Nuclear Energy Agency, Trends in the Nuclear Fuel Cycle; Economic, Environmental, and Social Aspects, Paris, 2001.
MODULE D1-3 GAS-COOLED REACTOR FUEL 41. “Business Case: DOE’s Proposed Baseline Approach for Disposing of Surplus Plutonium”;
USDOE National Nuclear Security Administration (NNSA): NA-26; April 2007.
42. “The Modular Pebble Bed Reactor Concept,” a presentation of the 22.33/.033 Design Course for the University of Cincinnati/Ohio State University, September 29, 1998 (viewgraph presentation with 58 slides including an economic analysis).

INL/EXT-07-12107 (March 2008) Advanced Fuel Cycle Cost Basis D1-93
43. DOE/NP-24 and ORNL Cost Evaluation Technical Support Group, New Production Reactors
Program: Life Cycle Cost Report, Rev 2, October 1991 unpublished.
44. D. Goodin, et al., Reducing the Costs of Targets for Inertial Fusion Energy, GA-A23833, General Atomics Corp, April 2002.
45. Gas-Cooled Reactor Associates and GA, Modular High Temperature Gas-cooled Reactor Commercialization and Generation Cost Estimates, DOE-HTGR-90365, November 1993. [This document has a restricted distribution, may be proprietary, or both; and is not publicly releasable.]
46. International Atomic Energy Agency, Current Status and Future Development of Modular High Temperature Gas-Cooled Reactor Technology, IAEA-TECDOC-1198, February 2001, http://www.iaea.or.at/inis/aws/htgr/fulltext/gcr_review.pdf, accessed December 20, 2005.
47. “PBMR Awards Fuel Contract,” Nuclear Engineering International, E-mail Report, (Nuclear Engineering International is a British Journal), May 13, 2005.
48. “PBMR Ltd. Hires Unit of Germany’s Thyssenkrupp for Fuel Plant Work,” Platt’s Nuclear Fuel, May 9, 2005.
49. GT-MHR Plutonium Consumption Study: Phase 2 Final Report, GA/DOE-051-94, GA Technologies Corporation, San Diego, CA, 1994. [This document has a restricted distribution, may be proprietary, or both; and is not publicly releasable.]
MODULE D1-4 CERAMIC PELLETIZED FAST REACTOR FUEL 50. Adam, R.; “The Nuclear Renaissance at Work in South Africa”; presentation delivered at ICAPP
Conference; Nice, France; May 14, 2007.
51. U.S. DOE Nuclear Energy Research Advisory Committee and the Generation IV International Forum, A Technology Roadmap for Generation IV Nuclear Energy Systems, GIF-002-00, December 2002.
52. “Economic Data of the JNC Sodium Cooled Fast Reactor (JSFR) System Design,” The 9th Meeting of the Generation IV Economic Model Working Group, February 2005.
53. Nuclear Energy Agency (NEA), Advanced Nuclear Fuel Cycles and Radioactive Waste Management, OECD-Paris, 2006.
54. “Sample Calculation of G4-ECONS Code on the JAEA JSFR System,” paper presented at the 14th Meeting of the Generation IV Economic Modeling Working Group, Tokyo, May 17−18, 2006.
MODULE D1-5 CERAMIC VIBROCOMPACTED FAST REACTOR FUEL 55. A. Mayorshin, V. Skiba, et al., “Practical Experience in Using MOX Fuel at Atomic Electric Power
Station,” Scientific Research Institute of Atomic Reactors; Dimitrovgrad, Russia, Proceedings of the 4th International Radioecological Conference “Utilization of Plutonium: Problems and Solutions,” Krasnoyarsk, Russia; June 5–10, 2000.

INL/EXT-07-12107 (March 2008) Advanced Fuel Cycle Cost Basis D1-94
56. D. Wade, “Generation IV Concept Summary: STAR-H2: The Secure Transportable Autonomous
Reactor for Hydrogen (Electricity and Potable Water) Production,” NERI Project No 2000-0060, Argonne National Laboratory, http://www.hydrogen.anl.gov/pdfs/STAR-H2summary.pdf, accessed December 20, 2005.
57. M. Kazimi, “High Performance Fuel Design for Next-Generation PWRs (Annular Fuel Project),” Massachusetts Institute of Technology, NERI Project 01-005, NERI Annual Report: 2002.
58. Phase II Final Report of Feasibility Study on Commercialized Fast Reactor Cycle Systems—Executive Summary, Japan Atomic Energy Agency, March 2006. [This document has a restricted distribution, may be proprietary, or both; and is not publicly releasable.]
59. “Assessment of the Cost and Feasibility of Converting and Operating the BN-600 Hybrid Core Using Vibro-Technology Fuel for Plutonium Disposition,” State Scientific Center of Russian Federation—Institute of Physics and Power Engineering (IPPE), Obninsk, Russia, 1998.
MODULE D1-6 METALLIC OR ALLOYED FAST REACTOR FUEL 60. Magnox Fuel; Westinghouse Nuclear Fuel Information Sheet; www.westinghousenuclear.com;
November 2004.
MODULE D1-7 CANDU FUEL 61. Design data submissions to the U.S. NRC for certification of the ACR-700 Pressurized
Heavy-Water Moderated Reactor; Atomic Energy Limited of Canada (AECL). [This document has a restricted distribution, may be proprietary, or both; and is not publicly releasable.]
62. H. Choi, W. Ko, and M.S. Yang, “Economic Analysis on Direct Use of Spent Pressurized Water Reactor Fuel in CANDU Reactors—1: DUPIC Fuel Fabrication Cost,” Nuclear Technology (ANS), Vol 134, May 2001.
63. Del Cul, G., Trowbridge, L., Renier, J., Ellis, R., Williams, K., Spencer, B., and Collins, E.; “Analysis of the Reuse of Uranium Recovered from the Processing of Commercial LWR Spent Fuel”; June 29, 2007; Oak Ridge National Laboratory; unpublished white paper.
MODULE D1-8 THORIUM-BASED FUELS 64. M. S. Kazimi, “Thorium Fuel for Nuclear Energy: An Unconventional Tactic Might One Day Ease
Concerns That Spent Fuel Could be Used to Make a Bomb;” American Scientist, Vol. 91, No. 5, September–October 2003.
65. Greneche, Dominique; “The Thorium Cycle: an Assessment of its Potentialities with a Focus on Nonproliferattion Aspects; AREVA Inc; presentation from ANS Winter Meeting; Albuquerque,NM; Nov 14, 2006.
66. “Norwegian firm proposes thorium nuclear plant”; Reuters New Service; www.reuters.com; March 30, 2007.

INL/EXT-07-12107 (March 2008) Advanced Fuel Cycle Cost Basis D1-95
67. Lifton, Jack; “Thoriun: An Alternative to Uranium: 2007 Update; www.resource investor.com;
Feb 22, 2007.
68. Filippov, Y.A.; “Plan for Plutonium-free Nuclear Electric Power Generation; www.proatom.ru; June 13, 2007.
69. “Nuclear Power Programme – Stage 3 (Thorium Utilization)”; Annual Report from India’s Atomic Energy Agency; 2006.
70. B. Cowell, S. Fisher, K. A. Williams, et al., Assessment of the Radkowsky Thorium-Plutonium Incinerator Concept for Plutonium Disposition, ORNL/TM-2005/120, Oak Ridge National Laboratory, May 2005, Official Use Only. [This document has a restricted distribution, may be proprietary, or both; and is not publicly releasable.]
71. IAEA, Thorium Fuel Cycle—Potential Benefits and Challenges, IAEA-TECDOC-1450, May 2005, http://www-pub.iaea.org/MTCD/publications/PDF/TE_1450_web.pdf, accessed December 20, 2005.
MODULE D1-9 INERT MATRIX AND OTHER ADVANCED FUELS 72. Web site: Status of research and development after the IMF8 Workshop;
http://arq.lanl.gov/source/orgs/nmt/nmtdo/AQarchive/03springsummer/deguelder.html.
73. Web site: http://www.nuclear.inl.gov/deliverables/docs/appendix_3.pdf.

INL/EXT-07-12107 (March 2008) Advanced Fuel Cycle Cost Basis D1-96

INL/EXT-07-12107 (March 2008) Advanced Fuel Cycle Cost Basis D2-1
Module D2 was combined with Module F2
(Go to Tab F2/D2 for this information)

INL/EXT-07-12107 (March 2008) Advanced Fuel Cycle Cost Basis D2-2

INL/EXT-07-12107 (March 2008) Advanced Fuel Cycle Cost Basis E1-1
Module E1
Wet Storage of Spent Nuclear Fuel

INL/EXT-07-12107 (March 2008) Advanced Fuel Cycle Cost Basis E1-2

INL/EXT-07-12107 (March 2008) Advanced Fuel Cycle Cost Basis E1-3
Module E1
Wet Storage of Spent Nuclear Fuel
E1-1. BASIC INFORMATION Module E1 discusses the cost involved with wet storage of commercial spent nuclear fuel. This
covers the spent fuel from the time it is removed from the reactor and it is placed in the pool until it is either placed into dry storage or packaged for shipment. In nearly all cases, this spent fuel storage was installed as a portion of the initial investment and was meant to hold just a few core changes before the waste would be sent to disposal. New reactors will certainly consider the economics of installing a pool capable of holding the spent fuel generated during the life of the facility.
All currently operating nuclear power reactors use water pools to store their spent fuel when it is first discharged from the reactor to allow the fuel to cool. There are 103 commercial nuclear reactors operating in the U.S. at 65 sites in 31 states. Of these, 69 are pressurized-water reactors (PWRs) and 34 are boiling-water reactors (BWRs). In addition there are 14 previously operating light-water-cooled power reactors in various stages of decommissioning. Some of these reactors share spent fuel pools, so that there is a total of 65 PWR and 34 BWR pools. There is also one independent site (prior commercial reprocessing site in Morris, Illinois) that is used for wet storage of spent fuel.
In any case, spent fuel is kept in wet storage for a minimum of 5 years to permit adequate decay of the shorter lived isotopes and meet criteria for packaging and transport from both a shielding and heat management basis.
As disposal options became elusive, utilities began efforts to increase their use of spent fuel storage space. This was accomplished by several means. In some cases, material was moved out of wet storage into dry storage at the reactor site or a site owned by the utility. In other cases, the fuel was restacked and use was made of neutron absorbing material to permit much closer “dense-packed” or “high density” storage spacing. Approximately 90 to 95% of spent fuel currently resides in wet storage. Most pools are densely packed so they can contain as much as 3.5 times more spent fuel than the original design. Tables E1-1 and E1-2 provide a 1998 snapshot of how such wet storage is distributed among the world nuclear power producers.
E1-2. FUNCTIONAL AND OPERATING DESCRIPTION In the United States, spent fuel storage pools are regulated by the Nuclear Regulatory Commission
(NRC). Figure E1-1 shows the locations of the reactors and storage pools in the U.S. The pools are typically 30 to 60 feet long, 20 to 40 feet wide, and 40 feet deep. Pools could nearly hold three semi-truck tractor-trailers parked side-by-side and stacked three deep. The pool is contained by a structure consisting of a 1/8-inch to 1/4-inch stainless steel liner, and 4 to 6-foot-thick walls of steel-reinforced concrete. The location of the pool is dependent on the type of reactor. Figures E1-2a and E1-2b show diagrams of “generic” PWR and BWR spent fuel pools. The water in the pool is constantly cooled and circulated to remove impurities. The fuel assemblies, stored vertically in racks, must be immersed at least 20 feet below the surface of the water in order to keep the fuel cool and to provide a sufficient radiation barrier.

INL/EXT-07-12107 (March 2008) Advanced Fuel Cycle Cost Basis E1-4
Table E1-1. At reactor wet storage.

INL/EXT-07-12107 (March 2008) Advanced Fuel Cycle Cost Basis E1-5
Table E1-2. Summary of away-from-reactor wet spent fuel storage (tonnes heavy metal as of 1997).
Spent fuel pool designs must meet specific performance criteria before NRC can issue a license for construction or operation. The requirements focus on ensuring that the safety features of the pool survive certain natural phenomena or accidents to ensure that, among other things, the pool will retain water and keep the stored fuel sufficiently cool. Spent fuel in wet storage is also protected by the physical security measures in place at the storage site. As part of the licensing process prior to construction and operation, utilities must submit reports that analyze the likelihood of certain natural phenomena, such as earthquakes, hurricanes, floods, and tidal waves. Using probability analyses, historical information, and current information on seismology, geology, meteorology, and hydrology, the utilities must determine the risks of certain types of natural phenomena. Then the utilities must show that the proposed pool designs would survive the most severe natural phenomena or combinations of less severe phenomena expected for that particular area.
The utilities must also perform the same exercise for the likelihood and severity of certain accidents, including airplane crashes. For example, pools constructed near airports may have to be designed to withstand certain types of accidental airplane crashes.
Consequently, although the specific designs of wet storage pools vary from site to site, they are massive, robust structures. Generally, the pools are contained in other buildings. The roofs of some of these buildings may be made from industrial-type corrugated steel. Spent fuel pools are also protected by the physical security measures in place at the facilities where they are located. About 95% of the spent fuel inventory is stored in pools, most of which are located at operating nuclear reactors. The perimeters of these reactor sites are secured by fences topped with barbed wire, vehicle barriers, and intrusion detection systems—including perimeter cameras and motion detection technology—that are monitored 24 hours per day. Access to the building containing the wet storage pools is impeded by locked steel doors capable of surviving armed assault and security checkpoints where a person’s identity must be verified and where security searches take place. Finally, these facilities are manned by a force of armed guards.

INL/EXT-07-12107 (March 2008) Advanced Fuel Cycle Cost Basis E1-6
Storage pools not only store the spent fuel prior to packaging for transport and disposal but also play a very important role in supporting reactor outages and refueling. All reactors are connected to the spent fuel pools via fuel-transfer canals or tubes. These transfer channels are used to reduce shutdown durations as reactor operators often transfer the entire core to the pool in order to facilitate and expedite inspection of the reactor pressure vessel internals as well as inspecting fuel for leaks.
U.S. nuclear power plant operators have dealt with the lack of an offsite destination for their accumulating spent fuel by packing as many fuel assemblies as possible into their storage pools and then, when the pools are full, acquiring dry storage casks for the excess. The original design density of spent fuel in the pools associated with PWRs had the fuel assemblies spaced out in a loose square array. The standard spacing for new dense-pack racks today is 23 cm—barely above the 21.4 cm spacing in reactor cores. This “dense-packed” fuel is kept subcritical by enclosing each fuel assembly in a metal box whose walls contain neutron-absorbing boron-51 (see Figures E1-3 and E1-4). This dense-pack approach has been extremely important to the U.S. nuclear power industry as the delay in providing final disposal has resulted in the spent fuel pools reaching near capacity (see Figures E1-5 and E1-6).
E1-3. PICTURES/SCHEMATICS
Figure E1-1. Locations of the reactors and storage pools in the U.S.

INL/EXT-07-12107 (March 2008) Advanced Fuel Cycle Cost Basis E1-7
Figure E1-2a. Layout of spent fuel pool and transfer system for pressurized water reactors.1
Figure E1-2b. Layout of spent fuel pool and transfer system for boiling-water-reactors.1

INL/EXT-07-12107 (March 2008) Advanced Fuel Cycle Cost Basis E1-8
Figure E1-3. Wet storage pool showing densely packed spent fuel.
Figure E1-4. Example of open versus dense-packed spent fuel rack.

INL/EXT-07-12107 (March 2008) Advanced Fuel Cycle Cost Basis E1-9
Figure E1-5. Spent fuel pools at capacity in the U.S.

INL/EXT-07-12107 (March 2008) Advanced Fuel Cycle Cost Basis E1-10
Figure E1-6. Data on spent fuel storage at reactors in the United States.

INL/EXT-07-12107 (March 2008) Advanced Fuel Cycle Cost Basis E1-11
Figure E1-6. Data on spent fuel storage at reactors in the United States (continued).

INL/EXT-07-12107 (March 2008) Advanced Fuel Cycle Cost Basis E1-12
Figure E1-6. Data on spent fuel storage at reactors in the United States (continued).
E1-4. MODULE INTERFACE DEFINITION Module E1 has direct interface with Module E2 as cost is involved with moving spent fuel from the
pools into dry storage and with Module H for ultimate packaging for transportation and disposal. While these costs are not significant in the overall cost, modeling must avoid doubling the expense as these costs are not always broken out separately. The same would be true when considering interface with reprocessing Modules F1 and F2/D2.
Wet storage requires continuous operation of cooling, filtration, cleaning, and sampling systems, which depend on mechanical components such as pumps, valves, and filters. The chemical and temperature control of cooling water requires continuous monitoring and sampling. These operations result in appreciable quantities of radioactive low-level wastes. Such operational requirements increase with the amount of fuel in the pond and are particularly high when pools are near to capacity. Thus a link to Module J exists, albeit not well documented and of low order cost importance.
For purpose of modeling interim storage cost, it is reasonable to consider such cost independent of scale.
E1-5. MODULE SCALING FACTORS There are no direct scaling factors to be considered for this module. Design of pools is fairly
straightforward; however, the module can be enhanced by more clearly understanding the cost impacts from dense packing versus open packing. There is an advantage to the unit cost for a larger storage pool (see Section E1-1.6). Relative to new light water reactor projects, most utilities are expected to provide wet storage adequate for the projected life of the facility. This would avoid the need for any additional interim storage cost to remove the spent fuel from the pool to a dry storage form.

INL/EXT-07-12107 (March 2008) Advanced Fuel Cycle Cost Basis E1-13
E1-6. COST BASES, ASSUMPTIONS, AND DATA SOURCES The cost bases for this module have been gleaned from numerous studies by the U.S. Department of
Energy, International Atomic Energy Agency, Organization for Economic Cooperation and Development /Nuclear Energy Agency, General Accounting Office, NRC, and independent studies such as by Bunn et al. 2,3,4
It is basically assumed that capital expenses for wet storage pools are captured in the original cost of reactor design and construction, and amortized with the rest of the reactor. It is further assumed that the ongoing surveillance and operations and maintenance expenses are included in the basic reactor facility staffing and represent partial staff responsibilities, not a separate significant expense. In general, ongoing Operations and Maintenance (O&M) cost for wet storage is much greater than dry storage on an annual basis since all the cooling and purification systems must be kept in service and generate a modest amount of low-level radioactive waste.
“Bowser et al. (1994) estimated that the annual running costs of wet ponds to store fuel from the closed Rancho Seco reactor in California to be $10.6 million per year and for dry stores $2.6 million per year, a saving of about $8 million per year.”5
Because most pool costs have been paid for and dry stores have yet to be constructed, a useful comparison is the amortized cost of constructing a dry store plus annual operating costs, compared with the annual operating costs of an existing pool. In a 1994 study by Bowser et al., of the Rancho Seco reactor shutdown, the costs of constructing a transportation plus dry storage system to store spent fuel were estimated at $12.4 million. The study amortized this figure over a 10-year depreciation period using a 5% interest rate. This, plus annual running costs, resulted in an estimated total annual cost of $4.2 million for dry storage compared with annual operating costs of $10.6 million for wet storage. In other words, considerable savings accrued from constructing dry stores and transferring fuel from pools to them. Table E1-3 compares estimated costs of wet and dry storage systems in more detail. It reveals that the cost of dry storing fuel can be as much as 2.5 times lower than wet storing it.5
Bunn et al., report on a 1998 Japanese study comparing costs (albeit generally much higher than the U.S. would expect) between wet and dry storage over a 54-year timeframe for 5,000 tonnes of heavy metal in a centralized facility and applying a 5% discount rate.4 The unit costs per this approach were as follows and were estimated for comparison only and obviously do not represent actual experience:
• Pool Storage $396/kgHM (roughly 1.15 mills/kWh)
• Cask Storage $238/kgHM (roughly 0.70 mills/kWh).
The report also analyzed costs at different scales (3,000 ton and 10,000 ton). Pool costs on a unit basis dropped considerably at the larger scale (see Figure E1-7). Please note that costs in Figure E1-7 are in yen.
Table E1-3. Cost of wet and dry storage options.

INL/EXT-07-12107 (March 2008) Advanced Fuel Cycle Cost Basis E1-14
Figure E1-7. Life-cycle costs for wet storage of spent nuclear fuel.
Initial fixed cost (licensing, design, construct and startup—includes interest) is normally considered part of the overall capital cost of building the reactor and would likely be depreciated over the same period as the reactor.
Annual O&M is certified manpower which is a very small part of the basic operating staff, utilities (electricity and cooling water), consumables for water purification, and a small amount of low-level waste for disposal.
Variable cost would be incurred should pool expansion be needed. This would include the capital cost of neutron absorbing, seismically qualified inserts to permit reracking of pool contents to a dense-packed arrangement with closer spacing. Existing fuel handling equipment and personnel would be expected to be adequate to support such a task although no such data were found.

INL/EXT-07-12107 (March 2008) Advanced Fuel Cycle Cost Basis E1-15
E1-6.1 Other Considerations Spent fuel pool operation and related personnel would be required for at least 5 years following
shutdown of reactor to permit cooling before loading spent fuel for shipment.
It is assumed that use of higher burnup or mixed oxide fuel will have no significant impact on interim storage cost.
Cost data for this module should be considered as a private enterprise expense, even when considering use of spent mixed oxide fuel.
Reference data should be viewed as a top-down speculative cost or estimate because well-defined data specific to this task were not found.
E1-7. LIMITS OF COST DATA Because it is a minor portion of the reactor capital cost and has relatively minor annual operating cost,
limited data are readily available for the unit costs of wet storage for spent fuel. Capital costs are buried in the overall capital and operating cost absorbed in the basic O&M cost.
When building a model, it is important that such costs not be included twice. Some foreign data are available but not considered of any real value because NRC standards do not necessarily apply.
Cost data are not considered to be of high quality because there has been no common basis or consistent approach.
Technology application is one of a fully mature commercial process.
E1-8. COST SUMMARIES To get a levelized unit cost for wet storage, the initial capital, annual operating expenses over the life
of the spent fuel pool (until emptied), the total amount of electricity produced by the reactor, and the total tons of spent fuel consumed and cooled must be considered.
At this point nearly all, if not all, nuclear plants in the U.S. have been amortized. So, cost reflects only the ongoing O&M costs (neglecting final decontamination and decommissioning costs), encompassing Code of Accounts 71−77. For purposes of this initial module input, related O&M costs are assumed to be in the range of $2M to $10M annually with an arbitrary selection of $6M for a typical 1,000 MWe reactor with a 90% capacity. The most relevant code of accounts are 71 and 74; although, we have not been able to collect data to this level.
The reference cost to be used is 0.76 mils/kWh with a range of 0.25 to 1.27 mils/kWh. Assuming a reference case for a 1,000 MWe plant discharging ~20 tonnes of heavy metal per year, an annual O&M expense of $6 million relates to $300/kgHM
The module cost information is summarized in the What-It-Takes (WIT) cost summary in Table E1-4. The summary shows the reference cost basis (constant year $U.S.), the reference basis cost contingency (if known), the cost analyst’s judgment of the potential upsides (low end of cost range) and downsides (high end of cost range) based on references and qualitative factors, and selected nominal costs (judgment of the expected costs based on the references, contingency factors, upsides, and downsides). These costs are subject to change and are updated as additional reference information is collected and evaluated, and as a result of sensitivity and uncertainty analysis. Refer to Section 2.6 in the main section of this report for additional details on the cost estimation approach used to construct the WIT table. The triangular distribution based on the costs in the WIT Table is shown in Figure E1-8. The distribution indicates an equal chance that the costs will be on the low end as on the high end.

INL/EXT-07-12107 (March 2008) Advanced Fuel Cycle Cost Basis E1-16
Table E1-4. Cost summary table. What-It-Takes (WIT) Table
Reference Cost(s) Based on Reference
Capacity (Low Cost)
Upsides (High Cost) Downsides
(Nominal Cost) Selected Values
0.76 mil/kWh (undiscounted)
0.25 mil/kWh ($100/kgHM) 1.27 mil/kWh ($500/kgHM)
0.76 mil/kWh ($300/kgHM)
Or average 1000 MWe Rx discharging ~20 tHM/yr $300/kgHM
Low side cost reflects a case of well planned capacity that may be anticipated for new reactors where-in significant reracking is not required. Basic costs would reflect cooling and purification costs only
The high side cost reflects a condition where a significant amount of spent fuel management is required over the duration of the facility, such as reracking for dense-packed storage. It should (again judgment) also be adequate to cover capital cost of initial installation of the pool, containment building and related systems.
(same as the reference case)
Module E1 Interim SNF Storage (Wet) OpsEstimated Cost Frequency Distribution
$/kgHM
Freq
uenc
y
Low Nominal/Mean High
$100 $300 $500
Figure E1-8. Module E1 interim SNF storage (wet) ops estimated cost frequency distribution.
E1-9. SENSITIVITY AND UNCERTAINTY ANALYSES There have been no significant sensitivity analyses applied to this cost module as the influence of this
module cost is so very low relative to the total fuel cycle cost. To improve these data, it will be necessary to perform more detailed investigation of cost parameters with emphasis on pursuing actual O&M cost data from operating U.S. utilities.

INL/EXT-07-12107 (March 2008) Advanced Fuel Cycle Cost Basis E1-17
New reactor facilities would consider a tradeoff of size of spent fuel pool versus cost to stage spent fuel into dry storage. To be attractive, the much lower cost of dry storage over a period of time must be considered versus the added expense to license such storage, procure casks and related O&M, to load, and to survey as well as provide safeguards and security.
This cost evaluation would be changed should the U.S. government decide to implement a centralized Monitored Retrievable Storage because strategy for length of wet storage could be impacted.
E1-10. BIBLIOGRAPHY Cochran, R., and N. Tsoulfanidis, The Nuclear Fuel Cycle: Analysis and Management – 2nd Edition,
American Nuclear Society, 1990.
E1-11. REFERENCES 1. R. Alvarez et al., “Reducing the Hazards from Stored Spent Power-Reactor Fuel in the United
States,” Science & Global Security, Vol. 11, No. 1, 2003, pp. 1–51, http://www.princeton.edu/~globsec/publications/pdf/11_1Alvarez.pdf, Web page accessed July 19, 2007.
2. Organization for Economic Cooperation and Development, “The Economics of the Nuclear Fuel Cycle,” 1994.
3. U.S. Nuclear Regulatory Commission Web site, www.nrc.gov, last revised January 24, 2005, Web page accessed January 24, 2006.
4. M. Bunn et al., Interim Storage of Spent Nuclear Fuel: A Safe, Flexible, and Cost-Effective Near-Term Approach to Spent Fuel Management, Harvard University Project on Managing the Atom and the University of Tokyo Project on Sociotechnics of Nuclear Energy, 2001.
5. I. Fairlie, “Dry Storage of Spent Nuclear Fuel: The Safer Alternative to Reprocessing,” Report to Greenpeace International in Response to Cogema Dossiers to the La Hague Public Inquiry, May 2000, http://scholar.google.com/scholar?hl=en&lr=&q=cache:ZVJt2rZ0S.

INL/EXT-07-12107 (March 2008) Advanced Fuel Cycle Cost Basis E1-18

INL/EXT-07-12107 (March 2008) Advanced Fuel Cycle Cost Basis E2-1
Module E2
Dry Storage of Spent Nuclear Fuel

INL/EXT-07-12107 (March 2008) Advanced Fuel Cycle Cost Basis E2-2

INL/EXT-07-12107 (March 2008) Advanced Fuel Cycle Cost Basis E2-3
Module E2
Dry Storage of Spent Nuclear Fuel
E2-1. BASIC INFORMATION Module E2 discusses the cost involved with dry storage of commercial spent nuclear fuel. This
includes the cost of licensing and construction of a dry storage area (assumed at the reactor site); procurement, loading and placement of casks and/or storage containers; and routine Operations and Maintenance expense. Spent fuel is assumed to have cooled for a minimum of five years before being placed in dry storage. Worldwide inventory of spent fuel in dry storage was only 5,300 metric tonnes of heavy metal (MTHM) in 1998 but expected to grow significantly (see Table E2-1).
Dry storage of spent fuel differs from wet storage by making use of gas or air instead of water as the coolant (often an inert gas such as helium or an only modestly reactive gas, such as nitrogen, to limit oxidation of the fuel while in storage) and metal or concrete instead of water as the radiation barrier. The casks are typically steel cylinders that are either welded or bolted closed. The steel cylinder provides a leak-tight containment of the spent fuel. Each cylinder is surrounded by additional steel, concrete, or other material to provide radiation shielding to workers and members of the public. Some of the cask designs can be used for both storage and transportation.
Spent fuel is currently stored in dry cask systems at a growing number of independent spent fuel storage installations located at 24 power plant sites, one decommissioned power plant site (Fort St. Vrain), two plants in the process of decommissioning (Rancho Seco and Trojan), and at an interim storage facility operated by the U.S. Department of Energy (DOE) located at the Idaho National Laboratory near Idaho Falls, Idaho. One additional independent spent fuel storage installation, the General Electric-Morris Operation in Illinois, is licensed for wet storage of spent fuel. Section E2-1.3 contains maps showing the location of existing independent spent fuel storage installations.
Cask designs approved for use under the general license are listed in the Nuclear Regulatory Commission (NRC) regulations in Title 10 of the Code of Federal Regulations under Part 72.214 and in Table E2-2.
The casks used in the dry storage systems are designed to resist floods, tornadoes, projectiles, temperature extremes, and other unusual scenarios. The NRC requires the spent fuel to be cooled in the spent fuel pool for several years before being transferred to dry casks. Typically, the maximum heat generated from 24 fuel assemblies stored in a cask is less than that given off by a typical home heating system in an hour. As the fuel cools further, the heat generated will decrease over time.
There are various dry storage cask system designs. Casks typically consist of a sealed metal cylinder that contains the spent fuel enclosed within a metal or concrete outer shell. With some designs, the steel cylinders that contain the fuel are placed vertically in a concrete vault; other designs orient the cylinders horizontally. The concrete vaults provide the radiation shielding. Other cask designs orient the steel cylinder vertically on a concrete pad at a dry cask storage site and use both metal and concrete outer cylinders for radiation shielding. See the picture of a typical dry cask storage systems in Section E2-1.3.
Reactor operators have a large range of choice of dry storage systems. For those seeking economies of scale in storing large quantities of spent fuel for a prolonged period, vaults and silos are attractive; while for those seeking the flexibility of a modular, piece-by-piece storage system, dry casks are preferred.

INL/EXT-07-12107 (March 2008) Advanced Fuel Cycle Cost Basis E2-4
The NRC currently licenses storage casks for 20 years although the NRC has stated in the Federal Register that “dry storage in particular is safe and environmentally sound for a period of 100 years.” Some U.S. dry-cask storage facilities will reach the 20-year mark in a few years. The NRC is, therefore, currently deciding what analysis will be required to provide a basis for license extensions. With reactor operators increasing fuel burnup, casks will also eventually have to be licensed for the storage of high-burnup fuel. Current licenses allow burnups of up to 45,000 MWd/MT. However, the CASTOR V/19 cask is already licensed in Germany to store 19 high-burnup Biblis-type fuel assemblies, which are slightly bigger and heavier than U.S. pressurized water reactor fuel assemblies. The license allows 15 five-year-cooled fuel assemblies with burnups of 55 MWd/kgU plus four with burnups of up to 65 MWd/kgU. U.S. storage casks have been tested with fuels with burnups of 60 MWd/kgU.
Operating costs are very modest. Once loaded, the operating costs principally relate to providing safeguards and security as necessary to meet the licensing requirements. Most U.S. operations use concrete pad storage for simplicity of operation and compatibility with transport. See examples in Section E2-1.3.
E2-2. FUNCTIONAL AND OPERATING DESCRIPTION The dry storage process begins with the same process as loading of spent fuel for transport. Removal
and transfer operations are scheduled to take place when no other operations are required or are underway in the storage pool. An approved cask (generally a multi-purpose canister) is brought into the reactor spent pool area and placed into the pool. The spent fuel is removed by loading it into the storage cask under water inside the pool. The cask is made of stainless steel alloy and also contains aluminum heat conduction elements and neutron absorbing materials. The multipurpose canister looks like a welded cylinder with flat ends. It consists of a honeycombed fuel basket, a base plate, a canister shell, a lid, and a closure ring. After assemblies have been loaded, the multipurpose container is vacuum-dried to remove all water and filled with helium after the used fuel rods are inserted and then sealed. The helium helps maintain the used nuclear fuel assemblies in an inert or passive environment as well as improving heat transfer. These inner containers are never opened after being sealed.
The pool crane is used to lift the loaded storage cask from the pool, and transfer the cask to an appropriate overpack container used for the dry-storage facilities. The overpack is a heavy-walled steel and concrete vessel also shaped as a cylinder. Its sidewalls consist of concrete enclosed between inner and outer steel shells. The overpack is designed to provide protection for the interior multipurpose canister while allowing air to circulate around the surface of this sealed canister. The overpack typically has inlets at the bottom and outlets at the top to allow air to circulate naturally through the cavity to help cool the multipurpose container inside. A special transporter is used to place the overpacks on the storage pads (see Section E2-3 for pictures of these functions).

INL/EXT-07-12107 (March 2008) Advanced Fuel Cycle Cost Basis E2-5
E2-3. PICTURES/SCHEMATICS Table E2-1. Summary of worldwide dry spent fuel storage (tonnes Heavy Metal as of 1998).

INL/EXT-07-12107 (March 2008) Advanced Fuel Cycle Cost Basis E2-6
Table E2-2. Dry spent fuel storage designs: NRC approved for general use.
Vendor Storage Design
Model
Certificate of Compliance Issue Date Docket
Amendment (A) ADAMS Accession
Number General Nuclear Systems, Inc. CASTOR V/21 08/17/1990 72-1000 A0—ML033020117 NAC International, Inc. NAC S/T 08/17/1990 72-1002 A0—ML033020120 NAC International, Inc. NAC-C28 S/T 08/17/1990 72-1003 A0—ML033020125 Transnuclear, Inc. TN-24 11/04/1993 72-1005 A0—ML033020128 BNFL Fuel Solutions Corp. VSC-24 05/07/1993 72-1007 A0—ML003728434
A1—ML003719688 A2—ML003764775 A3—ML011340049 A4—ML030230287
Transnuclear, Inc. NUHOMS-24P NUHOMS-52B NUHOMS-61BT
01/23/1995 72-1004 A0—ML033020053 A1—ML003704754 A2—ML003730072 A3—ML012620111 A4—ML020640202 A5—ML040150834 A6—ML040120831 A7—ML040640919
Holtec International HI-STAR 100 10/04/1999 72-1008 A0—ML033020058 A1—ML003780760 A2—ML011500503
Holtec International HI-STORM 100 06/01/2000 72-1014 A0—ML003711779 A1—ML022000176
Transnuclear, Inc. TN-32 04/19/2000 72-1021 A0—ML003696930 A1—ML010460291
NAC International, Inc. NAC-UMS 11/20/2000 72-1015 A0—ML003762577 A1—ML010230249 A2—ML020250546
NAC International, Inc. NAC-MPC 04/10/2000 72-1025 A0—ML003704081 A1—ML020250491 A2—ML021420129 A3—ML032820197
BNFL Fuel Solutions Corp. FuelSolutions 02/15/2001 72-1026 A0—ML010300147 A1—ML011210377 A2—ML020250512 A3—ML031320795
Transnuclear, Inc. TN-68 05/28/2000 72-1027 A0—ML003711273 Transnuclear, Inc. Advanced
NUHOMS-24PT1 02/05/2003 72-1029 A0—ML030100419
Disclaimer: This replaces NUREG-1419, Directory of Certificates of Compliance for Dry Spent Fuel Storage Casks, which is no longer available.

INL/EXT-07-12107 (March 2008) Advanced Fuel Cycle Cost Basis E2-7
Figure E2-1. Licensed/operating independent spent fuel storage installations.1

INL/EXT-07-12107 (March 2008) Advanced Fuel Cycle Cost Basis E2-8
Figure E2-2. Location of independent spent fuel storage sites.
Figure E2-3. Dry storage of spent fuel.

INL/EXT-07-12107 (March 2008) Advanced Fuel Cycle Cost Basis E2-9
Figure E2-4. Left: Receiving the MPC at J. A. FitzPatrick Nuclear Plant. Right: Fit up of the MPC and MPC lid at J. A. FitzPatrick Nuclear Plant.
Figure E2-5. Cask for dry fuel storage being closed under water for shielding protection.

INL/EXT-07-12107 (March 2008) Advanced Fuel Cycle Cost Basis E2-10
Figure E2-6. Cask being placed on dry storage pad.
Figure E2-7. Dry storage cask transporter.

INL/EXT-07-12107 (March 2008) Advanced Fuel Cycle Cost Basis E2-11
Figure E2-8. Typical dry storage casks.
Figure E2-9. Overview of typical dry storage pad.
E2-4. MODULE INTERFACE DEFINITION Module E2 has direct interface with Module E1 as cost is involved with moving spent fuel from the
pools into dry storage and with Module H for ultimate packaging for transportation and disposal. While these costs are not significant in the overall cost, modeling must avoid doubling the expense because these costs are not always broken out separately. The same would be true when considering interface with reprocessing Modules F1 and F2/D2.
For the purpose of modeling interim storage cost, it is reasonable to consider such cost independent of scale.

INL/EXT-07-12107 (March 2008) Advanced Fuel Cycle Cost Basis E2-12
E2-5. MODULE SCALING FACTORS There are no direct scaling factors to be considered for this module. Specific cost is more influenced
by choice of dry storage container and number of procurements for storage casks (i.e., the cask market).
E2-6. COST BASES, ASSUMPTIONS, AND DATA SOURCES The cost bases for this module have been gleaned from numerous studies by DOE, IAEA,
OECD/NEA, GAO, NRC and independent studies such as by Bunn et al.2
Specific costs for dry storage will vary by the type of system used, the modifications required at the facility that will receive the dry storage, the licensing requirements, the type of containers to be used, and the capacity of the dry storage unit to be acquired.
Bunn et al. did a thorough review of dry storage costs in the 2001 report, “Interim Storage of Spent Nuclear Fuel” published by Harvard University and the University of Tokyo.2 Their findings are summarized as follows. Capital costs for dry storage at reactors involve (1) upfront costs, which include costs for design, engineering, NRC licensing, equipment, construction of initial storage pads, security systems, and startup testing and (2) storage system and loading costs, which include the price of the casks themselves, additional pads, labor, decommissioning, and consumables.
In the United States, total upfront costs to establish a new dry storage facility at a reactor site (which are largely fixed, regardless of the amount of spent fuel to be stored) are estimated by different sources at $9 million or $8–12 million, regardless of the specific amount of fuel to be stored. Costs to purchase and load the dry casks, including labor, consumables, and decommissioning, are estimated to be in the range of $60–80 per kilogram of heavy metal (kgHM) in the spent fuel. Operating costs are very modest, because virtually nothing needs to be done to the casks each year once they are loaded. The principal operating costs relate to providing the security and safety monitoring needed to maintain the NRC license for the facility. For storage sites collocated with operating reactors, many of these costs can be charged to the reactor operation, and the net additional operating costs are estimated to be only $750,000 per year (largely independent of the amount of spent fuel to be stored).
For independent storage sites or storage sites at reactors that have been shut down, these costs must be attributed to the storage site itself, and so the net additional operational cost is substantially higher. For shutdown reactors with all their spent fuel in dry storage, operating costs are estimated to be $3–4 million per year.
Total undiscounted lifecycle costs for 40 years of dry cask storage for the roughly 1,000 tonnes of spent fuel generated in a typical reactor lifetime, if incurred while the reactor is still operating, would be roughly $120 million or $120/kgHM. For 40 years of storage after the reactor was shut down, total undiscounted costs would be $250 million or $250/kgHM. The discounted present value of this 40-year life-cycle cost is only modestly less, because nearly all the cost is up-front expenditure. At a 5% rate, the net present cost would be $100/kgHM for the case in which the reactor was operating during the storage period, and $160/kgHM for 40 years of post-shut-down storage. Per-kilogram estimates for a large centralized facility are similar to these at-reactor costs.
Bunn et al. also reported on a 1998 Japanese study comparing costs (albeit generally much higher than the U.S. would expect) between wet and dry storage over a 54-year time frame for 5,000 tHM in a centralized facility and applying a 5% discount rate. The unit costs per this approach were as follows and were estimated for comparison only and obviously do not represent actual experience:
Pool Storage $396/kgHM (roughly 1.15 mills/kWh)
Cask Storage $238/kgHM (roughly 0.70 mills/kWh).

INL/EXT-07-12107 (March 2008) Advanced Fuel Cycle Cost Basis E2-13
Figure E2-10. Storage costs. Please note that costs are in yen.
Table E2-3. Estimated costs of wet and dry storage systems.

INL/EXT-07-12107 (March 2008) Advanced Fuel Cycle Cost Basis E2-14
Dr. Ian Fairlie looked at advantages of dry storage.3 In a 1994 study by Bowser et al. of the Rancho Seco reactor shutdown, the costs of constructing a transportation plus dry storage system to store spent fuel were estimated at $12.4 million. The study amortized this figure over a 10-year depreciation period using a 5% interest rate. This, plus annual running costs, resulted in an estimated total annual cost of $4.2 million for dry storage compared with annual operating costs of $10.6 million for wet storage. This implied that considerable savings could be accrued from constructing dry stores and transferring fuel from pools to them. Table E2-3 compares estimated costs of wet and dry storage systems in more detail. It reveals that the cost of dry storing fuel is 2.5 times lower than wet storing it.
Fairlie also presented the following summary of dry storage estimates. Cost estimates of dry storage from various studies are listed in Table E2-4. The data in this table are not directly comparable because different assumptions, financial conventions, years for currencies, and exchange rates are used in their calculation. Also, estimates of storage costs that are expressed simply in $ per tonne should be treated as approximate, because costs will depend on the length of time that fuel is expected to be retained. This is often not stated in industry estimates or is indeterminate, as in the SN-BNFL 1995 agreement. A more precise indication of estimated costs would be expressed in costs per tonne per year, but this is rarely stated. Nevertheless, the data in the table report the figures from a number of studies that can be used to give an approximate indication of estimated dry store costs in various situations.
Alvarez reports that the cost of onsite dry-cask storage for an additional 35,000 tons of older spent fuel has been estimated at $3.5 to 7 billion ($100 to 300/kgHM).4 Storage cask capacity costs U.S. utilities from $90 to 210/kgU. Additional capital investments for new onsite dry storage facilities would include NRC licensing, storage pads, security systems, cask welding systems, transfer casks, slings, tractor-trailers, and startup testing. These costs are estimated to range from $9 to 18 million per site. However, at most sites, they will be incurred in any case, because even dense-packed pools are filling up. The capital cost of moving 35,000 tons of spent fuel into dry casks would, therefore, be dominated by the cost of the casks and would range from about $3.5 to 7 billion ($100 to 200/kgU). Per GWe of nuclear capacity, the cost would be $35 to 70 million.
The additional cost per kWh would be about 0.03 to 0.06 cents/kWh. The values reported by Alvarez compare favorably with the values suggested by the Bunn report.2,4
Table E2-4. Cost estimates of dry storage.

INL/EXT-07-12107 (March 2008) Advanced Fuel Cycle Cost Basis E2-15
The extra cost of dry storage would be reduced significantly if the casks could be used for transport and ultimate disposal as well. For multipurpose canisters with stationary concrete overpacks, the extra cost would then be associated primarily with the overpack (about 20% of the total cost) and with the need to buy the canisters earlier than if the spent fuel stayed in dense-packed pools until it was transported to the geological repository. However, the U.S. Department of Energy currently plans to have spent fuel unpacked from transport canisters and then repacked in special canisters for disposal.
Costs would be increased by the construction of buildings, berms, or other structures needed to surround the casks to provide buffering against possible attack by antitank missiles or crashing aircraft. The building at Gorleben (Germany), which is licensed to hold 420 casks that contain about 4,200 tons of uranium in spent fuel, would cost an estimated $20 to 25 million to build in the United States or about $6/kgU. Assuming conservatively that the building cost scales with the square root of the capacity (i.e., according to the length of its walls), the building would cost about $12/kgU to store 100 casks containing 1,000 tons of uranium in spent fuel. This would correspond to an inventory of a typical two-reactor site. Berms for a middle-sized storage area might cost about $1.5 to 3/kgU. The berms for the 300-cask site at the Palo Verde, Arizona, nuclear power plant were reported to cost $5 to 10 million.
E2-6.1 Other Consideration in Determining Life Cycle Costs for Dry Storage of Spent Nuclear Fuel
1. DOE could decide to use a multipurpose canister that does not require overpack.
2. DOE could decide to use a centralized Monitored Retrievable Storage approach for interim storage, relieving much of this cost from the utility.
3. Changes in safeguards and security standards could force additional design measures.
4. Use of deep burn fuels and mixed oxide could force some development of more expensive containers unless allowed to cool longer in a pool.
5. A new dynamic will arise should DOE initiate a program to take ownership of spent fuel as well as consider significant interim storage. Such storage has been suggested for DOE sites. Private Fuel Storage in Utah has recently been licensed by the NRC for spent fuel storage. Such operations would either be competitive in the case of Private Fuel Storage or use government funding. In any case, the impact comes from the additional transportation cost and not likely to greatly impact the cost of dry storage itself. It could bring more competition into the cask business and thus work to control cost growth.
Cost data for this module should be considered as a private enterprise expense.
Reference data should be viewed as top-down estimates but founded on several broad and independent studies that appear to be consistent in approach.
E2-7. LIMITS OF COST DATA Dry storage represents a relatively minor capital and operating cost relative to the total fuel cycle.
When building a model, it is important that cost for specific dry storage be separated from wet storage such that costs for spent fuel storage are not included twice.
Technology application is one of a relatively mature commercial application that utilizes NRC licensing requirements.

INL/EXT-07-12107 (March 2008) Advanced Fuel Cycle Cost Basis E2-16
E2-8. COST SUMMARIES To estimate the levelized unit cost for dry storage, several factors need to be considered. The factors
include the initial capital, the annual operating expenses over the duration of the interim storage (until shipped for disposal or reprocessing), the total amount of electricity produced by the reactor, and the total tons of spent fuel consumed and cooled.
At this point nearly all current operating nuclear plants in the U.S. are either using or considering the need for dry storage. It is assumed that new requirements for dry storage casks will not result in any significant growth in cost and that prior studies provide a sound basis for estimating costs.
Nearly all the code of accounts could be applied by treating new storage capacity as a project as most utilities would. However, that degree of detail has not been found at this time. The most relevant code of accounts are 71 and 74, considering initial startup to be a one-time expense and new casks being considered as a consumable.
The reference cost to be used has been arbitrarily selected at $120/kgHM with a range of $100 to 300/kgHM.
The module cost information is summarized in the What-It-Takes (WIT) cost summary in Table E2-5. The summary shows the reference cost basis (constant year $U.S.), the reference basis cost contingency (if known), the cost analyst’s judgment of the potential upsides (low end of cost range) and downsides (high end of cost range) based on references and qualitative factors, and selected nominal costs (judgment of the expected costs based on the references, contingency factors, upsides, and downsides). These costs are subject to change and are updated as additional reference information is collected and evaluated, and as a result of sensitivity and uncertainty analysis. Refer to Section 2.6 in the main section of this report for additional details on the cost estimation approach used to construct the WIT table. The triangular distribution based on the costs in the WIT Table is shown in Figure E2-11. The distribution is skewed toward the low cost because the cost analyst judged that the lower costs would be most similar to the reference costs, and a low likelihood for significant changes to the dry storage regulations.
Table E2-5. Cost summary table. What-It-Takes (WIT) Table
Reference Cost(s) Based on Reference
Capacity
Reference Cost Contingency
(+/- %) (Low Cost)
Upsides (High Cost) Downsides
(Nominal Cost) Selected Values
$120/kgHM (undiscounted)
$100/kgHM $300/kgHM $120/kgHM
Or considering an average 1,000 MWe Rx discharging ~20 tHM/yr
TBD Low side cost reflects a case of well-planned capacity where several reactors can share the cost of the dry storage operation.
The high side cost reflects a condition where dry storage regulations undergo significant change, increasing design and construction cost as well as stronger canisters.
(same as the reference case)

INL/EXT-07-12107 (March 2008) Advanced Fuel Cycle Cost Basis E2-17
Module E2 Interim SNF Storage (Dry) OpsEstimated Cost Frequency Distribution
$/kgHM
Freq
uenc
y Low Nominal Mean High
$100 $120 $173 $300
Figure E2-11. Interim SNF storage (dry) ops estimated cost frequency distribution.
E2-9. SENSITIVITY AND UNCERTAINTY ANALYSES There have been no significant sensitivity analyses applied to this cost module because the influence
of this module cost is so low relative to the total fuel cycle cost. To improve these data, it will be necessary to perform more detailed investigation of cost parameters with emphasis on pursuing actual Operations and Maintenance cost data from operating U.S. utilities and numerous cask vendors.
The owners of new reactor facilities would need to consider the trade-off of increasing the size of their spent fuel pool versus the cost to develop dry fuel storage. For dry storage to be attractive, the much lower cost of dry storage must be traded-off against the added expenses to license the storage, procure storage casks, provide operators and maintenance staff to load and survey the casks, and to provide additional guards for safeguards and security.
This cost evaluation would be changed should the U.S. government decide to implement a centralized Monitored Retrievable Storage because strategy for length of any interim dry storage could be impacted, including the addition of significant transportation costs.
E2-10. BIBLIOGRAPHY Bunn, M., et al., The Economics of Reprocessing vs. Direct Disposal of Spent Nuclear Fuel, Cambridge,
Mass, Project on Managing the Atom, Harvard University, DE-FG26-99FT4028, December 2003, pp. 19, 55–57; also on Web: http://http://bcsia.ksg.harvard.edu/.
Cochran, R., and N. Tsoulfanidis, The Nuclear Fuel Cycle: Analysis and Management, American Nuclear Society, 1990.
Government Accountability Office, “Spent Nuclear Fuel Options Exist to Further Enhance Security,” 2003.
Holt, M., “Civilian Nuclear Spent Fuel Temporary Storage Options,” CRS Report to Congress, National Library for the Environment, http://www.ncseonline.org/NLE/CRSreports/Waste/waste-20.cfm, last updated 27 March 1998, accessed January 26, 2006.

INL/EXT-07-12107 (March 2008) Advanced Fuel Cycle Cost Basis E2-18
Massachusetts Institute of Technology, “The Future of Nuclear Power,” 2003.
Organization for Economic Cooperation and Development, “Trends in the Nuclear Fuel Cycle,” 2001.
Organization for Economic Cooperation and Development, “The Economics of the Nuclear Fuel Cycle,” 1994.
U.S. Department of Energy, “USA National Report Joint Convention on the Safety of Spent Fuel Management and on the Safety of Radioactive Waste Management,” Office of Environmental Management, 2003.
E2-11. REFERENCES 1. U.S. Nuclear Regulatory Commission Web site, www.nrc.gov, last revised 24 January 2005,
Web page accessed 24 January 2006.
2. Bunn, M., Interim Storage of Spent Nuclear Fuel: A Safe, Flexible, and Cost-Effective Near-Term Approach to Spent Fuel Management, Harvard University Project on Managing the Atom and the University of Tokyo Project on Sociotechnics of Nuclear Energy, 2001.
3. I. Fairlie, “Dry Storage of Spent Nuclear Fuel: The Safer Alternative to Reprocessing,” Report to Greenpeace International in Response to Cogema Dossiers to the La Hague Public Inquiry, May 2000, http://scholar.google.com/scholar?hl=en&lr=&q=cache:ZVJt2rZ0S, Web page accessed May 2000.
4. Alvarez, R., J. Beyea, K. Janberg, J. Kang, E. Lyman, A. Macfarlane, G. Thompson, F. N. von Hippel, “Reducing the Hazards from Stored Spent Power-Reactor Fuel in the United States, Science & Global Security, Vol. 11, No. 1, 2003, pp. 1-51, http://www.princeton.edu/~globsec/publications/pdf/11_1Alvarez.pdf, Web page accessed July 19, 2007.

INL/EXT-07-12107 (March 2008) Advanced Fuel Cycle Cost Basis E3-1
Module E3
Recycled Product Storage

INL/EXT-07-12107 (March 2008) Advanced Fuel Cycle Cost Basis E3-2

INL/EXT-07-12107 (March 2008) Advanced Fuel Cycle Cost Basis E3-3
Module E3
Recycled Product Storage
E3-1. BASIC INFORMATION Recycled product storage facilities would safely store the actinide by-products produced from the
reprocessing of thermal reactor and fast reactor fuels. Three facilities were found that represent this type of operation: the Mayak facility in Russia, the Actinide Packaging and Storage Facility (APSF) at the Savannah River Site, and the Unirradiated Fuel Storage Facility (CPP-651) at Idaho National Laboratory (INL).a Information was also received on an unpublished study conducted by Savannah River Site for a consolidated storage facility with surveillance capabilities.
E3-2. DEFINE FUNCTIONAL AND OPERATIONAL DESCRIPTIONS Mayak
The Mayak facility is designed to store 25,000 containers capable of holding 50 metric tons (MT) of plutonium (Pu) and 200 MT of highly enriched uranium. Approximately half of the container capability would be used for the plutonium storage; the entire facility could accommodate 100 MT of plutonium. The only reference article found did not describe the facility further, i.e., square footage, degree of remote operation.
APSF
The APSF project, which was suspended in 1999, consists of a hardened, underground material access area totaling 49,300 ft2 and a 20,000-ft2 surface concrete utility building. It was sized for 2,000 positions with a potential to hold 5,000. Each position would hold a “3013” canister with a loading of 4.5 to 4.8 kg plutonium (or HM). This report assumes the 2,000-canister capacity, which equates to approximately 9.5 MTHM. Although a portion of the facility is used for plutonium oxide firing and packaging, it is classified as a storage facility.
Unirradiated Fuel Storage Facility (CPP-651)
CPP-651 was constructed in 1984 and is used to store unirradiated fuel. It is an entirely hands-on operation with heightened security capabilities. The hardened area for this facility is 4,960 ft2.
Consolidated Storage Facility
This APSF-style facility was the subject of an unpublished study by Savannah River Site in 2001.1 The storage capacity was 10,000 storage spots. Each storage spot would hold a “3013” canister with a similar quantity of HM as APSF (4.5–4.8 kg).
These facilities are not process facilities. The only technology considerations of note would be the remote aspects of the Mayak and APSF.
a. Beginning February 1, 2005, the name of the Idaho National Engineering and Environmental Laboratory (INEEL) was changed to Idaho National Laboratory (INL).

INL/EXT-07-12107 (March 2008) Advanced Fuel Cycle Cost Basis E3-4
E3-3. PICTURES/SCHEMATICS None.
E3-4. Module Interface Description The actinides that would be stored in these facilities would be received from Aqueous Reprocessing,
Module F1, or Electrochemical Reprocessing, Module F2/D2. One path out of this module is Module O1, Shipment of Materials to a Mixed Oxide Fuel Fabrication Facility (if fuel fabrication is not integrated at the reprocessing facility).
E3-5. MODULE SCALING FACTORS To report the costs in present day (2005) dollars, the Engineering News Record Construction Cost
Index and Building Cost Index were used to escalate the Work Breakdown Structure Level 2 costs to 2005. Work Breakdown Structure 1 and 3–7, where available, were escalated to 2005 using the U.S. Department of Labor, Bureau of Labor Statistics, Consumer Price Index—All Urban Consumers. Escalation to 2007 for all Work Breakdown Structure levels was also based on this index. Table E3-1 summarizes the information for the four facilities.
Figure E3-1 shows the costs of the four facilities in Table E3-1. A power trend line to these data was determined to be Cost (millions of 2007 dollars) = 16.123 (Capacity in MT)0.9119. This is based on a very small data sample, but shows that some benefits of scale may accrue to this type of facility.
Using just the data for APSF and the CSF, a linear equation can be derived:
Cost (millions of 2007 dollars) = 240.6 + 8.7417*[Capacity in MT]
Table E3-1. Recycled product storage summary.
Mayak APSF CPP-651 Consolidated Storage
Facility Hardened Area Unknown 49,300 ft2 4,960 ft2 Unknown Storage Capacity 100 MT Pu 9 MT Pu 1 MT Pua 45 MT Pu Total of Work Breakdown Structure Levels 1–6 in 2005 $K
$570,600 $319,300 $9,3200 $634,000
Cost/Unit of Capacity $5,700 $35,500 $9,320 $14,100/kg
a. Capacity estimated from the APSF of the basis of hardened area.
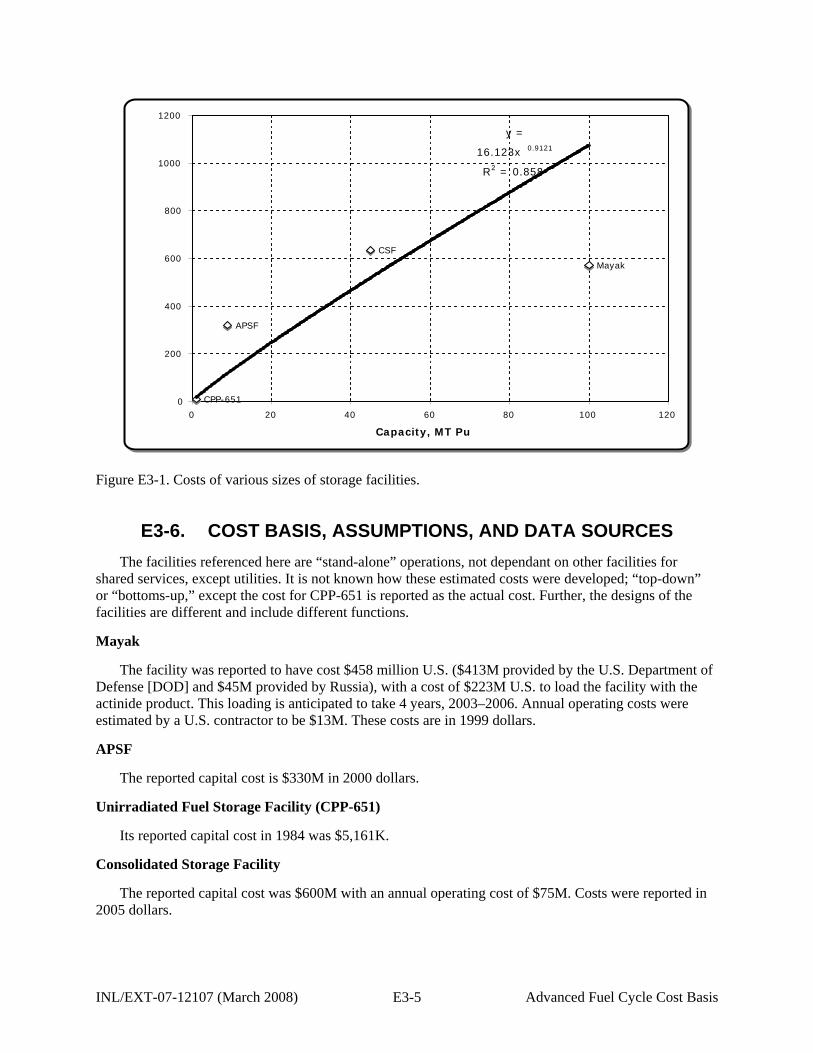
INL/EXT-07-12107 (March 2008) Advanced Fuel Cycle Cost Basis E3-5
CPP-651
CSF
APSF
Mayak
y =
16.123x 0.9121
R2 = 0.858
0
200
400
600
800
1000
1200
0 20 40 60 80 100 120
Capacity, MT Pu
Figure E3-1. Costs of various sizes of storage facilities.
E3-6. COST BASIS, ASSUMPTIONS, AND DATA SOURCES The facilities referenced here are “stand-alone” operations, not dependant on other facilities for
shared services, except utilities. It is not known how these estimated costs were developed; “top-down” or “bottoms-up,” except the cost for CPP-651 is reported as the actual cost. Further, the designs of the facilities are different and include different functions.
Mayak
The facility was reported to have cost $458 million U.S. ($413M provided by the U.S. Department of Defense [DOD] and $45M provided by Russia), with a cost of $223M U.S. to load the facility with the actinide product. This loading is anticipated to take 4 years, 2003–2006. Annual operating costs were estimated by a U.S. contractor to be $13M. These costs are in 1999 dollars.
APSF
The reported capital cost is $330M in 2000 dollars.
Unirradiated Fuel Storage Facility (CPP-651)
Its reported capital cost in 1984 was $5,161K.
Consolidated Storage Facility
The reported capital cost was $600M with an annual operating cost of $75M. Costs were reported in 2005 dollars.

INL/EXT-07-12107 (March 2008) Advanced Fuel Cycle Cost Basis E3-6
E3-7. LIMITATIONS OF COST DATA The information obtained for these facilities is at a very high level. Details were considered
proprietary and not available as of this writing. The technology readiness level (TRL) was considered to be “viable” or “commercial” for the facilities APSF and Consolidated Storage Facility because of the existence of an operating facility (Mayak). Mayak and CPP-651 are existing, operating facilities.
Mayak
Russian craft wages are considerably less than in the U.S.A. Productivity is historically much worse than in this country.
APSF
The overall technology incorporated into this facility is not considered “new technology;” some specially engineered equipment is included. Although a portion of the facility is used for plutonium oxide firing and packaging, it is classified as a storage facility. The relatively small storage capacity of this concept would tend to drive up the per-MTHM-cost.
CPP-651
Because of its hands-on operation, it does not compare well with the above two examples. The secure nature of this facility limits the amount of information available on storage capacity and operating costs. No attempt was made to adjust the capital cost to represent a totally remote-operated facility.
Consolidated Storage Facility
This “APSF-style” facility was the subject of an unpublished study by Savannah River Site in 2001. The estimate was considered rough order of magnitude.
E3-8. COST SUMMARIES The module cost information is summarized in the What-It-Takes (WIT) cost summary in Table E3-2.
The summary shows the reference cost basis (constant year U.S.dollars), the reference basis cost contingency (if known), the cost analyst’s judgment of the potential upsides (low end of cost range) and downsides (high end of cost range) based on references and qualitative factors, and selected nominal costs (judgment of the expected costs based on the references, contingency factors, upsides, and downsides). These costs are subject to change and are updated as additional reference information is collected and evaluated, and as a result of sensitivity and uncertainty analysis. Refer to Section 2.6 in the main section of this report for additional details on the cost estimation approach used to construct the WIT table.
The triangular distribution based on the costs in the WIT table is shown in Figure E3-2.

INL/EXT-07-12107 (March 2008) Advanced Fuel Cycle Cost Basis E3-7
Table E3-2. Cost summary table for recycled product storage selected values. What-It-Takes (WIT) Table
Reference Cost(s) Based on Reference
Capacity
Reference Cost Contingency
(+/- %) (Low Cost)
Upsides (High Cost) Downsides
(Nominal Cost)Selected Values
$13,600/kg Act capital cost for a 50-MTHM remote-handled facility
(± 25%) $15,000/kg Act $22,000/kg Act $18,000/ kg Act
Economy-of-scale for larger capacity facility or shared safeguards and security functions
Increased regulatory/safety requirements, ROM estimate as partial basis
Module E3 Recycled Product StorageEstimated Cost Frequency Distribution
$/kg Act
Freq
uenc
y
Low Nominal Mean High
$15000 $18000 $18333 $22000
Figure E3-2. Module E3 recycled product storage estimated cost frequency distribution.
E3-9. RESULTS FROM SENSITIVITY AND UNCERTAINTY ANALYSIS None performed to date.
E3-10. BIBLIOGRAPHY Bunn, M. et al., “The Economics of Reprocessing vs. Direct Disposal of Spent Nuclear Fuel,”
Cambridge, Massachusetts, Project on Managing the Atom, Harvard University, DE-FG26-99FT4028, December 2003, pp. 19, 55–57; also on Web: http://http://bcsia.ksg.harvard.edu/.
Michaels, G. E., and T. D. Welch, Evaluation of Disposition Options for Reprocessed Uranium, ORNL/TM-12326, February 1993, pp. 27–47, 89–109.

INL/EXT-07-12107 (March 2008) Advanced Fuel Cycle Cost Basis E3-8
OECD Nuclear Energy Agency and International Atomic Energy Agency, The Economics of the Nuclear Fuel Cycle, 1994, pp. 11, 27, 37–38, 50, 77–80, http://www.nea.fr/html/ndd/reports/efc/, Web site accessed January 24, 2006.
U.S. General Accounting Office, Weapons of Mass Destruction: Effort to Reduce Russian Arsenals May Cost More, Achieve Less Than Planned, GAO/NSIAD-99-76, April 1999.
E3-11. REFERENCES 1. W. B. Boore, Westinghouse Savannah River Company, Fax addressing estimated capitalized costs for
a proposed Actinide Packaging and Storage Facility (APSF), and an unpublished Savannah River Site study for a 10,000-canister storage facility completed in 2001. [This document has a restricted distribution, may be proprietary, or both; and is not publicly releasable.]

INL/EXT-07-12107 (March 2008) Advanced Fuel Cycle Cost Basis F1-1
Module F1
Spent Nuclear Fuel Aqueous Reprocessing Facility

INL/EXT-07-12107 (March 2008) Advanced Fuel Cycle Cost Basis F1-2

INL/EXT-07-12107 (March 2008) Advanced Fuel Cycle Cost Basis F1-3
Module F1
Spent Nuclear Fuel Aqueous Reprocessing Facility
F1-1. BASIC INFORMATION The spent nuclear fuel aqueous reprocessing facility is used for separations of spent nuclear fuel
elemental components to support recycling of fissile materials, transmutation, decay management of selected actinides and fission products, and segregated immobilization, storage, and disposal of remaining materials as different classes of wastes. The generic facility consists of a spent nuclear fuel receiving area, processing buildings (chemical separation area), interim storage facilities for both spent nuclear fuel and separated products, and support buildings for utilities, offices, and laboratories. The plant may also include collocated waste solidification, special nuclear material secured storage, reprocessed uranium conversion facilities, and mixed oxide fuel fabrication facilities.
A major feature of the reprocessing facility is the need for massive processing buildings. Multistory, below-grade, heavily shielded operating cells are typical. These building areas may be completely buried or bermed for parts of the process involving separated minor actinides. These large spaces are maintained at negative pressure to manage airborne particulate contamination, generally requiring large banks of high-efficiency particulate air (HEPA) filters.
Several approaches to aqueous separations exist or are under consideration, ranging from “conventional” PUREX-based, oxide fuel separation facilities with pure uranium and plutonium oxide products, such as THORP and La Hague, to multistep UREX+ process concepts that separate many actinides and fission products for tailored recycling or disposal. The latter, more complex separations, make possible better use of geologic repository space.1,2
F1-2. FUNCTIONAL AND OPERATIONAL DESCRIPTION Front End. Spent nuclear fuel arrives at the facility by truck or rail. Cranes lift the shipping casks
and move them inside for unloading with the spent nuclear fuel moved into a temporary storage area (wet or dry storage). Head-end processing begins either with use of a massive shear to cut the fuel assemblies without dismantling or with mechanical separation of the fuel rods from the balance of the fuel assembly hardware followed typically by cropping the fuel rods into short segments. The fuel is acid-leached from the chopped fuel rod, and the cladding hulls are washed and prepared for disposal as high-level waste (HLW), Greater-Than-Category-C, or low-level waste (LLW)—depending on their radioactivity level—or for possible recycling and reuse.
Aqueous Separations. The dissolved fuel is generally passed through a series of aqueous-organic solvent extraction processes to achieve chemical separations. The number and order of steps is dependent on the number of product streams. These separate liquid streams, typically nitrate solutions, are then subject to further processing to obtain the desired products or prepare them for waste handling. The PUREX process results in two primary product streams, a converted uranium form (uranium nitrate hexahydrate [UNH], salt, a uranium oxide, or UF6); and PuO2, and a primary HLW stream that contains the fission products and minor actinides. The UREX+ process has more product or by-product streams, including purified uranium suitable for disposal or recycle. Cesium/Strontium and technetium streams can be separated from the other fission product streams, and a suite of minor actinide by-products can be

INL/EXT-07-12107 (March 2008) Advanced Fuel Cycle Cost Basis F1-4
separated and tailored to meet specific fuel cycle by-product objectives (such as Pu/Np/Am/Cm, Pu/Np, Am/Cm, or americium separated from curium).
Back End. The back end process includes product storage and shipping facilities, and waste processing, storage, and shipping facilities. The most valuable products are fissile materials or special nuclear materials requiring secured storage and shipping. Collocation of fuel fabrication facilities, such as a mixed oxide facility, can eliminate secured shipping requirements of separated materials as well as provide for synergy of meeting security requirements. Waste processing is necessary to stabilize and solidify liquid waste streams. Streams containing volatile products such as iodine, tritium, and noble gases must also be processed and packaged in appropriate disposal media and containers.
Figure F1-1 shows an example of an UREX+ aqueous reprocessing process flow. The front end process consists of the dissolver (chop-leach process) with the cladding hulls going to recycling or disposal. The primary aqueous separations are completed in the UREX+ steps, which consist of chemical processes that separate uranium, Cs/Sr, Pu/Np, and Am/Cm. An alternative recently advanced through DOE’s Global Nuclear Energy Partnership produces a uranium/group-transuranic oxide product that can be used as actinide burning fuel in fast reactors. This fuel material has the additional qualities of proliferation resistance due to the presence of a much higher radiation field. The back end processes include denitration, immobilization, storage and decay-storage, uranium LLW disposal or storage, and fission product treatment, packaging, and shipment to the high-level waste repository.
LWRSpentFuel
Dissolver(Chop-Leach
Process)
Cladding HullCleanup
UREXSolvent Extraction
Process
Low-LevelWaste Disposal
or Storage
Cs/SrExtraction
Pu/NpExtraction
Am/CmExtraction
DenitrationImmobilization
Denitration
High-LevelWaste
Repository
Recycle orDisposal
Storage
HNO3
CladdingHulls
Hulls
Cs, Sr(oxides)
Acid solution of Actinides andFission Products
Uranium(UO3)
Liquid raffinate(nitrates of TRUand FPs)
LiquidRaffinate
LiquidRaffinate
Pu/Np oxides
Am, CmNitrates
Decay Storage
Lanthanides,Other FPs
Am/Cmoxides
FP Oxides inGlass
FP oxides
Storage
FutureReactor
FutureReactor
Figure F1-1. Example of UREX+ aqueous reprocessing process flow.1

INL/EXT-07-12107 (March 2008) Advanced Fuel Cycle Cost Basis F1-5
F1-3. PICTURES/SCHEMATICS The following pictures, Figures F1-2 – F1-4, show reprocessing sites with currently operating
PUREX facilities in France and the U.K., and another site in Japan with a PUREX plant now in the commissioning phase. Some of the buildings shown are not directly part of the reprocessing capability, but support other co-located functions.
Figure F1-2. La Hague site, France, with reprocessing plants, UP2-800 and UP-3 (AREVA).
Figure F1-3. Sellafield site, U.K., with THORP and B205 reprocessing plants (BNFL, plc).

INL/EXT-07-12107 (March 2008) Advanced Fuel Cycle Cost Basis F1-6
Figure F1-4. Rokkasho-Mura site, Japan, with Rokkasho Reprocessing Plant (JNFL).
F1-4. MODULE INTERFACE DEFINITION This module interfaces with upstream reactor (Modules R1 and R2) and spent nuclear fuel storage
modules (E1 and E2) that supply the spent nuclear fuel, downstream recycled product storage (Module E3 for higher actindes and Module K2 for separated uranium), fuel fabrication (Module F2/D2 for mixed oxide), HLW conditioning/storage/packaging (Module G), waste storage (Module I), and disposal modules (L and M). As noted previously, it is advantageous to collocate the separations and recycled fuel fabrication facilities to share the costs of security and storage as well as minimizing the need for dedicated secure transport for the separated fuel fabrication feed materials.
F1-5. MODULE SCALING FACTORS There are many aspects that impact the scaling of reprocessing plants. A schematic of drivers relating
to UREX+ conceptual design is provided in Figure F1-5 as an example. One important factor is appropriate equipment selection in conjunction with the engineering approach used to achieve operational functions of availability and maintainability. Others are flow-sheet adopted; maximum line size for particular separations equipment that can be made criticality safe; the need for fuel receipt, head-end (and fuel fabrication if included) equipment to meet full-scale reactor fuel assembly size regardless of how low the fuel throughput may be; the criticality safety approach adopted (extremes are administrative control versus inherently safe [e.g., geometric control]); margins to accommodate extreme burn-up (low and high) fuels; fuel decay time; overall decontamination factors; recovery factors; and close coupling or de-coupling of process steps, waste management, reagent recycle, etc.
Haire assessed several plant designs developed in the 1970s and early 1980s and noted that availability improves with designs that include redundancy, although this redundancy comes at a cost of duplicate equipment, additional facility size, and increased operational complexity.3 As facilities scale up, parallel process trains may provide increased operational availability, though at reduced throughput, without further equipment duplication. Since the capital cost of small to medium capacity PUREX plants is insensitive to scale (see below), construction of two “small” plants to ensure near constant reprocessing availability is not a viable economic solution.

F1-7 IN
L/EXT-07-12107 (M
arch 2008)
Advanced Fuel C
ycle Cost B
asis
Figure F1-5. Schematic of drivers for UREX+ Plant Concept Design.
Commercial Process Units
Equip Store, Decon, Scrap
UREX+ By-Product Specifications
Developed Technology (TRL)
Waste Storage Capacity
LWR Commercial Fuel Feed
Thruput Optimization: Capital & Operational Cost vs. Throughput
Product DFs, Recoveries & Characterization Reqs
Flexible 50 Yr Operation Flowsheets, Fuels, By-Prods
Extreme Fuel Feed – b.u. Decay
Product Stores and Sizing
Continuous Operation vs. Semi-batch, Batch Campaigns
Facility Layouts: Canyon, Large Cell, Small Cells, P&V
Cell Change/Maintenance- Full remote, Partial, None
Operational Regimes- H/E, Sep & By-Prod
Demonstrate Regulatory Compliance & Acceptability
Off-Gas Treatment
INTERNATIONAL & COMMERCIAL OBJECTIVES
MCA Safe-guards
Main Factors driving UREX+ Plant
Design
Peak Process Rate vs. Annual
Criticality Safety: Geometry e.g., Buffer Tanks, Dissolver
Safety Integrated Design, ISMS
Analytical Lab, Central Control Center, Utilities, HVAC
Sampling; Online Monitor, Flow-proportional, Fingerprint/tracer
Surge Tank Inventory and Hold Time (Liquid & Off-gas) vs Contactor Size & Availability
Chemical Reactor Control Using Feed Forward Control & % recycle
Breadth of Process Envelopes vs. By-Product Acceptance Criteria
Process Model – Flowsheets, Redundancy, RAMI, Risks
Process Optimization -Output vs. Equipment and Flowsheet
SNF Receipt & Storage Capacity

INL/EXT-07-12107 (March 2008) Advanced Fuel Cycle Cost Basis F1-8
Haire also noted two maintenance approaches. The first approach involved a “canyon-type” facility allowing for remote equipment replacement via overhead cranes. The second approach, which was to be used in the Barnwell, South Carolina, reprocessing plant, is to place failure-prone equipment in shielded alcoves for easier access in a primarily contact handling-based maintenance mode. While the fully remote maintenance approach involves larger facilities, and therefore higher costs, the canyon design for small throughput plants may require fewer changes with scale-up and provides flexibility to adapt to process evolution, changing fuel or product specifications, or other requirements. But, the progressive reduction in permissible dose levels and the application of “as low as reasonably achievable” now further restricts the use of this second approach.
An additional third approach, which has been used in Europe for chemical separations in particular, is to use “dark cells”, which require no planned maintenance for several decades, but may require tailored remote intervention afterward if initial design and operation is unsuccessful. THORP designed in the 1980s generally favored this approach by adopting remote maintenance of the massive shear/shear pack and full-life-of-plant “zero-maintenance” chemical separation equipment using airlifts, vacuum operated slug lifts, reverse flow diverters, steam ejectors, vacuum lifts and through-wall drives for CVFs, and non-wetted flow actuators using compressed air. Valveless maintenance-free diverters and distributors are used. There is limited hot cell access for maintenance work. Overall commercial facility design is often a hybrid of these. However, it should be noted that a fully remote canyon facility has never been constructed for the commercial nuclear fuel sector, but only for defense applications, which may be less cost sensitive.
The final factor noted by Haire is a difference in the scaling of facilities that process thermal and fast reactor fuel. The lower total heavy metal content and higher fissile content (fraction) of fast reactor fuels results in relatively larger front-end processes and the need for more criticality control features. This added complexity may result in additional unit cost for both capital and operations, though Haire added that this effect becomes insignificant at lower design throughputs (e.g., 300 MTHM/year), which is substantial for a FR processing plant (e.g., supports about 15 commercial scale fast reactors, each of ~1 GW(e)).
For the above and additional reasons, Haire differs with several other authors in avoiding the use of a constant 0.6 scaling factor as is commonly used in non-nuclear industry sectors (e.g., chemical and oil).4,5 Instead he notes, “In the familiar rule of thumb scaling law, capital costs are proportional to the nth powers of capacity; however, n is not a constant. The value of n approaches 0.1 for very small-capacity plants and 0.9 for very large plants.”3 This results in diminishing returns for scale-up. Haire recommended an optimal size for a reprocessing plant of ~2,500 MT/yr. Spencer, et al.6 extended Haire’s work to include several additional plant designs, supporting the development of a scaling curve, showing the difference in plant cost versus design throughput.3,6 This curve is provided in Figure F1-6. While the bottom of the curve is at ~7,000 MT/yr, they noted very little unit cost difference between 2,000 and 10,000 MT/yr. A throughput of 7,000 MTHM/yr may require 4 to 7 solvent extraction lines. Data for capacities beyond 10,000 MT/yr are questionable or suggest a capacity point where multiple plant locations become the only practical siting means, thus the unit cost increases.
However, the influence of line throughput and solvent exchange contactor types was not explicitly recognized. For a low burn-up fuel and use of mixer-settlers, where criticality safety restrictions from the relatively low Pu level are less significant, the actual throughput may be 1,500 MTHM/yr using a single line of contactors, for example the BNFL Magnox B205 plant at Sellafield. Cap La Hague, THORP, and now Rokkasho show that throughputs of 800–1,000 MTHM/yr are achievable with LWR oxide fuels using pulse columns of diameters in the range 300–500 mm. Beyond this, criticality safety restrictions become dominant and multiple-line plants or multiple single-line plants seem to be required. Given the complexity of reprocessing technology and relative lack of design standardization and operating experience, at least compared to LWR technology, the tendency has been to minimize risk to capital by

INL/EXT-07-12107 (March 2008) Advanced Fuel Cycle Cost Basis F1-9
Figure F1-6. Reprocessing unit cost versus capacity.3
constructing independent reprocessing plants. It is arguable that with current practice the minimum of the cost curve shown in Figure F1-6 should appear near the single line value, probably in the range 1,000–2,000 MTHM/yr. The latest generation U.S. designs appear to build on SRS DuPont philosophy by extensive use of centrifugal contactors with their operational benefits of high availability and rapid re-start of processing, but concomitant requirement for fully remote operation and maintenance. Whilst SRS has used designs of centrifugal contactor banks that appear to support single line throughputs of 1,000 MTHM/yr, the safety limit of centrifugal contactor diameter and associated throughput does not appear to have been established. Optimization, concerning process remote equipment versus capital cost and throughput, needs further development and appears critical to future plant design.
The four Cap La Hague and Sellafield operating PUREX reprocessing plants are at coastal sites and use sea discharges of low-level liquid wastes. The processing plant for these at Sellafield is significant in cost (Alpha discharges decreased by 100-fold over past 10–20 years due to pressure from Eire and Scandinavia). This cost should be included in reprocessing since it is affected by reprocessing plant design (e.g. salt free flowsheet and degree of recycle to high-level liquid waste). If as expected UREX+ were to be a zero liquid discharge plant with inland siting, this may well increase costs. Rokkasho is also at a coastal site and may have liquid discharges.
It may be worth noting that PUREX and UREX+ processes were developed in different historic time periods with different aims and design requirements. There are also potential processes intermediate in complexity to PUREX and UREX+ that use TBP and complexants to form uranium and mixed TRU products together with HLW. AREVA and British Nuclear Group (formerly BNFL) already store vitrified HLW in passive air-cooled vaults for decay of high heat, intermediate half-life emitters such as cesium and strontium.

INL/EXT-07-12107 (March 2008) Advanced Fuel Cycle Cost Basis F1-10
A factor further affecting scaling is the number of separations to be handled by the design. In a small plant, each additional separation stage adds an increment of complexity, including the separation equipment, process control, additional in-process holdup and product storage. However, since the latter separations typically involve small volumes (once the uranium, which is over 92% of the heavy-metal mass, is removed), considerable scale-up can be accommodated without substantial additional complexity provided that close coupling of process steps can be tolerated, flexible process envelopes are available, criticality safety and mal-operation scenarios, and process analytical requirements can be met. For UREX+, where there are a larger number of specified products (each by-product or “waste” stream has a specification rather than being a residual). The early removal of uranium is helpful in reducing chemical process mass, but it may be more valuable to remove Pu with some U/MA (for non-proliferation reasons), and then the buffer tanks presently needed between separation areas would be much less expensive (presently a significant contributor to overall capital cost) as they may not need to be safe regarding criticality. Also removing U does not necessarily substantially reduce the liquor volumes and equipment/cell sizing since these may now be governed by Pu concentrations and flowsheet chemistry to achieve desired DFs.
F1-6. COST BASES, ASSUMPTIONS, AND DATA SOURCES The cost basis for aqueous reprocessing should be straightforward because several facilities have been
built and run in the last 50 years, and there are current contracts for reprocessing services. However, most of these facilities were related to military programs, and little information is available for them. The two existing commercial reprocessing sites have published only rather limited cost data because the information is considered proprietary.
Current prices charged for spent nuclear fuel reprocessing services at La Hague are ~$900/kgHM.4 This should provide a base cost from which to work. However, the above price includes other services such as transportation, storage, and some waste disposal. Thus the reprocessing service alone is a lesser scope than this. The term “reprocessing service” is used to distinguish from the actual cost of reprocessing. Bunn notes the prices of reprocessing services at existing facilities in Europe were initially artificially high to cover capital costs, and prices have come down as the capital costs have been recovered and demand has reduced.5 But these may now be coming below long-term economic cost, for example leading to the planned closure of THORP in 2010. A number of European countries have removed the legal duty on their electric utilities to contract for reprocessing of their spent fuels. The fact that one of these services is being offered at a particular price does not in itself demonstrate that its full cost must be at that price or below.
The UREX+ suite of processes are much different from the traditional PUREX in that the presence of some fission products or other gamma emitters remain throughout the process. This creates a need for a greater degree of remote operations with its related increased complexity. The UREX+ processes also use more solvents and complexants increasing the number of separations stages required to meet the objectives of the program, which are quite different from the traditional reprocessing in Europe and Japan. The main transuranic product of the UREX+ process is also a significant heat generator that adds complexity. Therefore, there is no direct comparison that would seemingly match. Even the proposed initial front-end shearing, vol-oxidation, and dissolution is more complex in UREX+ due to higher TRU recovery requirements.
While direct construction and operating cost information on the THORP and La Hague plants are limited, there are a large number of independent cost studies of reprocessing facilities with various functional and operational requirements. There are also a number of studies of designs that were not built or operated. Rather than assess each of these studies, the work of others is referenced in integrating these different sources.6,7 Also, the 2004 scoping study is referenced for a UREX+ Spent Fuel Treatment Facility (SFTF) conducted for the Advanced Fuel Cycle Initiative (AFCI) program. And, the more

INL/EXT-07-12107 (March 2008) Advanced Fuel Cycle Cost Basis F1-11
detailed information available is used from this source to establish the code of accounts relative cost splits.8
The scaling studies sited previously recommended the optimal size of a reprocessing facility to be approximately 2,500 MT/yr. The design life of an aqueous processing facility has not been well established. The cost studies referenced above are based on a range of operating lives from 15–30 years. A longer life stretches out repayment of capital, reducing per unit cost, but it increases the risk of substantial equipment replacement and changed regulatory and commercial requirements. Given the large amounts of commercial spent nuclear fuel projected, any new reprocessing facility developed in the U.S. should be designed for a long life. The most economical would be a plant size of at least 2,500 MT/yr and an operating life of at least 40 years, resulting in a total processing throughput of 100,000 MTHM (or more).
However, an operating lifetime of 40 years may not always be desirable given that parts of the plant see aggressive conditions and that plants are normally designed to be economic for particular flowsheets and not easily converted to new standards such as much higher fissile contents/burnups. It may be reasonable and conservative to assume a 20-year economic lifetime since this period is likely to be met, and then further operation involving replacement of equipment to continue processing or meet a new flowsheet can be considered. At commercial interest rates, any operation after 20 years has lower impact, but it does reduce unit costs for near zero interest rates.
F1-7. LIMITATIONS OF COST DATA Direct construction and operating costs of commercial facilities are not available from the
construction and operating companies. Even if direct costs were available, they would provide only around four data points for one technical approach (PUREX) under one financing scheme for one facility size (though near optimal scale using pulse column technology with “dark cells”).
The number of cost estimates for the UREX + technology is more limited. There are also a number of options of technologies for waste processing, including collection and stabilization of key fission products (e.g., cesium, iodine, strontium, and technetium) and stabilization of the HLW component. Many of the newer technologies have high technical uncertainty that equates to high uncertainty in the limited cost data.
Technical improvements are possible and even probable after a facility is completed. One study estimated process improvements, and improved operating experience at La Hague would result in an 85% reduction in waste volume per unit processed over a 10-year period.9 Such dynamics can result in changes in operating costs over time for the same facility, making comparisons between facilities even more difficult, though these changes may be more for environmental and acceptability reasons and could possibly lead to increased costs.
Given the size of reprocessing facilities and the long construction time, financing is the major cost. The difference in financing costs alone of a government financed facility and a for-profit private facility of the same size can result in a factor of approximately 2.5 increase in the total facility cost.5,8 The existing commercial facilities in France and the U.K. were developed under unique customer financing arrangements. New facilities are likely to also be developed with special financing, including heavy government involvement.
While the costs for this module are based on 2005 dollars, this adjustment provides an incomplete picture. The prevailing interest rates at the time and place of the cost estimate are potentially a larger impact than changes due to inflation. Most of the studies referenced here used a 5% discount rate, but some other earlier studies assumed interest rates as high as 12%. Given construction periods of 6 to 10 years or longer, this difference from 5–12% was estimated to increase unit costs by 70%.8

INL/EXT-07-12107 (March 2008) Advanced Fuel Cycle Cost Basis F1-12
The method used to adjust costs to current year dollars can also impact cost estimates. For example, Bunn’s use of a gross domestic product deflator approach5 results in ~20% higher adjusted costs from the Nuclear Energy Agency, Organization for Economic Cooperation and Development study8 than is developed by using the Engineering New Record’s “Construction Cost Index History.”10
F1-8. COST SUMMARIES A number of capital cost estimates have been included as part of the studies in the referenced
analyses. For example, Haire includes reference capital costs for facilities ranging in capacity from very small (15 MTHM/yr) to large facilities (3,000 MTHM/yr).3 The National Academy of Sciences study on “Nuclear Wastes: Technologies for Separations and Transmutation” also has numerous tables with cost data in its Appendix J.4 This study along with that of Bunn, et al. are the most comprehensive studies to date in the area of reprocessing costs.5 Table F1-1 provides the reference capital costs along with the inflator factor and the equivalent costs for 2005.
Significantly larger escalated capital costs (from $5B–7B) for some of the facilities above are reported in Reference 4. These values may include some costs for onsite facilities covered in other modules, such as vitrification of high-level reprocessing wastes (a “G” module). The estimated actual costs for the La Hague (France) and the Rokkasho-mura (Japan) plants are reported (1996) in this range in a report from The National Academy of Sciences.4 More recent capital costs for Rokkasho-mura, however, are estimated at over $20B.
Figure F1-7 provides a plot of the capital costs (in 2005 dollars) versus design throughput with a best fit line through the data points. The approximate equation of the best fit line is: Plant Capital Cost ($B, 2005 m.v.) = $2.7B + $B(1.8E-3 * MTHM/yr), or for a 2,000-MTHM/yr facility; the estimated costs would be approximately $6.3B. Figure F1-7 and Table F1-1 shows that almost all values for the design/cost studies and for plants constructed, but not operated, lie below the best-fit line. There are four values just above the line in the throughput range 600–900 MTHM/yr—three of these are the only PUREX oxide fuel reprocessing plants now operating in the world—France UP-2 and UP-3 and U.K. THORP. The fourth value is an OECD cost exercise based closely on U.K. and French cost data from THORP, UP-2 and UP-3 at plant completion in 1994. There is a severe outlier value above the line at $20B and 800 MTHM that represents the recent Japanese construction of a French technology and know-how oxide PUREX plant. This plant is expected to operate actively in 2008. The other value, well above the best-fit line, is the 2,500 MTHM French CO-EX plant for U.S. irradiated LWR fuel, again based on operating La Hague and Melox technology. Although claiming significant economies of scale and know-how, this value appears not unreasonable compared to other French capital costs based on UP-3 and UP2-800 operating plant. The final point is marginally above the best fit line, located at 3,000 MTHM and $B 9.0 and corresponds to the “conservative” DuPont (SRS) canyon design of the late 1970s. Keep in mind that except for the operating French, Japanese and UK’s PUREX oxide plants, very few of these facilities were designed and/or built to today’s standards and expectations for minimizing exposure to personnel.

F1-13 IN
L/EXT-07-12107 (M
arch 2008)
Advanced Fuel C
ycle Cost B
asis
Table F1-1. Capital cost and throughput estimates for various reprocessing plants design studies and actual facilities. Plant or Design Study (Complete construct/
operate / design study)24
Design Rate MT/day
(days/yr)
Planned Throughput MTHM/yr
Actual Throughput MTHM/yr
100% Capacity
MTHM/yr Ref. Capital Cost ($B)
m.v. Basis year
Inflator Factor
Capital Cost2005 ($B)
Windscale B205(1964- )1 7 (214) 1,500 ~500-1,500 2,555 - - - - West Valley (1966-72)2 1 (300) 300 ~110 (640 – 6y) - - - - - HTGR Ref. RP (1969)3 - 260 Design/cost - 0.060 1969 ~4 0.24 GE Morris (1974)4 3 (900) Inoperable 1,095 0.064 - ~4 0.26 AGNS Barnwell (1974) 5 5 (300) 1,500 Not operated 1,825 1.50 1983 1.8 2.7 Exxon (1976)6 Est. 1.7 (300) 500 Design/cost 0.99 1978 2.6713 2.64 Exxon (1976)6 Est. 5 (300) 1,500 Cost estimate - 1.5 1983 1.8 2.7 IAEA (1976)7 - 300 Cost estimate - 0.48 1976 3.0786 1.48 IAEA (1976) 7 - 750 Cost estimate - 0.70 1976 3.0786 2.16 IAEA (1976) 7 - 1500 Cost estimate - 1.05 1976 3.0786 3.23 IAEA (1976) 7 - 3000 Cost estimate - 1.72 1976 3.0786 5.30 Tokai RP (1977- )8 0.7 (143) 100 40 (1,123 -28 y) 255 - - - - RT-1 Mayak (1977- )9 1 (200) 200 146 (3,500 -24y) 400 - - - - DuPont (1978)10 5 (300) 1,500 Design/cost 1,825 2.4 1983 1.8 4.3 DuPont (1978)10inc. fab 10 (300) 3,000 Design/cost 3,650 3.7 inc fuel fab 1978 2.6713 9.0 CFRP FR Dem (1979)11 0.1 (150) 15 Design/cost 30 0.80 ± 0.2 1982 1.8808 1.50 CFRP Hot Exp (1979)12 0.5 - Design/cost 183 1.0 ± 0.25 1982 1.8808 1.88 EDRP FR UK (1984)13 0.3 (250) 75 Design/cost 110 0.42 (£0.24B) 1982 1.8808 0.79 GE ALMR (1990)14 fab - 2,700 Design/cost - 5 1990 1.4 7 EPRI Study (1990) 15 - 1,500 Cost study - 3.0 1990 1.4 4.2 UP-3 (1990- )16 5 (160-200) 800 (1,000) 800+ 1,825 6.2 (28BFF’92) 2003 1.1 6.8 OECD study (1994) 17 ~5 (180) 900 Cost study 1,825 4.1B (£2.7B) ~1993 1.3623 5.5 THORP (1994- )18 5 (120) 600 600 1,825 4.1 (£2.3B) 1992 1.37 5.6 UP2-800 (1994- )19 5 (160-200) 800 (1,000) 800+ 1,500 5.8 (37BFF’00) 1990 1.4 8.1 SFTF – UREX+ (2004)20 7.4 (270) 2,000 Design/cost 2,700 3.0 2004 1.05 3.2 Rokkasho (2007-8) 21 5 (160) 800 Commission 1,500 5.2-6.5 1992 1.37 (~20) COEX–AREVA (2006)22 8.3 (300) 2,500 COEX design 3,030 16.2 inc fuel fab 2005 1 (~13)
NOTE: See Section F1-12 for additional notes to this table.

INL/EXT-07-12107 (March 2008) Advanced Fuel Cycle Cost Basis F1-14
Planned Fuel Throughput vs. Capital Cost
y = 0.0018x + 2.7416R2 = 0.1298
0
5
10
15
20
25
0 2000 4000
Planned throughput, MTHM/Yr
Capi
tal c
ost,
$Bn(
2005
m
.v.) Series1
Linear (Series1)
Figure F1-7. Plant capital cost versus planned throughput.
As discussed in Sections F1-6 and F1-7, most of the above estimates are for smaller plants or plant designs that were not built. Also, most are for the PUREX process. In this module, we are fortunate enough to have the results of an actual preconceptual design and cost estimate for a possible aqueous facility (SFTF) based on the UREX+ process. This illustrates how the various components of the reprocessing plant contribute to the overall facility cost. For these reasons, the selected reference case for the cost basis is the SFTF scoping study.11 The SFTF is a 2,000 MT/yr UREX+ design.
Most of the SFTF design is associated with aqueous reprocessing. However, the SFTF study identified five separate facilities that include processes related to HLW conditioning and storage. These facilities include HLW solidification, HLW storage, LLW solidification, LLW storage, and waste treatment. These facilities represent approximately 14% of the SFTF estimated area and 25% of the SFTF base construction cost. The SFTF costs were partitioned between Module F1 and G to provide consistency of evaluation and usage within the AFCI Cost Basis.1 Table F1-2 shows the code of accounts reference numbers for the SFTF balance of plant. The balance of plant includes the separation component that supports recycling of fissile materials, transmutation and decay management of selected actinides and fission products, and segregated disposal of remaining materials as different classes of wastes.

INL/EXT-07-12107 (March 2008) Advanced Fuel Cycle Cost Basis F1-15
Table F1-2. Code of accounts information for reference cost basis facility⎯2,000 MT/yr UREX+ design. AFCI Code of Accounts
Number Code of Accounts Description
SFTF Balance of Plant Cost
($M) Comments 0 Early Life Cycle Costs 233 1 Capitalized Pre-construction Costs 337 2 Capitalized Direct Costs 1,414 Total Directs 1,984
3 Capitalized Support Services 940 Base Construction Cost (BCC) 2,924
4 Capitalized Operations (Mostly plant owner costs prior to commercial operation)
30
5 Capitalized Supplementary Costs — Total Overnight Cost (TOC) 2,953
6 Capitalized Financial Costs — Assume gov funded Total Capital Investment Cost (TCIC) 2,953
7 Annualized O&M Cost 288 9 Annualized Financial Costs 22 Total Operating Costs 7,750 25-year life TOTAL PROJECT LIFE CYCLE COST = 10,710 Includes 45%
contingency Reference SFTF Balance of Plant Total Unit
Cost ($/kg) $214 25-year life, at 100%
availability
The reference facility includes several technical innovations that have not been proven in operation. These impact the relative cost of the primary process functions. The primary differences with previous designs are in the areas of in-process storage and waste management. These differences are discussed in more detail below and in Section F1-9. They do have a considerable impact on the capital cost of the facility. For example, the use of steam reforming for HLW instead of vitrification is estimated to change HLW solidification costs by a factor of 10 and the total facility cost by approximately $2.2B. However, an alternative waste form may possibly be needed to reduce storage space and enable use of natural convection cooling as often used with vitrified HLW.
Table F1-3 provides the relative percentages of capital costs by process function to allow the reader to make comparisons with other designs. Details on the breakdown of the major facility/separation processes are included in Reference 3, Section 7.
The Total Overnight Cost referenced in Table F1-2 of $2,953M would be roughly comparable to $4,200M as calculated from earlier studies of plant capital costs as provided in Section F1-8 for a 2,000-MTIHM/yr facility. The comparison suggests that the Total Overnight Cost for the SFTF is approximately 40% less than prior reprocessing facility cost estimates.
The module cost information is summarized in the What-It-Takes (WIT) cost summary in Table F1-4. The summary shows the reference cost basis (constant year U.S. dollars), the reference basis cost contingency (if known), the cost analyst’s judgment of the potential upsides (low end of cost range) and downsides (high end of cost range) based on references and qualitative factors, and selected nominal costs (judgment of the expected costs based on the references, contingency factors, upsides, and downsides). These costs are subject to change and are updated as additional reference information is collected and evaluated, and as a result of sensitivity and uncertainty analysis. Refer to Section 2.6 in the main section of this report for additional details on the cost estimation approach used to construct the WIT table.

INL/EXT-07-12107 (March 2008) Advanced Fuel Cycle Cost Basis F1-16
Table F1-3. Relative share of capital costs by process function for the reference facility. Function Cost (%)
Fuel Receiving and Preparation 11 U, Cs/Sr Extraction/Storage 23 Actinide Extraction/Solidification/Storage 30 HLW Solidification/Storage 7 Cs/Sr Solidification/Storage 7 Waste Solidification/Storage 9 Utility Facilities 11 Security/Admin/Support Facilities 2 Totals 100%
Table F1-4. Cost summary table.
What-It-Takes (WIT) Table Reference Cost(s)
Based on Reference Capacity
Upsides (Low Cost)
Downsides (High Cost)
Selected Values (Nominal Cost)
Reference Value = $214/kg, based on 2,000 MT/yr UREX+ design, estimate inc. 45% contingency
$460/kg, Based on Estimating Judgment at ~90% of Nominal$
$829/kg, Based on Adjustments to Reference Costs Shown Below
$502/kg, Based on High Economies of Scale (up to 3,000 MT/yr), 80% Utilization Factors, and Adj. to Reference Costs Shown Below
100% more process equipment
50% more process equipment
100% additional ancillary equipment
50% additional ancillary equipment
100% more structural concrete
50% more structural concrete
Vitrified glass waste form 75% of cost of Vitrification glass waste form
72 hours of in-process storage
72 hours of in-process storage
40 Cs/Sr storage structures needed
20 Cs/Sr storage structures needed
Operating life of 25 Years Extend operating life to 40 Years
100% more operational labor
50% more operational labor
100% more operational material
50% more operational material

INL/EXT-07-12107 (March 2008) Advanced Fuel Cycle Cost Basis F1-17
Facility costs for such things as waste disposition and fabrication would be additional costs as provided by other cost modules. Further details on the WIT shown in Table F1-4 are provided in the sensitivity analysis in Sections F1-9 through F1-11 and in Reference 1. The WIT estimate is based on the current understanding of the process and facility requirements and generally takes an optimistic view that efficient designs will be developed, technology improvements can be achieved, and reasonable facility production safety and security requirements will be adopted. Higher costs could result from increased facility rigor to meet the required availability, product quality and yield, and the degree to which the process is remotely operated and maintained (which could add to complexity and cost, but may reduce manpower). The facility could require additional equipment to achieve extremely high recovery yields, rework as necessary to recycle scrap, and need for final polishing type steps, etc., to meet the specific product quality requirements. The SFTF reference unit cost of $214 was judged to be low by $288, to arrive at the analysts’ selected WIT value of $502/kg. Given the magnitude of the cost correction, this could imply that the scope of the design and operational requirements do not fully match the requirements envisioned for a U.S. based used fuel separations facility. The WIT analysis will be updated as the technology is advanced and additional facility design information (e.g., Consolidated Fuel Treatment Center) becomes available. The triangular distribution used for modeling purposes is shown in Figure F1-8. The distribution is skewed to show that further reduction in costs from nominal are unlikely, with more potential for cost growth toward the high end due to the uncertainties in construction equipment, labor and materials, waste forms, and operational uncertainties.
Module F1-1 UREX+1A Aqueous SeparationEstimated Cost Frequency Distribution
$/kg
Freq
uenc
y
Low Nominal Mean High
$460 $502 $597 $829
Figure F1-8. UREX+1A aqueous separation estimated cost frequency distribution.
The extensive analyses in Appendix J of Reference 4 warn that cost experience with existing facilities, rather than estimates for new facilities, should be the basis for realistic estimates. It also warns that only government financing (in the U.S.) will keep the costs low enough to be in the least competitive. Reference 4 would suggest that aqueous reprocessing of UOX fuel will cost well over $1,000/kgHM and that reprocessing of light water reactor or fast reactor mixed oxide fuel will cost even more because of the more complex flowsheets. If costs for Rokkasho-mura were recovered in the manner of a private facility in the U.S., over $2,000/kgHM would be required. These higher unit costs are provided as a warning that any U.S. project for an aqueous reprocessing facility will have to avoid the problems encountered by previous projects. This will be difficult given the more stringent security, seismic, and safety requirements that have been imposed over the last 15 years. Political and funding issues are also likely to be encountered, and these can force project delays. The reader should consult References 4 and 5 for extensive discussion of the issues above. It may be advisable to raise the “downside” (pessimistic) unit cost value to $2,000/kgHM based on the above.

INL/EXT-07-12107 (March 2008) Advanced Fuel Cycle Cost Basis F1-18
The French company, AREVA, is interested in the possible U.S. market for reprocessing services. They are considering a process called COEX (co-extraction of uranium and plutonium) for export.12 A report commissioned by AREVA to the Boston Consulting Group (BCG) on this subject was released in July 2006 that indicates that a closed fuel cycle can be competitive with an open cycle.13 The result of the analysis was an overall discounted cost of recycling (defined to include used fuel separation and (U,Pu)O2 MOX fuel fabrication) on the order of $520/kg, which was described as comparable to the cost of a once-through strategy. The BCG analysis uses a substantial historical cost basis for twenty years of AREVA’s recycling experience and was performed using a reasonable estimating approach. The study suggests that improved economics can be achieved by combining used fuel separation and fuel fabrication functions in a single collocated facility. In the Cost Analysts’ view, the BCG cost evaluation employed several assumptions that help to promote a favorable evaluation for COEX over the once-through fuel cycle. Also, the COEX treatment has simpler objectives (e.g., no minor actinide recovery) than UREX+ leading to fewer separation processes and waste streams for disposition. Another consideration is that the AREVA strategy does not include the costs for disposition of the spent MOX fuel, and the stored MOX inventory is effectively excluded from the waste estimates. The COEX strategy could be viewed as a first step in the process toward fuel cycle closure, but not a comprehensive solution as envisioned by the AFCI Program.
F1-9. RESULTS FOR SENSITIVITY AND UNCERTAINTY ANALYSIS A sensitivity analysis was performed to assess the impact of significant assumptions and reasonable
variations in primary cost drivers. The SFTF estimate was used as the deterministic baseline on which the uncertainties are pivoted. The analysis improved the understanding of the potential for the cost estimate to change with improved information. The analysis also provided an independent derivation of contingency.
F1-10. SENSITIVITY METHODOLOGY AND UNCERTAINTY BOUNDARIES
The methodology involved:
1. Identifying those assumptions that may have a significant impact on the facility cost estimate
2. Determining the range of possible values to be applied to a specific assumption/driver
3. Identifying the full set of cost elements impacted by the assumption/driver (via multipliers)
4. Varying the single assumption/driver across its range
5. Noting the percent and dollar change in the pre-Operations and Annual Operations costs.
In all cases, the appropriate multiplying factors for indirect, total project, and operational costs were applied, and the impacts on these costs were added to determine the total impact.
The sensitivity ranges were developed by assessing the uncertainty in the design or indicated by assessment of the assumptions. A normal distribution approach was used to evaluate the SFTF cost estimate. A variable distribution range of +50%, -25% was considered as the starting point for future cost development. For symmetry, the low end of this range was expanded in the sensitivity analysis to –33% while the upper range of +50% was retained. This range was used for five of the nine areas included in the sensitivity analysis. The other four areas involved development of specific ranges that bounded or slightly exceeded variations noted previously in Sections F1-3 and F1-4. A summary of the cost drivers and assumptions assessed for sensitivity and the sensitivity ranges is provided in Table F1-5.

INL/EXT-07-12107 (March 2008) Advanced Fuel Cycle Cost Basis F1-19
Table F1-5. Sensitivity analysis parameters. Cost Driver or Assumption Sensitivity Range for Analysis
1. Operational Labor 2. Process Equipment 3. Operational Materials 4. Structural Concrete 5. Ancillary Equipment
The default range applied to a specific assumption/driver for sensitivity was –33% to +50%, based on the stated nominal accuracy range of the cost estimate modified for symmetry.
6. Period of Operation A range of 20–50 years was used for the operational life of the facility based on slightly extending the operating range of 25–40 years implied in the design. This factor was applied equally across all operating costs with no change to the decontamination and decommissioning contribution.
7. HLW Forms A 10x increase from steam reforming solidification was applied, based on estimated vitrification costs. Cost increases should account for the development costs needed to produce a better waste form than vitrification.
8. In-process Storage A range of 8 hours to 3 days for used for the in-process storage capacity, applied to the U&S and T buildings by increasing process equipment costs for the slab tanks (direct factor) and HEPA filters (T building calculated volume change). The structural concrete costs were increased by the same factor as the HEPA filters. The 21 slab tanks in the fuel prep building were not included.
9. Cs/Sr Facilities The Cs/Sr facilities were assessed for the full range of possible build-out (2–40 storage structures), with a calculated impact of hardening the Cs/Sr facilities with a 25% adder applied to the high end of the range. The potential use of an improved waste form (e.g., vitrified HLW) that permits natural convection cooled storage, see Driver No. 7, should be considered.

INL/EXT-07-12107 (March 2008) Advanced Fuel Cycle Cost Basis F1-20
F1-11. RESULTS FROM SENSITIVITY ANALYSIS The results of the sensitivity assessment are summarized in Table F1-6, and Dixon and Shropshire
include detailed calculations in their report.10 The impacts of some of the cost drivers/assumptions approach or exceed a 50% increase in total life-cycle costs when varied individually (and could be much higher). Potentially, more than one of the cost drivers could vary in the same direction (i.e., cost increase or cost reduction), resulting in a compounding increase (or decrease) in the costs. When the total variability of the cost drivers are combined to produce a composite low to high range, the range results in a swing of approximately –54% to +363% for preoperations costs and –21% to +396% for annual operations/decontamination and decommissioning costs. By applying a normal probability distribution to these ranges, the median costs would be about $6,153M for preoperations and $647M for annual operations/decontamination and decommissioning costs. On a unit cost basis, using a normal probability distribution for these ranges, the median costs would be about $446/kg. The SFTF estimates reside on the low end of the cost distribution scale, which suggests that the generic SFTF study represents an aggressive, optimistic cost estimate.9 The cost distributions resulting from the compounded uncertainty are shown in Figures F1-9, F1-10, and F1-11. These figures also show where the SFTF and WIT rough order of magnitude (ROM) costs lie within the normal distribution curve.
The significant breadth of this cost range reinforces the understanding that these costs are intended to represent ROM costs, not discrete cost estimates. These cost estimates need to be used on a relative comparison basis and not as absolute cost numbers.
The following items deserve specific comments:
• For cost drivers with direct field costs, the percent variation in project costs (resulting from application of the low and high sensitivity range) was also applied in the same proportion to the operation costs. The prorated operational costs are included to account for changing operational expenses that result from direct changes to the facility (e.g., amount of equipment and space, technologies used, storage requirements, instrumentation). The proportional change in operation costs was not applied in the sensitivity analysis for the additional Cs/Sr facilities, because it was felt that increases in long-term storage would not significantly change operation costs. Thus, comparison of the relative impact of Cs/Sr facilities to the other sensitivity items for preoperational costs versus operation and decontamination and decommissioning costs provides an indication to the reader of the impact of operational costs (see Figures F1-12–F1-14).
• The large change in annual operations cost due to varying the period of operation would be offset by the inverse change in the cost per unit processed. This is because of a corresponding change in the life-cycle amount of material processed. The SFTF study was based on 50,000 MTHM processed over 25 years. If the operating period is extended to 40 years, then 80,000 MTHM would be processed. The annual operating costs to run the facility for 40 years may be higher than for 25 years due to costs for equipment replacement, upgrades, increased operational materials, and utilities. Alternatively, the process may evolve into a more cost effective operation and could result in annual cost reductions (e.g., higher facility availability and capacity factors).
• The change in cost due to different assumptions on HLW forms is the second largest total change, representing the greatest potential design risk. The range used was based on limited information, and a more in-depth basis should be developed. However, given the uncertainty of both the technical process and the regulatory acceptance of the design, waste form research should also be conducted to reduce this aspect of project risk.
• The changes in the total cost due to variation of process equipment and in-process storage point to the need for an engineering scale experiment supporting research and development for process and equipment development and integration. This effort should be conducted to reduce the associated project risk.

F1-21 IN
L/EXT-07-12107 (M
arch 2008)
Advanced Fuel C
ycle Cost B
asis
Table F1-6. Sensitivity analysis summary.
Sensitivity Analysis Results Operational
Labor Process
Equipment Operational Materials
Structural Concrete
Period of Operation
HLW Costs
In-process Storage
Ancillary Equipment
Cs/Sr Facilities
Total Cost
Impact
Low N/A -$433 N/A -$161 N/A N/A -$480 -$235 -$61 -$1,370 Variation in Preoperational Costs ($M) High N/A $650 N/A $241 N/A $2,218 $1,439 $352 $2,871 $7,771 WIT N/A $325 N/A $120 N/A $1,663 $1,439 $126 $1,436 $5,159
Low N/A -16% N/A -6% N/A N/A -18% -9% -2% Variation in Preoperational Costs (%) High N/A 24% N/A 9% N/A 81% 53% 13% 105%
Low -$56 -$45 -$6 -$13 -$58 N/A -$47 -$19 -$1 -$245 Variation in Operation/D&D Costs (Annual $M) High $84 $68 $32 $19 $290 $201 $141 $28 $55 $918 WIT $42 $34 $16 $9 -$58 $150 $141 $14 $27 $375
Low -19% -16% -2% -4% -20% N/A -16% -7% 0% Variation in Operation/D&D Costs (%) High 29% 23% 11% 7% 100% 69% 48% 10% 19%
Total Unit Cost Low -$28 -$31 -$3 -$10 -$29 N/A -$33 -$14 -$2 -$150 Uncertainty Bounds High $42 $47 $16 $15 $145 $145 $99 $21 $85 $615
(Total $/kg) WIT $21 $23 $8 $7 -$29 $107 $99 $10 $42 $288 D&D= decontamination and decommissioning

INL/EXT-07-12107 (March 2008) Advanced Fuel Cycle Cost Basis F1-22
$6,153M$1,583M $10,724M
+363%-54%
$2,953M
SFTF
$2,953M
SFTF
$8,112M
WIT
$8,112M
WIT
$4,200M
ReferenceEstimates
$4,200M
ReferenceEstimates
Peak of Distribution
Figure F1-9. ROM Preoperations cost distribution based on compounded cost uncertainty.
$647M$65M $1,228M
+396%-21%
$310M
SFTF
$310M
SFTF
$685M
WIT
$685M
WIT
Peak of Distribution
Figure F1-10. ROM annual operations/decontamination and decommissioning cost distribution based on compounded cost uncertainty.

INL/EXT-07-12107 (March 2008) Advanced Fuel Cycle Cost Basis F1-23
$446$64 $829
+387%-30%
$214
SFTF
$214
SFTF
$502
WIT
$502
WIT
Peak of Distribution
Figure F1-11. ROM unit cost ($/kg) distribution based on compounded cost uncertainty.
$2,000 $3,000 $4,000 $5,000 $6,000
Structural concrete
Ancillary Equipment
Process equipment
In-process storage
HLW costs
Cs/Sr Facilities
Sensitivity - Pre-Operations Costs ($M)
Figure F1-12. Sensitivity of preoperations costs to baseline costs ($2,727M).

INL/EXT-07-12107 (March 2008) Advanced Fuel Cycle Cost Basis F1-24
Sensitivity - Pre-Operation Costs
-50% 0% 50% 100% 150%
Structural concrete
Ancillary Equipment
Process equipment
In-process storage
HLW costs
Cs/Sr Facilities
Figure F1-13. Sensitivity of preoperations costs by percentage.
$200 $300 $400 $500 $600
Structural concreteOperational
Ancillary EquipmentCs/Sr Facilities
Process equipmentOperational labor
In-process storageHLW costs
Period of Operation
Sensitivity - Annual Operational and D&D Costs ($M)
Figure F1-14. Sensitivity of annual operations and decontamination and decommissioning costs to baseline costs ($290M).
The cost for additional onsite storage of cesium/strontium should not be included in a generic aqueous separations cost module, as it represents a specific assumption change for this particular design. Long-term storage of processing by-products should instead be considered in a waste disposal cost module. Future uncertainties exist to meet undefined waste acceptance criteria requirements.
The results of the sensitivity assessment are summarized in Table F1-6, and the detailed calculations are included in Dixon and Shropshire’s report.11 The wide life-cycle uncertainty bounds associated with these categories is indicative of the preconceptual design stage of the SFTF facility. As engineering studies are performed to address the design unknowns, the range of cost uncertainty will be reduced. Key uncertainties and prioritized engineering studies and their associated costs are also provided in Dixon and Shropshire’s report.11

INL/EXT-07-12107 (March 2008) Advanced Fuel Cycle Cost Basis F1-25
Table F1-6 is a summary of the cost calculations provided in Dixon and Shropshire’s report.11 The nine variables listed across the top of the table are identified as key cost drivers with a high degree of cost uncertainty. Each of these variables was evaluated based on their potential for cost reduction or cost increase relative to the preoperational costs and the annual operations/decontamination and decommissioning costs. The cost variations are relative to the base costs developed in the SFTF study. For example, the preoperational cost variation for process equipment could be $433 less than a base cost of $1,299, for a low cost estimate of $866. The preoperational costs include the direct equipment and facility cost as well as the applicable indirect costs and other project costs. The variation in the annual operations/decontamination and decommissioning costs are additional to the preoperational costs, and include relevant factors for equipment replacement/facility upkeep and decontamination and decommissioning, operational material and utilities, operational labor, and owner’s cost. The sum of the cost variations are totaled in the right hand column to obtain the total cost impact for preoperational costs, operations/D&D, and total cost uncertainty bounds.
Figures F1-12 and F1-13 provide a graphical view of the data in Table F1-6 and show the relative dollar and percentage contributions to preoperational costs for the six construction-related items in the sensitivity analysis. The vertical line represents the baseline costs in the SFTF scoping study. Figures F1-14 and F1-15 show the same information for the annual operation and decontamination and decommissioning costs. Figure F1-14 shows these costs in dollars per year while Figure F1-15 shows the relative percent. The vertical line represents the baseline costs in the SFTF scoping study.
Table F1-7 shows the code of accounts for the What-it-Takes (WIT) nominal costs. The numbers under the plant costs reflect the WIT values shown in Table F1-6 for preoperational and operation/D&D costs. The total capital investment costs for the WIT case is $8,113M as compared to the SFTF balance of plant case at $2,953M shown in Table F1-2. The $8,113M WIT is the sum of the $5,159M cost impact and the $2,953M SFTF estimate. The operations and maintenance costs are $685M/year for the WIT versus $310M/year for the SFTF, including finance costs. The total unit costs are $502/kg for the WIT versus $214/kg for the SFTF balance of plant estimate. In addition to the preoperational and operation/D&D cost uncertainties, the composite unit costs also reflect the difference in projected facility operating lives (40 years versus 25 years) and associated availability factors (88% versus 100% for a 2,000 t/year facility) for the WIT versus SFTF, respectively.
Sensitivity - Annual Operational and D&D Costs
-40% 0% 40% 80% 120%
Structural concreteOperational materialsAncillary EquipmentCs/Sr FacilitiesProcess equipmentOperational laborIn-process storageHLW costsPeriod of Operation
Figure F1-15. Sensitivity of annual operations and decontamination and decommissioning costs by percentage.

INL/EXT-07-12107 (March 2008) Advanced Fuel Cycle Cost Basis F1-26
Table F1-7. Code of accounts for WIT nominal costs.
AFCI Code of Accounts
Number Code of Accounts Description
WIT Plant Cost
($M) Comments 0 Early Life Cycle Costs 233 1 Capitalized Pre-construction Costs 1,317 — 2 Capitalized Direct Costs 3,839 — Total Directs 5,389 — 3 Capitalized Support Services 2,694 — Base Construction Cost (BCC) 8,083 — 4 Capitalized Operations (Mostly plant owner
costs prior to commercial operation) 30
5 Capitalized Supplementary Costs — Total Overnight Cost (TOC) 8,113 6 Capitalized Financial Costs — Assume gov funded Total Capital Investment Cost (TCIC) 8,113 — 7 Annualized O&M Cost 636 — 9 Annualized Financial Costs 49 — Total Operating Costs 27,400 40-year life TOTAL PROJECT LIFE CYCLE COST 35,513 Includes 45% contingency Total Unit Cost ($/kg) $502 40-year life, at 88% availability
F1-12. NOTES FOR TABLE F1-1 1. The UK Windscale B205 reprocessing plant for Magnox, ≤ 8 GW(t).d/t burnup, gas-cooled, natural
uranium metal-fuelled (Gen I) reactors originally operated at over 1,000 t/yr throughput and is still operating at around 500 t(HM)/yr (one of two head-end decanning lines closed down as reactor fleet decreased) and planned for closure in 2012, when all reactor-lifetime fuel arising has been reprocessed. Plant described in “Nuclear Power Technology, Volume 2, Fuel Cycle, Edited W. Marshall, Clarendon Press, Oxford.23
2. NFS West Valley, NY reprocessing plant is the only plant in the U.S. to have reprocessed commercial reactors fuels. During its 6-year period of operation it separated 1,926 kg of plutonium from a mixture of AEC and commercial utility fuels. Process losses, discharges and exposures became higher than planned and final product sometimes did not meet expected quality levels. The plant was permanently shut down in 1976 after it was determined that stricter regulatory requirements could not be met. Ref. “Plutonium Recovery from Spent Fuel Reprocessing by Nuclear Fuel Services at West Valley, New York from 1966 to 1972,” Report prepared by U.S. Department of Energy, February 1996.
3. Conceptual design and capital cost estimate for HTGR Reference Fuel Reprocessing Plant, prepared for Idaho Nuclear Corporation by Bechtel, August 1969, INEEL report No. IN-1451. The plant design includes a crush-burn head-end process for removing the bulk of graphite, fuel particles are separated by screening, crushed to break SiC coatings, again burned and Th, U and FP are separated using an acid-thorex solvent extraction process.

INL/EXT-07-12107 (March 2008) Advanced Fuel Cycle Cost Basis F1-27
4. MFRP (Midwest Fuel Recovery Plant) hybrid aqueous/electrochemical nuclear fuel reprocessing plant constructed at Morris, Illinois, near the Dresden Nuclear Power Station. When in final cold testing in 1974, GE determined that its performance would not be acceptable without extensive modifications. The combination of complex processing equipment with higher expected failure rates, and close coupling of process steps, which required much longer time to resume operation after shutdown, would permit only a low throughput. The request for a reprocessing plant operating license was withdrawn and the plant was licensed only to store spent fuel (700 t). Ref. as given in Note 2 above.
5. AGNS Barnwell Plant was due to begin operation in 1974. But by 1977 was not completed or licensed when the US decided to defer indefinitely all reprocessing of commercial irradiated fuel. It was technically unproven since it never operated with spent fuel and has since been decommissioned. A technical description is given in Nuclear Chemical Engineering, pp. 491–501, M. Benedict, T. Pigford, H. Levi, 2nd Ed, McGraw-Hill, 1981. The flow-sheet gives a chemical separations feed of 5 t(HM)/d and the plant is described by Haire, ref. below, as having an annual capacity of 1,500 t(HM). It should be noted that to achieve this annual throughput, the availability would need to be nearly twice that of the French and UK plants, THORP, UP-2 and UP-3.
6. Exxon undertook conceptual design and capital cost estimates for oxide reprocessing plants with a period of 7 years of design effort including 200 man-years of architect engineering: Ref. Exxon Nuclear Company, Nuclear Fuel Recovery and Recycling Center Preliminary Safety Analysis Report, XN-FR-32, U.S. Nuclear Regulatory Commission, Docket No. 50-564 (filed June 1976). Also see Exxon nuclear fuel recovery and recycling center: process description, Ritter, G. L., Nuclear Technology, Vol./Issue: 43:2, April 1979. Capital cost for 1,500 t/yr plant is quoted by Haire M. J., Nuclear Fuel Reprocessing Costs, ANS Topical Meeting, Hilton Head Island, SC. Oct 5–8, 2003.
7. IAEA PUREX-based reprocessing plant cost studies to scope against plant scale. Ref. Regional Nuclear Fuel Cycle Centres, IAEA Study Project, V. Meckoni, R. J. Catlin, L. L. Bennett, International Atomic Energy Agency, Vienna, Salzburg, International Conference on Nuclear Power and its Fuel Cycle, 1977. Approximate capital costs may be derived from unit and levelized costs, but it is not clear whether costs were derived from bottoms up estimates or expert judgment.
8. Tokai Reprocessing Plant–PUREX thermal oxide uranium reprocessing pilot plant, no longer operating commercially for Japanese electric utilities but reserved for test runs, mainly with MOX fuels.
9. Mayak RT-1 at Ozersk, R. F. was commissioned in 1977 to reprocess spent fuel from VVER-440, BN-350, BN-600, research, and naval propulsion reactors. Most of the feed is from VVER-440 reactors and this is the only Russian facility that reprocesses spent power reactor fuel. The plant's nominal reprocessing capacity (based on spent fuel from the VVER-440 reactors) is 400 tons of spent fuel per year, The RT-1 facility is made up of a spent fuel storage pool, three chopping-dissolution process lines, and a modified PUREX process. High-level liquid radioactive waste from the reprocessing is vitrified, Ref. NTI, http://www.nti.org/db/nisprofs/russia/fissmat/pumayak/spentfue.htm .
10. Dupont SRP design studies completed around 1978. These used canyon design with rapid equipment replacement, selective centrifugal contactor placement and rapid startup compared to other plants. M. J. Haire, Nuclear Fuel Reprocessing Costs, ANS Topical Meeting, Hilton Head Island, SC. Oct 5-8, 2003, quotes the capital cost of the smaller plant. C. Bastin, Global Foundation, 22 Int. Energy Forum, Nov 5–6, 1999, ed. B. Kurosumnoaeglu, S. Mint and A. Permutter, Pub. Springer, 2000, quotes the capital cost for the larger plant which also includes MOX fuel fabrication. This cost was reduced by 10% ($0.9B) in Table F1-1 to account for removal of MOX fabrication scope. The plant is described in duPont de Nemours 3,000 t/a Reprocessing and Fabrication Plant, Nucl. Technol. Vol/Issue: 43:2, 1979. Detailed flow-sheets were prepared by Savannah River Laboratory for a conceptual 10 MT/day reprocessing facility. These plants were considered conservative and designed

INL/EXT-07-12107 (March 2008) Advanced Fuel Cycle Cost Basis F1-28
with stronger engineering emphasis on availability and capacity factor, design value of 80%, than the AGNS Barnwell and Exxon Nuclear Company designs. Haire quotes the Dupont 1,500 t/yr plant as being 60% higher capital cost than the AGNS Barnwell and Exxon Nuclear Company designs, both also of nominal 1,500 t/yr throughput.
11. ORNL studies performed under the Consolidated Fuel Reprocessing Program (CFRP) during the late 1970s and early 1980s as quoted by Haire M. J., Nuclear Fuel Reprocessing Costs, ANS Topical Meeting, Hilton Head Island, SC. Oct 5–8, 2003. The cost of a small scale FR reprocessing plant to support one or two demonstration fast reactors was scoped. Calculations showed almost no difference in capital cost of reprocessing plant for thermal and fast reactor fuels at throughputs < 300 t(HM)/yr. FR reprocessing then becomes more costly than thermal oxide fuel when expressed as per t(HM) but may be less expensive per kW(e)hr.
12. ORNL studies performed under the Consolidated Fuel Reprocessing Program (CFRP) during the late 1970s and early 1980s as quoted by Haire M. J. (2003). Except in throughput, the design basis of Hot Experimental Facility (HEF) is similar to that of the 1,500 t(HM)/yr LWR oxide fuel PUREX reprocessing plant and design was performed to obtain a direct comparison of capital costs.
13. Outline Planning Application for a European Demonstration Fast Reactor Reprocessing Plant (EDRP) at Dounreay, Caithness, UK was prepared in May 1985, by UKAEA, to treat fuel from four commercial fast reactors, but plant construction did not take place. The design used batch dissolvers, sulphate flowsheet for U-Pu partitioning, and liquid waste treatment by flocculation prior to sea discharge.
14. GE ALMR reprocessing plant. Ref. Nuclear Wastes – Technologies for Separations and Transmutation, Committee of Separations Technology and Transmutation Systems, National Research Council, Washington D.C., 1996. This reference provides an estimate of $6.1B (1990) capital cost for PUREX-TRUEX reprocessing plant (2,700 t/yr throughput) for high recovery of transuranic actinides for transmutation in the advanced liquid metal reactor (ALMR) and includes plant for fabrication of TRU MOX fuel. An earlier separate estimate for the same throughput and believed without MOX fuel fabrication was lower at a quoted value of $4.25B; Salerno L. N., Thompson M. L., Hutchins B. A., and Braun C., ALMR fuel cycle economics, Paper presented at the small and medium reactors seminar, San Diego, CA, August, 1989.
15. The EPRI 1990 study for a generic U.S. site estimated reprocessing plant capital costs ranging from $2.73B (government-owned plant) to $3.00B (privately-owned plant) with a planned annual throughput of 1,500 t/yr; Gingold, J. E., Kupp R. W., Schaeffer D. and Klein R. L., The cost of reprocessing irradiated fuel from light water reactors: an independent assessment, (S. M. Stoller), EPRI Report NP-7264, Palo Alto, CA.
16. AREVA (formerly COGEMA) thermal oxide reprocessing plant constructed in France for foreign customers. The capital cost value for UP-3 is quoted in Bunn M., Fetter S., Holdren J. P. and van der Zwaan B., The economics of reprocessing vs. direct disposal of spent nuclear fuel, Harvard University, DE-FG26-99FT4028, p. 29, December 2003. The capital costs provided for UP-3 and THORP plants do not include interest during construction, which were borne by reprocessing customers. In 1998, Cogéma submitted dossiers seeking authorization to reprocess up to 1,000 metric tons of heavy metal per year in UP2-800 and up to 1,000 in UP-3 (previously 800 t/yr each). Cogéma committed not to reprocess a total of more than 1,700 t per year. In 2003, permission was given, subject to the overall limit, for up to 1,000 t(HM)/yr for each plant.
17. OECD-NEA 1994, The Economics of the Nuclear Fuel Cycle; Cost data supplied by BNFL, capital cost includes reprocessing, fuel receipt & storage, ILW encapsulation and associated R&D but excludes vitrification and HLW management – likely higher cost in pounds sterling than THORP due to need for design modification and additional facilities for increased throughput as compared to

INL/EXT-07-12107 (March 2008) Advanced Fuel Cycle Cost Basis F1-29
THORP. The 1993 GBP exchange rate was approximately $1.50 USD – markedly weaker pound than 1992.
18. THORP is part of the UK Sellafield site, 988 acres. Capital Cost - THORP-only GBP £1.85B (1992 m.v.), THORP and associated waste facilities £2.85B. Ref. British Nuclear Fuels Limited, The Economic and Commercial Justification for THORP (Risley, UK: BNFL, 1993), p. 22. BNFL states that the “construction cost of THORP, spread over the ten years 1983-1992, equates to around £1.9B. However, taking account of other projects which are directly related to THORP, the overall capital cost of the programme was around £2.85 B.” Part of the stated £1B for associated waste facilities covers items (excluding vitrification of HLW) that are needed for a standalone reprocessing plant, e.g., receipt pond, liquid waste treatment, degraded solvent treatment, ILW encapsulation. The judgment is that a capital cost for THORP “reprocessing and excluding high level waste treatment” of £2.3B (1992 m.v.) would be reasonable (low rather than high). Using a mean historic exchange rate for 1992 of 1.77 and an inflator factor of 1.37 (approx. Engineering New Record’s “Construction Cost Index History”) gives a capital cost for THORP of $5.7B (1992 mv). Like Bunn, it is judged that use of a Construction Cost Index may underestimate costs of unique facilities such as reprocessing plant. Originally THORP was planned to have a throughput of 6,000 MTHM in 10 years. This figure was later revised to 7,000 MTHM in 10 years, but the higher throughput was not achieved. Of current generation, operating PUREX plants, THORP has published the most detailed economic data. The figure provided here is consistent with the OECD-NEA hypothetical for which BNFL provided cost input and COGEMA input on basic design and future improvements. Also similar to value given by Bunn et al, 2003.
19. AREVA (formerly COGEMA) thermal oxide reprocessing plant constructed at Cap La Hague site (717 acres) in France for Electricite de France. UP-2 commenced operation in 1966 as a reprocessing plant for Gaz-Graphite (Gen I reactor) metallic fuels, was converted in around 1976 to UP2-400 plant (400 t/yr) for oxide reprocessing (addition of UP2-HAO) and later still (1994) to UP2-800 (800 t/yr) LWR oxide fuel deriving from EDF French national electric utility. It seems unlikely that a definitive capital cost value can be given for this plant that evolved over many years. However, Bunn et al. quote a capital cost for UP-2. They also quote a combined capital cost for UP-2 and UP-3 facilities at Cap La Hague as FF90B (equated to $16B in 2003 m.v.). It is not clear whether this includes vitrification and other supporting requirements to oxide reprocessing or not; Bunn M., Fetter S., Holdren J. P. and van der Zwaan B., The economics of reprocessing vs. direct disposal of spent nuclear fuel, Harvard University, DE-FG26-99FT4028, p. 29, December 2003. The report “Economic assessment of Used Nuclear Fuel Management in the United States”, by Boston Consulting Group (BCM) for AREVA, July 2006, quotes a capital cost of $17.8B (2005 money value and assuming 1€ ≡ 1$(USD)) for oxide fuel reprocessing, HLW vitrification and MOX fuel fabrication (essentially Cap La Hague (UP-3, UP-2, etc) and Melox). On this basis, a capital cost of UP-3 (new, as-built plant rather than modified) of $6B– $7B (2005 m.v.) appears reasonable.
20. Scoping Study for the Spent Fuel Treatment Facility (SFTF), Prepared for Bechtel BWXT Idaho, LLC by Washington Group International, Job No. 26861-004, January 2004. The UREX+ process design, which is more complex than PUREX, provides for five distinct solvent extraction processes that yield the separation of uranium, technetium, cesium with strontium, plutonium with neptunium and americium with curium. Some volatile fission products are also separated and residual fission products including rare earths are immobilized. The cost is described as ROM (rough order of magnitude) value.
21. Rokkasho reprocessing plant (RRP), part of 939 acre fuel cycle center, was originally planned to operate in the year 2000 but is likely to be about 8 years late. Capital costs are reputed to have trebled from ¥7.6B to around ¥21B, but no official estimates were obtained. RRP uses the PUREX process as exemplified by French reprocessing technology, but will mix U and Pu streams to avoid separation of a pure PuO2 solid product.

INL/EXT-07-12107 (March 2008) Advanced Fuel Cycle Cost Basis F1-30
22. The report “Economic assessment of Used Nuclear Fuel Management in the United States”, by Boston Consulting Group (BCM) for AREVA, July 2006, quotes a capital cost of $16.2B (2005 money value and assuming 1€ ≡ 1$(USD)) for an integrated facility for fuel reprocessing, HLW vitrification and MOX fuel fabrication (essentially Cap La Hague (UP-3, UP-2, etc) and Melox). A capital cost of $13B (2005 m.v.) for reprocessing alone (removal of remote fuel fabrication, vitrification and interim storage components) does not appear unreasonable. But, it is noted that the days/yr full effective operation for reprocessing has been raised from 200 (UP-3 recent increased value, formerly 160) to 300. Also a long period of operation, 50 years, is assumed. In the COEX flowsheet, irradiated fuel is separated into three main streams: plutonium-uranium oxide, which is then fabricated into fuel on site in the MOX fuel fabrication unit; recycled uranium oxide, which is purified, converted and re-enriched outside the integrated recycling plant and fabricated into conventional uranium-based fuel; and mixed fission products and minor actinides, which are considered high-level waste and vitrified.
23. The S.I. (Systeme Internationale) symbol for metric ton is t, i.e., t ≡ MTHM.
24. In the first column of Table F1-1, the names of plants actually constructed are shown in bold ; some of these operated and some were never operated. The names of cost and design studies that were not used to construct actual plant are shown in normal font.
F1-13. REFERENCES 1. J. J. Laidler “AFCI Separations Overview,” PowerPoint presentation, AFCI Semiannual Review,
Santa Fe, New Mexico, August 2003. (This document has a restricted distribution, may be proprietary, or both; and is not publicly releasable.)
2. George F. Vandegrift, Monica C. Regalbuto et al. Argonne National Laboratory, LAB-SCALE Demonstration of the UREX+ process, WM’04 Conference, February 29–March 4, 2004, Tucson, AZ.
3. J. M. Haire, “Nuclear Fuel Reprocessing Costs,” American Nuclear Society Topical Meeting on Advances in Nuclear Fuel Management III, Hilton Head Island, SC, October 2003.
4. “Commission on Geosciences, Environment and Resources Nuclear Wastes: Technologies for Separations and Transmutation,” 1996, The National Academy of Sciences, 2000.
5. M. Bunn, et al., “The Economics of Reprocessing vs. Direct Disposal of Spent Nuclear Fuel,” DE FG26-99FT4028, Project on Managing the Atom, Harvard University, Cambridge, Massachusetts, 2003.
6. B. B. Spencer, D. D. Guillermo, E. D. Collins, “Effect of Scale on Capital Costs of Nuclear Fuel Reprocessing,” American Nuclear Society Winter Meeting, November, 2003.
7. Press release, “EDF and AREVA Sign a Contract for Managing EDF Used Nuclear Fuel,” August 24, 2004.
8. Washington Group International, “Spent Fuel Treatment Facility Scoping Study,” Job No. 26861 004, Washington Group International under contract to Bechtel BWXT, Idaho, LLC, Contract #17157, SOW-1113, Rev. 2, Denver, Colorado, January 29, 2004. (This document has a restricted distribution, may be proprietary, or both; and is not publicly releasable.)
9. Nuclear Energy Agency, The Economics of the Nuclear Fuel Cycle, Appendix 3, “Reprocessing Option Cost Estimates and Future Trends, Nuclear Energy Agency Organization for Economic Cooperation and Development, Paris, France, 1994.

INL/EXT-07-12107 (March 2008) Advanced Fuel Cycle Cost Basis F1-31
10. Defense and General Construction Escalation Indices based on an average of the Engineering News
Record Construction Cost Index and Building Cost Index, http://enr.construction.com/features/coneco/subs/recentindexes.asp.
11. B. Dixon and D. Shropshire, “Spent Fuel Recycling Facility Cost Trade-off Studies,” CCN 50146, Rev. 1, March 2005. (This document has a restricted distribution, may be proprietary, or both; and is not publicly releasable.)
12. “AREVA Dual-track Strategy Aimed at Two Reprocessing Plants,” Nuclear Fuel (McGraw-Hill newsletter), July 3, 2006, p 6.
13. “Economic Assessment of Used Nuclear Fuel Management in the United States,” Prepared by Boston Consulting Group for AREVA, July 2006.

INL/EXT-07-12107 (March 2008) Advanced Fuel Cycle Cost Basis F1-32

INL/EXT-07-12107 (March 2008) Advanced Fuel Cycle Cost Basis F2/D2-1
Combined Module F2/D2
Electrochemical Reprocessing and Remote Fuel Fabrication

INL/EXT-07-12107 (March 2008) Advanced Fuel Cycle Cost Basis F2/D2-2

INL/EXT-07-12107 (March 2008) Advanced Fuel Cycle Cost Basis F2/D2-3
Module F2/D2
Electrochemical Reprocessing and Remote Fuel Fabrication
F2/D2-1. BASIC INFORMATION A Combined Module. This module discusses predominantly electrochemical reprocessing of spent
nuclear fuel. Since remote fuel fabrication is an integral part of the overall recycle system and would be housed in the same facility, the associated remote fuel refabrication step is also included in this module. The technical reasons for such integration are considered below. (Another reason they are combined in this report is that very little cost data is available for which the electrochemical reprocessing steps are separated from the fuel refabrication steps.) Refabrication is usually the last process step in an integrated electrochemical recycle system usually proposed for fast reactor systems.
The Reprocessing Step. Sometimes the variants of this generic step are called pyrochemical, pyroprocessing, pyrometallurgical, pyrolytic or molten salt methods. In this document, the term electrochemical is used to encompass all of these terms. Their distinguishing characteristic is that they do not employ aqueous solution chemistry; they therefore fall into the class of what are called “dry” processes. All processes of this type involve molten salt chemistry at elevated temperatures. While this type of process has never been applied on a commercial scale, it has been demonstrated for research reactor fuel.
In early research, spent nuclear fuel (oxide and carbide) was treated in gaseous reducing and oxidizing environments. The resulting chemical and physical changes in the fuel structure breaks it down to release many of the fission products. Remaining material was subjected to a final reduction step to create the necessary composition for use in recycled fuel. Neither of these gaseous electrochemical processes (sometimes called “volatility” processes) was applied on a large scale, and no production facility was built and successfully operated. A good history on such processes was prepared by Benedict, Pigford, and Levi.1 Note that electrochemical processes were seriously considered in the UK for the reprocessing of magnox and AGR fuels.
More recent references to electrochemical processing relate to molten salt electrolytic treatment of fast reactor metal and oxide fuels, such as that developed at Argonne National Laboratory (ANL).a Fuel is separated electrochemically into waste and product streams via a molten salt electrolyte. Various types of separation are possible, depending on the fuel cycle needs and potential for chemical separations. Interim storage, waste stabilization, and recycle fuel refabrication may also occur in the same plant, and for nonproliferation, radiation safety, and cost minimization purposes, such consolidated operations are the recommended deployment path. This process has been successfully demonstrated on a small scale through treatment of the sodium-bonded metal fuel from Experimental Breeder Reactor-II (EBR-II). Current research and design efforts at the Materials and Fuels Complex (MFC) will result in a preconceptual design and preliminary costing for a molten salt electrochemical processing facility to treat current commercial spent nuclear fuel.
a. Beginning February 1, 2005, the name of the Idaho National Engineering and Environmental Laboratory (INEEL) was changed to Idaho National Laboratory (INL). Argonne National Laboratory-West was renamed the Materials and Fuels Complex (MFC).

INL/EXT-07-12107 (March 2008) Advanced Fuel Cycle Cost Basis F2/D2-4
Costing of several conceptual designs for first-of-a-kind molten salt electrochemical processing facilities are discussed in this module. These designs are based largely on the early work by ANL with EBR-II fuel. The costed facilities are designed for collocation with one or more power plants on a given site or can be centrally located to serve more than one power plant in a given region. Stated capacities of the facilities range from a minimum of 20 MTHM/yr to 200 MTHM/yr for a 30-year life span. Plant concepts handling as much as 2,500 MTHM (metric tons heavy metal) have also been investigated.
The Fuel Fabrication or Refabrication Step. As defined in the introduction to Module D1, fuel fabrication represents the set of chemical, ceramic/metallurgical, and mechanical steps that take a basic chemical form of the fissile material and convert it to finished fuel assemblies and associated hardware ready for insertion into the reactor. In F2/D2, however, the fissile material is assumed to arise from back-end fuel cycle steps (i.e., reprocessing or transmutation/separation: Modules F1 or F2/D2) rather than from front-end fuel cycle steps such as mining, conversion, and enrichment (Modules A, B, and C). In fact, the fuel refabrication step is likely to be totally integral to the reprocessing technology. The nature of these fuel fabrication operations and the associated facility is affected by the following factors:
1. If a fuel comes from front-end fuel cycle steps or has its uranium and/or plutonium separated out in a PUREX or COEX-type aqueous reprocessing step, it is likely to have such low radioactivity that it can be contact-handled. Low-enriched uranium (LEU) and thermal and fast mixed oxide (Pu, U, Np MOX) fuel fall in this category and are described in the Module D1 series. For this module, however, we are concerned with fuels that are refabricated from reprocessing steps and purposely contain grouped higher actinides, including Cm (curium) and Am (americium), or even some fission products, which are recycled into a reactor for destruction. Such grouped actinides and some fission products can originate from an aqueous spent LWR fuel reprocessing scheme such as UREX 1a from which highly radioactive mixed actinide oxide powder would be a product. (Such fuel cycles can have nonproliferation advantages because no weapons-useable fissile materials, such as plutonium, are separated out, and the refabricated fuel rods are self protecting from theft or tampering because of their high radiation fields.) Any stand-alone fuel fabrication plant that fabricates such higher actinide-laden (or FP-laden) material, whether derived from spent light-water reactor (LWR) or fast-reactor fuel, into drivers or targets for either reactor type will need to incorporate a remote-handling process in a very robust building. Since the building radiation safety and security requirements for such a remote-handling fabrication facility are much like a reprocessing plant, economics drives one to integrate fabrication and reprocessing into one building. These types of fuels, when used in tandem with fast reactor (FR) systems, also allow for destruction of selected long-lived fission products by transmutation and long-lived actinides by transmutation or fission. Because of the high gamma/neutron-radiation fields associated with the fuel material, the refabrication process must be contained in a highly shielded hot cell and must be highly automated, yet, at the same time be simple enough for cost-effective robotics to be used.
2. The regulatory and quality assurance requirements for such refabricated fuel are not yet available in the form of a fuel specification, such as that available for enriched UO2 and LWR-MOX fuel. Considerable research and development (R&D) and fuel qualification demonstration will be needed before these types of fuels reach this stage, but the reasons for quality assurance remain the same, i.e., fuel reliability, meaning prevention of fission–product, and actinide releases from the fuel form.
3. The fuel form must be capable of safe transport and storage both before and after each irradiation cycle. The integrity of the cladding or fuel matrix must be maintained at all times. If the reprocessing and refabrication facility is collocated with the reactors, such as in a multireactor park, transport concerns are obviated or minimized.

INL/EXT-07-12107 (March 2008) Advanced Fuel Cycle Cost Basis F2/D2-5
Some reactors and fuel cycles will have fuel components in the reactor simultaneously, some of which are contact-handled (Module D-1) such as driver fuel or blankets, and some of which are remote-handled ( this Module F2/D2) such as grouped-actinide driver fuel or targets for long-lived radionuclide destruction. This will depend on whether the reactor core or a given fuel assembly is homogeneous or heterogeneous. A heterogeneous-core fast reactor, which burns actinides and also breeds some new plutonium, may have depleted-uranium blankets. The blankets can be produced in a relatively inexpensive contact-handling facility. A driver fuel, which contains significant amounts of recycled higher actinides and makeup uranium and/or plutonium, must be produced in an expensive remote-handling facility. There is even the option of putting all the minor actinides (Am and Cm) and long-lived fission products in separate rods called “targets.” Fabrication of these highly radioactive rods would require a robust remote-handling facility. A homogeneous core for a “burner” fast reactor would have the driver fissile material (recycled and make-up) and higher actinides together in the same fuel rods, and would not include blanket fuel, since the intent is to destroy actinides (burn) and not to produce new ones (breed).
It can be seen that the fuel type (D Modules) and reprocessing scheme (F Modules) are intimately linked. Definition of the fueling scheme for the reactor will determine which components must be separated in the reprocessing plant and sent to the appropriate refabrication facilities or processed in integral refabrication facilities. Even thermal reactors can be configured to burn minor actinides by use of specially fabricated target rods that are interspersed among the more conventional UOX and/or U, Pu MOX rods in a given LWR fuel assembly. Unlike the UOX and U Pu MOX rods, the target rods would require remote refabrication, unless the concentrations of Am, Cm, and carried over fission products are very low.
Integrated Approach. In any case, it is worthwhile to integrate reprocessing and refabrication plants at a single site. Such collocation can eliminate the expensive and time-consuming packaging and transportation steps that would be required if sited separately. Life-cycle cost savings could be considerable. Careful design and operational measures must be taken to prevent cross-contamination of radionuclides from one facility to the other.
F2/D2-2. FUNCTIONAL AND OPERATIONAL DESCRIPTION Reprocessing Steps. At an electrochemical processing facility, spent nuclear fuel would be received,
unloaded, and temporarily stored until treatment (see sample flow sheet in Figure F2/D2-1). The general treatment involves spent fuel element disassembly followed by steps in preparation for electrorefining. Metal fuel, such as that which is processed at MFC, is chopped into small segments before immersion in LiCl-KCl salt within an electrorefiner vessel. In order to be compatible with electrorefining, spent oxide fuel would first undergo chemical or direct electrolytic reduction to the metallic form. This means that for spent LWR fuels most of the fuel mass that would require reduction to metal would be irradiated UO2. The large plant size and cost that would be required to reduce and electrochemically process such LWR-spent fuel may make this option less viable than aqueous reprocessing for LWR fuels. GE is considering a “dry” process for LWR spent fuel processing that would provide makeup actinides to the fast-reactor system for destruction.2
Uranium, fission products, transuranics, and unreactive metals can be separated from each other in the electrorefiner. In a separate process, the uranium may be removed from the electrorefiner and processed into a metal product to be stored as waste (likely to be Greater-Than-Class-C) or recycled into new fast reactor fuel (See Module K-3 for a detailed description of these options). Unreactive metals, including cladding and fuel components, may be removed from the electrorefiner and processed with other waste metals for creation of a metal, high-level waste form. Cleanup (refining) or dilution of this metal is another option that prevents the need to deal with high-level waste. Fission products, which largely remain in the electrorefiner and are dissolved in the salt electrolyte solution, may be extracted from the

INL/EXT-07-12107 (March 2008) Advanced Fuel Cycle Cost Basis F2/D2-6
Spent nuclear fuel
Fuel element disassembly
Chop fuel/clad Shred fuel Declad via chemical oxidation
Direct electrolytic reduction Chemically
reduce to metalChemically
reduce to fuel composition
(e.g. UO2 from U3O8)
Electrorefining
Metal waste production
Removal of fission products
Uranium product
processing
Ceramic waste production
From Storage (E1, E2)
Oxide fuelM etal fuelor or
oror
M etals
U + salt
Salt Recycle
Fission Products
Non-reactive m etals
Fuel Fabrication
(D2) Or Storage (E3) Or
HLW (G)
HLW (G)Storage (E3) Or
HLW (P)
LLW (P) Or Storage (E3) Or
Fuel Fabrication
(D2) Or Enrichment
(C)
Fuel Fabrication
(D2)
Electrolyte Salt SolutionTRU
Figure F2/D2-1. Example of electrochemical processing flow sheet for spent nuclear fuel. (Note: HLW metal waste might be diluted with DU to form Class C low-level waste or might be re-refined.)
salt and immobilized in a ceramic high-level waste form. Short-term (in terms of geologic time) storage (many decades) of the ceramic high-level waste form would allow for decay of fission products cesium and strontium, which are heat- load concerns for a geologic repository. The salt can then be recycled for reuse in the electrorefiner. Transuranics may be treated as a high-level waste, sent for decay storage, or returned to a reactor in the form of refabricated fuel. The nature of this treatment is dependent on the chemical and radioactive characteristics of the specific transuranic mix and the type of reactors available for fuel recycle (fast versus thermal).

INL/EXT-07-12107 (March 2008) Advanced Fuel Cycle Cost Basis F2/D2-7
Fuel Form. The fuel form most commonly envisioned today consists of thin, cylindrical, cast rods consisting of a uranium and plutonium (with some minor actinides and trace fission products) metal alloyed with a metal such as zirconium. The fuel material originates most likely from an electrochemical reprocessing scheme with the possible addition of some makeup plutonium (with possible other actinides) from storage and/or makeup uranium. These thin rods are then clad in stainless steel and inserted into a fast-reactor fuel assembly, which appears from the outside much like the fast-reactor oxide pellet (Module D1-4) or vibropacked (VIPAC; Module D1-5) fuel assembly. This is the fuel type envisioned for liquid metal reactor concepts such as the General Electric (GE) S-PRISM and the ANL Fast Burner Reactors. Ceramic remote-handled fuel (such as [U, Pu, MA] oxide) feed materials could originate from either an integral electrochemical or stand-alone aqueous reprocessing scheme. UREX 1-a is an example of the latter. (Note: a ceramic fuel refabrication plant could be located within the same building as an aqueous reprocessing plant; however, the two processes are not “integral” in the same process-chemistry sense as pyroreprocessing and pyro-refabrication.)
Status of the Industry. Reprocessing and production of remote-handled metal fast reactor fuels is not yet done on an industrial scale; however, a large central plant may not be needed. Proponents suggest that it will be best to keep this operation on a small scale, where refabrication is collocated with the electrochemical reprocessing step dedicated only to the onsite reactors. ANL–West successfully demonstrated such technology at their Idaho Integral Fast Reactor facility adjacent to EBR-II. (Nearly all of this work was discontinued in the mid-1990s as a result of policy decisions made by the U.S. Government to discourage plutonium recycle and fast reactors in general.) Work on fast reactor fuel cycles continues mainly in Russia, France, India, and Japan. The Generation IV program is also considering the Sodium-cooled Fast Reactor and its fuel cycle as one of the six concepts to be studied. K. Abney et al.,3 provides a good assessment of the technology status of electrochemical processing and the IAEA provides a good country-by-country assessment of reprocessing in general, including R&D on electrochemical processing.4
F2/D2-3. PICTURES/SCHEMATICS Process Diagrams. For the metal remote-fabricated fuel option, the refabrication and electrochemical
spent fuel reprocessing steps are part of one synergistic process (see Figure F2/D2-2). The metal-fuel fast reactor option is the best known in the U.S., since it is supported by GE in the PRISM reactor program. By adding steps at each end, oxide fuels can also be accommodated by pyrochemistry; and considerable R&D has been performed for the electrochemically compatible oxide fuel type in Russia. It also turns out that VIPAC fuels fit in well with electrochemical reprocessing schemes, since the powder morphology required for VIPAC fuel is well-accommodated by electrolytic electrochemical processing steps. For purposes of unit costing, it is very difficult to separate the reprocessing from the refabrication steps. Nearly of the unit costs reported in sections below are assumed to have some reprocessing steps included, hence the combining of Modules F2 and D2.
Figures F2/D2-3 and F2/D2-4 provide a conceptual drawing of a proposed molten salt electrochemical processing facility for treating commercial spent nuclear fuel. This concept is the subject of a preconceptual design effort underway at MFC. Results from this study5 provide some preliminary cost estimates for inclusion in the Advanced Fuel Cycle Initiative (AFCI) cost database.

INL/EXT-07-12107 (March 2008) Advanced Fuel Cycle Cost Basis F2/D2-8
Figure F2/D2-2. ANL Integral Fast Reactor concept showing last three refabrication steps.
Figure F2/D2-3. Three-dimensional conceptual rendering of the Advanced Pyroprocess Recycle Facility.5

INL/EXT-07-12107 (March 2008) Advanced Fuel Cycle Cost Basis F2/D2-9
Figure F2/D2-4. Three-dimensional conceptual rendering of the air and process cells.5
F2/D2-4. MODULE INTERFACE DEFINITION This F2/D2 module interfaces with upstream reactor (R1 for irradiated targets in thermal reactors
and R2 for irradiated fast-reactor driver fuel and/or targets) and possible upstream makeup actinide storage modules (E modules), and waste disposal modules (Module G). The fast reactor (R2) is also the downstream recipient of the integrated facility’s refabricated fuel product. In practice, a small throughput electrochemical processing facility may be immediately collocated with a fast reactor (or multiple modular fast reactors) as an integrated recycle function along with the fuel fabrication facility. Alternatively, a higher throughput centralized electrochemical processing facility might be integral to a larger group of fast reactors.
When considering costs for such facilities, care must be taken to differentiate between separation and waste management functions. This must be done to avoid double counting costs for waste management (Module G) that might already be in the integral reprocessing/refabrication facility Module F2/D2 cost breakdown.
Metal Fuel Considered. Nearly all the remotely handled fuels addressed in this section will be metal fuels for sodium-cooled fast reactors (such as the PRISM Advanced Liquid Metal Reactor [ALMR]) arising from electrochemical reprocessing. Early fuels are likely to have higher actinides blended with uranium and plutonium and small amounts of carried-over fission products such as lanthanides. Later, fuels may have some fabricated long-life fission product target rods slated for fission product destruction by transmutation. These rods would be produced in the same highly-shielded refabrication facility. Accommodation for the production of fast reactor first cores is also an interface issue, since a separate larger fabrication facility may be required, and the initial fuel may contain fewer actinides.
Dirty MOX Considered Elsewhere. The use of thermal or fast-reactor MOX containing plutonium, neptunium, and very small amounts of the highest actinides, Am, and Cm, (sometimes called dirty MOX) is considered in Modules D1-2 and D1-4. It is possible that such MOX fuel could be handled in special shielded gloveboxes designed for maximum personnel protection, however, a full-fledged, hot-cell-type, remote-handling facility will be needed if Am and Cm concentrations are sufficiently high. If higher concentrations of Am and Cm (and/or fission products) require destruction, LWR or FR target rods would definitely have to be fabricated in a remote-fabrication, hot cell environment. This is the type of facility envisioned for LWR-derived, grouped actinide (Pu, Np, Am, Cm) oxides arising from a UREX-1a reprocessing facility.

INL/EXT-07-12107 (March 2008) Advanced Fuel Cycle Cost Basis F2/D2-10
F2/D2-5. MODULE SCALING FACTORS Equipment Size Limited by Throughput. No scaling relations were found in the literature. For The
first processing line in a new facility fixed costs will predominate—the capital cost will not vary much with capacity. Any capacity additions to an existing line would likely be accomplished by adding more parallel process lines, especially since criticality concerns limit equipment sizes in a batch process of this type.
Some Cost Data on Different-sized Facilities. Four sets of unscaled reference costs are organized according to the AFC standard code of accounts in Table F2/D2-1. The table provides bottom-up cost estimates based on conceptual designs for the three main facilities discussed: the MFC Fuel Conditioning Facility (FCF), the ALMR, and the Super-Power Reactor Inherently Safe Module (S-PRISM) reactor system. All costs were adjusted to 2004 dollars from the year of the cost estimate. Construction costs were adjusted according to the Defense and General Construction Escalation Indices. All other costs were adjusted according to the Consumer Price Index.
Table F2/D2-1. Code-of-accounts life cycle cost estimate summary for spent nuclear fuel electrochemical process facilities of differing capacities and fuel types.
Code of Accounts
MFC FCF (metal fuel)
(>20 MTHM/yr)(2004$ × 106)
ALMR (metal fuel)
(200 MTHM/yr)(2004$ × 106)
S-PRISM (metal fuel)
(100 MTHM/yr) (2004$ × 106)
S-PRISM (oxide fuel)
(1,000 MTHM/yr)(2004$ × 106)
0-Early Life Cycle Costs 1-Capitalized Preconstruction Costs
2-Capitalized Direct Costs 69 233 260 3-Capitalized Support Services
14 61 61
4-Capitalized Operations
1812
5-Capitalized Supplementary Costs
126
6-Capitalized Financial Costs 7-Annualized Operations and Maintenance Costs
21 145 62 109
9-Annualized Financial Costs 6
Scaled reference summary costs are listed in Tables F2/D2-5 (metal fuel facility) and F2/D2-6 (oxide fuel facility) found below in Section F2/D2-8, “Cost Summaries.” A reference capacity of 100 MTHM/yr was chosen for the metal facility cost summaries. Because electrochemical processing is a batch process, as opposed to continuous or semicontinuous in aqueous processing, traditional chemical plant cost-scaling factors do not apply. A pyro-batch line would consist of the largest demonstrated equipment run in a serial batch mode. The number of parallel lines would produce the desired throughput. For this cost data collection activity, it is assumed that additional electrochemical process batch lines, for example, would simply be a multiple of the cost of the first line.
S-PRISM metal fuel facility costs (already designated for 100 MTHM/yr capacity) were chosen as the reference values given in Table F2/D2-2. ALMR costs were not included in the average, because the nature of initial investment costs was ill-defined in the available reference and, therefore, not easily compared to defined construction and equipment costs from the other facility cost references. The MFC FCF cost numbers were not used in the summary table based on the age of the study and the ill-defined heavy metal throughput for the facility.

INL/EXT-07-12107 (March 2008) Advanced Fuel Cycle Cost Basis F2/D2-11
Table F2/D2-2. Cost data on two ALMR-Integral Fast Reactor recycle plant concepts: central and co-located.
Plant annual capacity 200 MTHM/yr
Economic life 20 yrs
Total base capital cost including contingency (FOAK) 518.0 $MImputed interest during construction (2 yrs to construct) 25.9 $MTotal capital cost (2002$) 543.9 $M
Annual ops cost breakdown:
Manpower 32.8 $M/yrConsumables 143.0 $M/yr
Total annual operations cost 175.8 $M/yr
Operations contribution to levelized cost of product/service 879.00 $/kgU
Discount rate for government project (real) 3.80%
Capital recovery factor ( fraction per yr of ops) 0.0723
Annual payments to recover capital cost of plant over life 39.32 $M
Capital portion of unit product cost 196.58 $/kgUTotal levelized product cost (1991$) 1075.58 $/kgU
In 2004$: 1590.0 $/kgU
Plant annual capacity 20 MTHM/yr
Economic life 20 yrs
Total base capital cost including contingency (FOAK) 105.0 $MImputed interest during construction (2 yrs to construct) 5.3 $MTotal capital cost (1991$) 110.3 $M
Annual ops cost breakdown:
Manpower 10.4 $M/yrConsumables 17.4 $M/yr
Total annual operations cost 27.8 $M/yr
Operations contribution to levelized cost of product/service 1390.00 $/kgU
Discount rate for government project (real) 3.80%
Capital recovery factor ( fraction per yr of ops) 0.0723
Annual payments to recover capital cost of plant over life 7.97 $M
Capital portion of unit product cost 398.47 $/kgU
Total levelized product cost (1991$) 1788.47 $/kgUIn 2004$: 2650.0 $/kgU
Pyrochemical ALMR Reprocessing (central plant)
Pyrochemical ALMR Reprocessing (co-located with reactor plant)

INL/EXT-07-12107 (March 2008) Advanced Fuel Cycle Cost Basis F2/D2-12
F2/D2-6. COST BASES, ASSUMPTIONS, AND DATA SOURCES Costs of some early electrochemical processes. The Atomics International Reduction OXidation
(AIROX ) process was developed for treatment of UO2 fuel. Heat is applied in an oxidizing atmosphere to create U3O8, which results in breaking open the cladding and pulverizing the fuel due to material volume increase. Chemical reduction by reaction with hydrogen returns the uranium to UO2. Most fission products are removed during a series of these oxidation-reduction reactions, and the final UO2 product can be reformed into fuel pellets for recycle. Similarly, the CARBothermic-reduction OXidation (CARBOX) process was developed for UC fuel. Again, a series of oxidation and reduction reactions are performed, resulting in lower fission product concentrations. Costing for these two pioneer electrochemical processes was estimated in 1963 and 1965 government reports.6, Given the age of the estimates and the significant changes in technology and regulation, not to mention cost escalation during the intervening 40 years, values given in the reports are not considered useful for the purpose of AFCI system studies.
ANL-GE estimates. More recent electrochemical processing facility cost estimates are based on the fundamental technology developed at ANL. A detailed conceptual design study was performed for a commercial-scale electrochemical processing facility to serve a collocated 1,400 MWe fast breeder reactor. Annual processing of at least 25% of the full core metal fuel (reload minimum of 20 MTHM/yr) is necessary for reactor refueling. Recycled fuel is also fabricated in this facility. One-year decay storage of the fuel is assumed, and reactor plant services are shared. Bottom-up cost estimates for this facility are provided in a 1985 publication by ANL.7 While the estimate was performed by a government entity and based on government experience, no assumption was made on whether government or private funding/operation of the proposed facility is assumed.
Based on the ANL technology, GE’s ALMR more recently prepared a conceptual design and conducted a cost study for a more advanced electrochemical processing facility.8,9,10 This is a bottom-up cost estimate assuming private/utility ownership and operation, 30-year plant life, 200-MTHM/yr spent metal-fuel treatment, recycle fuel production, and a 15-year fuel cycle time. A report by the National Academy of Sciences uses this conceptual design and cost study in a 1996 economic assessment of fuel reprocessing technologies.11
A later generation ALMR system, the S-PRISM, incorporated a hybrid recycle scheme with facilities that processed oxide and metal fuel in parallel. The S-PRISM fast reactor would begin operation with metal fuel fabricated from LWR oxide fuel reprocessed material. Metal fuel would subsequently be reprocessed for use in the reactor, and the usage of LWR fuel material would decrease. Utility ownership, multireactor feed, metal fuel production, and minor actinide recycle are assumptions for design of both oxide and metal fuel facilities. A bottom-up cost estimate was performed for a 100-MTHM/yr metal fuel recycle facility. The LWR oxide fuel facility was cost estimated with a top-down approach for 1,000-MTHM/yr throughput. For the purpose of calculating the unit cost summaries given in Tables F2/D2-5 and F2/D2-6, a 30-year lifetime for both oxide and metal fuel facilities was assumed. These two plants are similar in design and function but significantly differ in heavy metal throughput rates. However, the fissile mass throughput for each facility is about the same because of the difference between metal and oxide fuel fissile enrichment (a throughput factor of 10).
The French and Japanese nuclear industries have also pursued development of molten salt electrochemical process technology from the ANL basis, but have not published cost estimates on their designs. The Russian institute RIAR at Dimitrovgrad is also active in this area and has linked their vibrocompaction method (Module D1-6) for fast reactor fuel fabrication to electrochemical fuel reprocessing.

INL/EXT-07-12107 (March 2008) Advanced Fuel Cycle Cost Basis F2/D2-13
The U.S. Department of Energy (DOE) has a multiyear program to debond and partially reprocess some of the sodium-bonded irradiated EBR-II fuel in the adjacent FCF using electrochemical techniques. A DOE report describes the anticipated cost and schedule for this activity.12 A section below will show the calculated unit costs for this activity.
Cost and Pricing of Remote-handled Fuel Fabrication. All this discussion will deal with projected costs, because there is no industry from which commercial pricing is available. Most of the cost data available are from GE or ANL reports prepared in the early 1990s. Table F2/D2-2 (above) shows the projected capital and life-cycle costs for both a central facility and collocated (at reactor) fuel recycle facility. The highlighted numbers come from a conceptual design report prepared by ORNL in 1981 and 1991 GE assessment data.13,14 The other plant life, discount rate, etc., data were added so that a unit cost of refabricated fuel in $/kgHM could be calculated. It is not surprising that the fabrication cost is higher than for thermal MOX fuel in light of the fact that reprocessing steps are included and a hot cell building is required. It can also be seen that a larger centralized facility has a lower unit cost; hence, one might surmise that scaling laws do appear to apply. The two facilities, however, would be very different in design and function, so scaling may not really apply. Economic benefits of the centralized plant are likely to be counteracted by spent fuel and freshly refabricated fuel packaging, safeguarding, and transportation difficulties.
Table F2/D2-3 shows projected unit costs from other literature sources for this type of fuel. Important underlying assumptions are noted where possible.
Table F2/D2-3. Projected unit costs for remote-handled fuel recycle/refabrication (from various literature sources).
Reference/Year
Unit cost in $/kgHM ($ in same yr as Ref
unless otherwise noted) Assumptions Ref. 14/1991 2,650 (2004$) Co-located 20 MTHM/yr recycle (FRC+FF)* plant Ref. 15/1991 1,540(2004$) Central recycle plant 200 MTHM/yr (FRC+FF) Ref. 15/2001 5,000–17,500 Accelerator–driven subcritical reactor fuel (transmutation)
fabrication (FF) only Ref. 16/1995 3,000–4,600 GE/ANL ALMR oxide fuel from electrochemical processing
(FRC+FF) Ref. 17/2000 4,600–7,700 ALMR-IFR metal fuel (FRC+FF) from electrochemical
processing Ref. 14/2005 5,810–7,210 Acceleration transmutation of waste target pyro-processing Ref. 22/2006 1,600–4,900 Remote handled VIPAC MOX from low DF aqueous
reprocessing plant (FF). Reprocessing range [FRC] is $2,700–$7,800/kgHM
* FRC = reprocessing range, FF = fuel refabrication (costs have both unless otherwise noted)
The newer the reference, the higher the unit cost for basically the same process, which is not surprising because unit cost projections usually increase as the R&D program proceeds.18 It can be seen that the inclusion of fission products and/or higher actinides for transmutation also increases the fuel recycle cost considerably. Another factor likely to influence such costs in the U.S. is the need to construct a very thick-walled robust concrete building to contain the hot cells and their processes. These costs are driven by seismic and terrorism mitigation requirements that are in turn driven by seismic event scenario and design basis threat scenarios, which include direct plane crashes for the latter. This kind of structure

INL/EXT-07-12107 (March 2008) Advanced Fuel Cycle Cost Basis F2/D2-14
is estimated to cost $10,000 to $20,000 per square foot for construction. If a refabrication facility has a small throughput, amortization of the fixed building cost becomes a significant part of the unit fuel fabrication cost. Recent cost escalation experience with U.S. Department of Energy/National Nuclear Security Administration heavily fortified facilities, such as the Savannah River Site-MOX facility (MFFF) and the Y-12 Highly Enriched Uranium Storage facility, is indicative of this trend. The magnitude of the cost impact however, will not be known until the first facility of this type is designed and estimated.
Electrochemical technology and metal fuels (drivers and targets) are envisioned for accelerator driven systems and fission-product transmutation schemes, such as Acceleration Transmutation of Waste. Cost trends for these cycles are discussed in References 19, 20, 21, and 22 and might be representative of the higher-end refabrication and reprocessing costs for fast reactor systems using metal fuel and electrochemical processing. (The latter two of these references discuss just-published initial economic results of the European Union’s “Red Impact” study, which is considering the best ways to manage nuclear wastes in Europe.) Only three reports, References 17, 23, and 24, were found where fabrication and reprocessing costs were separated. The table from Reference 17 is reproduced from the NEA/OECD report as Table F2/D2-4.
It can be seen that nominal values for some fuels, which in some cases are mostly target materials to be destroyed or transmuted, go as high as $11,000 per kgHM in year 2000, which would be around $12,000/kgHM in today’s dollars. Useful fast reactor capital cost data also appear in the table.
Table F2/D2-4. Fabrication and reprocessing unit costs for various fast reactor and transmutation systems.23

INL/EXT-07-12107 (March 2008) Advanced Fuel Cycle Cost Basis F2/D2-15
F2/D2-7. LIMITATIONS OF COST DATA Cost estimates for commercial-scale electrochemical processing facilities are of limited value as a
whole (Quality Level 5—Potentially biased or conflicting assessments collected from independent sources that do not use a common basis or consistent approach). No commercial-scale facility has been built and only one engineering-scale facility has operated. The FCF at MFC processed and fabricated metal fuel for the EBR-II and is now demonstrating electrochemical reprocessing.18 While significant, detailed cost estimates have been performed for commercial-scale facilities based on the FCF experience, this information is not easily modified to the necessary process and throughput changes for treatment of oxide fuel. The main reason for this is the batch process nature of electrochemical processing. Based on current technology, batch size is limited by the efficiency of electrorefining at large volumes and by criticality concerns for the postrefining process steps.
Technical Readiness Level. The technical readiness level for a metal fuel facility may be classified as pilot/feasible based on work to date. However, an oxide electrochemical processing facility is clearly at the R&D level, bringing the overall electrochemical processing facility concept to a R&D level.
The total challenge and cost impacts for electrochemical processing have yet to be established as the fast reactors of the future have not been defined. Even if the reactor coolant is specified as liquid sodium, the choice of metal or oxide fuel still remains. Following the choice of fuels is the mode of reactor operation. If used as an actinide burner, the lower conversion ratio and intended burnup will impact the electrochemical processing requirements. A breeder operation with its high conversion ratio and use of blankets presents an entire new set of criteria.
Clearly, a more detailed, current cost estimate is needed for a new generation electrochemical processing facility. For the purposes of AFCI, both oxide and metal fuel capability should be considered. Technology advancements for treatment of each fuel type must be incorporated into a new set of functional and operational requirements for the conceptual design and estimation efforts.
The level of technical readiness or deployment for this type of fuel is low compared with thermal LEU and MOX fuel. The production of thermal fuels is a highly mature private industry, while refabricated liquid-metal reactor fuel types are still in the bench scale or pilot plant development stage. Of all the concepts that considered the GE ALMR fuel cycle, MFC integrated fuel recycle has enjoyed the most R&D effort and success. Most of the well-documented cost data also come from estimates prepared for this concept.
Cost Data Gaps. It would be useful to study GE and ANL detailed cost data to determine the separation of unit cost between the reprocessing and refabrication parts of the Integral Fast Reactor recycle process. Data on electrochemical refabrication of oxide fuel would also be useful, especially to see if vibropacked fuel would have any cost advantage. Some data on Russian work at NIIAR might be available (see Module D1-5).
F2/D2-8. COST SUMMARIES The module cost information is summarized in the what-it-takes (WIT) cost summaries in
Tables F2/D2-5 (spent LWR oxide fuel) and F2/D2-6 (metal fast reactor fuel). The summary shows the reference cost basis (constant year $U.S.), the reference basis cost contingency (if known), the cost analyst’s judgment of the potential upsides (low end of cost range) and downsides (high end of cost range) based on references and qualitative factors, and selected nominal costs (judgment of the expected costs based on the references, contingency factors, upsides, and downsides). These costs are subject to change and are updated as additional reference information is collected and evaluated and as a result of

INL/EXT-07-12107 (March 2008) Advanced Fuel Cycle Cost Basis F2/D2-16
sensitivity and uncertainty analysis. Refer to introductory paragraphs in the main section of this report for additional details on the cost estimation approach used to construct the WIT table.
Comparison of electrochemical processing costs for metal and oxide fuels is problematic. While both sets of numbers in Tables F2/D2-5 and F2/D2-6 are listed in terms of dollars per metric ton of heavy metal, the relative worth of the heavy metals from each fuel type are not the same. This is because fast reactor metal fuel has historically been (and presumably in any future designs) enriched in fissile isotopes to a significantly higher level (~20 % U-235 or plutonium) than LWR oxide fuel (~4% U-235 or plutonium). In other words, the energy content per kilogram of FR metal fuel is higher than for LWR fuel. For this reason it may be more useful for future comparisons to look at cost-per-unit of fissile material.
Upsides and downsides affecting reference costs are mentioned qualitatively in Tables F2/D2-5 and F2/D2-6, and predicted dominant cost factors are stated; based on the nature of the data, it was not possible to quantify these affects. Of the three studies referenced in Table F2/D2-1, only one is an original cost estimate report.7 The two other references, a conference proceeding25 and a national laboratory report,8 provide summarized data based on an original cost study that is not publicly available. Simply stated, the level of detail given in the available references and the age of the one available detailed report did not allow a very sound estimate of a facility cost or the ability to assess effects of changing various cost factors. This assessment is strongly reiterated in Appendix J of the 1996 report of the National Academy of Sciences on Nuclear Wastes.11 They state that significant space must be given for cost growth in electrochemical processing vis-à-vis aqueous reprocessing due to the fact that electrochemical processing is a pioneer technology and aqueous reprocessing is an industrially demonstrated technology.
Table F2/D2-5. WIT cost summary table for spent LWR oxide fuel-based electrochemical processing facility. (Head-end and separations only; table does not include waste product packaging, storage, or disposal).
What-It-Takes (WIT) Table Reference Cost(s)
Based on Reference Capacity (Low Cost)
Upsides (High Cost) Downsides
(Nominal Cost) Selected Values
Capital ($/unit processed) Reference value = $1.1 × 10⁴/MTHM
Not available (N/A) N/A N/A
Operational Cost ($/unit processed) Reference value = $11 × 104/MTHM
N/A N/A N/A
Unit Cost ($/unit) Reference value = $121/kgHM (not realistic)
$500/kgHMa $2,500/kgHMa $1,500/kgHMa
Throughput of 1,000 MTHM/yr Scale to 2,000 MTHM/yr throughput
N/A 2,000 MTHM/yr
Plant life of 30 years Increase life to 40 years Decrease life to 20 years
40 years
Technology readiness level>>> No adjustment due to technology readiness level
First-of-a-kind plant; undemonstrated technology
(no quantification possible at this time)
a. Note: LWRs with lower fissile enrichments requires a factor of 3 or more HM per year than a fast reactor of equivalent thermal capacity. This is particularly true at low FR conversion ratios.
b. Refabricated fuel from this plant is likely to be fast reactor fuel made from separated actinides. Use of separated U for LWR REPU fuel would be covered in modules D-1 and K-3. These refab costs are not included in above table.

INL/EXT-07-12107 (March 2008) Advanced Fuel Cycle Cost Basis F2/D2-17
Table F2/D2-6. Cost summary table for integral electrochemical processing of fast reactor metal fuel. (Head end, separations, and fast-reactor fuel refabrication only, table does not include waste product packaging, storage, or disposal.)
What-It-Takes (WIT) Table Reference Cost(s)
Based on Reference Capacity
(Low Cost) Upsides
(High Cost) Downsides
(Nominal Cost) Selected Values
$2,400/kgHM 2,500/kgHM $7,500/kgHM $5,000/kgHM for metal fuel refabrication (homogeneous fuel with significant higher actinides; no blankets/targets included). $500/kgU for DU blankets
— — — $10,000/kgHM for LWR targets containing significant higher actinides (Np,Am,Cm)
Sum of “low FR-TRU” reprocessing and refabrication costs in Table R2/D2-4
None: GE report data are already optimistic
Costs normally increase as process proceeds to higher deployment level. Also more stringent safety, seismic, and design basis threat mitigation requirements for larger facility
Just above sum of “nominal FR-TRU” reprocessing and refabrication costs in Table R2/D2-4.
History suggests that the uncertainty and cost growth associated with a first-of-a-kind electrochemical
processing facility would be the dominant cost factor and, therefore, the cost per MTHM processed would increase, in practice, from the reference value. Both the first-of-a-kind status of the facility and lack of technology scale-up experience would be expected to dominate upward cost changes from the reference value.
The three unit costs (low, high, and WIT) have been increased for the following reasons:
• All operations would need to take place in a hardened, highly secure building that houses several hot cells for remote handling. Such facilities cost on the order of $15,000/ft2. The building cost alone for a electrochemical processing plant is likely to be over $100M regardless of size.
• Projected costs12 for the ongoing processing of EBR-II driver fuel are $94,000/kgHM ($282M to process 3,000 kgHM). Blanket fuel processing will cost $13,000/kgHM ($260M for 20,000 kgHM). It is unlikely that such unit costs will come down 2-orders of magnitude in a larger industrial facility.
Significant R&D will be necessary before any fuel electrochemical processing facility could be available on industrial scale, but even more R&D would be needed for the oxide fuel compared to the metal fuel.. Even with a tried and tested technology, first-of-a-kind issues would likely be a dominant cost factor. New technology and first-of-a-kind plant factors are expected to dominate costs.Current studies at ANL include continued development of an electrochemical process for treating LWR oxide fuel and an electrorefiner design that eases materials handling requirements (which is important in a remotely operated facility), facilitates scaling to achieve fuel throughput goals, and provides a means for electrorefining to transition from a batch process to a continuous process. These design and development efforts include establishing the technical and functional operational requirements for a fuel processing facility. Some preliminary cost estimates for this oxide pyro facility may eventually be made available. GE reports cited above incorporate the ANL metal fuel pyro process.

INL/EXT-07-12107 (March 2008) Advanced Fuel Cycle Cost Basis F2/D2-18
This Argonne work is a step toward a very necessary goal, specifically, to perform a cost estimate study on electrochemical processing facilities commensurate with the recent study26 on aqueous processing so that the two technologies can be more directly, fairly, and efficiently compared on a level playing field basis.
The triangular distribution shown in Figure F2/D2-5 is based on the costs in the WIT tables.
Module F2/D2 Electrochemical Reprocessing and Remote Fuel Fabrication
Estimated Cost Frequency Distribution
$/kgHM
Freq
uenc
y
Low Nominal/Mean High
$2500 $5000 $7500
Figure F2/D2-5. Module F2/D2 distribution of combined unit cost for electrochemical reprocessing and remote fabrication of fast reactor metal fuel.
F2/D2-9. RESULTS FROM SENSITIVITY AND UNCERTAINTY ANALYSIS
Once a current, detailed cost estimate for a spent nuclear fuel electrochemical processing facility is complete, cost sensitivity and uncertainty analyses may be performed. Cost driving factors that should be addressed in these analyses include:
• Batch versus continuous operation of the electrochemical process electrorefiner
• Capacity of the electrorefiner (throughput of the facility, scale-up possibility)
• Equipment reliability and related availability/utility versus design and throughput basis.
• Number and type of fuel component separations
• Fuel type (oxide, metal, or other)
• Ability to meet product and waste form specifications and acceptance criteria without additional secondary processes.
• Waste type, volume, and processing techniques.

INL/EXT-07-12107 (March 2008) Advanced Fuel Cycle Cost Basis F2/D2-19
F2/D2-10. REFERENCES 1. Benedict, M., Pigford, T., and Levi, H; Nuclear Chemical Engineering: Second Edition;
McGraw-Hill; New York NY; 1981.
2. “Nuclear fuel plan debated; Illinois sites eyed in idea for recycling,” Chicago Tribune; June 17, 2007.
3. K Abney, et al, “Advanced Nuclear Fuel Processing Options Final Report,” LA-UR-98-2773, Los Alamos National Laboratory, October 6, 1997.
4. “Status and Trends in Spent Fuel Reprocessing”; IAEA-TECDOC-1467, International Atomic Energy Agency, Vienna, Austria, September 2005.
5. Arthur A. Frigo, Dale R. Wahlquist, James L. Willit, “A Conceptual Advanced Pyroprocess Recycle Facility,” Proceedings of GLOBAL 2003, ANS, New Orleans, Louisiana, November 2003.
6. L. J. Jr. Colby, K. L. Mattern, H. Pearlman, E. W. Murbach, G. E. Brand, Comparative Fuel Cycle Evaluations, Low Decontamination Pyroprocessing vs Aqueous Reprocessing. Part I. UO2 Fuel in a Thermal Reactor, Report No.: NAA-SR-8036, Contract No.: AT-11-1-GEN-8, February 1, 1963. [This document has a restricted distribution, may be proprietary, or both; and is not publicly releasable.]
7. M. J. Lineberry, R. D. Phipps, and J. P. Burelbach, Commercial-size IFR Fuel Cycle Facility: Conceptual Design and Cost Estimate, DOE Document No. ANL-IFR-25, October 1985. (This document has a restricted distribution, may be proprietary, or both; and is not publicly releasable.)
8. J. G. Delene, L. C. Fuller, C. R. Hudson, ALMR Deployment Economic Analysis, Oak Ridge National Laboratory, ORNL/TM-12344, June 1993.
9. I. N. Taylor, M. L. Thompson, and D. C. Wadekamper, Fuel Cycle Assessment 1991, GEFR-00897, Rev 1, GE Nuclear Energy, Applied Technology, September 1991. [This document has a restricted distribution, may be proprietary, or both; and is not publicly releasable.]
10. ORNL, Review of the 1991 Cost Estimates for the Advanced Liquid Metal Reactor, Report of Team Assembled by ORNL including ORNL, Duke Power, and B&W personnel, Oak Ridge National Laboratory, Applied Technology, September 1992. [This document has a restricted distribution, may be proprietary, or both; and is not publicly releasable.]
11. National Academy of Sciences, Nuclear Wastes: Technologies for Separations and Transmutation, Appendix J: Fuel Reprocessing Economics, 1996, pp 413–446.
12. DOE, Report on the Preferred Treatment Plan for EBR-II Sodium-Bonded Spent Nuclear Fuel, Office of Nuclear Energy, Science, and Technology, U.S. Department of Energy, October 2003.
13. F. J. Jones, Conceptual Design Report Hot Experimental Facility for the Consolidated Fuel Reprocessing Program, ORNL/CFRP-81/4, Oak Ridge National Laboratory, Bechtel Corporation, 1981. [This document has a restricted distribution, may be proprietary, or both; and is not publicly releasable.]
14. I. N. Taylor, M. L. Thompson, and D.C. Wadekamper, Fuel Cycle Assessment—1991, GEER-00897, General Electric, San Jose, California, 1991. [This document has a restricted distribution, may be proprietary, or both; and is not publicly releasable.]
15. D. Westlén, et al., A Cost-Benefit Analysis of an Accelerator-driven Transmutation System, Stockholm: Royal Institute of Technology, 2001, http://www.neutron.kth.se/publications/library/DanielMSc.pdf, accessed December 20, 2005.

INL/EXT-07-12107 (March 2008) Advanced Fuel Cycle Cost Basis F2/D2-20
16. OIA, Management and Disposition of Plutonium:Reactor-related Options, National Academy of
Sciences, Washington, DC: National Academy Press, 1995, http://www.nap.edu/books/0309051452/html/R1.html, accessed December 21, 2005.
17. J. G. Delene, K. A.Williams, et al., “An Assessment of the Economics of Future Electric Power Generation Options and the Implications for Fusion,” ORNL/TM-1999/243/R1, January 2000.
18. K. A. Williams, A Methodology for Economic Evaluation of Process Technologies in the Early Research and Development Stages, Ph.D. thesis, Knoxville, Tennessee: University of Tennessee 1984.
19. NEA/OECD, Accelerator-driven Systems (ADS) and Fast Reactors (FR) in Advanced Nuclear Fuel Cycles: A Comparative Study, Nuclear Energy Agency/Organization for Economic Co-operation and Development, http://www.nea.fr/html/ndd/reports/2002/nea3109-ads.pdf, accessed December 21, 2005.
20. H. Zerriffi and A. Makhijani, The Nuclear Alchemy Gamble: An Assessment of Transmutation as a Nuclear Waste Management Strategy, August 25, 2000, http://www.ieer.org/reports/transm/report.pdf.posted with modifications to Appendix B on IEER Web site May 12, 2005, accessed on December 21, 2005.
21. Lauferts, U., et al., “Economic Assessment of Partitioning, Transmuation, and Waste Reduction Technologies,” Proceedings of ICAPP 2007, Nice, France, Paper 7382, May 13-18, 2007.
22. “Combining LWRs, Fast Reactors and ADS Called Best P&T Option,” Platt’s Nuclear Fuel, June 4, 2007, pp. 3-4.
23. NEA/OECD, Advanced Nuclear Fuel Cycles and Radioactive Waste Management, Nuclear Energy Agency/Organization for Economic Cooperation and Development, Paris, May 2006.
24. NEA/OECD, Trends in the Nuclear Fuel Cycle, 2001; Paris, www1.oecd.org/publications/e-book/6602011e.pdf, accessed December 21, 2005.
25. C. E. Boardman, M. Hui, D. G. Carroll, A. E. Dubberley, “Economic Assessment of S-PRISM Including Development and Generating Costs,” Proceedings of the 9th International Conference on Nuclear Engineering (ICONE-9), Nice, France, 2000.
26. Washington Group International, “Spent Fuel Treatment Facility Scoping Study,” Job No. 26861-004, Washington Group International under contract to Bechtel BWXT, Idaho, LLC, Contract #17157, SOW-1113, Rev. 2 (10/20/03), Denver, Colorado, January 29, 2004. [This document has a restricted distribution, may be proprietary, or both; and is not publicly releasable.]

INL/EXT-07-12107 (March 2008) Advanced Fuel Cycle Cost Basis G-1
Module G Series
Waste Conditioning, Storage, and Packaging (Summary and Modules G1 through G5)

INL/EXT-07-12107 (March 2008) Advanced Fuel Cycle Cost Basis G-2

INL/EXT-07-12107 (March 2008) Advanced Fuel Cycle Cost Basis G-3
Module G Series Waste Conditioning, Storage, and Packaging
G-1. INTRODUCTION This module includes all conditioning operations to prepare wastes for disposal or long-term storage
in compliance with relevant Nuclear Regulatory Commission (NRC), U.S. Department of Energy (DOE), and Environmental Protection Agency (EPA) regulations. Wastes include high-level waste (HLW) according to 10 CFR 60.2 highly radioactive reprocessing wastes, spent nuclear fuel (SNF), low-level waste Classes A, B, and C and Greater-than-Class-C (GTCC) waste (10 CFR 61.55), and transuranic (TRU) waste (40 CFR 191). Other than HLW conditioning, all other wastes are considered handled by disposal service contracts and do include dedicated facilities. Though not explicitly stated in each section, all waste operations will be handled considering ALARA principles and will maintain personnel dose and potential exposure of the public at or below regulatory limits. Also, where appropriate, all operations will maintain criticality control and incorporate intrinsically safe design with multiple layers of defense via engineering and administrative controls in that order of priority.
G-1.1 Module Series G Cost Summary The module cost information is summarized in the What-It-Takes (WIT) cost summary in Table G-1.
The summary shows the reference cost basis (constant year $U.S.), the reference basis cost contingency (if known), the cost analyst’s judgment of the potential upsides (low end of cost range) and downsides (high end of cost range) based on references and qualitative factors, and selected nominal costs (judgment of the expected costs based on the references, contingency factors, upsides, and downsides). These costs are subject to change and are updated as additional reference information is collected and evaluated, and as a result of sensitivity and uncertainty analysis. Refer to Section 2.6 in the main section of this report for additional details on the cost estimation approach used to construct the WIT table.
Costs for SNF, low-level waste (LLW), GTCC, and TRU are for services only and do not include dedicated facilities, which are assumed to be separate commercial ventures or independently funded federal facilities similar to current LLW/mixed LLW (MLLW) landfills, and the Waste Isolation Pilot Plant (WIPP) repository.

INL/EXT-07-12107 (March 2008) Advanced Fuel Cycle Cost Basis G-4
Table G-1. WIT cost summary table for waste conditioning selected values. Reference Cost(s)
Based on Reference Capacity
(Low Cost) Upsides
(High Cost) Downsides
(Nominal Cost) Selected Values
G1⎯HLW $162K/kg FP $2K/kg FP $10.8K/kg FP $5.4K/kg FP
G2⎯SNF $80−100K/MTHM SNF $50K/MTHM $130K/MTHM $100K/MTHM
G3⎯LLW $500/m3 LLW debris $400/m3 LLW debris $1K/m3 LLW debris $500/m3 LLW debris $11K/m3 LLW liquid $3.3K/m3 LLW liquid $22K/m3 LLW liquid $11K/m3 LLW liquid $90K/m3 resin $81K/m3 resin $99K/m3 resin $90K/m3 resin
G4⎯GTCC $88.8K/m3 $57K/m3, or
$200 kg/metal $270K/m3, or
$1,800 kg/metal $110K/m3, or $540 kg/metal
G5⎯TRU $88.8K/m3 CH-TRU $70K/m3 CH-TRU $90K/m3 CH-TRU $70K/m3 CH-TRU $577K/m3 RH-TRU $266K/m3 RH-TRU $888K/m3 RH-TRU $440K/m3 RH-TRU
CH = contact-handled FP = fission product GTCC = Greater-than-Class-C HLW = high-level waste LLW = low-level waste RH = remote-handled SNF = spent nuclear fuel TRU = transuranic

INL/EXT-07-12107 (March 2008) Advanced Fuel Cycle Cost Basis G-5
Module G1
High-Level Waste Conditioning, Storage, and Packaging

INL/EXT-07-12107 (March 2008) Advanced Fuel Cycle Cost Basis G-6

INL/EXT-07-12107 (March 2008) Advanced Fuel Cycle Cost Basis G-7
Module G1
HLW Conditioning Storage, and Packaging
G1-1. BASIC INFORMATION Module G1 receives HLW from a reprocessing facility, stabilizes the waste, provides interim storage
of the treated waste, and packages the waste in preparation for transport to a disposal site. According to the Nuclear Waste Policy Act, HLW includes:
“The highly radioactive material resulting from the reprocessing of spent nuclear fuel, including liquid waste produced directly in reprocessing and any solid material derived from such liquid waste that contains fission products in sufficient concentrations; and…
Other highly radioactive material that the Commission, consistent with existing law, determines by rule requires permanent isolation.”1
Several examples of existing and planned HLW facilities exist, including two examples in the United States, the Defense Waste Processing Facility (DWPF) and the West Valley Demonstration Project. These facilities represent completed HLW conditioning facilities. The Waste Treatment Plant at Hanford is under construction and currently in review to determine if the design is feasible and has an acceptable budget baseline. All these facilities are designed to vitrify the wastes into a glassy form in compliance with 40 CFR 268, Land Disposal Restrictions, Subpart D Treatment Standards.
HLVIT: Vitrification of high-level mixed radioactive wastes in units in compliance with all applicable radioactive protection requirements under control of the Nuclear Regulatory Commission.
These facilities receive liquid, sludge, and salt wastes from tank farms, or calcined wastes from interim storage where the wastes have been stored for variable durations in excess of 20 years. The wastes are characterized physically and chemically and held in interim storage pending development of Vitrification campaign plans including glass chemistry and waste loading. The wastes are then processed with glass additives in joule-heated melters. The waste chemical/glass mixture, including radionuclides, is heated to temperatures of 1,000−1,200°C; thermally labile salts (primarily nitrates and possibly sulfates) are decomposed (NOx and SOx gases are treated in the offgas system), and the balance is vitrified, becoming integral constituents of the borosilicate glass. Wastes are not so much encapsulated in glass as they are actually bound as chemical constituents of the glassy matrix. The glasses are decanted from the melters into stainless steel canisters that are then seal welded and decontaminated. Canisters are then stored onsite, pending shipment to a geologic repository.
Though other stabilization techniques and waste forms could be cost-effective for HLW, the current baseline in the United States is defined by DOE in the Waste Acceptance System Requirements Document and the DOE-Office of Environmental Management Waste Acceptance Product Specification for Vitrified High Level Waste Forms as borosilicate glass. This baseline is similar to operations in France and the planning basis in Japan, but other types of glass and crystalline waste forms are being considered as part of the evaluation of used fuel processing for fissile material recycle. The electrochemical processing fuel recycling flowsheet under development by Idaho National Laboratory includes production of metallic and glass-bonded ceramic waste forms. A ceramic waste form is planned for disposal of plutonium though these waste forms have not yet been adopted in the baseline.

INL/EXT-07-12107 (March 2008) Advanced Fuel Cycle Cost Basis G-8
In the UREX+ aqueous reprocessing system envisioned, light water reactor oxide fuel is dissolved in nitric acid and low-enriched uranium is recovered for reuse or disposal as LLW if sufficiently decontaminated. Transuranic elements (TRU) would be recovered in one or two partitions and either recycled in metal fuel to be consumed in a fast spectrum reactor or disposed of in a geologic repository. Cesium and strontium are segregated for interim “decay-storage” for ~300 years and not sent to a geologic repository. Presuming the chemical separation efficiency goals are met, after decay of the cesium and strontium to near-surface LLW disposal standards, these wastes would be disposed accordingly as LLW not HLW. This assumes the stream does not contain significant amounts of long-lived fission products or TRU, and a long-term (>300 years) storage facility is licensed to store the cesium and strontium pending decay. Technetium and iodine are captured separately and could be disposed of as GTCC LLW or codisposed with HLW, both of which would likely be in a geologic repository. The remaining fission products would be HLW and stabilized in a waste form for the repository. If a process is successfully developed to show that zirconium fuel cladding hulls can be decontaminated sufficiently and cost-effectively, they will be disposed as LLW. Different conceptual designs for treatment of the HLW streams incorporate calcination, steam reforming, precipitation with filtration and drying, or the baseline glass melters. Regardless of which design is used for estimating purposes, it is important that the costs used for reprocessing and the costs used for preparing HLW for disposal in a geologic repository do not double-count the waste treatment costs.
In the electrochemical processing system, metal fuel from fast reactors is dissolved electrolytically in an electrorefiner, with the chopped fuel submerged in a molten lithium/potassium chloride salt bath. Uranium and TRU are to be captured for recycle at a cathode, while zirconium from the fuel matrix and noble metal fission products including technetium remain with the stainless steel fuel hulls at the anode. The plan is to segregate cesium and strontium for storage and disposal as described for UREX, though this process has not yet been developed. The cladding/Tc/Zr/fission product (FP) stream is to be melted into ingots for disposal as a metal HLW form in a geologic repository. Waste salts containing the balance of FP are to be absorbed into zeolites and bonded using borosilicate glass to make a ceramic HLW form for disposal in a geologic repository.
Both fuel processing systems will also liberate tritium and noble gas fission products that will probably be captured and stabilized for decay storage and disposal as LLW, but these processes have not been developed.
All the streams from reprocessing could be considered HLW under current regulations. If we assume that the developed separations are adequate to meet disposal and recycling specifications and that the decay storage strategy is licensed and a repository for commercial TRU wastes is created, the steams from fuel processing may have more cost-effective disposition pathways available. A summary of the potential streams from aqueous UREX and high-temperature electrochemical processing and their planned and possible alternate disposition pathways is as shown in Table G1-2. Some entries in the table are undefined because testing has not yet been done, or data are unavailable.
Whether the HLW ends up in baseline glass or in a different form will be dictated by the reprocessing design and government policy. For the purposes of this document, cost bases are vitrification facilities with defense HLW liquid feeds because they remain the baseline for at least the next 20−30 years (DWPF and waste treatment process), and shipping and disposal costs are all based on canisters of glass. For estimating purposes, costs can be simply adjusted by density to estimate the canisters of wastes produced by electrochemical processing.
The costs reported here are based on the DWPF and do not include the cost for transportation or disposal of glass canisters. However, potentially higher waste loading and waste forms with greater density are considered in assigning the range of values in the cost tables.

INL/EXT-07-12107 (March 2008) Advanced Fuel Cycle Cost Basis G-9
Table G1-2. Fuel reprocessing streams. Planned Disposition Example Alternative Disposition
Aqueous UREX processing of
LWR fuel Disposition Potential
Waste Form
Range of Waste
Loading Disposition Potential Waste Form
Range of Waste
Loading U LLW Oxide powder
or grout 30–100%
TRU waste Oxide powder or grout
30–100%
HLW Glass or glass-like, Synroc or iron-phosphate
20−40%
Recycle via reenrichment
Fuel raw material Not waste
Recycle as DU metal
Metal Not waste
TRU Fuel Metal FR fuel Not Waste Burn in
LWR MOX or Inert Matrix Fuel
Not waste
TRU waste Oxide powder or grout
30–100%
Cs/Sr LLW Oxide in high integrity SS cans in wet storage.
100%
HLW Glass or glass-like, Synroc or iron-phosphate
10–20%
GTCC Grout 10–20% Tc HLW Metal 0–5
HLW Low-temp ceramic 10−30% GTCC Low-temp ceramic 10−30% I HLW Ag-zeolite in
grout 5–10%
HLW Anionic 5−10% Balance of FP HLW Glass 20–50
HLW Synroc, iron-phosphate
30−70%
HLW Crystalline, low-temp 10−30% GTCC Grout 20−50%

Table G1-2. (continued).
INL/EXT-07-12107 (March 2008) Advanced Fuel Cycle Cost Basis G-10
Planned Disposition Example Alternative Disposition Aqueous UREX
processing of LWR fuel Disposition
Potential Waste Form
Range of Waste
Loading Disposition Potential Waste Form
Range of Waste
Loading Zr Cladding
Hulls LLW Loose metal 100%
Re-use in FR metal fuel alloy
Not waste Not waste
TRU waste Compacted metal 100% HLW Compacted metal 100%
Electrochemical U/TRU Reuse in
burner FR Not waste Not waste
U only as LLW near surface disposal
metal or macroencapsualted
60−100%
TRU waste metal or macroencapsualted
60−100%
HLW Glass or glass-like, Synroc or iron-phosphate
20−40%
SS Cladding, Zr, Tc, noble FP
HLW Metal waste form with Tc and matrix Zr.
100%
TRU waste Compacted metal 100% HLW Compacted metal 100%
Cs/Sr Decay storage LLW
Oxide in high integrity SS cans in wet storage.
100%
HLW Glass or glass-like, glass-bonded salt in zeolite, Synroc, or iron-phosphate
10−20%
GTCC Grout 10−20% Salts, Balance
FP HLW Glass-bonded
salt in zeolite 10%
HLW Glass or glass-like, Synroc, iron-phosphate
20−40%
HLW Crystalline, Low Temp
20−50%
FP=fission product MOX=mixed oxide FR= Fast Reactor SS=stainless steel

INL/EXT-07-12107 (March 2008) Advanced Fuel Cycle Cost Basis G-11
G1-2. FUNCTIONAL AND OPERATIONAL DESCRIPTION All HLW will be handled remotely, in specially equipped hot cells, designed with 2 to 4-inch-thick
concrete walls, oil-filled windows, and manipulators. Waste will be received from tank farm or solid storage operations and held in interim storage that can be mixed sufficiently to allow representative sampling. Samples will be acquired remotely and analyzed to characterize wastes, including a full suite of α, β, and γ emitting radionuclides, toxic metals, and organic constituents likely to be present based on site history. In addition to establishing the basic chemistry of the waste to develop a recipe for a waste form, the analytical data will be reviewed as required to determine if the waste is hazardous according to the Resource Conservation and Recovery Act and if the waste contains any listed organic constituents. Once characterized, laboratory support facilities will develop a reliable chemical recipe for converting the waste to a borosilicate glass meeting disposal requirements.
The main process area of the facility will be equipped with reliable melter technology to convert the waste with additives into the desired glassy waste form, or parallel technology to produce a nonglass acceptable waste form. This area will be remotely operated as well, and all maintenance will be constrained by very limited access preceded by decontamination. Equipment will be designed for reliable operation and remote disassembly where possible. The facility must have the capability to conduct routine maintenance as well as nonroutine activities, such as changeout of damaged or worn out large equipment including the melter itself.
Facilities will also be equipped with postprocess remote sampling and analytical capabilities to characterize waste form products including durability in standard tests such as the Product Consistency Test2 and the Toxic Characteristic Leach Procedure3 if deemed necessary. The facility will be equipped with an offgas treatment system designed such that when operated in coordination with the melter system retention of materials in the waste form is maximized and gaseous effluents meet Maximum Achievable Control Standards as designated in the facility permit. This will probably require recycle of filter catch materials to the main process equipment (melter), include specialized operation such as specific RedOx chemistry control in the melter, and require operation with a cold-cap (layer of liquid feed covering most of the molten glass surface). The offgas system for a thermal process for highly radioactive materials may make up 60% or more of process space, and hot-cell area will likely drive facility capital cost.
The facility will likely recycle water use with the only exit for water being humidity of the emissions leaving the stack. Any process waters that cannot be purged in that manner will likely be stabilized in concrete or a similar stabilizer and disposed of as LLW.
Offgas filters, clothing, tools, and miscellaneous hardware will also generally be disposed of as LLW. There is a potential for generating GTCC and TRU wastes, but a properly designed waste management and decontamination system should minimize this occurrence.
This module generally does not include additional separations that could produce several streams from the HLW. Fractionation of the reprocessing wastes is contained within Modules F1 and F2/D2 dedicated to reprocessing.
G-2.1 Defense Waste Processing Facility The DWPF, located on the Savannah River Site (Figure G1-1), uses vitrification to process waste into
a stable glass medium. The project began in 1983 and finished turnover in 1989. For the purpose of this report, 1986 was chosen as the activity midpoint. The DWPF is a stand-alone process facility. The technology incorporated at the time of construction was considered new technology. It was built as a government-owned facility; therefore, the cost of money is not applicable. The hardened area of the facility is reported as 150,000 ft2. The square footage does not include the associated interim storage facility. The facility produces about 250 canisters of glass waste per year.

INL/EXT-07-12107 (March 2008) Advanced Fuel Cycle Cost Basis G-12
G1-3. PICTURES AND SCHEMATICS
Figure G1-1. Defense waste processing plant at the Savannah River Site.
G1-4. MODULE INTERFACE DEFINITION Module G1 receives HLW from Aqueous Reprocessing (Module F1) or Electrochemical
Reprocessing (Module F2/D2), conditions the waste (stabilizes to form a durable product such as glass), provides interim storage of the treated waste, and packages the waste in a canister for transport to a Geologic Repository (Module L), Long-term Monitored Retrievable Storage (Module I), or an Other Disposal Concept (Module M) by means of Module O1, Spent Nuclear Fuel (SNF)/HLW Transportation. Management of HLW in wet or dry bulk interim storage between reprocessing and the conditioning described in this module (e.g., a tank farm) is not included in this module. No transportation or disposal costs are included in this module.
As stated above, all streams from processing used fuel could be potentially classified as HLW under current regulations. In the United States, this is a functional rather than characteristic designation. Also in the United States, wastes that are not HLW that contain >100 nCi/g TRU are “TRU wastes,” but the WIPP repository for these wastes is restricted to receiving waste derived from defense materials. Wastes other than HLW and TRU are designated LLW, and the numerical limits designating disposition requirements for Classes A, B, and C, and GTCC are defined in 10 CFR 61 and described in detail in Submodule G3 on LLW. Though these wastes are relatively well defined based on characteristics, the disposition pathway for GTCC waste, a geologic repository, has not yet been designed or designated. Thus, for the purposes of this report, it is assumed that the regulations will be reevaluated and changes will allow some of the disposition options shown in Table G1-2. In summary, these changes may include:
1. Consideration of useful radionuclides for recycling, including limits on allowable contaminants.

INL/EXT-07-12107 (March 2008) Advanced Fuel Cycle Cost Basis G-13
2. Expansion of the technical bases for the HLW repository license to include additional HLW forms other than borosilicate glass based on performance of the material in standardized tests.
3. Expansion of the WIPP repository capacity and license, or development of a new TRU repository for commercially derived TRU wastes, including reevaluation of the 100 nCi/g limit, and disposition of wastes contaminated to greater than background levels but less than 100 nCi/g TRU.
4. Designation of a repository or other routine disposal pathway for GTCC not requiring a case-by-case performance assessment.
5. Consideration of the concept of “decay storage:” secure storage facilities to allow problematic radionuclides such as cesium, strontium, tritium, and noble gases to decay to LLW limits. These materials must be stored for several hundred years isolated from the biosphere and protected against unregulated use.
Costs for each of the major classes of waste are estimated in their respective sections of the report. The criteria for assigning waste classifications are assumed to be consistent with current regulations with no distinction between defense and commercial origin.
Vitrification is used as the HLW baseline because it is the most well-characterized. However, conversion of waste chloride salts to a glass-bonded ceramic, and metalliferous wastes to a metal ingot have been demonstrated on small scales for the electrochemical processing program, and preliminary data packages have been submitted to DOE-Office of Civilian Radioactive Waste Management. Iron-phosphate glasses could be produced using technology similar to current vitrification technology, and Synroc can be made using a hot-isostatic press or a cold-crucible melter, all of which have been published in the literature.47 Less well characterized are durable low-temperature ceramics, anionic waste forms for iodine and technetium, crystalline waste forms for noble gases, and steam reforming. Steam reforming is a mid-range high-temperature technology that can destroy organic contaminants and nitrates and convert the inorganic residuals to a mineral form. This type of approach could be particularly useful for some of the streams from aqueous processing that are produced in an organic form such as cesium and strontium. Conversion of this type of material to a durable crystalline form using steam reforming with clay and carbon additives is believed to be possible, but has not been verified at an engineering scale.
G1-5. MODULE SCALING FACTORS These facilities are unique and designs are not readily extrapolated. It is not expected that future
facilities will emulate current facilities and unit costs may be significantly different. Therefore, scaling is not considered practical. For the purposes of this report, costs are based purely on operation of the DWPF and the unit costs of glass production using the life-cycle costs of that facility. Also, advanced commercial fuel processing flowsheets may generate unprecedented waste streams such as concentrated cesium and strontium, iodine, and technetium streams for which disposal options are not currently specified and glass may be inappropriate. Disposal costs for all HLW forms are extrapolated from DWPF vitrification costs based on density and waste loading in the final waste form.
G1-6. COST BASES, ASSUMPTIONS, AND DATA SOURCES The total project cost for DWPF including the first two melter replacements is estimated to be about
$2.6B in 2006 dollars, (capitalized cost of the facility was $1,500,000,000 in 1986 dollars). The current year operating budget is $140M and planned operation is for 25 years.a Initially, the facility was designed to produce about 7000 canisters, but is now planned to produce 6000 canisters. This increase in efficiency
a. Telecon and email with Brent Boore and David McGuire, Savannah River Site, January 2006.

INL/EXT-07-12107 (March 2008) Advanced Fuel Cycle Cost Basis G-14
drives the cost per canister up because capital costs are fixed. A simple life-cycle analysis reduces the calculation to:
• Cost per canister = ($2.6B + $140M/yr × 25 yr + D&D) / (6,000 cans) = $1.02M/canister + D&D
• Rounding up to $1.1M/canister would allow $500M for two more melters and D&D.
• Per canister cost can be converted to a fission product basis with certain assumptions. As described above, the future reprocessing design has not yet been specified, but a conservative estimate can probably be assumed to be the PUREX baseline. Presumably a new reprocessing design would not be adopted if it generated more waste.
Assuming:
HLW from processing defense fuels is predominantly reprocessing chemicals contaminated with <1 wt% fission products (FP).
FP include a broad range of elements, but for simplicity assume 50% each Cs-137/Sr-90.
Glass product contains 33.3% HLW oxides.
Canister contains 1800 kg of HLW glass.
Therefore,
1 kg FP = 1.118 kg FP-oxides (Cs2O and SrO)
1 kg FP = 1.118 kg FP-oxides / (0.01 kg FP-oxides/kg HLW-oxides) / (0.333 kg HLW-oxide/kg glass)
1 kg FP = 339 kg glass = 339 kg glass / (1,800 kg glass/canister) = 0.188 canister
1 kg FP = 0.188 canister × $1.1M/canister = $207K/kg FP.
Thus $207K/kg FP is the reference case. However, the DWPF was designed for a particular mission, to vitrify Savannah River HLW in a 25-year life. If the DWPF lifetime is extended to process new HLW, these costs drop, and the incremental costs for more canisters result in the following: annual operating cost/canister production = $140M/250 canisters = $560K, or $105K/kg FP roughly half the baseline cost using the limited DWPF programmatic design life. Recalculating the entire basis, amortizing using a 50-year design life, producing 250 canisters per year yields:
Cost per canister = ($2.6B + $140M/yr × 50 yr + 8 melters × $80M/melter changeout + $500M D&D)/(50 × 250 cans) = $860K/canister, or $162K/kg FP.
Assuming a) commercialization of new technology for processing used nuclear fuels, b) many of the problematic radionuclides are partitioned, and c) the regulatory changes described above, it is likely that scale-up and market forces will drive these costs down. Further, assuming a glass waste form with the same nominal density, but a glass technology that would allow melting at a higher temperature to enable higher waste loading, a glass containing 50 wt% HLW oxides could be possible.5,8 If the waste contained 50 to 100% radionuclide oxides as envisioned in the UREX flowsheet, the processed waste form would contain 50% × (50 to 100%) = 25 to 50% radionuclides, vs. 1% ×33.3% = 0.33% used above in the baseline or 75 to 150 times more radionuclides per unit of glass. Thus, with $560K/canister operating cost, on the low end the HLW stabilization costs could be:
0.188 canister × $860K/canister /(75 to 150) = $1080 to 2,150/kg FP.

INL/EXT-07-12107 (March 2008) Advanced Fuel Cycle Cost Basis G-15
More conservatively, it could be assumed that maximum radionuclide loading is limited to 5%, but the facility costs remain at $560K/canister. This results in a cost of:
0.188 canister × $860K/canister /(5/.33) = $10.8K/kg FP.
Other waste forms may be more or less efficient depending on other constraints. For example technetium metal would be very concentrated, but melting to immobilize it with waste stainless steel cladding and contaminated zirconium would dilute it such that the overall waste loading offsets the high density (7.8 g/cc). Similarly, stabilizing iodine and noble gas fission products using sorbents, which may then still require further stabilization may be very dilute. For the purposes of this report, the glass baseline with higher radionuclide loading is used as a cost basis.
G1-7. LIMITATIONS OF COST DATA The reported costs are gross numbers based on a one-of-a-kind facility for processing defense HLW.
Future reprocessing concepts for commercial fuels may bare little similarity to PUREX processing DOE fuels and may generate entirely different waste forms including glass-ceramics, metal ingots, and pressed ceramic pucks. It can probably be assumed that transition to a new waste form would be driven by efficiency in terms of greater fission product loading (10 to 100 times or more), which could drive costs down (for stabilization and the repository, but not necessarily for the entire life-cycle). Assuming that all the separations are successful, the HLW form would only be limited by durability and not heat loading or criticality. Further, waste-form manufacture may be integrated with the reprocessing plant rather than in a dedicated facility, which should also drive cost down. Lastly, future processing scenarios envisioned in the Global Nuclear Energy Partnership programs include many different product streams with a significantly reduced HLW volume as described above. This may drive the unit costs for HLW forms up due to fixed facility costs, but the ratio of HLW to MTHM processed should be reduced enough to more than compensate, reducing overall waste management costs.
G1-8. COST SUMMARIES The module cost information is summarized in the What-It-Takes (WIT) cost summary in
Table G1-3. The summary shows the reference cost basis (constant year $U.S.), the reference basis cost contingency (if known), the cost analyst’s judgment of the potential upsides (low end of cost range) and downsides (high end of cost range) based on references and qualitative factors, and selected nominal costs (judgment of the expected costs based on the references, contingency factors, upsides, and downsides). These costs are subject to change and are updated as additional reference information is collected and evaluated, and as a result of sensitivity and uncertainty analysis. Refer to Section 2.6 in the main section of this report for additional details on the cost estimation approach used to construct the WIT table.
New fuel processing flowsheets are being developed to generate far less waste volume, and to segregate problematic radionuclides. It is also widely recognized that many waste forms are as durable or better than single-phase BSG in containing radionuclides for extended times in exposure to the environment. Based on this and knowing that much higher waste loading is attainable in other materials significant reduction in cost (10–100x) may be attainable for HLW stabilization by cutting operation costs and using much more efficient waste forms and stabilization technology. However, the costs of the vitrification facility at Hanford are currently under review, and little is known about large-scale production of some of the proposed waste forms such as glass-ceramics and metal ingots, so the potential reduction in costs may be nearer the low end of this range. The selected value is based on the current small-scale demonstrated waste loading for the electrochemical processing ceramic waste form.

INL/EXT-07-12107 (March 2008) Advanced Fuel Cycle Cost Basis G-16
Table G1-3. Cost summary table for HLW conditioning selected values. What-It-Takes (WIT) Table
Reference Cost(s) Based on Reference
Capacity (Low Cost)
Upsides (High Cost) Downsides
(Nominal Cost) Selected Values
$162K/kg FP $2K/kg FP $10.8K/kg FP $5.4K/kg FP 0.33% FP loading 25% FP loading 5% loading 10% loading
The triangular distribution based on the WIT Table is shown in Figure G1-2. The distribution is
skewed toward the high cost due to the difficulty in achieving fission product loading greater than 10% in the waste form.
Module G1 HLW Conditioning, Storage and Packaging
Estimated Cost Frequency Distribution
$/kgFP
Freq
uenc
y
Low Nominal Mean High
$2000 $5400 $6067 $10800
Figure G1-2. HLW conditioning, storage, and packaging estimated cost frequency distribution.
G1-9. RESULTS FROM SENSITIVITY AND UNCERTAINTY ANALYSES
None available.

INL/EXT-07-12107 (March 2008) Advanced Fuel Cycle Cost Basis G-17
Module G2
SNF Conditioning and Packaging

INL/EXT-07-12107 (March 2008) Advanced Fuel Cycle Cost Basis G-18

INL/EXT-07-12107 (March 2008) Advanced Fuel Cycle Cost Basis G-19
Module G2
SNF Conditioning & Packaging
G2-1. BASIC INFORMATION The SNF packaging module includes capabilities to safely remove SNF from wet or dry storage;
perform inspection as required; dry, package, seal, leak-check, and prepare the SNF package for shipping to reprocessing, storage, or disposal. Fuel is assumed to be in wet or dry interim storage at a nuclear facility, and a contractor is hired to provide packaging services. The contractor will interface with site personnel to receive fuel from interim storage and conduct all operations necessary to leave the fuel in stable dry storage at an onsite storage pad. Transportation offsite is covered in Module O.
In the future, these costs are envisioned to be routine, and could be part of the general maintenance and fueling of a commercial reactor. The costs are delineated here to estimate the burden on current nominal operating costs. Whether the actual costs are born by the reactor operator as part of operating costs, or are a part of the fee paid to the Nuclear Waste Fund is not defined.
G2-2. FUNCTIONAL AND OPERATIONAL DESCRIPTION Fuel will be removed from wet or dry interim storage, conditioned for indeterminate storage,
packaged, and left in a protective cask at the storage site. All fuel movement procedures and equipment will be designed to ensure criticality-safe conditions at all times. Facility procedures will ensure verification and visual inspection of all lifting equipment and heavy load handling procedures. Fuel assemblies selection will be verified to ensure only fuel assemblies approved for loading in a fuel storage container are loaded. Inspection will include verification of the condition of the fuel to ensure it is acceptable for packaging, including integrity of fuel rods and replacement of any removed rods to ensure configuration control.
Drying procedures will meet or exceed the methodology described in NUREG 1536 and be in compliance with the facility Safety Analysis Report. Moisture will be removed from the cask and container until vacuum can be maintained for the prescribed test period. Seal welding will of the multipurpose canister will meet all prescribed nondestructive examination tests. Transportation and storage casks and multipurpose canisters will be licensed by the NRC.
In general, the contractor will:
1. Bring a fuel container (container, basket) and a shielded transfer cask to the fuel pool
2. Place the container into the transfer cask, forming a cylinder within a cylinder
3. Fill the assembly with water and lower into the fuel loading pool
4. Place preselected fuel elements into the container compartments
5. Place a shielded plug in the top of the container
6. Move the loaded assembly to a draining area, then drain, and decontaminate
7. Weld the container shut by an automated machine
8. Apply a vacuum to the container while it is filled with an inert gas (helium)

INL/EXT-07-12107 (March 2008) Advanced Fuel Cycle Cost Basis G-20
9. Continue the vacuum procedure until a vacuum can be maintained, indicating negligible free water remaining
10. Weld the container ports, and apply another cap, and weld shut
11. Move the loaded transfer cask assembly to the fuel storage pad
12. Lower the sealed fuel container vertically or push horizontally (depending on design) directly from the transport cask into the storage cask, maintaining continuous shielding
13. Place the storage cask lid and bolt shut
14. Store fuel dry indefinitely pending disposition.
G2-3. PICTURES AND SCHEMATICS Several configurations are available for SNF packaging, shipment, and interim to long-term dry
storage. Examples are shown in Figures G2-1 through G2-5.
Figure G2-1. Holtec International fuel storage canister to be loaded with fuel assemblies. Figure copied from Holtec International Web site.

INL/EXT-07-12107 (March 2008) Advanced Fuel Cycle Cost Basis G-21
Figure G2-2. Holtec International cask in fuel storage pool). Figure copied from Holtec International Web site.
Figure G2-3. Holtec International HI-STORM Dry Storage Casks on storage pad (note vertical storage). Figure copied from Holtec International Web site.

INL/EXT-07-12107 (March 2008) Advanced Fuel Cycle Cost Basis G-22
Figure G2-4. Transnuclear NUHOMS design (Note horizontal storage allowing stacking).9
Figure G2-5. BNG Fuel Solutions vertical cask lift. Figure copied from BNG Web site.

INL/EXT-07-12107 (March 2008) Advanced Fuel Cycle Cost Basis G-23
G2-4. MODULE INTERFACE DEFINITION Module G2 SNF Packaging removes SNF from wet or dry interim storage and prepares it for
indeterminate dry Long-term Retrievable Storage (Module I), and shipping to reprocessing via Aqueous or Electrochemical Separations (Modules F1 and F2/D2), or a Geologic Repository (Module L) or Other Disposal Concepts (Module M). Module G2 can be considered more of an activity or service more than a facility. Conditioning and packaging of fuel can be done as a contracted service or an in-house capability, depending on the nature of the facility and whatever strategy is cost-effective. This module does not include shipment of SNF to an offsite facility even if the facility is owned by the utility. Transportation onsite is considered within the estimating error of the conditioning and packaging costs.
This module includes the costs of a multipurpose canister to move the fuel to a storage cask or a shipping cask, but not the cost of the cask itself. Transportation Module O1 includes the cost of the transportation cask (overpack) and impact limiters. The Fuel Storage Modules E1 and E2 include a dry-storage cask where necessary, but do not include the multipurpose canister.
G2-5. MODULE SCALING FACTORS Fuel is removed from the cooling pool and placed in dry storage by a contractor as described above.
The dry storage pad may be in an onsite or offsite leased Independent Spent Fuel Storage Installation. The reactor operator will buy the fuel movement and conditioning services and the necessary materials including the fuel container and the storage cask. The only scaling factor is a storage cask, which generally holds 11 to 15 MTHM, depending on the type and design of the fuel (pressurized versus boiling water reactor).
G2-6. COST BASES, ASSUMPTIONS, AND DATA SOURCES Commercial services and their costs are generally proprietary, but the following estimates are based
on informal vendor communications:
• Service contract labor costs for implementing the procedures above start at $200K/cask
• Capital costs for storage container and dry storage overpack (cask) start at $1M
• Cost per MTHM=($200K/cask loading + $1,000K/container and overpack capital)/(11−15 MTHM)
• Total cost to implement dry storage = $80−110K/MTHM.
These costs do not reflect the capital or operating costs of the Independent Spent Fuel Storage Installation itself because this module only includes SNF conditioning and packaging.
G2-7. LIMITATIONS OF COST DATA The cost data reported here are a snapshot in time and reflect the input from one helpful vendor. The
estimates are based on a utility having a contract for recurring services, but no economies of scale are considered for operators negotiating for services to multiple sites or multiple reactors. Also, no transportation costs are considered to support an offsite Independent Spent Fuel Storage Installation.

INL/EXT-07-12107 (March 2008) Advanced Fuel Cycle Cost Basis G-24
G2-8. COST SUMMARIES The module cost information is summarized in the What-It-Takes (WIT) cost summary in
Table G2-1. The summary shows the reference cost basis (constant year $U.S.), the reference basis cost contingency (if known), the cost analyst’s judgment of the potential upsides (low end of cost range) and downsides (high end of cost range) based on references and qualitative factors, and selected nominal costs (judgment of the expected costs based on the references, contingency factors, upsides, and downsides). These costs are subject to change and are updated as additional reference information is collected and evaluated, and as a result of sensitivity and uncertainty analysis. Refer to Section 2.6 in the main section of this report for additional details on the cost estimation approach used to construct the WIT table.
Cost data reflect starting prices for services and materials that imply costs can be higher, reflected in the downsides of about 33%. However, many utilities operate plural reactors and plural reactor sites, which may allow for some economies of scale and reduced negotiated contract prices, reflected in the upsides of about 17%. The selected value is the high end of the reference range because of the limited data available.
The triangular distribution based on the costs in the WIT Table is shown in Figure G2-6.
Table G2-1. Cost summary table for SNF conditioning selected values. What-It-Takes (WIT) Table
Reference Cost(s) Based on Reference Capacity
(Low Cost) Upsides
(High Cost) Downsides
(Nominal Cost) Selected Values
$80−100K/MTHM SNF $50K/MTHM $130K/MTHM $100K/MTHM
Module G2 SNF Conditioning and PackagingEstimated Cost Frequency Distribution
$K/MTHM
Freq
uenc
y
Low Mean Nominal High
$50 $93 $100 $130
Figure G2-6. SNF conditioning and packaging estimated cost frequency distribution.
G2-9. RESULTS FROM SENSITIVITY AND UNCERTAINTY ANALYSES
None available.

INL/EXT-07-12107 (March 2008) Advanced Fuel Cycle Cost Basis G-25
Module G3
LLW Conditioning, Storage, and Packaging

INL/EXT-07-12107 (March 2008) Advanced Fuel Cycle Cost Basis G-26

INL/EXT-07-12107 (March 2008) Advanced Fuel Cycle Cost Basis G-27
Module G3
LLW Conditioning, Storage, and Packaging
G3-1. BASIC INFORMATION Module G3 conditions and packages miscellaneous LLW (10 CFR 61) for disposal in an
NRC-licensed near surface landfill. If the wastes are both hazardous (40 CFR 261.3) and radioactive, treatment must consider EPA Land Disposal Restrictions (LDRs; 40 CFR 268), and the receiving landfill may be required to have a permit from the EPA or state if the hazardous constituents are listed wastes. Mixed waste treatment and disposal generally cost 2 to 5 times more than LLW because facilities are limited, and permits are few and the product of many years of effort. Currently, mixed waste treatment/disposal is a seller’s market, but this could change in the future, resulting in more consistent pricing based on waste volume.
Wastes are received by truck or rail and must be characterized to ensure that they are within the facility specific permit limits. For example, EnergySolutions in Utah is currently limited to Class A wastes, while Permafix can receive and treat some Class B and C wastes as long as after treatment the treated wastes meet Class A limits and can be sent to EnergySolutions. The regulations, particularly the mixed waste regulations issued independently by the DOE/NRC and EPA can conflict and produce so-called “orphan” wastes for which there are no permitted disposal facilities at this time. Clever combinations of permits and innovation by commercial entities such as the synergy described between Permafix and EnergySolutions have allowed treatment/disposal of many of the orphan wastes, but generally at a cost premium. This is an area that should be considered carefully in support of an expanded nuclear industry. Fortunately, the commercial nuclear industry has carefully evaluated many of their ongoing activities and has all but eliminated production of mixed wastes. Until facilities are decommissioned, production of mixed wastes will be minimal and should not be significant in future commercial nuclear facilities.
G3-2. FUNCTIONAL AND OPERATIONAL DESCRIPTION The LLW Conditioning, Storage, and Packaging Facility will likely be a part of future nuclear
facilities, but may also be contiguous with the disposal landfill such as the case with EnergySolutions (see Figures G3-1 through G3-4), or may be a separate contracted facility such as the Duratek facility in Tennessee; Pacific EcoSolutions Inc., (PEcoS) in Washington; or Permafix in Florida, that all ship the conditioned wastes to landfills such as Barnwell (see Figure G3-5) in South Carolina or EnergySolutions. External facilities must be capable of receiving wastes by truck and rail, and must have sufficient analytical facilities or access to such facilities to ensure that the materials they receive are within the limits imposed by their permits. At a minimum, the facilities must be able to inspect and repackage to meet the waste acceptance criteria for the landfill. Other conditioning and treatment services offered will likely be based on return on investment and local expertise. Some of the more common services include:
• Supercompaction to reduce volume of compressible materials
• Size reduction to reduce volume of oversized materials such as construction debris
• Stabilization using sorbents to immobilize free liquids
• Stabilization using a cement and/or a pozzolonic material to reduce leachability of metals
• Macroencapsulation of debris including lead bricks

INL/EXT-07-12107 (March 2008) Advanced Fuel Cycle Cost Basis G-28
• Chemical oxidation for reactive metals and some organics
• Thermal desorption to separate organic constituents from waste matrices
• Incineration to minimize ultimate volume of combustibles or destroy solvents and PCBs
• Specialized treatability studies and treatment for unique wastes.
G3-3. PICTURES AND SCHEMATICS
Figure G3-1. Aerial view of EnergySolutions Facility in Utah.10

INL/EXT-07-12107 (March 2008) Advanced Fuel Cycle Cost Basis G-29
Figure G3-2. Filling voids around drums at EnergySolutions Facility in Utah. Figure copied from EnergySolutions Web site.
Figure G3-3. EnergySolutions microencapsulation and macroencapsulation of waste in plastic polymer. Figure copied from EnergySolutions Web site.

INL/EXT-07-12107 (March 2008) Advanced Fuel Cycle Cost Basis G-30
Figure G3-4. Landfill disposal cell at EnergySolutions (Note line and leachate collection piping). Figure copied from EnergySolutions Web site.
Figure G3-5. Waste placement in landfill at Chem-Nuclear Systems Barnwell site.11
G3-4. MODULE INTERFACE DEFINITION Module G3 receives miscellaneous low activity waste streams from throughout the fuel cycle. These
wastes can be solid or liquid and may result from treatment of gaseous effluents, but the gases themselves are not considered in this module. Specific links are shown from Aqueous and Electrochemical Separations (Modules F1 and F2/D2), but wastes including decontamination solutions, clothing, resins, and so-called combustible rags, bags, and tags wastes may come from any module. All LLW leaving Module G3 is transported (Module O2) to Near Surface Disposal (Module J) once conditioned to meet

INL/EXT-07-12107 (March 2008) Advanced Fuel Cycle Cost Basis G-31
the facility waste acceptance criteria. Mixed wastes have essentially been eliminated from the commercial nuclear industry by careful selection of materials and waste management. However, mixed wastes are more likely to occur with fuel reprocessing activities generating process and decontamination solutions and spent solvents.
G3-5. MODULE SCALING FACTORS Little or no reliable cost data are available for construction of facilities, and scaling based on
throughput is unreliable because of the variable nature of the wastes, site-specific waste acceptance criteria, and conflicting regulations. In general, this type of work can be assumed to be contracted, but for the purposes of this document two reference studies were used, one by the DOE Office of Environmental Management12 and one by the General Accounting Office (GAO).13
G3-6. COST BASES, ASSUMPTIONS, AND DATA SOURCES Idaho National Laboratory (INL) has contracts with several waste treatment and disposal service
companies, and these values have been generalized to develop Table G3-1. The costs shown are in 2005 dollars and are subject to change, but provide reasonable factors for estimating the impacts for LLW generated in the fuel cycle. These costs are charges for treatment and disposal at disposal facilities. A rough estimate to include the generator costs for characterization, packaging and shipping would double these costs. The costs shown in Table G3-1 are bracketed by those reported by EM and the GAO. The EM study is an attempt to gather life-cycle costs including both generator and disposal facility costs. The GAO study is limited by the fact that disposal facilities are not consistent in billing practices and do not include full life cycle even for the disposal facilities themselves.
Table G3-1. Treatment/disposal cost estimating factors for LLW. Waste Type—these
wastes can be derived from any module Media
Characterization/Pack $/m3
Treatment $/m3
Total $/m3
General LLW combustible debris
Paper, plastic, cloth, wood 440 N/A 440
General LLW noncombustible debris
Metal, construction debris, labware
520 N/A 520
General LLW liquids Primarily aqueous solutions requiring stabilization prior to disposal
5,800 5,000 10,800
LLW water purification resins
Spent ionic exchange resins – Cs/Sr
5,800 84,000 90,000
General MLLW combustible debris
Paper, plastic, cloth, wood 4,000 3,400 7,400
General MLLW noncombustible debris
Metal, construction debris, labware
5,500 4,700 10,200
General MLLW liquids Typically combustible organic solvents, but may contain significant aqueous fraction
14,000 14,000 28,000
LLW/MLLW Premium cost per curie of H-3 or C-14
19,000 N/A 19,000

INL/EXT-07-12107 (March 2008) Advanced Fuel Cycle Cost Basis G-32
Reference 12 breaks down costs into disposal facility and predisposal (generator) costs with cost ranges of $70−2000/m3 and $130−4,100/m3 respectively or $200−6,000/m3 total. Disposal costs include charges by the disposal facility itself which should include management, operations, closure, long-term stewardship, and profit. Predisposal costs include characterization, treatment, packaging, and transportation. Disposal of bulk contaminated soils from CERCLA cleanup at DOE CERCLA disposal units may bias these values to the low end, and special case wastes of very small volume with unique characteristics are at the high end, with an order-of-magnitude or more between the unit costs for various waste streams. This type of rangeability can also be seen in Table G3-1 with $500−600/m3 for general LLW disposal requiring no special treatment up to $95,000 for volume reduction and disposal of spent ion-exchange resins, a nearly 200 times multiplier.
Reference 13 is somewhat dated in that the Nevada Test Site facility is now accepting mixed wastes and does not include full life-cycle costs for the generator or the disposal facilities, so in general the GAO study shows LLW disposal costs toward the low end of the spectrum at $60–400/m3. This may also be due to the weighted average emphasis on CERCLA wastes going to onsite CERCLA disposal facilities that limits characterization, treatment, and transportation costs. Some wastes at Idaho National Laboratory are also sent to an onsite CERCLA disposal landfill, but the costs shown in Table G3-1 are for wastes sent offsite. Offsite disposal is more likely representative of the true costs for Module G.
The scope of Module G covers only the costs prior to shipping; for LLW, this is generally characterization and packaging. At the treatment, storage, and disposal facility, wastes are treated as necessary for disposal in a landfill. Treatment is only mandated for mixed wastes, but absorption, size reduction, and compaction may also be done for nonhazardous LLW, depending on the waste and the waste acceptance criteria for the facility. Thus, it is difficult to allocate particular costs to before or after transportation. Table G3-1 includes estimated values for characterization and packaging, and treatment. These costs can be allocated as necessary, depending on how the operations are modeled.
G3-7. LIMITATIONS OF COST DATA Cost data shown represent 2005 unit costs for typical waste characterization, packaging, and
treatment. These numbers are subject to change at any time, and can be significantly impacted by specific combinations of contaminants and radionuclides.
G3-8. COST SUMMARIES In general, whether the operations are done by the generator or the treatment, storage, and disposal
facility, the costs for characterization, packaging and treatment for LLW debris are estimated at approximately $500/m3 and liquids at $11,000/m3. Most commercial nuclear facilities have essentially eliminated MLLW, but debris is estimated at $9,000/m3 and liquids at $28,000/m3. Special case waste streams, such as ion-exchange resins, should be estimated at $90,000/m3.
The module cost information is summarized in the What-It-Takes (WIT) cost summary in Table G3-2. The summary shows the reference cost basis (constant year $U.S.), the reference basis cost contingency (if known), the cost analyst’s judgment of the potential upsides (low end of cost range) and downsides (high end of cost range) based on references and qualitative factors, and selected nominal costs (judgment of the expected costs based on the references, contingency factors, upsides, and downsides). These costs are subject to change and are updated as additional reference information is collected and evaluated, and as a result of sensitivity and uncertainty analysis. Refer to Section 2.6 in the main section of this report for additional details on the cost estimation approach used to construct the WIT table.

INL/EXT-07-12107 (March 2008) Advanced Fuel Cycle Cost Basis G-33
Table G3-2. Cost summary table for LLW conditioning selected values. What-It-Takes (WIT) Table
Reference Cost(s) Based on Reference
Capacity (Low Cost)
Upsides (High Cost) Downsides
(Nominal Cost) Selected Values
$0.5K/m3 LLW debris $0.4K/m3 LLW debris $1K/m3 LLW debris $0.5K/m3 LLW debris $11K/m3 LLW liquid $3.3K/m3 LLW liquid $22K/m3 LLW liquid $11K/m3 LLW liquid $90K/m3 resins $81K/m3 resins $99K/m3 resins $90K/m3 resins
Cost data has been rounded to two significant digits. Values are sensitive to market, specific
waste characteristics, and regulatory changes. Waste disposal at EnergySolutions has been essentially monopolistic, but waste control specialists are still trying to establish themselves as a fully permitted facility. Similarly, waste disposal at Hanford and Barnwell has been limited to regional state pacts, but the National Test Site now accepts wastes, and the equilibrium on costs is expected to change. Costs for LLW/MLLW are +100%, -30%, based on experience of the author and recognition of the wide range over which the market may evolve.
The triangular distributions based on the costs in the WIT table are shown in Figures G3-6, G3-7, and G3-8.
Module G3-D LLW ConditioningEstimated Cost Frequency Distribution
$/m3 (debris)
Freq
uenc
y
Low Nominal Mean High
$400 $500 $633 $1000
Figure G3-6. Module G3-D LLW conditioning estimated cost frequency distribution.

INL/EXT-07-12107 (March 2008) Advanced Fuel Cycle Cost Basis G-34
Module G3-L LLW ConditioningEstimated Cost Frequency Distribution
$/m3 (liquids)
Freq
uenc
y Low Nominal Mean High
$3300 $11000 $12100 $22000
Figure G3-7. Module G3-L LLW conditioning estimated cost frequency distribution.
Module G3-R LLW ConditioningEstimated Cost Frequency Distribution
$/m3 (resins)
Freq
uenc
y
Low Nominal/Mean High
$81000 $90000 $99000
Figure G3-8. Module G3-R LLW conditioning estimated cost frequency distribution.
G3-9. RESULTS FROM SENSITIVITY AND UNCERTAINTY ANALYSES
None available.

INL/EXT-07-12107 (March 2008) Advanced Fuel Cycle Cost Basis G-35
Module G4
GTCC Conditioning, Storage, and Packaging

INL/EXT-07-12107 (March 2008) Advanced Fuel Cycle Cost Basis G-36

INL/EXT-07-12107 (March 2008) Advanced Fuel Cycle Cost Basis G-37
Module G4
GTCC Conditioning, Storage and Packaging
G4-1. BASIC INFORMATION This module is dedicated to those wastes that contain sufficient long or short-lived radionuclides to be
classified GTCC and are:
“Waste that is not generally acceptable for near-surface disposal is waste for which form and disposal methods must be different, and in general more stringent, than those specified for Class C waste. In the absence of specific requirements in this part, such waste must be disposed of in a geologic repository as defined in part 60 or 63 of this chapter unless proposals for disposal of such waste in a disposal site licensed pursuant to this part are approved by the Commission.” (40 CFR 61)
Without reprocessing or reactor deactivation, GTCC waste is not typically generated in commercial nuclear operations. With reprocessing, particularly if some problematic species are partitioned and concentrated, e.g., C-14, Tc-99, I-129, and TRU, these wastes will have to be disposed and in all likelihood will require a new disposal route. To date, reactor components, typically activated metals, have been disposed in surface facilities on DOE reservations based on specific safety analyses showing that this type of disposal is protective.
Depending on policy decisions yet to be made, treatment of these wastes could mirror the LLW disposal described in the previous section. If the wastes must be disposed of in a geologic repository, treatment may be more similar to the WIPP currently in use for disposal of TRU wastes. This is a policy issue and awaits development of new regulations governing a commercial nuclear power industry including fuel processing.
G4-2. FUNCTIONAL AND OPERATIONAL DESCRIPTION All waste handling and containment for these wastes are captured in Modules G3 (LLW) and G5
(TRU waste), with the exception that GTCC wastes may require specialized containment/shielding that may be a hybrid of the other two, depending on the alpha or beta/gamma radiation prevalence. In general, the beta/gamma radiation from these wastes will require some shielding or special handling that may not be necessary for Class A/B/C wastes. Also, depending on the nature of the waste matrix and the treatment technology, wastes that are not TRU (>100 nCi/g), but that contain appreciable TRU contamination, may also require alpha containment similar to TRU wastes. Refer to LLW and TRU waste modules for more detail.
If considered as LLW, in general this material excerpted from Module G3 applies:
The LLW Conditioning, Storage, and Packaging Facility will likely be a part of future nuclear facilities, but may also be contiguous with the disposal landfill such as the case with EnergySolutions, or may be a separate contracted facility such as the Duratek facility in Tennessee; Pacific EcoSolutions Inc., (PEcoS) in Washington; or Permafix in Florida, that all ship the conditioned wastes to landfills such as Barnwell in South Carolina or EnergySolutions. External facilities must be capable of receiving wastes by truck and rail and must have sufficient analytical facilities or access to such facilities to ensure that the materials they receive are within the limits imposed by their permits. At a minimum, the facilities must be able to inspect and repackage to meet the waste acceptance criteria for the landfill. Other conditioning and

INL/EXT-07-12107 (March 2008) Advanced Fuel Cycle Cost Basis G-38
treatment services offered will likely be based on return on investment and local expertise. Some of the more common services include:
• Supercompaction to reduce volume of compressible materials
• Size reduction to reduce volume of oversized materials such as construction debris
• Stabilization using sorbents to immobilize free liquids
• Stabilization using a cement and/or a pozzolonic material to reduce leachability of metals
• Macroencapsulation of debris including lead bricks
• Chemical oxidation for reactive metals and some organics
• Thermal desorption to separate organic constituents from waste matrices
• Incineration to minimize ultimate volume of combustibles or destroy solvents and PCBs
• Specialized treatability studies and treatment for unique wastes.
If considered similar to TRU for disposal purposes (literal reading of current regulations would place GTCC wastes in a geologic repository, perhaps similar to WIPP), in general this material excerpted from Module G5 applies:
WIPP waste acceptance criteria does not allow receipt of:
• Free liquids in excess of 1% of the container volume or 1 inch, whichever is less
• Sealed containers over 4 L
• Electrochemical radioactive materials over 1% by weight
• Ignitable, corrosive, or reactive wastes according to 40 CFR 261
• Explosives, corrosives, or compressed gases
• Flammable headspace gases >500 ppm.
Though this module does not include the repository itself (Module L), these requirements do imply the characterization capabilities to identify any of these characteristics and rectify them if found. Thus, some combination of verifiable information on how the waste was generated and analytical techniques for all these characteristics must be available.
Costs have been gathered and reported by the National Energy Technology Laboratory (NETL)14 including the following:
• Compilation of Acceptable Knowledge on the history of the waste
• Nondestructive assay
• Radiography and visual examination
• Gas generation testing
• Head space gas sampling and analysis.
At a minimum, it is likely that drums of TRU waste generated in the future will be subject to manual sorting and packaging and possibly radiography to verify packaging records. In the event that there are discrepancies identified, sampling and analytical capabilities designed for alpha containment and/or manual resorting and repackaging will be needed.

INL/EXT-07-12107 (March 2008) Advanced Fuel Cycle Cost Basis G-39
In addition to packaging waste drums and boxes to meet the waste acceptance criteria, receipt, inspection, decontamination, loading, and shipping of casks will also be necessary.
G4-3. PICTURES AND SCHEMATICS These wastes may require packaging and handling similar to contact-handled TRU wastes, which are
packaged in TRUPact-II Containers (see Figure G4-1), or more expensive remote-handled TRU due to radiation levels.
Figure G4-1. Schematic of TRUPACT-II shipping cask for TRU wastes.
G4-4. MODULE INTERFACE DEFINITION Module G4 receives GTCC wastes from reprocessing, including all streams not regulated as HLW,
containing <100 nCi/g TRU, and exceeding the limits established in 10 CFR 61 for Classes A, B, or C LLW. Wastes exit potentially to Near Surface Disposal (Module J) if considered LLW, Geologic Repository (Module L) if treated at TRU, or Other Disposal Concepts (Module M).
In terms of the fuel processing flowsheets under development and the new streams to be produced such as the iodine, cesium/strontium, tritium, and technetium wastes, any of these could be considered GTCC if not regulated as HLW and more concentrated than the limits defined in 10 CFR 60.
G4-5. MODULE SCALING FACTORS There is no precedent for treatment of these wastes. Potential handling can be extrapolated from LLW
and remote-handled TRU, but there is no basis for scaling of facilities.

INL/EXT-07-12107 (March 2008) Advanced Fuel Cycle Cost Basis G-40
G4-6. COST BASES, ASSUMPTIONS, AND DATA SOURCES The closest analogous costs are handling remote-handled TRU. Costs are derived from estimates
made for WIPP.
The information is from a study of TRU waste characterization and certification costs conducted by the NETL for WIPP.13 The study was based on a combination of actual 2002 costs from Idaho National Laboratory (INL)b and Rocky Flats Environmental Technology Site, and on estimated 2003 costs from Savannah River Site. Capital costs were not included.
Based on a typical drum of contact-handled TRU waste, the average life-cycle cost of characterization is $3,850 per drum (in 2002 dollars). Using 208 L per drum, this translates to $18,500/m3.
These costs were developed based on the sum of the average cost for a set of 15 individual waste certification activities (e.g., real-time radiography, nondestructive assay, and head space gas sampling). Furthermore, the data were based on the certification of 17,900 drums from a stored waste population of 24,600 drums, plus the visual examination of 14,200 drums. The cost of each activity was prorated by the percentage of drums for which the activity was applicable.
Table G4-1 shows the cost of three particularly high-cost activities to illustrate how dependent the cost of characterization is on specific activities. For example, if the waste requires solids coring and sampling, then the total cost of certification would jump to about $130,000/m3. To bring the cost back down to the average, solids coring and sampling would have to be restricted to approximately 1% of the waste drums (specific numbers can be obtained from the WIPP TRU characterization cost analysis13). The actual cost for an individual certification program then depends on the waste type, the certification activities required, and the number of containers available for averaging. The $18,500/drum represents a good current estimate for a large number of drums of waste of various types.
From Table 4.3-1 of the National TRU Waste Management Plan (NTWMP), “Baseline Cost Data,”15 the quoted dollar value for INL in FY 2002 was $72,937,000. The Carlsbad Field Office estimates that 75% of this value is used in waste characterization, certification, and preparing waste for shipment. Therefore, INL cost for TRU waste characterization and certification during FY 2002 is shown in Equation (1).
$72,937,000 × 0.75 = $54,702,750. (1)
Table G4-1. Examples of high-cost characterization activities.
Average Cost per Drum
(cost/m3) Activity Cost per Drum Cost/m3
Visual examination and retrievably store $22,500 $108,000 Solids coring and sampling (FY 2001) $24,000 $115,000 Solids analysis (FY 2001) $63,000 $303,000
The method of estimating the volume characterized and certified is shown below. The number of planned shipments to WIPP is given in Table 3.2.1-1 of the NTWMP; however, the volume of waste is
b. Idaho National Engineering and Environmental Laboratory (INEEL) was renamed Idaho National Laboratory (INL) on February 1, 2005.

INL/EXT-07-12107 (March 2008) Advanced Fuel Cycle Cost Basis G-41
not given. The following conservative assumptions were used to determine a best-case estimate of the volume disposed:
1. Each shipment consists of three Transuranic Package Transporter Model-IIs (TRUPACT-II)
2. Each TRUPACT-II is full (i.e., 14 drums/TRUPACT-II or 42 drums/shipment)
3. Each drum has a volume of 0.208 m3.
Again, using an FY 2002 INL reported value of 437 shipments and the assumptions above, the volume of waste is as shown in Equation (2).
437 shipments × 42 drums/shipment × 0.208 m3/drum = 3,817 m3/shipment. (2)
This volume, divided into the cost above, gives the characterization and certification cost of $14,327.
In most cases, the number of drums shipped is less than 42 because of transportation issues such as weight or wattage. Based on the INL shipping rate during the 3,100 m3 Project, the above estimate gives a volume estimate approximately 25% too high, or a cost estimate 25% too low in FY 2002. As such, the value calculated here should be considered a practical minimum. If the estimate of $14,327 is increased by 25%, it becomes $17,900/m3, which is within 3% of the NETL estimate of $18,500/drum ($88,800/m3) for characterization and certification. Thus, the same approximate cost can be estimated from two approaches, and this is believed to be a good baseline.
G4-7. LIMITATIONS OF COST DATA Little or no real precedent exists for treatment of GTCC wastes, because there are no treatment
requirements defined. The costs shown here are just duplicated from those estimated for TRU wastes, which are variable as shown in the examples given for various characterization activities.
The quoted values are baseline estimates based on operational costs; they do not include capital costs for the equipment or facilities used for characterization and certification. Characterization and certification costs can be dominated by sampling and analysis, which can be from 6 to 30 times the average cost of characterization and certification. Characterization costs reported here should be considered bounding. Much of the characterization is necessitated by a lack of acceptable knowledge due to the poor data quality describing legacy wastes. In the future, it is expected that TRU wastes generated by commercial facilities and future reprocessing will be well characterized, and most characterization will not be necessary. Also, a significant fraction of the characterization cost is related to container handling between characterization activities, and this should be greatly reduced for future wastes.
Costs for remote-handled TRU were not estimated separately from contact-handled TRU costs in this report. Costs estimated based on the NTWMP are simple averages; therefore, the costs are reasonably applicable to contact-handled TRU waste because the current plan is to fill the WIPP repository with 95% contact-handled TRU waste. If GTCC waste characterization and treatment must be done remotely, the costs could be 3 to 10 times greater.
G4-8. COST SUMMARIES The module cost information is summarized in the What-It-Takes (WIT) cost summary in
Table G4-2. The summary shows the reference cost basis (constant year $U.S.), the reference basis cost contingency (if known), the cost analyst’s judgment of the potential upsides (low end of cost range) and downsides (high end of cost range) based on references and qualitative factors, and selected nominal costs (judgment of the expected costs based on the references, contingency factors, upsides, and downsides).

INL/EXT-07-12107 (March 2008) Advanced Fuel Cycle Cost Basis G-42
Table G4-2. Cost summary table for GTCC waste conditioning selected values.*
What-It-Takes (WIT) Table Reference Cost(s)
Based on Reference Capacity
(Low Cost) Upsides
(High Cost) Downsides
(Nominal Cost) Selected Values
$88.8K/m3 $57K/m3, or $200 kg/metal
$270K/m3, or $1,800 kg/metal
$110K/m3, or $540 kg/metal
CH-TRU Regulated as LLW, surface disposal. Based on 3 Ci/m3
Regulated as TRU, with remote handling
Averaged 2/3 LLW, 1/3 RH-TRU
* GTCC may be remote handled and generally not allowed in commercial surface landfills, but this has occurred on DOE reservations. Premium charges based on curie content of specific radionuclides are extremely variable due to the limited capacity for these materials per disposal site permits. Developing a repository specifically for GTCC wastes or codisposal with TRU waste is an unknown at this time.
These costs are subject to change and are updated as additional reference information is collected and
evaluated, and as a result of sensitivity and uncertainty analysis. Refer to Section 2.6 in the main section of this report for additional details on the cost estimation approach used to construct the WIT table.
The triangular distribution based on the costs in the WIT Table is shown in Figure G4-2. The distribution is skewed toward the low costs based on waste characteristics more likely to be characteristic LLW-Class C rather than remote handled TRU wastes.
Module G4 GTCC Conditioning (RH-TRU)Estimated Cost Frequency Distribution
$/kg-metal
Freq
uenc
y
Low Nominal Mean High
$200 $540 $847 $1800
Figure G4-2. Module G4 GTCC.
G4-9. RESULTS FROM SENSITIVITY AND UNCERTAINTY ANALYSES
None available.

INL/EXT-07-12107 (March 2008) Advanced Fuel Cycle Cost Basis G-43
Module G5
TRU Conditioning, Storage, and Packaging

INL/EXT-07-12107 (March 2008) Advanced Fuel Cycle Cost Basis G-44

INL/EXT-07-12107 (March 2008) Advanced Fuel Cycle Cost Basis G-45
Module G5
TRU Conditioning, Storage, and Packaging
G5-1. BASIC INFORMATION Future fuel cycles are planned to include TRU recovery for recycle as fuel for fast reactors to destroy
TRU and to generate additional energy. Goals for recovery of TRU are very aggressive with an overall recovery of approximately 99.9%. This includes leaching and rework of off-specification products, scraps, and process residuals to further reduce losses. Keeping losses less than 0.1% could allow expanding the capacity of a geologic repository for HLW by two orders-of-magnitude. However, there will still be losses that contaminate consumable items and equipment, and some of these wastes will likely be classified as commercial transuranic.
Transuranic (TRU) waste is defined in 40 CFR 191.2:
“Transuranic radioactive waste, as used in this part, means waste containing more than 100 nanocuries of alpha-emitting transuranic isotopes, with half-lives greater than twenty years, per gram of waste, except for: (1) High-level radioactive wastes; (2) wastes that the Department has determined, with the concurrence of the Administrator, do not need the degree of isolation required by this part; or (3) wastes that the Commission has approved for disposal on a case-by-case basis in accordance with 10 CFR Part 61.”
Thus, the definition is not rigid similar to the description of GTCC wastes, and there remains some flexibility if it can be shown that the waste can be disposed of in a surface landfill. In general, however, these wastes will be disposed of in a geologic repository. The WIPP is the only example of this in the U.S., but WIPP is limited to accepting only wastes derived from defense activities and cannot accept commercial wastes.
This module includes waste conditioning, certification, interim storage, and packaging of TRU wastes. The closest analogues are the activities underway at several DOE sites that are shipping TRU waste to WIPP. Assuming that a future TRU waste repository would be similar to WIPP in design and operation, the costs can be estimated from current activities.
G5-2. FUNCTIONAL AND OPERATIONAL DESCRIPTION WIPP waste acceptance criteria does not allow receipt of:
• Free liquids in excess of 1% of the container volume or 1 inch, whichever is less
• Sealed containers over 4 L
• Electrochemical radioactive materials over 1% by weight
• Ignitable, corrosive, or reactive wastes according to 40 CFR 261
• Explosives, corrosives, or compressed gases
• Flammable headspace gases >500 ppm.
Though this module does not include the repository itself (Module L), these requirements do imply the characterization capabilities to identify any of these characteristics and rectify them if found. Thus,

INL/EXT-07-12107 (March 2008) Advanced Fuel Cycle Cost Basis G-46
some combination of verifiable information on how the waste was generated and analytical techniques for all these characteristics must be available.
Costs have been gathered and reported by the National Energy Technology Laboratory13 including the following:
• Compilation of acceptable knowledge on the history of the waste
• Nondestructive assay
• Radiography and visual examination
• Gas generation testing
• Head space gas sampling and analysis.
At a minimum, it is likely that drums of TRU waste generated in the future will be subject to manual sorting and packaging and possibly radiography to verify packaging records. In the event that there are discrepancies identified, sampling and analytical capabilities designed for alpha containment and/or manual resorting and repackaging will be needed.
In addition to packaging waste drums and boxes to meet the waste acceptance criteria, receipt, inspection, decontamination, loading, and shipping of casks will also be necessary.
G5-3. PICTURES AND SCHEMATICS Future generation of TRU wastes will probably be better characterized than legacy wastes, because
disposal in a repository will likely be planned, rather than assuming the waste can be buried in a surface landfill, as was the practice prior to 1970. Future wastes will probably be primarily stabilized waste forms, including ion-exchange media and precipitates encapsulated/mixed in a relatively inert matrix. Some wastes may still be generated that are debris. Figure G5-1 shows examples of legacy waste packaging that will hopefully serve as examples of what should be avoided.
Figure G5-1. Legacy TRU wastes packaged in 55-gallon drums with and without liners, bags, and stabilizing sorbent media.

INL/EXT-07-12107 (March 2008) Advanced Fuel Cycle Cost Basis G-47
Much has been learned from expensive retrieval and characterization activities for legacy wastes, and it is likely that future waste disposal will be more streamlined and cost effective. Figures G5-2 and G5-3 are photographs from INL showing waste drum tomographic and headspace sampling equipment. Figure G5-4 is a collage of pictures from a Sandia Web site showing one potential design for a manual TRU waste sorting system. Handling and sampling TRU wastes is very expensive, and hopefully better record keeping will allow handling these materials one time in the future to stabilize and prepare them for disposal.
Figure G5-5 shows a cutaway of the TRUPACT-II cask that is used for overland transport of packaged TRU wastes. Note the sophisticated design of the cask to ensure containment of the wastes even in the event of foreseeable accident scenarios. Figure G5-6 shows a typical truck shipment of three casks, each capable of holding 14 drums of waste.
Figure G5-2. X-ray tomographic equipment for imaging drummed waste without opening the drum.

INL/EXT-07-12107 (March 2008) Advanced Fuel Cycle Cost Basis G-48
Figure G5-3. Headspace gas sampling of heated drum using Fourier transform infrared.
Figure G5-4. Collage of pictures showing a TRU waste sorting system.

INL/EXT-07-12107 (March 2008) Advanced Fuel Cycle Cost Basis G-49
Figure G5-5. Schematic of TRUPACT-II shipping cask for TRU wastes.
Figure G5-6. Truck shipment of three TRUPACT-II casks.

INL/EXT-07-12107 (March 2008) Advanced Fuel Cycle Cost Basis G-50
G5-4. MODULE INTERFACE DEFINITION Module G5 includes waste conditioning, certification, and interim storage of TRU wastes. The TRU
wastes could be shipped (Module O1) to a Geologic Repository (Module L) as the nominal case, or an Other Disposal Concept (Module M) that is yet to be determined. Most TRU wastes are expected to come from Modules F1 and F2/D2, the fuel separations modules. In fuel fabrication, there is expected to be a significant effort made to leach or reprocess off-specification materials to recover TRU. Materials may also be recycled to separations to purify TRU. However, it is still expected that in addition to consumables such as protective clothing, filters, and analytical solutions, there will also be contaminated equipment such as gloveboxes, grinding machines, and molds that may contain over 100 nCi/g TRU.
G5-5. MODULE SCALING FACTORS This module does not represent a “facility” and cannot be scaled as such.
G5-6. COST BASES, ASSUMPTIONS, AND DATA SOURCES The information is from a study of TRU waste characterization and certification costs conducted by
the NETL for WIPP.13 The study was based on a combination of actual 2002 costs from INL and Rocky Flats Environmental Technology Site, and on estimated 2003 costs from Savannah River Site. Capital costs were not included.
Based on a typical drum of contact-handled TRU waste, the average life-cycle cost of characterization is $3,850 per drum (in 2002 dollars). Using 208 L per drum, this translates to $18,500/m3.
These costs were developed based on the sum of the average cost for a set of 15 individual waste certification activities (e.g., real-time radiography, nondestructive assay, and head space gas sampling). Furthermore, the data were based on the certification of 17,900 drums from a stored waste population of 24,600 drums, plus the visual examination of 14,200 drums. The cost of each activity was prorated by the percentage of drums for which the activity was applicable.
Table G5-1 shows the cost of three particularly high-cost activities to illustrate how dependent the cost of characterization is on specific activities. For example, if the waste requires solids coring and sampling, then the total cost of certification would jump to about $130,000/m3. To bring the cost back down to the average, solids coring and sampling would have to be restricted to approximately 1% of the waste drums (specific numbers can be obtained from the WIPP TRU characterization cost analysis13). The actual cost for an individual certification program then depends on the waste type, the certification activities required, and the number of containers available for averaging. The $18,500/drum represents a good current estimate for a large number of drums of waste of various types.
Table G5-1. Examples of high-cost characterization activities.
Average Cost per Drum
(cost/m3) Activity Cost per Drum Cost/m3
Visual examination and retrievably store $22,500 $108,000 Solids coring and sampling (FY 2001) $24,000 $115,000 Solids analysis (FY 2001) $63,000 $303,000

INL/EXT-07-12107 (March 2008) Advanced Fuel Cycle Cost Basis G-51
The method of computing the values in Table G5-2 is shown below with an example.
Table G5-2. Estimated characterization and certification costs for TRU wastes.a Waste Type Characterization $/m3
CH-TRU 88,800 RH-TRU 266,000−888,000
a. Costs do not include capital facility costs, waste treatment, or transportation.
From Table 4.3-1 of the NTWMP, “Baseline Cost Data,”14 the quoted dollar value for INL in
FY 2002 was $72,937,000. The CBFO estimates that 75% of this value is used in waste characterization, certification, and preparing waste for shipment. Therefore, INL cost for TRU waste characterization and certification during FY 2002 is shown in Equation (1).
$72,937,000 × 0.75 = $54,702,750. (1)
The method of estimating the volume characterized and certified is shown below. The number of planned shipments to WIPP is given in Table 3.2.1-1 of the NTWMP; however, the volume of waste is not given. The following conservative assumptions were used to determine a best-case estimate of the volume disposed:
• Each shipment consists of three Transuranic Package Transporter Model-IIs (TRUPACT-II)
• Each TRUPACT-II is full (i.e., 14 drums/TRUPACT-II or 42 drums/shipment)
• Each drum has a volume of 0.208 m3.
Again, using an FY 2002 INL reported value of 437 shipments and the assumptions above, the volume of waste is as shown in Equation (2).
437 shipments × 42 drums/shipment × 0.208 m3/drum = 3,817 m3/shipment. (2)
This volume, divided into the cost above, gives the characterization and certification cost of $14,327.
In most cases, the number of drums shipped is less than 42 because of transportation issues such as weight or wattage. Based on the INL shipping rate during the 3,100 m3 Project, the above estimate gives a volume estimate approximately 25% too high, or a cost estimate 25% too low in FY 2002. As such, the value calculated here should be considered a practical minimum. If the estimate of $14,327 is increased by 25%, it becomes $17,900/m3, which is within 3% of the NETL estimate of $18,500/drum ($88,800/m3) for characterization and certification of contact-handled TRU. Thus, the same approximate cost can be estimated from two approaches, and this is believed to be a good baseline.
G5-7. LIMITATIONS OF COST DATA The quoted values are baseline estimates based on operational costs; they do not include capital costs
for the equipment or facilities used for characterization and certification. Characterization and certification costs can be dominated by sampling and analysis, which can be from 6 to 30 times the average cost of characterization and certification. Characterization costs reported here should be considered bounding. Much of the characterization is necessitated by a lack of acceptable knowledge due to the poor data quality describing legacy wastes. In the future, it is expected that TRU wastes generated by commercial facilities and future reprocessing will be well characterized, and most characterization will

INL/EXT-07-12107 (March 2008) Advanced Fuel Cycle Cost Basis G-52
not be necessary. Also, a significant fraction of the characterization cost is related to container handling between characterization activities, and this should be greatly reduced for future wastes.
Costs for RH-TRU were not estimated separately from contact-handled TRU costs in this report. Costs estimated based on the NTWMP are simple averages; therefore, the costs are reasonably applicable to contact-handled TRU waste because the current plan is to fill WIPP repository with 95% contact-handled TRU waste. If waste characterization and treatment must be done remotely, the costs could be 3 to 10 times greater.
G5-8. COST SUMMARIES The module cost information is summarized in the What-It-Takes (WIT) cost summary in
Table G5-3. The summary shows the reference cost basis (constant year $U.S.), the reference basis cost contingency (if known), the cost analyst’s judgment of the potential upsides (low end of cost range) and downsides (high end of cost range) based on references and qualitative factors, and selected nominal costs (judgment of the expected costs based on the references, contingency factors, upsides, and downsides). These costs are subject to change and are updated as additional reference information is collected and evaluated, and as a result of sensitivity and uncertainty analysis. Refer to Section 2.6 in the main section of this report for additional details on the cost estimation approach used to construct the WIT table.
Costs for TRU wastes are driven almost entirely by regulations. If it can be assumed that future commercial wastes will be produced by well characterized processes, characterization costs will diminish, and treatment costs should be minimal and will be covered under operation of the recycling/separations facility.
The triangular distribution based on the costs in the WIT Table is shown in Figures G5-7. The distribution is skewed toward the low cost (the nominal was selected to be the low cost) because it is based on experience from WIPP. The distributions for RH-TRU are judged to be skewed toward low cost, but have potential to increase due to potential regulation of commercial facilities.
Table G5-3. Cost summary table for TRU waste conditioning selected values. What-It-Takes (WIT) Table
Reference Cost(s) Based on Reference
Capacity (Low Cost)
Upsides (High Cost) Downsides
(Nominal Cost) Selected Values
$88.8K/m3 CH-TRU $70K/m3 CH-TRU $90K/m3 CH-TRU $70K/m3 CH-TRU $577K/m3 RH-TRU $266K/m3 RH-TRU $888K/m3 RH-TRU $440K/m3 RH-TRU Average CH-TRU, Ave of RH-TRU range
20% savings for commercialization, reduced characterization for known waste streams
CH-TRU costs stay constant, RH-TRU costs are high range due to regulation of commercial facility
Selected values are a value judgment, based on successful experience base from WIPP
CH=contact-handled RH=remote-handled

INL/EXT-07-12107 (March 2008) Advanced Fuel Cycle Cost Basis G-53
Module G5 TRU Conditioning (CH-TRU)Estimated Cost Frequency Distribution
$/m3
Freq
uenc
yLow/Nominal Mean High
$70000 $76670 $90000
Figure G5-7. Module G5 TRU conditioning (CH-TRU) estimated cost frequency distribution.
G5-9. RESULTS FROM SENSITIVITY AND UNCERTAINTY ANALYSES
None available.
G5-10. REFERENCES 1. U.S. Department of Energy, Nuclear Waste Policy Act as Amended, U.S. Department of Energy,
Office of Civilian Radioactive Waste Management, Washington, DC, March 2004, http://www.ocrwm.doe.gov/documents/nwpa/css/nwpa.htm, Web page accessed January 2, 2005.
2. ASTM C1285-02, “Standard Test Methods for Determining Chemical Durability of Nuclear, Hazardous, and Mixed Waste Glasses and Multiphase Glass Ceramics: The Product Consistency Test (PCT),” American Society of Testing and Materials International.
3. EPA, “Toxicity Characteristic Leaching Procedure,” Method 1311, Rev. 0, July 1992.
4. B. D. Begg, et al., “Low-Risk Waste Forms to Lock Up High-Level Nuclear Waste,” Australian Nuclear Science and Technology Organisation, Waste Management '05, Tucson, Arizona, February 27−March 3, 2005.
5. R. A. Day, et al., “Glass-Ceramics in Cold-Crucible Melter: The Optimum Combinations for Greater Processing Efficiency,” Waste Management '03, Tucson, Arizona, February 23–27, 2003.
6. D. Kim and P. R. Hrma, “PNL Vitrification Technology Development Project High-Waste Loading High-Level Waste Glasses for High-Temperature Melter: Letter Report,” PNNL-10984, UC-2000, Pacific Northwest National Laboratory, February 1996.
7. E. Nicaise, et al., “Hanford High Level Waste Processing in a Cold Crucible Melter: Test Results Obtained in the Framework of the TWRS-P Contract,” Waste Management '99, Tucson, Arizona, February 28−March 4, 1999.

INL/EXT-07-12107 (March 2008) Advanced Fuel Cycle Cost Basis G-54
8. P. Hrma, et al., “Increasing High-Level Waste Loading in Glass without Changing the Baseline
Melter Technology,” Waste Management '01, Tucson, Arizona, February 25−March 1, 1999. 9. Transnuclear, “Nuhoms, A tailor-made dry storage solution with clear advantages,”
http://www.transnuclear.com/nuhoms.htm, Web page accessed July 19, 2007.
10. Energy Solutions, http://www.energysolutions.com/Disposal/clive.php, Web page accessed July 19, 2007.
11. Chem-Nuclear Systems, LLC., http://www.chemnuclear.com/disposal.html, Web page accessed July 19, 2007.
12. K. L. Yuracko, et al., “The Cost of Waste Disposal: Life Cycle Cost Analysis of Disposal of Department of Energy Low-Level Radioactive Waste at Federal and Commercial Facilities,” U.S. Department of Energy Office of Environmental Management, July 2002.
13. GAO, “Low-Level Radioactive Wastes, Department of Energy Has Opportunities to Reduce Disposal Costs,” U. S. General Accounting Office, GAO/RCED-00-64, April 2000.
14. National Energy Technology Laboratory, WIPP TRU Characterization Cost Analysis, NETL/CABE-575, Center for Acquisition and Business Excellence, National Energy Technology Laboratory, 2003.
15. DOE, National TRU Waste Management Plan (NTWMP), DOE/NTWMP-96-1204, Rev. 3, U.S. Department of Energy, 2002.

INL/EXT-07-12107 (March 2008) Advanced Fuel Cycle Cost Basis I-1
Module I
Long-term Monitored Retrievable Storage

INL/EXT-07-12107 (March 2008) Advanced Fuel Cycle Cost Basis I-2

INL/EXT-07-12107 (March 2008) Advanced Fuel Cycle Cost Basis I-3
Module I
Long-Term Monitored Retrievable Storage
I-1. BASIC INFORMATION Title 10, Code of Federal Regulations, Part 72 (10 CFR 72), contains the Nuclear Regulatory
Commission regulations pertaining to the licensing requirements for the independent storage of spent nuclear fuel and high-level radioactive waste. Licenses issued under the part are limited to the receipt, transfer, packaging, and possession of either:
1. Power reactor spent fuel to be stored in a complex that is designed and constructed specifically for storage of power reactor spent fuel aged for at least 1 year, other radioactive materials associated with spent fuel storage, and power reactor-related Greater-than-Class-C (GTCC) waste in a solid form in an independent spent fuel storage installation.
2. Power reactor spent fuel to be stored in a monitored retrievable storage installation owned by the U.S. Department of Energy (DOE) that is designed and constructed specifically for the storage of spent fuel aged for at least 1 year, high-level radioactive waste that is in a solid form, other radioactive materials associated with storage of these materials, and power reactor-related GTCC waste that is in a solid form.
The term Monitored Retrievable Storage Installation, as defined in 10 CFR 72.3, is derived from the Nuclear Waste Policy Act of 1982 and includes any installation that meets this definition:
A Monitored Retrievable Storage installation or MRS, means a complex designed, constructed, and operated by DOE for the receipt, transfer, handling, packaging, possession, safeguarding, and storage of spent nuclear fuel aged for at least 1 year, solidified high-level radioactive waste resulting from civilian nuclear activities, and solid reactor-related GTCC waste, pending shipment to a HLW repository or other disposal.
Although DOE has performed systems studies on various monitored retrievable storage installation designs, no detailed cost estimations have been produced to date. However, the Skull Valley Band of Goshute Indians have proposed and developed a detailed conceptual design of the nongovernmental adjunct, a privately owned and operated Independent Spent Fuel Storage Installation (ISFSI) to be located in Tooele County, Utah. Indeed, on February 21, 2006, the Nuclear Regulatory Commission issued a license to Private Fuel Storage, LLC (PFS) to build and operate its proposed temporary storage facility for spent nuclear fuel on the Skull Valley Goshute reservation in Skull Valley, Utah—the first nuclear facility to receive a license in more than 20 years.
Preliminary cost estimates for the Skull Valley ISFSI have been developed by PFS based on the detailed conceptual design depicted in Figure I-1 and having the layout as illustrated in Figure I-2. The detailed information is contained in the Skull Valley Environmental Impact Statement (EIS),1 which is prepared and submitted to the Environmental Protection Agency but also constitutes the basis of the formal license application to the Nuclear Regulatory Commission. The concept of the facility consists of a remotely located open area on which casks are stored in an upright position, having a maximum facility capacity of 4,000 casks, which is equivalent to approximately 40,000 MTHM.

INL/EXT-07-12107 (March 2008) Advanced Fuel Cycle Cost Basis I-4
Figure I-1. Artist rendition of Skull Valley Independent Spent Fuel Storage Facility.
I-2. FUNCTIONAL AND OPERATIONAL DESCRIPTION The following description was extracted with slight modifications from the Skull Valley EIS.1 The
basic site plan for the proposed private fuel storage facility is illustrated in Figure I-2. A fence would mark the boundaries of the 330-hectare (820-acres) general area. Within the general area, a 40-hectare (99-acre) restricted-access area would contain the storage pads and some of the support facilities. The entire 330-hectare site would be enclosed by a typical four-strand barbed wire range fence. Fencing around the restricted-access area would consist of two 2.4-m (8-ft) chain link security fences topped with barbed wire. The inner fence would be separated from the outer chain link nuisance fence by a 6-m (20-ft) isolation area. A new 4-km (2.5-mile) access road would lie within an 82-hectare (202-acre) right-of-way. The road would be built east of the site and would connect the site to the existing public roads. No fence would be constructed to enclose the new access road. Buildings and storage areas would primarily be located within the restricted-access area, with the exception of the administration building, concrete batch plant, and operations and maintenance building, which would be located on the site outside the security fences.
The facility would contain 4,000 modular concrete storage pads that would be 20 × 9 × 1 m (67 × 30 × 3 ft). Each storage pad would be constructed flush with grade level and would hold up to eight storage casks in a 2 × 4 array. Areas between the storage pads would be surfaced with compacted crushed rock 20 cm (8 in.) thick and sloped toward the north to facilitate drainage.
In addition to the storage pads described above, there would be four buildings:
1. The Canister Transfer Building, a massive, reinforced-concrete, high-bay structure approximately 60 m (200 ft) wide, 80 m (260 ft) long, and 27 m (90 ft) high. The Canister Transfer Building would facilitate the transfer of the spent nuclear fuel canister from its shipping cask into the storage cask and would be equipped with a 180-metric-ton (200-ton) overhead bridge crane for moving the shipping casks, a 135-metric-ton (150-ton) semigantry crane for canister transfer operations, and three canister transfer cells to provide a radiation-shielded work space for transferring the spent nuclear fuel canisters from the shipping casks to the storage casks. Shipping casks would be moved into the high bay portion of the building either on railcars or heavy/haul trailers, depending on the transportation option.

INL/EXT-07-12107 (March 2008) Advanced Fuel Cycle Cost Basis I-5
2. The Security and Health Physics Building, the entrance point for the 40-hectare (99-acre) restricted-access area, would be located adjacent to the Canister Transfer Building and consists of a single-story, concrete masonry structure approximately 23 m (76 ft) wide, 37 m (120 ft) long, and 5.5 m (18 ft) high. This building would provide office and laboratory space for security and health physics staff and would house security, communication, and electrical equipment needed by personnel.
3. The Administration Building consists of a single-story, steel-frame building approximately 24 m (80 ft) wide, 46 m (150 ft) long, and 5 m (17 ft) high that would include office and records management space, an emergency response center, meeting rooms, and a cafeteria.
4. The Operations and Maintenance Building consists of a single-story, steel-frame building approximately 24 m (80 ft) wide, 61 m (200 ft) long, and 8 m (26 ft) high, which would house maintenance shops and storage areas for spare parts and equipment to service vehicles and equipment at the facility.
Paved parking areas would be constructed adjacent to the Administration Building, the Operations and Maintenance Building, and the Security and Health Physics Building.
The storage pad emplacement area has a soil-cement subgrade to support the cask storage pads.
An 82-hectare (202-acre) right-of-way between the site and public roads would contain an asphalt paved access road to the proposed facility and overhead power and telephone lines. The road would consist of two 4.5-m (15-ft) lanes.
Onsite drainage at the storage pad area would be conveyed by a surface flow system to a 3-hectare (8-acre) storm water collection and detention basin to be located at the northern boundary of the restricted-access area (Figure I-3).
Electrical power for lighting, the security system, equipment operation, and other general purposes would be obtained from a new transformer to be connected with new lines on standard poles to existing 12.5 kV commercial power systems. Backup power for the security system, emergency lighting, and the site public address system would be provided by a diesel generator located in the Security and Health Physics Building. The communication system would consist of telephones, a public address system, and short-wave radio equipment. All buildings would be heated by propane due to the remoteness of the facility. Four propane tanks are located at a minimum distance of 550 m (1,800 ft) from the Canister Transfer Building and the cask storage area, and each propane tank would hold up to 19 m3
(5,000 gal). A potable water supply system would be provided for the facility, taking water from either a groundwater well on the site or from offsite sources. Aboveground storage tanks would provide adequate water for potable water for extinguishing fires and for the concrete batch plant. A fire suppression system in the Canister Transfer Building would be fed by fire pumps and both a primary and backup water tank, each with a capacity of 380 m3
(100,000 gal).
Other infrastructure includes a rail siding to connect to the existing trunk lines. The proposed right-of-way for the rail line would be approximately 51 km (32 miles) long and 60 m (200 ft) wide.
Figure I-4 shows the functional flow for the facility. Spent nuclear fuel is received in shipping casks, transferred to storage casks, and stored on a pad. At some later time, the spent nuclear fuel is transferred back to a shipping cask and shipped out (via Module O) for reprocessing (Modules F1 and F2/D2) or disposal (Modules L and M).

INL/EXT-07-12107 (March 2008) Advanced Fuel Cycle Cost Basis I-6
I-3. PICTURES/SCHEMATICS Figures I-2, I-3, and I-4 describe the Skull Valley site plan and layout.
This illustration shows the rail line (A) that will enter the PFS facility from the west and run to the cask transfer building (B). There, the shipping casks will be removed from the rail cars. Then the storage canisters will be removed from the shipping casks and placed into steel and concrete storage casks. The storage casks will then beplaced on three-foot thick reinforced concrete pads (C). The concrete for the robust storage casks will be made on site at the batch plant (D). http://www.privatefuelstorage.com/project/facility.html
This illustration shows the rail line (A) that will enter the PFS facility from the west and run to the cask transfer building (B). There, the shipping casks will be removed from the rail cars. Then the storage canisters will be removed from the shipping casks and placed into steel and concrete storage casks. The storage casks will then beplaced on three-foot thick reinforced concrete pads (C). The concrete for the robust storage casks will be made on site at the batch plant (D). http://www.privatefuelstorage.com/project/facility.html
Figure I-2. Basic site plan for the proposed private fuel storage facility.

INL/EXT-07-12107 (March 2008) Advanced Fuel Cycle Cost Basis I-7
Figure I-3. Skull Valley facility layout and major components.1
Receive Shipping
Casks
Transfer SNF to Storage
Casks
Place Storage Casks on Pad
Transfer SNF to Shipping
Casks
Ship Shipping
Casks
Figure I-4. Facility functional block diagram.
I-4. MODULE INTERFACE DEFINITION The module will accept spent nuclear fuel casks transported (Module O) from wet (Module E1) or
dry storage (Module E2) at nuclear power plants. On arrival, sealed canisters containing the spent fuel assemblies will be transferred to site-fabricated concrete storage casks and placed in storage. At unspecified future dates, fuel can be removed for ultimate disposition (Modules L or M) or for reprocessing (Modules F1 or F2/D2).

INL/EXT-07-12107 (March 2008) Advanced Fuel Cycle Cost Basis I-8
I-5. MODULE SCALING FACTORS Within a site, facilities can be expanded simply by the addition of more pads, which is an expense of
approximately $20,000 per 20 × 9-m pad, provided land is available.
I-6. COST BASES, ASSUMPTIONS, AND DATA SOURCES The reference cost basis in 2006 dollars for a private ISFSI is presented in Table I-1, generated from a
top-down estimate based on the Skull Valley representative design for a monitored retrievable system. Combining the capital cost of $480M and Operations and Maintenance cost of $2,400M for a 40,000 MTHM facility operating over a 40-year lifetime, yields a Total Life-Cycle Cost of $2,880M ($72/kgHM) before financing, which escalates to $3,780M ($94.53/kgHM) after assessing interest at 16.27% over a 10-year amortization schedule.
The Skull Valley annual operating expenses are estimated by a principal of PFS at $60M per year, as quoted during a recent (2006) interview in an industry trade publication. Division of the annual cost by the maximum number of casks envisioned to be stored at the facility yields a value of $15,000 per year as the amount required for operations on a per cask basis, which is the source of the entry in Table I-1.
I-7. LIMITATIONS OF COST DATA The cost estimate is based on direct conversations with the chairman and chief executive officer of
PFS, accompanied by recent information available from trade publications.
The technology readiness is considered to be commercially viable. While no facilities of this type currently exist, the technology is not substantially different from the dry storage facilities presently operating at multiple reactor sites throughout the country. The data quality is categorized as a top-down scoping assessment with a common basis/approach.
Table I-1. Surface monitored retrievable storage (Skull Valley). Private Fuel Storage (PFS) Goshute
Reservation, Skull Valley, Utah Value 2006 $ Units
Data Source or Person Making Assumption
Maximum number of casks onsite 4,000 casks PFS/JD Parkyn, Chairman and Chief Executive Officer (CEO)
MTHM maximum onsite 40,000 MTHM PFS/JD Parkyn, Chairman and CEO
Average kgHM per cask 10,000 kgHM/cask PFS/JD Parkyn, Chairman and CEO
Facility capital investment per cask 120,000 $/cask PFS/JD Parkyn, Chairman and CEO
Total PFS capital investment for land/facility development
480 106$ Calculated
Assumed number of years for facility to reach full storage capacity
10 years ORNL/KA Williams
Facility fill rate 400 casks/year Calculated 4,000,000 kgHM/year Calculated Operations charge 15,000 $/cask/year Nuclear Fuel, March 27, 2006,
Operations: $60 M/y

Table I-1. (continued).
INL/EXT-07-12107 (March 2008) Advanced Fuel Cycle Cost Basis I-9
Private Fuel Storage (PFS) Goshute Reservation, Skull Valley, Utah
Value 2006 $ Units
Data Source or Person Making Assumption
Operations charge per year per kgHM 1.5 $/kgHM/year Calculated Typical storage time 20 years ORNL/KA Williams $/kgHM for operations 30 $/kgHM Calculated Fixed charge rate interest 10.00% % ORNL/KA Williams Fixed charge rate to amortize capital over 10 years
16.27% % Calculated
Annual capital charge for facility 78.12 106$/year Calculated Capital investment per kgHM 19.53 $/kgHM Calculated Total levelized storage cost 49.53 $/kgHM Calculated Total life-cycle cost for PFS facility (without interest)
2.88 109$ Calculated
Total life-cycle cost with interest 3.78 109$ Calculated
I-8. COST SUMMARIES Table I-2 is a code-of-accounts cost summary.
Table I-2. Code-of-accounts information. AFCI Code of Accounts No. Code of Accounts Description
Cost (Million 2007 $) Comments
0 Early Life Cycle Costs — 1 Capitalized Preconstruction Costs — 2 Capitalized Direct Costs 489 Total Directs 489 3 Capitalized Support Services — Included above Base Construction Cost (BCC) 489 4 Capitalized Operations — Included above 5 Capitalized Supplementary Costs — Included above Total Overnight Cost (TOC) 489 6 Capitalized Financial Costs 306 Total Capital Investment Cost (TCIC) 795 7 Annualized O&M Cost 61.5 10-year fill period 9 Annualized Financial Costs 18.3 Total Operating Costs 3,057 50-year life* Total Project Life-Cycle Cost 3,852
* Note: The 50-year life includes 10 years to fill, 30 years at capacity, and 10 years to empty.

INL/EXT-07-12107 (March 2008) Advanced Fuel Cycle Cost Basis I-10
The module cost information is summarized in the What-It-Takes (WIT) cost summary in Table I-3. The summary shows the reference cost basis (constant year U.S. dollars), the reference basis cost contingency (if known), the cost analyst’s judgment of the potential upsides (low end of cost range) and downsides (high end of cost range) based on references and qualitative factors, and selected nominal costs (judgment of the expected costs based on the references, contingency factors, upsides, and downsides). These costs are subject to change and are updated as additional reference information is collected and evaluated, and as a result of sensitivity and uncertainty analysis. Refer to Section 2.6 in the main section of this report for additional details on the cost estimation approach used to construct the WIT table.
The cost summary includes potential upsides and downsides. A potential cost upside would be to arrange the storage casks closer together (e.g., for cooler spent fuel), for which a rough estimate of a 10% decrease in construction cost has been applied herein. A potential cost downside would be the stipulated requirement of a perimeter intrusion detection and assessment system (PIDAS) around the restricted area. A typical assessment for the cost of a PIDAS is $3,000 per foot, which is multiplied by an approximate estimate of 8,000 feet for the perimeter length. Such an upgrade in the security might require additional Operating and Maintenance costs as well (e.g., additional security guards), which are not included here. Another large potential cost downside would be associated with storage of the waste in underground bunkers to increase security and protection, for which a very rough estimate would result in a doubling of construction costs.
The triangular distribution based on the costs in the WIT Table is shown in Figure I-5. The distribution is skewed toward the low cost because there are many reactors already performing dry storage which provides the basis for the nominal cost.
Table I-3. Cost summary table. What-It-Takes (WIT) Table
Reference Cost(s) Based on Reference
Capacity Upsides
(Low Cost) Downsides (High Cost)
Selected Values (Nominal Cost)
Capital Costs of $796M Annual costs of $61.5M/year, 50-year life
$3,774M Total Project: Life Cycle Cost
$3,878M to $4,649M Total Project: Life Cycle Cost
$3,853M Total Project: Life Cycle Cost
Unit Cost/kgHM $94/ kgHM $116/kg HM $96/kgHM Based on a capacity of 40,000 MTHM* or a fill (and empty) rate of 4,000 MTHM/year
Lower cost for greater storage density (10% lower construction cost)
Additional cost for high-security perimeter ($24.5 M); increased cost for storage in buried bunkers (higher construction cost $1,592 M).

INL/EXT-07-12107 (March 2008) Advanced Fuel Cycle Cost Basis I-11
Module I Long Term Monitored Retrievable Storage
Estimated Cost Frequency Distribution
$/kgHM
Freq
uenc
y Low Nominal Mean High
$94 $96 $102 $116
Figure I-5. Module I long term monitored retrievable storage estimated cost frequency distribution.
I-9. RESULTS FOR SENSITIVITY AND UNCERTAINTY ANALYSIS No sensitivity or uncertainty analyses were performed.
I-10. BIBLIOGRAPHY Alvarez, R., J. Beyea, K. Janberg, J. Kang, E. Lyman, A. Macfarlane, G. Thompson, F. N. von Hippel,
“Reducing the Hazards from Stored Spent Power-Reactor Fuel in the United States, Science & Global Security, Vol. 11, No. 1, 2003, pp. 1–51, http://www.princeton.edu/~globsec/publications/pdf/11_1Alvarez.pdf.
Bunn, M., et al., Interim Storage of Spent Nuclear Fuel: A Safe, Flexible, and Cost-Effective Near-Term Approach to Spent Fuel Management, Harvard University Project on Managing the Atom and the University of Tokyo Project on Sociotechnics of Nuclear Energy, June 2001.
Bunn, M., The Economics of Reprocessing vs. Direct Disposal of Spent Nuclear Fuel, Cambridge, Mass, Project on Managing the Atom, Harvard University, DE-FG26-99FT4028, December 2003, pp. 19, 55–57; also on Web: http://www.bcsia.ksg.harvard.edu/.
Fairlie, I., “Dry Storage of Spent Nuclear Fuel: The Safer Alternative to Reprocessing,” Report to Greenpeace International in Response to COGEMA Dossiers to the La Hague Public Inquiry, May 2000, http://www.scholar.google.com/scholar?hl=en&lr=&q=cache:ZVJt2rZ0S.
GAO, “Spent Nuclear Fuel: Options Exist to Further Enhance Security,” U.S. General Accounting Office, GAO-03-426, July 2003, http://www.gao.gov/new.items/d03426.pdf.
National Academy of Sciences, “Disposition of High-Level Waste and Spent Nuclear Fuel: The Continuing Societal and Technical Challenges,” National Academy Press, Washington, DC, 2001.
OECD Nuclear Energy Agency and International Atomic Energy Agency, The Economics of the Nuclear Fuel Cycle, 1994, pp. 11, 27, 37–38, 50, 77–80, http://www.nea.fr/html/ndd/reports/efc/, Web page accessed January 24, 2006.

INL/EXT-07-12107 (March 2008) Advanced Fuel Cycle Cost Basis I-12
U.S. Department of Energy, United States of America National Report, Joint Convention on the Safety of Spent Fuel Management and on the Safety of Radioactive Waste Management, DOE/EM-0654, U.S. Department of Energy Office of Environmental Management, Washington.
I-11. REFERENCES 1. S. Nuclear Regulatory Commission, Final Environmental Impact Statement for the Construction and
Operation of an Independent Spent Fuel Storage Installation on the Reservation of the Skull Valley Band of Goshute Indians and the Related Transportation Facility in Tooele County, Utah, NUREG-1714, U.S. Nuclear Regulatory Commission, Office of Nuclear Material Safety and Safeguards, Washington, DC, December 2001.

INL/EXT-07-12107 (March 2008) J-1 Advanced Fuel Cycle Cost Basis
Module J
Near Surface Disposal

INL/EXT-07-12107 (March 2008) J-2 Advanced Fuel Cycle Cost Basis

INL/EXT-07-12107 (March 2008) J-3 Advanced Fuel Cycle Cost Basis
Module J Near Surface Disposal
J-1. BASIC INFORMATION Low-level waste (LLW) is disposed in shallow, or “near surface,” disposal trenches. The trenches are
lined, accessible by truck, and have an earthen cover. Currently, both U.S. Department of Energy (DOE) and commercial (Nuclear Regulatory Commission or state licensed) LLW disposal sites exist in several locations across the country. However, for the purposes of this module, costs were developed for a new or “greenfield” site, with a comparison to available cost data of existing disposal sites. LLW arrives prepackaged in 1.22 × 1.22 × 2.33-m (4 × 4 × 7-ft) containers and is buried in shallow (8-m) trenches for near surface disposal. Each trench or pit can hold approximately 146,000 m3 of waste (46,000 containers).
J-2. FUNCTIONAL AND OPERATIONAL DESCRIPTION Figure J-1 shows a simple diagram of the functional flow. Waste material arrives in trucks
prepackaged in standard waste (4 × 4 × 7-ft) containers. Containers are unloaded in the pit and stacked along the long wall for burial. Figures J-2 and J-3 illustrate typical operations for near surface disposal facilities. Figure J-4 provides an example of a typical near surface disposal layout, for which cost estimates were developed.
Receive Waste in Standard
Waste Boxes
Place Containers in
Pit Close Pit
Figure J-1. Functional block diagram for near surface waste disposal.
J-3. PICTURES/SCHEMATICS
Figure J-2. Low-Level Waste operations at Nevada Test Site.1

INL/EXT-07-12107 (March 2008) J-4 Advanced Fuel Cycle Cost Basis
Figure J-3. Nevada Test Site low-level waste disposal facility aerial view.1
Figure J-4. Typical near surface disposal site dimensions.

INL/EXT-07-12107 (March 2008) J-5 Advanced Fuel Cycle Cost Basis
J-4. MODULE INTERFACE DEFINITION Low-level waste is material that has been slightly contaminated by radioactive material. It typically
consists of clothing worn in contaminated (or potentially contaminated) areas, tools, cleaning supplies, and other contaminated disposable items. It can be generated at any nuclear facility, but the bulk will probably be generated at reprocessing plants (Module F), fuel fabrication plants (Module D), and reactors.
The module covers only the capital and operating expense of the LLW burial site. Transportation (Module O2), LLW containers, and ancillary expenditures are excluded. Depleted uranium from Module K can also be disposed of as LLW, but the expectation is that it will be dispositioned by Module K. Module J is a terminal module in that nothing leaves once it has been accepted.
Module J may also potentially be used to dispose of materials that exceed the general classification of LLW. In the United States, radioactive waste is generally categorized as one of three classes:
1. Spent nuclear fuel or the high-level waste resulting from the processing of spent nuclear fuel.
2. LLW, which is further subdivided into three successively stringent classes (Class A, Class B, and Class C) based on quantities and activities of the constituents.
3. Material that is in excess of the highest category of LLW (Class C), which is generally referred to as Greater Than Class C (GTCC) waste. The Code of Federal Regulations lacks clarity with regard to disposal of GTCC waste, which is commonly interpreted as being material destined for the mined geologic repository (Module L). However, it is possible to safely dispose of GTCC material without using valuable repository space by burying the waste at intermediate depths (~35 m), referred to as Greater Confinement Disposal (GCD). This document does not provide costs for GTCC disposal because such costs remain highly speculative until greater specificity is provided by the regulations or by licensing decisions.
The following historical summary regarding disposal of GTCC waste is provided for informational purposes. From 1984 until 1989, intermediate depth disposal operations were conducted by DOE at the Nevada Test Site. The operations emplaced high specific-activity low-level radioactive waste and limited quantities of transuranic (TRU) waste in GCD boreholes.
The GCD boreholes are about 3 m (10 ft) in diameter and 36 m (120 ft) deep, of which the bottom 15 m (50 ft) were used for waste emplacement and the upper 21 m (70 ft) were backfilled with native alluvium. The boreholes are situated in a thick sequence of arid alluvium of which the bottom is almost 200 m (650 ft) above the water table at the Nevada Test Site—one of the most arid regions of the U.S.
Following emplacement, a performance assessment was completed to determine whether the TRU waste posed a danger to human health, the requirements of which are defined under the U.S. Environmental Protection Agency (EPA) Code of Federal Regulations, Title 40, Part 191 Subpart B promulgated in 1985. The primary conclusions of the performance assessment were that disposal of TRU waste in intermediate depth GCD boreholes in the Nevada Test Site setting easily provides isolation under the 10,000-year Containment Requirement, and potential doses under the Individual Protection Requirements in the 1,000-year regulatory timeframe are almost insignificant.
Although there are currently no dedicated federal or commercially licensed facilities to dispose of GTCC materials, it is anticipated such facilities will become available in the near future, particularly for the eventual very large volumes expected from the decontamination and decommissioning of aged nuclear plants, including conversion, enrichment, reactors, reprocessing, and fuel fabrication facilities.

INL/EXT-07-12107 (March 2008) J-6 Advanced Fuel Cycle Cost Basis
J-5. MODULE SCALING FACTORS The traditional exponential scaling factor is not applicable to this type of facility. Capacity increases
are generally accomplished by increasing the number of pits, rather than by increasing the size of a single pit. Consequently, the capital cost of the facility is better expressed as a cost for a one-pit facility plus an incremental cost for each pit after the first one. For example, the capital cost for the facility estimated here is $52.19M + $29.79M • (N – 1), where N is the number of pits.
J-6. COST BASES, ASSUMPTIONS, AND DATA SOURCES Credible partitioned costs for near-surface disposal facilities are not readily available in the literature,
so an estimate was developed from the bottom up based on the Nevada Test Site facility diagrammed in Figure J-4. The following assumptions apply:
1. Facilities will be located on existing nuclear facility sites, remote federal lands, or remote private lands. In all cases, land cost is an insignificant factor and is ignored.
2. All waste arrives in 1.22 × 1.22 × 2.33-m (4 × 4 × 7-ft) rectangular standard waste boxes known as “B-25 Crates” (Figure J-2), the cost of which is covered under LLW transportation.
3. All material is transported by truck to the site.
4. The estimate includes groundwater-monitoring wells, which may or may not be required.
Each pit can contain approximately 146,000 m3 of waste based on standard B-25 boxes stacked four high and covered with a 2.4-m-thick cap.
Table J-1 shows the estimated operating costs for a near surface disposal facility. The estimated operating cost is $2,500,000 per year in 2006 dollars, with a discounted cost of $171.5/m3 for a 460,000 m3 capacity facility having a life of 30 years. Staffing and cost are based on interviews with Sandia National Laboratories personnel who are involved with storage facilities operations.
Table J-1. Estimated operating costs (2007 dollars/year). Cost Description Rate Units Quantity Extension
Direct labor Manager $86,500 $/year 2 $173,000 Waste Acceptance $65,200 $/year 8 $521,760 Heavy Equipment $27.00 $/hour 4,160 $112,320 Miscellaneous Support $13.50 $/hour 4,160 $56,160 Subtotal $863,240 Overhead and Support @ 1.25 $1,079,050 Total Labor $1,942,290 Fuel $3.00 $/gallon 25,000 $75,000 Repair to Operating Equipment $25,500 $2,042,790 Allowance Unforeseen Expenses @ 25% $510,700 $2,553,490 Regulatory @ 135% $3,447,200 Total (rounded) $6,000,000

INL/EXT-07-12107 (March 2008) J-7 Advanced Fuel Cycle Cost Basis
In addition to the costs shown in Table J-1, it is likely that costs for security, regulatory compliance, etc. will be incurred as part of a “facility charge” imposed by the federal or state site upon which the facility is located. As an example, the Hanford LLBG has annual operating costs of $3.1M and “regulatory” costs of $4.2M, or 135% of the operating cost. When this factor is applied, the annual costs are $6M.
Table J-2, on the next page, provides a cost estimate provided to Sandia by F. Wingate. The basic estimate is for three pits. The estimate was then adjusted, as shown in the last two columns, for just one pit. It was assumed that the surface facilities occupy approximately the same area as one pit. Thus, the area of a one-pit facility will be half that of a three-pit facility. By the same token, the fencing required for a one-pit facility will be 75% that of a three-pit facility. Table J-3 takes the results from Table J-2 and completes the cost estimate to include contingency and some “administrative” items. By taking the difference between the cost for three pits and the cost for one and dividing the result in half, the incremental cost for additional pits can be determined to be approximately $34.2M.
The amount of waste generation per year is an estimate. As described at their Web site,1 the Nevada Test Site facility accepts approximately 35,000 m3 per year (actually, less than 1 million ft3) with two pit systems operational. Hence, each trench is accepting about 17,000 m3 per year. This was taken to be a “reasonable” receipt rate and reduced slightly in the present analysis to 14,600 m3/year to accommodate a 10-year fill time for a single pit.
In addition to the capitalized costs to open the facility, it will be necessary to fund its closure and any long-term stewardship costs that might be imposed. The Hanford LLBG estimated $317,000/acre to close, INL estimated $400,000/acre, and SRS estimated $430,000/acre.2 Based on Figure J-3, this facility encompasses 61.75 acres, so its cost to close will be $24.7M at $400,000/acre. Various sites have estimated long-term stewardship costs at $0.5M/acre for 100 year ($50M) while Tennessee imposes a cost of $1M for 10 years ($10M).2 This study uses $50M.
It is now possible to combine the operating costs from Table J-1 and the capital costs from Table J-3 to estimate the life cycle costs presented in Table J-4. Table J-4 contains a present value analysis showing each capital cost outlay and the operations and maintenance (O&M) expenditures per year with inflation, taxes, and discount factors included. Inflation is assumed to be 2% per year and the discount factor used in the analysis is 15%, which should be sufficient to allow a reasonable return on investment and some profit. The unit cost (which also escalates annually) is approximately $1,245/m3. This compares well with Table J-5, providing a sort of “mid-range” estimate as compared to the many examples in the table.
The bottoms-up estimate shown in Table J-3 is accurate for the scope presented to within a range of 30% high or low.

INL/EX
T-07-12107 (March 2008)
J-8 A
dvanced Fuel Cycle C
ost Basis
Table J-2. Detailed capital cost estimate in 2003 dollars for near-surface disposal facility. File Name: Detail Worksheet
Code Description Quantity Unit Matl/Equip Unit Cost
Material/ Equipment Labor
One Only Mat/Equip
One Only Labor
1 Clear Site w/dozer. Medium clearing. 61.82 AC 110.00 $6,800 $3,555 $6,800 $3,555 2 Grade Site, 200-ft haul 299,209.00 SY 0.67 $200,470 $80,786 $100,235 $40,393 3 Excavate 3/ea 100 × 300 × 30-m pits. 4,594,287.00 CY 3.28 $15,057,776 $9,351,671 $5,019,259 $3,117,224 4 Haul Excavated Material (1 mile RT
w/12 CY dump truck) 4,594,287.00 CY 2.14 $9,831,774 $5,177,761 $3,277,258 $1,725,920
5 Spread fill, w/dozer 300 HP, 300-ft haul
4,594,287.00 CY 1.88 $8,637,260 $2,756,572 $2,879,087 $918,857
6 Fence, Chain Link, Sch.40, 3 Strands of Barbed wire, 6 ft H
6,500 LF 19.53 $126,926 $26,761 $95,195 $20,070
7 Gates, allowance 2 EA 7,000.00 $14,000 $6,000 $14,000 $6,000 8 Truck scale 1 EA 35,000.00 $35,000 $15,000 $35,000 $15,000 9 Concrete foundation for above 1 EA 4,700.00 $4,700 $8,900 $4,700 $8,900 10 Receiving station, all in cost 13,500 SF 106.00 $1,431,000 $1,431,000
11 Maintenance building 32,400 SF 83.00 $2,689,200 $2,689,200
12 Guard shack, all in cost, allowance 1 EA 100,000.00 $100,000 $100,000
$38,128,106 $17, 423,452 $15,651,733 $5,852,365 FREIGHT ALLOWANCE @ 0% DESIGN DEVELOPMENT @ 10% $3,812,810 $1,742,350 $1,565,173 $585,237 CONTRACTOR INDIRECT @ 35% LABOR/10% OF MATERIAL $4,194,092 $6,708,031 $6,025,917 $2,253,161 TOTAL $46,135,008 $25,873,833 $23,242,823 $8,690,762

INL/EXT-07-12107 (March 2008) J-9 Advanced Fuel Cycle Cost Basis
Table J-3. Summary capital cost estimate for near-surface disposal facility.
Description Factor Labor Hours
Three $ × 1,000s
Cost
One Only $ × 1,000s
Cost Equipment $46,135 $23,243 Material w/above w/above Labor 60.00 431,230/144,850 $25,874 $8,691 Total Field Cost 351,445 $72,009 $31,934 Construction Mgmt/Procurement @ % of Field
3% $2,160 $958
D.E./P.M. @ % of Field Cost 12% 100,840 $8,641 $3,832 Total Directs $82,810 $36,724 Owners Field (5% Craft Hours) @ $/hour 80.00 21,561/7,243 $1,725 $0 Owners Home Office (5% Direct Cost) $4,141 $1,836 Total Owners Cost $5,866 $2,415 Total Dir. + Owners $88,676 $39,139 Environmental Permitting@ % of Above 3.00 $2,660 $1,174 Licensing @ % of Above 0.00 $0 $0 Total Allowances $2,660 $1,174 Total Dir.+Owners+Allow $91,336 $40,313 Startup & Testing @ % Above 0.00 $0 $0 Total in 2003 Dollars $91,336 $40,313 Escalation/Rounding 11.6% $10,595 $4,676 Total in 2007 Dollars $101,931 $44,989 Contingency 20.0% $20,386 $8,998 Grand Total $122,317 $53,987

INL/EX
T-07-12107 (March 2008)
J-10A
dvanced Fuel Cycle C
ost Basis
Table J-4. Present value analysis (escalation at 2%/yr, and a 15% discount factor).
Year Capital Cost O&M Boxes/year Annual Volume Revenue
Pretax Income Depreciation Tax Cash Flow
Present Value
0 -$53,987 -$53,987 -$53,987 1 -$6,120 4,600 14,600 $18,615 $12,495 -$5,399 -$2,839 $9,656 $8,397 2 -$6,242 4,600 14,600 $18,987 $12,745 -$5,399 -$2,938 $9,806 $7,415 3 -$6,367 4,600 14,600 $19,367 $13,000 -$5,399 -$3,040 $9,959 $6,548 4 -$6,495 4,600 14,600 $19,754 $13,260 -$5,399 -$3,144 $10,115 $5,783 5 -$6,624 4,600 14,600 $20,149 $13,525 -$5,399 -$3,251 $10,274 $5,108 6 -$6,757 4,600 14,600 $20,552 $13,795 -$5,399 -$3,359 $10,437 $4,512 7 -$6,892 4,600 14,600 $20,964 $14,071 -$5,399 -$3,469 $10,602 $3,986 8 -$7,030 4,,600 14,600 $21,383 $14,353 -$5,399 -$3,582 $10,771 $3,521 9 -$7,171 4,600 14,600 $21,810 $14,640 -$5,399 -$3,696 $10,943 $3,111 10 -$41,647 -$7,314 4,600 14,600 $22,247 $14,933 -$5,399 -$3,814 -$30,528 -$7,546 11 -$7,460 4,600 14,600 $22,692 $15,231 -$4,165 -$4,427 $10,805 $2,322 12 -$7,609 4,600 14,600 $23,145 $15,536 -$4,165 -$4,549 $10,987 $2,054 13 -$7,762 4,600 14,600 $23,608 $15,847 -$4,165 -$4,673 $11,174 $1,816 14 -$7,917 4,600 14,600 $24,080 $16,164 -$4,165 -$4,800 $11,364 $1,606 15 -$8,075 4,600 14,600 $24,562 $16,487 -$4,165 -$4,929 $11,558 $1,420 16 -$8,237 4,600 14,600 $25,053 $16,817 -$4,165 -$5,061 $11,756 $1,256 17 -$8,401 4,600 14,600 $25,554 $17,153 -$4,165 -$5,195 $11,958 $1,111 18 -$8,569 4,600 14,600 $26,065 $17,496 -$4,165 -$5,333 $12,163 $983 19 -$8,741 4,600 14,600 $26,587 $17,846 -$4,165 -$5,472 $12,373 $869 20 -$50,767 -$8,916 4,600 14,600 $27,119 $18,203 -$4,165 -$5,615 -$38,180 -$2,333 21 -$9,094 4,600 14,600 $27,661 $18,567 -$5,077 -$5,396 $13,171 $700 22 -$9,276 4,600 14,600 $28,214 $18,938 -$5,077 -$5,545 $13,394 $619 23 -$9,461 4,600 14,600 $28,778 $19,317 -$5,077 -$5,696 $13,621 $547 24 -$9,651 4,600 14,600 $29,354 $19,703 -$5,077 -$5,851 $13,853 $484 25 -$9,844 4,600 14,600 $29,941 $20,097 -$5,077 -$6,008 $14,089 $428 26 -$10,041 4,600 14,600 $30,540 $20,499 -$5,077 -$6,169 $14,330 $379 27 -$10,241 4,600 14,600 $31,151 $20,909 -$5,077 -$6,333 $14,576 $335 28 -$10,446 4,600 14,600 $31,774 $21,328 -$5,077 -$6,500 $14,827 $296 29 -$10,655 4,600 14,600 $32,409 $21,754 -$5,077 -$6,671 $15,083 $262 30 -$10,868 4,600 14,600 $33,057 $22,189 -$5,077 -$6,845 $15,344 $232 31 -$136,722 -$11,086 0 0 -$147,807 -$1,941 Total Rate/m3 1.25 -$283,123 -$259,362 13,8000 43,8000 $755,175 $506,898 -$146,401 -$144,199 $68,491 $294

INL/EXT-07-12107 (March 2008) J-11 Advanced Fuel Cycle Cost Basis
Table J-5. Life cycle costs for disposal of DOE low-level waste at various facilities.2 Disposal Site Life-Cycle Cost ($/m3)
DOE CERCLA Disposal Facilities Hanford ERDF $29 Oak Ridge EMWMF $140 INL ICDF $160 Fernald OSDF $190 DOE Non-CERCLA Disposal Facilities Savannah River Site Trenches $130 Nevada Test Site $320 INL RWMC $700 Hanford LLBG $2,000 Savannah River Site Vaults $2,100 Commercial Disposal Facilities Envirocare (soil) $180 Envirocare (debris) $520 Barnwell $14,000 U.S. Ecology $2,500
Notes: (1) To gain a true cost comparison of disposal sites, generator costs including waste preparation, packaging, and transportation
must also be considered, which vary depending on the disposal site. (2) These costs do not include surcharges for remote handling, shielding, mixed low-level waste, etc. (3) The values shown for Barnwell and U.S. Ecology are their nominal average prices for low-level waste and do not include
curie or dose rate surcharges. (4) Cost estimates for DOE facilities include all future closure and long-term stewardship costs. Even though for many of the facilities, these are partially sunk costs that DOE must pay regardless of whether any future waste is emplaced in the facility.
J-7. LIMITATIONS OF COST DATA • Estimate is plus or minus 30% as standard factored cost on scope presented
• Scope is well established based on existing facilities
• Technology is well proven on a large scale commercially.
The technology readiness is commercially viable. Disposal of LLW is existing technology. The data quality is categorized as a scoping assessment with a common basis/approach.
J-8. COST SUMMARIES Given the variable nature of LLW, it is not possible to estimate the amount of uranium present.
Therefore, no attempt was made to relate these costs to uranium consumption based on a 2,000 MTHM/year spent nuclear fuel processing capacity. Instead, costs were normalized to the volume of material delivered to the site, which is based roughly on a volume rate similar to the current Nevada Test Site system and a 30-year life. The waste receipt rate and related volume of delivered material could possibly double. Table J-6 is a code-of-accounts breakdown of disposal cost.

INL/EXT-07-12107 (March 2008) J-12 Advanced Fuel Cycle Cost Basis
Table J-6. Code-of-accounts information. AFCI
Code of Accounts No. Code of Accounts Description
Cost (Million 2007 $) Comments
0 Early Life-Cycle Costs — 1 Capitalized Preconstruction Costs — 2 Capitalized Direct Costs 122 Closure Costs (Sinking Fund)* 24 Stewardship Costs (Sinking Fund)* 50 Total Directs 196 3 Capitalized Support Services — Included above Base Construction Cost (BCC) 196 4 Capitalized Operations — Included above 5 Capitalized Supplementary Costs — Included above Total Overnight Cost (TOC) 196 6 Capitalized Financial Costs — Total Capital Investment Cost (TCIC) 196 7 Annualized O&M Cost 6.0 9 Annualized Financial Costs, Taxes & Profit 5.7 Total Operating Costs 351 30-year life Total Project Life-Cycle Cost 547 Inflation not included * Note that end-of-life costs for closure and stewardship have been included with capital costs.
The module cost information is summarized in the What-It-Takes (WIT) cost summary in Table J-7. The summary shows the reference cost basis (constant year U.S. dollars), the reference basis cost contingency (if known), the cost analyst’s judgment of the potential upsides (low end of cost range) and downsides (high end of cost range) based on references and qualitative factors, and selected nominal costs (judgment of the expected costs based on the references, contingency factors, upsides, and downsides). These costs are subject to change and are updated as additional reference information is collected and evaluated and because of sensitivity and uncertainty analysis. Refer to Section 2.6 in the main section of this report for additional details on the cost estimation approach used to construct the WIT table. The triangular distribution based on the costs in the WIT Table is shown in Figure J-5.

INL/EXT-07-12107 (March 2008) J-13 Advanced Fuel Cycle Cost Basis
Table J-7. Cost summary table (2006 dollars/MTU). What-It-Takes (WIT) Table
Reference Cost(s) Based on Reference
Capacity
Reference Cost Contingency
(+/- %)
Upsides (Low Cost)
Downsides (High Cost)
Selected Values(Nominal Cost)
$1,250/m3 (± 30%) $875−$1,560/m3
$450/m3 (Comparable to Envirocare)
$2,500/m3 (Comparable to US Ecology)
$1,250/m3
Lower capital costs; lower stewardship costs (i.e., Tennessee at $10M)
More stringent requirements for security, environmental protection and long-term stewardship
Module J Near Surface DisposalEstimated Cost Frequency Distribution
$/m3 (LLW)
Freq
uenc
y
Low Nominal Mean High
$450 $1250 $1400 $2500
Figure J-5. Module J near surface disposal estimated cost frequency distribution.
J-9. RESULTS FOR SENSITIVITY AND UNCERTAINTY ANALYSIS No sensitivity analyses were performed for this module.
J-10. BIBLIOGRAPHY Bunn, M., et al., The Economics of Reprocessing vs. Direct Disposal of Spent Nuclear Fuel, Cambridge,
Mass, Project on Managing the Atom, Harvard University, DE-FG26-99FT4028, December 2003, pp. 19, 55–57; also on Web: http://www.bcsia.ksg.harvard.edu/.
“DOE to Transfer Depleted Uranium to BPA,” Platts Nuclear News Flashes, July 6, 2005.
LabelMaster, LabelMaster’s 2005 Catalog, Chicago, IL. http://www.labelmaster.com/resources/catalogpdfs/, p. 187, Web page accessed January 26, 2005.
“LES News,” Platt’s Nuclear News Flashes, May 27, 2005.

INL/EXT-07-12107 (March 2008) J-14 Advanced Fuel Cycle Cost Basis
Makhijani, A. and B. Smith, “Costs and Risks of Depleted Uranium from a Proposed Enrichment Facility,” Science for Democratic Action, Vol. 13, No. 2, June 2005, http://www.ieer.org/sdafiles/13-2.pdf.
Michaels, G. E and T. D. Welch, Evaluation of Disposition Options for Reprocessed Uranium, ORNL/TM-12326, February 1993, pp. 27–47, 89–109.
Neary, Ben, “NM Leaders Strike Deal on Uranium Waste Plant,” The New Mexican, June 4, 2005, http://www.freenewmexican.comlnews/14465.html, Web page accessed June 6, 2005.
OECD Nuclear Energy Agency and International Atomic Energy Agency, The Economics of the Nuclear Fuel Cycle, 1994, pp. 11, 27, 37–38, 50, 77–80, http://www.nea.fr/html/ndd/reports/efc/, Web page accessed January 24, 2006.
TRU TeamWorks, Transportation News (weekly e-newsletter of the Waste Isolation Pilot Plant team), RH-72B - Ready When the Time Comes, August 25, 2003, http://www.wipp.ws/TeamWorks/TRUTeamWorksArchives/08-25-03ext.pdf#search=‘RH%20Tru%2072B%2065’.
J-11. REFERENCES 1. U.S. Department of Energy,
http://www.nv.doe.gov/emprograms/environment/wastemanagement/low_level.aspx http://www.nv.doe.gov/library/PhotoLibrary/WB0103.jpg, Web page accessed July 10, 2006.
2. U.S. Department of Energy, Report to Congress; The Cost of Waste Disposal: Life Cycle Cost Analysis of Disposal of Department of Energy Low-Level Radioactive Waste at Federal and Commercial Facilities, U.S. Department of Energy, Office of Environmental Management, Washington, DC, July 2002, http://ndep.nv.gov/boff/doehqllwreport7-08-02.pdf, Web page accessed January 2, 2005.

INL/EXT-07-12107 (March 2008) Advanced Fuel Cycle Cost Basis K1-1
Module K1
Depleted Uranium Conversion and Disposition

INL/EXT-07-12107 (March 2008) Advanced Fuel Cycle Cost Basis K1-2

INL/EXT-07-12107 (March 2008) Advanced Fuel Cycle Cost Basis K1-3
Module K1 Depleted Uranium Conversion and Disposition
K1-1. BASIC INFORMATION Depleted uranium (DU) in the form of uranium hexafluoride (UF6) is the by-product of the isotope
separation processes used to enrich uranium above its natural isotopic abundance of 0.711 wt% U-235 for military and reactor applications (see Figure K1-1). Material balance demands that a stream of uranium of assay less than the natural feed abundance of 0.711 wt% U-235 also be produced. Because most uranium goes through the enrichment (isotope separation) process (Module C) in the form of UF6, most depleted uranium resides in this chemical form. The forms of depleted UF4 U-metal, and UO3 also exist in smaller amounts at some U.S. Department of Energy (DOE) sites. The U-235 assay of natural or slightly enriched uranium can also become depleted by virtue of being irradiated in a nuclear reactor (consumption of U-235 by the fission process). This fission-depleted uranium material is often found in the form of nitrate solutions or crystals or stable oxide powders from spent fuel reprocessing or plutonium recovery operations (Handling of this reprocessed uranium material derived from burned NATO or EU fuel is covered in Module K-2) In any case, the term “depleted” always indicates a U-235 assay of less than 0.711 wt% U-235.
In the U.S, most depleted uranium is in the form of DU6, resulting from 60+ years of uranium enrichment operations conducted by three DOE enrichment (gaseous diffusion enrichment process) plants for military, research, and commercial nuclear plant use. Over 700,000 metric tons of DUF6 reside at cylinder yards at the Paducah, Kentucky; and Portsmouth, Ohio gaseous diffusion plant (GDP) sites; this material constitutes the largest DOE radioactive material legacy inventory (in terms of mass, not Curies) in the U.S. (see Figures K1-2 and K1-4). It should be noted that approximately 6000 UF6 legacy cylinders located at the Oak Ridge (TN) Gaseous Diffusion Plant site were successfully transported to the Portsmouth site by the end of CY 2006.1
Figure K1-1. DUF6 is the by-product of uranium enrichment.2

INL/EXT-07-12107 (March 2008) Advanced Fuel Cycle Cost Basis K1-4
Figure K1-2. DUF6 cylinders stacked for storage at a DOE gaseous diffusion plant site.2
As of January 2007, the following amounts existed at each site as government legacy material:
• Portsmouth Gaseous Diffusion Plant site: 250,517 MTDUF6
• Paducah Gaseous Diffusion Plant site: 436,369 MTDUF6.
The United States Enrichment Corporation (USEC) owns 34,460 MTDUF6 mostly at Portsmouth. The grand total is 721,346 MTDUF6. The U-235 assay of this material varies from 0.15 to 0.55 wt% U-235. (The tails assay for operation of the enrichments plants is determined by balancing feed [ore mining and milling + U3O8 to UF6 conversion] costs against the cost of enrichment [separative work units or SWUs]). Figure K1-3 shows how the U-235 assay of the depleted UF6 inventory is distributed.
Figure K1-3. Cumulative distribution of DUF6 metric tonnage versus U-235 assay.

INL/EXT-07-12107 (March 2008) Advanced Fuel Cycle Cost Basis K1-5
The normal enrichment plant practice is to collect the DUF6 from the GDP tails withdrawal systems in 14-ton steel-walled cylinders that are stacked and stored on the enrichment plant site. (This is still being done by USEC at the Paducah Gaseous Diffusion Plant, the only U.S. GDP operating today. USEC’s tails cylinders represent nongovernment USEC DUF6, which is not considered part of the government legacy described above, but will in the future be treated by the same processes as the government material.) In the early 1990s, some of the older DUF6 cylinders were found to be so degraded and corroded that oxidation compounds formed by the reaction of solid UF6 with wet air were found on the surface of the cylinders. At this point, it was realized by Congress and DOE that a serious water and air contamination problem could ensue if the DUF6 storage problem were not fixed. (UF6 vapor, produced by ambient or elevated temperature sublimation of solid UF6, and moist air react to form gaseous hydrogen fluoride [HF, a very toxic and corrosive material] and UO2F2, a white, slightly radioactive powder that becomes airborne.) A program was initiated by the DOE Office of Nuclear Energy (DOE-NE) to begin looking at the options for long-term disposition of this legacy, including consideration of the best and safest chemical forms for future storage/disposal. These studies also included looking at possible beneficial uses of the depleted uranium, such as shielding for accelerator or nuclear facilities, containers for spent fuel or high-level waste, the diluent for mixed oxide fuel, reenrichment, and semiconductors, with the realization that such uses may only utilize a fraction of the DOE inventory. The official DOE Web site for DUF6 has links to many DUF6-related documents of use to the interested researcher.a,2
It soon became apparent that the best route for permanent disposition of legacy DUF6 is to convert to a more stable and less toxic chemical form, such as an oxide, and to isolate this form from the environment. In 2001, the U.S. nuclear and chemical industries were given the opportunity to propose and bid on the management, conversion, and disposition of the DOE-owned DUF6 legacy material. Uranium Disposition Services, LLC (UDS), a consortium of three firms (Framatome-ANP, Duratek [now part of Energy Solutions, and Burns and Roe) was selected3 in 2002 to design and construct two DUF6 to DU3O8 plants (one each at Paducah and Portsmouth [see Figure K1-4) and to contract for the disposition of the DU3O8 in the same manner as is done for low-level waste (LLW). (Note that the conversion product is more accurately described as UOx [x~2.4 to 2.6], because there is some variation in stoichiometry.) The likely shallow burial resting place for this DU3O8 material, now to be packed in the old but washed-out UF6 cylinders, was at that time designated to be Envirocare (a private firm now also part of the Energy Solutions consortium) in Clive, Utah, or Nevada Test Site (a government site) near Beatty, Nevada. Construction of the two DOE-owned conversion plants commenced on July 31, 2004. More recently, it has been determined that DOE’s LLW facility at the Nevada Test Site (NTS) is a more economical and environmentally acceptable location for disposal of the U3O8.b,c,4,5
a. Author’s note on beneficial uses: Early in the days of atomic energy, it was recognized that U-238, the isotope that constitutes over 99.29% of DU, could be readily converted in a reactor to the fissile isotope Pu-239. In fact, this is exactly what was done with the DU targets inserted into the U.S. plutonium production reactors that were located at Hanford and Savannah River for defense purposes. A fast neutron reactor fueled with plutonium could eventually produce enough new plutonium by irradiation of U-238 blanket assemblies that the fuel cycle would be self-sustaining with no requirement for new fissile material. Alvin Weinberg, former Director of Oak Ridge National Laboratory, once pointed out that the potential energy available from all the uranium in the DUF6 cylinders in the yard of the nearby Oak Ridge Gaseous Diffusion Plant (K-25 or ORGDP) was the same as that available from a significant fraction of the U.S. reserves of coal. b. Selection of NTS. Personal communication from Phillip McGinnis, ORNL DUF6 Program Manager; April 2007. c. Technical note: The two UDS facilities under construction will have to handle some DUF6 that is slightly contaminated with the higher actinides plutonium and neptunium plus some fission product Tc-99. This was introduced into the GDP tails when the U.S. Atomic Energy Commission fed slightly impure reprocessed uranium into the GDPs. These two plants are incorporating special safety features and procedures at some additional costs. Any new DUF6 conversion plants supporting new enrichment capacity are not likely to have to deal with this problem, because virgin or unreprocessed uranium will only be fed to the enrichment facilities. Tc-99 and transuranic nuclides are potential problems for only a few cylinders after the DUF6 is removed. Transferable Tc-99 and transuranic waste offer negligible additional radiological hazard in the proposed Portsmouth and Paducah processing plants and in the UOx produced.

INL/EXT-07-12107 (March 2008) Advanced Fuel Cycle Cost Basis K1-6
Figure K1-4. Source locations of U.S. DUF6 stockpile (all DUF6 now at Paducah and Portsmouth).2
It is realized that with present plans, these two facilities will handle only legacy DUF6 during most of their operating lives and that the same environmental/safety liability problem remains for the existing USEC DUF6 stockpile and any future DUF6 produced in new U.S. enrichment plants using UF6 as feedstock. Disposition of the future DUF6 stockpile is already the major public licensing issue6 for the National Enrichment Facility, a proposed Nuclear Regulatory Commission (NRC)-licensed7 gas centrifuge enrichment plant proposed for Hobbs, New Mexico, by the private firm Louisiana Energy Services, LLC (LES). Disposition of DUF6 will also need to be addressed by the proposed NRC-licensed American Centrifuge Plant to be constructed by USEC at DOE’s Portsmouth site.8 Being aware of DOE’s problems at the three legacy GDP sites, stakeholders in the southeast New Mexico area do not want long-term storage of DUF6 at the enrichment plant site. Because of such future enrichment commercial activity, it is very likely that new DUF6 conversion facilities, such as those under construction by Uranium Disposition Services, LLC (UDS) at Paducah and Portsmouth, will have to be constructed either at or nearby the new enrichment plant sites, as add-on or schedule-extension capacity at Paducah or Portsmouth, or at new, Greenfield locations. It is very likely that such plants will be financed, constructed, and operated by private firms, as opposed to the government contractor arrangement at Paducah and Portsmouth. In fact in February of 2005, LES and AREVA signed a memorandum of understanding that could lead to the possible construction of a private deconversion plant to support the proposed New Mexico enrichment facility. Siting options in Texas are being considered.9 Compared to other fuel cycle steps, this one has relatively low technical, safety, and environmental risk; hence, total privatization should not be difficult.
It is also very likely that this step will become a mandatory step in the front end of any fuel cycle where UF6-based uranium enrichment is involved. This means that a definite market for this service will exist. In order to eliminate or minimize transportation costs, the enricher might want to locate such

INL/EXT-07-12107 (March 2008) Advanced Fuel Cycle Cost Basis K1-7
conversion facilities adjacent to or as part of the new enrichment plant. France already does this with their DUF6 to DU3O8 W-Plant located immediately adjacent to Cogema/Eurodif’s Pierrelatte “Georges Besse” Gaseous Diffusion Plant. As mentioned earlier,9 LES is also known to be discussing DUF6 conversion/disposition possibilities with existing nuclear and chemical firms. USEC, for their existing GDP and future gas centrifuge capacity at Portsmouth (American Centrifuge Plant), is very likely to contract with UDS for new conversion capacity at Portsmouth or queue their cylinders for conversion at the government facility after the legacy DUF6 campaign is complete. (Note: Federal law allows a government DUF6 conversion plant to process nongovernment DUF6 on a total cost-recovery basis. In fact, DOE has provided a unit cost estimate to LES for the provision of such services.10)
K1-2. FUNCTIONAL AND OPERATIONAL DESCRIPTION The process to be used for DUF6 conversion is a dry (nonaqueous) one involving fluidized bed
reaction of UF6 vapor with steam and hydrogen to produce a flowable U3O8 powder. The process basically occurs in two steps:
UF6 (v) + H2O (v) UO2F2(s) + 4HF (v)
3UO2F2 + H2 + 2H2O U3O8 + 6HF
where:
(v) = vapor
(s) = solid
The hydrofluoric acid (HF) by-product has some value if it can be sold to an industrial user who is not concerned with the small (<10 ppm) amount of uranium that might be present in the HF. A nuclear user, such as a U3O8 (yellowcake) to natural UF6 converter, might be interested in this HF. According to Reference 11 an HF sales agreement was signed by UDS and Solvay Fluorides for an undisclosed amount of HF in May of 2006. If all the HF cannot be sold, it may be necessary to convert the HF to stable, slightly uranium-contaminated CaF2, which is relatively nontoxic, but which itself must be dispositioned, most likely by packaging and shallow burial as LLW. This disposal issue is also discussed in Reference 11.
K1-3. PROCESS SCHEMATIC The basic UDS process and material balance as shown from the Site Specific EIS for Paducah12 is
shown on Figure K1-5 and described in Table K1-1. The process is very similar to the one used at the Framatome fuel fabrication facility at Richland, Washington, which converts enriched UF6 to UO2 for use in light water reactor (LWR) fuel (see Module D1). The throughput of the proposed DUF6 plant, however, is orders of magnitude higher than that of the Richland EUF6 to EUO2 plant.

INL/EXT-07-12107 (March 2008) Advanced Fuel Cycle Cost Basis K1-8
Figure K1-5. DUF6 to DU3O8 conversion process.11
Table K1-1. Technical data for Paducah Uranium Disposition Services conversion facility.11

INL/EXT-07-12107 (March 2008) Advanced Fuel Cycle Cost Basis K1-9
K1-4. MODULE INTERFACE DEFINITION Front-end interface. The cost of storage of DUF6 at enrichment plant sites should be assigned to the
enrichment plant operational costs. If DUF6 conversion is to be located away from the enrichment plant site, the cost of DUF6 transportation (in 14-ton cylinders) by rail or truck should be assigned to the DUF6 to DU3O8 conversion facility.
Back-end interface. Disposal of the DU3O8 powder resulting from conversion has its own regulatory and procurement issues. UDS or any other conversion plant owner will need to contract with an LLW disposer, such as Envirocare or NTS, for shallow burial disposition. The converter must also appropriately package the powder to minimize water intrusion and allow safe transportation. Both purchased containers (such as supersacks or drums) or emptied, washed, and adapted DUF6 cylinders were being considered for this purpose. The latter option has been deemed economically superior. The tipping fee for this material is likely to constitute a significant percentage of the unit cost ($/kgU) of the overall conversion/disposition life cycle. Because tipping may be charged on a $/volume basis, the conversion process will need to achieve an as reasonably high as possible bulk powder density that can accommodate transportation and tipping requirements. The volumes of material (DU3O8) projected from a likely U.S. uranium enrichment/conversion enterprise will likely require the opening of new or the major expansion of LLW near-surface disposal capacity (Module J). (Note: Costs of our new LLW capacity specifically for DU3O8 burial should be assigned to this step [Module K1 and not Module J]). The near surface disposal will allow the eventual recovery of this depleted-uranium material if the breeder reactor plutonium economy ever evolves in the distant future and DU would be needed for target fuel assemblies.
The regulation of the shallow geologic disposal as LLW of large amounts of bulk DU3O8 or other uranium forms remains an issue. The very large inventory of this material and its concentration in one area means that in the distant future (thousands of years), after the cylinders enclosing the insoluble DU3O8 corrode away, the burial area will be a large producer of radon gas from the uranium decay chain. This gas will easily diffuse through the dry soil cap. In order to prevent this occurrence, a deeper or more robust engineered capped burial site will be needed or noncorrodable containers will be needed. The NRC is now investigating this issue as part of the LES National Enrichment Facility licensing process, and a future ruling is expected. If radon control is required, the unit disposition cost associated with more robust geologic disposal would be expected to rise significantly. Reference 13 briefly describes five designs for licensable near-surface LLW disposal facilities.
K1-5. MODULE SCALING FACTORS The Paducah facility described above will have four parallel conversion lines in a single building
(each line around 5,000 tons DUF6 per year). It is now anticipated that these four lines will be replicated at Portsmouth. Up to this single line capacity a capital cost scaling exponent of 0.6 is probably appropriate. Beyond 5,000 tons per year, a 0.9-capital cost scaling factor can account for multiple lines in a single building. Operational costs are manpower intensive, and a scale factor of 0.9 for large plants should apply.
K1-6. COST BASES, ASSUMPTIONS, AND DATA SOURCES Publicly-available cost information on this new step of the fuel cycle has evolved only over the last
8 years. The Paducah GDP formerly made depleted uranium compounds and metal from DUF6 for defense applications from the mid-1950s until the 1980s; however, the costs and other technical information on this operation are still classified. Among the sources of cost data are initial cost studies for the DOE-NE DUF6 program, DOE-UDS contract information, and proceedings related to the NRC licensing of the LES National Enrichment Facility. All this cost information is essentially in the form of

INL/EXT-07-12107 (March 2008) Advanced Fuel Cycle Cost Basis K1-10
projections. No such facilities are operating on a large scale in the U.S.; hence, no historical data are available. (The first DOE-UDS conversion operation is slated for 2008.) The cost figure of merit of interest for this step is the unit cost in $/kg U (as DUF6 ) converted and dispositioned for plants of capacities in the several thousands of metric tons of uranium per year (MTU/yr). Table K1-1 shows the throughput and other relevant technical data for the proposed Paducah facility. (The Portsmouth facility will be nearly identical.) Such plants consist of multiple identical process trains or lines of a few thousand MTU/yr each, thus any plant scaling/expansion beyond one line is achieved by line replication. Capital costs for such plants are expected to be in the $100+ million range, which is relatively low for nuclear facilities with similar footprints or process areas. We are discussing well-known chemical technology for which the radioactivity hazard is minimal and nuclear criticality concerns nonexistent. Chemical toxicity and facility seismic integrity concerns are more important for this fuel cycle step.
The 1997 Livermore report14 contains the first economic analysis projection performed for DOE DUF6 management after the program was formed in DOE-NE. It looked at several end products (such as U, UO2, U3O8, and the sale of by-product HF). Costs were expressed as lump-sum discounted life-cycle costs. The closest option considered by Lawrence Livermore National Laboratory to the one finally selected by DOE in 2002 is that of dry conversion to U3O8 followed by burial in shallow trenches. It was assumed that 28,000 MTU/yr be processed for 20 years in a single large privately owned and financed plant. At a discounted (7% real) life-cycle cost: including design, construction, operations, and decommissioning of $758M for the whole conversion/disposal program (not including revenues from by-product sales, which decrease the net unit cost by a few percent), a projected unit cost of $5.38/kgU was calculated by Oak Ridge National Laboratory from the Lawrence Livermore National Laboratory data in August 2004.
As will be seen, this unit cost is higher than the price derived from the life-cycle costs proposed by the winning bidder for the DOE legacy work. However, the latter considered revenues from HF sales, a smaller building and throughput, no financing charges (government funds to construct), and very competitive negotiated disposal fees (for shallow burial of U3O8). The analyst for Module K1, therefore, believes that the calculated $5.58/kgU ($6/kgU in 2007 $) estimate is a reasonable projection in light of the lower unit cost estimates made for the DUF6 to DU3O8 government-owned plants now under construction at Paducah, Kentucky, and Portsmouth, Ohio.
The $5+/kgU projected cost is supported by another fuel cycle study.15 One of the contentions brought up by interveners is the disposition of DUF6 tails from the proposed LES National Enrichment Facility to be located in southeastern New Mexico. The interveners question the validity of the $5.50/kgU cost of disposal number put forth by LES in the licensing documentation7 submitted to the NRC. (This was one of the admissible contentions brought forth by the interveners). Oak Ridge National Laboratory believes a number around this figure to be a credible projection for a privately owned and financed facility. It is surmised that LES, a private corporation, probably based their calculation of this unit cost on what it would cost for them to do these operations (deconversion of 7,800 MTDUF6/yr) as part of the enrichment step, i.e., as a fully amortized add-on facility to their gas-centrifuge plant. (If the $5.5/kgU unit cost was rolled into the price of enrichment, the latter $/SWU price would have to be increased on the order of 10%. Because of the highly competitive enrichment market, LES’s reluctance to commit to the additional step of DUF6 conversion/disposition at this time is not surprising. In a March 2005 letter,10 DOE indicated that its projected charge to LES to perform this service would be $3.34/kgDUF6 or $4.91/kgU in a government facility based on a pro-rata share of the capital and operating costs of the two UDS facilities under construction. NRC found another LES estimate of $4.68/kgU to be reasonable.16 In a June 2005 agreement with the State of New Mexico, LES is being required to put up a bond of $7.15/kgU.17 This unit cost is likely to be closer to the unit cost that will ultimately be realized later in this decade. Antinuclear groups such as Institute for Energy and Environmental Research18 suggest that even this is too low a value, and that values as high as $30/kgU should be used for the bond.19 Such a high value would imply that shallow burial of the DU3O8 would not be allowable because of radon

INL/EXT-07-12107 (March 2008) Advanced Fuel Cycle Cost Basis K1-11
considerations and that deep burial in a mine or repository would be required. Hopefully, all nuclear fuel cycle nations with enrichment plants will ultimately agree that DUF6 conversion/disposition is environmentally necessary and will add the needed DUF6 conversion/disposal capacity, which will eventually level the playing field for enrichment pricing. A new path for DUF6 disposition is now being pursued, i.e., reenrichment of the tails to produce natural assay feed. Rising uranium ore and conversion prices have convinced the Bonneville Power Administration that such a scheme is economic.20 The economics of tails reenrichment will be discussed in more detail in Module C.
The unit cost from a proposed UDS facility can also be roughly calculated from contract announcement3 information that mentions the $5.58/kgU value of the contract (2002 dollars), the 700+ thousand metric ton inventory (to be processed over 20 years), and the need to design and construct the two plants in 3 years and operate them for 5 years. (Additional years will be under a new contract.) The following Oak Ridge National Laboratory-generated spreadsheet (see Table K1-2) was used to project the unit cost from the proposed Paducah government-owned/contractor-built and operated conversion facility.
The calculation assumes a low (3.8%) government real discount rate and assumes that the 5-year constant dollar operating costs are maintained over the additional 15 years of plant production. The capital cost is assumed to be amortized over the 20 years of operations. Although the government does not amortize in the same sense as a private enterprise, an imputed amortization can be used to calculate the same unit cost that would be derived by discounting government cash flows at the same low discount rate.
As expected, a government financed plant can convert and disposition DUF6 at a lower unit cost, i.e., a projected $3/kgU unit cost as opposed to $5+/kgU for the private facility. For future fuel cycles, it should be assumed that private industry will finance, own, and operate such facilities. With process improvements and operational learning, a constant dollar price of $5.0/kgU for the private facility should certainly be realizable if deployment risks are minimized and shallow U3O8 burial is allowed. This cost is in line with Bunn, et al.’s estimate15 for producing fast reactor blanket feed material, presumably DU metal or DUO2 feed to the fuel/blanket fabrication plant, of $6/kgU. The earlier DOE/Lawrence Livermore National Laboratory studies show that producing DU metal or DUO2 is somewhat more expensive than producing DU3O8. This is because batchwise reduction operations are needed as opposed to the continuous process for DU3O8 production.
K1-7. LIMITATIONS OF COST DATA AND OTHER CONSIDERATIONS The following considerations are relevant to depleted-uranium materials in the fuel cycle:
1. If non-UF6 based enrichment processes are eventually realized, such as atomic vapor laser isotope separation (AVLIS) or chemical exchange (CHEMEX), the chemical form of DU from the enrichment plant will be different. Conversion costs for metal DU from AVLIS, for example, are likely to be somewhat higher than for conversion of DUF6. In Table K1-2, all costs are limited to DUF6 based processes.
2. If reprocessed uranium is ultimately fed back to enrichment plants, a possibility from closed fuel cycles, very small amounts of actinides and fission products might contaminate these “secondary” tails. Dealing with this problem and its safety consequences could cause a unit cost increase for DUF6 conversion/disposal. Future experience with the UDS (Paducah and Portsmouth) plants should provide better cost data, since some of the U.S. GDPs plants handled RU in periodic reenrichment campaigns and some DUF6 cylinders are likely to contain such minor constituents.

INL/EXT-07-12107 (March 2008) Advanced Fuel Cycle Cost Basis K1-12
Table K1-2. Unit DUF6 conversion/disposal cost from a government plant.
Plant annual capacity 12100 MTDU/yr
Economic life 20 yrs
Design and permitting cost 16 $MSite-related costs 10 $MFacility construction cost 84 $M
Total base capital cost including contingency 110.0 $MImputed interest during construction (2 yrs to construct) 5.5 $MTotal capital cost (2002$) 115.5 $M
Annual ops cost breakdown:
Conversion plant operations 15.6 $M/yrU3O8 packaging/disposal 10.4 $M/yr
Total annual operations cost 26.0 $M/yr
Operations contribution to levelized cost of product/service 2.15 $/kgU
Discount rate for government project (real) 3.80%
Capital recovery factor ( fraction per yr of ops) 0.0723
Annual payments to recover capital cost of plant over life 8.35 $M
Capital portion of unit product cost 0.69 $/kgU
Total levelized product cost (2002$) 2.84 $/kgUIn 2004$: 3.0 $/kgU
Effect on Enrichment Price:
W/P ratio for reload PWR enrichment (3.78% U-235) 7.46
SWU/P ratio for same (P=1) 4.86
Additional conv/disp $ to produce 4.86 SWU 21.18 $
Addition to SWU price to cover deconversion/disposal: 4.36 $/SWU
Proposed Government DUF6 Conversion Facility at Paducah
The 2007 constant dollar unit conversion/disposal cost would be ~$3.2/kgU.

INL/EXT-07-12107 (March 2008) Advanced Fuel Cycle Cost Basis K1-13
3. Unit conversion/disposal costs for natural assay or enriched UF6 up to approximately 0.9% U-235 are likely to be close to those for DUF6. (It is unlikely one would dispose of these materials unless irradiation or contamination has driven the fission product, transuranic, or U-236 levels up to a level at which recovery of pure uranium products would not be economic.) Up to this 0.9% U-235 assay, nuclear criticality under light-water moderation is not a concern for processing or disposal. A UREX-based reprocessing plant (Module R1) will produce such low enrichment U products as part of its multiple output streams (see Module K2).
4. The disposition of weapons grade plutonium by use of LWRs burning mixed oxide fuel may use 0.5 to 2% of the government DUF6 stockpile. DUO2 is the preferred diluent for the plutonium in LWR mixed oxide (MOX) fuel, i.e., ~96% DUO2 and 4% PuO2. A conversion facility will be needed to produce DUO2 from DUF6 for the U.S. plutonium disposition program, and Framatome (AREVA) has proposed such a facility for its Richland, Washington, facility. The DUO2 powder produced will have special quality assurance and fuel qualification requirements far exceeding those of dry-processed U3O8 or UO2 powder. A wet processed DUO2 powder, such as from the Framatome ammonium diuranate (ADU) process, that is capable of meeting the present mixed oxide fuel irradiation specification for the U.S. plutonium disposition program will have a unit cost considerably higher than the $5/kgU proposed for dry-processed U3O8, which will ultimately be buried. The conversion cost for this special MOX-grade powder will likely be in the $30 to $70/kgU range. This cost is eventually absorbed in the overall cost of the MOX fuel (Module D1-2).
5. Another beneficial use that would consume much of the DUF6 inventory is the use of DUO2 rough pellets as filler material in the final disposition spent fuel containers for the proposed Yucca Mountain repository. Since over eons, Pu-239 decays to U-235, the depleted uranium material could isotopically dilute any leached U-235 and prevent future repository criticality. In essence such an application would be rejoining the U-238 with the remaining unfissioned U-235 (in the spent fuel) from which it was originally separated. This concept is discussed in References 21 and 22, but is not presently part of the baseline Yucca Mountain spent fuel repository program. The author is not aware of any cost studies on this concept. An INL study23 reports that use in casks would cost $22.80/kg UF6.
6. If uranium ore prices rise significantly and SWUs remain cheap, reenrichment of DUF6 makes eminent economic sense. The Russians are already doing this with DUF6 from Urenco’s European Centrifuge Enrichment plants.24 Russian SWUs from fully amortized centrifuge plants are available at a very low cost. USEC has also recently requested that DOE make available its higher assay tails for re-enrichment at their Paducah facility.25 At 2007 EUF6 prices, with their high U3O8 component, USEC could realize significant profit from the use of this essentially free tails feed material, since the costs of additional enrichment from ~0.4% U-235 to 0.71% U-235 ( natural feed equivalent) are small compared to the purchase today (at over $200/kgU) of converted U3O8.
7. An unfavorable ruling from the NRC on shallow burial of DU3O8 at commercial LWR disposal sites, such as Envirocare, could significantly impact the unit cost, because a more expensive burial solution would be needed. Such a ruling might force burial at a non-NRC regulated site such as DOE’s Nevada Test Site19.d Even at a government site, such as Nevada Test Site, some radon amelioration measures are likely to be required. As mentioned earlier, NTS is now the preferred disposal option.
In general, the DUF6 conversion/disposal step of the fuel cycle can be placed in the viable-commercial category of technology readiness.
d. Personal communication from D. W. Lee, Oak Ridge National Laboratory.

INL/EXT-07-12107 (March 2008) Advanced Fuel Cycle Cost Basis K1-14
K1-8. COST SUMMARIES No DUF6 disposition life cycle cost data are publicly available in the Advanced Fuel Cycle standard
code-of-accounts. It is likely that UDS has such data in their conversion facility Title I design in the work breakdown structure or code-of-accounts system. However, it is available only to their DOE-EM customer.
In summary, a commercial (privately financed) conversion/disposal program is projected to disposition DUF6 at $5.00/kgU in 2004 dollars (~$5.40 in 2007 $). And a government program is projected to disposition the same material at $3−$5/kgU, depending on discount rate assumptions. Both of these assume that shallow burial as LLW is permissible and readily available in the near term. For reference purposes, the private plant with technology improvements is the most likely path for nonlegacy DUF6 in future fuel cycles. In determining a “selected value” for the table below, the author has decided to assume that some cost, schedule, and performance risks are real, and that when the plants are completed and disposal contracts signed, the price will be more like $10/kgU. Recent experience with DOE projects, such as the Savannah River Mixed Oxide Facility, the Hanford River Protection Project, and the Tritium extraction facility, indicated that “in-construction” projections of or completed facility “actuals” of capital and operating costs usually significantly exceed early preconstruction cost projections. The $8/kgU selected unit cost value should reflect such conversion facility cost escalation and likely prolonged regulatory and contracting difficulties with DU3O8 shallow burial. Ultimate project completion and success, however, is still assumed. A recent UDS communicatione 21 suggests that the conversion only cost may be $2.8/kgUF6 and the disposal cost $5/kg U3O8. This translates to a total of $10.1 per kgU.
The module cost information is summarized in the What-It-Takes (WIT) cost summary in Table K1-3. The summary shows the reference cost basis (constant year $U.S.), the reference basis cost contingency (if known), the cost analyst’s judgment of the potential upsides (low end of cost range) and downsides (high end of cost range) based on references and qualitative factors, and selected nominal costs (judgment of the expected costs based on the references, contingency factors, upsides, and downsides). These costs are subject to change and are updated as additional reference information is collected and evaluated, and as a result of sensitivity and uncertainty analysis. Refer to Section 2.6 in the main section of this report for additional details on the cost estimation approach used to construct the WIT table.
The triangular distribution based on the costs in the WIT Table is shown in Figure K1-6.
K1-9. RESULTS FROM SENSITIVITY AND UNCERTAINTY ANALYSIS Because of the conventional nature of their technology, no such calculations were performed.
e. Personal communication: John McCoy, Plant Manager, UDS LLC to Erich Schneider, Univ of Texas, Austin.

INL/EXT-07-12107 (March 2008) Advanced Fuel Cycle Cost Basis K1-15
Table K1-3. Cost summary table for DUF6 conversion/disposal from privately funded plant. What-It-Takes (WIT) Table
Reference Cost(s) Based on Reference
Capacity (Low Cost)
Upsides (High Cost) Downsides
(Nominal Cost) Selected Values
$6/kgU for 12,000–30,000 MTDU/yr Capacity
$5/kgU $50/kgU $10/kgU
Technology improvements, by-product sales revenues. No difficulty with DU3O8 burial.
Severe regulatory difficulties with shallow DU3O8 burial. Deep mine or repository burial required.19 Need to dispose of all by-products such as HF and CaF2 with no revenues. Reference 24 reports a cost as high as $110/kgU. This is felt to be unreasonable, since it is of the order-of-magnitude of spent nuclear fuel disposal.
Assumes increase from reference cost due to typical nuclear project cost growth and anticipated special requirements for shallow burial. Represents unit cost actually expected. Supported by recent UDS data.
Module K1 Depleted U Conversion & DispositionEstimated Cost Frequency Distribution
$/kgU
Freq
uenc
y
Low Nominal Mean High
$5 $10 $22 $50
Figure K1-6. Depleted U conversion and disposition estimated unit cost frequency distribution.
K1-10. BIBLIOGRAPHY Haire, M. J., and A. G. Croff, “Cost-Effectiveness of Utilizing Surplus Depleted Uranium (DU),” Waste
Management 2004 Symposium, Tucson, Arizona, February 29−March 4, 2004, http://www.ornl.gov/~webworks/cppr/y2001/pres/119071.pdf.
Nuclear Energy Agency and International Atomic Energy Agency, Management of Depleted Uranium, Paris, France, Organization for Economic Cooperation and Development, ISBN 92-64-19525-4, 2001.

INL/EXT-07-12107 (March 2008) Advanced Fuel Cycle Cost Basis K1-16
OECD Nuclear Energy Agency and International Atomic Energy Agency, The Economics of the Nuclear Fuel Cycle (1994), pp. 11, 27, 37–38, 50, 77–80, http://www.nea.fr/html/ndd/reports/efc/, Web page accessed January 24, 2006.
Office of Nuclear Energy, Science and Technology, Final Plan for the Conversion of Depleted Uranium Hexafluoride: As Required by Public Law 105-204, U.S. Department of Energy, July 1999, http://web.ead.anl.gov/uranium/pdf/finalplan.pdf.
K1-11. REFERENCES 1. DOE Removal Project Done Early: Uranium Hexafluoride Relocated within Budget, Reducing
Radiation Hazard, Knoxville News Sentinel, December 18, 2006.
2. U.S. Department of Energy, DUF6 Management Web site: www.ead.anl.gov/uranium.html, Web page accessed July 19, 2007.
3. U.S. Department of Energy, Press Releases, “Department of Energy Selects Uranium Disposition Services for Uranium Hexafluoride Conversion Plants in Ohio and Kentucky,” August 28, 2002, http://www.energy.gov/engine/content.do?PUBLIC_ID=12929&BT_CODE=PR_PRESSRELEASES&TT_CODE=PRESSRELEASE, Web page accessed January 2, 2005.
4. U.S. Department of Energy, Record of Decision for Construction and Operation of a Depleted Uranium Hexafluoride Conversion Facility at the Paducah, Kentucky Site, July 20, 2004, http://web.ead.anl.gov/uranium/pdf/PadROD.pdf, Web page accessed January 2, 2005.
5. U.S. Department of Energy, Record of Decision for Construction and Operation of a Depleted Uranium Hexafluoride Conversion Facility at the Portsmouth, Ohio Site; July 20, 2004, http://web.ead.anl.gov/uranium/pdf/PortROD.pdf, Web page accessed January 2, 2005.
6. U.S. Nuclear Regulatory Commission Atomic Safety and Licensing Board, In the Matter of Louisiana Energy Services, L.P.; Docket No. 70-3103-ML, July 19, 2004.
7. Application to the US NRC to Construct and Operate a Gas Centrifuge Enrichment Facility (National Enrichment Facility) near Eunice, New Mexico, Docket No. 70-3103, December 12, 2003.
8. Application to the US NRC to Construct and Operate a Gas Centrifuge Enrichment Facility (American Centrifuge Plant) at the DOE Portsmouth, Ohio Site, Docket # 70-7003, August 23, 2004.
9. NEI, “LES-AREVA Sign Pact for Deconversion Facility Near National Enrichment Site,” Nuclear Energy Overview, Nuclear Enterprise Institute newsletter, February 7, 2005.
10. “DOE Estimated Its Cost of Disposing of LES’ Enrichment Tails,” Platt’s Nuclear News Flashes, Tuesday, April 12, 2005.
11. DOE, Draft Supplement Analysis for Location(s) to Dispose of Deplete Uranium Oxide Conversion Product Generated from DOE’s Inventory of Depleted Uranium Hexafluoride (DOE/EIS-0359-SA1 and DOE/EIS-0360-SA1), March 2007.
12. U.S. Department of Energy, Site Specific Environmental Impact Statement for Depleted Uranium Conversion Facility to be Constructed at Paducah, Kentucky, DOE/EIS-0359, http://web.ead.anl.gov/uranium/pdf/PAD-Cover.pdf, Web page accessed January 2, 2005.
13. Safe Disposal of Low-Level Waste at Licensed Facilities; Nuclear Energy Institute Web site; http://www.nei.org/doc.asp?catnum=2&catid=73&docid=&format=print, Web page accessed July 19, 2007.

INL/EXT-07-12107 (March 2008) Advanced Fuel Cycle Cost Basis K1-17
14. H. Elayat, J. Zoller, Lisa Szytel, Cost Analysis Report for the Long-Term Management of Depleted
Uranium Hexafluoride, UCRL-AR-127650, Lawrence Livermore National Laboratory, May 1977, http://web.ead.anl.gov/uranium/documents/paddeis/index.cfm, Web page accessed January 2, 2005.
15. M. Bunn, et al., The Economics of Reprocessing Versus Direct Disposal of Spent Nuclear Fuel, Cambridge, Mass, Project on Managing the Atom, Harvard University, DE-FG26-99FT4028, December 2003, Nuclear Technology, Vol. 150, June 2005, also on Web: http://www.house.gov/science/hearings/energy05/july%2012/Fetter%20Bunn-reprocessing%20economics.pdf, Web page accessed December 20, 2003.
16. “LES News,” Platt’s Nuclear News Flashes, May 27, 2005.
17. Ben Neary, “NM Leaders Strike Deal on Uranium Waste Plant,” The New Mexican, June 4, 2005, Web page accessed June 6, 2005, http://www.freenewmexican.comlnews/14465.html.
18. A. Makhijani and B. Smith, “Costs and Risks of Management and Disposal of Depleted Uranium from the National Enrichment Facility Proposed to be Built in Lea County New Mexico by LES,” Institute for Energy and Environmental Research, version for public release redated February 1, 2005, http://www.ieer.org/reports/du/LESrptfeb05.pdf, Web page accessed January 2, 2005.
19. A. Makhijani and B. Smith, “Costs and Risks of Depleted Uranium from a Proposed Enrichment Facility,” IEER Science for Democratic Action; June 2005, http://www.ieer.org/sdafiles/13-2.pdf, accessed January 2, 2005.
20. “DOE to Transfer Depleted Uranium to BPA,” Platts Nuclear News Flashes, July 6, 2005.
21. Forsberg, C. W. “Effect of Depleted-Uranium Dioxide Particulate Fill on Spent-Nuclear Fuel Waste Packages,” Nuclear Technology, Vol. 131, No. 3, September 2000, pp. 337–353.
22. Forsberg, C.W. and Dole, L.R, Cermet Spent Nuclear Fuel Casks and Waste Packages, Proceedings of the Materials Research Society, Scientific Basis for waste Management, November 27-December 1, 2006, Boston, MA.
23. Hertzler and Nishimbo, Depleted Uranium Management Alternatives, INL Report EGG-MS-11416, 1994.
24. Diehl, Peter, Re-enrichment of West European Depleted Uranium Tails in Russia, Ecodefense Russia, June 2007, http://www.wise-uranium.org/edumu.html, Web page accessed July 19, 2007.
25. Exchange Monitor Publications and Forums, “Senate Minority Leader and Kentucky Delegation Back Transfer of Tails to USEC”; Nuclear Fuel Cycle Monitor; http://www.exchangemonitor.com/nuc_fuel.htm, Web page accessed June 18, 2007.

INL/EXT-07-12107 (March 2008) Advanced Fuel Cycle Cost Basis K1-18

INL/EXT-07-12107 (March 2008) Advanced Fuel Cycle Cost Basis K2-1
Module K2
Aqueously Reprocessed Uranium Conversion, Disposition, and Possible Recycle

INL/EXT-07-12107 (March 2008) Advanced Fuel Cycle Cost Basis K2-2

INL/EXT-07-12107 (March 2008) Advanced Fuel Cycle Cost Basis K2-3
Module K-2 Aqueously Reprocessed Uranium Conversion,
Disposition, and Possible Recycle
K2-1. BASIC INFORMATION For light water reactor fuel cycles and many fast reactor fuel cycles, uranium is the largest resulting
constituent of the irradiated spent fuel mass. If it is separated during reprocessing of spent fuel, it is known as “reprocessed uranium” (REPU). For light water reactors (LWR) operating on enriched UOX, only a small fraction of the total initial uranium radioisotopes are fissioned or transmuted to other actinides. After discharge from the reactor, typically over 93% of the heavy metal mass (not including zircalloy cladding or fuel assembly structures) is uranium. In the spent fuel pools of U.S. reactors, there is already over 45,000 MTU of this material which might be ultimately recovered as reprocessed uranium during future reprocessing operations. At first glance it would seem that this reprocessed uranium material could be economically recovered during reprocessing and reused in the fuel cycle. Doing so could reduce requirements for uranium ore and conversion and enrichment services. Realistically, however, there are several factors which affect the “recycleability,” hence the economics, of this uranium and its ultimate path through the fuel cycle. These are:
• The initial U-235 assay of the fuel before irradiation (this is one of the variables which will determine the post-irradiation U-235 assay and the concentrations of other uranium isotopes, such as U-236) Schneider, et al, have developed algorithms which allow calculation of the U-235 and U-236 content from the initial U-235 value and the fuel burnup for both PWR and BWR UOX fuel.1 These calculations are based on runs made with neutronics/depletion codes.
• The burnup level of the spent fuel, which also determines the fractions of the various isotopes of uranium in the irradiated fuel. (The higher the burnup, the smaller the ratio of the post irradiation U-235 content to the preirradiation U-235 content.) For example, pressurized water reactor fuel that starts out at 3.5–4.5% U-234 prior to irradiation could end up with 0.5–1.3% U-235 depending on initial assay and burnup. Because of these low postirradiation U-235 assays, any reprocessed uranium would need to be converted to UF6 and reenriched before being fabricated into “recycle” LWR UOX fuel for LWRs. (Reprocessed uranium might be more directly used in CANDU reactors. Del Cul et al. discusses this concept in a paper and it is presented in a later section below.)2 Reference 3 also discusses some of the technical issues associated with REPU use as LWR fuel burnup increases.3
• The initial U-235 assay and the burnup also determine the amounts of the undesirable isotopes U-232 and U-236 that are formed. Short-lived U-232 has radiologically potent decay daughters such as thallium-208, which complicate reprocessed uranium handling, and U-236 is a neutron poison (absorber), which adversely affects the performance of any new UOX fuel that is produced from reprocessed uranium. The higher the initial U-235 assay and burnup, the more of these undesirable, nonnatural isotopes are produced.
• The nature and chemistry of the reprocessing scheme (the associated “decontamination factors” determine the amounts of non-uranium impurities such as fission products [i.e., technicium] and higher actinides, such as plutonium and neptunium, carried over into the reprocessed uranium stream). Aqueous processes such as UREX and plutonium-uranium extraction (PUREX) have higher decontamination factors for separating uranium from fission products and higher actinides. The very low quantities of nonuranium impurities mean that any further handling of the reprocessed uranium stream can be in “contact-handling” facilities, provided that such handling is done quickly before U-232 daughters have a chance to build in. These U-232 daughters peak in concentration 10 years after irradiation. This module (K2) deals with the options for reprocessed uranium arising from

INL/EXT-07-12107 (March 2008) Advanced Fuel Cycle Cost Basis K2-4
aqueous reprocessing of light water reactor fuels. It will be seen that costs depend markedly on whether the U-232 daughters must be removed prior to further processing.
Electrochemical processes are possible for the reprocessing of legacy light water reactor spent fuel, however, the lower decontamination factors for fission products and higher actinides mean that the reprocessed uranium would probably require remote handling during packaging and storage. Module K3 will deal with options for handling the reprocessed uranium arising from the electrochemical reprocessing of light water reactor and fast reactor oxide or metallic fuels.
• The price of natural uranium, U3O8 to UF6 conversion, and uranium enrichment all affect the economics of reprocessed uranium use. If these prices are high, as is now the case, the attractiveness of recycling (reconverting, reenriching, and refabricating reprocessed uranium into UOX fuel) versus reprocessed uranium storage or disposal is enhanced. Del Cul, et al describe such sensitivity studies.2
The IAEA TECDOC report describes international efforts in the management of reprocessed uranium.4 Based on this document, the nations doing the most in this area are Russia, France, and Japan, which are the nations with the largest LWR fuel reprocessing capability.
K2-2. FUNCTIONAL AND OPERATIONAL DESCRIPTION Reprocessed uranium in a nitrate solution is separated from fission products and other actinides in an
early step in the separations part of the plutonium-uranium extraction (PUREX) or UREX aqueous spent fuel reprocessing facility. This large stream can be stored in tanks as a liquid or evaporated to produce dry crystals of uranyl nitrate hexahydrate (UNH). The French LaHague plant already performs such a reprocessed uranium separation on a large scale.5,6 The THORP facility, in the U.K. at Sellafield, also has this capability. There are several options for use or disposition of this reprocessed uranium nitrate material:
• Temporary Storage. The reprocessed uranium hexahydrate material can be converted to a more stable, solid chemical form and stored until a future decision on its ultimate fate (recycle or geologic disposal) is made. As with depleted uranium (Module K1), the chemical form of dry U3O8 powder has been determined to be the most stable and easy-to-handle form for storage. The French convert some of the LaHague reprocessed uranium in this manner and store the U3O8 in large (a few cubic meters) steel boxes at a Pierrelatte site warehouse where enrichment tails U3O8 are also stored. These reprocessed U3O8 boxes are surrounded by enrichment plant tails depleted U3O8 boxes, which are less radioactive boxes that act as shielding against the potent gamma radiation building up from U-232 decay daughters.
• Permanent Geologic Disposal. The material can be packaged for permanent geological disposal. U3O8 is chemically stable, however, robust packaging or grouting of the powder would be needed to reduce fines and prevent leaching of radionuclides. Near-surface burial of low-level waste-type packages, such as is proposed for enrichment tails depleted U3O8 (Module K1), might not be permissible. Small amounts of plutonium, neptunium, and technicium, plus the uranium decay products of radon and other daughters make this material considerably more radioactive than enrichment plant depleted U3O8. Low-level waste disposal sites, such as Envirocare, could not presently accept this type waste under today’s regulations. A deep or tunneled geologic repository type environment like Yucca Mountain would be more appropriate, and the heat load associated with this material would be orders of magnitude smaller than for high-level waste or spent fuel. U-234 is the radioisotope that would present the longest range radiotoxicity hazard. U-232 daughters remain a problem for only 300 years. No nation is currently pursuing this permanent reprocessed U disposal option at present.

INL/EXT-07-12107 (March 2008) Advanced Fuel Cycle Cost Basis K2-5
• Preparation for Recycle as UOX Fuel. The reprocessed uranyl nitrate hexahydrate can be converted to a form, such as UO3, suitable for fluorination/purification (similar to Module B) to reprocessed UF6 and reenrichment to a U-235 level somewhat above that required for “virgin” UOX fuel derived from natural uranium (similar to Module C). The extra enrichment is needed to compensate for the neutron absorbtion by U-236. The reprocessed UF6 can be refabricated into LWR reprocessed UOX in a conventional reprocessing plant if the small amount of U-232 remaining after purification is isotopically separated in the enrichment process. This re-enrichment option is discussed in detail in Module D1-1 (LWR UO2 Pellet Fuel Fabrication) and in a report by de la Garza.7 The French (AREVA) sent some of their reprocessed U3O8 to Russia (Seversk) for conversion and purification (removal of U-232 daughters), followed by enrichment in a “double cascade” of gas centrifuges, which produce an enriched U-235 product with very low U-232 content. The Russian company, TVEL, fabricates this enriched UF6 into fuel assemblies, which are burned in reactors in Sweden, Switzerland, Germany, and France.8 As the prices of enrichment and uranium ore rise, this option becomes increasingly attractive. Only one recycle of reprocessed UOX fuel is presently preferred because of the accumulation of the U-236 “poison” isotope that would occur with multiple recyclings. Note that the U.S. gaseous diffusion enrichment plants in the past have also re-enriched REPU from European customers, as well as re-enriching military REPU from production reactors.9
• Diluent UO2 for MOX Fuel. The reprocessed uranium can be used as the “diluent” for (Pu,U)O2 or (Pu,Np,U)O2 mixed oxide (MOX) fuel. This can be accomplished by conversion of the nitrates to oxide and physical blending or by coprecipitation directly from the reprocessing plant nitrate solutions. For COEX reprocessing, this would be the preferred option—only a fraction of the REPU would be used.
K2-3. PROCESS SCHEMATIC Figure K2-1 shows schematically the possible disposition paths for LWR spent fuel reprocessing-
derived reprocessed uranium. The paths were described in the subsection above.
Figure K2-1. Options for reprocessed uranium arising from aqueous reprocessing of light water reactor fuels.

INL/EXT-07-12107 (March 2008) Advanced Fuel Cycle Cost Basis K2-6
K2-4. MODULE INTERFACE DEFINITION Front-end interface. The aqueous spent fuel reprocessing plant (Module F1) represents the front-end
interface. The analyst should make sure the reprocessed uranium conversions (from stored uranyl nitrate hexahydrate to UO3, U3O8, UF6, or other form) are not already included in the $/kgHM cost of the reprocessing steps, since these conversion steps could conceivably be undertaken at the reprocessing complex (as is done in some foreign plants). Transportation of an evaporated solid to an off-reprocessing plant site location for further treatment or storage would likely be in the form of uranyl nitrate hexahydrate crystals by commercial carrier in lined and sealed drums. This transportation/packaging cost should be assigned to this module and is expected to be very small if these steps are taken soon after reprocessing and the U-232 daughters have not yet had a chance to form in radiologically significant amounts.
Back-end interface. Preparation, storage, or disposal of the reprocessed U3O8 powder resulting from conversion of uranyl nitrate hexahydrate, all have their own technical, regulatory, and procurement issues. U3O8 would most likely be prepared by ammonium nitrate precipitation of a double uranium salt (ADU) followed by calcination and adjustment of oxygen stoichiometry. UO3, for later fluorination to UF6, or UO2 for preparation of MOX, could both be prepared in the same manner with careful adjustment of oxygen stoichiometry. If the uranyl nitrate hexahydrate feed material has been sitting around long enough for U-232 daughters to build in, it would be advisable to aqueously “polish” a uranyl nitrate hexahydrate solution by using solvent extraction or ion exchange to remove the U-232 daughters. In this manner subsequent processing operations could involve less radiation dose to workers.
As with depleted U3O8 derived from enrichment plant tails, the environmental feasibility and regulation of the shallow geologic disposal of large amounts of bulk U3O8 or other uranium forms remains highly problematic. The U-232 daughters and higher U-234 and U-235 content of this material make the problem much more serious than for “virgin” tails derived U3O8. This material may have to be handled as greater-than-class-C (GTCC) low-level waste; however, no such regulations have been developed for it. As with the tail materials (>100,000 of MTU), the very large inventory of this reprocessed material (>10,000 of MTU) and its possible potential concentration into one geographic area means that in the distant future (thousands of years), after the containers enclosing the insoluble depleted U3O8 corrode away, the burial area will be a large producer of radon gas from the uranium decay chain. This gas would easily diffuse through any dry soil cap. In order to prevent this occurrence, a deeper or capped burial site or noncorrodible containers will be needed. U-234 would also present a long-term radiotoxicity hazard similar to that from higher actinides in a spent fuel repository. For this reason, long-term sequestration of reprocessed U3O8 in a deep mine or repository is likely to be required. The lack of high heat generating radioisotopes, however, means that such material could be efficiently emplaced in a repository without major spacing issues.
An option not yet considered might be to blend enrichment tails U3O8 (Module K-1) with reprocessed U3O8 for shallow burial. The former much less radioactive material is likely to be available in amounts ten or more times that of the latter. A “blend” might meet the allowable radionuclide limits for the less expensive shallow burial option.
The reprocessed uranium disposal options above should not be confused with those in Modules G3 (LLW Surface Ops), J (Near Surface Disposal), or L (Geologic Repository). The costs for Module K2 disposal options take the material all the way to final disposal and Modules G3, J, or L costs should not be superimposed.
If recycle is warranted, the costs for this Module K2 step include conversion of the uranyl nitrate hexahydrate to an oxide and fluorination of this oxide all the way to reprocessed UF6. If the uranyl nitrate hexahydrate feed has accumulated U-232 decay daughters, the fluorination process can be designed to remove them, thus reducing the radioactivity level in the enrichment and fuel fabrication facilities. Costs

INL/EXT-07-12107 (March 2008) Advanced Fuel Cycle Cost Basis K2-7
for enrichment and fuel refabrication are covered in Modules C1 (Uranium Enrichment) and D1-1 (LWR UO2 Pellet Fuel Fabrication). The use of REPU as a substitute for natural (virgin) feed is discussed briefly in Module A (Uranium Mining and Milling). Use of reprocessed uranium is anticipated to raise these separative work units and fabrication costs by up to 20% above that for virgin feed materials.
K2-5. MODULE SCALING FACTORS No data are available. Any reprocessed uranium conversion facilities are likely to be located on the
reprocessing plant site, hence sizing might be similar to that for Module F1.
K2-6. COST BASES, ASSUMPTIONS, AND DATA SOURCES The unit cost figure of merit of interest (and its value) for this step depends on which of the above
options is chosen. Each option will be separately discussed below.
Temporary Storage. Temporary storage costs will depend on how long the material is stored. An owner of separated reprocessed U3O8, the most likely reprocessed uranium storage form, will save it until the price of natural U3O8 rises to the point that recycling of reprocessed uranium as UOX fuel is economically beneficial. A recent Oak Ridge National Laboratory report10 describes some engineered product storage forms and options for this material, but does not include cost estimates. An earlier Oak Ridge National Laboratory report11 suggests that less-radioactive, contact-handled material, which can be stored in containers with a surface radioactivity of 200 mrem/hr or less, can be bulk stored in vaults at a capital cost of $3/kgU in today’s (2007) dollars. In light of other uranium storage capital costs, such as for less-radioactive depleted uranium products, this is felt to be low. A value of $6/kgU is felt to be more appropriate given today’s more stringent regulations and building standards (which are still evolving). The report also suggests that at a storage fill rate of ~2,000 MTU/yr, the facility would incur operational costs of $5M/yr (2007 dollars) during filling and $1.5M/yr (2007 dollars) during surveillance only. These operations costs seem to be reasonable for what is only a logistical/surveillance task. Assuming a 40-year storage time for each kgU before a decision to recycle or dispose, the total storage capacity would need to be 80,000 MTU. The storage facility would operate for 120 years, with 40 years to fill, 40 years of surveillance only, and 40 years to empty. This gives an average operations cost of $6/kgU for each kgU emplaced. The total (capital + operations) unit cost then calculates as $12/kgU, assuming a 40-year storage. This cost seems reasonable compared to the $4−$8/kgU range for handling less radioactive enrichment plant tails-derived depleted U3O8. The reprocessed U3O8 unit cost, however, does not include any ultimate disposal costs. As will be seen below, these final disposition unit costs are more substantial.
A calculated unit cost value of $16/kgU/yr was reported by the Generation IV Fuel Cycle Crosscut Group for “separated uranium.”12 For 40 years this would represent a cost of $640/kgU. This is more than many national cost estimates (in terms of kgHM) for disposing of spent fuel. Either the “per year” term was mistakenly added, or the value is inordinately high and would be for highly contaminated uranium. Note that this module is discussing well-known chemical technology for which the radioactivity hazard (and handling costs) can be minimized by “early” treatment (aqueous removal of U-232 daughters) and for which nuclear criticality concerns are non-existent for feedstocks of U-235 content 0.9% or less.
Permanent Geologic Disposal. Michaels and Welch suggests that reprocessed U3O8 could be disposed in a deep or tunnel type geologic repository for $72/kgU in 2007 dollars ($53/kgU in 1993 dollars).10 This would presumably include the waste package and transportation from the storage location. No mention was made of whether this material could be collocated with spent fuel in a Yucca Mountain type repository. By the time a decision is made whether to store or recycle (tens of years) the U-232 daughters will have built up to the point that a remote handling facility might be needed to empty the U3O8 storage containers or vaults, which might be volumetrically large, into volumetrically smaller, more robust packages for repository emplacement.

INL/EXT-07-12107 (March 2008) Advanced Fuel Cycle Cost Basis K2-8
For comparison, costs of $15/kgU (2007 dollars) ($11/kgU [1993 dollars]) were given for geologic disposal of the less radioactive depleted U3O8 derived from uranium enrichment operations. (Expensive deep or tunnel disposition of enrichment-derived [tails] depleted U3O8 will hopefully never be necessary. See Module K-1 for discussion of this material and its disposition paths and costs.)
Preparation for Recycle as Light Water Reactor UOX. The cost of the conversion/processing service required before enrichment will depend on how long the material has been stored since reprocessing. Again, the handling difficulty, and hence cost, is driven by the concentration of the U-232 daughters in the uranyl nitrate hexahydrate at the reprocessing plant or the U3O8 at the storage site. According to Michaels and Welch, a “new” recently-separated uranium electrochemical processing product can be converted to U3O8 for $7/kgU (2006 dollars).10 This would also represent a reasonable unit cost for converting “new” uranyl nitrate hexahydrate to UF6. If stored “old” U3O8 or UNH needs to be converted to UF6, aqueous polishing will be needed to remove the U-232 daughters. This would drive the unit cost up to $41/kgU (2007 dollars). To calculate the total UOX fuel cost, enrichment, and refabrication costs would need to be added (Modules C1 and D1-1). This option is further discussed in Trowbridge and Del Cul’s report and Module D1-1.6
Reprocessed UO2 would make an excellent fuel for CANDU reactors. No additional enrichment would be needed, since the U-235 content of reprocessed uranium fits the requirements of CANDU designs. (This cost is analyzed in Del Cul, et al.’s report2.) Since there would be no need to enrich LWR REPU for use in CANDUs, the economics of this application are even more attractive than those for REPU recycle in LWRs. In addition, there is not need to deal with enrichment plant tails. The major savings is the avoided cost of purchasing uranium ore. Pursuit of this option by Canada would allow more Canadian ore to be sold on the international market, since domestic use could be cut significantly. Table K2-1 shows that for high ore prices ($233/kgU assumed) the unit cost associated with REPU use is half that for CANDU fuel assemblies derived from virgin (mined) U3O8 (Module D1-7). This is true even if fabrication of REPU incurs a higher unit cost because of the radiation hazard associated with U-232 daughters.
Table K2-1 Comparison of CANDU unit fuel costs from reprocessed and virgin uranium.
NATURAL U CANDU FUEL FROM URANIUM ORE:
Uranium ore price (English) 89.6 $/lb U3O8
Uranium mine & mill price (Metric) (as if U3O8 produced) 233 $/kgU
Canadian conv of U-mill solutions to pure reactor-grade UO2 10 $/kgU
CANDU fuel fabrication price (from UO2 powder) 100 $/kgU
Total cost 343 $/kgU
CANDU FUEL FROM LWR REPROCESSED U*
Dissolution of REPU3O8, cleanup of sol'n, and conversion to UO2 of right powder morphology 40 $/kgU
CANDU fuel fab price (adj for higher handling risk) 130 $/kgU
Total cost 170 $/kU
* No enrichment step assumed. ~0.7%-0.9% U-235 in REPU; some U-236 present
Economics of the Use of LWR Reprocessed U in CANDU Reactors

INL/EXT-07-12107 (March 2008) Advanced Fuel Cycle Cost Basis K2-9
Use as a Diluent for Contact-Handled MOX Fuel. As for UOX recycle above, the unit cost to make a material suitable to refabrication into contact-handled fuel would depend on how-long it has been since the uranium product was separated during reprocessing. If the time is very short, a fuel grade, “moxable” UO2 powder could be prepared from uranyl nitrate hexahydrate for around $40/kgU. If old, U-232 daughter-laden feed material is used, another $35/kgU would be required for aqueous polishing prior to powder preparation. If these numbers are used in an analysis, care should be taken to remove the part of the unit MOX fabrication cost (Module D1-2) that comprises the depleted U3O8 to “moxable” depleted UO2 powder step. Around $30/kgHM of the overall MOX fab cost is attributable to this operation if the MOX plant receives enrichment plant tails derived depleted UF6 or depleted U3O8 as the PuO2 diluent.
Limitations of Cost Data and Other Considerations
The following considerations are relevant to reprocessed-uranium materials in the fuel cycle:
1. Because of U-236 buildup, it is likely that reprocessed UOX could undergo, at most, two recycles. If a highly selective method for uranium, such as a laser-based process, enrichment became available (one that could selectively remove U-236) more recycles of UOX would become feasible.
2. The reprocessing technology must keep levels of fission products and higher actinides low enough (in the uranium product) to allow contact-handling and favorable economics.
In general, the reprocessed uranium disposition step of the fuel cycle can be placed in the viable-commercial category of technology readiness. Uranium ore and enrichment prices will help dictate when and how reprocessed uranium is dispositioned. The UK Nuclear Decommissioning Authority (NDA) is presently performing such trade-off studies to inform their decision how to deal with the 35,000 MT of REPU arising from reprocessing of Magnox and AGR fuel.13
K2-7. COST SUMMARIES The module cost information is summarized in the What-It-Takes (WIT) cost summary in
Table K2-2. The summary shows the reference cost basis (constant year U.S.dollars), the reference basis cost contingency (if known), the cost analyst’s judgment of the potential upsides (low-end of cost range) and downsides (high-end of cost range) based on references and qualitative factors, and selected nominal costs (judgment of the expected costs based on the references, contingency factors, upsides, and downsides). These costs are subject to change and are updated as additional reference information is collected and evaluated, and as a result of sensitivity and uncertainty analysis. Refer to Section 2.6 in the main section of this report for additional details on the cost estimation approach used to construct the WIT table.
The triangular distribution based on the costs in the WIT Table is shown in Figure K2-2.
K2-8. RESULTS FROM SENSITIVITY AND UNCERTAINTY ANALYSIS Because of lack of detailed process/cost data no such calculations were performed.

INL/EXT-07-12107 (March 2008) Advanced Fuel Cycle Cost Basis K2-10
Table K2-2. Cost summary table for reprocessed uranium disposition options (Constant 2007 dollars). What-It-Takes (WIT) Table
Reference Cost(s) Based on Reference
Capacity
Reference Cost Contingency
(+/- %) Upsides
(Low Cost) Downsides (High Cost)
Selected Values (Nominal Cost)
Conversion of UNH to U3O8 storable form: “New” UNH to U3O8 “Old” UNH to U3O8 including removal of U-232 daughters
$4/kgU $20/kgU
$10/kgU $41/kgU
$5/kgU $30/kgU
Reprocessed U3O8 40-year Storage $6/kg U for 80,000 MTU/yr Storage Capacity. Annual costs of $1.5M to $5M/yr
In unit cost, amount unknown, but not felt to cover all risks.
$6/kgU if shallow burial allowed
$30/kgU if facility regulation and construction difficulties ensue or very long term storage is required.
$12/kgU
Aqueously–derived reprocessed U3O8 Permanent Geologic Repository Disposal
In unit cost, amount is unknown
$61/kgU if above temporary storage package could be emplaced
$93/kgU if regulatory and siting difficulties arise
$72/kgU including repackaging, transportation, emplacement, and perpetual surveillance
PREPARATION FOR UOX RECYCLE: “New” product to UF6 (no aq polish) “Old” product to UF6 (aq removal of U-232 daughters)
In unit cost, amount is unknown
$6/kgU $30/kgU
$12/kgU $50/kgU
$7/kgU $41/kgU
UOX diluent for MOX fuel: “New” product for immediate contact-handling to “moxable UO2” “Old” product processing requiring removal of U-232 daughters prior to contact-handling
In unit cost, amount is unknown
Not available Not available $41/kgU $77/kgU

INL/EXT-07-12107 (March 2008) Advanced Fuel Cycle Cost Basis K2-11
Module K2 Aqueous Reprocessed U DispositionEstimated Cost Frequency Distribution
$/kgU
Freq
uenc
y
Low Nominal Mean High
$6 $12 $16 $30
Figure K2-2. Module K2 aqueous reprocessed uranium 40-year storage estimated unit cost frequency distribution.
K2-9. REFERENCES 1. Schneider, Erich, et al, Recyclable Uranium as a Supply Source: Overview, Presentation made to
GNEP Economic Analysis Working Group, May 1, 2007, Las Vegas, NV.
2. Del Cul, G., Collins, E., Ellis, R., and Williams, K, Preliminary Analysis of the Reuse of Uranium Recovered from the Processing of Commercial LWR Spent Fuel., Report # is TBD, Oak Ridge National Laboratory, June 2007 (in preparation,not yet released).
3. “GKN Says Electrostal Option Only Solution for REPU Use,” Platt’s Nuclear Fuel, September 30, 2002, p. 11.
4. Management of Reprocessed Uranium: Current Status and Future Prospects, International Atomic Energy Agency, IAEA-TECDOC-1529, February 2007.
5. “French Sources and Stocks of Reprocessed Uranium,” Nuclear France Web site: www.francenuc.org/en_sources/sources_urepro_e.htm, Web page accessed July 19, 2007.
6. Trowbridge L., and G. Del Cul, Preliminary Analysis on the Economic Viability of the Reuse of Uranium Recovered from the Processing of Commercial LWR Spent Fuel, Oak Ridge National Laboratory, February 2003. (This document has a restricted distribution, may be proprietary, or both; and is not publicly releasable.)
7. de la Garza, A.; Uranium-236 in Light Water Reactor Spent Fuel Recycled to an Enriching Plant; Nuclear Technology; Vol 32; February 1977.
8. International Business Relations Corporation (IBR), Direct Enrichment of Reprocessed Uranium at Siberian Chemical Combine, Moscow, Russia, 2006, proprietary report. (This document has a restricted distribution, may be proprietary, or both; and is not publicly releasable.)
9. Williams, K. A.; A History of Uranium Enrichment in the 1950s; Report Y/NSP-259; History of Atomic projects Conference (HISAP-99); October 1999; Laxenburg, Austria.

INL/EXT-07-12107 (March 2008) Advanced Fuel Cycle Cost Basis K2-12
10. Michaels, G., and T. Welch, Evaluation of Disposition Options for Reprocessed Uranium,
ORNL/TM-12326, Oak Ridge National Laboratory, February 1993.
11. Spencer, B. B., et al., Spent Fuel Treatment Engineered Product Storage: Preferred Concepts for Uranium Disposition, ORNL/TM-2005/20, July 2005, Applied technology and official use only. (This document has a restricted distribution, may be proprietary, or both; and is not publicly releasable.)
12. DOE, “Generation-IV Fuel Cycle Crosscut Group Report—Attachment 2,” U.S. Department of Energy—Generation IV Reactor Systems Program: Office of Nuclear Energy and Technology, March 18, 2002.
13. UK Nuclear Decommissioning Agency; Uranium and Plutonium: Macro-Economic Study; prepared by Integrated Decision Management (IDM); NDA Report Ref: KP000040; June 2007.

INL/EXT-07-12107 (March 2008) Advanced Fuel Cycle Cost Basis K3-1
Module K3
Electrochemically Reprocessed Uranium Conversion, Disposition, and Possible Recycle

INL/EXT-07-12107 (March 2008) Advanced Fuel Cycle Cost Basis K3-2

INL/EXT-07-12107 (March 2008) Advanced Fuel Cycle Cost Basis K3-3
Module K-3 Electrochemically Reprocessed Uranium Conversion,
Disposition, and Possible Recycle
K3-1. BASIC INFORMATION For light-water reactor (LWR) fuel cycles and many fast reactor fuel cycles, uranium is the largest
resulting constituent of the irradiated spent fuel heavy metal mass. If it is separated during reprocessing of spent fuel, it is known as “reprocessed uranium” or “REPU.” For LWRs operating on enriched uranium oxide (UOX), only a small fraction of the total initial uranium radioisotopes are fissioned or transmuted to other actinides. After discharge from the reactor, typically over 93% of the heavy metal mass (not including zircalloy cladding or fuel assembly structures) is uranium. In the spent fuel pools of U.S. LWRs, there is already over 40,000 MTU of this material that might be ultimately recovered as reprocessed uranium during reprocessing.
For fast reactor cycles operating on uranium, plutonium mixed oxide fuel in the “breeder” mode, the uranium fraction in the driver fuel is typically 50 to 85% of the initial preirradiation heavy metal mass. For lower conversion ratio fast reactors utilizing higher actinide (Pu, Np, Am, Cm) fuels, the uranium content is likely to be smaller than for a “breeder.” The blanket fuel starts out as 100% uranium (most likely depleted uranium) and higher actinides, such as Pu-239, are produced by neutron absorption during irradiation. Both fast reactor driver fuel and blanket fuel need to be reprocessed: (1) to get the useful fissile plutonium from the blankets, and (2) to remove fission products and some of the less-desirable, U-232 and U-236 laden uranium from both the drivers and blankets. The remaining fissile mass can be refabricated into new drivers. The “discard” uranium mass can be made up by fabricating new depleted uranium blankets and by adding clean uranium to the refabricated driver fuel. In the U.S., there is very little fast reactor spent fuel, and what there is has limited irradiation exposure. The Experimental Breeder Reactor-II fast reactor was probably the most successful demonstration of U.S. fast reactor technology. The Fast Flux Test Facility (FFTF) also operated well, but was shut down early because of lack of funding. For fast reactors that are to be operated as “burners” rather than “breeders,” the actinide fissile content of the fuel is likely to be higher and the initial uranium content lower. This higher fissile content ensures that there are enough neutrons available to destroy (fission or transmute) the undesirable higher actinides and transmute certain long-lived fission products.
For metal-fueled fast reactors, there is likely to be uranium separated out in the aqueous or electrochemical reprocessing step (Module F2/D2). The choice of an electrochemical process depends on whether metal or ceramic fuel is being considered and what other alloying constituents, such as zirconium, are in the fuel mass. Regardless of the reprocessing method, the following factors affect the nature of the reprocessed uranium that can be obtained from reprocessing: • The initial U-235 assay of the fuel before irradiation (this is one of the variables which will determine
the post-irradiation U-235 assay and the concentrations of other uranium isotopes). • The burnup level of the spent fuel (this also determines the fractions of the various isotopes of
uranium in the irradiated uranium). The higher the burnup, the smaller the ratio of the postirradiation U-235 content to the preirradiation U-235 content.
• The initial U-235 assay and the burnup also determine the amounts of the undesirable isotopes U-232 and U-236 that are formed. Short-lived U-232 has radiologically potent decay daughters. such as thallium-208. which complicate reprocessed uranium handling. U-236 is a neutron poison (absorber) that adversely affects the performance of any new UOX or mixed oxide or metal fuel that is produced from reprocessed uranium. The higher the initial U-235 assay and burnup, the more of these undesirable, nonnatural isotopes are produced.

INL/EXT-07-12107 (March 2008) Advanced Fuel Cycle Cost Basis K3-4
• The nature and chemistry of the reprocessing scheme (the associated “decontamination factors” determine the amounts of nonuranium impurities, such as fission products and higher actinides, such as plutonium and neptunium carried over into the reprocessed uranium stream). Aqueous processes such as UREX and plutonium-uranium extraction (PUREX) have higher decontamination factors for separating uranium from fission products and higher actinides. The very low quantities of nonuranium impurities mean that any further handling of the reprocessed uranium stream can be in “contact-handling” facilities, provided that such handling is done quickly before U-232 daughters have a chance to build in. These daughters peak in concentration approximately 10 years after irradiation. Electrochemical processes (Module F2/D2) have been proposed for the reprocessing of legacy LWR spent fuel and the reprocessing of fast reactor blanket (or higher actinide targets) and driver fuel. These dry processes involve molten salt chemistry and electrochemistry and can be used to reprocess oxide or metal fuels. However, they seem to be better suited for the latter type metal fast reactor fuels. Electrochemical processes experience lower decontamination factors for fission products and higher actinides (from uranium). This means that electrochemically-derived reprocessed uranium would contain more residual radionuclides and probably require remote handling during packaging and storage. These lower decontamination factors are not a problem for many fast reactor cycles, because the fuel must be handled remotely from irradiation through refabrication anyhow, and the presence of small fractions of fission products or higher actinides does not pose a safety or personnel exposure problem. Also, some of the uranium can be directly recycled and does not even have to be totally separate from other actinides during the recycle/refab operations. This Module K3 will deal with options for handling the reprocessed uranium arising from the electrochemical reprocessing of LWR and fast reactor oxide or metallic fuels.
This distinction of whether fast reactor or LWR fuel is being electrochemically reprocessed is very important. Much larger quantities of uranium must be handled from the electrochemical processing of spent LWR fuel. It will likely be a few hundred years before enough fast reactors exist that could readily use the electrochemically-derived reprocessed uranium from LWR spent fuel as make-up material for fast reactor metal fuel refabrication or for fast reactor mixed oxide uranium-diluent. For this scenario, it is likely that thousands of metric tons of highly contaminated uranium-metal would be generated from an electrochemical process that takes UOX spent fuel as the feed form, reduces it to metal, and produces all metal products.
• The price of natural uranium, U3O8 to UF6 conversion, and uranium enrichment all affect the economics of reprocessed uranium use. If these prices are high, as they are now, the attractiveness of recycling (purifying, reconverting, reenriching, and refabricating reprocessed uranium into UOX fuel) versus reprocessed uranium storage or disposal is enhanced.
K3-2. FUNCTIONAL AND OPERATIONAL DESCRIPTION For a typical electrochemical option, reprocessed uranium in the form of a metal is separated from
fission products and other actinides in an early step in the separations part of the reprocessing facility. According to Michaels and Welch,1 the best option for safe storage is to first cast the separated uranium-metal into 180 kgU cylindrical ingots and store them in cans with stainless steel jackets. This jacketing step prevents moist air from oxidizing the uranium metal and producing fines which can become airborne or even burn. Because of the radioactivity from unseparated fission products and higher actinides, this ingoting/canning operation would likely have to take place in the remote handling part of the reprocessing plant. After this step there are several options for use or disposition of this reprocessed uranium product:

INL/EXT-07-12107 (March 2008) Advanced Fuel Cycle Cost Basis K3-5
• Long-Term but Temporary Storage. It is likely that electrochemically-derived reprocessed uranium would not be immediately “thrown away,” but saved for the possible future uses, some of which may be many decades away when fast reactor fuel cycles begin to dominate the nuclear enterprise. Among these future uses are the following: - If the electrochemically reprocessed uranium is derived from LWR spent fuel, it will be
produced in large quantities. It is possible to save it for eventual recycle into new LWR or higher-enrichment fast reactor startup fuel as described below. Tens of years of storage would probably be required.
- The reprocessed uranium can be saved for makeup uranium for refabrication of metal fuel for a fast reactor fuel cycle. It can also be used to make mixed oxide fuel for oxide-based fast reactor fuel cycles. Since introduction and widespread use of fast reactors could take a few hundred years, any LWR-derived electrochemically reprocessed uranium would have to be stored for that amount of time. Reprocessed uranium from fast reactor spent fuel electrochemical processing could be reintroduced in less time and would require fewer years of storage. The quantities of reprocessed uranium produced by fast reactor electrochemical processing are smaller than for LWR spent fuel electrochemical processing.
• Recycle. The reprocessed uranium could be cleaned up, converted to UF6, and reenriched. The enriched uranium could be used for LWRs or for highly enriched uranium startup of fast reactors. Many tens of years of storage would be required if there is no immediate need for uranium recycle fuel. The nature and cost of the required storage facility will depend on the radiation level at the surface of the U-metal ingots and the amount of worker protection which is needed during their emplacement and long-term surveillance.
• Permanent Geologic Disposal. The reprocessed uranium material, which is less radioactive than high-level waste or spent fuel, but a lot more radioactive than aqueously-derived reprocessed uranium, can be packaged for permanent geological disposal in a matter somewhat akin to Greater-Than-Class-C waste. Stainless jacketed metal ingots directly from the electrochemical plant or storage facility are not an ideal permanent disposal form, because the relatively thin stainless steel jacket may corrode away in several decades and expose the uranium-metal to water or moist air in a repository. U3O8 is a more chemically stable form, however, robust packaging or grouting of the powder would be needed to reduce the possibility of fines and prevent eventual leaching of radionuclides. A robust waste container would be needed to encase the grouted mass. Near-surface burial of low-level waste-type packages, such as is proposed for enrichment tails DU3O8 (Module K1), would not be permissible. A deep or tunneled geologic repository type environment, like Yucca Mountain, would be more appropriate, and the heat load associated with this material would be orders of magnitude smaller than for high-level waste or spent fuel. U-234 and some transuranic isotopes would present the longest range radiotoxicity hazard. U-232 daughters and most fission products remain a problem for only a few dozen years. Preparation of the packages for repository emplacement is likely to be a remote-handling operation.
• Preparation for Recycle as UOX Fuel for LWRs or Initial Fast Reactor Cores. The reprocessed uranium ingot can be dejacketed and converted to an oxidized form, such as UO3, by controlled burning. This powder is suitable for fluorination/purification to reprocessed UF6. (Fluorination itself can be a dry route to U-purification, because fission product and higher actinide fluorides are less volatile than UF6.) The reprocessed UF6 can undergo reenrichment to a U-235 level somewhat above that required for “virgin” LWR UOX fuel derived from natural uranium. The extra enrichment is needed to compensate for the neutron absorption by U-236. The reprocessed UF6 can be refabricated into LWR reprocessed UOX in a conventional reprocessing plant if the small amount of U-232 remaining after purification is separated out in the enrichment process. This option is discussed in greater detail in a special section of Module D1-1 (LWR UO2 Fuel Fabrication) and in Module K2. The reprocessed UF6 can also be taken to higher enrichment levels (>15% U-235) and the enriched

INL/EXT-07-12107 (March 2008) Advanced Fuel Cycle Cost Basis K3-6
product fabricated into fast reactor fuel (Module D1-4) for startup of the first fast reactors. This is an especially good option if not enough plutonium is available for the initial fast reactor cores.
K3-3. PROCESS SCHEMATIC Figure K3-1 shows schematically the possible disposition paths for reprocessed uranium resulting
from electrochemical fuel reprocessing. The paths were described in the subsection above.
Figure K3-1. Options for reprocessed uranium arising from electrochemical reprocessing of LWR and fast reactor fuels.
K3-4. MODULE INTERFACE DEFINITION Front-end interface. The electrochemical spent fuel reprocessing plant (Module F2/D2) represents
the front end interface. The analyst should make sure the reprocessed uranium ingot casting and jacketing operation is included in the $/kgHM cost of the reprocessing steps, since this remote-handling step must be undertaken at the reprocessing complex. Transportation of the metal ingots to the storage location would likely require special overpacks or containers, but could probably be handled by a commercial carrier. This transportation/packaging cost should be assigned to this module (K3) and is expected to be very small.
Back-end interface. The electrochemically-derived reprocessed uranium disposal options above should not be confused with those in Modules G3 (LLW Conditioning, Storage, and Packaging), J (Near Surface Disposal), or L (Geologic Repository). The costs for the Module K-3 permanent disposal option take the material all the way to final disposal and G3, J, or L costs should not be superimposed upon these.
If recycle is warranted, the costs for this Module K3 step include conversion of the metal to an oxide and fluorination of this oxide all the way to reprocessed UF6. If the uranium-metal feed has accumulated U-232 decay daughters, the fluorination process can be designed to remove them, thus reducing the radioactivity level in the enrichment and fuel fabrication facilities. Costs for enrichment and fuel refabrication are covered in Modules C1 (Uranium Enrichment), D1-1 (LWR UO2 Fuel Fabrication), and D1-4 (Ceramic Pelletized Fast Reactor Fuel). Use of even cleaned-up reprocessed uranium is anticipated to raise these separative work unit and fabrication costs by up to 20% above that for virgin feed materials.

INL/EXT-07-12107 (March 2008) Advanced Fuel Cycle Cost Basis K3-7
K3-5. MODULE SCALING FACTORS No data are available. Any reprocessed uranium handling/conversion facilities are likely to be located
on the reprocessing plant site, hence sizing might be similar to that for Module F2/D2.
K3-6. COST BASES, ASSUMPTIONS, AND DATA SOURCES The unit cost figure of merit of interest (and its value) for this step depends on which of the above
options is chosen. Each option will be separately discussed below.
Temporary Storage. Temporary storage costs will depend on how long the material is stored. An owner of separated reprocessed uranium metal, the most likely reprocessed uranium storage form, will save it in monitored retrievable storage until the price of natural U3O8 rises to the point that recycling of reprocessed uranium as LWR for higher enrichment fast reactor fuel is economically beneficial, or the owner will arrange for its permanent disposal. A 1993 Oak Ridge National Laboratory report,1 prepared to support the Department of Energy Office of Nuclear Energy, Science, and Technology (DOE/NE) Advanced Liquid Metal Reactor program at that time, suggests that the more radioactive material, requiring remote-handling (a container surface radioactivity of 200 mrem/hr or more), can be bulk stored in vaults at a capital cost of $13/kgU in today’s (2007) dollars ($9/kgU in 1993 dollars). In light of other radioactive material storage capital costs, such as those for transuranic waste storage and for spent fuel casks, this unit cost is felt to be possible, but optimistic. A value of $20/kgU is felt to be more appropriate given today’s more stringent regulations and building standards (which are still evolving). The report also suggests that at a storage fill rate of ~2,000 MTU/yr, the facility would incur operational cost of $5 million/yr (2007 dollars) during filling and $1.5 million/yr (2007 dollars) during surveillance only. These operations costs seem to be reasonable for what is only a logistical/surveillance task, and are the same as those for the less radioactive aqueous reprocessing–derived reprocessed uranium. The problem is that this material may have to be stored for many decades before the reprocessed uranium can be used in fast reactor cycles. Any utility considering recycle in LWRs is likely to want to start with reprocessed uranium from aqueous reprocessing because of its lower radioactivity and lower handling costs, hence, electrochemically-derived reprocessed uranium would be used lastly for this purpose. A vault-type storage facility holding 80,000 MTU would cost $1.6 billion and if it operated for 300 years would accumulate $750 million in operations costs. The total unit cost would amount to around $30/kgU. If multiple centuries of storage are required, unit costs could rise into the hundreds of dollars per kgU.1
Permanent Geologic Disposal. Reference 1 suggest that reprocessed U3O8 could be disposed in a deep or tunnel-type geologic repository for $72/kgU in 2007 dollars ($53/kgU in 1993 dollars). This would presumably include the waste package and transportation from the storage location. It does not include the cost of converting the uranium-metal ingots to U3O8. Reference 1 suggests a cost of $7/kgU (2007 dollars) for this conversion; however, this seems low in light of the radioactivity level of the metal feed. A unit cost of $21/kgU seems more realistic and would include transfer of the U3O8 into the new waste container. This would give an overall cost of $93/kgU for permanent geologic disposal. For comparison, costs of $15/kgU (2007 dollars) ($11/kgU in 1993 dollars) were given for geologic disposal of the less radioactive DU3O8 derived from uranium enrichment operations and $72/kgU for aqueous reprocessing-derived reprocessed U3O8. (Note: Expensive deep or tunnel disposition of enrichment-derived tails DU3O8 will hopefully never be necessary. See Module K-1 for discussion of this material and its disposition paths and costs. Module K-2 discusses reprocessed uranium from aqueous reprocessing.)
Preparation for Recycle as LWR Fuel. The cost of the conversion/processing service required before enrichment will depend on how long the material has been stored since reprocessing and the amounts of fission product and transuranic contaminants in the U-metal starting material. It is likely that a “dry” volatility-type fluorination process can be used to make UF6 and at the same time separate out the

INL/EXT-07-12107 (March 2008) Advanced Fuel Cycle Cost Basis K3-8
small amounts of fission products, TRUs, and U-232 daughters. According to Reference 1, “new” recently-separated uranium metal electrochemical processing product can be converted to U3O8 for $7/kgU (2007 dollars). In the subsection above, this number was revised to $21/kgU. This unit cost is probably too low for converting U-metal to UF6, which is a more complex process. Reference 1 suggests a unit cost of $42/kgU (2007 dollars). To calculate the total UOX fuel cost, enrichment and refabrication costs would need to be added (Modules C1 and D1-1). This option is further discussed in Modules D1-1 and K2.
Reprocessed UO2 would make an excellent fuel for CANDU reactors. No additional enrichment would be needed, since the U-235 content of reprocessed uranium fits the requirements of CANDU designs. This cost is discussed in Module K2.
Use as a Diluent for Contact-Handled MOX Fuel. As for UOX recycle above, the unit cost to make a material suitable to refabrication into contact-handled fuel would depend on how long it has been since the uranium product was separated during reprocessing (the U-232 daughter problem) and how bad the feed material is contaminated with fission products. Transuranic contamination would be less important, because glovebox operations can accommodate most plutonium and neptunium isotopes. If the time is very short and fission product concentrations low, a fuel grade, “moxable” UO2 powder could be prepared from uranium-metal for around $42/kgU. If old, daughter-laden feed material is used or fission product concentrations too high, another $42/kgU would be required for aqueous polishing prior to powder preparation. If these numbers are used in an analysis, care should be taken to remove the part of the unit mixed oxide fabrication cost (Module D1-2) that comprises the depleted U3O8 to “moxable” depleted UO2 powder step. Around $30/kgHM of the overall mixed oxide fabrication cost is attributable to this operation if the mixed oxide plant receives enrichment plant derived depleted UF6 or depleted U3O8 as the PuO2 diluent.
Limitations of Cost Data and Other Considerations
The following considerations are relevant to reprocessed uranium materials in the fuel cycle:
1. Because of U-236 buildup, it is likely that reprocessed UOX could undergo at most two recycles. If a highly selective method for uranium enrichment became available (one that could selectively remove U-236) more recycles of UOX would become feasible.
2. The problem of large amounts of contaminated reprocessed uranium is one reason that electrochemical processing is better suited for the internal recycle of fast reactor fuel and not the large scale reprocessing of spent LWR fuels.
In general, the reprocessed uranium disposition step of the electrochemical fuel cycle can be placed in the “demonstration required” category of technology readiness. Uranium ore prices will help dictate when and how reprocessed uranium is dispositioned.
K3-7. COST SUMMARIES The module cost information is summarized in the What-It-Takes (WIT) cost summary in
Table K3-1. The summary shows the reference cost basis (constant year $U.S.), the reference basis cost contingency (if known), the cost analyst’s judgment of the potential upsides (low end of cost range) and downsides (high end of cost range) based on references and qualitative factors, and selected nominal costs (judgment of the expected costs based on the references, contingency factors, upsides, and downsides). These costs are subject to change and are updated as additional reference information is collected and evaluated, and as a result of sensitivity and uncertainty analysis. Refer to Section 2.6 in the main section of this report for additional details on the cost estimation approach used to construct the WIT table.

INL/EXT-07-12107 (March 2008) Advanced Fuel Cycle Cost Basis K3-9
Table K3-1. Cost summary table for reprocessed uranium disposition options. What-It-Takes (WIT) Table
Reference Cost(s) Based on Reference
Capacity
Reference Cost Contingency
(+/- %) Upsides
(Low Cost) Downsides (High Cost)
Selected Values (Nominal Cost)
SS-clad U-metal ingots: 300-year Storage” $20/Kg U for 80,000 MTU/yr Storage Capacity ($1,600M). Annual costs of $1.5M to $5M/yr
In unit cost, amount unknown, but not felt to cover all risks.
$25/kgU for tens of years of storage
$100+/kgU if centuries of temporary retrievable storage required.
$31/kgU for 300-yr storage
Electrochemically-derived reprocessed U3O8 Permanent Geologic Repository Disposal
In unit cost, amount is unknown
$75/kgU if contamination level only marginally above that of aqueously-derived reprocessed uranium
$150/kgU if sitting and regulatory difficulties arise
$93/kgU including metal to U3O8 conversion, repackaging, transportation, emplacement, and perpetual surveillance
Preparation for UOX recycle: U-Metal product to UF6 (including fluoride volatility removal of fission product, higher actinides, & U-232 daughters)
In unit cost, amount is unknown
$30/kgU $60/kgU $42/kgU
Internal reuse in fast reactor electrochemical fuel cycle
Included in fuel fabrication cost Module F2/D2
Included in fuel fabrication cost Module F2/D2
Included in fuel fabrication cost Module F2/D2
UO2 diluent preparation for contact-handled MOX fuel
$30/kgU $60/kgU $42/kgU including aqueous polishing and conversion to fuel grade UO2 powder

INL/EXT-07-12107 (March 2008) Advanced Fuel Cycle Cost Basis K3-10
The triangular distribution based on the costs in the WIT Table is shown in Figure K3-2.
Module K3 Electrochemical Reprocessed U Disposition
Estimated Cost Frequency Distribution
$/kgU
Freq
uenc
yLow Nominal Mean High
$75 $93 $106 $150
Figure K3-2. Electrochemical reprocessed U disposition estimated cost frequency distribution.
K3-8. RESULTS FROM SENSITIVITY AND UNCERTAINTY ANALYSIS Due to lack of detailed process/cost data no such calculations were performed.
K3-9. REFERENCES 1. G. Michaels, and T. Welch, Evaluation of Disposition Options for Reprocessed Uranium,
ORNL/TM-12326, Oak Ridge National Laboratory, February 1993.

INL/EXT-07-12107 (March 2008) L-1 Advanced Fuel Cycle Cost Basis
Module L
Geologic Repository

INL/EXT-07-12107 (March 2008) L-2 Advanced Fuel Cycle Cost Basis

INL/EXT-07-12107 (March 2008) L-3 Advanced Fuel Cycle Cost Basis
Module L
Geologic Repository
L-1. BASIC INFORMATION This is a top-down estimate based on life-cycle cost analysis of the proposed Yucca Mountain
Project (YMP) geologic repository (a Monitored Geologic Repository [MGR]) being developed by the U.S. Department of Energy (DOE) Office of Civilian Radioactive Waste Management (OCRWM). The primary reference is the Analysis of the Total System Life-cycle Cost of the Civilian Radioactive Waste Management Program.1 Additional information is given in the Life-cycle Cost Analysis for Repository Flexible Design Concepts.2
L-2. FUNCTIONAL AND OPERATIONAL DESCRIPTION The life cycle and associated costs for YMP consist of three major types of activities: (1) the MGR
itself, (2) transportation, and (3) management and oversight. Module L does not include waste conditioning or transportation; however, those costs are relevant to Modules G (High-Level Waste Conditioning, Storage, and Packaging), H (Spent Nuclear Fuel Packaging for Transport and Disposal), and O (Spent Nuclear Fuel/High-Level Waste Transportation). The current plan calls for utilities and DOE sites to ship their waste to the YMP in standardized canisters designed to fit inside waste containers in the YMP.
It is convenient to divide costs for an MGR into Capital and Operating categories. The current plan for the repository is to “construct” it in a staged fashion, so that some construction continues after operations begin. Repository capital costs include development of the license application and Licensing Support Network; engineering, procurement, and construction of the surface facilities (including Canister Receipt and Closure Facility, Wet Handling Facility, Initial Handling Facility, Receipt Facility) and subsurface facilities needed for Initial Operating Capability (main access tunnels and emplacement drifts); design and procurement of the waste container; physical security systems; and Program management. Operating costs include the same three subdivisions (Repository, Waste Acceptance & Transportation, and Program Management & Integration) and are further divided into three time- and activity-based phases of repository operation. These include Emplacement, during which the waste is received, packaged into the waste containers (see Figure L-3) and emplaced in the repository, Monitoring, during which the repository and its contained waste packages are monitored to ensure adequate performance during the period of higher heat generation, and Closure, during which drip shield are placed over the waste packages to deflect any intruding water and the repository is physically closed. For Yucca Mountain repository, the approximate time spans are (1) Development and Construction – 1983 to 2023; (2) Emplacement – 2017 to 2047; (3) Monitoring – 2048 to 2112; and (4) Closure – 2113 to 2126. This encompasses a total time period of 144 years.
Figure L-1 is a simple diagram of the functional flow for Module L.
Receive Shipping Casks
Transfer Waste to Disposal
Containers
Emplace Containers in Mined Drifts
Seal Repository
Figure L-1. Functional block diagram for geologic repository waste disposal.

INL/EXT-07-12107 (March 2008) L-4 Advanced Fuel Cycle Cost Basis
L-3. PICTURES/SCHEMATICS Figure L-2 is a schematic of the overall radioactive waste management system. Module L includes
only the repository, which is enclosed in the black box in the diagram.
Figure L-2. Concept for the Civilian Radioactive Waste Management System.1
Figure L-3 shows the various barriers used in the MGR and shows the waste package accommodating various waste canisters
Figure L-3. Yucca Mountain Repository Barrier System.1
INL/EXT-07-12107 (March 2008) L-5 Advanced Fuel Cycle Cost Basis
L-4. MODULE INTERFACE DEFINITION This module receives Spent Nuclear Fuel (SNF) and high-level waste (HLW) from Module O
(SNF/HLW Transportation) and retains the SNF/HLW in perpetuity.
L-5. MODULE SCALING FACTORS The basic scaling relationship for the module shows how cost varies with the size of the repository.
Costs have been estimated for repositories of two sizes at Yucca Mountain: 70,000 metric tons of heavy metal (MTHM) and 97,800 MTHM.1,2 These cost estimates are summarized in the next section and a crude cost estimate for an intermediate repository size could be obtained by interpolation. Extrapolation to a larger repository size could also be calculated by a crude linear extrapolation as a first estimate, but due consideration of differences in scaling of the various cost elements would be much more preferable. Nevertheless, a cost predictor formula is provided. Note however, the “normal” power law scaling may not be applicable because the repository can be viewed as involving replications of a basic structure, so that additional units of capacity all cost about the same.
It would be problematic to guess from the available cost information how much a second repository would cost, since many of the costs could be argued to be unique to the Yucca Mountain site. For example, selecting another site with dissimilar hydrological and geochemical conditions might require different waste-package materials, and could have a significant impact on the cost. Some research costs might be lower for a second repository due to the experience gained in designing, licensing, and building the first one, but this experience would only help to a limited extent since the geology is unique for every site. Also, if the legal and regulatory environment were more favorable for a second repository, some of the licensing costs might be reduced. However, more-favorable conditions are not ensured. Cost estimates for European repositories, presented in the next section, may provide some insight. Otherwise, the uncertainties associated with geology, public acceptance, and licensing environment are so large that the YMP cost is likely the best estimate for a second repository.
The report on cost analysis for flexible design concepts2 has some useful information on how costs at Yucca Mountain vary for several variations on the basic design. The types of variations considered have to do with possible alternatives to achieve a cooler repository and are presented in the next section.
L-6. COST BASES, ASSUMPTIONS, AND DATA SOURCES Appendix LA provides a cost profile for the entire life of the Yucca Mountain Project. It has been
developed from several sources and the profile is presented in terms of year 2000 dollars, year 2007 dollars, and year-of-expenditure dollars. Table L-1 shows a summary of the total life-cycle cost estimate for YMP. This estimate is for a repository containing a total of 97,800 MTHM, including 83,800 MTHM of commercial SNF, 4,140 MTHM of government-managed SNF (including Naval SNF), and approximately 22,000 canisters of vitrified HLW. The amount of commercial SNF was an estimate for the amount generated by all existing reactors during their service life. However, it does not include plant life extensions, which have since been granted for several reactors and are expected for many more. Table L-1 also shows the application of these costs to a “generic” MGR.
The repository is assumed to be government-owned, though most of the work would be contracted out. The cost of land is not included as the Yucca Mountain site and surrounding land is already U.S. government property.

INL/EXT-07-12107 (March 2008) L-6 Advanced Fuel Cycle Cost Basis
Table L-1. Yucca Mountain Project costs and application to Monitored Geologic Repository estimate. Cost, in Millions of Year 2007 Dollars Construction Emplacement Monitoring Closure Totals Yucca Mountain Project
Repository $20,937 $18,075 $4,800 $6,988 $50,800 Nevada Transport $2,460 $2,460 National Transport $1,630 $14,359 $15,989 Program Management & Integration $4,911 $3,794 $1,135 $733 $10573
Total $29,938 $36,227 $5,934 $7,722 $79,821 Monitored Geologic Repository
Repository $20,937 $18,075 $4,800 $6,988 $50,800 Nevada Transport $2,460 $2,460 Program Management & Integration $4,591 $2,114 $1,135 $733 $8,573
Total $27,988 $20,189 $5,934 $7,722 $61,833
The costs are broken down into four major categories: (1) monitored geologic repository, (2) National transportation, (3) Nevada transportation, and (4) program management and integration. All costs (including historical costs) are stated in 2000 dollars. Costs incurred by the Project for a second repository are not included, nor are budget transfers to the Nuclear Regulatory Commission (NRC) and Environmental Protection Agency (EPA) that are funded through DOE appropriations.
In applying these costs to a generic MGR, the National Transportation costs have not been included because those costs are covered in Module O1. Nevada Transportation costs are included because they are primarily for a rail spur to the facility that would be required for any MGR. Project Management & Integration costs have been prorated to eliminate the portion applicable to National Transportation activities
The total adjusted cost of $61.83B is for a repository holding of 97,800 MTHM. The report on cost analysis for flexible design concepts also includes cost estimates for a 70,000-MTHM repository, the maximum allowed by the Nuclear Waste Policy Act.3 This repository is assumed to hold 63,000 MTHM of commercial SNF, 2,333 MTHM of DOE-managed SNF, and 4,667 MTHM of vitrified HLW. Less detail is presented for this case, but a summary of the costs is given in Table L-2, with the corresponding numbers for the 97,800-MTHM case also provided for comparison. The total estimated cost of $50.4B for the 70,000-MTHM repository, less the portion for transportation, comes to an estimated $45.7B for the costs relevant to Module L (in 2000 dollars). If the difference in Module L cost is divided by the difference in capacity, a cost of $210,000 (in 2000 dollars) per incremental metric tonnes of heavy metal disposed is obtained. This can be used to construct a “cost predictor formula” for capacity expansions as follows:
Cost (billions of 2007 $) = 37.6 + 2.48 × 10⁻⁴•Capacity (in MTHM)
Table L-2 also shows, for the two capacities considered, the disposal cost (allocable to Module L).

INL/EXT-07-12107 (March 2008) L-7 Advanced Fuel Cycle Cost Basis
Table L-2. Estimated costs for two repository capacities (in millions of 2000 dollars).1,2 Cost Element 70,000 MTHM 97,800 MTHM
Monitored Geologic Repository $36,900 $42,070 Waste Acceptance, Storage, and Transportation (WAST) $4,700 $5,960 Nevada Transportation $800 $840 Program Integration $3,900 $4,070 Institutional $4,100 $4,580 Total $50,400 $57,520 Total, Less WAST $45,700 $51,5600 Cost for each incremental MTHM, $/MTHM $210,800/MTHM Cost per MTHM, based on predictor formula (2007 $) $771,000/MTHM $622,000/MTHM
NOTE: Costs for 70,000 MTHM are rounded to the nearest $100M.
A recent technical report4 from the Electric Power Research Institute (EPRI) indicated that significant additional capacity might exist at Yucca Mountain. The projected capacity is thought to lie between four times (260,000 MTHM) and nine times (570,000 MTHM) the current (legislative) capacity. If such a capacity expansion were possible, the cost predictor formula can be used to generate a “Rough Order of Magnitude” cost estimate as shown in Table L-3.
Table L-3. Cost projections for larger repository sizes. Capacity 70,000 MTHM 97,800 MTHM 270,000 MTHM 560,000 MTHM
Estimated Cost
$55.0 B $61.8 B $104.6 B $176.5 B
Unit Cost $771,000/MTHM $622,000/MTHM $384,000/MTHM $313,000/MTHM
A recent article5 in Nuclear Engineering International discussed costs for a British geologic repository. The costs were based on cost studies for such facilities in Sweden, Switzerland, and Belgium. Costs considered two capacities: (1) only SNF from “new build” reactors, and (2) SNF (and HLW) from existing reactors. Two major cost elements were considered: (1) cost of the repository and (2) cost of encapsulation (cost to place the SNF in an appropriate container and emplace it in the repository). Encapsulation costs were not available for Belgium, so only the data for Sweden and Switzerland are presented in Table L-4. These data were provided without detail, so it is not possible to assess their applicability to the situation in this country. The greatest insight is probably gained from looking at the cost predictor formula, similar to that developed above for YMP. Note that the coefficients that multiply capacity are comparable: $2.48 × 10⁻⁴B/MTHM for YMP, $2.56 × 10⁻⁴B/MTHM for the Swedish model and $3.62 × 10⁻⁴B/MTHM for the Swiss model. The “constant” is similar between the two European models, but the U.S. value ($37.6B, compared to $2.9B for the Swedish model and $2.1B for the Swiss model) is dramatically different. This may be due, in part, to the protracted preconstruction phase in the U.S.

INL/EXT-07-12107 (March 2008) L-8 Advanced Fuel Cycle Cost Basis
Table L-4. Preliminary cost estimates for two geologic repositories.5 Existing Reactors New Build Reactors Total Projected Spent Nuclear Fuel Inventory Sweden 13,498 MTHM 14,030 MTHM 27,528 MTHM Switzerland 16,433 MTHM 14,030 MTHM 30,463 MTHM Cost of Geologic Repository (2004 $) Sweden $4,239M $2,027M $6,266M Switzerland $5,345M $3,041M $8,386M Cost for Encapsulation (2004 $) Sweden $1,659M $1,290M $2,949M Switzerland $2,119M $1,659M $3,778M Total Disposal Cost (2004 $) Sweden $5,898M $3,317M $9,215M Switzerland $7,464M $4,700M $12,164M Unit Costs (2007 $) Sweden $472,100/MHTM $255,500/MHTM $361,700/MHTM Switzerland $490,800/MHTM $361,900/MHTM $431,400/MHTM Cost Predictor Equation (2007 $) Sweden $2.924B+ $2.56 × 10⁻⁴ B/MTHM Switzerland $2.117B+ $3.62 × 10⁻⁴ B/MTHM
High temperature and its possible effects on the surrounding rock, chemistry, corrosion rates, etc., is one of the biggest issues for the Yucca Mountain repository. The reference design includes a period of 1,000 years or so when waste package temperatures are above boiling. The main purpose of the report on cost analysis for flexible design concepts2 is to provide cost estimates for seven cooler alternative designs (maximum temperature of 85°C). Very briefly, the seven scenarios considered are: (1) a 250-year period of natural ventilation after an initial 50-year period of forced ventilation, plus increased waste package spacing, (2) a 250-year period of natural ventilation after an initial 50-year period of forced ventilation, plus smaller waste packages, (3) a 300-year period of forced ventilation before closure, plus increased drift spacing, (4) a 100-year period of forced ventilation before closure, plus increased waste package spacing, (5) surface aging of the commercial SNF for 30 years before Emplacement, plus increased waste package spacing, (6) surface aging of half of the commercial SNF for 30 years before Emplacement, plus a shorter period of forced ventilation before closure and increased waste package spacing, and (7) a 300-year period of forced ventilation before closure, plus increased waste package spacing.
A number of scaling relationships were used in determining the costs for the seven low-temperature scenarios and they may be useful for other economic analyses. The current construction cost estimate has a different basis than the then current estimate, so the factors may no longer produce valid results. The estimated cost differentials (i.e., additional cost over the referenced repository design) for the seven scenarios are given in Table L-5. The alternate scenarios illustrate the potential increase in cost of the repository if it is decided designs using lower temperatures are preferable.

INL/EXT-07-12107 (March 2008) L-9 Advanced Fuel Cycle Cost Basis
Table L-5. Cost differentials for the seven below-boiling scenarios (in millions of 2000 dollars).3
Scenario Number 70,000 MTHM
(Billions of 2006 $) 97,800 MTHM
(Billions of 2006 $) 1 $6.89 $7.53 2 $11.51 $13.45 3 $12.70 $12.70 4 $6.56 $7.96 5 $14.85 $16.46 6 $10.76 $12.48 7 $15.38 $15.06
L-7. LIMITATIONS OF COST DATA The Nuclear Waste Policy Act3 places a limit of 70,000 MTHM on the first geologic repository, so
scenarios considering higher capacities are contingent on legislation to modify this restriction. Note also that lawsuits and delays have already caused substantial expenditures for YMP, and could well incur additional costs in the future. Such costs are included in the existing contingency estimates to some extent, but possibly be even higher than for what has already been accounted. It is also not guaranteed that the Yucca Mountain site will be approved for disposal of waste.
The technology readiness could probably be considered pilot–feasible. While no HLW repository has yet been built, portions of the Yucca Mountain repository have been constructed as part of the testing activities, and the Waste Isolation Pilot Plant is an operating geologic repository for transuranic waste. The data quality is categorized as a scoping assessment with a common basis/approach
L-8. COST SUMMARIES Table L-6 is a code-of-accounts breakdown of repository cost information, for the case of
97,800 MTHM. Cost estimates were taken from Table L-2 and the Appendix. Preconstruction costs are those that occur before construction authorization is granted by NRC. “National Transportation” costs have been excluded. Operations and maintenance includes both the Emplacement period and the Monitoring period. Costs during the Closure period have been included as a separate line item.
The module cost information is summarized in the advanced fuel cycle (AFC) What-It-Takes (WIT) Table L-7. The summary shows the normalized reference costs (constant year dollars), reference contingency factors (if known), and the cost analyst’s judgment of the potential upsides (reductions to the costs from the reference case), downsides (additions to cost from the reference base), and selected values (i.e., expected costs based on the reference cost, contingency, upsides, and downsides). These values are preliminary and will be updated as additional reference information is collected and evaluated, and as a result of sensitivity and uncertainty analysis. Refer to report Section 2.6 for additional details on the cost estimation approach used to construct the WIT table. Note that contingency estimates to measure uncertainty are not available. The “project” contingencies have been included in the estimates for the individual line items.
The triangular distribution based on the HM as SNF and vitrified HLW costs in the WIT Table is shown in Figure L-4, while the distribution for HM fuel is shown in Figure L-5. The distribution is skewed toward the low cost as described in the next paragraph.

INL/EXT-07-12107 (March 2008) L-10 Advanced Fuel Cycle Cost Basis
Table L-6. Code of accounts breakdown of Module L costs. AFCI Code of Accounts No. Code of Accounts Description
Cost (Million 2006 $) Comments
0 Early Life-cycle Costs — 1 Capitalized preconstruction costs $16,649 9/11 Const. Auth. 2 Capitalized Direct Costs $11,339 Total Directs $27,988
3 Capitalized support services — Included Base Construction Cost (BCC) $27,988
4 Capitalized operations — Included 5 Capitalized supplementary costs — Included Total Overnight Cost (TOC) $27,988
6 Capitalized financial costs — Government funded Total Capital Investment Cost (TCIC) $27,988
7 Operations and maintenance cost $26,123 Emplacement & Monitoring 8 Closure cost $7,722 9 Annualized financial costs — Government funded Total Operating & Closure Costs $33,845 Total Project Life-Cycle Cost $61,833
Table L-7. Cost summary table for a geologic repository.
What-It-Takes Table (2007 $) Reference Cost and Related Capacity
Upsides (Low Unit Cost)
Downsides (High Unit Cost)
Selected Values (Nominal Cost)
$61.8B (97,800 MTHM) $632/kgiHM (SNF or HLW) $249/kgiHM (HLW with 2.5x loading factor)b
$104.6B (270,000 MTHM) $387/kgiHM $155/kgiHM
$64.0B a (70,000 MTHM)
$914/kgiHM $365/kgiHM
$69.6B (129,000 MTHM) $548/kgiHM $219/kgiHM
a. Cost represents a cooler geologic repository design. b. Assumes light water reactor fuel discharged at 50 GWd/MTHM, 12% fission product loading, and emplacement of 1 MT
HLW in same space as 1 MTHM SNF. The resulting unit costs reflect a 2.5 factor improvement in repository loading over SNF. The factor is dependent on the specific conditions defined including fuel burn-up, separations efficiency and waste loading for disposal in a deep geologic repository.

INL/EXT-07-12107 (March 2008) L-11 Advanced Fuel Cycle Cost Basis
Module L1 Geologic Repository (SNF)Estimated Cost Frequency Distribution
$/kgiHM
Freq
uenc
y
Low Nominal Mean High
$387 $548 $616 $914
Figure L-4. Geologic repository (SNF or HLW) estimated cost frequency distribution.
Figure L-5. Geologic repository (HLW with 2.5x loading factor) estimated cost frequency distribution.
The estimate of $69.6B (for a 129,000 MTHM repository), is used as the selected value. This represents the capacity that has been considered the maximum theoretical. Because the EPRI report indicates that much higher capacities are attainable, it appears appropriate to settle on this capacity and take advantage of the lower unit cost. The downside assumptions include an inability to achieve legislative authority to exceed the 70,000 MTHM current limit, coupled with a requirement for a cooler repository. This would increase costs by several billion dollars, as summarized in Table L-5; for which a mid-range estimate was selected here.
Reprocessing SNF removes many of the heat-producing radionuclides, allowing for more efficient disposal. A study by Wigeland & Bauer6 determined that uranium, plutonium, americium, and neptunium, along with fission products cesium and strontium were responsible for limiting loading in a repository

INL/EXT-07-12107 (March 2008) L-12 Advanced Fuel Cycle Cost Basis
based on volumetric and thermal constraints. However, when transuranic elements are recycled and short-lived fission products (Cs, Sr) are placed in separate decay storage, then there could be an increased utilization of space as indicated by the allowable linear loading in repository drifts (tunnels). The results further showed that limited recycling in thermal reactors would provide only a fraction of the benefit that could be achieved with repeated processing and recycling, as is possible in fast neutron reactors.
Ultimately, the disposal efficiency will depend on the partitioning efficiency in the separations process and on the “loading” of HLW in the vitrified end product. A simple rule of thumb applicable to all nuclear reactors consuming uranium or plutonium is that energy production of 1 GWdt consumes 1 kg of fuel and therefore produces 1 kg of fission products. A 1 GWe plant operating with a capacity factor of 0.9 and a thermal efficiency of 33% therefore produces approximately 1 MT/yr of fission products per year. Elsewhere it has been assumed that such a reactor produces 20 MT/yr of SNF. This corresponds to a fuel discharge exposure of approximately 50 GWD/MT. Elsewhere it has also been assumed that the loading of the vitrified product is 12%. The vitrified HLW equivalent to the SNF output will be 8 MT/yr. If the fission product loading and partitioning efficiency are such that 1 MT of vitrified HLW can be emplaced in the same space as 1 MT of SNF, then the cost to emplace 1 MT of vitrified HLW will be the same as the cost to emplace 1 MT of SNF. In terms of the amount of SNF represented by the fission product content of the HLW, this will increase the disposal efficiency to 250% of that for SNF. This would produce the equivalent HLW “selected value” disposal cost shown in Table L-7 of about $200/kgiHM. This is in general agreement with the Harvard report.7
Note that this result applies to light water reactor fuel with performance characteristics that are a small “stretch” compared to those attainable today. If, for example, the discharge exposure were increased to 100 GWD/MTHM, twice as much vitrified HLW would be generated from each tonne of SNF. Since only half as much of that SNF would be discharged annually, the annual production of HLW would remain the same as would the annual cost. If 1 MTiHM of such SNF could be emplaced in the same space as 1 MTIHM of SNF discharged at 50 GWD/MTiHM, the disposal costs for SNF would be halved. Consequently, the disposal cost for HLW, in terms of its equivalent SNF would be doubled. In the case of fast reactor SNF, with discharge exposures possibly exceeding 200 GWD/MTiHM, the disposal efficiency for such material, either as SNF or HLW is more uncertain and requires further evaluation.
L-9. RESULTS FOR SENSITIVITY AND UNCERTAINTY ANALYSIS No sensitivity analyses were performed for this module.
L-10. BIBLIOGRAPHY Delene, J. G., K. A. Williams, et al., An Assessment of the Economics of Future Electric Power
Generation Options and the Implications for Fusion, ORNL/TM-1999/243/R1, January 2000.
Forsberg, C. W., “Effect of Depleted-Uranium Dioxide Particulate Fill on Spent-Nuclear Fuel Waste Packages,” Nuclear Technology, Vol. 131, No. 3, September 2000, pp. 337–353.
Greene, S. R., et al., FMDP Reactor Alternative Summary Report: Vol 1—Existing Reactor-related Alternative, Oak Ridge National Laboratory, ORNL/TM-13275/V1, October 7, 1996, http://www.ornl.gov/~webworks/cpr/rpt/88103.pdf.
Michaels, G. E., and T. D. Welch, Evaluation of Disposition Options for Reprocessed Uranium, ORNL/TM-12326, February 1993, pp. 27-47, 89-109.
National Academy of Sciences, “Disposition of High-Level Waste and Spent Nuclear Fuel: The Continuing Societal and Technical Challenges,” National Academy Press, Washington, DC, 2001.

INL/EXT-07-12107 (March 2008) L-13 Advanced Fuel Cycle Cost Basis
OECD NEA, Trends in the Nuclear Fuel Cycle: Economic, Environmental and Social Aspects, 2001, Paris, pp. 54, 127, www1.oecd.org/publications/e-book/6602011e.pdf.
OECD Nuclear Energy Agency and International Atomic Energy Agency, The Economics of the Nuclear Fuel Cycle, 1994, pp. 11, 27, 37-38, 50, 77-80, http://www.nea.fr/html/ndd/reports/efc/, accessed January 24, 2006.
OECD Nuclear Energy Agency, The French R&D Programme on Deep Geological Disposal of Radioactive Waste: An International Peer Review of the “Dossier 2001 Argile,” Organization for Economic Cooperation and Development, Paris, France, 2003.
Office of International Affairs, “Management and Disposition of Excess Weapons Plutonium,” Committee on International Security and Arms Control, National Academy of Sciences, National Academy Press, Washington, D.C., 1994, Ch. 6, pp. 141-222, http://www.
U.S. Department of Energy, Final Environmental Impact Statement for a Geologic Repository for the Disposal of Spent Nuclear Fuel and High-Level Radioactive Waste at Yucca Mountain, Nye County, Nevada, DOE/EIS 0250, Vol. 1, U.S. Department of Energy, Office.
U.S. Department of Energy; Final Environmental Impact Statement for a Geologic Repository for the Disposal of Spent Nuclear Fuel and High-Level Radioactive Waste at Yucca Mountain, Nye County, Nevada, February, 2002, DOE/EIS-0250.
L-11. REFERENCES 1. U.S. Department of Energy, Analysis of the Total System Life-cycle Cost of the Civilian Radioactive
Waste Management Program, DOE/RW-0533, U.S. Department of Energy, Office of Civilian Radioactive Waste Management, Washington, DC, May 2001, http://www.ocrwm.doe.gov/pm/pdf/tslccr1.pdf, accessed January 2, 2005.
2. Scott G. Gillespie, “Life-cycle Cost Analysis for Repository Flexible Design Concepts,” TDR-CRW-SE-000017, Rev. 00, Bechtel SAIC Co., Washington, DC, October 2001.
3. U.S. Department of Energy, Nuclear Waste Policy Act as Amended, U.S. Department of Energy, Office of Civilian Radioactive Waste Management, Washington, DC, March 2004, http://www.ocrwm.doe.gov/documents/nwpa/css/nwpa.htm, accessed January 2, 2005.
4. EPRI, “Program on Technology Innovation: Room at the Mountain - Analysis of the Maximum Disposal Capacity for Commercial Spent Nuclear Fuel in a Yucca Mountain Repository” Electric Power Research Institute, May 2006.
5. Neil Chapman and Charles McCombie, “The cost of new UK build,” Nuclear Engineering International Magazine, Vol. 51, No. 621, April 2006.
6. R.A.Wigeland, T.H.Bauer, R.N.Hill, and J.A.Stillman, Impact on Geologic Repository Usage from Limited Actinide Recycle in Pressurized Light Water Reactors, Journal of Nuclear Science and Technology, Vol. 44, No.3, p. 415-422, 2007.
7. M. Bunn, et al., The Economics of Reprocessing vs. Direct Disposal of Spent Nuclear Fuel, Project on Managing the Atom, Harvard University, DE-FG26-99FT4028, Cambridge, Massachusetts, December 2003, also on Web: http://http://bcsia.ksg.harvard.edu/.

INL/EXT-07-12107 (March 2008) L-14 Advanced Fuel Cycle Cost Basis

INL/EXT-07-12107 (March 2008) L-15 Advanced Fuel Cycle Cost Basis
Appendix LA-1
Recapitulation of OCRWM Costs

INL/EXT-07-12107 (March 2008) L-16 Advanced Fuel Cycle Cost Basis

INL/EXT-07-12107 (March 2008) L-17 Advanced Fuel Cycle Cost Basis
Appendix LA-1
Recapitulation of OCRWM Costs It is difficult to find consistent sets of cost data for the Yucca Mountain Project that cover extended
periods of time. This appendix attempts to provide such a set. It is constructed primarily from Reference 1 and Reference 2, with appropriate “fillers” as needed. Within this appendix, all costs are in constant year 2000 dollars. Conversion to other bases, such as “Year of Expenditure (YOE)” or constant year 2007 dollars is accomplished by using the Gross Domestic Product (GDP) deflator. This is the basis used in federal budgeting and is therefore especially appropriate when federal budgets and projects are involved. Projections of the GDP Deflator are from the Congressional Budget Office.3 Cost data, including GDP Deflator values, are given in the tables at the end of this appendix.
Table LA-1, below, provides the source data and the techniques used to adjust those data for use in this module. One source of difficulty is “joining” the costs from Reference 2 with those from Reference 1 and then extending the “operating costs” throughout the Emplacement period. Much of that is explained in the table. A more complicated approach was used for the repository costs, and that is explained in the next section.
LA-1. ESTIMATION OF REPOSITORY COSTS DURING THE EMPLACEMENT PERIOD
According to Reference 1, the Yucca Mountain Project will hold 83,800 MTU of commercial Spent Nuclear Fuel (SNF), 4141 MTU of Department of Energy (DOE) SNF (including Naval fuels), and 22,147 canisters of DOE high-level waste (HLW). The capacity is said to be 97,800 MTU of SNF. On that basis, the HLW is equivalent to 9859 MTU of SNF, or about 44.5% of the number of canisters. In this appendix, an “SNF equivalent” to DOE contributions to the Monitored Geologic Repository (MGR) is determined each year as the amount of DOE SNF and 44.5% of the number of canisters of HLW.
Also according to Reference 1, 28.1% of the cost of the repository is allocable to DOE SNF/HLW. In this appendix, annual repository operating costs are assumed to have two components – a “monitoring” component proportional to the total amount of SNF/HLW emplaced and an “emplacement” component proportional to the amount of SNF/HLW emplaced during the year. It is reasonable to assume that the monitoring component continues unchanged after the repository is full, so that the costs during the Monitoring phase are equal to the monitoring costs during the Emplacement phase, pro-rated for the amount of SNF/HLW emplaced. The “Repository” costs during the 70-year Monitoring Phase are $6.0B in constant year 2000 dollars. 28.1% of this, or $1.686B is for DOE SNF/HLW. Since there will be 14,000 MTU equivalent of DOE SNF/HLW, the annual cost for that material is $1.72M per 1000 MTU of SNF equivalent. This leaves $43.14M for 83,600 MTU of commercial SNF, or $0.737M per 1000 MTU.
Total “Repository” costs during the Emplacement period are $19.700B, according to Reference 1. The DOE share of this is $5.536B. Deducting the monitoring costs of $364M leaves Emplacement costs of $5.172B or about $369M per 1000 MTU emplaced. The comparable calculation for commercial SNF yields a cost of $158M per 1000 MTU. The cost estimates near the end of the Emplacement period do not exhibit the steep drop-off that is observed in the amount of material emplaced. A reasonable “fit” can be made by “spreading” the cost so that 28% occurs in the year of emplacement, 12% in the following year, 10% in the year after that, and 50% two years before emplacement. Using this approach, costs for the first few years of emplacement (2016 through 2023) were calculated. A reasonable match to Reference 2 for the year 2022 and 2023 can be obtained by reducing the costs by 20.8%. Then, “adjustments” were made to the costs in 2017, 2019, and 2020 to better match the information from Reference 2. In October 2005,

INL/EXT-07-12107 (March 2008) L-18 Advanced Fuel Cycle Cost Basis
DOE announced a “simpler, more cost effective” approach to some operations in the repository that could be achieved through the use of standardized containers that would eliminate repackaging SNF at the MGR. The roughly 20% reduction in cost may be a measure of the effectiveness of that change.
Table LA-1. Source information for Yucca Mountain Project costs used in this module. Years Source Comments
1983-2000 Reference 1 Costs in 2000 dollars 2000 Reference 4 YOE costs from Audit Report 2001 Reference 5 YOE costs from Audit Report 2002 Reference 6 YOE costs from Audit Report 2003 Reference 7 YOE costs from Audit Report 2004 Reference 8 YOE costs from Audit Report 2005 Reference 9 See Note #1. These factors were applied to the final BA & O from the reference
(“final” BA & O for FY 2005 appear in the Budget for 2007) from the reference to obtain a total; that was apportioned according to the average from 2000 to 2004, inclusive.
2006 Reference 10 See Note #1. These factors were applied to the final BA & O from the reference to obtain a total; that was apportioned according to the average from 2000 to 2004, inclusive.
2007 Reference 10 See Note #1. These factors were applied to the estimated BA & O from the reference to obtain a total; that was apportioned according to the average from 2000 to 2004, inclusive.
2008 Reference 10 See Note #1. These factors were applied to the proposed BA & O from the reference to obtain a total; that was apportioned according to the average from 2000 to 2004, inclusive.
2009-2047 References 11 & 2
“Repository” costs adjusted to Reference 2 using the information from Reference 1 and the technique outlined in the section below entitled “Estimation of Repository Costs during the Emplacement Period.” National Transportation costs estimated per Note #2 PM&I costs estimated per Note #3
2048-2112 Reference 1 Costs from Monitoring Period, but note that 65 years of monitoring are included in this period, rather than 70. Costs begin to increase after 65 years in anticipation of closure, and it seemed more reasonable to begin the Closure Period with that increase.
2113-2126 Reference 1 Costs from the Closure Period and from that last few years of the Monitoring Period.
1. Analysis of data from References 2 thru 6 and 7 thru 13 revealed that the “Actuals” for a fiscal year are, on average, 106% of Budget Authorizations (BA) and 107% of Outlays (O).
2. Reference 1 provides a National Transportation cost of $5.4B during the Emplacement period, with 21.2% of that allocated to DOE shipments, or $81.77M per 1000 MTU SNF equivalent. The cost for commercial SNF is $50.77 per 1000 MTU. Reference 2 provides a cost that is 2.097 times the Reference 1 cost and that adjustment was made to obtain a new projection.
3. Reference 1 indicates an allocation of 26.9% of PM&I costs to DOE materials. The amount calculated in that manner is 14.65% of Repository and National Transportation costs attributed to DOE materials. When the same approach is applied to commercial SNF, PM&I turns out to be 14.45% of costs attributed to such materials. This is a satisfying result, as one would expect PM&I to be a form of “overhead” applied equally to all expenses. Also, 15% is a very reasonable value. When these percentages are applied to costs estimated using the techniques described above, they are higher than the data from Reference 2, and must be multiplied by 0.898 to get a reasonable agreement. At the end of the Emplacement period, there is not a sharp decrease in PM&I costs. This is consistent with the concept that a certain amount of administrative work remains after the apparent end of a project. This is accommodated here by assigning 70% of the cost to the year in which the Repository and National Transportation expenditures are made, 20% to the following year, and 10% to the year after that.

INL/EX
T-07-12107 (March 2008)
L-19
A
dvanced Fuel Cycle C
ost Basis
Table LA-2. Costs in millions of dollars of the year of expenditure. Construction (Capital) Emplacement (Operating) Monitoring (Operating) Closure (Operating)
TOTAL MGR NevTrn Nat.Trn PM&I TOTAL MGR Nat.Trn PM&I TOTAL MGR PM&I TOTAL MGR PM&I FY1983 $179 $166 $0 $4 $9 FY2016 $119 $0 $119 $0 FY2048 $436 $363 $72 FY2113 $1,645 $1,410 $235 FY1984 $279 $229 $0 $11 $39 FY2017 $376 $129 $222 $24 FY2049 $303 $228 $75 FY2114 $4,866 $4,467 $399 FY1985 $324 $249 $0 $18 $58 FY2018 $856 $317 $491 $48 FY2050 $229 $153 $76 FY2115 $5,359 $4,872 $487 FY1986 $413 $328 $0 $15 $70 FY2019 $1,052 $447 $523 $82 FY2051 $207 $156 $52 FY2116 $4,960 $4,464 $496 FY1987 $488 $400 $0 $23 $65 FY2020 $1,275 $532 $632 $111 FY2052 $211 $158 $53 FY2117 $4,965 $4,460 $505 FY1988 $416 $303 $0 $26 $87 FY2021 $1,509 $704 $665 $141 FY2053 $215 $161 $54 FY2118 $5,054 $4,540 $514 FY1989 $360 $232 $0 $34 $94 FY2022 $1,570 $787 $622 $161 FY2054 $219 $164 $55 FY2119 $5,232 $4,796 $436 FY1990 $350 $203 $0 $36 $111 FY2023 $1,642 $834 $634 $174 FY2055 $223 $167 $56 FY2120 $5,682 $5,238 $444 FY1991 $337 $185 $0 $36 $115 FY2024 $1,705 $870 $653 $182 FY2056 $227 $170 $57 FY2121 $5,874 $5,422 $452 FY1992 $368 $188 $0 $47 $134 FY2025 $1,741 $888 $665 $187 FY2057 $231 $173 $58 FY2122 $5,980 $5,520 $460 FY1993 $414 $224 $0 $43 $147 FY2026 $1,788 $910 $685 $192 FY2058 $235 $176 $59 FY2123 $4,589 $4,215 $375 FY1994 $451 $272 $0 $36 $144 FY2027 $1,822 $931 $695 $196 FY2059 $239 $179 $60 FY2124 $1,049 $858 $191 FY1995 $555 $370 $0 $36 $149 FY2028 $1,853 $951 $703 $200 FY2060 $244 $183 $61 FY2125 $971 $776 $194 FY1996 $373 $245 $0 $32 $96 FY2029 $1,890 $970 $715 $204 FY2061 $248 $186 $62 FY2126 $296 $99 $198 FY1997 $372 $280 $0 $10 $82 FY2030 $1,928 $992 $728 $208 FY2062 $252 $189 $63 FY1998 $432 $341 $0 $7 $85 FY2031 $1,968 $1,014 $741 $213 FY2063 $257 $193 $64 FY1999 $373 $292 $0 $2 $79 FY2032 $2,008 $1,037 $754 $217 FY2064 $262 $196 $65 FY2000 $372 $283 $0 $2 $87 FY2033 $2,050 $1,060 $768 $222 FY2065 $266 $200 $67 FY2001 $385 $304 $0 $2 $79 FY2034 $2,091 $1,082 $782 $227 FY2066 $271 $203 $68 FY2002 $382 $301 $0 $2 $78 FY2035 $2,128 $1,102 $796 $231 FY2067 $276 $207 $69 FY2003 $422 $342 $0 $6 $74 FY2036 $2,170 $1,126 $809 $235 FY2068 $281 $211 $70 FY2004 $531 $409 $0 $22 $100 FY2037 $2,187 $1,132 $817 $238 FY2069 $250 $214 $36 FY2005 $580 $458 $0 $8 $113 FY2038 $2,220 $1,147 $832 $241 FY2070 $255 $218 $36 FY2006 $534 $422 $0 $8 $105 FY2039 $2,230 $1,159 $828 $243 2071-99 $9,760 $8,366 $1,394 FY2007 $466 $368 $0 $7 $91 FY2040 $2,289 $1,207 $833 $249 FY2100 $435 $373 $62 FY2008 $514 $406 $0 $7 $101 FY2041 $2,303 $1,208 $842 $252 FY2101 $443 $380 $63 FY2009 $1,140 $690 $237 $36 $176 FY2042 $2,423 $1,266 $895 $262 FY2102 $451 $386 $64 FY2010 $1,409 $654 $519 $56 $180 FY2043 $2,436 $1,280 $891 $266 FY2103 $459 $393 $66 FY2011 $1,589 $662 $660 $82 $184 FY2044 $2,508 $1,310 $926 $273 FY2104 $467 $400 $67 FY2012 $1,967 $957 $680 $139 $190 FY2045 $2,291 $1,111 $928 $252 FY2105 $476 $408 $68 FY2013 $1,768 $1,145 $292 $130 $200 FY2046 $1,899 $761 $933 $206 FY2106 $553 $415 $138 FY2014 $1,903 $1,291 $272 $136 $204 FY2047 $1,375 $644 $569 $161 FY2107 $563 $422 $141 FY2015 $1,655 $1,285 $0 $159 $211 FY2108 $573 $430 $143 FY2016 $1,676 $1,284 $0 $175 $217 FY2109 $657 $511 $146 FY2017 $1,491 $1,139 $0 $185 $166 FY2110 $668 $520 $149 FY2018 $1,032 $926 $0 $0 $106 FY2111 $680 $529 $151 FY2019 $888 $799 $0 $0 $89 FY2112 $693 $539 $154 FY2020 $648 $582 $0 $0 $66 FY2021 $600 $540 $0 $0 $60 FY2022 $361 $344 $0 $0 $18 FY2023 $340 $327 $0 $0 $13

INL/EX
T-07-12107 (March 2008)
L-20
A
dvanced Fuel Cycle C
ost Basis
Table LA-3. Costs in millions of constant year 2000 dollars. Construction (Capital) Emplacement (Operating) Monitoring (Operating) Closure (Operating)
TOTAL MGR NevTrn Nat.Trn PM&I TOTAL MGR Nat.Trn PM&I TOTAL MGR PM&I TOTAL MGR PM&I FY1983 $275 $255 $0 $6 $14 FY2016 $86 $0 $86 $0 FY2048 $121 $91 $30 FY2113 $210 180 30 FY1984 $413 $339 $0 $16 $58 FY2017 $266 $91 $157 $17 FY2049 $90 $60 $30 FY2114 $610 560 50 FY1985 $466 $357 $0 $26 $83 FY2018 $595 $220 $341 $33 FY2050 $80 $60 $20 FY2115 $660 600 60 FY1986 $579 $460 $0 $21 $98 FY2019 $718 $305 $357 $56 FY2051 $80 $60 $20 FY2116 $600 540 60 FY1987 $668 $547 $0 $32 $89 FY2020 $855 $357 $424 $74 FY2052 $80 $60 $20 FY2117 $590 530 60 FY1988 $551 $402 $0 $34 $115 FY2021 $994 $464 $438 $93 FY2053 $80 $60 $20 FY2118 $590 $530 $60 FY1989 $459 $296 $0 $43 $120 FY2022 $1,016 $509 $402 $104 FY2054 $80 $60 $20 FY2119 $600 $550 $50 FY1990 $431 $250 $0 $44 $137 FY2023 $1,044 $530 $403 $110 FY2055 $80 $60 $20 FY2120 $640 $590 $50 FY1991 $400 $220 $0 $43 $137 FY2024 $1,065 $543 $408 $114 FY2056 $80 $60 $20 FY2121 $650 $600 $50 FY1992 $426 $217 $0 $54 $155 FY2025 $1,068 $545 $408 $115 FY2057 $80 $60 $20 FY2122 $650 $600 $50 FY1993 $468 $253 $0 $49 $166 FY2026 $1,077 $548 $413 $116 FY2058 $80 $60 $20 FY2123 $490 $450 $40 FY1994 $500 $301 $0 $40 $159 FY2027 $1,078 $551 $411 $116 FY2059 $80 $60 $20 FY2124 $110 $90 $20 FY1995 $602 $401 $0 $39 $162 FY2028 $1,078 $553 $408 $116 FY2060 $80 $60 $20 FY2125 $100 $80 $20 FY1996 $397 $261 $0 $34 $102 FY2029 $1,079 $554 $408 $117 FY2061 $80 $60 $20 FY2126 $30 $10 $20 FY1997 $389 $293 $0 $10 $86 FY2030 $1,082 $556 $408 $117 FY2062 $80 $60 $20 FY1998 $447 $352 $0 $7 $88 FY2031 $1,084 $559 $408 $117 FY2063 $80 $60 $20 FY1999 $381 $298 $0 $2 $81 FY2032 $1,087 $561 $408 $118 FY2064 $80 $60 $20 FY2000 $372 $283 $0 $2 $87 FY2033 $1,090 $564 $408 $118 FY2065 $80 $60 $20 FY2001 $376 $297 $0 $2 $77 FY2034 $1,092 $565 $408 $118 FY2066 $80 $60 $20 FY2002 $366 $289 $0 $2 $75 FY2035 $1,092 $565 $408 $118 FY2067 $80 $60 $20 FY2003 $396 $321 $0 $5 $70 FY2036 $1,094 $567 $408 $119 FY2068 $70 $60 $10 FY2004 $485 $374 $0 $20 $91 FY2037 $1,083 $561 $405 $118 FY2069 $70 $60 $10 FY2005 $514 $406 $0 $7 $101 FY2038 $1,080 $558 $405 $117 FY2070 $70 $60 $10 FY2006 $460 $364 $0 $7 $90 FY2039 $1,066 $554 $396 $116 2071-99 $2,030 $1,740 $290 FY2007 $394 $311 $0 $6 $77 FY2040 $1,074 $566 $391 $117 FY2100 $70 $60 $10 FY2008 $427 $337 $0 $6 $84 FY2041 $1,062 $557 $388 $116 FY2101 $70 $60 $10 FY2009 $930 $563 $194 $30 $144 FY2042 $1,097 $573 $405 $119 FY2102 $70 $60 $10 FY2010 $1,130 $525 $416 $45 $145 FY2043 $1,084 $569 $396 $118 FY2103 $70 $60 $10 FY2011 $1,251 $522 $520 $65 $145 FY2044 $1,096 $572 $405 $119 FY2104 $70 $60 $10 FY2012 $1,521 $740 $526 $108 $147 FY2045 $983 $477 $399 $108 FY2105 $70 $60 $10 FY2013 $1,343 $870 $222 $99 $152 FY2046 $801 $321 $394 $87 FY2106 $80 $60 $20 FY2014 $1,421 $964 $203 $101 $153 FY2047 $569 $267 $236 $67 FY2107 $80 $60 $20 FY2015 $1,214 $942 $0 $116 $155 FY2108 $80 $60 $20 FY2016 $1,207 $925 $0 $126 $156 FY2109 $90 $70 $20 FY2017 $1,055 $806 $0 $131 $118 FY2110 $90 $70 $20 FY2018 $717 $644 $0 $0 $73 FY2111 $90 $70 $20 FY2019 $606 $545 $0 $0 $61 FY2112 $90 $70 $20 FY2020 $434 $390 $0 $0 $44 FY2021 $395 $355 $0 $0 $40 FY2022 $234 $223 $0 $0 $11 FY2023 $216 $208 $0 $0 $8

INL/EX
T-07-12107 (March 2008)
L-21
A
dvanced Fuel Cycle C
ost Basis
Table LA-4. Costs in millions of constant year 2007 dollars. Construction (Capital) Emplacement (Operating) Monitoring (Operating) Closure (Operating)
TOTAL MGR NevTrn Nat.Trn PM&I TOTAL MGR Nat.Trn PM&I TOTAL MGR PM&I TOTAL MGR PM&I FY1983 $325 $302 $0 $7 $17 FY2016 $101 $0 $101 $0 FY2048 $210 $175 $35 FY2113 $248 $213 $35 FY1984 $488 $401 $0 $19 $69 FY2017 $314 $108 $186 $20 FY2049 $143 $108 $35 FY2114 $721 $662 $59 FY1985 $551 $422 $0 $31 $98 FY2018 $703 $260 $404 $40 FY2050 $106 $71 $35 FY2115 $780 $709 $71 FY1986 $685 $544 $0 $25 $116 FY2019 $849 $361 $422 $66 FY2051 $95 $71 $24 FY2116 $709 $639 $71 FY1987 $790 $647 $0 $38 $105 FY2020 $1,011 $422 $501 $88 FY2052 $95 $71 $24 FY2117 $698 $627 $71 FY1988 $652 $475 $0 $40 $136 FY2021 $1,176 $548 $518 $110 FY2053 $95 $71 $24 FY2118 $698 $627 $71 FY1989 $543 $350 $0 $51 $142 FY2022 $1,201 $602 $476 $123 FY2054 $95 $71 $24 FY2119 $709 $650 $59 FY1990 $510 $296 $0 $52 $162 FY2023 $1,234 $627 $477 $131 FY2055 $95 $71 $24 FY2120 $757 $698 $59 FY1991 $473 $260 $0 $51 $162 FY2024 $1,259 $642 $483 $134 FY2056 $95 $71 $24 FY2121 $769 $709 $59 FY1992 $504 $257 $0 $64 $183 FY2025 $1,263 $644 $483 $136 FY2057 $95 $71 $24 FY2122 $769 $709 $59 FY1993 $553 $299 $0 $58 $196 FY2026 $1,274 $649 $488 $137 FY2058 $95 $71 $24 FY2123 $579 $532 $47 FY1994 $591 $356 $0 $47 $188 FY2027 $1,275 $652 $486 $137 FY2059 $95 $71 $24 FY2124 $130 $106 $24 FY1995 $712 $474 $0 $46 $192 FY2028 $1,274 $654 $483 $138 FY2060 $95 $71 $24 FY2125 $118 $95 $24 FY1996 $469 $309 $0 $40 $121 FY2029 $1,276 $655 $483 $138 FY2061 $95 $71 $24 FY2126 $35 $12 $24 FY1997 $460 $346 $0 $12 $102 FY2030 $1,279 $658 $483 $138 FY2062 $95 $71 $24 FY1998 $529 $416 $0 $8 $104 FY2031 $1,282 $661 $483 $139 FY2063 $95 $71 $24 FY1999 $451 $352 $0 $2 $96 FY2032 $1,286 $664 $483 $139 FY2064 $95 $71 $24 FY2000 $440 $335 $0 $2 $103 FY2033 $1,289 $667 $483 $140 FY2065 $95 $71 $24 FY2001 $444 $351 $0 $2 $91 FY2034 $1,292 $669 $483 $140 FY2066 $95 $71 $24 FY2002 $433 $342 $0 $3 $88 FY2035 $1,292 $669 $483 $140 FY2067 $95 $71 $24 FY2003 $469 $380 $0 $6 $82 FY2036 $1,293 $671 $482 $140 FY2068 $95 $71 $24 FY2004 $574 $442 $0 $24 $108 FY2037 $1,281 $663 $479 $139 FY2069 $83 $71 $12 FY2005 $608 $480 $0 $9 $119 FY2038 $1,277 $660 $479 $139 FY2070 $83 $71 $12 FY2006 $544 $430 $0 $8 $107 FY2039 $1,260 $655 $468 $137 2071-99 $2,400 $2,058 $344 FY2007 $466 $368 $0 $7 $91 FY2040 $1,270 $670 $462 $138 FY2100 $83 $71 $12 FY2008 $505 $399 $0 $7 $99 FY2041 $1,255 $659 $459 $137 FY2101 $83 $71 $12 FY2009 $1,100 $666 $229 $35 $170 FY2042 $1,298 $678 $479 $140 FY2102 $83 $71 $12 FY2010 $1,336 $620 $491 $53 $171 FY2043 $1,282 $673 $469 $140 FY2103 $83 $71 $12 FY2011 $1,480 $617 $615 $76 $172 FY2044 $1,296 $677 $478 $141 FY2104 $83 $71 $12 FY2012 $1,799 $875 $622 $127 $174 FY2045 $1,163 $564 $471 $128 FY2105 $83 $71 $12 FY2013 $1,588 $1,029 $263 $117 $180 FY2046 $947 $379 $465 $102 FY2106 $95 $71 $24 FY2014 $1,680 $1,140 $240 $120 $180 FY2047 $673 $316 $279 $79 FY2107 $95 $71 $24 FY2015 $1,435 $1,114 $0 $138 $183 FY2108 $95 $71 $24 FY2016 $1,428 $1,094 $0 $149 $185 FY2109 $106 $83 $24 FY2017 $1,247 $953 $0 $155 $139 FY2110 $106 $83 $24 FY2018 $848 $761 $0 $0 $87 FY2111 $106 $83 $24 FY2019 $717 $645 $0 $0 $72 FY2112 $106 $83 $24 FY2020 $514 $461 $0 $0 $52 FY2021 $467 $420 $0 $0 $47 FY2022 $277 $263 $0 $0 $13 FY2023 $256 $246 $0 $0 $10

INL/EXT-07-12107 (March 2008) Advanced Fuel Cycle Cost Basis L-22
Table LA-5. GNP Deflator (2000 = 100.00).14 Year Deflator Year Deflator Year Deflator Year Deflator 1981 58.30 2021 151.80 2061 309.87 2101 632.53 1982 62.29 2022 154.53 2062 315.44 2102 643.92 1983 65.04 2023 157.31 2063 321.12 2103 655.51 1984 67.44 2024 160.14 2064 326.90 2104 667.31 1985 69.63 2025 163.02 2065 332.79 2105 679.32 1986 71.25 2026 165.96 2066 338.78 2106 691.55 1987 73.11 2027 168.95 2067 344.87 2107 704.00 1988 75.41 2028 171.99 2068 351.08 2108 716.67 1989 78.34 2029 175.08 2069 357.40 2109 729.57 1990 81.25 2030 178.23 2070 363.83 2110 742.70 1991 84.30 2031 181.44 2071 370.38 2111 756.07 1992 86.42 2032 184.71 2072 377.05 2112 769.68 1993 88.38 2033 188.03 2073 383.84 2113 783.53 1994 90.28 2034 191.42 2074 390.75 2114 797.64 1995 92.18 2035 194.86 2075 397.78 2115 811.99 1996 93.95 2036 198.37 2076 404.94 2116 826.61 1997 95.59 2037 201.94 2077 412.23 2117 841.49 1998 96.75 2038 205.58 2078 419.65 2118 856.64 1999 98.02 2039 209.28 2079 427.20 2119 872.06 2000 100.00 2040 213.04 2080 434.89 2120 887.75 2001 102.40 2041 216.88 2081 442.72 2121 903.73 2002 104.19 2042 220.78 2082 450.69 2122 920.00 2003 106.40 2043 224.76 2083 458.80 2123 936.56 2004 109.43 2044 228.80 2084 467.06 2124 953.42 2005 112.74 2045 232.92 2085 475.47 2125 970.58 2006 116.04 2046 237.11 2086 484.02 2126 988.05 2007 118.25 2047 241.38 2087 492.74 2008 120.38 2048 245.73 2088 501.61 2009 122.54 2049 250.15 2089 510.64 2010 124.75 2050 254.65 2090 519.83 2011 126.99 2051 259.24 2091 529.18 2012 129.28 2052 263.90 2092 538.71 2013 131.61 2053 268.65 2093 548.41 2014 133.98 2054 273.49 2094 558.28 2015 136.39 2055 278.41 2095 568.33 2016 138.84 2056 283.42 2096 578.56 2017 141.34 2057 288.52 2097 588.97 2018 143.89 2058 293.72 2098 599.57 2019 146.48 2059 299.00 2099 610.36 2020 149.11 2060 304.39 2100 621.35

INL/EXT-07-12107 (March 2008) Advanced Fuel Cycle Cost Basis L-23
APPENDIX LA-1 REFERENCES 1. U.S. Department of Energy, Analysis of the Total System Life-cycle Cost of the Civilian Radioactive
Waste Management Program, DOE/RW-0533, U.S. Department of Energy, Office of Civilian Radioactive Waste Management, Washington, DC, May 2001.
2. Office of Civilian Radioactive Waste Management, OCRWM Budget Projection, 2009-2023, Executive Summary, March 2007 (provided as supplementary testimony to Reference 16).
3. Congressional Budget Office, Budget & Economic Outlook Fiscal Years 2008-2017, USGPO, January 2007.
4. OCRWM, Annual Report to Congress, FY2000, DOE/RW-0543, Appendix A (Financial Statements), U.S. Department of Energy, September 2001.
5. OCRWM, Annual Report to Congress, FY2001, DOE/RW-0556, Appendix A (Financial Statements), U.S. Department of Energy, October 2002.
6. OCRWM Annual Report to Congress, FY2002, DOE/RW-0560, Appendix A (Financial Statements), U.S. Department of Energy, September 2003.
7. OCRWM Annual Report to Congress, DOE/RW-0569, Appendix (Accountability Report), U.S. Department of Energy, December 2004.
8. Golan, Paul, 2005 Annual Report to Congress (Letter Report transmitting the Independent Auditor’s Report), OCRWM, U.S. DOE, September 30, 2005.
9. Office of Management & Budget, Analytical Perspectives, Budget of the United States Government, Fiscal Year 2007; U.S. Government Printing Office, 2006.
10. Office of Management & Budget, Analytical Perspectives, Budget of the United States Government, Fiscal Year 2008; U.S. Government Printing Office, 2007.
11. Sproat, Edward F. III, Testimony before the Subcommittee on Energy and Air Quality, Committee on Energy and Commerce, U.S. House of Representatives, July 19, 2006.
12. Office of Management & Budget, Analytical Perspectives, Budget of the United States Government, Fiscal Year 2000; U. S. Government Printing Office, 1999.
13. Office of Management & Budget, Analytical Perspectives, Budget of the United States Government, Fiscal Year 2001; U. S. Government Printing Office, 2000.
14. Bureau of Economic Analysis, National Income and Product Accounts Tables, Table 1.1.4, Price Indexes for the Gross Domestic Product, accessible at http://www.bea.gov/national/nipaweb/SelectTable.asp?Selected=Y, Web page accessed July 19, 2007.

INL/EXT-07-12107 (March 2008) Advanced Fuel Cycle Cost Basis L-24

INL/EXT-07-12107 (March 2008) Advanced Fuel Cycle Cost Basis M-1
Module M Series
Alternative Disposal Concepts (Modules M1 through M3)

INL/EXT-07-12107 (March 2008) Advanced Fuel Cycle Cost Basis M-2

INL/EXT-07-12107 (March 2008) Advanced Fuel Cycle Cost Basis M-3
Module M1
Deep Borehole Disposal

INL/EXT-07-12107 (March 2008) Advanced Fuel Cycle Cost Basis M-4

INL/EXT-07-12107 (March 2008) Advanced Fuel Cycle Cost Basis M-5
Module M1
Deep Borehole Disposal M1-1. BASIC INFORMATION
Three alternative disposal concepts were briefly investigated: Deep Boreholes (Section M1), Seabed (Section M2), and Extraterrestrial (Section M3). All the alternative disposal options are only at a very preliminary conceptual stage, and therefore, no definitive detailed information or cost estimates are available.
Very deep boreholes, perhaps 4 km deep, have been considered in several countries for the disposal of spent fuel or high-level waste, as well as a proliferation-resistant approach to the disposition of plutonium. In several current concepts, material would be placed in thin-walled canisters in the bottom 2-km portion of a 4-km-deep hole, with clay seals separating each canister and a long column of clay, topped by concrete, on top of the entire assembly of canisters. As a result of the great depth of the boreholes and very low permeability of the granite formations proposed for the concepts, deep boreholes may potentially isolate radioactive materials from the biosphere for much longer periods than even mined geologic repositories. Nevertheless, deep boreholes have not been selected as the preferred disposal method in any country. This is in part because of the greater difficulty of engineering the disposal site, characterizing the physics and chemistry of the surrounding rock, monitoring the material once emplaced, and finally, recovering the material should unforeseen circumstances require retrieval.
The risk of releasing material to the environment from boreholes at such depths requires further study. There are substantial reasons to believe the risk should be very low if the borehole is in an area free of geologic activity that could possibly bring the material to the surface and is also free of vertical faults in the rock that might create pathways for migration toward the surface. The very saline water often found at great depths would make it virtually impossible for material in the borehole to rise to the surface by convection. The saline water is significantly denser than the fresher water above and, therefore, does not rise through even if heated.
Swedish estimates place the cost of deep hole disposal of spent fuel in the range of $100M per hole, although a Russian group advertises it will drill a set of boreholes for much less.1 A potential lower cost alternative to the generalized approach involves grinding the waste and pumping the slurry into a deep borehole, possibly one developed during the exploration and production of petroleum, resulting in potential savings of approximately $5M if an existing borehole is used. The primary advantage of the slurry method is the stability of the formation. The main disadvantage is the high equipment maintenance associated with pumping slurries, which could result in the approach being prohibitive from either a cost or safety perspective.

INL/EXT-07-12107 (March 2008) Advanced Fuel Cycle Cost Basis M-6
M1-2. FUNCTIONAL AND OPERATIONAL DESCRIPTION
After review of seven disposal concepts, Chapman and Gibb2 propose a low temperature disposal conceptual model in which encapsulated wastes are placed in the lower 1,000 m of a borehole 4,000 m in depth, in stable crystalline basement rocks of regions with average geothermal flux. Containment of the waste package within the natural geological barrier is the primary feature of the system.
Key elements of the containment concept follow:
• “The rock in the disposal zone is expected to have no effective movement of pore and fracture fluids under undisturbed conditions.” Evidence from very deep boreholes in Russia, Sweden, and Germany indicates fluids in the proposed disposal zone are hydrogeologically stable, with residence times of millions of years.
• The wastes disposed in the deep boreholes are sufficiently cooled such that thermal load imposed on the rock-fluid system does not destabilize the structure by causing fluid convection. The thermal load can be controlled, to some extent, by the proper spacing of the waste containers.
• “A long system of borehole seals isolates the disposal zone from overlying rock formations and groundwater systems.” In addition, upper casing sections can be cut and withdrawn, causing the borehole to collapse or backfill, making reentry difficult.
The design described here uses a conceptual borehole diameter of 0.8 m in the disposal zone, which is best suited for small volumes of waste in compact packages. The diameter of the borehole would permit thin-walled metal containers with diameters about 0.5 m and lengths about 1 m. Each of the packages could contain 0.17 m3 of waste, equivalent to approximately half of a metric tonne. Assuming a nominal emplacement pitch of 2 m and an emplacement zone 100 m in length, a single borehole could accommodate about 250 MT of waste.a The disposal method would be best suited to programs with relatively small quantities of high-level waste. A simple diagram of the functional flow is presented in Figure M1-1.
Receive Shipping Casks
Grind Up Waste or
Transfer to Disposal
Containers
Inject Waste or Place
Containers in Borehole
Seal Borehole
Figure M1-1. Functional block diagram for deep borehole waste disposal.
M1-3. PICTURES/SCHEMATICS
The conceptual model for deep borehole disposal is illustrated in Figures M1-2 and M1-3.
a. If the waste is UO2 spent fuel, 250 MT waste equates to about 220 MTHM. If the waste is high-level waste, the equivalent amount of fuel will depend on the exposure of the fuel. A simple rule of thumb is that fission of 1 g of an actinide yields 1 MWd of energy, and also 1 g of fission products. If the high-level waste form is 50% fission products (and therefore 50% matrix), 250 MT of waste is equivalent to 125 TWd of thermal energy. At an exposure of 50 GWd/MTHM, that is equivalent to 2500 MTHM; at 30 GWd/MTHM, it is 4267 MTHM.

INL/EXT-07-12107 (March 2008) Advanced Fuel Cycle Cost Basis M-7
Figure M1-2. Conceptual model for deep borehole disposal.2
Figure M1-3. Sealing concepts for a deep borehole under thick sediments.2

INL/EXT-07-12107 (March 2008) Advanced Fuel Cycle Cost Basis M-8
M1-4. MODULE INTERFACE DEFINITION
Module M accepts spent nuclear fuel or high-level waste casks transported by Module O and is a terminal module in that nothing leaves once it has been accepted.
M1-5. MODULE SCALING FACTORS
Not directly applicable.
M1-6. COST BASES, ASSUMPTIONS, AND DATA SOURCES
An illustration of a project estimate is provided in Table M1-1. The estimate is for a facility to inject waste into a deep borehole. Two other estimates, for boreholes only, were referenced by Chapman and Gibb2 from other sources: an estimate of the drilling cost of a large-diameter 4-km-deep borehole at £1M (2000) per km and an estimate of €4.65M (2000) for a 0.8-m-diameter, 4-km-deep borehole. For exchange rates (in 2000) of 0.6609 pounds per dollar and 1.0854 euros per dollar, the former estimate works out to $6.1M for a 4-km-deep hole and the latter works out to $4.3M. If the previous values are multiplied by a factor of 1.13 to convert the estimates from 2000 to 2006 dollars, yields $6.9M and $4.9M for the alternate sources, which are comparable to the 2004 $5M cost ($5.3M 2006) for the disposal well in Table M1-1.
Table M1-1. Estimated cost for deep borehole and injection facility.
Aug. 19, 2004
Dollars in MillionsDescription Factor Labor-Hours Cost
Disposal Well $5.00 Injection Facility $10.00 Total Field Cost 0 $15.00 Construction Management/Procurement @ % of Field 0.00 $0.00 D.E/P.M @ % of Field Cost 10.00 0 $1.50 Total Directs $16.50 Owners Field (10% Craft Labor-Hours) @ $/Labor-Hour 80.00 0 $0.00 Owners Home Office @ 7.73% of Field Cost $1.16 Total Owners Cost $1.16 Total Direct + Owners Costs $17.66 Environmental Permitting @ % of Above 3.00% $0.53 Licensing @ % of Above 0.00% $0.00 Total Allowances $0.53 Total Direct + Owners + Allowances Costs $18.19 Startup & Testing @ % Above 2.00% $0.36 Total in 2004 Dollars $18.55 Escalation / Rounding 0.00% $0.00 Total in 2004 Dollars $18.55 Contingency 20.00% $3.71 Grand Total $22.26 Grand Total in 2006 Dollars @ 1.06 CPI 106.00% $23.60

INL/EXT-07-12107 (March 2008) Advanced Fuel Cycle Cost Basis M-9
M1-7. LIMITATIONS OF COST DATA
All cost data are extraordinarily preliminary and should be considered only as rough order of magnitude costs. The technology readiness is considered to be research and development–possible. Considerable work and expense would be required to design and license one of these facilities. The data quality is categorized as independent sources without a common basis.
The cost estimates referenced by Chapman and Gibb2 are for the borehole drilling alone and do not include surface structures, facilities, and associated maintenance, nor the cost of the land. Although the estimates are from references concerned with nuclear waste disposal, costs due to increased analysis and safety criteria have not been included. Detailed designs and analyses have not been completed and much additional work on the design of the borehole, the effect of borehole fluids on the waste emplacement procedure, and the effect of the mechanical load on a column of packages would be required. In addition, the experience of the Yucca Mountain Project and other nuclear waste disposal projects has demonstrated quality assurance and other regulatory activities, including oversight groups and delays caused by litigation. These activities can—and probably will—add large additional costs, which are not considered here. Indeed, such activities and the required associated responses have already incurred long delays and cost billions of dollars to the Yucca Mountain Project.
M1-8. COST SUMMARIES
The code-of-accounts information for the concept is summarized in Table M1-2. Capital costs are extracted from Table M1-1, where operating and management costs are not estimated. The total cost of $24M is unrealistically much too low and should be considered an extremely optimistic result.
The module cost information is summarized in the What-It-Takes (WIT) cost summary in Table M-2. The summary shows the reference cost basis (constant year $U.S.), the reference basis cost contingency (if known), the cost analyst’s judgment of the potential upsides (low end of cost range) and downsides (high end of cost range) based on references and qualitative factors, and selected nominal costs (judgment of the expected costs based on the references, contingency factors, upsides, and downsides). These costs are subject to change and are updated as additional reference information is collected and evaluated, and as a result of sensitivity and uncertainty analysis. Refer to Section 2.6 in the main section of this report for additional details on the cost estimation approach used to construct the WIT table.
The reference case is the deep borehole injection facility estimated in Table M1-3. The other case presented is the $24,000/MT estimate ($25,500/MT [2006 dollars]) for 280 deep boreholes at $6M each, based on 70,000 metric tonnes of uranium (MTU) of waste and 250 MTU in each borehole, similar to the concept proposed by Chapman and Gibb.2 The estimate does not include surface facilities or operating, maintenance, and management. The cost of surface facilities is probably small in comparison to drilling the boreholes, but operations and maintenance costs would likely be significant.
The distribution is skewed toward the high cost because this disposal method has not been done before (the technology is at the research stage), so there is a large amount of uncertainty with the cost.

INL/EXT-07-12107 (March 2008) Advanced Fuel Cycle Cost Basis M-10
Table M1-2. Code-of-accounts information for deep borehole disposal. AFCI Code of Accounts
Number Code of Accounts Description Cost (Million 2006 dollars) Comments
0 Early Life Cycle Costs — — 1 Capitalized pre-construction costs — — 2 Capitalized Direct Costs 24 — Total Directs 24 —
3 Capitalized support services — — Base Construction Cost (BCC) 24 —
4 Capitalized operations — — 5 Capitalized supplementary costs — — Total Overnight Cost (TOC) 24 —
6 Capitalized financial costs — — Total Capital Investment Cost (TCIC) 24 —
7 Annualized O&M cost — Not estimated 9 Annualized financial costs — Not estimated Total Operating Costs — — Total Project Life-Cycle Cost 24 20% contingency
Table M1-3. Cost summary table for deep borehole disposal. What-It-Takes (WIT) Table
Reference Cost(s) Based on Reference
Capacity
Reference Cost Contingency
(+/- %) (Low Cost)
Upsides (High Cost) Downsides
(Nominal Cost)Selected Values
$24 M $96,000/MT waste $109,090/MTHM if SNF $9,600/MTHM if high-level waste from fuel at 50 GWd/MTHM
20% — $1,700 M $21,600/MT waste $24,530/MTHM if SNF $2,160/MTHM if high-level waste from fuel at 50 GWd/MTHM
$1,700 M
Cost for deep borehole injection (one borehole)
— — Cost for 280 deep boreholes
Further analysis required
M1-9. RESULTS OF SENSITIVITY AND UNCERTAINTY ANALYSIS
No sensitivity analyses were performed for Module M.

INL/EXT-07-12107 (March 2008) Advanced Fuel Cycle Cost Basis M-11
Module M2
Seabed Disposal

INL/EXT-07-12107 (March 2008) Advanced Fuel Cycle Cost Basis M-12

INL/EXT-07-12107 (March 2008) Advanced Fuel Cycle Cost Basis M-13
Module M2
Seabed Disposal
M2-1. BASIC INFORMATION Seabed disposal involves emplacing wastes in a subseafloor location in the ocean. The waste can
either be emplaced in boreholes or dropped from a ship in a package specially designed to kinetically penetrate into the seabed mud at an appropriate depth.
M2-2. FUNCTIONAL AND OPERATIONAL DESCRIPTION Disposal of high-level waste by burial in the mud layer on the deep ocean floor, referred as
“subseabed disposal,” has long been considered the leading alternative to mined geologic repositories. A detailed study by the Nuclear Energy Agency of the Organization for Economic Cooperation and Development in 1988 concluded “sub-seabed burial appears to be a technically feasible method of disposal of high-level radioactive wastes or spent fuel.”3 The work was summarized in an eight-volume report of which the most relevant are Volume 1, containing an overview and conclusions, and Volume 4, which discusses engineering aspects and provides some information on cost estimates.
The idea of subseabed disposal is to put the material in metallic canisters that would be emplaced in the “abyssal clay formation” several kilometers beneath the ocean surface. The canisters would be emplaced perhaps 30 m below the deep ocean mud surface, for which core samples demonstrate has been undisturbed in some areas for millions of years. Placement could be accomplished by the following three methods:
The use of free-falling “penetrators” dropped from ships that would accelerate falling through the ocean depths and become embedded in the benthic mud A long drill stem from a surface ship Lowering an emplacement package by a cable from the ship.
An alternate approach would be to drill through the sediments into the bedrock below and emplace the canisters in the holes. This in essence combines the deep-borehole and subseabed concepts.
A number of methods for emplacing the waste are illustrated in Figure M2-1. The waste can be emplaced in a trench or drilled borehole or embedded by means of a penetrator. The waste can either be embedded in the soft near-surface seabed sediments or, if drilled, emplaced in deeper rock layers. The disposal site should be away from the edges of tectonic plates, continental margins, potential mineral, or biological resources and have little erosion and active pore water movement. A simple functional-flow diagram is shown in Figure M2-1.
Receive Shipping Casks
Transfer to Disposal
Containers
Emplace Containers (in Boreholes or
directly in Seabed)
Seal Boreholes (if required)
Ship Disposal Containers to Disposal Site
Figure M2-1. Functional block diagram for seabed waste disposal.

INL/EXT-07-12107 (March 2008) Advanced Fuel Cycle Cost Basis M-14
The subseabed disposal option in mid-ocean areas considered herein should not be confused with the concept of emplacement in the “subduction zone,” where one tectonic plate is slipping beneath another with the waste being carried deep into the crust of the earth. The difficulty with the subduction disposal approach is even “fast” seafloor motions occur at a rate of approximately 1 cm per year. This means that in all of historic time (~5,000 years) the material would have moved only 50 m. Furthermore, subduction zones are geologically active and unpredictable, prone to volcanoes among other phenomenon, and as a result research into the concept is presently only very preliminary.
M2-3. PICTURES/SCHEMATICS Concepts for seabed disposal are illustrated in Figures M2-2 and M2-3.
Figure M2-2. Representative emplacement methods for seabed disposal,3 Volume 4, p. 27.

INL/EXT-07-12107 (March 2008) Advanced Fuel Cycle Cost Basis M-15
Figure M2-3. A general logistic cycle for seabed disposal3, Volume 4, p. 22.
M2-3.1 Module Interface Definition
The module accepts spent nuclear fuel or high-level waste casks transported by Module O. Module M is a terminal module in that nothing leaves once it has been accepted.
M2-4. MODULE SCALING FACTORS Not directly applicable.
M2-5. COST BASES, ASSUMPTIONS, AND DATA SOURCES Although preliminary, past analyses for the case of spent nuclear fuel and high-level waste suggest
the costs of subseabed disposal would be competitive with mined geological disposal, with the actual cost of emplacement in the range of a few hundred million dollars. However, the development and demonstration program necessary to meet licensing requirements might well cost billions of dollars, similarly as in the case of land repositories. In addition, subseabed disposal would likely face intense public and political opposition from many quarters, including a complex of both national and international legal barriers and regulation, with the consequence of making any further development of the option difficult, uncertain of success, time-consuming, and expensive.

INL/EXT-07-12107 (March 2008) Advanced Fuel Cycle Cost Basis M-16
Two options for seabed disposal discussed in some detail in Volume 4 of the Nuclear Energy Agency report3 have been analyzed to derive cost estimates:
1. Emplacement in predrilled boreholes 750 m deep and 1,000 m apart (horizontal spacing). Each borehole would receive a 450-m column of waste packages and would be sealed after waste-package emplacement.
2. Use of free-falling penetrators to embed waste packages about 50 m deep in the seabed, in an array with a nominal horizontal spacing of 180 m.
The spacings were defined to achieve thermal and chemical isolation of each disposal location from neighboring boreholes.
Various parameters for the two cases are listed in Table M2-1. Cost estimates from the Nuclear Energy Agency report are listed in Table M2-2. The cost units are not explicitly stated, but are apparently 1987 British Pound Sterling (UK £) and are based on disposal of vitrified high-level waste. The canisters referred to are European Reference Canisters (ERC), which hold 1.39 MTHM of high-level waste; hence, the 3,750 MTHM per year of Table M2-1 is equivalent to the 2,700 canisters per year of Table M2-2. The conversion rate for pounds per dollar was 1.634 in 1987, and U.S. inflation from 1987 to 2006 was 1.76 based on the Consumer Price Index. Thus, a factor of 2.88 is needed to convert the costs in Table M2-2 to 2006 dollars. The final values presented in the table yield a result of approximately $137,000 (2006 $U.S.)/MTHM for drilled emplacement and $56,000 (2006 $U.S.)/MTHM for penetrator emplacement (following division by a factor of 1.39 MTHM/ERC).
Table M2-1. Utilization parameters for a 100,000 MTHM disposal site receiving waste at a rate of 3,750 MTHM per year,3 Volume 4, page 143.
Parameter Units Drilled
Emplacement
European Reference Penetrators
U.S. Reference Penetrators
Horizontal Spacing (Square Array) m 1,000 180 180 1.97 (RW) Heavy Metal per Emplacement Location MTHM 417 6.95 1.50 (SF)
50,761 (RW) Total Number of Emplacement Locations
— 240 14,389 66,667 (SF) 1,904 (RW) Number of Emplacement Sites Used per
Year — 9 540
2,500 (SF) 1,645 (RW) Disposal Site Area km2 240 466 2,165 (SF)
40.6 (RW) Disposal Site Width (Square Area) km2 15.5 21.6 46.5 (SF)
804 (RW) Transport Ship Capacity MTHM 423 584 524 (SF)
4.7 (RW) Shipments to Site per Year — 8.9 6.4 7.2 (SF) 1–2 (RW) Emplacement or Transport Ships
Required — 1–2 1–2
2 (SF) RW = reprocessed waste, SF = spent fuel (apportioned as 60% pressurized water reactor and 40% boiling water reactor)

INL/EXT-07-12107 (March 2008) Advanced Fuel Cycle Cost Basis M-17
Table M2-2. Costs of drilled versus penetrator emplacement (1987 UK £)3, Volume 4, page 147. Drilled Emplacement Penetrator Emplacement
No. Unit
Cost (k£)
Total Cost (k£)
Amorti-zation
Annual Cost (k£) No.
Unit Cost (k£)
Total Cost (k£)
Amorti-zation
Annual Cost (k£)
Canister land transport:
Canister flask capital 8 750 6,000 12.5 858 8 750 6,000 12.5 858
Railway wagon capital 8 50 400 12.5 57 8 50 400 12.5 57
Canister transport 24 8 192 0 192 24 8 192 0 192
Flask & canister maintenance
— — 1,000 0 1,000 — — 1,000 0 1,000
2,107 2,107
Ullage filling & overpacking or penetrator assembly plant:
Assembly buildings capital 1 180,000 180,000 25 19,800 1 180,000 180,000 25 19,800
Assembly equip. capital 1 128,300 180,000 12.5 18,304 1 120,000 120,000 12.5 18,304
Pen/overpack components 2,700 7.5 20,250 0 20,250 540 25 13,500 0 13,500
Assembly materials included — — 0 0 540 5 2,700 0 2,700
Operating costs included — — 0 0 540 3 1,620 0 1,620
Staffing 200 30 6,000 0 6,000 200 30 6,000 0 6,000
Maintenance — — 100 0 100 — — 100 0 100
Insurance (@ 0.25%)
— — 770 0 770 — — 770 0 770
65,224 62,794
Dockside facilities:
Civil works capital 1 2,000 2,000 25 220 1 10,000 10,000 25 1,100
Dock equipment capital 1 2,000 2,000 12.5 286 1 5,000 5,000 12.5 715
Dock operation — — 1,000 0 1,000 1,200 0 1,200
Dock staffing 50 30 1,500 0 1,500 20 30 600 0 600
Maintenance included — — 0 0 included — — 0 0
Insurance — — 10 0 10 — — 38 0 38
1,516 3,653
Penetrator/Canister Sea Transport:
Ship capital — — N/A 0 0 1 15,000 15,000 12.5 2,145
Flasks 54 750 40,500 12.5 5,792 2 1,000 2,000 12.5 286
Ship operation included — — 0 0 7 70 490 0 490
Ship staffing included — — 0 0 20 40 800 0 800

Table M2-2. (continued).
INL/EXT-07-12107 (March 2008) Advanced Fuel Cycle Cost Basis M-18
Drilled Emplacement Penetrator Emplacement
No. Unit
Cost (k£)
Total Cost (k£)
Amorti-zation
Annual Cost (k£) No.
Unit Cost (k£)
Total Cost (k£)
Amorti-zation
Annual Cost (k£)
Maintenance included — — 0 0 — — 200 0 200
Insurance included — — 0 0 — — 255 0 255
5,792 4,176
Supply Ships:
Ship charter — — 5,000 0 5,000 — — — 0 0
Drilling Ships:
Ship charter — — 34,500 0 34,500
Hole casings 9 100 900 0 1,900
Consumables 9 20 180 0 180
46,372 0
Semi-submersible:
Construction site capital 1 45,011
Main structure 1 33,269
Superstructure capital 1 39,697
Construction site capital 1 45,011
117,977 25 12,977
Equipment capital 1 61,285 61,285 12.5 8,764
Towing and installation 1 9,682 9,682 12.5 1,385
Miscellaneous capital 1 18,849 18,849 25 2,073
Consumables (+ backfilling)
— 3,811 3,811 0 3,811
Staffing 444 50,000 22,200 0 22,200
Energy — — 5,500 0 5,500
Maintenance — — 3,502 0 3,502
Insurance (@ 1.5%) — — 3,095 0 3,095
63,307 0 0
Decommissioning:
Assembly plants 1 5,800 5,800 –25 64 — — — –25 64
Transport vessels — — — 0 0 — — — 0 0
Quayside facilities — — — 0 0 — — — 0 0
Emplacement vessel 1 100,000 100,000 –25 1,100 — — — 0
1,164 64
Total: 179,690 72,794
Cost/European Reference
179,690,000 2,700 = 66,000
72,794,000 2,700 = 26,960

Table M2-2. (continued).
INL/EXT-07-12107 (March 2008) Advanced Fuel Cycle Cost Basis M-19
Drilled Emplacement Penetrator Emplacement
No. Unit
Cost (k£)
Total Cost (k£)
Amorti-zation
Annual Cost (k£) No.
Unit Cost (k£)
Total Cost (k£)
Amorti-zation
Annual Cost (k£)
Canister:
M2-6. LIMITATIONS OF COST DATA All cost data are extraordinarily preliminary and should be considered only as rough order of
magnitude costs. The technology readiness is considered to be research and development–possible. While subseabed burial appears to be a technically feasible method of disposal of high-level wastes or fuel, the option faces major problems of public and international acceptability as well as major legal restrictions. Moreover, a substantial period of further development would be required prior to implementation. The United States cancelled the program investigating subseabed disposition in 1986, and presently no country in the world is actively pursuing research and development on subseabed disposal. Considerable work and expense would be required to design and license one of these facilities, and as no country is pursuing development, further improved cost estimates are not expected anytime in the near future. The data quality is categorized as independent sources without a common basis.
As discussed in the National Academy of Sciences report, research on seabed disposal has been discontinued as a matter of policy, and any further consideration would require amendments to international treaties involving use of the seabed.4 Overcoming such an obstacle would presumably incur additional costs. Further, the experience of the Yucca Mountain Project and other nuclear waste disposal projects has demonstrated quality assurance and other regulatory activities, including oversight organizations and delays due to litigation. These activities can—and probably will—add large additional costs not considered in the presented estimates. Such actions have already cost the Yucca Mountain Project billions of dollars.
M2-7. COST SUMMARIES Code of accounts information for the concept is summarized in Table M2-3. The presented costs are
based on the values in Table M2-2 for penetrator emplacement, which is less expensive than drilled emplacement, normalized to cost per MTHM and converted to 2006 dollars. The unit mass and constant dollar conversion factors, as presently previously, are 1.39 MTHM per canister and 2.88 2006 dollars per 1987£, respectively.
The module cost information is summarized in the What-It-Takes (WIT) cost summary in Table M2-4. The summary shows the reference cost basis (constant year $U.S.), the reference basis cost contingency (if known), the cost analyst’s judgment of the potential upsides (low end of cost range) and downsides (high end of cost range) based on references and qualitative factors, and selected nominal costs (judgment of the expected costs based on the references, contingency factors, upsides, and downsides). These costs are subject to change and are updated as additional reference information is collected and evaluated, and as a result of sensitivity and uncertainty analysis. Refer to Section 2.6 in the main section of this report for additional details on the cost estimation approach used to construct the WIT table.
The costs assume vitrified high-level waste in ERC, and no detailed cost estimates for direct disposal of spent fuel have been found employing the sub-seabed approach.

INL/EXT-07-12107 (March 2008) Advanced Fuel Cycle Cost Basis M-20
Table M2-3. Code-of-accounts information for seabed disposal. AFCI Code of Accounts
Number Code-of-Accounts Description
Cost (Thousand 2006 dollars per
MTHM) Comments 0 Early Life Cycle Costs — — 1 Capitalized Preconstruction costs — — 2 Capitalized Direct Costs 16 — Total Directs 16 —
3 Capitalized Support Services — — Base Construction Cost (BCC) 16 —
4 Capitalized Operations — — 5 Capitalized Supplementary Costs — — Total Overnight Cost (TOC) 16 —
6 Capitalized Financial Costs — — Total Capital Investment Cost (TCIC) 16 —
7 Operation and Maintenance Cost 22 — 9 Financial Costs 18 — Total Operating Costs 40 — Total Project Life-Cycle Cost 56 —
Table M2-4. Cost summary table for seabed disposal. What-It-Takes (WIT) Table
Reference Cost(s) Based on Reference Capacity
(Low Cost) Upsides
(High Cost) Downsides
(Nominal Cost) Selected Values
$56,000/MTHM — $137,000/MTHM $56,000/MTHM Cost for seabed disposal with penetrator emplacement
— Cost for seabed disposal with drilled emplacement
Further analysis required
M2-8. RESULTS OF SENSITIVITY AND UNCERTAINTY ANALYSIS No sensitivity analyses were performed for the module.

INL/EXT-07-12107 (March 2008) Advanced Fuel Cycle Cost Basis M-21
Module M3
Extraterrestrial Disposal

INL/EXT-07-12107 (March 2008) Advanced Fuel Cycle Cost Basis M-22

INL/EXT-07-12107 (March 2008) Advanced Fuel Cycle Cost Basis M-23
Module M3
Extraterrestrial Disposal
M3-1. BASIC INFORMATION Extraterrestrial disposal involves placing the waste into distant earth orbit, a heliocentric orbit
between Venus and Earth, or launching into the sun. To maximize payloads and reduce costs would require the spent nuclear fuel to be processed to remove the short half-life (tens to perhaps a 100 years) of radionuclides as well as any useful elements, such as uranium or plutonium.
The usual concept when considering space disposal is to initially launch the material into a circular low-earth orbit of approximately 300 km altitude. This requires a rocket velocity gain of about 8 km/s, followed by an additional burn to move the material onto some desired deep-space path, whether another orbit around the sun, beyond the solar system, or directly into the sun. Staging from low-earth orbit with a subsequent additional burn requires the least amount of energy and is, therefore, likely the lowest cost approach to launching payloads into space.
M3-2. FUNCTIONAL AND OPERATIONAL DESCRIPTION As an alternate low cost approach to expendables, Ehricke5 proposes using a space shuttle to transport
waste into near-earth orbit, and subsequently release the waste sending it on to a primary candidate disposal “site” between Venus and Earth. The spent fuel is first reprocessed to remove the short half-life and recyclable isotopes, and following 10 years of storage as liquid waste is solidified in 6-inch diameter pots and shipped for final disposal. A single-launch mode is envisioned for early initiation of space disposal but is likely to be more costly than a multilaunch mode.
Depicted below in Figure M3-1 is an associated simplified diagram of the functional flow of the extraterrestrial waste disposal process.
Receive Shipping Casks
Reprocess Waste and
Place in Containers
Place Containers in
Launch Vehicle
Launch into Space
Figure M3-1. Functional block diagram for extraterrestrial waste disposal.
M3-3. PICTURES/SCHEMATICS Salkeld and Beichel6 also examined the possibility of nuclear waste disposal in space. A schematic of
one possible nuclear waste cask and shipping container for extraterrestrial disposal to be loaded in an orbit vehicle is shown in Figure M3-2.

INL/EXT-07-12107 (March 2008) Advanced Fuel Cycle Cost Basis M-24
Figure M3-2. Conceptual nuclear waste cask and shipping container for extraterrestrial disposal.5
M3-4. MODULE INTERFACE DEFINITION Module M accepts spent nuclear fuel or high-level waste casks being transported via Module O.
The waste will likely have been reprocessed in Module F, conditioned and repackaged in Module G, and subsequently transported via Module O directly bypassing any storage at nuclear power plants or long-term storage facility. Module M is a terminal module with respect that nothing leaves once the spent nuclear fuel or high-level waste has been accepted for disposal.
M3-5. MODULE SCALING FACTORS Not directly applicable.
M3-6. COST BASES, ASSUMPTIONS, AND DATA SOURCES The National Academy of Sciences has evaluated extraterrestrial disposal for the disposition of
plutonium, and estimates today large payloads cost approximately $10,000/kg to launch and achieve low-earth orbit.4 Achieving low-earth orbit is not sufficient, as the material must still be launched to an orbit unlikely to encounter the earth, put on a path to the sun, or finally escape the solar system to circumvent falling back to the earth. However, just the case of launching the spent nuclear fuel or high-level waste to LEO equates to approximately $10M per MT, which compares very unfavorably with respect to both the earlier deep borehole and subseabed alternatives estimated at $25,500/MT and $56,000/MT, respectively.
An alternative concept proposes using a space shuttle to transport waste into near-earth orbit, and subsequently release and send the material on to a disposal area between Venus and Earth. The ability to reuse the shuttle may be lower in cost as compared to expendables, and a detailed cost estimate analysis has been performed on the concept. Information from Ehricke5 is summarized in Tables M3-1 through M3-3.

INL/EXT-07-12107 (March 2008) Advanced Fuel Cycle Cost Basis M-25
Table M3-1. Energy characteristics of extraterrestrial disposal of nuclear waste.5 Lunar Surface
Soft
From Near-Earth Orbit Earth Orbit
Geosync Orbit (28°)
Venu. S.4)Crash
Landing Direct CLO To Edgeof Sun
To 0.01 A.U.
To 0.02 A.U.
To 0.05 A.U.
To 0.1 A.U.
Solar Escape
1. Direct Flight (Km/S) 3.3 3.9 3.1 5.7 5.9 22.2 20.2 18.4 15.6 12.4 — 2. Via Venu. S. Gravity Assist (Km/S)1) — — — — — 20.2 19.0 17.2 14.2 10.4 —
3. Via Jupiter Gravity Assist (KM/S)2) — — — — — — — — — — 6.7
From Earth Surface: ● Disposal Energy Efficiency3)
X= 0.97 0.97 0.97 0.985 0.985 0.9999 0.9999 0.9999 0.999 0.999 0.990 1. Direct Flight 0.0063 0.0013 0.008 0.0054 0.0042 0.0007 0.0013 0.0022 0.0011 0.0056 — 2. Via Venu. S. G-assist — — — — — 0.0013 0.0019 0.0029 0.0028 0.0095 — 3. Via Jupiter G-assist — — — — — — — — — — 0.0067 ● Ratio of Energy for Space Disposal to Energy Generated 1. 3.2 10-5 2.2 10-4 2.2 10-5 1.1 10-4 1.5 10-4 1.3 10-2 5.8 10-3 2.8 10-3 4.1 10-3 5.1 10-4 — 2. — — — — — 5.8 10-3 3.5 10-3 1.9 10-3 1.3 10-3 2.1 10-4 — 3. — — — — — — — — — — 1.2 10-4 CLO = Circumlunar orbit; ETO = Earth-to-orbit; X = Mass fraction = Launch window recurs every 19.2 months. Launch window recurs every 13.1 months. ∆VETO = 8.84 km/s; plus ∆V in first three lines above.
Ratio of propellant weight to sum of propellant plus structural weight. Above values of X, refer to the number of stages needed to achieve the overall velocity increment from earth surface, based on a mean effective specific impulse of 375 sec. The above values give the mass fraction needed, if a single stage was used for the entire mission.
4. Using Venus G-assist to throw load into heliocentric orbit inside 1 AU; or delivery to Venus surface. One major powered phase near earth required (3.7 ≤ ∆V ≤ 4.3 KM/S)

INL/EXT-07-12107 (March 2008) Advanced Fuel Cycle Cost Basis M-26
Table M3-2. Characteristic data of single-launch disposal missions (LWR waste; orbiter payload: 14.5 ton, carrying waste and IOV; no jettisonable containers).5
Waste Storage Lunar Surface Heliocentric orbit
< 1 A.U.
Performance Cost
DEO r=50,000
km
Hi-speed
Landing
Soft Landing via CLO
Earth Escape
Venus. G-assist
PerihelionManeuver
Solar SystemEscape
Σ ∆V from NEO (KM/S) 4.4 5.0 5.9 3.3 4.0 4.1 6.7 Number of IOV Stages 2 2 2 1 2 2 2 ∆V, ST. 1 / ST. 2 (KM/S) 2.9/1.5 3.3/1.7 3.3/2.6 3.3 2.5/1.5 3.3/0.8 3.3/3.4 ISP, ST. 1 / ST.2 (SEC) 460/350 470/460 470/460 460 460/420 460/320 470/460Waste Oxide Weight, Wλ* (T) 0.360 0.319 0.229 0.590 0.525 0.367 0.24 Gross Weight, Stage 2 (T) 6.4 5.92 5.83 7.96 5.30 5.92 Gross Weight, IOV (T) 14.22 14.45 14.22 14.22 14.46 14.32 14.44 IOV, Liquid H2 Volume (Fraction of Orbiter PLD. Bay Volume)
0.04 0.06 0.07 0.05 0.05 0.05 0.07
Thermal Energy (Twt-YR) Generated Corresponding to W λ*
0.00650 0.00575 0.00411 0.0106 0.00943 0.00659 0.00431
Corresponding Electric Energy @ 30% Conversion Efficiency (KWHE)
1.7 1010 1.51 1010 1.08 1010 2.786 1010 2.48 1010 1.73 1010 1.13 1010
Corresponding Revenue @ 5¢/KWHE (106$) 850 755.6 540.7 1393 1240 866.5 566.7
Cost of ETO Mission (106$) (1978 $) 35 35 35 35 35 35 35
Cost of IOV (106$) 15 20 30 10 15 20 30 Other Cost Associated with Launch and Maintenance (106$)
20 20 20 15 25 25 30
Disposal Mission Cost (¢/KWHE) 0.412 0.496 0.786 0.215 0.302 0.462 0.838
Special Waste Processing, Transportation, Pre-launch Storage Loading & Associate Operations (¢/KWHE)
0.01 0.01 0.01 0.01 0.01 0.01 0.01
Total space disposal cost, incl. 20% contingency (¢/KWHE)
0.51 0.61 0.96 0.27 0.38 0.57 1.02
DEO = distant earth orbit; CLO = circumlunar orbit; IOV = interorbital vehicle; TWT = terawatt-thermal; NEO = near-earth orbit; all cost figures in 1978-$

INL/EXT-07-12107 (March 2008) Advanced Fuel Cycle Cost Basis M-27
Table M3-3. Characteristic data of multiple-launch disposal missions (LWR waste; NWCO payload: 14.5 MT; orbiter payload for IOV transport: 29.5 MT; no jettisonable containers).5
Waste Storage Lunar Surface Heliocentric Orbit
< 1 A.U.
Performance Cost
DEO R=50,000
KM Hi-speed Landing
Soft Landingvia CLO
Earth Escape
Venu.s. G-assist
PerihelionManeuver
Solar SystemEscape
Number of IOV Stages 2 2 2 1 2 2 2 Weight of IOV Without Payload (T) 28.93 28.98 28.95 28.95 29.44 28.79 28.88 Associated Payload of IOV (T) 8.4 7.1 4.85 17 14.5 8.75 5.0 NWCO Net Payload (T) (Waste Oxides & Glass Matrix) 5.0 5.0 5.0 5.0 5.0 5.0 5.0
Minimum IOV Payload Weights Equal to Multiple NWCO Launchings @ 5 Ton per Mission (T)
25 14.21) 4.85 15 29 35 5
Associated Number of IOVs Needed In NEO 3 2 1 1 2 4 1
Number of NWCO Missions to NEO 5 3 1 3 6 7 1 Total Number of ETO missions 8 5 2 4 8 11 2 Total Weight of Waste Oxides Delivered to NEO (T) 8.25 2.3 1.60 4.95 9.57 11.55 1.65
Corresponding Thermal Energy Generated (TWT-YR) 0.14814 0.0413 0.0287 0.0888 0.1718 0.2074 0.03
Corresponding Electric Energy @ 30% Conversion Efficiency (KWHE) 3.896 1010 1.086 1011 7.56 1010 2.337 1011 4.519 1011 5.454 1011 7.79 1010
Cost of ETO Flights @ $35 106 for NWCO Mission and @ $30 106 for Transport of IOV (106 $)
195 165 65 135 210 245 65
Cost of IOVs (106 $) 60 50 30 18 50 120 30 Cost of All Other Associated Operations (106 $) 100 50 30 40 90 120 40
Disposal Mission Cost (¢/KWHE) 0.091 0.0244 0.0165 0.0826 0.0755 0.0889 0.173 Special Waste Processing, Transportation, Pre-launch Storage Loading & assoc. Operations (¢/KWHE)
0.01 0.01 0.01 0.01 0.01 0.01 0.01
Total Space Disposal Cost, incl. 20% Contingency (¢/KWHE) 0.12 0.3 0.21 0.11 0.105 0.12 0.22
DEO = distant earth orbit; CLO = circumlunar orbit; NEO = Near-Earth Orbit; IOV = Interorbital Vehicle; NWCO = Nuclear Waste Carrying Orbiter; TWT = terawatt-thermal; all cost figures in 1978-$ 1)10 ton IOV payload weights, 4.2 ton impact absorber structure
The figures given in the above tables in ¢/kWhe may be suspect. The energy released per metric tonne of waste appears to be 6,590 GWd/MT. Using the “rule of thumb” that fission of 1 g of fissile material yields 1 MWd of energy and 1 g of fission products, an energy content of 6590 GWd/MT would imply 6,590 kg of fission products per metric tonne of waste. That, in turn, implies significant processing to remove low or non-heat generating nuclides from the waste⎯likely an extremely expensive option. A better approach is to take the raw costs and determine the cost per metric tonne of waste. Tables M3-4 and M3-5 recast the information from Tables M3-2 and M3-3 into costs per metric tonne of waste.

INL/EXT-07-12107 (March 2008) Advanced Fuel Cycle Cost Basis M-28
Total cost estimates for space disposal in heliocentric orbit between Earth and Venus are $44M to $50M/metric tonne waste for multiple-launch disposal missions and $171M to $262M/metric tonne waste for single-launch disposal missions (1978 dollars). Costs increase to $98M/MT waste and $475M/MT waste for solar system escape disposal for multiple- and single-launch missions, respectively (1978 dollars). The multiplier to convert to 2006 dollars is 3.06 based upon the Consumer Price Index.
Table M3-4. Recast costs (in millions of dollars) for single-launch missions. Lunar Landing Heliocentric Orbit
DEO Hi-Speed Soft Earth
Escape Venus Assist
Perihelion Maneuver
Solar System Escape
ETO 35 35 35 35 35 35 35 IOV(s) 15 20 30 10 15 20 30 Other 20 20 20 15 25 25 30 Total 70 75 85 60 75 80 95 MT Waste 0.360 0.319 0.229 0.590 0.525 0.367 0.240 $/MT with 20% Cont. 233 282 45 122 171 262 475
Table M3-5. Recast costs (in millions of dollars) for multiple-launch missions. Lunar Landing Heliocentric Orbit
DEO Hi-Speed Soft Earth
Escape Venus Assist
Perihelion Maneuver
Solar System Escape
ETO 195 195 65 135 210 245 65 IOV(s) 60 50 30 18 50 120 30 Other 100 50 30 40 90 120 40 Total 355 265 125 193 350 485 135 MT Waste 8.25 2.3 1.6 4.95 9.57 11.55 1.65 $/MT with 20% Cont. 52 138 94 47 44 50 98
M3-7. LIMITATIONS OF COST DATA All cost data are extraordinarily preliminary and should be considered only as rough order of
magnitude estimates. The technology readiness level is considered to be research and development-possible. A significant research and development effort accompanied with considerable expense would be needed to design, construct, license, and operate a high-level waste space disposal facility. The data quality is categorized as independent sources without a common basis.
Although the cost estimates by Ehricke5 appear fairly comprehensive and include processing and packaging of the spent fuel waste, the analysis was completed in 1983 and does not reflect the current atmosphere surrounding space shuttle missions following the 1986 Challenger and 2003 Columbia disasters. The cost estimates would very likely rise because of increased analysis and safety requirements. In addition, the experience of the Yucca Mountain Project and other nuclear waste disposal projects has been quality assurance and other regulatory activities, including oversight groups and delays caused by litigation. These activities can—and probably will—add large additional costs. Although not considered here, the litigation, regulatory activities, and license application delays have already cost the Yucca Mountain Project billions of dollars.

INL/EXT-07-12107 (March 2008) Advanced Fuel Cycle Cost Basis M-29
M3-8. COST SUMMARIES The module cost information is summarized in the What-It-Takes (WIT) cost summary in
Table M3-6. The summary shows the reference cost basis (constant year $U.S.), the reference basis cost contingency (if known), the cost analyst’s judgment of the potential upsides (low end of cost range) and downsides (high end of cost range) based on references and qualitative factors, and selected nominal costs (judgment of the expected costs based on the references, contingency factors, upsides, and downsides). These costs are subject to change and are updated as additional reference information is collected and evaluated, and as a result of sensitivity and uncertainty analysis. Refer to Section 2.6 in the main section of this report for additional details on the cost estimation approach used to construct the WIT table.
Table M3-6. Code of accounts information for extraterrestrial disposal. AFCI
Code-of-Accounts Number Code of Accounts Description
Cost (2006 $/MT Waste) Comments
0 Early Life Cycle Costs — — 1 Capitalized pre-construction costs — — 2 Capitalized Direct Costs — — Total Directs — —
3 Capitalized Support Services — — Base Construction Cost (BCC) — —
4 Capitalized Operations — — 5 Capitalized Supplementary Costs — — Total Overnight Cost (TOC) — —
6 Capitalized Financial Costs — — Total Capital Investment Cost (TCIC) — —
7 Annualized O&M Cost — — 9 Annualized Financial Costs — — Total Operating Costs — — Total Project Life-Cycle Cost (M of $) 134–154 20% contingency

INL/EXT-07-12107 (March 2008) Advanced Fuel Cycle Cost Basis M-30
Table M3-7. Cost summary table for extraterrestrial disposal. What-It-Takes (WIT) Table
Reference Cost(s) Based on Reference
Capacity
Reference Cost Contingency
(+/- %) (Low Cost)
Upsides (High Cost) Downsides
(Nominal Cost) Selected Values
$134−154 M/MT $13.4−15.4 M/MTHM at 50 GWd/MTHM
20% (included)
— $525−800 M/MT waste ($52.5−60 M/MTHM) $300 M/MT waste ($30 M/MTHM) $1,454 M/MT waste ($145.4 M/MTHM)
$134−154 M/MT $13.4−15.4 M/MTHM at 50 GWd/MTHM
Cost for multiple launch missions, orbit between Earth and Venus
— — Single-launch missions, orbit between Earth and Venus; Multiple-launch missions, solar system escape; Single-launch missions, solar system escape
Further analysis required
M3-9. RESULTS OF SENSITIVITY AND UNCERTAINTY ANALYSIS No sensitivity analyses were performed for the module.
M3-10. BIBLIOGRAPHY Bunn, M., et al., The Economics of Reprocessing vs. Direct Disposal of Spent Nuclear Fuel, Cambridge,
Mass, Project on Managing the Atom, Harvard University, DE-FG26-99FT4028, December 2003, pp. 19, 55−57; also on Web: http://www.bcsia.ksg.harvard.edu/.
OECD Nuclear Energy Agency, “Trends in the Nuclear Fuel Cycle: Economic, Environmental and Social Aspects,” 2001, Paris, pp. 54, 127, www1.oecd.org/publications/e-book/6602011e.pdf.
OECD Nuclear Energy Agency and International Atomic Energy Agency, “The Economics of the Nuclear Fuel Cycle,” 1994, pp. 11, 27, 37−38, 50, 77−80, http://www.nea.fr/html/ndd/reports/efc/, accessed January 24, 2006.
Price, L., Disposal Configuration Options for Future Uses of Greater Confinement Disposal at the Nevada Test Site, SAND94-2105, Sandia National Laboratories, Albuquerque, New Mexico, September 1994.
U.S. Department of Energy, Nuclear Waste Policy Act As Amended, U.S. Department of Energy, Office of Civilian Radioactive Waste Management, Washington, DC, March 2004, http://www.ocrwm.doe.gov/documents/nwpa/css/nwpa.htm, accessed January 2, 2005.

INL/EXT-07-12107 (March 2008) Advanced Fuel Cycle Cost Basis M-31
M3-11. REFERENCES
1. Office of International Affairs, “Management and Disposition of Excess Weapons Plutonium,” Committee on International Security and Arms Control, National Academy of Sciences, National Academy Press, Washington, D.C., 1994.
2. Neil Chapman and Fergus Gibb, “A Truly Final Waste Management Solution: Is Very Deep Borehole Disposal a Realistic Option for High-Level Waste or Fissile Materials?,” Radwaste Solutions 10, 26–37, July/August 2003.
3. Nuclear Energy Agency, “Feasibility of Disposal of High-Level Radioactive Waste into the Seabed,” Organization for Economic Cooperation and Development, Paris, France, 1988.
4. National Academy of Sciences, “Disposition of High-Level Waste and Spent Nuclear Fuel: The Continuing Societal and Technical Challenges,” National Academy Press, Washington, DC, 2001.
5. K. A. Ehricke, “A Practical Approach to the Disposal of Highly Toxic and Long-lived Spent Nuclear Fuel Waste between Venus and Earth,” Acta Astronautica, Vol. 10, 1983, pp. 719–737.
6. R. Salkeld and R. Beichel, “Nuclear Waste Disposal in Space: Implications of Advanced Space Transportation,” Acta Astronautica, Vol. 7, 1980, pp. 1373–1387.

INL/EXT-07-12107 (March 2008) Advanced Fuel Cycle Cost Basis M-32

INL/EXT-07-12107 (March 2008) Advanced Fuel Cycle Cost Basis O-1
Module O Series
Transportation Processes (Modules 01, 02, and Annex OX)

INL/EXT-07-12107 (March 2008) Advanced Fuel Cycle Cost Basis O-2

INL/EXT-07-12107 (March 2008) Advanced Fuel Cycle Cost Basis O-3
Module O1
Transportation of Radioactive Materials

INL/EXT-07-12107 (March 2008) Advanced Fuel Cycle Cost Basis O-4

INL/EXT-07-12107 (March 2008) Advanced Fuel Cycle Cost Basis O-5
Module O1
Transportation of Radioactive Materials
O1-1. BASIC INFORMATION This module develops cost estimates for the shipment of:
• Spent nuclear fuel (SNF) from nuclear power plants to a monitored retrieval storage facility, to a permanent geologic repository, or to other disposal or processing facilities. SNF is assumed to be intact fuel rods in assemblies or bundles placed into a canister. Damaged fuel will be packed into an additional container in such a manner as to prevent criticality or contamination.
• Mixed oxide fuel (MOX)a from MOX fuel fabrication facilities to nuclear power plants. MOX is assumed to be intact fuel rods in assemblies placed into canisters.
• Vitrified high-level waste (HLW) from vitrification plants to a monitored retrieval storage facility, to a permanent geologic repository, or to other disposal facilities. HLW is assumed to be in a glass form (presumably a borosilicate glass) and placed in canisters.
• Fuel from naval reactor cores could be handled in a manner similar to that described herein. However, some details of naval fuel remain classified. Recovery of residual fuel values or disposal is the responsibility of the federal government and is not included in this study.
Spent nuclear fuel and vitrified HLW are shipped in shielded casks that are licensed by the Nuclear Regulatory Commission (NRC) and meet NRC requirements for Type-B packages.1 In this module, it is assumed that MOX will be shipped in Type-B packages.
The Type-B packagesb that are used to ship SNF, MOX, and vitrified HLW use massive, highly shielded casks that are fitted on their ends with energy absorbing devices called impact limiters, which protect the cask and its bolted closure from damage during high speed impact accidents. The highly radioactive materials that are shipped in Type-B packages may be placed in a metal canister that has a lid that is welded to its body before they are loaded into the Type-B package. Vitrified HLW is always canisterized before it is shipped in a Type-B package. Although some Type-B package systems for SNF and MOX do not use canisters, it is assumed in this module that both SNF and MOX are canisterized when shipped in Type-B packages. Because of the length of the MOX assemblies, the shipping casks will be similar to, if not the same as, the casks used for SNF.
Transportation costs for materials shipped as Type-B packages consist of the cost of the Type-B packaging, loading costs at the shipment origin, shipping costs while in transit, and unloading costs at the shipment destination. The transportation costs developed in this module assume that the Type-B packaging is a HI-STAR cask. The HI-STAR cask system was selected as the basis for packaging costing because of the quantity of detailed information available. Its selection makes no statement regarding the merits of other cask systems. Rudimentary investigation indicates that all modern commercial Type-B cask systems approved by the NRC for the shipment of SNF, MOX, and vitrified HLW are cost competitive based on life-cycle cost estimates.
a. MOX often refers to fuel containing a mix of oxides of uranium and of plutonium that is primarily Pu-239. The term “TRUMOX” is used to describe fuels containing other transuranic nuclides or greater concentrations of the higher plutonium isotopes. In this section, MOX refers to both of these fuels. b. In this section, the term “packaging” refers to the devices into which radioactive material is placed for shipment⎯in other words, the shipping container. The term “package” refers to the container and its contents.

INL/EXT-07-12107 (March 2008) Advanced Fuel Cycle Cost Basis O-6
O1-2. PICTURES/SCHEMATICS Figure O1-1 shows the HI-STAR cask canister and transportation overpack and a schematic of one of
the two transportation overpack impact limiters.
Multipurpose Canister
Overpack Impact Limiter Schematic
Figure O1-1. HI-STAR cask components.
O1-3. FUNCTIONAL AND OPERATIONAL DESCRIPTION The HI-STAR cask system consists of (a) a multipurpose canister equipped with a welded lid that
contains the spent fuel assemblies, (b) an overpack in which the canister is housed that provides the required radiation shielding, and (c) two impact limiters, which, when mounted on the ends of the overpack, protect the overpack from the mechanical loads that the cask system might experience during severe collision accidents. Figure O1-1 shows these three principal components of the HI-STAR cask system.
Because the overpack and the two impact limiters can be reused, the cost calculations presented below amortize the costs of these cask system components over the useful life of these components. Because the multipurpose canister is a single use item, its cost is a one-time expense. Since failure of rod cladding due to embrittlement is not a significant concern for average burnup spent fuel, the multipurpose canister may be used to house spent fuel when stored in a geologic repository. If so used, its lifetime should essentially be the same as the lifetime of the geologic repository.
It is possible that the shattering of embrittled high burnup spent fuel cladding might cause a critical pile of spent fuel pellets to form in the bottom of the multipurpose canister before emplacement in a permanent repository. Consequently, transfer of high burnup spent fuel assemblies from the multipurpose canister to single assembly canisters could be required to prevent a criticality event. Such transfer of high burnup assemblies to single assembly canisters is not treated by this module, and the associated cost does not affect the cost estimates developed here.

INL/EXT-07-12107 (March 2008) Advanced Fuel Cycle Cost Basis O-7
NRC cask licenses must be renewed every 5 years. In theory, there is no limit on the number of times a cask license can be renewed. However, technological advances tend to render casks obsolete after 20 to 30 years. Moreover, licenses are often revised at less than 5-year intervals because of ongoing changes to the cask design or operational envelope.
Although SNF, MOX, and vitrified HLW can be shipped by truck or by rail, the majority of future shipments of these materials are expected to be by rail. Therefore, only rail casks are considered in this module. Table O1-1 presents SNF capacities for five typical SNF rail casks. The information in Table O1-1 was extracted from the cask Safety Analysis Report for Packaging that the cask manufacturer submitted to the NRC in support of the cask’s license application. Because SNF transportation cask systems and in particular the HI-STAR transportation cask system are commercially available technology, the quality of the cost data presented in Table O1-1 is entirely adequate for the scoping analyses performed in this module.
Module G states that the outside diameter of vitrified HLW canisters is 2 ft. Because the inside diameter of the HI-STAR cask cavity is 69-3/4 in., a HI-STAR cask licensed to carry vitrified HLW should be able to carry six vitrified HLW canisters (five canisters placed in a pentagonal array positioned around one central canister) after meeting cask thermal limits by cooling of the vitrified HLW.
Table O1-1 shows that, regardless of fuel type (pressurized water reactor [PWR] or boiling water reactor [BWR]) most SNF Type-B casks can transport about 10 metric tons of initial heavy metal (MTIHM). Thus, for both SNF and for MOX, the shipment packaging cost per kg of initial heavy metal (uranium and plutonium) roughly equals the cask system cost divided by 104.
The block diagram in Figure O1-2 presents a flow chart for the operational steps that support the loading of SNF into an SNF cask at a nuclear reactor and shipment of the SNF to a reprocessing plant, a permanent storage facility (e.g., Yucca Mountain Project [YMP]), or an interim storage facility (e.g., PFS, or possibly a spent fuel pool or dry storage facility located at another nuclear reactor).
The diagram shows that the SNF loading sequence consists of three steps. First, the SNF assemblies are loaded into a multipurpose canister; second, the canister is placed in a transportation cask overpack; and finally, the overpack is equipped with impact limiters. After shipment to a reprocessing or storage facility, the multipurpose canister is removed from the cask overpack by reversing the loading sequence, after which the overpack and its impact limiters can be reused.
The functional block diagram for vitrified HLW packaging and transportation would be identical to Figure O1-2 with the topmost block in the diagram that represents storage of SNF at reactor sites replaced by a block that represents storage of vitrified HLW in canisters at the vitrification facility. The functional block diagram for MOX would be very simple, as it would consist of only two blocks, one for the MOX fabrication facility and one for the nuclear power plant to which the MOX fuel is shipped.
Table O1-1. Cask capacities. Pressurized Water Reactor Fuel
Assembly Design Boiling Water Reactor Fuel Assembly
Cask Ass’y per
Cask Initial U kg/Ass’y
Initial U kg/Cask
Ass’y per Cask
Initial U kg/Ass’y
Initial U kg/Cask
HI-STAR 100 24 440 10,560 68 150 10,200 BFS-TS125 24 440 10,560 NAC-UMS 24 440 10,560 64 150 9,600 NAC-STC 26 440 11,440 56 180 10,080

INL/EXT-07-12107 (March 2008) Advanced Fuel Cycle Cost Basis O-8
Figure O1-2. Functional block diagram for SNF packaging and transportation.
O1-4. MODULE INTERFACE DEFINITION Module O receives vitrified HLW from vitrification plants (Module G) and SNF from interim storage
in spent fuel pools or dry storage facilities at nuclear power plants (Modules E1 and E2). After packaging, Module O delivers them to interim storage facilities at another nuclear power plant (Modules E1 and E2), to long-term monitored retrieval storage facilities (Module I), to geologic repositories (Module L), or to other permanent disposal sites (Module M). Module O also receives MOX fuel from recycled fuel fabrication plants (Module F2/D2) and delivers this recycled fuel to nuclear power plants.
O1-5. COST BASES, ASSUMPTIONS AND DATA SOURCES Annex OX to this module derives the algorithm used to estimate transportation costs under
consideration for this module and for Module O2 Costs that are not package-specific are provided there, including costs that have been input to a Monte Carlo analysis as distributions.
O1-5.1 Packaging Costs The costs developed for this module assume that, after placed or poured into a single-use canister,
SNF, MOX, and vitrified HLW are shipped in reusable Type-B packagings that are equipped with reusable impact limiters. Although these highly radioactive materials can be shipped in either truck or rail casks, the costs developed in this module assume shipment in rail casks.

INL/EXT-07-12107 (March 2008) Advanced Fuel Cycle Cost Basis O-9
In 2001, Sandia National Laboratories solicited informal quotes for several rail cask systems2 to support the performance of a proposed extra regulatory impact test of a full-scale rail cask. The 2001 quote for the HI-STAR cask system was updated in 2003.3 Table O1-2 summarizes these cask system cost quotes. All quotes have been escalated to 2007 dollars.c The unit costs ($/kg U) shown in the table were calculated using the number of assemblies and total kg of uranium per cask presented in Table O1-1. As Table O1-2 shows, when expressed in 2007 dollars, cask system unit cost estimates range from $368/kgU to $547/kgU (for PWR SNF), and cluster around the escalated November 2003 $456/kgU unit cost quote for the HI-STAR cask system. More detailed cask system descriptions and cost component data are needed if differences in cask system unit costs are to be explained.
A phone conversation with a representative of Holtec International, the firm that manufactures and markets the HI-STAR spent fuel transportation cask system, provided more detailed cost data for this cask system. These data are summarized in Table O1-3, which presents low, modal, and high cost estimates for each costed item.
The range of each of these cost estimates reflects the difference between the 2001 and 2003 cost quotes and the fact that the difference between high end cost estimates and modal cost estimates are often larger than the difference between modal cost estimates and low end cost estimates.4 Table O1-3 shows that the modal value for the total cask system cost is $5.36M. Interestingly, in Appendix E of Reference 5, Feizollahi et al. gives a cost of approximately $3.75M for an earlier type of SNF shipping cask as of 1993. Conversion of this 1993 cost to 2007 dollars using the Urban Consumer Price Index (CPI) also yields an estimate of $5.36M for the 2007 cost of a spent fuel cask system.
The data in Table O1-3 were used to perform a “1st of a kind/nth of a kind” cost analysis for the HI-STAR cask system. The data were also used to develop cost distributions for the single-use HI-STAR cask canister and for the reusable cask overpack and its two impact limiters by random (Monte Carlo) sampling of the cost distributions for the single-use canister and for the reusable cask system components. A present value analysis was then performed to convert the costs of the reusable items to a daily rental cost. This rental cost is combined with trip lengths (km) and shipment costs per km to estimate total shipment costs for SNF, MOX, and vitrified HLW. Figure O1-3 shows schematically the process through which the raw informal cost quotes were transformed into the information needed to estimate transportation costs for SNF, MOX, and vitrified HLW.
Table O1-2. Summary of Sandia informal quotes (direct costs). Direct Cost (Millions of 2007 dollars)
Cask System Multipurpose
Canister Transportation
Overpack
Impact Limiter (two per
overpack) Complete Cask
System Unit Cost ($/kg U)
HI-STAR 2001 quote 2003 quote
0.66 0.55
2.08 2.63
1.42 0.82
5.58 4.82
528/547 456/473
BFS-TS125 5.84 553 (PWR) NAC-UMS 0.81 2.92 0.30 4.33 410/451 NAC-STC 0.70 2.92 0.29 4.20 368/417
c. Cask and container costs have been escalated using the Bureau of Labor Statistics (BLS) Producer Price Index for Construction Machinery and transportation costs have been escalated using the BLS Producer Price Index for Line Haul Railroads. These (and many other) data can be obtained at www.bls.gov.

INL/EXT-07-12107 (March 2008) Advanced Fuel Cycle Cost Basis O-10
Table O1-3. HI-STAR cost components. Cost
(Millions of 2007 dollars)Component Low Modal High Comments
Licensing 8.75 10.94 21.88 High cost reflects additional expenses to obtain a license to transport high burnup SNF. Licensing costs are incorporated into cask system costs by the cask system manufacturer.
Initial fixtures for fabrication 4.38 5.47 10.94 This one time cost is incorporated into cask system costs by the cask system manufacturer.
Single-use multipurpose canister with SNF basket
0.44 0.55 0.77 2001 quote escalated to 2007 dollars is 0.66, which suggests a low end cost uncertainty of $0.1M.
Cask overpack 1.97 2.63 3.50 2001 quote escalated to 2007 dollars is 2.08. Current quote of 2.63 (a 30% increase) is consistent with Holtec’s suggestion of a pricing uncertainty of about 33%
Two impact limiters 1.31 1.64 1.97 Reusable Ancillary equipment for welding and cask loading steps
0.55 0.66 0.88 This is a one-time cost.
Reusable cask components 3.72 4.92 6.35 Sum of Overpack, Impact Limiter, and Ancillary Equipment Costs
Total cask cost 4.27 5.36 7.11 Sum of canister, overpack, impact limiter, and ancillary equipment costs
Annual maintenance costs Nominal Because of the design of the single-use multipurpose canister, seals are not an issue. Thus, cask system maintenance will consist of occasional painting and other cosmetic activities
Expected lifetime (years) of the HI-STAR cask overpack and impact limiters
5 25 30 Design life is on the order of 100 years. A license extension every 5 years is initially easy to obtain, but becomes harder to obtain as material and fabrication specifications mature and become obsolete.

INL/EXT-07-12107 (March 2008) Advanced Fuel Cycle Cost Basis O-11
Raw Data (Bids) Adjust BidInformation to
2004$
nth of a KindAnalysis Accountsfor Learning Curveand Amortizationof Up Front Costs
Present ValueAnalysis Estimates
Rental Rate forReusable Items
Canister CostDistribution
Overpack, ImpactLimiters, and ToolsDaily Rental Cost
Distribution
Monte CarloSimulation
Accounts forVariability
Start
End
VariabilityAnalyses of Both
ReusableComponents and
Canisters
Figure O1-3. Process used to produce consistent cost estimates.
Bids were quoted as nth of a kind costs by Holtec and thus should need no adjustment for the effects of the learning curve on or amortization of up-front costs. Holtec has sold a large number of HI-STORM storage cask systems and is no longer operating as a startup company. Although only a small number of HI-STAR storage/transportation cask systems have been sold to date, Holtec should be able to sell them for an nth of a kind price. Nonetheless, for completeness, a typical “1st of a kind/nth of a kind” cost analysis was performed using the method of analysis presented in the Generation IV economic working group report6 and the modal HI-STAR cask system costs presented in Table O1-3. For this analysis, the nth of a kind cost was assumed to be reached when the 200th cask system was sold. Figure O1-4 presents the results of this analysis for the reusable cask system components (transportation overpack, impact limiters, and ancillary equipment). Inspection of the figure shows that if Holtec only sells a few HI-STAR cask systems, reusable cask system component costs might be about twice as high as the $4.8M (escalated) nth of a kind cost quoted by Holtec for reusable cask system components.
Canister Costs. Figure O1-5 presents the cumulative distribution of SNF and MOX canister costs that were developed by Monte Carlo sampling of the triangular distribution of canister costs specified in Table O1-3 for the HI-STAR cask system canister assuming that the procurement costs are about 10% of the canister purchase price (with the 10% procurement costs included, the low, modal, and high values for the triangular cost distribution for the canister become $0.481M, $0.602M, and $0.842M). Figure O1-5 shows that canister costs (canister purchase price + canister procurement costs) might have a median value of about $675,300 and could range from $583,700 to $796,700. Because vitrified HLW is stored at the vitrification plant before being shipped, HLW canister costs are treated as an operational expense in Module G and are not costed in this module.

INL/EXT-07-12107 (March 2008) Advanced Fuel Cycle Cost Basis O-12
Figure O1-4. Nth of a kind curve for reusable items based on modal costs.
Figure O1-5. Cumulative distribution of multipurpose canister costs resulting from a triangular distribution of canister plus procurement costs.
Rental Costs of Reusable Cask Components. The present value analysis that was performed to develop daily rental costs for reusable cask system components (the cask overpack and its two impact limiters plus the cost of ancillary equipment) used the discounted cash flow methods recommended in Higgins.7 Price was assumed to match cost at a discount rate of 10%. Table O1-4 presents the parameters that were used in this analysis. The utilization factor represents the fraction of days per year the HI-STAR cask system is assumed to be in use (earning money). Instead of applying an overhead percent to the cask system purchase price, a nominal Operations and Maintenance (O&M) cost ($117,100) was included in

INL/EXT-07-12107 (March 2008) Advanced Fuel Cycle Cost Basis O-13
Table O1-4. Present value analysis parameters. Fixed Parameters Values Units
Utilization Factor 0.9 Fraction Inflation 3% Tax Rate 36% Discount Rate 10% O&M $117,100 2007 $/year Sampled Parameters Low Modal High Price of Reusable Items $3.72 $4.92 $6.35 Millions 2007 $ Useful Life 5 25 30 Years
the analysis as a fixed cost. The analysis uses straight line depreciation based on the expected life of the cask system. For discounting purposes, year zero was assumed to be 2007. The first five parameters in this table were assumed to be fixed. The final two parameters, the price and useful life of the reusable items, were assumed to vary stochastically. Values for these two parameters were selected by random sampling from the distributions specified for these parameters in Table O1-3.
The present value analysis was run 10,000 times. For each simulation, the calculated cost of the reusable cask components was adjusted to return a zero net present value based on the sum of discounted cash flows for all years of the analysis. Figure O1-6 displays the results of the analysis as a series of rental costs sorted low to high.
Inspection of Figure O1-6 shows that rental costs increase very rapidly once cumulative fractions pass 0.9. Thus, the 90th percentile rental cost is $3,057 per day while the 100th percentile rental cost is over $5,000 per day.
The very rapid increase of daily rental costs at high percentile values is caused by the very asymmetric shape of the triangular distribution assumed for the useful life of the reusable cask system components. This sharp dependence of daily rental cost on useful life is illustrated in Figure O1-7. Figure O1-7 presents a plot of 100 paired values of daily rental cost and the specific value of useful life that generated this daily rental cost. Specifically, the 100 plotted points are the first 100 outputs of the 10,000 calculations that underlie the results presented in Figure O1-6. Because the 10,000 calculations selected their variable input by random Monte Carlo sampling, these 100 results constitute a representative sample of the output of the full set of 10,000 calculations. Also plotted in Figure O1-7 is the best fit regression line through these 100 points. Inspection of Figure O1-7 shows that rental costs for reusable cask components are expected to be about $2,000 per day if the useful life of these components is about 25 years, while daily rental costs increase rapidly as useful life decreases passing $4,000 per day as useful life falls toward 5 years.

INL/EXT-07-12107 (March 2008) Advanced Fuel Cycle Cost Basis O-14
Figure O1-6. Distribution of daily rental cost for reusable cask components. Based on cash flow discounted at 10%.
Figure O1-7. Variation of the daily rental rate for cask system reusable components with component useful life.

INL/EXT-07-12107 (March 2008) Advanced Fuel Cycle Cost Basis O-15
O1-6. RESULTS Ten thousand sets of values for the 21 input parameters in the Cost Algorithm, for which distributions
were developed, were selected by Monte Carlo sampling. Combination of each set of these values with the values specified for the 11 parameters that had single values generated 10,000 full sets of input for the Cost Algorithm. Running of the Cost Algorithm using these 10,000 sets of input allowed distributions of the five output parameters (fTotalCost, fPackCost, fLCost, fShipCost, fUCost) to be constructed. Output was developed for single shipments in the HI-STAR rail cask of:
• SNF from reactor sites to Yucca Mountain using the reactor sites to Yucca Mountain distribution of trip distances
• SNF from reactor sites to regional reprocessing facilities or interim storage sites using the reactor sites to regional sites distribution of trip distances
• MOX from regional fuel fabrication facilities to reactor sites using the reactor sites to regional sites distribution of trip distances
• Vitrified HLW from regional vitrification plants to regional interim storage sites using the regional sites to regional sites distribution of trip distances.
Monte Carlo sampling of parameters described by normal distributions or any other simple continuous algebraic formula is straightforward. The value of the independent variable in the algebraic formula is selected by Monte Carlo sampling, and then the value of the formula is used to calculate the value of the dependent variable. Selecting values for parameters represented by triangular distributions was done as follows. For any probability, P, the stochastic parameter X is calculated as
( )
( ) ( )mode
mode
P P X min P * (mode - min)max - minXP P X min * (max - mode)max - min1- P
⎧ ≤ = + ⋅⎪= ⎨> = + ⋅⎪⎩
(1)
where “X” stands for any of the parameters in Table O1-4 or for any other parameter represented by a triangular distribution,
modemode - minPmax - min
= (2)
and max, min, and mode are the high, low, and modal values used to specify the triangular distribution.8
Table O1-5 presents the input and output for one of the 10,000 calculations that were performed to develop the distribution of trip costs for the shipment of SNF from an operating reactor to Yucca Mountain. Table O1-5 shows that this single calculation predicts a total shipment cost of $831,000, a packaging cost of $733,000 ($725,000 for the single use canister and approximately $6,000 for the rental costs for the reusable cask system components), en route shipping costs of $850, and loading and unloading costs of $8,000 and $10,000, respectively (loading and unloading costs are not the same because different random numbers are used to select loading and unloading parameter values for parameters represented by distributions).
Figure O1-8 presents the distribution of total shipment costs developed by the Monte Carlo calculations. Because the calculation for SNF shipments from reactor sites to regional sites and for MOX shipments from regional sites to reactor sites yield the same cost distribution, Figure O1-8 only presents three distributions of total shipment costs. Inspection of this figure shows that the total costs in 2006 dollars for a single shipment of SNF or MOX are quite similar, averaging about $0.8M per shipment

INL/EXT-07-12107 (March 2008) Advanced Fuel Cycle Cost Basis O-16
Table O1-5. Input and output for one of the ten thousand trip cost calculations for the shipment of SNF from operating reactor sites to Yucca Mountain (2005 $).
Inputs Variable Name Value Units SNF Shipped iTons 20 Tonne U/yr Weight of Canister Contents 43.27 Tonne Mat’l/yr Canisters per Year 2 Cans/yr Shipments per Year 2 Shipments/yr Number of Packages per Vehicle iNPackVeh 1 Can/Vehicle Number of Vehicles per Train iNPackVeh 1 Veh/Shipment Number of Buffer Vehicles iNBufVeh 2 Veh/Vehicle Weight of Impact Limiters iWWL 16.56 Tonne Weight of Overpack iWtOP 59.87 Tonne Weight of Canister iWtCan 18.02 Tonne Weight of Canister Contents iWtCanCont 21.64 Tonne Cost per Shipment fTotalCost $830,715 $/Shipment Cost per Year fTot/year $1,661,430 $/year Annual Cost per Tonne of Heavy Metal fTotMTiHM $83.07 $/MTIHM/year Annual Cost per MTIHM-Km fTotMTiHM_km $0.0753 $/MTIHM-km/yr Cost of Packages fPackCost $733,250 $/Shipment Number of Packages per Shipment cNPack/Ship 1 Packages/Shipment Cost of Multiuse Container sCanCost $724,955 $/Can Overpack Rental Daily Cost sOpCost $2,155 $/year Impact Limiter Rental Daily Cost sILCost $/year Cost of Loading fLCost $7,844 $/Shipment Overhead Factor sLhead 2.02 Loading Duration per Package sLdur/Pack 14.02 Hr/Pkg/Person Loading Duration per Shipment cLdur/Ship 14.92 Hr/Shipment Loading Wage Random Number sLRand 0.1329973992 Loading Supervisor Hourly Wage sLS $23.68 $/hr Loading Rad Tech Hourly Wage sLR $10.68 $/hr Loading Labor Hourly Wage sLC $10.68 $/hr Number of Loading Oversight iNLS 1 Person Number of Loading Rad Technicians iNLR 4 Persons Number of Loading Crew Members iNLC 11 Persons Cost of En-Route Shipment fShipCost $79,953 $/Shipment

Table O1-5. (continued).
INL/EXT-07-12107 (March 2008) Advanced Fuel Cycle Cost Basis O-17
Inputs Variable Name Value Units Distance Scenario Reactor to Yucca
Mountain
Shipment Duration cDays 1.92 Days/Shipment One-Way Trip Distance strip 1104 Km Average Speed sSpeed 573 Km/Day Convoy Vehicles cNVeh 3 Daily Rental Cost for Vehicles sVehCost $/day Tonne Shipped sTonnekm 139,156 Tonne-km Shipper Tariff sTarrif $0.1064 $/Tonne-km States Traversed sStates 2 States Individual State Fees sSFee $2,436 $/State Dedicated Tran Cost sDedVeh $60,273 $/Trip Cost of Unloading fUCost $9,668 $/Shipment Overhead Factor sUhead 2.885 Unloading Duration per Package sUdur/Pack 10.35 Hr/Pkg/Person Unloading Duration per Shipment cUdurShip 14.92 Hr/Shipment Unloading Wage Random Number sUS $32.66 $/hr Unloading Supervisor Hourly Wage sUR $14.68 $/hr Unloading Rad Tech Hourly Wage sUC $14.68 $/hr Number Pf Unloading Oversight iNUS 1 Person Number of Unloading Rad Technicians iNUR 4 Persons Number of Unloading Crew Members iNUC 9 Persons
and ranging from about $0.6 to $1.1M per shipment in 2006 dollars. Total costs for a single shipment of vitrified HLW average about $0.2M and range from about $0.04M to $0.5M. Because the $0.6M cost of the SNF or MOX canister is included in the trip costs for the shipment, while the cost of vitrified HLW canisters is an operational cost for the vitrification facility, the cost distributions for SNF and MOX are shifted toward larger costs by about $0.6M. Thus, this figure indicates that total shipment costs are not strong functions of the differing trip distance distributions used in the three Monte Carlo trip cost calculations.

INL/EXT-07-12107 (March 2008) Advanced Fuel Cycle Cost Basis O-18
Figure O1-8. Distribution of total shipment costs for shipments of SNF, MOX, and vitrified HLW.
For each of the three Monte Carlo shipment cost calculations for which cost distributions are presented in Figure O1-7, average values for the total shipment costs and for the cask system cost the loading and unloading costs, and the enroute shipping costs that sum to give this total cost are presented in Table O1-6. Also presented in Table O1-6 are the fractional contribution of each cost component to the total cost and the average distance of each shipment and the weight of the material shipped.
Table O1-6 shows that SNF and MOX total trip costs depend mainly on packaging costs, secondarily on en-route shipping costs, and minimally on loading and unloading costs. For vitrified HLW, because canister costs are operational expenses for the vitrification plant, total trip costs depend mainly on en-route shipping costs.
Canister purchase costs, overpack, and impact limiter daily rental costs were developed above. Figures O1-5 and O1-6 present cumulative distributions for these two cost components. Figure O1-9 presents the cumulative distributions of packaging and en-route shipping costs that were calculated for the shipment of SNF or MOX between reactor sites and regional facilities.
Shipping Costs per Tonne per km. Division of the average value for the total trip cost by the product of the average trip distance and weight of the canister contents (the SNF, MOX, or vitrified HLW plus the weight of the canister basket and fuel assembly structures for SNF and MOX) yields the following values for the cost of shipping 1.0 tonne (1,000 kg) of each waste 1.0 km: $18.62 per tonne-km for shipping SNF from reactor sites to Yucca Mountain, $12.61 per tonne-km for shipping SNF or MOX from reactor sites to regional facilities, and $7.92 per tonne-km for shipping vitrified HLW from regional to regional sites.
Finally, an estimate of the annual shipping costs associated with the operation of one typical nuclear power plant for 1 year was developed as follows. First, the mass of the SNF generated by the operation of a typical nuclear power plant for 1 year is estimated. Next, the number of SNF shipments per year of reactor operation was estimated by dividing the mass of SNF generated by a typical reactor during 1 year of operation by the SNF mass carried in one spent fuel cask. Multiplication of the average number of SNF shipments per year of reactor operation times the sum of the average SNF shipment cost per trip and the average MOX shipment cost per trip then developed an estimate of the average annual shipping cost associated with the operation of one typical reactor for 1 year.

INL/EXT-07-12107 (March 2008) Advanced Fuel Cycle Cost Basis O-19
Table O1-6. Average shipment cost (2007 dollars), trip distance (km), and weight (tonnes) of the contents of the canister for each of the three Monte Carlo shipment cost calculations.
SNF Reactors to YMP
SNF or MOX Reactor to Regional
Centers
Vitrified HLW Regional Centers To
YMP
Value (2007 $) Fraction
Value (2007 $) Fraction
Value (2007 $) Fraction
Total Cost 962,875 1.000 890,524 1.000 249,982 1.000 Packaging 669,726 0.695 664,645 0.746 18,811a 0.072 Shipping 275,276 0.286 208,029 0.234 211,143 0.860 Load & Unload 18,068 0.019 18,115 0.020 8,509 0.067 Trip Length, km 2351 3210 2,746
Contents Wt, MT 22 10.6b
Ass’ys IHM
22 10.6b
Ass’ys IHM
12.4 29.8c
Glass IHM
Unit Cost $18.62/MT-km $38.78/MTIHM-km
$12.61/MT-km $26.27/MTIHM-km
$7.92/MT-km $3.30/MTIHM-km
Since the vitrified HLW canister cost does not enter this calculation, the packaging cost is the rental cost of the cask over-pack and its impact limiters
Figure O1-9. Cumulative distributions of packaging and en-route shipping costs for shipment of SNF or MOX between reactor sites and regional facilities.
Assumes PWR fuel, cost for BWR fuel will be slightly higher since loading is slightly lower (Table O1-2)
Glass loading is assumed to be 0.12 MT fission products (FP)/MT glass. SNF contains approximately 0.001E MT FP/MTIHM if discharged at E GWd/MTIHM. Thus 1 MT glass is equivalent to 120/E MTIHM , or 2.4 MTIHM if E is assumed to be 50 GWd/MTIHM. The container holds 12.4 MT glass or 29.8 MTIHM equivalent.

INL/EXT-07-12107 (March 2008) Advanced Fuel Cycle Cost Basis O-20
Annual Shipping Costs per Operating Reactor. The amount of vitrified HLW and MOX generated per year by a single operating reactor will depend on the degree to which SNF is reprocessed, which is a scenario-dependent quantity. Consequently, annual shipping costs per operating reactor for vitrified HLW and MOX can not be meaningfully developed in this module. Of course, if all the fresh fuel used in an operating reactor is MOX, then the amount of MOX used per year by that reactor will be the same as the amount of SNF generated by that reactor.
The amount of SNF generated per year by a nuclear power reactor (iTons) depends on the plant’s design power rating (GWe), its utilization factor or capacity factor, thermal efficiency, and burnup. Specifically,
MT SNF Produced = {Plant Rating • 365 • Capacity Factor]/[Thermal Efficiency • Burnup]. (3)
Figure O1-10 plots burnup data (GWd/ton) for the last 30 years. Figure O1-10 shows that the data are well fit (R2 = 0.9658) by a straight line with a slope of 0.928. Thus, burnup has historically been increasing linearly with time. Discussions with nuclear power scientists indicate that the projected future increases in burnup, predicted in the figure by extrapolation of the historic data, are both feasible and economically attractive. Because they are economically attractive, it is likely that a technical basis will be developed for increasing the current regulatory burnup limit. Hence, a reasonable range for burnup would be from the current 35 GWd/ton to something like 75 GWd/ton several decades hence.
Reasonable values of these parameters for modern nuclear power reactors are: Plant Rating = 1 GWe; Capacity Factor = 0.9, and Thermal Efficiency = 33%. Use of these parameter values, the preceding expression for SNF produced, and the linear dependence of burnup on time presented in Figure O1-10 now allows the variation with burnup of the annual fuel consumption (MTIHM) of a typical 1 GWe nuclear power reactor to be calculated. Division of the consumption results by 10 tonnes, the fuel capacity in MTIHM of the HI-STAR cask, then allows the number of SNF shipments per year for a typical nuclear power plant to be estimated.
Figure O1-10. Extrapolation of fuel burnup data.
Figure O1-11 presents the results of these calculations. Inspection of Figure O1-11 shows that for a typical 1 GWe nuclear power plant annual fuel consumption and the number of spent fuel shipments per

INL/EXT-07-12107 (March 2008) Advanced Fuel Cycle Cost Basis O-21
year are respectively about 25 MTIHM and 2.5 shipments/year, if fuel burnup is 40 GWd/ton and about 15 MTIHM and 1.5 shipments/year, if fuel burnup is 70 GWd/ton. Thus, two SNF shipments per year per operating reactor is a reasonable factor to use to convert trip costs into annual SNF shipping costs. Application of this factor to the average trip cost of $0.88M for shipping SNF or MOX yields an annual SNF shipping cost per reactor of about $1.76M. Of course, if a reactor is fueled using only MOX, because the cost per trip for MOX is the same as that for SNF, annual MOX + SNF shipping costs for this reactor will be double, or $3.25M.
Figure O1-11. Projected SNF production from a typical nuclear power plant.
O1-7. LIMITATIONS OF COST DATA Because spent fuel pools at commercial reactors are rapidly filling up, substantial quantities of SNF
will need to be shipped in transportation casks to interim or permanent storage facilities in the near future. However, at present, there is very little data available on the estimated or actual costs of shipping SNF, MOX, or vitrified HLW. Cost estimates or data for these shipments are sparse because neither a permanent repository for high-level commercial radioactive wastes nor regional monitored retrievable storage facilities for such wastes currently exit. Consequently, shipments of SNF, MOX, or vitrified HLW are rare. A U.S. Department of Energy Report 9 contains some estimates for the costs of shipping SNF, but they are specific to the current inventory of SNF and to specific shipping campaigns to the proposed Yucca Mountain repository.
Because the cask systems and railroad rolling stock, that would be used to ship SNF, MOX, and vitrified HLW by rail, are already commercially available technologies, the shipping cost estimates developed in this module, though approximate, are not likely to be highly uncertain. Thus, upper bound (downside) estimates of shipping costs should not be substantially larger than the central estimates developed in this module. However, lower bound (upside) estimates could be substantially smaller than the central estimates developed here if the nuclear fuel cycle becomes much larger in the future, whereupon substantial economies of scale might be achievable.
The HI-STAR transportation cask system that is the basis of the cost estimates developed in this module uses a single-use multipurpose canister that has a welded lid, plus a reusable cask overpack and reusable impact limiters to support shipment of SNF. If the HI-STAR multipurpose canister can be used

INL/EXT-07-12107 (March 2008) Advanced Fuel Cycle Cost Basis O-22
for permanent storage, the cost of transferring SNF from the multipurpose canister to a permanent storage canister will be eliminated and extensive periodic maintenance on the cask system will not be required. Other cask systems that do not use a canister or use a reusable canister will have lower up-front costs but higher maintenance costs. Limited investigation suggests that life-cycle costs for alternative cask systems are similar to those calculated in this module for the HI-STAR cask system. If future model development permits the use of cask system cost data for any cask system, then the suggestion that transportation costs will not vary greatly with cask system should be examined in more detail.
The cost estimates developed in this module contain no costs for any capital facilities needed for the packaging of SNF, MOX, or vitrified HLW. It is assumed that either these costs are incorporated into the capital cost of the power plant, the recycled fuel fabrication plant, or the vitrification facility, or the choice of cask system obviates the need for expensive transfer equipment. Finally, significant cost savings may be obtained if the cask systems used and the equipment at the facilities to which these HLWs are shipped are designed to be mutually compatible. Once a full nuclear fuel cycle economic model has been developed, cask system/storage system costs should be reviewed to identify any significant cost savings that would result from the use of mutually compatible equipment designs.
O1-8. COST ESTIMATE SENSITIVITIES AND UNCERTAINTIES During the development of shipment cost estimates in Section O1-5, a number of sensitivity
calculations were performed. These sensitivity calculations are summarized and discussed in this section. Figure O1-5 shows that the 10th, 50th, and 90th percentile values for the cost of single-use canisters are respectively about $0.566M, $0.657M, and $0.773M. Thus, the cost of an actual canister will probably differ from the best estimate cost by at most about 20%. Figure O1-6 shows that the 10th, 50th, and 90th percentile values for the daily rental cost of the reusable cask components (the overpack and its impact limiters) are respectively about $2,160; $2,430; and $3,060. Thus, the actual daily rental cost for the reusable cask components will probably differ from the best estimate cost by at most about 30%.
Figure O1-4 presents the results of a “1st of a kind/nth of a kind” analysis of the costs of reusable cask system components. This figure indicates that the purchase cost of the reusable cask components is expected to be about $4.9M so long as the manufacturer of the cask system sells at least 40 cask systems. The figure also shows that the cost of the reusable cask system components will rapidly increase as the number of cask systems sold falls below 40 systems and could approach $10M if less than 10 systems are sold. Figure O1-7 shows that the daily rental cost for the reusable cask system components depends strongly on the useful life of these components. For example, if these components are used for 25 years, then the rental cost is about $2,170 per day. However, if component life is only 5 years, then the rental cost can exceed $4,700 per day. Thus, rapid technological obsolescence could significantly increase the daily rental costs for reusable cask system components. For example, current SNF cask systems are designed to transport 5-year cooled SNF. Therefore, without additional cooldown time, the thermal capacities of current cask systems will not allow them to be completely filled when they are transporting high burnup SNF. Thus, if the nuclear fuel cycle shifts largely to high burnup fuels and if longer cooldown time is uneconomic, then either these casks will have to be replaced, or when shipping high burnup SNF, they will not be able to be fully loaded. Either of these outcomes could increase shipping costs significantly.

INL/EXT-07-12107 (March 2008) Advanced Fuel Cycle Cost Basis O-23
Annex OX to this module shows that shipment distances range form 0 to 5,000 km and average about 2,500 km. It also shows that regular freight trains travel about 800 km per day. Because dedicated trains will make fewer stops than regular freight trains, they might cover 1,900 km = (80 km/hr) (24 hr in a day). The Annex further shows that for a 2,500 km trip, the cost per ton-km is about $0.12. Therefore, because a fully loaded SNF cask weighs about 125 tonnes, the weight-based shipping cost of this cask will be about $37,500 = ($0.12 tonne-km)(125 tonnes)(2,500 km). The cost of renting the cask’s reusable components will be no more than $6,560 = ($2,100/day)(2,500 km)/(800 km/day) for this trip. Because both of these costs are small compared to the $650,000 cost of an SNF canister, shipments of SNF and MOX will be relatively insensitive to shipment distance or to weight-related shipping costs.
States may try to levy a tariff on each shipment of a highly radioactive material that enters their state. However, even if state tariffs for shipments of highly radioactive materials survive court challenges, because these tariffs are not expected to be much larger than about $2,500 per state traversed, and because the average shipment of SNF, MOX, or vitrified HLW will traverse perhaps eight states, state tariffs should not exceed $20,000. Therefore, the state tariffs will constitute a minor component of total shipping costs. Finally, because shipping costs depend minimally on loading and unloading costs, none of the uncertainties associated with labor rates are important.
O1-9. MODULE SCALING FACTORS The analysis presented in Section O1-5 shows that the cost of shipping a single SNF or MOX cask by
dedicated train will depend principally on the cost of the single-use canister that houses the SNF or the MOX. Thus, for a single shipment of one cask, shipping costs will be relatively invariant. Of course, the cost of a single shipment should scale more-or-less linearly with the number of casks in the shipment. In addition, the annual shipping costs for SNF and MOX should approximately equal the product of the annual cost per operating reactor and the number of operating reactors. For vitrified HLW, since canister costs are an operating expense for the vitrification facility, shipping costs per cask depend principally on en-route shipping costs per cask and thus should also scale with the number of casks per shipment and with the number of operating reactors.
O1-10. COST SUMMARIES The module cost information is summarized in the What-It-Takes (WIT) cost summary in
Table O1-7. The summary shows the reference cost basis (constant year $U.S.), the reference basis cost contingency (if known), the cost analyst’s judgment of the potential upsides (low end of cost range) and downsides (high end of cost range) based on references and qualitative factors, and selected nominal costs (judgment of the expected costs based on the references, contingency factors, upsides, and downsides). These costs are subject to change and are updated as additional reference information is collected and evaluated, and as a result of sensitivity and uncertainty analysis. Refer to Section 2.6 in the main section of this report for additional details on the cost estimation approach used to construct the WIT table.

INL/EXT-07-12107 (March 2008) Advanced Fuel Cycle Cost Basis O-24
Table O1-7. What It Takes (WIT) Cost summary table (2007 $).
Reference Cost Low Cost (Upsides)
High Cost (Downsides)
Selected Value (Nominal Cost)
Canister Purchase 566,000 773,000 657,000 Cask System Rental $/day $/trip
2,100 7,600
3,060
32,400
2,430
17,900 Total Costs SNF, Reactors to YMP SNF/MOX Between Reactor & Reg’l Cntr HLW to YMP
804,000 714,000 133,000
1,122,000 1,077,000
417,000
966,000 881,000 263,000
Cost/kg IHM SNF, Reactors to YMP SNF/MOX Between Reactor & Reg’l Cntr HLW to YMP
75.90 67.60
4.50
106.30 102.00
14.00
91.59 83.40
8.80 Cost/ MTIHM-km SNF, Reactors to YMP SNF/MOX Between Reactor & Reg’l Cntr HLW to YMP
32.30 21.10
1.60
45.20 31.30
5.10
38.90 26.00
3.20
Table O1-8. Code-of-accounts data (median costs per operating reactor, millions 2006 dollars).
AFCI Code of Accounts
Number Code of Accounts Description
Cost Per Operating Reactor
($ Million) Comments
7
Annualized O&M cost Once-Through Reprocess Recycle
1.93 1.95 3.71
9 Annualized financial costs
Total Annual Operating Costs Once-Through Reprocess Recycle
1.93 1.95 3.71
Once-Through considers only SNF to YMP. Reprocess considers SNF to Regional Center and HLW from there to YMP Recycle considers MOX from Regional Center to Reactor, SNF return and HLW to YMP

INL/EXT-07-12107 (March 2008) Advanced Fuel Cycle Cost Basis O-25
O1-11. BIBLIOGRAPHY 10 CFR 73, Packaging and Transportation of Radioactive Material, Subpart E, Package Approval
Standards (Sections 71.41 – 71.47, 71.51, and 71.61) and Subpart F, Package, Special Form, and LSA-III Tests (Section 71.71, Normal Conditions of Transport, and Section 71.73, Hypothetical Accident conditions).
Ammerman, D. J., and J. L. Sprung, “Cost Estimates for Test Article Options for the Package Performance Study,” Internal Sandia Report, Sandia National Laboratories, Albuquerque, New Mexico 87185, April 4, 2001.
Blessing, C. (Holtec International) to D. Ammerman, (Sandia National Laboratories), dated November 8, 2003.
Bureau of Labor Statistics, “National Compensation Survey: Occupational Wages in the United States, July 2003 Supplementary Tables,” U.S. Department of Labor, Bureau of Labor Statistics, August 2006.
Feizollah, Feizollahi, D. Shropshire, and D. Burton, “Waste Management Facilities Cost Information for Transportation of Radioactive and Hazardous Materials,” INEL-95/0300 (formerly EGG-WM-10877) Rev. 1, Idaho National Engineering Laboratory, June 1995.
Fultz, K. et al., “Nuclear Waste: Shipping Damaged Fuel from Three Mile Island to Idaho,” PB87229753, Resources and Economic Development Division, U.S. General Accounting Office, Washington DC, report to Congress, August 1987.
Gen. IV Economic Modeling Working Group, “Cost Estimating Guidelines for Generation IV Nuclear Energy Systems,” Oak Ridge National Laboratory, 2003.
Higgins, R. C.; Analysis for Financial Management; Irwin/McGraw Hill; ISBN 0.07.231531.8; 2001.
Holtec, Safety Analysis Report for the Holtec International Storage, Transport, and Repository Cask System (HI-STAR 100 Cask System), Revision 9, Holtec Report HI-951251, dated April 20, 2000.
Johnson, P. E. and R. D. Michelhaugh, Transportation Routing Analysis Geographic Information System (TRAGIS) User’s Manual, ORNL/NTRC-006, Oak Ridge National Laboratory, Oak Ridge, Tennessee, 37831–6285, June 2003.
Michelhaugh, R. D. “TRANSCOST Version 3.0 User’s Manual,” Oak Ridge National Laboratory, Oak Ridge, Tennessee, June 2002.
Morrow, C. W., Internal Memorandum Summarizing “Economic Modeling – Shipping Cask Life Cycle Costs,” Sandia National Laboratories, Albuquerque, NM, June 30, 2004.
Newendorp, P. D., Decision Analysis for Petroleum Exploration, PennWell Publishing Co., 1975; p. 274.
Sprung, J. L., et al., “Reexamination of Spent Fuel Shipment Risk Estimates,” NUREG/CR-6672, U.S. Nuclear Regulatory Commission, Washington DC 20555, March 2000.
U.S. Department of Commerce, Surface Transportation Board, Office of Economics, Environmental Analysis and Administration, Statistics of Class I Freight Railroads in the United States, 1998, 1999, 2000, 2001, 2002, and 2003.
U.S. Department of Energy, Analysis of the Total System Life Cycle Cost of the Civilian Radioactive Waste Management Program, DOE/RW-0533, U.S. Department of Energy, Office of Civilian Radioactive Waste Management, Washington, DC, May 2001.

INL/EXT-07-12107 (March 2008) Advanced Fuel Cycle Cost Basis O-26
U.S. Department of Energy, Final Environmental Impact Statement for a Geologic Repository for the Disposal of Spent Nuclear Fuel and High-Level Radioactive Waste at Yucca Mountain, Nye County, Nevada, DOE/EIS-0250, U.S. Department of Energy, Office of Civilian Radioactive Waste Management, Washington, DC, February 2002.

INL/EXT-07-12107 (March 2008) Advanced Fuel Cycle Cost Basis O-27
Module O2
Transport of Nuclear Fuel and Low-Level Radioactive Materials

INL/EXT-07-12107 (March 2008) Advanced Fuel Cycle Cost Basis O-28

INL/EXT-07-12107 (March 2008) Advanced Fuel Cycle Cost Basis O-29
Module O2
Transport of Nuclear Fuel and Low-Leveld Radioactive Materials
O2-1. BASIC INFORMATION This module develops cost estimates for the shipment of nuclear fuel and low-level radioactive
materials between nuclear fuel cycle facilities. Table O2-1 presents a summary of the 14 facility pairs (an origin facility and a destination facility) between which low-level radioactive materials are shipped. Table O2-1 lists these 14 origin/destination facility pairs and the module that describes each facility. Table O2-1 also specifies for each facility pair the material that is shipped from the origin facility to the destination facility and one or more packages used to ship the material. Although Table O2-1 shows that enriched UF6 (EUF6) may be transported in at least three different packages and depleted UO2 (DUO2) in at least two different packages, the cost analyses presented in this module examined only one package for each material shipped. For example, the package examined for EUF6 was the UX-30 package, and for DUO2 it was the CHT-OP-TU package. Thus, trip costs were developed for nine packages.
Table O2-1. Fourteen pairs of an origin facility and a destination facility, the material shipped between these facilities, and typical shipment packages.
Modules Flow Stream From To Origin Facility to Destination Facility Material Shipped Typical Packages
1 A B Mill to UOX Conversion Yellow Cake, U3O8 55-gal drums 2 B C UOX Conversion to Enrichment UF6 Paducah Tiger 3 C D1 Enrichment to Fresh Fuel Fabrication 4 C F2/D2 Enrichment to Recycled Fuel
Fabrication
EUF6 UX-30 NCI-21PF-1 ESP-30X
5 C K Enrichment to DUF6 Conversion DUF6 Paducah Tiger 6 K F2/D2 DUF6 Conversion to Recycled Fuel
Fabrication DUO2 powder or pellets
7 K J DUF6 Conversion to Surface Disposal DUO2 8 F B Reprocessing to UOX Conversion UOX
CHT-OP-TU (B)ANF-250
9 F F2/D2 Reprocessing to Recycled Fuel Fabrication
TRU/TRUOX 9975 (B)
10 F E3 Reprocessing to Decay Storage TRU, FPa RH-TRU 72B (B)11 F J Reprocessing to Surface Disposal LLW, UOX CHT-OP-TU (B) 12 E3 F2/D2 Decay Storage to Recycled Fuel
Fabrication TRU RH-TRU 72B (B)
13 E3 J Decay Storage to LLW Surface Disposal
FPa CNS10-160B (B)
14 D1 R Fresh Fuel Fabrication to Reactor Fresh PWR Fuel Assemblies Fresh BWR Fuel Assemblies
MCC-4 SP-1,2,3
a. FP, as used in the table above, means fission products such as cesium, iodine, strontium, & technetium.
d. “Low-Level” is a widely used term defined only within the U.S. Department of Energy (DOE). In effect, it means anything other than “high-level.” The NRC categorizes “low-level” materials into those that are suitable for land disposal and those that are not. There are three classes of land disposal materials (A, B, & C), with the radioactive content increasing from A through C. The NRC also recognizes a type of “low-level” material that is greater than Class C (GTCC) and which is NOT eligible for land disposal. Some of the materials discussed here may be in the GTCC category.

INL/EXT-07-12107 (March 2008) Advanced Fuel Cycle Cost Basis O-30
Low-level radioactive materials can be shipped by truck or rail. Because they are usually shipped by truck, the shipping costs developed in this module assume shipment using 18-wheel tractor/semi-trailer trucks that are fully loaded (i.e., the truck is loaded with the largest number of packages that it is allowed to carry). Moreover, because the vulnerability risks posed by these materials are small, it is assumed that each shipment consists of one truck (i.e., no shipments are made by a convoy of trucks) and also that the truck is not guarded by any escort vehicles.
Many of the packages listed in Table O2-1 are low-specific activity or Type-Ae packages. Those that are not are indicated by “(B).” Transportation costs for materials shipped in low-specific activity or Type-A packages consist of the cost of the packaging,f loading costs at the shipment origin, shipping costs while in transit, and unloading costs at the shipment destination. For Type B packages, it may be necessary to add costs for certification/recertification and for periodic testing and maintenance.
The objective here has been to establish a cost estimate, not to prejudge which packagings might eventually be selected for actual use. In some cases, the certificates currently issued for the packagings assumed may require some amendment to be used for the purposes indicted in Table O2-1. In particular, the 9975 has been certified by DOE under authority granted for weapons-related work and materials. Acceptance by the NRC may be required for “commercial” materials. Such acceptance is considered highly likely.
O2-2. MODULE INTERFACE DEFINITION Columns two and three of Table O2-1 list the fourteen pairs of modules that describe the origin
facility and the destination facility for each material shipped. The table shows that low-level radioactive material fuel cycle shipments originate at the following seven types of facilities: uranium mills (Module A), UO2 to UF6 conversion facilities (Module B), UF6 enrichment facilities (Modules C1 and C2), depleted UF6 (DUF6) conversion facilities (Modules K1, K2, and K3), SNF reprocessing facilities (Modules F1 and F2/D2), interim decay/storage facilities (Module E3), and fresh fuel fabrication facilities (Module D1). The table also shows that the low-level radioactive materials produced at these six types of facilities are shipped to one or more of the following seven types of facilities: UO2 conversion facilities (Module B), UF6 enrichment facilities (Modules C 1 and C2), fresh fuel fabrication facilities (Module D1), recycled fuel fabrication facilities (Module F2/D2), depleted UF6 conversion facilities (Modules K1, K2, and K3), interim decay/storage facilities (Module E3), near surface low-level waste disposal facilities (Module J), and nuclear power plants.
O2-3. PICTURES/SCHEMATICS Figure O2-1 presents photographs of two typical Type-A packagings, a carbon steel 55-gallon open
top drum used to ship yellow cake, and a UX-30 packaging used to ship enriched UF6.
e. Transportation packages fall into two categories, depending primarily on radioactive content, with Type A having lower radioactive content than Type B. As long as the enrichment level is less than 5%, virtually all packages containing unirradiated uranium are Type A. However, fairly small amounts of TRU can cause a package to be classified as Type B; the threshold for Pu-239, for example, is only 0.087 g. f. In this section, the term “packaging” refers to the devices into which radioactive material is placed for shipment⎯in other words, the shipping container. The term “package” refers to the container and its contents.

INL/EXT-07-12107 (March 2008) Advanced Fuel Cycle Cost Basis O-31
Figure O2-1. Typical Type-A packagings.
O2-4. FUNCTIONAL AND OPERATIONAL DESCRIPTION At the facility where it is generated, each of the materials listed in Table O2-1 is loaded into a
package designed and certified to carry that material. After being loaded onto a truck, the packages are transported from their origin facility to their destination facility where they are unloaded from the truck. At all destination facilities except near surface disposal facilities, the shipped material is removed from the shipping package so that it can be converted to a new material.
O2-5. COST BASES, ASSUMPTIONS, AND DATA SOURCES
O2-5.1 Input Parameter Values Annex OX to Module O derives the algorithms used to estimate transportation costs and provides
values for the parameters that are not packaging-specific. Table O2-2 presents the packaging-specific input parameters. In Table O2-2:
• The values of package loaded weights and package contents weights were extracted from the package Certificates of Compliance
• Package costs were estimated (see Section O2-5.2 for details) from literature data and discussions with two shippers of low-level radioactive materials and a manufacturer of low-level radioactive material packages
• The number of packages carried per truck was based on the package carrying capacity of the floor space of an 18-wheel tractor/semi-trailer truck, reduced where necessary to reflect shielding and criticality limits
• The low, modal, and high values for the triangular distribution used to represent package loading and unloading durations were selected based on the experience of Sandia National Laboratories technical staff.

INL/EXT-07-12107 (March 2008) Advanced Fuel Cycle Cost Basis O-32
Although a specific package loading parameter and its analogous unloading parameter could have different triangular distributions (different low, modal, and high values), the calculations presented here assumed that they were the same. Accordingly, as is shown in Table O2-2, the triangular distribution for the overhead factor on wages for loading is the same as for unloading, and the distribution for time required to load a package is the same as to unload.
Table O2-2. Parameter values for packaging-specific parameters. Single Value Parameters Load/Unload Distribution
Material Carried Name Certificate
Packages per Truck
Cost (2007$)
Loaded Wt. (lb)
Contents (kg HM) Trip Routes Lo Mode Hi
Yellow Cake 55-gal drums Industrial Package 104 $110 440 139 Mills to
Regional 0.167 0.25 0.5
UF6, DUF6 Paducah Tiger 6553/AF 1 $211,580 40,000 6,450 6 12 24 EUF6 UX-30 9196/AF-85 4 $24,540 8,270 1,540 1.5 2 3 DUO2, UOX, LLW CHT-OP-TU 9288/B(U)F-85 10 $27,890 3,757 643 0.5 1 1.5
TRU/TRUOX 9975 9975/B(M)F-85(DOE) 22 $8,030 404 2 0.167 0.5 0.75
FP CNS10-160B 9204/B(U)-85 1 $725,000 72,000 2,630 18 24 36 TRU, FP RH-TRU 72B 9212/B(M)F-85 1 $725,000 45,000 1,475
Regional to Regional
18 24 36 MCC-4 9239/AF 2 $49,080 10,500 2 PWR 4 6 8 Fresh Fuel
Assemblies SP-1,2,3 9248/AF 3 $29,000 2,800 2 BWR Regional to Reactors 4 6 8
As Table O2-2 indicates, the cost calculations performed in this module require a distribution of
possible shipment distances. Except for shipments of yellow cake from uranium mills to conversion facilities and of fresh fuel assemblies from fresh fuel fabrication facilities to nuclear power reactors, all the other shipments considered will be between regional facilities. Accordingly, three distance distributions are needed, between uranium mills and conversion facilities located at regional sites (Mills to Regional), between regional conversion, enrichment, reprocessing, fuel fabrication, interim decay/storage, and near surface disposal facilities (Regional to Regional), and between regional fresh fuel fabrication facilities and nuclear power reactors (Regional to Reactors). These are developed in Annex OX.
Before being placed into service, Type-A packages must be certified by the Department of Transportation (DOT)10 and also by NRC,11 if they will carry significant quantities of fissile materials. Because almost all the materials listed in Table O2-1 contain uranium or plutonium, all the packages listed in Table O2-1 should have been certified by both DOT and NRC. Type B packages are certified by the NRC.
Because some Type-A packages used to ship nuclear fuel cycle low-level radioactive materials are likely to be reused, when estimating shipping costs, packaging costs should be amortized over the useful life of the packaging and expressed as a rental cost. This was performed for all the Type B packagings, whereas Type A packagings were considered single use. In retrospect, this is probably appropriate only for the 55-gallon drum. Some cost savings could be achieved by considering the other Type A packagings to be multiple use containers and a rental charge devised to evaluate the cost. Finally, because the packagings examined in this module are all commercially available, the data presented in Table O2-2 are entirely adequate for the scoping cost analyses performed in this module.

INL/EXT-07-12107 (March 2008) Advanced Fuel Cycle Cost Basis O-33
O2-5.2 Packaging Costs The packaging costs developed for this module consider two types of packages. Some materials will
be shipped in Type B packages. These packages are used for the more intensely radioactive materials; they are certified by the NRC; and they tend to be complex in design and relatively expensive per unit of payload. Less intensely radioactive materials are shipped in Type A packages, which are generally simpler in design; certified by the DOT, and/or the NRC (NRC certification is required if they carry fissile materials). In Table O2-3, the Type B Packages are indicated by a (B) following the name. The remaining packages are Type A packages. Although these radioactive materials can be shipped by either truck or rail, the costs developed in this module assume shipment by truck.
Table O2-3 again lists the nine packagings considered in this module, presents for each packaging the name of the packaging manufacturer, the approximate cost of the packaging, the number of packages that can be transported by an 18-wheel tractor/semi-trailer truck, and the material carried in the package. All packaging costs have been adjusted to 2007 dollars using the producer price index for hardware. More detailed packaging descriptions and cost component data would be needed if differences in packaging unit costs are to be explained.
Table O2-3. Approximate packaging costs and manufacturers.
Material Carried Name
Packages per
Truck Cost per Package
(2007 $) Manufacturer Yellow Cake 55-gal drum 104 $110 LabelMaster Inc. UF6 Paducah Tiger 1 $211,580 US Enrichment Corp. Enriched UF6 UX-30 4 $24,540 Columbiana Hi Tech Front End LLC LLW, DUO2, UOX CHT-OP-TU (B) 10 $27,890 Columbiana Hi Tech Front End LLC TRU/TRUOX 9975 (B) 22 $8,030 DOE - Savannah River Operations Office FP CNS10-160B (B) 1 $725,000 Duratek TRU, FP RH-TRU 72B (B) 1 $725,000 DOE Unirradiated PWR Fuel Assemblies MCC-4 2 $49,080 Westinghouse Electric Company Unirradiated BWR Fuel Assemblies SP-1,2,3 3 $29,000 Framatone ANP
Costs to Acquire Packagings. Informal cost quotes for the UX-30, the CHT-OP-TU, and the 9975 packagings were obtained by phone calls to and email exchanges with a representative of the manufacturer of each of these packagings. The cost of the RH-TRU 72B packaging was taken from one of the weekly newsletters published by the Waste Isolation Pilot Plant.12 The cost and capacity of the 55 gallon open-head steel drums used to ship yellow cake were obtained from the one manufacturer’s 2005 catalog.13
When cost data could not be directly obtained for the remaining seven packagings, packaging cost estimates were developed as follows. For the MCC-4, the SP-1, 2, 3, and the CNS10-160B packagings, packaging costs were assumed to be about the same as those of a similar packaging. Thus, after cost data for fresh PWR and fresh BWR fuel packagings manufactured by Columbiana Hi Tech Front End, LLC were obtained by phone calls and email exchanges with a manufacturer’s representative, packaging costs for the MCC-4 fresh PWR fuel packaging and for the SP-1, 2, 3 fresh BWR fuel packaging were assumed to be about the same as the costs of the PWR and BWR fresh fuel packagings manufactured by Columbiana Hi Tech Front End LLC. And because the size and design of the CNS10-160B packaging are similar to that of the RH-TRU 72B packaging, it was assumed that the cost of this packaging would be about the same as that of the RH-TRU 72B packaging.

INL/EXT-07-12107 (March 2008) Advanced Fuel Cycle Cost Basis O-34
Finally, the cost of one packaging was estimated assuming a cost of about $10.00/lb (in 2004 $) of packaging weight. Since Table O2-2 shows that the Paducah Tiger packaging weighs 21,030 lb, the cost was estimated to be about $210,300 in 2004 $, or $211,600 in 2007 $.
Rental Costs for Packagings Assumed to be Reused Many Times. Because they are more complex and relatively more expensive, all Type B packagings were assumed to be reused many times over the duration of their service lives, which were represented by a triangular distribution with low, modal, and high values of 1, 10, and 30 years. The median life was approximately 20 years. For these packagings, a daily rental cost was developed by performing a present value analysis. This analysis was performed using the discounted cash flow methods recommended in Higgins.7 The purchase price was assumed to match the manufacturer’s cost at a discount rate of 10%. Table O2-4 presents the parameters that were used in this analysis. The utilization factor represents the fraction of the days in a year the packagings are assumed to be in use. Instead of applying an overhead percent to the packaging purchase price, a nominal O&M cost ($10,000 in 2004 $, then escalated using the Consumer Price Index [CPI] for all items) was included in the analysis as a fixed cost. This assumes that the cost to test and maintain a packaging is independent of its size or weight. The analysis uses straight line depreciation based on the expected life of the packaging. For discounting purposes, year zero was assumed to be 2007. The first six parameters in Table O2-4 were assumed to be fixed. The final parameter, the useful life of the packaging, was assumed to vary stochastically. Values for this parameter were selected by random sampling from the triangular distribution for this parameter.
Table O2-4. Present value analysis parameters. Fixed Parameters Values Units
Price of Reusable Items CNS10-160B $725,000 RH-TRU 72Ba $613,400
CHT-OP-TU $27,890 9975 $8,030
2007 $
Utilization Factor 0.90 Fraction Inflation 3.0% Tax Rate 36.0% Discount Rate 10.0% O&M $11,150 2007 $/year Sampled Parameter Low Modal High Useful Life 1 10 30 Years a. The RH-TRU 72B packaging consists of a welded canister and an overpack that is fitted with two impact limiters. Based on the costs of these items for SNF casks, the costs of the RH-TRU 72B canister and its overpack and impact limiters were estimated to be $111,600, $362,400, and $251,000 in 2007 $.
The present value analysis was run 10,000 times. For each simulation, the calculated cost was adjusted to return a zero net present value based on the sum of discounted cash flows for all years of the analysis. Figure O2-2 displays the results of the analysis as a series of rental costs sorted low to high. Because some consideration was given to using the interior canister of the RH-TRU 72B as a single use container, the rental costs for that packaging do not include the canister. When it is included, the daily rental cost is exactly the same as the CNS10-160B. The rental costs displayed in Figure O2-2 are for a shipment, not a single package. The CHT-OP-TU results are for 10 packages and the 9975 results for 22.

INL/EXT-07-12107 (March 2008) Advanced Fuel Cycle Cost Basis O-35
Inspection of Figure O2-2 shows that rental costs increase very rapidly once cumulative fractions pass 0.90. This corresponds roughly to lifetimes dropping below about 5 years. Thus, the 90th percentile rental cost is $563/day for the CNS10-160B while the 99th percentile rental cost (corresponding to a 2-year life) is over $1,300/day. Also, the rental cost for 9975 does not vary strongly with the life of the packaging, but is driven instead by the maintenance costs. For an average life of 13 years, the daily rental cost for 22 packagings (a shipment) is $811, of which $731 is for maintenance and $80 is to recover the cost of the packaging. In contrast, of the $360 rental charge for the CNS 10-160B, the vast majority, $327, is for recovery of the packaging cost and only $33 is for maintenance.
Figure O2-2. Cumulative distribution of daily rental costs for Type B packagings.
O2-6. RESULTS Ten thousand sets of values for the 17 input parameters in the Cost Algorithm, for which distributions
were developed, were selected by Monte Carlo sampling. Combination of each set of these values with the values specified for the 12 parameters that had single values generated 10,000 full sets of input for the Cost Algorithm. Running of the Cost Algorithm using these 10,000 sets of input allowed distributions for the five output parameters (Total Cost, Packaging Cost, Loading Cost, Shipping Cost, and Unloading Cost) to be constructed. Output was developed for single shipments of
• Yellow cake from the mills or ports of entry to regional facilities for conversion using the distribution of trip distances constructed for these shipment routes
• UF6, enriched UF6, depleted UF6, depleted UO2, UOX, TRU/TRUOX, TRU, FP, and U from regional facilities to regional facilities using the distribution of trip distances constructed for the routes that interconnect regional facilities
• Fresh PWR and BWR fuel assemblies from the regional facilities to the reactor sites using the distribution of trip distances taken from NUREG/CR-6672 for shipments of spent fuel from reactors to these six hypothetical regional facilities.

INL/EXT-07-12107 (March 2008) Advanced Fuel Cycle Cost Basis O-36
Monte Carlo sampling of parameters described by normal distributions or any other simple continuous algebraic formula is straightforward. The value of the independent variable in the algebraic formula is selected by Monte Carlo sampling, and then the value of the formula is used to calculate the value of the dependent variable. Selecting values for parameters represented by triangular distributions was done as follows. For any probability, P, the stochastic parameter, X, is calculated as
P ≤ Pmode: X = min + √P • (max – min) • (mode – min) (4a)
_____________________________
P > Pmode: X = max - √(1 – P) • (max – min) • (max - mode) (4b)
where “X” stands for any of the parameters in Table O2-4 or for any other parameter represented by a triangular distribution,
Pmode = (mode – min)/(max – min) (5)
and max, min, and mode are the high, low, and modal values used to specify the triangular distribution.8
To simplify discussion of the results, the nine packagings are divided into two groups: The first group contains the four Type B packagings, for which rental costs were developed. The remaining five packagings, the Type A packagings, constitute the second group.
O2-6.1 Type B Packages Figures O2-3 through O2-6 present the distribution of shipment costs developed for each Type B
package by the Monte Carlo calculations. Figure O2-3 shows that the median total cost for the CNS10-160B package is about $32,700, and costs range from about $15,000 to $60,000 per shipment. Figure O2-4 shows that for the median total cost for the RH-TRU 72B package is about $140,900, and costs range from about $125,000 to $180,000 per shipment. The RH-TRU 72B has an inner canister that was assumed to be used as a single-use container. If that were not done, the cost for the RH-TRU 72B would decrease by about $110,000⎯the cost of the inner container. It should be evident that for single use packagings (or packaging systems that have expensive single use components), total trip costs will be largely determined by the cost of the single use items. Figures O2-5 and O2-6 present similar data for the CHT-OP-TU and 9975 packages.
Figures O2-3 through O2-6 also present for the Type B packages the distributions of trip cost without the packaging costs. The distributions of “handling” cost (loading, shipping, and unloading) are quite similar for the CNS10-160B and the RH-TRU 72B because, the loading, en-route, and unloading costs differ significantly only in weight based (i.e., tonne-km based) shipping costs. If the RH-TRU 72B canister is used as a single use container, the difference between the “handling” costs (loading shipping and unloading) for the RH-TRU 72B would decrease by over $100,000. Figures O2-5 and O2-6 show that the cost for the CHT-OP-TU and 9975 packages are also similar and not dramatically different from the costs of the other two Type B packages.
Table O2-5 presents for the Type B packages median values for the total shipment cost and also for the packaging related costs (loading and unloading costs, and the en-route shipping costs) that sum to give the total cost. Also presented in this table is the fractional distribution of each cost component to the total cost, the average distance of each shipment, and the weight of the package contents. Finally, the cost per kilogram and the cost per tonne-km are provided.

INL/EXT-07-12107 (March 2008) Advanced Fuel Cycle Cost Basis O-37
Figure O2-3. Cumulative distribution of shipment costs using a CNS10-160B package.
Figure O2-4. Cumulative distribution of shipment costs using a RH-TRU 72B package.

INL/EXT-07-12107 (March 2008) Advanced Fuel Cycle Cost Basis O-38
Figure O2-5. Cumulative distribution of shipment costs using a CHT-OP-TU package.
Figure O2-6. Cumulative distribution of shipment costs using a 9975 package.

INL/EXT-07-12107 (March 2008) Advanced Fuel Cycle Cost Basis O-39
Table O2-5. Package median shipment cost and other data for Type B packages.a
CNS10-160B
Regional Sites to Regional Sites RH-TRU 72B
Regional Sites to Regional Sites
Value
(2007 $) Fraction Value
(2007 $) Fraction Total Cost $ 32,745 1.00 $ 140,853 1.00 Packaging $ 1,228 0.04 $ 112,592 0.809 Shipping $ 8,109 0.264 $5,084 0.037 Load/Unload $ 21,354 0.696 $ 21,510 0.155 Distance 2,690 km 2,690 km Payload 2.63 MT HM 1.475 MT HM Unit Cost $12.45/kg HM
$4.63/MT-km
$95.49/kg HM $35.50/MT-km
CHT-OP-TU Regional Sites to Regional Sites
9975 Regional Sites to Regional Sites
Value
(2007 $) Fraction Value
(2007 $) Fraction Total Cost $3,871 1.00 $11,794 1.00 Packaging $1,418 0.103 $2,374 0.202 Shipping $4,212 0.304 $900 0.077 Loading $8,206 0.593 $8,488 0.722 Distance 2,690 2,690 Payload 10 × .643 MTHM 22 × 2 kg HM Unit Cost $2.16/kg HM
$0.80/MT-km
$268.05/kg HM $99.65/MT-km
Note: The component values may not sum to the total cost. The actual medial values for the components usually do not exist in the case with the median total cost unless all are distributed similarly.
O2-6.2 Type A Packages Figures O2-7 through O2-9 present the distribution of shipment costs developed for each Type A
package using the Monte Carlo method. In each case, the packaging is treated as being used only once. As a consequence, except for the 55-gallon drum, the total costs including packaging are dramatically different from the “handling” costs, that is, the costs without packaging costs. The cost of the 55-gallon drum is only about $100. The component of the rental costs devoted to O&M costs is about $30 per day. For a three to four-day shipment, the rental component due to O&M roughly equals the purchase price of the container, and a “single-use” approach is very reasonable. For the other packages, the case for single-use treatment is much less persuasive.
With the exception of the 55-gallon drum, the handling costs are quite similar⎯generally between about $7,000 and $25,000 per shipment. These values are also similar to the handling costs for the Type B packages. The implication is that shipment costs are primarily dependent on the cost of the packaging if it is single-use, as in the case of the Type A packages, but mostly dependent on the handling costs for the multiple-use packages, as in the case of the Type B packages.

INL/EXT-07-12107 (March 2008) Advanced Fuel Cycle Cost Basis O-40
Figure O2-7. Cumulative distribution of shipment costs using an MCC-4 package (PWR fuel) or a SP-1, 2, 3 package (BWR fuel).
Figure O2-8. Cumulative distribution of shipment costs using a Paducah Tiger or a UX-30 package.

INL/EXT-07-12107 (March 2008) Advanced Fuel Cycle Cost Basis O-41
Figure O2-9. Cumulative distribution of shipment costs using a 55-gallon drum.
Table O2-6 presents for the Type A packages, median values for the total shipment cost and also for the packaging related costs, the loading and unloading costs, and the en-route shipping costs that sum to give the total cost. Also presented in this table is the fractional contribution of each cost component to the total cost, the average distance of each shipment, and the weight of the package contents. Finally, the cost per kilogram and the cost per tonne-km are provided.
Table O2-6. Median shipment cost (2007 dollars), and other data for Type A packages. SP-1,2,3
Regional Sites to Reactors MCC-4
Regional Sites to Reactors
Value
(2007 $) Fraction Value
(2007 $) Fraction Total Cost $103,247 1.0 $105,634 1.0 Packaging $86,998 0.848 $11,734 0.882 Shipping $779 0.008 $1,587 0.017 Load/Unload $14,774 0.144 $4,851 0.090 Distance 2140 km 2140 km Payload 3 × 0.636 MTHM 2 × 1.15 MTHM
Unit Cost $54.11/kg HM $25.29/MTHM-km
$48.13/kg HM $22.49/MTHM-km

Table O2-6. (continued).
INL/EXT-07-12107 (March 2008) Advanced Fuel Cycle Cost Basis O-42
SP-1,2,3 Regional Sites to Reactors
MCC-4 Regional Sites to Reactors
Value
(2007 $) Fraction Value
(2007 $) Fraction Paducah Tiger Regional Sites to Regional Sites
UX-30 Regional Sites to Regional Sites
Value (2007 $) Fraction
Value (2007 $) Fraction
Total Cost $228,246 1.0 $109,668 1.0 Packaging $211,583 0.930 $98,151 0.900 Shipping $4,524 0.0120 $3,690 0.034 Load/Unload $11,341 0.050 $7,178 0.066 Distance 2690 km 2690 km Payload 6.45 MTHM 4 × 1.54 MTHM
Unit Cost $22.79/kg HM
$8.47/MTHM-km
$17.8/kg HM $6.62/MTHM-km
55-Gallon Drum Mills to Regional Sites
Value (2007 $) Fraction
Total Cost $43,683 1.0 Packaging $11,484 0.271 Shipping $5,114 0.121 Load/Unload $12,592 0.609 Distance 2550 km Payload 104 × 0.196 MT
Unit Cost $3.02/kg HM $1.19/MTHM-km
O2-6.3 Unit Shipping Costs Division of the average value for the total trip cost by the product of the average trip distance and
weight of the contents of all packages shipped together in one shipment yields the value for the cost of shipping 1.0 tonne (1000 kg) of material 1.0 km. Table O2-7 presents these values for all the packages examined by this module. The table shows that the value of the shipping cost per tonne-km for the 9975 package is two orders of magnitude larger than the values for eight of the other nine packages. This very high cost per tonne per kilometer is caused by the low capacity⎯only 2 kg/package. Criticality generally limits the capacity to 4.5 kg of contained weapons grade plutonium. Other TRU may allow a higher capacity, but the content is limited to a heat generation rate of 19 Wand for TRU with higher isotopes, this will probably further limit the capacity. The 2 kg value used in this analysis is likely conservative.

INL/EXT-07-12107 (March 2008) Advanced Fuel Cycle Cost Basis O-43
O2-7. LIMITATIONS OF COST DATA At present, there is very little data available on the estimated or actual costs of shipping low-level
radioactive materials. Actual or estimated cost data for the shipments considered in this module are sparse because for many of the shipments examined one or both of the facilities between which the shipments would take place (e.g., reprocessing, recycled fuel fabrication, and interim decay storage facilities) do not exist, because reprocessing of SNF is currently not performed in the United States.
Table O2-7. Median package shipping cost.
Package Cost per Shipment
(2007$) Cost per kilogram
(2007 $) Cost per tonne-km
(2006 $)
55-gallon drum $41,047 $2.013 $0.79
Paducah Tiger $217,872 $22.79 $8.47
UX-30 $104,551 $11.46 $4.26
CHT-OP-TU $12,679 $1.73 $0.645
9975 $10,229 $232.47 $86.43
CNS10-160B $30,401 $4.61 $1.715
RH-TRU 72B $27,548 $7.57 $2.797
MCC-4 $105,634 $45.86 $21.43
SP-1,2,3 $98,508 $51.63 $24.12
Because the packages and trucking infrastructure that would be used to ship the low-level radioactive materials that are considered by this module are already commercially available technologies, the shipping cost estimates developed in this module, though approximate, are not likely to be highly inaccurate. Thus, upper bound (downside) estimates of shipping costs should not be substantially larger than the central estimates developed in this module. However, lower bound (upside) estimates could be substantially smaller than the central estimates developed here if the nuclear fuel cycle becomes much larger in the future, whereupon substantial economies of scale might be achievable.
The cost estimates for the shipment of yellow cake assume that the cost per tonne of yellow cake at a North American mill is about the same as the cost per tonne when delivered by ship to a port of entry. The cost estimates developed in this module contain no costs for any capital facilities needed to load the low-level radioactive materials of concern into their shipment packages (e.g., for loading of the CNS10-160B or the RH-TRU 72B packages). It is assumed that either these costs are incorporated into the capital cost of the regional facility where these packages would be initially loaded or that these costs are not large enough to be significant. Finally, significant cost savings may be obtained if the packagings utilized and the equipment at the facilities to which these low-level radioactive materials are shipped should be designed to be mutually compatible. Once a full nuclear fuel cycle economic model has been developed, package/storage system costs should be reviewed to identify any significant cost savings that would result from the use of mutually compatible equipment designs.

INL/EXT-07-12107 (March 2008) Advanced Fuel Cycle Cost Basis O-44
O2-8. COST ESTIMATE SENSITIVITIES AND UNCERTAINTIES The analysis results presented in Section O2-6 show that package trip costs depend strongly on the
purchase price of single use packagings. For the five packagings that were assumed to be single-use items, the assumption that the packagings would be used only once is the principal determinant of trip costs. Consequently, trip costs would decrease substantially, if these packagings were reused several times. For example, the daily rental cost for the CNS10-160B packaging is about $275 per day if the service life of the packaging is 25 years, while if it is only 5 years then the packaging daily rental cost is about $500 per day. But, in either case, the rental cost for a trip of a few days is at least an order of magnitude less than the purchase price of the packaging.
Some states may try to levy a tariff on each shipment of low-level radioactive material that enters their state. These tariffs are not expected to be much larger than about $2,500 per state traversed, and because the average shipment of low-level radioactive material will traverse perhaps eight states, state tariffs should not exceed $20,000. Therefore, the state tariffs will constitute a minor component of total shipping costs. Finally, because shipping costs depend minimally on loading and unloading costs, none of the uncertainties associated with labor rates are important.
O2-9. MODULE SCALING FACTORS The analysis presented in Section O2-5 shows that the cost of shipping low-level radioactive material
in single use packagings depends principally on the purchase price cost of the packaging or of any expensive single use packaging components. Thus, for a single shipment of one package, shipping costs will be relatively invariant. However, if any of the packagings assumed to be single-use in this module are actually used multiple times, then, very approximately, shipment costs should vary inversely with the number of times that the packaging is reused. In addition, the annual shipping costs for a low-level radioactive material will not equal the product of its annual cost per operating reactor and the number of operating reactors. This is because some of the low-level radioactive materials shipped will be recycled, and thus the amount of fresh fuel needed per operating reactor will depend on the amount SNF that is being reprocessed.
O2-10. COST SUMMARIES The module cost information is summarized in the What-It-Takes (WIT) cost summary in
Table O2-8. The summary shows the reference cost basis (constant year $U.S.), the reference basis cost contingency (if known), the cost analyst’s judgment of the potential upsides (low end of cost range) and downsides (high end of cost range) based on references and qualitative factors, and selected nominal costs (judgment of the expected costs based on the references, contingency factors, upsides, and downsides). These costs are subject to change and are updated as additional reference information is collected and evaluated, and as a result of sensitivity and uncertainty analysis. Refer to Section 2.6 in the main section of this report for additional details on the cost estimation approach used to construct the WIT table.
Because the amounts of each low-level radioactive material generated per operating reactor per year will depend on the degree to which SNF is reprocessed and also on the reprocessing method (aqueous or electrochemical) used, annual shipping costs are highly scenario dependent. Consequently, no annual shipping costs are presented in this table, and no code-of-accounts table is presented. Once nuclear fuel cycle scenarios have been constructed, annualized costs for the shipment of low-level radioactive fuel cycle materials should be entered as an annualized O&M cost in any code-of-accounts table.

INL/EXT-07-12107 (March 2008) Advanced Fuel Cycle Cost Basis O-45
Table O2-8. What-It-Takes (WIT) cost summary table. Cost per kilogram of material for one
fully loaded truck shipment
Package (Packaging and Contents)
Pack
ages
/ Sh
ipm
ent Flow
Streams from Table O2-1
Upside (Low Cost)
Downside (High Cost)
Selected Value
(Nominal Cost)
55-gallon drums for yellow cake 104 1 $1.54 $2.76 $2.01 Paducah Tiger for UF6 or Depleted UF6 1 2,5 $22.28 $22.79 $23.54 UX-30 for Enriched UF6 4 3,4 $11.34 $12.09 $11.73 CHT-OP-TU for depleted UO2, UOX or LLW 10 6,7,8 $1.23 $2.43 $1.73
9975 for TRU or TRUOX 22 9,13 $149.39 $355.41 $232.48 CNS10-160B for FP 1 10 $3.37 $6.26 $4.61 RH-TRU 72B for TRU or FP 1 12 $5.39 $10.53 $7.57 MCC-4 for fresh PWR fuel assemblies 2 14 $32.95 $35.59 $34.08 SP-1,2,3 for fresh BWR fuel assemblies 3 14 $49.18 $55.16 $51.63
O2-11. BIBLIOGRAPHY 10 CFR 71, Packaging and Transportation of Radioactive Material.
49 CFR 173, Shippers, General Requirements for Shipments and Packagings.
49 CFR 173.417, Authorized fissile materials packages.
Bureau of Labor Statistics, “National Compensation Survey: Occupational Wages in the United States, July 2003 Supplementary Tables,” U.S. Department of Labor, Bureau of Labor Statistics, August 2004.
Higgins, R. C., Analysis for Financial Management, Irwin/McGraw Hill; ISBN 0.07.231531.8; 2001.
Johnson, P. E., and R. D. Michelhaugh, Transportation Routing Analysis Geographic Information System (TRAGIS) User’s Manual, ORNL/NTRC-006, Oak Ridge National Laboratory, Oak Ridge Tennessee, 37831-6285, June 2003.
LabelMaster Inc., LabelMaster Inc. 2005 Catalog, Chicago, Illinois, 2005.
Michelhaugh, R. D., TRANSCOST Version 3.0 User’s Manual, Oak Ridge National Laboratory, Oak Ridge, Tennessee, June 2002.
Newendorp, P. D., Decision Analysis for Petroleum Exploration, PennWell Publishing Co., 1975; p. 274.
Sprung, J. L., et al., “Reexamination of Spent Fuel Shipment Risk Estimates,” NUREG/CR-6672, U.S. Nuclear Regulatory Commission, Washington DC 20555, March 2000.
TRU TeamWorks, “RH-72B – Ready When the Time Comes,” Weekly E-Newsletter for the Waste Isolation Pilot Plant team, August 25, 2003, Web Address: http://www.wipp.ws/TeamWorks/TRUTeamWorksArchives/08-25-03ext.pdf#search='RH%20Tru%2072B%20650

INL/EXT-07-12107 (March 2008) Advanced Fuel Cycle Cost Basis O-46

INL/EXT-07-12107 (March 2008) Advanced Fuel Cycle Cost Basis O-47
Annex OX to Module O
Transportation Cost Methodology

INL/EXT-07-12107 (March 2008) Advanced Fuel Cycle Cost Basis O-48

INL/EXT-07-12107 (March 2008) Advanced Fuel Cycle Cost Basis O-49
Annex OX to Module O
Transportation Cost Methodology
OX-1. COST ALGORITHM This section formulates a general set of equations that specifies the total cost for a single shipment of
a radioactive material from a point of origin to a destination. Terms in the set of equations are preceded by letters which indicate whether the value of the term is a single valued input quantity (i), a sampled input quantity (s), a quantity computed from other input (c), or a final output quantity (f). Each of the parameters used below is defined in Table OX-1, along with representative input values.
The total cost (fTotalCost) of a single radioactive material shipment is calculated as the sum of four costs:
1. The cost of the packages in which the radioactive material is shipped (fPackCost)
2. The costs associated with loading of the filled packages onto the shipment vehicles at the shipment origin (fLCost)
3. The en-route shipment costs (fShipCost)
4. The costs associated with unloading of the filled packages from the shipment vehicles at the shipment destination (fUCost).
Thus,
fTotalCost = fPackCost + fLCost +fShipCost + fUCost. (6)
Packaging costs are calculated as the sum of the costs of the radioactive material container (e.g., an SNF canister), a container overpack, and overpack impact limiters. For single-use items (e.g., the canister), the item cost is the sum of the purchase cost and the procurement cost for the item; for reusable items, the item cost is the product of the daily rental cost of the item and the trip duration in days. Thus,
fPackCost = (cNPack/Ship)[sCanCost + 2(cDays)(sOPCost + sILCost)] (7)
where
cNPack/Ship = number of radioactive material packages carried by the shipment
2 (cDays) = round trip duration of the trip (the total number of days that the reusable cask components are rented) in days
sCanCost = cost of the single use radioactive material canister
sOPCost = rental costs per day of the canister overpack
sILCost = overpack impact limiters
As formulated, Equation 7 is directly applicable to a Type B package. For shipments in Type-A packages, if the container is reusable, then sOPCost is used to enter its rental cost, and if it is single-use, then sCanCost is used to enter its purchase cost.

INL/EXT-07-12107 (March 2008) Advanced Fuel Cycle Cost Basis O-50
The number of packages (cNPack/Ship) carried by the shipment is expressed as the product of the number of packages (iNPack/Veh) carried by a single package carrying shipment vehicle (truck or rail car) and the number of vehicles (iNPackVeh) in the train or the convoy of trucks that are carrying radioactive material packages. Thus,
cNPack/Ship = (iNPackVeh)(iNPack/Veh) (8)
the one-way duration of the shipment in days (cDays) is calculated as the quotient of the trip length in kilometers (sTrip) and the average trip speed in kilometers per day (sSpeed). Thus,
cDays = sTrip/sSpeed (9)
shipment loading costs (fLCost) are calculated as the sum of the wages for the loading crew, radiation technicians, and supervisors increased by an overhead factor (sLHead) with wages calculated as the product of the number of workers, an hourly rate, and the time required to load the packages onto the shipment vehicles (cLDur/Ship). Thus,
fLnCost = (sLHead)(cLDur/Ship)[(sLS)(iNLS) + (sLR)(iNLR) + (sLC)(sNLC)] (10)
where
sLS = hourly wages of the supervisors
sLR = hourly wages of the radiation technicians
sLC = hourly wages of the loading crew
iNLS = numbers of supervisors
iNLR = numbers of radiation technicians
iNLC = numbers of crew members.
Similarly, the shipment unloading costs (fUCost) are calculated using the following equation.
fUCost = (sUHead)(sUDur/Ship)[(sUS)(iNUS) + (sUR)(iNUR) + (sUC)(sNUC)] (11)
where all the terms have meanings analogous to those specified for the terms in Equation 10 for loading costs.
The time required to load (cLDur/Ship) all the vehicles in the train or the truck convoy that are carrying radioactive material packages is calculated as the product of the total number of radioactive material packages in the shipment (cNPack/Ship) and the loading time per package (sLDur/Pack). Thus,
cLDur/Ship = (cNPack/Ship)(sLDur/Pack) (12)
similarly, for unloading,
cUDur/Ship = (cNPack/Ship)(sUDur/Pack). (13)
The en-route shipping cost (fShipCost) is calculated as the sum of the vehicle rental costs, the weight-based shipping costs for the radioactive material packages, any charge for transporting the radioactive material by dedicated vehicles, and any fees charged by states for the passage of the radioactive material packages through their states. Thus,

INL/EXT-07-12107 (March 2008) Advanced Fuel Cycle Cost Basis O-51
fShipCost = 2(cDays)(cNVeh)(sVehCost)+(iNPackVeh)[(cTonnekm)(sTariff)+sDedVeh+(sStates) (sSFee)] (14)
where
cNVeh and iNPackVeh = total number of vehicles (trucks, rail cars) and the number of package carrying vehicles (trucks, rail cars) used to carry out the shipment
VehCost = rental cost per vehicle per day
2 (cDays) = round trip duration of the trip (the total number of days that the shipment vehicles are rented) in days
cTonnekm and sTariff = number of metric tonne-km transported by the radioactive material shipment and the shipping cost per metric tonne-km
sDedVeh = charge for using dedicated vehicles to transport the radioactive material
sStates and sSFee = number of states traversed by the shipment and the average state fee per radioactive material package for trans-shipment of the packages through the state.
The total number of vehicles (trucks or rail cars) used to carry out the shipment (cNVeh) is calculated as the sum of the vehicles that carry the radioactive material packages plus any additional vehicles (escort vehicles, buffer cars) in the shipment consist. Thus,
cNVeh = iNPackVeh+iNBufVeh (15)
where iNPackVeh and iNBufVeh are the number of package vehicles and the number of buffer plus escort vehicles in the shipment consist.
Finally, the number of metric tonne-km of weight (cTonnekm) carried by a single package vehicle is calculated as
cTonnekm = sTrip(iWtIL + iWtOP + iWtCan + iWtCanCont) (16)
where
sTrip = trip distance
iWtIL, iWtOP, iWtCant, and iWtCanCont = weights of the overpack impact limiters, the overpack, the canister, and the canister contents.

INL/EXT-07-12107 (March 2008) Advanced Fuel Cycle Cost Basis O-52
Table OX-1. Cost algorithm parameters. Input Calc’d
Parameter Description S TD OD IC FR Value RefiCanCost sCanCost
Purchase cost single use canister ($) X X
Type A: Table O2-2 Type B: $0.44/.55/.77
cDays One-way shipment duration (days) X sDedVeh Charge for shipment by dedicated
vehicles ($) X Type B: $0/43K/86K T
sILCost Rental cost reusable impact limiters ($) X sLC Loading crew labor rate ($/hr) X Figure OX-1 fLCost Loading costs ($) X sLDur/Pack Loading time per package (hr/pkg) X
X Type A: Table O2-2
Type B: 6/12/24 hr S,O
cLDur/Ship Loading time per shipment (hr) X sLHead Cost loading overhead factor X 1.75/2.5/3 O sLR Loading radiation technician labor rate
($/hr) X Figure OX-1
sLS Loading supervisor labor rate ($/hr) X Figure OX-2 iNBufVeh No. of buffer and/or escort vehicles X Type A: 0
Type B: 3
sNLC Size loading crew X Type A: 4/6/10 Type B: 6/10/12
S,O
iNLR No. of loading radiation technicians X Type A: 1 Type B: 2
STS
iNLS No. of loading supervisors X 1 STScNPack/ Ship No. packages/ shipment X iNPackVeh No. of vehicles that carry packages X 1 iNPack/Veh No. packages/ vehicle X Type A: Table O2-2
Type B: 1
sNUC Size unloading crew X Type A: 4/6/10 Type B: 6/10/12
S,O
iNUR No. of unloading radiation technicians X Type A: 1 Type B: 2
STS
iNUS No. of unloading supervisors X 1 STScNVeh Total No. of vehicles used to perform
shipment X
sOPCost Rental cost reusable overpack ($/day) X fPackCost Package cost ($) X sSFee State fee ($) X
X Type A: $0
Type B:0/2500/5000 T
fShipCost En-route shipping costs ($) X sSpeed Shipment speed (km/day) X 1222.6/1800/2113.7 S,OsStates No. of states traversed X sTariff Cost per tonne-km ($/tonne-km) X $0.06/0.075/0.10 S,OcTonnekm Tonne-km per shipment X fTotalCost Total trip cost ($) X

Table OX-1. (continued).
INL/EXT-07-12107 (March 2008) Advanced Fuel Cycle Cost Basis O-53
Input Calc’d Parameter Description S TD OD IC FR Value Ref
sTrip Shipment distance (km) X sUC Unloading crew labor rate ($/hr) X Figure OX-1 fUCost Unloading costs ($) X sUDur/Pack Unloading time per package (hr/pkg) X Type A: Table O2-2
Type B: 6/12/24 hr S,O
cUDur/Ship Unloading time per shipment (hr) X sUHead Cost unloading overhead factor X 1.75/2.5/3 O sUR Unloading radiation technician labor
rate ($/hr) X Figure OX-1
sUS Unloading supervisor labor rate ($/hr) X Figure OX-2 iVehCost sVehCost
Vehicle rental cost ($) X X
Type A: in sTariff Type B: 1K/2K/5K
iWtCan Weight canister (tonne) X Type A: Table O2-2 Type B: 18 MT
iWtCan Cont Weight canister contents (tonne) X Type A: Table O2-2 Type B: 22 MT
iWtOP Weight overpack (tonne) X 70 MT iWtIL Weight overpack impact limiters
(tonne)
X 17 MT
Parameter Types S = Single value input TD = Triangular distribution input OD = Other distribution input
IC = Intermediate calculated value FR = Final result
References S = Sandia Shipping Staff O = Shipping staff at other governmental laboratories
STS = Sandia Technical Staff T = Shipments of materials from TMI
OX-2. LABOR RATES
OX-2.1 Hourly Labor Wage (sLR, sUR, sLC, and sUC) Figure OX-1 below shows U.S. Bureau of Labor Statistics distributions of hourly take-home wage
for representative skilled nonexempt occupations under which loading or unloading labor might fall.14 Included in this figure is a line that represents the amalgamation of the U.S. Bureau of Labor Statistics on the premise that all shown categories are equally likely. Because the hourly take-home wage for radiation technicians should be similar to that for operating engineers, this amalgamated labor rate distribution was assumed to apply not only to members of the loading crew but also to radiation technicians
OX-2.2 Hourly Oversight Wage (sLS, sUS) Figure OX-2 shows U.S. Bureau of Labor Statistics distributions of take-home wage for selected
technical occupations under which loading or unloading oversight might fall.14 Included in this figure is a line that represents the amalgamation of the U.S. Bureau of Labor Statistics on the premise that all shown categories are equally likely.

INL/EXT-07-12107 (March 2008) Advanced Fuel Cycle Cost Basis O-54
Figure OX-1. Hourly labor wage.14
Figure OX-2. Hourly oversight wage.14

INL/EXT-07-12107 (March 2008) Advanced Fuel Cycle Cost Basis O-55
OX-3. TRIP ONE-WAY DISTANCES (sTrip)
OX-3.1 Shipments by Rail Three distributions of shipment distances were used to develop the transportation cost estimates
presented in this module. The first distribution assumed that the number of operating reactors in the fuel cycle would not be much increased over the current number of operating reactors. For this scenario, no fuel reprocessing occurs and SNF is shipped directly from operating reactor sites to a permanent repository located at Yucca Mountain. The second and third distributions assumed:
• The number of operating reactors in the fuel cycle would be much larger than the current number
• SNF would be shipped to regional sites for interim storage or reprocessing
• MOX fuel fabricated at regional fuel fabrication facilities would be shipped back to operating reactor sites
• Vitrified HLW generated by reprocessing would be shipped to regional monitored retrievable storage sites.
This scenario uses two trip distance distributions. Both of these distributions assumed that one regional facility would be located in the north western, the north central, the north eastern, the south western, the south central, and the south eastern portions of the continental United States. Table OX-2 presents the hypothetical locations of these six regional sites.
For the first scenario, which covers shipments from operating reactors to Yucca Mountain, distance estimates published in the Yucca Mountain environmental impact statement15 were used to construct the distribution of possible trip distances. The second scenario used the trip distance distribution that was developed in NUREG/CR-6672,16 assuming SNF shipments from currently operating reactors to the six regional sites listed in Table OX-2. For the third scenario, which covers shipments between regional facilities, the Transportation Routing Analysis Geographic Information System (TRAGIS) routing code17 was used to identify the shortest mainline rail route that connected each of these 15 origin/destination pairs that can be generated from the six hypothetical regional site locations listed in Table OX-2 and to calculate the lengths of these routes. Figure OX-3 depicts the routes identified by these TRAGIS calculations.
Because the six regional site locations listed in Table OX-2 are only hypothetical, the set of 15 distances calculated by TRAGIS was treated as a representative sample drawn from the “true” but presently “unknown” distribution of real distances between the locations of future regional sites. Because a reprocessing and a vitrification facility might both be located at the same regional site, a trip distance of 0 km was also assumed to be possible.
Table OX-2. Hypothetical locations for regional facilities. Region Location
North Western Hanford, WA North Central Prairie Island Indian Reservation, MN North Eastern West Valley, NY South Western Yucca Mountain, NV South Central Kay County, OK South Eastern Savannah River, SC

INL/EXT-07-12107 (March 2008) Advanced Fuel Cycle Cost Basis O-56
Figure OX-3. Mainline rail routes calculated using TRAGIS that connect the six hypothetical locations for regional facilities.
Low, modal, and high values for a triangular distribution of trip distances between future regional sites were selected as follows. First, the low value of the triangular distribution was set equal to zero to accommodate the possibility that a reprocessing facility and a vitrification plant might both be located at the same regional site. Then, the fifteen trip distances were rank ordered and modal and high values for the triangular distribution were selected that minimized the sum of the squares of the differences between the values of the fifteen representative distances and values of these distances on the cumulative distribution of trip distances generated from the triangular distribution.
Figure OX-4 presents the cumulative distribution that was generated by this minimization method with the restriction that the cumulative distribution passes through the point (0,0). Also plotted in Figure OX-4 are the 15 trip distances that were used to construct the triangular distribution and the low, modal, and high values of the triangular distribution that underlies the cumulative distribution.
Figure OX-5 plots all three of the trip distance distributions. Inspection of Figure OX-5 shows that the three distance distributions are quite similar. Thus, given the somewhat uncertain identities of many of the route origins or destinations, the differences in the three distributions are not very significant.

INL/EXT-07-12107 (March 2008) Advanced Fuel Cycle Cost Basis O-57
Source: Cask Shipment RevX.xls
Figure OX-4. Fit of region to region rail distance data to triangular distributions.
Figure OX-5. Distribution of trip distances (sTrip) for rail shipments from reactors to Yucca Mountain and for shipments to regional storage facilities.

INL/EXT-07-12107 (March 2008) Advanced Fuel Cycle Cost Basis O-58
OX-3.2 Shipments by Truck Three distributions of shipment distances were used to develop the transportation cost estimates
presented in this module. The three distributions assume that the number of operating reactors in the fuel cycle will be much larger than the current number and therefore that low-level radioactive material will be shipped to regional facilities for conversion, fabrication, recycling, or interim storage. The first distribution assumes that yellow cake will be shipped to regional conversion facilities from uranium mines located near Moab, Utah or from two representative ports of entry, Long Beach, California, and Norfolk, Virginia, if imported from overseas. The second distribution assumes that shipments between conversion, fabrication, recycling, or interim storage facilities will all be shipments between the regional facilities. Both of these distributions assumed that one regional facility will be located in the north western, north central, north eastern, south western, south central, and south eastern portions of the continental United States. The third distribution assumes that the fresh fuel fabricated at the regional facilities will be shipped to operating reactors.
For shipments of fresh fuel from regional fuel fabrication facilities to reactor sites, the distribution of route lengths used was the distribution developed in NUREG/CR-667216 for the shipment of spent fuel from reactor sites to the six hypothetical regional sites listed in Table OX-2. For yellow cake shipments or for shipments between regional facilities, the TRAGIS routing code17 was used to identify shipping routes and to calculate their route lengths as restricted by the routing rules for Highway Route Controlled Quantities of Radioactive Materials. The 18 shipment routes selected by TRAGIS, which connect the uranium mines near Moab, Utah, and the ports of Long Beach, California, and Norfolk, Virginia, to the six hypothetical regional conversion facilities, are plotted in Figure OX-6. The 15 shipment routes selected by TRAGIS, that interconnect the six hypothetical regional site locations, are plotted in Figure OX-7.
Because the six regional site locations listed in Table OX-2 are only hypothetical, the set of 18 yellow cake shipment distances calculated by TRAGIS was treated as a representative sample drawn from the “true” but presently “unknown” distribution of real distances between uranium mines or port facilities and the locations of the six hypothetical future regional sites. A triangular distribution for the 18 trip distances was constructed as follows. First, the 18 trip distances were rank ordered. Then low, modal, and high values for a triangular distance distribution were selected. These values minimized the sum of the squares of the differences between the values of the 18 representative distances and values of these distances on the cumulative distribution (the integral of the triangular distribution) of trip distances generated from the triangular distribution.8 Figure OX-8 presents the cumulative distribution of yellow cake shipment distances that was generated by this minimization method. Also plotted in Figure OX-8 are the eighteen trip distances that were used to construct the triangular distribution and the low, modal, and high values of the triangular distribution that underlies the cumulative distribution.

INL/EXT-07-12107 (March 2008) Advanced Fuel Cycle Cost Basis O-59
Figure OX-6. Truck routes calculated using TRAGIS that connect the yellow cake shipment sites to the six hypothetical locations for regional facilities.
Figure OX-7. Truck routes calculated using TRAGIS that connect the six hypothetical locations for regional facilities.

INL/EXT-07-12107 (March 2008) Advanced Fuel Cycle Cost Basis O-60
Figure OX-8. Cumulative distribution fit to the 18 route lengths that connect uranium mines in Moab, Utah, or the Long Beach, California, and Norfolk, Virginia, ports of entry to the six hypothetical regional facility sites.
The minimization analysis was also applied to the 15 shipment routes selected by TRAGIS that interconnect the six hypothetical regional site locations. However, because a conversion, fabrication, recycling, or interim storage facility might both be located at the same regional site, a trip distance of 0 km was also assumed to be possible. Therefore, the cumulative distribution generated by the minimization analysis was forced to pass through zero. Figure OX-9 presents the cumulative distribution that was generated by the minimization analysis with the restriction that the cumulative distribution passes through the point (0, 0). Also plotted in Figure OX-9 are the 15 trip distances that were used to construct the triangular distribution and the low, modal, and high values of the triangular distribution that underlies the cumulative distribution.
Figure OX-10 plots all three trip distance distributions. Inspection of Figure OX-10 shows that the three distance distributions are quite similar. Thus, given the somewhat uncertain identities of many of the route origins or destinations, the differences in the three distributions are not very significant.

INL/EXT-07-12107 (March 2008) Advanced Fuel Cycle Cost Basis O-61
Figure OX-9. Fit of region to region truck distance data to triangular distribution.
Figure OX-10. Cumulative distribution of trip distances (sTrip) for shipments from regional facilities.

INL/EXT-07-12107 (March 2008) Advanced Fuel Cycle Cost Basis O-62
OX-4. STATES TRAVERSED (sStates) The TRANSCOST database18 includes a significant amount of information on routes between
existing DOE facilities. These data include both route lengths and the states crossed by each route for more than 1,150 routes. Figure OX-11 presents a plot of these data.
Figure OX-11. States traversed vs. trip distance.
As Figure OX-11 shows, the TRANSCOST data are well represented by the following linear relationship,
sStatesav = 0.0024 sTrip + 1.00. (17)
Because of the scatter in the data, the standard error (SEy) of this linear relationship is SEy = 1.25. Nevertheless, despite the scatter in the data, the linear relationship has a surprisingly strong correlation coefficient of R2 = 0.8258.
For the Monte Carlo calculation of trip costs, the estimate of sStates was taken as the random variate of a normal distribution using the linear relation for sStatesav as a function of distance as the mean value of this distribution and the value of SEy as its standard deviation. Thus,
sStates = (N| sStateav, SEy). (18)

INL/EXT-07-12107 (March 2008) Advanced Fuel Cycle Cost Basis O-63
OX-5. SHIPMENT SPEED (sSpeed)
OX-5.1 Shipments by Rail Train speeds are based on data collected by the Surface Transportation Board, successor to the
Interstate Commerce Commission.19 The Surface Transportation Board collects total train miles and road service hours, which includes time in switching yards and sidings. The quotient of these two yields an average speed that includes the delays inherent in normal commercial railroad freight traffic. Data were available for 6 years for each different rail freight company operating in the contiguous United States. The number of companies dropped from ten to six over the 5-year period, but averaged eight. The resulting 48 data points are plotted in Figure OX-12. As Figure OX-12 shows, these points are well fit by a normal distribution with a mean of 768 km/day and a standard deviation of 72.0 km/day.
Source: Cask Shipment RevX.xls
Figure OX-12. Estimating train speeds.
The standard deviation of the sample presented in Figure OX-12 represents the variability of a set of averages. The actual deviation of the full population has been lost. To account for the wider variability of the full population, the estimates of sSpeed used in the Monte Carlo trip cost calculation were calculated using three times the standard deviation of the normal distribution that was fit to the data in Figure OX-12.
sSpeed = (N|xav = 768, s = 216) (19)
OX-5.2 Shipments by Truck Truck speeds are based on data collected by the TRAGIS routing code.17 Figure OX-13 shows an
example of the TRAGIS Standard Listing output. The figure shows that TRAGIS provides estimates of driving time and driving distances for each trip route segment.

INL/EXT-07-12107 (March 2008) Advanced Fuel Cycle Cost Basis O-64
Figure OX-13. TRAGIS standard listing output.
TRAGIS has preset biases incorporated into the routing portion of the code. These biases determine the time traveled between each of its nodes. TRAGIS also assumes two drivers per truck for each shipment and 30-minute rest periods at approximately every 250 miles. Because of the required rest periods and also for trips that take significantly less than 24 hours, the trip speed needed is the effective speed that reflects time when the truck isn’t moving. At a constant 55 mph, a truck will travel 2,124 km in 24 hr. For the shortest trips considered (822 km for yellow cake shipments and 1,216 km between the closest regional sites), if an effective trip duration of 24 hr is assumed, then the effective speeds for these two trips are 21 mph = 34 km/hr = 822 km/24 hr and 31 mph = 51 km/hr = 1,216 km/24 hr, respectively. So, if the high and low values of the triangular speed distribution are taken to be 55 mph and either 21 or 31 mph, respectively, and the modal values is placed at about two thirds of the range, then the modal value will be about 47 mph = 75 km/hr = 1,800 km/24 hr.
As stated above, this analysis assumes that SNF, MOX, and vitrified HLW will be shipped by dedicated trains, which, when compared to regular freight trains, are likely to make fewer stops in yards and may travel at higher speeds. Nevertheless, although the values of sSpeed calculated using the preceding equation may underestimate dedicated train speeds, the speeds calculated with this equation were used to calculate trip costs without further adjustment.

INL/EXT-07-12107 (March 2008) Advanced Fuel Cycle Cost Basis O-65
OX-6. RAILWAY TARIFF (sTariff) Feizollahi et al.5 contains data on railway transportation tariffs. These data are plotted in
Figure OX-14. Values in this figure have been escalated to 2006 dollars and converted to metric units. Although the data in Figure OX-14 displays some scatter, it is well fit via regression by the following equation.
sTariffav = 3.27 sTrip-0.4221. (20)
The standard error of the estimate for this equation was 0.304 $/tonne-km. If one assumes a normal distribution of data about the regressed line, then sTariff becomes
sTariff = (N|sTariffav,.304) (21)
which is the equation that was used to calculate sSpeed during the Monte Carlo calculation of Trip Costs.
Figure OX-14. Railway tariff as a function of trip distance.
Except for the cost of single-use canisters (sCanCost), low, modal, and high values for triangular distributions were selected (1) by review of the costs associated with the shipment of damaged radioactive Three Mile Island (TMI) reactor components to INL,20 (2) by discussions with staff of the Sandia National Laboratories Shipping and Receiving Department, and (3) based on operational experience of technical staff at Sandia or other government research laboratories.
Although a specific loading parameter and its analogous unloading parameter could have different triangular distributions (different low, modal, and high values), the calculations presented here assumed that they were the same.

INL/EXT-07-12107 (March 2008) Advanced Fuel Cycle Cost Basis O-66
MODULE O REFERENCES
1. 10 CFR 73, Packaging and Transportation of Radioactive Material, Subpart E, “Package Approval Standards” (Sections 71.41 – 71.47, 71.51, and 71.61) and Subpart F, “Package, Special Form, and LSA-III Tests” (Section 71.71, Normal Conditions of Transport, and Section 71.73, Hypothetical Accident conditions).
2. D. J. Ammerman and J. L. Sprung, Cost Estimates for Test Article Options for the Package Performance Study, Internal Sandia Report, Sandia National Laboratories, Albuquerque, New Mexico, 87185, April 4, 2001.
3. C. Blessing, (Holtec International) to D. Ammerman, (Sandia National Laboratories), dated November 8, 2003. [This document has a restricted distribution, may be proprietary, or both; and is not publicly releasable.]
4. C. W. Morrow, Internal Memorandum Summarizing “Economic Modeling – Shipping Cask Life Cycle Costs,” Sandia National Laboratories, Albuquerque, New Mexico, June 2004.
5. Feizollahi Feizollah, D. Shropshire, and D. Burton, Waste Management Facilities Cost Information for Transportation of Radioactive and Hazardous Materials, INEL-95/0300 (formerly EGG-WM-10877) Rev. 1, Idaho National Engineering Laboratory, June 1995.
6. Generation IV Economic Modeling Working Group, “Cost Estimating Guidelines for Generation IV Nuclear Energy Systems,” Oak Ridge National Laboratory, 2003.
7. R. C. Higgins, Analysis for Financial Management, Irwin/McGraw Hill; ISBN 0.07.231531.8, 2001.
8. P. D. Newendorp, Decision Analysis for Petroleum Exploration, PennWell Publishing Co., 1975; p. 274.
9. U.S. Department of Energy, “Analysis of the Total System Life Cycle Cost of the Civilian Radioactive Waste Management Program,” DOE/RW-0533, U.S. Department of Energy, Office of Civilian Radioactive Waste Management, Washington, DC, May 2001.
10. 49 CFR 173.417, “Authorized fissile materials packages,” Code of Federal Regulations, Office of the Federal Register, June 12, 2006.
11. 10 CFR 71, “Packaging and Transportation of Radioactive Material,” Code of Federal Regulations, Office of the Federal Register, November 18, 2005.
12. TRU TeamWorks, “RH-72B – Ready When the Time Comes,” Weekly E-Newsletter for the Waste Isolation Pilot Plant Team, August 25, 2003, Web Address: http://www.wipp.ws/TeamWorks/TRUTeamWorksArchives/08-25-03ext.pdf#search='RH%20Tru%2072B%20650.
13. LabelMaster Inc., LabelMaster Inc. 2005 Catalog, Chicago, Illinois, 2005.
14. Bureau of Labor Statistics, “National Compensation Survey: Occupational Wages in the United States, July 2003 Supplementary Tables,” U.S. Department of Labor, Bureau of Labor Statistics, August 2006.
15. U.S. Department of Energy, “Final Environmental Impact Statement for a Geologic Repository for the Disposal of Spent Nuclear Fuel and High-Level Radioactive Waste at Yucca Mountain, Nye County, Nevada,” DOE/EIS-0250, U.S. Department of Energy, Office of Civilian Radioactive Waste Management, Washington, DC, February 2002.
16. J. L. Sprung, et al., “Reexamination of Spent Fuel Shipment Risk Estimates,” NUREG/CR-6672, U.S. Nuclear Regulatory Commission, Washington DC 20555, March 2000.

INL/EXT-07-12107 (March 2008) Advanced Fuel Cycle Cost Basis O-67
17. P. E. Johnson and R. D. Michelhaugh, “Transportation Routing Analysis Geographic Information
System (TRAGIS) User’s Manual,” ORNL/NTRC-006, Oak Ridge National Laboratory, Oak Ridge, Tennessee, 37831–6285, June 2003.
18. R. D. Michelhaugh, “TRANSCOST Version 3.0 User’s Manual,” Oak Ridge National Laboratory, Oak Ridge, Tennessee, June 2002.
19. U.S. Department of Commerce, Surface Transportation Board, Office of Economics, Environmental Analysis and Administration, Statistics of Class I Freight Railroads in the United States, 1998,1999, 2000, 2001, 2002, and 2003.
20. K. Fultz, et al., Nuclear Waste: Shipping Damaged Fuel from Three Mile Island to Idaho, PB87229753, Resources and Economic Development Division, U.S. General Accounting Office, Washington DC, report to Congress, August 1987.

INL/EXT-07-12107 (March 2008) Advanced Fuel Cycle Cost Basis O-68

INL/EXT-07-12107 (March 2008) Advanced Fuel Cycle Cost Basis R1-1
Module R1
Thermal Reactors

INL/EXT-07-12107 (March 2008) Advanced Fuel Cycle Cost Basis R1-2

INL/EXT-07-12107 (March 2008) Advanced Fuel Cycle Cost Basis R1-3
Module R1
Thermal Reactors
R1-1. BASIC INFORMATION The reactor is the central facility of the overall energy system and is supported by the nuclear
materials initially processed in the fuel cycle “front end,” “burned” in the reactor, and finally dispositioned or recycled in the overall fuel cycle “back end.” This section deals with “thermal” reactors; reactors in which the average neutron energies are in the thermal or “slow” range (~0.025-eV) and for which moderators of low atomic number are required. The moderators most commonly used are light water, heavy water, or graphite (carbon). All operating commercial reactors in the U.S. are of this thermal type, all being pressurized water reactors (PWRs) or boiling water reactors (BWRs), approximately two to one in ratio, respectively. As a group, these U.S. plants are called light water reactors (LWRs). Their name distinguishes them from heavy water reactors (HWRs) such as those used predominantly in Canada (CANDU), and gas-cooled reactors such as those used predominantly in the UK, which use a graphite moderator. The predominant product from thermal reactors is electricity. However, the heat generated (in the form of steam) can also be used for industrial applications such as district heat, process heat, or water desalination. Capacities of existing U.S. thermal reactors vary from a few hundred megawatts of electrical power per unit to around 1,400 MWe per unit. A nuclear power plant may actually have more than one unit (reactor) on the same site. The Palo Verde plant in Arizona has three reactors on one site. The fuel cycle cost for a reactor is just one of the four main components of the busbar levelized unit electricity cost (LUEC) from a nuclear power plant. (“Busbar” cost refers to the fact that the electricity cost is measured at the reactor plant boundary connection on the primary side of the switchyard transformer and does not include distribution [transmission] or other utility overhead costs.) The LUEC is usually expressed in mills/kWh or $/MWh; the value is the same in these two units. (One mill=1/1,000th of a dollar or 0.1 cents). This and other economics-related definitions are described in the Cost Estimating Guidelines for Generation IV Nuclear Energy Systems.1 The four components of the LUEC are:
1. Capital component: recovery of reactor capital plus financing costs. The capital component includes all “up-front” costs prior to commercial operation, including: design, construction, project management, ownership costs, interest during construction, and reactor start-up (commissioning).
2. Operations and maintenance component: annual nonfuel costs including manpower, nonfuel consumables, and overheads. Manpower costs for refueling outages are usually captured in this category. Replacements for major capital items not related to life extension, such as steam generators, can also be placed in this category.
3. Fuel cycle component: the sum of the relevant costs for the needed fuel cycle steps (modules) converted to mills/kWh or $/MWh unit costs. Models such as G4-ECONS can perform this sometimes complex calculation.2 Depending on the utility, accounting practices, carrying charges (interest) on stored fuel, and fuel cycle materials undergoing processing are sometimes assessed to this category.
4. Decontamination and decommissioning (D&D) component: usually covered by an escrow or sinking fund accumulated to cover D&D costs for the reactor at its end of life. The calculation of the levelized annual payments to this fund over the operational life of the reactor is described in Reference 1.

INL/EXT-07-12107 (March 2008) Advanced Fuel Cycle Cost Basis R1-4
These four components are ranked from top to bottom with the highest contributors to LUEC at the top. Table R1-1 shows the projected contributors to LUEC for an “Nth-of-a-kind” (NOAK) Generation III PWR. The example table was generated by the G4-ECONS model.2 All values in the table are in constant (unescalated) 2001 dollars, and fuel cycle costs are based on the lower values of fuel cycle materials and services in that year. The discount (interest) rate is typical of a lower risk, highly-regulated financial environment. Since we are dealing with constant dollars, a “real” or uninflated discount rate is used. This older 2001 example was provided because detailed PWR cost input was available for G4-ECONS input and it could be benchmarked against other LUEC models. The more current (2007) reactor cost environment (higher construction and fuel costs) is discussed later in this section.
Table R1-1. Projected breakdown of electricity cost from a 1,300 MWe Generation III thermal reactor.2
Discount Rate = 5.00%
Annualized Cost in $M/YearMills/kwh or
$/MWh
Capital (Including 1st Core and Financing) 158.52 17.40Operations Cost 78.47 8.61
Fuel Cycle - Front End 29.07 3.19Fuel Cycle - Back End 9.90 1.09
D&D Sinking Fund 2.48 0.27
TOTAL LUEC 278.44 30.56
Summary of Model Results
The capital component is always the largest of these costs, which is different than most other electricity generation sources, such as oil, natural gas, or coal, where recurring fuel purchase costs can be predominant and also unstable—subject to wide market price fluctuation. The low fuel cycle cost is one of the advantages of nuclear power and is due, in part, to the fact that nuclear fuel (uranium or plutonium) delivers nearly one-million times the energy per unit mass than chemical fuel sources such as fossil fuels (higher energy density). The high capital cost of nuclear power is partly because of the need to safely confine the highly energetic and radioactive reactor core and prevent radioactive materials from escaping to the environment or harming plant workers. Because of the possibly catastrophic consequences of a nuclear accident, nuclear power plants must be constructed to much more stringent safety and quality standards than those for fossil power plants. Massive amounts of steel and concrete with the associated installation labor are required for nuclear power plants.
The most interesting and useful cost figure of merit associated with a reactor project is the “specific” capital cost, which is the cost of planning, designing, constructing, and starting up the reactor divided by the power capacity. It is usually expressed in $/kilowatt electric ($/kWe.) One must be careful to specify whether the capital cost includes financing (interest) costs and other ownership costs. If not, the capital cost is called the “overnight” cost—the cost if the plant could be built “overnight” and not encounter any interest costs. The total capital cost includes interest during construction, which can be a significant percentage of the overnight cost because of the multi-year construction period. (This sensitivity is examined later in this section.) The following discussion deals mostly with the “overnight” expression of the specific capital cost because it is most dependent on the reactor technology and construction efficiency.

INL/EXT-07-12107 (March 2008) Advanced Fuel Cycle Cost Basis R1-5
R1-2. FUNCTIONAL AND OPERATIONAL DESCRIPTION Thermal reactors all use uranium oxide (see Module D1-1) or mixed oxide (see Module D1-2) fuel
in some form. LWRs and HWRs use pelletized ceramic fuel clad in zirconium or zirconium alloy rods. The rods are bundled into fuel assemblies that are inserted into the reactor prior to startup. U.S. concept gas-cooled thermal reactors have uranium oxycarbide particle fuel in the form of tiny beads that are coated with heat and diffusion-resistant coatings. Module D1-3 describes this “TRISO” type of fuel, which is embedded in a graphite matrix. The internal heat generated by fission of the U-235 and Pu-239 in the fuel is removed by flowing coolant and transferred by pumps, heat exchangers, and steam generators to a rotating turbine that generates electricity. Because thermodynamic cycles (Rankine cycle for LWRs and Brayton cycle for direct cycle GCRs) are involved, most of the heat energy is rejected to the environment, as is true of all power plants using fossil or nuclear fuel. The ratio of electric power generated to total heat generation is the thermodynamic efficiency. Other important reactor performance parameters are:
The capacity factor: the number of effective full power hours divided by the total hours in the year. This factor is lowered by planned or unplanned outages. Outages are planned for refueling and scheduled maintenance, normally during times of lower power demand such as fall or spring. Today’s typical U.S. LWR enjoys a capacity factor of over 90%.
The fuel burnup: expressed in (thermal) megawatt-days per metric ton of heavy metal, this figure-of-merit designates the amount of energy that can be extracted from a unit mass of fuel. The accumulation of nuclear poisons (neutron-absorbing nuclides) and fuel materials (cladding, pellet integrity, etc.) limit the lifetime of a fuel assembly in the reactor.
The vintage of reactor technology used is referred to as its “generation.” Early prototype and small commercial (a few hundred MWe) units are designated as Generation I. The later and larger units built in the 1960s, 1970s, 1980s, and 1990s are called Generation II. The advanced LWRs and evolutionary design units being built today in the Far East and proposed for construction in the U.S. by 2015 are Generation III or III+ units. These units may incorporate passive safety features. Generation IV reactors are those proposed for deployment after 2020 that may use advanced safety features, incorporate waste minimization, and have additional economics-enhancing and proliferation-resistant features. They are the subject of several extensive international research and development (R&D) programs involving several nations and six technology concepts.
R1-3. PICTURES/SCHEMATICS/DEPLOYMENT STATUS The “Generations” concept as applied to reactors is explained in Figure R1-1.
To further the advancement of Generation III and III+ reactors in the U.S., the U.S. Department of Energy (DOE) has instituted the NP-2010 program. The NP-2010 program focuses on reducing the technical, regulatory, and institutional barriers to deployment of new nuclear power plants based on expert recommendations documented in A Roadmap to Deploy New Nuclear Power Plants in the United States by 2010.3

INL/EXT-07-12107 (March 2008) Advanced Fuel Cycle Cost Basis R1-6
Figure R1-1. Nuclear power evolution by “generations.”4
The technology focus of the Nuclear Power 2010 program is on Generation III+ advanced LWR designs, which offer advancements in safety and economics over the Generation III designs certified by the Nuclear Regulatory Commission (NRC) in the 1990s. To enable the deployment of new Generation III+ nuclear power plants in the United States in the relatively near future, it is essential to completely develop the first-of-a-kind Generation III+ reactor technology and demonstrate the untested federal regulatory and licensing processes for the siting, construction, and operation of new nuclear plants. The Department utilizes competitive procurement processes and conducts program activities in cost-share cooperation with industry. The Department has initiated cooperative projects with industry to develop the business case for new nuclear power plants, to obtain NRC approval of three sites for construction of new nuclear power plants under the Early Site Permit (ESP) process, to support completion of Generation III+ design engineering work, to resolve generic COL regulatory issues, and to support the NRC review of COL applications. The COL process is a “one-step” licensing process by which nuclear plant public health and safety concerns are resolved prior to commencement of construction, and NRC approves and issues a license to build and operate a new nuclear power plant.
The Energy Policy Act of 2005 (EPACT 2005) also includes investment stimuli for new nuclear power plants (NPPs). These include:
• Federal loan guarantees that cover up to 80% of the project cost
• Production tax credits for 8 years of $18/MWh for up to 6,000 MWe of capacity, limited to $750,000,000 per year
• Federal standby support (to cover some of the economic damages from regulatory delays)
- $2 Billion of risk coverage for first six plants - Coverage for delays resulting from licensing or litigation.
The intent of these incentives is to make investors (Wall Street) more likely to finance the high up-front costs required for a reactor project. Utility interest in these incentives has been forthcoming as is evidenced by the number of projects that have announced to the NRC their intent to pursue a COL. Table R1-2 lists the projects announced as of fall 2006:

INL/EXT-07-12107 (March 2008) Advanced Fuel Cycle Cost Basis R1-7
Table R1-2. New plant table as compiled by the nuclear regulatory commission.5
R1-4. INTERFACES WITH OTHER MODULES The reactor receives fuel assemblies from the fuel fabrication plant (see Module D1-1) for uranium
oxide-fueled thermal reactors, (see Module D1-2) for mixed oxide fueled thermal reactors, or (see Module D1-3) for gas-cooled thermal reactors. Module D1-7 covers the fuel supply for CANDU HWR reactors, and Module D1-8 covers thorium-based fuel in thermal reactors, but mainly for those of Russian design (VVERs).
After irradiation, fuel assemblies are stored in an onsite pool. At some point, the fuel assemblies might be moved to storage casks for onsite or offsite storage (see Modules E1 and E2). Direct transfer to an aqueous reprocessing facility (see Module F1) is also possible.

INL/EXT-07-12107 (March 2008) Advanced Fuel Cycle Cost Basis R1-8
R1-5. MODULE SCALING FACTORS In general, the cost of electricity and the specific capital cost decrease with higher reactor size
(electrical generation capacity). There is likely to be a point where factory production of small reactor modules, as opposed to traditional onsite construction, will allow reduction of unit costs. Studies, such as those being pursued by the Generation IV Economic Modeling Working Group, are investigating this issue. Reference 6 is a good summary of such studies to date. The following diagram (Figure R1-2) shows how various concepts for reactor “modularity” affect construction and ultimately the capital costs. It should be kept in mind that any factory that produces modules will need to have its costs amortized over the fleet of NPPs that are supported by it.
Figure R1-2. How implementation of modularity affects construction.

INL/EXT-07-12107 (March 2008) Advanced Fuel Cycle Cost Basis R1-9
R1-6. COST BASES, ASSUMPTIONS, AND DATA SOURCES Before addressing current LWR cost bases, a little cost history is useful. When Generation I reactors
were being designed, there was much optimism regarding how the costs of all aspects of nuclear power, including capitals costs would eventually come down. Generation I and early Generation II reactors enjoyed project specific costs that in today’s dollars would be less than $1,000/kWe. In the late 1970s environment, safety, and health (ES&H) considerations and the Three Mile Island accident greatly affected the regulation, public perception, and project execution aspects of nuclear power in a negative fashion, coming on the heels of the 1973–1974 Arab Oil Embargo, which rapidly reduced the annual growth in electricity demand. The net result was redesign, retrofit, delay, and even abandonment for many proposed LWR projects. During resolution of regulatory issues, some reactors had several years elapse between completion of construction and commercial operation, and some, such as the Shoreham NPP, were never allowed to operate at power levels commensurate with economic commercial operation. These projects were also constructed during a time when interest rates were high. Given the delays, accrued financing (interest) costs, and multiple retrofits, many of these plants experienced specific costs that in today’s dollars would be in the $3,000–$6,000/kWe range. Busbar costs for many projects ended up in the range of 60–130 mills/kWh. References 7 and 8 discuss some of this history and Figure R1-3 shows some of the data.
Figure R1-3. Levelized unit cost history.7,8

INL/EXT-07-12107 (March 2008) Advanced Fuel Cycle Cost Basis R1-10
As time progressed and other forms of electricity production became more competitive, it became apparent that nuclear plants constructed in such an environment could no longer produce competitive electricity, hence, interest in nuclear power waned. Nuclear power would only be saved by (1) safer, more economic, and standardized reactor designs, (2) regulatory reform, (3) improved operations and maintenance procedures (O&M) and lower annual operating costs, and (4) higher capacity factors. Fortunately, new standardized certified designs have evolved, a new licensing paradigm, the COL, has been established, and today’s operating reactors have decreased their O&M costs and increased their capacity factors. All of these factors make nuclear power more attractive for future generations, and the competitiveness of nuclear power has been enhanced by rising fossil fuel costs and the possibility of controls or taxes on CO2 emissions.
Costs for reactors recently completed or now under construction are considered here. Cost and capacity information sometimes appear in trade press and general press sources. Utilities and architect engineers do not typically publish costs for their projects, especially under today’s environment of less economic regulation. Table R1-3 shows some cost, capacity, and specific cost data. References 9 and 10 summarize other cost studies that were not available to the Economic Analysis Working Group (EAWG) in 2006. Some references may also present the cost results in a manner that reflects the authoring or organization’s view on nuclear power.11
Table R1-3. Specific costs for some actual projects and generic reactors.
Reactor and Size Total Capital Cost
(2007$B) Specific Capital Cost ($/kWe) Olkiluoto 3 (Finland) 1,600 MWe EPR (PWR)12
3.2B Euros=$3.6B fixed price contract
$2,400/kWe incl financing (FOAK)
Lungmen (Taiwan) 2 units: 2,770 MWe total GE ABWRs13,14
Old estimate: $5.6B (2,000 $) esc to $6.5B in 2007$ (incl financing). New estimate: $7.1B (2007 $).
$2,370/kWe incl financing (old) $2,560/kWe incl financing (new)
AP-1000 PWR (Generic in U.S.)15 1,000 Mwe
$1.4B to $1.9B (2006 $) overnight cost
$1,400−$1,900/kWe overnight (NOAK)
System 80+ PWR (Generic in U.S.) 1,300 MWe1
$2.65B including financing $2,040/kWe incl financing (2001 $)
Large LWRs (1,500+MWe) Nth of a Kind (NOAK) 4-module GT-MHR (gas-cooled, direct cycle)16]
$1,100−$1,700/kWe overnight (NOAK) $1,000/kWe overnight (NOAK) (optimistic)
ABWR or AP1000 in U.S. 17,18 Not available $1,200–$1,600/kWe overnight $2,100/kWe total project for ABWR FOAK in U.S.19
ESBWR in Europe20,21 (factor of 1.3 used to convert Euros to U.S. $)
2007 estimate: $4.4B $1,430/kwe (total capital project/NOAK) (2006 estimate) $2,750/kw (Foak incl. Financing: 2007 estimate [1,600 MWe])
AECL CANDU 6 (HWR) 22 AECL ACR 700 (HWR)22
Not available $2,630/kWe overnight (NOAK) $2,075/kWe overnight (NOAK)
Mitsubishi Heavy Industries 1,700 MWe APWR in Texas23,24 (39% thermal efficiency)
$5.17B for 2 units (2007 $) $1,520/kWe overnight (2007 $)

Table R1-3. (continued).
INL/EXT-07-12107 (March 2008) Advanced Fuel Cycle Cost Basis R1-11
Reactor and Size Total Capital Cost
(2007$B) Specific Capital Cost ($/kWe) New LWR capacity for Constellation Energy25
Not available $2,400/kWe overnight (NOAK over 4 units [2007 $])
TVA rehab and restart of Brown’s Ferry 1 (1,200 MWe BWR)26
$1,500/kWe incl financing (predicted actual cost in 2007 $)
Generic LWR in Indonesia (1,000 MWe)27
$1.5B (2007$) $1,500/kWe overnight (2007 $)
Recent MIT estimate for generic LWR28 Not available $2,300/kwe overnight (2007 $) Completion of 2 partially complete VVER-1000 PWRs in Bulgaria (1,000 MWe/unit)29
3.3B Euros ($3.3B) $1,650/kWe incl financing (2007 $)
Generic LWR (UK Study9) OXERA Forecast
Not available FOAK: 1,625 UK lb/kWe 3,250 $/kWe NOAK 1,150 UK lb/kWe 2,300 $/kWe (all in 2007 $)
Generic LWR (World Energy Council30) Not available 1,800 Euros/kWe or 2,430 $/kWe (NOAK, overnight, 2007 $)
NOAK= Nth-of-a-kind FOAK= First-of-a-kind
Unfortunately, there are not O&M projections, D&D estimates, and fuel cycle data for all of the above cases. Therefore, the overall busbar LUEC cannot be calculated for each of the above cases. Historically U.S. reactors have non-fuel O&M costs in the range of $70M–$120M per unit annually. An example estimate showing O&M subcategories in the Code-of-accounts structure from the Gen IV Guidelines1 is shown in Table R1-4 below. Over the last 15 years, the average cost has decreased markedly as utilities have learned how to operate their plants more efficiently. New simpler reactor designs should also experience further decreases. There is some variation of O&M costs with reactor size and energy output. According to Reference 31, the fixed component of the O&M cost depends on the reactor electrical capacity, which is typically around $60/kW yr. The variable component depends on energy production and is typically around 0.5 mills/kWh. For the Generation III+ reactor in the table below, this formulation would result in an annual cost of $83M/yr; however, it would not include capital replacements.

INL/EXT-07-12107 (March 2008) Advanced Fuel Cycle Cost Basis R1-12
Table R1-4. Typical nonfuel O&M costs for a Gen III+ LWR.
REACTOR O&M COST DATA in Const 2007$COA 7 OPERATIONS COST CATEGORY Units
70 series71+72 On-site Staffing Cost (71: Non-Management 72: Management) 27.06 $M/Year
73 Pensions and Benefits 7.23 $M/Year76, 74 Consumables 21.43 $M/Year
75 Repair costs including spare parts 5.24 $M/Year93 Charges on working capital 0.00 $M/Year84 Purchased services including refuelling crews 7.33 $M/Year78 Insurance Premiums & Taxes 8.10 $M/Yeartbd Regulatory Fees 4.69 $M/Yeartbd Radioactive Waste Management (non-spent fuel) 2.02 $M/Yeartbd Other General and Administrative (G&A) 9.16 $M/Year77 Capital replacements/upgrades (levelized over plant life) 10.00 $M/Year79 Contingency on O&M (sometimes imbedded in accounts above) 0.00 $M/Year
COA 7 Total 102.26 $M/Year
Annualized O&M cost per kwh #REF! mills/kwhor $/MWh
This estimate is for a 1300MWe ABB-CE System 80+ APWR operating at a 90% capacity factor
D&D costs are handled by annual sinking fund payments not in this table
G4-ECONS WORKSHEET NAME: Operations & Decommissioning
The actual generation costs for nuclear electricity in the U.S. have varied widely. For projects in which high capital costs caused by delays or construction problems are still being amortized, the power cost might be in the range of 60 to 100 mills/kWh. For projects where the capital has already been written off, the production cost (non-fuel O&M + fuel cycle) may be as low as 18 mills/kWh. LUEC projections for new LWRs depend heavily on the interest rates and construction schedule as well as the projected specific capital cost. The regulatory environment will affect all of these factors. Merchant plants with higher risk financing are expected to have considerable higher LUECs than for plants constructed under legislated economic regulation, guaranteed markets, and lower financial risks. LUECs in the range of 30 to 80 mills/kWh would cover most possibilities based on today’s models and their inputs.
R1-7. LIMITATIONS OF COST DATA Nearly all the data available on existing or ongoing thermal reactor projects are from outside the U.S.
because no new U.S. reactors have been completed since the mid-1990s or ordered since the mid-1970s. Adapting such data to the U.S. is difficult because of currency fluctuations, different wage rates and labor productivity, and different regulatory environments. For example, Far Eastern reactor projects have benefited from short construction times (little regulatory or legal interference), and low interest rates (3% real discount rate or less). It cannot be guaranteed that such beneficial conditions will exist in the U.S. in the near future. Note that constant dollars and real discount rates are used for these reactor analyses, including those in Section R2 on fast reactors.

INL/EXT-07-12107 (March 2008) Advanced Fuel Cycle Cost Basis R1-13
R1-8. COST SUMMARIES
The module cost information is summarized in the What-It-Takes (WIT) cost summary in Table R1-5. The summary shows the reference cost basis (constant year $U.S.), the reference basis cost contingency (if known), the cost analyst’s judgment of the potential upsides (low end of cost range), and downsides (high end of cost range) based on references and qualitative factors, and selected nominal costs (judgment of the expected costs based on the references, contingency factors, upsides, and downsides). The financial bases for the upside, reference, downside, and nominal cases may not be the same because the literature sources did not identify these assumptions in any detail, e.g., whether a project is financed by both debt and equity instruments. These costs are subject to change and are updated as additional reference information is collected and evaluated, and as a result of sensitivity and uncertainty analysis. It should be noted that since 2006, a lot of new data have appeared in the trade press and reports, and projected capital cost estimates are rising. This reflects more conservative and realistic estimating for a technology for which new orders in the U.S. are imminent and regulatory work is underway. This accounts for the author’s significant increases in the specific data WIT table capital cost entries from those last published in March of 2007, using 2006 data. A recent article and graphic (Figure R1-4) from the New York Times on power plant construction costs validates this fact.32 A more recent analysis, based partly on very conservative analyses by investment firms, warns of possible “all-in” specific costs as high as $5,000–$6,000/kWe, including escalation.33
Table R1-5. Cost summary table (costs in constant $ unless otherwise noted.). What-It-Takes (WIT) Table
Reference Cost(s) Based on Reference Capacity
Upsides (Low Cost)
Downsides (High Cost)
Selected Values (Nominal Cost)
Generic LWR in U.S.: (specific overnight cost) NOAK $2,100/kWe
$1,800/kWe $3,500/kWe $2,300/kWe
(Specific total capital cost including financing, NOAK) $2,400/kWe (5% DR [discount rate])
$2,000/kWe (low risk financing)
$4,700/kWe (high risk financing)
$2,600/kWe (most likely utility financing at 5% real DR)
Non-fuel O&M including contribution to D&D fund: fixed component 62 $/kWe-yr (w/o D&D adj)31
55 $/kWe-yr including D&D fund adj
75 $/kWe-yr including D&D fund adj
$64/kWe-yr including D&D fund adj
Non-fuel O&M including capital replacements: variable component 0.45 mills/kWh (w/o capital replacements adj) 30
0.8 mills/kWh including capital replacements adj
2.5 mills/kWh including capital replacements adj
1.8 mills/kWh including capital replacements adj
Figure R1-4. Power plant cost escalation.32

INL/EXT-07-12107 (March 2008) Advanced Fuel Cycle Cost Basis R1-14
Note that values for nonfuel O&M costs have also been added to Table R1-5. To get the overall O&M cost in millions of dollars per year, the fixed cost component is multiplied times the reactor capacity in kW and this product is added to the product of the variable cost times the annual electrical generation. The O&M components are adjusted to include average lifetime capital replacements for the reactor and contributions to a D&D fund to decommission the reactor at the end of its life. It should be noted that fuel cycle costs are not included in any of these costs, and that this component of the LUEC must be added to the capital and nonfuel O&M costs derived from the table below in order to calculate the total LUEC for the reactor system. Refer to Section 2.6 in the main section of this report for additional details on the cost estimation approach used to construct the WIT table.
R1-9. SENSITIVITY ANALYSES It is known that the factors that most influence the LUEC are the reactor capacity factor, the total
capital cost, and the time it takes to construct it. The overnight cost will be affected strongly by commodity prices for items such as concrete, structural steel, and rebar. Time to construct and the associated interest will affect the total capital cost, which is the sum of the overnight cost plus the financing cost (interest during construction [IDC]). The IDC depends on the discount rate and time required to design, build, and start-up the reactor. Figures R1-5 and R1-6 below show how the discount rate (cost of financing) affects the specific total capital cost and the capital cost component of the LUEC. The overall time to design, construct, and start-up the LWR is assumed to be 5 years for this sensitivity, and the cumulative expenditure pattern over the 5 years is assumed to follow the typical S-curve shape. The G4-ECONS model was used to generate the data below.
The time to design, construct, and start-up a reactor is itself an important cost driver. The most successful reactor projects are those for which this overall time is minimized. It is anticipated that new U.S. projects can be completed in 4 to 6 years. Experience in Asia shows that such project durations are indeed achievable.
Specific TCC for a Reactor with a Specific Overnight Cost of $2300/kwe
0500
1000150020002500300035004000
0% 2% 4% 6% 8% 10% 12% 14% 16%
Real Discount Rate
Spec
ific
Tota
l Cap
ital C
ost
($/k
we)
Figure R1-5. Effect of discount rate on the specific total capital cost.

INL/EXT-07-12107 (March 2008) Advanced Fuel Cycle Cost Basis R1-15
0
10
20
30
40
50
60
70
0% 2% 4% 6% 8% 10% 12% 14% 16%
Real Discount Rate
Cap
ital C
ompo
nent
of L
UEC
Figure R1-6. Effect of discount rate on the capital component (in mills/kwh) of the LUEC.
R1-10. REFERENCES 1. Gen IV Economic Modeling Working Group (EMWG), Cost Estimating Guidelines for
Generation IV Nuclear Energy Systems, Rev 2, September 2005.
2. Gen IV Economic Modeling Working Group (EMWG), “G-4 ECONS User’s Manual, Version 1.0,” May 2006. [This document has a restricted distribution, may be proprietary, or both; and is not publicly releasable.]
3. DOE-NE, “A Roadmap to Deploy New Nuclear Power Plants in the United States by 2010,” prepared for the U.S. DOE Office of Nuclear Energy, Science and Technology by the Nuclear Energy Research Advisory Committee (NERAC) Subcommittee on Generation IV Technology Planning, October 2001.
4. USDOE/Nuclear Energy Generation IV Website: http://www.ne.doe.gov/genIV/neGenIV1.html.
5. USNRC Website: http://www.nrc.gov/reactors/new-licensing/new-licensing-files/expected-new-rx-applications.pdf.
6. C. W. Mycoff and G. Locatelli, “Different Economic Factors between a Large Reactor and a Small Modular Reactor,” presentation to IRIS Working Group (PowerPoint presentation), June 2006. [This document has a restricted distribution, may be proprietary, or both; and is not publicly releasable.]
7. N. E. Hultman, et al, “What History Can Teach Us About the Future Costs of U.S. Nuclear Power,” Environmental Science and Technology, American Chemical Society, April 1, 2007.
8. S. McClary et al, Nuclear Power in California: 2007 Status Report, MRW & Associates, Inc., viewgraph presentation at IEPR Committee Nuclear Issues Workshop, June 25 and 26, 2007.
9. Steve Thomas, The Economics of Nuclear Power: Analysis of Recent Studies; Public Services International Research Unit (PSIRU), July 2005, (United Kingdom).
10. World Energy Council, The Role of Nuclear Power in Europe, London, UK, January 2007.

INL/EXT-07-12107 (March 2008) Advanced Fuel Cycle Cost Basis R1-16
11. Greenpeace International, The Economics of Nuclear Power,
http://www.greenpeace.org/usa/press/reports/the-economics-of-nuclear-power, May 2007.
12. “EPR: An expensive, subsidized nuclear reactor for Finland,” Greenpeace briefing (Web), June 5, 2005.
13. “Taiwanese group to stage protest in hope of pressuring government to cease construction work on a nuclear power plant,” South African News Site, June 23, 2006.
14. Platt’s Nuclear News Flashes, “A Taipower Request for Nearly $2 Billion to Complete Two ABWRs at Lungmen Has Been Approved.” http://www.platts.com/search_premium.jsp, August 17, 2006.
15. John Gertner, “Atomic Balm? A Nuclear Renaissance?,” New York Times Magazine, July 16, 2006.
16. M. P. LaBar, “The Gas Turbine-Modular Helium Reactor: A Promising Option for Near-Term Deployment,” General Atomics Paper, American Nuclear Society, http://www.gt-mhr.ga.com/images/ANS.pdf, April 2002.
17. DOE-NE, “The Economic Future of Nuclear Power,” prepared for U.S. DOE-NE by the University of Chicago, August 2004.
18. Tennessee Valley Authority (TVA), ABWR Cost/Schedule/COL Project at TVA’s Bellefonte Site, DOE Report DE-A107-04ID14620.
19. Reiner Kuhr & Thomas Vivenzio, Investing in Megaprojects: A Comparison of Costs and Risks, Shaw/Stone&Webster Management Consultants, Inc., presented at POWER-GEN 2005 Conference, Las Vegas, NV, December 6, 2005.
20. General Electric Corp, Nuclear Reactivation Perspective, presentation at Paris Dauphine CGEMP Meeting, May 19, 2006.
21. Nucnet, “France Gives Final Go-Ahead for Flamanville EPR,” www.worldnuclear.org, April 11, 2007.
22. Uranium Information Centre, “The Economics of Nuclear Power: Briefing Paper 8,” http://www.uic.com.au/nip08.htm, April 2006.
23. “Japan’s Mitsubishi Heavy ReactorTechnology Selected for TXU Corp. Power Plant,” Technology Review (Website: www.technologyreview.com), March 14, 2007.
24. Platt’s Nuclear News Flashes, “TXU Corp. Could Have Up to Six New Reactors On-line Between 2015 and 2020,” http://www.platts.com/search_premium.jsp, August 31, 2006.
25. Platt’s Nuclear News Flashes, “Constellation is Estimating an Overnight Cost of $2400/kw for New Nuclear Plant Construction,” http://www.platts.com/search_premium.jsp#, April 25, 2007.
26. M. L. Wald, “Cost of Re-opening U.S. Nuclear Reactor Shows How Difficult It Will Be to Build New Facilities.” International herald Tribune, May 9, 2007.
27. Indonesian National News Agency (Antara), “Indonesia Nuclear Plant to Cost U.S. $1.5 Billion,” Website: www.antara.co.id, Feb 23, 2007.
28. Platt’s Nuclear News Flashes, “The Volatility of Natural Gas Prices is One of the Primary Reasons Electric Company Executives Have Been Giving Serious Consideration to Building New Nuclear Power Plants,” http://www.platts.com/search_premium.jsp, October 6, 2006.
29. Tatiana Sinitsyna, “The Russian Peaceful Atom Stages a Comeback in Europe,” RIA Novosti New Service (Russia).
30. World Energy Council, The Role of Nuclear Power in Europe, London, UK, January 2007.

INL/EXT-07-12107 (March 2008) Advanced Fuel Cycle Cost Basis R1-17
31. F. Roques, et al. “Nuclear Power: A Hedge Against Uncertain Gas and Carbon Prices?” The Energy
Journal, Vol 27, No.4, 2006, data is from IAEA sources.
32. Matthew Wald, “Costs Surge for Building Power Plants,” The New York Times (World Business Section), July 10, 2007.
33. Feature: “Power Market Developments: How Much?” Nuclear Engineering International, Wilmington media Inc., November 20, 2007.

INL/EXT-07-12107 (March 2008) Advanced Fuel Cycle Cost Basis R1-18

INL/EXT-07-12107 (March 2008) Advanced Fuel Cycle Cost Basis R2-1
Module R2
Fast Reactors

INL/EXT-07-12107 (March 2008) Advanced Fuel Cycle Cost Basis R2-2

INL/EXT-07-12107 (March 2008) Advanced Fuel Cycle Cost Basis R2-3
Module R2 Fast Reactors
R2-1. BASIC INFORMATION The reactor is the central facility of the overall energy system and is supported by the overall fuel
cycle. This section deals with “fast” reactors, which are those reactors in which the average neutron energies are in the higher energy or “fast” range (>0.1 MeV) for which less or no moderation is required. This allows the use of coolants that are higher in atomic number, including liquid metals such as sodium or lead, or even liquid salts. There are at present no operating commercial reactors in the U.S. of this type. However, small units, such as Fermi-I and Experimental Breeder Reactor (EBR)-II, produced power in the past. A large demonstration project, the Clinch River Breeder Reactor Project, existed as a project in the 1970s and 1980s, but it was never completed. Construction work on the CRBR had begun and some large equipment had been procured and fabricated when the project was canceled. The largest projects have been built in Russia (BN-600), France (Superphenix), and Japan (Monju). Russia, India, and China are the only countries presently constructing new fast reactors, the BN-800 (Russia), the 500 MWe Prototype Fast Breeder Reactor, the Chinese Experimental Fast Reactor (CEFR). As with thermal reactors, the predominant product from fast reactors is electricity. However, the heat that is generated can also be used for industrial applications such as hydrogen production (lower-temperature hydrogen production processes), district heat, process heat, or water desalination.
Fast reactors have the advantage over light-water reactors in that the fast spectrum provides sufficient excess neutrons for complete fission of the initial natural uranium, including all transuranic isotopes produced along with additional surplus neutrons that can be used to transmute some fission products, consume transuranics from thermal reactor recycled spent fuel, and/or breed additional fissile material. The thermal spectrum requires additional fissile support, generally in the form of enriched uranium, and can therefore only consume a small fraction (on the order of 1%) of the initial uranium ore. Additionally and possibly more importantly, the fast spectrum is far less sensitive to isotopic variation in the fuel composition, which will vary widely, depending on the source and age of the feed material being recycled.
Closing the fuel cycle is a significant part of the mission projected for the fast neutron reactor. In this case, a waste management mission can be accomplished in addition to electricity production. Fast reactors can also be used to convert fertile U-238 to fissile Pu-239, which makes for a highly-sustainable fuel cycle. This concept is known as “breeding,” and the reactors are known as fast breeder reactors. A fast-neutron nuclear power plant may actually consist of more than one “unit” or reactor on the same site. In fact, there are several concepts for modular sodium-cooled fast reactors that could be located in a reactor park along with dedicated fuel cycle facilities for spent fuel recycle and refabrication.
The fuel cycle cost for a fast reactor is just one of the main four components of the busbar levelized unit electricity cost. (“Busbar” cost refers to the fact that the cost of electricity is that at the plant electrical boundary connection [busbar] and does not include distribution or other utility overhead costs.) As in Module R-1, the four components of the levelized unit electricity cost are:
1. Capital component (recovery of total project capital plus financing costs).
2. Operations and maintenance component (annual nonfuel costs including manpower). Refueling manpower is usually carried in this major account.
3. Fuel cycle component (the sum of the relevant costs for the needed fuel cycle steps [modules] converted to mills/kWh or $/MWh unit costs). For the fast reactor fuel cycle, this account would include the costs of processing the actinide products received from an LWR reprocessing facility.

INL/EXT-07-12107 (March 2008) Advanced Fuel Cycle Cost Basis R2-4
4. Decontamination and decommissioning (D&D) costs, a fund accumulated to cover D&D of the reactor at its end-of-life.
Of these costs, the capital component for the fast reactor will always be the largest (as is the case for thermal reactors). This is different than other electricity generation sources, such as oil, natural gas, or coal, where fuel costs can be predominant and also unstable. The low fuel cycle cost is one of the advantages of nuclear power and is due to the fact that nuclear fuel delivers nearly one-million times the energy per unit mass of chemical fuel sources such as fossil fuels. The high capital cost of nuclear power is in part because of the need to confine radioactive materials originating in the reactor core during design basis accidents. With fast reactors, there is also the fact that the main coolant candidate is liquid sodium, a reactive metal that will burn in air. Nuclear power plants are built to safety and quality control standards that exceed in breadth and scope that of fossil-fueled power plants.
The most useful cost figure of merit here is the specific total capital cost, which is the cost of planning, designing, constructing, and starting up the reactor (up-front costs) divided by the net power capacity. It is usually expressed in $/kilowatt electric or $/kWe. One must be careful to specify whether the capital cost includes financing (interest) and other owner’s costs. If the financing (interest) is excluded from the capital cost, this cost figure is called the “overnight” capital cost and is the best measure to compare costs from plant to plant. The total capital cost (TCC) includes interest during construction, which can be a significant percentage of the overnight cost if project construction or regulatory delays are encountered. The discussion below will deal mostly with the “overnight” (OCC) expression of the specific capital cost, because it is most dependent on the reactor technology and also the one which appears most frequently in the literature.
R2-2. FUNCTIONAL AND OPERATIONAL DESCRIPTION Fast reactors all require the use of fuel with higher fissile content than LWRs, whether it is U-235 or
transuranics. Most international (outside the United States) experience is with MOX or mixed oxide (uranium, plutonium O2) ceramic fuel clad in stainless steel rods (Module D1-4). The fissile content for the MOX driver fuel is generally 17% or more of the heavy metal mass. The rods, thinner than those for thermal reactors, are bundled into fuel assemblies that are inserted into the reactor prior to startup. The United States has extensive experience with metal-based fast reactor fuels (Module D1-6) in EBR-II and Fast Flux Test Facility (testing only). The advantage of metal fuel is heat removal (high thermal conductivity) capability, its compatibility with sodium coolant, its passive-safety response characteristics during beyond design basis accidents, its high breeding capacity, its ease in fabricability, and its compatibility with electrochemical spent fuel recycling schemes. The internal heat generated by fission in the fuel is removed by the flowing liquid metal coolant and transferred by heat exchangers to steam generators where water is turned into steam. The steam then flows to turbine generators where electricity is generated. Because thermodynamic cycles are involved, most of the heat energy is rejected to the environment, as is true of all power plants using fossil or nuclear fuel. The ratio of the electric power generated to the total heat generation is the thermodynamic efficiency. Because of the higher liquid sodium temperature, the fast reactor is thermodynamically more efficient than the light water reactor.
Other reactor performance measures are the capacity factor and the fuel burnup. These have the same definitions as those in Module R1.
R2-3. PICTURES/SCHEMATICS/DEPLOYMENT STATUS Figure R2-1 shows the flow concepts within a fast reactor using a liquid sodium coolant.

INL/EXT-07-12107 (March 2008) Advanced Fuel Cycle Cost Basis R2-5
Figure R2-1. Major elements of a liquid-metal cooled fast reactor.
The last fast reactor project actually completed in the U.S. was the Fast Flux Test Facility (FFTF) at Hanford, Washington. This now-defueled and drained DOE-owned reactor was not designed to produce electricity; however, the addition of a power generating balance of plant was considered at one time. The next U.S. fast reactor project is projected to comprise a few hundred megawatts of electrical capacity and will also demonstrate actinide burning on a large scale. The decision of whether the reactor will be started up with metal or oxide fuel has yet to be made.
R2-4. INTERFACES WITH OTHER MODULES The reactor will receive fuel assemblies from the fuel fabrication plant for its startup fast reactor fuel.
Initially, this startup fuel is expected to be a more conventional fast reactor fuel, such as U-Pu-Zr metal fuel, Mixed Oxide fuel, or Low Enriched Uranium metal fuel, as appropriate. As transuranic-based fuels are fabricated and qualified for reactor use, they will be converted over to the transuranic-based fuel.
After irradiation, fuel assemblies are stored in a special area in liquid sodium until they decay to a degree that handling can be accomplished in air. Once the fuel assemblies have decayed, the fuel assemblies might be moved to storage casks for onsite or offsite storage (Modules E1 and E2). Direct transfer to a reprocessing facility (Modules F1 or F2/D2, depending on whether aqueous or electrochemical fuel reprocessing is used) is also possible.
R2-5. MODULE SCALING FACTORS In general, the cost of electricity and the specific capital cost decrease with higher reactor size
(electrical generation capacity). There is likely to be a point where factory production of small reactor modules, as opposed to traditional onsite construction, will allow reduction of unit costs. Studies, such as those being pursued by the Generation IV Economic Modeling Working Group, are investigating this

INL/EXT-07-12107 (March 2008) Advanced Fuel Cycle Cost Basis R2-6
issue. Section R-1 has a more comprehensive discussion and diagram dealing with the modularity issue. It should be noted that the General Electric PRISM FR (aka ALMR or Advanced Liquid Metal Reactor) concept is modular in nature and is the subject of several papers and reports.1,2,3,4
R2-6. COST BASES, ASSUMPTIONS, AND DATA SOURCES The question often arises as to how the specific overnight cost of a fast reactor compares to that for
light water reactors. From a pure engineering standpoint, one would expect pipe sizes to be larger because of the lower volumetric heat capacity of liquid sodium vis-à-vis liquid water.5 There are also the additional safety considerations associated with the use of liquid sodium, a chemically-reactive metal. The core size, however, for a fast reactor can be smaller, since higher fissile content means less heavy metal content compared to LWRs. Other recent studies6 have looked at the issue of capital cost as a function of the conversion ratio. The well-defined PRISM reactor was used as the basis for this study. There seems to be a feeling among some utilities and other stakeholders that the specific capital cost for a NOAK fast reactor will be 1.0 to 1.6 times that for Nth of a Kind (NOAK) LWRs. There are, however, no recent detailed studies to backup this claim. It is known that the Japanese and French are carefully considering the “lessons learned” from past FR projects to reduce this “FR/LWR” specific capital cost factor for their new concepts such as the Japanese Sodium-cooled Fast Reactor (JSFR), the European Fast Reactor (EFR), and the prototypes7,8 that will precede them. However, as discussed above, it should be noted that fast reactor are the ultimate solution for closing the nuclear fuel cycle and have capabilities in regards to transmutation and sustainability that cannot be accomplished with LWR technology.
It is now useful to consider capital costs for fast reactors actually built or proposed (paper studies only for the latter). Cost and capacity information sometimes appear in trade press and general press sources. Utilities and architect engineers do not typically publish costs for their projects, especially under today’s environment of less economic regulation. Table R2-1 shows some historical data for FR projects actually completed and projected data for a few that have been recently announced. Table R2-2 shows similar, but more detailed, data for FR projects never completed, are new-proposed, or that are the subject of “paper studies” (cost projections for the latter).
Table R2-1. Historical capital costs for completed fast reactor systems and projected costs for recently announced or currently under construction systems.a
Reactor and Size Total Capital Cost
(2006B $) Specific Capital Cost
($/kWe) MONJU (Japan) 280 MWe (completed) $6B (2006 $) $21,400/kWe (2006 $) Superphenix (France) 1,240 MWe (completed)
9B Euros = $11B $8,870/kWe (2006 $)
Proposed Large Japanese Sodium-cooled Fast Reactor 1,500 MWe (announced proto)
$2.3B (all-in costs) $1,600/kWe (all-in costs)
BN-800 (Russia) (under construction) $2B in 2006 $ $2,500/kWe Future French Prototype7 800 MWe (announced proto)
1.5B Euros ($2.0B in 2007 $) $2,500/kwe
Kalpakkam Prototype FBR (India)9 (under construction)
$767M ~$1,500/kWe
a. There is not sufficient and publicly-available “lessons learned” information to explain the above historical costs. Historical costs are usually “all-in” or total capital cost and include financing and owner’s costs. Announced and “under construction” projects are generally expressed as overnight costs in constant dollars. U.S. standard GDP deflators were used to escalate historical costs to 2006 $. Most of these costs appear in the references listed at the end of this section.

INL/EX
T-07-12107 (March 2008)
R2-7
Advanced Fuel C
ycle Cost B
asis
Table R2-2. Projected capital costs for never-completed, new-proposed, or conceptual fast reactor systems.
Facility Name Proposed Location
Size/Capacity
(Electric and
Thermal) Units
Proposed Operation
dates
Capital overnight
cost in millions of
local currency
units
Currency type
(FCU) Foreign
Currency Unit
Exchange rate to $ ($/FCU)
Exchange rate date
Capital cost in "then
year" $M Deflator
Capital cost in
2006$M
Electricity Specific
Overnight Capital Cost
($/kWe)
Thermal Energy Specific
Overnight Capital Cost
($/kWth)
Clinch River Breeder Reactor Project Oak Ridge, TN USA 1000 MWth late 1980s 3600 US$ 1 1984 3600 1.75 6300 18000 6300
350 Mwe (term in 1983)
BN-800 Beloyarsk, Russia 2300 MWth 2010 2000 US$ 1 2006 2000 1 2000 2500 870800 Mwe
Prototype Fast Breeder Reactor (PFBR) Kalpakkam, India 1400 MWth 2010 3492 crores 0.205 2003 717 1.07 767 1534 548
500 Mwe
Japanese Sodium-cooled Fast Reactor (JSFR) Japan (Conceptual Plant) 3530 MWth 2050 224700 Yen 0.009346 2006 2100 1 2100 1400 595
1500 MWe
General Electric S-Prism USA (Conceptual Plant) 4360 MWth 2020 2200 US$ 1 1996 2200 1.22 2684 1626 616(modular:2 power blocks/4 Rx modules) Nth of a kind 1651 MWe
Low Conversion ratio variants of PRISM USA (Conceptual Plant) 1680 Mwe 2020 2004 1.047 1600-1700
ANL-AFCI-118 Report (Hoffman) 4430 MWth

INL/EXT-07-12107 (March 2008) Advanced Fuel Cycle Cost Basis R2-8
R2-7. LIMITATIONS OF COST DATA All fast reactors constructed to date have been “first-of-a-kind” (FOAK) facilities that have not
enjoyed the economic benefits (lower costs) of construction learning and near-design replication (FOAK to NOAK cost improvement) that, to some degree, thermal water reactors enjoy. Instead, the specific capital cost for completed facilities is quite high. The projected specific capital cost given for the reactor cost estimates appearing in planning or “paper studies,” is usually optimistic in that it incorporates some developer optimism, but may not include financing costs.
Newer FR paper studies are incorporating many new innovative features that should lend technical support to what seem to be optimistic claims.
R2-8. COST SUMMARIES As can be seen above, specific capital costs, both realized and projected, for fast reactors vary widely.
Cost experience for actual projects has not been good. These systems have additional piping and components than for light water reactors because of the additional intermediate coolant loop (water to sodium) and the larger equipment needed to pump and handle liquid sodium. As part of the Generation IV program, however, new design concepts are being investigated that will hopefully include much enhanced passive safety, simpler systems, and improved economics. The Japanese have worked on such a concept, the JSFR, which they believe for an NOAK system can come in at well below $2,000/kWe including interest during construction.10 Recent PRISM studies1,2,3,4,5 for multiunit modular plants are also calculating specific capital costs in or below this $2000/kWe range.
As mentioned earlier, many nuclear critics believe that fast reactors will have inherently larger costs than light water reactors. A commonly heard “rule-of-thumb” is that the fast reactor will be 20% higher than a light water reactor on a per kilowatt of capital basis. Russian experience has shown this factor to be more like 60% (VVER cost versus BN cost).11 It should also be noted that estimates prepared by designers of the European Fast Reactor (EFR) show it to be a 25% cost increase per kilowatt than the European Pressurized-water Reactor (EPR), also estimated by the same team. These cost comparison are currently speculative because neither light water reactor nor fast reactor have been built in the developed world in the past two decades to furnish much actual data for comparison. Again, as mentioned earlier, the fast reactor has benefits that the light water reactor does not, namely the ability to either breed or burn actinide materials, and in contributing to closing the fuel cycle, while generating electricity on the grid.
The module cost information is summarized in the What-It-Takes (WIT) cost summary in Table R2-3. These values are larger based on cost analyst’s judgment and are intended to provide a cost distribution that is consistent with LWR (Module R1) values and available cost data for commercial-scale NOAK fast reactors. Future versions of this report are anticipated to provide greater detail and better basis and justification for the cost values. The summary shows the reference cost basis (constant year U.S. $), the reference basis cost contingency (if known), the cost analyst’s judgment of the potential upsides (low end of cost range) and downsides (high end of cost range) based on references and qualitative factors, and selected nominal costs (judgment of the expected costs based on the references, contingency factors, upsides, and downsides). These costs are subject to change and are updated as additional reference information is collected and evaluated, and as a result of sensitivity and uncertainty analysis. Refer to Section 2.6 in the main section of this report for additional details on the cost estimation approach used to construct the WIT table (Table R2-3). It should be noted that the selected value of $2,900/kWe (overnight) for the fast reactor compares to the same value of $2,300/kWe (overnight) for the LWR (Module R1). This is a 26% difference, and assumes the fast reactor will benefit from some design changes that will reduce the amount of labor and materials needed for construction.

INL/EXT-07-12107 (March 2008) Advanced Fuel Cycle Cost Basis R2-9
Table R2-3. What-It-Takes cost summary table. What-It-Takes (WIT) Table
Reference Cost(s) Based on Reference Capacity
Upsides (Low Cost)
Downsides (High Cost)
Selected Values (Nominal Cost)
Overnight Cost for NOAK FR in U.S. $2,500/kWe
$1,800/kWe $5,000/kWe $2,900/kWe (NOAK)
Total Capital (low risk financing) $2,800/kWe
$2,200/kWe $6,500/kWe $3,200/kWe (NOAK)
O&M Fixed Component including D&D fund contribution [no ref available]
$60/kWe-yr $80/kWe-yr $68/kWe-yr
O&M Variable component including Capital Replacement Component [no ref available]
1.0 mills/kWh 2.7 mills/kWh 2.0 mills/kWh
O&M costs for the reactor have been added to this edition of the Cost Basis Report. They are applied
in the same manner as in Module R1—they have a fixed and variable component. The code of accounts structure would also be the same as that described in Module R1. O&M costs are expected to be somewhat larger for FRs as compared to LWRs, mainly because of the more complex systems.
R2-9. SENSITIVITY ANALYSES No studies of this type have been undertaken recently. It is known, however, that as with thermal
reactors, the factors that will most influence the levelized unit electricity cost are the reactor capacity factor (% of time it is generating electricity), the total capital cost, and the time it takes to construct it.
R2-10. BIBLIOGRAPHY Lineberry, M. J., et al; Commercial-Size IFR Fuel Cycle Facility: Conceptual Design and Cost Estimate;
ANL-IFR-25; Argonne National Laboratory; Argonne IL USA; October 1985; APPLIED TECHNOLOGY [Onsite electrochemical facility servicing 1,400 MWe of ALMR capacity]. [This document has a restricted distribution, may be proprietary, or both; and is not publicly releasable.]
Taylor, I. N, Thompson, M. L., et al; ALMR Fuel Cycle Assessment-1991; GE-Nuclear Energy; San Jose, CA; GEFR-00897 Rev 1; September 1991; APPLIED TECHNOLOGY; [Describes electrochemical fuel cycle for GE-PRISM system.] [This document has a restricted distribution, may be proprietary, or both; and is not publicly releasable.]
Delene, J. G., et al; Review of the 1991 Cost Estimates for the Advanced Liquid Metal Reactor; Oak Ridge National Laboratory; Oak Ridge TN USA; September 1992; APPLIED TECHNOLOGY [Report of multi-organizational team assembled by ORNL to evaluate estimate in report above.] [This document has a restricted distribution, may be proprietary, or both; and is not publicly releasable.]
Delene, J. G.; Fuller, L. C., and Hudson, C. R.; ALMR Deployment Analysis; ORNL/TM-12344; Oak Ridge National Laboratory; Oak Ridge TN USA; June 1993.
Delene, J. G., et al; Economics of ALMR Deployment; Paper for American Nuclear Society 1994 Annual Meeting; June 19–23; New Orleans LA USA; CONF 94602-22.
Boardman, C. E.; Economic Assessment of S-PRISM Including Development and Generating Costs; GE-Nuclear Energy; San Jose CA USA; 1999

INL/EXT-07-12107 (March 2008) Advanced Fuel Cycle Cost Basis R2-10
Dubberly, Allen E.; S-PRISM Fuel Cycle Study; Proceedings of ICAPP ’03; Cordoba, Spain; May 4–7, 2003; Paper # 3144; (GE Nuclear Energy)
R2-11. REFERENCES 1. C. S. Ehrman and C. E. Boardman (General Electric), “System Considerations for Actinide Recycle
in Fast Reactors,” Selected Papers from Global 1995, pp 133–142.
2. A. E. Dubberly, et al. (GE Nuclear Energy), “S-PRISM Fuel Cycle Study: Future Deployment Programs and Issues,” Proceedings of ICAPP 2003, Cordoba, Spain, May 4–7, 2003, paper 3144.
3. A. E. Dubberly, “S-PRISM High Burnup Metal-Fuel Core Design,” Proceedings of ICAPP 2003, Cordoba, Spain, May 4–7, 2003, paper 3142.
4. Fletcher, Kelly (General Electric), “Prepared Testimony Before the Energy and Water Subcommittee: U.S. Senate Appropriations Committee,” September 14, 2006.
5. C. W. Forsberg, “Use of Liquid Salt Coolants to Improve Fast-Reactor Economics,” Summary submitted for American Nuclear Society 2007 Annual Meeting; Boston MA USA; June 24–28, 2007; prepared by Oak Ridge National Laboratory.
6. E. A. Hoffman, Estimated Cost for Low Conversion Ratio Burners; Argonne National Laboratory, ANL-AFCI-118, June 2004.
7. Mainichi Daily News (Japan), “Japan Plans to Build New Fast Breeder Reactor by 2025,” June 1, 2006.
8. Platt’s Nuclear News Flashes, “France Will Build a Sodium-Cooled Fast Reactor by 2020,” December 27, 2006.
9. T. S. Subramanian, “Nuclear Power: A Prototype of Promise,” Frontline (India), Vol 20-Issue 21, August 11, 2006.
10. K. Ono, et al., “JAEA Sodium-Cooled Fast Reactor (JSFR) Total System Cost Analysis Using the G4-ECONS Code,” American Nuclear Society Annual Meeting, June 25-28, 2007, Boston MA, USA.
11. V. E. Minkov, et al., Design Description of Soviet Liquid-Metal-Cooled Fast-Breeder Reactors, Argonne National Laboratory, 1990.