decreased serum level of mir-146a as sign of chronic inflammation in type 2 diabetic patients
TRANSCRIPT

RESEARCH ARTICLE
Decreased Serum Level of miR-146a asSign of Chronic Inflammation in Type 2Diabetic PatientsLucy Baldeon R.1,3*, Karin Weigelt1, Harm de Wit1, Behiye Ozcan2,Adri van Oudenaren1, Fernando Sempertegui3, Eric Sijbrands2, Laura Grosse5,Wilma Freire4, Hemmo A. Drexhage1,6, Pieter J. M. Leenen1
1. Department of Immunology, Erasmus MC, University Medical Center, Rotterdam, The Netherlands, 2.Department of Internal Medicine, Erasmus MC, University Medical Center, Rotterdam, The Netherlands, 3.Department of Immunology, Central University of Ecuador, Quito, Ecuador, 4. Institute of Research in Healthand Nutrition, University San Francisco de Quito, Quito, Ecuador, 5. Department of Psychiatry, University ofMunster, Munster, Germany, 6. Prometeo Program SENESCYT, Central University of Ecuador andUniversidad de las Fuerzas Armadas, Quito, Ecuador
Abstract
Background: There is increasing evidence that chronic inflammation is an
important determinant in insulin resistance and in the pathogenesis of type 2
diabetes (T2D). MicroRNAs constitute a newly discovered system of cell regulation
and in particular two microRNAs (miR-146a and miR-155) have been described as
regulators and biomarkers of inflammation.
Aim: To determine a putative association between the levels of miR-146a and miR-
155 in serum of T2D patients, clinical parameters and serological indicators of
inflammation.
Methods: We performed quantitative Real Time PCR (qPCR) of microRNAs from
serum (56 Ecuadorian T2D ambulatory patients and 40 non-diabetic controls). In
addition, we evaluated T2D-related serum cytokines.chemokines and growth
factors using a commercially available multi-analyte cytometric bead array system.
We correlated outcomes to clinical parameters, including BMI, HbA1c and lipid
state.
Results: The Ecuadorian non-diabetic controls appeared as overweight (BMI.25:
patients 85%, controls 82.5%) and as dyslipidemic (hypercholesterolemia: patients
60.7%, controls 67.5%) as the patients.
- The serum levels of miR-146a were significantly reduced in T2D patients as
compared to these non-diabetic, but obese/dyslipidemic control group (mean
patients 0.61, mean controls set at 1; p50.042), those of miR-155 were normal.
- The serum levels of both microRNAs correlated to each other (r50.478; p,0.001)
OPEN ACCESS
Citation: Baldeon R L, Weigelt K, de Wit H, OzcanB, van Oudenaren A, et al. (2014) DecreasedSerum Level of miR-146a as Sign of ChronicInflammation in Type 2 Diabetic Patients. PLoSONE 9(12): e115209. doi:10.1371/journal.pone.0115209
Editor: Walter Lukiw, Louisiana State UniversityHealth Sciences Center, United States of America
Received: August 12, 2014
Accepted: November 19, 2014
Published: December 12, 2014
Copyright: � 2014 Baldeon R. et al. This is anopen-access article distributed under the terms ofthe Creative Commons Attribution License, whichpermits unrestricted use, distribution, and repro-duction in any medium, provided the original authorand source are credited.
Data Availability: The authors confirm that all dataunderlying the findings are fully available withoutrestriction. All relevant data are within the paperand its Supporting Information files.
Funding: This study was supported by grants fromThe Dutch Diabetes Research Foundation(Diabetes Fonds), The Netherlands (www.diabetesfonds.nl; to PL and LB). The funder had norole in study design, data collection and analysis,decision to publish, or preparation of the manu-script.
Competing Interests: The authors have declaredthat no competing interests exist.
PLOS ONE | DOI:10.1371/journal.pone.0115209 December 12, 2014 1 / 16

and to leptin levels. The microRNAs did not correlate to BMI, glycemia and
dyslipidemia.
- From the tested cytokines, chemokines and growth factors, we found IL-8 and
HGF significantly raised in T2D patients versus non-diabetic controls (p50.011 and
0.023 respectively).
Conclusions: This study shows decreased serum anti-inflammatory miR-146a,
increased pro-inflammatory IL-8 and increased HGF (a vascular/insular repair
factor) as discriminating markers of failure of glucose control occurring on the
background of obesity and dyslipidemia.
Introduction
It is well accepted that obesity and type 2 diabetes can be viewed as inflammatory
disorders. Early, in the 1990s Hotamisligi et al. showed that TNF-a was present in
obese individuals and animals in proportional levels to insulin resistance and they
proposed a pathogenic role of inflammatory molecules, such as TNF-a, in the
development of insulin resistance and diabetes [1]. To support this idea it was
later shown that TNF-a was indeed capable to induce insulin resistance in lean
animals [1–3] and that various pro-inflammatory cytokines trigger intracellular
pathways such as Nuclear Factor for Kappa light chain in B-cells (NF- kB), IkB
kinase-b (IKKb) and Jun kinase (JNK) which are capable to inhibit the insulin
signaling pathway [4–8].
Macrophages in adipose tissue as well as the adipocytes themselves are the
prime source of the raised pro-inflammatory cytokines and adipokines, leading to
a chronic pro-inflammatory state in obese subjects. In conjunction with these
cellular responses in so-called ‘‘chronically inflamed’’ adipose tissue, a disturbed
lipid metabolism is capable of inducing such a chronic pro-inflammatory state.
High levels of Ox-LDL and low levels of HDL correlate to inflammatory activation
and insulin resistance through a mechanism called lipotoxicity [4, 9–11].
Moreover, free fatty acids enhance the secretion of TNF-a, IL-6 and PAI-1, which
stimulate macrophages to secrete more inflammatory cytokines and chemokines
aggravating the feed-forward loop of inflammation [2, 11, 12]. All in all, there is a
vast literature on increased levels of pro-inflammatory cytokines in the metabolic
syndrome (MetS) and type 2 diabetes (T2D), and excellent reviews exist on this
topic [13–17].
MicroRNAs represent a newly discovered level of cell regulation, functioning by
inhibiting protein translation, and microRNAs have been suggested to be useful
biomarkers in various pathological conditions, including diabetes [18, 19]. A
substantial literature indicates that two microRNAs, i.e. miR-146a and miR-155,
are key regulators of (auto)-inflammatory processes [20–31]. Dysregulation of
these microRNAs in peripheral blood mononuclear cells (PBMC) has been
implicated in diabetes [20, 32]. MiR-146a and miR-155 expression levels have
Decreased Serum Level of miR-146a in Type 2 Diabetic Patients
PLOS ONE | DOI:10.1371/journal.pone.0115209 December 12, 2014 2 / 16

been found to be significantly decreased in the PBMCs of patients with T2D as
compared to control subjects and expression values correlated negatively to
parameters of metabolic control (Hb1Ac, glucose) and signs of inflammation
(NFkB mRNA levels in PBMC, circulatory levels of pro-inflammatory cytokines).
MicroRNAs are, however, also detectable in serum and there are indications that
microRNAs are very stable in this milieu [33–36], although they might be less
stable in other milieus, such as the brain [37]. Measured in serum, they can serve
as biomarkers and there is a study that has determined the level of miR-146a in
the serum of T2D patients as one of the microRNAs of a set of 7 microRNAs
considered to act as key regulators of the expression, production, secretion or
effectiveness of insulin [38]. This study found raised levels of these 7 microRNAs
when evaluated in relatively small groups (n519 each) of newly diagnosed T2D
patients as compared to pre-diabetic individuals and T2D-susceptible individuals
[38].
In the current study we determined the levels of miR-146a and miR-155a in the
serum of 56 Ecuadorian T2D patients and of 40 non-diabetic controls and
associated the levels of these microRNAs to parameters of glucose control,
dyslipidemia, obesity and the serum level of 12 T2D-related inflammatory
mediators (TNFa, IL-1b, IL-6, NFG, HGF, PAI, Resistin, CCL2, Adiponectin,
Leptin, IL-8, and CCL4) using a commercially available multi-analyte cytometric
bead array system, especially developed for type 2 diabetes (Milliplex Map,
U.S.A.).
Patients and Methods
Patients
A total of 56 patients positively diagnosed with type 2 diabetes, according to the
criteria of The Expert Committee on the diagnosis and clasification of Diabetes
Mellitus [39], were recruited in 4 medical centers of Quito-Ecuador (Eugenio
Espejo Hospital, Club de Leones Sur, Fundacion Oftalmologica del Valle and
Fundacion de la Psoriasis) from 2009 til 2012. Patients with immune disorders,
serious medical illness, recent infections (last 2 weeks), obvious vascular
complications, fever, pregnancy/postpartum, use of statins and LADA patients
(positive GAD-65 Abs) were excluded. Forty non-diabetic controls taken from the
same ethnic and societal background, not suffering from important medical
disorders (including acute infection) served as controls. They were included at the
same time as the patients and had to be over 30 years of age and preferably of the
same gender as the patients. The Medical Ethical Review Committee of the
Ecuadorian Corporation of Biotechnology Quito, Ecuador approved the study.
Written informed consent was obtained from the patients and controls in the
study. The Ethic Committee of the Central University also validated the ethical
approval of the study. The Ecuadorian Ministry of Health (MSP) gave the
respective permit to export and process the samples in Erasmus MC, Rotterdam,
The Netherlands.
Decreased Serum Level of miR-146a in Type 2 Diabetic Patients
PLOS ONE | DOI:10.1371/journal.pone.0115209 December 12, 2014 3 / 16

Serum cytokines and lipid profile
In the morning fasting venous peripheral blood (10 mL) was collected in a
clotting tube and processed within 4 hours. Serum was frozen and stored at minus
80 C for approximately 24 months before testing. The levels of TNFa, IL-1b, IL-6,
NGF, HGF, PAI, Resistin, CCL2 (MCP-1), Adiponectin, Leptin, IL-8, and MIP1b
(CCL4) were measured by flow cytometry (BD LSR II Biosciences, California, and
EE.UU.) using a commercially available multi-analyte cytometric bead array
system (Milliplex Map, U.S.A.). The data were analyzed using a 5-parameter
logistic method for calculating analyte concentrations in samples (MAGPIX with
xPONENT software, Luminex, Austin, USA). Undetectable serum analyte levels
were considered as 0 pg/ml and included in the statistical analysis. The lipid
profile was performed according to standard lab procedures in Quito-Ecuador
(AMCOR laboratory) and assays were validated in Erasmus MC.
MicroRNA quantitative real-time PCR (qPCR)
Total RNA was isolated from serum using the Qiagen miRNeasy kit (Qiagen,
Hilden, Germany). In order to correct for variations in RNA isolation derived, we
spiked-in a non-human (C. elegans) synthetic miRNA cel-miR-39 miRNA Mimic
(MSY000010) into the sample before nucleic acid isolation. Subsequently, specific
stem-looped reverse transcription primers were used to obtain cDNA for mature
microRNAs. The RNA was reverse transcribed using the TaqMan MicroRNA
Reverse Transcription Kit from Applied Biosystems, The Netherlands (ABI). PCR
was performed using pre-designed TaqMan microRNA assays and TaqMan
Universal Master Mix, NoAmpEraseUNG, with an ABI 7900 HT real-time PCR
machine. The PCR conditions were 2 min at 50 C, 10 min at 95 C, followed by 40
cycles of 15 s at 95 C, and finally 1 min at 60 C. The spiked-in syn-cel-miR-39
goes through the entire RNA isolation process and serves as endogenous control
for data normalization.
TaqMan assay data processing
SDS software (ABI) was used to collect the data and the RQ Manager Program
(ABI) was used to assign, check and standardize CT values. Data Assist software
was used to normalize the data to the syn-cel-miR-39. For threshold cycles below
40, the corresponding microRNA was considered detected, higher cycle numbers
were not included in the calculations. The results were represented using the
ddCT method (2 –ddCT, User Bulletin, ABI).
Data analysis
Statistical analysis was performed using SPSS 20 (IBM, Inc.) package for
Windows. Data were tested for normal distribution using the Kolmogorov-
Smirnov test. The Grubbs’ test for outlier detection was applied (http://graphpad.
com/support/faqid/1598/). Depending on the distribution pattern and the total
Decreased Serum Level of miR-146a in Type 2 Diabetic Patients
PLOS ONE | DOI:10.1371/journal.pone.0115209 December 12, 2014 4 / 16

number of subjects, parametric (normal distribution, independent t test) or
nonparametric group comparison (Mann-Whitney U test) were applied.
Correlations were determined by Spearman correlation. Level of significance were
set at p50.05 (two tailed). A dendrogram visualizing associations was constructed
in SPSS using hierarchical cluster analysis of the serum cytokines using the
between-groups linkage method. Hierarchical regression analysis was used to test
if means of miR-146a, IL-8 and HGF were significantly different between Non
diabetic controls and T2D patients, when controlling for BMI and lipids. Graphs
were designed with GraphPad Prism 5.04 (GraphPad Software, Inc.) for
Windows.
Results
Patient and control characteristics
Table 1 shows the number of patients and non-diabetic controls used for this
study and their ages, gender, HbA1c/hyperglycemia, BMI, lipid profile and
medication. As expected, the T2D patients had a significantly higher fasting
glucose and HbA1c level as the non-diabetic controls. 70% of the patients used
oral anti-diabetic treatment and 30% used insulin. Of the patients 61% had a
history of cardiovascular disease, while 48% had a family history (1st, 2nd degree)
of diabetes (values were 29% and 29% respectively for the non-diabetic control
group).
With regard to the non-diabetic control group, we selected the controls by
asking hospital staff (60%) and accompanying care takers (40%) to volunteer to
donate blood at the same time as the patients were investigated. Controls needed
to be over 30 years of age, while we tried to match as much as possible for gender.
Table 1 show that we did not completely succeed in matching for age, since our
controls were on average 8 years younger than the T2D patients. Gender
distribution was not significantly different with a slight over representation of
women in the control group.
We found the collected non-diabetic controls to be as overweight as the patients
with a normal BMI in only 17.5% of the 40 non-diabetic controls as compared to
14.8% of the 56 T2D patients. There were no differences in BMI between non-
diabetic hospital staff and non-diabetic care-takers. The T2D patients and non-
diabetic controls also appeared to have the same disturbed lipid profile; the non-
diabetic controls had hypercholesterolemia in 67.5% of individuals, the T2D
patients had a hypercholesterolemia in 60.7% of cases (for further details see
Table 1). There were again no differences between non-diabetic hospital staff and
non-diabetic care-takers with regard to dislipidemia.
MicroRNA’s, cytokines, chemokines and growth factors in serum
Table 2 gives the mean and standard error of the mean (SEM) of the fold change
values of the two tested microRNAs (146a and 155 versus the reference
Decreased Serum Level of miR-146a in Type 2 Diabetic Patients
PLOS ONE | DOI:10.1371/journal.pone.0115209 December 12, 2014 5 / 16
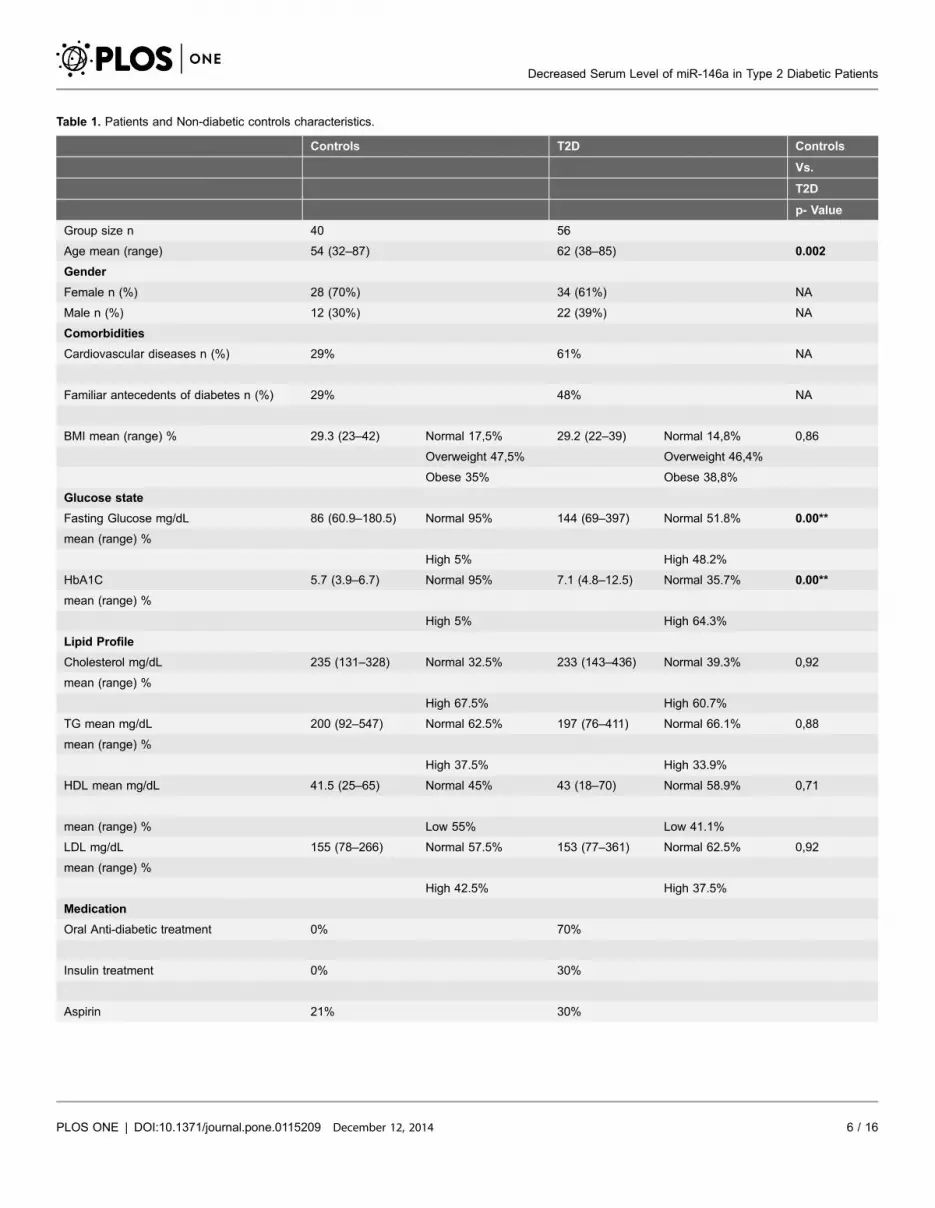
Table 1. Patients and Non-diabetic controls characteristics.
Controls T2D Controls
Vs.
T2D
p- Value
Group size n 40 56
Age mean (range) 54 (32–87) 62 (38–85) 0.002
Gender
Female n (%) 28 (70%) 34 (61%) NA
Male n (%) 12 (30%) 22 (39%) NA
Comorbidities
Cardiovascular diseases n (%) 29% 61% NA
Familiar antecedents of diabetes n (%) 29% 48% NA
BMI mean (range) % 29.3 (23–42) Normal 17,5% 29.2 (22–39) Normal 14,8% 0,86
Overweight 47,5% Overweight 46,4%
Obese 35% Obese 38,8%
Glucose state
Fasting Glucose mg/dL 86 (60.9–180.5) Normal 95% 144 (69–397) Normal 51.8% 0.00**
mean (range) %
High 5% High 48.2%
HbA1C 5.7 (3.9–6.7) Normal 95% 7.1 (4.8–12.5) Normal 35.7% 0.00**
mean (range) %
High 5% High 64.3%
Lipid Profile
Cholesterol mg/dL 235 (131–328) Normal 32.5% 233 (143–436) Normal 39.3% 0,92
mean (range) %
High 67.5% High 60.7%
TG mean mg/dL 200 (92–547) Normal 62.5% 197 (76–411) Normal 66.1% 0,88
mean (range) %
High 37.5% High 33.9%
HDL mean mg/dL 41.5 (25–65) Normal 45% 43 (18–70) Normal 58.9% 0,71
mean (range) % Low 55% Low 41.1%
LDL mg/dL 155 (78–266) Normal 57.5% 153 (77–361) Normal 62.5% 0,92
mean (range) %
High 42.5% High 37.5%
Medication
Oral Anti-diabetic treatment 0% 70%
Insulin treatment 0% 30%
Aspirin 21% 30%
Decreased Serum Level of miR-146a in Type 2 Diabetic Patients
PLOS ONE | DOI:10.1371/journal.pone.0115209 December 12, 2014 6 / 16

syn-cel-miR-39) in the serum of the T2D patients as compared to the non-
diabetic controls. The serum levels of miR-146a were significantly reduced in T2D
patients as compared to the non-diabetic controls (Fig. 1), those of miR-155 were
not. Nevertheless there existed a good correlation between the serum levels of
both microRNAs (r50.478; p,0.001).
Fig. 2 shows the unsupervised cluster analysis of the levels of the microRNAs
and the tested T2D-related cytokines, chemokines and growth factors in the
serum of patients and non-diabetic controls. As can be seen from the diagram
Table 1. Cont.
Controls T2D Controls
Vs.
T2D
p- Value
Statins (%) 0% 0%
Values in bold denote a significant difference between two groups.Table 1 shows the number of patients and controls used in this study and their ages, gender, comorbidities, HbA1c/hyperglycemia, BMI, lipid profile andmedication use.
doi:10.1371/journal.pone.0115209.t001
Table 2. Cytokines, chemokines and growth factors in Non-diabetic controls and T2D patients.
Controls vs. T2D
T2D T test
N Mean (SEM) p-Value
NGF 56 1,24 0,36 0,707
IL1beta 56 0,79 0,18 0,686
IL6 56 1,38 0,21 0,131
CCL4 56 0,92 0,1 0,775
HGF 56 1,34 0,09 0.023*
TNFalpha 56 1,11 0,07 0,22
Resistin 56 1,19 0,08 0,097
IL8 56 2,19 0,36 0.011*
Adiponectin 56 1,25 0,14 0,222
CCL2 56 1,00 0,07 0,883
miR146a 56 0,61 0,05 0.042*
miR155 56 0,93 0,07 0,844
Leptin 56 0,86 0,11 0,338
PAI1 56 1,17 0,23 0,565
Values in bold denote a significant difference between two groupsGroup size, mean and SEM in the order of the cluster analysis. To avoid inter-assay variation, serum levels (pg/ml) were expressed in fold change comparedto non-diabetic controls, the average of the Controls in each assay was set to one. Differences between groups were tested using independent T test. Levelsof significance were set at p50.05 (two-tailed).
doi:10.1371/journal.pone.0115209.t002
Decreased Serum Level of miR-146a in Type 2 Diabetic Patients
PLOS ONE | DOI:10.1371/journal.pone.0115209 December 12, 2014 7 / 16

there was the expected strong clustering of both microRNAs, which also clustered
to some extent with leptin. With regard to the other cytokines and chemokines,
there existed a clustering of the pro-inflammatory mediators CCL4, IL-6, IL-1b
and NGF, and between TNF-a, IL-8, HGF and resistin. To avoid inter-assay
variation, serum levels were expressed in fold changes compared to controls for
each mediator.
Table 2 gives the relative levels of the tested cytokines, chemokines and other
mediators in the serum of the T2D patients and non-diabetic controls in the order
of the cluster analysis. From the factors determined, only the levels of IL-8 and
Fig. 1. Expression level of serum miR-146a in Ecuadorian Non-diabetic controls and T2D patients.Fig. 1 shows mean and standard deviation of the fold change values of miR-146a (reference microRNA sync-cel-mir-39) in the serum of the T2D patients as compared to Non-diabetic controls. Differences betweengroups were tested using independent T test. Levels of significance were set at p50.05 (two-tailed).
doi:10.1371/journal.pone.0115209.g001
Fig. 2. Dendrogram of unsupervised hierarchical cluster analysis of the tested serum levels ofmicroRNAs, cytokines, chemokines and growth factors in T2D patients and Non-diabetic controls. Thedendrogram shows the clustering of miR-146a and miR-155, and of the pro-inflammatory cytokines CCL4, IL-6, IL-1b and NGF and of TNF-a, IL-8, HGF and resistin.
doi:10.1371/journal.pone.0115209.g002
Decreased Serum Level of miR-146a in Type 2 Diabetic Patients
PLOS ONE | DOI:10.1371/journal.pone.0115209 December 12, 2014 8 / 16

HGF appeared to be significantly different between T2D patients and the non-
diabetic controls. Both IL-8 and HGF levels were higher in the serum of the T2D
patients as compared to the non-diabetic controls. Resistin was also higher in the
serum of the patients, but only approached the level of significance (p50.09). All
in all, the picture emerges of particularly the cluster of HGF, TNF-a, Resistin and
IL-8 to be raised in the serum of the diabetic patients versus the non-diabetic
controls.
The correlations of the level of the microRNAs with the cytokines/
chemokines/growth factors and clinical variables
We performed correlation analyses between the different parameters measured
and only took correlations with a level of p,0.01 into consideration.
Since our patients and non-diabetic controls differed 8 years in age we took
special notice of correlations with age. The microRNAs did not correlate with age.
Of the cytokines HGF, resistin and adiponectin correlated positively to age. It is
important to note that correction for age did not change the association of HGF
with disease (r50.258, p50.008). Of the clinical variables HbA1c levels correlated
to age.
It is also of note that the levels of miR-146a and miR-155 correlated to each
other, corroborating our findings in the cluster diagram. With regard to
correlations of microRNAs with cytokines we found miR-146a to correlate
significantly and positively to the serum PAI level (r50.259; p50.01). There were
no correlations of miR-146a and clinical variables. The serum miR-155 level
correlated significant to the serum leptin level (r50.326, p50.001) and IL-8
(r50.268, p50.008).
Serum IL-8 levels correlated to HbA1c levels (r50.301; p50.003) and also
positively to TNFa levels (r50.288, p50.004), which in turn correlated to HGF
levels (r50.367; p50.000), corroborating our findings in the cluster diagram
(Fig. 2). Positive correlations were also found between HGF and resistin levels and
resistin and IL-6 levels, again corroborating the findings in the cluster diagram
(Fig. 2).
Expected significant correlations were between leptin and BMI and leptin and
leptin and gender.
Discussion
In this study we determined two inflammation-related microRNAs in the serum
of Ecuadorian T2D patients. We observed a significantly reduced level of one of
these microRNAs, i.e. of miR-146a, in the serum of T2D patients as compared to a
non-diabetic control group. Reduced expression of miR-146a is classically
considered a sign of a pro-inflammatory state. Boldin et al. described that miR-
146a-null mice systematically overproduce pro-inflammatory cytokines (such as
TNF-a, IL-6 and IL-1b) in response to injection with a sub-lethal LPS dose. Tissue
Decreased Serum Level of miR-146a in Type 2 Diabetic Patients
PLOS ONE | DOI:10.1371/journal.pone.0115209 December 12, 2014 9 / 16

macrophages were the primary source of this enhanced pro-inflammatory
cytokine production. This implicates miR-146a in attenuating macrophage
inflammatory responses [40]. In agreement with these results, in vitro studies
show that induction of miR-146a expression in monocyte/macrophage cell lines
negatively regulates the inflammatory response [23, 41], while transfection with
miR-146a inhibitors in both resting and LPS-stimulated macrophage-like cell lines
had an opposite effect and resulted in an up-regulation of these inflammation-
related genes. Collectively these data show that miR-146a is a strong down
regulator of the production of classical inflammatory compounds in macro-
phages.
We also found the level of serum IL-8 significantly up regulated in the T2D
patients as compared to the non-diabetic controls in agreement with previous
findings of Herder et al [42]. IL-8 is considered a primary cytokine for M1
inflammatory macrophages. On the basis of these significant alterations in miR-
146a and IL-8 levels we like to conclude that our study supports the concept of an
activation of the inflammatory response system in T2D patients. The correlation
of the IL-8 level with Hb1Ac supports the idea that chronic hyperglycemia plays at
least a partial role in this activation.
A limitation of our study is that our non-diabetic control group was not
matched for age to our diabetic patient group, and non-diabetic controls were on
average 8 years younger than our patients; patients and non-diabetic controls did
have similar readings for lipid profiles and BMI. In correlation analysis miR-146a
levels and IL-8 levels appeared not to be dependent of age. When we performed
hierarchical regression analysis for BMI and lipid profiles, it appeared that the
disease state always was the determinant for abnormal miR-146a and IL-8 levels
and that BMI and lipid profiles did virtually not determine these levels, except for
IL-8 which was also determined by the cholesterol levels (see S1 and S2 Table).
We are thus confident that indeed abnormal levels of miR-146a and IL-8 are
determined by the T2D state in this study.
A reduced level of miR-155 has been described in the circulating leukocytes of
T2D patients [32]. However we were not able to find a significant change of miR-
155 in the serum of T2D patients as compared to our non-diabetic control group.
We however did find a significant positive correlation between the serum levels of
miR-155 and miR-146a and we found a clustered expression of both miR-146a
and miR-155 with leptin in cluster analysis. Since leptin is primarily derived from
adipose tissue, this might suggest that a significant proportion of the circulating
microRNAs miR-146a and miR-155 is produced by activated macrophages and
adipocytes in adipose tissue.
Our T2D cases lacked a significant over-expression of several classical pro-
inflammatory compounds in serum: similar levels of TNF-a, IL-1b and IL-6 were
found in the serum of patients and non-diabetic controls. This contrasts to
previous findings by others, such as Costantini et al., who observed increased
levels of IL-1a, leptin, resistin and PAI-1 in T2D patients [43]. Our negative
findings might be due to the fact that our non-diabetic controls appeared to have
many signs of the metabolic syndrome: BMI values were over 25 in 82.5%
Decreased Serum Level of miR-146a in Type 2 Diabetic Patients
PLOS ONE | DOI:10.1371/journal.pone.0115209 December 12, 2014 10 / 16

(average BMI 29.3), while hypercholesterolemia was present in 67.5% with raised
LDL in 42.5% of non-diabetic controls. These values were similar to the ones
found in the T2D cases. The Ecuadorian non-diabetic control group was
composed of care-takers (40%, friends and family), and hospital staff (60%) from
the Quito area. Considering this excessively high prevalence of obesity and
dyslipidemia in the Quito non-diabetic control group, it is important to note that
a recent healthcare report of the Ecuadorian government corroborates this high
prevalence of obesity and dyslipidemia in urban Ecuadorian populations [44].
In a parallel study we have collected Dutch T2D patients and Dutch non-
diabetic controls that were tested at the same time with the same multi-analyte
system for cytokines and growth factors. The Dutch healthy controls had on
average a BMI of 23.8 and had normal lipid values (hypercholesterolemia none,
raised LDL 14%). Interestingly our Ecuadorian ‘‘healthy’’ control group indeed
had higher levels of CCL4 and IL-6 (see S4 Table), suggesting that in particular
obesity and dyslipidemia determine a higher level of these classical pro-
inflammatory cytokines in serum, and not (only) the diabetes state and/or
pathology per se.
Reduced levels of miR-146a have previously been found in T2D patients, be it
in circulating leukocytes [20]. However, our report contrasts with another report
that showed elevated levels of miR-146a in the serum of newly diagnosed T2D
patients [38]. These elevated levels were found in comparison to the serum levels
of pre-diabetic individuals with a disturbed OGT and T2D-susceptible individuals
(family), who only had a moderate overweight (average BMI of 26) and moderate
hypercholesterolemia (average 5.6 mmol/l), as had the newly T2D cases in that
study. We therefore assume that the distinct status of the control population with
regard to obesity and/or severe dyslipidemia might have played a role in the
differences. In addition, our T2D patients had longstanding diabetes, and the
stage of disease may have played a role as well.
Apart from the involvement of inflammatory miR-146a and IL-8, our study
suggests an involvement of other molecular systems associated with the failure to
control glucose homeostasis on the background of an already existing obesity and
dyslipidemia.
First, significantly higher serum levels of HGF were found in the T2D patients
as compared to the non-diabetic controls. HGF levels correlated to age, but
correction for age left the association with T2D intact (similar results were
obtained with corrections for BMI and dyslipidemia, see S3 Table). HGF was first
described as a hepatocyte factor involved in liver regeneration after partial
hepatectomy [45]. Recent evidence shows that the factor is also produced by
monocytes and macrophages and that it is involved in various regeneration
processes, including vascular repair and b cell growth [46–48]. HGF can thus be
viewed as a key factor in insulin resistance-associated compensatory mechanisms
at the level of the pancreatic islet by stimulating its regeneration and at the level of
the vasculature by stimulating repair of hyperglycemia-damaged vessels by
inducing proliferation of endothelial cells. In marked contrast, however, HGF has
also been implicated with a pathogenic role in macrovascular disease as HGF
Decreased Serum Level of miR-146a in Type 2 Diabetic Patients
PLOS ONE | DOI:10.1371/journal.pone.0115209 December 12, 2014 11 / 16

levels in type 2 diabetes patients correlated positively with carotid intimal-media
thickness and plaque score [49].
In addition to a higher level of HGF there was also an over-expression (non-
significant, p50.09) of resistin in the serum of the Ecuadorian T2D cases as
compared to the non-diabetic controls. Resistin was initially identified in
adipocytes, but significant levels of resistin expression in humans are mainly
found in immune cells, particularly monocytes [50, 51]. Resistin was first
described as a factor contributing to the development of insulin resistance and
diabetes in humans, but debate is still ongoing regarding its role in obesity, insulin
sensitivity and the development of T2D. In addition also evidence for a
pathogenic role of resistin in atherogenic vascular diseases is growing [52, 53].
In conclusion this study shows signs of chronic inflammation (decreased serum
anti-inflammatory miR-146a/increased IL-8) and signs of islet and vascular repair
(increased HGF) in patients with a failure to control glucose homeostasis when
compared to non-diabetic controls with a similar prevalence of obesity and
dyslipidemia. Our study also suggests that miR-146a can be considered as a serum
biomarker of the inflammatory process linked to the failure of glucose control of
the T2D state against a background of obesity and dyslipidemia.
Supporting Information
S1 Table. Hierarchical Regression Model of miRNA-146a. Hierarchical
regression analysis for BMI and lipid profiles shows that the disease state was the
determinant for abnormal miR-146a.
doi:10.1371/journal.pone.0115209.s001 (DOCX)
S2 Table. Hierarchical Regression Model of IL-8. Hierarchical regression analysis
for BMI and lipid profiles shows that the disease state and cholesterol levels were
the determinant for abnormal IL-8.
doi:10.1371/journal.pone.0115209.s002 (DOCX)
S3 Table. Hierarchical Regression Model of HGF. Hierarchical regression
analysis for BMI and lipid profiles shows that the disease state was the
determinant for abnormal HGF.
doi:10.1371/journal.pone.0115209.s003 (DOCX)
S4 Table. Cytokines and chemokines mediators of Ecuadorian Non-diabetic
controls and Dutch healthy controls. Group size, median, inter-quartile range
(IQR) and p-values obtained by Mann—Whitney U-test is represented. Serum
levels (pg/ml) are shown in the order of the cluster analysis. In a parallel study we
have collected Dutch healthy controls that were tested at the same time with the
same multi-analyte system for cytokines and growth factors. Ecuadorian non-
diabetic controls showed higher levels of the classical pro-inflammatory cytokines
(CCL4 and IL-6).
doi:10.1371/journal.pone.0115209.s004 (DOCX)
Decreased Serum Level of miR-146a in Type 2 Diabetic Patients
PLOS ONE | DOI:10.1371/journal.pone.0115209 December 12, 2014 12 / 16

S1 Data. Raw data points of the tested serum levels of microRNAs, cytokines,
chemokines and growth factors of T2D patients and Non-diabetic controls. The
levels of TNFa, IL-1b, IL-6, NGF, HGF, PAI, Resistin, CCL2 (MCP-1),
Adiponectin, Leptin, IL-8, and MIP1b (CCL4) were measured by flow cytometry
(BD LSR II Biosciences, California, and EE.UU.) using a commercially available
multi-analyte cytometric bead array system (Milliplex Map, U.S.A.). MicroRNA
quantitative real-time PCR (qPCR) was performed using pre-designed TaqMan
microRNA, with an ABI 7900 HT real-time PCR machine. SDS software (ABI)
was used to collect the data.
doi:10.1371/journal.pone.0115209.s005 (ZIP)
Acknowledgments
The authors would like to acknowledge W. Beumer (Erasmus MC, Rotterdam,
The Netherlands) for his scientific perspective; MD. MSc. Jorge Perez G (Leiden
University Medical Center, The Netherlands) for the figure design; MD. Internist
Cesar Procel, Clınica Pasteur, Quito, Ecuador; MD. Oftalmologist Sandra
Montalvo, Fundacion Oftalmologica del Valle; MDD. Johnson Viteri, Club de
Leones La Villaflora, Quito, Ecuador; Corporacion Ecuatoriana de Biotecnologıa,
and Fundacion Ecuatoriana de la Psoriasis for the patients recruitment and
logistic support.
Author ContributionsConceived and designed the experiments: LB KW HD PL. Performed the
experiments: LB KW HW AVO. Analyzed the data: LB KW HW BO FS ES LG HD
PL. Contributed reagents/materials/analysis tools: LB KW AVO HW LG. Wrote
the paper: LB KW HW BO AVO FS ES LG WF HD PL.
References
1. Hotamisligil GS, Shargill NS, Spiegelman BM (1993) Adipose expression of tumor necrosis factor-alpha: direct role in obesity-linked insulin resistance. Science 259(5091): 87–91.
2. Hotamisligil GS, Peraldi P, Budavari A, Ellis R, White MF, et al. (1996) IRS-1-mediated inhibition ofinsulin receptor tyrosine kinase activity in TNF-alpha- and obesity-induced insulin resistance. Science271(5249): 665–668.
3. Peraldi P, Hotamisligil GS, Buurman WA, White MF, Spiegelman BM (1996) Tumor necrosis factor(TNF)-alpha inhibits insulin signaling through stimulation of the p55 TNF receptor and activation ofsphingomyelinase. The Journal of biological chemistry 1996 271(22): 13018–13022.
4. Scazzocchio B, Vari R, D’Archivio M, Santangelo C, Filesi C, et al. (2009) Oxidized LDL impairadipocyte response to insulin by activating serine/threonine kinases. Journal of lipid research 50(5):832–845.
5. Israel A (2010) The IKK complex, a central regulator of NF-kappaB activation. Cold Spring Harborperspectives in biology 2(3): a000158.
6. Nakamori Y, Emoto M, Fukuda N, Taguchi A, Okuya S, et al. (2006) Myosin motor Myo1c and itsreceptor NEMO/IKK-gamma promote TNF-alpha-induced serine307 phosphorylation of IRS-1. TheJournal of cell biology 173(5): 665–671.
Decreased Serum Level of miR-146a in Type 2 Diabetic Patients
PLOS ONE | DOI:10.1371/journal.pone.0115209 December 12, 2014 13 / 16

7. Bastard JP, Maachi M, Lagathu C, Kim MJ, Caron M, et al. (2006) Recent advances in the relationshipbetween obesity, inflammation, and insulin resistance. European cytokine network 17(1): 4–12.
8. Hooper PL (2009) Inflammation, heat shock proteins, and type 2 diabetes. Cell stress & chaperones14(2): 113–115.
9. Karki S, Chakrabarti P, Huang G, Wang H, Farmer SR, et al. (2011) The multi-level action of fatty acidson adiponectin production by fat cells. PloS one 6(11): e28146.
10. Mooradian AD. Dyslipidemia in type 2 diabetes mellitus. Nature clinical practice Endocrinology &metabolism 2009 5(3)150–159.
11. Wilcox G (2005) Insulin and insulin resistance. The Clinical biochemist Reviews/Australian Associationof Clinical Biochemists 26(2): 19–39.
12. Hajer GR, van Haeften TW, Visseren FL (2008) Adipose tissue dysfunction in obesity, diabetes, andvascular diseases. European heart journal 29(24): 2959–2971.
13. Qu D, Liu J, Lau CW, Huang Y (2014) Interleukin-6 in diabetes and cardiovascular complications.British journal of pharmacology.
14. Febbraio MA (2014) Role of interleukins in obesity: implications for metabolic disease. Trends inendocrinology and metabolism: TEM.
15. Pickup JC (2004) Inflammation and activated innate immunity in the pathogenesis of type 2 diabetes.Diabetes care 27(3): 813–823.
16. Spranger J, Kroke A, Mohlig M, Hoffmann K, Bergmann MM, et al. (2003) Inflammatory cytokinesand the risk to develop type 2 diabetes: results of the prospective population-based EuropeanProspective Investigation into Cancer and Nutrition (EPIC)-Potsdam Study. Diabetes 52(3): 812–817.
17. Hu FB, Meigs JB, Li TY, Rifai N, Manson JE (2004) Inflammatory markers and risk of developing type 2diabetes in women. Diabetes 53(3): 693–700.
18. Kolfschoten IG, Roggli E, Nesca V, Regazzi R (2009) Role and therapeutic potential of microRNAs indiabetes. Diabetes, obesity & metabolism 11 Suppl 4: 118–129.
19. McClelland AD, Kantharidis P (2014) microRNA in the development of diabetic complications. Clin Sci(Lond) 126(2): 95–110.
20. Balasubramanyam M, Aravind S, Gokulakrishnan K, Prabu P, Sathishkumar C, et al. (2011)Impaired miR-146a expression links subclinical inflammation and insulin resistance in Type 2 diabetes.Molecular and cellular biochemistry 351(1–2): 197–205.
21. Cui JG, Li YY, Zhao Y, Bhattacharjee S, Lukiw WJ (2010) Differential regulation of interleukin-1receptor-associated kinase-1 (IRAK-1) and IRAK-2 by microRNA-146a and NF-kappaB in stressedhuman astroglial cells and in Alzheimer disease. The Journal of biological chemistry 285(50): 38951–38960.
22. Liu F, Zeng ZG, Ding CZ, Shao Q, Li Y, et al. (2010) [Expression of microRNA-146a inlipopolysaccharide challenged alveolar macrophages in vitro]. Zhongguo wei zhong bing ji jiu yi xue5 Chinese critical care medicine 5 Zhongguo weizhongbing jijiuyixue 22(9): 540–542.
23. Nahid MA, Pauley KM, Satoh M, Chan EK (2009) miR-146a is critical for endotoxin-induced tolerance:IMPLICATION IN INNATE IMMUNITY. The Journal of biological chemistry 284(50): 34590–34599.
24. Taganov KD, Boldin MP, Chang KJ, Baltimore D (2006) NF-kappaB-dependent induction of microRNAmiR-146, an inhibitor targeted to signaling proteins of innate immune responses. Proceedings of theNational Academy of Sciences of the United States of America 103(33): 12481–12486.
25. Xu WD, Lu MM, Pan HF, Ye DQ (2012) Association of MicroRNA-146a with autoimmune diseases.Inflammation 35(4): 1525–1529.
26. Bi Y, Liu G, Yang R (2009) MicroRNAs: novel regulators during the immune response. Journal of cellularphysiology 218(3): 467–472.
27. Donners MM, Wolfs IM, Stoger LJ, van der Vorst EP, Pottgens CC, et al. (2012) HematopoieticmiR155 deficiency enhances atherosclerosis and decreases plaque stability in hyperlipidemic mice.PloS one 7(4): e35877.
Decreased Serum Level of miR-146a in Type 2 Diabetic Patients
PLOS ONE | DOI:10.1371/journal.pone.0115209 December 12, 2014 14 / 16

28. El-Ekiaby N, Hamdi N, Negm M, Ahmed R, Zekri AR, et al. (2012) Repressed induction of interferon-related microRNAs miR-146a and miR-155 in peripheral blood mononuclear cells infected with HCVgenotype 4. FEBS open bio 2: 179–186.
29. O’Connell RM, Taganov KD, Boldin MP, Cheng G, Baltimore D (2007) MicroRNA-155 is inducedduring the macrophage inflammatory response. Proceedings of the National Academy of Sciences of theUnited States of America 104(5): 1604–1609.
30. O’Connell RM, Kahn D, Gibson WS, Round JL, Scholz RL, et al. (2010) MicroRNA-155 promotesautoimmune inflammation by enhancing inflammatory T cell development. Immunity 33(4): 607–619.
31. Urbich C, Kuehbacher A, Dimmeler S (2008) Role of microRNAs in vascular diseases, inflammation,and angiogenesis. Cardiovascular research 79(4): 581–588.
32. Corral-Fernandez NE, Salgado-Bustamante M, Martinez-Leija ME, Cortez-Espinosa N, Garcia-Hernandez MH, et al. (2013) Dysregulated miR-155 expression in peripheral blood mononuclear cellsfrom patients with type 2 diabetes. Experimental and clinical endocrinology & diabetes: official journal,German Society of Endocrinology [and] German Diabetes Association 121(6): 347–353.
33. Grasedieck S, Scholer N, Bommer M, Niess JH, Tumani H, et al. (2012) Impact of serum storageconditions on microRNA stability. Leukemia 26(11): 2414–2416.
34. Cheng L, Sharples RA, Scicluna BJ, Hill AF (2014) Exosomes provide a protective and enrichedsource of miRNA for biomarker profiling compared to intracellular and cell-free blood. Journal ofextracellular vesicles 3.
35. Chen X, Ba Y, Ma L, Cai X, Yin Y, Wang K, et al. (2008) Characterization of microRNAs in serum: anovel class of biomarkers for diagnosis of cancer and other diseases. Cell research 18(10): 997–1006.
36. Mitchell PS, Parkin RK, Kroh EM, Fritz BR, Wyman SK, et al. (2008) Circulating microRNAs as stableblood-based markers for cancer detection. Proceedings of the National Academy of Sciences of theUnited States of America 105(30): 10513–10518.
37. Sethi P, Lukiw WJ (2009) Micro-RNA abundance and stability in human brain: specific alterations inAlzheimer’s disease temporal lobe neocortex. Neuroscience letters 459(2): 100–104.
38. Kong L, Zhu J, Han W, Jiang X, Xu M, et al. (2011) Significance of serum microRNAs in pre-diabetesand newly diagnosed type 2 diabetes: a clinical study. Acta diabetologica 48(1): 61–69.
39. Diagnosis and classification of diabetes mellitus. (2011) Diabetes care, 34 Suppl 1: S62–69.
40. Boldin MP, Taganov KD, Rao DS, Yang L, Zhao JL, et al. (2011) miR-146a is a significant brake onautoimmunity, myeloproliferation, and cancer in mice. The Journal of experimental medicine 208(6):1189–1201.
41. Perry MM, Moschos SA, Williams AE, Shepherd NJ, Larner-Svensson HM, et al. (2008) Rapidchanges in microRNA-146a expression negatively regulate the IL-1beta-induced inflammatory responsein human lung alveolar epithelial cells. J Immunol 180(8): 5689–5698.
42. Herder C, Baumert J, Thorand B, Martin S, Lowel H, et al. (2006) Chemokines and incident coronaryheart disease: results from the MONICA/KORA Augsburg case-cohort study, 1984–2002.Arteriosclerosis, thrombosis, and vascular biology 26(9): 2147–2152.
43. Costantini S, Capone F, Guerriero E, Marfella R, Sorice A, et al. (2012) Cytokinome profile of patientswith type 2 diabetes and/or chronic hepatitis C infection. PloS one 7(6): e39486.
44. Freire WR, Ramirez MJ, Belmont P, Mendieta M, Silva K, et al. (2013) RESUMEN EJECUTIVO,TOMO I. Encuesta Nacional de Salud y Nutricion Ecuador. ENSANUT-ECU 2011–2013. In: Ministerio deSalud Publica/Instituto Nacional de Estadıstica y Censos Quito- Ecuador.
45. You WK, McDonald DM (2008) The hepatocyte growth factor/c-Met signaling pathway as a therapeutictarget to inhibit angiogenesis. BMB reports 41(12): 833–839.
46. Saiki A, Watanabe F, Murano T, Miyashita Y, Shirai K (2006) Hepatocyte growth factor secreted bycultured adipocytes promotes tube formation of vascular endothelial cells in vitro. Int J Obes (Lond)30(11): 1676–1684.
47. Schubert SY, Benarroch A, Ostvang J, Edelman ER (2008) Regulation of endothelial cell proliferationby primary monocytes. Arteriosclerosis, thrombosis, and vascular biology 28(1): 97–104.
48. Alvarez-Perez JC, Ernst S, Demirci C, Casinelli GP, Mellado-Gil JM, et al. (2014) Hepatocyte growthfactor/c-Met signaling is required for beta-cell regeneration. Diabetes 63(1): 216–223.
Decreased Serum Level of miR-146a in Type 2 Diabetic Patients
PLOS ONE | DOI:10.1371/journal.pone.0115209 December 12, 2014 15 / 16

49. Satani K, Konya H, Hamaguchi T, Umehara A, Katsuno T, et al. (2006) Clinical significance ofcirculating hepatocyte growth factor, a new risk marker of carotid atherosclerosis in patients with Type 2diabetes. Diabetic medicine: a journal of the British Diabetic Association 23(6): 617–622.
50. Lee S, Lee HC, Kwon YW, Lee SE, Cho Y, et al. (2014) Adenylyl cyclase-associated protein 1 is areceptor for human resistin and mediates inflammatory actions of human monocytes. Cell metabolism19(3): 484–497.
51. Nagaev I, Bokarewa M, Tarkowski A, Smith U (2006) Human resistin is a systemic immune-derivedproinflammatory cytokine targeting both leukocytes and adipocytes. PloS one 1: e31.
52. Burnett MS, Lee CW, Kinnaird TD, Stabile E, Durrani S, et al. (2005) The potential role of resistin inatherogenesis. Atherosclerosis 182(2): 241–248.
53. Rashid S (2013) Mechanism by which Elevated Resistin Levels Accelerate AtheroscleroticCardiovascular Disease. Rheumatol Curr Res 3(115).
Decreased Serum Level of miR-146a in Type 2 Diabetic Patients
PLOS ONE | DOI:10.1371/journal.pone.0115209 December 12, 2014 16 / 16