characterization of the first tetrameric transcription factor of the
TRANSCRIPT
HAL Id: hal-03367389https://hal.archives-ouvertes.fr/hal-03367389
Submitted on 6 Oct 2021
HAL is a multi-disciplinary open accessarchive for the deposit and dissemination of sci-entific research documents, whether they are pub-lished or not. The documents may come fromteaching and research institutions in France orabroad, or from public or private research centers.
L’archive ouverte pluridisciplinaire HAL, estdestinée au dépôt et à la diffusion de documentsscientifiques de niveau recherche, publiés ou non,émanant des établissements d’enseignement et derecherche français ou étrangers, des laboratoirespublics ou privés.
Characterization of the first tetrameric transcriptionfactor of the GntR superfamily with allosteric regulation
from the bacterial pathogen Agrobacterium fabrumArmelle Vigouroux, Thibault Meyer, Anaïs Naretto, Pierre Legrand, MagaliAumont-Nicaise, Aurélie Di cicco, Sébastien Renoud, Jeanne Doré, Daniel
Lévy, Ludovic Vial, et al.
To cite this version:Armelle Vigouroux, Thibault Meyer, Anaïs Naretto, Pierre Legrand, Magali Aumont-Nicaise, et al..Characterization of the first tetrameric transcription factor of the GntR superfamily with allostericregulation from the bacterial pathogen Agrobacterium fabrum. Nucleic Acids Research, Oxford Uni-versity Press, 2021, 49 (1), pp.529-546. �10.1093/nar/gkaa1181�. �hal-03367389�
- 1 -
Characterization of the first tetrameric transcription factor of the 1
GntR superfamily with allosteric regulation from the bacterial 2
pathogen Agrobacterium fabrum 3
Armelle Vigouroux1†, Thibault Meyer2†, Anaïs Naretto1#, Pierre Legrand3, Magali Aumont-Nicaise1, 4 Aurélie Di Cicco4, Sébastien Renoud2, Jeanne Doré2, Daniel Lévy4, Ludovic Vial2, Céline Lavire2*, 5 Solange Moréra1* 6
1 Université Paris-Saclay, CEA, CNRS, Institute for Integrative Biology of the Cell (I2BC), 91198, Gif-7 sur-Yvette, France 8
2 Université Claude Bernard Lyon 1, CNRS, INRAE, VetAgro Sup, UMR Ecologie Microbienne, 69622 9 Villeurbanne, France 10
3 Synchrotron SOLEIL, L'Orme des Merisiers, Saint-Aubin, 91192, Gif-sur-Yvette, France 11
4 Laboratoire Physico Chimie Curie, Institut Curie, PSL Research University, CNRS UMR 168, Paris 12
75005, France 13
#Present Address: Anaïs Naretto, Department of Biochemistry, Vanderbilt University, Nashville, 14 Tennessee, 37235, USA 15 † These authors contributed equally to this work 16
* To whom correspondence should be addressed. Tel: +33169824213; E-mail: 17 [email protected]; Tel: +33426237126 [email protected] 18
19
ABSTRACT 20
A species-specific region, denoted SpG8-1b allowing hydroxycinnamic acids (HCAs) degradation is 21
important for the transition between the two lifestyles (rhizospheric versus pathogenic) of the plant 22
pathogen Agrobacterium fabrum. Indeed, HCAs can be either use as trophic resources and/or as 23
induced-virulence molecules. The SpG8-1b region is regulated by two transcriptional regulators, namely, 24
HcaR (Atu1422) and Atu1419. In contrast to HcaR, Atu1419 remains so far uncharacterized. The high-25
resolution crystal structures of two fortuitous citrate complexes, two DNA complexes and the apoform 26
revealed that the tetrameric Atu1419 transcriptional regulator belongs to the VanR group of Pfam 27
PF07729 subfamily of the large GntR superfamily. Until now, GntR regulators were dimeric. Here, we 28
showed that Atu1419 represses three genes of the HCAs catabolic pathway. We characterized both 29
the effector and DNA binding sites and identified key nucleotides in the target palindrome. From 30
promoter activity measurement using defective gene mutants, structural analysis and gel-shift assays, 31
we propose N5,N10-methylenetetrahydrofolate as the effector molecule, which is not a direct 32
product/substrate of the HCA degradation pathway. The Zn2+ ion present in the effector domain has 33
both a structural and regulatory role. Overall, our work shed light on the allosteric mechanism of 34
transcription employed by this GntR repressor. 35
36
- 2 -
37
38
INTRODUCTION 39
Agrobacterium fabrum has two lifestyles: it can interact with a large variety of plants as a rhizosphere 40
inhabitant or as a pathogen when it harbors a tumor-inducing plasmid (which is a virulence plasmid), 41
and transfers a portion of this to the plant cells upon infection, resulting in the crown-gall disease (1-3). 42
A. fabrum possesses a species-specific region, denoted SpG8-1b (a region present in strains of this 43
species but absent from other Agrobacterium species), located in the circular chromosome and 44
responsible for hydroxycinnamic acids (HCAs) degradation such as ferulic acid, caffeic acid and p-45
coumaric acid (4,5) (Figure 1). These latter compounds are common plant secondary metabolites being 46
precursors of lignin incorporated into plant cell walls. They are abundantly released in soil during the 47
decay of root cells and are significant environmental molecules for soil-and plant-interacting bacteria 48
(6). Although HCAs are generally a strong bacterial repellent, they appear to be chemoattractants in 49
the case of rhizobia and agrobacteria for which they can be used as trophic resources and/or induced-50
virulence molecules (7-11). We have previously showed that HCAs degradation via the SpG8-1b region 51
interferes with virulence genes expression suggesting that this metabolic pathway is important for the 52
transition between the two lifestyles (rhizospheric versus pathogenic) of Agrobacterium (11). Such a 53
transition requires a fine-tune regulation of gene expression to express the appropriate genes at the 54
right time (12-14). 55
56
The SpG8-1b genomic region encodes six enzymes (Figure 1A). Five of them operate in this sequential 57
order for the degradation of ferulic acid leading to different intermediates (5): Atu1416 (a feruloyl-CoA 58
synthase), Atu1417 (an enoyl-CoA hydratase), Atu1415 (a phenylhydroxypropionyl-CoA 59
dehydrogenase), Atu1421 (a 4-hydroxy-3-methoxyphenyl-β-ketopropionyl-CoA β-keto-thiolase) and 60
Atu1420 (a tetrahydrofolate-dependent vanillate O-demethylase). Atu1420 shares 56% sequence 61
identity with Sphingomonas paucimobilis and Sphingobium sp. SYK-6 homologues of known structures 62
(PDB 5TL4 (15) and PDB 5X1I (16), respectively). This enzyme degrades vanillic acid into 63
protocatechuic acid using the tetrahydrofolate (H4F) cofactor and producing the N5-methyl-64
tetrahydrofolate compound (MH4F) (5). Protocatechuic acid is then processed by pca genes to produce 65
intermediates of the tricarboxylic acid (TCA) cycle (17). Based on sequence identity of 29% with the 66
N5,N10-methylene tetrahydrofolate reductase MetF of Sphingobium sp. SYK-6, Atu1418 the sixth 67
enzyme of the SpG8-1b genomic region, is likely a 5,10-methylene tetrahydrofolate reductase which 68
transforms MH4F into N5,N10-methylenetetrahydrofolate (MEF), which would, in turn, allow the 69
regeneration of H4F (4,18) (Figure 1A). 70
Although the SpG8-1b genomic region degrades both ferulic and p-coumaric acids, this latter induces 71
the gene expression of the first part of the SpG8-1b region while ferulic acid induces that of the whole 72
pathway (11). Therefore, two expression units are differently regulated suggesting the existence of two 73
regulators. These regulators are Atu1419 (predicted to be a GntR member) and Atu1422 denoted HcaR 74
- 3 -
(for hydroxycinnamic acid catabolic repressor belonging to the MarR family), respectively (4,11) (Figure 75
1B). HcaR is the repressor of its own transcription and that of the first atu1416 and atu1417 genes of 76
HCA degradation pathway (11). However, because atu1415 and atu1416 belong to the same 77
transcription unit as well as atu1421 and hcaR do, HcaR also regulates atu1415 and atu1421 genes 78
expression, totalizing the regulation of five genes (Figure 1B). In contrast to HcaR, the second 79
regulatory protein Atu1419 likely involved in the second part of the pathway corresponding to the 80
vanillate degradation remains uncharacterized so far. 81
82
Herein, we investigated the molecular role and structural aspects of Atu1419 combining in vitro and in 83
vivo approaches. We first proved that Atu1419 was a transcription repressor of three genes of the 84
second part of the HCA degradation pathway. None of HCA degradation intermediates could release 85
Atu1419 from DNA binding. Nonetheless, structural analysis of five high-resolution crystal structures of 86
Atu1419 in apoform, in complex with a fortuitous citrate molecule bound to the effector domain 87
originated from the crystallization condition (2 structures), in complex with DNA and in complex with 88
both DNA and citrate, helped us infer a possible effector molecule, which was confirmed by gel shift 89
assays and microcalorimetry. The structures revealed Atu1419 to be a member of the VanR group of 90
the FadR C-terminal domain (FCD; Pfam PF07729) subfamily of the large GntR superfamily of 91
transcriptional factors (>93135 members in Pfam database) (19-22). The FCD subfamily encompasses 92
two groups of regulators namely FadR and VanR. So far, the dimeric FadR from Escherichia coli was 93
the best characterized of the FadR group of FCD-GntR regulators shown to be regulated by the acyl-94
CoA effector and able to bind specific palindromic DNA through a winged Helix-Turn-Helix (wHTH) motif 95
(23). Like FadR, Atu1419 possesses a characteristic molecular architecture, composed of a conserved 96
N-terminal DNA binding domain containing the wHTH motif and a C-terminal effector 97
binding/oligomerization domain. Unlike FadR, this latter domain of Atu1419 displays six helices instead 98
of seven observed in members of FadR group. Atu1419 is the first example of a transcriptional regulator 99
of the whole GntR superfamily to be tetrameric. Our work brings new insights into mechanistic aspects 100
of such repressor, which uses an induced-allosteric mechanism for DNA release upon effector binding. 101
102
- 4 -
MATERIAL AND METHODS 103
Bacterial strains and growth conditions 104
The bacteria and plasmids used for this study are listed in Supplementary Table S1. Escherichia coli 105
were grown routinely, with shaking (150 rpm), at 37°C in LB medium. Growth media were supplemented 106
with appropriate antibiotics (tetracycline, 10 µg/ml; gentamicin, 15 µg/ml; ampicillin, 100 µg/ml) when 107
necessary. The A. fabrum strains were grown with shaking (160 rpm), at 28°C in YPG (Yeast Peptone 108
Glucose)-rich medium or in AT minimal medium supplemented with 10 mM succinate and 10 mM 109
ammonium sulfate. AT minimal medium was supplemented with 750 μM of ferulic acid or citrate and 110
with the appropriate antibiotic (gentamicin, 10 µg/ml). Ferulic acid and MH4F were obtained from Sigma 111
Aldrich (St. Louis, USA) and MEF from Merck Company (Switzerland). 112
113
Construction of the deletion mutant C58Δatu1419 and transcriptional fusions 114
The C58Δatu1419 and C58Δatu1420 strains were constructed according to a strategy as described 115
(4,11). Vectors containing the recombinant region (amplified by PCR with specific primers listed in 116
Supplementary Table S2), flanking downstream and upstream of the atu1419 or atu1420 genes, were 117
introduced into A. fabrum C58 by electroporation. Single-crossover integration was selected by 118
gentamycin resistance on YPG medium plates. Gentamycin-resistant colonies were spread on YPG 119
plates containing 5% of sucrose to obtain plasmid excision and double-crossover events leading to 120
nonpolar mutants. atu1419 and atu1420 deletions were confirmed by PCR analysis and DNA 121
sequencing (GenoScreen, Lille, France). 122
pOT1e (24) transcriptional fusions of the promoter regions of SpG8-1b genes, namely Patu1419 and 123
Patu1420 were generated as described (11) (Supplementary Table S2 for specific primers). Reporter 124
constructions were introduced into A. fabrum C58 wild-type and derivatives by electroporation, and 125
gentamycin-resistant colonies were selected. 126
Measurement of promoter activity 127
Genes expression was measured after 24 hours in A. fabrum with a pOT1e plasmid harboring an eGFP 128
transcriptional fusion (24) as described (11). Results were normalized by dividing the fluorescence level 129
by the optical density at 600 nm values. At least five technical replicates and two biological replicates 130
were performed for each condition. Differences between conditions were determined with Tukey test 131
(P-value= 0.05). 132
Oligonucleotides and DNA preparation 133
The synthetic palindromic oligodeoxyribonucleotide 5’-ATGTATACAT-3’ was purchased from Sigma-134
Aldrich (Darmstadt, Germany). Oligonucleotide solution in sterile water at 2 mM was hybridized by 135
- 5 -
heating to 90°C for 5 min and cooling in the crystallization room at 18°C overnight to produce a 10-mer 136
DNA. 137
The atu1420 promoter regions were amplified with specific primer pairs listed in Supplementary Table 138
S2. The atu1416-1417, atu1418-1419, virB and hcaR promoter regions were prepared as previously 139
described (11) and purified with a PCR Clean-up kit (Macherey-Nagel, Düren, Germany). 140
Cloning, expression and purification of Atu1419 and Atu1419-H3A mutant 141
Coding sequences for Atu1419 was amplified by PCR adding a C-terminal 6-Histidine tag and using 142
atu1419F and atu1419R primers and was inserted into the NdeI/XhoI restriction sites of the pET-20b 143
vector (Novagen, Merck Biosciences, France). The nucleotide sequence was confirmed by DNA-144
sequence analysis (GATC Biotech, Mulhouse, France). E. coli BL21 competent cells transformed with 145
pET-20b-Atu1419 were grown in LB media until OD600 of 0.8 and protein production was induced by 146
0.5 mM isopropyl β-D-thio-galactopyranoside (IPTG) for 3h at 37°C. Cells were centrifuged at 4000 g 147
for 15 min at 4°C, resuspended in a buffer of 50 mM Tris-HCl pH 8, 300 mM NaCl and 20 mM imidazole 148
and disrupted by sonication. After centrifugation at 25000 g for 30 min at 4°C, the filtrated supernatant 149
was loaded onto a 5 ml His-Trap HP column (GE Healthcare, Chicago, Illinois, USA). After a washing 150
step of 6% with 50 mM Tris-HCl pH 8, 300 mM NaCl and 300 mM imidazole (Buffer B), protein elution 151
was performed with Buffer B. Protein fractions were loaded onto a gel filtration column (HiLoad 26/60 152
Superdex 200 prep grade, GE Healthcare) equilibrated with 50 mM Tris-HCl pH 8 and 150 mM NaCl. 153
The protein fractions were pooled, concentrated and stored at -80°C. 154
The synthetic gene (Genscript, Piscataway, New Jersey, USA) coding for Atu1419 mutant (H192A, 155
H141A and H214A) namely Atu1419-H3A was inserted into pET-20b. The Atu1419-H3A mutant was 156
expressed and purified as the wild-type protein described above. 157
Size exclusion chromatography (SEC) and SEC-MALS. For size exclusion chromatography (SEC) 158
and SEC coupled to multi-angle light scattering (SEC-MALS) analyses, apo Atu1419 was prepared at 159
25 M and Atu1419 in complex with the palindromic DNA was prepared with a ratio protein:DNA of 1:2 160
in a buffer containing 50 mM Tris pH 8 and 150 mM NaCl. The same buffer was used as the mobile 161
phase for SEC using a Superdex 200 10/300 GL column on an AKTA FPLC system (GE Healthcare) 162
and on a Shimadzu HPLC. Multiangle light scattering was detected with a MiniDAWN TREOS light 163
scattering module and a refractometer Optilab T-rEX (Wyatt Technology). 164
Electrophoretic mobility shift assay (EMSA) 165
Atu1419 or Atu1419-H3A mutant were mixed with different promoter regions (Patu1416-1417, 166
Patu1418-1419, PhcaR, Patu1420 and PvirB) and with variants of the atu1418-1419 and atu1420 167
regions. The intergenic regions of virB was used as a nonspecific control probe. Gel-shift assays were 168
performed in 10 µl reaction mixture containing 30 nM of DNA probe without and with Atu1419 at different 169
concentrations in 50 mM Tris-HCl pH 8 and 150 mM NaCl. 50 to 300 µM of MEF, MH4F, H4F or citrate 170
- 6 -
were added for testing their influence on Atu1419-DNA complex formation. After incubation for 30 min 171
at room temperature, the samples were separated by electrophoresis in TBE buffer (45 mM Tris-HCl 172
pH 8, 45 mM boric acid and 1 mM EDTA) on non-denaturing 6% or 12% polyacrylamide gels at 150 V 173
and 4°C for 2 h. Gels were then stained with either SYBR® Green EMSA nucleic acid gel stain 174
(Invitrogen, Carlsbad, CA, USA) or ethidium bromide for 20 min. DNA was visualized under UV light 175
(Fisher Bioblock Scientific, Illkirch, France or UVP BioDoc-it2 Imager, Analytic Jena, Germany). 176
177
Crystallization and structure determination of Atu1419 178
Crystallization conditions are summarized in Table 1. For all protein samples (140 µM tetrameric protein 179
alone or in complex with 700 µM palindromic DNA), conditions were screened using QIAGEN kits 180
(Valencia, CA, USA) with a Mosquito nanodrop robot (TTP Labtech, Melbourn, Great Britain) and were 181
manually optimized at 20°C in hanging drop by mixing equal volumes of the protein or protein-DNA 182
solution with precipitant solution. Crystals were transferred to a cryoprotectant solution (paraffin oil or 183
mother liquor supplemented with 20% PEG 400) and flash-frozen in liquid nitrogen. Diffraction data 184
were collected at 100 K on PROXIMA 1 and PROXIMA 2 beamlines at synchrotron SOLEIL (Saint-185
Aubin, France). Intensities were integrated using the XDS package (25) (Table 1). 186
The first structure of Atu1419 in P212121 space group was determined at 2.35 Å resolution by single-187
wavelength anomalous dispersion (SAD) method at the peak absorption energy of Zinc (Table 1). The 188
presence of a zinc metal in crystals was found thanks to an X-ray fluorescence emission scan on the 189
beamline. The steps of zinc ion substructure determination, phases calculation and density modification 190
were performed using CRANK from CCP4 (Collaborative Computational Project, Number 4) and a 191
partial model was built using BUCCANEER (CCP4). This model was then used to calculate the phases 192
of a higher resolution dataset at 2 Å resolution leading to the complete polypeptide chain model. A 193
tetramer is present in the asymmetric unit. Other structure determinations were performed by molecular 194
replacement with PHASER (26) using the first refined structure of Atu1419 (monomer, dimer or 195
tetramer). Because of the anisotropy of the diffraction of Atu1419-DNA complex in P6422 crystals and 196
apo Atu1419, the DEBYE and STARANISO programs developed by Global phasing Ltd were applied 197
to the data scaled with XDS using the STARANISO server (http://staraniso.globalphasing.or/). These 198
programs perform an anisotropic cut-off of merge intensity data on the basis of an analysis of local I/(I), 199
compute Bayesian estimates of structures amplitudes, taking into account their anisotropic fall-off, and 200
apply an anisotropic correction to the data. The corrected anisotropic amplitudes were used for further 201
refinement. Refinement of each structure was performed with BUSTER-2.10 (27) employing TLS 202
groups and NCS restraints. Inspection of the density maps and manual rebuilding were performed using 203
COOT (28). Refinement details of each structure are shown in Table 1. Molecular graphics images were 204
generated using PyMOL (http://www.pymol.org). 205
Circular dichroism experiments (CD) 206
- 7 -
Circular dichroïsm in the far-UV region was performed using a spectropolarimeter (Jasco J-810, Jasco, 207
Lisses, France) equipped with a water-cooled Peltier unit (Jasco circular dichroïsm spectrometer model 208
J810). Apo Atu1419 and Atu1419-H3A mutant were both concentrated at 25 M in 50 mM Tris pH 8 209
and 150 mM NaCl. Spectra were recorded in a cell width of 0.1 mm path length (121.QS, Hellma, Hellma 210
Analytics, Müllheim, Baden Württemberg, Germany) from 190 to 240 nm at 20°C. Five consecutive 211
scans from each sample were merged to produce an averaged spectrum; the spectra were corrected 212
using buffer baselines measured under the same conditions. Data were recorded in mdeg and 213
converted using the mean residues ellipticity method (deg.cm2mol−1). Secondary structure estimates 214
were derived from the normalized spectra using the CDSSTR, SELCON3, CONTIN of the DICHROWEB 215
server (29,30). 216
Differential scanning calorimetry (auto PEAQ DSC) 217
Thermal stability of 10 μM apo Atu1419, 10 μM Atu1419 in the presence of 100 μM MEF and 20 μM 218
Atu1419-H3A mutant was performed by DSC on an auto PEAQ DSC (Malvern, France) in a standard 219
buffer. Each measurement was preceded by a baseline scan with the standard buffer. Scans were 220
performed at 1 K.min-1 between 20 and 90°C. The heat capacity of the buffer was subtracted from that 221
of the protein sample before analysis. Thermodynamic parameters were determined by fitting the data 222
to the following equation: 223
∆𝑪𝒑(𝑻) = 𝑲𝒅(𝑻) ∆𝑯𝒄𝒂𝒍 ∆𝑯𝒗𝑯
[𝟏 + 𝑲𝒅(𝑻)]𝟐 𝑹𝑻𝟐 224
where Kd is the equilibrium constant for a two-state process, ΔHvh is the enthalpy calculated on the 225
basis of a two-state process and ΔHcal is the measured enthalpy. 226
Isothermal titration microcalorimetry measurements (ITC) 227
Isothermal titration microcalorimetry experiments were performed with an ITC200 isothermal titration 228
calorimeter from MicroCal (Malvern, Orsay, France). The experiments were carried out at 20°C. Protein 229
concentration in the microcalorimeter cell (0.2 ml) was 100 µM. Nineteen injections of 2 µl MEF solution 230
at 1.2 mM were performed at intervals of 180 s while stirring at 500 rpm. The experimental data were 231
fitted to theoretical titration curves with software supplied by MicroCal (ORIGIN®). 232
Electron Microscopy 233
Atu1419 (150 nM) was incubated with equimolar Patu1418-1419 region (370 bp containing two 234
palindromes separated by 190 bp) for 10 min at room temperature in a buffer containing 50 mM Tris pH 235
8 and 150 mM NaCl. Samples were deposited on a glow-discharged carbon coated grid and stained 236
with 2% uranyl acetate. Images were recorded with a Lab6 Tecnai Spirit operating at 80kVolt and a 237
Quemesa Olympus CCD camera. Nominal magnification was X 45 000 corresponding to 3.17 Å/pixel. 238
239
- 8 -
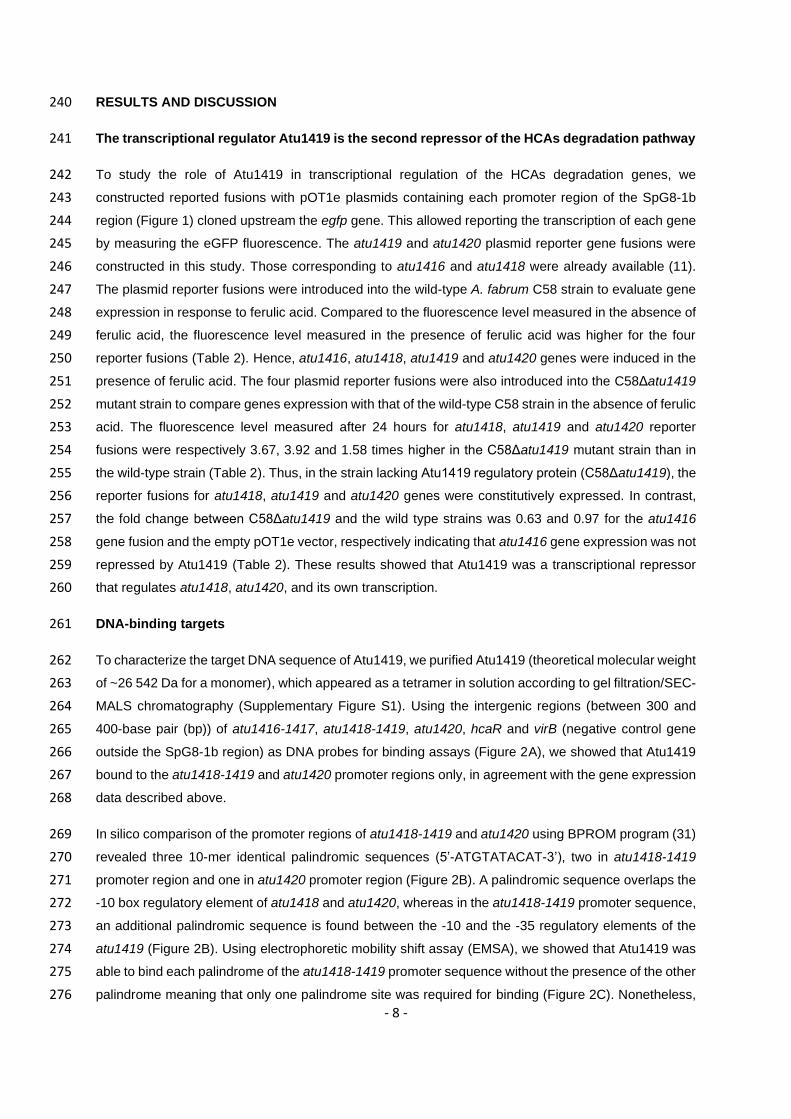
RESULTS AND DISCUSSION 240
The transcriptional regulator Atu1419 is the second repressor of the HCAs degradation pathway 241
To study the role of Atu1419 in transcriptional regulation of the HCAs degradation genes, we 242
constructed reported fusions with pOT1e plasmids containing each promoter region of the SpG8-1b 243
region (Figure 1) cloned upstream the egfp gene. This allowed reporting the transcription of each gene 244
by measuring the eGFP fluorescence. The atu1419 and atu1420 plasmid reporter gene fusions were 245
constructed in this study. Those corresponding to atu1416 and atu1418 were already available (11). 246
The plasmid reporter fusions were introduced into the wild-type A. fabrum C58 strain to evaluate gene 247
expression in response to ferulic acid. Compared to the fluorescence level measured in the absence of 248
ferulic acid, the fluorescence level measured in the presence of ferulic acid was higher for the four 249
reporter fusions (Table 2). Hence, atu1416, atu1418, atu1419 and atu1420 genes were induced in the 250
presence of ferulic acid. The four plasmid reporter fusions were also introduced into the C58Δatu1419 251
mutant strain to compare genes expression with that of the wild-type C58 strain in the absence of ferulic 252
acid. The fluorescence level measured after 24 hours for atu1418, atu1419 and atu1420 reporter 253
fusions were respectively 3.67, 3.92 and 1.58 times higher in the C58Δatu1419 mutant strain than in 254
the wild-type strain (Table 2). Thus, in the strain lacking Atu1419 regulatory protein (C58Δatu1419), the 255
reporter fusions for atu1418, atu1419 and atu1420 genes were constitutively expressed. In contrast, 256
the fold change between C58Δatu1419 and the wild type strains was 0.63 and 0.97 for the atu1416 257
gene fusion and the empty pOT1e vector, respectively indicating that atu1416 gene expression was not 258
repressed by Atu1419 (Table 2). These results showed that Atu1419 was a transcriptional repressor 259
that regulates atu1418, atu1420, and its own transcription. 260
DNA-binding targets 261
To characterize the target DNA sequence of Atu1419, we purified Atu1419 (theoretical molecular weight 262
of ~26 542 Da for a monomer), which appeared as a tetramer in solution according to gel filtration/SEC-263
MALS chromatography (Supplementary Figure S1). Using the intergenic regions (between 300 and 264
400-base pair (bp)) of atu1416-1417, atu1418-1419, atu1420, hcaR and virB (negative control gene 265
outside the SpG8-1b region) as DNA probes for binding assays (Figure 2A), we showed that Atu1419 266
bound to the atu1418-1419 and atu1420 promoter regions only, in agreement with the gene expression 267
data described above. 268
In silico comparison of the promoter regions of atu1418-1419 and atu1420 using BPROM program (31) 269
revealed three 10-mer identical palindromic sequences (5’-ATGTATACAT-3’), two in atu1418-1419 270
promoter region and one in atu1420 promoter region (Figure 2B). A palindromic sequence overlaps the 271
-10 box regulatory element of atu1418 and atu1420, whereas in the atu1418-1419 promoter sequence, 272
an additional palindromic sequence is found between the -10 and the -35 regulatory elements of the 273
atu1419 (Figure 2B). Using electrophoretic mobility shift assay (EMSA), we showed that Atu1419 was 274
able to bind each palindrome of the atu1418-1419 promoter sequence without the presence of the other 275
palindrome meaning that only one palindrome site was required for binding (Figure 2C). Nonetheless, 276
- 9 -
the intensity of the shifted bands was greater for the DNA fragment containing both palindromes (Figure 277
2C). We also analyzed the quaternary structure of Atu1419 in complex with the 10-bp palindrome using 278
gel filtration/SEC-MALS measurements (Supplementary Figure S1). Atu1419 was also tetrameric upon 279
DNA binding. 280
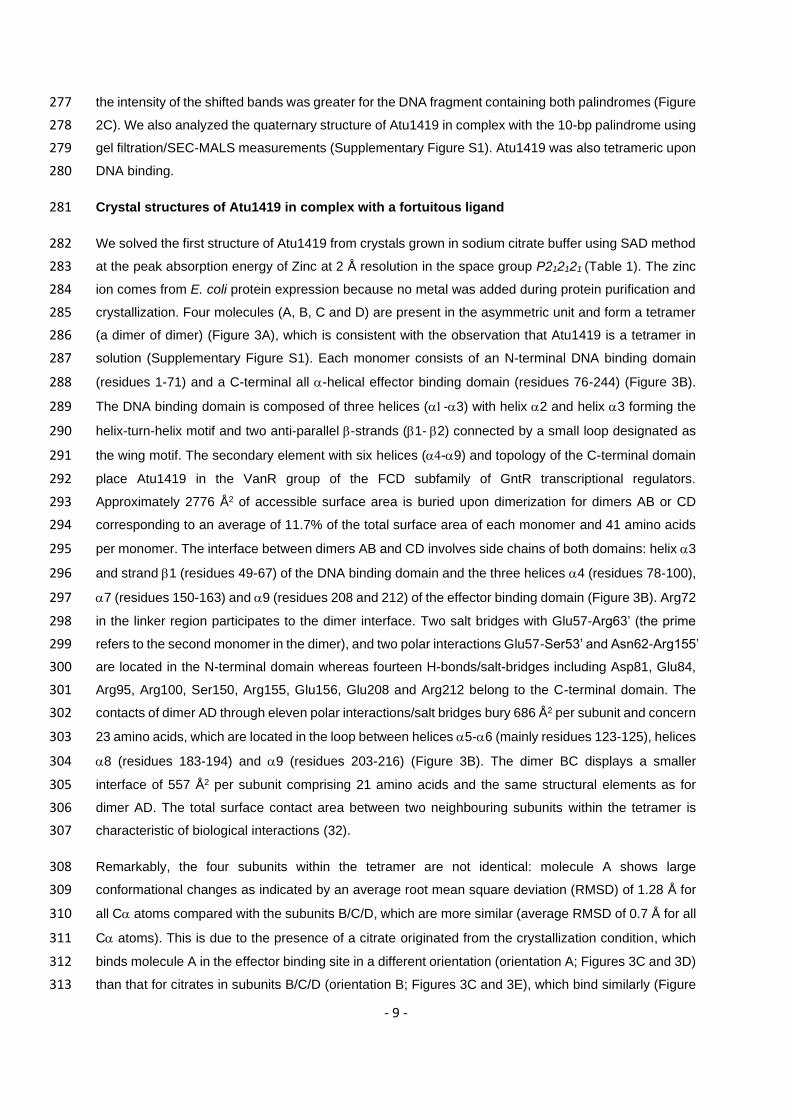
Crystal structures of Atu1419 in complex with a fortuitous ligand 281
We solved the first structure of Atu1419 from crystals grown in sodium citrate buffer using SAD method 282
at the peak absorption energy of Zinc at 2 Å resolution in the space group P212121 (Table 1). The zinc 283
ion comes from E. coli protein expression because no metal was added during protein purification and 284
crystallization. Four molecules (A, B, C and D) are present in the asymmetric unit and form a tetramer 285
(a dimer of dimer) (Figure 3A), which is consistent with the observation that Atu1419 is a tetramer in 286
solution (Supplementary Figure S1). Each monomer consists of an N-terminal DNA binding domain 287
(residues 1-71) and a C-terminal all -helical effector binding domain (residues 76-244) (Figure 3B). 288
The DNA binding domain is composed of three helices (-3) with helix 2 and helix 3 forming the 289
helix-turn-helix motif and two anti-parallel -strands (1- 2) connected by a small loop designated as 290
the wing motif. The secondary element with six helices (-9) and topology of the C-terminal domain 291
place Atu1419 in the VanR group of the FCD subfamily of GntR transcriptional regulators. 292
Approximately 2776 Å2 of accessible surface area is buried upon dimerization for dimers AB or CD 293
corresponding to an average of 11.7% of the total surface area of each monomer and 41 amino acids 294
per monomer. The interface between dimers AB and CD involves side chains of both domains: helix 3 295
and strand 1 (residues 49-67) of the DNA binding domain and the three helices 4 (residues 78-100), 296
7 (residues 150-163) and 9 (residues 208 and 212) of the effector binding domain (Figure 3B). Arg72 297
in the linker region participates to the dimer interface. Two salt bridges with Glu57-Arg63’ (the prime 298
refers to the second monomer in the dimer), and two polar interactions Glu57-Ser53’ and Asn62-Arg155’ 299
are located in the N-terminal domain whereas fourteen H-bonds/salt-bridges including Asp81, Glu84, 300
Arg95, Arg100, Ser150, Arg155, Glu156, Glu208 and Arg212 belong to the C-terminal domain. The 301
contacts of dimer AD through eleven polar interactions/salt bridges bury 686 Å2 per subunit and concern 302
23 amino acids, which are located in the loop between helices 5-6 (mainly residues 123-125), helices 303
8 (residues 183-194) and 9 (residues 203-216) (Figure 3B). The dimer BC displays a smaller 304
interface of 557 Å2 per subunit comprising 21 amino acids and the same structural elements as for 305
dimer AD. The total surface contact area between two neighbouring subunits within the tetramer is 306
characteristic of biological interactions (32). 307
Remarkably, the four subunits within the tetramer are not identical: molecule A shows large 308
conformational changes as indicated by an average root mean square deviation (RMSD) of 1.28 Å for 309
all C atoms compared with the subunits B/C/D, which are more similar (average RMSD of 0.7 Å for all 310
C atoms). This is due to the presence of a citrate originated from the crystallization condition, which 311
binds molecule A in the effector binding site in a different orientation (orientation A; Figures 3C and 3D) 312
than that for citrates in subunits B/C/D (orientation B; Figures 3C and 3E), which bind similarly (Figure 313

- 10 -
3C). Four loop regions (shown in red in Figure 3C), comprised of residues 64-67 of the wing between 314
1 and 2 of the wHTH motif, residues 119-130 between helices 5 and 6, residues 169-184 between 315
helices 7 and 8 and residues 225-244 corresponding to the end of the effector binding domain, can 316
move between 3 and 10 Å. The loop region 169-184 can drastically rearrange upon ligand binding. In 317
molecule A, the C atoms of Ser169, Lys175 and Arg183 are respectively, 0.92 Å, 6.84 Å and 7.34 Å 318
away from those in molecules B/C/D, allowing the side chains of Lys175, Arg183 and the NH main 319
chain of Ser169 to interact with the citrate molecule (Figures 3C and 3D). These latter protein-citrate 320
interactions cannot exist in subunits B/C/D. Nonetheless, all bound citrates share interactions with 321
Arg86, Tyr133, Asn137, His141, His214, Asn221 and a Zn2+ ion that co-purified with Atu1419 (Figures 322
3D and 3E). Thirteen polar interactions are observed between monomer A and the citrate molecule 323
(orientation A), which is buried within the monomer, leaving only 26.6 Å2 or 8.4% of the molecule surface 324
exposed to solvent. In contrast, there are only ten polar interactions between monomers B/C/D and the 325
citrate with a similar buried surface area. 326
The orientation B of the citrate was also observed in another structure of Atu1419 solved at a higher 327
resolution of 1.75 Å but in a different space group (P21212). Here, two similar monomers (RMSD of 0.98 328
Å for all C atoms) are in the asymmetric unit and form a dimer, which in turn form a tetramer by the 329
crystal symmetry with globally unchanged dimer interfaces (1553 Å2 and 701 Å2 per subunit for dimers 330
AB and AD, respectively) compared with those from the P212121 structure. They resemble subunits 331
B/C/D of the P212121 structure and bind similarly a citrate molecule. Nonetheless, their citrates are 332
slightly shifted by 0.6 Å towards Arg86 losing the interaction with Asn221 compared with those in the 333
P212121 structure (Supplementary Figure S2). 334
Crystal structures of Atu1419 in complex with the palindromic DNA 335
The structures of two palindromic DNA-Atu1419 complexes solved at 2.79 Å resolution (P6422 space 336
group) and 2.05 Å resolution (C2221 space group) present a distinct neighboring crystal packing with 337
an asymmetric unit containing a monomer bound to a single DNA strand and a dimer bound to the 10-338
mer palindromic DNA, respectively (Table 1, Supplementary Figure S3). Nonetheless, a tetramer, 339
where dimers AB and CD bind each to a DNA palindrome, was reconstituted by crystal symmetries 340
(Figures 4A and 4B) in line with the conservation of Atu1419 tetramer in solution upon DNA binding. 341
The three monomers of the asymmetric units (one in P6422 and two in C2221) are similar with an 342
average RMSD value of 1 Å for all Cα atoms making almost identical interactions with DNA, although 343
the positions of the DNA binding domains within the dimers between the two crystal structures do not 344
completely overlap (Figure 4C). This observation explains the different crystal packing resulting of 345
flexibility from both the DNA ligand and the DNA binding domains of Atu1419. Each monomer 346
recognizes a half-site DNA with helices 2 and 3 of the HTH motif making nine polar interactions with 347
both strands in the major groove of the DNA (Figures 4D and 4E). Helix 3 via Ser44, Thr46, Arg45 348
and Arg49 side chains is responsible for six hydrogen bonds with both strands, half with oxygens of 349
phosphate groups 5’ of guanine (G3) at position 3 on one strand and of adenine (A5) at position 5 on 350
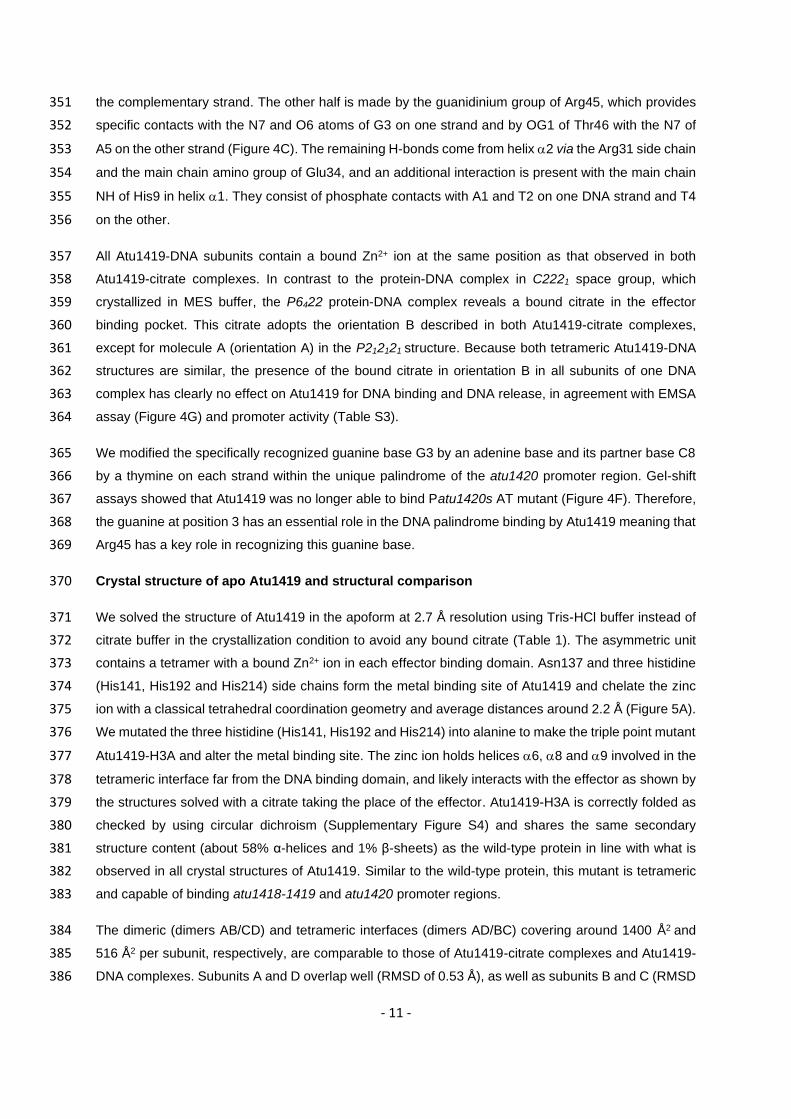
- 11 -
the complementary strand. The other half is made by the guanidinium group of Arg45, which provides 351
specific contacts with the N7 and O6 atoms of G3 on one strand and by OG1 of Thr46 with the N7 of 352
A5 on the other strand (Figure 4C). The remaining H-bonds come from helix 2 via the Arg31 side chain 353
and the main chain amino group of Glu34, and an additional interaction is present with the main chain 354
NH of His9 in helix 1. They consist of phosphate contacts with A1 and T2 on one DNA strand and T4 355
on the other. 356
All Atu1419-DNA subunits contain a bound Zn2+ ion at the same position as that observed in both 357
Atu1419-citrate complexes. In contrast to the protein-DNA complex in C2221 space group, which 358
crystallized in MES buffer, the P6422 protein-DNA complex reveals a bound citrate in the effector 359
binding pocket. This citrate adopts the orientation B described in both Atu1419-citrate complexes, 360
except for molecule A (orientation A) in the P212121 structure. Because both tetrameric Atu1419-DNA 361
structures are similar, the presence of the bound citrate in orientation B in all subunits of one DNA 362
complex has clearly no effect on Atu1419 for DNA binding and DNA release, in agreement with EMSA 363
assay (Figure 4G) and promoter activity (Table S3). 364
We modified the specifically recognized guanine base G3 by an adenine base and its partner base C8 365
by a thymine on each strand within the unique palindrome of the atu1420 promoter region. Gel-shift 366
assays showed that Atu1419 was no longer able to bind Patu1420s AT mutant (Figure 4F). Therefore, 367
the guanine at position 3 has an essential role in the DNA palindrome binding by Atu1419 meaning that 368
Arg45 has a key role in recognizing this guanine base. 369
Crystal structure of apo Atu1419 and structural comparison 370
We solved the structure of Atu1419 in the apoform at 2.7 Å resolution using Tris-HCl buffer instead of 371
citrate buffer in the crystallization condition to avoid any bound citrate (Table 1). The asymmetric unit 372
contains a tetramer with a bound Zn2+ ion in each effector binding domain. Asn137 and three histidine 373
(His141, His192 and His214) side chains form the metal binding site of Atu1419 and chelate the zinc 374
ion with a classical tetrahedral coordination geometry and average distances around 2.2 Å (Figure 5A). 375
We mutated the three histidine (His141, His192 and His214) into alanine to make the triple point mutant 376
Atu1419-H3A and alter the metal binding site. The zinc ion holds helices 6, 8 and 9 involved in the 377
tetrameric interface far from the DNA binding domain, and likely interacts with the effector as shown by 378
the structures solved with a citrate taking the place of the effector. Atu1419-H3A is correctly folded as 379
checked by using circular dichroism (Supplementary Figure S4) and shares the same secondary 380
structure content (about 58% α-helices and 1% β-sheets) as the wild-type protein in line with what is 381
observed in all crystal structures of Atu1419. Similar to the wild-type protein, this mutant is tetrameric 382
and capable of binding atu1418-1419 and atu1420 promoter regions. 383
The dimeric (dimers AB/CD) and tetrameric interfaces (dimers AD/BC) covering around 1400 Å2 and 384
516 Å2 per subunit, respectively, are comparable to those of Atu1419-citrate complexes and Atu1419-385
DNA complexes. Subunits A and D overlap well (RMSD of 0.53 Å), as well as subunits B and C (RMSD 386
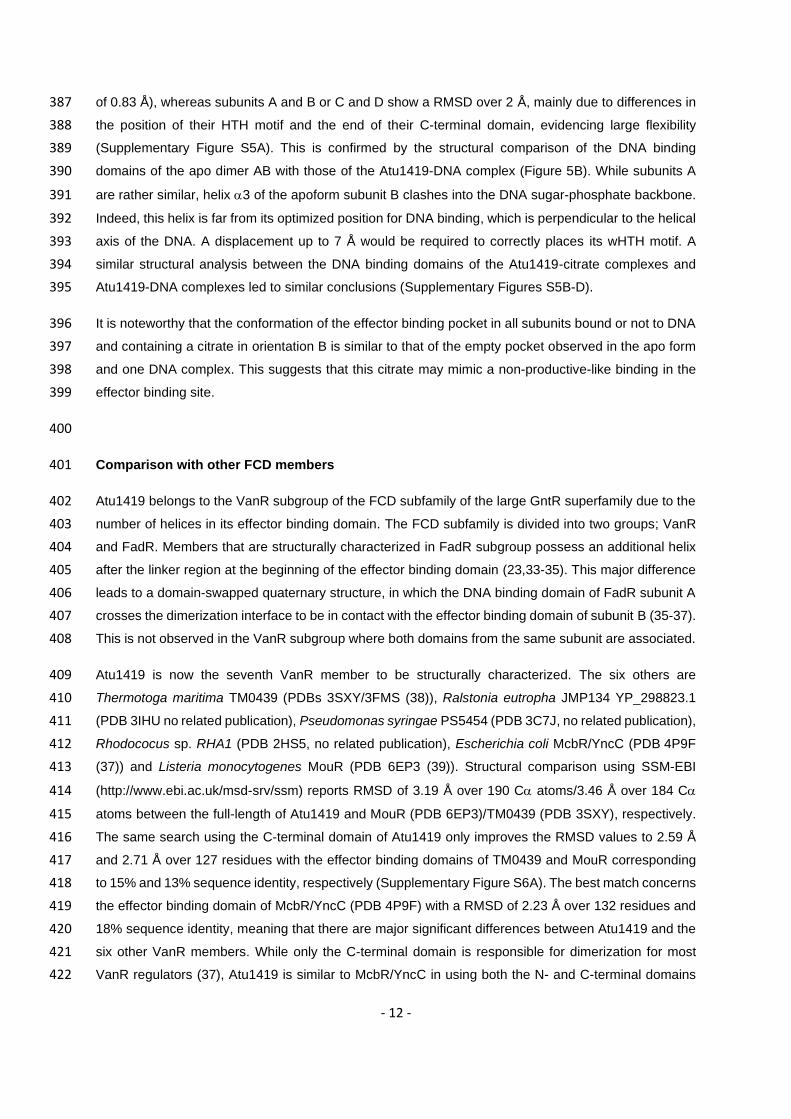
- 12 -
of 0.83 Å), whereas subunits A and B or C and D show a RMSD over 2 Å, mainly due to differences in 387
the position of their HTH motif and the end of their C-terminal domain, evidencing large flexibility 388
(Supplementary Figure S5A). This is confirmed by the structural comparison of the DNA binding 389
domains of the apo dimer AB with those of the Atu1419-DNA complex (Figure 5B). While subunits A 390
are rather similar, helix 3 of the apoform subunit B clashes into the DNA sugar-phosphate backbone. 391
Indeed, this helix is far from its optimized position for DNA binding, which is perpendicular to the helical 392
axis of the DNA. A displacement up to 7 Å would be required to correctly places its wHTH motif. A 393
similar structural analysis between the DNA binding domains of the Atu1419-citrate complexes and 394
Atu1419-DNA complexes led to similar conclusions (Supplementary Figures S5B-D). 395
It is noteworthy that the conformation of the effector binding pocket in all subunits bound or not to DNA 396
and containing a citrate in orientation B is similar to that of the empty pocket observed in the apo form 397
and one DNA complex. This suggests that this citrate may mimic a non-productive-like binding in the 398
effector binding site. 399
400
Comparison with other FCD members 401
Atu1419 belongs to the VanR subgroup of the FCD subfamily of the large GntR superfamily due to the 402
number of helices in its effector binding domain. The FCD subfamily is divided into two groups; VanR 403
and FadR. Members that are structurally characterized in FadR subgroup possess an additional helix 404
after the linker region at the beginning of the effector binding domain (23,33-35). This major difference 405
leads to a domain-swapped quaternary structure, in which the DNA binding domain of FadR subunit A 406
crosses the dimerization interface to be in contact with the effector binding domain of subunit B (35-37). 407
This is not observed in the VanR subgroup where both domains from the same subunit are associated. 408
Atu1419 is now the seventh VanR member to be structurally characterized. The six others are 409
Thermotoga maritima TM0439 (PDBs 3SXY/3FMS (38)), Ralstonia eutropha JMP134 YP_298823.1 410
(PDB 3IHU no related publication), Pseudomonas syringae PS5454 (PDB 3C7J, no related publication), 411
Rhodococus sp. RHA1 (PDB 2HS5, no related publication), Escherichia coli McbR/YncC (PDB 4P9F 412
(37)) and Listeria monocytogenes MouR (PDB 6EP3 (39)). Structural comparison using SSM-EBI 413
(http://www.ebi.ac.uk/msd-srv/ssm) reports RMSD of 3.19 Å over 190 C atoms/3.46 Å over 184 C 414
atoms between the full-length of Atu1419 and MouR (PDB 6EP3)/TM0439 (PDB 3SXY), respectively. 415
The same search using the C-terminal domain of Atu1419 only improves the RMSD values to 2.59 Å 416
and 2.71 Å over 127 residues with the effector binding domains of TM0439 and MouR corresponding 417
to 15% and 13% sequence identity, respectively (Supplementary Figure S6A). The best match concerns 418
the effector binding domain of McbR/YncC (PDB 4P9F) with a RMSD of 2.23 Å over 132 residues and 419
18% sequence identity, meaning that there are major significant differences between Atu1419 and the 420
six other VanR members. While only the C-terminal domain is responsible for dimerization for most 421
VanR regulators (37), Atu1419 is similar to McbR/YncC in using both the N- and C-terminal domains 422
- 13 -
as the dimeric interface. However, the dimer of Atu1419 does not structurally resemble that of 423
McbR/YncC (Supplementary Figure S6B). 424
Like Atu1419, two other VanR members, which are TM0439 and PS5454 display a metal binding site 425
with three histidine residues and an asparagine or an aspartate residue involved in the metal 426
coordination (37,38). These histidine residues are conserved and structurally close (Supplementary 427
Figure S6C). LldR (PDB 2DI3) from the FadR group binds a zinc ion chelated by these three conserved 428
histidines and an aspartate (35). It was proposed that an additional subgroup within the FCD subfamily 429
could be created for regulators from both FadR and VanR members, which are capable of binding to 430
metal ions (35,38). Using thermal denaturation experiments by differential scanning calorimetry (DSC), 431
Tm of 52.6°C and 34°C were measured with the wild-type Atu1419 and Atu1419-H3A mutant 432
respectively (Supplementary Figure S7). The drastic difference of almost 20°C indicates that the metal 433
assists in stabilizing the structure affording an explanation as to why Atu1419-H3A could not be 434
concentrated over 50 M without precipitating, in contrast to the wild-type protein (140 M). All attempts 435
to crystallize Atu1419-H3A were unsuccessful. 436
Atu1419 is the first VanR member to be structurally characterized in complex with DNA whereas several 437
FadR-DNA complexes are available (23,33,34). Each dimer of Atu1419 within the tetramer can bind an 438
identical palindrome. Similarly to regulators with a wHTH motif such as MarR regulators (40,41), FCD 439
regulators bind to one half-site of the palindromic DNA, with the dimerization interface helping to 440
establish the spacing between the two half-sites. The DNA binding domains of Atu1419, which are 441
involved in the dimerization interface, allow Atu1419 to bind a short palindrome of 10 base pairs. As in 442
E. coli FadR (PDB 1H9T (23) and 1HW2 (33)) and in Vibrio cholerae FadR (PDB 4P9U(34)), the DNA-443
binding site of each Atu1419 monomer is recognized by conserved residues such as Glu34 in helix 2, 444
Arg45 (specific DNA contacts), Thr46 and Arg49 (phosphate backbone contacts) in helix 3 that interact 445
with the major groove and Gly66 in the tip of the wing (residues 64-68) between 1 and 2. Nonetheless, 446
the wing is not crucial for DNA interaction of Atu1419 unlike FadR, which recognizes a pseudo-447
palindrome of 17 base pairs. Indeed, His65, which specifically recognizes a DNA base in FadR is a 448
glycine in Atu1419. DNA binding domains superposition of the Atu1419-DNA complex with those of E. 449
coli and V. cholerae FadR-DNA complexes shows that although the positions of subunits A are rather 450
similar, the second subunit of Atu1419 makes steric clashes with the DNA bound to FadR and that of 451
FadR is too far from the DNA bound to Atu1419 (Supplementary Figure S8). Atu1419 displays only one 452
specific interaction shared in FadR with the guanine present within the major groove of DNA via their 453
conserved Arg45, a typical feature of the GntR family (22). The other specific DNA contacts of FadR 454
(via Arg35, Thr44, Thr46 and His65) are not comparable with those of Atu1419. The recognized DNA 455
sequence of Atu1419 which is 5’-ATGTATACAT-3’ is in agreement with the predicted DNA signature 456
for the GntR family: 5’-(N)yGT(N)xAC(N)y-3’ where the number x and y vary (20). Later, this DNA binding 457
signature was suggested to be modified as 5’-TNG(N)nCNA-3’ on the basis of base-specific interactions 458
(22) or as 5’-TGGTNxACCA-3’ for FadR subgroup (35) but both sequences are not appropriate for 459
Atu1419. 460
- 14 -
The DNA binding of Atu1419 requires conformational changes of the DNA binding domains. Indeed, 461
the distance between the two DNA recognition helices (Thr46 of helix 3) narrows from 12 Å in the 462
apoform to 9.3 Å in the Atu1419-DNA complex, for a productive interaction with DNA (Figure 5C). A 463
similar observation was reported for Vibrio cholerae FadR (PDB 4P9U (34)). The structures of FadR 464
repressors in complex with their effector show significant conformational changes transmitted from the 465
effector binding domain to the DNA binding domain, leading to a conformational state that is no longer 466
favorable for interaction with DNA (22,23,34). The fundamental process wherein the binding of a ligand 467
or effector molecule alters the activity of the protein at a distant site is defined as an allosteric 468
mechanism. In the case of Atu1419, the citrate in orientation A bound in the effector binding pocket 469
induces large conformational changes from the C-terminal domain to the N-terminal domain. It affects 470
four different protein regions: the wing of the DNA binding domain and three regions of the effector 471
binding domain including the C-terminus protein which is in contact with the DNA binding domain 472
(Figure 3C). The presence of this citrate clearly reveals the plasticity of the effector binding pocket and 473
the large potential rearrangement of the repressor. It also shows that within the tetramer, one subunit 474
can adopt a different conformation around the effector binding pocket and further away (Figure 3C) 475
compared to the three others subunits, highlighting an allosteric mechanism. The orientation A of the 476
citrate may mimic an active-like position of the physiological effector part bound to the metal ion. 477
Atu1419 effector is the N5,N10-methylenetetrahydrofolate (MEF) 478
The effector molecule bound to the members of the GntR superfamily are often related to catabolic 479
substrates or intermediates of the pathway controlled by the transcription factor (19,20), and several 480
molecules are produced during the ferulic acid degradation pathways (5). Because the citrate molecule 481
was able to bind to the effector binding site of Atu1419, we searched for molecules resembling citrate 482
among those described in the HCA pathway (Figure 1A), and we asked whether the substrate-cofactor 483
H4F or the product-cofactor M4HF of the O-demethylase Atu1420 enzyme could be a potential effector. 484
Indeed, citrate compound with three carboxylate groups mimics two carboxylate groups located at one 485
end of the H4F or MH4F molecules. Alternatively, MEF, the putative product of Atu1418 enzyme, which 486
possesses the same two carboxylate groups could also be a potential effector of Atu1419. 487
To verify this, Patu1418, Patu1419 and Patu1420 plasmid reporter gene fusions were introduced into 488
the C58Δatu1418 and C58Δatu1420 mutant strains. For each strain, the fluorescence level was 489
monitored in the presence or absence of ferulic acid and compared to the wild-type A. fabrum C58 490
(Figures 6A-C). For the C58Δatu1418 strain, the overproduction of fluorescence observed in the 491
presence of ferulic acid is significantly lower than that in the wild-type C58 and C58Δatu1420 strains. 492
These results indicate that the presence of atu1418 gene is important for the full induction of atu1418, 493
atu1419 and atu1420 genes expression in the presence of ferulic acid. The accumulation of MH4F and 494
the lack of MEF production in the defective C58Δatu1418 mutant suggests that MEF could be the 495
effector of Atu1419. MEF is not stable in aqueous in vitro solutions as it enters a rapid reversible 496
equilibrium into H4F (42,43). Nonetheless, immediately using freshly-made MEF solution for gel-shift 497
assays, we were able to show that MEF could relieve repression of Atu1419 (Figure 6D) whereas H4F 498
- 15 -
and MH4F had no effect (Figure 6E). In the C58Δatu1418 mutant, induction of Patu1418, Patu1419 and 499
Patu1420 was not totally abolished, probably due to functional redundancy of N5,N10-methylene 500
tetrahydrofolate reductase activity in A. fabrum genome, which allows to keep a basal pool of folate and 501
intermediates essential for the cell (44). 502
The interaction between MEF and Atu1419 was confirmed by DSC with a Tm of 63.5°C for Atu1419 in 503
complex with MEF compared to the Tm of 52.6°C for the apo Atu1419 (Figure 6F). This was also 504
confirmed by isothermal titration microcalorimetry (ITC, Figure 6G). Because MEF instability did not 505
allow a return to the baseline between two injections, we could not rigorously determine a dissociation 506
constant KD value, which is around 20 M. Injection of MEF towards buffer solution was a control of its 507
instability effect (Figure 6H). No interaction could be observed between MH4F and Atu1419 by DSC 508
and ITC, in agreement with the results from EMSA assays. 509
Atu1419 tetramer is the biologically active form 510
We analyzed the quaternary structure of Atu1419 in complex with MEF using gel filtration measurement 511
(Supplementary Figure S9). Atu1419 remains tetrameric when bound to MEF. Thus, Atu1419 is a 512
tetramer in its apo form, upon DNA binding or effector binding suggesting that this quaternary structure 513
is the biologically active form. Both crystal structures of Atu1419 in complex with DNA revealed that 514
each dimer of Atu1419 within the tetramer can bind a palindromic site of 10 bp, separated by 515
approximately 10 nM (Figure 3A). This separation distance is compatible with DNA loop formation 516
allowing the simultaneous binding of two distant palindromes (190 bp apart) within the intergenic region 517
of atu1418-1419. Thus, Atu1419 tetramer could repress gene expression via DNA looping, such as 518
several negative regulators in prokaryotes (47) with the example of the intensively studied tetrameric 519
lac operon repressor (48). 520
We searched for a second potential DNA binding site of Atu1419 in atu1420 region and found a 521
degenerated palindrome (8 bp conserved over the 10 bp palindrome; Figure 7A). The degenerated 522
palindrome is separated by 109 bp from the palindrome and is located downstream within the open 523
reading frame of atu1420 gene (Figure 7A). We then performed EMSA assays with three 524
oligonucleotides containing either the palindrome, the degenerated palindrome, or both and identified 525
in the gel a retarded band for each oligonucleotide proving the formation of a stable non-covalent 526
protein-DNA complex (Figure 7B). Thus, the repressor can recognize a palindrome and a degenerated 527
palindrome providing it the opportunity to bind simultaneously to two DNA sites in each region (atu1418-528
1419 and atu1420), in agreement with its oligomeric state. Similarly, the structure of Cupriavidus 529
necator CbnR transcriptional regulator (a tetramer composed of dimer of dimer) from LysR family (PDBs 530
1IXC and 1IZL (45)) is compatible with an interaction with two DNA binding sites on a bended DNA 531
fragment, where the authors suggested that the quaternary structure of the CbnR tetramer should be 532
changed to relax the bent DNA that binds to the CbnR tetramer (45). In contrast to the quaternary 533
organization of Lac repressor (a tetramer comprising a pair of dimers loosely associated with each other) 534
which suggests that the structural change of each dimer seems to be able to occur independently, 535
- 16 -
conformational changes of one subunit of Atu1419 and CbnR can be easily propagated to the other 536
parts of the tetramer though inter-subunit interactions. Noteworthy, single molecule experiments 537
revealed that a repressor securing a DNA loop is a stronger transcriptional roadblock for RNA 538
polymerases than one bound to a single DNA site (49). 539
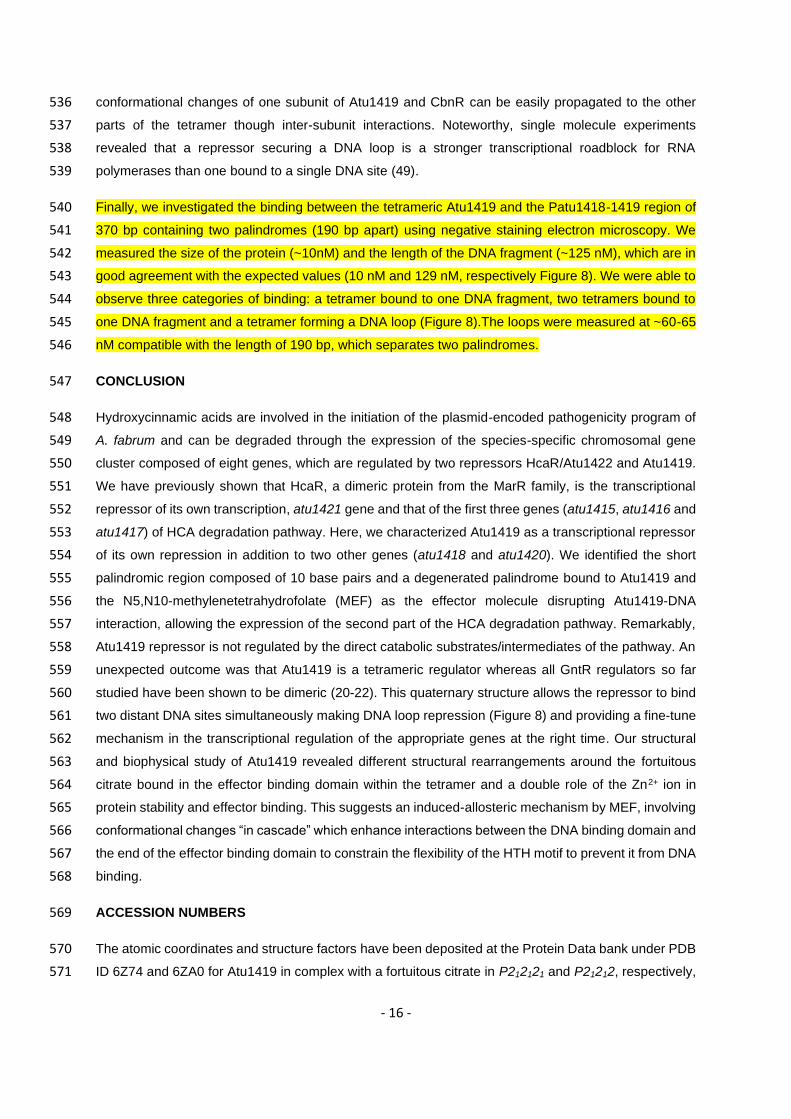
Finally, we investigated the binding between the tetrameric Atu1419 and the Patu1418-1419 region of 540
370 bp containing two palindromes (190 bp apart) using negative staining electron microscopy. We 541
measured the size of the protein (~10nM) and the length of the DNA fragment (~125 nM), which are in 542
good agreement with the expected values (10 nM and 129 nM, respectively Figure 8). We were able to 543
observe three categories of binding: a tetramer bound to one DNA fragment, two tetramers bound to 544
one DNA fragment and a tetramer forming a DNA loop (Figure 8).The loops were measured at ~60-65 545
nM compatible with the length of 190 bp, which separates two palindromes. 546
CONCLUSION 547
Hydroxycinnamic acids are involved in the initiation of the plasmid-encoded pathogenicity program of 548
A. fabrum and can be degraded through the expression of the species-specific chromosomal gene 549
cluster composed of eight genes, which are regulated by two repressors HcaR/Atu1422 and Atu1419. 550
We have previously shown that HcaR, a dimeric protein from the MarR family, is the transcriptional 551
repressor of its own transcription, atu1421 gene and that of the first three genes (atu1415, atu1416 and 552
atu1417) of HCA degradation pathway. Here, we characterized Atu1419 as a transcriptional repressor 553
of its own repression in addition to two other genes (atu1418 and atu1420). We identified the short 554
palindromic region composed of 10 base pairs and a degenerated palindrome bound to Atu1419 and 555
the N5,N10-methylenetetrahydrofolate (MEF) as the effector molecule disrupting Atu1419-DNA 556
interaction, allowing the expression of the second part of the HCA degradation pathway. Remarkably, 557
Atu1419 repressor is not regulated by the direct catabolic substrates/intermediates of the pathway. An 558
unexpected outcome was that Atu1419 is a tetrameric regulator whereas all GntR regulators so far 559
studied have been shown to be dimeric (20-22). This quaternary structure allows the repressor to bind 560
two distant DNA sites simultaneously making DNA loop repression (Figure 8) and providing a fine-tune 561
mechanism in the transcriptional regulation of the appropriate genes at the right time. Our structural 562
and biophysical study of Atu1419 revealed different structural rearrangements around the fortuitous 563
citrate bound in the effector binding domain within the tetramer and a double role of the Zn2+ ion in 564
protein stability and effector binding. This suggests an induced-allosteric mechanism by MEF, involving 565
conformational changes “in cascade” which enhance interactions between the DNA binding domain and 566
the end of the effector binding domain to constrain the flexibility of the HTH motif to prevent it from DNA 567
binding. 568
ACCESSION NUMBERS 569
The atomic coordinates and structure factors have been deposited at the Protein Data bank under PDB 570
ID 6Z74 and 6ZA0 for Atu1419 in complex with a fortuitous citrate in P212121 and P21212, respectively, 571
- 17 -
PDB ID 6ZAB and 6ZA3 for Atu1419 in complex with DNA in P6422 and C2221, respectively and PDB 572
ID 6ZA7 for apo Atu1419. 573
SUPPLEMENTARY DATA 574
Supplementary Data are available at NAR online: Supplementary Figures S1 to S9 and Tables S1 to 575 S3. 576
ACKNOWLEDGEMENT 577
We acknowledge SOLEIL for provision of synchrotron radiation facilities (proposals ID 20130869, 578
20140774, 20150780 and 20170872) in using Proxima beamlines. We are grateful to Nadine Assrir 579
(ICSN, Gif sur Yvette) and Pascal Retailleau (ICSN, Gif sur Yvette) for access to the CD equipment and 580
help in data processing. We are grateful to Christophe Velours for performing SEC-MALS experiment 581
on the Protein-protein interactions platform. We thank the Cell and Tissue Imaging (PICT IBiSA), Institut 582
Curie, member of the French National Research Infrastructure France-BioImaging (ANR10-INBS-04). 583
We thank Andrew Saurin for a critical reading of the manuscript. 584
FUNDING 585
AV, SM, TM, LV, CL was supported by CNRS (Mission pour l’interdisciplinarité, Agromics 2014-2016). 586
This work was submitted to fulfill the requirements for a doctorate of biology at ED341-E2M2 from 587
Université de Lyon, granted from the French Ministère de l’Education Nationale, de l’Enseignement 588
Supérieur et de la Recherche (T.M). This work has benefited from the I2BC crystallization and Protein-589
protein interactions platforms supported by FRISBI ANR-10-INSB-05-01. 590
591
CONFLICT OF INTEREST 592
The authors declare that they have no competing interests. 593
594
595
- 18 -
FIGURES LEGENDS 596
Figure 1. (A) Ferulic acid degradation pathway: a coenzyme A is added to ferulic acid by Atu1416, a 597
feruloyl-CoA synthase. Feruloyl-CoA is then converted by Atu1417, an enoyl-CoA hydratase, into 4-598
hydroxy-3-methoxyphenyl-β-hydroxypropionyl (HMPHP)-CoA, which is in turn transformed into vanillic 599
acid by Atu1415, a phenylhydroxypropionyl-CoA dehydrogenase, and then Atu1421, a 4-hydroxy-3-600
methoxyphenyl-β-ketopropionyl-CoA (HMPKP)-CoA β-keto-thiolase. The O-demethylase Atu1420 601
degrades vanillic acid into protocatechuic acid using tetrahydrofolate (H4F) as a cofactor and produces 602
N5-methyl-tetrahydrofolate (MH4F). Protocatechuic acid enters the cycle of Krebs. Atu1418 enzyme 603
was proposed to be involved in the recycling of H4F from transformation of MH4F into MEF, a compound 604
that can be enzymatically or spontaneously converted to H4F (18,50). Dashed arrows indicated putative 605
reactions based on sequence similarities and references (4,18,44,50). (B) Organization of the SpG8-606
1b region for which genes expression is regulated by the two transcriptional factors HcaR and Atu1419 607
(their genes are framed in red). Promoters are shown with small arrows in black for HcaR dependent-608
transcription and in blue for putative Atu1419 dependent-transcription indicating the direction of gene 609
transcription. 610
Figure 2. Atu1419 regulation mechanism. (A) Gel shift analysis of 30 nM of each promoter region 611
Patu1416-1417, Patu1418-1419, Patu1420, PhcaR (atu1422) incubated without and with 250 nM 612
tetrameric Atu1419 (ratio protein:DNA of 8.3). PvirB was used as a promoter region control. (B) In silico 613
analysis of the atu1418-1419 and atu1420 promoter regions performed with the BPROM program (31): 614
-10 and -35 boxes are underlined, and the palindromic sequences are shown in red. The transcription 615
initiation sites are shown with an arrow and the translation start sites are indicated in bold. Palindromic 616
regions are separated by 190 bp in atu1418-1419 region. (C) Gel mobility shift assay analysis of 30 nM 617
of three parts of the promoter region of atu1418-1419 containing each one palindrome (P1 or P2) or 618
none (P3) incubated without and with 250 nM tetrameric Atu1419 (ratio protein:DNA of 8.3). 619
Figure 3. (A) Wire representation of Atu1419 tetramer in complex with a fortuitous citrate molecule and 620
a co-purified Zn2+ ion, shown as sticks and ball, respectively, bound to the effector binding domain in 621
the structure at 2 Å resolution (molecule A is in cyan whereas molecules B/C/D in gray). (B) Left: ribbon 622
representation of dimer AB within the tetramer in A. The secondary structural elements are indicated in 623
subunit A and the orange elements form the dimeric interface. The linker joining the N-terminal DNA 624
binding domain and the C-terminal effector binding domain is shown in black. Right: ribbon 625
representation of dimer AD within the tetramer in A. The secondary structural elements are indicated in 626
subunit A and the orange elements form the other dimeric interface (C) Superposition of the subunits A 627
in cyan and B in gray of the tetramer in A (the subunits B, C, D adopt the same fold). The red parts 628
indicate major conformational changes between both subunits. A close-up view of the citrate and ion 629
binding sites in the effector/metal binding domain shown in blue and orange for subunits A and B, 630
respectively. (D) Interactions between the bound citrate in orientation A and in blue/Zn2+ (blue ball) and 631
subunit A in cyan. Hydrogen bonds are shown as dashed lines in black (distance below 3.2 Å) and 632
metal contacts are shown as dashed lines in red. Residues involved in the interactions are labeled and 633
- 19 -
shown as sticks. Citrate is shown in its Fo-Fc omit map contoured at 4σ in subunit A. (E) Interactions 634
between the bound citrate in orientation B and in orange/Zn2+ (orange ball) and subunit B in gray. 635
Hydrogen bonds are shown as dashed lines in black (distance below 3.2 Å) and metal contacts are 636
shown as dashed lines in red. Residues involved in the interactions are labeled and shown as sticks. 637
Citrate is shown in its Fo-Fc omit map contoured at 4σ in subunit A. 638
Figure 4. Cartoon representation of the tetrameric Atu1419-DNA complex (A) in the P6422 structure 639
with the monomer of the asymmetric unit shown in purple. (B) in the P212121 structure with the dimer of 640
the asymmetric unit shown in magenta. (C) Superposition of the DNA binding domains of the dimers 641
AB of the P6422 structure in purple and gray for subunits A and B, respectively and of the P212121 642
structure in magenta. The palindromic 10-mer DNA is in green and orange in the P6422 and P212121 643
structures, respectively. (D) View of the DNA binding domain of the dimer AB of the P6422 structure in 644
purple and gray for subunits A and B, respectively bound to the palindromic 10-mer DNA shown in 645
green. The secondary elements are indicated in subunit A. Arg45 in helix 3 is the key residue, which 646
interacts with the essential guanine base at position 3. This residue is shown as sticks. (E) View showing 647
a close-up of the Atu1419-DNA interface within a monomer and schematic diagram of Atu1419-DNA 648
contacts. Nucleotide bases that interact with Atu1419 are shown in green. (F) Gel mobility shift assay 649
analysis of Patu1420 incubated without and with Atu1419, and with Atu1419 and 100 µM citrate (ratio 650
tetrameric protein:DNA of 8.3). (G) Gel mobility shift assay analysis of Patu1420s containing a unique 651
palindrome or Patu1420s AT, in which the palindrome was mutated with the recognized guanine at 652
position 3 replaced by an adenine and its cytosine partner replaced by a thymine, incubated without 653
and with Atu1419 (ratio tetrameric protein:DNA of 4.6). 654
Figure 5. (A) Cartoon representation of the C-terminal domain except for helix 5 shown in ribbon of 655
Atu1419 with a co-purified Zn2+ ion and a close-up view of the Zn2+ binding site. The four amino acid 656
residues bound to the metal ion (orange ball) are shown as sticks. (B) Superposition of dimers AB of 657
apo Atu1419 (in orange) and Atu1419-DNA complex (in purple and gray). The DNA is in green. (C) 658
Close-up view showing the superposition of their DNA binding domains colored as in B with a view at 659
90°. 660
Figure 6. (A) (B) (C) Patu1418, Patu1419 or Patu1420 expression in A. fabrum C58 wild-type strain 661
compared with that in C58atu1420 and C58atu1418 mutants in the presence of ferulic acid. Values 662
correspond to normalized fluorescence intensity in the presence of ferulic acid corrected by subtracting 663
values without ferulic acid. Different letters indicate statistical differences between conditions (one-way 664
ANOVA and Tukey test; P-value=0.05). (D) Gel mobility shift assay analysis of Patu1420 DNA region 665
incubated without and with Atu1419 (ratio tetrameric protein:DNA of 17) and N5,N10-666
methylenetetrahydrofolate at different concentrations (0 to 300 M). (E) Gel mobility shift assay analysis 667
of Patu1420 DNA region incubated without and with Atu1419, and with Atu1419 and H4F, MH4F or 668
MEF at 100 M. (F) Differential scanning calorimetry thermograms of apo Atu1419 (black) and Atu1419 669
in the presence of MEF (magenta). The table below indicates the Tm. DSC experiments were performed 670
- 20 -
twice. (G) Isothermal titration microcalorimetry (ITC) experiments of Atu1419 towards MEF. The top 671
panel shows heat differences upon injection of MEF and low panel shows integrated heats of injection 672
with the best fit (solid line) to a single binding model using Microcal ORIGIN. (H) Control of MEF injection 673
in the buffer solution by ITC. 674
Figure 7. (A) atu1420 promoter region: -10 and -35 boxes are underlined, the palindromic sequence 675
and the degenerated palindromic sequence (109 bp apart) are in red. The transcription initiation site is 676
shown with an arrow and the translation start site is indicated in bold. (B) Gel mobility shift assay 677
analysis of four parts of the promoter region of atu1420 containing each one palindrome or one 678
degenerated palindrome (P1 or P2), or both (P1+P2) or none (P3) incubated without and with 250 nM 679
or 500 nM tetrameric Atu1419 (ratio protein:DNA of 8.3 or 16.6). 680
Figure 8. Interactions between the tetrameric Atu1419 repressor and Patu1418-1419 region of 370 bp 681
containing two palindromes separated by 190 bp visualized by electron microscopy and corresponding 682
model. (A) Image of Atu1419 tetramer as a control, (B) Image of Patu1418-1419 region as a control, 683
(C) Image of one tetramer bound to one palindrome only, (D) Image of two tetramers bound each to 684
one palindrome, (E) Image of one tetramer and a DNA loop. 685
686
REFERENCES 687
1. Nester, E.W. (2014) Agrobacterium: nature's genetic engineer. Front Plant Sci, 5, 730. 688 2. Dessaux, Y. and Faure, D. (2018) Niche Construction and Exploitation by Agrobacterium: How 689
to Survive and Face Competition in Soil and Plant Habitats. Curr Top Microbiol Immunol, 418, 690 55-86. 691
3. Meyer, T., Thiour-Mauprivez, C., Wisniewski-Dye, F., Kerzaon, I., Comte, G., Vial, L. and Lavire, 692 C. (2019) Ecological Conditions and Molecular Determinants Involved in Agrobacterium 693 Lifestyle in Tumors. Front Plant Sci, 10, 978. 694
4. Lassalle, F., Campillo, T., Vial, L., Baude, J., Costechareyre, D., Chapulliot, D., Shams, M., 695 Abrouk, D., Lavire, C., Oger-Desfeux, C. et al. (2011) Genomic species are ecological species 696 as revealed by comparative genomics in Agrobacterium tumefaciens. Genome Biol Evol, 3, 697 762-781. 698
5. Campillo, T., Renoud, S., Kerzaon, I., Vial, L., Baude, J., Gaillard, V., Bellvert, F., Chamignon, 699 C., Comte, G., Nesme, X. et al. (2014) Analysis of hydroxycinnamic acid degradation in 700 Agrobacterium fabrum reveals a coenzyme A-dependent, beta-oxidative deacetylation pathway. 701 Appl Environ Microbiol, 80, 3341-3349. 702
6. Bhattacharya, A., Sood, P. and Citovsky, V. (2010) The roles of plant phenolics in defence and 703 communication during Agrobacterium and Rhizobium infection. Mol Plant Pathol, 11, 705-719. 704
7. Guo, M., Huang, Z. and Yang, J. (2017) Is there any crosstalk between the chemotaxis and 705 virulence induction signaling in Agrobacterium tumefaciens? Biotechnol Adv, 35, 505-511. 706
8. Parke, D., Ornston, L.N. and Nester, E.W. (1987) Chemotaxis to plant phenolic inducers of 707 virulence genes is constitutively expressed in the absence of the Ti plasmid in Agrobacterium 708 tumefaciens. J Bacteriol, 169, 5336-5338. 709
9. Kape, R., Parniske, M. and Werner, D. (1991) Chemotaxis and nod Gene Activity of 710 Bradyrhizobium japonicum in Response to Hydroxycinnamic Acids and Isoflavonoids. Appl 711 Environ Microbiol, 57, 316-319. 712
10. Kalogeraki, V.S., Zhu, J., Eberhard, A., Madsen, E.L. and Winans, S.C. (1999) The phenolic vir 713 gene inducer ferulic acid is O-demethylated by the VirH2 protein of an Agrobacterium 714 tumefaciens Ti plasmid. Mol Microbiol, 34, 512-522. 715
- 21 -
11. Meyer, T., Renoud, S., Vigouroux, A., Miomandre, A., Gaillard, V., Kerzaon, I., Prigent-716 Combaret, C., Comte, G., Morera, S., Vial, L. et al. (2018) Regulation of hydroxycinnamic acid 717 degradation drives Agrobacterium fabrum lifestyles. Mol Plant Microbe Interact. 718
12. Duprey, A., Reverchon, S. and Nasser, W. (2014) Bacterial virulence and Fis: adapting 719 regulatory networks to the host environment. Trends Microbiol, 22, 92-99. 720
13. Valentini, M., Gonzalez, D., Mavridou, D.A. and Filloux, A. (2018) Lifestyle transitions and 721 adaptive pathogenesis of Pseudomonas aeruginosa. Curr Opin Microbiol, 41, 15-20. 722
14. Barton, I.S., Fuqua, C. and Platt, T.G. (2018) Ecological and evolutionary dynamics of a model 723 facultative pathogen: Agrobacterium and crown gall disease of plants. Environ Microbiol, 20, 724 16-29. 725
15. Kohler, A.C., Mills, M.J.L., Adams, P.D., Simmons, B.A. and Sale, K.L. (2017) Structure of aryl 726 O-demethylase offers molecular insight into a catalytic tyrosine-dependent mechanism. Proc 727 Natl Acad Sci U S A, 114, E3205-E3214. 728
16. Harada, A., Kamimura, N., Takeuchi, K., Yu, H.Y., Masai, E. and Senda, T. (2017) The crystal 729 structure of a new O-demethylase from Sphingobium sp. strain SYK-6. FEBS J, 284, 1855-730 1867. 731
17. Parke, D. (1995) Supraoperonic clustering of pca genes for catabolism of the phenolic 732 compound protocatechuate in Agrobacterium tumefaciens. J Bacteriol, 177, 3808-3817. 733
18. Abe, T., Masai, E., Miyauchi, K., Katayama, Y. and Fukuda, M. (2005) A tetrahydrofolate-734 dependent O-demethylase, LigM, is crucial for catabolism of vanillate and syringate in 735 Sphingomonas paucimobilis SYK-6. J Bacteriol, 187, 2030-2037. 736
19. Hoskisson, P.A. and Rigali, S. (2009) Chapter 1: Variation in form and function the helix-turn-737 helix regulators of the GntR superfamily. Adv Appl Microbiol, 69, 1-22. 738
20. Rigali, S., Derouaux, A., Giannotta, F. and Dusart, J. (2002) Subdivision of the helix-turn-helix 739 GntR family of bacterial regulators in the FadR, HutC, MocR, and YtrA subfamilies. J Biol Chem, 740 277, 12507-12515. 741
21. Suvorova, I.A., Korostelev, Y.D. and Gelfand, M.S. (2015) GntR Family of Bacterial 742 Transcription Factors and Their DNA Binding Motifs: Structure, Positioning and Co-Evolution. 743 PLoS One, 10, e0132618. 744
22. Jain, D. (2015) Allosteric control of transcription in GntR family of transcription regulators: A 745 structural overview. IUBMB Life, 67, 556-563. 746
23. van Aalten, D.M., DiRusso, C.C. and Knudsen, J. (2001) The structural basis of acyl coenzyme 747 A-dependent regulation of the transcription factor FadR. EMBO J, 20, 2041-2050. 748
24. Allaway, D., Schofield, N.A., Leonard, M.E., Gilardoni, L., Finan, T.M. and Poole, P.S. (2001) 749 Use of differential fluorescence induction and optical trapping to isolate environmentally 750 induced genes. Environ Microbiol, 3, 397-406. 751
25. Kabsch, W. (2010) Xds. Acta Crystallogr D Biol Crystallogr, 66, 125-132. 752 26. McCoy, A.J., Grosse-Kunstleve, R.W., Adams, P.D., Winn, M.D., Storoni, L.C. and Read, R.J. 753
(2007) Phaser crystallographic software. J Appl Crystallogr, 40, 658-674. 754 27. Blanc, E., Roversi, P., Vonrhein, C., Flensburg, C., Lea, S.M. and Bricogne, G. (2004) 755
Refinement of severely incomplete structures with maximum likelihood in BUSTER-TNT. Acta 756 Crystallogr D Biol Crystallogr, 60, 2210-2221. 757
28. Emsley, P. and Cowtan, K. (2004) Coot: model-building tools for molecular graphics. Acta 758 Crystallogr. D Biol. Crystallogr., 60, 2126-2132. 759
29. Sreerama, N. and Woody, R.W. (2000) Estimation of protein secondary structure from circular 760 dichroism spectra: comparison of CONTIN, SELCON, and CDSSTR methods with an 761 expanded reference set. Anal Biochem, 287, 252-260. 762
30. Whitmore, L. and Wallace, B.A. (2004) DICHROWEB, an online server for protein secondary 763 structure analyses from circular dichroism spectroscopic data. Nucleic Acids Res, 32, W668-764 673. 765
31. Solovyev, V. and Salamov, A. (2011) Automatic Annotation of Microbial Genomes and 766 Metagenomic Sequences. In Metagenomics and its Applications in Agriculture, Biomedicine 767 and Environmental Studies. (Ed. R. W. Li)Nova Science Publishers, 17. 768
32. Janin, J., Rodier, F., Chakrabarti, P. and Bahadur, R.P. (2007) Macromolecular recognition in 769 the Protein Data Bank. Acta Crystallogr D Biol Crystallogr, 63, 1-8. 770
33. Xu, Y., Heath, R.J., Li, Z., Rock, C.O. and White, S.W. (2001) The FadR.DNA complex. 771 Transcriptional control of fatty acid metabolism in Escherichia coli. J Biol Chem, 276, 17373-772 17379. 773
- 22 -
34. Shi, W., Kovacikova, G., Lin, W., Taylor, R.K., Skorupski, K. and Kull, F.J. (2015) The 40-774 residue insertion in Vibrio cholerae FadR facilitates binding of an additional fatty acyl-CoA 775 ligand. Nat Commun, 6, 6032. 776
35. Gao, Y.G., Suzuki, H., Itou, H., Zhou, Y., Tanaka, Y., Wachi, M., Watanabe, N., Tanaka, I. and 777 Yao, M. (2008) Structural and functional characterization of the LldR from Corynebacterium 778 glutamicum: a transcriptional repressor involved in L-lactate and sugar utilization. Nucleic Acids 779 Res, 36, 7110-7123. 780
36. van Aalten, D.M., DiRusso, C.C., Knudsen, J. and Wierenga, R.K. (2000) Crystal structure of 781 FadR, a fatty acid-responsive transcription factor with a novel acyl coenzyme A-binding fold. 782 EMBO J, 19, 5167-5177. 783
37. Lord, D.M., Uzgoren Baran, A., Soo, V.W., Wood, T.K., Peti, W. and Page, R. (2014) 784 McbR/YncC: implications for the mechanism of ligand and DNA binding by a bacterial GntR 785 transcriptional regulator involved in biofilm formation. Biochemistry, 53, 7223-7231. 786
38. Zheng, M., Cooper, D.R., Grossoehme, N.E., Yu, M., Hung, L.W., Cieslik, M., Derewenda, U., 787 Lesley, S.A., Wilson, I.A., Giedroc, D.P. et al. (2009) Structure of Thermotoga maritima TM0439: 788 implications for the mechanism of bacterial GntR transcription regulators with Zn2+-binding 789 FCD domains. Acta Crystallogr D Biol Crystallogr, 65, 356-365. 790
39. Pinheiro, J., Lisboa, J., Pombinho, R., Carvalho, F., Carreaux, A., Brito, C., Pontinen, A., 791 Korkeala, H., Dos Santos, N.M.S., Morais-Cabral, J.H. et al. (2018) MouR controls the 792 expression of the Listeria monocytogenes Agr system and mediates virulence. Nucleic Acids 793 Res, 46, 9338-9352. 794
40. Otani, H., Stogios, P.J., Xu, X., Nocek, B., Li, S.N., Savchenko, A. and Eltis, L.D. (2016) The 795 activity of CouR, a MarR family transcriptional regulator, is modulated through a novel 796 molecular mechanism. Nucleic Acids Res, 44, 595-607. 797
41. Cogan, D.P., Baraquet, C., Harwood, C.S. and Nair, S.K. (2018) Structural basis of 798 transcriptional regulation by CouR, a repressor of coumarate catabolism, in 799 Rhodopseudomonas palustris. J Biol Chem, 293, 11727-11735. 800
42. Danenberg, P.V., Gustavsson, B., Johnston, P., Lindberg, P., Moser, R., Odin, E., Peters, G.J. 801 and Petrelli, N. (2016) Folates as adjuvants to anticancer agents: Chemical rationale and 802 mechanism of action. Crit Rev Oncol Hematol, 106, 118-131. 803
43. Jagerstad, M. and Jastrebova, J. (2014) 5,10-Methylene-tetrahydrofolate dissociates into 804 tetrahydrofolate and formaldehyde at physiological pH and acidic pH, typical conditions used 805 during sample extraction and LC-MS/MS analysis of biological samples. Biomed Chromatogr, 806 28, 1041-1042. 807
44. Feirer, N., Xu, J., Allen, K.D., Koestler, B.J., Bruger, E.L., Waters, C.M., White, R.H. and Fuqua, 808 C. (2015) A Pterin-Dependent Signaling Pathway Regulates a Dual-Function Diguanylate 809 Cyclase-Phosphodiesterase Controlling Surface Attachment in Agrobacterium tumefaciens. 810 mBio, 6, e00156. 811
45. Muraoka, S., Okumura, R., Ogawa, N., Nonaka, T., Miyashita, K. and Senda, T. (2003) Crystal 812 structure of a full-length LysR-type transcriptional regulator, CbnR: unusual combination of two 813 subunit forms and molecular bases for causing and changing DNA bend. J Mol Biol, 328, 555-814 566. 815
46. Amouyal, M., Mortensen, L., Buc, H. and Hammer, K. (1989) Single and double loop formation 816 when deoR repressor binds to its natural operator sites. Cell, 58, 545-551. 817
47. Bylino, O.V., Ibragimov, A.N. and Shidlovskii, Y.V. (2020) Evolution of Regulated Transcription. 818 Cells, 9. 819
48. Lewis, M., Chang, G., Horton, N.C., Kercher, M.A., Pace, H.C., Schumacher, M.A., Brennan, 820 R.G. and Lu, P. (1996) Crystal structure of the lactose operon repressor and its complexes with 821 DNA and inducer. Science, 271, 1247-1254. 822
49. Voros, Z., Yan, Y., Kovari, D.T., Finzi, L. and Dunlap, D. (2017) Proteins mediating DNA loops 823 effectively block transcription. Protein Sci, 26, 1427-1438. 824
50. De Brouwer, V., Zhang, G.F., Storozhenko, S., Straeten, D.V. and Lambert, W.E. (2007) pH 825 stability of individual folates during critical sample preparation steps in prevision of the analysis 826 of plant folates. Phytochem Anal, 18, 496-508. 827
828
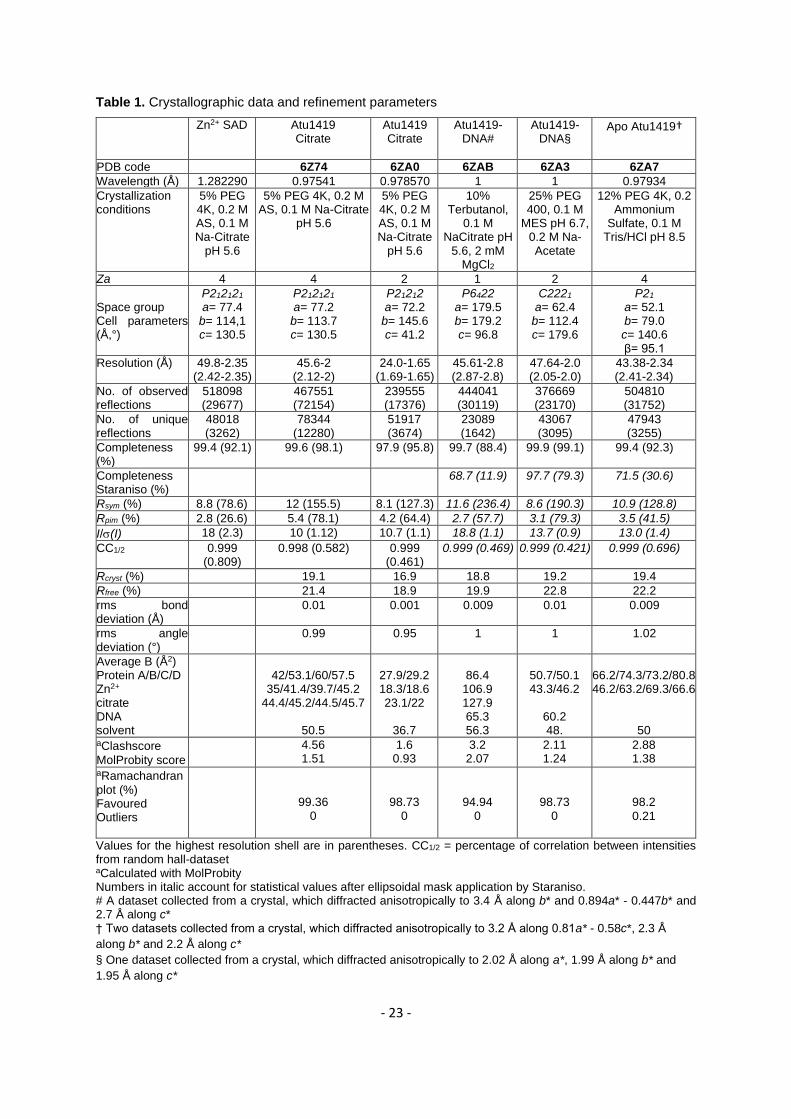
- 23 -
Table 1. Crystallographic data and refinement parameters
Zn2+ SAD
Atu1419 Citrate
Atu1419 Citrate
Atu1419-DNA#
Atu1419-DNA§
Apo Atu1419†
PDB code 6Z74 6ZA0 6ZAB 6ZA3 6ZA7
Wavelength (Å) 1.282290 0.97541 0.978570 1 1 0.97934
Crystallization conditions
5% PEG 4K, 0.2 M AS, 0.1 M Na-Citrate
pH 5.6
5% PEG 4K, 0.2 M AS, 0.1 M Na-Citrate
pH 5.6
5% PEG 4K, 0.2 M AS, 0.1 M Na-Citrate
pH 5.6
10% Terbutanol,
0.1 M NaCitrate pH
5.6, 2 mM MgCl2
25% PEG 400, 0.1 M
MES pH 6.7, 0.2 M Na-Acetate
12% PEG 4K, 0.2 Ammonium
Sulfate, 0.1 M Tris/HCl pH 8.5
Za 4 4 2 1 2 4
Space group Cell parameters (Å,°)
P212121 a= 77.4
b= 114,1 c= 130.5
P212121 a= 77.2
b= 113.7 c= 130.5
P21212 a= 72.2
b= 145.6 c= 41.2
P6422 a= 179.5 b= 179.2 c= 96.8
C2221
a= 62.4 b= 112.4 c= 179.6
P21 a= 52.1 b= 79.0 c= 140.6 β= 95.1
Resolution (Å) 49.8-2.35 (2.42-2.35)
45.6-2 (2.12-2)
24.0-1.65 (1.69-1.65)
45.61-2.8 (2.87-2.8)
47.64-2.0 (2.05-2.0)
43.38-2.34 (2.41-2.34)
No. of observed reflections
518098 (29677)
467551 (72154)
239555 (17376)
444041 (30119)
376669 (23170)
504810 (31752)
No. of unique reflections
48018 (3262)
78344 (12280)
51917 (3674)
23089 (1642)
43067 (3095)
47943 (3255)
Completeness (%)
99.4 (92.1) 99.6 (98.1) 97.9 (95.8) 99.7 (88.4) 99.9 (99.1) 99.4 (92.3)
Completeness Staraniso (%)
68.7 (11.9) 97.7 (79.3) 71.5 (30.6)
Rsym (%) 8.8 (78.6) 12 (155.5) 8.1 (127.3) 11.6 (236.4) 8.6 (190.3) 10.9 (128.8)
Rpim (%) 2.8 (26.6) 5.4 (78.1) 4.2 (64.4) 2.7 (57.7) 3.1 (79.3) 3.5 (41.5)
I/(I) 18 (2.3) 10 (1.12) 10.7 (1.1) 18.8 (1.1) 13.7 (0.9) 13.0 (1.4)
CC1/2 0.999 (0.809)
0.998 (0.582) 0.999 (0.461)
0.999 (0.469) 0.999 (0.421) 0.999 (0.696)
Rcryst (%) 19.1 16.9 18.8 19.2 19.4
Rfree (%) 21.4 18.9 19.9 22.8 22.2
rms bond deviation (Å)
0.01 0.001 0.009 0.01 0.009
rms angle deviation (°)
0.99 0.95 1 1 1.02
Average B (Å2) Protein A/B/C/D Zn2+ citrate DNA solvent
42/53.1/60/57.5
35/41.4/39.7/45.2 44.4/45.2/44.5/45.7
50.5
27.9/29.2 18.3/18.6 23.1/22
36.7
86.4
106.9 127.9 65.3 56.3
50.7/50.1 43.3/46.2
60.2 48.
66.2/74.3/73.2/80.8 46.2/63.2/69.3/66.6
50 aClashscore
MolProbity score
4.56 1.51
1.6 0.93
3.2 2.07
2.11 1.24
2.88 1.38
aRamachandran
plot (%) Favoured Outliers
99.36 0
98.73 0
94.94 0
98.73 0
98.2
0.21
Values for the highest resolution shell are in parentheses. CC1/2 = percentage of correlation between intensities from random hall-dataset aCalculated with MolProbity Numbers in italic account for statistical values after ellipsoidal mask application by Staraniso. # A dataset collected from a crystal, which diffracted anisotropically to 3.4 Å along b* and 0.894a* - 0.447b* and 2.7 Å along c* † Two datasets collected from a crystal, which diffracted anisotropically to 3.2 Å along 0.81a* - 0.58c*, 2.3 Å
along b* and 2.2 Å along c*
§ One dataset collected from a crystal, which diffracted anisotropically to 2.02 Å along a*, 1.99 Å along b* and
1.95 Å along c*
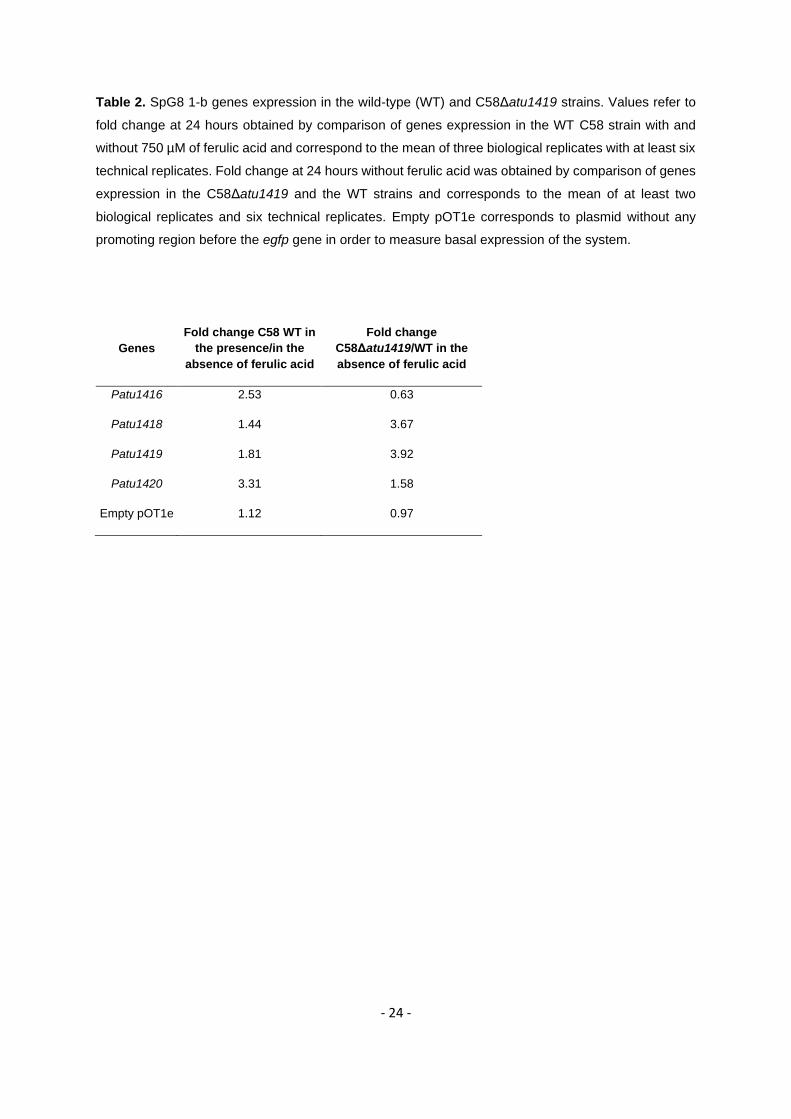
- 24 -
Table 2. SpG8 1-b genes expression in the wild-type (WT) and C58Δatu1419 strains. Values refer to
fold change at 24 hours obtained by comparison of genes expression in the WT C58 strain with and
without 750 µM of ferulic acid and correspond to the mean of three biological replicates with at least six
technical replicates. Fold change at 24 hours without ferulic acid was obtained by comparison of genes
expression in the C58Δatu1419 and the WT strains and corresponds to the mean of at least two
biological replicates and six technical replicates. Empty pOT1e corresponds to plasmid without any
promoting region before the egfp gene in order to measure basal expression of the system.
Genes
Fold change C58 WT in
the presence/in the
absence of ferulic acid
Fold change
C58Δatu1419/WT in the
absence of ferulic acid
Patu1416 2.53 0.63
Patu1418 1.44 3.67
Patu1419 1.81 3.92
Patu1420 3.31 1.58
Empty pOT1e 1.12 0.97
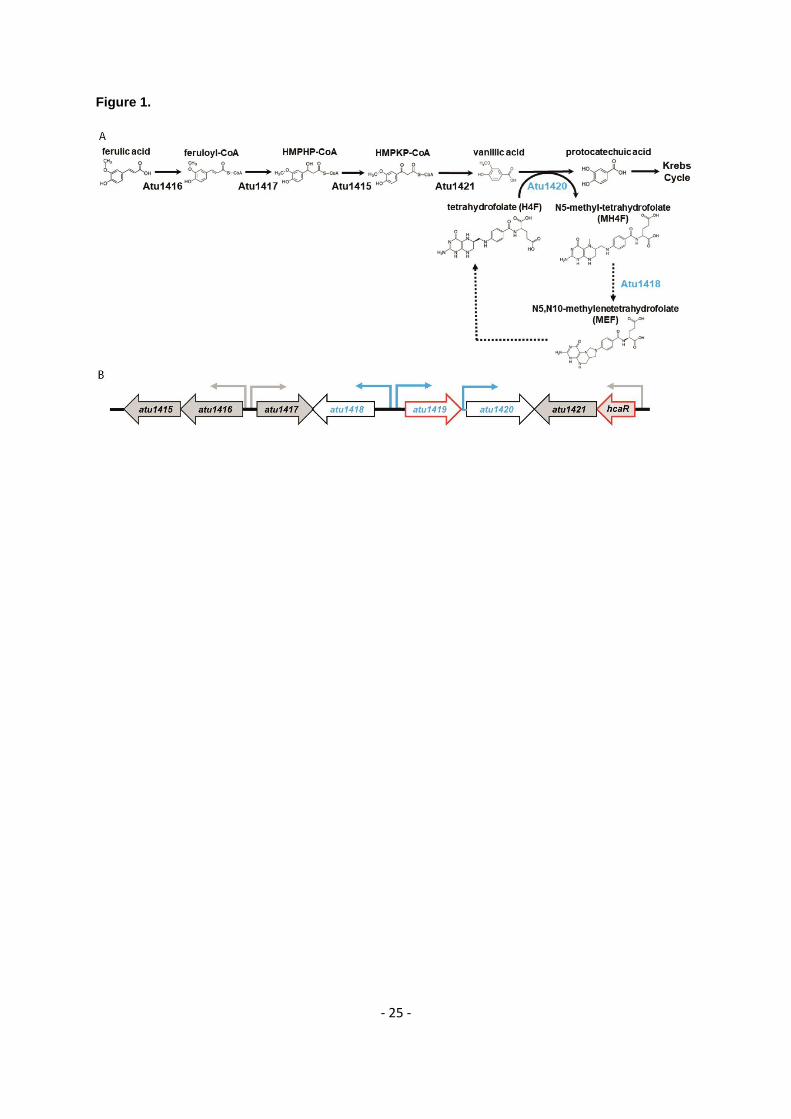
- 25 -
Figure 1.
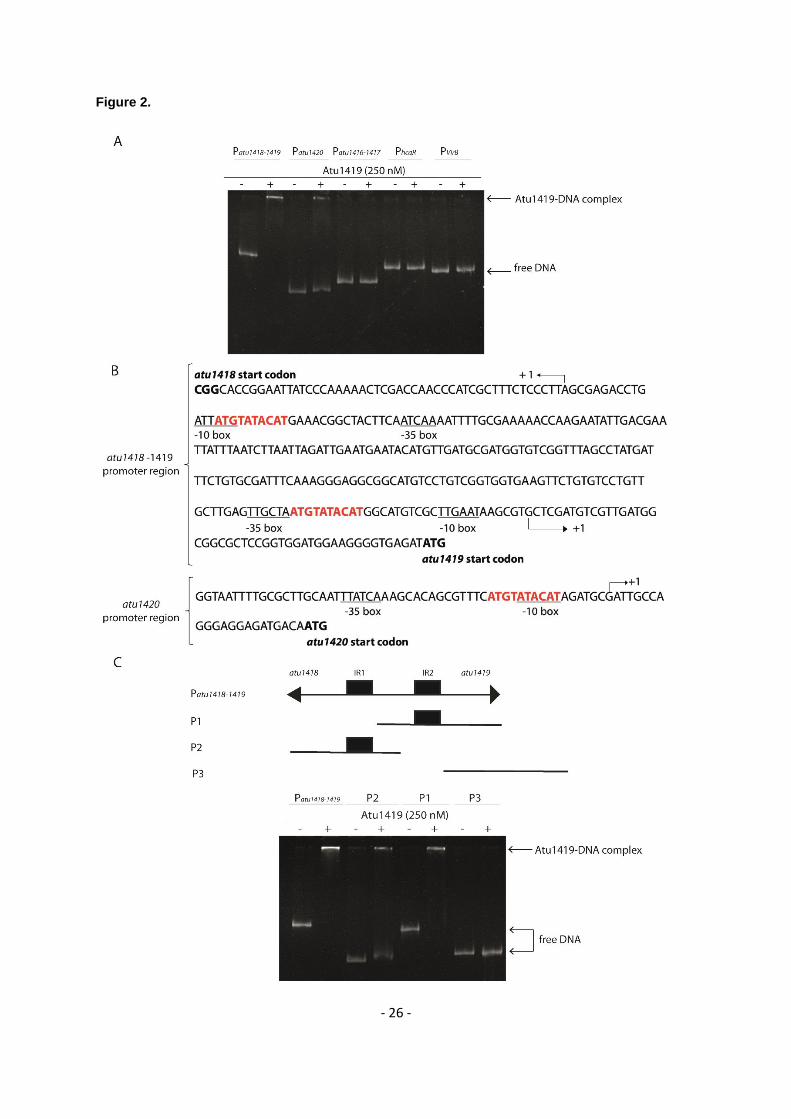
- 26 -
Figure 2.
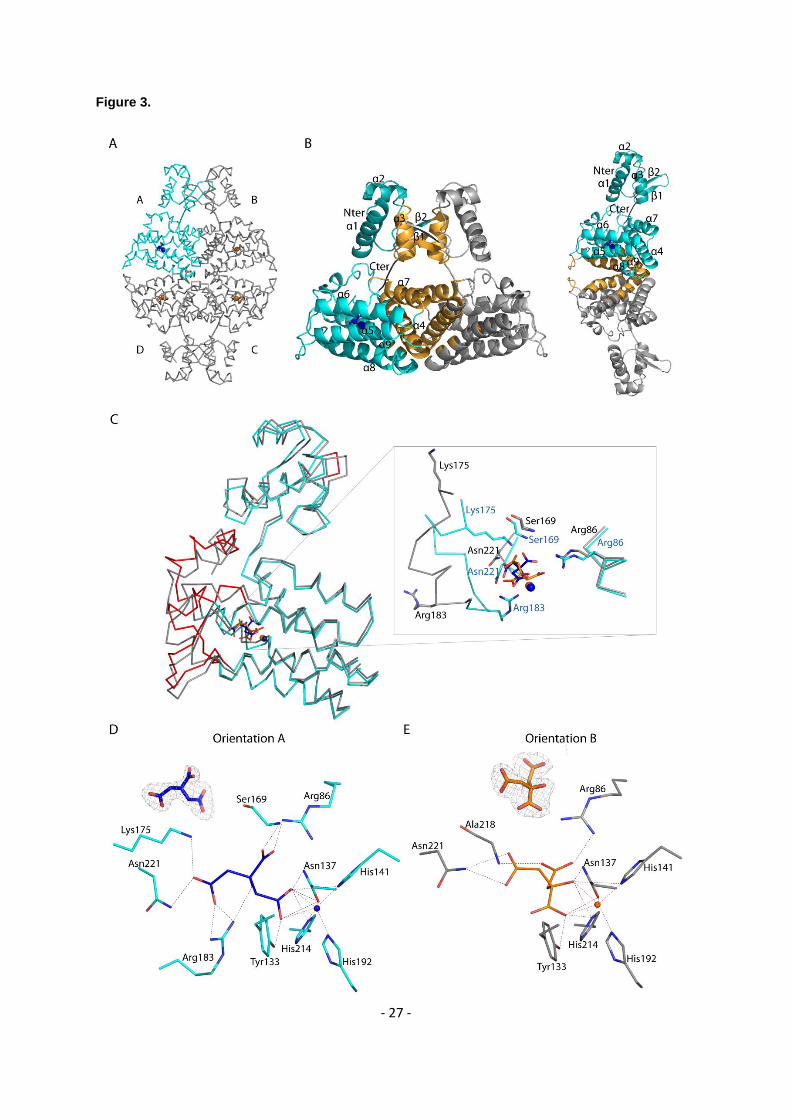
- 27 -
Figure 3.
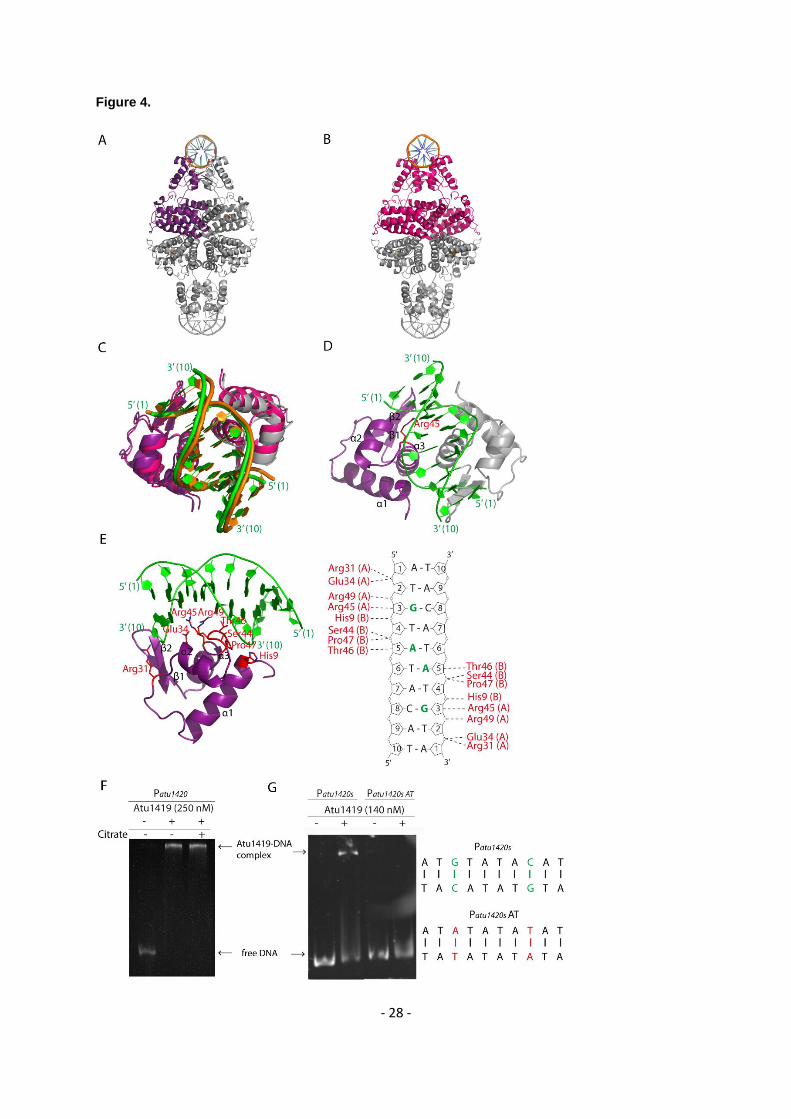
- 28 -
Figure 4.
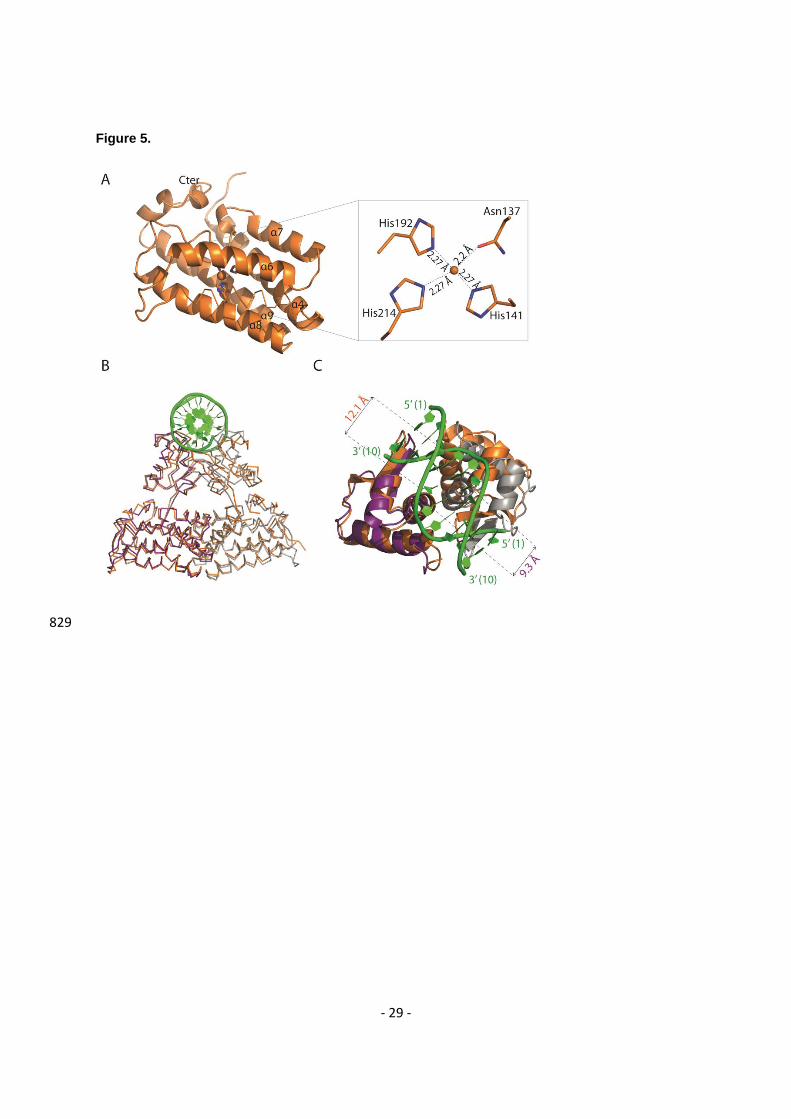
- 29 -
Figure 5.
829
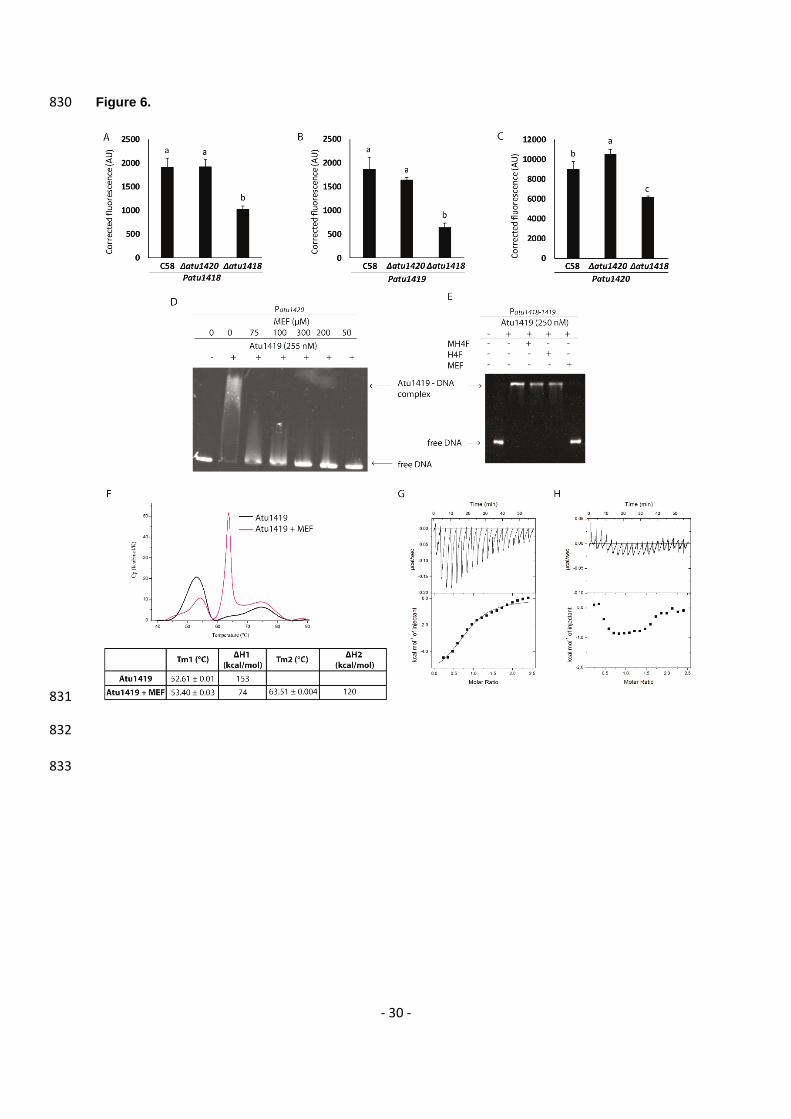
- 30 -
Figure 6. 830
831
832
833
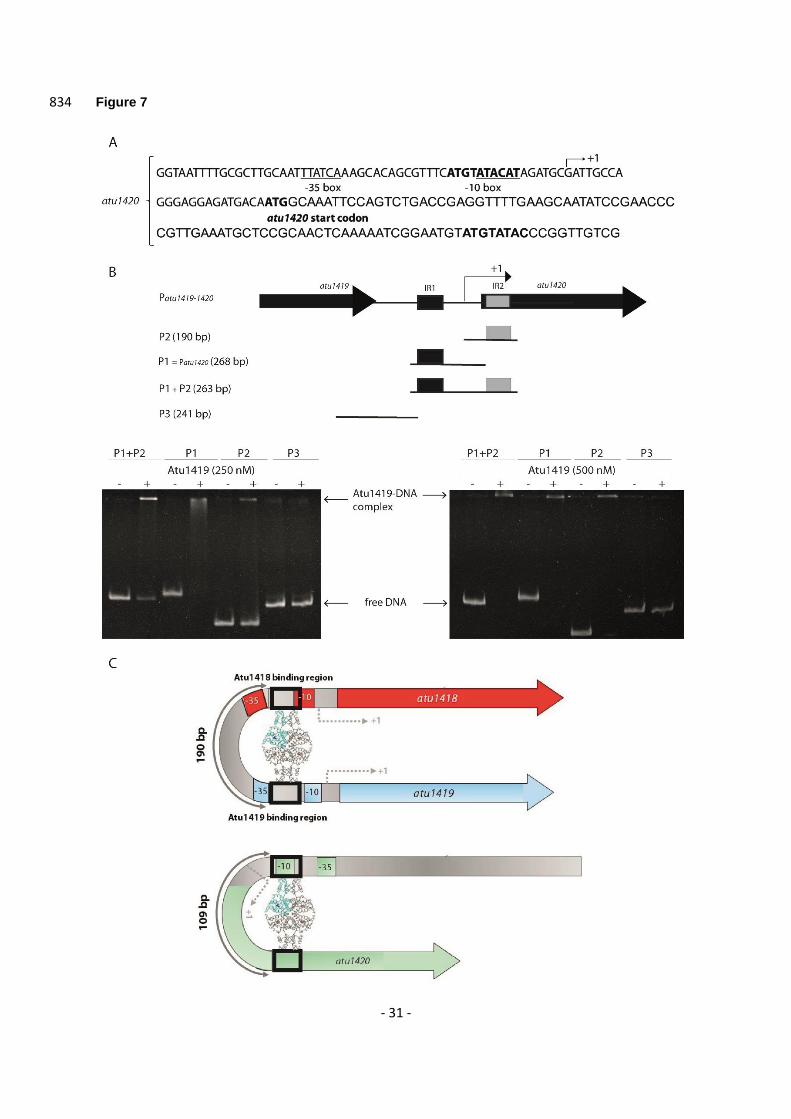
- 31 -
Figure 7 834