molecular architecture of transcription factor hotspots in early adipogenesis
TRANSCRIPT
Cell Reports
Report
Molecular Architecture of Transcription FactorHotspots in Early AdipogenesisRasmus Siersbæk,1 Songjoon Baek,2 Atefeh Rabiee,1 Ronni Nielsen,1 Sofie Traynor,1 Nicholas Clark,3 Albin Sandelin,3
Ole N. Jensen,1 Myong-Hee Sung,2 Gordon L. Hager,2 and Susanne Mandrup1,*1Department of Biochemistry and Molecular Biology, University of Southern Denmark, 5230 Odense M, Denmark2Laboratory of Receptor Biology and Gene Expression, Center for Cancer Research, National Cancer Institute, NIH, Bethesda,
MD 20892, USA3The Bioinformatics Centre, Department of Biology & Biotech Research and Innovation Centre, University of Copenhagen,2200 Copenhagen N, Denmark
*Correspondence: [email protected]
http://dx.doi.org/10.1016/j.celrep.2014.04.043This is an open access article under the CC BY-NC-ND license (http://creativecommons.org/licenses/by-nc-nd/3.0/).
SUMMARY
Transcription factors have recently been shown tocolocalize in hotspot regions of the genome, whichare further clustered into super-enhancers. However,the detailed molecular organization of transcriptionfactors at hotspot regions is poorly defined. Here,we have used digital genomic footprinting to pre-cisely define factor localization at a genome-widelevel during the early phase of 3T3-L1 adipocyte dif-ferentiation, which allows us to obtain detailed mo-lecular insight into how transcription factors targethotspots. We demonstrate the formation of ATF-C/EBP heterodimers at a composite motif on chro-matin, and we suggest that this may be a generalmechanism for integrating external signals on chro-matin. Furthermore, we find evidence of extensiverecruitment of transcription factors to hotspotsthrough alternative mechanisms not involving theirknownmotifs and demonstrate that these alternativebinding events are functionally important for hotspotformation and activity. Taken together, these find-ings provide a framework for understanding tran-scription factor cooperativity in hotspots.
INTRODUCTION
The recent increase in the number of genome-widemaps of tran-
scription factor binding has made it increasingly clear that tran-
scription factors do not work alone but rather collaborate with
other transcription factors at genomic target regions. Colocaliza-
tion of two cooperating factors has been observed in several
different systems, e.g., activating protein 1 (AP1) has been
shown to regulate the chromatin accessibility at glucocorticoid
receptor (GR)-binding sites in mammary cells (Biddie et al.,
2011), FoxA1 regulates the estrogen receptor (ER)-activated
gene program by directly targeting ER-binding sites (Carroll
et al., 2005; Hurtado et al., 2011), PU.1 cooperates with several
different factors at specific target sites including CCAAT/
1434 Cell Reports 7, 1434–1442, June 12, 2014 ª2014 The Authors
enhancer-binding protein b (C/EBPb) (Heinz et al., 2010),
and peroxisome proliferator-activated receptor g and C/EBPa-
binding profiles overlap extensively in mature adipocytes
(Lefterova et al., 2008; Nielsen et al., 2008) and cooperate in
gaining access to chromatin (Madsen et al., 2014). In addition
to cooperation between transcription factor pairs, we (Boerge-
sen et al., 2012; Siersbæk et al., 2011; 2014, this issue of Cell
Reports) and others (Chen et al., 2008; Gerstein et al., 2012;
He et al., 2011) have demonstrated that multiple transcription
factors can target the same genomic regions that we refer to
as transcription factor hotspots (Siersbæk et al., 2011). Cooper-
ative binding of transcription factors is also the basis for
modeling of cis-regulatory modules determining cell specificity
(Frith et al., 2003; Krivan andWasserman, 2001). However, chro-
matin immunoprecipitation sequencing (ChIP-seq), which is the
most widely used method to map transcription factor binding,
has a relatively low resolution and does not discriminate between
direct protein binding to DNA and indirect recruitment to chro-
matin through protein-protein interactions. The molecular archi-
tecture (i.e., the organization) of transcription factors at hotspots
is therefore poorly understood.
Here, we have used digital genomic footprinting to precisely
define protein localization for several adipogenic transcription
factors at a genome-wide level. In combination with ChIP-seq
data, these analyses reveal molecular insight into the organi-
zation of transcription factors at hotspot regions, which provides
a framework for understanding transcription factor cooperativity
on chromatin.
RESULTS
Digital Genomic Footprinting Reveals Precise ProteinFootprints at a Genome-wide LevelTo begin to understand how transcription factors communicate
in hotspots, it is essential to know how the factors are organized
at these regions, including which factors are engaged in direct
DNA interactions. We therefore employed high-resolution digital
genomic footprinting (Figure 1A), a recently developed method
to identify protein footprints (i.e., areas of restricted nuclease
access) within DNase I hypersensitive (DHS) regions based on
ultradeep sequencing (>100 M sequence tags) of DHS-seq
00.51.01.52.02.53.0
Aver
age
cut c
ount
3.54.0
00.050.100.150.200.250.30
Phas
tcon
s sc
ore
0.350.40
-50 -25 0 5025Distance from footprint (bp)
1 2 3 4 5 6 7
1.0
1.5
2.0
0.5
0
JunB
0
1
2
3
4
5
Aver
age
cut c
ount
0
0.05
0.10
0.15
0.20
0.25
0.30
Phas
tcon
s sc
ore
-50 -25 0 5025Distance from footprint (bp)
1 2 3 4 5 6 7 8 9 10
1.0
1.5
2.0
0.5
0
KLF5
0
0.05
0.10
0.15
0.20
0.25
0.35
Phas
tcon
s sc
ore
0.30
0
0.5
1.0
1.5
2.0
2.5
3.5
Aver
age
cut c
ount 3.0
-50 -25 0 5025Distance from footprint (bp)
1 2 3 4 5 6 7 8 9 10 11 12
1.0
1.5
2.0
0.5
0
PBX1
A C
D
E
B
CEBPβ
foot
prin
ts (4
,821
)
DNase I cut counts C/EBPβ ChIP-seq
10000-1000100-100
1 2 3 4 5 6 7 8 90
0.5
1.0
1.5
2.0
0
0.5
1.0
1.5
2.0
2.5
3.0
0
0.05
0.10
0.15
0.20
0.25
0.30
Phas
tcon
s sc
ore
Aver
age
cut c
ount
-50 -25 0 5025Distance from footprint (bp)
C/EBPβ
Median=532 bp
Median=21 bpMedian=14 bp
DHS region
Digital genomic footprinting
Chr4:78,419,439-78,420,414
bp
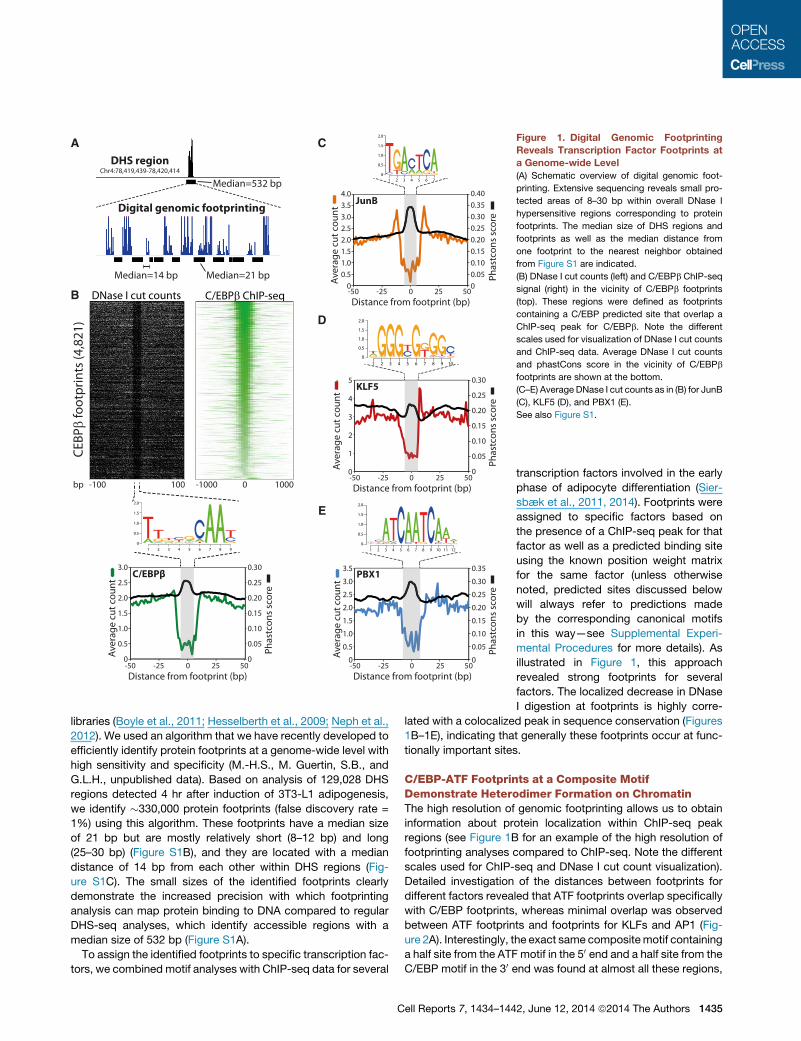
Figure 1. Digital Genomic Footprinting
Reveals Transcription Factor Footprints at
a Genome-wide Level
(A) Schematic overview of digital genomic foot-
printing. Extensive sequencing reveals small pro-
tected areas of 8–30 bp within overall DNase I
hypersensitive regions corresponding to protein
footprints. The median size of DHS regions and
footprints as well as the median distance from
one footprint to the nearest neighbor obtained
from Figure S1 are indicated.
(B) DNase I cut counts (left) and C/EBPb ChIP-seq
signal (right) in the vicinity of C/EBPb footprints
(top). These regions were defined as footprints
containing a C/EBP predicted site that overlap a
ChIP-seq peak for C/EBPb. Note the different
scales used for visualization of DNase I cut counts
and ChIP-seq data. Average DNase I cut counts
and phastCons score in the vicinity of C/EBPb
footprints are shown at the bottom.
(C–E) Average DNase I cut counts as in (B) for JunB
(C), KLF5 (D), and PBX1 (E).
See also Figure S1.
libraries (Boyle et al., 2011; Hesselberth et al., 2009; Neph et al.,
2012). We used an algorithm that we have recently developed to
efficiently identify protein footprints at a genome-wide level with
high sensitivity and specificity (M.-H.S., M. Guertin, S.B., and
G.L.H., unpublished data). Based on analysis of 129,028 DHS
regions detected 4 hr after induction of 3T3-L1 adipogenesis,
we identify �330,000 protein footprints (false discovery rate =
1%) using this algorithm. These footprints have a median size
of 21 bp but are mostly relatively short (8–12 bp) and long
(25–30 bp) (Figure S1B), and they are located with a median
distance of 14 bp from each other within DHS regions (Fig-
ure S1C). The small sizes of the identified footprints clearly
demonstrate the increased precision with which footprinting
analysis can map protein binding to DNA compared to regular
DHS-seq analyses, which identify accessible regions with a
median size of 532 bp (Figure S1A).
To assign the identified footprints to specific transcription fac-
tors, we combined motif analyses with ChIP-seq data for several
Cell Reports 7, 1434–144
transcription factors involved in the early
phase of adipocyte differentiation (Sier-
sbæk et al., 2011, 2014). Footprints were
assigned to specific factors based on
the presence of a ChIP-seq peak for that
factor as well as a predicted binding site
using the known position weight matrix
for the same factor (unless otherwise
noted, predicted sites discussed below
will always refer to predictions made
by the corresponding canonical motifs
in this way—see Supplemental Experi-
mental Procedures for more details). As
illustrated in Figure 1, this approach
revealed strong footprints for several
factors. The localized decrease in DNase
I digestion at footprints is highly corre-
lated with a colocalized peak in sequence conservation (Figures
1B–1E), indicating that generally these footprints occur at func-
tionally important sites.
C/EBP-ATF Footprints at a Composite MotifDemonstrate Heterodimer Formation on ChromatinThe high resolution of genomic footprinting allows us to obtain
information about protein localization within ChIP-seq peak
regions (see Figure 1B for an example of the high resolution of
footprinting analyses compared to ChIP-seq. Note the different
scales used for ChIP-seq and DNase I cut count visualization).
Detailed investigation of the distances between footprints for
different factors revealed that ATF footprints overlap specifically
with C/EBP footprints, whereas minimal overlap was observed
between ATF footprints and footprints for KLFs and AP1 (Fig-
ure 2A). Interestingly, the exact same compositemotif containing
a half site from the ATF motif in the 50 end and a half site from the
C/EBP motif in the 30 end was found at almost all these regions,
2, June 12, 2014 ª2014 The Authors 1435
0123456789
% o
f p
ea
ks
ATF0
0.5
1.0
1.5
2.0
2.5
Composite0
0.20.40.60.81.01.21.41.6
C/EBP
ATF only
C/EBP only
ATF-C/EBP shared
ChIP-seq peaks
* *
*
*
*
*
A B
C
0 4 8 12 16 20-4-8-12-16-20
0
4
5
1
2
3
0
2
3
4
5
6
7
1
0
2.02.5
0.51.01.5
Av
era
ge
cu
t co
un
tsA
ve
rag
e c
ut
cou
nts
Av
era
ge
cu
t co
un
ts
AT
F c
on
sen
sus
4 5 6 7 81 2 3
4 5 6 7 81 2 3
4 5 6 7 81 2 3
C/E
BP
co
nse
nsu
sC
om
po
site
C/E
BP
C/E
BP
C/E
BP
AT
FA
TF
AT
F
5’ 3’
5’ 3’
5’ 3’5 6 7 8
5 6 7 8
41 2 3
41 2 3
Distance from center (bp)
4.04.5
3.03.5
0
0.01
0.02
0.03
0.04
De
nsi
ty
0
0.01
0.02
0.03
0.04
De
nsi
ty
0
0.01
0.02
0.03
0.04
De
nsi
ty
0 50 100 150 200 250Distance between footprints
ATF & AP1
ATF & C/EBP
ATF & KLF
Consensus sites
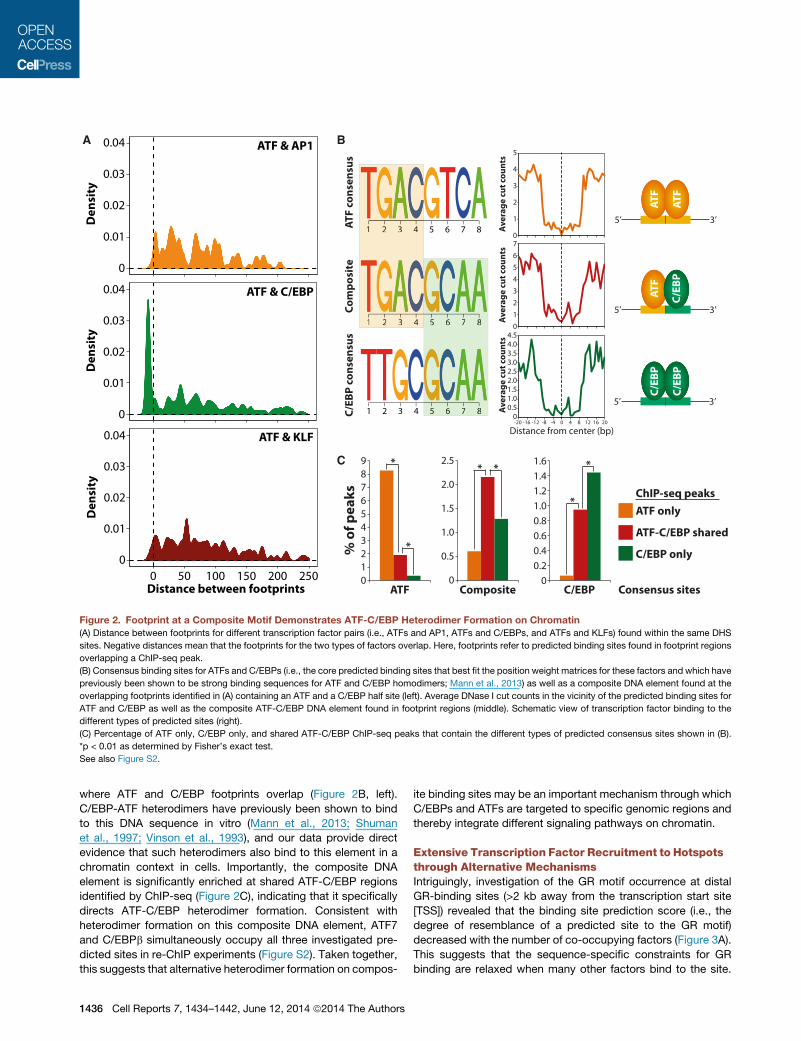
Figure 2. Footprint at a Composite Motif Demonstrates ATF-C/EBP Heterodimer Formation on Chromatin
(A) Distance between footprints for different transcription factor pairs (i.e., ATFs and AP1, ATFs and C/EBPs, and ATFs and KLFs) found within the same DHS
sites. Negative distances mean that the footprints for the two types of factors overlap. Here, footprints refer to predicted binding sites found in footprint regions
overlapping a ChIP-seq peak.
(B) Consensus binding sites for ATFs and C/EBPs (i.e., the core predicted binding sites that best fit the position weight matrices for these factors and which have
previously been shown to be strong binding sequences for ATF and C/EBP homodimers; Mann et al., 2013) as well as a composite DNA element found at the
overlapping footprints identified in (A) containing an ATF and a C/EBP half site (left). Average DNase I cut counts in the vicinity of the predicted binding sites for
ATF and C/EBP as well as the composite ATF-C/EBP DNA element found in footprint regions (middle). Schematic view of transcription factor binding to the
different types of predicted sites (right).
(C) Percentage of ATF only, C/EBP only, and shared ATF-C/EBP ChIP-seq peaks that contain the different types of predicted consensus sites shown in (B).
*p < 0.01 as determined by Fisher’s exact test.
See also Figure S2.
where ATF and C/EBP footprints overlap (Figure 2B, left).
C/EBP-ATF heterodimers have previously been shown to bind
to this DNA sequence in vitro (Mann et al., 2013; Shuman
et al., 1997; Vinson et al., 1993), and our data provide direct
evidence that such heterodimers also bind to this element in a
chromatin context in cells. Importantly, the composite DNA
element is significantly enriched at shared ATF-C/EBP regions
identified by ChIP-seq (Figure 2C), indicating that it specifically
directs ATF-C/EBP heterodimer formation. Consistent with
heterodimer formation on this composite DNA element, ATF7
and C/EBPb simultaneously occupy all three investigated pre-
dicted sites in re-ChIP experiments (Figure S2). Taken together,
this suggests that alternative heterodimer formation on compos-
1436 Cell Reports 7, 1434–1442, June 12, 2014 ª2014 The Authors
ite binding sites may be an important mechanism through which
C/EBPs and ATFs are targeted to specific genomic regions and
thereby integrate different signaling pathways on chromatin.
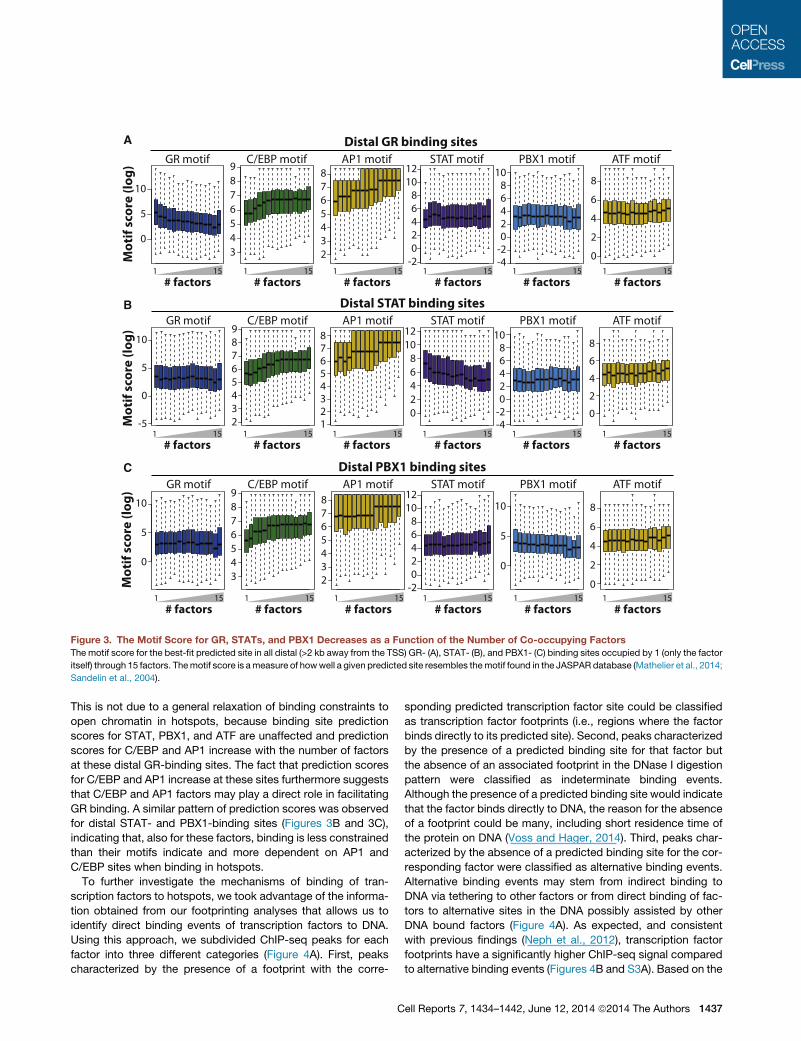
Extensive Transcription Factor Recruitment to Hotspotsthrough Alternative MechanismsIntriguingly, investigation of the GR motif occurrence at distal
GR-binding sites (>2 kb away from the transcription start site
[TSS]) revealed that the binding site prediction score (i.e., the
degree of resemblance of a predicted site to the GR motif)
decreased with the number of co-occupying factors (Figure 3A).
This suggests that the sequence-specific constraints for GR
binding are relaxed when many other factors bind to the site.
0
5
10
GR motif
3456789
C/EBP motif
2345678
AP1 motif
-202468
1012
STAT motif
-4-202468
10PBX1 motif
0
2
4
6
8
ATF motif
Mo
tif
sco
re (
log
)
Distal GR binding sites
1 15 1 15 1 15 1 15 1 15 1 15# factors # factors # factors # factors # factors # factors
A
0
5
10
3456789
2345678
-202468
1012
0
5
10
0
2
4
6
8
GR motif C/EBP motif AP1 motif STAT motif PBX1 motif ATF motifDistal PBX1 binding sites
Mo
tif
sco
re (
log
)
1 15 1 15 1 15 1 15 1 15 1 15# factors # factors # factors # factors # factors # factors
B
C
02468
1012
23456789
12345678
-4-202468
10
-5
0
5
10
0
2
4
6
8
GR motif C/EBP motif AP1 motif STAT motif PBX1 motif ATF motifDistal STAT binding sites
Mo
tif
sco
re (
log
)
1 15 1 15 1 15 1 15 1 15 1 15# factors # factors # factors # factors # factors # factors
Figure 3. The Motif Score for GR, STATs, and PBX1 Decreases as a Function of the Number of Co-occupying Factors
The motif score for the best-fit predicted site in all distal (>2 kb away from the TSS) GR- (A), STAT- (B), and PBX1- (C) binding sites occupied by 1 (only the factor
itself) through 15 factors. Themotif score is ameasure of howwell a given predicted site resembles themotif found in the JASPAR database (Mathelier et al., 2014;
Sandelin et al., 2004).
This is not due to a general relaxation of binding constraints to
open chromatin in hotspots, because binding site prediction
scores for STAT, PBX1, and ATF are unaffected and prediction
scores for C/EBP and AP1 increase with the number of factors
at these distal GR-binding sites. The fact that prediction scores
for C/EBP and AP1 increase at these sites furthermore suggests
that C/EBP and AP1 factors may play a direct role in facilitating
GR binding. A similar pattern of prediction scores was observed
for distal STAT- and PBX1-binding sites (Figures 3B and 3C),
indicating that, also for these factors, binding is less constrained
than their motifs indicate and more dependent on AP1 and
C/EBP sites when binding in hotspots.
To further investigate the mechanisms of binding of tran-
scription factors to hotspots, we took advantage of the informa-
tion obtained from our footprinting analyses that allows us to
identify direct binding events of transcription factors to DNA.
Using this approach, we subdivided ChIP-seq peaks for each
factor into three different categories (Figure 4A). First, peaks
characterized by the presence of a footprint with the corre-
C
sponding predicted transcription factor site could be classified
as transcription factor footprints (i.e., regions where the factor
binds directly to its predicted site). Second, peaks characterized
by the presence of a predicted binding site for that factor but
the absence of an associated footprint in the DNase I digestion
pattern were classified as indeterminate binding events.
Although the presence of a predicted binding site would indicate
that the factor binds directly to DNA, the reason for the absence
of a footprint could be many, including short residence time of
the protein on DNA (Voss and Hager, 2014). Third, peaks char-
acterized by the absence of a predicted binding site for the cor-
responding factor were classified as alternative binding events.
Alternative binding events may stem from indirect binding to
DNA via tethering to other factors or from direct binding of fac-
tors to alternative sites in the DNA possibly assisted by other
DNA bound factors (Figure 4A). As expected, and consistent
with previous findings (Neph et al., 2012), transcription factor
footprints have a significantly higher ChIP-seq signal compared
to alternative binding events (Figures 4B and S3A). Based on the
ell Reports 7, 1434–1442, June 12, 2014 ª2014 The Authors 1437
C
A B
FOSL2c-JunJunB
C/EBPβC/EBPδ
ATF2ATF7
KLF4KLF5
STAT1
STAT5A
PBX1
GR
VDR
FOSL2c-Jun
JunB
C/EBPβ
C/EBPδ
ATF2ATF7
KLF4KLF5
STAT1
STAT5APBX1GR
VDR
0.3
0.2
0.1
0 Fra
cti
on
of
site
s
Fraction of alternative binding events
overlapping with footprints
01234567Neg. reg. of cysteine-type endopeptidase act.
Glucose metabolic processActivation of MAPK activityInsulin receptor signaling pathwayBMP signaling pathwaySkeletal muscle fiber developmentERK1 and ERK2 cascadePos. reg. of tyrosine phos. of STAT3 protein‘De novo’ posttranslational protein foldingInactivation of MAPK activityPathway-restricted SMAD protein phos.Actin filament polymerizationPos. regulation of Rho GTPase activitymRNA 3’-end processingPurine ribonucleoside triphos. biosynthetic proc.Histone ubiquitinationATP metabolic processmRNA splicing, via spliceosomeEpidermal growth factor receptor signaling pathwayRho protein signal transductionEphrin receptor signaling pathwayNuclear-transcribed mRNA cat. proc., deaden.-dep. decayProteosomal ubiquitin-dep. protein catabolic processRetinoid metabolic processPos. reg. of phospholipase C activityVascular endothelial growth factor signaling pathwayActivation of cysteine-type endopeptidase act.Prostaglandin biosynthetic processPeptidyl-threonine modificationCytosolic calcium ion transportCellular calcium ion homeostasisPos. reg. of peptidyl-serine phosphorylation
Com
mon
ca
tego
ries
Cate
gorie
s se
lect
ive
for
subs
ets
of fa
ctor
s
-log1
0(p
valu
e)
KLF4KLF5
C/EBPβC/EBPδ
FOSL2c-Ju
nJunB
D
F
C/EBPβ
0
50
100
150*
Alternativemechanism
Footprint
Ta
g c
ou
nts
(25
0 b
p w
ind
ow
) JunB
020406080
*
E
ChIP-seq peaks
DNA
DNase I
digestion
?
Footprint Indeterminate Alternative mechanism
or
Known motif Alternative motif
DHSC/EBPβ
C/EBPδc-Jun
JunBFOSL2
KLF4KLF5
02468
1012141618
% i
n p
rom
ote
rs
* * *
*
*
Footprints
Enhancer hotspot
STATsNRs ATFsPBX1
AP1
KL
Fs
Alternative motif
C/EBPs
Indirect
TF
TFTF
Dire
ct
Model for alternative recruitment
to early adipogenic hotspots
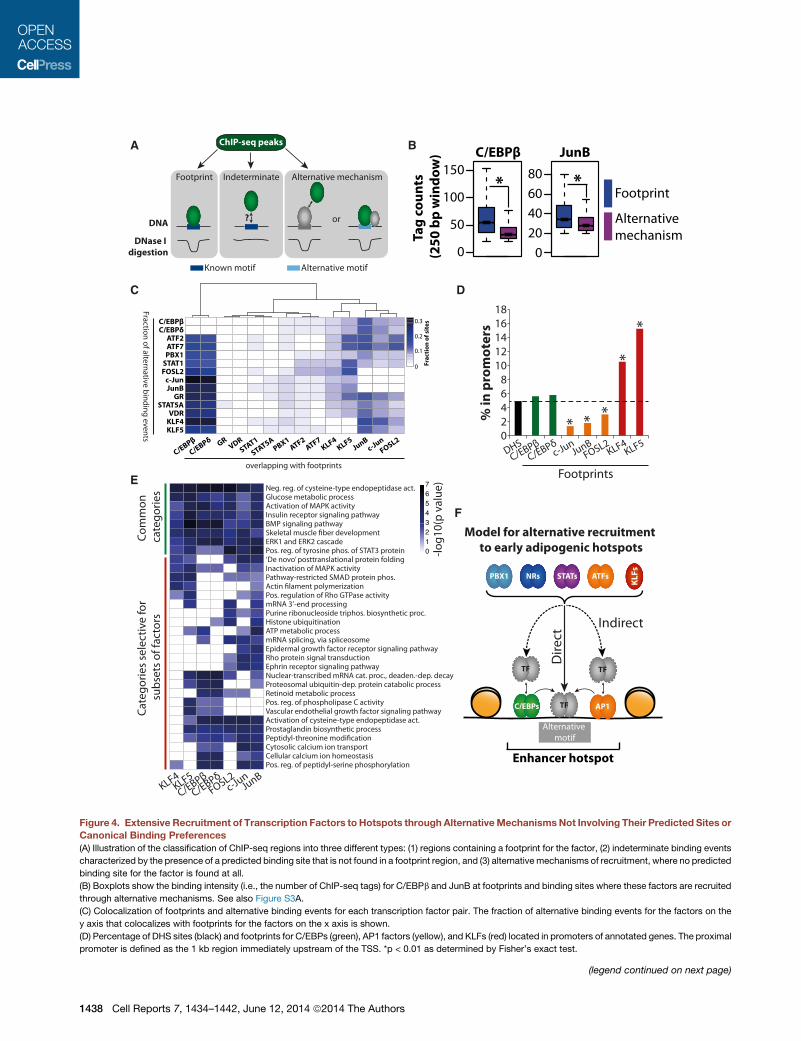
Figure 4. Extensive Recruitment of Transcription Factors to Hotspots through AlternativeMechanismsNot Involving Their Predicted Sites orCanonical Binding Preferences
(A) Illustration of the classification of ChIP-seq regions into three different types: (1) regions containing a footprint for the factor, (2) indeterminate binding events
characterized by the presence of a predicted binding site that is not found in a footprint region, and (3) alternative mechanisms of recruitment, where no predicted
binding site for the factor is found at all.
(B) Boxplots show the binding intensity (i.e., the number of ChIP-seq tags) for C/EBPb and JunB at footprints and binding sites where these factors are recruited
through alternative mechanisms. See also Figure S3A.
(C) Colocalization of footprints and alternative binding events for each transcription factor pair. The fraction of alternative binding events for the factors on the
y axis that colocalizes with footprints for the factors on the x axis is shown.
(D) Percentage of DHS sites (black) and footprints for C/EBPs (green), AP1 factors (yellow), and KLFs (red) located in promoters of annotated genes. The proximal
promoter is defined as the 1 kb region immediately upstream of the TSS. *p < 0.01 as determined by Fisher’s exact test.
(legend continued on next page)
1438 Cell Reports 7, 1434–1442, June 12, 2014 ª2014 The Authors
classification of binding events for each factor described above,
we can correlate these different mechanisms of transcription
factor binding for all transcription factor pairs. Indeterminate
binding events are omitted from these analyses as it is not clear
whether or not the corresponding predicted binding site is
involved in recruitment of the factor to chromatin. Interestingly,
footprints for C/EBPs, KLFs, and AP1 factors (i.e., c-Jun,
JunB, and FOSL2) are highly associated with alternative binding
events for all other factors (Figure 4C). Taken together with the
motif analyses described above (Figure 3), this indicates that
these factors may function through direct interactions with their
known binding sites to facilitate recruitment of other factors
either through indirect binding (tethering) or through direct DNA
binding to sites not corresponding to their canonical motifs by
dynamic assisted loading (Voss et al., 2011).
Importantly, the footprints for C/EBPs, KLFs, and AP1 factors
are significantly enriched in the vicinity of genes that are induced
during the first 4 hr of differentiation (Figure S3B), strongly
suggesting that these regions are in fact involved in regulating
gene transcription. Interestingly, KLF footprints are significantly
enriched in the proximal promoter region of annotated genes
relative to all DHS sites, whereas footprints for the AP1 factors
JunB, c-Jun, and FOSL2 are depleted in promoter regions
relative to DHS sites (Figure 4D). This indicates that KLF factors
function as facilitating factors that preferentially bind directly at
promoters in addition to distal elements, whereas AP1 factors
almost exclusively bind directly to their predicted binding sites
in distal enhancers. Interestingly, assigning genes that are
induced during the first 4 hr of differentiation to hotspots where
different factors form a footprint reveals that these hotspots are
associated with distinct sets of Gene Ontology (GO) categories
(Figure 4E). Thus, different facilitating factors appear to drive
the formation of hotspots that control different gene programs.
Taken together, these detailed footprinting analyses suggest
that alternative mechanisms of transcription factor recruitment
not involving the known factor motifs are central for hotspot
formation and that especially C/EBPs, AP1, and KLF proteins
may be involved in facilitating alternative mechanisms of recruit-
ment of other factors (Figure 4F).
Alternative Mechanisms of C/EBPb Recruitment AreFunctionally as Important as Direct Binding to PredictedC/EBP SitesTo investigate the relative functional importance of footprints
and alternative binding events for hotspot formation, we first
analyzed the effect of C/EBPb depletion on recruitment of tran-
scription factors to hotspots where C/EBPb binds directly to its
predicted binding sites in DNA relative to hotspots where
C/EBPb binds through alternative mechanisms. Surprisingly,
alternative STAT5A and VDR recruitment to these two types of
(E) Genes that were induced during the first 4 hr of differentiation (Siersbæk et al.
footprint was located within 50 kb of their TSS. The genes assigned to C/EBP, K
p values for the significant GO terms are illustrated in the heatmap. GO term-enr
(F) Schematic model of the alternative mechanisms through which transcription
recruitment do not involve the factor’s canonical motif. Instead, transcription fac
protein interactions that are facilitated by DNA-bound factors (e.g., C/EBPs and A
which may also be facilitated by other factors.
See also Figure S3.
C
hotspots is impaired to the same extent by C/EBPb depletion
(Figure 5A). Importantly, STAT5A and VDR recruitment to sites
without C/EBPb binding is largely unaffected by C/EBPb knock-
down. This indicates that alternative mechanisms of C/EBPb
binding to hotspots are functionally as important as direct
binding to its predicted sites for the recruitment of additional
transcription factors. Consistent with a functionally important
role of alternative binding mechanisms, MED1 recruitment is
similarly affected at C/EBPb footprints and alternative C/EBPb-
binding regions by knockdown of C/EBPb, whereas MED1
recruitment to binding regions without C/EBPb is unaffected
(MED1 ChIP-seq data were obtained from Siersbæk et al.,
2014) (Figure 5B). Furthermore, RNA-seq in 3T3-L1 cells
depleted of C/EBPb revealed that early induced genes in the
vicinity of hotspots where C/EBPb binds through alternative
mechanisms are affected to the same extent by the C/EBPb
knockdown as induced genes in the vicinity of hotspots, where
C/EBPb binds directly to its predicted sites (Figure 5C). Interest-
ingly, however, hotspots where C/EBPb is recruited through
alternativemechanisms are associated with a different gene pro-
gram than the hotspots with a C/EBPb footprint (Figure 5D),
which is consistent with the observation that hotspots occupied
by different facilitating factors are associated with distinct gene
programs (Figure 4E). Taken together, this demonstrates that,
despite the lower ChIP-seq signal, C/EBPb recruitment to chro-
matin by alternative mechanisms is as important as direct C/
EBPb binding to its predicted sites for additional transcription
factor recruitment, enhancer formation, and gene activation.
DISCUSSION
The functional importance of hotspots (Siersbæk et al., 2014)
alongwith the intriguing finding that multiple transcription factors
associate with a relatively small stretch of DNA of a few hundred
base pairs at hotspots prompted us to investigate how transcrip-
tion factors are organized at these regions.
We demonstrate that digital genomic footprinting combined
with ChIP-seq andmotif analyses can be used to identify binding
of specific heterodimers to accessible chromatin. The findings
that a specific composite ATF-C/EBP motif is found in footprints
and enriched within shared C/EBP and ATF ChIP-seq peaks
strongly suggest that these sites direct ATF-C/EBP heterodimer
formation on chromatin. It has previously been demonstrated
that ATF2 and ATF4 can form heterodimers with C/EBPb that
bind to the composite site also identified here (i.e., TGACGCAA)
in vitro (Mann et al., 2013; Shuman et al., 1997; Vinson et al.,
1993). Our data suggest that this is a general feature of
C/EBPs and ATFs, and we provide direct evidence of ATF-
C/EBP heterodimer formation in a chromatin context within cells.
In addition to the composite ATF-C/EBP motif described here, it
, 2014) were assigned to a given factor if a hotspot where that factor formed a
LF, and AP1 factors were then subjected to GO enrichment analysis, and the
ichment analysis was performed using GeneAnswers (Feng et al., 2010).
factors can be recruited to hotspots. In all cases, alternative mechanisms of
tors can be recruited indirectly to DNA through mechanisms involving protein-
P1 factors) or they can be directly recruited to DNA through alternative motifs,
ell Reports 7, 1434–1442, June 12, 2014 ª2014 The Authors 1439
A B
C D
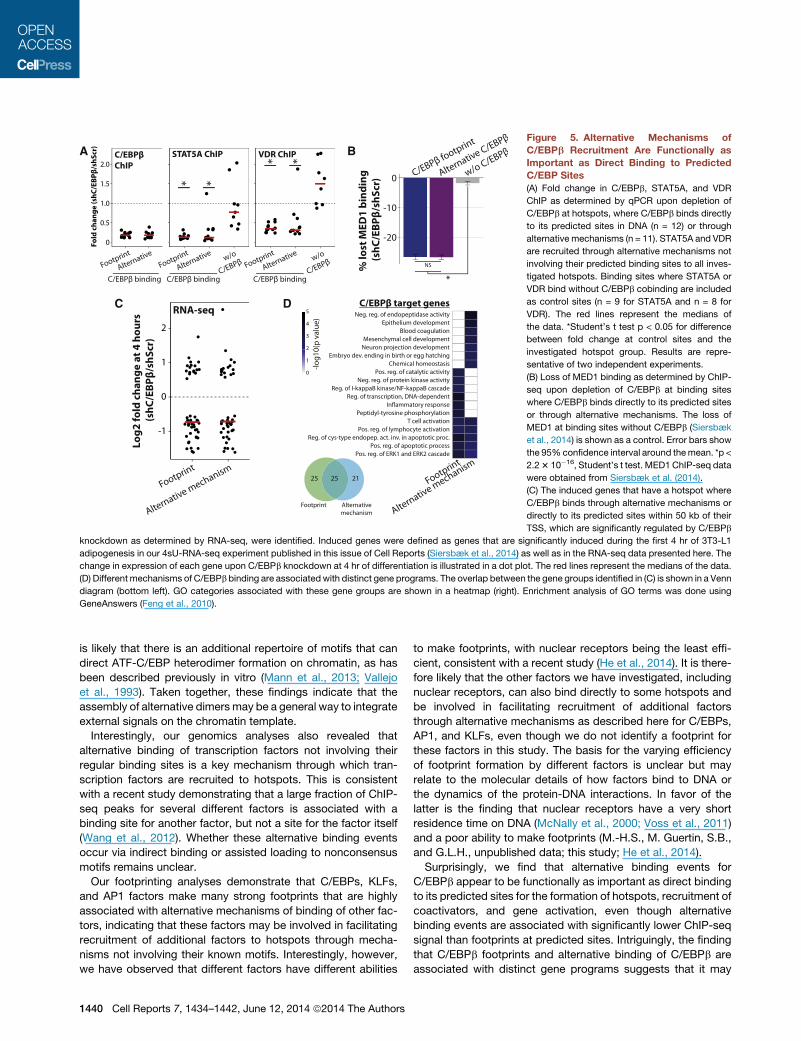
Figure 5. Alternative Mechanisms of
C/EBPb Recruitment Are Functionally as
Important as Direct Binding to Predicted
C/EBP Sites
(A) Fold change in C/EBPb, STAT5A, and VDR
ChIP as determined by qPCR upon depletion of
C/EBPb at hotspots, where C/EBPb binds directly
to its predicted sites in DNA (n = 12) or through
alternative mechanisms (n = 11). STAT5A and VDR
are recruited through alternative mechanisms not
involving their predicted binding sites to all inves-
tigated hotspots. Binding sites where STAT5A or
VDR bind without C/EBPb cobinding are included
as control sites (n = 9 for STAT5A and n = 8 for
VDR). The red lines represent the medians of
the data. *Student’s t test p < 0.05 for difference
between fold change at control sites and the
investigated hotspot group. Results are repre-
sentative of two independent experiments.
(B) Loss of MED1 binding as determined by ChIP-
seq upon depletion of C/EBPb at binding sites
where C/EBPb binds directly to its predicted sites
or through alternative mechanisms. The loss of
MED1 at binding sites without C/EBPb (Siersbæk
et al., 2014) is shown as a control. Error bars show
the 95%confidence interval around themean. *p <
2.23 10�16, Student’s t test. MED1 ChIP-seq data
were obtained from Siersbæk et al. (2014).
(C) The induced genes that have a hotspot where
C/EBPb binds through alternative mechanisms or
directly to its predicted sites within 50 kb of their
TSS, which are significantly regulated by C/EBPb
knockdown as determined by RNA-seq, were identified. Induced genes were defined as genes that are significantly induced during the first 4 hr of 3T3-L1
adipogenesis in our 4sU-RNA-seq experiment published in this issue of Cell Reports (Siersbæk et al., 2014) as well as in the RNA-seq data presented here. The
change in expression of each gene upon C/EBPb knockdown at 4 hr of differentiation is illustrated in a dot plot. The red lines represent the medians of the data.
(D) Different mechanisms of C/EBPb binding are associatedwith distinct gene programs. The overlap between the gene groups identified in (C) is shown in a Venn
diagram (bottom left). GO categories associated with these gene groups are shown in a heatmap (right). Enrichment analysis of GO terms was done using
GeneAnswers (Feng et al., 2010).
is likely that there is an additional repertoire of motifs that can
direct ATF-C/EBP heterodimer formation on chromatin, as has
been described previously in vitro (Mann et al., 2013; Vallejo
et al., 1993). Taken together, these findings indicate that the
assembly of alternative dimers may be a general way to integrate
external signals on the chromatin template.
Interestingly, our genomics analyses also revealed that
alternative binding of transcription factors not involving their
regular binding sites is a key mechanism through which tran-
scription factors are recruited to hotspots. This is consistent
with a recent study demonstrating that a large fraction of ChIP-
seq peaks for several different factors is associated with a
binding site for another factor, but not a site for the factor itself
(Wang et al., 2012). Whether these alternative binding events
occur via indirect binding or assisted loading to nonconsensus
motifs remains unclear.
Our footprinting analyses demonstrate that C/EBPs, KLFs,
and AP1 factors make many strong footprints that are highly
associated with alternative mechanisms of binding of other fac-
tors, indicating that these factors may be involved in facilitating
recruitment of additional factors to hotspots through mecha-
nisms not involving their known motifs. Interestingly, however,
we have observed that different factors have different abilities
1440 Cell Reports 7, 1434–1442, June 12, 2014 ª2014 The Authors
to make footprints, with nuclear receptors being the least effi-
cient, consistent with a recent study (He et al., 2014). It is there-
fore likely that the other factors we have investigated, including
nuclear receptors, can also bind directly to some hotspots and
be involved in facilitating recruitment of additional factors
through alternative mechanisms as described here for C/EBPs,
AP1, and KLFs, even though we do not identify a footprint for
these factors in this study. The basis for the varying efficiency
of footprint formation by different factors is unclear but may
relate to the molecular details of how factors bind to DNA or
the dynamics of the protein-DNA interactions. In favor of the
latter is the finding that nuclear receptors have a very short
residence time on DNA (McNally et al., 2000; Voss et al., 2011)
and a poor ability to make footprints (M.-H.S., M. Guertin, S.B.,
and G.L.H., unpublished data; this study; He et al., 2014).
Surprisingly, we find that alternative binding events for
C/EBPb appear to be functionally as important as direct binding
to its predicted sites for the formation of hotspots, recruitment of
coactivators, and gene activation, even though alternative
binding events are associated with significantly lower ChIP-seq
signal than footprints at predicted sites. Intriguingly, the finding
that C/EBPb footprints and alternative binding of C/EBPb are
associated with distinct gene programs suggests that it may
be possible to design drugs to target specific gene programs by
specifically targeting one, but not the other, of these binding
mechanisms of a particular transcription factor.
In conclusion, we presentmolecular insight into how transcrip-
tion factors are organized and function at shared target regions,
thereby providing a framework for understanding transcription
factor cooperativity on chromatin.
EXPERIMENTAL PROCEDURES
Cell Culture and Knockdown
3T3-L1 cells were grown and induced to differentiate as described in Siersbæk
et al. (2014). Knockdown of C/EBPb was done using the pSicoR PGK puro
(Addgene; 12084) system as described in Siersbæk et al. (2014).
ChIP
ChIP was performed as described (Siersbæk et al., 2011) using antibodies
against C/EBPb (C-19, sc-150; Santa Cruz Biotechnology), VDR (C-20,
sc-1008; Santa Cruz), and STAT5A (L-20, sc-1081; Santa Cruz). Purified
DNA was analyzed by quantitative PCR (qPCR).
RNA-Seq
Cells were harvested in Isol-RNA lysis reagent (5 PRIME) and purified accord-
ing to the manufacturer. Purified RNA was then prepared for sequencing
(Illumina) according to the instructions of the manufacturer. Sequence reads
were mapped to the mouse genome (mm9) as described in Siersbæk et al.
(2014). Mapped reads in exons were counted using HOMER (Heinz et al.,
2010), and differentially expressed genes (adjusted p < 0.05) were identified
using DESeq (Anders and Huber, 2010).
Digital Genomic Footprinting
Using ultradeep sequencing of our previously published DHS-seq library (Sier-
sbæk et al., 2011), we obtained 137 million mapped sequence tags. These
were analyzed using a footprinting algorithm we developed, DNase2TF, to
obtain footprints of 8–30 bp (M.-H.S., M. Guertin, S.B., and G.L.H., unpub-
lished data). All footprints were scanned with JASPAR motifs (Mathelier
et al., 2014; Sandelin et al., 2004) to predict binding sites for the investigated
factors. See Supplemental Experimental Methods for more details.
Genomics Analyses
Mapped ChIP-seq (Siersbæk et al., 2011, 2014) and RNA-seq (this study;
Siersbæk et al., 2014) were analyzed by HOMER (Heinz et al., 2010) and
BEDTools (Quinlan and Hall, 2010).
ACCESSION NUMBERS
Sequencing data are available from the Gene Expression Omnibus (GEO)
under accession number GSE57415. Additional information is available in
the Supplemental Experimental Procedures online.
SUPPLEMENTAL INFORMATION
Supplemental Information includes Supplemental Experimental Procedures
and three figures and can be found with this article online at http://dx.doi.
org/10.1016/j.celrep.2014.04.043.
AUTHOR CONTRIBUTIONS
R.S. and S.M. conceived and designed the study. R.S., A.R., R.N., and S.T.
performed the experiments. R.S., S.B., M.-H.S., N.C., and A.S. analyzed the
data. A.S., O.N.J., M.-H.S., G.L.H., and S.M. supervised the study. R.S. and
S.M. wrote the manuscript with input from the other authors.
C
ACKNOWLEDGMENTS
We thank members of the Mandrup and Hager groups for valuable discus-
sions. In particular, we thank Bjørk D. Larsen for experimental assistance.
The work was in part carried out at the Villum Center for Bioanalytical Sci-
ences, Department of Biochemistry and Molecular Biology, SDU, supported
by the Villum Foundation. Work in the Mandrup laboratory was supported by
grants from the Danish Independent Research CounciljNatural Sciences and
the Novo Nordisk Foundation; work in the Jensen laboratory was financed
by the Danish National Research Foundation grant number DNRF82 to the
Center for Epigenetics; work in the Hager laboratory was supported by the
Intramural Research Program of the NIH, National Cancer Institute, Center
for Cancer Research; and work in the Sandelin group was supported by the
Lundbeck foundation and Novo Nordisk Foundation.
Received: October 10, 2013
Revised: April 2, 2014
Accepted: April 18, 2014
Published: May 22, 2014
REFERENCES
Anders, S., and Huber,W. (2010). Differential expression analysis for sequence
count data. Genome Biol. 11, R106.
Biddie, S.C., John, S., Sabo, P.J., Thurman, R.E., Johnson, T.A., Schiltz, R.L.,
Miranda, T.B., Sung, M.-H., Trump, S., Lightman, S.L., et al. (2011). Transcrip-
tion factor AP1 potentiates chromatin accessibility and glucocorticoid recep-
tor binding. Mol. Cell 43, 145–155.
Boergesen, M., Pedersen, T.A., Gross, B., van Heeringen, S.J., Hagenbeek,
D., Bindesbøll, C., Caron, S., Lalloyer, F., Steffensen, K.R., Nebb, H.I., et al.
(2012). Genome-wide profiling of liver X receptor, retinoid X receptor, and
peroxisome proliferator-activated receptor a in mouse liver reveals extensive
sharing of binding sites. Mol. Cell. Biol. 32, 852–867.
Boyle, A.P., Song, L., Lee, B.-K., London, D., Keefe, D., Birney, E., Iyer, V.R.,
Crawford, G.E., and Furey, T.S. (2011). High-resolution genome-wide in vivo
footprinting of diverse transcription factors in human cells. Genome Res. 21,
456–464.
Carroll, J.S., Liu, X.S., Brodsky, A.S., Li, W., Meyer, C.A., Szary, A.J.,
Eeckhoute, J., Shao, W., Hestermann, E.V., Geistlinger, T.R., et al. (2005).
Chromosome-wide mapping of estrogen receptor binding reveals long-range
regulation requiring the forkhead protein FoxA1. Cell 122, 33–43.
Chen, X., Xu, H., Yuan, P., Fang, F., Huss, M., Vega, V.B., Wong, E., Orlov, Y.L.,
Zhang,W., Jiang, J., et al. (2008). Integration of external signaling pathwayswith
the core transcriptional network in embryonic stem cells. Cell 133, 1106–1117.
Feng, G., Du, P., Krett, N.L., Tessel, M., Rosen, S., Kibbe, W.A., and Lin, S.M.
(2010). A collection of bioconductor methods to visualize gene-list annota-
tions. BMC Res. Notes 3, 10.
Frith, M.C., Li, M.C., and Weng, Z. (2003). Cluster-Buster: Finding dense clus-
ters of motifs in DNA sequences. Nucleic Acids Res. 31, 3666–3668.
Gerstein, M.B., Kundaje, A., Hariharan, M., Landt, S.G., Yan, K.-K., Cheng, C.,
Mu, X.J., Khurana, E., Rozowsky, J., Alexander, R., et al. (2012). Architecture
of the human regulatory network derived from ENCODE data. Nature 489,
91–100.
He, A., Kong, S.W., Ma, Q., and Pu, W.T. (2011). Co-occupancy by multiple
cardiac transcription factors identifies transcriptional enhancers active in
heart. Proc. Natl. Acad. Sci. USA 108, 5632–5637.
He, H.H., Meyer, C.A., Hu, S.S., Chen, M.-W., Zang, C., Liu, Y., Rao, P.K., Fei,
T., Xu, H., Long, H., et al. (2014). Refined DNase-seq protocol and data anal-
ysis reveals intrinsic bias in transcription factor footprint identification. Nat.
Methods 11, 73–78.
Heinz, S., Benner, C., Spann, N., Bertolino, E., Lin, Y.C., Laslo, P., Cheng, J.X.,
Murre, C., Singh, H., and Glass, C.K. (2010). Simple combinations of lineage-
determining transcription factors prime cis-regulatory elements required for
macrophage and B cell identities. Mol. Cell 38, 576–589.
ell Reports 7, 1434–1442, June 12, 2014 ª2014 The Authors 1441
Hesselberth, J.R., Chen, X., Zhang, Z., Sabo, P.J., Sandstrom, R., Reynolds,
A.P., Thurman, R.E., Neph, S., Kuehn, M.S., Noble, W.S., et al. (2009). Global
mapping of protein-DNA interactions in vivo by digital genomic footprinting.
Nat. Methods 6, 283–289.
Hurtado, A., Holmes, K.A., Ross-Innes, C.S., Schmidt, D., and Carroll, J.S.
(2011). FOXA1 is a key determinant of estrogen receptor function and endo-
crine response. Nat. Genet. 43, 27–33.
Krivan, W., and Wasserman, W.W. (2001). A predictive model for regulatory
sequences directing liver-specific transcription. Genome Res. 11, 1559–1566.
Lefterova, M.I., Zhang, Y., Steger, D.J., Schupp, M., Schug, J., Cristancho, A.,
Feng, D., Zhuo, D., Stoeckert, C.J., Jr., Liu, X.S., and Lazar, M.A. (2008).
PPARgamma and C/EBP factors orchestrate adipocyte biology via adjacent
binding on a genome-wide scale. Genes Dev. 22, 2941–2952.
Madsen, M.S., Siersbæk, R., Boergesen, M., Nielsen, R., and Mandrup, S.
(2014). Peroxisome proliferator-activated receptor g and C/EBPa synergisti-
cally activate key metabolic adipocyte genes by assisted loading. Mol. Cell.
Biol. 34, 939–954.
Mann, I.K., Chatterjee, R., Zhao, J., He, X., Weirauch, M.T., Hughes, T.R., and
Vinson, C. (2013). CG methylated microarrays identify a novel methylated
sequence bound by the CEBPBjATF4 heterodimer that is active in vivo.
Genome Res. 23, 988–997.
Mathelier, A., Zhao, X., Zhang, A.W., Parcy, F., Worsley-Hunt, R., Arenillas,
D.J., Buchman, S., Chen, C.Y., Chou, A., Ienasescu, H., et al. (2014). JASPAR
2014: an extensively expanded and updated open-access database of tran-
scription factor binding profiles. Nucleic Acids Res. 42 (Database issue),
D142–D147.
McNally, J.G., Muller, W.G., Walker, D., Wolford, R., and Hager, G.L. (2000).
The glucocorticoid receptor: rapid exchange with regulatory sites in living
cells. Science 287, 1262–1265.
Neph, S., Vierstra, J., Stergachis, A.B., Reynolds, A.P., Haugen, E., Vernot, B.,
Thurman, R.E., John, S., Sandstrom, R., Johnson, A.K., et al. (2012). An expan-
sive human regulatory lexicon encoded in transcription factor footprints.
Nature 489, 83–90.
Nielsen, R., Pedersen, T.A., Hagenbeek, D., Moulos, P., Siersbaek, R.,
Megens, E., Denissov, S., Børgesen, M., Francoijs, K.-J., Mandrup, S., and
Stunnenberg, H.G. (2008). Genome-wide profiling of PPARgamma:RXR and
RNA polymerase II occupancy reveals temporal activation of distinct meta-
1442 Cell Reports 7, 1434–1442, June 12, 2014 ª2014 The Authors
bolic pathways and changes in RXR dimer composition during adipogenesis.
Genes Dev. 22, 2953–2967.
Quinlan, A.R., and Hall, I.M. (2010). BEDTools: a flexible suite of utilities for
comparing genomic features. Bioinformatics 26, 841–842.
Sandelin, A., Alkema, W., Engstrom, P., Wasserman, W.W., and Lenhard, B.
(2004). JASPAR: an open-access database for eukaryotic transcription factor
binding profiles. Nucleic Acids Res. 32 (Database issue), D91–D94.
Shuman, J.D., Cheong, J., and Coligan, J.E. (1997). ATF-2 and C/EBPalpha
can form a heterodimeric DNA binding complex in vitro. Functional implica-
tions for transcriptional regulation. J. Biol. Chem. 272, 12793–12800.
Siersbæk, R., Nielsen, R., John, S., Sung,M.-H., Baek, S., Loft, A., Hager, G.L.,
and Mandrup, S. (2011). Extensive chromatin remodelling and establishment
of transcription factor ‘hotspots’ during early adipogenesis. EMBO J. 30,
1459–1472.
Siersbæk, R., Rabiee, A., Nielsen, R., Sidoli, S., Traynor, S., Loft, A., Poulsen,
L.L.C., Rogowska-Wrzesinska, A., Jensen, O.N., and Mandrup, S. (2014).
Transcription factor cooperativity in early adipogenic hotspots and super-
enhancers. Cell Rep. 7, this issue, 1443–1455.
Vallejo, M., Ron, D., Miller, C.P., and Habener, J.F. (1993). C/ATF, a member of
the activating transcription factor family of DNA-binding proteins, dimerizes
with CAAT/enhancer-binding proteins and directs their binding to cAMP
response elements. Proc. Natl. Acad. Sci. USA 90, 4679–4683.
Vinson, C.R., Hai, T., and Boyd, S.M. (1993). Dimerization specificity of the
leucine zipper-containing bZIP motif on DNA binding: prediction and rational
design. Genes Dev. 7, 1047–1058.
Voss, T.C., andHager, G.L. (2014). Dynamic regulation of transcriptional states
by chromatin and transcription factors. Nat. Rev. Genet. 15, 69–81.
Voss, T.C., Schiltz, R.L., Sung, M.-H., Yen, P.M., Stamatoyannopoulos, J.A.,
Biddie, S.C., Johnson, T.A., Miranda, T.B., John, S., and Hager, G.L. (2011).
Dynamic exchange at regulatory elements during chromatin remodeling
underlies assisted loading mechanism. Cell 146, 544–554.
Wang, J., Zhuang, J., Iyer, S., Lin, X., Whitfield, T.W., Greven, M.C., Pierce,
B.G., Dong, X., Kundaje, A., Cheng, Y., et al. (2012). Sequence features and
chromatin structure around the genomic regions bound by 119 human tran-
scription factors. Genome Res. 22, 1798–1812.