tle3 is a dual-function transcriptional coregulator of adipogenesis
TRANSCRIPT
Cell Metabolism
Article
TLE3 Is a Dual-Function TranscriptionalCoregulator of AdipogenesisClaudio J. Villanueva,1 Hironori Waki,1 Cristina Godio,3 Ronni Nielsen,4Wen-Ling Chou,3 Leo Vargas,5 KevinWroblewski,1
Christian Schmedt,5 Lily C. Chao,1 Rima Boyadjian,1 Susanne Mandrup,4 Andrea Hevener,2 Enrique Saez,3,*and Peter Tontonoz1,*1Howard Hughes Medical Institute and Department of Pathology and Laboratory Medicine2Department of Medicine, Division of Endocrinology
University of California, Los Angeles, Los Angeles, CA 90095, USA3Department of Chemical Physiology, The Skaggs Institute for Chemical Biology, The Scripps Research Institute, La Jolla, CA 92037, USA4Department of Biochemistry and Molecular Biology, University of Southern Denmark, 5230 Odense M, Denmark5Genomics Institute of the Novartis Research Foundation, San Diego, CA 92121, USA
*Correspondence: [email protected] (E.S.), [email protected] (P.T.)
DOI 10.1016/j.cmet.2011.02.014
SUMMARY
PPARg and Wnt signaling are central positive andnegative regulators of adipogenesis, respectively.Here we identify the groucho family member TLE3as a transcriptional integrator of the PPARg andWnt pathways. TLE3 is a direct target of PPARgthat participates in a feed-forward loop during adipo-cyte differentiation. TLE3 enhances PPARg activityand functions synergistically with PPARg on itstarget promoters to stimulate adipogenesis. At thesame time, induction of TLE3 during differentiationprovides a mechanism for termination of Wntsignaling. TLE3 antagonizes TCF4 activation byb-catenin in preadipocytes, thereby inhibiting Wnttarget gene expression and reversing b-catenin-dependent repression of adipocyte gene expression.Transgenic expression of TLE3 in adipose tissuein vivo mimics the effects of PPARg agonist andameliorates high-fat-diet-induced insulin resistance.Our data suggest that TLE3 acts as a dual-functionswitch, driving the formation of both active andrepressive transcriptional complexes that facilitatethe adipogenic program.
INTRODUCTION
Adipocytes are specialized cells that store excess energy in the
form of triglycerides and also serve an endocrine function,
secreting adipokines that influence systemic energy homeo-
stasis (Halaas et al., 1995; Steppan et al., 2001; Yamauchi
et al., 2001). The formation of adipocytes is dependent on perox-
isome proliferator-activated receptor g (PPARg) and CCAAT/
enhancer binding proteins (C/EBPs), transcription factors that
coordinately regulate genes involved in lipid metabolism (Frey-
tag et al., 1994; Tontonoz et al., 1994b). Ectopic expression of
PPARg programs fibroblasts to differentiate into adipocytes
(Tontonoz et al., 1994c). Many of the genes characteristic of
C
the differentiated adipocyte are direct targets of PPARg and/or
C/EBPa (Christy et al., 1989; Dalen et al., 2004; Schoonjans
et al., 1996; Tontonoz et al., 1994b, 1995). PPARg is also the
therapeutic target of the thiazolidinedione antidiabetic drugs
that promote lipid storage and adipokine production in adipose
tissue (Lehmann et al., 1995).
Cell-specific gene regulation is driven by DNA-binding factors
working in concert with cofactors (Roeder, 2005). Several cofac-
tors have been identified that interact with PPARg and facilitate
its action (Cho et al., 2009; Ge et al., 2002; Gelman et al., 1999;
Grøntved et al., 2010; Qi et al., 2003). Interestingly, however, few
if any of these factors are regulated components of the differen-
tiation program, i.e., their expression does not change during
differentiation. Rather, they act as constitutive factors to permit
PPARg-dependent transcription. In line with this constitutive
role, increasing the expression of most PPARg coactivators
above the basal state does not enhance adipogenesis. Expres-
sion of PPARg coactivator-1a (PGC-1a) is highly regulated in
brown adipose tissue (BAT) and promotes the expression of
genes important for thermogenesis (Puigserver et al., 1998).
However, PGC-1a is not believed to play an important role in
the development of WAT, and therefore the question of whether
coactivators may be regulated components of the white adipose
tissue differentiation program remains to be addressed.
The Wnt signaling pathway is a major physiological inhibitor of
adipogenesis that is responsible for maintaining preadipocytes
in an undifferentiated state (Ross et al., 2000). Wnts are secreted
glycoproteins that signal through frizzled receptors leading to the
inhibition of the Disheveled/axin/GSK3b complex, thereby
preventing the targeted degradation of b-catenin (MacDonald
et al., 2009). Accumulation of nuclear b-catenin activates TCF/
LEF transcription factors and increases the expression of Wnt
target genes (Molenaar et al., 1996). A number of studies have
shown that Wnt opposes the actions of PPARg in adipogenesis
(Bennett et al., 2002; Liu and Farmer, 2004). Blocking TCF
signaling, for example by ectopic expression of a dominant-
negative or conditional deletion of b-catenin in mesenchyme, is
sufficient to promote differentiation (Arango et al., 2005; Ross
et al., 2000). It has also been suggested that the Wnt signaling
pathway is downregulated through the action of PPARg (Moldes
et al., 2003). However, the molecular mechanisms by which Wnt
ell Metabolism 13, 413–427, April 6, 2011 ª2011 Elsevier Inc. 413
Cell Metabolism
TLE3 Is an Adipogenic Coregulator
blocks adipogenesis, as well as those that serve to integrate the
PPARg and Wnt signaling pathways, remain to be elucidated.
Previously, we developed a high-throughput phenotypic
screening platform for the identification of modulators of adipo-
genesis (Waki et al., 2007). We utilized this approach to identify
small molecules that drive differentiation through the induction
of PPARg expression (Park et al., 2010; Waki et al., 2007).
Here we report the adaptation of this strategy for cDNA library
screening and the identification of the groucho family member
transducin-like enhancer of split 3 (TLE3) as an adipogenic
factor. Despite the fact that TLE proteins have been studied
primarily as transcriptional repressors, we find that TLE3 is
a potent facilitator of PPARg activity on its target promoters.
We further uncover a mechanism for Wnt-dependent inhibition
of adipogenesis and demonstrate that TLE3 antagonizes the
Wnt pathway during differentiation. These studies identify TLE3
as a dual-function modulator of adipogenesis that augments
PPARg action and inhibits Wnt signaling.
RESULTS
A High-Throughput Screen for cDNA Modulatorsof AdipogenesisWe previously validated a phenotype-based high-throughput
screen for chemical modulators of adipogenesis (Waki et al.,
2007). We modified this approach to screen genome-size
cDNA libraries in 384-well format and used it to identify candi-
date regulators of adipocyte differentiation (Figure S1A).
10T1/2 cells were retrotransfected simultaneously with a lucif-
erase reporter driven by the �5.4 kb aP2 promoter and a collec-
tion of 18,292 individually spotted mammalian cDNA expression
vectors. The day after transfection, cells were treated with insulin
and a PPARg agonist (rosiglitazone) to induce adipogenic
differentiation; luciferase activity was evaluated 4 days later
(Figure S1B). The screen was run in duplicate; each plate con-
tained cDNAs encoding PPARg and C/EBPa as positive
controls. Relative intensities were normalized to their respective
plate median values, and mean values and standard deviations
were calculated for each well from the replicate screens to iden-
tify hits. For reconfirmation, a set of 96 cDNAs encoding putative
adipogenesis regulators was chosen and reassayed, and lucif-
erase values were normalized to empty vector controls (Fig-
ure S1C). A number of cDNAs were identified as activators of
aP2-driven luciferase activity in our screen. PPARg emerged
as the most potent activator, and several additional known
adipogenic factors were also represented, including C/EBPa,
C/EBPd, early B cell factor 1 (EBF1), and mitogen-activated
protein kinase kinase 6 (MAPKK6). Select cDNAs were subse-
quently evaluated for adipogenic potential by means of stable
retroviral transduction of 10T1/2 cells (Figure S1D). TLE3 was
chosen for further analysis, as this factor had not previously
been linked with adipocyte biology.
TLE3 Expression Is Regulated during AdipocyteDifferentiationWe reasoned that if TLE3 was a regulated component of the
differentiation program, then its expression should change
over the course of differentiation. Indeed, analysis of a time
course of 10T1/2 and 3T3-L1 differentiation revealed that TLE3
414 Cell Metabolism 13, 413–427, April 6, 2011 ª2011 Elsevier Inc.
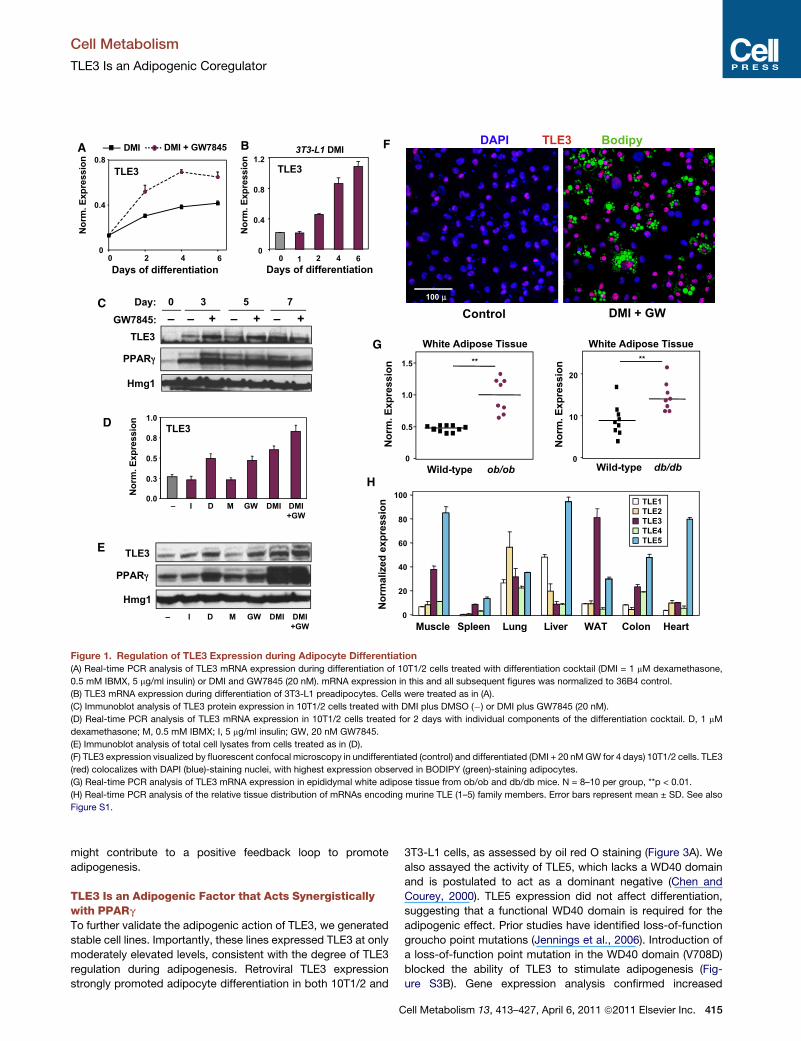
mRNA expression rose during differentiation and was further
enhanced by treatment of the cells with PPARg agonist (Figures
1A and 1B). A strong increase in TLE3 protein expression was
also observed, and again treatment with GW7845 increased its
levels (Figure 1C). To determine which component of the differ-
entiation cocktail was primarily responsible for TLE3 induction,
10T1/2 cells were stimulated for 2 dayswith insulin (I), dexameth-
asone (D), methylisobutyl xanthine (M), and/or GW7845. TLE3
mRNA and protein expression were found to be responsive to
both dexamethasone and PPARg ligand (Figures 1D and 1E).
We also employed confocal immunofluorescence microscopy
to visualize TLE3 expression. In 10T1/2 cells, TLE3 expression
colocalized with DAPI staining, consistent with nuclear localiza-
tion (Figure 1F). Furthermore, the level of TLE3 protein increased
robustly in cells induced to differentiate (DMI + GW), and lipid-
laden mature adipocytes were consistently TLE3 positive (Fig-
ure 1F). In vivo, TLE3 protein expression was readily detected
inWAT andBAT, but not in adjacent skeletalmuscle (Figure S1E).
Interestingly, immunoblot analysis revealed more prominent
expression of TLE3 in WAT compared to BAT (Figure S2A). In
fractionated mouse WAT, TLE3 was more abundant in adipo-
cytes compared to the stromal-vascular fraction (Figure S2B).
We also investigated whether TLE3 levels were altered in
murine models of obesity. We found that ob/ob and db/db
mice expressed more TLE3 mRNA in WAT, compared to WT
controls (Figures 1G and S2C). Examination of the tissue distri-
bution of the mammalian TLE family of proteins revealed that,
although TLE3 was expressed in a number of tissues, its expres-
sion was particularly prominent in WAT (Figure 1H).
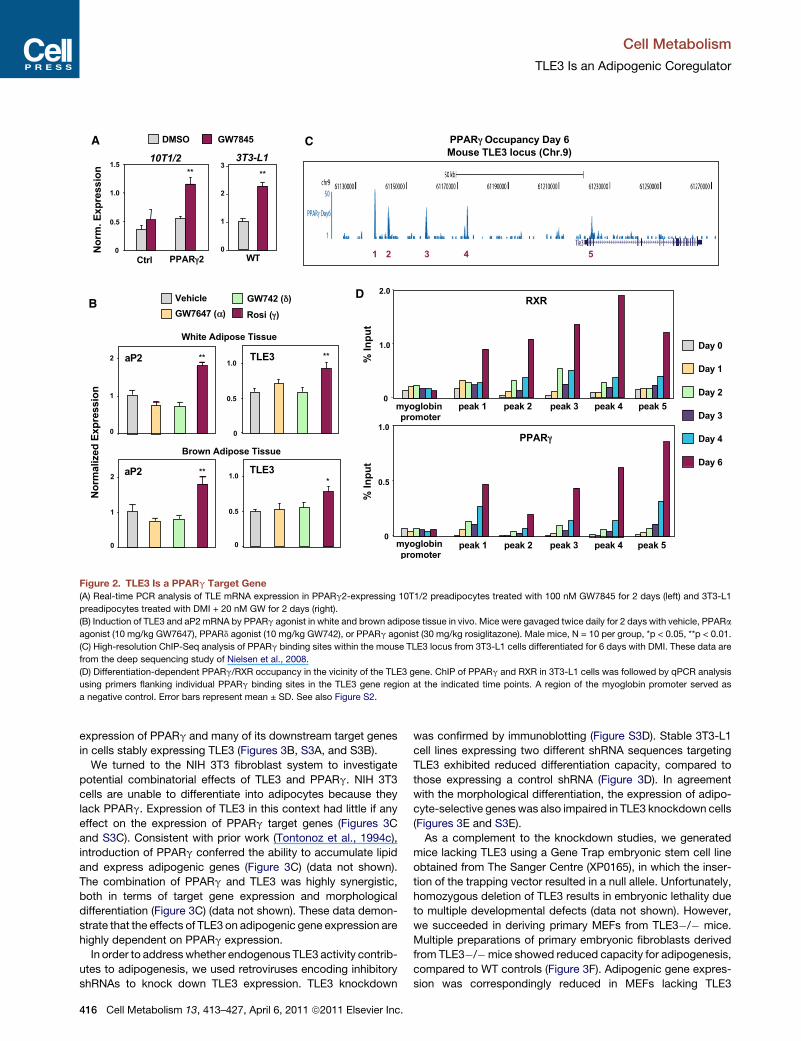
TLE3 Is a Direct Target of PPARgThe observation that TLE3 expression increased during differen-
tiation and was responsive to PPARg agonist administration led
us to explore whether TLE3 might be a direct target of PPARg.
We confirmed that short-term treatment of PPARg-expressing
10T1/2 cells with PPARg agonist induced TLE3 mRNA (Fig-
ure 2A). A similar induction by GW7845 was seen in 3T3-L1 cells.
TLE3 expression was also responsive to PPARg administration
in vivo. Treatment of mice with PPARg (rosiglitazone), but not
PPARa (GW7647) or PPARd (GW742) agonists, induced TLE3
mRNA in WAT and BAT (Figure 2B).
To address whether PPARg bound directly to the TLE3
promoter, we employed chromatin immunoprecipitation (ChIP)
assays combined with deep sequencing (Nielsen et al., 2008).
Through analysis of the global PPARg DNA binding data of Niel-
sen et al., we identified several putative PPARg binding regions
in the mouse TLE3 locus (Figure 2C). Four of these regions were
locatedmore than 50 kb upstream of the transcriptional start site
(peaks 1–4), while one was located in an intronic region (peak 5).
Sequence analysis revealed that DR-1 sequences were associ-
ated with each of these peaks, increasing our confidence that
thesewere likely to be bona fide PPARg binding sites. To confirm
this, we performed ChIP-PCR analysis over the time course of
3T3-L1 adipocyte differentiation. Both RXR and PPARg bound
to the five putative binding sites in the TLE3 genomic region in
a differentiation-dependent manner (Figure 2D). No binding
was observed with a control region from the myoglobin
promoter. These results indicated that TLE3 is a direct PPARg
target gene and suggested that induction of TLE3 by PPARg
TLE3DAPI Bodipy
100 µµ
Control DMI + GW
F
TLE3
PPAR
0 3 5 7
– – + – + – +
Day:
GW7845:
TLE3
0.0
0.3
0.5
0.8
1.0
No
rm
. E
xp
ressio
n
C
D
Hmg1
TLE3
PPAR
E
– I D M GW DMI DMI
+GW
Hmg1
– I D M GW DMI DMI
+GW
DMI DMI + GW7845
No
rm
. E
xp
ressio
n
Days of differentiation
A
TLE3
0
0.4
0.8
0 2 4 6
White Adipose Tissue
Wild-type ob/ob
G
0
0.5
1.0
1.5 **
No
rm
. E
xp
ressio
n
White Adipose Tissue
Wild-type db/db
0
10
20
**
0
20
40
60
80
100
Spleen LungMuscle WAT Colon HeartLiver
No
rm
alized
exp
ressio
n TLE1
TLE2
TLE3
TLE4
TLE5
H
0
0.4
0.8
1.2
TLE3
Days of differentiation
0 2 4 61
B
No
rm
. E
xp
ressio
n
3T3-L1 DMI
No
rm
. E
xp
ressio
n
Figure 1. Regulation of TLE3 Expression during Adipocyte Differentiation
(A) Real-time PCR analysis of TLE3 mRNA expression during differentiation of 10T1/2 cells treated with differentiation cocktail (DMI = 1 mM dexamethasone,
0.5 mM IBMX, 5 mg/ml insulin) or DMI and GW7845 (20 nM). mRNA expression in this and all subsequent figures was normalized to 36B4 control.
(B) TLE3 mRNA expression during differentiation of 3T3-L1 preadipocytes. Cells were treated as in (A).
(C) Immunoblot analysis of TLE3 protein expression in 10T1/2 cells treated with DMI plus DMSO (�) or DMI plus GW7845 (20 nM).
(D) Real-time PCR analysis of TLE3 mRNA expression in 10T1/2 cells treated for 2 days with individual components of the differentiation cocktail. D, 1 mM
dexamethasone; M, 0.5 mM IBMX; I, 5 mg/ml insulin; GW, 20 nM GW7845.
(E) Immunoblot analysis of total cell lysates from cells treated as in (D).
(F) TLE3 expression visualized by fluorescent confocal microscopy in undifferentiated (control) and differentiated (DMI + 20 nMGW for 4 days) 10T1/2 cells. TLE3
(red) colocalizes with DAPI (blue)-staining nuclei, with highest expression observed in BODIPY (green)-staining adipocytes.
(G) Real-time PCR analysis of TLE3 mRNA expression in epididymal white adipose tissue from ob/ob and db/db mice. N = 8–10 per group, **p < 0.01.
(H) Real-time PCR analysis of the relative tissue distribution of mRNAs encoding murine TLE (1–5) family members. Error bars represent mean ± SD. See also
Figure S1.
Cell Metabolism
TLE3 Is an Adipogenic Coregulator
might contribute to a positive feedback loop to promote
adipogenesis.
TLE3 Is an Adipogenic Factor that Acts Synergisticallywith PPARgTo further validate the adipogenic action of TLE3, we generated
stable cell lines. Importantly, these lines expressed TLE3 at only
moderately elevated levels, consistent with the degree of TLE3
regulation during adipogenesis. Retroviral TLE3 expression
strongly promoted adipocyte differentiation in both 10T1/2 and
C
3T3-L1 cells, as assessed by oil red O staining (Figure 3A). We
also assayed the activity of TLE5, which lacks a WD40 domain
and is postulated to act as a dominant negative (Chen and
Courey, 2000). TLE5 expression did not affect differentiation,
suggesting that a functional WD40 domain is required for the
adipogenic effect. Prior studies have identified loss-of-function
groucho point mutations (Jennings et al., 2006). Introduction of
a loss-of-function point mutation in the WD40 domain (V708D)
blocked the ability of TLE3 to stimulate adipogenesis (Fig-
ure S3B). Gene expression analysis confirmed increased
ell Metabolism 13, 413–427, April 6, 2011 ª2011 Elsevier Inc. 415
Day 0
Day 1
Day 2
Day 3
Day 4
Day 6
% In
pu
t
C
D
DMSO GW7845
No
rm
. E
xp
ressio
n
A
0
0.5
1.0
1.5
Ctrl PPAR 2
3T3-L1
0
1
2
3
10T1/2
****
Vehicle
GW7647 ( )
GW742 ( )
Rosi ( )
White Adipose Tissue
TLE3 **
Brown Adipose Tissue
TLE3
0
0.5
1.0
*
No
rm
alized
Exp
ressio
n
B
0.5
1.0
0
WT
aP2
aP2
1
2
0
1
2
0
**
**
1 2 3 4 5
PPAR Occupancy Day 6
Mouse TLE3 locus (Chr.9)
RXR
0
1.0
2.0
myoglobin
promoter
PPAR
0
0.5
1.0
myoglobin
promoter
peak 4
peak 4
peak 3
peak 3
peak 2
peak 2
peak 1
peak 1
peak 5
peak 5
% In
pu
t
Figure 2. TLE3 Is a PPARg Target Gene
(A) Real-time PCR analysis of TLE mRNA expression in PPARg2-expressing 10T1/2 preadipocytes treated with 100 nM GW7845 for 2 days (left) and 3T3-L1
preadipocytes treated with DMI + 20 nM GW for 2 days (right).
(B) Induction of TLE3 and aP2 mRNA by PPARg agonist in white and brown adipose tissue in vivo. Mice were gavaged twice daily for 2 days with vehicle, PPARa
agonist (10 mg/kg GW7647), PPARd agonist (10 mg/kg GW742), or PPARg agonist (30 mg/kg rosiglitazone). Male mice, N = 10 per group, *p < 0.05, **p < 0.01.
(C) High-resolution ChIP-Seq analysis of PPARg binding sites within the mouse TLE3 locus from 3T3-L1 cells differentiated for 6 days with DMI. These data are
from the deep sequencing study of Nielsen et al., 2008.
(D) Differentiation-dependent PPARg/RXR occupancy in the vicinity of the TLE3 gene. ChIP of PPARg and RXR in 3T3-L1 cells was followed by qPCR analysis
using primers flanking individual PPARg binding sites in the TLE3 gene region at the indicated time points. A region of the myoglobin promoter served as
a negative control. Error bars represent mean ± SD. See also Figure S2.
Cell Metabolism
TLE3 Is an Adipogenic Coregulator
expression of PPARg and many of its downstream target genes
in cells stably expressing TLE3 (Figures 3B, S3A, and S3B).
We turned to the NIH 3T3 fibroblast system to investigate
potential combinatorial effects of TLE3 and PPARg. NIH 3T3
cells are unable to differentiate into adipocytes because they
lack PPARg. Expression of TLE3 in this context had little if any
effect on the expression of PPARg target genes (Figures 3C
and S3C). Consistent with prior work (Tontonoz et al., 1994c),
introduction of PPARg conferred the ability to accumulate lipid
and express adipogenic genes (Figure 3C) (data not shown).
The combination of PPARg and TLE3 was highly synergistic,
both in terms of target gene expression and morphological
differentiation (Figure 3C) (data not shown). These data demon-
strate that the effects of TLE3 on adipogenic gene expression are
highly dependent on PPARg expression.
In order to addresswhether endogenous TLE3 activity contrib-
utes to adipogenesis, we used retroviruses encoding inhibitory
shRNAs to knock down TLE3 expression. TLE3 knockdown
416 Cell Metabolism 13, 413–427, April 6, 2011 ª2011 Elsevier Inc.
was confirmed by immunoblotting (Figure S3D). Stable 3T3-L1
cell lines expressing two different shRNA sequences targeting
TLE3 exhibited reduced differentiation capacity, compared to
those expressing a control shRNA (Figure 3D). In agreement
with the morphological differentiation, the expression of adipo-
cyte-selective genes was also impaired in TLE3 knockdown cells
(Figures 3E and S3E).
As a complement to the knockdown studies, we generated
mice lacking TLE3 using a Gene Trap embryonic stem cell line
obtained from The Sanger Centre (XP0165), in which the inser-
tion of the trapping vector resulted in a null allele. Unfortunately,
homozygous deletion of TLE3 results in embryonic lethality due
to multiple developmental defects (data not shown). However,
we succeeded in deriving primary MEFs from TLE3�/� mice.
Multiple preparations of primary embryonic fibroblasts derived
from TLE3�/�mice showed reduced capacity for adipogenesis,
compared to WT controls (Figure 3F). Adipogenic gene expres-
sion was correspondingly reduced in MEFs lacking TLE3
ApBabe TLE3 TLE5
3T3-L1
DI+GW
10T1/2
DMI+GW
pBabe TLE3
3T3-L1
DI+GW
No
rm
alized
exp
ressio
n
pBabe PPAR 2 TLE3 Both
NIH-3T3pBabe TLE3 TLE53T3-L1
0
3
6
9
0
10
20
30
No
rm
alized
exp
ressio
n
0
10
20
D0 D1 D3 D6
0
10
20
0
2
4
6
aP2PPAR 1
PPAR 2
TLE3 TLE5
0
10
20
D0 D1 D3 D6
CD36
B
aP2
0
0.5
1.0
CD36
0
0.5
1.0
PPAR 2
0
1
2
TLE3
0
2
4
2.0
Adiponectin
0
0.5
1.0
1.5
Perilipin
0
0.5
1.0
1.5
C
TLE3
0
0.4
0.8
1.2
Adiponectin
0
0.4
0.8
1.2
CD36
0
0.5
1.0
Perilipin
0
0.5
1.0
aP2
0
0.5
1.0
Aqp7
0
0.5
1.0
1.5
D LacZ sh TLE3 sh1 TLE3 sh2
3T3-L1
DMI+GW
No
rm
alized
exp
ressio
n
LacZ sh TLE3 sh1 TLE sh2E FWT #1 TLE3-/- #1
MEFs
WT #2 TLE3-/- #2
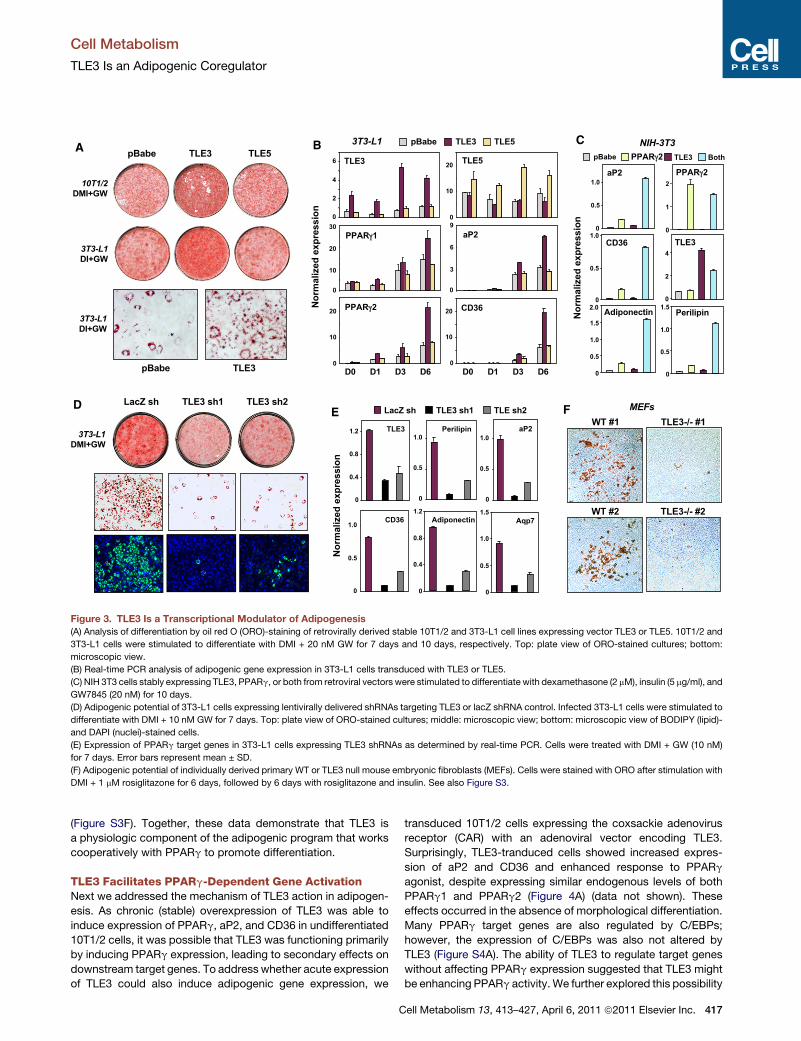
Figure 3. TLE3 Is a Transcriptional Modulator of Adipogenesis(A) Analysis of differentiation by oil red O (ORO)-staining of retrovirally derived stable 10T1/2 and 3T3-L1 cell lines expressing vector TLE3 or TLE5. 10T1/2 and
3T3-L1 cells were stimulated to differentiate with DMI + 20 nM GW for 7 days and 10 days, respectively. Top: plate view of ORO-stained cultures; bottom:
microscopic view.
(B) Real-time PCR analysis of adipogenic gene expression in 3T3-L1 cells transduced with TLE3 or TLE5.
(C) NIH 3T3 cells stably expressing TLE3, PPARg, or both from retroviral vectors were stimulated to differentiate with dexamethasone (2 mM), insulin (5 mg/ml), and
GW7845 (20 nM) for 10 days.
(D) Adipogenic potential of 3T3-L1 cells expressing lentivirally delivered shRNAs targeting TLE3 or lacZ shRNA control. Infected 3T3-L1 cells were stimulated to
differentiate with DMI + 10 nM GW for 7 days. Top: plate view of ORO-stained cultures; middle: microscopic view; bottom: microscopic view of BODIPY (lipid)-
and DAPI (nuclei)-stained cells.
(E) Expression of PPARg target genes in 3T3-L1 cells expressing TLE3 shRNAs as determined by real-time PCR. Cells were treated with DMI + GW (10 nM)
for 7 days. Error bars represent mean ± SD.
(F) Adipogenic potential of individually derived primary WT or TLE3 null mouse embryonic fibroblasts (MEFs). Cells were stained with ORO after stimulation with
DMI + 1 mM rosiglitazone for 6 days, followed by 6 days with rosiglitazone and insulin. See also Figure S3.
Cell Metabolism
TLE3 Is an Adipogenic Coregulator
(Figure S3F). Together, these data demonstrate that TLE3 is
a physiologic component of the adipogenic program that works
cooperatively with PPARg to promote differentiation.
TLE3 Facilitates PPARg-Dependent Gene ActivationNext we addressed the mechanism of TLE3 action in adipogen-
esis. As chronic (stable) overexpression of TLE3 was able to
induce expression of PPARg, aP2, and CD36 in undifferentiated
10T1/2 cells, it was possible that TLE3 was functioning primarily
by inducing PPARg expression, leading to secondary effects on
downstream target genes. To address whether acute expression
of TLE3 could also induce adipogenic gene expression, we
C
transduced 10T1/2 cells expressing the coxsackie adenovirus
receptor (CAR) with an adenoviral vector encoding TLE3.
Surprisingly, TLE3-tranduced cells showed increased expres-
sion of aP2 and CD36 and enhanced response to PPARg
agonist, despite expressing similar endogenous levels of both
PPARg1 and PPARg2 (Figure 4A) (data not shown). These
effects occurred in the absence of morphological differentiation.
Many PPARg target genes are also regulated by C/EBPs;
however, the expression of C/EBPs was also not altered by
TLE3 (Figure S4A). The ability of TLE3 to regulate target genes
without affecting PPARg expression suggested that TLE3 might
be enhancing PPARg activity. We further explored this possibility
ell Metabolism 13, 413–427, April 6, 2011 ª2011 Elsevier Inc. 417
Normalized Expression
LacZ TLE3 LacZ+GW TLE3+GW
cd36
aP2
Plin
Aqp7
Fgf21
Adipsin
Acrp30
Hmgcs2
Pnpla2
Adam12
Hsd11b1
Acot1
Akap1
Acsl1
Fitm2
Agpat2
LPL
Angptl4
Hk2
0 5 10 15 20 25
0 2 4
0 1 2 3
No
rm
alized
Exp
ressio
n
LacZ TLE3
GW7845 (nM)
1 5 10 50 1000
aP2aP2
0
1
2
CD36CD36
0
4
8
aP2
0
0.5
1.0
1.5
No
rm
alized
Exp
ressio
n
GW: – + – +PPAR
CD36
0
0.5
1.0
Perilipin
0
0.25
0.50
pBabe
A
B
E
LacZ TLE3
PPAR TLE3
432 102 519
– PPAR
+ TLE3
+GW
D
C
+ LacZ
– PPAR +GW
0
1
2 PPAR 2
-1.3 1.30
Normalized Expression (log)
CAR3
Gbp3
Fabp4
Obfc2a
CAR3
Elavl2
CD36
Ear2
Chrna2
Ephx2
Adipoq
Ucp2
Pex11a
Atf3
Slc35f1
Igtp
Eno3
Serpina3c3
Serpinb1a
Mx1
Spink5
Igp1
Ald1a7
Spnr1b
Spnr1a
Tmod1
Adamtsl1
Cxcl10
CAR3
Gbp4
Mpa21
Oas1g
Peg10
Cyp2f2
Pnpla2
Trim30
Irf7
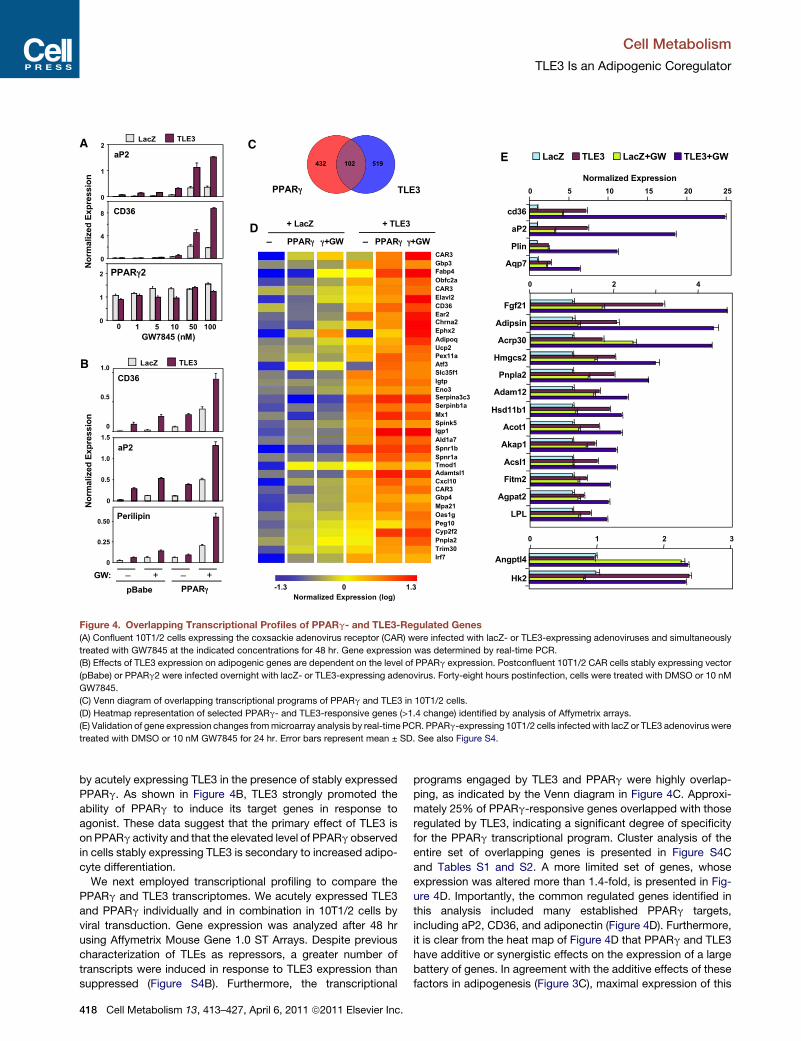
Figure 4. Overlapping Transcriptional Profiles of PPARg- and TLE3-Regulated Genes
(A) Confluent 10T1/2 cells expressing the coxsackie adenovirus receptor (CAR) were infected with lacZ- or TLE3-expressing adenoviruses and simultaneously
treated with GW7845 at the indicated concentrations for 48 hr. Gene expression was determined by real-time PCR.
(B) Effects of TLE3 expression on adipogenic genes are dependent on the level of PPARg expression. Postconfluent 10T1/2 CAR cells stably expressing vector
(pBabe) or PPARg2 were infected overnight with lacZ- or TLE3-expressing adenovirus. Forty-eight hours postinfection, cells were treated with DMSO or 10 nM
GW7845.
(C) Venn diagram of overlapping transcriptional programs of PPARg and TLE3 in 10T1/2 cells.
(D) Heatmap representation of selected PPARg- and TLE3-responsive genes (>1.4 change) identified by analysis of Affymetrix arrays.
(E) Validation of gene expression changes frommicroarray analysis by real-time PCR. PPARg-expressing 10T1/2 cells infectedwith lacZ or TLE3 adenovirus were
treated with DMSO or 10 nM GW7845 for 24 hr. Error bars represent mean ± SD. See also Figure S4.
Cell Metabolism
TLE3 Is an Adipogenic Coregulator
by acutely expressing TLE3 in the presence of stably expressed
PPARg. As shown in Figure 4B, TLE3 strongly promoted the
ability of PPARg to induce its target genes in response to
agonist. These data suggest that the primary effect of TLE3 is
on PPARg activity and that the elevated level of PPARg observed
in cells stably expressing TLE3 is secondary to increased adipo-
cyte differentiation.
We next employed transcriptional profiling to compare the
PPARg and TLE3 transcriptomes. We acutely expressed TLE3
and PPARg individually and in combination in 10T1/2 cells by
viral transduction. Gene expression was analyzed after 48 hr
using Affymetrix Mouse Gene 1.0 ST Arrays. Despite previous
characterization of TLEs as repressors, a greater number of
transcripts were induced in response to TLE3 expression than
suppressed (Figure S4B). Furthermore, the transcriptional
418 Cell Metabolism 13, 413–427, April 6, 2011 ª2011 Elsevier Inc.
programs engaged by TLE3 and PPARg were highly overlap-
ping, as indicated by the Venn diagram in Figure 4C. Approxi-
mately 25% of PPARg-responsive genes overlapped with those
regulated by TLE3, indicating a significant degree of specificity
for the PPARg transcriptional program. Cluster analysis of the
entire set of overlapping genes is presented in Figure S4C
and Tables S1 and S2. A more limited set of genes, whose
expression was altered more than 1.4-fold, is presented in Fig-
ure 4D. Importantly, the common regulated genes identified in
this analysis included many established PPARg targets,
including aP2, CD36, and adiponectin (Figure 4D). Furthermore,
it is clear from the heat map of Figure 4D that PPARg and TLE3
have additive or synergistic effects on the expression of a large
battery of genes. In agreement with the additive effects of these
factors in adipogenesis (Figure 3C), maximal expression of this
C
0
0.05
0.10
0.15
0.20
aqp7
0
0.5
1.0
1.5
aqp7
IgG PPAR
IgG TLE3
0
0.1
0.2
0.3
Perilipin
0
0.5
1.0
1.5
2.0
Perilipin
IG PPAR
IgG TLE3
IgG TLE3
IgG PPAR
0
0.05
0.10
CD36
0
0.04
0.08
0.12
0.16
CD36
0
0.2
0.4
0.6
Angptl4
0
1.0
2.0
3.0
IgG TLE3
IgG PPAR
0
0.01
0.02
0.03
0.04
Chr.15
0
0.01
0.02
0.03
0.04
0.05
Chr.15
IgG PPAR
IgG TLE3
0
0.05
0.10
0.15
0.20
IgG TLE3
0
0.5
1.0
1.5
2.0
IgG PPAR
aP2
aP2
PPAR target promoter ChIP
% In
pu
t
D
0
0.05
0.10
0.15
0.20
0.25
Agpat2
0
0.5
1.0
1.5
2.0
Agpat2
0
0.05
0.10
0.15
0.20
LPL
IgG TLE3
0
0.25
0.50
0.75
LPL
IgG PPAR
IgG TLE3
IgG PPAR
PreAd Adipocyte
No
rm
alized
L
ucif
erase
5.4 Kb aP2
DMSO
GW7845
PPAR /RXR –
0
400
800
1200
1600
2000
– –+ + +
+TLE3 +V708D
PPAR /RXR – –+ +
+TLE3Vect Vect
0
200
400
600
800
1000
1200
No
rm
alized
L
ucif
erase
TK3X-PPRE
DMSO
GW7845
A BLuc Luc
Angptl4
% In
pu
t
Ad-TLE3
Pre-TLE3
Ad-IgG
Pre-IgG
Ad-PPAR
Pre-PPAR
Ad-IgG
Pre-IgG
Ad-Pol2
Pre-Pol2
Ad-IgG
Pre-IgG
% In
pu
t
0
0.05
0.10
0.15
0
0.5
1.0
1.5
0
aP2 Promoter ChIP
TSS -5.4kb
TLE3
PPAR
2
4
Pol2
PPRE
Perilipin Promoter ChIP
0
0.25
0.50
0.5
1.0
1.5
-4.7 kb
0
1
2
3
4
5
TSS PPRE
0
% In
pu
t
Ad-TLE3
Pre-TLE3
Ad-IgG
Pre-IgG
Ad-PPAR
Pre-PPAR
Ad-IgG
Pre-IgG
Ad-Pol2
Pre-Pol2
Ad-IgG
Pre-IgG
TLE3
PPAR
Pol2
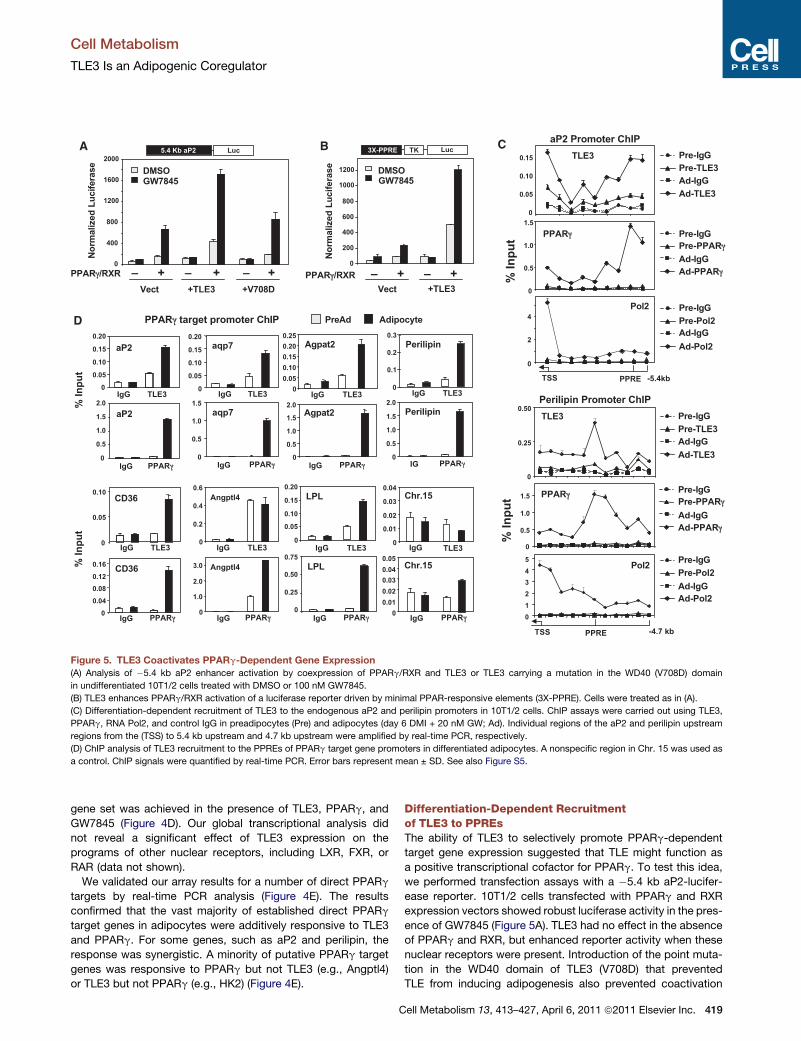
Figure 5. TLE3 Coactivates PPARg-Dependent Gene Expression(A) Analysis of �5.4 kb aP2 enhancer activation by coexpression of PPARg/RXR and TLE3 or TLE3 carrying a mutation in the WD40 (V708D) domain
in undifferentiated 10T1/2 cells treated with DMSO or 100 nM GW7845.
(B) TLE3 enhances PPARg/RXR activation of a luciferase reporter driven by minimal PPAR-responsive elements (3X-PPRE). Cells were treated as in (A).
(C) Differentiation-dependent recruitment of TLE3 to the endogenous aP2 and perilipin promoters in 10T1/2 cells. ChIP assays were carried out using TLE3,
PPARg, RNA Pol2, and control IgG in preadipocytes (Pre) and adipocytes (day 6 DMI + 20 nM GW; Ad). Individual regions of the aP2 and perilipin upstream
regions from the (TSS) to 5.4 kb upstream and 4.7 kb upstream were amplified by real-time PCR, respectively.
(D) ChIP analysis of TLE3 recruitment to the PPREs of PPARg target gene promoters in differentiated adipocytes. A nonspecific region in Chr. 15 was used as
a control. ChIP signals were quantified by real-time PCR. Error bars represent mean ± SD. See also Figure S5.
Cell Metabolism
TLE3 Is an Adipogenic Coregulator
gene set was achieved in the presence of TLE3, PPARg, and
GW7845 (Figure 4D). Our global transcriptional analysis did
not reveal a significant effect of TLE3 expression on the
programs of other nuclear receptors, including LXR, FXR, or
RAR (data not shown).
We validated our array results for a number of direct PPARg
targets by real-time PCR analysis (Figure 4E). The results
confirmed that the vast majority of established direct PPARg
target genes in adipocytes were additively responsive to TLE3
and PPARg. For some genes, such as aP2 and perilipin, the
response was synergistic. A minority of putative PPARg target
genes was responsive to PPARg but not TLE3 (e.g., Angptl4)
or TLE3 but not PPARg (e.g., HK2) (Figure 4E).
C
Differentiation-Dependent Recruitmentof TLE3 to PPREsThe ability of TLE3 to selectively promote PPARg-dependent
target gene expression suggested that TLE might function as
a positive transcriptional cofactor for PPARg. To test this idea,
we performed transfection assays with a �5.4 kb aP2-lucifer-
ease reporter. 10T1/2 cells transfected with PPARg and RXR
expression vectors showed robust luciferase activity in the pres-
ence of GW7845 (Figure 5A). TLE3 had no effect in the absence
of PPARg and RXR, but enhanced reporter activity when these
nuclear receptors were present. Introduction of the point muta-
tion in the WD40 domain of TLE3 (V708D) that prevented
TLE from inducing adipogenesis also prevented coactivation
ell Metabolism 13, 413–427, April 6, 2011 ª2011 Elsevier Inc. 419
Cell Metabolism
TLE3 Is an Adipogenic Coregulator
of PPARg (Figure 5A). TLE3 showed similar ability to enhance
PPARg-dependent transcription when a reporter driven by iso-
lated PPAR response elements (PPREs) was used (Figure 5B).
This result strongly suggested that TLE3 was acting to increase
aP2-promoter transcription by increasing PPARg activity on its
cognate response element, rather than by acting through other
binding sites. Preliminary studies indicated that TLE3 also
promoted the action of PPARa and PPARd in transfection assays
(Figure S5A).
To provide additional evidence for the ability of TLE3 to
enhance PPARg activity on PPREs, we performed ChIP assays
in 10T1/2 cells. We initially analyzed PPARg and TLE3 occu-
pancy along the 50-flanking region of the aP2 gene extending
from �5.4 kb to the transcriptional start site. Strong differentia-
tion-dependent binding of PPARg was detected in the region
corresponding to the previously characterized PPREs in the
aP2 enhancer (Tontonoz et al., 1994a). Remarkably, TLE3 was
also found to occupy the aP2 promoter/enhancer in a differentia-
tion-dependent manner (Figures 5C and 5D). A strong peak was
detected in the region corresponding to the PPREs, coincident
with PPARg binding, and an additional peak was noted closer
to the proximal promoter. As expected, Pol2 occupancy was
detected at the transcriptional start site in adipocytes but not
preadipocytes. Analysis of the 50-flanking region of the perilipin
gene revealed similar differentiation-dependent co-occupancy
of PPARg and TLE3 in the region of the PPRE (Figure 5C).
We next addressed whether TLE3 was localized with PPARg
on the regulatory regions of other adipocyte PPARg target
genes. Indeed, regulatory regions containing previously vali-
dated PPREs from the CD36, Aqp7, Agpat2, LPL, and perilipin
genes were all co-occupied by PPARg and TLE3 in a differentia-
tion-dependent manner (Figure 5D). By contrast, there was no
enrichment of PPARg or TLE3 on control regions not containing
PPREs, such as a sequence on Chromosome 15 (Figure 5D).
Interestingly, we did not observe differentiation-dependent
changes in TLE3 occupancy on the Angptl4 promoter. This
finding was consistent with our prior observation that TLE3
expression did not enhance Angptl4 expression (Figure 4E).
We also investigated whether TLE3 could be localized to
PPARg-containing complexes in adipocytes. We were unable
to detect a direct interaction between TLE3 and PPARg using
standard in vitro pull-down assays (data not shown). However,
two different lines of evidence support the hypothesis that these
proteins are present in a transcriptional complex. First, TLE3
could be identified in complexes immunoprecipitated from
10T1/2 adipocytes with a PPARg antibody (Figure S5B). Second,
TLE3 was independently identified as a PPARg-associated
protein in mass spectrometry analysis of PPARg-containing
fractions purified from 3T3-L1 adipocytes (R.N. and S.M.,
unpublished data). Together, these data indicate that TLE3 is
present in PPARg-containing differentiation-dependent tran-
scriptional complexes and facilitates adipocyte differentiation
by enhancing the activity of PPARg on its target promoters.
TLE3 Counteracts Wnt Signaling in PreadipocytesStudies in Drosophila have characterized the TLE ortholog grou-
cho as a repressor that binds TCF and inhibits Wnt signaling
(Cavallo et al., 1998). We hypothesized that increased TLE3
expression during differentiation might provide a mechanism
420 Cell Metabolism 13, 413–427, April 6, 2011 ª2011 Elsevier Inc.
for counteracting Wnt signaling in this context. In support of this
idea, we found that TLE3 could be identified in complexes immu-
noprecipitated from 3T3-L1 adipocytes with a TCF4 antibody
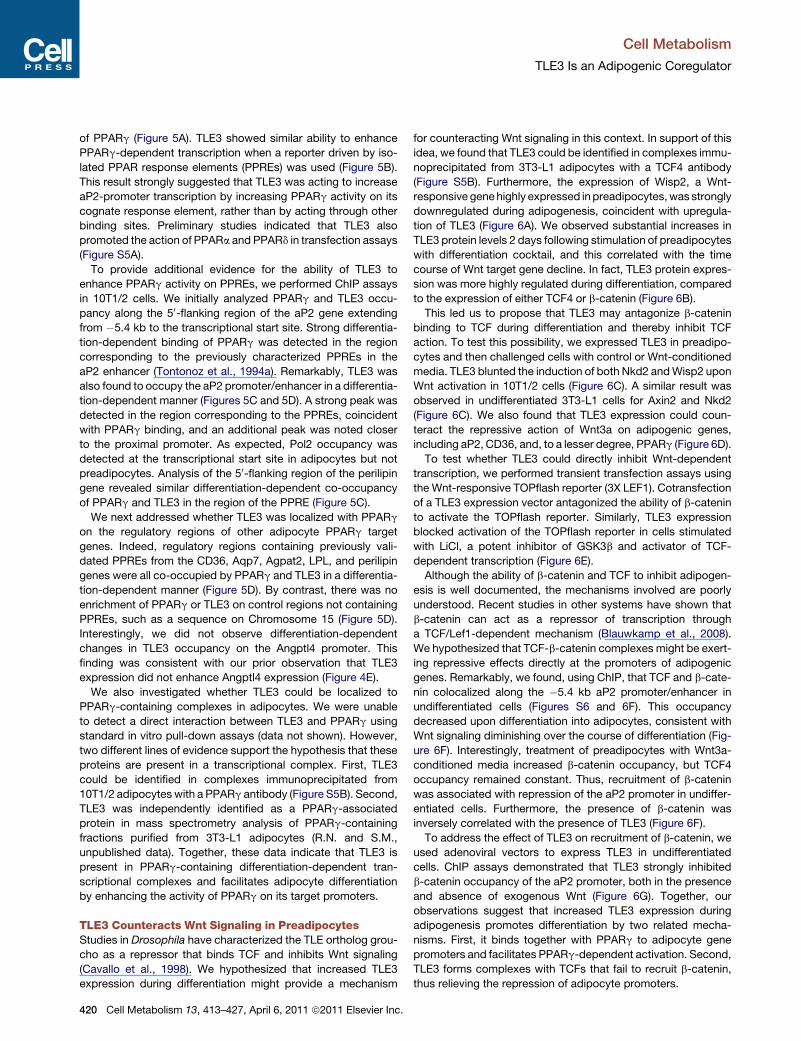
(Figure S5B). Furthermore, the expression of Wisp2, a Wnt-
responsive genehighly expressed in preadipocytes,was strongly
downregulated during adipogenesis, coincident with upregula-
tion of TLE3 (Figure 6A). We observed substantial increases in
TLE3 protein levels 2 days following stimulation of preadipocytes
with differentiation cocktail, and this correlated with the time
course of Wnt target gene decline. In fact, TLE3 protein expres-
sion was more highly regulated during differentiation, compared
to the expression of either TCF4 or b-catenin (Figure 6B).
This led us to propose that TLE3 may antagonize b-catenin
binding to TCF during differentiation and thereby inhibit TCF
action. To test this possibility, we expressed TLE3 in preadipo-
cytes and then challenged cells with control or Wnt-conditioned
media. TLE3 blunted the induction of both Nkd2 andWisp2 upon
Wnt activation in 10T1/2 cells (Figure 6C). A similar result was
observed in undifferentiated 3T3-L1 cells for Axin2 and Nkd2
(Figure 6C). We also found that TLE3 expression could coun-
teract the repressive action of Wnt3a on adipogenic genes,
including aP2, CD36, and, to a lesser degree, PPARg (Figure 6D).
To test whether TLE3 could directly inhibit Wnt-dependent
transcription, we performed transient transfection assays using
the Wnt-responsive TOPflash reporter (3X LEF1). Cotransfection
of a TLE3 expression vector antagonized the ability of b-catenin
to activate the TOPflash reporter. Similarly, TLE3 expression
blocked activation of the TOPflash reporter in cells stimulated
with LiCl, a potent inhibitor of GSK3b and activator of TCF-
dependent transcription (Figure 6E).
Although the ability of b-catenin and TCF to inhibit adipogen-
esis is well documented, the mechanisms involved are poorly
understood. Recent studies in other systems have shown that
b-catenin can act as a repressor of transcription through
a TCF/Lef1-dependent mechanism (Blauwkamp et al., 2008).
We hypothesized that TCF-b-catenin complexes might be exert-
ing repressive effects directly at the promoters of adipogenic
genes. Remarkably, we found, using ChIP, that TCF and b-cate-
nin colocalized along the �5.4 kb aP2 promoter/enhancer in
undifferentiated cells (Figures S6 and 6F). This occupancy
decreased upon differentiation into adipocytes, consistent with
Wnt signaling diminishing over the course of differentiation (Fig-
ure 6F). Interestingly, treatment of preadipocytes with Wnt3a-
conditioned media increased b-catenin occupancy, but TCF4
occupancy remained constant. Thus, recruitment of b-catenin
was associated with repression of the aP2 promoter in undiffer-
entiated cells. Furthermore, the presence of b-catenin was
inversely correlated with the presence of TLE3 (Figure 6F).
To address the effect of TLE3 on recruitment of b-catenin, we
used adenoviral vectors to express TLE3 in undifferentiated
cells. ChIP assays demonstrated that TLE3 strongly inhibited
b-catenin occupancy of the aP2 promoter, both in the presence
and absence of exogenous Wnt (Figure 6G). Together, our
observations suggest that increased TLE3 expression during
adipogenesis promotes differentiation by two related mecha-
nisms. First, it binds together with PPARg to adipocyte gene
promoters and facilitates PPARg-dependent activation. Second,
TLE3 forms complexes with TCFs that fail to recruit b-catenin,
thus relieving the repression of adipocyte promoters.
Time (days)
No
rm
alized
L
ucif
erase
-Cat-Cat
TLE3TLE3
TK3X-LEF1
Top FlashTop Flash
TLE3
-Cat
TCF4
PPAR
Flag
Hmg1
GW:
d0 d3 d5 d7
– – + – + – +
10T1/2293
ctrlB
0
0.4
0.8
No
rm
alized
Exp
ressio
n
10T1/2 cells DMI+GW
0
1.0
2.0
TLE3
0 2 4 6
Wisp2Wisp2
0 2 4 6
ALuc
50
100
150
200
250
300
0
+
++
+ TLE3TLE3 + +
E
No
rm
alized
Exp
ressio
n
wnt3a
LacZ TLE3
Nkd2
0
2
4
Wisp2
0
2
4Nkd2
0
1
2
Axin2
0
2
4
6
3T3-L1
wnt3a
10T1/2
C
0
0.004
0.008
0.012
ctrl wnt3a ctrl wnt3a
% In
pu
t
IgG -Cateninwnt3a
aP2
0
1
2
No
rm
alized
Exp
ressio
n
CD36
0
1
2
PPAR 2
0
1
2
LacZ TLE3
–
D
aP2 prom
LacZ TLE3
F
G
ChIP:
% In
pu
t
aP2 prom
0
5
10
15
-CatIgG TCF4
Ctrl Wnt3a
-Catenin
0
0.01
0.02
0.03
aP2
prom
PreAd Ad
ChIP:
Media:
0
50
100
150
200
250
Nacl LiCl
0
0.05
0.10
0.15
0.20
IgG TLE3
aP2
prom
-cat
Hmg1
PPAR
TLE3
TCF4
10T1/2 d2
–DMI
+GW
Fla
g-
TL
E3
TL
E3
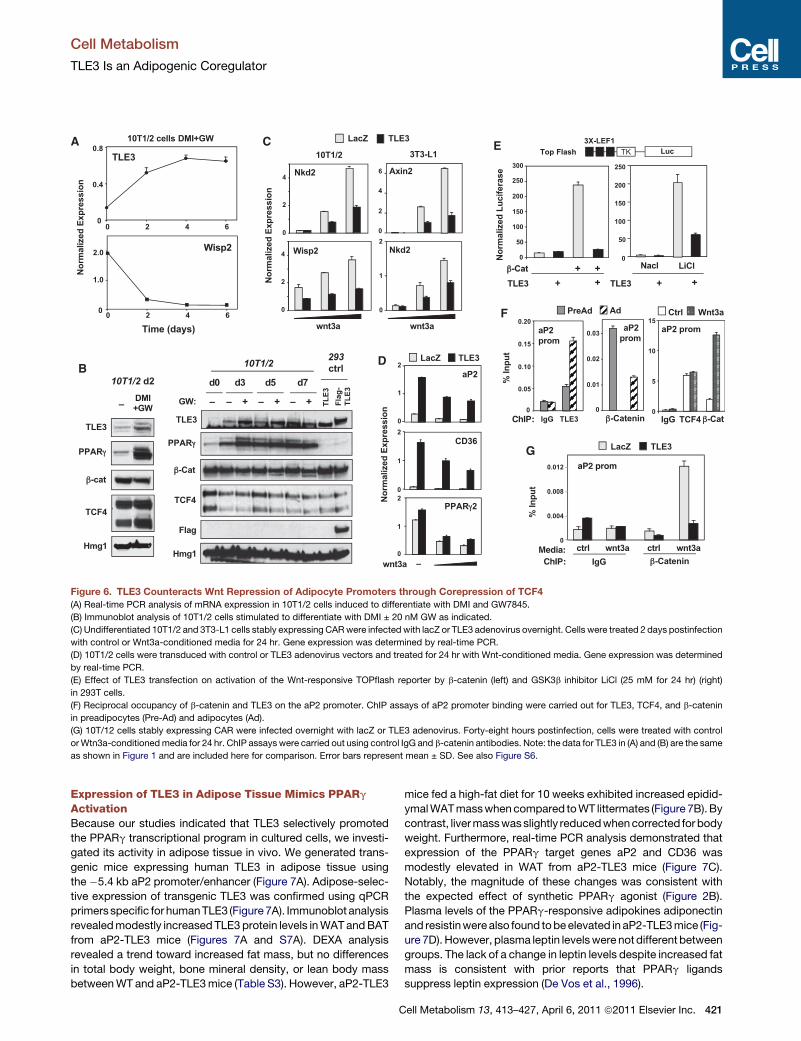
Figure 6. TLE3 Counteracts Wnt Repression of Adipocyte Promoters through Corepression of TCF4
(A) Real-time PCR analysis of mRNA expression in 10T1/2 cells induced to differentiate with DMI and GW7845.
(B) Immunoblot analysis of 10T1/2 cells stimulated to differentiate with DMI ± 20 nM GW as indicated.
(C) Undifferentiated 10T1/2 and 3T3-L1 cells stably expressing CARwere infected with lacZ or TLE3 adenovirus overnight. Cells were treated 2 days postinfection
with control or Wnt3a-conditioned media for 24 hr. Gene expression was determined by real-time PCR.
(D) 10T1/2 cells were transduced with control or TLE3 adenovirus vectors and treated for 24 hr with Wnt-conditioned media. Gene expression was determined
by real-time PCR.
(E) Effect of TLE3 transfection on activation of the Wnt-responsive TOPflash reporter by b-catenin (left) and GSK3b inhibitor LiCl (25 mM for 24 hr) (right)
in 293T cells.
(F) Reciprocal occupancy of b-catenin and TLE3 on the aP2 promoter. ChIP assays of aP2 promoter binding were carried out for TLE3, TCF4, and b-catenin
in preadipocytes (Pre-Ad) and adipocytes (Ad).
(G) 10T/12 cells stably expressing CAR were infected overnight with lacZ or TLE3 adenovirus. Forty-eight hours postinfection, cells were treated with control
orWtn3a-conditionedmedia for 24 hr. ChIP assays were carried out using control IgG and b-catenin antibodies. Note: the data for TLE3 in (A) and (B) are the same
as shown in Figure 1 and are included here for comparison. Error bars represent mean ± SD. See also Figure S6.
Cell Metabolism
TLE3 Is an Adipogenic Coregulator
Expression of TLE3 in Adipose Tissue Mimics PPARgActivationBecause our studies indicated that TLE3 selectively promoted
the PPARg transcriptional program in cultured cells, we investi-
gated its activity in adipose tissue in vivo. We generated trans-
genic mice expressing human TLE3 in adipose tissue using
the �5.4 kb aP2 promoter/enhancer (Figure 7A). Adipose-selec-
tive expression of transgenic TLE3 was confirmed using qPCR
primersspecific for humanTLE3 (Figure7A). Immunoblot analysis
revealedmodestly increased TLE3protein levels inWATandBAT
from aP2-TLE3 mice (Figures 7A and S7A). DEXA analysis
revealed a trend toward increased fat mass, but no differences
in total body weight, bone mineral density, or lean body mass
betweenWT and aP2-TLE3mice (Table S3). However, aP2-TLE3
C
mice fed a high-fat diet for 10 weeks exhibited increased epidid-
ymalWATmasswhencompared toWT littermates (Figure 7B).By
contrast, livermasswasslightly reducedwhencorrected forbody
weight. Furthermore, real-time PCR analysis demonstrated that
expression of the PPARg target genes aP2 and CD36 was
modestly elevated in WAT from aP2-TLE3 mice (Figure 7C).
Notably, the magnitude of these changes was consistent with
the expected effect of synthetic PPARg agonist (Figure 2B).
Plasma levels of the PPARg-responsive adipokines adiponectin
and resistinwerealso found tobeelevated in aP2-TLE3mice (Fig-
ure 7D). However, plasma leptin levelswere not different between
groups. The lack of a change in leptin levels despite increased fat
mass is consistent with prior reports that PPARg ligands
suppress leptin expression (De Vos et al., 1996).
ell Metabolism 13, 413–427, April 6, 2011 ª2011 Elsevier Inc. 421
0
100
200
300
400
500
600
700
0 15 30 45 60 75 90 105 120
Time (min)
P<0.001
0
20
40
60
80
100
120
Time (min)
% In
itia
l V
alu
e
B
E
5.4kb aP2 hTLE3 polyA
Glu
co
se (
mg
/dL
)
Glu
co
se (
mg
/dl)
0
20
40
60
80
HO
MA
-IR
0
2
4
6
Insu
lin
(n
g/m
L)
* *
200
220
240
260
280
*
Lep
tin
(n
g/m
L)
0
20
40
60
Ad
ipo
nectin
(m
g/m
l)
**
0
10
20
30
40
0
2
4
6
8
Resis
tin
(n
g/m
L) **
0
1
2
3
No
rm
. E
xp
ressio
n
hTLE3
N.D.
A
eW
AT
W
eig
ht (
g)
0
1
2
3 *
0
0.5
1.0
1.5
2.0
%b
od
y w
eig
ht (
g)
WT Tg
DF
WT aP2-TLE3
WT TLE3 Tg
TLE3
-actin
eWAT
WT aP2-TLE3
GTT
0 15 30 45 60 75 90
P<0.01
ITT
WT aP2-TLE3WT aP2-TLE3
GIR
(m
g/k
g/m
in)
0
10
20
30
IS-G
DR
(m
g/k
g/m
in)
0
25
50
75
100
HG
P S
up
pressio
n (
%)
0
4
8
12
HG
P (
mg
/kg
/min
)
**
**
0
10
20
30
40
50
*
G
WT Tg
WT WT WT WT WT WTTg Tg Tg Tg
No
rm
. E
xp
ressio
n
CD36
0
1
2
3
*
0
aP2
2
4
6
8 *
WAT
G6Pase
0
1
2
3
PEPCK
0
0.4
0.8
1.2
*
*
Liver
No
rm
. E
xp
ressio
n
H
Tg Tg
WAT C
WT Tg WT Tg
Hyperinsulinemic-euglycemic clamp
LIVER
*
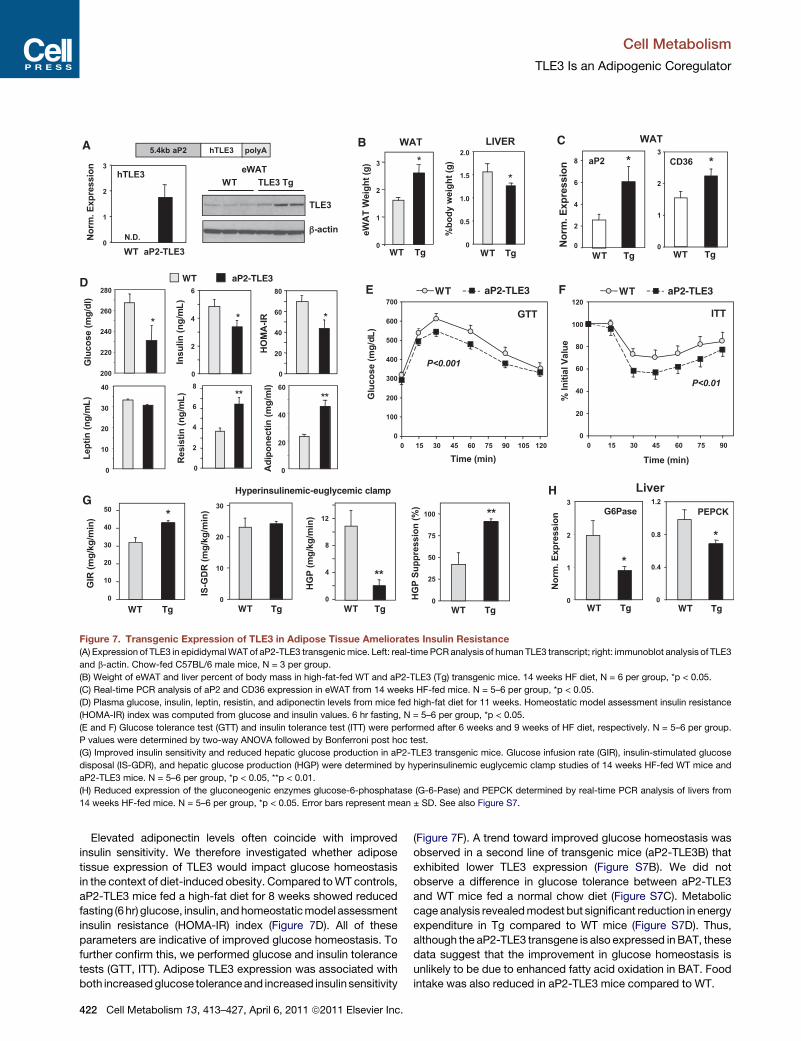
Figure 7. Transgenic Expression of TLE3 in Adipose Tissue Ameliorates Insulin Resistance
(A) Expression of TLE3 in epididymalWAT of aP2-TLE3 transgenicmice. Left: real-time PCRanalysis of human TLE3 transcript; right: immunoblot analysis of TLE3
and b-actin. Chow-fed C57BL/6 male mice, N = 3 per group.
(B) Weight of eWAT and liver percent of body mass in high-fat-fed WT and aP2-TLE3 (Tg) transgenic mice. 14 weeks HF diet, N = 6 per group, *p < 0.05.
(C) Real-time PCR analysis of aP2 and CD36 expression in eWAT from 14 weeks HF-fed mice. N = 5–6 per group, *p < 0.05.
(D) Plasma glucose, insulin, leptin, resistin, and adiponectin levels from mice fed high-fat diet for 11 weeks. Homeostatic model assessment insulin resistance
(HOMA-IR) index was computed from glucose and insulin values. 6 hr fasting, N = 5–6 per group, *p < 0.05.
(E and F) Glucose tolerance test (GTT) and insulin tolerance test (ITT) were performed after 6 weeks and 9 weeks of HF diet, respectively. N = 5–6 per group.
P values were determined by two-way ANOVA followed by Bonferroni post hoc test.
(G) Improved insulin sensitivity and reduced hepatic glucose production in aP2-TLE3 transgenic mice. Glucose infusion rate (GIR), insulin-stimulated glucose
disposal (IS-GDR), and hepatic glucose production (HGP) were determined by hyperinsulinemic euglycemic clamp studies of 14 weeks HF-fed WT mice and
aP2-TLE3 mice. N = 5–6 per group, *p < 0.05, **p < 0.01.
(H) Reduced expression of the gluconeogenic enzymes glucose-6-phosphatase (G-6-Pase) and PEPCK determined by real-time PCR analysis of livers from
14 weeks HF-fed mice. N = 5–6 per group, *p < 0.05. Error bars represent mean ± SD. See also Figure S7.
Cell Metabolism
TLE3 Is an Adipogenic Coregulator
Elevated adiponectin levels often coincide with improved
insulin sensitivity. We therefore investigated whether adipose
tissue expression of TLE3 would impact glucose homeostasis
in the context of diet-induced obesity. Compared toWT controls,
aP2-TLE3 mice fed a high-fat diet for 8 weeks showed reduced
fasting (6hr) glucose, insulin, andhomeostaticmodel assessment
insulin resistance (HOMA-IR) index (Figure 7D). All of these
parameters are indicative of improved glucose homeostasis. To
further confirm this, we performed glucose and insulin tolerance
tests (GTT, ITT). Adipose TLE3 expression was associated with
both increasedglucose toleranceand increased insulin sensitivity
422 Cell Metabolism 13, 413–427, April 6, 2011 ª2011 Elsevier Inc.
(Figure 7F). A trend toward improved glucose homeostasis was
observed in a second line of transgenic mice (aP2-TLE3B) that
exhibited lower TLE3 expression (Figure S7B). We did not
observe a difference in glucose tolerance between aP2-TLE3
and WT mice fed a normal chow diet (Figure S7C). Metabolic
cage analysis revealedmodest but significant reduction in energy
expenditure in Tg compared to WT mice (Figure S7D). Thus,
although the aP2-TLE3 transgene is also expressed inBAT, these
data suggest that the improvement in glucose homeostasis is
unlikely to be due to enhanced fatty acid oxidation in BAT. Food
intake was also reduced in aP2-TLE3 mice compared to WT.
Cell Metabolism
TLE3 Is an Adipogenic Coregulator
Finally, we performed hyperinsulinemic-euglycemic clamp
studies in order to more directly measure insulin sensitivity and
gain insight into the tissues involved in the phenotype of aP2-
TLE3 mice. aP2-TLE3 mice required an increased glucose infu-
sion rate (GIR) to maintain euglycemia, a sensitive measurement
of whole-body insulin sensitivity (Figure 7G). Insulin-stimulated
glucose disposal rate (IS-GDR), which primarily reflects skeletal
muscle insulin sensitivity, was similar between genotypes (Fig-
ure 7G). By contrast, the suppression of hepatic glucose produc-
tion (HGP) by insulin was improved in aP2-TLE3 mice relative to
controls. These findings indicate that the observed changes in
GIR largely reflected improved hepatic insulin sensitivity. Histo-
logical analysis of livers revealed that aP2-TLE3 mice had
reduced lipid accumulation in the liver (Figure S7E). The expres-
sion of gluconeogenic genes was reduced in aP2-TLE3 mice in
accordance with the HGP results (Figure 7H). Interestingly,
a selective effect on HGP compared to IS-GDR is consistent
with the effect of low-dose TZD administration (Kubota et al.,
2006). Thus, our results are in line with the expected effects of
modest stimulation of the adipocyte PPARg pathway.
DISCUSSION
Herewe outline a role for amember of the highly conserved grou-
cho transcription factor family as a facilitator of nuclear receptor
action during cell differentiation. TLE3 is a direct target for regu-
lation by PPARg and functions in a feed-forward loop with
PPARg to promote differentiation. Mechanistically, TLE3 func-
tions as a coregulator of both PPARg and Wnt signaling, driving
the formation of active and repressive transcriptional complexes
on the promoters of adipocyte genes. The dual ability of TLE3 to
function as a coactivator for PPARg and a corepressor for TCF
provides an elegant mechanism for the integration of pro- and
antiadipogenic signals during adipocyte development.
The function of TLE proteins in adipocyte development has not
previously been investigated. Our discovery of TLE3 as a coacti-
vator for PPARg-dependent transcription was unexpected, as
groucho and mammalian TLEs have been primarily studied for
their rolesascorepressors (ChenandCourey, 2000). TLEproteins
lack a DNA-binding domain, and therefore their ability to regulate
transcription is believed to bedependent on interactionwith other
proteins. Several transcription factors are known to interact with
TLEs, including PAX, Hes, Engrailed, and TCFs (Buscarlet and
Stifani, 2007). TLEs are recruited to silence gene expression in
various contexts through direct interactions with histones and
histone-modifying enzymes (Chen et al., 1999; Sekiya and Zaret,
2007). Our demonstration that TLE3 expression acts to positively
reinforce PPARg action has uncovered a previously unrecog-
nized mode of action for this transcriptional cofactor.
Previous work has identified several coactivators that interact
with PPARg (Cho et al., 2009; Ge et al., 2002; Gelman et al.,
1999; Grøntved et al., 2010; Louet et al., 2006; Qi et al., 2003; Ta-
kahashi et al., 2002). Unlike TLE3, however, the levels of these
factors are not regulated during differentiation. They are likely
required for the efficient action of PPARg and other transcription
factors, but are not utilized as developmental switches per se.
PGC-1a, a coregulator whose expression is highly regulated by
physiological stimuli, is critical for the brown adipocyte thermo-
genic program, but is not believed to play a central role in white
C
adipose differentiation (Puigserver et al., 1998). The high expres-
sion of TLE3 in WAT, relative to BAT, leads us to speculate that
TLE3 may function as a white adipocyte counterpart to PGC-1a
in brown adipocytes. Transcriptional profiling supports this, as
the brown adipocyte markers PRDM16, Cidea, Elovl3, Ucp1,
and PGC-1a were not upregulated in 10T1/2 cells expressing
TLE3.
TLE3 mRNA and protein expression accumulate during prea-
dipocyte differentiation and in response to PPARg activation.
Thus, coactivation of PPARg by TLE3 may serve as a feed-
forward mechanism to enhance differentiation. Expression of
TLE3 at levels present in differentiated adipocytes promotes pre-
adipocyte differentiation, and this effect is highly dependent on
PPARg expression. Indeed, coexpression of PPARg and TLE3
has a synergistic effect on the expression of a number of terminal
adipocyte genes. Moreover, we found a high degree of overlap
between the transcriptional programs regulated by TLE3 and
PPARg, indicating that TLE3 exerts a preferential effect on the
PPARg signaling pathway in this cell type. Further studies will
be needed to determine whether there may be additional tran-
scription factors other than PPARg involved in TLE3 signaling
in preadipocytes. Mechanistic studies indicate that TLE3 is
recruited along with PPARg to PPREs in adipocyte target genes
in a differentiation-dependent manner. PPARg and TLE3 can be
localized to common transcription complexes by immunoprecip-
itation and biochemical purification, although the two proteins do
not appear to interact directly.
The Wnt signaling pathway is important for the maintenance
and proliferation of preadipocytes (Ross et al., 2000). Differenti-
ation is accompanied by the suppression of Wnt signaling and
the concurrent activation of PPARg (Ross et al., 2002). Surpris-
ingly, the mechanisms underlying this switch are poorly under-
stood. In particular, it is unclear how the Wnt pathway is shut
off. We propose that induction of TLE3 expression is a compo-
nent of a developmental switch that silences Wnt signaling and
allows adipogenesis to proceed. TCF4 and b-catenin are present
on the aP2 promoter in preadipocytes, and this correlates with
the suppression of transcription. In the course of differentiation,
endogenous TLE3 is recruited to differentiation-dependent
adipocyte promoters, where it can interact directly with TCF4
and compete for the binding of b-catenin. Forced expression
of TLE3 in preadipocytes displaces b-catenin and relieves
repression of differentiation-dependent genes. Interestingly,
a similar mode of TCF action has recently been proposed to
operate in the context of skin differentiation (Nguyen et al.,
2006). TCF3 was found to actively repress epidermal and seba-
ceous gland differentiation in the stem cell compartment through
repression of lipid metabolism genes such as PPARg and CD36.
There is precedence for dual-function transcriptional cofac-
tors. It is becoming increasingly clear that the strict labels of
‘‘coactivator’’ and ‘‘corepressor’’ may not accurately reflect the
complex interactions of some of these nuclear proteins. For
example, in addition to coactivating TCF/Lef1, b-catenin can
also act as a repressor (Blauwkamp et al., 2008). The nuclear
receptor cofactor RIP140 has also been reported to perform
both coactivator and corepressor functions (Debevec et al.,
2007; Subramaniam et al., 1999). Furthermore, the functional
roles of transcriptional coregulators may be context specific
and varywith the transcriptionalmachinery present in a particular
ell Metabolism 13, 413–427, April 6, 2011 ª2011 Elsevier Inc. 423
Cell Metabolism
TLE3 Is an Adipogenic Coregulator
cell. One possibility is that TLE3 is directing chromatin remodel-
ing and generating a chromatin structure that facilitates PPARg-
dependent transcription.
The physiological importance of TLE3 for the adipocyte
program is illustrated by the demonstration that suppression of
TLE3 expression compromises preadipocyte differentiation
and PPARg target gene expression. In addition, we showed
that expression of TLE3 from the adipose-selective aP2
promoter in mice mimics the effect of synthetic PPARg agonist
administration. aP2-TLE3 transgenic mice challenged with
a high-fat diet were partially protected against insulin resistance.
Clamp studies showed that the improvement in glucose handling
in aP2-TLE3 mice was largely attributable to improved hepatic
insulin sensitivity. This result is in line with previously reported
effects of low-dose TZD treatment. Submaximal doses of piogli-
tazone have been shown to increase the GIR and suppress HGP
in the absence of major effects on IS-GDR (Kubota et al., 2006).
Improvements in hepatic insulin sensitivity may reflect redistri-
bution of triglycerides away from liver and into adipose tissue.
We found that aP2-TLE3 mice have increased adipose tissue,
reduced liver mass, and reduced hepatic lipid accumulation on
a high-fat diet. A similar finding was reported in ob/ob animals
expressing an adiponectin transgene (Kim et al., 2007). Further-
more, adiponectin has been shown to act directly on the liver to
suppress gluconeogenesis (Combs et al., 2001). Therefore, our
demonstration that aP2-TLE3 mice have higher plasma adipo-
nectin levels provides a plausible mechanistic explanation for
the beneficial effects of TLE3 on systemic glucose metabolism.
Interestingly, despite aP2-TLE3 mice having reduced food
intake, their leptin levels were not elevated, suggesting a change
in leptin sensitivity. Additional studies will be needed to explore
this issue. Since TLE3 and aP2 are also expressed in macro-
phages, it will be interesting to address the function of TLE3 in
this cell type and its potential contribution to the phenotype of
the aP2-TLE3 mice. Finally, given the lethality of global TLE3
deficiency, future in vivo loss-of-function studies will necessitate
the generation of tissue-selective conditional deletions of TLE3.
EXPERIMENTAL PROCEDURES
Cell Culture
Confluent 10T1/2 and 3T3-L1 cells were stimulated to differentiate with DMEM
containing 10% FBS, 1 mM dexamethasone, 0.5 mM isobutylmethylxanthine,
and 5 mg/ml insulin for 2 days, followed by 5 mg/ml insulin alone. When spec-
ified, PPARg agonist GW7845 or rosiglitazone was included. NIH 3T3 cells
were differentiated by 2 days treatment with dexamethasone, insulin, and
GW7845, followed by insulin and GW7845 alone. Stable cells expressing
TLE3 (Puro), PPARg (Hygro), or CAR (Neo) were generated using pBabe retro-
viral vectors (Hummasti and Tontonoz, 2006). For MEF studies, TLE3 null
animals were generated from ES gene trap line XP0165 obtained from The
Wellcome Trust Sanger Institute. Heterozygous animals were bred to generate
E13 embryos that were used to derive fibroblasts. Adipocyte differentiation
was induced by treating confluent MEFs with DMEM containing 10% FBS,
0.5 mM isobutylmethylxanthine, 1 mM dexamethasone, 5 mg/ml insulin, and
1 mM rosiglitazone for 6 days. Subsequently, cells were treated for 6 days
with insulin and rosiglitazone. lacZ- or TLE3-expressing adenoviruses were
generated as described (Zelcer et al., 2009). Control and Wnt3a-conditioned
media were prepared using L cells (ATCC) as described (Waki et al., 2007).
Cell-Based cDNA Screen
An arrayed library of 18,292 human and mouse full-length cDNAs from
the OriGene TrueClone Collection (Rockville, MD) was screened by high-
424 Cell Metabolism 13, 413–427, April 6, 2011 ª2011 Elsevier Inc.
throughput reverse transfection of 10T1/2 cells as described (Cho et al.,
2006; Waki et al., 2007). Briefly, a 15 ml mixture of FuGENE 6 and luciferase
reporter (20 ng/well) in serum-free medium was added to prespotted
384-well plates containing 62.5 ng of plasmid DNA per well. PPARg, LIP,
and GAL4-LXR were used as controls. After a 30 min incubation, 2000 cells
in 20 ml of DMEM supplemented with 20% FBS were added to each well.
The following day, 5 ml of differentiation-induction media containing insulin
(5 mg/ml) and rosiglitazone (1 mM) were added. Plates were incubated for
4 more days, and luciferase activity was determined. Relative intensities
were normalized to their respective plate median values, then normalized by
log2 transformation, and mean values and standard deviations were calcu-
lated for each well from the replicate screens. These values were then reverse
log2 transformed, and the ratio of ‘‘afa’’ (derived frommeans) to ‘‘mfa’’ (derived
from standard deviations) was calculated to penalize wells for replicate quality.
Each cDNA was ranked by afa score. A secondary screen was performed on
a set of 96 cDNAs chosen from the top afa/mfa scores reassayed in quadrupli-
cate, and raw luciferase values were normalized to empty vector controls.
shRNA Plasmids
TLE3 shRNA constructs were designed using BLOCK-IT RNAi designer tool
(Invitrogen, Carlsbad, CA). Sense and antisense oligos were annealed and
cloned into pENTR/U6 plasmid (Invitrogen). Using the LR recombinase (Invitro-
gen), shRNA constructswere recombined into a gateway adapted pBabe-Puro
plasmid. The following shRNA oligos were used: lacZ shRNA CACCGGGC
CAGCTGTATAGACATCTCGAA AGATGTCTATACAGCTGGCCC; TLE3sh1
CACCGCACAAGCAGACAGAGATTGCCGAAGCAATCTCTGTCTGCTTGTGC;
and TLE3sh2 CACCGGGCCA GCTGTATAGACATCTCGAAAGATGTCTATA
CAGCTGGCCC. Only sense strands are shown.
Luciferase Reporter Assay
10T1/2 cells were seeded in 24-well culture plates at 90% confluence. Cells
were cotransfected with 100 ng pGL3-aP2-luciferase or 100 ng PTK-3XPPRE-
luciferase and 100 ng pCMX-PPARg, 20 ng pCMX-RXR, 100 ng pCMX-TLE3,
100ngpCMX-TLE3(V708D), and5ngRenilla control vectorusingLipofectamine
2000 (Invitrogen). Forty-eight hours later, cells were treated with DMSO or
100 nMGW7845 in DMEMwith 1%FBS for 24 hr. Luciferase activitywas deter-
mined with STOP&GLO (Promega, Madison, WI) and a GLOMAX luminometer
(Promega). Firefly luciferase activity was normalized to Renilla luciferase.
Wnt-reporter activity was determined by cotransfecting 50 ng TOPflash
reporter, 25 ng constitutively active b-catenin (S37A), 500 ng pCMX-TLE3,
and 15 ng Renilla luciferase in 293T cells. Luciferase activity was determined
48 hr after transfection with FuGENE 6 (Roche, Indianapolis, IN).
Gene Expression and Microarray Analysis
Total RNA was isolated using TRIzol reagents (Invitrogen) and reverse tran-
scribed using iScript cDNA synthesis kit (Bio-Rad, Hercules, CA). cDNA was
quantified by real-time PCR using SYBR Green (Diagenode, Denville, NJ)
and an ABI 7900 instrument. Gene expression levels were determined by using
a standard curve. Each gene was normalized to 36B4. Primers used for real-
time PCR are listed in Table S5. For microarray experiments, 10T1/2 cells
stably expressing CAR ± PPARg were infected overnight with lacZ or TLE3
expressing adenovirus. Forty-eight hours after infection, cells were stimulated
with DMSO or 10 nM GW7845 for 24 hr. RNA was pooled from six biological
replicates and processed in the UCLA Microarray Core Facility using Gene-
Chip Mouse Gene 1.0 ST Arrays (Affymetrix, Santa Clara, CA). The results
were analyzed using GenespringGX (Agilent, Santa Clara, CA).
Nuclear Extracts
Cells were washedwith 13 PBS and incubated with TEN-buffer (10mMTris-Cl
[pH 8], 100mMNaCl, 1 mMEDTA [pH 8]). Cells were allowed to swell on ice for
15 min in 10 mM HEPES, 10 mM KCl, 0.1 mM EGTA, 0.1 mM EDTA, 1 mM
DTT + complete proteinase inhibitor (Roche). Cells were then mixed with
0.6% NP-40 alternative (Calbiochem, San Diego, CA) for 10 s and centrifuged
at 12,000 g. Nuclear pellet was resuspended in ice-cold 20 mM HEPES,
420 mM NaCl, 1.5 mM MgCl2, 0.2 mM EDTA, 25% glycerol, 1 mM DTT +
complete proteinase inhibitor (Roche). Nuclear extracts were spun at
12,000 g for 5 min, and the supernatant was used for further analysis.
Cell Metabolism
TLE3 Is an Adipogenic Coregulator
Protein Analysis
Proteins were diluted in Nupage loading dye (Invitrogen), heated at 70�C for
20min, and run on 4%–12%Bis-Tris Gel (Invitrogen). Proteinswere transferred
to hybond ECL membrane (GE Healthcare, Piscataway, NJ) and blotted using
TLE3 (M-201, Santa Cruz Biotechnology, Santa Cruz, CA, or 11372-1-AP,
Proteintech Group, Chicago, IL), PPARg (81B8, Cell Signaling, Danvers, MA),
Hmg1 (556528, BD PharMingen, San Diego, CA), TCF4 (C48H11, Cell
Signaling), or b-catenin (H-102, Santa Cruz) antibodies. For immunoprecipita-
tion, nuclear extracts were diluted in IP buffer (20mMTris, 137mMNaCl, 2mM
EDTA, 1%NP-40, 10% glycerol) and precleared with Protein A agarose beads
(Santa Cruz Biotechnology). Extracts were mixed with IgG (PP64, Millipore,
Billerica, MA), TCF4 (C48H11, Cell Signaling), or PPARg (81B8, Cell Signaling)
antibodies and incubated with beads. After spinning, beads were washed with
IP buffer and protein-eluted for immunoblotting.
Chromatin Immunoprecipitation
ChIP experiments were performed according to standard protocols (Nielsen
et al., 2008). Lysed cells were sonicated using a Bioruptor (Diagenode) accord-
ing to the manufacturer’s protocol, and chromatin was immunoprecipitated
with antibodies against TLE3 (11372-1-AP, Proteintech Group), TCF4
(C48H11, Cell Signaling), RNA Pol2 (CTD4H8, Millipore), IgG (PP64, Millipore),
b-catenin (610154, BD Transduction Laboratories, San Diego, CA), PPARg
(H-100, sc7196; Santa Cruz Biotechnology or RXR (D197, sc774; Santa Cruz
Biotechnology) overnight at 4�C in the presence of Protein A beads (GEHealth-
care). DNA enrichment was quantified by real-time PCR (MX-3000, Strata-
gene, Santa Clara, CA, or ABI 7900, ABI, Carlsbad, CA) using SYBR Green
Master Mix (Diagenode or Sigma-Aldrich, St. Louis, MO). Primers used for
these studies are listed in Table S4. Occupancy was quantified using a stan-
dard curve and normalized to input DNA.
Immunofluorescence
10T1/2 cells were plated in gelatin-treated (0.2%) glass-bottom dishes (Mat
TeK Corp., Ashland, MA) and differentiated with DMI + 20 nM GW7845. At
day 4 of differentiation, cells were fixed with 4% PFA (1XPBS) and washed
with PBS. Cells were permeabilized with 0.1% triton and blocked with
3% BSA. Cells were incubated with TLE3 antibody in 3% BSA overnight,
washed, and incubated with Alexa Fluor 555 (A21429, Invitrogen) for 1 hr. After
washing, cells were stained with 1 mg/ml BODIPY 493/503 (D3922, Invitrogen)
or DAPI (Invitrogen) and washed with PBS. Cells were visualized with LSM 510
confocal laser scanning microscope (Carl Zeiss, Thornwood, NY).
Animal Studies
Male C57BL/6 ob/ob, db/db, and WT littermates were acquired from Jackson
Laboratory (Sacramento, CA). Mice were sacrificed at 3 months of age. Trans-
genic mice were generated at the UCLA transgenic core facility. The �5.4 kb
enhancer region of aP2 (Graves et al., 1992) was subcloned into PCR2.1
containing TLE3 cDNA followed by bovine growth hormone polyA (TLE3-
PolyA). The linearized construct was gel-purified (Zymol) and microinjected
into C57BL/6 fertilized zygotes. Founders were identified by PCR using the
following primers: Forward, AGGGAGAACCAAAGTTGAGAAAT, and Reverse,
GTCTTCTCGTTTGCCAGCTT. At 12 weeks of age, aP2-TLE3 transgenic mice
(F2 generation) and their wild-type littermates were fed a 60% high-fat diet
(Research Diets, New Brunswick, NJ) for the indicated times. For glucose
tolerance tests, mice were fasted for 6 hr and challenged with an i.p. injection
of glucose (2 g/kg). For insulin tolerance tests, mice were fasted for 3 hr and
given an i.p. injection of insulin (1 U/kg). Blood glucose levels were monitored
using the ACCU-CHEK active glucometer (Roche). Serum adiponectin levels
were determined by ELISA (B-Bridge International Inc., Cupertino, CA), and
insulin, resistin, and leptin were determined by multiplex immunoassay
(Milliplex Kit, Millipore) after 6 hr fast. Body composition and bone mineral
density were determined by DEXA analysis. GIR, IS-GDR, and glucose
production were determined by euglycemic hyperinsulinemic clamp as
described previously (Hevener et al., 2003, 2007; Steele, 1959). No differences
in clamp glucose or steady-state insulin concentration were observed
between the two genotypes of mice. Indirect calorimetry was performed using
a Columbus Instruments Comprehensive Lab Animal Monitoring System
(CLAMS, Columbus Instruments, Columbus, OH). Animals were placed indi-
vidually in chambers for 3 consecutive days at ambient temperature (26.5�C)
C
with 12 hr light/dark cycles. Animals had free access to food and water. Respi-
ratory measurements were made in 20 min intervals after initial 12 hr acclima-
tion period. Energy expenditure was calculated from VO2 and RER using the
Lusk equation, EE in cal/min = (3.815 + 1.2323RER)3 VO2 inml/min (McLean
and Tobin, 1987). Statistical significance for EE measurements was deter-
mined by using two-way ANOVA.
SUPPLEMENTAL INFORMATION
Supplemental Information includes seven figures and five tables and can be
found with this article online at doi:10.1016/j.cmet.2011.02.014.
ACKNOWLEDGMENTS
We thank Stephen Young and Karen Reue for helpful discussions and Loren
Fong for help with histology. P.T. is an investigator of the Howard Hughes
Medical Institute and was also supported by NIH grants HL090553 and
DK063491. C.J.V. was supported by NIH training grant HL069766. E.S. was
supported by a Career Development Award from the American Diabetes
Association, The McDonald’s Center for Type 2 Diabetes and Obesity, and
NIH grant DK081003.
Received: August 12, 2010
Revised: November 25, 2010
Accepted: January 6, 2011
Published: April 5, 2011
REFERENCES
Arango, N.A., Szotek, P.P., Manganaro, T.F., Oliva, E., Donahoe, P.K., and
Teixeira, J. (2005). Conditional deletion of beta-catenin in the mesenchyme
of the developing mouse uterus results in a switch to adipogenesis in the
myometrium. Dev. Biol. 288, 276–283.
Bennett, C.N., Ross, S.E., Longo, K.A., Bajnok, L., Hemati, N., Johnson, K.W.,
Harrison, S.D., and MacDougald, O.A. (2002). Regulation of Wnt signaling
during adipogenesis. J. Biol. Chem. 277, 30998–31004.
Blauwkamp, T.A., Chang, M.V., and Cadigan, K.M. (2008). Novel TCF-binding
sites specify transcriptional repression by Wnt signalling. EMBO J. 27,
1436–1446.
Buscarlet, M., and Stifani, S. (2007). The ‘Marx’ of Groucho on development
and disease. Trends Cell Biol. 17, 353–361.
Cavallo, R.A., Cox, R.T., Moline, M.M., Roose, J., Polevoy, G.A., Clevers, H.,
Peifer, M., and Bejsovec, A. (1998). Drosophila Tcf and Groucho interact to
repress Wingless signalling activity. Nature 395, 604–608.
Chen, G., and Courey, A.J. (2000). Groucho/TLE family proteins and transcrip-
tional repression. Gene 249, 1–16.
Chen, G., Fernandez, J., Mische, S., and Courey, A.J. (1999). A functional
interaction between the histone deacetylase Rpd3 and the corepressor grou-
cho in Drosophila development. Genes Dev. 13, 2218–2230.
Cho, C.Y., Koo, S.H., Wang, Y., Callaway, S., Hedrick, S., Mak, P.A., Orth,
A.P., Peters, E.C., Saez, E., Montminy, M., et al. (2006). Identification of the
tyrosine phosphatase PTP-MEG2 as an antagonist of hepatic insulin signaling.
Cell Metab. 3, 367–378.
Cho, Y.W., Hong, S., Jin, Q., Wang, L., Lee, J.E., Gavrilova, O., and Ge, K.
(2009). Histone methylation regulator PTIP is required for PPARgamma and
C/EBPalpha expression and adipogenesis. Cell Metab. 10, 27–39.
Christy, R.J., Yang, V.W., Ntambi, J.M., Geiman, D.E., Landschulz, W.H.,
Friedman, A.D., Nakabeppu, Y., Kelly, T.J., and Lane, M.D. (1989).
Differentiation-induced gene expression in 3T3-L1 preadipocytes: CCAAT/
enhancer binding protein interacts with and activates the promoters of two
adipocyte-specific genes. Genes Dev. 3, 1323–1335.
Combs, T.P., Berg, A.H., Obici, S., Scherer, P.E., and Rossetti, L. (2001).
Endogenous glucose production is inhibited by the adipose-derived protein
Acrp30. J. Clin. Invest. 108, 1875–1881.
ell Metabolism 13, 413–427, April 6, 2011 ª2011 Elsevier Inc. 425
Cell Metabolism
TLE3 Is an Adipogenic Coregulator
Dalen, K.T., Schoonjans, K., Ulven, S.M., Weedon-Fekjaer, M.S., Bentzen,
T.G., Koutnikova, H., Auwerx, J., and Nebb, H.I. (2004). Adipose tissue expres-
sion of the lipid droplet-associating proteins S3-12 and perilipin is controlled
by peroxisome proliferator-activated receptor-gamma. Diabetes 53,
1243–1252.
De Vos, P., Lefebvre, A.M., Miller, S.G., Guerre-Millo, M., Wong, K., Saladin,
R., Hamann, L.G., Staels, B., Briggs, M.R., and Auwerx, J. (1996).
Thiazolidinediones repress ob gene expression in rodents via activation of
peroxisome proliferator-activated receptor gamma. J. Clin. Invest. 98,
1004–1009.
Debevec, D., Christian, M., Morganstein, D., Seth, A., Herzog, B., Parker, M.,
and White, R. (2007). Receptor interacting protein 140 regulates expression of
uncoupling protein 1 in adipocytes through specific peroxisome proliferator
activated receptor isoforms and estrogen-related receptor alpha. Mol.
Endocrinol. 21, 1581–1592.
Freytag, S.O., Paielli, D.L., and Gilbert, J.D. (1994). Ectopic expression of the
CCAAT/enhancer-binding protein alpha promotes the adipogenic program in
a variety of mouse fibroblastic cells. Genes Dev. 8, 1654–1663.
Ge, K., Guermah, M., Yuan, C.X., Ito, M., Wallberg, A.E., Spiegelman, B.M.,
and Roeder, R.G. (2002). Transcription coactivator TRAP220 is required for
PPAR gamma 2-stimulated adipogenesis. Nature 417, 563–567.
Gelman, L., Zhou, G., Fajas, L., Raspe, E., Fruchart, J.C., and Auwerx, J.
(1999). p300 interacts with the N- and C-terminal part of PPARgamma2 in
a ligand-independent and -dependent manner, respectively. J. Biol. Chem.
274, 7681–7688.
Graves, R.A., Tontonoz, P., Platt, K.A., Ross, S.R., and Spiegelman, B.M.
(1992). Identification of a fat cell enhancer: analysis of requirements for
adipose tissue-specific gene expression. J. Cell. Biochem. 49, 219–224.
Grøntved, L., Madsen, M.S., Boergesen, M., Roeder, R.G., and Mandrup, S.
(2010). MED14 tethers mediator to the N-terminal domain of peroxisome
proliferator-activated receptor gamma and is required for full transcriptional
activity and adipogenesis. Mol. Cell. Biol. 30, 2155–2169.
Halaas, J.L., Gajiwala, K.S., Maffei, M., Cohen, S.L., Chait, B.T., Rabinowitz,
D., Lallone, R.L., Burley, S.K., and Friedman, J.M. (1995). Weight-reducing
effects of the plasma protein encoded by the obese gene. Science 269,
543–546.
Hevener, A.L., He, W., Barak, Y., Le, J., Bandyopadhyay, G., Olson, P., Wilkes,
J., Evans, R.M., and Olefsky, J. (2003). Muscle-specific Pparg deletion causes
insulin resistance. Nat. Med. 9, 1491–1497.
Hevener, A.L., Olefsky, J.M., Reichart, D., Nguyen, M.T., Bandyopadyhay, G.,
Leung, H.Y.,Watt, M.J., Benner, C., Febbraio, M.A., Nguyen, A.K., et al. (2007).
Macrophage PPAR gamma is required for normal skeletal muscle and hepatic
insulin sensitivity and full antidiabetic effects of thiazolidinediones. J. Clin.
Invest. 117, 1658–1669.
Hummasti, S., and Tontonoz, P. (2006). The peroxisome proliferator-activated
receptor N-terminal domain controls isotype-selective gene expression and
adipogenesis. Mol. Endocrinol. 20, 1261–1275.
Jennings, B.H., Pickles, L.M., Wainwright, S.M., Roe, S.M., Pearl, L.H., and
Ish-Horowicz, D. (2006). Molecular recognition of transcriptional repressor
motifs by the WD domain of the Groucho/TLE corepressor. Mol. Cell 22,
645–655.
Kim, J.Y., van de Wall, E., Laplante, M., Azzara, A., Trujillo, M.E., Hofmann,
S.M., Schraw, T., Durand, J.L., Li, H., Li, G., et al. (2007). Obesity-associated
improvements in metabolic profile through expansion of adipose tissue.
J. Clin. Invest. 117, 2621–2637.
Kubota, N., Terauchi, Y., Kubota, T., Kumagai, H., Itoh, S., Satoh, H., Yano,W.,
Ogata, H., Tokuyama, K., Takamoto, I., et al. (2006). Pioglitazone ameliorates
insulin resistance and diabetes by both adiponectin-dependent and -indepen-
dent pathways. J. Biol. Chem. 281, 8748–8755.
Lehmann, J.M., Moore, L.B., Smith-Oliver, T.A., Wilkison, W.O., Willson, T.M.,
and Kliewer, S.A. (1995). An antidiabetic thiazolidinedione is a high affinity
ligand for peroxisome proliferator-activated receptor gamma (PPAR gamma).
J. Biol. Chem. 270, 12953–12956.
426 Cell Metabolism 13, 413–427, April 6, 2011 ª2011 Elsevier Inc.
Liu, J., and Farmer, S.R. (2004). Regulating the balance between peroxisome
proliferator-activated receptor gamma and beta-catenin signaling during
adipogenesis. A glycogen synthase kinase 3beta phosphorylation-defective
mutant of beta-catenin inhibits expression of a subset of adipogenic genes.
J. Biol. Chem. 279, 45020–45027.
Louet, J.F., Coste, A., Amazit, L., Tannour-Louet,M.,Wu, R.C., Tsai, S.Y., Tsai,
M.J., Auwerx, J., and O’Malley, B.W. (2006). Oncogenic steroid receptor
coactivator-3 is a key regulator of the white adipogenic program. Proc. Natl.
Acad. Sci. USA 103, 17868–17873.
MacDonald, B.T., Tamai, K., and He, X. (2009). Wnt/beta-catenin signaling:
components, mechanisms, and diseases. Dev. Cell 17, 9–26.
McLean, J.A., and Tobin, G. (1987). Animal and Human Calorimetry
(Cambridge: Cambridge University Press).
Moldes, M., Zuo, Y., Morrison, R.F., Silva, D., Park, B.H., Liu, J., and Farmer,
S.R. (2003). Peroxisome-proliferator-activated receptor gamma suppresses
Wnt/beta-catenin signalling during adipogenesis. Biochem. J. 376, 607–613.
Molenaar, M., van de Wetering, M., Oosterwegel, M., Peterson-Maduro, J.,
Godsave, S., Korinek, V., Roose, J., Destree, O., and Clevers, H. (1996).
XTcf-3 transcription factor mediates beta-catenin-induced axis formation in
Xenopus embryos. Cell 86, 391–399.
Nguyen, H., Rendl, M., and Fuchs, E. (2006). Tcf3 governs stem cell features
and represses cell fate determination in skin. Cell 127, 171–183.
Nielsen, R., Pedersen, T.A., Hagenbeek, D., Moulos, P., Siersbaek, R.,
Megens, E., Denissov, S., Børgesen, M., Francoijs, K.J., Mandrup, S., and
Stunnenberg, H.G. (2008). Genome-wide profiling of PPARgamma:RXR and
RNA polymerase II occupancy reveals temporal activation of distinct
metabolic pathways and changes in RXR dimer composition during adipogen-
esis. Genes Dev. 22, 2953–2967.
Park, K.W.,Waki, H., Choi, S.P., Park, K.M., and Tontonoz, P. (2010). The small
molecule phenamil is a modulator of adipocyte differentiation and PPARg
expression. J. Lipid Res. 51, 2775–2784.
Puigserver, P., Wu, Z., Park, C.W., Graves, R., Wright, M., and Spiegelman,
B.M. (1998). A cold-inducible coactivator of nuclear receptors linked to adap-
tive thermogenesis. Cell 92, 829–839.
Qi, C., Surapureddi, S., Zhu, Y.J., Yu, S., Kashireddy, P., Rao, M.S., and
Reddy, J.K. (2003). Transcriptional coactivator PRIP, the peroxisome prolifer-
ator-activated receptor gamma (PPARgamma)-interacting protein, is required
for PPARgamma-mediated adipogenesis. J. Biol. Chem. 278, 25281–25284.
Roeder, R.G. (2005). Transcriptional regulation and the role of diverse coacti-
vators in animal cells. FEBS Lett. 579, 909–915.
Ross, S.E., Hemati, N., Longo, K.A., Bennett, C.N., Lucas, P.C., Erickson, R.L.,
and MacDougald, O.A. (2000). Inhibition of adipogenesis by Wnt signaling.
Science 289, 950–953.
Ross, S.E., Erickson, R.L., Gerin, I., DeRose, P.M., Bajnok, L., Longo, K.A.,
Misek, D.E., Kuick, R., Hanash, S.M., Atkins, K.B., et al. (2002). Microarray
analyses during adipogenesis: understanding the effects of Wnt signaling on
adipogenesis and the roles of liver X receptor alpha in adipocyte metabolism.
Mol. Cell. Biol. 22, 5989–5999.
Schoonjans, K., Peinado-Onsurbe, J., Lefebvre, A.M., Heyman, R.A., Briggs,
M., Deeb, S., Staels, B., and Auwerx, J. (1996). PPARalpha and
PPARgamma activators direct a distinct tissue-specific transcriptional
response via a PPRE in the lipoprotein lipase gene. EMBO J. 15, 5336–5348.
Sekiya, T., and Zaret, K.S. (2007). Repression by Groucho/TLE/Grg proteins:
genomic site recruitment generates compacted chromatin in vitro and impairs
activator binding in vivo. Mol. Cell 28, 291–303.
Steele, R. (1959). Influences of glucose loading and of injected insulin on
hepatic glucose output. Ann. N Y Acad. Sci. 82, 420–430.
Steppan, C.M., Bailey, S.T., Bhat, S., Brown, E.J., Banerjee, R.R., Wright,
C.M., Patel, H.R., Ahima, R.S., and Lazar, M.A. (2001). The hormone resistin
links obesity to diabetes. Nature 409, 307–312.
Subramaniam, N., Treuter, E., and Okret, S. (1999). Receptor interacting
protein RIP140 inhibits both positive and negative gene regulation by gluco-
corticoids. J. Biol. Chem. 274, 18121–18127.
Cell Metabolism
TLE3 Is an Adipogenic Coregulator
Takahashi, N., Kawada, T., Yamamoto, T., Goto, T., Taimatsu, A., Aoki, N.,
Kawasaki, H., Taira, K., Yokoyama, K.K., Kamei, Y., and Fushiki, T. (2002).
Overexpression and ribozyme-mediated targeting of transcriptional coactiva-
tors CREB-binding protein and p300 revealed their indispensable roles in
adipocyte differentiation through the regulation of peroxisome proliferator-
activated receptor gamma. J. Biol. Chem. 277, 16906–16912.
Tontonoz, P., Graves, R.A., Budavari, A.I., Erdjument-Bromage, H., Lui, M.,
Hu, E., Tempst, P., and Spiegelman, B.M. (1994a). Adipocyte-specific
transcription factor ARF6 is a heterodimeric complex of two nuclear hormone
receptors, PPAR gamma and RXR alpha. Nucleic Acids Res. 22, 5628–5634.
Tontonoz, P., Hu, E., Graves, R.A., Budavari, A.I., and Spiegelman, B.M.
(1994b). mPPAR gamma 2: tissue-specific regulator of an adipocyte enhancer.
Genes Dev. 8, 1224–1234.
Tontonoz, P., Hu, E., and Spiegelman, B.M. (1994c). Stimulation of adipogen-
esis in fibroblasts by PPAR gamma 2, a lipid-activated transcription factor. Cell
79, 1147–1156.
C
Tontonoz, P., Hu, E., Devine, J., Beale, E.G., and Spiegelman, B.M. (1995).
PPAR gamma 2 regulates adipose expression of the phosphoenolpyruvate
carboxykinase gene. Mol. Cell. Biol. 15, 351–357.
Waki, H., Park, K.W., Mitro, N., Pei, L., Damoiseaux, R., Wilpitz, D.C., Reue, K.,
Saez, E., and Tontonoz, P. (2007). The small molecule harmine is an antidia-
betic cell-type-specific regulator of PPARgamma expression. Cell Metab. 5,
357–370.
Yamauchi, T., Kamon, J., Waki, H., Terauchi, Y., Kubota, N., Hara, K., Mori, Y.,
Ide, T., Murakami, K., Tsuboyama-Kasaoka, N., et al. (2001). The fat-derived
hormone adiponectin reverses insulin resistance associated with both lipoa-
trophy and obesity. Nat. Med. 7, 941–946.
Zelcer, N., Hong, C., Boyadjian, R., and Tontonoz, P. (2009). LXR regulates
cholesterol uptake through Idol-dependent ubiquitination of the LDL receptor.
Science 325, 100–104.
ell Metabolism 13, 413–427, April 6, 2011 ª2011 Elsevier Inc. 427