e2f transcription factor-1 regulates oxidative metabolism
TRANSCRIPT
L E T T ERS
E2F transcription factor-1 regulatesoxidative metabolismEmilie Blanchet1,2,3,4,5,6,10, Jean-Sébastien Annicotte1,2,3,4,5,6,10, Sylviane Lagarrigue1,2,3,4,5,6, Victor Aguilar1,2,3,4,Cyrielle Clapé1,2,3,4, Carine Chavey1,2,3,4,5,6, Vanessa Fritz1,2,3,4,5,6, François Casas7, Florence Apparailly8,Johan Auwerx9 and Lluis Fajas1,2,3,4,5,6,11
Cells respond to stress by coordinating proliferative andmetabolic pathways. Starvation restricts cell proliferative(glycolytic) and activates energy productive (oxidative)pathways. Conversely, cell growth and proliferation requireincreased glycolytic and decreased oxidative metabolismlevels1. E2F transcription factors regulate both proliferativeand metabolic genes2,3. E2Fs have been implicated in theG1/S cell-cycle transition, DNA repair, apoptosis, developmentand differentiation2–4. In pancreatic β-cells, E2F1 generegulation facilitated glucose-stimulated insulin secretion5,6.Moreover, mice lacking E2F1 (E2f1−/−) were resistant todiet-induced obesity4. Here, we show that E2F1 coordinatescellular responses by acting as a regulatory switch between cellproliferation and metabolism. In basal conditions, E2F1repressed key genes that regulate energy homeostasis andmitochondrial functions in muscle and brown adipose tissue.Consequently, E2f1−/− mice had a marked oxidative phenotype.An association between E2F1 and pRB was required forrepression of genes implicated in oxidative metabolism.This repression was alleviated in a constitutively active CDK4(CDK4R24C) mouse model or when adaptation to energydemand was required. Thus, E2F1 represents a metabolicswitch from oxidative to glycolytic metabolism that responds tostressful conditions.
E2f1−/− mice are resistant to diet-induced obesity; thus, E2Ftranscription factor-1 (E2F1) may participate in the control of energyhomeostasis4. E2f1−/−mice consumedmore oxygen (O2) than E2f1+/+
mice (Fig. 1a) and had a lower respiratory exchange ratio (Fig. 1b),indicating an enhanced level of fatty acid oxidation. This may besecondary to higher brown adipose tissue (BAT) regulation of heatproduction. Indeed, E2f1−/− rectal temperatures were increased in
1IRCM, Institut de Recherche en Cancérologie de Montpellier, Montpellier F-34298, France. 2INSERM, U896, Montpellier F-34298, France. 3Université deMontpellier1, Montpellier, F-34298, France. 4CRLC Val d’Aurelle Paul Lamarque, Montpellier F-34298, France. 5IGMM, Institut de Génétique Moléculaire deMontpellier, Montpellier F-34293, France. 6CNRS, UMR5535, Montpellier F-34293, France. 7INRA, UMR0866, Montpellier F-34060, France. 8INSERM U844,Montpellier F-34295, France. 9Ecole Polytechnique Fédérale de Lausanne, 1115 Lausanne, Switzerland. 10These authors equally contributed to this work.11Correspondence should be addressed to L.F. (e-mail: [email protected])
Received 28 April 2011; accepted 28 June 2011; published online 14 August 2011; DOI: 10.1038/ncb2309
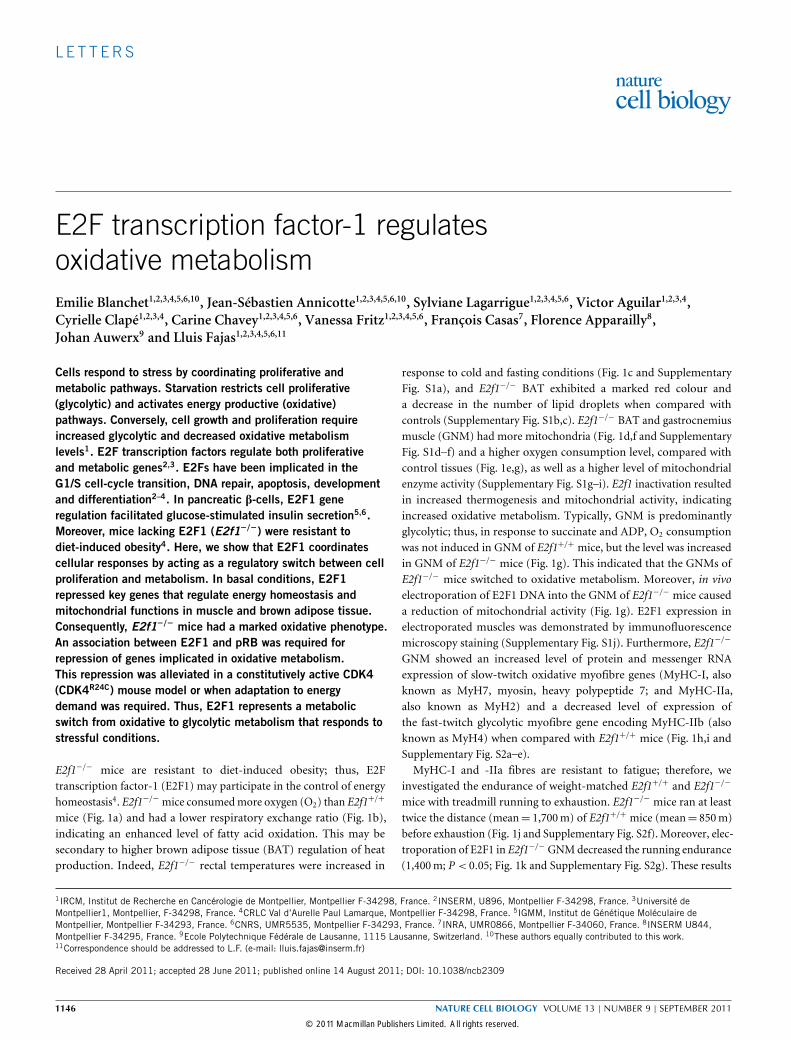
response to cold and fasting conditions (Fig. 1c and SupplementaryFig. S1a), and E2f1−/− BAT exhibited a marked red colour anda decrease in the number of lipid droplets when compared withcontrols (Supplementary Fig. S1b,c). E2f1−/− BAT and gastrocnemiusmuscle (GNM) had more mitochondria (Fig. 1d,f and SupplementaryFig. S1d–f) and a higher oxygen consumption level, compared withcontrol tissues (Fig. 1e,g), as well as a higher level of mitochondrialenzyme activity (Supplementary Fig. S1g–i). E2f1 inactivation resultedin increased thermogenesis and mitochondrial activity, indicatingincreased oxidative metabolism. Typically, GNM is predominantlyglycolytic; thus, in response to succinate and ADP, O2 consumptionwas not induced in GNM of E2f1+/+ mice, but the level was increasedin GNM of E2f1−/− mice (Fig. 1g). This indicated that the GNMs ofE2f1−/− mice switched to oxidative metabolism. Moreover, in vivoelectroporation of E2F1 DNA into the GNM of E2f1−/− mice causeda reduction of mitochondrial activity (Fig. 1g). E2F1 expression inelectroporated muscles was demonstrated by immunofluorescencemicroscopy staining (Supplementary Fig. S1j). Furthermore, E2f1−/−
GNM showed an increased level of protein and messenger RNAexpression of slow-twitch oxidative myofibre genes (MyHC-I, alsoknown as MyH7, myosin, heavy polypeptide 7; and MyHC-IIa,also known as MyH2) and a decreased level of expression ofthe fast-twitch glycolytic myofibre gene encoding MyHC-IIb (alsoknown as MyH4) when compared with E2f1+/+ mice (Fig. 1h,i andSupplementary Fig. S2a–e).MyHC-I and -IIa fibres are resistant to fatigue; therefore, we
investigated the endurance of weight-matched E2f1+/+ and E2f1−/−
mice with treadmill running to exhaustion. E2f1−/− mice ran at leasttwice the distance (mean= 1,700m) of E2f1+/+ mice (mean= 850m)before exhaustion (Fig. 1j and Supplementary Fig. S2f). Moreover, elec-troporation of E2F1 in E2f1−/− GNMdecreased the running endurance(1,400m; P < 0.05; Fig. 1k and Supplementary Fig. S2g). These results
1146 NATURE CELL BIOLOGY VOLUME 13 | NUMBER 9 | SEPTEMBER 2011
© 2011 Macmillan Publishers Limited. All rights reserved.
L E T T ERS
a
VO
2 (m
l kg
–1 h
–1)
E2f1+/+
E2f1–/–
Time (h)
c
E2f1+/+
E2f1–/–
j
d
mtD
NA
/nu
cle
ar
DN
A
BAT
E2f1+/+
E2f1–/–
O2 c
on
su
mp
tio
n
(nm
ol m
in–1 m
g–1 o
f p
rote
in)
*
Succinate – +
BAT
E2f1+/+
E2f1–/–e
g
O2 c
on
su
mp
tio
n
(nm
ol m
in–1m
g–1 o
f p
rote
in)
– +
– +
Muscle
E2f1+/+ pCMV
E2f1–/– pCMV
E2f1–/– pCMV-E2F1
f
*
Myhc-
**
E2f1+/+
E2f1–/–
Muscle
h
Cu
mu
lative n
um
ber
of
sh
ocks
E2f1+/+
E2f1–/–
k
mtD
NA
/nu
cle
ar
DN
A
Muscle
E2f1+/+
E2f1–/–
iE2f1–/– pCMV-E2F1E2f1–/– pCMV
E2f1+/+ pCMV
Cu
mu
lative n
um
ber
of
sh
ocks
b
Resp
irato
ry e
xch
an
ge r
atio
Recta
l te
mp
era
ture
(°C
)
Ligh
tDar
k
Tota
l
E2f1+/+
E2f1–/–
E2f
1–/–
E2f
1+/+
Rela
tive m
RN
A
exp
ressio
n
22%
42%
12%
22%
56%
28%
22% 12% 56%
0 2 4 6 8 10 12 14
2
6
10
14
0
0.2
0.4
0.6
0.8
1.0
1.2
Col
d
Fast
ed
Con
trol24
28
32
36
0
1
2
3
4
0
2
4
6
8
10
12
0
1
2
3
4
Succinate
ADP
0
2
4
6
8
10
0
1
2
3
4
I IIa IIX IIb
0
40
80
120
160
200
500 1,000 2,0001,500
Distance run (m)
2,5000
Hoechst Hoechst MyHC-IIa Hoechst MyHC-IIbMyHC-I
0
40
80
120
160
200
500 1,000 2,0001,500
Distance run (m)
2,5000
42% 22% 28%
Figure 1 Loss of E2F1 affects energy expenditure, adaptive thermogenesis,mitochondrial function and physical activity. (a) Energy expenditure (VO2 ).n =4 animals per group. The black frame indicates the period of time usedfor calculation in b. (b) Respiratory exchange ratio (VCO2/VO2 ) during thetotal, light and dark phases of the experiment. n = 5 animals per group.(c) Rectal temperatures under room temperature, fed (control), cold or fastedconditions. n=4 animals per group. (d) Mitochondrial DNA (mtDNA) contentmeasured relative to nuclear DNA in BAT tissues of E2f1+/+ and E2f1−/−
mice. n=5 animals per group. (e) Mitochondrial oxygen consumption without(−) and with (+) succinate. n=4 animals per group. (f) Mitochondrial DNAcontent in E2f1+/+ and E2f1−/− muscles. n=5 animals per group. (g) GNMmitochondrial O2 consumption measured after electrotransfer of pCMV orpCMV-E2F1, without (−) and with (+) ADP and succinate. n=4 animals pergroup. (h) Relative gene expression levels of GNM MyHC type I, IIa, IIX (also
known as MyH1), and IIb. Results were normalized to the expression of mouse18S RNA. n = 7 animals per group. (i) Immunofluorescence microscopyanalysis of serial GNM sections showing expression of MyHC-I, MyHC-IIaand MyHC-IIb (red) in fibres. Nuclei are stained with Hoechst reagent. n=4animals per group. The percentage of positive stained fibres is indicated.Scale bars, 100 µm. (j) E2f1+/+ and E2f1−/− mice were tested for physicalendurance. Individual animal performances are shown. n = 11 E2f1+/+
animals; n=14 E2f1−/− animals. (k) The effect of E2F1 rescue in E2f1−/−
mice was evaluated with an endurance test. Individual performances arerepresented for E2f1 wild-type mice electroporated with empty vector(E2f1+/+ pCMV), knockout (E2f1−/− pCMV) and knockout-rescued animals(E2f1−/− pCMV-E2F1). n=4 animals for E2f1+/+ pCMV group; n=3 animalsfor E2f1−/− pCMV group; n = 3 animals for E2f1−/− pCMV-E2F1 group.Values represent means±s.e.m. ∗P <0.05. ∗∗P <0.01.
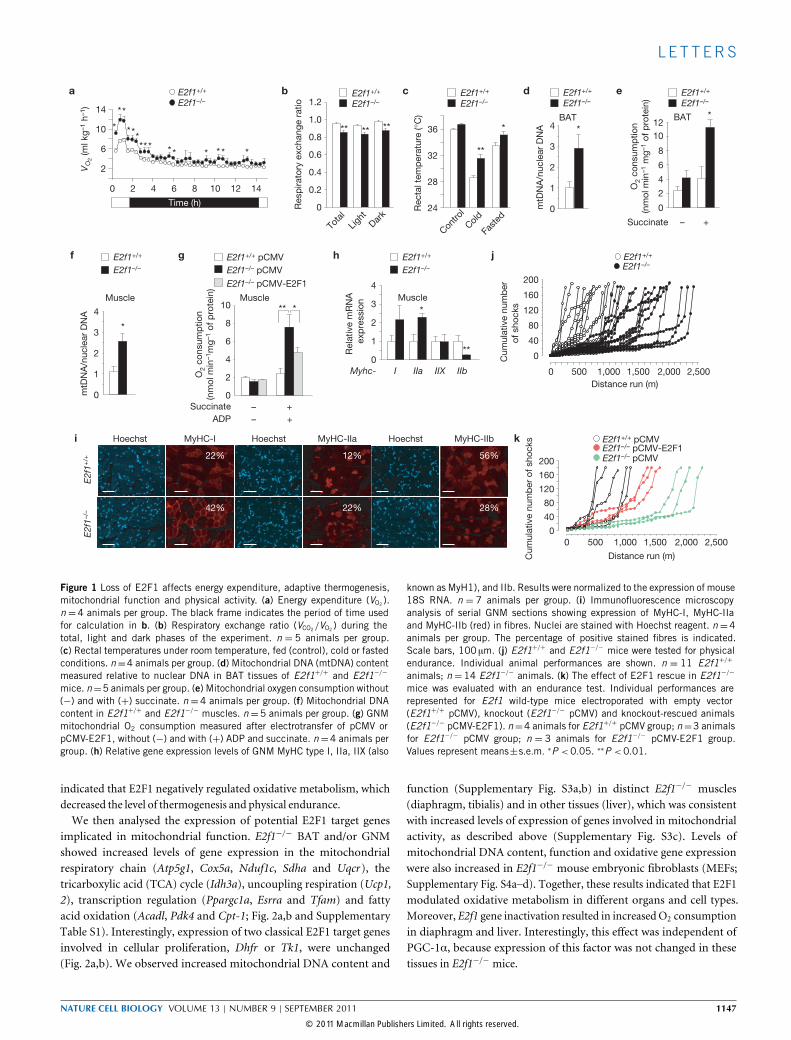
indicated that E2F1 negatively regulated oxidative metabolism, whichdecreased the level of thermogenesis and physical endurance.We then analysed the expression of potential E2F1 target genes
implicated in mitochondrial function. E2f1−/− BAT and/or GNMshowed increased levels of gene expression in the mitochondrialrespiratory chain (Atp5g1, Cox5a, Nduf1c, Sdha and Uqcr), thetricarboxylic acid (TCA) cycle (Idh3a), uncoupling respiration (Ucp1,2), transcription regulation (Ppargc1a, Esrra and Tfam) and fattyacid oxidation (Acadl, Pdk4 and Cpt-1; Fig. 2a,b and SupplementaryTable S1). Interestingly, expression of two classical E2F1 target genesinvolved in cellular proliferation, Dhfr or Tk1, were unchanged(Fig. 2a,b). We observed increased mitochondrial DNA content and
function (Supplementary Fig. S3a,b) in distinct E2f1−/− muscles(diaphragm, tibialis) and in other tissues (liver), which was consistentwith increased levels of expression of genes involved in mitochondrialactivity, as described above (Supplementary Fig. S3c). Levels ofmitochondrial DNA content, function and oxidative gene expressionwere also increased in E2f1−/− mouse embryonic fibroblasts (MEFs;Supplementary Fig. S4a–d). Together, these results indicated that E2F1modulated oxidative metabolism in different organs and cell types.Moreover, E2f1 gene inactivation resulted in increasedO2 consumptionin diaphragm and liver. Interestingly, this effect was independent ofPGC-1α, because expression of this factor was not changed in thesetissues in E2f1−/− mice.
NATURE CELL BIOLOGY VOLUME 13 | NUMBER 9 | SEPTEMBER 2011 1147
© 2011 Macmillan Publishers Limited. All rights reserved.
L E T T ERS
a
Ucp2 Tfam Nrf1 Acadl Acadm Pdk4 Cpt-1 Dhfr Tk1Pparβ EsrraPpargc1a
Ucp2 Pparβ EsrraPpargc1a
Atp5g1 Nduf1c Uqcr Idh3aCox5a Ucp1
E2f1+/+ BAT
E2f1–/– BAT
Sdha Tfam Nrf1 Acadl Acadm Pdk4 Cpt-1 Dhfr Tk1
Rela
tive m
RN
A
exp
ressio
n
Atp5g1 Nduf1c Uqcr Idh3aCox5a
E2f1+/+ GNM
E2f1–/– GNM
b
c
E2f1–/– pRNAT-Ppargc1a shRNA
E2f1–/– pRNAT-Esrra shRNA
E2f1–/– pRNAT-control
E2f1+/+ pRNAT-control E2f1–/– pRNAT-Ucp2 shRNA
E2f1–/– pRNAT-Pdk4 shRNA
+
+ADP
–
–
–
–
–
–
–
–
+
+
+
+
+
+O
2 c
onsu
mp
tio
n
(nm
ol m
in–1m
g–1 t
issu
e)
SuccinateEsrra
d
1
2
3
Rela
tive m
RN
A
exp
ressio
n
0
4
0
1
2
3
4
1.0
0.20.40.60.8
1.2
Rela
tive m
RN
A
exp
ressio
n
0
1.4
Rela
tive m
RN
A
exp
ressio
n
Rela
tive m
RN
A
exp
ressio
n
Rela
tive m
RN
A
exp
ressio
n
+
–
–
+
Control:
shRNA: Ucp2
1.0
0.20.40.60.8
1.2
0
1.4
1.0
0.20.40.60.8
1.2
0
1.4
1.0
0.20.40.60.8
1.2
0
1.4
Ppargc1a Pdk4
+
–
–
+
+
–
–
+
+
–
–
+
0
2
4
6
8
Figure 2 Increased E2f1−/− oxidative metabolic gene expression level.(a,b) Relative expression of relevant mitochondrial genes in BAT (a) andGNM (b). Results were normalized to mouse 18S RNA expression. n =7animals per group. (c) Relative expression levels of oxidative genes inE2f1−/− GNM electroporated with an empty vector (pRNAT-control) ora plasmid expressing shRNA targeting Ucp2, Ppargc1a, Esrra or Pdk4.
mRNA levels are represented relative to 18S mRNA. n=3 animals. (d) At72h post-electroporation, O2 consumption was measured in isolatedmitochondria from GNM using a Clark electrode. The consumption ofO2 was measured in the absence and presence of succinate and ADP.n = 3 animals. Values represent means±s.e.m. ∗P < 0.05; ∗∗P < 0.01;∗∗∗P <0.001.
Computational analysis of the promoter region of oxidative genesrevealed the presence of an E2F binding site in the regulatory sequencesof Cox5a, Cpt-1, Pdk4, Ppargc1a, Ucp1, Ucp2, Tfam, Esrra and Sdha(data not shown). In vivo knockdown experiments of these genesby muscle electroporation of short hairpin RNAs (shRNAs) in anE2f1-null background decreased the level of oxygen consumptionof mitochondria isolated from GNM (Fig. 2c,d) or permeabilizedMEFs (Supplementary Fig. S4e,f). Therefore, the partial rescue of thewild-type phenotype in E2f1−/− cells by specific shRNAs indicatedthat each of these genes contributed to the effect of E2F1 onoxidative metabolism.Under cold and fasting conditions, the oxidative metabolism
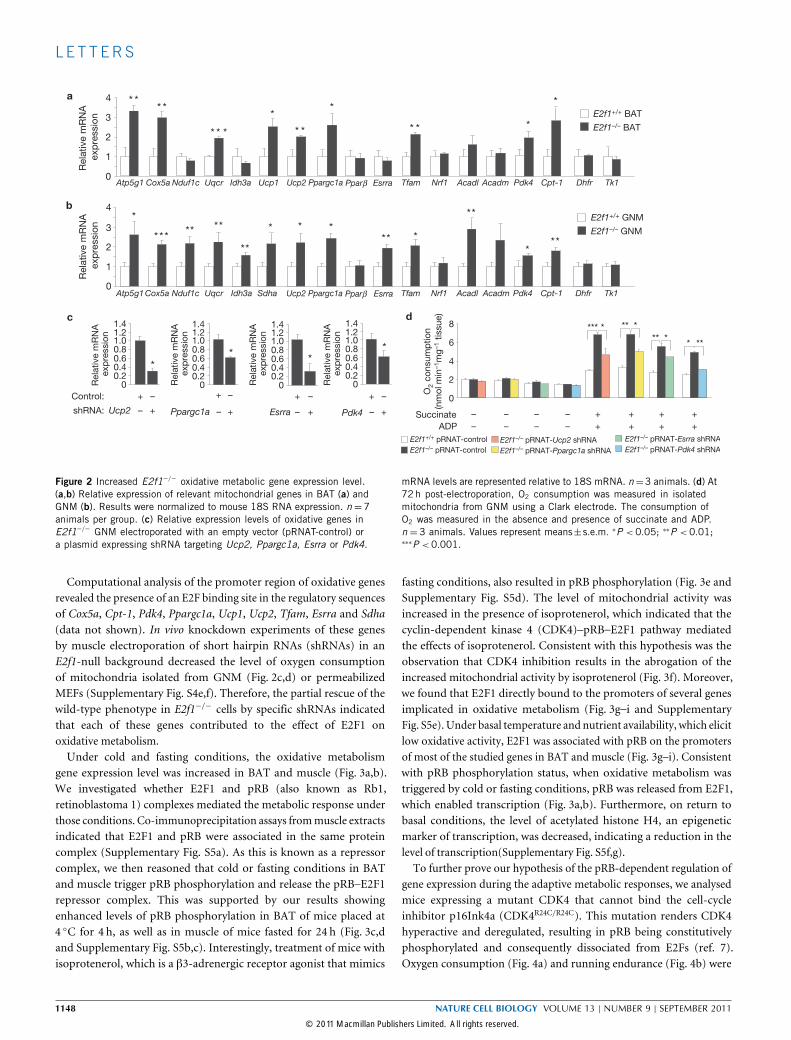
gene expression level was increased in BAT and muscle (Fig. 3a,b).We investigated whether E2F1 and pRB (also known as Rb1,retinoblastoma 1) complexes mediated the metabolic response underthose conditions. Co-immunoprecipitation assays frommuscle extractsindicated that E2F1 and pRB were associated in the same proteincomplex (Supplementary Fig. S5a). As this is known as a repressorcomplex, we then reasoned that cold or fasting conditions in BATand muscle trigger pRB phosphorylation and release the pRB–E2F1repressor complex. This was supported by our results showingenhanced levels of pRB phosphorylation in BAT of mice placed at4 ◦C for 4 h, as well as in muscle of mice fasted for 24 h (Fig. 3c,dand Supplementary Fig. S5b,c). Interestingly, treatment of mice withisoprotenerol, which is a β3-adrenergic receptor agonist that mimics
fasting conditions, also resulted in pRB phosphorylation (Fig. 3e andSupplementary Fig. S5d). The level of mitochondrial activity wasincreased in the presence of isoprotenerol, which indicated that thecyclin-dependent kinase 4 (CDK4)–pRB–E2F1 pathway mediatedthe effects of isoprotenerol. Consistent with this hypothesis was theobservation that CDK4 inhibition results in the abrogation of theincreased mitochondrial activity by isoprotenerol (Fig. 3f). Moreover,we found that E2F1 directly bound to the promoters of several genesimplicated in oxidative metabolism (Fig. 3g–i and SupplementaryFig. S5e). Under basal temperature and nutrient availability, which elicitlow oxidative activity, E2F1 was associated with pRB on the promotersof most of the studied genes in BAT and muscle (Fig. 3g–i). Consistentwith pRB phosphorylation status, when oxidative metabolism wastriggered by cold or fasting conditions, pRB was released from E2F1,which enabled transcription (Fig. 3a,b). Furthermore, on return tobasal conditions, the level of acetylated histone H4, an epigeneticmarker of transcription, was decreased, indicating a reduction in thelevel of transcription(Supplementary Fig. S5f,g).To further prove our hypothesis of the pRB-dependent regulation of
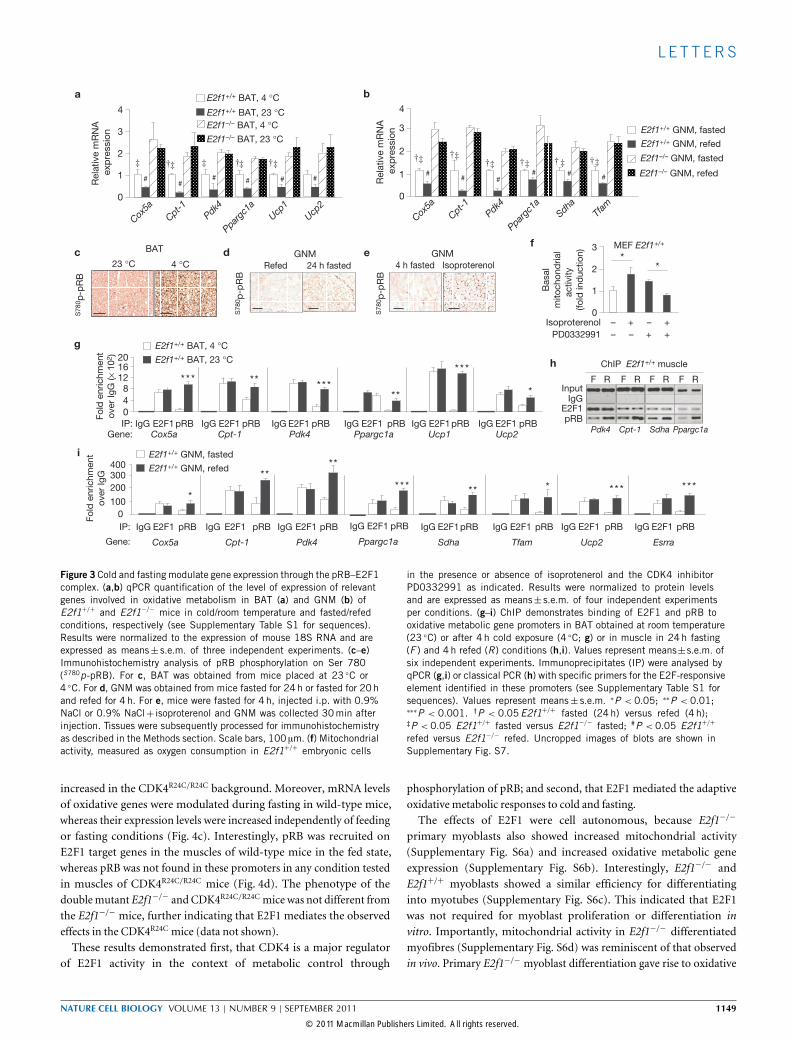
gene expression during the adaptive metabolic responses, we analysedmice expressing a mutant CDK4 that cannot bind the cell-cycleinhibitor p16Ink4a (CDK4R24C/R24C). This mutation renders CDK4hyperactive and deregulated, resulting in pRB being constitutivelyphosphorylated and consequently dissociated from E2Fs (ref. 7).Oxygen consumption (Fig. 4a) and running endurance (Fig. 4b) were
1148 NATURE CELL BIOLOGY VOLUME 13 | NUMBER 9 | SEPTEMBER 2011
© 2011 Macmillan Publishers Limited. All rights reserved.
L E T T ERS
g
E2F1 E2F1E2F1 E2F1E2F1 E2F1
Fo
ld e
nrichm
ent
over
IgG
(×
10
2)
E2f1+/+ BAT, 23 °CE2f1+/+ BAT, 4 °C
i
E2F1 E2F1E2F1 E2F1
E2F1E2F1
Ucp2
IgG E2F1 pRB
Esrra
IgG E2F1 pRB
Fo
ld e
nrichm
ent
over
IgG
E2f1+/+ GNM, refed
E2f1+/+ GNM, fasted
b
E2f1+/+ GNM, fasted
E2f1+/+ GNM, refed
E2f1–/– GNM, fasted
E2f1–/– GNM, refed
a
c d
Rela
tive m
RN
A
exp
ressio
n
#
e
## # # #
# ##
###
Ppargc1a
ChIP E2f1+/+ muscle
Sdha Cpt-1Pdk4
F R F R F R F R
h
fBAT
24 h fastedRefed
GNM
S7
80p
-pR
B
S780p
-pR
B
4 h fasted Isoproterenol
GNM
S7
80p
-pR
B
Basal
mito
cho
nd
rial
activity
(fo
ld ind
uctio
n) MEF E2f1+/+
4 °C23 °C
0
1
2
3
4
1
2
3E2f1–/– BAT, 4 °CE2f1–/– BAT, 23 °C
E2f1+/+ BAT, 4 °CE2f1+/+ BAT, 23 °C
Ucp1
Cpt-1
Cox5a
Pdk4Ucp
2
Ppargc
1a
Rela
tive m
RN
A
exp
ressio
n
0
4
SdhaCpt-1
Cox5a
Pdk4Tf
am
Ppargc
1a
0
1
2
3
Isoproterenol
PD0332991
– + – +
– – + +
Input
E2F1pRB
IgG
0
4
8121620
Gene:IP:
Ucp1IgG pRB
Ppargc1aIgG pRB
Pdk4IgG pRB
Cpt-1IgG pRB
Cox5aIgG pRB
Ucp2IgG pRB
0
100
200
300400
IP:
Gene: Cox5a
IgG pRB
Cpt-1
IgG pRB
Pdk4
IgG pRB
Ppargc1a
IgG pRB
Sdha
IgG pRB
Tfam
IgG pRB
Figure 3 Cold and fasting modulate gene expression through the pRB–E2F1complex. (a,b) qPCR quantification of the level of expression of relevantgenes involved in oxidative metabolism in BAT (a) and GNM (b) ofE2f1+/+ and E2f1−/− mice in cold/room temperature and fasted/refedconditions, respectively (see Supplementary Table S1 for sequences).Results were normalized to the expression of mouse 18S RNA and areexpressed as means± s.e.m. of three independent experiments. (c–e)Immunohistochemistry analysis of pRB phosphorylation on Ser 780(S780p-pRB). For c, BAT was obtained from mice placed at 23 ◦C or4 ◦C. For d, GNM was obtained from mice fasted for 24 h or fasted for 20 hand refed for 4 h. For e, mice were fasted for 4 h, injected i.p. with 0.9%NaCl or 0.9% NaCl+ isoproterenol and GNM was collected 30min afterinjection. Tissues were subsequently processed for immunohistochemistryas described in the Methods section. Scale bars, 100 µm. (f) Mitochondrialactivity, measured as oxygen consumption in E2f1+/+ embryonic cells
in the presence or absence of isoprotenerol and the CDK4 inhibitorPD0332991 as indicated. Results were normalized to protein levelsand are expressed as means± s.e.m. of four independent experimentsper conditions. (g–i) ChIP demonstrates binding of E2F1 and pRB tooxidative metabolic gene promoters in BAT obtained at room temperature(23 ◦C) or after 4 h cold exposure (4 ◦C; g) or in muscle in 24h fasting(F ) and 4h refed (R) conditions (h,i). Values represent means±s.e.m. ofsix independent experiments. Immunoprecipitates (IP) were analysed byqPCR (g,i) or classical PCR (h) with specific primers for the E2F-responsiveelement identified in these promoters (see Supplementary Table S1 forsequences). Values represent means± s.e.m. ∗P < 0.05; ∗∗P < 0.01;∗∗∗P < 0.001. †P < 0.05E2f1+/+ fasted (24h) versus refed (4 h);‡P < 0.05 E2f1+/+ fasted versus E2f1−/− fasted; #P < 0.05 E2f1+/+
refed versus E2f1−/− refed. Uncropped images of blots are shown inSupplementary Fig. S7.
increased in the CDK4R24C/R24C background. Moreover, mRNA levelsof oxidative genes were modulated during fasting in wild-type mice,whereas their expression levels were increased independently of feedingor fasting conditions (Fig. 4c). Interestingly, pRB was recruited onE2F1 target genes in the muscles of wild-type mice in the fed state,whereas pRB was not found in these promoters in any condition testedin muscles of CDK4R24C/R24C mice (Fig. 4d). The phenotype of thedoublemutant E2f1−/− andCDK4R24C/R24C mice was not different fromthe E2f1−/− mice, further indicating that E2F1 mediates the observedeffects in the CDK4R24C mice (data not shown).These results demonstrated first, that CDK4 is a major regulator
of E2F1 activity in the context of metabolic control through
phosphorylation of pRB; and second, that E2F1 mediated the adaptiveoxidative metabolic responses to cold and fasting.The effects of E2F1 were cell autonomous, because E2f1−/−
primary myoblasts also showed increased mitochondrial activity(Supplementary Fig. S6a) and increased oxidative metabolic geneexpression (Supplementary Fig. S6b). Interestingly, E2f1−/− andE2f1+/+ myoblasts showed a similar efficiency for differentiatinginto myotubes (Supplementary Fig. S6c). This indicated that E2F1was not required for myoblast proliferation or differentiation invitro. Importantly, mitochondrial activity in E2f1−/− differentiatedmyofibres (Supplementary Fig. S6d) was reminiscent of that observedin vivo. Primary E2f1−/− myoblast differentiation gave rise to oxidative
NATURE CELL BIOLOGY VOLUME 13 | NUMBER 9 | SEPTEMBER 2011 1149
© 2011 Macmillan Publishers Limited. All rights reserved.
L E T T ERS
CDK4R24C/R24C GNM, refed
Sdha Ppargc1a Tfam
Pdk4 Cpt-1
**
***
Cox5a
a
b
––
++
Muscle
d
c
Wild-type GNM, fasted Wild-type GNM, refed CDK4R24C/R24C GNM, fasted
Cox5a
Sdha
Ppargc
1a
Cpt-1Esrr
a
Atp5g
Wild type GNM, fasted
Wild type GNM, refed
CDK4R24C/R24C GNM, fasted
CDK4R24C/R24C GNM, refed
Idh3
aUcp
2
Rela
tive m
RN
A
exp
ressio
n
***
Esrra
***
Ucp2
E2F1 pRB E2F1 pRB
E2F1 pRB E2F1 pRB
E2F1 pRB E2F1 pRB E2F1 pRB E2F1 pRB
Wild type
CDK4R24C/R24C
Wild type
CDK4R24C/R24C
## # # # # # #
SuccinateADP
2
4
O2 c
on
su
mp
tio
n
(nm
ol m
in–1m
g–1 o
f p
rote
in)
0
6
0
1
2
3
4
100
200
50
150
Fo
ld e
nrich
men
t
over
IgG
0
250
IP :
Gene :
100
200
50
150
Fo
ld e
nrich
men
t
over
IgG
0
250
IP :
Gene :
10
20
30
40
Ru
nn
ing
tim
e (m
in)
0
50
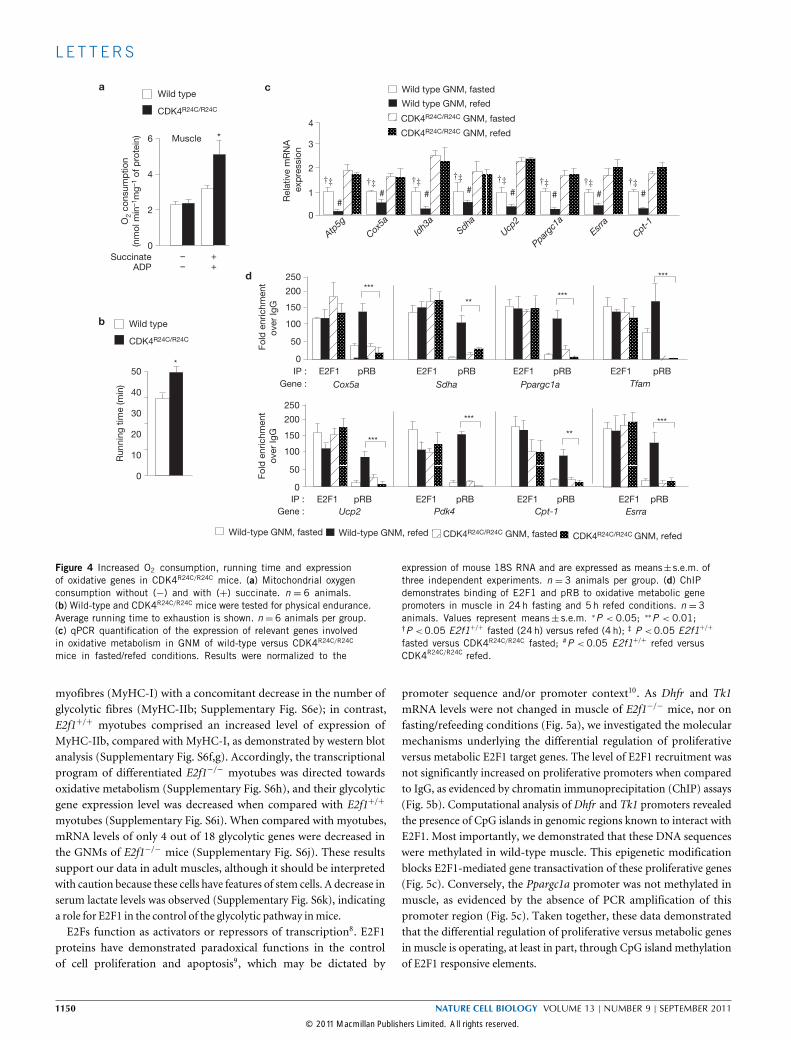
Figure 4 Increased O2 consumption, running time and expressionof oxidative genes in CDK4R24C/R24C mice. (a) Mitochondrial oxygenconsumption without (−) and with (+) succinate. n = 6 animals.(b) Wild-type and CDK4R24C/R24C mice were tested for physical endurance.Average running time to exhaustion is shown. n = 6 animals per group.(c) qPCR quantification of the expression of relevant genes involvedin oxidative metabolism in GNM of wild-type versus CDK4R24C/R24C
mice in fasted/refed conditions. Results were normalized to the
expression of mouse 18S RNA and are expressed as means±s.e.m. ofthree independent experiments. n = 3 animals per group. (d) ChIPdemonstrates binding of E2F1 and pRB to oxidative metabolic genepromoters in muscle in 24h fasting and 5h refed conditions. n = 3animals. Values represent means± s.e.m. ∗P < 0.05; ∗∗P < 0.01;†P <0.05 E2f1+/+ fasted (24h) versus refed (4 h); ‡ P <0.05 E2f1+/+
fasted versus CDK4R24C/R24C fasted; #P < 0.05 E2f1+/+ refed versusCDK4R24C/R24C refed.
myofibres (MyHC-I) with a concomitant decrease in the number ofglycolytic fibres (MyHC-IIb; Supplementary Fig. S6e); in contrast,E2f1+/+ myotubes comprised an increased level of expression ofMyHC-IIb, compared with MyHC-I, as demonstrated by western blotanalysis (Supplementary Fig. S6f,g). Accordingly, the transcriptionalprogram of differentiated E2f1−/− myotubes was directed towardsoxidative metabolism (Supplementary Fig. S6h), and their glycolyticgene expression level was decreased when compared with E2f1+/+
myotubes (Supplementary Fig. S6i). When compared with myotubes,mRNA levels of only 4 out of 18 glycolytic genes were decreased inthe GNMs of E2f1−/− mice (Supplementary Fig. S6j). These resultssupport our data in adult muscles, although it should be interpretedwith caution because these cells have features of stem cells. A decrease inserum lactate levels was observed (Supplementary Fig. S6k), indicatinga role for E2F1 in the control of the glycolytic pathway inmice.E2Fs function as activators or repressors of transcription8. E2F1
proteins have demonstrated paradoxical functions in the controlof cell proliferation and apoptosis9, which may be dictated by
promoter sequence and/or promoter context10. As Dhfr and Tk1mRNA levels were not changed in muscle of E2f1−/− mice, nor onfasting/refeeding conditions (Fig. 5a), we investigated the molecularmechanisms underlying the differential regulation of proliferativeversus metabolic E2F1 target genes. The level of E2F1 recruitment wasnot significantly increased on proliferative promoters when comparedto IgG, as evidenced by chromatin immunoprecipitation (ChIP) assays(Fig. 5b). Computational analysis of Dhfr and Tk1 promoters revealedthe presence of CpG islands in genomic regions known to interact withE2F1. Most importantly, we demonstrated that these DNA sequenceswere methylated in wild-type muscle. This epigenetic modificationblocks E2F1-mediated gene transactivation of these proliferative genes(Fig. 5c). Conversely, the Ppargc1a promoter was not methylated inmuscle, as evidenced by the absence of PCR amplification of thispromoter region (Fig. 5c). Taken together, these data demonstratedthat the differential regulation of proliferative versus metabolic genesin muscle is operating, at least in part, through CpG island methylationof E2F1 responsive elements.
1150 NATURE CELL BIOLOGY VOLUME 13 | NUMBER 9 | SEPTEMBER 2011
© 2011 Macmillan Publishers Limited. All rights reserved.
L E T T ERS
ca
Dhfr Tk1
b
Input Methylated DNA+ –
Dhfr Tk1
E2f1+/+ GNM, fasted
E2f1+/+ GNM, refed
d Fasting/cold
E2F1
ProliferationMetabolism
Oxphos
BAT Muscle
Thermogenesis Physical activity
Methylation
CDK4–pRB
E2f1+/+ GNM, fasted
E2f1+/+ GNM, refed
ChIP
1
Rela
tive m
RN
A e
xp
ressio
n
0
2
10
Fo
ld e
nrichm
en
t E
2F
1 o
ver
IgG
0
20
Dhfr
Tk1
Promoter
Ppargc1a
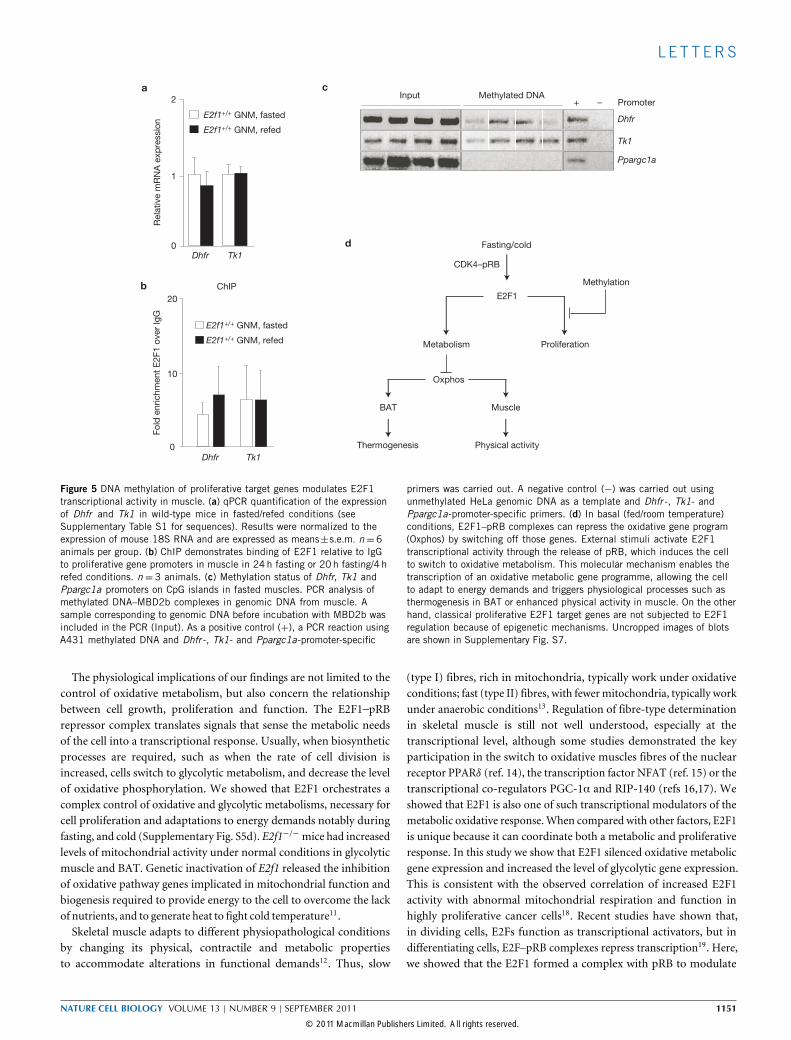
Figure 5 DNA methylation of proliferative target genes modulates E2F1transcriptional activity in muscle. (a) qPCR quantification of the expressionof Dhfr and Tk1 in wild-type mice in fasted/refed conditions (seeSupplementary Table S1 for sequences). Results were normalized to theexpression of mouse 18S RNA and are expressed as means±s.e.m. n =6animals per group. (b) ChIP demonstrates binding of E2F1 relative to IgGto proliferative gene promoters in muscle in 24h fasting or 20h fasting/4 hrefed conditions. n = 3 animals. (c) Methylation status of Dhfr, Tk1 andPpargc1a promoters on CpG islands in fasted muscles. PCR analysis ofmethylated DNA–MBD2b complexes in genomic DNA from muscle. Asample corresponding to genomic DNA before incubation with MBD2b wasincluded in the PCR (Input). As a positive control (+), a PCR reaction usingA431 methylated DNA and Dhfr -, Tk1- and Ppargc1a-promoter-specific
primers was carried out. A negative control (−) was carried out usingunmethylated HeLa genomic DNA as a template and Dhfr -, Tk1- andPpargc1a-promoter-specific primers. (d) In basal (fed/room temperature)conditions, E2F1–pRB complexes can repress the oxidative gene program(Oxphos) by switching off those genes. External stimuli activate E2F1transcriptional activity through the release of pRB, which induces the cellto switch to oxidative metabolism. This molecular mechanism enables thetranscription of an oxidative metabolic gene programme, allowing the cellto adapt to energy demands and triggers physiological processes such asthermogenesis in BAT or enhanced physical activity in muscle. On the otherhand, classical proliferative E2F1 target genes are not subjected to E2F1regulation because of epigenetic mechanisms. Uncropped images of blotsare shown in Supplementary Fig. S7.
The physiological implications of our findings are not limited to thecontrol of oxidative metabolism, but also concern the relationshipbetween cell growth, proliferation and function. The E2F1–pRBrepressor complex translates signals that sense the metabolic needsof the cell into a transcriptional response. Usually, when biosyntheticprocesses are required, such as when the rate of cell division isincreased, cells switch to glycolytic metabolism, and decrease the levelof oxidative phosphorylation. We showed that E2F1 orchestrates acomplex control of oxidative and glycolytic metabolisms, necessary forcell proliferation and adaptations to energy demands notably duringfasting, and cold (Supplementary Fig. S5d). E2f1−/−mice had increasedlevels of mitochondrial activity under normal conditions in glycolyticmuscle and BAT. Genetic inactivation of E2f1 released the inhibitionof oxidative pathway genes implicated in mitochondrial function andbiogenesis required to provide energy to the cell to overcome the lackof nutrients, and to generate heat to fight cold temperature11.Skeletal muscle adapts to different physiopathological conditions
by changing its physical, contractile and metabolic propertiesto accommodate alterations in functional demands12. Thus, slow
(type I) fibres, rich in mitochondria, typically work under oxidativeconditions; fast (type II) fibres, with fewermitochondria, typically workunder anaerobic conditions13. Regulation of fibre-type determinationin skeletal muscle is still not well understood, especially at thetranscriptional level, although some studies demonstrated the keyparticipation in the switch to oxidative muscles fibres of the nuclearreceptor PPARδ (ref. 14), the transcription factor NFAT (ref. 15) or thetranscriptional co-regulators PGC-1α and RIP-140 (refs 16,17). Weshowed that E2F1 is also one of such transcriptional modulators of themetabolic oxidative response.When compared with other factors, E2F1is unique because it can coordinate both a metabolic and proliferativeresponse. In this study we show that E2F1 silenced oxidative metabolicgene expression and increased the level of glycolytic gene expression.This is consistent with the observed correlation of increased E2F1activity with abnormal mitochondrial respiration and function inhighly proliferative cancer cells18. Recent studies have shown that,in dividing cells, E2Fs function as transcriptional activators, but indifferentiating cells, E2F–pRB complexes repress transcription19. Here,we showed that the E2F1 formed a complex with pRB to modulate
NATURE CELL BIOLOGY VOLUME 13 | NUMBER 9 | SEPTEMBER 2011 1151
© 2011 Macmillan Publishers Limited. All rights reserved.
L E T T ERS
oxidative gene expression. This is consistent with recent results thatindicated that adipose-tissue-specific pRb−/− mice had a strongmetabolic phenotype, markedly similar to E2f1−/−mice20.Muscle adaptation to nutrient availability, cold conditions or
exercise requires signalling pathways that will ultimately activate E2F1transcriptional activity. In line with this hypothesis, we observedincreased levels of phosphorylation of pRB during these processes.However, the pathways regulating the CDK4–E2F1–pRB complexesin muscles were still unknown. We showed here that catecholamines,whose secretion is increased during fasting/cold conditions, play a rolein activating cyclin D–CDK4 complexes.Our results, showing that E2F1 and pRB complexes repress oxidative
metabolism, underscore an important role for E2F1 in the control ofmitochondrial metabolism. �
METHODSMethods and any associated references are available in the onlineversion of the paper at http://www.nature.com/naturecellbiology
Note: Supplementary Information is available on the Nature Cell Biology website
ACKNOWLEDGEMENTSWe thank M. Barbacid, B.M. Spiegelman, C. Sardet and L. Le Cam for the gift ofmaterials and D. Greuet, C. Henriquet, S. Hure and J. Teyssier for their technicalhelp. The authors are grateful to C. Cazevieille from Centre de Ressources enImagerie Cellulaire de Montpellier for her technical assistance, data interpretationand ultrastructural evaluations. We are indebted to the RHEM network (Réseaud’Histologie Expérimentale de Montpellier, IFR122, France) for histology and, inparticular, for tissue and slide preparations. Members of the Fajas laboratory areacknowledged for support and discussions. This work was supported by grants fromAgence Nationale pour la Recherche (ANR genopath), INSERM-Association pourla Recherche sur le Diabète (PNR Diabète), Association Française des Diabétiques,Société Francophone du Diabète, Association pour la Recherche contre le Cancer,Fondation pour la Recherche Médicale, Ligue Contre le Cancer, European ResearchCouncil, National Institutes ofHealth, SwissNational Science Foundation and EPFL.E.B. was supported by a grant from the Ministère de l’Enseignement Supérieur etde la Recherche; C.C. was supported by a grant from the Agence Nationale pourla Recherche.
AUTHOR CONTRIBUTIONSJ-S.A. and L.F. designed the study. E.B., J-S.A., S.L., V.A., V.F., C. Chavey and C.Clapé carried out the experiments. F.A., F.C. and J.A. provided reagents and data.J-S.A. and L.F. wrote the manuscript.
COMPETING FINANCIAL INTERESTSThe authors declare no competing financial interests.
Published online at http://www.nature.com/naturecellbiologyReprints and permissions information is available online at http://www.nature.com/reprints
1. Warburg, O. Ueber den Stoffwechsel der Tumoren (Constable, 1930).2. Dimova, D. K. & Dyson, N. J. The E2F transcriptional network: old acquaintances
with new faces. Oncogene 24, 2810–2826 (2005).3. Sardet, C., Le Cam, L., Fabbrizio, E. & Vidal, M. E2Fs and the retinoblastoma protein
family. Prog. Gene Exp. 2, 1–62 (1997).4. Fajas, L. et al. E2Fs regulate adipocyte differentiation. Dev. Cell 3, 39–49 (2002).5. Annicotte, J. S. et al. The CDK4–pRB–E2F1 pathway controls insulin secretion.
Nat. Cell Biol. 11, 1017–1023 (2009).6. Fajas, L. et al. Impaired pancreatic growth, β cell mass, and β cell function in
E2F1(−/−) mice. J. Clin. Invest. 113, 1288–1295 (2004).7. Rane, S. G. et al. Loss of Cdk4 expression causes insulin-deficient diabetes and
Cdk4 activation results in β-islet cell hyperplasia. Nat. Genet. 22, 44–52 (1999).8. Frolov, M. V. & Dyson, N. J. Molecular mechanisms of E2F-dependent activation and
pRB-mediated repression. J. Cell Sci. 117, 2173–2181 (2004).9. Hallstrom, T. C., Mori, S. & Nevins, J. R. An E2F1-dependent gene expression
program that determines the balance between proliferation and cell death.Cancer Cell 13, 11–22 (2008).
10. Freedman, J. A., Chang, J. T., Jakoi, L. & Nevins, J. R. A combinatorial mechanismfor determining the specificity of E2F activation and repression. Oncogene 28,2873–2881 (2009).
11. Puigserver, P. et al. A cold-inducible coactivator of nuclear receptors linked toadaptive thermogenesis. Cell 92, 829–839 (1998).
12. Schiaffino, S. & Reggiani, C. Molecular diversity of myofibrillar proteins: generegulation and functional significance. Physiol. Rev. 76, 371–423 (1996).
13. Gollnick, P. D., Armstrong, R. B., Saubert, C. W. T., Piehl, K. & Saltin, B. Enzymeactivity and fiber composition in skeletal muscle of untrained and trained men.J. Appl. Physiol. 33, 312–319 (1972).
14. Wang, Y. X. et al. Regulation of muscle fiber type and running endurance byPPARdelta. PLoS Biol. 2, e294 (2004).
15. Calabria, E. et al. NFAT isoforms control activity-dependent muscle fiber typespecification. Proc. Natl Acad. Sci. USA 106, 13335–13340 (2009).
16. Lin, J., Puigserver, P., Donovan, J., Tarr, P. & Spiegelman, B. M. Peroxisomeproliferator-activated receptor γ coactivator 1β (PGC-1β), a novel PGC-1-relatedtranscription coactivator associated with host cell factor. J. Biol. Chem. 277,1645–1648 (2002).
17. Seth, A. et al. The transcriptional corepressor RIP140 regulates oxidative metabolismin skeletal muscle. Cell Metab. 6, 236–245 (2007).
18. Wallace, D. C. A mitochondrial paradigm of metabolic and degenerative diseases,aging, and cancer: a dawn for evolutionary medicine. Annu. Rev. Genet. 39,359–407 (2005).
19. Chong, J. L. et al. E2f1-3 switch from activators in progenitor cells to repressors indifferentiating cells. Nature 462, 930–934 (2009).
20. Dali-Youcef, N. et al. Adipose tissue-specific inactivation of the retinoblastomaprotein protects against diabesity because of increased energy expenditure.Proc. Natl Acad. Sci. USA 104, 10703–10708 (2007).
1152 NATURE CELL BIOLOGY VOLUME 13 | NUMBER 9 | SEPTEMBER 2011
© 2011 Macmillan Publishers Limited. All rights reserved.
DOI: 10.1038/ncb2309 METHODS
METHODSMaterials and oligonucleotides. Chemicals, unless stated otherwise, werepurchased from Sigma. PD0332991 was purchased from Euromedex. Anti-E2F1(C-20 and KH-95) and anti-pRB (C-15) antibodies were from Santa CruzBiotechnology. Anti-acetylated H4 (Lys 12) and anti-Ser-780-phospho-pRB werefrom Cell Signaling. Anti-MyHC-I (BA-F8), IIa (SC-71) and IIb (BF-F3) werepurchased from the Developmental Studies Hybridoma Antibody Core at theUniversity of Iowa. Oligonucleotide sequences are given in Supplementary Table S1.
Animal experiments. E2f1+/+ and E2f1−/− mice were purchased from the JacksonLaboratory. CDK4R24C/R24C mice were described previously7. Mice were maintainedaccording to European Union guidelines for use of laboratory animals. In vivoexperiments were carried out in compliance with the French guidelines for studieson experimental animals (AnimalHouse agreement no. B-34-172-27, Authorizationfor Animal Experimentation no. 34.324). All experiments were performed withmale mice. Energy expenditure was measured with Oxymax apparatus (ColumbusInstruments). The cold test was carried out on animals individually housed at4 ◦C for 4 h as described previously20. Endurance was tested in 2-h-fasted micewith a treadmill equipped with an electrical shock grid (Bioseb)21. Briefly, animalswere acclimatized to the test using a habituation protocol one day before the testconsisting of a run at 27 cm s−1 for 10min. The endurance test was carried outon 2-h-fasted weight-matched E2f1+/+ and E2f1−/− mice at an initial speed of18 cm s−1 for 10min. The speed was progressively increased (around 4 cm s−1 each10min) to reach the maximal speed of 38 cm s−1 at the end of the running test.The distance run and the number of shocks were recorded throughout the testand a mouse was considered exhausted and removed from the experiment when itreceived 180 shocks. For intramuscular (i.m.) electrotransfer,micewere randomizedand anaesthetized by intraperitoneal (i.p.) injection of a ketamine (30mg kg−1)and xylazine (10mg kg−1) solution. The paws were shaved, and 70 µg of pCMVexpressing E2F1 or empty plasmid was injected i.m. in 70 µl into the GNM ofE2f1+/+ and E2f1−/− mice. For in vivo silencing experiments, 50 µg of pRNATU6(control), or pRNATU6 expressing shRNA against Ucp2, Ppargc1a, Esrra or Pdk4was injected i.m. into the GNM. Following i.m. injections, echographic gel wasapplied and transcutaneous electric pulses were applied using two custom-madestainless-steel plate electrodes placed on either side of the hind limb as describedpreviously22. Experiments were carried out four days after electroporation, exceptif stated otherwise. For fasting/refeeding experiments, mice were fasted for 24 h orfasted for 20 h and refed 4 h before collecting tissues. For cold experiments, micewere maintained at 23 ◦C or placed at 4 ◦C for 4 h and fasted during the time of theexperiment. For isoproterenol treatment, mice were fasted for 4 h and treated for30min by i.p. injection of isoproterenol at a dose of 10mg kg−1 body weight.
Ultrastructural evaluation. GNM and BAT were immersed in a solution of 3.5%glutaraldehyde in phosphate buffer (0.1M, pH 7.4) overnight at 4 ◦C, subsequentlyrinsed in phosphate buffer and post-fixed in 1% osmic plus 0.8% potassiumferrocianide for 2 h in the dark at room temperature. After two rinses in a phosphatebuffer, tissues were dehydrated in a graded series of ethanol solutions (30–100%)and then embedded in EmBed 812 DER 736. Thin sections (85 nm ; Leica-ReichertUltracut E) were collected at different levels of each block. These sections werecounterstained with uranyl acetate and lead citrate and observed using a Hitachi7100 transmission electron microscope in the Centre de Ressources en ImagerieCellulaire de Montpellier (France).
Oxygen consumption. Measurements of oxygen consumption were carried outin liver, muscle and BAT isolated mitochondria or myoblasts, myotubes and MEFspermeabilized with 100 µgml−1 of digitonin. Briefly, tissues were homogenized intoisolation buffer (250mMmannitol, 10mMEDTA, 45mMTris-HCl, 5mMTris baseat pH 7.4) using a Dounce homogenizer. Nuclei and cell debris were removed bycentrifugation at 326g for 10min. Mitochondria were isolated from supernatantby spinning twice at 326g for 10min. The mitochondrial pellet was resuspendedin isolation buffer and kept on ice. Mitochondrial protein was measured by theBradford method (BioRad). The rate of mitochondrial oxygen consumption wasmeasured at 37 ◦C in an incubation chamber with a Clark-type O2 electrode, asdescribed in ref. 21 (Strathkelvin Instruments), filled with 1ml of respirationmedium (15mM KCl, 30mM KH2PO4, 25mM Tris base, 45mM sucrose, 12mMmannitol, 5mM MgCl2, EDTA 7mM, 20mM glucose and 0.2% BSA). Cells werecollected by trypsinization andwashed twice in respirationmedium (0.25M sucrose,20mMHEPES at pH 7.1 and 10mMMgCl2 forMEFs; PBS, 35mMHEPES, 5.55mMglucose and 1% BSA for myoblasts and myotubes). Cell pellets were kept on ice.Before the addition of the cells in the chamber, the medium was supplemented with2mM KH2PO4, 5mM malate and 100 µgml−1 digitonin. Concentrated cells wereadded to 1ml of respiration medium. All measurements were carried out usingmitochondria (3mgml−1) or MEFs (3 million cells), myoblasts (4 million cells)and myotubes (1 million cells) incubated with succinate (5mM) as a substrate,
in the presence or absence of 1mM ADP. The incubation medium was constantlystirred with amagnetic stirrer. Respiration values were normalized tomitochondrialprotein content for tissues or cell number for MEFs, myoblasts and myotubes.
Mitochondrial DNA quantification, RNA extraction, RT–PCR andqRT–PCR. For DNA extraction, tissues were digested in a lysis buffer containingproteinase K and 10% Chelex 100 resin (BioRad). Quantitative PCR (qPCR) wascarried out on DNA diluted 200 times using mitochondrial- (ND2) and nuclear-(28S) specific primers. For gene expression analysis, total RNA extraction fromE2f1+/+ and E2f1−/− tissues and primary MEFs, myoblasts and myotubes and PCRwith reverse transcription (RT–PCR) were carried out as described previously6,23.qPCR was carried out using a LightCycler 480 and the DNA-double-strand-specificPower SYBR Green master mix for detection (Applied Biosystems). qPCR wascarried out using gene-specific oligonucleotides and results were then normalizedto 18S levels (Supplementary Table S1).
Histology, immunofluorescence microscopy, biochemical analysis andMitoTracker staining. Haematoxylin staining, immunohistochemistry (phospho-pRB, 1:50) and immunofluorescence microscopy (MyHC, 2 µg per section; E2F1,1:50) analyses were carried out on 5 µm formalin-fixed paraffin-embedded tissuesections and succinate dehydrogenase activity was measured using 10 µm frozensections as described previously24,25. Citrate synthase activity was determined onGNM homogenates as described previously21,26. Serum lactate levels were measuredat the Service Phenotypage de l’IFR 150 (Toulouse, France) on mice fasted for 16 h.For MitoTracker staining, primary MEFs were cultured on coverslips overnightand then incubated for 30min with 100 nMMitoTracker red CMXROS (MolecularProbes). Cells were subsequently rinsed with PBS and fixed with 3.7% formaldehyde,for 15min. After washing, cells were mounted with fluorescent medium (Dako) andobserved under a fluorescence microscope (Leica Microsystemes SAS).
Protein extracts, co-immunoprecipitation and immunoblot analysis. Pro-tein extracts and sodium dodecyl sulphate (SDS)–polyacrylamide gel electrophore-sis (PAGE), electrotransfer and immunoblotting were carried out as describedpreviously27. Co-immunoprecipitation experiments were described elsewhere5. An-tibody dilutions were 1:50,000 for MHC, 1:5,000 for tubulin, 1:5,000 for actin,1:1,000 for pRB and 1:500 for E2F1.
Cell culture and shRNA experiments. Primary E2f1+/+ and E2f1−/− MEFs wereobtained from embryos at embryonic day 13.5 by standard methods. PrimarypRb−/− MEFs were described elsewhere28. Monolayer cell cultures were grown inDulbecco’s modified Eagle’s medium (DMEM) supplemented with 25mM glucoseand 10% fetal calf serum (FCS; Invitrogen). In vitro shRNA experiments werecarried out by retroviral infection. Phoenix cells were transfected with eitherpSUPERretro (Oligoengine), or pSUPERretro expressing shRNA against Tfam (5′-GTGTGAAACGATCCGGAGA-3′),Cpt-1 (5′-GAAGTTCATCCGATTCAAG-3′) orUcp2 (5′-GCCTACAAGACCATTGCAC-3′), or pSUPER expressing shRNA againstPpargc1a (5′-CAGCCGAGGACACGAGGAA-3′), Esrra (5′-GCTGTACGCCATG-CCTGAC-3′) or Pdk4 (5′-GCCACATTGGAAGTATCGA-3′) using JetPEI (Invitro-gen). After 48 h of transfection, the medium containing retroviruses was collected,filtered, treated with Polybrene (1 µgml−1) and transferred to MEF target cells.At 48 h after transfection, cells were collected and processed for oxygen consump-tion analysis. For in vivo experiments, shRNA oligonucleotides were cloned inpRNAT-U6 vector, and electroporated in GNM of E2f1+/+ and E2f1−/− mice mice.Downregulation was verified by qPCR analysis, and 4 out of 6 shRNAwere validated.
Primary muscle cell cultures were derived from GNM and tibialis anteriormuscles of three 1-week-old mice, as described previously29. Briefly, muscles werepartly digestedwith four sequential 10min incubations inDMEM/HamF12mediumcontaining 0.14% pronase (Gibco). The supernatants from the second, third andfourth digestions were pooled and filtered through a 100-µm cell strainer. Cells werecentrifuged, washed twice, counted and plated at a low density (100 cells cm−2) on12-well plates coated with gelatin (type A from pig skin; Sigma). Myoblasts weregrown in completemedium (DMEM/HamF12, 2%Ultroser G, 20% fetal calf serum,penicillin, streptomycin and l-glutamine) on gelatine-coated plates. After one week,wells containing myoblasts without contaminating fibroblasts were trypsinized,pooled and expanded. Experiments were carried out on cells kept in culture for notmore than one month (6–15 passages). Complete medium was changed every twodays, and cultures were trypsinized before subconfluence to avoid differentiation. Todifferentiate muscle cells, myoblasts were plated onMatrigel-coated dishes at 30,000cells cm−2 in DMEM/Ham F12 containing 2% horse serum.
ChIP. ChIP assays were carried out as described previously5,30 on mice subjectedto 4 h at room temperature versus 4 ◦C (for BAT) or 24 h fasted versus 20 hfasted and then 4 h refed. Briefly, proteins from BAT and muscle tissues wereformaldehyde crosslinked to DNA. After homogenization, lysis and DNA
NATURE CELL BIOLOGY
© 2011 Macmillan Publishers Limited. All rights reserved.
METHODS DOI: 10.1038/ncb2309
sonication, proteins were then immunoprecipitated using purified IgGs, anti-E2F1,anti-pRB or anti-acetylated H4 antibodies. After washing, DNA–protein complexeswere subsequently eluted and crosslinking was reversed by heating the samples at65 ◦C for 16 h. DNA was then purified using a Qiagen PCR purification kit (Qiagen)and qPCR was carried out using promoter-specific primers (Supplementary TableS1). As a negative control, tissues from E2f1−/− mice were used and qPCR analysisdemonstrated no binding of E2F1 on its target genes.
DNA methylation analysis. The methylation status of Dhfr and Tk1 promoterswas analysed in silico using http://www.urogene.org/methprimer/ and in vivo onisolated genomic DNA using the MethylCollector kit (Active Motif) followingthe manufacturer’s instructions. Briefly, DNA was extracted from GNM usinga DNeasy Blood and Tissue Kit (Qiagen). A quantity of 4 µg of DNA wasdigested for 2 h at 37 ◦C by MseI and incubated with purified methyl-CpGbinding domain 2b (MBD2b) proteins. DNA–protein complexes were capturedusing magnetic beads and DNA was recovered after washing and elution. Themethylation status of the promoter was subsequently analysed by PCR usingpromoter-specific primers.
Statistical analysis. Data are presented as mean± s.e.m. Statistical analyses werecarried out with unpaired Student’s t -tests. Differences were considered statisticallysignificant at P < 0.05.
21. Lagouge, M. et al. Resveratrol improves mitochondrial function and protects againstmetabolic disease by activating SIRT1 and PGC-1α. Cell 127, 1109–1122 (2006).
22. Mir, L. M. et al. High-efficiency gene transfer into skeletal muscle mediated byelectric pulses. Proc. Natl Acad. Sci. USA 96, 4262–4267 (1999).
23. Annicotte, J. et al. Pancreatic-duodenal homeobox 1 regulates expression ofliver receptor homolog 1 during pancreas development. Mol. Cell Biol. 23,6713–6724 (2003).
24. Mensink, M. et al. Improved skeletal muscle oxidative enzyme activity and restorationof PGC-1α and PPAR β/δ gene expression upon rosiglitazone treatment in obesepatients with type 2 diabetes mellitus. Int. J. Obes. 31, 1302–1310 (2007).
25. Handschin, C. et al. PGC-1α regulates the neuromuscular junction program andameliorates Duchenne muscular dystrophy. Genes Dev. 21, 770–783 (2007).
26. Casas, F. et al. Overexpression of the mitochondrial T3 receptor p43 induces a shiftin skeletal muscle fiber types. PLoS ONE 3, e2501 (2008).
27. Sarruf, D. A. et al. Cyclin D3 promotes adipogenesis through activation of peroxisomeproliferator-activated receptor γ. Mol. Cell Biol. 25, 9985–9995 (2005).
28. Fajas, L. et al. The retinoblastoma-histone deacetylase 3 complex inhibits theperoxisome proliferator-activated receptor γ and adipocyte differentiation. Dev. Cell3, 903–910 (2002).
29. Aguilar, V. et al. S6 kinase deletion suppresses muscle growth adaptations to nutrientavailability by activating AMP kinase. Cell Metab. 5, 476–487 (2007).
30. Annicotte, J. S. et al. Peroxisome proliferator-activated receptor γ regulatesE-cadherin expression and inhibits growth and invasion of prostate cancer.Mol. Cell Biol. 26, 7561–7574 (2006).
NATURE CELL BIOLOGY
© 2011 Macmillan Publishers Limited. All rights reserved.
S U P P L E M E N TA RY I N F O R M AT I O N
WWW.NATURE.COM/NATURECELLBIOLOGY 1
DOI: 10.1038/ncb2309
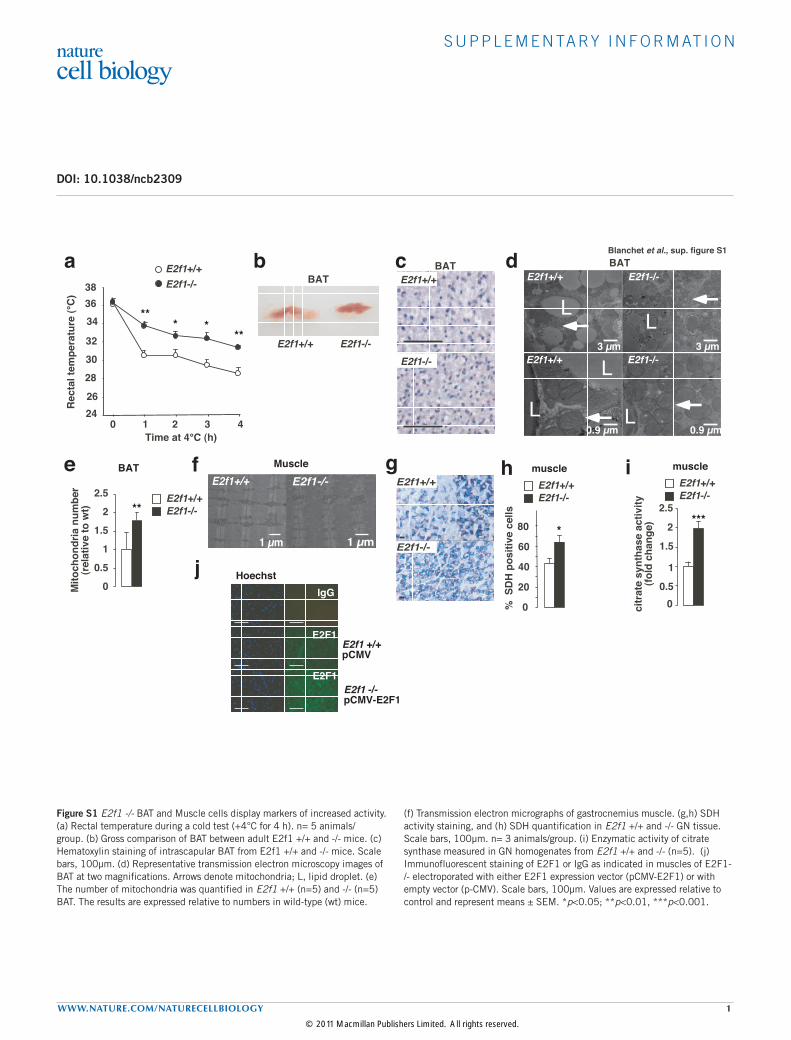
Figure S1 E2f1 -/- BAT and Muscle cells display markers of increased activity. (a) Rectal temperature during a cold test (+4°C for 4 h). n= 5 animals/group. (b) Gross comparison of BAT between adult E2f1 +/+ and -/- mice. (c) Hematoxylin staining of intrascapular BAT from E2f1 +/+ and -/- mice. Scale bars, 100µm. (d) Representative transmission electron microscopy images of BAT at two magnifications. Arrows denote mitochondria; L, lipid droplet. (e) The number of mitochondria was quantified in E2f1 +/+ (n=5) and -/- (n=5) BAT. The results are expressed relative to numbers in wild-type (wt) mice.
(f) Transmission electron micrographs of gastrocnemius muscle. (g,h) SDH activity staining, and (h) SDH quantification in E2f1 +/+ and -/- GN tissue. Scale bars, 100µm. n= 3 animals/group. (i) Enzymatic activity of citrate synthase measured in GN homogenates from E2f1 +/+ and -/- (n=5). (j) Immunofluorescent staining of E2F1 or IgG as indicated in muscles of E2F1-/- electroporated with either E2F1 expression vector (pCMV-E2F1) or with empty vector (p-CMV). Scale bars, 100µm. Values are expressed relative to control and represent means ± SEM. *p<0.05; **p<0.01, ***p<0.001.
E2f1-/-
E2f1+/+BAT
**
0
0.5
1
1.5
2
2.5
Mito
chon
dria
num
ber
(rel
ativ
e to
wt)
E2f1+/+E2f1-/-
BATe
a
24 26
28
30
32
34 36 38
0 1 2 3 4
**
****
E2f1+/+E2f1-/-
E2f1+/+
BAT
E2f1-/-
b Blanchet et al., sup. figure S1BAT
L
L
L
L
E2f1+/+ E2f1-/-
E2f1+/+ E2f1-/-
L
c d
fE2f1+/+ E2f1-/-
Muscle
E2f1+/+
E2f1-/-*
0
20
40
60
80
% S
DH
pos
itive
cel
ls
E2f1+/+E2f1-/-
muscleh
0
1
2
2.5
1.5
0.5
citr
ate
synt
hase
act
ivity
(fo
ld c
hang
e)
***
iE2f1+/+E2f1-/-
muscleg
IgG
E2f1 +/+ pCMV
E2f1 -/- pCMV-E2F1
Hoechst
E2F1
E2F1
j
© 2011 Macmillan Publishers Limited. All rights reserved.
S U P P L E M E N TA RY I N F O R M AT I O N
2 WWW.NATURE.COM/NATURECELLBIOLOGY
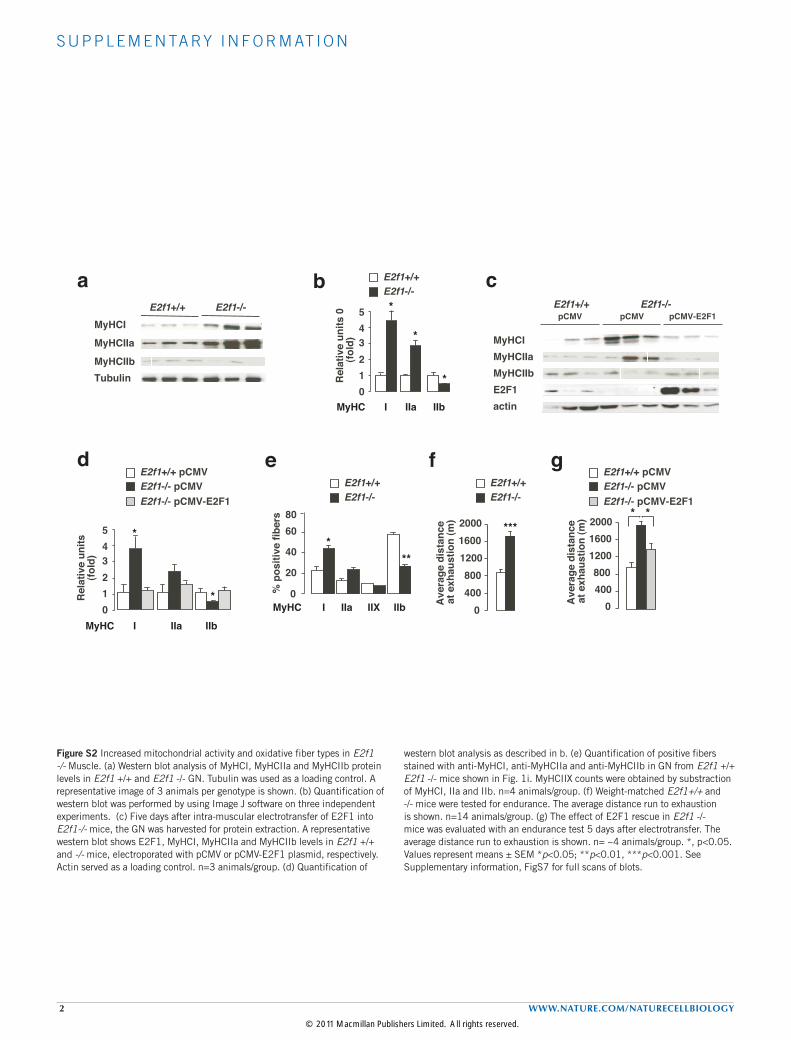
Figure S2 Increased mitochondrial activity and oxidative fiber types in E2f1 -/- Muscle. (a) Western blot analysis of MyHCI, MyHCIIa and MyHCIIb protein levels in E2f1 +/+ and E2f1 -/- GN. Tubulin was used as a loading control. A representative image of 3 animals per genotype is shown. (b) Quantification of western blot was performed by using Image J software on three independent experiments. (c) Five days after intra-muscular electrotransfer of E2F1 into E2f1-/- mice, the GN was harvested for protein extraction. A representative western blot shows E2F1, MyHCI, MyHCIIa and MyHCIIb levels in E2f1 +/+ and -/- mice, electroporated with pCMV or pCMV-E2F1 plasmid, respectively. Actin served as a loading control. n=3 animals/group. (d) Quantification of
western blot analysis as described in b. (e) Quantification of positive fibers stained with anti-MyHCI, anti-MyHCIIa and anti-MyHCIIb in GN from E2f1 +/+ E2f1 -/- mice shown in Fig. 1i. MyHCIIX counts were obtained by substraction of MyHCI, IIa and IIb. n=4 animals/group. (f) Weight-matched E2f1+/+ and -/- mice were tested for endurance. The average distance run to exhaustion is shown. n=14 animals/group. (g) The effect of E2F1 rescue in E2f1 -/- mice was evaluated with an endurance test 5 days after electrotransfer. The average distance run to exhaustion is shown. n= ~4 animals/group. *, p<0.05. Values represent means ± SEM *p<0.05; **p<0.01, ***p<0.001. See Supplementary information, FigS7 for full scans of blots.
ba
d
E2F1
MyHCI
E2f1-/-pCMV-E2F1pCMV
E2f1+/+pCMV
actin
MyHCIIaMyHCIIb
* *
400 800
1200 1600 2000
Ave
rage
dis
tanc
e a
t exh
aust
ion
(m)
E2f1+/+ pCMVE2f1-/- pCMVE2f1-/- pCMV-E2F1
0 0 400 800
1200 1600
Ave
rage
dis
tanc
e a
t exh
aust
ion
(m) 2000 ***
E2f1+/+E2f1-/-
g
0 % p
ositi
ve fi
bers
20
40
80 60
***
MyHC I IIa IIX IIb
E2f1+/+E2f1-/-
e
*
*
1 23 4 5
0 MyHC I IIa IIb
Rel
ativ
e un
its 0
(fold
)
*
E2f1+/+E2f1-/-
Rel
ativ
e un
its
(fold
)
MyHC I IIa IIb
E2f1+/+ pCMVE2f1-/- pCMVE2f1-/- pCMV-E2F1
1 23 4 5
0
*
*
E2f1-/-E2f1+/+
MyHCIIa
MyHCIIb
MyHCI
Tubulin
c
f
Blanchet et al., sup. figure S2
© 2011 Macmillan Publishers Limited. All rights reserved.
S U P P L E M E N TA RY I N F O R M AT I O N
WWW.NATURE.COM/NATURECELLBIOLOGY 3
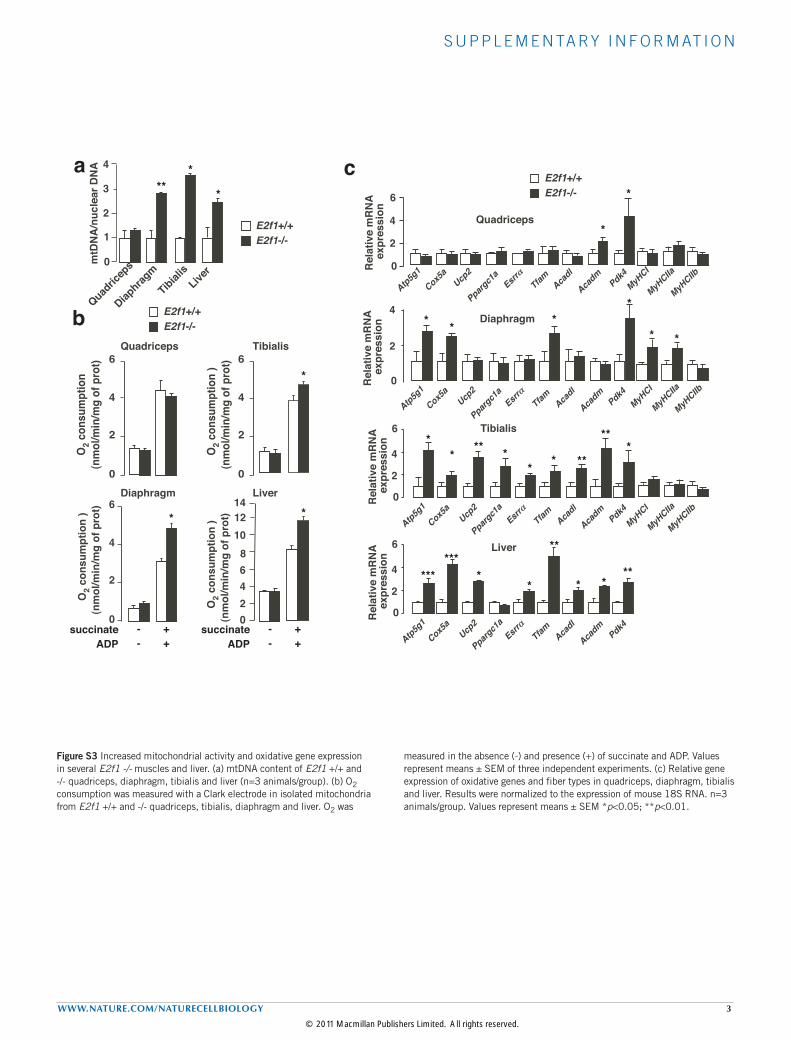
Figure S3 Increased mitochondrial activity and oxidative gene expression in several E2f1 -/- muscles and liver. (a) mtDNA content of E2f1 +/+ and -/- quadriceps, diaphragm, tibialis and liver (n=3 animals/group). (b) O2 consumption was measured with a Clark electrode in isolated mitochondria from E2f1 +/+ and -/- quadriceps, tibialis, diaphragm and liver. O2 was
measured in the absence (-) and presence (+) of succinate and ADP. Values represent means ± SEM of three independent experiments. (c) Relative gene expression of oxidative genes and fiber types in quadriceps, diaphragm, tibialis and liver. Results were normalized to the expression of mouse 18S RNA. n=3 animals/group. Values represent means ± SEM *p<0.05; **p<0.01.
Blanchet et al., sup. figure S3a
Tibialis
*
Liver
*
0
1
2
3
4
mtD
NA
/nuc
lear
DN
A
Quadric
eps
**
Diaphrag
m
b
0 2 4 6 8
10
14
O2 c
onsu
mpt
ion
)(n
mol
/min
/mg
of p
rot)
succinate - +ADP - +
Liver
12 *
0
2
4
6
O2 c
onsu
mpt
ion
)(n
mol
/min
/mg
of p
rot)
succinate - +ADP - +
Diaphragm
*
0
2
4
6
O2 c
onsu
mpt
ion
(nm
ol/m
in/m
g of
pro
t)
Quadriceps
0
2
4
6
O2 c
onsu
mpt
ion
)(n
mol
/min
/mg
of p
rot)
Tibialis
*
E2f1+/+E2f1-/-
E2f1+/+E2f1-/-
*
*
Quadriceps
Acadl
Acadm
Pdk4TfamEsrr
αUcp
2
2
4
6
Rel
ativ
e m
RN
A
exp
ress
ion
0
Atp5g1
Cox5a
Acadl
Acadm
Pdk4
*
TfamEsrrα
*
Ucp2
Diaphragm
2
4
Rel
ativ
e m
RN
A
exp
ress
ion
0
Atp5g1
Cox5a
**
2
4
6
Rel
ativ
e m
RN
A
exp
ress
ion
0
Acadl
Acadm
Pdk4TfamEsrr
αUcp
2
Ppargc1
a
Atp5g1
Cox5a
**
***
* *
Tibialis
** **
*
2
4
6
Rel
ativ
e m
RN
A
exp
ress
ion
0
Acadl
Acadm
Pdk4TfamEsrr
αUcp
2
Atp5g1
Cox5a
Liver
******
** **
**
**
E2f1+/+E2f1-/-
c
MyHCI
MyHCIIa
MyHCIIb
MyHCI
MyHCIIa
MyHCIIb
MyHCI
MyHCIIa
MyHCIIb
* *
Ppargc1
a
Ppargc1
a
Ppargc1
a
© 2011 Macmillan Publishers Limited. All rights reserved.
S U P P L E M E N TA RY I N F O R M AT I O N
4 WWW.NATURE.COM/NATURECELLBIOLOGY
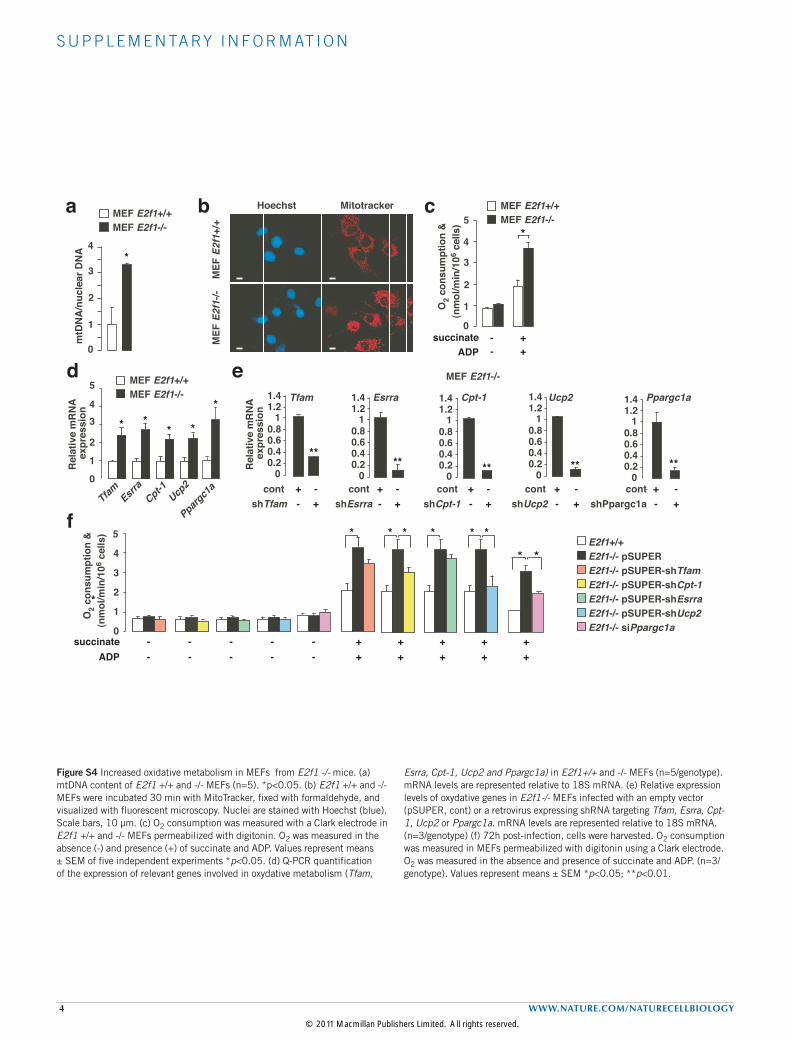
Figure S4 Increased oxidative metabolism in MEFs from E2f1 -/- mice. (a) mtDNA content of E2f1 +/+ and -/- MEFs (n=5). *p<0.05. (b) E2f1 +/+ and -/- MEFs were incubated 30 min with MitoTracker, fixed with formaldehyde, and visualized with fluorescent microscopy. Nuclei are stained with Hoechst (blue). Scale bars, 10 µm. (c) O2 consumption was measured with a Clark electrode in E2f1 +/+ and -/- MEFs permeabilized with digitonin. O2 was measured in the absence (-) and presence (+) of succinate and ADP. Values represent means ± SEM of five independent experiments *p<0.05. (d) Q-PCR quantification of the expression of relevant genes involved in oxydative metabolism (Tfam,
Esrra, Cpt-1, Ucp2 and Ppargc1a) in E2f1+/+ and -/- MEFs (n=5/genotype). mRNA levels are represented relative to 18S mRNA. (e) Relative expression levels of oxydative genes in E2f1-/- MEFs infected with an empty vector (pSUPER, cont) or a retrovirus expressing shRNA targeting Tfam, Esrra, Cpt-1, Ucp2 or Ppargc1a. mRNA levels are represented relative to 18S mRNA. (n=3/genotype) (f) 72h post-infection, cells were harvested. O2 consumption was measured in MEFs permeabilized with digitonin using a Clark electrode. O2 was measured in the absence and presence of succinate and ADP. (n=3/genotype). Values represent means ± SEM *p<0.05; **p<0.01.
Blanchet et al., sup. figure S4bM
EF E
2f1+
/+M
EF E
2f1-
/-Hoechst Mitotracker c
0
1
2
3
4 *
O2 c
onsu
mpt
ion
&(n
mol
/min
/106 c
ells
)
- +ADP - +
5MEF E2f1+/+MEF E2f1-/-
succinate
a
*
0
1
2
3
4
mtD
NA
/nuc
lear
DN
A
MEF E2f1+/+MEF E2f1-/-
d
0
1
2
3 4
5 MEF E2f1+/+MEF E2f1-/-
* ** *
Ucp2
Esrra
Tfam Cpt-1
*
Ppargc1
a0
1
0.20.40.60.8
1.21.4
+-
-+
cont shTfam
0
1
0.20.40.60.8
1.21.4
+-
-+
cont shEsrra
0
1
0.20.40.60.8
1.21.4
+-
-+
cont shCpt-1
0
1
0.20.40.60.8
1.21.4
+-
-+
cont shUcp2
**** ** **
MEF E2f1-/-e
+-
-+
0
1
0.20.40.60.8
1.21.4
contshPpargc1a
Tfam Esrra Cpt-1 Ucp2 Ppargc1a
++
0
1
2
3
4
5
succinateADP
--
O2 c
onsu
mpt
ion
&(n
mol
/min
/106 c
ells
)
*E2f1-/- pSUPER-shCpt-1E2f1-/- pSUPER-shEsrra
E2f1-/- pSUPERE2f1+/+
E2f1-/- pSUPER-shTfam
E2f1-/- siPpargc1aE2f1-/- pSUPER-shUcp2
* *
--
--
--
--
*** * **
++
++
++
++
f
Rel
ativ
e m
RN
A
exp
ress
ion
Rel
ativ
e m
RN
A
exp
ress
ion
**
© 2011 Macmillan Publishers Limited. All rights reserved.
S U P P L E M E N TA RY I N F O R M AT I O N
WWW.NATURE.COM/NATURECELLBIOLOGY 5
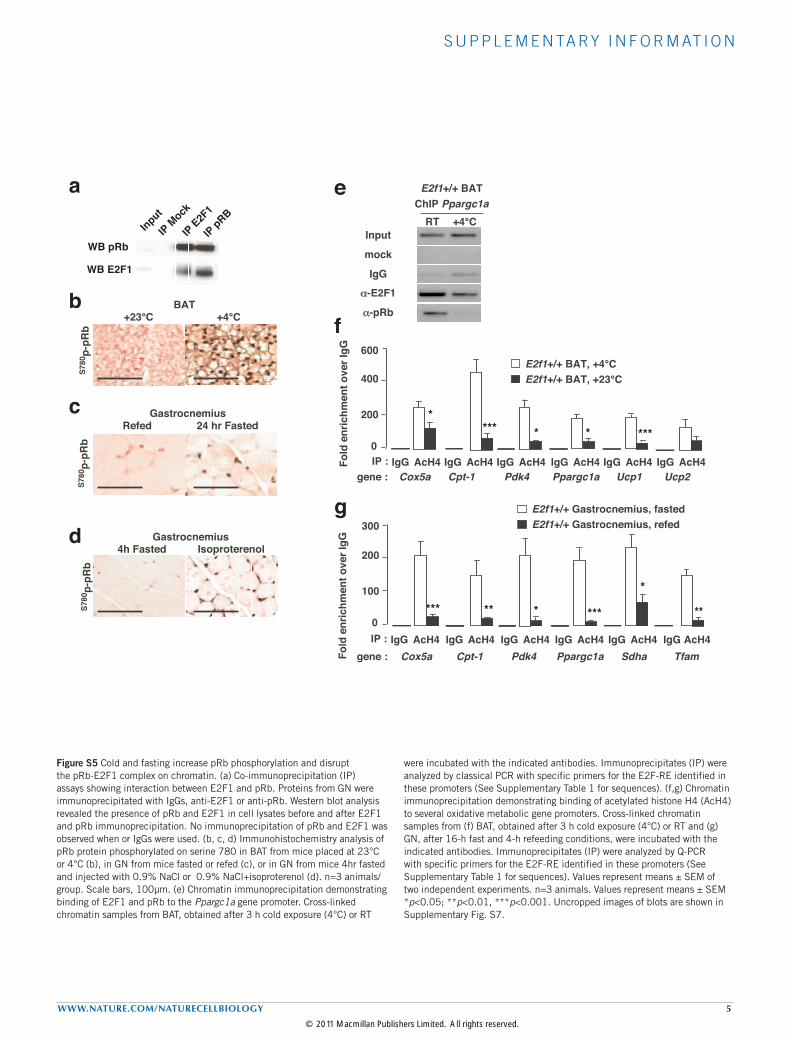
Figure S5 Cold and fasting increase pRb phosphorylation and disrupt the pRb-E2F1 complex on chromatin. (a) Co-immunoprecipitation (IP) assays showing interaction between E2F1 and pRb. Proteins from GN were immunoprecipitated with IgGs, anti-E2F1 or anti-pRb. Western blot analysis revealed the presence of pRb and E2F1 in cell lysates before and after E2F1 and pRb immunoprecipitation. No immunoprecipitation of pRb and E2F1 was observed when or IgGs were used. (b, c, d) Immunohistochemistry analysis of pRb protein phosphorylated on serine 780 in BAT from mice placed at 23°C or 4°C (b), in GN from mice fasted or refed (c), or in GN from mice 4hr fasted and injected with 0.9% NaCl or 0.9% NaCl+isoproterenol (d). n=3 animals/group. Scale bars, 100µm. (e) Chromatin immunoprecipitation demonstrating binding of E2F1 and pRb to the Ppargc1a gene promoter. Cross-linked chromatin samples from BAT, obtained after 3 h cold exposure (4°C) or RT
were incubated with the indicated antibodies. Immunoprecipitates (IP) were analyzed by classical PCR with specific primers for the E2F-RE identified in these promoters (See Supplementary Table 1 for sequences). (f,g) Chromatin immunoprecipitation demonstrating binding of acetylated histone H4 (AcH4) to several oxidative metabolic gene promoters. Cross-linked chromatin samples from (f) BAT, obtained after 3 h cold exposure (4°C) or RT and (g) GN, after 16-h fast and 4-h refeeding conditions, were incubated with the indicated antibodies. Immunoprecipitates (IP) were analyzed by Q-PCR with specific primers for the E2F-RE identified in these promoters (See Supplementary Table 1 for sequences). Values represent means ± SEM of two independent experiments. n=3 animals. Values represent means ± SEM *p<0.05; **p<0.01, ***p<0.001. Uncropped images of blots are shown in Supplementary Fig. S7.
a Blanchet et al., sup. figure S5
Input
IP E2F1
IP Mock
IP pRB
WB pRb
WB E2F1
IgG AcH4IP : IgG AcH4 IgG AcH4 IgG AcH4 IgG AcH4 IgG AcH4Cox5a Pdk4 Ppargc1a Ucp1 Ucp2Cpt-1
Fold
enr
ichm
ent o
ver I
gG
gene :
E2f1+/+ E2f1+/+
0
200
400
600
**** * * ***
f
Cox5a Cpt-1 Ppargc1a Sdha TfamPdk4Fold
enr
ichm
ent o
ver I
gG
gene : IgG AcH4IP : IgG AcH4 IgG AcH4 IgG AcH4 IgG AcH4 IgG AcH4
E2f1+/+ Gastrocnemius, fastedE2f1+/+ Gastrocnemius, refed
**0
100
200
300
*** ** * ***
*
g
b
c
d
BAT
S780
p-pR
b
24 hr FastedRefedGastrocnemius
S780
p-pR
b
4h Fasted IsoproterenolGastrocnemius
S780
p-pR
b
e
Input
IgG
α-E2F1
α-pRb
mock
ChIP Ppargc1a RT
E2f1+/+ BAT
© 2011 Macmillan Publishers Limited. All rights reserved.
S U P P L E M E N TA RY I N F O R M AT I O N
6 WWW.NATURE.COM/NATURECELLBIOLOGY
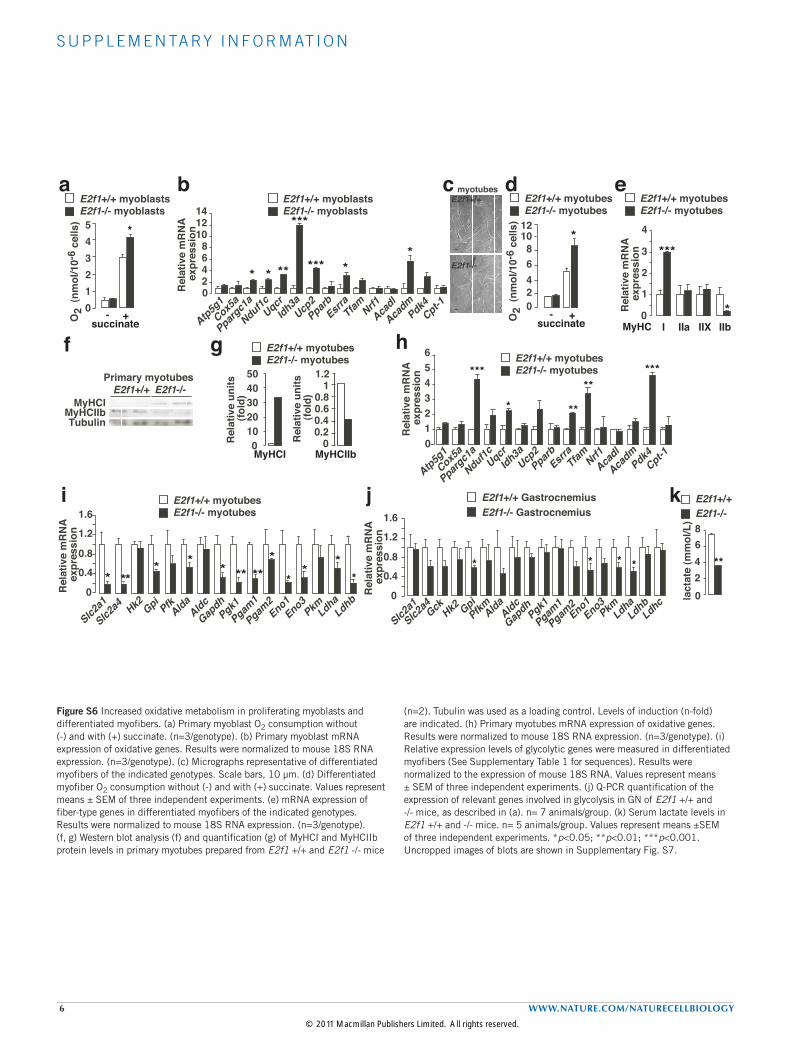
Figure S6 Increased oxidative metabolism in proliferating myoblasts and differentiated myofibers. (a) Primary myoblast O2 consumption without (-) and with (+) succinate. (n=3/genotype). (b) Primary myoblast mRNA expression of oxidative genes. Results were normalized to mouse 18S RNA expression. (n=3/genotype). (c) Micrographs representative of differentiated myofibers of the indicated genotypes. Scale bars, 10 µm. (d) Differentiated myofiber O2 consumption without (-) and with (+) succinate. Values represent means ± SEM of three independent experiments. (e) mRNA expression of fiber-type genes in differentiated myofibers of the indicated genotypes. Results were normalized to mouse 18S RNA expression. (n=3/genotype). (f, g) Western blot analysis (f) and quantification (g) of MyHCI and MyHCIIb protein levels in primary myotubes prepared from E2f1 +/+ and E2f1 -/- mice
(n=2). Tubulin was used as a loading control. Levels of induction (n-fold) are indicated. (h) Primary myotubes mRNA expression of oxidative genes. Results were normalized to mouse 18S RNA expression. (n=3/genotype). (i) Relative expression levels of glycolytic genes were measured in differentiated myofibers (See Supplementary Table 1 for sequences). Results were normalized to the expression of mouse 18S RNA. Values represent means ± SEM of three independent experiments. (j) Q-PCR quantification of the expression of relevant genes involved in glycolysis in GN of E2f1 +/+ and -/- mice, as described in (a). n= 7 animals/group. (k) Serum lactate levels in E2f1 +/+ and -/- mice. n= 5 animals/group. Values represent means ±SEM of three independent experiments. *p<0.05; **p<0.01; ***p<0.001. Uncropped images of blots are shown in Supplementary Fig. S7.
Blanchet et al., sup. figure S6a
f
E2f1-/-E2f1+/+
MyHCIIbMyHCI
Tubulin
Primary myotubes
0
0.4
1
0.2
0.6 0.8
Rel
ativ
e un
its
(fol
d)
10 20 30 40 50
0 Rel
ativ
e un
its
(fol
d)
MyHCI MyHCIIb
E2f1+/+ myotubesE2f1-/- myotubes
1.2
g
*
2 4 6 8
10 12
0
O2
(nm
ol/1
0-6
cells
)
succinate- +
dE2f1+/+ myotubesE2f1-/- myotubes
O2
(nm
ol/1
0-6
cells
)
succinate- +
1 2 3 4 5 *
0
b
* **
***
*** **
Atp5g1Cox5
a
Nduf1cUqcrIdh3a
Ucp2Pparb TfamNrf1
Esrra
Acadl
Acadm
Pdk4Cpt-1
Ppargc1
a
2
64
8 10 12 14
0Rel
ativ
e m
RN
A
exp
ress
ion
*
E2f1+/+ myoblastsE2f1-/- myoblasts
E2f1+/+ myoblastsE2f1-/- myoblasts
E2f1+/+ myotubes
E2f1-/-
c
h
*
*** *****
**1
5
2 3
6
4
0
E2f1+/+ myotubesE2f1-/- myotubes
Rel
ativ
e m
RN
A
exp
ress
ion
Atp5g1Cox5
a
Nduf1cUqcrIdh3a
Ucp2Pparb TfamNrf1
Esrra
Acadl
Acadm
Pdk4Cpt-1
Ppargc1
a
lact
ate
(mm
ol/L
)
4 2 0
6 8
**
E2f1+/+E2f1-/-
* *** *
***
***
Slc2a1 Hk2 Gpi
AldaPgk1 Pkm
Pgam1
LdhaLdhb
Eno1Aldc
PfkGap
dhEno3
Slc2a4
Pgam2
* ***0
1.6
1.2
0.8
0.4
Rel
ativ
e m
RN
A
exp
ress
ion
i E2f1+/+ myotubesE2f1-/- myotubes
Slc2a1
Slc2a4Gck Hk2 Gpi
PfkmAldaAldc
Gapdh
Pgk1
Pgam1
Pgam2Eno1
Eno3PkmLdha
LdhbLdhc
*
E2f1+/+ GastrocnemiusE2f1-/- Gastrocnemius
Rel
ativ
e m
RN
A
exp
ress
ion
0
1.6
1.2
0.8
0.4* * *
I IIa IIX IIb
1
2
3
4
MyHC0R
elat
ive
mR
NA
e
xpre
ssio
n ***
*
E2f1+/+ myotubesE2f1-/- myotubes
e
j k
© 2011 Macmillan Publishers Limited. All rights reserved.
S U P P L E M E N TA RY I N F O R M AT I O N
WWW.NATURE.COM/NATURECELLBIOLOGY 7
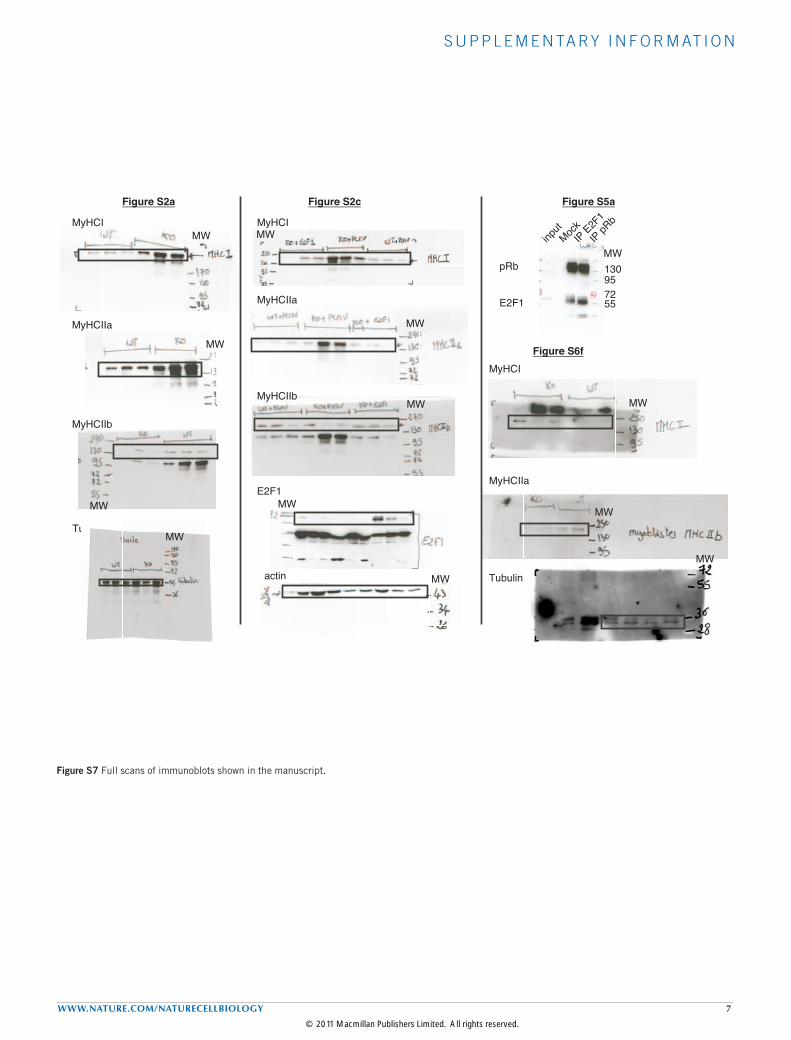
Figure S7 Full scans of immunoblots shown in the manuscript.
Blanchet et al., sup. figure S7
Figure S2a Figure S2c
Figure S6f
MyHCI
Figure S5a
MyHCIIa
MyHCIIb
MyHCI
MyHCIIa
MyHCIIb
E2F1
actin
MyHCI
MyHCIIa
Tubulin
Tubulin
pRb
E2F1
input
MockIP E2F
1
IP pRb
MW MW
MW
MW
MW
MW
MW
MW
MW
MW
MW
MW
MW
7255
95130
© 2011 Macmillan Publishers Limited. All rights reserved.

S U P P L E M E N TA RY I N F O R M AT I O N
8 WWW.NATURE.COM/NATURECELLBIOLOGY
Table S1 Oligonucleotide sequences used in this study.
© 2011 Macmillan Publishers Limited. All rights reserved.