bioelectric sensors - mdpi
TRANSCRIPT
Bioelectric Sensors
Printed Edition of the Special Issue Published in Biosensors
www.mdpi.com/journal/biosensors
Spyridon KintziosEdited by
Bioelectric Sensors • Spyridon Kintzios

Bioelectric Sensors

Bioelectric Sensors
Editor
Spyridon Kintzios
MDPI • Basel • Beijing • Wuhan • Barcelona • Belgrade • Manchester • Tokyo • Cluj • Tianjin

Editor
Spyridon Kintzios
Agricultural University of
Athens
Greece
Editorial Office
MDPI
St. Alban-Anlage 66
4052 Basel, Switzerland
This is a reprint of articles from the Special Issue published online in the open access journal
Biosensors (ISSN 2079-6374) (available at: https://www.mdpi.com/journal/biosensors/special
issues/bioelectric sens).
For citation purposes, cite each article independently as indicated on the article page online and as
indicated below:
LastName, A.A.; LastName, B.B.; LastName, C.C. Article Title. Journal Name Year, Article Number,
Page Range.
ISBN 978-3-03943-084-0 (Hbk) ISBN 978-3-03943-085-7 (PDF)
c© 2020 by the authors. Articles in this book are Open Access and distributed under the Creative
Commons Attribution (CC BY) license, which allows users to download, copy and build upon
published articles, as long as the author and publisher are properly credited, which ensures maximum
dissemination and a wider impact of our publications.
The book as a whole is distributed by MDPI under the terms and conditions of the Creative Commons
license CC BY-NC-ND.

Contents
About the Editor . . . . . . . . . . . . . . . . . . . . . . . . . . . . . . . . . . . . . . . . . . . . . . vii
Preface to ”Bioelectric Sensors” . . . . . . . . . . . . . . . . . . . . . . . . . . . . . . . . . . . . . ix
Spyridon Kintzios
Bioelectric Sensors: On the Road for the 4.0 Diagnostics and Biomedtech RevolutionReprinted from: Biosensors 2020, 10, 96, doi:10.3390/bios10080096 . . . . . . . . . . . . . . . . . . 1
Fahed Elsamnah, Anubha Bilgaiyan, Muhamad Affiq, Chang-Hoon Shim, Hiroshi Ishidai and Reiji Hattori
Reflectance-Based Organic Pulse Meter Sensor for Wireless Monitoring of Photoplethysmogram SignalReprinted from: Biosensors 2019, 9, 87, doi:10.3390/bios9030087 . . . . . . . . . . . . . . . . . . . 7
Mahdi Kiani, Nan Du, Manja Vogel, Johannes Raff, Uwe Hubner, Ilona Skorupa, Danilo Burger, Stefan E. Schulz, Oliver G. Schmidt and Heidemarie Schmidt
P-N Junction-Based Si Biochips with Ring Electrodes for Novel Biosensing ApplicationsReprinted from: Biosensors 2019, 9, 120, doi:10.3390/bios9040120 . . . . . . . . . . . . . . . . . . 21
Jesslyn Janssen, Mike Lambeta, Paul White and Ahmad Byagowi
Carbon Nanotube-Based Electrochemical Biosensor for Label-Free Protein DetectionReprinted from: Biosensors 2019, 9, 144, doi:10.3390/bios9040144 . . . . . . . . . . . . . . . . . . . 33
George Lagoumintzis, Zoi Zagoriti, Mogens S. Jensen, Theodoros Argyrakos, Constantinos Koutsojannis and Konstantinos Poulas
Wireless Direct Microampere Current in Wound Healing: Clinical and Immunohistological Data from Two Single Case ReportsReprinted from: Biosensors 2019, 9, 107, doi:10.3390/bios9030107 . . . . . . . . . . . . . . . . . . . 45
Sophia Mavrikou, Vasileios Tsekouras, Maria-Argyro Karageorgou, Georgia Moschopoulou and Spyridon Kintzios
Detection of Superoxide Alterations Induced by 5-Fluorouracil on HeLa Cells with a Cell-Based BiosensorReprinted from: Biosensors 2019, 9, 126, doi:10.3390/bios9040126 . . . . . . . . . . . . . . . . . . 59
Georgia Paivana, Sophie Mavrikou, Grigoris Kaltsas and Spyridon Kintzios
Bioelectrical Analysis of Various Cancer Cell Types Immobilized in 3D Matrix and Cultured in3D-Printed WellReprinted from: Biosensors 2019, 9, 136, doi:10.3390/bios9040136 . . . . . . . . . . . . . . . . . . . 71
Mariam Ibrahim, Ahmad Alsheikh and Aseel Matar
Attack Graph Modeling for Implantable PacemakerReprinted from: Biosensors 2020, 10, 14, doi:10.3390/bios10020014 . . . . . . . . . . . . . . . . . . 91
v


About the Editor
Spyridon Kintzios holds a Ph.D. in Genetics (TU Munich), with background studies in Plant &
Agricultural Science and Chemistry, as well as a DAAD scholarship at the Max-Planck Institute for
Biochemistry in Munich. He is Full Professor and the current Rector of the Agricultural University
of Athens. He has over 30 years of work experience in Biotechnology, particularly in the fields of
Biosensors and Cell Biology. He is the author or co-author of 120 peer-reviewed articles in cited
international scientific journals, as well as the author or co-author of more than 90 international book
chapters and conference presentations. He is also the editor of five international books and holder of
two European and two national patents.
vii

Preface to ”Bioelectric Sensors”
Bioelectric sensors represent a continuously growing segment of biosensor technologies and
applications, offering key advantages in terms of their practicability of application and scalability
of manufacturing. Progress in related fields has been considerably boosted by advances in
microelectronics and nanotechnology, in general, while the quiver of biocompatible materials
serving as intermediates between biorecognition elements and electronic components has been
impressively expanded. Although bioelectric sensors share many traits with electrochemical sensors,
especially regarding common features of instrumentation, they are focused on the measurement
of the electric properties of biorecognition elements as a reflection of cellular, biological, and
biomolecular functions in a rapid, very sensitive, and often non-invasive manner. Bioelectric
sensors offer a plethora of options in terms both of assay targets (molecules, cells, organs,
and organisms) and methodological approaches (e.g., potentiometry, impedance spectrometry,
patch-clamp electrophysiology). Irrespective of the method of choice, “bioelectric profiling” is being
rapidly established as a superior concept for several applications, including in vitro toxicity, signal
transduction, real-time medical diagnostics, environmental risk assessment, and drug development.
The Special Issue Bioelectric Sensors is the first one exclusively dedicated to advanced and
emerging concepts and technologies of bioelectric sensors. Contributed articles focus on key
topics such as reflectance-based pulse sensors, wireless monitoring systems, and bioelectric biochips
and applications including non-invasive wound healing, cancer cell fingerprinting, differential
drug screening, and advanced pacemaker performance modeling. All approaches are handled
in the context of point-of-care/portable and wireless instrumentation and intelligent bioelectric
sensing platforms.
Spyridon Kintzios
Editor
ix

biosensors
Editorial
Bioelectric Sensors: On the Road for the 4.0Diagnostics and Biomedtech Revolution
Spyridon Kintzios
Laboratory of Cell Technology, Faculty of Biotechnology, Agricultural University of Athens/EU-CONEXUSEuropean University, 11855 Athens, Greece; [email protected]
Received: 30 July 2020; Accepted: 4 August 2020; Published: 11 August 2020
Bioelectric sensors lie, by definition, on the interface between biological elements and electroniccircuits, irrespective of scale, manufacturing method, and working principle. They distinguishthemselves from electrochemical sensors in the sense that they rely exclusively on cells, tissues,and even organs as the biorecognition elements, instead of using only biomolecular moieties, such asantibodies, enzymes, or oligonucleotides.
Bioelectric sensors are quite popular as tools for rapidly accessing the cellular physiologic status:this is a field where both potentiometric and bioimpedance-based biosensors are being increasinglyused for toxicity and/or metabolic effects screening [1–4]. Recent examples in the later application areaare represented both by the XF Extracellular Flux Analyzer platform for metabolic assays [5,6] and theCell Culture Metabolite Biosensor prototype [7] for measuring glycolytic metabolism and inhibitoreffects on CD4+ T cells. More advanced systems and approaches are able to provide considerablevolumes of experimental information, for example, by means of impedance frequency spectrometry,which can, in turn, be used to train dedicated software for identification and classification of datasubgroups. On the biological side, significant progress has been made by immobilizing cells eithertwo-dimensionally onto the surface of conducting electrodes or in a three-dimensional configurationin the appropriate gel: the last option usually contributes to significant simplification and increasedefficiency of operation, as well as extended cell viability and storage stability [8].
Among the advantageous traits of bioelectric sensors, speed, non-invasiveness and low costper assay are the most prominent ones. As a paradigm, bioelectric profiling toxicity assays againstpesticide residues can be conducted within a few minutes whereas conventional enzyme-based opticalassays may require several hours or even days [9,10]. On the downside, information on the electricproperties of living cells and tissues is rarely associated with specific molecular functions, unless thecellular biorecognition element is tailor-made to couple certain biochemical responses to a bioelectricmechanism. Such is the case of membrane-engineered cells and cells with synthetic gene circuits [11–13].Otherwise, the preferable field of application for bioelectric sensors remains that of a more holisticscreening of cellular physiology, in particular cell toxicity and membrane channel activity.
Similar to electrochemical sensors but also distinct from them, bioelectric sensors are able to monitorin real-time, often continuously, physiological patterns and transmit results via Bluetooth/internetto remote data storage, process, and interpretation sites. In several cases, monitoring is conductednon-invasively and, most importantly, not requiring sample extraction. In this way, it is possibleto couple biosensors with dedicated, true point-of-care (POC) or point-of-test (POT) platforms(e.g., wearables) that are integrated in various Internet of Things (IoT) networks, includingsmartphone-based telemetry and e-health applications [14–19].
In this context, the present Special Issue is not only the first volume exclusively dedicated tobioelectric sensors. In a genuinely emblematic approach, its seven articles, selected through veryrigorous peer review and authored by experts of the highest caliber globally, deal with the foremostand advanced technologies and applications in the field of bioelectric sensors. Moreover, they focus
Biosensors 2020, 10, 96; doi:10.3390/bios10080096 www.mdpi.com/journal/biosensors1
Biosensors 2020, 10, 96
on system integration to deliver practical point-of-care/portable and wireless instrumentation andintelligent bioelectric sensing platforms. These will be presented in more detail in following.
Organic biosensors with minimum power consumption represent the next stage of pulsemeters, i.e., devices serving as non-invasive rapid medical diagnostic tools by measuring the rateof rhythmic contraction and expansion of an artery, in sync with the heart. They are based on thephotoplethysmogram (PPG) principle, according to which, changes in reflected light, detectable asa PPG signal, correspond to changes in the volume of the underlying artery. In their contribution,Elsamnah et al. [20] report the development of a novel organic optoelectronic device purposed as a pulseoximeter and based on two alternative designs using large organic photodiodes (OPDs) and organiclight-emitting diodes (OLEDs). These two models were simulated by representing the simplifiedfour-layer structure of a finger model, with red OLED being preferred over green and infrared ones.Both devices were reliable and obtained a clear and stable PPG signal from a healthy individual,with minimum power consumption in wireless monitoring of PPG waveforms. The biosensor pulsemeter showed promising results with ultra-low power consumption, 8 μW at 18 dB signal-to-noiseratio (SNR), and demonstrated its ability to measure a clear PPG signal up to 46 dB SNR at a constantcurrent of 93.6 μA. Coupled with a low manufacturing cost, the novel system is very promising forlong-term wireless PPG signal monitoring, possibly also as part of a wearable medical device.
Next, Kiani et al. [21] report on the combination of a miniaturized—and therefore fullyportable—p-n junction-based Si biochip with impedance spectroscopy, and using the industrialmetal-binding, metal-remediating bacteria Lysinibacillus sphaericus JG-A12 as the biosensing element.The ohmic or Schottky contacts in the biochip was modelled as the combination of resistors andcapacitors, while impedance spectrometry was modelled by using constant phase elements (CPEs).The bulk capacitance of the depletion region of the semiconductor and the capacitance of the Schottkycontacts between electrodes and semiconductor contributed to the impedance spectra of the biochips.A linear pattern of response was determined with increasing bacteria concentration measured at testfrequencies of 40 Hz, 400 Hz, and 4000 Hz.
Nanotechnology is a major accelerator in the race for continuous device miniaturization and,naturally, bioelectric sensors could not be kept out of this progress. Janssen et al. [22] elaborate on theuse of carbon nanotubes (CNTs) for improved sensitivity and response time as potential candidatesfor PoC protein detection, with the detection of bovine serum albumin (BSA) as a proof-of-conceptapplication. Having a nanometer-scale diameter, CNTs are characterized by large surface and highelectrical conductivity, which renders them ideal substrates for manufacturing bioelectric sensingelement at the nanoscale. When considering a large, three-dimensional population of such conductivenanoelements interacting with biological moieties—such as antibodies—the systemic conductivitydepends on the topological alignment of the nanoelements in this network. In other words, dependingon the interaction between nanoelements such as CNTs and their immediate environment, includingantibodies and target antigens (analytes in a sample), any disruption of the network continuity willresult in a measurable increase in the network’s electrical resistance. This effect is called electricalpercolation. The authors applied this working principle to develop a CNT-based, bioelectricalpercolation sensor for rapid (10 min) BSA determination with a limit of detection of 2.89 ng/mL anda linear response between 5 and 45 ng/mL. The biosensor was built upon a disposable cellulose paperstrip impregnated with CNTs and antibodies for protein detection, the electrical resistance of whichwas measured with a programmed Arduino Uno.
Application wise, one of the most intriguing and, at the same time, fascinating areas is theintercalation of bioelectric sensors with bioelectromagnetic medical interventions. Wound healingwith the aid of external electric fields is such a case. Electrical simulation (ES) is one of the currentelectromagnetic therapeutic approaches to non-surgical wound healing. Lagoumintzis et al. [23] reporton wireless micro current stimulation (WMCS), an alternative non-invasive and non-contact methodto electrode-based ES. This approach utilizes the current-carrying capacity of charged air gas, basedon the ability of nitrogen (N2) and/or oxygen (O2) molecules to accept or donate electrons, in order
2
Biosensors 2020, 10, 96
to distribute currents and voltages within the subject tissue. The authors applied an O2−-induced
microcurrent of 1.5–4.0 μA intensity in the patient’s body by using a device capable of producinga specific number of charged particles which covered the wound area from a distance of 12–15 cm.Clinical observations after a three-month treatment period demonstrated the considerable reduction ofmassive pressure ulcers and the formation of healthy new epithelial tissue. Immunohistochemicalanalysis revealed both a suppression of inflammation upon WMCS treatment, as well as an increase inmyofibroblastic activity, collagen formation, mast cell existence, and a reduced granulocyte aggregation.In essence, the application of tandem WMCS sessions led to reverse the wound-associated electricalleak that short-circuits the skin and to restore the physiological electric fields and ionic currents of theaffected tissues. The potential benefits of wide adoption of WMCS in clinical practice as a non-invasive,reagent-free method for wound healing is more than obvious.
Bioelectric profiling is being rapidly established as a superior concept for several applications,including in vitro toxicity, signal transduction, real-time medical diagnostics, environmental riskassessment, and drug development. In the case of cancer, research in the field of hypoxia revealedhow critical the pericellular oxygenation in a cell culture is. In this context, a critical marker for themonitoring the differentiation of cancer cells within a cell population is superoxide anion, which ismainly generated as a by-product of the oxidative phosphorylation by the electron transport chainof the mitochondria, is released to the mitochondrial matrix, where it is converted immediately tohydrogen peroxide. Mitochondrial hydrogen peroxide can then diffuse to the cytosol and the nucleusand react with other free radical species, alter signaling pathways or cause cellular damage. Along withother free radical species, superoxide has been found to mediate the development and/or survivalof cancer cells and tumors, both in vivo and in vitro [24–26]. While hypoxia-regulated processescan result in the bad prognosis of conventional chemotherapy it is essential to monitor and controlthe cellular microenvironment. Mavrikou et al. [27] demonstrate an innovative and technologicallydisruptive approach for cell culture monitoring that can be used as an indicator for the response todifferent chemotherapy options. In particular, they investigated the accumulation of superoxide ionsin cultured HeLa cervical cancer cells in response to different 5-fluorouracil (5-FU) concentrations.The anticancer activity of 5-FU emerges from the inhibition of thymidylate synthase (TS) activityduring the S phase of the cell cycle and its incorporation into RNA and DNA of tumor cells, as well asfrom the generation mitochondrial ROS in the p53-dependent pathway [28–32]. Superoxide ionaccumulation was monitored with the aid of an advanced bioelectric sensor based on Vero cells whichwere membrane-engineered with superoxide dismutase. As proven in several reports, the membranepotential of membrane-engineered Vero cell fibroblasts is affected by the interactions of electroinsertedSOD molecules and superoxide anions, producing measurable changes in the membrane potentialand can be used to determine superoxide extracellular accumulation, e.g., in association with in vitroneuronal differentiation. Therefore, by monitoring superoxide anion concentration in the culturemedium after treatment with the chemotherapeutic agent, the authors were able to establish in a highthroughput, non-invasive way the in vitro efficacy of 5-FU. This novel cell monitoring tool could beused for the accurate assessment of chemoresistance in cervical and other cancer cells, at least as far asits association with redox balance is concerned [33–35].
Within the same field of application and instead of measuring superoxide accumulation incancer cells, Paivana et al. [36] opted for the direct assessment of the bioelectric properties of fourdifferent cancer cell lines (SK-N-SH, HEK293, HeLa and MCF-7) in response, once again, to 5-FU.Cancer cells were immobilized in calcium alginate matrix to mimic the natural tumor environmentin vivo and cultured in different cell population densities (50,000 μL, 100,000 μL, and 200,000/100 μL).Bioelectric profiling was conducted by means of bioelectrical impedance-based measurements atthree frequencies (1 KHz, 10 KHz, and 100 KHz). For impedance measurements, a voltage of0.74 Vrms ± 50 mVrms was applied via the two terminals to the gold-coated electrodes. In this way,multi-dimensional mapping (cell line x population density x frequency) was achieved for the responseof each cancer cell line against different 5-FU concentrations, in a rapid and entirely non-invasive
3

Biosensors 2020, 10, 96
way. It was demonstrated that bioimpedance measurements were highly correlated with standardcytotoxicity assays. This innovative bioimpedance profiling approach could enable the acquisition ofa unique fingerprint for each cancer cell line response to a particular anticancer compound, thereforesignificantly accelerating the pace of chemotherapy drug screening.
The final contribution by Ibrahim et al. [37] is the one more closely related to the title of thiseditorial; namely, the integration of bioelectric sensors in the IoT networks and their role in the ongoingDigital or Industrial Revolution 4.0. In their report, the authors deal with the advanced yet quitean issue of protection against cyberattacks on remote health monitoring systems. In recent years,these systems have experienced almost incredible growth and popularity mainly due to their wideavailability as fitness/daily life components of wearables and associated apps. On a more strictlymedicinal level, IoT implantable therapeutic equipment and networks (availing over more than onehundred medical tools) are becoming standard issues of modern medical practice. One solution tocounter cyberattacks, including tampering, sniffing, and unauthorized access is the construction ofattack graphs as a technique to determine risks and vulnerabilities within interoperable systems and toidentify possible attack paths. For this purpose, the authors used the pacemaker automatic remotemonitoring system (PARMS) as a model for developing tailor-made attack graphs. They illustratelife-threatening risks to patients presented by hacking into the pacemaker’s system and the feasibilityof protecting implantable medical devices (IMDs) [38] by carrying out security strategies completelyon an external device called a shield. This is definitely a technological field with considerablegrowth perspectives.
In conclusion, bioelectric sensors are here to stay in spite of their relatively recent emergencein diagnostic technology and related business. Without a doubt, they constitute an internal part ofthe wearables industry, which will keep on expanding in the next years. Bioelectric profiling is alsobecoming a valuable tool for rapid toxicity assays and compound x cell type fingerprinting, e.g., in thearea of food safety control [10]. Innovative bioelectric sensors are being continuously developedto meet dire and yet unpreceded diagnostic and analytical needs; a vivid, very recent example isthe expedient development of a cell-based bioelectric sensor for the ultra-sensitive detection of theSARS-CoV-2 S1 spike protein antigen in just three minutes [39]. As a final comment, bioelectricsensors may evolve as a separate scientific field themselves, opening new perspectives for a deeperunderstanding of bioelectric phenomena and their exploitation for practical purposes. One of the manypossibilities in this direction is demonstrated by the new scientific topic of non-chemical distant cellinteraction (NCDCI), where new principles of biology are being currently discovered in parallel withthe development of innovative bioelectric sensing tools [40].
References
1. Bera, T.K. Bioelectrical impedance methods for non-invasive health monitoring: A review. J. Med. Eng. 2014,2014, 381251. [CrossRef] [PubMed]
2. Nascimento, L.M.S.; Bonfati, L.V.; Freitas, M.L.B.; Mendes Junior, J.J.A.; Siqueira, H.V.; Stevan, S.L., Jr.Sensors and Systems for Physical Rehabilitation and Health Monitoring—A Review. Sensors 2020, 20, 4063.[CrossRef] [PubMed]
3. Liu, J.; Liu, M.; Bai, Y.; Zhang, J.; Liu, H.; Zhu, W. Recent Progress in Flexible Wearable Sensors for VitalSign Monitoring. Sensors 2020, 20, 4009. [CrossRef] [PubMed]
4. Brosel-Oliu, S.; Abramova, N.; Uria, N.; Bratov, A. Impedimetric transducers based on interdigitated electrodearrays for bacterial detection—A review. Anal. Chim. Acta 2019, 1088, 1–19. [CrossRef]
5. Kramer, P.A.; Ravi, S.; Chacko, B.; Johnson, M.S.; Darley-Usmar, V.M. A review of the mitochondrialand glycolytic metabolism in human platelets and leukocytes: Implications for their use as bioenergeticbiomarkers. Redox Biol. 2014, 2, 206–210. [CrossRef]
6. Souders, C.L., 2nd; Liang, X.; Wang, X.; Ector, N.; Zhao, Y.H.; Martyniuk, C.J. High-throughput assessment ofoxidative respiration in fish embryos: Advancing adverse outcome pathways for mitochondrial dysfunction.Aquat. Toxicol. 2018, 199, 162–173. [CrossRef]
4
Biosensors 2020, 10, 96
7. Crowe, S.M.; Kintzios, S.; Kaltsas, G.; Palmer, C.S. A Bioelectronic System to Measure the GlycolyticMetabolism of Activated CD4+ T Cells. Biosensors 2019, 9, 10. [CrossRef]
8. Neves, M.I.; Moroni, L.; Barrias, C.C. Modulating Alginate Hydrogels for Improved Biological Performanceas Cellular 3D Microenvironments. Front. Bioeng. Biotechnol. 2020, 8, 665. [CrossRef]
9. Ferentinos, K.P.; Yialouris, C.P.; Blouchos, P.; Moschopoulou, G.; Kintzios, S. Pesticide residue screeningusing a novel artificial neural network combined with a bioelectric cellular biosensor. BioMed Res. Int. 2013,2013, 813519. [CrossRef]
10. Moschopoulou, G.; Dourou, A.-M.; Fidaki, A.; Kintzios, S. Assessment of pesticides cytoxicity by means ofbioelectric profiling of mammalian cells. Environ. Nanotechnol. Monitor. Manag. 2017, 8, 254–260. [CrossRef]
11. Kokla, A.; Blouchos, P.; Livaniou, E.; Zikos, C.; Kakabakos, S.E.; Petrou, P.S.; Kintzios, S. Visualization ofthe membrane engineering concept: Evidence for the specific orientation of electroinserted antibodies andselective binding of target analytes. J. Mol. Recognit. 2013, 26, 627–632. [CrossRef] [PubMed]
12. Dewey, J.A.; Dickinson, B.C. Split T7 RNA polymerase biosensors to study multiprotein interaction dynamics.Methods Enzymol. 2020, 641, 413–432. [PubMed]
13. Wiechert, J.; Gätgens, C.; Wirtz, A.; Frunzke, J. Inducible expression systems based on xenogeneic silencingand counter-silencing and design of a metabolic toggle switch. ACS Synth Biol 2020, in press.
14. Kintzios, S. Consumer Diagnostics. In Portable Biosensors and Point-of-Care Systems; Kintzios, S., Ed.; IET:London, UK, 2017; pp. 309–331.
15. Kanakaris, G.P.; Sotiropoulos, C.; Alexopoulos, L.G. Commercialized point-of-care technologies. In PortableBiosensors and Point-of-Care Systems; Kintzios, S., Ed.; IET: London, UK, 2017; pp. 256–330.
16. Guo, J.; Liu, D.; Yang, Z.; Weng, W.; Chan, E.W.C.; Zeng, Z.; Wong, K.-Y.; Ling, P.; Chen, S.A photoelectrochemical biosensor for rapid and ultrasensitive norovirus detection. Bioelectrochemistry2020, 136, 107591. [CrossRef] [PubMed]
17. Campuzano, S.; Pedrero, M.; Gamella, M.; Serafín, V.; Yáñez-Sedeño, P.; Pingarrón, J.M. Beyond sensitiveand selective electrochemical biosensors: Towards continuous, real-time, antibiofouling and calibration-freedevices. Sensors 2020, 20, 3376. [CrossRef]
18. Rodrigues, D.; Barbosa, A.I.; Rebelo, R.; Kwon, I.K.; Reis, R.L.; Correlo, V.M. Skin-Integrated WearableSystems and Implantable Biosensors: A Comprehensive Review. Biosensors 2020, 10, 79. [CrossRef]
19. Yáñez-Sedeño, P.; Campuzano, S.; Pingarrón, J.M. Screen-Printed Electrodes: Promising Paper and WearableTransducers for (Bio) Sensing. Biosensors 2020, 10, 76. [CrossRef]
20. Elsamnah, F.; Bilgaiyan, A.; Affiq, M.; Shim, C.-H.; Ishidai, H.; Hattori, R. Reflectance-Based Organic PulseMeter Sensor for Wireless Monitoring of Photoplethysmogram Signal. Biosensors 2019, 9, 87. [CrossRef]
21. Kiani, M.; Du, N.; Vogel, M.; Raff, J.; Hübner, U.; Skorupa, I.; Bürger, D.; Schulz, S.E.; Schmidt, O.G.;Schmidt, H. P-N Junction-Based Si Biochips with Ring Electrodes for Novel Biosensing Applications.Biosensors 2019, 9, 120. [CrossRef]
22. Janssen, J.; Lambeta, M.; White, P.; Byagowi, A. Carbon Nanotube-Based Electrochemical Biosensor forLabel-Free Protein Detection. Biosensors 2019, 9, 144. [CrossRef]
23. Lagoumintzis, G.; Zagoriti, Z.; Jensen, M.S.; Argyrakos, T.; Koutsojannis, C.; Poulas, K. Wireless DirectMicroampere Current in Wound Healing: Clinical and Immunohistological Data from Two Single CaseReports. Biosensors 2019, 9, 107. [CrossRef] [PubMed]
24. Zhang, M.-L.; Wu, H.-T.; Chen, W.-J.; Xu, Y.; Ye, Q.-Q.; Shen, J.-X.; Liu, J. Involvement of glutathioneperoxidases in the occurrence and development of breast cancers. J. Transl. Med. 2020, 18, 247. [CrossRef][PubMed]
25. Brassart-Pasco, S.; Brézillon, S.; Brassart, B.; Ramont, L.; Oudart, J.B.; Monboisse, J.C.Tumor microenvironment: Extracellular matrix alterations influence tumor progression. Front. Oncol.2020, 10, 397. [CrossRef] [PubMed]
26. Gao, L.; Loveless, J.; Shay, C.; Teng, Y. Targeting ROS-mediated crosstalk between autophagy and apoptosisin cancer. Adv. Exp. Med. Biol. 2020, 1260, 1–12. [PubMed]
27. Mavrikou, S.; Tsekouras, V.; Karageorgou, M.-A.; Moschopoulou, G.; Kintzios, S. Detection of SuperoxideAlterations Induced by 5-Fluorouracil on HeLa Cells with a Cell-Based Biosensor. Biosensors 2019, 9, 126.[CrossRef] [PubMed]
5

Biosensors 2020, 10, 96
28. Noordhuis, P.; Holwerda, U.; van der Wilt, C.L.; Groeningen, C.; Smid, K.; Meijer, S.; Pinedo, H.; Peters, G.5-Fluorouracil incorporation into RNA and DNA in relation to thymidylate synthase inhibition of humancolorectal cancers. Ann. Oncol. 2004, 15, 1025–1032. [CrossRef]
29. Walko, C.M.; Lindley, C. Capecitabine: A review. Clin. Ther. 2005, 27, 23–44. [CrossRef]30. Hwang, P.M.; Bunz, F.; Yu, J.; Rago, C.; Chan, T.A.; Murphy, M.P.; Kelso, G.F.; Smith, R.A.; Kinzler, K.W.;
Vogelstein, B. Ferredoxin reductase affects p53-dependent, 5-fluorouracil-induced apoptosis in colorectalcancer cells. Nat. Med. 2001, 7, 1111–1117. [CrossRef]
31. Fan, C.; Chen, J.; Wang, Y.; Wong, Y.S.; Zhang, Y.; Zheng, W.; Cao, W.; Chen, T. Selenocystine potentiatescancer cell apoptosis induced by 5-fluorouracil by triggering reactive oxygen species-mediated DNA damageand inactivation of the ERK pathway. Free Radic. Biol. Med. 2013, 65, 305–316. [CrossRef]
32. Liu, M.P.; Liao, M.; Dai, C.; Chen, J.F.; Yang, C.J.; Liu, M.; Chen, Z.G.; Yao, M.C. Sanguisorba officinalis L.synergistically enhanced 5-fluorouracil cytotoxicity in colorectal cancer cells by promoting a reactive oxygenspecies-mediated, mitochondria-caspase-dependent apoptotic pathway. Sci. Rep. 2016, 27, 34245. [CrossRef]
33. Chen, J.; Solomides, C.; Parekh, H.; Simpkins, F.; Simpkins, H. Cisplatin resistance in human cervical, ovarianand lung cancer cells. Cancer Chemother. Pharmacology 2015, 75, 1217–1227.
34. Liu, Y.; Li, Q.; Zhou, L.; Xie, N.; Nice, E.C.; Zhang, H.; Huang, C.; Lei, Y. Cancer drug resistance: Redoxresetting renders a way. Oncotarget 2016, 7, 42740. [CrossRef] [PubMed]
35. Luo, M.; Wicha, M.S. Targeting cancer stem cell redox metabolism to enhance therapy responses.Semin. Radiat. Oncol. 2019, 29, 42–54. [CrossRef] [PubMed]
36. Paivana, G.; Mavrikou, S.; Kaltsas, G.; Kintzios, S. Bioelectrical Analysis of Various Cancer Cell TypesImmobilized in 3D Matrix and Cultured in 3D-Printed Well. Biosensors 2019, 9, 136. [CrossRef] [PubMed]
37. Ibrahim, M.; Alsheikh, A.; Matar, A. Attack Graph Modeling for Implantable Pacemaker. Biosensors 2020,10, 14. [CrossRef] [PubMed]
38. Gollakota, S.; Hassanieh, H.; Ransford, B.; Katabi, D.; Fu, K. They can Hear Your Heartbeats: Non-InvasiveSecurity for Implantable Medical Devices. In Proceedings of the ACM SIGCOMM Conference, Toronto, ON,Canada, 15–19 August 2011; pp. 2–13.
39. Mavrikou, S.; Moschopoulou, G.; Tsekouras, V.; Kintzios, S. Development of a Portable, Ultra-Rapid andUltra-Sensitive Cell-Based Biosensor for the Direct Detection of the SARS-CoV-2 S1 Spike Protein Antigen.Sensors 2020, 20, 3121. [CrossRef]
40. Apostolou, S.; Kintzios, S. Cell-to-Cell Communication: Evidence of Near-Instantaneous Distant,Non-Chemical Communication between Neuronal (Human SK-N-SH Neuroblastoma) Cells by Usinga Novel Bioelectric Biosensor. J. Conscious. Studies 2018, 25, 62–74.
© 2020 by the author. Licensee MDPI, Basel, Switzerland. This article is an open accessarticle distributed under the terms and conditions of the Creative Commons Attribution(CC BY) license (http://creativecommons.org/licenses/by/4.0/).
6

biosensors
Article
Reflectance-Based Organic Pulse Meter Sensor forWireless Monitoring of Photoplethysmogram Signal
Fahed Elsamnah 1, Anubha Bilgaiyan 2, Muhamad Affiq 1, Chang-Hoon Shim 2, Hiroshi Ishidai 3
and Reiji Hattori 1,4,*
1 Department of Applied Science for Electronics and Materials, Kyushu University, Fukuoka 816-8580, Japan2 COI STREAM, Center for Organic Photonics and Electronics Research (OPERA), Kyushu University,
Fukuoka 819-0395, Japan3 Konica Minolta, Inc., Ishikawa-cho, Hachioji 192-8505, Japan4 Global Innovation Center (GIC), Kyushu University, Fukuoka 816-8580, Japan* Correspondence: [email protected]; Tel.: +81-92-583-7887
Received: 19 June 2019; Accepted: 3 July 2019; Published: 10 July 2019
Abstract: This paper compares the structural design of two organic biosensors that minimize powerconsumption in wireless photoplethysmogram (PPG) waveform monitoring. Both devices werefabricated on the same substrate with a red organic light-emitting diode (OLED) and an organicphotodiode (OPD). Both were designed with a circular OLED at the center of the device surroundedby OPD. One device had an OLED area of 0.06 cm2, while the other device had half the area. The gapdistance between the OLED and OPD was 1.65 mm for the first device and 2 mm for the second. Bothdevices had an OPD area of 0.16 cm2. We compared the power consumption and signal-to-noise ratio(SNR) of both devices and evaluated the PPG signal, which was successfully collected from a fingertip.The reflectance-based organic pulse meter operated successfully and at a low power consumption of8 μW at 18 dB SNR. The device sent the PPG waveforms, via Bluetooth low energy (BLE), to a PChost at a maximum rate of 256 kbps data throughput. In the end, the proposed reflectance-basedorganic pulse meter reduced power consumption and improved long-term PPG wireless monitoring.
Keywords: organic optoelectronic device; pulse meter; biosensor; Bluetooth low energy (BLE);photoplethysmogram (PPG)
1. Introduction
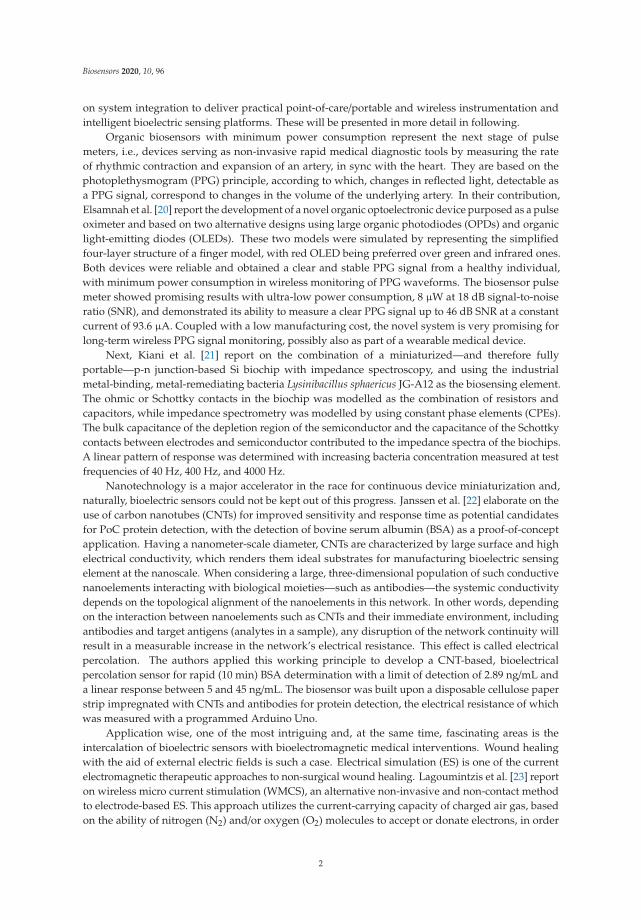
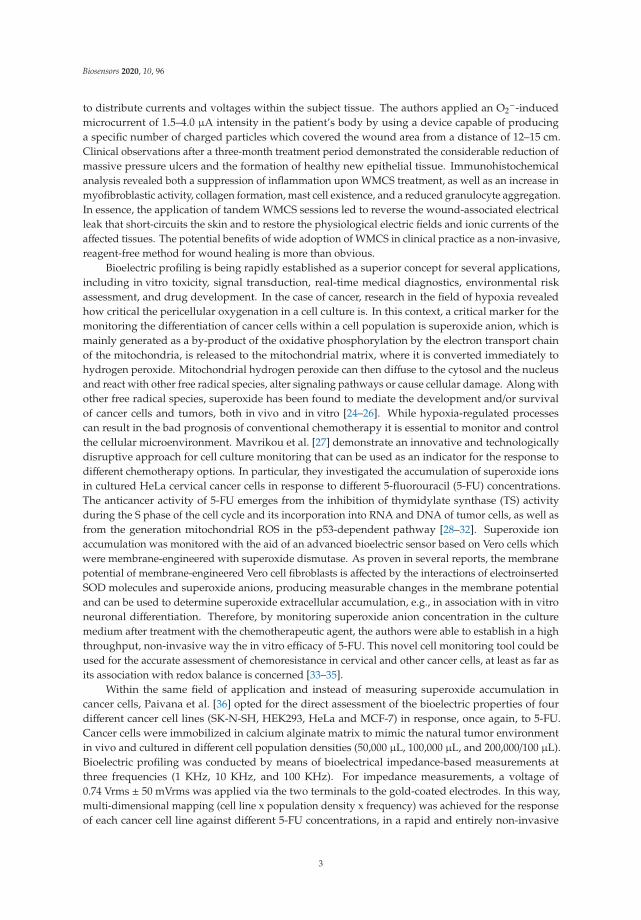
A pulse meter is a device used to measure the rate of rhythmic contraction and expansion of anartery at each beat of the heart based on the photoplethysmogram (PPG) principle. It has receivedenormous attention over the past decade, primarily from the healthcare industry, due to its continuous,real-time, and noninvasive monitoring, which provides the information necessary to determine anindividual’s health status and even provide a preliminary medical diagnosis [1–3]. Pulse meters relyon the PPG principle, which necessitates a light source and a light detector. The light is transmittedthrough tissue and reflects onto the light detector, as shown in Figure 1. When the heart beats, the bloodvolume of the arteries changes accordingly and causes variable light absorption, allowing changesin reflected light to be detected as a PPG signal. The detected PPG signal comprises an alternating(AC) component, due to the variable absorption of the pulsatile arterial blood, and a steady-state (DC)component, from the veins, capillaries, tissues, bones, and other non-pulsatile components, as shownin Figure 2 [4]. The AC component is the outcome of light absorption by the arteries, while the DCcomponent is the outcome of light absorption by body tissues and veins. Therefore, the pulsatileeffect occurs only in the arteries, not in the veins or other non-pulsatile components. There are twoapproaches that can be used to obtain a PPG signal from a biosensor pulse meter: reflection andtransmission. The reflection method was utilized in this work because of the freedom of use. The
Biosensors 2019, 9, 87; doi:10.3390/bios9030087 www.mdpi.com/journal/biosensors7
Biosensors 2019, 9, 87
device could be easily worn or attached to different parts of the human body. The transmission methodinvolves tissue transillumination and required that a light source and a detector be placed oppositeeach other. Consequently, the transmission method could only be used on external body parts such asfingertips and ear lobes.
Figure 1. Acquisition of photoplethysmogram (PPG) signal from the reflection method.
Figure 2. Schematic of light absorption in body tissues.
In recent years, organic pulse oximeters have received significant attention from researchers dueto the many advantages of organic optoelectronic devices, including their relative low cost, simplefabrication and their ability to be fabricated on flexible substrates, for comfortable wearable medicaldevices. Furthermore, large organic photodiodes (OPDs) can be easily fabricated, compared to therestricted size of generic silicon-based photodiodes (PD). This has made organic light-emitting diodes(OLEDs) and OPDs preferable for use in wearable pulse oximeters [5–7]. In the literature, there wereseveral proposed OLED and OPD designs that aimed to improve power consumption and signalquality. To improve the longevity of the batteries in inorganic reflective pulse oximeters, the authorsof [8] proposed an annular PD ring design with a light-emitting diode (LED) located at the center.A rectangular OPD device and a device with two separated square OLEDs were proposed in [9].Meanwhile, the authors in [10] proposed a design with a circular OPD in the center of a half-ringof red polymer light-emitting diodes (PLEDs) and a half-ring of green PLEDs. The authors of [11]conducted optical simulations to test the power consumption of their designs involving a ring of OPDssurrounding a circular OLED. Various other researchers have attempted to develop a wireless pulsemeter and to solve the problems associated with it, such as signal quality and power consumption.In [12], the study proposed a compact portable module composed of an array of photodetectors thatcould be distributed radially around LEDs and the PPG signal sent via a Zigbee protocol wireless
8
Biosensors 2019, 9, 87
module. The chip consumed 38 mA to transmit the data and 37 mA to receive the data. The red LEDsconsumed about 38 mW and the IR LEDs about 26 mW. The authors of [13] proposed a wireless heartrate (HR) and peripheral oxygen saturation (SpO2) monitoring system that could be connected to alocal wireless network via Wi-Fi technology and the information was transmitted in real time to awebpage for remote monitoring. The current consumption of that wireless microcontroller unit (MCU)chip was 229 mA for transmission (TX) traffic and 59 mA for reception (RX) traffic. Other researchersproposed wireless pulse oximeters but did not mention the power consumption of the proposeddevice, such as [14], who proposed a wireless ring-type pulse oximeter with multiple detectors forsending the signal to the host system via Bluetooth. In [15], the authors presented a PPG wirelessmonitoring device embedded in a hat and glove that could send the signal via Bluetooth. However,the wireless PPG signal quality was not adequately addressed in the previous research and prototypes.Moreover, power consumption is a top priority in the development of wireless pulse meters becausethey are battery operated. Although the previous works on pulse oximeters required two light sources,which consumed double the power of one light source. The previously proposed wireless devicesremained impractical for long-term use, although the pulse oximeters required two light sources, whichconsumed double the power of one light source. Therefore, miniature, portable, wearable pulse metersthat are able to be monitored wirelessly will provide more freedom and comfort and will be morecompatible with conventional devices, which will lead to simplified health monitoring [16]. In terms oforganic optoelectronic devices, the material structure, dimension design, and the characteristics of theOPDs and OLEDs in this paper were different to those in previous works. Here, we propose differentmaterial structures and dimensions of OLED/OPD devices based on our previous works [17–19] aspart of our continued attempts to improve the power consumption and signal quality of organicpulse oximeter.
In this work, we compared two different organic pulse meter designs using OLEDs and OPDs.We evaluated their performances in terms of the power consumption of the wireless pulse meter.This paper highlighted the importance of designing OPD and OLED structures, guided by opticalsimulation, to enhanced signal quality and minimize the power consumption for monitoring the PPGwaveforms via Bluetooth low energy (BLE).
2. Materials and Methods
Two devices, Device-1 and Device-2, were fabricated with different OLED areas. Both devices hada circular OLED at the center and were surrounded by a ring of OPDs. Device-1 had an OLED area of0.06 cm2 while Device-2 had an OLED area of 0.03 cm2. The gap distance between the OLED and OPDwas 1.65 mm and 2 mm for Device-1 and Device-2, respectively. Both devices had the same OPD areaof 0.16 cm2. The OPDs were ring-shaped and surrounded the OLED to effectively collect the reflectedphotons from the skin.
2.1. Optical Simulation
To simulate the whole system optically, a simplified finger model was designed and configured,followed by the OLED and OPD device models. Next, all models were simulated optically usingLightTools software (Synopsys, Inc., Mountain View, CA, USA), which uses the ray-tracing and MonteCarlo methods. Figure 3 illustrates the distribution of the light rays from the red OLED into the humanfinger and shows the simplified four-layer structure of a finger model. The red OLED was adopted dueto its advantages over other OLEDs colors including the green OLED and near-infrared (NIR) OLED.In the case of green OLED, the green light has a shorter wavelength, which leads to decreasing thepenetration depth of the light in the human body and getting absorbed. In the case of the NIR OLED,the NIR region of the spectrum has a longer wavelength, which leads to increasing the penetrationdepth of the light in the human body. However, the EQE in this region is significantly lower than theOLED in the visible region. Moreover, fabricating NIR OLED/OPD is difficult and still under researchand development [20,21]. In the model, the arterial blood vessels were assumed to be included in the
9
Biosensors 2019, 9, 87
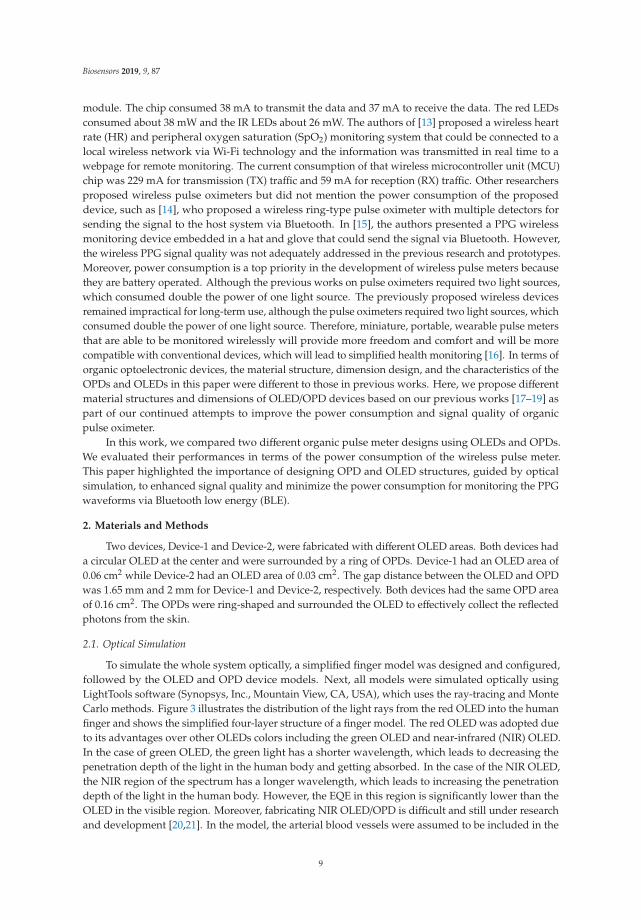
skin and the subcutaneous adipose tissue for simplicity. Device-1 and Device-2 were attached to thesimplified finger model as shown in Figure 3A,B. The optical parameters were approximated using theliterature [22–25], and are shown in Table 1 where the refractive index of the material describes howfast light propagates through the material. The Henyey–Greenstein function was used to approximatethe angular scattering dependence of single scattering events in biological tissues.
Figure 3. A simplified finger schematic with the organic light-emitting diode (OLED) as the light sourceand the organic photodiodes (OPDs) as the surface receiver for (A) Device-1 and (B) Device-2.
Table 1. Summary of the approximated optical parameters of a human finger.
TissueWave-length
(nm)
Index ofRefraction
(n)
Henyey–Greenstein(g)
AbsorptionCoefficient
(Ua) in mm−1
ScatterCoefficient
(Us) in mm−1
Thickness(mm)
Human Skin 625 1.55 0.81 0.27 18.7 2SubcutaneousFat 625 1.44 0.9 1.14 12.8 2.5
Muscle 625 1.37 0.9 0.56 64.7 3Bone 625 1.37 0.9 0.04 19.5 6
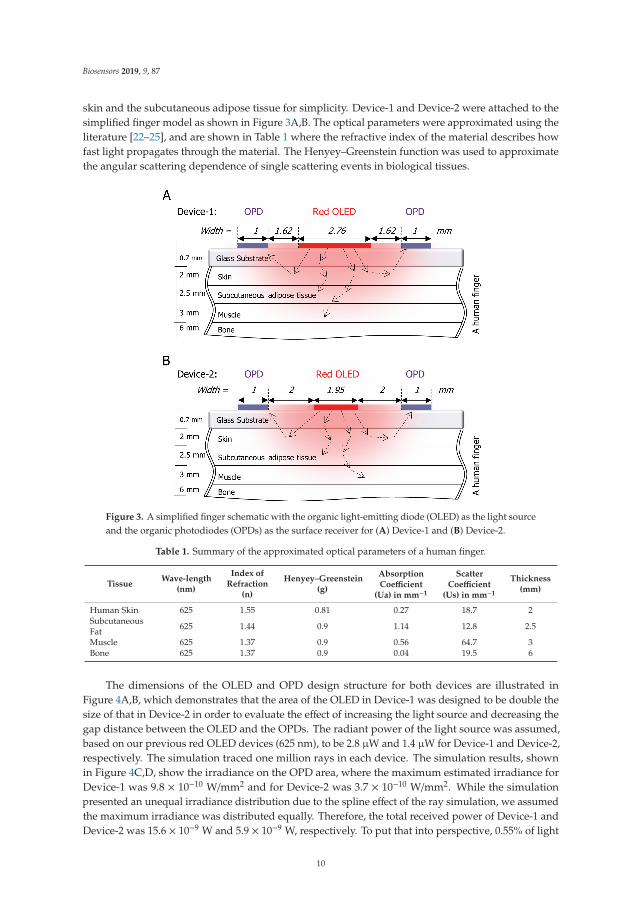
The dimensions of the OLED and OPD design structure for both devices are illustrated inFigure 4A,B, which demonstrates that the area of the OLED in Device-1 was designed to be double thesize of that in Device-2 in order to evaluate the effect of increasing the light source and decreasing thegap distance between the OLED and the OPDs. The radiant power of the light source was assumed,based on our previous red OLED devices (625 nm), to be 2.8 μW and 1.4 μW for Device-1 and Device-2,respectively. The simulation traced one million rays in each device. The simulation results, shownin Figure 4C,D, show the irradiance on the OPD area, where the maximum estimated irradiance forDevice-1 was 9.8 × 10⁻¹⁰ W/mm2 and for Device-2 was 3.7 × 10⁻¹⁰ W/mm2. While the simulationpresented an unequal irradiance distribution due to the spline effect of the ray simulation, we assumedthe maximum irradiance was distributed equally. Therefore, the total received power of Device-1 andDevice-2 was 15.6 × 10⁻⁹ W and 5.9 × 10⁻⁹ W, respectively. To put that into perspective, 0.55% of light
10
Biosensors 2019, 9, 87
rays reflected on the OPD of Device-1, while Device-2 received 0.42% of the light rays on the OPD.In these simulation results, when the gap between the OLED and the OPDs was decreased from 2 mmin Device-2 to 1.62 mm in Device-1, the total power increased to more than double, which means thatthe amplitude of the PPG in Device-1 was expected to be bigger than the amplitude in Device-2.
Figure 4. The dimensions of the OLED and OPD design structure in (A) Device-1 and (B) Device-2.The optical simulation results at the receiver’s surface in Watt per mm2 for (C) Device-1 and (D) Device-2.
2.2. The Organic Optoelectronic Device
Device-1 and Device-2 were fabricated with two different OLED sizes and a similar OPD area.As a monolithic device, the OLED and the OPD were deposited onto the same 0.7-mm-thick glasssubstrate. For simplicity of the structure of the device and future fabrication, identical red OLED andOPD structures, shown in Figure 5A, were fabricated on the same substrate. The organic materialstructure of the OLEDs and OPDs were the same for Device-1 and Device-2, as shown in Figure 5B.
11

Biosensors 2019, 9, 87
Figure 5. (A) The fabricated organic biosensor pulse meter for Device-1 and Device-2. (B) A cross-sectionof the organic material structure of the OLED and OPD for both devices.
The fabrication process of the organic pulse meter sensor started with the preparation of glasssubstrates that were coated with indium-tin-oxide (ITO) and then loaded into an evaporator chamberto deposit organic metal layers with the proper shadow mask patterns for the OLED and followedby the OPD. The shadow masks were designed in a way to prevent the issue of misalignment in themulti-mask processing of monolithic device fabrication. Then, the samples were encapsulated withoutexposure to air in a glove box, which was connected to the deposition chamber by glass lid using UVcurable epoxy resin [18]. Thereafter, the samples were used for evaluating the performance of the pulsemeter sensor. Figure 5B illustrates the structure of the OLED and OPD used in Device-1 and Device-2.The OLED device structure consisted of ITO (110 nm), a transparent anode that allowed the generatedlight to be emitted from the glass panel, HAT-CN (10 nm) as the hole injection layer, Tris-PCz (60 nm)as the hole transport layer, mCBP:10 wt% Ir(piq)3 + (30 nm) as the emissive layer where the holes andelectrons recombined to emit light, T2T (10 nm) as the electron blocking layer, Bpy-TP2 (70 nm) as theelectron transport layer, LiF (0.8 nm) as the electron injection layer, and Al (100 nm) as the cathode forthe OLED. The OPD structure consisted of ITO (110 nm), with MoOx (10 nm) as the hole injection layer,DBP (10 nm), DBP:C60 (50 nm), and C60 (20 nm) combined in the device active layer, BCP (8 nm) asthe electron transport layer, and Al (100 nm) as the cathode.
The characteristics of the OLED and OPD devices were essential to the signal quality of thebiosensor pulse meter. Organic LEDs have many advantages over LEDs, despite the fact that theyhave a shorter lifetime. OLEDs are relatively easy to produce, flexible, foldable, transparent, andcapable of fast switching. Moreover, their cost is lower and they consume less power. The emissionspectra of the OLED for Device-1 and Device-2, where the maximum intensity of light was 625 nm, areshown in Figure 6A. The slight difference in the characteristics of both devices was due to thicknessvariation because the devices were not fabricated at the same time. Figure 6B presents the OPD’sexternal quantum efficiency (EQE) at zero-bias condition, where the maximum EQE was about 37% at625 nm, which sufficiently overlapped with the peak EL of the red OLED wavelength.
12

Biosensors 2019, 9, 87
Figure 6. (A) The OLED’s electroluminescence spectrum with respect to wavelength (nm). (B) TheOPD’s external quantum efficiency (EQE) with respect to the wavelength.
2.3. The Device Structure
The structure of the proposed biosensor pulse meter for wireless monitoring was composed ofthree parts: an organic optoelectronic device, a device holder, and a PCB that included a driver circuitand a wireless microcontroller unit (MCU) module, as illustrated in Figure 7.
Figure 7. (A) The proposed portable pulse meter prototype for wireless monitoring via Bluetooth lowenergy (BLE). (B) The device holder, that used to fix the parts together, and its dimensions.
13

Biosensors 2019, 9, 87
In the driver circuit, the small photocurrent generated by the OPD needed a transimpedanceamplifier (TIA) to convert the OPD current to a voltage signal. Next, the PPG signal required afiltration process to eliminate the high-frequency noise and the DC component from the signal. The laststage was to amplify the AC component of the PPG signal and send it through an analog-to-digitalconverter (ADC) process. Then, the PPG signal was transmitted via serial communication block (SCB)or Bluetooth low energy (BLE). The analog circuit employed in this work was previously described,see [17] for more details. Figure 7A presents the portable pulse meter prototype that was proposed forwireless monitoring of the PPG signal, and Figure 7B illustrates the dimensions of our novel tool forfixing the biosensor pulse meter and the PCB, including the driver circuit and wireless MCU togetherwith aluminum shield for further protection. The wireless MCU module (CYBLE-214015-01, CypressSemiconductor, San Jose, CA, USA) implemented in this work is a certified and qualified modulesupporting BLE wireless communication. It uses a BLE technology in which the battery life is enhancedby keeping the radio activity short and allowing the device to reside in standby or power-down modeduring most of its operating time to consume less power.
3. Results and Discussion
3.1. Comparative Results for Device-1 and Device-2
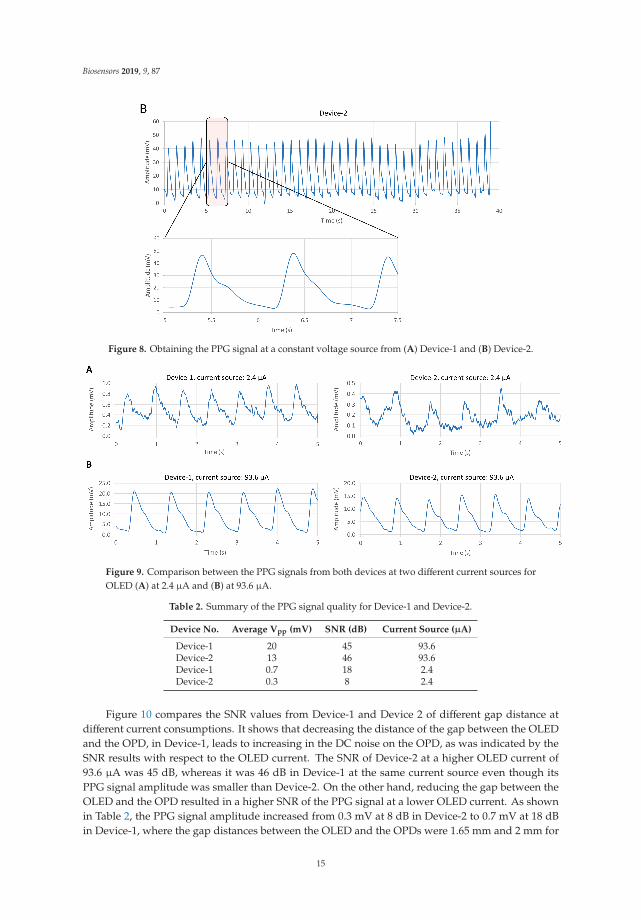
The two pulse meters were evaluated in vivo on a healthy male subject, on his index finger. ThePPG signal was collected from Device-1 and Device-2 sequentially, within a specific time period, whilehe was sitting on a chair. The data were recorded at the sampling frequency of 500 SPS, 8-bit resolutionfrom the SCB and used to evaluate both devices. Figure 8 shows that both devices were reliable andobtained a clear and stable PPG signal. With Device-1, Figure 8A, the peak-to-peak amplitude (Vpp) ofthe PPG signal was about 100 mV, while in Figure 8B, the PPG amplitude of Device-2 was less than 45mV with a constant voltage of 5 V of the OLED. Consequently, the power consumption of each devicewas different. Device-1 consumed about 1.6 mW and Device-2 about 0.6 mW. Therefore, in order tounify the power consumption of both devices, we supplied a constant current. We compared theamplitude and signal-to-noise ratio (SNR) values of both devices for each PPG signal at differentOLED’s driving currents, from 1.2 μA to 93.6 μA, as shown in Figure 9. The constant current wassupplied using the MCU’s analog current source. Table 2 summarizes the PPG signal characteristics ofDevice-1 and Device-2. The method for quantifying the PPG signal quality using the SNR measurementwas previously described in [17].
Figure 8. Cont.
14
Biosensors 2019, 9, 87
Figure 8. Obtaining the PPG signal at a constant voltage source from (A) Device-1 and (B) Device-2.
Figure 9. Comparison between the PPG signals from both devices at two different current sources forOLED (A) at 2.4 μA and (B) at 93.6 μA.
Table 2. Summary of the PPG signal quality for Device-1 and Device-2.
Device No. Average Vpp (mV) SNR (dB) Current Source (μA)
Device-1 20 45 93.6Device-2 13 46 93.6Device-1 0.7 18 2.4Device-2 0.3 8 2.4
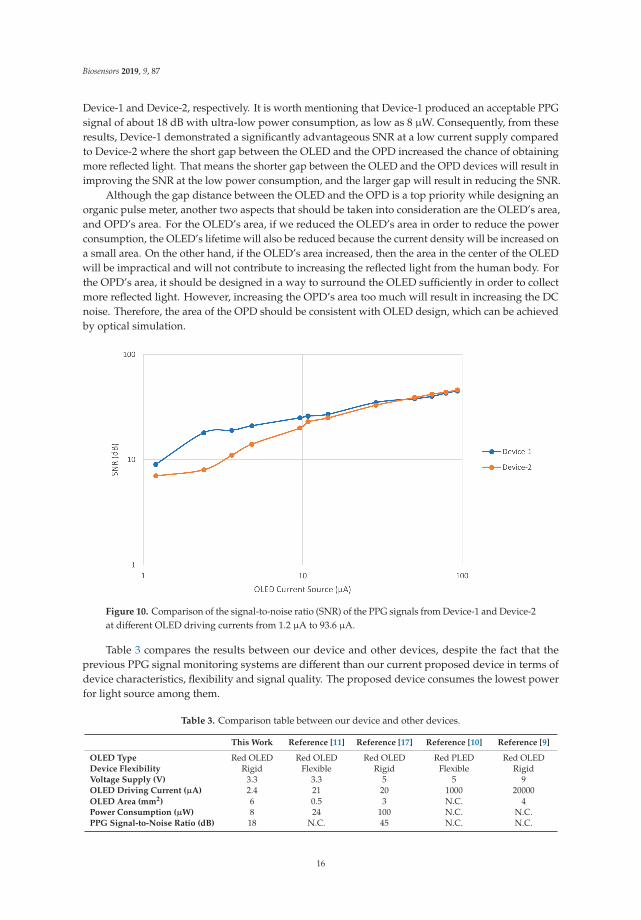
Figure 10 compares the SNR values from Device-1 and Device 2 of different gap distance atdifferent current consumptions. It shows that decreasing the distance of the gap between the OLEDand the OPD, in Device-1, leads to increasing in the DC noise on the OPD, as was indicated by theSNR results with respect to the OLED current. The SNR of Device-2 at a higher OLED current of93.6 μA was 45 dB, whereas it was 46 dB in Device-1 at the same current source even though itsPPG signal amplitude was smaller than Device-2. On the other hand, reducing the gap between theOLED and the OPD resulted in a higher SNR of the PPG signal at a lower OLED current. As shownin Table 2, the PPG signal amplitude increased from 0.3 mV at 8 dB in Device-2 to 0.7 mV at 18 dBin Device-1, where the gap distances between the OLED and the OPDs were 1.65 mm and 2 mm for
15
Biosensors 2019, 9, 87
Device-1 and Device-2, respectively. It is worth mentioning that Device-1 produced an acceptable PPGsignal of about 18 dB with ultra-low power consumption, as low as 8 μW. Consequently, from theseresults, Device-1 demonstrated a significantly advantageous SNR at a low current supply comparedto Device-2 where the short gap between the OLED and the OPD increased the chance of obtainingmore reflected light. That means the shorter gap between the OLED and the OPD devices will result inimproving the SNR at the low power consumption, and the larger gap will result in reducing the SNR.
Although the gap distance between the OLED and the OPD is a top priority while designing anorganic pulse meter, another two aspects that should be taken into consideration are the OLED’s area,and OPD’s area. For the OLED’s area, if we reduced the OLED’s area in order to reduce the powerconsumption, the OLED’s lifetime will also be reduced because the current density will be increased ona small area. On the other hand, if the OLED’s area increased, then the area in the center of the OLEDwill be impractical and will not contribute to increasing the reflected light from the human body. Forthe OPD’s area, it should be designed in a way to surround the OLED sufficiently in order to collectmore reflected light. However, increasing the OPD’s area too much will result in increasing the DCnoise. Therefore, the area of the OPD should be consistent with OLED design, which can be achievedby optical simulation.
Figure 10. Comparison of the signal-to-noise ratio (SNR) of the PPG signals from Device-1 and Device-2at different OLED driving currents from 1.2 μA to 93.6 μA.
Table 3 compares the results between our device and other devices, despite the fact that theprevious PPG signal monitoring systems are different than our current proposed device in terms ofdevice characteristics, flexibility and signal quality. The proposed device consumes the lowest powerfor light source among them.
Table 3. Comparison table between our device and other devices.
This Work Reference [11] Reference [17] Reference [10] Reference [9]
OLED Type Red OLED Red OLED Red OLED Red PLED Red OLEDDevice Flexibility Rigid Flexible Rigid Flexible RigidVoltage Supply (V) 3.3 3.3 5 5 9OLED Driving Current (μA) 2.4 21 20 1000 20000OLED Area (mm2) 6 0.5 3 N.C. 4Power Consumption (μW) 8 24 100 N.C. N.C.PPG Signal-to-Noise Ratio (dB) 18 N.C. 45 N.C. N.C.
16

Biosensors 2019, 9, 87
3.2. Results of BLE PPG Signal from Device-1
This section presents the results of the wireless PPG waveforms from Device-1, which was selectedas the more effective device, in terms of power consumption, for the portable pulse meter. The PPGsignal was obtained from the index finger of the subject while he was resting in a chair during a specificperiod of time. The data were obtained wirelessly from the portable organic pulse meter using BLEtechnology. The PPG signal was sent to a PC host using a universal serial bus (USB) dongle (PRoCBLE CYBL10162-56LQXI, Cypress Semiconductor, San Jose, CA, USA) with 500 SPS of ADC and 8-bitresolution. The recorded length of the PPG signal on the receiving PC host was constrained by thesampling rate of the ADC in the chip. Although the BLE chip had an on-air data rate of 1000 kbps,the maximum throughput data rate between the chip and our receiving PC host was 256 kbps at aminimum connection interval of 7.5 ms. The maximum throughput was measured using the PSoCCreator program from [26] on the BLE module and displayed on terminal window software (Tera Term,Ver. 4.93).
Device-1 successfully showed a very clear PPG signal on the receiving PC host. Figure 11A showsthe wireless PPG waveform on our C# program where the data was obtained from the USB dongle thatsupported BLE. The role of the USB dongle is to convert the Bluetooth signal to a COM port serialsignal. Therefore, the dongle was needed in the case that the PC did not have a built-in Bluetooth ordid not support the BLE. PPG waveform was recorded from the program as a comma-separated values(CSV) file and is presented in Figure 11B. It is noteworthy to mention that the PPG signals encounterseveral factors that can influence the signal’s quality such as the amount of pressure from the humanbody against OLED/OPD device substrate. The device substrate should be coupled with the skin inorder to receive the reflected light on the OPD. However, more pressure on the skin results in morepressure on the blood vessels and that causes weakness of the PPG signal’s amplitude. Therefore,moderate pressure from the human body should be applied to the pulse meter’s substrate.
Figure 11. (A) The C# program shows PPG signal obtained from a universal serial bus (USB) donglethat was connected to the portable pulse meter via BLE. (B) PPG waveform after being recorded fromthe program as a comma-separated values (CSV) file.
17

Biosensors 2019, 9, 87
4. Conclusions
This paper compared two structural designs of organic pulse meters, Device-1 and Device-2,in order to minimize the power consumption in wireless monitoring of PPG waveforms. We discussedthe optical simulation results of both devices. The proposed designs were simulated using ray-tracingand Monte Carlo methods to evaluate the effect of increasing the light source area and decreasingthe gap distance between the OLED and OPD. Based on the simulation, the total optical power ofDevice-1 was more than double to that of Device-2, where the gap distance between the OLED andOPD was 2 mm and 1.62 mm for Device-1 and Device-2, respectively. The simulation results wereverified by fabricating two pulse meter structures with different circular OLED areas at the centerof the device but surrounded by same ring-shaped OPD area. The performance of the proposeddevices was tested in vivo on a healthy individual. In the experimental results, reducing the gapbetween the OLED and the OPDs resulted in a higher SNR of the PPG signal at a low OLED powersource, and a slightly lower SNR at a high OLED power source due to the DC noise. The biosensorpulse meter showed promising results with ultra-low power consumption, 8 μW at 18 dB SNR, anddemonstrated its ability to measure a clear PPG signal up to 46 dB SNR at constant current of 93.6 μA.The proposed reflectance-based organic pulse meter sensor was used to wirelessly monitor the PPGsignals, and its compatible characteristics were successfully demonstrated. Clear PPG waveformswere obtained from the portable pulse meter via BLE at 500 SPS and 8-bit resolution on the receivingPC host. The maximum throughput data rate between the chip and the PC host was 256 kbps atthe minimum connection interval of 7.5 ms. Our proposed device was capable of producing a clearPPG signal and operating on ultra-low power, which is essential for long-term wireless PPG signalmonitoring. In future work, the organic optoelectronic device, OPD/OLED, will be fabricated ontoa flexible substrate in order to add flexibility to the pulse meter as well as comfortability of use as awearable medical device.
Author Contributions: Supervision and validation, R.H.; conceptualization, all authors; formal analysis, F.E.and M.A.; methodology, A.B., H.I., C.-H.S., and F.E.; software, F.E.; writing—original draft preparation F.E.;writing—review and editing, R.H. and F.E. All authors approved the final manuscript.
Funding: This research was funded by the Center of Innovation Program (COI STREAM) from the Japan Scienceand Technology Agency (JST).
Acknowledgments: Support from Kyushu University and the Ministry of Education, Culture, Sports, Science,and Technology (MEXT), Japan is highly appreciated.
Conflicts of Interest: The authors declare no conflict of interest. The funder had no role in the design of the study,the collection, analysis, or interpretation of the data, the writing of the manuscript, or the decision to publishthe results.
References
1. Webster, J.G. Design of Pulse Oximeters; CRC Press: Boca Raton, FL, USA, 1997.2. Jubran, A. Pulse oximetry. In Applied Physiology in Intensive Care Medicine 1, 3rd ed.; Physiological
Notes—Technical Notes—Seminal Studies in Intensive Care; Springer-Verlag: Berlin/Heidelberg, Germany,2012; pp. 51–54.
3. Guk, K.; Han, G.; Lim, J.; Jeong, K.; Kang, T. Evolution of Wearable Devices with Real-Time DiseaseMonitoring for Personalized Healthcare. Nanomaterials 2019, 9, 813. [CrossRef] [PubMed]
4. de Kock, J.P.; Tarassenko, L. Pulse oximetry: theoretical and experimental models. Med. Biol. Eng. Comput.1993, 31, 291–300. [CrossRef] [PubMed]
5. Chen, C.T. Evolution of red organic light-emitting diodes: Materials and devices. Chem. Mater. 2004, 16,4389–4400. [CrossRef]
6. Thejo Kalyani, N.; Dhoble, S.J. Organic light emitting diodes: Energy saving lighting technology—A review.Renew. Sustain. Energy Rev. 2012, 16, 2696–2723. [CrossRef]
7. Geffroy, B.; le Roy, P.; Prat, C. Organic light-emitting diode (OLED) technology: Materials, devices anddisplay technologies. Polym. Int. 2006, 55, 572–582. [CrossRef]
18
Biosensors 2019, 9, 87
8. Mendelson, Y.; Pujary, C. Measurement site and photodetector size considerations in optimizing powerconsumption of a wearable reflectance pulse oximeter. In Proceedings of the 25th Annual InternationalConference of the IEEE Engineering in Medicine and Biology Society, Cancun, Mexico, 17–21 September2003; pp. 3016–3019.
9. Lochner, C.M.; Khan, Y.; Pierre, A.; Arias, A.C. All-organic optoelectronic sensor for pulse oximetry. Nat.Commun. 2014, 5, 1–7. [CrossRef] [PubMed]
10. Tachibana, Y.; Kaltenbrunner, M.; Koizumi, M.; Matsuhisa, N.; Yukita, W.; Zalar, P.; Jinno, H.; Someya, T.;Kitanosako, H.; Yokota, T. Ultraflexible organic photonic skin. Sci. Adv. 2016, 2, e1501856.
11. Kim, H.; Lee, H.; Yoo, S.; Kim, M.; Kim, E.; Lee, J.; Yoo, H.-J.; Lee, Y. Toward all-day wearable healthmonitoring: An ultralow-power, reflective organic pulse oximetry sensing patch. Sci. Adv. 2018, 4, eaas9530.
12. Li, K.; Warren, S. A wireless reflectance pulse oximeter with digital baseline control for unfilteredphotoplethysmograms. IEEE Trans. Biomed. Circuits Syst. 2012, 6, 269–278. [CrossRef] [PubMed]
13. Ayance, T.; Trevi, C.G. Wireless heart rate and oxygen saturation monitor Wireless Heart Rate and OxygenSaturation Monitor. AIP Conf. Proc. 2019, 2090, 1–5.
14. Huang, C.; Chan, M.; Chen, C.; Lin, B. Novel Wearable and Wireless Ring-Type Pulse Oximeter withMulti-Detectors. Sensors 2014, 14, 17586–17599. [CrossRef] [PubMed]
15. Spigulis, J.; Erts, R.; Nikiforovs, V.; Kviesis-kipge, E. Wearable wireless photoplethysmography sensors.In Proceedings of the Biophotonics: Photonic Solutions for Better Health Care, Strasbourg, France, 7–11 April2008; Volume 6991, pp. 1–7.
16. Ha, M.; Lim, S.; Ko, H. Wearable and flexible sensors for user-interactive health-monitoring devices. J. Mater.Chem. B 2018, 6, 4043–4064. [CrossRef]
17. Elsamnah, F.; Bilgaiyan, A.; Affiq, M.; Shim, C.-H.; Ishidai, H.; Hattori, R. Comparative Design Study forPower Reduction in Organic Optoelectronic Pulse Meter Sensor. Biosensors 2019, 9, 48. [CrossRef] [PubMed]
18. Bilgaiyan, A.; Sugawara, R.; Elsamnah, F.; Shim, C.; Affiq, M.; Hattori, R. Optimizing performance ofreflectance-based organic Photoplethysmogram (PPG) sensor. In Proceedings of the Organic and HybridSensors and Bioelectronics XI, San Diego, CA, USA, 19–23 August 2018; Volume 10738, p. 1073808.
19. Elsamnah, F.; Hattori, R.; Shim, C.-H.; Bilgaiyan, A.; Sugawara, R.; Affiq, M. Reflectance-based MonolithicOrganic Pulsemeter Device for Measuring Photoplethysmogram Signal. In Proceedings of the 2018 IEEEInternational Instrumentation and Measurement Technology Conference (I2MTC), Houston, TX, USA, 14–17May 2018; pp. 1–5.
20. Sommer, J.R.; Farley, R.T.; Graham, K.R.; Yang, Y.; Reynolds, J.R.; Xue, J.; Schanze, K.S. Efficient Near-InfraredPolymer and Organic Light-Emitting Diodes Based on Electrophosphorescence from. ACS Appl. Mater.Interfaces 2009, 1, 274–278. [CrossRef] [PubMed]
21. Xue, J.; Li, C.; Xin, L.; Duan, L.; Qiao, J. High-efficiency and low efficiency roll-off near-infrared fluorescentOLEDs through triplet fusion. Chem. Sci. 2016, 7, 2888–2895. [CrossRef] [PubMed]
22. Jacques, S.L. Optical properties of biological tissues: a review. Phys. Med. Biol. 2013, 58, R37. [CrossRef][PubMed]
23. Zamburlini, M.; Pejovic-Milic, A.; Chettle, D.R.; Webber, C.E.; Gyorffy, J. In vivo study of an x-ray fluorescencesystem to detect bone strontium non-invasively. Phys. Med. Biol. 2007, 52, 2107–2122. [CrossRef] [PubMed]
24. Akkus, O.; Uzunlulu, M.; Kizilgul, M. Evaluation of Skin and Subcutaneous Adipose Tissue Thickness forOptimal Insulin Injection. J. Diabetes Metab. 2012, 3. [CrossRef]
25. Drahansky, M.; Kanich, O.; Brezinová, E.; Shinoda, K. Experiments with Optical Properties of Skin on Fingers.Int. J. Opt. Appl. 2016, 6, 37–46.
26. Luthra, G. PROJECT #024: BLE Throughput—Pushing the Limits. Available online: http://www.cypress.com/blog/100-projects-100-days/project-024-ble-throughput-pushing-limits (accessed on 10 June 2019).
© 2019 by the authors. Licensee MDPI, Basel, Switzerland. This article is an open accessarticle distributed under the terms and conditions of the Creative Commons Attribution(CC BY) license (http://creativecommons.org/licenses/by/4.0/).
19

biosensors
Article
P-N Junction-Based Si Biochips with Ring Electrodesfor Novel Biosensing Applications
Mahdi Kiani 1,*, Nan Du 1,*, Manja Vogel 2, Johannes Raff 2, Uwe Hübner 3, Ilona Skorupa 2,
Danilo Bürger 1, Stefan E. Schulz 1,4, Oliver G. Schmidt 5 and Heidemarie Schmidt 1,3,*
1 Department Back-End of Line, Fraunhofer Institute for Electronic Nano Systems, Technologie-Campus 3,09126 Chemnitz, Germany
2 Helmholtz-Zentrum Dresden-Rossendorf, Bautzner Landstraße 400, 01328 Dresden, Germany3 Leibniz Institute of Photonic Technology, Albert-Einstein-Str. 9, 07745 Jena, Germany4 Center for Microtechnologies, Chemnitz University of Technology, Reichenhainer Str. 70,
09126 Chemnitz, Germany5 Institute for Integrative Nanosciences IFW Dresden, Helmholtzstr. 20, 01069 Dresden, Germany* Correspondence: [email protected] (M.K.); [email protected] (N.D.);
[email protected] (H.S.)
Received: 28 August 2019; Accepted: 2 October 2019; Published: 11 October 2019
Abstract: In this work, we report on the impedance of p-n junction-based Si biochips with gold ring topelectrodes and unstructured platinum bottom electrodes which allows for counting target biomaterialin a liquid-filled ring top electrode region. The systematic experiments on p-n junction-basedSi biochips fabricated by two different sets of implantation parameters (i.e. biochips PS5 andBS5) are studied, and the comparable significant change of impedance characteristics in thebiochips in dependence on the number of bacteria suspension, i.e., Lysinibacillus sphaericus JG-A12,in Deionized water with an optical density at 600 nm from OD600 = 4–16 in the electrode ring regionis demonstrated. Furthermore, with the help of the newly developed two-phase electrode structure,the modeled capacitance and resistance parameters of the electrical equivalent circuit describing thep-n junction-based biochips depend linearly on the number of bacteria in the ring top electrode region,which successfully proves the potential performance of p-n junction-based Si biochips in observingthe bacterial suspension. The proposed p-n junction-based biochips reveal perspective applicationsin medicine and biology for diagnosis, monitoring, management, and treatment of diseases.
Keywords: biochips; impedance spectroscopy; electrical equivalent circuit; biomaterial; Lysinibacillussphaericus JG-A12
1. Introduction
Biochips [1], as one of the most advancing technologies in the biomedical field, have attractedlots of attention in the past decades due to their promising functionalities, e.g., for the detection andrecognition of biomaterial in a considerable wide range [2]. In the application field of microbiology,in comparison to optical microscopy, the biochips can prevent human errors and offer faster and easierfunctional operation as lab measurement tools for biosensing purposes. Thus, the biochips can behelpful for the disease diagnosis with high reliability and time efficiency. Biochips possess manyadvantages such as mass production, simple immobilization, high density, and high throughput [3].
In this work, the miniaturized p-n junction-based Si biochips are proposed with well-defined goldring top electrodes and unstructured platinum bottom electrodes, which offer the advantages for sensingthe biomaterial such as cost-effectiveness and high portability. The impedance spectroscopy (ImS) [4]has been used to characterize the novel designed biochips. After applying the biomaterial in the Au ringtop electrode region, the two-phase electrode structure has been successfully developed and investigated
Biosensors 2019, 9, 120; doi:10.3390/bios9040120 www.mdpi.com/journal/biosensors21

Biosensors 2019, 9, 120
for establishing the functioning electrical equivalent circuit of biochips, which can be utilized forinterpreting the impedance properties that recorded between the top and bottom electrodes [5].Based on the two-phase electrode structure, the straight-forward linear relationship between thespecific equivalent circuit parameters and the cell numbers has been discovered, which offers theopportunity for determining biomaterial concentration with low cost and high efficiency [6].
Furthermore, the novel p-n junction-based Si biochips possess the advantages from differentperspectives. First, the analysis cost required by p-n junction-based Si biochips for determining the celldensity of the biomaterials is considerably lower than that required by other methods [7]. For example,in comparison to analytical techniques such as mass spectrophotometry, gas chromatography, or liquidchromatography [8], the proposed biochips need no special treatments to the biomaterials and they canbe kept alive during the detection process. In perspective applications, the number of biomaterials willbe determined in a large concentration range by using p-n junction-based Si biochips in conductionwith their impedance characterization. Second, the newly developed two-phase electrode structureenhanced the sensitivity of the corresponding equivalent circuit and improved the analytical accuracyof the recorded impedance properties of biochips, which enabled the possibility for sensing biomaterialwith considerable low cost [9]. In this paper, the bacteria Lysinibacillus sphaericus JG-A12 [10] has beenstudied due to its potential industrial applications in metal remediation or selective recovery of metalsin recycling processes. The S-layer protein in Lysinibacillus sphaericus JG-A12 is mainly responsible forsuch outstanding metal-binding capabilities. The impedance spectroscopy of p-n junction-based Sibiochips may offer a new possibility for online monitoring the biomass during the cultivation process.
The paper is structured as follows: In Materials and Methods section, we describe the structure ofproposed p-n junction-based Si biochips and introduce electrical equivalent circuit. In Results section,the systematical experimental study of impedance properties of biochips is demonstrated, and theequivalent circuit parameters are extracted. In Discussions section, the origin of two-phase electrodestructure is studied and validated by the experimentally recorded impedance data. The paper issummarized and an outlook is given in Conclusion section.
2. Materials and Methods
The bacteria used for the investigation in the work is Lysinibacillus sphaericus JG-A12,i.e., a Gram-positive, rod-shaped soil bacterium isolated from the uranium mining waste pile"Haberland" near Johanngeorgenstadt in Saxony, Germany. They were cultivated in nutrient broth(8 g/L, Mast Group) overnight in Erlenmeyer flasks at 30 ◦C with shaking at 100 rpm. Cell densitywas determined by measuring the optical density at 600 nm (OD600) using a UV–Vis spectrometer.Correlation between OD600 and cell number was achieved by cell counting under a microscope using aNeubauer counting chamber.
Detection and culture purity of the Lysinibacillus sphaericus JG-A12 is usually done with help ofmicroscopy, including the morphology of colonies on agar plates, the growth behavior, even the smellof the culture. To make sure that a microorganism is Lysinibacillus sphaericus JG-A12, one has to usegenetics means for detecting the 16S rDNA sequence. All these tests are time-consuming. The cellnumber could be estimated by optical density measurements (OD 600 nm) by putting culture samplesinto UV–VIS spectrophotometer and using established correlation between cell count by microscopyand OD values. The proposed p-n junction-based Si biochip could be used in a bypass of a culturevessel to measure cell density.
2.1. Structural Description
As illustrated in Figure 1, phosphor or boron ions have been implanted into p- or n-type siliconwafers with a thickness of 525 μm, which results in an n-p junction or a p-n junction, respectively.The 150 nm thick gold (Au) ring top electrodes have been deposited by dc-magnetron sputtering withinner and outer diameters of 6.7 mm and 8.0 mm (Figure 1b). A ring electrode has been chosen becauseof the homogenous field distribution between top and bottom electrodes. In the work, the biochips
22

Biosensors 2019, 9, 120
PS5 and BS5 have been manufactured, measured, and modeled to analyze influence of bacteria onthe biochips. Table 1 lists the overview of the implantation parameters for the manufacturing of thebiochips PS5 and BS5 with ring top electrodes.
Figure 1. Schematic sketch of the p-n junction-based Si biochip with a ring top electrode with (a) boronions implanted into Si:P or with (c) phosphorous ions implanted into Si:B. (b) Photograph of a socketedp-n junction-based Si biochip with Au ring electrode. Top and bottom electrodes have been wire-bondedto a diode socket and connected to an Agilent 4294A impedance bridge.
Table 1. Implantation parameters of biochips PS5 (phosphor into Si:B) and BS5 (boron into Si:P). The Auring top electrodes and unstructured Pt bottom contacts have been prepared after ion implantation.
Biochip Implanted Ion Ion Energy (MeV) Ion Fluence (cm−2)
PS5 Phosphor 1 3 × 10¹³
BS5 Boron 0.45 3 × 10¹³
The impedance characteristics of biochips PS5 and BS5 have been recorded within the frequencyrange from 40 Hz to 1 MHz under normal daylight at room temperature. These measurementswere taken using the Agilent 4294A precision impedance analyzer. In the impedance experiments,the solvent (Deionized water) and the bacteria (Lysinibacillus sphaericus JG-A12) are added into the Auring top electrode region.
In order to visualize the different concentrations of Lysinibacillus sphaericus JG-A12, the opticalmicroscopic images have been taken before adding (Figure 2a) and after adding bacteria withcorresponding optical density at 600 nm (OD600) (Figure 2b–d). The Au ring top electrodes aredeposited on a glass slide for utilizing the phase contrast mode of microscope. The OD600 is a commonmeasure for microbial cell density, which can be correlated to the cell number per volume dependingon the chosen bacteria. In this work, the OD600 of 4 up to 16 are applied in the Au ring top electroderegion for further impedance characterization, which corresponds to bacteria concentration of 1.23E9up to 6.15E9 cfu/mL under the assumption that all of the cells are alive.
Figure 2. Top view optical microscopic image of a section of ring electrode on glass with (a) Deionizedwater, (b) bacteria in water at OD600 0.25, (c) bacteria in water at OD600 1, (d) bacteria in water atOD600 2 in the ring top electrode region. Here a transparent glass substrate has been used to illuminatethe sample with light from the backside. The thickness of the ring top electrodes was 150 nm and waslarge enough to keep the inserted liquid in the ring top electrode.
23
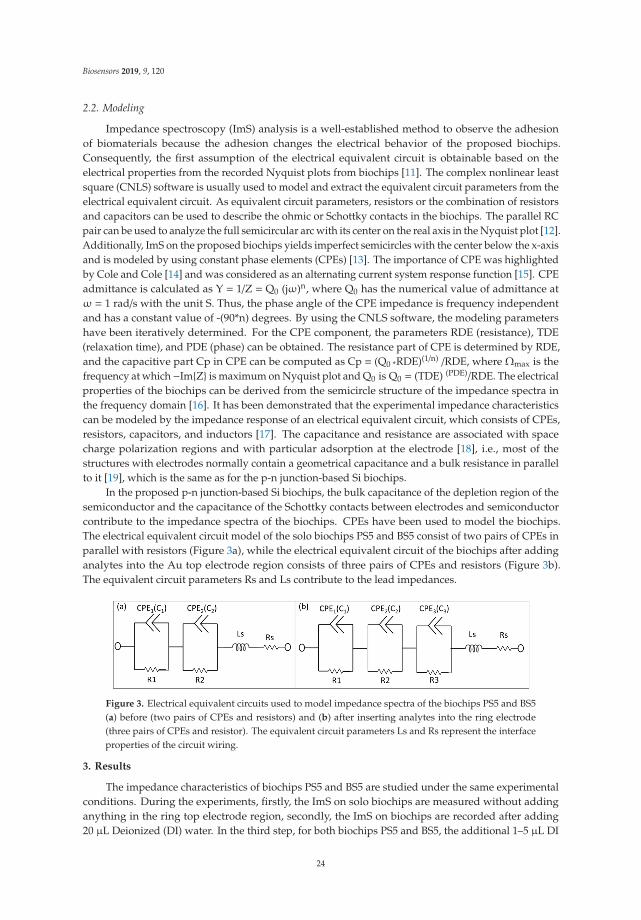
Biosensors 2019, 9, 120
2.2. Modeling
Impedance spectroscopy (ImS) analysis is a well-established method to observe the adhesionof biomaterials because the adhesion changes the electrical behavior of the proposed biochips.Consequently, the first assumption of the electrical equivalent circuit is obtainable based on theelectrical properties from the recorded Nyquist plots from biochips [11]. The complex nonlinear leastsquare (CNLS) software is usually used to model and extract the equivalent circuit parameters from theelectrical equivalent circuit. As equivalent circuit parameters, resistors or the combination of resistorsand capacitors can be used to describe the ohmic or Schottky contacts in the biochips. The parallel RCpair can be used to analyze the full semicircular arc with its center on the real axis in the Nyquist plot [12].Additionally, ImS on the proposed biochips yields imperfect semicircles with the center below the x-axisand is modeled by using constant phase elements (CPEs) [13]. The importance of CPE was highlightedby Cole and Cole [14] and was considered as an alternating current system response function [15]. CPEadmittance is calculated as Y = 1/Z = Q0 (jω)n, where Q0 has the numerical value of admittance atω = 1 rad/s with the unit S. Thus, the phase angle of the CPE impedance is frequency independentand has a constant value of -(90*n) degrees. By using the CNLS software, the modeling parametershave been iteratively determined. For the CPE component, the parameters RDE (resistance), TDE(relaxation time), and PDE (phase) can be obtained. The resistance part of CPE is determined by RDE,and the capacitive part Cp in CPE can be computed as Cp = (Q0 *RDE)(1/n) /RDE, where Ωmax is thefrequency at which−Im{Z} is maximum on Nyquist plot and Q0 is Q0 = (TDE) (PDE)/RDE. The electricalproperties of the biochips can be derived from the semicircle structure of the impedance spectra inthe frequency domain [16]. It has been demonstrated that the experimental impedance characteristicscan be modeled by the impedance response of an electrical equivalent circuit, which consists of CPEs,resistors, capacitors, and inductors [17]. The capacitance and resistance are associated with spacecharge polarization regions and with particular adsorption at the electrode [18], i.e., most of thestructures with electrodes normally contain a geometrical capacitance and a bulk resistance in parallelto it [19], which is the same as for the p-n junction-based Si biochips.
In the proposed p-n junction-based Si biochips, the bulk capacitance of the depletion region of thesemiconductor and the capacitance of the Schottky contacts between electrodes and semiconductorcontribute to the impedance spectra of the biochips. CPEs have been used to model the biochips.The electrical equivalent circuit model of the solo biochips PS5 and BS5 consist of two pairs of CPEs inparallel with resistors (Figure 3a), while the electrical equivalent circuit of the biochips after addinganalytes into the Au top electrode region consists of three pairs of CPEs and resistors (Figure 3b).The equivalent circuit parameters Rs and Ls contribute to the lead impedances.
Figure 3. Electrical equivalent circuits used to model impedance spectra of the biochips PS5 and BS5(a) before (two pairs of CPEs and resistors) and (b) after inserting analytes into the ring electrode(three pairs of CPEs and resistor). The equivalent circuit parameters Ls and Rs represent the interfaceproperties of the circuit wiring.
3. Results
The impedance characteristics of biochips PS5 and BS5 are studied under the same experimentalconditions. During the experiments, firstly, the ImS on solo biochips are measured without addinganything in the ring top electrode region, secondly, the ImS on biochips are recorded after adding20 μL Deionized (DI) water. In the third step, for both biochips PS5 and BS5, the additional 1–5 μL DI
24
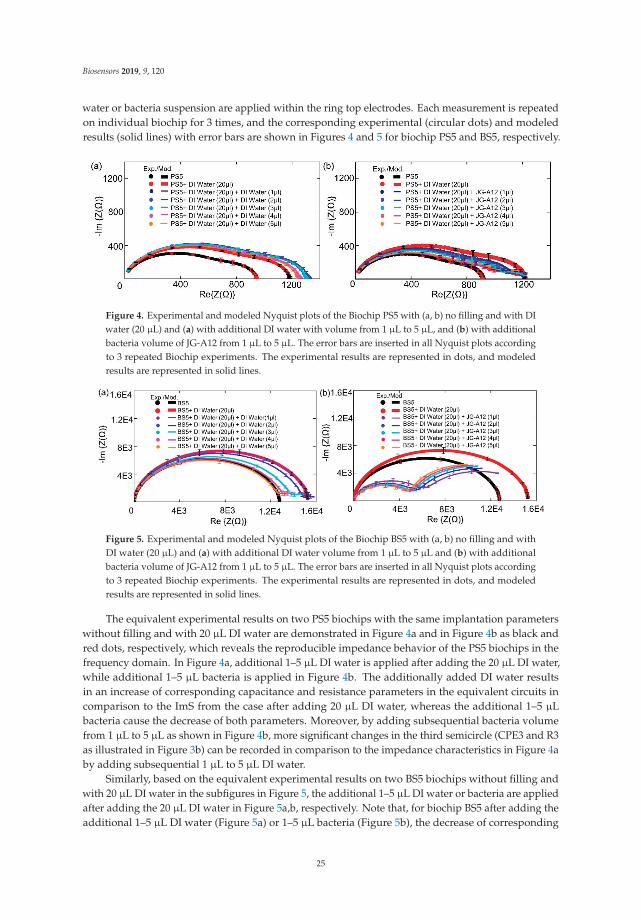
Biosensors 2019, 9, 120
water or bacteria suspension are applied within the ring top electrodes. Each measurement is repeatedon individual biochip for 3 times, and the corresponding experimental (circular dots) and modeledresults (solid lines) with error bars are shown in Figures 4 and 5 for biochip PS5 and BS5, respectively.
Figure 4. Experimental and modeled Nyquist plots of the Biochip PS5 with (a, b) no filling and with DIwater (20 μL) and (a) with additional DI water with volume from 1 μL to 5 μL, and (b) with additionalbacteria volume of JG-A12 from 1 μL to 5 μL. The error bars are inserted in all Nyquist plots accordingto 3 repeated Biochip experiments. The experimental results are represented in dots, and modeledresults are represented in solid lines.
Figure 5. Experimental and modeled Nyquist plots of the Biochip BS5 with (a, b) no filling and withDI water (20 μL) and (a) with additional DI water volume from 1 μL to 5 μL and (b) with additionalbacteria volume of JG-A12 from 1 μL to 5 μL. The error bars are inserted in all Nyquist plots accordingto 3 repeated Biochip experiments. The experimental results are represented in dots, and modeledresults are represented in solid lines.
The equivalent experimental results on two PS5 biochips with the same implantation parameterswithout filling and with 20 μL DI water are demonstrated in Figure 4a and in Figure 4b as black andred dots, respectively, which reveals the reproducible impedance behavior of the PS5 biochips in thefrequency domain. In Figure 4a, additional 1–5 μL DI water is applied after adding the 20 μL DI water,while additional 1–5 μL bacteria is applied in Figure 4b. The additionally added DI water resultsin an increase of corresponding capacitance and resistance parameters in the equivalent circuits incomparison to the ImS from the case after adding 20 μL DI water, whereas the additional 1–5 μLbacteria cause the decrease of both parameters. Moreover, by adding subsequential bacteria volumefrom 1 μL to 5 μL as shown in Figure 4b, more significant changes in the third semicircle (CPE3 and R3as illustrated in Figure 3b) can be recorded in comparison to the impedance characteristics in Figure 4aby adding subsequential 1 μL to 5 μL DI water.
Similarly, based on the equivalent experimental results on two BS5 biochips without filling andwith 20 μL DI water in the subfigures in Figure 5, the additional 1–5 μL DI water or bacteria are appliedafter adding the 20 μL DI water in Figure 5a,b, respectively. Note that, for biochip BS5 after adding theadditional 1–5 μL DI water (Figure 5a) or 1–5 μL bacteria (Figure 5b), the decrease of corresponding
25
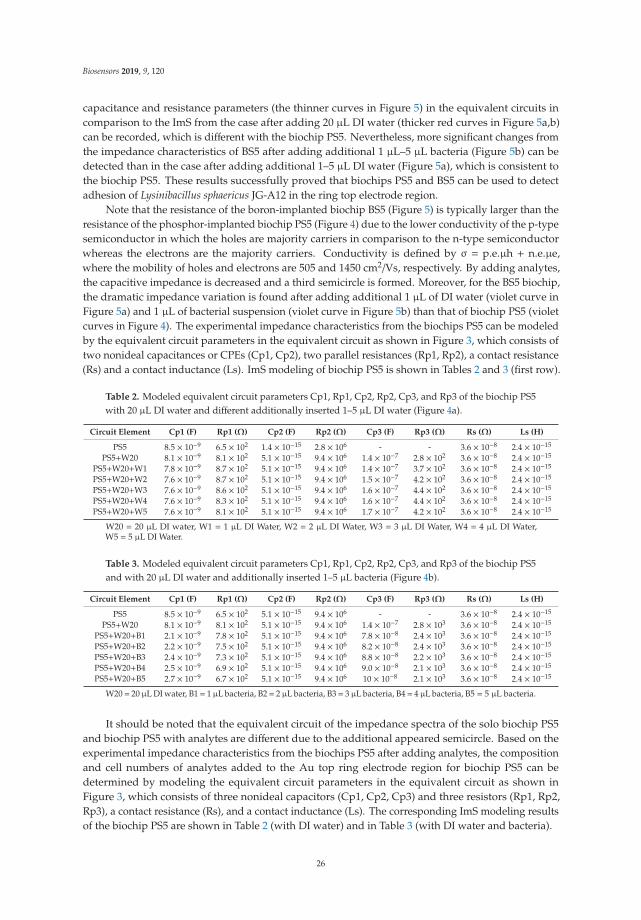
Biosensors 2019, 9, 120
capacitance and resistance parameters (the thinner curves in Figure 5) in the equivalent circuits incomparison to the ImS from the case after adding 20 μL DI water (thicker red curves in Figure 5a,b)can be recorded, which is different with the biochip PS5. Nevertheless, more significant changes fromthe impedance characteristics of BS5 after adding additional 1 μL–5 μL bacteria (Figure 5b) can bedetected than in the case after adding additional 1–5 μL DI water (Figure 5a), which is consistent tothe biochip PS5. These results successfully proved that biochips PS5 and BS5 can be used to detectadhesion of Lysinibacillus sphaericus JG-A12 in the ring top electrode region.
Note that the resistance of the boron-implanted biochip BS5 (Figure 5) is typically larger than theresistance of the phosphor-implanted biochip PS5 (Figure 4) due to the lower conductivity of the p-typesemiconductor in which the holes are majority carriers in comparison to the n-type semiconductorwhereas the electrons are the majority carriers. Conductivity is defined by σ = p.e.μh + n.e.μe,where the mobility of holes and electrons are 505 and 1450 cm2/Vs, respectively. By adding analytes,the capacitive impedance is decreased and a third semicircle is formed. Moreover, for the BS5 biochip,the dramatic impedance variation is found after adding additional 1 μL of DI water (violet curve inFigure 5a) and 1 μL of bacterial suspension (violet curve in Figure 5b) than that of biochip PS5 (violetcurves in Figure 4). The experimental impedance characteristics from the biochips PS5 can be modeledby the equivalent circuit parameters in the equivalent circuit as shown in Figure 3, which consists oftwo nonideal capacitances or CPEs (Cp1, Cp2), two parallel resistances (Rp1, Rp2), a contact resistance(Rs) and a contact inductance (Ls). ImS modeling of biochip PS5 is shown in Tables 2 and 3 (first row).
Table 2. Modeled equivalent circuit parameters Cp1, Rp1, Cp2, Rp2, Cp3, and Rp3 of the biochip PS5with 20 μL DI water and different additionally inserted 1–5 μL DI water (Figure 4a).
Circuit Element Cp1 (F) Rp1 (Ω) Cp2 (F) Rp2 (Ω) Cp3 (F) Rp3 (Ω) Rs (Ω) Ls (H)
PS5 8.5 × 10⁻⁹ 6.5 × 10² 1.4 × 10⁻¹⁵ 2.8 × 10⁶ - - 3.6 × 10⁻⁸ 2.4 × 10⁻¹⁵
PS5+W20 8.1 × 10⁻⁹ 8.1 × 10² 5.1 × 10⁻¹⁵ 9.4 × 10⁶ 1.4 × 10⁻⁷ 2.8 × 10² 3.6 × 10⁻⁸ 2.4 × 10⁻¹⁵
PS5+W20+W1 7.8 × 10⁻⁹ 8.7 × 10² 5.1 × 10⁻¹⁵ 9.4 × 10⁶ 1.4 × 10⁻⁷ 3.7 × 10² 3.6 × 10⁻⁸ 2.4 × 10⁻¹⁵
PS5+W20+W2 7.6 × 10⁻⁹ 8.7 × 10² 5.1 × 10⁻¹⁵ 9.4 × 10⁶ 1.5 × 10⁻⁷ 4.2 × 10² 3.6 × 10⁻⁸ 2.4 × 10⁻¹⁵
PS5+W20+W3 7.6 × 10⁻⁹ 8.6 × 10² 5.1 × 10⁻¹⁵ 9.4 × 10⁶ 1.6 × 10⁻⁷ 4.4 × 10² 3.6 × 10⁻⁸ 2.4 × 10⁻¹⁵
PS5+W20+W4 7.6 × 10⁻⁹ 8.3 × 10² 5.1 × 10⁻¹⁵ 9.4 × 10⁶ 1.6 × 10⁻⁷ 4.4 × 10² 3.6 × 10⁻⁸ 2.4 × 10⁻¹⁵
PS5+W20+W5 7.6 × 10⁻⁹ 8.1 × 10² 5.1 × 10⁻¹⁵ 9.4 × 10⁶ 1.7 × 10⁻⁷ 4.2 × 10² 3.6 × 10⁻⁸ 2.4 × 10⁻¹⁵
W20 = 20 μL DI water, W1 = 1 μL DI Water, W2 = 2 μL DI Water, W3 = 3 μL DI Water, W4 = 4 μL DI Water,W5 = 5 μL DI Water.
Table 3. Modeled equivalent circuit parameters Cp1, Rp1, Cp2, Rp2, Cp3, and Rp3 of the biochip PS5and with 20 μL DI water and additionally inserted 1–5 μL bacteria (Figure 4b).
Circuit Element Cp1 (F) Rp1 (Ω) Cp2 (F) Rp2 (Ω) Cp3 (F) Rp3 (Ω) Rs (Ω) Ls (H)
PS5 8.5 × 10⁻⁹ 6.5 × 10² 5.1 × 10⁻¹⁵ 9.4 × 10⁶ - - 3.6 × 10⁻⁸ 2.4 × 10⁻¹⁵
PS5+W20 8.1 × 10⁻⁹ 8.1 × 10² 5.1 × 10⁻¹⁵ 9.4 × 10⁶ 1.4 × 10⁻⁷ 2.8 × 10³ 3.6 × 10⁻⁸ 2.4 × 10⁻¹⁵
PS5+W20+B1 2.1 × 10⁻⁹ 7.8 × 10² 5.1 × 10⁻¹⁵ 9.4 × 10⁶ 7.8 × 10⁻⁸ 2.4 × 10³ 3.6 × 10⁻⁸ 2.4 × 10⁻¹⁵
PS5+W20+B2 2.2 × 10⁻⁹ 7.5 × 10² 5.1 × 10⁻¹⁵ 9.4 × 10⁶ 8.2 × 10⁻⁸ 2.4 × 10³ 3.6 × 10⁻⁸ 2.4 × 10⁻¹⁵
PS5+W20+B3 2.4 × 10⁻⁹ 7.3 × 10² 5.1 × 10⁻¹⁵ 9.4 × 10⁶ 8.8 × 10⁻⁸ 2.2 × 10³ 3.6 × 10⁻⁸ 2.4 × 10⁻¹⁵
PS5+W20+B4 2.5 × 10⁻⁹ 6.9 × 10² 5.1 × 10⁻¹⁵ 9.4 × 10⁶ 9.0 × 10⁻⁸ 2.1 × 10³ 3.6 × 10⁻⁸ 2.4 × 10⁻¹⁵
PS5+W20+B5 2.7 × 10⁻⁹ 6.7 × 10² 5.1 × 10⁻¹⁵ 9.4 × 10⁶ 10 × 10−8 2.1 × 10³ 3.6 × 10⁻⁸ 2.4 × 10⁻¹⁵
W20= 20 μL DI water, B1= 1 μL bacteria, B2= 2 μL bacteria, B3= 3 μL bacteria, B4= 4 μL bacteria, B5 = 5 μL bacteria.
It should be noted that the equivalent circuit of the impedance spectra of the solo biochip PS5and biochip PS5 with analytes are different due to the additional appeared semicircle. Based on theexperimental impedance characteristics from the biochips PS5 after adding analytes, the compositionand cell numbers of analytes added to the Au top ring electrode region for biochip PS5 can bedetermined by modeling the equivalent circuit parameters in the equivalent circuit as shown inFigure 3, which consists of three nonideal capacitors (Cp1, Cp2, Cp3) and three resistors (Rp1, Rp2,Rp3), a contact resistance (Rs), and a contact inductance (Ls). The corresponding ImS modeling resultsof the biochip PS5 are shown in Table 2 (with DI water) and in Table 3 (with DI water and bacteria).
26
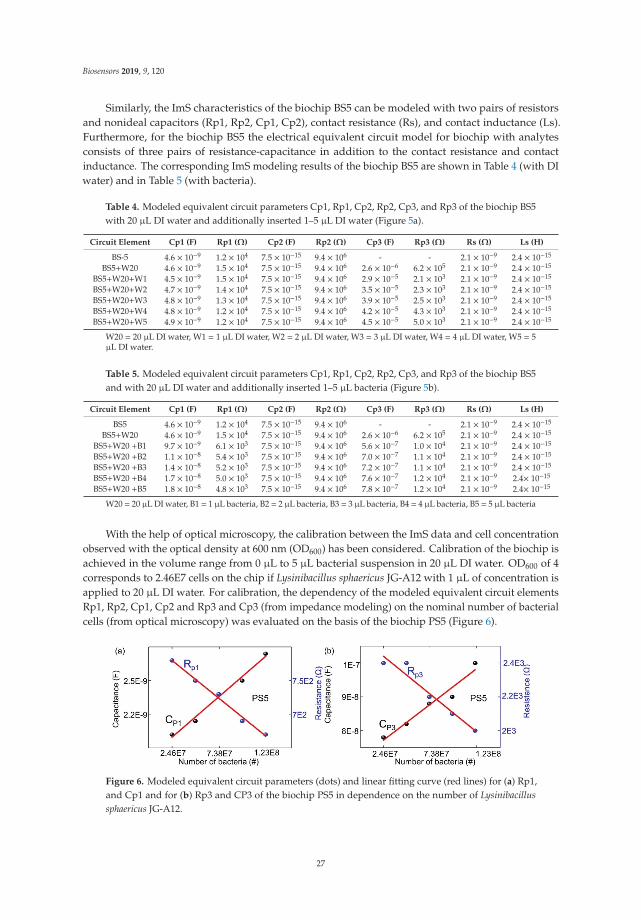
Biosensors 2019, 9, 120
Similarly, the ImS characteristics of the biochip BS5 can be modeled with two pairs of resistorsand nonideal capacitors (Rp1, Rp2, Cp1, Cp2), contact resistance (Rs), and contact inductance (Ls).Furthermore, for the biochip BS5 the electrical equivalent circuit model for biochip with analytesconsists of three pairs of resistance-capacitance in addition to the contact resistance and contactinductance. The corresponding ImS modeling results of the biochip BS5 are shown in Table 4 (with DIwater) and in Table 5 (with bacteria).
Table 4. Modeled equivalent circuit parameters Cp1, Rp1, Cp2, Rp2, Cp3, and Rp3 of the biochip BS5with 20 μL DI water and additionally inserted 1–5 μL DI water (Figure 5a).
Circuit Element Cp1 (F) Rp1 (Ω) Cp2 (F) Rp2 (Ω) Cp3 (F) Rp3 (Ω) Rs (Ω) Ls (H)
BS-5 4.6 × 10⁻⁹ 1.2 × 10⁴ 7.5 × 10⁻¹⁵ 9.4 × 10⁶ - - 2.1 × 10⁻⁹ 2.4 × 10⁻¹⁵
BS5+W20 4.6 × 10⁻⁹ 1.5 × 10⁴ 7.5 × 10⁻¹⁵ 9.4 × 10⁶ 2.6 × 10⁻⁶ 6.2 × 10⁵ 2.1 × 10⁻⁹ 2.4 × 10⁻¹⁵
BS5+W20+W1 4.5 × 10⁻⁹ 1.5 × 10⁴ 7.5 × 10⁻¹⁵ 9.4 × 10⁶ 2.9 × 10⁻⁵ 2.1 × 10³ 2.1 × 10⁻⁹ 2.4 × 10⁻¹⁵
BS5+W20+W2 4.7 × 10⁻⁹ 1.4 × 10⁴ 7.5 × 10⁻¹⁵ 9.4 × 10⁶ 3.5 × 10⁻⁵ 2.3 × 10³ 2.1 × 10⁻⁹ 2.4 × 10⁻¹⁵
BS5+W20+W3 4.8 × 10⁻⁹ 1.3 × 10⁴ 7.5 × 10⁻¹⁵ 9.4 × 10⁶ 3.9 × 10⁻⁵ 2.5 × 10³ 2.1 × 10⁻⁹ 2.4 × 10⁻¹⁵
BS5+W20+W4 4.8 × 10⁻⁹ 1.2 × 10⁴ 7.5 × 10⁻¹⁵ 9.4 × 10⁶ 4.2 × 10⁻⁵ 4.3 × 10³ 2.1 × 10⁻⁹ 2.4 × 10⁻¹⁵
BS5+W20+W5 4.9 × 10⁻⁹ 1.2 × 10⁴ 7.5 × 10⁻¹⁵ 9.4 × 10⁶ 4.5 × 10⁻⁵ 5.0 × 10³ 2.1 × 10⁻⁹ 2.4 × 10⁻¹⁵
W20 = 20 μL DI water, W1 = 1 μL DI water, W2 = 2 μL DI water, W3 = 3 μL DI water, W4 = 4 μL DI water, W5 = 5μL DI water.
Table 5. Modeled equivalent circuit parameters Cp1, Rp1, Cp2, Rp2, Cp3, and Rp3 of the biochip BS5and with 20 μL DI water and additionally inserted 1–5 μL bacteria (Figure 5b).
Circuit Element Cp1 (F) Rp1 (Ω) Cp2 (F) Rp2 (Ω) Cp3 (F) Rp3 (Ω) Rs (Ω) Ls (H)
BS5 4.6 × 10⁻⁹ 1.2 × 10⁴ 7.5 × 10⁻¹⁵ 9.4 × 10⁶ - - 2.1 × 10⁻⁹ 2.4 × 10⁻¹⁵
BS5+W20 4.6 × 10⁻⁹ 1.5 × 10⁴ 7.5 × 10⁻¹⁵ 9.4 × 10⁶ 2.6 × 10⁻⁶ 6.2 × 10⁵ 2.1 × 10⁻⁹ 2.4 × 10⁻¹⁵
BS5+W20 +B1 9.7 × 10⁻⁹ 6.1 × 10³ 7.5 × 10⁻¹⁵ 9.4 × 10⁶ 5.6 × 10⁻⁷ 1.0 × 10⁴ 2.1 × 10⁻⁹ 2.4 × 10⁻¹⁵
BS5+W20 +B2 1.1 × 10⁻⁸ 5.4 × 10³ 7.5 × 10⁻¹⁵ 9.4 × 10⁶ 7.0 × 10⁻⁷ 1.1 × 10⁴ 2.1 × 10⁻⁹ 2.4 × 10⁻¹⁵
BS5+W20 +B3 1.4 × 10⁻⁸ 5.2 × 10³ 7.5 × 10⁻¹⁵ 9.4 × 10⁶ 7.2 × 10⁻⁷ 1.1 × 10⁴ 2.1 × 10⁻⁹ 2.4 × 10⁻¹⁵
BS5+W20 +B4 1.7 × 10⁻⁸ 5.0 × 10³ 7.5 × 10⁻¹⁵ 9.4 × 10⁶ 7.6 × 10⁻⁷ 1.2 × 10⁴ 2.1 × 10⁻⁹ 2.4× 10⁻¹⁵
BS5+W20 +B5 1.8 × 10⁻⁸ 4.8 × 10³ 7.5 × 10⁻¹⁵ 9.4 × 10⁶ 7.8 × 10⁻⁷ 1.2 × 10⁴ 2.1 × 10⁻⁹ 2.4× 10⁻¹⁵
W20 = 20 μL DI water, B1 = 1 μL bacteria, B2 = 2 μL bacteria, B3 = 3 μL bacteria, B4 = 4 μL bacteria, B5 = 5 μL bacteria
With the help of optical microscopy, the calibration between the ImS data and cell concentrationobserved with the optical density at 600 nm (OD600) has been considered. Calibration of the biochip isachieved in the volume range from 0 μL to 5 μL bacterial suspension in 20 μL DI water. OD600 of 4corresponds to 2.46E7 cells on the chip if Lysinibacillus sphaericus JG-A12 with 1 μL of concentration isapplied to 20 μL DI water. For calibration, the dependency of the modeled equivalent circuit elementsRp1, Rp2, Cp1, Cp2 and Rp3 and Cp3 (from impedance modeling) on the nominal number of bacterialcells (from optical microscopy) was evaluated on the basis of the biochip PS5 (Figure 6).
Figure 6. Modeled equivalent circuit parameters (dots) and linear fitting curve (red lines) for (a) Rp1,and Cp1 and for (b) Rp3 and CP3 of the biochip PS5 in dependence on the number of Lysinibacillussphaericus JG-A12.
27
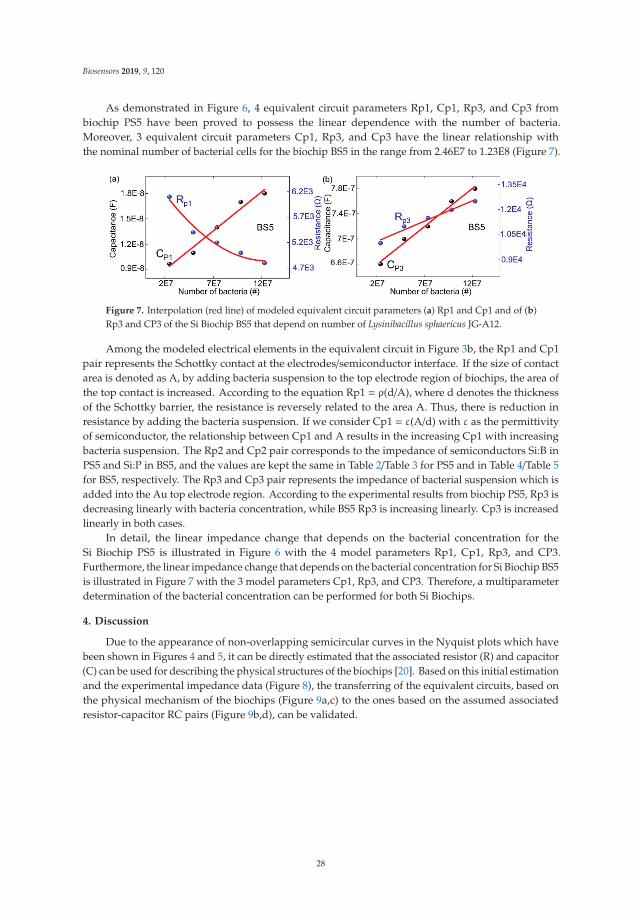
Biosensors 2019, 9, 120
As demonstrated in Figure 6, 4 equivalent circuit parameters Rp1, Cp1, Rp3, and Cp3 frombiochip PS5 have been proved to possess the linear dependence with the number of bacteria.Moreover, 3 equivalent circuit parameters Cp1, Rp3, and Cp3 have the linear relationship withthe nominal number of bacterial cells for the biochip BS5 in the range from 2.46E7 to 1.23E8 (Figure 7).
Figure 7. Interpolation (red line) of modeled equivalent circuit parameters (a) Rp1 and Cp1 and of (b)Rp3 and CP3 of the Si Biochip BS5 that depend on number of Lysinibacillus sphaericus JG-A12.
Among the modeled electrical elements in the equivalent circuit in Figure 3b, the Rp1 and Cp1pair represents the Schottky contact at the electrodes/semiconductor interface. If the size of contactarea is denoted as A, by adding bacteria suspension to the top electrode region of biochips, the area ofthe top contact is increased. According to the equation Rp1 = ρ(d/A), where d denotes the thicknessof the Schottky barrier, the resistance is reversely related to the area A. Thus, there is reduction inresistance by adding the bacteria suspension. If we consider Cp1 = ε(A/d) with ε as the permittivityof semiconductor, the relationship between Cp1 and A results in the increasing Cp1 with increasingbacteria suspension. The Rp2 and Cp2 pair corresponds to the impedance of semiconductors Si:B inPS5 and Si:P in BS5, and the values are kept the same in Table 2/Table 3 for PS5 and in Table 4/Table 5for BS5, respectively. The Rp3 and Cp3 pair represents the impedance of bacterial suspension which isadded into the Au top electrode region. According to the experimental results from biochip PS5, Rp3 isdecreasing linearly with bacteria concentration, while BS5 Rp3 is increasing linearly. Cp3 is increasedlinearly in both cases.
In detail, the linear impedance change that depends on the bacterial concentration for theSi Biochip PS5 is illustrated in Figure 6 with the 4 model parameters Rp1, Cp1, Rp3, and CP3.Furthermore, the linear impedance change that depends on the bacterial concentration for Si Biochip BS5is illustrated in Figure 7 with the 3 model parameters Cp1, Rp3, and CP3. Therefore, a multiparameterdetermination of the bacterial concentration can be performed for both Si Biochips.
4. Discussion
Due to the appearance of non-overlapping semicircular curves in the Nyquist plots which havebeen shown in Figures 4 and 5, it can be directly estimated that the associated resistor (R) and capacitor(C) can be used for describing the physical structures of the biochips [20]. Based on this initial estimationand the experimental impedance data (Figure 8), the transferring of the equivalent circuits, based onthe physical mechanism of the biochips (Figure 9a,c) to the ones based on the assumed associatedresistor-capacitor RC pairs (Figure 9b,d), can be validated.
28

Biosensors 2019, 9, 120
Figure 8. Impedance magnitude measured at test frequencies of 40 Hz, 400 Hz, and 4000 Hz on biochips(a) BS5 (Table S1) and (b) PS5 (Table S2) that depend on the number of bacteria. The experiments arecarried out under normal illumination.
Figure 9. Equivalent circuit models of biochips without analyte bacteria (a) based on the physicalstructure of biochip and (b) based on the associated RC pairs. The parallel capacitor C2 and resistor R2
are transferred from Cdep and Rss. Equivalent circuit models of biochip with analyte (c) in Maxwellfashion and in (d) Voigt fashion. The Voigt fashion can be transferred into Maxwell fashion by usingEquations (1)–(3).
For the proposed p-n junction-based Si biochip, the Schottky contacts are formed at the interfacesboth between Au top electrode/semiconductor and between Pt bottom electrode/semiconductor.These two metal/semiconductor Schottky contacts can be represented by one pair of CPE and resistor inthe electrical equivalent circuit [21]. As demonstrated in Figure 9a, the p-n junction in the biochip PS5or BS5 can be described by depletion region capacitor Cdep and semiconductor resistor Rss, which canbe further converted to the parallel C2 // R2 pair fashion (Figure 9b), where C2 = Cdep·(Q2⁄ (1+Q2)),R2 = Rss·(1+Q2) with the definition of Q = 1/(ω·Cdep·Rss) [22]. Thus, the impedance spectra from solobiochips PS5 and BS5 as depicted in thick black curves in Figures 4 and 5 can be modeled by usingequivalent circuits in Figure 9b.
After applying the analytes (DI water or bacteria), a two-phase electrode contact [23] can bedeveloped by using the proposed biochips, where one phase is resulted from the electrodes of biochips
29
Biosensors 2019, 9, 120
and the other phase is related to the added analytes [24]. The Maxwell circuit in Figure 9c can betransferred into Voigt circuit as illustrated in Figure 9d by utilizing the following equations [25]:
C2,3 = 2Cb
⎛⎜⎜⎜⎜⎜⎜⎝1∓RssRb − Cb
Cdep+1
k1/2
⎞⎟⎟⎟⎟⎟⎟⎠−1
, (1)
R2,3 =Rb2
⎛⎜⎜⎜⎜⎜⎜⎝1±Cb
Cdep − RssRb+1
k1/2
⎞⎟⎟⎟⎟⎟⎟⎠, (2)
k =
(Cb
Cdep+
RssRb
+ 1)2− 4Cb.Rss
Cdep.Rb. (3)
The validity of equivalent circuit for biochips after applying bacteria can be described byexperimental impedance data as shown in Figure 8. Here, the impedance magnitude of the biochipsPS5 and BS5 after adding additional 1–5 μL bacteria has been depended on cell concentration.The overall impedance magnitude at different frequencies is decreasing with increasing bacteriaconcentration, which indicates the validity of parallel connection of RC pairs for the equivalent circuitof biochips with added bacteria. It means that the RC pair which is corresponding to the addedbacteria should be in parallel with the p-n junction-based RC pair as shown in Figure 9d. Thus, it canbe concluded that the additional semicircles after adding the bacteria as demonstrated in Figures 4band 5b are caused by the liquid phase in the two-phase electrode structure.
Based on the development of two-phase electrode contact, the final equivalent circuit for thebiochips with analytes can be achieved as shown in Figure 3b, where three RC pairs applied.The two-phase electrode structure offers the opportunity for detecting the adhesion of bacteria byanalyzing the impedance changes recorded in the Nyquist plot with higher accuracy and efficiency.
5. Conclusions
In this work, we propose the p-n junction-based Si biochips with gold ring top electrodes andunstructured platinum bottom electrodes, which offer a novel possibility for online monitoring thebiomass during the cultivation with considerable low cost. The promising reproducible impedancecharacteristics of two types of p-n junction-based Si biochips, i.e., PS5 and BS5, with differentimplantation ion types and ion energy but the same ion fluence, are discussed and demonstrate thesignificant change between the impedance spectra before and after adding the bacteria suspensionLysinibacillus sphaericus JG-A12 in the top electrode region. With the help of the developedtwo-phase electrode structure, the equivalent circuit is designed for the p-n junction-based Si biochips,four modeling parameters for PS5 (Rp1, Cp1, Rp3, and Cp3) and three modeling parameters forBS5 (Cp1, Rp3, and Cp3) reveal the linear dependence relationship with the bacterial concentration.Such linear dependent parameters are useful for the quantitative measure of the bacteria concentration.The limitation of the bacteria detection utilizing p-n junction-based Si biochips strongly depends oninner and outer diameters of the ring top electrode. Thus, for detecting a smaller number of bacteria,the inner and outer diameters should be reduced. In the future, the p-n junction-based Si biochips byadding different live cells or tissues with different cell dimensions will be studied and their furtherpotential in medicine and biology applications will be explored.
Supplementary Materials: The following are available online at http://www.mdpi.com/2079-6374/9/4/120/s1.Table S1: The impedance magnitude for boron-doped biochip BS5 with different amounts of analyte (1–5 μLbacteria) at frequencies 40 Hz, 400 Hz, and 4 kHz. This table corresponds to the experimental results in Figure 8a.Table S2. The impedance magnitude for the biochip PS5 with different amounts of analyte (1–5 μL bacteria) atfrequencies 40 Hz, 400 Hz, and 4 kHz. This table corresponds to the experimental results in Figure 8b.
Author Contributions: Conceptualization: H.S. and J.R.; methodology: H.S., N.D., and D.B.; software: M.K. andN.D.; validation: M.K.; formal analysis: M.K., N.D., and H.S.; investigation: M.K. and N.D.; resources: U.H., M.V.,I.S., and D.B.; data curation: M.K.; writing—original draft preparation, M.K.; writing—review and editing, N.D.
30

Biosensors 2019, 9, 120
and H.S.; visualization: J.R.; supervision: H.S. and N.D.; project administration: H.S., S.E.S., and O.G.S.; fundingacquisition: H.S., S.E.S., and O.G.S.
Funding: Funding by Sächsische Aufbaubank (SAB) is gratefully acknowledged (PolCarr-Sens project,grant number: 100260515).
Conflicts of Interest: The authors declare no conflict of interest.
References
1. D’Souza, S.F. Microbial biosensors. Biosens. Bioelectron. 2001, 16, 337–353. [CrossRef]2. Aloisi, A.; Della Torre, A.; De Benedetto, A.; Rinaldi, R. Bio-Recognition in Spectroscopy-Based Biosensors for
*Heavy Metals-Water and Waterborne Contamination Analysis. Biosensors 2019, 9, 96. [CrossRef] [PubMed]3. Neves, M.M.P.S.; Martín-Yerga, D. Advanced Nanoscale Approaches to Single-(Bio)entity Sensing and
Imaging. Biosensors 2018, 8, 100. [CrossRef] [PubMed]4. Zhang, F.Z.; Keasling, J. Biosensors and their applications in microbial metabolic engineering. Trends Microbiol.
2011, 19, 323–329. [CrossRef] [PubMed]5. Arefev, K.M.; Guseva, M.A.; Khomchenkov, B.M. Determination of the coefficient of diffusion of cadmium
and magnesium vapors in gases by the Stefan method. High Temp. 1987, 25, 174–179.6. Selenska-Pobell, S.; Panak, P.; Miteva, V.; Boudakov, I.; Bernhard, G.; Nitsche, H. Selective accumulation of
heavy metals by three indigenous Bacillus strains, B. cereus, B. megaterium and B. sphaericus, from drainwaters of a uranium waste pile. FEMS Microbiol. Ecol. 1999, 29, 59–67. [CrossRef]
7. Su, L.; Jia, W.; Hou, C.; Lei, Y. Microbial biosensors: A review. Biosens. Bioelectron. 2011, 26, 1788–1799.[CrossRef] [PubMed]
8. Shul’ga, A.A.; Soldatkin, A.P.; El’skaya, A.V.; Dzyadevich, S.V.; Patskovsky, S.V.; Strikha, V.I. Thin-filmconductometric biosensors for glucose and urea determination. Biosens. Bioelectron. 1994, 9, 217–223.[CrossRef]
9. Durrieu, C.; Lagarde, F.; Jaffrezic-Renault, N. Nanotechnology assets in biosensors design for environmentalmonitoring. In Nanomaterials: A Danger or a Promise; Brayner, R., Fiévet, F., Coradin, T., Eds.; Springer:London, UK, 2013.
10. Raff, J.; Soltmann, U.; Matys, S.; Selenska-Pobell, S.; Böttcher, H.; Pompe, W. Biosorption of Uranium andCopper by Biocers. Chem. Mater. 2003, 15, 240–244. [CrossRef]
11. Scognamiglio, V. Nanotechnology in glucose monitoring: Advances and challenges in the last 10 years.Biosens. Bioelectron. 2013, 47, 12–25. [CrossRef] [PubMed]
12. Molero, F.J.; Crespo, F.; Ferrer, S. A Note on Reparametrizations of the Euler Equations. Theory Dyn. Syst.2017, 16, 453. [CrossRef]
13. Fricke, H. The theory of Electrolyte Polarization. Philos. Mag. 1953, 14, 310–318. [CrossRef]14. Kerrison, L. The capacitor. Stud. Q. J. 1933, 4, 100. [CrossRef]15. Cole, K.S.; Cole, R.H. Dispersion and Absorption in Dielectrics.I. Alternating-Current Characteristics. J. Chem.
Phys. 1941, 9, 341–351. [CrossRef]16. McKubre, M.C.H.; Macdonald, D.D. Electronic Instrumentation for Electrochemical Studies. In A
Comprehensive Treatise of Electrochemistry; Bockris, J.O., Conway, B.E., Yeager, E., Eds.; Plenum Press:Boston, MA, USA; New York, NY, USA, 1984.
17. Zandman, F.; Stein, S. A New Precision Film Resistor Exhibiting Bulk Properties. IEEE T. Compon. Pack T.1964, 11, 107–119. [CrossRef]
18. Usui, Y. Equivalent Circuit of Distributed Constant Circuit and Transmission Equation. JIEP. 2018, 21,311–316. [CrossRef]
19. Van Putten, A.F.P. Interfacing to Sensors. In Electronic Measurement Systems; CRC Press: Boca Raton, FL, USA,1996. [CrossRef]
20. Karuthedath, C.; Schwesinger, N. Unique and Unclonable Capacitive Sensors. IEEE Sens. J. 2018, 18,6097–6105. [CrossRef]
21. Sihvola, A. Electromagnetic Mixing Formulas and Applications; The Institute of Electrical Engineers: London,UK, 1999.
22. Bauerle, J.E. Study of Solid Electrolyte Polarization by a Complex Admittance Method. J. Phys. Chem. Solids1969, 30, 2657–2670. [CrossRef]
31
Biosensors 2019, 9, 120
23. Fricke, H. The Maxwell-Wagner Dispersion in a Suspension of Ellipsoids. J. Phys. Chem. 1932, 57, 934–937.[CrossRef]
24. Barsoukov, E.; Ross Macdonald, J. Impedance Spectroscopy: Theory, Experiment, and Applications; John Wiley &Sons: Hoboken, NJ, USA, 2018.
25. Novoseleskii, M.; Gudina, N.N.; Fetistov, Y.I. Identical Equivalent Impedance Circuits. Sov. Electrochem.1972, 8, 546–548.
© 2019 by the authors. Licensee MDPI, Basel, Switzerland. This article is an open accessarticle distributed under the terms and conditions of the Creative Commons Attribution(CC BY) license (http://creativecommons.org/licenses/by/4.0/).
32
biosensors
Article
Carbon Nanotube-Based Electrochemical Biosensorfor Label-Free Protein Detection
Jesslyn Janssen 1,*, Mike Lambeta 2,3, Paul White 3 and Ahmad Byagowi 3
1 Department of Biological Sciences, University of Manitoba, Winnipeg, MB R3T 2N2, Canada2 Department of Physics and Astronomy, University of Manitoba, Winnipeg, MB R3T 2N2, Canada;
[email protected] Department of Electrical and Computer Engineering, University of Manitoba, Winnipeg, MB R3T 2N2,
Canada; [email protected] (P.W.); [email protected] (A.B.)* Correspondence: [email protected]
Received: 3 October 2019; Accepted: 9 December 2019; Published: 17 December 2019
Abstract: There is a growing need for biosensors that are capable of efficiently and rapidly quantifyingprotein biomarkers, both in the biological research and clinical setting. While accurate methodsfor protein quantification exist, the current assays involve sophisticated techniques, take long toadminister and often require highly trained personnel for execution and analysis. Herein, we explorethe development of a label-free biosensor for the detection and quantification of a standard protein.The developed biosensors comprise carbon nanotubes (CNTs), a specific antibody and cellulosefiltration paper. The change in electrical resistance of the CNT-based biosensor system was usedto sense a standard protein, bovine serum albumin (BSA) as a proof-of-concept. The developedbiosensors were found to have a limit of detection of 2.89 ng/mL, which is comparable to theperformance of the typical ELISA method for BSA quantification. Additionally, the newly developedmethod takes no longer than 10 min to perform, greatly reducing the time of analysis compared tothe traditional ELISA technique. Overall, we present a versatile, affordable, simplified and rapidbiosensor device capable of providing great benefit to both biological research and clinical diagnostics.
Keywords: electrochemical biosensors; SWCNT; point-of-care diagnostics; label-free biosensors;ELISA; carbon nanotubes; bovine serum albumin
1. Introduction
Recently, the need for affordable, rapid and simplified diagnostic devices has been growing,especially in third world countries. Many diseases such as cancer and infectious disease require anearly-stage diagnosis, when treatment options can be most effective. It is also suspected that drugdiscovery may be accelerated for incurable diseases such as Alzheimer’s disease where the inability todiagnose the disease at its earliest stages may be leading to ineffective drug trials which are usuallyadministered to patients that possess irreversible, late-stage pathology. In the case of breast cancer,5-year survival rates are much lower for developing countries such as Gambia (12.0%) and Algeria(38.8%) in comparison to the United States of America (83.9%) and Sweden (82.0%) [1]. It is believedthat lower survival rates in developing countries are due to diagnosis in the advanced stages of diseaseand access barriers to medical care [2–4]. In the case of infectious disease, just under 1 million peopledie from malaria, 4.3 million people from acute respiratory infections and 2.9 million from entericinfections every year [5]. More than 90% of the deaths due to infectious disease occur in developingcountries [5]. Affordable, rapid and simplified diagnostics are critical for combatting these diseases,yet most diagnostic methods are inaccessible to those who need them most.
Currently, immunological assays such as enzyme-linked immunosorbent assay (ELISA) forthe detection of biomarkers in bodily fluids are sensitive and provide accurate results. However,
Biosensors 2019, 9, 144; doi:10.3390/bios9040144 www.mdpi.com/journal/biosensors33

Biosensors 2019, 9, 144
the current assays involve sophisticated techniques and require highly trained personnel for executionand analysis. It may take days to weeks for patients to obtain results from the current immunoassaytechnologies. ELISA also requires large amounts of samples and due to its label-based approach,expensive and specialized reagents are needed, which prevents the use of these assays in resource-poorenvironments [6,7]. Therefore, the need for a rapid, inexpensive and simplified diagnostic device isstill unmet.
Biosensing technology is a promising alternative, owing to its potential for rapid, simple, sensitive,low-cost and portable detection [8]. Biosensors are devices that comprise a biological componentfor recognition, and a physiochemical detector component for transduction [9]. The transductioncomponent can be optical, electrochemical, piezoelectric, magnetic or calorimetric [9]. The biologicalrecognition component can be developed using enzymes, antibodies, cells, tissues, peptides, nucleicacids and aptamers [10–14]. In regard to biosensing technology for protein detection, there is an interestin label-free biosensors as they require only a single recognition element, leading to a simplified designand a reduction in reagent costs and assay time [15]. Optical interferometry [16], fiber optic surfaceplasmon resonance [17–20], piezoelectric [21–24] and electrochemical [25–28] label-free methods havebeen developed to overcome the limitations of label-based biosensing technologies. In particular,electrochemical label-free methods are most promising with regard to high sensitivity, lower detectionlimit, lower response time, cost-effectiveness, miniaturization, simplification and portability [29,30].Electrochemical measurement methods are most suitable for mass fabrication and have played a crucialrole in the transition towards simplified point-of-care diagnostics [11]. This shift has been evidentthrough the market domination of self-testing glucose strips, based on screen-printed enzyme electrodes,coupled to pocket-sized amperometric meters for diabetes over the past two decades [31]. Althoughvarious research efforts have been made, the development of a simplified, affordable, easy-to-use andhighly performant protein detection system for point-of-care analysis remains a challenge.
Electrochemical biosensors that utilize nanomaterials such as carbon nanotubes (CNTs) forimproved sensitivity and response time are potential candidates for point-of-care protein detection.CNTs are hollow, cylindrical molecules consisting of a hexagonal arrangement of hybridized carbonatoms, one or more walls and a nanometer scale diameter [32]. Their well-ordered arrangementof carbon atoms is linked via sp2 bonds, making them the stiffest and strongest fibers known [32].Depending on their number of walls, CNTs can be divided into single-walled carbon nanotubes(SWCNTs) and multi-walled carbon nanotubes. In particular, SWCNTs offer great promise forbiosensing applications due to a unique combination of electrical, magnetic, optical, mechanical andchemical properties [32]. SWCNTs exhibit the simplest morphology and may be formed by rolling upa single graphene sheet. The large surface area of SWCNTs enables interactions with a large numberof biological agents at the carbon nanotube surface, allowing for sensitive detection of biomolecularinteractions [33]. Additionally, the electrical conductance of SWCNTs are sensitive to the environmentand vary significantly with surface adsorption of various chemicals and biomolecules, making SWCNTspromising candidates for label-free biosensing [34–36].
Due to their unique characteristics, SWCNTs have been used in several label-free detectionmodalities. One such label-free modality includes electrical percolation-based biosensors. In electricalpercolation, a long-range electrical connectivity is formed in randomly oriented and distribute systemsof conductive elements, such as SWCNTs [37]. In these systems, the passage of current throughthe conductive network depends on the continuity of the network [36]. Electrical percolation-basedbiosensors often comprise a 3-dimensional carbon nanotube and antibody network [37]. In suchbiosensors, molecular interactions, such as the binding of antigens to antibodies, disrupt the networkcontinuity causing an increase in the network’s electrical resistance [37].
This paper describes the development and performance of a label-free disposable biosensor basedon cellulose paper impregnated with SWCNTs and antibodies for protein detection. The biosensors takeadvantage of the electrical percolation principle in order to facilitate label-free and simplified detectionof protein biomarkers. Biosensors were developed for the measurement of BSA and comprised an
34
Biosensors 2019, 9, 144
antibody specific to BSA. These biosensors were developed for the detection and quantification ofBSA because it is often used as a protein concentration standard in lab experiments. Additionally,targeting such a protein could be useful for determining whether our developed biosensors werecapable of measuring a standard protein in solution as a proof-of-concept and whether our methodcould compete with other standard techniques such as ELISA. The data obtained in this work indicatethat such biosensors may be utilized as a foundation for rapid, inexpensive and simplified diagnostics.
2. Materials and Methods
2.1. Material and Reagents
The poly(sodium 4-styrene sulfonate) (PSS) and antibodies specific to bovine serum albuminwere obtained from Sigma Aldrich (St. Louis, MO, USA). SWCNTs were purchased from Cheap TubesInc. (Brattleboro, VT, USA) and used without purification. Filter paper discs were cut from Whatmancellulose filtration paper obtained from Sigma Aldrich (St. Louis, MO, USA). A bovine serum albuminstock solution bought from Thermo Fisher Scientific (Rockford, IL, USA) was used for the preparationof various testing concentrations of BSA. Ovalbumin stock solution was purchased from Sigma Aldrich(St. Louis, MO, USA). The BSA ELISA kit was purchased from Cygnus Technologies (Southport,NC, USA).
2.2. Biosensor Fabrication
SWCNTs and PSS were dispersed in distilled water to achieve a final concentration of 50 mg/mL.The SWCNT and PSS solution underwent bath sonication for 30 min prior to centrifugation for 20 min forthe removal of aggregates. PSS was used to facilitate electrostatic adsorption for protein immobilization.8 μL of BSA antibody was added to 5 mL of the PSS and SWCNT solution. The SWCNT-antibodysolution was vortexed for 1 min and then drop-casted onto 3 mm × 3 mm cellulose paper disks.The disks were then placed onto a printed circuit board (PCB) electrode and freeze-dried under vacuumto prevent antibody denaturation. Biosensors were also developed without the use of BSA antibody,in order to control for non-specific BSA binding.
2.3. Sample Preparation
Various concentrations of BSA were prepared from a 10% BSA stock solution. 1 ng/mL, 5 ng/mL,10 ng/mL, 20 ng/mL and 40 ng/mL BSA solutions were prepared. Ovalbumin standard solutions usedin our control experiment were prepared from a 10% stock solution in a similar manner.
2.4. Measurements
5 μL of each BSA standard solution were placed onto a biosensor disk and the biosensorswere left to dry. To determine the optimal temperature at which the biosensors should dry, or theimmunoreaction should occur, the drying and subsequent measurements were carried out undervarious temperatures (4 ◦C, 23 ◦C, 37 ◦C and 50 ◦C). All electrical measurements were performed usinga programmed Arduino Uno. The Arduino measurement device was programmed to measure electricalresistance and record the value at the transient plateau of resistance readings, before subtracting therecorded value from the initial measurement that was taken prior to the reaction, resulting in a finalvalue for the change in resistance (see supplementary online material for further details). Changes inresistance were correlated with the concentration of BSA. To control for non-specific binding, variousconcentrations of BSA were applied to biosensors developed without the use of the BSA antibody.Additionally, concentrations of a non-target analyte solution were applied to the developed biosensors.The standard solutions of BSA were analyzed using traditional ELISA for verification and comparison.All experiments were carried out five times before the average values were calculated. The detectionlimit was calculated using LOD = 3.3 SD/S, where LOD is the limit of detection, SD is the standarddeviation and S is the slope of the resulting standard curve of the trials with BSA standard solutions.
35

Biosensors 2019, 9, 144
3. Results and Discussion
3.1. Biosensor Design
Accurate and rapid quantification of protein biomarkers plays an important role in the diagnosisof numerous diseases. With the potential that carbon nanotube biosensors offer for rapid, simple,sensitive and portable diagnostics, we developed SWCNT-coated paper-based biosensors for thedetection and quantification of a standard protein, bovine serum albumin. Similar to a finger-prickblood test, the developed SWCNT biosensors were designed for the quantification of a specific proteinin a single drop (5 μL) of sample solution.
Only SWCNTs were used for the fabrication of the biosensors, due to their larger surface area.Cellulose paper discs were drop-casted with the SWCNT/PSS/antibody solution, 6 times in a row toachieve an electrical resistance in a sufficient 200–250 Ω range. The discs were placed onto a printedcircuit board (PCB) electrode which was subsequently freeze dried under vacuum. One of the fabricatedbiosensors is depicted in Figure 1. All biosensors used during experimentation had SWCNT-coateddiscs that were firmly attached to the PCB substrate. Attaching the SWCNT-coated discs to the PCBelectrodes in this way allowed us to avoid clamping electrodes that bend the flexible paper-basedbiosensors, causing resistance changes due to strain that interfere with analyte measurement.
Figure 1. Photograph of a developed biosensor. The image displays the SWCNT-coated paper biosensordisc at the centre of the PCB substrate.
3.2. Biosensor Testing with BSA
Biosensors were tested with increasing concentrations of BSA standard solutions in addition tocontrol solutions containing a non-target analyte. 5 μL of each solution was tested to generate a curvewith increasing BSA concentration. After 5 μL of a particular solution was placed onto a biosensor disc,the reaction was allowed to proceed for 5 min before a measurement was recorded. This time-framewas chosen in order to allow for antibody-antigen complex formation in addition to the absorption ofthe sample on the disc.
With the goal of developing a biosensor based on the electrical percolation principle in order tofacilitate label-free and simplified detection of protein biomarkers, we suspected that the magnitudeof change in the electrical resistance of the developed biosensors following the addition of a samplesolution would show a positive correlation with the concentration of BSA. A detailed schematic ofthe suspected sensing mechanism of our electrical percolation-based biosensor system is depicted in
36
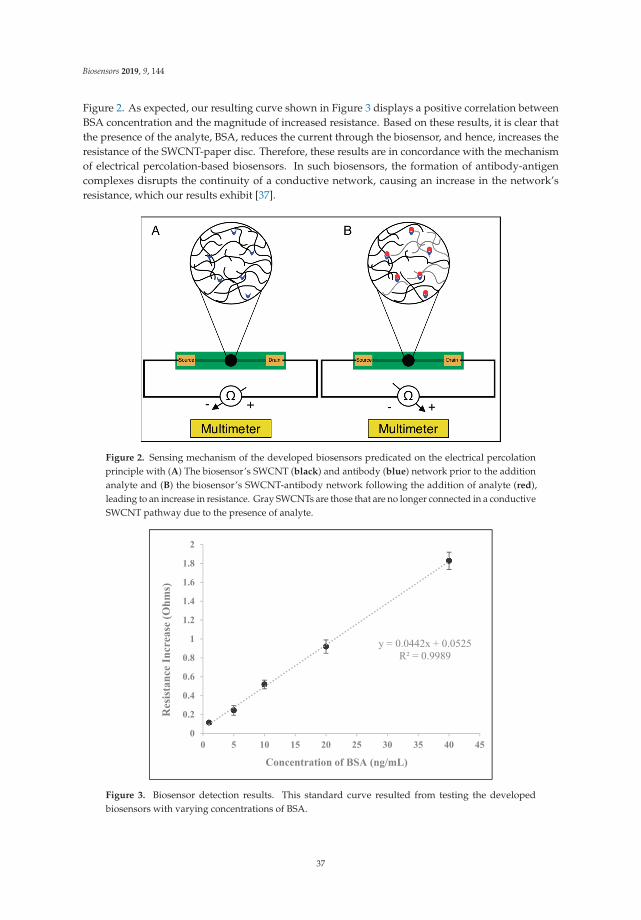
Biosensors 2019, 9, 144
Figure 2. As expected, our resulting curve shown in Figure 3 displays a positive correlation betweenBSA concentration and the magnitude of increased resistance. Based on these results, it is clear thatthe presence of the analyte, BSA, reduces the current through the biosensor, and hence, increases theresistance of the SWCNT-paper disc. Therefore, these results are in concordance with the mechanismof electrical percolation-based biosensors. In such biosensors, the formation of antibody-antigencomplexes disrupts the continuity of a conductive network, causing an increase in the network’sresistance, which our results exhibit [37].
Figure 2. Sensing mechanism of the developed biosensors predicated on the electrical percolationprinciple with (A) The biosensor’s SWCNT (black) and antibody (blue) network prior to the additionanalyte and (B) the biosensor’s SWCNT-antibody network following the addition of analyte (red),leading to an increase in resistance. Gray SWCNTs are those that are no longer connected in a conductiveSWCNT pathway due to the presence of analyte.
Figure 3. Biosensor detection results. This standard curve resulted from testing the developedbiosensors with varying concentrations of BSA.
37

Biosensors 2019, 9, 144
3.3. Temperature Optimization
The performance of electrochemical biosensors is often strongly influenced by the environmentalconditions, such as the temperature at which the reaction proceeds. Temperature can influence biosensorperformance by affecting various parameters such as the antibody-antigen reaction and SWCNT electrontransfer. Thus, temperature is a variable that required optimization prior to performance assessmentand comparisons with standard techniques such as ELISA. Accordingly, biosensor performancewas tested with standard sample solutions at 4 ◦C, 23 ◦C, 37 ◦C and 50 ◦C (Figure 4). All of thesetemperatures are regularly deployed for the analysis of immunoreactions except for 50 ◦C, which wasarbitrarily chosen to display a broad coverage of the effects of temperature. Between the temperaturesthat were tested, biosensors showed the most optimal performance at 37 ◦C. Beginning at 4 ◦C,the efficiency of the biosensors increased with temperature until 37 ◦C which is typically the mostefficient temperature for antibody-antigen reactions. At 50 ◦C, efficiency of the biosensors was minimalagain due to the denaturation of the antibodies. As 37 ◦C was found to be the optimal temperaturefor biosensor performance, we show a standard curve of the testing results under such conditions inFigure 3.
Figure 4. Temperature optimization of the sensing conditions for BSA. Biosensors were tested withvarious concentrations of BSA at 4 different temperatures.
3.4. Analysis of Biosensor Performance and Controlled Experiments
With the optimal temperature determined, we can evaluate overall biosensor performance andcompare the developed biosensors to standard methods such as ELISA. At large, the performance of thedeveloped biosensors greatly exceeded our expectations. With an LOD (limit of detection) of 2.89 ng/mL,the developed biosensors could sufficiently respond to even minor changes in BSA concentrations.The developed biosensors were also found to be highly specific as the addition of a non-target analytesolution, ovalbumin, and the addition of BSA to biosensors that were developed without BSA antibodyresulted in only a slight change in resistance (Figure 5). Additionally, when increasing concentrationsof ovalbumin were applied to the SWCNT-discs, or when increasing concentrations of BSA wereapplied to SWCNT-discs that were developed without the use of BSA antibody, there was no systematiccorrelation between the increasing concentrations and the magnitude of change in resistance. The slightchanges in resistance were most likely a result of minor changes in the SWCNT network due tointerference by the non-target or BSA analyte. Additionally, the weight of the solution may have
38

Biosensors 2019, 9, 144
caused strain in the SWCNT-coated disk or a modest change in morphology, leading to a slight increasein resistance. We suspect that with higher quality SWCNTs or further optimization of environmentalconditions, the performance and LOD can be improved.
Figure 5. Control experiments with the developed biosensors. Developed biosensors were tested withvarious concentrations of a non-target analyte, ovalbumin. Biosensors were also developed without theuse of BSA antibody and tested with various concentrations of BSA.
Our resulting standard curve for our developed biosensors displayed excellent linearity, withR2 of 0.9989 (Figure 3). The curve is in the range of 0–40 ng/mL and even at 40 ng/mL, there is nodeviation from linearity. We suspect that the biosensor’s constituent antibodies are not fully saturated,and the biosensor may be capable of responding to more concentrated BSA solutions.
3.5. Analysis and Comparison with ELISA and Recently Developed Methods
We generated a standard curve with our prepared BSA concentrations using the traditional ELISAmethod in order to verify that our BSA test solutions were of the correct concentration (Figure 6).To generate this standard curve, we deployed a BSA ELISA kit that had an LOD of 6.26 ng/mLand a detection range of 6.25–400 ng/mL. As ELISA is a standard technique for the detection andmeasurement of proteins, both in the research lab and the clinical setting, it is of great interest tocompare our developed biosensor system to the traditional ELISA method.
Our SWCNT-paper biosensor system’s LOD of 2.89 ng/mL is comparable to the LOD of 6.25 ng/mLfor the BSA ELISA kit. As our standard curve does not deviate from linearity over its entire range, wesuspect that the SWCNT-paper biosensor’s detection range has an upper limit that exceeds 40 ng/mL. Inaddition, our newly developed method takes no longer than 10 min while analysis by ELISA typicallyexceeds 4 h.
BSA was utilized in our experiments as a proof-of-concept, in order to determine whether thenewly developed biosensor system could detect and measure a standard protein in solution. Overall,our results showed a positive correlation between BSA concentration and biosensor response. Thus,we suspect that our developed biosensors may be applied for the quantification of other proteins,simply by substituting specific antibodies. With the goal of developing a biosensor device that couldpotentially be deployed in the medical setting for the measurement of human proteins in bodily fluid,we used medically relevant (1–40 ng/mL) BSA concentrations for our experiments. For example, normallevels of prostate specific antigen (PSA), a prostate cancer biomarker in serum, are 0.5 to 2 ng/mL whilethe danger zone for PSA serum concentration is 4 to 10 ng/mL, a level that is indicative of the earliest
39

Biosensors 2019, 9, 144
stages of prostate cancer [38]. However, many biomarkers in human serum surpass this range, oftenreaching concentrations of 1–10 μg/mL [39].
Figure 6. ELISA results for the prepared concentrations of BSA. The various concentrations of BSA thatwere used to analyze biosensor detection and performance were tested using ELISA for validation.
Thus, although an increased upper limit of detection for our presented methodology is suspected,further research should be carried out to determine whether it may be applicable for the measurementof protein biomarkers of a broadened range of concentrations.
Due to its medically relevant sensitivity, high specificity and rapid response time, our newlydeveloped method may be more suitable for protein biomarker quantification than the traditionaltechniques often deployed in the clinical setting, such as ELISA. However, ELISA has a broad range ofdetection (6.25–400 ng/mL) for the quantification of BSA, and the presented method has only beentested with BSA concentrations within the 1–40 ng/mL range. Although the standard curve for thedeveloped biosensors displayed a strong linear relationship between BSA concentration and biosensorresponse, and we appropriately suspect that the upper limit of detection may exceed 40 ng/mL,we cannot conclusively compare the detection range of the presented method with ELISA or otherrelevant methods until further research is carried out.
Additionally, the biosensor system is comprised of cellulose paper and utilizes minimal equipment,making the device more affordable than many standard techniques. The paper-based discs aredisposable while the PCB substrate can be reused. In comparison to other rapid, sensitive and portablelabel-free biosensors for protein quantification that have recently been reported in the literature [16–28],the presented method has improved cost-effectiveness, simplification and ease of use.
4. Conclusions
We describe here an electrical percolation-based label free biosensor capable of quantifying astandard protein. With the goal of meeting the need for a rapid, simplified and affordable analyticaldevice, the biosensors were developed using carbon nanotubes, a specific antibody and cellulosefiltration paper. Based on the electrical-percolation principle, the biosensors were hypothesized tosense analytes on the basis of antibody-antigen complex formation, leading to a disruption of theSWCNT-antibody network’s continuity and an increase in the network’s resistance. The developedbiosensors comprised an antibody specific to a standard protein, BSA, and were tested with various
40
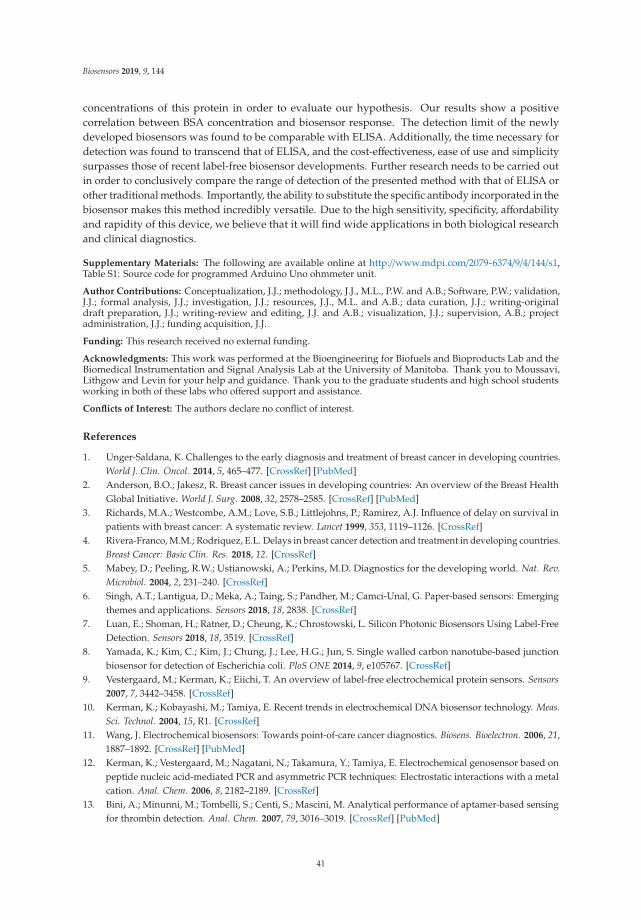
Biosensors 2019, 9, 144
concentrations of this protein in order to evaluate our hypothesis. Our results show a positivecorrelation between BSA concentration and biosensor response. The detection limit of the newlydeveloped biosensors was found to be comparable with ELISA. Additionally, the time necessary fordetection was found to transcend that of ELISA, and the cost-effectiveness, ease of use and simplicitysurpasses those of recent label-free biosensor developments. Further research needs to be carried outin order to conclusively compare the range of detection of the presented method with that of ELISA orother traditional methods. Importantly, the ability to substitute the specific antibody incorporated in thebiosensor makes this method incredibly versatile. Due to the high sensitivity, specificity, affordabilityand rapidity of this device, we believe that it will find wide applications in both biological researchand clinical diagnostics.
Supplementary Materials: The following are available online at http://www.mdpi.com/2079-6374/9/4/144/s1,Table S1: Source code for programmed Arduino Uno ohmmeter unit.
Author Contributions: Conceptualization, J.J.; methodology, J.J., M.L., P.W. and A.B.; Software, P.W.; validation,J.J.; formal analysis, J.J.; investigation, J.J.; resources, J.J., M.L. and A.B.; data curation, J.J.; writing-originaldraft preparation, J.J.; writing-review and editing, J.J. and A.B.; visualization, J.J.; supervision, A.B.; projectadministration, J.J.; funding acquisition, J.J.
Funding: This research received no external funding.
Acknowledgments: This work was performed at the Bioengineering for Biofuels and Bioproducts Lab and theBiomedical Instrumentation and Signal Analysis Lab at the University of Manitoba. Thank you to Moussavi,Lithgow and Levin for your help and guidance. Thank you to the graduate students and high school studentsworking in both of these labs who offered support and assistance.
Conflicts of Interest: The authors declare no conflict of interest.
References
1. Unger-Saldana, K. Challenges to the early diagnosis and treatment of breast cancer in developing countries.World J. Clin. Oncol. 2014, 5, 465–477. [CrossRef] [PubMed]
2. Anderson, B.O.; Jakesz, R. Breast cancer issues in developing countries: An overview of the Breast HealthGlobal Initiative. World J. Surg. 2008, 32, 2578–2585. [CrossRef] [PubMed]
3. Richards, M.A.; Westcombe, A.M.; Love, S.B.; Littlejohns, P.; Ramirez, A.J. Influence of delay on survival inpatients with breast cancer: A systematic review. Lancet 1999, 353, 1119–1126. [CrossRef]
4. Rivera-Franco, M.M.; Rodriquez, E.L. Delays in breast cancer detection and treatment in developing countries.Breast Cancer: Basic Clin. Res. 2018, 12. [CrossRef]
5. Mabey, D.; Peeling, R.W.; Ustianowski, A.; Perkins, M.D. Diagnostics for the developing world. Nat. Rev.Microbiol. 2004, 2, 231–240. [CrossRef]
6. Singh, A.T.; Lantigua, D.; Meka, A.; Taing, S.; Pandher, M.; Camci-Unal, G. Paper-based sensors: Emergingthemes and applications. Sensors 2018, 18, 2838. [CrossRef]
7. Luan, E.; Shoman, H.; Ratner, D.; Cheung, K.; Chrostowski, L. Silicon Photonic Biosensors Using Label-FreeDetection. Sensors 2018, 18, 3519. [CrossRef]
8. Yamada, K.; Kim, C.; Kim, J.; Chung, J.; Lee, H.G.; Jun, S. Single walled carbon nanotube-based junctionbiosensor for detection of Escherichia coli. PloS ONE 2014, 9, e105767. [CrossRef]
9. Vestergaard, M.; Kerman, K.; Eiichi, T. An overview of label-free electrochemical protein sensors. Sensors2007, 7, 3442–3458. [CrossRef]
10. Kerman, K.; Kobayashi, M.; Tamiya, E. Recent trends in electrochemical DNA biosensor technology. Meas.Sci. Technol. 2004, 15, R1. [CrossRef]
11. Wang, J. Electrochemical biosensors: Towards point-of-care cancer diagnostics. Biosens. Bioelectron. 2006, 21,1887–1892. [CrossRef] [PubMed]
12. Kerman, K.; Vestergaard, M.; Nagatani, N.; Takamura, Y.; Tamiya, E. Electrochemical genosensor based onpeptide nucleic acid-mediated PCR and asymmetric PCR techniques: Electrostatic interactions with a metalcation. Anal. Chem. 2006, 8, 2182–2189. [CrossRef]
13. Bini, A.; Minunni, M.; Tombelli, S.; Centi, S.; Mascini, M. Analytical performance of aptamer-based sensingfor thrombin detection. Anal. Chem. 2007, 79, 3016–3019. [CrossRef] [PubMed]
41

Biosensors 2019, 9, 144
14. Evgeni, E.; Cosnier, S.; Marks, R. Biosensors based on combined optical and electrochemical transduction formolecular diagnostics. Expert Rev. Mol. Diagn. 2011, 11, 533–546.
15. Sin, M.L.; Mach, K.E.; Wong, P.K.; Liao, J.C. Advances and challenges in biosensor-based diagnosis ofinfectious diseases. Expert Rev. Mol. Diagn. 2014, 14, 225–244. [CrossRef] [PubMed]
16. Mun, K.; Alvarez, S.D.; Choi, W.; Sailor, M. A stable, Label-free optical interferometric biosensor based onTIO2 nanotube arrays. ACS Nano 2010, 4, 2070–2076. [CrossRef]
17. Wang, W.; Mai, Z.; Chen, Y.; Wang, J.; Li, L.; Su, Q.; Li, X.; Hong, X. A label-free fiber optic SPR biosensor forspecific detection of C-reactive protein. Sci. Rep. 2017, 7, 16904. [CrossRef]
18. Chammem, H.; Hafaid, I.; Meilhac, O.; Menaa, F.; Mora, L.; Abdelghani, A. Surface plasmon resonance forC-reactive protein detection in human plasma. J. Biomater. Nanobiotechnol. 2014, 5, 153–158. [CrossRef]
19. Kim, Y.; Kim, J.P.; Han, S.J.; Sim, S.J. Aptamer biosensor for label-free detection of human immunoglobulin Ebased on surface plasmon resonance. Sens. Actuators B. Chem. 2009, 139, 471–475. [CrossRef]
20. Endo, T.; Kerman, K.; Nagatani, N.; Hiepa, H.M.; Kim, D.; Yonezawa, Y.; Nakano, K.; Tamiya, E. Multiplelabel-free detection of antigen-antibody reaction using localized surface plasmon resonance-based core-shellstructures nanoparticle layer nanochip. Anal. Chem. 2006, 78, 6464–6475. [CrossRef]
21. Nascimento, N.M.; Juste-Dolz, A.; Grau-Garcia, E.; Roman-Ivorra, J.A.; Puchades, R.; Maquieira, A.; Morais, S.;Gimenez-Romero, D. Label-free piezoelectric biosensor for prognosis and diagnosis of Systemic LupusErythematosus. Biosens. Bioelectron. 2017, 15, 166–173. [CrossRef] [PubMed]
22. Lee, J.H.; Yoon, K.H.; Hwang, K.S.; Park, J.; Ahn, S.; Kim, T.S. Label free novel electrical detection usingmicromachined PZT monolithic thin film cantilever for the detection of C-reactive protein. Biosens. Bioelectron.2004, 20, 269–275. [CrossRef] [PubMed]
23. Lee, J.H.; Hwang, K.S.; Park, J.; Yoon, K.H.; Yoon, D.S.; Kim, T.S. Immunoassay of prostate-specific antigen(PSA) using resonant frequency shift of piezoelectric nanomechanical microcantilever. Biosens. Bioelectron.2005, 20, 2157–2162. [CrossRef] [PubMed]
24. Capobianco, J.A.; Shi, W.Y.; Adams, G.P.; Shih, W. Label-free Her2 detection and dissociation constantassessment in diluted human serum using a longitudinal extension mode of a piezoelectric microcantileversensor. Sens. Actuators B. Chem. 2011, 160, 349–356. [CrossRef] [PubMed]
25. Lee, J.A.; Hwang, S.; Kwak, J.; Park, S.; Lee, S.S.; Lee, K. An electrochemical impedance biosensor withaptamer-modified pyrolyzed carbon electrode for label-free protein detection. Sens. Actuators B. Chem. 2008,129, 372–379. [CrossRef]
26. Du, Y.; Li, B.; Wei, H.; Wang, Y.; Wang, E. Multifunctional label-free electrochemical biosensor based on anintegrated aptamer. Anal. Chem. 2008, 80, 5110–5117. [CrossRef]
27. Ohno, Y.; Maehashi, K.; Matsumoto, K. Label-free biosensors based on aptamer-modified graphene field-effecttransistors. J. Am. Chem. Soc. 2010, 132, 18012–18013. [CrossRef]
28. Wang, H.; Zhang, H.; Xu, S.; Gan, T.; Huang, K.; Liu, Y. A sensitive and label-free electrochemical impedancebiosensor for protein detection based on terminal protection of small molecule-linked DNA. Sens. ActuatorsB. Chem. 2014, 194, 478–483. [CrossRef]
29. Thangamuthu, M.; Santschi, C.; Martin, O.J.F. Label-free electrochemical immunoassay for C-reactive protein.Biosensors 2018, 8, 34. [CrossRef]
30. Harrad, E.; Bourais, I.; Mohammadi, H.; Amine, A. Recent advances in electrochemical biosensors based onenzyme inhibition for clinical and pharmaceutical applications. Sensors 2018, 18, 164. [CrossRef]
31. Newman, J.D.; Turner, A.P. Home blood glucose biosensors: A commercial perspective. Biosens. Bioelectron.2005, 20, 2435–2453. [CrossRef] [PubMed]
32. Tilmaciu, C.M.; Morris, M.C. Carbon nanotube biosensors. Front. Chem. 2015, 3, 59. [CrossRef] [PubMed]33. Bruck, H.A.; Yang, M.; Kostov, Y.; Rasooly, A. Electrical percolation-based biosensors. Methods 2013, 63,
282–289. [CrossRef] [PubMed]34. Charlier, J.C. Electronic and transport properties of nanotubes. Rev. Mod. Phys. 2007, 79, 677. [CrossRef]35. Batra, B.; Pundir, C.S. An amperometric glutamate biosensor based on immobilization of glutamate oxidase
onto carboxylated multiwalled carbon nanotubes/gold nanoparticles/chitosan composite film modified Auelectrode. Biosens. Bioelectron. 2013, 47, 496–501. [CrossRef] [PubMed]
36. Chen, C.C.; Chou, Y.C. Electrical-conductivity fluctuations near the percolation threshold. Phys. Rev. Lett.1985, 54, 2529–2532. [CrossRef] [PubMed]
42

Biosensors 2019, 9, 144
37. Balasubramania, K.; Burghard, M. Biosensors based on carbon nanotubes. Anal. Bioanal. Chem. 2006, 385,452–468. [CrossRef]
38. Rusling, J.F.; Kumar, C.V.; Gutkind, J.S.; Patel, V. Measurement of biomarker proteins for point-of-care earlydetection and monitoring of cancer. Analyst 2010, 135, 2496–2511. [CrossRef]
39. Kuang, Z.; Huang, R.; Yang, Z.; Lv, Z.; Chen, X.; Xu, F.; Yi, Y.; Wu, J.; Huang, R. Quantitative screening ofserum protein biomarkers by reverse phase protein arrays. Oncotarget 2018, 99, 32624–32641. [CrossRef]
© 2019 by the authors. Licensee MDPI, Basel, Switzerland. This article is an open accessarticle distributed under the terms and conditions of the Creative Commons Attribution(CC BY) license (http://creativecommons.org/licenses/by/4.0/).
43

biosensors
Article
Wireless Direct Microampere Current in WoundHealing: Clinical and Immunohistological Data fromTwo Single Case Reports
George Lagoumintzis 1,*, Zoi Zagoriti 1, Mogens S. Jensen 2, Theodoros Argyrakos 3,
Constantinos Koutsojannis 4 and Konstantinos Poulas 1,*
1 Department of Pharmacy, Laboratory of Molecular Biology & Immunology, University of Patras, 26504 Rio,Greece; [email protected]
2 Institute of Physic, Danish Technical University, DK-2800 Kgs Lyngby, Denmark;[email protected]
3 Department of Pathology, Evaggelismos General Hospital, GR 10676 Athens, Greece; [email protected] Department of Physiotherapy, Laboratory of Health Physics and Computational Intelligence, University of
Patras, 25100 Aigion, Greece; [email protected]* Correspondence: [email protected] (G.L.); [email protected] (K.P.); Tel.: +30-2610-969953 (K.P.)
Received: 17 July 2019; Accepted: 2 September 2019; Published: 5 September 2019
Abstract: Chronic pressure ulcers are hard-to-heal wounds that decrease the patient’s quality of life.Wireless Micro Current Stimulation (WMCS) is an innovative, non-invasive, similar to electrode-basedelectrostimulation (ES) technology, that generates and transfers ions that are negatively-charged to theinjured tissue, using accessible air gases as a transfer medium. WMCS is capable of generating similartissue potentials, as electrode-based ES, for injured tissue. Here, through immunohistochemistry,we intended to characterize the induced tissue healing biological mechanisms that occur during WMCStherapy. Two single cases of bedridden due to serious stroke white men with chronic non-healingpressure ulcers have been treated with WMCS technology. WMCS suppresses inflammatory responsesby decreasing the aggregation of granulocytes, followed by stimulating myofibroblastic activity and anew formation of collagen fibers, as depicted by immunohistochemistry. As a result, WMCS providesa special adjunct or stand-alone therapy choice for chronic and non-healing injuries, similar toelectrode-based ES, but with added (i.e., contactless) benefits towards its establishment as a routineclinical wound healing regime.
Keywords: chronic wounds; electrical stimulation; direct microcurrent; non-invasive; pressure ulcer;wireless technology
1. Introduction
The majority of chronic (i.e., non-healing) wounds and ulcers are associated with lifestyle-relateddiseases such as diabetes, cardiovascular pathologies, venous stasis disease, cancer, as well as withcomplications caused after the treatment of life-threatening diseases, such as stroke and cerebralpalsy [1,2]. Chronic wounds affect more than 10 million people worldwide, and result in enormoushealth care expenditures, with the total cost estimated at more than 20 billion dollars per year [3–7].Chronic wounds remain a challenging problem for every clinician, with complications contributingsubstantially to the rates of morbidity and mortality [8]. Understanding the physiology of healing andwound care with emphasis upon new therapeutic approaches is a prerequisite for acute and long-termwound management [4].
The wound healing process consists of four major phases: (i) Hemostasis, (ii) inflammation,(iii) proliferation and (iv) tissue remodeling [9]. These phases and their biochemical outcomes must
Biosensors 2019, 9, 107; doi:10.3390/bios9030107 www.mdpi.com/journal/biosensors45
Biosensors 2019, 9, 107
occur in the proper sequence, at a specific time, and continue for a specific duration at an optimalintensity [2].
Wounds that exhibit impaired healing, including delayed acute wounds and chronic wounds,generally have failed to progress through the normal stages of healing. Such wounds frequentlyenter a state of pathologic inflammation due to a postponed, incomplete, or uncoordinated healingprocess [10]. There are many factors that can affect wound healing which interfere with one or morephases in this process, causing improper or impaired tissue repair [2].
As a consequence, the task of proper diagnosis and the treatment of difficult-to-heal woundsfor most health professionals is not a straightforward process. Indeed, health care professionals areoften challenged with perplex medical conditions in the field of chronic wound healing, despite thetechnological innovations and the emergence of a wide range of treatments for wounds.
Besides surgical treatment, various non-surgical approaches have been developed, andnumerous drugs have been introduced to help chronic wounds. These include treatments suchas bandages, vacuum-assisted closure, hyperbaric oxygen and maggot debridement therapy [11].Alternatively, radiant heat dressing, ultrasound therapy, laser treatment, hydrotherapy, electromagnetictherapy and electrotherapy are other non-surgical approaches that have a scientific basis, and havetherefore been advocated in the treatment of chronic wounds [12].
In this context, there is a considerable growing body of evidence on the indication and positiveeffects of electrical stimulation (ES) in wound healing [13–17]. ES has an extensive history, with recordsof its use since the 17th Century [18]. ES has been shown to be effective in accelerating wound repairusing different currents and types of stimulation, thus it is currently recommended as an adjuncttreatment for chronic ulcers and for reinitiating or accelerating the healing process of wounds [19,20].In fact, previous studies have shown that alternating currents (AC) are useful in managing diabeticfoot ulcers [21], and direct current (DC) has shown beneficial effects in the treatment of chronicskin ulcers [19]. Furthermore, pulsed current has been reported to enhance the healing of chronicwounds [22]. High-voltage ES has shown significant therapeutic results in healing chronic ulcers byincreasing blood flow and oxygen concentration around the wound, and by directing cell migrationand other components of the extracellular matrix [16,17]. The usual principle for electrode-based ESimplementation is to transfer the current through moist surface electrode pads that are in electrolyticcontact with both the external skin surface and the wound bed. Despite the considerable evidence onthe beneficial effects of electrode-based ES in wound healing, it has not been widely adopted, mostlydue to pain discomfort and the increased risk of infection upon the position of the electrodes next tothe wound [16].
Recently, we and others have shown the clinical beneficial effects of an innovative technology,alternative to electrode-based ES, named Wireless Micro Current Stimulation (WMCS), which belongs tothe non-invasive or non-contact treatment modalities of ES [20,22]. WMCS utilizes the current-carryingcapacity of charged air gas, based on the ability of nitrogen (N2) and/or oxygen (O2) molecules toaccept or donate electrons, in order to distribute currents and voltages within the tissue, comparablewith the electrode-based ES method (see Supplementary Materials: Calculation Model S1).
Based on that specific ability of WMCS to generate microcurrent in the tissues in a comparablemanner with electrode-based ES, here we extend our previous clinical applications and findings byreporting the results of treatments of two different types of wounds, using the WMCS method. We alsopresent important experimental evidence on the improvement of these two representative cases withchronic, non-healing, pressure ulcers of different etiology and severity. Particularly, by a series ofphotographs, we monitor the course of wound healing over treatment with WMCS and we record thebeneficial clinical outcome of the treated cases. Furthermore, by an immunohistochemical analysis ofpatient’s biopsies we try to delineate the activation of the most characteristic subsequent cellular andmolecular events that take place during the process of patients’ wound healing.
46
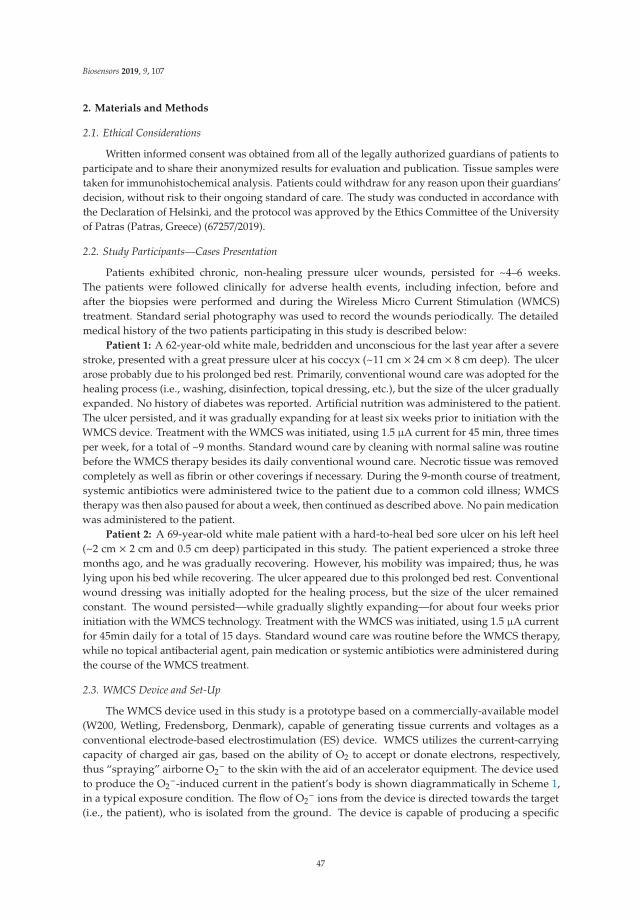
Biosensors 2019, 9, 107
2. Materials and Methods
2.1. Ethical Considerations
Written informed consent was obtained from all of the legally authorized guardians of patients toparticipate and to share their anonymized results for evaluation and publication. Tissue samples weretaken for immunohistochemical analysis. Patients could withdraw for any reason upon their guardians’decision, without risk to their ongoing standard of care. The study was conducted in accordance withthe Declaration of Helsinki, and the protocol was approved by the Ethics Committee of the Universityof Patras (Patras, Greece) (67257/2019).
2.2. Study Participants—Cases Presentation
Patients exhibited chronic, non-healing pressure ulcer wounds, persisted for ~4–6 weeks.The patients were followed clinically for adverse health events, including infection, before andafter the biopsies were performed and during the Wireless Micro Current Stimulation (WMCS)treatment. Standard serial photography was used to record the wounds periodically. The detailedmedical history of the two patients participating in this study is described below:
Patient 1: A 62-year-old white male, bedridden and unconscious for the last year after a severestroke, presented with a great pressure ulcer at his coccyx (~11 cm × 24 cm × 8 cm deep). The ulcerarose probably due to his prolonged bed rest. Primarily, conventional wound care was adopted for thehealing process (i.e., washing, disinfection, topical dressing, etc.), but the size of the ulcer graduallyexpanded. No history of diabetes was reported. Artificial nutrition was administered to the patient.The ulcer persisted, and it was gradually expanding for at least six weeks prior to initiation with theWMCS device. Treatment with the WMCS was initiated, using 1.5 μA current for 45 min, three timesper week, for a total of ~9 months. Standard wound care by cleaning with normal saline was routinebefore the WMCS therapy besides its daily conventional wound care. Necrotic tissue was removedcompletely as well as fibrin or other coverings if necessary. During the 9-month course of treatment,systemic antibiotics were administered twice to the patient due to a common cold illness; WMCStherapy was then also paused for about a week, then continued as described above. No pain medicationwas administered to the patient.
Patient 2: A 69-year-old white male patient with a hard-to-heal bed sore ulcer on his left heel(~2 cm × 2 cm and 0.5 cm deep) participated in this study. The patient experienced a stroke threemonths ago, and he was gradually recovering. However, his mobility was impaired; thus, he waslying upon his bed while recovering. The ulcer appeared due to this prolonged bed rest. Conventionalwound dressing was initially adopted for the healing process, but the size of the ulcer remainedconstant. The wound persisted—while gradually slightly expanding—for about four weeks priorinitiation with the WMCS technology. Treatment with the WMCS was initiated, using 1.5 μA currentfor 45min daily for a total of 15 days. Standard wound care was routine before the WMCS therapy,while no topical antibacterial agent, pain medication or systemic antibiotics were administered duringthe course of the WMCS treatment.
2.3. WMCS Device and Set-Up
The WMCS device used in this study is a prototype based on a commercially-available model(W200, Wetling, Fredensborg, Denmark), capable of generating tissue currents and voltages as aconventional electrode-based electrostimulation (ES) device. WMCS utilizes the current-carryingcapacity of charged air gas, based on the ability of O2 to accept or donate electrons, respectively,thus “spraying” airborne O2
− to the skin with the aid of an accelerator equipment. The device usedto produce the O2
−-induced current in the patient’s body is shown diagrammatically in Scheme 1,in a typical exposure condition. The flow of O2
− ions from the device is directed towards the target(i.e., the patient), who is isolated from the ground. The device is capable of producing a specific
47

Biosensors 2019, 9, 107
number of charged particles which are covering the area to be treated and by this way a micro-currentof 1.5–4.0 μA intensity is generated.
Scheme 1. Schematic representation of the Wireless Micro Current Stimulation (WMCS) device, in atypical “spraying” of generated airborne O2
− onto a wound.
The patient, while lying in bed, is connected to the WMCS device through a neutral electrode.The return path, established by wrist or ankle straps, has a dual purpose. It makes the measurement ofexposure possible, and it maintains the target at virtually zero potential with respect to the ground.A control box permits the adjustment of the current and treatment duration. The intensity was set to1.5 μA for all of the therapies, and the distance from the head of the device to any wound was 12–15 cm.If the head of the device was too far from the wound area for the transferred electric effect to reach thepatient, there was a continuous warning tone.
2.4. Immunohistochemical Analysis of Biopsies
Standard—but not identical—immunohistochemical analysis was performed on each patient’sspecimens. In particular, Hematoxylin and Eosin stain was done to visualize any signs of inflammation,Masson’s trichrome stain in order to clearly differentiate the collagen fibers and c-kit antigen asa marker of mast cell existence. Both Patients’ wound biopsies were taken by a qualified generalpractitioner at indicative time-points during the WMCS treatment. Both patients underwent afull-thickness wedge biopsy of the wound’s edge. Samples were stored in paraffin blocks, and then3 μm histological sections were made using a histological microtome. The specimens were analyzed atthe Department of Pathology, Evaggelismos Hospital, Athens, Greece, by routine semi-quantitativeimmunohistochemistry, as described below, and observed under a Leica DM2000 microscope. Cellularand/or protein findings were descriptively quantified without the aid of any computerized resources,by a single pathologist, in order to avoid measurement biases by multiple measurers.
48
Biosensors 2019, 9, 107
2.5. Hematoxylin and Eosin
Slides were placed in staining jar and deparaffinized by submerging into three series of absolutexylene for four minutes, followed by 100%, 95%, 90% and 70% of ethanol for four minutes of eachpercentage. These slides were then washed in running tap water for two minutes.
After this, slides were submerged into Harris Hematoxylin for two minutes and then washed inrunning tap water for another two minutes. The slides were then submerged into 1% acid alcohol forthree dips to decolorize it, and washed in running tap water for two minutes. Next, the slides weresubmerged into 2% potassium acetate for three minutes and again washed in running tap water for twominutes. Slides were then submerged into hematoxylin for 10 min. After that, slides were submergedinto Eosin for two minutes, followed by washing in running tap water for a further two minutes.Before observation, slides were dipped into absolute xylene for one minute and finally mounted withcover slip using DPX mounting.
2.6. Human CD117/c-Kit 17 Antigen
Immunohistochemistry was performed on formalin-fixed and paraffin-embedded 3 μm thicksections. Tissue sections were deparaffinized in xylene and rehydrated in decreasing ethanol series.For antigen retrieval, sections were boiled in 0.01 M citrate buffer (pH = 6, slightly acidic) for10 min. Methanol with 0.5% H2O2 was used to block endogenous peroxidase activity for 10 min.Tissue sections were then washed in Tris-buffered saline (TBS, pH = 7.6, slightly alkali) and incubatedwith diluted normal serum for 10 min and then treated with primary antibody for 30 min, accordingto the procedure outlined by the manufacturer. The applied primary antibody was c-kit monoclonalantibody (Novocastra RTU-CD117, RE 7290 k, Newcastle, UK). After rinsing with TBS, the sectionswere incubated with secondary antibody (Dako Envision Dual Link Labeled Polymer HRP, Glostrup,Denmark), washed again in TBS and reacted with diaminobenzine hydrochloride (DAB) for fiveminutes. Finally, slides were counterstained with hematoxylin and cover-slipped with a syntheticmounting media.
2.7. Masson’s Trichrome
For visualization of collagen fibers and the histological assessment of collagen deposition, trichromestaining was performed using the Masson Trichrome Staining Kit (Sigma Aldrich, St. Louis, MO, USA).First, the slides were deparaffinized and rehydrated through a descending manner of alcohol: 100%alcohol, 95% alcohol and 70% alcohol, for four minutes in each percentage. The slides were washedin distilled water. The slides then were submerged in warmed Bouin’s solution at 60 ◦C for 45 min.Next, the slides were washed in running tap water until the yellow color in samples disappeared.To differentiate nuclei, slides then were immersed in modified Wiegert’s hematoxylin for eight minutes,after that washed in running water for two minutes. In order to stain the cytoplasms and erythrocytes,the slides were submerged in anionic dyes, acid fuschin for five minutes; then again these slides werewashed with running tap water for two minutes. Next, slides were treated with a phosphomolybidicacid solution for another 10 min as a mordant, and immediately the slides were submerged into methylblue solution for five minutes in order to stain fibroblast and collagen. After that, slides were washedin running water for two minutes and lastly treated with 1% acetic acid solution for one minute.Slides then were dehydrated into a series of alcohol of 70%, 80%, 95% and 100%, respectively, for oneminute within each percentage. Before observation, slides were dipped into absolute xylene for oneminute and finally mounted with cover slip using DPX mounting. Finally, the slides were examinedunder the microscope by the same pathologist blinded to the treatments.
2.8. Measurement of Wound Closure
Wound closure was measured by serial standard photographs taken at several time intervalsduring the WMCS treatment. The target wound’s greatest length and width were measured at baseline.
49
Biosensors 2019, 9, 107
The ulcer size was calculated by multiplying the length and width. Percentage wound area reductionwas calculated by dividing the wound area at the indicative time point after WMCS treatment with thewound area before WMCS treatment (Day = 0), and then multiplied by 100. The entire process of areameasurement was done by a single person who was blinded to the group of the patient and the sessionfor each wound being measured.
3. Results
3.1. Clinical Outcome
The clinical picture of Patient One’s massive pressure ulcer prior WMCS treatment is shown inFigure 1A (a–i). A clear change in wound edges with an obvious reduction in the wound’s dimensionsand total area was observed after a period of ~3-month treatment Figure 1A (c). A 50% of woundclosure was achieved after a 6-month period of treatment Figure 1A (d–f), while a more than 90%wound closure and regrowth of normal skin was seen by the end of a total of 8 to 9 month WMCStreatment Figure 1A (g–i).
(A)
(B)
Figure 1. (A) (a–i): Serial photography of the clinical outcome of Patient 1 after WMCS treatment.(B) Presentation of photographic wound closure percentage of Patient 1. Wound healing is expressedas percentage wound area closure relative to original size [(wound area)/(original wound area)].
50
Biosensors 2019, 9, 107
Measurement of the wounded area is one of the key aspects in the assessment of the healingprocess, since it can indicate healing improvement. Figure 1B shows the percentage (%) of woundclosure for Patient 1 from photographs taken immediately after treatment with WMCS. As shown,wound healing started gradually after WMCS treatment, with an obvious macroscopic improvementeven at the end of the 1st month of treatment. At approximately six months of treatment, a 50% woundclosure was achieved, while by the end of the 9-month treatment a greater than 95% of wound closurewas observed as compared to the initial wound area before WMCS treatment.
For Patient 2, the clinical picture of the wound prior WMCS treatment is shown in Figure 2A (a).After three sessions, healthy new epithelial tissue was visible in the wound bed and at the woundedge, Figure 2A (b). A clear reduction in the wound’s dimensions and total area was achieved after6 sessions, Figure 2A (c), allowing for no dressing changes. Continued decrease in scar tissue andregrowth of normal skin were observed from day 9 to day 15, Figure 2A (d–f), with improved woundcontraction and significant re-epithelization.
(A)
(B)
Figure 2. (A) (a–f): Serial photography of the clinical outcome of Patient 2 after WMCS treatment.(B) Presentation of the photographic wound closure percentage of Patient 2. Wound healing is expressedas percentage wound area closure relative to original size [(wound area)/(original wound area)].
51
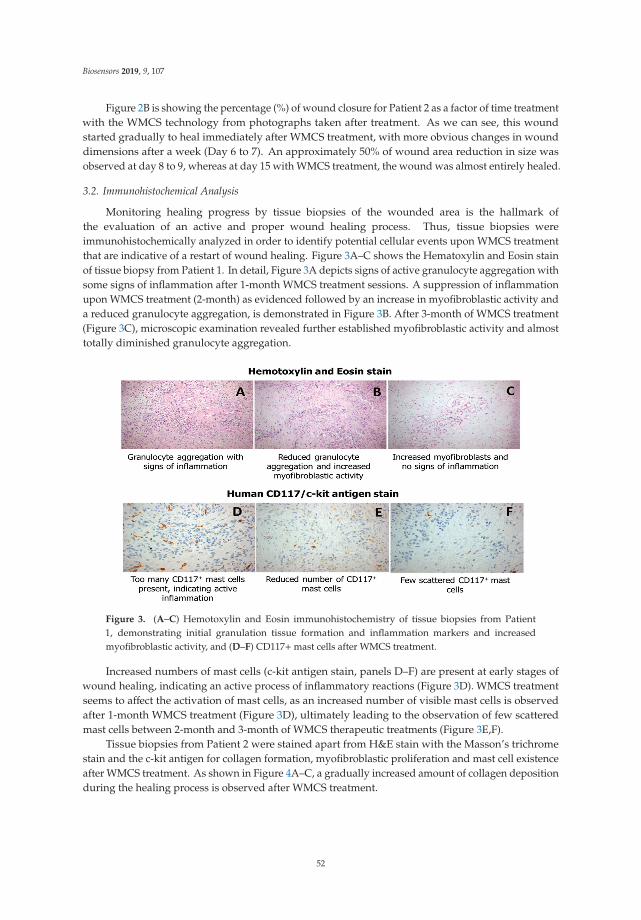
Biosensors 2019, 9, 107
Figure 2B is showing the percentage (%) of wound closure for Patient 2 as a factor of time treatmentwith the WMCS technology from photographs taken after treatment. As we can see, this woundstarted gradually to heal immediately after WMCS treatment, with more obvious changes in wounddimensions after a week (Day 6 to 7). An approximately 50% of wound area reduction in size wasobserved at day 8 to 9, whereas at day 15 with WMCS treatment, the wound was almost entirely healed.
3.2. Immunohistochemical Analysis
Monitoring healing progress by tissue biopsies of the wounded area is the hallmark ofthe evaluation of an active and proper wound healing process. Thus, tissue biopsies wereimmunohistochemically analyzed in order to identify potential cellular events upon WMCS treatmentthat are indicative of a restart of wound healing. Figure 3A–C shows the Hematoxylin and Eosin stainof tissue biopsy from Patient 1. In detail, Figure 3A depicts signs of active granulocyte aggregation withsome signs of inflammation after 1-month WMCS treatment sessions. A suppression of inflammationupon WMCS treatment (2-month) as evidenced followed by an increase in myofibroblastic activity anda reduced granulocyte aggregation, is demonstrated in Figure 3B. After 3-month of WMCS treatment(Figure 3C), microscopic examination revealed further established myofibroblastic activity and almosttotally diminished granulocyte aggregation.
Figure 3. (A–C) Hemotoxylin and Eosin immunohistochemistry of tissue biopsies from Patient1, demonstrating initial granulation tissue formation and inflammation markers and increasedmyofibroblastic activity, and (D–F) CD117+mast cells after WMCS treatment.
Increased numbers of mast cells (c-kit antigen stain, panels D–F) are present at early stages ofwound healing, indicating an active process of inflammatory reactions (Figure 3D). WMCS treatmentseems to affect the activation of mast cells, as an increased number of visible mast cells is observedafter 1-month WMCS treatment (Figure 3D), ultimately leading to the observation of few scatteredmast cells between 2-month and 3-month of WMCS therapeutic treatments (Figure 3E,F).
Tissue biopsies from Patient 2 were stained apart from H&E stain with the Masson’s trichromestain and the c-kit antigen for collagen formation, myofibroblastic proliferation and mast cell existenceafter WMCS treatment. As shown in Figure 4A–C, a gradually increased amount of collagen depositionduring the healing process is observed after WMCS treatment.
52
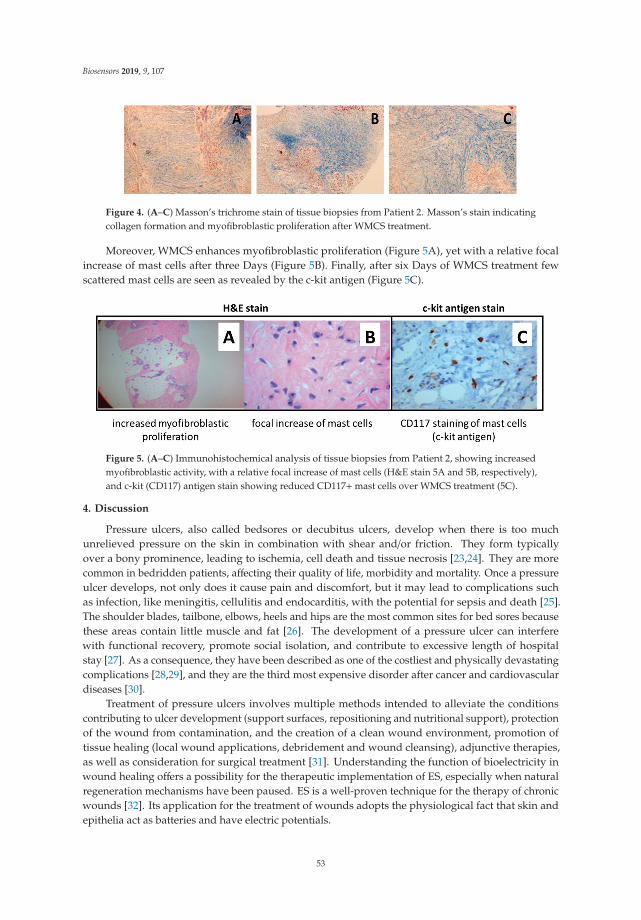
Biosensors 2019, 9, 107
Figure 4. (A–C) Masson’s trichrome stain of tissue biopsies from Patient 2. Masson’s stain indicatingcollagen formation and myofibroblastic proliferation after WMCS treatment.
Moreover, WMCS enhances myofibroblastic proliferation (Figure 5A), yet with a relative focalincrease of mast cells after three Days (Figure 5B). Finally, after six Days of WMCS treatment fewscattered mast cells are seen as revealed by the c-kit antigen (Figure 5C).
Figure 5. (A–C) Immunohistochemical analysis of tissue biopsies from Patient 2, showing increasedmyofibroblastic activity, with a relative focal increase of mast cells (H&E stain 5A and 5B, respectively),and c-kit (CD117) antigen stain showing reduced CD117+mast cells over WMCS treatment (5C).
4. Discussion
Pressure ulcers, also called bedsores or decubitus ulcers, develop when there is too muchunrelieved pressure on the skin in combination with shear and/or friction. They form typicallyover a bony prominence, leading to ischemia, cell death and tissue necrosis [23,24]. They are morecommon in bedridden patients, affecting their quality of life, morbidity and mortality. Once a pressureulcer develops, not only does it cause pain and discomfort, but it may lead to complications suchas infection, like meningitis, cellulitis and endocarditis, with the potential for sepsis and death [25].The shoulder blades, tailbone, elbows, heels and hips are the most common sites for bed sores becausethese areas contain little muscle and fat [26]. The development of a pressure ulcer can interferewith functional recovery, promote social isolation, and contribute to excessive length of hospitalstay [27]. As a consequence, they have been described as one of the costliest and physically devastatingcomplications [28,29], and they are the third most expensive disorder after cancer and cardiovasculardiseases [30].
Treatment of pressure ulcers involves multiple methods intended to alleviate the conditionscontributing to ulcer development (support surfaces, repositioning and nutritional support), protectionof the wound from contamination, and the creation of a clean wound environment, promotion oftissue healing (local wound applications, debridement and wound cleansing), adjunctive therapies,as well as consideration for surgical treatment [31]. Understanding the function of bioelectricity inwound healing offers a possibility for the therapeutic implementation of ES, especially when naturalregeneration mechanisms have been paused. ES is a well-proven technique for the therapy of chronicwounds [32]. Its application for the treatment of wounds adopts the physiological fact that skin andepithelia act as batteries and have electric potentials.
53
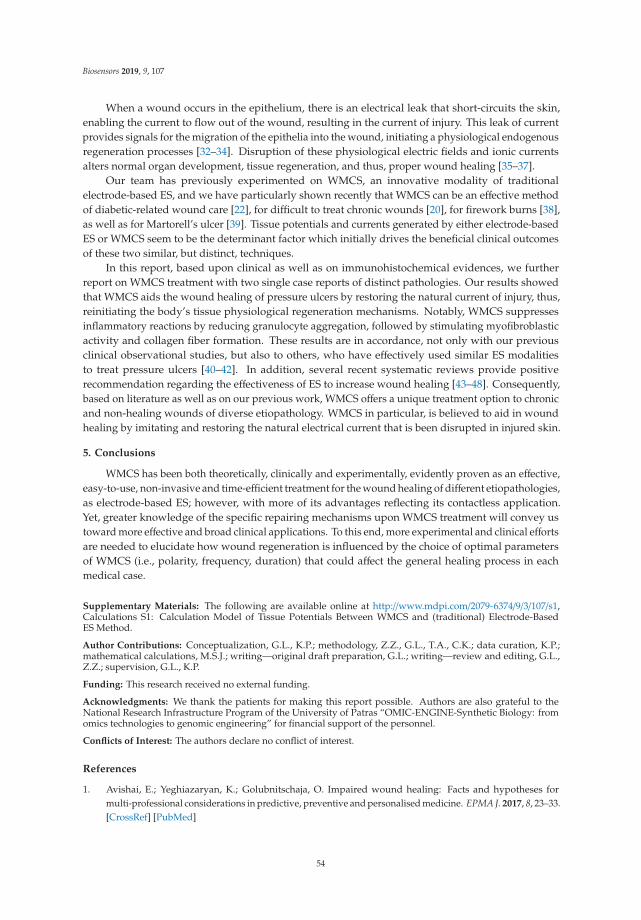
Biosensors 2019, 9, 107
When a wound occurs in the epithelium, there is an electrical leak that short-circuits the skin,enabling the current to flow out of the wound, resulting in the current of injury. This leak of currentprovides signals for the migration of the epithelia into the wound, initiating a physiological endogenousregeneration processes [32–34]. Disruption of these physiological electric fields and ionic currentsalters normal organ development, tissue regeneration, and thus, proper wound healing [35–37].
Our team has previously experimented on WMCS, an innovative modality of traditionalelectrode-based ES, and we have particularly shown recently that WMCS can be an effective methodof diabetic-related wound care [22], for difficult to treat chronic wounds [20], for firework burns [38],as well as for Martorell’s ulcer [39]. Tissue potentials and currents generated by either electrode-basedES or WMCS seem to be the determinant factor which initially drives the beneficial clinical outcomesof these two similar, but distinct, techniques.
In this report, based upon clinical as well as on immunohistochemical evidences, we furtherreport on WMCS treatment with two single case reports of distinct pathologies. Our results showedthat WMCS aids the wound healing of pressure ulcers by restoring the natural current of injury, thus,reinitiating the body’s tissue physiological regeneration mechanisms. Notably, WMCS suppressesinflammatory reactions by reducing granulocyte aggregation, followed by stimulating myofibroblasticactivity and collagen fiber formation. These results are in accordance, not only with our previousclinical observational studies, but also to others, who have effectively used similar ES modalitiesto treat pressure ulcers [40–42]. In addition, several recent systematic reviews provide positiverecommendation regarding the effectiveness of ES to increase wound healing [43–48]. Consequently,based on literature as well as on our previous work, WMCS offers a unique treatment option to chronicand non-healing wounds of diverse etiopathology. WMCS in particular, is believed to aid in woundhealing by imitating and restoring the natural electrical current that is been disrupted in injured skin.
5. Conclusions
WMCS has been both theoretically, clinically and experimentally, evidently proven as an effective,easy-to-use, non-invasive and time-efficient treatment for the wound healing of different etiopathologies,as electrode-based ES; however, with more of its advantages reflecting its contactless application.Yet, greater knowledge of the specific repairing mechanisms upon WMCS treatment will convey ustoward more effective and broad clinical applications. To this end, more experimental and clinical effortsare needed to elucidate how wound regeneration is influenced by the choice of optimal parametersof WMCS (i.e., polarity, frequency, duration) that could affect the general healing process in eachmedical case.
Supplementary Materials: The following are available online at http://www.mdpi.com/2079-6374/9/3/107/s1,Calculations S1: Calculation Model of Tissue Potentials Between WMCS and (traditional) Electrode-BasedES Method.
Author Contributions: Conceptualization, G.L., K.P.; methodology, Z.Z., G.L., T.A., C.K.; data curation, K.P.;mathematical calculations, M.S.J.; writing—original draft preparation, G.L.; writing—review and editing, G.L.,Z.Z.; supervision, G.L., K.P.
Funding: This research received no external funding.
Acknowledgments: We thank the patients for making this report possible. Authors are also grateful to theNational Research Infrastructure Program of the University of Patras “OMIC-ENGINE-Synthetic Biology: fromomics technologies to genomic engineering” for financial support of the personnel.
Conflicts of Interest: The authors declare no conflict of interest.
References
1. Avishai, E.; Yeghiazaryan, K.; Golubnitschaja, O. Impaired wound healing: Facts and hypotheses formulti-professional considerations in predictive, preventive and personalised medicine. EPMA J. 2017, 8, 23–33.[CrossRef] [PubMed]
54

Biosensors 2019, 9, 107
2. Guo, S.; DiPietro, L.A. Factors affecting wound healing. J. Dent. Res. 2010, 89, 219–229. [CrossRef] [PubMed]3. Augustin, M.; Brocatti, L.K.; Rustenbach, S.J.; Schäfer, I.; Herberger, K. Cost-of-illness of leg ulcers in the
community. Int. Wound, J. 2014, 11, 283–292. [CrossRef] [PubMed]4. Frykberg, R.G.; Banks, J. Challenges in the treatment of chronic wounds. Adv. Wound Care 2015, 4, 560–582.
[CrossRef] [PubMed]5. Järbrink, K.; Ni, G.; Sönnergren, H.; Schmidtchen, A.; Pang, C.; Bajpai, R.; Car, J. The humanistic and
economic burden of chronic wounds: A protocol for a systematic review. Syst. Rev. 2017, 6, 15. [CrossRef][PubMed]
6. Phillips, C.J.; Humphreys, I.; Fletcher, J.; Harding, K.; Chamberlain, G.; Macey, S. Estimating the costsassociated with the management of patients with chronic wounds using linked routine data. Int. Wound J.2016, 13, 1193–1197. [CrossRef] [PubMed]
7. Posnett, J.; Franks, P.J. The burden of chronic wounds in the UK. Nurs. Times 2008, 104, 44–45. [PubMed]8. Agale, S.V. Chronic leg ulcers: Epidemiology, aetiopathogenesis, and management. Ulcers 2013, 2013, 1–9.
[CrossRef]9. Gosain, A.; DiPietro, L.A. Aging and wound healing. World J. Surg. 2004, 28, 321–326. [CrossRef]10. Diegelmann, R.F.; Evans, M.C. Wound healing: An overview of acute, fibrotic and delayed healing.
Front. Biosci. 2004, 9, 283–289. [CrossRef]11. Han, G.; Ceilley, R. Chronic wound healing: A review of current management and treatments. Adv. Ther.
2017, 34, 599–610. [CrossRef] [PubMed]12. Korzendorfer, H.; Hettrick, H. Biophysical technologies for management of wound bioburden. Adv. Wound
Care 2014, 3, 733. [CrossRef] [PubMed]13. Janssen, T.; Smit, C.; Hopman, M. Prevention and treatment of pressure ulcers using electrical stimulation.
In Pressure Ulcer Research; Bader, D.L., Bouten, C., Colin, D., Oomens, C.W.J., Eds.; Springer-Verlag:Berlin/Heidelberg, Germany, 2005; pp. 89–107. ISBN 978-3-540-28804-6.
14. Liu, L.Q.; Moody, J.; Traynor, M.; Dyson, S.; Gall, A. A systematic review of electrical stimulation for pressureulcer prevention and treatment in people with spinal cord injuries. J. Spinal Cord Med. 2014, 37, 703–718.[CrossRef] [PubMed]
15. Messerli, M.A.; Graham, D.M. Extracellular electrical fields direct wound healing and regeneration. Biol. Bull.2011, 221, 79–92. [CrossRef] [PubMed]
16. Tai, G.; Tai, M.; Zhao, M. Electrically stimulated cell migration and its contribution to wound healing.Burn. Trauma 2018, 6, 20. [CrossRef] [PubMed]
17. Wang, E.; Zhao, M. Regulation of tissue repair and regeneration by electric fields. Chin. J. Traumatol.2010, 13, 55–61. [PubMed]
18. Kambouris, M.; Zagoriti, Z.; Lagoumintzis, G.; Poulas, K. From therapeutic electrotherapy to electroceuticals:Formats, applications and prospects of electrostimulation. Annu. Res. Rev. Biol. 2014, 4, 3054–3070.[CrossRef]
19. Adunsky, A.; Ohry, A.; DDCT Group. Decubitus direct current treatment (DDCT) of pressure ulcers: Resultsof a randomized double-blinded placebo controlled study. Arch. Gerontol. Geriatr. 2005, 41, 261–269.[CrossRef]
20. Guerriero, F.; Botarelli, E.; Mele, G.; Polo, L.; Zoncu, D.; Renati, P.; Sgarlata, C.; Rollone, M.; Ricevuti, G.;Maurizi, N.; et al. Effectiveness of an innovative pulsed electromagnetic fields stimulation in healing ofuntreatable skin ulcers in the frail elderly: Two case reports. Case Rep. Dermatol. Med. 2015, 2015, 1–6.[CrossRef]
21. Lundeberg, T.C.; Eriksson, S.V.; Malm, M. Electrical nerve stimulation improves healing of diabetic ulcers.Ann. Plast. Surg. 1992, 29, 328–331. [CrossRef]
22. Castana, O.; Dimitrouli, A.; Argyrakos, T.; Theodorakopoulou, E.; Stampolidis, N.; Papadopoulos, E.;Pallantzas, A.; Stasinopoulos, I.; Poulas, K. Wireless electrical stimulation. Int. J. Low. Extrem. Wounds2013, 12, 18–21. [CrossRef] [PubMed]
23. Ramadhinara, A.; Poulas, K. Use of wireless microcurrent stimulation for the treatment of diabetes-relatedwounds. Adv. Skin Wound Care 2013, 26, 1–4. [CrossRef] [PubMed]
24. Bansal, C.; Scott, R.; Stewart, D.; Cockerell, C.J. Decubitus ulcers: A review of the literature. Int. J. Dermatol.2005, 44, 805–810. [CrossRef] [PubMed]
55
Biosensors 2019, 9, 107
25. Prevention and Treatment of Pressure Ulcers: Quick Reference Guide; Cambridge Media: Cambridge, UK, 2009;ISBN 978-0-9579343-6-8.
26. Bolton, L. Evidence corner: Evidence-based care for malignant wounds. Wounds Compend. Clin. Res. Pract.2016, 28, 214–216.
27. Moore, Z.E.; Webster, J.; Samuriwo, R. Wound-care teams for preventing and treating pressure ulcers.Cochrane Database Syst. Rev. 2015, 16, CD011011. [CrossRef] [PubMed]
28. Reddy, M.; Gill, S.S.; Rochon, P.A. Preventing pressure ulcers: A systematic review. JAMA 2006, 296, 974.[CrossRef] [PubMed]
29. Burdette-Taylor, S.R.; Kass, J. Heel ulcers in critical care units: A major pressure problem. Crit. Care Nurs. Q.2002, 25, 41–53. [CrossRef] [PubMed]
30. Demarré, L.; Van Lancker, A.; Van Hecke, A.; Verhaeghe, S.; Grypdonck, M.; Lemey, J.; Annemans, L.;Beeckman, D. The cost of prevention and treatment of pressure ulcers: A systematic review. Int. J. Nurs.Stud. 2015, 52, 1754–1774. [CrossRef]
31. Pattanshetty, R.B.; Prasade, P.M.; Aradhana, K.M. Risk assessment of decubitus ulcers using four scales amongpatients admitted in medical and surgical intensive care units in a tertiary care set up: A cross-sectionalstudy. Int. J. Physiother. Res. 2015, 3, 971–977. [CrossRef]
32. Reddy, M.; Gill, S.S.; Kalkar, S.R.; Wu, W.; Anderson, P.J.; Rochon, P.A. Treatment of pressure ulcers. JAMA2008, 300, 2647. [CrossRef]
33. Enoch, S.; Price, P.E. Cellular, molecular and biochemical differences in the pathophysiology of healingbetween acute wounds, chronic wounds and wounds in the aged. World Wide Wounds 2004, 2005, 12.
34. Snyder, S.; DeJulius, C.; Willits, R.K. Electrical stimulation increases random migration of human dermalfibroblasts. Ann. Biomed. Eng. 2017, 45, 2049–2060. [CrossRef] [PubMed]
35. Piccolino, M. Luigi Galvani’s path to animal electricity. C. R. Biol. 2006, 329, 303–318. [CrossRef] [PubMed]36. Finger, S.; Piccolino, M.; Stahnisch, F.W. Alexander von Humboldt: Galvanism, animal electricity, and
self-experimentation part 2: The electric eel, animal electricity, and later years. J. Hist. Neurosci.2013, 22, 327–352. [CrossRef]
37. Foulds, I.S.; Barker, A.T. Human skin battery potentials and their possible role in wound healing. Br. J.Dermatol. 1983, 109, 515–522. [CrossRef] [PubMed]
38. Lagoumintzis, G.; Sideris, S.; Kampouris, M.; Koutosjannis, C.; Rennekampff, H.-O.; Poulas, K. WirelessMicro Current Stimulation Technology Improves Firework Burn Healing Clinical Applications of WmcsTechnology. In Transforming Healthcare Through Innovations in Mobile and Wireless Technologies, Proceedings ofthe 4th International Conference on Wireless Mobile Communication and Healthcare, Athens, Greece, 3–5 November2014; ICST: South Portland, MM, USA, 2014.
39. Wirsing, P.G.; Konstantakaki, M.; Poulas, K.A. Martorell’s ulcer successfully treated by wireless microcurrentstimulation technology. Adv. Skin Wound Care 2019, 32, 81–84. [CrossRef] [PubMed]
40. Lala, D.; Spaulding, S.J.; Burke, S.M.; Houghton, P.E. Electrical stimulation therapy for the treatment ofpressure ulcers in individuals with spinal cord injury: A systematic review and meta-analysis. Int. Wound J.2016, 13, 1214–1226. [CrossRef] [PubMed]
41. Smit, C.A.J.; de Groot, S.; Stolwijk-Swuste, J.M.; Janssen, T.W.J. Effects of electrical stimulation on risk factorsfor developing pressure ulcers in people with a spinal cord injury. Am. J. Phys. Med. Rehabil. 2016, 95, 535–552.[CrossRef]
42. Khouri, C.; Kotzki, S.; Roustit, M.; Blaise, S.; Gueyffier, F.; Cracowski, J.-L. Hierarchical evaluation ofelectrical stimulation protocols for chronic wound healing: An effect size meta-analysis. Wound Repair Regen.2017, 25, 883–891. [CrossRef]
43. Thakral, G.; LaFontaine, J.; Najafi, B.; Talal, T.K.; Kim, P.; Lavery, L.A. Electrical stimulation to acceleratewound healing. Diabet. Foot Ankle 2013, 4, 22081. [CrossRef]
44. Ud-Din, S.; Bayat, A. Electrical stimulation and cutaneous wound healing: A review of clinical evidence.Healthcare 2014, 2, 445–467. [CrossRef] [PubMed]
45. Ashrafi, M.; Alonso-Rasgado, T.; Baguneid, M.; Bayat, A. The efficacy of electrical stimulation in lowerextremity cutaneous wound healing: A systematic review. Exp. Dermatol. 2017, 26, 171–178. [CrossRef][PubMed]
46. Kloth, L.C. Electrical stimulation technologies for wound healing. Adv. Wound Care 2014, 3, 81–90. [CrossRef][PubMed]
56

Biosensors 2019, 9, 107
47. Hunckler, J.; de Mel, A. A current affair: Electrotherapy in wound healing. J. Multidiscip. Healthc.2017, 10, 179–194. [CrossRef] [PubMed]
48. Zhao, M.; Song, B.; Pu, J.; Wada, T.; Reid, B.; Tai, G.; Wang, F.; Guo, A.; Walczysko, P.; Gu, Y.; et al.Electrical signals control wound healing through phosphatidylinositol-3-OH kinase-γ and PTEN. Nature2006, 442, 457–460. [CrossRef] [PubMed]
© 2019 by the authors. Licensee MDPI, Basel, Switzerland. This article is an open accessarticle distributed under the terms and conditions of the Creative Commons Attribution(CC BY) license (http://creativecommons.org/licenses/by/4.0/).
57

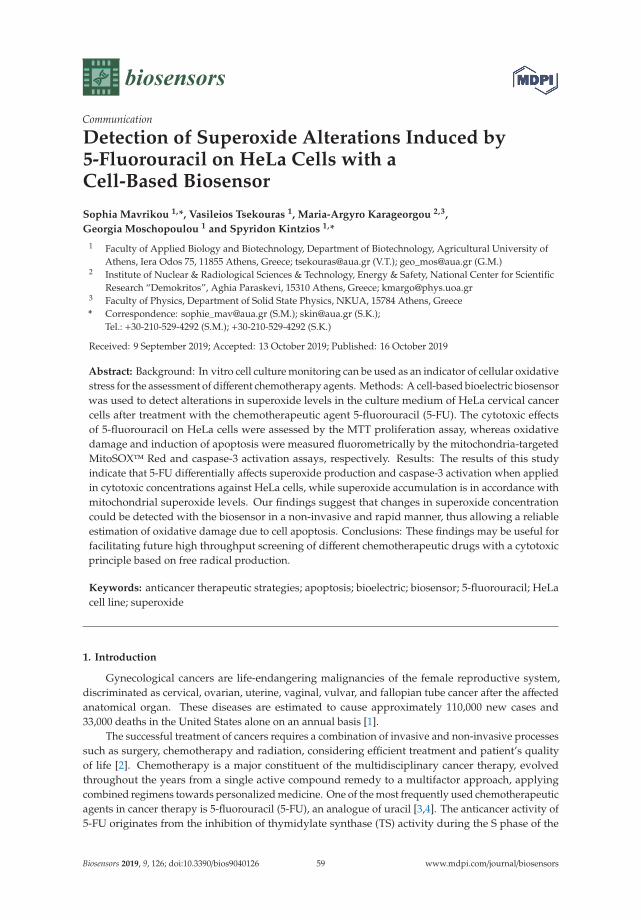
biosensors
Communication
Detection of Superoxide Alterations Induced by5-Fluorouracil on HeLa Cells with aCell-Based Biosensor
Sophia Mavrikou 1,*, Vasileios Tsekouras 1, Maria-Argyro Karageorgou 2,3,
Georgia Moschopoulou 1 and Spyridon Kintzios 1,*
1 Faculty of Applied Biology and Biotechnology, Department of Biotechnology, Agricultural University ofAthens, Iera Odos 75, 11855 Athens, Greece; [email protected] (V.T.); [email protected] (G.M.)
2 Institute of Nuclear & Radiological Sciences & Technology, Energy & Safety, National Center for ScientificResearch “Demokritos”, Aghia Paraskevi, 15310 Athens, Greece; [email protected]
3 Faculty of Physics, Department of Solid State Physics, NKUA, 15784 Athens, Greece* Correspondence: [email protected] (S.M.); [email protected] (S.K.);
Tel.: +30-210-529-4292 (S.M.); +30-210-529-4292 (S.K.)
Received: 9 September 2019; Accepted: 13 October 2019; Published: 16 October 2019
Abstract: Background: In vitro cell culture monitoring can be used as an indicator of cellular oxidativestress for the assessment of different chemotherapy agents. Methods: A cell-based bioelectric biosensorwas used to detect alterations in superoxide levels in the culture medium of HeLa cervical cancercells after treatment with the chemotherapeutic agent 5-fluorouracil (5-FU). The cytotoxic effectsof 5-fluorouracil on HeLa cells were assessed by the MTT proliferation assay, whereas oxidativedamage and induction of apoptosis were measured fluorometrically by the mitochondria-targetedMitoSOX™ Red and caspase-3 activation assays, respectively. Results: The results of this studyindicate that 5-FU differentially affects superoxide production and caspase-3 activation when appliedin cytotoxic concentrations against HeLa cells, while superoxide accumulation is in accordance withmitochondrial superoxide levels. Our findings suggest that changes in superoxide concentrationcould be detected with the biosensor in a non-invasive and rapid manner, thus allowing a reliableestimation of oxidative damage due to cell apoptosis. Conclusions: These findings may be useful forfacilitating future high throughput screening of different chemotherapeutic drugs with a cytotoxicprinciple based on free radical production.
Keywords: anticancer therapeutic strategies; apoptosis; bioelectric; biosensor; 5-fluorouracil; HeLacell line; superoxide
1. Introduction
Gynecological cancers are life-endangering malignancies of the female reproductive system,discriminated as cervical, ovarian, uterine, vaginal, vulvar, and fallopian tube cancer after the affectedanatomical organ. These diseases are estimated to cause approximately 110,000 new cases and33,000 deaths in the United States alone on an annual basis [1].
The successful treatment of cancers requires a combination of invasive and non-invasive processessuch as surgery, chemotherapy and radiation, considering efficient treatment and patient’s qualityof life [2]. Chemotherapy is a major constituent of the multidisciplinary cancer therapy, evolvedthroughout the years from a single active compound remedy to a multifactor approach, applyingcombined regimens towards personalized medicine. One of the most frequently used chemotherapeuticagents in cancer therapy is 5-fluorouracil (5-FU), an analogue of uracil [3,4]. The anticancer activity of5-FU originates from the inhibition of thymidylate synthase (TS) activity during the S phase of the
Biosensors 2019, 9, 126; doi:10.3390/bios9040126 www.mdpi.com/journal/biosensors59
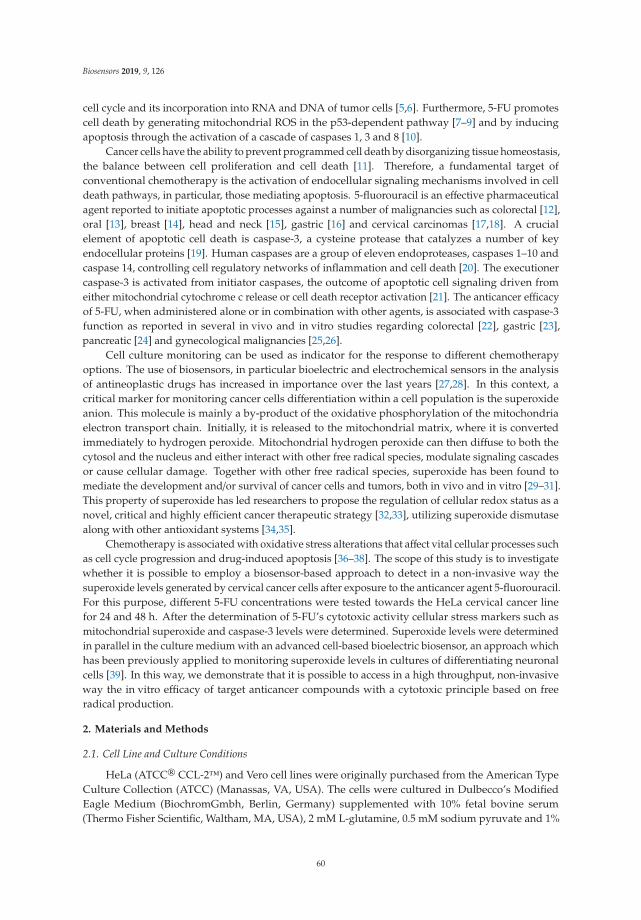
Biosensors 2019, 9, 126
cell cycle and its incorporation into RNA and DNA of tumor cells [5,6]. Furthermore, 5-FU promotescell death by generating mitochondrial ROS in the p53-dependent pathway [7–9] and by inducingapoptosis through the activation of a cascade of caspases 1, 3 and 8 [10].
Cancer cells have the ability to prevent programmed cell death by disorganizing tissue homeostasis,the balance between cell proliferation and cell death [11]. Therefore, a fundamental target ofconventional chemotherapy is the activation of endocellular signaling mechanisms involved in celldeath pathways, in particular, those mediating apoptosis. 5-fluorouracil is an effective pharmaceuticalagent reported to initiate apoptotic processes against a number of malignancies such as colorectal [12],oral [13], breast [14], head and neck [15], gastric [16] and cervical carcinomas [17,18]. A crucialelement of apoptotic cell death is caspase-3, a cysteine protease that catalyzes a number of keyendocellular proteins [19]. Human caspases are a group of eleven endoproteases, caspases 1–10 andcaspase 14, controlling cell regulatory networks of inflammation and cell death [20]. The executionercaspase-3 is activated from initiator caspases, the outcome of apoptotic cell signaling driven fromeither mitochondrial cytochrome c release or cell death receptor activation [21]. The anticancer efficacyof 5-FU, when administered alone or in combination with other agents, is associated with caspase-3function as reported in several in vivo and in vitro studies regarding colorectal [22], gastric [23],pancreatic [24] and gynecological malignancies [25,26].
Cell culture monitoring can be used as indicator for the response to different chemotherapyoptions. The use of biosensors, in particular bioelectric and electrochemical sensors in the analysisof antineoplastic drugs has increased in importance over the last years [27,28]. In this context, acritical marker for monitoring cancer cells differentiation within a cell population is the superoxideanion. This molecule is mainly a by-product of the oxidative phosphorylation of the mitochondriaelectron transport chain. Initially, it is released to the mitochondrial matrix, where it is convertedimmediately to hydrogen peroxide. Mitochondrial hydrogen peroxide can then diffuse to both thecytosol and the nucleus and either interact with other free radical species, modulate signaling cascadesor cause cellular damage. Together with other free radical species, superoxide has been found tomediate the development and/or survival of cancer cells and tumors, both in vivo and in vitro [29–31].This property of superoxide has led researchers to propose the regulation of cellular redox status as anovel, critical and highly efficient cancer therapeutic strategy [32,33], utilizing superoxide dismutasealong with other antioxidant systems [34,35].
Chemotherapy is associated with oxidative stress alterations that affect vital cellular processes suchas cell cycle progression and drug-induced apoptosis [36–38]. The scope of this study is to investigatewhether it is possible to employ a biosensor-based approach to detect in a non-invasive way thesuperoxide levels generated by cervical cancer cells after exposure to the anticancer agent 5-fluorouracil.For this purpose, different 5-FU concentrations were tested towards the HeLa cervical cancer linefor 24 and 48 h. After the determination of 5-FU’s cytotoxic activity cellular stress markers such asmitochondrial superoxide and caspase-3 levels were determined. Superoxide levels were determinedin parallel in the culture medium with an advanced cell-based bioelectric biosensor, an approach whichhas been previously applied to monitoring superoxide levels in cultures of differentiating neuronalcells [39]. In this way, we demonstrate that it is possible to access in a high throughput, non-invasiveway the in vitro efficacy of target anticancer compounds with a cytotoxic principle based on freeradical production.
2. Materials and Methods
2.1. Cell Line and Culture Conditions
HeLa (ATCC® CCL-2™) and Vero cell lines were originally purchased from the American TypeCulture Collection (ATCC) (Manassas, VA, USA). The cells were cultured in Dulbecco’s ModifiedEagle Medium (BiochromGmbh, Berlin, Germany) supplemented with 10% fetal bovine serum(Thermo Fisher Scientific, Waltham, MA, USA), 2 mM L-glutamine, 0.5 mM sodium pyruvate and 1%
60

Biosensors 2019, 9, 126
penicillin/streptomycin, all procured from Biowest (Biowest, Nuaillé, France). Cells were incubated ina 5% CO2 incubator (HF90Air jacketed CO2 Incubator, Heal Force Bio-Meditech Holdings Limited,Shanghai, China) at 37 ◦C for proliferation.
2.2. MTT Cell Proliferation Assay
Cells were plated in transparent flat-bottom 96-well plates (SPL Life Sciences Co Ltd.,Naechon-Myeon, Korea) at two different population densities according to two incubation timeintervals (24 and 48 h): 103 and 8 × 10³ cells per well, both supplemented with 100 μL of culturemedium. The next day the medium was replaced with 200 μL of medium supplemented with 1%FBS that contained the different 5-fluorouracil (5-FU) concentrations. Cells not treated with 5-FUwere considered as control (0). The cytotoxic agent 5-FU was initially diluted in dimethyl-sulfoxide.After 24 and 48 h incubation 0.5 mg/mL 3-(4,5-dimethylthiazol-2-yl)-2,5-diphenyltetrazolium bromide(MTT) (Duchefa Biochemie, Haarlem, the Netherlands) was added in each well. After 3 h in culture,the MTT-containing medium was removed and cells were solubilized with 200 μL dimethyl sulfoxide(DMSO). Cell viability was determined by measuring the absorbance at 560 nm wavelength, using aPowerWave 240 microplate photometer (Biotek, Winooski, VT, USA). The results were expressed as thepercentage of absorbance values compared to control and were assessed to determine the changesin viability.
2.3. Measurement of Mitochondrial Superoxide Production
Mitochondria-targeted MitoSOX™ Red fluorogenic dye (Thermo Fisher Scientific, Rockford, IL,USA) was used to measure mitochondrial superoxide accumulation according to the manufacturer’sinstructions. Briefly, cells were seeded in 96-well black plates (at the same densities indicated atthe MTT viability assessment) with clear bottom and were left for 24 and 48 h incubation with thebioactive compounds. Antimycin-A (50 μM) was used as a positive control. After overnight incubation,the medium was aspirated, and cells were incubated for 10 min at 37 ◦C in 0.2 mL of measurementbuffer containing 5 μM MitoSOX™ Red. Then, the cells were washed twice with PBS. MitoSOX™fluorescence was measured at 510 nm excitation and 580 nm emission wavelengths on an InfiniteM200PRO multimode microplate reader (Tecan Group Ltd., Männedorf, Switzerland). MitoSOX™fluorescence was adjusted based on total protein content as determined by the Bradford assay [40]measured at an absorbance of 595 nm. The results were expressed as the percentage of adjusted valuescompared to control.
2.4. Measurement of Caspase Activity
The activity of caspase-3 enzymes was measured in cell lysates by a colorimetric assay kit(CASP-3-C, SIGMA-ALDRICH, Saint Louis, MO, USA), that is based on the hydrolysis of the compoundacetyl-Asp-Glu-Val-Asp p-nitroanilide (Ac-DEVD-pNA) (A 2559, Sigma-Aldrich, Saint Louis, MO,USA) by caspase-3. The reaction releases the p-nitroaniline moiety (p-NA) that absorbs at 405 nm.Cells were pre-incubated with 5 μM doxorubicin hydrochloride (DOX) (Sigma–Aldrich, Deisenhofen,Germany) for 3 h for caspase cascade initiation [41,42]. Samples (10 μL) were tested both with andwithout the caspase-3 inhibitor acetyl-Asp-Glu-Val-Asp-al (Ac-DEVD-CHO, 20 μM final concentration),in a total reaction volume of 100 μL in 96-well plates. The substrate Ac-DEVD-pNA concentration was200 μM and the assay was performed at 37 ◦C for 90 min. The caspase-3 specific activity was expressedas the percentage of μmol of p-nitroaniline released per min per μg of total protein values comparedto control.
2.5. HeLa Cell Total Protein Extraction
For total protein extraction, cells were lysed in assay buffer (20 mM HEPES, pH 7.4, 2 mM EDTA,0.1% CHAPS, 5 mM DTT) containing protease inhibitors (11873580001; Roche Diagnostics; Mannheim,Germany). Protein concentration was determined by the Bradford assay [40]. Briefly, the medium was
61

Biosensors 2019, 9, 126
removed from cells cultured in six-well plates and cells were washed with PBS. Then, 50 μL of assaybuffer was added in each well and cells were left for 20 min in −20 ◦C. After incubation, lysed cellswere centrifuged at 15,000× g for 15 min at 4 ◦C and the supernatants were transferred to Eppendorftubes. The cytoplasmic proteins were maintained at −80 ◦C until use.
2.6. Creation of Membrane-Engineered Cells and Bioensor Fabrication (Vero-SOD)
Membrane-engineered mammalian cells were created by the electroinsertion of the enzymesuperoxide dismutase (SOD) into the membrane of Vero cell fibroblasts following the protocol ofMoschopoulou et al. [43]. Initially, cells at a density of 3 × 10⁶ mL−1 were centrifuged at 1000 rpmfor 2 min and the pellet was resuspended in PBS (pH 7.4). Afterwards, cells were incubated with1500 U·mL−1 CuZnSOD (EC1.15.1.1) for 20 min at 4 ◦C and the mixture was transferred to electroporator(Eppendorf Eporator, Eppendorf AG, Germany) cuvettes. Electroinsertion was performed by applyingfour pulses of an electric field at 1800 V·cm−1. Then, cells were centrifuged at 1000 rpm for 2 minand resuspended in cell culture medium. Finally, the sensors were fabricated by mixing 1 volume ofVero-SOD cells with 2 volumes of 4% (w/v) sodium alginate solution and was added dropwise withthe use of a 22G syringe in 0.8 M CaCl2. Cells were immobilized in calcium alginate, forming beadscontaining 75 × 103 cells per bead with an approximate diameter of 2 mm. As already reported [39,43],the membrane potential of membrane-engineered Vero cell fibroblasts is affected by the interactionsof electroinserted SOD molecules and superoxide anions, producing measurable changes in themembrane potential.
2.7. Biosensor Setup for Recording Superoxide Concentration and Data Processing
For recording the signal and processing of data, the PMD-1608FSA/D card (MeasurementComputing, Norton, MA, USA) recording device and the software InstaCal (Measurement Computing)were used, respectively. A two-electrode system (working and reference) was connected to the device.These silver electrodes were electrochemically coated with an AgCl layer. A cell-bearing bead wasattached to the working electrode while a cell-free bead was connected to the reference electrode.For each assay, both beads (sensor system, Figure 1) were immersed into the well containing adherentcells [39] and the response of each biosensor potential was achieved within 100 s after its sinking intothe culture medium. The biosensor was calibrated with known superoxide concentration produced bythe oxidation of xanthine by the xanthine oxidase. The range of xanthine concentration was from 1 pMto 10 nM and the xanthine oxidase was 100 mU/mL [43]. Each response was expressed as the averageof the cellular membrane potential of each assay, which has been calibrated to correspond to relativechanges in superoxide concentration.
Figure 1. Cell-based biosensor system configuration.
62
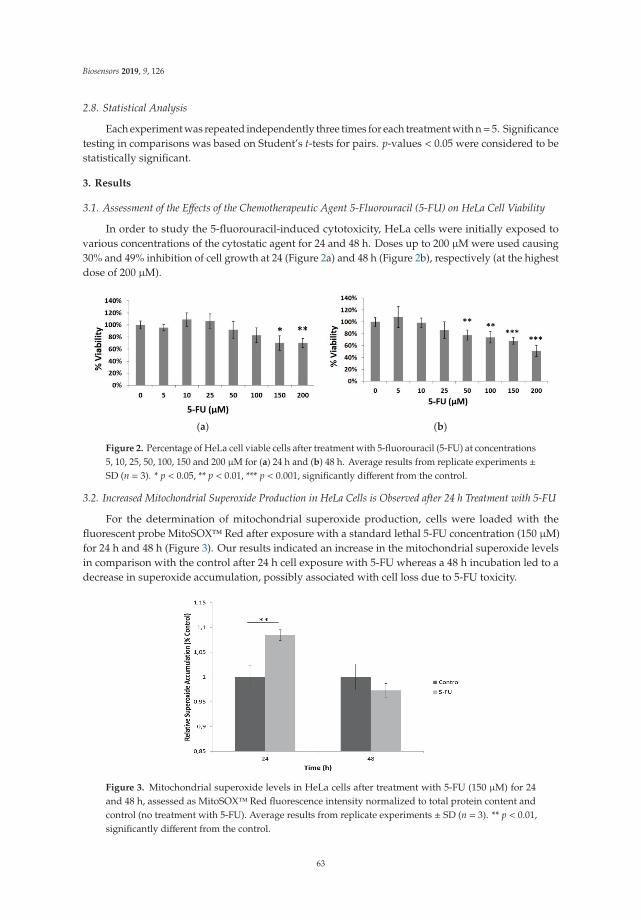
Biosensors 2019, 9, 126
2.8. Statistical Analysis
Each experiment was repeated independently three times for each treatment with n= 5. Significancetesting in comparisons was based on Student’s t-tests for pairs. p-values < 0.05 were considered to bestatistically significant.
3. Results
3.1. Assessment of the Effects of the Chemotherapeutic Agent 5-Fluorouracil (5-FU) on HeLa Cell Viability
In order to study the 5-fluorouracil-induced cytotoxicity, HeLa cells were initially exposed tovarious concentrations of the cytostatic agent for 24 and 48 h. Doses up to 200 μM were used causing30% and 49% inhibition of cell growth at 24 (Figure 2a) and 48 h (Figure 2b), respectively (at the highestdose of 200 μM).
(a) (b)
Figure 2. Percentage of HeLa cell viable cells after treatment with 5-fluorouracil (5-FU) at concentrations5, 10, 25, 50, 100, 150 and 200 μM for (a) 24 h and (b) 48 h. Average results from replicate experiments ±SD (n = 3). * p < 0.05, ** p < 0.01, *** p < 0.001, significantly different from the control.
3.2. Increased Mitochondrial Superoxide Production in HeLa Cells is Observed after 24 h Treatment with 5-FU
For the determination of mitochondrial superoxide production, cells were loaded with thefluorescent probe MitoSOX™ Red after exposure with a standard lethal 5-FU concentration (150 μM)for 24 h and 48 h (Figure 3). Our results indicated an increase in the mitochondrial superoxide levelsin comparison with the control after 24 h cell exposure with 5-FU whereas a 48 h incubation led to adecrease in superoxide accumulation, possibly associated with cell loss due to 5-FU toxicity.
Figure 3. Mitochondrial superoxide levels in HeLa cells after treatment with 5-FU (150 μM) for 24and 48 h, assessed as MitoSOX™ Red fluorescence intensity normalized to total protein content andcontrol (no treatment with 5-FU). Average results from replicate experiments ± SD (n = 3). ** p < 0.01,significantly different from the control.
63
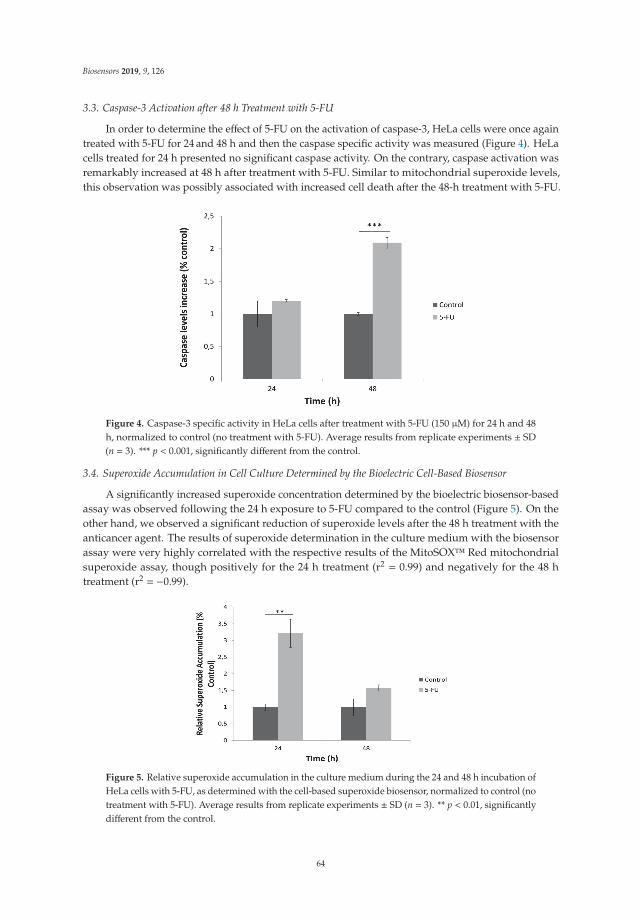
Biosensors 2019, 9, 126
3.3. Caspase-3 Activation after 48 h Treatment with 5-FU
In order to determine the effect of 5-FU on the activation of caspase-3, HeLa cells were once againtreated with 5-FU for 24 and 48 h and then the caspase specific activity was measured (Figure 4). HeLacells treated for 24 h presented no significant caspase activity. On the contrary, caspase activation wasremarkably increased at 48 h after treatment with 5-FU. Similar to mitochondrial superoxide levels,this observation was possibly associated with increased cell death after the 48-h treatment with 5-FU.
Figure 4. Caspase-3 specific activity in HeLa cells after treatment with 5-FU (150 μM) for 24 h and 48h, normalized to control (no treatment with 5-FU). Average results from replicate experiments ± SD(n = 3). *** p < 0.001, significantly different from the control.
3.4. Superoxide Accumulation in Cell Culture Determined by the Bioelectric Cell-Based Biosensor
A significantly increased superoxide concentration determined by the bioelectric biosensor-basedassay was observed following the 24 h exposure to 5-FU compared to the control (Figure 5). On theother hand, we observed a significant reduction of superoxide levels after the 48 h treatment with theanticancer agent. The results of superoxide determination in the culture medium with the biosensorassay were very highly correlated with the respective results of the MitoSOX™ Red mitochondrialsuperoxide assay, though positively for the 24 h treatment (r2 = 0.99) and negatively for the 48 htreatment (r2 = −0.99).
Figure 5. Relative superoxide accumulation in the culture medium during the 24 and 48 h incubation ofHeLa cells with 5-FU, as determined with the cell-based superoxide biosensor, normalized to control (notreatment with 5-FU). Average results from replicate experiments ± SD (n = 3). ** p < 0.01, significantlydifferent from the control.
64
Biosensors 2019, 9, 126
4. Discussion
In this study, we demonstrate the successful implementation of a cell-based biosensor setup forthe direct and rapid detection of superoxide released from cervical cancer cell culture treated with5-FU, one of the most widely applied chemotherapeutic compounds in clinical therapy. Superoxideis considered a particularly significant ROS with an extremely short half-life; thus real-time levelmonitoring is an important yet complex issue. The in vitro determination of reactive oxygen speciessuperoxide is generally assessed by spectrophotometric, analytical, electron spin resonance andelectrochemical biosensor approaches [44]. Biosensors could provide reliable methods for the detectionof relative superoxide levels in cell cultures without the need for extensive chemical and physical cellculture treatments.
The determination of dynamic radical changes in cellular microenvironment with non-invasiveapproaches is an essential mean for assessing the effectiveness of anticancer agents on cancertreatment [45–48]. As mentioned above, 5-FU’s chemotherapeutic properties are attributed tothymidylate synthase (TS) activity inhibition, to mitochondrial ROS generation and the caspases cascadeactivation [49]. Our findings demonstrate that 5-FU differentially affects superoxide production andcaspase-3 activation when applied in cytotoxic concentrations against HeLa cells. MTT assay was usedto evaluate the antiproliferative effect of 5-FU at 24 h and 48 h treatments. We spectrophotometricallydetermined elevated mitochondrial superoxide production after the 24-h treatment but no changes incaspase-3 activity. On the contrary, mitochondrial superoxide release was decreased to control levelswhereas caspase-3 activity was significantly upregulated. These trends are in accordance with theresults obtained from the superoxide biosensor as 5-FU significantly upraised superoxide productionafter the 24 h treatment, followed by a downregulation to control levels after 48-h incubation, possiblyalso associated with increased number of cells undergoing apoptosis.
The correlation between the response of the superoxide bioelectric biosensor and the superoxideconcentration is indirectly linked to changes caused in the cell membrane potential of cells which havebeen membrane-engineered with SOD moieties, i.e., SOD units which have been electroinserted in thecell membrane. This technology is known as molecular identification through membrane engineering.This is a generic methodology of artificially inserting tens of thousands of receptor molecules on thecell surface, thus rendering the cell a selective responder against analytes binding to the insertedreceptors. Receptor molecules can vary from antibodies to enzymes to polysaccharides [50–54]. It hasbeen previously proven [55] that this principle is associated, in a unique way, with certain changes inthe cellular electric properties (in particular, cell membrane hyperpolarization) as a consequence ofthe interaction of the analytes under determination with the electroinserted molecules and thereforechanges in the cellular structure.
It must be emphasized that cell membrane hyperpolarization is the dominant change in theengineered cell membrane electric properties following a mechanical distortion of the membrane(according to the novel assay principle described in the method) as also expected by the concurrentchange in the actin cytoskeleton structure, in particular the actin cytoskeleton network adjunct tothe sites of the interaction, including the circumferential actin belt and changes in the propagationof electric signals along actin filaments [56]. On the contrary, the main change in the cell membraneelectric properties of normal (i.e., non-membrane engineered) cells is depolarization, as frequentlydescribed in prior approaches [57–59].
It has been previously proven that superoxide dismutation triggered changes to the membranepotential of fibroblast cells membrane-engineered with SOD [43]. In order to measure theaforementioned changes in the engineered cell membrane potential, the superoxide biosensor usedin the present study was designed according to the principle of the bioelectric recognition assay(BERA) [57]. This methodology has been often applied to detect cellular interactions with bioactivecompounds via the determination of electrical conductivity generated adjacent to a cell cluster as ameans of indirect measurement of the relative changes in the cell membrane potential. This meansthat the AgCl electrode system applied is able to measure conductivity alterations of the extracellular
65
Biosensors 2019, 9, 126
microenvironment reflecting the bioelectric profiling of cell responses to various treatments [60]. It hasbeen previously demonstrated that by using this superoxide biosensor system it is possible to rapidlymeasure superoxide concentrations as low as 1 pM [43] and also to correlate the biosensor responsewith currently available conventional methods for superoxide determination [43,50,61].
Mitochondrial superoxide is produced when electrons released from the electron transfer systemin the inner membrane of mitochondria are captured by molecular oxygen and become superoxide [62].It has been reported that extracellular superoxide is closely linked to mitochondrial superoxideproduction [63]. Our results support this statement as high mitochondrial superoxide levels, measuredwith mitochondria-targeted MitoSOX™ Red fluorogenic dye are accompanied by high extracellularaccumulation of the anion. However, superoxide concentration data recorded with the cell-basedbiosensor should be considered with caution compared with MitoSOX™ results, since the biosensorassayed superoxide eluted in the culture medium, not its actual intracellular concentration. Thatsaid, it is worth elaborating on the observation that, although the results obtained with the bioelectricbiosensor for the 24 h treatment were very highly and positively correlated with the MitoSOX™ assay, anegative yet high correlation was established for the 48-h treatment. This could be possibly explained bythe reduced number of live HeLa cells after their prolonged exposure to 5-FU. As already hypothesizedin Section 3, this would result in a lower level of superoxide accumulation in the mitochondria (sincefewer cells will be metabolically active) and at the same time in a higher level of superoxide releasedin the culture media (compared to control) due to cell membrane leakage from dead cells. In thisrespect, the reliability of the biosensor-based assay in accessing the ROS-mediated toxicity of 5-FUis considerably higher than the MitoSOX™ assay, since it allows for a more realistic and accurateestimation of the level of oxidative stress related to and/or resulting from the anticancer drug effect.
5. Conclusions
Intracellular ROS are increasingly recognized as critical determinants of cellular signaling and canbe used as markers of 5-FU-mediated anti-tumor effects. Biosensors are widely used for the assessmentof physiological and pathological applications since they are non-invasive methods for the detectionof crucial biomarkers of cancer cell cytotoxicity without the need for extensive sample pretreatment.In this study, we present a cell-based biosensor tool suitable for cell culture superoxide monitoringwithout the need for cell transfer and staining, which could affect cellular responses due to extrinsicchemical and mechanical stress. This biosensor is applied for the estimation of total superoxide levelsreleased from the cancer cells into the culture medium after treatment with the chemotherapeuticagent. Our results are in agreement with the findings of the biochemical assays for the assessmentof mitochondrial superoxide and caspase-3 activities. Further validation is required of the feasibilityof our biosensor-based approach for monitoring alterations in the in vitro redox status of cancercells treated with anticancer agents, e.g., by testing more and different cancer cell lines crossed withchemotherapeutical drug combinations. In a longer perspective, the availability of a reliable, highthroughput and rapid system for superoxide determination in cancer cells will allow for the accurateassessment of chemoresistance in cervical and other cancer cells, at least as far as its association withredox balance is concerned [38,64–66].
Author Contributions: Methodology, S.M., V.T., M.-A.K., G.M.; investigation, S.M., V.T., M.-A.K., G.M.; datacuration, S.M., V.T.; writing—original draft preparation, S.M., V.T., S.K., G.M.; writing—review and editing, S.K.;supervision, S.K.; project administration, G.M.
Funding: This work is supported by the Operational Program “Human Resources Development, Education andLifelong Learning”, Priority Axes 6, 8, 9 co-financed by European Social Fund entitled “Support of Researcherswith Emphasis on Senior Researchers” (NSRF 2014-2020).
Conflicts of Interest: The authors declare no conflict of interest.
References
1. Siegel, R.L.; Miller, K.D.; Jemal, A. Cancer statistics. CA Cancer J. Clin. 2019, 69, 7–34. [CrossRef] [PubMed]
66
Biosensors 2019, 9, 126
2. Melville, A.; Eastwood, A.; Kleijnen, J.; Kitchener, H.; Martin-Hirsch, P.; Nelson, L. Management ofgynaecological cancers. Qual. Health Care 1999, 8, 270–279. [CrossRef] [PubMed]
3. Grem, J.L. Mechanisms of Action and Modulation of Fluorouracil. Semin. Radiat. Oncol. 1997, 7, 249–259.[CrossRef]
4. Zhang, Y.; Talmon, G.; Wang, J. MicroRNA-587 antagonizes 5-FU-induced apoptosis and confers drugresistance by regulating PPP2R1B expression in colorectal cancer. Cell Death Dis. 2015, 6, e1845. [CrossRef]
5. Noordhuis, P.; Holwerda, U.; van der Wilt, C.L.; Groeningen, C.; Smid, K.; Meijer, S.; Pinedo, H.; Peters, G.5-Fluorouracil incorporation into RNA and DNA in relation to thymidylate synthase inhibition of humancolorectal cancers. Ann. Oncol. 2004, 15, 1025–1032. [CrossRef]
6. Walko, C.M.; Lindley, C. Capecitabine: A review. Clin. Ther. 2005, 27, 23–44. [CrossRef]7. Hwang, P.M.; Bunz, F.; Yu, J.; Rago, C.; Chan, T.A.; Murphy, M.P.; Kelso, G.F.; Smith, R.A.; Kinzler, K.W.;
Vogelstein, B. Ferredoxin reductase affects p53-dependent, 5-fluorouracil-induced apoptosis in colorectalcancer cells. Nat. Med. 2001, 7, 1111–1117. [CrossRef]
8. Fan, C.; Chen, J.; Wang, Y.; Wong, Y.S.; Zhang, Y.; Zheng, W.; Cao, W.; Chen, T. Selenocystine potentiatescancer cell apoptosis induced by 5-fluorouracil by triggering reactive oxygen species-mediated DNA damageand inactivation of the ERK pathway. Free Radic. Biol. Med. 2013, 65, 305–316. [CrossRef]
9. Liu, M.P.; Liao, M.; Dai, C.; Chen, J.F.; Yang, C.J.; Liu, M.; Chen, Z.G.; Yao, M.C. Sanguisorba officinalis L.synergistically enhanced 5-fluorouracil cytotoxicity in colorectal cancer cells by promoting a reactive oxygenspecies-mediated, mitochondria-caspase-dependent apoptotic pathway. Sci. Rep. 2016, 27, 34245. [CrossRef]
10. Ohtani, T.; Hatori, M.; Ito, H.; Takizawa, K.; Kamijo, R.; Nagumo, M. Involvement of caspases in 5-FUinduced apoptosis in an oral cancer cell line. Anticancer Res. 2000, 20, 3117–3121.
11. Ricci, M.S.; Zong, W.X. Chemotherapeutic approaches for targeting cell death pathways. Oncologist 2006, 11,342–357. [CrossRef] [PubMed]
12. Mhaidat, N.M.; Bouklihacene, M.; Thorne, R.F. 5-Fluorouracil-induced apoptosis in colorectal cancer cellsis caspase-9-dependent and mediated by activation of protein kinase C-δ. Oncol. Lett. 2014, 8, 699–704.[CrossRef] [PubMed]
13. Tong, D.; Poot, M.; Hu, D.; Oda, D. 5-Fluorouracil-induced apoptosis in cultured oral cancer cells. Oral Oncol.2000, 36, 236–241. [CrossRef]
14. Ponce-Cusi, R.; Calaf, G. Apoptotic activity of 5-fluorouracil in breast cancer cells transformed by low dosesof ionizing α-particle radiation. Int. J. Oncol. 2016, 48, 774–782. [CrossRef] [PubMed]
15. Shigeishi, H.; Biddle, A.; Gammon, L.; Rodini, C.O.; Yamasaki, M.; Seino, S.; Sugiyama, M.; Takechi, M.;Mackenzie, I.C. Elevation in 5-FU-induced apoptosis in head and neck cancer stem cells by a combination ofCDHP and GSK3β inhibitors. J. Oral Pathol. Med. 2015, 44, 201–207. [CrossRef]
16. Zhao, P.; Zhang, J.; Pang, X.; Zhao, L.; Li, Q.; Cao, B. Effect of apatinib combined with 5-fluorouracil (5-FU)on proliferation, apoptosis and invasiveness of gastric cancer cells. Ann. Oncol. 2017, 28. [CrossRef]
17. Koraneekit, A.; Limpaiboon, T.; Sangka, A.; Boonsiri, P.; Daduang, S.; Daduang, J. Synergistic effects ofcisplatin-caffeic acid induces apoptosis in human cervical cancer cells via the mitochondrial pathways.Oncol. Lett. 2018, 15, 7397–7402. [CrossRef]
18. Hemaiswarya, S.; Doble, M. Combination of phenylpropanoids with 5-fluorouracil as anti-cancer agentsagainst human cervical cancer (HeLa) cell line. Phytomedicine 2012, 20, 151–158. [CrossRef]
19. Porter, A.G.; Jänicke, R.U. Emerging roles of caspase-3 in apoptosis. Cell Death Differ. 1999, 6, 99–104.[CrossRef]
20. Li, J.; Yuan, J. Caspases in apoptosis and beyond. Oncogene 2008, 27, 6194–6206. [CrossRef]21. Parrish, A.B.; Freel, C.D.; Kornbluth, S. Cellular mechanisms controlling caspase activation and function.
Cold Spring Harb. Perspect. Biol. 2013, 5, a008672. [CrossRef] [PubMed]22. Shi, T.; Gao, M.; He, M.; Yue, F.; Zhao, Y.; Sun, M.; He, K.; Chen, L. 5-FU preferably induces apoptosis in
BRAF V600E colorectal cancer cells via downregulation of Bcl-xL. Mol. Cell. Biochem. 2019, 461, 151–158.[CrossRef] [PubMed]
23. Fu, Z.; Zhou, Q.; Zhu, S.; Liu, W. Anti-tumor mechanism of IL-21 used alone and in combination with5-fluorouracil in vitro on human gastric cancer cells. J. Biol. Regul. Homeost. Agents 2018, 32, 619–625.[PubMed]
67

Biosensors 2019, 9, 126
24. Ghadban, T.; Dibbern, J.L.; Reeh, M.; Miro, J.T.; Tsui, T.Y.; Wellner, U.; Izbicki, J.R.; Güngör, C.; Vashist, Y.K.HSP90 is a promising target in gemcitabine and 5-fluorouracil resistant pancreatic cancer. Apoptosis 2017, 22,369–380. [CrossRef] [PubMed]
25. Chen, X.X.; Leung, G.P.H.; Zhang, Z.J.; Xiao, J.B.; Lao, L.X.; Feng, F.; Zhang, K.Y.B. Proanthocyanidins fromUncaria rhynchophylla induced apoptosis in MDA-MB-231 breast cancer cells while enhancing cytotoxiceffects of 5-fluorouracil. Food Chem. Toxicol. 2017, 107, 248–260. [CrossRef]
26. Deveci, H.A.; Nazıroglu, M.; Nur, G. 5-Fluorouracil-induced mitochondrial oxidative cytotoxicity andapoptosis are increased in MCF-7 human breast cancer cells by TRPV1 channel activation but not Hypericumperforatum treatment. Mol. Cell. Biochem. 2018, 439, 189–198. [CrossRef]
27. Lima, H.R.S.; da Silva, J.S.; de Oliveira Farias, E.A.; Teixeira, P.R.S.; Eiras, C.; Nunes, L.C.C. Electrochemicalsensors and biosensors for the analysis of antineoplastic drugs. Biosens. Bioelectron. 2018, 108, 27–37.[CrossRef]
28. Meneghello, A.; Tartaggia, S.; Alvau, M.D.; Polo, F.; Toffoli, G. Biosensing technologies for therapeutic drugmonitoring. Curr. Med. Chem. 2018, 25, 4354–4377. [CrossRef]
29. Shibayama-Imazu, T.; Sonoda, I.; Sakairi, S.; Aiuchi, T.; Ann, W.W.; Nakajo, S.; Itabe, H.; Nakaya, K.Production of superoxide and dissipation of mitochondrial transmembrane potential by vitamin K2 triggerapoptosis in human ovarian cancer TYK-nu cells. Apoptosis 2006, 11, 1535–1543. [CrossRef]
30. Dhar, S.K.; St Clair, D.K. Manganese superoxide dismutase regulation and cancer. Free Radic. Biol. Med. 2012,52, 2209–2222. [CrossRef]
31. Coso, S.; Harrison, I.; Harrison, C.B.; Vinh, A.; Sobey, C.G.; Drummond, G.R.; Williams, E.D.; Selemidis, S.NADPH oxidases as regulators of tumor angiogenesis: Current and emerging concepts. Antioxid. RedoxSignal. 2012, 16, 1229–1247. [CrossRef] [PubMed]
32. Baffy, G.; Derdak, Z.; Robson, S.C. Mitochondrial recoupling: A novel therapeutic strategy for cancer? Br. J.Cancer 2011, 105, 469–474. [CrossRef]
33. Montero, A.J.; Jassem, J. Cellular redox pathways as a therapeutic target in the treatment of cancer. Drugs2011, 71, 1385–1396. [CrossRef] [PubMed]
34. Brown, D.P.; Chin-Sinex, H.; Nie, B.; Mendonca, M.S.; Wang, M. Targeting superoxide dismutase 1 toovercome cisplatin resistance in human ovarian cancer. Cancer Chemother. Pharmacol. 2009, 63, 723–730.[CrossRef] [PubMed]
35. Radenkovic, S.; Milosevic, Z.; Konjevic, G.; Karadzic, K.; Rovcanin, B.; Buta, M.; Gopcevic, K.; Jurisic, V.Lactate dehydrogenase, catalase, and superoxide dismutase in tumor tissue of breast cancer patients inrespect to mammographic findings. Cell Biochem. Biophys. 2013, 66, 287–295. [CrossRef]
36. Shacter, E.; Williams, J.A.; Hinson, R.M.; Senturker, S.; Lee, Y.-J. Oxidative stress interferes with cancerchemotherapy: Inhibition of lymphoma cell apoptosis and phagocytosis. Blood 2000, 96, 307–313. [CrossRef]
37. Hu, Y.; Rosen, D.G.; Zhou, Y.; Feng, L.; Yang, G.; Liu, J.; Huang, P. Mitochondrial manganese-superoxidedismutase expression in ovarian cancer: Role in cell proliferation and response to oxidative stress. J. Biol. Chem.2005, 280, 39485–39492. [CrossRef]
38. Tamaki, R.; Kanai-Mori, A.; Morishige, Y.; Koike, A.; Yanagihara, K.; Amano, F. Effects of 5-fluorouracil,adriamycin and irinotecan on HSC-39, a human scirrhous gastric cancer cell line. Oncol. Rep. 2017, 37,2366–2374. [CrossRef]
39. Moschopoulou, G.; Kintzios, S. Non-invasive Superoxide Monitoring of In Vitro Neuronal DifferentiationUsing a Cell-Based Biosensor. J. Sens. 2015, 2015, 768352. [CrossRef]
40. Bradford, M.M. A rapid and sensitive method for the quantitation of microgram quantities of protein utilizingthe principle of protein-dye binding. Anal. Biochem. 1976, 72, 248–254. [CrossRef]
41. Ueno, M.; Kakinuma, Y.; Yuhki, K.; Murakoshi, N.; Iemitsu, M.; Miyauchi, T.; Yamaguchi, I. Doxorubicininduces apoptosis by activation of caspase-3 in cultured cardiomyocytes in vitro and rat cardiac ventriclesin vivo. J. Pharmacol. Sci. 2006, 101, 151–158. [CrossRef] [PubMed]
42. Wang, S.; Konorev, E.A.; Kotamraju, S.; Joseph, J.; Kalivendi, S.; Kalyanaraman, B. Doxorubicin InducesApoptosis in Normal and Tumor Cells via Distinctly Different Mechanisms. J. Biol. Chem. 2004, 279,25535–25543. [CrossRef] [PubMed]
43. Moschopoulou, G.; Valero, T.; Kintzios, S. Superoxide determination using membrane-engineered cells:An example of a novel concept for the construction of cell sensors with customized target recognitionproperties. Sens. Actuators B Chem. 2012, 175, 78–84. [CrossRef]
68
Biosensors 2019, 9, 126
44. Zhang, Y.; Dai, M.; Yuan, Z. Methods for the detection of reactive oxygen species. Anal. Methods 2018, 10,4625–4638. [CrossRef]
45. Senthil, K.; Aranganathan, S.; Nalini, N. Evidence of oxidative stress in the circulation of ovarian cancerpatients. Clin. Chim. Acta 2004, 339, 27–32. [CrossRef] [PubMed]
46. Patel, S.; Nanda, R.; Sahoo, S.; Mohapatra, E. Biosensors in Health Care: The Milestones Achieved in TheirDevelopment towards Lab-on-Chip-Analysis. Biochem. Res. Int. 2016, 2016, 3130469. [CrossRef]
47. Lewandowski, M.; Gwozdzinski, K. Nitroxides as antioxidants and anticancer drugs. Int. J. Mol. Sci. 2017,18, 2490. [CrossRef]
48. Nunes, S.C.; Serpa, J. Glutathione in ovarian cancer: A double-edged sword. Int. J. Mol. Sci. 2018, 19, 1882.[CrossRef]
49. Akpinar, B.; Bracht, E.V.; Reijnders, D.; Safarikova, B.; Jelinkova, I.; Grandien, A.; Vaculova, A.H.;Zhivotovsky, B.; Olsson, M. 5-Fluorouracil-induced RNA stress engages a TRAIL-DISC-dependent apoptosisaxis facilitated by p53. Oncotarget 2015, 6, 43679–43697. [CrossRef]
50. Moschopoulou, G.; Kintzios, S. Application of “membrane-engineering” to bioelectric recognition cell sensorsfor the detection of picomole concentrations of superoxide radical: A novel biosensor principle. Anal. Chim.Acta 2006, 573–574, 90–96. [CrossRef]
51. Moschopoulou, G.; Vitsa, K.; Bem, F.; Vassilakos, N.; Perdikaris, A.; Blouhos, P.; Yialouris, C.; Frossiniotis, D.;Anthopoulos, I.; Maggana, O.; et al. Engineering of the membrane of fibroblast cells with virus-specificantibodies: A novel biosensor tool for virus detection. Biosens. Bioelectron. 2008, 24, 1033–1036. [CrossRef][PubMed]
52. Perdikaris, A.; Alexandropoulos, N.; Kintzios, S. Development of a Novel, Ultra-rapid Biosensorfor the Qualitative Detection of Hepatitis B Virus-associated Antigens and Anti-HBV, Based on“Membrane-engineered” Fibroblast Cells with Virus-Specific Antibodies and Antigens. Sensors 2009,9, 2176–2186. [CrossRef] [PubMed]
53. Perdikaris, A.; Vassilakos, N.; Yiakoumettis, I.; Kektsidou, O.; Kintzios, S. Development of a portable, highthroughput biosensor system for rapid plant virus detection. J. Virol. Methods 2011, 177, 94–99. [CrossRef][PubMed]
54. Gramberg, B.; Kintzios, S.; Schmidt, U.; Mewis, I.; Ulrichs, C. A basic approach towards the development ofbioelectric bacterial biosensors for the detection of plant viruses. J. Phytopathol. 2012, 160, 106–111. [CrossRef]
55. Kokla, A.; Blouchos, P.; Livaniou, E.; Zikos, C.; Kakabakos, S.E.; Petrou, P.S.; Kintzios, S. Visualization ofthe membrane-engineering concept: Evidence for the specific orientation of electroinserted antibodies andselective binding of target analytes. J. Mol. Recognit. 2013, 26, 627–632. [CrossRef]
56. Nin, V.; Hernandez, J.A.; Chiffle, S. Hyperpolarization of the plasma membrane potential provokesreorganization of the actin cytoskeleton and increases the stability of adherens junctions in bovine cornealendothelial cells in culture. Cell Motil. Cytoskelet. 2009, 66, 1087–1099. [CrossRef]
57. Kintzios, S.; Bem, F.; Mangana, O.; Nomikou, K.; Markoulatos, P.; Alexandropoulos, N.; Fasseas, C.;Arakelyan, V.; Petrou, A.-L.; Soukouli, K.; et al. Study on the mechanism of Bioelectric Recognition Assay:Evidence for immobilized cell membrane interactions with viral fragments. Biosens. Bioelectron. 2004, 20,907–916. [CrossRef]
58. Mavrikou, S.; Flampouri, E.; Moschopoulou, G.; Mangana, O.; Michaelides, A.; Kintzios, S. Assessment oforganophosphate and carbamate pesticide residues in cigarette tobacco with a novel cell biosensor. Sensors2008, 8, 2818–2832. [CrossRef]
59. Flampouri, E.; Mavrikou, S.; Kintzios, S.; Miliaids, G.; Aplada-Sarli, P. Development and Validation of aCellular Biosensor Detecting Pesticide Residues in Tomatoes. Talanta 2010, 80, 1799–1804. [CrossRef]
60. Crowe, S.M.; Kintzios, S.; Kaltsas, G.; Palmer, C.S. A Bioelectronic System to Measure the GlycolyticMetabolism of Activated CD4+ T Cells. Biosensors 2019, 9, 10. [CrossRef]
61. Moschopoulou, G.; Papanastasiou, I.; Makri, O.; Lambrou, N.; Economou, G.; Soukouli, K.; Kintzios, S.Cellular redox-status is associated with regulation of frond division in Spirodela polyrrhiza. Plant Cell Rep.2007, 26, 2063–2069. [CrossRef] [PubMed]
62. Suski, J.M.; Lebiedzinska, M.; Bonora, M.; Pinton, P.; Duszynski, J.; Wieckowski, M.R. Relation betweenmitochondrial membrane potential and ROS formation. Methods Mol. Biol. 2012, 810, 183–250. [CrossRef][PubMed]
69
Biosensors 2019, 9, 126
63. Li, Y.; Zhu, H.; Kuppusamy, P.; Zweier, J.L.; Trush, M.A. Mitochondrial Electron Transport Chain-DerivedSuperoxide Exits Macrophages: Implications for Mononuclear Cell-Mediated Pathophysiological Processes.React. Oxyg. Species 2016, 1, 81–98. [CrossRef] [PubMed]
64. Chen, J.; Solomides, C.; Parekh, H.; Simpkins, F.; Simpkins, H. Cisplatin resistance in human cervical, ovarianand lung cancer cells. Cancer Chemother. Pharmacol. 2015, 75, 1217–1227. [CrossRef]
65. Liu, Y.; Li, Q.; Zhou, L.; Xie, N.; Nice, E.C.; Zhang, H.; Huang, C.; Lei, Y. Cancer drug resistance: Redoxresetting renders a way. Oncotarget 2016, 7, 42740–42761. [CrossRef]
66. Luo, M.; Wicha, M.S. Targeting cancer stem cell redox metabolism to enhance therapy responses. Semin.Radiat. Oncol. 2019, 29, 42–54. [CrossRef]
© 2019 by the authors. Licensee MDPI, Basel, Switzerland. This article is an open accessarticle distributed under the terms and conditions of the Creative Commons Attribution(CC BY) license (http://creativecommons.org/licenses/by/4.0/).
70
biosensors
Article
Bioelectrical Analysis of Various Cancer Cell TypesImmobilized in 3D Matrix and Cultured in3D-Printed Well
Georgia Paivana 1, Sophie Mavrikou 1,*, Grigoris Kaltsas 2 and Spyridon Kintzios 1
1 Laboratory of Cell Technology, Department of Biotechnology, Agricultural University of Athens,118 55 Athens, Greece; [email protected] (G.P.); [email protected] (S.K.)
2 microSENSES Laboratory, Department of Electrical and Electronic Engineering, University of West Attica,122 44 Athens, Greece; [email protected]
* Correspondence: [email protected]; Tel.: +30-210-529-4292
Received: 3 October 2019; Accepted: 11 November 2019; Published: 14 November 2019
Abstract: Cancer cell lines are important tools for anticancer drug research and assessment.Impedance measurements can provide valuable information about cell viability in real time.This work presents the proof-of-concept development of a bioelectrical, impedance-based analysistechnique applied to four adherent mammalian cancer cells lines immobilized in a three-dimensional(3D) calcium alginate hydrogel matrix, thus mimicking in vivo tissue conditions. Cells weretreated with cytostatic agent5-fluoruracil (5-FU). The cell lines used in this study were SK-N-SH,HEK293, HeLa, and MCF-7. For each cell culture, three cell population densities were chosen (50,000,100,000, and 200,000 cells/100 μL). The aim of this study was the extraction of mean impedance valuesat various frequencies for the assessment of the different behavior of various cancer cells when 5-FUwas applied. For comparison purposes, impedance measurements were implemented on untreatedimmobilized cell lines. The results demonstrated not only the dependence of each cell line impedancevalue on the frequency, but also the relation of the impedance level to the cell population density forevery individual cell line. By establishing a cell line-specific bioelectrical behavior, it is possible toobtain a unique fingerprint for each cancer cell line reaction to a selected anticancer agent.
Keywords: cell immobilization; 3D-printed well; bioelectric profiling; impedance analysis;real-time measurements
1. Introduction
Cancer is the main cause of death in many countries, as it appears in different types, most commonlyaffecting women (e.g., cervical, breast, and lung adenocarcinoma cancers) [1,2]. In medical treatment,doctors take steps to anticipate the development of the disease (primary prophylaxis) or to minimizeits further development (secondary prophylaxis) [3]. Considering secondary prophylaxis measures,sophisticated processes are required to detect possible cellular disorders at the very earliest stages ofthe disease’s incubation period, taking into account the dependence of the timeliness with which thedisease is detected [4]. Due to the fact that many cancer diagnostic methods combined with radiological,surgical biopsy, and pathological assessments of tissue samples based on immunohistochemical andmorphological characteristics [5] are time-consuming, invasive, and complicated, and require rigorouslaboratory conditions, new cancer detection methods are being developed which are minimallyinvasive, more reliable, cheaper, and easier to use [6].
Chemotherapy, newer immunotherapy, and targeted therapy constitute the various treatmentstrategies that have been proposed and modified in order to increase effectiveness and precision [7,8].Although many approaches for cancer treatments have been developed successfully, sooner or later,
Biosensors 2019, 9, 136; doi:10.3390/bios9040136 www.mdpi.com/journal/biosensors71
Biosensors 2019, 9, 136
resistance among the subgroups of cancer cells will emerge as a hurdle to the efficacy of most currenttherapeutic approaches [9]. One of the most commonly used drugs for cancer treatment is 5-fluorouracil(5-FU). This compound is used in the treatment of many types of cancer, including breast cancer,colon cancer, skin cancer, etc., as it intercalates in nucleoside metabolism, leading to cytotoxicity andcell death [10].
Electrical impedance spectroscopy (EIS) is a technique that measures the electrical impedance ofliving cells in order to identify various cell types. This technique can be used for the successful separationof pathological cells from normal ones, taking into account the electrophysiological properties of cellsbased on the frequency range [11,12]. Cell electrical impedance can identify the physical, mechanical,and biochemical functions of living biological cells. EIS focuses on the analysis and discriminationof cancer cells, utilizing the fact that impedance measurements represent an effective approach forcell characterization based on the electrical responses over a particular frequency domain. As theimpedance value of several tissue parameters (e.g., morphology, growth, and differentiation) varywith the frequency of the applied signal, an impedance analysis conducted over a wide frequencyrange provides more information about the tissue interiors, which helps us to better understand thebiological tissues physiology, anatomy, and pathology [13]. For example, researchers have used theimpedance technique to measure three dimensional cell cultures for four breast cell lines [14–16].
Recently, bioimpedance has been able to provide in-depth biological measurement analyses fromthe cell-level to DNA [17,18]. The evaluation of parameters such as cell adhesion, differentiation,spreading, morphology, growth, motility, and death for any adherent cell type is possible by monitoringthe impedance changes at the contact point between the cells and electrodes [19]. In addition,bioimpedance research can nominate the pathological status of a single cell, and also be used todetermine the occurrence of bacterial infections, toxicity, and changes of environmental parameters,and in the direct or indirect detection of compounds and other factors [20]. Critical changes in cellularbehavior, such as the integrity of the extracellular membrane, morphology, as well as alterations inintracellular structure, significantly influence the corresponding impedance level which can be detectedquickly and cost-effectively using electrodes [13,19]. Thus, impedance measurements can also be usedin studying cell viability, which provides an alternative to slow and invasive traditional cytotoxicityassays [21].
Biomaterial research for drug development, cell culture, and tissue regeneration applicationsaims to mimic the natural extracellular matrix (ECM) in order to bridge the gap between in vivo andin vitro environments [22]. In the body, nearly all tissue cells are supported by an ECM that comprisesa complex, three-dimensional (3D), fibrous mesh network of collagen and elastic fibers integrated intoa high hydrated, gel-like material containing proteoglycans, glycosaminoglycans, and glycoproteins.This complex system is responsible for the triggering of various biochemical and physical signals [23].In practice, most cell culture studies are carried out using cells cultured as two-dimensional (2D)monolayers on hard plastic surfaces due to the convenience, ease, and high cell proliferation that theseculture techniques provide. On the other hand, cell adaption to an artificial monolayer culture onan inflexible surface would lead to metabolic and functional alterations, resulting in behavior differentfrom the in vivo environment [23]. Thus, research is focused on developing more controllable 3Dcell culture matrices resembling, as much as possible, the in vivo conditions that are able to supportcell growth, differentiation, and organization. Bearing in mind all the above, we can define 3D cellculture as the integration of cells into a hydrogel matrix in order to receive signals from the scaffoldand surrounding cells [23,24]. This procedure initially necessitates a cellular suspension in a hydrogelprecursor solution, and then entrapment through a gel initiation reaction that leads to the formation ofcovalently- or noncovalently-linked molecules [25,26].
A great number of synthetic and natural polymers can be used for cell entrapment gelled intohydrophilic matrices under mild conditions with minimal loss of viability [27]. The properties of thegel, i.e., either hydrophobic either hydrophilic, and its porosity, can be regulated. The entrapment ofcells constitutes one of the most widely used methods for living cell immobilization within spherical
72

Biosensors 2019, 9, 136
beads of calcium alginate. This method is considered successful due to the fact that immobilization isa simple, quick and cost-effective technique, and is usually performed under very mild conditions [28].
Three-dimensional (3D) printing is a cheap additive layer manufacturing technology thatis able to create sophisticated and complex-shaped bodies in a short time, especially for rapidprototyping engineering applications [29–31]. In many cases, 3D printing technology usespolymers, depending on the specific characteristics that are required for the microfabricateddevices (e.g., polycarbonate (PC), PLA, nylon, polymethyl methacrylate (PMMA), polystyrene, andpolyethylene terephthalate glycol (PETG)) [32–35]. Depending on the area of interest, 3D printingtechnology is increasing rapidly and is extensively used in many fields, such as bio-printing, medicaldevices, the automotive industry, soft sensors and actuators, space, art and jewelry, education, andtissue printing [36,37]. PETG constitutes a copolymer known for its biocompatibility, chemicalresistance, recyclability, and transparency [38]. It can be used in different applications in the food andmedical industry, with an acceptable flammability rating [39]. Unfortunately, it presents low resistanceto ultraviolet (UV) light and performs weakly against frictional contact and scratching.
The aim of this study is to develop a proof-of-concept bioelectrical profiling assay to study thereaction of various cancer cell lines exposed to a common anticancer drug as a function of the cellpopulation density. For comparison purposes, bioelectrical impedance-based measurements weretaken on both untreated immobilized cells and on cells treated with 5-FU. Thus, two gold-plated (Au)electrodes were embedded in a 3D-printed PETG well for impedance measurements on four cancercell lines (SK-N-SH, HEK293, HeLa and MCF-7) immobilized in calcium alginate matrix. Cell cultureswere realized in three population densities tested with various frequencies. In this way, a more detailedapplication of the bioelectrical analysis on an in vitro system for monitoring different responses betweenvarious cancer cells (control and treated with 5-FU) was possible.
2. Materials and Methods
2.1. Theory
Bioimpedance, as a passive electrical property, is described as the capability of biological tissue toimpede electric current. Bioimpedance measurements detect the response to electrical activity (potentialor current). Bioimpedance is a complex quantity, mainly determined by the resistance (R) of the totalamount of body water and by the capacitance of the cell membrane [40]. Electrical Impedance (Z) isdefined by the ratio of the voltage (V) to the current (I), and is quite similar to resistance. The basicdifference is that impedance extends to the frequency domain, and thus, is used in AC circuits,while resistance mainly refers to DC applications. The equation for the calculation of electricalimpedance is:
Z = V/I (1)
The determination of electrical impedance requires not only the application of an alternatingcurrent across a biological tissue, but also the measurement of the consequential differential voltage ofthe tissue sample, described in the following equations:
I(ω) = I0·cos(ωt + θ) (2)
V(ω) = V0·sin(ωt + ψ) (3)
where I0 and V0 represent the amplitude θ andψ the phase of the current and voltage signal, respectively.Taking into account that both I0 and V0 are calculated at the same angular frequency, i.e., ω = 2πf,electrical impedance can be described as Z(ω) = (V(ω))/(I(ω)) [41]. The expression of Z (Equation (1))as a complex function can be used either as the modulus of the absolute value and the phase shift,or as the real part, R, representing resistance, and the imaginary part, X, representing capacitanceand inductance, respectively [42]. In the case of direct current (DC) application, the imaginary partwould be zero. The inverse of the impedance is called admittance (Y) and describes the current flow.
73
Biosensors 2019, 9, 136
Impedance and admittance constitute AC parameters, and both are frequency dependent. The EISmeasurement procedure involves the characterization of the complex impedance over a wide range offrequencies, as shown in Equation (3):
Z(ω) = |Z|(cos ϕ + j sin ϕ) = R + j X (4)
2.2. Cell Culture
SK-N-SH neuroblastoma cells (ATCC® HTB-11™) were cultured under standard conditions(37 ◦C, 5% CO2) in 90% Minimum Essential Medium (MEM) (Eagle) with Earle’s balanced saltsolution (BSS) (Biowest, Nuaillé, France) and fetal bovine serum (FBS) (Thermo Fisher Scientific,Waltham, MA, USA) to a final concentration of 10%, 2 mM l-glutamine, 1.5 g/L sodium bicarbonate,0.1 mM non-essential amino acids, 1 U μg−1 antibiotics (penicillin/streptomycin), and 1.0 mMsodium pyruvate (Biowest, Nuaillé, France). HEK293 (ATCC® CRL-1573™), HeLa (ATCC®
CRM-CCL-2™) and MCF-7 (ATCC® HTB-22™) cell lines were grown in Dulbecco’s ModifiedEagle Medium (Biochrom Gmbh, Berlin, Germany), supplemented with 10% Fetal Bovine Serum(Thermo Fisher Scientific, Waltham, MA, USA), 2 mM l-glutamine, 0.5 mM sodium pyruvate, and 1%Penicillin-Streptomycin (Biowest, Nuaillé, France) in T-75 flasks (Sarstedt AG & Co. KG, Nümbrecht,Germany). Subcultivation was done in a 1:10 ratio. Cells were detached from culture flasks bytreatment with trypsin-EDTA for 3–10 min. After detachment, they were resuspended in the culturemedium to inactivate any remaining trypsin activity. After centrifugation for 5 min (1000 rpm), theywere resuspended in the medium at concentrations of 106, 2 × 10⁶, and 4 × 10⁶ cells/mL.
2.3. Cells Preparation/Immobilization
Cell immobilization was performed in calcium alginate as an immobilization matrix.Briefly, sodium alginate in 1.5% concentration, sterilized by autoclave (121 ◦C, 20 min), was mixedwith 5 × 10⁴, 105, and 2 × 10⁵ cells to a 0.75% final concentration and poured together in the well.Then, a 1% CaCl2 gelling solution was added for 10 s for cross-linking, and washed with phosphatebuffered saline (PBS). After washing, the calcium alginate scaffolds with the cells were incubated in theculture medium. The next day, the culture medium was removed and replaced with 1% FBS mediumand 1% FBS with different concentrations 5-FU (Sigma-Aldrich Chemie GmbH, Taufkirchen, Germany).
2.4. Cell Viability Assay
Cell viability was evaluated by a 3-(4, 5-dimethylthiazol-2-yl)-2,5-diphenyltetrazolium bromide(MTT) colorimetric assay [43] with 5-FU as the positive control. The concentration of 5-FU for each cellline, indicated in Table 1, was selected based on previously published data [44–48]. These concentrationsgave at least 30% inhibition in cell proliferation after 24 h incubation. The next day, the cells weretreated with 0.5 mg/mL MTT (Duchefa Biochemie, Haarlem, The Netherlands) and incubated with dyefor 3 h. After incubation, the medium was removed and the cell containing alginate scaffolds weresolubilized with 0.1 M ethylenediaminetetraacetic acid per well. Cell morphology observations wereperformed with an inverted microscope (ZEISS Axio Vert.A1, Carl Zeiss Microscopy, LLC, White Plains,NY, USA), and pictures were processed using the ZEN lite software. The optical absorbance wasmeasured with a PowerWave240 plate reader (BioTek, Winooski, VT, USA) at 560 nm. The experimentwas repeated independently three times for each treatment, and the mean results were expressedas the average OD for each treatment. All values were presented as means ± SD, and significancetesting in the comparisons was based on Student’s T-tests for pairs, as they did not follow a normaldistribution. The Student’s T-test gives the probability that the difference between the two means iscaused by chance. p values < 0.05 were considered to be statistically significant.
74
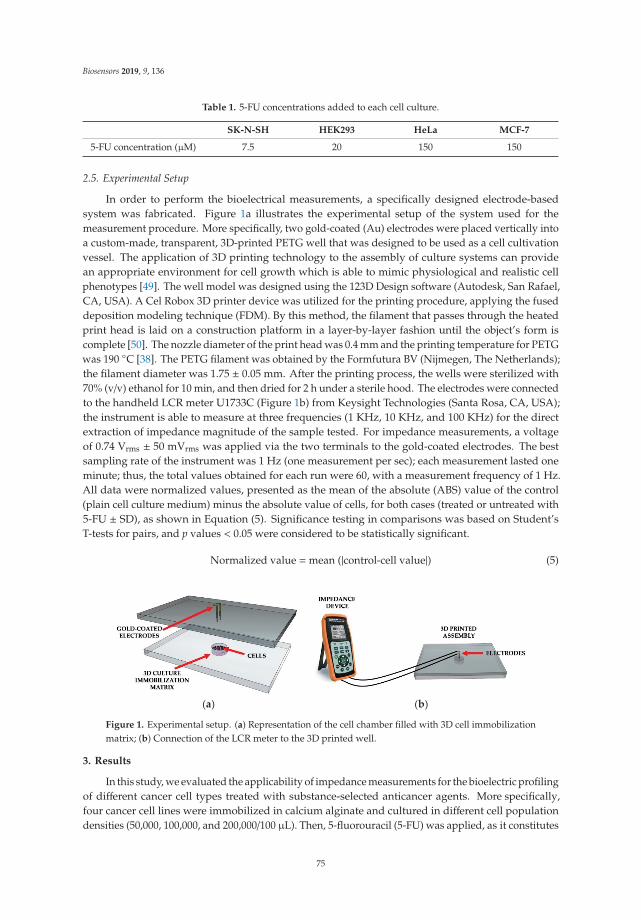
Biosensors 2019, 9, 136
Table 1. 5-FU concentrations added to each cell culture.
SK-N-SH HEK293 HeLa MCF-7
5-FU concentration (μM) 7.5 20 150 150
2.5. Experimental Setup
In order to perform the bioelectrical measurements, a specifically designed electrode-basedsystem was fabricated. Figure 1a illustrates the experimental setup of the system used for themeasurement procedure. More specifically, two gold-coated (Au) electrodes were placed vertically intoa custom-made, transparent, 3D-printed PETG well that was designed to be used as a cell cultivationvessel. The application of 3D printing technology to the assembly of culture systems can providean appropriate environment for cell growth which is able to mimic physiological and realistic cellphenotypes [49]. The well model was designed using the 123D Design software (Autodesk, San Rafael,CA, USA). A Cel Robox 3D printer device was utilized for the printing procedure, applying the fuseddeposition modeling technique (FDM). By this method, the filament that passes through the heatedprint head is laid on a construction platform in a layer-by-layer fashion until the object’s form iscomplete [50]. The nozzle diameter of the print head was 0.4 mm and the printing temperature for PETGwas 190 ◦C [38]. The PETG filament was obtained by the Formfutura BV (Nijmegen, The Netherlands);the filament diameter was 1.75 ± 0.05 mm. After the printing process, the wells were sterilized with70% (v/v) ethanol for 10 min, and then dried for 2 h under a sterile hood. The electrodes were connectedto the handheld LCR meter U1733C (Figure 1b) from Keysight Technologies (Santa Rosa, CA, USA);the instrument is able to measure at three frequencies (1 KHz, 10 KHz, and 100 KHz) for the directextraction of impedance magnitude of the sample tested. For impedance measurements, a voltageof 0.74 Vrms ± 50 mVrms was applied via the two terminals to the gold-coated electrodes. The bestsampling rate of the instrument was 1 Hz (one measurement per sec); each measurement lasted oneminute; thus, the total values obtained for each run were 60, with a measurement frequency of 1 Hz.All data were normalized values, presented as the mean of the absolute (ABS) value of the control(plain cell culture medium) minus the absolute value of cells, for both cases (treated or untreated with5-FU ± SD), as shown in Equation (5). Significance testing in comparisons was based on Student’sT-tests for pairs, and p values < 0.05 were considered to be statistically significant.
Normalized value =mean (|control-cell value|) (5)
(a) (b)
Figure 1. Experimental setup. (a) Representation of the cell chamber filled with 3D cell immobilizationmatrix; (b) Connection of the LCR meter to the 3D printed well.
3. Results
In this study, we evaluated the applicability of impedance measurements for the bioelectric profilingof different cancer cell types treated with substance-selected anticancer agents. More specifically,four cancer cell lines were immobilized in calcium alginate and cultured in different cell populationdensities (50,000, 100,000, and 200,000/100 μL). Then, 5-fluorouracil (5-FU) was applied, as it constitutes
75
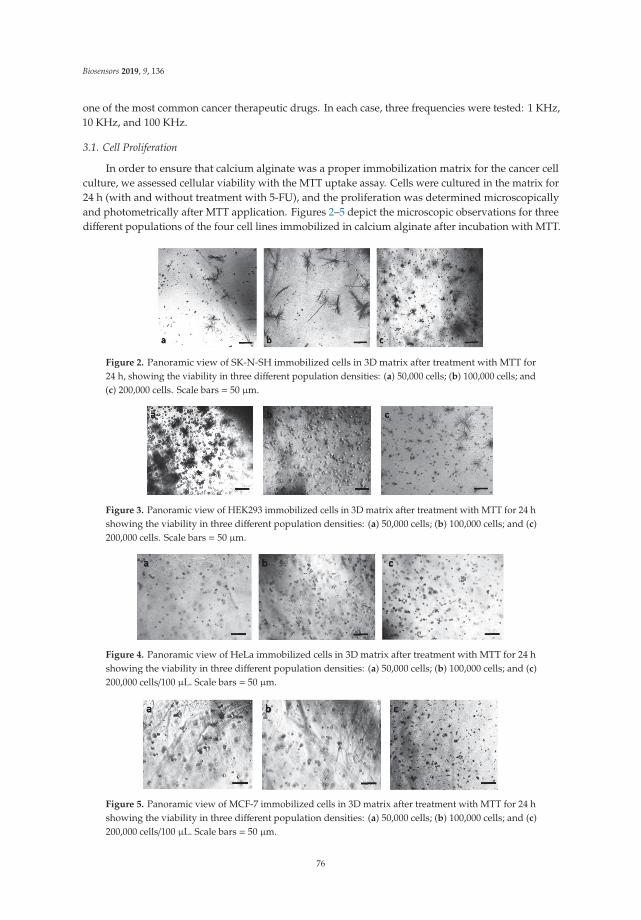
Biosensors 2019, 9, 136
one of the most common cancer therapeutic drugs. In each case, three frequencies were tested: 1 KHz,10 KHz, and 100 KHz.
3.1. Cell Proliferation
In order to ensure that calcium alginate was a proper immobilization matrix for the cancer cellculture, we assessed cellular viability with the MTT uptake assay. Cells were cultured in the matrix for24 h (with and without treatment with 5-FU), and the proliferation was determined microscopicallyand photometrically after MTT application. Figures 2–5 depict the microscopic observations for threedifferent populations of the four cell lines immobilized in calcium alginate after incubation with MTT.
Figure 2. Panoramic view of SK-N-SH immobilized cells in 3D matrix after treatment with MTT for24 h, showing the viability in three different population densities: (a) 50,000 cells; (b) 100,000 cells; and(c) 200,000 cells. Scale bars = 50 μm.
Figure 3. Panoramic view of HEK293 immobilized cells in 3D matrix after treatment with MTT for 24 hshowing the viability in three different population densities: (a) 50,000 cells; (b) 100,000 cells; and (c)200,000 cells. Scale bars = 50 μm.
Figure 4. Panoramic view of HeLa immobilized cells in 3D matrix after treatment with MTT for 24 hshowing the viability in three different population densities: (a) 50,000 cells; (b) 100,000 cells; and (c)200,000 cells/100 μL. Scale bars = 50 μm.
Figure 5. Panoramic view of MCF-7 immobilized cells in 3D matrix after treatment with MTT for 24 hshowing the viability in three different population densities: (a) 50,000 cells; (b) 100,000 cells; and (c)200,000 cells/100 μL. Scale bars = 50 μm.
76
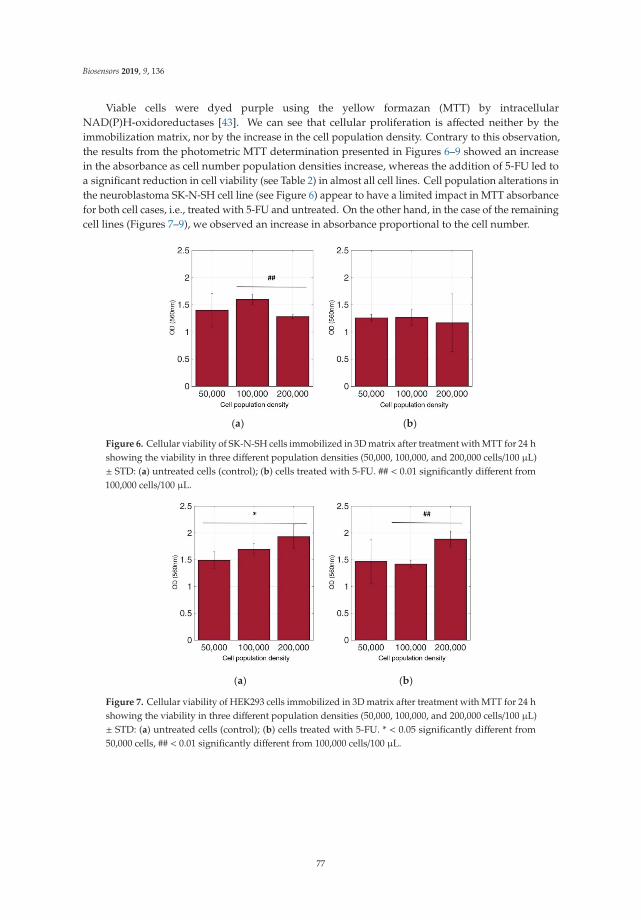
Biosensors 2019, 9, 136
Viable cells were dyed purple using the yellow formazan (MTT) by intracellularNAD(P)H-oxidoreductases [43]. We can see that cellular proliferation is affected neither by theimmobilization matrix, nor by the increase in the cell population density. Contrary to this observation,the results from the photometric MTT determination presented in Figures 6–9 showed an increasein the absorbance as cell number population densities increase, whereas the addition of 5-FU led toa significant reduction in cell viability (see Table 2) in almost all cell lines. Cell population alterations inthe neuroblastoma SK-N-SH cell line (see Figure 6) appear to have a limited impact in MTT absorbancefor both cell cases, i.e., treated with 5-FU and untreated. On the other hand, in the case of the remainingcell lines (Figures 7–9), we observed an increase in absorbance proportional to the cell number.
(a) (b)
Figure 6. Cellular viability of SK-N-SH cells immobilized in 3D matrix after treatment with MTT for 24 hshowing the viability in three different population densities (50,000, 100,000, and 200,000 cells/100 μL)± STD: (a) untreated cells (control); (b) cells treated with 5-FU. ## < 0.01 significantly different from100,000 cells/100 μL.
(a) (b)
Figure 7. Cellular viability of HEK293 cells immobilized in 3D matrix after treatment with MTT for 24 hshowing the viability in three different population densities (50,000, 100,000, and 200,000 cells/100 μL)± STD: (a) untreated cells (control); (b) cells treated with 5-FU. * < 0.05 significantly different from50,000 cells, ## < 0.01 significantly different from 100,000 cells/100 μL.
77
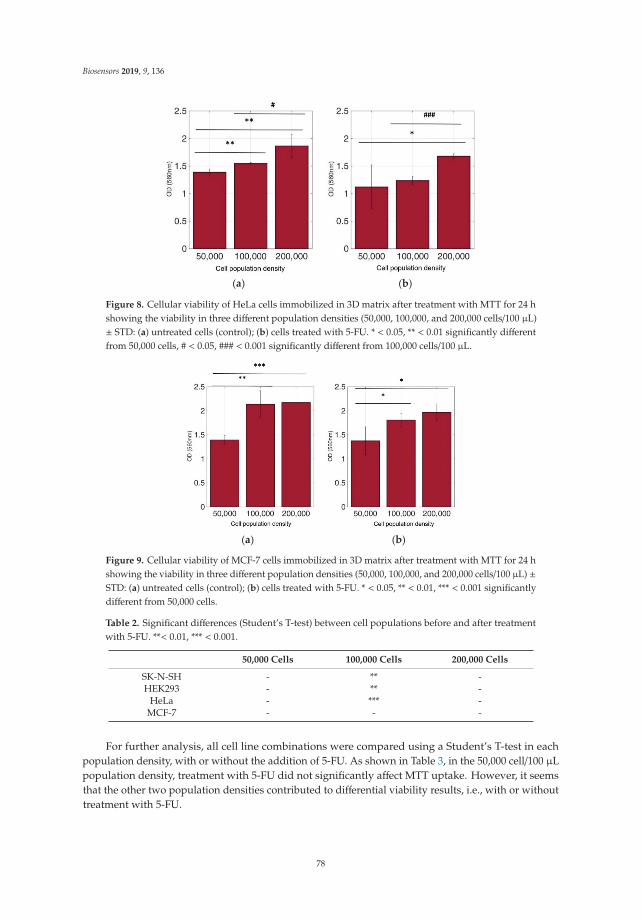
Biosensors 2019, 9, 136
(a) (b)
Figure 8. Cellular viability of HeLa cells immobilized in 3D matrix after treatment with MTT for 24 hshowing the viability in three different population densities (50,000, 100,000, and 200,000 cells/100 μL)± STD: (a) untreated cells (control); (b) cells treated with 5-FU. * < 0.05, ** < 0.01 significantly differentfrom 50,000 cells, # < 0.05, ### < 0.001 significantly different from 100,000 cells/100 μL.
(a) (b)
Figure 9. Cellular viability of MCF-7 cells immobilized in 3D matrix after treatment with MTT for 24 hshowing the viability in three different population densities (50,000, 100,000, and 200,000 cells/100 μL) ±STD: (a) untreated cells (control); (b) cells treated with 5-FU. * < 0.05, ** < 0.01, *** < 0.001 significantlydifferent from 50,000 cells.
Table 2. Significant differences (Student’s T-test) between cell populations before and after treatmentwith 5-FU. **< 0.01, *** < 0.001.
50,000 Cells 100,000 Cells 200,000 Cells
SK-N-SH - ** -HEK293 - ** -
HeLa - *** -MCF-7 - - -
For further analysis, all cell line combinations were compared using a Student’s T-test in eachpopulation density, with or without the addition of 5-FU. As shown in Table 3, in the 50,000 cell/100 μLpopulation density, treatment with 5-FU did not significantly affect MTT uptake. However, it seemsthat the other two population densities contributed to differential viability results, i.e., with or withouttreatment with 5-FU.
78
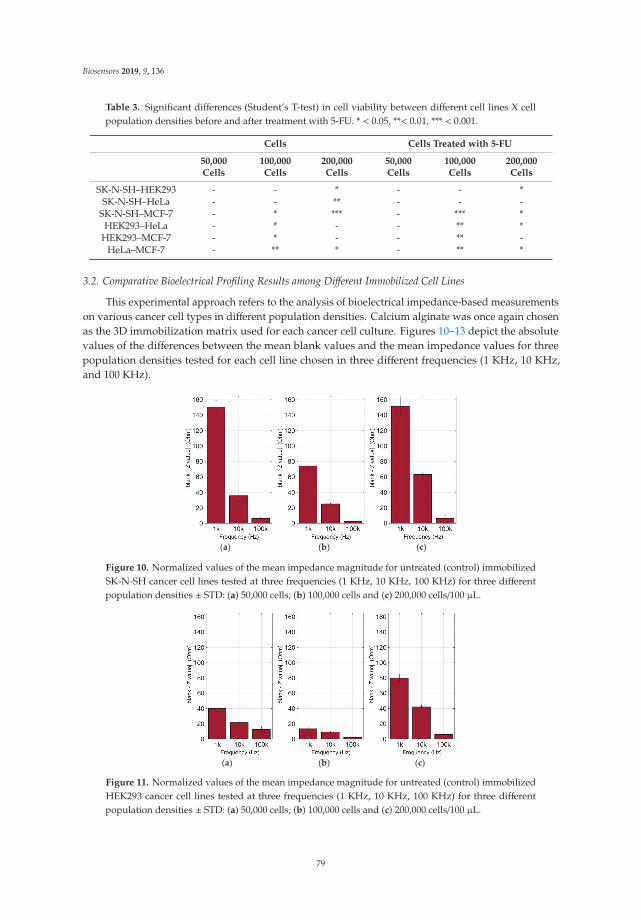
Biosensors 2019, 9, 136
Table 3. Significant differences (Student’s T-test) in cell viability between different cell lines X cellpopulation densities before and after treatment with 5-FU. * < 0.05, **< 0.01, *** < 0.001.
Cells Cells Treated with 5-FU
50,000Cells
100,000Cells
200,000Cells
50,000Cells
100,000Cells
200,000Cells
SK-N-SH–HEK293 - - * - - *SK-N-SH–HeLa - - ** - - -
SK-N-SH–MCF-7 - * *** - *** *HEK293–HeLa - * - - ** *
HEK293–MCF-7 - * - - ** -HeLa–MCF-7 - ** * - ** *
3.2. Comparative Bioelectrical Profiling Results among Different Immobilized Cell Lines
This experimental approach refers to the analysis of bioelectrical impedance-based measurementson various cancer cell types in different population densities. Calcium alginate was once again chosenas the 3D immobilization matrix used for each cancer cell culture. Figures 10–13 depict the absolutevalues of the differences between the mean blank values and the mean impedance values for threepopulation densities tested for each cell line chosen in three different frequencies (1 KHz, 10 KHz,and 100 KHz).
(a) (b) (c)
Figure 10. Normalized values of the mean impedance magnitude for untreated (control) immobilizedSK-N-SH cancer cell lines tested at three frequencies (1 KHz, 10 KHz, 100 KHz) for three differentpopulation densities ± STD: (a) 50,000 cells; (b) 100,000 cells and (c) 200,000 cells/100 μL.
(a) (b) (c)
Figure 11. Normalized values of the mean impedance magnitude for untreated (control) immobilizedHEK293 cancer cell lines tested at three frequencies (1 KHz, 10 KHz, 100 KHz) for three differentpopulation densities ± STD: (a) 50,000 cells; (b) 100,000 cells and (c) 200,000 cells/100 μL.
79

Biosensors 2019, 9, 136
(a) (b) (c)
Figure 12. Normalized values of the mean impedance magnitude for untreated (control) immobilizedHeLa cancer cell lines tested at three frequencies (1 KHz, 10 KHz, 100 KHz) for three different populationdensities ± STD: (a) 50,000 cells; (b) 100,000 cells and (c) 200,000 cells/100 μL.
(a) (b) (c)
Figure 13. Normalized values of the mean impedance magnitude for untreated (control) immobilizedMCF-7 cancer cell lines tested at three frequencies (1 KHz, 10 KHz, 100 KHz) for three differentpopulation densities: (a) 50,000 cells; (b) 100,000 cells and (c) 200,000 cells/100 μL.
As indicated by many studies, and also in our case, a frequency-dependent impedance responseis observed. Each cell line x population density combination corresponds to a different pattern inthe impedance magnitude measured in each frequency. Thus, in neuroblastoma SK-N-SH cells (seeFigure 10), we can observe that the normalized impedance value drops when we move from 50,000 to100,000 cells, and then increases at 200,000 cells/100 μL at each frequency. A similar pattern is observedin the case of HEK293 cells, but as shown in Figure 11, at 200,000 cells/100 μL population density,the impedance value is higher than the respective impedance in 50,000 cells. However, HeLa andMCF-7 cell cultures (Figures 12 and 13) appear to have a totally different behavior. More specifically,at a lower frequency (1 KHz), HeLa cells initially demonstrated a high impedance value (54, 23 Ohm),and as population density increased, a dramatic decrease was observed (1, 60 Ohm). In contrast,MCF-7 cells demonstrated the opposite trend, starting with 66, 72 Ohm at 50,000 cells and ending up at79, 23 Ohm at 200,000 cells/100 μL. Furthermore, at the other two frequencies, we observed differentialfluctuations for both cell lines. In other words, each cell line x population density combination wascharacterized by its own unique impedance behavior fingerprint.
80
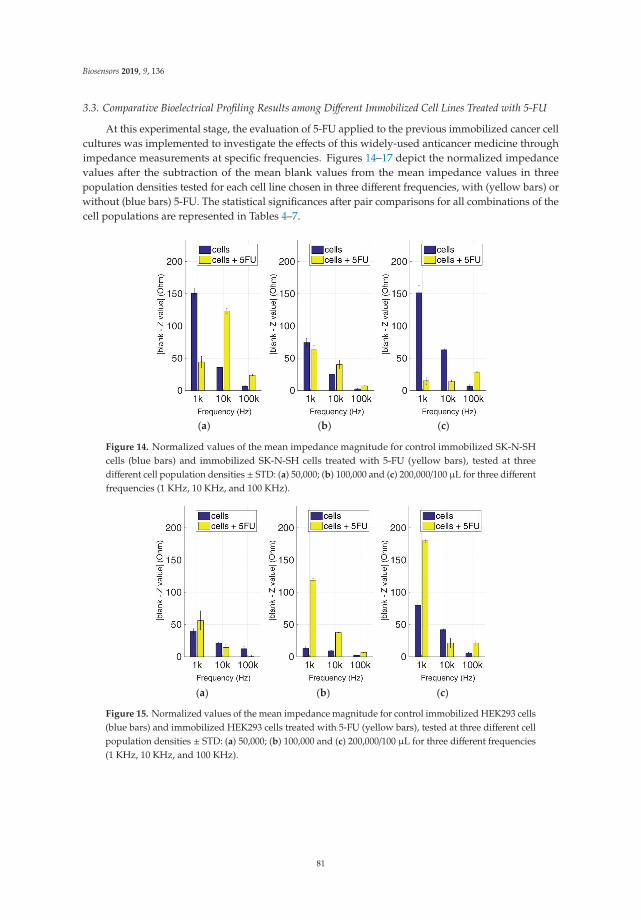
Biosensors 2019, 9, 136
3.3. Comparative Bioelectrical Profiling Results among Different Immobilized Cell Lines Treated with 5-FU
At this experimental stage, the evaluation of 5-FU applied to the previous immobilized cancer cellcultures was implemented to investigate the effects of this widely-used anticancer medicine throughimpedance measurements at specific frequencies. Figures 14–17 depict the normalized impedancevalues after the subtraction of the mean blank values from the mean impedance values in threepopulation densities tested for each cell line chosen in three different frequencies, with (yellow bars) orwithout (blue bars) 5-FU. The statistical significances after pair comparisons for all combinations of thecell populations are represented in Tables 4–7.
(a) (b) (c)
Figure 14. Normalized values of the mean impedance magnitude for control immobilized SK-N-SHcells (blue bars) and immobilized SK-N-SH cells treated with 5-FU (yellow bars), tested at threedifferent cell population densities ± STD: (a) 50,000; (b) 100,000 and (c) 200,000/100 μL for three differentfrequencies (1 KHz, 10 KHz, and 100 KHz).
(a) (b) (c)
Figure 15. Normalized values of the mean impedance magnitude for control immobilized HEK293 cells(blue bars) and immobilized HEK293 cells treated with 5-FU (yellow bars), tested at three different cellpopulation densities ± STD: (a) 50,000; (b) 100,000 and (c) 200,000/100 μL for three different frequencies(1 KHz, 10 KHz, and 100 KHz).
81
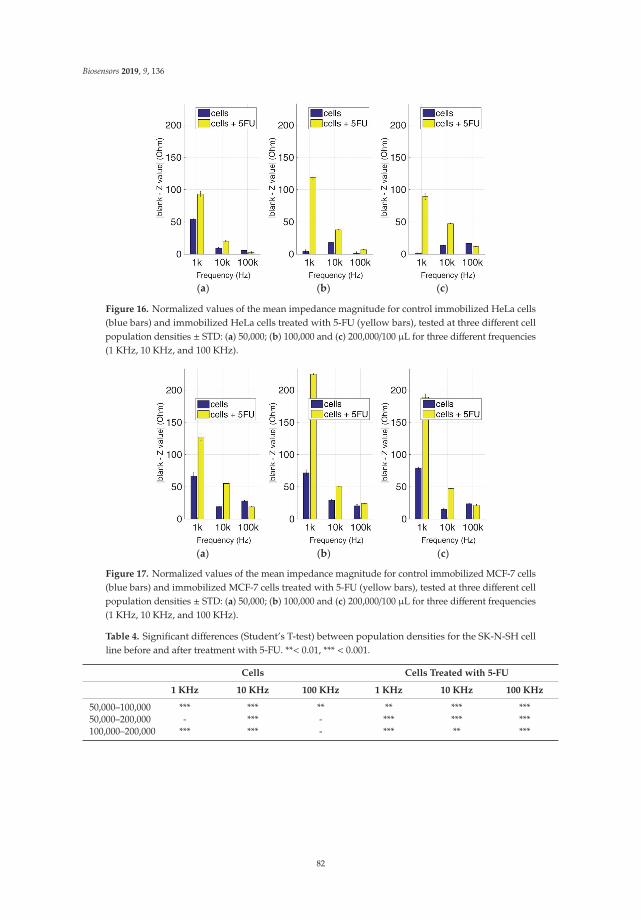
Biosensors 2019, 9, 136
(a) (b) (c)
Figure 16. Normalized values of the mean impedance magnitude for control immobilized HeLa cells(blue bars) and immobilized HeLa cells treated with 5-FU (yellow bars), tested at three different cellpopulation densities ± STD: (a) 50,000; (b) 100,000 and (c) 200,000/100 μL for three different frequencies(1 KHz, 10 KHz, and 100 KHz).
(a) (b) (c)
Figure 17. Normalized values of the mean impedance magnitude for control immobilized MCF-7 cells(blue bars) and immobilized MCF-7 cells treated with 5-FU (yellow bars), tested at three different cellpopulation densities ± STD: (a) 50,000; (b) 100,000 and (c) 200,000/100 μL for three different frequencies(1 KHz, 10 KHz, and 100 KHz).
Table 4. Significant differences (Student’s T-test) between population densities for the SK-N-SH cellline before and after treatment with 5-FU. **< 0.01, *** < 0.001.
Cells Cells Treated with 5-FU
1 KHz 10 KHz 100 KHz 1 KHz 10 KHz 100 KHz
50,000–100,000 *** *** ** ** *** ***50,000–200,000 - *** - *** *** ***100,000–200,000 *** *** - *** ** ***
82

Biosensors 2019, 9, 136
Table 5. Significant differences (Student’s T-test) between population densities for HEK293 cell linebefore and after treatment with 5-FU. * < 0.05, **< 0.01, *** < 0.001.
Cells Cells Treated with 5-FU
1 KHz 10 KHz 100 KHz 1 KHz 10 KHz 100 KHz
50,000–100,000 *** *** ** *** *** **50,000–200,000 *** *** * *** - **100,000–200,000 *** *** *** *** * **
Table 6. Significant differences (Student’s T-test) between population densities for HeLa cell line beforeand after treatment with 5-FU. * < 0.05, **< 0.01, *** < 0.001.
Cells Cells Treated with 5-FU
1 KHz 10 KHz 100 KHz 1 KHz 10 KHz 100 KHz
50,000–100,000 *** *** * *** *** **50,000–200,000 *** ** *** - *** ***100,000–200,000 * *** *** *** *** ***
Table 7. Significant differences (Student’s T-test) between population densities for MCF-7 cell linebefore and after treatment with 5-FU. * < 0.05, **< 0.01, *** < 0.001.
Cells Cells Treated with 5-FU
1 KHz 10 KHz 100 KHz 1 KHz 10 KHz 100 KHz
50,000–100,000 - *** ** *** *** ***50,000–200,000 ** *** *** *** *** ***100,000–200,000 * *** * *** *** **
When the anticancer agent 5-fluorouracil was applied for 24 h, we observed that in most cases(18 out of 27), 5-FU treatment gave higher impedance normalized values in comparison to cells withno treatment. The SK-N-SH cell line (see Figure 14) followed mostly the opposite pattern when 5-FUwas applied compared to the rest of the cell lines, especially at a frequency of 1 KHz. In the case of200,000 cells/100 μL population density, the cell impedance magnitude followed a downward trend,as opposed to cells under 5-FU exposure, that gave higher values in the frequency range of 1–100 KHz.
Figure 15 summarizes the results for the HEK293 cell line. Similar to the aforementionedobservations, impedance significantly dropped with an increase in frequency in all populationdensities, and treatment with 5-FU led to higher normalized values (see Table 5). An exception canbe observed at the frequencies of 10 KHz and 100 KHz in 50,000 cell population density, and also atthe frequency of 10 KHz in 200,000 cells/100 μL population density, where the values obtained fromcontrol cells were higher than the respective values with 5-FU.
As depicted in Figure 16, HeLa cells treated with 5-FU follow a frequency-dependent,downward motif for every population density. On the other hand, untreated cells do not showthe same pattern, since a downward trend is observed at 50,000 cells/100 μL, followed by an upwardtendency at 200,000 cells/100 μL, and general non-linear behavior at 100,000 cells/100 μL. Once again,in almost all cases, the response of the cells treated with 5-FU is significantly higher in comparison withcontrol cells (Table 6). The only exception is observed in 50,000 and 200,000 cells/100 μL populationdensities at 100 KHz. The latter frequency gave low impedance values for both the treated anduntreated cell populations.
In the MCF-7 cell line (Figure 17), we observed particularly high impedance values when 5-FUwas applied for every population density tested when compared with untreated cells, especially ata frequency of 1 KHz. These values significantly increased with population density at the samefrequency (Table 7). The impedance values of cells not treated with 5-FU depicted low variations
83

Biosensors 2019, 9, 136
between different cell population densities. A general observation is that as frequency magnitudeincreases, the normalized impedance values decrease.
4. Discussion
Up to now, the development of cancer diagnostics was primarily controlled by direct tumortissue biopsies for either pathologic and/or histologic analyses. Novel advanced molecular biologytechniques such as next-generation DNA sequencing and genomics bioinformatics analysis representexamples of the transition from traditional microscopy of tissue samples to molecular genomics forcancer diagnosis. In combination with remarkable advances in drug development and efficiency,these exciting new trends have contributed to the transition to the era of personalized cancer diagnosisand therapy. Therefore, these advances in cancer management and treatment have incentivized thepursuit of avant-garde, non-invasive approaches for accurate detection and monitoring.
For this purpose, in this study, we investigated the differences between the electrical propertiesof different in vitro 3D cancer cell cultures such as cervical, breast, and kidney tumor models viaimpedance evaluation at various frequencies. In general, several variances are observed in cell activitiessuch as morphology, proliferation, and gene and protein expression due to the additional dimensionalityof 3D culture, compared to the 2D planar culture [51]. Hydrogels such as alginate (SA), collagen (COL),fibrin, and agarose (AG) have attracted the most attention as promising matrices for bioinks because oftheir innate biocompatibility, low cytotoxicity, and high water content, mimicking natural ECM [52–54].SA, which offers fast gelling in the presence of Ca2+ or other divalent cations, was frequently usedas a bioink for cells to be easily and quickly encapsulated, and for interlayer adhesion during thelayer-by-layer printing process [55–57]. Studies have indicated that alginate and agarose bioinkssupport the development of hyaline-like cartilage tissues, whereas GelMA- and PEGMA-based bioinksfavor the development of fibrocartilaginous tissues [58,59]. The main disadvantage of chitosan isthat it provides poor mechanical integrity to the tissue, making the 3D bioprinted structures brittleand delicate. Finally, the major pitfall with fibrin use is the fast and irreversible gelation at bodytemperature, which makes its bioprinting difficult [60].
An optical inverted microscope was used for the observation of the differences in cellmorphology between the four different cell lines after conducting the MTT colorimetricassay [43]. Similar observations were reported for studies on epithelial cancer cells in 3Dculture [61–63]. Our results indicated that the immobilization matrix did not affect cell viability.Furthermore, the photometric MTT determination revealed an increase in cellular proliferation relativeto the cell population density. On the other hand, when the anticancer agent 5-fluorouracil (5-FU) wasadded to the cell medium, viability was significantly reduced, suggesting that the 3D immobilizationmatrix does not influence the influx of the compound in the alginate hydrogel.
After completing the biochemical cytotoxic assays, a bioelectrical analysis by means of impedancemeasurements was performed on each cancer cell line coupled with its corresponding electrodes in the3D alginate matrix. The measurement protocol was divided into two cases, based on different aspectsof the cell cultures we wanted to investigate. In the first stage, impedance measurements were recordedfor different population densities (50,000, 100,000, and 200,000 cells/100 ul) of the aforementioned celllines in 3D cultures in plain medium. In the second step, the respective measurements were evaluatedfor 3D cultures after 24 h application of the anticancer compound, 5-FU.
We used the resulting characteristic features to determine contrasts between distinctive celltypes by means of normalized impedance magnitudes. The method has been particularly effectivein discriminating not only cells of different tissue origin, but also the cytotoxic impact of theanticancer compound.
The method can provide useful information as the assay provides information about the responseof cells in specific frequency values, giving us the opportunity to utilize it as a putative cancer diagnostictechnique. For further research, this methodology could efficiently be expanded to additional cell
84
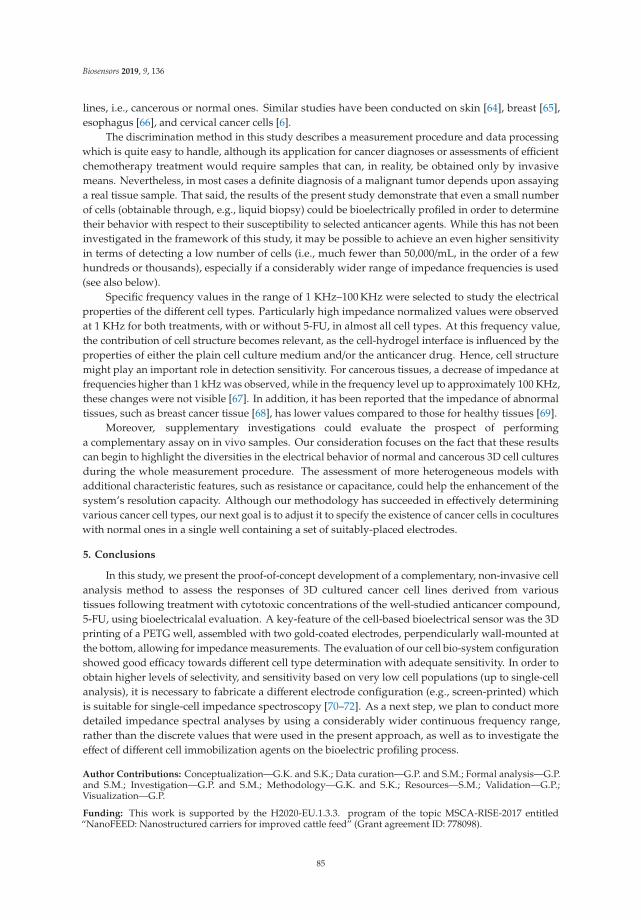
Biosensors 2019, 9, 136
lines, i.e., cancerous or normal ones. Similar studies have been conducted on skin [64], breast [65],esophagus [66], and cervical cancer cells [6].
The discrimination method in this study describes a measurement procedure and data processingwhich is quite easy to handle, although its application for cancer diagnoses or assessments of efficientchemotherapy treatment would require samples that can, in reality, be obtained only by invasivemeans. Nevertheless, in most cases a definite diagnosis of a malignant tumor depends upon assayinga real tissue sample. That said, the results of the present study demonstrate that even a small numberof cells (obtainable through, e.g., liquid biopsy) could be bioelectrically profiled in order to determinetheir behavior with respect to their susceptibility to selected anticancer agents. While this has not beeninvestigated in the framework of this study, it may be possible to achieve an even higher sensitivityin terms of detecting a low number of cells (i.e., much fewer than 50,000/mL, in the order of a fewhundreds or thousands), especially if a considerably wider range of impedance frequencies is used(see also below).
Specific frequency values in the range of 1 KHz–100 KHz were selected to study the electricalproperties of the different cell types. Particularly high impedance normalized values were observedat 1 KHz for both treatments, with or without 5-FU, in almost all cell types. At this frequency value,the contribution of cell structure becomes relevant, as the cell-hydrogel interface is influenced by theproperties of either the plain cell culture medium and/or the anticancer drug. Hence, cell structuremight play an important role in detection sensitivity. For cancerous tissues, a decrease of impedance atfrequencies higher than 1 kHz was observed, while in the frequency level up to approximately 100 KHz,these changes were not visible [67]. In addition, it has been reported that the impedance of abnormaltissues, such as breast cancer tissue [68], has lower values compared to those for healthy tissues [69].
Moreover, supplementary investigations could evaluate the prospect of performinga complementary assay on in vivo samples. Our consideration focuses on the fact that these resultscan begin to highlight the diversities in the electrical behavior of normal and cancerous 3D cell culturesduring the whole measurement procedure. The assessment of more heterogeneous models withadditional characteristic features, such as resistance or capacitance, could help the enhancement of thesystem’s resolution capacity. Although our methodology has succeeded in effectively determiningvarious cancer cell types, our next goal is to adjust it to specify the existence of cancer cells in cocultureswith normal ones in a single well containing a set of suitably-placed electrodes.
5. Conclusions
In this study, we present the proof-of-concept development of a complementary, non-invasive cellanalysis method to assess the responses of 3D cultured cancer cell lines derived from varioustissues following treatment with cytotoxic concentrations of the well-studied anticancer compound,5-FU, using bioelectricalal evaluation. A key-feature of the cell-based bioelectrical sensor was the 3Dprinting of a PETG well, assembled with two gold-coated electrodes, perpendicularly wall-mounted atthe bottom, allowing for impedance measurements. The evaluation of our cell bio-system configurationshowed good efficacy towards different cell type determination with adequate sensitivity. In order toobtain higher levels of selectivity, and sensitivity based on very low cell populations (up to single-cellanalysis), it is necessary to fabricate a different electrode configuration (e.g., screen-printed) whichis suitable for single-cell impedance spectroscopy [70–72]. As a next step, we plan to conduct moredetailed impedance spectral analyses by using a considerably wider continuous frequency range,rather than the discrete values that were used in the present approach, as well as to investigate theeffect of different cell immobilization agents on the bioelectric profiling process.
Author Contributions: Conceptualization—G.K. and S.K.; Data curation—G.P. and S.M.; Formal analysis—G.P.and S.M.; Investigation—G.P. and S.M.; Methodology—G.K. and S.K.; Resources—S.M.; Validation—G.P.;Visualization—G.P.
Funding: This work is supported by the H2020-EU.1.3.3. program of the topic MSCA-RISE-2017 entitled“NanoFEED: Nanostructured carriers for improved cattle feed” (Grant agreement ID: 778098).
85
Biosensors 2019, 9, 136
Conflicts of Interest: The authors declare no conflict of interest.
References
1. Lindsey, A.T.; Islami, F.; Siegel, R.L.; Ward, M.E.; Jemal, A. Global Cancer in Women: Burden and Trends.Cancer Epidemiol. Biomark. Prev. 2017, 26, 444–457.
2. Cruz, C.S.D.; Tanoue, L.T.; Matthay, R.A. Lung Cancer: Epidemiology, Etiology, and Prevention. Clin. Chest Med.2011, 32, 605–644. [CrossRef] [PubMed]
3. Izetbegovic, S.; Alajbegovic, J.; Mutevelic, A.; Pasagic, A.; Masic, I. Prevention of Diseases in Gynecology.Int. J. Prev. Med. 2013, 4, 1347–1358. [PubMed]
4. Nigel, S.K.; Alok, A.K.; Nicole, M.K.; Kari, B.; Agnes, Y.Y.L.; Juan, I.A.; Sandra, L.W.; Edward, P.B.;Christopher, R.F.; Charles, W.F.; et al. Venous Thromboembolism Prophylaxis and Treatment in PatientsWith Cancer: ASCO Clinical Practice Guideline Update. J. Clin. Oncol. 2019. [CrossRef]
5. Montagnana, M.; Lippi, G. Cancer diagnostics: Current concepts and future perspectives. Ann. Transl. Med.2017, 5, 268. [CrossRef] [PubMed]
6. Hong, J.L.; Lan, K.C.; Jang, L.S. Electrical characteristics analysis of various cancer cells using a microfluidicdevice based on single-cell impedance measurement. Sens. Actuators B Chem. 2012, 173, 927–934. [CrossRef]
7. Arruebo, M.; Vilaboa, N.; Sáez-Gutierrez, B.; Lambea, J.; Tres, A.; Valladares, M.; González-Fernández, Á.Assessment of the Evolution of Cancer Treatment Therapies. Cancers 2011, 3, 3279–3330. [CrossRef]
8. Park, S.Y.; Choi, J.B.; Kim, S. Measurement of cell-substrate impedance and characterization of cancer cellgrowth kinetics with mathematical model. Int. J. Precis. Eng. Manuf. 2015, 16, 1859–1866. [CrossRef]
9. Liu, D.; Li, X.; Chen, X.; Sun, Y.; Tang, A.; Li, Z.; Zheng, J.; Shi, M. Neural regulation of drug resistance incancer treatment. BBA-Rev. Cancer 2019, 1871, 20–28. [CrossRef]
10. Yadav, A.K.; Agarwal, A.; Rai, G.; Mishra, P.; Jain, S.; Mishra, A.K.; Agrawal, H.; Agrawal, G.P.Development and characterization of hyaluronic acid decorated PLGA nanoparticles for delivery of5-fluorouracil. Drug Deliv. 2010, 17, 561–572. [CrossRef]
11. Paivana, G.; Apostolou, T.; Kaltsas, G.; Kintzios, S. Study of the dopamine effect into cell solutions byimpedance analysis. In Proceedings of the Bio-Medical Instrumentation and related Engineering and PhysicalSciences, Athens, Greece, 12–13 October 2017.
12. Paivana, G.; Apostolou, T.; Mavrikou, S.; Barmpakos, D.; Kaltsas, G.; Kintzios, S. Impedance Study ofDopamine Effects after Application on 2D and 3D Neuroblastoma Cell Cultures Developed on a 3D-PrintedWell. Chemosensors 2019, 7, 6. [CrossRef]
13. Kilic, T.; Navaee, F.; Stradolini, F.; Renaud, P.; Carrara, S. Organs-on-chip monitoring: Sensors and otherstrategies. Microphysiol. Syst. 2018, 2, 5. [CrossRef]
14. Qiao, G.; Duan, W.; Sinclair, A.; Wang, W.W. Electrical properties of breast cancer cells from impedancemeasurement of cell suspensions. J. Phys. Conf. Ser. 2010, 224, 012081. [CrossRef]
15. Chaoshi, R.; Huiyan, W.; Yuan, A.; Hong, S.; Guojing, L. Development of Electrical Bioimpedance Technology inthe Future; IEEE: Piscataway, NJ, USA, 2002.
16. Altinagac, E.; Taskin, S.; Kizil, H. Single Cell Array Impedance Analysis for Cell Detection and Classificationin a Microfluidic Device. In Proceedings of the 10th International Joint Conference on Biomedical EngineeringSystems and Technologies (BIOSTEC 2017), Porto, Portugal, 21–23 February 2017; pp. 49–53.
17. Hanbin, M.; Wallbank, R.W.R.; Chaji, R.; Li, J.; Suzuki, Y.; Jiggins, C.; Nathan, A. An impedance-basedintegrated biosensor for suspended DNA characterization. Sci. Rep. 2013, 3, 2730.
18. Bera, T.K. Bioelectrical Impedance Methods for Noninvasive Health Monitoring: A Review. J. Med. Eng.2014, 2014, 381251. [CrossRef]
19. Asphahani, F.; Zhang, M. Cellular impedance biosensors for drug screening and toxin detection. Analyst2007, 132, 835–841. [CrossRef]
20. Wang, M.-H.; Kao, M.-F.; Jang, L.-S. Single HeLa and MCF-7 cell measurement using minimized impedancespectroscopy and microfluidic device. Rev. Sci. Instrum. 2011, 82, 064302. [CrossRef]
21. Heileman, K.; Daoud, J.; Tabrizian, M. Dielectric spectroscopy as a viable biosensing tool for cell and tissuecharacterization and analysis. Biosens. Bioelectron. 2013, 49, 348–359. [CrossRef]
22. Pampaloni, F.; Reynaud, E.G.; Stelzer, E.H. The third dimension bridges the gap between cell culture andlive tissue. Nat. Rev. Mol. Cell Biol. 2007, 8, 839. [CrossRef]
86

Biosensors 2019, 9, 136
23. Lee, J.; Cuddihy, M.J.; Kotov, N.A. Three-dimensional cell culture matrices: State of the art. Tissue Eng. Part B Rev.2008, 14, 61. [CrossRef]
24. Prestwich, G.D. Simplifying the extracellular matrix for 3-D cell culture and tissue engineering: A pragmaticapproach. J. Cell. Biochem. 2007, 101, 1370. [CrossRef] [PubMed]
25. Drury, J.L.; Mooney, D.J. Hydrogels for tissue engineering: Scaffold design variables and applications.Biomaterials 2003, 24, 4337. [CrossRef]
26. Place, E.S.; George, J.H.; Williams, C.K.; Stevens, M.M. Synthetic polymer scaffolds for tissue engineering.Chem. Soc. Rev. 2009, 38, 1139. [CrossRef] [PubMed]
27. Nagaoka, T.; Shiigi, H.; Tokonami, S.; Saimatsu, K. Entrapment of Whole Cell Bacteria into ConductingPolymers. J. Flow Inject. Anal. 2012, 29, 7–10.
28. Willaert, R. Cell Immobilization and Its Applications in Biotechnology: Current Trends and Future Prospects.Cell Immobil. Appl. Biotechnol. 2011, 12, 313.
29. Kitson, P.J.; Rosnes, M.H.; Sans, V.; Dragone, V.; Cronin, L. Configurable 3D-printed millifluidic andmicrofluidic ‘lab on a chip’ reactionware devices. Lab Chip 2012, 12, 183267–183271. [CrossRef] [PubMed]
30. Waldbaur, A.; Rapp, H.; Lange, K.; Rapp, B.E. Let there be chip-Towards towards rapid prototyping ofmicrofluidic devices: One-step manufacturing processes. Anal. Methods 2011, 3, 2681–2716. [CrossRef]
31. Munshi, A.S.; Martin, R.S. Microchip-Based Electrochemical Detection using a 3-D Printed Wall-Jet ElectrodeDevice. Analyst 2016, 141, 862–869. [CrossRef]
32. Kwon, K.W.; Park, M.C.; Lee, S.H.; Kim, S.M.; Suh, K.Y.; Kim, P. Soft lithography for microfluidics: A review.Biochip. J. 2008, 2, 1–11.
33. Liu, K.; Fan, Z.H. Thermoplastic microfluidic devices and their applications in protein and DNA analysis.Analyst 2011, 136, 1288–1297. [CrossRef]
34. Becker, H.; Nevitt, M.; Gray, B.L. Selecting and designing with the right thermoplastic polymer for yourmicrofluidic chip: A close look into cyclo-olefin polymer. Microfluid. BioMEMS Med. Microsyst. XI 2013,8615, 86150F.
35. Bhattacharyya, A.; Klapperich, C.M. Thermoplastic microfluidic device for on-chip purification of nucleicacids for disposable diagnostics. Anal. Chem. 2006, 78, 788–792. [CrossRef] [PubMed]
36. Sharma, S.; Goel, S.A. Three-Dimensional Printing and its Future in Medical World. J. Med. Res. Innov. 2018,3, e000141. [CrossRef]
37. Garcia, J.; Yang, Z.; Mongrain, R.; Leask, R.L.; Lachapelle, K. 3D printing materials and their use in medicaleducation: A review of current technology and trends for the future. BMJ Simul. Technol. Enhanc. Learn.2018, 4, 27–40. [CrossRef] [PubMed]
38. Yuan, L.; Ding, S.; Wen, C. Additive manufacturing technology for porous metal implant applications andtriple minimal surface structures: A review. Bioact. Mater. 2019, 4, 56–70. [CrossRef]
39. Otero, J.J.; Vijverman, A.; Mommaerts, M.Y. Use of fused deposit modeling for additive manufacturing inhospital facilities: European certification directives. J. Cranio-Maxillofac. Surg. 2017, 45, 1542–1546. [CrossRef]
40. Grimnes, S.; Martinsen, G. Bioimpedance & Bioelectricity, Basics, 3rd ed.; Acaademic Press: Cambridge, MA,USA, 2014.
41. Barsoukov, E.; Macdonald, J.R. Impedance Spectroscopy Theory, Experiment, and Applications, 2nd ed.;Wiley Interscience Publication: Hoboken, NJ, USA, 2005.
42. Ramírez-Chavarría, R.G.; Sanchez-Perez, C.; Matatagui, D.; Qureshi, N.; Perez-García, A.; Hernandez-Ruíz, J.Ex-vivo biological tissue differentiation by the Distribution of Relaxation Times method applied to ElectricalImpedance Spectroscopy. Electrochim. Acta 2018, 276, 214–222. [CrossRef]
43. Mosmann, T. Rapid colorimetric assay for cellular growth and survival: Application to proliferation andcytotoxicity assays. J. Immunol. Methods 1983, 65, 55–63. [CrossRef]
44. Li, J.; Wang, X.; Hou, J.; Huang, Y.; Zhang, Y.; Xu, W. Enhanced anticancer activity of 5-FU in combination withBestatin: Evidence in human tumor-derived cell lines and an H22 tumor-bearing mouse. Drug Dev. Ther. 2015, 9,45–52. [CrossRef]
45. Maney, V.; Singh, M. The Synergism of Platinum-Gold Bimetallic Nanoconjugates Enhances 5-FluorouracilDelivery In Vitro. Pharmaceutics 2019, 11, 439. [CrossRef]
46. Hemaiswarya, S.; Doble, M. Combination of phenylpropanoids with 5-fluorouracil as anti-cancer agentsagainst human cervical cancer (HeLa) cell line. Phytomedicine 2013, 20, 151–158. [CrossRef] [PubMed]
87
Biosensors 2019, 9, 136
47. Kazi, J.; Mukhopadhyay, R.; Sen, R.; Jha, T.; Ganguly, S.; Debnath, M.C. Design of 5-fluorouracil (5-FU)loaded, folate conjugated peptide linked nanoparticles, a potential new drug carrier for selective targeting oftumor cells. Med. Chem. Commun. 2019, 10, 559–572. [CrossRef] [PubMed]
48. Pasquier, E.; Ciccolini, J.; Carré, M.; Giacometti, S.; Fanciullino, R.; Pouchy, C.; Montero, M.; Serdjebi, C.;Kavallaris, M.; André, N.V. Propranolol potentiates the anti-angiogenic effects and anti-tumor efficacy ofchemotherapy agents: Implication in breast cancer treatment. Oncotarget 2011, 2, 797–809. [CrossRef][PubMed]
49. Antoni, D.; Burckel, H.; Josset, E.; Noel, G. Three-dimensional cell culture: A breakthrough in vivo. Int. J.Mol. Sci. 2015, 16, 5517–5527. [CrossRef]
50. JWeisman, A.; Nicholson, J.C.; Tappa, K.; Jammalamadaka, U.; Wilson, C.G.; Mills, D.K. Antibiotic andchemotherapeutic enhanced three-dimensional printer filaments and constructs for biomedical applications.Int. J. Nanomed. 2015, 10, 357–370.
51. Schwartz, M.A.; Chen, C.S. Deconstructing dimensionality. Science 2013, 339, 402–404. [CrossRef]52. Chung, J.H.Y.; Naficy, S.; Yue, Z.; Kapsa, R.; Quigley, A.; Moulton, S.E.; Wallace, G.G. Bio-ink properties and
printability for extrusion printing living cells. Biomater. Sci. 2013, 1, 763–773. [CrossRef]53. Frampton, J.P.; Hynd, M.R.; Shuler, M.L.; Shain, W. Fabrication and optimization of alginate hydrogel
constructs for use in 3D neural cell culture. Biomed. Mater. 2011, 6, 015002. [CrossRef]54. Guillotin, B.; Guillemot, F. Cell patterning technologies for organotypic tissue fabrication. Trends Biotechnol.
2011, 29, 183–190. [CrossRef]55. Axpe, E.; Oyen, M.L. Applications of Alginate-Based Bioinks in 3D Bioprinting. Int. J. Mol. Sci. 2016,
17, 1976. [CrossRef]56. Yeo, M.G.; Kim, G.H. A cell-printing approach for obtaining hASC-laden scaffolds by using
a collagen/polyphenol bioink. Biofabrication 2017, 9, 025004. [CrossRef] [PubMed]57. Kim, Y.B.; Lee, H.; Kim, G.H. Strategy to Achieve Highly Porous/Biocompatible Macroscale Cell Blocks,
Using a Collagen/Genipin-bioink and an Optimal 3D Printing Process. ACS Appl. Mater. Interfaces 2016, 8,32230–32240. [CrossRef] [PubMed]
58. Daly, A.C.; Critchley, S.E.; Rencsok, E.M.; Kelly, D.J. A comparison of different bioinks for 3D bioprinting offibrocartilage and hyaline cartilage. Biofabrication 2016, 8, 045002. [CrossRef] [PubMed]
59. Zhang, Y.; Yu, Y.; Ozbolat, I.T. Direct bioprinting of vessel-like tubular microfluidic channels. J. Nanotechnol.Eng. Med. 2013, 4, 020902. [CrossRef]
60. Murphy, S.V.; Skardal, A.; Atala, A. Evaluation of hydrogels for bio-printing applications. J. Biomed. Mater. Res.2013, 101, 272–284. [CrossRef] [PubMed]
61. Weaver, V.M.; Petersen, O.W.; Wang, F.; Larabell, C.; Briand, P.; Damsky, C.; Bissell, M.J. Reversion of themalignant phenotype of human breast cells in three-dimensional culture and in vivo by integrin blockingantibodies. J. Cell Biol. 1997, 137, 231–245. [CrossRef]
62. Lee, G.Y.; Kenny, P.A.; Lee, E.H.; Bissell, M.J. Three-dimensional culture models of normal and malignantbreast epithelial cells. Nat. Methods 2007, 4, 359–365. [CrossRef]
63. Zhao, Y.; Yao, R.; Ouyang, L.; Ding, H.; Zhang, T.; Zhang, K.; Cheng, S.; Sun, W. Three-dimensional printingof Hela cells for cervical tumor model in vitro. Biofabrication 2014, 6, 035001. [CrossRef]
64. Moqadam, S.M.; Grewal, P.K.; Haeri, Z.; Ingledew, P.A.; Kohli, K.; Golnaraghi, F. Cancer detection based onelectrical impedance spectroscopy: A clinical study. J. Electr. Bioimpedance 2018, 9, 17–23. [CrossRef]
65. Huerta-Nuñez, L.F.E.; Gutierrez-Iglesias, G.; Martinez-Cuazitl, A.; Mata-Miranda, M.M.;Alvarez-Jiménez, V.D.; Sánchez-Monroy, V.; Golberg, A.; González-Díaz, C.A. A biosensor capable ofidentifying low quantities of breast cancer cells by electrical impedance spectroscopy. Sci. Rep. 2019, 9, 6419.[CrossRef]
66. Wang, H.-C.; Nguyen, N.-V.; Lin, R.-Y.; Jen, C.-P. Characterizing Esophageal Cancerous Cells at DifferentStages Using the Dielectrophoretic Impedance Measurement Method in a Microchip. Sensors 2017, 17, 1053.[CrossRef] [PubMed]
67. Fraczek, M.; Krecicki, T.; Moron, Z.; Krzywaznia, A.; Ociepka, J.; Rucki, Z.; Szczepanik, Z. Measurements ofelectrical impedance of biomedical objects. Acta Bioeng. Biomech. 2016, 18, 11–17. [PubMed]
68. Pethig, R. Dielectric properties of body tissues. Clin. Phys. Physiol. Meas. 1987, 8, 5–12. [CrossRef] [PubMed]69. Wtorek, J. Techniki Elektroimpedancyjne w Medycynie; Wydawnictwo PG: Gdansk, Poland, 2002.
88

Biosensors 2019, 9, 136
70. Charwat, V.; Joksch, M.; Sticker, D.; Purtscher, M.; Rothbauer, M.; Ertl, P. Monitoring cellular stress responsesusing integrated high-frequency impedance spectroscopy and time-resolved ELISA. Analyst 2014, 139,5271–5282. [CrossRef]
71. Holmes, D.; Pettigrew, D.; Reccius, C.H.; Gwyer, J.D.; van Berkel, C.; Holloway, J.; Davies, D.E.; Morgan, H.Leukocyte analysis and differentiation using high speed microfluidic single cell impedance cytometry.Lab Chip 2009, 9, 2881–2889. [CrossRef]
72. Malleo, D.; Nevill, J.T.; Lee, L.P.; Morgan, H. Continuous differential impedance spectroscopy of single cells.Microfluid. Nanofluidics 2010, 9, 191–198. [CrossRef]
© 2019 by the authors. Licensee MDPI, Basel, Switzerland. This article is an open accessarticle distributed under the terms and conditions of the Creative Commons Attribution(CC BY) license (http://creativecommons.org/licenses/by/4.0/).
89

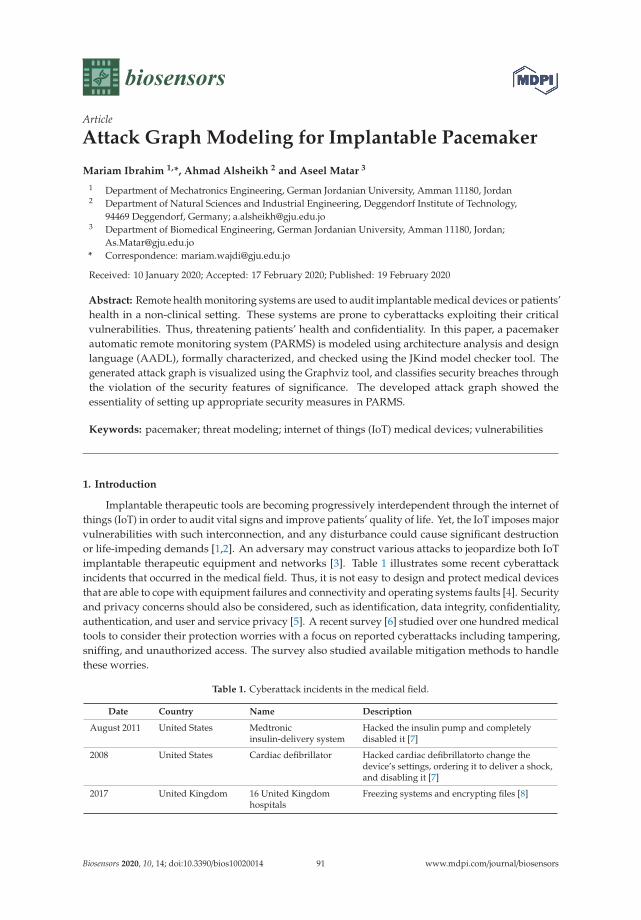
biosensors
Article
Attack Graph Modeling for Implantable Pacemaker
Mariam Ibrahim 1,*, Ahmad Alsheikh 2 and Aseel Matar 3
1 Department of Mechatronics Engineering, German Jordanian University, Amman 11180, Jordan2 Department of Natural Sciences and Industrial Engineering, Deggendorf Institute of Technology,
94469 Deggendorf, Germany; [email protected] Department of Biomedical Engineering, German Jordanian University, Amman 11180, Jordan;
[email protected]* Correspondence: [email protected]
Received: 10 January 2020; Accepted: 17 February 2020; Published: 19 February 2020
Abstract: Remote health monitoring systems are used to audit implantable medical devices or patients’health in a non-clinical setting. These systems are prone to cyberattacks exploiting their criticalvulnerabilities. Thus, threatening patients’ health and confidentiality. In this paper, a pacemakerautomatic remote monitoring system (PARMS) is modeled using architecture analysis and designlanguage (AADL), formally characterized, and checked using the JKind model checker tool. Thegenerated attack graph is visualized using the Graphviz tool, and classifies security breaches throughthe violation of the security features of significance. The developed attack graph showed theessentiality of setting up appropriate security measures in PARMS.
Keywords: pacemaker; threat modeling; internet of things (IoT) medical devices; vulnerabilities
1. Introduction
Implantable therapeutic tools are becoming progressively interdependent through the internet ofthings (IoT) in order to audit vital signs and improve patients’ quality of life. Yet, the IoT imposes majorvulnerabilities with such interconnection, and any disturbance could cause significant destructionor life-impeding demands [1,2]. An adversary may construct various attacks to jeopardize both IoTimplantable therapeutic equipment and networks [3]. Table 1 illustrates some recent cyberattackincidents that occurred in the medical field. Thus, it is not easy to design and protect medical devicesthat are able to cope with equipment failures and connectivity and operating systems faults [4]. Securityand privacy concerns should also be considered, such as identification, data integrity, confidentiality,authentication, and user and service privacy [5]. A recent survey [6] studied over one hundred medicaltools to consider their protection worries with a focus on reported cyberattacks including tampering,sniffing, and unauthorized access. The survey also studied available mitigation methods to handlethese worries.
Table 1. Cyberattack incidents in the medical field.
Date Country Name Description
August 2011 United States Medtronicinsulin-delivery system
Hacked the insulin pump and completelydisabled it [7]
2008 United States Cardiac defibrillator Hacked cardiac defibrillatorto change thedevice’s settings, ordering it to deliver a shock,and disabling it [7]
2017 United Kingdom 16 United Kingdomhospitals
Freezing systems and encrypting files [8]
Biosensors 2020, 10, 14; doi:10.3390/bios10020014 www.mdpi.com/journal/biosensors91

Biosensors 2020, 10, 14
Table 1. Cont.
Date Country Name Description
2014 United States Boston Children’sHospital
Caused the hospital network to lose internetaccess using distributed Denial of Service (DoS)attack [9]
January, 2015 United States Anthem Breached a database with 80 million customersrecords [10]
July, 2018 England National Health Service(NHS)
A data breach caused the NHS to shareconfidential health data of 150,000 patients [11]
June, 2018 Singapore SingHealth The data of 1.5 million patients were stolen [12]
2019 United States NeuroSky 156brain–computer interfaceapplication
Victims’ brain wave data were stolen [13]
Attack graphs provide a viewable technique to determine risks within interoperable systems.The actions needed to conduct an attack can be identified utilizing this technique. The identificationof attacks helps engineers to establish defensive actions in order to eliminate the execution of anattack [14]. For instance, a method is presented by [15] for indicating the best placement of a collectionof IoT tools within an institution using a traditional attack graph which is augmented to consider thesubstantial placement of IoT tools and their connectivity effectiveness.
Attack graphs can also help forensic investigators to identify many possible attack paths.An empirical study is provided by [16] on the growth of using data gathered by smartphone tools(developed to correlate a therapeutic tool) as digital clue in legal cases. A report is included aboutevidence which is possibly helpful in a digital forensics inspection.
A digital inspection system is proposed by [17] for the examination of fatal attack scenarios oncardiac implantable medical devices (IMDs). The system reports the identification and regeneration ofpossible attack scenarios that result in a patient’s death. An approach of three stages is proposed, alongwith a collection of approaches to use in every stage. In the first stage, the approach aids determiningthe reason for a death based on the therapeutic conclusions gathered by the IMD. Second, the approachfollows the entries and system logs gathered from the IMD under consideration, which determinethe critical actions associated with distant access and construction. The technique aims to collect thepossible attack scenarios that could achieve similar impact in the gathered log proof, as if they had beenconducted. A library of threats and a model checking established algorithm are utilized to conduct theautomatic reformation which is made in forward chaining. The third stage of the approach correlatesthe generated scenarios, identifies the most persuasive composite of medical and vocational scenarios,and confirms the presence of abnormal attitude in the chosen composite that caused a patient’s death.
The main contribution of this work manifests an approach for developing attack graphs forthe pacemaker automatic remote monitoring system (PARMS). This demands a general specificationof system model (design and communications, units, resources, protections, vulnerabilities, andattack instances), and exploration of the security concerns. The model and the security propertiesare encoded using architecture analysis and design language (AADL) [18] and verified using JKindchecker embedded software [19]. The developed attack graph contains the attack scenarios causingsystem compromise through gaining ability to alter the settings of the home monitoring device. Thus,controlling the wireless pacemaker and jeopardizing the patient’s life. The resulting graph is visualizedutilizing Graphviz [20]. The rest of this paper is organized as follows: Section 1.1 reviews the relevantwork. Section 2 presents the modeling process of the pacemaker automatic remote monitoring system(PARMS). Section 3 illustrates attack graph construction and visualization for the PARMS. Section 4recaps and discusses some forthcoming work.
92

Biosensors 2020, 10, 14
1.1. Related Work
Different papers were investigated in the literature for modelling attack graphs for medicaldevices. A model-based system, a safety and security co-engineering (MB3SE) technique, and acorrelated toolchain for the implementation of medical equipment was proposed by [21]. The toolchainincluded architecture modelling and safety and cyber-security risk analysis tools. Explanations forsecurity concerns of 5G networks aiding electronic healthcare applications were presented by [22].The explanations incorporated knowledge graph development, automated attack and protectiontechnologies, and a security testbed.
An approach is presented by [23] for developing attack trees for IMDs which receive two inputs:functional workflow and a hazard study of the IMD in consideration. A process-modeling softwareis utilized to illustrate the IMD system as it is arranged, booted up, and managed by the caregiver.Hazards can be identified as system states that are built-in unprotected for the user. Hazard studyrequires determining system states that will ultimately cause critical harm to the patient.
Threat modeling is examined in medical cyber physical systems (MCPS) by [24]. This includesthe roles of stakeholders and system components, trust models, threat models, and threat analysis.An abstract architecture is also sketched for an MCPS to demonstrate various threat modeling options.
A methodology has been developed by [2] for generating attack trees for patient controlledanalgesia (PCA-IMD). This process contains four steps: (1) process modeling, (2) fault tree analysis(FTA), (3) attack tree generation, and (4) quantification. First, the user of the PCA-IMD takes a depictionof the workflow of the PCA-IMD and constructs a process-modeling design for it. Once the processmodel is constructed, the IMD user establishes the distinct hazards that can happen as a result ofrunning the system, leading to extra infusion.
Two internal activities are studied by [25], involving the utilization of Universal Serial Bus(USB) drives and Compact Disc Read-Only Memory (CD-ROM) as the entrance methods leadingto data loss in the healthcare firm surroundings. The generated augmented threat trees show thevulnerabilities abused, the actions required to abuse them, and the fingerprint implemented by theattackers’ functionalities. A Markov models set is developed by [26] for a healthcare IoT foundation,that enables the consideration of the particularity of clients’ machines, connectivity, advancement ofdata stream, and protection and security worries of these elements.
The modeling and study of cyberattacks utilizing a multimodal graph technique is shown by [27].This work illustrates how cyber actions, parties, targets, and networks that gathered them can bemodeled using a multimodal graph, such that multiple graphs of distinct modalities are connected toshow the features of the attack.
A framework is presented by [28] for modeling and assessing security of the IoT which incorporatespreprocessing, security model generation using a hierarchical attack representation model (HARM),conception and repository, security study, and transformations and updates. In the scheme, an IoT,security model generators, and an evaluator are implemented.
The authors of [29] investigated whether the ideas of model checking and attack tree refinementcorrespond to using an IoT healthcare illustrative example. The extension by model checking andthe enclosing of attack trees into the Isabelle internal scheme permitted the investigation of thiscorrespondence utilizing the analytical strict and automated proof assistance of Isabelle. Hence,reassessing the interpretation of state evolution in model checking and importing a variation thatshowed the attack sequences. This permitted the conversion of attack paths established by modelchecking into the attack tree refinement procedure.
An attack graph-based study is presented by [4] of attacks on a certain interoperability surroundingto provide patient pain medication (PCA) among multiple levels of interoperability from simple datagathering to complete closed loop control. Explanations of the potential prevention methods aredetermined for every class of attack vectors. The work showed that security has a deep impact on thesafety of medical device interoperability and the patients they are provided to.
93

Biosensors 2020, 10, 14
Conceptual graphs are collected by [30] with Dung’s disputation system that supplied convenientextensions for dependable selection procedures, all adapted to telemedicine in general and tele-expertisein particular. The work implemented the visual graph of attacks where distinct interpretation of thereasoning logic is adapted to verify the possible adequate arguments.
A systematic threat-modeling approach is proposed by [31] to investigate IMD security. The attacktree approach provided an overall and organized scheme of the strengths and weaknesses of the IMDsystem. The work showed a systematic method for conducting system-level security examination toincorporate various potential attack surfaces. The research done by [14] demonstrated attack graphmodeling on hypothetical ambulatory medical equipment. The research examined specific attacks thatjeopardized ambulatory equipment, like physical attacks and social engineering.
2. Pacemaker Automatic Remote Monitoring System (PARMS) Modeling
In this work, the pacemaker automatic remote monitoring system (PARMS) is modeled to illustratehow hacking into the pacemaker’s system imposes life-threatening risks to patients. The modelincludes system topology, possible attack instances, and the system’s formal description.
2.1. PARMS Topology
Figure 1 shows a modified pacemaker automatic remote monitoring system (PARMS) from [32].The PARMS includes the following components:
• Wireless Pacemaker: This is a battery-powered implantable device that produces an excitatorywave at an appropriate site within the heart. The pacemaker initiates the electrical depolarizationcycle of the heart at approximately 72 beats/min in the atrioventricular (AV) node to replace amalfunctioning AV node. The AV node is the electrical connecting point from the atria to theventricles, which continues excitation beyond a partial or total heart block. Modern pacemakerscan also store diagnostic data [33].
Figure 1. pacemaker automatic remote monitoring system (PARMS).
94
Biosensors 2020, 10, 14
The pacemaker consists of a cardiac pulse generator, which is a device with a power source andelectronic circuitry that produces the excitatory signal. The pulse generator contains a power source“battery” to power it. It also contains a programmable segment to evaluate the heart function and sendthe appropriate electric impulse signal from the pulse generator to the heart [33]. Other components ofthe pacemaker are the leads which conduct electrical signals from the pulse generator to the tissue and,in some pacemakers, also conduct signals from the tissue to the pulse generator.
The pacemaker has also an electrode which is located at the end of the lead which continuouslymeasures the heart rate. The sensed signal is then amplified using a low noise amplifier. Next,the amplified signal is filtered using a second order low pass filter, and the result is an appropriateelectrocardiogram (ECG) signal. This signal is then applied to a comparator which compares it to adefined threshold to detect the heartbeat event executed by the heart and generates a pulse with everyheartbeat using a pulse generator [34]. The wireless pacemakers are embedded with a micro-antennato enable wireless communication with the home monitoring device and the programmer [35].
• Physician Programmer (PP): A computer with specific software and associated hardwaremodifications is used to program the pacemaker at the time of implantation. It is used totest pacemaker functionality in the follow-up visits to the physician’s office by sending instructionsto change therapy parameters, and reading battery status and heart rhythms. The physicianprogrammer contains a transceiver which communicates with the pacemaker antenna via radiofrequency (RF) [32,35].
• Home Monitoring Device (HS): This is a transceiver placed in proximity to the patient and usedto monitor the pacemaker by collecting the data that the pacemaker sends periodically at a set offrequencies (e.g., every two days or every week) using RF transmissions via the micro-antenna.The HS then sends data to the physician programmer via analog landlines or wireless datanetworks. The data incorporate heart rate, battery status, pacing lead impedance, episodes ofarrhythmias, conveyed antitachycardia pacing, percent pacing, histogram, real-time and magnetelectrograms (EGM), reserved EGMs, arrhythmia reviews, and mode switch period [35,36].
• Patient Support Network (PN): This works on the principle of cloud computing, where the datatransmitted from the home monitoring device can be stored into the network servers and can beuploaded onto a secure website that the physician may log in to, to review the data. [32,36].
• Access Point (AP): This exists for outside internet communication. We assume the attacker islocated at this point.
Communication among the PARMS’ components can be summarized as follow [32]:
i. RF communication between the PP and the wireless pacemaker in order to program it and checkits functionality.
ii. The PP and the PN are connected through online communication platforms: “cloud networking”.iii. RF communication between the HS and the wireless pacemaker to inquire different measurements
related to the pacemaker such as the battery state and pulse rate.iv. The communication between the HS and the PN involves sending measurements to the PN to be
stored there and accessed later by the responsible PP. The PN also transmits updates from thenetwork to the HS using analog landlines, a wireless data network, or a wireless Global Systemfor Mobile communications (GSM).
To illustrate how hacking into the pacemaker’s system presents life-threatening risks to patients,two vulnerabilities are identified within PARMS. These are the microprocessor commercial off-the-shelf(COTS) vulnerability, and the firmware update vulnerability due to loss of validation of the source offirmware updates [32]. These vulnerabilities can be exploited resulting in the following possible attackinstances:
1. Intelligent Gathering (IG): This is used for gathering information about IoT devices such as InternetProtocol (IP) addresses, and checking the type of firmware, as well as the existence of COTS.
95

Biosensors 2020, 10, 14
2. Social Engineering (SE): This attack is used to gain access and disclose information. It generallytargets enterprises and organizations.
3. Pivoting (PV): This is a standard technique used in penetration testing to navigate from machineto machine [37].
4. Sniffing (S): This attack is used to steal or break off data by capturing the network traffic using asniffer, for example to get login usernames and passwords that are sent by the HS [32].
5. Man-in-the-Middle (MiM): This attack can occur when the attacker has access over the networkconnection. Thus, disclosing and manipulating the data flow between two parties.
6. Phishing (PS): This is used to steal user data and allow the attacker to disguise as a trustedentity [38].
7. Malware Injection (MA): The attacker can edit, copy, or install the code at the host. Thus, gaining aroot access.
8. SQL Injection (SQL): This attack is used to exploit the web application. Thus, allowing the attackerto gain unauthorized access to the PN database or retrieve information directly from it [39].
2.2. Formal Description of PARMS
The System can be formally described as follows:
1. The attacker is assumed to be located at (AP) and has a root privilege.2. system components S; variable s ∈ {PP, PN, HS, AP} (static).3. system connectivity, C ⊆ PP × PN, HS × PN; cij = 1 if component i is connected to component j
(static).4. System vulnerabilities V; Boolean vi = 1 if vulnerability v ∈ {COTS, firmware} exists on i (static).5. Set of possible attacks B; variable b ∈ {IG, SE, S, PS, PV, SQL, MiM, MA}.6. Attack instances, AI ⊆ B × C; labeled bij ≡ attack b from source i to target j, b ∈ B.7. Attacker level of privilege P on HS device; variable pHS ∈ {none, root} (dynamic).8. Attacker level of privilege PH on host i ∈ {PP, PN, AP}; variable phi ∈ {none, user, root} (dynamic).9. Data identification D of component i; Boolean di = 1 if identification data about i gets collected by
attacker (dynamic).10. Confidential data disclosure K of component i; Boolean ki = 1 if confidential data of component i
get disclosed to attacker (dynamic).11. Data alteration E of component i, Boolean ei = 1 if attacker is able to edit the setting on component
i (dynamic).12. Attack instances pre-conditions:
• Pre(IGij) = (cij = 1) ∧ (phi = root) ∧ (pHS = none)• Pre(SEij) = (cij = 1) ∧ (phi = root) ∧ (phj = none)• Pre(SEij) = (cij = 1) ∧ (phi = root) ∧ (phj = none)• Pre(Sij) = (cij = 1) ∧ (pHS = none) ∧ (dHS = 1) ∧ (COTSj = 1)• Pre(PSij) = (cij = 1) ∧ (phi = user) ∧ (dj = 1) ∧ (firmwarej = 1)• Pre(PVij) = (cij = 1) ∧ (phi = user) ∧ (dj = 1)• Pre(SQLij) = (cij = 1) ∧ (phi = root) ∧ (phj = user) ∧ (dj = 1) ∧ (ej = 1) ∧ (kj = 1)• Pre(MIMij) = (cij = 1) ∧ (phi = user) ∧ (dj = 1) ∧ (ej = 0) ∧ (kj = 1)• Pre(MAij) = (cij = 1) ∧ (phi = root) ∧ (pHS = none) ∧ (dj = 1) ∧ (ej = 1) ∧ (kj = 1) ∧ (COTSj = 1 ∨
firmwarej = 1)
13. Attack instances post-conditions:
• Post(IGij) = (dHS = 1) ∧ (pHS = none)• Post (SEij) = (phj = user) ∧ (dj = 1)
96
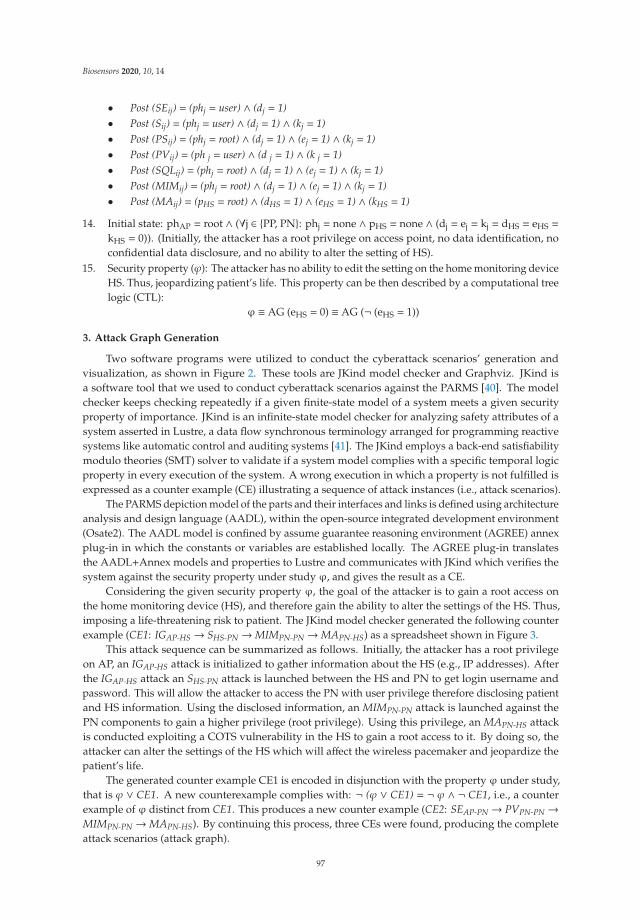
Biosensors 2020, 10, 14
• Post (SEij) = (phj = user) ∧ (dj = 1)• Post (Sij) = (phj = user) ∧ (dj = 1) ∧ (kj = 1)• Post (PSij) = (phj = root) ∧ (dj = 1) ∧ (ej = 1) ∧ (kj = 1)• Post (PVij) = (ph j = user) ∧ (d j = 1) ∧ (k j = 1)• Post (SQLij) = (phj = root) ∧ (dj = 1) ∧ (ej = 1) ∧ (kj = 1)• Post (MIMij) = (phj = root) ∧ (dj = 1) ∧ (ej = 1) ∧ (kj = 1)• Post (MAij) = (pHS = root) ∧ (dHS = 1) ∧ (eHS = 1) ∧ (kHS = 1)
14. Initial state: phAP = root ∧ (∀j ∈ {PP, PN}: phj = none ∧ pHS = none ∧ (dj = ej = kj = dHS = eHS =
kHS = 0)). (Initially, the attacker has a root privilege on access point, no data identification, noconfidential data disclosure, and no ability to alter the setting of HS).
15. Security property (ϕ): The attacker has no ability to edit the setting on the home monitoring deviceHS. Thus, jeopardizing patient’s life. This property can be then described by a computational treelogic (CTL):
ϕ ≡ AG (eHS = 0) ≡ AG (¬ (eHS = 1))
3. Attack Graph Generation
Two software programs were utilized to conduct the cyberattack scenarios’ generation andvisualization, as shown in Figure 2. These tools are JKind model checker and Graphviz. JKind isa software tool that we used to conduct cyberattack scenarios against the PARMS [40]. The modelchecker keeps checking repeatedly if a given finite-state model of a system meets a given securityproperty of importance. JKind is an infinite-state model checker for analyzing safety attributes of asystem asserted in Lustre, a data flow synchronous terminology arranged for programming reactivesystems like automatic control and auditing systems [41]. The JKind employs a back-end satisfiabilitymodulo theories (SMT) solver to validate if a system model complies with a specific temporal logicproperty in every execution of the system. A wrong execution in which a property is not fulfilled isexpressed as a counter example (CE) illustrating a sequence of attack instances (i.e., attack scenarios).
The PARMS depiction model of the parts and their interfaces and links is defined using architectureanalysis and design language (AADL), within the open-source integrated development environment(Osate2). The AADL model is confined by assume guarantee reasoning environment (AGREE) annexplug-in in which the constants or variables are established locally. The AGREE plug-in translatesthe AADL+Annex models and properties to Lustre and communicates with JKind which verifies thesystem against the security property under study ϕ, and gives the result as a CE.
Considering the given security property ϕ, the goal of the attacker is to gain a root access onthe home monitoring device (HS), and therefore gain the ability to alter the settings of the HS. Thus,imposing a life-threatening risk to patient. The JKind model checker generated the following counterexample (CE1: IGAP-HS → SHS-PN →MIMPN-PN →MAPN-HS) as a spreadsheet shown in Figure 3.
This attack sequence can be summarized as follows. Initially, the attacker has a root privilegeon AP, an IGAP-HS attack is initialized to gather information about the HS (e.g., IP addresses). Afterthe IGAP-HS attack an SHS-PN attack is launched between the HS and PN to get login username andpassword. This will allow the attacker to access the PN with user privilege therefore disclosing patientand HS information. Using the disclosed information, an MIMPN-PN attack is launched against thePN components to gain a higher privilege (root privilege). Using this privilege, an MAPN-HS attackis conducted exploiting a COTS vulnerability in the HS to gain a root access to it. By doing so, theattacker can alter the settings of the HS which will affect the wireless pacemaker and jeopardize thepatient’s life.
The generated counter example CE1 is encoded in disjunction with the property ϕ under study,that is ϕ ∨ CE1. A new counterexample complies with: ¬ (ϕ ∨ CE1) = ¬ ϕ ∧ ¬ CE1, i.e., a counterexample of ϕ distinct from CE1. This produces a new counter example (CE2: SEAP-PN → PVPN-PN →MIMPN-PN →MAPN-HS). By continuing this process, three CEs were found, producing the completeattack scenarios (attack graph).
97
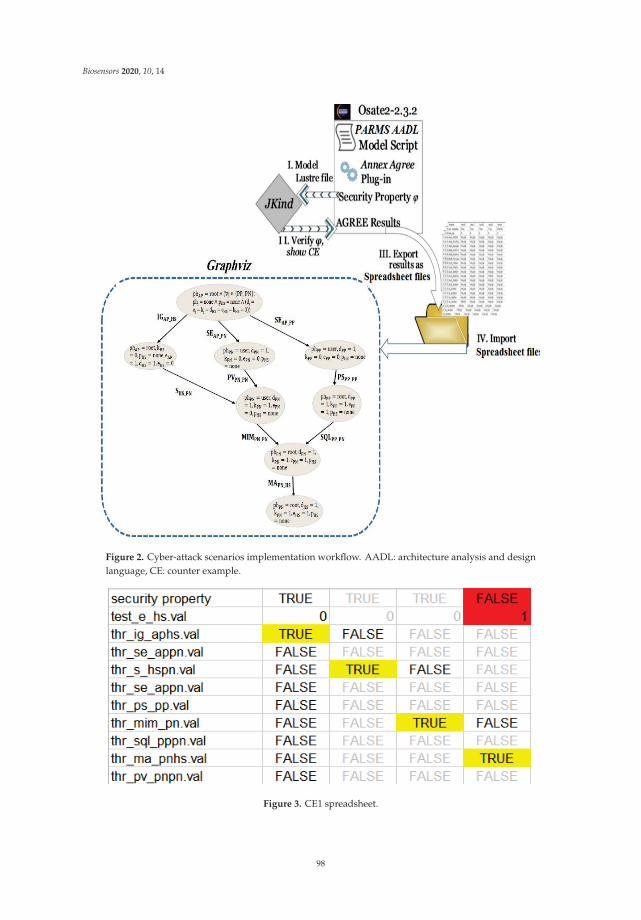
Biosensors 2020, 10, 14
Figure 2. Cyber-attack scenarios implementation workflow. AADL: architecture analysis and designlanguage, CE: counter example.
Figure 3. CE1 spreadsheet.
98

Biosensors 2020, 10, 14
In order to visualize the union of generated cyberattack scenarios (attack graph), the Graphviztool and DOT graph description language are used. Graphviz is a package of open-source tools usedto represent structural information as diagrams of abstract graphs and networks. Graphviz takes thedescriptions of graphs in a simple text language [20]. The resulting attack graph shown in Figure 4consists of arrows and nodes. Each arrow illustrates a possible occurrence of an attack instance, whileeach node represents the system state resulting from executing the attack instance. An attack scenariois a sequence of attack instances represented by any path from the initial node to the final node in theattack graph. The shown attack graph has three attack scenarios that terminate in a reachable statewhere the settings of HS can be altered by the attacker. Hence, the attacker can gain a root privilege onthe pacemaker, which may threaten the patient’s life.
Figure 4. PARMS generated attack graph. MA: Malware Injection, SE: Social Engineering, IG: IntelligentGathering, MiM: Man-in-the-Middle, SQL: SQL Injection, S: Sniffing, PV: Pivoting, PS: Phishing, HS:Home Monitoring Device, PN: Patient Support Network, AP: Access Point, PP: Physician ProgrammerpHS: Attacker level of privilege on HS, phi: Attacker level of privilege on host i, di: Data identificationof component i; ki: Confidential data disclosure of component i, ei: Data alteration of component i.
99

Biosensors 2020, 10, 14
The generated graph may aid system administrators to decide the placement of appropriatedetection and prevention measures. For instance, experimental results showed that an MA attack cannever be correctly conducted against the HS without running MIM or SQL attacks first against the PN.Thus, by way of preventing MIM and SQL, the system administrators can also eliminate the MA attackwhich would immensely enhance the system security.
In addition to that, the MA attack against the HS required exploiting the COTS vulnerabilityin its operating system or the firmware update vulnerability. Therefore, securing the HS operatingsystem and deploying an intrusion detection system (IDS) between the HS and the PN may preventthe attacker from executing the remaining attacks.
The feasibility of protecting implantable medical devices (IMDs) is explored by [42] withoutadjusting them by carrying out security strategies completely on an external device called a shield.The shield is placed between the IMD and possible correspondents, e.g., worn on the body close to theimplanted device. The shield performs as a gateway that conveys messages between the IMD andaccredited endpoints. Such an approach improves the security of IMDs for patients who already havethem and enables medical staff to access a protected IMD by discarding the external device or turningit off.
4. Conclusions
In this work, attack graph generation for PARMS is presented using a JKind model checker andDOT language within Graphviz. The idea for modeling is the application of an architectural descriptivelanguage to capture the security-related details of PARMS that an attacker may exploit to imposelife-threatening risks to patients. The main goal of this research is to increase the awareness about thesecurity of IoT medical devices. This is done by identifying some of the cyberattacks and estimatingtheir impacts against PARMS. Cyberattacks and vulnerabilities need to be taken into considerationwhen designing medical IoT devices. Even though some healthcare companies aim to consider withintheir product development life-cycle safety and security concerns, yet more testing and verificationmethods are required to produce a systematic method to test the detection or mitigations determined orprovided during the safety and security analyses phase against some sophisticated hacking tools. It isimportant that attacks and defenses be carefully and independently investigated in order to accuratelyassess risk of the attack and effectiveness of the defense. Determining appropriate detection andmitigation techniques are future directions to pursue.
Author Contributions: Conceptualization, M.I.; methodology, M.I.; software, A.A., and A.M.; validation, M.I.,A.A.; formal analysis, M.I.; investigation, M.I., A.A., and A.M; resources, M.I.; data curation, M.I., A.A.;writing—original draft preparation, M.I., A.A., and A.M.; Writing—review and editing, M.I.; visualization, M.I.,and A.A.; supervision, M.I.; project administration, M.I.; funding acquisition, M.I. All authors have read andagreed to the published version of the manuscript.
Funding: This research was funded by the Deanship of Graduation Studies and Scientific Research at the GermanJordanian University for the seed fund SATS 02/2018.
Acknowledgments: The authors would like to acknowledge Abdulrahman Mhawesh for his valuable discussionon PARMS.
Conflicts of Interest: The authors declare no conflict of interest.
References
1. Abouzakhar, N.S.; Jones, A.; Angelopoulou, O. Internet of Things Security: A Review of Risks and Threatsto Healthcare Sector. In Proceedings of the 2017 IEEE International Conference on Internet of Things(iThings) and IEEE Green Computing and Communications (GreenCom) and IEEE Cyber, Physical andSocial Computing (CPSCom) and IEEE Smart Data (SmartData), Exeter, UK, 21–23 June 2017; pp. 373–378.
2. Xu, J. Systematic Vulnerability Evaluation of Interoperable Medical Device System using Attack Trees.Master’s Theses, Worcester Polytechnic Institute, Worcester, MA, USA, December 2015.
100

Biosensors 2020, 10, 14
3. Islam, S.M.R.; Kwak, D.; Kabir, H.; Hossain, M.; Kwak, K.S. The Internet of Things for Health Care:A Comprehensive Survey. IEEE Access 2015, 3, 678–708. [CrossRef]
4. Taylor, C.; Venkatasubramanian, K.; Shue, C.A. Understanding the security of interoperable medicaldevices using attack graphs. In Proceedings of the 3rd International Conference on Mobile and UbiquitousMultimedia (MUM ’04), College Park, MD, USA, 27–29 October 2014; pp. 31–40.
5. Virat, M.S.; Bindu, S.; Aishwarya, B.; Dhanush, B.; Kounte, M.R.; M, B.S.; N, D.B. Security and PrivacyChallenges in Internet of Things. In Proceedings of the 2018 2nd International Conference on Trends inElectronics and Informatics (ICOEI), Tirunelveli, India, 11–12 May 2018; pp. 454–460.
6. Yaqoob, T.; Abbas, H.; Atiquzzaman, M. Security Vulnerabilities, Attacks, Countermeasures, and Regulationsof Networked Medical Devices—A Review. IEEE Commun. Surv. Tutor. 2019, in press. [CrossRef]
7. Peck, M. Medical Devices Are Vulnerable to Hacks, But Risk Is Low Overall. Available online: https://spectrum.ieee.org/biomedical/devices/medical-devices-are-vulnerable-to-hacks-but-risk-is-low-overall (accessed on26 May 2019).
8. Brandom, R. UK Hospitals Hit with Massive Ransomware Attack. Available online: https://www.theverge.com/2017/5/12/15630354/nhs-hospitals-ransomware-hack-wannacry-bitcoin (accessed on 26 May 2019).
9. Center of Internet Security. DDoS Attacks: In the Healthcare Sector. Available online: https://www.cisecurity.org/blog/ddos-attacks-in-the-healthcare-sector/ (accessed on 26 May 2019).
10. Abelson, R.; Goldstein, M. Millions of Anthem Customers Targeted in Cyberattack. Available online: https://www.nytimes.com/2015/02/05/business/hackers-breached-data-of-millions-insurer-says.html (accessed on26 May 2019).
11. Evenstad, L. NHS Data Breach Caused Details of 150,000 Patients to be Shared. Availableonline: https://www.computerweekly.com/news/252444145/NHS-data-breach-caused-details-of-150000-patients-to-be-shared (accessed on 26 May 2019).
12. Vincent, J. 1.5 Million Affected by Hack Targeting Singapore’s Health Data. Availableonline: https://www.theverge.com/2018/7/20/17594578/singapore-health-data-hack-sing-health-prime-minister-lee-targeted (accessed on 26 May 2019).
13. Xiao, Y.; Jia, Y.; Cheng, X.; Yu, J.; Liang, Z.; Tian, Z. I Can See Your Brain: Investigating Home-UseElectroencephalography System Security. IEEE Internet Things J. 2019, 6, 6681–6691. [CrossRef]
14. Luckett, P.; McDonald, J.; Glisson, W. Attack-Graph Threat Modeling Assessment of Ambulatory MedicalDevices. In Proceedings of the 50th Hawaii International Conference on System Sciences (2017), HiltonWaikoloa Village, HI, USA, 4–7 January 2017; Volume 4, pp. 3648–3657.
15. Agmon, N.; Shabtai, A.; Puzis, R. Deployment optimization of IoT devices through attack graph analysis.In Proceedings of the 12th Conference on Security and Privacy in Wireless and Mobile Networks (WiSec ’19),Miami, FL, USA, 15–17 May 2019; pp. 192–202.
16. Grispos, G.; Glisson, W.B.; Cooper, P. A Bleeding Digital Heart: Identifying Residual Data Generation fromSmartphone Applications Interacting with Medical Devices. In Proceedings of the 52nd Hawaii InternationalConference on System Sciences, Maui, HI, USA, 8–11 January 2019.
17. Ellouze, N.; Rekhis, S.; Boudriga, N.; Allouche, M.; Elouze, N. Cardiac Implantable Medical Devices forensics:Postmortem analysis of lethal attacks scenarios. Digit. Investig. 2017, 21, 11–30. [CrossRef]
18. Carnegie-Mellon-University. Open Source Aadl Tool Environment for the SAE Architecture. 2018. Availableonline: http://osate.github.io/index.html (accessed on 15 May 2018).
19. Sheeran, M.; Singh, S.; Stålmarck, G. Checking Safety Properties Using Induction and a SAT-Solver.In International Conference on Formal Methods in Computer-Aided Design; Springer: Berlin/Heidelberg, Germany,2000; Volume 1954, pp. 127–144.
20. Graphviz—Graph Visualization Software. Available online: https://www.graphviz.org/download/ (accessedon 26 May 2019).
21. Sango, M.; Godot, J.; Gonzalez, A.; Nolasco, R.R. Model-Based System, Safety and Security Co-EngineeringMethod and Toolchain for Medical Devices Design. In Proceedings of the 2019 Design of Medical DevicesConference, Saint Paul, MN, USA, 15–18 April 2019.
22. Tian, Z.; Sun, Y.; Su, S.; Li, M.; Du, X.; Guizani, M. Automated Attack and Defense Framework for 5G Securityon Physical and Logical Layers. arXiv 2019, arXiv:1902.04009.
101

Biosensors 2020, 10, 14
23. Xu, J.; Venkatasubramanian, K.K.; Sfyrla, V. A methodology for systematic attack trees generation forinteroperable medical devices. In Proceedings of the 2016 Annual IEEE Systems Conference (SysCon),Orlando, FL, USA, 18–21 April 2016; pp. 1–7.
24. Almohri, H.; Cheng, L.; Yao, D.; Alemzadeh, H. On Threat Modeling and Mitigation of Medical Cyber-PhysicalSystems. In Proceedings of the 2017 IEEE/ACM International Conference on Connected Health: Applications,Systems and Engineering Technologies (CHASE), Philadelphia, PA, USA, 17–19 July 2017; pp. 114–119.
25. Tu, M.; Spoa-Harty, K.; Xiao, L. Data Loss Prevention Management and Control: Inside Activity IncidentMonitoring, Identification, and Tracking in Healthcare Enterprise Environments. J. Digit. Forensics Secur.Law 2015, 10, 27–44. [CrossRef]
26. Strielkina, A.; Kharchenko, V.; Uzun, D. Availability models for healthcare IoT systems: Classification andresearch considering attacks on vulnerabilities. In Proceedings of the 2018 IEEE 9th International Conferenceon Dependable Systems, Services and Technologies (DESSERT), Kyiv, Ukraine, 24–27 May 2018; pp. 58–62.
27. Ghose, N.; Lazos, L.; Rozenblit, J.; Breiger, R. Multimodal graph analysis of cyber attacks. In Proceedings ofthe IEEE Spring Simulation Conference (SpringSim), Tucson, AZ, USA, 29 April–2 May 2019; pp. 1–12.
28. Ge, M.; Kim, D.S. A Framework for Modeling and Assessing Security of the Internet of Things. In Proceedingsof the 2015 IEEE 21st International Conference on Parallel and Distributed Systems (ICPADS), Melbourne,Australia, 14–17 December 2015; pp. 776–781.
29. Kammüller, F.; Tryfonas, T. Formal Modeling and Analysis with Humans in Infrastructures for IoT HealthCare Systems. In Proceedings of the Formal Aspects of Component Software, Braga, Portugal, 10–13 October2017; Volume 10292, pp. 339–352.
30. Doumbouya, M.B.; Kamsu-Foguem, B.; Kenfack, H.; Foguem, C. Combining conceptual graphs andargumentation for aiding in the teleexpertise. Comput. Boil. Med. 2015, 63, 157–168. [CrossRef] [PubMed]
31. Siddiqi, M.A.; Seepers, R.M.; Hamad, M.; Prevelakis, V.; Strydis, C. Attack-tree-based Threat Modelingof Medical Implants. In Proceedings of the 7th International Workshop on Security Proofs for EmbeddedSystems, Amsterdam, The Netherlands, 13 September 2018; pp. 32–49.
32. Rios, B.; Butts, J. Security Evaluation of the Implantable Cardiac Device Ecosystem Architecture andImplementation Interdependencies. 2017. Available online: https://a51.nl/whitescope-security-evaluation-implantable-cardiac-device-ecosystem-architecture-and-implementation (accessed on 17 May 2017).
33. Sanders, R.S. The Pulse Generator. In Cardiac Pacing for the Clinician; Kusumoto, F.M., Goldschlager, N.F.,Eds.; Springer: Boston, MA, USA, 2008; pp. 47–71.
34. Chede, S.; Kulat, K. Design Overview of Processor Based Implantable Pacemaker. J. Comput. 2008, 3, 49–57.[CrossRef]
35. Ibrahimi, S. A Secure Communication Model for the Pacemaker a Balance between Security Mechanisms andEmergency Access; Technische Universiteit Eindhoven: Eindhoven, The Netherland, 2014.
36. Lakshmanadoss, U.; Shah, A.; Daubert, J.P. Telemonitoring of the pacemakers. In Modern Pacemakers-Presentand Future; IntechOpen: London, UK, 2011; pp. 129–146.
37. Meixell, B.; Forner, E. Out of control: Demonstrating SCADA exploitation. In Proceedings of the Black Hat,Las Vegas, NV, USA, 27 July–1 August 2013.
38. Nagunwa, T. Behind Identity Theft and Fraud in Cyberspace: The Current Landscape of Phishing Vectors.Int. J. Cyber-Security Digit. Forensics 2014, 3, 72–83. [CrossRef]
39. Patel, N. SQL Injection Attacks: Techniques and Protection Mechanisms. IJCSE 2011, 3, 199–203.40. Mebsout, A.; Tinelli, C. Proof certificates for SMT-based model checkers for infinite-state systems.
In Proceedings of the Formal Methods in Computer-Aided Design (FMCAD), Mountain View, CA, USA, 3–6October 2016; pp. 117–124.
41. Halbwachs, N.; Caspi, P.; Raymond, P.; Pilaud, D. The synchronous data flow programming languageLUSTRE. Proc. IEEE 1991, 79, 1305–1320. [CrossRef]
42. Gollakota, S.; Hassanieh, H.; Ransford, B.; Katabi, D.; Fu, K. They can hear your heartbeats: Non-invasivesecurity for implantable medical devices. In Proceedings of the ACM SIGCOMM Conference, Toronto, ON,Canada, 15–19 August 2011; pp. 2–13.
© 2020 by the authors. Licensee MDPI, Basel, Switzerland. This article is an open accessarticle distributed under the terms and conditions of the Creative Commons Attribution(CC BY) license (http://creativecommons.org/licenses/by/4.0/).
102

MDPISt. Alban-Anlage 66
4052 BaselSwitzerland
Tel. +41 61 683 77 34Fax +41 61 302 89 18
www.mdpi.com
Biosensors Editorial OfficeE-mail: [email protected]
www.mdpi.com/journal/biosensors


MDPI St. Alban-Anlage 66 4052 Basel Switzerland
Tel: +41 61 683 77 34 Fax: +41 61 302 89 18
www.mdpi.com ISBN 978-3-03943-085-7