on the bioelectric fields of plant roots and their possible role in
TRANSCRIPT
·~ · ·, •
• ..
ON THE BIOELECTRIC FIFLDS OF PLANT ROOTS
AIJD THEIR :OSSIBLE. ROLE II ORGA1ISATION.
THESIS SUBMITTED FOR EXAMINA":'ION FOR THE
DEGREE OF DOCTOR OF HILOSOPHY
by
B.I .H. SCOTT, B. Sc (TAS).
I
•
(i)
PREFACE
The investigation described in this thesis was conducted as a
part time research between 1949 and 1955 . Except for a year
spent at the University of British Columbia, all the work was done
at the University of Tasmania under the supervision of Professor
.L.McAulay.
In the early years much exploratory work was necessary to overcome
difficulties in experimental technique which only became apparent as
the work progressed and which had been the cause of much inc01.sistency
in the results of previous investigations . The early work is
described only briefly in this thesis. The major part of the thesis
is devoted to the results obtained in the past three years , using
methods developed as a consequence of the earlier work.
An outline of the experimental work to be described in this
thesis is not given until section I . 5 (page 7) of the Introduction .
It was thought desirable that the work should be considered in relation
to the general problem of organisation and in the light of the
achievements and difficulties of earlier investigations, and these
matters are discussed first.
The results of the investigation have been published as follows:-
Bluh, 0 and Scott B. I.H (1950): "Vibrating Probe Electrometer for the
Measu:r·ement of Bioelectric Potentials", Rev . Sci . Inst. 21 , 867.
McAulay, A.L. and Scott,B . I .H. (1954): II
of Electric Fields produced by Growing Roots",
new ~proach to the Study
Nature 174, 924 .
•
(i)
'PREFACE
The investigation described in this thesis was conducted as a
part time research between 1949 and 1955. ·Except for a year
spent at the University of British Columbia, all the work was done
at the University of Tasmania under, the supervision of-Professor
A.L.McAulay.
In the early years much explorato.ry'work was necessary to overcome
difficulties in experimental technique which only became apparent as
:bhe wo'rk progressed and which had been the cause of much inconsistency
in the results of previous investigations. The early work is
described only briefly in this thesis.. The major part of the thesis
is devoted to the results obtained in the past three years, using
methods developed as a consequence of the earlier worka
An outline of the experimental work to be describ'ed·in this
thesis is not given untii section I.5 (page 7) of the Introduction,
It was thought desirable that the w.ork should be co'nsi.dered, in relation
to the general problem of organisation and in t~e light of the
achievements and difficulties of. earlier investigations, and these
matters are discussed first.
The results of the investigation_have been published as follows:-
Bltth, 0 and Scott B.I.H (1950): 11Vibrating Probe Electrometer for the
Measurement of Bioelectric Potentials", Rev. Sci. Inst. 21, 867.
McAulay, A.L. and Scott,B.I.H. (1954): 11.A. new Ai:iproach to the Study
of Electric Fields produced by Growing Roots", Nature 174, 924.
•
. (ii)
§cott, B.I.H., EcAulay, _.:,..L. o.nd Jeycs, ~.)auline (1955) i:correlE:tion
between the Electric Current generc::ted by a Bean Root Growing in·
Water and the Rate of Elongation of' the Root". tust.J.Biol. Sci, 8, 36.
It is protJosed shortl;,r to prepere for publication papers em.bodying
the work d.escribed in sections· IV and V of thil? thesis.
The author finds some difficulty i.r,_ ac1<..nm1leding adequately
his indebtedness to Professor il..L.l·Ic.A.ulay in this investigation • .. Professor llcaulay first suggested the problem, collabor~ted closely
in the early stages, and maintained a strong and critical interest
throughout. His assistance ii:; gratefully aclG;owlsdged.
The vibrating probe elec'trometer (Section II .J) suggested by the
author was cor..structed and tested in the Unive1"sit;y of British
Colur;ibia in collaboratior.. with Dr. O.Bluh, whose interest and help is
here acknowledged.·
?:uch of the success of the experimental work is due to· the efforts
of Er. D. Le SouEf and i.:r. D.J!rillirnod, technfoians in the De~e..rtment
of i~hysics, who gave valuable assistance to the author in the design
and construction of a)paratus~
Thanks are also due to: Mrs. 7. Jeyes, l<iss G.:i'Tewell and other
assistants in the Biophysics Laboratory for their aid in the .
compilation of numerical data;
~he Photographic section of the University of Tasmania for the
r .. 1
I~ INTRODUCTION
I.1 The Organisation of Living Systems
' One· of the fundamentai problems of biology is the method
whereby undiff eren~iated'' cells organise to form ~pecif~c organs
and tissues. The influences which govern the' way a cell develops
are to some extent not predetermin~d but are dependent on .the
environment in which the cell'fillds itself~
· ~periments. with animals wh~ch ha~e lea to this point of view ' '
are discussed by Huxley.and De Beer (1934). (See also Agar 1943). ' '
For example, if 'U;ndif.L'erentiated ~issue is tran!Spla.nted from one part ~ ' I ' ~
of a living system to another it may develop in a' manner characte~istic
of.the region into which it is transplanted and ~ot as. was predestined_
a~cording to ~ts original '1ocatiori. In other cases a system
has been said to establish a 'polarity• which co~trols its subsequent
development.,
Few comparable studies have been made of plants, but here too
~here is some evidence that 'similar control ·is exerted by the system
as a whole over further development within that sy~te~.
_ This differentiating influence has been called the 'biological
· field 1 but little is laloi;.m of its nature or of the mechanisms
involved in the controlling processes8 This is especially true
in plant systems~
Research work in the Biophysics Laboratory, at the University
--
I .. 1.
-2-
of Tasmania, a section of which is described in this thesis
is directed at finding out more about t~e biological field.
In particular, experiments will be described in this thesis
designed with the ultimate aim 'of .testing whether the bioelectric
field of plant roots has the necessary properties of a biological
field.
I~2 Bioelectricity - Historical Discussion.
For a great many years it has been known that an intimate
relationship exists between elect.ricity and living systems.
Galvani (1791) obserVed that muscular contractions of a frog's
leg occurred when it was touched with joined leads of iron and
copper. Even earlier it had been established that the shock
received from certain fish such as- the torpedo and electric
eel was in fact due to an electric discharge •. Volta (1800)
described his first Voltaic pile as an tArticifical electric
organt because qf its similarity to the electric organ of these
f ishs
In the nineteenth century~ large number'of papers appeared
which indicated that living tissue of every type was affected by,
and itself apparently generated, electric fields. Much of this
early work was very crude and unreliable, being hampered by the
lack of suitable experimental techniques and measuring apparatus*
In the early years the only method sufficiently sensitive to
detect a small potential difference was by the contraction
--
. r~2 -3-
it caused in a frog's muscleQ
In medical therapy; electric treatments were widely used ·in
the nineteenth century, and as Curtis (1950) has remarked 11at one
time or another'it is probable that electric currents have-been
advocated.as a remedy for.practically every disease that afflicts'
mankind". Parallel developments took place in the field of
agriculture and a great volume of unreliable and contradictory
literatu:re appea1·ed dealing with 'the effects of applJ.ed electric
.fields on the growth and yield of agricultural crops (reviewed
by Briggs,1926).
As the reliability and sen'sitivity of the measuring apparatus
increased it became possible to make measur~me~ts 0£ the small
bioelectric potentia+ differences generated by plant and animal
tissues, including 'in some cases those associated with sfugle ceD.s.
The response time of th~ me~surlng instruments was decreased,
permitting the study of t~e rapid changes in potental (called ·'action
potentials 1 ) which take place in nerve and muscle$ These studies
have led to great advances in our knowledge' of the behavior of
the nervous system {cf.Eccles 1953)0 The use of valve circuits . '
since about 1920 has produced considerable improvements in the
techniques of measuring bioelectric potent;i_al~ ..
Io3• Causes of Electric Fields associated with Living Organso
The reasons why electric potential differences occur in and
around living tissues are reasonably well understood, although there are

.e
I.3,.
_4_;_
still many differences of opinion over the detailed mechanisms
especially in plant systems. It is not proposed to discuss these
processes in any detail in this thesis, but a brief comment on
the cause of bioelectric fields appears to be desirable.
In the case of a -single cell, it is known that the ionic
concentrations inside the cell are very different from those in the
surrounding medium8 ' Respiratory- energy is used to mai1;1tain
, these concentration differences. The ions tend to diffuse so as to
equalise concentrations inside and_outs~de the cell, but because
-the ionic mobilities in the membranes and phases' tµ.rough which the
ions have to pass gene!ally differ markedly from.each other and
from their values in free solution, diffusion potential d~ff erences
are usually set up • ·In addition the presence of fixed ions of ·
. one charge~in one phase 'or membrane causes ~nequal concentrations
' of diffusible anions and cations in that phase. This leads to the
establishment of a potential difference (kno'..m as a Donnan potenti~
difference) across the bc;iundary of that phase with another containing
no fixed ions"
The potential differences and ionic concentrations associated
with the cell adjust themselves so that in equilibrium the total
flux across any boundary of each ion due to respiratory processes
( 11 ionic or molecular pumps11 ), concentration gradients, plus the
electric field, is. zero.
e
·e
--
,1 ~
I .. 3,,,
·-5-
These phenomena are discussed in detail by Hbber. et. ai (1947), •
In tho ce.se of most cells which have been measured, the steady
potential inside the cell is of the order of 50-100 mv more negative
than that of the external n:edium (Bunning l9J7)~ ' '
Th~s difJerence
of ·potential difference depends on the ~onic concentration of the
external inedium as well as other factors ..
A siqgle cell placed in a uni~'orm environment probably would
exhibit the same potentiq.l difference across its bounda1°ies on
all, sides Bnd no external field would be· e~?ected~ :tiowever; ·if-
a gra~ient of some factor 'affecting the 'p'o.tentio.l of the cell '
( e .g~ionic concentration) exists in the. e:;cternal medium, ·symmetry
is no l<;mger present and a small residual· field may_ be observed
around the cell'.· With .an aggreg2te of cells ir1 sucb ·a grB:dient,
these residual Dotential differences uould integr::-,te, setting UD I,; ' ' I I-
an ob,servable electric 'field in the surrot'.nding medium.
It' is obvious that such· gradients of ionic concentration ' '
must occur throughout develo~Jing systems, .in which ·salts are
continually being absorbed "tli:rough: one region and, trensfer;ed to
anothe1~ region where they are required by enlarging cells •. , · Thus
it is to be ex:_:iected that characteristic potential differences would
qe found in association with any specific organ or tissue in the
process of development.
I~4 · Possible role of the Bioelect1~ic :s'ield as an Organiser.
In view of the universal presence of elect~ic fields in the
•"
-6-
around li~ing systems, due to·the processes outlined above, it· '
has occurred to some workers (cf. Lund,1947; Burr, 1947; McAulay
et al 1951) that these fields might be responsible for the organisation
9f aifferentiating tissue., The bioelectfic-f~eld established by - '
an, 9rgan in a characteristic p_attern might itself. control the
further development of that organ. In other words the bioelectric
fie~d was sugges~e~ as a p~ssible ,biological field .. ,
rt is well knoym that elec~ric forces are of great importance
in the organisation of the inanimate world~. .An exam12le, superficially ' '
.resembling the postulated rqi~·of electric force~ ip living syste~s. · ' \. ~ ,'
occurs ~n the growth of a crystal. New atoms· attach t'hem~elves
to the crystal in a'pattern which is 'controlled by.the pattern of ' ' '
the electric fi~ld.of atoms already forming the _crystal.
In order to test whether the bioelectric field is indeed
responsible for the organisation and development of biological systems ' '
' the follo"'.ing questions clearly must be- answered:'-
(1) -. Does the electric field in and arounq a biological system in
a particular stage of its development form a recognisable and ' ' ~ l r 1 ' ' '
characteristic- pattern?
(2) If this is so, and if the electric. -pattern, is ,suitably ,
modified (say by short~~ircuiting,' or by ~sing an external ~ource
of P .D .. ), do c·orrespondine changes occur in the biological development
of the system?
If the a~swers to these questions are in the e.ffirmative there
can be no doubt that the, bioelectric field is a biological field,
-7-
possibly the only biological field.
A number of investigators claim to have shown that consistent
and characteristic electric fields are associated with particular
living organs. Unfortl.Ulately the results obta.ined .by different
research groups seldom agree and are often completely contradictory.
A tyPical example of this is given in Section II.2 for the case of
plant roots.
Again, :the effect of applied. electric fields has been the
subject of controversy between observers f~r mariy years (see Lund
et al 1947 eh.IV). . Alth;ough S~hrank .. and co-workers·· (e·.g. Wiegand
and· Schrank 1955) have recently performed experiments which appea~ . -
to indicate a positiv~ correlation between applied electric
currents and plant. bending, it is still open to some doubt whether
their techniques ar·e' sufficient~y satisfactory to permit the
'definite conclusion that the electric ·field is the primary cause.
For example the bending which was observed by Schrank's group when
· a current was passed transversely across a· pl,ant shoot might ·have
been caused by the accumulation of a particular ion from the· bathing
solution at one point of electrical contact, due to the method of
passing current. Other ~nsatisfactory features o~ Schra~_k's
technio'ue are discussed later"(section IV.1'). .. .
I.5 Reasons for Present Investigation and Outline of Work Described in Thesis
· In the early stages of the present research it was realised
that a critical analysis of techniques used for making measurements
of bioelectric fields was a necessary preliminary to a detailed study
-8-
of these fields if a significant contribution to knowledge of
them was to be hoped fore
A number of possible sources of artefacts in measurement.were
considered, many of which had been overlooked by previous
investigators. Thes~ considerations led to the development of
four new methods of measurement of bioelectric fields in which
these possible sources of error were largely eliminated. These
uill be desc·ribed in section II of this thesis. '
In wh2t was considered to be the most satisfactory of the
new methods a plant root was immersed in a weakly conducting solution ' .
and measurements made of potential differences in the water near
the root due to curr.ents generated by the root and flowing t:q.rough
'the water,.
This method was applied to the study of the bioelectric fields
of bean roots, and in section III it is shown that an actively
elongating root develops a characteristic and usually steady
potential pattern in the external medium. Furthermore it is shown
that by inhibiting elongation of the root by tuo methods, the
magnitudes of tne potential differences along the root were
significantly reduced, and with one method the process was reversable~
In section IV, the study of this steady external potential
pattern is continued~ Techniques are described which permit
the mapping of the field lines in the surrounding medium. Estimates
are made of the electric currents flowing from the root, and the
electric power dissipated by the root in the external medium. The
-9-
amount of electric power, produced is considered in relation to the
total power av~.ilable in the root through respiratio~~
Experiments to test the effects of different ions in the •'
external medium are als.~ discussed in section ·!'J, and consideration
is given to, which ·ion,s are responsible for' carrying the electric
current, in particulap across.the plant ·surface.
In 1953 it was decid~d that some 1:~pects of bioelectric fields - "· \
, could' better be s'tudied from :s-ut~ma tic .r~cordings ~f bioelectric -
potential differences., · _ ~ccordingly appara tu~ was' constructed" which I ' I ~
~ " \_
recor,ded au"tomatic'ally -~he potential diffe~,ences between several points - ,
1
~ ' , L l \.
1
1
I '
near a root growing in water at frec~uent _intervals- over long per_iods - '
of ,tim<;J .. This is described in section V• ''
In the same section, a very' sensitive recorder of the rate of ' ,
. elongation of a root is described. It is beli~ved that this apparatus
detects smaller increases in length 'than ;any other growth meter.that
hes been described elsewhere. The rate of elongation and potential
pa~tern.are measured. simultaneously and recorded on the same chart.
With the automatically recording apparat~s it has been ~ound
that under some coI?-ditions bean rQots generatie sinusoidal electrJ.c. . ,•
oscillations with periods of about 5 minutes which are superimposed
on the steady or background potential pattern. They may continue
for several hours. The;:ie regular oscillations which have not been
observed by other investigators are described in section V and the
'conditions under which the3r arise are discussed ..
-10-
The mechanisms for these and similar oscillatory processes
in living systems are also discussed in this section, and a
particular feedback mechanism is postulated to account for the
observed electric oscillations.
In the concluding section (VI) the results' of the uhole
investigation are discussed in relation to the general problem
of orga.nise.tion and c~ntrol, and consideration is given to
proposals for further investigation~
Ie6 Electric Fields within Living Tissue
It will be noted that throughout this investigation, bioelectric
measurements have been confin.e'dc to the conducting m~dium externe.l
to the root. No experiments to determine th~ electric pattern
and current paths within the plant have been describede Although
preliminary observations of internal potential differences have been
made by the author and by others in the laboratory (McAulay, Ford
und Hope 19)1) and reasonably consistent results obtained, the
interpretation of these results is difficult and they have not been
included in this thesis ..
Interpretation is difficult because even the finest practicable
microelectrode damages many cells during its insertion into the
root, and it is difficult to be certain of the material in the
immediate vicinity of the microelectrode tip. At first it is
probably largely the sap of broken cells, but gradually salt would
be absorbed by surrounding cells 8;nd healing tissue would form ..
The, electric che.nges resulting from these processes are likely to be

r.6.
-11-
complex and 'much larger than the relatively small potential differences
causing internil currents to flow. Further analysis has been
postponed until the external pattern has been studied more completelys
e
·e
e
-12- II.1
II., DISCUSSION OF POSSIBLE SOURCES OF ERROR IN MAKING
:!ll.QE1ECTRIC MEASUREMENTS,Al\ru l\'EW E.,'{PERIMENTAL METHODS.
II.1 Potential Differences measured in Plant Systems ..
Experiments made at the University'of Tasmania and elsewhere
show clearly that electric potentials measured on the surface of
plant organs depend on a number of causes. In addition to those
due to the plant itself when in its normal steady state of
metabolism, there are a number of other sources of potential
difference, ·some of them generated by the plant itself due to
treatment it receives during measurem~nt, and others introduced
from.outside~
By using suitable experimental techniques which will be
discussed later, it is ?Ossible to eliminate effects associated
with the process of measurer;'.ent and other external factors, and
measure the electric fields generated by the plant ~lonea ,.
· The electric fields generated by plant organs may be divided
into two types':-
(a) Fields due to static or quasi-static charges within the ' ,
plant system. These fields are conservative (i.e. electric
energy is not being dissipated) .. They may, however, separate
ions within cells and hold them in this polarised condition.
(b) Fields due to active electromotive forces generated by the
plant which are supplying· power. These dissipative fields cause
currents to flow continuously through closed circuits uithin and
e
e
e
II.1
-13-
a:.:ound the plant.
In seeking a correlation between electric field and morphogenesis,
a study of the second type of field appears .to off er the best
immediate prospect.
It must be recognised however, that the conservative type of
field, possibly by polarising cells or creating double layers, may
well affect morphogenesis. Tropism due to gravitation provides
an example of an undoubted effect on plant growth produced by
a conserva~ive field.
The obj'ect of the present section is, in the first place, to
show how potential differences due to the plant itself can be
distinguished from those introduced from outside and during
the process of ,measurement. In the second place, its object
is to describe methpds of measurement in which the fields due to
the plants themselves have been isolated. In the first of these
methods, only the dissipative field due to the active electromotive
.force supplying power is measured, while in the ~tb.ers, the
conservative type of field is measured also. , .
In section III of this thesis, results of experiments using
the first of these techniques are described. It is there shown
that a correlation exists bet~rn~n the observed elec.tric potential
pattern along a bean root and its rate of elongation for bean
:rioots whose growth is controlled by certain treatments.
••
-14-
Condit:Lons Reguired to Distinguish Normal Plant 0
Elecitromotive ' -Forces from __iu-tef acts.
A number of investigations of the electric potential diffei·ences
associat'ed with plants have been made in .. the pas.t~ An examination
of the literaturc:> sbows very ii~tle agreem.en~ be~wt:en the results .
obtainedw
Some of the 'results that have been obtained using roots as
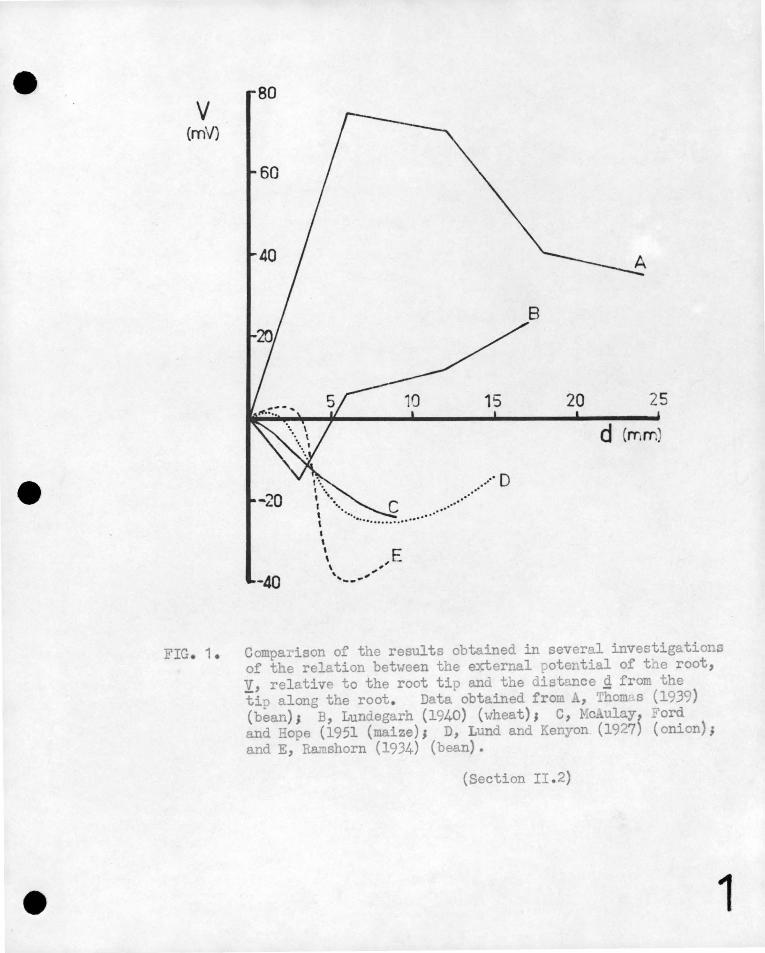
Il!-ater'ial,' are compared in Fi.gure 1 , in which the potential of the
root relative to the tip is ulotted against the distance from the ' ' .
tip. It is evident that there is a wid~· ,diversity bet"".een"
~he 'results o~'differ~nt observers~ 'it i~ true· that these
results q~e·not directly comparable since they have-been obtained ' ' '
under a vari'ety of conditions, and some of the variation between , ' , 1 '" ' '
them is certainly du·~ t9 such factors as the t;Y'pe of plant used,
its age, and the state of its environment •. Nevertheless a:
critical examination of the experimental techniques employed - .
in the investigations shows that in most cases the meas~red'
potential'differenees were due not only to the plant e.m.f's
but also to factors introduced by the measuring techniques.
In view of the lack 'or complete recognition of these difficulties -
in the past, it is now proposed to examine in some detai;t. the
· sources of error which may occur in making electric measurements
on plant material.
(a) Local ~otential differences may be set up at the points of
contact of the measuring.tubes and the plant surface due to
80 v
(mV)
60
40
10 15 20 25
d (mm
,... ··o ~ ..... . .. ······ I ••• . •.. ·•• ~ ·· ..................... ···
-20
I
' \ ,E \ ,' -40 ' .. ___ ...
FIG. 1. Comparison of the results obtained in several investigations of the relation between the external potential of the root, y, relative to the root tip and the distance g from the tip along the root . Data obtained from , Thom· s (1939) (bean); B, Lundegarh (1940) (wheat)# C, Mc.!i.ulo.y, Ford and Hope (1951 (maize); D, Lund and Kenyon (1927) (onion); and E, Rarnshorn (1934) (bean).
(Section II .2)
1
9.
. e ,•
e
rr.2 ..
-15-
diEferences in concentration of ions ,in the contacting mediumo
It is well knmm that plant tissue absorbs inorganic ions
differentially ,from the bathing solution .. A phase toundary exists
' betwee,n the solution and.the cytoplasm of the tissue p,nd for re~sons
given' in I.3 boundary ;:iotentials are set up which depend on the
n:ature of the tissue, .8.nd the n~ture. and concentration:of the ions. ' ' '
·In m~asurement of plant potentials, salt concent~ation changes
frequently occur due to-the follouing two causes.
(i) Evapo:r;?-tiOD;.of the liquid at th~ point of contact may take
place causing!an increase in salt concentrations
., (ii) Sal !:.s may be removed f1~om the contacting liquid d~~ to 'salt , - '
uptak~. b§ the plant ,causing large decreases in its ~alt concentratio~~ ' ,'• ' ,. J ., ' ,-.
To' ill'ustrate' the magnitude of the pote,htials set UtJ in this
.way, it is found that if the concentration of KCl at one .poi?t of
contact on the bean root is c~nged by a factor of ... ten·· ( tl~e· · ' . '
' ' '
concentration at the other contact remaining unchanged) the"~otential
d;U'ference betwee:i the contacts changes by more than 30 milliYoltso
(Hope i951).
Unless special precautions are taken, such sources of error
2.re nearly always found to be' [)resent. In spite of the magnitude
and importance of these effects,· little consideration has been given
to their elimination in the ?ast ru1d many of the published results
have been obtained using stagment water or agar contacts. This
, .
-16-
must be taken into account in evaluating the results obtained :in
previous investigations.
(b) Local conditioning of the plant surface may occur at the
point of contact. The point of contact may differ from neighbouring
points on the plant surface in a number of ways. It may be
wetter and less well aerated than surrounding points, and there
are likely to b~ differences in temperature .and ~ighting.conditions.
The condition of cytoplasm is changed when salt concentration is
changed of a solution uhich is in contact with it •. As a consequence
of this,, 1:1- potential difference is shovm between two regions
otherwise identical which have been subJectecl to different histories
such as exnosure to accidental differences in salt concentration ' ' .
of the contact points.
(c) Variation of the overall state of the plant's env:Lronment
preceding and during measurement may give rise to transient potential
patterns that obscure the desired steady st'ate pattern~ Important
factors uhich may have to be controlled are temperature, humidity,
salt concentration, degree of aeration, and possibly light and
gravitational influences.
It is clearly necessary to disturb as little as possible the
uniformity, either locally or generally, of the plant's environment
in the process of measurement.
( d) lfochanical or electrical stimulation of the plant when be:ing
set up for measurement, and local injury caused by the contacting
probes influence plant potentials.
e
e
II.-3
e
II .. 2
-17-
It is usual for an area on a plant surf ace to become more
negative if it is stimulated~ The effect of stimulation usually
disappears in a few minutes, but in some cases may remain much
longer:! Extreme cal'e must be taken when making cont8:ct with
a plant surface that no local ~njury occurs as quite large.
potential variations may result, and electromotive forces
associated with healing are likely t.ci continue as long as tissue
repair continues~
(e) The electrometer may be influenced if alternating current
pick~U:p ~ccurs. in the, measm~ing circuit. ,,A signal due to _this , l'
cause is usually partially rectified .(probably at the electrometer
valve grid) and a d.~. potenti~l is registered by the instrument,
s~periihposeq on the potential being measured. Pick.:..tJ.p. cari. be'
prE;vented by adequate shielding of the input circuit.
(f) Errors are introduced if too.much current is· drawn from·
the plant,, Unbalanced and possibly variable potenti'al b'oundaries
in the electrical connections to the measuring instrument may also
cause errorss ·As is well known, these effects can be eliminated
by the ··use o.f suitable electrometers with high input impedence,
and reversible ~on-polarisable electrode systems. High
insulation of the input circuit is of course necessary to avoid
d.c. leakage.
Some New Methods of Measuring Plant Potentials.
Four new exrerimental methods have been devised and tested
with a vieu to measure true plant potentials when the plant is
II.3.
-l8-
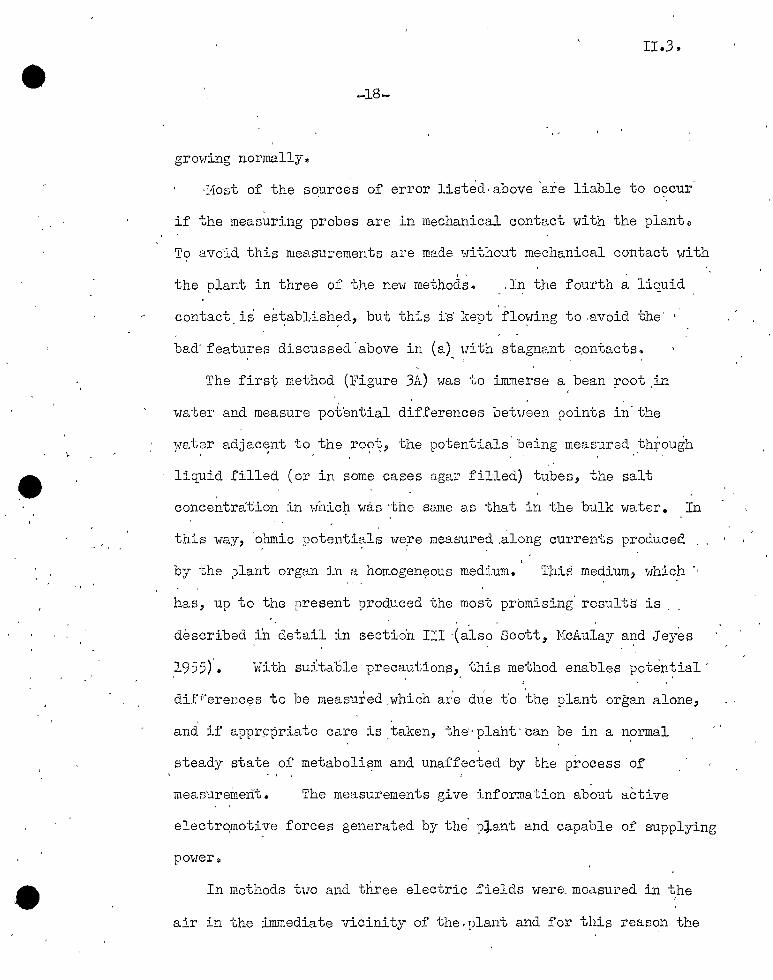
growing normally*
·Host of the sources of error listed· above 'are liable to occur
if the meas~ring prob'es are in mechanical contact with the plant.,
To avo-id this measurements are made without mechanical contact with
the plant in three of the new methods. .In the fourth a liquid
contact is established, but this i-s' kept flowing to .avoid the ' ~ I I I
bad· features discussed, above in (a) iJi th stagnant c.ontacts ..
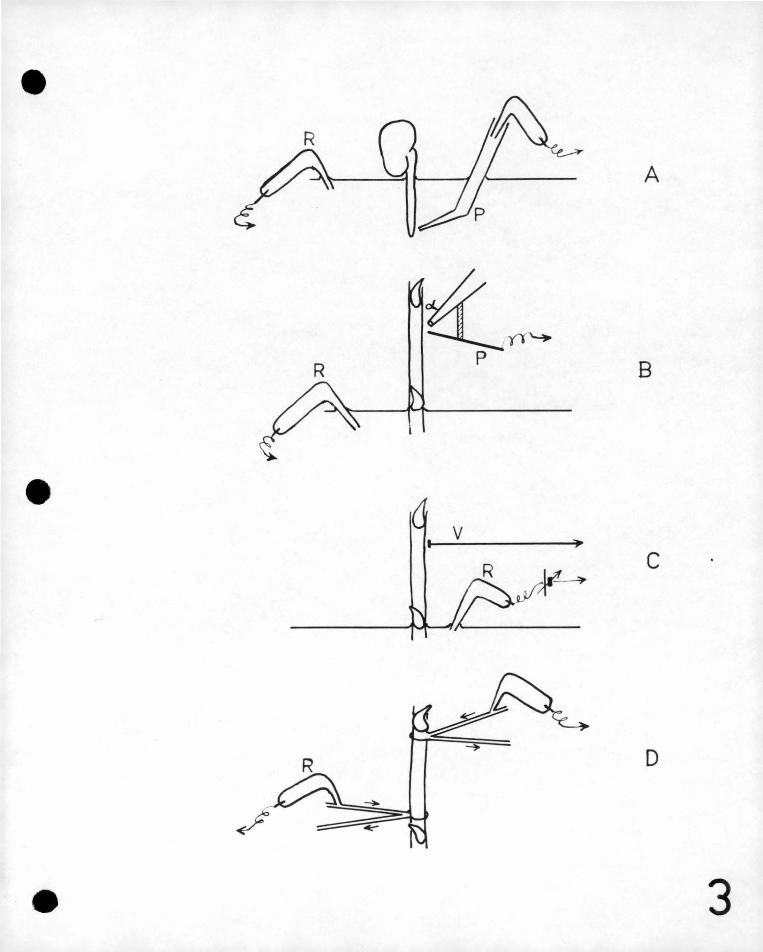
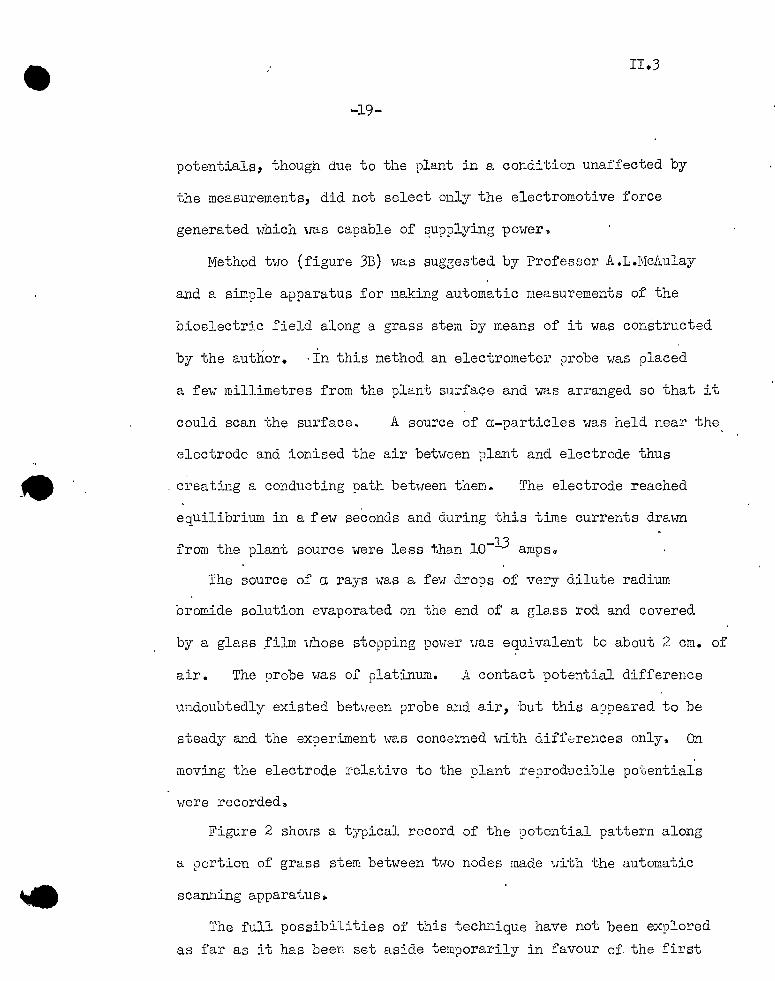
The first method (Figure JA) was to immerse a bean root .in
water and measure pot'ential differences betueen points in· the
}-Tater adj ac~nt to, the .ro?~' the potentials' ~eing measured .thi'?ugh ,.
liquid filled (or in some cases agar filled) tubes, the- salt
concentration in whicl,1 was ·the sarne as that in the bulk water. In
this way, 'o.hmic potenti~l~ were measured .along currents produced
by the .Jlant organ in a homogen~ous medium. This medium; which
has, up to the present !_Jroduced the most promising' results is
described in detail in sectfon'III ·(a.'1so.Scott, HcAulay ar:id Jeyes
With suitable precautions,, this method enabl~s poten~ial'
dif:'.~erellCf?S to be measured ,Which a1~e dlJ~e t'o ~Che plant organ alone,
and if appr.opria te care is , taken, the'· plaht · can be in a normal
steady state of metaboli~m and unaffected by t.he process of
measurement. The measurements give information about active
electro.motive forces generated by the' p:}.ant and capable of supplying
power a
In methods tuo and three electric fields were_ measured in the
air in the immediate vicinity of the.plant and for this reason the
0
' 2 ' 4 ·o 2 4 o
I
CtNTIMCT~ts
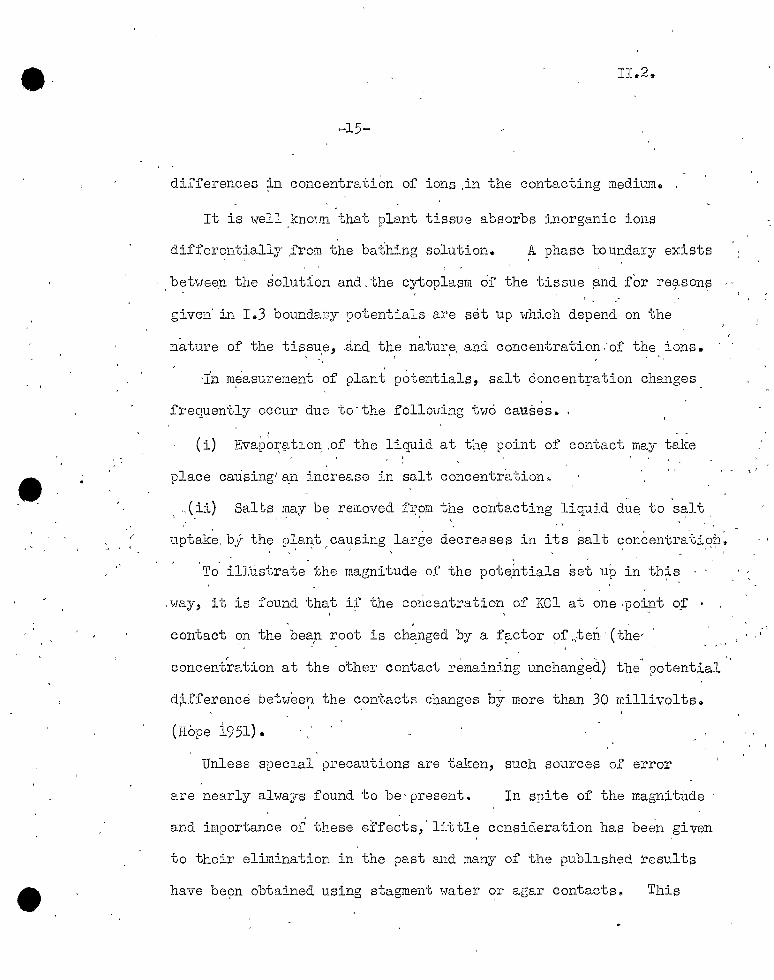
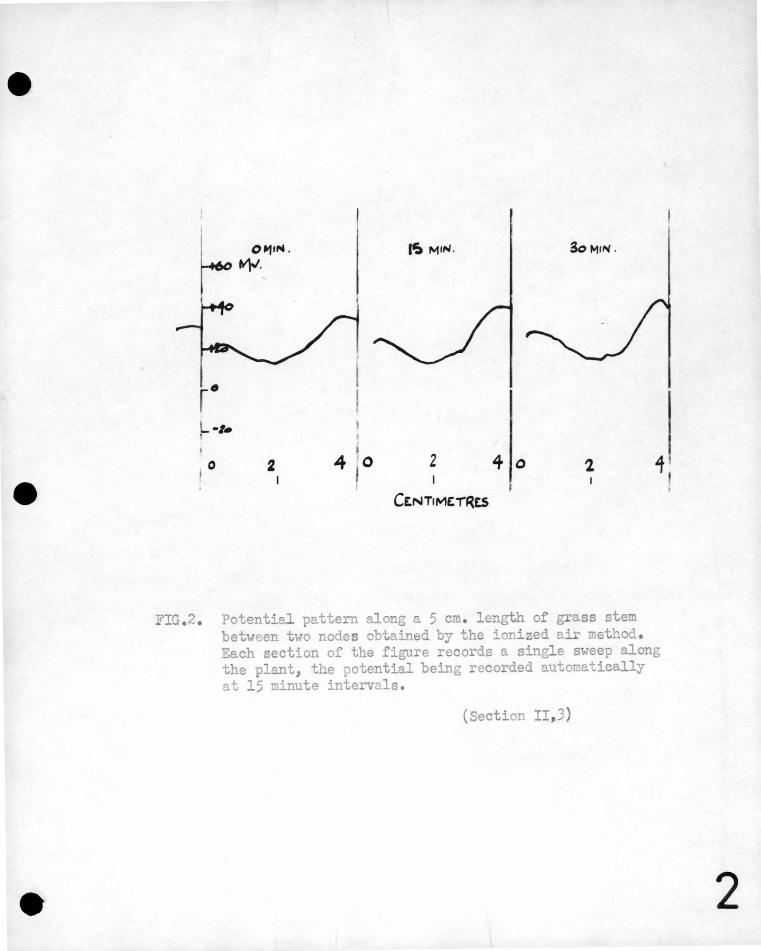
IG . 2. Potential pattern along a 5 cm. length of grass stem between two nodes obtained by the ionized air method . Each section of the figure records a single sweep along the plant, the potential being recorded automatically at 15 minute intervals.
(Section II, 3)
2
en u
0
>
-·
..
,' II.3
-19-
potentials, though due to the plant in a condition unaffected by
the measurements, did not select only the electromotive force
generated which uas capable of ~upplying powers
Method two (figure 3B) i,,ras suggested by Professor A.L.McAulay
and a simple apparatus for making automatic measurements of the
bioelectric field along a grass stem by means of it was constructed
by the author. ·In this method an electrometer ?robe was placed
a few millimetres from the plant surface and was arranged so that it
could scan the surface. A source of a-particles was held near the
electrode and ionised the air between plant and electrode thus
creating a conducting path between then. The electrode reached
equilibrium in a few seconds and during this time currents drai,m
from the plant source were less than lo-l3 amps .•
The source of a rays was a few drops of ve'r'IJ dilute radium
bromide solution evaporated on the end of a glass rod and covered
by a glass _film '\Those stopping power uas equivalent to about 2 cm. of
air. The probe was of platinum .• A contact potential difference
undoubtedly existed betlJeen ;_:irobe and air, ·but this appea1·ed to be
steady and the experiment was concerned with differences only. On
moving the electrode i 0 elative to the plant re?roducible potentials
were recorded"
Figure 2 shous a tYPical record of the potential pattern along
a portion of grass stem between two nodes made uith the automatic
scanning apparatus.
The full possibilities of this technique have not been explored
as far as it has been set aside temporarily in favour of. the first
.e
---
·e
II.-.3.,
-20-
method.
Method 3 .(Fig.JC) was suggested by the author.and was tested
by him i.ri'colla.boration with Dr .. o. BlUh at the University of-British
' Columbia. With this method no currents were drawn from the
source. and pu~ely'static charges coula be' observed. A vibrating
- nrobe connected' to an electrometer was brought close to the plant I: ' ( ,
surface and an alternating current was induced in the input circuit ' ' ' '
if a P.D~ existed. between pla1:-t and electrode-. This was amplified
and disp..ayed .on a cathode ray oscillograph screen,., A 'compensating
poteiftial was a~plied to the input circuit and this ~a's varied
until no A.G. was observed on the screen. The prob~ was then
as.sumed .to be at the same potential as the adjacent plant surface.
By moving the probe relative to the plant and.observing the change
in the compensating 9o~ential_necess~y.for a null reading, it was-
· possib1e to.measure the potential pattern along the plan~ surface ' f' -.
without drm~ing any .current 'from i~e _,This method has been
desc1~ibed in more detail elsewhere., (B;:Luh''and Scott 1950)
In the fourth method which was suggested by the author (Figure 3D)
contact was made thr.ough a stream of running water which was applied
to a point on the surface of the stema The stream of water flowed
down 011e tube about 2 mm. in diameter and was sucked up another
similar tube. ~he two tubes which compr'.ised one contact were
adjacent to one another and attached to the surf~ce on the plant.
In this way the plant was wet by a.flowing stream of constant
-21-
composition, and no water escaped down the plant surface. Each
str.eam was part of a· separate highly insulate?: circuit$ By ' '
.this meth9d changes of concentration due to uptake by ~he plant
or due to drying are avoided~ Conditioning of th~ point qf
contact on the plant ~s not'prevented but is as nea~ly as
This method has some ' '
advantages in' the" measur.ement of' p~tential ,diffe,rer+ces' on'.
plant stems•
The mechanisms which prod~ce electromotive forces in plant'
tissu~s may be su~h that some can supply more power than others.
Whether the fie1d produced by one of these will be observed '
outside the plant in a particular case ,depends on the magnitude
of. the qurrent generated in'the. conditions of measuremente If ,
thfa current is ~oo large~ the fi.eld may not be m,easureq, either
because the e.~~f. itself 'is poiaris~d or because the 9otential \I \ ', J
drop in the tissue, is so great that the external field is
insignificant.,,,
Method 1 selects for· measurement only those bioele,ctric
processes which are capable of supplying.a relatively.large
amount of power ·to the external medium. By using one of the
other methods it is possible to investigate less powerful bioelec.tric
processes taking place in the organ and so·galn a more complete
picture of the bioelectric behavior of plant~0
III., 1
-22-
III* THE STE..A_DY ELECTRIC POTENTIB.1 PATTERN GEiJEfilTED BY A :SEAN ROOT
GROWING IN WATER AND THE co_~:S.ELATlON WlTH RATE OF ELOIJGATIOlJ
QF tHE ROOT.
III.1 Outline of Observations.
When a bean root grows activel3; in aerated water it generates
an el~ctromotive force which passes current through the water~
This section of the thesis describes.measurements which have been
made of the ohmic po,tential dJ.fferences due to these curren~s in
·.the wate~ adjacent to the root. The pattern of these potentials
is characteristic and ,reproducible when the root is grouing strongly,.
The s,ection further describes e~periment,s in which the growth
of the root has been controlled and a co1~relation uhich has been
found betueen the chL"nge in potential pattern and the rate of
elongation iri certain cases•
By addition of auxin of suitable concentration to the·bath
in which the root is grown, it is possible to arrest growth and
observe the change in potential pattern. This process proves
to be reversible, as removal of the auxin allows the plant to grow
again and the potential pattern to recover.
A similar correlation is observed when the temperature at which
the roots are grown is raised, but the root cannot be restored to
its original condition by lowering the temperature.
III.2 Experimental Hethod •
The method used was the first of those suggested in section II
of this thes1s. It 11as designed to eliminate from the observed
potentials any effects introduced by the method of measurement,
•
rrr .. z
-23-
and also to maintain the plant organ in its normal steady state
of metabolism. A furtunate property of the root is its
ability to erow strongly and healthily in aerated water. If
the conductivity of the water is sufficiently low, potential
differences between points in the water adjacent to the root
can be observed due to the currents generated by the root e.m~f's.
For this reason it was decided to grow bean roots vertically in
a 10-4N KCl solution under controlled conditions and observe
the potential pattern in the water adjacent to the root and
its relat~on to the rate of elongation of the root.
In section II a number of possible artefacts were discussed •
It is believed that the method outlined above eliminates all of
these.
Since the measuring tubes are not in contact with the plant,
no effects due to injury by them can occur$ As the salt
concentration in the measuring tubes and in the bath is the same,
the point of measurement on the plant is not in a ~iff erent
condition from neighbouring points due to local diffusion or other
local variations.
Errors introduced in the measuring cL_.cuit have been prevented
by the use of a suitable vale electrometer and mercury-calomel
electrodes. The 11hole input circuit is insulated with polystyrene
and shielded to prevent A.C. pick-up0 The plants are left
in the measuring bath for at least an hour before measurements are
commenced to avoid stimulation effects which may occur in setting
III.2.
-24-
up the plant for measurement9 The bath is aerated, stirred, and its
temperature controlled to avoid changes in environment. No effect
was observed on either rate of growth or the potential pattern of
bean roots due to light.
As the potential mensured is an ohmic dro~ along a current, its
source is evidently an active e.m.f. involving energ-y change in
the plant organ.
III;3 Materiale
For the experiments described in this thesis, the broad bean,
Vicia faba L., Johnson 1 s,Long Pod variety was used. ' '
After soaking
the seeds overnight in 1rate1·, the seed coats were removed and a
number of seeds impaled on stainless steel rods 1/1611 in diameter.
Mounted in this way, the seedlings could be handled easily for
growing in water baths and could be transferred to the measuring
bath with a minimum of stimulation~ Impa11ng'the seed did not
appear to affect the development of the plant in any way.
For most experirnentG the beans were prepared by growing in baths
of aerated distilled water at 25°c. The water in the tank was slowly
changed from a reservoir tank. The rods supported the plants so that
the shoot uas above water level and the roots were submerged and
grew vertically. Plants 2-3 days old with roots 20-30 mm. long
were used in experiments •
• In one series of experiments discussed later, roots were prepared
by growing in air saturated with water vapour and minute water
• rrr .. 3.
-25-
droplets. The fine spray was produced by a sirrlple atomiser
using compressed air. In this bath the roots grew quite strongly
but the root surface appeared rather different from that of a root
grm.m in water and more like what is observed for a root grmm
in dry soil or sphagnum moss~
III.4 Annaratus.
The 11Perspex11 measuring bath is shown in Figur.e 4. It was 711
long, 611 wicle and 311 deep and was :j.nsulated uith polystyrene. The
bath 1ras aerated and the water in the tank circulated by passi-ng
'con!pressed air· through a ·sintered glass plug 'P~ mounted in the
tarJc, Tue small bubbles passing through provided much more efficient·
aeration than with a larger air jet&
Heating of the bath presented some ?roblems. Electrical
interference had to be avoided and an arrangement giving rapid response
to the thermostat was esser,tial. It i.ras decided to heat the bath
by means of a coil of nichrome wire stretched across the top, of the
bath just above the water level. A 12 volt A.C. supply was connected
to the coil and hea.t radiated downwards warmed the water. Surprisingly
little A.C. pick-up was experienced, and this arrangement with some
shielding of the heater from the measuring circuit, proved very
satisfactory. The thermostat was a mercury-alcohol switch 1C1 which
controlled the heater through a relay.
uas :!: o.5°c.
'i'empera ture stabili t;)T
The lo-4n KCl solution used in the measuring be.th was changed
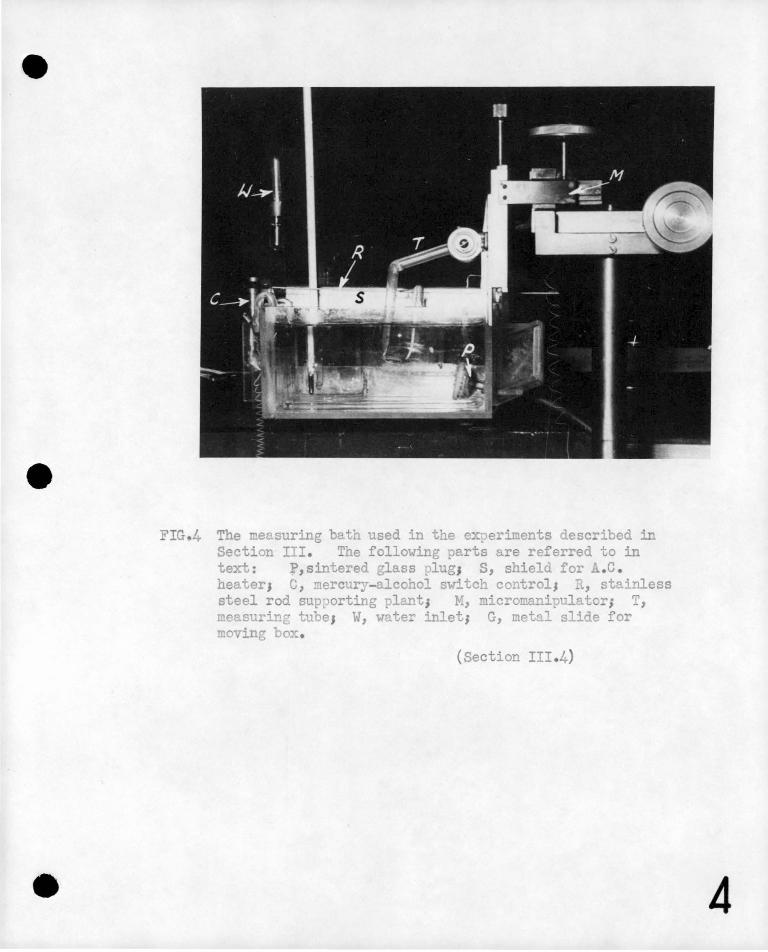
FIG.4 The measuring bath used in the experiments described in Section III. The following parts are referred to in text: p,sintered glass plug1 S, shield for .c. heater1 c, ~ercury-alcohol ~witch control1 R, stainless steel rod sup~orting plant; M, micromanipulator; T, measuring tube1 W, water inlet1 G, metal slide for moving box.
(Section III.4)
A
' .•
-26- -
from a reservoir ~ 'i'he water was made to drip into the bath,
and to drip- out at the overflow to facilitate electrical·
insulation of· the bath~ .
The beans were set UP' in the measuring tank on a sta~nless
steel ro~l pdssing through the cotyledon 1~i th only the roots
immersed' and held vertica'lly •.
The electromete1· used in these experiments employed a -pair
of matched M.E. 1400 Mullard electrometer. valves in a balanced
circui,t. The instrument was designed to be insensitive to I
fluctuations in ~he high tension voltage and in the valve heater
current. A C~bridge st:i,at galvanometer (full ·scale defle~tion .
a,bout 2µa) was used and th~ maximum sensitivity of the, ~lectrometer
was such'that an input of- 1 mv. produced a 'deflection of 3 cm.
on the scale. Currents flowing in the input circuit of the
electrometer under the c.ondi tions ·of opera ~ion 'were not g~·ea te1~
than lo-12 ainperes. The circuit used is simiiar to that shoim.
in 'Figure 17.
The c.onnections to the measur:i,ng bath ·were made using mercury
calomel electrodes. The reference electrode was.connected.
directly·to the path. The· other electrode made contact with the
bath through a measµring tube, 1T1 , con~aining eitper 10-4N KCl
agar or io-4N KCl' solution. This tube was mounted on a
micromanipula tor 1M1 , allowing it to be moved easily in the
vicinity of the plan~ root. Since lo-4n KCl has a low conductivity
5 1 . 0 ~ (about l.5x10- mho~ cm.- at 25 C) the tip of the measuring tube
had to be coarse or hend capacity effects became· troublesome due
-27-
to the high resistance of the input circuit. In most of these
experiments the uiq.meter of the tip was about 0~5 mm. 9orresponding
to a tip resistance of about 15 MS\~
Elongation of the root was measured by projecting a greatly
erii8.rged image on a -v~all. A 511 1rlaterworth projection lens was used, . ('
mounted in front of the box with its axis horizontal.· For most·
' ' , experiments, back lighting was employed, giving ~ enlarged shad~w
of the :t;'Oot, but in some experiments the root was marked, and strongly ' '
illuminated ~rom the front s? that the regions of elongation. of the ,
root could· be found~, In.this way, changes in length of the order of
Oe02 mm. could be observed. The light had no ~pparent effect on either
the growth or the potential pattern of the root.
The'whole box could be' moved laterally on a metal slide, 'G',
so that each pean in the box, coufd be'plac~d in turn in front, of .the
lens for measureµient.
III.5· Results., ' c,
The present'section comprises a study of"the potential pattern
.close to a bean root actively growing in water contrasted with that
which appears when growth is inhibited.
The aspect of growth that has been selected.is. elongation and
attempts ha~e been made to control this by a variety of means and
study the re·sulting potential changes ..
Several treatments have been applied to the growing root, such
as subjecting it to mechanical vibration, controlling its oxygen
supply, growing it at varying temperatures and inhibiting growth by '
III~5·
-28-
the application of auxine
The last of these methods, auxin treatment, was c'onsiderably the
most successful. By this means elo,ngation could be inhibited and.
tl;ie inhibition subsequently r:~moved and growth restored. The method
of temperature control also provided results of interest which are
described below,' bµt preliminary resµl ts by th~ other methods were
not so promising ru1d study of these has riot yet been 'followed up. - ' '
In. both c~ses studied, the. pattt;rn of ~he. active e.m.,f. ~ias
correlated with rate of elongation in -spite of the fact that subsequent
growth was v,ery diff_erent in the tw9 cases. This suggests a direct
link between e;Longa,tion and poten~~al pa~.t~r~~. ot co~rse it is ' < -
possible that both elongation an~ potential.pattern are ~ore 'dependent
upon 'some third change common to both methods :or control• ' ' .,., '
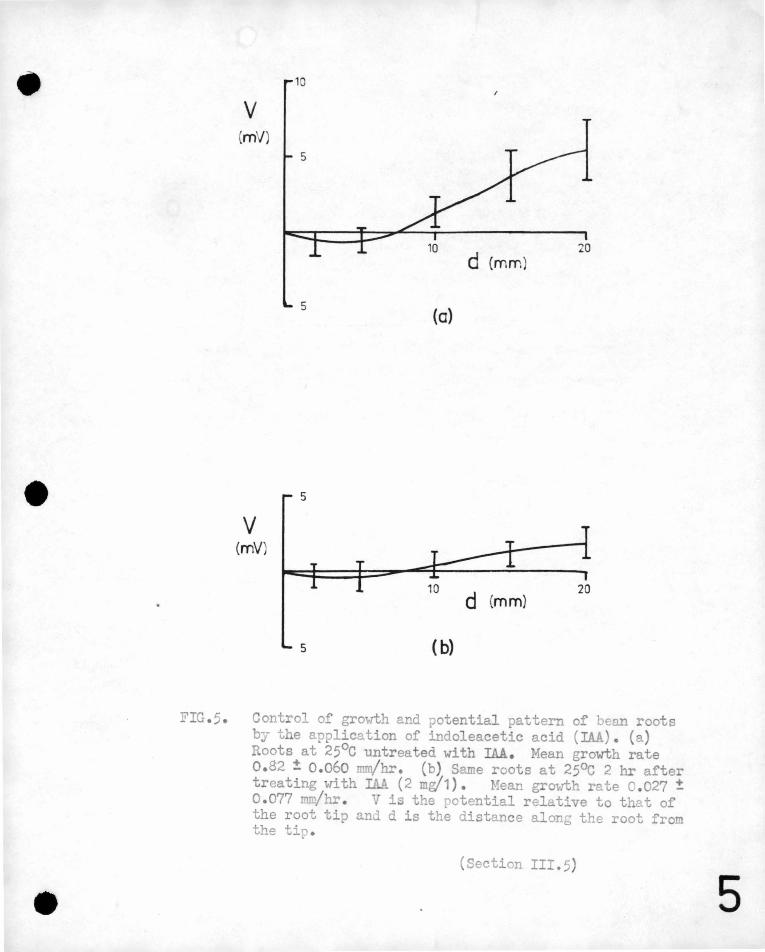
(a) Control of Growth with Auxin6
(i)' .:E)ean seedlings with roots a?;iroximately 25 mm. long uere
tra~sferre~ to the ,lo-4N KCl measuring bath at 25°c and allowed ,• ., ' r' I ' \
to reach equilibrium with their environment.
' After about 2 hours, the potential pattern and rate of ~longation
of the roots were measured, but those whose growth rate was less
, than 0~4 mm/hr. discarded. 2 mg. of indole ace"\:-ic acid ·.(Iµ) ,,
per litre of solution was then added to the bath containing the
rapidly growing beans. After about an hour the potential
pattern had reached a new steady state and the average
potential and rate of elongation over the next two hou:rs were
-'
..
-29-
The results of this exp~riment are shovm in ~igure 5. In this
and subsequent diagrams.throughout this thesis, the vertical ..
lines t"hrough the po,ints mark the 95 per cent c'onfidence limits;
that i~, the probability is o~95 that the mean of t~e population I ' ' ~
repre~ented by the sample lies withtn the l~its given by the
ends of 'the line. The ~imits for.the mea.n growth rate also are
the 95 per cent confidence limits.
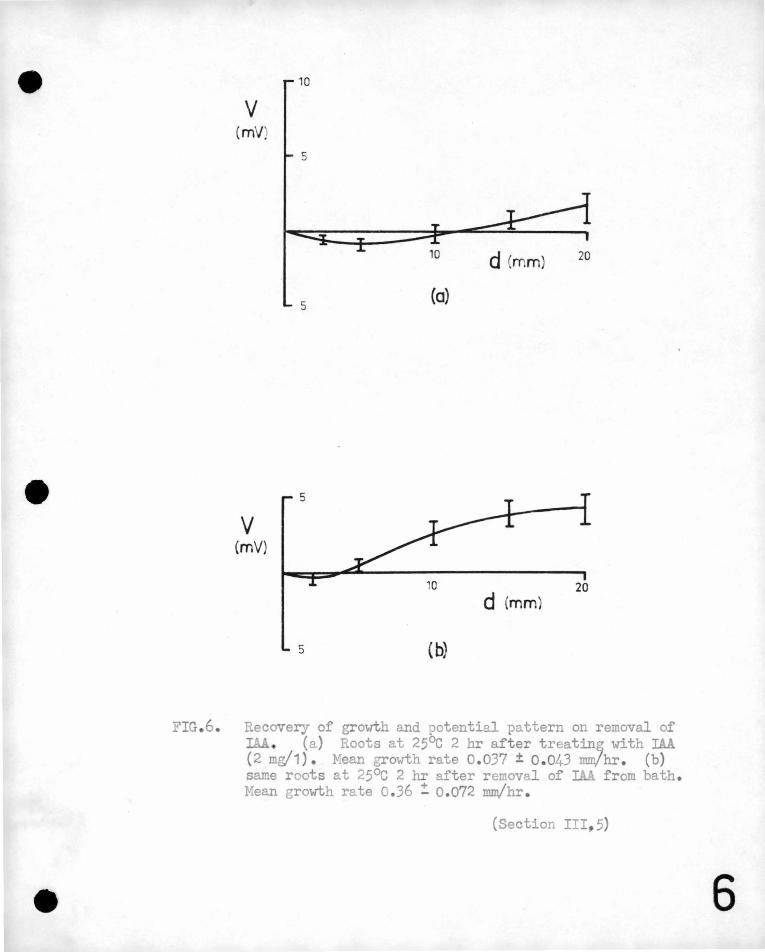
(ii) Bean seedlings were transferr'ed to the measuring bath at
25°c contain,ing io-4N KCl and ~ mg/litr~ IA.A. After about two '
hou~s elon·gation h,ad practically ceased .. The potential pattern
was then observed, .~~d the water in'.the bB;th replaced with KCl
solution without,indoleacetic aci~. One to three hours after
the removal of IAA when the root· was a gain elonga.ting', 'the mean
potential pattern arid growth rate were ~easured@
The results of this experiment are given in ~igure 6.
An exaJnination of these graphs shows th~t the inhibited
roots have 1?- markei;lly different potential pattern from those
grow~ng strongly~ The no~al potential pattern of a growing
root shows·'a regfon 2-5 mm. from a tip most negative with the
base of the root ap9roximately 6 mv. more positivee Suitable
treatment with indoleacetic acid inhibits the elongation of the
root and reduces the potential gradients along the root by a
significant amount@ Removal of the auxin allows the root to
•
-30-
grow again, (although the recoyery is not complete in two hours, the
growth rate being well below th2t of untreat~d roots)· and the potent~al
gradient along the root returns almost to its value,pr~or to auxin
treatment.
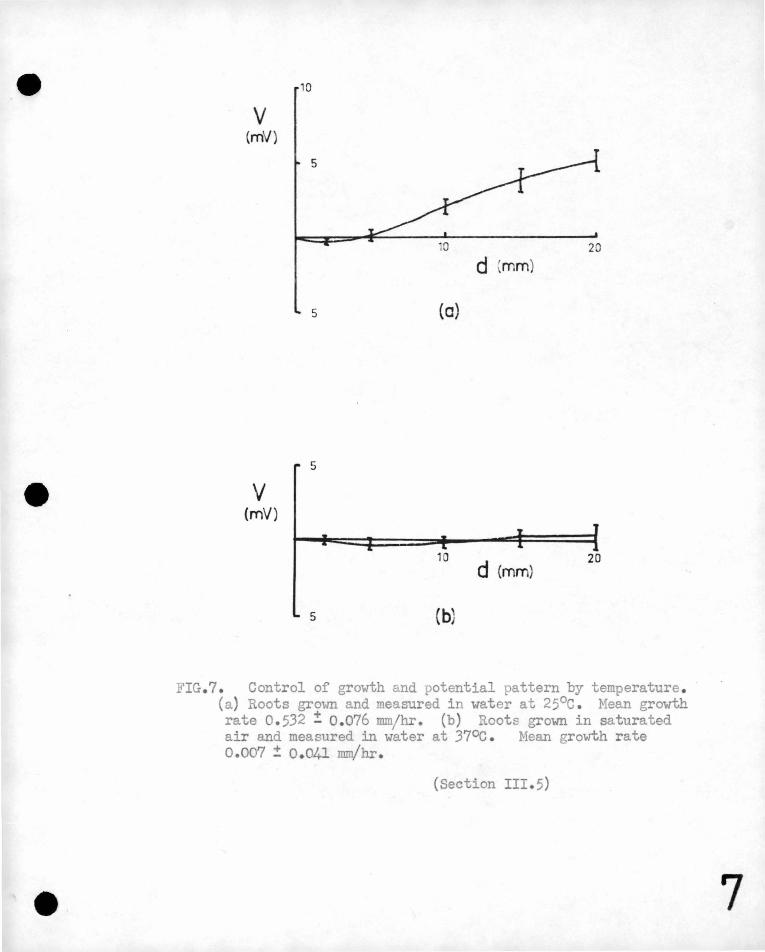
(b) Control of Growth by Temperature.
Graph 7 (a) shows ~he normal. potential pattern for roots grovm in
0 in ~fiis case, and in the following one at 37 C,
the growth and potentials were averaged for a 24 hour period f?.llowing
the initial settling dovm@ ' ,
Graph ry, (b) shows the' potential ·pattern for roots measured in
lo-4N KCl at 37°c. , Inhibition of growth at this temp(3rature was most
marked in the case of r9ots yre-tr~~ted,by growth in a saturated
atmosphere for 24'hour~ before exrosure to 37°0., The graph refers
to roots treated in this way.· It is seen that the roots have almost
e~tirely stopIJ,ed elongating and the potential differences along the
' ' root al'e not significantly different from zero., Roots measured' at
this temperature for 24 hours and then returned-to a 25°c bath do
not recover normal .growth. · The activity of ~he primary meristem
is suppressed and the main root stops growing, but pronounced initiation
of secondary roots quite close to the primary root tip is observed.
(See Figure 8) o Electromotive forces are once more produced by the
0 root when it is returned to the 25 C bath, but they are not the
same as those.for a root which has not been treated at 37°c.
' L
10
v mV
5
d (mm 20
5 (a}
5
v (mV)
d (mm) 20
5 ( b}
FIG.5. Control of growth and potential pattern of bean roots by the application of indoleacetic acid (IAJ,). (a) Roots at 25°c untreated with IAA. Mean growth rate 0.82 ± 0.060 mm/hr. (b) Same roots at 25°c 2 hr after treating with IAA (2 mg/1). fean growth rate 0.027 ± 0.077 JllJ!/hr . V is the potential relative to that of the root tip and d is the distance along the root from the tip.
(Section III.5)
5
v (mV.
v (mV}
10
s
s
s
s
d (mm) 20
(a)
20 d (mm)
(b)
FIG.6. Recovery of growth and potential pattern on removal of IAA (a) Roots at 25°c 2 hr after treatin~ with IAA (2 mg/1) . Mean growth rate 0.037 ± 0.043 mm/hr . (b) same roots at 25°c 2 hr after removal of IA.A from bath. Mean growth rate 0.36 ! 0.072 mm/hr .
(Section III , 5)
6
v (mV)
v (mV)
10
5
5
5
5
d 'mm)
(a)
10 d (mm)
20
(b;
FIG.7. Control of growth and potential pattern by temperature . (a) Roots grown and measured in water at 25°c . Mean growth rate 0.532 ! 0 . 076 mm/hr. (b) Roots grown in saturated air and measured in water at 37oc . Mean growth rate 0.007 ! 0 . 041 mrn/hr .
(Section III . 5)
7
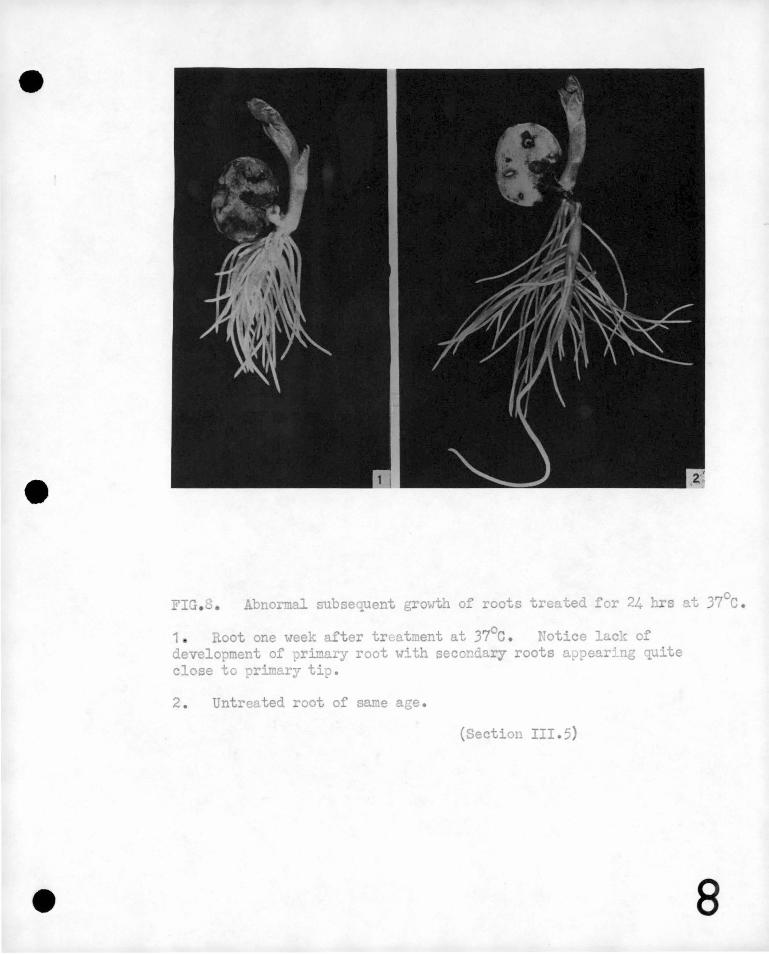
FIG. • Abno mal subsequent growth of roots treated for 24 s ~t 37°c.
1 oot one week after tr~atment at 37°c. Potice 1 ck of development of primary root with secondary roots appear~ng quite close to primary tip.
2 . Untreated root of same age.
(Section III.5)
8
"N@,1
N • 'FURTHER STUDIES OF THE STEADY BIOELECTRIC PATTERN .AROUND A
BEAH ROOT GROWING IN WATER INCLUDING ME11-SUREMENT OF THE
ELECTRIC CUHRENT AND POWER GENERATED
IV .1 'Introductory Discussion
Measurements of ootential differences in the water close to a ' -
root give only a'partial description of the bioelectric pattern
external to the root. ' In order to describe this more completely
further information is required, i~cluding tµe magnitudes and
directions·of the currents flowing out'from the plant surface; and , ''
th~ paths they take.through'the water before re-entering.the root _
(Le. the paths of the field lines in th~ wa:ter), and 'the amount of,
electric power dissipat,~d in the water. In addition it is of
intere~t to know which of the ions present are actually carrying ' '
the ?u~r~nt, especially across the plant surface.-
The e~periments described in thi~ section 'were designed to
provid~ some of this information.
The long range plan of the present research is to test the
hypothesi? tha~ the bioelectric field has a formative influence
on the bioelectric paaern (see secti~n ~.4). It is therefore
important to know the arn.ount of electric power being developed by
the plant and the relation of this to the amounts involved in other
power pr9duci_ng and power consuming processes within the tissue.
The knowle~ge of current paths is needed to give a sound basis to
a subsequent investigation now being plannea of the effect on plant
development of currents from an external source .. For these experiments
N.I.
-32-
it will be of considerable importance to lmow the manner in which the
external field modifies the bioelectric field of the plant, and in
particular the amount of current from the external source which passes
through the plcmt and the regions on the plant surface through which
the current enters and leaves.
In some previous investigations of the ef Iect of e~ternally
a.9plied 'currents, this ~nformation does not appear to be lmmm' with
any certainty~ For 'example in Schran.k's (1944) experiments, it
does not appear ~)ossible to state how much of the current from the
external source actually passed thr:ough -J;.~e plant and how much by-pas~ed
the plant through tht? external medium. (see tracing in Lund et al
The mapping procedure developed in this parer woul.d allow this
information to be obtained.
Little consideration appears'to have been'given ill the past to
the measurement of the electric power generated by bi~electric sources
in plants or its ilnportance. (see discussion by Crane' 19 50) ~ Blinks
(1933) made some measureme1its of the power output of a single
Halicystis cell. McAulay, Ford and Hope (1951) estir:iated the power
ciissipated in an external circuit when two contacts were made ori the
surface of turnip hypocotyls and couch grass shoots8 They estimated
that the current flowing in the external circuit through these points
of contact was of the order lo-8 amperes (depending, of course, on
the resistance of the external circuit) and the external pouer
dissipation was about 10-9 watts. However, it must be pointed out
IV .. 1.
-33-
that the objections to the method of measurement through isolated
contacts of salt solution discussed in section II~ 2 still apply
in this ca.se, and part o.L the reL1tively large ar.10unt of powe.r
observed may be due to processes resulting from lack of equilibrium
on the contacting system. For exai~ple, the energy changes
associated with ·an evaporating liquid contac~ are likely to be
considerably higher than the energy associated with the bioelectric
source.
IV.2 Estimation of Current and Power.
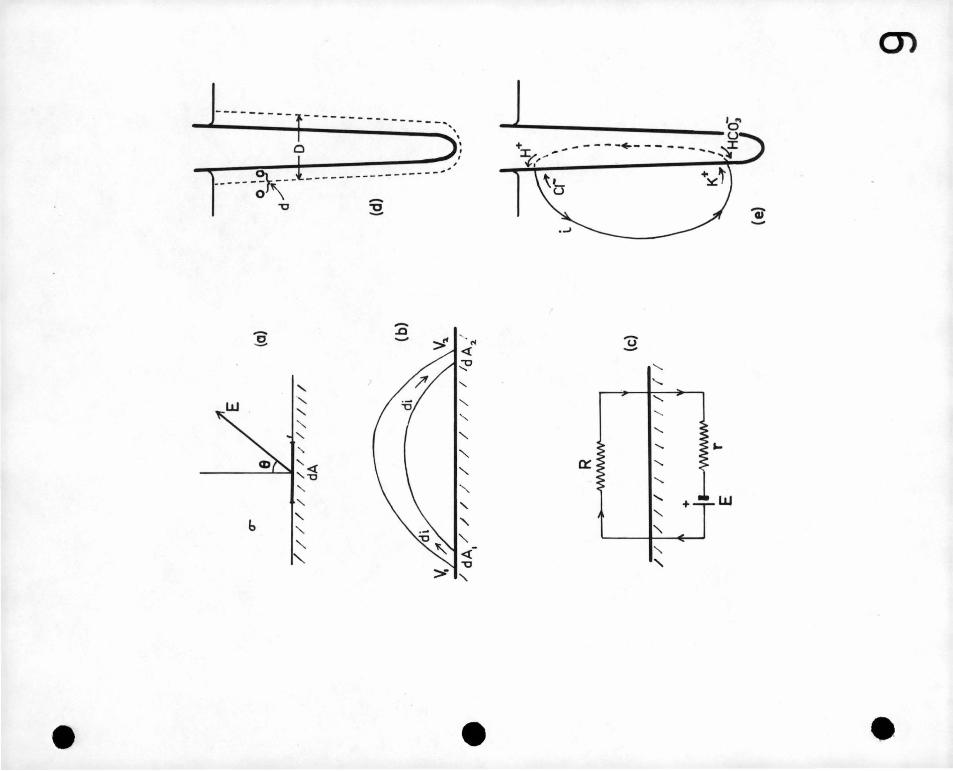
Consider an area d1L of a plant surface immersed in a mediufi of
conductivity Q (Figure 9a). If the electric field strength in
the medium adjacent to the area is E, in a direction inclined at
an angle 8 to the surfe.ce normal, the density j' of the electric·
current near the surface is given by
J :::oE
Thus the total current di passing through dA is given by.
di :::: JdA cos Q
:::: ' - (J Clv dA cir
.u .. (1)
where dv is the radial ;Jotential gradient (i.e. at right angles to, dr
and away from the surface of the root).
If the maximum potential gradient in the 9lane of dA is also
known, the direction of current flow may be obtained in addition. To
obtain the total current leaving the root the quantity - G Clv di'-.. is dr
integrated for all areas where dV is negative; and the total current CJr
entering the root is obtained by integrating tbe same quantity for areas
Dl .2.
-34
where .£:£ is positive. If the bean and bath are carefully insulated Clr
so that other current paths are eli.IJ.1inated, these two integrals must,
of course, be equal.
Consider now a cu:r:rent tube along which a_ current di is flowing
(Figure 9b). The current leaves the ?1ant surface through dA1
and re-enters it, through dA2. The potentials (relative tq an
arbitary origin) close to these areas are v1 and v2 respectively •
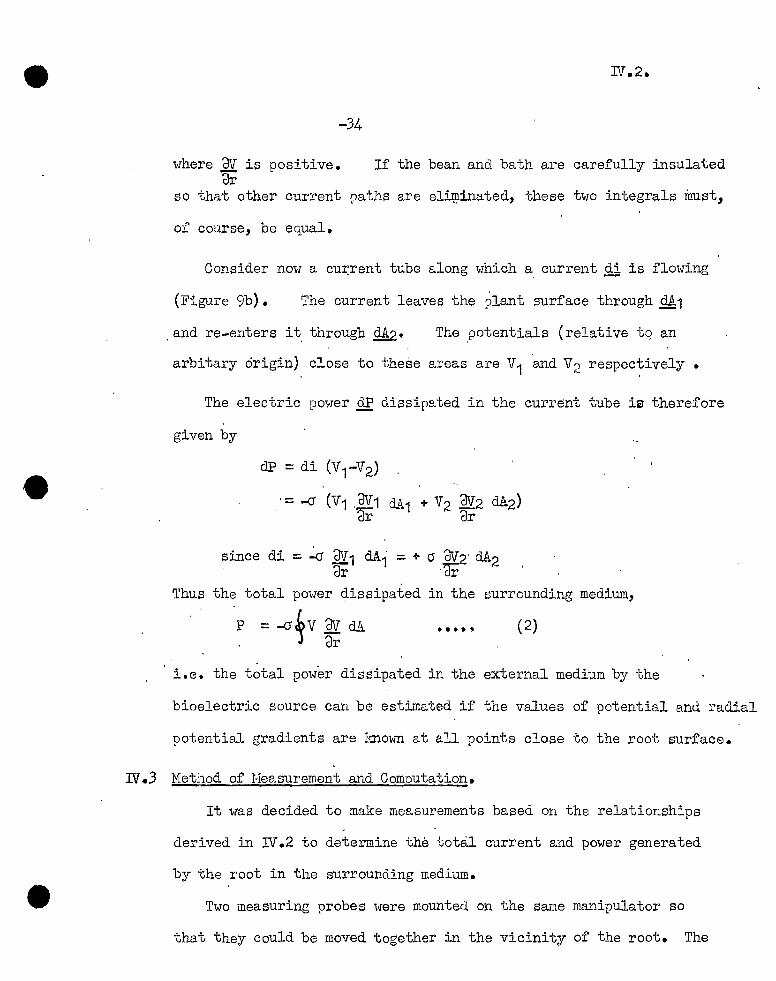
The electric power dP dissipated in the· current tube ig therefore
given by
Thus
dP =di (V1-V2)
_· = --0 {V1 -~r1 d.A1 + V2 Clv2 dA2) dr 'ar·
since di = --0 CJv1 dA · = + a ClV2· dA2 Clr 1 ·"cir -
the total power dissipated
P = -cr~V dV dA
in the surrounding medium,
.... ., (2) . Clr
i.e. the total power dissipated in the external medium by the
bioelectric source can be estimated if the values of potential and radial
potential gradients are known at all points close to the root surface.
J.V • .3 Met:iod of Measurement and Comoutation.
It was decided to make measurements based on the relationships
derived in IV.2 to determine the total current and power generated
by the root in the surrounding medium.
Two measuring probes were mounted on the same manipulator so
that they could be moved together in the vicinity of the root. The
':" ..
. . -.,.,-;:
~· : .... ':
I,..-,
\,
·'·
·' ',• r ~
.·· .. _,
·--. ,. , .... ::· 'l ',• ·' •• ,.-
' ' ' ·-·' - ,
~ . . ...... '
·-;' . ~- - . .
' - .
. ·:
.. . ' } '
'" '.:
,-
. ;.,, ..
"·':. _,, ' : .- ~ '- -.~ ; ' : . ,•.' " : - ... , - •'
" • '' .- ... ', (' ~~ ' l '
•I,.'•',', ','1
, .. '' ' .".. .. - .. -. ' . ~ ,,
','..,•,
.'. •, ·-·
'~·: , ' ~ ···,,,'
'··,
, ..
. /' , ..
•,
"'
,.,
· ... -. '• - '
'"
.. ,'. ·"
' ,• / ....
, ..
" -. " " '-' '• -" ~ - •,,'
'~ ,..: ...
... ' ',:,
.. t·'.•
. :'
') . . ..
,'', ,,
-. "·
, ... • '1 ,- \-.'
'"
'• ~, I
:
'.' ~
-· . I,~·:• '.' ~ ·:~~ - '•'
•, ',
' .. ~~ • l
,,' ,•,-.
, ! • ~. ·'' ' ' • -
~. . ' - '. ',, '_' ·:-,,_
' ,_ ,' ;
.. --. ' ' , . -
' ., '
',:".-' :' l ~ ' - -
- ~ .. .. ,.
.. - ,l
,. '
--· \
., ~ ' .
",
. ::-.. _ ., ,.
:· .-;:·:-;: :_ ·:._;_.::/ ",;.'. r ' ' /'
;:r,"
' ' -' ~ ... -.-.....
··,; ' -
' ~ ' ..... . ' . . :· ' ' ,
-- - ~ '·: ,,.
'' -, .
,•
/ '
'. ' . - ' ~ -- I'.'
.. . _/•
' ·' ,,_
'-,' -, -: '
',-
''
' ' \ ,•I ,, ·-''
----------"-----t------_-_-_-.:.-.:.-.:.-.:.-.:.-:-.:-.:.:'· \ 0
--- -- -~-- -_____ ...
------------o'~
-- ..c E. - ~
' ' " .......
' ...... '<t: '--u
' ' b ' .......
.......
" >-
' I ,
"' <{
.:0
' " ' ' .......
.......
.......
' ' ....... <{-
"O
"
___ J ----.'d' u
+ - - - - - -+ - - - - - ,:r. 7.,,. .... - - .... , ..... -4
-u -' " ' ' ' ' ... ' ' ......
+ UJ
" ' ' '
IV .3.
-35-
probe tips were a small constant distance apart , the line joining
them being always normal to the adjacent plant surface. (Figure 9d)
The plant was mounted on an insulated holder with only its root
immersed and could be rotated about the vertical axis of the root
so that .all ·sides of it could be measured. In other respects the
apparatus was the same as in section !rr.4. The temperature of
measurement throughout was 2~0c.
The probes were first moved along the root as close as possible
to its surface and the ?Otential y of the nearer one measured relative
to a distant point in the bath. The electrometer was then switched
to read the potential ~V between the tips,and the scanning was repeated.
Measurements of y and ~V were obtained on four sides of the root by
rotating it, and finally the first side was rechecked in order to find
whether the potential of the plant had changed significantly during
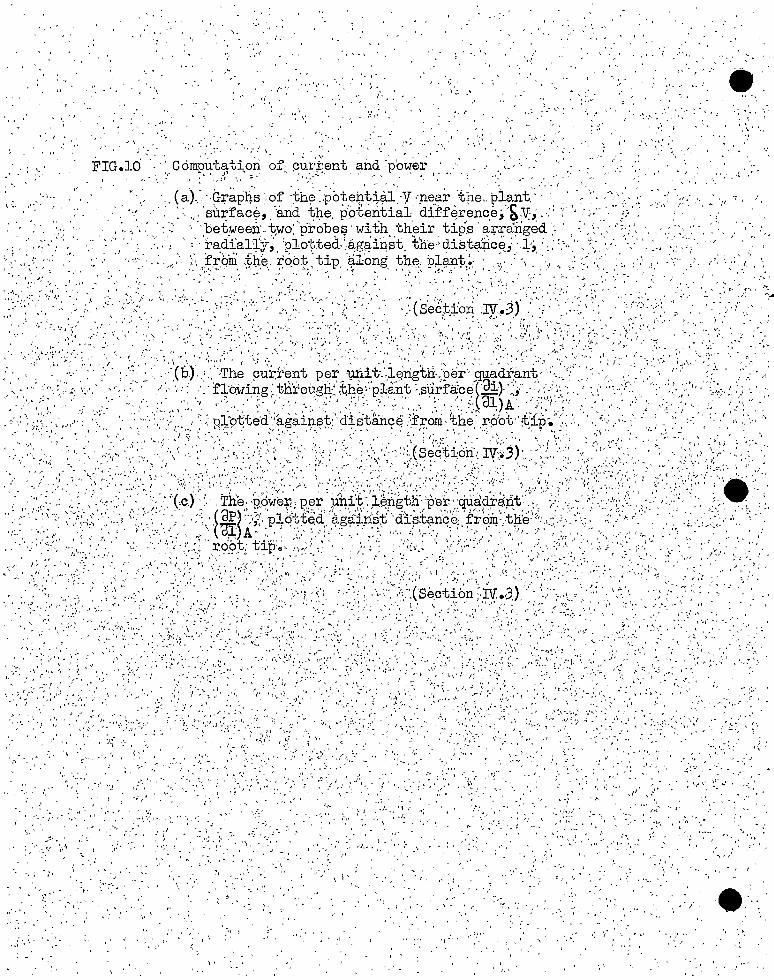
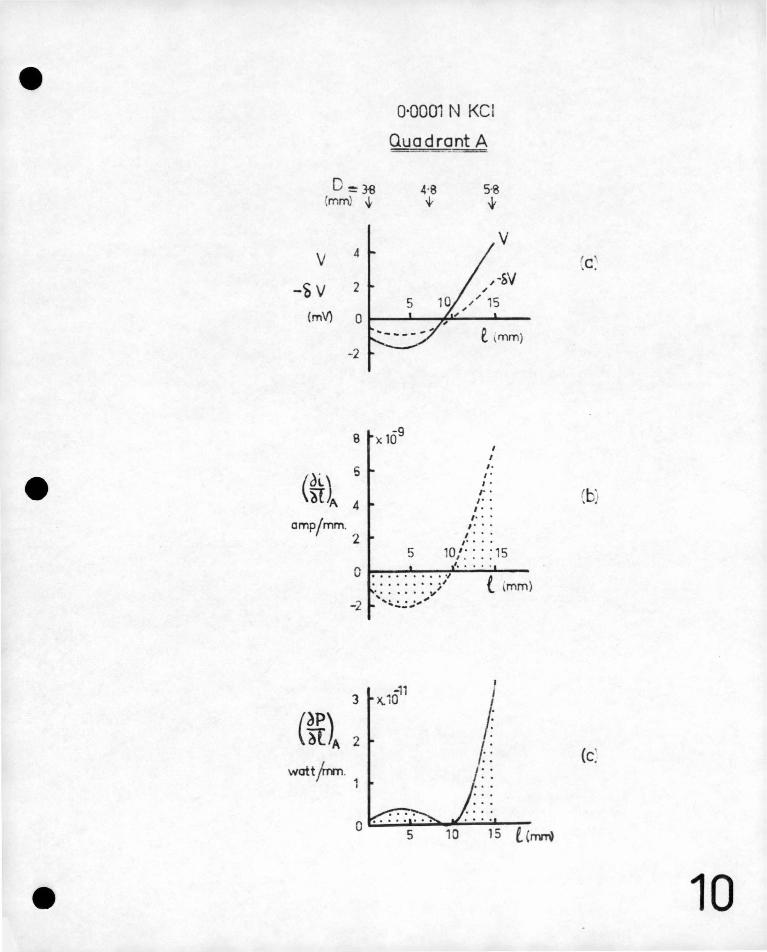
the period of measurement. Typical curves for y and Sv along one
side of the root are shown in figure lOa. Note that y and ~ are
zero in this case at about the same position on the plant indicating
that the zero equipotential surface is normal to the plant surface
at this point . This , however, is not always found to be tl:e case.
For the reasons given in section III.2, the measuring probes were
filled with the same solution as was in the bath. Because this was
frequently only weakly conducting the tips were made rather large in
diameter (0.5-0.7 mm) in order to keep their electric resistance
reasonably low and so avoid undue electric pick-Up in the measuring
circuit. The separation of the tip centres, g, was 1.5 to 2.0 mm.
IV .3.
-35-
p*'ob'e tips were a small constant distance apart, the lin~ joining
them being always normal to the adjacent plant surface. (Figu~e 9d)
The plant was mounted on an insulated· hold~r wi.th only its root
immersed an'd. could be r'otated· about the vertical axis of the· ro~t
so that all sides of it could be measured. In other.respects the ' .
apparatus 1~as the same as in section 'III.4. The temperature_ qf
measure;-nen:t . throughout was 2)°C.
The probes'were first moved along the r.oot as close as possible
to its surface and the potential V of the nearer one measured relative ' -
to a distall;t point in the bath. ';['he electrometer was then, switched
to read. ~he ~~tential ·~v betwe.en tl~e tips ,and ~he .~canning was repeat~d.
Me,~suremerits of y ·and· S~ were ob~~ined 'on four sides of the ro0t. by ..
rotating it, and finally-the first side was rechecked in order to find
whether the'. potential of. the ?lant had changed significantly during
. ~he period of measuremen~. . Typical curves for y and Sv along one
side of the root a1'e ·.shown in figure lOa. Note that y and h1 are
zero in -.this' case, _at about. 'the SE!Jlle.' pos,itio.n on the plant indic~ting ' . . -
that the, zero equip_otential su:r;fac'~ is normal to the plant surface
at this point. This, however, is riot always found to be tl:E case.
For the reasons given in sectio~ III.2, the measuri~g· probes wer~
filled with the same solution as was in the bath. · Because this was
frequently only weakly conducting the tips were made rather large .in
diameter (0•5-0.7 mm) in order to keep t~eir electric resistance
;easonably low and so avoid undue electric pick-up in th~ measuring
circuit. The separation of the tip centres, g, was 1.5 to 2.0 mm.
•, '
'',
IV .3.
-36-
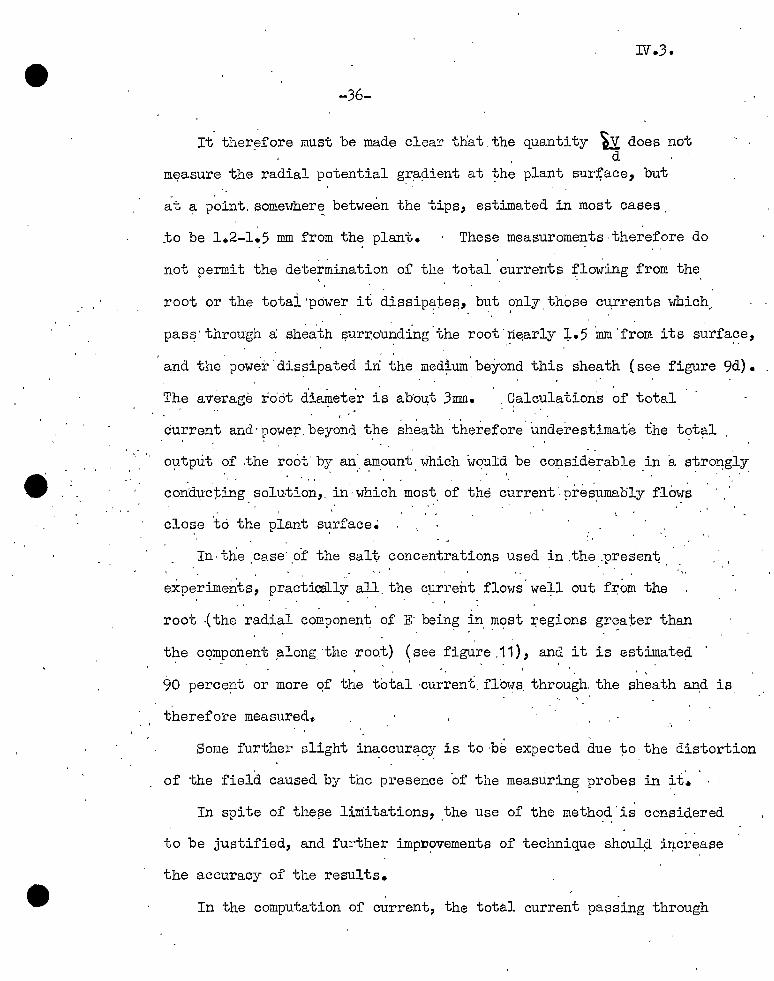
It ther~fore must be mad~ clear that.the quantity ~does not d
m~asure the radial potential gr~~ient at the plant sur~ace, but ' -
at a p~int. somewher~ between the tips, estimated in most cases.
to be 1.2-1~5 mm from th~ plant. These measurements.therefore do . '
not permit the determination of the total currents :flowing from the.
root or the totai ·power it dissipate~,· but ?nly. those C'll;rrents which,, ' . '
pas~· through a sh~a.th l?urrou~ciing 'the root· ri~arly i.5·. 'mm ·r;om its s~rface, . ,• '•
and the power.dissipated iri the med~um.beyond this sheath (see figure 9d).
The average ro'cit diaJ?.eter is abou,t 3mm. . ~alcula tion's of total
current and·powe~.beyond t~e sheath therefore.underestimate the total ' I - I
o~tput of .the root' by an'. ~ount which WC?Uld be COI,lSiderabf-e in a stro:qgly ' ' ' • I ' • J ' • • • ' '
con:dt;r~:ting solution,_ in'-which most. of the c~rrent: pres:umaoly f~o~s
clo~e to the plant surface~
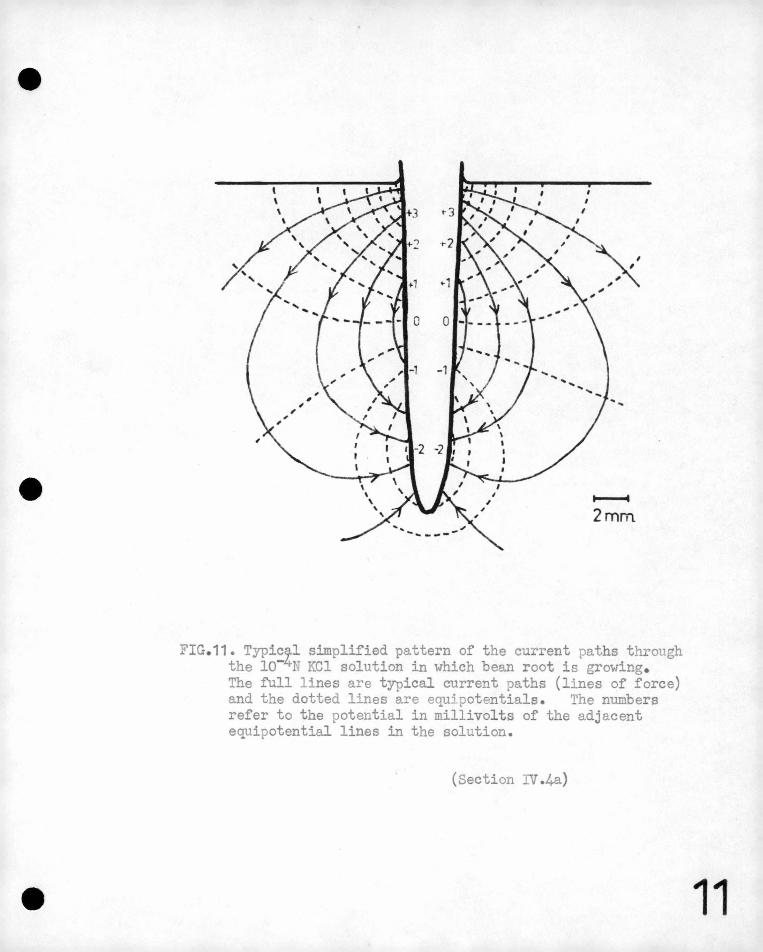
In· the :case· ,of the salt concentrations used ~n .the :presen~.
experime~ts, pr~ctically a~l_ the cµrrent flows' well out f~om the
root .(the :radial componen~ of E' being in most regions greater than ' ' . ' . . .
' . the cqmponent _alol;lg_ ·the ·roo.t} \see figure .11), and it is estimated
' '•
9o percent or more qf the total ·current. fl'ows_ through. the sheath al'.l:d is
therefore measurede
Some further slight in~ccur~c~ is. to ·be expected due to the distortion
of the field caused by the presence of the measuring probes in it~
In spite of the13e limitations, _the use of the method'is considered
to be justified, and further impD~vements of technique shoulµ increase
the.accuracy of the results.
In the computation of current, the totel current passing through
ic. ...-.
··. -- ; ' ' ... , ' ' \, \'"
·~' q ~.·~._:':' ~~-
:: ·. -"' - " \- J,•,
·'· -«' ' ..
~··' ,.
" • ... ,
"·
,•,
'-~ ·. " .
·•' .. ,
"
., . :- 1t',, - ' .,.
·.:
''"\''I'
' ''
'4•v ' .
,,, '
- .. '1"
·- ,•
"'
\ \ '-
:· _.-,.•, :''
,, ' - '~ , '
. .. ~'
~·-- - '-' "t," ...
,, ,• - '.,
' .. ·: '
' ',
,,,•']._, •,
"'
_,; I,-. .;. ....... , :-1_
-· •"'·~ - ' \ .~
"
"•
''
• :i
.,,
.. , " I•,~'
·, ~:
,'• ,• ....... )..· '·',
' ·~-
··1' -
'/: ',. - - /f ' :. ··:~·::' '
~ :-' -~- .. ' ~ : '"
"'
,,:.'
, .; . ·~ .
·,.
.,.
',•
-. : -
f•'
·-· .. '•
" '
'• ~ '
-.. -
:···· '.'
c,
·,:
•' •, ,•-,,,
' -::.
... ····-
; .
., ~ • I
' , '
. ',' ._
I ·~ "
...
i '
( 'J
".
/
' .... -, ·r··
' ·'
- > ':· ',•
t':
_a.· .... .,. '
., '"
D::w
0·0001 N KCI
Quadrant A =
4·8 {mm) -.!i -}
5·8 -lt
v -~ v
(mV)
4
2 5
0
-2
I I
I• I• I• ,. . ,. .
I • • , ... I• • •
I • • • , .... s 10/::::1s
0 ......... •/ ........ ;; ...... v
-2 '':...:._:.:.-""'
'· ... . { mm)
I /. t I.: . .
(c.
(b)
(c .
10
I
I
I
~
2mm
FIG.11. Typic~l simplified pattern of the current paths through the 10- N KCl solution in which bean root is growing. The full lines are tyPical current paths (lines of force) and the dotted lines are equipotentials . The numbers refer to the potential in millivolts of the adjacent equipotential lines in the solution.
(Section IV.4a)
11
e
-
e
N.,4
-38-
Although in other in~estigations external 'current paths h~ve
been largely eliminateq by having ·the root surface only slightly
moistened it is. not considered that this 'would cause the ~olarity
of the root to change. In fact preliminary ~xoeriments by the ' '
' ' '
author wi·th roots along which only a thin film of water was ruim:µig:
have shown rises :i,.n' the e:tj;e~~~~l pot~nti"'.-1 differenc'es and no •., ' '
suggestion of a reversal of polarity. Roots of different kinds
of plants might show a reversed polarity&· The only other material
measured by the author is the. Onion root and this has a pattern > '~ ; ' > t I ! ' \ I ' " I \ L '' ~ ' ! I \ I ! 11: ' \<. I 1': 1 : J )
very similar to that of the oean root. It seems urilikely that ~he· ,
plants used by other investigators (maize and wheat). would differ ' '
·.from this significantly., .. In the opinion' 'of the a,uthor the reversed
'readings of other,investigators have been due to unsatisfactory ' ' - ~
m~asuring procedures discussed previously (section II).
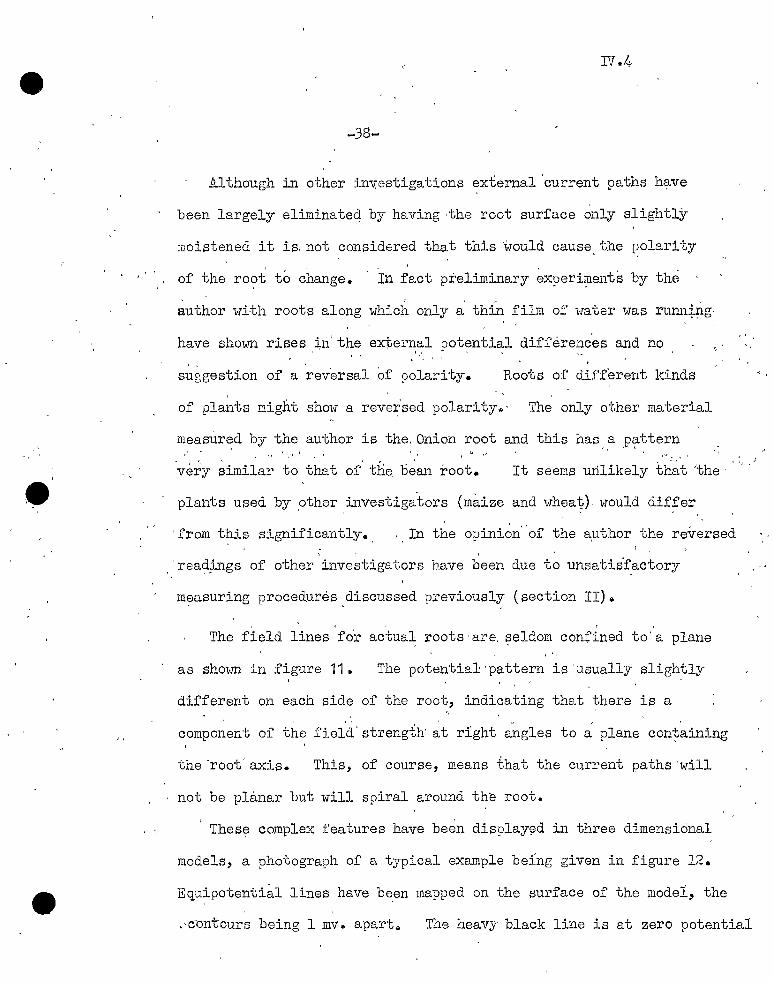
The field lines 'ro'r actual roots ·are. ~eldom confined to' a plane
as sho-vm in figure 11 ., The potential·pattern is ·usually slightly
different on each side of the root, indicating that there is a '·
component of the fi~l"i· strength' ~t right ~gles to ;_ plane cont-~ining
the ·root' axis. This, of course, means that the current paths'will
not be planar but will spiral around the root.
These complex features have been display\:)d in three diIIJ.ensional
models, a photograph of a typical example being given in figure 12.
Equipotential lines have b~en mapped on the surface of the mode1, the
,,c-ontours being 1 mv .. apart .. The heaV'J black line is at zero potential
e··
-39-
relative to a dis;tant point in the bath. The magnitude and
direction of the currents are represented by the length.and direction
of wires projecting from ,the model at typical points, the current
leaving through a circle, and. en~ering through a cross.
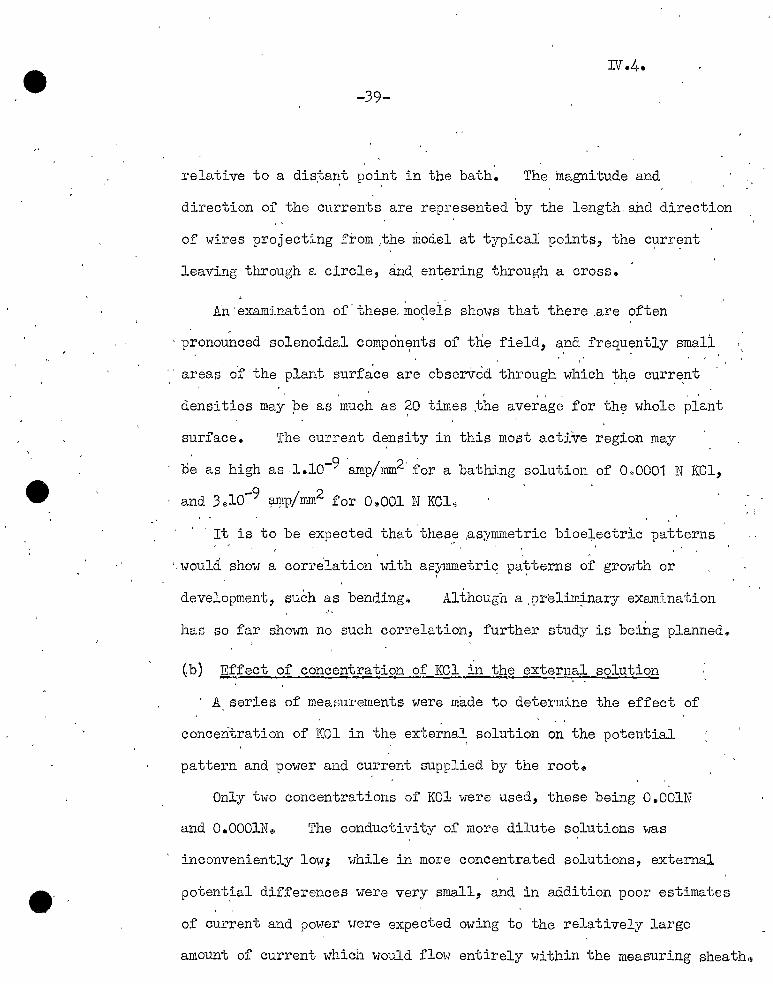
An·examination of' these.model~ shows that there .are often .,
· pronou~ced solenoidal comporn~mts of the field, a,na. frequ?ntly small
areas of the plant surf ~ce are obseri.red through which ~4e curr~nt .
densities may pe as much as ~O times ~he average for the whole plant
surface. The current d~nsity in this most active region may
o~ as high as-1.lo-9 -amp/mm2-for a bathing solution of 0~0001 N KCl,
and 3.,10-9 lill!lP/mm2 for 0.,001 N KCl.,
' · It is to be expected that thes.::i .asyimnetric bioe+ectrJ.c patterns
'.would show a corre'lation with asymmetric patterns of growth or ' - .
development, such as bending~ Although a,prelim~nary examination
has so far shovm no such correlation, further study is being planned~
(b) Effect of concentration of KCl in the external solution
A series of measur·ements were made to determine the effect of
concentration of KCl in the external solution on the potential
pattei·n and power and current supplied by the root0
Only two concentrations of KC1 were used, these being O.OOlN
and 0. ooou:r ® The conductivity of more dilute solutions was
inconveniently low; while in more concentrated solutions, external
potent~al differences were very small, and in addition poor estimates
of current and power uere expected owing to the relatively large
. :
amount of current which would flow entirely within the measuring sheath"'
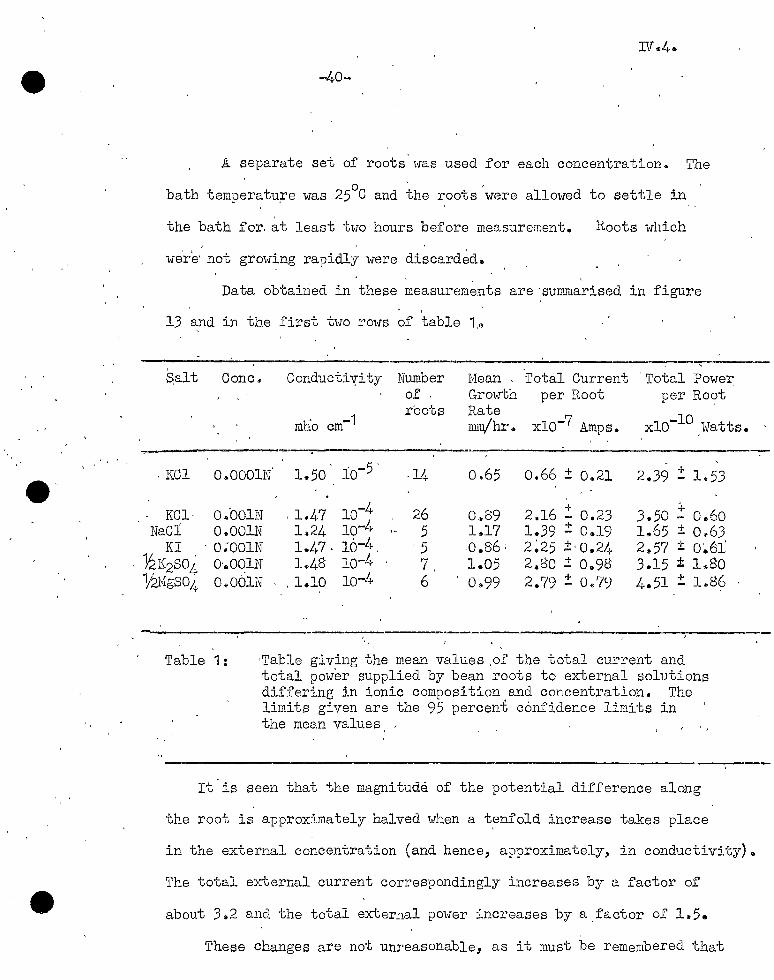
-40-
A separate set of roots was used for each concentration. The 0 ' ,
bath temperatu,re was 25 C and the ~oots were allowed to settle in
the bath for. at least two hours before measurement. Roots which
we're· not growing rapidly were discard~d.
Data obtained in these measurem~nts are ·summarised in figure
13 and in the first two rows of table 1,G
E\alt Cone.
. KCl 0-sOOOlN
KCl· 04001N NaCJ'. OoOOlN
KI - 0;001N °Y.2K2so4 o.oolN 1/2MgS04 O~OOlN
Conducti'l!ity
mlio cm-1
1.50
'1.47 L24 1.47' 1.,48
, 1.10
lo-4 lo-L• lo-L,. io-4 lo-4
Number or ' r-oots
-14
26 5
·5 7, 6
Mean , Growth Rate mrn/hr.
o.65
0~89 1.17 :0.86: 1.05 0 .. 99
Total Current per Root
xlo-7 Amps.
o.66 + 0,21
+ 2.16 - 0.23 1.39 .± 0.19 2~25 :J:. 0.24 2.80 + 0.98 2.79 2: 0<;79
'Total Powel'. per Ro?t
-10 xlO Watts.
+ 2.39 - 1.53
+ 3.50 - 0.60 1.65 ± Oe63 2,.57 ± 0~61 3.15 ± 1~80 4.51 :!: 188?
Table 1: ·Table giving the mean values .or the total current and total power supplied by bean roots to external solutions differing in ionic composition and concentration. The limits given are the 95 perceni confidence limits in the mean values
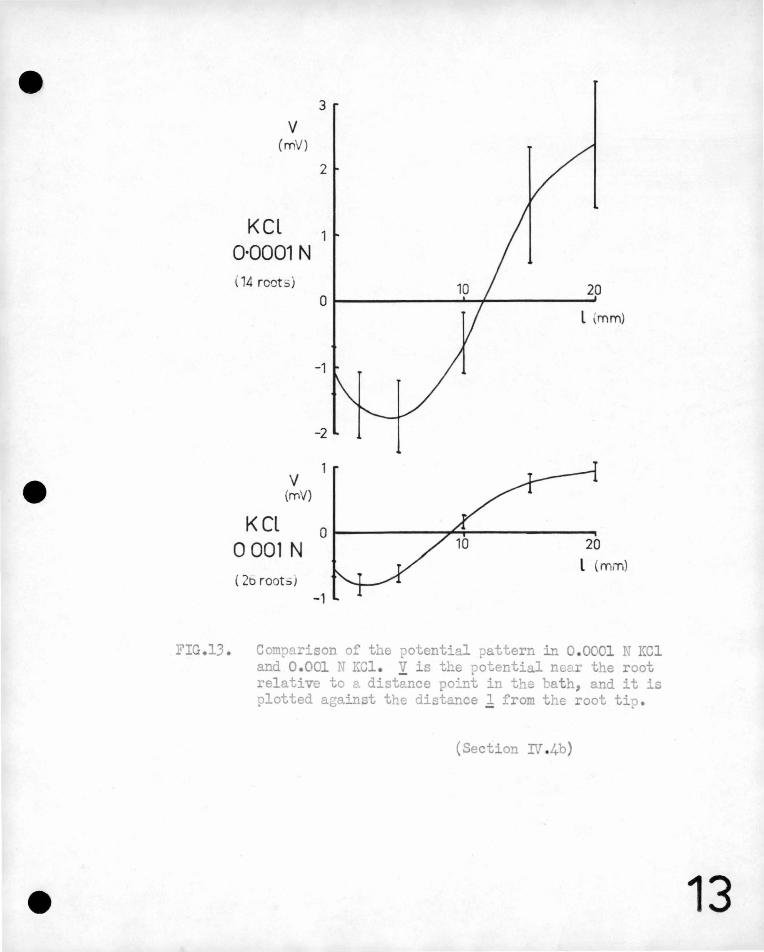
It is seen that the magnitude of the potential difference along
the root is approximately halved when a t~nfold increase takes place
in the external concentration (and hence, a~proximately, in conductivity).
The total external current correspondingly increases by a factor of
about 3"2 and the total external power increases by a.factor of 1~5.
These changes are not unreasonable, as it must be remembered that
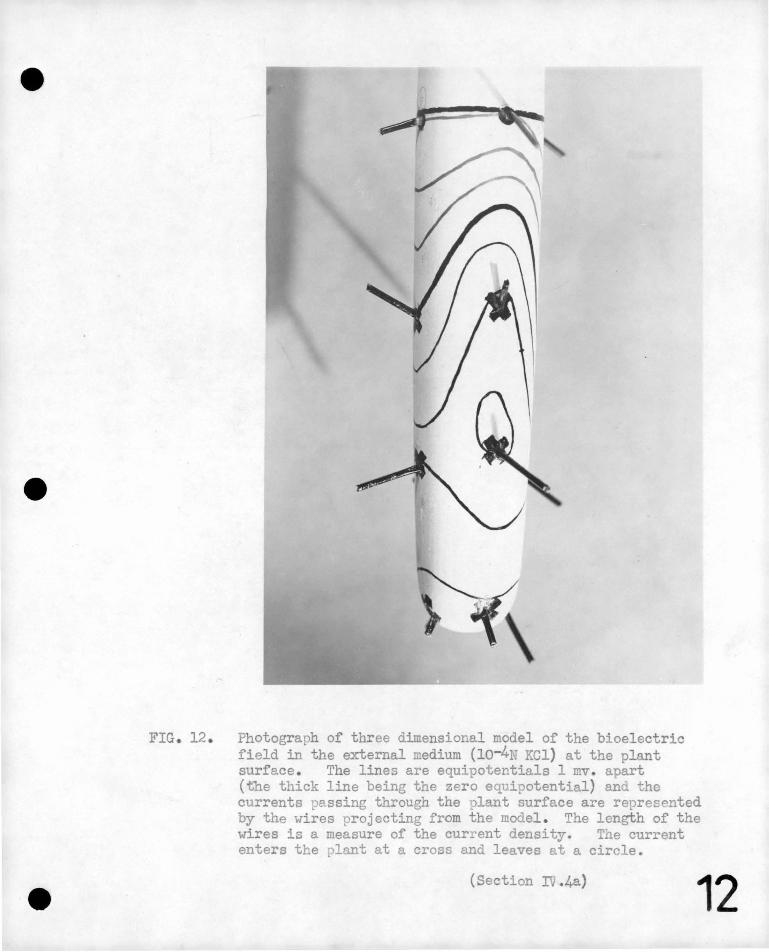
FIG. 12 . Photograph of three dimensional model of the bioelectric field in the external medium (10-4N KCl) at the plant surface . The lines are equipotentials 1 mv . apart (tbe thick line being the zero equipotential) and the currents passing through the plant surface are represented by the wires projecting from the model . The length of the wires is a measure of the current density. Tne current enters the plant at a cross and leaves at a circle.
(Section IV .4a) 12
v (mV)
KCL 0·0001 N ( 14 root ;)
v (rnV)
KCL 0 001 N ( 2o root:>)
3
2
20
l \mm)
-1
-2
0 20
l (mm)
-1
FIG .13 . Comparison of the potential pattern in 0 .0001 N KCl and 0. 001 N KCl . y is the potential near the root relative to a distance point in the ~ath, and it is plotted against the distance 1 from the root tip.
{Section rf 4b)
13
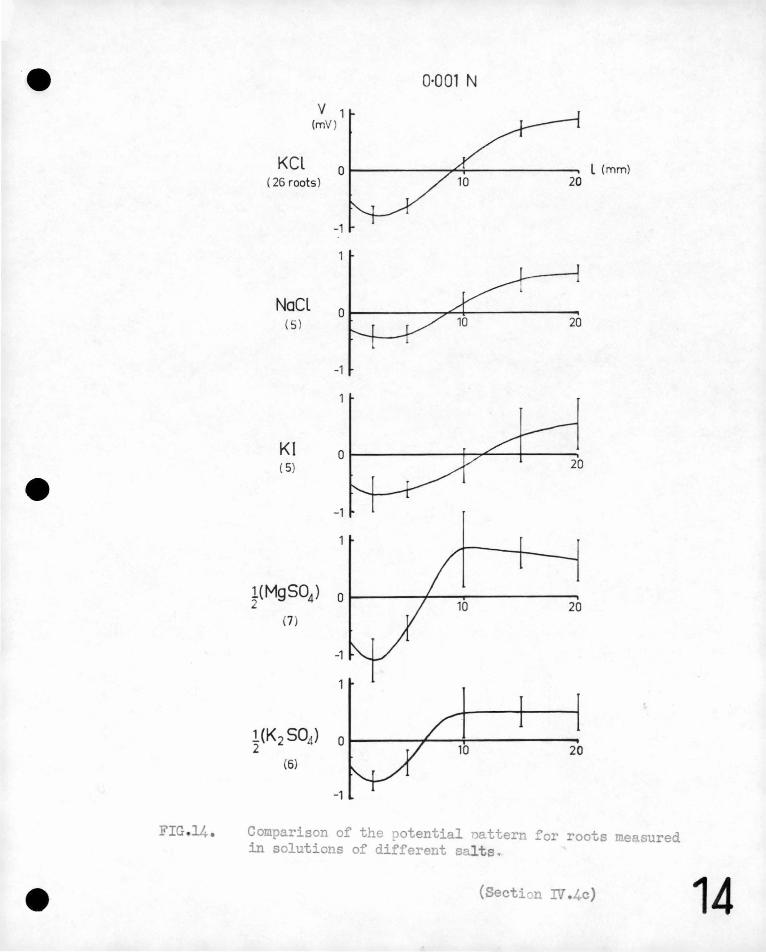
FIG 14.
KCL
v 1 (mV )
( 26 roots)
NaCl ( 5)
Kl (5)
-1
-1
0·001 N
l (mm)
~(K 2 S0.1) o 1-----r---t-------:-20
(6)
-1
Comparison of the potential nattern for roots measured in solutions of different salts .
(Section IV .4c) 14
••
•
•
rv ,.4,.
-41-
the currents are flowing in closed loops through the external medium
and returning along paths ~nside the plant. In these exp~rimen~~
only the properties 9f th~ external path are ~eing changed ap9reciably~
If it is' 9ermitted,to represent the curren~ path by a ~imple 1oop
(fieure>96) and to 'assume that a tenfold concentration cha.~ge in
the external solution causes a tenfold ~esistance change in the
external circuit, but .no change.either in the ~nternal resistance
! or the. e.fff3ctive e .nLf. ~' it is possible to calcl).late values of
E 'and r using the mes;sured values of external· currents and powers. ' ''
If' this is done, Eis found to be about 5.6 mv, and r is 19,000 ~hms
which is intermediate between the values of the effeetive external
resistance for the two concentrations~ "'
" The nower dissipated viithin the root is about 5. io-11 '-in the. J. ' ,t
case of 0.0001 N KCl, and 9~ lo-10 in the case of ~.001 N KCl.·
How~ver, it must be pointed out that the f!;bove ~ientioned
assumptions. considerably over~simplify the problem and it is
doubtful whether calculations based on' them 'have any r'eal signil'i~ance.
(c) Effect of various ions in the external medium.
A series of experiments has been performed to test'the effect
of different ions in th.e •external solution on the poten~ial pattern and
the power and current supplied to the external medium. The results
are summa~ised in figure 14 and table 1~
The external concentration was in each case O.OOlH.
In the case of divalent ions the mols..rity was 0.0005 M so that
the conductivities of the external solution were all approximately the
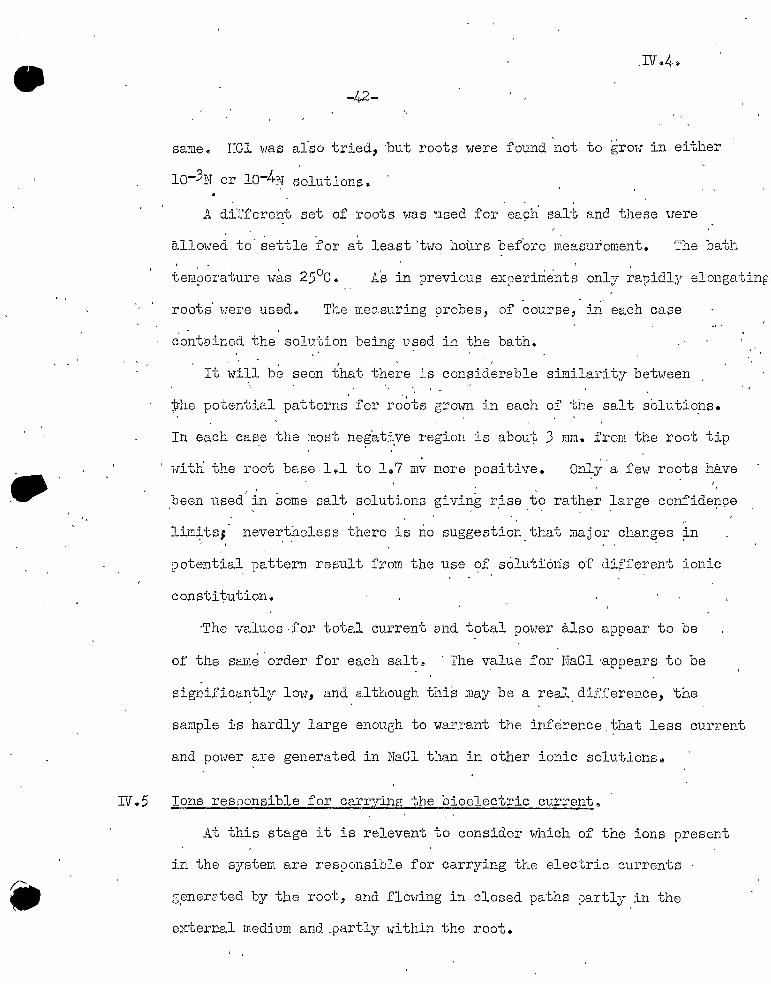
•
•
-42-
same. HCl was also tried, ·but roots were found not to grow in either
lo-3N or lo-4N solutlons,
A diTferent set of r0ots was used for each salt and these uere ' -
allowed to- settle for at least 'two hours before measurement. The bath
tem9~rature was 25°c. .A's in prev:Lous experiments only ~apidl;T elongatine
roots' were used. The measuring probes, of course, in' each case
contained the sohri::ion being u~ed i.o. the bath. ,
It will be seen that there ls considerable similarity between ~, \ -
yhe potenti2.l patterns' for r~ots grown in each of the salt solutions.
In each case the most negative region is about 3 ~mn .. from the root tip - ' '
'' with the root base.Ll to 1.7 mv more positive. On~y a few roots .have
" I ' ,
been used in some salt solutions giving rise to rather large confide~~e ' ' ~ '
liP.l+:ts; nevertheless there is no suggestion that major changes in
potentia~ pattern result from the use of solutions of different ionic
.constitution.
·The values -for total current end total pqwer also appear to be
of the same 'order for each salt., - The v~lue for NaCl ·appears to be
significa~tly low, and although this may be a real, difference, 'the
sample 1s hardly large enough to war;cant the inference, that less current
and power are generated in NaCl than in other ionic solutlonse
IV .. 5 Ions resoonsible for carrying the bioelectric current~
At this stage it is relevent to consider which of the ions present
in the system are res9onsible for carrying the electric currents
g,enersted by the root, and flowing in closed paths ,)artl;y in the
external medjum and.partly within the root.
•
•
•
DJ ,.5 •
-43-
In the external medium, the mobilities of all ions used in the
p1·esent series of experiments are of the same c;:irder~ hence
approximately half the external current is ear~1ed, by the anions and ' '· ' .
half by the cations. Cations migrate·in the external medium from
the' vicini~y of mature parts .of the root .to the ,rapidly' elongating
:cegion ··iJhere the potential is ~ost :i;iegative·, and anions in th.e reverse
dir'ection. Had H+ or OH- been present in the external solution in
appreciable concentrations, ·these ions would have carried a proportione.lly
higher ,fraction' .of th~ purrent because of their much, high mobilities~
The situation 'is diffe~ent across the root surface. Here the
relative concentrations of the ions are not'the same as those in the
external Solution, a~d their JilObilfbies ·in the ·extern~l membrane S
:thro~-&h which the current ·must flow are likely .to be very different
.from their values in free solution, and to differ greatly from ion
to ion .. . .
Unfortunatel~.there does not appear to be much reliable
in.formation about th~ movell!ent of ions within.plant tissue under the
action of ele6tric forces& Osterhout (1936) a~d Blinks (1949) working
with large algal cells, and Hop~ (1951).working with roots have made
estimates of the relative mobilities of various ions in membranes by
obser:ving the changes in potential between the plant and external
solution which occur when the salt c;:oncentration in the external
solution is changed suddenly~
These calculations are made on the essuinption that the sim~le.
•
-44-
Nernst i;iquation. for diffusion potentials is appli~ab.le. For examule ·' . ·Bljnks (19~-9) gives ,the following values for the ionic mobilities in
the oute1· membrane of Halicvstis relative· to Cl-. taken as unity: -
u ++ 1'0 .L''lg ., • /; Na+ 0.-2;.
Hope .(1951) .estimated that K+ was about three 'times more mobile' than
·c1- in the outer surface of 1;>ean root,.
However, it is not now ~onsidered by most investigators that
the observed -potential change~ a~e. ~ue solely to diffusion .processes~···
The presence of iIPJnobiie ·anions in the out'~i: m~mbra~es almo'st certainly
'"'gives rise to Dori.nan potentials across the external boundary a?d these ' . (
afe also .functions of the ionic concentration 'of the ext~rnal :solution. . ..
(,Teorell .(1935), Briggs and R~bertson. (1948), Hope. (1953) ) -' '
' '
Thus' .the relative mobil~ties quote'd above may qe far from correct.
However the Donnan eqµilibrium does not discriminate between ve,rious . .
anions~or between various cations, so that the large difference betueen ' I ' ' ' I ~ '
'• "
the v~~u~s quoted by Blinks '(1949) for K+ and Ha+ and for C:[.- ;and (so4)•- .
in the case of Halicystis are likelJ'." to be real.
T;h.e 'pres'ent investigation has shown that the external electric
field,and the total current generated by the.roo~ apparently do not ''
depend on th~ nature of the ions present ~n the -external s.olution, provided
that the normality is not c~.nged. In:view of the high probability
that the ions investigated would differ greatly in their mobilities
within the root membranes, it is therefore sug'gested that 'none of then~
play a major part in carr:ying tlie electric current in or out of the root.
The most likely ions within the root ·uhich could CB.rry the bioelectric
•
•
-45-
current are those derived directly.from respiration. StaTch
a_-r1d suga1·s are oxidised continously >li thin the tissue with the
liberation of carbon dioxide, largely in the form of H+ and
Kos3rchev (1927) states that the amount of
co2 liberated 9er day by roots is equal to about 10 percent of their
ueighte
These ions are likely to pass through plant membranes more
readily than other ions present, and are therefore likely to carry
the bulk of the current to the external solution.
The follmring description of the current-carrying process is
therefore postulated (see figure 9e)
When an electric·field is set up within and around a root
(i) in the external solution cations (say K+) move to the more
negative region outside the plant, while anions (say Cl-) move
to the more positive region.
(ii) H+ ions move in the direction of the return current nath
within the root and emerge from the root in the more positive part
of the external solution. Hco3- (or co3
• -,) ions move in the reverse
direction within the root and emerge into the more negative external
region.
If this is the case, and the external solution were prevented
from mixing it would be exi)ec ted that the external region with
a positive ?otential uould become more acid, and the region with
a negative potential would become more alkaline. A simple test
uith litmus failed to show this, which is to be expected as any
effect would be swamped by a general outflow of H2co3 from the root.
•
•
~46-
The movements of ions carrying the electric current should
of course, not be confused with ionic.movements due to salt
accumulatio~ which may be taking place at the same time•
N.6, The Amount of Electric Power generated compared uith the Total Amount
available from Respiratory Processes.
It ;is of interest t'o compare the amount of electi·ic power
.generated py the .root with the total amount being released by
;r,espirat_ory _proc.esses within the_ root.
· For 'the case of a root gr~i.[ing. in 0 .ooi N KCl it was . estimated
' ·.,earlier .. ( secti.on :IV .4br that 3 .io-1? watts .of. electri~ po~rer is · ' ' - ''
dissipated ·fu-t)'.l.e external .medium. and perhaps another 9.10·-~o watts
within the root.
Doyer (1915) made an estimate of the energy released in res~iration
based ~n the al:n.ou~t of 002 liberated b~ young ~heat rootlets. ·H~·assumed
that the co2 had arisen from the complete decomposition of starch,
~ccording to the equation •,•
On this b:::,sis he ca;t.cula ted the total energy released as· apopt
6 .1o3 cal/hr/kgm. of roots which corresponds to a· total power .o~
7 .10-3 watt/ gm. This is likely to be the \lpper limit of newer , 4 L ,
production and wciuld be. less if the starch were not completely broken
down •
He also measured directly the rate of liberation of heat energy
by the· roots. This was about 3 .10-3 watts/ gm.
•·
•
-47-
If these results also apply·for bean roots, a tyPical root (20 mm
long, 3 mm diam) would liberate a maximum of l .. lo-3 watts through
'respiration, about 4elo-4 watts of this being the form of· heat~ Most
~f the difference would be used in metabolism9
Thu·s it is seen that only about one millionth of the total energy
produced in the' root by, respiratory processes is used to cause a current
to fl'ow through a circuit partly in the external medium. In this ' ' l '
estimate~ current circuits wholly'withil'l; the root have not been taken
into acc'ount.
" It 'is·; of course, true tl;lat electric forces are doing work across·
membr~eS· 'of individual cells associated·' with salt accumulation, and· the > I ~ < - I
ei;iergies associated with these may be considerable. However, they . ' are. not'·the primary concern of this research.· It is c,oncerned with
the electric fields a.ssociated with aggregates of cells and the' ·
possible role of ~hes,e .field's in establ'ishing a pattern for the future
develop~18nt of the system·.,
It might be argued that the electric energy would have little bearing ·
on the development· of the root, 'being 'so small a. p~.rt of the .total ·.'
energy of the root. Although this :i:µay be so it should be borne in
mind that this form of energy has special properties wh~ch make it
convenient for communication and pattern for~ation~ The oscillatoi'Y
and wave-like behavior of the electric field described in section V suggest
special features' of this kinde
Ii' the electric field controls development, considerable power
•
• '''
- "
. '
•
rv.6®
-48-
p.mplification is, necessary. This could be availcble if the electric
fie~d controls the IlJ.OVement 'o;f.' the plane ho~o~e ·~auxi:1) 1'minut~ ·- .
_ quantiti~s of which are capable of causing considerable' changes in
a ple:nt ~ystem, ,,
! ,• ~
'' ~~~ ' 1
, J
•7 '•
' "
'"
:• . ' '"~'~
. '
''
••
•
-49-
V. RHYTIDvIIC OSCILLA'.!:'IOI~ OF THE ELECTRIC Pi.TTEHN GENERATED
BY A BEAN ROOT GROWING IN WATER AND A POSSIBLE
FEEDBACK 11ECHANISM RES?ONSIBLE FOR IT.
V .. 1 Introductory Discussion
v .. 1.
In sections II and III a new method of measuring the bioelectric
fields generated.by plant roots was described (see also Scott, McAulay ' '
and Jeyes, 1955). A root was'grown vertically in a·bath of water
made weakly conducting with KCl. Potential differences were then
observed between points in the water adjacent to the root due to
electric cu~rents·generated by the root and flowing through the water.
This method was claimed to be an improvement on.those employed
in previous invest.igations. · Inter .ference with the normal growth
of the root by the measuring process was avoided, leading to.r~sults
which app'eared to be morf3 c'onsiste~t than those reported previously.
In earlier sections the steady electric pattern generated by a normal,
growing root'was dE!scribed." A more detailed study of this paitern
has shown that'l..1-nder some circumstances large 9eriodic fluctuations
in the' electric potentials are generated (Mcf ... ulay and Scott, 1954) 3
These oscillations are superimpos~d on the st~ady or background
pattern. They are sinusoidal in form and have periods of the order
of five minutes, amplitudes of a few millivolts and may persist
f0r several hours.
The observed oscillatory pat~ern and the conditions under which
it is generated wil:\. be described in detail in section Vo3 ..
Study of these variations in electric' pattern has been made practicable
by the construction in this laboratory.of apparatus which automatically
•
•
-50-
measures and records at frequent intervals electric potential
differences between a number of points in the bath adjacent
to the root. This apparatus will be described in section V-e2.
A new apparatus for measuring and recording the rate ?f
elongation. of a root simultan~ously with the measurement of its
electric potential pattern is also described in section V.2. This
, apparatus was constructed in order to discover whether rhyt~..mic
oscillations of 'rate of growth accompanied the electric oscillations~
Ooservations made.with this equipment.are described in section 'v$3d.
The observation of rhythmic changes in the electric field of
roots has raised the general question of the cause of these and
similar oscillatory phenomena-associated with biolog~cal material
which do not appear to be related to any corresponqing oscillatory·
changes in the environment. · Possible ~echanisms for the generation
.of such oscillations will be' discussed· in section v,,4 and in- particular ''
a possible source of the electric oscillations described in this
paper will be suggested.
V.2 Auparatus and Materials~
(a) Automatic Apparatus for Measuring and Recording Potential Differences between a Number of Points near Plant Roots grown in Water.
The a?paratus used for automatically recording bioelectric
potential differences near bean ro.ots growing in weakly
conducting water is shown in figure 15. 'A schematic
diagram is given in figure 16 .. ·
The basic recording instrument used was a Cambridge six
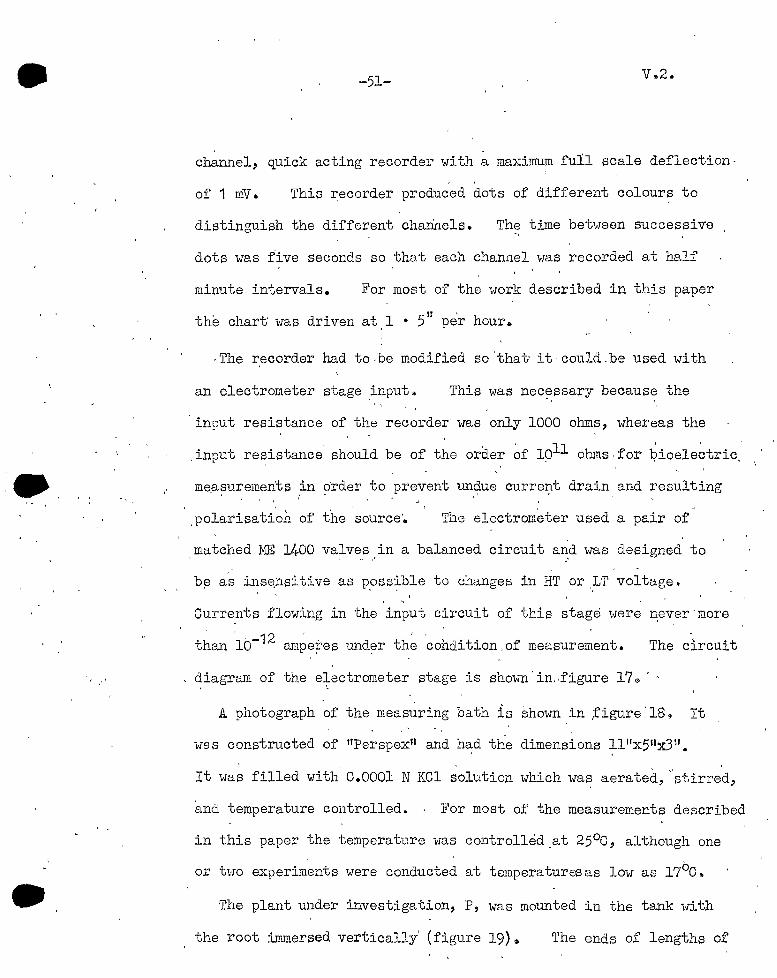
•
•
-51-
channel, quick acting recorder with a maximum full scale deflection-
of 1 mV. This r.ecorder produced dots of different colour~ to
distinguish the different channels. The time between successive
dots was five seconds so that each channel was recorded at half
minute intervals. For most of the work described in this paper II ,
the chart' was driven at 1 • 5 per hour •
. The recorder had to . be modified so·· that· it · could -be used with
an electrometer stage .input* This was nec~ssary becaus~ the
input resistance of the recorder· was only 1000 ohms, whereas the
.input resistance' should be of the order ~f 1911 ohms.for ~ioele~tric .
me.asurements in 6rder to prevent undue current drain and resulting
. polarisation of the source·. The electrom'eter used a pair of
matched ME 1400 valves in a balanced circuit and was designed to - "
b~ a's inse,nsitive as p_oss~ble to changes in HT or .,LT voltage.
Currents flowing in the input circuit of this stage were never·more
than '10-12 ampetes und~r the condition.of measurement. The circuit
diagram of the e+ectrometer stage is shown· in .. figure 17,. ' -
A photograph of the measuring bath is shmm in .figure. 18. It
was constructed of 11Perspex11 and hB;d the dimensions ll"x511:iLJ 11 •
' '
It was filled with 0.0001 N KCl solution which wa~ aerated, "stirred,
and temperature controlled. For most of the measurements described
in this paper the temperature was controlled_at 25°c, although one
or two experiments were conducted at temperaturesas low as 17°0@
The plant under investigation, P, was mounted in the tank with
the root immersed vertically' (figure 19). The ends of lengths of
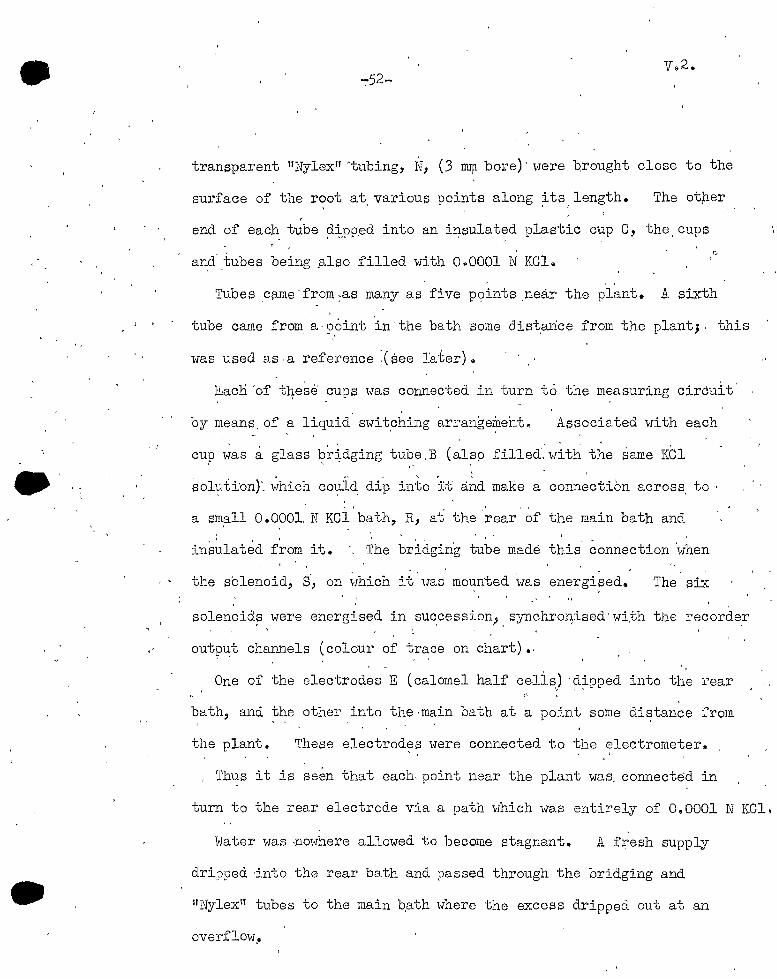
-
•
•
v.2. ""."52-
transparent 11 Nylex11 ·tubing, N, (3 mrp. bore)' were "Qrought close to the
surface of the root at various points along its length. < I I J
The ot):ler •'
end of each tube ?-~.PfJ.ed into an i:q.sulated plastic cup C, the. cups
al'l:cf :tubes being .also filled with 0 .0001 l~ KCL. r.
Tubes ,c0me·from:as many as five p9i11ts ,near the plant. A sixth
tube came from.· a-p.oint 'in 'the bath ·some dist,arice from the plant;. this
was used as.a·reference :(see Iater)~
Each 'of these cups was connected in turn to the measuring circuit
by means.of a liquid, switching arrangement. Associated with each ' ' '
cup WC!-S a glass ~ridging tube' B ( alsp filled'.' with the same KCl
sohtti'on)'_ 1r~hich co~1i~ dip into 'r:t and make a connection across, to '
a small O~OOOl. N KCl bath, R, at the 'rear of the main bath and
insulated f~om it. " The bridging tube made this- ~onnection 'when
the solenoid, S, on which it· uas mounted ~ms energi,sed. The- si..x
solenoids were energised in succession, synchronised· wi,th the recorder - ' ' ' ,.
output channels (colour of trace on chart) •. ' '
One of the electrodes E (calomel half cells) 'dipped into the rear ·~ ' \
bath, and the other into the·main bath at a point some distance from
the plant. These electrodes were connected to the electrometer~
, Thus it is seen that each. point near the plant was, connected in
turn to the rear electrode via a path which was entirely of 0.0001 N KCL
Water was -nowhere allowed to become stagnant. .A f:i;esh supply
dri~ped ·into.the rear bath and passed through the bridging and
11Nylex11 tubes to the main b,ath where the excess dripped out at an
overflow .•
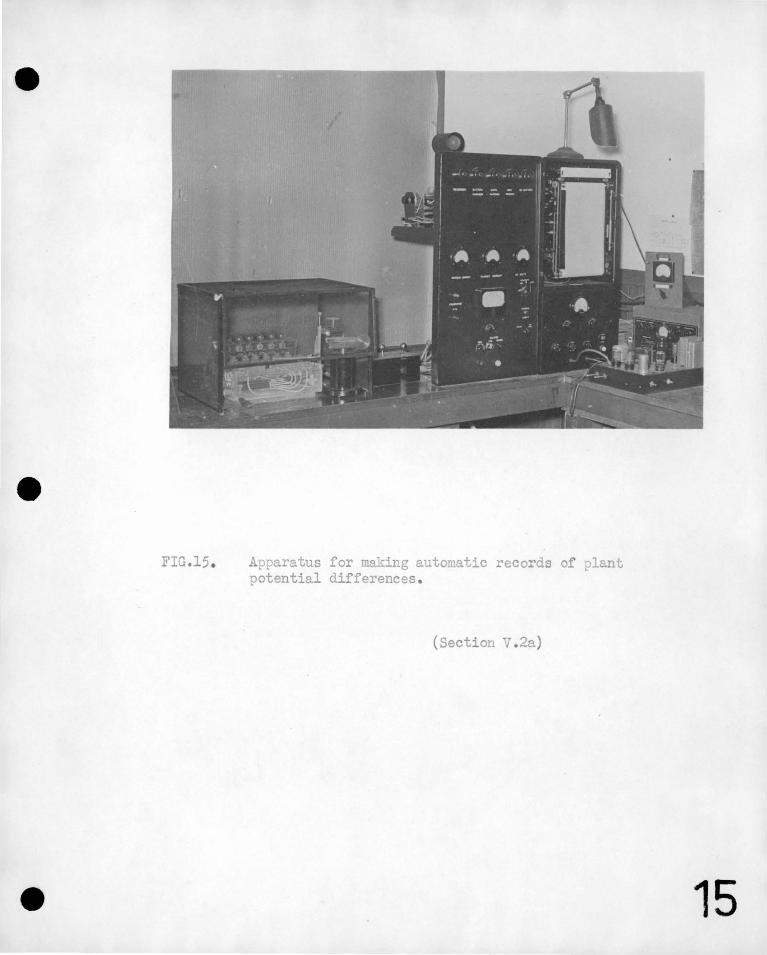
FIG.15. Apparatus for making automatic records of plant potential differences .
(Section V.2a)
15
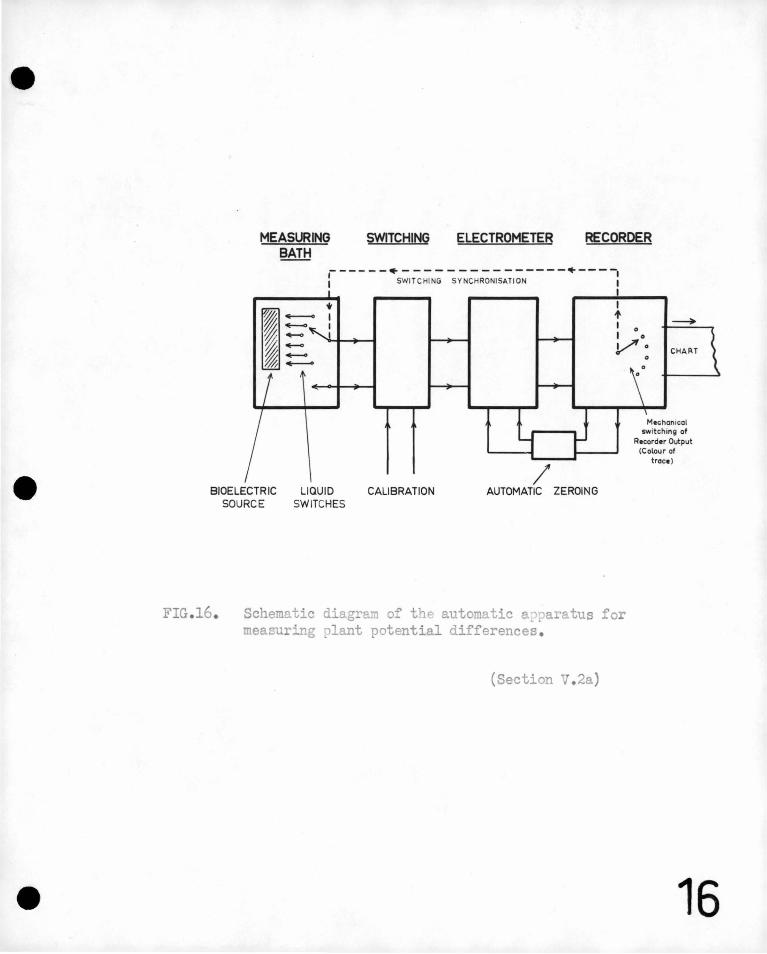
MEASURING BATH
SWITCHING ELECTROMETER RECORDER
-- ----~----- -- --------~---, : SWITCHI NG SYNCH RONI SAT I ON I
+ -· -- I I --
/
I I + I o I o J../'o
0
0
•
CHART
Mt:chonical switching of
Recorder Output (Colour of
t roco )
BIOELECTR IC LIQUID CALIBRATION AUTOMATIC ZEROIN G
FIG.16.
SOURCE SWITCHES
Schematic diagram o~ the automatic a.pa atus for measuring plant potential differences .
(Section V. 2a)
16
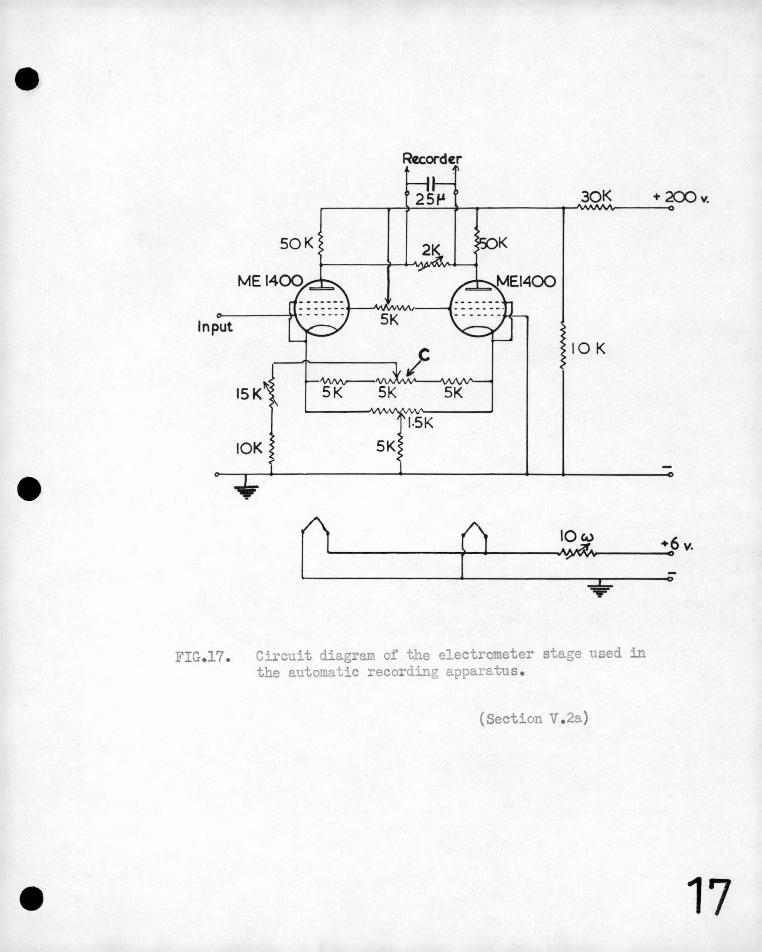
Recorder
30K + 2CX)v.
SOK
Input
IOK
(') p IOw • 6 v.
L-~_...______...~-;
FIG.17. Circuit diagram of the electrometer stage used in the automatic recording apparatus .
(Section V . 2a)
17
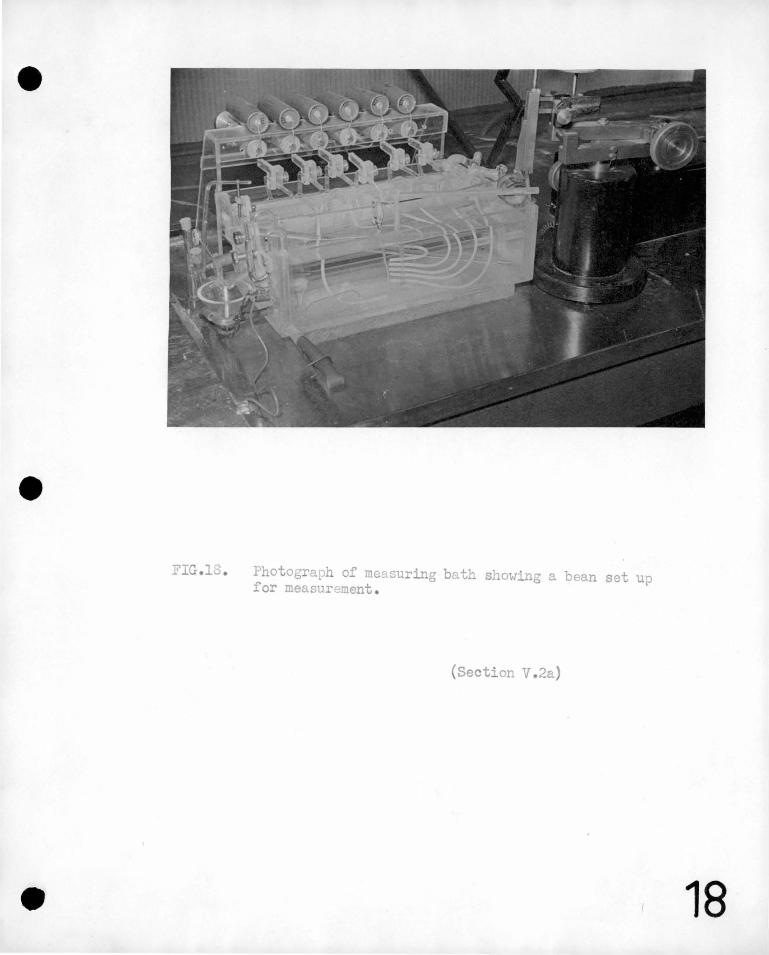
FIG.l • Photograph of me~suring bath showing a bean set up for measurement .
(Section V.2a)
18
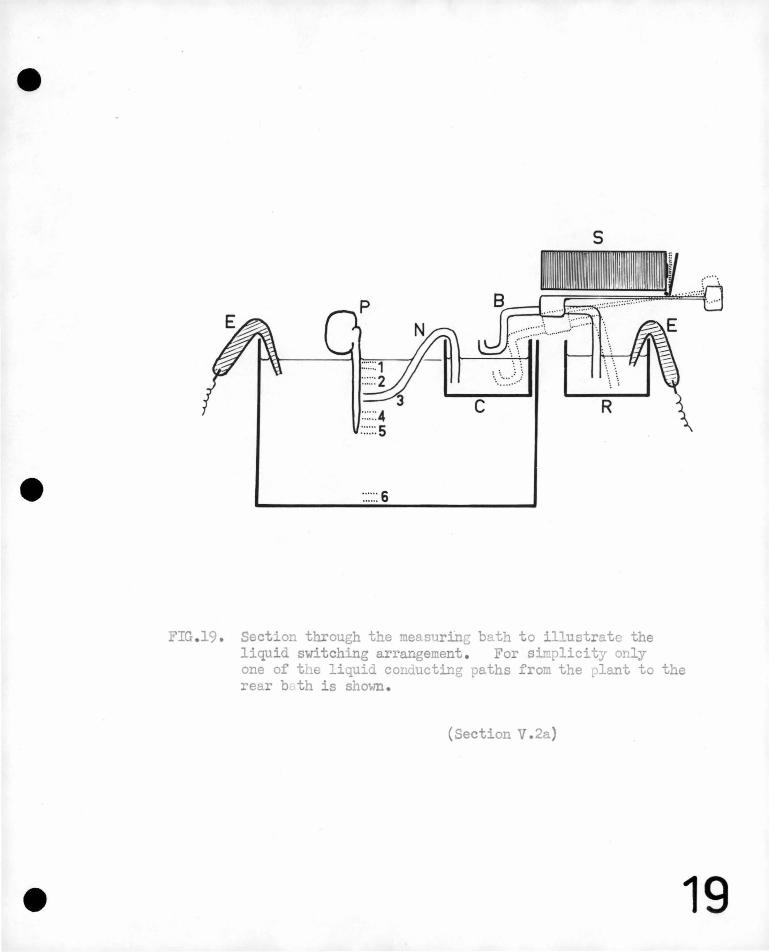
s
FIG .19 . Section through the measuring bath to illustrate the liquid switching arrangement . For simplicity only one of the liquid conducting paths from the plant to the rear b th is shown .
(Section V.2a)
19
v. '2.
-53-
It might appear that the rather complicated bath switching
arrangement described above which required high insulation could
have been avoided if, instead of using a single pair of electrodes
ans! e single electrometer, se?arate electrometer stages and electrodes
uere used for each channel. Selection of the various channels for
~easurement could then be done by a relatively simple metallic
selector switch in the recorder itself.
The former system ~as used, partly to avoid duplication, but more
especially because electrometer circuits and half cells are never
absolutely stable, but show slow potential drifts over long :Jeriods
of 'time. In order to determine whether an observed change in
potential is a genuine 9lant cha.nge or due merely to a drift in
the measuring apparatus, it is nece.ssa.ry to "switch the plant out 11 ,
Le. to measure the potential at a point in the bath rernote from
the plant and where the pcotential is presumably unaffected by it.
To obtain a reference reading uith an automatic recorder it is
t:ierefore necessary either i:.o move ,the measuring probe away from the plani:
to a distant point at frequent intervals, or to use some sort of bath
switch such as that described above, and for one cham1el to switch to
a distant point.
In the present case the reference potential was recorded at 30
second intervals. For convenience in reading the charts any drifts
in the measuring apparatus were automatically compensated for, so
that the reference trace aluays showed no deflection from zero on the
chart., A phase sensitive motor which drove the zeroing c:::introl, c,
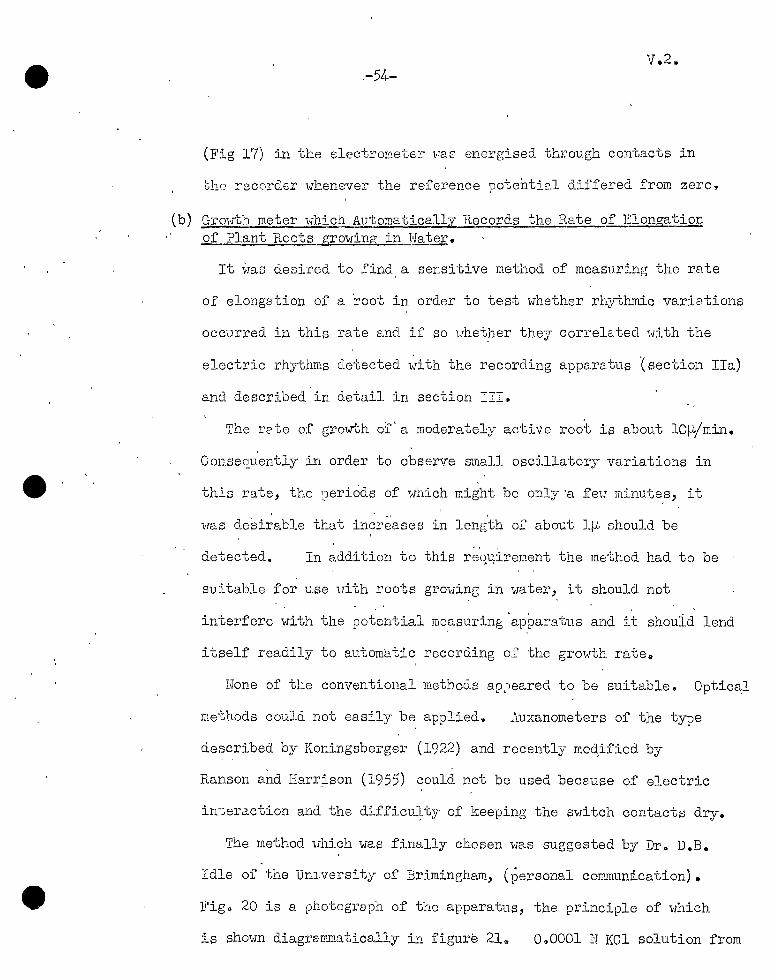
v .2,. ,-5~--
(Fig 17) in the clecti~ometc· Faf energised through contacts' in
t.ho recorder wl:::.enever the reference potentie.l differed from zero~
(b) Growth meter which Automatically Records the Rate of Elongation of Plant Roots growing in Water.
It ~ms desired to find a sensitive method of measuring the r8.te
of elongation of a root in order to test whetlier rhythmic variations
occurred in this rate and if so uhether they con'elated with the
electric rhythms detected with the recording apparatus '(section IIa)
and described in detail in section III.
The rete of growth of' a moderately active root is about lCµ/min.
Consequently in order to observe small oscillatory variations in
this rate, the periods of which might be only ·a feu minute,s, it
was desirable that increases in length of abo"L:t lµ should be . ' '
detected. In addition to this rec;ll;irement the metl~od had to be ,
suitable for use vith roots growing in water, it should not
interfere with the potential measuring ·apparatus and it should lend f
itself readily to automa.tic recording of the growth ratea
Hone of the conventional methods a9;-ieared to be suitable. Optic~l
methods could not easily be applied. ~uxanometers of the type
described by Koningsberger (1922) and recently rnoc\ified by
Ranson and Harr~son (1955) could not be used because of electric
interaction and the difficu~ty of keeping the switch contacts dry.
The method uhich was finally chosen we.s suggested by Dr. D.B.
Idle of the University of Brimingham, (personal cor;i.murni..cation).
Figo 20 is a photogroph of the apparatus, the principle of which
is shown diagrammatically in figure 21,. O~OOOl lJ KCl solution from
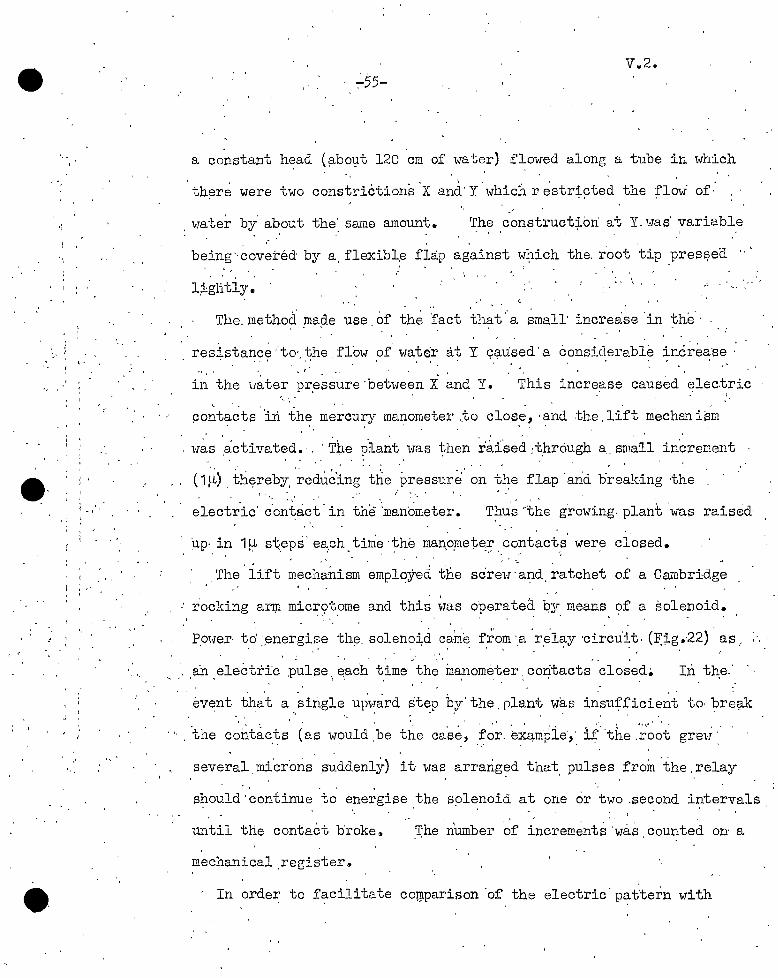
. :
) '
' ' ; _,·. ''
: ~ J
I
'.
v .. 2.
~55-
a constant h~ad (p.boµt 120 cm of water) .flowed along a tube in which
th~re were two constrictions ·x and· Y ·which r. ~str:j_~ted the fl~w· of· . ·
water by. about the' srune amount. The construct;Lon· at Y.was· variable
being·. covered by a. flexibl.e flap against wJ;1ich the. r'oot 'tip _pres9ed "' ',
' ' '
l;iglitly. ' ..._, •,'
.. '
The. method map_e use _of th~ fact tl1a t,. a ~mall· increase -in the- · -
resistanc~ ··to< the . fl'ow or' water at Y caused' a consiclerable inc~ea·se ·· ' ' ••I ' I: ' • I ' ' ' ' '.' J • . '
'•; .-
in the \1ater nressure ·between X and Y. This increase caused elec.tric "' ' ' '
"-','
~o~t1:1-cts ''in the mercury manometer .,to clos_~' 'and the' lift mechan is~
. was .a:ctivated.-. ·The p-lant was ~hen :r~.i'sed :t.hrough a .. small in.crement
( 1 ·µ) .· thE?reb;, ·~e~~~·j_~g: t~e ·~ressur~. ~~ t·~e f~ap · ~nd b~e~king ·t~e ! : .. '
electric' c-on~act- in the ·manometer. Thus ~the g'rowing. plant 'was raised:
'.Up· in 1µ s~eps' ea.eh time the man.~~ete:r ~~ntacts' were closed. • ' ' ' ~ ' 4 • ' - ,, ': -~· -:. ,
The lift meci1anism employed the screw·and ratchet of a Cambridge
rocking a rip. micr9tome and this was operated. qy_means of a solenoid. - '
P.ower- td :.energise th!=J. soleno~d carr;e from ·_a ·r.~lay ·circu'it. (E'.;ig .. 22) as" ..
·. an ~lectric, .p~l.~e. ~·ach- tl~ff,·th~·. ina~om0
et~r _ ~orit~cts. -clo~~d• In th·~-. - · .... ' ' • ' l ' ' . • '. ' ' ' •
event that a single upward ste:_p b.;y-' the_ plant VfaS insufficient to· break . .
·" . 'the cohtac.ts (as would .be the ca'se~ f~~- ~~~mpie·; · l:(the ,;·~~t gre\·f _. · ',' . .
several mi'cr'ons _suddenly) it- v.ras arrarig~d that. pulses froin the. relay
should'continue to energise the solenoid at one or two .second intervals • ' I •
until the contact broke& ~he nmnber of increm~nts'was,counted on a
mechanical .register.
· In order to facilitate cowparison -of the electric.pattern with
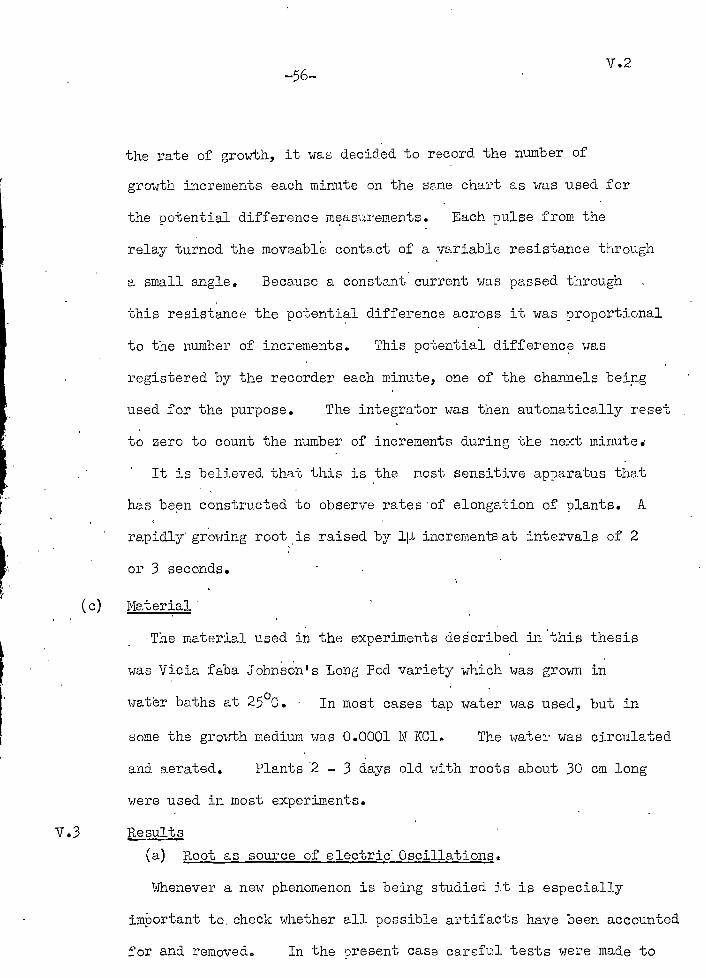
v.2 -56-
the rate of growth, it was decided to record the number of
growth increments each minute on the same chart as was used for
the potential difference m~asurements. Each pulse from the
relay turned the moveable contact of a variable resistance through
a small angle. Because a constant current was passed through
this resistance the potenti~l difference across it was proportional
to the number of increments. This potential diff erenc~ uas
registered by the recorder each minute, one of the channels bei?g
used for the purpose. The integrator was then automatically reset
to zero to count the number of increments during the next minute.
It is believed that this is the most sensitive apparatus that
ha.s been constructed to observe rates ·of elongation of plants. A
rapidly' growing root is raised by lp. increments at intervals of 2
or 3 seconds.
( c) Material·
The materie.l used in the experiments described in 'this thesis
was Vicia faba Johnson's Long Pod variety which was gro1-m in
water baths at 25°C. · In most cases tap water was used, but in
some the growth medium was 0.0001 l\T KCl. The wate1· was circulated
and aerated. Plants ·2 - 3 days old with roots about 30 cm long
were used in most experiments.
V.3 Results
(a) . 'Root as source of electric· Oscillations.
·whenever a new phenomenon is being studied it is especially
important to. check whether all possible artifacts have been accounted
for and removede In the 0resent case careful tests were made to
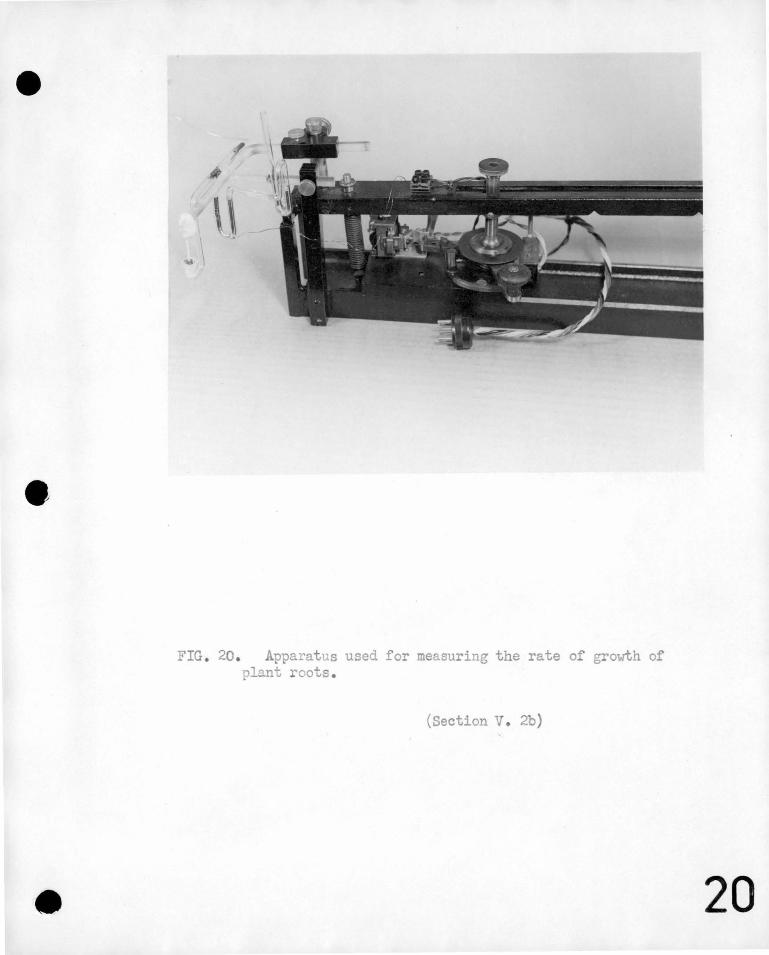
FIG. 20. Apparatus used for measuring the rate of growth of plant roots .
(Section V. 2b)
20
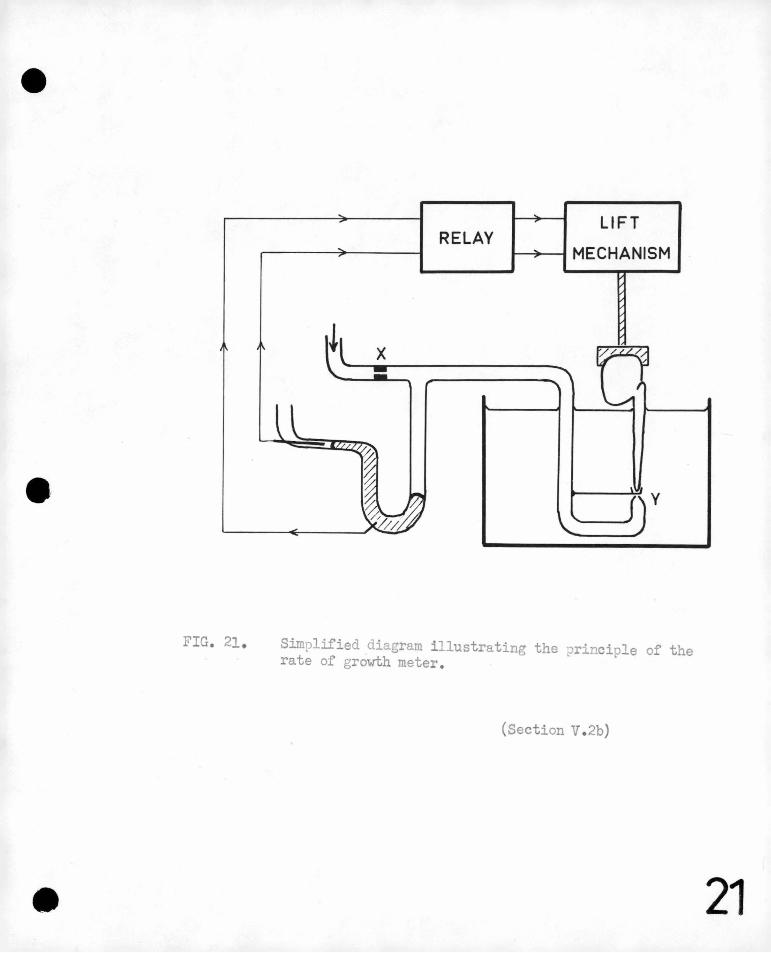
FIG. 21 .
RELAY LIFT
t---:j--. MECHANISM
y
Simplified diag~am illustrating the principle of the rate of growth meter .
(Section V. 2b)
21
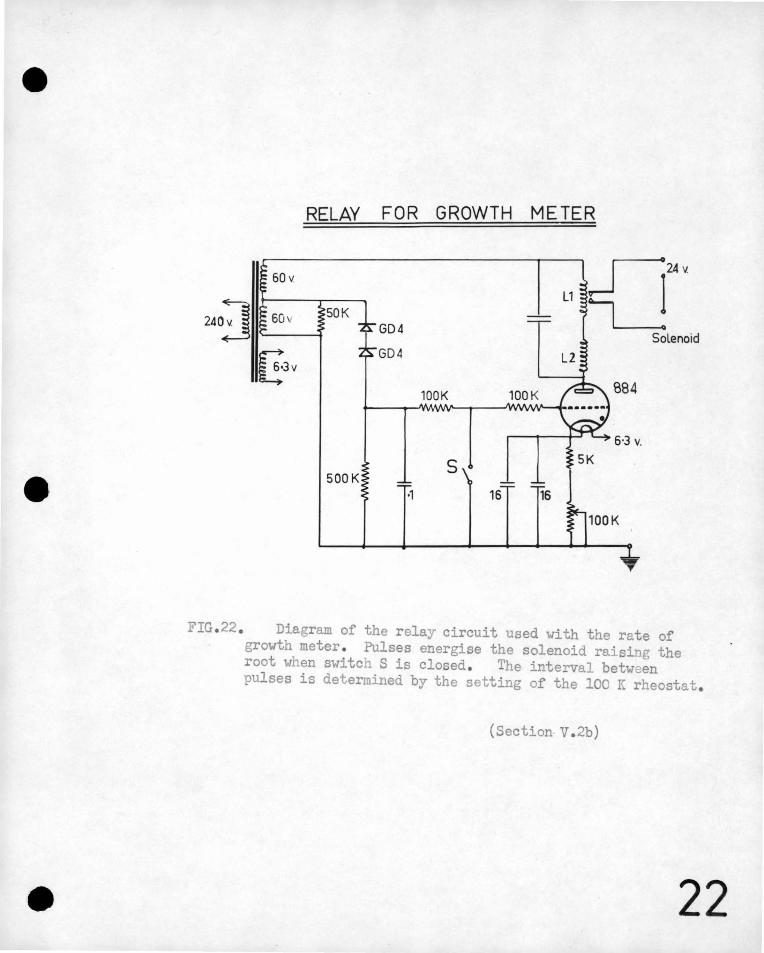
RELAY FOR GROWTH METER
J124 v. LJ 2AOJ SO K
GD4 Solenoid
E3v GD 4
884
500 K ·1
FIG . 22 . Diagram of the relay circuit used with the rate of growth meter . Pulses energise the solenoid raising the root when switch S is closed . The interval between pulses is determined by the setting of the 100 K rheostat .
(Section V.2b)
22
•
••
-57-
eliminate processes other than those due to the plant which could
ha,ve given rise to the observed electric oscillations.
Such oscillatio~s clearly couid not h~ve arisen in the electrodes, ' -
el'ectrometer or r;~corder,, as the reference trace giving the
potential at a point remot-e from the root in the bath showed no
oscillations.
Since the temperature of the measuring bE..th was ~hermostatically
- controlled i~ was necessary to ch~ck whether the 'electric oscilla~ions
correlated with the switching off an on of the heat. No such
, correlai1ion was fourn;l; , in fact the electric osc;illations still
took place \vhen the , thermostat' was disconnected. In a simiiar' way
it was sho~n that small fluctuations of height ?f the water in the
bath v!ere not responsible for 'electric fluctuati mis. · Interaction
1:li th neighboµring eJ_ectrical circuits _was also ruled out.
That the root was itself the source·of the. electric 9scillations
could be seen most conclusively by moving the measuring p~obes in :•
the vinicity of the root. The amplitude of the oscillations became-
smaller 'as the probes·w:ere_moved away from the root and varied with
the posit~on of _the probes along and around the root.
It is therefore c,oncluded that the electric oscillations were
generated by the plant itself~
(b) Descriotion of the Oscillatory Pattern.
T:P.e results obtained in 26 cases of bean roots which were
observed to gener·ate regular and persistent electric oscillations
have been analysed. The general features of this oscillatory
•
-58- v .3
pat~tern will now be described.
When a plant was taken from the growth bath to the meai:iuring bath
an<i allowed to settle for, some time ( about 1 hour), the electric
pattern in the water surrounding the root usually became steady,
although slou changes occurred over long periods of time. This steady
pattern agreed 11i th that described in sections III and IV, the region
in the vicinity of the root tip being more negative tha~ the root
base. This indicated that an electric current flowed out from
the plant at the root base, entering it again in the vicinity of the
tip,.
In the case of the group of plants. now under conside~ation,
oscillatory variations· were' observed to be superimposed on 'this normal
steady potential pattern. These oscillations commenced from one
to ten hours (with ~n average of 4.7 hours) after' setting the root
-up for measurement, and ·continued for an average of 5,.8 hours. The
average number of oscillations generated b;>r the plant during this
time was 55.8~-
It was noticeable that the oscillations uere very nearly
sinusoidal in•form. Certainly they never resembled relaxation
oscillations. For a particular p:)..ant the period of oscillation
at all points in its vicinity was ;the same and remained remarkably
constant while the plant was in the oscillatory state. For a
typical root, the average period for 42 cycles was 5.68 minutes with
a standard deviation of 0.60 minutess
For the maj 01 i t;>r of plants studied the period was of this order,
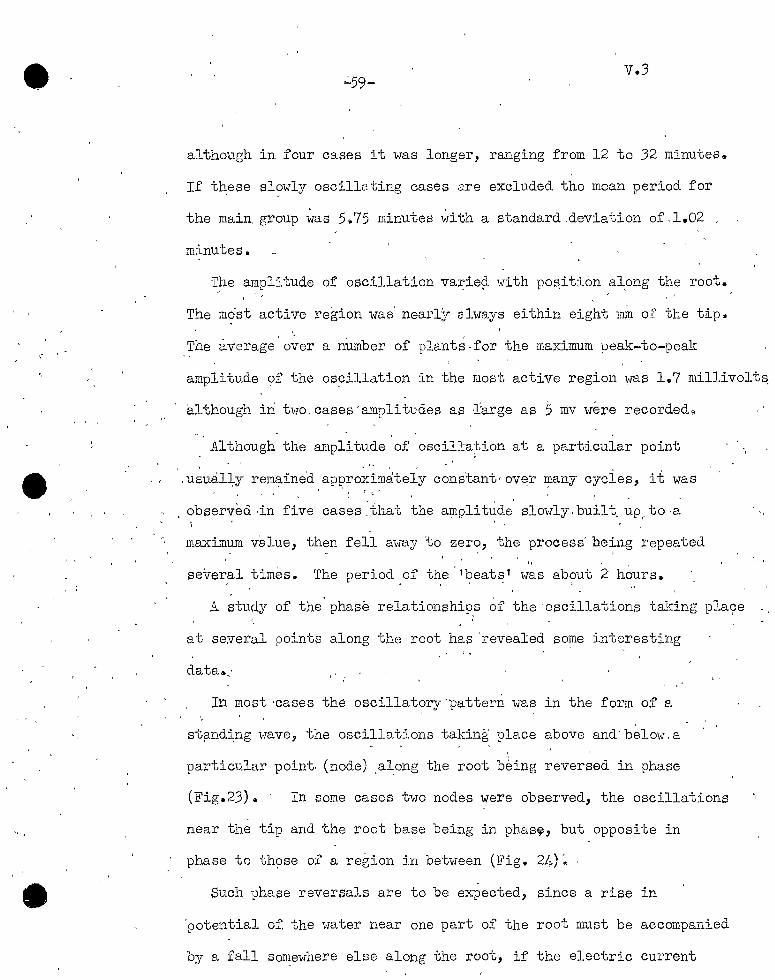
v.3 ..:.59-
although in four cases it was longer, ranging from 12 to 32 minutes.
If t~ese slowly oscillating cases are excluded the mean period for
the main, group was 5,,.75 minutes with a st,andard.deviation of.l.02
minutes.
T_he amplitude of oscillation va~ie?- with pos,ition al,ong the root.
The m<?st active region was' nearly always eithin eight min of the tap~
The average over a nrunber of plants-for the maximum peak-to-peak
amplitude ?f the oscillation in the most active region ~as 1.7 millivolt~
although in two, cases 'amplitudes as J:arge as 5 mv were recorded~
Although the amplitude of oscill:a~ion at a particu;I,ar point
'. u~ual~y rem~ine'd apl?ro~·im~tely c~nstant· ov~r J?-8-IlY cycles, it was t r LI
observed ·in five cases . that the ai,npli t~de slowly, built_ U[\ to ,a
maximum vall1e, then fell 0way 'to zero, the process' being repeated " '
se~veral times. The period of the -1beats 1 was about 2 h~urs. I I f ~ ) • /
A study of the phase relationshi~s of the ·oscillations taking pla9e
at several points along the root has 'revealed some interesting ''
data .. ·
In most ·cases the oscillatory "pattern was in the form of a
stp.nd~ng wave, the oscillations taking' place above and' below. a
particular point. (node) .a~ong the root b~ing reversed in phase
(Fig.23) .. · In some cases two nodes were observed, the oscillations
near the tip and the root base being in phas~, but opposite in
phase to th9se of a region in between (Fig. 24) ·• ·
Such phase reversals are to be expected, since a rise in
'potential of the water near one part of the root must be accompanied
by a fall somewhere else along the root, if the electric current
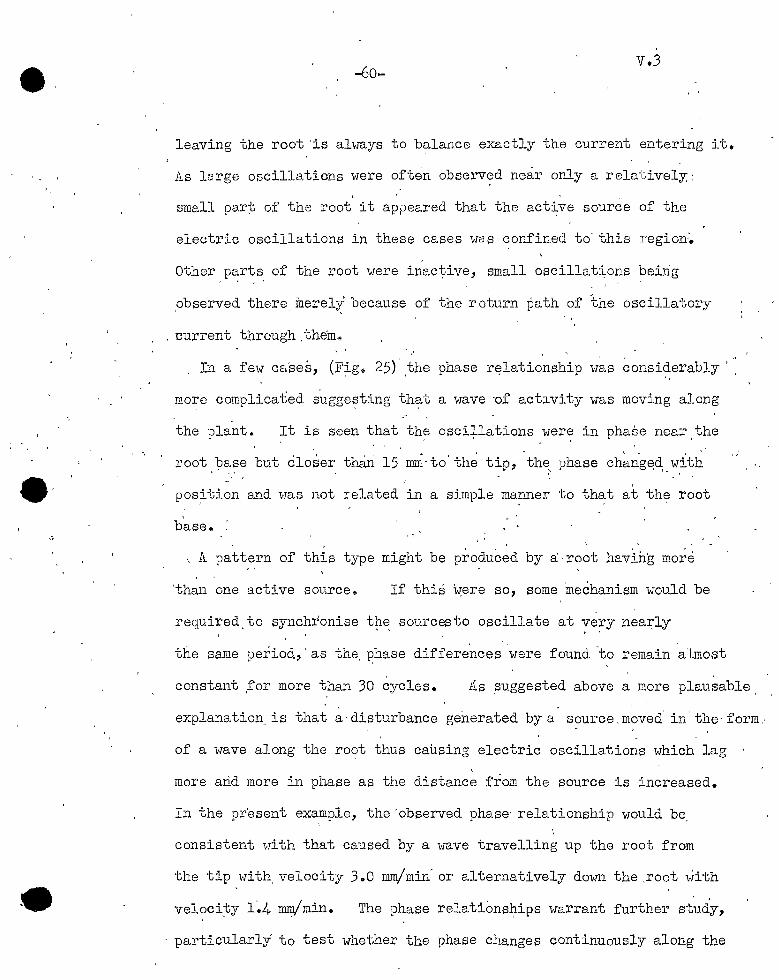
,,
•
-60-v .3
~eaving the root 'is always to b~lance exactly the current entering it.
As large oscillations were ofte'n observ~d near only a relatively;:
small par:t of the -root' it ap:Jeared that the act~ve source of the
electric oscillations in these cases was confined to· this region:.
Other parts qf the root were inac~ive, small oscillat~ons being ' ' ; '
,observed there_ merel~ because of the return path of the oscillatory
. current through :them ..
, In a few ca'ses, (F~g~ 25) ·.the phase rf?lationship was considerably '
more comolicaied s~ggesting that a wave ·of activity was moving along 1 i: 1 '
the plant. It is seen that the osci:)..lations were in phase near the
root base but closer than 15 mill-to' th~ tip, -th~, phase chang~~y.ith
pos~tion and was not related in a simple manner to that at the root
b'ase~ :
·. A pattern of this type might be produced by a· root having more
'than one active source& If this ~ere so, some mechanism would be
required.to synchroµise t~~ sourcesto oscillate at ~ery nea~ly
the same period," as the, ~hase differences were found -to remain almost
constant ,for more than 30 cycles. As ~uggested above a more plausable.
explanation_ is tha,.t ~-disturbance generated by a- source_m~ved· in' the-form,· - - '
of a wave along the root thus causing electric oscillations which lag
more arid- more in phase as the distance from the source is increased.
In the pr'esent example, the "observed phase· relationship would be
consistent with that caused by a wave travelling up the root from
the tip with, velocity 3.0 mm/min' or alte~natively down the ,root with
veloci:ty 1~4 Illl!1i'min. The phase relationships warrant further study,
particularly to test whether the phase changes continuously along the
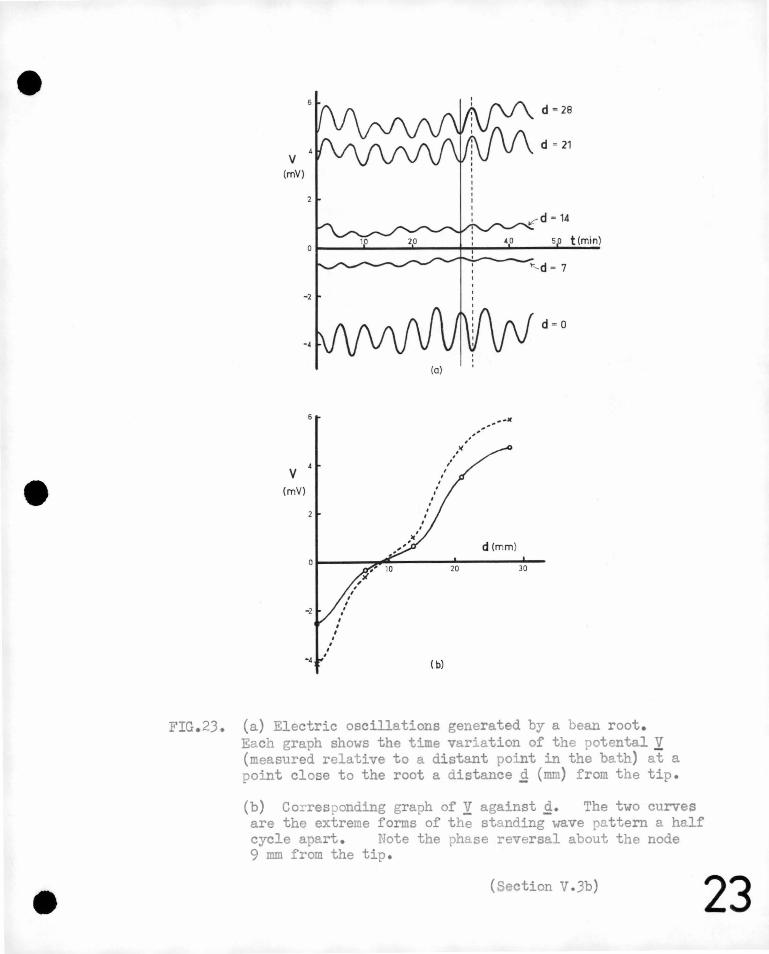
v (mV)
-2
v (mV)
-2
- 4 I
. I
I I • ,
•
, , I ,
I ,
(a)
I ,
,"' 10 'if
(b)
/' /
20
,.----"' ,,''
d(mm)
d = O
30
FIG. 23. (a) Electric oscillations generated by a bean root . Each graph shows the time variation of the potental 1 (measured relative to a distant point in the bath) at a point close to the root a distance g (mm) from the tip.
(b) Corresponding graph of 1 against g. The two curves are the extreme forms of the standing wave pattern a half cycle apart . Note the phase reversal about the node 9 mm from the tip.
(Section V.3b) 23
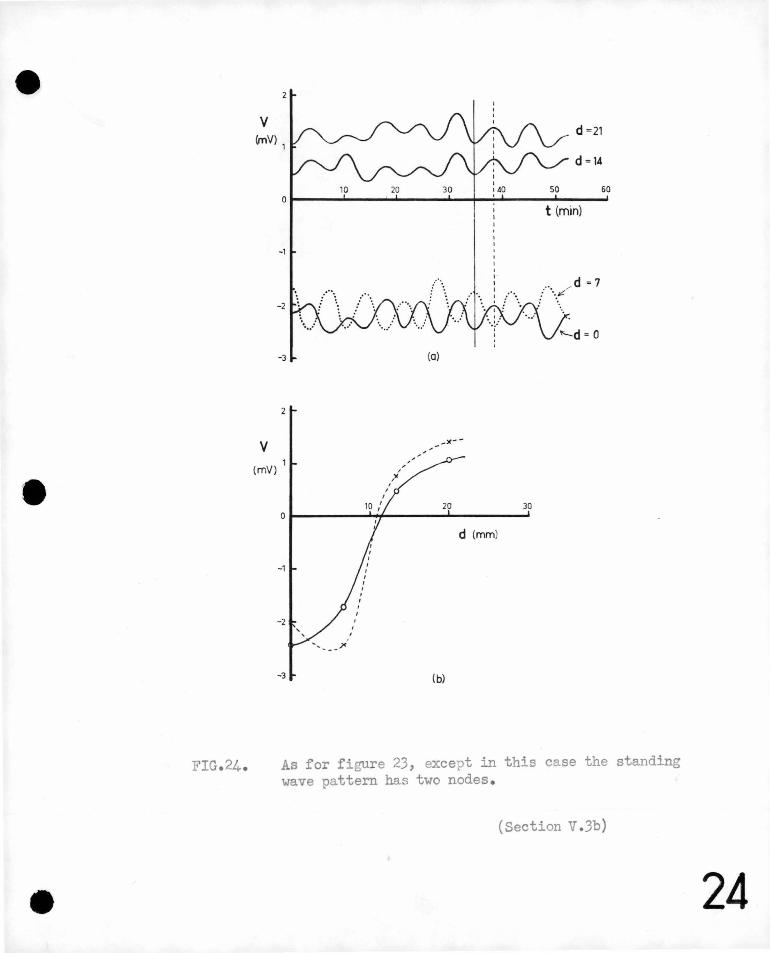
•
FIG. 24.
v d =21
(fnV) 1
v (mV)
0
- 1
- 2
-3
1
0
- 1
- 2
-3
' ' --
10 20
d =14
I 30 I AO so 60
t (min)
(a)
-"--
20 30
d (mm)
{b)
As for figure 23, except in this case the standing wave pattern has two nodes .
(Section V.3b)
24
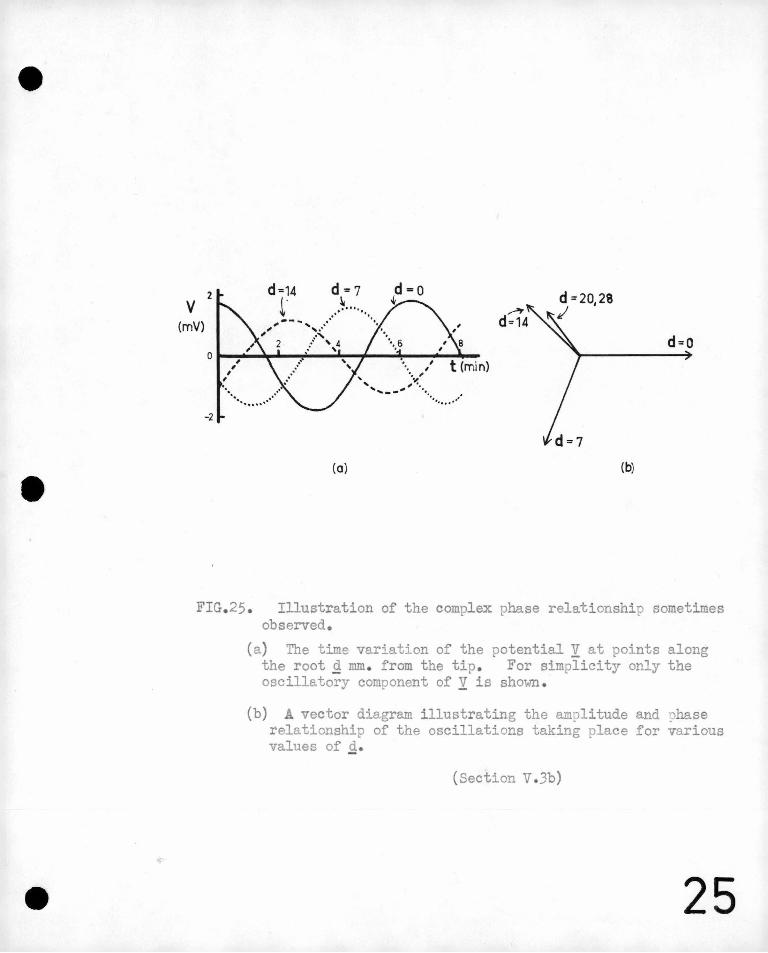
v (mV)
2
-2
, , , , ·· ........... .
(a)
d =20,28 ~
d=O
(b)
FIG. 25 . Illustration of the compl ex phase relationship sometimes observed.
(a) The time variation of the potential y at points along the root£ mm . from the tip . For simplicity only the oscillatory component of y is shown .
(b) A vector diagram illustrating the amplitude and phase relationship of the oscillations taking place for various values of£•
(Section V.3b)
25
e
' '
·-
e
v @3
-61..:.
root in the active region.
(c) Transient Oscillations resulting from Stimulation~
The electric pattern of a bean root was ver7 sensitive to
stimulation and changes in environment, large changes in the electric
potenti~l along the root being produced immediately® When the
cause of the disturbance was removed, _the pattern again becomes
practically,steady,after a time which might rfl.nge· from a few minutes ' -
to· an hour, dependi~g on the degree of stimulation& ~ l l
Duri~g thi~ transitory time befor~ the.steady·pattern is restored,
the po~ential changes wert? frequently in -!;.he' _fo'rn1 of damped ' ,, '
oscil·lations (Fig. 26). Suc,h oscillations almost always occurred
when a' plant was taken 'from the". tank in "\'1hich it w1s grown and set ,
, up for .measurement.,, Overshoot procesoe.s foll.owed -by damped':·.·· ' I ~ ! '
oscill_ations were also obse~ed JC.o ~esult from ~mch treatment~- as
mechan'ical stimulation of part of the root, sudden clianges in the
salt content of the water j_n the bath,- addition of indolc-acetic ' ''
acid to the bath and.exposure of the root to air for a short 'time,.
In a preliminC!-ry study of ,.these patterns it was .Lound that the
' period of the transient oscillations was of the same. order as the
maintained oscillations described in section V~Jb, although the
variability was greater, both during the ?scillB;tion of one plant, and
from plant to plant.
Further study of these transient electric changes-is planned~
( d) Observa.tions of the Rate of Elongation of the Roote
Since section IIT of this thesis had shown some correlation between
·e
e
e
v .3
-62-
the steady electric pattern and the mean rate of elongation of the
root, it was considered rossible that the observed oscillatory
electric changes might be accompanied by corresponding oscillations
in the rate of elongation-.
The rate of elongation of the root was measured and recorded
simultaneously with the· electric potential measurements, using the
a9paratus described in section v.2~ No Special tests were made
of the accura.cy and reliability of the grm.rth meter, b:it this uas ·
considered to be good judging by the small amount of scatter ( less than
5 percent) which was observed in the rat~ of growth record of some
roots. Other roots showe.d more random .scatter than this, and this
was considered ~o be due to a genuine variability in the rate of
growth, although no exhaustive tests have yet been made of other
possible sources of scatter.
On a feu occasions,- variations uhich were approxima,tely !_Jeriodic
were observed, (fig~ 27) but these qid not ~ccur uhpe electric
oscillations were being generated and there appeared'to be no correlation
between the tuo. It is of course possible that growth oscillations
too small to be detected were taking place during the time of electric
oscillation. If this we1·e so the ampli tvde of the growth oscillations
must have been less than aboL1t 15 percent of the mean growth rate in
order to escape detection.
The la te1·al movements of been roots have been studied using time
lar,is8 photography. It has been found that the growing root usually
soirals around'a vertical axis with a rJeriod of about 2 hours~ So ' '
v .J
-63-
far there is no indication of a five minute rhythm superimposed on
this$
(e) Correlation uith wessure anplied to the root tiu.
A large number of treatments h8ve been applied. to a root producing
its normal steady electric pattern with a view to causine it to start
generating electric oscillation::;. None of these treatwents has been
entirely sctlsfacto!Y• Nevertheless there is some evidence that pressure
applied to the root tip tending to prevent elongation is one important
factor requi1·ed for the oscillatory state.
On only two occasions uere roots w:iich were not ex:-;:ieriencing ti-:?
pressure observed to be generating· electric oscillations. 'on 18
other occasions, oscillations were in each case found to be associated
with the ~')resence of an upward force on the root tip. In some cases
oscillations were produced w~en the root' grew against a fixed obstacle,
·while in others they were produced when the root tip ex-;;ierienced a
constant upward force of about 100 dyne~
These oscillations usually commenced soon after pressu:re was applled
to the tip, and lasted for some time after it was removed, although
in one or two cases oscillations ceased uhile the root uas still
experiencing pressure. Permanent bending of the root frequently
resulted from these tip pressures.
Although the above results sug2',est that tip pressure is an important
contributing factor for the oscillatory state it is not true to say
that oscillations always arise if tip pressure is applied. On a
large number of occasions roots were subjected to tip :?ressure and no
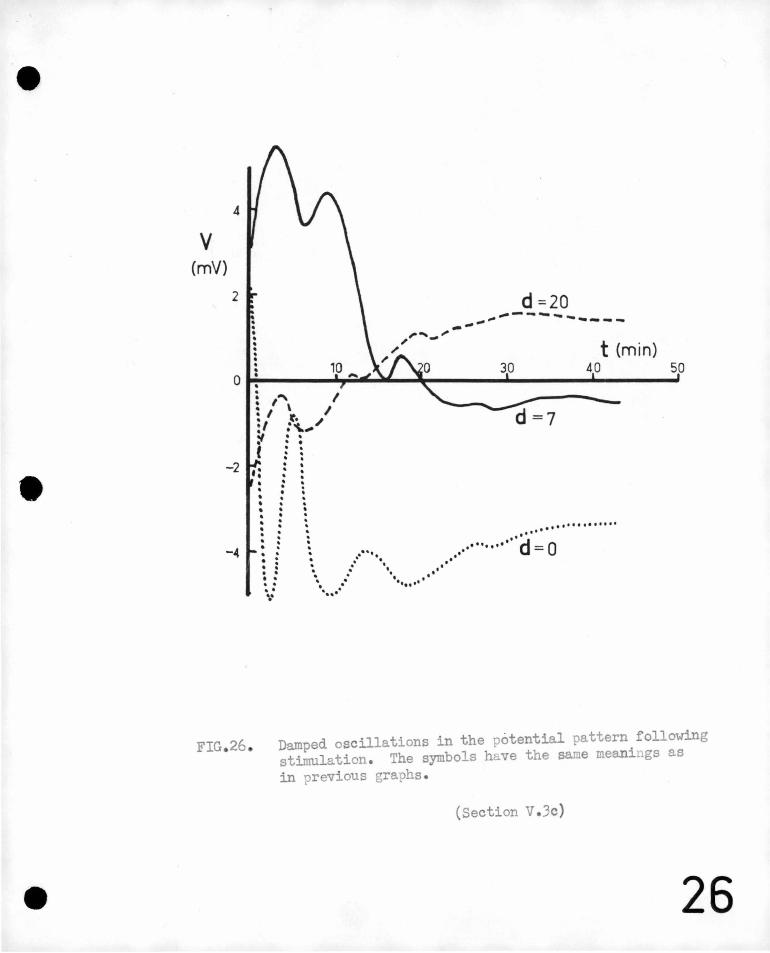
v (mV)
. . • . • . . • • •
/ ~
-,, .... _, d =20
-------~-----------
30 t (min)
40 50 0 •
•
-2
-4
FIG. 26
: ,~ ! I \ I :, ,. / . :""', :I : f :
•: . • . . .
• • . • . • • . • • • . . . . . . . • • . . • . . . . . \•
. . . • . . • . . . ~ ............... . . •' .... . ........ d- 0 ~ .. ···· .. -. .. ·. ..· ·~ . . ·.. ..·· ·...... . ..... .
Damped oscillations in the potential pattern following stimulation. The symbols have the same meanings as in previous graphs .
(Section V. 3c)
26
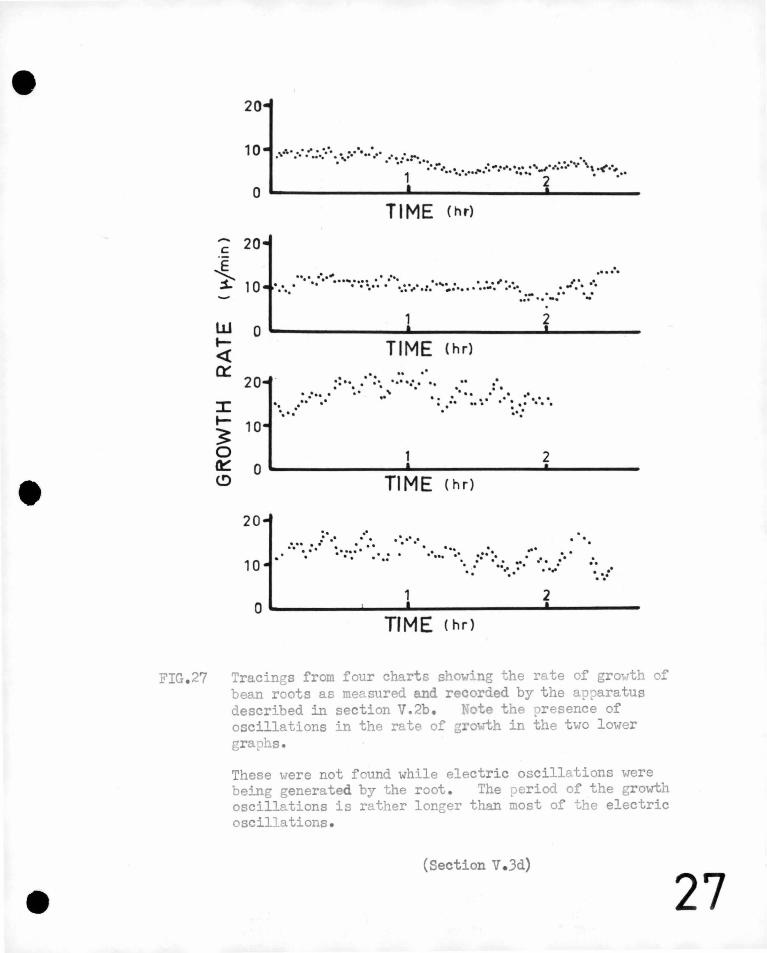
20
10 ii. • .. •• • • ..... . ... . . : .... ·.· .. :·· •.. ... . . ,.. .· ·.:·· ···... . ...... ... . . ~ . -........... ,_,....... . ., .~.·, 1 ··········· .••.. 2 ·'" ...
0 TIME Chr)
- 20 c
~ ~ 10
. ···· .. · .. -......... . . .... . , ,. . .... . ·.·.: . . . .... . ·.:· .. ·.:. '""':_: .... ·.: .. ·. :..... . ..... . ·- . .. . . ... .. -· -1 2 llJ 0 ____________ ...... ____________ .a.... ______ _
~ TIME <hr)
Q: 20
. . .. .. .. . :· ··. . ··. ... .... . .. . . .... . .. ··' . . . . . . . . . . .. .. . . . . . . .. •·. .· . . . . .. .. . . . ·: ... I . . . . .. .,_ 10 3 0 2 0::: 0 ______________ ..._ ____________ .__ ______ __
<.!)
20
10
TIME Chr)
.. . . . .. . .. · .. . . . · ..... .. . . . :- .. : . . . . . . . . . .. ... . ... . ·... .. ·:· ·. . .. . . . . .. .. . : . ·. ~· ··.·.... . ... 1 2
. . . . . . ·.·
0 ____________________________ ...... .._ ______ __
TrME c hr)
FIG. 27 Tracings from four charts show · ng the rate of growth of bean roots as measured and recorded by the apparatus described in section V.2b . Note the presence of oscillations in the rate of g owth in the two lower graphs .
These were not found while electr i c oscill.::itions were being generated by the root . The ~eriod of the growth oscillations is rather longer than most of the electric oscillations .
(Section V. Jd)
27
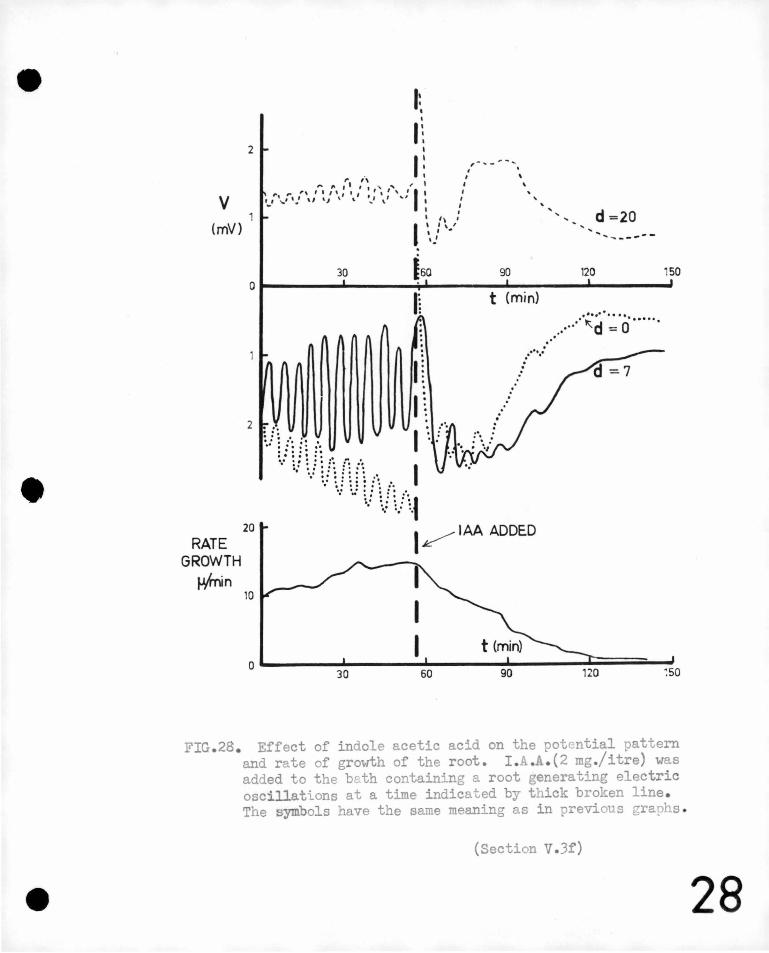
v (mV)
RATE GROWTH ~n
2
I: • I
1: I
I : ,.. " ,,., /~ ' ' , '
,. ,. ,, , I I\ I t I , ' I ' , I I ,_,' .... •' .. ' ,, ,, \ '" ' .. ' ,, ,, ~ I
I I\ I
I I I \ ' ' , . •.! .
30
I , ,- .. -,. ~ ...
90
' '
d=20 ... , ____ _
120 150 iso or----------------;-.._ ______ _,_ ______ ~---------' Ii t (min)
2
20
r . n .. .. I ..... .. . .. .. . .. : : : : : :~ ..... ' . ·::::.:!::r::-~ . .. . . . . . . . I ......... •
·: ~: : : : : ~ . .. .. . . : :~ . • M ~.: \} V\f
.. . ....... . .
l~IAA ADDED
......... ;zd ~·(;······
FIG.28. Effect of indole acetic acid on the potc-ntial pattern and rate of growth of the root. I.A.A.(2 mg./itre) was added to the bath containing a root generating electric oscillations at a time indicated by thick broken line . The symbols have the same meaning as in previous graphs
(Section V.3f)
28
••
'',
v .3
-64-
electric oscillations were observed.
These preliminary investigations su~gest that the nlant must comply
with certain,other conditions, as yet not ascertained, before it
has the capacity to generate electric oscillations. Only_then will I / l >
it oscillate when pressure is applied to the 'tip.
(f) Effect of Auxin.
In one seri~s of experime~ts indole acetic acid (I.KA) was ~dded
to' the measuring-bath·in,which a root was generating electric ~ . ~ ' ' ' ;
oscHlations. The concentrati~n of IAA w~s usually made 2mg/litre.
·~t th1s stren~th the auxin inhibits elongation of the root (see section
In-' each' case it was observed that H.P._· had. a marked effect on the
· electric oscillations. , A typi?al exarhp~e is shown in' figure 28.
It will be seen that the· ,ele;ctric' ·9otentials. were immediately altE?red ' ~ ' '
· ( s~imul~t~on effect) after which the .osc:El.lation was' rapidly damped,.'
At the same time :the rate of growth fell until the roo,t, had
practically stopped ~longating about an hour after the·additio'n
of auxin. ',
_lifter several hours the plant was sometimes obs'erved to generate
an oscillation again and at about the same, time the root in some
cases .resumed elongating slowly. As the experime:pt was performed
in daylight it was thought possible that the auxin effect was. reduced
due to destruction of the auxin by lighte
Discussion.
Rhythmic oscillatory processes are frequently observed in living
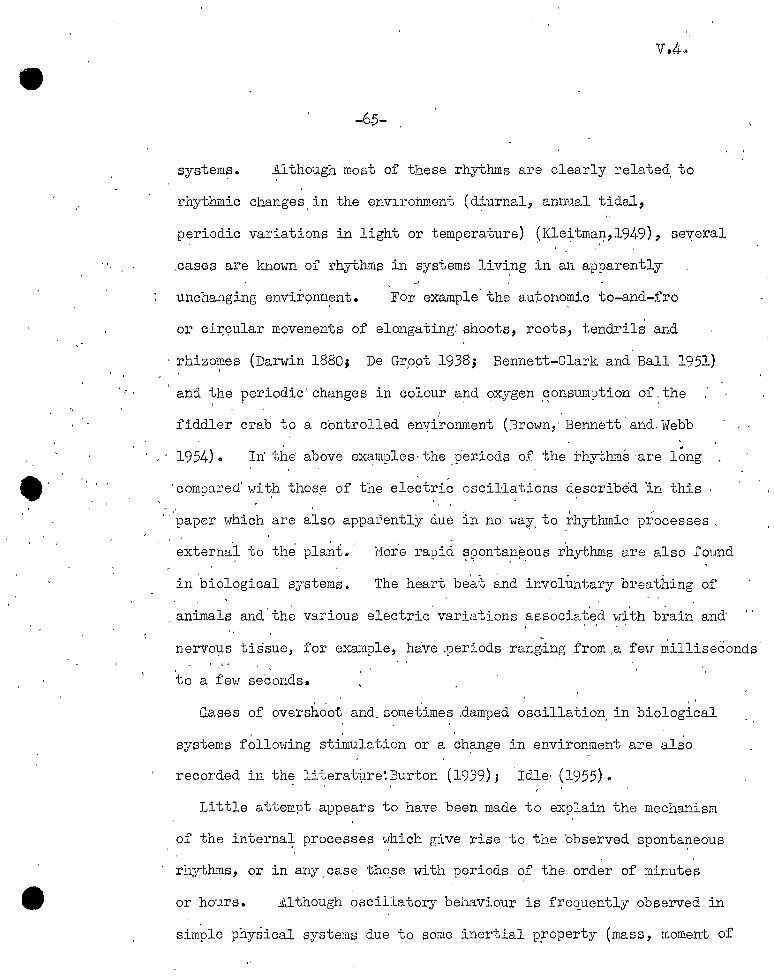
r,
-6;5-
system~. Although most of these rhythms are clearly related. to
rhythmic changes.in the environment (d~urnal, annual tidal,
p~riodic variations in light or temperature). (Kle~tma~,1949), se~eral
.cases are known of rhythms in systems liv~ng in an apparently
unchanging envir9nm~nt. For example' the autono~ic to-and-fro
or cir:<;mlar movements of elongating-' shoots, roots, tendrils and
· rhizo~nes (Darwin 1880; De Gr,opt 1938; Bennett-Clark and Ball 1951)
and the periodic' changes in colour a~d oxygen .~onsumption of:the
fiddler crab to a c'ontrolled enyi.~onment (Brown,.' Bennett· and. Webb
1954). .
In the above ex~mples·the_per.iods of the rhythms ·are long
·compared' wi~h thos~ of the electric oscillations described ln this ,
. ·'paper which 'are also apparently due in no way, to. rhythmic processes '
externa·l to the planL. Mor'e rapid ~ponta~1~.ous rhythms are also found
in biological systems. Th.e heart be;,_ t ~nd involuntary breathing of ·
' ' '
animals and.the various electric variations associated with brain and
nervous tissue, for example, have .periods rangi~g from ,a feu milliseconds'
to a few seconds'.
'' Gases of overshoot an~. sometimes .damped oscillation, in biological
systems f;llowing sti~ulation or a :ch~nge in environment are also
recorded in thE'. literat-\lre:Burton (1939); 'Idle· (1955)"
Little attempt appears to have been made to explain the mechanism
of the interna~ p.rocesses which give rise to the 'observed sponta~eous
rhythms, or in any.case th~se with periods of the order of minutes
or hours. .:CJ.though oscillatory behaviour is frequently observed in
simple physical systems due to some inertial ~roperty (mass, moment of
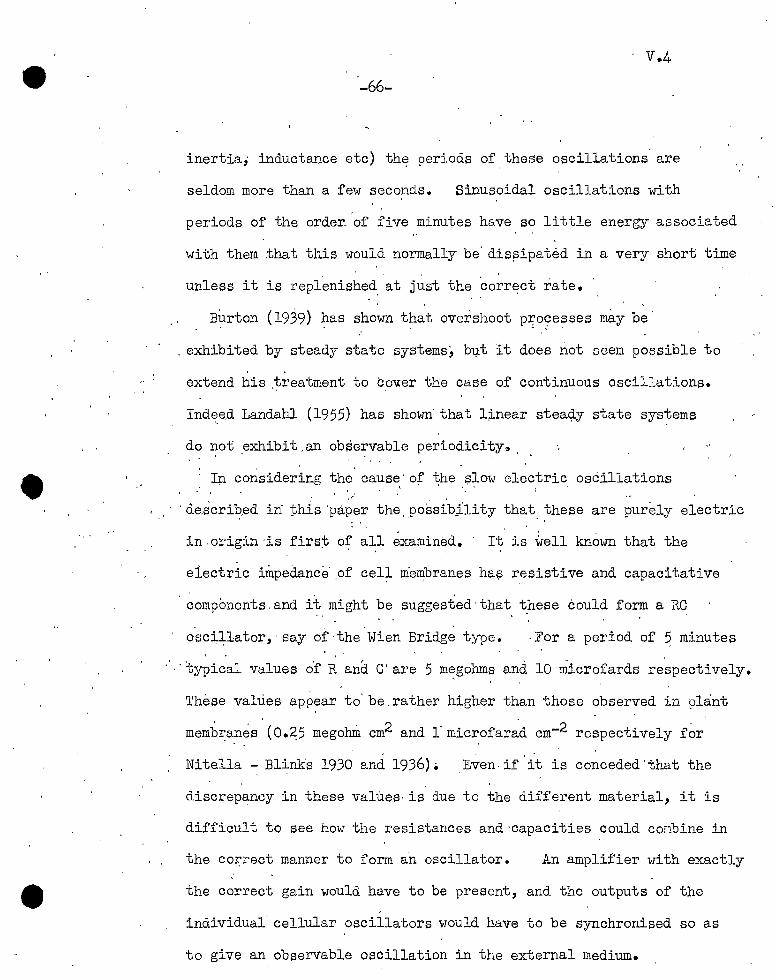
-66-
inertia,. inductance etc) the periods of these oscillations are
seldom more than a few seconds. Sinusoidal oscillations with
periods of the orde~'of five minutes h&ve so little energy associated
with them tha~ this would normally be' dispipated in a very short time
unless it is repl,enished, at just the 'correct rate.
Burton (19J9) has shovm that overshoot p:i;ocesses may be' - ; .
. exhibited by steady state systems:, but it does not seem possible to ' .
extend his .~reatment to C?~er the case of continuous oscillations.
Indee.d Landabl (1955) has shown· that l;inear stea<J.y state systems
do not _exhibit.an observable periodicity~.
Iµ considering the cause· or ~he .?~ow electric oscillations
· de.scrib.ed in· this ·papel'.1 the .. possib;ili ty that .. these are purely electric ' '
in .origin ·is firs:t o~ all examined. · · It is well known that the
electric iillpedance· .of cell nie~branes ha:;; resistive and capacitative·
'components. and it might be suggested· that t_hese could form a RC
·o-sc:i,llator, ·say of ·the .Wien Bridg~ type. .For a period of ~minutes
.··,typical values of R and C' are 5 m~gohms and 10 microfards respectively.
These values appear to' be.rather higher than those observed in plant
memb~anes.(0.~5 megohrll cm2 and l·microfar~d cm-2 respectively for
Nitella - B~inks 1930 and 1936) • Even.if it is conceded'that the ' '
discrepancy in these values· is due to the different material, it is
difficult to see how the resistances and-capacities could conbine in
the co~rect manner to form an oscillator. An amplifier with exactly
the correct gain would have to be present, and the outputs of the
individual· cellular oscillators would have to be synchronised so as
to give an observable oscillation in the external medium.
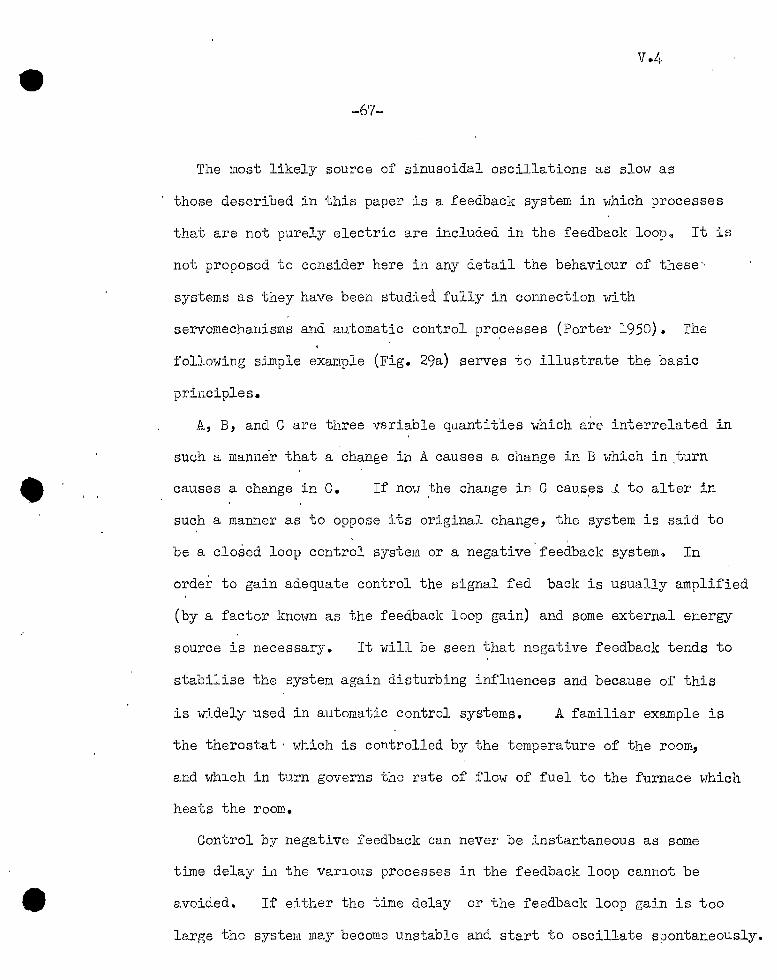
-67-
The most likely source of sinusoidal oscillations as slow as
those described in this paper is a feedback system in which processes
that are not purely electric are included in the feedback loop@ It is
not proposed to consider here in any detail the behaviour of these-·
systems as they have been studied fully in connection with
servomechanisms and automatic control pro~esses (Porter 1950). The
following simple example (Fig. 29a) serves to illustrate the basic
principles.
A, B, and C are three variable qu.antit'ies which are interrelated in
such a manne-r that a change i:n A causes a change in B which in turn
causes a change in c. If noll the change in C causes .l.. to alter in ' '
such a manner as to oppose its original change, the system is said to
be a closed loop control syste!1l or a negative feedback system~ In
order to gain adequate control the signal fed back is usually amplified
(by a factor lmown as the feedback loop gain) and some external energy
source is necessary. It will be seen that negative feedback tends to
stabilise the system again disturbing influences and because of this
is widely used in automatic control systems. A familiar example is
the therostat · which is controlled by the temperature of the room,
and wlnch in turn governs the rate of flow of fuel to the furnace which
heats the room.
Control by negative feedback can never be instantaneous as some
time delay in the various processes in the feedback loop cannot be
avoided. If either the time delay or the feedback loop gain is too
large the system may become unstable and start to oscillate spontaneously.
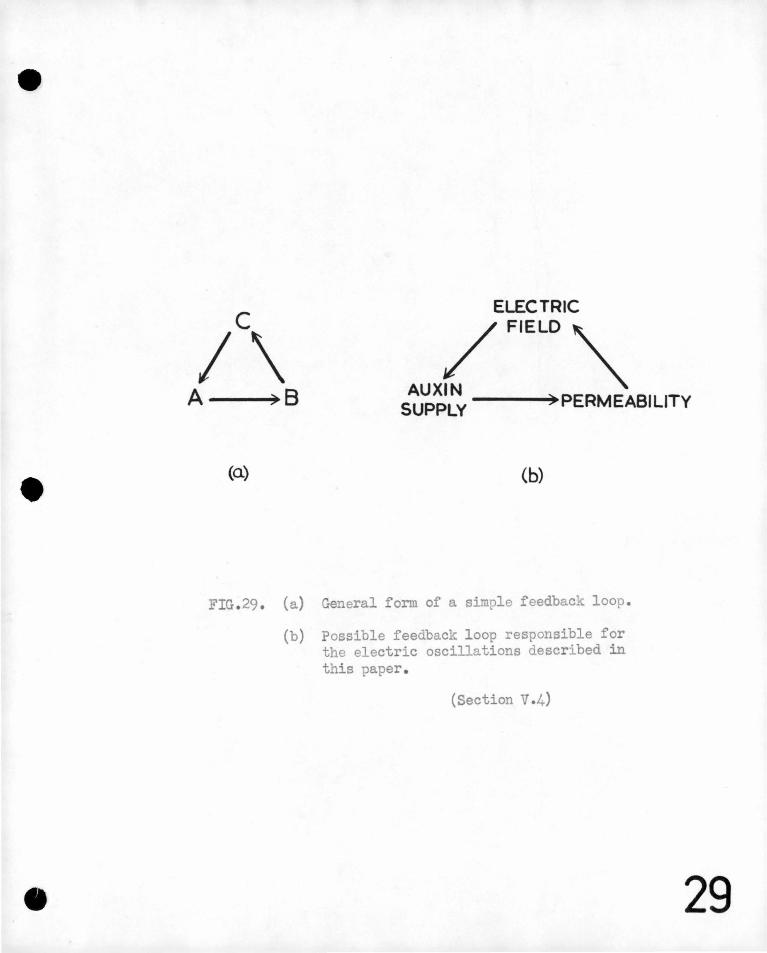
c
I\ ELECTRIC
/FIELD\..
A-~B AUXIN " SUPPLY ---•PERMEABILITY
(a.) (b)
FIG . 29 . (a) General form of a simple feedback loop .
(b) Possible feedback loop responsible for the electric oscillations described in this paper .
(Section v.4)
29
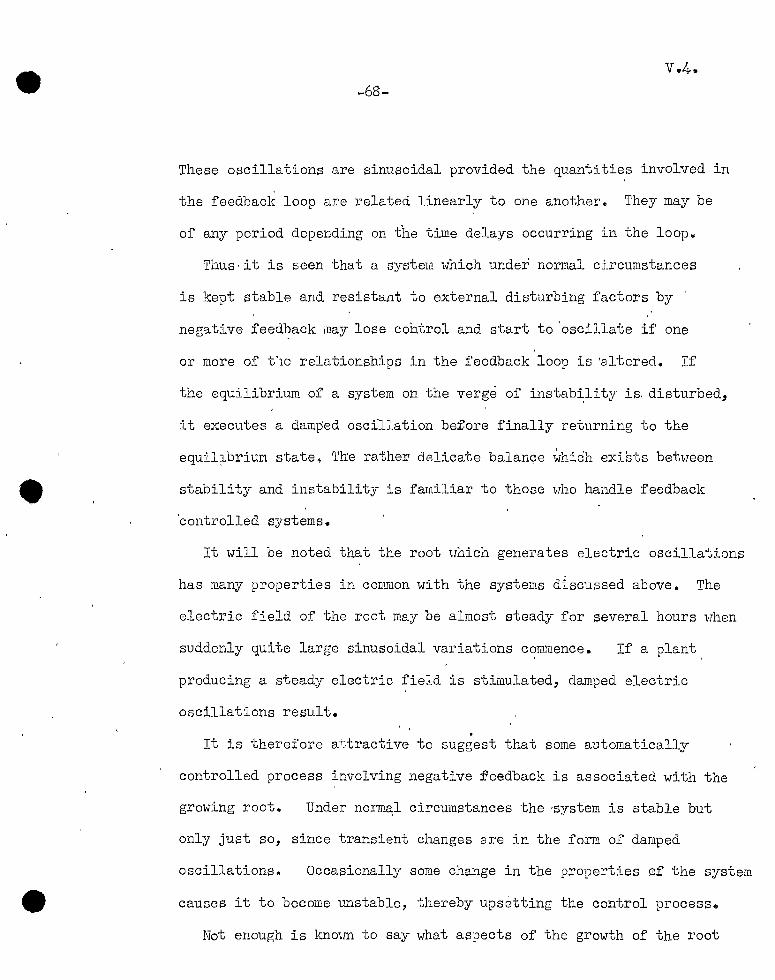
-68-
These oscillations are sinusoidal provided the quantities involved in
the feedback loop are related linearly to one another. They may be
of any period depending on the time delays occurring in the loop~
Thus· it is seen that a system which under normal circumstances
is kept stable and resistant to external disturbing factors by ·
negative feed~ack may lose control and start to 'oscillate if one
or more of t'1e relationships in the feedback loop is 'altered. If
the equilibrium of a system on the verge of instab~lity is. disturbed,
it executes a damped oscfllation before finally returning to the
equil~brium state. Tb:e ra:theri delicate balance whic'h exists between
stability and instability is familiar to those who handle feedback
'controlled systems.
It will be noted that the root uhich generates electric oscillations
has many properties in conunon with the systems discussed above. The
electric field of the root may be almost steady for several hours when
suddenly quite large sinusoidal variations commence. If a plant
producing a steady electric field is stimulated, damped electric
oscillations result. .
It is therefore a-+:.tractive to suggest that some automatically
controlled process involving negative feedback is associated with the
growing root. Under normal circumstances the ·system is stable but
only just so, since transient changes are in the form of damped
oscillationse Occasionally some change in the properties IDf the system
causes it to become unstable, thereby upsetting the control process ..
Not enough is knoim to say what aspects of the growth of the root
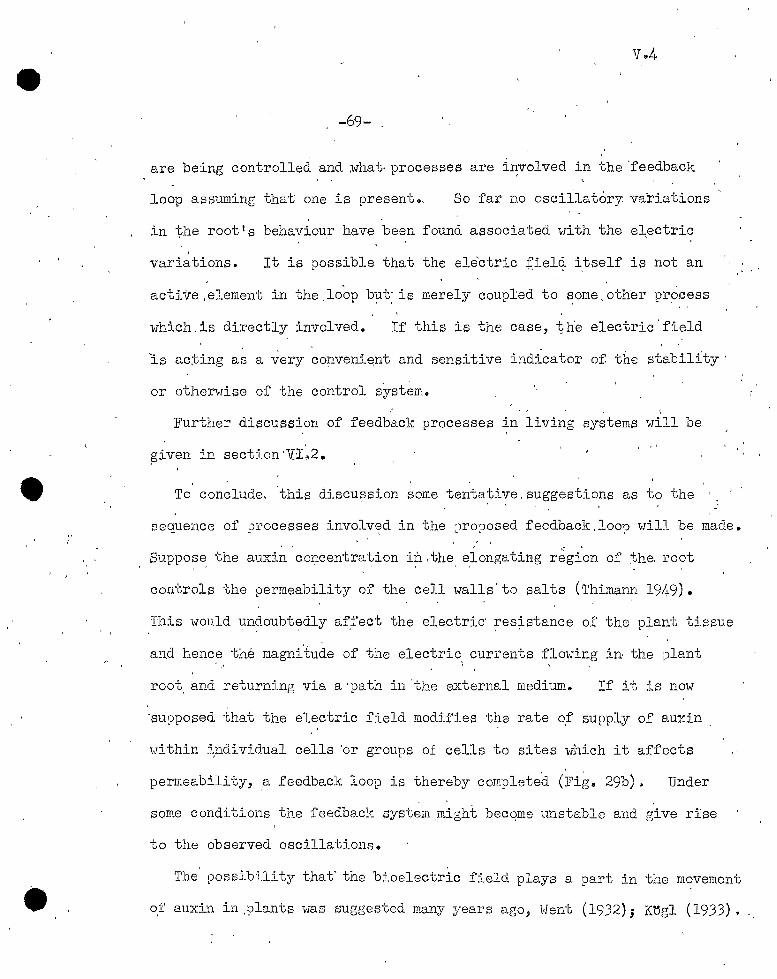
' -69-
are being controlled and ~hat-processes are involved in the 'feedback
loop assuming that one is present •. So far no oscillatory, va·riations
in the root 1 s behaviou.r have been found associated with the el.ectric
variations. It is possible that the electric fiel~ itself is not an
active.element ~n the.loop b~t: is merely coupled to ~ome,other pr~cess
which.is directly involved. If this is the case, ~he electric ·field
ls ac:ting as a very coµveniElnt and sensitive indicator of the stabil1ty ·
or otherwise of the control system.
Further discussion of feedback processes in living systems will be
~iven in section·YI.2.
To conclude, 'this discussion some tenta~ive. suggestions as to the .
sequence of processes involv~d in the ~ro?osed feedback.loop will be made.
Suppos~ the auxin cm:icentration i~ .the. E'.longating r~gi,on of ;the. root
controls the permeability of the cell walls'to salts (Thimann 1949) •
. This would ~m?.oubt~dly af.fect the ·electric' pes~stance of the plant tissue
a:!.1.d hence the magni.tude of the electric currents flowing in the plant ' \
root. and returning via a·path in -the external medium. If it is now
·supposed that the electric field modifies the rate of supply of auxin ,
within individual cells 'or groups of cells to sites which it affects
permeability, .a feedback loop is thereby completed (Fig. 29b). Under
some conditions the feedback syst~m.might becqme unstable and.give rise
to the observed oscillations.
The possibility that· the bioelectric field plays a part in the movement
of auxin in ,plants was suggested many years ago, Went (1932); :t\~gl (1933).
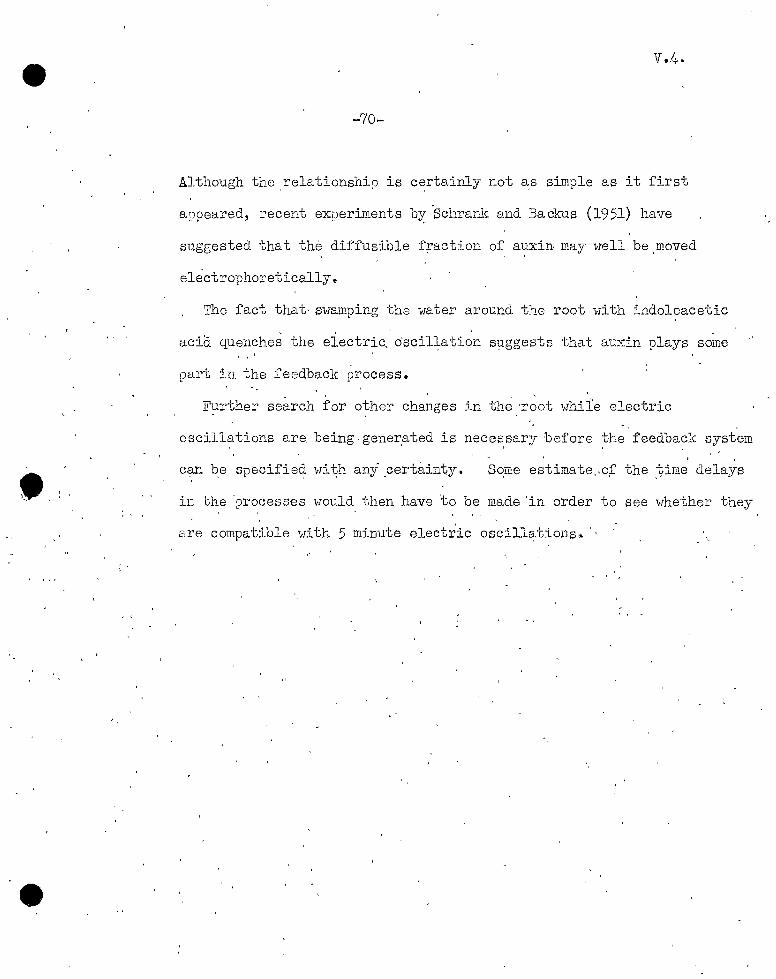
e
•
e
v.4.
-70-
Al though the , rela tionshi9 is c~rtairiJ_y not a,s simple as it first
a?peared, recent experiments b~Schrank and Backus (1951) have
suggested that the diffusible fraction of a~xin may well be moved
electrophor·etically.
The fact that, swamping the water around the root with iDdoleacetic
acid. quenches the electric, o·scil~ati~n sµggests that au.."'\:in plays some
part in the feedback process.
Further search for other changes in th~ ·root whiie electric
oscillations are_ being·generated is necessary ·before the feeClback system ' '
C1?-ll b,e specified wi t,h any ,certain~y. S~me estimate,,o;f the }fime delays
in the -'.Jrocesses would then have 'to be made 'in order to see whether they
are comDatible with 5 minute elect1~ic oscillations .. · ' '

•
VI, 1.
-71-
WI. CONCLUSIONS AiID FURTHER DISCUSSION.
This thesis. should be considered as a report of -progress in :a . .
continuing i:p.vestigation of the broad problem of the electric fields
of plants and their possible roles as organisers. It is not claimed·
that any large section of the inve.stigation has yet been com~leted.
' '
In the c0urse of the research many matters have arisen which require
further study. -
It remains now to ask \.{hat main conclusions may·be draw from the
v~o_'.rk. s~· far c~mpleted,, how do. th~se relat_e ~o., the ge::ieral problem of
organisations and· .control, and what further lines· of _investigati~n
',could most.fruitfully be fallowed up at t:his stage.
V.'.r.,1" 1'1ain Conclusions from the Present Investigation.
The! following main conclusions may pe drawn from the work described
in this the~is:-
(a) The present method of.me~suring bioelectric fields can be . .
accepte~ with· confidence, the observed electric pattern and the associated ' '
amounts of current and power being in fact those genere.ted by a bean root-
growing .in water when it is in a condition undisturbed by the process
of measurement.
(b) Tpe electric pattern of an actively growing bean root is
nornally steady_and persistent and retains its polarity under a variety
of conditions (for example of ionic composition and concentration in the
external solution}. The polarity described in this thesis 'is a complete
reversal of that frequently quoted in the literature (most recently by
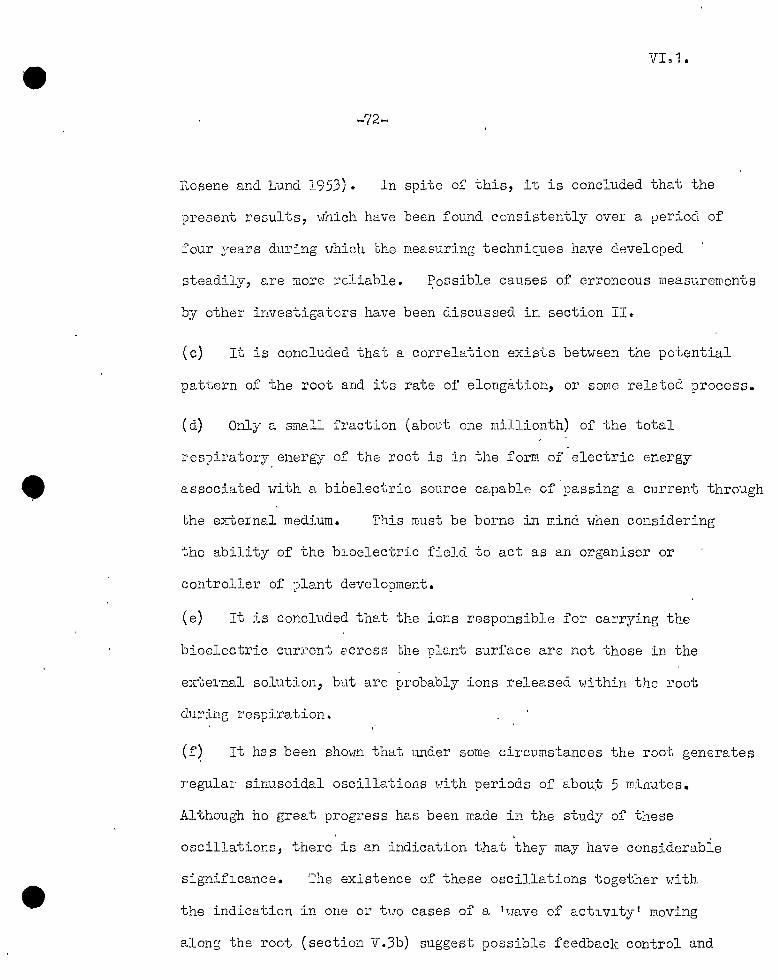
e
•
e
VI.1.
-72-
Rosene and l,und 1953). ln spite of' this, it is concluded that the
present results, which have been found consistently over a fleriod of
four ~rears dm.·ing uhich the mea~::uring techniques have d.evelored
steadily, are :nore i·E.liable. :t:ossible causes of erroneous measurewents
by other investii:;ators have been discussed in section II ..
(c) It is concluded that a correlation exists between the potential
pattern of the root and its rate of elongation, or some releted process.
( d) Only a SlTle.11 fraction (about one millionth) of the total
,;·espiratory_ energy of the root is in the form of electric energy
associated with a bioelectric source capable of passing a current through
the external medium. This must be borne in mind when considering
the ability of the bioelectric field to act as an organlser or
controller of :_Jlant development.
( e) It is concluded the. t the ions responsible for carrying the
bioelectric current ecross the plant surface are not those in the
external solution, but are probably ions released within the root
during respiration~
(f~ It has been shown that under some circumstances the root generates
regular sinusoidal oscillations with periods of' abou;t 5 minutes.
Although ho great progress has been made in the study of these
oscillations, there is an indication that they may have considerable
significance. The existence of these oscillations together with
the indication in one or tvo cases of a 1uave of activity• moving
along the root (section V.Jb) suggest possible feedback control and

VI.1.
-73-
comrr.unicatfon processes hivherto unsuspected in Dlant systems.
, VI&2 Further Discussion of Feedback Processes in LiVing Systems;;
, Many self r;8gulating processes emp.J-oying negative feedback, . ' ,
are now recogn:Lsed in the higher animals (Wiener 194.S; Walter 195.3).
E?Camples of' these a:c·e the 'control -or' body temperature, balance;
blood pressure, and :the co2 concentratio:n in the blood. These.are
all ;ontrolled autor;i_atically without conscious effort; ,the controlled , I I \ ~
state being described as homeosta:sis; P.nother ex3.rmle of unconscious . ' ' ' .
control occurs in the coordination of muscular movement, effected also
by negative feedback (Eccles 1953) .. ,
Walter· (1953) rightly str~s~es the importance of.homeostasis to ..
the higher animals." H~ coi:-s~ders ,tl1;a t tpe. dev~lopment of internal
processes wh~ch autom<l;tically compensate f~r enviro:ncieptal and . .
0ther flvctuations has been a necessary :'actor in the survival of
, the mammals •. Because in man nart'icule.rl:v :'this control is achieved j. t.i ' •
in the lower brain· wi th~ut 'conscious effort~ the main part of the
.brain is kept ~ree for other ftmct~ons including the development of
mind ..
·or course there.are innumerable examples of feedback processes
requiring conscious effort. For jnstance, wh~n a pencil is to be
picked up, an E)rror signal ( vhe separation of hand 'and 'pencil) is
fed back to the brain via the eye and this results in the approp~iate
muscular move1nent.
Although these feedback processes in man are usually adjusted to
-74-
·achieve positive control, occasionally overcorrection occurs, resulting
in loss of cor.trol and oscillatory behavior.
For- exam:;ile, _the balance controls. acting in an unfamiliar
situation,.may introduce too hi'gh a feedback loop .gain (a child
learning to ride -a bicycle 'wobbles•·) • Fo~ a person with the
disease known as 1 purpose tremor 1 ~he feedbaclr :::irocess employed
in re.aching to pick' up an object is overcor:rected and the hand
moves up and do\-m in an irncon~~olled oscillation. (Wiener 1948).
Recently Cherry, Sayers and i-1arland (1955) r~ported that stammering . . .
could be aimost .enth'ely suppre~se.d, · eve·n· in bad .~ases,: _if the_ subject
were prevented from hearing 1:1~at !J.e. was" saying.· This can be
interpreted' in terms of a ~eedback process. In norma~ individuals,
. speech ':ls subject. to· feedback control through the ear (we "tend to . .
shout when wearing. earphone's)" In stanm1erers the feedback appears
to pe too great (the starnrr1e~ing being a' form of unco~trolled
oscillation) and normal speech requires the suppression or reduction
of aural feedback.
In vieu of the .widespread occurrence of ,feedback controlled processes·
in the higher animals, from which great' benefit is d~rived, it is to be
expected that plants and the lower animals lacking nervous systems would
have qeveloped rudimentary feedback mechanisms in their struggle for
survival which would perm~t so~e regulation of their own development
•and some compensation for. environmental changes. Yet hardly any
evidence for this has been put forward. Walter (personal comn'unica tion)
has pointed out that in mechanisms of control surprisingly few valid
--
-75-
analogies have been found between plants and animals0
One case in which feedback control [Jrobably is involved is the
tropic respo~~e of plants. ~or example, in phototropism, unilateral
illumination of a shoot tip causes bending as a result of unequal
growth on the two sides of the shoot in the elongating region
several millimetres below the tiR• Schrank's experiments (see for
example Backus and Schrank 1952) suggest that a transverse electric
ootential difference is established in the shoot by unilateral
light and this modifies the diffusion of auxin from the tip to the
elongating region. Si~ilar mechanisms are possible in geotropism
and other tropic response~.
It is of interest to consider what happens when a root,w;hich is
grouing .vertically because of geotropism,encounters an obstacle.
It is not lrnoi,.m hou the inf orrna tion that the root ca.n no longer grow
vertically is transmltted from the tip to.the elongating region.
Although the mechanism has had little study, the root's behavior
does not suggest that the bending stimulus :is due merely to the
transrniss~on of mechanical stresses within the root~
· The suggestion from V .3e that electric oscillation often accompanies
tip pressure might provide an explanation of this behavior. If the
geotropic response is indeed controlled by negative feedback processes
involving the bioelectric field, then tip pressure frequently would
appear to upset the f eeclback loop in some way causing the system
to become unstable and oscillate. As a result of tliis the ,geot::-oT?_ic _
e
e
e
VL2
-76-
response would be tenporally suspended and the root tip free to make
ex9loratory movements and so 11feel its way around the obstacle 11 •
Although there is little evidence to support these speculations
it is of interest to note that almost exactly the same procedure was
incorporated in Tlalter's (1953) mechanical 'imitation 1 of a living
system to suppress temporally its phototropic response uhen it
encountered an obstacle.
VI~3 Pro~osals for Further Investigation.
It is now -pro~osed to discuss some problems which have e.risen in
the present investigation on which further uork is planned. ·
It is proposed to study further the electric oscillations of plant
roots in the ho?e of finding definitely whether they are due to an
overcorrected feedback system, and if so uhat sequence of processes
com'?rises the feedback loop9 If periodic changes in the electric
resistances o.f the plant 1 s outer meI!lbranes are involved it should be
'.JOSsihle to detect these by t::iassing a current from an external source
through the root~ ~o rhythmic oscillation of rate or elongation
has been found which correlates with the five minute electric rhythms ..
It is nevertheless possible that sl'nall lateral movements of the root, tip
occur with this period. If so they should be detectable with a
modified' version of the gro>rth meter described in V&2b~ At this stage it
is difficult to see uhat other processes possible involved in the feedback
loop (such as movement of auxin) would shou changes uhich could be
detected if the periods of variation were as short as five rninutese
VI~J.
-77-
It is also proposed to study the bioelectric pattern of roots and
shoots not immersed in a bulk liquid medium~ In prelim~nary ·
experiments, measurements have been made on roots coated with a thin
' uniform sheath of water. ?:he water uas flowing continuously to avoid
the effects of stagnati.on described in II.2aa .This has been achieved
by de~osi ting on the nlot a thin layer of· short. fibres" (made by
completely disintegratipg filter paper) and the wate~ film being
maintained around the root by SU!face tension. With this tecbniq~e
the fine structure of the' potential pattern close to tne root surfac~
can be studied more easily. It is hop,ed' later to, apply it to ~mall er
structures such,a5 adventitious buds and r?ots in an early stage of
The use of one of the other new methods of ·measurement ! t ! < I
described in ~I.3 rnigh~ also be consider:ed here ..
In the near future it is also proposed to a'pply the pre~ent
tec!L~iqu6s· to the study of the effects of externally applied electric
fie1ds on ulant development. Schrank's resul~s indicating that'
electric fields induce bending should be confirme~ with a c~reful
analysis which indicates how much of the external current passes
through the root, what ions are involved and uhere the current enters .
and leaves the root·.
External fields in a variety of patterns should be applied ·to the
plant to test whether developme::-it is affected. In particular the
the effect of alternating fields with periods in the vicinity of the
natural oscillatory perj_od of the root (about 5 minutes) might be of
great interest. , One re.calls, the effect of flickering lights at
specific 1resonant 1 freque.ocies 'on epileptics (Walter 1953).

VI .. J.
-78-
·Finally there is the problem of the potential differences and
current, paths within the root .. It is h~ped to develop technique~
which are considered to be sufficiently reliable to study the
'' inter.nal bioelectric field .but this is likely. to. be postpon~d
until a later stage.
In conclusion it may be stated that the .:i_uE'.stion 11 Is the
bioelectric ·field a biological field? 11 , is still far from answered
with any certainty.,_ The result's of the work described in this
thesis provide some support for an. affirmative answe'r. '' '
'"
' ,'
' ' '
REFERENCES
Agar, W.E. (1934)
·~ Backus, G.E. and Schrank A.R~ (1952)
"A contribution to the theory of the living Organism".
:Melbourne Uni. Press
Electrical and Curvature responses of the Avena Coleoptile.
Plant Physiol, 27, 251
Bennett-Clark 'T .A. and Ball N~G~ The Diagestropic Beha,vior of PJlizomes (1951) J. Exp. Bot. 2, 169.
Blinks, L.R. (1930)
Blinks,· L.~. (1933)
Blinks, LeR~ (1949)
Bluh O and Scott B.I.H~ (1950)
Briggs, L.J. (1926)
Briggs, G.E~ and Robertson R.~. (1948)
Brmm, F.A., Benn.ett ]'~.F. and Hebb H.F. (1943)
Bu:nning, E~ (1937)
Burr (1947)
' '
The Direct Current Resistance of Nitella
J. Gen • .?hysiol, 13, L,95.
Cold Springs Harb.Sym. Quant. Biol 1, 127.
The Source of the Bioelectric Potentials in Large Plant Cells.
Proc. Nat. Ji.cad. Sci, ~5,566.'
Vibrating Probe Eleotrometer for the Measurement of Bioelectric Potentials.
Rev~ Sci. Inst, 21, 867.
Electroculture
U ~S. De'pt. Agric. Bull, 1379.
Diffusion and ·Absorption in Disks of Plant Tissue
New Phitologist, 47, 265e
Persistent daily and tidal rhythms of 02- consumption in fiddler crabs.
Je Cell~ Comp. Physiol, 44, 477~
Bio-Electrische Potentiale der Pflanzon
Tabulae Biologica£, 14, 51.
~ield Theory in Biology
Sci. Monthly, 64, 217.
REFEREmES (cont) .
Burton, .c . (1939)
Cherry, E.C, Sayers B.M. and I,~rland P.1'!. (1955)
Crane, E.E . (1950)
(1880)
(1938)
Doyer L.O . (1915)
Eccles, J .C. (1953)
Galvani, L. (1791)
The Properties of the Steady State compared to those of Equilibrium as shown in Characteristic Biological Behavior .
J. Cell . Comp . Physiol, 14, 327 .
Ex~eriments in the ComJlete Suppression of Stammering.
Nature 176, 874.
Bioelectric Potentials , their Maintenance and Function.
p . 85 in Butler and Randall eds. 11 Progress in Biophysics", Butterw;-rthSpringer Ltd., London.
Bioelectric Measurements
p. 283 of Uber et al 11Biophysical Research Methods" . Interscience "Publishers Inc. N.Y.
11 Tlie Power of Movement in Plants".
London: Murray.
On the mechanism of periodic movements of variation.
Ree • Trav . Bot • Ne'er 1, 3 5, 7 58.
Energie-Unsetzungen Wtthrend der von Weizenkornern . /
Ree . Trav . Jot . 1eerl, 12, 369.
"The leurophysiological Basis of ind11
Clarendon Press .
11Comreentary on the Effects of Electricity on huscular Motion" .
trans . by M. Foley, Bundy Library, Connecticut.

--
REFL-rn.ENCES ( cop.t)
Hobe:r, R ·and Collaborators (1947) "Physical Chemistry of Cells and Tissues"~
· Churchill, London.
Hope, A.B. (1951) r~embrane .?otential Differences in Bean
, . Hope, ~ll.B. (1953)
·Huxley, J.S. and De Beer, G.R. (1934)'
"Idle·, D.B. (1955)
Kle~tmah, ·N. (1949)
- Kogl, E. (1933)
Koningsberger,. V .J. (-1922)
Kostychev (1927)
Landahl, H.B~ (1955)' .
. '
Lund, E.J. and Kenyon W .A. (1927)
Roots.
Aust. J.Sci. Res. B', 4, 265.
Sal~ Uptake.by Root Tissue Cytoplasm: the Relation between Uptake and External.Concentration.
Aust. J. Bi.ol Sci., 6, 396 .•
"The Elements of Experimental Embryology11 •
. Cambridge. Uni. Press. ·
·- An· AuxE+nometer for Isolated Plant Sections
Nature, 176, 778.
Biologic~l R.~ythms and Cycles
~hysiol Rev.·., 29, 1.
Uber Auxins·
Angew. Chem, 46·, 469.
Tropisms and Hachstwn,.
Ree. d •. Trav. Bot. N~rl, 19, l~
. "Plant B.espiration" ·
" Trans :Lyon C .J. P. Blakiston 1 s ·son and Co, Philadelphia .• -
Note on the Periodic Properties of Biochemical Systems. Represented by Linear Equations·.
Bull. 1fa th. Biophys. 17, 127.
Relation between- Continuous Bio.electric Currents and Cell Respiration I. Electric Correlation fotentials in Growing Root Tips.
J. Exp. Zool., 48, 333.
Schrank, A.R and Backus G.E. (1951)
The Relati9nships of Auxin to Electrically induced Growth responses in the Ayeria Coleoptile.
J. Cell •. Comp. Physiol, 38, 361.
Scott,. B.I.H., l~fcP..ulay, .A.L. and_ Jeyes, P. (1955) Correlation between the Electric Current
generated by a Bean Root growing in
Teorell, T. (1935}
.',
Thimann, K.V .- (1949) -
Thomas, J.B. (1939)
Volta, .!l.. (1800)
Walter, W. Grey (1953)
Went, F.W. -(1932)
Wiegand, O.F. and Schrank A.R. (1955)
Wiener, N. (1948)
Water and the Rate of Elongation of the Root.
Aust. J. Biol. Sci. 8, 36.
~n attempt to formulate a quantitative the~ry of membrane permeability.
Proc. Soc •. Exp. Biol. N.Y.; 33,' 282 •
Plant Growth Hormones, p. 61 ill·Parpart _ed. 11.The Chemistry and Physiology of . Growth11
Princeton Uni. Press.
Electrical control of polarity in ?lants.
Ree. Trav. Bot. Neerl, 36, 373.
110n the ele'ctricity excited by the mere contact of conducting substances of different kinds 11 •
Phil. Trans. 2. 'Trans Aus. J.Phys 13, 397 (1945}
"The Living Brain11 ,
Duckworth, London.
Enie botanische Polaristatstheorie,
Jahrb. Hiss. Bot, 76; 528.
Curvature Res'.Jonses of Electrically. Stimulated Avena Coleoptile to 3-lAA
Arch Bi9chem.and.Biophys., 56, 459. 11Cyberrieticsn, Wiley, N.Y.,
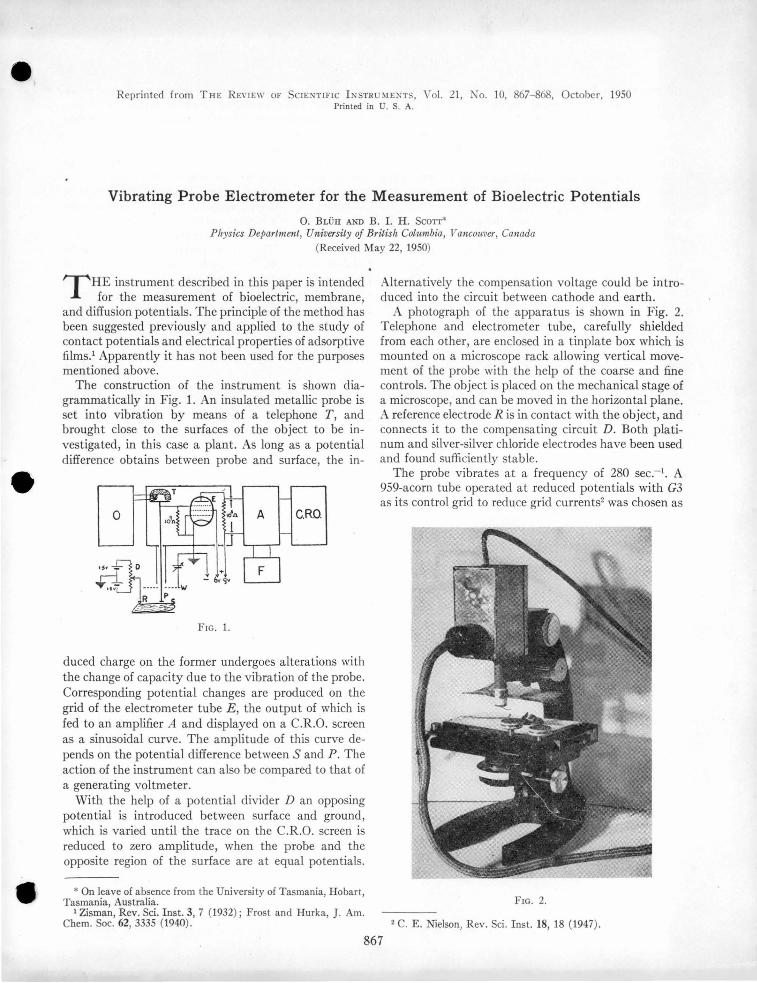
• Reprinted from TH E REVIEW OF CIENTIF!C I NSTR UME NT , Vol. 21, No. 10, 867- 868, October, 1950 Printed in U. S. A.
Vibrating Probe Electrometer for the Measurement of Bioelectric Potentials
0. BLUR AND B. I. H. SCOTT* Physics Department, University of British Columbia, Vancouver, Canada
(Received fay 22, 1950)
T HE instrument described in this paper is intended for the measurement of bioelectric, membrane,
and diffusion potentials. The principle of the method has been suggested previously and applied to the study of contact potentials and electrical properties of adsorptive .films.1 Apparently it has not been used for the purposes mentioned above.
The construction of the instrument is shown diagrammatically in Fig. 1. An insulated metallic probe is set into vibration by means of a telephone T, and brought close to the surfaces of the object to be investigated, in this case a plant. As long as a potential difference obtains between probe and surface, the in-
F1G. 1.
duced charge on the former undergoes alterations with the change of capacity due to the vibration of the probe. Corresponding potential changes are produced on the grid of the electrometer tube E, the output of which is fed to an amplifier A and displayed on a C.R.O. screen as a sinusoidal curve. The amplitude of this curve depends on the potential difference between Sand P. The action of the instrument can also be compared to that of a generating voltmeter.
With the help of a potential divider D an opposing potential is introduced between surface and ground, which is varied until the trace on the C.R.O. screen is reduced to zero amplitude, when the probe and the opposite region of the surface are at equal potentials.
* On leave of absence from the University of Tasmania, Hobart, Tasmania, Australia.
1 Zisman, Rev. Sci. Inst. 3, 7 (1932); Frost and Hurka, ]. Am. Chem. Soc. 62, 3335 (1940).
Alternatively the compensation voltage could be introduced into the circuit between cathode and earth.
A photograph of the apparatus is shown in Fig. 2. Telephone and electrometer tube, carefully shielded from each other, are enclosed in a tinplate box which is mounted on a microscope rack allowing vertical movement of the probe with the help of the coarse and fine controls. The object is placed on the mechanical stage of a microscope, and can be moved in the horizontal plane. A reference electrode R is in contact with the object, and connects it to the compensating circuit D. Both platinum and silver-silver chloride electrodes have been used and found sufficiently stable.
The probe vibrates at a frequency of 280 sec.- 1• A 959-acorn tube operated at reduced potentials with G3 as its control grid to reduce grid currents2 was chosen as
FIG. 2.
2 C. E. ielson, Rev. Sci . Inst. 18, 18 (1947).
867
868 0. BLUI-I AND B. I. H. SCOTT
ele'...trometer tube. The amplifier A is a three-stage battery operated General Radio Company Model 1231-A.3 A parallel antiresonant filter F tuned to 280 sec.-1 i used to reduce the noise level and 60 sec.-1
alternating current interference. The object is shielded with wire gauze W to reduce a.c. pick-up.
One of the main advantages of the in trument is the possibility of using a.c. amplification. Further, since the probe does not make contact with the surface, no galvanic current is drawn from the source of potential and no diffusion potentials are introduced, as by the use of conventional electrodes. The possibility of producing injury potentials through the mechanical contact between electrode and object also does not ii.rise. The use
3 The amplifier has been placed at the disposal of one of us (O.B.) by the ational Research Council of Canada in connection with another research problem.
of the instrument is, of course, limited to surface measurements. The vibrating probe electrometer can be used for the investigation of resting potentials and their slow changes in time (growth, external influences), or for the study of the electric potential distribution across an extended surface; it could also be adapted for the measurement of action potentials. With the present arrangement and a probe area 2-mm2 readings could be obtained only within 2- 3 mv. It is hoped that the noise level can be still further reduced with more adequate shielding, and by using an electrometer tube of lower input capacity. This would permit the use of smaller
. probes, and even microprobes for the mapping of microscopic electrical structures. The instrument has been used in preliminary experiments for the mapping of surface potentials of various plant materials, and the observation of diffusion processes in ionic solutions.
Reprinted from the
AUSTRALIAN JOURNAL OF BIOLOGICAL SCIENCES VOLUME 8, NUMBER 1, PAGES 36-46, 1955
CORRELATION BETWEEN THE ELECTRIC CURRENT GENERATED BY A BEAN ROOT GROWING IN WATER
AND THE RATE OF ELONGATION OF THE ROOT
By B. I. H. ScoTT, A. L. McAULEY, and PAULINE JEYES
Reprinted from the
AUSTRALIAN JOURNAL OF BIOLOGICAL SCIENCES
VCLUME 8, NUMBER l , PAGES 36-46, 1955
CORRELATION BETWEEN THE ELECTRIC CURRENT GENERATED BY A BEAN ROOT GROWING IN WATER
AND THE RATE OF ELONGATION OF THE ROOT
By B. I. H. Scorr, A. L. MCAULEY, and PAULINE JEYES
Reprinted from the Australian Journal of Biological Sciences Vol. 8, No. 1, pp. 36-46, 1955
CORRELATION BETWEEN THE ELECTRIC CURRENT GENERATED BY A BEAN ROOT GROWING IN WATER AND THE RATE OF
ELONGATION OF THE ROOT
By B. I. H. Scorr,0 A. L. McAULAY,° and PAULINE }EYES"
[Manuscript received September 6, 1954]
Summary
Methods of measurement of the electric fields produced by plants have been developed which eliminate arlefacts commonly present in such investigations.
The normal potential pattern in the water surrounding actively growing bean roots is described.
When rates of elongation of roots are controlled by two methods which produce very different types of overall metabolic change, the potential pattern is shown to be correlated with the rate of elongation.
Values are given of the electric power dissipated in water in which a bean root is growing, and of the current generated by the root in the water.
I. INTRODUCTION
Experiments made here and elsewhere show clearly that electric potentials measured on the surface of plant organs depend on a number of causes. In addition to those due to the plant itself when in its normal steady statP. of metabolism, there are a number of other sources of potential difference, some of them generated by the plant itself owing to treatment it receives during measurement, and others introduced from outside.
In this paper a new approach is made to the problem of the bioelectric phenomena associated with plant metabolism. The effect of the process of measurement on the observations made is entirely eliminated by measuring the potential fall down currents produced by the plant in an external medium.
When a bean root grows actively in aerated water it generates an electromotive force which passes current through the water. This paper describes measurements which have been made of the ohmic potential differences due to these currents in the water adjacent to the root. The pattern of these potentials is characteristic and reproducible when the root is growing strongly.
The paper further describes experiments in which the growth of the root has been controlled and in which a correlation has been found between the change in potential and the rate of elongation.
By addition of auxin of suitable concentration to the bath in which the root is grown, it is possible to arrest growth and observe the change in potential pattern. This process proves to be reversible, as removal of the auxin allows the plant to grow again and the potential pattern to recover.
0 Department of Physics, University of Tasmania.
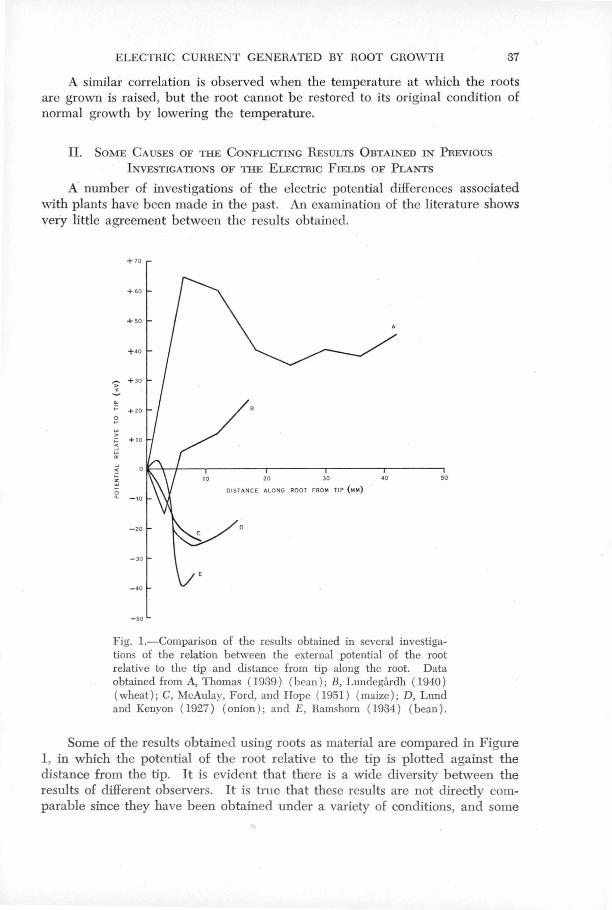
ELECTRIC CURRE T GENERATED BY ROOT GROWTH 37
A similar correlation is observed when the temperature at which the roots are grown is raised, but the root cannot be restored to its original condition of normal growth by lowering the temperature.
II. SOME CAUSES OF THE CONFLICTING RESULTS 0BTAI ED IN PREVIOUS
I VESTIGATIONS OF THE ELECTRIC FIELDS OF PLANTS
A number of investigations of the electric potential differences associated with plants have been made in the past. An examination of the literature shows ver·y little agreement between the results obtained.
+ 10
+ •o
+ so
+ •o
~ + Jo ~ .. ;: +zo
- zo
- 30
-40
- so
20 JO 40 so OlST ANC E ALONG ROOT FROM TIP (MM)
Fig. !.-Comparison of the results obtained in several investigations of the relation between the external potential of the root relative to the tip and distance from tip along the root. Data obtained from A, Thomas ( 1939) (bean ); B, Lundegiirdh ( 1940) (wheat); C, McAulay, Ford, and Hope (1951 ) (maize); D, Lund and Kenyon ( 1927) (onion ); and E, Ramshorn (1934) (bean) .
Some of the results obtained using roots as material are compared in Figure 1, in which the potential of the root relative to the tip is plotted against the distance from the tip. It is evident that there is a wide diversity between the results of different observers. It is true that these results are not directly comparable since they have been obtained under a variety of conditions, and some
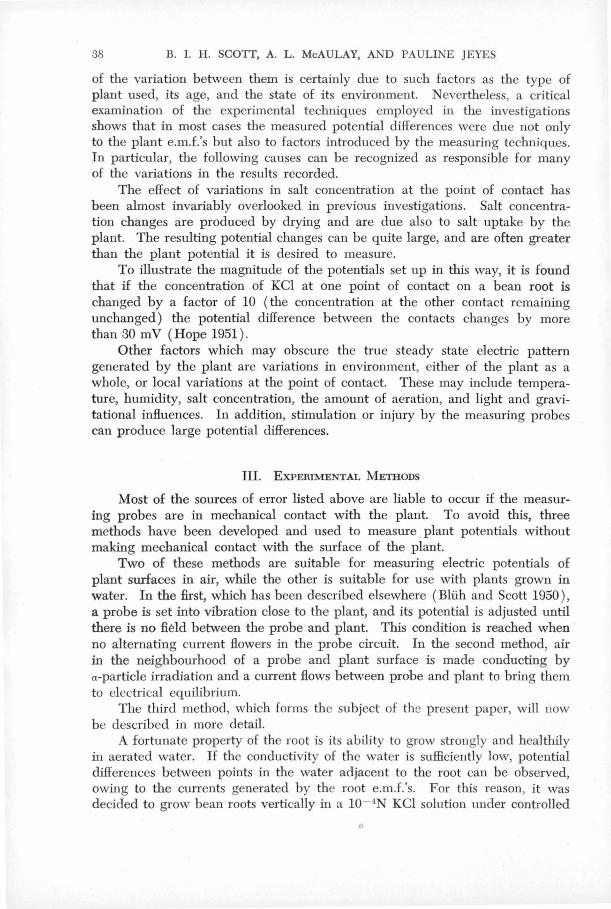
38 B. I. H. SCOTT, A. L. McAULAY, A D PAULINE }EYES
of the variation between them is certainly due to such factors as the type of plant used, its age, and the state of its environment. Nevertheless, a critical examination of the experimental techniques employed in the investigations shows that in most cases the measured potential differences were due not only to the plant e.m.f.'s but also to factors introduced by the measuring techniques. In particular, the following causes can be recognized as responsible for many of the variations in the results recorded.
The effect of variations in salt concentration at the point of contact has been almost invariably overlooked in previous investigations. Salt concentration changes are produced by drying and are due also to salt uptake by the plant. The resulting potential changes can be quite large, and are often greater than the plant potential it is desired to measure.
To illustrate the magnitude of the potentials set up in this way, it is found that if the concentration of KCl at one point of contact on a bean root is changed by a factor of 10 (the concentration at the other contact remaining unchanged) the potential difference between the contacts changes by more than 30 m V (Hope 1951 ) .
Other factors which may obscure the true steady state electric pattern generated by the plant are variations in environment, either of the plant as a whole, or local variations at the point of contact. These may include temperature, humidity, salt concentration, the amount of aeration, and light and gravitational influences. In addition, stimulation or injury by the measuring probes can produce large potential differences.
III. EXPERIME TAL METIIODS
Most of the sources of error listed above are liable to occur if the measuring probes are in mechanical contact with the plant. To avoid this, three methods have been developed and used to measure plant potentials without making mechanical contact with the surface of the plant.
Two of these methods are suitable for measuring electric potentials of plant surfaces in air, while the other is suitable for use with plants grown in water . In the first, which has been described elsewhere ( Bhih and Scott 1950 ), a probe is set into vibration close to the plant, and its potential is adjusted until there is no £~ld between the probe and plant. This condition is reached when no alternating current flowers in the probe circuit. In the second method, air in the neighbourhood of a probe and plant surface is made conducting by a-particle irradiation and a current flows between probe and plant to bring them to electrical equilibrium.
The third method, which forms the subject of the present paper, will now be described in more detail.
A fortunate property of the root is its ability to grow strongly and healthily in aerated water. If the conductivity of the water is sufficiently low, potential differences b etween points in the water adjacent to the root can be observed, owing to the currents generated by the root e.m.f.'s . For this reason, it was decided to grow bean roots vertically in a 10- 4N KCl solution under controlled
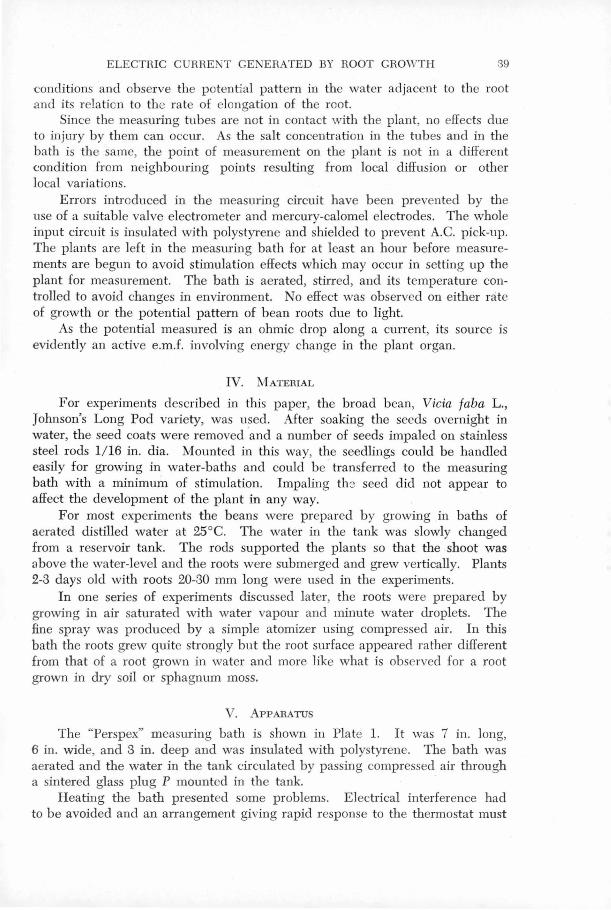
ELECTRIC C RRENT GENERATED BY HOOT GROWTH 39
conditions and observe the potential pattern in the water adjacent to the root and its relation to the rate of elongation of the root.
Since the measuring tubes are not in contact with the plant, no effects due to injury by them can occur. As the salt concentration in the tubes and in the bath is the same, the point of measurement on the plant is not in a different condition from neighbouring points resulting from local diffusion or other local variations.
Errors introduced in the measuring circuit have been prevented by the use of a suitable valve electrometer and mercury-calomel electrodes. The whole input circuit is insulated with polystyrene and shielded to prevent A.C. pick-up. The plants are left in the measuring bath for at least an hour before measurements are begun to avoid stimulation effects which may occur in setting up the plant for measurement. The bath is aerated, stirred, and its temperature controlled to avoid changes in environment. No effect was observed on either rate of growth or the potential pattern of bean roots due to light.
As the potential measured is an ohmic drop along a current, its source is evidently an active e.m.f. involving energy change in the plan t organ.
IV. MATERIAL
For experiments described in this paper, the broad bean, Vicia faba L., Johnson's Long Pod variety, was used. After soaking the seeds overnight in water, the seed coats were removed ·and a number of seeds impaled on stainless steel rods 1/16 in. dia. Mounted in this way, the seedlings could be handled easily for growing in water-baths and could be · transferred to the measuring bath with a minimum of stimulation. Impaling the seed did not appear to affect the development of the plant in any way.
For most experiments the beans were prepared by growing in baths of aerated distilled water at 25°C. The water in the tank was slowly changed from a reservoir tank. The rods supported the plants so that the shoot was above the water-level and the roots were submerged and grew vertically. Plants 2-3 days old with roots 20-30 mm long were used in the experiments .
In one series of experiments discussed later, the roots were prepared by growing in air saturated with water vapour and minute water droplets. The fine spray was produced by a simple atomizer using compressed air. In this bath the roots grew quite strongly but the root surface appeared rather different from that of a root grown in water and more like what is observed for a root grown in dry soil or sphagnum moss.
v. APPARATUS
The "Perspex" measming bath is shown in Plate l. It was 7 in. long, 6 in. wide, and 3 in. deep and was insulated with polystyrene. The bath was aerated and the water in the tank circulated by passing compressed air through a sintered glass plug P mounted in the tank.
Heating the bath presented some problems . Electrical interference had to be avoided and an arrangement giving rapid response to the thermostat must
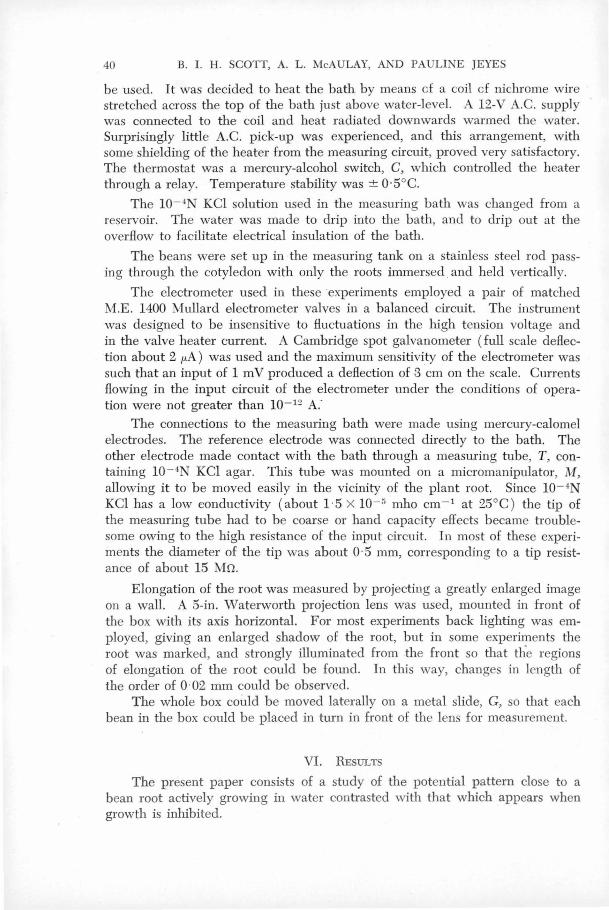
40 B. I. H. SCOTT, A. L. McAULAY, A.J'\ID PAULI 1E JEYES
be used. It was decided to heat the bath, by means cf a coil cf nichrome wire stretched across the top of the bath just above water-level. A 12-V A.C. supply was connected to the coil and heat radiated downwards warmed the water. Surprisingly little A.C. pick-up was experienced, and this arrangement, with some shielding of the heater from the measuring circuit, proved very satisfactory. The thermostat was a mercury-alcohol switch, C, which controlled the heater through a relay. Temperature stability was ± 0 ·5°C.
The 10- 4 KCl solution used in the measuring bath was changed from a reservoir. The water was made to drip into the bath, and to drip out at the overflow to facilitate elech·ical insulation of the bath.
The beans were set up in the measuring tank on a stainless steel rod pa sing through the cotyledon with only the roots immersed . and held vertically.
The electrometer used in these experiments employed a pair of matched M.E. 1400 Mullard electrometer valves in a balanced circuit. The instrument was designed to be insensitive to fluctuations in the high tension voltage and in the valve heater current. A Cambridge spot galvanometer (full scale deflection about 2 µ.A) was used and the maximum sensitivity of the electrometer was such that an input of 1 mV produced a deflection of 3 cm on the scale. Currents flowing in the input circuit of the electrometer under the conditions of operation were not greater than 10- 12 A:
The connections to the measuring bath were made using mercury-calomel electrodes. The reference electrode was connected directly to the bath. The other electrode made contact with the bath through a measw·ing tube, T, containing l0 - 4N KCI agar. This tube was mounted on a micromanipulator, M, allowing it to be moved easily in the vicinity of the plant root. Since 10- 4N KCl has a low conductivity (about 1 ·5 X 10- 5 mho cm-1 at 25°C ) the tip of the measuring tube had to be coarse or hand capacity effects became troublesome owing to the high resistance of the input circuit. In most of these experiments the diameter of the tip was about 0 · 5 mm, corresponding to a tip resistance of about 15 Mn.
Elongation of the root was measured by projecting a greatly enlarged image on a wall. A 5-in. Waterworth projection lens was used, mounted in front of the box with its axis horizontal. For most experiments back lighting was employed, giving an enlarged shadow of the root, but in some experiments the root was marked, and strongly illuminated from .the front so that tl{e regions of elongation of the root could be found. In this way, changes in length of the order of 0 ·02 mm could be observed.
The whole box could be moved laterally on a metal slide, G, so that each bean in the box could be placed in turn in front of the lens for measurement.
VI. RESULTS
The present paper consists of a study of the potential pattern close to a bean root actively growing in water contrasted with that which appears when growth is inhibited.
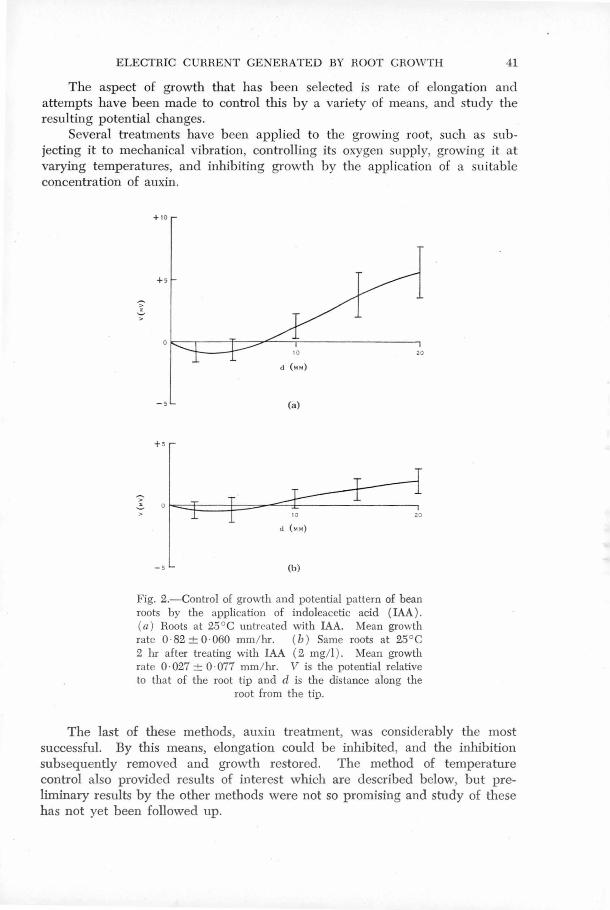
ELECTRIC CURRENT GENERATED BY ROOT GROWTH 41
The aspect of growth that has been selected is rate of elongation and attempts have been made to control this by a variety of means, and study the resulting potential changes.
Several treatments have been applied to the growing root, such as subjecting it to mechanical vibration, controlling its oxygen supply, growing it at varying temperatures, and inhibiting growth by the application of a suitable concentration of auxin.
> . ~
>
> . >
+ 10
+ s
- s
+ s
- 5
(a)
10 zo
(b)
Fig. 2.-Control of growth and potential pattern of bean roots by the application of indoleacetic acid ( IAA). (a ) Roots at 25°C untreated with IAA. Mean growth rate 0 ·82 ± 0·060 mm / hr. (b) Same roots at 25° C 2 hr after treating with IAA ( 2 mg/ I ) . Mean growth rate 0 · 027 ± 0 · 077 mm/ hr. V is the potential relative to that of the root tip and d is the distance along the
root from the tip.
The last of these methods, auxin treatment, was considerably the most successful. By this means, elongation could be inhibited, and the inhibition subsequently removed and growth restored. The method of temperature control also provided results of interest which are described below, but preliminary results by the other methods were not so promising and study of these has not yet been followed up.
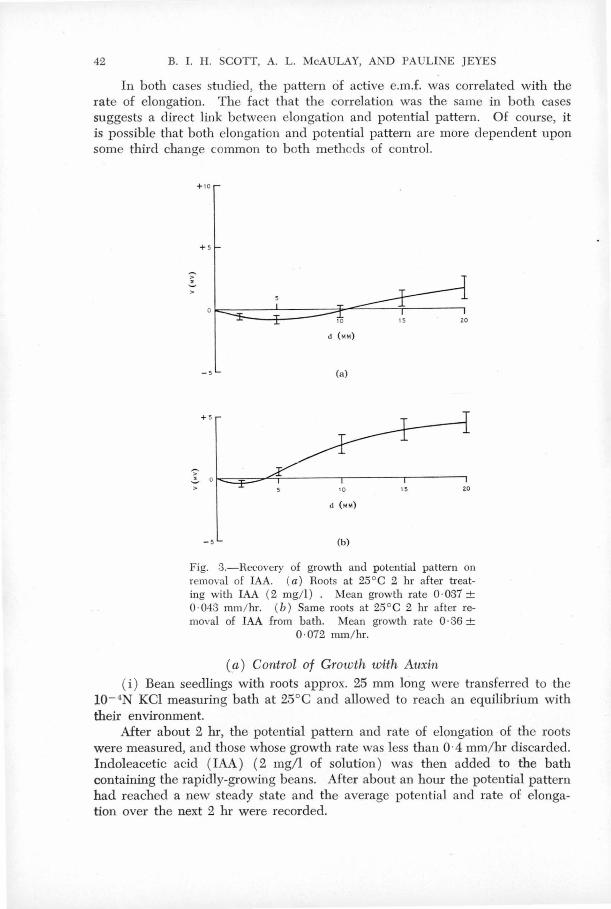
42 B. I. H. SCOTT, A. L. McAULAY, AND PAULINE )EYES
In both cases studied, the pattern of active e.m.f. was correlated with the rate of elongation. The fact that the correlation was the same in both cases suggests a direct link between elongation and potential pattern. Of course, it is possible that both elongation and potential pattern are more dependent upon some third change common to both methcds of control.
~
> . ~
>
+ s
- s
+ s
- s
10
d (MM)
(a)
IQ IS zo
d ( MM)
(b)
Fig. 3.-Hecovery of growth and potential pattern on removal of IAA. (a) Roots at 25°C 2 hr after treating with !AA (2 mg/ l) . Mean growth rate 0·037 ± 0 · 043 mm / hr. ( b) Same roots at 25°C 2 hr after removal of !AA from bath. Mean growth rate 0 ·36 ±
0 ·072 rnm/hr.
(a) Control of Growth with Auxin ( i ) Bean seedlings with roots approx. 25 mm long were transferred to the
I0- 4N KCl measuring bath at 25°C and allowed to reach an equilibrium with their environment.
After about 2 hr, the potential pattern and rate of elongation of the roots were measured, and those whose growth rate was less than 0-4 mm/hr discarded. lndoleacetic acid ( IAA) ( 2 mg/l of solution) was then added to the bath containing the rapidly-growing beans. After about an hour the potential pattern had reached a new steady state and the average potential and rate of elongation over the next 2 hr were recorded.
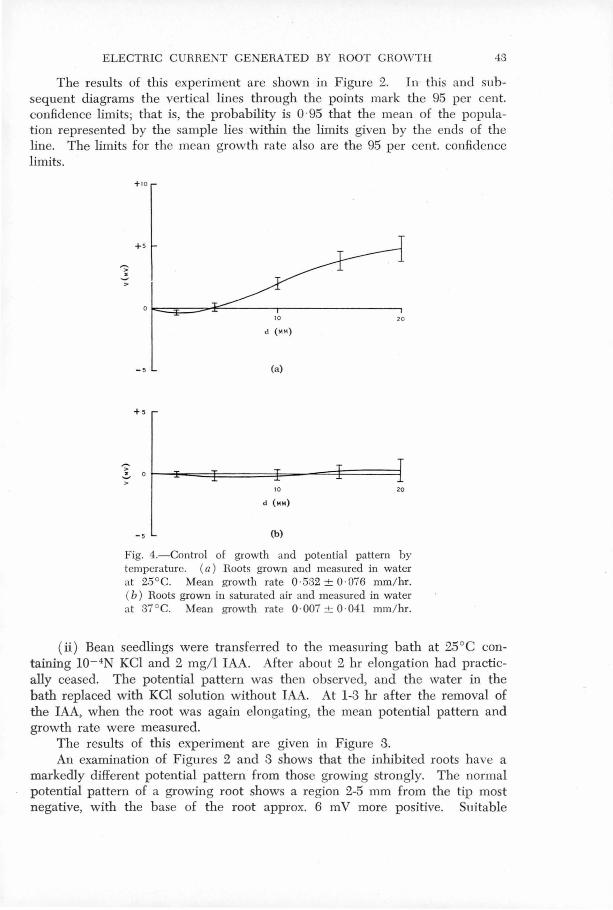
ELECTRIC CURHENT GE ERATED BY HOOT GHOWTII 43
The results of this experiment are shown in Figure 2. In· this and subsequent diagrams the vertical lines through the points mark the 95 per cent. confidence limits; that is, the probability is 0 ·95 that the mean of the population represented by the sample lies within the limits given by the ends of the line. The limits for the mean growth rate also are the 95 per cent. confidence limits.
+ 10
+ 5
~
~ >
10 20
d (MM)
- 5 (a)
+ >
~
,!, 0
> 10 20
d (MM)
- 5 (b)
Fig. 4.-Control of growth and potential pattern by temperatme. (a) Roots grown and measured in water at 25°C. Mean growth rate 0·532 ± 0 ·076 mm/hr. ( b ) Roots grown in saturated air and measured in water at 37°C. Mean growth rate 0·007 ± 0 ·041 mm/hr.
(ii) Bean seedlings were transferred to the measuring bath at 25°C containing 10-4N KCl and 2 mg/ l IAA. After abou t 2 hr elongation had practically ceased. The potential pattern was then observed, and the water in the bath replaced with KCl solution without IAA. At 1-3 hr after the removal of the IAA, when the root was again elongating, the mean potential pattern and growth rate were measured.
The results of this experiment are given in Figure 3. An examination of Figures 2 and 3 shows that the inhibited roots have a
markedly different potential pattern from those growing strongly. The normal potential pattern of a growing root shows a region 2-5 mm from the tip most negative, with the base of the root approx. 6 m V more positive. Suitable
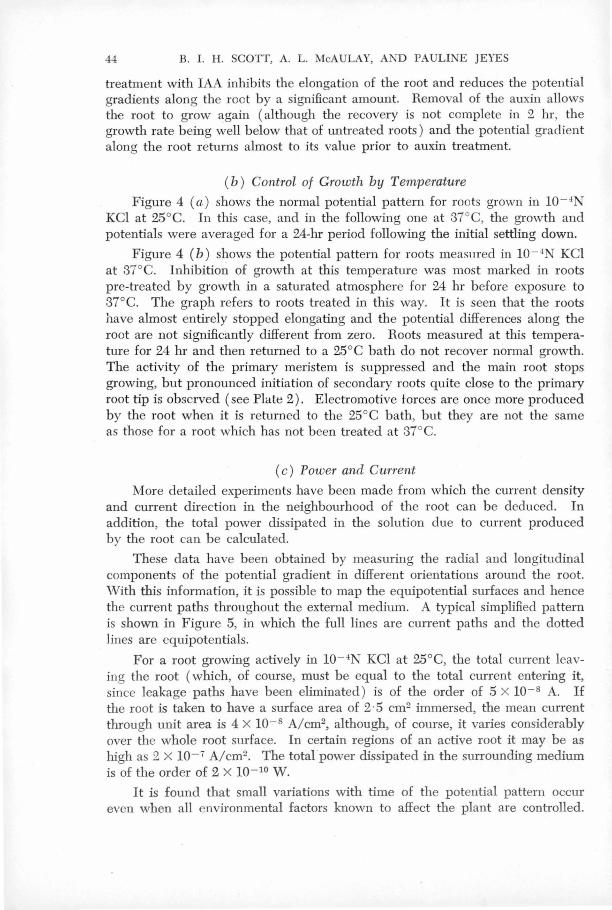
44 B. I. H. SCOTI, A. L. McAULAY, AND PAULINE )EYES
treatment with IAA inhib.its the elongation of the root and reduces the potential gradients along the root by a significant amount. Removal of the auxin allows the root to grow again (although the recovery is not complete in 2 hr, the growth rate being well below that of untreated roots ) and the potential gradient along the root returns almost to its value prior to auxin treatment.
( b ) Control of Growth by Temperature
Figure 4 (a) shows the normal potential pattern for roots grown in 10-~N KCl at 25°C. In this case, and in the following one at 37°C, the growth and potentials were averaged for a 24-hr period following the initial settling down.
Figure 4 ( b) shows the potential pattern for roots measmed in 10-~N KCl at 37°C. lnhibition of growth at this temperature was most marked in roots pre-treated by growth in a saturated atmosphere for 24 hr before exposure to 37°C. The graph refers to roots treated in this way. It is seen that the roots have almost entirely stopped elongating and the potential differences along the root are not significantly different from zero. Roots measured at this temperature for 24 hr and then returned to a 25°C bath do not recover normal growth. The activity of the primary meristem is suppressed and tl1e main root stops growing, but pronounced initiation of secondary roots quite close to the primary root tip is observed (see Plate 2). Electromotive torces are once more produced by the root when it is returned to the 25°C bath, but they are not the same as those for a root which has not been treated at 37°C.
( c) Power and Current
More detailed experiments have been made from which the current density and current direction in the neighbourhood of the root can be deduced. In addition, the total power dissipated in the solution due to current produced by the root can be calculated.
These data have been obtained by measuring the radial and longitudinal components of the potential gradient in different orientations around the root. With this information, it is possible to map the equipotential surfaces and hence the current paths throughout the external medium. A typical simplified pattern is shown in Figure 5, in which the full lines are current paths and the dotted lines are equipotentials.
For a root growing actively in l0 - 4 KCl at 25°C, the total cmrent leaving the root (which, of course, must be equal to the total current entering it, since leakage paths have been eliminated) is of the order of 5 x 10- 8 A. If tl1e root is taken to have a surface area of 2·5 cm2 immersed, the mean current through unit area is 4 x 10⁻⁸ A/cm2, although, of course, it varies considerably over tl1e whole root surface. In certain regions of an active root it may be as high as 2 x 10- 7 A/cm2 • The total power dissipated in the surrounding medium is of the order of 2 x ro-10 w.
It is found that small variations with time of the potential pattern occur even when all environmental factors known to affect the plant are controlled.
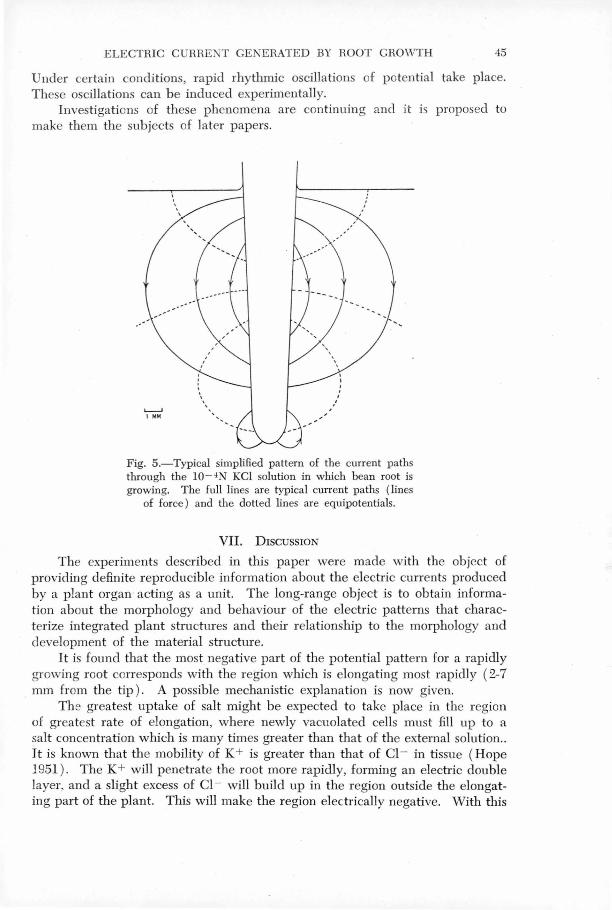
ELECTRIC CURRENT GE lERATED BY ROOT GROWTH 45
Under certain conditions, rapid rhythmic oscillations of potential take place. These oscillations can be induced experimentally.
Investigations of these phenomena are continuing and it is proposed to make them the subjects of later papers.
...___. I MM
'. . \
Fig. 5.-Typical simplified pattern of the current paths through the 1Q- 4N KC! solution in which bean root is growing. The full lines are typical current paths (lines
of force) and the dotted lines are equipotentials.
VII. DISCUSSION
The experiments described in this paper were made with the object of providing definite reproducible information about the electric currents produced by a plant organ acting as a unit. The long-range object is to obtain information about the morphology and behaviour of the electric patterns that characterize integrated plant struch1res and their relationship to the morphology and development of the material structure.
It is found that the most negative part of the potential pattern for a rapidly growing root corresponds with the region which is elongating most rapidly ( 2-7 mm from the tip ) . A possible mechanistic explanation is now given.
The greatest uptake of salt might be expected to take place in the region of greatest rate of elongation, where newly vacuolated cells must fill up to a salt concentration which is many times greater than that of the external solution .. It is known that the mobility of K + is greater than that of CJ - in tissue (Hope l 951 ). The K + will penetrate the root more rapidly, forming an electric double layer, and a slight excess of Cl- will build up in the region outside the elongating part of the plant. This will make the region electrically negative. With this
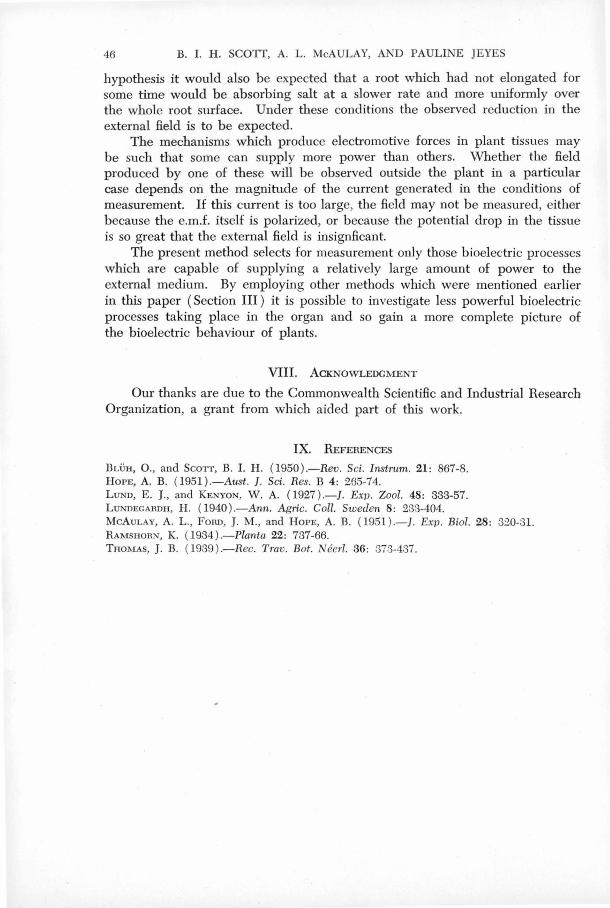
46 B. I . H. SCOTT, A. L. McAULAY, AND PAULI E ]EYES
hypothesis it would also be expected that a root which had not elongated for some time would be absorbing salt at a slower rate and more uniformly over the whole root surface. Under these conditions the observed reduction in the external field is to be expected.
The mechanisms which produce electromotive forces in plant tissues may be such that some can supply more power than others. Whether the field produced by one of these will be observed outside the plant in a particular case depends on the magnitude of the current generated in the conditions of measurement. If this current is too large, the field may not be measured, either because the e.m.f. itself is polarized, or because the potential drop in the tissue is so great that the external field is insignficant.
The present method selects for measurement only those bioelectric processes which are capable of supplying a relatively large amount of power to the external medium. By employing other methods which were mentioned earlier in this paper (Section III) it is possible to investigate less powerful bioelectric processes taking place in the organ and so gain a more complete picture of the bioelectric behaviour of plants.
VIII. ACKNOWLEDGME T
Our thanks are due to the Commonwealth Scientific and Industrial Research Organization, a grant from which aided part of this work.
IX. REFERENCES
IlLiiH, 0 ., and Scorr, B. I. H . (1950).-Rev. Sci . Instrum. 21 : 867-8. HOPE, A. B. (1951) .-Aust. ]. Sci. Res. B 4: 265-74. L UND, E . J., and KENYON, W. A. ( 1927 ) .-]. Exp. Zool. 48: 333-57. L UNDEGARDH, H . (1940).-Ann. Agric. Coll. Sweden 8: 233-404. MCAULAY, A. L ., Form, J. M., and HOPE, A. B. (1951).-J. Exp. Biol. 28 : 320-31. RAMSHOHN, K. ( 1934) .-Plan ta 22 : 737-66. TH0111As, J. B. (1939 ) .-Rec. Trav. Bot. N eerl. 36: 373-437.
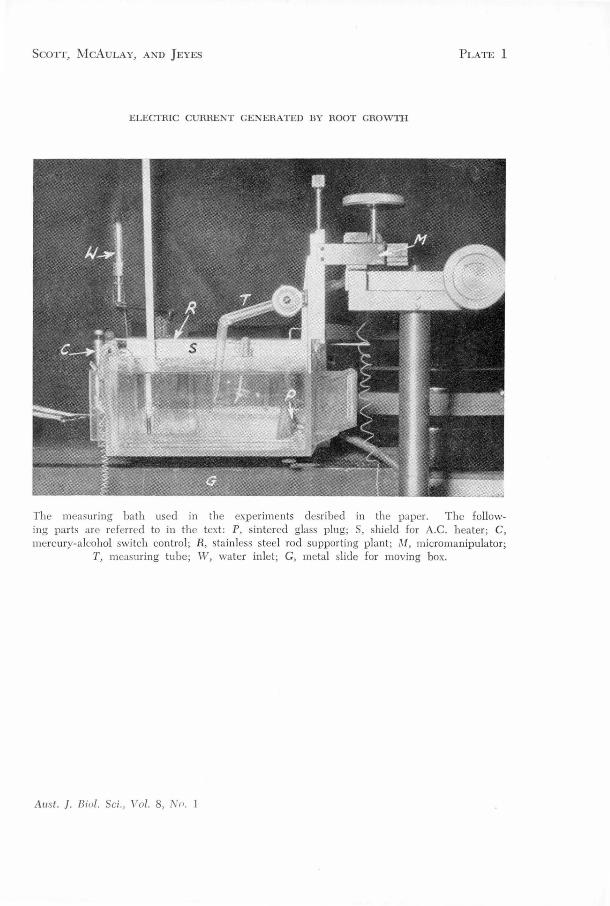
Scarr, McAULAY, AND }EYES PLATE 1
ELECrRIC CURRE ' T GENERATED BY ROOT GROWTH
The measuring bath used in the experiments desribed in the paper. The fo llowing parts are referred to in the text: P, sintered glass plug ; S, shield fo r A.C. h eater; C, mercury-alcohol switch control; R, stainless steel rod supporting plant; M, micromanipulator;
T, measming tube; W, water inle t; G, metal slide for moving box.
Aust. ]. Biol. Sci. , Vol. 8, NP. l
;:...
r:n
(')
~ 0
':-<
~~ tx
; ~
~ ('
) >
r.n
~ .. P·
>
<:
trJ
~><
~
t"'
trJ
>
(')
s ~
;l '.;;
: ....
.......,
(')
trJ
::> ('
) ><
......
q trJ
55 rJ
l
trJ z ..., ()
trJ z trJ ~ ..., trJ
tl
tJ:j >< ~
0 0 ..., ()
~
0 ~ 5J
Ab
nor
mal
sub
seq
uen
t gr
owth
of
root
s tr
eate
d fo
r 24
hr
at 3
7°C
.
Fig
. 1
.-R
oo
t on
e w
eek
afte
r tr
eatm
ent
at 3
7°C
. To
tice
la
ck
of
dev
elop
men
t of
pr
imar
y ro
ot
wit
h se
cond
ary
roo
ts
appe
arin
g qu
ite
clos
e to
p
rim
ary
tip.
F
ig.
2.-
Un
trea
ted
root
of
sam
e ag
e.

TJli ADVEllTl5ER PRINTING OFFICE, ADELAIDB.
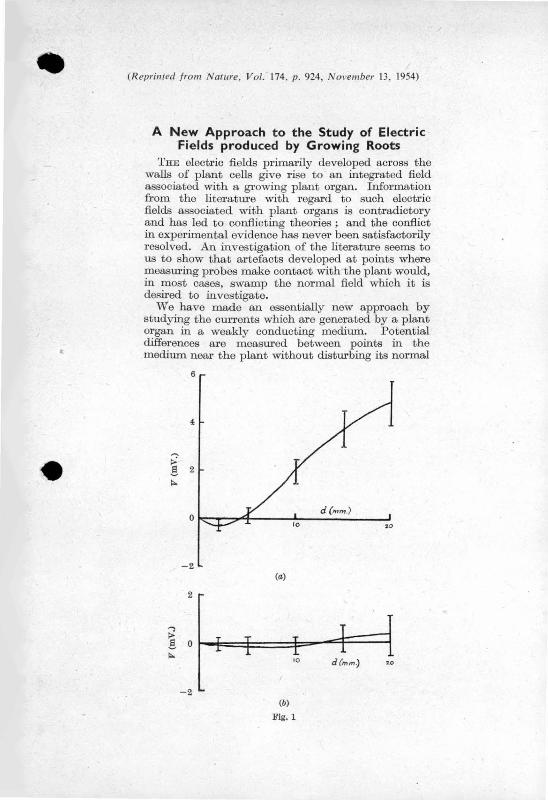
•
(Reprinted from Nature , Vol. 174, p. 924, November 13, 1954)
A New Approach to the Study of Electric Fields produced by Growing Roots
THE electric fields primarily developed across the walls of plant cells give rise to an integrated field associated with a growing plant organ. Information from the literatlll·e with regard to such electric fields associated with plant organs is contradictory and has led to conflicting theories ; and the conflict in experimental evidence has never been satisfactorily resolved. An investigation of the literature seems to us to show that artefacts developed at points where mea lll'ing probes make contact with the plant would, in most cases, swamp the normal field which it is desired to investigate.
We have made an essentially new approach by studying the currents which are generated by a plant organ in a weakly conducting medium. Potential differences are measured between points in the medium near the plant without disturbing its normal
6
4
-2 (a)
2
;;: ! 0 ;::..
10 d (mm ) •o
-2 (b)
Fig. I
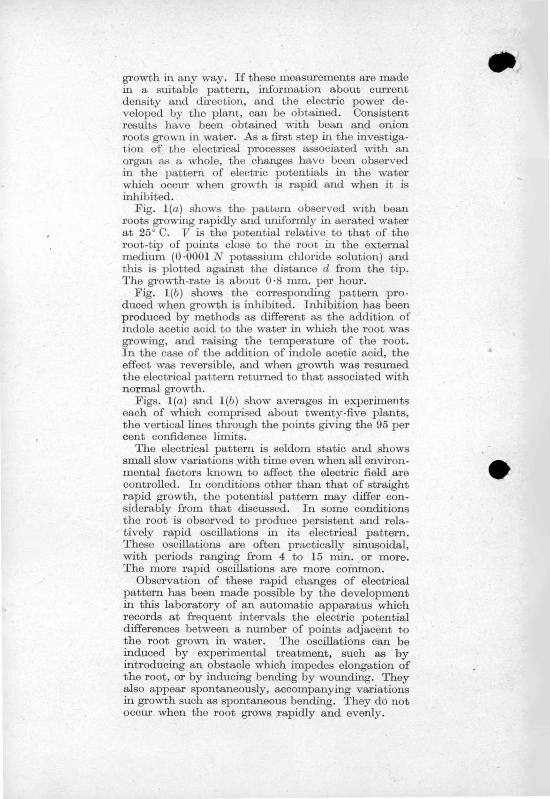
growth in any way. If these measurements are made in a suitable pattern, information about current density and direction, and the electric power developed by the plant, can be obtained. Consistent results have been obtained with bean and onion roots grown in water. As a first step in the investigation of the electrical processes associated with an organ as a whole, the changes have been observed in the pattern of electric potentials in the water which occur when growth is rapid and when it is inhibited.
Fig. l(a) shows the paLLem observed with bean roots growing rapidly and uniformly in aerated water at 25° C. V is the potential relative to that of the root-tip of points close to the root in the external medium (0·0001 N potassium chloride solution) and this is plotted against the distance d from the tip. The growth-rate is about 0·8 mm. per hour.
Fig. l(b) shows the co1Tesponding pattern produced when growth is inhibited. Inhibition has been produced by methods as different as the addition of indole acetic acid to the water in which the root was growing, and raising the temperature of the root . In the case of the addition of indole acetic acid, the effect was reversible, and when growth was resumed the electrical pattern returned to that associated with normal growth.
Figs. l(a) and l(b) show averages in e>..-perilmmts each of which comprised about twenty-five plants, the vertical lines through the points giving the 95 per cent confidence limits.
The electrical pattern is seldom static and shows small slow variations with time even when all environmental factors known to affect the electric field are controlled. In conditions other than that of straight rapid growth, the potential pattern may differ considerably from that discussed. In some conditions the root is observed to produce persistent and relatively rapid oscillations in its electrical pattern. These oscillations are often practically sinusoidal, with periods ranging from 4 to 15 min. or more. The more rapid oscillations are more common.
Observation of these rapid changes of electrical pattern has been made possible by the development in this laboratory of an automatic apparatus which records at frequent intervals the electric potential differences between a number of points adjacent to the root grown in water. The oscillations can be induced by experimental treatment, such as by introducing an obstacle which impedes elongation of the root, or by inducing bending by wounding. They also appear spontaneously, accompanying variations in growth such as spontaneous bending. They do not pccur. when the root grows rapidly and evenly.
•
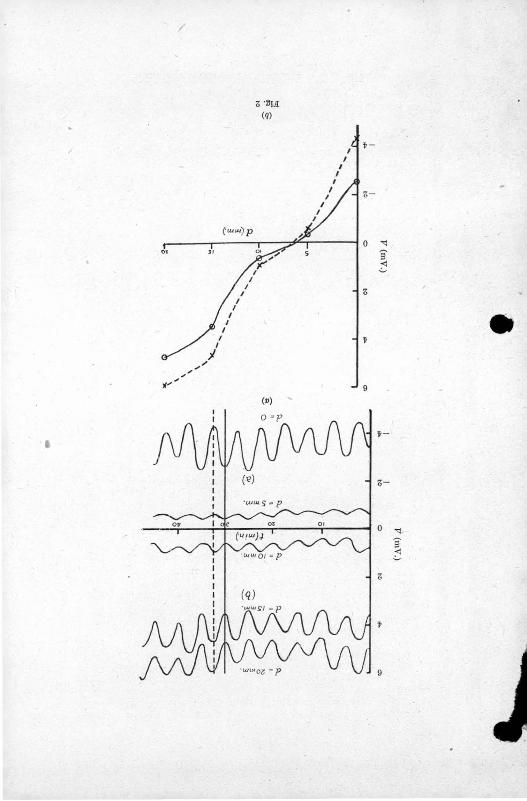
)("
•
/
" " "" "
,, I
I
;I
z •l!J.[
(q)
z-
• 9
•
Fig. 2(a) shows a graph of potential against time in a typical case where electrical oscillation accompanied bending. Each trace shows the potential V relative to a distant point in the bath plotted against time t, for a point near the root at a distance d from the root-tip. The graph shows simultaneous potentials for several values of d. Note the phase differences at a and b. Fig. 2(b) shows the corresponding graph of potential plotted against distance from the root-tip. Two traces are shown giving potentials at times corresponding to a crest and a trough of the oscillatory potential. Where the two traces cross, the phase changes by 7t.
These investigations, which are part of a general study of patterns of morphogenesis, are being con- · tinued and will be described in more detail elsewhere.
Physics Laboratory, University of Tasmania. July 8 .
A. L. MCAULAY B. I. H. SCOTT
Printed in Great Britain by Fisher, Kniaht & Co .. Ltd., St. Albans.
..