automated acoustic detection of vanellus chilensis lampronotus
TRANSCRIPT
Expert Systems with Applications 42 (2015) 6098–6111
Contents lists available at ScienceDirect
Expert Systems with Applications
journal homepage: www.elsevier .com/locate /eswa
Automated acoustic detection of Vanellus chilensis lampronotus
http://dx.doi.org/10.1016/j.eswa.2015.03.0360957-4174/� 2015 Elsevier Ltd. All rights reserved.
⇑ Corresponding author at: Department of Electronics, Technical University ofVarna, str. Studentska 1, 9010 Varna, Bulgaria. Tel.: +359 888 096974.
E-mail addresses: [email protected] (T.D. Ganchev), [email protected] (O. Jahn),[email protected] (M.I. Marques), [email protected] (J.M. de Figueiredo),[email protected] (K.-L. Schuchmann).
1 INAU Project 3.14 ‘‘Monitoring Bioindicators and Migratory Birds in the Pantanal.Applied Acoustomics – a Tool for Bio-sustainability Assessment’’, INAU Lab.3 – Biodiversity and Ecological Processes (INAU: www.inau.org.br;2011–2014) – Program CsF (www.cienciasemfronteiras.gov.br/web/csf).
Todor D. Ganchev a,b,⇑, Olaf Jahn a,c, Marinez Isaac Marques a,d, Josiel Maimone de Figueiredo e,Karl-L. Schuchmann a,c,d
a National Institute for Science and Technology in Wetlands (INAU), Science without Borders Program, Federal University of Mato Grosso (UFMT), Av. Fernando Corrêa da Costa2367, Cuiaba-MT, Brazilb Department of Electronics, Technical University of Varna, str. Studentska 1, 9010 Varna, Bulgariac Zoological Research Museum A. Koenig (ZFMK), Adenauerallee 160, 53113 Bonn, Germanyd Institute of Biosciences, UFMT, Av. Fernando Corrêa da Costa 2367, Cuiaba-MT, Brazile Institute of Computation, UFMT, Av. Fernando Corrêa da Costa 2367, Cuiaba-MT, Brazil
a r t i c l e i n f o
Article history:Available online 7 April 2015
Keywords:Computational bioacousticsAutomated acoustic detectorGMM–UBMSouthern LapwingVanellus chilensis lampronotus
a b s t r a c t
Traditional human-observer-based biological surveys are expensive. Therefore most biodiversity studiesare implemented only periodically, for short periods, and predominantly during daytime and underfavorable weather conditions. Automated data acquisition and analysis can overcome these shortcomingsand facilitate continuous monitoring. Here we report on the development of an automated acoustic rec-ognizer for Southern Lapwing Vanellus chilensis lampronotus vocalizations, a first for this species. The rec-ognizer is a species-specific information retrieval agent, which searches throughout long audiorecordings in order to detect and timestamp call events of the target species. The recognizer relies ona log-likelihood ratio estimator, based on a Gaussian Mixture Model–Universal Background Model(GMM–UBM), complemented with purposely-developed temporal post-processing that incorporatesdomain knowledge about the structure of V. chilensis vocalizations. Validation experiments with real-fieldrecordings of complex soundscapes indicate that the recognizer is sensitive enough to register V. chilensiscall events with sound levels down to �30 dB and recognition accuracy of up to 85.6%, at zero false pos-itive rates. The recognizer is considered a valuable tool for computer-assisted analysis of hourly and dailyacoustic activity of V. chilensis over extended periods of time, as it offers an indispensable support to long-term monitoring studies and conservation efforts in the Pantanal region.1
� 2015 Elsevier Ltd. All rights reserved.
1. Introduction
Birds tend to integrate a wide spectrum of ecological factors andare the best-known indicator group for the conservation and man-agement of natural resources in tropical ecosystems, includingwetlands (Stotz, Fitzpatrick, Parker, III, & Moskovits, 1996;Wetlands International, 2010). At the same time, crucial informa-tion about the life history and ecology of many tropical wetlandbirds is lacking, particularly with respect to their response to fluc-tuating water levels and availability of food resources. The main
difficulty in acquiring such information is that classical surveymethods require the long-term involvement of well-trained obser-vers, which is expensive and often logistically prohibitive. Thus,biologists who study the consequences of human activity on cer-tain bird populations would greatly benefit from non-intrusiveand cost-effective automated monitoring tools.
Recent technological developments, related to automated infor-mation retrieval from audio, have focused on the elaboration ofmethods in support of biological studies on the presence/absenceand activity patterns of rare, threatened, or elusive species(Bardeli et al., 2010; Frommolt & Tauchert, 2014; Henríquezet al., 2014; Huang, Yang, Yang, & Chen, 2009; Potamitis,Ntalampiras, Jahn, & Riede, 2014) and tools in support of thenon-intrusive and cost-effective assessment of biodiversity (Aideet al., 2013; Briggs et al., 2012; Digby, Towsey, Bell, & Teal, 2013;Stowell & Plumbley, 2014; Sueur, Pavoine, Hamerlynck, & Duvail,2008).
Specifically Huang et al. (2009) presented an automated tool forthe identification of five anuran species. Their approach relies on

2 Wildlife Acoustics: www.wildlifeacoustics.com3 CO.BRA: www.ic.ufmt.br/cobra4 INAU: www.inau.org.br
T.D. Ganchev et al. / Expert Systems with Applications 42 (2015) 6098–6111 6099
the algorithm of Härmä (2003) to automatically segment the audiointo syllables. Subsequently syllables are then classified. In theexperimental validation of their approach, Huang et al. (2009) per-formed closed-set classification of preselected files, which wereassumed to contain sounds of a single species. In that sense,Huang et al. (2009) did not investigate the potential of theirmethod with respect to timestamp determination of individual syl-lables or series of syllables. Classification accuracy ranged between82% and 100% for the different species, depending on the classifierused.
Henríquez et al. (2014) studied a semi-automatic system for batclassification. For that purpose they built multiple GMM models foreach species and then classified some manually selected audiofiles, each containing sound emissions of a single bat species.Species-level classification accuracy of 92–99.9% was reported.
Potamitis et al. (2014) developed HMM-based recognizers andinvestigated the automated detection of American Robin Turdusmigratorius and Common Kingfisher Alcedo atthis. On the song-leveldetection task they reported 85.1% precision for the former and84.9% for the latter species. Determination of timestamps of acous-tic events and their use for estimating activity patterns of the tar-get species was not discussed in their work.
Frommolt and Tauchert (2014) created a system for semiauto-matic recognition of the nocturnal activity of Eurasian BitternBotaurus stellaris. Data acquisition was performed with four omni-directional microphones. The system functionality included detect-ing the direction of the sound source, estimating the number ofcalling animals, identification of the bird species, and determina-tion of the timestamps. The system made use of continuous record-ings, acquired only during windless nights. Averaged diagrams ofthe hourly acoustic activity of the target species were presentedfor the five-year period 2008–2012. Recognition accuracy of84.9% was reported at nearly zero false acceptance rates.
A comparison of various machine learning approaches for theclassification of bird and amphibian calls was provided byAcevedo, Corrada-Bravo, Corrada-Bravo, Villanueva-Rivera, andAide (2009) and Henríquez et al. (2014); while Stowell andPlumbley (2010) presented a comprehensive review of methods.
In the present contribution we focus on the development of anautomated acoustic recognizer for the Southern Lapwing Vanelluschilensis, since we consider it an indicator of certain processes inthe Pantanal ecosystem, such as the annual flood-drought cycle.The Pantanal wetlands are increasingly affected by climate changeas well as the construction of hydroelectric dams, gold miningactivities, erosion, and the use of agrochemicals in Brazil’sCerrado region (Brendle, 2003; Junk & da Cunha, 2005). An under-standing of the ongoing environmental changes requires carefulmonitoring of multiple factors, such as the status of certain animalpopulations, water levels, contaminant concentrations, and cli-matic data.
Here we regard the resident V. chilensis as a model for otherwetland birds and for migratory species, as the lapwing formsnoisy flocks and carries out local movements in reaction to theextensive flooding of its breeding habitats during several monthsof the year. Our principal aim is to study the potential benefits ofautomated detection of V. chilensis acoustic activity, without thepresence of human observers in the field. We anticipate that sucha technological tool would facilitate the long-term monitoring of V.chilensis and provide insights into the biology, ecology, and behav-ior of this species.
To that end we propose a method for the automated recognitionof V. chilensis sound events (single-note calls and call series), whichalso estimates the start and end timestamps of each call event. Thismethod is based on the statistical modeling of the acoustic back-ground and the target species making use of the GaussianMixture Model–Universal Background Model (GMM–UBM)
approach. This method was originally developed for the needs ofspeaker verification (Reynolds, Quatieri, & Dunn, 2000), wheredecisions are made at the level of complete sentences or entirefiles. Here we make use of a log-likelihood ratio estimator basedon the GMM–UBM approach to search continuous audio recordingsfor the presence of V. chilensis sounds. The output scores of the log-likelihood ratio estimator are post-processed with a purposely-developed temporal smoothing algorithm that incorporatesdomain knowledge about the structure and duration of V. chilensiscall events. The latter allows detection of single-note call eventsand call series as well as the determination of the correspondingtimestamps.
In Section 2 we provide a short account of the variety of V.chilensis vocalizations and present a comprehensive descriptionof the proposed method and the technological framework onwhich the acoustic event recognizer is built. There we also describethe datasets and define the experimental protocol used in ourwork. The performance assessment results of the V. chilensis recog-nizer are discussed in Section 3. The evaluation is carried out onrecordings of complex soundscapes collected at one of our moni-toring stations in the northern part of the Brazilian Pantanal.Making use of the estimated start and end times of each call event,we present diagrams of the hourly and daily acoustic activity of V.chilensis over a complete month of continuous recordings made in24/7 mode. In Section 4 we discuss the innovative aspects of thepresent work, clarify the current limitations of the V. chilensis rec-ognizer, and point out the future research directions. Finally, inSection 5 we make concluding remarks about the scope and theimportance of our work.
2. Materials and methods
In this section we consequently outline the audio datasets usedin the present study (Section 2.1), provide a description of theoverall architecture and building blocks of the proposed Vanelluschilensis recognizer (Section 2.2), and specify the experimental pro-tocol used in the technology evaluation tests (Section 2.3).
2.1. Materials
We first specify the origin of audio recordings used in our study(Sections 2.1.1 and 2.1.2), then describe the data splits employedfor the purpose of technology development and evaluation(Section 2.1.3), and finally outline the acoustic characteristics ofV. chilensis vocalizations (Section 2.1.4).
2.1.1. Study areaThe study was carried out in agricultural, natural, and semi-
natural habitats of the northern Pantanal region, municipality ofPoconé, Mato Grosso, Brazil. The audio recordings analyzed herewere collected with Song Meter SM2 + recorders (WildlifeAcoustics2) in the areas of Fazenda Pouso Alegre (�16.50303 S,�56.74533 W; 115–126 m a.s.l.; c. 110 km2; recording period Jul.2012 through Oct. 2013) and SESC Pantanal Private NaturalHeritage Reserve (�16.49879 S, �56.41309 W; 119–131 m a.s.l.;878.7 km2; recording period Nov. 2013 until to date). These activi-ties were carried out by the Computational Bioacoustics ResearchUnit3 within the scope of the INAU 3.14 Project ‘‘MonitoringBioindicators and Migratory Birds in the Pantanal’’ of the NationalInstitute for Science and Technology in Wetlands,4 aiming at thepromotion of Applied Acoustomics as a tool for bio-sustainabilityassessment (Schuchmann, Marques, Jahn, Ganchev, & de
6100 T.D. Ganchev et al. / Expert Systems with Applications 42 (2015) 6098–6111
Figueiredo, 2014). The overall goals of the project are to establishand calibrate an automated remote monitoring system for bio-indi-cators of various sound-producing animal species.
2.1.2. The target speciesThe bird species Southern Lapwing Vanellus chilensis (Molina,
1782) is of strictly Neotropical occurrence. It is distributed fromPanama south to Tierra del Fuego, Argentina and is present in allcountries of South America (Marchant, Prater, & Hayman, 1986;Wiersma, 1996; Ridgely & Gwynne, 1992). One vagrant wasrecorded north to Campeche, Mexico (Martin, 1997). Four sub-species of V. chilensis are usually recognized (Wiersma, 1996;Santos, 2010). However, differences in morphology and vocaliza-tions suggest that two valid species might be involved, with nom-inate race chilensis and closely related fretensis restricted tosouthern South America, and a separation of cayennensis, incorpo-rating lampronotus, which are distributed from northern Argentinanorth to Panama (cf. Internet Bird Collection., 2014). The residentsubspecies of Southern Lapwing in our central Brazilian study areais V. c. lampronotus (Wagler, 1827).
V. chilensis belongs to the avian Order Charadriiformes, whichconsists of 17 families and 385 recognized species (Gill &Donsker, 2014). In the northern Pantanal this ground-dwellinglapwing is common in open and semi-open habitats, such assavannah grasslands, pastures, and muddy lake margins but vir-tually absent from forests and dense scrublands. It is vocal duringall months of the year, active during day and night, and gregari-ous outside the breeding season (Marchant et al., 1986;Maruyama, Cunha, Tizo-Pedroso, & Del-Claro, 2010). Extensiveareas of the Pantanal are flooded at the height of the rainy seasonfor several months of the year (Junk, da Silva, da Cunha, &Wantzen, 2011). Our study area is inundated mostly betweenJanuary and March; however in 2013, when the study atFazenda Pouso Alegre took place, some recording stations wereflooded until the beginning of June. When the water level risesV. chilensis is forced to perform short-distance movements as itabandons its inundated breeding areas and gathers in appropriateterra firma habitats. This behavior nicely emulates the seasonalmovements of migratory species.
2.1.3. Dataset description5
Between July 2012 and October 2014 we implemented contin-uous monitoring in 24/7 mode and collected about 90 TB of audiorecordings (files with duration of 14, 15, and 30 minutes, samplingrate 48 kHz, resolution 16 bits), including one complete annualcycle each at Fazenda Pouso Alegre and SESC Pantanal PrivateNatural Heritage Reserve. From these recordings we extracted sev-eral excerpts which served for technology development and evalu-ation as follows:
2.1.3.1. Acoustic background model training dataset. For the creationof a balanced acoustic background model we combined two data-sets of audio recordings, representative of the Pantanal sound-scapes. The first consists of fifty-four 14-minute recordings of theFazenda Pouso Alegre with a total duration of over 12 hours. Theoriginal recordings were manually edited to remove over 150(mostly weak) call series of the target species (V. chilensis). The sec-ond dataset consists of thirty-two 30-minute recordings made atSESC Pantanal, corresponding to approximately 15 h of continuousrecordings from a sound recording station located inside forest.Since the latter habitat is avoided by the target species, the
5 According to the principles of reproducible research, we will provide all datasetsdescribed here through the website of the Computational Bioacoustics Research Unit(CO.BRA; www.ic.ufmt.br/cobra) of the Federal University of Mato Grosso (UFMT).
recordings from that station were regarded as V. chilensis free,although occasionally some vocalizing lapwings may have flownover the site. In this way, approximately 27 h of audio recordingsfrom the Pantanal were available for training the acoustic back-ground model.
2.1.3.2. Vanellus chilensis training dataset. From about 4500 manu-ally selected snippets of animal sounds we built a reference libraryof 258 recordings with V. chilensis vocalizations. These recordingsare excerpts of the original 14, 15 or 30 minute audio recordingsand were neither edited nor filtered. Most recordings containedcompeting sounds of other sources, such as vocalizations of non-target species, anthropogenic noise, and wind. For the trainingdataset we selected representative recordings from the referencelibrary and subsequently removed non-target signals by manualediting and selective filtering. The final training dataset consistedof 93 recordings, containing �45 min of target sounds. Amongthese are 38 recordings virtually clean of competing interference(�18 min), 52 recordings that still contain some other competitivelow-volume background sounds overlapping with the target sig-nals (�24 min), and 3 recordings representing choruses of lapwingflocks (�2 min). We aimed to include examples of a wide spectrumof V. chilensis call types but for some rarer call variants we foundfew examples in the reference library.
2.1.3.3. Vanellus chilensis validation dataset. The original audiorecordings are often very noisy due to wind, rain, competing soundsignals of other species, and interferences from other sources.Furthermore, some calls of the target species may be so faint thatthey are barely identifiable, even for a bird sound expert. Toaddress the challenges related to manual tagging of real-fieldrecordings we took the following approach:
(a) We compiled a few dozen soundscapes that were known tocontain at least one good call series of V. chilensis. By select-ing recordings that were not previously processed during themanual snippet selection we made sure that there was nooverlap between the audio signals used for recognizer train-ing and evaluation.
(b) We randomly chose a subset of these audio files in order toannotate the timestamps of V. chilensis call events (single-note call or a sequence of calls).
(c) Only for the purpose of tagging we made use of a graphicequalizer to reduce competing noises such as wind andinsects by �48 dB in the frequency ranges [0, 630] Hz and[12.5, 24] kHz. In stronger target signals the lowestand some of the upper harmonics were removed involuntar-ily during this procedure. However the V. chilensis recognizerdirectly processes the original audio as described in Sections2.2.1 and 2.2.2.
(d) The filtered recordings were screened by a bird-soundexpert using a headset with integrated manual volume con-trol but without additional software amplification, andsimultaneously through visual inspection of the spectro-grams in Adobe Audition.
(e) The bird-sound expert tagged the start and end times of eachacoustic event; however, the number of calls per vocaliza-tion event was not counted.
(f) The following rules were applied to separate call events:
(1) A pause of at least one second between target signalswas used to separate call events of similar sound pres-sure levels.
(2) Abrupt changes in sound pressure levels were used toseparate different call series even if there was no pausebetween the signals;

Fig. 1.recordin
T.D. Ganchev et al. / Expert Systems with Applications 42 (2015) 6098–6111 6101
(3) However, call sequences that varied greatly in soundpressure levels over time were not divided into differentcall series when the calling birds seemed to continuouslymove (fly) around the recording stations.
(g) In addition, we noted the compound dB-values of the loud-est call of each vocalization event; that is, the volume ofthe target signal plus the volume of the remaining back-ground noise. In most cases this approach led to a consider-able overestimation of the dB-values for weaker targetsignals below about �35 dB. These levels depend on theproximity and orientation of the sound source to themicrophone.
(h) The manual annotation of the timestamps was repeatedtwice. Depending on the complexity of the soundscape, thetime effort per 14-minute sound file was between about 4and 16 h.
(i) Some audio signals could not be identified with certaintyas target or non-target, either because they were too faintor because background noise levels were too high. Such callseries were time-stamped and excluded from analysis; fordataset (I) these were N = 70 and for dataset (II) N = 137.
The aforementioned procedure led to two datasets consisting of14-min original soundscapes containing vocalizations of the targetspecies:
(I) four recordings with a total of 80 V. chilensis call events forthe purpose of technology optimization and adjustment ofthe parameters of the recognizer, hereafter referred to asdataset VL01, and
(II) ten recordings with a total of 337 V. chilensis call events toevaluate the performance of the recognizer, hereafterreferred to as dataset VL02.
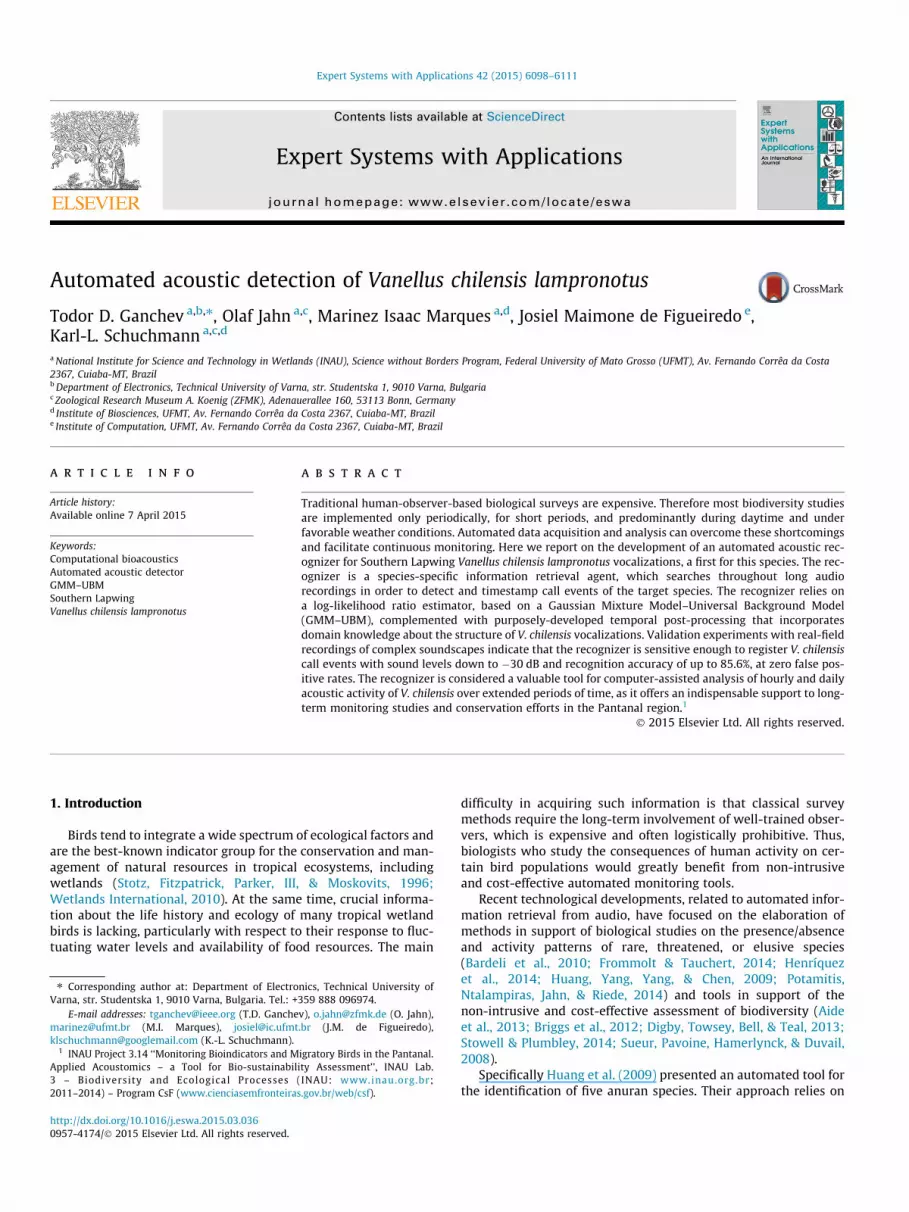
Examples of Vanellus chilensis lampronotus vocalizations from the northern Pantgs sampled at 48 kHz (cf. Table 1 and Appendix A for further details).
2.1.4. Acoustic characteristics of V. chilensis lampronotus vocalizationsV. chilensis lampronotus vocalizes from the ground and in flight,
particularly during courtship and territory displays as well as inresponse to the presence of potential predators. The most oftenheard vocalization is a strident ‘‘keh-keh-keh-keh-keh. . .’’ that isconsistently repeated by alarmed birds (Gwynne, Ridgely, Tudor,& Argel, 2010, p. 99). On occasions the lapwings give emphatic vir-tually double-note ‘‘keh-a, keh-a, keh-a, keh-a, keh-a. . .’’ vocaliza-tions or similar variants of the call (Fig. 1, Table 1). Vocalizationsof perched birds are often rather short, sometimes consisting ofonly one or few notes. During the non-breeding season, flocks ofa few to several dozen birds congregate and often vocalize inchoruses.
The spectral structure of single call notes is quite complex, con-sisting of multiple harmonics with most of the energy concentratedin the frequency range [1.1, 10] kHz (Fig. 1). The specific peak fre-quencies of individual call notes seem to depend on the agitationlevel of the birds (Table 1). In addition, some weak spectral detailsare available for frequencies below 1 kHz and above 10 kHz, so har-monics may spread over the entire audible frequency range above550 Hz in recordings made close to the birds (Fig. 1g and h).However, since the energy of these details is weak they are usuallyburied in the ambient noise, and thus do not offer reliable cues forthe acoustic detection of V. chilensis in real-field recordings.
2.2. The Vanellus chilensis recognizer
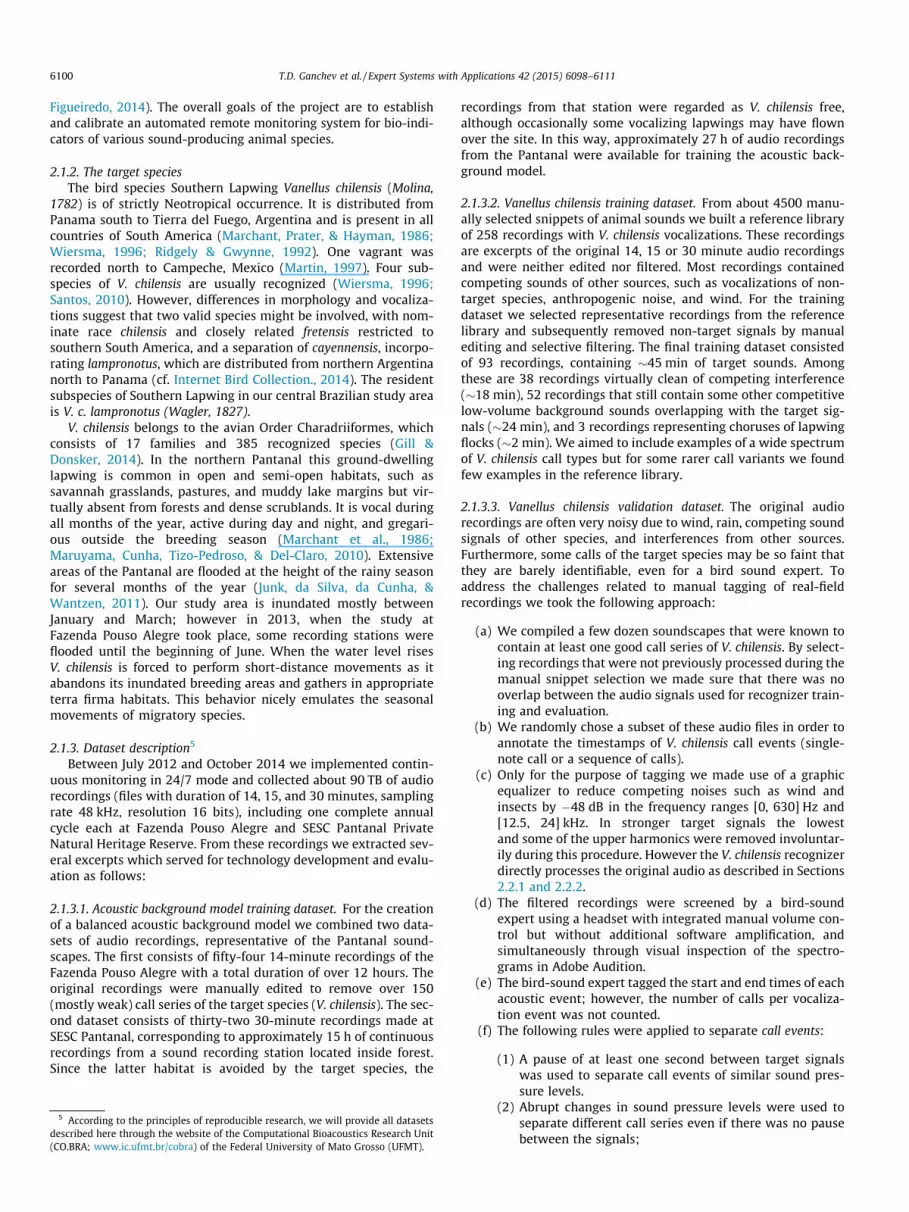
The overall architecture of the V. chilensis acoustic recognizer ispresented in Fig. 2. Two main processing stages are defined: audioparameterization (details in Section 2.2.1) and pattern recognition(details in Sections 2.2.2 and 2.2.3). Firstly, the audio signal is pre-processed and then audio descriptors are computed and standard-ized to facilitate the pattern recognition process. Secondly, a
anal, Brazil. Shown are 1.5-second segments of unedited and unfiltered reference

Table 1Characterization of Vanellus chilensis lampronotus vocalizations from the northern Pantanal, Brazil (cf. Fig. 1 and Appendix A). The column ‘‘N calls’’ refers to the number of callsconsidered for analysis. The association between vocalizations and behavioral contexts was not previously studied by our project.
Spectrogram Signals/s Call duration(s)
Peakfrequency(Hz)
Ncalls
Sound description Observations
a 4.6 0.123–0.129 2400 50 Fast Accipiter-like series of keh-keh-keh-keh-keh calls Single perched bird; mate vocalizes shortlythereafter; recorded during night at 02:15 h
b 4.3 0.098–0.135 3400 11 Fast series of keh-keh-keh-keh-keh calls Chorus of at least four agitated birds in flight; atdawn (05:45 h)
c 5.9 0.107–0.116 6000 17 Fast and high-pitched series of kre-kre-kre-kre-kre calls Single agitated and perched bird in response to ashort call series of a conspecific individual
d 6.3 0.112–0.136 3000/4000 9 Fast series of rail-like kreh-kreh-krek-kreh-kreh calls Two agitated birds at duske 1.9 0.240–0.260 2800 5 Slow series of keeh, keeh, keeh, keeh, keeh calls Single bird; second bird vocalizes shortly
thereafter; recorded during night at 01:30 hf 2.0 0.241–0.273 2300 23 Slow series of emphatic virtually double-note keh-a,
keh-a, keh-a, keh-a, keh-a callsSingle perched bird; mate vocalizes shortly beforeand after; recorded during night at 02:30 h
g 2.0 0.192–0.235 3800 7 Emphatic keeh-keeh-keeh-keeh-kwo calls Flight calls of a single bird; a second bird vocalizesshortly before and after
h 2.5 0.218–0.264 2400 10 Emphatic kweh-kweh-kweh-kweh-kweh calls Flight calls of a single bird; the mate and otherconspecific birds vocalize shortly before and after
Fig. 2. Overall block diagram of the Vanellus chilensis recognizer.
6102 T.D. Ganchev et al. / Expert Systems with Applications 42 (2015) 6098–6111
detector is used for selecting those parts of the audio recordingwhere acoustic activity occurs and for labeling the signals for fur-ther processing. The pattern recognition stage evaluates the degreeof proximity between the audio feature vectors and the V. chilensismodel and the acoustic background model. The resultant scores arepost-processed and subsequently serve as the basis for decisionmaking about the presence or absence of V. chilensis vocalizationsin the specific portion of audio. The final recognizer output consistsof timestamps that specify the start and end times of each V. chilen-sis call event.
2.2.1. Audio parameterizationThe audio parameterization converts the acoustic signal into a
series of low-dimensional feature vectors, each representing ashort segment of the acoustic signal. The block diagram, shownin Fig. 3, summarizes the audio parameterization steps.
The first step, denoted as pre-filtering of the input signal sðnÞ,consist of mean value removal, band-pass filtering, and down-sam-pling of the signal to 24 kHz in order to reduce the computationaldemands during the subsequent processing steps. Band-pass filter-ing with Butterworth filter of order 10 is seen as a simple butadequate noise reduction step, which aims at improving the sig-nal-to-noise ratio (SNR) before parameterization. It preserves thefrequency range of 800 Hz to 11 kHz, where most of the energyof V. chilensis vocalizations is located and reduces the influenceof additive low-frequency interferences (for instance due to windblowing in the microphone or to mechanical vibrations provokedby wind). Except for the attenuation of the dc-offset andlow-frequency interferences, the band-pass filtering also reducesthe contribution of the high-frequency components that mightoccur in clipped signals.
The second processing step, signal segmentation, is based onthe assumption that the spectral characteristics of the audio sig-nal do not change significantly within short periods of time. Inthe process of segmentation, we apply a sliding window functionwith 20 ms in length to the band-limited audio signal. At a sam-pling frequency of 24 kHz this leads to the creation of audio seg-ments with length N = 480 samples. Subsequent segments areoverlapped by 75%, i.e., the time step of audio parameterizationis 5 ms. The pre-processed signal is subject to parameterizationas follows:
Each audio segment, consisting of N samples of the pre-pro-cessed signal, is subject to the short-time discrete Fouriertransform:
SlðkÞ ¼XN�1
i¼0
s_ðiþ lÞ �WðiÞ � exp � j2pik
N
� �; 0 6 i; k 6 N � 1; ð1Þ
where i is the index of the time domain samples, k is the index ofthe Fourier coefficients, and l denotes the relative displacement ofthe current segment. Since the following steps apply to every seg-ment, in the rest of this article we omit the subscript l but it remainsimplied. The Hamming window
WðmÞ ¼ 0:54� 0:46 cos2pm
N
� �; m ¼ 0;1; . . . ; N � 1; ð2Þ
is applied to reduce the spectral distortions caused by an abruptchange of signal amplitude at the boundary points of the audiosegment.
We cover the frequency range [1, 11] kHz with the filter bankHiðkÞ, consisting of B ¼ 100 equal-bandwidth and equal-height

Fig. 3. Block diagram of the audio parameterization process.
T.D. Ganchev et al. / Expert Systems with Applications 42 (2015) 6098–6111 6103
filters on the logarithmically compressed power spectrum. Each fil-ter is defined as:
HiðkÞ ¼
0 for k < f bi�1
k�f bi�1
� �f bi�f bi�1
� � for f bi�16 k 6 f bi
f biþ1�k
� �f biþ1
�f bi
� � for f bi6 k 6 f biþ1
0 for k > f biþ1
8>>>>>>>>>><>>>>>>>>>>:
; ð3Þ
where i ¼ 1;2; . . . B stands for the i th filter, f biare the boundary
points of the filters, and k ¼ 1;2; . . . N corresponds to the k th coef-ficient of the N-point discrete Fourier transform (DFT). The bound-ary points f bi
are expressed in terms of position, which depends onthe sampling frequency Fs and the number of points N in the DFT.The center of the first filter is at 1 kHz and the centers of the subse-quent filters are linearly displaced at 100 Hz and serve as boundarypoints for the neighboring filters. We have chosen linear spacing(equal frequency resolution) because V. chilensis produces wide-band sounds which are spread over the entire frequency range [1,11] kHz.
Next, we perform decorrelation of the log-energy filter-bankoutputs Si, where
Si ¼ log10
XN�1
k¼0
jSðkÞj2 � HiðkÞ !
; ð4Þ
via the discrete cosine transform (DCT):
xj ¼XB
i¼1
Si cos jði� 0:5ÞpB
� �; j ¼ 0;1; . . . D: ð5Þ
In (5) j is the index of the linear frequency cepstral coefficients(LFCC), and D is the total number of LFCC that are computed, whereD 6 B. In the present work D = 35, as these represent over 90% of thesignal energy.
Since the above analysis applies to every audio segment, theoutput of the signal parameterization stage is a sequence of LFCCvectors. We use Xall to represent a sequence of LFCC vectorsextracted from the original audio signal. In the general case, Xall
is a sequence of T D-dimensional LFCC vectors, Xall ¼ fxtgTt¼1, where
xt ¼ fxjgjt is the vector at time instance t, and T is the total numberof vectors.
Subsequently, post-processing of the LFCC is carried out in orderto reduce the negative consequences of time-varying acoustic con-ditions and to exclude from further processing the non-promisingregions of the audio. For this purpose we first perform statisticalstandardization of the LFCC, i.e., Xall is normalized to zero meanvalue and unit standard deviation. This results in obtaining the z-score �xj of each individual parameter xj of the LFCC vector:
�xj ¼xj � mj
nj; j ¼ 0;1; . . . D: ð6Þ
The z-scores, computed from the LFCC, quantify the distance fromthe mean in terms of the standard deviation. The mean value mj
and the standard deviation nj are estimated on a per file basis foreach of the D dimensions.

6104 T.D. Ganchev et al. / Expert Systems with Applications 42 (2015) 6098–6111
Furthermore we make use of an energy-based acoustic activitydetector to prune the sequence of audio feature vectors �Xall andexclude from further processing the audio feature vectors�xt ¼ f�xjgjt corresponding to low-energy frames. The former stephelps to remove silence from the training data and to speed upcomputations in the V. chilensis recognizer. Our acoustic activitydetector is based on modeling the log-energy distribution on aper file basis with a three-component Gaussian Mixture Model(GMM):
pð�x0t ;w;l;rÞ¼X3
i¼1
wi1
ri
ffiffiffiffiffiffiffi2pp exp � 1
2r2i
ð�x0t�liÞ0ð�x0t�liÞ
ð7Þ
where wi are the mixture weights, li are the means, and r2i are the
variances of the individual components. These parameters are esti-mated from the sequence of z-scores �x0t , computed after applying(6) for the 0th LFCC x0 (5). From (5) we can see that x0 is propor-tional to the full-band log energy computed for each audio frame.
The maximum likelihood model parameters of the GMM areestimated using the iterative expectation–maximization (EM)algorithm.
In order to identify the silent audio portions, we interpret theindividual components of the three-component GMM as follows:
� The mixture component with the lowest mean value l1 corre-sponds to portions of audio with the lowest energy, and wetherefore label these as silence/background noise, which isexcluded from further processing.� The mixture component with the highest mean value l3 corre-
sponds to portions of audio with significant acoustic activityand therefore we label these as acoustic events kept for furtherprocessing.� Finally, the mixture component with the middle mean value l2
corresponds to weak signals originating from low-energysources or sound sources located at a significant distance fromthe microphone. We keep only the upper P percents of the mid-dle component.
As a result, the acoustic activity detector acts as a gatewaywhich labels for further processing sequences of audio feature vec-tors Xe # f�xtgjP , each corresponding to an acoustic event withenergy in the range specified by the upper P percent of the middleGaussian component (with mean l2) and the third one with meanl3. In the present work we consider P = 15% for the training datasetand P = 75% for the tests datasets as we aim at recognizing V.chilensis vocalizations at audio levels down to �30 dB. In the fol-lowing we process each sequence Xe independently from theothers. For simplicity of notations we drop the subscript e but itremains implied.
2.2.2. GMM–UBM-based bird species detectionThe V. chilensis recognizer follows the GMM-UBM likelihood
test approach, introduced by Reynolds et al. (2000) on the speakerverification task. In brief, given a sequence of audio feature vectorsX, computed for a sequence of audio frames and the hypothesizedbird species S, the task of automated bird species detection consistsin determining whether X originates from the target species S.From this perspective, the task consists in testing the followingtwo hypotheses:
H0: X originates from the hypothesized bird species S,H1: X does NOT originate from the hypothesized bird species S.
Given a sequence of audio feature vectors X, and given a mech-anism for the reliable estimation of likelihoods of the hypotheses
H0 and H1, we can apply the optimum test (8) and decide betweenthese two hypotheses:
Likelihood ratio test
Comparison with threshold and decision (8) pðXjH0ÞpðXjH1ÞP h accept H0, (Decision: Xoriginates from the bird species S),< h reject H0, (Decision: X does NOToriginate from the bird species S).
Here pðXjH0Þ and pðXjH1Þ are the probability density functions forthe hypotheses H0 and H1, which are evaluated for the sequenceof audio feature vectors X , computed for the observed audio seg-ment. The decision threshold h for accepting or rejecting H0 needsto be estimated on the basis of a representative developmentdataset.
In practice, H0 is represented with the mathematical model khyp,which characterizes the hypothesized species S in the audio featurespace. Likewise khyp represents the alternative hypothesis H1. Thus
the likelihood ratio (8) can be rewritten as
pðXjkhypÞpðXjkhypÞ
: ð9Þ
Furthermore, the logarithm of (9) gives representation of the log-likelihood ratio as:
KðXÞ ¼ log pðXjkhypÞ� �
� log pðXjkhypÞh i
: ð10Þ
The model khyp for H0 is well defined and can be estimated using thetraining dataset for the target bird species S. However the modelkhyp for H1 is not well specified as it has to represent all possible
alternatives to the hypothesized target species.Given a collection of audio recordings from a large number of
species that are representative of the community of sound-emit-ting species observed in the habitat, a single model kUBM � khyp is
build to represent the alternative hypothesis. It is also possible touse multiple background models tailored to specific sets of speciesor habitats, but the use of a single background model has advan-tages in terms of computational efficiency.
An important step in the implementation of the likelihood ratiotest is the selection of the actual likelihood function pð�xt jkÞ: Thechoice of this function depends on the audio features being used,as well as on the specifics of the application. The mixture densityused for the likelihood function is defined as follows:
pð�xt jkÞ ¼XM
i¼1
wipið�xtÞ: ð11Þ
The mixture density is a weighted linear combination of M uni-modal Gaussian densities pið�xtÞ, each parameterized by a D � 1mean vector li and a D � D covariance matrix Ri. The mixture
weights wi satisfy the constraintPM
i¼1wi ¼ 1. Here pið�xtÞ are definedas:
pið�xtÞ ¼1
ð2pÞD=2jRij1=2 exp �12
�xt � li
� �0X�1
i�xt � li
� � : ð12Þ
While the general form of the model supports full covariancematrices, typically only diagonal covariance matrices are used inorder to reduce the number of adjustable parameters.Collectively, the parameters of the density model are denoted ask ¼ fwi;li;rig, i = 1,2, ...M.
Given a training dataset of audio feature vectors, maximumlikelihood model parameters can be estimated using the iterativeexpectation-maximization (EM) algorithm. The EM algorithm iter-atively refines the GMM parameters to monotonically increase thelikelihood of the estimated model for the observed feature vectors.

T.D. Ganchev et al. / Expert Systems with Applications 42 (2015) 6098–6111 6105
Under the assumption of independent feature vectors, the log-like-lihood of a model k for a sequence of T audio feature vectors iscomputed as:
LðkÞ ¼ 1T
XT
t¼1
log ½pð�xtjkÞ�: ð13Þ
In the present work we compute (13) for a sliding sequence ofT = 3 vectors, as this allows the achieving of good time resolutionin the identification of start and end timestamps for each V. chilen-sis vocalization.
Aiming at computational efficiency, we made use of a singlebackground model to represent p ðXjkhypÞ. Using a GMM as the like-
lihood function, the background model kUBM is typically imple-mented as a large GMM trained to uniformly represent thedistribution of audio features for the specific acoustic environment.Specifically, the background dataset was selected in such a way asto reflect the expected acoustic environment encountered duringthe operation of the V. chilensis recognizer.
The model khyp for the target species S is obtained as adaptedGMM, derived by adjusting the parameters of the backgroundmodel kUBM via maximum a posteriori (MAP) estimation(Reynolds et al., 2000), using the training dataset for S. Since thedataset representing the target species is usually quite small, theMAP adaption only updates the mean vectors of the model.Because the target species model khyp is created by updating theparameters in the background model kUBM , there is a close associa-tion between the corresponding mixture components of the twomodels. The last facilitates the discriminative capability of the spe-cies-specific recognizer.
The decorrelation stage as described by (5) permits the use ofdiagonal covariance mixture density GMMs that have fewer freevariables in their covariance matrices to estimate and, therefore,are better trained to represent the target classes when limitedtraining data are available (Reynolds et al., 2000).
Computing the log-likelihood ratio (LLR) (10) for a sequence ofaudio feature vectors X requires estimation of the likelihood twice:for the target species model and for the background model. This is
Fig. 4. Post-processing of the output of
repeated for each audio feature vector in X and is computationallyexpensive for models with large number of mixtures. However thefact that the hypothesized species model khyp was adapted from thebackground model kUBM allows the use of fast scoring methods(Reynolds et al., 2000; Saeidi, Sadegh Mohammadi, Ganchev, &Rodman, 2009). Since the components of the adapted GMM retaina correspondence with the mixtures of the background model, theacoustic feature vectors close to a particular mixture in the back-ground model will also be close to the corresponding mixture inthe target bird model. For that reason, instead of scoring all mix-tures of the background model and the target model for each audiofeature vector, we determine the top-C scoring mixtures in thebackground model and compute the background model likelihoodusing only these top-C mixtures (Reynolds et al., 2000). Next, weonly score the audio feature vector against the correspondingC = 10 components in the adapted target species model to evaluatethe likelihood. For a background model with M mixtures, thisrequires only M + C computations per feature vector comparedwith 2M computations for the case of exhaustive likelihood ratioevaluation. In the present work we made use of the ALIZE imple-mentation of the GMM–UBM (Benoit et al., 2007).
2.2.3. Score post-processing and decision makingDecisions computed via the likelihood ratio test are post-
processed in order to estimate the sound event boundaries, thatis the start and end timestamps of V. chilensis sound emissions,viz. isolated single-note call events and entire call series. Becausein our study on the seasonal activity patterns of V. chilensis anysplit of call series into single-note calls or fragments composed ofseveral calls is undesirable, we made use of a sequence of post-processing steps (Fig. 4).
The post-processing aims to merge together segments belong-ing to an isolated single-note call or to a call series emitted by sin-gle birds, pairs, or groups of V. chilensis. At each of these steps thealgorithm operates on different time scales and applies certaindomain knowledge about the structure of V. chilensis vocalizations(cf. Table 1). Such domain knowledge is related to the structure ofV. chilensis vocalizations and the parameters minimum, maximum,
the log-likelihood ratio estimator.

Table 2Domain knowledge used in the post-processing algorithm about the structure ofisolated single-note call events and call series, by single birds, pairs, and groups ofVanellus chilensis.
Duration[seconds]
Isolated single-note callsMinimum duration 0.10Maximum duration 0.30Estimated medium duration 0.15Arbitrarily chosen minimum duration of pauses between distinct
call events>1.0
Call series of a single birdMinimum duration of pauses between call notes 0.05Defined maximum duration of pauses between call notes,
pertaining to the same call series0.99
ChorusesMinimum duration of overlapping call notes 0.10Maximum duration of overlapping call notes 0.60Estimated medium duration of overlapping call notes 0.30Minimum duration of pauses between subsequent overlapping
call notes0.01
Defined maximum duration of pauses between subsequentoverlapping call notes
0.99
6106 T.D. Ganchev et al. / Expert Systems with Applications 42 (2015) 6098–6111
and estimated medium duration of isolated call events as well asthe duration of pauses between subsequent calls in call series ofa single bird and in choruses (Table 2).
Admittedly, at this stage of development we made no effort tobuild a recognizer that can distinguish between call series/cho-ruses emitted by single birds, pairs, or groups of V. chilensis.Likewise, overlapping vocalizations that, based on their largely dif-fering amplitudes, were evidently emitted by several birds weresometimes merged within a single detection. This is because inthe current study we make use of single-channel recordings, whichdo not facilitate the spatial localization and the acoustic separationof different birds.
In brief, each sequence of audio feature vectors X, computed asexplained in Section 2.2.1, is subject to the log-likelihood ratio test(10) applied on frame-by-frame basis. Subsequently, the scoresobtained in this manner are compared with the decision thresholdh, resulting in a series of binary decisions: ‘‘1’’ – if the audio featurevector belongs to a V. chilensis call event or ‘‘0’’ – if the feature vectorcorresponds to sound of a different origin. Finally, these decisionsare processed as follows in order to discover the boundaries andtimestamps of the beginning and end of each call event.
For that purpose, we first convolve the frame-by-frame binarydecisions with a rectangular window with a duration of 50 ms.This first step helps to avoid sporadic misclassifications of neigh-boring frames, which are due to short bursts of interfering audiosignals. We keep for further processing only sequences with alength of at least 20 ms and thereby alleviate short events thatare not likely to correspond to a V. chilensis vocalization.
In order to merge together closely spaced call events into a callseries, we convolve the decisions made so far with a rectangularwindow of 1 s duration and estimate the call series boundaries.
Thus the sequence of post-processing steps constitutes the rec-ognizer output which is converted to timestamps, indicating theonset and end of the V. chilensis call events. During the perfor-mance evaluation experiments the timestamps found by the recog-nizer were compared with the manually tagged ground-truthtimestamps derived as explained in Section 2.1.3.
2.3. Experimental protocol and performance metrics
In all experiments we followed a common protocol that makesuse of the datasets described in Section 2.1.3. Specifically, for thecreation of the acoustic background model kUBM we made use of
approximately 27 h of audio recordings, representing the acousticconditions specific to the area of the northern Pantanal. Next, usingthe method described in Section 2.2.2, we adapted a species-specific GMM model khyp for V. chilensis. Collectively these twomodels were used for implementing the log-likelihood ratio test(10) for short sequences of three feature vectors. For estimatingthe value of the threshold h (8) we made use of the four recordings,described as set VL01 (cf. Section 2.1.3), which contains a total of80 call series of the target species. The decision threshold h wasset as the minimum value of h that maximizes the recognition ofV. chilensis call series with zero false positives on set VL01. Oncethe threshold h was adjusted, the performance of the V. chilensisrecognizer was evaluated with the validation dataset VL02,consisting of ten audio recordings with a total of 337 call seriesof the target species (cf. Section 2.1.3).
The recognition results were evaluated in terms of two perfor-mance metrics: accuracy (14) and correct (15) measured inpercentages:
Accuracy ¼ H � IN� 100; ½%�; ð14Þ
Correct ¼ HN� 100; ½%�; ð15Þ
where H (hits) indicates how many times the V. chilensis recognizercorrectly recognized a target vocalization, I stands for insertions(false positives), and N is the total number of target events accord-ing to the annotations of the test dataset VL02. The annotations ofVL02 contain two types of V. chilensis events:
� 337 vocalizations confirmed by an expert ornithologist as orig-inating from the target species V. chilensis,� 137 vocalizations heard and/or seen in the spectrogram and
allegedly originating from the target species but impossible toconfirm acoustically with high confidence due to competitivesound events, high noise floor, or great distance of the callingbird from the microphone.
The events of the first type were considered as targets (N = 337)and were used when counting the number of hits (H) and misses(N–H) of the V. chilensis recognizer. The 137 events of the secondgroup were merged with the 337 to form an extended set of337 + 137 = 474 V. chilensis events. This extended set was used asa reference when counting the number of insertions I. Therefore,for insertions we count only detections which do not coincide withthe extended set of 474 V. chilensis events. However, due to the factthat many V. chilensis call series overlap with competing, some-times very strong signals of other species, we inspected all recog-nizer-generated timestamps in Adobe Audition to exclude thepossibility that an apparent hit in fact represented a false positivedetection.
Since the validation dataset VL02 (Section 2.1.3) consists ofunedited field audio recordings, the V. chilensis events have dissim-ilar amplitude and clarity. In the present study the main focus is ondetecting call events emitted by birds within a range of few metersto several dozen meters from the microphone and with amplitudeabove �30 dB. These sound levels correspond to signal strengthsthat ornithologists can identify with certainty when using tradi-tional audio visual survey methods (cf. Jahn, 2011a, 2011b) andthus facilitate the interpretation of the observed acoustic activitypatterns.
However for the purpose of comprehensiveness, in Section 3 wereport the recognition results at a wider range of sound levels: [0,�20] dB, [0, �30] dB, [0, �40] dB, [0, �50] dB. In fact, the category[0, �50] dB also incorporates a certain number of call events withamplitude below �50 dB, which were discernible during manualannotation by an expert bioacoustician. These sound levels

Table 3Split of the Vanellus chilensis vocalizations depending of the amplitude of the loudestnote in a sound event.
Range # Target # Not confirmed # Total
[0, �20] dB 44 0 44[0, �30] dB 111 0 111[0, �40] dB 240 2 242[0, �50] dB 337 137 474
Table 4Recognition results depending on the loudest call amplitude in Vanellus chilensisvocalizations.
[0, �20 dB] [0, �30 dB] [0, �40 dB] [0, �50 dB]
GMM1024Hits, H 43 80 82 83Misses, N-H 1 31 158 254Insertions, I 0 0 0 0Total instances, N 44 111 240 337
Accuracy 93.2% 85.6% 45.4% 32.9%Correct 97.7% 87.4% 46.3% 33.5%
GMM512Hits, H 43 92 100 101Misses, N-H 1 19 140 236Insertions, I 0 0 0 0Total instances, N 44 111 240 337
Accuracy 97.7% 82.9% 41.7% 30.0%Correct 97.7% 82.9% 41.7% 30.0%
GMM256Hits, H 43 95 109 111Misses, N-H 1 16 131 226Insertions, I 3 3 3 3Total instances, N 44 111 240 337
Accuracy 90.9% 82.9% 44.2% 32.0%Correct 97.7% 86.5% 45.4% 32.9%
GMM128Hits, H 43 93 104 105Misses, N-H 1 18 136 232Insertions, I 0 0 0 0Total instances, N 44 111 240 337
Accuracy 97.7% 83.8% 43.3% 31.2%Correct 97.8% 83.8% 43.3% 31.2%
GMM64Hits, H 42 72 73 73Misses, N-H 2 39 167 264Insertions, I 0 0 0 0Total instances, N 44 111 240 337
Accuracy 95.5% 64.9% 30.4% 21.7%Correct 95.5% 64.9% 30.4% 21.7%
GMM32Hits, H 42 86 94 95Misses, N-H 2 25 146 242Insertions, I 1 1 1 1Total instances, N 44 111 240 337
Accuracy 93.2% 76.6% 38.8% 27.9%Correct 95.5% 77.5% 39.2% 28.2%
GMM16Hits, H 42 97 122 124Misses, N-H 2 14 118 213Insertions, I 6 6 6 6Total instances, N 44 111 240 337
Accuracy 81.8% 82.0% 48.3% 35.0%Correct 95.5% 87.4% 50.8% 36.8%
GMM8Hits, H 40 77 86 87Misses, N-H 4 34 154 250Insertions, I 8 8 8 8Total instances, N 44 111 240 337
Accuracy 72.7% 62.2% 32.5% 23.4%Correct 90.9% 69.4% 35.8% 25.8%
T.D. Ganchev et al. / Expert Systems with Applications 42 (2015) 6098–6111 6107
correspond to the maximum amplitude of the loudest note in eachcall event. The number of target events for each of these ranges ispresented Table 3.
In the reporting for each group, target events with amplitudebelow the specified lower boundary were not counted as missesif not detected by the V. chilensis recognizer.
3. Results
3.1. Detector performance assessment
All experimental results reported here are for the validation setVL02, which consists of ten 14-minute recordings (Section 2.1.3).In Table 4 we present the recognition results for the V. chilensis rec-ognizer for models of varying complexity: 1024, 512, 256, 128, 64,32, 16 or 8 mixture components in the model, depending on theamplitude of the loudest call in each bird call series: [0, �20] dB,[0, �30] dB, [0, �40] dB, and [0, �50] dB.
The accuracy and correctly recognized target events depend onthe size and the quality of the model (Table 4). All models achievedover 90% correct detections for V. chilensis vocalizations with highamplitude [0, �20] dB; however the models with 512 and 128 mix-ture components demonstrated superior accuracy as they allowedrecognition of V. chilensis sounds with higher accuracy and withoutfalse positives (insertions) for all amplitude ranges. Although theaccuracy results for the models with 512 and 128 mixture compo-nents are quite close, the performance of the model GMM128 isslightly better for signals with loudest calls in the range of primaryinterest [0, �30] dB as well as in the ranges [0, �40] dB and [0,�50] dB.
The results, namely recognition accuracy of 97.7% for strong V.chilensis sound events [0, �20] dB, and accuracy 83% for vocaliza-tions with amplitude of the strongest call in the range [0,�30] dB, chart the margins of applicability of the current V. chilen-sis recognizer. Since the noise floor in natural environments istime-varying, many of the weaker calls and call series often getburied in the background noise. However we feel that this doesnot affect the usefulness of the recognizer since the acoustic activ-ity of the lapwing is very well captured in the vicinity of therecording stations. In this context it is of particular importance thatthe reported accuracy is obtained on real-field recordings and foroperational settings tuned at zero insertions, i.e., zero false posi-tives rate. Avoidance of false positives is desirable as this makesthe recognizer appropriate for automating biological studiesfocused on statistical analysis of presence/absence data and ofhourly and daily V. chilensis vocal activity (Figs. 5 and 6).
3.2. Processing speed
On a contemporary PC with processor i7 working at 3.4 GHz andOS Microsoft Windows 7, the V. chilensis recognizer operates at0.08 real time when a single core of the i7 processor is used.Further speed-up of computations is feasible by optimization ofthe audio pre-processing and audio feature extraction code, andby means of multi-core computing schemes. Such a speed-up willbe the subject of further investigations.
3.3. Analysis of detector results
The V. chilensis detections indicate a pronounced decrease incumulated daily acoustic activity during July 2013 (Fig. 6).Furthermore, nocturnal activity is considerable higher duringmoonlight nights, i.e., between first quarter and last quarter mooncompared with moonless nights around new moon. With respectto diurnal activity patterns there is a significant increase in thenumber of vocalization events near sunrise and sunset (Fig. 5), as

Fig. 5. Decrease in cumulated daily acoustic activity of Vanellus chilensis at the end of the breeding season in July 2013 and variation in nocturnal activity in relation of thelunar phases; recording station PPA001, Fazenda Pouso Alegre, Mato Grosso, Brazil.
Fig. 6. Variation of cumulated diurnal acoustic activity of Vanellus chilensis in relation to sunrise and sunset in July 2013; recording station PPA001, Fazenda Pouso Alegre,Mato Grosso, Brazil.
6108 T.D. Ganchev et al. / Expert Systems with Applications 42 (2015) 6098–6111
is to be expected for bird species that are mostly diurnal (cf. Aideet al. (2013, p. 13, Fig. 4). The recognition results demonstrate thatautomated acoustic detection facilitates the quantitative assess-ment of changes in acoustic activity. In other words, detailedstatistics on different time scales can be derived.
6 Impostor (non-target) is when a species-specific model is tested againstrecordings of other species.
4. Discussion
4.1. Technology development aspects
The GMM-UBM approach employed here was originally devel-oped for speaker verification tasks to determine whether or not agiven sentence was pronounced by a specific person (Reynoldset al., 2000). The decision is usually made at the file level, based
on audio segments with durations in the range of a few secondsto some dozens of seconds or even minutes. The GMM-UBMapproach was previously used for bird species classification onlyin a speaker verification-like setup (Graciarena, Delplanche,Shriberg, Stolcke, & Ferrer, 2010). Making use of audio recordings,assumed to contain a single bird species per file, Graciarena et al.(2010) tested each species-specific model with multiple true trialsfrom the target species and with impostor6 trials from other speciesin order to compute the classification accuracy.
In contrast to Graciarena et al. (2010), our species-specific rec-ognizer scans through long real-field recordings and detects start

T.D. Ganchev et al. / Expert Systems with Applications 42 (2015) 6098–6111 6109
and end times of V. chilensis call events, without the need of pre-liminary segmentation of the audio to single-species segments.Furthermore, our method makes use of a purposely-developedpost-processing algorithm, incorporating domain knowledge aboutthe structure and duration of V. chilensis call events. This post-pro-cessing algorithm is applied on the output of the log-likelihoodratio estimator in order to obtain the boundaries and timestampsof single-note calls and call series.
In addition, while Graciarena et al. (2010) relied on GMM–UBMwith 1024 components in order to study the applicability of differ-ent audio parameterization setups, we demonstrated that for the V.chilensis recognizer a smaller model with 128 components is moreappropriate, even if we derived the V. chilensis model using anabundance of recordings for the target species (�45 min).
Kwan et al. (2006) created a complete system for localization,tracking, and classification of birds with multiple microphones.They reported 90% classification rates in experimental setupswhere bird sounds were simulated (played through a personalcomputer) and detected by their system. Later on, Marcarini,Williamson, and de Sisternes Garcia (2008) followed the sameapproach for GMM-based closed-set classification of nine bird spe-cies. The reported classification accuracy was in the range between7.1% and 81.9% depending on the species and the acceptable levelof false positive rates. Both works made use of plain GMM classifi-cation of birds, under the assumption that preliminary segmenta-tion of the audio to single-species segments is available. The useof plain GMM classification does not allow for proper account ofunlabeled co-occurring sound events and proper modeling of theacoustic background, which makes the classifier error prone inuncontrolled real-field conditions. By contrast, the GMM–UBMapproach used in our work creates species-specific models, whichare adapted from a large acoustic background model built for thespecific operational environment. Therefore our modelingapproach has the potential to achieve a better discriminativepower in real-field conditions. Of course this advantage dependson the assumption that the acoustic background model is repre-sentative of the specific environment.
In the aforementioned studies (i.e., Graciarena et al. (2010),Kwan et al. (2006), Marcarini et al. (2008)) the experimental eval-uation was performed with test files that contained only one dom-inant species per file, and the decision was made at file levelwithout the need to estimate the boundaries of call events. In thepresent work, we evaluate the proposed method with continuousreal-field recordings captured in uncontrolled conditions (cf.Sections 2 and 3) and automatically search for the call events ofinterest and their boundaries.
4.2. Practical use of the recognizer
The GMM–UBM based V. chilensis recognizer facilitates theanalysis of acoustic activity patterns at different time scales. Wedemonstrate the practical usefulness of the recognizer with resultson cumulated diurnal and daily acoustic activity of V. chilensis overone month of continuous recordings (Figs. 5 and 6). Comparabletime resolution is hardly achievable with observer-based tradi-tional bird survey methods, particularly in long-term monitoringstudies.
In the near future we will screen complete annual cycles ofrecordings from multiple Pantanal recording stations with the V.chilensis recognizer. We hypothesize that the analysis of the distri-bution and abundance of the target species will show a close cor-relation between the annual flood-drought cycle in the Pantanalregion and the life history of the lapwing. A research effort on sucha scale is neither practical nor possible for human observers, as thecollection of any comparable amount and quality of evidence is
logistically prohibitive, and most importantly, it is beyond the lim-its of traditional human-expert-based methods.
Autonomous acoustic recording units, in combination withautomated species-specific recognizers, such as the one describedhere, facilitate the continuous 24/7 surveillance of sound-produc-ing animal species and thereby provide valuable information onthe biology and the conservation status of the species observed.
4.3. Research limitations
In the present study we aimed to achieve high recognition accu-racy at zero false positives rates. Therefore we only considered V.chilensis vocalizations with loudest call notes in the range [0,�30] dB. Bird vocalizations at these sound levels can be undoubt-edly confirmed by experienced ornithologists during traditionalfield surveys, even under noisy environmental conditions (Jahn,2011a, 2011b). At the same time, a reliable automated recognitionof weaker call events, with audio levels below �30 dB, would be ofsignificant interest for biological studies, considering that humanexperts routinely detect animal vocalization down to �40 dB oreven less (pers. obs.). However at the present development stage,any fine-tuning on the detection of such faint call events leads toa significant increase in the false positives rates. A major challengeto be addressed when targeting the detection of weak call events,with amplitude on or below the ambient noise floor, is that therecognition results heavily depend on the availability of reliablenoise suppression methods and their efficiency in rapidly varyingambient noise conditions. At small distances of a few meters,multi-sensor microphone arrays provide the means for noise sup-pression, but at greater distances alternative approaches must beused.
A direct comparison of the automatically detected timestampswith the tags of the expert-annotated validation library VL02revealed that in many cases only parts of longer call series weredetected. In certain cases even some of the high-amplitude callnotes went undetected. One reason for this phenomenon is theco-occurrence of sounds emitted by V. chilensis and by other spe-cies. The use of more advanced noise suppression methods, whichoperate off-line and are applied directly on the audio spectrogramseen as an image, may offer a solution to this problem (Briggs et al.,2012; Cadore, Gallardo-Antolan, & Pelaez-Moreno, 2011;Potamitis, 2014). However future research is required in order toinvestigate the applicability of these methods to the processingof long uncontrolled real-field recordings.
Finally, these acoustic models were built from a moderateamount of training (approx. 45 min) and background recordings(approx. 27 h), representing the acoustic conditions over a periodof only a few months. In particular, for the background model wemade use of fifty-four 14-minute recordings with a total durationof about 12 h from Fazenda Pouso Alegre soundscapes recordedin 2012, covering August (38 files), October (4), and November(12), as well as thirty-two 30-minute recordings (about 15 h) madein the SESC Pantanal Reserve area in January 2014. It is likely thatthis relatively small background library cannot represent thecomplex and variable Pantanal soundscapes of a complete annualcycle of recordings. Therefore, recognition accuracy over long timeperiods will depend on the availability of a representativeacoustic background model, containing samples of all months ofthe year.
4.4. Follow-up technological development and research
Future research efforts will aim to increase the sensitivity of theV. chilensis recognizer in order to detect vocalizations down toamplitudes of at least �40 dB. The latter signal strengths are closerto the limits at which a bird-sound expert can identify

6110 T.D. Ganchev et al. / Expert Systems with Applications 42 (2015) 6098–6111
vocalizations under low-to-medium ambient noise conditions.Recent off-line noise suppression methods, which operate on theaudio spectrogram seen as an image, offer promising options forthe elimination of ambient noise (Briggs et al., 2012; Cadore,Gallardo-Antolan, & Pelaez-Moreno, 2011; Potamitis, 2014).These methods are usually based on morphological filtering ofthe spectrogram or make use of other established image noisereduction techniques in order to deal with short-duration soundevents and/or long-duration interferences. Furthermore, embed-ding domain knowledge about the operational environment, thestructure of the species-specific sound emissions, and other priorinformation are seen as promising research directions that couldfacilitate the detection of weaker call events. Likewise, rule- andgrammar-based methods for post-processing the output of thelog-likelihood ratio estimator could contribute to the improvementof the V. chilensis recognition results.
Other improvements, like the expansion of the acoustic back-ground model, processing complete annual cycles of recordings,and the compilation of more comprehensive V. chilensis traininglibraries will be investigated as well. Specifically, we plan to inves-tigate whether the enlargement and the enhancement of the V.chilensis training library with annotations at the level of call typesand ethological functions could facilitate the analysis of the lap-wings’ behavior.
In order to implement long-term monitoring efforts, we foreseeintegration of the V. chilensis recognizer in the large PantanalDatabase Repository created by the INAU Project 3.14.
5. Conclusion
The main advantage of the approach presented here is that wedetect target species’ call events and their timestamps in continu-ous real-field recordings, regardless of weather conditions andtime of day. Related previous research focused on classificationtasks at the file-level, that is, on the processing of short audiorecordings containing sound signals of a single dominant speciesor on the processing of continuous soundscapes made in favorableclimatic conditions, such as dry and calm weather.
The proposed automated method for the recognition of Vanelluschilensis call events incorporates three important components: (i)traditional audio parameterization, which is adapted to the fre-quency range of V. chilensis sound emissions; (ii) a statistical log-likelihood ratio estimator based on the GMM–UBM approach,which here is employed in a search-and-detect mode in order tofind segments with acoustic activity of the target species; and(iii) post-processing of the log-likelihood estimator output in orderto aggregate segments belonging to single-note calls and call ser-ies, and to estimate their boundaries in terms of absolute time.The recognizer demonstrated good sensitivity and ability to detectweak sounds with amplitudes down to �30 dB with low false pos-itive rates and robustness to the variability of acoustic environ-ments. Validation experiments on real-field recordings andanalysis of recognizer results confirmed the practical usefulnessof our approach. It provides the means to automatize ornithologi-cal studies and to perform statistical analysis of the acoustic activ-ity patterns of V. chilensis.
We anticipate that the V. chilensis recognizer will be particularlyuseful in large-scale and long-term biological studies, as the auto-matically detected call events and their timestamps provide thebasis for processing terabytes of recordings within reasonable time.
The automated detection of V. chilensis acoustic activity at zero falsepositive rates facilitates statistical tests at multiple time and geo-graphical scales. For instance, it supports the detection of pres-ence/absence patterns and the estimation of the target species’abundance in relation to the flood/drought cycle in our study area.
Future research will be focused on call-type level annotation ofan expanded V. chilensis training library in order to support theanalysis of the behavioral contexts in which certain vocalizationsare emitted. This will make possible the determination of distinctphases of the species’ natural history, namely start/end dates ofterritory establishment, copulations, nesting, presence of hatch-lings and juveniles, and formation of flocks. Subsequently, specificbehaviors could be correlated with other ecological factors such asclimate and the water level data. It is clear that such a detailedknowledge would be very helpful for the implementation of mean-ingful management and conservation measures. Finally, an impor-tant research direction will be the increase of processing speed anddata throughput of the recognizer. This will allow simultaneousprocessing of complete annual cycles of recordings recorded atmultiple locations.
Beyond the horizon of our project, we expect that automatedmonitoring technologies will gain importance in global efforts toreduce biodiversity loss and avert dangerous degradation in thepopulations of sound-emitting animal species.
Author contributions
Collected and prepared audio recordings: MIM, KLS, OJ, and TG.Identified, analyzed, and tagged the data: OJ. Contributedreagents/materials/analysis tools: MIM, KLS, and JMF. Performedthe experiments: TG. Validated the recognizer performance: TGand OJ. Wrote the paper: TG, OJ, MIM, JMF, and KLS.
Acknowledgments
The authors acknowledge with thanks the financial and logisticproject support by the Brazilian Science Council (CNPq), theNational Institute for Science and Technology in Wetlands (INAU/UFMT), the Brehm Foundation for International BirdConservation, Germany, the project OP ‘‘Competitiveness’’BG161PO003-1.2.04-0044-C0001 financed by the StructuralFunds of the European Union, and the project ISP1 financed bythe Technical University of Varna, Bulgaria. The authors acknowl-edge funds for laboratory and field equipment provided byFundação de Amparo à Pesquisa do Estado de Mato Grosso(FAPEMAT), Brazil, Programa de Apoio a Núcleos de Excelência,(PRONEX) No. 009/2009.
The interns Dan Codea, Robert Koch, and Thibaut Bezardkindly selected the recording segments (snippets) that served asthe basis for the compilation of reference and training libraries.Luiz Vicente da Silva Campos Filho, Fazenda Pouso Alegre, andDirector Waldir Wolfgang Valutky, Estância Ecológica SESCPantanal: Reserva Particular do Patrimônio Natural, Baía dasPedras, generously allowed us to conduct our studies on theirhabitat-rich lands. Roseneide Soares kindly provided her immenseadministrative expertise during the project implementationphase. Last not least, special thanks go to the INAU directorsProf. Dr. Wolfgang Junk and Prof. Dr. Paulo Teixeira for theircontinuous support and encouragement throughout our fieldand laboratory work.

Appendix A
Source files for the generation of spectrograms. The start and end times refer to the 1.5-second segments shown in Fig. 1.
Spectrogram Reference file Start[m:ss.ms]
End[m:ss.ms]
a BIAVCHCHVACHLA_BRMTAPPPA001C001A20120731T021500B_S001306E022415_ID1q1c1e0f0R 0:12.961 0:14.461b BIAVCHCHVACHLA_BRMTAPPPA001C001A20120727T054500B_S042800E050394_ID1q2c3e0f0R 0:16.353 0:17.853c BIAVCHCHVACHLA_BRMTAPPPA001C001A20120729T164500A_S142704E145800_ID1q3c3e0f0R 0:26.129 0:27.629d BIAVCHCHVACHLA_BRMTAPPPA001C001A20120731T174500A_S063200E080400_ID1q3c3e0f0R 0:14.788 0:16.288e BIAVCHCHVACHLA_BRMTAPPPA001C001A20120801T013000B_S031499E032000_ID1q2c2e0f0R 0:14.348 0:15.848f BIAVCHCHVACHLA_BRMTAPPPA001C001A20120730T023000B_S054014E064302_ID1q2c1e0f0R 0:15.883 0:17.383g BIAVCHCHVACHLA_BRMTAPPPA001C001A20120731T101500A_S023000E032500_ID1q1c2e0f0R 0:26.352 0:27.852h BIAVCHCHVACHLA_BRMTAPPPA001C001A20120730T060000B_S110003E145800_ID1q1c3e0f0R 3:44.997 3:46.497
T.D. Ganchev et al. / Expert Systems with Applications 42 (2015) 6098–6111 6111
References
Aide, T. M., Corrada-Bravo, C., Campos-Cerqueira, M., Milan, C., Vega, G., & Alvarez,R. (2013). Real-time bioacoustics monitoring and automated speciesidentification. PeerJ, 1, e103. http://dx.doi.org/10.7717/peerj.103.
Acevedo, M. A., Corrada-Bravo, C. J., Corrada-Bravo, H., Villanueva-Rivera, L. J., &Aide, T. M. (2009). Automated classification of bird and amphibian calls usingmachine learning: A comparison of methods. Ecological Informatics, 4(4),206–214.
Bardeli, R., Wolff, D., Kurth, F., Koch, M., Tauchert, K.-H., & Frommolt, K.-H. (2010).Detecting bird sounds in a complex acoustic environment and application tobioacoustic monitoring. Pattern Recognition Letters, 31, 1524–1534.
Brendle, A. (2003). Behind threats to world’s largest freshwater wetland. nationalgeographic news. January 10, 2003 (pp. 1–2). Retrieved March 10, 2015.
Briggs, F., Lakshminarayanan, B., Neal, L., Fern, X. Z., Raich, R., Hadley, S. J. K., et al.(2012). Acoustic classification of multiple simultaneous bird species: A multi-instance multi-label approach. Journal of the Acoustical Society of America, 131,4640–4650.
Benoit, G., Fauve, B., Matrouf, D., Scheffer, N., Bonastre, J.-F., & Mason, J. S. D. (2007).State-of-the-art performance in text-independent speaker verification throughopen-source software. IEEE Transactions on Audio, Speech and LanguageProcessing, 15, 1960–1968.
Cadore, J., Gallardo-Antolan, A., & Pelaez-Moreno, C. (2011). Morphologicalprocessing of spectrograms for speech enhancement. In Advances in nonlinearspeech processing. Lecture notes in computer science (Vol. 7015, pp. 224–231).Berlin Heidelberg: Springer.
Digby, A., Towsey, M., Bell, B. D., & Teal, P. D. (2013). A practical comparisonof manual and autonomous methods for acoustic monitoring. Methodsin Ecology and Evolution, 4, 675–683. http://dx.doi.org/10.1111/2041-210X.12060.
Gill, F., & Donsker, D. (Eds). (2014). IOC World bird list (v 4.1). http://dx.doi.org/10.14344/IOC.ML.4.1. URL: <www.worldbirdnames.org>, last accessed 7 February.
Graciarena, M., Delplanche, M., Shriberg, E., Stolcke, A., & Ferrer, L. (2010). Acousticfront-end optimization for bird species recognition. In Proceedings of ICASSP-2010 (pp. 293–296). Dallas, USA.
Gwynne, J. A., Ridgely, R. S., Tudor, G., & Argel, M. (2010). Birds of Brazil, Pantanal andCerrado of Central Brazil (Vol. 1). Ithaca, New York: Comstock PublishingAssociates.
Frommolt, K.-H., & Tauchert, K.-H. (2014). Applying bioacoustic methods for long-term monitoring of a nocturnal wetland bird. Ecological Informatics, 21, 4–12.
Internet Bird Collection. (2014). Southern Lapwing (Vanellus chilensis). In Theinternet bird collection. URL: <http://ibc.lynxeds.com/species/southern-lapwing-vanellus-chilensis?t=1400664871>, last accessed 12 May 2014.
Jahn, O. (2011a). Surveying tropical bird communities: in search of an appropriaterapid assessment method. In K.-L. Schuchmann (Ed.), Bird communities of theEcuadorian Chocó: A case study in conservation (pp. 63–107). Bonn, Germany:Bonner zoologische Monographien 56. Zoological Research Museum A. Koenig(ZFMK). URL: <http://zoologicalbulletin.de/BzB_Volumes/BzM_56/BZM_56.pdf>, last accessed 25 June 2014.
Jahn, O. (2011b). Structure and organization of the bird community. In K.-L.Schuchmann (Ed.), Bird communities of the Ecuadorian Chocó: A case study inconservation (pp. 109–178). Bonn, Germany: Bonner zoologische Monographien56. Zoological Research Museum A. Koenig (ZFMK). URL:<http://zoologicalbulletin.de/BzB_Volumes/BzM_56/BZM_56.pdf>, lastaccessed 25 June 2014.
Junk, W. J., da Silva, C. J., da Cunha, C. N., & Wantzen, K. M. (2011). The Pantanal:Ecology, biodiversity and sustainable management of a large Neotropical seasonalwetland. Sofia, Bulgaria: Pensoft Publishers.
Junk, W. J., & da Cunha, C. N. (2005). The Pantanal: A large South American wetlandat a crossroads. Ecological Engineering, 24, 391–401.
Härmä, A. (2003). Automatic identification of bird species based on sinusoidalmodeling of syllables. In Proceedings of the 2003 IEEE international conference onacoustics, speech, and signal processing, (ICASSP ’03) (Vol. 5. pp. 545–548).
Henríquez, A., Alonso, J. B., Travieso, C. M., Rodríguez-Herrera, B., Bolaños, F.,Alpízar, P., et al. (2014). An automatic acoustic bat identification system basedon the audible spectrum. Expert Systems with Applications, 41, 5451–5465.
Huang, C.-J., Yang, Y.-J., Yang, D.-X., & Chen, Y.-J. (2009). Frog classification usingmachine learning techniques. Expert Systems with Applications, 36, 3737–3743.
Kwan, C., Ho, K. C., Mei, G., Li, Y., Ren, Z., Xu, R., et al. (2006). An automated acousticsystem to monitor and classify birds. EURASIP Journal on Advances in SignalProcessing, 1, 1687–6180. http://dx.doi.org/10.1155/ASP/2006/96706.
Marchant, J., Prater, A. J., & Hayman, P. (1986). Shorebirds – an identification guide tothe waders of the world. London, UK: Christopher Helm Publishers Ltd.
Martin, J. P. (1997). The first Southern Lapwing Vanellus chilensis in Mexico. Cotinga,8, 52–54.
Maruyama, P. K., Cunha, A. F., Tizo-Pedroso, E., & Del-Claro, K. (2010). Relation ofgroup size and daily activity patterns to Southern Lapwing (Vanellus chilensis)behavior. Journal of Ethology, 28, 339–344.
Marcarini, M., Williamson, G. A., & de Sisternes Garcia, L. (2008). Comparison ofmethods for automated recognition of avian nocturnal flight calls. In IEEEinternational conference on acoustics, speech and signal processing (ICASSP-2008)(pp. 2029–2032). http://dx.doi.org/10.1109/ICASSP.2008.451803.
Potamitis, I. (2014). Automatic classification of a taxon-rich community recorded inthe wild. PLoS ONE, 9, e96936. http://dx.doi.org/10.1371/journal.pone.0096936.
Potamitis, I., Ntalampiras, S., Jahn, O., & Riede, K. (2014). Automatic bird sounddetection in long real-field recordings: Applications and tools. Applied Acoustics,80, 1–9.
Ridgely, R. S., & Gwynne, J. A. (1992). A guide to the birds of Panama: with Costa Rica,Nicaragua, and Honduras. NJ, USA: Princeton University Press.
Reynolds, D. A., Quatieri, T. F., & Dunn, R. B. (2000). Speaker verification usingadapted Gaussian mixture models. Digital Signal Processing, 10(1–3), 19–41.
Saeidi, R., Sadegh Mohammadi, H. R., Ganchev, T., & Rodman, R. D. (2009). Particleswarm optimization for sorted adapted Gaussian mixture models. IEEETransactions on Audio, Speech and Language Processing, 17, 344–353.
Santos, E. S. A. (2010). Southern Lapwing (Vanellus chilensis). In T. S. Schulenberg(Ed.), Neotropical birds online. Ithaca: Cornell lab of ornithology. URL:<http://neotropical.birds.cornell.edu/portal/species/overview?p_p_spp=144596>, last accessed 22 May 2014.
Stowell, D. & Plumbley, M. D. (2010). Birdsong and C4DM: A survey of UK birdsongand machine recognition for music researchers. Technical report C4DM-TR-09-12. Centre for Digital Music, Queen Mary University of London.
Stowell, D., & Plumbley, M. D. (2014). Automatic large-scale classification of birdsounds is strongly improved by unsupervised feature learning. PeerJ, 2, e488.http://dx.doi.org/10.7717/peerj.488.
Sueur, J., Pavoine, S., Hamerlynck, O., & Duvail, S. (2008). Rapid acoustic survey forbiodiversity appraisal. PLoS ONE, 3, e4065. http://dx.doi.org/10.1371/journal.pone.0004065.
Schuchmann, K.-L., Marques, M. I., Jahn, O., Ganchev, T., & de Figueiredo, J. M.(2014). Os sons do Pantanal: um projeto de monitoramento acústicoautomatizado da biodiversidade. O Biólogo, Revista do Conselho Regional deBiologia, 29, 12–15.
Stotz, D. F., Fitzpatrick, J. W., Parker, T. A., III, & Moskovits, D. K. (1996). Neotropicalbirds: Ecology and conservation. Chicago, USA and London, UK.
Wetlands International, 2010. State of the World’s Waterbirds, 2010. (Compiled bySimon Delany, Szabolcs Nagy, and Nick Davidson). Wetlands International, Ede,The Netherlands. Retrieved March 2014. URL: http://www.wetlands.org/Portals/0/publications/Report/SOWW2010%20%283%29.pdf.
Wiersma, P. (1996). Southern Lapwing (Vanellus chilensis). In J. del Hoyo, A. Elliott,& J. Sargatal (Eds.), Handbook of the birds of the world. Hoatzin to Auks (Vol. 3).Barcelona, Spain: Lynx Editions, p. 420.