astro malaysia holdings - i3investor
TRANSCRIPT
PP13693/03/2013(032114)
The return of the Pay-TV giant!
Astro Malaysia Holdings Bhd (AMH) is on track to raise some RM4.6bn from its listing
after it acquired the Malaysian businesses of Astro All Asia Networks Limited (AAAN)
(which was privatized back in 2010) as part of its reorganization process in March 2011
and April 2011. We initiate coverage on AMH with a HOLD recommendation. Our target
price of RM3.09 is based on DCF valuation (WACC: 7.4%, β: 1.5, terminal growth: 1%).
SE Asia’s leading integrated consumer media entertainment group � Astro Malaysia Holdings Bhd (AMH) is one of Southeast Asia’s leading integrated
consumer media entertainment group, engaging primarily in the creation,
aggregation and distribution of content over multiple delivery platforms including
TV, radio, publications and digital media within Malaysia.
� AMH was incorporated in February 2011 and acquired the Malaysian businesses of
Astro All Asia Networks Limited (AAAN) as part of the Group’s reorganization in
March 2011 and April 2011. AMH is housing the Malaysian businesses of AAAN.
Investment merits � Higher pay-TV penetration rates to drive the subscriber base. Although Malaysia
has a higher pay-TV penetration rate of 50% compared to its regional peers such as
Vietnam (19%) and Thailand (14%), it is still lagging behind some of the higher
income countries such as South Korea (122%) and Singapore (70%). We believe the
penetration rate in Malaysia will continue to grow given the increasing household
income level as well as rising proportion of households in the higher income bands.
� Value-added service and innovative initiatives to sustain residential ARPU growth.
AMH’s residential average revenue per user (ARPU) has remained flattish for two
consecutive years since FY08. However, thanks to the introduction of value added
services and innovative initiatives since Dec 2009, its residential ARPU has since
consistently increased and in 1HFY13 recorded an all-time high ARPU of RM92. We
believe that HD and PVR are strong drivers for ARPU growth as global data has
shown that the launch of these value-added services by regional pay-TV players
appears to have a positive impact on its ARPU. � Leading position creates significant barriers to entry. We view that given AMH’s
leading position as: (i) the exclusive Direct-to-Home (DTH) licence holder in
Malaysia with nationwide reach of 6.7m households, (ii) a rich content distributor
with exclusive rights for some of the third party internationally sourced channels in
Malaysia, and (iii) a Group with deep pockets for high capex requirements; have
created significant barriers for competitors to enter into the market.
Key risks � Extensive regulation
� Potential of losing the DTH licence
� Satellites failure
� Failure and disruption on broadcast facilities
� Escalation of content cost
� Foreign currency risk
Valuation � Initiate coverage on AMH with a HOLD recommendation as our target price of
RM3.09 has only 3% upside from the indicative IPO price of RM3.00 which could be
revised lower depending on the book-building exercise.
� Given the strong cash generation profile of AMH and potentially high cash flow (due
to stable earnings streams, visibility of capex and AMH’s target dividend payout
ratio of not less than 75% of its consolidated profit starting from FY14), we value
AMH using DCF method based on an explicit forecast period of 10 years.
Initiating Coverage 25 September 2012
Astro Malaysia Holdings MEDIA
Hold Bloomberg Ticker: ASTRO MK
12-month upside potential
IPO price (RM) 3.00
Listing sought Main market
Closing date of application 1 Oct 12
Listing date 19 Oct 12
Market cap @ IPO Price (RMm) 15,592
Issued shares (m) 5,197
12-month upside potential
Target price 3.09
IPO price 3.00
Capital upside (%) 3.0
Net dividends (%) 3.4
Total return (%) 6.4
Major shareholders (Post-IPO) %
Astro Networks (Malaysia) 70.8
Analyst
Team Coverage
+603 2089 2980
Astro Malaysia Holdings Bhd | The return of the Pay-TV giant! | 25 September 2012 2
SNAPSHOT OF FINANCIAL AND VALUATION METRICS
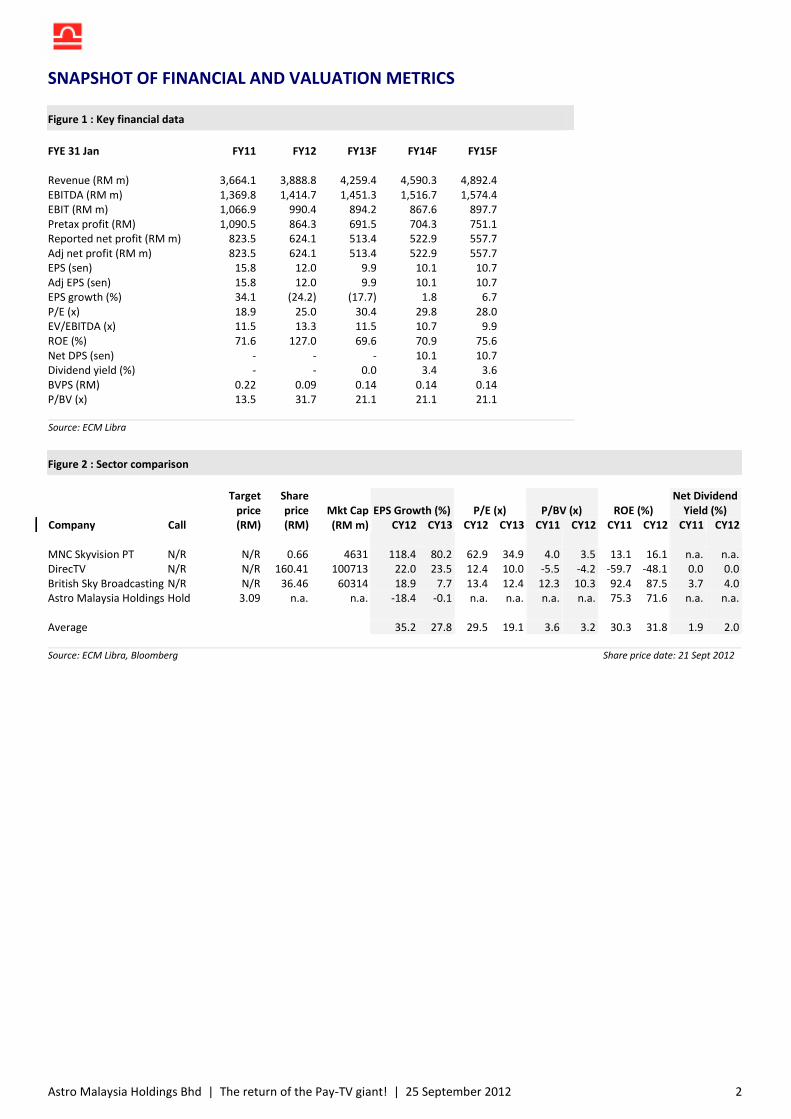
Figure 1 : Key financial data
FYE 31 Jan FY11 FY12 FY13F FY14F FY15F
Revenue (RM m) 3,664.1 3,888.8 4,259.4 4,590.3 4,892.4
EBITDA (RM m) 1,369.8 1,414.7 1,451.3 1,516.7 1,574.4
EBIT (RM m) 1,066.9 990.4 894.2 867.6 897.7
Pretax profit (RM) 1,090.5 864.3 691.5 704.3 751.1
Reported net profit (RM m) 823.5 624.1 513.4 522.9 557.7
Adj net profit (RM m) 823.5 624.1 513.4 522.9 557.7
EPS (sen) 15.8 12.0 9.9 10.1 10.7
Adj EPS (sen) 15.8 12.0 9.9 10.1 10.7
EPS growth (%) 34.1 (24.2) (17.7) 1.8 6.7
P/E (x) 18.9 25.0 30.4 29.8 28.0
EV/EBITDA (x) 11.5 13.3 11.5 10.7 9.9
ROE (%) 71.6 127.0 69.6 70.9 75.6
Net DPS (sen) - - - 10.1 10.7
Dividend yield (%) - - 0.0 3.4 3.6
BVPS (RM) 0.22 0.09 0.14 0.14 0.14
P/BV (x) 13.5 31.7 21.1 21.1 21.1
Source: ECM Libra
Figure 2 : Sector comparison
EPS Growth (%) P/E (x) P/BV (x) ROE (%)
Net Dividend
Yield (%)
Company Call
Target
price
(RM)
Share
price
(RM)
Mkt Cap
(RM m) CY12 CY13 CY12 CY13 CY11 CY12 CY11 CY12 CY11 CY12
MNC Skyvision PT N/R N/R 0.66 4631 118.4 80.2 62.9 34.9 4.0 3.5 13.1 16.1 n.a. n.a.
DirecTV N/R N/R 160.41 100713 22.0 23.5 12.4 10.0 -5.5 -4.2 -59.7 -48.1 0.0 0.0
British Sky Broadcasting N/R N/R 36.46 60314 18.9 7.7 13.4 12.4 12.3 10.3 92.4 87.5 3.7 4.0
Astro Malaysia Holdings Hold 3.09 n.a. n.a. -18.4 -0.1 n.a. n.a. n.a. n.a. 75.3 71.6 n.a. n.a.
Average 35.2 27.8 29.5 19.1 3.6 3.2 30.3 31.8 1.9 2.0
Source: ECM Libra, Bloomberg Share price date: 21 Sept 2012
Astro Malaysia Holdings Bhd | The return of the Pay-TV giant! | 25 September 2012 3
IPO DETAILS
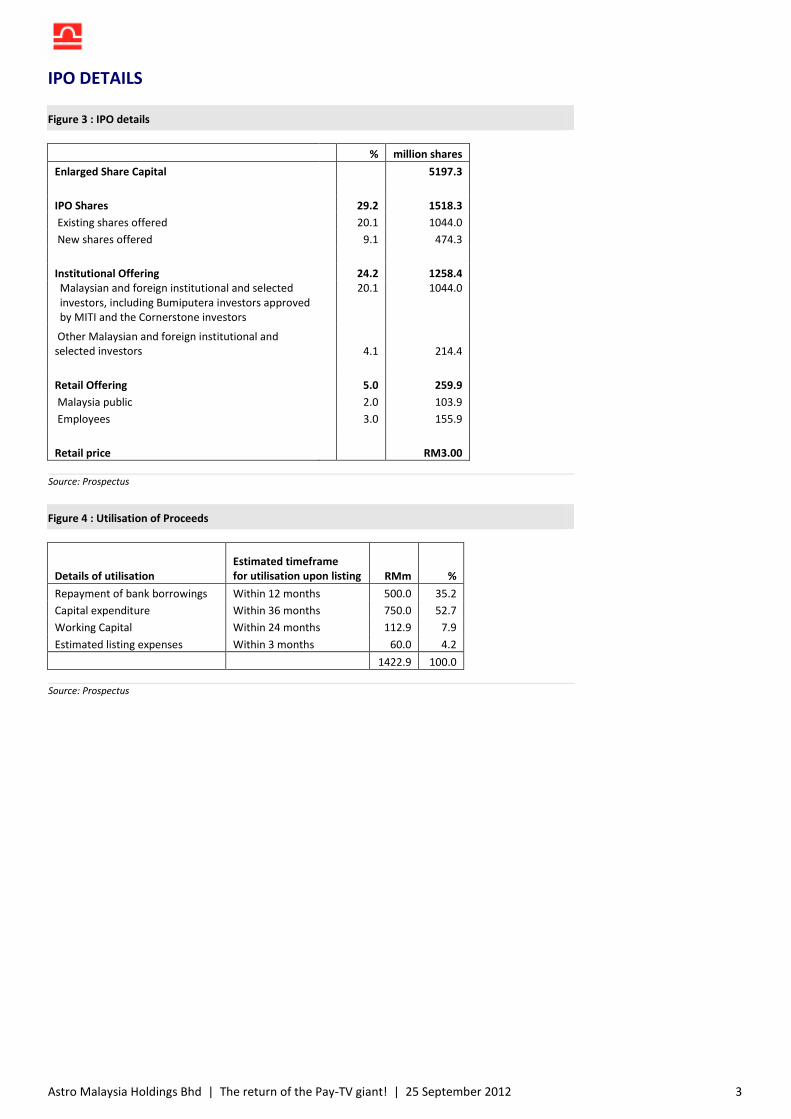
Figure 3 : IPO details
% million shares
Enlarged Share Capital 5197.3
IPO Shares 29.2 1518.3
Existing shares offered 20.1 1044.0
New shares offered 9.1 474.3
Institutional Offering 24.2 1258.4
Malaysian and foreign institutional and selected
investors, including Bumiputera investors approved
by MITI and the Cornerstone investors
20.1 1044.0
Other Malaysian and foreign institutional and
selected investors 4.1 214.4
Retail Offering 5.0 259.9
Malaysia public 2.0 103.9
Employees 3.0 155.9
Retail price RM3.00
Source: Prospectus
Figure 4 : Utilisation of Proceeds
Details of utilisation
Estimated timeframe
for utilisation upon listing RMm %
Repayment of bank borrowings Within 12 months 500.0 35.2
Capital expenditure Within 36 months 750.0 52.7
Working Capital Within 24 months 112.9 7.9
Estimated listing expenses Within 3 months 60.0 4.2
1422.9 100.0
Source: Prospectus
Astro Malaysia Holdings Bhd | The return of the Pay-TV giant! | 25 September 2012 4
COMPANY OVERVIEW
Background and history
Astro Malaysia Holdings Bhd (AMH) is one of Southeast Asia’s leading integrated consumer
media entertainment groups, engaging primarily in the creation, aggregation and distribution of
content over multiple delivery platforms including TV, radio, publications and digital media
within Malaysia. AMH’s leading position is reflected by its 156 TV channels (as at 30 Jun 2012), of
which 68 are Astro-created and branded channels. It distributes content to its customers via
broadcast and on-demand programmes through its Direct-to-Home (DTH) satellite TV, Internet
Protocol TV (IPTV) and Over-The-Top (OTT) platforms, making its TV offerings increasingly
platform-agnostic in reaching its customers.
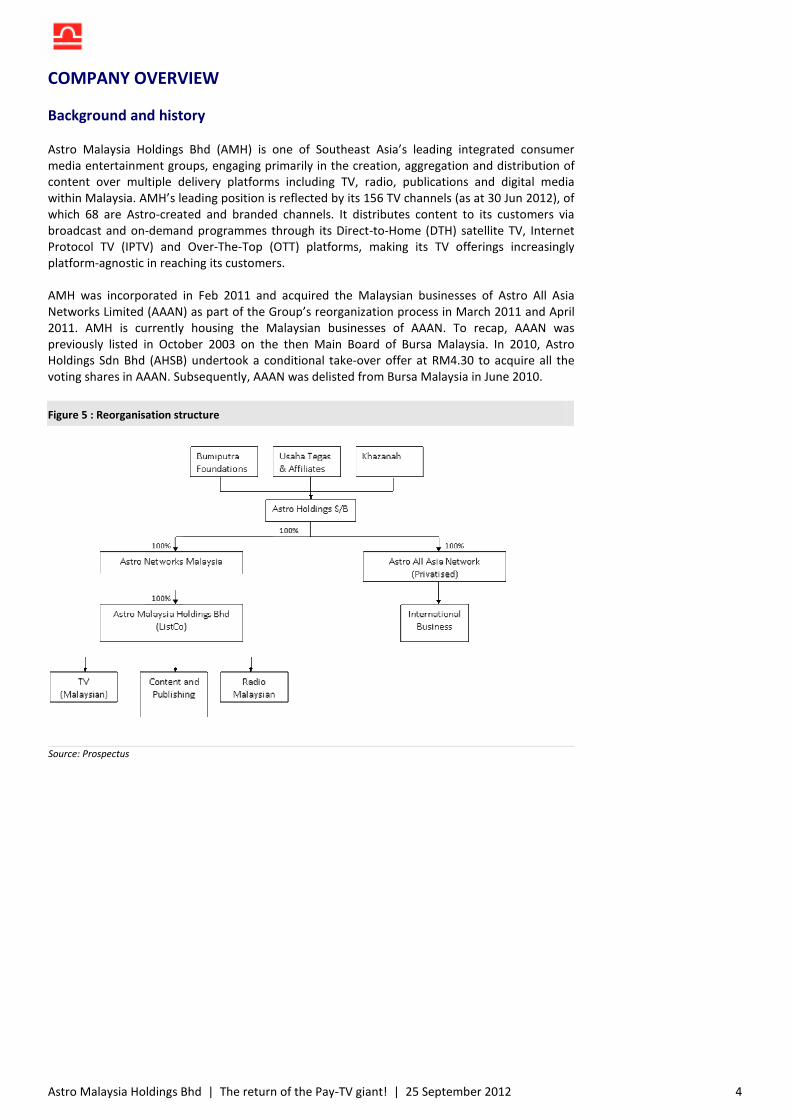
AMH was incorporated in Feb 2011 and acquired the Malaysian businesses of Astro All Asia
Networks Limited (AAAN) as part of the Group’s reorganization process in March 2011 and April
2011. AMH is currently housing the Malaysian businesses of AAAN. To recap, AAAN was
previously listed in October 2003 on the then Main Board of Bursa Malaysia. In 2010, Astro
Holdings Sdn Bhd (AHSB) undertook a conditional take-over offer at RM4.30 to acquire all the
voting shares in AAAN. Subsequently, AAAN was delisted from Bursa Malaysia in June 2010.
Figure 5 : Reorganisation structure
Source: Prospectus
Astro Malaysia Holdings Bhd | The return of the Pay-TV giant! | 25 September 2012 5
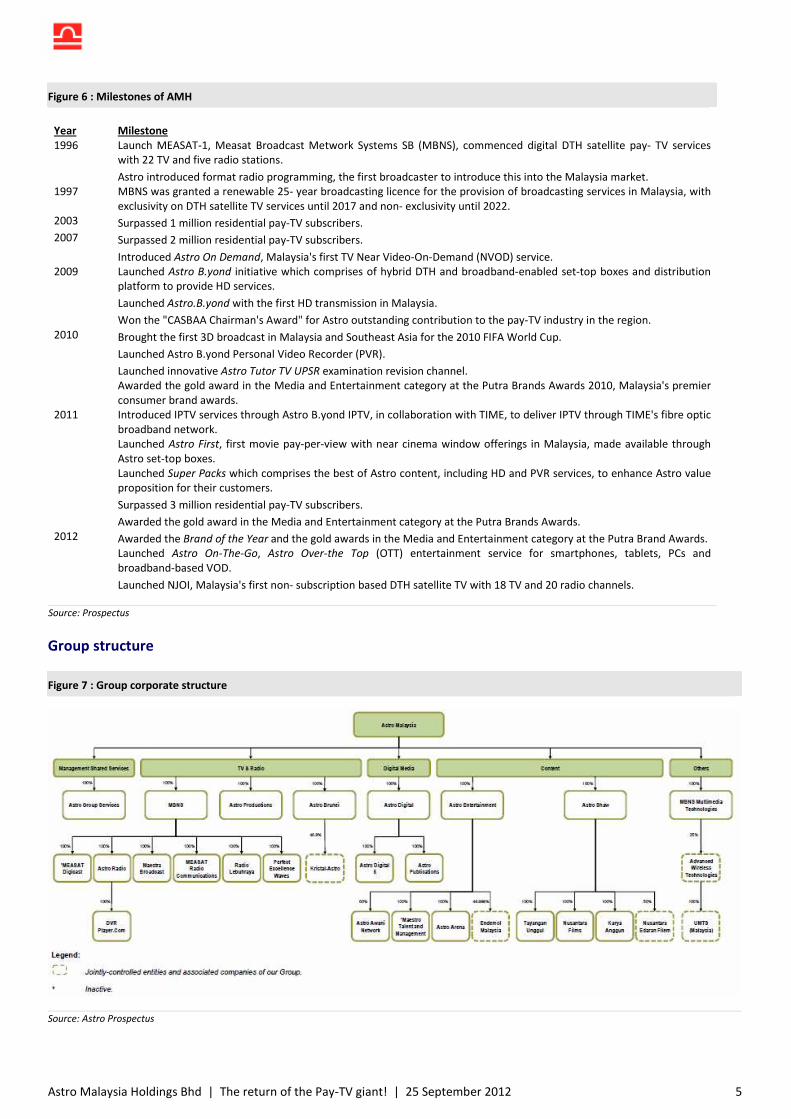
Figure 6 : Milestones of AMH
Year Milestone
1996 Launch MEASAT-1, Measat Broadcast Metwork Systems SB (MBNS), commenced digital DTH satellite pay- TV services
with 22 TV and five radio stations.
Astro introduced format radio programming, the first broadcaster to introduce this into the Malaysia market.
1997 MBNS was granted a renewable 25- year broadcasting licence for the provision of broadcasting services in Malaysia, with
exclusivity on DTH satellite TV services until 2017 and non- exclusivity until 2022.
2003 Surpassed 1 million residential pay-TV subscribers.
2007 Surpassed 2 million residential pay-TV subscribers.
Introduced Astro On Demand, Malaysia's first TV Near Video-On-Demand (NVOD) service.
2009 Launched Astro B.yond initiative which comprises of hybrid DTH and broadband-enabled set-top boxes and distribution
platform to provide HD services.
Launched Astro.B.yond with the first HD transmission in Malaysia.
Won the "CASBAA Chairman's Award" for Astro outstanding contribution to the pay-TV industry in the region.
2010 Brought the first 3D broadcast in Malaysia and Southeast Asia for the 2010 FIFA World Cup.
Launched Astro B.yond Personal Video Recorder (PVR).
Launched innovative Astro Tutor TV UPSR examination revision channel.
Awarded the gold award in the Media and Entertainment category at the Putra Brands Awards 2010, Malaysia's premier
consumer brand awards.
2011 Introduced IPTV services through Astro B.yond IPTV, in collaboration with TIME, to deliver IPTV through TIME's fibre optic
broadband network.
Launched Astro First, first movie pay-per-view with near cinema window offerings in Malaysia, made available through
Astro set-top boxes.
Launched Super Packs which comprises the best of Astro content, including HD and PVR services, to enhance Astro value
proposition for their customers.
Surpassed 3 million residential pay-TV subscribers.
Awarded the gold award in the Media and Entertainment category at the Putra Brands Awards.
2012 Awarded the Brand of the Year and the gold awards in the Media and Entertainment category at the Putra Brand Awards.
Launched Astro On-The-Go, Astro Over-the Top (OTT) entertainment service for smartphones, tablets, PCs and
broadband-based VOD.
Launched NJOI, Malaysia's first non- subscription based DTH satellite TV with 18 TV and 20 radio channels.
Source: Prospectus
Group structure
Figure 7 : Group corporate structure
Source: Astro Prospectus
Astro Malaysia Holdings Bhd | The return of the Pay-TV giant! | 25 September 2012 6
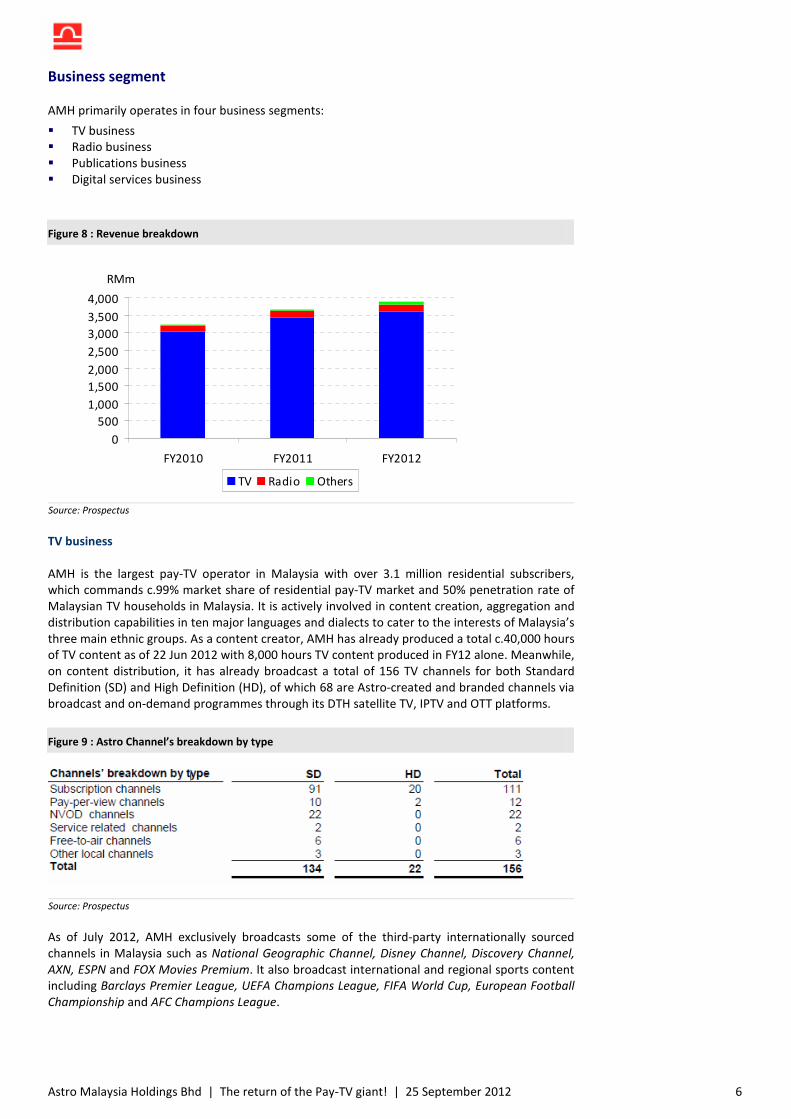
Business segment
AMH primarily operates in four business segments:
� TV business
� Radio business
� Publications business
� Digital services business
Figure 8 : Revenue breakdown
0
500
1,000
1,500
2,000
2,500
3,000
3,500
4,000
FY2010 FY2011 FY2012
RMm
TV Radio Others
Source: Prospectus
TV business
AMH is the largest pay-TV operator in Malaysia with over 3.1 million residential subscribers,
which commands c.99% market share of residential pay-TV market and 50% penetration rate of
Malaysian TV households in Malaysia. It is actively involved in content creation, aggregation and
distribution capabilities in ten major languages and dialects to cater to the interests of Malaysia’s
three main ethnic groups. As a content creator, AMH has already produced a total c.40,000 hours
of TV content as of 22 Jun 2012 with 8,000 hours TV content produced in FY12 alone. Meanwhile,
on content distribution, it has already broadcast a total of 156 TV channels for both Standard
Definition (SD) and High Definition (HD), of which 68 are Astro-created and branded channels via
broadcast and on-demand programmes through its DTH satellite TV, IPTV and OTT platforms.
Figure 9 : Astro Channel’s breakdown by type
Source: Prospectus
As of July 2012, AMH exclusively broadcasts some of the third-party internationally sourced
channels in Malaysia such as National Geographic Channel, Disney Channel, Discovery Channel,
AXN, ESPN and FOX Movies Premium. It also broadcast international and regional sports content
including Barclays Premier League, UEFA Champions League, FIFA World Cup, European Football
Championship and AFC Champions League.
Astro Malaysia Holdings Bhd | The return of the Pay-TV giant! | 25 September 2012 7
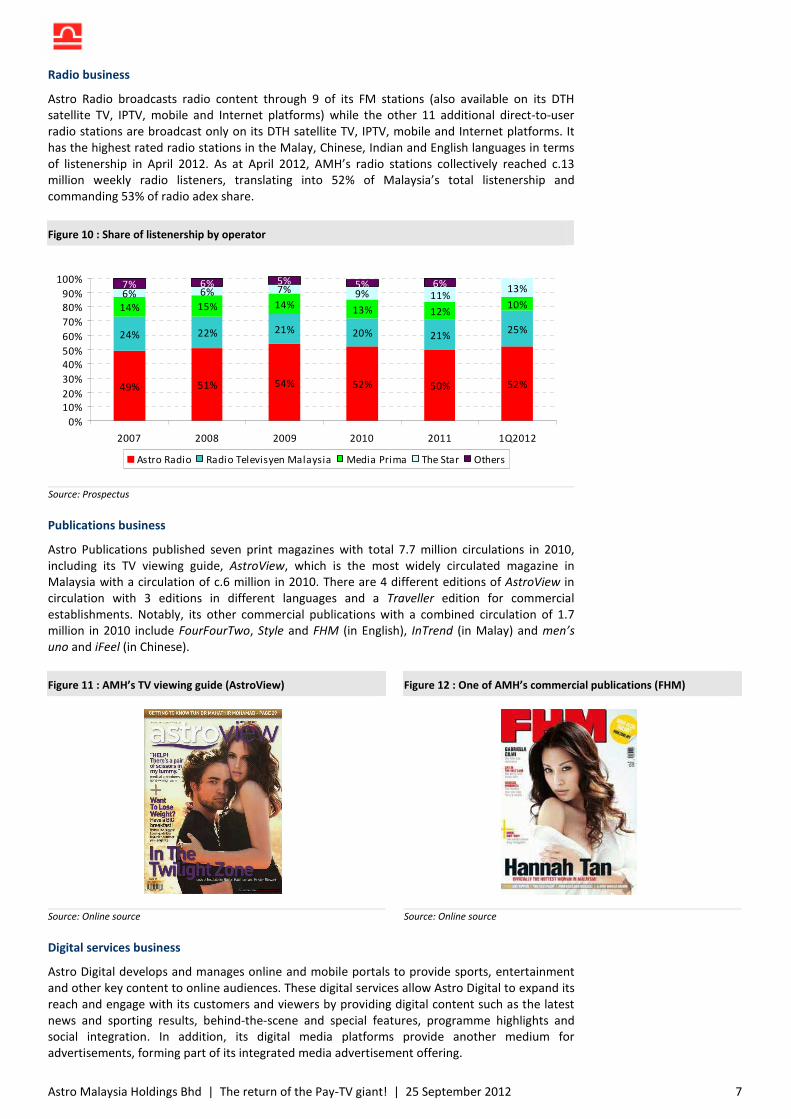
Radio business
Astro Radio broadcasts radio content through 9 of its FM stations (also available on its DTH
satellite TV, IPTV, mobile and Internet platforms) while the other 11 additional direct-to-user
radio stations are broadcast only on its DTH satellite TV, IPTV, mobile and Internet platforms. It
has the highest rated radio stations in the Malay, Chinese, Indian and English languages in terms
of listenership in April 2012. As at April 2012, AMH’s radio stations collectively reached c.13
million weekly radio listeners, translating into 52% of Malaysia’s total listenership and
commanding 53% of radio adex share.
Figure 10 : Share of listenership by operator
49% 51% 54% 52% 50% 52%
21% 20% 21%
15% 14%13% 12%
6% 6% 7% 9% 11%13%7% 6% 5% 5% 6% 0%
24%25%22%
10%14%
0%
10%
20%
30%
40%
50%
60%
70%
80%
90%
100%
2007 2008 2009 2010 2011 1Q2012
Astro Radio Radio Televisyen Malaysia Media Prima The Star Others
Source: Prospectus
Publications business
Astro Publications published seven print magazines with total 7.7 million circulations in 2010,
including its TV viewing guide, AstroView, which is the most widely circulated magazine in
Malaysia with a circulation of c.6 million in 2010. There are 4 different editions of AstroView in
circulation with 3 editions in different languages and a Traveller edition for commercial
establishments. Notably, its other commercial publications with a combined circulation of 1.7
million in 2010 include FourFourTwo, Style and FHM (in English), InTrend (in Malay) and men’s
uno and iFeel (in Chinese).
Figure 11 : AMH’s TV viewing guide (AstroView) Figure 12 : One of AMH’s commercial publications (FHM)
Source: Online source Source: Online source
Digital services business
Astro Digital develops and manages online and mobile portals to provide sports, entertainment
and other key content to online audiences. These digital services allow Astro Digital to expand its
reach and engage with its customers and viewers by providing digital content such as the latest
news and sporting results, behind-the-scene and special features, programme highlights and
social integration. In addition, its digital media platforms provide another medium for
advertisements, forming part of its integrated media advertisement offering.
Astro Malaysia Holdings Bhd | The return of the Pay-TV giant! | 25 September 2012 8
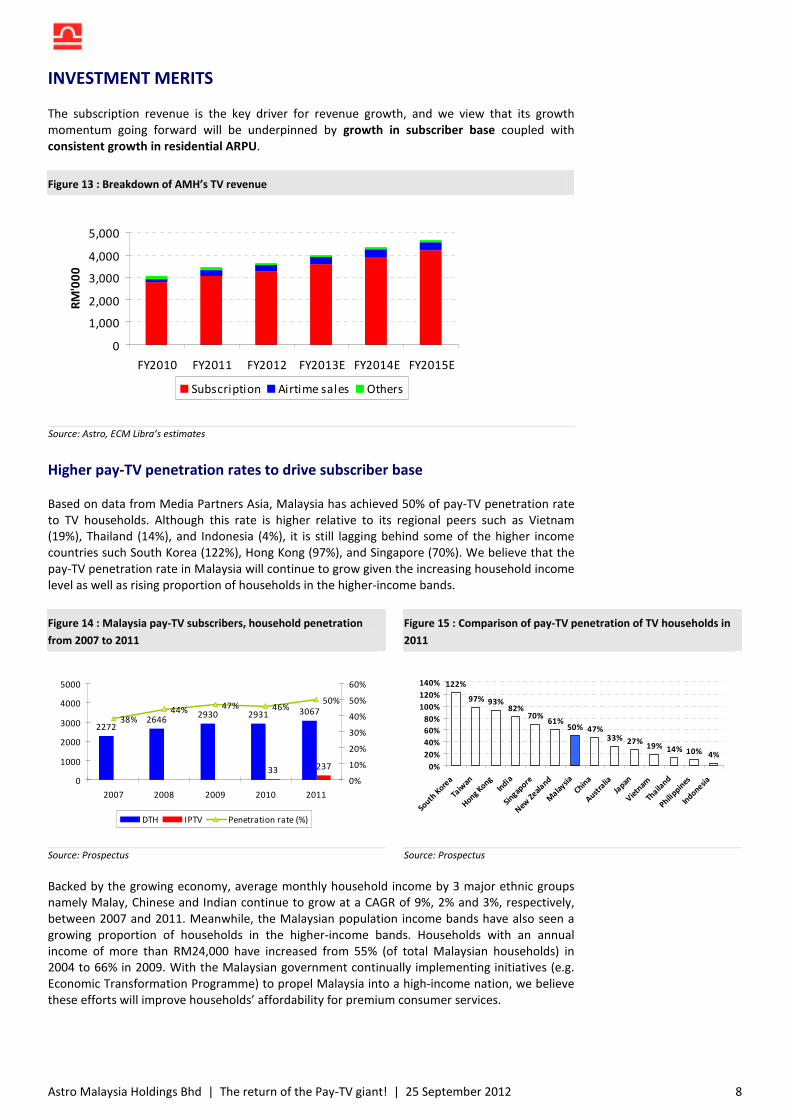
INVESTMENT MERITS
The subscription revenue is the key driver for revenue growth, and we view that its growth
momentum going forward will be underpinned by growth in subscriber base coupled with
consistent growth in residential ARPU.
Figure 13 : Breakdown of AMH’s TV revenue
0
1,000
2,000
3,000
4,000
5,000
FY2010 FY2011 FY2012 FY2013E FY2014E FY2015E
RM
'00
0
Subscription Airtime sales Others
Source: Astro, ECM Libra’s estimates
Higher pay-TV penetration rates to drive subscriber base
Based on data from Media Partners Asia, Malaysia has achieved 50% of pay-TV penetration rate
to TV households. Although this rate is higher relative to its regional peers such as Vietnam
(19%), Thailand (14%), and Indonesia (4%), it is still lagging behind some of the higher income
countries such South Korea (122%), Hong Kong (97%), and Singapore (70%). We believe that the
pay-TV penetration rate in Malaysia will continue to grow given the increasing household income
level as well as rising proportion of households in the higher-income bands.
Figure 14 : Malaysia pay-TV subscribers, household penetration
from 2007 to 2011
Figure 15 : Comparison of pay-TV penetration of TV households in
2011
22722646
2930 2931 3067
33 237
38%44%
47% 46%50%
0
1000
2000
3000
4000
5000
2007 2008 2009 2010 2011
0%
10%
20%
30%
40%
50%
60%
DTH IPTV Penetration rate (%)
122%
97% 93%82%
70%61%
50% 47%33% 27%
19% 14% 10% 4%
0%
20%
40%
60%
80%
100%
120%
140%
South
Kore
a
Taiw
an
Hong Kong
India
Singap
ore
New
Zeal
and
Mala
ysia
China
Austra
lia
Japan
Vietn
am
Thaila
nd
Philippin
es
Indonesia
Source: Prospectus Source: Prospectus
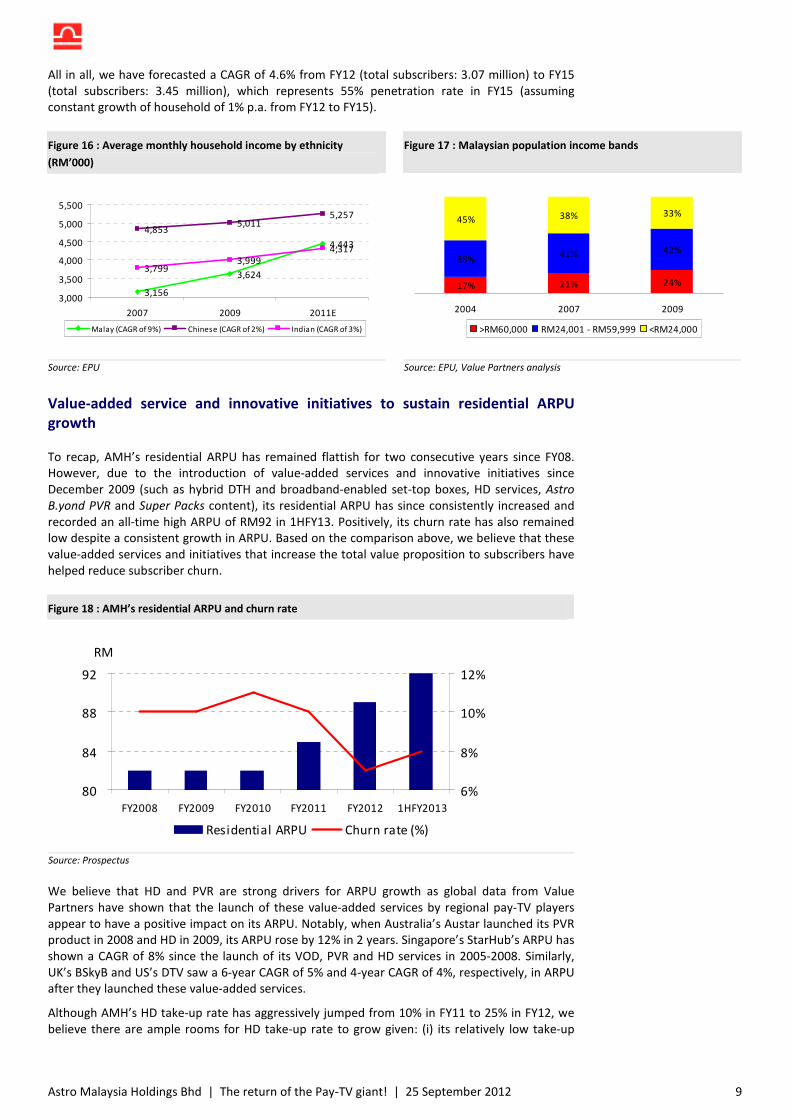
Backed by the growing economy, average monthly household income by 3 major ethnic groups
namely Malay, Chinese and Indian continue to grow at a CAGR of 9%, 2% and 3%, respectively,
between 2007 and 2011. Meanwhile, the Malaysian population income bands have also seen a
growing proportion of households in the higher-income bands. Households with an annual
income of more than RM24,000 have increased from 55% (of total Malaysian households) in
2004 to 66% in 2009. With the Malaysian government continually implementing initiatives (e.g.
Economic Transformation Programme) to propel Malaysia into a high-income nation, we believe
these efforts will improve households’ affordability for premium consumer services.
Astro Malaysia Holdings Bhd | The return of the Pay-TV giant! | 25 September 2012 9
All in all, we have forecasted a CAGR of 4.6% from FY12 (total subscribers: 3.07 million) to FY15
(total subscribers: 3.45 million), which represents 55% penetration rate in FY15 (assuming
constant growth of household of 1% p.a. from FY12 to FY15).
Figure 16 : Average monthly household income by ethnicity
(RM’000)
Figure 17 : Malaysian population income bands
3,156
3,624
4,443
4,8535,011
5,257
3,7993,999
4,317
3,000
3,500
4,000
4,500
5,000
5,500
2007 2009 2011E
Malay (CAGR of 9%) Chinese (CAGR of 2%) Indian (CAGR of 3%)
17% 21% 24%
38%41% 42%
45% 38% 33%
2004 2007 2009
>RM60,000 RM24,001 - RM59,999 <RM24,000
Source: EPU Source: EPU, Value Partners analysis
Value-added service and innovative initiatives to sustain residential ARPU
growth
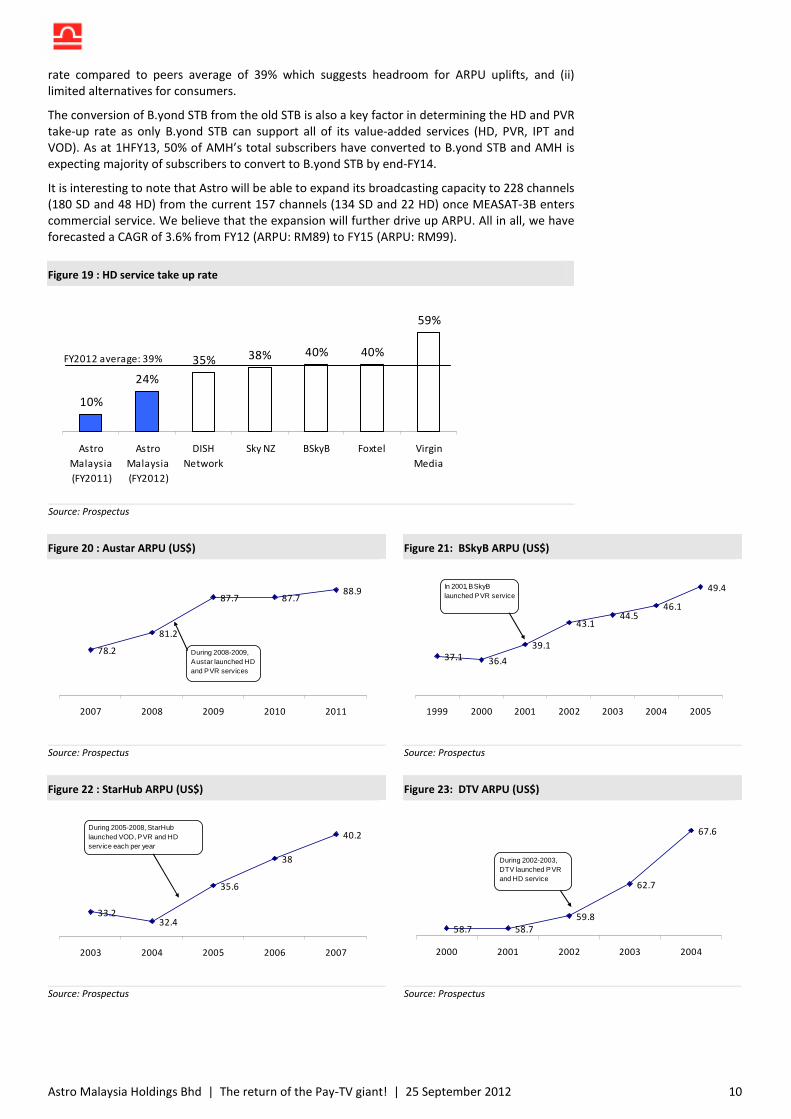
To recap, AMH’s residential ARPU has remained flattish for two consecutive years since FY08.
However, due to the introduction of value-added services and innovative initiatives since
December 2009 (such as hybrid DTH and broadband-enabled set-top boxes, HD services, Astro
B.yond PVR and Super Packs content), its residential ARPU has since consistently increased and
recorded an all-time high ARPU of RM92 in 1HFY13. Positively, its churn rate has also remained
low despite a consistent growth in ARPU. Based on the comparison above, we believe that these
value-added services and initiatives that increase the total value proposition to subscribers have
helped reduce subscriber churn.
Figure 18 : AMH’s residential ARPU and churn rate
80
84
88
92
FY2008 FY2009 FY2010 FY2011 FY2012 1HFY2013
RM
6%
8%
10%
12%
Residential ARPU Churn rate (%)
Source: Prospectus
We believe that HD and PVR are strong drivers for ARPU growth as global data from Value
Partners have shown that the launch of these value-added services by regional pay-TV players
appear to have a positive impact on its ARPU. Notably, when Australia’s Austar launched its PVR
product in 2008 and HD in 2009, its ARPU rose by 12% in 2 years. Singapore’s StarHub’s ARPU has
shown a CAGR of 8% since the launch of its VOD, PVR and HD services in 2005-2008. Similarly,
UK’s BSkyB and US’s DTV saw a 6-year CAGR of 5% and 4-year CAGR of 4%, respectively, in ARPU
after they launched these value-added services.
Although AMH’s HD take-up rate has aggressively jumped from 10% in FY11 to 25% in FY12, we
believe there are ample rooms for HD take-up rate to grow given: (i) its relatively low take-up
Astro Malaysia Holdings Bhd | The return of the Pay-TV giant! | 25 September 2012 10
rate compared to peers average of 39% which suggests headroom for ARPU uplifts, and (ii)
limited alternatives for consumers.
The conversion of B.yond STB from the old STB is also a key factor in determining the HD and PVR
take-up rate as only B.yond STB can support all of its value-added services (HD, PVR, IPT and
VOD). As at 1HFY13, 50% of AMH’s total subscribers have converted to B.yond STB and AMH is
expecting majority of subscribers to convert to B.yond STB by end-FY14.
It is interesting to note that Astro will be able to expand its broadcasting capacity to 228 channels
(180 SD and 48 HD) from the current 157 channels (134 SD and 22 HD) once MEASAT-3B enters
commercial service. We believe that the expansion will further drive up ARPU. All in all, we have
forecasted a CAGR of 3.6% from FY12 (ARPU: RM89) to FY15 (ARPU: RM99).
Figure 19 : HD service take up rate
10%
24%
35% 38% 40% 40%
59%
Astro
Malaysia
(FY2011)
Astro
Malaysia
(FY2012)
DISH
Network
Sky NZ BSkyB Foxtel Virgin
Media
FY2012 average: 39%
Source: Prospectus
Figure 20 : Austar ARPU (US$) Figure 21: BSkyB ARPU (US$)
78.2
81.2
87.7 87.788.9
2007 2008 2009 2010 2011
During 2008-2009, Austar launched HD and PVR services
37.1 36.4
39.1
43.144.5
46.1
49.4
1999 2000 2001 2002 2003 2004 2005
In 2001, BSkyB launched PVR service
Source: Prospectus Source: Prospectus
Figure 22 : StarHub ARPU (US$) Figure 23: DTV ARPU (US$)
33.232.4
35.6
38
40.2
2003 2004 2005 2006 2007
During 2005-2008, StarHub launched VOD, PVR and HD service each per year
58.7 58.7
59.8
62.7
67.6
2000 2001 2002 2003 2004
During 2002-2003, DTV launched PVR and HD service
Source: Prospectus Source: Prospectus
Astro Malaysia Holdings Bhd | The return of the Pay-TV giant! | 25 September 2012 11
Leading position creates significant barriers to entry
In our view, AMH’s leading position as (i) an exclusive DTH licence holder in Malaysia with
nationwide reach of 6.7 million households, (ii) a rich content distributor that owns the exclusive
rights for some of the third party internationally sourced channels in Malaysia, and (iii) a Group
with deep pockets for high capex requirements; have created significant barriers for competitors
to enter into the market.
To recap, with an exclusive DTH licence (until 2017), AMH is the largest pay-TV operator in
Malaysia which commands c.99% market share of residential pay-TV market and 50%
penetration rate of Malaysian TV households in Malaysia. While we believe that the current
head-to-head battle is only limited to alternative IPTV offerings, we view that the impact from
IPTV players such as Hypp TV is non-detrimental due to TM’s limited reach of households (target
of 1.3 million by end-2013), compared to AMH’s 6.7 million households via its DTH services.
Positively, to strengthen its foothold in the market, it has also collaborated with Maxis to
exclusively develop and co-market unique consumer offerings combining its Astro B.yond IPTV
and Astro On The Go services with Maxis’ fibre, mobile, wireless internet and ADSL services.
AMH has proven its leadership as an unrivalled content powerhouse in Malaysia by obtaining
some exclusive rights for popular content and produce a broad suite of local vernacular content
that is tailored to meet the diverse multi-lingual needs of different ethnic groups. As of July 2012,
AMH exclusively broadcasts some of the third party internationally sourced channels in Malaysia
such as National Geographic Channel, Disney Channel, Discovery Channel, AXN, ESPN and FOX
Movies Premium. It also broadcasts international and regional sports content including Barclays
Premier League, UEFA Champions League, FIFA World Cup, European Football Championship and
AFC Champions League. Coupled with its well-bundled packages such as Super Packs which act as
a ‘buffet’-style content to appeal to different customer segments, we believe that its pioneer
leadership as a content creator, aggregator and distributor will continue to thwart new entrants.
Recall that the privatized Astro All Asia Networks (AAAN) which began its services in 1996 with 22
channels took a decade to break even despite being a pioneer in the DTH Pay-TV business. We
believe that a new DTH TV-operator is likely to take a longer gestation period due to rising capex
as well as expensive satellite transponder capacity.
Astro Malaysia Holdings Bhd | The return of the Pay-TV giant! | 25 September 2012 12
INDUSTRY OUTLOOK
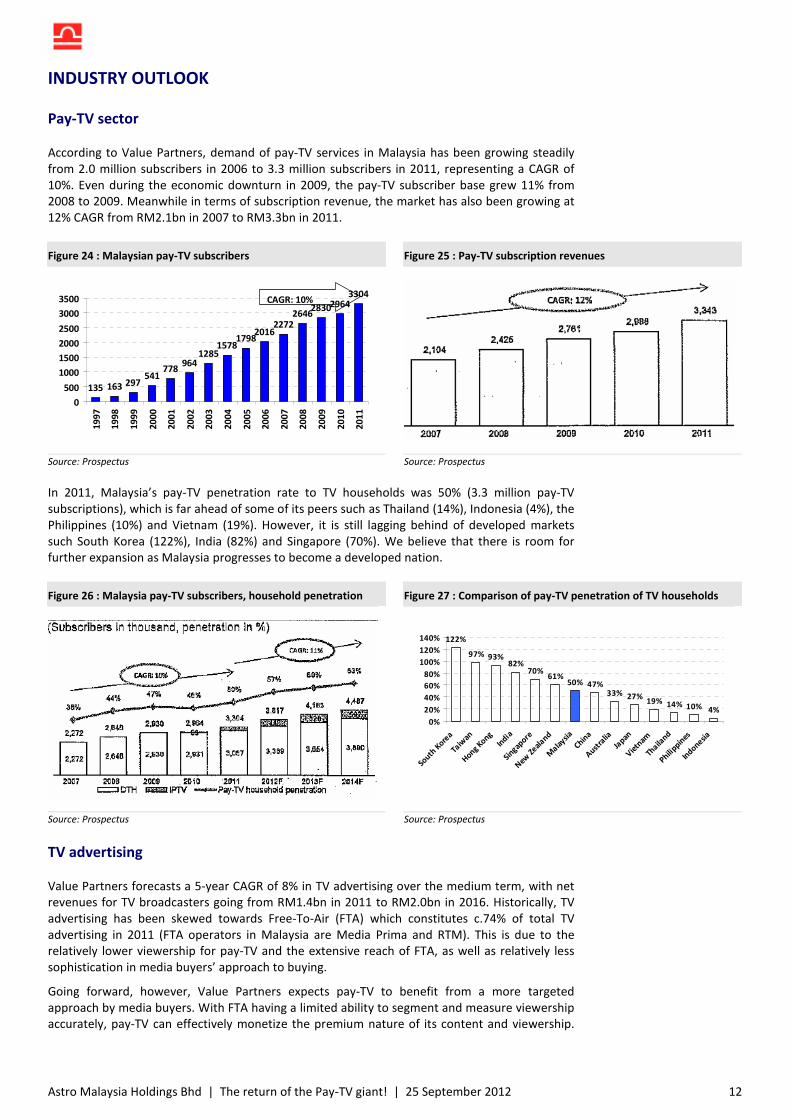
Pay-TV sector
According to Value Partners, demand of pay-TV services in Malaysia has been growing steadily
from 2.0 million subscribers in 2006 to 3.3 million subscribers in 2011, representing a CAGR of
10%. Even during the economic downturn in 2009, the pay-TV subscriber base grew 11% from
2008 to 2009. Meanwhile in terms of subscription revenue, the market has also been growing at
12% CAGR from RM2.1bn in 2007 to RM3.3bn in 2011.
Figure 24 : Malaysian pay-TV subscribers Figure 25 : Pay-TV subscription revenues
135 163 297541
778964
12851578
17982016
22722646
283029643304
0
500
1000
1500
2000
2500
3000
3500
19
97
19
98
19
99
20
00
20
01
20
02
20
03
20
04
20
05
20
06
20
07
20
08
20
09
20
10
20
11
CAGR: 10%
Source: Prospectus Source: Prospectus
In 2011, Malaysia’s pay-TV penetration rate to TV households was 50% (3.3 million pay-TV
subscriptions), which is far ahead of some of its peers such as Thailand (14%), Indonesia (4%), the
Philippines (10%) and Vietnam (19%). However, it is still lagging behind of developed markets
such South Korea (122%), India (82%) and Singapore (70%). We believe that there is room for
further expansion as Malaysia progresses to become a developed nation.
Figure 26 : Malaysia pay-TV subscribers, household penetration Figure 27 : Comparison of pay-TV penetration of TV households
122%
97% 93%82%
70%61%
50% 47%33% 27%
19% 14% 10% 4%
0%
20%
40%
60%
80%
100%
120%
140%
South
Kore
a
Taiw
an
Hong Kong
India
Singap
ore
New
Zeal
and
Mala
ysia
China
Austra
lia
Japan
Vietn
am
Thaila
nd
Philippin
es
Indonesia
Source: Prospectus Source: Prospectus
TV advertising
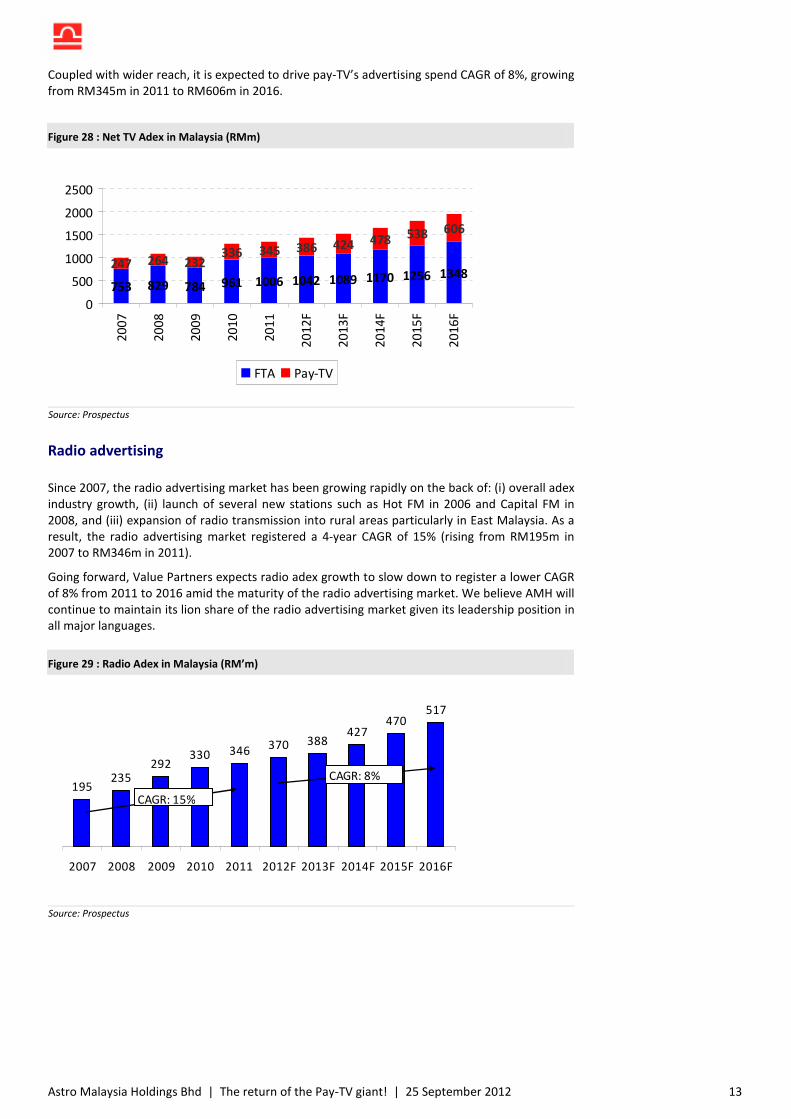
Value Partners forecasts a 5-year CAGR of 8% in TV advertising over the medium term, with net
revenues for TV broadcasters going from RM1.4bn in 2011 to RM2.0bn in 2016. Historically, TV
advertising has been skewed towards Free-To-Air (FTA) which constitutes c.74% of total TV
advertising in 2011 (FTA operators in Malaysia are Media Prima and RTM). This is due to the
relatively lower viewership for pay-TV and the extensive reach of FTA, as well as relatively less
sophistication in media buyers’ approach to buying.
Going forward, however, Value Partners expects pay-TV to benefit from a more targeted
approach by media buyers. With FTA having a limited ability to segment and measure viewership
accurately, pay-TV can effectively monetize the premium nature of its content and viewership.
Astro Malaysia Holdings Bhd | The return of the Pay-TV giant! | 25 September 2012 13
Coupled with wider reach, it is expected to drive pay-TV’s advertising spend CAGR of 8%, growing
from RM345m in 2011 to RM606m in 2016.
Figure 28 : Net TV Adex in Malaysia (RMm)
753 829 784 961 1006 1042 1089 1170 1256 1348247 264 232
336 345 386 424 478 538 606
0
500
1000
1500
2000
2500
20
07
20
08
20
09
20
10
20
11
20
12
F
20
13
F
20
14
F
20
15
F
20
16
F
FTA Pay-TV
Source: Prospectus
Radio advertising
Since 2007, the radio advertising market has been growing rapidly on the back of: (i) overall adex
industry growth, (ii) launch of several new stations such as Hot FM in 2006 and Capital FM in
2008, and (iii) expansion of radio transmission into rural areas particularly in East Malaysia. As a
result, the radio advertising market registered a 4-year CAGR of 15% (rising from RM195m in
2007 to RM346m in 2011).
Going forward, Value Partners expects radio adex growth to slow down to register a lower CAGR
of 8% from 2011 to 2016 amid the maturity of the radio advertising market. We believe AMH will
continue to maintain its lion share of the radio advertising market given its leadership position in
all major languages.
Figure 29 : Radio Adex in Malaysia (RM’m)
195235
292330 346
370 388427
470517
2007 2008 2009 2010 2011 2012F 2013F 2014F 2015F 2016F
CAGR: 15%
CAGR: 8%
Source: Prospectus
Astro Malaysia Holdings Bhd | The return of the Pay-TV giant! | 25 September 2012 14
RISKS
� Extensive regulation. The Communication and Multimedia Act (CMA) allows licensees to set
rates provided that the rates comply with Section 198 of the CMA but there are provisions in
the CMA which prescribe the circumstances in which the Ministry of Information,
Communication and Culture of Malaysia (Ministry), on the recommendation of the
Malaysian Communications and Multimedia Commission (MCMC), may intervene to the set
rates.
AMH currently possesses licences issued under the Communication and Multimedia Act
(CMA) to provide, among others, multi-channel subscription TV and radio broadcasting
services. According to the CMA, the Ministry may take action to modify, vary or revoke the
special conditions on existing individual licences issued under the CMA. The CMA also allows
the Ministry, to suspend or cancel a licence granted under certain circumstances.
� Potentially losing the DTH licence. AMH’s exclusive rights for DTH broadcasting in Malaysia
under its licence expire on 28 Feb 2017, while its non-exclusive rights expire on 28 Feb 2022.
The CMA provides that the Ministry may take action to modify, vary or revoke the special
conditions on existing individual licences issued under the CMA. The CMA also allows the
Ministry, on the recommendation of the MCMC to suspend or cancel a licence granted under
the CMA in certain circumstances.
� Satellites failure. AMH is currently dependent on MEASAT-3 and MEASAT-3A (with life
expectancies of up to 2021 and 2024, respectively) to provide DTH satellite broadcasting
services in Malaysia and Brunei. Although MEASAT-3 and MEASAT-3A provide back-up and
recovery functions for each other, in the event of failure of either satellite or should the
service levels of either one of the satellites degrade or become unavailable, AMH may not be
able to provide full service to its customers.
AMH has leased 18 Ku-band transponders on MEASAT-3B (which is expected to be launched
in 2014) from MEASAT International (South Asia) Ltd (MISA) in order to expand the number
of its TV channels. Should there be any failure or delay in the launch or commencement of
the commercial operations of MEASAT-3B, or should MISA fails to provide the MEASAT-3B
Ku-band capacity to AMH, its TV channel expansion plans may be delayed or disrupted.
� Failure and disruption on broadcast facilities. AMH has two broadcast facilities—the All Asia
Broadcast Centre in Bukit Jalil and Cyberjaya Broadcast Centre in Cyberjaya. The broadcast
facilities are vulnerable to damage or cessation of operations due to fire, floods, severe
storms, power loss, acts of terrorism and other potential catastrophic events. It may also
experience failures or shutdowns relating to the individual components of the broadcast
facilities or catastrophic failure of all of AMH’s broadcast facilities. In addition, no alternative
third-party Ku-band uplink facilities are currently available for lease in Malaysia.
� Escalation of content cost. AMH ability to retain existing subscribers and attract new
subscribers depends on their ability to deliver content that is popular with TV audiences and
entices consumers to subscribe to their services. The increase in the cost of sourcing and
procuring external content, especially relating to sports and premium content may result in
AMH’s inability to obtain attractive TV content from third parties at reasonable rates.
Content cost is approximately 50% of AMH’s cost of sales and this may escalate due to
intense competition for external content especially those relating to sports and premium
cost.
� Foreign currency risk. AMH incurred and expects to continue to incur, significant expenses
that are denominated mainly in USD such as purchases of set-top boxes, international
content costs and transponder lease payments. Hence movement of USD against the RM
may have a significant effect on AMH’s financial condition. A depreciation of the RM against
the USD could increase the costs of equipment and content cost that is necessary for the
operation of AMH’s business.
Astro Malaysia Holdings Bhd | The return of the Pay-TV giant! | 25 September 2012 15
VALUATION & RECOMMENDATION
We initiate coverage on AMH with a HOLD recommendation as our target price of RM3.09 has
only 3% upside from the indicative IPO price of RM3.00 which could be revised lower depending
on the book-building exercise. Given the strong cash generation profile of AMH and potentially
high cash flow (due to stable earnings streams, visibility of capex and AMH’s target dividend
payout ratio of not less than 75% of its consolidated profit starting from FY14), we value AMH
using the DCF method based on explicit forecast for a period of 10 years. Our DCF-derived target
price of RM3.09 is based on the Weighted Average Cost of Capital (WACC) of 7.4%. Key
assumptions include market risk premium of 10.6%, risk free rate of 3.42% (yield for 10-year
Malaysian Government Securities), Beta of 1.5 (which is higher than FTA-TV player Media Prima’s
of 1.1), and terminal growth rate of 1%.
We forecast FY13, FY14, and FY15 adjusted net profit growth of -18%, 2%, and 7% respectively,
assuming higher operating expenses particularly in marketing and installation expenses,
particularly in FY13-FY14 to account for the migration of majority subscriber base to B.yond STB
before its profit normalises. We also incorporated higher content cost in FY13 and FY15 for major
sport events such as the Euro Cup /Olympics and FIFA respectively. At the top line, we believe
that our revenue growth assumption range of 6.6%-9.5% p.a. will be supported by healthy
subscribers and ARPU growth.
We have also assumed a dividend payout of 100% from FY14 onwards as our projected free cash
flow of c.RM940m-1,361m in FY13-FY15 (after incorporating the additional capex for B.yond STB)
allows AMH to adopt a 100% dividend payout (RM523m-558m in FY14-FY15) and also a potential
capital management.
At our target price of RM3.09, AMH would be trading on a CY13 PER of 30.6x compared to global
peers average of 19.1x (Figure 2), given its dominant position (99% market share) in Malaysia. It
is also supported by our forecast net dividend yield of 3.3% p.a., which is comparable to
Malaysian 12-month fixed deposit rates.
Astro Malaysia Holdings Bhd | The return of the Pay-TV giant! | 25 September 2012 16
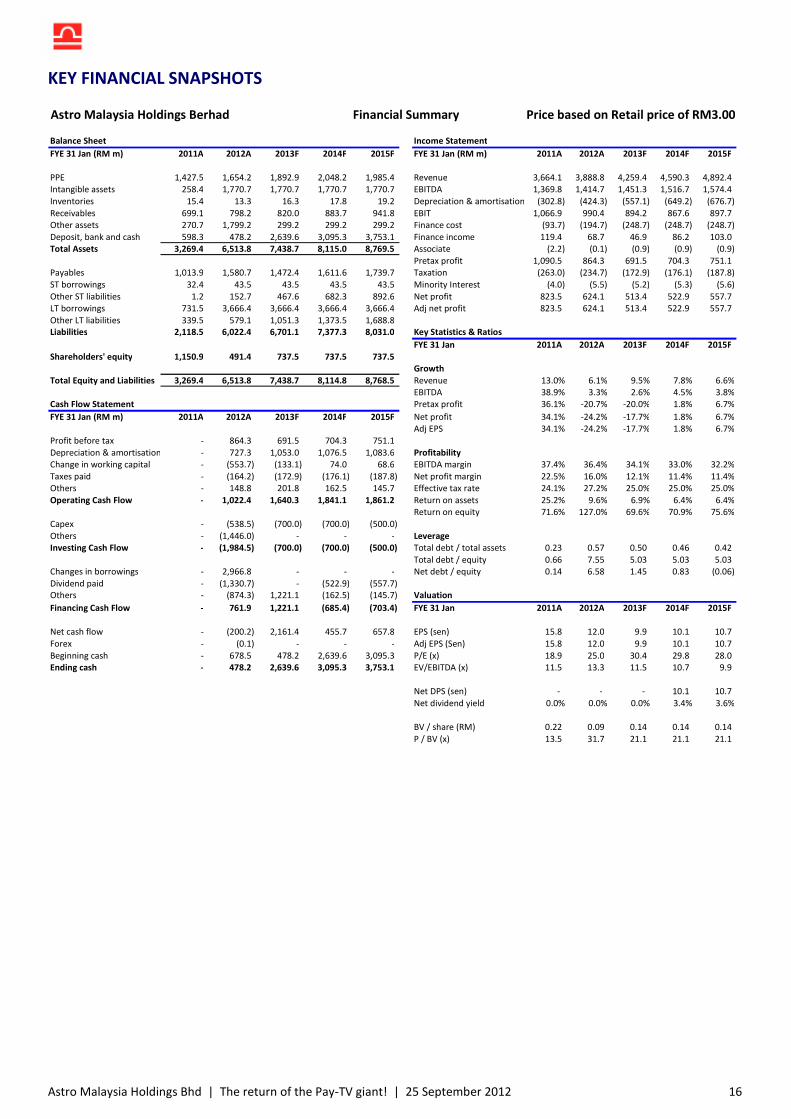
KEY FINANCIAL SNAPSHOTS
Astro Malaysia Holdings Berhad Financial Summary Price based on Retail price of RM3.00
Balance Sheet Income Statement
FYE 31 Jan (RM m) 2011A 2012A 2013F 2014F 2015F FYE 31 Jan (RM m) 2011A 2012A 2013F 2014F 2015F
PPE 1,427.5 1,654.2 1,892.9 2,048.2 1,985.4 Revenue 3,664.1 3,888.8 4,259.4 4,590.3 4,892.4
Intangible assets 258.4 1,770.7 1,770.7 1,770.7 1,770.7 EBITDA 1,369.8 1,414.7 1,451.3 1,516.7 1,574.4
Inventories 15.4 13.3 16.3 17.8 19.2 Depreciation & amortisation (302.8) (424.3) (557.1) (649.2) (676.7)
Receivables 699.1 798.2 820.0 883.7 941.8 EBIT 1,066.9 990.4 894.2 867.6 897.7
Other assets 270.7 1,799.2 299.2 299.2 299.2 Finance cost (93.7) (194.7) (248.7) (248.7) (248.7)
Deposit, bank and cash 598.3 478.2 2,639.6 3,095.3 3,753.1 Finance income 119.4 68.7 46.9 86.2 103.0
Total Assets 3,269.4 6,513.8 7,438.7 8,115.0 8,769.5 Associate (2.2) (0.1) (0.9) (0.9) (0.9)
Pretax profit 1,090.5 864.3 691.5 704.3 751.1
Payables 1,013.9 1,580.7 1,472.4 1,611.6 1,739.7 Taxation (263.0) (234.7) (172.9) (176.1) (187.8)
ST borrowings 32.4 43.5 43.5 43.5 43.5 Minority Interest (4.0) (5.5) (5.2) (5.3) (5.6)
Other ST liabilities 1.2 152.7 467.6 682.3 892.6 Net profit 823.5 624.1 513.4 522.9 557.7
LT borrowings 731.5 3,666.4 3,666.4 3,666.4 3,666.4 Adj net profit 823.5 624.1 513.4 522.9 557.7
Other LT liabilities 339.5 579.1 1,051.3 1,373.5 1,688.8
Liabilities 2,118.5 6,022.4 6,701.1 7,377.3 8,031.0 Key Statistics & Ratios
FYE 31 Jan 2011A 2012A 2013F 2014F 2015F
Shareholders' equity 1,150.9 491.4 737.5 737.5 737.5
Growth
Total Equity and Liabilities 3,269.4 6,513.8 7,438.7 8,114.8 8,768.5 Revenue 13.0% 6.1% 9.5% 7.8% 6.6%
EBITDA 38.9% 3.3% 2.6% 4.5% 3.8%
Cash Flow Statement Pretax profit 36.1% -20.7% -20.0% 1.8% 6.7%
FYE 31 Jan (RM m) 2011A 2012A 2013F 2014F 2015F Net profit 34.1% -24.2% -17.7% 1.8% 6.7%
Adj EPS 34.1% -24.2% -17.7% 1.8% 6.7%
Profit before tax - 864.3 691.5 704.3 751.1
Depreciation & amortisation - 727.3 1,053.0 1,076.5 1,083.6 Profitability
Change in working capital - (553.7) (133.1) 74.0 68.6 EBITDA margin 37.4% 36.4% 34.1% 33.0% 32.2%
Taxes paid - (164.2) (172.9) (176.1) (187.8) Net profit margin 22.5% 16.0% 12.1% 11.4% 11.4%
Others - 148.8 201.8 162.5 145.7 Effective tax rate 24.1% 27.2% 25.0% 25.0% 25.0%
Operating Cash Flow - 1,022.4 1,640.3 1,841.1 1,861.2 Return on assets 25.2% 9.6% 6.9% 6.4% 6.4%
Return on equity 71.6% 127.0% 69.6% 70.9% 75.6%
Capex - (538.5) (700.0) (700.0) (500.0)
Others - (1,446.0) - - - Leverage
Investing Cash Flow - (1,984.5) (700.0) (700.0) (500.0) Total debt / total assets 0.23 0.57 0.50 0.46 0.42
Total debt / equity 0.66 7.55 5.03 5.03 5.03
Changes in borrowings - 2,966.8 - - - Net debt / equity 0.14 6.58 1.45 0.83 (0.06)
Dividend paid - (1,330.7) - (522.9) (557.7)
Others - (874.3) 1,221.1 (162.5) (145.7) Valuation
Financing Cash Flow - 761.9 1,221.1 (685.4) (703.4) FYE 31 Jan 2011A 2012A 2013F 2014F 2015F
Net cash flow - (200.2) 2,161.4 455.7 657.8 EPS (sen) 15.8 12.0 9.9 10.1 10.7
Forex - (0.1) - - - Adj EPS (Sen) 15.8 12.0 9.9 10.1 10.7
Beginning cash - 678.5 478.2 2,639.6 3,095.3 P/E (x) 18.9 25.0 30.4 29.8 28.0
Ending cash - 478.2 2,639.6 3,095.3 3,753.1 EV/EBITDA (x) 11.5 13.3 11.5 10.7 9.9
Net DPS (sen) - - - 10.1 10.7
Net dividend yield 0.0% 0.0% 0.0% 3.4% 3.6%
BV / share (RM) 0.22 0.09 0.14 0.14 0.14
P / BV (x) 13.5 31.7 21.1 21.1 21.1
Astro Malaysia Holdings Bhd | The return of the Pay-TV giant! | 25 September 2012 17
DISCLOSURE & DISCLAIMER
Stock rating definitions
Strong buy - High conviction buy with expected 12-month total return (including dividends) of 30% or more
Buy - Expected 12-month total return of 10% or more
Hold - Expected 12-month total return between -10% and 10%
Sell - Expected 12-month total return of -10% or less
Trading buy - Expected 6-month total return of 10% or more arising from positive newsflow. However, upside may not be
sustainable.
Sector rating definitions
Overweight - Industry expected to outperform the market over the next 12 months
Neutral - Industry expected to perform in-line with the market over the next 12 months
Underweight - Industry expected to underperform the market over the next 12 months
Disclaimer
This report is for information purposes only and general in nature. The information contained in this report is based on data and
obtained from sources believed to be reliable. However, the data and/or sources have not been independently verified and as
such, no representation, express or implied, is made with respect to the accuracy, completeness or reliability of the information
or opinions in this report. Accordingly, neither we nor any of our related companies and associates nor persons related to us
accept any liability whatsoever for any direct, indirect or consequential losses (including loss of profits) or damages that may
arise from the use of or reliance on the information or opinions in this publication. Any information, opinions or
recommendations contained herein are subject to change at any time without prior notice.
It is not possible to have regard to the specific investment objectives, the financial situation and the particular needs of each
person who may receive or read this report. As such, investors should seek financial, legal and other advice regarding the
appropriateness of investing in any securities or the investment strategies discussed or recommended in this report.
Under no circumstances should this report be considered as an offer to sell or a solicitation of an offer to buy any securities
referred to herein. This company and its related companies, their associates, directors, connected parties and/or employees
may, from time to time, own, have positions or be materially interested in any securities mentioned herein or any securities
related thereto, and may further deal with such securities and provide advisory, investment or other services for any company
or entity mentioned in this report. In reviewing this report, investors should be aware that any or all of the foregoing, among
other things, may give rise to real or potential conflict of interests.
Published & printed by:
ECM Libra Capital Sdn Bhd (579116-A)
2nd Floor, West Wing, Bangunan ECM Libra
No. 8 Jalan Damansara Endah
Damansara Heights
50490 Kuala Lumpur
Tel: (603) 2089 1888
Fax: (603) 2096 1868