malaysia cahya mata sarawak - i3investor
TRANSCRIPT
SEE APPENDIX I FOR IMPORTANT DISCLOSURES AND ANALYST CERTIFICATIONS
Initiating Coverage 4 November 2013
PP16832/01/2013 (031128)
Malaysia
Cahya Mata Sarawak Hardcore SCORE-ing: Initiate with BUY
Initiate with BUY at MYR7.20 TP. Riding on bustling SCORE
development in Sarawak, we expect CMS’s net profit to grow at a
stellar 19% 3-year CAGR, driven by: i) robust demand for its cement
and construction materials and ii) growing contribution from its direct
investments in SCORE. CMS’s stock is hugely undervalued at single-
digit forward PERs. Our discounted SOP-based TP of MYR7.20,
representing 10x FY14 PER (ex- net cash of MYR1.31/sh), is
undemanding, with further upside potential to our earnings forecasts.
With its future growth plans, CMS offers strong earnings growth even
beyond 2015.
Strengthening core with SCORE. Buoyant construction activities led
by SCORE developments have bolstered CMS’s core businesses,
consisting of cement and construction materials, which historically
accounts for 75% of group pre-tax profit. Going forward, CMS’s robust
EBIT growth would be largely propelled by record-high capacity
utilisation (>90%) and cost normalisation in its cement division. Usage
of cheaper local coal could drive further upside to cement earnings.
Into Samalaju, the core of SCORE. With its cash-generative core
units, CMS has shored up a sizeable war chest of MYR436m as of Jun
2013 to seize strategic direct investments in SCORE and boost bottom-
line growth. Maiden investment was its 20%-associate stake in OM
Sarawak that would be the world’s lowest-cost ferrosilicon producer
with 60% off-take of its Phase 1 production already secured. With a
potential integrated phosphate plant JV, both investments in Samalaju
could triple CMS’s 2012 earnings when fully operational by 2017.
Undervalued growth stock. CMS’s current valuation of 9x FY14 PER
not only undervalues its strong cement and construction businesses,
but its other profitable businesses and property land bank are not yet
priced in. Our MYR7.20 TP is undemanding, equivalent to 10x FY14
PER ex-net cash. There is further near-term re-rating potential from the
revaluation of its property land bank and positive earnings surprise.
CMS’s strong earnings growth trajectory should continue beyond 2015,
buoyed by its expansion plans, strategic investments and property
development, all long-term catalysts. Dividend yield of 3-4% is decent.
Cahya Mata Sarawak – Summary Earnings Table Source: Maybank KE FYE Dec (MYR m) 2011A 2012A 2013F 2014F 2015F Revenue 1,012.6 1,203.6 1,232.8 1,239.3 1,290.4 EBITDA 207.0 287.4 337.9 354.9 368.3 Recurring Net Profit 108.6 135.7 159.9 195.5 229.1 Recurring Basic EPS (sen) 33.0 40.8 48.1 58.8 68.9 EPS growth (%) 65.1 23.9 17.8 22.3 17.1 DPS (sen) 11.3 12.8 14.4 17.6 20.7 BVPS (MYR) 4.30 4.45 4.79 5.20 5.69 PER 15.6 12.6 10.7 8.7 7.4 EV/EBITDA (x) 5.6 4.0 3.4 3.3 3.1 Div Yield (%) 2.2 2.5 2.8 3.4 4.0 P/BV(x) 1.2 1.2 1.1 1.0 0.9 Net Gearing (%) Cash Cash Cash Cash Cash ROE (%) 8.5 9.2 10.0 11.3 12.1 ROA (%) 5.7 6.4 7.2 8.3 8.9
Buy (new)
Share price: MYR5.13 Target price: MYR7.20 (new)
Wong Chew Hann [email protected] (603) 2297 8686
Chai Li Shin [email protected] (603) 2297 8684
Stock Information
Description: Conglomerate with operations mainly in Sarawak. Sole cement manufacturer in Sarawak, also involves in construction materials manufacturing, construction, road maintenance, property, temporary housing, and investments in two listed companies and in Samalaju Industrial Park. Ticker: CMS MK Shares Issued (m): 338.5 Market Cap (MYR m): 1,736.3 3-mth Avg Daily Turnover (US$ m): 1.84 KLCI: 1,810.41 Free float (%): 30.3 Major Shareholders: % ALWEE ALSREE SYED AH 13.5 MAJAHARTA SDN BHD 13.3 TAIB LEJLA 10.9 ABDUL RAHMAN TAIB SU 8.7
Key Indicators
Net cash / (debt) (MYR m): 436.3 NTA/shr (MYR): 4.62 Net Gearing (x): NA
Historical Chart
1.5
2.5
3.5
4.5
5.5
6.5
Nov-11 Mar-12 Jul-12 Nov-12 Mar-13 Jul-13
CMS MK Equity
Performance:
52-week High/Low MYR6.24/MYR2.99
1-mth 3-mth 6-mth 1-yr YTD
Absolute (%) (0.8) (3.9) 55.9 54.1 54.1
Relative (%) (3.0) (5.8) 49.1 46.0 46.9

4 November 2013 Page 2 of 21
Cahya Mata Sarawak
CMS: Six key business segments
CAHYA MATA SARAWAK
CementConstruction
Materials & TradingConstruction &
Road MaintenanceSamalaju
DevelopmentProperty
Development
•Sole cement manufacturer in Sarawak.
•Installed capacity of 1.75m Mtpa.
•Sole manufacturer of clinker in Sarawak.
•Clinker capacity of 0.9m MT pa ,fully utilised.
•Combined quarries annual capacity of 3.15m MT (23% market share in Sarawak)
•Supplies 60% of Sarawak’s market for high quality premix & bitumen emulsion.
•Manufactures steel drawn wires & wire mesh.
•Involved in a wide range of construction & road maintenance projects across Sarawak.
•Maintains approximately: - 680 km of Federal roads .- 4,800 km of State roads.
•20% investment in OM Sarawak which is developing a manganese and ferroalloy smelter.
•Worker s accommodation & related services .
•Planned new township & service centre.
•Owns 2 large land banks in Kuching comprising:- 5,200-acre in Petra Jaya being developed into a riverinetownship called Bandar BaruSamariang.- 275-acre in MuaraTebas being developed into Kuching ‘s new CBD, The Isthmus.
•25.07% stake in K&N Kenanga Holdings.
•20% stake in KKB Engineering Bhd.
Unlisted
•CMS Opus
•Tunku Putra School
Strategic Investments - Listed
CMS: Corporate structure
PPES Concrete Product Sdn Bhd 100% CMS Quarries Sdn Bhd 100%CMS Premix (Miri) Sdn Bhd 60% 20%CMS Premix Sdn Bhd 60% 40%
CMS Penkuari Sdn Bhd 60%40%
CEMENT DIVISION
CMS Clinker Sdn Bhd 100%CMS Concrete Products Sdn Bhd 100%
CMS Agrotech Sdn Bhd 100%
CMS Wires Sdn Bhd 69%
CONSTRUCTION & ROAD MAINTENANCE DIVISION
CONSTRUCTION MATERIALS & TRADING DIVISION
CMS Roads Sdn Bhd 100%CMS Pavement Tech Sdn Bhd 100%PPES Works (Sarawak )Sdn Bhd 51%
PROPERTY DEVELOPMENT DIVISION
CMS Development Services Sdn Bhd 100% CMS Land Sdn Bhd 51%CMS Property Management Sdn Bhd 51%CMS Hotels Sdn Bhd 100%
SAMALAJU DEVELOPMENT DIVISION
Samalaju Property Development Sdn Bhd 51%•Samalaju Hotel Management Sdn Bhd 100%Samalaju Aluminium Industries Sdn Bhd 100%•Sarawak Aluminium Company Sdn Bhd 100%OM Materials (Sarawak) Sdn Bhd 20%
STRATEGIC INVESTMENTS
K&N Kenanga Holdings Bhd* 21% 4% CMS Opus Private Equity Sdn Bhd 51%
CORE BUSINESS DIVISIONS
STRATEGIC INVESTMENTS
CMS Cement Sdn Bhd 100%
CMS Infra Trading Sdn Bhd 51%
CMS Steel Bhd 100%
CMS Resources Sdn Bhd 51%
CMS Works Sdn Bhd 100%
Projek Bandar Samariang Sdn Bhd 100%
CMS Property Development Sdn Bhd 100%
Samalaju Industries Sdn Bhd 100%
CMS Education Sdn Bhd 93%
KKB Engineering Bhd* 20%
CMS Capital Sdn Bhd 95%
Source: Company * Listed on Main Market of Bursa Malaysia
Source: Company
4 November 2013 Page 3 of 21
Cahya Mata Sarawak
The concrete foundation: Riding on buoyant Sarawak
Major beneficiary of SCORE. CMS’s strong monopoly position in the
Sarawak cement market is fortified by its wide distribution network, cost
advantage through economies of scale, long-term raw material supply
and continuous efficiency upgrades. As the sole cement supplier and
with its sizeable market share in other construction materials supply in
Sarawak, CMS’s cement and construction materials divisions have
grown strongly in the past few years and would continue to ride on
Sarawak’s growth as development in SCORE accelerates.
• Stable growing cement business
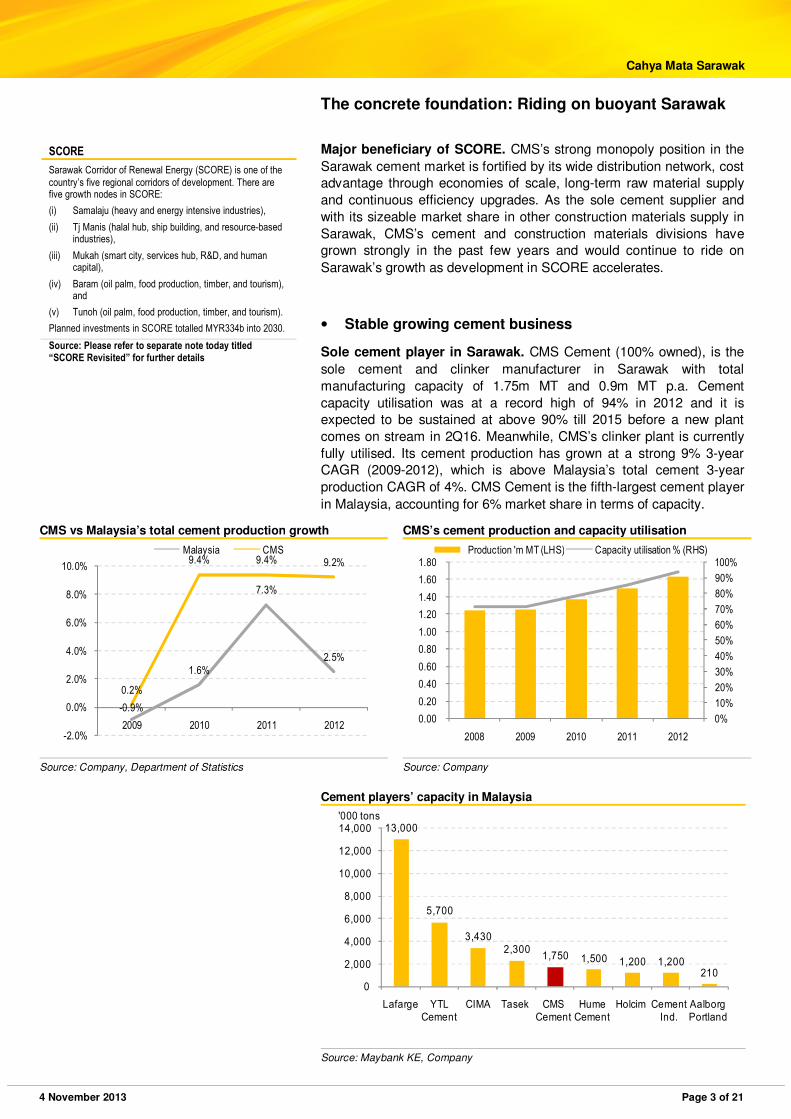
Sole cement player in Sarawak. CMS Cement (100% owned), is the
sole cement and clinker manufacturer in Sarawak with total
manufacturing capacity of 1.75m MT and 0.9m MT p.a. Cement
capacity utilisation was at a record high of 94% in 2012 and it is
expected to be sustained at above 90% till 2015 before a new plant
comes on stream in 2Q16. Meanwhile, CMS’s clinker plant is currently
fully utilised. Its cement production has grown at a strong 9% 3-year
CAGR (2009-2012), which is above Malaysia’s total cement 3-year
production CAGR of 4%. CMS Cement is the fifth-largest cement player
in Malaysia, accounting for 6% market share in terms of capacity.
CMS vs Malaysia’s total cement production growth CMS’s cement production and capacity utilisation
-0.9%
1.6%
7.3%
2.5%
0.2%
9.4% 9.4% 9.2%
-2.0%
0.0%
2.0%
4.0%
6.0%
8.0%
10.0%
2009 2010 2011 2012
Malaysia CMS
0%
10%
20%
30%
40%
50%
60%
70%
80%
90%
100%
0.00
0.20
0.40
0.60
0.80
1.00
1.20
1.40
1.60
1.80
2008 2009 2010 2011 2012
Production 'm MT (LHS) Capacity utilisation % (RHS)
Source: Company, Department of Statistics Source: Company
Cement players’ capacity in Malaysia
13,000
5,700
3,4302,300
1,750 1,500 1,200 1,200210
0
2,000
4,000
6,000
8,000
10,000
12,000
14,000
Lafarge YTL Cement
CIMA Tasek CMS Cement
Hume Cement
Holcim Cement Ind.
Aalborg Portland
'000 tons
Source: Maybank KE, Company
SCORE
Sarawak Corridor of Renewal Energy (SCORE) is one of the country’s five regional corridors of development. There are five growth nodes in SCORE:
(i) Samalaju (heavy and energy intensive industries),
(ii) Tj Manis (halal hub, ship building, and resource-based industries),
(iii) Mukah (smart city, services hub, R&D, and human capital),
(iv) Baram (oil palm, food production, timber, and tourism), and
(v) Tunoh (oil palm, food production, timber, and tourism).
Planned investments in SCORE totalled MYR334b into 2030.
Source: Please refer to separate note today titled “SCORE Revisited” for further details
4 November 2013 Page 4 of 21
Cahya Mata Sarawak
Wide distribution network. Cement player in Sarawak faces more
logistical challenges due to the lack of extensive road and train systems
compared to Peninsular Malaysia, despite both having a similar land
size. CMS’s Kuching plant is equipped with a jetty and two bulk
handling barges, while its Bintulu plant is located in the adjoining
Bintulu Port and is linked by a conveyor to the berth. These plants ease
raw materials unloading as well as shipping of cement to customers
and its receiving bulk terminals in Miri and Sibu. All of its grinding plants
and bulk terminals have integrated bagging facilities.
New plant to enhance grinding capacity. Effectively, CMS has four
distribution points – Kuching, Miri, Sibu and Bintulu. From there, cement
is delivered to customers by land via bulk tankers and lorry operators
with long-term contracts. CMS plans to build another grinding plant next
to its clinker plant in Mambong that is 40km inland from Kuching to
cater to development in the interior parts of Sarawak. Construction
would start in 2Q14 with production expected to start in 2Q16, raising
its total grinding capacity by 57%. Capex is e.MYR150m.
Cost advantages. Leveraging its wide distribution network, CMS is
able to supply all of Sarawak, thereby acquiring economies of scale and
creating high barriers to entry. In addition, CMS also benefits from
logistics cost savings by using local clinker. This is because c.50% of its
clinker requirement is extracted from land adjacent to the clinker plant
in Mambong, which is the only location in Sarawak that is adjacent to
extensive limestone, shale and sandstone reserves. The raw material
reserves could last longer than 50 years.
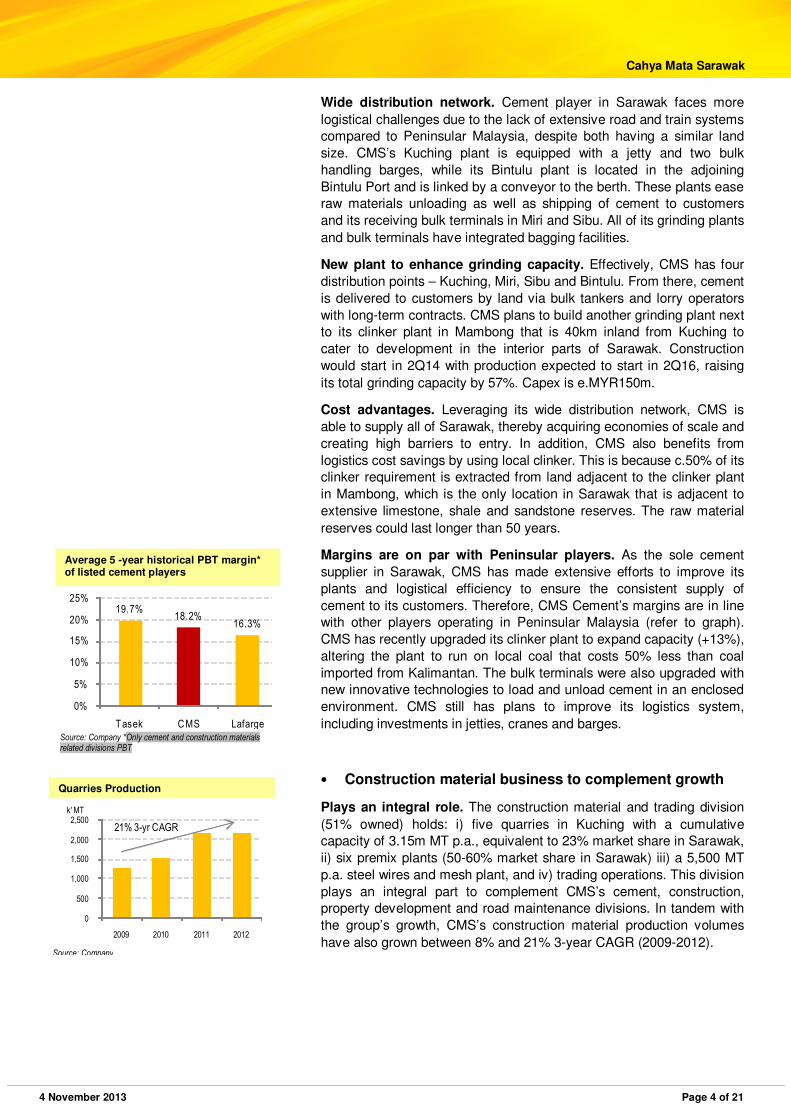
Margins are on par with Peninsular players. As the sole cement
supplier in Sarawak, CMS has made extensive efforts to improve its
plants and logistical efficiency to ensure the consistent supply of
cement to its customers. Therefore, CMS Cement’s margins are in line
with other players operating in Peninsular Malaysia (refer to graph).
CMS has recently upgraded its clinker plant to expand capacity (+13%),
altering the plant to run on local coal that costs 50% less than coal
imported from Kalimantan. The bulk terminals were also upgraded with
new innovative technologies to load and unload cement in an enclosed
environment. CMS still has plans to improve its logistics system,
including investments in jetties, cranes and barges.
• Construction material business to complement growth
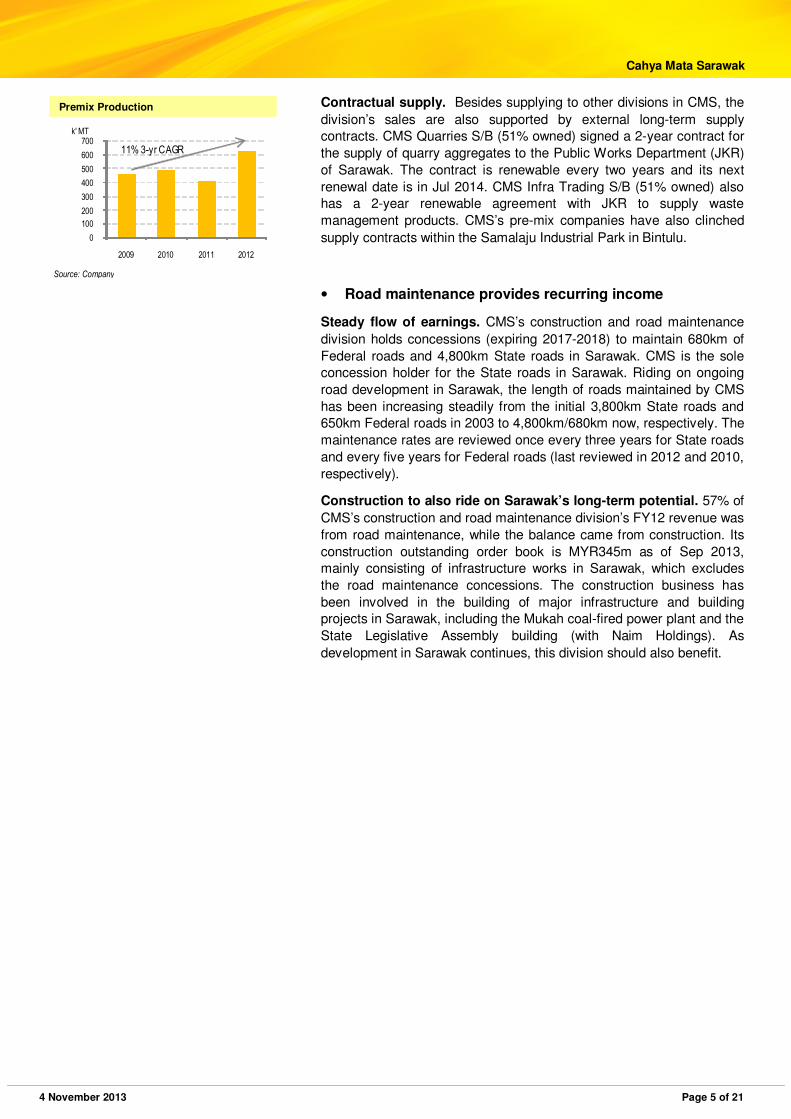
Plays an integral role. The construction material and trading division
(51% owned) holds: i) five quarries in Kuching with a cumulative
capacity of 3.15m MT p.a., equivalent to 23% market share in Sarawak,
ii) six premix plants (50-60% market share in Sarawak) iii) a 5,500 MT
p.a. steel wires and mesh plant, and iv) trading operations. This division
plays an integral part to complement CMS’s cement, construction,
property development and road maintenance divisions. In tandem with
the group’s growth, CMS’s construction material production volumes
have also grown between 8% and 21% 3-year CAGR (2009-2012).
19.7%18.2%
16.3%
0%
5%
10%
15%
20%
25%
Tasek CMS LafargeSource: Company *Only cement and construction materials related divisions PBT
Average 5 -year historical PBT margin* of listed cement players
0
500
1,000
1,500
2,000
2,500
2009 2010 2011 2012
k' MT
21% 3-yr CAGR
Source: Company
Quarries Production
4 November 2013 Page 5 of 21
Cahya Mata Sarawak
Contractual supply. Besides supplying to other divisions in CMS, the
division’s sales are also supported by external long-term supply
contracts. CMS Quarries S/B (51% owned) signed a 2-year contract for
the supply of quarry aggregates to the Public Works Department (JKR)
of Sarawak. The contract is renewable every two years and its next
renewal date is in Jul 2014. CMS Infra Trading S/B (51% owned) also
has a 2-year renewable agreement with JKR to supply waste
management products. CMS’s pre-mix companies have also clinched
supply contracts within the Samalaju Industrial Park in Bintulu.
• Road maintenance provides recurring income
Steady flow of earnings. CMS’s construction and road maintenance
division holds concessions (expiring 2017-2018) to maintain 680km of
Federal roads and 4,800km State roads in Sarawak. CMS is the sole
concession holder for the State roads in Sarawak. Riding on ongoing
road development in Sarawak, the length of roads maintained by CMS
has been increasing steadily from the initial 3,800km State roads and
650km Federal roads in 2003 to 4,800km/680km now, respectively. The
maintenance rates are reviewed once every three years for State roads
and every five years for Federal roads (last reviewed in 2012 and 2010,
respectively).
Construction to also ride on Sarawak’s long-term potential. 57% of
CMS’s construction and road maintenance division’s FY12 revenue was
from road maintenance, while the balance came from construction. Its
construction outstanding order book is MYR345m as of Sep 2013,
mainly consisting of infrastructure works in Sarawak, which excludes
the road maintenance concessions. The construction business has
been involved in the building of major infrastructure and building
projects in Sarawak, including the Mukah coal-fired power plant and the
State Legislative Assembly building (with Naim Holdings). As
development in Sarawak continues, this division should also benefit.
0
100
200
300
400
500
600
700
2009 2010 2011 2012
k' MT
11% 3-yr CAGR
Source: Company
Premix Production
4 November 2013 Page 6 of 21
Cahya Mata Sarawak
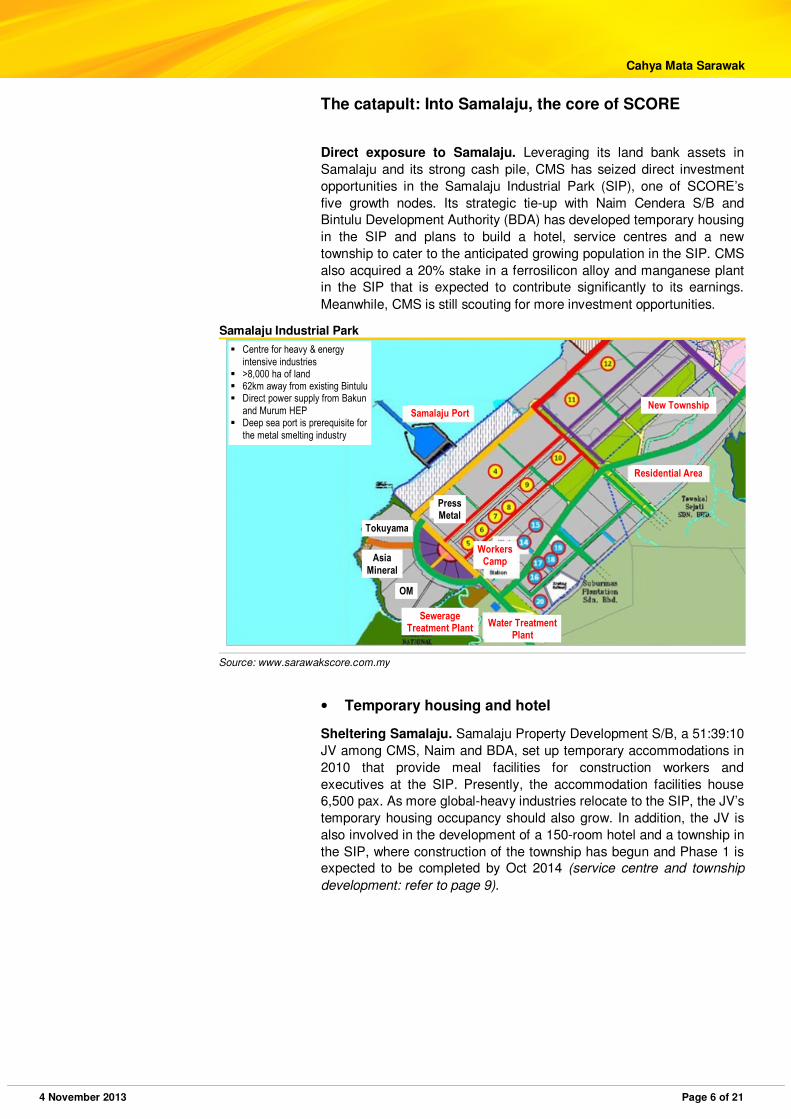
The catapult: Into Samalaju, the core of SCORE
Direct exposure to Samalaju. Leveraging its land bank assets in
Samalaju and its strong cash pile, CMS has seized direct investment
opportunities in the Samalaju Industrial Park (SIP), one of SCORE’s
five growth nodes. Its strategic tie-up with Naim Cendera S/B and
Bintulu Development Authority (BDA) has developed temporary housing
in the SIP and plans to build a hotel, service centres and a new
township to cater to the anticipated growing population in the SIP. CMS
also acquired a 20% stake in a ferrosilicon alloy and manganese plant
in the SIP that is expected to contribute significantly to its earnings.
Meanwhile, CMS is still scouting for more investment opportunities.
Samalaju Industrial Park
Source: www.sarawakscore.com.my
• Temporary housing and hotel
Sheltering Samalaju. Samalaju Property Development S/B, a 51:39:10
JV among CMS, Naim and BDA, set up temporary accommodations in
2010 that provide meal facilities for construction workers and
executives at the SIP. Presently, the accommodation facilities house
6,500 pax. As more global-heavy industries relocate to the SIP, the JV’s
temporary housing occupancy should also grow. In addition, the JV is
also involved in the development of a 150-room hotel and a township in
the SIP, where construction of the township has begun and Phase 1 is
expected to be completed by Oct 2014 (service centre and township
development: refer to page 9).
Tokuyama
Press Metal
Asia
Mineral
OM
Samalaju Port New Township
Residential Area
Workers Camp
Sewerage Treatment Plant
Water Treatment Plant
� Centre for heavy & energy intensive industries
� >8,000 ha of land � 62km away from existing Bintulu � Direct power supply from Bakun
and Murum HEP � Deep sea port is prerequisite for
the metal smelting industry
4 November 2013 Page 7 of 21
Cahya Mata Sarawak
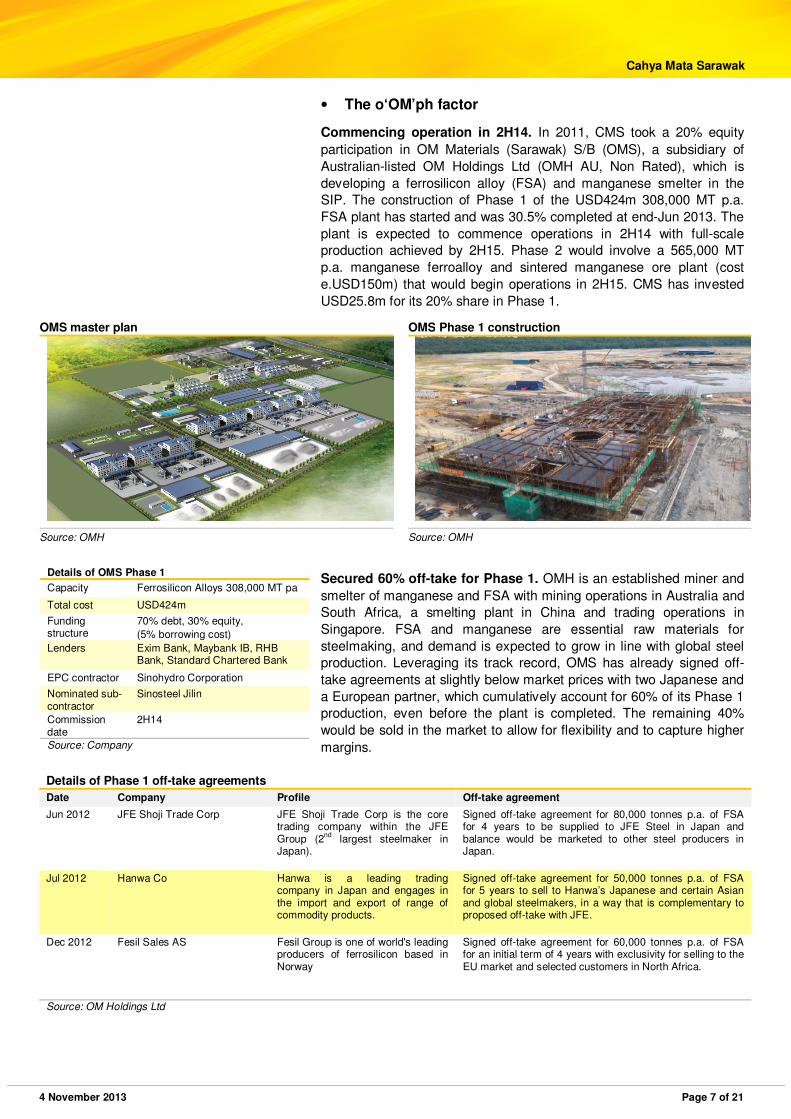
• The o‘OM’ph factor
Commencing operation in 2H14. In 2011, CMS took a 20% equity
participation in OM Materials (Sarawak) S/B (OMS), a subsidiary of
Australian-listed OM Holdings Ltd (OMH AU, Non Rated), which is
developing a ferrosilicon alloy (FSA) and manganese smelter in the
SIP. The construction of Phase 1 of the USD424m 308,000 MT p.a.
FSA plant has started and was 30.5% completed at end-Jun 2013. The
plant is expected to commence operations in 2H14 with full-scale
production achieved by 2H15. Phase 2 would involve a 565,000 MT
p.a. manganese ferroalloy and sintered manganese ore plant (cost
e.USD150m) that would begin operations in 2H15. CMS has invested
USD25.8m for its 20% share in Phase 1.
OMS master plan OMS Phase 1 construction
Source: OMH Source: OMH
Secured 60% off-take for Phase 1. OMH is an established miner and
smelter of manganese and FSA with mining operations in Australia and
South Africa, a smelting plant in China and trading operations in
Singapore. FSA and manganese are essential raw materials for
steelmaking, and demand is expected to grow in line with global steel
production. Leveraging its track record, OMS has already signed off-
take agreements at slightly below market prices with two Japanese and
a European partner, which cumulatively account for 60% of its Phase 1
production, even before the plant is completed. The remaining 40%
would be sold in the market to allow for flexibility and to capture higher
margins.
Details of Phase 1 off-take agreements
Date Company Profile Off-take agreement
Jun 2012 JFE Shoji Trade Corp JFE Shoji Trade Corp is the core trading company within the JFE Group (2
nd largest steelmaker in
Japan).
Signed off-take agreement for 80,000 tonnes p.a. of FSA for 4 years to be supplied to JFE Steel in Japan and balance would be marketed to other steel producers in Japan.
Jul 2012 Hanwa Co Hanwa is a leading trading company in Japan and engages in the import and export of range of commodity products.
Signed off-take agreement for 50,000 tonnes p.a. of FSA for 5 years to sell to Hanwa’s Japanese and certain Asian and global steelmakers, in a way that is complementary to proposed off-take with JFE.
Dec 2012 Fesil Sales AS Fesil Group is one of world's leading producers of ferrosilicon based in Norway
Signed off-take agreement for 60,000 tonnes p.a. of FSA for an initial term of 4 years with exclusivity for selling to the EU market and selected customers in North Africa.
Source: OM Holdings Ltd
Details of OMS Phase 1
Capacity Ferrosilicon Alloys 308,000 MT pa
Total cost USD424m
Funding structure
70% debt, 30% equity,
(5% borrowing cost)
Lenders Exim Bank, Maybank IB, RHB Bank, Standard Chartered Bank
EPC contractor Sinohydro Corporation
Nominated sub-contractor
Sinosteel Jilin
Commission date
2H14
Source: Company

4 November 2013 Page 8 of 21
Cahya Mata Sarawak
Lock-in raw materials requirements. The major raw materials
required for FSA production encompass manganese ore, quartzite and
reductants. Manganese ore would be sourced internally from OM’s
manganese mine in Australia and South Africa. On the other hand,
OMS has executed long-term off-take agreements with Chinese
quartzite suppliers for 50% of its requirement and is looking to finalise
supply agreements with reductants suppliers from China soon.
Low-cost FSA and manganese producer. OMH’s venture into the SIP
represents a game changer to the industry as its cost structure falls
within the lowest-cost quartile, due to: i) competitively priced power
supply under a signed 20-year Power Purchase Agreement with the
state electricity company (power consist of 50% and 25% of FSA and
manganese alloy production cost), ii) tax incentives via a 5-year pioneer
status tax exemption and iii) strategic location with close proximity to
port facilities, raw material supply and key alloy markets in Asia, which
would create logistics costs savings.
OMS raw materials inflows and finished product outflows
Source: OMH
• Keep it rolling!
The story does not stop there. CMS is still exploring other major
investment opportunities in the SIP that would contribute material
earnings. CMS signed an MOU with Malaysian Phosphate Additives
S/B (MPA, non-listed) in July 2012 to negotiate a JV (CMS would
potentially own 40%) for an integrated phosphate plant in the SIP. The
plant would have a capacity of 500,000 MT p.a. and is estimated to cost
MYR850m. Both parties are currently in the final stages of negotiation
of the term sheet for the power purchase agreement for the plant, which
could be finalised before end-2013. The plant is scheduled to begin
operations in 1H16.
Potential downstream business. CMS’s 100%-owned subsidiary,
Samalaju Industries S/B, owns 654 acres of industrial land in the SIP
and 350 acres have been earmarked for its potential phosphate plant.
The CMS-MPA JV has plans to utilise the remaining 304 acres for
phosphate-related downstream operations such as fertilisers, animal
feed or food phosphate products manufacturing.
4 November 2013 Page 9 of 21
Cahya Mata Sarawak
Background of MPA. Established in 2001, MPA manufactures and
markets inorganic feed phosphate and currently owns a 30,000 MT p.a.
plant in Lumut. In 2007, it was one of the recipients of the Malaysian
Technology Development Corporation’s (Khazanah’s wholly-owned
company) grant for the commercialisation of its inorganic feed
phosphate products. In Apr 2013, MPA signed an MOU with an
Egyptian company to secure long-term rock phosphate raw materials in
order to cater to the potential Sarawak plant and other future
developments. Khazanah Nasional holds a 18.8% stake in MPA
through its investment arm.
The future: Unlocking property land bank value
Huge property land bank. There is latent value to be unlocked in
CMS’s vast land bank, strategically located in Kuching and Samalaju.
Project Bandar Samariang S/B (100% owned) owns 4,211 acres of
township developments at Bandar Samariang, 7km from Kuching town.
Meanwhile, CMS Land S/B (51%) holds 246 acres of land bank in
Muara Tebas, Kuching, which will be developed into Kuching’s new
central business district, The Isthmus. Under its Samalaju Development
division, Samalaju Property Development S/B (51%) will develop the
Samalaju Township (2,000 acres), service centre (111 acres) and light
industrial estate (233 acres), all adjacent to the SIP.
Samalaju: Fast-tracked development. Samalaju Township is
expected to be developed on a fast-track basis in anticipation of the
fast-growing population in the SIP with infrastructure support from the
State. The nearest towns are in Bintulu and Miri, which are 75km and
125km from the SIP, respectively. Its close proximity to the SIP and
being the first-mover, CMS would be able to fully leverage increasing
workers and executives working in the SIP. It will be developed into a
green township with high international standards to meet expatriates’
expectations. Land clearing works have started and maiden launches
are expected in 2Q14.
Samalaju: Maiden launching of MYR950m GDV in 2014. The service
centre, which has a GDV of MYR349m, will launch 3-storey commercial
units in 2Q14 with a GDV of MYR155m. As for Samalaju Township, the
initial phase 1A with a GDV of MYR795m will include 700 units of
landed residential, 1,000 apartments and 150 units of shop houses. The
landed residential and shop houses are targeted to be launched in
2Q14 while the apartments would be launched in 2H14, subject to
demand.
Kuching: Bigger plans for the long run. In Kuching, CMS is planning
to develop 283.5 acres in 2013-18 with an estimated GDV of MYR1.7b.
However, a majority of the GDV would only be realised in the last three
years (2016-18) as the company is now more focused on developing
public amenities, infrastructure, supermarkets and hotels to attract
population growth. If we extrapolate the GDV/acre of the current plan to
its whole land bank in Kuching (MYR3m/acre for Bandar Samariang
and MYR9m/acre for The Isthmus), its total GDV in Kuching could be
worth MYR15.5b, the third-highest among property stocks under our
coverage, after UEM Sunrise and Sunway Berhad.
4 November 2013 Page 10 of 21
Cahya Mata Sarawak
Land sales now. CMS’s near-term plans would be to monetise a small
portion of its land bank and to launch some niche property
developments. It has executed a 275.5-acre land sale in Bandar
Samariang to Hock Seng Lee (HSL MK; BUY) for residential
development in 2012, while a 300-acre land sale to Sentoria (SNT MK,
Non-rated) for commercial and residential development is still ongoing.
These strategic land sales would expedite growth in Samariang and
enhance property value. CMS is talking to a few Chinese universities to
set up campuses in Samariang. CMS plans to sell another 60 acres in
Samariang and five acres in The Isthmus between 2013 and 2018.
Financials
19% net profit forward CAGR. We expect CMS’s net profit to grow at
a robust 19% 3-year CAGR, outdoing its 2.3% 3-year revenue CAGR
(2012-15). The strong double-digit bottom-line growth will be driven by:
i) EBIT margin expansion on cost normalisation at its cement division in
2013-14, ii) steady earnings contribution from construction materials,
road maintenance and temporary housing and ii) new earnings kicker
from its 20% associate, OMS, in 2014-15. On top of that, we have yet to
factor in the potential positive earnings impact from: i) the usage of
cheaper local coal at its cement division, ii) property sales in the SIP
that would be launched in 2H14 and completed by 2H16 and iii) phase
2 of OMS that would start operations in 2H15. We also have not
factored in its potential phosphate plant JV in the SIP.
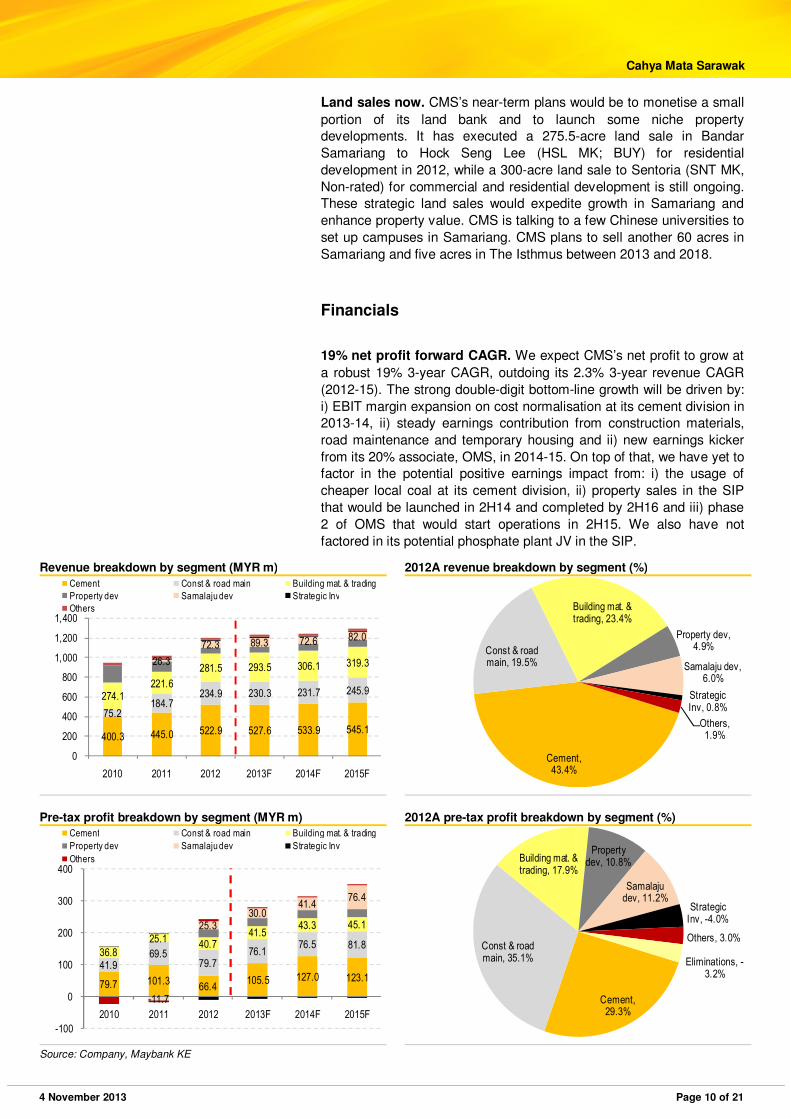
Revenue breakdown by segment (MYR m) 2012A revenue breakdown by segment (%)
400.3 445.0 522.9 527.6 533.9 545.1
75.2184.7
234.9 230.3 231.7 245.9274.1221.6
281.5 293.5 306.1 319.326.3
72.3 89.3 72.6 82.0
0
200
400
600
800
1,000
1,200
1,400
2010 2011 2012 2013F 2014F 2015F
Cement Const & road main Building mat. & trading
Property dev Samalaju dev Strategic Inv
Others
Cement, 43.4%
Const & road main, 19.5%
Building mat. & trading, 23.4%
Property dev, 4.9%
Samalaju dev, 6.0%
Strategic Inv, 0.8%
Others, 1.9%
Pre-tax profit breakdown by segment (MYR m) 2012A pre-tax profit breakdown by segment (%)
79.7 101.366.4
105.5 127.0 123.141.9
69.579.7
76.176.5 81.8
36.8
25.1 40.741.5
43.3 45.1
-11.7
25.330.0
41.476.4
-100
0
100
200
300
400
2010 2011 2012 2013F 2014F 2015F
Cement Const & road main Building mat. & trading
Property dev Samalaju dev Strategic Inv
Others
Cement, 29.3%
Const & road main, 35.1%
Building mat. & trading, 17.9%
Property dev, 10.8%
Samalaju dev, 11.2%
Strategic Inv, -4.0%
Others, 3.0%
Eliminations, -3.2%
Source: Company, Maybank KE
4 November 2013 Page 11 of 21
Cahya Mata Sarawak
• Earnings drivers
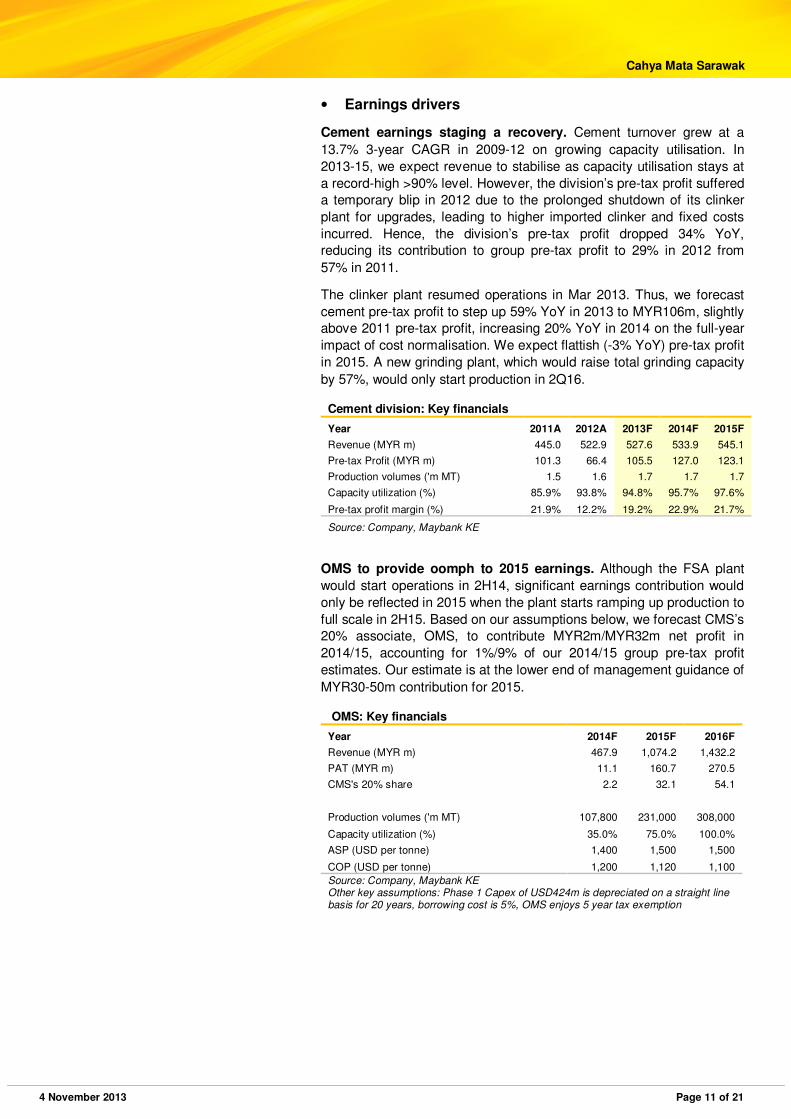
Cement earnings staging a recovery. Cement turnover grew at a
13.7% 3-year CAGR in 2009-12 on growing capacity utilisation. In
2013-15, we expect revenue to stabilise as capacity utilisation stays at
a record-high >90% level. However, the division’s pre-tax profit suffered
a temporary blip in 2012 due to the prolonged shutdown of its clinker
plant for upgrades, leading to higher imported clinker and fixed costs
incurred. Hence, the division’s pre-tax profit dropped 34% YoY,
reducing its contribution to group pre-tax profit to 29% in 2012 from
57% in 2011.
The clinker plant resumed operations in Mar 2013. Thus, we forecast
cement pre-tax profit to step up 59% YoY in 2013 to MYR106m, slightly
above 2011 pre-tax profit, increasing 20% YoY in 2014 on the full-year
impact of cost normalisation. We expect flattish (-3% YoY) pre-tax profit
in 2015. A new grinding plant, which would raise total grinding capacity
by 57%, would only start production in 2Q16.
Cement division: Key financials
Year 2011A 2012A 2013F 2014F 2015F
Revenue (MYR m) 445.0 522.9 527.6 533.9 545.1
Pre-tax Profit (MYR m) 101.3 66.4 105.5 127.0 123.1
Production volumes ('m MT) 1.5 1.6 1.7 1.7 1.7
Capacity utilization (%) 85.9% 93.8% 94.8% 95.7% 97.6%
Pre-tax profit margin (%) 21.9% 12.2% 19.2% 22.9% 21.7%
Source: Company, Maybank KE
OMS to provide oomph to 2015 earnings. Although the FSA plant
would start operations in 2H14, significant earnings contribution would
only be reflected in 2015 when the plant starts ramping up production to
full scale in 2H15. Based on our assumptions below, we forecast CMS’s
20% associate, OMS, to contribute MYR2m/MYR32m net profit in
2014/15, accounting for 1%/9% of our 2014/15 group pre-tax profit
estimates. Our estimate is at the lower end of management guidance of
MYR30-50m contribution for 2015.
OMS: Key financials
Year 2014F 2015F 2016F
Revenue (MYR m) 467.9 1,074.2 1,432.2
PAT (MYR m) 11.1 160.7 270.5
CMS's 20% share 2.2 32.1 54.1
Production volumes ('m MT) 107,800 231,000 308,000
Capacity utilization (%) 35.0% 75.0% 100.0%
ASP (USD per tonne) 1,400 1,500 1,500
COP (USD per tonne) 1,200 1,120 1,100
Source: Company, Maybank KE Other key assumptions: Phase 1 Capex of USD424m is depreciated on a straight line basis for 20 years, borrowing cost is 5%, OMS enjoys 5 year tax exemption
4 November 2013 Page 12 of 21
Cahya Mata Sarawak
• Upside to earnings forecasts
Upside from cheaper coal and Samalaju property. After the upgrade
of its clinker plant, the cement division is using local coal as fuel that
could cost up to 50% less than imported coal, as guided by
management. Based on a scenario of 10% savings in clinker production
cost after the switch to local coal, and with clinker costs making up
about 60% of cement production costs, the cheaper coal could lead to
an 8-9% (MYR13-18m) rise in our CMS 2013-15 net profit estimates.
Besides, Samalaju Property Development (51% owned) would be
launching properties with a GDV of MYR950m in 2Q14. Based on
conservative variables, we estimate Samalaju could contribute MYR7m-
14m p.a. in 2013-15. We have yet to factor both into our earnings.
OMS’s oomph to earnings: Part 2. Our earnings have also yet to
reflect OMS Phase 2 - the 565,000 MT p.a. manganese ferroalloy and
sintered manganese ore plant that is scheduled to begin operations in
2H15, as it is not yet finalised. Based on the latest feasibility study
issued by OM Holdings Ltd in Jul 2012, OMS is expected to generate
USD1.16b p.a. turnover when Phase 1 and 2 are operating at full-scale
production. The expected total project capex is USD592m and payback
period is forecasted to be three years (assuming 100% production) with
a project IRR of 33%.
• Long-term growth potential
Sustainable growth beyond 2015. CMS’s strong earnings growth
trajectory would continue beyond 2015, buoyed by its expansion plans,
strategic investments and property development:
i) Expansion plans would include CMS’s new 1m MT p.a. cement
grinding plant (raising its total capacity by 57%) that would be
completed in 2Q16 and a potential second clinker production line in
2017. CMS is also planning to expand its construction materials
production capacity in Sarawak, especially in Bintulu, to cater to
rising demand from the SIP.
ii) Strategic investments would mainly be in the SIP. The integrated
phosphate plant is projected to contribute between MYR80m and
MYR100m p.a. to CMS’s bottom line. If successful, the plant will
begin operations in 1H16. Following that, it is also planning to build a
downstream plant with phosphate as its feedstock next to the
phosphate plant.
iii) Property development with e.MYR15.5b GDV potential.
Leveraging the spillover effect of SCORE development and rising
urbanisation, demand for property in Kuching could ride on
population growth in Sarawak. This would bode well for CMS’s
property development, which owns vast property land bank in
Kuching with an estimated total GDV of MYR15.5b. Property could
emerge as a major earnings contributor to CMS in the long run.
Armed with cash for expansion. CMS has shored up its net cash to
MYR436m (MYR1.31/share) as of Jun 2013 for its future growth plans.
In addition to its cash, CMS could also gear up further. Assuming net
gearing of 0.2x, this translates into an additional war chest of
MYR737m. CMS also has the mandate to make a private placement of
new shares, up to 10% of its share capital. The expected timeline for
the placement is in 1H14 or when market conditions are ideal.

4 November 2013 Page 13 of 21
Cahya Mata Sarawak
Intensive capex plans. From its MYR436m net cash pile, CMS plans
to spend MYR130m on its equity participation in OMS, MYR120m on its
phosphate plant JV, MYR50m on the Samalaju property development
business and the rest on other investment opportunities that may arise.
Management has guided for capex of MYR88m/MYR226m in 2013/14
for its MYR150m new cement grinding plant, equity investment in OMS
and other maintenance capex. We assume flattish 2015 capex at
MYR227m.
30% net dividend pay-out policy. CMS has adopted a dividend policy
to distribute a minimum of 30% of its net profit subject to a minimum of
at least 5sen per share p.a. from FY12. The 30% net dividend pay-out
translates into decent net dividend yield of 2.8-4.0% in 2013-15.
Shareholders and management
ROARing transformation. CMS went through a management revamp
in 2006 when the current Group Chairman (Tan Sri Dato’ Seri Syed
Anwar Jamalullail), Group Executive Director (Datuk Syed Ahmad
Alwee Alsree), Group Managing Director (Dato’ Richard Curtis) and
Group Financial Officer (Tuan Syed Hizam Alsagoff) were appointed.
The new management team executed its successful 4-phase ROAR
transformation strategy – Restructure, Organise, Advance and ROAR
Ahead. Since then, CMS has shut down loss-making businesses,
disposed businesses with less coherent value, acquired businesses to
enhance its core units and introduced new performance-based culture.
Major restructuring followed. As part of its restructuring and
organising phase, CMS Modular Housing and CMS Steel Bhd ceased
operations in 2005 and 2006, respectively, due to continued losses in
both businesses. CMS also decided to not pursue several overseas
business proposals and subsequently disposed of CMS Works
International Ltd in 2006. The new management also implemented a
performance-based culture in CMS via a KPI system.
Advanced forward. Under the advance phase in 2007, CMS acquired
Sarawak’s sole clinker operation in Mambong and a 20% stake in an
established steel fabricator in Sarawak – KKB Engineering Bhd (KKB
MK; Not Rated). These acquisitions were targeted to enhance its core
businesses. In the same year, CMS executed a major divestment
involving RHB to EPF as well as its steel rolling mill and land.
Stable shareholdings. CMS’s major shareholders, who are related to
the Sarawak Chief Minister Taib Family, collectively own a 41.6% stake.
Their holdings have been stable and management indicated that they
have no intention to sell down. CMS’s shareholders also encompass
government agencies/institutional investors, which accounted for 8% of
shares in 2012. In 2013, EPF emerged as a substantial shareholder
with a 6% stake. As of end-Sep 2013, foreign shareholding was 16%.
Substantial shareholders as of 1 Apr 2013
Substantial shareholders Shareholding (%)
Majaharta S/B* 13.26
Lejla Taib 10.92
Dato Sri Sulaiman AB Rahman Taib 8.70
Dato Sri Mahmud Abu Bekir Taib 8.68
Sarawak Economic Development Corporation 7.96
Source: Company * owned by Taib Family
4 November 2013 Page 14 of 21
Cahya Mata Sarawak
Valuations
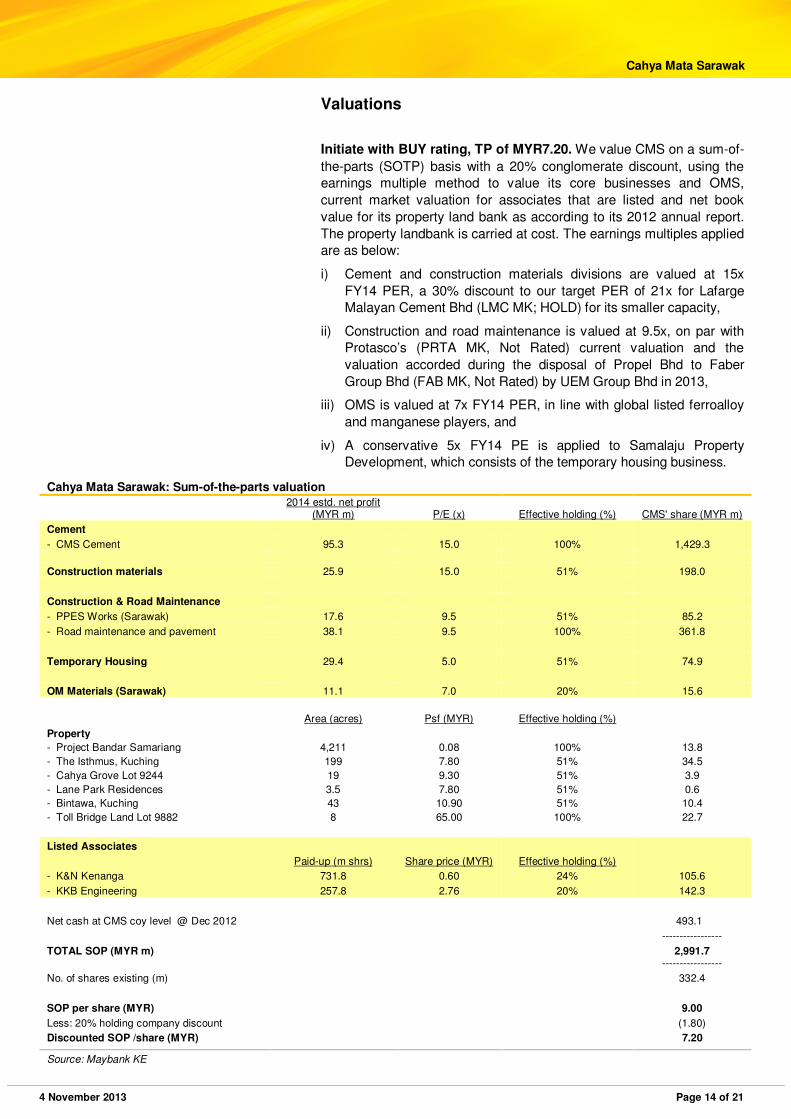
Initiate with BUY rating, TP of MYR7.20. We value CMS on a sum-of-
the-parts (SOTP) basis with a 20% conglomerate discount, using the
earnings multiple method to value its core businesses and OMS,
current market valuation for associates that are listed and net book
value for its property land bank as according to its 2012 annual report.
The property landbank is carried at cost. The earnings multiples applied
are as below:
i) Cement and construction materials divisions are valued at 15x
FY14 PER, a 30% discount to our target PER of 21x for Lafarge
Malayan Cement Bhd (LMC MK; HOLD) for its smaller capacity,
ii) Construction and road maintenance is valued at 9.5x, on par with
Protasco’s (PRTA MK, Not Rated) current valuation and the
valuation accorded during the disposal of Propel Bhd to Faber
Group Bhd (FAB MK, Not Rated) by UEM Group Bhd in 2013,
iii) OMS is valued at 7x FY14 PER, in line with global listed ferroalloy
and manganese players, and
iv) A conservative 5x FY14 PE is applied to Samalaju Property
Development, which consists of the temporary housing business.
Cahya Mata Sarawak: Sum-of-the-parts valuation
2014 estd. net profit
(MYR m) P/E (x) Effective holding (%) CMS' share (MYR m)
Cement
- CMS Cement 95.3 15.0 100% 1,429.3
Construction materials 25.9 15.0 51% 198.0
Construction & Road Maintenance
- PPES Works (Sarawak) 17.6 9.5 51% 85.2
- Road maintenance and pavement 38.1 9.5 100% 361.8
Temporary Housing 29.4 5.0 51% 74.9
OM Materials (Sarawak) 11.1 7.0 20% 15.6
Area (acres) Psf (MYR) Effective holding (%)
Property
- Project Bandar Samariang 4,211 0.08 100% 13.8
- The Isthmus, Kuching 199 7.80 51% 34.5
- Cahya Grove Lot 9244 19 9.30 51% 3.9
- Lane Park Residences 3.5 7.80 51% 0.6
- Bintawa, Kuching 43 10.90 51% 10.4
- Toll Bridge Land Lot 9882 8 65.00 100% 22.7
Listed Associates
Paid-up (m shrs) Share price (MYR) Effective holding (%)
- K&N Kenanga 731.8 0.60 24% 105.6
- KKB Engineering 257.8 2.76 20% 142.3
Net cash at CMS coy level @ Dec 2012 493.1
-----------------
TOTAL SOP (MYR m) 2,991.7
-----------------
No. of shares existing (m) 332.4
SOP per share (MYR) 9.00
Less: 20% holding company discount (1.80)
Discounted SOP /share (MYR) 7.20
Source: Maybank KE
4 November 2013 Page 15 of 21
Cahya Mata Sarawak
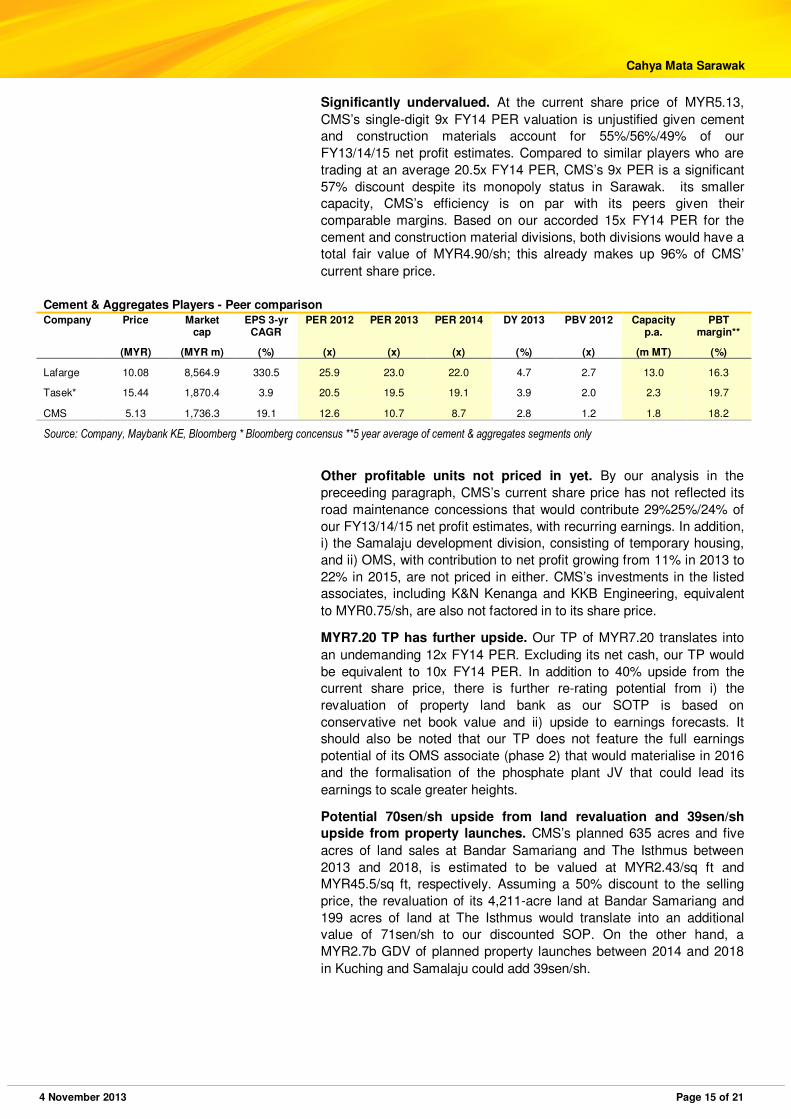
Significantly undervalued. At the current share price of MYR5.13,
CMS’s single-digit 9x FY14 PER valuation is unjustified given cement
and construction materials account for 55%/56%/49% of our
FY13/14/15 net profit estimates. Compared to similar players who are
trading at an average 20.5x FY14 PER, CMS’s 9x PER is a significant
57% discount despite its monopoly status in Sarawak. its smaller
capacity, CMS’s efficiency is on par with its peers given their
comparable margins. Based on our accorded 15x FY14 PER for the
cement and construction material divisions, both divisions would have a
total fair value of MYR4.90/sh; this already makes up 96% of CMS’
current share price.
Cement & Aggregates Players - Peer comparison
Company Price Market cap
EPS 3-yr CAGR
PER 2012 PER 2013 PER 2014 DY 2013 PBV 2012 Capacity p.a.
PBT margin**
(MYR) (MYR m) (%) (x) (x) (x) (%) (x) (m MT) (%)
Lafarge 10.08 8,564.9 330.5 25.9 23.0 22.0 4.7 2.7 13.0 16.3
Tasek* 15.44 1,870.4 3.9 20.5 19.5 19.1 3.9 2.0 2.3 19.7
CMS 5.13 1,736.3 19.1 12.6 10.7 8.7 2.8 1.2 1.8 18.2
Source: Company, Maybank KE, Bloomberg * Bloomberg concensus **5 year average of cement & aggregates segments only
Other profitable units not priced in yet. By our analysis in the
preceeding paragraph, CMS’s current share price has not reflected its
road maintenance concessions that would contribute 29%25%/24% of
our FY13/14/15 net profit estimates, with recurring earnings. In addition,
i) the Samalaju development division, consisting of temporary housing,
and ii) OMS, with contribution to net profit growing from 11% in 2013 to
22% in 2015, are not priced in either. CMS’s investments in the listed
associates, including K&N Kenanga and KKB Engineering, equivalent
to MYR0.75/sh, are also not factored in to its share price.
MYR7.20 TP has further upside. Our TP of MYR7.20 translates into
an undemanding 12x FY14 PER. Excluding its net cash, our TP would
be equivalent to 10x FY14 PER. In addition to 40% upside from the
current share price, there is further re-rating potential from i) the
revaluation of property land bank as our SOTP is based on
conservative net book value and ii) upside to earnings forecasts. It
should also be noted that our TP does not feature the full earnings
potential of its OMS associate (phase 2) that would materialise in 2016
and the formalisation of the phosphate plant JV that could lead its
earnings to scale greater heights.
Potential 70sen/sh upside from land revaluation and 39sen/sh
upside from property launches. CMS’s planned 635 acres and five
acres of land sales at Bandar Samariang and The Isthmus between
2013 and 2018, is estimated to be valued at MYR2.43/sq ft and
MYR45.5/sq ft, respectively. Assuming a 50% discount to the selling
price, the revaluation of its 4,211-acre land at Bandar Samariang and
199 acres of land at The Isthmus would translate into an additional
value of 71sen/sh to our discounted SOP. On the other hand, a
MYR2.7b GDV of planned property launches between 2014 and 2018
in Kuching and Samalaju could add 39sen/sh.
4 November 2013 Page 16 of 21
Cahya Mata Sarawak
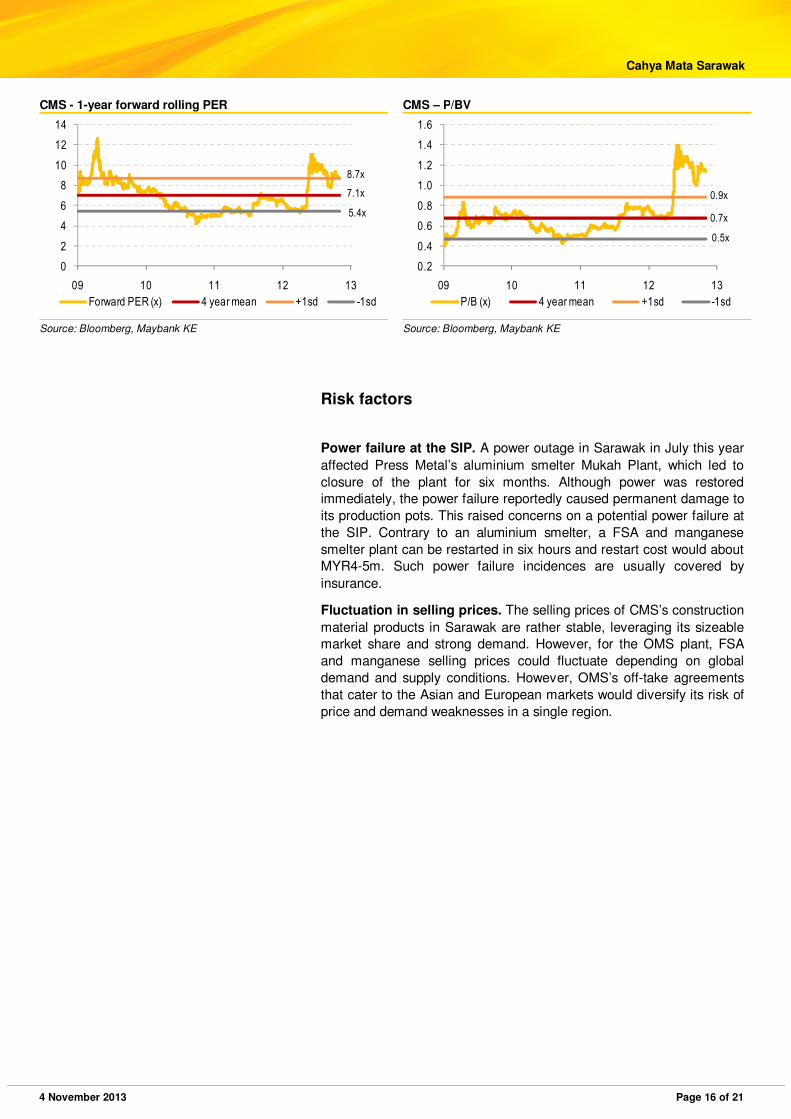
CMS - 1-year forward rolling PER CMS – P/BV
0
2
4
6
8
10
12
14
09 10 11 12 13
Forward PER (x) 4 year mean +1sd -1sd
5.4x
7.1x
8.7x
0.2
0.4
0.6
0.8
1.0
1.2
1.4
1.6
09 10 11 12 13
P/B (x) 4 year mean +1sd -1sd
0.5x
0.7x
0.9x
Source: Bloomberg, Maybank KE Source: Bloomberg, Maybank KE
Risk factors
Power failure at the SIP. A power outage in Sarawak in July this year
affected Press Metal’s aluminium smelter Mukah Plant, which led to
closure of the plant for six months. Although power was restored
immediately, the power failure reportedly caused permanent damage to
its production pots. This raised concerns on a potential power failure at
the SIP. Contrary to an aluminium smelter, a FSA and manganese
smelter plant can be restarted in six hours and restart cost would about
MYR4-5m. Such power failure incidences are usually covered by
insurance.
Fluctuation in selling prices. The selling prices of CMS’s construction
material products in Sarawak are rather stable, leveraging its sizeable
market share and strong demand. However, for the OMS plant, FSA
and manganese selling prices could fluctuate depending on global
demand and supply conditions. However, OMS’s off-take agreements
that cater to the Asian and European markets would diversify its risk of
price and demand weaknesses in a single region.
4 November 2013 Page 17 of 21
Cahya Mata Sarawak
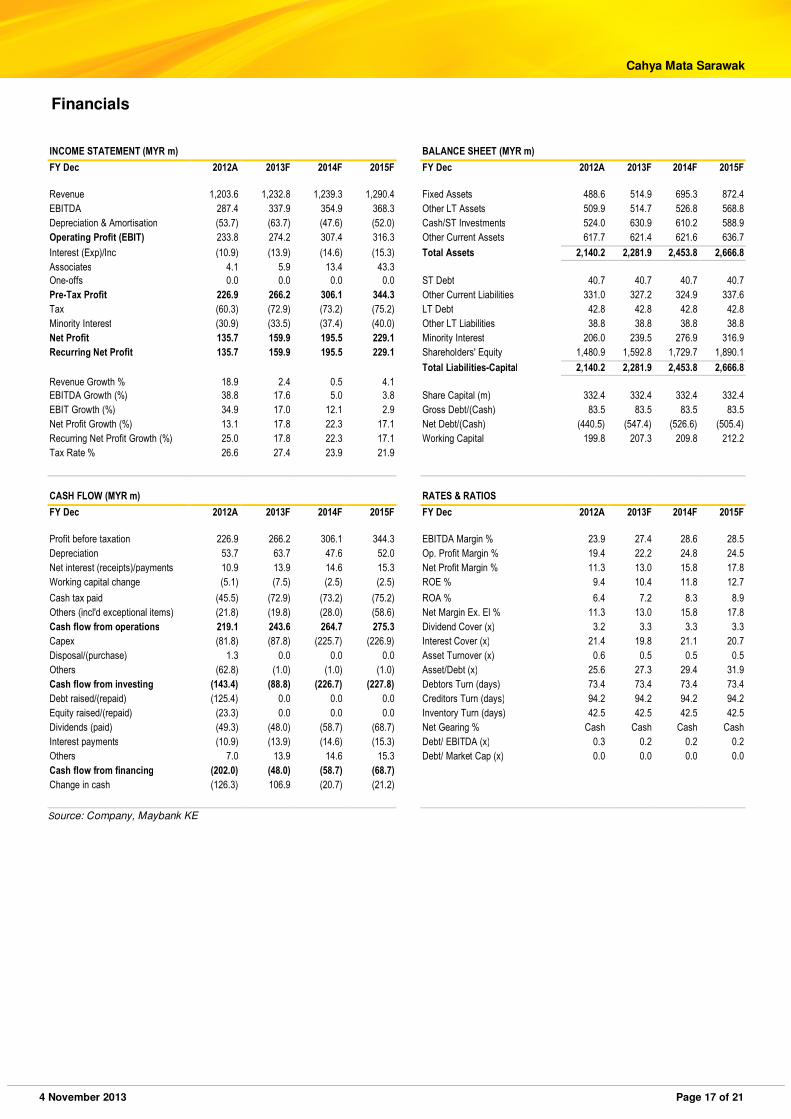
Financials
INCOME STATEMENT (MYR m) BALANCE SHEET (MYR m)
FY Dec 2012A 2013F 2014F 2015F FY Dec 2012A 2013F 2014F 2015F
Revenue 1,203.6 1,232.8 1,239.3 1,290.4 Fixed Assets 488.6 514.9 695.3 872.4
EBITDA 287.4 337.9 354.9 368.3 Other LT Assets 509.9 514.7 526.8 568.8
Depreciation & Amortisation (53.7) (63.7) (47.6) (52.0) Cash/ST Investments 524.0 630.9 610.2 588.9
Operating Profit (EBIT) 233.8 274.2 307.4 316.3 Other Current Assets 617.7 621.4 621.6 636.7
Interest (Exp)/Inc (10.9) (13.9) (14.6) (15.3) Total Assets 2,140.2 2,281.9 2,453.8 2,666.8
Associates 4.1 5.9 13.4 43.3
One-offs 0.0 0.0 0.0 0.0 ST Debt 40.7 40.7 40.7 40.7
Pre-Tax Profit 226.9 266.2 306.1 344.3 Other Current Liabilities 331.0 327.2 324.9 337.6
Tax (60.3) (72.9) (73.2) (75.2) LT Debt 42.8 42.8 42.8 42.8
Minority Interest (30.9) (33.5) (37.4) (40.0) Other LT Liabilities 38.8 38.8 38.8 38.8
Net Profit 135.7 159.9 195.5 229.1 Minority Interest 206.0 239.5 276.9 316.9
Recurring Net Profit 135.7 159.9 195.5 229.1 Shareholders' Equity 1,480.9 1,592.8 1,729.7 1,890.1
Total Liabilities-Capital 2,140.2 2,281.9 2,453.8 2,666.8
Revenue Growth % 18.9 2.4 0.5 4.1
EBITDA Growth (%) 38.8 17.6 5.0 3.8 Share Capital (m) 332.4 332.4 332.4 332.4
EBIT Growth (%) 34.9 17.0 12.1 2.9 Gross Debt/(Cash) 83.5 83.5 83.5 83.5
Net Profit Growth (%) 13.1 17.8 22.3 17.1 Net Debt/(Cash) (440.5) (547.4) (526.6) (505.4)
Recurring Net Profit Growth (%) 25.0 17.8 22.3 17.1 Working Capital 199.8 207.3 209.8 212.2
Tax Rate % 26.6 27.4 23.9 21.9
CASH FLOW (MYR m) RATES & RATIOS
FY Dec 2012A 2013F 2014F 2015F FY Dec 2012A 2013F 2014F 2015F
Profit before taxation 226.9 266.2 306.1 344.3 EBITDA Margin % 23.9 27.4 28.6 28.5
Depreciation 53.7 63.7 47.6 52.0 Op. Profit Margin % 19.4 22.2 24.8 24.5
Net interest (receipts)/payments 10.9 13.9 14.6 15.3 Net Profit Margin % 11.3 13.0 15.8 17.8
Working capital change (5.1) (7.5) (2.5) (2.5) ROE % 9.4 10.4 11.8 12.7
Cash tax paid (45.5) (72.9) (73.2) (75.2) ROA % 6.4 7.2 8.3 8.9
Others (incl'd exceptional items) (21.8) (19.8) (28.0) (58.6) Net Margin Ex. El % 11.3 13.0 15.8 17.8
Cash flow from operations 219.1 243.6 264.7 275.3 Dividend Cover (x) 3.2 3.3 3.3 3.3
Capex (81.8) (87.8) (225.7) (226.9) Interest Cover (x) 21.4 19.8 21.1 20.7
Disposal/(purchase) 1.3 0.0 0.0 0.0 Asset Turnover (x) 0.6 0.5 0.5 0.5
Others (62.8) (1.0) (1.0) (1.0) Asset/Debt (x) 25.6 27.3 29.4 31.9
Cash flow from investing (143.4) (88.8) (226.7) (227.8) Debtors Turn (days) 73.4 73.4 73.4 73.4
Debt raised/(repaid) (125.4) 0.0 0.0 0.0 Creditors Turn (days) 94.2 94.2 94.2 94.2
Equity raised/(repaid) (23.3) 0.0 0.0 0.0 Inventory Turn (days) 42.5 42.5 42.5 42.5
Dividends (paid) (49.3) (48.0) (58.7) (68.7) Net Gearing % Cash Cash Cash Cash
Interest payments (10.9) (13.9) (14.6) (15.3) Debt/ EBITDA (x) 0.3 0.2 0.2 0.2
Others 7.0 13.9 14.6 15.3 Debt/ Market Cap (x) 0.0 0.0 0.0 0.0
Cash flow from financing (202.0) (48.0) (58.7) (68.7)
Change in cash (126.3) 106.9 (20.7) (21.2)
Source: Company, Maybank KE

4 November 2013 Page 18 of 21
Cahya Mata Sarawak
RESEARCH OFFICES REGIONAL
WONG Chew Hann, CA Regional Head, Institutional Research
(603) 2297 8686 [email protected]
Alexander GARTHOFF Institutional Product Manager (852) 2268 0638 [email protected]
ONG Seng Yeow Regional Head, Retail Research (65) 6432 1453 [email protected]
ECONOMICS Suhaimi ILIAS Chief Economist
� Singapore | Malaysia (603) 2297 8682 [email protected]
Luz LORENZO � Philippines (63) 2 849 8836 [email protected]
Tim LEELAHAPHAN � Thailand (662) 658 1420 [email protected]
JUNIMAN Chief Economist, BII
� Indonesia (62) 21 29228888 ext 29682 [email protected]
Josua PARDEDE Economist / Industry Analyst, BII
� Indonesia (62) 21 29228888 ext 29695 [email protected]
MALAYSIA WONG CHEW HANN, CA Head of Research (603) 2297 8686 [email protected] � Strategy DESMOND CH’NG, ACA (603) 2297 8680 [email protected] � Banking & Finance LIAW THONG JUNG (603) 2297 8688 [email protected] � Oil & Gas – Regional � Shipping ONG CHEE TING, CA (603) 2297 8678 [email protected] � Plantations – Regional MOHSHIN AZIZ (603) 2297 8692 [email protected] � Aviation – Regional � Petrochem YIN SHAO YANG, CPA (603) 2297 8916 [email protected] � Gaming – Regional
� Media TAN CHI WEI, CFA (603) 2297 8690 [email protected] � Power � Telcos WONG WEI SUM, CFA (603) 2297 8679 [email protected] � Property & REITs LEE YEN LING (603) 2297 8691 [email protected] � Building Materials � Glove producers
CHAI LI SHIN (603) 2297 8684 [email protected] � Plantation � Construction & Infrastructure KANG CHUN EE (603) 2297 8675 [email protected] � Consumer IVAN YAP (603) 2297 8612 [email protected] � Automotive LEE Cheng Hooi, Regional Chartist (603) 2297 8694 [email protected] Tee Sze Chiah, Head of Retail Research (603) 2297 6858 [email protected]
�HONG KONG / CHINA Howard WONG Head of Research
(852) 2268 0648 [email protected] � Oil & Gas - Regional Alexander LATZER (852) 2268 0647 [email protected] � Metals & Mining - Regional Jacqueline KO, CFA (852) 2268 0633 [email protected] � Consumer Terence LOK (852) 2268 0630 [email protected] � Consumer Jeremy TAN (852) 2268 0635 [email protected] � Gaming Karen KWAN (852) 2268 0640 [email protected] � HK & China Property Philip TSE (852) 2268 0643 [email protected] � HK & China Property Simon QIAN (852) 2268 0634 [email protected] � Telecom & Internet Steven CHAN (852) 2268 0645 [email protected] � Banking & Financials Warren LAU (852) 2268 0644 [email protected] � Technology – Regional
INDIA Jigar SHAH Head of Research (91) 22 6623 2601 [email protected] � Oil & Gas � Automobile � Cement Anubhav GUPTA (91) 22 6623 2605 [email protected] � Metal & Mining � Capital goods � Property Urmil SHAH (91) 22 6623 2606 [email protected] � Technology � Media
SINGAPORE Gregory YAP Head of Research (65) 6432 1450 [email protected] � Technology & Manufacturing � Telcos Wilson LIEW (65) 6432 1454 [email protected] � Property Developers James KOH (65) 6432 1431 [email protected] � Consumer - Regional YEAK Chee Keong, CFA (65) 6432 1460 [email protected] � Offshore & Marine Alison FOK (65) 6432 1447 [email protected] � Small & Mid Caps � Construction ONG Kian Lin (65) 6432 1470 [email protected] � S-REITs Wei Bin (65) 6432 1455 [email protected] � Commodity � Logistics � S-chips Derrick HENG (65) 6432 1446 [email protected] � Transport (Land, Shipping & Aviation) John CHEONG (65) 6432 1461 [email protected] � Small & Mid Caps � Healthcare
INDONESIA Lucky ARIESANDI, CFA (62) 21 2557 1127 [email protected] � Base metals � Mining � Oil & Gas � Wholesale Pandu ANUGRAH (62) 21 2557 1137 [email protected] � Automotive � Heavy equipment � Plantation � Toll road Rahmi MARINA (62) 21 2557 1128 [email protected] � Banking � Multifinance Adi N. WICAKSONO (62) 21 2557 1128 [email protected] � Generalist Anthony YUNUS (62) 21 2557 1139 [email protected] � Cement � Infrastructure � Property
PHILIPPINES Luz LORENZO Head of Research
(63) 2 849 8836 [email protected] � Strategy Laura DY-LIACCO (63) 2 849 8840 [email protected] � Utilities � Conglomerates � Telcos Lovell SARREAL (63) 2 849 8841 [email protected] � Consumer � Media � Cement Luz LORENZO (63) 2 849 8836 [email protected] � Conglomerates � Property � Ports/ Logistics � Gaming Katherine TAN (63) 2 849 8843 [email protected] � Banks � Construction Ramon ADVIENTO (63) 2 849 8845 [email protected] � Mining
THAILAND Sukit UDOMSIRIKUL Head of Research (66) 2658 6300 ext 5090 [email protected]
Maria LAPIZ Head of Institutional Research Dir (66) 2257 0250 | (66) 2658 6300 ext 1399 [email protected] � Consumer/ Big Caps
Mayuree CHOWVIKRAN (66) 2658 6300 ext 1440 [email protected] � Strategy Padon Vannarat (66) 2658 6300 ext 1450 [email protected] � Strategy Surachai PRAMUALCHAROENKIT (66) 2658 6300 ext 1470 [email protected] � Auto � Conmat � Contractor � Steel Suttatip PEERASUB (66) 2658 6300 ext 1430 [email protected] � Media � Commerce Sutthichai KUMWORACHAI (66) 2658 6300 ext 1400 [email protected] � Energy � Petrochem Termporn TANTIVIVAT (66) 2658 6300 ext 1520 [email protected] � Property Woraphon WIROONSRI (66) 2658 6300 ext 1560 [email protected] � Banking & Finance Jaroonpan WATTANAWONG (66) 2658 6300 ext 1404 [email protected] � Transportation � Small cap. Chatchai JINDARAT (66) 2658 6300 ext 1401 [email protected] � Electronics
VIETNAM Nguyen Thi Ngan Tuyen (84) 844 55 58 88 x 8081 [email protected] � Food and Beverage � Oil and Gas Hang Vu (84) 844 55 58 88 x 8087 [email protected] � Banking Trinh Thi Ngoc Diep (84) 844 55 58 88 x 8242 [email protected] � Technology � Utilities � Construction Dang Thi Kim Thoa (84) 844 55 58 88 x 8083 [email protected] � Consumer Nguyen Trung Hoa (84) 844 55 58 88 x 8088 [email protected] � Steel � Sugar � Resources

4 November 2013 Page 19 of 21
Cahya Mata Sarawak
APPENDIX I: TERMS FOR PROVISION OF REPORT, DISCLAIMERS AND DISCLOSURES
DISCLAIMERS
This research report is prepared for general circulation and for information purposes only and under no circumstances should it be considered or intended as an offer to sell or a solicitation of an offer to buy the securities referred to herein. Investors should note that values of such securities, if any, may fluctuate and that each security’s price or value may rise or fall. Opinions or recommendations contained herein are in form of technical ratings and fundamental ratings. Technical ratings may differ from fundamental ratings as technical valuations apply different methodologies and are purely based on price and volume-related information extracted from the relevant jurisdiction’s stock exchange in the equity analysis. Accordingly, investors’ returns may be less than the original sum invested. Past performance is not necessarily a guide to future performance. This report is not intended to provide personal investment advice and does not take into account the specific investment objectives, the financial situation and the particular needs of persons who may receive or read this report. Investors should therefore seek financial, legal and other advice regarding the appropriateness of investing in any securities or the investment strategies discussed or recommended in this report.
The information contained herein has been obtained from sources believed to be reliable but such sources have not been independently verified by Maybank Investment Bank Berhad, its subsidiary and affiliates (collectively, “MKE”) and consequently no representation is made as to the accuracy or completeness of this report by MKE and it should not be relied upon as such. Accordingly, MKE and its officers, directors, associates, connected parties and/or employees (collectively, “Representatives”) shall not be liable for any direct, indirect or consequential losses or damages that may arise from the use or reliance of this report. Any information, opinions or recommendations contained herein are subject to change at any time, without prior notice.
This report may contain forward looking statements which are often but not always identified by the use of words such as “anticipate”, “believe”, “estimate”, “intend”, “plan”, “expect”, “forecast”, “predict” and “project” and statements that an event or result “may”, “will”, “can”, “should”, “could” or “might” occur or be achieved and other similar expressions. Such forward looking statements are based on assumptions made and information currently available to us and are subject to certain risks and uncertainties that could cause the actual results to differ materially from those expressed in any forward looking statements. Readers are cautioned not to place undue relevance on these forward-looking statements. MKE expressly disclaims any obligation to update or revise any such forward looking statements to reflect new information, events or circumstances after the date of this publication or to reflect the occurrence of unanticipated events.
MKE and its officers, directors and employees, including persons involved in the preparation or issuance of this report, may, to the extent permitted by law, from time to time participate or invest in financing transactions with the issuer(s) of the securities mentioned in this report, perform services for or solicit business from such issuers, and/or have a position or holding, or other material interest, or effect transactions, in such securities or options thereon, or other investments related thereto. In addition, it may make markets in the securities mentioned in the material presented in this report. MKE may, to the extent permitted by law, act upon or use the information presented herein, or the research or analysis on which they are based, before the material is published. One or more directors, officers and/or employees of MKE may be a director of the issuers of the securities mentioned in this report.
This report is prepared for the use of MKE’s clients and may not be reproduced, altered in any way, transmitted to, copied or distributed to any other party in whole or in part in any form or manner without the prior express written consent of MKE and MKE and its Representatives accepts no liability whatsoever for the actions of third parties in this respect.
This report is not directed to or intended for distribution to or use by any person or entity who is a citizen or resident of or located in any locality, state, country or other jurisdiction where such distribution, publication, availability or use would be contrary to law or regulation. This report is for distribution only under such circumstances as may be permitted by applicable law. The securities described herein may not be eligible for sale in all jurisdictions or to certain categories of investors. Without prejudice to the foregoing, the reader is to note that additional disclaimers, warnings or qualifications may apply based on geographical location of the person or entity receiving this report.
Malaysia
Opinions or recommendations contained herein are in the form of technical ratings and fundamental ratings. Technical ratings may differ from fundamental ratings as technical valuations apply different methodologies and are purely based on price and volume-related information extracted from Bursa Malaysia Securities Berhad in the equity analysis.
Singapore
This report has been produced as of the date hereof and the information herein may be subject to change. Maybank Kim Eng Research Pte. Ltd. (“Maybank KERPL”) in Singapore has no obligation to update such information for any recipient. For distribution in Singapore, recipients of this report are to contact Maybank KERPL in Singapore in respect of any matters arising from, or in connection with, this report. If the recipient of this report is not an accredited investor, expert investor or institutional investor (as defined under Section 4A of the Singapore Securities and Futures Act), Maybank KERPL shall be legally liable for the contents of this report, with such liability being limited to the extent (if any) as permitted by law.
Thailand
The disclosure of the survey result of the Thai Institute of Directors Association (“IOD”) regarding corporate governance is made pursuant to the policy of the Office of the Securities and Exchange Commission. The survey of the IOD is based on the information of a company listed on the Stock Exchange of Thailand and the market for Alternative Investment disclosed to the public and able to be accessed by a general public investor. The result, therefore, is from the perspective of a third party. It is not an evaluation of operation and is not based on inside information.The survey result is as of the date appearing in the Corporate Governance Report of Thai Listed Companies. As a result, the survey may be changed after that date. Maybank Kim Eng Securities (Thailand) Public Company Limited (“MBKET”) does not confirm nor certify the accuracy of such survey result.
Except as specifically permitted, no part of this presentation may be reproduced or distributed in any manner without the prior written permission of MBKET. MBKET accepts no liability whatsoever for the actions of third parties in this respect.
US
This research report prepared by MKE is distributed in the United States (“US”) to Major US Institutional Investors (as defined in Rule 15a-6 under the Securities Exchange Act of 1934, as amended) only by Maybank Kim Eng Securities USA Inc (“Maybank KESUSA”), a broker-dealer registered in the US (registered under Section 15 of the Securities Exchange Act of 1934, as amended). All responsibility for the distribution of this report by Maybank KESUSA in the US shall be borne by Maybank KESUSA. All resulting transactions by a US person or entity should be effected through a registered broker-dealer in the US. This report is not directed at you if MKE is prohibited or restricted by any legislation or regulation in any jurisdiction from making it available to you. You should satisfy yourself before reading it that Maybank KESUSA is permitted to provide research material concerning investments to you under relevant legislation and regulations.
UK
This document is being distributed by Maybank Kim Eng Securities (London) Ltd (“Maybank KESL”) which is authorized and regulated, by the Financial Services Authority and is for Informational Purposes only. This document is not intended for distribution to anyone defined as a Retail Client under the Financial Services and Markets Act 2000 within the UK. Any inclusion of a third party link is for the recipients convenience only, and that the firm does not take any responsibility for its comments or accuracy, and that access to such links is at the individuals own risk. Nothing in this report should be considered as constituting legal, accounting or tax advice, and that for accurate guidance recipients should consult with their own independent tax advisers.

4 November 2013 Page 20 of 21
Cahya Mata Sarawak
DISCLOSURES
Legal Entities Disclosures
Malaysia: This report is issued and distributed in Malaysia by Maybank Investment Bank Berhad (15938-H) which is a Participating Organization of Bursa Malaysia Berhad and a holder of Capital Markets and Services License issued by the Securities Commission in Malaysia. Singapore: This material is issued and distributed in Singapore by Maybank KERPL (Co. Reg No 197201256N) which is regulated by the Monetary Authority of Singapore. Indonesia: PT Kim Eng Securities (“PTKES”) (Reg. No. KEP-251/PM/1992) is a member of the Indonesia Stock Exchange and is regulated by the BAPEPAM LK. Thailand: MBKET (Reg. No.0107545000314) is a member of the Stock Exchange of Thailand and is regulated by the Ministry of Finance and the Securities and Exchange Commission.Philippines:MATRKES (Reg. No.01-2004-00019) is a member of the Philippines Stock Exchange and is regulated by the Securities and Exchange Commission. Vietnam: Kim Eng Vietnam Securities Company (“KEVS”) (License Number: 71/UBCK-GP) is licensed under the StateSecuritiesCommission of Vietnam.Hong Kong: KESHK (Central Entity No AAD284) is regulated by the Securities and Futures Commission. India: Kim Eng Securities India Private Limited (“KESI”) is a participant of the National Stock Exchange of India Limited (Reg No: INF/INB 231452435) and the Bombay Stock Exchange (Reg. No. INF/INB 011452431) and is regulated by Securities and Exchange Board of India. KESI is also registered with SEBI as Category 1 Merchant Banker (Reg. No. INM 000011708) US: Maybank KESUSA is a member of/ and is authorized and regulated by the FINRA – Broker ID 27861. UK: Maybank KESL (Reg No 2377538) is authorized and regulated by the Financial Services Authority.
Disclosure of Interest
Malaysia: MKE and its Representatives may from time to time have positions or be materially interested in the securities referred to herein and may further act as market maker or may have assumed an underwriting commitment or deal with such securities and may also perform or seek to perform investment banking services, advisory and other services for or relating to those companies.
Singapore: As of 4 November 2013, Maybank KERPL and the covering analyst do not have any interest in any companies recommended in this research report.
Thailand: MBKET may have a business relationship with or may possibly be an issuer of derivative warrants on the securities /companies mentioned in the research report. Therefore, Investors should exercise their own judgment before making any investment decisions. MBKET, its associates, directors, connected parties and/or employees may from time to time have interests and/or underwriting commitments in the securities mentioned in this report.
Hong Kong: KESHK may have financial interests in relation to an issuer or a new listing applicant referred to as defined by the requirements under Paragraph 16.5(a) of the Hong Kong Code of Conduct for Persons Licensed by or Registered with the Securities and Futures Commission.
As of 4 November 2013, KESHK and the authoring analyst do not have any interest in any companies recommended in this research report.
MKE may have, within the last three years, served as manager or co-manager of a public offering of securities for, or currently may make a primary market in issues of, any or all of the entities mentioned in this report or may be providing, or have provided within the previous 12 months, significant advice or investment services in relation to the investment concerned or a related investment.
OTHERS
Analyst Certification of Independence
The views expressed in this research report accurately reflect the analyst’s personal views about any and all of the subject securities or issuers; and no part of the research analyst’s compensation was, is or will be, directly or indirectly, related to the specific recommendations or views expressed in the report.
Reminder
Structured securities are complex instruments, typically involve a high degree of risk and are intended for sale only to sophisticated investors who are capable of understanding and assuming the risks involved. The market value of any structured security may be affected by changes in economic, financial and political factors (including, but not limited to, spot and forward interest and exchange rates), time to maturity, market conditions and volatility and the credit quality of any issuer or reference issuer. Any investor interested in purchasing a structured product should conduct its own analysis of the product and consult with its own professional advisers as to the risks involved in making such a purchase.
No part of this material may be copied, photocopied or duplicated in any form by any means or redistributed without the prior consent of MKE.
Definition of Ratings
Maybank Kim Eng Research uses the following rating system:
BUY Total return is expected to be above 10% in the next 12 months (excluding dividends)
HOLD Total return is expected to be between -10% to +10% in the next 12 months (excluding dividends)
SELL Total return is expected to be below -10% in the next 12 months (excluding dividends)
Applicability of Ratings
The respective analyst maintains a coverage universe of stocks, the list of which may be adjusted according to needs. Investment ratings are only
applicable to the stocks which form part of the coverage universe. Reports on companies which are not part of the coverage do not carry investment ratings
as we do not actively follow developments in these companies.
Some common terms abbreviated in this report (where they appear):
Adex = Advertising Expenditure FCF = Free Cashflow PE = Price Earnings
BV = Book Value FV = Fair Value PEG = PE Ratio To Growth
CAGR = Compounded Annual Growth Rate FY = Financial Year PER = PE Ratio
Capex = Capital Expenditure FYE = Financial Year End QoQ = Quarter-On-Quarter
CY = Calendar Year MoM = Month-On-Month ROA = Return On Asset
DCF = Discounted Cashflow NAV = Net Asset Value ROE = Return On Equity DPS = Dividend Per Share
NTA = Net Tangible Asset ROSF = Return On Shareholders’ Funds
EBIT = Earnings Before Interest And Tax P = Price WACC = Weighted Average Cost Of Capital
EBITDA = EBIT, Depreciation And Amortisation P.A. = Per Annum YoY = Year-On-Year
EPS = Earnings Per Share PAT = Profit After Tax YTD = Year-To-Date
EV = Enterprise Value PBT = Profit Before Tax
4 November 2013 Page 21 of 21
Cahya Mata Sarawak
� Malaysia
Maybank Investment Bank Berhad (A Participating Organisation of Bursa Malaysia Securities Berhad) 33rd Floor, Menara Maybank, 100 Jalan Tun Perak, 50050 Kuala Lumpur Tel: (603) 2059 1888; Fax: (603) 2078 4194
� Singapore
Maybank Kim Eng Securities Pte Ltd Maybank Kim Eng Research Pte Ltd 9 Temasek Boulevard #39-00 Suntec Tower 2 Singapore 038989 Tel: (65) 6336 9090 Fax: (65) 6339 6003
� London
Maybank Kim Eng Securities (London) Ltd 6/F, 20 St. Dunstan’s Hill London EC3R 8HY, UK Tel: (44) 20 7621 9298 Dealers’ Tel: (44) 20 7626 2828 Fax: (44) 20 7283 6674
� New York
Maybank Kim Eng Securities USA Inc 777 Third Avenue, 21st Floor New York, NY 10017, U.S.A. Tel: (212) 688 8886 Fax: (212) 688 3500
Stockbroking Business: Level 8, Tower C, Dataran Maybank, No.1, Jalan Maarof 59000 Kuala Lumpur Tel: (603) 2297 8888 Fax: (603) 2282 5136
� Hong Kong
Kim Eng Securities (HK) Ltd Level 30, Three Pacific Place, 1 Queen’s Road East, Hong Kong Tel: (852) 2268 0800 Fax: (852) 2877 0104
� Indonesia
PT Kim Eng Securities Plaza Bapindo Citibank Tower 17th Floor Jl Jend. Sudirman Kav. 54-55 Jakarta 12190, Indonesia
Tel: (62) 21 2557 1188 Fax: (62) 21 2557 1189
� India
Kim Eng Securities India Pvt Ltd
2nd Floor, The International 16, Maharishi Karve Road, Churchgate Station, Mumbai City - 400 020, India Tel: (91).22.6623.2600 Fax: (91).22.6623.2604
� Philippines
Maybank ATR Kim Eng Securities Inc. 17/F, Tower One & Exchange Plaza Ayala Triangle, Ayala Avenue Makati City, Philippines 1200 Tel: (63) 2 849 8888 Fax: (63) 2 848 5738
� Thailand
Maybank Kim Eng Securities (Thailand) Public Company Limited 999/9 The Offices at Central World, 20th - 21st Floor, Rama 1 Road Pathumwan, Bangkok 10330, Thailand Tel: (66) 2 658 6817 (sales) Tel: (66) 2 658 6801 (research)
� Vietnam In association with
Kim Eng Vietnam Securities Company 1st Floor, 255 Tran Hung Dao St. District 1 Ho Chi Minh City, Vietnam Tel : (84) 838 38 66 36 Fax : (84) 838 38 66 39
� Saudi Arabia In association with
Anfaal Capital Villa 47, Tujjar Jeddah Prince Mohammed bin Abdulaziz Street P.O. Box 126575 Jeddah 21352 Tel: (966) 2 6068686 Fax: (966) 26068787
� South Asia Sales Trading
Kevin FOY [email protected] Tel: (65) 6336-5157 US Toll Free: 1-866-406-7447
� North Asia Sales Trading
Eddie LAU [email protected] Tel: (852) 2268 0800 US Toll Free: 1 866 598 2267
www.maybank-ke.com | www.kimengresearch.com.sg