property - i3investor
TRANSCRIPT
7 October 2020
PROPERTY Affordability is key
In this report: Demand stays strong in affordable segment
KINDLY REFER TO THE LAST PAGE OF THIS PUBLICATION FORIMPORTANT DISCLOSURES
AmInvestment Bank Bhd 2
Table of Contents
Property Sector ...................................................... 3
Crest Builder Holdings ............................................ 8
Mah Sing Group ……….............................................. 11
Scientex ................................................................. 14
Matrix Concepts ..................................................... 18
Paramount Corp ..................................................... 20
Disclosure and Disclaimer
AmInvestment Bank Bhd 3
Sector report
7 Oct 2020
PROPERTY Demand stays strong in affordable segment
NEUTRALThong Pak Leng [email protected] 03-2036 2025
(Maintained)
Rationale for report: Sector update
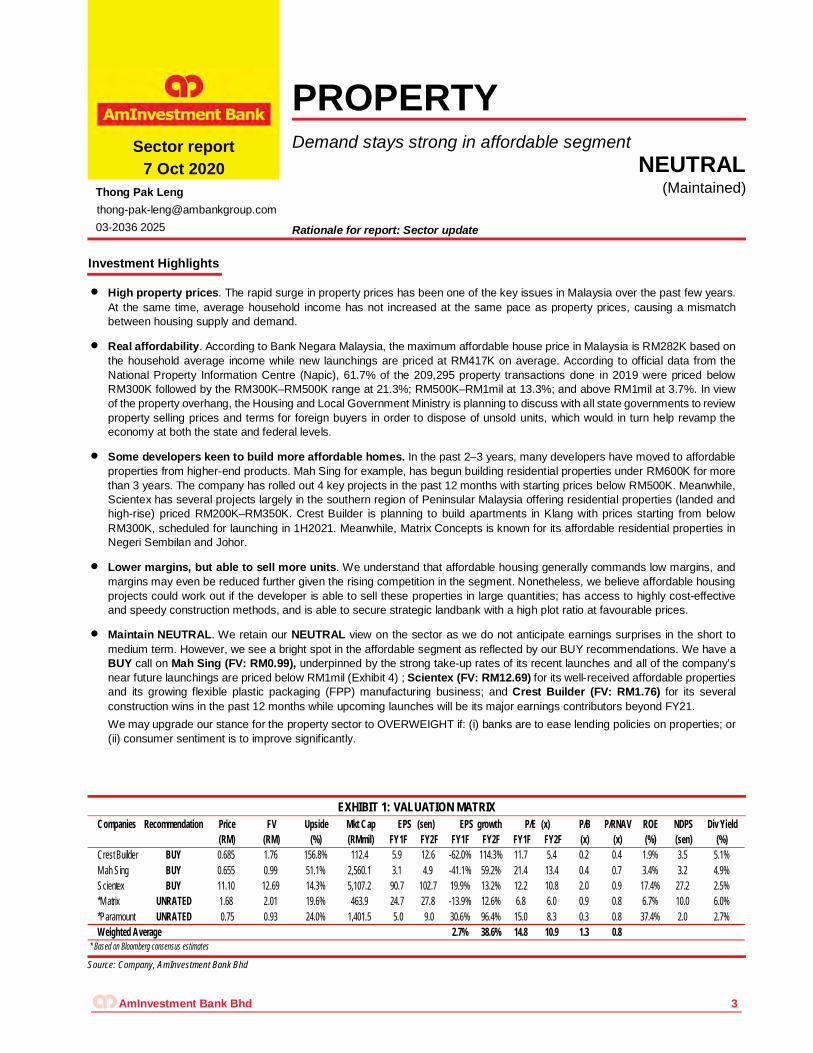
EXHIBIT 1: VALUATION MATRIX
Source: Company, AmInvestment Bank Bhd
Companies Recommendation Price FV Upside Mkt Cap EPS (sen) EPS growth P/E (x) P/B P/RNAV ROE NDPS Div Yield(RM) (RM) (%) (RMmil) FY1F FY2F FY1F FY2F FY1F FY2F (x) (x) (%) (sen) (%)
Crest Builder BUY 0.685 1.76 156.8% 112.4 5.9 12.6 -62.0% 114.3% 11.7 5.4 0.2 0.4 1.9% 3.5 5.1%M ah Sing BUY 0.655 0.99 51.1% 2,560.1 3.1 4.9 -41.1% 59.2% 21.4 13.4 0.4 0.7 3.4% 3.2 4.9%Scientex BUY 11.10 12.69 14.3% 5,107.2 90.7 102.7 19.9% 13.2% 12.2 10.8 2.0 0.9 17.4% 27.2 2.5%*M atrix UNRATED 1.68 2.01 19.6% 463.9 24.7 27.8 -13.9% 12.6% 6.8 6.0 0.9 0.8 6.7% 10.0 6.0%*Paramount UNRATED 0.75 0.93 24.0% 1,401.5 5.0 9.0 30.6% 96.4% 15.0 8.3 0.3 0.8 37.4% 2.0 2.7%Weighted Average 2.7% 38.6% 14.8 10.9 1.3 0.8
* Based on Bloomberg consensus estimates
Investment Highlights
High property prices. The rapid surge in property prices has been one of the key issues in Malaysia over the past few years. At the same time, average household income has not increased at the same pace as property prices, causing a mismatch between housing supply and demand.
Real affordability. According to Bank Negara Malaysia, the maximum affordable house price in Malaysia is RM282K based on the household average income while new launchings are priced at RM417K on average. According to official data from the National Property Information Centre (Napic), 61.7% of the 209,295 property transactions done in 2019 were priced below RM300K followed by the RM300K–RM500K range at 21.3%; RM500K–RM1mil at 13.3%; and above RM1mil at 3.7%. In view of the property overhang, the Housing and Local Government Ministry is planning to discuss with all state governments to review property selling prices and terms for foreign buyers in order to dispose of unsold units, which would in turn help revamp the economy at both the state and federal levels.
Some developers keen to build more affordable homes. In the past 2–3 years, many developers have moved to affordable properties from higher-end products. Mah Sing for example, has begun building residential properties under RM600K for more than 3 years. The company has rolled out 4 key projects in the past 12 months with starting prices below RM500K. Meanwhile, Scientex has several projects largely in the southern region of Peninsular Malaysia offering residential properties (landed and high-rise) priced RM200K–RM350K. Crest Builder is planning to build apartments in Klang with prices starting from below RM300K, scheduled for launching in 1H2021. Meanwhile, Matrix Concepts is known for its affordable residential properties in Negeri Sembilan and Johor.
Lower margins, but able to sell more units. We understand that affordable housing generally commands low margins, and margins may even be reduced further given the rising competition in the segment. Nonetheless, we believe affordable housing projects could work out if the developer is able to sell these properties in large quantities; has access to highly cost-effective and speedy construction methods, and is able to secure strategic landbank with a high plot ratio at favourable prices.
Maintain NEUTRAL. We retain our NEUTRAL view on the sector as we do not anticipate earnings surprises in the short to medium term. However, we see a bright spot in the affordable segment as reflected by our BUY recommendations. We have a BUY call on Mah Sing (FV: RM0.99), underpinned by the strong take-up rates of its recent launches and all of the company’s near future launchings are priced below RM1mil (Exhibit 4) ; Scientex (FV: RM12.69) for its well-received affordable properties and its growing flexible plastic packaging (FPP) manufacturing business; and Crest Builder (FV: RM1.76) for its several construction wins in the past 12 months while upcoming launches will be its major earnings contributors beyond FY21. We may upgrade our stance for the property sector to OVERWEIGHT if: (i) banks are to ease lending policies on properties; or (ii) consumer sentiment is to improve significantly.
Property Sector 7 Oct 2020
THE SEGMENT DEVELOPERS COULD NOT IGNORE
Definition of affordable housing
Housing affordability has widely been discussed in recent years. Complex is its definition and there have been numerous attempts to understand what it means. According to Bank Negara Malaysia, the maximum affordable house price in Malaysia is RM282K based on the household average income while the new launchings are averagely priced at RM417K.
According to the definition by the Valuation and Property Services Department (JPPH) under the Ministry of Finance, the average affordable house is priced RM200K–RM300K. However, property developers consider affordable houses as those within the range of RM400K–RM700K.
The largest segment of Malaysia’s residential properties by far
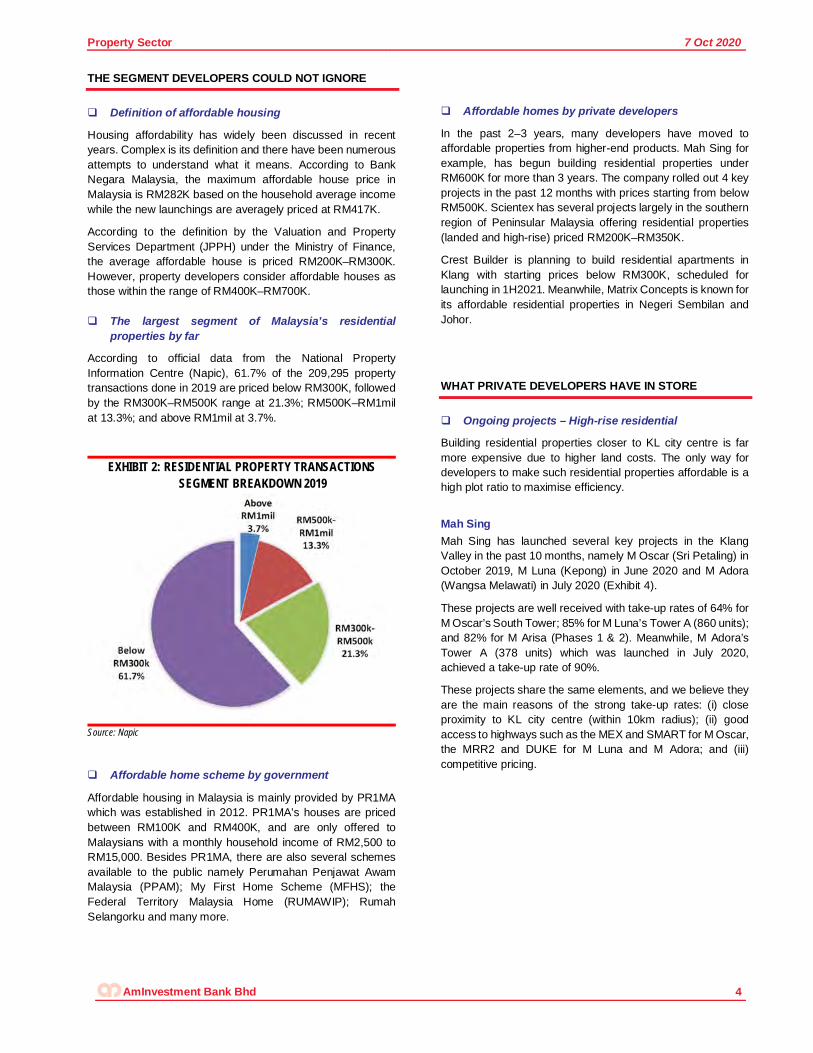
According to official data from the National Property Information Centre (Napic), 61.7% of the 209,295 property transactions done in 2019 are priced below RM300K, followed by the RM300K–RM500K range at 21.3%; RM500K–RM1mil at 13.3%; and above RM1mil at 3.7%.
EXHIBIT 2: RESIDENTIAL PROPERTY TRANSACTIONS SEGMENT BREAKDOWN 2019
Source: Napic
Affordable home scheme by government
Affordable housing in Malaysia is mainly provided by PR1MA which was established in 2012. PR1MA’s houses are priced between RM100K and RM400K, and are only offered to Malaysians with a monthly household income of RM2,500 to RM15,000. Besides PR1MA, there are also several schemes available to the public namely Perumahan Penjawat Awam Malaysia (PPAM); My First Home Scheme (MFHS); the Federal Territory Malaysia Home (RUMAWIP); Rumah Selangorku and many more.
Affordable homes by private developers
In the past 2–3 years, many developers have moved to affordable properties from higher-end products. Mah Sing for example, has begun building residential properties under RM600K for more than 3 years. The company rolled out 4 key projects in the past 12 months with prices starting from below RM500K. Scientex has several projects largely in the southern region of Peninsular Malaysia offering residential properties (landed and high-rise) priced RM200K–RM350K.
Crest Builder is planning to build residential apartments in Klang with starting prices below RM300K, scheduled for launching in 1H2021. Meanwhile, Matrix Concepts is known for its affordable residential properties in Negeri Sembilan and Johor.
WHAT PRIVATE DEVELOPERS HAVE IN STORE
Ongoing projects – High-rise residential
Building residential properties closer to KL city centre is far more expensive due to higher land costs. The only way for developers to make such residential properties affordable is a high plot ratio to maximise efficiency. Mah Sing Mah Sing has launched several key projects in the Klang Valley in the past 10 months, namely M Oscar (Sri Petaling) in October 2019, M Luna (Kepong) in June 2020 and M Adora (Wangsa Melawati) in July 2020 (Exhibit 4).
These projects are well received with take-up rates of 64% for M Oscar’s South Tower; 85% for M Luna’s Tower A (860 units); and 82% for M Arisa (Phases 1 & 2). Meanwhile, M Adora’s Tower A (378 units) which was launched in July 2020, achieved a take-up rate of 90%.
These projects share the same elements, and we believe they are the main reasons of the strong take-up rates: (i) close proximity to KL city centre (within 10km radius); (ii) good access to highways such as the MEX and SMART for M Oscar, the MRR2 and DUKE for M Luna and M Adora; and (iii) competitive pricing.
AmInvestment Bank Bhd 4
Property Sector 7 Oct 2020
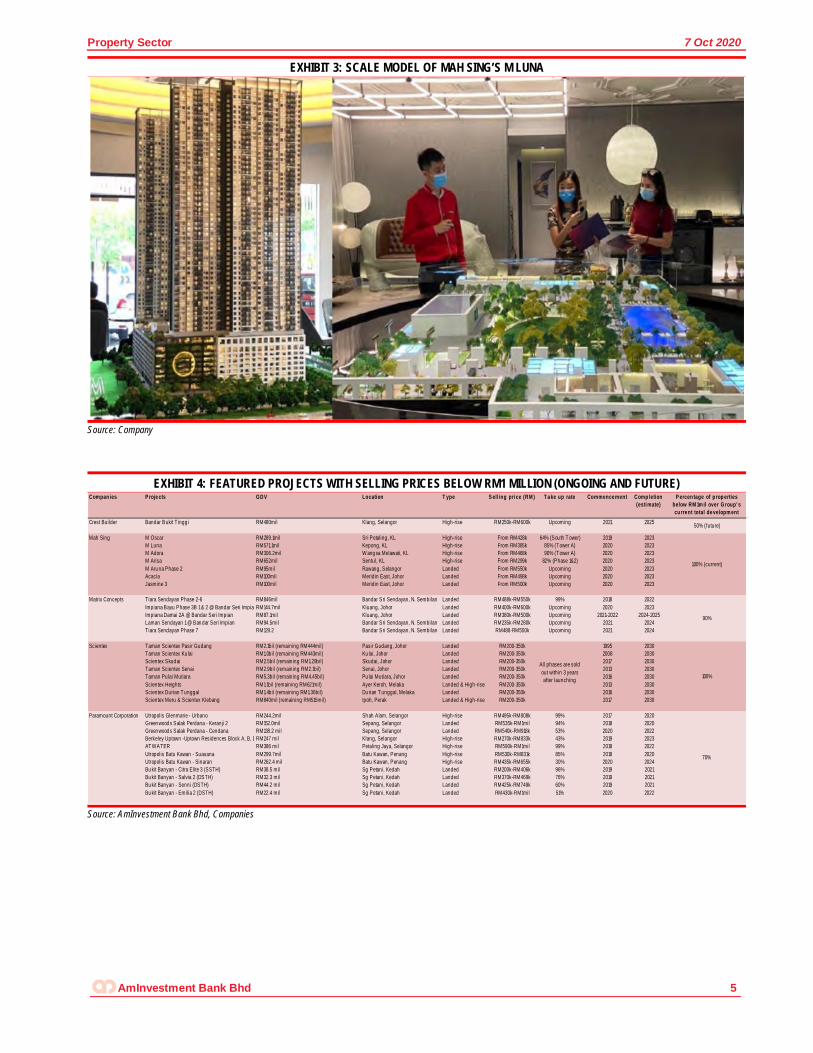
EXHIBIT 3: SCALE MODEL OF MAH SING’S M LUNA
Source: Company
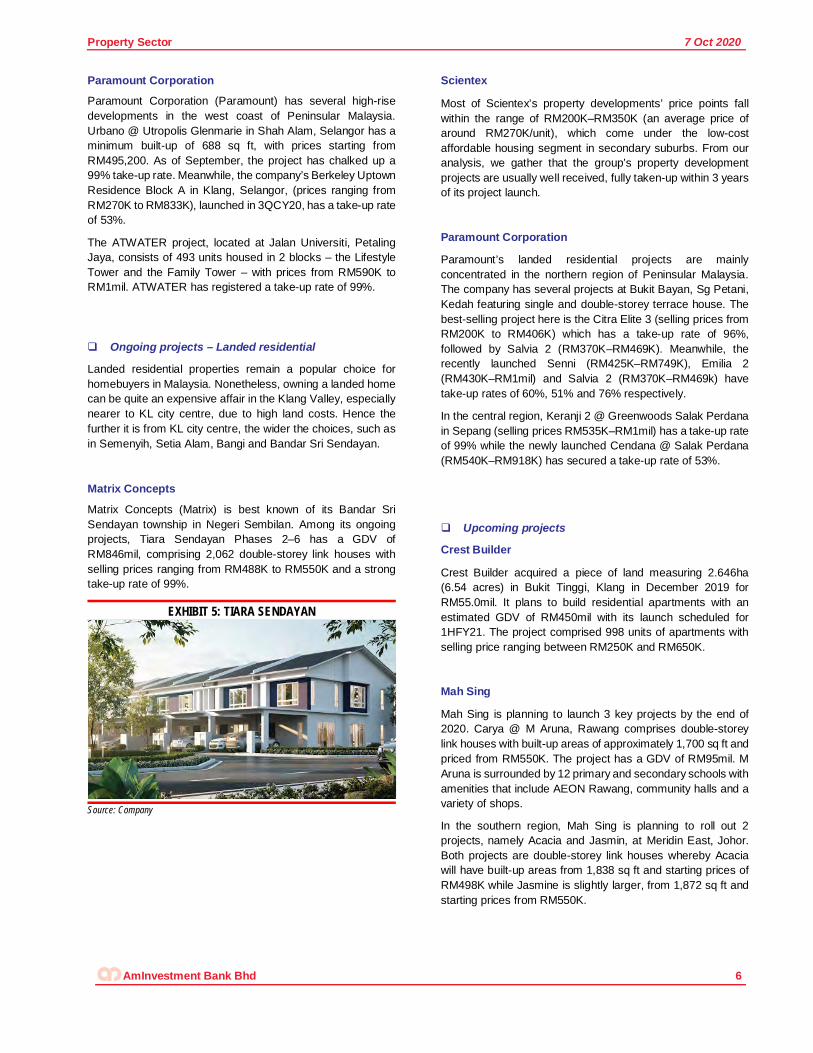
EXHIBIT 4: FEATURED PROJECTS WITH SELLING PRICES BELOW RM1 MILLION (ONGOING AND FUTURE)
Source: AmInvestment Bank Bhd, Companies
Compan ies P roje cts GDV Location T ype S ell ing pri ce (RM ) T a ke up rate Commence ment Comp letion (esti mate)
P ercen tage of p rop erties below RM 1m il over Group' s cu rre nt total de velopm ent
Crest Builder Bandar Bukit Tingg i RM480mil Klang, Selangor High-rise RM250k-RM600k Upcoming 2021 2025
Mah Sing M Oscar RM289.1mil Sri Petaling, KL High-rise From RM428k 64% (Sou th T ower) 2019 2023M Luna RM571.1mil Kepong, KL High-rise From RM385k 85% (Tower A) 2020 2023M Adora RM306.2mil W ang sa Melawati, KL High-rise From RM468k 90% (Tower A) 2020 2023M Arisa RM652mil Sentul, KL High-rise From RM299k 82% (Phase 1&2) 2020 2023M Aru na Phase 2 RM95mil Rawang, Selangor Landed From RM550k Upcoming 2020 2023Acacia RM100mil Meridin East, Johor Landed From RM498k Upcoming 2020 2023Jasmine 3 RM100mil Meridin East, Johor Landed From RM500k Upcoming 2020 2023
Matrix Concepts Tiara Sendayan Phase 2-6 RM846mil Bandar Sri Sendayan, N. Sembilan Landed RM488k-RM550k 99% 2018 2022Impiana Bayu Phase 3B 1 & 2 @ Bandar Seri ImpianRM144.7mil Kluang, Johor Landed RM400k-RM600k Upcoming 2020 2023Impiana Damai 2A @ Bandar Seri Impian RM87.1mil Kluang, Johor Landed RM380k-RM500k Upcoming 2021-2022 2024-2025Laman Sendayan 1 @ Ban dar Seri Impian RM94.5mil Bandar Sri Sendayan, N. Sembilan Landed RM235k-RM280k Upcoming 2021 2024Tiara Sendayan Phase 7 RM129.2 Bandar Sri Sendayan, N. Sembilan Landed RM488-RM550k Upcoming 2021 2024
Scientex Taman Scientex Pasir Gudang RM2.1bil (remaining RM444mil) Pasir Gudang, Johor Landed RM200-350k 1995 2030Taman Scientex Ku lai RM1.0bil (remaining RM443mil) Ku lai, Johor Landed RM200-350k 2008 2030Scientex Skud ai RM2.5bil (remain ing RM1.29bil) Skudai, Johor Landed RM200-350k 2017 2030Taman Scientex Senai RM2.9bil (remain ing RM2.1bil) Senai, Johor Landed RM200-350k 2013 2030Taman Pulai Mutiara RM5.3bil (remain ing RM4.45bil) Pu lai Mutiara, Johor Landed RM200-350k 2016 2030Scientex Heights RM1.1bil (remaining RM621mil) Ayer Keroh, Melaka Landed & High-rise RM200-350k 2013 2030Scientex Durian T unggal RM1.4bil (remaining RM1.36bil) Du rian T unggal, Melaka Landed RM200-350k 2016 2030Scientex Meru & Scientex Klebang RM840mil (remaining RM515mil) Ipoh, Perak Landed & High-rise RM200-350k 2017 2030
Paramount Corporation Utropolis Glenmarie - Urbano RM244.2mil Sh ah Alam, Selangor High-rise RM495k-RM808k 99% 2017 2020Green wood s Salak Perdana - Keranji 2 RM152.0mil Sepang, Selangor Landed RM535k-RM1mil 94% 2018 2020Green wood s Salak Perdana - Cendana RM138.2 mil Sepang, Selangor Landed RM540k-RM918k 53% 2020 2022Berkeley Uptown -Uptown Residences Block A, B, D, E & FRM247 mil Klang, Selangor High-rise RM270k-RM833k 43% 2019 2023AT WATER RM386 mil Petaling Jaya, Selangor High-rise RM590k-RM1mil 99% 2018 2022Utropolis Batu Kawan - Suasana RM299.7mil Batu Kawan, Penang High-rise RM530k-RM831k 85% 2018 2020Utropolis Batu Kawan - Sinaran RM262.4 mil Batu Kawan, Penang High-rise RM435k-RM655k 30% 2020 2024Bu kit Banyan - Citra Elite 3 (SSTH) RM38.5 mil Sg Petani, Kedah Landed RM200k-RM406k 96% 2019 2021Bu kit Banyan - Salvia 2 (DSTH) RM32.3 mil Sg Petani, Kedah Landed RM370k-RM469k 76% 2019 2021Bu kit Banyan - Senni (DSTH) RM44.2 mil Sg Petani, Kedah Landed RM425k-RM749k 60% 2019 2021Bu kit Banyan - Emilia 2 (DSTH) RM22.4 mil Sg Petani, Kedah Landed RM430k-RM1mil 51% 2020 2022
50% (future)
100% (current)
100%
90%
70%
All phases are sold out within 3 years after launching
AmInvestment Bank Bhd 5
Property Sector 7 Oct 2020
Paramount Corporation
Paramount Corporation (Paramount) has several high-rise developments in the west coast of Peninsular Malaysia. Urbano @ Utropolis Glenmarie in Shah Alam, Selangor has a minimum built-up of 688 sq ft, with prices starting from RM495,200. As of September, the project has chalked up a 99% take-up rate. Meanwhile, the company’s Berkeley Uptown Residence Block A in Klang, Selangor, (prices ranging from RM270K to RM833K), launched in 3QCY20, has a take-up rate of 53%.
The ATWATER project, located at Jalan Universiti, Petaling Jaya, consists of 493 units housed in 2 blocks – the Lifestyle Tower and the Family Tower – with prices from RM590K to RM1mil. ATWATER has registered a take-up rate of 99%.
Ongoing projects – Landed residential
Landed residential properties remain a popular choice for homebuyers in Malaysia. Nonetheless, owning a landed home can be quite an expensive affair in the Klang Valley, especially nearer to KL city centre, due to high land costs. Hence the further it is from KL city centre, the wider the choices, such as in Semenyih, Setia Alam, Bangi and Bandar Sri Sendayan.
Matrix Concepts
Matrix Concepts (Matrix) is best known of its Bandar Sri Sendayan township in Negeri Sembilan. Among its ongoing projects, Tiara Sendayan Phases 2–6 has a GDV of RM846mil, comprising 2,062 double-storey link houses with selling prices ranging from RM488K to RM550K and a strong take-up rate of 99%.
EXHIBIT 5: TIARA SENDAYAN
Source: Company
Scientex
Most of Scientex’s property developments’ price points fall within the range of RM200K–RM350K (an average price of around RM270K/unit), which come under the low-cost affordable housing segment in secondary suburbs. From our analysis, we gather that the group’s property development projects are usually well received, fully taken-up within 3 years of its project launch.
Paramount Corporation
Paramount’s landed residential projects are mainly concentrated in the northern region of Peninsular Malaysia. The company has several projects at Bukit Bayan, Sg Petani, Kedah featuring single and double-storey terrace house. The best-selling project here is the Citra Elite 3 (selling prices from RM200K to RM406K) which has a take-up rate of 96%, followed by Salvia 2 (RM370K–RM469K). Meanwhile, the recently launched Senni (RM425K–RM749K), Emilia 2 (RM430K–RM1mil) and Salvia 2 (RM370K–RM469k) have take-up rates of 60%, 51% and 76% respectively.
In the central region, Keranji 2 @ Greenwoods Salak Perdana in Sepang (selling prices RM535K–RM1mil) has a take-up rate of 99% while the newly launched Cendana @ Salak Perdana (RM540K–RM918K) has secured a take-up rate of 53%.
Upcoming projects
Crest Builder
Crest Builder acquired a piece of land measuring 2.646ha (6.54 acres) in Bukit Tinggi, Klang in December 2019 for RM55.0mil. It plans to build residential apartments with an estimated GDV of RM450mil with its launch scheduled for 1HFY21. The project comprised 998 units of apartments with selling price ranging between RM250K and RM650K.
Mah Sing
Mah Sing is planning to launch 3 key projects by the end of 2020. Carya @ M Aruna, Rawang comprises double-storey link houses with built-up areas of approximately 1,700 sq ft and priced from RM550K. The project has a GDV of RM95mil. M Aruna is surrounded by 12 primary and secondary schools with amenities that include AEON Rawang, community halls and a variety of shops.
In the southern region, Mah Sing is planning to roll out 2 projects, namely Acacia and Jasmin, at Meridin East, Johor. Both projects are double-storey link houses whereby Acacia will have built-up areas from 1,838 sq ft and starting prices of RM498K while Jasmine is slightly larger, from 1,872 sq ft and starting prices from RM550K.
AmInvestment Bank Bhd 6
Property Sector 7 Oct 2020
Matrix Concepts
With the success of its Tiara Sendayan project in the Bandar Sri Sendayan township, Matrix is planning to roll out Tiara Sendayan Phase 7 comprising 254 units of double-storey terrace houses by the end of 2020. The project will have a GDV of RM129.2mil. Meanwhile, at Laman Sendayan, 306 units of 1 & 2-storey terrace houses with prices ranging between RM235K and RM280K will go on sale by the end of the year.
On top of that, Matrix is also planning to launch 110 units at Impiana Bayu 3B and 124 units at Impiana Damai 2A, Bandar Seri Impian, Kluang Johor. Both are double-storey link homes and will be priced at RM400K–600K for Impiana Bayu 3B and RM380K–RM500K for Impiana Damai 2A.
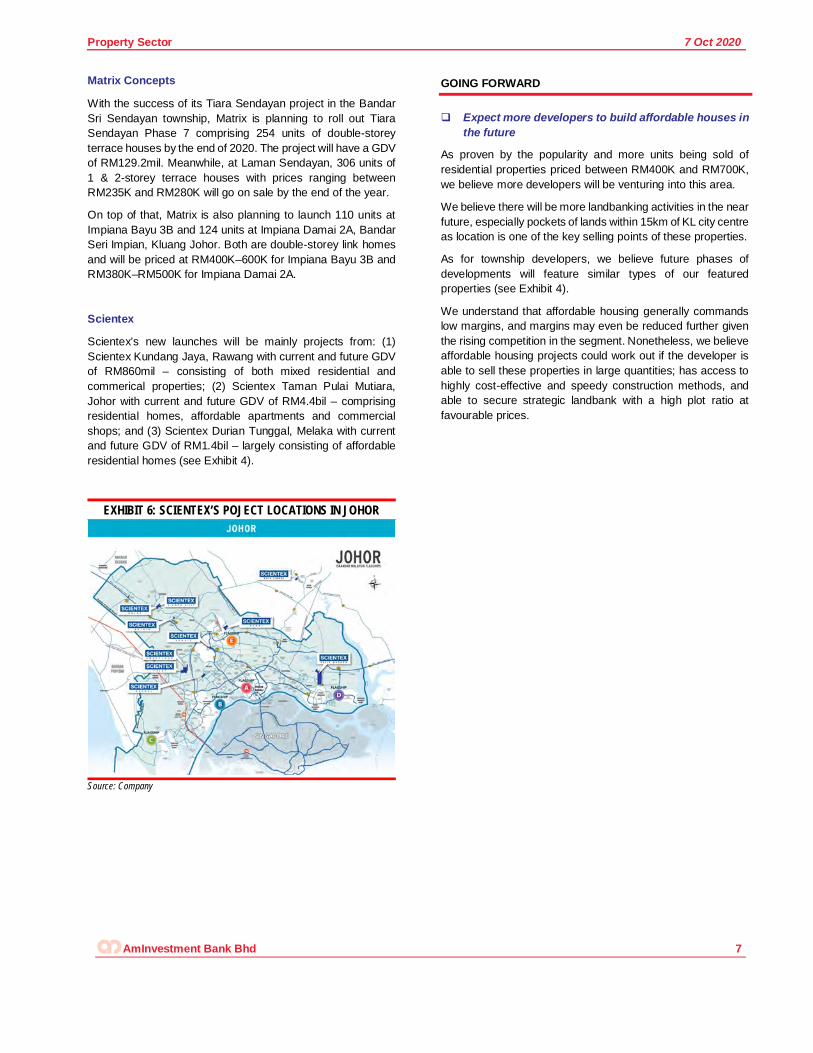
Scientex
Scientex’s new launches will be mainly projects from: (1) Scientex Kundang Jaya, Rawang with current and future GDV of RM860mil – consisting of both mixed residential and commerical properties; (2) Scientex Taman Pulai Mutiara, Johor with current and future GDV of RM4.4bil – comprising residential homes, affordable apartments and commercial shops; and (3) Scientex Durian Tunggal, Melaka with current and future GDV of RM1.4bil – largely consisting of affordable residential homes (see Exhibit 4).
EXHIBIT 6: SCIENTEX’S POJECT LOCATIONS IN JOHOR
Source: Company
GOING FORWARD
Expect more developers to build affordable houses in the future
As proven by the popularity and more units being sold of residential properties priced between RM400K and RM700K, we believe more developers will be venturing into this area.
We believe there will be more landbanking activities in the near future, especially pockets of lands within 15km of KL city centre as location is one of the key selling points of these properties.
As for township developers, we believe future phases of developments will feature similar types of our featured properties (see Exhibit 4).
We understand that affordable housing generally commands low margins, and margins may even be reduced further given the rising competition in the segment. Nonetheless, we believe affordable housing projects could work out if the developer is able to sell these properties in large quantities; has access to highly cost-effective and speedy construction methods, and able to secure strategic landbank with a high plot ratio at favourable prices.
AmInvestment Bank Bhd 7
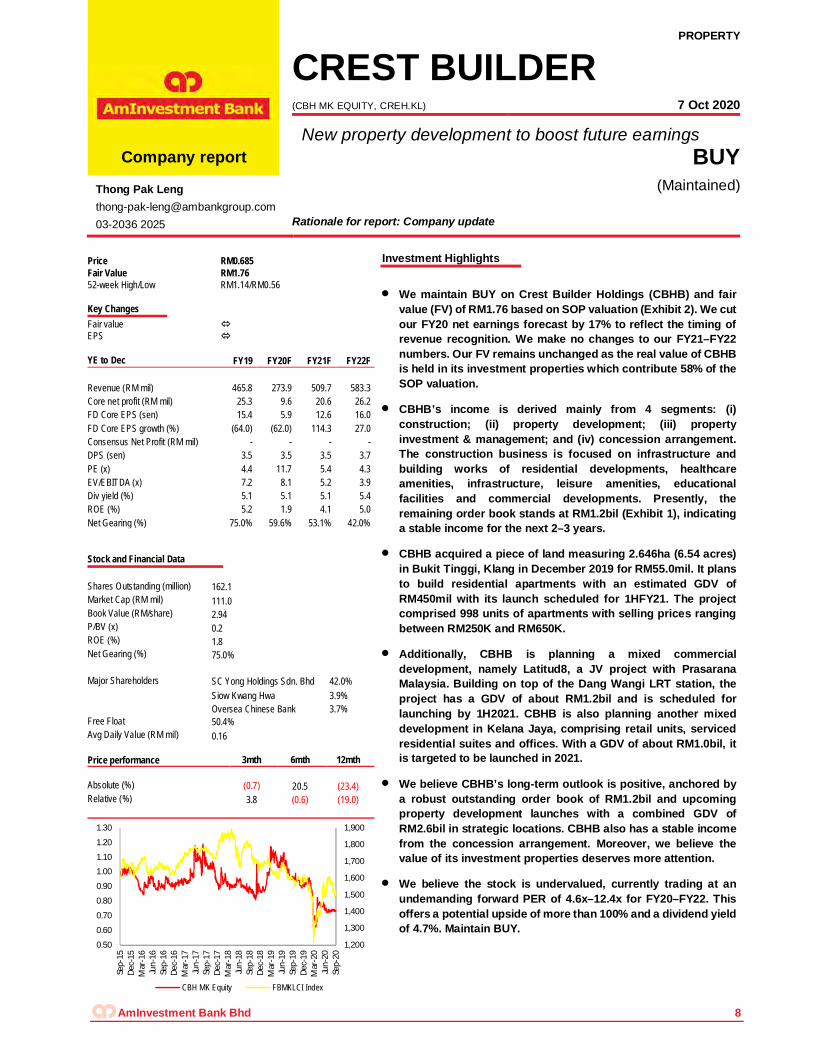
Price RM0.685 Fair Value RM1.76 52-week High/Low RM1.14/RM0.56 Key Changes Fair value EPS YE to Dec FY19 FY20F FY21F FY22F Revenue (RM mil) 465.8 273.9 509.7 583.3 Core net profit (RM mil) 25.3 9.6 20.6 26.2 FD Core EPS (sen) 15.4 5.9 12.6 16.0 FD Core EPS growth (%) (64.0) (62.0) 114.3 27.0 Consensus Net Profit (RM mil) - - - - DPS (sen) 3.5 3.5 3.5 3.7 PE (x) 4.4 11.7 5.4 4.3 EV/EBITDA (x) 7.2 8.1 5.2 3.9 Div yield (%) 5.1 5.1 5.1 5.4 ROE (%) 5.2 1.9 4.1 5.0 Net Gearing (%) 75.0% 59.6% 53.1% 42.0%
Stock and Financial Data Shares Outstanding (million) 162.1 Market Cap (RM mil) 111.0 Book Value (RM/share) 2.94 P/BV (x) 0.2 ROE (%) 1.8 Net Gearing (%) 75.0% Major Shareholders SC Yong Holdings Sdn. Bhd 42.0% Siow Kwang Hwa 3.9% Oversea Chinese Bank 3.7% Free Float 50.4% Avg Daily Value (RM mil) 0.16 Price performance 3mth 6mth 12mth Absolute (%) (0.7) 20.5 (23.4) Relative (%) 3.8 (0.6) (19.0)
1,200
1,300
1,400
1,500
1,600
1,700
1,800
1,900
0.50
0.60
0.70
0.80
0.90
1.00
1.10
1.20
1.30
Sep-
15De
c-15
Mar
-16
Jun-
16Se
p-16
Dec-
16M
ar-1
7Ju
n-17
Sep-
17De
c-17
Mar
-18
Jun-
18Se
p-18
Dec-
18M
ar-1
9Ju
n-19
Sep-
19De
c-19
Mar
-20
Jun-
20Se
p-20
CBH MK Equity FBMKLCI Index
PROPERTY
CREST BUILDER (CBH MK EQUITY, CREH.KL) 7 Oct 2020
New property development to boost future earnings Company report BUY
Thong Pak Leng [email protected] 03-2036 2025
(Maintained)
Rationale for report: Company update
Investment Highlights
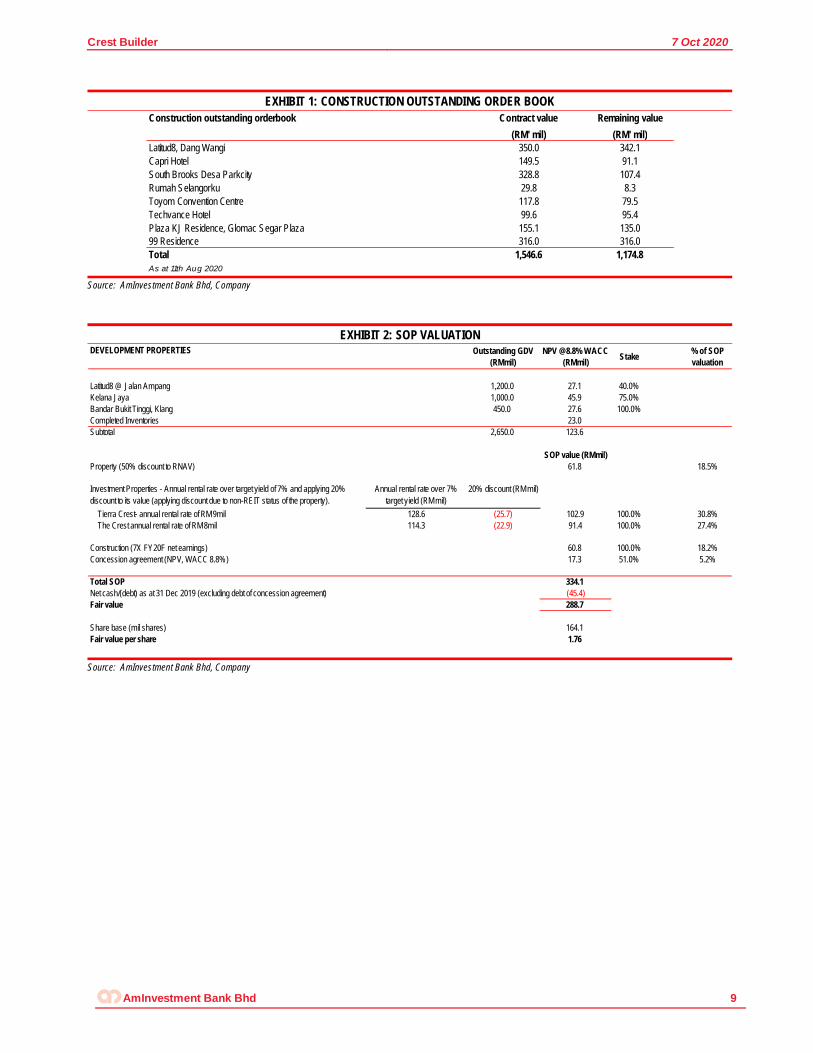
We maintain BUY on Crest Builder Holdings (CBHB) and fair value (FV) of RM1.76 based on SOP valuation (Exhibit 2). We cut our FY20 net earnings forecast by 17% to reflect the timing of revenue recognition. We make no changes to our FY21–FY22 numbers. Our FV remains unchanged as the real value of CBHB is held in its investment properties which contribute 58% of the SOP valuation.
CBHB’s income is derived mainly from 4 segments: (i) construction; (ii) property development; (iii) property investment & management; and (iv) concession arrangement. The construction business is focused on infrastructure and building works of residential developments, healthcare amenities, infrastructure, leisure amenities, educational facilities and commercial developments. Presently, the remaining order book stands at RM1.2bil (Exhibit 1), indicating a stable income for the next 2–3 years.
CBHB acquired a piece of land measuring 2.646ha (6.54 acres) in Bukit Tinggi, Klang in December 2019 for RM55.0mil. It plans to build residential apartments with an estimated GDV of RM450mil with its launch scheduled for 1HFY21. The project comprised 998 units of apartments with selling prices ranging between RM250K and RM650K.
Additionally, CBHB is planning a mixed commercial development, namely Latitud8, a JV project with Prasarana Malaysia. Building on top of the Dang Wangi LRT station, the project has a GDV of about RM1.2bil and is scheduled for launching by 1H2021. CBHB is also planning another mixed development in Kelana Jaya, comprising retail units, serviced residential suites and offices. With a GDV of about RM1.0bil, it is targeted to be launched in 2021.
We believe CBHB’s long-term outlook is positive, anchored by a robust outstanding order book of RM1.2bil and upcoming property development launches with a combined GDV of RM2.6bil in strategic locations. CBHB also has a stable income from the concession arrangement. Moreover, we believe the value of its investment properties deserves more attention.
We believe the stock is undervalued, currently trading at an undemanding forward PER of 4.6x–12.4x for FY20–FY22. This offers a potential upside of more than 100% and a dividend yield of 4.7%. Maintain BUY.
AmInvestment Bank Bhd 8
Crest Builder 7 Oct 2020
EXHIBIT 1: CONSTRUCTION OUTSTANDING ORDER BOOK
Source: AmInvestment Bank Bhd, Company
EXHIBIT 2: SOP VALUATION
Source: AmInvestment Bank Bhd, Company
Construction outstanding orderbook Contract value Remaining value(RM' mil) (RM' mil)
Latitud8, Dang Wangi 350.0 342.1 Capri Hotel 149.5 91.1 South Brooks Desa Parkcity 328.8 107.4 Rumah Selangorku 29.8 8.3 Toyom Convention Centre 117.8 79.5 Techvance Hotel 99.6 95.4 Plaza KJ Residence, Glomac Segar Plaza 155.1 135.0 99 Residence 316.0 316.0 Total 1,546.6 1,174.8 As at 11th Aug 2020
DEVELOPMENT PROPERTIES Outstanding GDV (RMmil)
NPV @8.8% WACC (RMmil) Stake % of SOP
valuation
Latitud8 @ Jalan Ampang 1,200.0 27.1 40.0%Kelana Jaya 1,000.0 45.9 75.0%Bandar Bukit Tinggi, Klang 450.0 27.6 100.0%Completed Inventories 23.0Subtotal 2,650.0 123.6
SOP value (RMmil)Property (50% discount to RNAV) 61.8 18.5%
Investment Properties - Annual rental rate over target yield of 7% and applying 20% discount to its value (applying discount due to non-REIT status of the property).
Annual rental rate over 7% target yield (RMmil)
20% discount (RMmil)
Tierra Crest- annual rental rate of RM9mil 128.6 (25.7) 102.9 100.0% 30.8%The Crest annual rental rate of RM8mil 114.3 (22.9) 91.4 100.0% 27.4%
Construction (7X FY20F net earnings) 60.8 100.0% 18.2%Concession agreement (NPV, WACC 8.8%) 17.3 51.0% 5.2%
Total SOP 334.1Net cash/(debt) as at 31 Dec 2019 (excluding debt of concession agreement) (45.4)Fair value 288.7
Share base (mil shares) 164.1Fair value per share 1.76
AmInvestment Bank Bhd 9
Crest Builder 7 Oct 2020
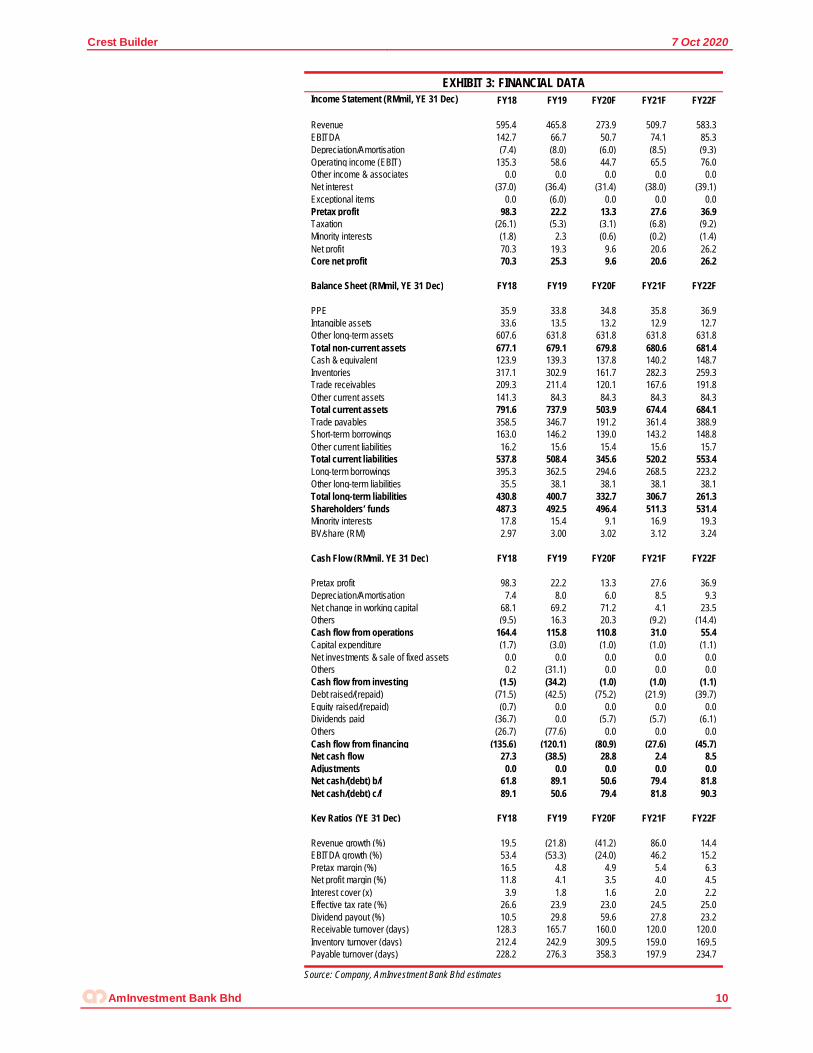
EXHIBIT 3: FINANCIAL DATA Income Statement (RMmil, YE 31 Dec) FY18 FY19 FY20F FY21F FY22F Revenue 595.4 465.8 273.9 509.7 583.3 EBITDA 142.7 66.7 50.7 74.1 85.3 Depreciation/Amortisation (7.4) (8.0) (6.0) (8.5) (9.3) Operating income (EBIT) 135.3 58.6 44.7 65.5 76.0 Other income & associates 0.0 0.0 0.0 0.0 0.0 Net interest (37.0) (36.4) (31.4) (38.0) (39.1) Exceptional items 0.0 (6.0) 0.0 0.0 0.0 Pretax profit 98.3 22.2 13.3 27.6 36.9 Taxation (26.1) (5.3) (3.1) (6.8) (9.2) Minority interests (1.8) 2.3 (0.6) (0.2) (1.4) Net profit 70.3 19.3 9.6 20.6 26.2 Core net profit 70.3 25.3 9.6 20.6 26.2 Balance Sheet (RMmil, YE 31 Dec) FY18 FY19 FY20F FY21F FY22F PPE 35.9 33.8 34.8 35.8 36.9 Intangible assets 33.6 13.5 13.2 12.9 12.7 Other long-term assets 607.6 631.8 631.8 631.8 631.8 Total non-current assets 677.1 679.1 679.8 680.6 681.4 Cash & equivalent 123.9 139.3 137.8 140.2 148.7 Inventories 317.1 302.9 161.7 282.3 259.3 Trade receivables 209.3 211.4 120.1 167.6 191.8 Other current assets 141.3 84.3 84.3 84.3 84.3 Total current assets 791.6 737.9 503.9 674.4 684.1 Trade payables 358.5 346.7 191.2 361.4 388.9 Short-term borrowings 163.0 146.2 139.0 143.2 148.8 Other current liabilities 16.2 15.6 15.4 15.6 15.7 Total current liabilities 537.8 508.4 345.6 520.2 553.4 Long-term borrowings 395.3 362.5 294.6 268.5 223.2 Other long-term liabilities 35.5 38.1 38.1 38.1 38.1 Total long-term liabilities 430.8 400.7 332.7 306.7 261.3 Shareholders’ funds 487.3 492.5 496.4 511.3 531.4 Minority interests 17.8 15.4 9.1 16.9 19.3 BV/share (RM) 2.97 3.00 3.02 3.12 3.24 Cash Flow (RMmil, YE 31 Dec) FY18 FY19 FY20F FY21F FY22F Pretax profit 98.3 22.2 13.3 27.6 36.9 Depreciation/Amortisation 7.4 8.0 6.0 8.5 9.3 Net change in working capital 68.1 69.2 71.2 4.1 23.5 Others (9.5) 16.3 20.3 (9.2) (14.4) Cash flow from operations 164.4 115.8 110.8 31.0 55.4 Capital expenditure (1.7) (3.0) (1.0) (1.0) (1.1) Net investments & sale of fixed assets 0.0 0.0 0.0 0.0 0.0 Others 0.2 (31.1) 0.0 0.0 0.0 Cash flow from investing (1.5) (34.2) (1.0) (1.0) (1.1) Debt raised/(repaid) (71.5) (42.5) (75.2) (21.9) (39.7) Equity raised/(repaid) (0.7) 0.0 0.0 0.0 0.0 Dividends paid (36.7) 0.0 (5.7) (5.7) (6.1) Others (26.7) (77.6) 0.0 0.0 0.0 Cash flow from financing (135.6) (120.1) (80.9) (27.6) (45.7) Net cash flow 27.3 (38.5) 28.8 2.4 8.5 Adjustments 0.0 0.0 0.0 0.0 0.0 Net cash/(debt) b/f 61.8 89.1 50.6 79.4 81.8 Net cash/(debt) c/f 89.1 50.6 79.4 81.8 90.3 Key Ratios (YE 31 Dec) FY18 FY19 FY20F FY21F FY22F Revenue growth (%) 19.5 (21.8) (41.2) 86.0 14.4 EBITDA growth (%) 53.4 (53.3) (24.0) 46.2 15.2 Pretax margin (%) 16.5 4.8 4.9 5.4 6.3 Net profit margin (%) 11.8 4.1 3.5 4.0 4.5 Interest cover (x) 3.9 1.8 1.6 2.0 2.2 Effective tax rate (%) 26.6 23.9 23.0 24.5 25.0 Dividend payout (%) 10.5 29.8 59.6 27.8 23.2 Receivable turnover (days) 128.3 165.7 160.0 120.0 120.0 Inventory turnover (days) 212.4 242.9 309.5 159.0 169.5 Payable turnover (days) 228.2 276.3 358.3 197.9 234.7
Source: Company, AmInvestment Bank Bhd estimates
AmInvestment Bank Bhd 10
Price RM0.655 Fair Value RM0.99 52-week High/Low RM0.91/RM0.31 Key Changes Fair value EPS YE to Dec (RM mil) FY19 FY20F FY21F FY22F Revenue (RM mil) 1,789.7 1,433.5 1,771.5 1,846.1 Core net profit (RM mil) * 133.3 78.4 124.9 126.2 FD Core EPS (sen) 5.2 3.1 4.9 4.9 FD Core EPS growth (%) (29.9) (41.1) 59.2 1.0 Consensus Net Profit (RM mil) - 89.8 128.1 142.9 DPS (sen) 3.2 3.2 3.2 3.2 PE (x) 11.9 20.3 12.7 12.6 EV/EBITDA (x) 3.8 5.0 4.9 5.2 Div yield (%) 4.9 4.9 4.9 4.9 ROE (%) 2.8 1.7 2.9 2.9 Net Gearing (%) nm nm nm 2.0% *Core net profit after distribution to perpetual sukuk/securities
Stock and Financial Data Shares Outstanding (million) 2,427.7 Market Cap (RM mil) 1,675.1 Book Value (RM/share) 1.73 P/BV (x) 0.4 ROE (%) 3.3 Net Gearing (%) net cash Major Shareholders Mayang Teratai SB 26.9% Amanah Saham Nasional 12.6% Mayang Teratai Limit 7.4% Free Float 53.1% Avg Daily Value (RM mil) 9.52 Price performance 3mth 6mth 12mth Absolute (%) 39.0 117.8 (7.7) Relative (%) (9.2) 32.5 (6.9)
1,200
1,300
1,400
1,500
1,600
1,700
1,800
1,900
0.30
0.50
0.70
0.90
1.10
1.30
1.50
Sep-
17
Dec-
17
Mar
-18
Jun-
18
Sep-
18
Dec-
18
Mar
-19
Jun-
19
Sep-
19
Dec-
19
Mar
-20
Jun-
20
Sep-
20
MSGB MK Equity FBMKLCI Index
PROPERTY
MAH SING GROUP (MSGB MK EQUITY, MAHS.KL) 7 Oct 2020
Strong take-up provides good earnings visibility Company report BUY
Thong Pak Leng [email protected] 03-2036 2025
(Maintained)
Rationale for report: Company update
Investment Highlights
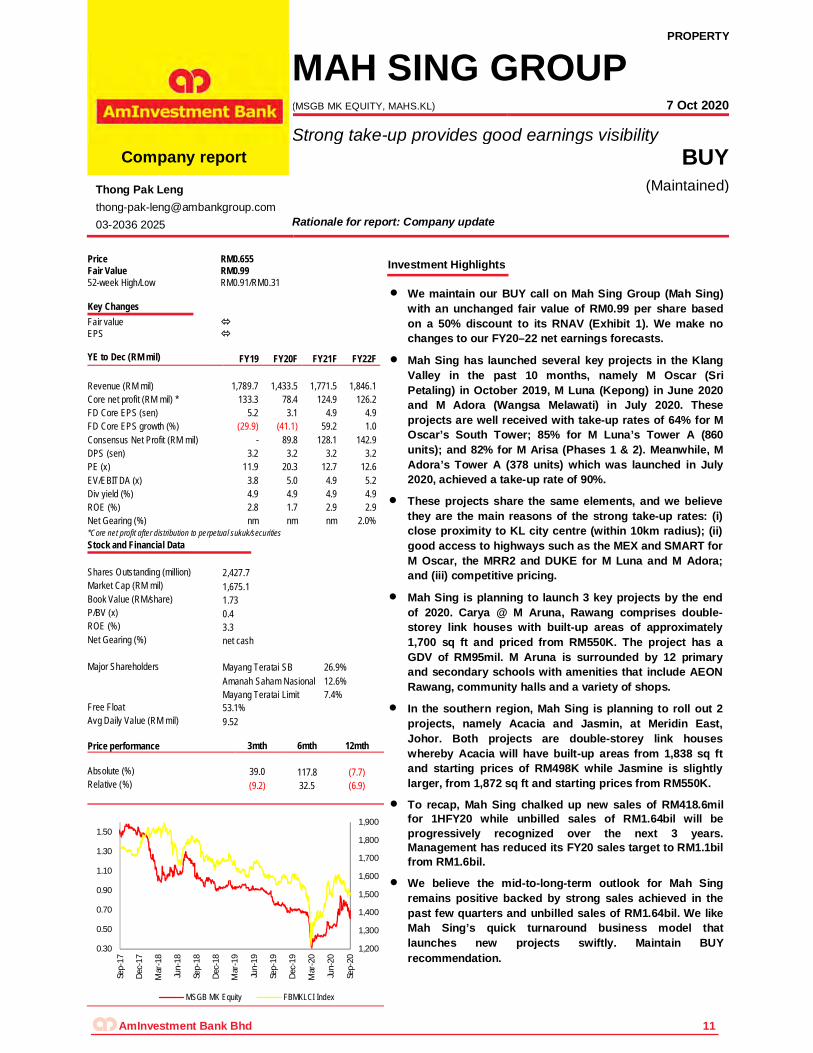
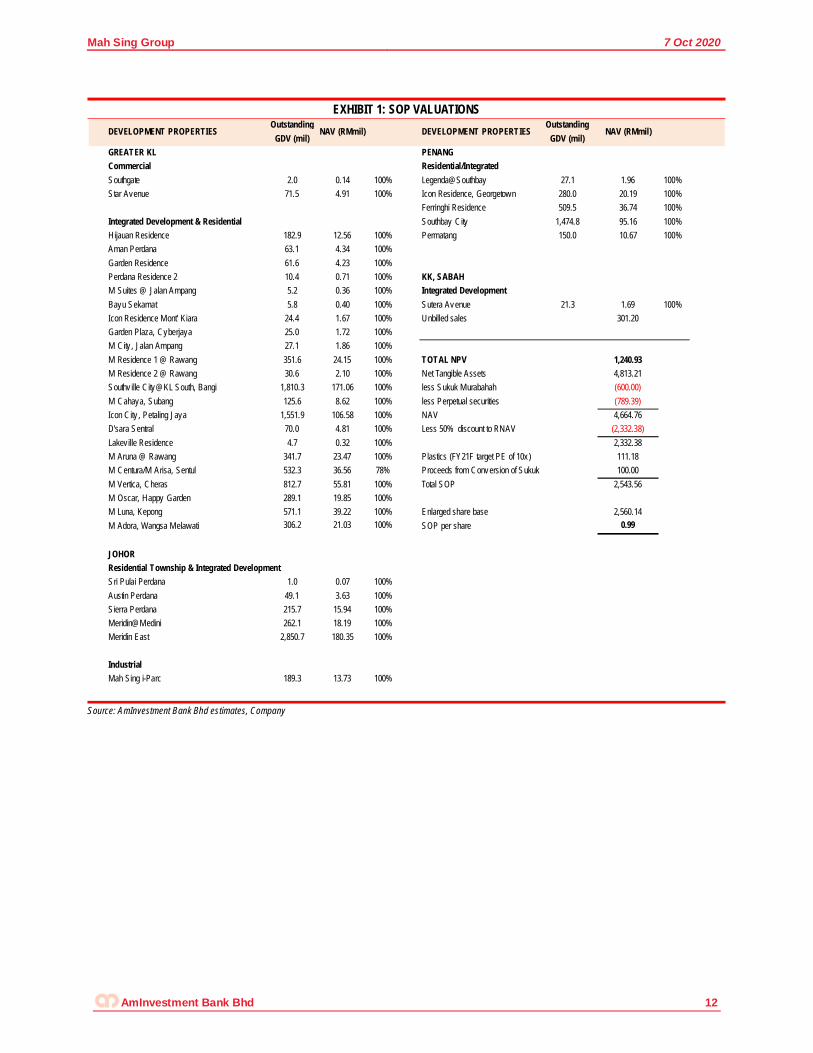
We maintain our BUY call on Mah Sing Group (Mah Sing) with an unchanged fair value of RM0.99 per share based on a 50% discount to its RNAV (Exhibit 1). We make no changes to our FY20–22 net earnings forecasts.
Mah Sing has launched several key projects in the Klang Valley in the past 10 months, namely M Oscar (Sri Petaling) in October 2019, M Luna (Kepong) in June 2020 and M Adora (Wangsa Melawati) in July 2020. These projects are well received with take-up rates of 64% for M Oscar’s South Tower; 85% for M Luna’s Tower A (860 units); and 82% for M Arisa (Phases 1 & 2). Meanwhile, M Adora’s Tower A (378 units) which was launched in July 2020, achieved a take-up rate of 90%.
These projects share the same elements, and we believe they are the main reasons of the strong take-up rates: (i) close proximity to KL city centre (within 10km radius); (ii) good access to highways such as the MEX and SMART for M Oscar, the MRR2 and DUKE for M Luna and M Adora; and (iii) competitive pricing.
Mah Sing is planning to launch 3 key projects by the end of 2020. Carya @ M Aruna, Rawang comprises double-storey link houses with built-up areas of approximately 1,700 sq ft and priced from RM550K. The project has a GDV of RM95mil. M Aruna is surrounded by 12 primary and secondary schools with amenities that include AEON Rawang, community halls and a variety of shops.
In the southern region, Mah Sing is planning to roll out 2 projects, namely Acacia and Jasmin, at Meridin East, Johor. Both projects are double-storey link houses whereby Acacia will have built-up areas from 1,838 sq ft and starting prices of RM498K while Jasmine is slightly larger, from 1,872 sq ft and starting prices from RM550K.
To recap, Mah Sing chalked up new sales of RM418.6mil for 1HFY20 while unbilled sales of RM1.64bil will be progressively recognized over the next 3 years. Management has reduced its FY20 sales target to RM1.1bil from RM1.6bil.
We believe the mid-to-long-term outlook for Mah Sing remains positive backed by strong sales achieved in the past few quarters and unbilled sales of RM1.64bil. We like Mah Sing’s quick turnaround business model that launches new projects swiftly. Maintain BUY recommendation.
AmInvestment Bank Bhd 11
Mah Sing Group 7 Oct 2020
EXHIBIT 1: SOP VALUATIONS
Source: AmInvestment Bank Bhd estimates, Company
DEVELOPMENT PROPERTIESOutstanding
GDV (mil)NAV (RMmil) DEVELOPMENT PROPERTIES
Outstanding GDV (mil)
NAV (RMmil)
GREATER KL PENANGCommercial Residential/IntegratedSouthgate 2.0 0.14 100% Legenda@Southbay 27.1 1.96 100%Star Avenue 71.5 4.91 100% Icon Residence, Georgetown 280.0 20.19 100%
Ferringhi Residence 509.5 36.74 100%Integrated Development & Residential Southbay City 1,474.8 95.16 100%Hijauan Residence 182.9 12.56 100% Permatang 150.0 10.67 100%Aman Perdana 63.1 4.34 100%Garden Residence 61.6 4.23 100%Perdana Residence 2 10.4 0.71 100% KK, SABAHM Suites @ Jalan Ampang 5.2 0.36 100% Integrated DevelopmentBayu Sekamat 5.8 0.40 100% Sutera Avenue 21.3 1.69 100%Icon Residence Mont' Kiara 24.4 1.67 100% Unbilled sales 301.20 Garden Plaza, Cyberjaya 25.0 1.72 100%M City , Jalan Ampang 27.1 1.86 100%M Residence 1 @ Rawang 351.6 24.15 100% TOTAL NPV 1,240.93 M Residence 2 @ Rawang 30.6 2.10 100% Net Tangible Assets 4,813.21 Southv ille City@KL South, Bangi 1,810.3 171.06 100% less Sukuk Murabahah (600.00)M Cahaya, Subang 125.6 8.62 100% less Perpetual securities (789.39)Icon City , Petaling Jaya 1,551.9 106.58 100% NAV 4,664.76 D'sara Sentral 70.0 4.81 100% Less 50% discount to RNAV (2,332.38)Lakeville Residence 4.7 0.32 100% 2,332.38 M Aruna @ Rawang 341.7 23.47 100% Plastics (FY21F target PE of 10x ) 111.18 M Centura/M Arisa, Sentul 532.3 36.56 78% Proceeds from Conversion of Sukuk 100.00 M Vertica, Cheras 812.7 55.81 100% Total SOP 2,543.56 M Oscar, Happy Garden 289.1 19.85 100%M Luna, Kepong 571.1 39.22 100% Enlarged share base 2,560.14 M Adora, Wangsa Melawati 306.2 21.03 100% SOP per share 0.99
JOHORResidential Township & Integrated Development Sri Pulai Perdana 1.0 0.07 100%Austin Perdana 49.1 3.63 100%Sierra Perdana 215.7 15.94 100%Meridin@Medini 262.1 18.19 100%Meridin East 2,850.7 180.35 100%
IndustrialMah Sing i-Parc 189.3 13.73 100%
AmInvestment Bank Bhd 12
Mah Sing Group 7 Oct 2020
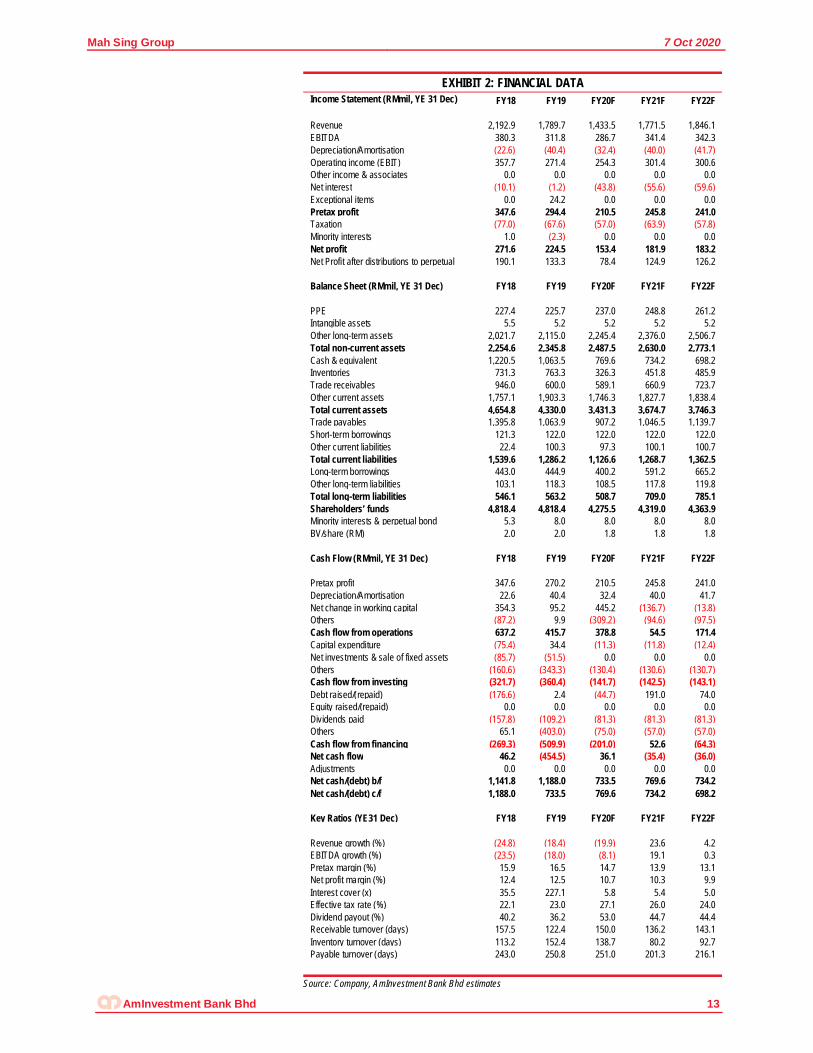
EXHIBIT 2: FINANCIAL DATA Income Statement (RMmil, YE 31 Dec) FY18 FY19 FY20F FY21F FY22F Revenue 2,192.9 1,789.7 1,433.5 1,771.5 1,846.1 EBITDA 380.3 311.8 286.7 341.4 342.3 Depreciation/Amortisation (22.6) (40.4) (32.4) (40.0) (41.7) Operating income (EBIT) 357.7 271.4 254.3 301.4 300.6 Other income & associates 0.0 0.0 0.0 0.0 0.0 Net interest (10.1) (1.2) (43.8) (55.6) (59.6) Exceptional items 0.0 24.2 0.0 0.0 0.0 Pretax profit 347.6 294.4 210.5 245.8 241.0 Taxation (77.0) (67.6) (57.0) (63.9) (57.8) Minority interests 1.0 (2.3) 0.0 0.0 0.0 Net profit 271.6 224.5 153.4 181.9 183.2 Net Profit after distributions to perpetual 190.1 133.3 78.4 124.9 126.2 Balance Sheet (RMmil, YE 31 Dec) FY18 FY19 FY20F FY21F FY22F PPE 227.4 225.7 237.0 248.8 261.2 Intangible assets 5.5 5.2 5.2 5.2 5.2 Other long-term assets 2,021.7 2,115.0 2,245.4 2,376.0 2,506.7 Total non-current assets 2,254.6 2,345.8 2,487.5 2,630.0 2,773.1 Cash & equivalent 1,220.5 1,063.5 769.6 734.2 698.2 Inventories 731.3 763.3 326.3 451.8 485.9 Trade receivables 946.0 600.0 589.1 660.9 723.7 Other current assets 1,757.1 1,903.3 1,746.3 1,827.7 1,838.4 Total current assets 4,654.8 4,330.0 3,431.3 3,674.7 3,746.3 Trade payables 1,395.8 1,063.9 907.2 1,046.5 1,139.7 Short-term borrowings 121.3 122.0 122.0 122.0 122.0 Other current liabilities 22.4 100.3 97.3 100.1 100.7 Total current liabilities 1,539.6 1,286.2 1,126.6 1,268.7 1,362.5 Long-term borrowings 443.0 444.9 400.2 591.2 665.2 Other long-term liabilities 103.1 118.3 108.5 117.8 119.8 Total long-term liabilities 546.1 563.2 508.7 709.0 785.1 Shareholders’ funds 4,818.4 4,818.4 4,275.5 4,319.0 4,363.9 Minority interests & perpetual bond 5.3 8.0 8.0 8.0 8.0 BV/share (RM) 2.0 2.0 1.8 1.8 1.8 Cash Flow (RMmil, YE 31 Dec) FY18 FY19 FY20F FY21F FY22F Pretax profit 347.6 270.2 210.5 245.8 241.0 Depreciation/Amortisation 22.6 40.4 32.4 40.0 41.7 Net change in working capital 354.3 95.2 445.2 (136.7) (13.8) Others (87.2) 9.9 (309.2) (94.6) (97.5) Cash flow from operations 637.2 415.7 378.8 54.5 171.4 Capital expenditure (75.4) 34.4 (11.3) (11.8) (12.4) Net investments & sale of fixed assets (85.7) (51.5) 0.0 0.0 0.0 Others (160.6) (343.3) (130.4) (130.6) (130.7) Cash flow from investing (321.7) (360.4) (141.7) (142.5) (143.1) Debt raised/(repaid) (176.6) 2.4 (44.7) 191.0 74.0 Equity raised/(repaid) 0.0 0.0 0.0 0.0 0.0 Dividends paid (157.8) (109.2) (81.3) (81.3) (81.3) Others 65.1 (403.0) (75.0) (57.0) (57.0) Cash flow from financing (269.3) (509.9) (201.0) 52.6 (64.3) Net cash flow 46.2 (454.5) 36.1 (35.4) (36.0) Adjustments 0.0 0.0 0.0 0.0 0.0 Net cash/(debt) b/f 1,141.8 1,188.0 733.5 769.6 734.2 Net cash/(debt) c/f 1,188.0 733.5 769.6 734.2 698.2 Key Ratios (YE31 Dec) FY18 FY19 FY20F FY21F FY22F Revenue growth (%) (24.8) (18.4) (19.9) 23.6 4.2 EBITDA growth (%) (23.5) (18.0) (8.1) 19.1 0.3 Pretax margin (%) 15.9 16.5 14.7 13.9 13.1 Net profit margin (%) 12.4 12.5 10.7 10.3 9.9 Interest cover (x) 35.5 227.1 5.8 5.4 5.0 Effective tax rate (%) 22.1 23.0 27.1 26.0 24.0 Dividend payout (%) 40.2 36.2 53.0 44.7 44.4 Receivable turnover (days) 157.5 122.4 150.0 136.2 143.1 Inventory turnover (days) 113.2 152.4 138.7 80.2 92.7 Payable turnover (days) 243.0 250.8 251.0 201.3 216.1
Source: Company, AmInvestment Bank Bhd estimates AmInvestment Bank Bhd 13
Price RM11.10 Fair Value RM12.69 52-week High/Low RM11.82/RM5.96 Key Changes Fair value EPS YE to Jul FY20 FY21F FY22F FY23F Revenue (RM mil) 3,518.6 4,369.8 4,905.3 5,506.6 Core net profit (RM mil) 390.1 467.7 529.5 598.9 FD Core EPS (sen) 75.6 90.7 102.7 116.1 FD Core EPS growth (%) 13.4 19.9 13.2 13.1 Consensus Net Profit (RM mil) - 446.7 500.2 587.3 DPS (sen) 23.0 27.2 30.8 34.8 PE (x) 14.7 12.2 10.8 9.6 EV/EBITDA (x) 9.7 8.2 7.2 6.4 Div yield (%) 2.1 2.5 2.8 3.1 ROE (%) 16.3 17.4 17.6 17.6 Net Gearing (%) 24.5 20.6 14.7 8.9
Stock and Financial Data Shares Outstanding (million) 515.9 Market Cap (RM mil) 5,726.2 Book Value (RM/share) 6.29 P/BV (x) 1.8 ROE (%) 16.3 Net Gearing (%) 24.5 Major Shareholders Scientex Holdings Sdn Bhd (21.1%)
Scientex Leasing Sdn Bhd (9.2%) Scientex Infinity Sdn Bhd (8.1%)
Free Float - Avg Daily Value (RM mil) 3.9 Price performance 3mth 6mth 12mth Absolute (%) 23.9 49.0 23.9 Relative (%) 25.3 31.7 31.6
0
200
400
600
800
1,000
1,200
1,400
1,600
1,800
2,000
0.0
2.0
4.0
6.0
8.0
10.0
12.0
Sep-15 Sep-16 Sep-17 Sep-18 Sep-19
SCI MK FBMKLCI Index
MANUFACTURING
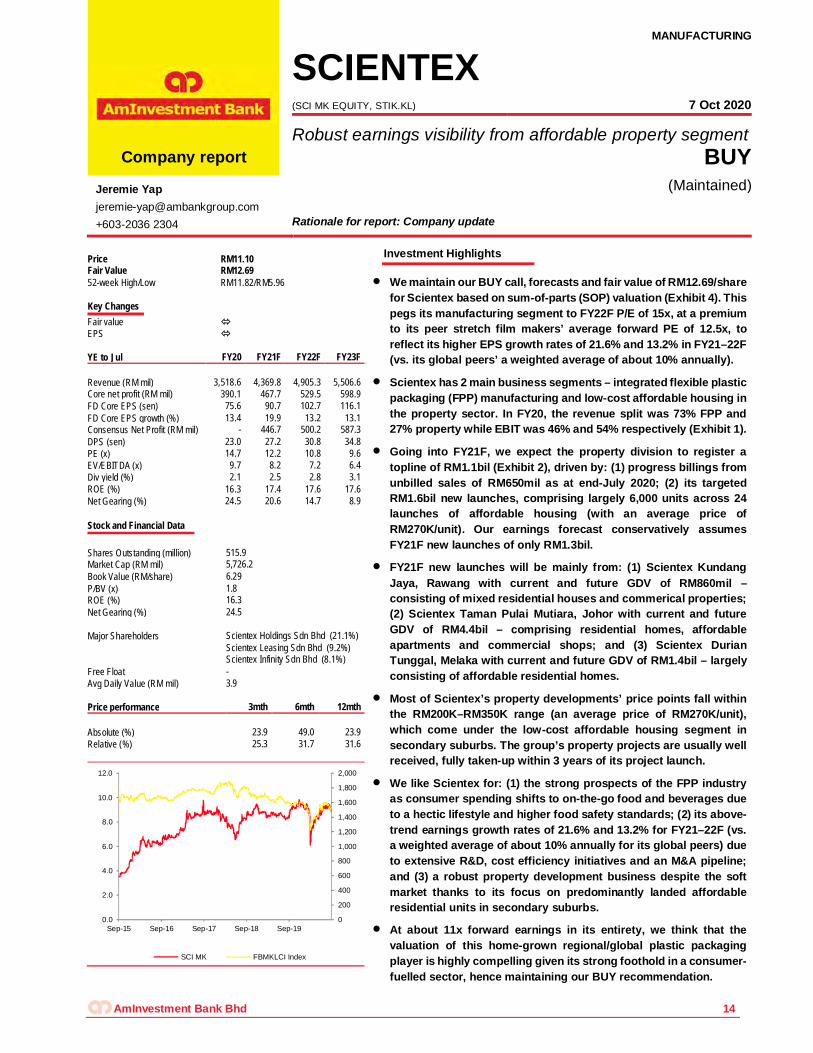
SCIENTEX (SCI MK EQUITY, STIK.KL) 7 Oct 2020
Robust earnings visibility from affordable property segment Company report BUY
Jeremie Yap [email protected] +603-2036 2304
(Maintained)
Rationale for report: Company update
Investment Highlights
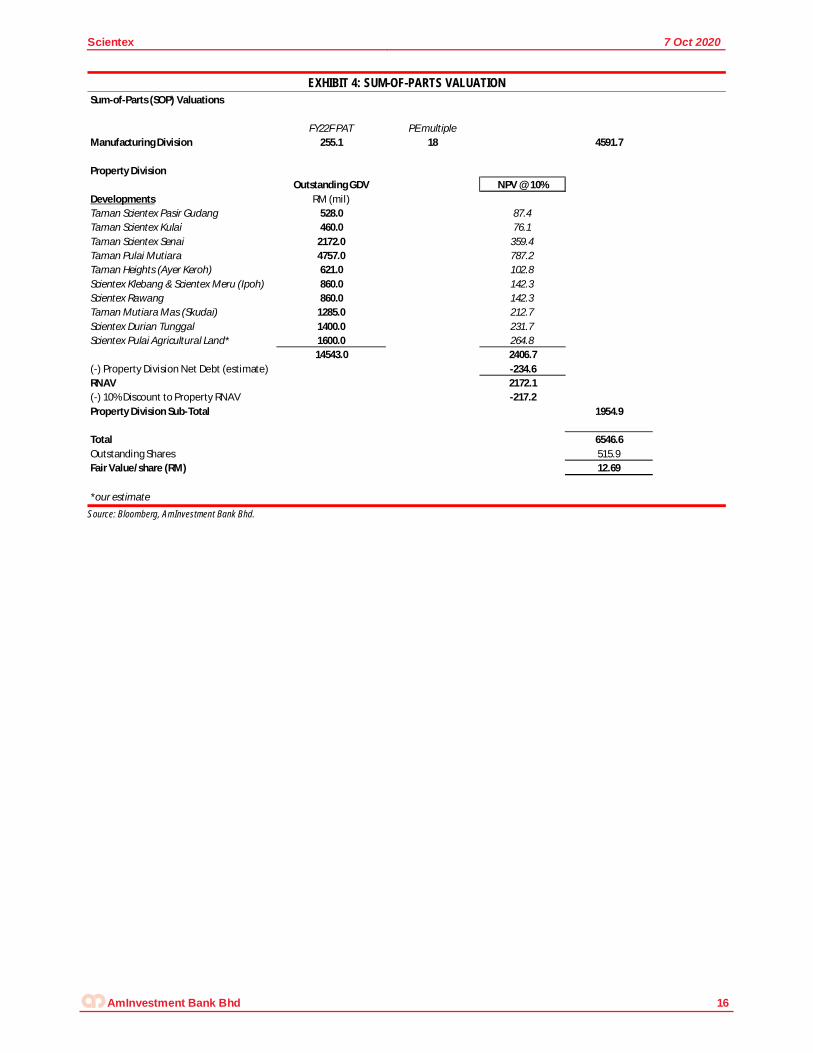
We maintain our BUY call, forecasts and fair value of RM12.69/share for Scientex based on sum-of-parts (SOP) valuation (Exhibit 4). This pegs its manufacturing segment to FY22F P/E of 15x, at a premium to its peer stretch film makers’ average forward PE of 12.5x, to reflect its higher EPS growth rates of 21.6% and 13.2% in FY21–22F (vs. its global peers’ a weighted average of about 10% annually).
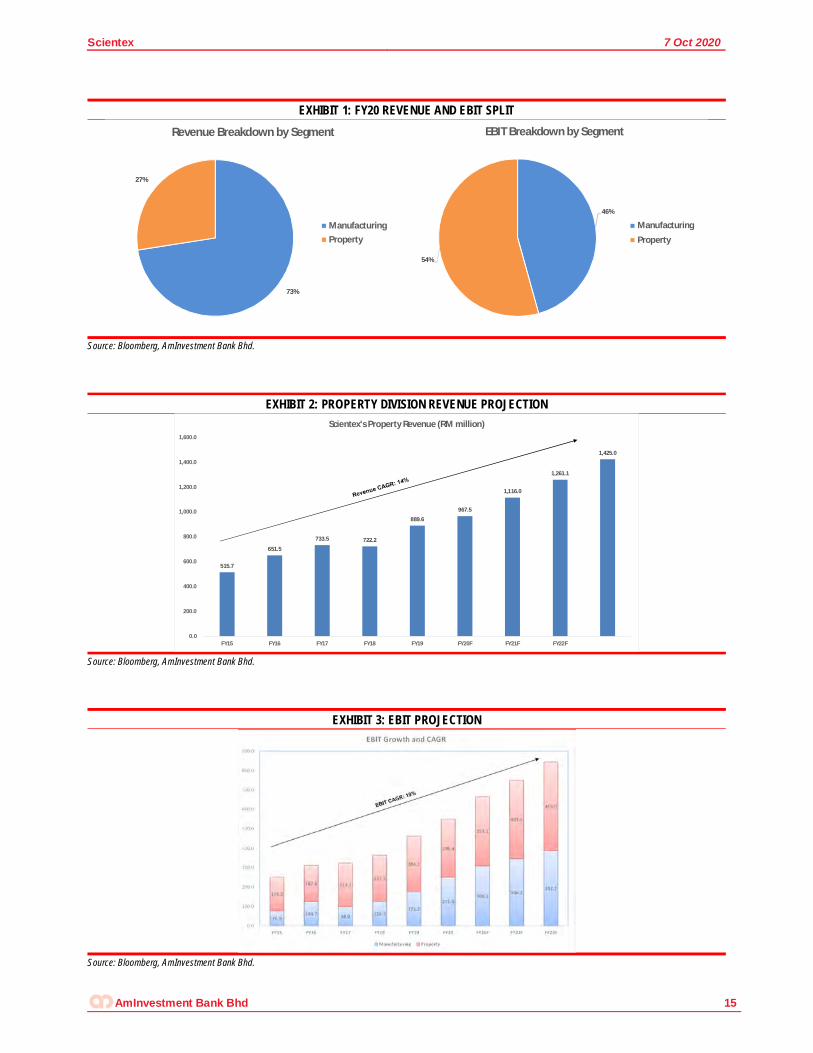
Scientex has 2 main business segments – integrated flexible plastic packaging (FPP) manufacturing and low-cost affordable housing in the property sector. In FY20, the revenue split was 73% FPP and 27% property while EBIT was 46% and 54% respectively (Exhibit 1).
Going into FY21F, we expect the property division to register a topline of RM1.1bil (Exhibit 2), driven by: (1) progress billings from unbilled sales of RM650mil as at end-July 2020; (2) its targeted RM1.6bil new launches, comprising largely 6,000 units across 24 launches of affordable housing (with an average price of RM270K/unit). Our earnings forecast conservatively assumes FY21F new launches of only RM1.3bil.
FY21F new launches will be mainly from: (1) Scientex Kundang Jaya, Rawang with current and future GDV of RM860mil – consisting of mixed residential houses and commerical properties; (2) Scientex Taman Pulai Mutiara, Johor with current and future GDV of RM4.4bil – comprising residential homes, affordable apartments and commercial shops; and (3) Scientex Durian Tunggal, Melaka with current and future GDV of RM1.4bil – largely consisting of affordable residential homes.
Most of Scientex’s property developments’ price points fall within the RM200K–RM350K range (an average price of RM270K/unit), which come under the low-cost affordable housing segment in secondary suburbs. The group’s property projects are usually well received, fully taken-up within 3 years of its project launch.
We like Scientex for: (1) the strong prospects of the FPP industry as consumer spending shifts to on-the-go food and beverages due to a hectic lifestyle and higher food safety standards; (2) its above-trend earnings growth rates of 21.6% and 13.2% for FY21–22F (vs. a weighted average of about 10% annually for its global peers) due to extensive R&D, cost efficiency initiatives and an M&A pipeline; and (3) a robust property development business despite the soft market thanks to its focus on predominantly landed affordable residential units in secondary suburbs.
At about 11x forward earnings in its entirety, we think that the valuation of this home-grown regional/global plastic packaging player is highly compelling given its strong foothold in a consumer-fuelled sector, hence maintaining our BUY recommendation.
AmInvestment Bank Bhd 14
Scientex 7 Oct 2020
EXHIBIT 1: FY20 REVENUE AND EBIT SPLIT
Source: Bloomberg, AmInvestment Bank Bhd.
EXHIBIT 2: PROPERTY DIVISION REVENUE PROJECTION
Source: Bloomberg, AmInvestment Bank Bhd.
EXHIBIT 3: EBIT PROJECTION
Source: Bloomberg, AmInvestment Bank Bhd.
73%
27%
Revenue Breakdown by Segment
ManufacturingProperty
46%
54%
EBIT Breakdown by Segment
Manufacturing
Property
515.7
651.5
733.5 722.2
889.6
967.5
1,116.0
1,261.1
1,425.0
0.0
200.0
400.0
600.0
800.0
1,000.0
1,200.0
1,400.0
1,600.0
FY15 FY16 FY17 FY18 FY19 FY20F FY21F FY22F
Scientex's Property Revenue (RM million)
AmInvestment Bank Bhd 15
Scientex 7 Oct 2020
EXHIBIT 4: SUM-OF-PARTS VALUATION
Source: Bloomberg, AmInvestment Bank Bhd.
Sum-of-Parts (SOP) Valuations
FY22F PAT PE multipleManufacturing Division 255.1 18 4591.7
Property DivisionOutstanding GDV NPV @ 10%
Developments RM (mil)Taman Scientex Pasir Gudang 528.0 87.4Taman Scientex Kulai 460.0 76.1Taman Scientex Senai 2172.0 359.4Taman Pulai Mutiara 4757.0 787.2Taman Heights (Ayer Keroh) 621.0 102.8Scientex Klebang & Scientex Meru (Ipoh) 860.0 142.3Scientex Rawang 860.0 142.3Taman Mutiara Mas (Skudai) 1285.0 212.7Scientex Durian Tunggal 1400.0 231.7Scientex Pulai Agricultural Land* 1600.0 264.8
14543.0 2406.7(-) Property Division Net Debt (estimate) -234.6RNAV 2172.1(-) 10% Discount to Property RNAV -217.2Property Division Sub-Total 1954.9
Total 6546.6Outstanding Shares 515.9Fair Value/share (RM) 12.69
*our estimate
AmInvestment Bank Bhd 16
Scientex 7 Oct 2020
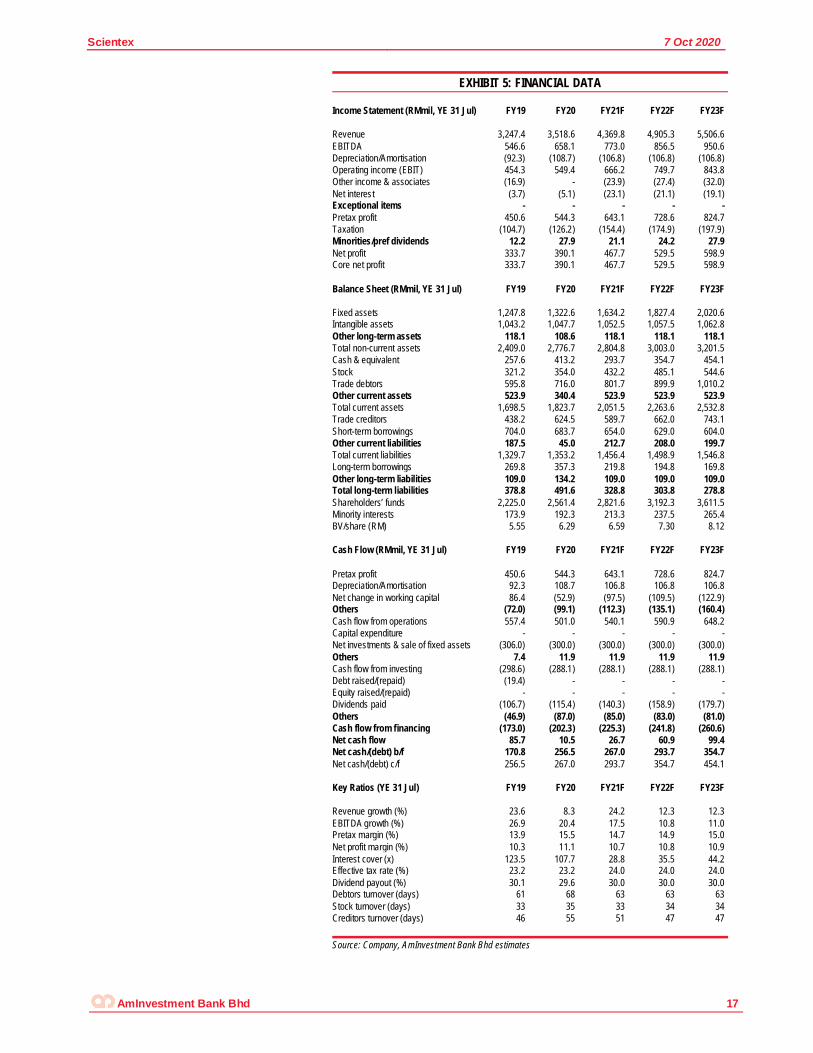
EXHIBIT 5: FINANCIAL DATA Income Statement (RMmil, YE 31 Jul) FY19 FY20 FY21F FY22F FY23F Revenue 3,247.4 3,518.6 4,369.8 4,905.3 5,506.6 EBITDA 546.6 658.1 773.0 856.5 950.6 Depreciation/Amortisation (92.3) (108.7) (106.8) (106.8) (106.8) Operating income (EBIT) 454.3 549.4 666.2 749.7 843.8 Other income & associates (16.9) - (23.9) (27.4) (32.0) Net interest (3.7) (5.1) (23.1) (21.1) (19.1) Exceptional items - - - - - Pretax profit 450.6 544.3 643.1 728.6 824.7 Taxation (104.7) (126.2) (154.4) (174.9) (197.9) Minorities/pref dividends 12.2 27.9 21.1 24.2 27.9 Net profit 333.7 390.1 467.7 529.5 598.9 Core net profit 333.7 390.1 467.7 529.5 598.9 Balance Sheet (RMmil, YE 31 Jul) FY19 FY20 FY21F FY22F FY23F Fixed assets 1,247.8 1,322.6 1,634.2 1,827.4 2,020.6 Intangible assets 1,043.2 1,047.7 1,052.5 1,057.5 1,062.8 Other long-term assets 118.1 108.6 118.1 118.1 118.1 Total non-current assets 2,409.0 2,776.7 2,804.8 3,003.0 3,201.5 Cash & equivalent 257.6 413.2 293.7 354.7 454.1 Stock 321.2 354.0 432.2 485.1 544.6 Trade debtors 595.8 716.0 801.7 899.9 1,010.2 Other current assets 523.9 340.4 523.9 523.9 523.9 Total current assets 1,698.5 1,823.7 2,051.5 2,263.6 2,532.8 Trade creditors 438.2 624.5 589.7 662.0 743.1 Short-term borrowings 704.0 683.7 654.0 629.0 604.0 Other current liabilities 187.5 45.0 212.7 208.0 199.7 Total current liabilities 1,329.7 1,353.2 1,456.4 1,498.9 1,546.8 Long-term borrowings 269.8 357.3 219.8 194.8 169.8 Other long-term liabilities 109.0 134.2 109.0 109.0 109.0 Total long-term liabilities 378.8 491.6 328.8 303.8 278.8 Shareholders’ funds 2,225.0 2,561.4 2,821.6 3,192.3 3,611.5 Minority interests 173.9 192.3 213.3 237.5 265.4 BV/share (RM) 5.55 6.29 6.59 7.30 8.12 Cash Flow (RMmil, YE 31 Jul) FY19 FY20 FY21F FY22F FY23F Pretax profit 450.6 544.3 643.1 728.6 824.7 Depreciation/Amortisation 92.3 108.7 106.8 106.8 106.8 Net change in working capital 86.4 (52.9) (97.5) (109.5) (122.9) Others (72.0) (99.1) (112.3) (135.1) (160.4) Cash flow from operations 557.4 501.0 540.1 590.9 648.2 Capital expenditure - - - - - Net investments & sale of fixed assets (306.0) (300.0) (300.0) (300.0) (300.0) Others 7.4 11.9 11.9 11.9 11.9 Cash flow from investing (298.6) (288.1) (288.1) (288.1) (288.1) Debt raised/(repaid) (19.4) - - - - Equity raised/(repaid) - - - - - Dividends paid (106.7) (115.4) (140.3) (158.9) (179.7) Others (46.9) (87.0) (85.0) (83.0) (81.0) Cash flow from financing (173.0) (202.3) (225.3) (241.8) (260.6) Net cash flow 85.7 10.5 26.7 60.9 99.4 Net cash/(debt) b/f 170.8 256.5 267.0 293.7 354.7 Net cash/(debt) c/f 256.5 267.0 293.7 354.7 454.1 Key Ratios (YE 31 Jul) FY19 FY20 FY21F FY22F FY23F Revenue growth (%) 23.6 8.3 24.2 12.3 12.3 EBITDA growth (%) 26.9 20.4 17.5 10.8 11.0 Pretax margin (%) 13.9 15.5 14.7 14.9 15.0 Net profit margin (%) 10.3 11.1 10.7 10.8 10.9 Interest cover (x) 123.5 107.7 28.8 35.5 44.2 Effective tax rate (%) 23.2 23.2 24.0 24.0 24.0 Dividend payout (%) 30.1 29.6 30.0 30.0 30.0 Debtors turnover (days) 61 68 63 63 63 Stock turnover (days) 33 35 33 34 34 Creditors turnover (days) 46 55 51 47 47
Source: Company, AmInvestment Bank Bhd estimates
AmInvestment Bank Bhd 17
Price RM1.68 Fair Value NA 52-week High/Low RM1.97/RM1.24 Key Changes Fair value NA EPS NA YE to Mar (RM'mil) FY20 FY21F FY22F FY23F Revenue (RM mil) 1,283.4 1,058.8 1,196.5 1,242.5 Core net profit (RM mil) 239.6 206.3 232.3 236.5 FD Core EPS (sen) 28.7 24.7 27.8 28.3 FD Core EPS growth (%) 9.9% -13.9% 12.6% 1.8% DPS (sen) 12.0 10.0 11.0 12.0 PE (x) 5.8 5.7 6.8 6.7 Div yield (%) 7.1% 6.0% 6.5% 7.1% * All forecasts figures are based on Bloomberg consensus estimates
Stock and Financial Data Shares Outstanding (million) 834.23 Market Cap (RM mil) 1,401.5 Book Value (RM/share) 2.0 P/BV (x) 0.9 ROE (%) 13.95 Net Gearing (%) 9% Major Shareholders Datuk Lee Tian Hock 15.1% Shining Term SB 12.7% EPF 9.9% Free Float 62.0% Avg Daily Value (RM mil) 0.45 Price performance 3mth 6mth 12mth Absolute (%) (1.6) 9.7 (5.6) Relative (%) (3.6) (5.4) (6.8)
1,200
1,300
1,400
1,500
1,600
1,700
1,800
1,900
0.60
0.70
0.80
0.90
1.00
1.10
1.20
1.30
Mar
-16
Jun-
16Se
p-16
Dec-1
6M
ar-1
7Ju
n-17
Sep-
17De
c-17
Mar
-18
Jun-
18Se
p-18
Dec-1
8M
ar-1
9Ju
n-19
Sep-
19De
c-19
Mar
-20
Jun-
20Se
p-20
PAR MK Equity FBMKLCI Index
PROPERTY
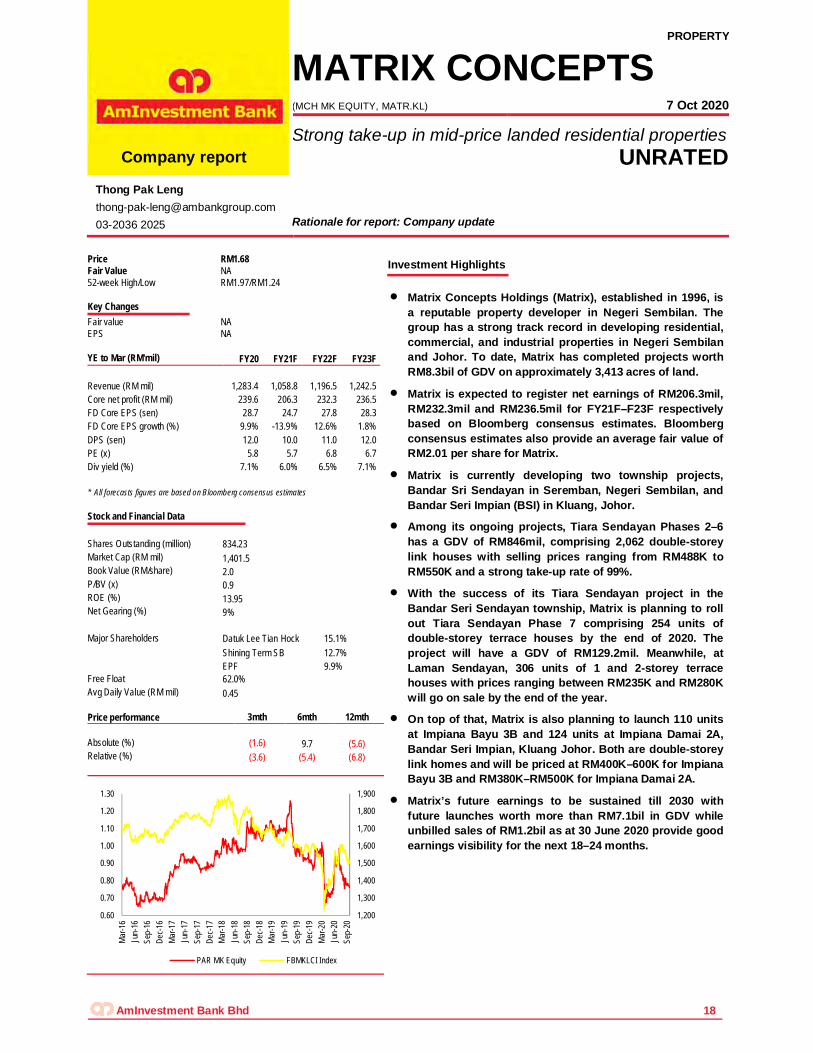
MATRIX CONCEPTS (MCH MK EQUITY, MATR.KL) 7 Oct 2020
Strong take-up in mid-price landed residential properties Company report UNRATED
Thong Pak Leng [email protected] 03-2036 2025 Rationale for report: Company update
Investment Highlights
Matrix Concepts Holdings (Matrix), established in 1996, is a reputable property developer in Negeri Sembilan. The group has a strong track record in developing residential, commercial, and industrial properties in Negeri Sembilan and Johor. To date, Matrix has completed projects worth RM8.3bil of GDV on approximately 3,413 acres of land.
Matrix is expected to register net earnings of RM206.3mil, RM232.3mil and RM236.5mil for FY21F–F23F respectively based on Bloomberg consensus estimates. Bloomberg consensus estimates also provide an average fair value of RM2.01 per share for Matrix.
Matrix is currently developing two township projects, Bandar Sri Sendayan in Seremban, Negeri Sembilan, and Bandar Seri Impian (BSI) in Kluang, Johor.
Among its ongoing projects, Tiara Sendayan Phases 2–6 has a GDV of RM846mil, comprising 2,062 double-storey link houses with selling prices ranging from RM488K to RM550K and a strong take-up rate of 99%.
With the success of its Tiara Sendayan project in the Bandar Seri Sendayan township, Matrix is planning to roll out Tiara Sendayan Phase 7 comprising 254 units of double-storey terrace houses by the end of 2020. The project will have a GDV of RM129.2mil. Meanwhile, at Laman Sendayan, 306 units of 1 and 2-storey terrace houses with prices ranging between RM235K and RM280K will go on sale by the end of the year.
On top of that, Matrix is also planning to launch 110 units at Impiana Bayu 3B and 124 units at Impiana Damai 2A, Bandar Seri Impian, Kluang Johor. Both are double-storey link homes and will be priced at RM400K–600K for Impiana Bayu 3B and RM380K–RM500K for Impiana Damai 2A.
Matrix’s future earnings to be sustained till 2030 with future launches worth more than RM7.1bil in GDV while unbilled sales of RM1.2bil as at 30 June 2020 provide good earnings visibility for the next 18–24 months.
AmInvestment Bank Bhd 18
Matrix Concepts 7 Oct 2020
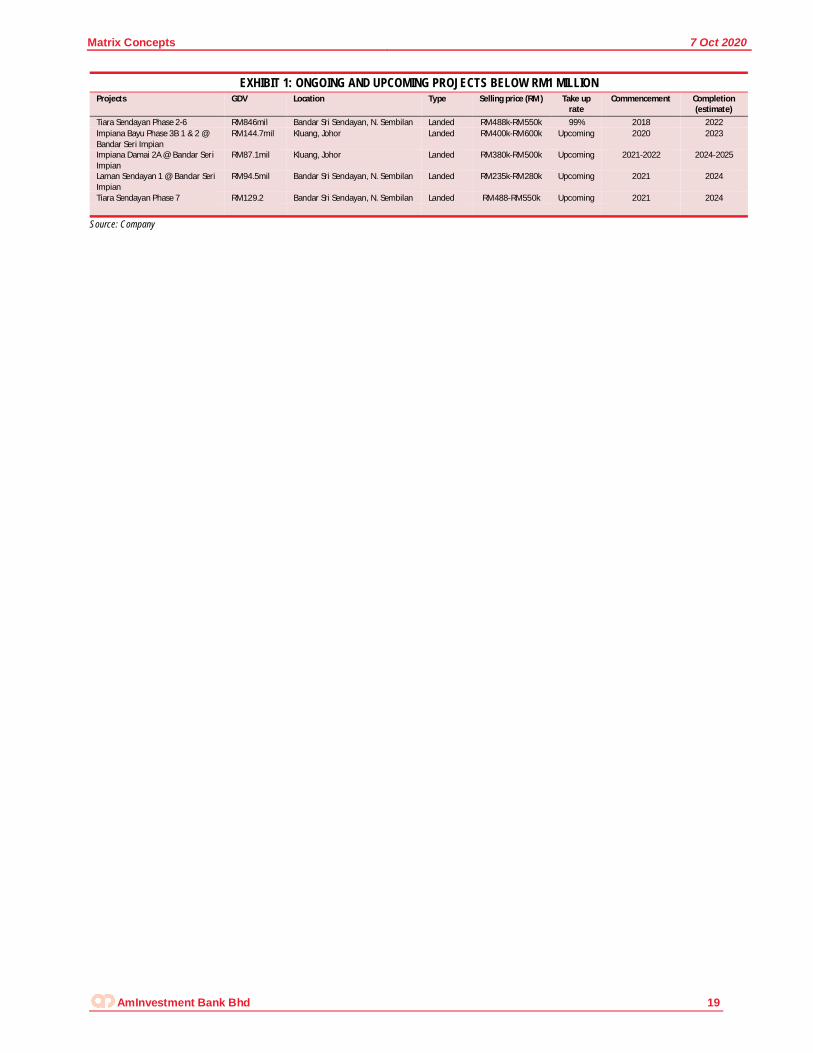
EXHIBIT 1: ONGOING AND UPCOMING PROJECTS BELOW RM1 MILLION Projects GDV Location Type Selling price (RM) Take up
rate Commencement Completion
(estimate) Tiara Sendayan Phase 2-6 RM846mil Bandar Sri Sendayan, N. Sembilan Landed RM488k-RM550k 99% 2018 2022 Impiana Bayu Phase 3B 1 & 2 @ Bandar Seri Impian
RM144.7mil Kluang, Johor Landed RM400k-RM600k Upcoming 2020 2023
Impiana Damai 2A @ Bandar Seri Impian
RM87.1mil Kluang, Johor Landed RM380k-RM500k Upcoming 2021-2022 2024-2025
Laman Sendayan 1 @ Bandar Seri Impian
RM94.5mil Bandar Sri Sendayan, N. Sembilan Landed RM235k-RM280k Upcoming 2021 2024
Tiara Sendayan Phase 7 RM129.2 Bandar Sri Sendayan, N. Sembilan Landed RM488-RM550k Upcoming 2021 2024
Source: Company
AmInvestment Bank Bhd 19
Price RM0.76 Fair Value NA 52-week High/Low RM1.05/RM0.63 Key Changes Fair value NA EPS NA YE to Dec (RM'mil) FY19 FY20F FY21F FY22F Revenue (RM mil) 706.0 682.0 761.0 863.0 Core net profit (RM mil) 21.4 28.0 55.0 69.0 FD Core EPS (sen) 3.5 5.0 9.0 11.0 FD Core EPS growth (%) -64.6% 30.6% 96.4% 25.5% DPS (sen) 7.0 2.0 4.0 6.0 PE (x) 47.5 33.6 18.7 15.3 Div yield (%) 9.2% 2.6% 5.3% 7.9% * All forecasts figures are based on Bloomberg consensus estimates
Stock and Financial Data Shares Outstanding (million) 614.4 Market Cap (RM mil) 467.0 Book Value (RM/share) 2.32 P/BV (x) 0.3 ROE (%) 42.1 Net Gearing (%) 62.0% Major Shareholders Paramount Equities 25.1% Southern Palm Ind SB 8.5% Southern Acids M Bhd 4.4% Free Float 62.0% Avg Daily Value (RM mil) 0.31 Price performance 3mth 6mth 12mth Absolute (%) (12.4) 6.3 (13.8) Relative (%) (2.6) (16.4) (16.4)
1,200
1,300
1,400
1,500
1,600
1,700
1,800
1,900
0.60
0.70
0.80
0.90
1.00
1.10
1.20
1.30
Mar
-16
Jun-
16Se
p-16
Dec-1
6M
ar-1
7Ju
n-17
Sep-
17De
c-17
Mar
-18
Jun-
18Se
p-18
Dec-1
8M
ar-1
9Ju
n-19
Sep-
19De
c-19
Mar
-20
Jun-
20Se
p-20
PAR MK Equity FBMKLCI Index
PROPERTY
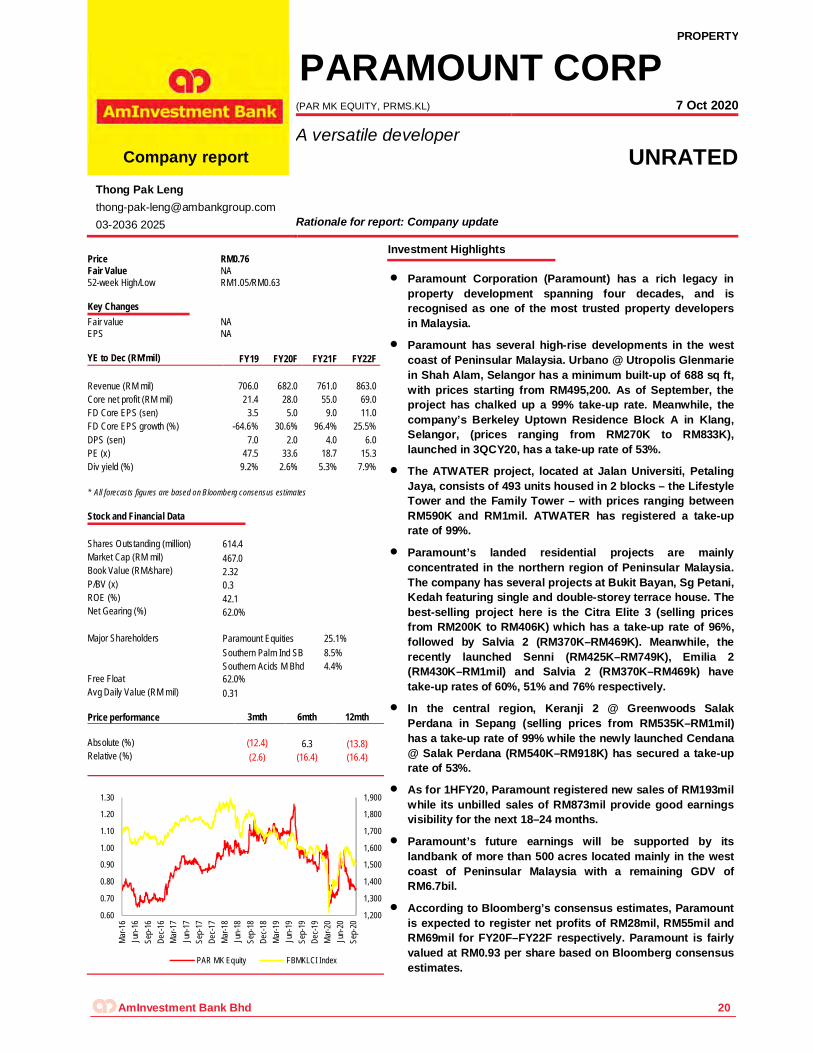
PARAMOUNT CORP (PAR MK EQUITY, PRMS.KL) 7 Oct 2020
A versatile developer Company report UNRATED
Thong Pak Leng [email protected] 03-2036 2025 Rationale for report: Company update
Investment Highlights
Paramount Corporation (Paramount) has a rich legacy in property development spanning four decades, and is recognised as one of the most trusted property developers in Malaysia.
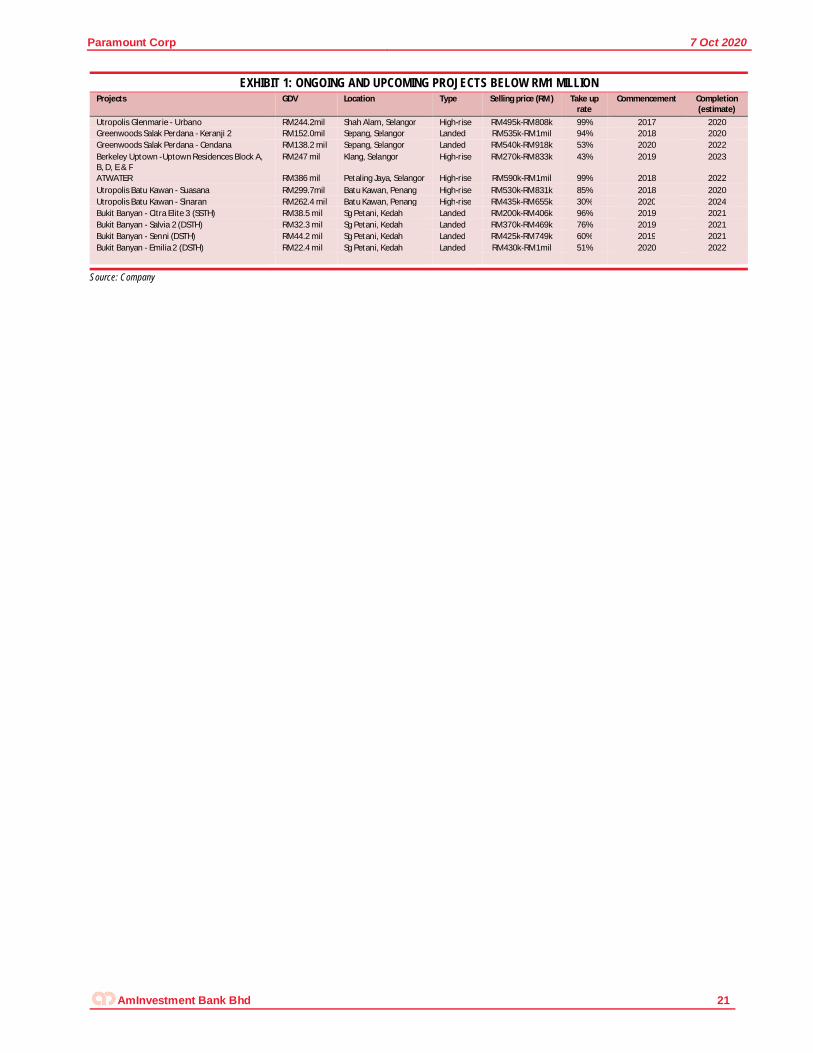
Paramount has several high-rise developments in the west coast of Peninsular Malaysia. Urbano @ Utropolis Glenmarie in Shah Alam, Selangor has a minimum built-up of 688 sq ft, with prices starting from RM495,200. As of September, the project has chalked up a 99% take-up rate. Meanwhile, the company’s Berkeley Uptown Residence Block A in Klang, Selangor, (prices ranging from RM270K to RM833K), launched in 3QCY20, has a take-up rate of 53%.
The ATWATER project, located at Jalan Universiti, Petaling Jaya, consists of 493 units housed in 2 blocks – the Lifestyle Tower and the Family Tower – with prices ranging between RM590K and RM1mil. ATWATER has registered a take-up rate of 99%.
Paramount’s landed residential projects are mainly concentrated in the northern region of Peninsular Malaysia. The company has several projects at Bukit Bayan, Sg Petani, Kedah featuring single and double-storey terrace house. The best-selling project here is the Citra Elite 3 (selling prices from RM200K to RM406K) which has a take-up rate of 96%, followed by Salvia 2 (RM370K–RM469K). Meanwhile, the recently launched Senni (RM425K–RM749K), Emilia 2 (RM430K–RM1mil) and Salvia 2 (RM370K–RM469k) have take-up rates of 60%, 51% and 76% respectively.
In the central region, Keranji 2 @ Greenwoods Salak Perdana in Sepang (selling prices from RM535K–RM1mil) has a take-up rate of 99% while the newly launched Cendana @ Salak Perdana (RM540K–RM918K) has secured a take-up rate of 53%.
As for 1HFY20, Paramount registered new sales of RM193mil while its unbilled sales of RM873mil provide good earnings visibility for the next 18–24 months.
Paramount’s future earnings will be supported by its landbank of more than 500 acres located mainly in the west coast of Peninsular Malaysia with a remaining GDV of RM6.7bil.
According to Bloomberg’s consensus estimates, Paramount is expected to register net profits of RM28mil, RM55mil and RM69mil for FY20F–FY22F respectively. Paramount is fairly valued at RM0.93 per share based on Bloomberg consensus estimates.
AmInvestment Bank Bhd 20
Paramount Corp 7 Oct 2020
EXHIBIT 1: ONGOING AND UPCOMING PROJECTS BELOW RM1 MILLION Projects GDV Location Type Selling price (RM) Take up
rate Commencement Completion
(estimate) Utropolis Glenmarie - Urbano RM244.2mil Shah Alam, Selangor High-rise RM495k-RM808k 99% 2017 2020 Greenwoods Salak Perdana - Keranji 2 RM152.0mil Sepang, Selangor Landed RM535k-RM1mil 94% 2018 2020 Greenwoods Salak Perdana - Cendana RM138.2 mil Sepang, Selangor Landed RM540k-RM918k 53% 2020 2022 Berkeley Uptown -Uptown Residences Block A, B, D, E & F
RM247 mil Klang, Selangor High-rise RM270k-RM833k 43% 2019 2023
ATWATER RM386 mil Petaling Jaya, Selangor High-rise RM590k-RM1mil 99% 2018 2022 Utropolis Batu Kawan - Suasana RM299.7mil Batu Kawan, Penang High-rise RM530k-RM831k 85% 2018 2020 Utropolis Batu Kawan - Sinaran RM262.4 mil Batu Kawan, Penang High-rise RM435k-RM655k 30% 2020 2024 Bukit Banyan - Citra Elite 3 (SSTH) RM38.5 mil Sg Petani, Kedah Landed RM200k-RM406k 96% 2019 2021 Bukit Banyan - Salvia 2 (DSTH) RM32.3 mil Sg Petani, Kedah Landed RM370k-RM469k 76% 2019 2021 Bukit Banyan - Senni (DSTH) RM44.2 mil Sg Petani, Kedah Landed RM425k-RM749k 60% 2019 2021 Bukit Banyan - Emilia 2 (DSTH) RM22.4 mil Sg Petani, Kedah Landed RM430k-RM1mil 51% 2020 2022
Source: Company
AmInvestment Bank Bhd 21
Property Sector 7 Oct 2020
DISCLOSURE AND DISCLAIMER
This report is prepared for information purposes only and it is issued by AmInvestment Bank Berhad (“AmInvestment”) without regard to your individual financial circumstances and objectives. Nothing in this report shall constitute an offer to sell, warranty, representation, recommendation, legal, accounting or tax advice, solicitation or expression of views to influence any one to buy or sell any real estate, securities, stocks, foreign exchange, futures or investment products. AmInvestment recommends that you evaluate a particular investment or strategy based on your individual circumstances and objectives and/or seek financial, legal or other advice on the appropriateness of the particular investment or strategy.
The information in this report was obtained or derived from sources that AmInvestment believes are reliable and correct at the time of issue. While all reasonable care has been taken to ensure that the stated facts are accurate and views are fair and reasonable, AmInvestment has not independently verified the information and does not warrant or represent that they are accurate, adequate, complete or up-to-date and they should not be relied upon as such. All information included in this report constitute AmInvestment’s views as of this date and are subject to change without notice. Notwithstanding that, AmInvestment has no obligation to update its opinion or information in this report. Facts and views presented in this report may not reflect the views of or information known to other business units of AmInvestment’s affiliates and/or related corporations (collectively, “AmBank Group”).
This report is prepared for the clients of AmBank Group and it cannot be altered, copied, reproduced, distributed or republished for any purpose without AmInvestment’s prior written consent. AmInvestment, AmBank Group and its respective directors, officers, employees and agents (“Relevant Person”) accept no liability whatsoever for any direct, indirect or consequential losses, loss of profits and/or damages arising from the use or reliance of this report and/or further communications given in relation to this report. Any such responsibility is hereby expressly disclaimed.
AmInvestment is not acting as your advisor and does not owe you any fiduciary duties in connection with this report. The Relevant Person may provide services to any company and affiliates of such companies in or related to the securities or products and/or may trade or otherwise effect transactions for their own account or the accounts of their customers which may give rise to real or potential conflicts of interest.
This report is not directed to or intended for distribution or publication outside Malaysia. If you are outside Malaysia, you should have regard to the laws of the jurisdiction in which you are located.
If any provision of this disclosure and disclaimer is held to be invalid in whole or in part, such provision will be deemed not to form part of this disclosure and disclaimer. The validity and enforceability of the remainder of this disclosure and disclaimer will not be affected.