oldtown berhad - i3investor
TRANSCRIPT
Refer to important disclosures at the end of this report
BBBBUYUYUYUY RMRMRMRM2.202.202.202.20 KLCIKLCIKLCIKLCI : : : : 1,885.721,885.721,885.721,885.72
PricPricPricPrice Target :e Target :e Target :e Target :12-MonthRM2.55 (Prev RM2.35)
Reason for Report :Reason for Report :Reason for Report :Reason for Report :Company update
Potential Catalyst: Potential Catalyst: Potential Catalyst: Potential Catalyst: Successful penetration into new markets
AllianceDBSAllianceDBSAllianceDBSAllianceDBSvs vs vs vs Consensus:Consensus:Consensus:Consensus: 92% of consensus for FY15/FY16 Analyst Ian WAN+603 2604 3919 [email protected]
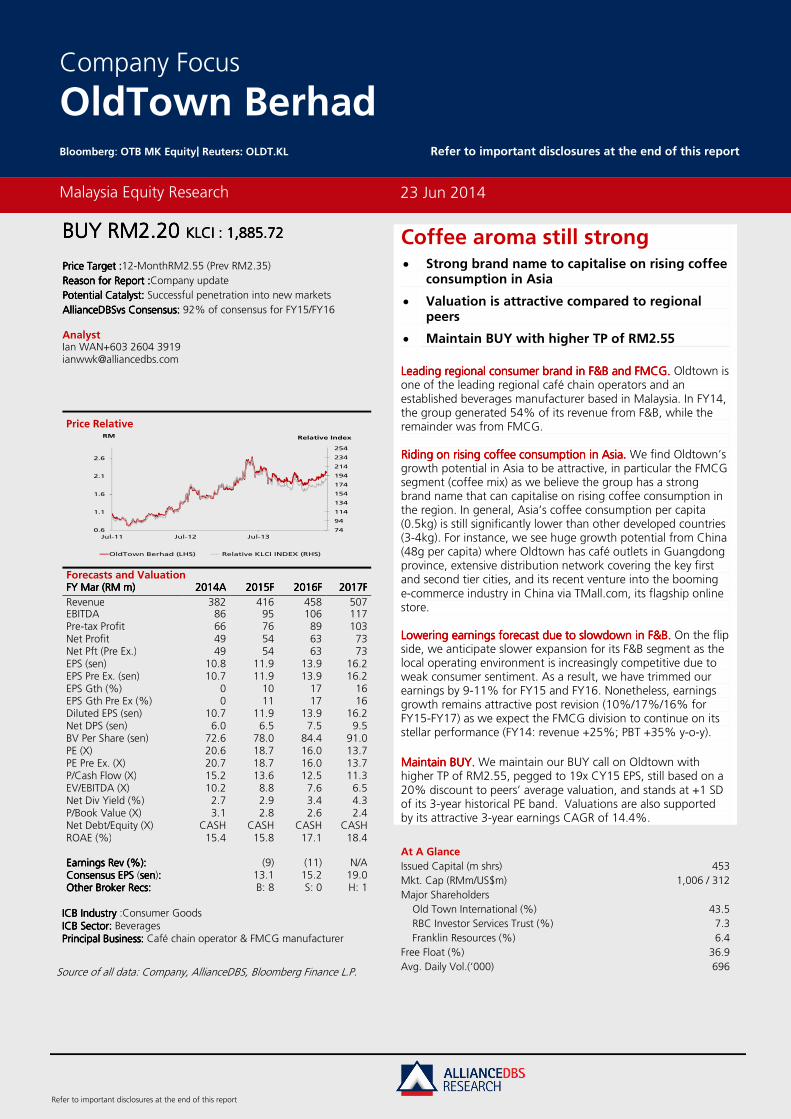
Price Relative
Forecasts and Valuation FY FY FY FY MarMarMarMar ((((RMRMRMRM m) m) m) m) 2014201420142014AAAA 2015201520152015FFFF 2016201620162016FFFF 2017201720172017FFFF
Revenue 382 416 458 507 EBITDA 86 95 106 117 Pre-tax Profit 66 76 89 103 Net Profit 49 54 63 73 Net Pft (Pre Ex.) 49 54 63 73 EPS (sen) 10.8 11.9 13.9 16.2 EPS Pre Ex. (sen) 10.7 11.9 13.9 16.2 EPS Gth (%) 0 10 17 16 EPS Gth Pre Ex (%) 0 11 17 16 Diluted EPS (sen) 10.7 11.9 13.9 16.2 Net DPS (sen) 6.0 6.5 7.5 9.5 BV Per Share (sen) 72.6 78.0 84.4 91.0 PE (X) 20.6 18.7 16.0 13.7 PE Pre Ex. (X) 20.7 18.7 16.0 13.7 P/Cash Flow (X) 15.2 13.6 12.5 11.3 EV/EBITDA (X) 10.2 8.8 7.6 6.5 Net Div Yield (%) 2.7 2.9 3.4 4.3 P/Book Value (X) 3.1 2.8 2.6 2.4 Net Debt/Equity (X) CASH CASH CASH CASH ROAE (%) 15.4 15.8 17.1 18.4 Earnings Rev (%):Earnings Rev (%):Earnings Rev (%):Earnings Rev (%): (9) (11) N/A Consensus EPS Consensus EPS Consensus EPS Consensus EPS (sensensensen):::: 13.1 15.2 19.0 Other Broker Recs:Other Broker Recs:Other Broker Recs:Other Broker Recs: B: 8 S: 0 H: 1
ICB IndustryICB IndustryICB IndustryICB Industry :Consumer Goods ICB Sector: ICB Sector: ICB Sector: ICB Sector: Beverages Principal Business:Principal Business:Principal Business:Principal Business: Café chain operator & FMCG manufacturer
Source of all data: Company, AllianceDBS, Bloomberg Finance L.P.
At A Glance Issued Capital (m shrs) 453 Mkt. Cap (RMm/US$m) 1,006 / 312 Major Shareholders Old Town International (%) 43.5 RBC Investor Services Trust (%) 7.3 Franklin Resources (%) 6.4 Free Float (%) 36.9 Avg. Daily Vol.(‘000) 696
Malaysia Equity Research
23 Jun 2014
Company Focus
OldTown Berhad Bloomberg: OTB MK Equity| Reuters: OLDT.KL Refer to important disclosures at the end of this report
Coffee aroma still strong • Strong brand name to capitalise on rising coffee
consumption in Asia
• Valuation is attractive compared to regional peers
• Maintain BUY with higher TP of RM2.55
Leading Leading Leading Leading regional regional regional regional consumer brand in Fconsumer brand in Fconsumer brand in Fconsumer brand in F&B and FMCG.&B and FMCG.&B and FMCG.&B and FMCG. Oldtown is one of the leading regional café chain operators and an established beverages manufacturer based in Malaysia. In FY14, the group generated 54% of its revenue from F&B, while the remainder was from FMCG. RidingRidingRidingRiding on on on on rising coffee rising coffee rising coffee rising coffee consumption in Asiaconsumption in Asiaconsumption in Asiaconsumption in Asia.... We find Oldtown’s growth potential in Asia to be attractive, in particular the FMCG segment (coffee mix) as we believe the group has a strong brand name that can capitalise on rising coffee consumption in the region. In general, Asia’s coffee consumption per capita (0.5kg) is still significantly lower than other developed countries (3-4kg). For instance, we see huge growth potential from China (48g per capita) where Oldtown has café outlets in Guangdong province, extensive distribution network covering the key first and second tier cities, and its recent venture into the booming e-commerce industry in China via TMall.com, its flagship online store. LowerLowerLowerLoweringinginging earnings earnings earnings earnings forecast forecast forecast forecast due due due due to to to to slowdown in F&Bslowdown in F&Bslowdown in F&Bslowdown in F&B.... On the flip side, we anticipate slower expansion for its F&B segment as the local operating environment is increasingly competitive due to weak consumer sentiment. As a result, we have trimmed our earnings by 9-11% for FY15 and FY16. Nonetheless, earnings growth remains attractive post revision (10%/17%/16% for FY15-FY17) as we expect the FMCG division to continue on its stellar performance (FY14: revenue +25%; PBT +35% y-o-y).
MaintainMaintainMaintainMaintain BUY.BUY.BUY.BUY. We maintain our BUY call on Oldtown with higher TP of RM2.55, pegged to 19x CY15 EPS, still based on a 20% discount to peers’ average valuation, and stands at +1 SD of its 3-year historical PE band. Valuations are also supported by its attractive 3-year earnings CAGR of 14.4%.
74
94
114
134
154
174
194
214
234
254
0.6
1.1
1.6
2.1
2.6
Jul-11 Jul-12 Jul-13
Relative IndexRM
OldTown Berhad (LHS) Relative KLCI INDEX (RHS)
Page 2
Company Focus
OldTown Berhad
Company Background
Oldtown is a regional café chain operator and an established
beverages manufacturer based in Malaysia. As at end-March
2014, the group operates 238 café outlets in the Asian region,
of which 208 are in Malaysia, 17 in Indonesia, 10 in Singapore,
and 3 in China. In FY14, the group generated 54% of its
revenue from food and beverages (F&B) segment, while the
remaining was contributed by fast moving consumable goods
(FMCG) segment.
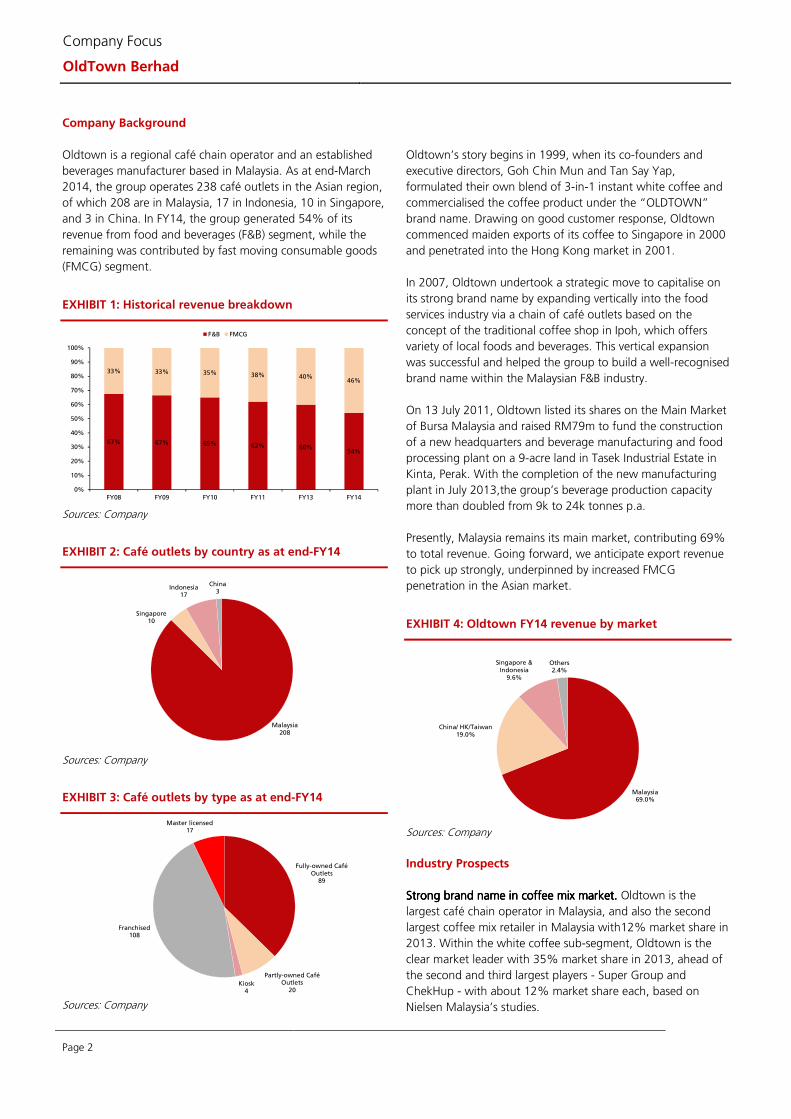
EXHIBIT 1: Historical revenue breakdown
Sources: Company
EXHIBIT 2: Café outlets by country as at end-FY14
Sources: Company
EXHIBIT 3: Café outlets by type as at end-FY14
Sources: Company
Oldtown’s story begins in 1999, when its co-founders and
executive directors, Goh Chin Mun and Tan Say Yap,
formulated their own blend of 3-in-1 instant white coffee and
commercialised the coffee product under the “OLDTOWN”
brand name. Drawing on good customer response, Oldtown
commenced maiden exports of its coffee to Singapore in 2000
and penetrated into the Hong Kong market in 2001.
In 2007, Oldtown undertook a strategic move to capitalise on
its strong brand name by expanding vertically into the food
services industry via a chain of café outlets based on the
concept of the traditional coffee shop in Ipoh, which offers
variety of local foods and beverages. This vertical expansion
was successful and helped the group to build a well-recognised
brand name within the Malaysian F&B industry.
On 13 July 2011, Oldtown listed its shares on the Main Market
of Bursa Malaysia and raised RM79m to fund the construction
of a new headquarters and beverage manufacturing and food
processing plant on a 9-acre land in Tasek Industrial Estate in
Kinta, Perak. With the completion of the new manufacturing
plant in July 2013,the group’s beverage production capacity
more than doubled from 9k to 24k tonnes p.a.
Presently, Malaysia remains its main market, contributing 69%
to total revenue. Going forward, we anticipate export revenue
to pick up strongly, underpinned by increased FMCG
penetration in the Asian market.
EXHIBIT 4: Oldtown FY14 revenue by market
Sources: Company
Industry Prospects
Strong Strong Strong Strong brand namebrand namebrand namebrand name in coffee mix marketin coffee mix marketin coffee mix marketin coffee mix market.... Oldtown is the
largest café chain operator in Malaysia, and also the second
largest coffee mix retailer in Malaysia with12% market share in
2013. Within the white coffee sub-segment, Oldtown is the
clear market leader with 35% market share in 2013, ahead of
the second and third largest players - Super Group and
ChekHup - with about 12% market share each, based on
Nielsen Malaysia’s studies.
67% 67% 65% 62% 60%54%
33% 33% 35% 38% 40%46%
0%
10%
20%
30%
40%
50%
60%
70%
80%
90%
100%
FY08 FY09 FY10 FY11 FY13 FY14
F&B FMCG
Malaysia208
Singapore10
Indonesia17
China3
Fully-owned Café Outlets
89
Partly-owned Café Outlets
20Kiosk
4
Franchised108
Master licensed17
Malaysia69.0%
China/ HK/Taiwan19.0%
Singapore & Indonesia
9.6%
Others2.4%
Page 3
Company Focus
OldTown Berhad
RivalRivalRivalRivalry is expected to remain ry is expected to remain ry is expected to remain ry is expected to remain intenseintenseintenseintense.... As for the Hong Kong
and Singapore coffee mix markets, Oldtown is ranked number
2 with market share of 22% and 13% in 2013 respectively,
challenging consumer giant Nestle’s Nescafe’s market share of
c.40% and 33%. Going forward, we expect the competition
within the coffee mix industry to remain intense as the major
players strive to capture larger market shares.
F&B is a growing but competitive industry.F&B is a growing but competitive industry.F&B is a growing but competitive industry.F&B is a growing but competitive industry. The Malaysian F&B
industry is a growing but competitive industry. According to
2010 Population and Housing Census of Malaysia (Census
2010), Malaysia has a young population with a median age of
27.6 years or 57.2% of the population is younger than 30
years old. This so-called Generation Y (Gen-Y) population is
considered the fastest growing segment of the country’s
workforce and the majority of them are deemed to have a high
propensity to spend, including on F&B as compared to previous
generations. As such, we believe the F&B industry could be one
of the biggest beneficiaries of the country’s young population.
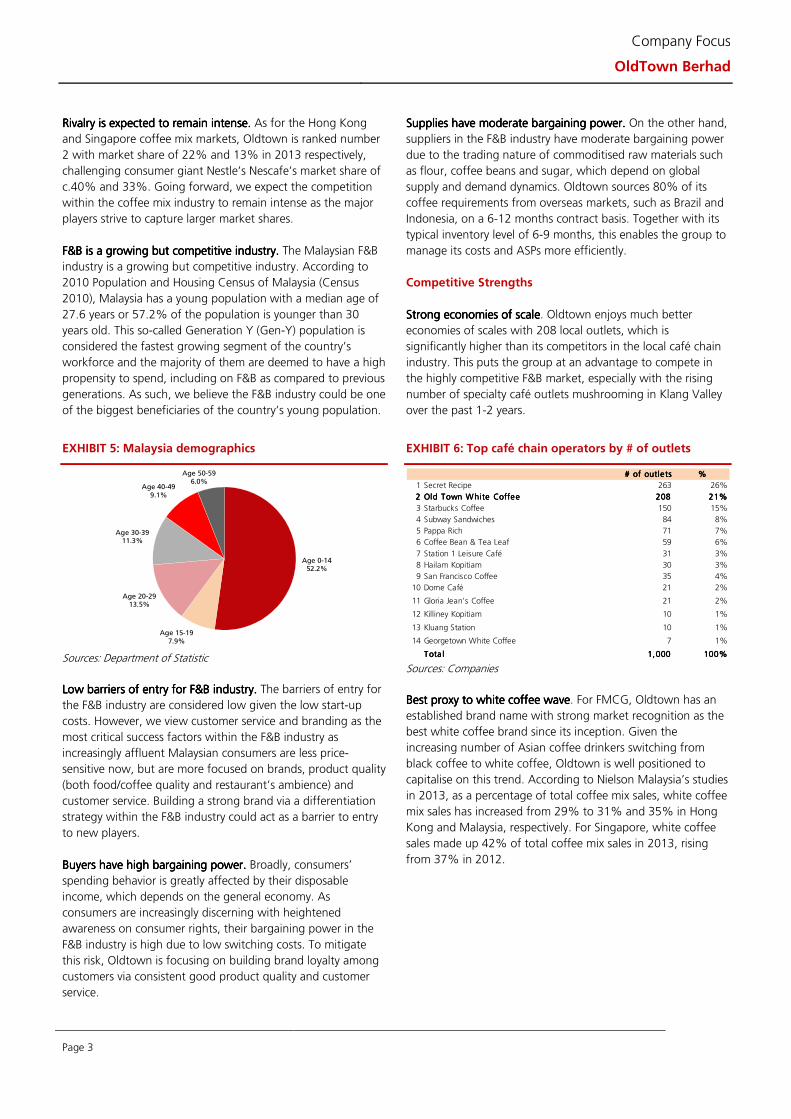
EXHIBIT 5: Malaysia demographics
Sources: Department of Statistic
Low barriers of entryLow barriers of entryLow barriers of entryLow barriers of entry for F&B industryfor F&B industryfor F&B industryfor F&B industry.... The barriers of entry for
the F&B industry are considered low given the low start-up
costs. However, we view customer service and branding as the
most critical success factors within the F&B industry as
increasingly affluent Malaysian consumers are less price-
sensitive now, but are more focused on brands, product quality
(both food/coffee quality and restaurant’s ambience) and
customer service. Building a strong brand via a differentiation
strategy within the F&B industry could act as a barrier to entry
to new players.
Buyers have hBuyers have hBuyers have hBuyers have high igh igh igh bbbbargaining powerargaining powerargaining powerargaining power.... Broadly, consumers’
spending behavior is greatly affected by their disposable
income, which depends on the general economy. As
consumers are increasingly discerning with heightened
awareness on consumer rights, their bargaining power in the
F&B industry is high due to low switching costs. To mitigate
this risk, Oldtown is focusing on building brand loyalty among
customers via consistent good product quality and customer
service.
Supplies have moderate Supplies have moderate Supplies have moderate Supplies have moderate bargaining powerbargaining powerbargaining powerbargaining power.... On the other hand,
suppliers in the F&B industry have moderate bargaining power
due to the trading nature of commoditised raw materials such
as flour, coffee beans and sugar, which depend on global
supply and demand dynamics. Oldtown sources 80% of its
coffee requirements from overseas markets, such as Brazil and
Indonesia, on a 6-12 months contract basis. Together with its
typical inventory level of 6-9 months, this enables the group to
manage its costs and ASPs more efficiently.
Competitive Strengths
Strong eStrong eStrong eStrong economies of scaleconomies of scaleconomies of scaleconomies of scale. Oldtown enjoys much better
economies of scales with 208 local outlets, which is
significantly higher than its competitors in the local café chain
industry. This puts the group at an advantage to compete in
the highly competitive F&B market, especially with the rising
number of specialty café outlets mushrooming in Klang Valley
over the past 1-2 years.
EXHIBIT 6: Top café chain operators by # of outlets
Sources: Companies
Best proxy toBest proxy toBest proxy toBest proxy to white coffee wavewhite coffee wavewhite coffee wavewhite coffee wave. For FMCG, Oldtown has an
established brand name with strong market recognition as the
best white coffee brand since its inception. Given the
increasing number of Asian coffee drinkers switching from
black coffee to white coffee, Oldtown is well positioned to
capitalise on this trend. According to Nielson Malaysia’s studies
in 2013, as a percentage of total coffee mix sales, white coffee
mix sales has increased from 29% to 31% and 35% in Hong
Kong and Malaysia, respectively. For Singapore, white coffee
sales made up 42% of total coffee mix sales in 2013, rising
from 37% in 2012.
Age 0-1452.2%
Age 15-197.9%
Age 20-2913.5%
Age 30-3911.3%
Age 40-499.1%
Age 50-596.0%
# of outlets# of outlets# of outlets# of outlets %%%%
1 Secret Recipe 263 26%
2222 Old Town White CoffeeOld Town White CoffeeOld Town White CoffeeOld Town White Coffee 208208208208 21%21%21%21%
3 Starbucks Coffee 150 15%
4 Subway Sandwiches 84 8%
5 Pappa Rich 71 7%
6 Coffee Bean & Tea Leaf 59 6%
7 Station 1 Leisure Café 31 3%
8 Hailam Kopitiam 30 3%
9 San Francisco Coffee 35 4%
10 Dome Café 21 2%
11 Gloria Jean's Coffee 21 2%
12 Killiney Kopitiam 10 1%
13 Kluang Station 10 1%
14 Georgetown White Coffee 7 1%
Tota lTota lTota lTota l 1,0001,0001,0001,000 100%100%100%100%
Page 4
Company Focus
OldTown Berhad
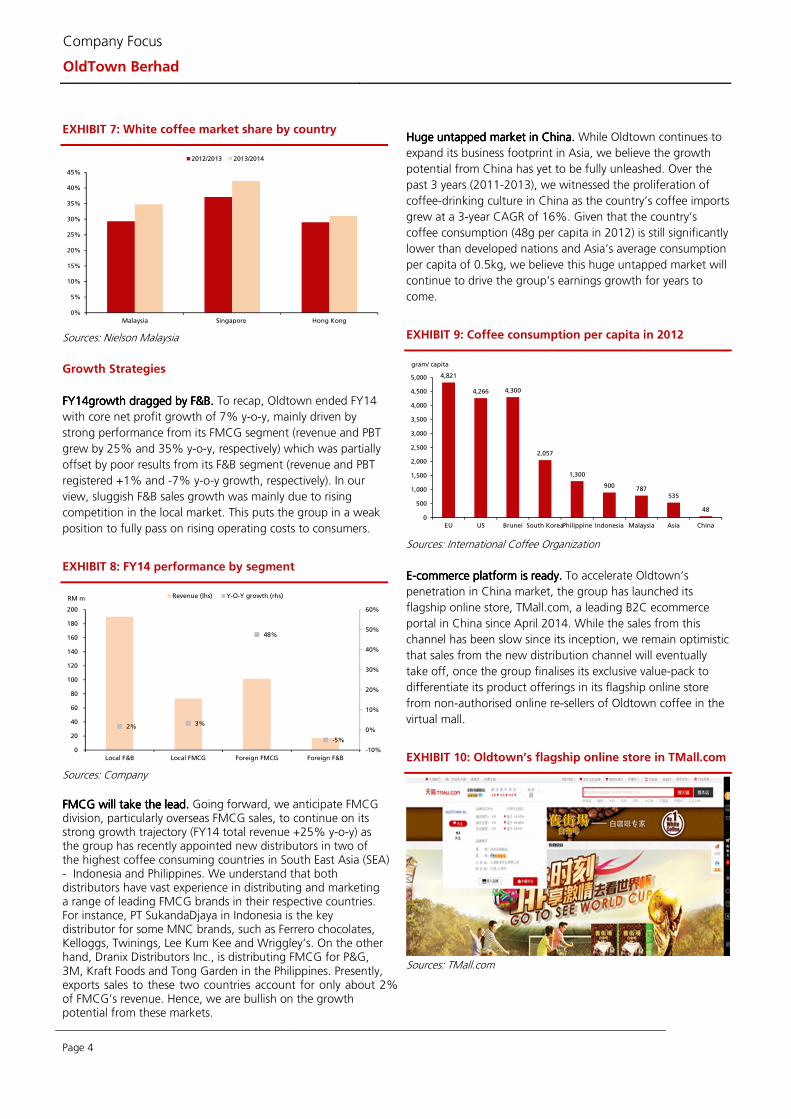
EXHIBIT 7: White coffee market share by country
Sources: Nielson Malaysia
Growth Strategies
FY14FY14FY14FY14growth dragged by growth dragged by growth dragged by growth dragged by F&BF&BF&BF&B.... To recap, Oldtown ended FY14
with core net profit growth of 7% y-o-y, mainly driven by
strong performance from its FMCG segment (revenue and PBT
grew by 25% and 35% y-o-y, respectively) which was partially
offset by poor results from its F&B segment (revenue and PBT
registered +1% and -7% y-o-y growth, respectively). In our
view, sluggish F&B sales growth was mainly due to rising
competition in the local market. This puts the group in a weak
position to fully pass on rising operating costs to consumers.
EXHIBIT 8: FY14 performance by segment
Sources: Company
FMCG will take the lead.FMCG will take the lead.FMCG will take the lead.FMCG will take the lead. Going forward, we anticipate FMCG division, particularly overseas FMCG sales, to continue on its strong growth trajectory (FY14 total revenue +25% y-o-y) as the group has recently appointed new distributors in two of the highest coffee consuming countries in South East Asia (SEA) - Indonesia and Philippines. We understand that both distributors have vast experience in distributing and marketing a range of leading FMCG brands in their respective countries. For instance, PT SukandaDjaya in Indonesia is the key distributor for some MNC brands, such as Ferrero chocolates, Kelloggs, Twinings, Lee Kum Kee and Wriggley’s. On the other hand, Dranix Distributors Inc., is distributing FMCG for P&G, 3M, Kraft Foods and Tong Garden in the Philippines. Presently, exports sales to these two countries account for only about 2% of FMCG’s revenue. Hence, we are bullish on the growth potential from these markets.
Huge untapped market inHuge untapped market inHuge untapped market inHuge untapped market in China.China.China.China. While Oldtown continues to
expand its business footprint in Asia, we believe the growth
potential from China has yet to be fully unleashed. Over the
past 3 years (2011-2013), we witnessed the proliferation of
coffee-drinking culture in China as the country’s coffee imports
grew at a 3-year CAGR of 16%. Given that the country’s
coffee consumption (48g per capita in 2012) is still significantly
lower than developed nations and Asia’s average consumption
per capita of 0.5kg, we believe this huge untapped market will
continue to drive the group’s earnings growth for years to
come.
EXHIBIT 9: Coffee consumption per capita in 2012
Sources: International Coffee Organization
EEEE----commerce commerce commerce commerce platform is readyplatform is readyplatform is readyplatform is ready.... To accelerate Oldtown’s
penetration in China market, the group has launched its
flagship online store, TMall.com, a leading B2C ecommerce
portal in China since April 2014. While the sales from this
channel has been slow since its inception, we remain optimistic
that sales from the new distribution channel will eventually
take off, once the group finalises its exclusive value-pack to
differentiate its product offerings in its flagship online store
from non-authorised online re-sellers of Oldtown coffee in the
virtual mall.
EXHIBIT 10: Oldtown’s flagship online store in TMall.com
Sources: TMall.com
0%
5%
10%
15%
20%
25%
30%
35%
40%
45%
Malaysia Singapore Hong Kong
2012/2013 2013/2014
2% 3%
48%
-5%
-10%
0%
10%
20%
30%
40%
50%
60%
0
20
40
60
80
100
120
140
160
180
200
Local F&B Local FMCG Foreign FMCG Foreign F&B
Revenue (lhs) Y-O-Y growth (rhs)RM m
4,821
4,266 4,300
2,057
1,300
900787
535
48
0
500
1,000
1,500
2,000
2,500
3,000
3,500
4,000
4,500
5,000
EU US Brunei South KoreaPhilippine Indonesia Malaysia Asia China
gram/ capita
Page 5
Company Focus
OldTown Berhad
F&B F&B F&B F&B is is is is likely to take a back seat. likely to take a back seat. likely to take a back seat. likely to take a back seat. For the F&B segment, we
sense that expansion plans for its existing markets (Malaysia,
China, Singapore and Indonesia) is likely to be slow following
weak same store sales (SSS) growth of 2% in FY14 due to
weak local consumer sentiment and stiff competition.
Nonetheless, we are positive on the group’s recent venture
into Australia’s F&B market via a master licensing agreement
(5+5 year) with OTK (AUSTRALIA) SDN BHD and Mr Leong
Kwan Yew (both referred to Master Licensee).
Australia venture is a sweet deal.Australia venture is a sweet deal.Australia venture is a sweet deal.Australia venture is a sweet deal. Under the agreement, the
Master Licensee shall at its own cost build and operate a
distribution centre and a central kitchen to support the
operation, while Oldtown will receive (1) a non-refundable
license fee of USD200k, (2) outlet opening fee of USD20k per
outlet within Australia, (3) 3% royalty fees on monthly gross
sales (2% for the first 2 years of the pilot outlet), and (4)
market development fund of 1% of monthly gross sales. This
coupled with its option to purchase 19-51% shareholding of
the Master Licensee’s businesses and operations at any time
during the last 12 months of any of the 5-year term of the
agreement, has limited business risk and provides huge
business opportunities to the group in expanding its overseas
F&B operations.
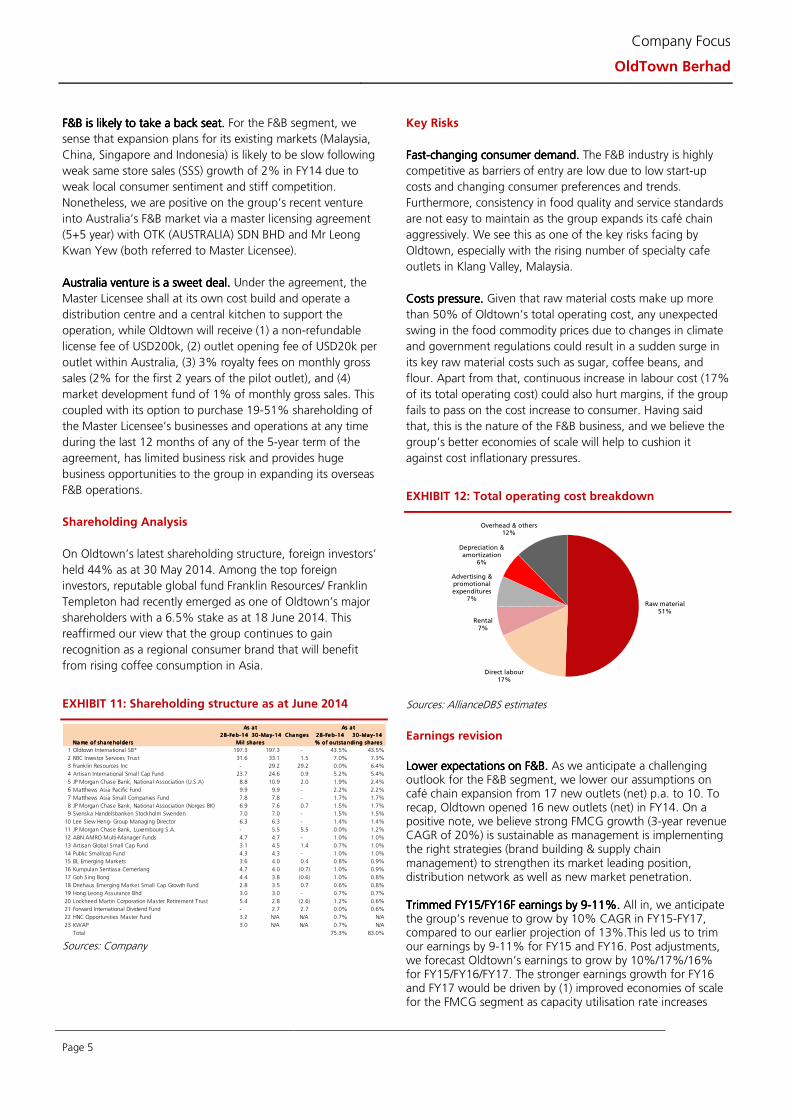
Shareholding Analysis
On Oldtown’s latest shareholding structure, foreign investors’
held 44% as at 30 May 2014. Among the top foreign
investors, reputable global fund Franklin Resources/ Franklin
Templeton had recently emerged as one of Oldtown’s major
shareholders with a 6.5% stake as at 18 June 2014. This
reaffirmed our view that the group continues to gain
recognition as a regional consumer brand that will benefit
from rising coffee consumption in Asia.
EXHIBIT 11: Shareholding structure as at June 2014
Sources: Company
Key Risks
FastFastFastFast----changing consumer demandchanging consumer demandchanging consumer demandchanging consumer demand.... The F&B industry is highly
competitive as barriers of entry are low due to low start-up
costs and changing consumer preferences and trends.
Furthermore, consistency in food quality and service standards
are not easy to maintain as the group expands its café chain
aggressively. We see this as one of the key risks facing by
Oldtown, especially with the rising number of specialty cafe
outlets in Klang Valley, Malaysia.
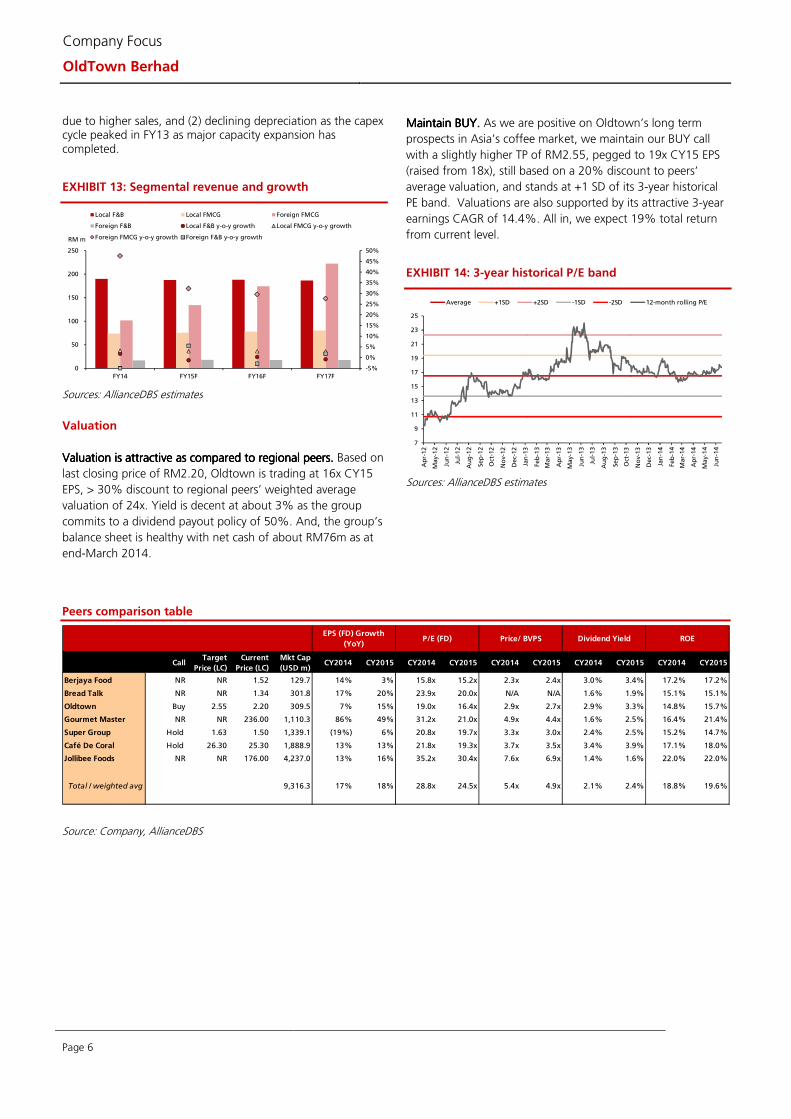
Costs pressure. Costs pressure. Costs pressure. Costs pressure. Given that raw material costs make up more
than 50% of Oldtown’s total operating cost, any unexpected
swing in the food commodity prices due to changes in climate
and government regulations could result in a sudden surge in
its key raw material costs such as sugar, coffee beans, and
flour. Apart from that, continuous increase in labour cost (17%
of its total operating cost) could also hurt margins, if the group
fails to pass on the cost increase to consumer. Having said
that, this is the nature of the F&B business, and we believe the
group’s better economies of scale will help to cushion it
against cost inflationary pressures.
EXHIBIT 12: Total operating cost breakdown
Sources: AllianceDBS estimates
Earnings revision
Lower expectations on F&B.Lower expectations on F&B.Lower expectations on F&B.Lower expectations on F&B. As we anticipate a challenging outlook for the F&B segment, we lower our assumptions on café chain expansion from 17 new outlets (net) p.a. to 10. To recap, Oldtown opened 16 new outlets (net) in FY14. On a positive note, we believe strong FMCG growth (3-year revenue CAGR of 20%) is sustainable as management is implementing the right strategies (brand building & supply chain management) to strengthen its market leading position, distribution network as well as new market penetration. TrimTrimTrimTrimmedmedmedmed FY15/FY16FY15/FY16FY15/FY16FY15/FY16FFFF earnings by 9earnings by 9earnings by 9earnings by 9----11%11%11%11%.... All in, we anticipate the group’s revenue to grow by 10% CAGR in FY15-FY17, compared to our earlier projection of 13%.This led us to trim our earnings by 9-11% for FY15 and FY16. Post adjustments, we forecast Oldtown’s earnings to grow by 10%/17%/16% for FY15/FY16/FY17. The stronger earnings growth for FY16 and FY17 would be driven by (1) improved economies of scale for the FMCG segment as capacity utilisation rate increases
28-Fe b-1428-Fe b-1428-Fe b-1428-Fe b-14 30-Ma y-1430-Ma y-1430-Ma y-1430-Ma y-14 Cha nge sCha nge sCha nge sCha nge s 28-Fe b-1428-Fe b-1428-Fe b-1428-Fe b-14 30-Ma y-1430-Ma y-1430-Ma y-1430-Ma y-14
Na me o f sha re holde rsNa me o f sha re holde rsNa me o f sha re holde rsNa me o f sha re holde rs
1 Oldtown International SB* 197.3 197.3 - 43.5% 43.5%
2 RBC Investor Services Trust 31.6 33.1 1.5 7.0% 7.3%
3 Franklin Resources Inc - 29.2 29.2 0.0% 6.4%
4 Artisan International Small Cap Fund 23.7 24.6 0.9 5.2% 5.4%
5 JP Morgan Chase Bank, National Association (U.S.A) 8.8 10.9 2.0 1.9% 2.4%
6 Matthews Asia Pacific Fund 9.9 9.9 - 2.2% 2.2%
7 Matthews Asia Small Companies Fund 7.8 7.8 - 1.7% 1.7%
8 JP Morgan Chase Bank, National Association (Norges BK) 6.9 7.6 0.7 1.5% 1.7%
9 Svenska Handelsbanken Stockholm Swenden 7.0 7.0 - 1.5% 1.5%
10 Lee Siew Heng- Group Managing Director 6.3 6.3 - 1.4% 1.4%
11 JP Morgan Chase Bank, Luxembourg S.A. - 5.5 5.5 0.0% 1.2%
12 ABN AMRO Multi-Manager Funds 4.7 4.7 - 1.0% 1.0%
13 Artisan Global Small Cap Fund 3.1 4.5 1.4 0.7% 1.0%
14 Public Smallcap Fund 4.3 4.3 - 1.0% 1.0%
15 BL Emerging Markets 3.6 4.0 0.4 0.8% 0.9%
16 Kumpulan Sentiasa Cemerlang 4.7 4.0 (0.7) 1.0% 0.9%
17 Goh Sing Bong 4.4 3.8 (0.6) 1.0% 0.8%
18 Driehaus Emerging Market Small Cap Growth Fund 2.8 3.5 0.7 0.6% 0.8%
19 Hong Leong Assurance Bhd 3.0 3.0 - 0.7% 0.7%
20 Lockheed Martin Corporation Master Retirement Trust 5.4 2.8 (2.6) 1.2% 0.6%
21 Forward International Dividend Fund - 2.7 2.7 0.0% 0.6%
22 HNC Opportunities Master Fund 3.2 N/A N/A 0.7% N/A
23 KWAP 3.0 N/A N/A 0.7% N/A
Total 75.3% 83.0%
As a tAs a tAs a tAs a t As a tAs a tAs a tAs a t
Mi l sha re sMi l sha re sMi l sha re sMi l sha re s % o f outsta nding sha re s% o f outsta nding sha re s% o f outsta nding sha re s% o f outsta nding sha re s
Raw material51%
Direct labour17%
Rental7%
Advertising & promotional expenditures
7%
Depreciation & amortization
6%
Overhead & others12%
Page 6
Company Focus
OldTown Berhad
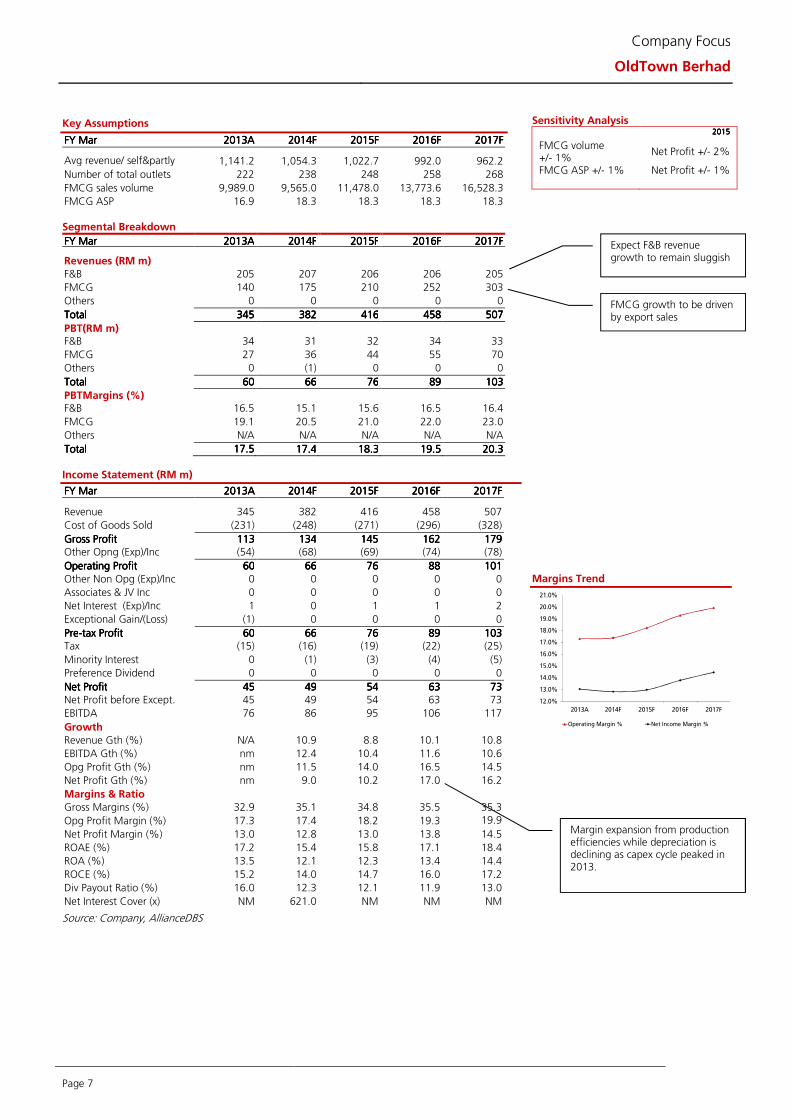
due to higher sales, and (2) declining depreciation as the capex cycle peaked in FY13 as major capacity expansion has completed.
EXHIBIT 13: Segmental revenue and growth
Sources: AllianceDBS estimates
Valuation
Valuation is attractive as compared to regional peersValuation is attractive as compared to regional peersValuation is attractive as compared to regional peersValuation is attractive as compared to regional peers.... Based on
last closing price of RM2.20, Oldtown is trading at 16x CY15
EPS, > 30% discount to regional peers’ weighted average
valuation of 24x. Yield is decent at about 3% as the group
commits to a dividend payout policy of 50%. And, the group’s
balance sheet is healthy with net cash of about RM76m as at
end-March 2014.
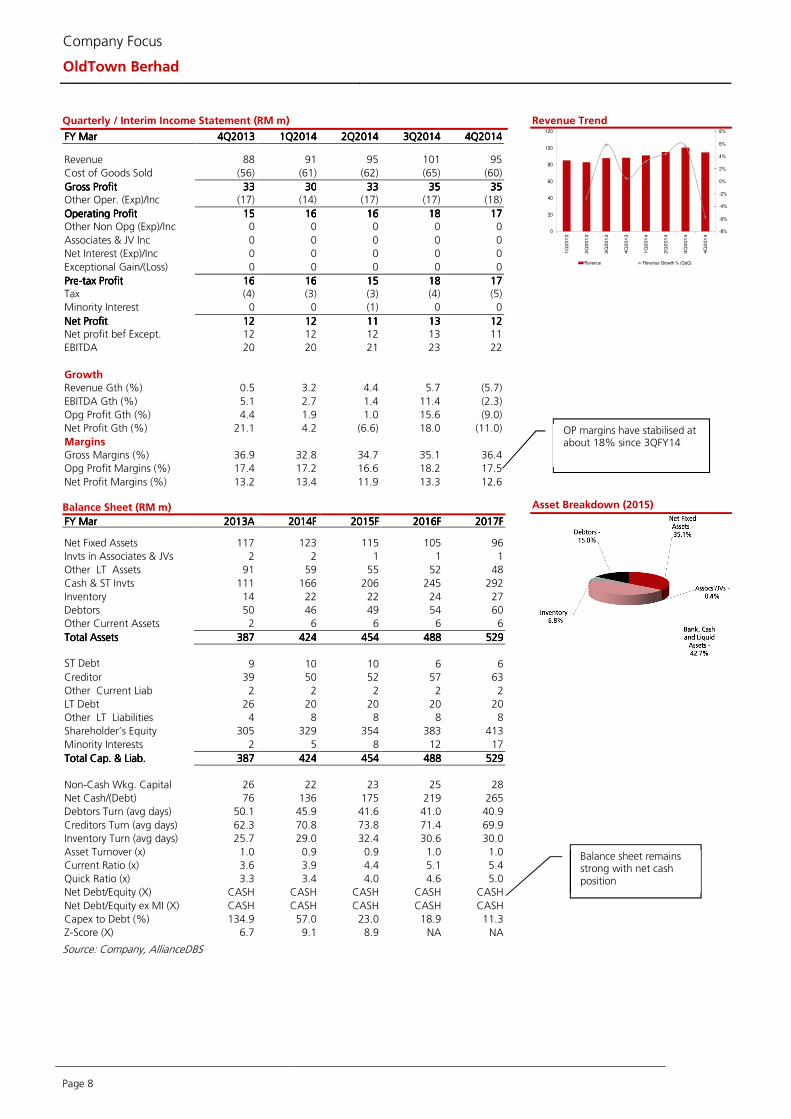
Maintain BUY.Maintain BUY.Maintain BUY.Maintain BUY. As we are positive on Oldtown’s long term
prospects in Asia’s coffee market, we maintain our BUY call
with a slightly higher TP of RM2.55, pegged to 19x CY15 EPS
(raised from 18x), still based on a 20% discount to peers’
average valuation, and stands at +1 SD of its 3-year historical
PE band. Valuations are also supported by its attractive 3-year
earnings CAGR of 14.4%. All in, we expect 19% total return
from current level.
EXHIBIT 14: 3-year historical P/E band
Sources: AllianceDBS estimates
Peers comparison table
Source: Company, AllianceDBS
-5%
0%
5%
10%
15%
20%
25%
30%
35%
40%
45%
50%
0
50
100
150
200
250
FY14 FY15F FY16F FY17F
Local F&B Local FMCG Foreign FMCG
Foreign F&B Local F&B y-o-y growth Local FMCG y-o-y growth
Foreign FMCG y-o-y growth Foreign F&B y-o-y growthRM m
7
9
11
13
15
17
19
21
23
25
Apr-
12
May-1
2
Jun-1
2
Jul-12
Aug-1
2
Sep-1
2
Oct
-12
Nov-1
2
Dec-
12
Jan-1
3
Feb-1
3
Mar-
13
Apr-
13
May-1
3
Jun-1
3
Jul-13
Aug-1
3
Sep-1
3
Oct
-13
Nov-1
3
Dec-
13
Jan-1
4
Feb-1
4
Mar-
14
Apr-
14
May-1
4
Jun-1
4
Average +1SD +2SD -1SD -2SD 12-month rolling P/E
CallTarget
Price (LC)
Current
Price (LC)
Mkt Cap
(USD m)CY2014 CY2015 CY2014 CY2015 CY2014 CY2015 CY2014 CY2015 CY2014 CY2015
Berjaya Food NR NR 1.52 129.7 14% 3% 15.8x 15.2x 2.3x 2.4x 3.0% 3.4% 17.2% 17.2%
Bread Talk NR NR 1.34 301.8 17% 20% 23.9x 20.0x N/A N/A 1.6% 1.9% 15.1% 15.1%
Oldtown Buy 2.55 2.20 309.5 7% 15% 19.0x 16.4x 2.9x 2.7x 2.9% 3.3% 14.8% 15.7%
Gourmet Master NR NR 236.00 1,110.3 86% 49% 31.2x 21.0x 4.9x 4.4x 1.6% 2.5% 16.4% 21.4%
Super Group Hold 1.63 1.50 1,339.1 (19%) 6% 20.8x 19.7x 3.3x 3.0x 2.4% 2.5% 15.2% 14.7%
Café De Coral Hold 26.30 25.30 1,888.9 13% 13% 21.8x 19.3x 3.7x 3.5x 3.4% 3.9% 17.1% 18.0%
Jollibee Foods NR NR 176.00 4,237.0 13% 16% 35.2x 30.4x 7.6x 6.9x 1.4% 1.6% 22.0% 22.0%
Total / weighted avg 9,316.3 17% 18% 28.8x 24.5x 5.4x 4.9x 2.1% 2.4% 18.8% 19.6%
EPS (FD) Growth
(YoY)P/E (FD) Price/ BVPS Dividend Yield ROE
Page 7
Company Focus
OldTown Berhad
Key Assumptions
FY FY FY FY MarMarMarMar 2013201320132013AAAA 2014201420142014FFFF 2015201520152015FFFF 2016201620162016FFFF 2017201720172017FFFF
Avg revenue/ self&partly owned outlet (RM k/yr)
1,141.2 1,054.3 1,022.7 992.0 962.2
Number of total outlets 222 238 248 258 268
FMCG sales volume 9,989.0 9,565.0 11,478.0 13,773.6 16,528.3
FMCG ASP 16.9 18.3 18.3 18.3 18.3 Segmental Breakdown
FY FY FY FY MarMarMarMar 2013201320132013AAAA 2014201420142014FFFF 2015201520152015FFFF 2016201620162016FFFF 2017201720172017FFFF Revenues (RM m)
F&B 205 207 206 206 205
FMCG 140 175 210 252 303
Others 0 0 0 0 0
TotalTotalTotalTotal 345345345345 382382382382 416416416416 458458458458 507507507507
PBT(RM m) F&B 34 31 32 34 33
FMCG 27 36 44 55 70
Others 0 (1) 0 0 0
TotalTotalTotalTotal 60606060 66666666 76767676 89898989 103103103103
PBTMargins (%) F&B 16.5 15.1 15.6 16.5 16.4
FMCG 19.1 20.5 21.0 22.0 23.0
Others N/A N/A N/A N/A N/A
TotalTotalTotalTotal 17.517.517.517.5 17.417.417.417.4 18.318.318.318.3 19.519.519.519.5 20.320.320.320.3
Income Statement (RM m)
FY FY FY FY MarMarMarMar 2013201320132013AAAA 2014201420142014FFFF 2015201520152015FFFF 2016201620162016FFFF 2017201720172017FFFF
Revenue 345 382 416 458 507
Cost of Goods Sold (231) (248) (271) (296) (328)
Gross ProfitGross ProfitGross ProfitGross Profit 113113113113 134134134134 145145145145 162162162162 179179179179 Other Opng (Exp)/Inc (54) (68) (69) (74) (78)
Operating ProfitOperating ProfitOperating ProfitOperating Profit 60606060 66666666 76767676 88888888 101101101101
Other Non Opg (Exp)/Inc 0 0 0 0 0
Associates & JV Inc 0 0 0 0 0
Net Interest (Exp)/Inc 1 0 1 1 2
Exceptional Gain/(Loss) (1) 0 0 0 0
PrePrePrePre----tax Profittax Profittax Profittax Profit 60606060 66666666 76767676 89898989 103103103103 Tax (15) (16) (19) (22) (25)
Minority Interest 0 (1) (3) (4) (5)
Preference Dividend 0 0 0 0 0
Net ProfitNet ProfitNet ProfitNet Profit 45454545 49494949 54545454 63636363 73737373 Net Profit before Except. 45 49 54 63 73
EBITDA 76 86 95 106 117
Growth
Revenue Gth (%) N/A 10.9 8.8 10.1 10.8
EBITDA Gth (%) nm 12.4 10.4 11.6 10.6
Opg Profit Gth (%) nm 11.5 14.0 16.5 14.5
Net Profit Gth (%) nm 9.0 10.2 17.0 16.2
Margins & Ratio
Gross Margins (%) 32.9 35.1 34.8 35.5 35.3
Opg Profit Margin (%) 17.3 17.4 18.2 19.3 19.9
Net Profit Margin (%) 13.0 12.8 13.0 13.8 14.5
ROAE (%) 17.2 15.4 15.8 17.1 18.4
ROA (%) 13.5 12.1 12.3 13.4 14.4
ROCE (%) 15.2 14.0 14.7 16.0 17.2
Div Payout Ratio (%) 16.0 12.3 12.1 11.9 13.0
Net Interest Cover (x) NM 621.0 NM NM NM
Source: Company, AllianceDBS
Sensitivity Analysis 2012012012015555
FMCG volume +/- 1%
Net Profit +/- 2%
FMCG ASP +/- 1% Net Profit +/- 1%
Margins Trend
12.0%
13.0%
14.0%
15.0%
16.0%
17.0%
18.0%
19.0%
20.0%
21.0%
2013A 2014F 2015F 2016F 2017F
Operating Margin % Net Income Margin %
Expect F&B revenue growth to remain sluggish
FMCG growth to be driven by export sales
Margin expansion from production efficiencies while depreciation is declining as capex cycle peaked in 2013.
Page 8
Company Focus
OldTown Berhad
Quarterly / Interim Income Statement (RM m)
FY FY FY FY MarMarMarMar 4Q4Q4Q4Q2013201320132013 1Q1Q1Q1Q2014201420142014 2Q2Q2Q2Q2014201420142014 3Q3Q3Q3Q2014201420142014 4Q4Q4Q4Q2014201420142014
Revenue 88 91 95 101 95
Cost of Goods Sold (56) (61) (62) (65) (60)
Gross ProfitGross ProfitGross ProfitGross Profit 33333333 30303030 33333333 35353535 35353535 Other Oper. (Exp)/Inc (17) (14) (17) (17) (18)
Operating ProfitOperating ProfitOperating ProfitOperating Profit 15151515 16161616 16161616 18181818 17171717 Other Non Opg (Exp)/Inc 0 0 0 0 0
Associates & JV Inc 0 0 0 0 0
Net Interest (Exp)/Inc 0 0 0 0 0
Exceptional Gain/(Loss) 0 0 0 0 0
PrePrePrePre----tax Profittax Profittax Profittax Profit 16161616 16161616 15151515 18181818 17171717 Tax (4) (3) (3) (4) (5)
Minority Interest 0 0 (1) 0 0
Net ProfitNet ProfitNet ProfitNet Profit 12121212 12121212 11111111 13131313 12121212 Net profit bef Except. 12 12 12 13 11
EBITDA 20 20 21 23 22
Growth
Revenue Gth (%) 0.5 3.2 4.4 5.7 (5.7)
EBITDA Gth (%) 5.1 2.7 1.4 11.4 (2.3)
Opg Profit Gth (%) 4.4 1.9 1.0 15.6 (9.0)
Net Profit Gth (%) 21.1 4.2 (6.6) 18.0 (11.0)
Margins Gross Margins (%) 36.9 32.8 34.7 35.1 36.4
Opg Profit Margins (%) 17.4 17.2 16.6 18.2 17.5
Net Profit Margins (%) 13.2 13.4 11.9 13.3 12.6 Balance Sheet (RM m)
FY FY FY FY MarMarMarMar 2013201320132013AAAA 2014201420142014FFFF 2015201520152015FFFF 2016201620162016FFFF 2017201720172017FFFF Net Fixed Assets 117 123 115 105 96
Invts in Associates & JVs 2 2 1 1 1
Other LT Assets 91 59 55 52 48
Cash & ST Invts 111 166 206 245 292
Inventory 14 22 22 24 27
Debtors 50 46 49 54 60
Other Current Assets 2 6 6 6 6
Total AssetsTotal AssetsTotal AssetsTotal Assets 387387387387 424424424424 454454454454 488488488488 529529529529
ST Debt
9 10 10 6 6
Creditor 39 50 52 57 63
Other Current Liab 2 2 2 2 2
LT Debt 26 20 20 20 20
Other LT Liabilities 4 8 8 8 8
Shareholder’s Equity 305 329 354 383 413
Minority Interests 2 5 8 12 17
Total Cap. &Total Cap. &Total Cap. &Total Cap. & Liab.Liab.Liab.Liab. 387387387387 424424424424 454454454454 488488488488 529529529529
Non-Cash Wkg. Capital 26 22 23 25 28
Net Cash/(Debt) 76 136 175 219 265
Debtors Turn (avg days) 50.1 45.9 41.6 41.0 40.9
Creditors Turn (avg days) 62.3 70.8 73.8 71.4 69.9
Inventory Turn (avg days) 25.7 29.0 32.4 30.6 30.0
Asset Turnover (x) 1.0 0.9 0.9 1.0 1.0
Current Ratio (x) 3.6 3.9 4.4 5.1 5.4
Quick Ratio (x) 3.3 3.4 4.0 4.6 5.0
Net Debt/Equity (X) CASH CASH CASH CASH CASH
Net Debt/Equity ex MI (X) CASH CASH CASH CASH CASH
Capex to Debt (%) 134.9 57.0 23.0 18.9 11.3
Z-Score (X) 6.7 9.1 8.9 NA NA
Source: Company, AllianceDBS
Revenue Trend
Asset Breakdown (2015)
-8%
-6%
-4%
-2%
0%
2%
4%
6%
8%
0
20
40
60
80
100
120
1Q
201
3
2Q
201
3
3Q
201
3
4Q
201
3
1Q
201
4
2Q
201
4
3Q
201
4
4Q
201
4
Revenue Revenue Growth % (QoQ)
OP margins have stabilised at about 18% since 3QFY14
Balance sheet remains strong with net cash position
Page 9
Company Focus
OldTown Berhad
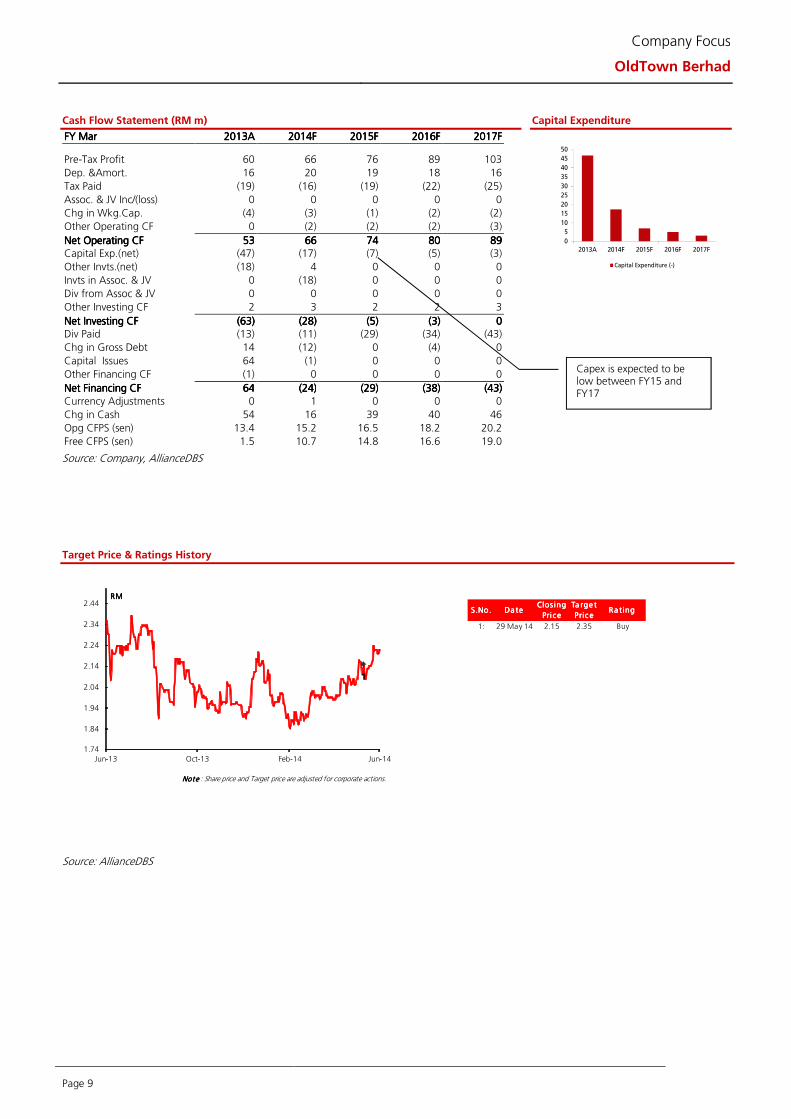
Cash Flow Statement (RM m)
FY FY FY FY MarMarMarMar 2013201320132013AAAA 2014201420142014FFFF 2015201520152015FFFF 2016201620162016FFFF 2017201720172017FFFF
Pre-Tax Profit 60 66 76 89 103
Dep. &Amort. 16 20 19 18 16
Tax Paid (19) (16) (19) (22) (25)
Assoc. & JV Inc/(loss) 0 0 0 0 0
Chg in Wkg.Cap. (4) (3) (1) (2) (2)
Other Operating CF 0 (2) (2) (2) (3)
Net Operating CFNet Operating CFNet Operating CFNet Operating CF 53535353 66666666 74747474 80808080 89898989 Capital Exp.(net) (47) (17) (7) (5) (3)
Other Invts.(net) (18) 4 0 0 0
Invts in Assoc. & JV 0 (18) 0 0 0
Div from Assoc & JV 0 0 0 0 0
Other Investing CF 2 3 2 2 3
Net Investing CFNet Investing CFNet Investing CFNet Investing CF (63)(63)(63)(63) (28)(28)(28)(28) (5)(5)(5)(5) (3)(3)(3)(3) 0000 Div Paid (13) (11) (29) (34) (43)
Chg in Gross Debt 14 (12) 0 (4) 0
Capital Issues 64 (1) 0 0 0
Other Financing CF (1) 0 0 0 0
Net Financing CFNet Financing CFNet Financing CFNet Financing CF 64646464 (24)(24)(24)(24) (29)(29)(29)(29) (38)(38)(38)(38) (43)(43)(43)(43)
Currency Adjustments 0 1 0 0 0
Chg in Cash 54 16 39 40 46
Opg CFPS (sen) 13.4 15.2 16.5 18.2 20.2
Free CFPS (sen) 1.5 10.7 14.8 16.6 19.0
Source: Company, AllianceDBS
Capital Expenditure
Target Price & Ratings History
Source: AllianceDBS
0
5
10
15
20
25
30
35
40
45
50
2013A 2014F 2015F 2016F 2017F
Capital Expenditure (-)
S.No.S.No.S.No.S.No. Da teDa teDa teDa teClos ing Clos ing Clos ing Clos ing
Pri cePri cePri cePri ce
Ta rge t Ta rge t Ta rge t Ta rge t
Pric ePric ePric ePric eRa ting Ra ting Ra ting Ra ting
1: 29 May 14 2.15 2.35 Buy
Note Note Note Note : Share price and Target price are adjusted for corporate actions.
1
1.74
1.84
1.94
2.04
2.14
2.24
2.34
2.44
Jun-13 Oct-13 Feb-14 Jun-14
RMRMRMRM
Capex is expected to be low between FY15 and FY17
Page 10
Company Focus
OldTown Berhad
DISCLOSURE
Stock rating definitions STRONG BUY - > 20% total return over the next 3 months, with identifiable share price catalysts within this time frame BUY - > 15% total return over the next 12 months for small caps, >10% for large caps HOLD - -10% to +15% total return over the next 12 months for small caps, -10% to +10% for large caps FULLY VALUED - negative total return > -10% over the next 12 months SELL - negative total return of > -20% over the next 3 months, with identifiable catalysts within this time frame Commonly used abbreviations Adex = advertising expenditure EPS = earnings per share PBT = profit before tax bn = billion EV = enterprise value P/B = price / book ratio BV = book value FCF = free cash flow P/E = price / earnings ratio CF = cash flow FV = fair value PEG = P/E ratio to growth ratio CAGR = compounded annual growth rate FY = financial year q-o-q = quarter-on-quarter Capex = capital expenditure m = million RM = Ringgit CY = calendar year M-o-m = month-on-month ROA = return on assets Div yld = dividend yield NAV = net assets value ROE = return on equity DCF = discounted cash flow NM = not meaningful TP = target price DDM = dividend discount model NTA = net tangible assets trn = trillion DPS = dividend per share NR = not rated WACC = weighted average cost of capital EBIT = earnings before interest & tax p.a. = per annum y-o-y = year-on-year EBITDA = EBIT before depreciation and amortisation PAT = profit after tax YTD = year-to-date
Page 11
Company Focus
OldTown Berhad
DISCLAIMER
This report has been prepared for information purposes only by AllianceDBS Research Sdn Bhd (“ADBSR”) (formerly known as HwangDBS Vickers Research Sdn Bhd), a subsidiary of Alliance Investment Bank Berhad (“AIBB”) and an associate of DBS Vickers Securities Holdings Pte Ltd (“DBSVH”). DBSVH is a wholly-owned subsidiary of DBS Bank Ltd. This report is strictly confidential and is meant for circulation to clients of ADBSR, AIBB and DBSVH only or such persons as may be deemed eligible to receive such research report, information or opinion contained herein. Receipt and review of this report indicate your agreement not to distribute, reproduce or disclose in any other form or medium (whether electronic or otherwise) the contents, views, information or opinions contained herein without the prior written consent of ADBSR. This report is based on data and information obtained from various sources believed to be reliable at the time of issuance of this report and any opinion expressed herein is subject to change without prior notice and may differ or be contrary to opinions expressed by ADBSR’s affiliates and/or related parties. ADBSR does not make any guarantee, representation or warranty (whether express or implied) as to the accuracy, completeness, reliability or fairness of the data and information obtained from such sources as may be contained in this report. As such, neither ADBSR nor its affiliates and/or related parties shall be held liable or responsible in any manner whatsoever arising out of or in connection with the reliance and usage of such data and information or third party references as may be made in this report (including, but not limited to any direct, indirect or consequential losses, loss of profits and damages). The views expressed in this report reflect the personal views of the analyst(s) about the subject securities or issuers and no part of the compensation of the analyst(s) was, is, or will be directly or indirectly related to the inclusion of specific recommendation(s) or view(s) in this report. ADBSR prohibits the analyst(s) who prepared this report from receiving any compensation, incentive or bonus based on specific investment banking transactions or providing a specific recommendation for, or view of, a particular company. This research report provides general information only and is not to be construed as an offer to sell or a solicitation to buy or sell any securities or other investments or any options, futures, derivatives or other instruments related to such securities or investments. In particular, it is highlighted that this report is not intended for nor does it have regard to the specific investment objectives, financial situation and particular needs of any specific person who may receive this report. Investors are therefore advised to make their own independent evaluation of the information contained in this report, consider their own individual investment objectives, financial situations and particular needs and consult their own professional advisers (including but not limited to financial, legal and tax advisers) regarding the appropriateness of investing in any securities or investments that may be featured in this report. ADBSR, AIBB, DBSVH and DBS Bank Ltd, their directors, representatives and employees or any of their affiliates or their related parties may, from time to time, have an interest in the securities mentioned in this report. AIBB, DBSVH and DBS Bank Ltd, their affiliates and/or their related persons may do and/or seek to do business with the company(ies) covered in this report and may from time to time act as market maker or have assumed an underwriting commitment in securities of such company(ies), may sell or buy such securities from customers on a principal basis and may also perform or seek to perform significant investment banking, advisory or underwriting services for or relating to such company(ies) as well as solicit such investment, advisory or other services from any entity mentioned in this report. AIBB, DBSVH, DBS Bank Ltd (which carries on, inter alia, corporate finance activities) and their activities are separate from ADBSR. AIBB, DBSVH and DBS Bank Ltd may have no input into company-specific coverage decisions (i.e. whether or not to initiate or terminate coverage of a particular company or securities in reports produced by ADBSR) and ADBSR does not take into account investment banking revenues or potential revenues when making company-specific coverage decisions. ADBSR, AIBB, DBSVH, DBS Bank Ltd and/or other affiliates of DBS Vickers Securities (USA) Inc (“DBSVUSA”), a U.S.-registered broker-dealer, may beneficially own a total of 1% or more of any class of common equity securities of the subject company mentioned in this report. ADBSR, AIBB, DBSVH, DBS Bank Ltd and/or other affiliates of DBSVUSA may, within the past 12 months, have received compensation and/or within the next 3 months seek to obtain compensation for investment banking services from the subject company. DBSVUSA does not have its own investment banking or research department, nor has it participated in any investment banking transaction as a manager or co-manager in the past twelve months. Any US persons wishing to obtain further information, including any clarification on disclosures in this disclaimer, or to effect a transaction in any security discussed in this report should contact DBSVUSA exclusively. DBS Vickers Securities (UK) Ltd is an authorised person in the meaning of the Financial Services and Markets Act and is regulated by The Financial Services Authority. Research distributed in the UK is intended only for institutional clients. In reviewing this report, an investor should be aware that any or all of the foregoing, among other things, may give rise to real or potential conflicts of interest. Additional information is, subject to the overriding issue of confidentiality, available upon request to enable an investor to make their own independent evaluation of the information contained herein.
Wong Ming Tek, Executive Director
Published and Printed by
AllianceDBS Research Sdn Bhd AllianceDBS Research Sdn Bhd AllianceDBS Research Sdn Bhd AllianceDBS Research Sdn Bhd (128540 U)
(formerly known as HWANGDBS Vickers Research Sdn Bhd)
19th Floor, Menara Multi-Purpose, Capital Square, 8 Jalan Munshi Abdullah, 50100 Kuala Lumpur, Malaysia.
Tel.: +603 2604 3333 Fax: +603 2604 3921 email : [email protected]