vtech holdings
TRANSCRIPT

www.jpmorganmarkets.com
Asia Pacific Equity Research12 February 2016
VTech Holdings▲ Neutral
Previous: Underweight
0303.HK, 303 HK
Upgrade to Neutral - proposed merger is positive long term
Price: HK$83.65
Price Target: HK$80.00
China
SMID-Caps
Leon Chik, CFA AC
(852) 2800-8590
Bloomberg JPMA CHIK <GO>
Christine Wang
(852) 2800-8528
J.P. Morgan Securities (Asia Pacific) Limited
YTD 1m 3m 12mAbs 4.1% 10.8% -7.1% -23.5%Rel 24.8% 20.8% 18.2% 10.8%
VTech Holdings (Reuters: 0303.HK, Bloomberg: 303 HK)
$ in mn, year-end Mar FY13A FY14A FY15A FY16E FY17ERevenue ($ mn) 1,858 1,899 1,880 1,927 2,043Net Profit ($ mn) 202 203 198 195 222EPS ($) 0.80 0.81 0.79 0.78 0.88DPS ($) 0.80 0.80 0.78 0.78 0.87Revenue growth (%) 4.1% 2.2% (1.0%) 2.5% 6.0%EPS growth (%) 5.5% 0.8% (2.5%) (1.5%) 13.8%ROCE 29.9% 29.8% 29.8% 31.2% 35.6%ROE 30.0% 30.0% 30.0% 31.4% 35.9%P/E (x) 13.4 13.3 13.6 13.8 12.2P/BV (x) 4.7 4.6 4.9 4.9 4.9EV/EBITDA (x) 10.5 10.4 10.8 11.1 9.8Dividend Yield 7.5% 7.5% 7.3% 7.2% 8.1%Source: Company data, Bloomberg, J.P. Morgan estimates.
Company DataShares O/S (mn) 249Market Cap ($ mn) 2,674Market Cap ($ mn) 2,674Price (HK$) 83.65Date Of Price 11 Feb 16Free Float(%) 64.3%3M - Avg daily vol (mn) 0.413M - Avg daily val (HK$ mn) 32.953M - Avg daily val ($ mn) 4.2HSCEI 7657.92Exchange Rate 7.79Price Target End Date 31-Dec-16Price Target (HK$) 80.00
See page 12 for analyst certification and important disclosures, including non-US analyst disclosures.J.P. Morgan does and seeks to do business with companies covered in its research reports. As a result, investors should be aware that the firm may have a conflict of interest that could affect the objectivity of this report. Investors should consider this report as only a single factor in making their investment decision.
70
90
110
130
HK$
Feb-15 May-15 Aug-15 Nov-15 Feb-16
Price Performance
0303.HK share price (HK$)
HSCEI (rebased)
We upgrade VTech from UW to Neutral as the potential merger with Leapfrog (LF) (if finalized) would make VTech a leader in the children’s ELP market.
VTech-LF merger has many attractions. Both V-Tech and LF have been offering similar products in the children’s electronic learning segment for 2 decades and have a similar presence in the key US markets (with VTech larger in the EU). This potential merger (if finalized) should give VTech more market share and shelf space for ELP globally. Any restructuring costs related to LF would not be that large as LF does not have manufacturing capacity or factory workforce. LF has a large R&D and marketing team that has developed many innovative products and this should enhance VTech’s strengths in low manufacturing. One of the biggest risks for VTech was if one of the top two major toy companies snapped up LF and revamped its product lines. This appears less likely now.
No changes to our estimates and PT. Our upgrade to Neutral is based on the assumption that the possible positive impact of this proposed merger justifies a less negative stance on VTech. We remove the stock from our AFL UW. We have not made any changes to our estimates and DCF valuation as we do not have sufficient information regarding the impact of LF to sales and profits of the potentially merged Vtech-LF entity. Profit contribution from incremental sales from LF is unlikely as LF has been making losses recently.
Valuation, PT and risks. VTech trades at 13.5x CY16E P/E. Our PT (Dec-16, DCF-based) of HK$80 implies fwd P/BV of 4.7x / fwd P/E of 12.0x (CY17E). Key upside risks are successful launch of new products in ELP division and recovery in demand for cordless phones in the US as the housing market recovers. A risk is the relatively attractive yield of 6-7% (based on 90-95% payout ratio) is vulnerable to earnings volatility.

2
Asia Pacific Equity Research12 February 2016
Leon Chik, CFA(852) [email protected]
Key catalysts for the stock price: Upside risks to our view: Downside risks to our view:
• Stronger demand in cordless phone
• Larger decline in raw material
prices in China
• Demand for ELP products increase
significantly
• The successful launch of new products in the ELP division
• A recovery in demand for cordless phones in the US as the
housing market recovers
• Increasing wage cost in China
• ELP growth decelerating
Key financial metrics FY13 FY14 FY15 FY16E FY17E Valuation and price target basis
Revenues (LC) 1,858 1,899 1,880 1,927 2,043 Our price target is based upon DCF methodology. The nature of
the industry leads us to apply a terminal growth of 1%. Revenue growth (%) 4.1% 2.2% -1.0% 2.5% 6.0%
EBITDA (LC) 257 257 251 242 275
EBITDA margin (%) 13.8% 13.6% 13.3% 12.5% 13.4%
Tax rate (%) 11% 11% 11% 11% 11%
Net profit (LC) 202 203 198 195 222
EPS (LC) 0.802 0.808 0.788 0.776 0.883
EPS growth (%) 5.5% 0.8% -2.5% -1.5% 14% Sales growth and GPM trends
DPS (LC) 0.80 0.80 0.78 0.78 0.87
BVPS (LC) 2.30 2.31 2.17 2.17 2.18
Operating cash flow (LC mn) 195 232 228 192 240
Free cash flow (LC mn) 179 201 195 158 206
Net margin (%) 10.8% 10.7% 10.5% 10.1% 10.1%
Sales/assets (X) 2.00 2.04 2.04 2.07 2.10
Debt/equity (%) 0.0% 0.0% 0.0% 0.0% 0.0%
Net debt/equity (%) -53.9% -56.1% -54.4% -48.5% -48.0%
ROE (%) 30% 30% 30% 31% 35.9%
Key model assumptions FY13 FY14 FY15E FY16E FY17E
Telecom sales gth -6% -6% 4% -4% -4%
ELP sales gth 11% 6% -10% -6% 4.%
CMS sales gth 9% 7% 6% 22% 17%
Source: Company and J.P. Morgan estimates. Source: Bloomberg, Company and J.P. Morgan estimates.
Sensitivity analysis EBITDA EPS JPMe vs. consensus, change in estimates
Sensitivity to FY16E FY17E FY16E FY17E EPS (LC) FY16E FY17E
Telecom sales (5%) 1.6% 1.5% 1.8% 1.6% JPMe old 0.83 0.85
ELP sales (5%) 1.7% 1.7% 1.9% 1.9% JPMe new 0.78 0.88
CMS sales (5%) 1.5% 1.7% 1.7% 1.8% % chg -6% 4%
1% chg in GM 7.9% 7.4% 8.8% 8.2% Consensus 0.82 0.87
Source: J.P. Morgan estimates. Source: Bloomberg, J.P. Morgan estimates.
VTech: Peer Valuations
Company Name Code
Price
(PT)
MCAP
US$MM
Vol
US$MM
1W
Chg
3M
Chg
15
P/E(x)
16E
P/E(x)
ROE
(%)
13E P/BV
(x)
Yld
(%)
Industrial companies
XINYI GLASS (OW) 868 HK 3.8 (6) 1,871 4.8 (3.1) (5.5) 7.7 6.4 11.1 1.3 4.0
KB CHEMICAL (OW) 148 HK 11 (17) 1,444 1.2 (3.3) (1.4) 7.2 5.8 7.3 0.3 4.6
SHENZHOU (OW) 2313 HK 38.9 (41) 6,184 10.3 (6.7) (3.7) 20.2 16.6 18.7 4.3 3.0
LM PAPER (OW) 2314 HK 4.27 (7) 2,499 3.4 (4.0) (10.9) 8.8 7.8 12.6 1.3 3.3
TECHTRONIC INDS (OW) 669 HK 28.25 (46) 6,641 13.5 (3.7) (7.2) 18.0 14.4 16.2 3.6 1.1
ND PAPER (OW) 2689 HK 4.49 (7.3) 2,690 6.4 (6.7) (7.2) 13.9 11.3 7.8 0.8 2.1
HAITIAN (OW) 1882 HK 9.17 (18) 1,876 2.8 (5.5) (32.3) 9.3 8.5 19.7 2.4 2.3
VTECH (UW) 303 HK 83.95 (80) 2,703 4.0 3.3 (6.5) 13.8 12.6 35.4 N/A 7.4
Average (3.7) (9.3) 12.4 10.4 16.1 2.0 3.5
Source: Bloomberg, Company data, J.P. Morgan estimates. Share prices are as of close of Feb 12, 2016
-2%-1%0%1%2%3%4%5%6%7%
30%30%31%31%32%32%33%33%34%34%
2012 2013 2014 2015 2016E 2017E
Gross margin (LHS)

3
Asia Pacific Equity Research12 February 2016
Leon Chik, CFA(852) [email protected]
Highlights from analysts briefing
Upgrade to Neutral with merger too positive to ignore. The shares of VTech has fallen 21% over the past 12 months (Hang Seng Index down 20% over this period) and most of our key negatives on the stock (depreciating Euro and falling demand on Innotab tablets) have been more or less reflected in the current share price. VTech’s dividend yield is approx. 8% and this makes the stock quite defensive in this volatile market. We see little downside at current levels with some upside potential once we have more information about Vtech’s strategy post the potential merger with LF. Overall, we believe the potential merger should be taken relatively positively by the market. One of the biggest risks for VTech was if one of the top two major toy companies snapped up LF and revamped its product lines. This appears less likely now given the proposed VTech-LF merger and also the proposed merger (in the news) for the top two US toy makers.
Makes sense from a market perspective. Both V-Tech and LF have been offering similar products in the children’s electronic learning segment for 2 decades and have a similar presence in the key US markets (with VTech larger in the EU). However, LF’s relatively larger exposure to the children’s tablet market (over 50% of ELP sales vs <10% for VTech over past 12 months) made it more vulnerable when demand in this troubled market segment was taken over by more mainstream tablets (tablets made for adults but can also be used by children)made by other electronic makers. This merger (if finalized) should give VTech more market share and shelf space for ELP globally.
Antitrust considerations probably quite small. The performance of LF’s shares during the 5 Jan trading session (close US$0.98 up 72% on the day) suggests a high probability of the merger likely being completed. Furthermore, VTech would have considered regulatory and antitrust considerations before making such a bid. Although a combined Vtech and LF would have a considerable presence in the electronic learning products category in the US, the share of the combined entity in the general toy market and the general electronics market would be quite small (that would be a likely argument for VTech supporting the regulatory approval of the merger from an antitrust perspective). Coincidentally after trading on 5 Feb, there was news (Bloomberg story on Hasbro-Mattel said to have held talks about a possible merger) regarding a much larger proposed merger between the top 2 toy companies in the US (Mattel – MAT US – NC) and Hasbro (HAS US – NC), which would be more significant from a US antitrust perspective and perhaps relegate the VTech–LF potential combination a relatively insignificant matter for US regulators.
Purchase an insignificant burden for VTech. The purchase price of approx.US$72m is a small fraction of the US$270m net cash on hand for VTech. While the current tough environment for ELP has depressed the share prices of VTech and LF, the impact is much more negative for LF because VTech has much larger operations and a cash rich balance sheet. Furthermore, LF does not have any net debt (based on last quarterly filing), and VTech would remain in a healthy net cash position after the proposed merger.
Restructuring charges should be manageable. There would inevitably be some restructuring charges but LF is an asset and workforce light entity (only 524 workers (Bloomberg) vs 30,000 for VTech). Any restructuring costs for LF would not be that large as LF does not have manufacturing capacity or factory

4
Asia Pacific Equity Research12 February 2016
Leon Chik, CFA(852) [email protected]
workforce. LF has a large R&D and marketing team that has developed many innovative products and this should be enhance VTech’s strengths in low cost-high speed to market manufacturing.
Timetable for conclusion of merger. The tender offer is expected to commence on or about 3 March 2016, and will be open for a minimum of 20 business days. The closing of the transaction is subject to satisfaction of certain conditions set forth in the merger agreement, which has been unanimously approved by the Boards of Directors of both companies. LF’s Board has agreed to unanimously recommend to its stockholders that they tender their shares of L common stock pursuant to the tender offer. Other terms and conditions in the announcement here: http://www.hkexnews.hk/listedco/listconews/SEHK/2016/0205/LTN20160205779.pdf
Too early to estimate the impact of the merger. Other than the subjectively positive impact of larger market share and greater shelf space with retailers, it’stoo early to estimate the financial impact of the possible VTech-LF merger. We do not have sufficient info regarding the sales and profits of the merged Vtech –LF entity yet and the merger is not likely to be concluded any time soon. The consensus estimates sales for LF of US$243m for FY17 (April 16 to Mar 17) is about 12% of VTech’s estimated sales over this period. Profit contribution from incremental sales from LF is unlikely as LF has been making losses for over 8 quarters, VTech would most certainly try to curtail such losses through manufacturing changes and other operational synergies but it’s too early to estimate the positive or negative impact of the new LF operations on the combined entity.
Valuation and share price analysis
DCF valuation
Our Dec-16 price target is based on a DCF valuation that assumes a market risk premium of 6.0% and a risk free rate of 4.2% (the yield on 10-year government notes in China). We assume a beta of 1.0 and a WACC of 10.2%. We estimate free cash flow for VTech until 2020 and assume a terminal growth rate of 1%. The terminal growth is based on the annual growth rate expected after 2016 (the final year of the estimate period) subject to a minimum of 1% and a maximum of 6%, depending on the nature of the industry and the level of maturity in China.
We also analyze the DCF price sensitivity to WACC, and the terminal multiple.

5
Asia Pacific Equity Research12 February 2016
Leon Chik, CFA(852) [email protected]
Table 3: VTech – Base-case DCF analysis
USMM (YE March 2013 2014 2015 2016E 2017E 2018E 2019E Terminal
Cash flow estimates
Sales 1,858 1,899 1,880 1,927 2,043 2,155 2,293 2,455
EBIT 225 226 220 217 247 254 266 281
NOPAT 204 202 197 194 221 227 237 251
Capex, net (29) (30) (30) (32) (34) (36) (39) (41)
Depreciation 32 31 30 25 28 30 32 36
Change in working capital (42) (1) 2 (26) (13) (11) (12) (8)
Free CF (excl. non-core)) 165 202 199 161 203 212 223 243
DCF Parameters Assumptions
Liabilities as a % of EV 0% Terminal growth 1.0%
WACC 10.2% Risk-free rate 4.2%
Market risk 6.0%
Enterprise NPV (10E-16E) 2,294 Beta 1.0
+ Net cash (debt), current 261 Cost of debt 6.2%
- Minorities (Market value) 0
+/- Other items 0 Implied exit P/E multiple (x) 10x
= Equity value 2,554
/ Number of shares 249
= Equity value per share (HK$) 80.0
Source Company data, J.P. Morgan estimates.
Table 4: VTech – Sensitivity analysis based on WACC and perpetual terminal growth rate
Terminal growth rate
75.0 -0.5% 0.0% 0.5% 1.0% 1.5% 2.0% 2.5%
WA
CC
8.7% 83 87 91 95 101 107 114
9.2% 79 82 86 90 94 99 105
9.7% 75 78 81 85 88 93 98
10.2% 72 74 77 80 83 87 92
10.7% 68 71 73 76 79 82 86
11.2% 66 68 70 72 75 78 81
11.7% 83 87 91 95 101 107 114
Source: Company data, J.P. Morgan estimates.
6
Asia Pacific Equity Research12 February 2016
Leon Chik, CFA(852) [email protected]
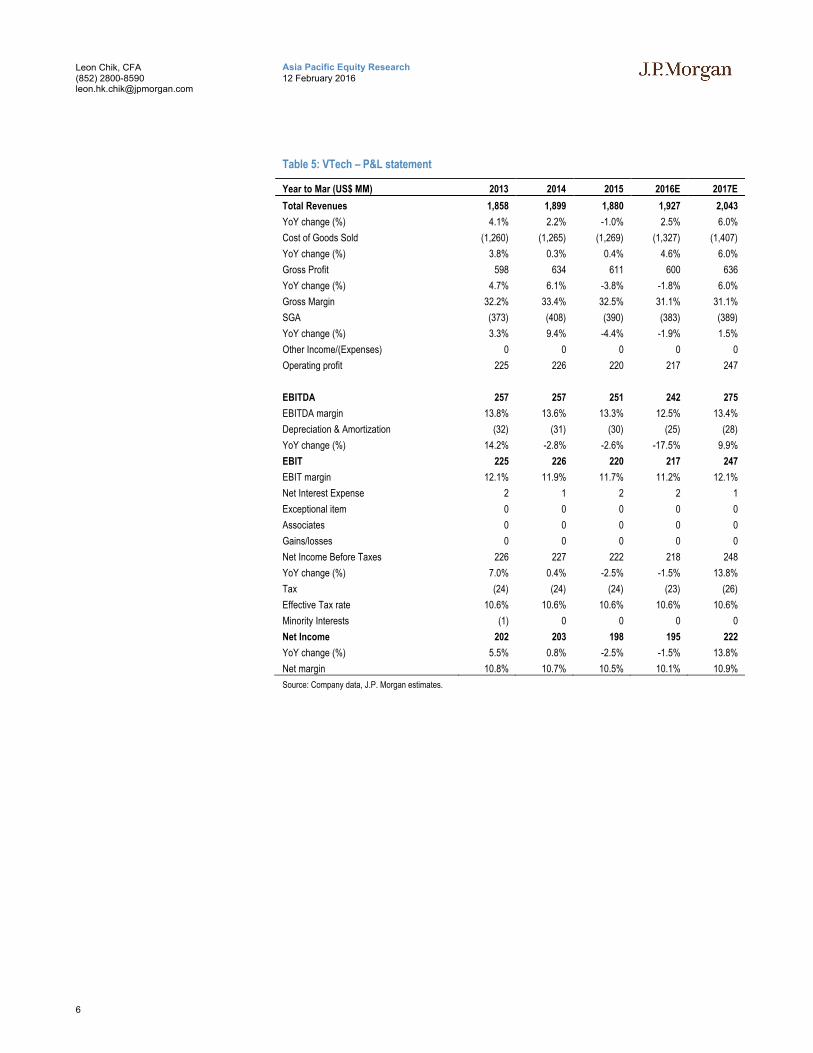
Table 5: VTech – P&L statement
Year to Mar (US$ MM) 2013 2014 2015 2016E 2017E
Total Revenues 1,858 1,899 1,880 1,927 2,043
YoY change (%) 4.1% 2.2% -1.0% 2.5% 6.0%
Cost of Goods Sold (1,260) (1,265) (1,269) (1,327) (1,407)
YoY change (%) 3.8% 0.3% 0.4% 4.6% 6.0%
Gross Profit 598 634 611 600 636
YoY change (%) 4.7% 6.1% -3.8% -1.8% 6.0%
Gross Margin 32.2% 33.4% 32.5% 31.1% 31.1%
SGA (373) (408) (390) (383) (389)
YoY change (%) 3.3% 9.4% -4.4% -1.9% 1.5%
Other Income/(Expenses) 0 0 0 0 0
Operating profit 225 226 220 217 247
EBITDA 257 257 251 242 275
EBITDA margin 13.8% 13.6% 13.3% 12.5% 13.4%
Depreciation & Amortization (32) (31) (30) (25) (28)
YoY change (%) 14.2% -2.8% -2.6% -17.5% 9.9%
EBIT 225 226 220 217 247
EBIT margin 12.1% 11.9% 11.7% 11.2% 12.1%
Net Interest Expense 2 1 2 2 1
Exceptional item 0 0 0 0 0
Associates 0 0 0 0 0
Gains/losses 0 0 0 0 0
Net Income Before Taxes 226 227 222 218 248
YoY change (%) 7.0% 0.4% -2.5% -1.5% 13.8%
Tax (24) (24) (24) (23) (26)
Effective Tax rate 10.6% 10.6% 10.6% 10.6% 10.6%
Minority Interests (1) 0 0 0 0
Net Income 202 203 198 195 222
YoY change (%) 5.5% 0.8% -2.5% -1.5% 13.8%
Net margin 10.8% 10.7% 10.5% 10.1% 10.9%
Source: Company data, J.P. Morgan estimates.

7
Asia Pacific Equity Research12 February 2016
Leon Chik, CFA(852) [email protected]
Table 6: VTech – Interim estimates
Year to Mar (US$ MM) 1H14 2H14 1H15 2H15 1H16E 2H16E
Total Revenues 1,007 901 979 928 999 1,007
Gross Profit 352 290 320 286 314 352
EBIT 121 113 107 111 106 121
Net Income Before Taxes 121 114 107 112 107 121
Net Income 108 103 95 100 95 108
Diluted EPS (HK$)
0.43 0.408
0.38 0.398
0.38 0.43
Ratios
Revenue split 53.0% 47.9% 52.1% 48.2% 51.8% 53.0%
GPM 35.0% 32.2% 32.7% 30.8% 31.4% 35.0%
EBIT margin 12.0% 12.6% 10.9% 12.0% 10.6% 12.0%
NPM 10.7% 11.4% 9.7% 10.8% 9.5% 10.7%
YoY
Revenue 2.5% 0.9% -2.7% 3.0% 2.0% 2.5%
GP 6.1% 2.7% -9.0% -1.4% -2.1% 6.1%
EBIT -3.7% 7.5% -11.5% -1.9% -1.1% -3.7%
NP -2.4% 7.5% -11.5% -2.5% -0.5% -2.4%
Source: Company data, J.P. Morgan estimates.

8
Asia Pacific Equity Research12 February 2016
Leon Chik, CFA(852) [email protected]
Table 7: VTech – Balance sheet
Year to Mar (US$ MM) 2013 2014 2015 2016E 2017E
Cash and Cash Equivalents 309 323 294 263 261
Inventories 277 266 290 283 294
Accounts receivable 260 236 260 253 263
Other Current Assets 0 1 0 60 57
Total Current Assets 845 826 844 858 875
Intangible Assets 0 0 0 0 0
Property and Equipment, Net 88 86 67 74 81
Other Assets 9 8 10 10 10
Non-Current assets 97 94 77 84 91
Total Assets 943 919 921 943 966
Accounts Payable 331 304 343 351 372
Other Accrued Expenses 28 28 24 38 34
Taxes Payable 7 5 7 7 10
ST and current LT debts 0 0 0 0 0
Total Current Liabilities 366 337 377 396 417
Long-term Debt 0 0 0 0 0
Other Noncurrent Liability 5 6 3 6 6
Noncurrent liabilities 5 6 3 6 6
Total Liabilities 371 344 380 402 423
Share capital 13 13 13 13 13
Reserves and Surplus 560 563 528 528 531
Total Shareholders' Equity 572 576 541 541 543
Minority Interest 0 0 0 0 0
Total Shareholders' Equity 572 576 541 541 543
Total Liabilities and Equity 943 919 921 943 966
Source: Company data, J.P. Morgan estimates.
Table 8: VTech – Cash flow statement
Year-end 31Dec (HK$ MM) 2013 2014 2015 2016E 2017E
EBIT 225 226 220 217 247
Depreciation and Amortization 32 31 30 25 28
Working Capital Changes (42) (1) 2 (26) (13)
Net Interest (20) (24) (24) (24) (23)
Tax Paid 195 232 228 192 239
Cash Flow From Operations
(29) (30) (30) (32) (34)
Capital expenditures 15 0 (2) (0) (0)
Investments and others 2 1 2 2 1
Cash Flow from Investing (12) (28) 36 (31) (33)
Free Cash Flow 183 204 264 161 206
Dividends (190) (201) (199) (196) (207)
Common issue 0 0 0 0 0

9
Asia Pacific Equity Research12 February 2016
Leon Chik, CFA(852) [email protected]
Other Financing 8 4 (3) 3 0
Contribution from owner 0 0 0 0 0
Cash Flow from financing (183) (197) (202) (193) (207)
Change in cash (18) 14 (29) (31) (2)
Cash beginning 327 309 323 294 263
Foreign exchange changes 0 0 0 0 0
Cash at end 309 323 294 263 261
Source: Company data, J.P. Morgan estimates
Investment Thesis, Valuation and Risks
VTech Holdings (Neutral; Price Target: HK$80.00)
Investment Thesis
VTech is the world’s largest maker of cordless phones and one of the largest makers of electronic learning products. Advances in technology have made the cordless phone less relevant in today’s households. The rapid drop in home computer prices as well as advances in portable computing (tablets and smartphones) have allowed more devices to compete in the provision of education applications to young children, crimping VTech’s once-dominant lock in this industry segment.
Valuation
Our Dec-16 price target is based on a DCF valuation that assumes a market risk premium of 6.0% and a risk-free rate of 4.2% (the yield on 10-year government notes in China). We assume a beta of 1.0 and a WACC of 10.2%. We estimate free cashflow for VTech until 2015 and assume a terminal growth rate of 1%. The terminal growth is based on the annual growth rate expected after 2016 (the final year of the estimate period) subject to a minimum of 1% and a maximum of 6%, depending on the nature of the industry and the level of maturity in China.
Risks to Rating and Price Target
The key upside risks to our PT are the successful launch of new products in the ELP division as well as a recovery in demand for cordless phones in the US as the housing market recovers.

10
Asia Pacific Equity Research12 February 2016
Leon Chik, CFA(852) [email protected]
VTech Holdings: Summary of FinancialsIncome Statement Cash flow statement
$ in millions, year end Mar FY14 FY15 FY16E FY17E FY18E $ in millions, year end Mar FY14 FY15 FY16E FY17E FY18E
Revenues 1,899 1,880 1,927 2,043 2,155 EBIT 226 220 217 247 254
% change Y/Y 2.2% (1.0%) 2.5% 6.0% 5.5% Depr. & amortization 31 30 25 28 30Gross Profit 634 611 600 636 664 Change in working capital (1) 2 (26) (13) (11)
% change Y/Y 6.1% (3.8%) (1.8%) 6.0% 4.5% Taxes (24) (24) (24) (23) (26)
EBITDA 257 251 242 275 284 Cash flow from operations 232 228 192 239 246% change Y/Y 0.6% (2.7%) (1.5%) 14.0% 2.8%
EBIT 226 220 217 247 254 Capex (30) (32) (33) (35) (36)
% change Y/Y 0.6% (2.7%) (1.5%) 14.0% 2.8% Net Interest 1 2 2 1 1EBIT Margin 10.3% 10.1% 9.9% 10.7% 10.4% Other 0 66 0 0 0
Net Interest 1 2 2 1 1 Free cash flow 201 195 158 203 208Earnings before tax 227 222 218 248 255
% change Y/Y 0.4% (2.5%) (1.5%) 13.8% 2.8% Equity raised/(repaid) 0 0 0 0 0
Tax (24) (24) (23) (26) (27) Debt raised/(repaid) 4 (3) 3 0 0as % of EBT 10.6% 10.6% 10.6% 10.6% 10.6% Other 0 (0) 0 0 0
Net income (reported) 203 198 195 222 228 Dividends paid (201) (199) (196) (207) (218)
% change Y/Y 0.8% (2.5%) (1.5%) 13.8% 2.8% Beginning cash 309 323 294 263 261Shares outstanding 251 251 251 251 251 Ending cash 323 294 263 261 254EPS (reported) 0.81 0.79 0.78 0.88 0.91 DPS 0.80 0.78 0.78 0.87 0.86
% change Y/Y 0.8% (2.5%) (1.5%) 13.8% 2.8%
Balance sheet Ratio Analysis
$ in millions, year end Mar FY14 FY15 FY16E FY17E FY18E $ in millions, year end Mar FY14 FY15 FY16E FY17E FY18E
Cash and cash equivalents 323 294 263 261 254 Gross margin 33.4% 32.5% 31.1% 31.1% 30.8%
Accounts receivable 236 260 253 263 272 EBITDA margin 11.9% 11.7% 11.2% 12.1% 11.8%Inventories 266 290 283 294 304 Operating margin 10.3% 10.1% 9.9% 10.7% 10.4%Others 1 0 60 57 71 Net margin 9.1% 8.9% 8.8% 9.5% 9.2%
Current assets 826 844 858 875 900Sales per share growth 2.2% (1.0%) 2.5% 6.0% 5.5%
LT investments 8 10 10 10 10 Sales growth 2.2% (1.0%) 2.5% 6.0% 5.5%Net fixed assets 86 67 74 81 87 Net profit growth 0.8% (2.5%) (1.5%) 13.8% 2.8%Total Assets 919 921 943 966 998 EPS growth 0.8% (2.5%) (1.5%) 13.8% 2.8%
Liabilities Interest coverage (x) NM NM NM NM NMShort-term loans 0 0 0 0 0Payables 304 343 351 372 393
Others 33 32 44 45 45 Net debt to equity (56.1%) (54.4%) (48.5%) (48.0%) (45.7%)Total current liabilities 337 374 396 417 437 Working Capital to Sales 0.3 0.3 0.2 0.2 0.2
Long-term debt 0 0 0 0 0 Sales/assets 2.0 2.0 2.1 2.1 2.2Other liabilities 0 0 0 0 0 Assets/equity 1.6 1.6 1.7 1.8 1.8Total Liabilities 343 380 402 423 443 ROE 30.0% 30.0% 31.4% 35.9% 36.1%
Shareholders' equity 576 541 541 543 554 ROCE 29.8% 29.8% 31.2% 35.6% 35.9%BVPS 2.31 2.17 2.17 2.18 2.23
Source: Company reports and J.P. Morgan estimates.

11
Asia Pacific Equity Research12 February 2016
Leon Chik, CFA(852) [email protected]
JPM Q-ProfileVTech Holdings Limited (HONG KONG / Information Technology)As Of: 05-Feb-2016 [email protected]
Local Share Price Current: 82.15 12 Mth Forward EPS Current: 0.84
PE (1Yr Forward) Current: 12.5x P/E Relative to Hong Kong Index Current: 0.95
Earnings Yield (& Local Bond Yield) Current: 7.99% Dividend Yield (Trailing) Current: 7.52
ROE (Trailing) Current: 39.17 Price/Book (Value) Current: 5.5x
SummaryVTech Holdings Limited 2536.01 As Of:
HONG KONG 3.509078 TICKER 303 HK Local Price: 82.15
Information Technology Communications Equipment EPS: 0.84
Latest Min Max Median Average 2 S.D.+ 2 S.D. - % to Min % to Max % to Med % to Avg12mth Forward PE 12.52x 1.58 17.07 10.09 10.04 17.06 3.01 -87% 36% -19% -20%
P/BV (Trailing) 5.45x 0.54 7.17 4.67 4.11 7.69 0.53 -90% 31% -14% -25%
Dividend Yield (Trailing) 7.52 0.00 38.35 6.54 7.78 19.44 -3.87 -100% 410% -13% 3%
ROE (Trailing) 39.17 -50.46 50.00 39.17 32.64 81.90 -16.62 -229% 28% 0% -17%
Source: Bloomberg, Reuters Global Fundamentals, IBES CONSENSUS, JPMorgan Quantitative & Derivative Strategy
05-Feb-16
-0.40
-0.20
0.00
0.20
0.40
0.60
0.80
1.00
1.20
1.40
1.60
Jan/
01
Sep
/01
May
/02
Jan/
03
Sep
/03
May
/04
Jan/
05
Sep
/05
May
/06
Jan/
07
Sep
/07
May
/08
Jan/
09
Sep
/09
May
/10
Jan/
11
Sep
/11
May
/12
Jan/
13
Sep
/13
May
/14
Jan/
15
Sep
/15
0%
10%
20%
30%
40%
50%
60%
70%
Jan/
01
Sep
/01
May
/02
Jan/
03
Sep
/03
May
/04
Jan/
05
Sep
/05
May
/06
Jan/
07
Sep
/07
May
/08
Jan/
09
Sep
/09
May
/10
Jan/
11
Sep
/11
May
/12
Jan/
13
Sep
/13
May
/14
Jan/
15
Sep
/15
12Mth fwd EY Hong Kong BY Proxy
0.00
20.00
40.00
60.00
80.00
100.00
120.00
140.00
Jan/
01
Oct
/01
Jul/0
2
Apr
/03
Jan/
04
Oct
/04
Jul/0
5
Apr
/06
Jan/
07
Oct
/07
Jul/0
8
Apr
/09
Jan/
10
Oct
/10
Jul/1
1
Apr
/12
Jan/
13
Oct
/13
Jul/1
4
Apr
/15
Jan/
16
0.0x
2.0x
4.0x
6.0x
8.0x
10.0x
12.0x
14.0x
16.0x
18.0x
Jan/
01
Sep
/01
May
/02
Jan/
03
Sep
/03
May
/04
Jan/
05
Sep
/05
May
/06
Jan/
07
Sep
/07
May
/08
Jan/
09
Sep
/09
May
/10
Jan/
11
Sep
/11
May
/12
Jan/
13
Sep
/13
May
/14
Jan/
15
Sep
/15
0.0x
1.0x
2.0x
3.0x
4.0x
5.0x
6.0x
7.0x
8.0x
9.0x
Jan/
01
Sep
/01
May
/02
Jan/
03
Sep
/03
May
/04
Jan/
05
Sep
/05
May
/06
Jan/
07
Sep
/07
May
/08
Jan/
09
Sep
/09
May
/10
Jan/
11
Sep
/11
May
/12
Jan/
13
Sep
/13
May
/14
Jan/
15
Sep
/15
P/B Trailing P/B Forward
-60.00
-40.00
-20.00
0.00
20.00
40.00
60.00
Jan/
01
Sep
/01
May
/02
Jan/
03
Sep
/03
May
/04
Jan/
05
Sep
/05
May
/06
Jan/
07
Sep
/07
May
/08
Jan/
09
Sep
/09
May
/10
Jan/
11
Sep
/11
May
/12
Jan/
13
Sep
/13
May
/14
Jan/
15
Sep
/15
0.0
5.0
10.0
15.0
20.0
25.0
30.0
35.0
40.0
45.0
Jan/
01
Sep
/01
May
/02
Jan/
03
Sep
/03
May
/04
Jan/
05
Sep
/05
May
/06
Jan/
07
Sep
/07
May
/08
Jan/
09
Sep
/09
May
/10
Jan/
11
Sep
/11
May
/12
Jan/
13
Sep
/13
May
/14
Jan/
15
Sep
/15
0.00
0.20
0.40
0.60
0.80
1.00
1.20
1.40
Jan/
01
Sep
/01
May
/02
Jan/
03
Sep
/03
May
/04
Jan/
05
Sep
/05
May
/06
Jan/
07
Sep
/07
May
/08
Jan/
09
Sep
/09
May
/10
Jan/
11
Sep
/11
May
/12
Jan/
13
Sep
/13
May
/14
Jan/
15
Sep
/15

12
Asia Pacific Equity Research12 February 2016
Leon Chik, CFA(852) [email protected]
Analyst Certification: The research analyst(s) denoted by an “AC” on the cover of this report certifies (or, where multiple research analysts are primarily responsible for this report, the research analyst denoted by an “AC” on the cover or within the document individually certifies, with respect to each security or issuer that the research analyst covers in this research) that: (1) all of the views expressed in this report accurately reflect his or her personal views about any and all of the subject securities or issuers; and (2) no part of any of the research analyst's compensation was, is, or will be directly or indirectly related to the specific recommendations or views expressed by the research analyst(s) in this report. For all Korea-based research analysts listed on the front cover, they also certify, as per KOFIA requirements, that their analysis was made in good faith and that the views reflect their own opinion, without undue influence or intervention.
Important Disclosures
Market Maker/ Liquidity Provider: J.P. Morgan Securities plc and/or an affiliate is a market maker and/or liquidity provider in VTech Holdings.
Other Significant Financial Interests: J.P. Morgan owns a position of 1 million USD or more in the debt securities of VTech Holdings.
Company-Specific Disclosures: Important disclosures, including price charts and credit opinion history tables, are available for compendium reports and all J.P. Morgan–covered companies by visiting https://jpmm.com/research/disclosures, calling 1-800-477-0406, or e-mailing [email protected] with your request. J.P. Morgan’s Strategy, Technical, and Quantitative Research teams may screen companies not covered by J.P. Morgan. For important disclosures for these companies, please call 1-800-477-0406 or e-mail [email protected].
Date Rating Share Price (HK$)
Price Target (HK$)
18-Sep-10 N 82.00 77.00
01-Jun-11 N 93.00 90.00
17-Nov-11 OW 74.70 98.00
23-May-12 OW 86.00 100.00
09-Aug-12 UW 95.05 90.00
14-Nov-12 UW 89.40 82.00
16-May-13 UW 101.50 90.00
31-Oct-13 UW 111.30 106.00
13-Nov-13 UW 107.90 103.00
11-Feb-14 UW 92.10 85.00
22-May-14 UW 102.00 82.00
11-Aug-14 UW 95.50 69.00
11-Nov-14 UW 99.40 80.00
14-Apr-15 UW 107.50 75.00
12-Nov-15 UW 90.00 80.00
The chart(s) show J.P. Morgan's continuing coverage of the stocks; the current analysts may or may not have covered it over the entire period. J.P. Morgan ratings or designations: OW = Overweight, N= Neutral, UW = Underweight, NR = Not Rated
Explanation of Equity Research Ratings, Designations and Analyst(s) Coverage Universe: J.P. Morgan uses the following rating system: Overweight [Over the next six to twelve months, we expect this stock will outperform the average total return of the stocks in the analyst’s (or the analyst’s team’s) coverage universe.] Neutral [Over the next six to twelve months, we expect this stock will perform in line with the average total return of the stocks in the analyst’s (or the analyst’s team’s) coverage universe.] Underweight [Over the next six to twelve months, we expect this stock will underperform the average total return of the stocks in the analyst’s (or the analyst’s team’s) coverage universe.] Not Rated (NR): J.P. Morgan has removed the rating and, if applicable, the price target, for this stock because of either a lack of a sufficient fundamental basis or for legal, regulatory or policy reasons. The previous rating and, if applicable, the price target, no longer should be relied upon. An NR designation is not a recommendation or a rating. In our Asia (ex-Australia) and U.K. small- and mid-cap equity research, each stock’s expected total return is compared to the expected total return of a benchmark country market index, not to those analysts’ coverage universe. If it does not appear
0
36
72
108
144
180
216
Price(HK$)
Oct06
Apr08
Oct09
Apr11
Oct12
Apr14
Oct15
VTech Holdings (0303.HK, 303 HK) Price Chart
UW HK$82 UW HK$85UW HK$80
UW HK$90 UW HK$103UW HK$69
N HK$77N HK$90OW HK$98OW HK$100UW HK$90UW HK$106UW HK$82UW HK$75UW HK$80
Source: Bloomberg and J.P. Morgan; price data adjusted for stock splits and dividends.
Initiated coverage Sep 18, 2010.

13
Asia Pacific Equity Research12 February 2016
Leon Chik, CFA(852) [email protected]
in the Important Disclosures section of this report, the certifying analyst’s coverage universe can be found on J.P. Morgan’s research website, www.jpmorganmarkets.com.
Coverage Universe: Chik, Leon: CAR Inc. (0699.HK), CP Pokphand Co., Ltd (0043.HK), China Lesso (2128.HK), China Lodging Group Limited (HTHT), China State Construction (3311.HK), China Travel International Investments HK Ltd (0308.HK), Fu Shou Yuan International (1448.HK), Fufeng Group (0546.HK), Genscript Biotech Corporation (1548.HK), Haitian International Holdings (1882.HK), Hisense Electric Co Ltd - A (600060.SS), Home Inns & Hotels Management Inc. (HMIN), Jiangnan Group Ltd (1366.HK), Johnson Electric Holdings (0179.HK), Kingboard Chemical (0148.HK), Kingboard Laminates (1888.HK), Lee & Man Paper Manufacturing (2314.HK), New Oriental Education (EDU), Nine Dragons Paper Holdings Ltd (2689.HK), Nord Anglia Education (NORD), PAX Global Technology Ltd (0327.HK), Shenzhou International (2313.HK), Skyworth Digital Holdings (0751.HK), TAL Education Group (XRS), TCL Multimedia (1070.HK), Techtronic Industries (0669.HK), Texhong Textile (2678.HK), VTech Holdings (0303.HK), Wasion Group Holdings Ltd (3393.HK), Xinyi Glass (0868.HK), Xinyi Solar (0968.HK), eHi Car Services Ltd (EHIC)
J.P. Morgan Equity Research Ratings Distribution, as of December 31, 2015
Overweight(buy)
Neutral(hold)
Underweight(sell)
J.P. Morgan Global Equity Research Coverage 44% 44% 12%IB clients* 52% 47% 35%
JPMS Equity Research Coverage 45% 47% 8%IB clients* 70% 63% 50%
*Percentage of investment banking clients in each rating category.For purposes only of FINRA/NYSE ratings distribution rules, our Overweight rating falls into a buy rating category; our Neutral rating falls into a hold rating category; and our Underweight rating falls into a sell rating category. Please note that stocks with an NR designation are not included in the table above.
Equity Valuation and Risks: For valuation methodology and risks associated with covered companies or price targets for covered companies, please see the most recent company-specific research report at http://www.jpmorganmarkets.com, contact the primary analyst or your J.P. Morgan representative, or email [email protected].
Equity Analysts' Compensation: The equity research analysts responsible for the preparation of this report receive compensation based upon various factors, including the quality and accuracy of research, client feedback, competitive factors, and overall firm revenues.
Registration of non-US Analysts: Unless otherwise noted, the non-US analysts listed on the front of this report are employees of non-US affiliates of JPMS, are not registered/qualified as research analysts under NASD/NYSE rules, may not be associated persons of JPMS, and may not be subject to FINRA Rule 2711 and NYSE Rule 472 restrictions on communications with covered companies, public appearances, and trading securities held by a research analyst account.
Other Disclosures
J.P. Morgan ("JPM") is the global brand name for J.P. Morgan Securities LLC ("JPMS") and its affiliates worldwide. J.P. Morgan Cazenove is a marketing name for the U.K. investment banking businesses and EMEA cash equities and equity research businesses of JPMorgan Chase & Co. and its subsidiaries.
All research reports made available to clients are simultaneously available on our client website, J.P. Morgan Markets. Not all research content is redistributed, e-mailed or made available to third-party aggregators. For all research reports available on a particular stock, please contact your sales representative.
Options related research: If the information contained herein regards options related research, such information is available only to persons who have received the proper option risk disclosure documents. For a copy of the Option Clearing Corporation's Characteristics and Risks of Standardized Options, please contact your J.P. Morgan Representative or visit the OCC's website at http://www.optionsclearing.com/publications/risks/riskstoc.pdf
Legal Entities Disclosures U.S.: JPMS is a member of NYSE, FINRA, SIPC and the NFA. JPMorgan Chase Bank, N.A. is a member of FDIC. U.K.: JPMorgan Chase N.A., London Branch, is authorised by the Prudential Regulation Authority and is subject to regulation by the Financial Conduct Authority and to limited regulation by the Prudential Regulation Authority. Details about the extent of our regulation by the Prudential Regulation Authority are available from J.P. Morgan on request. J.P. Morgan Securities plc (JPMS plc) is a member of the London Stock Exchange and is authorised by the Prudential Regulation Authority and regulated by the Financial Conduct Authority and the Prudential Regulation Authority. Registered in England & Wales No. 2711006. Registered Office 25 Bank Street, London, E14 5JP. South Africa: J.P. Morgan Equities South Africa Proprietary Limited is a member of the Johannesburg Securities Exchange and is regulated by the Financial Services Board. Hong Kong: J.P. Morgan Securities (Asia Pacific) Limited (CE number AAJ321) is regulated by the Hong Kong Monetary Authority and the Securities and Futures Commission in Hong Kong and/or J.P. Morgan Broking (Hong Kong) Limited (CE number AAB027) is regulated by the Securities and Futures Commission in Hong Kong. Korea: This material is issued and distributed in Korea by or through J.P. Morgan Securities (Far East) Limited, Seoul Branch, which is a member of the Korea Exchange(KRX) and is regulated by the Financial Services Commission (FSC) and the Financial Supervisory Service (FSS). Australia: J.P. Morgan Australia Limited (JPMAL) (ABN 52 002 888 011/AFS Licence No: 238188) is regulated by ASIC and J.P. Morgan Securities Australia Limited (JPMSAL) (ABN 61 003 245 234/AFS Licence No: 238066) is regulated by ASIC and is a Market, Clearing and Settlement Participant of ASX Limited and CHI-X. Taiwan: J.P.Morgan Securities (Taiwan) Limited is a

14
Asia Pacific Equity Research12 February 2016
Leon Chik, CFA(852) [email protected]
participant of the Taiwan Stock Exchange (company-type) and regulated by the Taiwan Securities and Futures Bureau. India: J.P. Morgan India Private Limited (Corporate Identity Number - U67120MH1992FTC068724), having its registered office at J.P. Morgan Tower, Off. C.S.T. Road, Kalina, Santacruz - East, Mumbai – 400098, is registered with Securities and Exchange Board of India (SEBI) as a ‘Research Analyst’ having registration number INH000001873. J.P. Morgan India Private Limited is also registered with SEBI as a member of the National Stock Exchange of India Limited (SEBI Registration Number - INB 230675231/INF 230675231/INE 230675231) and Bombay Stock Exchange Limited (SEBI Registration Number - INB 010675237/INF 010675237). Telephone: 91-22-6157 3000, Facsimile: 91-22-6157 3990 and Website: www.jpmipl.com. For non local research reports, this material is not distributed in India by J.P. Morgan India Private Limited. Thailand: This material is issued and distributed in Thailand by JPMorgan Securities (Thailand) Ltd., which is a member of the Stock Exchange of Thailand and is regulated by the Ministry of Finance and the Securities and Exchange Commission and its registered address is 3rd Floor, 20 North Sathorn Road, Silom, Bangrak, Bangkok 10500. Indonesia: PT J.P. Morgan Securities Indonesia is a member of the Indonesia Stock Exchange and is regulated by the OJK a.k.a. BAPEPAM LK. Philippines: J.P. Morgan Securities Philippines Inc. is a Trading Participant of the Philippine Stock Exchange and a member of the Securities Clearing Corporation of the Philippines and the Securities Investor Protection Fund. It is regulated by the Securities and Exchange Commission. Brazil: Banco J.P. Morgan S.A. is regulated by the Comissao de Valores Mobiliarios (CVM) and by the Central Bank of Brazil. Mexico: J.P. Morgan Casa de Bolsa, S.A. de C.V., J.P. Morgan Grupo Financiero is a member of the Mexican Stock Exchange and authorized to act as a broker dealer by the National Banking and Securities Exchange Commission. Singapore: This material is issued and distributed in Singapore by or through J.P. Morgan Securities Singapore Private Limited (JPMSS)[MCI (P) 100/03/2015 and Co. Reg. No.: 199405335R] which is a member of the Singapore Exchange Securities Trading Limited and is regulated by the Monetary Authority of Singapore (MAS) and/or JPMorgan Chase Bank, N.A., Singapore branch (JPMCB Singapore) which is regulated by the MAS. This material is provided in Singapore only to accredited investors, expert investors and institutional investors, as defined in Section 4A of the Securities and Futures Act, Cap. 289. Recipients of this document are to contact JPMSS or JPMCB Singapore in respect of any matters arising from, or in connection with, the document. Japan: JPMorgan Securities Japan Co., Ltd. and JPMorgan Chase Bank, N.A., Tokyo Branch are regulated by the Financial Services Agency in Japan. Malaysia: This material is issued and distributed in Malaysia by JPMorgan Securities (Malaysia) Sdn Bhd (18146-X) which is a Participating Organization of Bursa Malaysia Berhad and a holder of Capital Markets Services License issued by the Securities Commission in Malaysia. Pakistan: J. P. Morgan Pakistan Broking (Pvt.) Ltd is a member of the Karachi Stock Exchange and regulated by the Securities and Exchange Commission of Pakistan. Saudi Arabia: J.P. Morgan Saudi Arabia Ltd. is authorized by the Capital Market Authority of the Kingdom of Saudi Arabia (CMA) to carry out dealing as an agent, arranging, advising and custody, with respect to securities business under licence number 35-07079 and its registered address is at 8th Floor, Al-Faisaliyah Tower, King Fahad Road, P.O. Box 51907, Riyadh 11553, Kingdom of Saudi Arabia. Dubai: JPMorgan Chase Bank, N.A., Dubai Branch is regulated by the Dubai Financial Services Authority (DFSA) and its registered address is Dubai International Financial Centre - Building 3, Level 7, PO Box 506551, Dubai, UAE.
Country and Region Specific Disclosures U.K. and European Economic Area (EEA): Unless specified to the contrary, issued and approved for distribution in the U.K. and the EEA by JPMS plc. Investment research issued by JPMS plc has been prepared in accordance with JPMS plc's policies for managing conflicts of interest arising as a result of publication and distribution of investment research. Many European regulators require a firm to establish, implement and maintain such a policy. This report has been issued in the U.K. only to persons of a kind described in Article 19 (5), 38, 47 and 49 of the Financial Services and Markets Act 2000 (Financial Promotion) Order 2005 (all such persons being referred to as "relevant persons"). This document must not be acted on or relied on by persons who are not relevant persons. Any investment or investment activity to which this document relates is only available to relevant persons and will be engaged in only with relevant persons. In other EEA countries, the report has been issued to persons regarded as professional investors (or equivalent) in their home jurisdiction. Australia: This material is issued and distributed by JPMSAL in Australia to "wholesale clients" only. This material does not take into account the specific investment objectives, financial situation or particular needs of the recipient. The recipient of this material must not distribute it to any third party or outside Australia without the prior written consent of JPMSAL. For the purposes of this paragraph the term "wholesale client" has the meaning given in section 761G of the Corporations Act 2001. Germany: This material is distributed in Germany by J.P. Morgan Securities plc, Frankfurt Branch and J.P.Morgan Chase Bank, N.A., Frankfurt Branch which are regulated by the Bundesanstalt für Finanzdienstleistungsaufsicht. Hong Kong: The 1% ownership disclosure as of the previous month end satisfies the requirements under Paragraph 16.5(a) of the Hong Kong Code of Conduct for Persons Licensed by or Registered with the Securities and Futures Commission. (For research published within the first ten days of the month, the disclosure may be based on the month end data from two months prior.) J.P. Morgan Broking (Hong Kong) Limited is the liquidity provider/market maker for derivative warrants, callable bull bear contracts and stock options listed on the Stock Exchange of Hong Kong Limited. An updated list can be found on HKEx website: http://www.hkex.com.hk. Japan: There is a risk that a loss may occur due to a change in the price of the shares in the case of share trading, and that a loss may occur due to the exchange rate in the case of foreign share trading. In the case of share trading, JPMorgan Securities Japan Co., Ltd., will be receiving a brokerage fee and consumption tax (shouhizei) calculated by multiplying the executed price by the commission rate which was individually agreed between JPMorgan Securities Japan Co., Ltd., and the customer in advance. Financial Instruments Firms: JPMorgan Securities Japan Co., Ltd., Kanto Local Finance Bureau (kinsho) No. 82 Participating Association / Japan Securities Dealers Association, The Financial Futures Association of Japan, Type II Financial Instruments Firms Association and Japan Investment Advisers Association. Korea: This report may have been edited or contributed to from time to time by affiliates of J.P. Morgan Securities (Far East) Limited, Seoul Branch. Singapore: As at the date of this report, JPMSS is a designated market maker for certain structured warrants listed on the Singapore Exchange where the underlying securities may be the securities discussed in this report. Arising from its role as designated market maker for such structured warrants, JPMSS may conduct hedging activities in respect of such underlying securities and hold or have an interest in such underlying securities as a result. The updated list of structured warrants for which JPMSS acts as designated market maker may be found on the website of the Singapore Exchange Limited: http://www.sgx.com.sg. In addition, JPMSS and/or its affiliates may also have an interest or holding in any of the securities discussed in this report – please see the Important Disclosures section above. For securities where the holding is 1% or greater, the holding may be found in the Important Disclosures section above. For all other securities mentioned in this report, JPMSS and/or its affiliates may have a holding of less than 1% in such securities and may trade them in ways different from those discussed in this report. Employees of JPMSS and/or its affiliates not involved in the preparation of this report may have investments in the securities (or derivatives of such securities) mentioned in this report and may trade them in ways different from those discussed in this report. Taiwan: This material is issued and distributed in Taiwan by J.P. Morgan Securities (Taiwan) Limited. India: For private circulation only, not for sale. Pakistan: For private circulation only, not for sale. New Zealand: This material is issued and distributed by JPMSAL in New Zealand only to persons whose principal business is the investment of money or who, in the course of and for the purposes of their business, habitually invest money. JPMSAL does not issue or distribute this material to members of "the public" as determined in accordance with section 3 of the Securities Act 1978. The recipient of this material must not distribute it to any third party or outside New Zealand without the prior written consent of JPMSAL. Canada: The information contained herein is not, and under no circumstances is to be construed as, a prospectus, an advertisement, a public offering, an offer to sell securities described herein, or solicitation of an offer
15
Asia Pacific Equity Research12 February 2016
Leon Chik, CFA(852) [email protected]
to buy securities described herein, in Canada or any province or territory thereof. Any offer or sale of the securities described herein in Canada will be made only under an exemption from the requirements to file a prospectus with the relevant Canadian securities regulators and only by a dealer properlyregistered under applicable securities laws or, alternatively, pursuant to an exemption from the dealer registration requirement in the relevant province or territory of Canada in which such offer or sale is made. The information contained herein is under no circumstances to be construed as investment advice in any province or territory of Canada and is not tailored to the needs of the recipient. To the extent that the information contained herein references securities of an issuer incorporated, formed or created under the laws of Canada or a province or territory of Canada, any trades in such securities must be conducted through a dealer registered in Canada. No securities commission or similar regulatory authority in Canada has reviewed or in any way passed judgment upon these materials, the information contained herein or the merits of the securities described herein, and any representation to the contrary is an offence. Dubai: This report has been issued to persons regarded as professional clients as defined under the DFSA rules. Brazil: Ombudsman J.P. Morgan: 0800-7700847 / [email protected].
General: Additional information is available upon request. Information has been obtained from sources believed to be reliable but JPMorgan Chase & Co. or its affiliates and/or subsidiaries (collectively J.P. Morgan) do not warrant its completeness or accuracy except with respect to any disclosures relative to JPMS and/or its affiliates and the analyst's involvement with the issuer that is the subject of the research. All pricing is as of the close of market for the securities discussed, unless otherwise stated. Opinions and estimates constitute our judgment as of the date of this material and are subject to change without notice. Past performance is not indicative of future results. This material is not intended as an offer or solicitation for the purchase or sale of any financial instrument. The opinions and recommendations herein do not take into account individual client circumstances, objectives, or needs and are not intended as recommendations of particular securities, financial instruments or strategies to particular clients. The recipient of this report must make its own independent decisions regarding any securities or financial instruments mentioned herein. JPMS distributes in the U.S. research published by non-U.S. affiliates and accepts responsibility for its contents. Periodic updates may be provided on companies/industries based on company specific developments or announcements, market conditions or any other publicly available information. Clients should contact analysts and execute transactions through a J.P. Morgan subsidiary or affiliate in their home jurisdiction unless governing law permits otherwise.
"Other Disclosures" last revised January 01, 2016.
Copyright 2016 JPMorgan Chase & Co. All rights reserved. This report or any portion hereof may not be reprinted, sold or redistributed without the written consent of J.P. Morgan. #$J&098$#*P