padini holdings - alliance bank
TRANSCRIPT
Refer to important disclosures at the end of this report
ed: CK / sa:BC
FULLY VALUED (Downgrade from Hold)
Last Traded Price ( 27 Aug 2018): RM6.04 (KLCI : 1,811.60)
Price Target 12-mth: RM5.05 (-16% downside)
Analyst CHEAH King Yoong +60 32604 3908 [email protected] Abdul Azim Muhthar +60 32604 3967 [email protected]
What’s New FY18 earnings within expectations
Rich valuation, trading at +2SD of its mean
Downgrade to FULLY VALUED with RM5.05 TP
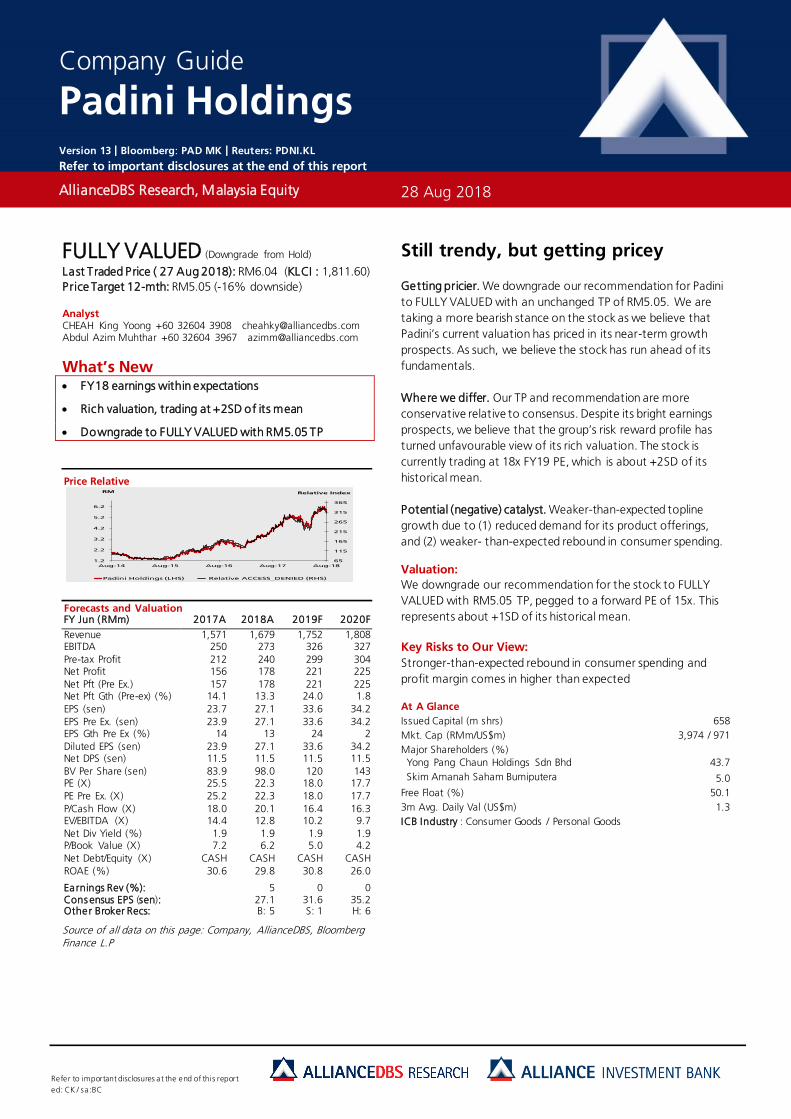
Price Relative
Forecasts and Valuation FY Jun (RMm) 2017A 2018A 2019F 2020F
Revenue 1,571 1,679 1,752 1,808 EBITDA 250 273 326 327
Pre-tax Profit 212 240 299 304 Net Profit 156 178 221 225
Net Pft (Pre Ex.) 157 178 221 225 Net Pft Gth (Pre-ex) (%) 14.1 13.3 24.0 1.8
EPS (sen) 23.7 27.1 33.6 34.2
EPS Pre Ex. (sen) 23.9 27.1 33.6 34.2 EPS Gth Pre Ex (%) 14 13 24 2
Diluted EPS (sen) 23.9 27.1 33.6 34.2 Net DPS (sen) 11.5 11.5 11.5 11.5
BV Per Share (sen) 83.9 98.0 120 143 PE (X) 25.5 22.3 18.0 17.7
PE Pre Ex. (X) 25.2 22.3 18.0 17.7
P/Cash Flow (X) 18.0 20.1 16.4 16.3 EV/EBITDA (X) 14.4 12.8 10.2 9.7
Net Div Yield (%) 1.9 1.9 1.9 1.9 P/Book Value (X) 7.2 6.2 5.0 4.2
Net Debt/Equity (X) CASH CASH CASH CASH
ROAE (%) 30.6 29.8 30.8 26.0 Earnings Rev (%): 5 0 0 Cons ensus EPS (sen): 27.1 31.6 35.2 Other Broker Recs: B: 5 S: 1 H: 6
Source of all data on this page: Company, AllianceDBS, Bloomberg Finance L.P
Still trendy, but getting pricey
Getting pricier. We downgrade our recommendation for Padini
to FULLY VALUED with an unchanged TP of RM5.05. We are
taking a more bearish stance on the stock as we believe that
Padini’s current valuation has priced in its near-term growth
prospects. As such, we believe the stock has run ahead of its
fundamentals.
Where we differ. Our TP and recommendation are more
conservative relative to consensus. Despite its bright earnings
prospects, we believe that the group’s risk reward profile has
turned unfavourable view of its rich valuation. The stock is
currently trading at 18x FY19 PE, which is about +2SD of its
historical mean.
Potential (negative) catalyst. Weaker-than-expected topline
growth due to (1) reduced demand for its product offerings,
and (2) weaker- than-expected rebound in consumer spending. Valuation:
We downgrade our recommendation for the stock to FULLY
VALUED with RM5.05 TP, pegged to a forward PE of 15x. This
represents about +1SD of its historical mean.
Key Risks to Our View:
Stronger-than-expected rebound in consumer spending and
profit margin comes in higher than expected
At A Glance
Issued Capital (m shrs) 658
Mkt. Cap (RMm/US$m) 3,974 / 971
Major Shareholders (%)
Yong Pang Chaun Holdings Sdn Bhd 43.7
Skim Amanah Saham Bumiputera 5.0
Free Float (%) 50.1
3m Avg. Daily Val (US$m) 1.3
ICB Industry : Consumer Goods / Personal Goods
AllianceDBS Research, Malaysia Equity
28 Aug 2018
Company Guide
Padini Holdings Version 13 | Bloomberg: PAD MK | Reuters: PDNI.KL
Refer to important disclosures at the end of this report
65
115
165
215
265
315
365
1.2
2.2
3.2
4.2
5.2
6.2
Aug-14 Aug-15 Aug-16 Aug-17 Aug-18
Relative IndexRM
Padini Holdings (LHS) Relative ACCESS_DENIED (RHS)
Page 2
Company Guide
Padini Holdings
WHAT’S NEW
FY18 earnings came within expectations
FY18 earnings within expectations: 4QFY18 core earnings
grew 42% y-o-y to RM57m, supported by (1) 3.8% topline
growth, (2) GP margin strengthening from 34% in 4QFY17 to
40% in 4QFY18 due to better sales mix, and (3) higher other
income. We believe that q-o-q performance does not serve as
a good comparison given that Padini’s business is highly
seasonal.
FY18 core earnings amounted to RM178m, accounting for
104%/101% of our/consensus full-year forecast, which is
within expectations.
Topline growth supported by new outlet openings. Revenue
for 4QFY18 increased by 3.8% y-o-y, mainly driven by new
store openings. Padini has opened five Padini Concept stores
(PSCs) and seven Brands Outlet stores (BOs) during the 12-
month period under review.
2.5 sen/share fourth interim dividend declared. The group
declared its fourth interim dividend of 2.5 sen/share. This
brings its FY18 DPS to 11.5 sen, in line with our expectations.
We make no changes to our earnings forecasts.
Stock price has run ahead of its fundamentals. While we
continue to like Padini for its solid fundamentals and hands-
on management, we believe that the group’s valuations have
run ahead of its fundamentals. The group is currently trading
at about 18x forward PE, which is about +2D of its historical
mean.
Downgrade to FULLY VALUED. We downgrade our
recommendation for Padini to FULLY VALUED with an
unchanged TP of RM5.05. We are taking a more bearish
stance on the stock as we believe that Padini’s current
valuation has priced in its near-term growth prospects. Our TP
is still pegged to 15x forward PE.
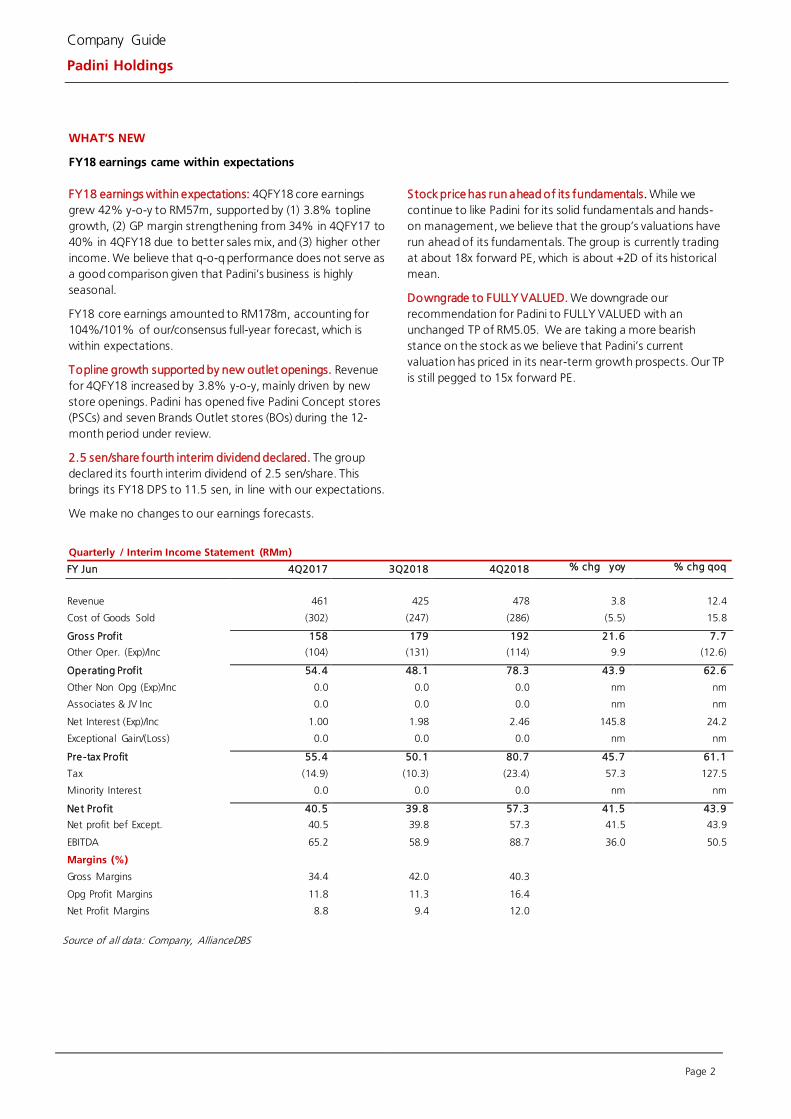
Quarterly / Interim Income Statement (RMm)
FY Jun 4Q2017 3Q2018 4Q2018 % chg yoy % chg qoq
Revenue 461 425 478 3.8 12.4
Cost of Goods Sold (302) (247) (286) (5.5) 15.8
Gros s Profit 158 179 192 21.6 7.7
Other Oper. (Exp)/Inc (104) (131) (114) 9.9 (12.6)
Operating Profit 54.4 48.1 78.3 43.9 62.6
Other Non Opg (Exp)/Inc 0.0 0.0 0.0 nm nm
Associates & JV Inc 0.0 0.0 0.0 nm nm
Net Interest (Exp)/Inc 1.00 1.98 2.46 145.8 24.2
Exceptional Gain/(Loss) 0.0 0.0 0.0 nm nm
Pre-tax Profit 55.4 50.1 80.7 45.7 61.1
Tax (14.9) (10.3) (23.4) 57.3 127.5
Minority Interest 0.0 0.0 0.0 nm nm
Net Profit 40.5 39.8 57.3 41.5 43.9
Net profit bef Except. 40.5 39.8 57.3 41.5 43.9
EBITDA 65.2 58.9 88.7 36.0 50.5
Margins (%)
Gross Margins 34.4 42.0 40.3
Opg Profit Margins 11.8 11.3 16.4
Net Profit Margins 8.8 9.4 12.0
Source of all data: Company, AllianceDBS
Page 3
Company Guide
Padini Holdings
CRITICAL DATA POINTS TO WATCH
Critical Factors
SSSG and number of new outlets are key revenue drivers. Like
other fashion retailers, same store sales growth (SSSG) and the
number of outlets opened in the financial year is a key revenue
driver for the group. After a relatively weak SSSG (<1%) registered
in FY18, we estimate SSSG for FY19 to be about 3%, mainly driven
by rebound in consumer spending in Malaysia.
Brand Outlet could benefit from downtrading. We observe that
consumers are increasingly looking for value in the competitive
apparel market. This bodes well for the expansion of the group’s
rising star, Brands Outlet, over the next 2-3 years.
S izeable untapped market in suburban cities. The group will focus
on the Brands Outlet (BO) chain over the next three years, to
improve business scale, distribution network, and operating
leverage, to strengthen its presence in the local apparel market.
Management sees business opportunities in the huge underserved
markets in Malaysia’s suburban cities, and tapping these markets
should keep it busy over the next few years. Once BO hits
saturation point, management will review its growth strategy,
including expanding its product lines and overseas business.
Potential waning of its mix-and-match bundling strategy and
margin compression remain key concerns. We are concerned that
the popularity of its mix-and-match bundling strategy implemented
in Padini Concept Store (PCS) will eventually taper off, which could
drag down SSSG, given the slower-than-expected recovery in
domestic consumer spending.
Furthermore, potentially high cost of inventories and marketing
costs could erode its margins. At present, the group sources about
70% of its products from China through its sourcing agents. We
understand that the group has experienced rising inventory costs
due to rising costs in China.
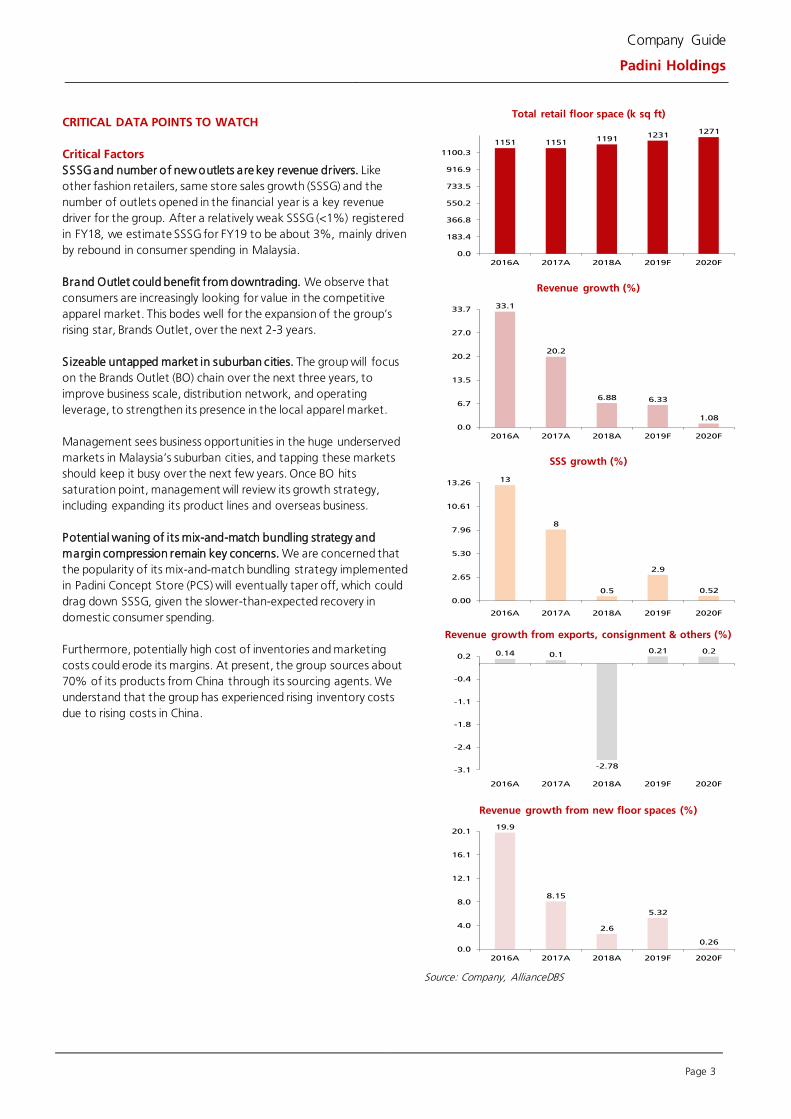
Total retail floor space (k sq ft)
Revenue growth (%)
SSS growth (%)
Revenue growth from exports, consignment & others (%)
Revenue growth from new floor spaces (%)
Source: Company, AllianceDBS
1151 11511191
12311271
0.0
183.4
366.8
550.2
733.5
916.9
1100.3
2016A 2017A 2018A 2019F 2020F
33.1
20.2
6.88 6.33
1.08
0.0
6.7
13.5
20.2
27.0
33.7
2016A 2017A 2018A 2019F 2020F
13
8
0.5
2.9
0.52
0.00
2.65
5.30
7.96
10.61
13.26
2016A 2017A 2018A 2019F 2020F
0.14 0.1
-2.78
0.21 0.2
-3.1
-2.4
-1.8
-1.1
-0.4
0.2
2016A 2017A 2018A 2019F 2020F
19.9
8.15
2.6
5.32
0.260.0
4.0
8.0
12.1
16.1
20.1
2016A 2017A 2018A 2019F 2020F
Page 4
Company Guide
Padini Holdings
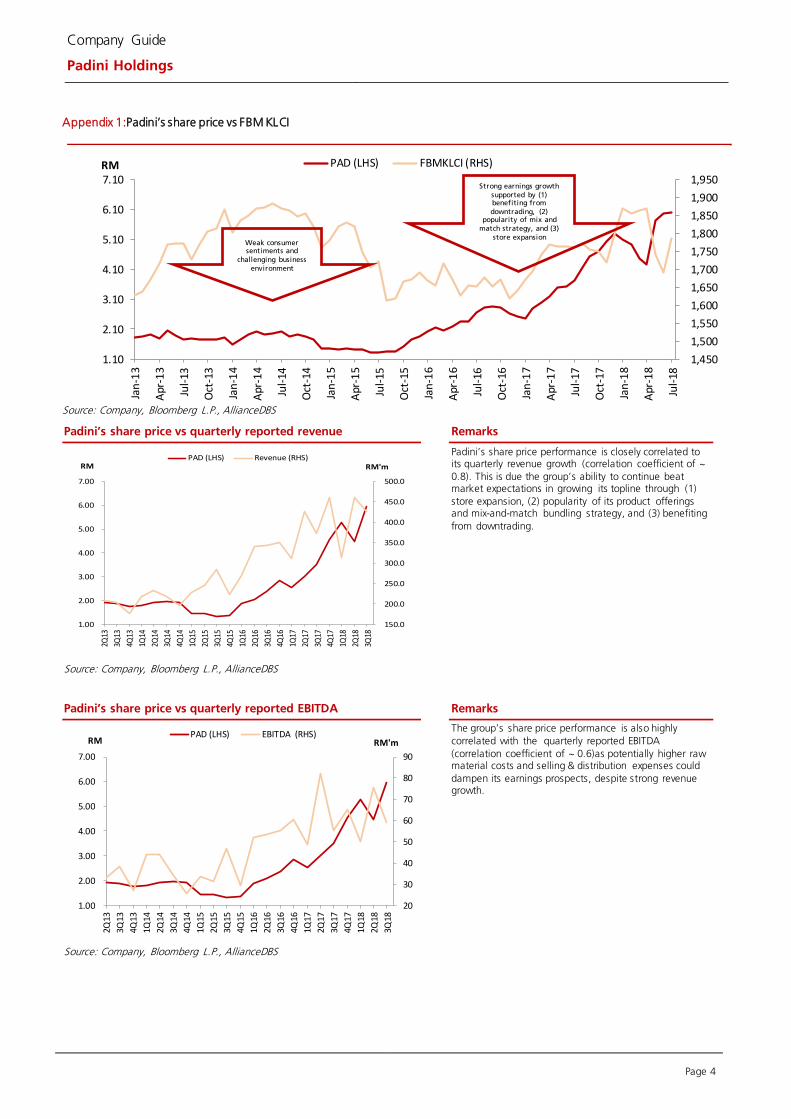
Appendix 1:Padini’s share price vs FBM KLCI
Source: Company, Bloomberg L.P., AllianceDBS
Padini’s share price vs quarterly reported revenue Remarks
Padini’s share price performance is closely correlated to its quarterly revenue growth (correlation coefficient of ~
0.8). This is due the group’s ability to continue beat market expectations in growing its topline through (1)
store expansion, (2) popularity of its product offerings and mix-and-match bundling strategy, and (3) benefiting
from downtrading.
Source: Company, Bloomberg L.P., AllianceDBS
Padini’s share price vs quarterly reported EBITDA Remarks
The group’s share price performance is also highly
correlated with the quarterly reported EBITDA
(correlation coefficient of ~ 0.6)as potentially higher raw material costs and selling & distribution expenses could
dampen its earnings prospects, despite strong revenue growth.
Source: Company, Bloomberg L.P., AllianceDBS
1,450
1,500
1,550
1,600
1,650
1,700
1,750
1,800
1,850
1,900
1,950
1.10
2.10
3.10
4.10
5.10
6.10
7.10
Jan
-13
Apr
-13
Jul-
13
Oct
-13
Jan
-14
Apr
-14
Jul-
14
Oct
-14
Jan
-15
Apr
-15
Jul-
15
Oct
-15
Jan
-16
Apr
-16
Jul-
16
Oct
-16
Jan
-17
Apr
-17
Jul-
17
Oct
-17
Jan
-18
Apr
-18
Jul-
18
RM PAD (LHS) FBMKLCI (RHS)
150.0
200.0
250.0
300.0
350.0
400.0
450.0
500.0
1.00
2.00
3.00
4.00
5.00
6.00
7.00
2Q13
3Q13
4Q13
1Q14
2Q14
3Q14
4Q14
1Q15
2Q15
3Q15
4Q15
1Q16
2Q16
3Q16
4Q16
1Q17
2Q17
3Q17
4Q17
1Q18
2Q18
3Q18
RM'mRMPAD (LHS) Revenue (RHS)
20
30
40
50
60
70
80
90
1.00
2.00
3.00
4.00
5.00
6.00
7.00
2Q13
3Q13
4Q13
1Q14
2Q14
3Q14
4Q14
1Q15
2Q15
3Q15
4Q15
1Q16
2Q16
3Q16
4Q16
1Q17
2Q17
3Q17
4Q17
1Q18
2Q18
3Q18
RM'mRMPAD (LHS) EBITDA (RHS)
Strong earnings growth
supported by (1) benefiting from
downtrading, (2) popularity of mix and
match strategy, and (3)
store expansion Weak consumer sentiments and
challenging business
environment
Page 5
Company Guide
Padini Holdings
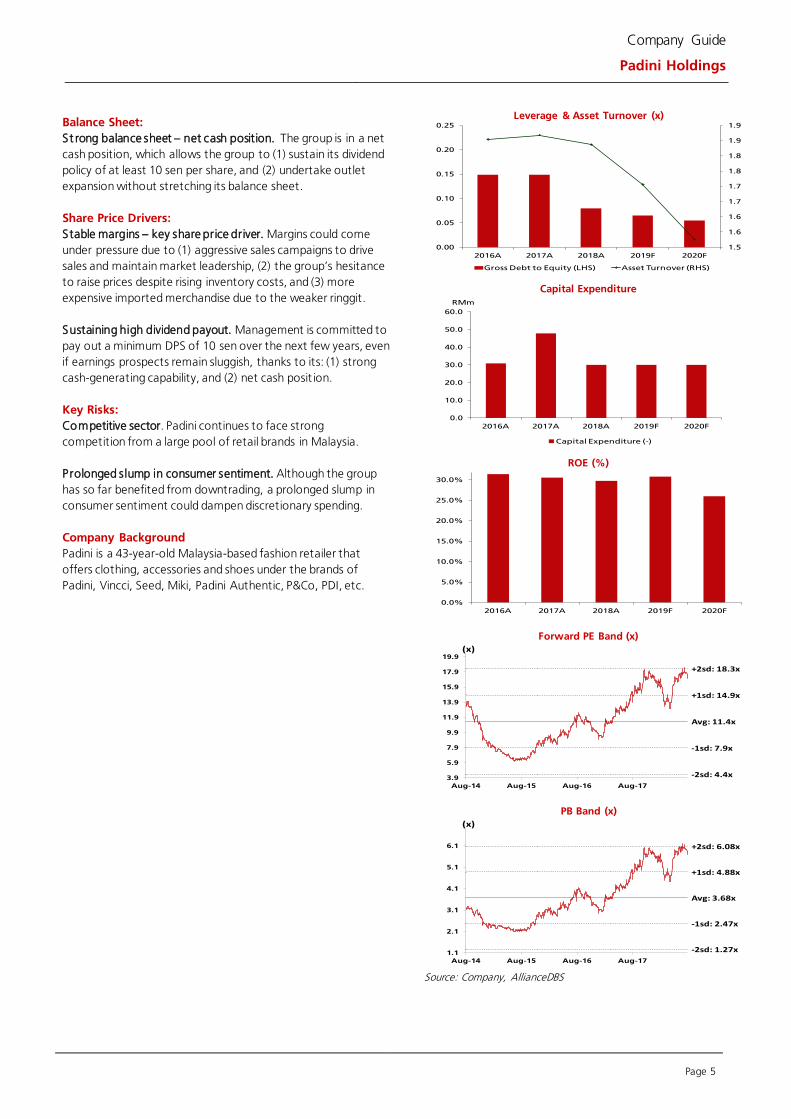
Balance Sheet:
St rong balance sheet – net cash position. The group is in a net
cash position, which allows the group to (1) sustain its dividend
policy of at least 10 sen per share, and (2) undertake outlet
expansion without stretching its balance sheet.
Share Price Drivers:
Stable margins – key share price driver. Margins could come
under pressure due to (1) aggressive sales campaigns to drive
sales and maintain market leadership, (2) the group’s hesitance
to raise prices despite rising inventory costs, and (3) more
expensive imported merchandise due to the weaker ringgit.
Sustaining high dividend payout. Management is committed to
pay out a minimum DPS of 10 sen over the next few years, even
if earnings prospects remain sluggish, thanks to its: (1) strong
cash-generating capability, and (2) net cash posit ion.
Key Risks:
Competitive sector. Padini continues to face strong
competition from a large pool of retail brands in Malaysia.
Prolonged slump in consumer sentiment. Although the group
has so far benefited from downtrading, a prolonged slump in
consumer sentiment could dampen discretionary spending.
Company Background
Padini is a 43-year-old Malaysia-based fashion retailer that
offers clothing, accessories and shoes under the brands of
Padini, Vincci, Seed, Miki, Padini Authentic, P&Co, PDI, etc.
Leverage & Asset Turnover (x)
Capital Expenditure
ROE (%)
Forward PE Band (x)
PB Band (x)
Source: Company, AllianceDBS
1.5
1.6
1.6
1.7
1.7
1.8
1.8
1.9
1.9
0.00
0.05
0.10
0.15
0.20
0.25
2016A 2017A 2018A 2019F 2020F
Gross Debt to Equity (LHS) Asset Turnover (RHS)
0.0
10.0
20.0
30.0
40.0
50.0
60.0
2016A 2017A 2018A 2019F 2020F
Capital Expenditure (-)
RMm
0.0%
5.0%
10.0%
15.0%
20.0%
25.0%
30.0%
2016A 2017A 2018A 2019F 2020F
Avg: 11.4x
+1sd: 14.9x
+2sd: 18.3x
-1sd: 7.9x
-2sd: 4.4x3.9
5.9
7.9
9.9
11.9
13.9
15.9
17.9
19.9
Aug-14 Aug-15 Aug-16 Aug-17
(x)
Avg: 3.68x
+1sd: 4.88x
+2sd: 6.08x
-1sd: 2.47x
-2sd: 1.27x1.1
2.1
3.1
4.1
5.1
6.1
Aug-14 Aug-15 Aug-16 Aug-17
(x)
Page 6
Company Guide
Padini Holdings
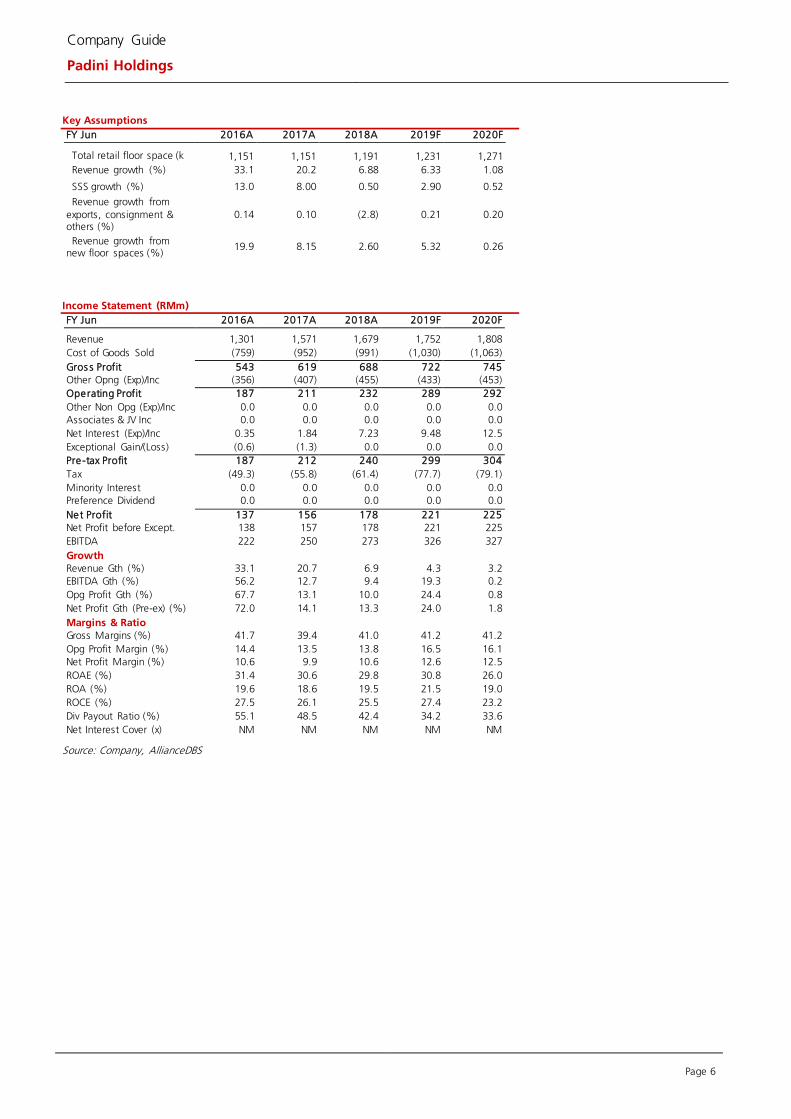
Key Assumptions
FY Jun 2016A 2017A 2018A 2019F 2020F
Total retail floor space (k sq ft)
1,151 1,151 1,191 1,231 1,271
Revenue growth (%) 33.1 20.2 6.88 6.33 1.08
SSS growth (%) 13.0 8.00 0.50 2.90 0.52
Revenue growth from
exports, consignment & others (%)
0.14 0.10 (2.8) 0.21 0.20
Revenue growth from new floor spaces (%)
19.9 8.15 2.60 5.32 0.26
Income Statement (RMm)
FY Jun 2016A 2017A 2018A 2019F 2020F
Revenue 1,301 1,571 1,679 1,752 1,808
Cost of Goods Sold (759) (952) (991) (1,030) (1,063)
Gros s Profit 543 619 688 722 745
Other Opng (Exp)/Inc (356) (407) (455) (433) (453)
Operating Profit 187 211 232 289 292
Other Non Opg (Exp)/Inc 0.0 0.0 0.0 0.0 0.0
Associates & JV Inc 0.0 0.0 0.0 0.0 0.0
Net Interest (Exp)/Inc 0.35 1.84 7.23 9.48 12.5
Exceptional Gain/(Loss) (0.6) (1.3) 0.0 0.0 0.0
Pre -tax Profit 187 212 240 299 304
Tax (49.3) (55.8) (61.4) (77.7) (79.1)
Minority Interest 0.0 0.0 0.0 0.0 0.0
Preference Dividend 0.0 0.0 0.0 0.0 0.0
Net Profit 137 156 178 221 225
Net Profit before Except. 138 157 178 221 225
EBITDA 222 250 273 326 327
Growth
Revenue Gth (%) 33.1 20.7 6.9 4.3 3.2
EBITDA Gth (%) 56.2 12.7 9.4 19.3 0.2
Opg Profit Gth (%) 67.7 13.1 10.0 24.4 0.8
Net Profit Gth (Pre-ex) (%) 72.0 14.1 13.3 24.0 1.8
Margins & Ratio
Gross Margins (%) 41.7 39.4 41.0 41.2 41.2
Opg Profit Margin (%) 14.4 13.5 13.8 16.5 16.1
Net Profit Margin (%) 10.6 9.9 10.6 12.6 12.5
ROAE (%) 31.4 30.6 29.8 30.8 26.0
ROA (%) 19.6 18.6 19.5 21.5 19.0
ROCE (%) 27.5 26.1 25.5 27.4 23.2
Div Payout Ratio (%) 55.1 48.5 42.4 34.2 33.6
Net Interest Cover (x) NM NM NM NM NM
Source: Company, AllianceDBS
Page 7
Company Guide
Padini Holdings
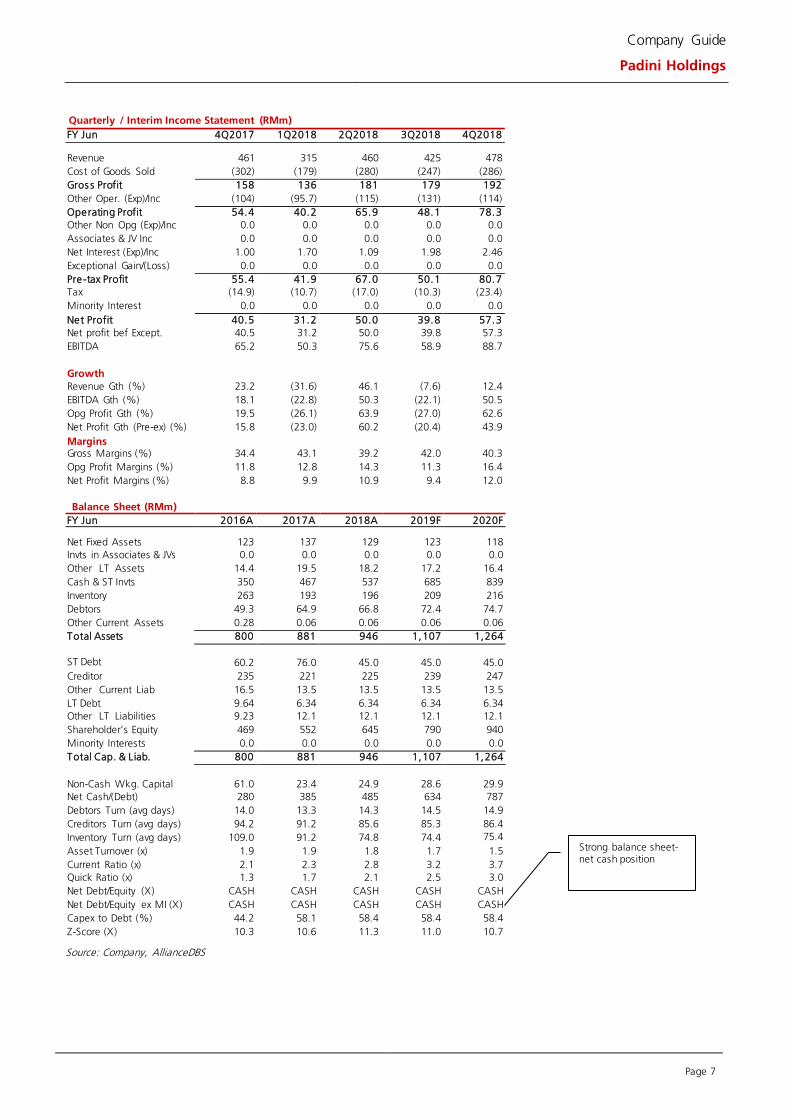
Quarterly / Interim Income Statement (RMm)
FY Jun 4Q2017 1Q2018 2Q2018 3Q2018 4Q2018
Revenue 461 315 460 425 478
Cost of Goods Sold (302) (179) (280) (247) (286)
Gros s Profit 158 136 181 179 192
Other Oper. (Exp)/Inc (104) (95.7) (115) (131) (114)
Operating Profit 54.4 40.2 65.9 48.1 78.3
Other Non Opg (Exp)/Inc 0.0 0.0 0.0 0.0 0.0
Associates & JV Inc 0.0 0.0 0.0 0.0 0.0
Net Interest (Exp)/Inc 1.00 1.70 1.09 1.98 2.46
Exceptional Gain/(Loss) 0.0 0.0 0.0 0.0 0.0
Pre -tax Profit 55.4 41.9 67.0 50.1 80.7
Tax (14.9) (10.7) (17.0) (10.3) (23.4)
Minority Interest 0.0 0.0 0.0 0.0 0.0
Net Profit 40.5 31.2 50.0 39.8 57.3
Net profit bef Except. 40.5 31.2 50.0 39.8 57.3
EBITDA 65.2 50.3 75.6 58.9 88.7
Growth
Revenue Gth (%) 23.2 (31.6) 46.1 (7.6) 12.4
EBITDA Gth (%) 18.1 (22.8) 50.3 (22.1) 50.5
Opg Profit Gth (%) 19.5 (26.1) 63.9 (27.0) 62.6
Net Profit Gth (Pre-ex) (%) 15.8 (23.0) 60.2 (20.4) 43.9
Margins Gross Margins (%) 34.4 43.1 39.2 42.0 40.3
Opg Profit Margins (%) 11.8 12.8 14.3 11.3 16.4
Net Profit Margins (%) 8.8 9.9 10.9 9.4 12.0
Balance Sheet (RMm)
FY Jun 2016A 2017A 2018A 2019F 2020F Net Fixed Assets 123 137 129 123 118
Invts in Associates & JVs 0.0 0.0 0.0 0.0 0.0
Other LT Assets 14.4 19.5 18.2 17.2 16.4
Cash & ST Invts 350 467 537 685 839
Inventory 263 193 196 209 216
Debtors 49.3 64.9 66.8 72.4 74.7
Other Current Assets 0.28 0.06 0.06 0.06 0.06
Total Assets 800 881 946 1,107 1,264
ST Debt
60.2 76.0 45.0 45.0 45.0
Creditor 235 221 225 239 247
Other Current Liab 16.5 13.5 13.5 13.5 13.5
LT Debt 9.64 6.34 6.34 6.34 6.34
Other LT Liabilities 9.23 12.1 12.1 12.1 12.1
Shareholder’s Equity 469 552 645 790 940
Minority Interests 0.0 0.0 0.0 0.0 0.0
Total Cap. & Liab. 800 881 946 1,107 1,264
Non-Cash Wkg. Capital 61.0 23.4 24.9 28.6 29.9
Net Cash/(Debt) 280 385 485 634 787
Debtors Turn (avg days) 14.0 13.3 14.3 14.5 14.9
Creditors Turn (avg days) 94.2 91.2 85.6 85.3 86.4
Inventory Turn (avg days) 109.0 91.2 74.8 74.4 75.4
Asset Turnover (x) 1.9 1.9 1.8 1.7 1.5
Current Ratio (x) 2.1 2.3 2.8 3.2 3.7
Quick Ratio (x) 1.3 1.7 2.1 2.5 3.0
Net Debt/Equity (X) CASH CASH CASH CASH CASH
Net Debt/Equity ex MI (X) CASH CASH CASH CASH CASH
Capex to Debt (%) 44.2 58.1 58.4 58.4 58.4
Z-Score (X) 10.3 10.6 11.3 11.0 10.7
Source: Company, AllianceDBS
Strong balance sheet- net cash position
Page 8
Company Guide
Padini Holdings
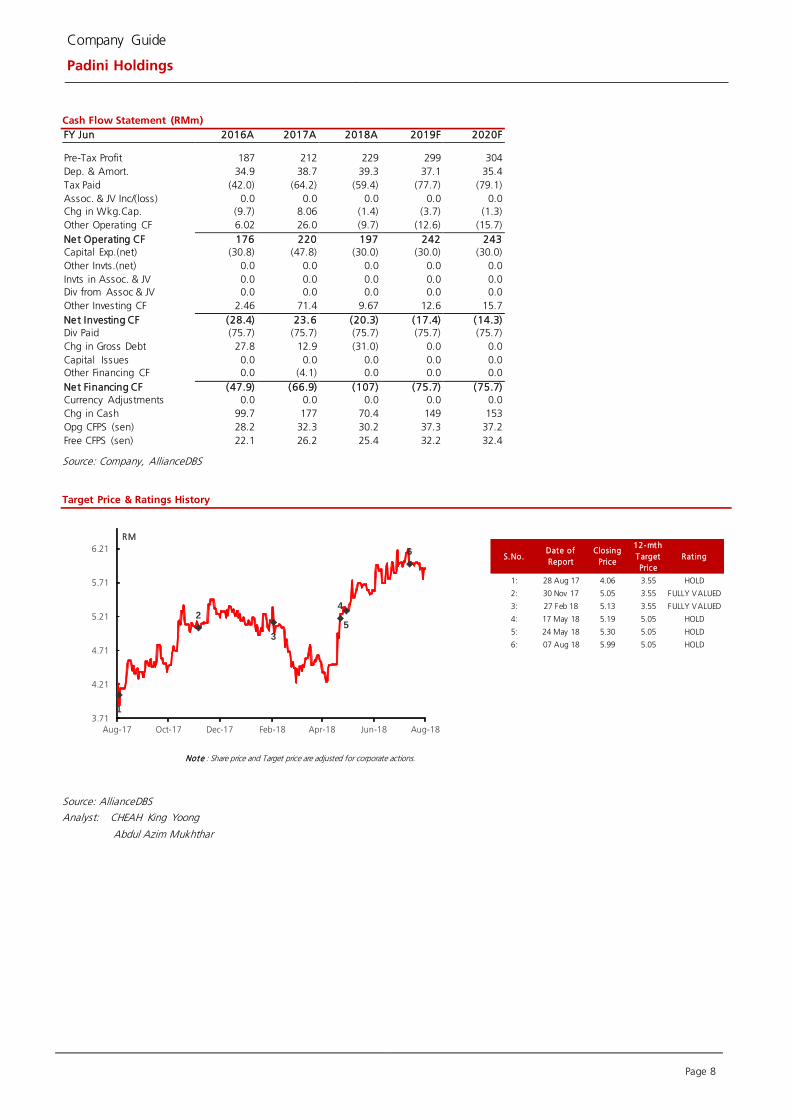
Cash Flow Statement (RMm)
FY Jun 2016A 2017A 2018A 2019F 2020F
Pre-Tax Profit 187 212 229 299 304
Dep. & Amort. 34.9 38.7 39.3 37.1 35.4
Tax Paid (42.0) (64.2) (59.4) (77.7) (79.1)
Assoc. & JV Inc/(loss) 0.0 0.0 0.0 0.0 0.0
Chg in Wkg.Cap. (9.7) 8.06 (1.4) (3.7) (1.3)
Other Operating CF 6.02 26.0 (9.7) (12.6) (15.7)
Net Operating CF 176 220 197 242 243
Capital Exp.(net) (30.8) (47.8) (30.0) (30.0) (30.0)
Other Invts.(net) 0.0 0.0 0.0 0.0 0.0
Invts in Assoc. & JV 0.0 0.0 0.0 0.0 0.0
Div from Assoc & JV 0.0 0.0 0.0 0.0 0.0
Other Investing CF 2.46 71.4 9.67 12.6 15.7
Net Investing CF (28.4) 23.6 (20.3) (17.4) (14.3)
Div Paid (75.7) (75.7) (75.7) (75.7) (75.7)
Chg in Gross Debt 27.8 12.9 (31.0) 0.0 0.0
Capital Issues 0.0 0.0 0.0 0.0 0.0
Other Financing CF 0.0 (4.1) 0.0 0.0 0.0
Net Financing CF (47.9) (66.9) (107) (75.7) (75.7)
Currency Adjustments 0.0 0.0 0.0 0.0 0.0
Chg in Cash 99.7 177 70.4 149 153
Opg CFPS (sen) 28.2 32.3 30.2 37.3 37.2
Free CFPS (sen) 22.1 26.2 25.4 32.2 32.4
Source: Company, AllianceDBS
Target Price & Ratings History
Source: AllianceDBS
Analyst: CHEAH King Yoong
Abdul Azim Mukhthar
S.No.Date of
Report
Closing
Price
12-mth
Target
Price
Rat ing
1: 28 Aug 17 4.06 3.55 HOLD
2: 30 Nov 17 5.05 3.55 FULLY VALUED
3: 27 Feb 18 5.13 3.55 FULLY VALUED
4: 17 May 18 5.19 5.05 HOLD
5: 24 May 18 5.30 5.05 HOLD
6: 07 Aug 18 5.99 5.05 HOLD
Note : Share price and Target price are adjusted for corporate actions.
1
2
3
4
5
6
3.71
4.21
4.71
5.21
5.71
6.21
Aug-17 Oct-17 Dec-17 Feb-18 Apr-18 Jun-18 Aug-18
RM
Page 9
Company Guide
Padini Holdings
DISCLOSURE
Stock rating definitions
STRONG BUY - > 20% total return over the next 3 months, with identifiable share price catalysts within this time frame BUY - > 15% total return over the next 12 months for small caps, >10% for large caps
HOLD - -10% to +15% total return over the next 12 months for small caps, -10% to +10% for large caps FULLY VALUED - negative total return > -10% over the next 12 months
SELL - negative total return of > -20% over the next 3 months, with identifiable catalysts within this time frame
Commonly used abbreviations Adex = advertising expenditure EPS = earnings per share PBT = profit before tax
bn = billion EV = enterprise value P/B = price / book ratio BV = book value FCF = free cash flow P/E = price / earnings ratio
CF = cash flow FV = fair value PEG = P/E ratio to growth ratio CAGR = compounded annual growth rate FY = financial year q-o-q = quarter-on-quarter
Capex = capital expenditure m = million RM = Ringgit CY = calendar year M-o-m = month-on-month ROA = return on assets
Div yld = dividend yield NAV = net assets value ROE = return on equity DCF = discounted cash flow NM = not meaningful TP = target price
DDM = dividend discount model NTA = net tangible assets trn = trillion DPS = dividend per share NR = not rated WACC = weighted average cost of capital
EBIT = earnings before interest & tax p.a. = per annum y-o-y = year-on-year EBITDA = EBIT before depreciation and amortisation PAT = profit after tax YTD = year-to-date
Page 10
Company Guide
Padini Holdings
DISCLAIMER
This report has been prepared for information purposes only by AllianceDBS Research Sdn Bhd (“ADBSR”), a subsidiary of Alliance Investment
Bank Berhad (“AIBB”) and an associate of DBS Vickers Securities Holdings Pte Ltd (“DBSVH”). DBSVH is a wholly -owned subsidiary of DBS Bank Ltd. This report is strictly confidential and is meant for circulation to clients of ADBSR, AIBB and DBSVH only or such persons as may be deemed
eligible to receive such research report, information or opinion contained herein. Receipt and review of this report indicate your agreement not to distribute, reproduce or disclose in any other form or medium (whether electronic or otherwise) the contents, views, information or opinions contained herein without the prior written consent of ADBSR.
This report is based on data and information obtained from various sources believed to be reliable at the time of issuance of this report and any
opinion expressed herein is subject to change without prior notice and may differ or be contrary to opinions expressed by ADBSR’s affiliates and/or related parties. ADBSR does not make any guarantee, representation or warranty (whether express or implied) as to the accuracy,
completeness, reliability or fairness of the data and information obtained from such sources as may be contained in this repo rt. As such, neither ADBSR nor its affiliates and/or related parties shall be held liable or responsible in any manner whatsoever arising out of or in connection wi th
the reliance and usage of such data and information or third party references as may be made in this report (including, but not limited to any direct, indirect or consequential losses, loss of profits and damages).
The views expressed in this report reflect the personal views of the analyst(s) about the subject securities or issuers and no part of the
compensation of the analyst(s) was, is, or will be directly or indirectly related to the inclusion of specific recommendation(s) or view(s) in this report. ADBSR prohibits the analyst(s) who prepared this report from receiving any compensation, incentive or bonus based on specific
investment banking transactions or providing a specific recommendation for, or view of, a particular company.
This research report provides general information only and is not to be construed as an offer to sell or a solicitation to buy or sell any securities or other investments or any options, futures, derivatives or other instruments related to such securities or investments. In particular, it is
highlighted that this report is not intended for nor does it have regard to the specific investment objecti ves, financial situation and particular needs of any specific person who may receive this report. Investors are therefore advised to make their own independent eval uation of the
information contained in this report, consider their own individual investment objectives, financial situations and particular needs and consult their own professional advisers (including but not limited to financial, legal and tax advisers) regarding the appropria tenes s of investing in any
securities or investments that may be featured in this report.
ADBSR, AIBB, DBSVH and DBS Bank Ltd, their directors, representatives and employees or any of their affiliates or their related parties may, from time to time, have an interest in the securities mentioned in this report. AIBB, DBSVH and DBS Bank Ltd, their affiliates and/or their related persons may do and/or seek to do business with the company(ies) covered in this report and may from time to time act as market maker
or have assumed an underwriting commitment in securities of such c ompany(ies), may sell or buy such securities from customers on a principal basis and may also perform or seek to perform significant investment banking, advisory or underwriting services for or relati ng to such
company(ies) as well as solicit such investment, advisory or other services from any entity mentioned in this report.
AIBB, DBSVH, DBS Bank Ltd (which carries on, inter alia, corporate finance activities) and their activities are separate from ADBSR. AIBB, DBSVH and DBS Bank Ltd may have no input into company-specific coverage decisions (i.e. whether or not to initiate or terminate coverage of a
particular company or securities in reports produced by ADBSR) and ADBSR does not take into account investment banking revenues or potential revenues when making company-specific coverage decisions.
ADBSR, AIBB, DBSVH, DBS Bank Ltd and/or other affiliates of DBS Vickers Securities (USA) Inc (“DBSVUSA”), a U.S. -registered broker-dealer,
may beneficially own a total of 1% or more of any class of common equity securities of the subject company mentioned in this report. ADBSR, AIBB, DBSVH, DBS Bank Ltd and/or other affiliates of DBSVUSA may, within the past 12 months, have received compensation and/o r within the
next 3 months seek to obtain compensation for investment banking services from the subject company. DBSVUSA does not have its own investment banking or research department, nor has it participated in any investment banking transaction as a manager or co-manager in the
past twelve months. Any US persons wishing to obtain further information, including any clarification on disclosures in this disclaimer, or to effect a transaction in any security discussed in this report should contact DBSVUSA exclusively. DBS Vickers Securities (UK) Ltd is an authorised
person in the meaning of the Financial Services and Markets Act and is regulated by The Financial Services Authority. Research distributed in the UK is intended only for institutional clients.
In reviewing this report, an investor should be aware that any or all of the foregoing, among other things, may give rise to real or potential
conflicts of interest. Additional information is, subject to the overriding issue of confidentiality, available upon request to enable an investor to make their own independent evaluation of the information contained herein.
Wong Ming Tek, Executive Director
Published by
AllianceDBS Research Sdn Bhd (128540 U)
19th Floor, Menara Multi-Purpose, Capital Square, 8 Jalan Munshi Abdullah, 50100 Kuala Lumpur, Malaysia.
Tel.: +603 2604 3333 Fax: +603 2604 3921 email : [email protected]