ranhill holdings - bursa marketplace
TRANSCRIPT
MIDF RESEARCH is a unit of MIDF AMANAH INVESTMENT BANK
Kindly refer to the last page of this publication for important disclosures
20 September 2018 | Initiating Coverage
Ranhill Holdings Initiating Coverage BUY Deep value Target Price TP: RM1.15
INVESTMENT HIGHLIGHTS
• We initiate coverage of Ranhill with a BUY and TP of RM1.15/share. At just 8x FY19F earnings, Ranhill is a deeply
undervalued utility play paying out solid 8% dividend yields
• Via a stake in Tawau Green Energy, Ranhill is an early cycle
play into the development of geothermal power in Malaysia
• More importantly, Ranhill is a solid proxy to the water-sewerage integration drive, which could drive a double-digit
earnings expansion
• Near-term, earnings is expected to gap-up from scheduled rate hike for Johor water operations
Initiating coverage with a BUY. We initiate coverage of Ranhill Holdings (Ranhill) with a BUY and a TP of RM1.15/share. Our conviction is premised on: (1) Solid 8% dividend yields backed by asset-light water business (2) Double-digit earnings gap-up from scheduled rate hike for water operation (3) Emerging play in the renewable energy sector (4) Imminent entry into sewerage services (5) Favourable risk reward at current depressed valuations of just 8x FY19F earnings.
Overlooked potential. Ranhill is an overlooked, hence under-institutionalised, utilities play with exposures both the water and power sectors. The group is the most profitable water operator in the country with a solid 19 years track record in Johor and the largest IPP in Sabah. Backed by cash flows from its asset-light water operations (mainly) and management’s commitment to an at least 60% payout, Ranhill entails solid dividend yields of 8%. Earnings is set to gap-up from FY19F on an impending water tariff hike which will drive a 12% growth next year.
Emerging renewable energy play. Via a 26.7% stake in Tawau Green Energy Sdn Bhd (TGE) Ranhill is the only listed play into the country’s 1st geothermal development project, located in Tawau, Sabah. Backed by a 21-year REPPA and a conservative 30MW initial capacity (full potential of 100MW capacity), TGE is expected to generate attractive IRR in the low teens and could raise our valuations by a further 4%. Ranhill is in fact looking to raise its stake in TGE to 50% which can in turn almost double the value accretion.
Proxy to water-sewerage integration. In line with the direction set by the Water Services Industry Act 2006 and on the back of a strong track record in Johor, Ranhill had signed an MoU with Indah Water to explore joint billing and ultimately, take-over Johor’s sewerage operations. A switch to a volumetric tariff regime could turn around the currently loss making sewerage operations (under IWK) and has the potential to drive a massive 30% earnings expansion for Ranhill.
Deeply undervalued. At just 7.6x FY19F PE, Ranhill is deeply undervalued. At current market cap, implied valuation for its water business is a mere 7x, well below Penang-based peer, PBA Holdings’ 10x PE and the broader utilities sector’s average PE of 11x. Balance sheet has been successfully de-geared since its 2016 IPO, while attractive dividend yields cushions downside. Key catalysts: (1) Schedule rate hike for Johor water (2) TGE progress into production well drilling (3) Johor water-sewerage integration
RETURN STATS
Price (19 Sep 2018) RM0.755
Target Price RM1.15
Expected Share Price
Return +52.3%
Expected Dividend Yield +7.9%
Expected Total Return +60.2%
STOCK INFO
KLCI 1800.71
Bursa / Bloomberg 5272/RAHH MK
Board / Sector Main / Power
Syariah Compliant Yes
Issued shares (mil) 888.3
Market cap. (RM’m) 670.7
Price over NA 1.16
52-wk price Range RM0.65 – RM0.83
Beta (against KLCI) 0.59
3-mth Avg Daily Vol 0.97m
3-mth Avg Daily Value RM0.73m
Major Shareholders (%)
Tan Sri Hamdan 33.5%
Cheval Infrastructure 20.4%
Permodalan Darul Takzim 10.6%
MIDF RESEARCH Thursday, 20 September 2018
2
INVESTMENT STATISTICS
FYE Dec FY16 FY17 FY18F FY19F FY20F
Revenue (RM’m) 1,455.1 1,478.7 1,515.1 1,710.8 1,726.5
EBITDA (RM'm) 418.6 463.9 489.4 534.4 539.1
Pre-tax Profit (RM’m) 168.5 198.1 203.9 240.9 235.5
Net profit (RM'm) 55.3 72.4 74.5 88.0 86.0
FD EPS (sen) 6.2 8.1 8.4 9.9 9.7
EPS growth (%) 133% 31% 3% 18% -2%
PER (x) 12.1 9.3 9.0 7.6 7.8
Net Dividend (sen) 7.8 5.0 5.0 5.9 5.8
Net Dividend Yield (%) 10.3% 6.6% 6.7% 7.9% 7.7% Source: Company, MIDF
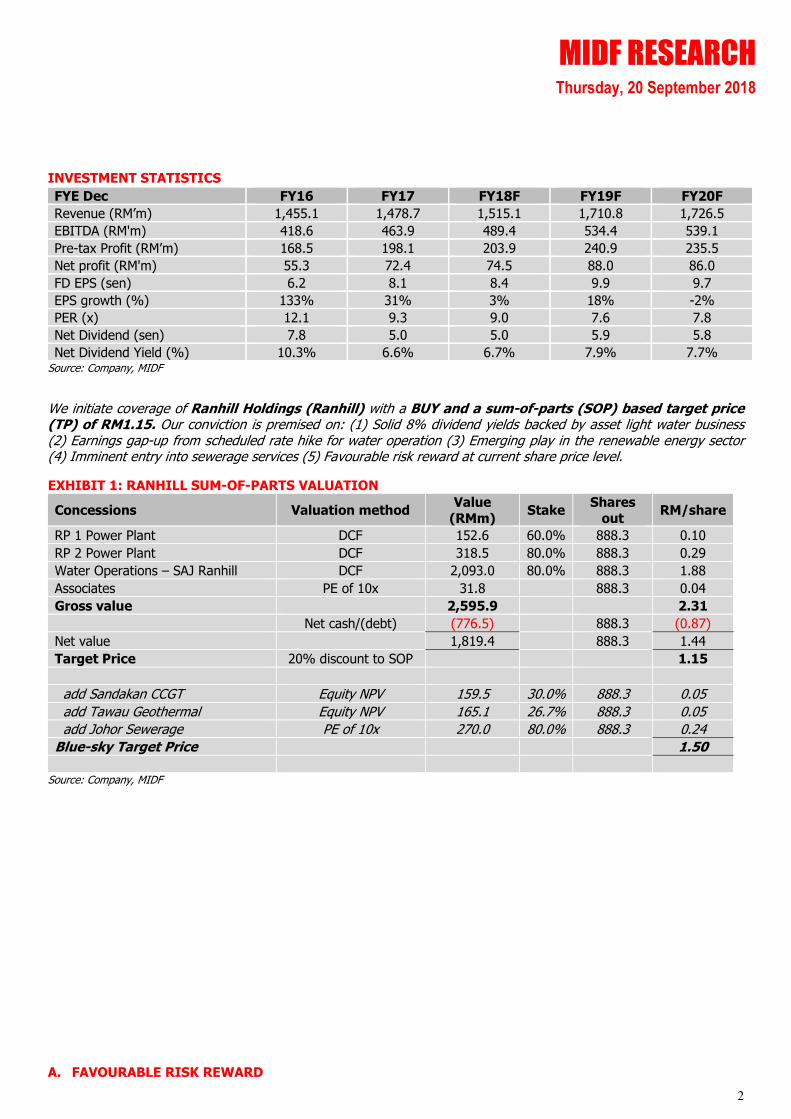
We initiate coverage of Ranhill Holdings (Ranhill) with a BUY and a sum-of-parts (SOP) based target price (TP) of RM1.15. Our conviction is premised on: (1) Solid 8% dividend yields backed by asset light water business (2) Earnings gap-up from scheduled rate hike for water operation (3) Emerging play in the renewable energy sector (4) Imminent entry into sewerage services (5) Favourable risk reward at current share price level.
EXHIBIT 1: RANHILL SUM-OF-PARTS VALUATION
Concessions Valuation method Value
(RMm) Stake
Shares
out RM/share
RP 1 Power Plant DCF 152.6 60.0% 888.3 0.10
RP 2 Power Plant DCF 318.5 80.0% 888.3 0.29
Water Operations – SAJ Ranhill DCF 2,093.0 80.0% 888.3 1.88
Associates PE of 10x 31.8
888.3 0.04
Gross value
2,595.9
2.31
Net cash/(debt) (776.5)
888.3 (0.87)
Net value
1,819.4
888.3 1.44
Target Price 20% discount to SOP
1.15
add Sandakan CCGT Equity NPV 159.5 30.0% 888.3 0.05
add Tawau Geothermal Equity NPV 165.1 26.7% 888.3 0.05
add Johor Sewerage PE of 10x 270.0 80.0% 888.3 0.24
Blue-sky Target Price
1.50
Source: Company, MIDF
A. FAVOURABLE RISK REWARD
MIDF RESEARCH Thursday, 20 September 2018
3
Ranhill is an overlooked and under-institutionalised utilities play with exposure to both the water and power
sectors. Balance sheet has been successfully degeared in the past 2 years, sustainable dividend yields are above-
industry at a solid 8% (relative to sector average yields of 5%), while a number of development and new projects in the pipeline could propel earnings higher in the next few years.
Deep discount to listed water plays. More importantly, Ranhill is deeply undervalued. One of Ranhill’s most prized assets is SAJ Ranhill (SAJ), its water distribution business in Johor which accounts for 80% of our gross SOP valuation
and 60% of group earnings. At current market cap, implied valuation of Ranhill’s 80% stake in SAJ is a mere 7x FY17A PE (prior to expected rate hike in FY19F), a deep discount to local peer such as PBA Holdings which is trading
at 10x PE (and offers a mere 3.2% dividend yield) despite SAJ being one of the most profitable water operators in the
country (See Exhibit 5). Given current deep undervaluation, SAJ looks to be an attractive acquisition target, in our opinion.
EXHIBIT 2: MARKET VALUING SAJ AT JUST 7.2X P/E
Current market cap (RMm) 692.9
Value of Power Business & Associates (RMm) 502.9
Remaining value attributable (RMm) 190.0
(add back) Net Debt (RMm) 776.5
Value attributed to SAJ (RMm) 966.5
SAJ net profit (FY17A) (Pre-rate hike) (RMm) 134.3
Implied PE for SAJ at current market cap (x) 7.2 Source: Company, MIDF
Favourable risk reward. Even as a group, Ranhill’s FY19F PE of just 8x is depressed, relative to overall Malaysian
utilities sector average FY19F PE of 11x. As Ranhill’s earnings are backed by quality, concession based businesses, and considering the depressed valuations it is trading at currently coupled with attractive yields, we see minimal
downside to the stock and risk reward is very attractive at current price levels. Successful execution of several new
power and water projects in the pipeline could drive our TP higher, with a potential blue-sky TP of RM1.50 from the current RM1.15.
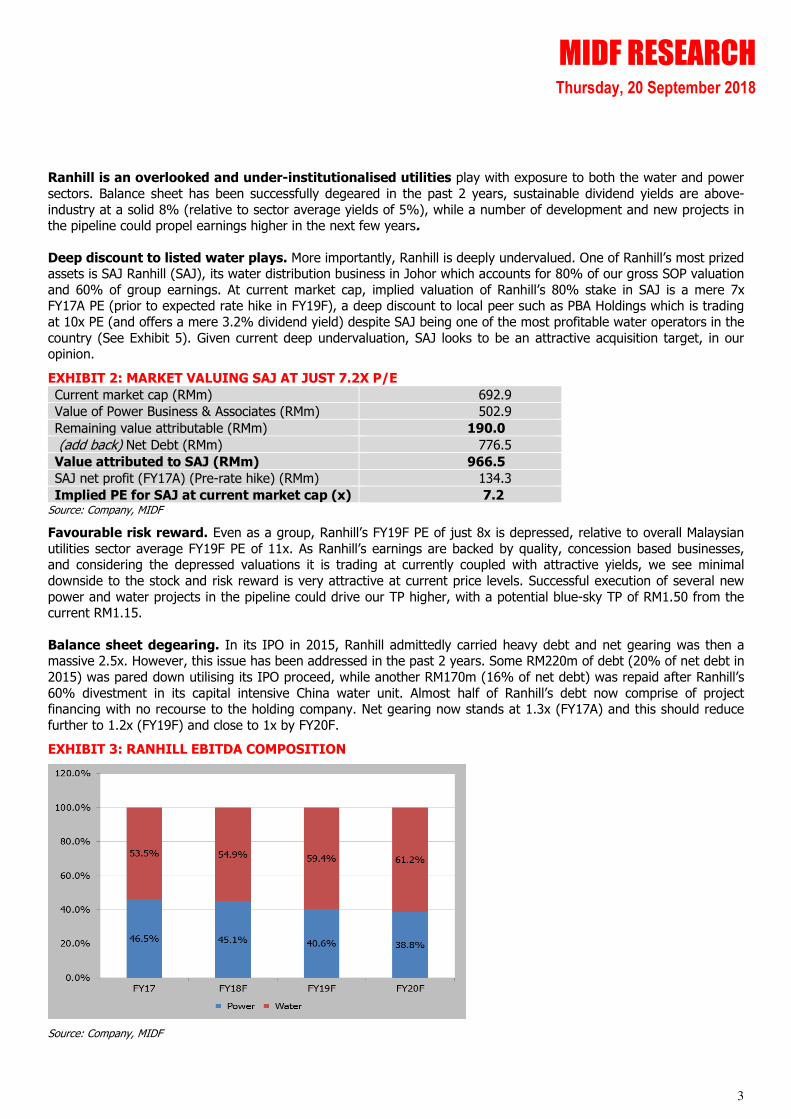
Balance sheet degearing. In its IPO in 2015, Ranhill admittedly carried heavy debt and net gearing was then a massive 2.5x. However, this issue has been addressed in the past 2 years. Some RM220m of debt (20% of net debt in
2015) was pared down utilising its IPO proceed, while another RM170m (16% of net debt) was repaid after Ranhill’s
60% divestment in its capital intensive China water unit. Almost half of Ranhill’s debt now comprise of project financing with no recourse to the holding company. Net gearing now stands at 1.3x (FY17A) and this should reduce
further to 1.2x (FY19F) and close to 1x by FY20F.
EXHIBIT 3: RANHILL EBITDA COMPOSITION
Source: Company, MIDF
MIDF RESEARCH Thursday, 20 September 2018
4
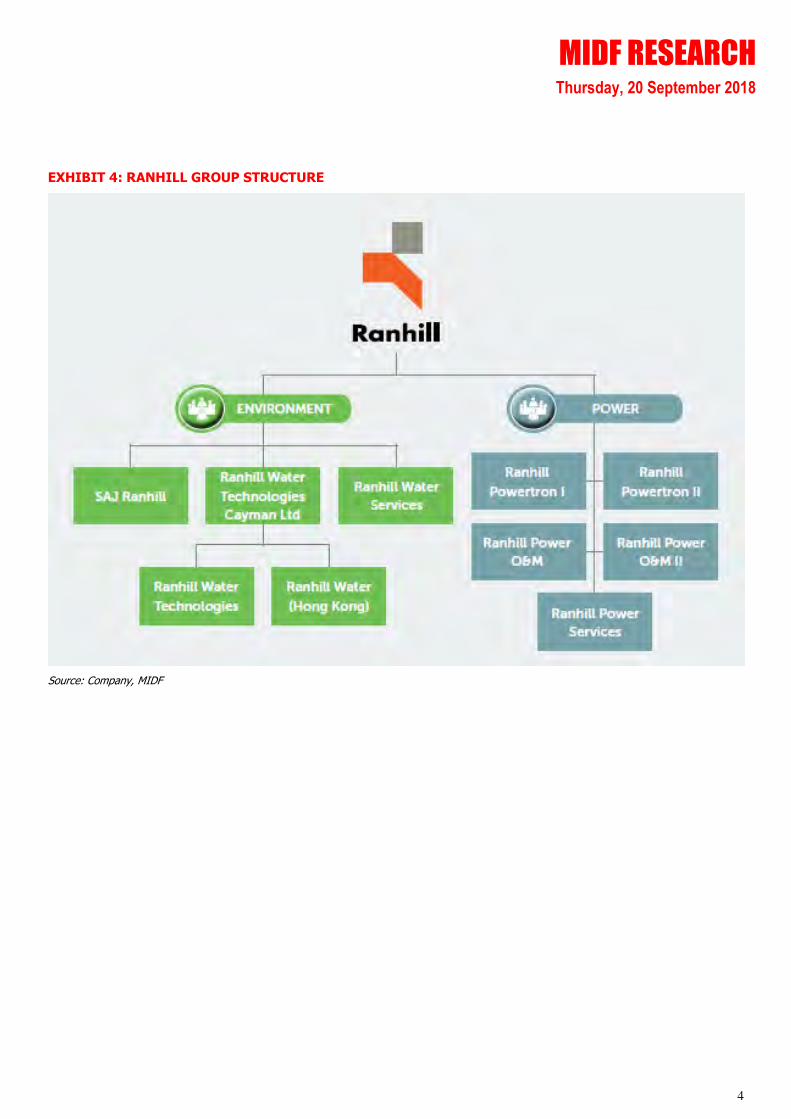
EXHIBIT 4: RANHILL GROUP STRUCTURE
Source: Company, MIDF
MIDF RESEARCH Thursday, 20 September 2018
5
B. SOLID YIELDS BACKED BY WATER STALWART
Solid dividend yields. Ranhill’s perhaps, most attractive proposition at current market cap is its attractive dividend
yields of 8% (FY19F). In FY17A, Ranhill paid out dividends of 5sen/share representing a generous 60% payout and attractive 6.4% yields. These are sustainable dividends backed by earnings from 80%-owned SAJ. Ranhill generates
an attractive FCFF yield of 15% (FY19F), and management commits to maintain at least a 60% dividend payout ratio going forward.
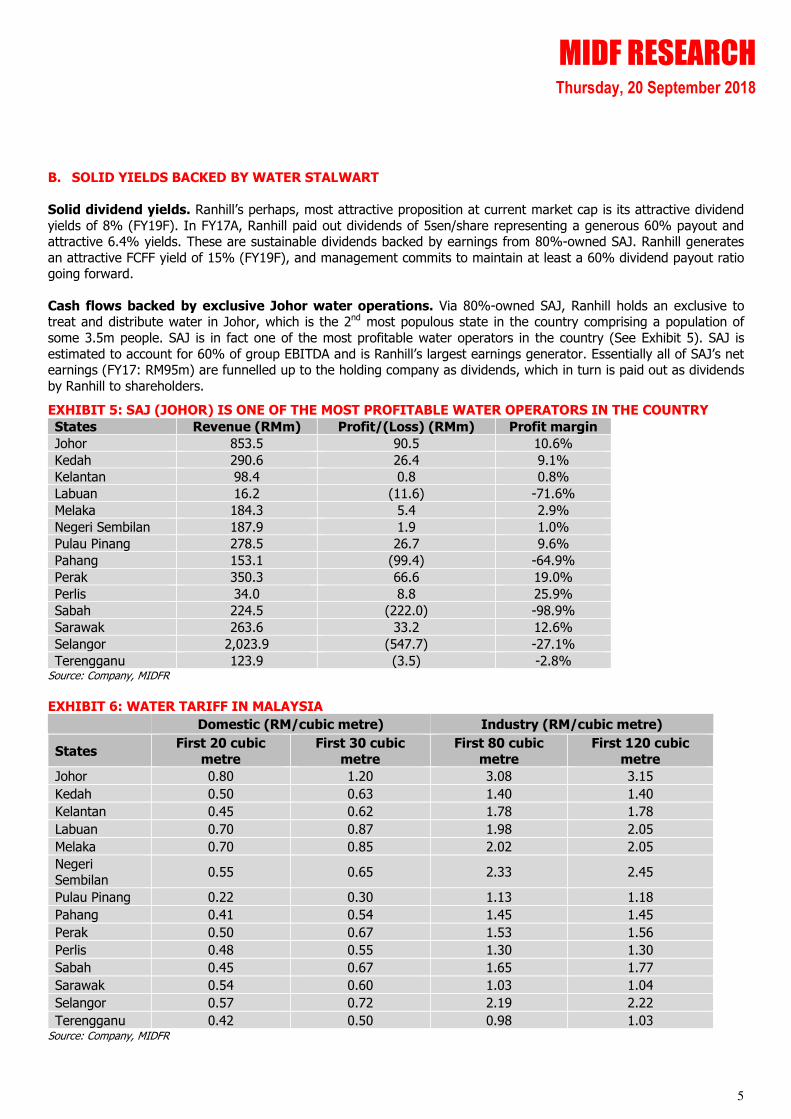
Cash flows backed by exclusive Johor water operations. Via 80%-owned SAJ, Ranhill holds an exclusive to treat and distribute water in Johor, which is the 2nd most populous state in the country comprising a population of
some 3.5m people. SAJ is in fact one of the most profitable water operators in the country (See Exhibit 5). SAJ is
estimated to account for 60% of group EBITDA and is Ranhill’s largest earnings generator. Essentially all of SAJ’s net earnings (FY17: RM95m) are funnelled up to the holding company as dividends, which in turn is paid out as dividends
by Ranhill to shareholders.
EXHIBIT 5: SAJ (JOHOR) IS ONE OF THE MOST PROFITABLE WATER OPERATORS IN THE COUNTRY
States Revenue (RMm) Profit/(Loss) (RMm) Profit margin
Johor 853.5 90.5 10.6%
Kedah 290.6 26.4 9.1%
Kelantan 98.4 0.8 0.8%
Labuan 16.2 (11.6) -71.6%
Melaka 184.3 5.4 2.9%
Negeri Sembilan 187.9 1.9 1.0%
Pulau Pinang 278.5 26.7 9.6%
Pahang 153.1 (99.4) -64.9%
Perak 350.3 66.6 19.0%
Perlis 34.0 8.8 25.9%
Sabah 224.5 (222.0) -98.9%
Sarawak 263.6 33.2 12.6%
Selangor 2,023.9 (547.7) -27.1%
Terengganu 123.9 (3.5) -2.8% Source: Company, MIDFR
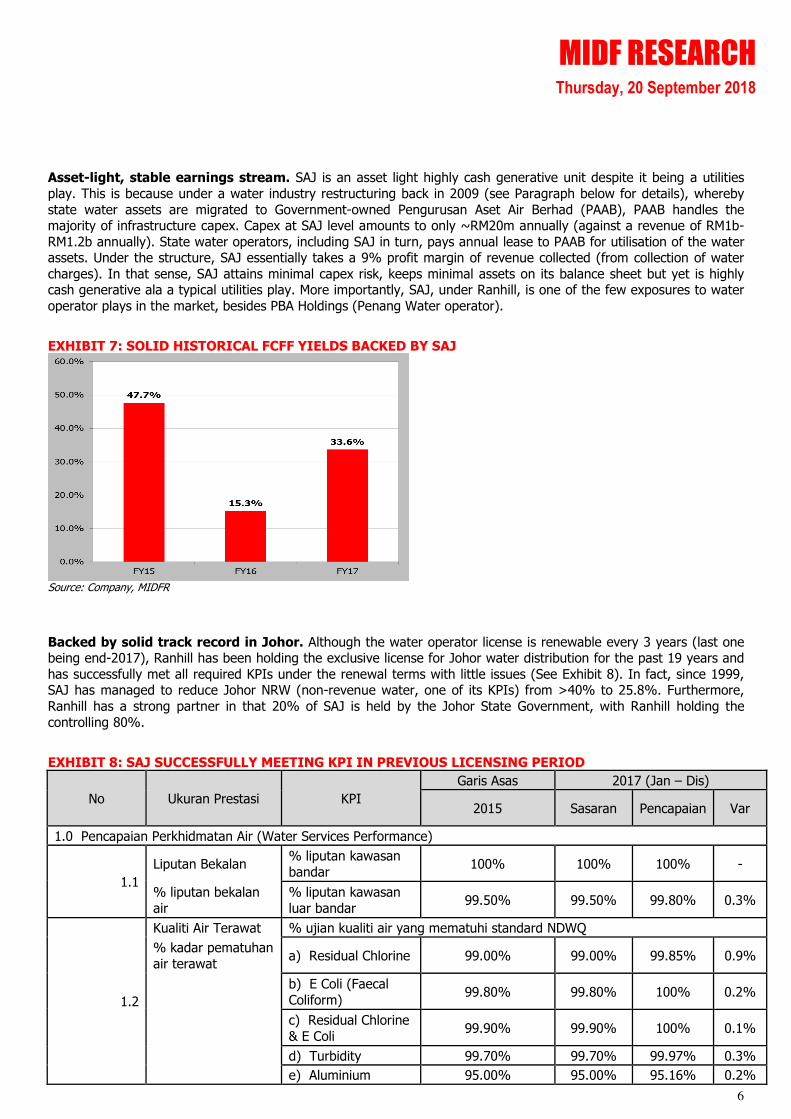
EXHIBIT 6: WATER TARIFF IN MALAYSIA
Domestic (RM/cubic metre) Industry (RM/cubic metre)
States First 20 cubic
metre
First 30 cubic
metre
First 80 cubic
metre
First 120 cubic
metre
Johor 0.80 1.20 3.08 3.15
Kedah 0.50 0.63 1.40 1.40
Kelantan 0.45 0.62 1.78 1.78
Labuan 0.70 0.87 1.98 2.05
Melaka 0.70 0.85 2.02 2.05
Negeri Sembilan
0.55 0.65 2.33 2.45
Pulau Pinang 0.22 0.30 1.13 1.18
Pahang 0.41 0.54 1.45 1.45
Perak 0.50 0.67 1.53 1.56
Perlis 0.48 0.55 1.30 1.30
Sabah 0.45 0.67 1.65 1.77
Sarawak 0.54 0.60 1.03 1.04
Selangor 0.57 0.72 2.19 2.22
Terengganu 0.42 0.50 0.98 1.03 Source: Company, MIDFR
MIDF RESEARCH Thursday, 20 September 2018
6
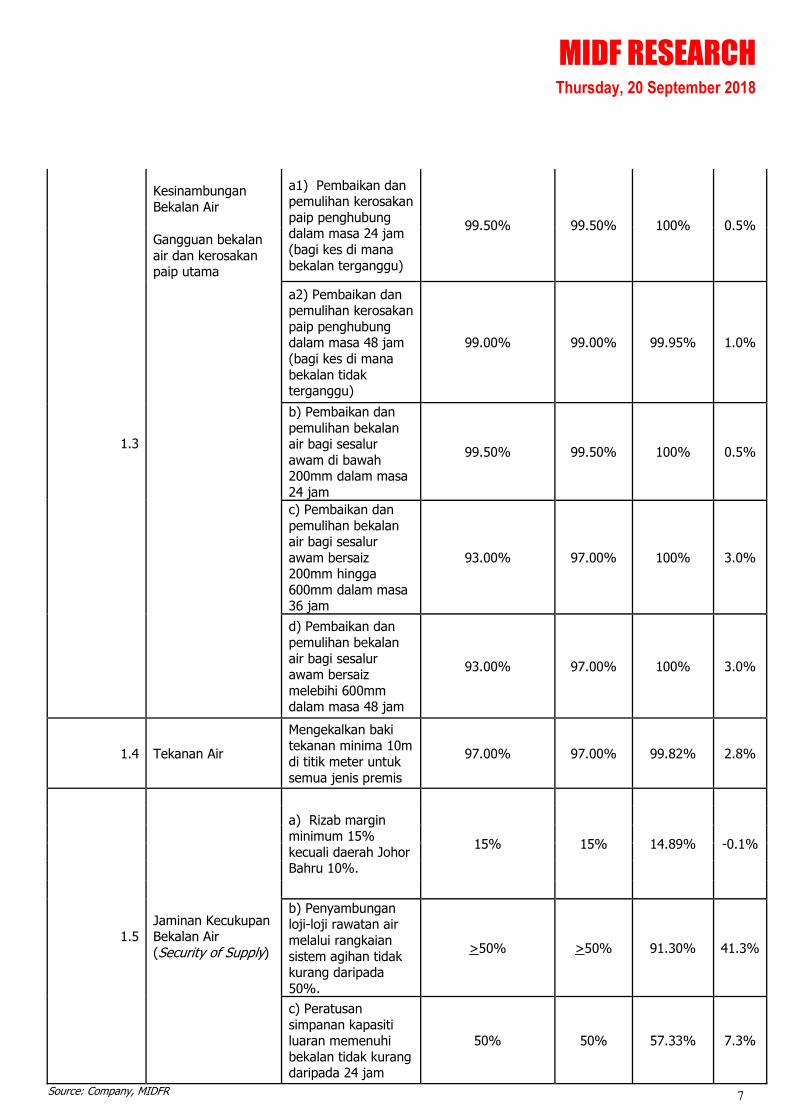
Asset-light, stable earnings stream. SAJ is an asset light highly cash generative unit despite it being a utilities
play. This is because under a water industry restructuring back in 2009 (see Paragraph below for details), whereby
state water assets are migrated to Government-owned Pengurusan Aset Air Berhad (PAAB), PAAB handles the majority of infrastructure capex. Capex at SAJ level amounts to only ~RM20m annually (against a revenue of RM1b-
RM1.2b annually). State water operators, including SAJ in turn, pays annual lease to PAAB for utilisation of the water assets. Under the structure, SAJ essentially takes a 9% profit margin of revenue collected (from collection of water
charges). In that sense, SAJ attains minimal capex risk, keeps minimal assets on its balance sheet but yet is highly cash generative ala a typical utilities play. More importantly, SAJ, under Ranhill, is one of the few exposures to water
operator plays in the market, besides PBA Holdings (Penang Water operator).
EXHIBIT 7: SOLID HISTORICAL FCFF YIELDS BACKED BY SAJ
Source: Company, MIDFR
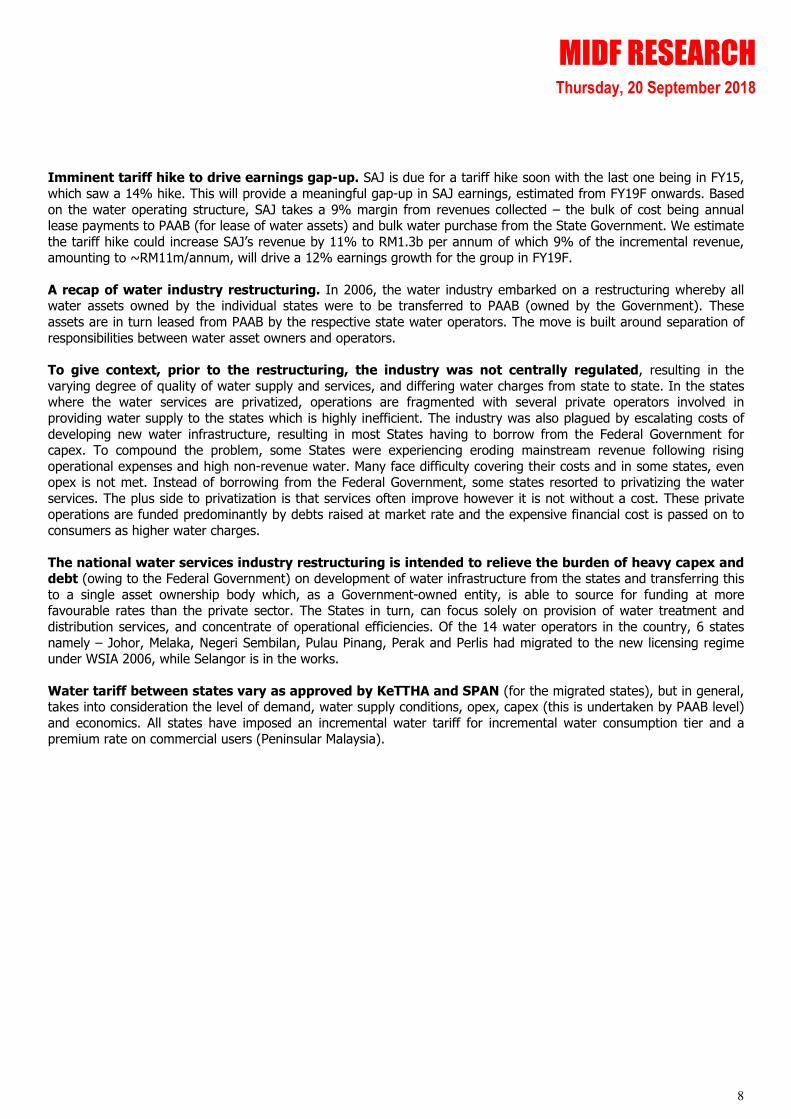
Backed by solid track record in Johor. Although the water operator license is renewable every 3 years (last one being end-2017), Ranhill has been holding the exclusive license for Johor water distribution for the past 19 years and
has successfully met all required KPIs under the renewal terms with little issues (See Exhibit 8). In fact, since 1999, SAJ has managed to reduce Johor NRW (non-revenue water, one of its KPIs) from >40% to 25.8%. Furthermore,
Ranhill has a strong partner in that 20% of SAJ is held by the Johor State Government, with Ranhill holding the
controlling 80%.
EXHIBIT 8: SAJ SUCCESSFULLY MEETING KPI IN PREVIOUS LICENSING PERIOD
No Ukuran Prestasi KPI
Garis Asas 2017 (Jan – Dis)
2015 Sasaran Pencapaian Var
1.0 Pencapaian Perkhidmatan Air (Water Services Performance)
1.1
Liputan Bekalan % liputan kawasan
bandar 100% 100% 100% -
% liputan bekalan
air
% liputan kawasan
luar bandar 99.50% 99.50% 99.80% 0.3%
1.2
Kualiti Air Terawat % ujian kualiti air yang mematuhi standard NDWQ
% kadar pematuhan
air terawat a) Residual Chlorine 99.00% 99.00% 99.85% 0.9%
b) E Coli (Faecal
Coliform) 99.80% 99.80% 100% 0.2%
c) Residual Chlorine
& E Coli 99.90% 99.90% 100% 0.1%
d) Turbidity 99.70% 99.70% 99.97% 0.3%
e) Aluminium 95.00% 95.00% 95.16% 0.2%
MIDF RESEARCH Thursday, 20 September 2018
7
1.3
Kesinambungan
Bekalan Air
a1) Pembaikan dan pemulihan kerosakan
paip penghubung dalam masa 24 jam
(bagi kes di mana
bekalan terganggu)
99.50% 99.50% 100% 0.5% Gangguan bekalan
air dan kerosakan paip utama
a2) Pembaikan dan pemulihan kerosakan
paip penghubung dalam masa 48 jam
(bagi kes di mana
bekalan tidak terganggu)
99.00% 99.00% 99.95% 1.0%
b) Pembaikan dan
pemulihan bekalan air bagi sesalur
awam di bawah 200mm dalam masa
24 jam
99.50% 99.50% 100% 0.5%
c) Pembaikan dan
pemulihan bekalan air bagi sesalur
awam bersaiz 200mm hingga
600mm dalam masa 36 jam
93.00% 97.00% 100% 3.0%
d) Pembaikan dan
pemulihan bekalan
air bagi sesalur awam bersaiz
melebihi 600mm dalam masa 48 jam
93.00% 97.00% 100% 3.0%
1.4 Tekanan Air
Mengekalkan baki tekanan minima 10m
di titik meter untuk
semua jenis premis
97.00% 97.00% 99.82% 2.8%
1.5 Jaminan Kecukupan Bekalan Air
(Security of Supply)
a) Rizab margin minimum 15%
kecuali daerah Johor Bahru 10%.
15% 15% 14.89% -0.1%
b) Penyambungan loji-loji rawatan air
melalui rangkaian
sistem agihan tidak kurang daripada
50%.
>50% >50% 91.30% 41.3%
c) Peratusan
simpanan kapasiti luaran memenuhi
bekalan tidak kurang daripada 24 jam
50% 50% 57.33% 7.3%
Source: Company, MIDFR
MIDF RESEARCH Thursday, 20 September 2018
8
Imminent tariff hike to drive earnings gap-up. SAJ is due for a tariff hike soon with the last one being in FY15,
which saw a 14% hike. This will provide a meaningful gap-up in SAJ earnings, estimated from FY19F onwards. Based
on the water operating structure, SAJ takes a 9% margin from revenues collected – the bulk of cost being annual lease payments to PAAB (for lease of water assets) and bulk water purchase from the State Government. We estimate
the tariff hike could increase SAJ’s revenue by 11% to RM1.3b per annum of which 9% of the incremental revenue, amounting to ~RM11m/annum, will drive a 12% earnings growth for the group in FY19F.
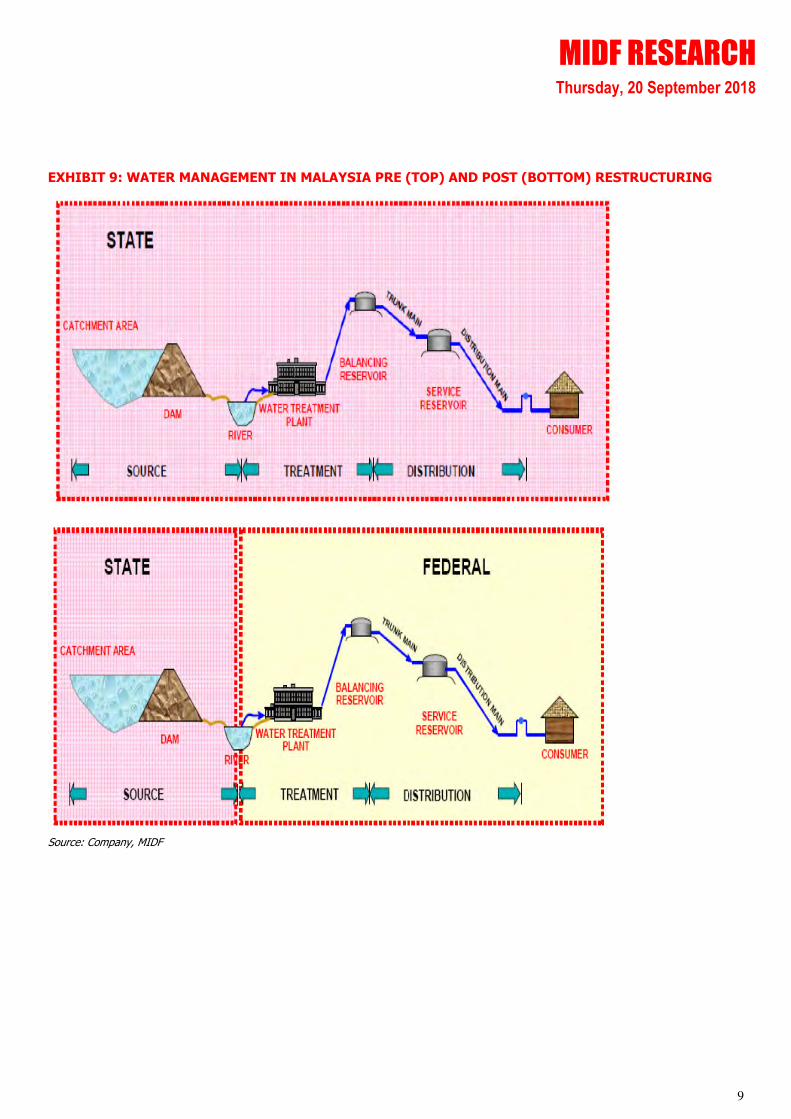
A recap of water industry restructuring. In 2006, the water industry embarked on a restructuring whereby all water assets owned by the individual states were to be transferred to PAAB (owned by the Government). These
assets are in turn leased from PAAB by the respective state water operators. The move is built around separation of
responsibilities between water asset owners and operators.
To give context, prior to the restructuring, the industry was not centrally regulated, resulting in the
varying degree of quality of water supply and services, and differing water charges from state to state. In the states where the water services are privatized, operations are fragmented with several private operators involved in
providing water supply to the states which is highly inefficient. The industry was also plagued by escalating costs of
developing new water infrastructure, resulting in most States having to borrow from the Federal Government for capex. To compound the problem, some States were experiencing eroding mainstream revenue following rising
operational expenses and high non-revenue water. Many face difficulty covering their costs and in some states, even opex is not met. Instead of borrowing from the Federal Government, some states resorted to privatizing the water
services. The plus side to privatization is that services often improve however it is not without a cost. These private operations are funded predominantly by debts raised at market rate and the expensive financial cost is passed on to
consumers as higher water charges.
The national water services industry restructuring is intended to relieve the burden of heavy capex and debt (owing to the Federal Government) on development of water infrastructure from the states and transferring this
to a single asset ownership body which, as a Government-owned entity, is able to source for funding at more favourable rates than the private sector. The States in turn, can focus solely on provision of water treatment and
distribution services, and concentrate of operational efficiencies. Of the 14 water operators in the country, 6 states
namely – Johor, Melaka, Negeri Sembilan, Pulau Pinang, Perak and Perlis had migrated to the new licensing regime under WSIA 2006, while Selangor is in the works.
Water tariff between states vary as approved by KeTTHA and SPAN (for the migrated states), but in general, takes into consideration the level of demand, water supply conditions, opex, capex (this is undertaken by PAAB level)
and economics. All states have imposed an incremental water tariff for incremental water consumption tier and a premium rate on commercial users (Peninsular Malaysia).
MIDF RESEARCH Thursday, 20 September 2018
9
EXHIBIT 9: WATER MANAGEMENT IN MALAYSIA PRE (TOP) AND POST (BOTTOM) RESTRUCTURING
Source: Company, MIDF
MIDF RESEARCH Thursday, 20 September 2018
10
C. EMERGING RENEWABLE ENERGY PLAY
Mandate from MESTECC (Ministry of Energy, Science, Technology, Environment and Climate Change).
Minister, YB Yeo Bee Yin has made clear of the Ministry’s intention to make an aggressive push into renewable energy (RE). The Ministry has set a target to increase RE contribution to the energy mix to 20% by FY25F from 2% currently.
Ranhill is a potential play into this theme, backed by its venture in the country’s 1st geothermal development, which could potentially expand the group’s gross power capacity by up to 32%.
Early cycle play into geothermal energy development. Via a 26.7% stake in Tawau Green Energy Sdn Bhd (TGE) Ranhill is the only listed play into the country’s 1st geothermal development project, located in Tawau, East
Sabah. The group is targeting and has received approval for an initial gross capacity of 37MW (net output of 30MW).
Based on initial studies though, the area could entail sufficient resource to power up to 120MW power generation capacity, which could increase Ranhill’s current gross power capacity of 380MW by up to 32%. On top of this, Ranhill
is also looking to almost double its stake in the project to 50% in the near future. The project is backed by a 21-year Renewable Energy PPA (REPPA) and lucrative FiT rates (details in paragraphs below). Philippine based EDC (which
operates the largest geothermal plant in the region with 1000MW capacity) is understood to be interested to take up
a meaningful stake in TGE. Commercial Operation Date (COD) is targeted in FY20F.
A lucrative venture. The project for the initial 30MW capacity involves a capital cost of RM692m (RM19m/gross
MW) a construction period of 24 months and an expected commercial operation date (COD) in FY20F. Notably, the project has also received facilitation fund from the Government of Malaysia of RM55m (~9% of total estimated project
cost). The target is to have a 75:25 debt-to-equity i.e. RM479m debt funding and another RM158m via equity. So far, RM70m has been pumped in (based on TGE’s current paid-up of RM70m) – project progress so far has been entirely
funded via equity.
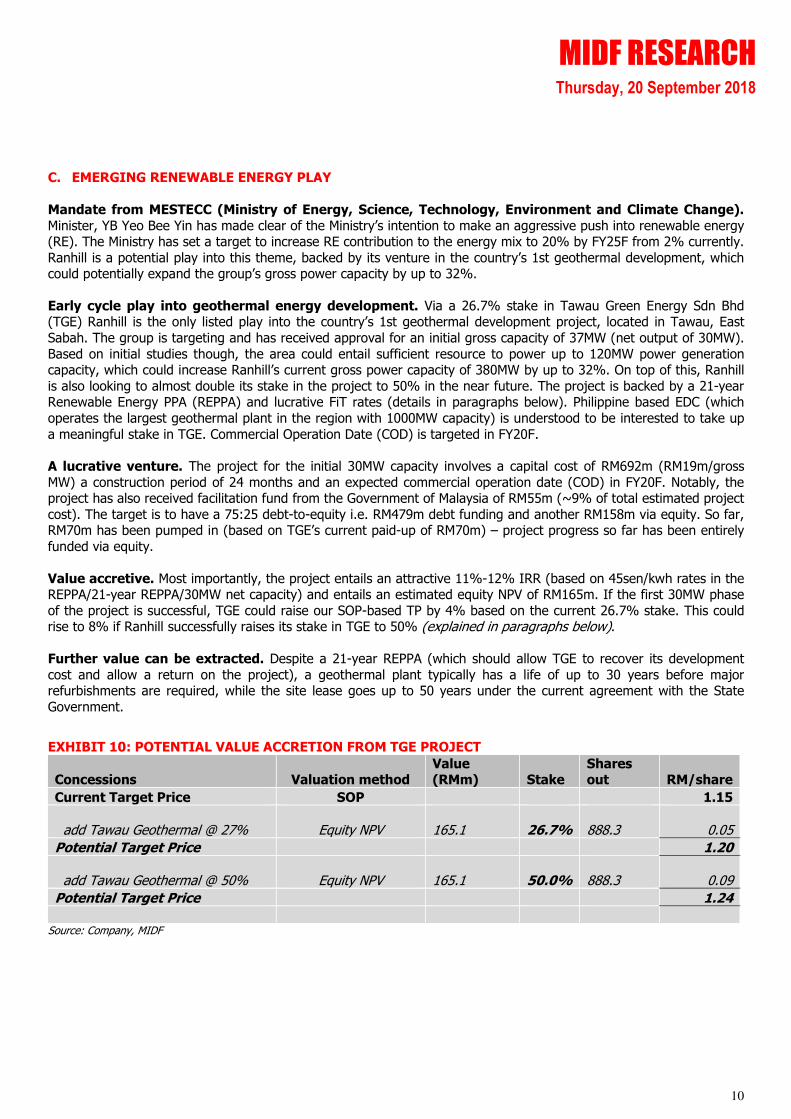
Value accretive. Most importantly, the project entails an attractive 11%-12% IRR (based on 45sen/kwh rates in the REPPA/21-year REPPA/30MW net capacity) and entails an estimated equity NPV of RM165m. If the first 30MW phase
of the project is successful, TGE could raise our SOP-based TP by 4% based on the current 26.7% stake. This could rise to 8% if Ranhill successfully raises its stake in TGE to 50% (explained in paragraphs below).
Further value can be extracted. Despite a 21-year REPPA (which should allow TGE to recover its development
cost and allow a return on the project), a geothermal plant typically has a life of up to 30 years before major refurbishments are required, while the site lease goes up to 50 years under the current agreement with the State
Government.
EXHIBIT 10: POTENTIAL VALUE ACCRETION FROM TGE PROJECT
Concessions Valuation method Value (RMm) Stake
Shares out RM/share
Current Target Price SOP 1.15
add Tawau Geothermal @ 27% Equity NPV 165.1 26.7%
888.3 0.05
Potential Target Price 1.20
add Tawau Geothermal @ 50% Equity NPV 165.1 50.0%
888.3 0.09
Potential Target Price 1.24
Source: Company, MIDF
MIDF RESEARCH Thursday, 20 September 2018
11
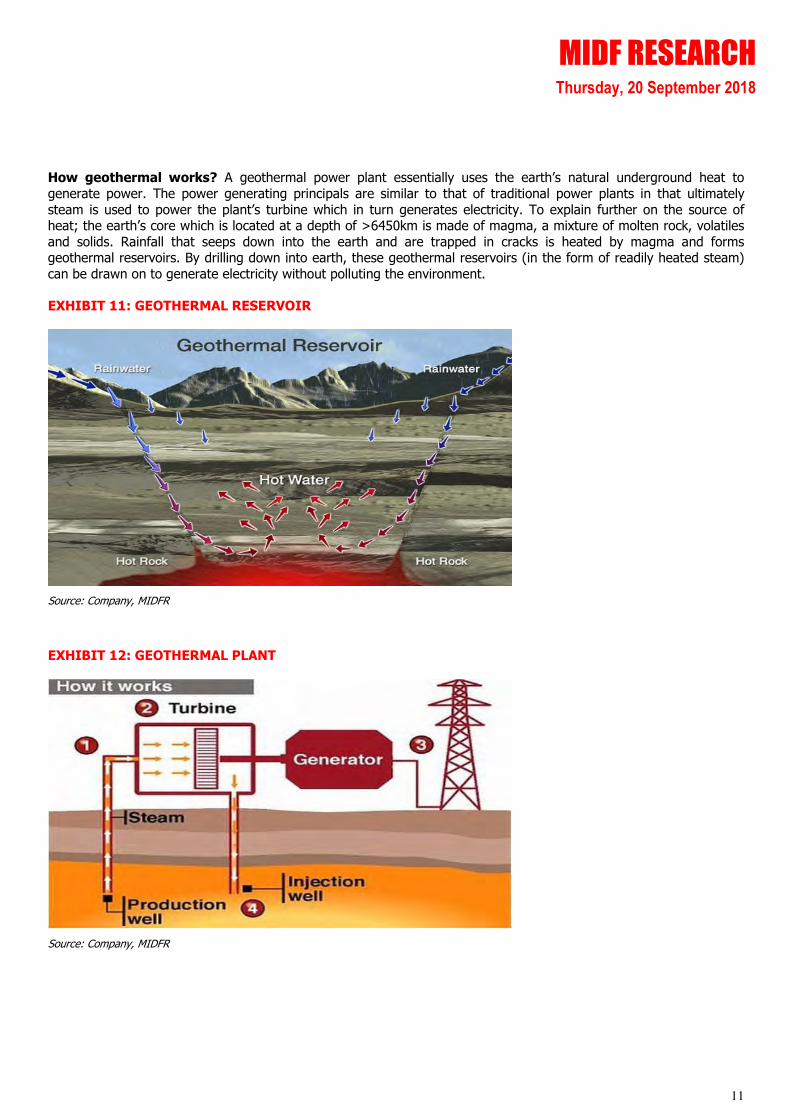
How geothermal works? A geothermal power plant essentially uses the earth’s natural underground heat to
generate power. The power generating principals are similar to that of traditional power plants in that ultimately
steam is used to power the plant’s turbine which in turn generates electricity. To explain further on the source of heat; the earth’s core which is located at a depth of >6450km is made of magma, a mixture of molten rock, volatiles
and solids. Rainfall that seeps down into the earth and are trapped in cracks is heated by magma and forms geothermal reservoirs. By drilling down into earth, these geothermal reservoirs (in the form of readily heated steam)
can be drawn on to generate electricity without polluting the environment.
EXHIBIT 11: GEOTHERMAL RESERVOIR
Source: Company, MIDFR
EXHIBIT 12: GEOTHERMAL PLANT
Source: Company, MIDFR
MIDF RESEARCH Thursday, 20 September 2018
12
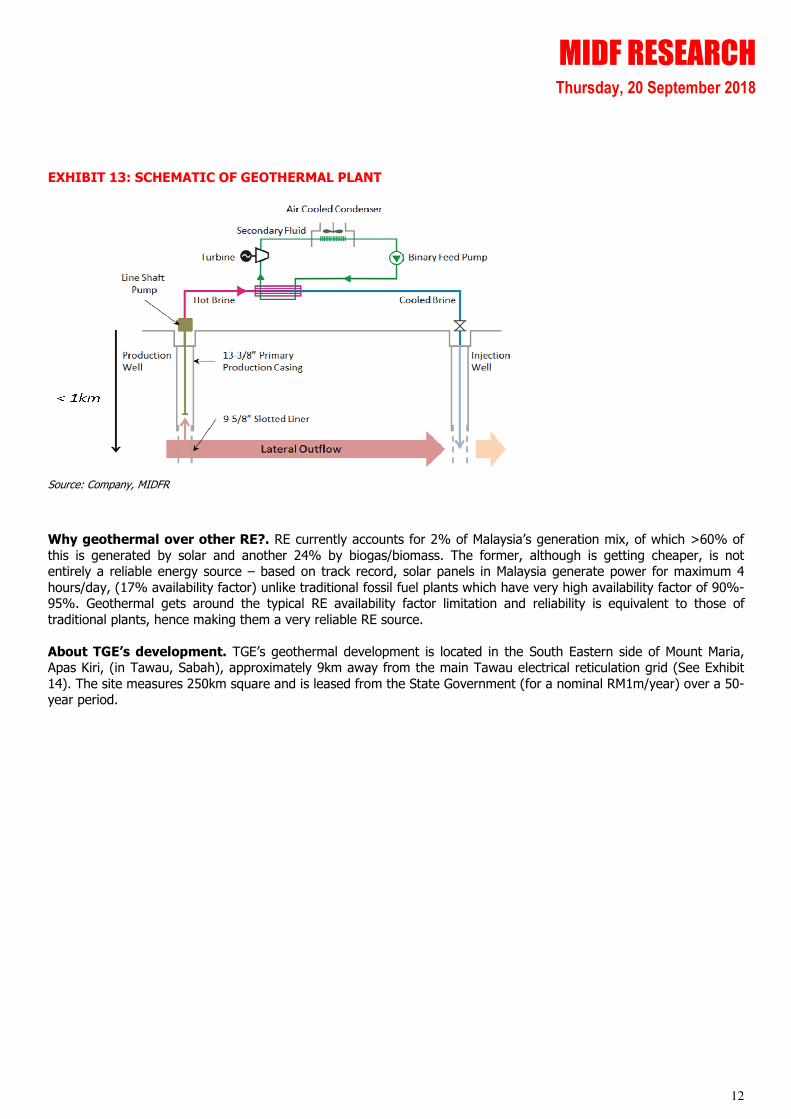
EXHIBIT 13: SCHEMATIC OF GEOTHERMAL PLANT
Source: Company, MIDFR
Why geothermal over other RE?. RE currently accounts for 2% of Malaysia’s generation mix, of which >60% of
this is generated by solar and another 24% by biogas/biomass. The former, although is getting cheaper, is not entirely a reliable energy source – based on track record, solar panels in Malaysia generate power for maximum 4
hours/day, (17% availability factor) unlike traditional fossil fuel plants which have very high availability factor of 90%-95%. Geothermal gets around the typical RE availability factor limitation and reliability is equivalent to those of
traditional plants, hence making them a very reliable RE source.
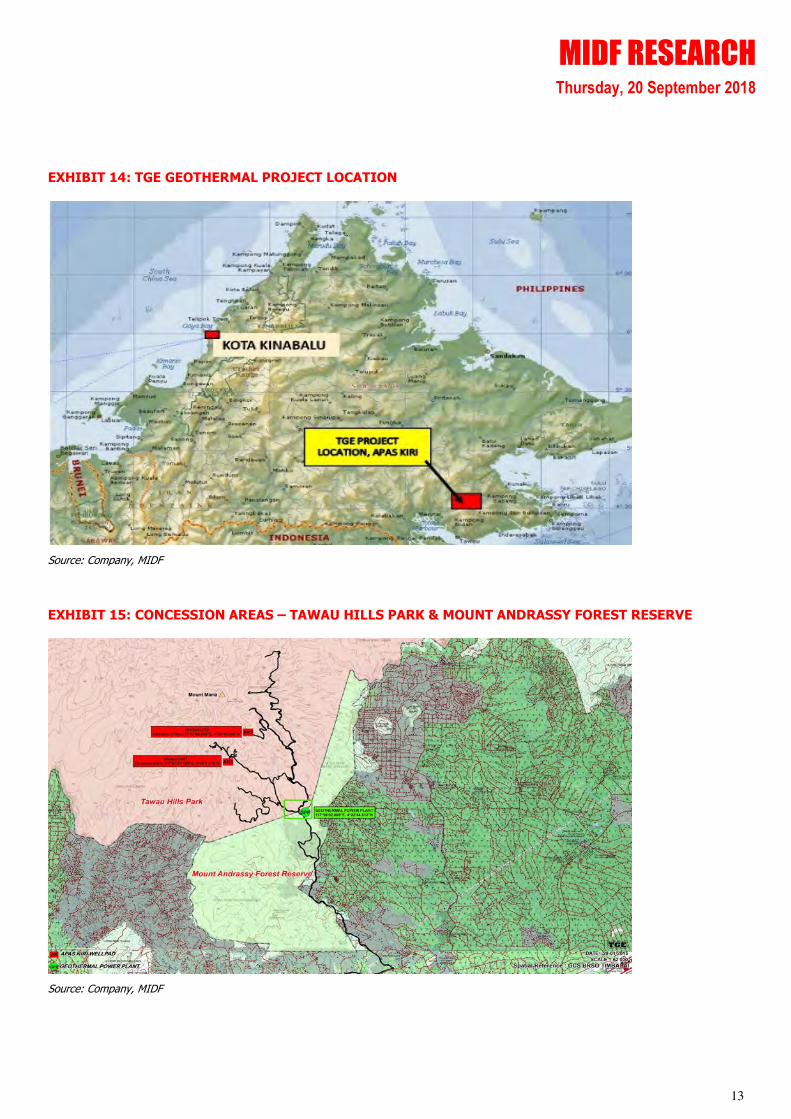
About TGE’s development. TGE’s geothermal development is located in the South Eastern side of Mount Maria, Apas Kiri, (in Tawau, Sabah), approximately 9km away from the main Tawau electrical reticulation grid (See Exhibit
14). The site measures 250km square and is leased from the State Government (for a nominal RM1m/year) over a 50-year period.
MIDF RESEARCH Thursday, 20 September 2018
13
EXHIBIT 14: TGE GEOTHERMAL PROJECT LOCATION
Source: Company, MIDF
EXHIBIT 15: CONCESSION AREAS – TAWAU HILLS PARK & MOUNT ANDRASSY FOREST RESERVE
Source: Company, MIDF
MIDF RESEARCH Thursday, 20 September 2018
14
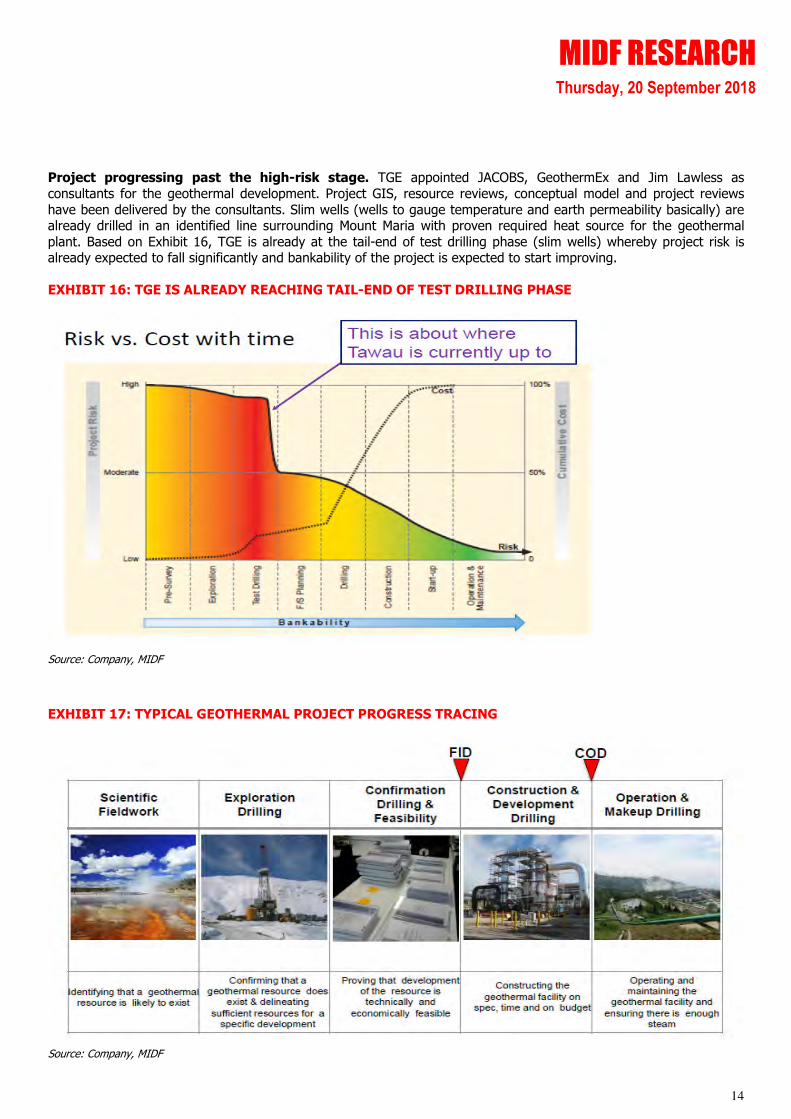
Project progressing past the high-risk stage. TGE appointed JACOBS, GeothermEx and Jim Lawless as
consultants for the geothermal development. Project GIS, resource reviews, conceptual model and project reviews
have been delivered by the consultants. Slim wells (wells to gauge temperature and earth permeability basically) are already drilled in an identified line surrounding Mount Maria with proven required heat source for the geothermal
plant. Based on Exhibit 16, TGE is already at the tail-end of test drilling phase (slim wells) whereby project risk is already expected to fall significantly and bankability of the project is expected to start improving.
EXHIBIT 16: TGE IS ALREADY REACHING TAIL-END OF TEST DRILLING PHASE
Source: Company, MIDF
EXHIBIT 17: TYPICAL GEOTHERMAL PROJECT PROGRESS TRACING
Source: Company, MIDF
MIDF RESEARCH Thursday, 20 September 2018
15
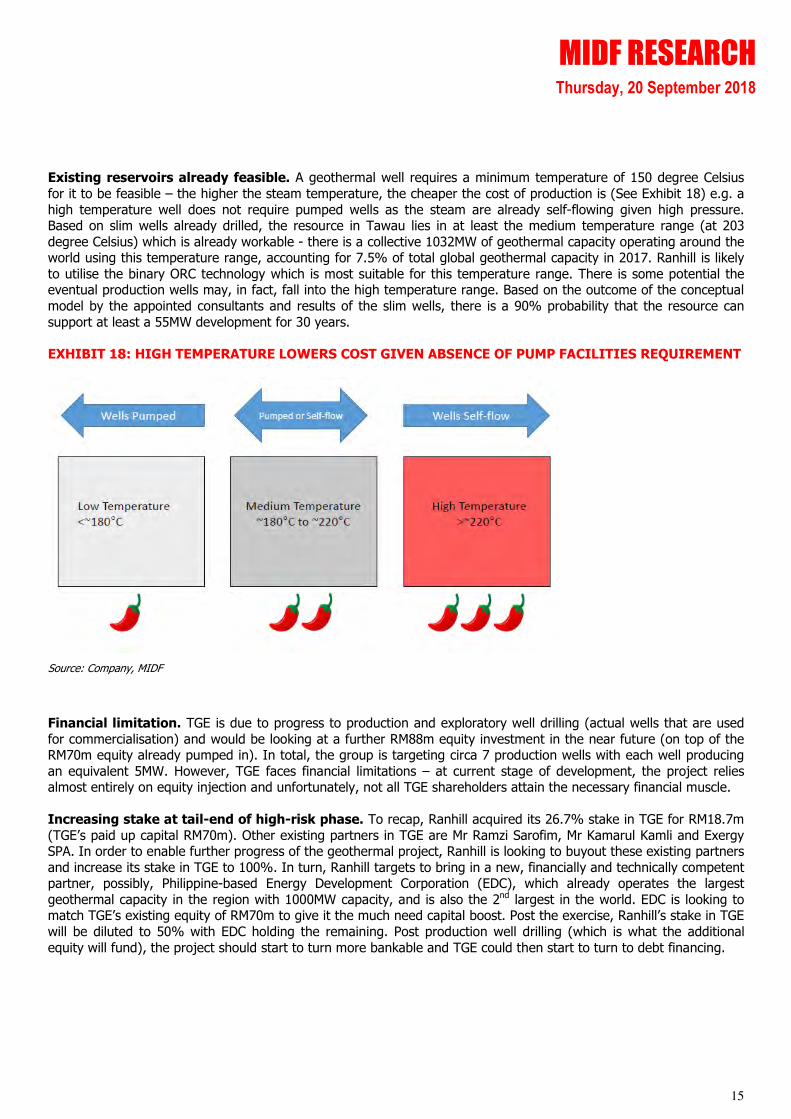
Existing reservoirs already feasible. A geothermal well requires a minimum temperature of 150 degree Celsius
for it to be feasible – the higher the steam temperature, the cheaper the cost of production is (See Exhibit 18) e.g. a
high temperature well does not require pumped wells as the steam are already self-flowing given high pressure. Based on slim wells already drilled, the resource in Tawau lies in at least the medium temperature range (at 203
degree Celsius) which is already workable - there is a collective 1032MW of geothermal capacity operating around the world using this temperature range, accounting for 7.5% of total global geothermal capacity in 2017. Ranhill is likely
to utilise the binary ORC technology which is most suitable for this temperature range. There is some potential the eventual production wells may, in fact, fall into the high temperature range. Based on the outcome of the conceptual
model by the appointed consultants and results of the slim wells, there is a 90% probability that the resource can
support at least a 55MW development for 30 years.
EXHIBIT 18: HIGH TEMPERATURE LOWERS COST GIVEN ABSENCE OF PUMP FACILITIES REQUIREMENT
Source: Company, MIDF
Financial limitation. TGE is due to progress to production and exploratory well drilling (actual wells that are used
for commercialisation) and would be looking at a further RM88m equity investment in the near future (on top of the RM70m equity already pumped in). In total, the group is targeting circa 7 production wells with each well producing
an equivalent 5MW. However, TGE faces financial limitations – at current stage of development, the project relies almost entirely on equity injection and unfortunately, not all TGE shareholders attain the necessary financial muscle.
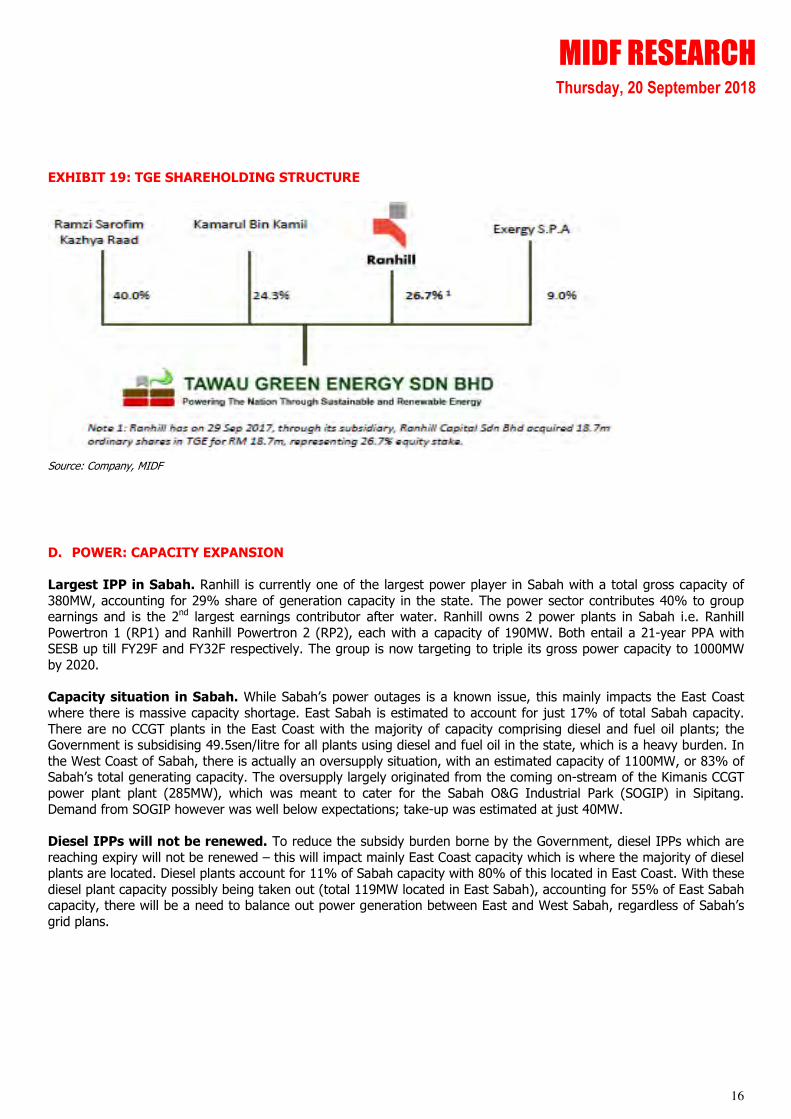
Increasing stake at tail-end of high-risk phase. To recap, Ranhill acquired its 26.7% stake in TGE for RM18.7m
(TGE’s paid up capital RM70m). Other existing partners in TGE are Mr Ramzi Sarofim, Mr Kamarul Kamli and Exergy SPA. In order to enable further progress of the geothermal project, Ranhill is looking to buyout these existing partners
and increase its stake in TGE to 100%. In turn, Ranhill targets to bring in a new, financially and technically competent partner, possibly, Philippine-based Energy Development Corporation (EDC), which already operates the largest
geothermal capacity in the region with 1000MW capacity, and is also the 2nd largest in the world. EDC is looking to match TGE’s existing equity of RM70m to give it the much need capital boost. Post the exercise, Ranhill’s stake in TGE
will be diluted to 50% with EDC holding the remaining. Post production well drilling (which is what the additional
equity will fund), the project should start to turn more bankable and TGE could then start to turn to debt financing.
MIDF RESEARCH Thursday, 20 September 2018
16
EXHIBIT 19: TGE SHAREHOLDING STRUCTURE
Source: Company, MIDF
D. POWER: CAPACITY EXPANSION
Largest IPP in Sabah. Ranhill is currently one of the largest power player in Sabah with a total gross capacity of
380MW, accounting for 29% share of generation capacity in the state. The power sector contributes 40% to group earnings and is the 2nd largest earnings contributor after water. Ranhill owns 2 power plants in Sabah i.e. Ranhill
Powertron 1 (RP1) and Ranhill Powertron 2 (RP2), each with a capacity of 190MW. Both entail a 21-year PPA with SESB up till FY29F and FY32F respectively. The group is now targeting to triple its gross power capacity to 1000MW
by 2020.
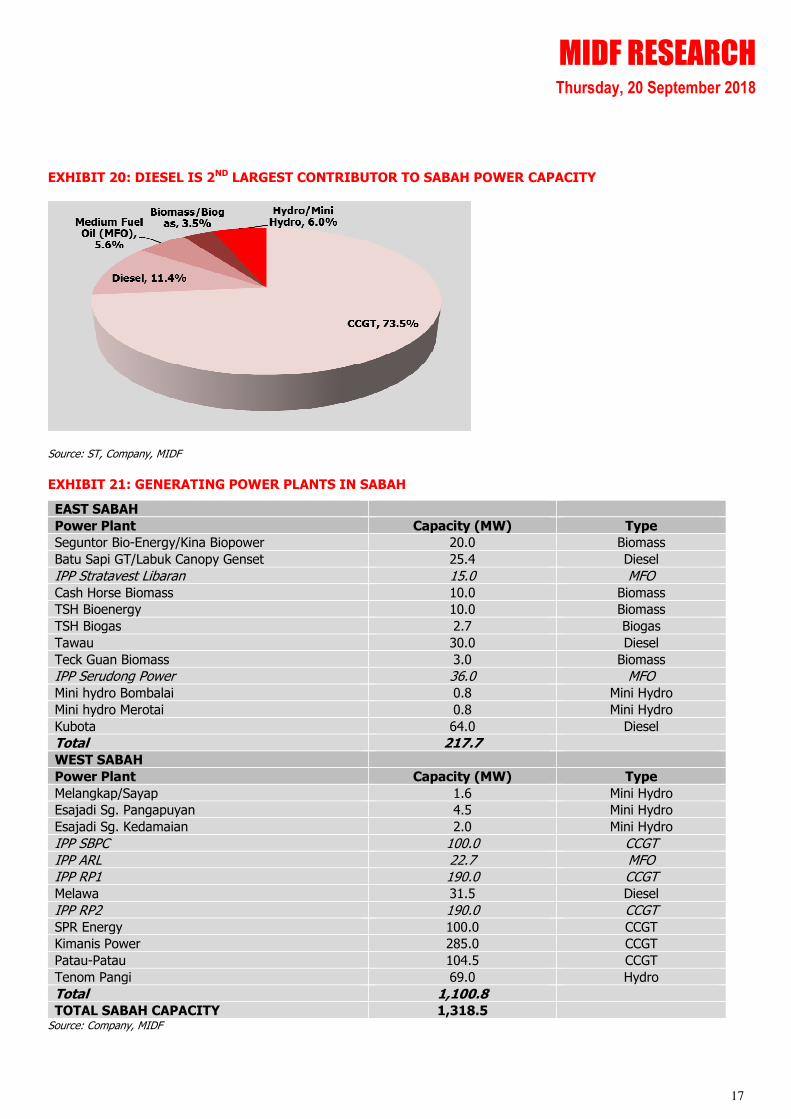
Capacity situation in Sabah. While Sabah’s power outages is a known issue, this mainly impacts the East Coast
where there is massive capacity shortage. East Sabah is estimated to account for just 17% of total Sabah capacity.
There are no CCGT plants in the East Coast with the majority of capacity comprising diesel and fuel oil plants; the Government is subsidising 49.5sen/litre for all plants using diesel and fuel oil in the state, which is a heavy burden. In
the West Coast of Sabah, there is actually an oversupply situation, with an estimated capacity of 1100MW, or 83% of Sabah’s total generating capacity. The oversupply largely originated from the coming on-stream of the Kimanis CCGT
power plant plant (285MW), which was meant to cater for the Sabah O&G Industrial Park (SOGIP) in Sipitang.
Demand from SOGIP however was well below expectations; take-up was estimated at just 40MW.
Diesel IPPs will not be renewed. To reduce the subsidy burden borne by the Government, diesel IPPs which are
reaching expiry will not be renewed – this will impact mainly East Coast capacity which is where the majority of diesel plants are located. Diesel plants account for 11% of Sabah capacity with 80% of this located in East Coast. With these
diesel plant capacity possibly being taken out (total 119MW located in East Sabah), accounting for 55% of East Sabah capacity, there will be a need to balance out power generation between East and West Sabah, regardless of Sabah’s
grid plans.
MIDF RESEARCH Thursday, 20 September 2018
17
EXHIBIT 20: DIESEL IS 2ND LARGEST CONTRIBUTOR TO SABAH POWER CAPACITY
Source: ST, Company, MIDF
EXHIBIT 21: GENERATING POWER PLANTS IN SABAH
EAST SABAH
Power Plant Capacity (MW) Type
Seguntor Bio-Energy/Kina Biopower 20.0 Biomass
Batu Sapi GT/Labuk Canopy Genset 25.4 Diesel
IPP Stratavest Libaran 15.0 MFO Cash Horse Biomass 10.0 Biomass
TSH Bioenergy 10.0 Biomass
TSH Biogas 2.7 Biogas
Tawau 30.0 Diesel
Teck Guan Biomass 3.0 Biomass
IPP Serudong Power 36.0 MFO Mini hydro Bombalai 0.8 Mini Hydro
Mini hydro Merotai 0.8 Mini Hydro
Kubota 64.0 Diesel
Total 217.7 WEST SABAH
Power Plant Capacity (MW) Type
Melangkap/Sayap 1.6 Mini Hydro
Esajadi Sg. Pangapuyan 4.5 Mini Hydro
Esajadi Sg. Kedamaian 2.0 Mini Hydro
IPP SBPC 100.0 CCGT IPP ARL 22.7 MFO IPP RP1 190.0 CCGT Melawa 31.5 Diesel
IPP RP2 190.0 CCGT SPR Energy 100.0 CCGT
Kimanis Power 285.0 CCGT
Patau-Patau 104.5 CCGT
Tenom Pangi 69.0 Hydro
Total 1,100.8 TOTAL SABAH CAPACITY 1,318.5
Source: Company, MIDF
MIDF RESEARCH Thursday, 20 September 2018
18
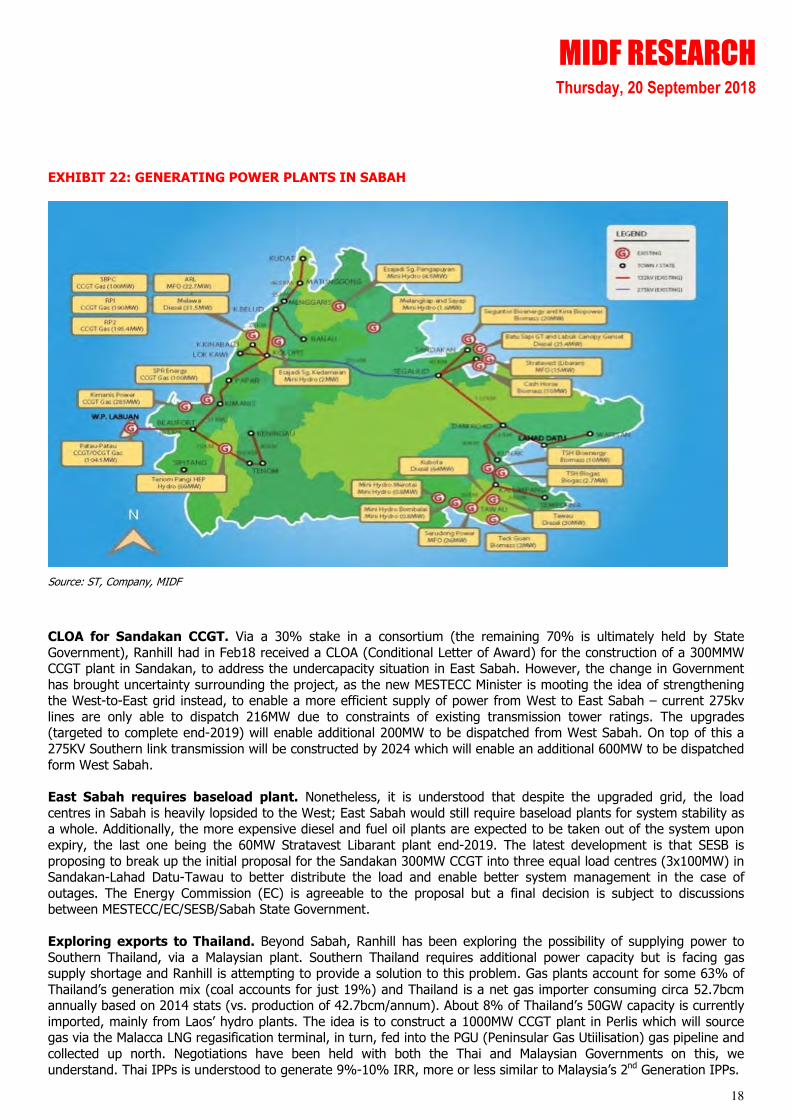
EXHIBIT 22: GENERATING POWER PLANTS IN SABAH
Source: ST, Company, MIDF
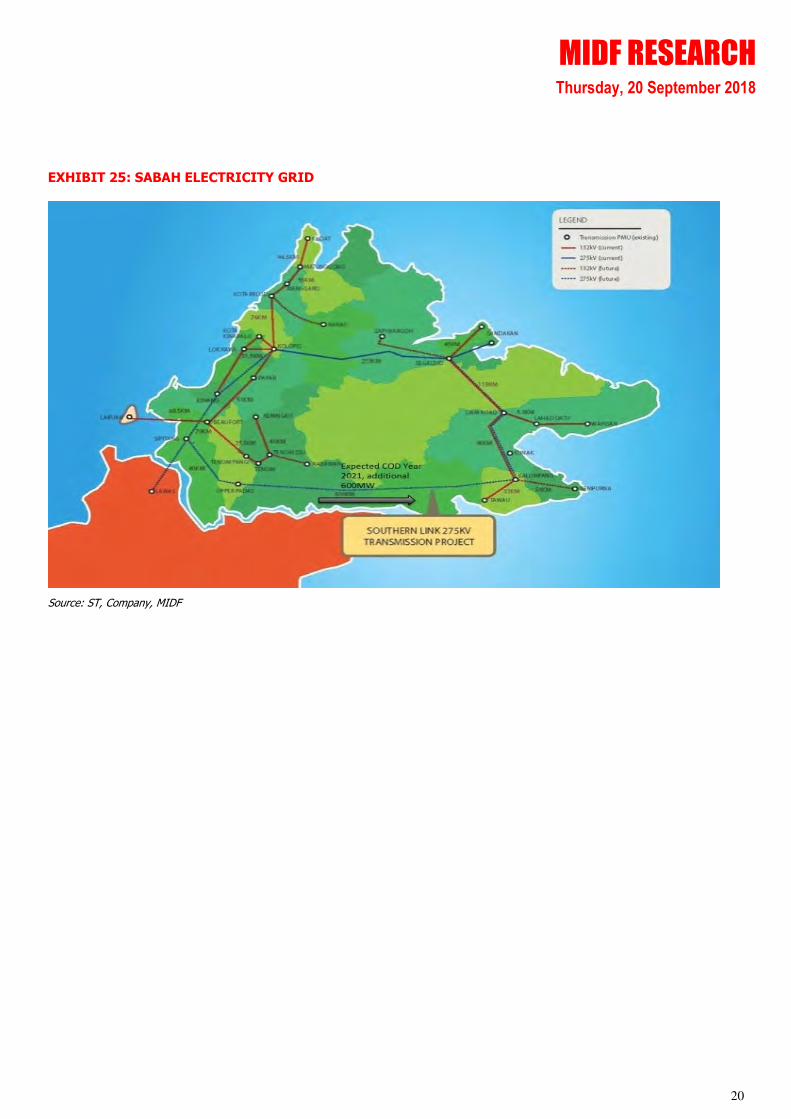
CLOA for Sandakan CCGT. Via a 30% stake in a consortium (the remaining 70% is ultimately held by State
Government), Ranhill had in Feb18 received a CLOA (Conditional Letter of Award) for the construction of a 300MMW CCGT plant in Sandakan, to address the undercapacity situation in East Sabah. However, the change in Government
has brought uncertainty surrounding the project, as the new MESTECC Minister is mooting the idea of strengthening the West-to-East grid instead, to enable a more efficient supply of power from West to East Sabah – current 275kv
lines are only able to dispatch 216MW due to constraints of existing transmission tower ratings. The upgrades (targeted to complete end-2019) will enable additional 200MW to be dispatched from West Sabah. On top of this a
275KV Southern link transmission will be constructed by 2024 which will enable an additional 600MW to be dispatched
form West Sabah.
East Sabah requires baseload plant. Nonetheless, it is understood that despite the upgraded grid, the load
centres in Sabah is heavily lopsided to the West; East Sabah would still require baseload plants for system stability as a whole. Additionally, the more expensive diesel and fuel oil plants are expected to be taken out of the system upon
expiry, the last one being the 60MW Stratavest Libarant plant end-2019. The latest development is that SESB is
proposing to break up the initial proposal for the Sandakan 300MW CCGT into three equal load centres (3x100MW) in Sandakan-Lahad Datu-Tawau to better distribute the load and enable better system management in the case of
outages. The Energy Commission (EC) is agreeable to the proposal but a final decision is subject to discussions between MESTECC/EC/SESB/Sabah State Government.
Exploring exports to Thailand. Beyond Sabah, Ranhill has been exploring the possibility of supplying power to
Southern Thailand, via a Malaysian plant. Southern Thailand requires additional power capacity but is facing gas supply shortage and Ranhill is attempting to provide a solution to this problem. Gas plants account for some 63% of
Thailand’s generation mix (coal accounts for just 19%) and Thailand is a net gas importer consuming circa 52.7bcm annually based on 2014 stats (vs. production of 42.7bcm/annum). About 8% of Thailand’s 50GW capacity is currently
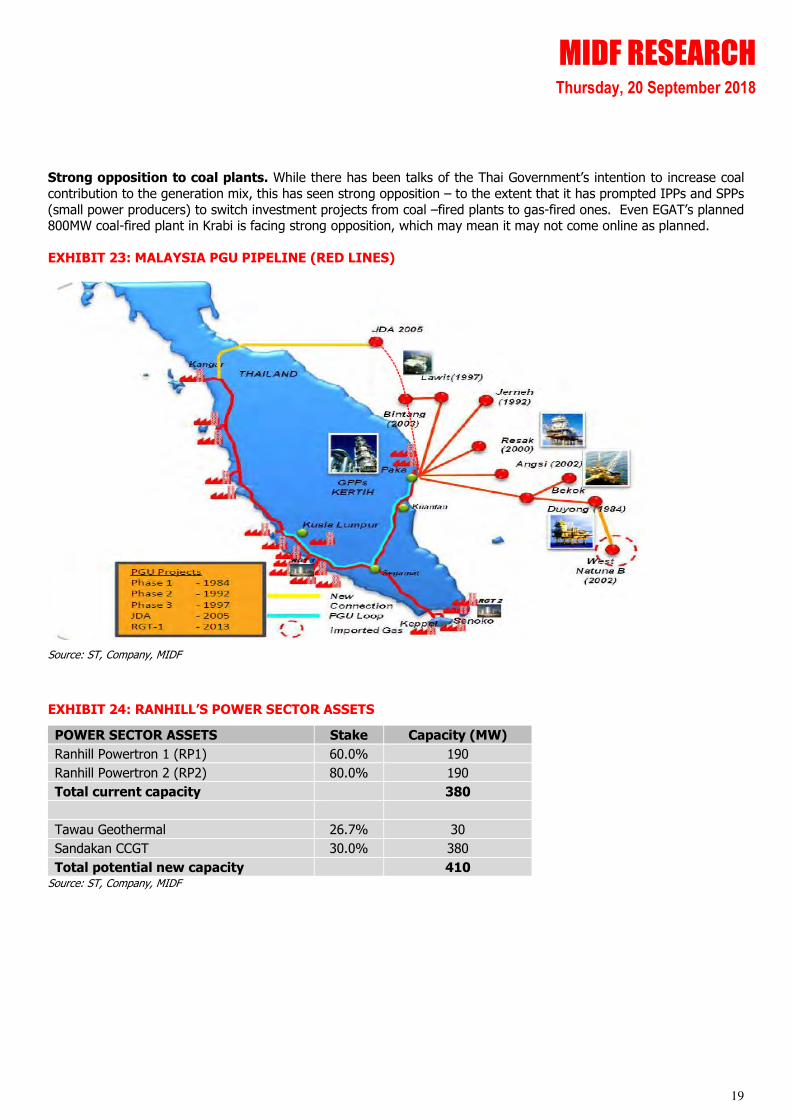
imported, mainly from Laos’ hydro plants. The idea is to construct a 1000MW CCGT plant in Perlis which will source gas via the Malacca LNG regasification terminal, in turn, fed into the PGU (Peninsular Gas Utiilisation) gas pipeline and
collected up north. Negotiations have been held with both the Thai and Malaysian Governments on this, we
understand. Thai IPPs is understood to generate 9%-10% IRR, more or less similar to Malaysia’s 2nd Generation IPPs.
MIDF RESEARCH Thursday, 20 September 2018
19
Strong opposition to coal plants. While there has been talks of the Thai Government’s intention to increase coal
contribution to the generation mix, this has seen strong opposition – to the extent that it has prompted IPPs and SPPs
(small power producers) to switch investment projects from coal –fired plants to gas-fired ones. Even EGAT’s planned 800MW coal-fired plant in Krabi is facing strong opposition, which may mean it may not come online as planned.
EXHIBIT 23: MALAYSIA PGU PIPELINE (RED LINES)
Source: ST, Company, MIDF
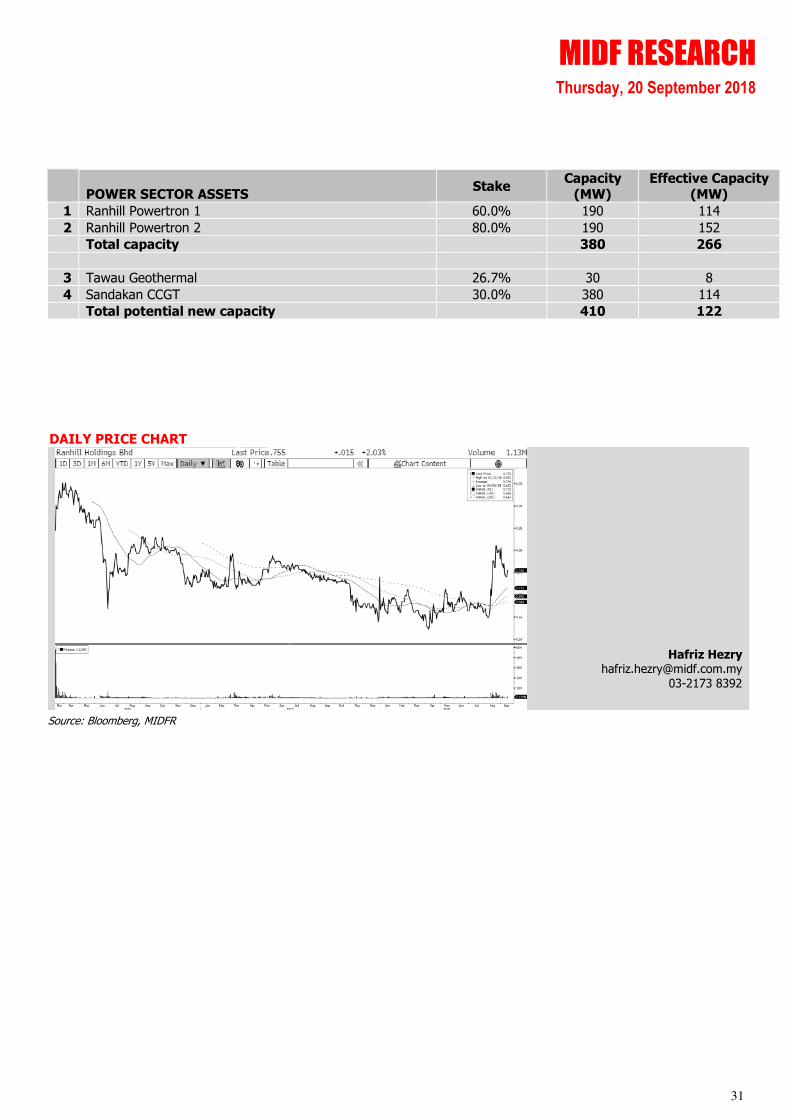
EXHIBIT 24: RANHILL’S POWER SECTOR ASSETS
POWER SECTOR ASSETS Stake Capacity (MW)
Ranhill Powertron 1 (RP1) 60.0% 190
Ranhill Powertron 2 (RP2) 80.0% 190
Total current capacity
380
Tawau Geothermal 26.7% 30
Sandakan CCGT 30.0% 380
Total potential new capacity
410 Source: ST, Company, MIDF
MIDF RESEARCH Thursday, 20 September 2018
20
EXHIBIT 25: SABAH ELECTRICITY GRID
Source: ST, Company, MIDF
MIDF RESEARCH Thursday, 20 September 2018
21
E. POTENTIAL PLAY INTO WATER-SEWERAGE INTEGRATION
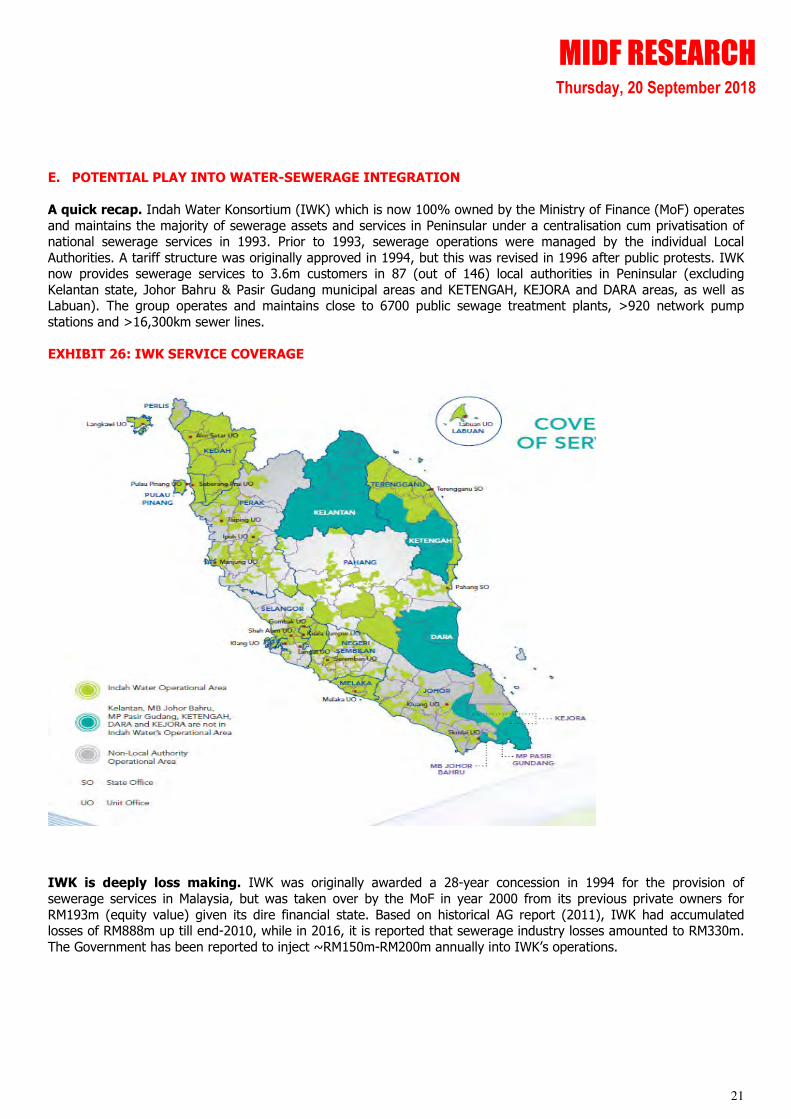
A quick recap. Indah Water Konsortium (IWK) which is now 100% owned by the Ministry of Finance (MoF) operates
and maintains the majority of sewerage assets and services in Peninsular under a centralisation cum privatisation of national sewerage services in 1993. Prior to 1993, sewerage operations were managed by the individual Local
Authorities. A tariff structure was originally approved in 1994, but this was revised in 1996 after public protests. IWK now provides sewerage services to 3.6m customers in 87 (out of 146) local authorities in Peninsular (excluding
Kelantan state, Johor Bahru & Pasir Gudang municipal areas and KETENGAH, KEJORA and DARA areas, as well as Labuan). The group operates and maintains close to 6700 public sewage treatment plants, >920 network pump
stations and >16,300km sewer lines.
EXHIBIT 26: IWK SERVICE COVERAGE
IWK is deeply loss making. IWK was originally awarded a 28-year concession in 1994 for the provision of
sewerage services in Malaysia, but was taken over by the MoF in year 2000 from its previous private owners for
RM193m (equity value) given its dire financial state. Based on historical AG report (2011), IWK had accumulated losses of RM888m up till end-2010, while in 2016, it is reported that sewerage industry losses amounted to RM330m.
The Government has been reported to inject ~RM150m-RM200m annually into IWK’s operations.
MIDF RESEARCH Thursday, 20 September 2018
22
Key factors for IWK’s losses during its concession:
(1) Fixed tariff structure and low tariff rates introduced since 1997 which has remained unchanged to-date e.g. fixed
RM8/month for domestic consumers, instead of volumetric tariff adopted for water distribution.
(2) Poor bill collection – IWK bills are issued independent of water bills; there is currently circa RM1b outstanding bills
yet to be collected. Under WSIA, water treatment operators do not have the right to disconnect services or take enforcement action against defaulting customers – given potential impact to public health. Even at 100% collection
rate, it is understood IWK still cannot break-even given the low tariffs.
(3) Underestimation of the magnitude of operational effort and investment required for refurbishment and new capital
works due to poor planning prior to privatisation – actual investment required was RM18b compared to the initial
estimate of RM6.2b.
(4) The requirement for sludge management was omitted from the financial model – WSIA 2006 offers a resolution
i.e. refusal for individual septic tank desludging service and maintenance of private sewage treatment plants.
(5) Unclear and undefined role of the various stakeholders; with the concessionaire taking an all encompassing role in
sewerage operation and development while ownership and authority rested with the Government
(6) Poor customer acceptance of the privatisation due to poor public perception
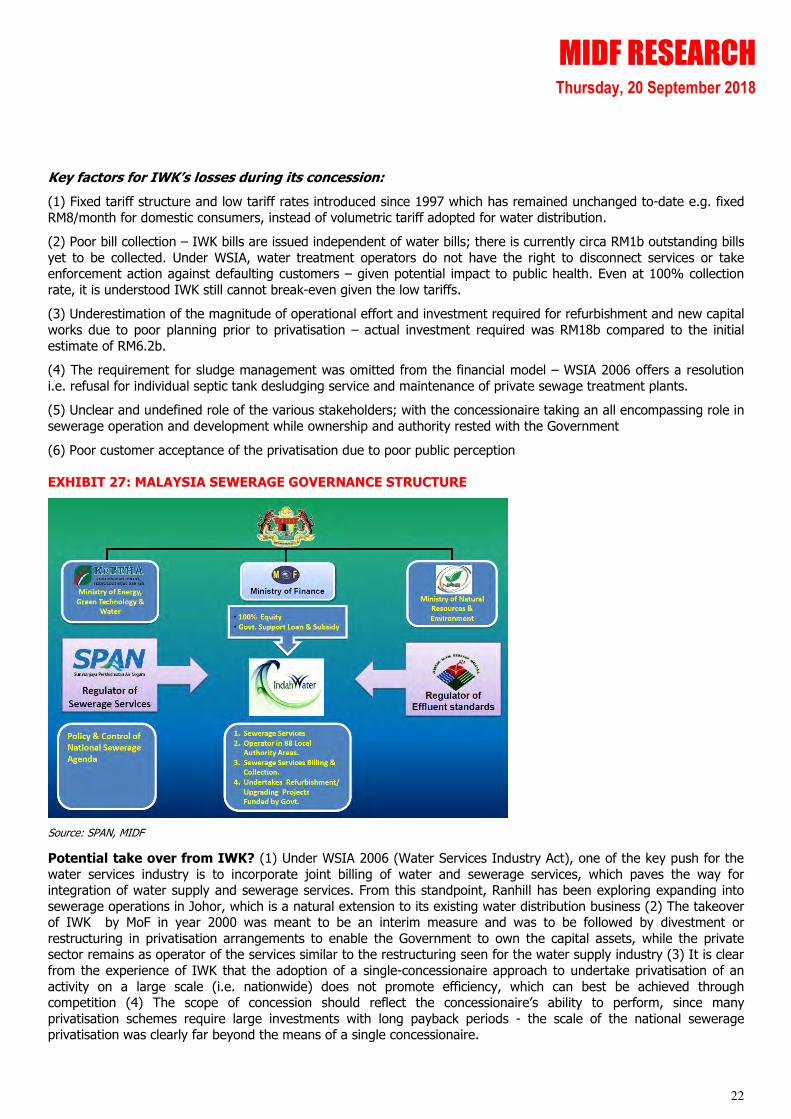
EXHIBIT 27: MALAYSIA SEWERAGE GOVERNANCE STRUCTURE
Source: SPAN, MIDF
Potential take over from IWK? (1) Under WSIA 2006 (Water Services Industry Act), one of the key push for the
water services industry is to incorporate joint billing of water and sewerage services, which paves the way for integration of water supply and sewerage services. From this standpoint, Ranhill has been exploring expanding into
sewerage operations in Johor, which is a natural extension to its existing water distribution business (2) The takeover of IWK by MoF in year 2000 was meant to be an interim measure and was to be followed by divestment or
restructuring in privatisation arrangements to enable the Government to own the capital assets, while the private sector remains as operator of the services similar to the restructuring seen for the water supply industry (3) It is clear
from the experience of IWK that the adoption of a single-concessionaire approach to undertake privatisation of an
activity on a large scale (i.e. nationwide) does not promote efficiency, which can best be achieved through competition (4) The scope of concession should reflect the concessionaire’s ability to perform, since many
privatisation schemes require large investments with long payback periods - the scale of the national sewerage privatisation was clearly far beyond the means of a single concessionaire.
MIDF RESEARCH Thursday, 20 September 2018
23
MoU with Indah Water. Ranhill has entered into an MOU with IWK in December 2016 to undertake the joint review
for a joint billing exercise for water supply and sewerage services in the Johor state (excluding Johor Bahru and Pasir
Gudang currently managed by respective city councils) as the immediate phase with the intention to pursue the integration of water supply and sewerage services in Johor and transition from the current fixed sewerage tariff to a
volumetric tariff regime.
Supported by the Ministry. The 11th Malaysia Plan in 2015 highlighted the intention to integrate the operations of
water supply and sewerage services in line with WSIA2006 and has been successfully implemented in Labuan in March 2016. Despite the change in Government the policy has not changed. The new Water, Land and Natural
Resources Minister Dr Xavier Jayakumar recently indicated that the joint billing initiative is intact and targeted to be
implemented latest by end-FY18, starting with selective states.
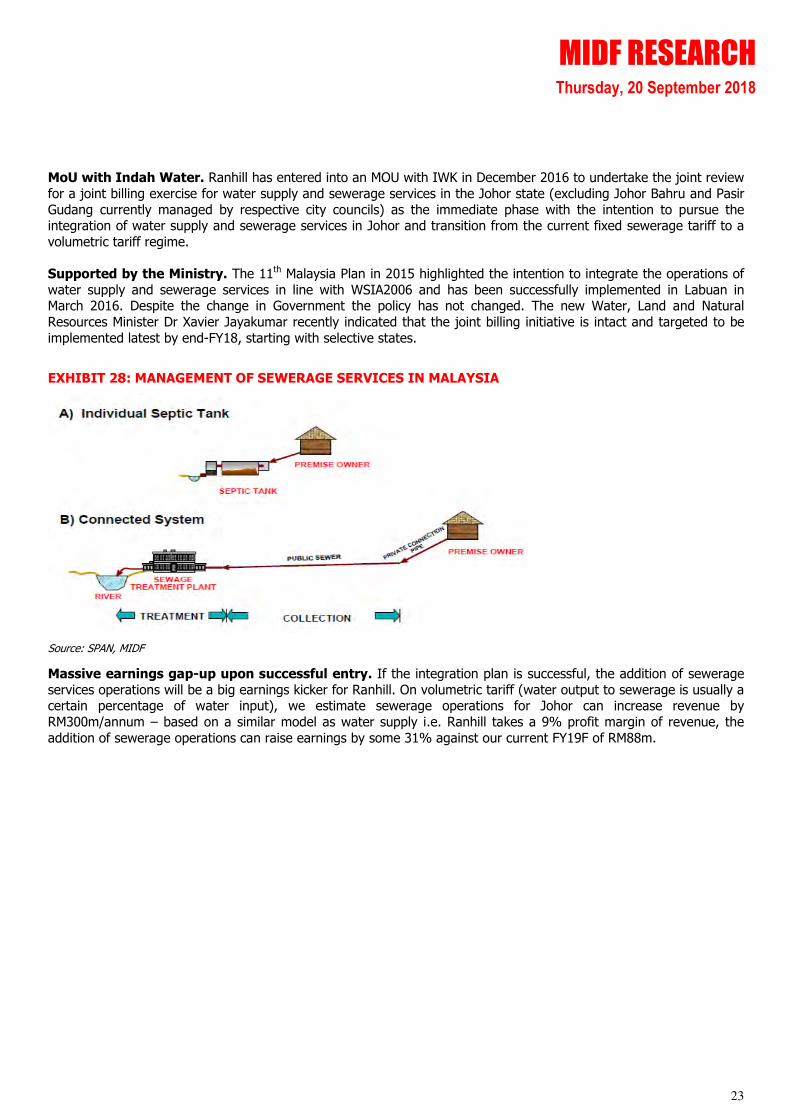
EXHIBIT 28: MANAGEMENT OF SEWERAGE SERVICES IN MALAYSIA
Source: SPAN, MIDF
Massive earnings gap-up upon successful entry. If the integration plan is successful, the addition of sewerage
services operations will be a big earnings kicker for Ranhill. On volumetric tariff (water output to sewerage is usually a certain percentage of water input), we estimate sewerage operations for Johor can increase revenue by
RM300m/annum – based on a similar model as water supply i.e. Ranhill takes a 9% profit margin of revenue, the
addition of sewerage operations can raise earnings by some 31% against our current FY19F of RM88m.
MIDF RESEARCH Thursday, 20 September 2018
24
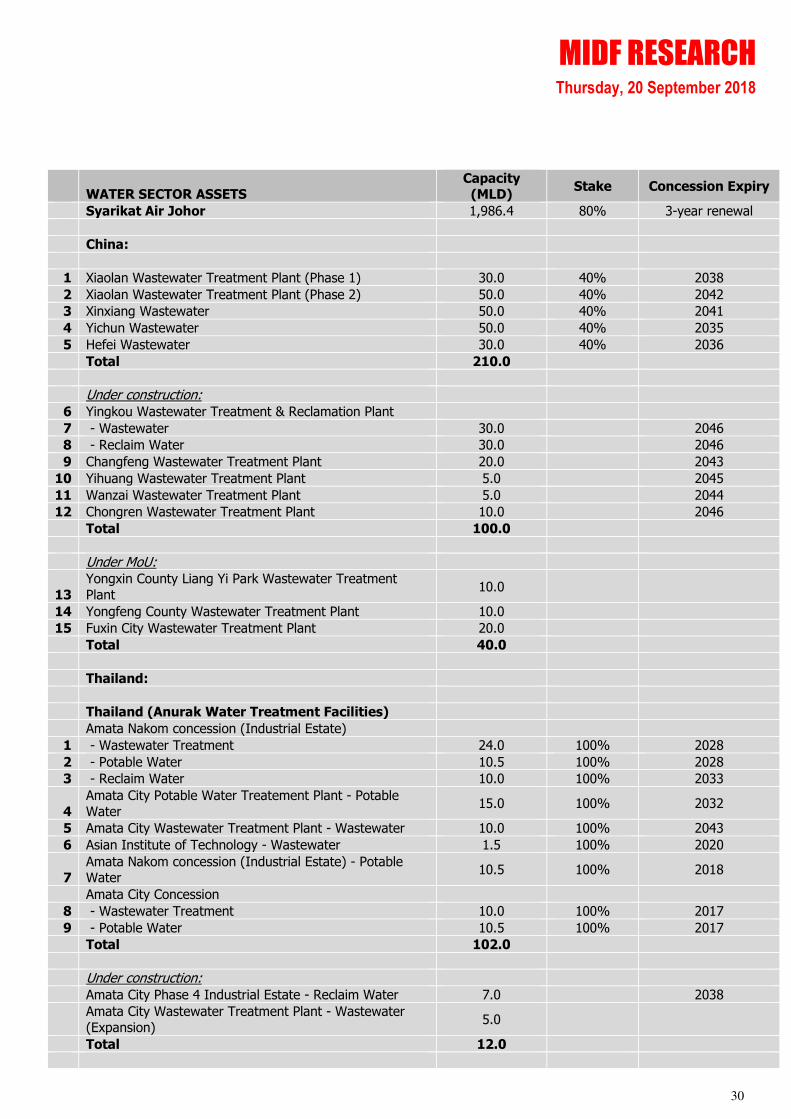
F. EXPOSURE TO INTERNATIONAL WATER SECTOR
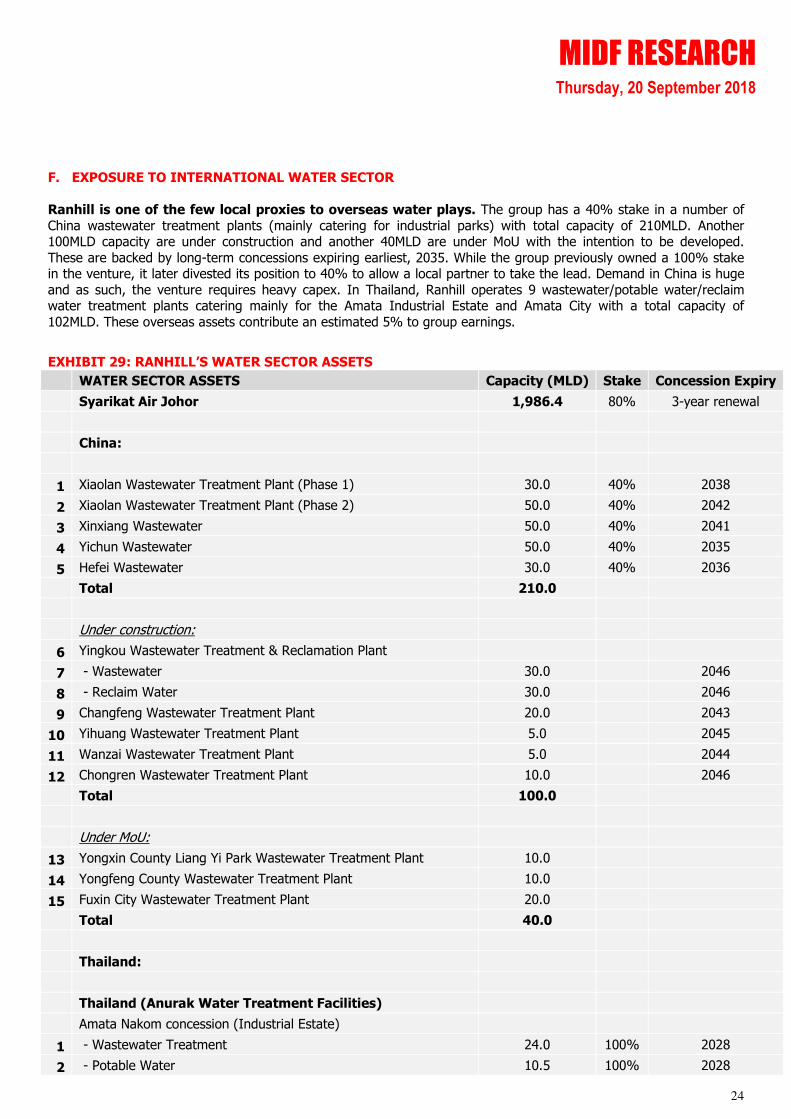
Ranhill is one of the few local proxies to overseas water plays. The group has a 40% stake in a number of
China wastewater treatment plants (mainly catering for industrial parks) with total capacity of 210MLD. Another 100MLD capacity are under construction and another 40MLD are under MoU with the intention to be developed.
These are backed by long-term concessions expiring earliest, 2035. While the group previously owned a 100% stake in the venture, it later divested its position to 40% to allow a local partner to take the lead. Demand in China is huge
and as such, the venture requires heavy capex. In Thailand, Ranhill operates 9 wastewater/potable water/reclaim water treatment plants catering mainly for the Amata Industrial Estate and Amata City with a total capacity of
102MLD. These overseas assets contribute an estimated 5% to group earnings.
EXHIBIT 29: RANHILL’S WATER SECTOR ASSETS
WATER SECTOR ASSETS Capacity (MLD) Stake Concession Expiry
Syarikat Air Johor 1,986.4 80% 3-year renewal
China:
1 Xiaolan Wastewater Treatment Plant (Phase 1) 30.0 40% 2038
2 Xiaolan Wastewater Treatment Plant (Phase 2) 50.0 40% 2042
3 Xinxiang Wastewater 50.0 40% 2041
4 Yichun Wastewater 50.0 40% 2035
5 Hefei Wastewater 30.0 40% 2036
Total 210.0
Under construction:
6 Yingkou Wastewater Treatment & Reclamation Plant
7 - Wastewater 30.0
2046
8 - Reclaim Water 30.0
2046
9 Changfeng Wastewater Treatment Plant 20.0
2043
10 Yihuang Wastewater Treatment Plant 5.0
2045
11 Wanzai Wastewater Treatment Plant 5.0
2044
12 Chongren Wastewater Treatment Plant 10.0
2046
Total 100.0
Under MoU:
13 Yongxin County Liang Yi Park Wastewater Treatment Plant 10.0
14 Yongfeng County Wastewater Treatment Plant 10.0
15 Fuxin City Wastewater Treatment Plant 20.0
Total 40.0
Thailand:
Thailand (Anurak Water Treatment Facilities)
Amata Nakom concession (Industrial Estate)
1 - Wastewater Treatment 24.0 100% 2028
2 - Potable Water 10.5 100% 2028
MIDF RESEARCH Thursday, 20 September 2018
25
3 - Reclaim Water 10.0 100% 2033
4 Amata City Potable Water Treatement Plant - Potable Water 15.0 100% 2032
5 Amata City Wastewater Treatment Plant - Wastewater 10.0 100% 2043
6 Asian Institute of Technology - Wastewater 1.5 100% 2020
7 Amata Nakom concession (Industrial Estate) - Potable Water 10.5 100% 2018
Amata City Concession
8 - Wastewater Treatment 10.0 100% 2017
9 - Potable Water 10.5 100% 2017
Total 102.0
Under construction:
Amata City Phase 4 Industrial Estate - Reclaim Water 7.0
2038
Amata City Wastewater Treatment Plant - Wastewater (Expansion) 5.0
Total 12.0
Source: Company, MIDF
EXHIBIT 30: ONE OF RANHILL’S WATER TREATMENT FACILITIES IN THAILAND
Source: Company, MIDF
MIDF RESEARCH Thursday, 20 September 2018
26
G. VALUATION AND RECOMMENDATION
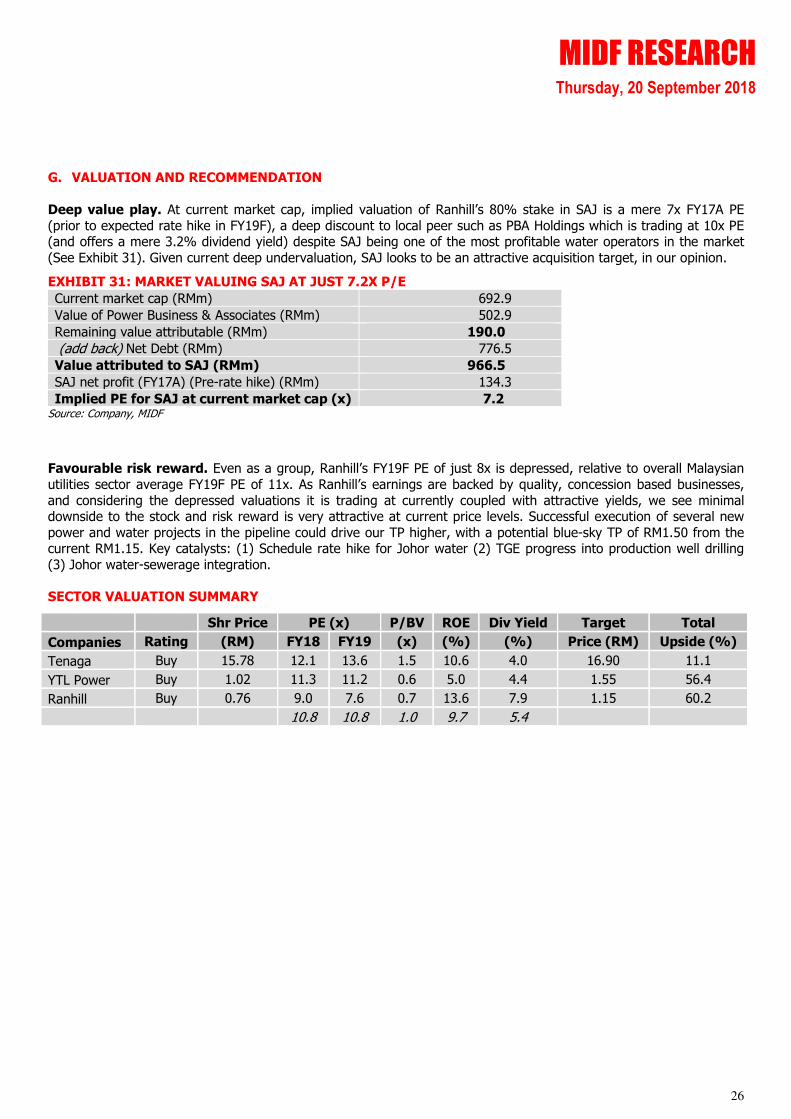
Deep value play. At current market cap, implied valuation of Ranhill’s 80% stake in SAJ is a mere 7x FY17A PE
(prior to expected rate hike in FY19F), a deep discount to local peer such as PBA Holdings which is trading at 10x PE (and offers a mere 3.2% dividend yield) despite SAJ being one of the most profitable water operators in the market
(See Exhibit 31). Given current deep undervaluation, SAJ looks to be an attractive acquisition target, in our opinion.
EXHIBIT 31: MARKET VALUING SAJ AT JUST 7.2X P/E
Current market cap (RMm) 692.9
Value of Power Business & Associates (RMm) 502.9
Remaining value attributable (RMm) 190.0
(add back) Net Debt (RMm) 776.5
Value attributed to SAJ (RMm) 966.5
SAJ net profit (FY17A) (Pre-rate hike) (RMm) 134.3
Implied PE for SAJ at current market cap (x) 7.2 Source: Company, MIDF
Favourable risk reward. Even as a group, Ranhill’s FY19F PE of just 8x is depressed, relative to overall Malaysian
utilities sector average FY19F PE of 11x. As Ranhill’s earnings are backed by quality, concession based businesses,
and considering the depressed valuations it is trading at currently coupled with attractive yields, we see minimal downside to the stock and risk reward is very attractive at current price levels. Successful execution of several new
power and water projects in the pipeline could drive our TP higher, with a potential blue-sky TP of RM1.50 from the current RM1.15. Key catalysts: (1) Schedule rate hike for Johor water (2) TGE progress into production well drilling
(3) Johor water-sewerage integration.
SECTOR VALUATION SUMMARY
Shr Price PE (x) P/BV ROE Div Yield Target Total
Companies Rating (RM) FY18 FY19 (x) (%) (%) Price (RM) Upside (%)
Tenaga Buy 15.78 12.1 13.6 1.5 10.6 4.0 16.90 11.1
YTL Power Buy 1.02 11.3 11.2 0.6 5.0 4.4 1.55 56.4
Ranhill Buy 0.76 9.0 7.6 0.7 13.6 7.9 1.15 60.2
10.8 10.8 1.0 9.7 5.4
MIDF RESEARCH Thursday, 20 September 2018
27
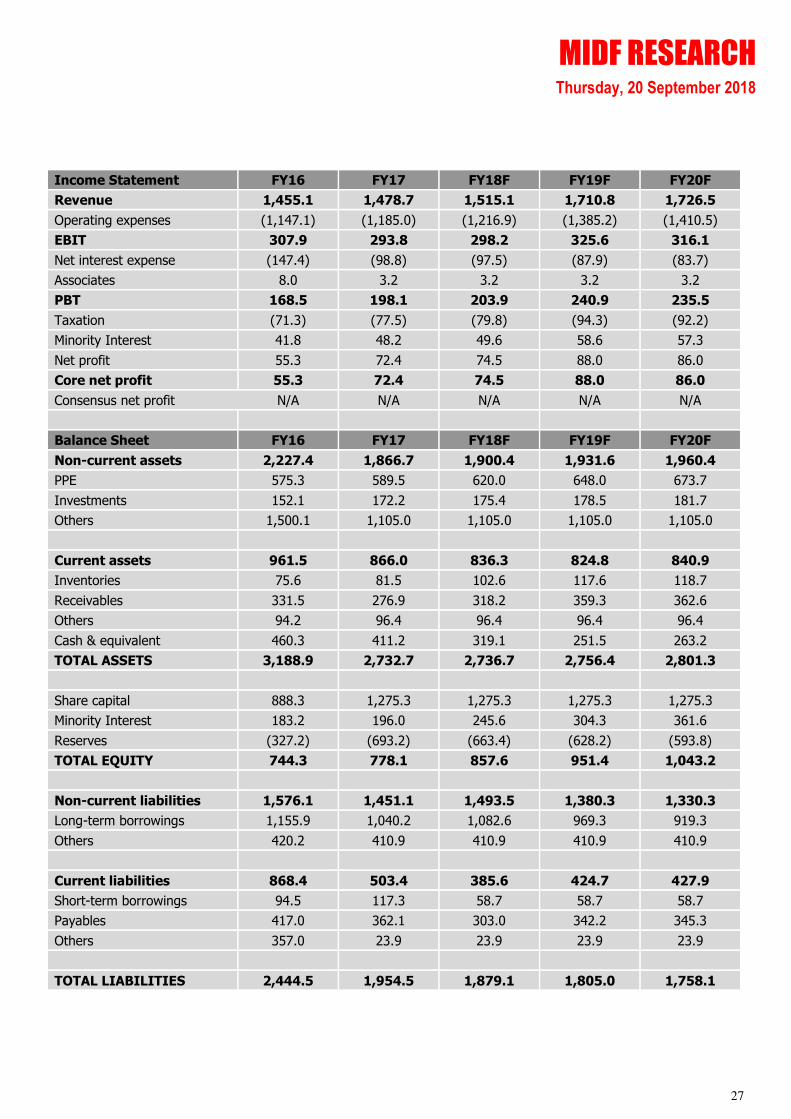
Income Statement FY16 FY17 FY18F FY19F FY20F
Revenue 1,455.1 1,478.7 1,515.1 1,710.8 1,726.5
Operating expenses (1,147.1) (1,185.0) (1,216.9) (1,385.2) (1,410.5)
EBIT 307.9 293.8 298.2 325.6 316.1
Net interest expense (147.4) (98.8) (97.5) (87.9) (83.7)
Associates 8.0 3.2 3.2 3.2 3.2
PBT 168.5 198.1 203.9 240.9 235.5
Taxation (71.3) (77.5) (79.8) (94.3) (92.2)
Minority Interest 41.8 48.2 49.6 58.6 57.3
Net profit 55.3 72.4 74.5 88.0 86.0
Core net profit 55.3 72.4 74.5 88.0 86.0
Consensus net profit N/A N/A N/A N/A N/A
Balance Sheet FY16 FY17 FY18F FY19F FY20F
Non-current assets 2,227.4 1,866.7 1,900.4 1,931.6 1,960.4
PPE 575.3 589.5 620.0 648.0 673.7
Investments 152.1 172.2 175.4 178.5 181.7
Others 1,500.1 1,105.0 1,105.0 1,105.0 1,105.0
Current assets 961.5 866.0 836.3 824.8 840.9
Inventories 75.6 81.5 102.6 117.6 118.7
Receivables 331.5 276.9 318.2 359.3 362.6
Others 94.2 96.4 96.4 96.4 96.4
Cash & equivalent 460.3 411.2 319.1 251.5 263.2
TOTAL ASSETS 3,188.9 2,732.7 2,736.7 2,756.4 2,801.3
Share capital 888.3 1,275.3 1,275.3 1,275.3 1,275.3
Minority Interest 183.2 196.0 245.6 304.3 361.6
Reserves (327.2) (693.2) (663.4) (628.2) (593.8)
TOTAL EQUITY 744.3 778.1 857.6 951.4 1,043.2
Non-current liabilities 1,576.1 1,451.1 1,493.5 1,380.3 1,330.3
Long-term borrowings 1,155.9 1,040.2 1,082.6 969.3 919.3
Others 420.2 410.9 410.9 410.9 410.9
Current liabilities 868.4 503.4 385.6 424.7 427.9
Short-term borrowings 94.5 117.3 58.7 58.7 58.7
Payables 417.0 362.1 303.0 342.2 345.3
Others 357.0 23.9 23.9 23.9 23.9
TOTAL LIABILITIES 2,444.5 1,954.5 1,879.1 1,805.0 1,758.1
MIDF RESEARCH Thursday, 20 September 2018
28
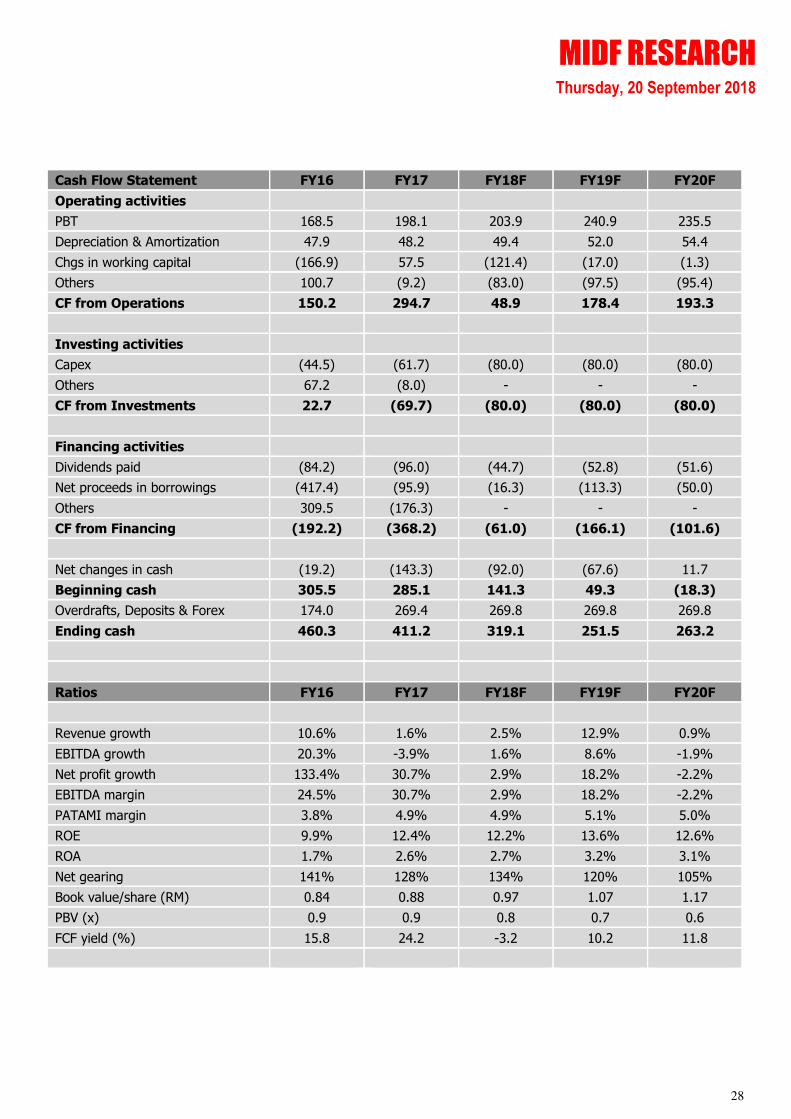
Cash Flow Statement FY16 FY17 FY18F FY19F FY20F
Operating activities
PBT 168.5 198.1 203.9 240.9 235.5
Depreciation & Amortization 47.9 48.2 49.4 52.0 54.4
Chgs in working capital (166.9) 57.5 (121.4) (17.0) (1.3)
Others 100.7 (9.2) (83.0) (97.5) (95.4)
CF from Operations 150.2 294.7 48.9 178.4 193.3
Investing activities
Capex (44.5) (61.7) (80.0) (80.0) (80.0)
Others 67.2 (8.0) - - -
CF from Investments 22.7 (69.7) (80.0) (80.0) (80.0)
Financing activities
Dividends paid (84.2) (96.0) (44.7) (52.8) (51.6)
Net proceeds in borrowings (417.4) (95.9) (16.3) (113.3) (50.0)
Others 309.5 (176.3) - - -
CF from Financing (192.2) (368.2) (61.0) (166.1) (101.6)
Net changes in cash (19.2) (143.3) (92.0) (67.6) 11.7
Beginning cash 305.5 285.1 141.3 49.3 (18.3)
Overdrafts, Deposits & Forex 174.0 269.4 269.8 269.8 269.8
Ending cash 460.3 411.2 319.1 251.5 263.2
Ratios FY16 FY17 FY18F FY19F FY20F
Revenue growth 10.6% 1.6% 2.5% 12.9% 0.9%
EBITDA growth 20.3% -3.9% 1.6% 8.6% -1.9%
Net profit growth 133.4% 30.7% 2.9% 18.2% -2.2%
EBITDA margin 24.5% 30.7% 2.9% 18.2% -2.2%
PATAMI margin 3.8% 4.9% 4.9% 5.1% 5.0%
ROE 9.9% 12.4% 12.2% 13.6% 12.6%
ROA 1.7% 2.6% 2.7% 3.2% 3.1%
Net gearing 141% 128% 134% 120% 105%
Book value/share (RM) 0.84 0.88 0.97 1.07 1.17
PBV (x) 0.9 0.9 0.8 0.7 0.6
FCF yield (%) 15.8 24.2 -3.2 10.2 11.8
MIDF RESEARCH Thursday, 20 September 2018
29
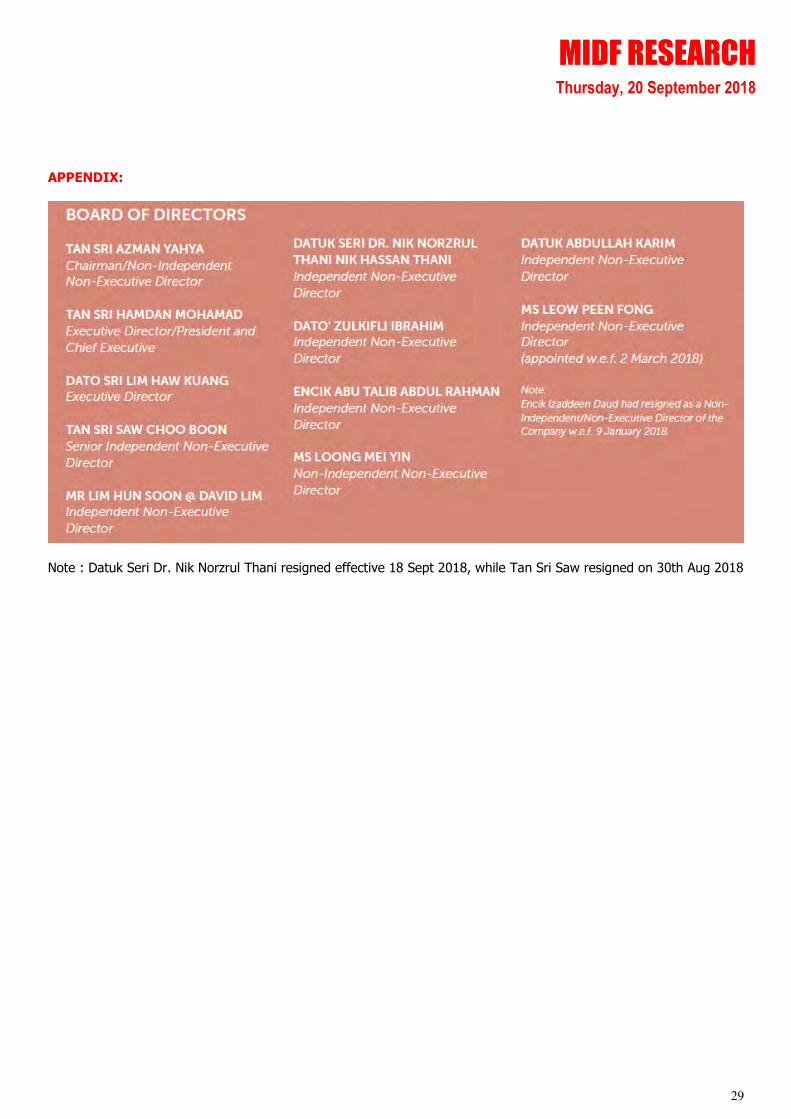
APPENDIX:
Note : Datuk Seri Dr. Nik Norzrul Thani resigned effective 18 Sept 2018, while Tan Sri Saw resigned on 30th Aug 2018
MIDF RESEARCH Thursday, 20 September 2018
30
WATER SECTOR ASSETS Capacity (MLD)
Stake Concession Expiry
Syarikat Air Johor 1,986.4 80% 3-year renewal
China:
1 Xiaolan Wastewater Treatment Plant (Phase 1) 30.0 40% 2038
2 Xiaolan Wastewater Treatment Plant (Phase 2) 50.0 40% 2042
3 Xinxiang Wastewater 50.0 40% 2041
4 Yichun Wastewater 50.0 40% 2035
5 Hefei Wastewater 30.0 40% 2036
Total 210.0
Under construction:
6 Yingkou Wastewater Treatment & Reclamation Plant
7 - Wastewater 30.0
2046
8 - Reclaim Water 30.0
2046
9 Changfeng Wastewater Treatment Plant 20.0
2043
10 Yihuang Wastewater Treatment Plant 5.0
2045
11 Wanzai Wastewater Treatment Plant 5.0
2044
12 Chongren Wastewater Treatment Plant 10.0
2046
Total 100.0
Under MoU:
13
Yongxin County Liang Yi Park Wastewater Treatment
Plant 10.0
14 Yongfeng County Wastewater Treatment Plant 10.0
15 Fuxin City Wastewater Treatment Plant 20.0
Total 40.0
Thailand:
Thailand (Anurak Water Treatment Facilities)
Amata Nakom concession (Industrial Estate)
1 - Wastewater Treatment 24.0 100% 2028
2 - Potable Water 10.5 100% 2028
3 - Reclaim Water 10.0 100% 2033
4
Amata City Potable Water Treatement Plant - Potable
Water 15.0 100% 2032
5 Amata City Wastewater Treatment Plant - Wastewater 10.0 100% 2043
6 Asian Institute of Technology - Wastewater 1.5 100% 2020
7 Amata Nakom concession (Industrial Estate) - Potable Water
10.5 100% 2018
Amata City Concession
8 - Wastewater Treatment 10.0 100% 2017
9 - Potable Water 10.5 100% 2017
Total 102.0
Under construction:
Amata City Phase 4 Industrial Estate - Reclaim Water 7.0
2038
Amata City Wastewater Treatment Plant - Wastewater
(Expansion) 5.0
Total 12.0
MIDF RESEARCH Thursday, 20 September 2018
31
POWER SECTOR ASSETS Stake
Capacity (MW)
Effective Capacity (MW)
1 Ranhill Powertron 1 60.0% 190 114
2 Ranhill Powertron 2 80.0% 190 152
Total capacity
380 266
3 Tawau Geothermal 26.7% 30 8
4 Sandakan CCGT 30.0% 380 114
Total potential new capacity
410 122
Source: Bloomberg, MIDFR
DAILY PRICE CHART
Hafriz Hezry [email protected]
03-2173 8392
MIDF RESEARCH Thursday, 20 September 2018
32
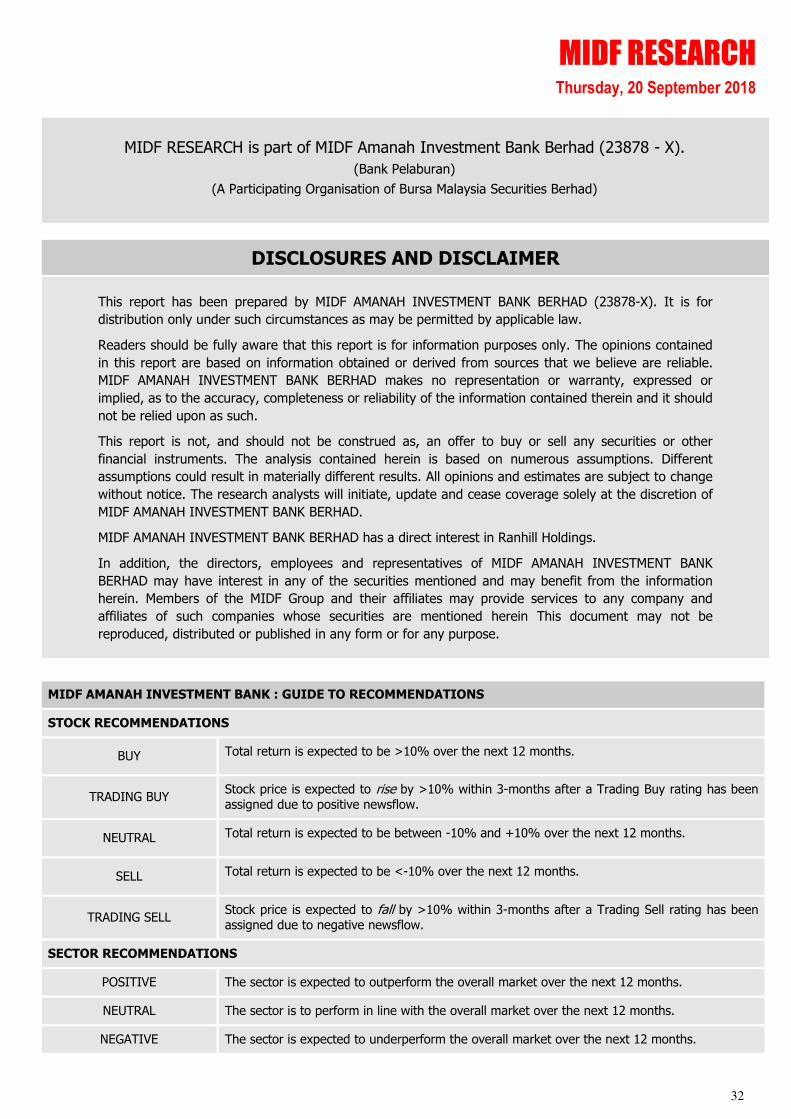
MIDF RESEARCH is part of MIDF Amanah Investment Bank Berhad (23878 - X).
(Bank Pelaburan)
(A Participating Organisation of Bursa Malaysia Securities Berhad)
DISCLOSURES AND DISCLAIMER
This report has been prepared by MIDF AMANAH INVESTMENT BANK BERHAD (23878-X). It is for
distribution only under such circumstances as may be permitted by applicable law.
Readers should be fully aware that this report is for information purposes only. The opinions contained
in this report are based on information obtained or derived from sources that we believe are reliable.
MIDF AMANAH INVESTMENT BANK BERHAD makes no representation or warranty, expressed or
implied, as to the accuracy, completeness or reliability of the information contained therein and it should
not be relied upon as such.
This report is not, and should not be construed as, an offer to buy or sell any securities or other
financial instruments. The analysis contained herein is based on numerous assumptions. Different
assumptions could result in materially different results. All opinions and estimates are subject to change
without notice. The research analysts will initiate, update and cease coverage solely at the discretion of
MIDF AMANAH INVESTMENT BANK BERHAD.
MIDF AMANAH INVESTMENT BANK BERHAD has a direct interest in Ranhill Holdings.
In addition, the directors, employees and representatives of MIDF AMANAH INVESTMENT BANK
BERHAD may have interest in any of the securities mentioned and may benefit from the information
herein. Members of the MIDF Group and their affiliates may provide services to any company and
affiliates of such companies whose securities are mentioned herein This document may not be
reproduced, distributed or published in any form or for any purpose.
MIDF AMANAH INVESTMENT BANK : GUIDE TO RECOMMENDATIONS
STOCK RECOMMENDATIONS
BUY Total return is expected to be >10% over the next 12 months.
TRADING BUY Stock price is expected to rise by >10% within 3-months after a Trading Buy rating has been
assigned due to positive newsflow.
NEUTRAL Total return is expected to be between -10% and +10% over the next 12 months.
SELL Total return is expected to be <-10% over the next 12 months.
TRADING SELL Stock price is expected to fall by >10% within 3-months after a Trading Sell rating has been
assigned due to negative newsflow.
SECTOR RECOMMENDATIONS
POSITIVE The sector is expected to outperform the overall market over the next 12 months.
NEUTRAL The sector is to perform in line with the overall market over the next 12 months.
NEGATIVE The sector is expected to underperform the overall market over the next 12 months.