are special education students happy
TRANSCRIPT
This article was downloaded by: [University of Helsinki]On: 03 November 2012, At: 08:19Publisher: RoutledgeInforma Ltd Registered in England and Wales Registered Number: 1072954 Registeredoffice: Mortimer House, 37-41 Mortimer Street, London W1T 3JH, UK
Scandinavian Journal of EducationalResearchPublication details, including instructions for authors andsubscription information:http://www.tandfonline.com/loi/csje20
Are Special Education Students Happy?Lotta Uusitalo-Malmivaara a , Paula Kankaanpää a , Tuula Mäkinena , Tiina Raeluoto a , Karoliina Rauttu a , Veera Tarhala a & JuhaniE. Lehto aa University of Helsinki, FinlandVersion of record first published: 21 Nov 2011.
To cite this article: Lotta Uusitalo-Malmivaara, Paula Kankaanpää, Tuula Mäkinen, Tiina Raeluoto,Karoliina Rauttu, Veera Tarhala & Juhani E. Lehto (2012): Are Special Education Students Happy?,Scandinavian Journal of Educational Research, 56:4, 419-437
To link to this article: http://dx.doi.org/10.1080/00313831.2011.599421
PLEASE SCROLL DOWN FOR ARTICLE
Full terms and conditions of use: http://www.tandfonline.com/page/terms-and-conditions
This article may be used for research, teaching, and private study purposes. Anysubstantial or systematic reproduction, redistribution, reselling, loan, sub-licensing,systematic supply, or distribution in any form to anyone is expressly forbidden.
The publisher does not give any warranty express or implied or make any representationthat the contents will be complete or accurate or up to date. The accuracy of anyinstructions, formulae, and drug doses should be independently verified with primarysources. The publisher shall not be liable for any loss, actions, claims, proceedings,demand, or costs or damages whatsoever or howsoever caused arising directly orindirectly in connection with or arising out of the use of this material.
Are Special Education Students Happy?
Lotta Uusitalo-Malmivaara, Paula Kankaanpaa, Tuula Makinen, Tiina Raeluoto,Karoliina Rauttu, Veera Tarhala and Juhani E. Lehto
University of Helsinki, Finland
This study compared the subjective and school-related happiness of 75 11- to 16-year-oldspecial education students to 77 age- and gender-matched mainstream students using twoquantitative measures. Additionally, the respondents chose from a list of 12 putativehappy makers what they felt increased their happiness. Ten special education studentsalso described their opinions on happiness qualitatively. In both quantitative measures,the special education students reported lower happiness than did their counterparts.Girls reported lower happiness than did boys in subjective happiness. Both educationalgroups valued money, success in school and leisure time. The most frequent choice ofspecial education students was to have more friends. This paper discusses reasons forthe relative unhappiness of special education children.
Keywords: happiness, special education students, mainstream students, school-relatedhappiness
The ultimate goal in human life is happiness. Over 2,000 years ago, Aristotle (2000)identified this goal as everything good and as living a good life. Accordingly, in this paperwe ask a simple question which we consider very relevant for all special educationalists:Are special education students happy and is their happiness comparable to that of mainstreamstudents?
Definition of Happiness
Happiness is a major theme of positive psychology (Diener, 1984; Seligman & Csikszent-mihalyi, 2000; Seligman, Steen, Park, & Peterson, 2005), the paradigm that complements thetraditional psychopathology-centered approach. The research literature uses the term happinesssynonymously with subjective well-being (SWB) (Diener, 2000; Ivens, 2007; Lyubomirsky,Sheldon, & Schkade, 2005), a broad concept of people’s physical and mental health andemotional well-being.
ISSN 0031-3831 print/ISSN 1470-1170 online# 2012 Scandinavian Journal of Educational Researchhttp://dx.doi.org/10.1080/00313831.2011.599421http://www.tandfonline.com
Lotta Uusitalo-Malmivaara, University of Helsinki, Special Pedagogy and Open University; PaulaKankaanpaa, University of Helsinki, Special Pedagogy and Open University; Tuula Makinen, Univer-sity of Helsinki, Special Pedagogy and Open University; Tiina Raeluoto, University of Helsinki,Special Pedagogy and Open University; Karoliina Rauttu, University of Helsinki, Special Pedagogyand Open University; Veera Tarhala University of Helsinki, Special Pedagogy and Open University;Juhani E. Lehto, University of Helsinki, Special Pedagogy and Open University.
Correspondence concerning this article should be addressed to Lotta Uusitalo-Malmivaara, Univer-sity of Helsinki, Special Pedagogy and Open University, Teollisuuskatu 23, P.O. Box 26, Helsinki,00014 Hgin yo, Finland. Email: [email protected]
Scandinavian Journal of Educational ResearchVol. 56, No. 4, August 2012, 419–437
Dow
nloa
ded
by [
Uni
vers
ity o
f H
elsi
nki]
at 0
8:19
03
Nov
embe
r 20
12
According to the set point theory presented by Lyubomirsky et al. (2005), 50% of an indi-vidual’s happiness is determined by genetic factors. Temperamental and affective personalitytraits, for instance, are highly heritable, change little over one’s life span, and are highly pre-dictive of subjective happiness (Costa & McCrae, 1980). The theory suggests that demo-graphic factors, such as gender, age or race, account for 10% of the individual’shappiness, and intentional activity, such as optimism, striving for personal goals or beingkind to others, determines the final 40% of one’s happiness (Lyubomirsky et al., 2005).
Happiness can be further divided into three components: positive effect, negative effectand life satisfaction, the last of which is an overall cognitive appraisal of how good one’s lifeis, and is a complementary component to the affect components (Diener, 1984, 1994). Some-times, the terms life satisfaction and happiness are used interchangeably (Proctor, Linley &Maltby, 2009; Veenhoven, 1984). According to Proctor et al. (2009, p. 584), “Throughout theresearch literature, scores on measures of life satisfaction are often used to indicate happinessor unhappiness.” Accordingly, we use the terms “life satisfaction” and “happiness”interchangeably.
The present study adopts Veenhoven’s definition of happiness. Accordingly, we under-stand happiness in its broad form as the degree to which one judges the quality of one’slife favorably or enjoys life (Veenhoven, 2000; Veenhoven & Ehrhardt, 1995; see alsoLyubomirsky & Lepper, 1999).
Research on Children’s Happiness
In addition to expanding research on adult happiness, growing attention has also focusedon the happiness of children and adolescents. Similar to findings in adults, most of thestudies report high overall happiness in children and adolescents (e.g., Huebner, Drane, &Valois, 2000; Park & Huebner, 2005). In this paper, children and adolescents refer toindividuals aged 12 and under, and individuals aged 13–19, respectively (see alsoProctor et al., 2009, p. 584). “Students” refer to both children and adolescents studying inany school.
The following section briefly reviews the research most relevant to our current studyfocusing on psychological, school-related and demographic factors behind normally achiev-ing and special educational children’s and adolescent’s happiness.
Psychological Factors
Personal characteristics and temperament strongly relate to happiness. Extraversion pre-dicts increase in happiness whereas neuroticism predicts lowered happiness in adults (Costa& McCrae, 1980), in children and adolescents (Ash & Huebner, 2001; Holder & Klassen,2010). The heritable effects of personality are evidenced from infancy and predispose indi-vidual levels of happiness (Diener, Suh, Lucas & Smith, 1999). Self-esteem, self-efficacy(Huebner, 1991; Natvig, Albrektsen, & Qvarnstrøm, 2003), and feelings of competence (per-taining to academic tasks) predict high life satisfaction among adolescents (Suldo & Huebner,2006).
Character strengths such as love, zest, hope and gratitude (Park & Peterson, 2006) relateto self-esteem and self-efficacy and promote happiness. Typically, special education childrenpossess fewer emotional and behavioral strengths (Lappalainen, Savolainen, Kuorelahti, &Epstein, 2009). This lack of strengths may also lead to fewer chances to live a full life and
420 UUSITALO-MALMIVAARA ET AL.
Dow
nloa
ded
by [
Uni
vers
ity o
f H
elsi
nki]
at 0
8:19
03
Nov
embe
r 20
12
to experience happiness in that way (Peterson, Park, & Seligman, 2005). Moreover, specialeducational status in and of itself may already be stigmatizing and thus lead to unfavorableself-perceptions and unhappiness (Norwich, 1997).
An internal locus of control is strongly related to life satisfaction. Believing that lifeevents depend on one’s own behavior (vs. luck, fate or powerful others) clearly adds to hap-piness (Ash & Huebner, 2001). Special education students with cognitive disabilities areprobably less capable of finding optimistic or alternate interpretations of their life eventsand are consequently less able to control the quality of their lives (see also Matikka &Ojanen, 2004).
School-related Factors
Children’s and adolescents’ happiness and school performance have been connected inprevious work, although not consistently. Student’s perceptions of their academic abilities,teacher support and overall satisfaction with school are strong correlates of global life satis-faction. Grades or overall academic success, in turn, either fail to predict happiness or do soonly rather weakly (Huebner, 1991). Park and Huebner (2005) compared correlates ofhappiness between U.S. and Korean adolescents and found that satisfaction with schoolcontributed significantly to global life satisfaction for the Korean, but not the U.S.adolescents. Overall, social comparison correlates with happiness (Diener et al., 1999; Veen-hoven & Ehrhardt, 1995). The more positive the outcome of the comparison, the happier aperson is.
The results concerning special education students’ happiness are inconclusive. IQ, mentaldisabilities or diagnosed learning difficulties do not predict lowered personal happiness(Brantley, Huebner, & Nagle, 2002; McCullough & Huebner, 2003; Suldo, Riley, &Shaffer, 2006). In accordance with these results are Finnish studies that show greaterschool satisfaction among special education students than among their normally achievingpeers (e.g., Rinne, Kivirauma, & Wallenius, 2004). Good teacher relationships and a suppor-tive climate in the classroom appear to be the factors behind this satisfaction. However, alsodiminished happiness of students in special educational classes have been reported (Smith,Adelman, Nelson, Taylor, & Phares, 1987). Those students perceived themselves ashaving less control at school and reported lower levels of happiness than their normallyachieving peers.
Social self-efficacy acts as a mediator between extraversion and happiness (Fogle,Huebner, & Laughlin, 2002). Social affiliation is strongly related to happiness, and extremelyhappy adolescents experience high support from their friends (Suldo & Huebner, 2006). InFinland, full-time special education students reportedly have fewer friends and experiencemore frequent bullying than do their normally achieving peers (Rinne et al., 2004).Overall, ongoing life events are uniquely related to children’s and adolescents’ happiness,and chronic daily stressors or enjoyable experiences impact life satisfaction than do acuteevents (Ash & Huebner, 2001). Thus, everyday unpleasant confluences with peers can dras-tically reduce perceived happiness.
On the whole, most students report being happy with their schooling (Brantley et al.,2002; Ivens, 2007; McCullough & Huebner, 2003). However, in Finland, Linnakyla andMalin (e.g., Linnakyla, 1996; Malin & Linnakyla, 2001) studied the quality of school lifeand the affective outcome of schooling. Their results show rather low general school satisfac-tion and problematic teacher-student relationships among Finnish adolescents.
ARE SPECIAL EDUCATION STUDENTS HAPPY? 421
Dow
nloa
ded
by [
Uni
vers
ity o
f H
elsi
nki]
at 0
8:19
03
Nov
embe
r 20
12
Demographic Factors
Demographic variables such as gender, age or race do not strongly relate to children’s andadolescents’ life satisfaction (Gilman, Huebner & Laughlin, 2000). Studies show equal hap-piness among both genders in American (e.g., Dew & Huebner, 1994; Huebner, 1991) andAustralian (Bearsley & Cummins, 1999) children. In contrast, however, some Europeansamples have indicated lower levels of happiness among girls, for example, in Portugal(Neto, 1993) and in the Netherlands (Verkuyten, 1986).
Several studies show that life happiness varies little across age (Suldo & Huebner,2004b). However, happiness often diminishes with age during adolescence (Park, 2004;Park & Huebner, 2005; Suldo & Huebner, 2004a, 2004b).
Socioeconomic status seems to correlate mildly to life satisfaction in favor of higher-income individuals (e.g., Ash & Huebner, 2001). According to the “livability” theory (Veen-hoven & Ehrhardt, 1995), meeting children’s basic needs is enough to yield life satisfaction.Additional economic resources do not significantly increase this satisfaction. In Finland,special education children clearly have poorer socio-economical backgrounds than do main-stream education students, and in many cases, their basic needs may not be optimally met(Kivirauma, Klemela, & Rinne, 2006).
Authoritative parenting, close relations with parents (Petito & Cummins, 2000), and con-tinuity in parents’ marital status (Demo & Acock, 1996) positively correlate with children’slife satisfaction. Finnish special education students, especially students in special educationclasses, often come from single-parent families. Special education students represent ethnicminorities more often than mainstream students (Kivirauma et al., 2006), which renders themvulnerable to bullying and harassment (Lahelma, 2004).
Special Education in Finland
During the comprehensive school in Finland, special educational services are pro-vided in essentially two forms: part-time and full-time. The child may be assigned tothese services at any time during his or her schooling. In part-time special education, stu-dents attend a normal class of 20–30 students and receive special education in one ormore subjects during the school day. This typically takes place individually or in smallgroups in a separate “clinic” led by a special teacher. Approximately 23% of all studentsin comprehensive school receive part-time special education (Finnish Statistical Centre,2009).
In full-time special education, students may attend classes intended for special educationstudents only. These classes may be located in the same school building as mainstreamclasses or in a separate special educational school. Alternatively, full-time special educationstudents may also be integrated into mainstream classes, where they receive extra learningsupport. Of all students in comprehensive school, 8.5% receive full-time special educationat least in one subject, and of these students, about 29% are integrated into mainstreamclasses (Finnish Statistical Centre, 2009); the trend has been to increase the number of stu-dents in integrative settings.
Nowadays, special education classes are more commonly heterogeneous and compriselearners with a diversity of problems. The labeling of classes follows varying communalregulations. Typically, a special education class has six to ten students of about the sameage, and one teacher, often assisted by a paraeducator.
422 UUSITALO-MALMIVAARA ET AL.
Dow
nloa
ded
by [
Uni
vers
ity o
f H
elsi
nki]
at 0
8:19
03
Nov
embe
r 20
12
The Purpose of the Present Study
In this study, the happiness of special education students aged 11–16 was compared tothat of gender- and age-matched mainstream students using a measure for subjective happi-ness (Lyubomirsky & Lepper, 1999) and school-related happiness (Ivens, 2007). We alsoasked what would make our participants happier. Complementary to this quantitativeapproach, we interviewed special education students in order to determine how they constructhappiness. These data were analyzed qualitatively. The qualitative part of our study reliedheavily on a previous study by Eloff (2008).
It is obvious by definition that special education students differ from their peers innormal classes. Their academic career is poorer and they experience often behavioral andsocial problems abundantly (Finnish Statistical Centre, 2009). They frequently come fromsocioeconomically disadvantaged families (Kivirauma et al., 2006) and possess feweremotional and personal strengths than do students in mainstream classes (Lappalainenet al., 2009).
The set point theory states that 50% of personal happiness is heritable, with the rest beingdepending on circumstances (10%) and intentional activity (40%) (Lyubomirsky et al.,2005). Although the theory has acquired evidence mainly from studies of adults, andalthough the abovementioned proportions may be approximate, children’s and adolescents’happiness is no doubt also determined by personality/genetic and circumstantial/demographic factors. Based on that theory, as well as available data on more detailed corre-lates of children and adolescents’ happiness, we hypothesized that special education studentsmight be less happy than their non-special educational peers. We also hypothesized thatspecial education students’ choices from the list of putative happy makers would differfrom choices made by their non-special educational peers. Finally, we hypothesized thatno differences in happiness would exist between genders or age groups.
Research Questions
1. Is the subjective happiness of special education students comparable to that of theirnormally achieving peers?
2. Is the school-related happiness of special education students comparable to that oftheir normally achieving peers?
3. What factors would increase the (subjective) happiness of special education childrenand their normally achieving peers?
4. Does the level of happiness differ between genders or age groups among special edu-cation children or their normally achieving peers?
Method
Participants
The special education students (n ¼ 77) came from seven different schools in theHelsinki area, two of which were purely special education schools (for mildly mentallyretarded, learning disabled students), and five were mainstream schools with special edu-cation classes. All of the special education students attended classes intended only for chil-dren with special needs. The special education participants in this study had learningdifficulties and behavioral problems, but had no diagnosis of severe cognitive impairment.
ARE SPECIAL EDUCATION STUDENTS HAPPY? 423
Dow
nloa
ded
by [
Uni
vers
ity o
f H
elsi
nki]
at 0
8:19
03
Nov
embe
r 20
12
Because the diagnoses of special education children are often multiple, and the Finnish edu-cational system no longer strictly categorizes different learners, a precise subgrouping of thestudents in this study is ill advised. Many students had learning disabilities and, in addition,socio-emotional problems. Some of them were also physically disabled.
One of the special education students was later excluded from the study due to too manymissing values, and another was excluded due to an outlying position in school-related hap-piness (see below). Thus, the final amount of special education students was 75.
Students (n ¼ 77) attending normal classes came from five different schools in theHelsinki area. The special education students in this study attended none of these schools.Care was taken in matching the special education students with the mainstream students.Letters of informed consent were issued to the parents of the special education students.Based solely on available time in the students’ daily routine, the headmasters randomlychose the classes that would participate. The grade levels of the mainstream studentsroughly matched those of the special education students.
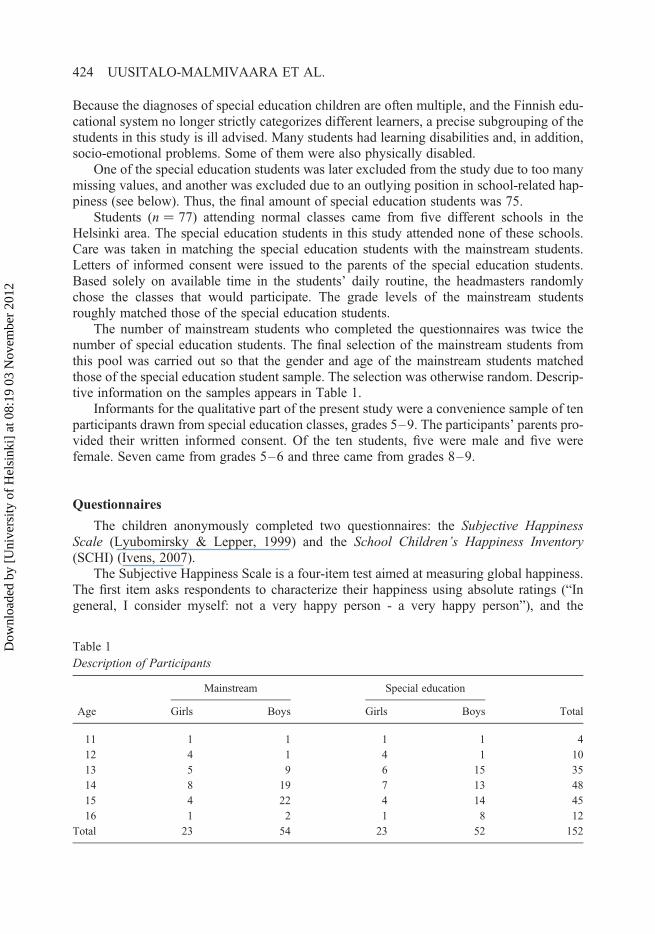
The number of mainstream students who completed the questionnaires was twice thenumber of special education students. The final selection of the mainstream students fromthis pool was carried out so that the gender and age of the mainstream students matchedthose of the special education student sample. The selection was otherwise random. Descrip-tive information on the samples appears in Table 1.
Informants for the qualitative part of the present study were a convenience sample of tenparticipants drawn from special education classes, grades 5–9. The participants’ parents pro-vided their written informed consent. Of the ten students, five were male and five werefemale. Seven came from grades 5–6 and three came from grades 8–9.
Questionnaires
The children anonymously completed two questionnaires: the Subjective HappinessScale (Lyubomirsky & Lepper, 1999) and the School Children’s Happiness Inventory(SCHI) (Ivens, 2007).
The Subjective Happiness Scale is a four-item test aimed at measuring global happiness.The first item asks respondents to characterize their happiness using absolute ratings (“Ingeneral, I consider myself: not a very happy person - a very happy person”), and the
Table 1
Description of Participants
Mainstream Special education
Age Girls Boys Girls Boys Total
11 1 1 1 1 4
12 4 1 4 1 10
13 5 9 6 15 35
14 8 19 7 13 48
15 4 22 4 14 45
16 1 2 1 8 12
Total 23 54 23 52 152
424 UUSITALO-MALMIVAARA ET AL.
Dow
nloa
ded
by [
Uni
vers
ity o
f H
elsi
nki]
at 0
8:19
03
Nov
embe
r 20
12
second, relative to peers. The third item asks respondents to compare their happiness tovery happy people, and the fourth asks them to compare their happiness to very unhappypeople. The response format is a seven-point Likert scale, and a single composite score iscomputed by averaging responses to the four items, the fourth item being reverse-coded(range 1–7).
The Subjective Happiness Scale was developed and validated by Lyubomirsky andLepper (1999). The average scores of the scale have ranged between 4.5 and 5.5. Thescale’s internal consistency has proved to be high and stable. In the present study, Cronbach’sa was .81 and .64, for mainstream (n ¼ 76) and special education (n ¼ 74) students, respect-ively (one value missing was from both student groups). In our study (Uusitalo-Malmivaraa,& Lehto, 2010) on the happiness and depression of 737 Finnish 6th graders, the SubjectiveHappiness Scale showed satisfactory construct validity: correlation coefficients with theSCHI and the Children’s Depression Inventory (Kovacs, 1985) were .53, p , .001 and2.60, p , .001, respectively (cf. Cheng & Furnham, 2003).
We also asked what would make the respondents happier by presenting a given list of 12alternative choices plus an open option of putative happy makers (e.g., peaceful family life,money, friends, boy/girlfriend, becoming a celebrity). The respondents could choose asmany of these options as they desired.
The School Children’s Happiness Inventory (see Table 4 for these items) was developedand validated against widely used measures of self-esteem, affect and depression by (Ivens,2007). The SCHI is a context-related questionnaire on subjective well-being. The SCHIoffers a simple response format with 15 positive and 15 negative SWB items (e.g., I feltrelaxed, or I wanted to give up). Participants (aged 8–15) are asked to rate their thoughtsand feelings during the past week at school. Each response to each SCHI item is scoredfrom 1 to 4. Half of the items are reverse-coded to yield a total SWB. The compositescore is computed by averaging all the items.
While translating the inventory into Finnish, however, we realized the similarity inmeaning between two items, namely I was cross and I was in a bad mood (in Finnish,Olin pahalla tuulella), which led us to decide to discard one of these items. In addition,after using the inventory in a study measuring the happiness and depression of 737Finnish 6th graders (Uusitalo-Malmivaraa, & Lehto, 2010), four more items were removedbecause they provided no additional information in the Finnish version of the inventory.The excluded items were: I had lots of energy, I was cross, I was tired, I felt wide awakeand I had headaches.
In the previous study (Uusitalo-Malmivaraa, & Lehto, 2010), shortening of the question-naire did not violate its internal consistency, Cronbach’s a was .91 for the 30-item scale and.90 for the 25-item scale. Neither was the shorter version’s construct validity impaired: it cor-related highly significantly with the Children’s Depression Inventory: r ¼ –.71, p , .001(cf. Ivens, 2007). In the present study Cronbach’s a for the 25-item version was .80 and.83 (ns ¼ 77 and 75) for mainstream and special education students, respectively.
To obtain the overall school happiness score, we reverse-coded 12 items and thenaveraged all 25 items. Thus, the possible range of scores was 1–4, with four indicatinghigh happiness. The average score of the inventory was 3.30 in a previous study(Uusitalo-Malmivaraa, & Lehto, 2010).
Thus, our measures of happiness included a total of 30 items (the Subjective HappinessScale, a question concerning happiness-increasing factors, and the SCHI) and two back-ground variables: age and gender.
ARE SPECIAL EDUCATION STUDENTS HAPPY? 425
Dow
nloa
ded
by [
Uni
vers
ity o
f H
elsi
nki]
at 0
8:19
03
Nov
embe
r 20
12
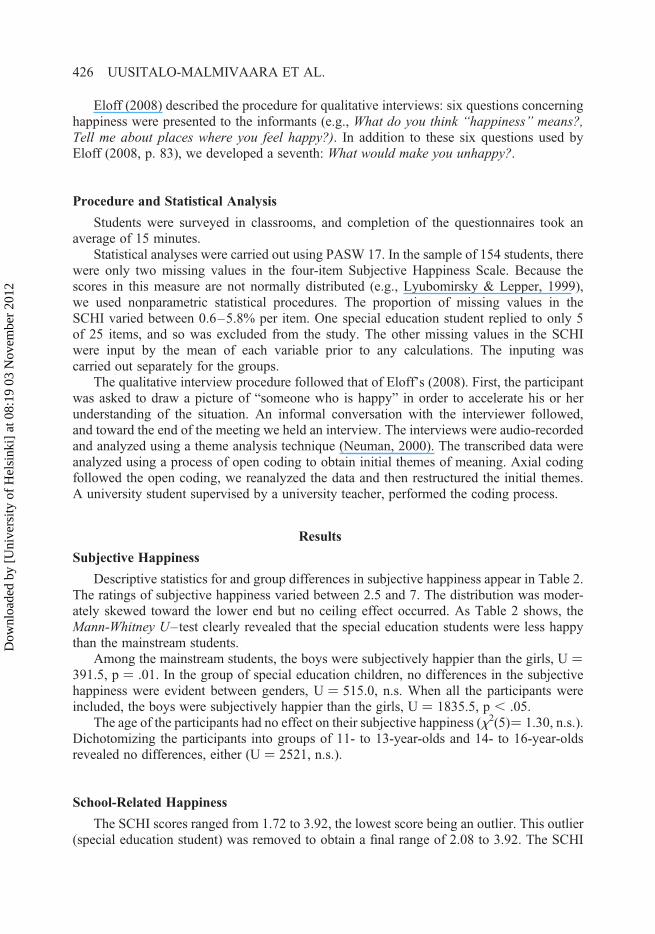
Eloff (2008) described the procedure for qualitative interviews: six questions concerninghappiness were presented to the informants (e.g., What do you think “happiness” means?,Tell me about places where you feel happy?). In addition to these six questions used byEloff (2008, p. 83), we developed a seventh: What would make you unhappy?.
Procedure and Statistical Analysis
Students were surveyed in classrooms, and completion of the questionnaires took anaverage of 15 minutes.
Statistical analyses were carried out using PASW 17. In the sample of 154 students, therewere only two missing values in the four-item Subjective Happiness Scale. Because thescores in this measure are not normally distributed (e.g., Lyubomirsky & Lepper, 1999),we used nonparametric statistical procedures. The proportion of missing values in theSCHI varied between 0.6–5.8% per item. One special education student replied to only 5of 25 items, and so was excluded from the study. The other missing values in the SCHIwere input by the mean of each variable prior to any calculations. The inputing wascarried out separately for the groups.
The qualitative interview procedure followed that of Eloff’s (2008). First, the participantwas asked to draw a picture of “someone who is happy” in order to accelerate his or herunderstanding of the situation. An informal conversation with the interviewer followed,and toward the end of the meeting we held an interview. The interviews were audio-recordedand analyzed using a theme analysis technique (Neuman, 2000). The transcribed data wereanalyzed using a process of open coding to obtain initial themes of meaning. Axial codingfollowed the open coding, we reanalyzed the data and then restructured the initial themes.A university student supervised by a university teacher, performed the coding process.
Results
Subjective Happiness
Descriptive statistics for and group differences in subjective happiness appear in Table 2.The ratings of subjective happiness varied between 2.5 and 7. The distribution was moder-ately skewed toward the lower end but no ceiling effect occurred. As Table 2 shows, theMann-Whitney U–test clearly revealed that the special education students were less happythan the mainstream students.
Among the mainstream students, the boys were subjectively happier than the girls, U ¼391.5, p ¼ .01. In the group of special education children, no differences in the subjectivehappiness were evident between genders, U ¼ 515.0, n.s. When all the participants wereincluded, the boys were subjectively happier than the girls, U ¼ 1835.5, p , .05.
The age of the participants had no effect on their subjective happiness (x2(5)¼ 1.30, n.s.).Dichotomizing the participants into groups of 11- to 13-year-olds and 14- to 16-year-oldsrevealed no differences, either (U ¼ 2521, n.s.).
School-Related Happiness
The SCHI scores ranged from 1.72 to 3.92, the lowest score being an outlier. This outlier(special education student) was removed to obtain a final range of 2.08 to 3.92. The SCHI
426 UUSITALO-MALMIVAARA ET AL.
Dow
nloa
ded
by [
Uni
vers
ity o
f H
elsi
nki]
at 0
8:19
03
Nov
embe
r 20
12
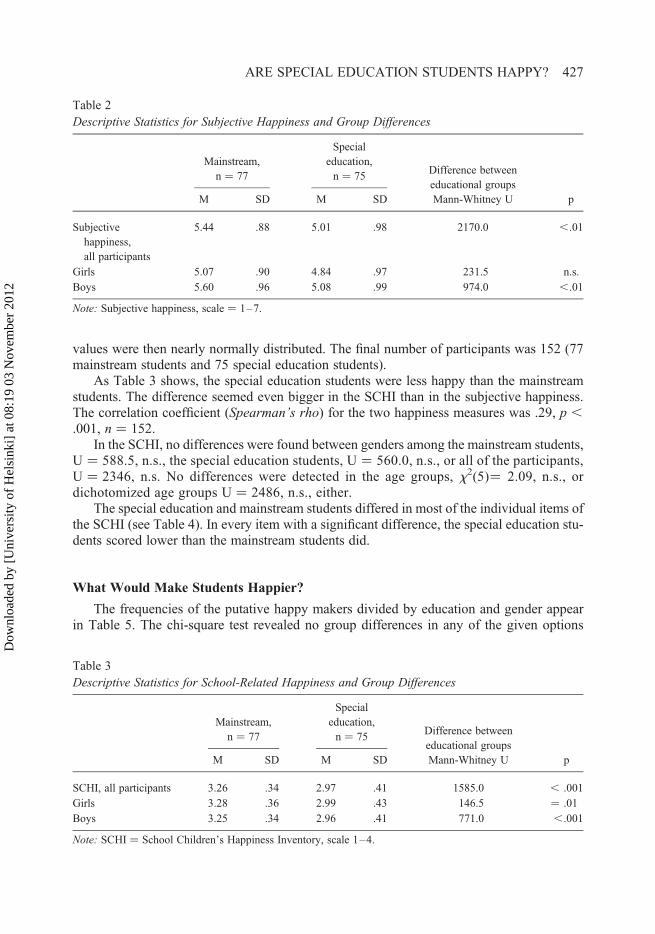
values were then nearly normally distributed. The final number of participants was 152 (77mainstream students and 75 special education students).
As Table 3 shows, the special education students were less happy than the mainstreamstudents. The difference seemed even bigger in the SCHI than in the subjective happiness.The correlation coefficient (Spearman’s rho) for the two happiness measures was .29, p ,
.001, n ¼ 152.In the SCHI, no differences were found between genders among the mainstream students,
U ¼ 588.5, n.s., the special education students, U ¼ 560.0, n.s., or all of the participants,U ¼ 2346, n.s. No differences were detected in the age groups, x2(5)¼ 2.09, n.s., ordichotomized age groups U ¼ 2486, n.s., either.
The special education and mainstream students differed in most of the individual items ofthe SCHI (see Table 4). In every item with a significant difference, the special education stu-dents scored lower than the mainstream students did.
What Would Make Students Happier?
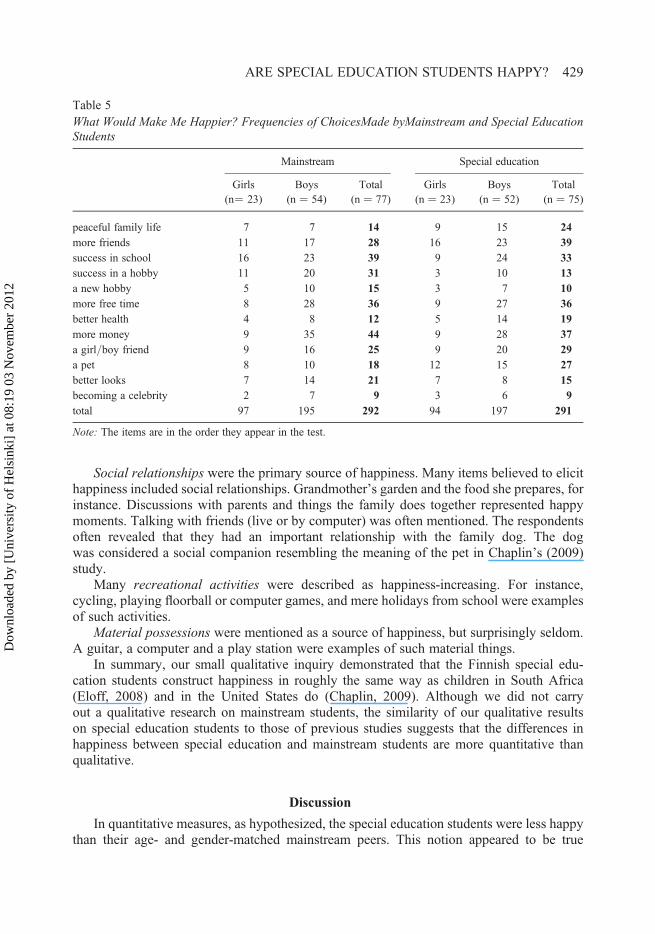
The frequencies of the putative happy makers divided by education and gender appearin Table 5. The chi-square test revealed no group differences in any of the given options
Table 2
Descriptive Statistics for Subjective Happiness and Group Differences
Mainstream,
n ¼ 77
Special
education,
n ¼ 75Difference between
educational groups
M SD M SD Mann-Whitney U p
Subjective
happiness,
all participants
5.44 .88 5.01 .98 2170.0 ,.01
Girls 5.07 .90 4.84 .97 231.5 n.s.
Boys 5.60 .96 5.08 .99 974.0 ,.01
Note: Subjective happiness, scale ¼ 1–7.
Table 3
Descriptive Statistics for School-Related Happiness and Group Differences
Mainstream,
n ¼ 77
Special
education,
n ¼ 75Difference between
educational groups
M SD M SD Mann-Whitney U p
SCHI, all participants 3.26 .34 2.97 .41 1585.0 , .001
Girls 3.28 .36 2.99 .43 146.5 ¼ .01
Boys 3.25 .34 2.96 .41 771.0 ,.001
Note: SCHI ¼ School Children’s Happiness Inventory, scale 1–4.
ARE SPECIAL EDUCATION STUDENTS HAPPY? 427
Dow
nloa
ded
by [
Uni
vers
ity o
f H
elsi
nki]
at 0
8:19
03
Nov
embe
r 20
12
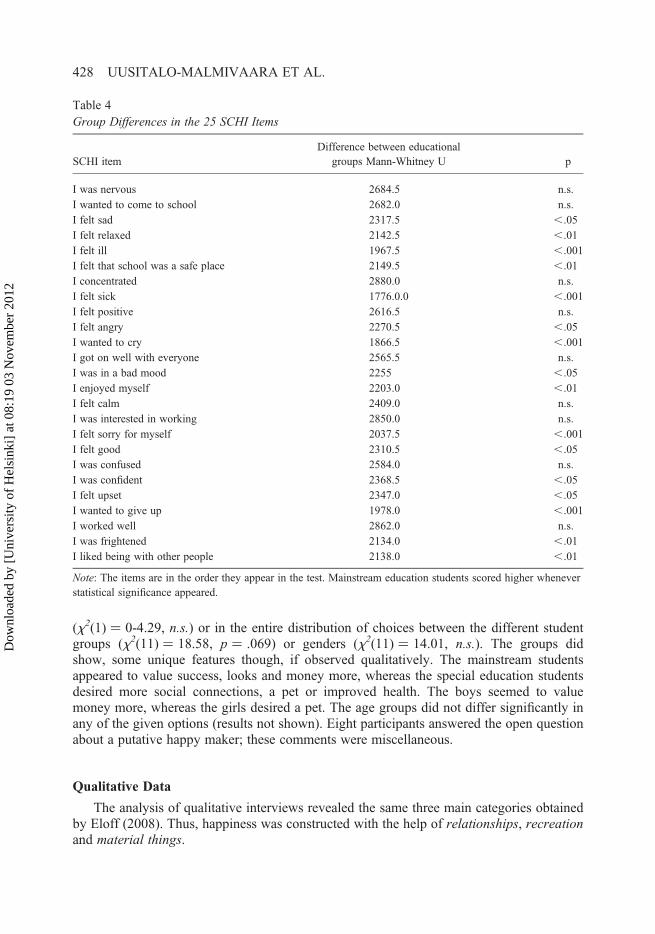
(x2(1) ¼ 0-4.29, n.s.) or in the entire distribution of choices between the different studentgroups (x2(11) ¼ 18.58, p ¼ .069) or genders (x2(11) ¼ 14.01, n.s.). The groups didshow, some unique features though, if observed qualitatively. The mainstream studentsappeared to value success, looks and money more, whereas the special education studentsdesired more social connections, a pet or improved health. The boys seemed to valuemoney more, whereas the girls desired a pet. The age groups did not differ significantly inany of the given options (results not shown). Eight participants answered the open questionabout a putative happy maker; these comments were miscellaneous.
Qualitative Data
The analysis of qualitative interviews revealed the same three main categories obtainedby Eloff (2008). Thus, happiness was constructed with the help of relationships, recreationand material things.
Table 4
Group Differences in the 25 SCHI Items
SCHI item
Difference between educational
groups Mann-Whitney U p
I was nervous 2684.5 n.s.
I wanted to come to school 2682.0 n.s.
I felt sad 2317.5 ,.05
I felt relaxed 2142.5 ,.01
I felt ill 1967.5 ,.001
I felt that school was a safe place 2149.5 ,.01
I concentrated 2880.0 n.s.
I felt sick 1776.0.0 ,.001
I felt positive 2616.5 n.s.
I felt angry 2270.5 ,.05
I wanted to cry 1866.5 ,.001
I got on well with everyone 2565.5 n.s.
I was in a bad mood 2255 ,.05
I enjoyed myself 2203.0 ,.01
I felt calm 2409.0 n.s.
I was interested in working 2850.0 n.s.
I felt sorry for myself 2037.5 ,.001
I felt good 2310.5 ,.05
I was confused 2584.0 n.s.
I was confident 2368.5 ,.05
I felt upset 2347.0 ,.05
I wanted to give up 1978.0 ,.001
I worked well 2862.0 n.s.
I was frightened 2134.0 ,.01
I liked being with other people 2138.0 ,.01
Note: The items are in the order they appear in the test. Mainstream education students scored higher whenever
statistical significance appeared.
428 UUSITALO-MALMIVAARA ET AL.
Dow
nloa
ded
by [
Uni
vers
ity o
f H
elsi
nki]
at 0
8:19
03
Nov
embe
r 20
12
Social relationships were the primary source of happiness. Many items believed to elicithappiness included social relationships. Grandmother’s garden and the food she prepares, forinstance. Discussions with parents and things the family does together represented happymoments. Talking with friends (live or by computer) was often mentioned. The respondentsoften revealed that they had an important relationship with the family dog. The dogwas considered a social companion resembling the meaning of the pet in Chaplin’s (2009)study.
Many recreational activities were described as happiness-increasing. For instance,cycling, playing floorball or computer games, and mere holidays from school were examplesof such activities.
Material possessions were mentioned as a source of happiness, but surprisingly seldom.A guitar, a computer and a play station were examples of such material things.
In summary, our small qualitative inquiry demonstrated that the Finnish special edu-cation students construct happiness in roughly the same way as children in South Africa(Eloff, 2008) and in the United States do (Chaplin, 2009). Although we did not carryout a qualitative research on mainstream students, the similarity of our qualitative resultson special education students to those of previous studies suggests that the differences inhappiness between special education and mainstream students are more quantitative thanqualitative.
Discussion
In quantitative measures, as hypothesized, the special education students were less happythan their age- and gender-matched mainstream peers. This notion appeared to be true
Table 5
What Would Make Me Happier? Frequencies of ChoicesMade byMainstream and Special EducationStudents
Mainstream Special education
Girls
(n¼ 23)
Boys
(n ¼ 54)
Total
(n ¼ 77)
Girls
(n ¼ 23)
Boys
(n ¼ 52)
Total
(n ¼ 75)
peaceful family life 7 7 14 9 15 24
more friends 11 17 28 16 23 39
success in school 16 23 39 9 24 33
success in a hobby 11 20 31 3 10 13
a new hobby 5 10 15 3 7 10
more free time 8 28 36 9 27 36
better health 4 8 12 5 14 19
more money 9 35 44 9 28 37
a girl/boy friend 9 16 25 9 20 29
a pet 8 10 18 12 15 27
better looks 7 14 21 7 8 15
becoming a celebrity 2 7 9 3 6 9
total 97 195 292 94 197 291
Note: The items are in the order they appear in the test.
ARE SPECIAL EDUCATION STUDENTS HAPPY? 429
Dow
nloa
ded
by [
Uni
vers
ity o
f H
elsi
nki]
at 0
8:19
03
Nov
embe
r 20
12
regardless of whether we investigated subjective happiness or happiness related to the schoolcontext. More than the mainstream students, the special education attendants felt that thesocial content of life, a peaceful family life, more friends and a pet would make themhappier. In contrast, the mainstream students appeared to value success at school, moneyand better looks slightly more.
The girls in this study were subjectively less happy than the boys, and this differencereached statistical significance only among the mainstream students. Lower happinessamong girls was not only unexpected but also contrasted with the majority of studiesshowing equal happiness between genders (e.g., Dew & Huebner, 1994; Huebner, 1991).On the other hand, slight differences have been found in European samples in favor ofhigher happiness among males (Neto, 1993). In line with these results is the well-knownfact that depression is more common among adolescent females than males (e.g., Fleming& Offord, 1990).
However, the mainstream girls in the present study were not especially unhappy: rather,the happiness of mainstream boys seemed high. This is an interesting finding that may reflectthe fact that happiness often decreases with age during adolescence (Park, 2005). Boys lagbehind girls in the development of puberty and, thus, may remain happier for longerperiod of time. This does not, however, explain the equal, relative unhappiness of girlsand boys in the group of special education students. Different mechanisms may affect thehappiness of special education children. Because the gender groups were rather small (23girls/educational group), the results may be ungeneralizable. School-related happiness,however, showed no gender differences.
As hypothesized, age had no impact on either of the happiness measures in the presentstudy. Our sample comprised students aged 11 to 16 the majority of whom were 13–14years old. Had the age groups been equally sized, the decrease in happiness in oldergroups may have been observable.
We qualitatively interviewed only ten special education students. They seemed to con-struct happiness in a similar way to that in a previous study (Eloff, 2008) with the help ofthree categories: social relationships, recreational activities and material possessions, thislast category being of only minor importance.
The results revealed that overall subjective happiness was quite high for both studentgroups and was of the same magnitude as that obtained from adult participants in studiesby Lyubomirsky and Lepper (1999) and from children in a study by Holder and Klassen(2009).
The school happiness of mainstream students was roughly equal to that in studies byIvens (2007) and in our previous study (Uusitalo-Malmivaraa, & Lehto, 2010), butappeared lower among special education students. These results contrast with those ofsome previous studies; according to Brantley, Huebner and Nagle (2002), for instance,students with mild disabilities showed comparable overall happiness and greater happinesswith their school than did their normally achieving peers. In a study conducted byMcCullough and Huebner (2003), students with learning disabilities and controlsshowed equal overall happiness and equal school happiness.
Below, we propose possible reasons for the relative unhappiness of special educationstudents in this study. Reflecting the correlates of children’s happiness represented in thebeginning of the article, we consider psychological, school-related, and lastly, demographicfactors.
430 UUSITALO-MALMIVAARA ET AL.
Dow
nloa
ded
by [
Uni
vers
ity o
f H
elsi
nki]
at 0
8:19
03
Nov
embe
r 20
12
Psychological Factors
Character strengths are related to self-esteem, a strong predictor of happiness (Park &Peterson, 2006). In a study by Lappalainen et al. (2009), children receiving part-timespecial education possessed fewer emotional and behavioral strengths than did their normallyachieving peers, and the difference was particularly salient in school functioning. This prob-ably holds even more true with full-time special education students. Also, special educationalstatus may bear a negative stigma affecting self-esteem (Cooney, Jahoda, Gumley, & Knott,2006; Norwich, 1997). In the current study, special education students scored significantlylower than others did in the SCHI item on self confidence (Table 4). Lack of strengths andconfidence may lower self-esteem and lead to decreased happiness in the school context.
Also, the special education children more often than others felt sorry for themselves. Thisindicates helplessness and lack of feeling of being able to influence one’s life events (see alsoMatikka & Ojanen, 2004). Acute negative events and everyday stressors the special edu-cation children may face can also lead to external perceptions of control and causelowered happiness (McKnight, Huebner, & Suldo, 2002).
School-Related Factors
The present study did not directly examine bullying, but previous studies have shown thatspecial education students are more vulnerable to bullying and victimization than their peers(Flynt & Morton, 2004; Rose, Espelage, & Monda-Amaya, 2009). For instance, Rose et al.(2009) observed that students in special education programmes experience more perpetrationand victimization than do mainstream students. These problems were more prevalent inspecial education classes than among mainstreamed special education students.
Consequently, our special education students may be less happy than the mainstream stu-dents because they are bullied and victimized more frequently. This suggestion is supportedby some SCHI items. For instance, compared to the mainstream students, the special edu-cation students felt less safe at school and less confident, and did not like being withothers as much as their normally achieving peers (see Table 4).
If not bullied, special education children may have fewer peer interactions overall than doothers. The behaviorally and socially heterogenic special classes may offer insufficientopportunities to make friends. This is even more likely when one considers that Finnishspecial education classes comprise only six to ten students which represent quite a smallpool of potential friends. In addition, in the Finnish school system, even the smallest studentswith special needs not often attend their nearest school, but are transported to a school fartheraway (particularly when attending a special class). This reduces opportunities for social par-ticipation during leisure time and extracurricular activities at school, factors that are known toincrease happiness (e.g., Huebner, 2004; Lyubomirsky et al., 2005). Thus, social affiliation isrendered more difficult for a special education student who may already experience problemswith friend making.
Furthermore, social comparison correlates with happiness (Diener et al., 1999; Veenho-ven & Ehrhardt, 1995). Negative social comparison is a potential problem not only in inte-grative special educational settings, but also in special education classes comprising verydifferent learners placed in regular schools (Cooney et al., 2006).
Previous studies suggest that happiness does not strongly correlate with school grades(Huebner, 1991; Suldo, 2006; Suldo, Shaffer, & Riley, 2008) or intellectual ability
ARE SPECIAL EDUCATION STUDENTS HAPPY? 431
Dow
nloa
ded
by [
Uni
vers
ity o
f H
elsi
nki]
at 0
8:19
03
Nov
embe
r 20
12
(Huebner & Alderman, 1993; Matikka & Ojanen, 2004). The importance of school satisfac-tion to overall happiness, however, is culture sensitive (Park & Huebner, 2005). School per-formance and education are highly appreciated in Finland (Hautamaki et al., 2008), which wasreflected in the current study as well. Success in school was the second most desired of theputative happy makers among mainstream students, and the fourth among special educationstudents. Thus, both groups valued success in school, but academic tasks do not appear tobe the main concern of special education students. The most popular desire among special edu-cation students was to have more friends. In conclusion, social relationships may be theAchilles’ heel in the school happiness of special education children.
Demographic Factors
Socioeconomic status correlates slightly to life satisfaction in favor of higher-income stu-dents (e.g., Ash & Huebner, 2001).
In Finland, special education children have poorer socio-economical backgrounds thando mainstream education students, they often come from single-parent families and representan ethnic minority (Kivirauma et al., 2006). Thus, the backgrounds of special education stu-dents in this study are likely to be poorer than those of their general education peers. This, inturn, may negatively influence their sense of happiness.
Limitations of the Study
Several limitations of this study should be noted. First, measuring happiness is alwayssusceptible to validity concerns (Diener et al., 1999), and daily happiness can vary consider-ably (Moneta, Schneider, & Csikszentmihalyi, 2001). Second, the number of participants inthis study does not allow rigorous subgrouping (e.g., in age groups). Third, the heterogenicsample of special education student limits the generalization of the results. Fourth, one mightquestion whether our 11- to 16-year-old participants were capable of judging their happinesslevel, as one’s ability to assess one’s own happiness and to identify the causes of their happi-ness change with age (Chaplin, 2009; Holder & Coleman, 2008). Moreover, the desirabilityof self-reporting happiness and its predictors is culture-dependent (Park & Huebner, 2005).Nevertheless, children aged 11 to 16 are old enough to identify their emotions and are capableof attributing causal relations to their feelings in a manner similar to that of adults (Denham,1998; Harter, 1982), thus supporting the validity of such comparisons.
Fifth, previous studies have shown that the Subjective Happiness Scale (Lyubomirsky &Lepper, 1999) has high and stable internal consistency, but in this study, Cronbach’s alphawas only .64 for the special education children (.81 for the mainstream students). Thismay stem from the difficulty that some special education children had in answering thefourth, reverse-coded item of the scale. The reliability of the scale improved to a ¼ .78when we removed the item, Some people are generally not very happy. Although they arenot depressed, they never seem as happy as they might be. We found that the same phenom-enon occurred in a study of the happiness of 9- to 12-year-old children by Holden andKlassen (2009). To achieve higher reliability, they suggest rewording or replacing theitem, when using the scale with children.
Finally, the correlation between subjective and school happiness was low (Spearman’srho .29, p , .001) although studies have shown that global happiness and school happinessare linked (e.g., Gilman & Huebner, 2006). According to the WHO’s Health Report (Currie
432 UUSITALO-MALMIVAARA ET AL.
Dow
nloa
ded
by [
Uni
vers
ity o
f H
elsi
nki]
at 0
8:19
03
Nov
embe
r 20
12
et al., 2008), Finnish youth dislike school. Only 18% and 10% of 13- and 15-year-old stu-dents, respectively, liked school a lot. Similar results were obtained in earlier studies onthe quality of school life by Malin and Linnakyla (2001), who found that Finnish students’satisfaction with school remained low during the 1990s even though curricular changesfocused on pupil-centeredness, motivation, collaboration and self-esteem.
Constant dissatisfaction with school may partly explain the low correlation between hap-piness measures. Many students seemed to be very happy overall irrespective of dissatisfac-tion in school. Interestingly, we found no students who are happy at school, but globally(subjectively) unhappy. School life may be viewed as a separate, mandatory (battle) fieldwith only a slight connection to global happiness. Moreover, situational factors or socialdesirability may have affected some respondents. For some adolescents, disliking schoolmay be socially advantageous. Paradoxically, success in school is also highly appreciated;better success in school scored second (together with more free-time) among all respondentsin the list of putative happy makers; having more money was the only wish surpassing it.When the two student groups were analyzed separately, the correlation coefficient (Spear-man’s rho) between subjective and school happiness was .12 n.s. and .30, p , .001 forthe mainstream and special education students, respectively. Thus, the mainstream studentsmore often rated themselves as quite happy overall but not too happy in school, whereas sub-jective and school based happiness seemed to go hand-in-hand more among special educationstudents.
Conclusions
The overall results of the present study do not seem to favor settings which segregatespecial education students. However, whether an inclusive educational setting wouldimprove matters remains unknown.
For instance, in a study conducted by Brantley et al. (2002), children with mild mentalretardation were globally just as satisfied with their lives as their peers, but less satisfiedwith their friends. Moreover, these children were more satisfied with their school experiencesthan normally achieving students, but school satisfaction depended on the form of special edu-cation: students in full-time special education classes were more satisfied with their schoolthan special education students who were in mainstream, regular classes. In line with theseresults are Finnish studies that show greater satisfaction (overall satisfaction, closer teacher-student relationships and spirit in the classroom) among students in full-time special educationclasses than among those integrated in mainstream classes (e.g., Rinne et al., 2004; see alsoJahnukainen, 1997). However, school satisfaction is not a synonym of school happiness,which includes an affective component. Thus, satisfaction with the learning conditions in aspecial class, for instance, does not guarantee student happiness.
Our present study comprised special education students from full-time special edu-cational settings only. These students were significantly less happy with their school thanwere their normally achieving peers. This discordance with the results obtained by Brantleyet al. (2002) and Rinne et al. (2004) may partly stem from differences in measurements or thetype of special education students or both. Our scale consisted of a larger spectrum of school-related statements and more items focusing on emotions and physiological states than did thedomain-specific measures used in previous studies. Additionally, the participants in our studymay have had fewer cognitive impairments than those in the studies by Brantley et al. (2002)and Rinne et al. (2004); the latter study clearly showed that among full-time special education
ARE SPECIAL EDUCATION STUDENTS HAPPY? 433
Dow
nloa
ded
by [
Uni
vers
ity o
f H
elsi
nki]
at 0
8:19
03
Nov
embe
r 20
12
students, those in classes for mildly mentally retarded, learning disabled students liked schoolbest. This parallels findings among adults with intellectual disabilities, (Matikka & Ojanen,2004); who are generally happier than others.
However, the happiness of special education students in various part-time, full-time andnational settings clearly merits further research. Because educationalists should foster stu-dents’ happiness, this issue should be vital.
In summary, the present study found that fulltime special education students were system-atically less happy than their peers in mainstream education, and valued higher social contentof life. Reasons for these differences in happiness remain to be identified through furtherpsychological, sociological, and educational research.
References
Aristotle. (2000). The Nicomachean ethics, (R. Crisp, transl.). Cambridge: Cambridge University Press.Ash, C., & Huebner, E.S. (2001). Environmental events and life satisfaction reports of adolescents:
A test of cognitive mediation. School Psychology International, 22(3), 320–336.Bearsley, C., & Cummins, R.A. (1999). No place called home: Life quality and purpose of homeless
youths. Journal of Social Distress and the Homeless, 8(4), 207–226.Brantley, A., Huebner, E.S., & Nagle, R.J. (2002). Multidimensional life satisfaction reports of ado-
lescents with mild mental disabilities. Mental Retardation, 40(4), 321–329.Chaplin, L. (2009). Please may I have a bike? Better yet, may I have a hug? An examination of chil-
dren’s and adolescents’ happiness. Journal of Happiness Studies, 10(5), 541–562.Cheng, H., & Furnham, A. (2003). Personality, self-esteem, and demographic predictions of happiness
and depression. Personality & Individual Differences, 34(6), 921–942.Cooney, G., Jahoda, A., Gumley, A., & Knott, F. (2006). Young people with intellectual disabilities
attending mainstream and segregated schooling: Perceived stigma, social comparison and futureaspirations. Journal of Intellectual Disability Research, 50(6), 432–444.
Costa, P.T., & McCrae, R.R. (1980). Influence of extraversion and neuroticism on subjective well-being: Happy and unhappy people. Journal of Personality and Social Psychology, 38(4),668–678.
Currie, C., Gabhainn, S.N., Godeau, E., Roberts, C., Smith, R., Currie, D., & Barnekow, V. (Eds.).(2008). Inequalities in young people’s health. HBSC international report from the 2005/2006survey (Health Policy for Children and Adolescents, No. 5). Copenhagen: WHO RegionalOffice for Europe.
Demo, D.H., & Acock, A.C. (1996). Family structure, family process, and adolescent well-being.Journal of Research on Adolescence, 6(4), 457–488.
Denham, S.A. (1998). Emotional development in young children. New York: The Guilford Press.Dew, T., & Huebner, E.S. (1994). Adolescents’ perceived quality of life: An exploratory investigation.
Journal of School Psychology, 32(2), 185–199.Diener, E. (1984). Subjective well-being. Psychological Bulletin, 95(3), 542–575.Diener, E. (1994). Assessing subjective well-being: Progress and opportunities. Social Indicators
Research, 31(2), 103–157.Diener, E. (2000). Subjective well-being: The science of happiness and a proposal for a national index.
American Psychologist, 55(1), 34–43.Diener, E., Suh, E.M., Lucas, R.E., & Smith, H.L. (1999). Subjective well-being: Three decades of
progress. Psychological Bulletin, 125(2), 276–302.Eloff, I. (2008). In pursuit of happiness: How some young African children construct happiness.
Journal of Psychology in Africa, 18(1), 81–88.Finnish Statistical Centre. (2009). Erityisopetukseen siirretyt peruskoulun oppilaat otto- tai siirtopaa-
toksen perusteen mukaan 2008 [Elementary school students taken in special education according
434 UUSITALO-MALMIVAARA ET AL.
Dow
nloa
ded
by [
Uni
vers
ity o
f H
elsi
nki]
at 0
8:19
03
Nov
embe
r 20
12
to judgment of their endorsement in 2008]. Retrieved from http://www.stat.fi/til/erop/2008/erop_2008_2009-06-10_tau_002.html
Fleming, J., & Offord, D.R. (1990). Epidemiology of childhood depressive disorders: A criticalreview. Journal of the American Academy of Child & Adolescent Psychiatry, 29(4), 571–580.
Flynt, S.W., & Morton, R.C. (2004). Bullying and children with disabilities. Journal of InstructionalPsychology, 31(4), 330–333.
Fogle, L.M., Huebner, E.S., & Laughlin, J.E. (2002). The relationship between temperament and lifesatisfaction in early adolescence: Cognitive and behavioral mediation models. Journal ofHappiness Studies, 3(4), 373–392.
Gilman, R., Huebner, E.S., & Laughlin, J.E. (2000). A first study of the multidimensional students’ lifesatisfaction scale with adolescents. Social Indicators Research, 52(2), 135–160.
Gilman, R., & Huebner, E. (2006). Characteristics of adolescents who report very high life satisfaction.Journal of Youth & Adolescence, 35(3), 293–301.
Harter, S. (1982). The perceived competence scale for children. Child Development, 53(1), 87–97.Hautamaki, J., Harjunen, E., Hautamaki, A., Karjalainen, T., Kupiainen, S., Laaksonen, S., &
Scheinin, P. (2008). PISA 06 Finland. Analyses, reflections and explanations, Ministry ofEducation Publications. Helsinki: Ministry of Education.
Holder, M.D., & Coleman, B. (2008). The contribution of temperament, popularity, and physicalappearance to children’s happiness. Journal of Happiness Studies, 9(2), 279–302.
Holder, M.D., & Coleman, B. (2009). The contribution of social relationships to children’s happiness.Journal of Happiness Studies, 10(3), 329–349.
Holder, M.D., & Klassen, A. (2010). Temperament and happiness in children. Journal of HappinessStudies, 11(4), 419–439.
Huebner, E.S. (1991). Correlates of life satisfaction in children. School Psychology Quarterly, 6(2),103–111.
Huebner, E.S. (2004). Research on assessment of life satisfaction of children and adolescents. SocialIndicators Research, 66(1), 3–33.
Huebner, E.S., & Alderman, G.L. (1993). Convergent and discriminant validation of a children’s lifesatisfaction scale: Its relationship to self- and teacher-reported psychological problems andschool functioning. Social Indicators Research, 30(1), 71–82.
Huebner, E.S., Drane, J.W., & Valois, R.F. (2000). Levels and demographic correlates of adolescentlife satisfaction reports. School Psychology International, 21(3), 281–292.
Ivens, J. (2007). The development of a happiness measure for schoolchildren. Educational Psychologyin Practice, 23(3), 221–239.
Jahnukainen, M. (1997). Koulun varjosta aikuisuuteen. Entisten tarkkailuoppilaiden peruskoulun jalk-eiset elamanvaiheet, [From the shadow of school to adulthood. Postschool adjustment and lifecourse of students who have attended special classes for the emotionally and behaviourally dis-ordered]. (Tutkimuksia No. 182). Helsinki: Helsingin yliopisto, Opettajankoulutuslaitos.
Kivirauma, J., Klemela, K., & Rinne, R. (2006). Segregation, integration, inclusion—the ideology andreality in Finland. European Journal of Special Needs Education, 21(2), 117–133.
Kovacs, M. (1985). The children’s depression inventory (CDI). Psychopharmacology Bulletin, 21(4),995–998.
Lahelma, E. (2004). Tolerance and understanding? Students and teachers reflect on differences atschool. Educational Research & Evaluation, 10(1), 3–19.
Lappalainen, K., Savolainen, H., Kuorelahti, M., & Epstein, M.H. (2009). An international assessmentof the emotional and behavioral strengths of youth. Journal of Child and Family Studies, 18(6),746–753.
Linnakyla, P. (1996). Quality of school life in the Finnish comprehensive school: A comparative view.Scandinavian Journal of Educational Research, 40(1), 69–85.
Lyubomirsky, S., & Lepper, H.S. (1999). A measure of subjective happiness: Preliminary reliabilityand construct validation. Social Indicators Research, 46(2), 137–155.
ARE SPECIAL EDUCATION STUDENTS HAPPY? 435
Dow
nloa
ded
by [
Uni
vers
ity o
f H
elsi
nki]
at 0
8:19
03
Nov
embe
r 20
12
Lyubomirsky, S., Sheldon, K.M., & Schkade, D. (2005). Pursuing happiness: The architecture of sus-tainable change. Review of General Psychology, 9(2), 111–131.
Malin, A., & Linnakyla, P. (2001). Multilevel modelling in repeated measures of the quality of Finnishschool life. Scandinavian Journal of Educational Research, 45(2), 145–166.
Matikka, L.M., & Ojanen, M. (2004). Happiness in persons with intellectual disabilities. EuropeanJournal of Mental Disability, 7(4), 17.
McCullough, G., & Huebner, E.S. (2003). Life satisfaction reports of adolescents with learning disabil-ities and normally achieving adolescents. Journal of Psychoeducational Assessment, 21(4),311–324.
McKnight, C.G., Huebner, E.S., & Suldo, S. (2002). Relationships among stressful life events, tem-perament, problem behavior, and global life satisfaction in adolescents. Psychology in theSchools, 39(6), 677.
Moneta, G.B., Schneider, B., & Csikszentmihalyi, M. (2001). A longitudinal study of the self-conceptand experiential components of self-worth and affect across adolescence. Applied DevelopmentalScience, 5(3), 125–142.
Natvig, G.K., Albrektsen, G., & Qvarnstrøm, U. (2003). Associations between psychosocial factorsand happiness among school adolescents. International Journal of Nursing Practice, 9(3),166–175.
Neto, F. (1993). The satisfaction with life scale: Psychometrics properties in an adolescent sample.Journal of Youth and Adolescence, 22(2), 125–134.
Neuman, W.L. (2000). Social research methods: Qualitative and quantitative approaches. Boston:Allyn & Bacon.
Norwich, B. (1997). Exploring the perspectives of adolescents with moderate learning difficulties ontheir special schooling and themselves: Stigma and self-perceptions. European Journal ofSpecial Needs Education, 12(1), 38–53.
Park, N. (2004). The role of subjective well-being in positive youth development. Annals of theAmerican Academy of Political and Social Science, 591(1), 25–39.
Park, N., & Huebner, E.S. (2005). A cross-cultural study of the levels and correlates of life satisfactionamong adolescents. Journal of Cross-Cultural Psychology, 36(4), 444–456.
Park, N., & Peterson, C. (2006). Character strengths and happiness among young children: Contentanalysis of parental descriptions. Journal of Happiness Studies, 7(3), 323–341.
Peterson, C., Park, N., & Seligman, M.E.P. (2005). Orientations to happiness and life satisfaction: Thefull life versus the empty life. Journal of Happiness Studies, 6(1), 25–41.
Petito, F., & Cummins, R.A. (2000). Quality of life in adolescence: The role of perceived control, par-enting style and social support. Behaviour Change, 17, 196–207.
Proctor, C., Linley, P., & Maltby, J. (2009). Youth life satisfaction: A review of the literature. Journalof Happiness Studies, 10(5), 583–630.
Rinne, R., Kivirauma, J., & Wallenius, L. (2004). Koulutus erityisoppilaan kokemana [How specialeducation students experience their schooling?]. In J. Kivirauma, R. Rinne, & K. Klemela(Eds.), Erityisopetus laajenevana koulutiena. Turkulainen erityisopetus oppilaiden, vanhempienja opettajien kokemana [Special education as broadening schooling. Special education in Turkuthe way students, parents and teachers experience it] (pp. 51–93). Turku: Turun yliopiston kas-vatustieteiden laitos.
Rose, C.A., Espelage, D.L., & Monda-Amaya, L. (2009). Bullying and victimisation rates among stu-dents in general and special education: A comparative analysis. Educational Psychology, 29(7),761–776.
Seligman, M.E.P., & Csikszentmihalyi, M. (2000). Positive psychology: An introduction. AmericanPsychologist, 55(1), 5–14.
Seligman, M.E.P., Steen, T.A., Park, N., & Peterson, C. (2005). Positive psychology progress:Empirical validation of interventions. American Psychologist, 60(5), 410–421.
436 UUSITALO-MALMIVAARA ET AL.
Dow
nloa
ded
by [
Uni
vers
ity o
f H
elsi
nki]
at 0
8:19
03
Nov
embe
r 20
12
Smith, D.C., Adelman, H.S., Nelson, P., Taylor, L., & Phares, V. (1987). Students’ perception ofcontrol at school and problem behavior and attitudes. Journal of School Psychology, 25(2),167–176.
Suldo, S.M. (2006). Academic correlates of children and adolescents’ life satisfaction. SchoolPsychology International, 27(5), 567.
Suldo, S.M., & Huebner, E.S. (2004a). The role of life satisfaction in the relationship between author-itative parenting dimensions and adolescent problem behavior. Social Indicators Research,66(1), 165–195.
Suldo, S.M., & Huebner, E.S. (2004b). Does life satisfaction moderate the effects of stressful lifeevents on psychopathological behavior during adolescence? School Psychology Quarterly,19(2), 93–105.
Suldo, S.M., & Huebner, E.S. (2006). Is extremely high life satisfaction during adolescence advan-tageous? Social Indicators Research, 78(2), 179–203.
Suldo, S.M., Riley, K., & Shaffer, E.S. (2006). Academic correlates of children and adolescents’ lifesatisfaction. School Psychology International, 27(5), 567–582.
Suldo, S.M., Shaffer, E.S., & Riley, K. (2008). A social-cognitive-behavioral model of academic pre-dictors of adolescents’ life satisfaction. School Psychology Quarterly, 23(1), 56–69.
Uusitalo-Malmivaraa, L., & Lehto, J.E. (2010). Porin kuudesluokkalaisten onnellisus, masentuneisuusja vakivaltakokemukset. Raportti 700 nuoren onnellisuuden taustatekijoista [Happiness,depression and experiences of violence among 6th graders in Pori. Report of factors behindthe happiness of 700 youths]. Porin kaaupungin julkaisusarja. Retrieved from http://www2.pori.fi/kov/raportit/pori16.2.10.pdf.
Veenhoven, R. (1984). Conditions of happiness. Dodrecht: Kluwer Academic.Veenhoven, R. (2000). The four qualities of life. Journal of Happiness Studies, 1(1), 1–39.Veenhoven, R., & Ehrhardt, J. (1995). The cross-national pattern of happiness: Test of predictions
implied in three theories of happiness. Social Indicators Research, 34, 33–68.Verkuyten, M. (1986). The impact of ethnic and sex differences on happiness among adolescents in the
netherlands. Journal of Social Psychology, 126(2), 259.
ARE SPECIAL EDUCATION STUDENTS HAPPY? 437
Dow
nloa
ded
by [
Uni
vers
ity o
f H
elsi
nki]
at 0
8:19
03
Nov
embe
r 20
12