happy life-expectancy - eurohex
TRANSCRIPT
RLrOT V ~ N H O V ~
H A P P Y L I F E - E X P E C T A N C Y
A c o m p r e h e n s i v e measure of quality-of-life in ~ i o ~ 1
(Accopted 25 ~ , 1996)
ABSTRACT. One of the aims of social indicator research is to develop a com- prehemive measure of quality-of-life in nations that is analogous to GNP in economic indicator research. For that purpme, several multi dimensional indexes have been proposed. In addition to economic performance, these also acknowledge the nation's success in matte~_ like schooling and social eqnality. The most current indicator of this type is the 'Human Development Index'. In this approach QOL is measured by input; the degree to which society provides conditions deemed beneficial ('presumed' QOL). The ~bosi_'r problem is that one never knows to what extent the cherished provisions are really good for people.
An alternative is measuring QOL in nations by output, and consider how well people actually flourish in the country. This 'apparent' QOL can be meamm~ by the degree to which citizens live long and happily. This conception is opera- fionalized by combining registration based estimates of length-of-life, with survey data on subjective appreciation-of-life. Life-expectancy in years is multiplied by average happiness on a 0-1 scale. The product is named 'Happy Life-Expectancy' (HI.R), and can be interlxeted as the number of years the average citizen in a country lives happily at a certain time.
HLI~- was assessed in 48 nations in the early 1990's. It appears to be highest in North-West European nations (about 60) and lowest in Afi'ica (below 35).
HI.~ scores are systematically higher in nations that are most affluent, free, educated, and tolerant. Together, these country-characterimics explain 70% of the statistical variance in HLE. Yet Ill.~ is not significantly related to unemployment, state weffare and income equality, nor to r e l i g i ~ and trust in in~tutious. tILE does not differ either with military dominance and population pressure.
The conclusion is that HLE qualifies as the envisioned com~hensive social indicator. It has both clear substantive meaning (happy life-years) and theoretical sicrnificance (ulfima~ output measure). HLE differentiates welL Its correlations fit most assamp'dons about required input, but also challenge some. The indicator is likely to have political appeal.
1. INTRODUCTION
In the first ha l f o f thiq century, quali ty-of-l ife in nat ions was largely measured by the mater ia l level o f living. The h igher that level in a
Social lndicators Research 39: 1-58, 1996. (~ 1996 Kluwer Academic Publishers. Printed in the Netherlands.
2 R U U T V E E N H O V E N
Economic affluence x x x
State welfare x x
F..ducation x x x
Pubfie health x x x
Social equality x (x)'
Peacefulness x x x
] Physical habitability x x
Social stability x x
Cultural diversity
Lifestyle
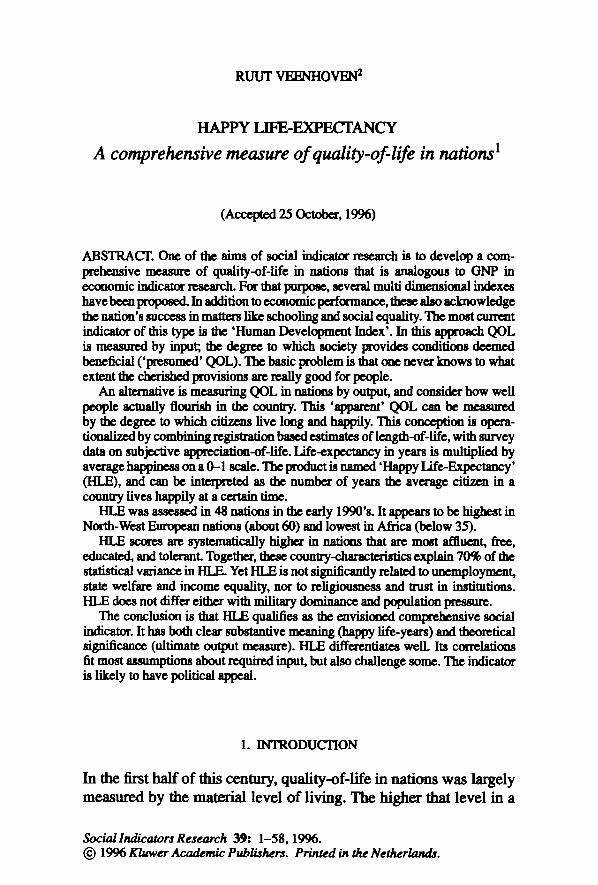
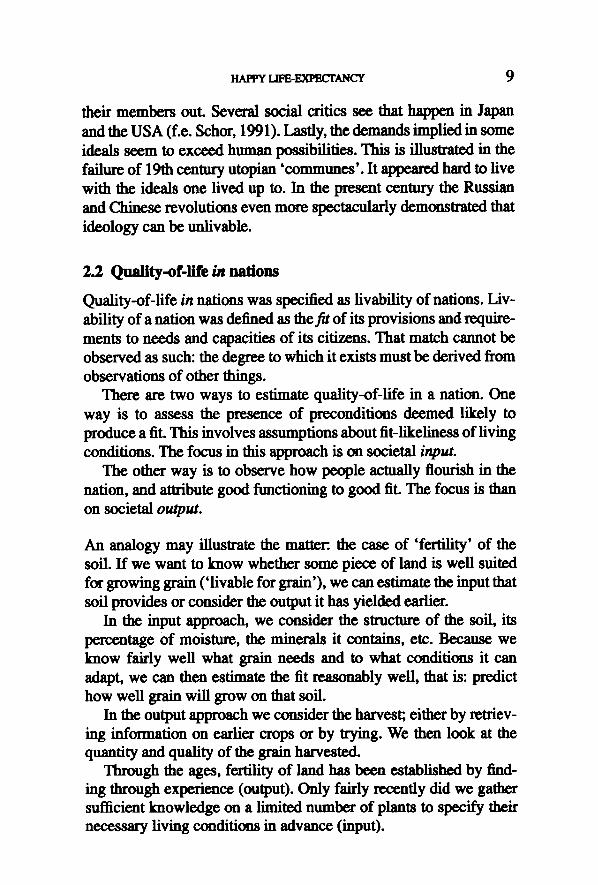
Exhibit 1. Some current measures of quality-of-life in nations.
country, the better the life of its citizens was presumed to be. As such, quality-of-life was measured by GNP related measures, currently by 'real' GDP per head.
This materialistic conception of QOL was never unquestioned, but criticism long remained marginal. Yet in the 1960's, the opinion climate changed. Saturation levels were reached and the ecological limits of economic growth came in view. This gave rise to a call for broader indicators of quality-of-life, which materialized in the so called 'Social Indicator' movement. The name of 'social' indicators signifies that the mere economic performance does not suffice.
From its beginning, one of the aims of Social Indicators Research was to develop a social equivalent to the economist's GNP. Several measures have been proposed since.
1.1 Current measures of Quality-of-Life in nations
Though social indicators research arose from discontent with eco- "nomic indicators, most alternative measures do involve material
'level of living'. They add further criteria. The new social indicators of quality-of-life differ in the criteria which they add and how many. Exhibit 1 provides an illustrative overview. Similar indicators of this kind have been proposed by Drenowski (1974), Liu (1977), Mootz (1990) and Slottje (1991), to mention a few.
As yet, none of these indicators reached acceptance comparable to GNP, neither in the realm of politics, nor in the scientific world.
nAPpY ~ A h ' c Y 3
The Human Development Index is still the most accepted one in this class, but it is also the least different.
1.2 Problems with these measures
The reason for this lack of success is not only found in the continued dominance of m~texialist views, but also in several weaknesses of this generation of indicators.
Arbitrary selection The most evident weakness is the selection of aspects of Q O L There is difference in number of aspects and in content of aspects involved.
As we can see in exhibit 1, the Human Development Index suffices with 3 aspects, whereas the Index of Social Progress involves 11. Estes tried to include as much information as available in national statistics. Yet is more better? Should we include all things ever associated with QOL? Obviously inclusiveness goes at the cost of substantive meaning.
Yet selection requires choice, and choice for one aspect or another is difficult to argument. The example of divorce may illustrate the problem. Divorce-rate is part of the indexes of Naroll and Estes, but does not figure in the other indexes. Should it be included? Divoree is clearly no fun and has several negative consequences for affected children and society. Yet dissolution of unsuccessful marriages has advantages as well, particularly in highly individualized societies.
Arbitrary weights Next to the question whether divorce rate should be counted positive or negative, there is the question whether it is more or less important that other items in the index. For instance: is divorce-rate more important than murder-rate, or less important than GNU.
Still another problem is that relative importance is mostly not the same everywhere. As suggested, the effects of divorce may be more positive in highly individualized societies. That means that its weight should in fact be variable.
Current indexes do not acknowledge such complications. They simply count items either positive or negative, and give items the same weight, irrespective of the situation of the nation. In the Human Development Index for instance, schooling counts equally strong as GNP.
4 RI llJT VEENHOVEN
Limited universal relevance of items This brings us a more fundamental problem: Most items do not have the same significance across culture and time.
Some of the items in current QOL-indexes seem to be valued everywhere. For instance 'economic prosperity' and 'high life-expec- tancy', though even on these matters there is difference in degree of adherence. However, on many further points disagreement prevails. For example on women's rights. Several countries see that as a sign of decay (like divorce) rather than as quality-of-life.
One can discount that problem by saying that value-free measure- ment of QOL is not possible, and admit that one measures the quality of the world's countries by current Western values. Yet, the political use of the indicator is clearly limited by such disagreements.
Still another problem is that most of the items tend to loose sig- nificance over time. This is for instance the case with 'education', which seems subject to the law of diminishing utility. Schooling for everybody is clearly better than mass-illiteracy, but should we call the quality-of-life in a society better if 50% of its citizens receives university education rather than 15%? Possibly over-education can even reduce the quality-of-life. Likewise, gain~ in economic afflu- ence become less relevant when society becomes m o r e affluent. 4 In fact, items appear on the QOL-list if they are problematic at some point in history, and should therefore be omitted if no longer press- ing.
One can dispose of the problem by saying that present day indi- cators suit present day problems. Still it is preferable to have an indicator that allows comparison over time. How else can we judge whether QOL improves or not?
No clear meaning of sum-scores GDP per head has a clear substantive meaning. It indicates the amount of goods and services the average citizen can purchase. The indicator may labor some technical imrmi'fections, but it is at least clear as to what it is about.
That is not the case with current 'social' indexes of QOL. The sum-scores reflect the degree to which different notions about the good society are met, but not which notions precisely. They reflect mixed qualities rather than one quality. In other words: these mea- sures provide a 'quality profile', but not 'inclusive value'.
Some of the indexes are in fact more specific and ecp)~te quality- of-life more or less with 'modernity'. They measure in fact the degree to which characteristics of dominant Western society are present in a nation. This may be apt when the aim is to monitor how the nation is doing in catching up. Yet it is misleading to call that 'quafity-of- life'. Modernization should not be equated with the good life. One of the very reasons for QOL-measurement is checking whether 'social progress' leads us to a better life.
Mixing up means and ends The most fundamental problem with this generation of QOL-indi- cators is that they involve criteria of a different order. They do not distinguish between means and ends, nor between societal input and societal output. This can be illusU'ated with the two items that are part of most indexes: 'economic affluence' and 'life-expectancy'.
Economic affluence can hardly be seen as an end in itself. Com- mand over goods and services may be instrumental in creating a good life, but does not constitute the good life itself. On the other hand, life-expectancy is typically an endvalue. We want to life long because we value life in itself.
In the same vein, supply with goods and services can be seen as a societal 'input', and life-expectancy as 'output'. In the following paragraphs I will argue th~ quality-of-life in a nation can be better measured by output than by input.
Shoveling means and ends on one heap is not only theoreti- cally unsatisfactory, but also reduces the political relevance of these measures. Policy-makers must know two things: to what extent instrumental policy-aims are realized, and whether success in that contributes to higher goals. Sum-scores that mix up these ma~ers do not inform about either. The label of 'quality-of-life' bears the suggestion that some final end is indicated. Yet in practice the items in the indexes are issues on the political agenda. As such these mca- s'ur~ say more about advancement in the course taken than about the merits of that heading.
2. CONCEPTIONS OF QUALITY-OF-LIFE IN NATIONS
The core of the problem with these measures lies at the conceptual level. If we are not clear about what we mean with QOL, we will
6 RUUT VEENItOVEN
never have sensible measures of it. Let us therefore consider the various notions involved.
A first thing then is to distinguish between quality of nations and quality-of-life in nations. In other words: between conceptions of the 'good society' and conceptions of the 'good life'. These notions are related, and even overlap to some extent. Yet they are not the same.
2.1 Q,u.~llty ofnattom
Chrrent standards for the quality of nations can be summarized in four clusters: 1) stability-criteria, 2) productivity-criteria, 3) ideal- criteria and 4) criteria of habitability. The latter is also referred to as 'quality-of-life in nations'.
System-stability Standards of the good society concern first of all the presence of a stable social fabric. Without society there can be no good society. Applied to nations, this criterion requires that there is order and continuity in the country. In this respect, the quality of many new African nations is currently judged poor.
It is clear that every nation at least needs some stability. Once past a minimum level, preference for more stability or less is a matter of taste. In present day Western societies, conservatives complain about the fast pace of change, while modernists see too much continuity.
The criterion of stability has many aspects (e.g. predictability, constancy) and can be applied on various subsystems (e.g. political system, kinship system). Hence a nation may be stable in some respects, but not in others. This is one of the reasons why there are no comprehensive measures of social stability in nations.
Productivity Nations are also judged by their yields. In the current discourse the emphasis is on economic productivity. The greater the quantity, quality and variety of the goods and services it generates, the better the country. In this respect East Asian countries are seen to do well, while Western nations are seen to loose their edge. Economic productivity of nations is typically measured by GNP.
Though mostly used for market products, the criterion can also be applied to non-market services, such as family support for the aged
~,v ~ ~ a ~ c v 7
on the basis of normative reciprocity. Non-monetary productivity is not reflected by calculations of GNP, and only partly by estimates of 'real' GDP.
In a longer view, the productivity criterion is also applied to inventions, not only technical and scientific discoveries, but also innovations in arts and in social organiT~tion. In this respect we think more of early Greek civilization than of the Viking's productivity. This latter kind of productivity is not well reflected in GNP either.
Ideal-expression Another class of criteria concerns the degree to which a nation real- izes certain values. Early writings on the Good Society emphasized individual lifestyle values, such as 'bravery', 'modesty' and reli- gious 'devotion'. The quality of a society was deemed higher, the more it emphasized such values, and the more its members actually lived accordingly. This view is still dominant in present day 'fun- damentalist' thinking. Modem notions focus more on social orga- niT~tion. Nations are currently judged by the degree to which they allow 'political freedom', respect 'civil fights' and realize 'social eqamlity'.
In this genre, there are as many criteria as there are ideologies. Though innumerable in principle, the actual variation in values endorsed is limited. Present day world-society witnesses a grow- ing ideological consensus around Humanist values (Naroll, 1984: ch 2). In fact, there is a strong movement to canonize such values as 'Universal Human Rights'. Some of these notions of quality have been m~d~ measurable. In the following paragraphs we meet with indicators of nation-performance with respect to freedom, justice and equality.
L/vabi//ty The last category of criteria concerns the nation's quality as a habi- tat. 'Livability' or 'habitability' of a country is also referred to as 'quality-of-life in the nation' .5
Concept. 'Livability' of a nation can be defined as the degree to which its provisions and requirements fit with the needs and capacities of its c/t/zens. A nation is not well livable if, for instance, it fails to meet minimal needs for food, safety and contacts. It is also unlivable
8 Rtrtrr vmsnov~
if its structure is too complex to handle for most citizens, or if its morals require the impossible.
Human needs and capacities are to a great extent given by nature. SocialiTztlon typically modifies and cultivates parts of our innate possibilities. There are thus limits to human a claptability, which soci- eties cannot ignore. Where bio-physiological needs are concerned this is rather evident. Any society must provide 'food' and 'shelter'. The existence of bio-psychological needs is less obvious, but no less Irue. Societies must also provide a sense of 'security', 'identity' and 'meaning'.
To some extent societies can mould their members to their provisions. A society that provides little security can socialize to psychological hardiness, and therefore be still reasonably livable for its members. Such compensation through socialization is not an automatism however;, unsafe societies tend to breed vulnerable people.
Social evolution does not guarantee that all societies are highly livable. Extremely unlivable societies probably tend to extinction; either because their members die out, or because they desert. How- ever, societies that provide only poor livability do not always have fewer survival chances. Low livability can instigate wars of con- quest, or mobilize economic effort. Badly livable societies can there- fore become dominant. Critics of modernity claim that is typically the case with present day nation states. Yet there are also anthropologi- cal reports of 'primitive' societies that are badly livable (Edgerton, 1992).
Difference with other quality concepts. The criterion of quality-of- life in the nation 0ivability) overlaps to some extent with the earlier mentioned criteria of quality of the nation. Good life for its citizens requires at least some order and continuity in the nation, a minimum of productivity and some congruence between ideal and reality. For that reason, the two quality concepts are often equated.
Yet, a nation can fail to provide a good life to its citizens in spite of high performance on the other quality criteria. In some nations, social stability is enforced by brute repression. Such nations are typically not very livable. This was the case with former East- European nations. Likewise, highly productive societies can wear
HAn'Y ~ ~ 9
their members out. Several social critics see that happen in Japan and the USA (f.e. Schor, 1991). Lastly, the demands implied in some ideals seem to exceed human possibilities. This is illustrated in the failure of 19th century utopian'communes'. It appeared hard to live with the ideals one lived up to. In the present century the Russian and Chinese revolutions even more ~ y demonstrated that ideology can be unlivable.
2.2 Q,,~dity-of-life in nations
Quality-of-life in nations was specified as livability of nations. Liv- ability of a nation was defined as thefit of its provisions and require- ments to needs and capacities of its citizens. That match cannot be observed as such: the degree to which it exists must be derived from observations of other things.
There are two ways to estimate quality-of-life in a nation. One way is to assess the presence of preconditions deemed likely to produce a fit. This involves assumptions about fit-likeliness of living conditions. The focus in thin approach is on societal input.
The other way is to observe how people at .rally flourish in the nation, and atuibute good functioning to good fit, The focus is than on societal output.
An analogy may illustrate the man~:, the case of 'fertifity' of the soft. If we want to know whether some piece of land is well suited for growing grain ('livable for grain'), we can estimate the input that soil provides or consider the output it has yielded earlier.
In the input approach, we consider the structure of the soil, its percentage of moisture, the minerals it contains, etc. Because we know fairly well what grain needs and to what conditions it can adapt, we can then estimate the fit reasonably well that is: predict how well grain will grow on that soil.
In the output approach we consider the harvest; either by retriev- ing information on earlier crops or by trying. We then look at the quantity and quality of the grain harvested.
Through the ages, fertility of land has been established by find- ing through experience (output). Only fairly recently did we gather sofficient knowledge on a limited number of plants to specify their necessary living conditions in advance (input).
10 Rutrr v m ~ o v ~
The living conditions of grain can now be specified reasonably well. Needs and capacities of that species are rather clear cut and have been discovered by controlled experimentation. The necessary living conditions for humans can less easily be specified however. Not only is the human organism more complicated and many-sided than grain is, but also are humans much more adaptable. In fact, a major biological specialization of the human species is its unspecial- ism, combined with a capacity for learning. Therefore, the possible variation in livable societies for humans is greater than the possible variation in fi'uitful soils for grain. Controlled experimentation is hardly possible with humans and human societies. Hence it is also more difficult to discover basic human needs and capacities.
Let us keep these problems in mind and now consider current estimates of quality-of-life in nations.
Input approach: 'presumed' quality-of-life As we have seen in the introductory paragraph, most measures of quality-of-life in nations assess presence of conditions such as mate- rial affluence, schooling, political freedom and social equality. The common assumption is that more of such conditions fits human nature better than less. There are at least two problems with this approach:
The first problem is that the assumed fit is highly questionable in most cases. Consider the example of economic affluence: Does a rich society provide a better fit with individual needs and capacities than a not so rich society? Though people typically 'want' to improve their material standard of living, it is doubtful that they really 'need' to. It is also uncertain whether a rich society challenges human capacities more optimally than one not so rich. In fact, the human species has developed in material conditions that would be judged as poor by present day standards.
The second problem in this approach is the assumption that more of such conditions always denote better quality-of-life. Let us con- sider the case of social stability. A minimum level of stability is certainly required, too much change frustrates needs for safety and overcharges adaptive capacities. However, a society without any change is not likely to fit either, it will frustrate the need for novelty and leave adaptive capacities under-utilized.
H~WY ~ ~ ' q C Y 11
An evident way to avoid these problems is to depart fi'om a well established theory about hmnan needs and capacities and to specif 3, the social conditions that are required to fit with these. Thin is called the basic need approach. Though better in principle, it has brought us little further.
A first problem on thin track is that there is no well established theory about human needs and capacities. There is much speculation on this m a ~ , some of which is rather plausible, but little empirical proof. Methodologically, it is extremely difficult to demonstrate what people 'really' need and can.
The currently most cited theory is Maslow's (1964) need hierar- chy. According to thin theory the most pressing need in human life is to overcome some basic deficiencies: first organic deficiencies such as hunger, and next socio-psychological needs like safety, belon~ng and esteem. Beyond these 'deficiency needs', 'growth needs' would prevail. That means that people need meaningful challenges that fit their capacities and involve ongoing development.
At the level of deficiency needs, this theory allows some speci- fication of necessary living conditions. The gratification of organic needs requires that there is a production system that provides 'food' and 'shelter'. Required minimum levels can be fairly well speci- fied in this case. Things become more difficult where the socio- psychological needs are concerned. There is much variation in the way societies provide 'safety', 'belongingness' and 'esteem', and it is difficult to define minima or compare perform~ce. What is for instance the minimum required degree of belongingness? Are these needs better gratified in the traditional stem family than in the modern nuclear family? Things become even more complicated where 'growth needs' are concerned, which concern the use and development of capacities. These needs are too varied to allow the specification of satisfiers. At best one can say that gratification of such needs requires a considerable degree of 'freedom' and 'variety' in society (Veenhoven, 1996b). Again it is hardly possible to indicate minimum and maximum levels.
In fact, current input indicators have little scientific ground. The assumptions about the good life rather root in bad experience and in ideology. Presont QOL indicators typically reflect Western remem-
12 Rutrr vtmmiov~
brance of poverty and inequality. Positively they reflect Western Enlighted creed.
Output approach: 'apparent" quality-of-life By lack of a theory from which we can deduct necessary living con- ditions, we must therefore resort to the other approach and assess inductively what societal conditions appear to be livable. The ques- tion is than how livability manifests itself.
The flouri.~hing of plants or animals in a given ecological environ- ment is usually measured by their functioning as apparent in growth, adequacy of behavior and absence of disease. Succe.ssful procreation is also seen as a sign of good functioning.
Can the flourishing of humans in a social environment be mea- sured by the same criteria? To some extent yes. Human thriving also manifests physically, particularly in good health and a long life. Therefore, we can induce the quality-of-life in a nation from the health of its citizens.
The flourishing of humans involves more than biological func- tioning alone. Unlike plants and animals, humans can reflect on themselves and their situation. Their suit to society is therefore also reflected in their judotnnents. As such we can also infer quality-of-life in a nation from the citizen's appraisals of life.
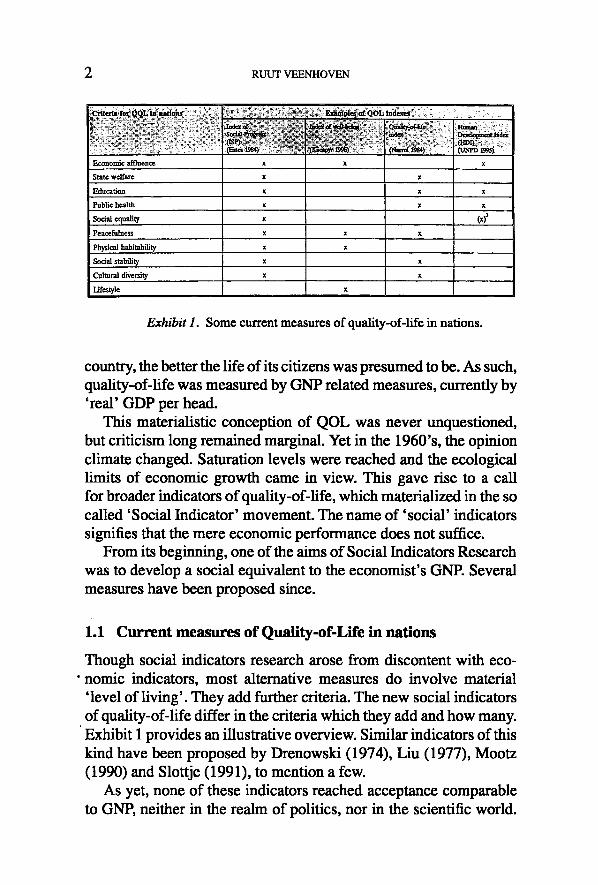
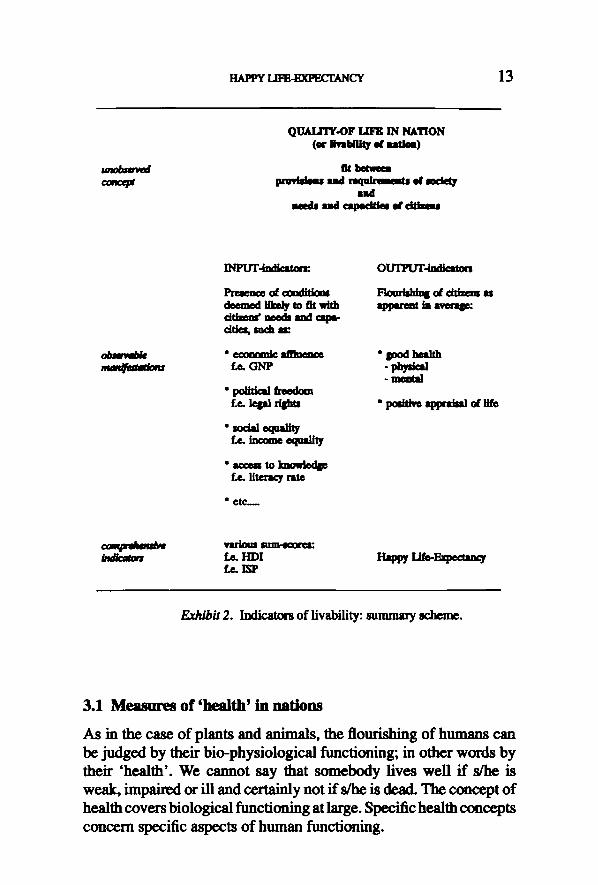
The two approaches to the measurement of quality-of-life in nations are summarized in exhibit 2. In the next paragraphs we shall consider the manifestations of apparent quality-of-life in more detail. First we shall review current measures of 'health' and 'appraisal', and then propose a new measure that combines both.
3. CURRENT INDICATORS OF APPARF_2qF QUALITY-OF-LIFE IN NATIONS
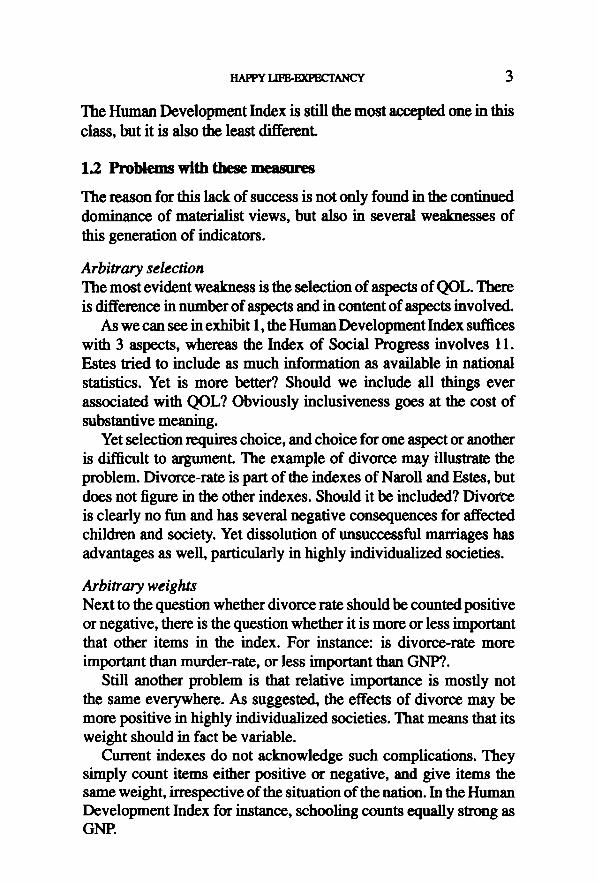
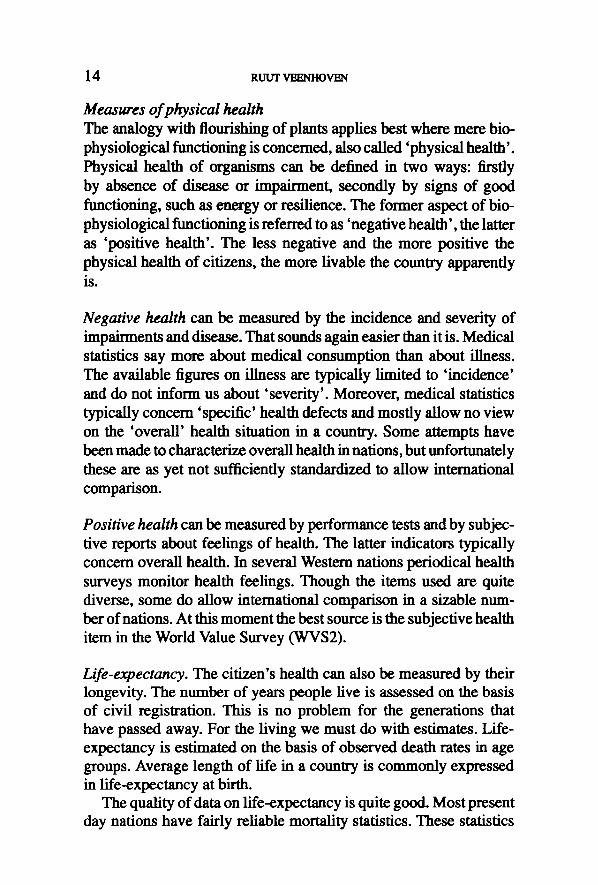
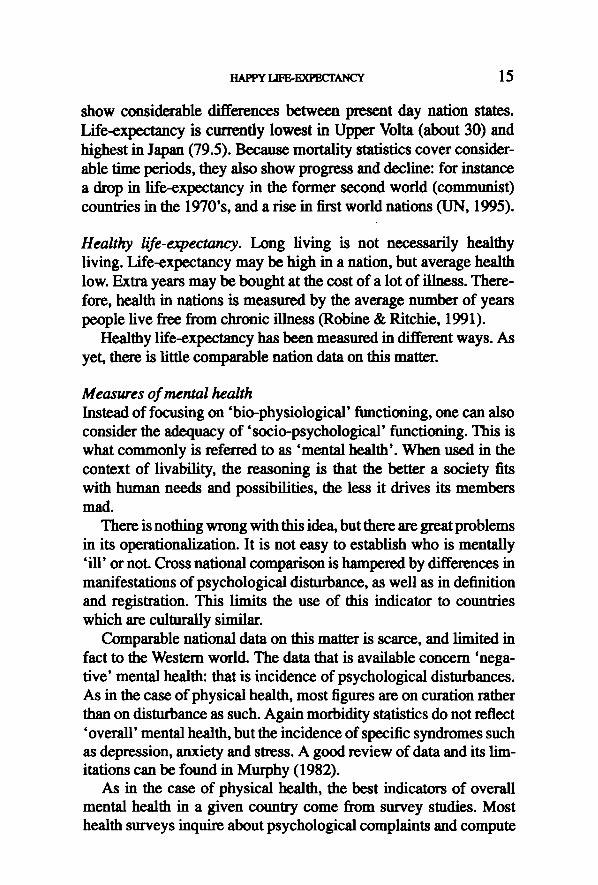
Inferring quality-of-life from 'health' and 'appraisal of life' is less easy than it seems. What do these terms mean precisely? Can these matters be measured, in principle and in practice? In thi.~ paragraph I will review current indicators and their usefulness for this purpose. The review is summarized in exhibit 3. It will appear that only a few indicators qualify.
H ~ Ln~-EX~Cr~CY 13
um~m~d
QUALITY-OF ~ IN NA'rlON (er i i , ~ d ~ eC , ,ate)
nt b e t m ~
mid
INPUT-4adleata~
~ ~ comtttiom dzzmed m ~ m fit wtth dttzm~ nzods md mlm- d t l ~ md~ E
OUTlnJT-imtie~on
~ ot cttimM u
~ �9 g ~ d health
- m e e m l
f.e. i ep l r y m
�9 ux~ ~L~my
* ~ ta immdedp f.e. ll~'~-y rims
�9 p e ~ v e , ~ p . ~ ~ ale
varlm= m m - ~ m ~ f.e. H D I te. ISP
Exh/b/t 2. Indicators o f livability: summary scheme.
3.1 Measures o f 'health' in nat ions
As in the case of plants and animals, the flourighing of humans can be judged by their bio-physiological functioning, in other words by their 'health'. We cannot say that somebody fives well if s/he is weak, impaired or ill and certainly not if s/he is dead. The concept of health covers biological functioning at large. ~ c health concepts concern specific aspects of human functioning.
14 RtJtrr ~ v ~
Measures of physical health The analogy with flourishing of plants applies best where mere bio- physiological functioning is concerned, also called 'physical health'. Physical health of organisms can be defined in two ways: firstly by absence of disease or impairment, secondly by si~.~ of good functioning, such as energy or resilience. The former aspect of bio- physiological functioning is referred to as 'negative health', the latter as 'positive health'. The less negative and the more positive the physical health of citizens, the more livable the country apparently is.
Negative health can be measured by the incidence and severity of impairments and disease. That sounds again easier than it is. Medical statistics say more about medical consumption than about illness. The available figures on illness are typically limited to 'incidence' and do not inform us about 'severity'. Moreover, medical statistics typically concern 'specific' health defects and mostly allow no view on the 'overall' health situation in a country. Some attempts have been made to characterize overall health in nations, but unfortunately these are as yet not sufficiently standardized to allow international comparison.
Positive health can be measured by performance tests and by subjec- tive reports about feelings of health. The latter indicators typically concem overall health. In several Western nations periodical health surveys monitor health feelings. Though the items used are quite diverse, some do allow international comparison in a sizable num- ber of nations. At this moment the best source is the subjective health item in the World Value Survey (WVS2).
Life-expectancy. The citizen's health can also be measured by their longevity. The number of years people live is assessed on the basis of civil registration. This is no problem for the generations that have passed away. For the living we must do with estimates. Life- expectancy is estimated on the basis of observed death rates in age groups. Average length of life in a country is commonly expressed in life-expectancy at birth.
The quality of data on life-expectancy is quite good. Most present day nations have fairly reliable mortality statistics. These statistics
nAet'Y lm~I~'tm'rANcY 15
show considerable differences between present day nation states. Life-expectancy is currently lowest in Upper Volta (about 30) and highest in Japan (79.5). Bccatmc mortality statistics cover consider- able time periods, they also show progress and decline: for instance a drop in life-expectancy in the former second world (communi.q 0 countries in the 1970's, and a rise in first world nations (UN, 1995).
Healthy life-expectancy. Long living is not necessarily healthy living. I ire-expectancy may be high in a nation, but average health low. Extra years may be bought at the cost of a lot of ilirmss. There- fore, health in nations is measured by the average number of years people live free fi'om chronic illness (Robine & Ritchie, 1991).
Healthy life-expectancy has been measured in different ways. As yet, there is little comparable nation data on thi.q matter.
Measures of mental health Instead of focusing on 'bio-physiological' functioning, one can also consider the adequacy of 'socio-psychological' functioning. This is what commonly is referred to as 'mental health'. When used in the context of livability, the reasoning is that the better a society fits with human needs and possibilities, the less it drives its members mad.
There is nothing wrong with this idea, but there are great problems in its operationalization. It is not easy to establish who is mentally 'ill' or not. Cross national comparison is hampered by differences in manifestations of psychological disturbance, as well as in definition and registration. This limits the use of this indicator to countries which are culturally similar.
Comparable national data on thi~ matter is scarce, and limited in fact to the Western world. The data that is available concern 'nega- tive' mental health: that is incidence of psychological disturbances. As in the case of physical health, most figures are on curation rather than on disturbance as such. Again morbidity statistics do not reflect 'overall' mental health, but the incidence of specific syndromes such as depression, anxiety and stress. A good review of data and its lim- itations can be found in Murphy (1982).
As in the case of physical health, the best indicators of overall mental health in a given country come from survey studies. Most health surveys inquire about psychological complaints and compute
16 RUUT VEE2qHOVEN
a m m ~taa0m of 4,~,_
~d th �9 medictl ommmptim -- + + �9 ~ ot ~te , te + • + �9 mbjecttv, hetlth + + + �9 ~ + + + + +
�9 h = ~ , ~ ++ • •
M e m l l lm, l th �9 cmiti~ mnmmpt~ - - • �9 p r e ~ t ~ z ~ o t ~ + • - -
~ nmnt fe tmt tom of /
* ~ • + + +
�9 I • ~ • * P r o ~ t t n d de te r t
�9 protett beh,vion -- -- -- �9 t t e k 2 r t t k ~ • • •
A v o i d ~ �9 ~ of m-bet~
�9 ~ • • - -
�9 ,miety, ~ m ~ z , m m + • • �9 Overtn wen-be~
�9 mood levzl + + + + �9 ~ + + +
' o~mll l ~ m + + +
++=~:3,good + - g o o d • - - = l m i
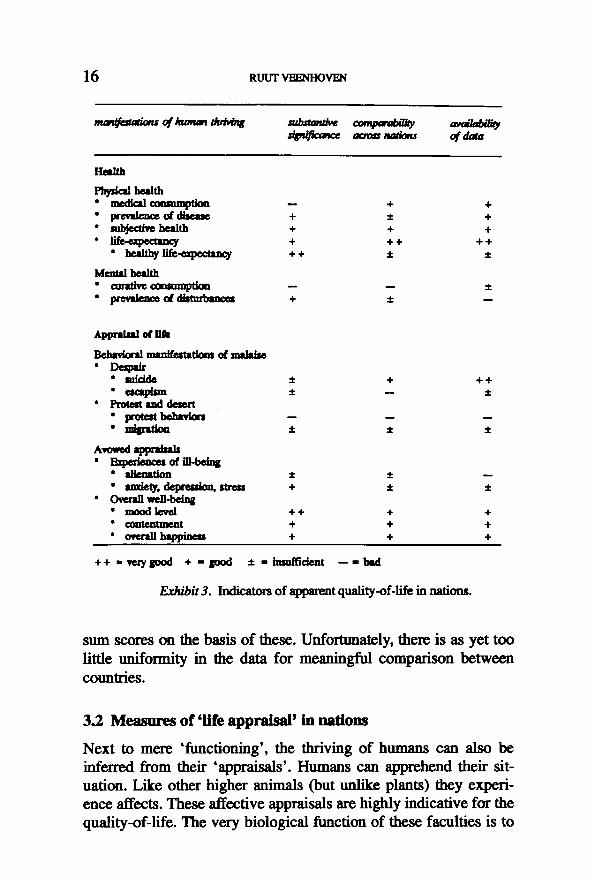
Exhibit 3. Imticato~ of apparent quality-of-life in nation,.
s u m scores on the bas is o f these . Unfo r tu n a t e ly , t he re is as y e t t o o
l i t t le u n i f o r m i t y in the da t a f o r m e a n i n g f u l c o m p a r i s o n b e t w e e n
coun t r i e s .
3 - 2 M e a s u r e s o f ' l i f e a p p r a i s a l ' i n n a t i o n s
N e x t to m e r e ' f u n c t i o n i n g ' , the th r iv ing o f h u m a n s can a l so b e
i n f e r r e d f r o m the i r ' app ra i s a l s ' . H u m a n s can a p p r e h e n d the i r sit-
ua t ion . L i k e o t h e r higher an ima l s (bu t un l ike p lan ts ) t h ey ex p e r i -
e n c e affects . T h e s e a f f e c t i v e appra i sa l s are h ig h ly i nd i ca t i ve fo r the
qua l i ty -o f - l i f e . T h e v e r y b io log i ca l f u n c t i o n o f these facu l t i e s is to
lead the organism to the best suited conditions. 6 Positive affect is generally indicative of good adaptation. Contrary to other animals humans are also able to appraise their si,~,a6on co~,nitively. Positive judgement of life is generally indicative of good ~Ap~tion as welL
The degree to which inhabitants of a nation appraise their life positively can be assessed in different ways: indirectly by inferring from their behaviors and directly by asking how they feel about their life. For long social scientists have preferred the former method. By now it is clear that only the latter is viable for thi~ purpose.
Behavioral manifestations of malaise
Traditionally, the quality-of-life in a nation was measured by the incidence of behaviors deemed indicative of despair. The more such behaviors observed, the less livable the cotmtry was supposed to be.
This approach does not require that people are fully aware of their malaise. Behavioral reactions can be affect driven or subconscious. Therefore, similar indicators are used for estimating well-being in ~ . Aggression and self infliction are often mentioned as indica- tive of despair in captive animals. Among wild animals migration can sometimes be seen as a mauifestafion of discomfort in their earlier habitat.
Desk- Quality of life in nations has been measured by various manifes- tations of despam, mostly deviant behaviors such as use of drugs, aggression and excessive risk-taking, but also non-offensive behav- iors such as religious retreat. The problem with thin approach is that these behaviors are at best partly linked to livability of society, and probably not equally much in all societies at all times.
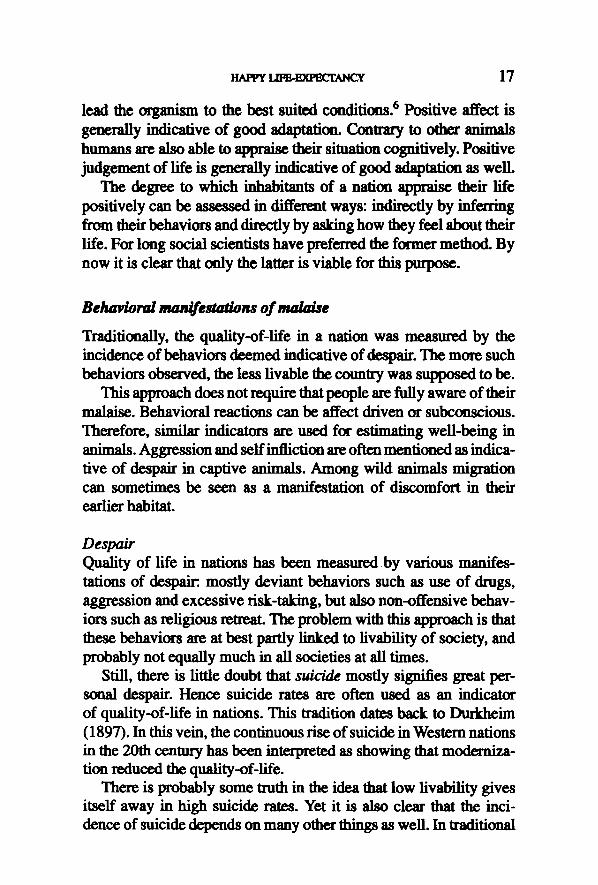
Still, there is little doubt that su/c/de mostly signifies great per- sonal despair. Hence suicide rates are often used as an indicator of quality-of-life in nations. This tradition dates back to Duddmim (1897). In this vein, the continuous rise of suicide in Western nations in the 20th century has been interpreted as showing that moderniza- tion reduced the quafity-of-life.
There is probably some truth in the idea that low livability gives itself away in high suicide rates. Yet it is also clear that the inci- dence of suicide depends on many other things as well. In traditional
18 RUtm VEEm~VEN
societies such as Japan, suicide was in some situations a moral obligation. In present day Western society, suicide rates may rise because it is no longer taboo and because medical technology post- pones natural death. It is also possible that modem people are less willing to endure suffering. As in the case of other despair behaviors, these effects are not equally great in all societies at all times.
Nevertheless, suicide is often used assess quality of life in nations. This is probably due to the fact that suicide is well documented. In most countries this cause of death has been systematically registered since long. Though the accuracy of registration varies somewhat between countries and through time, the data seem well compara- ble. The best available statistics are prepared by the World Health Organization (WHO, 1987). These data show sizable differences. Around 1980 mortality by suicide was greatest in Hungary (+ 460 per million) and lowest in the Philippines (+ 9 per million).
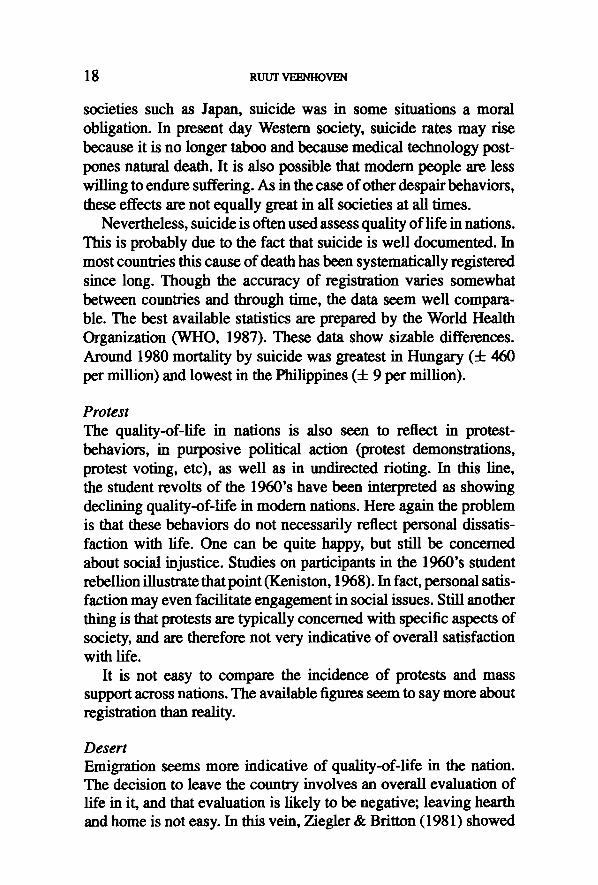
Protest The quality-of-life in nations is also seen to reflect in protest- behaviors, in purposive political action (protest demomtratious, protest voting, etc), as well as in undirected doting. In this line, the student revolts of the 1960's have been interpreted as showing declining quality-of-life in modem nations. Here again the problem is that these behaviors do not necessarily reflect personal dissatis- faction with life. One can be quite happy, but still be concerned about social injustice. Studies on participants in the 1960's student rebellion illustrate that point (Keniston, 1968). In fact, personal satis- faction may even facilitate engagement in social issues. Still another thing is that protests are typically concerned with specific aspects of society, and are therefore not very indicative of overall satisfaction with life.
It is not easy to compare the incidence of protests and mass support across nations. The available figures seem to say more about registration than reality.
Desert Emigration seems more indicative of quality-of-life in the nation. The decision to leave the country involves an overall evaluation of life in it, and that evaluation is likely to be negative; leaving hearth and home is not easy. In this vein, Ziegler & Britton (1981) showed
n~*rv ta~-~xvt~"rANcv 19
that riving conditions in emigration countries are typically poor. Yet, emigration may say more about opp(munity to settle abroad than about the quality-of-life in the country. Also, e ~ o m about a better life elsewhere do not necessarily mean that the quality-of-life in one's home country is poor. Further, emigration is not always due to dissatisfaction with life. Part of the migrants seek new horizons for positive reasons, and often migration comes about more or less unintendedly by involvement in love or work.
Migration is a well documented phenomenon, and the figures are fairly comparable across nations.
Self reported appraisals
Though higher animals have the faculty of experience, they are typ- ically tmable to reflect on that experience and communicate it. We humans can. We can appraise how we feel about life and can com- municate the estimate. Therefore, human appraisals can in principle be assessed by interrogation.
Research has shown thiq is practically possible as well. Though self reports could be distorted in various ways, present interrogation techniques seem to measure it reasonably valid and reliable. On that basis a survey research tradition established since the 1960's.
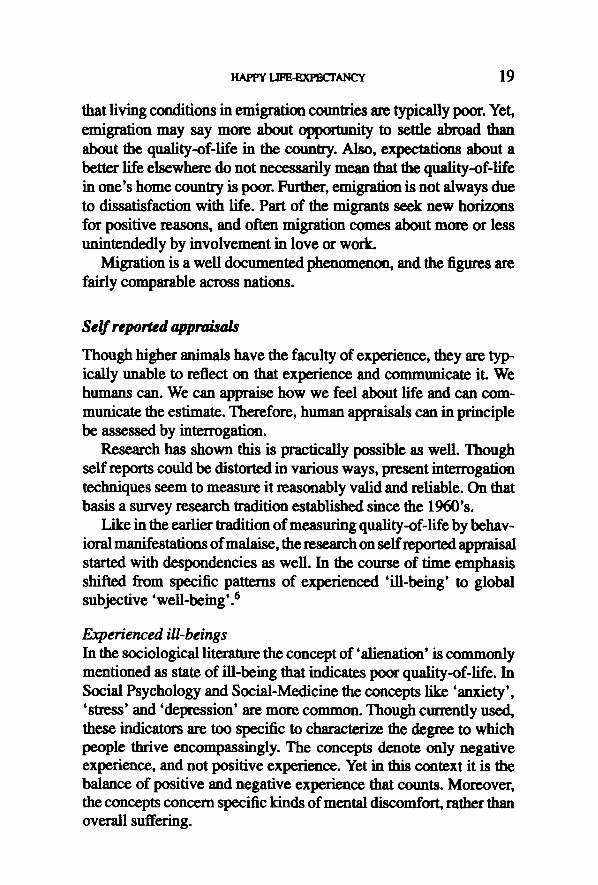
Like in the earlier tradition of measuring quality-of-life by behav- ioral manifestations of malaise, the research on self reported appraisal started with despondoncies as well. In the course of time emplmsis shifted from specific patterns of experienced 'ill-being' to global subjective 'well-being'.6
Experienced ill-beings In the sociological literature the concept of 'alienation' is commonly mentioned as state of ill-being that indicates poor quality-of-life. In Social Psychology and Social-Medicine the concepts like 'anxiety', 'stress' and 'depression' are more common. Though currently used, these indicators are too specific to characterize the degree to which people thrive cncompassingly. The concepts denote only negative experience, and not positive experience. Yet in thi~ context it is the balance of positive and negative experience that counts. Moreover, the concepts concern specific kinds of mental discomfort, rather than overall suffering.
20 RUUT VEENHOVEN
Alienation is seen as something that results from a lack of fit between ways of life provided by a society and human potentials. That condi- tion is believed to manifest in individual feelings of powerlessness and meaninglessness. There are many variations in this theme, some of which come close to conceptions of mental health.
The incidence of subjective alienation in a society can be measured by means of surveys. Several questionnaires have been developed for that purpose. The currently most used is the Seeman Alienation Scale (Seeman, 1975). A major limitation of all these measures is that they do not involve a general judgement of life, but rather describe dissatisfaction in a cluster of life-aspects. Therefore, it is better not to use them for assessing overall quality- of-life.
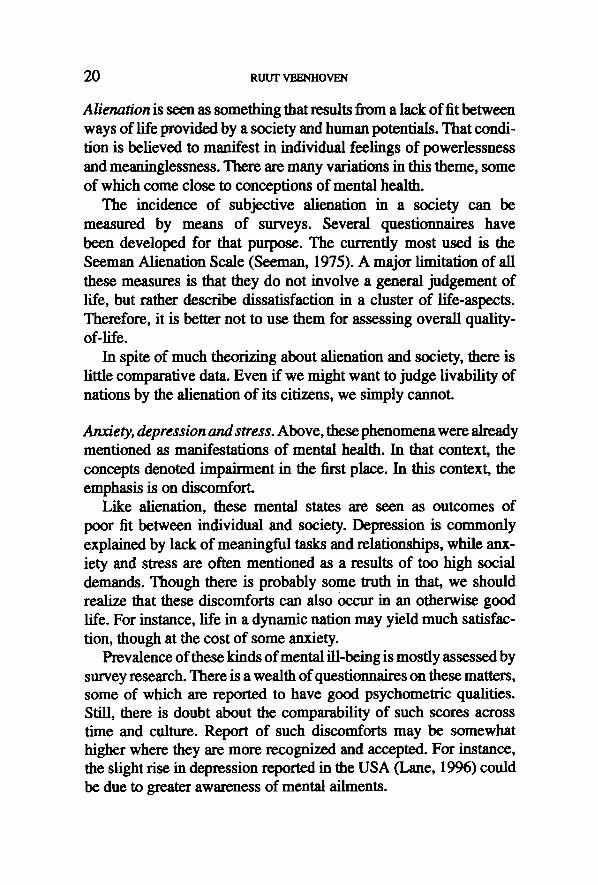
In spite of much theorizing about alienation and society, there is little comparative data. Even ff we might want to judge livability of nations by the alienation of its citizens, we simply cannot.
Anxiety, depression andstress. Above, these phenomena were already mentioned as manifestations of mental health. In that context, the concepts denoted impairment in the first place. In this context, the emphasis is on discomfort.
Like alienation, these mental states are seen as ontcomes of poor fit between individual and society. Depression is commonly explained by lack of meaningful tasks and relationships, while anx- iety and stress are often mentioned as a results of too high social demands. Though there is probably some truth in that, we should realize that these discomforts can also occur in an otherwise good life. For instance, life in a dynamic nation may yield much satisfac- tion, though at the cost of some anxiety.
Prevalence of these kinds of mental ill-being is mostly assessed by survey research. There is a wealth of questionnaires on these matters, some of which are reported to have good psychometric qualities. Still, there is doubt about the comparability of such scores across time and culture. Report of such discomforts may be somewhat higher where they are more recotmiTed and accepted. For instance, the slight rise in depression reported in the USA (Lane, 1996) could be due m greater awareness of mental ailments.
t-L'a'~ ~ ~ ' ~ 21
There is a lot of data on these m~tt_ers of psychological ill-being. Yet the available data allow tittle opportunity for cross-national comparison. The few cross-national studies that did involve a sizable number of nations is limited to specific groups, such as employees or students. So again, it is simply not possible to measure the livability of nations in this way.
Overall happiness Assessing the appraisal of life in a nation requires that the total of experienced well-being is estimated. This sum of experience is denoted by the concept of 'happiness'. Happiness is a person's over- all evaluation of hi~dher life as-a-whole.
Concept. In tiffs context it is worth disfingni~hing between j~dgments about 'society' and judgments about ones 'life in that society'. A society that is judged positively by its citizens is not necessarily a very livable one. The judgement can concern aspects that are very prominent in public discourse, but have little relevance for the actual enjoyment of life. Also, basically dissatisfied people can still be positive about their society, because they are unaware of its s h ~ and attribute their mi.q~ry to other matters. The degree to which people flourish in a society can thus best be me.asmed by how they evaluate their own life, in other words by their personal sat~acr/on.
Personal satisfaction judgments can concern 'aspects-of-life', or one's 'life-as-a-whole'. Satisfaction with specific aspects of life such as 'work', 'marriage' or 'governments' says little about the general livability of a society. Most citizens may be satisfied with their work, but still be unhappy because their society offers little more. Also they can be satisfied with most aspects of life, but nevertheless judge their life-as-a-whole negatively; for instance because they miss something essential in it, i.e. 'freedom'. Still another complication is that aspects of life are not equally important in all societies at all times. 'Work' for instance is less central in most third world countries than in the homelands of the Protestant Ethic. For these reasom the focus on is here on 'overa//' personal satisfaction.
When we appraise how much we appreciate the life we live, we seem to use two sources of information, we estimate our typical affective experience to asses how well we feel generally (hedonic

22 RUUT VEENHOVEN
level of affec0 and at the cognitive level we compare 'life as it is' with standards of 'how life should be' (contentmen0. The for- mer affective source of information seems generally more important than the latter cognitive one (Veenhoven, 1996a: 33-35). The word happiness is commonly used for these 'subtotals' as well as for the comprehensive appraisal. I use the terms 'overall happiness' or 'life-satisfaction' for the last judgement and refer to the affective and cognitive sub-appraisals as respectively 'hedonic level of affect' and' contentment'. Elsewhere, these concepts are delineated in more detail (Veenhoven, 1984: ch 2).
Measures. All these variants of happiness can be measured by self- report. Various questions have been developed for that purpose. For a review of items and scales see Veenhoven (1984: ch 4). The most commonly used item is the single question: "Taking all together, how happy would you say you are? Very happy, fairly happy, not too happy or not at all happy?" Another current question is how 'satisfied' one is with one's life-as-a-whole. Hedonic level is often measured by the ten item Affect Balance Scale (Bradburn, 1969), which concerns occurrence of specific positive and negative affects in the past few weeks. This latter method seems best suited for cross-national comparison, s
Since the 1970's, happiness serves as a core variable in 'Quality- of-life surveys' in many developed nations. In the reports, happi- ness is often presented as an indicator of livability, the happier the inhabitants are on average, the more livable the nation or region is presumed to be.
There is now a growing body of data on average happiness in na t ions . 9 Presently there are comparable surveys in some fifty nations. The data are brought together in the World Database of Happiness (Veenhoven, 1992).
3.3 Measuring happiness in nations
Though currently used, these measures are much criticized. Three main objections are misecL which all imply that self reports of happiness provide no good basis for estimating livability of nations. If true, these objections would be fatal to the new indicator proposed in this paper. Therefore I will now review that criticism in more

~mprv ~ ~ 23
detail. For more elaborate discussions of the measurement problems involved here see: Dieaer (1995), Headey & Wearing (1992) Saris et al. (1996), and Veenhoven (1993, 1996a).
Validity of happiness self reports The first objection is that responses to questions about happiness do not adequately reflect how people really feel about their life. Several reasons have been suggested.
One of the misgivings is that most people have no opinion about their happiness. They would be more aware of how happy they are expected to be, and report that instead. Though this may happen incidentally, it appears not to be the rule. Most people know quite well whether or not they enjoy life. Eight out of ten Americans think of it every weeL Responses on questions about happiness tend m be prompt. Non-restxmse on these items is low; both absolutely (+ 1%) and relatively m other attitudinal questions. 'Don't know' responses are infrequent as well.
A related assertion is that respondents mix up how satisfied they acn_mlly are, with how satisfied other people think they are, given their life-situation. If so, people considered to be well off would typically report to be happy, and people regarded as disadvantaged should avow themselves unhappy. That pattern does occur, but it is not general. For instance, in The Netherlands good education is seen as required for a good life, but the best educated appear slightly less happy.
Another objection concerns the presence of systematic bias in responses. It is assumed that questions on happiness are interpreted correctly, but that the reslxmses are often false. People who are actu- ally dissatisfied with their life would answer that they are contented. Both ego-defense and socialMesirability are said to cause such distor- tions. This bias is seen to manifest itself in over-report of happiness; most people claiming to be happy, and most perceiving themselves as happier than average. Another indication of bias is seen in the finding that psycho-somatic complaints are not uncommon among the happy. These observations are ccmect, but the findings allow other interpretations as well. F'Lrstly, the fact that more people say to be happy does not imply over-report. It is quite possible that most people are truly satisfied with life. When living conditions are not too bad, this is in fact quite probable. Secondly, there are also good
24 RUUT VEENI-IOVEN
reasons why most people think that they are more satisfied than average. One such reason is that we underestimate happiness of our fellow-man, because mi.gery is more salient than prosperity. Thirdly, the occurrence of head-aches and worries among the satisfied does not prove response distortion. Life can be a sore trial some times, but still be satisfying on a balance. The proof of the pudding is in demonstrating the response distortion itself. Some clinical studies have tried to do so by comparing responses to single direct questions with ratings based on depth interviews and projective tests. The results are generally not much different from responses to single direct question posed by an anonymous interviewer.
Elsewhere the surmi.~d flaws of self reported happiness have been checked in more detail. See Veenhoven (1984: chapter 3) and Headey & Wearing (1992: ch 3). None of them was corroborated as yet.
Significance of average happiness The second objection is are that happiness does not reflect real quality of life. This objection has two variants: one variant holds that happiness is merely a matter of perceived advantage and the other that it is a mere matter of outlook.
Relative? The first variant holds that happiness judgements draw on conlparison within the nation, and can therefore not meaning- fully compared across nations. This view is based on the theory that happiness results from social comparison. Some often cited investigations claim support for this theory. Easterlin (1974) saw the theory proved by his observation that happiness is as high in poor countries as it is in rich countries. Brickman et al. (1978) claim proof in their observation that lottery-winners are no more satisfied with life than paralysed accident victims. Elsewhere, I scrutini7ed these sensational claims (Veenhoven, 1991, 1995). The results of that enquiry can be summarized as follows:
First of all, average happiness is clearly not the same in poor and rich nations. Neither are accident victims equally satisfied as lottery winners. The differences may be smaller than one might have thought, but they exist undeniably.
~ t.we-exvm'r~ 25
Some other implications of theory that happiness is relative failed an empirical test as welL One such implication is that changes in living-conditions, to the better or the worse, do not have a lasting effect on happiness. However, there is good evidence that we do not adjust to evcryflling; for instance, we doll't adjust to the misfofUme of having a handicapped child or the loss ofa spouce.
Another implication is that earlier hardship favors laLear happiness. This hYtmtiz~ does not fit the data either. For example, survivors of the Holoczust were found to be less satisfied with life than Israelis of the same age who got off scot-free.
A last empirical check to be mentioeed is the correlation with income. The theory that happiness is relative predicts a strong cor- relation in all countries, irrespective of their wealth. Income is a salient criterion for social comparison, and we comlmre typically with com r~riots. Again, the prediction is not conCrmed by the data. The correlation is high in poor countries bet low in rich ones.
The theory that happiness is 'relative' assun~ that happiness is a purely cognitive mR try- and does not acknowledge affcctive experience. It focusses on'wants' and neglects 'needs'. Contrary to wants, needs are not relative. An alternative 'affective' theory is that we infer happiness from how we feel generally. If we feel fine, we gather that we must be satisfied. If we feel lousy most of the time we conclude we must be dissatisfied. Unlike conscious comparisons between ideal and reality, affects are largely tmreasoncd experiences, that probably signal the degree to which basic needs are met. The evidence for this theory is mounting. It denotes that happiness rat- ings reflect something universal, that can be meaningfully compared cross-culturaUy.
Folklore? A second variant of the insitmificance objection is that happiness reflects the dominant view-on-life, rather than actual qnality-of-life in a country. In this view, happiness-ratings reflect local 'folklore'. Corn!turin ~ happiness reports would hence be equat- ing apples and pears.
The theory of happiness behind this argument is cognitive as well. Happiness is seen as a judgement that depends on socially constructed frames of reference, which are supposed to be culturally unique. This relativistic theory fotuu] support in tmexpected differ-
26 RLIUT VEENHOVEN
ences in average happiness between nations, such as low happiness in France and the high level in the USA. The idea was also nourished by the finding that average happiness remained at the same level in postwar USA, in spite of a doubling of the national income.
El~where I put this theory to several tests (Veenhoven, 1992b: 66-79, 1994, 1995). One implicated hypothesis is that differences in average happiness are unrelated to variation in objective quality of life. Five such differences were considered: economic alitu- ence, social equality, political freedom and intellectual development. These nation-characteristics explained 78% of the differences in average happiness in a 28 nation set. Further, there are examples of change in average happiness following imm~ovement and decline of quality-of-life in the country.
I also considered the residual variances in regression charts. If French national character would tend to understate happiness and the American way to overstatement, we can expect to find the French less happy than predicted on the basis of objective welfare and Americans more happy than their situation justifies. No such patterns appeared.
Still another test involved the analysis of happiness among migrants. If happiness reflects the quality of the conditions one lives in, the happiness of migrants in a country must be close to the level of autochthons. If happiness were a matter of socialized outlook, the happiness of migrants should be closer to the level in their motherland. The former prediction appeared true, the latter not .
Comparability of happiness across countries Methodological objections involve various claims about differential distortion in responses to questions about happiness. Several of these assertiom have been tested empirically (Veenhoven 1993, 1996a). Again, the results are negative as yet.
The most common objection holds that differences in language hinder comparison. Words like 'happiness' and 'satisfaction' would not have the same connotations in different tongues. Questions using such terms would therefore measure slightly different matters. That hypothesis was checked by comparing the rank-orders produced by three kinds of questions on the overall appreciation of life-as- whole: a question about 'happiness', a question about 'satisfaction' with life and a question that invites to a rating between 'best-' and

aAr~ ~ A ~ r Z 27
'worst possible life'. The rank-orders appeared to be almost identical Next, responses on questions on happiness and satisfaction in two bi-lingual countries were compared. Thi~ did not show linguistic bias either.
A second objection is that ~ to questions are distorted by social desirability, and that such biases differ across cultures. One of the manifestations would be more avowal of happiness in countries where happiness ranks high in the value-hierarchy. That latter claim was inspected by check'in s whether reported happiness is indeed higher in countries where hedonic values are most endorsed. This appeared not to be the case. As a second check, it was also inspected whether reports of general happiness deviate more from feelings in the past few weeks in these countries; the former measure being more wdnerable for desirability distortion than the latter. This appeared not to be the case either.
A third claim is that convention in communication distort the answers dissimilarly in different countries. For instance, collectivis- tic orientation would discourage 'very' satisfied reslxmses, because modest self-presentation is more appropriate within that culttmd context. This latter hypothesis was tested by comparing happiness in countries differing in value-collectivi.qm, but found no effect in the predicted direction. The hypoth~is failed several other tests as well.
A related claim holds that happiness is a typical Western concept. Unfamiliarity with it in non-Western nations is said to involve several effects; responses would be more hal~7~rd, and uncertainty would press to choice for middle categories on response scale, s, which results in relatively low average scores. If so, more 'don't know' and 'no answer' responses can be expected in non-Western nations. However, that appeared not to be the case. The frequency of these responses is about 1% in all parts of the world.
All these claims imply that there will be tittle relationship between average happiness rating and real characteristics of the nations. Yet we have seen that country differences in economic prosperity, free- dora, equality and schooling explained 78% of the differences in reported happiness.
28 RUU'r ~ V ~
Possibly, there are some other distortions. Time will learn. For the time being, it seems that self reports of overall happiness can de meaningfully compared across nations.
4. NEW SUMMARY-MEASURE OF APPARENT QUALITY-OF-LIFE IN NATIONS
In recapitulation, quality-of-life in nations is meaimm~ in two ways: 1), by presence of conditions deemed beneficial, such as affluence, freedom, learning, etc (assumed QOL), and 2) by the degree to which citizens thrive, as manifested in their health and happiness (apparent QOL). We have seen encompassing ~ of assumed quality- of-life, the multi dimensional indexes which we reviewed in the intreductory paragraph. As yet, we did not meet with a comprehen- sive meast~ of apparent quality-of-life. This paper proposes such a messure.
4.1 Notion of long and happy Hying
The 'apparent' livability of a nation can be measured by the degree to which its citizens live long and happily. The longer and happier the citizens live, the better the provisions and requirements of society apparently fit with their needs and capacities.
An evident advantage to measuring q-ality-of-lffe by longevity alone is that the subjects' appraisal of life is acknowledged. People may live long, but not happily. For instance, in a repressive nation where healthy lifestyle is enforced, or where blind medical tech- nology stretches life too long. Likewise, an advantage to measuring quality-of-life by happiness alone is that the length-of-life is taken into account. People may live happy in a culture of irresponsible hedonism, where they indulge in drugs and risky sensations, but they won't enjoy that life very long.
In fairy tales the happy end is commonly de, scn'bed by the phrase 'and they rived long and happily ever after'. This phrase reflects common conviction that the good life manifests in a long and happy life. In thi~ conception, that individual level notion of quality-of-life is aggregated to the nafon level. Instead of the fairy tales hero, we consider the average citizen.
~,~vrv ~ ~ . , ~ , 29
4.2 ~ n a l i s a t i o n in 'Happy I M e - ~ ' (HI.E)
Empirical assessment requires information on average length-of-life and on average appreciation-of-life in the country. As noted, this information is available from two sources: l) civil registration of death, and 2) survey data on happiness. On the basis of registrations of death we can estimate how long people live in a nation at a certain time. These data are of an 'objective' nature, only an outsider can assess how long one lived. Surveys allow an estimate of how happy people are on average. This data is of a 'subjective' kind. Only the oneself knows whether one is happy or not. Combined, these sources of information can tell us how long and happily people live in a country.
Analogous to 'healthy' life-expectancy, this combination can be labeled as 'happy life-expectancy'. In line with custom I will abbrevi- ate to 'HI.EL The idea of such an analogous measure was developed with Anton Kun~t (Kunst et al. 1990).
Computation 'Healthy' life-expectancy is usually computed by detracting ex- pected years in bad health from expected years of life, both estimates based on age specific information. 1~ Here 'happy' life-expectancy is computed by multiplying 'standard' life-expectancy in years with average happiness as expressed on a scale ranging from zero to one. In formula:
Happy life-expectancy = standard life-expectancy • 0-1 happiness.
Suppose that life-expectancy in a country is 50 years, and that the average score on a 0 to 10 step happiness scale is 5. Converted to a 0-1 scale, the happiness score is than 0,5. The product of 50 and 0,5 is 25. So happy life-expectancy in that country is 25 years. This example characterizes most of the poor nations in the present day world.
If life-expectancy is 80 years and average happiness 8, happy life-expectancy is 64 years (80 • 0,8). This example characterizes the most livable nations in the present day world.
30 RUtrl" VmmHOV~
Range Theoretically, this indicator has a broad variation. Happy life-exix~- tancy is zero if nobody can live in the country at all, and will be endless if society is ideal and its inhabitants immortal.
The practical range will be between about 20 and 75 years. Presently at least, life-expectancy at birth in nations varies between 30 and 80, whereas average happiness is seldom lower than 0,4 on a 0 to 1 scale and seldom higher than 0,8.
Happy life-expectancy will always be lower than standard life- expectancy. It can equal real length of life only if everybody is perfectly happy in the country (score 1 on scale 0 to 1). This is clearly not possible. The highest level of happiness ever observed is 0,8 (Iceland 1990), which is probably close to the maximum.
Interpretation High happy life-expectancy means that citizens live both long and happily, low happy life-expectancy implies that the life of the average citizen is short and mi.,~rable. Medium values of happy life-expectancy in a country can mean three things: 1) both mod- erate length-of-life and moderate appreciation-of-life, 2) long but unhappy life, and 3) short but happy life. In thi~ measure these three situations are treated alike.
Metaphorically, the scores can be interpreted as the number of happy years the nation affords its citizens.
Practical requirements Actual measurement of HI.F~ requires that data on both happiness and life-expectancy is available for a sufficient number of nations. Another condition is that these com[mnents involve distinct infor- marion.
Availability of data. Availability is no problem for life-expectancy. This is known for all present day nations, and on a lot of countries there are also time-series which date back to more than a century (i.rN 1995).
Data on average happiness in nations is less abundant. Survey- research is relatively recent, and items on happiness appeared only until the 1970's. Still there are some 50 nations of which we know present happiness, and on a dozen we have time-series of one or
~ ~ ~ a , ~ c r 31
more decades (World Database of Happiness). For the moment, that suffices for an exploration. In the coming decades happiness surveys will probably get established in most of the world's nations.
Differentiation ofcomt~nenta. At the conceptual level there is a clear difference between life-expectancy and happiness, but does that dif- ference appear at the empirical level as well? If life-expectancy and happiness coincide completely, we shall not get wiser by combining them.
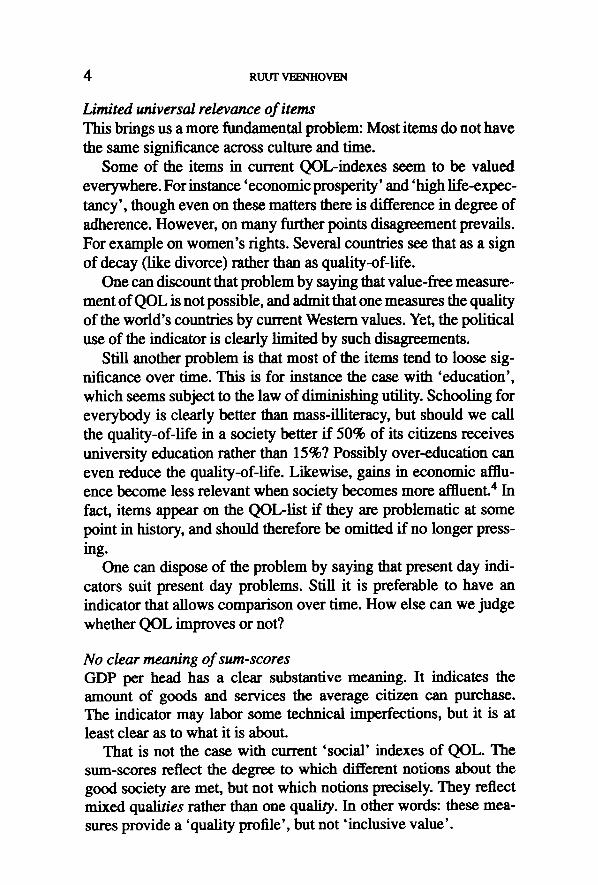
A look at the available data shows good differentiation. See exhibit 4. On the le~ the case of Nigeria (WAN) demonstrates that low length-of-life can go together with reasonable appreciation-of- life. To the fight below, the Eastern Eurotman nations illustrate that the reverse occurs as well. Right on top we see that the nations with the highest life-expectancy (typically the developped nations) differ considerably in average happiness.
5. F'[RST DATA ON HAPPY LIFF_,-F.XPF_L~ANCY
Life-expectancy in nations can be computed in several ways. The variant used here is life-expectancy at birth. This implies that infant mortality has a considerable effect, n Data were obtained from the Un Demographic Ye, aflxmk (UN 1993, table 21).
Happiness in nations can be assessed in different ways as well. As we have seen above, the most currently used question is a single item about how 'happy' one would say one is. Average scores on that question are available for 48 nations. 12 Average life-satisfaction is available for 42 nations, and Affect Balance (the best choice) only for 39 nations. High intercon'elations suggest that these three indicators measure essentially the same thing) 3 Hence I will use the best available one for this exploration, that is: the happiness item.
The data are presented on appendix 1. The first and the second column present respectively standard life-expectancy and average happiness in these countries in the early 1990's. The third column displays the inclusive score of 'happy life-expectancy' (HLE).

32 RUUT ~ V E N
U
~P, JI.
i 2,S'
m
O
m
h
a
m ~
W l r l t
~ b INn �9
d
I
I p
w
Exhibit 4. Plot of average length-of-life by appreciation-of-life in 48 nations early 1990's.
5.1 Level o f happy life-expectancy in 48 nations early 1990's
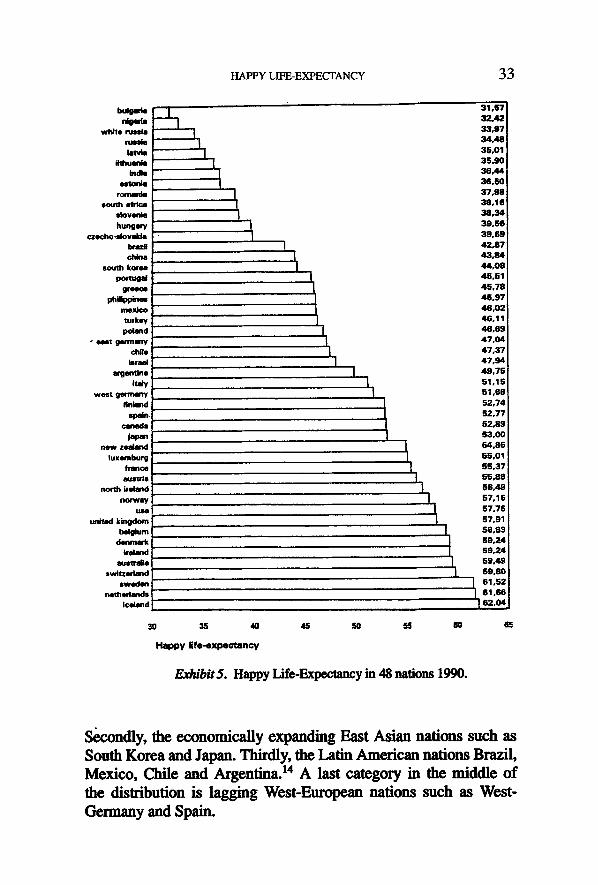
The bardiagram in exhibit 5 presents the nations in order of their HI .1~. score.
The lowest scores appear in the two least developed nations in this set, that is in India and Nigeria, and in the formerly communist East European nations of Bulgaria and Belarus (White Russia).
The highest scores are observed in rich West European nations, in particular in Iceland, the Netherlands, Sweden and Switzerland. Australia also qualifies well on the fifth place in this rankorder.
In the middle we see four categories of nations. Firstly, the luckier East-European countries, such as former East Germany and Poland.
H A P P Y LIFE-EXPECTANCY 3 3
r,~eda wh~o nmde
m latvia
~ h u m i kndla aerobe ~.
roma~a
e~vml~
south korea
9 ~
t ~ k ~ ~ d
- e ~ t ~ y cl'~e
west 9 ~
canada
luxmburg ~rance aus~s
norm llelancl norway
usa u~tad k~Hom
t)*~um denmark
tr~and au,t~ie
sw~zerla~d sweden
nethaHands Iceland
I I
I I
I
I I
I I I
I I I
J I I
31,67 32.42 33,97 34,48 35,01 35.9O 36,44 36,50 37,98 38,16 38,34 39,66 39,69 42.87 43,84 44,08 45,51 45,78 46,97 46,02 46,11 46,69 47,04 47,37 47,94 49,75 51,15 51.88 52,74 52,77 52,89 53,00 54,85 55,01 55,37 55,88 56,49 57,16 57,76 57,91 58,83 59,24 59,24 59,49 69,80 61.82 61,66 II 152.0,,,
30 35 40 46 50 5S 60 6S
Happy l i fe-expectancy
Exhibit 5. Happy Life-Expectancy in 48 nations 1990.
Secondly, the economically expanding East Asian nations such as South Korea and Japan. Thirdly, the Latin American nations Brazil, Mexico, Chile and Argentina. TM A last category in the middle of the distribution is lagging West-European nations such as West- Germany and Spain.
34 RUUT VE~rHOV'~
~ 4 m c k a r a c t e r t g t ~ ~ ~ / / L E
onset
N
Material l m u e n c e
Income per head: * purcha~ng power 1989
Standard of living * malnutri t ion: % < 2500 c a i m ~ * % w/thout safe water �9 r o o l ~ per dwe-Ilir~
+.78 �9 43
--.41" +.07 42 -- .65"* --.13 39 + .46 ~ + .04 42
See=rity
* ~i.l-der rate; medical registration --.48"* --.32 * lethal acc ide~: medkal ~ o n --.67"* --.55"* * maternal deaths --.38" --.20
I .e~ ~mmay �9 imi,:m~ of com,pt~ --.Sl'" --.46"
Im.cm-lty * state expenditures in ~ GDP +.57 +.15
39 39 47
35
34
P r e ~ o m
Political f reedom * re~rpe~ of poli t ical r i ~ +.55"* +.14 47 �9 respect of civil rights +.60** +.18 47
Perr, oaal f reedom * of marriage: -__,:r162 divorce +.35 +.16 42 �9 o f ~ : abor t /on avafllh~e +.32 -- .07 38 �9 ofum~tltty:, s eeeptance o f h o n m u m ' u ~ t y +.72"* +.38" 42 * to d i tpme of own life: ~___,y>rptance m i d d e +.43* +.16 42
Self-perceived f r eedom �9 in life +.49"* +.25 42 * at work +.67"* +.54"* 41
Combined freedom factor + .73* �9 +.37" 39
So,=t,l e q u l ~
Income/aequ~/ty * dtspenkm in iacom~ smti~ics - .10 * ~ tn w.Jf ra ted family income -- .17
+ .07 +.05
41 40
/aequ~ty ~ w~m~m e m p o ~ r m e n t index --.68 ~176 --.19 37
~ Lwe-exeecr,, ,~-~ :35
Caltm~ dlmate
* Education * ~ l i terate + A 5 * " +.21 47 " school enrolment ratio +.37 +A3" 38
lnfornatlon " ~ p c +.46" --.04 32 " ' IV receivers pc +.57'" --.18 42
" belief in God +.24 +.30 37 * ~ identification +.11 +.12 41 * realiom participation -.O3 +.14 38
Value orientation * ind/videaIimm +.74"" +.53 32 * power distance --.63"* --_13 32 * emmcml/~ty - .13 - .40 32 * uncena/my avoidance --28 --_16 32
Social dlautte
T o ~ * ~ attitudes to social categories --.67"" --.43" 38
Trust * trim in family +.27 +.32 42 ~ tru~ in mmpatrio~ +.11 +.25 42 ~ trust in institutiom - . 0 5 + .14 30
s o ~ ~ * in work: unemployment +.40** +.41" 42 * in volnntaff mmciaflmec membenddt~ +.53"" +.22 34
PeacduIn~ " m/]itmy dominance in u)ciety --.19 --.27 41 * milttany expenditure - . 1 6 --.18 41
Population pressure
Population den~ty - .03 +.04 42
Population growth +.16 -.-.07 39
Urbanization +.57 *o +.24 40 --.74"" --.24 30
Infcmnaflza/inn +.80"* +.18 42
IadJvidealbatt~ +.68"" +.12 38
Exh/b/t 6. Correlates of Happy Life-Expectancy in 48 nations 1990.
36 RUm" V ~ V ~
The range in this nation set is between 30 and 60 'happy years'. Probably the top of the present day world is better representated than the bottom in this collection.
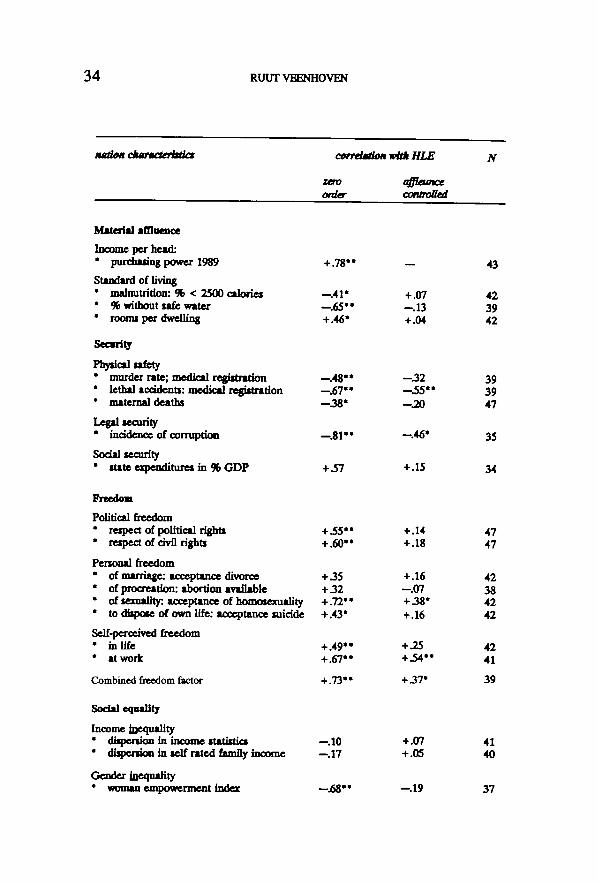
5.2 Correlates of happy life-expectancy
The next question is of course whether these differences in 'appar- ent' quality-of-life in nations have any correspondence with the earlier mentioned notions of 'assumed' quality-of-life. Is HLE higher in the nations that perform best on these standards? To answer that question we inspected the statistical relationship of happy life- expectancy with various nation-characteristics that are cmrently seen as required for a good life. From the limited number of indicators that are available for this nation set we selected the ones that denote cherished traits the most.
Separate correlates
Variables and findings are presented in exhibit 6. The first column in that exhibit denotes the nation characteristics considered. Detail about source and measurement is presented in appendix 2. Corre- lations with happy life-expectancy are presented in the columns 2 and 3, in column 2 the zero order correlations and in column 3 par- tial correlations that control the effect of economic development as measured by GDP. The last column mentions the number of nations involved in these correlations. Due to missing values, the numbers differ considerably. As a result, the nation-set differs somewhat from variable to variable.
Expected relationships A first look at exhibit 6 shows that several assumptions about liv- ability features of nations are confirmed. Happy life-expectancy is indeed higher in the nations were people live most securely, and where the material level of living is highest. This is in agreement with common 'materialist' assumptions.
Happy life-expectancy is also higher in the most free and indi- viduali.~tic nations, which is in line with 'liberal' expectation. The observed mlation.~hips with enligtenment and tolerance fit liberal view as well.
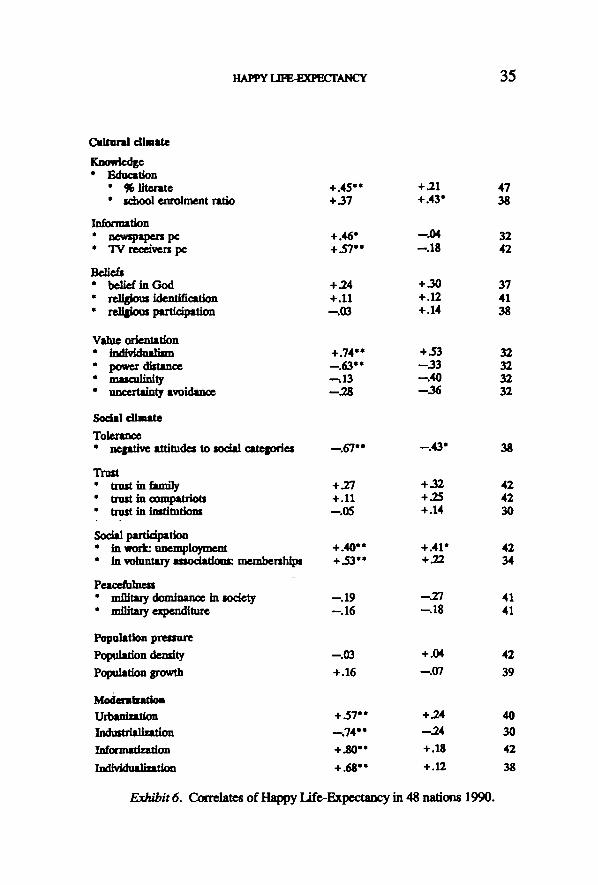
Hmrv ~ ~ , ~ v 37
I-II.R is also higher in the more equal nations, at least were gender equality and educational homogamy are concerned. This confirms cm'tent 'egalitarist' expecr
Further, we see a positive correlation with participation in vol- untary organisafions, which supports 'communitarist' assumptions about livability. Yet we will see below that other findings are contrary to that view.
These most livable nations are typically the most modem nations in the present day world. This will be no surprise for believers in progress, though it will anoy prophets of doom.
Unexpected relationslu'ps Yet there are also findings that do not fit ctment assumptions.
FLrstly, Ill .E is not related to social security and income equality. This is contrary to common 'egalitarist' assumption. Even more surprising in that context is the positive relationship with unem- ployment. This effect is caused by the former communist countries, where employment was still high at the time of the investigation. When these cases are omitted, we see no relationship. This may mean that unemployment has some positive consequences which balance out the negative ones) s
Further we do not see siLmificant correlations with the measm'~ of trust and religiousness. This is contrary to current 'communitarist' thinking.
Noteworthy is also that HI.I~. is not lower in nations characterized by military dominance and population pressure. Apparently, we can live with these conditions.
Control by economic affluence Several correlations are reduced to insignificance when economic prosperity is controlled. This is the case with social security, political freedom, social equality, social participation and trust. That can mean that these societal qualities have no independent effect, but it is also possible that thi~q control procedure is too severe, in that common variance with economic prosperity is not necessarily all causated by that matter.
In one case there is evidence that the partial correlations are valid. This is the case of 'social security'. Cross temporal data have shown that l i f e - e ~ c y and happiness did not rise more in the nations
38 RUUT VEENHOVEN
were state-welfare expanded most since the 1950's (Veenhoven & Ouweneel 1994).
Probably, the observed correlations do not fully reflect the true effectsizes. The measures are far from perfect, therefore the correla- tions will be reduced by error.
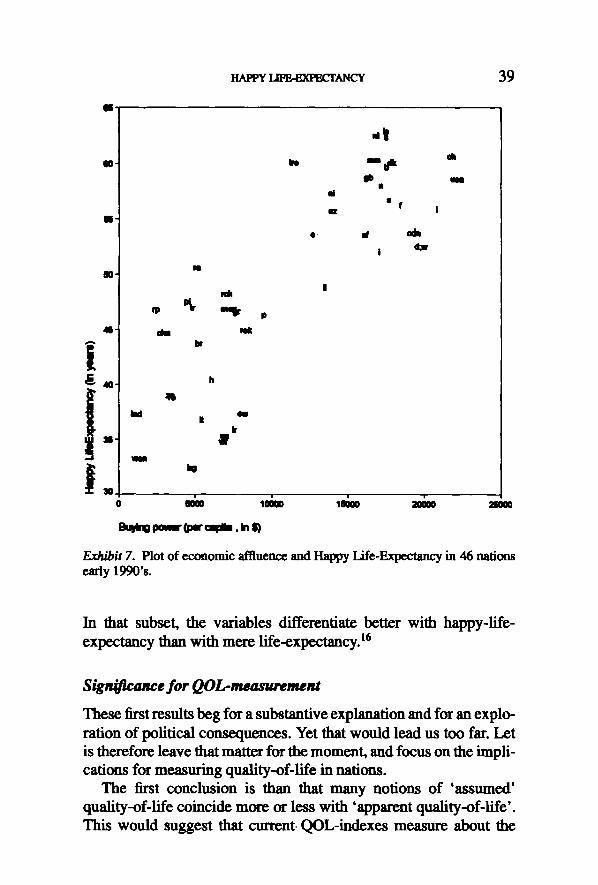
Shape of relationships Next to the size of these statistical relationships, we also considered their shape. In the case of economic prosperity we found a convex pattern, which is indicative of diminishing returns. The scattergram is presented on exhibit 7. Similar shapes were observed in the rela- tionship of HLE with urbanization, informatization and safety.
Most of the patterns are more or less linear, for instance in the case of freedom. See exhibit 8. IJinear relationships were also observed with gender equality, schooling, social participation and tolerance. This suggests that these societal qualities have not yet reached satu- ration levels.
Causa/ity One must realize that positive correlations do not prove that these nation qualities are conductive to long and happy living. The statis- tical relationships can also reflect effects of the latter on the former. For instance, a healthy and happy labor force is likely to generate more economic prosperity. Though it is unlikely that all correlations are fully caused that way, the real benefits of these alleged nation virtues could be more modest than the correlations suggest.
Joint correlation
Due to mi~ing values we could not assess the joint effect of all the variables in exhibit 6. The best we could do was compute vari- ance explained by seven variables in 26 nations. These variables are: income per head, social security, political freedom, literacy and gen- der equality. Together these variables explained 70% of the variance in HLE in this dataset.
The same variables explain even more variance in standard life- expectancy alone (84%), but less in happiness separately (36%). When we consider rich nations apart, a different picture emerges.
~ , ~ ~ - ' Y 39
4S
GO-
I l l -
0 0 -
4$-
i' S "
di
Im a m b 4 ( dt
Ib a m s
d �9 f - . I
I
h
W I'
o mo lmo ,~oo - - - ' - - , 2mOO
atom ~ t t g ~ t ~ . ~
Exh/b/t 7. Plot of economic affluence and Happy Life-Expectancy in 46 nations early 1990's.
In that subset, the variables differentiate better with happy-life- expectancy than with mere life-expectancy) 6
$or QOI m.m,rement
These first results beg for a substantive explanation and for an explo- ration of political consequences. Yet that would lead us too far. Let is therefore leave that matter for the moment, and focus on the impli- cations for measuring q-ality-of-life in nations.
The first conclusion is than that many notions of 'assumed' quality-of-life coincide more or less with 'apparent quality-of-life'. This would suggest that current QOL-indexes measure about the
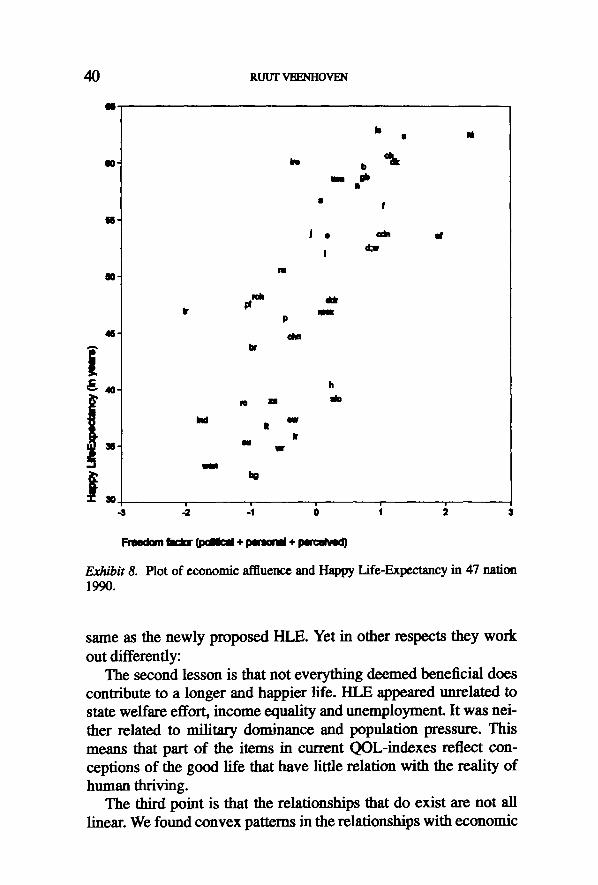
4 0 R U U T V I ~ / q r l O V E N
I I
W"
16"
tin"
48"
Im
Imm
J �9
!
$ R
Ix"
P
Im
b % p
a xl'
nl
Ima
u
m
u l
Into
m II
Ir lift
h
#do
~ a o m Imclor (pom~ + I ~ M I + p 0 n ~
Exh/b/t 8. Plot of eeonomic affluence and Happy Life-Expectancy in 47 nation 1990.
same as the newly proposed I-ILE, Yet in other respects they work out differently:
The second lesson is that not everything deemed beneficial does contribute to a longer and happier life. I-ILE appeared unrelated to state welfare effort, income equality and unemployment. It was nei- ther related to military dominance and population pressure. This means that part of the item,~ in current QOL-indexes reflect con- ceptions of the good life that have little relation with the reality of human thriving.
The third point is that the relationships that do exist are not all linear. We found convex patterns in the relationships with economic
~ ~ 41
affluence, urbanization, informatization and safety. This underlines the earlier point that ever more of the good is not always be_~tter~_.
The forth thing to note is that not all correlation8 are equally strong. For instance, personal freedom seem~ more conductive to long and happy living than income equality. This underscores the earlier objection that current QOL-indexes do not acknowledge differences in importance of the merits they list.
6. USEHR2q~S OF HLE
We started this paper with the quest for a comprehensive indicator of quafity-of-life in nations. Is HI~F~ the promished measme? Does it qualify as an equivalent to economi~'s GNP? Is it better than current QOL-indexes? Let us summarize its theoretical relevance, political appeal and practical usabih'ty, and recapitulate the differences with current QOL-indexes.
6.1 Theoretical bearing
I-lI~ is a well interpretable indicator. Contrary to current QOL- indexes, it measures a clear phenomenon, that represents a specific quality concept in a comprehensive way.
C/ear denotat/on HI rE measures the degree to which people five long and happily in a country at a certain time. As such the indicator has a clear substantive meaning.
This is not the case with current QOL-indexes. These reflect the degree to which some bunch of desiderata is met. Interpretation differs with contents of the bunch and is always uncertain.
Conceptually specific The degree to which citizens live long and happily in a country denotes a specific conception of quality-of-life/n society. It manifests societal output in "apparent' livability.
Current QOL-indexes are conceptually less specific. Most do not d~fmguish between quality of society and quality-of-life in society. The few that claim to focus quality-of-life ' in' nations, sti l l mingle items on 'input' and 'output', or 'assumed' and 'apparent' livability.
42 strtrr vm~-rtov~
The correlations in exhibit 6 showed that happy life-expectancy measures something different indeed. Though most of the assumed nation-qualities correlated well with happy life-expectancy, some did not. For instance not income equality, and unemployment.
Inclusive Long and happy living of citizens is an all-encompassing manifes- tation of this specific quality-of-life concept. Happy life-expectancy is hence a comprehensive measure of 'apparent' livability.
Current QOL-indexes do not cover a conception inclusively. They typically provide a convenience sample of features deemed indica- tive of something good.
6.2 Directional meaning
As happy life-expectancy measures societal 'output' specifically, it does not mix means and ends. Therefore it provides more ground for policy evaluation.
Focus on ends Happy life-expectancy denotes the degree to which endvalues are realized in society, and does not involve means. As such it is well suited to evaluate long term effects of social policy.
Current QOL-indexes typically mix means and ends, such as 'healthcare' and 'health'. In policy-evaluations this leads into con- tamination. When means are in the effect-measure, the measures indicates at best to what extent the instnmaental goals are achieved. Not whether that serves any ultimate end.
Gauge for means As happy life-expectancy is a measure of 'apparent' quality-of-life specifically, it can be used to calibrate notions of 'assumed' quality- of-life. As such it can inform social policy about the best means to create a livable society.
In exhibit 6 we have seen correlations between happy life-expec- tancy and several nation-characteristics believed to be beneficial. Happy life-expectancy was indeed positively related to most of these, but not in equal terms. For instance, it related more to to gender equality than to income equality. This is worth knowing in setting priorities.

rL, a ~ ~ 43
Some of the believed features of livability were not related to happy life-expectancy at all, for instance not unemployment. So enforcing full employment will probably not add to long and happy riving of the citizens, even though it may still be desirable from other points of view.
Current QOL-indexes do not allow a reality correction of assump- tions about the good life, because they are partly based on presum~ don themselves. Therefore they are of little help in selecting the best ways to a more livable society. At best they indicate success in the way followed.
6.3 Political appeal
The end values happy life-expectancy refers to are fairly universally recognized and endorsed. Their appeal is likely to grow in the future.
Universal value Long and happy living is a widely appreciated value. This appears not only in preference for tales that conclude this way, but also in the results of survey studies. Health and happiness are typically the most mentioned end values. There are good reasons to assume that adherence to these values is more or less implied in the human condition. Glorification of death and suffering may exist everywhere, but is mostly marginal. Happy life-expectancy appeals to the vast majority.
Upcoming value The attractiveness of long and happy riving is even likely to become greater in the future. Growing individtmlizafion adds to the value attributed to personal health and happiness.
On the other hand, the traditionM deficit measures loose relevance in the course of social progress. The more money, education and freedom we get, the less the attraction of more of the same is. A related development is that public demand diversifies when the most common deficiencies are satiated. This leads to more encompassing notions of progress as well. One of the manifestations of thi~ trend is value shift to 'post materialism' in Western society (Inglehart, 1990).
44. RUUT VEENItOVEN
6.4 Metric quality
Next to its theoretical and political relevance, HI.F. seems to have good metric properties. The indicator combines good substantive validity, with good differential- and good concurrent validity.
Substantive validity Happy life-expectancy is presumed to reflect the degree to which people live long and happily in a country. There is little reason to doubt it does. The life-expectancy com[ument can hardly measure anything else than real longevity. At its worst it can measure that matter imperfectly, but the problem is then reliability rather than validity. There are more qualms about the validity of the happiness component. However, we have seen in section 2.3 that none of the misgivings has been proven true as yet.
Discriminative validity Happy life-expectancy differentiates well. As we have seen in exhibit 5, happy life-expectancy varies between 32 and 62 in this nationset. Probably, scores below 32 could be observed in some countries that are not included in this dataset. Differentiation is not haphazamt, but systematic.
Concurrent validity The correlations in exhibit 6 showed sensible relationships with some nation qualifies. The better the living conditions in a country, the higher the happy life-expectancy. Together, affluence, literary, freedom and gender equality explained 70% of the variance in happy life-expectancy in nations. This indicates substantive relevance as well.
6 .SLimi~f lons
HIrE is a longt~m output measure, which is not bound to specific inputs. As such it is of little help in daily piecemeal decision making. Next to this substantive limitation there is the practical problem that data on happiness are limited as yet.
Substantive limitations The strengths of HLE are also limitations. Because it is a long term measure, it reacts slowly. Because it is an ultimate output measure, it tell us little about required in rgiL
HI F~ reacts slowly, because environmental change affects life- expectancy typically in the long run, at least ffno disaster is involved. The happiness component is probably more sensitive to change, trot still happiness levels tend to be fairly stable. So, decreasing livability of society will manifest in HLE only with considerable delay. As such it is more analogous to climate change than to the weather.
A related problem is that the reason for changes in HI.F. will not always be obvious. Because it is an ultimat~ outtmt measure, it tells us little about required input. As many effects can possibly be involved, there will always be discussion on why livability changes the way it does.
Consequently, the measure is not suited for early warning or for choosing between specific policy options. It strength is in the evaluation in retrospect.
Data shortage At this moment, a more practical problem is in the required data on average happiness. The data-quality is less than ideal, and the quantity is still limited. Not only is the number of countries small as yet, but also is there as yet little sight on the development of timeseries.
7. CONCLUSION
Quality-of-life in nations can be assessed by prevalence of condi- tions deemed beneficial (assumed quality-of-life) and by the degree to which citizens thrive (apparent quality-of-life). The former con- ception is more problematic than the latter.
Hour/shing of people in a nation manifests most completely in the degree to which they live long and happily. This can be measured comprehensively by combining registration data on length-of-life with survey data on appreciation.of-life in nations. The resulting scores of 'happy life-expectancy' provide a useful social indicator.
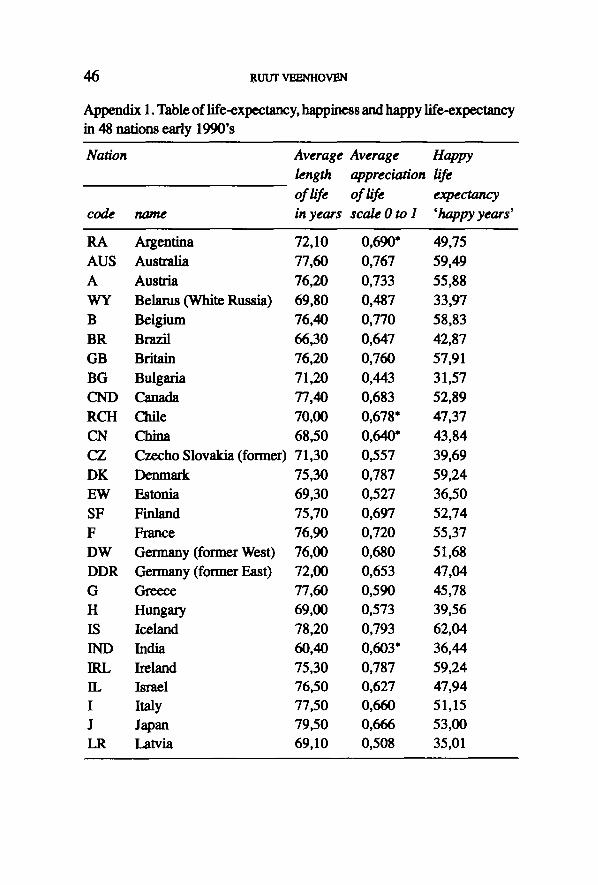
46 R ~ v ~ o v ~
Appendix 1. Table of life-expectancy, happiness and happy life-expectancy in 48 nations early 1990's
Nation Average Average Happy length appreciation life of life of life expectancy
code name in years scale 0 to 1 'happy years'
RA Argentina 72,10 AUS Australia 77,60 A Austria 76,20 WY Belarus (White Russia) 69,80 B Belgium 76,40 BR Brazil 66,30 GB Britain 76,20 BG Bulgaria 71,20 CND _Canada 77,40 RCH Chile 70,00 CN China 68,50 CZ Czx~ho Slovakia (former) 71,30 DK Denmark 75,30 EW Estonia 69,30 SF Finland 75,70 F France 76,90 DW Germany (former West) 76,00 DDR Germany (former East) 72,00 G Greece 77,60 H Hungary 69,00 IS Iceland 78,20 IND India 60,40 IRL Ireland 75 ,30 IL Israel 76,50 I Italy 77,50 J Japan 79,50 LR Latvia 69,10
0,690* 0,767 0,733 0,487 0,770 0,647 0,760 0,443 0,683 0,678" 0,640* 0,557 0,787
0,527 0,697 0,720 0,680 0,653 0,590 0,573 0,793 O, 603*
0,787 0 627 0660 0,666 0,508
49,75 59,49 55,88 33,97 58,83 42,87 57,91 31,57 52,89 47,37 43,84 39,69 59,24 36.50 5274 55.37 51.68 47.04 45.78 39,56 62,04 36,44 59,24 47,94 51,15 53,00 35,01

n A ~ ~ A N C V 47
Appendix 1. Continued
Nation Average Average length appreciation o f life o f life
code name in years scale 0 to I
Happy
expectancy 'happy years'
LT Lithuania 70,40 0,497 35,90
L Luxembourg 75,70 0,727 55,01
MEX Mexico 70,80 0,650 46,02
NI Northern Ireland 74,00 0,763 56,49 NZ New Zealand 75,50 0,722 54,86 NL Neth~dat~ 77,40 0,797 61,66 WAN Nigeria 50,40 0,643 32,42 N Norway 76,90 0,743 57,16 RP Phil'mpinc8 66,_30 0,693 45,97
PL Poland 71,10 0,657 46,69
P Portugal 74,60 0,610 45,51
RO Romania 69,90 0,543 37,98
SU Russia 67,60 0,510 34,48 ZA South Africa 62,90 0,607 38,16 ROK South Korea 71,10 0,620 44,08 SLO Slovenia 71,00 0,540 38,34 SP Spain 77,60 0,680 52,77 S Sweden 78,20 0,787 61,52 CH Switzerland 78,00 0,767 59,80 TR Turkey 66,50 0,693" 46,11 US United States of America 76,00 0,760 57,76
Life-expectancy: Data from tiN Demographic Ye.arlxx~k 1993 Data from World DetA_hase of Happiness (Ul~m 1996), tables l.l.la
and l.I.Ib �9 Probably too high. Score based on samples in which poor rural population was un&,r ~

48 RUUT V E ~ O ~ N
i 1! q~
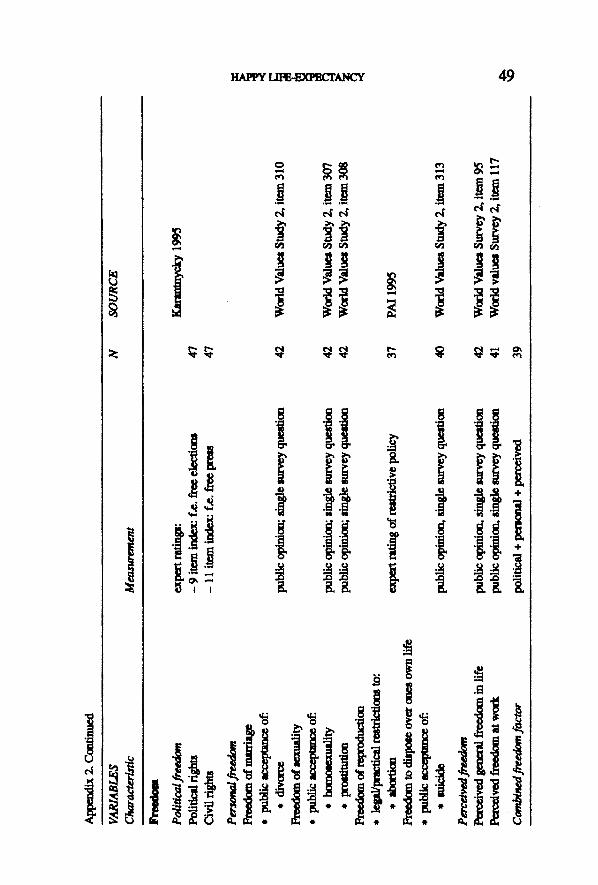
HAPI'Y I . a ~ X ~ t A ~ 49
r ~
g
ii i!!
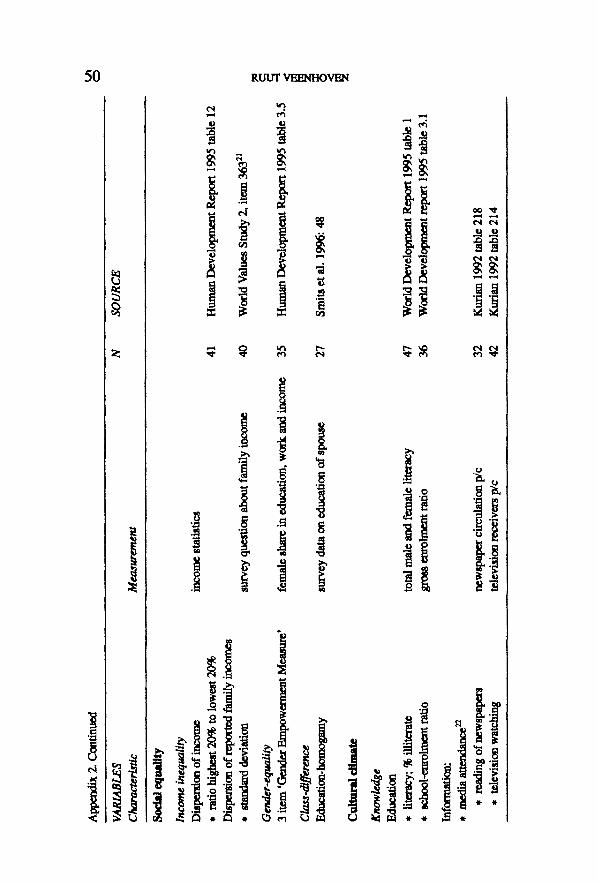
50 Rtm'r ~ v ~
e4
qm
r
:~i ~ ~
oi! ! �9 ii
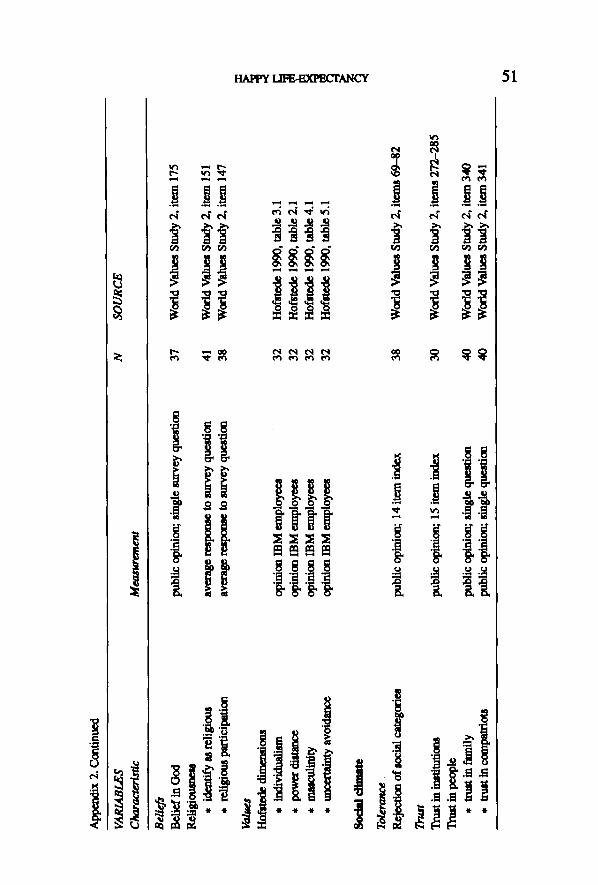
H A P P Y ~ 51
1 !!! lJ
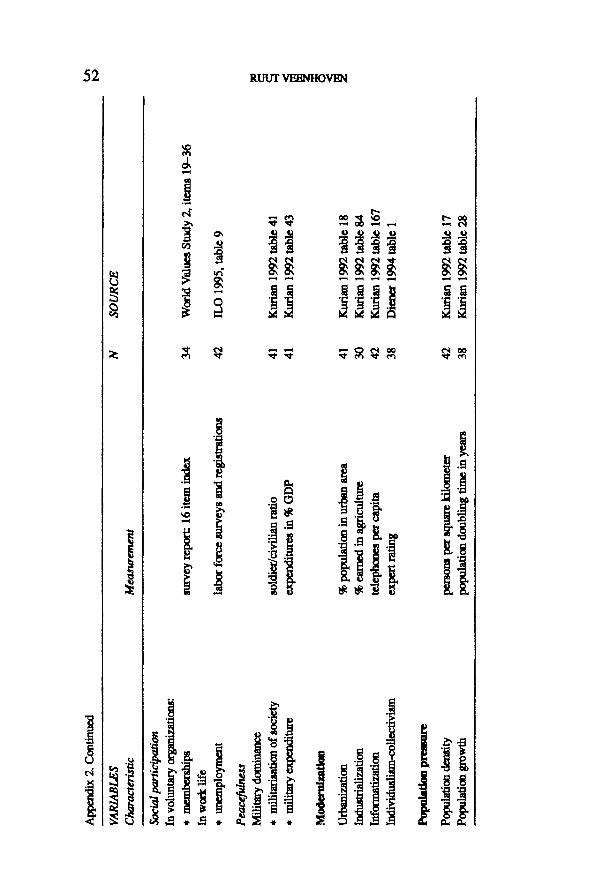
52 Rtrtrr vm,~nov~
I
er
O"2
iii!.
H~J~'V L e ~ e x ] ~ c r ~ v 53
NOTES
This ~ was ~ during my s~y at the W'msemdmfts Zenlrum fur Sozial- wissemchaft Berlin, Germany. An ea r l~ vendon w u ~ at the Internation- al Conference on Quality-of-Life at the University of Northern Brili~ Columbia, Prince (kor~, Omad~ August 1996. 2 The study reported in this paper is part of a Ixoader research pmgramm on r n~tional differences in quality of life at Erasmus Univef~. Other investigators are Joop Ehrhardt, Pieuika Okma, Pier Ouweneel and Peggy Schyns. An t~ Kunst sdded also to this paper by his valuable ~ 3 The Human Development Index is also available in a ve~ion with gender equality included, called 'Gender-sensitive HDI'. See Human Development Report 1992 table 1.3. 4 The Human Development Index acknowledges declining utility of wealth, by 'di~zmting' income above average levels (UNDP 1995: 134). s The f lue 'quality-of-life in nations' has a somewhat broader cocmotafion thaa 'livability of nations' or 'habitability of the nations'. The lJ,t~_ eXlXe~ons refer primarily to a fit with the needs of inhabitants. The form~ ~ o n also d e a o ~ moral and esthetical qualities of the citizens' life. As such it is closet to concep- lions of 'ideal quality' of society (mentioned third). I-Iete, the term 'quality-of-life in natiOOa' ill uaed in the limited ~ of 'livability' of natiofl8. 6 For a ~u~nx~n of the adaptive functions affect see Morris (1992) and Neute (1990). Affect and cognition developed only in species that can choose how to live and where. The faculties would be of little use for plenty. 7 The diffegence between subjective 'ill-being' and 'well-being' was ~ b y Hesdey & Wearing 0984). s The Affect Balance Scale (ABS) has at least four advanta8~ in a cross- national context. 1) ABS is less vulnerable for language differences than the ~ngle happiness- and ~ac t i on - i t ems . Because ABS involves 10 item& possi- ble distortiom in translation and understandin~ are l i l l y to nemrMize each oth~ 2) ABS is alao less vulnerable for deairability ~ o n , end ~ aim le~ vul- nerable for differential ~ o n of that kind. ABS inquires about recent affecfive experience, which a more tangible m~-~ than general happiness and satisfaction. Aho is admiuing that one felt bad during the last few weeks te~ threatening than avowing oneself as unhappy. 3) ABS does not require acquintance with ccmcep~ retch as 'happiness' or 'lml~faction'. Though single items on happiness do not appear to be vulnentble for these ~ o m either ( V ~ e n 1993, chapter 5), use of ABS is still safer. 4)ABS ~ t h e affective ~ of ~ (hedonic level), which may reflect the fit between individual needs and societal supply better than cognitive appraisals of life (contentment). ~ IRm.r_ variant could be mote ~ u ~ t i b l e to cognitive accommodation. Affective apprai~ is more direct and 'unreasoned'. 9 The first cro~-national ~rveys involving items on satisfaction wea'e initiated in the USA and effected by Gallup Intemafion~ In 1948, nine wesU=n nations wexe surveyed (Buchanan & Cantril 1953). In 1960 and 1975 wodd-ma'veys were performed (C__,anu'fl 1965, Gallup 1975). These were once-only projec~ Periodic quality-of-life surveys were held in most of the rich m~ons ~ the 1970's. Initially, these surveys provided little opporlunity for crm~nafional comparison of satisfacticm, because itema differed too much. Over the year~ the pool of corn-
5 4 RUUT VEENHOVEN
parable items has grown, both as a result of spoutaneoes consensus and ~liberate effort to develop standard questions. In 1991, the Internatlonal-Social-Survey- Program (ISSP) included the same set of questions on satisfaction in 12 nations. In the early 1980's the first World Value Survey (WVS 1), took place in 22 nations. The standard questionnaire of that survey involves three items on happineu. In the early 1990's WVS2 was held in 43 nations. WVS 3 is planned to cover about 75 nations at the Ixtrn of the ceatm'y. 10 SO called 'Sullivs.u i n c h . ' . ~ 8 t ~ [ ~ l i f~- -e~3q~cy at a c~tain a ~ of a certain birth-cohort is calculated by means of a conventional life.table. To that end it is estimated how many persons in that cohort will survive until a certain time; e.g. their 70th birthday. On that basis it is calculat~l how many years are lived by persons in that birth-cohort at a certain age, f.e.: the number of years rived between the 70th and 71 th birthday. The total number of years rived over all agegroups equals the life-expectaacy. Next it is estimated how many of these years are lived in bad health. To that end, surveyd~t~ on prevalence of healthlx-oblems in specific age-categories are used. E.g. ff survey data show that of the 70-years old 50% is in bad health, the number of years lived in bad health can be estimated as r half. The total number of years lived in bad health equals the 'unhealthy life- expectancy'. Subtracting this estimate from the standard life-expectancy yields the 'health' life-expectancy.
This method makes sense if the purpose is to estimate the healthy life- expectancy of a particular person at a certain age, which is typically the case in medical research. Yet specification by age is not necessary if the purpose is to estimate general life-expectancy of the population, which is the case here. For our purpose, age specification would be required only if the age compomtion of the lifetable popelation differed considerably from the age-compositkm in the survey. For the sake of simplicity I assume that such diffeamces are negligible.
Age specification is also more ~ in the case of 'health' life-expec- tancy than in the case of 'happy' life-expectancy. Health does indeed deteriorate with increasing age, but happiness does not (Okma & Veeahoven). u One cotdd object that high infant mortality does not ~ally signify poor quality- of-life, because it is fairly natural and sometimes even necessary for avoiding overpo~lafion. From that point of view on can better depart from life-expectancy at age 5 or so.
In this explorative study I opt for life-expectancy at birth, both because this conceptually the most consequent and because the other way leads into arbitrary choice. Still I acknowledge that this rigor may involve a blow-up of the differences between developed and under-developed nations. 12 Of the 48 nations of which we know the average report on 'happiness', 42 were surveyed in the context of the World value~ Study 2. All these mrveys involved an identical question, sinmt~! in the same place in the questionaire. The question is: "Taking all thin f, s together, would you say you are: very happy, quire happy, not v,~ry happy, not at all happyT"
The other 6 cases come from various surveys and involved slightly differ- cat rating ~ales. These cases are: Australia, Greece, Israel, Luxembourgh, New Zealand and the Philippines. Scores ,m these items were tran~otmed to scale 0-10 by n~ans of a Thurstone ~ and next Izanaformed lineady to scale 1-4. These procedln'e8 arc deg~'ibed and evalnated in Veeahovr 1993: chapter 7.
~j,p,,, L,nm~-e:u,ecr~ 55
Scores on these items were transformed to scale 0-1 by linear trm~otmafion. ~3 In the World Values Study, overall happiness is meammxi by a ,ingle questi~ ra~d on a 4 sWp sca~ l i f ~ by a ~in~le que~oo ra~i on a I0 step scale and Affect Balance by a I0 item index. Intercorrelations are: Happiness by Lffe~ salisfacfion: + 0.90, Happiness by Affect Balance + 0.61, and Life-satisfaction by Affect Balance + 0.61. 14 SCoreS of Al~e~fina, ChiJe arK! C~ina may be too high..i~e h a p l m sccge8 of these nations are based on samples in whi~ po~ rural [mpulation was under
15 One possible positive effect could be that people can shrink from wage-work, w ~ nnnlo~vatg~l or unfit. This effect is likely to be most protmmged in the l ~ o n s that pair hi oh wo~ c l e ~ with good social 8eculity. 16 Amollg thc poog n~o!18 ~ var iab~ cxplfin sinsle life-expeotancy better (70%) than ~inEle happiness (30%). However among the rich nations they dif- ferentiate more on single happineu (44%) than on single life-expeotancy (24%). This is comprchen~le ff we remember exhibit 4, which showed that poor corm- tries differ mo~ in tile-expectancy then in happiness, and rich countries more in
than in life-expectancy. l~ lvfming vaines estimated: �9 Northern Ireland: between Great Brittain and Ireland ($10.600) �9 CzechoSlovakia: i~e f i e i g h ~ East European nafiot~ ($ 7.420) ts Tbe amount of daily calorie8 needed is 2500. All coqmtr~ at or above that level were coded 0. Cases below coded as numberless than the required 2500. In this d a t ~ t Oily four countries score below that level (India, China, Nigeria, phirq~es). 19 Daga 1980. Some scores seem implausible (Finland 84%, Spain%, Hungary 44%). 20 Square meter per person would seem a better indicator. However, for a lot of nations a,.~ on this m~tt~ are not available. 21 The question about family income was not identical in all countri~. In most cases subjects indicated their income on a 10 step scale, wbere each answer cate- gory was defined in a local currency. In a few cases scales of a diferent length were used (France, USA, Ca~d~_~ Mexico, South Africa, ~ o v A k i ~ ) . These were recoded to scale 1-10. In Romania the answ~ categori~ were not labeled with monetary value~. Respondents indicated their income position from 10owest) to 10 (highest).
In the responses, extremely high incomes cannot be reco~izeck F.e. in Germany the highest income category is labeled: DM 8.000 or more per month. This reduces the dispenion on this meamre. 22 Tbe indicators listed here do not inform about freedom of press. Preedom of press is part of the civil liberty index (see freedom).
56 Rub'r v m m o v ~
REFERENCES
Bradbum, N. M.: 1969, "Fne Slxucmre of Psychological Well-Being (Aldine, Chicago, USA).
Brid~man, P., D. Coates and IL Janoff-Bulman: 1978, 'Lottery winners and accident victims: Is happiness relative?' Journal of Personality and Social Psychology 36, pp. 917-927.
Diener, E., M. Diener and C. Diener:. 1995, 'Factors ixedicting the subjective well-being of nations', Journal of Personality and Social psychology 69, pp. 851-864.
Diener, E., K lVL Suh, tL Smith and L Shao: 1995, 'National differences in r~xx~d subjective well-being, why do they occur?' Social Indicators Research 34, pp. 7-32.
Diener, E. and E Fujita: 1996, 'Social comparison and subjective well-being', in B. Bunnk and IL Gibbons (eds.), Health, Coping and Social Comparison (Erlbaum, USA).
Drewnowski, J.: 1974, On Measuring and Planning the Quality of Life (Mouto~ The Hague).
Durkbeim, E.: 1897, Le Suicide: ! ~ de Sociologie (Suicide, a Sociological Study) (~can, Paris).
Eastedin, 1~ A.: 1974, 'Does economic growth imtxove the human lot? Some empirical evidence', in P.A. David and W.R. Melvin (eds.), Nations and House- holds in Economic Growth (Stanford University Press, Paolo Alto California, USA).
Edgerton, R. B.: 1992, Sick Societies; (~tllenging the Myth of Primitive Harmony (The Free Press, New York, USA).
Esping-AMersen, G.: 1990, Three Worlds of Welfare-Capitalism (Polity Press, London).
Estes, 1L: 1984, The Social Progress of Nations 0Weager, New York, USA). Headey, B. W., E. L Holstrom and A. J. Wearing. 1984, 'Well-being and ill-being:.
Different dimensions?' Social Indicators Research 14, pp. 211-234. Headey, B. M. and A. J. Wearing:. 1992, Understanding Happiness. A Theory of
Subjective Well-being (Longman Cheshire, Melbourne, Australia). Hofstede, G.: 1990, Cul~ea and Organizations (McGraw Hill; Loodo~ UK). ILO:. 1995, Yearhook of Lahor Stali~cs, 54th issue (International Lahor O~,ani-
7nfion, Geneva). ILO:. 1996, The Costs of Social Security:. 14th International Inquiry 1987-1989
(Int~-national Labor O~miTatlon, Gl~lcva, Switze.~ls~). lnglehart, I~: 1990, Culture Shift in Advanced I~j~n'ial Society (Princeton
University Press, Princeton, NJ, USA). Kacapyr, E.: 1996, 'Index of well-being', American demographics, February 1996. Karantnycky, A., C. Cavanugh and J. Vmn (ods.): 1995, Freedom in the World
1994-1995. The Annual Survey of Political Rights and Civil Liberties (Freedom House, New York).
Keniston, IC: 1968, Young Radicals: Notes on Committed Yotlth (Harcourt, New York).
Kunst, A. E., P. T. Okma-VanKeulen and R. Veenhoven: 1994, 'Happy life expectancy in 5 European countries', Paper presented at the XIII World Congress of Sociology, Bielefeld, Germany, July 1994.
Kurian, G. T.: 1992, 'The new book of wodd nmkings', 3rd edition, updated by J. Marti (Facts On File, New York, USA).
Lane, R~ 1996, 'Thejoyles nueket economy',Paper Preaemed at ~ on Vah~ and O r g a n i n ~ at Yale U n i v . , New haven CT April
1996. Liu, B.: 1977, 'Economic and non-econmnic quali~ of life', American Jonmal of
Economics and Sociology 36, pp. 22.%240. Mootz, M. and M. Konin~-Vandea~noek: 1990, 'De mate van welzijn (Degree of
well-being)', Sociaal en Cultureel Planburea~ Cahier 79 (The Hague, Nether- lands).
Monis, D. M.: 1979. Meamn'ing the Condition of the Wodds Poor: The Phymcal Quality of Life Index (Pergamon, New York).
Mon'i& W. N.: 1992, 'A fanctional analym of the role of mood in affective ~ymms', in M. S. Ct~k (ed.), 'Emotion', Review of Peno~ty end Social Psychology nr 13 (Sage, New YoA).
Murphy, H. B.: 1982, Comparative Psychiatry:. The Intematio~ and Intemdtm-tl Di~bu~n of ~ ~ (Sp~ng~, ~-tin).
Neaae, IL M.: 1990, Evolutionary Explanations of Emotion& Human Nature 1, pp. 261-289.
PAI: 1995, 'Relmxluctive Risk: A world wide aaaeaament of women's sexual and maternal health', 1995 Report on Prognum Towards World Population StabiliTa- tion (Popuhtion Action ~mational, Washington, USA).
Robin, J-IvY. ~ K. Ritchie: 1991, 'Healthy lffe-expcctanc~, evaluation of global indicator of change in population health', British Medical Join'hal 302, pp. 457- 460.
Saris, W., A. ~ 1 , and It. Vee~evea (ed~): 1996, Sat/sfact/~/n Europe (Eee~ Univmity Press, Budapest, Hungary).
Schof, J. B.: 1991, The Overworked American (Basic books, New York). Seeman, M.: 1975, 'Alievation studies', in A. Inkeles, J. Coleman and N. Schmelz-
er (r Anmud R_evivw of Sociology 1, pp. 91-123. Slottje, D. J.: 1991, ' ~ the quality of life acrou countries', The Review
of Economics and Statistics 73, pp. 684-693. SmiUh J., W. Ultl~ ~ J. ]..ammef$: 1996, 'De veddaring van vegschilten in
o p l ~ i d i n w g - ~ ~ 65 LaBdl~', Me,Is ~11Maatachappij 71, pp. 41-57. TI: Transpanmcy International: 1995, ' 1995 TI Corruption Index', Press release,
15 june 1995, ~ Intem~onal, ~e~ixL UN" 1995, Demographic Yearbook 1993 (United N~ons, New York). UNDO. 1995, 'Human Development Report 1995', United Nations Development
Programma (Oxford University Press New York, USA). Veeniurven, R.: 1984, Conditions of Happiness (Reidel, Dordrecht). Veonhoven, R.: 1991, 'Is happiness relative7' Social Indi_cJtc~s Research 24, pp.
1-34. Veenhoven, R.: 1992, 'Happiness in nations. Subjective appreciation of life in 56
nations 1946-1992', RISBO, Famtmus University, Rotterdam (see also World Va~hase of Happine~).
Veenimven, R.: 1994, 'Is happinesa a trait7 Teats of the theory that a better society does not maire people any happier', Social Imficatotl ~ 32, pp. 101-160.
Veenimven, R.: 1995, 'The cross national ~ o f ~ . Tern of lxedictions implied in three theoriea of happineas', Social IndicatoN Research 34, pp. 33--68.
5 8 Rotrr v m m n o v ~
Veenhoven, R.: 1996a, 'Developments in satisfaction research', Social Indicator ~ h 37, pp. 1--46.
Veenhoven, R.: 1996b, 'Happiness and Freedom: The merits of multiple choice society', Paper lxesented at the 26th International Conference of Psychology, Montreal, Canada.
Veenhovea, R. and P. Ouweneel: 1995, 'Livability of the welfare-state. Appeeciafion-of-life and length-of-life in nations varying in state-welfare# effort', Social Indicator Research 36, pp. 1-49.
WHO:. 1988, 'World Health Statistics, Annual 1987' (World Health Organization, Geneva).
World Bank: 1995, World Development Report 1995. Workers in an Integrated World (Oxford University Press, New York, USA).
World Database of Happine~: 1996, 'C~t~!ogue of happiness in Nations, 1996 update' (Erasmus Univcl'tdty of R ~ Rotterdam, Netherlands), Intemet site: h t t p ' . / / w w w . e u r . n l / f s w / ~ . h t m l Bookversion: Veenhoven 1992.
WVS 2, 'World Value Survey 2 1990-92, Cumulative file', ICPSR, file 6160 (Ann Arbor, Michigan, USA).
Ziegler, J. A. and C. R. Britfin: 1981, 'A comparative analysis of socioeconomic variations in measuring the quality of life', Social Science Quarterly 62, pp. 303-312.
Erasmus University Rotterdam and Utrecht University Postadress: POB 1738, NL3OOODR Rotterdam, Netherlands E-mail: [email protected]~.eur.nl