ict-based dynamic assessment to reveal special education students' potential in mathematics
TRANSCRIPT

PLEASE SCROLL DOWN FOR ARTICLE
This article was downloaded by: [University of Utrecht]On: 28 July 2010Access details: Access Details: [subscription number 907217953]Publisher RoutledgeInforma Ltd Registered in England and Wales Registered Number: 1072954 Registered office: Mortimer House, 37-41 Mortimer Street, London W1T 3JH, UK
Research Papers in EducationPublication details, including instructions for authors and subscription information:http://www.informaworld.com/smpp/title~content=t713707783
ICT-based dynamic assessment to reveal special education students'potential in mathematicsMarjolijn Peltenburga; Marja van den Heuvel-Panhuizena; Alexander Robitzschb
a Freudenthal Institute for Science and Mathematics Education, Utrecht University, Utrecht, TheNetherlands b Federal Institute for Education Research, Innovation and Development of the AustrianSchool System, Salzburg, Austria
Online publication date: 28 July 2010
To cite this Article Peltenburg, Marjolijn , van den Heuvel-Panhuizen, Marja and Robitzsch, Alexander(2010) 'ICT-baseddynamic assessment to reveal special education students' potential in mathematics', Research Papers in Education, 25: 3,319 — 334To link to this Article: DOI: 10.1080/02671522.2010.498148URL: http://dx.doi.org/10.1080/02671522.2010.498148
Full terms and conditions of use: http://www.informaworld.com/terms-and-conditions-of-access.pdf
This article may be used for research, teaching and private study purposes. Any substantial orsystematic reproduction, re-distribution, re-selling, loan or sub-licensing, systematic supply ordistribution in any form to anyone is expressly forbidden.
The publisher does not give any warranty express or implied or make any representation that the contentswill be complete or accurate or up to date. The accuracy of any instructions, formulae and drug dosesshould be independently verified with primary sources. The publisher shall not be liable for any loss,actions, claims, proceedings, demand or costs or damages whatsoever or howsoever caused arising directlyor indirectly in connection with or arising out of the use of this material.

Research Papers in EducationVol. 25, No. 3, September 2010, 319–334
ISSN 0267-1522 print/ISSN 1470-1146 online© 2010 Taylor & FrancisDOI: 10.1080/02671522.2010.498148http://www.informaworld.com
ICT-based dynamic assessment to reveal special education students’ potential in mathematics
Marjolijn Peltenburga*, Marja van den Heuvel-Panhuizena and Alexander Robitzschb
aFreudenthal Institute for Science and Mathematics Education, Utrecht University, Utrecht, The Netherlands; bFederal Institute for Education Research, Innovation and Development of the Austrian School System, Salzburg, AustriaTaylor and FrancisRRED_A_498148.sgm(Received 15 March 2010; final version received 31 May 2010)10.1080/02671522.2010.498148Research Papers in Education0267-1522 (print)/1470-1146 (online)Original Article2010Taylor & [email protected]
This paper reports on a research project on information and communicationtechnology (ICT)-based dynamic assessment. The project aims to reveal themathematical potential of students in special education. The focus is on a topic thatis generally recognised as rather difficult for weak students: subtraction up to 100with crossing the ten. The students involved in the project were 8–12 years old.Their mathematical level was one to four years behind the level of their peer groupin regular schools. In special education, teachers often use standardised writtentests to assess their students’ mathematical understanding and computationalskills. These tests do not allow students to use auxiliary resources. In the researchproject, an assessment instrument was developed and used in which items takenfrom a standardised written test were placed in an ICT environment. The digitiseditems were enriched with an optional auxiliary tool that students could use forsolving the problems. Currently, two sub-studies, investigating two differentauxiliary tools for the same set of subtraction problems, have been completed. Inthe first study (n = 37), the tool provided students with digital manipulatives. Inthe second study (n = 43), an empty number line was included in the ICTenvironment. In both studies the students’ scores in the ICT version of the testitems were compared with the standardised written version of the test items. Theresults of both sub-studies show that the students could benefit from using anauxiliary tool. Consequently, the ICT-based dynamic assessment could help toreveal weak students’ potential in subtraction. In addition, the studies disclosedthat in the manipulatives study there was a clear preference for direct subtractionprocedures (taking away), whereas in the number line study indirect addition orsubtraction procedures (e.g. adding on) were frequently used as well.
Keywords: mathematics; dynamic assessment; special needs students; ICT
Introduction
When students in special education leave primary school, their mathematical level isgenerally one to four years behind the level of their peer group in regular schools. Thisimplies a serious delay in the students’ mathematical development. However, we haveto realise that the students’ mathematical level is generally assessed with standardisedwritten tests. For example, in the Netherlands the CITO Monitoring Test for Mathe-matics (Janssen, Scheltens, and Kraemer 2005) is a frequently used assessment instru-ment for collecting information about the students’ development. It is characteristic of
*Corresponding author. Email: [email protected]
Downloaded By: [University of Utrecht] At: 13:06 28 July 2010

320 M. Peltenburg et al.
such standardised written tests that they do not allow the use of auxiliary resources.This implies that standardised written tests cannot provide information on whatresources may help students in solving problems. As a consequence, part of thestudents’ mathematical potential may remain invisible.
To collect this missing information, an information and communication technol-ogy (ICT)-based assessment instrument was developed that contains test items takenfrom a standardised test. The digitised items have been enriched with an optionalauxiliary tool that students can use to solve them. In this paper, two sub-studies arepresented, each focusing on a different auxiliary tool for the same set of test items.Both sub-studies investigate whether the ICT version of the test items, including anoptional auxiliary tool, can reveal more about the students’ potential with respect tosubtraction than the standardised test items do.
Theoretical background
On the one hand, this research project on assessing special education students’ poten-tial in solving subtraction problems with crossing the ten is theoretically grounded onknowledge about how children solve calculations in the number domain up to 100, andon the other hand on what is known about applying dynamic assessment and the useof ICT in the context of mathematics education. Both the theoretical perspectivesinspired the development of the dynamic auxiliary tools that were included in the ICTversion of the test items.
Calculating up to 100: strategies and models
In general, subtraction in the number domain up to 100 is a difficult topic for studentsin special education. Based on the students’ results at the end of primary specialeducation, this topic can be considered a final goal, rather than an intermediate goalfor learning calculation (Kraemer, Van der Schoot, and Engelen 2000; Kraemer, Vander Schoot, and Van Rijn 2009). As subtraction up to 100 is a real obstacle in specialeducation, we have chosen this topic as the focus of our study.
There are three basic strategies for calculating up to 100: splitting, stringing andvarying (Van den Heuvel-Panhuizen 2001; see similar classifications used by otherauthors as well: Beishuizen 1993; Fuson et al. 1997; Klein, Beishuizen, and Treffers1998; Torbeyns, Verschaffel, and Ghesquière 2006). Using a splitting strategy meansthat a problem is solved by splitting both numbers in tens and ones. These tens andones are processed separately. Characteristic of a stringing strategy is that the firstnumber is kept as a whole number and that the second number is added or subtractedin parts. A varying strategy is a kind of stringing, but not in a straightforward way. Itimplies flexible processing of numbers, based on number relationships and propertiesof operations, for example, by making use of nearby round numbers (e.g. 59 + 28 =[60 − 1] + [30 − 2] = 60 + 30 − 3) or converting a problem to an easier problem butkeeping the difference the same (e.g. 57 − 29 = 58 − 30) (Van den Heuvel-Panhuizen2001).
Together with these different strategies, different models can be distinguished tosupport these strategies. In fact, each type of strategy matches with a particular typeof model (Van den Heuvel-Panhuizen 2008). Line models such as the empty numberline are suitable models to support a stringing strategy. Groups models such as rods often and blocks of one are more adequate to represent a splitting strategy.
Downloaded By: [University of Utrecht] At: 13:06 28 July 2010

Research Papers in Education 321
The three above-mentioned strategies for solving calculation problems all have incommon that they describe how one deals with the numbers involved: They are eitherprocessed as whole numbers (in the case of the stringing and varying strategies), orthey are split decimally and processed as tens and ones (in the case of the splitting strat-egy). Instead of focusing on how the numbers are processed, one can also describecalculations from the perspective of how an operation is carried out. Several proce-dures are possible. For subtraction problems, Torbeyns et al. (2009) distinguish: (1)direct subtraction; and (2) indirect addition or subtraction. We prefer a classificationwhich includes three different ways of carrying out the subtraction operation. Asubtraction problem like a − b = ? can be solved by: (1) taking away b from a (directsubtraction); (2) adding on from b until a is reached (b + ? = a) (indirect addition oradding on) or subtracting from a until b is reached (a − ? = b) (indirect subtraction);and (3) taking away from a, a number that is different from b but is easier to handleand then correct it afterward (a − [b + n] = ? – n) or changing the problem into an easierproblem by keeping the difference the same ([a + n] − [b + n] = ?) (subtraction bycompensating).1 If a direct subtraction procedure is used, it is possible to apply eithera splitting or a stringing strategy. For indirect addition or subtraction, a stringing orvarying strategy can be used. Subtraction by compensating goes together with varying.
In cases where students have to solve subtraction problems in which the ones digitof the subtrahend (the second number in a subtraction) is larger than that of the minuend(the first number in a subtraction), they can do this in different ways that clearly havea different success rate. The most error-sensitive approach is solving these problemsby a direct subtraction procedure together with a splitting strategy, where one has to‘borrow’ from the tens. For example, 62 − 58 = _; 60 − 50 = 10, 12 − 8 = 4. A frequentmistake in these problems is reversing the digits (in this case, subtracting 2 from 8 insteadof 8 from 2). Some authors call this mistake the ‘smaller-from-larger’ bug (Beishuizen1993). A much less error-sensitive approach is solving these problems by an indirectaddition procedure together with a stringing strategy. For example, 62 − 58 = _; 58 +2 + 2 = 62; so, the difference is 4. Using an indirect addition procedure is, however,not very common in primary special education in the Netherlands.
The two different auxiliary tools that were developed as part of the ICT-basedassessment instrument are based upon the models that match the two basic strategiesfor subtraction, that is stringing and splitting. To support a stringing strategy, a digitalempty number line was developed. To support a splitting strategy, a tool with digitalmanipulatives was developed.
As stated above, applying a splitting strategy is generally seen as an error-sensitiveapproach for solving subtraction problems with crossing the ten. However, in specialeducation it is very common for students to learn to solve calculation problems up to100 with support from manipulatives, such as rods and blocks. Therefore, we decidednot only to develop a tool based on a line model but also one that is based on a groupmodel. However, instead of only providing the students with the manipulatives, weadded a 100-board with 10 × 10 and 5 × 5 structures to give them more of a hold whenusing the material. For more details about the tools, refer to sub-section ‘Assessmentinstruments’.
ICT-based dynamic assessment
The standardised way of assessing requires an approach in which students are notallowed to receive any help from the person who administers the test, nor are the
Downloaded By: [University of Utrecht] At: 13:06 28 July 2010
322 M. Peltenburg et al.
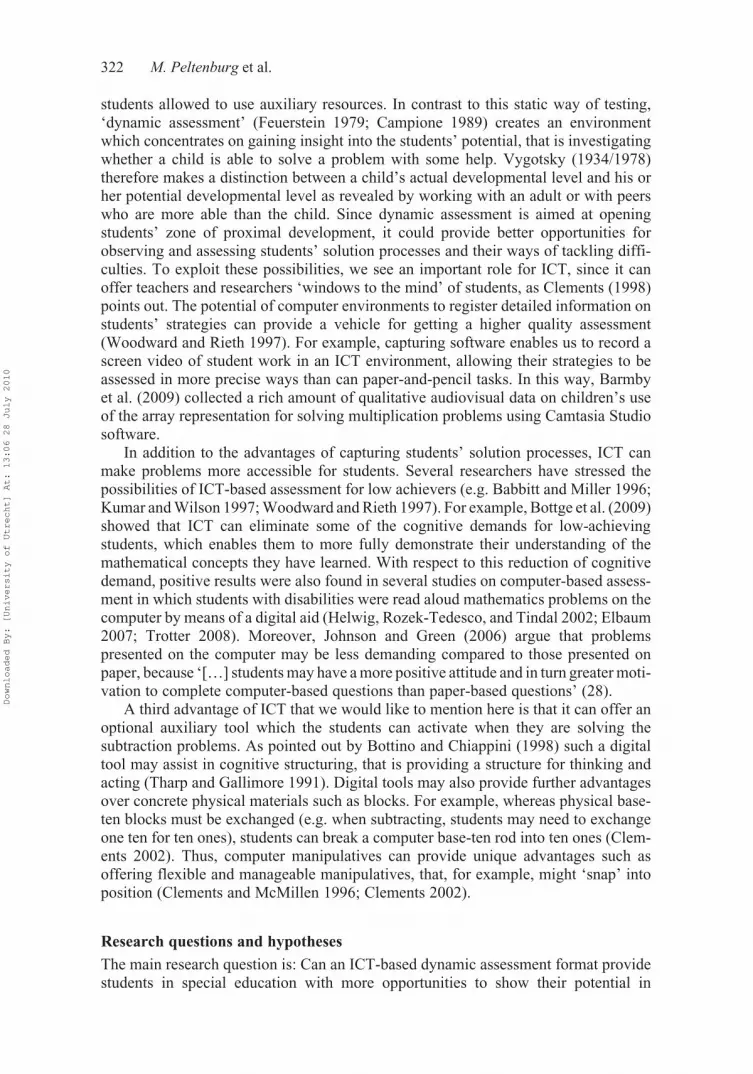
students allowed to use auxiliary resources. In contrast to this static way of testing,‘dynamic assessment’ (Feuerstein 1979; Campione 1989) creates an environmentwhich concentrates on gaining insight into the students’ potential, that is investigatingwhether a child is able to solve a problem with some help. Vygotsky (1934/1978)therefore makes a distinction between a child’s actual developmental level and his orher potential developmental level as revealed by working with an adult or with peerswho are more able than the child. Since dynamic assessment is aimed at openingstudents’ zone of proximal development, it could provide better opportunities forobserving and assessing students’ solution processes and their ways of tackling diffi-culties. To exploit these possibilities, we see an important role for ICT, since it canoffer teachers and researchers ‘windows to the mind’ of students, as Clements (1998)points out. The potential of computer environments to register detailed information onstudents’ strategies can provide a vehicle for getting a higher quality assessment(Woodward and Rieth 1997). For example, capturing software enables us to record ascreen video of student work in an ICT environment, allowing their strategies to beassessed in more precise ways than can paper-and-pencil tasks. In this way, Barmbyet al. (2009) collected a rich amount of qualitative audiovisual data on children’s useof the array representation for solving multiplication problems using Camtasia Studiosoftware.
In addition to the advantages of capturing students’ solution processes, ICT canmake problems more accessible for students. Several researchers have stressed thepossibilities of ICT-based assessment for low achievers (e.g. Babbitt and Miller 1996;Kumar and Wilson 1997; Woodward and Rieth 1997). For example, Bottge et al. (2009)showed that ICT can eliminate some of the cognitive demands for low-achievingstudents, which enables them to more fully demonstrate their understanding of themathematical concepts they have learned. With respect to this reduction of cognitivedemand, positive results were also found in several studies on computer-based assess-ment in which students with disabilities were read aloud mathematics problems on thecomputer by means of a digital aid (Helwig, Rozek-Tedesco, and Tindal 2002; Elbaum2007; Trotter 2008). Moreover, Johnson and Green (2006) argue that problemspresented on the computer may be less demanding compared to those presented onpaper, because ‘[…] students may have a more positive attitude and in turn greater moti-vation to complete computer-based questions than paper-based questions’ (28).
A third advantage of ICT that we would like to mention here is that it can offer anoptional auxiliary tool which the students can activate when they are solving thesubtraction problems. As pointed out by Bottino and Chiappini (1998) such a digitaltool may assist in cognitive structuring, that is providing a structure for thinking andacting (Tharp and Gallimore 1991). Digital tools may also provide further advantagesover concrete physical materials such as blocks. For example, whereas physical base-ten blocks must be exchanged (e.g. when subtracting, students may need to exchangeone ten for ten ones), students can break a computer base-ten rod into ten ones (Clem-ents 2002). Thus, computer manipulatives can provide unique advantages such asoffering flexible and manageable manipulatives, that, for example, might ‘snap’ intoposition (Clements and McMillen 1996; Clements 2002).
Research questions and hypotheses
The main research question is: Can an ICT-based dynamic assessment format providestudents in special education with more opportunities to show their potential in
Downloaded By: [University of Utrecht] At: 13:06 28 July 2010

Research Papers in Education 323
solving subtraction problems compared to a standardised test format? This question issubdivided in the following sub-questions and accompanying hypotheses:
(1a) Is there a difference in percentages of correct answers on the standardised testitems and the ICT version of the test items including the manipulatives?Hypothesis 1a: The students will attain a higher percentage of correct answerson the ICT version of the test items including the manipulatives in compari-son to the standardised test items.
(1b) Is there a difference in percentages of correct answers on the standardised testitems and the ICT version of the test items including the empty number line?Hypothesis 1b: The students will attain a higher percentage of correct answerson the ICT version of the test items including the empty number line incomparison to the standardised test items.
(2a) What strategies are applied by the students when using the manipulatives inthe ICT version of the test items?Hypothesis 2a: The manipulatives encourage the students to use a splittingstrategy.
(2b) What strategies are applied by the students when using the empty number linein the ICT version of the test items?Hypothesis 2b: The empty number line encourages the students to use astringing or a varying strategy.
Method
Assessment instruments
Data were collected with two assessment instruments: the CITO Monitoring Test forMathematics End Grade 2 (Janssen, Scheltens, and Kraemer 2005) and an ICT-basedassessment instrument.2 The latter consists of seven subtraction problems with cross-ing the ten. These items were taken from the CITO Monitoring Test for MathematicsEnd Grade 2. Every item, consisting of text and a picture illustrating the context, isdisplayed on the screen and the accompanying text is read out by the computer. Byclicking on a button, the student can repeat the spoken problem once or several times.There are two versions of the ICT-based assessment instrument, each containing adifferent auxiliary tool: one offers digital manipulatives and the other offers a digitalempty number line.
The manipulatives tool consists of counters that can be placed on a 100-board witha 10 × 10 grid, which is structured in four parts with a 5 × 5 structure. The studentscan select a number of counters from the stock on the left-hand side of the 100-board.Then they can drag the counters to the board and rearrange or remove them (seeFigure 1). We expect that through an on-screen visual representation of the subtractionoperation that has to be carried out, the students will be less inclined to process theones digits in the reverse way. For example, in the case of 62 − 58, the tool can providea visual prompt to find a solution for subtracting 8 from 2 by opening up the next ten.Figure 1. Manipulatives tool with counters and 100-board.The empty number line tool consists of a horizontal line on which the students canput markers and add number symbols and on which they can carry out operations bydrawing jumps backward or forward (see Figure 2). The tool operates by touchscreentechnology. This tool can help the students in solving subtraction problems, since itcan function as an aid to order the numbers involved in the problems and carry out thenecessary operations. Moreover, when working on the number line the students can
Downloaded By: [University of Utrecht] At: 13:06 28 July 2010

324 M. Peltenburg et al.
visually keep track of their actions. For example, in the case of 62 – 58, by putting thenumbers 62 and 58 on the number line, it can become clear that these numbers areactually quite close to each other in the number sequence. This understanding cantrigger the students to bridge the difference.Figure 2. Empty number line tool.
Participants and data collection
Two sub-studies were carried out in which the two auxiliary tools were investigated.Thirty-seven students from two schools for special education participated in themanipulatives study, and 43 students from two other schools for special educationparticipated in the empty number line study. All four special schools are within the
Figure 1. Manipulatives tool with counters and 100-board.
Figure 2. Empty number line tool.
Downloaded By: [University of Utrecht] At: 13:06 28 July 2010

Research Papers in Education 325
metropolitan area of Utrecht, the Netherlands. The students were 8–12 years old andtheir mathematical level was at about the end of Grade 2. This means that the studentshad a developmental delay in mathematics that ranged from one to four years, sinceeight- to nine-year-olds are usually in Grade 3 and 11- to 12-year-olds in Grade 6. Inthe Netherlands, about 3% of the children of primary school age are in special educa-tion schools, which is about 45,000 students (CBS 2008, 2009). This percentageinvolves only the students who have learning difficulties, that is no students withphysical disabilities are included.
In both sub-studies two types of performance scores were collected. First, datawere collected with the ICT-based assessment instrument. The students workedindividually in the ICT version of the test for about 15 minutes. In the background,Camtasia Studio software was running to record a screen video file of the studentwork. Five weeks later, data were collected with the CITO Monitoring Test forMathematics End Grade 2. The students did the complete test, including the sevensubtraction items. The reason for administering the ICT version first was to avoid aretest effect in the scores of the ICT version.
Data analysis
An analysis was conducted to compare the correctness of the students’ answers in thestandardised test format and the ICT-based test format. To test for significantdifferences between the scores in the two test formats, we used a t-test for pairedsamples both for the total score and for all individual items in the tests. We did thisfor the manipulatives study and the empty number line study separately. To makea comparison between the results from these two studies, we converted differences inp-values to Cohen’s d effect sizes.
Furthermore, we analysed the students’ procedures and strategies. These proce-dures and strategies are described in the section ‘Calculating up to 100: Strategies andModels’. In the analysis we focused on the cases in which the students used the toolin the ICT environment. Their work was captured on screen video. All students’procedures and strategies were initially coded by the first author. In a second roundthey were coded by the second author. After discussion on the few cases of disagree-ment (<5%), full agreement was reached.
Results
Differences in proportions of correct answers
Influence of the ICT version with the manipulatives tool
In the manipulatives study, our observations included a total of 259 cases (37 studentsdid seven problems each). A case covers two scores: one for the ICT test format andone for the standardised test format. Table 1 shows the percentages of correct and incor-rect answers for both formats. The percentage of correct answers was higher for theICT version of the seven items (54%) than for the items in the standardised test format(34%). This appears to be a significant difference in correct answers in favour of theICT test format (t[36] = 3.67, p < .01, d = 0.71). This result confirms Hypothesis 1a.
Table 2 displays for each item the proportion of correct answers in the two testformats in the manipulatives study. For five out of the seven items the differencebetween the two proportions was significantly larger than zero (p < .05).
Downloaded By: [University of Utrecht] At: 13:06 28 July 2010

326 M. Peltenburg et al.
Influence of the ICT version with the empty number line tool
In the empty number line study, our observations included a total of 301 cases (43students did seven problems each). As in the manipulatives study, a case covers twoscores: one for the ICT test format and one for the standardised test format. Table 3displays the results for the 301 cases. It appears that the percentage of correct answerswas higher for the ICT version of the seven items (55%) than for the items in thestandardised test format (36%). This is a significant difference in correct answers infavour of the ICT test format (t[42] = 4.77, p < .01, d = 0.75). This result confirmsHypothesis 1b.
Table 1. Cross tabulation of correct and incorrect answers in both test formats in themanipulatives study.
ICT test
Correct answer Incorrect answer Total
Standardised testCorrect answer 24% (61) 11% (28) 34% (89)Incorrect answer 30% (78) 36% (92) 66% (170)
Total 54% (139) 47% (120) 100% (259)
Table 2. Proportion of correct answers in the two test formats in the manipulatives study.
Proportion correct
ItemStandardised test
format ICT test formatDifference in
proportion correct SE t
1 .22 .43 .22 .10 2.25*2 .49 .54 .05 .09 0.573 .19 .38 .19 .09 2.02*4 .30 .51 .22 .10 2.09*5 .54 .73 .19 .12 1.64*6 .41 .57 .16 .11 1.537 .27 .59 .32 .10 3.40**M .34 .54 .19 .05 3.67**SD .14 .11 .08
*p < .05; **p < .01.
Table 3. Cross tabulation of correct and incorrect answers in both test formats in emptynumber line study.
ICT test
Correct answer Incorrect answer Total
Standardised testCorrect answer 28% (83) 9% (26) 36% (109)Incorrect answer 28% (83) 36% (109) 64% (192)
Total 55% (166) 45% (135) 100% (301)
Downloaded By: [University of Utrecht] At: 13:06 28 July 2010

Research Papers in Education 327
Table 4 displays for each item the proportion of correct answers in the two testformats in the empty number line study. For four out of the seven items the differencebetween the two proportions was significantly larger than zero (p < .01).
The two tools compared
Apparently, the ICT version of the test items including an optional auxiliary toolprovided the students in both tool conditions with more opportunities to show theirmathematical capabilities in solving subtraction problems as opposed to the standard-ised test items. Table 5 shows that the percentage of correct answers (54%) in the ICTversion including the manipulatives and the percentage of correct answers (55%) inthe ICT version including the empty number line are quite similar (see also Tables 1and 3). At the same time, in both studies we found almost equal means and standarddeviations in the standardised CITO test. The stability of the effect was also revealedby the similarities of the d-values in both studies.
To estimate the effect of the ICT test format in both studies on an item level, wetransformed the proportion differences (displayed in Tables 2 and 4) to d-values (bydividing these by the pooled standard deviation of the standardised test of .26). Thesed-values shown in Table 6 indicate that the ICT test format did not influence all itemsin the same way. In some items – such as Item 1 – the type of tool (manipulatives orempty number line) included in the ICT format did not really matter; in other itemssuch as Items 2 and 5 the type of tool did matter. In Item 2 the students benefitted more
Table 5. Effect of the ICT-based test format in both studies.
Standardised test ICT test
Study n M SD M SD d
Manipulatives 37 0.34 0.27 0.54 0.30 0.73Empty number line 43 0.36 0.25 0.55 0.26 0.72
Note: Effect size Cohen’s d is calculated as the difference in mean scores divided by the pooled standard deviation of the standardised test.
Table 4. Proportion of correct answers in the two test formats in the empty number line study.
Proportion correct
ItemStandardised test format ICT test format
Difference in proportion correct SE t
1 .16 .42 .26 .09 2.89**2 .33 .63 .30 .09 3.55**3 .07 .47 .40 .08 5.24**4 .37 .60 .23 .08 2.89**5 .67 .72 .05 .10 0.476 .51 .49 −.02 .08 −0.277 .42 .53 .12 .08 1.40M .36 .55 .19 .04 4.77**SD .20 .11 .15
**p < .01.
Downloaded By: [University of Utrecht] At: 13:06 28 July 2010

328 M. Peltenburg et al.
from the ICT test format with the empty number line; in Item 5 the students benefittedmore from the ICT test format with the manipulatives.
Thus, although we did not find overall differences between the two ICT formats,we can conclude that on item level there are differences: The ICT version with themanipulatives seems to work differently on item level than the ICT version with theempty number line. This kind of differential item functioning in the two ICT formatsshould be further explored in tests with a larger number of items and in larger studentsamples.
Students’ awareness of their competence
In addition, it appears that the students from both studies were quite capable of judg-ing their mathematical competence and therefore could decide whether the use of atool could be beneficial. That is, the students who gave an incorrect answer on thestandardised test had used the tool more frequently (50% in the manipulatives studyand 60% in the empty number line study) than the students who gave a correct answeron the standardised test format (21% in the manipulatives study and 29% in the emptynumber line study). Note that the ICT version of the test items was administered inadvance of the standardised written version of the test items.
Tool use and strategies
Influence of the manipulatives tool3
Table 7 shows the percentages of applied procedures in the cases that the students(n = 104) used the manipulatives tool, independent of the correctness of their answers.
In two-thirds of these cases a direct subtraction procedure was applied. This proce-dure went together with a stringing strategy. In contrast with our expectations(Hypothesis 2a) the students did not perform a splitting strategy. An indirect additionor subtraction procedure was applied in only 10% of the cases. Even in the case of theproblem 62 − 58, in which the numbers are relatively close to each other, thisprocedure was not applied, and in the case of 48 − 39 it was used only three times. Inthe cases that the students used an indirect addition or subtraction procedure, they all
Table 6. Differences in effect of ICT test format between the two studies per item.
d-values
Item Manipulatives study Empty number line study Difference in d-values
1 0.82 0.97 0.152 0.21 1.55 0.943 0.72 1.50 0.784 0.82 0.88 0.065 0.72 0.18 −0.546 0.62 −0.99 −0.717 1.23 0.44 0.79M 0.73 0.72 −0.01SD 0.31 0.56 0.70
Downloaded By: [University of Utrecht] At: 13:06 28 July 2010
Research Papers in Education 329
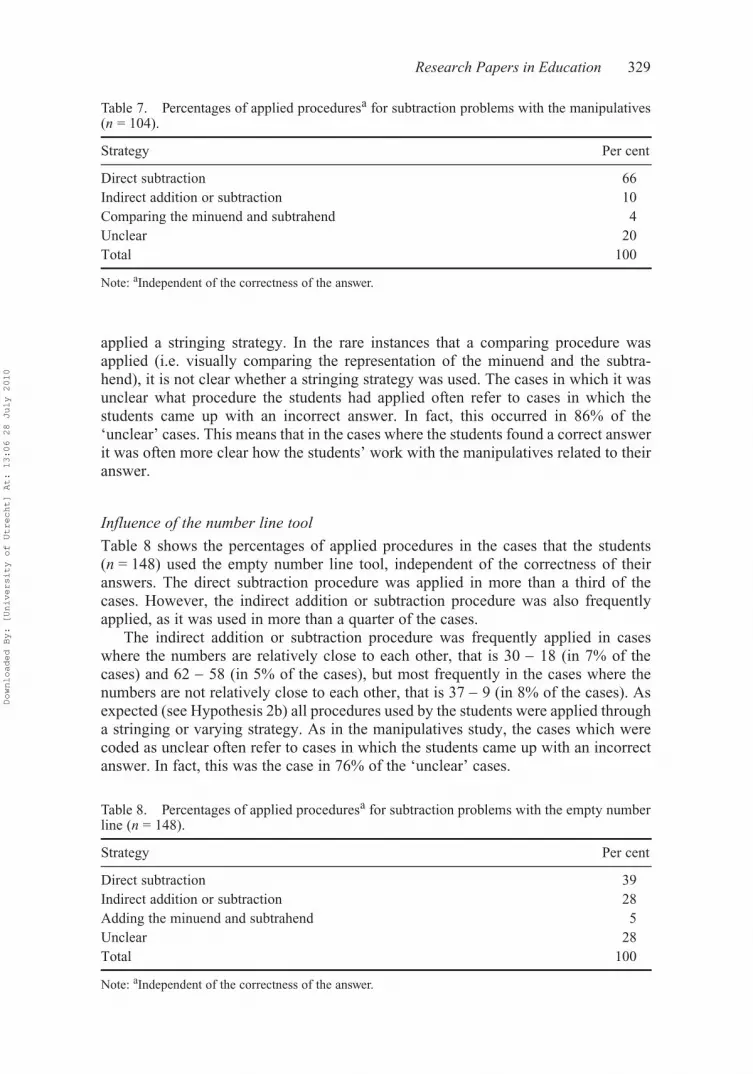
applied a stringing strategy. In the rare instances that a comparing procedure wasapplied (i.e. visually comparing the representation of the minuend and the subtra-hend), it is not clear whether a stringing strategy was used. The cases in which it wasunclear what procedure the students had applied often refer to cases in which thestudents came up with an incorrect answer. In fact, this occurred in 86% of the‘unclear’ cases. This means that in the cases where the students found a correct answerit was often more clear how the students’ work with the manipulatives related to theiranswer.
Influence of the number line tool
Table 8 shows the percentages of applied procedures in the cases that the students(n = 148) used the empty number line tool, independent of the correctness of theiranswers. The direct subtraction procedure was applied in more than a third of thecases. However, the indirect addition or subtraction procedure was also frequentlyapplied, as it was used in more than a quarter of the cases.
The indirect addition or subtraction procedure was frequently applied in caseswhere the numbers are relatively close to each other, that is 30 − 18 (in 7% of thecases) and 62 − 58 (in 5% of the cases), but most frequently in the cases where thenumbers are not relatively close to each other, that is 37 − 9 (in 8% of the cases). Asexpected (see Hypothesis 2b) all procedures used by the students were applied througha stringing or varying strategy. As in the manipulatives study, the cases which werecoded as unclear often refer to cases in which the students came up with an incorrectanswer. In fact, this was the case in 76% of the ‘unclear’ cases.
Table 7. Percentages of applied proceduresa for subtraction problems with the manipulatives(n = 104).
Strategy Per cent
Direct subtraction 66Indirect addition or subtraction 10Comparing the minuend and subtrahend 4Unclear 20Total 100
Note: aIndependent of the correctness of the answer.
Table 8. Percentages of applied proceduresa for subtraction problems with the empty numberline (n = 148).
Strategy Per cent
Direct subtraction 39Indirect addition or subtraction 28Adding the minuend and subtrahend 5Unclear 28Total 100
Note: aIndependent of the correctness of the answer.
Downloaded By: [University of Utrecht] At: 13:06 28 July 2010

330 M. Peltenburg et al.
Conclusions and discussion
Confirmation of hypotheses
From the experiences and results in this research project, we can conclude that an ICT-based assessment including an optional dynamic auxiliary tool provides students inspecial education with more opportunities to show their mathematical capabilities insolving subtraction problems compared to a standardised assessment. In both sub-studies, the students attained a significantly higher percentage of correct answers inthe ICT version of the subtraction items than in the standardised test items. This resultwas found even though the ICT-based test format preceded the standardised testformat. Thus, any gain from retest effect would be in favour of the standardised testscore, which implies that the ‘true’ effect size of the ICT version could be somewhatlarger.
Unexpected results
Although both sub-studies generally confirmed our thoughts about the influence of thetools, there were some unexpected results as well. First, the match between the modeland the strategy was not found in the students’ responses. The students in the manip-ulatives tool condition did not apply the hypothesised splitting strategy. This could bea result of the fact that stringing is given more attention in the students’ mathematicslessons than splitting. Another reason for not applying a splitting strategy could be thatthe students had to put the manipulatives on a 100-board with a 10 × 10 grid insteadof on a neutral empty background on which the numbers can be presented as rods often and blocks of one. Finally, different than for an addition problem, for subtraction,decomposing and representing both numbers of a problem as tens and ones, which ischaracteristic for splitting, is not an obvious strategy.
A second unexpected finding was that in the number line tool condition, the proce-dure of indirect subtraction or addition was frequently applied, even though thisprocedure is not very common in primary special education. Apparently, the emptynumber line stimulated the students to bridge the difference between the numbers bymaking use of the inverse relation between addition and subtraction. So it could beargued that, from a mathematical point of view, working with the empty number lineencouraged the students to apply more cognitive sophisticated strategies than workingwith the manipulatives.
A third unforeseen result was that the indirect procedure was most frequently usedfor solving a subtraction problem with a minuend and subtrahend which are not rela-tively close to each other. One explanation for this finding is that the context, in whichthe problem was presented, stimulated the students to use an indirect addition orsubtraction procedure. As Van den Heuvel-Panhuizen and Treffers (2009) pointed out,contexts such as eating candy refer to direct subtraction, whereas contexts such as‘finding out how many pages still have to be read’ may elicit an indirect addition oradding on strategy. In fact, it was the latter type of context in which the particularsubtraction problem in our study was presented. A second explanation for the frequentuse of indirect procedures in problems with a large difference between the numbers isthat in these cases the students more often used an empty number line which makesthe strategy visible, while in the cases in which the numbers are relatively close toeach other, the students are probably more inclined to mentally bridge the differencebetween the numbers.
Downloaded By: [University of Utrecht] At: 13:06 28 July 2010

Research Papers in Education 331
Limitations of the study
The two sub-studies have shown that it is important to have adequate assessmentinstruments, which can open the students’ zone of proximal development in order toobtain a good understanding of special education students’ potential, albeit the studiesalso have some limitations. To begin with, we should keep in mind that the ICT testformat and the standardised test format did not only differ in the availability of anauxiliary tool. The difference in test format (ICT-based or paper-based) as such couldalso have caused differences in performances. Several studies have indicated that itmay not be naturally assumed that student work on a paper-and-pencil test is similarto that on a computer-based test (see, e.g., Clariana and Wallace 2002; Johnson andGreen 2006; Bennett et al. 2008). On the one hand, this difference in results betweenthe two test formats can be a threat to the validity of the assessment. On the otherhand, it can be argued that technologies included in a computer version can make atest more accessible for students (Van den Heuvel-Panhuizen and Peltenburg,forthcoming) and therefore result in a higher construct validity. For example, byimplementing a read-aloud function, as is also shown in other studies (Helwig, Rozek-Tedesco, and Tindal 2002; Elbaum 2007; Trotter 2008), children can concentrate onconstructing meaning from text without the need to read it.
A possible limitation that is also related to the difference in test format concernsthe lack of background information on the students’ familiarity with working on thecomputer. Since the students’ ages ranged between 8 and 12 years, it could beassumed that there were differences in familiarity with the computer, which may haveaffected the students’ performance on the ICT-based test format. As Bennet et al.(2008) found ‘[…] some students may score better on a computer-based test comparedto equally mathematically proficient peers simply because the former ones are morefacile with computers’ (25).
A serious reason for treating our results with caution is that the length of the testdiffered between the two test formats. In the standardised test format, the students didthe complete CITO Monitoring Test for Mathematics End Grade 2 (54 items admin-istered on two successive days), whereas in the ICT test format they only did the sevenitems on subtraction with crossing the ten. Therefore, differences in performance onthe two test formats could also be explained by factors such as tiredness, loss ofconcentration or lack of motivation on the standardised test format.
Finally, both sub-studies have quite limited sample sizes (n = 37 and 43).
Further research
To attain a thorough understanding of special education students’ potential in mathe-matics, we will extend our study to larger groups of students. Moreover, future inves-tigations are required to refine our findings with other types of students. For example,Johnson and Green (2006) have shown that the use of on-screen mathematical toolsmay also help primary school students who are in regular education.
The sub-studies studies have yielded new insights in ICT-based dynamic assess-ment for special education students, but they also clearly point to further research intwo directions. One direction involves the need to increase our mathe-didacticalknowledge (see Van den Heuvel-Panhuizen and Treffers 2009) on the domain ofsubtraction with crossing the ten. This includes further investigation of the relationbetween models and strategies. Therefore, the next step in our research project will bethe revision of the manipulatives tool in such a way that it imposes fewer restrictions
Downloaded By: [University of Utrecht] At: 13:06 28 July 2010

332 M. Peltenburg et al.
and offers better accessibility for students to show their mathematical capabilities.Moreover, our findings suggest the need for research on the influence of contexts andnumbers on students’ use of the indirect addition procedure.
The second direction includes the need to increase our knowledge on assessingstudents’ work. To gain a more thorough insight into how the auxiliary tools affect thestudents’ procedures and strategies, we will ask students to think aloud (see, e.g.,Ericsson and Simon 1993; Van Someren, Barnard, and Sandberg 1994) during or aftersolving the problems, in a test format with and without an auxiliary tool. In addition,conducting post-hoc interviews could provide an adequate method to investigatestudents’ reactions to and perceptions of ICT-based dynamic assessment.
AcknowledgementsWe are grateful to the teachers whose students participated in our studies and who were alwaysvery helpful in making room in their lesson schedule to make the data collection possible. Wewould also like to thank the reviewers and editor for their constructive feedback on an earlierversion of this paper.
Notes1. Torbeyns et al. (2009) mention subtraction by compensation only as another term for the
varying strategy. Moreover, they see the splitting, stringing and varying strategies all asbelonging to the direct subtraction class of procedures.
2. The ICT-based assessment instrument was programmed by Barrie van Burk, a softwareengineer at the Freudenthal Institute.
3. For a more detailed description of tool use and strategies in the manipulatives study, seePeltenburg, Van den Heuvel-Panhuizen, and Doig (2009).
Notes on contributorsMarjolijn Peltenburg is a PhD student at the Freudenthal Institute for Science and MathematicsEducation. Her research project focuses on mathematics education in primary special educa-tion.
Marja van den Heuvel-Panhuizen is a professor of mathematics education at the FreudenthalInstitute for Science and Mathematics Education. Her research interests lie in the learning andteaching of mathematics in early childhood and primary school.
Alexander Robitzsch is a researcher at the Federal Institute for Education Research, Innovationand Development of the Austrian School System. His research focuses on a broad range ofmethodological and substantive problems in large-scale studies on educational assessment.
ReferencesBabbitt, B., and S. Miller. 1996. Using hypermedia to improve the mathematics problem-solving
skills of students with disabilities. Journal of Learning Disabilities 29, no. 4: 391–401.Barmby, P., T. Harries, S. Higgins, and J. Suggate. 2009. The array representation and
primary children’s understanding and reasoning in multiplication. Educational Studies inMathematics 70, no. 3: 217–41.
Beishuizen, M. 1993. Mental strategies and materials or models for addition and subtractionup to 100 in Dutch second grades. Journal for Research in Mathematics Education 24, no.4: 294–323.
Bennett, R.E., J. Braswell, A. Oranje, B. Sandene, B. Kaplan, and F. Yan. 2008. Does itmatter if I take my mathematics test on computer? A second empirical study of mode
Downloaded By: [University of Utrecht] At: 13:06 28 July 2010

Research Papers in Education 333
effects in NAEP. Journal of Technology, Learning, and Assessment 6, no. 9. http://www.jtla.org.
Bottge, B.A., E. Rueda, J.M. Kwon, T. Grant, and P. LaRoque. 2009. Assessing and trackingstudents’ problem solving performances in anchored learning environments. EducationalTechnology Research and Development 57, no. 4: 529–52.
Bottino, R.M., and G. Chiappini. 1998. User action and social interaction mediated by directmanipulation interfaces. Education and Information Technologies 3: 203–16.
Campione, J.C. 1989. Assisted assessment: A taxonomy of approaches and an outline ofstrengths and weaknesses. Journal of Learning Disabilities 22, no. 3: 151–65.
CBS (Central Bureau of Statistics, the Netherlands). 2008. Landelijke jeugdmonitorrapportage 2e kwartaal 2008 [National youth monitor report 2nd quarter 2008]. TheHague: CBS.
CBS. 2009. Jaarrapport 2009 landelijke jeugdmonitor [Annual report 2009 national youthmonitor]. The Hague: CBS.
Clariana, R., and P. Wallace. 2002. Paper-based versus computer-based assessment: Keyfactors associated with the test mode effect. British Journal of Educational Technology33, no. 5: 593–602.
Clements, D.H. 1998. Computers in mathematics education assessment. In Classroomassessment in mathematics: Views from a national science foundation working conference,ed. G.W. Bright and J.N. Joyner, 153–59. Lanham, MD: University Press of America.
Clements, D.H. 2002. Computers in early childhood mathematics. Contemporary Issues inEarly Childhood 3, no. 2: 160–81.
Clements, D.H., and S. McMillen. 1996. Rethinking concrete manipulatives. TeachingChildren Mathematics 2, no. 5: 270–79.
Elbaum, B. 2007. Effects of an oral testing accommodation on the mathematics performanceof secondary students with and without learning disabilities. Journal of Special Education40, no. 4: 218–29.
Ericsson, K.A., and H.A. Simon. 1993. Protocol analysis: Verbal reports as data. London:MIT Press.
Feuerstein, R. 1979. The dynamic assessment of retarded performers: The learning potentialassessment device, theory, instruments, and techniques. Baltimore, MD: University ParkPress.
Fuson, K.C., D. Wearne, J. Hiebert, H. Murray, P. Human, A. Olivier, T. Carpenter, and E.Fennema. 1997. Children’s conceptual structures for multidigit numbers and methods ofmultidigit addition and subtraction. Journal for Research in Mathematics Education 28:130–62.
Helwig, R., M. Rozek-Tedesco, and G. Tindal. 2002. An oral versus a standard administrationof a large-scale mathematics test. Journal of Special Education 36, no. 1: 39–47.
Janssen, J., F. Scheltens, and J. Kraemer. 2005. Leerling- en onderwijsvolgsysteem. Rekenen-wiskunde groep 4. Handleiding [Student and education monitoring system. Mathematicsgrade 2. Teachers guide]. Arnhem: CITO.
Johnson, M., and S. Green. 2006. On-line mathematics assessment: The impact of mode onperformance and question answering strategies. Journal of Technology, Learning, andAssessment 4, no. 5. http://www.jtla.org.
Klein, A.S., M. Beishuizen, and A. Treffers. 1998. The empty number line in Dutch secondgrades: Realistic versus gradual program design. Journal for Research in MathematicsEducation 29: 443–64.
Kraemer, J., F. van der Schoot, and R. Engelen. 2000. Balans van het reken- en wiskunde-onderwijs op LOM- en MLK-scholen 2 [Second assessment of mathematics education atspecial education schools]. Arnhem: CITO.
Kraemer, J., F. van der Schoot, and P. Van Rijn. 2009. Balans van het reken- en wiskunde-onderwijs in het speciaal basisonderwijs 3 [Third assessment of mathematics education atspecial education schools]. Arnhem: CITO.
Kumar, D., and C.L. Wilson. 1997. Computer technology, science education, and students withlearning disabilities. Journal of Science Education and Technology 6, no. 2: 155–60.
Peltenburg, M., M. van den Heuvel-Panhuizen, and B. Doig. 2009. Mathematical power ofspecial needs pupils: An ICT-based dynamic assessment format to reveal weak pupils’learning potential. British Journal of Educational Technology 40, no. 2: 273–84.
Downloaded By: [University of Utrecht] At: 13:06 28 July 2010

334 M. Peltenburg et al.
Tharp, R.G., and R.G. Gallimore. 1991. Rousing minds to life. Cambridge: CambridgeUniversity Press.
Torbeyns, J., B. de Smedt, N. Stassens, P. Ghesquière, and L. Verschaffel. 2009. Solvingsubtraction problems by means of indirect addition. Mathematical Thinking and Learning11, no. 1: 79–91.
Torbeyns, J., L. Verschaffel, and P. Ghesquière. 2006. Developmental changes of children’sadaptive expertise in the number domain 20 to 100. Cognition and Instruction 24: 439–65.
Trotter, A. 2008. Math study evaluates digital aids. http://www.edweek.org/ew/articles/2008/10/22/09software.h28.html?tmp=1674880697.
Van den Heuvel-Panhuizen, M., ed. 2001. Children learn mathematics. Utrecht: FreudenthalInstitute, Utrecht University.
Van den Heuvel-Panhuizen, M. 2008. Learning from ‘didactikids’: An impetus for revisitingthe empty number line. Mathematics Education Research Journal 20, no. 3: 6–31.
Van den Heuvel-Panhuizen, M., and A. Treffers. 2009. Mathe-didactical reflections on youngchildren’s understanding and application of subtraction-related principles. MathematicalThinking and Learning 11, no. 1: 102–12.
Van den Heuvel-Panhuizen, M., and M. Peltenburg. Forthcoming. Using a cognitive loadperspective to understand why ICT-based assessment helps special education students tosolve mathematical problems.
Van Someren, M., Y. Barnard, and J. Sandberg. 1994. The think aloud method: A practicalguide to modelling cognitive processes. London: Academic Press.
Vygotsky, L.S. 1978. Mind in society: The development of higher psychological processes.Ed. M. Cole, J. Scribner, V. John-Steiner, and E. Souberman. Cambridge, MA: HarvardUniversity Press (Orig. pub. 1934).
Woodward, J., and H. Rieth. 1997. A historical review of technology research in specialeducation. Review of Educational Research 67: 503–36.
Downloaded By: [University of Utrecht] At: 13:06 28 July 2010