application of geographic information system (gis) in - african
TRANSCRIPT
GLOBAL JOURNAL OF GEOLOGICAL SCIENCES VOL, 10, NO.1, 2012 99-109COPYRIGHT© BACHUDO SCIENCE CO. LTD PRINTED IN NIGERIA. ISSN 1596-6798
www.globaljournalseries.com, Email: [email protected]
APPLICATION OF GEOGRAPHIC INFORMATION SYSTEM (GIS) INRESIDENTIAL LAND CAPABILITY INDEX MAPPING OF ADEVELOPING COUNTRY. A CASE STUDY OF ENUGU STATE, SOUTH-EASTERN NIGERIA
A. A. ONUNKWO(Received 16 November 2011; Revision Accepted 16 December 2011)
ABSTRACT
It was projected that the population of Enugu State will grow at approximately 300% by the year 2020. This is trueconsidering the 3,237,298 population figure of the area in the year 1991. Accommodation problems and lowering ofpeoples standard of living are always associated with over population. It therefore, becomes necessary to map out areason a sustainable basis and most suitable for the siting of residential buildings to accommodate the teeming population.Land capability index mapping using Geographic Information System (GIS) principles was used for this study. The studywas undertaken using Arc View 3.2a academic, Micro soft Excel statistical software and integrated land and waterinformation system software (ILWIS). A total of 12 land use determinants were selected as thematic data layers and basicfactors influencing the choice of residential landuse. Soil characteristics and geology were integrated into the thematicmaps to facilitate the weighting of the basic determinants. The thematic layers were weighted on a scale of 0%-100% and0-2 inclusive, using the criteria obtained from field work and laboratory investigation. The thematic layers were subjectedto overlay using Arcview software overlay model builder. The operation yielded a layer of preferred residential landuseoptions in a map form. Three areas of varying suitabilities resulted from this operation, and includes areas suitable forresidential landuse-options, and occupies 10% of the study area. Others are areas of low suitability (60%) and areasunsuitable for residential landuse, which occupies 30%.
KEYWORDS: population, residential, land capability, mapping accommodation.
INTRODUCTION
Population explosion in developing world hasgenerated acute accommodation problems and lowstandard of living.
It is necessary to make effective use of theavailable lands especially in developing countries, whereland tenure system and population impose land scarcity.Enugu State being, the area under study is within theheart of Ibo community of Nigeria, where land is scarcedue to over population and land tenure system (Dutra andHober, 1998). Population in Enugu State of Nigeria wasprojected to increase at about 300% by the year 2020.This is evident considering the attained 3,237,298population figure of Enugu State in 1991. Going by thisbad State of affairs, there is an urgent need to locateareas on most sustainable basis for the establishment ofresidential buildings to accommodate the teemingpopulation. Geographic Information Systems (GIS) is oneof the best approaches for this type of project, since itsapplication has been widely acclaimed to facilitate efficientdecision making and planning (Holland and Smith, 2003).GIS consists of a set of computerized tools andprocedures that can be used to effectively store, retrieve,overlay, correlate, manipulate, analyse , display anddisseminate land related information (Kang, 2002). Pearce
and Turner (1990) observed that unplanned landdevelopment has resulted in severe environmentaldamage and declining quality of life for many people.Dimitri and Crynine (2003) observed that the developmentof any land area for residential setup requires detailedgeological and engineering studies as to ascertain thecapability of the land for the purpose. Landuse planning isaccomplished through the use of a variety of factors.These factors can be divided into four categories such asphysical (Geological and topography), economic, socialand political factors (Chapin, 1965).
According to Arthur and Irwin (1982), residentialbuildings should be located in an area of flat or gentleslope. Other factors to be considered include flood plain,surface and ground water resource, soil factor andgeostructural instabilities. The acceptable site shouldhave a distance margin of at least 1000m from the floodplain zone. Residential building should be in an area ofabundant water resource, Gauley and Kroine, (2002).
Materials and MethodsDescription of Study area
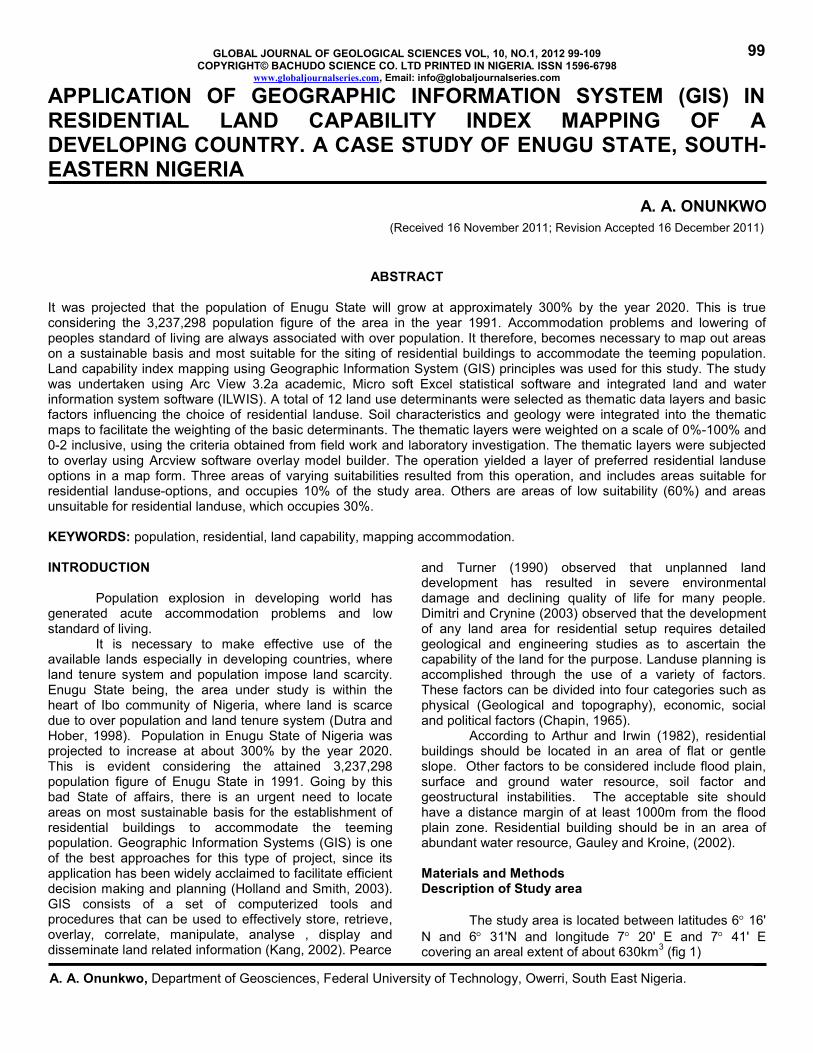
The study area is located between latitudes 6 16'N and 6 31'N and longitude 7 20' E and 7 41' Ecovering an areal extent of about 630km3 (fig 1)
99
A. A. Onunkwo, Department of Geosciences, Federal University of Technology, Owerri, South East Nigeria.
It is also located within the rainforest-belt of Nigeria andhas annual rainfall of about 1100mm a year, ( Iloeje 1981).The most striking feature within the study area is Enugu –Awgu escarpment. The escarpment was formed by theresistant sandstones of Mamu Formation. Drainagesystem is controlled by the escarpment, which forms themost important watershed separating the Cross Riverdrainage system to the east from a network of streamsflowing west towards Anambra drainage basin (Ofomata,1985). Egboka (1993), described the drainage basin as
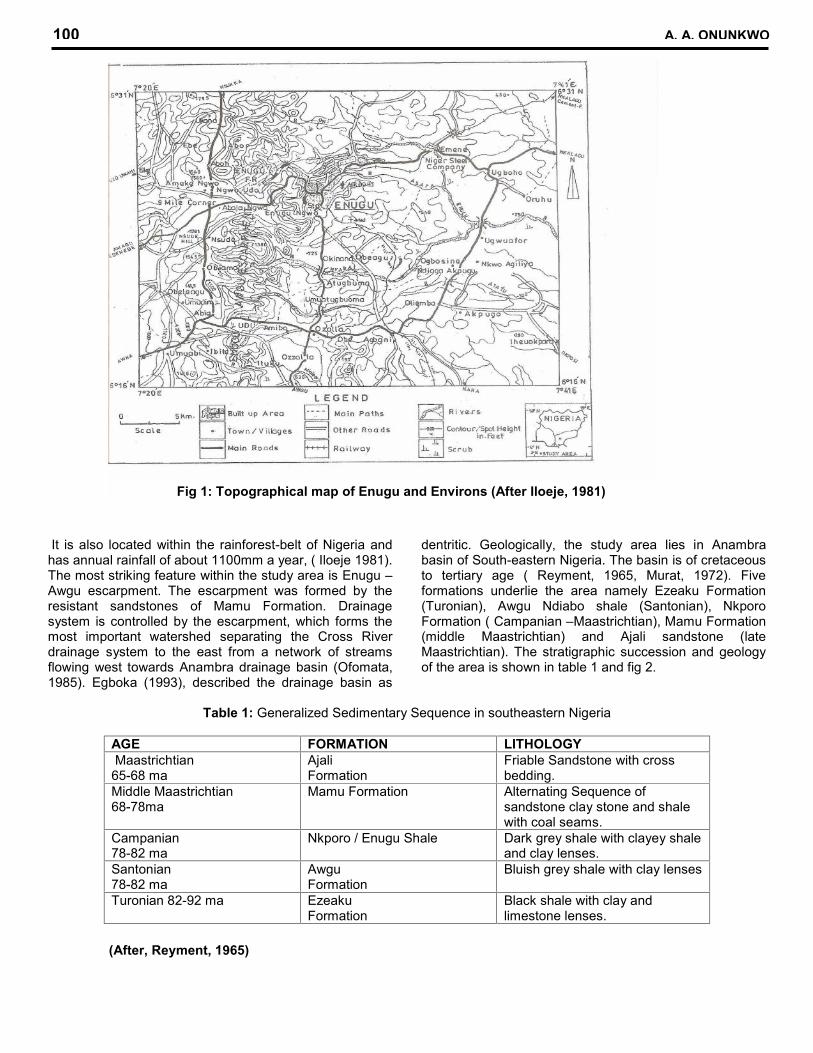
dentritic. Geologically, the study area lies in Anambrabasin of South-eastern Nigeria. The basin is of cretaceousto tertiary age ( Reyment, 1965, Murat, 1972). Fiveformations underlie the area namely Ezeaku Formation(Turonian), Awgu Ndiabo shale (Santonian), NkporoFormation ( Campanian –Maastrichtian), Mamu Formation(middle Maastrichtian) and Ajali sandstone (lateMaastrichtian). The stratigraphic succession and geologyof the area is shown in table 1 and fig 2.
Table 1: Generalized Sedimentary Sequence in southeastern Nigeria
AGE FORMATION LITHOLOGY Maastrichtian65-68 ma
AjaliFormation
Friable Sandstone with crossbedding.
Middle Maastrichtian68-78ma
Mamu Formation Alternating Sequence ofsandstone clay stone and shalewith coal seams.
Campanian78-82 ma
Nkporo / Enugu Shale Dark grey shale with clayey shaleand clay lenses.
Santonian78-82 ma
AwguFormation
Bluish grey shale with clay lenses
Turonian 82-92 ma EzeakuFormation
Black shale with clay andlimestone lenses.
Fig 1: Topographical map of Enugu and Environs (After Iloeje, 1981)
(After, Reyment, 1965)
100 A. A. ONUNKWO
The hydrogeology of the area indicates that the majorwater bearing unit is Ajali sandstone that underlies areasto the west with deep static water table of about 30m to40m (Nwankwor et al 1988).
Egboka (1993), observed the occurrence ofaquifer within Mamu Formation, while aquitards occur
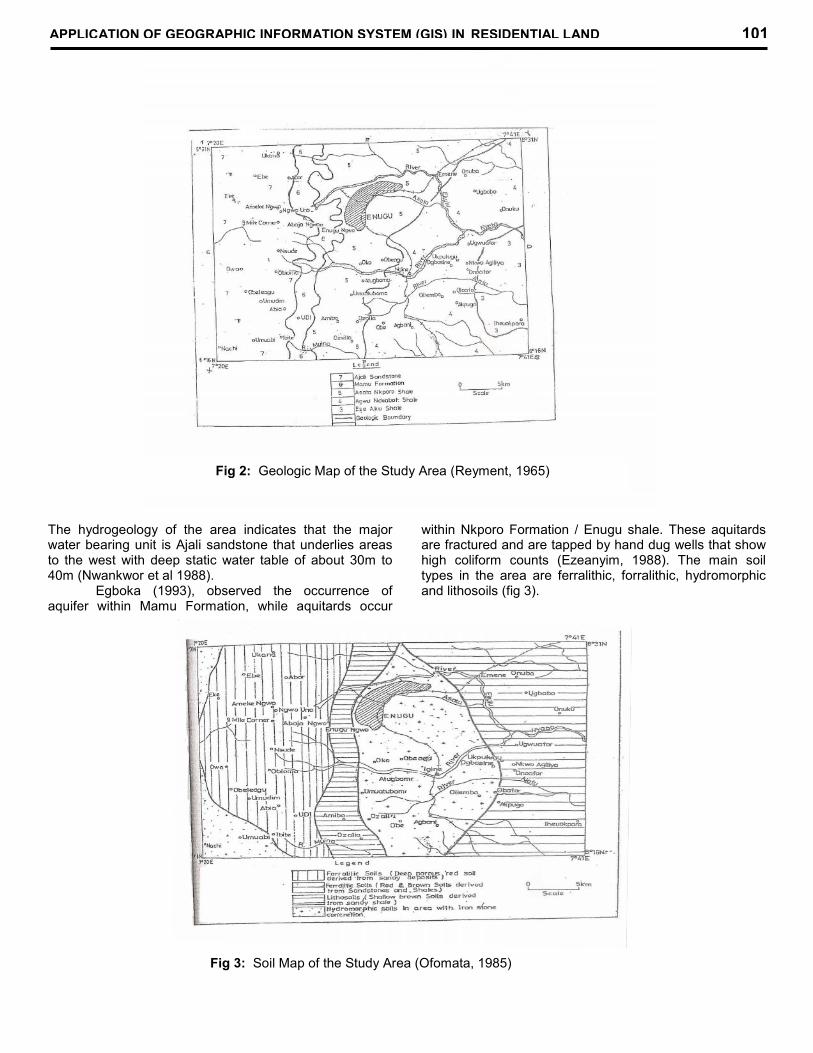
within Nkporo Formation / Enugu shale. These aquitardsare fractured and are tapped by hand dug wells that showhigh coliform counts (Ezeanyim, 1988). The main soiltypes in the area are ferralithic, forralithic, hydromorphicand lithosoils (fig 3).
Fig 3: Soil Map of the Study Area (Ofomata, 1985)
Fig 2: Geologic Map of the Study Area (Reyment, 1965)
APPLICATION OF GEOGRAPHIC INFORMATION SYSTEM (GIS) IN RESIDENTIAL LAND 101
These soils were derived from Enugu shale andAjali sandstone (Ogbukagu, 1976). The soils derived fromEnugu shale are expansive and have hydraulicconductivity values of about 10-5 m/s (Egboka andOnyebueke, 1999) making them poor constructionmaterials.
Sampling Techniques and Analytical MethodsSoil samples were collected at Owa, Ngwo,
Ugwuafor, Agbani and Enugu Township from pits dug at adepth of 5 metres using soil auger. They were placed inpolythene bags, and transported to laboratory for analysis.Random sampling method was adopted through which 6(six) soil samples representing the entire soil types of thearea were selected. The selected soil samples weresubjected to the following analysis using specifiedmethods and equipments: Atterberg limit tests (usingCassagrande apparatus and Hammer methods), particlesize distribution (using British electric shaker machine),porosity and permeability (using falling head method andpermeameter), Consolidation test was performed usingconsolidometer. Shear strength was carried out usingtriaxial shear box and finally compressive strength.
Analysis was done using ASTM D, 4318-98
(2000) and ASTM, 1988 Standard specifications. Allanalytical procedures are shown in (Robert, 2001) Twelve(12) thematic maps of the landuse determinants withinEnugu area obtained from different sources wereemployed as landuse determinants. These include, slopemap, elevation map, soil depth map, soil class map,geologic map, drainage map, surface water map, depth towater table map, soil erosion map, flooded/ landslide map,fault map and escarpment map. These maps are thethematic data layers for GIS operation. The equipmentsused for GIS analysis include Integrated Land and WaterInformation System (ILWIS) used for digitization andgeoreferencing. Other equipments used includeGeographic Information System (GPS eterex 76) used formeasuring cordinate and elevation, Microsoft Excelstatistical software used for data organization andcomputation., Arc view 3.2a academic, used foroverlaying, information importation into GIS environment,digitization and georeferencing. The thematic maps wereconverted to GIS compatible format by scanning,digitization, georeferencing, projection, polygonization andconversion to common scale of 1:10,000. The thematiclayers were saved in different layers in readiness for GISanalysis.
102 A. A. ONUNKWO
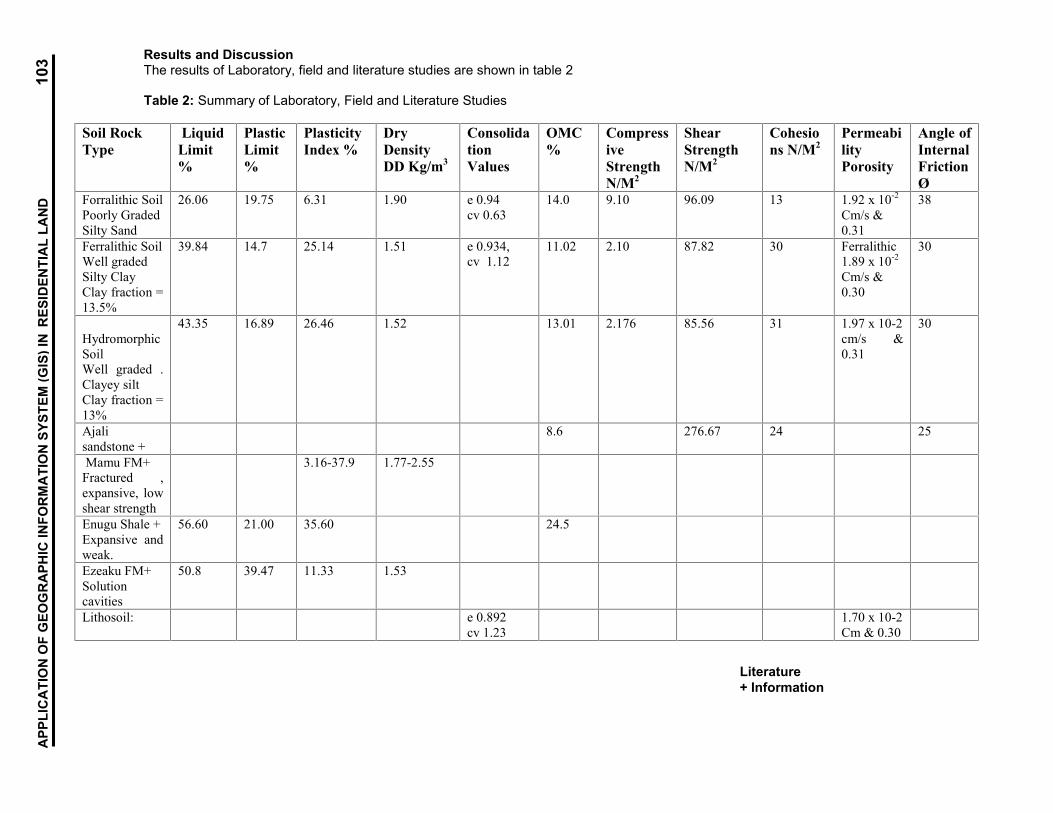
Results and DiscussionThe results of Laboratory, field and literature studies are shown in table 2
Table 2: Summary of Laboratory, Field and Literature Studies
Soil RockType
LiquidLimit%
PlasticLimit%
PlasticityIndex %
DryDensityDD Kg/m3
ConsolidationValues
OMC%
CompressiveStrengthN/M2
ShearStrengthN/M2
Cohesions N/M2
PermeabilityPorosity
Angle ofInternalFrictionØ
Forralithic SoilPoorly GradedSilty Sand
26.06 19.75 6.31 1.90 e 0.94cv 0.63
14.0 9.10 96.09 13 1.92 x 10⁻²
Cm/s &0.31
38
Ferralithic SoilWell gradedSilty ClayClay fraction =13.5%
39.84 14.7 25.14 1.51 e 0.934,cv 1.12
11.02 2.10 87.82 30 Ferralithic1.89 x 10-2
Cm/s &0.30
30
HydromorphicSoilWell graded .Clayey siltClay fraction =13%
43.35 16.89 26.46 1.52 13.01 2.176 85.56 31 1.97 x 10⁻²cm/s &0.31
30
Ajalisandstone +
8.6 276.67 24 25
Mamu FM+Fractured ,expansive, lowshear strength
3.16-37.9 1.77-2.55
Enugu Shale +Expansive andweak.
56.60 21.00 35.60 24.5
Ezeaku FM+Solutioncavities
50.8 39.47 11.33 1.53
Lithosoil: e 0.892cv 1.23
1.70 x 10⁻²Cm & 0.30
Literature+ Information
APP
LIC
ATI
ON
OF
GEO
GR
APH
IC IN
FOR
MA
TIO
N S
YSTE
M (G
IS) I
NR
ESID
ENTI
AL
LAN
D10
3
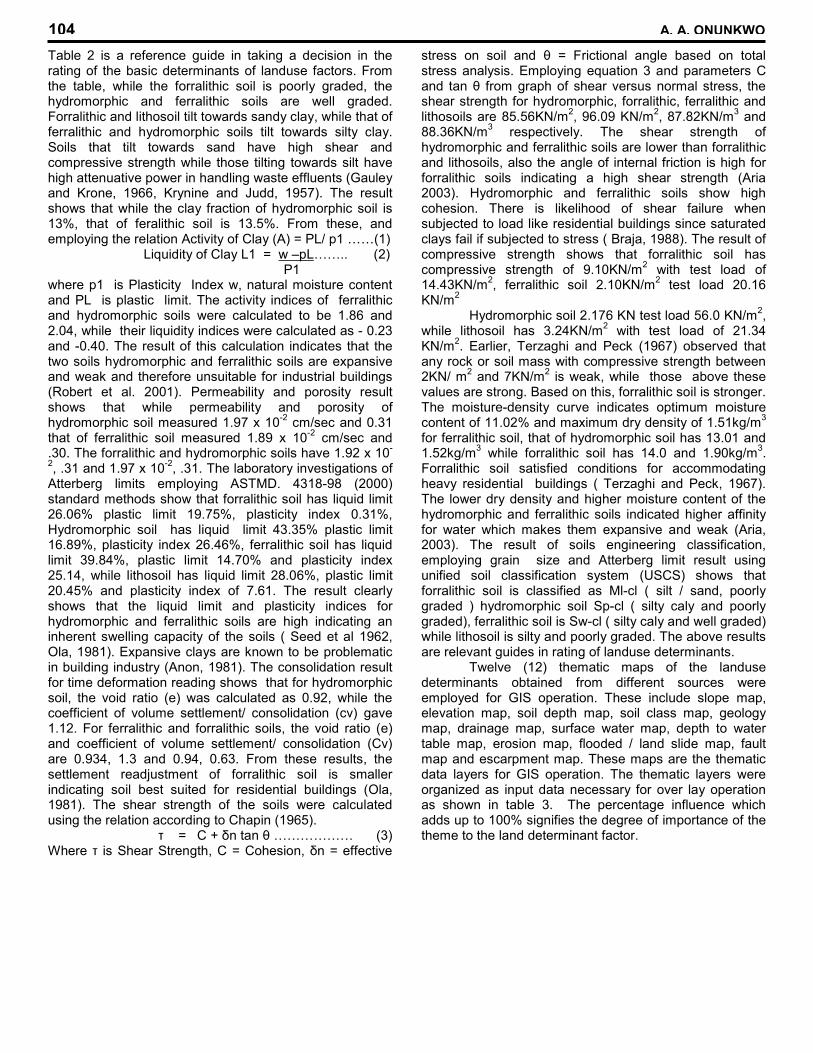
Table 2 is a reference guide in taking a decision in therating of the basic determinants of landuse factors. Fromthe table, while the forralithic soil is poorly graded, thehydromorphic and ferralithic soils are well graded.Forralithic and lithosoil tilt towards sandy clay, while that offerralithic and hydromorphic soils tilt towards silty clay.Soils that tilt towards sand have high shear andcompressive strength while those tilting towards silt havehigh attenuative power in handling waste effluents (Gauleyand Krone, 1966, Krynine and Judd, 1957). The resultshows that while the clay fraction of hydromorphic soil is13%, that of feralithic soil is 13.5%. From these, andemploying the relation Activity of Clay (A) = PL/ p1 ……(1)
Liquidity of Clay L1 = w –pL…….. (2) P1where p1 is Plasticity Index w, natural moisture contentand PL is plastic limit. The activity indices of ferralithicand hydromorphic soils were calculated to be 1.86 and2.04, while their liquidity indices were calculated as - 0.23and -0.40. The result of this calculation indicates that thetwo soils hydromorphic and ferralithic soils are expansiveand weak and therefore unsuitable for industrial buildings(Robert et al. 2001). Permeability and porosity resultshows that while permeability and porosity ofhydromorphic soil measured 1.97 x 10⁻² cm/sec and 0.31that of ferralithic soil measured 1.89 x 10⁻² cm/sec and.30. The forralithic and hydromorphic soils have 1.92 x 10-
2, .31 and 1.97 x 10⁻², .31. The laboratory investigations ofAtterberg limits employing ASTMD. 4318-98 (2000)standard methods show that forralithic soil has liquid limit26.06% plastic limit 19.75%, plasticity index 0.31%,Hydromorphic soil has liquid limit 43.35% plastic limit16.89%, plasticity index 26.46%, ferralithic soil has liquidlimit 39.84%, plastic limit 14.70% and plasticity index25.14, while lithosoil has liquid limit 28.06%, plastic limit20.45% and plasticity index of 7.61. The result clearlyshows that the liquid limit and plasticity indices forhydromorphic and ferralithic soils are high indicating aninherent swelling capacity of the soils ( Seed et al 1962,Ola, 1981). Expansive clays are known to be problematicin building industry (Anon, 1981). The consolidation resultfor time deformation reading shows that for hydromorphicsoil, the void ratio (e) was calculated as 0.92, while thecoefficient of volume settlement/ consolidation (cv) gave1.12. For ferralithic and forralithic soils, the void ratio (e)and coefficient of volume settlement/ consolidation (Cv)are 0.934, 1.3 and 0.94, 0.63. From these results, thesettlement readjustment of forralithic soil is smallerindicating soil best suited for residential buildings (Ola,1981). The shear strength of the soils were calculatedusing the relation according to Chapin (1965). τ = C + δn tan θ ……………… (3)Where τ is Shear Strength, C = Cohesion, δn = effective
stress on soil and θ = Frictional angle based on totalstress analysis. Employing equation 3 and parameters Cand tan θ from graph of shear versus normal stress, theshear strength for hydromorphic, forralithic, ferralithic andlithosoils are 85.56KN/m2, 96.09 KN/m2, 87.82KN/m3 and88.36KN/m3 respectively. The shear strength ofhydromorphic and ferralithic soils are lower than forralithicand lithosoils, also the angle of internal friction is high forforralithic soils indicating a high shear strength (Aria2003). Hydromorphic and ferralithic soils show highcohesion. There is likelihood of shear failure whensubjected to load like residential buildings since saturatedclays fail if subjected to stress ( Braja, 1988). The result ofcompressive strength shows that forralithic soil hascompressive strength of 9.10KN/m2 with test load of14.43KN/m2, ferralithic soil 2.10KN/m2 test load 20.16KN/m2
Hydromorphic soil 2.176 KN test load 56.0 KN/m2,while lithosoil has 3.24KN/m2 with test load of 21.34KN/m2. Earlier, Terzaghi and Peck (1967) observed thatany rock or soil mass with compressive strength between2KN/ m2 and 7KN/m2 is weak, while those above thesevalues are strong. Based on this, forralithic soil is stronger.The moisture-density curve indicates optimum moisturecontent of 11.02% and maximum dry density of 1.51kg/m3
for ferralithic soil, that of hydromorphic soil has 13.01 and1.52kg/m3 while forralithic soil has 14.0 and 1.90kg/m3.Forralithic soil satisfied conditions for accommodatingheavy residential buildings ( Terzaghi and Peck, 1967).The lower dry density and higher moisture content of thehydromorphic and ferralithic soils indicated higher affinityfor water which makes them expansive and weak (Aria,2003). The result of soils engineering classification,employing grain size and Atterberg limit result usingunified soil classification system (USCS) shows thatforralithic soil is classified as Ml-cl ( silt / sand, poorlygraded ) hydromorphic soil Sp-cl ( silty caly and poorlygraded), ferralithic soil is Sw-cl ( silty caly and well graded)while lithosoil is silty and poorly graded. The above resultsare relevant guides in rating of landuse determinants.
Twelve (12) thematic maps of the landusedeterminants obtained from different sources wereemployed for GIS operation. These include slope map,elevation map, soil depth map, soil class map, geologymap, drainage map, surface water map, depth to watertable map, erosion map, flooded / land slide map, faultmap and escarpment map. These maps are the thematicdata layers for GIS operation. The thematic layers wereorganized as input data necessary for over lay operationas shown in table 3. The percentage influence whichadds up to 100% signifies the degree of importance of thetheme to the land determinant factor.
104 A. A. ONUNKWO
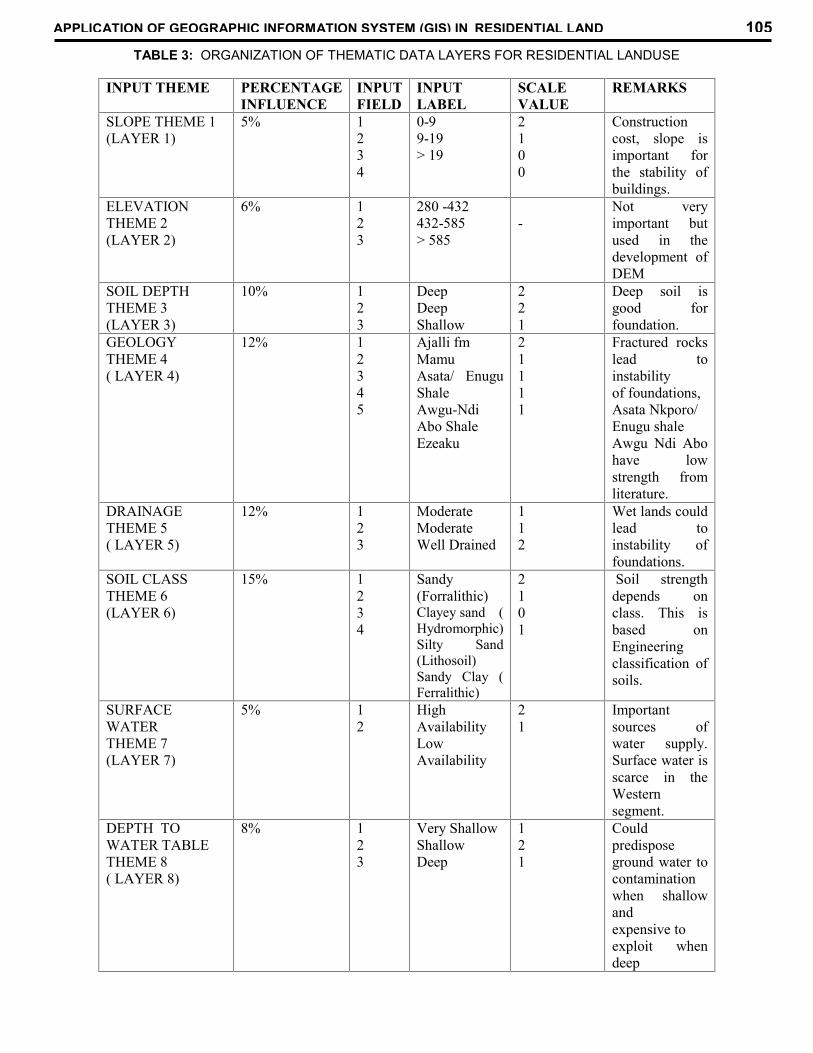
TABLE 3: ORGANIZATION OF THEMATIC DATA LAYERS FOR RESIDENTIAL LANDUSE
INPUT THEME PERCENTAGEINFLUENCE
INPUTFIELD
INPUTLABEL
SCALEVALUE
REMARKS
SLOPE THEME 1(LAYER 1)
5% 1234
0-99-19> 19
2100
Constructioncost, slope isimportant forthe stability ofbuildings.
ELEVATIONTHEME 2(LAYER 2)
6% 123
280 -432432-585> 585
-Not veryimportant butused in thedevelopment ofDEM
SOIL DEPTHTHEME 3(LAYER 3)
10% 123
DeepDeepShallow
221
Deep soil isgood forfoundation.
GEOLOGYTHEME 4( LAYER 4)
12% 12345
Ajalli fmMamuAsata/ EnuguShaleAwgu-NdiAbo ShaleEzeaku
21111
Fractured rockslead toinstabilityof foundations,Asata Nkporo/Enugu shaleAwgu Ndi Abohave lowstrength fromliterature.
DRAINAGETHEME 5( LAYER 5)
12% 123
ModerateModerateWell Drained
112
Wet lands couldlead toinstability offoundations.
SOIL CLASSTHEME 6(LAYER 6)
15% 1234
Sandy(Forralithic)Clayey sand (Hydromorphic)Silty Sand(Lithosoil)Sandy Clay (Ferralithic)
2101
Soil strengthdepends onclass. This isbased onEngineeringclassification ofsoils.
SURFACEWATERTHEME 7(LAYER 7)
5% 12
HighAvailabilityLowAvailability
21
Importantsources ofwater supply.Surface water isscarce in theWesternsegment.
DEPTH TOWATER TABLETHEME 8( LAYER 8)
8% 123
Very ShallowShallowDeep
121
Couldpredisposeground water tocontaminationwhen shallowandexpensive toexploit whendeep
APPLICATION OF GEOGRAPHIC INFORMATION SYSTEM (GIS) IN RESIDENTIAL LAND 105
EROSIONTHEME 9( LAYER 9)
10%12
BUFFEREDACTIVENONACTIVE
00
Creates hazardsof housing andeconomicactivitycontainingerosion isexpensive.
ESCARPMENTTHEME 10( LAYER 10)
4% 1 ScarpCrestDip
012
Slope problems
FLOODED / LANDSLIDETHEME 11( LAYER 11)
5%12
BUFFEREDACTIVENONACTIVE
00
Could results inenvironmentaldevastation andhazard GISBuffer 1000m (1km).
FAULTTHEME 12(LAYER 12)
8%12
BUFFEREDACTIVENONACTIVE
00
Promoteinstability andfailure in slopesand buildingsespecially whenfault planeslopes in thedirection ofbuildings.
TOTAL 100%
The table is a computer statement where scale valueswere selected based on the results of laboratory and fieldstudies, of table 2 and are the capability ratings assignedto each environmental factor based on a scale of 0-2
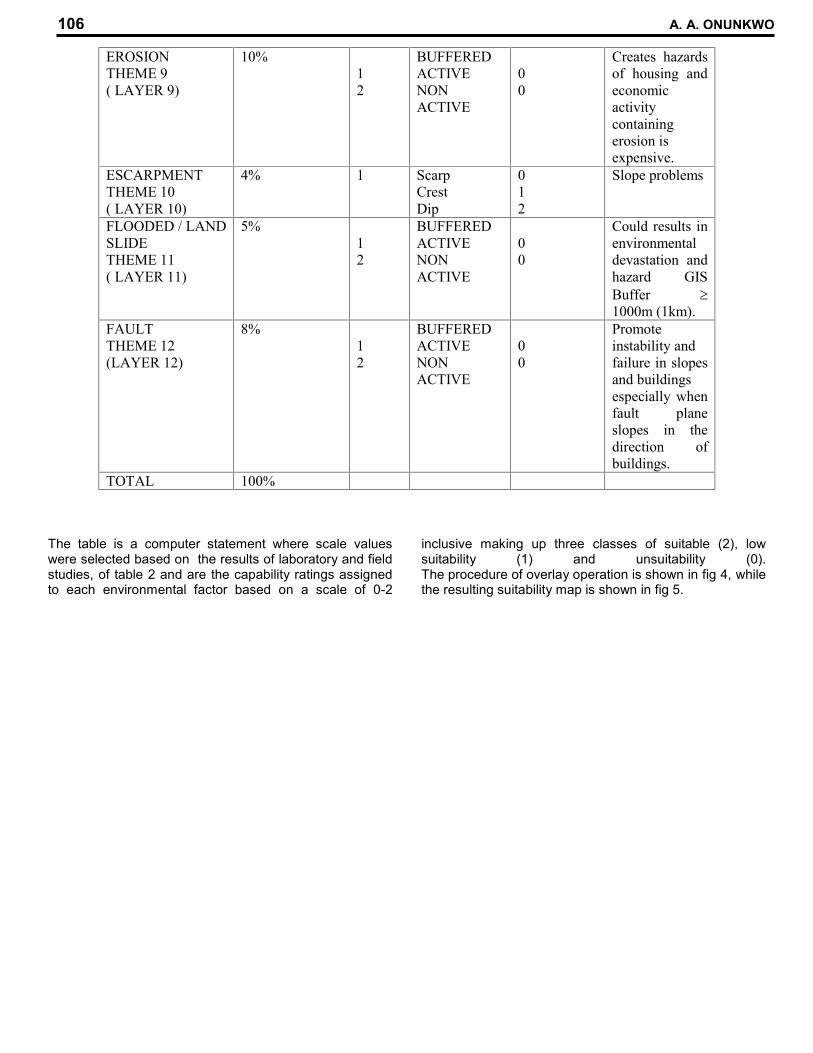
inclusive making up three classes of suitable (2), lowsuitability (1) and unsuitability (0).The procedure of overlay operation is shown in fig 4, whilethe resulting suitability map is shown in fig 5.
106 A. A. ONUNKWO
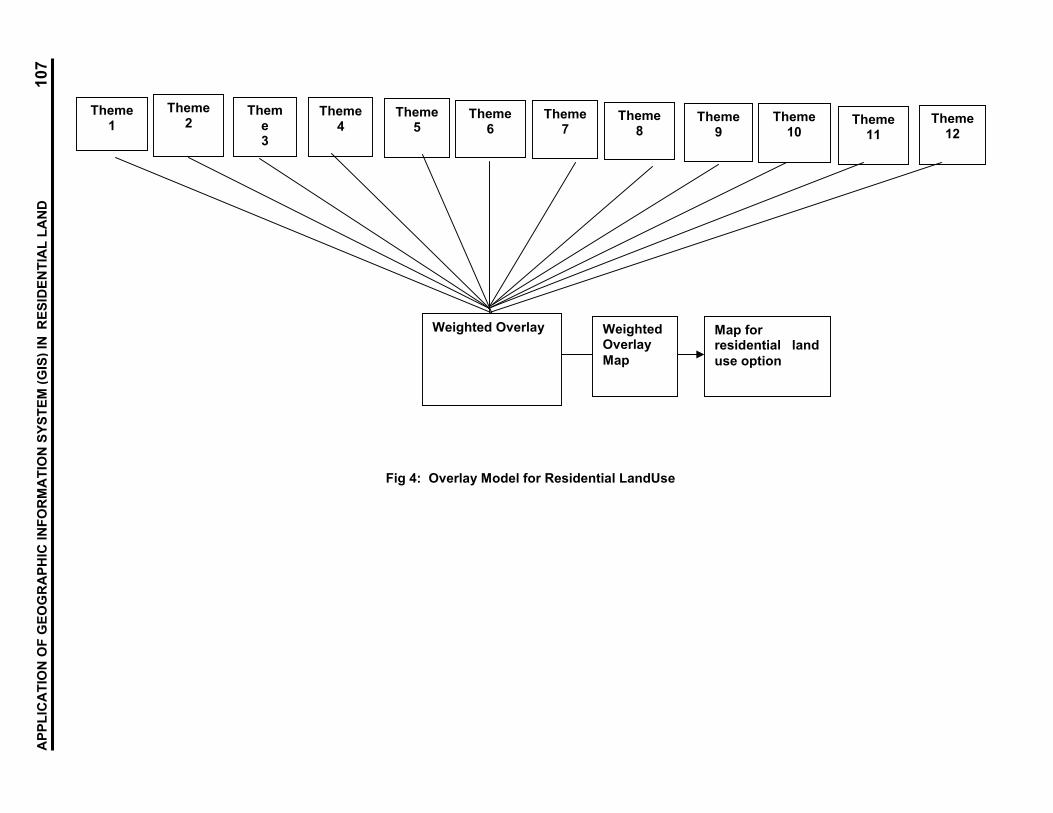
Theme1
Theme2
Theme3
Theme4
Theme5
Theme6
Theme7
Theme8
Theme9
Theme10
Theme11
Theme12
Weighted Overlay WeightedOverlayMap
Map forresidential landuse option
Fig 4: Overlay Model for Residential LandUse
APP
LIC
ATI
ON
OF
GEO
GR
APH
IC IN
FOR
MA
TIO
N S
YSTE
M (G
IS) I
NR
ESID
ENTI
AL
LAN
D10
7
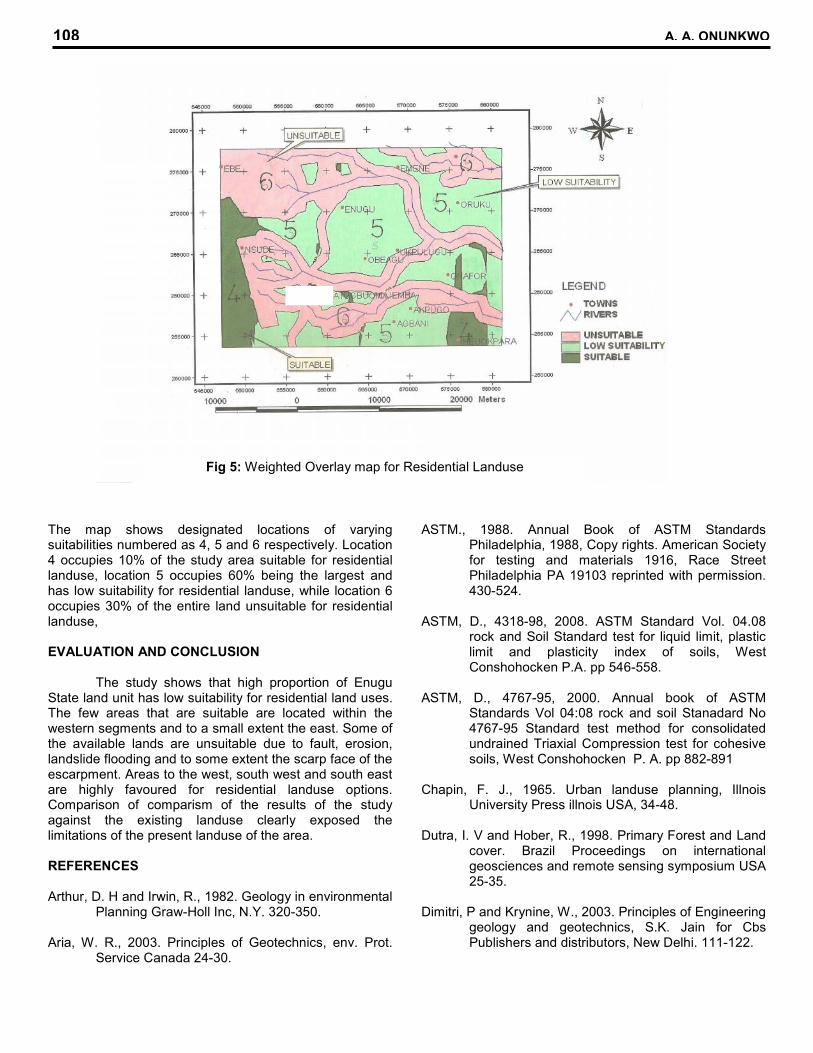
The map shows designated locations of varyingsuitabilities numbered as 4, 5 and 6 respectively. Location4 occupies 10% of the study area suitable for residentiallanduse, location 5 occupies 60% being the largest andhas low suitability for residential landuse, while location 6occupies 30% of the entire land unsuitable for residentiallanduse,
EVALUATION AND CONCLUSION
The study shows that high proportion of EnuguState land unit has low suitability for residential land uses.The few areas that are suitable are located within thewestern segments and to a small extent the east. Some ofthe available lands are unsuitable due to fault, erosion,landslide flooding and to some extent the scarp face of theescarpment. Areas to the west, south west and south eastare highly favoured for residential landuse options.Comparison of comparism of the results of the studyagainst the existing landuse clearly exposed thelimitations of the present landuse of the area.
REFERENCES
Arthur, D. H and Irwin, R., 1982. Geology in environmentalPlanning Graw-Holl Inc, N.Y. 320-350.
Aria, W. R., 2003. Principles of Geotechnics, env. Prot.Service Canada 24-30.
ASTM., 1988. Annual Book of ASTM StandardsPhiladelphia, 1988, Copy rights. American Societyfor testing and materials 1916, Race StreetPhiladelphia PA 19103 reprinted with permission.430-524.
ASTM, D., 4318-98, 2008. ASTM Standard Vol. 04.08rock and Soil Standard test for liquid limit, plasticlimit and plasticity index of soils, WestConshohocken P.A. pp 546-558.
ASTM, D., 4767-95, 2000. Annual book of ASTMStandards Vol 04:08 rock and soil Stanadard No4767-95 Standard test method for consolidatedundrained Triaxial Compression test for cohesivesoils, West Conshohocken P. A. pp 882-891
Chapin, F. J., 1965. Urban landuse planning, IllnoisUniversity Press illnois USA, 34-48.
Dutra, I. V and Hober, R., 1998. Primary Forest and Landcover. Brazil Proceedings on internationalgeosciences and remote sensing symposium USA25-35.
Dimitri, P and Krynine, W., 2003. Principles of Engineeringgeology and geotechnics, S.K. Jain for CbsPublishers and distributors, New Delhi. 111-122.
Fig 5: Weighted Overlay map for Residential Landuse
108 A. A. ONUNKWO
Egboka, B. C. E., 1993. Water resources problem in theEnugu area of Enugu State Nigeria. Journal ofMining geology. 20, 1-6.
Egboka, B. C. E and Onyebueke, F. O., 1999. AcuteHydrogeological problems vis a vis planning andmanagement of developing economy. A casestudy of Enugu area, Nigeria. 10-12
Ezeanyim, E. C., 1988. Hydrogeology of Enugu area andenvirons, unpublished M.Sc thesis, University ofNigeria Nsukka. 34-40.
Gauley, D. N and Krone, R. B., Soil Mantle as a wastetreatment system, University of California BerkelyCalifornia Serial Report. (6607): 120-131.
Holland, D. A and Smith, S. L., 2003. The effect ofchanging grid size in creation of Laser Scanner,Digital Surface Models in Geo ComputationOxford University Press. 230-240.
Iloeje, N. P., 1981. A new geography of Nigeria (A newrevised edition) Published in Great Britain byWilliam Clowes (Beccles) Ltd. London. 85-120.
Kang, V. C., 2002. Introduction to geographic informationsystem, Tata M.C. Graw-Hill Publishing Company.Ltd New Delhi. 20-25.
Krynine, D. P and Jude, W. R., 1957. Principles ofEngineering Geology and Geotechniques, MCGraw-Hill Book Company. 47-60.
Murat, R. C., 1972. Stratigraphy and Paleogeography ofCretaceous and Lower Tertiary in SouthernNigeria, African Geology, Ibadan University Press.251-266.
Nwankwor, G. I., Okeke, O. C and Ahiarakwem, C. A.,2004. Land Capability Index Mapping of Enugu area and
environs for presidential landuse options.Advances in geo sciences 2, (1): Cape PublishersInternational Ltd, 27 Alaenyi-Street, Owerri. 4-64.
Ofomata, G. E. K., 1985. Technical report on feasibilitystudy of erosion vulnerability areas in the easternpart of Nigeria, Ethiope Publishing House Benin.35-37.
Ola, P. C., 1981. Geotechnical properties of soft rocks.International Journal on Engineering GeologyUSA 2, 25.
Pearce, D. W and Turner, R. K., 1990. Economics ofnatural resources the environment, harvestwheat sheaf London. 21-28.
Reyment, R. A., 1965. Aspect of the geology of Nigeria,Ibadan University Press. 25-38.
Robert, W. D., Krebs, D and Richard, D. W., 2001. Highway materials, M.C. Graw Hill Book Company,New York. 211-224.
Seed, H. B., Wood, W and Lundgren, R. J., 1962.Prediction of swelling potential for compactedClays ASCE. J Soil Mechanics. 53-57.
Terzaghi, K and Peck, R. B., 1967. Soil Mechanics in Eng.Practice 2nd Ed. John Wiley and Sons Publishers,New York. 35-50.
APPLICATION OF GEOGRAPHIC INFORMATION SYSTEM (GIS) IN RESIDENTIAL LAND 109