molecular genetic variation across the southern and eastern geographic ranges of the african lion,...
TRANSCRIPT

Molecular genetic variation across the southern and eastern geographic ranges
of the African lion, Panthera leo
Jean Dubach1,*, B.D. Patterson2, M.B. Briggs3, K. Venzke4,7, J. Flamand5, P. Stander4,L. Scheepers4 & R.W. Kays2,61Department of Conservation Biology, Daniel F. and Ada L. Rice Conservation Biology and Research Center,Brookfield Zoo, Brookfield, IL 60513, USA; 2Department of Zoology, Field Museum of Natural History,1400 S. Lakeshore Drive, Chicago, IL 60605-2496, USA; 3Department of Veterinary Services, BrookfieldZoo, Brookfield, IL 60513, USA; 4The Ministry of Environment and Tourism, Namibia; 5Natal Parks Board,Republic of South Africa; 6Present address: Research & Collections, New York State Museum, CEC 3140,Albany, NY 12230, USA; 7Presently retired. (*Author for correspondence: Phone: 708-485-0263 ext 502;fax: 708-485-6048; e-mail: [email protected])
Received 9 March 2004; accepted 5 May 2004
Key words: African lion, cytochrome b, mitochondrial variation, NADH dehydrogenase, Panthera leo,phylogeography
Abstract
We examined sequence variation in the mitochondrial cytochrome b and NADH dehydrogenase subunit 5genes (2,360 bp total) for 26 lions from eleven locations throughout sub-Saharan Africa. Six distincthaplotypes were observed in the combined sequences, forming two clades: the eastern and the westernsavannas. The Uganda-Western Kenya haplotype grouped at a basal position with the eastern clade oflions from Tsavo south to the Transvaal and Natal regions. The phylogenetic position of the haplotypefrom Sabi Sands in the southern part of Kruger National Park remained poorly resolved. The haplotypesfound in Namibia and Botswana formed the western clade. The modest genetic variation documented hereargues against taxonomic distinctions among living African lions.
Introduction
Until historic times, the lion (Panthera leo) wasone of the most broadly distributed terrestrialmammals. Lions ranged over most of non-Saha-ran Africa, the Middle East, and southwest Asiainto the eastern Balkans in Europe and westernIndia (Guggisberg 1961, Coheleach 1982). Duringthe Pleistocene, the same or similar species ran-ged over much of northern and western Eurasia,and into North America (Vereshchagin 1971;Hemmer 1974; Guthrie 1990). The collapse of thePleistocene megafauna in the Holarctic andexpanding human populations have paced therange contraction of P. leo on all fronts (Smuts1978; Hanby & Bygott 1979). Range collapseduring historic times seems to have eliminated
several of the more peripheral populations(O’Brien et al. 1987; Kingdon 1997). The dis-tinctive Barbary and Cape lions, often treated asseparate subspecies, are now extinct (Mazak1970; 1975), as are all southwest Asian popula-tions, leaving only the highly endangered GirForest lions as the last remnant Asian population(O’Brien et al. 1987).
Like other large-bodied, wide-ranging species,lions show great morphological variation(Hallgrimsson & Maiorana 2000). Variation isparticularly marked in size, coat thickness andcolor, retention of juvenile spots, and in malesecondary characters (Hollister 1917). Themane can vary considerably in color, density anddistribution within and among populations(Patterson 2004; West & Packer 2002).
Conservation Genetics 6: 15–24, 2005. � Springer 2005DOI 10.1007/s10592-004-7729-6

Previous analyses of intraspecific variation inmorphology of lions have been plagued byinadequate treatment of age- and sex-relatedvariation. This is especially true for East Africawhere nine different subspecies have been namedand substantial morphological variation has beennoted (Elliot 1897; Patterson 1927; Wolffe 1955;Schaller 1972). Twenty-four different names havebeen proposed for geographic races of AfricanP. leo (Allen 1939; Meester & Setzer 1971 (asrevised 1977)), but most taxonomic authoritiesrecognize only two subspecies of extant lions,P. leo leo and P. leo persicus, for African andAsian populations, respectively (Ellerman et al.1953; Meester & Setzer 1971 (as revised 1977);O’Brien et al. 1987).
Here, we evaluate sequence data from twomitochondrial genes, cytochrome b and NADHdehydrogenase subunit 5, to examine the geneticdiversity among geographically distant popula-tions of sub-Saharan lions across the southern andeastern parts of their range. Patterns of geneticvariation should help to identify significant evo-lutionary units within P. leo and clarify theirbiogeographic history.
Materials and methods
Sample collection
Blood samples were obtained from wild lionsfollowing the method described by Blood et al.(1979). Peripheral whole blood and buffy coatswere preserved frozen in liquid nitrogen or inlong-term storage buffer (100 mM Tris–HCL,100 mM EDTA, 2%SDS, pH 8.0, mixed 1:1blood to buffer), and brought to the BrookfieldZoo genetics lab. Dried skin samples fromKenyan lions were hydrated in long-term storagebuffer prior to transport to the Field Museum ofNatural History. Sample locations (Figure 1) andnumber of individuals used for sequence analysisper population are given in Table 1. Blood wasalso obtained from an Amur tiger at BrookfieldZoo.
DNA extraction, amplification and sequencing
Following overnight digestion of the blood/bufferor tissue sample with 5–10 l Proteinase K, DNA
was extracted using standard phenol, phenol-chloroform/isoamyl alcohol, and chloroform/iso-amyl alcohol washes followed by precipitationwith 3 M sodium acetate and 100% ethanol(Sambrook et al. 1989). Genomic DNA was usedas a template for PCR amplification of the mito-chondrial genes, cytochrome b (CYTB), NADHdehydrogenase subunits 5 and 6 (ND5/6) and theRs3 portion of the control region. The followingPCR parameters were used for CYTB: 94 �C for40 s, 50 �C for 45 s, 72 �C for 45 s for 35 cycles,followed by a 10 min extension at 72 �C. ForND5/6 and Rs3 control region, the annealingtemperature was increased to 52 �C. Primersequences can be found in Table 2.
All PCR products were cleaned for sequenc-ing using QIAquick Spin Columns (Qiagen) andsubmitted to Iowa State Nucleic Acid Facilityfor Automated sequencing on either an ABI 373or an ABI 377 system or sequenced on a Beck-man/Coulter CEQ2000XL. To verify sequenceaccuracy, several haplotypes were sequenced onboth instruments. Sequences have been depositedin Genebank under the accession numbersAF384809-AF384818 for CYTB, AF385613 andAF385614 for the complete ND5/6, andAF385615-AF385623 for ND5 partial sequences.
Figure 1. Current lion distribution in shaded areas (Kingdon1997). Location of sample sites are indicated.
16
Validation of sequence fidelity and independence
The CYTB and ND5/6 genes were initially selectedbecause Lopez et al. (1994, 1996) concluded theywere not part of the transposed mtDNA in thefelid nuclear genome (Numt). However, ourCYTB sequences differed from those reported byJanczewski et al. (1995) in nucleotide composition.Cracraft et al.(1998) has subsequently identifiedboth nuclear and mitochondrial copies of CYTB.Therefore, to determine if the variation notedbetween populations was due to nuclear pseudo-gene contamination or PCR artifact, validation ofthe fidelity of two CYTB sequences reported herewas undertaken.
The CYTB gene was PCR amplifiedusing genomic DNA from the Uganda and theTransvaal lions. PCR products were cleaned usingthe Quaquick PCR kit (Qiagen), ligated intopGEM-T (pGEM�-T Easy Vector System,Promega), and transformed into JM109 HighEfficiency Competent cells (Promega) followingthe Promega protocol. Plasmid DNA was isolatedfrom positive transformants using Wizard� PlusSV Miniprep Purification Kit (Promega). Inserts
were amplified using CYTB primers (Table 2) andsequenced on both strands using a Beckman/Coulter CEQ2000XL sequencer. A total of 10clones from the Uganda lion and 8 clones from theTransvaal lion were sequenced. All sequences wererepeated from the same PCR product and from asecond PCR reaction to verify authentic substitu-tions from those due to PCR artifact.
To ensure that individuals within populations,included in this study, were not related alongmatrilines, the highly variable repetitive Rs3 por-tion of the control region, found only in themitochondria (Hoelzel et al. 1994; Cracraft et al.1998) was amplified using TaKaRa Ex Taq� andsequenced for each lion (Table 2). A pair of femalesiblings and three offspring, spanning three gen-erations, were included in the data set to examinepotential haplotype variability among known first-order relatives.
Sequence analysis
Sequences were aligned using the sequence editorand multiple alignment operations of MacDNA-SIS v3.2 (Hitachi Software Engineering America,
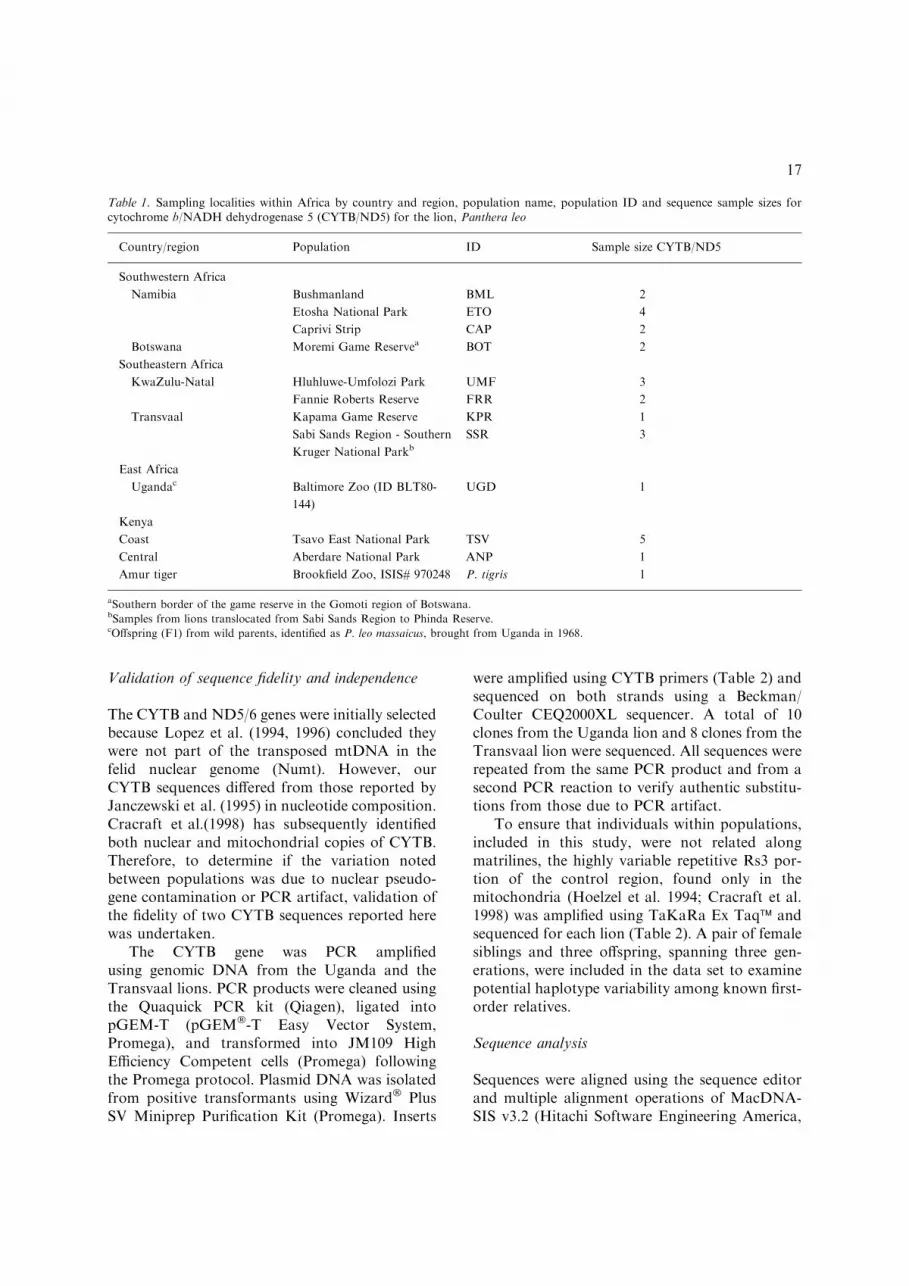
Table 1. Sampling localities within Africa by country and region, population name, population ID and sequence sample sizes forcytochrome b/NADH dehydrogenase 5 (CYTB/ND5) for the lion, Panthera leo
Country/region Population ID Sample size CYTB/ND5
Southwestern Africa
Namibia Bushmanland BML 2
Etosha National Park ETO 4
Caprivi Strip CAP 2
Botswana Moremi Game Reservea BOT 2
Southeastern Africa
KwaZulu-Natal Hluhluwe-Umfolozi Park UMF 3
Fannie Roberts Reserve FRR 2
Transvaal Kapama Game Reserve KPR 1
Sabi Sands Region - Southern
Kruger National ParkbSSR 3
East Africa
Ugandac Baltimore Zoo (ID BLT80-
144)
UGD 1
Kenya
Coast Tsavo East National Park TSV 5
Central Aberdare National Park ANP 1
Amur tiger Brookfield Zoo, ISIS# 970248 P. tigris 1
aSouthern border of the game reserve in the Gomoti region of Botswana.bSamples from lions translocated from Sabi Sands Region to Phinda Reserve.cOffspring (F1) from wild parents, identified as P. leo massaicus, brought from Uganda in 1968.
17

Ltd.). Since these genes have reduced intraspecificvariation, and they yielded similar results whenanalyzed separately, they were combined toenhance the phylogenetic signal. The sequenceswere analyzed using Phylogenetic Analysis UsingParsimony (PAUP) Beta Version 4.0B1 forMacintosh (Swofford 1998). An Amur tiger,Panthera tigris, was included in the analyses foroutgroup rooting. Trees were constructed usingeither maximum parsimony or distance methodsand branch reliability was evaluated with 1000bootstrap replications. A standard error test ofneighbor-joining interior-branch lengths (Felsen-stein 1988; Nei 1996) was obtained using MEGA(v 1.01) (Kumar et al. 1993). The standard-errortest calculates a confidence probability (CP) foreach interior branch length, where CP ¼ 1)a, abeing the significance level of type I error(Rzhetskky & Nei 1992; Takezaki et al. 1995).
In order to evaluate substitution rate constancyamong haplotypes, Maximum Likelihood analyseswere performed using PAUP. The transition-to-transversion ratio was used to compute log-likeli-hood values with and without a molecular clock.Substitution rate constancy was tested using thelog-likelihood ratio (Felsenstein 1988; Nei 1996)and evaluated as a v2[0.05,df ¼ n)2] distribution.
The significance of the genetic variation wasfirst evaluated among all lion populations usingan Analysis of Molecular variation (AMOVA)(Excoffier et al. 1992) implemented in ArlequinVersion 2001 (Schneider et al. 2000). Populationswere then partitioned into three geographicgroups for a two-factor AMOVA to test for sig-nificant subdivision among regions and popula-tions within regions. The significance of thefixation indices, FST, FSC, and FCT, was deter-mined with 1023 haplotype permutations at eachlevel.
Results
DNA sequence
Twenty-six lions were compared for DNAsequence variation at the mitochondrial genes forCYTB (1140 bp) and ND5 (1222 bp) (Table 1).The complete ND5/6 sequence (2338 bp) wasobtained for the Uganda and the Transvaal lions,and internal primers were designed from thesesequences to amplify a portion of ND5 beginningat position 561 and ending at position 1782 for allother lions (Table 2).
Table 2. Primer pairs used to amplify and sequence each gene region. All Internal primers were developed for this study
Region Site Sequence Source
CYTB L-glu L14724 5’ CGAAGCTTGATATGAAAAAC-
CATCGTTG
Irwin et al. (1991)
H-Thr H15915a 5’ AACTGCAGTCATCTCCGGTTTA-
CAAGAC
Irwin et al. (1991)
CB538L 5’ GCCTTCCACTTCATCCTTCC Internal
CB553H 5’ GGATGAACTGGAAGGCAAAG Internal
ND5 ND5L-Leu 763 5’ AATAGTTTATCCATTGGTCT-
TAGG
Georgiadis et al. (1994)
ND5L-560 5’ GTAGGATTTATCACGGCTATAG Internal
ND5H-560c 5’ CTATAGCCGTGATAAATCCTAC Internal complement
ND5L-1180 5’ TAATCATCGAGACAGCCAATAC Internal
ND6 ND6H-530 5’ CTAAGTAGGAGTAGGCTAAG Internal
ND6H-Glu 764 5’ TTACAACGATGGTTTTTCATAT-
CA
Georgiadis et al. (1994)
DLOOP HCAT-Phe 5’ ATTTTCAGTGTCTTGCTTT Shankaranarayanan &
Singh (1998)
LDL 5’ CATCTGGTTCCTACTTCAGG Internal
HCAT-221 5’ GGCAAGACAGAAATAGACACG Sequencing, internal
aFor sequencing H-Thr H15915-s 5’ TCATCTCCGGTTTACAAGAC was substituted.
18

Analysis of 16 cloned sequences, includingsequence repeated from the same clone and thesame PCR template, verified the initial CYTBhaplotypes observed for the Uganda and Trans-vaal lions. The mitochondrial origin of these se-quences are supported by complete translation(including ND5 and ND5/6), comparisons withmultiple mammalian CYTB sequences reported byIrwin et al. (1991), and by close agreement withdata reported by Arnason et al. (1995) and Cra-craft et al. (1998). While the haplotype reported byCracraft et al. (1998) was very similar to the hap-lotype found in the Transvaal region, the haplo-type from Arnason et al. (1995) was not observedin any of the samples examined here. Two addi-tional clones shared many substitutions with thenuclear pseudogene for tigers, reported byCracraft et al. (1998) and were substantially dif-ferent from our mitochondrial sequences. BothCYTB and ND5/6 sequences from these two lionsare also concordant with sequence reported for thedomestic cat (Lopez et al. 1996).
The control region Rs3 sequence was similar tothat reported by Shankaranarayanan and Singh(1998) and Cracraft et al. (1998), and was identicalamong the two sibling females and their offspring,indicating that this region can detect maternally
related individuals. Sequences differed in repetitivepattern and length among 25 of 26 individualsincluded in this study (unpublished data) suggest-ing these individuals represent unrelated matri-lines. Two lions from the Umfolozi populationshared the same haplotype, a finding that was notsurprising since this population was founded bytwo Transvaal females and one Mozambique male(Anderson 1980; Maddock et al. 1996).
Overall, sequence variation for the combinedgenes (2362 bp) were suggestive of geographicdifferentiation (Table 3). Among the geographicsamples there were six haplotypes that contained26 nucleotide substitutions, one of these a trans-version. The only haplotype polymorphism withina population occurred in Etosha National Park.Five nucleotide substitutions were non-synony-mous. For CYTB, the Namibian/Botswana pop-ulations and the Sabi Sands lions each had oneamino acid substitution, and a third was shared byboth. For ND5, one amino acid substitution wasfound in the Transvaal group (KPR, FRR, TSV)but not in Umfolozi and another was observed inthe Sabi Sands lions.
The rate of substitution is most likely constantover these lion lineages as indicated by a non-sig-nificant log-likelihood ratio test (Takezaki et al.
Table 3. Nucleotide substitutions within the mitochondrial genes, NADH dehydrogenase subunit 5 and cytochrome b, among 12populations of lion, Panthera leo, located throughout eastern and southern Africa
ND5 CYTB
Nucleotide Position: 1111 111111
334560011 347778000111
258190861512 34470169258123
Haplotype (N) Population 520679998194 15219924302621
1 (2) Uganda,Aberdare(ANP) GTTTTTGCGGGT GTCGTTCCGCTTTC
2 (5) Tsavo (TSV) ACC.CCATAA.. .......TAT.CC.
2 (3) Transvaal(KPR,FRR) ACC.CCATAA.. .......TAT.CC.
3 (3) Umfolozi (UMF) ACC.CCA.AA.. .......TAT.CC.
4 (3) Sabi Sands(SSR) ACCCC.A..AAC .CT.CCT.A.C.CG
5 (2) Botswana (BOT) ACCCC.A..A.. A.TA..T.A.C.C.
5 (2) Caprivi (CAP) ACCCC.A..A.. A.TA..T.A.C.C.
5 (2) Bushmanland(BML) ACCCC.A..A.. A.TA..T.A.C.C.
5 (2) Etosha (ETO) ACCCC.A..A.. A.TA..T.A.C.C.
6 (2) Etosha (ETO) ACCCC.A..A.. A.T...T.A.C.C.
(1) P. tigris A.CC.C.TCAA. A.T.C.T.A...CT
The Amur tiger, P. tigris, nucleotide is included for those positions that vary within lions. Total sequence length is 1222 bp for ND5 and
1140 bp for cytb. ‘‘.’’ denotes a base that is identical to the first row nucleotide; boldface identified the single transversion (Ti/Tv = 25/1 among
lion populations). N = sample size.
19

1995; Nei 1996). Genetic distances (Table 4),averaged 10% between P. leo and P. tigris and lessthan 1% among all African lion populations.Comparisons of CYTB with the P. leo reported byArnason et al. (1995) yielded an average distancevalue of D ¼ 1.2% (range 1.0% with FRR to1.4% with SSR).
Phylogeographic analysis
Parsimony analysis of the combined sequences(PAUP), including the tiger for outgroup root-ing, produced two trees of 259 steps, with aconsistency index of 0.973 (Figure 2a). There
were 17 parsimony-informative characters. In thetwo most parsimonious trees, the position ofEtosha haplotype #6 was unstable, grouping withthe Etosha lions or remaining unresolved. TheSabi Sands haplotype remained in an unresolvedpolytomy.
Distance-based analysis (Figure 2b) produceda slightly different topology showing two clades.The southwestern and Sabi Sands haplotypes areunited in one clade and all eastern haplotypes wereplaced together in a second clade with high boot-strap values. Only one confidence probability wassignificant for the eastern cluster.
Maximum Likelihood analysis, without themolecular clock, produced a topology similar tothe parsimony tree (Figure 2a), except the SabiSands haplotype was united with the eastern cladeat a position basal to the Uganda haplotype.When the molecular clock was enforced, theresulting tree was identical to the neighbor-joiningdistance tree (Figure 2b).
The single-factor AMOVA showed that 99.5%of the variation is due to differences among popu-lations, the remaining due to the polymorphismobserved in the Etosha lions. When this variationwas partitioned geographically into Uganda–western Kenya, eastern savannas, and westernsavannas, the majority of the variance, 62.3%, wasamong groups (FCT ¼ 0.623, P < 0.005), while36.6% was among populations (FST ¼ 0.988,P < 0.001). These results indicate a high level ofgenetic structuring among populations and evengreater divergence across geographic regions.
Table 4. Average genetic distances among geographic populations of African lion, denoted by haplotype number 1 through 6, and anAmur tiger outgroup, based on uncorrected ‘‘p’’, the total number of pairwise differences/total number of nucleotide sites
1-Ugandaa 2-Tsavob 3-Umfolozi 4-SabiSands 5-Etoshac 6-Etosha
Tiger 0.101 0.101 0.101 0.100 0.099 0.100
1 – 0.006 0.006 0.008 0.006 0.006
2 – 0.0004 0.007 0.005 0.005
3 – 0.006 0.004 0.004
4 – 0.003 0.003
5 – 0.0004
6
Kimura-two-parameter values were identicalaIncludes Uganda (UGD), Aberdare (ANP)bIncludes Tsavo (TSV), Transvaal (KPR), Fannie Roberts (FRR)cIncludes Etosha (ETO), Caprivi (CAP), Bushmanland (BML), Botswana (BOT)
Figure 2. (a) The 50% majority-rule consensus parsimony tree.Bootstrap values (above each branch) were obtained using thebranch-and-bound algorithm and sequence addition ‘‘as is’’. (b)Distance-based Neighbor Joining phylogram obtained usingminimum evolution and either uncorrected ’P’ or Kimura’s-two-parameter method. Bootstrap values are above the linebefore the corresponding node and confidence probabilities(interior branch test, from MEGA) are below the line. Branchlengths in parentheses are above the four longest branches (allremaining branches are 60.0008).
20

Discussion
Systematic relationships
Mitochondrial sequence variation among Africanlions is modest and supports the current view thatall extant African lions belong to a single subspe-cies (Ellerman et al. 1953; Meester & Setzer 1971(as revised 1977); O’Brien et al. 1987). Withoutclear evidence to indicate that Barbary lions dif-fered genetically from other African lions, thistaxon should be called Panthera leo leo. Althoughthe name Panthera leo leo is based on the nowextinct Barbary lion (Allen 1939), applying othersubspecific names from the extensive synonymy ofPanthera leo should await a comprehensive anal-ysis of this species across its extensive geographicand temporal range and include both genetic andmorphological diagnoses.
Geographic variation
Lions exhibit sex-biased dispersal, in which maleoffspring leave the natal group at puberty, whereasfemales may remain in their natal area for life(Schaller 1972; Pusey & Packer 1987; Spong et al.2002). Observed regional sequence differentiationamong lion populations for these two conservedmitochondrial genes supports female fidelity tonatal regions.
Distance-based analyses identified two majorgeographic clades of lions: those in southwesternAfrica and those to the east, extending fromeastern Kenya south to KwaZulu-Natal. A similareast-southwest dichotomy among genetic haplo-types was observed in seven African bovids(Arctander et al. 1999; Nersting & Arctander2001; Pitra et al. 2002; Van Hooft et al. 2002);cheetah (Acinonyx jubatus)(Freeman et al. 2001);black rhinoceros (Diceros bicornis)(Brown &Houlden 2000); and African elephant (Loxodontaafricana)(Georgiadis et al. 1994). Many additionalwide-ranging mammals show range disjunctionsthat coincide with this haplotype distribution (seemaps in Kingdon 1997).
The eastern lions can be further subdividedalong each side of the Great African Rift thatstretches into South Africa. The lion haplotypefrom Tsavo, Kenya was identical to the haplotypefrom the Transvaal region, yet differed consider-ably from the haplotype found at Aberdares
National Park in western Kenya. A similar patternof variation across the Rift Valley was alsoreported for sable (Hippotragus niger) (Pitra et al.2002); wildebeest (Connochaetes taurinus) andimpala (Aepyceros melampus) (Templeton &Georgiadis 1996; Arctander et al. 1999); andAfrican wild dogs (Lycaon pictus) (Girman et al.2001). The distinctness and basal position of theUgandan haplotype suggest isolation and inde-pendent evolution by lion populations north of theCongo Basin and west of the Rift, or reflect anancestral polymorphism alternately fixed by line-age sorting (Lieberman & Vrba 1995; Tosi et al.2000). AMOVA analysis suggest that the signifi-cant portion of genetic variation is found amonggeographic regions while populations withinregions are less divergent most likely due to ashared evolutionary history.
The Sabi Sands haplotype was unresolved byparsimony. Maximum Likelihood placed it basalto the Ugandan haplotype and distance-basedanalysis grouped it with the southwestern lions at abasal node. Several ancestral and derived substi-tutions are shared with the southwestern groupand the Ugandan haplotype suggesting some typeof historical connection. Finding a divergenthaplotype in the Sabi Sands area, bounded to thenorth and south by the haplotype shared by Tsavoand Transvaal lions was surprising. Collection ofadditional samples from Kruger National Parkwould be a future priority.
Additional surveys are needed to expand thegeographic coverage into West Africa, Tanzania,Angola, Zambia, and Zimbabwe. Collection ofsamples between KwaZulu-Natal and Botswana inSouth Africa will be especially important. A geo-graphic contact zone was observed betweenDiceros bicornis subspecies in Namibia andKwaZulu-Natal (Swart & Ferguson 1997) andbetween distinct east and southwest wild dogpopulations thought to be isolated (Girman et al.2001). Until these central regions of Africa aremore thoroughly studied, conclusions about thedistinctness of the eastern and southwestern cladescannot be made.
Conservation implications
While free ranging lion populations appear to beprevalent in some areas of their distribution, theAfrican Lion Working Group recently estimated
21

that as few as 22,600 lions remain in Africa, per-haps 10% of the number living there only 25 yearsago (Loveridge et al. 2002). Consequently, thereare an increasing number of lions in peripherallyisolated populations or confined in reserves andzoological parks that are closed to gene flow.Management of these populations must balancethe need to maintain stable densities at or belowthe carrying capacity of the reserve and, at thesame time, minimize loss of genetic variabilitythrough drift or inbreeding. The managementhistory of the Hluhluwe-Umfolozi Park lionsexemplifies how difficult this task is (Anderson1980; Maddock et al. 1996).
Ideally, translocations to increase geneticdiversity would mimic natural gene flow by movingonly individuals from the nearest areas with similarhaplotypes. However, lions have already beentranslocated from Namibia into southeast Africa,and appear to have successfully reproduced there.For long-termmanagement, however, a geographicdetermination of conservation units should bemade. The unit for conservation management hasbeen the subject of much discussion (see Cracraftet al. 1998; Bininda-Emonds et al. 2000; Crandallet al. 2000 and references contained in these papers)and depends on taxonomic, ecological and geneticfactors. At this time, ecological and geneticexchangeability have not been studied in translo-cated lions in a controlled fashion.
Phylogenetic data from this study suggest thereare at least four lion groups – the southwesternpopulations, the populations to the east and westof the rift valley and the Sabi Sands population.While taxonomic distinctions await further sam-pling for resolution, these regions might defineevolutionary significant units (ESU) as defined byCrandall et al. (2000).
Finally, conservation management plans shouldconsider disease status as an overriding factor forlocating a source population for genetically de-pressed populations. Lion populations are beingexposed to various diseases, such as canine distem-per (Alexander et al. 1996; Roelke-Parker et al.1996), rabies (Kat et al. 1995), and tuberculosis(Moore 1999), with catastrophic results. The effectsof the feline lentivirus or feline immunodeficiencyvirus (FIV) are still poorly understood, butmay alsoplay a significant role in their ultimate survivability(Briggs, personal communication). Translocatingdiseased lions or lions carrying a latent virus could
potentially harm the resident population partic-ularly if they have become inbred with reducedimmune (MHC) variability (Gilbert et al. 1991).Plans for translocations should include anassessment of disease exposure. Future geneticstudies should include additional individuals,locations, and nuclear genes, such as microsatel-lites, that will provide more detailed informationregarding population diversity to guide veterinaryand management efforts for health and conser-vation purposes.
Acknowledgements
We are grateful to several wildlife agencies,including the Kenya Wildlife Service, for permis-sion to collect and study samples from theirrespective countries. Our work had financial sup-port from SEACON (Chicago Zoological SocietyConservation Research Grant), N. Alberts,S. Evans, and M. Webster, as well as the MarshallField Fund (Field Museum). We would also like tothankO.Forge,R.Murnane, V. PiperKimball, andA. Studley for assistance with sample collection inthe field, and J. Lebbin for lab assistance. M.Cranfield at The Baltimore Zoo, and M. Rosenthalat The Lincoln Park Zoo provided lion bloodsamples.
References
Allen GM (1939) A checklist of African mammals. Bull. Mus.Compar. Zool., 83, 1–763.
Alexander KA, Kat PW, Munson LA, Kalake A, Appel JJ(1996) Canine distemper-related mortality among wild dogs(Lycaon pictus) in Chobe National Park, Botswana. J. Zoo.Wildlife Med., 27, 426–427.
Anderson JL (1980) The re-establishment and management of alion Panthera leo population in Zululand, South Africa. Biol.Conserv., 19, 107–117.
Arctander P, Johansen C, Coutellec-Vreto M (1999) Phyloge-ography of three closely related African bovids (TribeAlcelaphini). Mol. Biol. Evol., 16, 1724–1739.
Arnason R, Bodin K, Gullberg A, Ledje C, Mouchaty S (1995)A molecular view of pinniped relationships with particularemphasis on the true seals. J. Mol. Evol, 40, 78–85.
Bininda-Emonds ORP, Vazquez DP, Manne LL (2000) Thecalculus of biodiversity: integrating phylogeny and conser-vation. Trend Ecol. Evol., 15, 92–94.
Blood DC, Henderson JA, Radostits OM (1979) VeterinaryMedicine, 5th edn. pp. 3–27. Philadelphia, Lea and Febiger.
Brown SM, Houlden BA (2000) Conservation genetics of theblack rhinoceros (Diceros bicornis). Conserv. Genet., 1, 365–370.
22

Coheleach G (1982) The Big Cats: The Paintings of GuyCoheleach. Harry N. Abrams, Inc., New York.
Cracraft J, Feinstein J, Vaughn J, Helm-Bychowski K (1998)Sorting out tigers (Panthera tigris): Mitochondrialsequences, nuclear inserts, systematics, and conservationgenetics. Animal Conserv., 1, 139–150.
Crandall KA, Bininda-Emonds ORP, Mace GM, Wayne RK(2000) Considering evolutionary processes in conservationbiology. Trends Ecol. Evol., 15, 290–295.
Ellerman JR, Morrison-Scott TCS, Hayman RW (1953)Southern African Mammals 1758–1951: a Reclassification.British Museum (Natural History), London.
Elliot DG (1897) Lists of mammals from Somali-land obtainedby the museum’s East African expedition. Field ColumbianMuseum, 19, 109–155.
Excoffier L, Smouse PE, Quattro JM (1992) Analysis ofmolecular variance inferred from metric distances amongDNA haplotypes: application to human mitochondrial DNArestriction data. Genetics, 131, 479–491.
Felsenstein J (1988) Phylogenies from molecular sequences:Inference and reliability. Ann. Rev. Genet., 22, 521–565.
Freeman A, Machugh D, Mckeown S, Walzer C, Mcconnell D,Bradley D (2001) Sequence variation in the mitochondrialDNA control region of wild African cheetahs (Acinonyxjubatus). Heredity, 86, 355–362.
Georgiadis N, Bischof L, Templeton A, Patton J, Karesh W,Western D (1994) Structure and history of African elephantpopulations: I. Eastern and southern Africa. J. Hered., 85,100–104.
Gilbert DA, Packer C, Pusey AE, Stephens JC, O’Brien SJ(1991). Analytical DNA fingerprinting in lions: Parentage,genetic diversity, and kinship. J. Hered., 82, 378–386.
Girman D, Vila C, Geffen E, Creel S, Mills M, McNutt J,Ginsberg J, Kat P, Mamiya K, Wayne R (2001) Patterns ofpopulation subdivision, gene flow and genetic variability inthe African wild dog (Lycaon pictus). Mol. Ecol., 10, 1703–1723.
Guggisberg CAW (1961) Simba, the Life of the Lion. HowardTimmins, Capetown, South Africa.
Guthrie RD (1990) Frozen Fauna of the Mammoth Steppe:The Story of Blue Babe. University of Chicago Press,Chicago.
Hallgrimsson B, Maiorana V (2000) Variability and size inmammals and birds. Biological J. Linn Soci., 70, 571–595.
Hanby JP, Bygott JD (1979) Population Changes in Lions andOther Predators. In Serengeti: Dynamics of an Ecosystem.(eds. Sinclair ARE and Norton-Griffiths M), pp. 249–262.University of Chicago Press, Chicago.
Hemmer H (1974) Zur Artgeschichte des Lowen Panthera(Panthera) leo (Linnaeus, 1758). Veroff. Zool. Staatssamml.Munchen, 17, 167–280.
Hoelzel AR, Lopez JV, Dover GA, O’Brien SJ (1994) Rapidevolution of a heteroplasmic repetitive sequence in themitochondrial DNA control region of carnivores. J. Mol.Evol., 39, 191–199.
Hollister N (1917) Some effects of environment and habit oncaptive lions. Proc. U. S. Natl. Mus., 53, 177–193.
Irwin DM, Kocher TD, Wilson AC (1991) Evolution of thecytochrome b gene of mammals. J. Mol. Evol., 32, 128–144.
Janczewski DN, Modi WS, Stephens JC, O’Brien SJ (1995)Molecular evolution of 12S RNA and cytochrome b se-quences in the pantherine lineage of Felidae.Mol. Biol. Evol.,12, 690–707.
Kat PW, Alexander KA, Smith JS, Munson L (1995) Rabiesand African wild dogs in Kenya. Proc. R. Soc. Lond. Ser B,262, 229–233.
Kingdon J (1997) The Kingdon Field Guide to African Mam-mals. Academic Press, San Diego, California.
Kumar S, Tamura K, Nei N. (1993) MEGA: Molecular Evo-lutionary Genetics Analysis. Vs. 1.02, Pennsylvania StateUniversity, University Park, Pennsylvania.
Lieberman BS, Vrba ES (1995) Hierarchy theory, selection, andsorting. BioScience, 45, 394–399.
Lopez JV, Yuhki N, Masuda R, Modi WS, O’Brien SJ (1994)Numt, a recent transfer and tandem amplification of mito-chondrial DNA to the nuclear genome of the domestic cat. J.Mol. Evol., 39, 174–190.
Lopez JV, Cevario S, O’Brien SJ (1996) Complete nucleotidesequence of the domestic cat (Felis catus) mitochondrialgenome and a transposed mtDNA tandem repeat (Numt) inthe nuclear genome. Genomics, 33, 229–246.
Loveridge AJ, Lyman T, Macdonald DW (2002) Lion Con-servation Research Workshop 2: Modeling Conflict. 98 pp.Wildlife Conservation Research Unit, Oxford.
Maddock A, Anderson A, Carlisle F, Galli N, James A, VersterA, Whitfield W (1996) Changes in lion numbers inHluhluwe-Umfolozi Park. Lammergeyer, 44, 6–18.
Mazak V (1970) The Barbary lion, Panthera leo leo (Linnaeus,1758); some systematic notes, and an interim list of thespecimens preserved in European museums. Zeitschrift furSaugetierkunde, 35, 34–44.
Mazak V (1975) Notes on the Black-maned Lion of the Cape,Panthera leo melanochaita (Ch. H. Smith, 1842) and aRevised List of the Preserved Specimens. North-HollandPublishing Company, Amsterdam, London.
Meester JAJ, Setzer HW (1971, as revised 1977) The Mammalsof Africa. An Identification Manual. Smithsonian Institu-tion, Washington, D.C.
Moore M (1999) New Hluhluwe Lions Face Probable Death.African Eye News Service, South Africa.
Nei M (1996) Phylogenetic analysis in molecular evolutionarygenetics. Ann. Rev. Genet., 30, 371–403.
Nersting LG, Arctander P (2001) Phylogeography and conser-vation of impala and greater kudu. Mol. Ecol., 10, 711–720.
O’Brien SJ, Martenson JS, Packer C, Herbst L, Vos VD, JoslinP, Ott-Joslin J, et al. (1987) Biochemical genetic variation ingeographic isolates of African and Asiatic lions. Natl. Geog.Res., 3, 114–124.
Patterson BD (2004) The Lions of Tsavo: Exploring the Legacyof Africa’s Notorious Maneaters. McGraw-Hill, New York.
Patterson JH (1927) The Man-eaters of Tsavo and other Afri-can Adventures. The Macmillan Company, New York.
Pitra C, Hansen A, Lieckfeldt D, Arctander P (2002) Anexceptional case of historical outbreeding in African sableantelope populations. Mol. Ecol., 11, 1197–1208.
Pusey AE, Packer C (1987) The evolution of sex-biased dis-persal in lions. Behavior, 101, 275–310.
Roelke-Parker M, Munson L, Packer C, Kock R, O’Brien SJ,Pospischil A, Hofmann-Lehmann R, Lutz H, MwamemgeleGLM, Mgasa MN, Machange GA, Summers BA, AppelMJG (1996) A canine distemper epidemic in serengeti lions(Panthera leo). Nature, 379, 441–445.
Rzhetsky A, Nei N (1992) A simple method for estimating andtestingminimum-evolution trees.Mol. Biol. Evol., 9, 945–967.
Sambrook J, Fritsch EF, Maniatis T (1989) Molecular Cloninga Laboratory Manual.(2nd edn). Cold Spring Harbor Lab-oratory Press, New York.
23

Schaller GB (1972) The Serengeti Lion; a Study of Predator–prey Relations: Wildlife Behavior and Ecology. University ofChicago Press, Chicago.
Schneider S, Roessli D, Excoffier L (2000) Arlequin, Version2.000: a Software for Population Genetics Data Analysis.Genetics and Biometry Laboratory. University of Geneva,Geneva, Switzerland.
Shankaranarayanan P, Singh L (1998) Mitochondrial DNAsequence divergence among big cats and their hybrids. Cur-rent Science, 75, 919–923.
Smuts GL (1978) Effects of population reduction on the travelsand reproduction of lions in Kruger National Park. Carni-vore, 1,17–28.
Spong G, Stone J, Creel S, Bjorklund M (2002) Geneticstructure of lions (Panthera leo L.) in the Selous GameReserve: implications for the evolution of sociality. J. Evol.Biol., 15, 945–953.
Swart MKJ, Ferguson JWH (1997) Conservation implicationsof genetic differentiation in southern African populations ofblack rhinoceros (Diceros bicornis). Conserv. Biol., 11, 79–83.
Swofford DL (1998) PAUP*. Phylogenetic Analysis UsingParsimony (*and Other Methods). V.4. Sinauer Associates,Sunderland, Massachusetts.
Takezaki N, Rzhetsky A, Nei M (1995) Phylogenetic test of themolecular clock and linearized trees. Mol. Biol. Evol., 12,823–833.
Templeton AR, Georgiadis NJ (1996) A landscape approach toconservation genetics: Conserving evolutionary processes inthe African bovidae. In: Conservation Genetics: Case Histo-ries from Nature: (eds. Avise J, Hamrich J), pp. 398–430.Chapman & Hall, New York.
Tosi AJ, Morales JC, Melnick DJ (2000) Comparison of Ychromosome and mtDNA phylogenies leads to uniqueinferences of macaque evolutionary history. Mol. Phylo.Evol., 17, 133–144.
Van Hooft WF, Groen AF, Prins HHT (2002) Phylogeographyof the African buffalo based on mitochondrial and Y-chro-mosomal loci: Pleistoncene origin and population expansionof the Cape buffalo subspecies. Mol. Ecol., 11, 267–279.
Vereshchagin NK (1971) The cave lion and its history in theHoloarctic and on the territory of the USSR. Trudy Zool.Inst. Akad. Nauk. SSSR, 49, 123–197.
West PM, Packer C (2002) Sexual selection, temperature, andthe lion’s mane. Science, 297, 1339–1343.
Wolffe JFV (1955) Mammals of Ethiopia and Principal Rep-tiles. Rhodesian Litho, Salisbury, Southern Rhodesia.
24