gis-ila: the gis for italian logistics in antarctica
TRANSCRIPT
Geo-spatial Information Science
Vol. 4,No. 2,p. 32~39 June 2001
GIS-ILA:THE GIS FOR ITALIAN LOGISTICS
IN ANTARCTICA
Luigi Rossi
A. B. Della Rocca
R. Cervellati
D. Marco
R. Chiocchini
F. Chiocchini
A. Cimloelli
K E Y WORDS basic cartography;GIS-ILA;USGS maps
ABSTRACT A geographic information system (GIS) is a hardware/software tool which is
very effective in collecting, storing, searching, handling, and visualizing geographic data to-
gether with their descriptive attributes. Such a tool is very helpful to approach a wide range
of situations, including many logistic problems. ENEA, as the agency having the task of im-
plementing the Italian Antarctic Program (PNRA), has decided to use a GIS, in order to in-
crease the efficiency in managing the huge amount of data collected in the c o ~ of Italian
activity in Antarctica,which counts fifteen expeditions up to now.
1 Introduction
The GIS for the Italian Logistics in Antarctica
(GIS- ILA) collects the data involved with the Ital-
ian scientific expeditions in Antarctica, obtained
from the yearly Expedition Reports. All thematic
information available up to now have been inserted
into the data base, from the first Italian expedition
( 1 9 8 5 / 1 9 8 6 ) up to the last campaign ( 1 9 9 9 /
2000) . A continuous updating of data is planned for
the future, funding permitting.
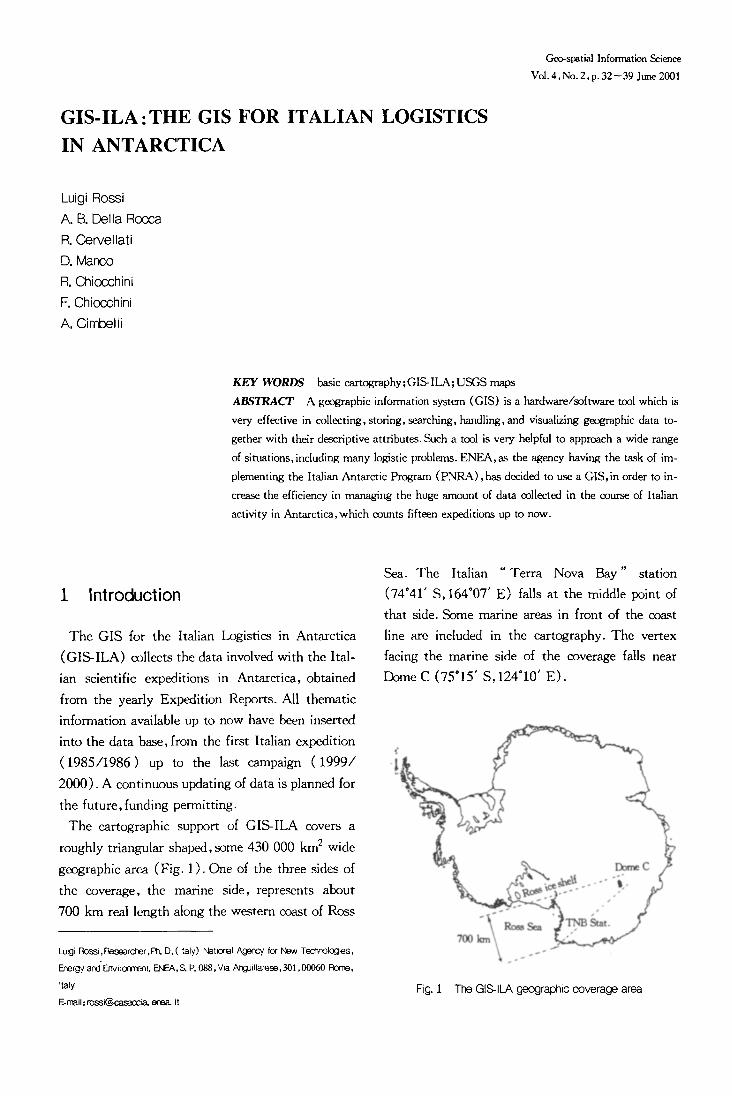
The cartographic support of GIS-ILA covers a
roughly triangular shaped, .some 430 000 km 2 wide
geographic area (Fig. 1 ). One of the three sides of
the coverage, the marine side, represents about
700 km real length along the western coast of Ross
Lu~ji Rossi, Researoher, Ph. D, (Italy) Natu3nal ,akoef~y for New Technologes,
Energy and'Environment. E.k,'EA, S, P. 088, V~a Anguillarese,301,00060 Rome,
Italy
E-maih ross~@casaocia, enea. it
Sea. The Italian " T e r r a Nova Bay" station
(74"41 ' S, 164007 , E) falls at the middle point of
that side. Some marine areas in front of the coast
line are included in the cartography. The vertex
facing the marine side of the coverage falls near
Dome C (75~ ' S, 124~ ' E) .
7oo km \ . - - - "
Fig. t The GIS-ILA geogra~ic coverage area
GIS-ILA: the GIS for Italian Logistics in Antarctica 33
2 GIS-ILA generalities
GIS-ILA is developed on the software products
Arc/Info and ArcView from ESRI Inc., and on
ACCESS from Microsoft Corp.
The whole information stored into the GIS is log-
ically split in two large blocks of data:
1) basic cartography, namely the data derived
from direct measurement of ground parameters,
which enable the cartographic representation of the
geographic area as for its outlines such as the coast
line, the contour lines, etc.
2) thematic information, namely the data which
enable to represent the distribution upon the terri-
tory of one or more entities such as field camps, fuel
dumps, sampling sites, etc.
Basic cartography is the framework which sup-
ports the whole GIS. The data may be rendered in
different ways. The most useful and usual one is the
chart, a symbolic drawing of ground shape and oth-
er geographic features, but more realistic renderings
(DEMs: Digital Electronic Models) of the same
data are possible for special applications, as well.
In order to handle basic cartography properly at
the computer, it is very useful to recall some basic
concepts.
1 ) The cartography scale is established by the ac-
curacy of the survey: zooming at the computer can
only magnify the visual representation of the chart
itself,but it can not create the data surpluses which
make the difference between different scales, in
other words, once establishing the scale of the car-
tography, only equally or less detailed charts, with
the same or wider tolerances, are derivable from it;
2) New data to be inserted into the cartography
must be homogeneous with the previous ones stored
into it.
3 Basic cartography
No one .site specific survey was made in order to
set up GIS-ILA. Only previously existing carto-
graphic data were utilized for that purtx3se,on two
different scales for two different zones of the entire
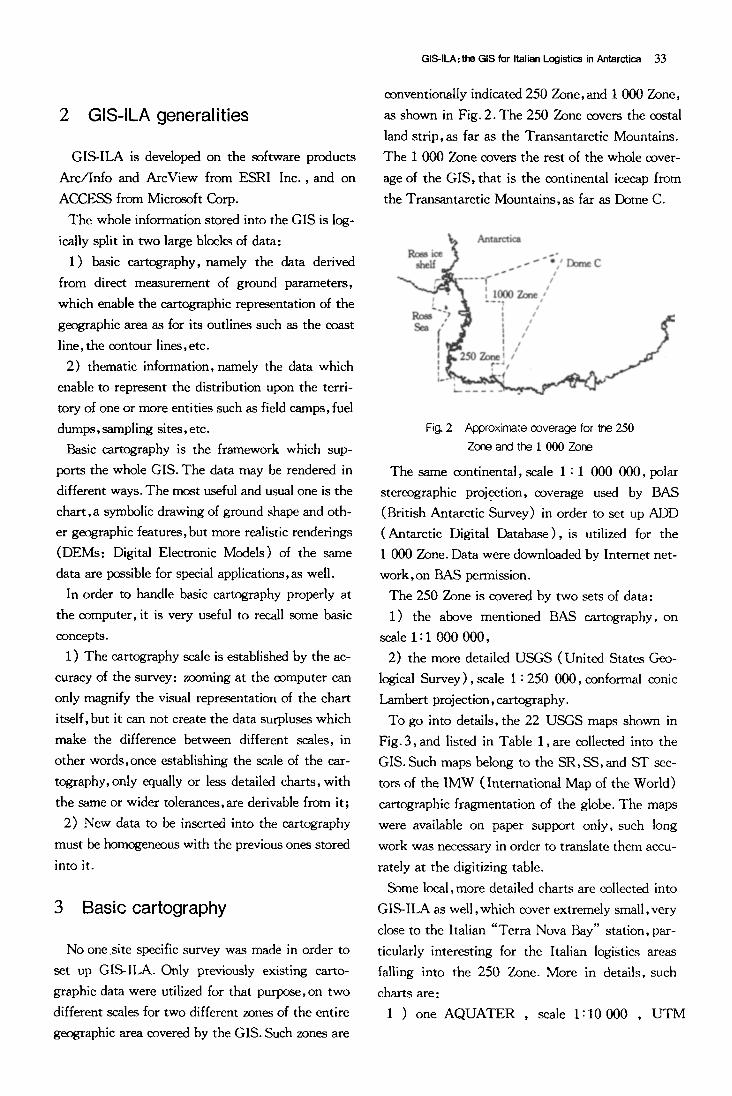
geographic area covered by the GIS. Such zones are
conventionally indicated 250 Zone, and 1 000 Zone,
as shown in Fig. 2. The 250 Zone covers the co6tal
land strip, as far as the Transantarctic Mountains.
The 1 000 Zone covers the rest of the whole cover-
age of the GIS, that is the continental icecap from
the Transantarctic Mountains, as far as Dome C.
Fig. 2 Approximate coverage for the 250
Zone and the 1 000 Zone
The same continental, scale 1 : 1 000 000, polar
stereographic proj.ection, coverage used by BAS
(British Antarctic Survey) in order to set up ADD
(Antarctic Digital Database), is utilized for the
1 000 Zone. Data were downloaded by Internet net-
work, on BAS permission.
The 250 Zone is covered by two sets of data:
1) the above mentioned BAS cartography, on
scale 1 : 1 000 000,
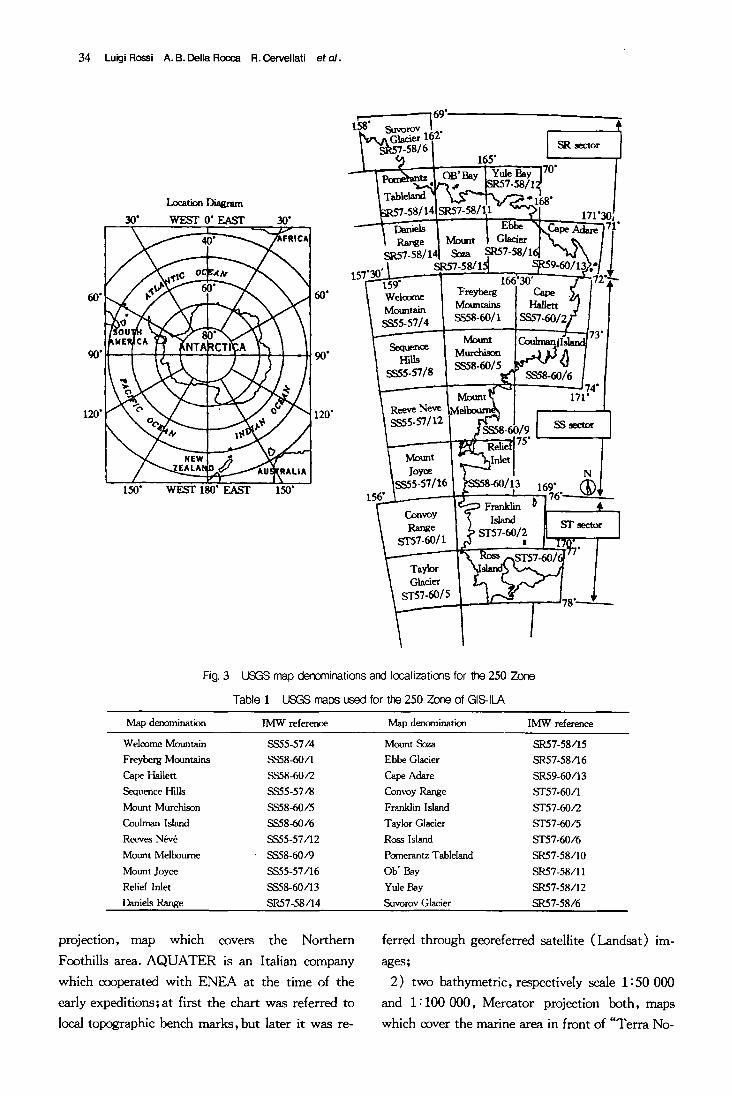
2) the more detailed USGS (United States Geo-
logical Survey), scale 1 :250 000, conformal conic
Lambert projection, cartography.
To go into details, the 22 USGS maps shown in
Fig. 3, and listed in Table 1, are collected into the
GIS. Such maps belong to the SR, SS, and ST sec-
tors of the IMW (International Map of the World)
cartographic fragmentation of the globe. The maps
were available on paper support only, such tong
work was necessary in order to translate them accu-
rately at the digitizing table.
Some local, more detailed charts are collected into
GIS-ILA as well, which cover extremely small, very
close to the halian "Terra Nova Bay" station, par-
ticularly interesting for the Italian logistics areas
falling into the 250 Zone. More in details, such
charts are:
1 ) one AQUATER , scale 1 :10000 , UTM
34 Luigt Ressi A.B. Della Rocca R. Cervellati et o1.
Loeat~ Diagram
30" WEST 0" EAST 30"
A~FRICA
60"
I ,,i f l
120,i ~ i '
" ~ NEw, ,
150" WEST 180' EAST 150'
60"
90'
120"
15T
Suvorovq 69" . c,1.,4,,,- 162"
sa.s7 58/14
165"
.•] 166"30.60/ Welcome Mountains Hallett
Mountain SS58-60/1 SS,55-57/4
Sequence Murehk~ Hals SS58-60/
SS55-57/8
Reeve Neve SS55-57/12
Joyce SS55-57/t6
t56' ~-'~" Convoy
Range SI'57-60/1
Taylor Glacier
s-r57-60/5
Island ST57-60/2
t
sector
171"30; ~__771
SS58-60/6 ---__d, 171"
) /9 SS sector 75"
16,. B-"] 76"- �9
ST sector
Fig. 3 USGS ma0 denominations and Iocalizations for the 250 Zone
Table 1 ~ maps used for the 250 Zone of GIS-ILA
Map denomination IMW reference Map denomination IMW reference
Welcome Mountain SS55-57/4 Mount Soca SR57-58/15 Freybetg Mountains $858-60/1 Ebbe Glacier SR57-58/16 Gape t-Iallert SS58-60/'2 Cape Adare SR59-60/13 Sequence Hills 8S55-57/B Convoy Range 8T57-60/1 Mount Murchison SS58-60/5 Franklin Island ST57-60/2 Coulman Island SS58-60/6 Taylor Glacier UT57-60/5 Reeves N6v6 SS55-57/12 Ross Island ST57-60/6 Mount Melbourne SS58-60/9 Pomerantz Tableland SR57-58/10 Mount Joyce SS55-57/16 Ob" Bay SR57-58/11 Relief Inlet SS58-60/13 Yule Bay SR57-58/12 Daniels Range SR57-58dI4 Suvorov Glacier SR57-58/6
projection, map which covers the Northern
Foothills area. AQUATER is an Italian company
which cooperated with ENEA at the time of the
early expeditions;at first the chart was referred to
local topographic bench marks, but later it was re-
ferred through georeferred satellite (Landsat) im-
ages;
2) two bathymetric, respectively scale 1 : 50 000
and i:I00 000, Mercator projection both, maps
which cover the marine area in front of "Terra No-
va Bay". Such maps, both georeferred, were made
by a team coordinated by prof. C. Stocchino, and
were published by the "Istituto Idografico della
Marina Militate Italiana" (Italian Navy Hydro-
graphic Institute).
4 Visualization of cartographic data on different scales
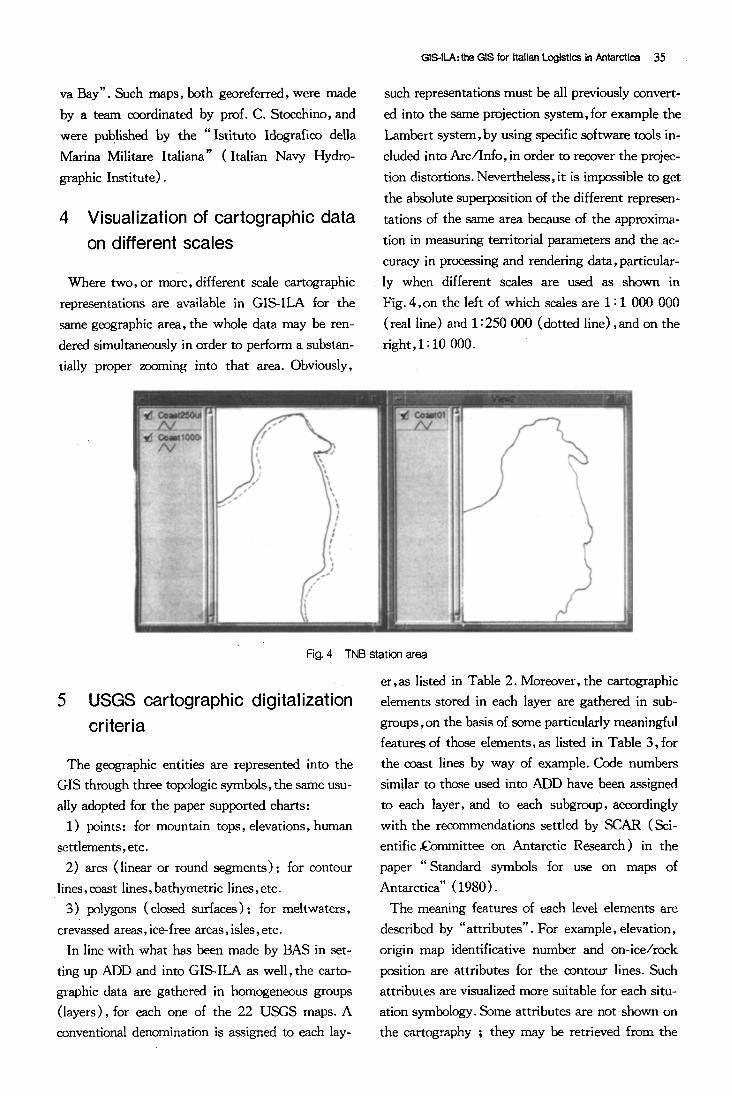
Where two, or more, different scale cartographic
representations are available in GIS-ILA for the
same geographic area, the whole data may be ren-
dered simultaneously in order to perform a substan-
tially proper zooming into that area. Obviously,
GIS-ILA:the GIS for Italian Logistics in Antarctica 35
such representations must be all previously convert-
ed into the same projection system,for example the
Lambert system, by using specific software tools in-
cluded into Arc/lnfo, in order to recover the projec-
tion distortions. Nevertheless, it is impossible to get
the absolute superposition of the different represen-
tations of the same area because of the approxima-
tion in measuring territorial parameters and the ac-
curacy in processing and rendering data, particular-
ly when different scales are used as shown in
Fig. 4,on the left of which scales are 1 : 1 000 000
(real line) and 1:250 000 (dotted line), and on the
right, 1 : 10 000.
5
Fig. 4
USGS cartographic digitalization criteria
The geographic entities are represented into the
GIS through three topologie symbols, the same usu-
ally adopted for the paper supported charts:
1) points: for mountain tops, elevations, human
settlements, etc.
2) arcs (linear or round segments): for contour
lines, coast lines, bathymetric lines, etc.
3) polygons (dosed surfaces) : for meltwaters,
crevassed areas, ice-free areas, isles, etc.
In line with what has been made by BAS in set-
ting up ADD and into GIS-ILA as well, the carto-
graphic data are gathered in homogeneous groups
(layers), for each one of the 22 USGS maps. A
conventional denomination is assigned to each lay-
TNB station area
er,as listed in Table 2. Moreover, the cartographic
elements stored in each layer are gathered in sub-
groups, on the basis of some particularly meaningful
features of those elements, as listed in Table 3, for
the coast lines by way of example. Code numbers
similar to those used into ADD have been assigned
to each layer, and to each subgroup, accordingly
with the recommendations settled by SCAR (Sci-
entificgommittee on Antarctic Research) in the
paper " Standard symbols for use on maps of
Antarctica" (1980).
The meaning features of each level elements are
described by "attributes". For example, elevation,
origin map identificative number and on-ice/rock
position are attributes for the contour lines. Such
attributes are visualized more suitable for each situ-
ation symbology. Some attributes are not shown on
the cartography ; they may be retrieved from the
36 Luigi Rossi A.B. Della Rocca R. Cervellati et ol.
Table 2 Layer denomination
Layer Geographic Symbol Code Layer Geographic Symbol Code Name Feature Type Name Feature Type
CLF CLIFF25 Cliff Arc HMN HUMAN25 Human site Point BTH BATHY25 Bathymetry Arc RCK ROCK25 Ice free area Polygon CST ODAS'I25 Coast Polygon LAK LAKEs Lakes Polygon CNT O3N'I25 Contour Are SEA SEA25 Open sea Polygon ELV ELEVN25 Elevation Point STR STRM25 Stream Arc CRV CREV25 Crevasses Polygon SPA SPAPT25 Protected area Point FNA FAUNA25 Fauna Point SPA SPAPOL25 Protected area Polygon GMG GMARG25 Glacier margin Arc SSI SSSIPT25 Scientific Site Point HST HISTP25 Historical Site Point SS[ SSSIPOL25 Scientific Site Polygon
Table 3 Different coastline features
Geographic S C A R Definition code code
22010 2.1 Ice coastline (definite) 22011 2.1 Rock coastline (definite) 22020 2.2 Ice coastline (indefinite) 22021 2.2 Rock coastline (indefinite) 22040 2.4 Floating glacier tongue 22050 2.5 Ice shelf and front 22060 2.6 Ice wall 22070 2.7 Rock wall
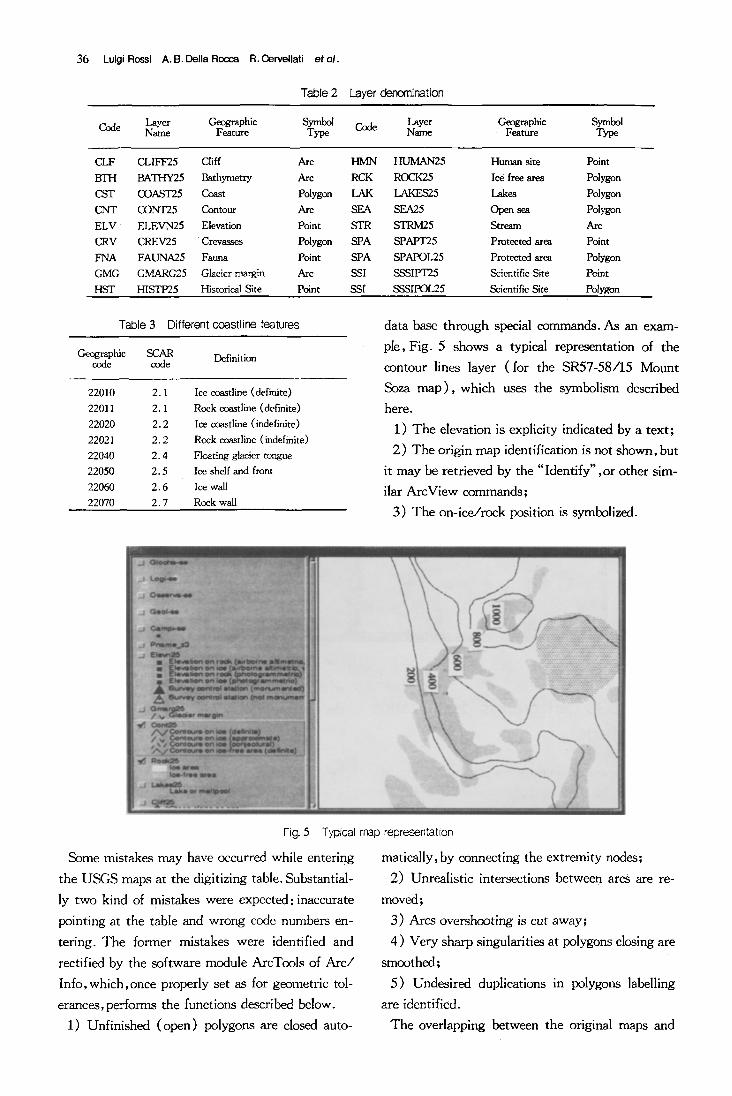
data base through special commands. As an exam-
ple, Fig. 5 shows a typical representation of the
contour lines layer ( fo r the SR57-58/15 Mount
Soza m a p ) , which uses the symbolism described
here.
1) The elevation is explicity indicated by a text ;
2) The origin map identification is not shown, but
it may be retrieved by the "Ident i fy" , or other sim-
ilar ArcView commands;
3) The on-ice/rock position is symbolized.
Fig. 5
Some mistakes may have occurred while entering
the USGS maps at the digitizing table. Substantial-
ly two kind of mistakes were expected: inaccurate
point ing at the table and wrong code numbers en-
tering. The former mistakes were identified and
rectified by the software module AreTools of A r c /
Info ,which ,once properly set as for geometric tol-
erances, performs the functions described below.
1) Unfinished (open) polygons are closed auto-
Typical map representation
matically, by connecting the extremity nodes;
2) Unrealistic intersections between arcs are re-
moved;
3) Arcs overshooting is cut away;
4 ) Very sharp singularities at polygons closing are
smoothed;
5) Undesired duplications in polygons labelling
are identified.
The overlapping between the original maps and
GIS-ILA:the GIS for Italian Logistics in Antarctica 37
their digitized reproductions was verified by super-
imposition of the two charts, through a point by
point visual check.
As for the latter mistakes, an automatic tool does not
exist in order to rectify the wrcsag data, so the code
numbers in the data bose were checked by samples. A
very low error percentage was found out, and the mis-
takes were adjusted by hand. Obviously some wrong da-
ta may have still remained in the GIS.
6 USGS maps contiguity questions
As described above, the 250 Zone is covered by
22 USGS maps. Each map is drawn with reference
to different values of the Lambert system projection
parametres such as standard parallels and meridi-
ans. Therefore the borders of contiguous maps do
not match, i. e. the facing extremities of carto-
graphic elements (contour lines, coast lines, etc. )'
do not match between one map and the adjacent
ones. Such effect is rather evident for maps belong-
ing to the same sector, and it gains more effect for
charts belonging to different sectors. Consequently,
if a representation involving two or more adjacent
maps all together is requested, it is necessary to
preliminarily handle such maps to avoid irregulari-
ties in the visualization of the assembled chart.
The software tools available in GIS-ILA are able
Table
1 Geology
2 Global change
3 Observatories
4 Technology 5 Logistics
Many less important, but
collected into the GIS, such
to perform an automatically assembled, logically
correct representation of the 22 USGS maps all to-
gether, through a recalculation of the whole data
from a Lambert projection system, with map by
map different parametres values, to a polar stereo-
graphic projection system with the same parametres
values for each map. Such way of getting a collec-
tive representation of the whole USGS maps would
request, anyway, some manual adjustment of the
cartographic dements onto the boundary of the
maps. Furthermore, it would involve more consis-
tent distortions far away from the projection pole.
So a mending job by hand was made once for all,
for each couple of map borders falling in the same
sector. The same job has not been made for the bor-
ders facing different sectors because of the unac-
ceptable error it would have introduced.
Now three collective representations of the USGS
maps inserted into GIS-ILA are available, one for
each of the SIR, SS, and ST sectors.
7 Thematic information
The whole thematic data are organized into tables
and secondary sections, as described below, in line
with what settled by PNRA as for the articulation
of the main research and support activities in
Antarctica:
Secondary sections
1.1 Geodesy (with the geodetic survey network) 1.2 Sampling and measuring sites 1.3 Field camps
1.4 Seismic and gravimetric profiles 2.1 Moorings 2 .2 Sampling and measuring sites 2.3 Field camps
2.4 International Trans Antarctic Scientific Expeditions (ITASE) routes
2.5 "Italica" vessel routes for scientific pourposes 3.1 Field camps
3.2 Meteorological stations 3.3 Mareographic,glaciologic, radiometric observatories
4.1 Robotics 5.1 Field camps
5.2 Fuel and food dumps 5.3 On sea ice landing strips (as year by year realized)
useful data have been historic sites, topographic ground control points,
as pictures, local maps, etc. Furthermore, the text files of the last Expedi-
38 Luigi Rossi A.B. Della Rocca R. Cervellati et al.
tion Reports are directly accessible from the GIS.
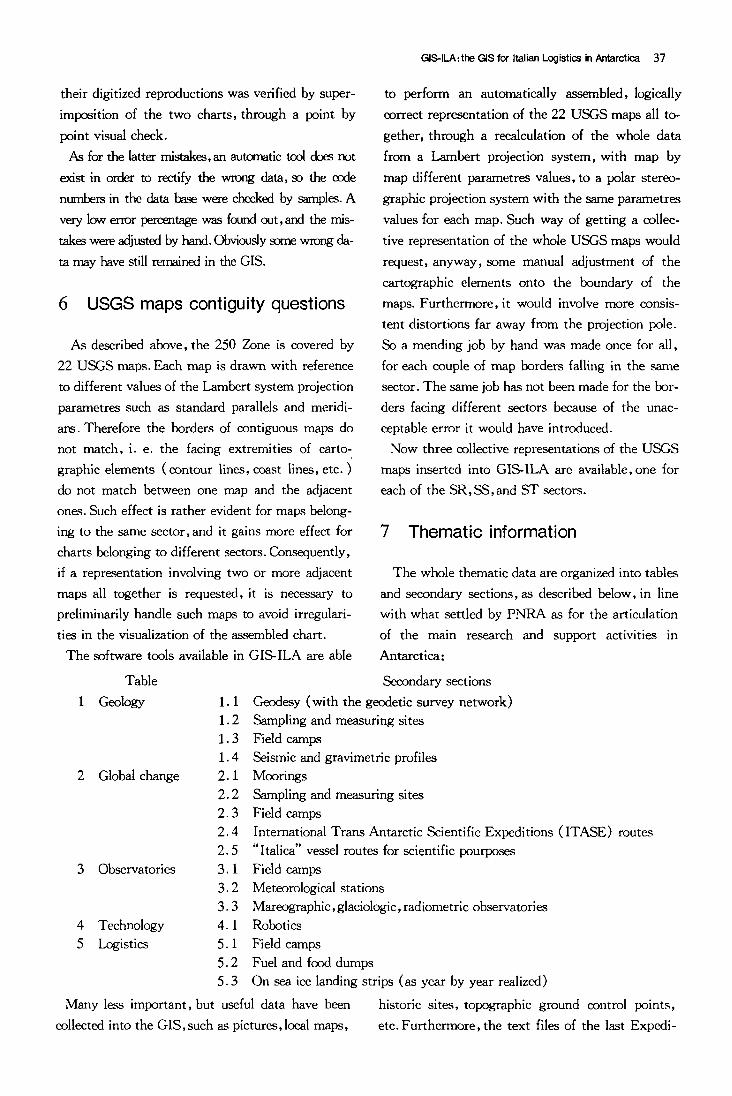
8 GIS-ILA operation generalities
Consultation and updating of GIS-ILA data is
possible by command menus,organized into hierar-
chic levels. In Fig. 6 the first level command form is
shown, with its command buttons described below.
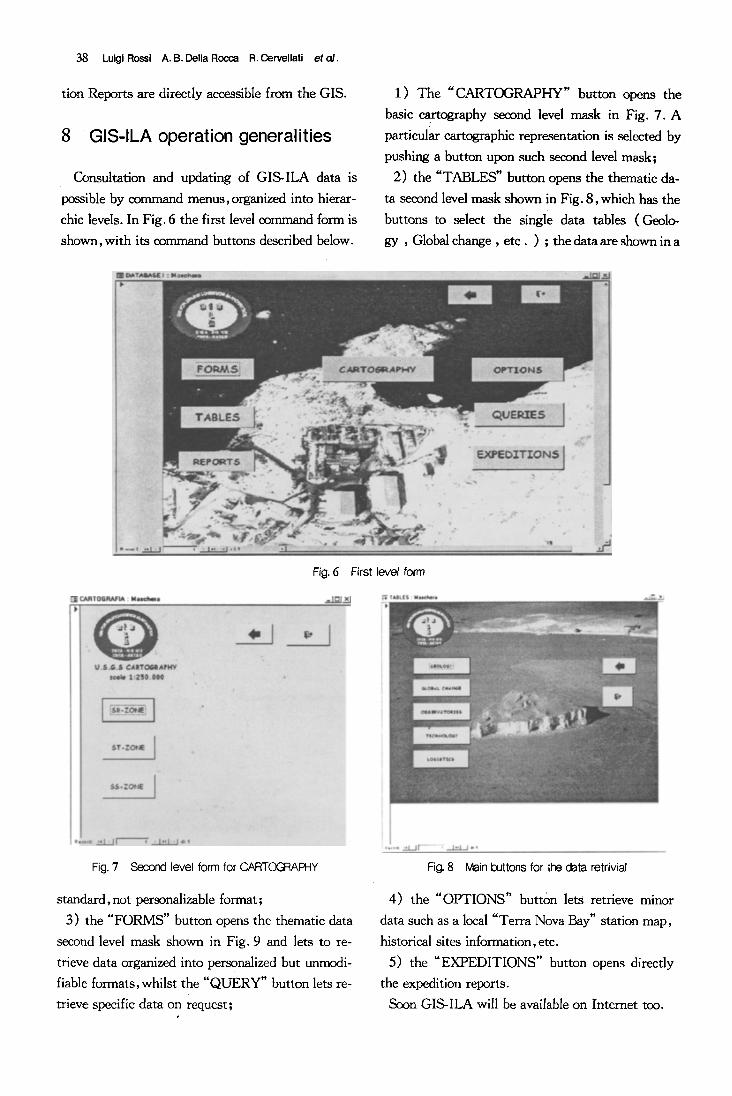
1) The "CARTOGRAPHY" button opens the
basic cartography second level mask in Fig. 7. A !
particular cartographic representation is selected b y
pushing a button upon such second level mask;
2) the "TABLES" button opens the thematic da-
ta second level mask shown in Fig. 8, which has the
buttons to select the single data tables (Geolo-
gy , Global change, etc. ) ; the data are shown in a
Fig. 6 First level form
Fig. 7 Second level form for CARTOGRAPHY
standard, not personalizable format;
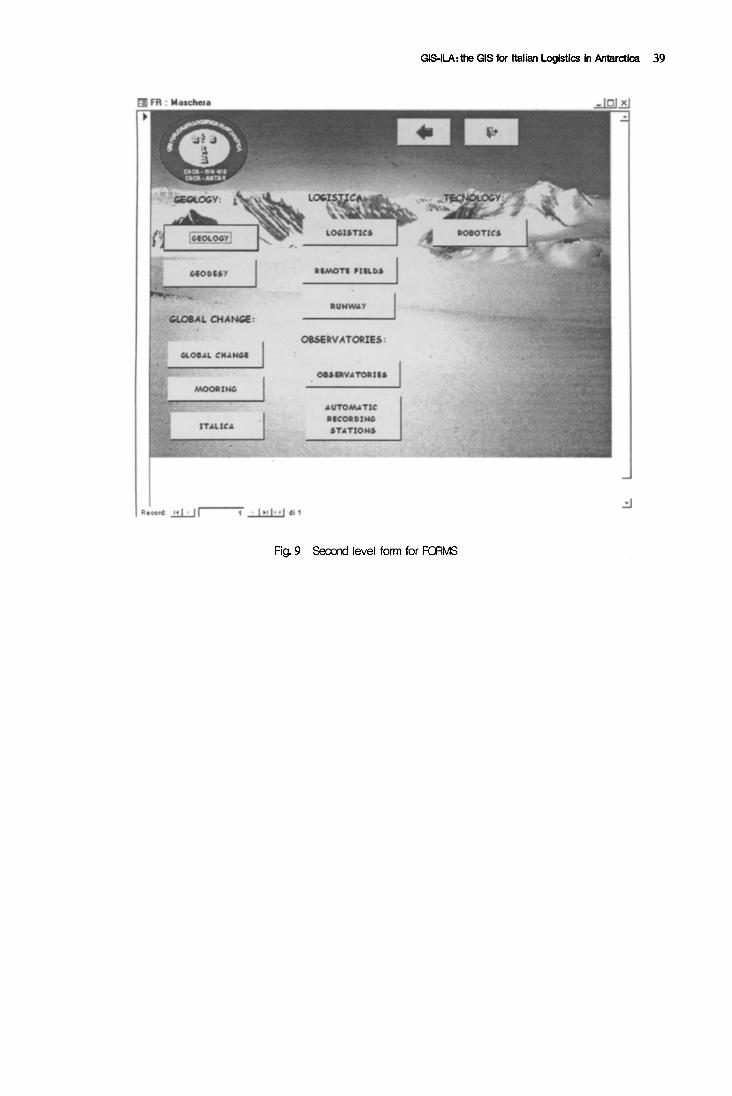
3) the "FORMS" button opens the thematic data
second level mask shown in Fig. 9 and lets to re-
trieve data organized into personalized but unmodi-
fiable formats, whilst the "QUERY" button lets re-
trieve specific data on request;
Fig. 8 Main buttons for the data retrivial
4) the "OPTIONS" button lets retrieve minor
da ta such as a local "Terra Nova Bay" station map,
historical sites information, etc.
5) the "EXPEDITIONS" button opens directly
the expedition reports.
Soon GIS-ILA will be available on Interact too.
~S~lLA:the GIS ~or Italian Logistics in Antarctica 39
Fig. 9 Second level form for FORMS