from temporal gis to dynamics gis
TRANSCRIPT
From Temporal GIS to Dynamics GIS
May Yuan, Ph.D.University of Oklahoma
GIS day presentation at University of Kansas
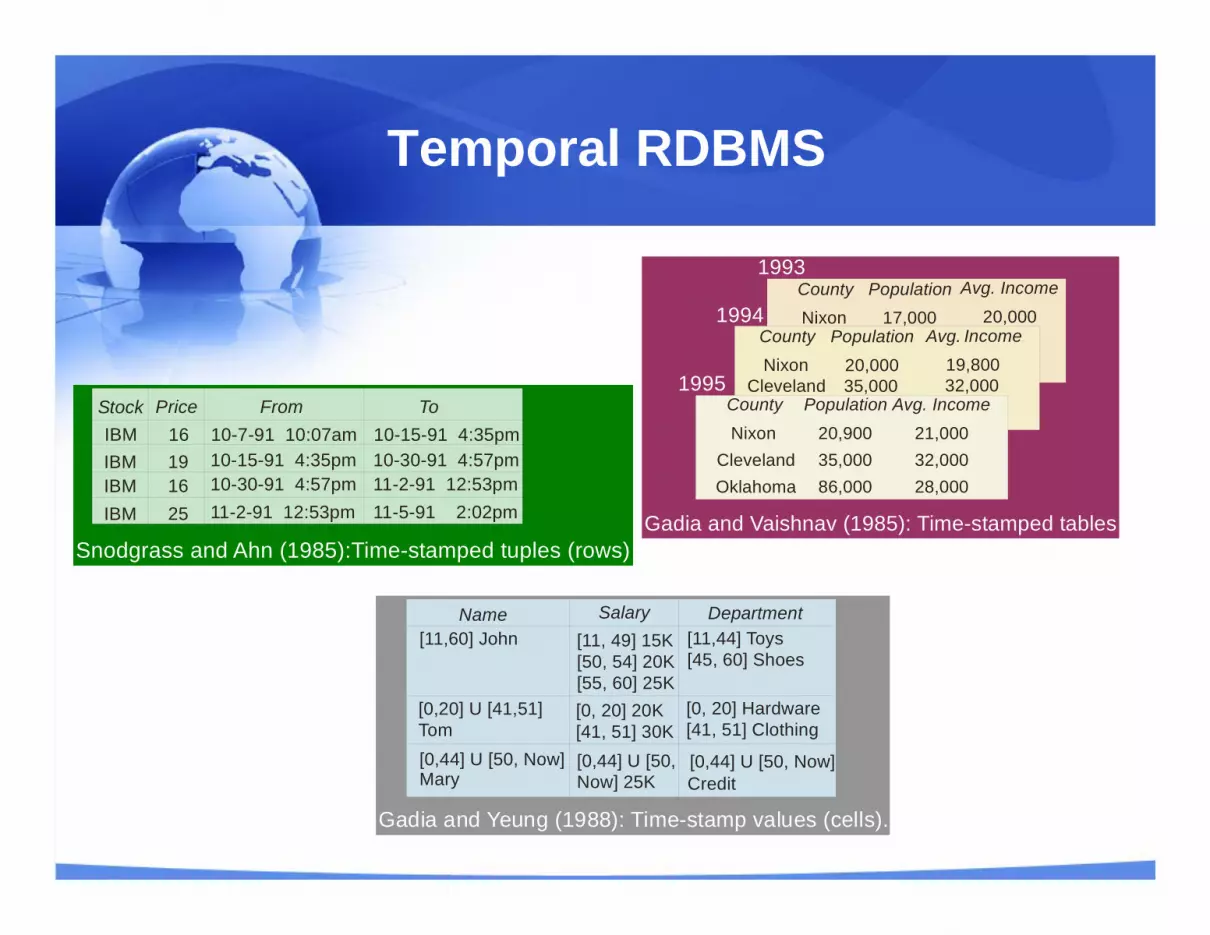
Temporal RDBMS
Gadia and Vaishnav (1985): Time-stamped tables
CountyNixon
Population17,000
Avg. Income
20,000
1993
1994
1995
Avg. . CountyNixon
Cleveland
Population
20,00035,000
Income
19,80032,000
County
NixonClevelandOklahoma
Population
20,90035,00086,000
Avg. Income
21,00032,00028,000
Snodgrass and Ahn (1985):Time-stamped tuples (rows)
From ToPrice16191625
IBMIBMIBMIBM
10-30-91 4:57pm
10-7-91 10:07am10-15-91 4:35pm
11-2-91 12:53pm
Stock10-15-91 4:35pm10-30-91 4:57pm11-2-91 12:53pm11-5-91 2:02pm
Department[11,60] John
[0,20] U [41,51]Tom
Salary[11, 49] 15K[50, 54] 20K[55, 60] 25K[0, 20] 20K[41, 51] 30K
[0, 20] Hardware[41, 51] Clothing
[11,44] Toys[45, 60] Shoes
Name
[0,44] U [50, Now] Mary
[0,44] U [50,Now] 25K
[0,44] U [50, Now]Credit
Gadia and Yeung (1988): Time-stamp values (cells).
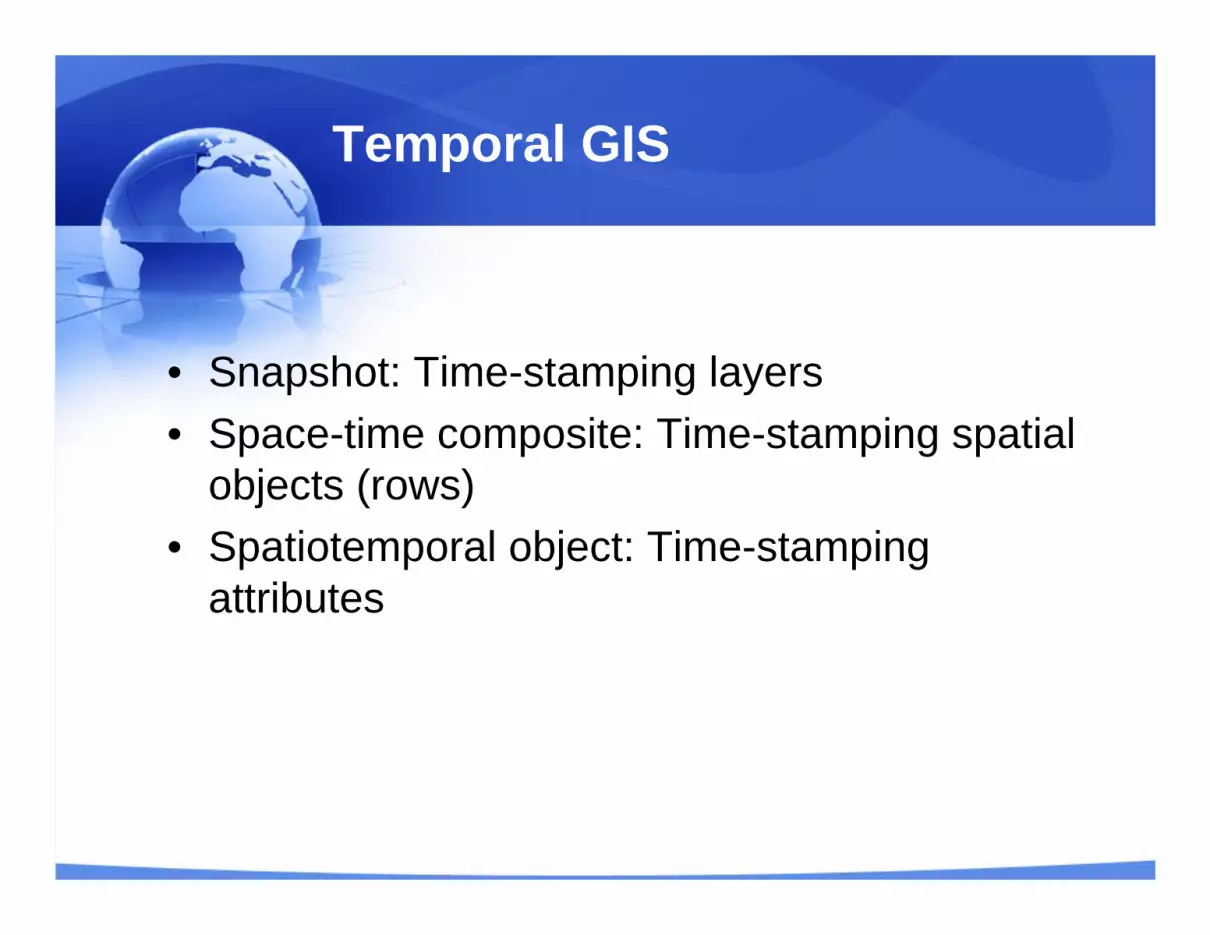
Temporal GIS
• Snapshot: Time-stamping layers• Space-time composite: Time-stamping spatial
objects (rows)• Spatiotemporal object: Time-stamping
attributes

Snapshots
• Temporal time sets
Metro Denver Temporal GIS Project by Temporal GIS, Inc.http://www.rrcc-online.com/~gey235/bpop.html
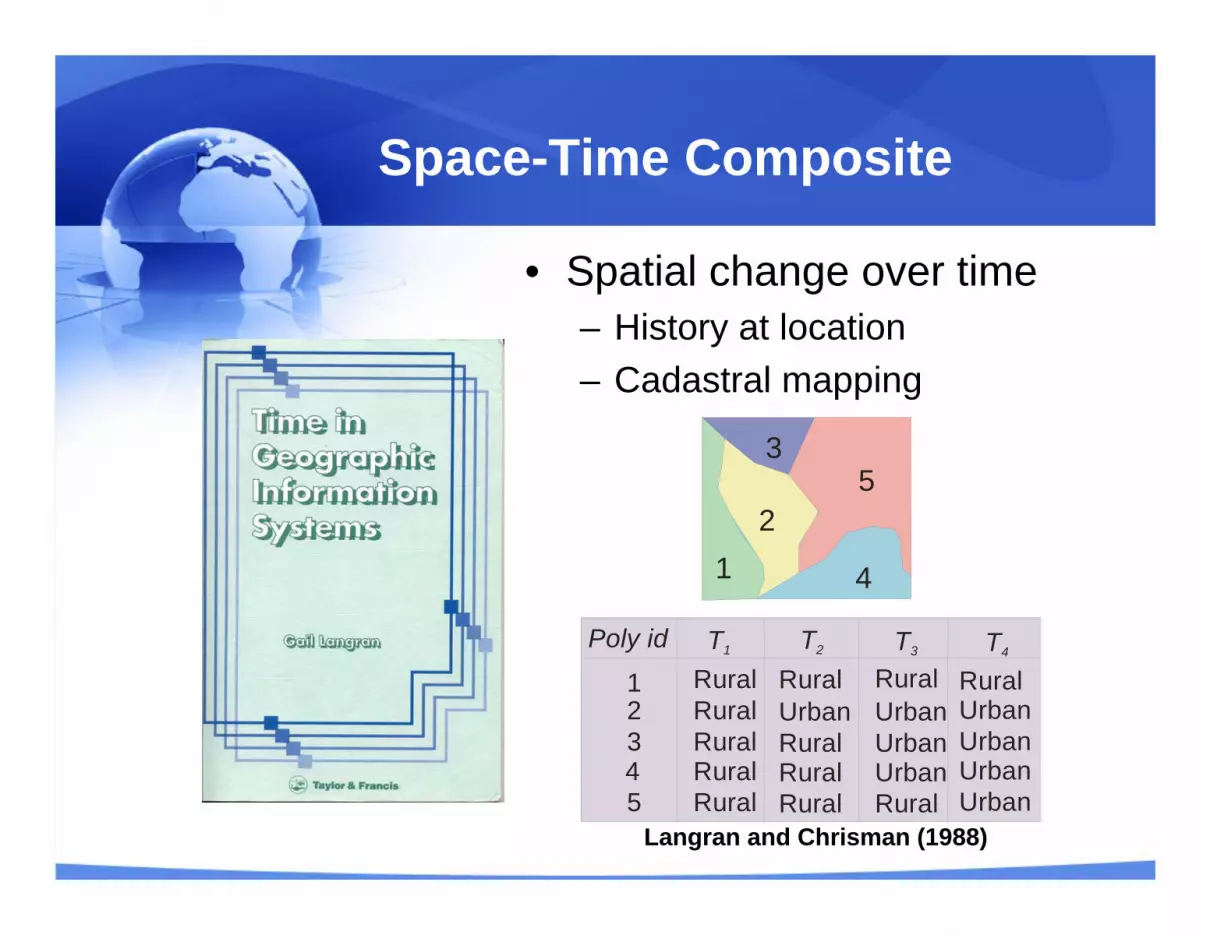
Space-Time Composite
• Spatial change over time– History at location– Cadastral mapping
12
3
4
5
T1 T2 T3 T4Poly id
12345
RuralRuralRural
RuralRural
Rural
Rural
Rural
Urban
Rural
RuralUrbanUrban
UrbanUrban
Rural
Rural
UrbanUrbanUrban
Langran and Chrisman (1988)
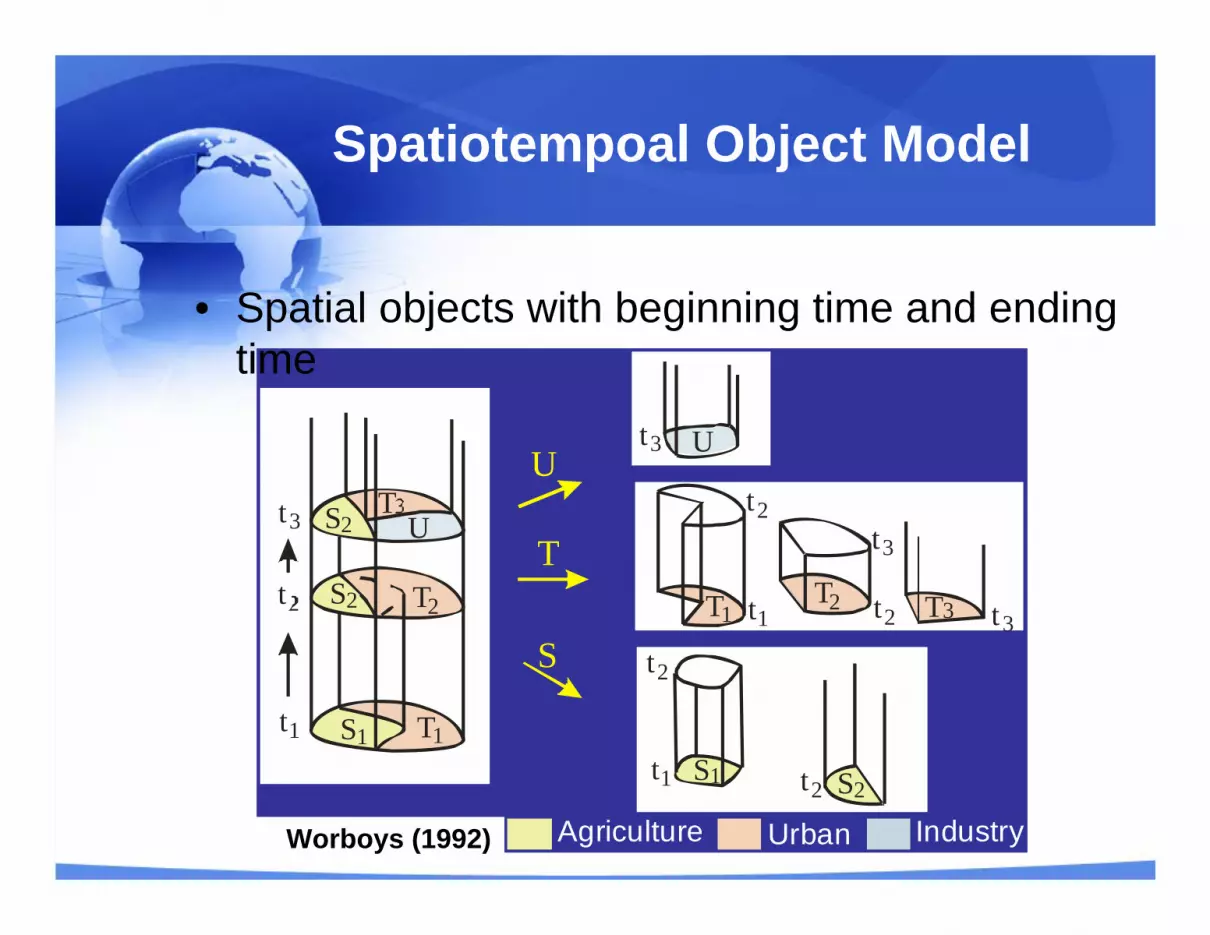
Spatiotempoal Object Model
T
U
1S1
S2
S2
T2
T
t1
t
t3
U
T
S
Ut3
T1 t1
t2
T2 T3t2
t3
t3
S1 S2t1
t2
t2
UrbanAgriculture IndustryWorboys (1992)
• Spatial objects with beginning time and ending time
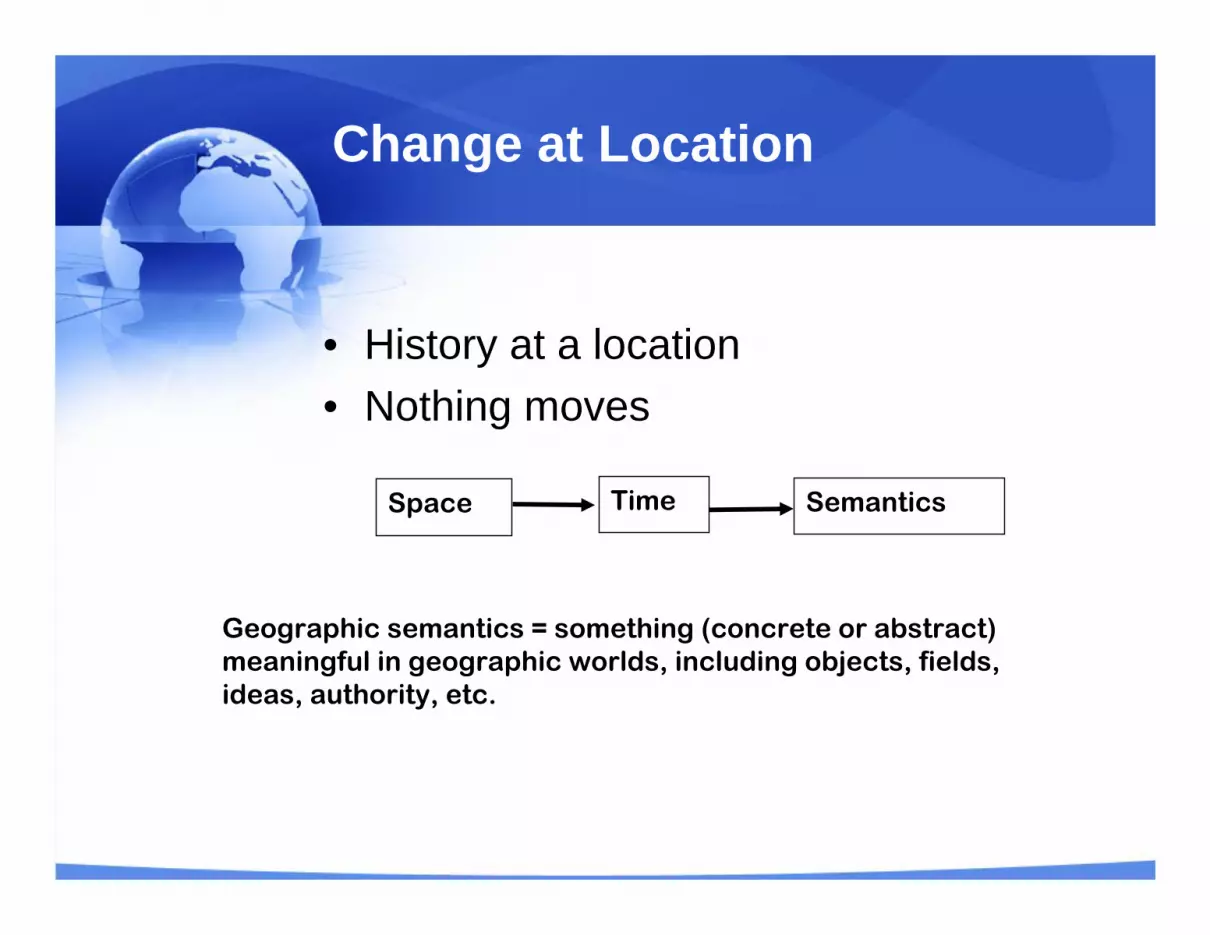
Change at Location
• History at a location • Nothing moves
Space SemanticsTime
Geographic semantics = something (concrete or abstract) meaningful in geographic worlds, including objects, fields, ideas, authority, etc.
Commercial TGIS
• 4Datalink (2002)• STEMgis (2003?)• TerraSeer (2004)
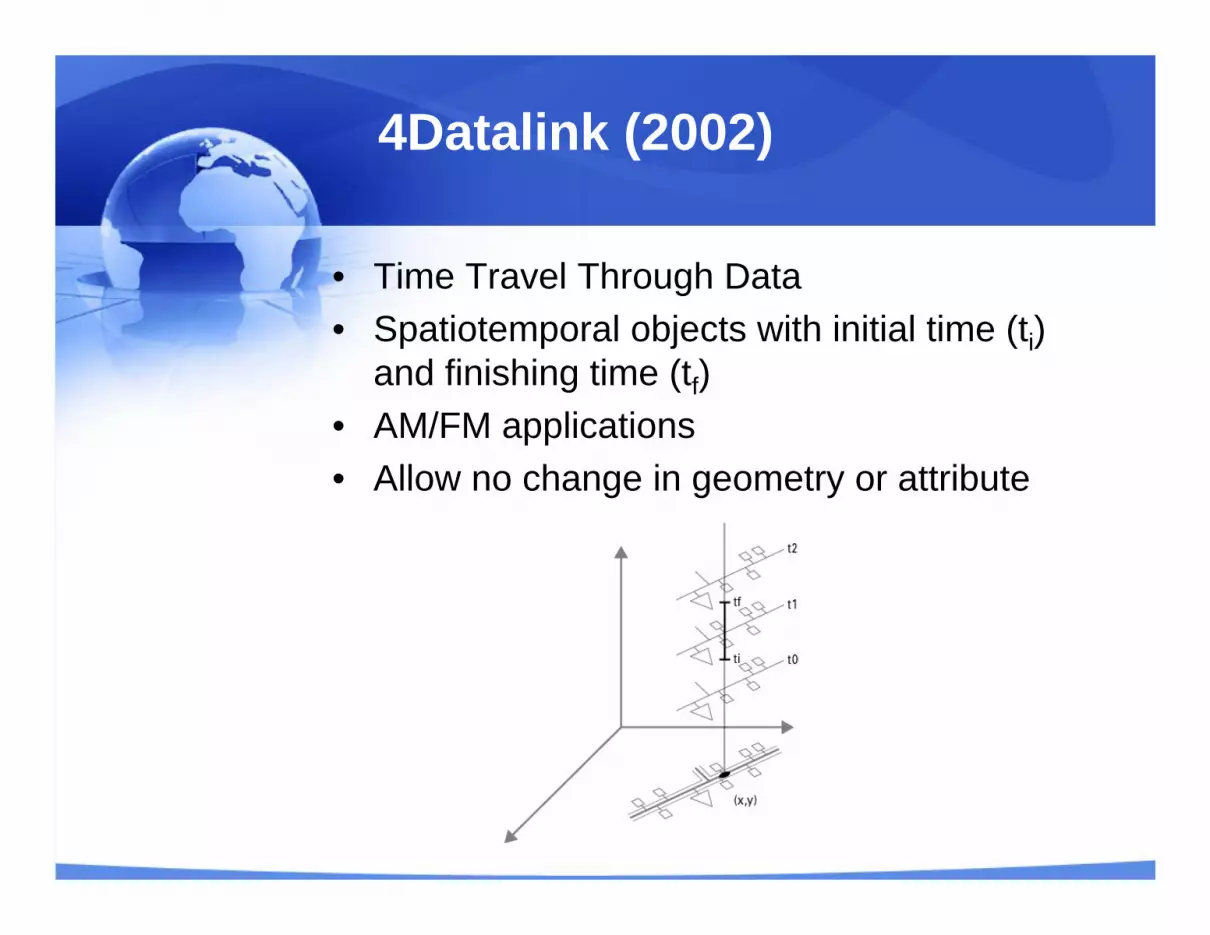
4Datalink (2002)
• Time Travel Through Data• Spatiotemporal objects with initial time (ti)
and finishing time (tf)• AM/FM applications• Allow no change in geometry or attribute
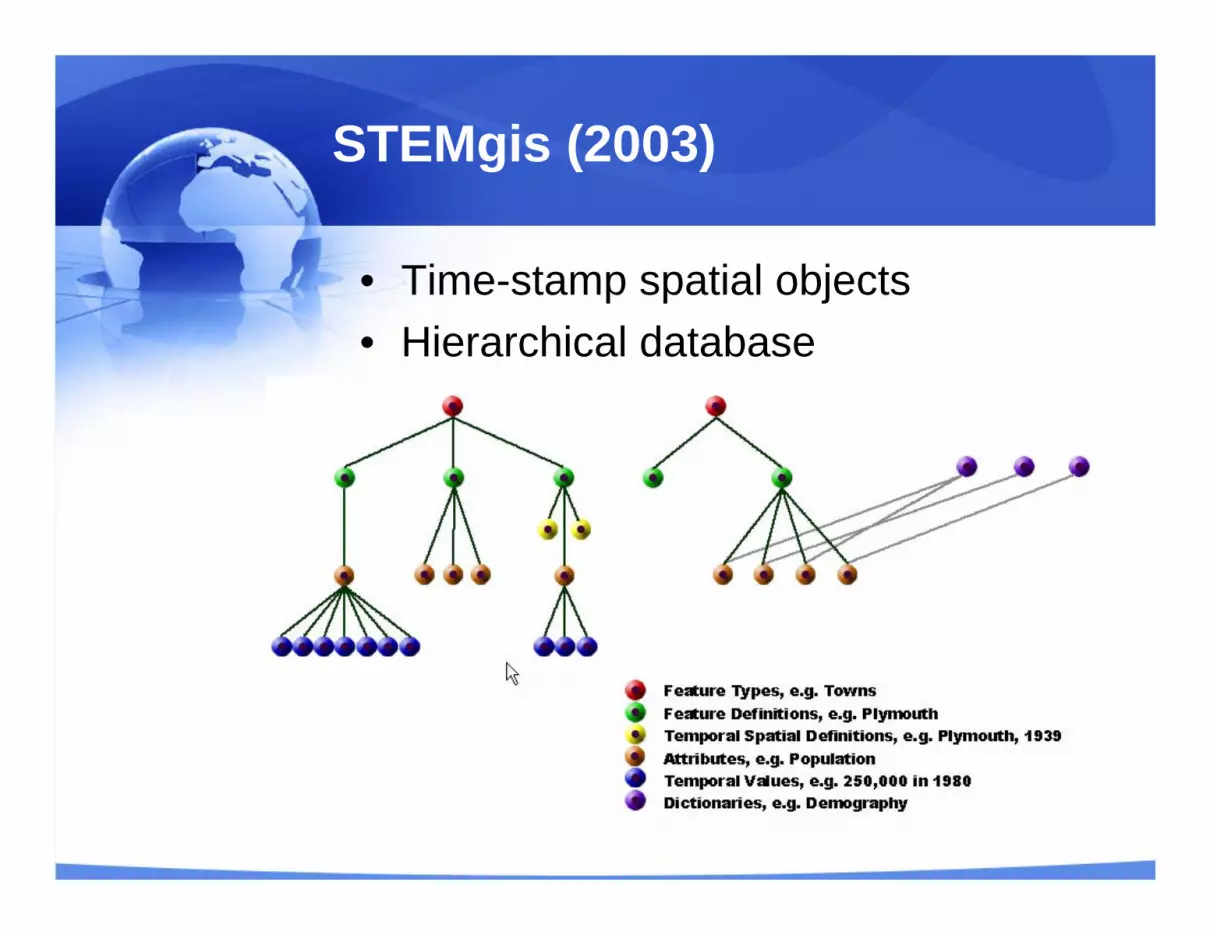
STEMgis (2003)
• Time-stamp spatial objects• Hierarchical database
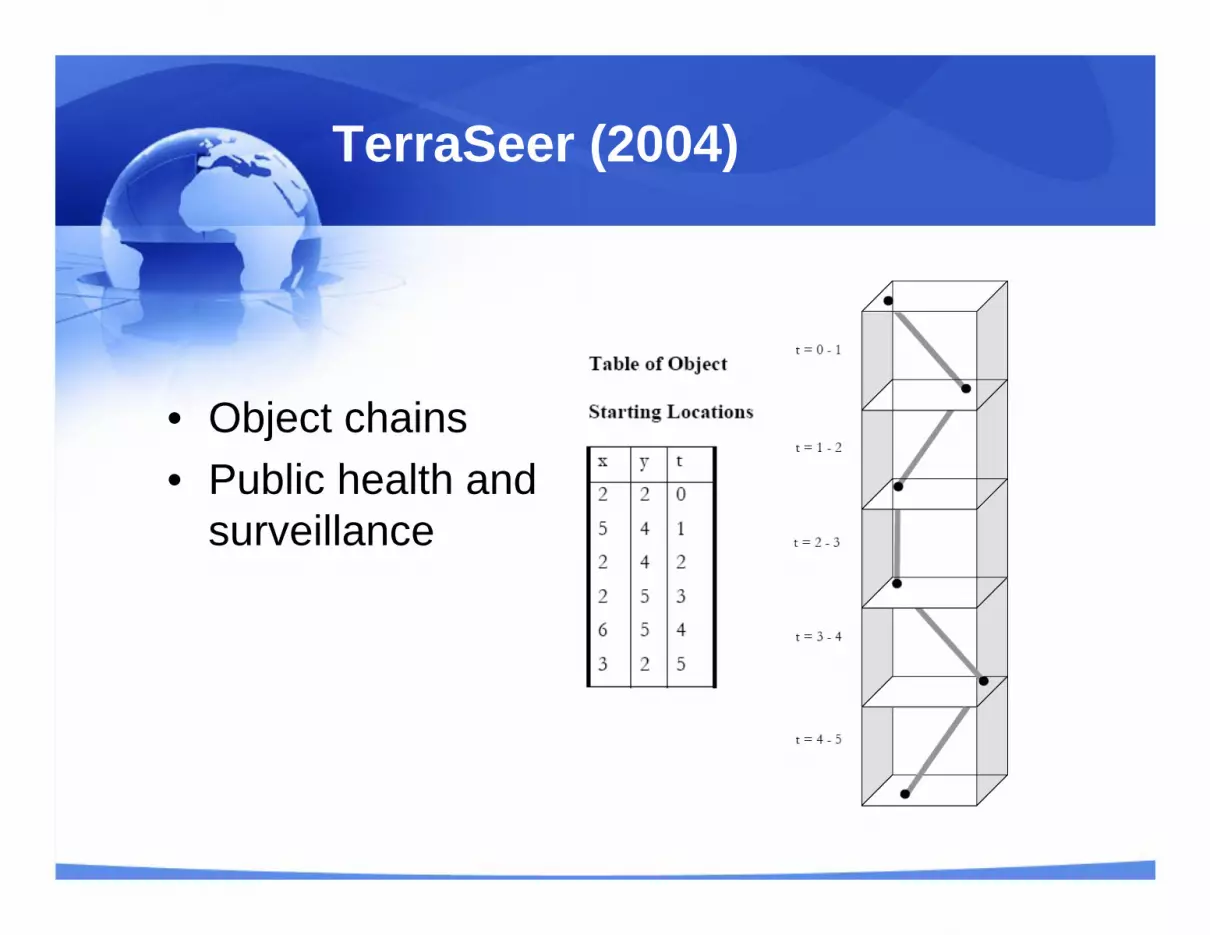
TerraSeer (2004)
• Object chains • Public health and
surveillance

Drawbacks
• Mostly point data• Change-based information• Uniform change• Do not consider:
– Change with spatial variation– Split– Merge– Development (temporal lineage)
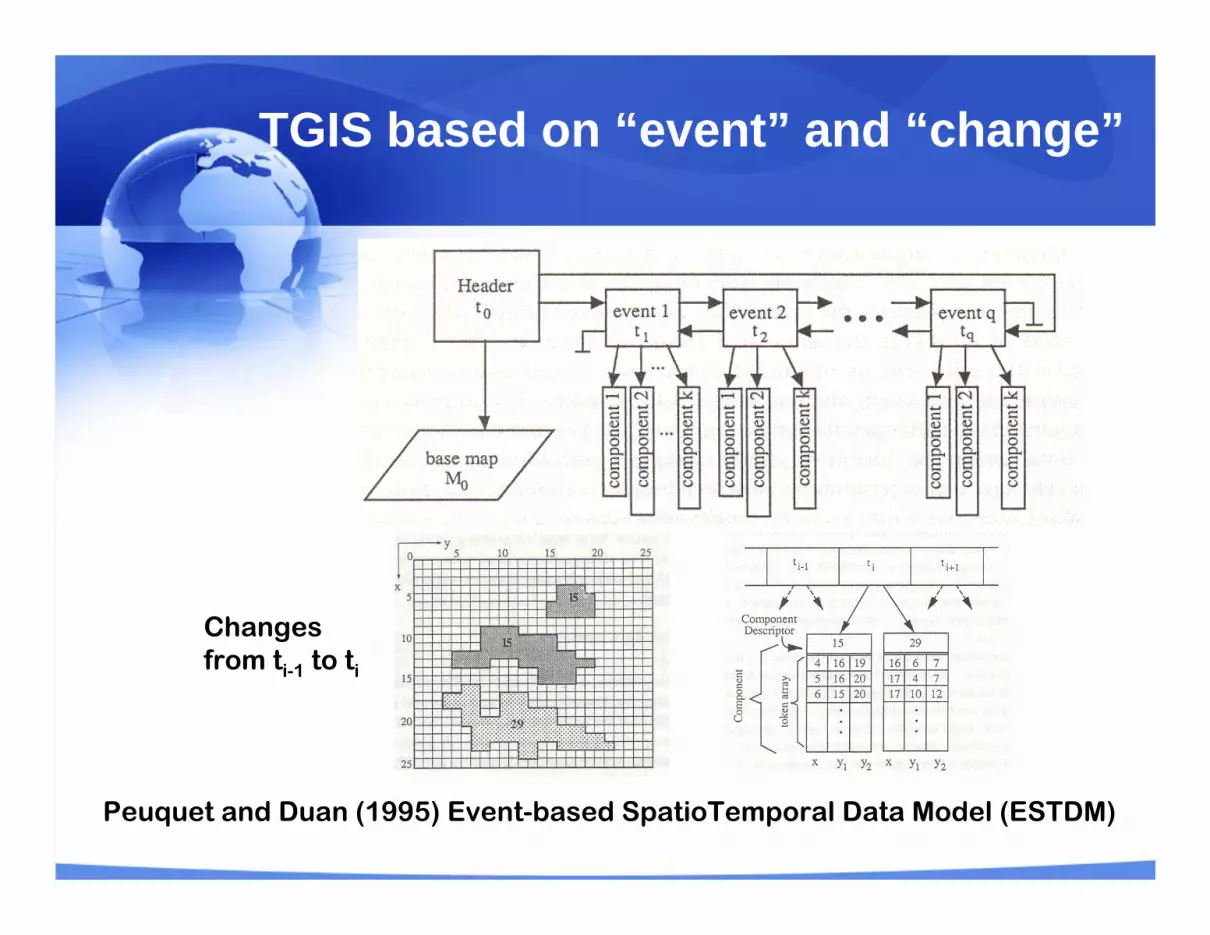
TGIS based on “event” and “change”
Peuquet and Duan (1995) Event-based SpatioTemporal Data Model (ESTDM)
Changes from ti-1 to ti
Time Series Feature Series
Raster SeriesAttribute Series
Time
Var
iabl
e
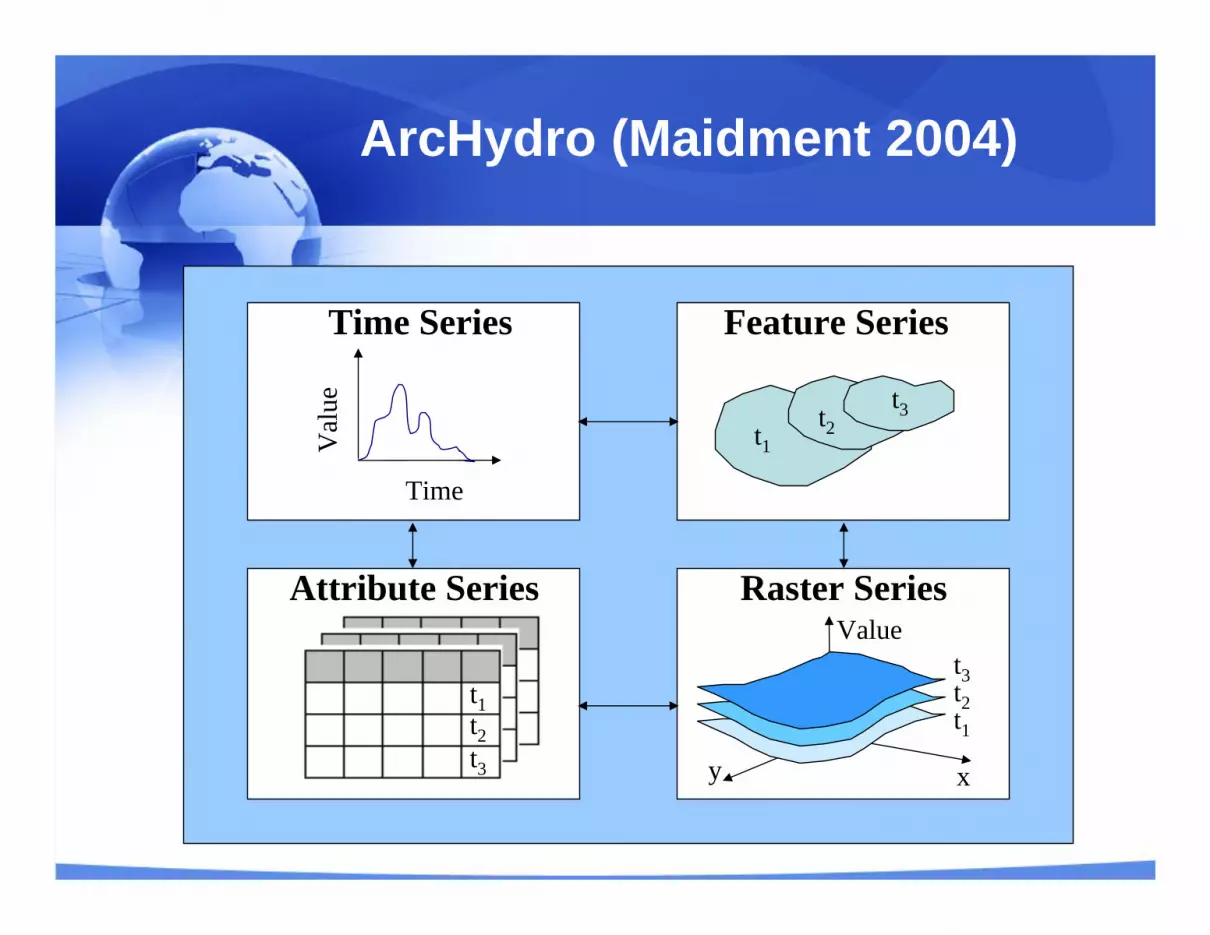
ArcHydro (Maidment 2004)
xy
Value
t1
t2
t3
Val
ue
Time
t1t2
t3
t3
t2
t1
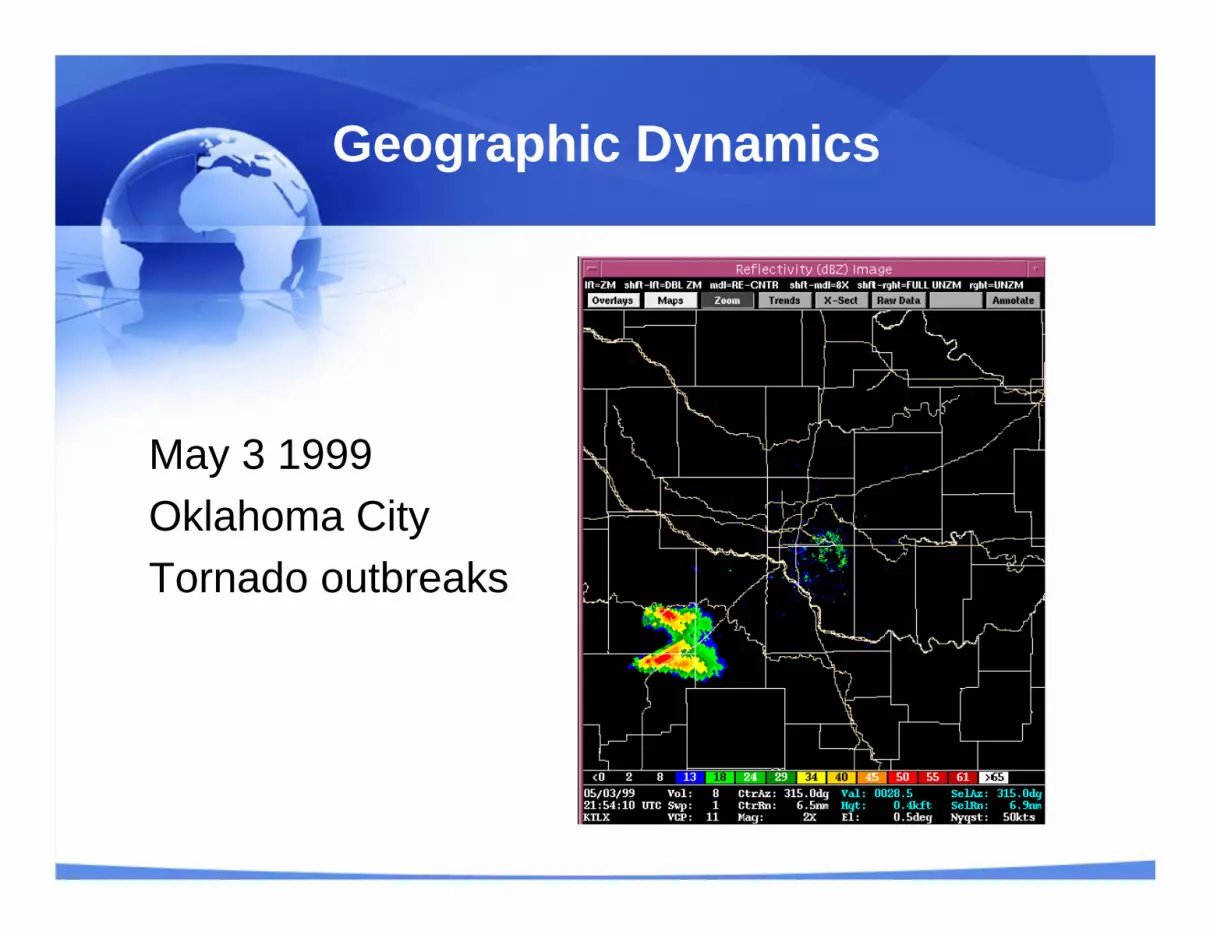
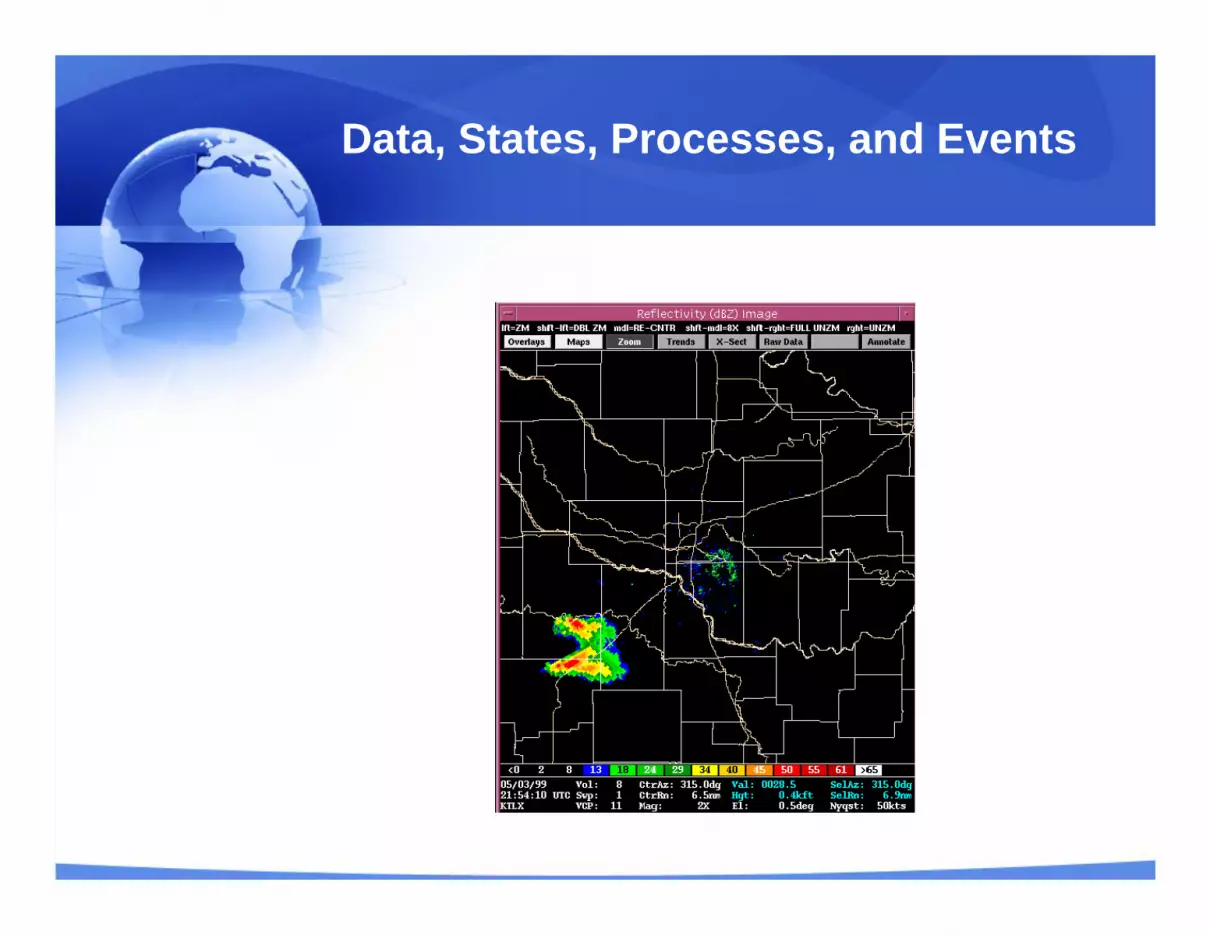
Geographic Dynamics
May 3 1999 Oklahoma City Tornado outbreaks
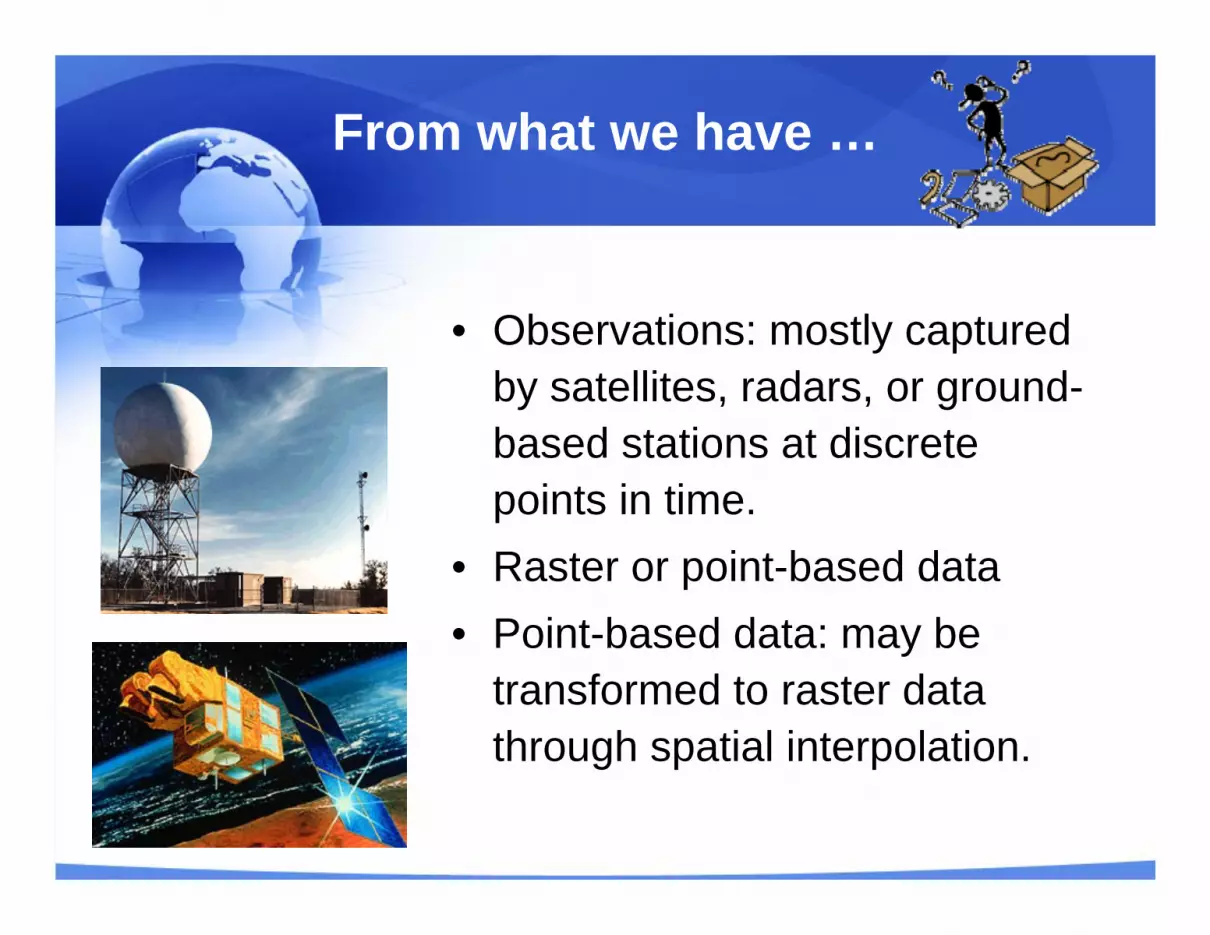
From what we have …
• Observations: mostly captured by satellites, radars, or ground-based stations at discrete points in time.
• Raster or point-based data• Point-based data: may be
transformed to raster data through spatial interpolation.
To what we want
Information beyond pixels and points: • How does “something” vary in space?• How does “something” change over time?• How does “something” progress in space?• How does “something” develop over time?• How often do similar “things” occur in space and
time?
Want to know about “something”
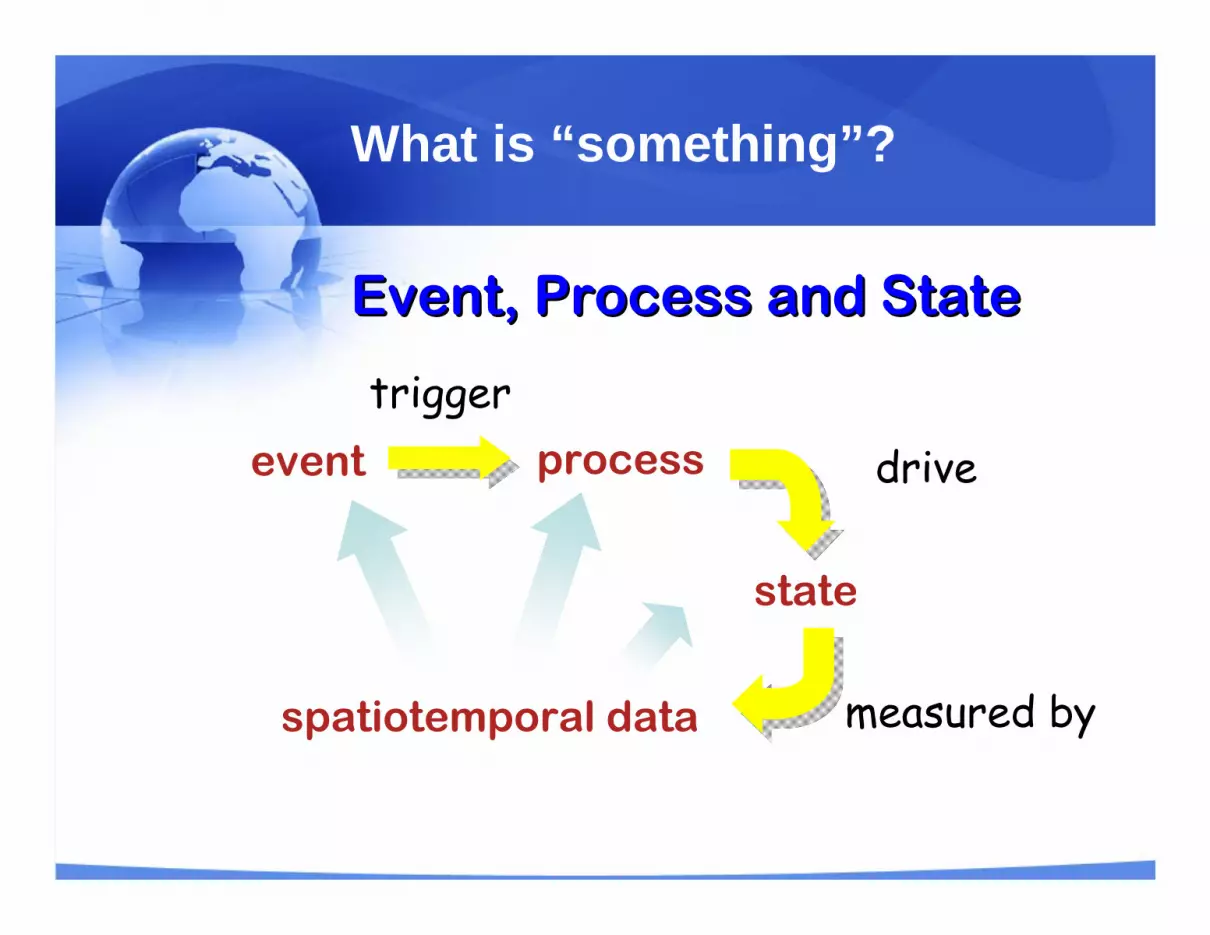
What is “something”?
Event, Process and StateEvent, Process and State
state
process
spatiotemporal data
event
measured by
triggerdrive
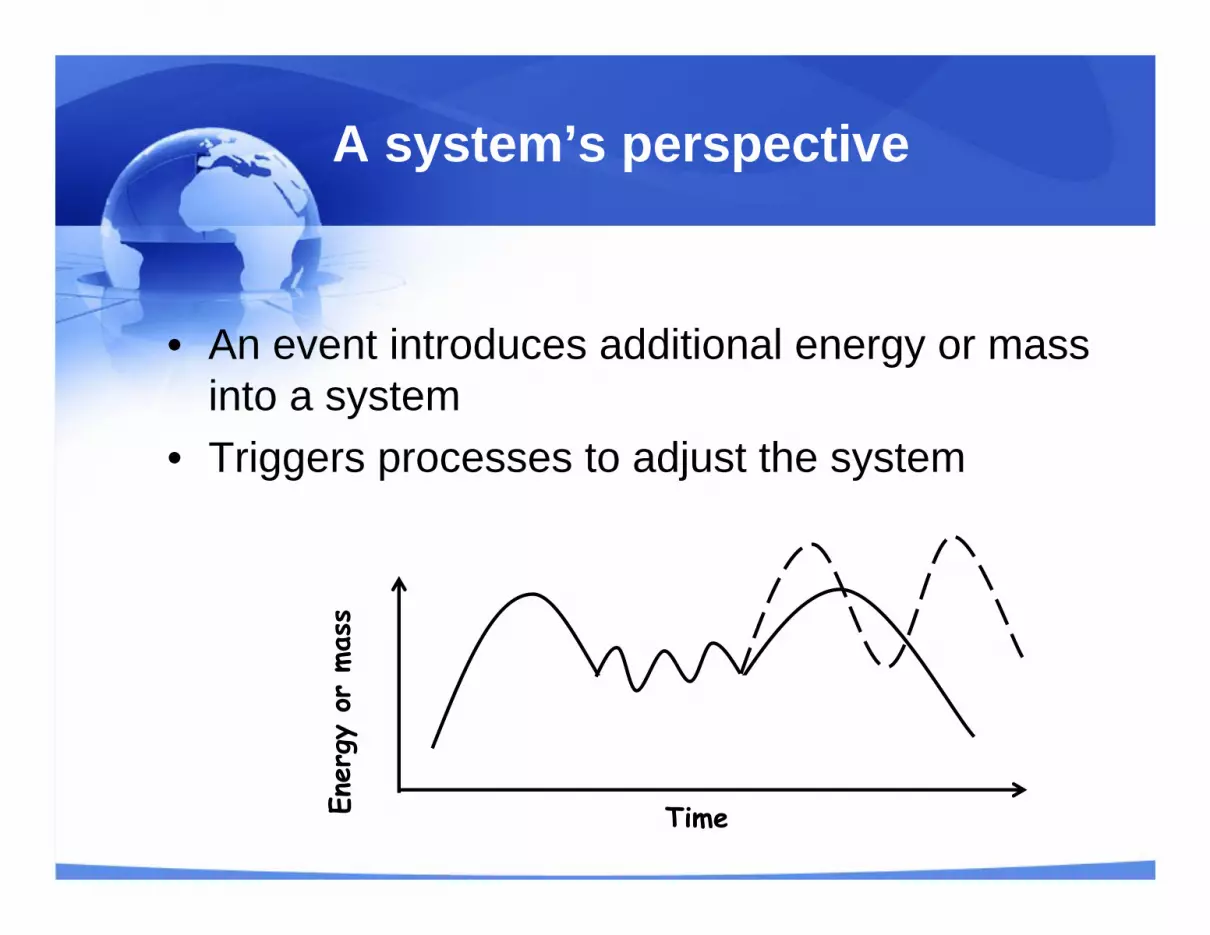
A system’s perspective
• An event introduces additional energy or mass into a system
• Triggers processes to adjust the system
TimeEner
gy o
r mas
s

State
• Fields• Objects• Fields of objects• Objects of fields
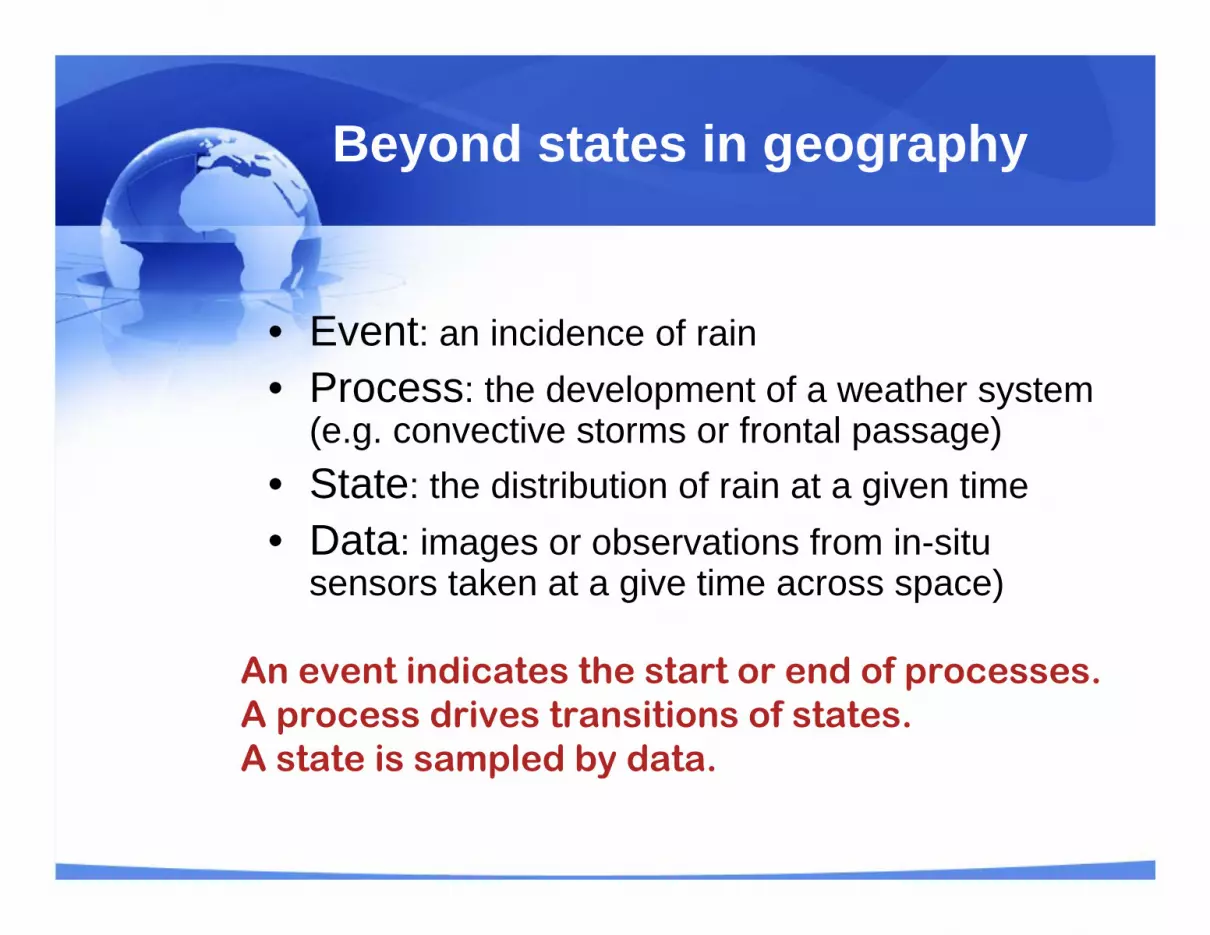
Beyond states in geography
• Event: an incidence of rain • Process: the development of a weather system
(e.g. convective storms or frontal passage)• State: the distribution of rain at a given time• Data: images or observations from in-situ
sensors taken at a give time across space)
An event indicates the start or end of processes.A process drives transitions of states.A state is sampled by data.
Issues
• Scale• Granularity• uncertainty
Represent geographic dynamics
Shift our emphasis• From “storage”
– Observation based– Organize data accordingly how data were
collected by sensors or observers• To “analysis”
– Process based– Data are results of processes and should be
organized accordingly
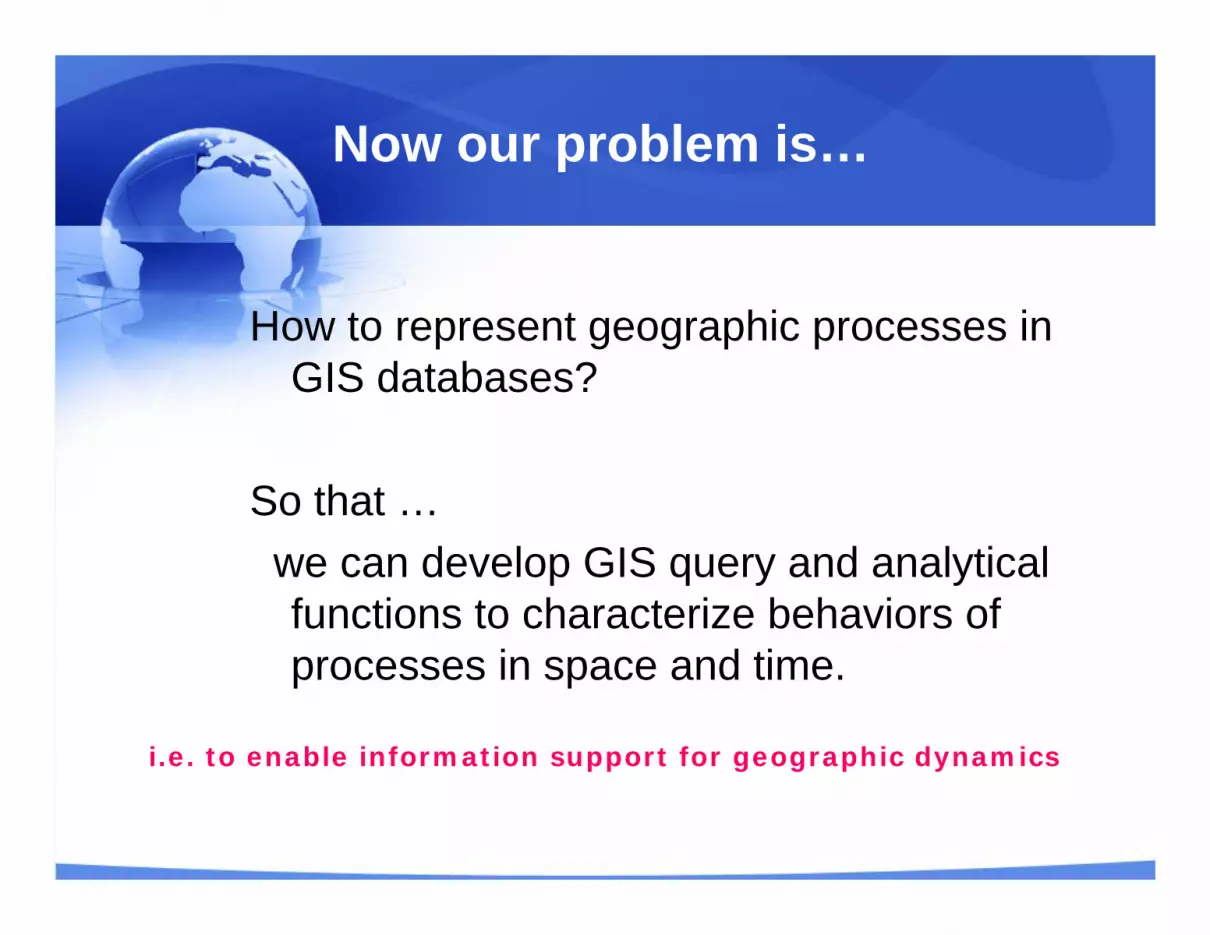
Now our problem is…
How to represent geographic processes in GIS databases?
So that …we can develop GIS query and analytical functions to characterize behaviors of processes in space and time.
i.e. to enable information support for geographic dynamics
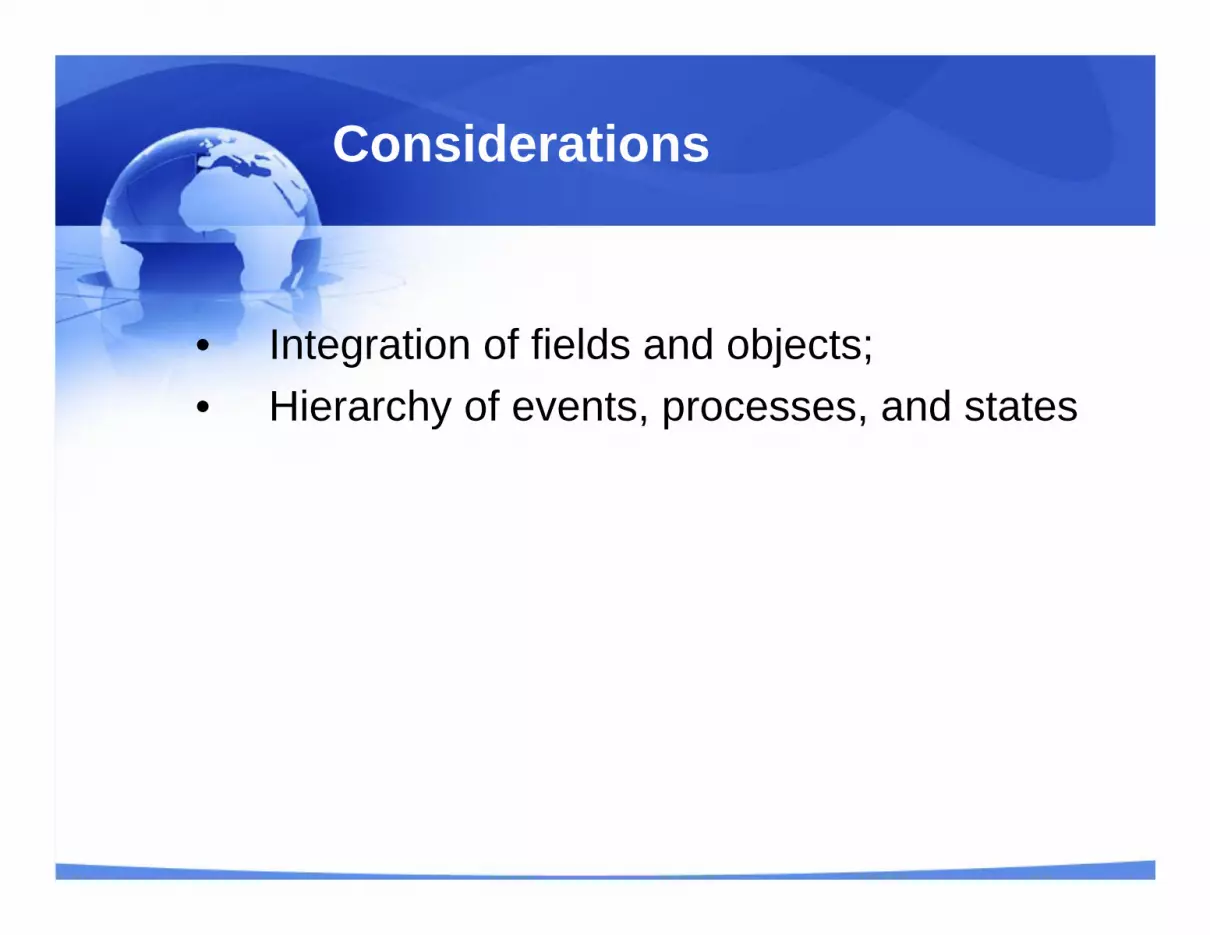
Considerations
• Integration of fields and objects;• Hierarchy of events, processes, and states
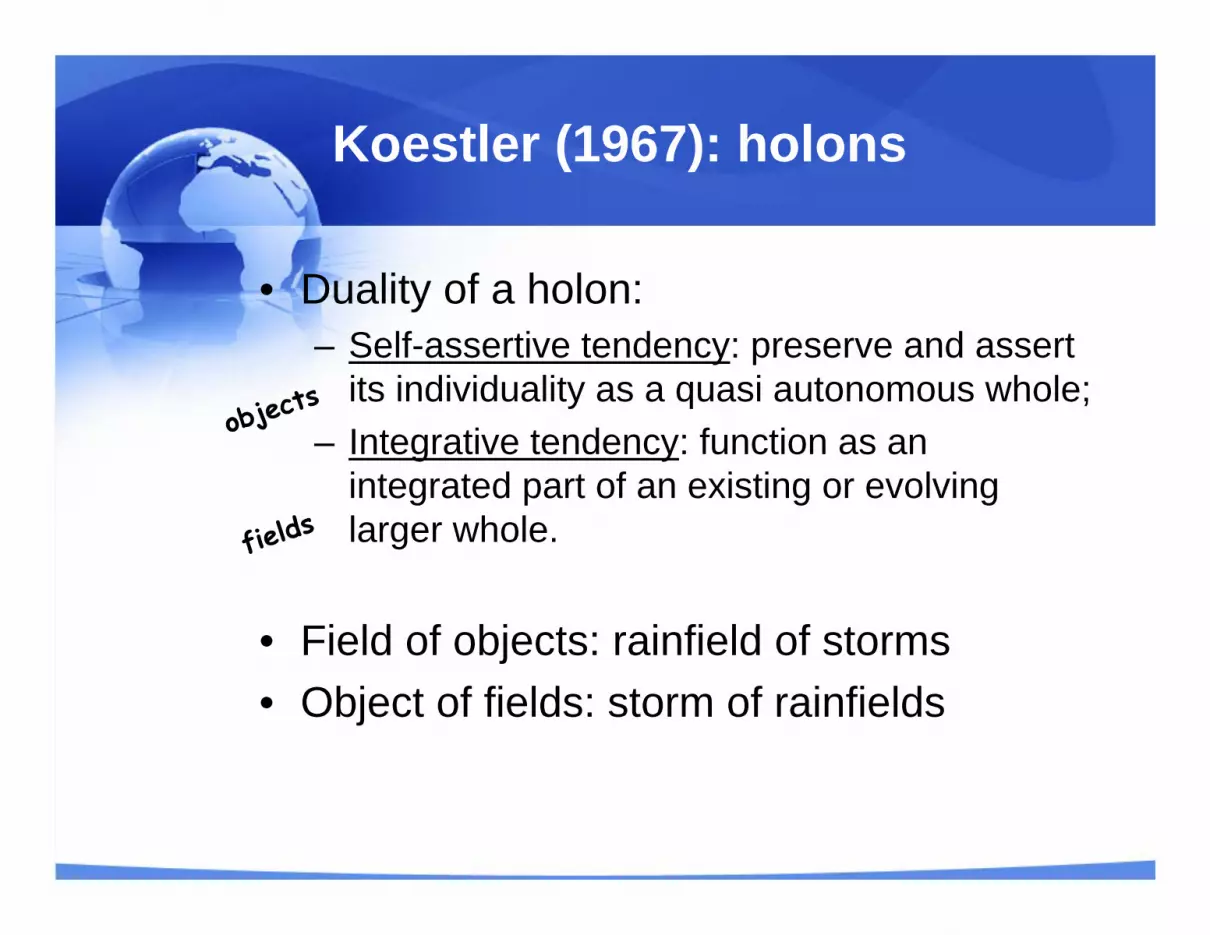
Koestler (1967): holons
• Duality of a holon:– Self-assertive tendency: preserve and assert
its individuality as a quasi autonomous whole; – Integrative tendency: function as an
integrated part of an existing or evolving larger whole.
• Field of objects: rainfield of storms • Object of fields: storm of rainfields
objects
fields
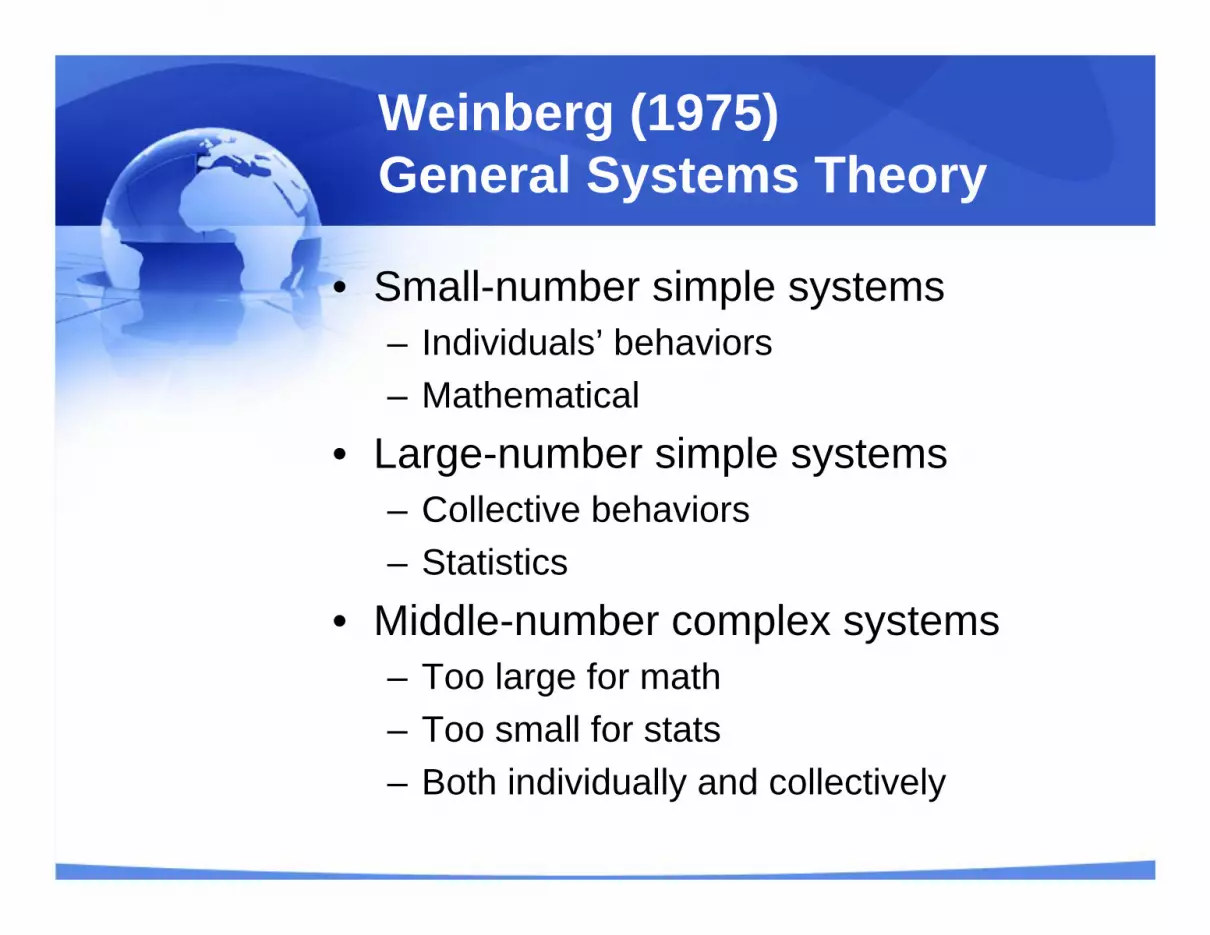
Weinberg (1975) General Systems Theory
• Small-number simple systems– Individuals’ behaviors– Mathematical
• Large-number simple systems– Collective behaviors– Statistics
• Middle-number complex systems– Too large for math– Too small for stats– Both individually and collectively

Hierarchy Theory Is For …
Middle-number complex systems in which elements are…
• Few enough to be self-assertive and noticeably unique in their behavior.
• Too numerous to be modeled one at a time with any economy and understanding.
A hierarchy is necessary to understand middle-number complex systems (Simon 1962).
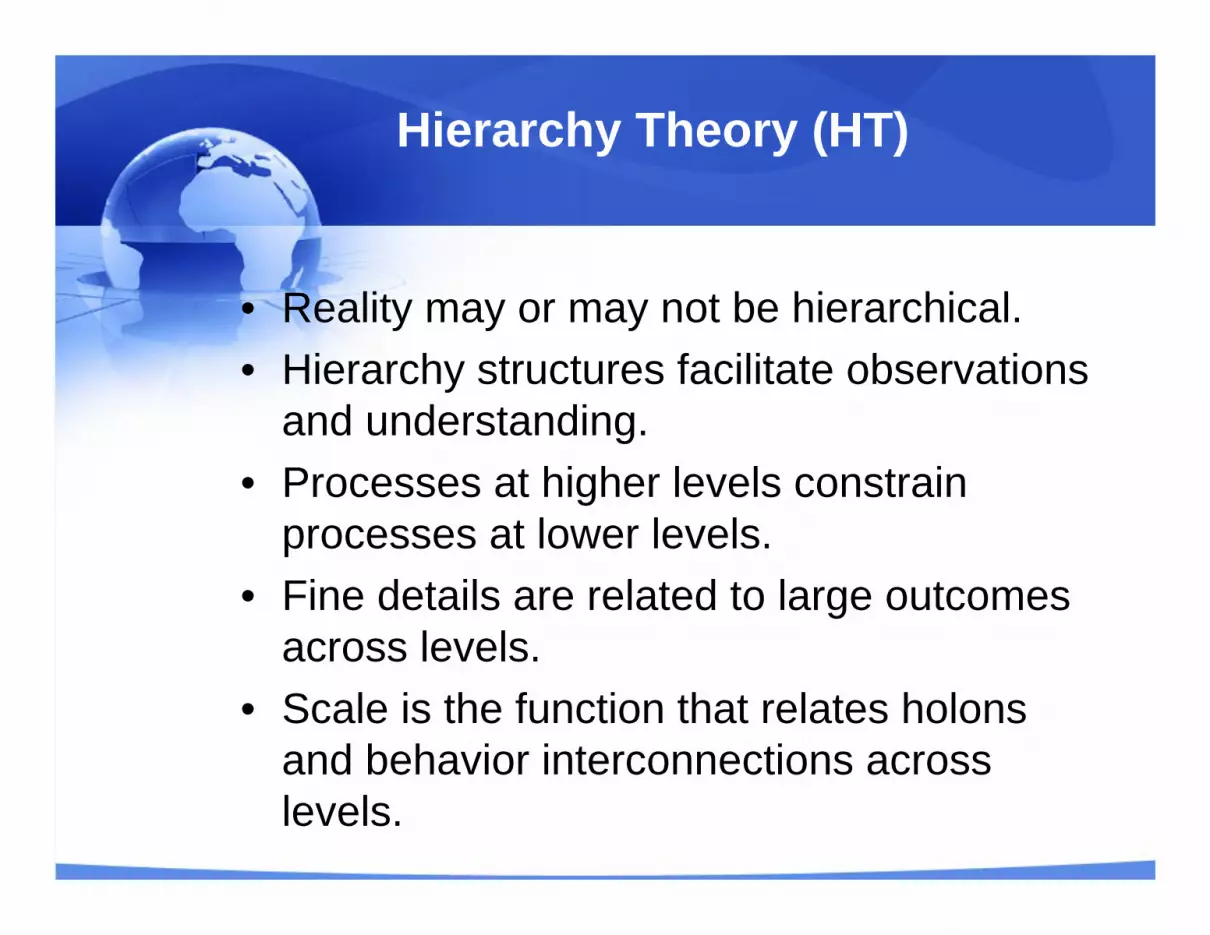
Hierarchy Theory (HT)
• Reality may or may not be hierarchical.• Hierarchy structures facilitate observations
and understanding.• Processes at higher levels constrain
processes at lower levels.• Fine details are related to large outcomes
across levels.• Scale is the function that relates holons
and behavior interconnections across levels.
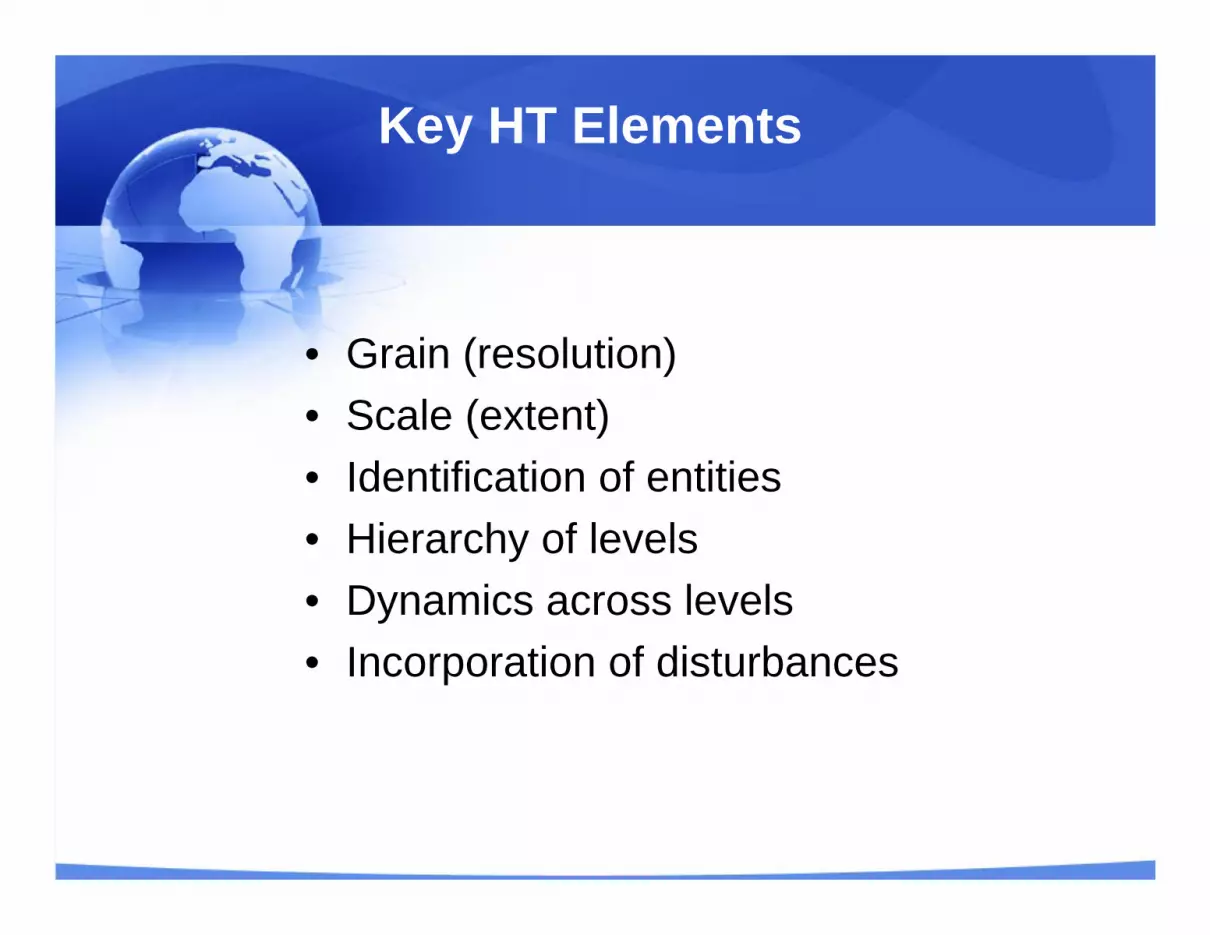
Key HT Elements
• Grain (resolution)• Scale (extent)• Identification of entities• Hierarchy of levels• Dynamics across levels• Incorporation of disturbances
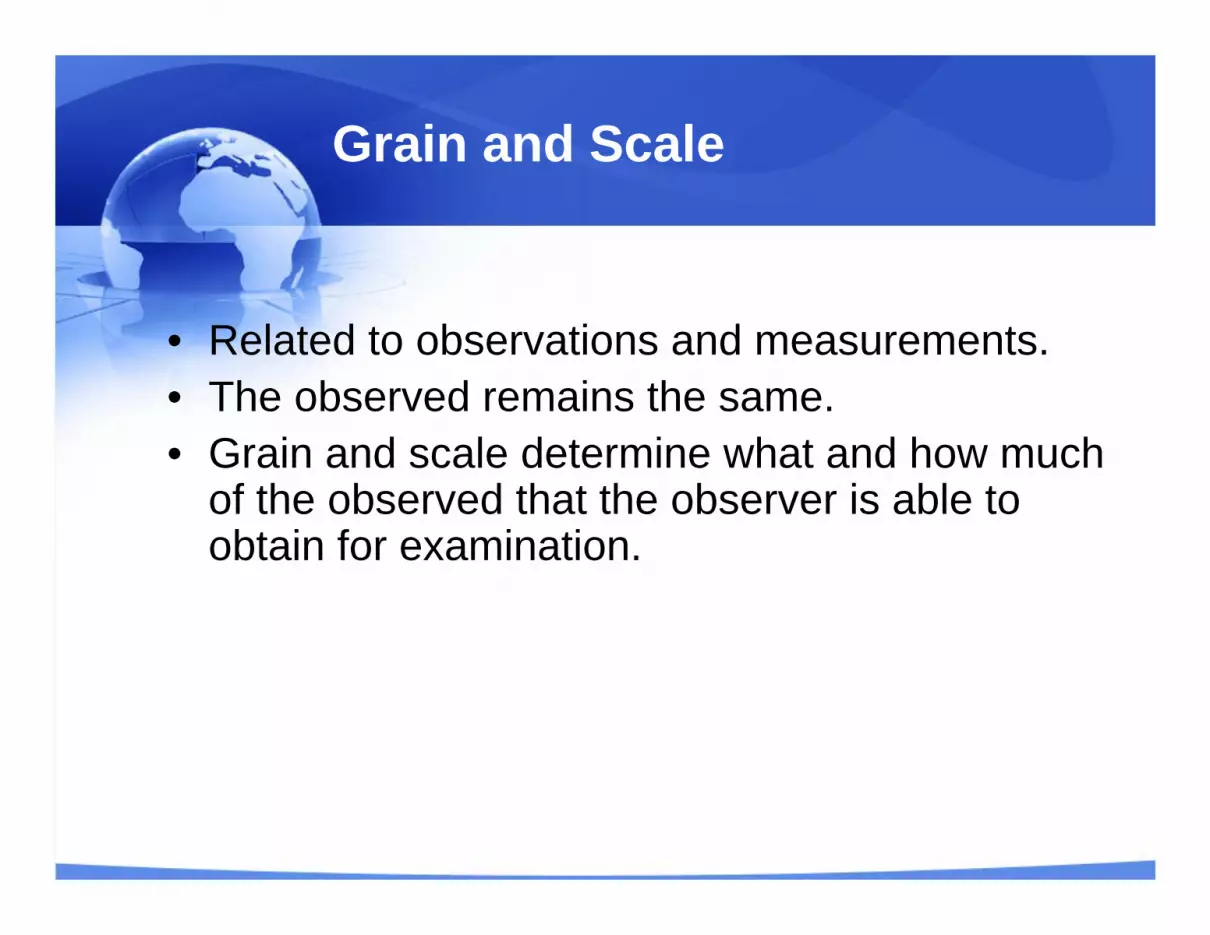
Grain and Scale
• Related to observations and measurements.• The observed remains the same.• Grain and scale determine what and how much
of the observed that the observer is able to obtain for examination.
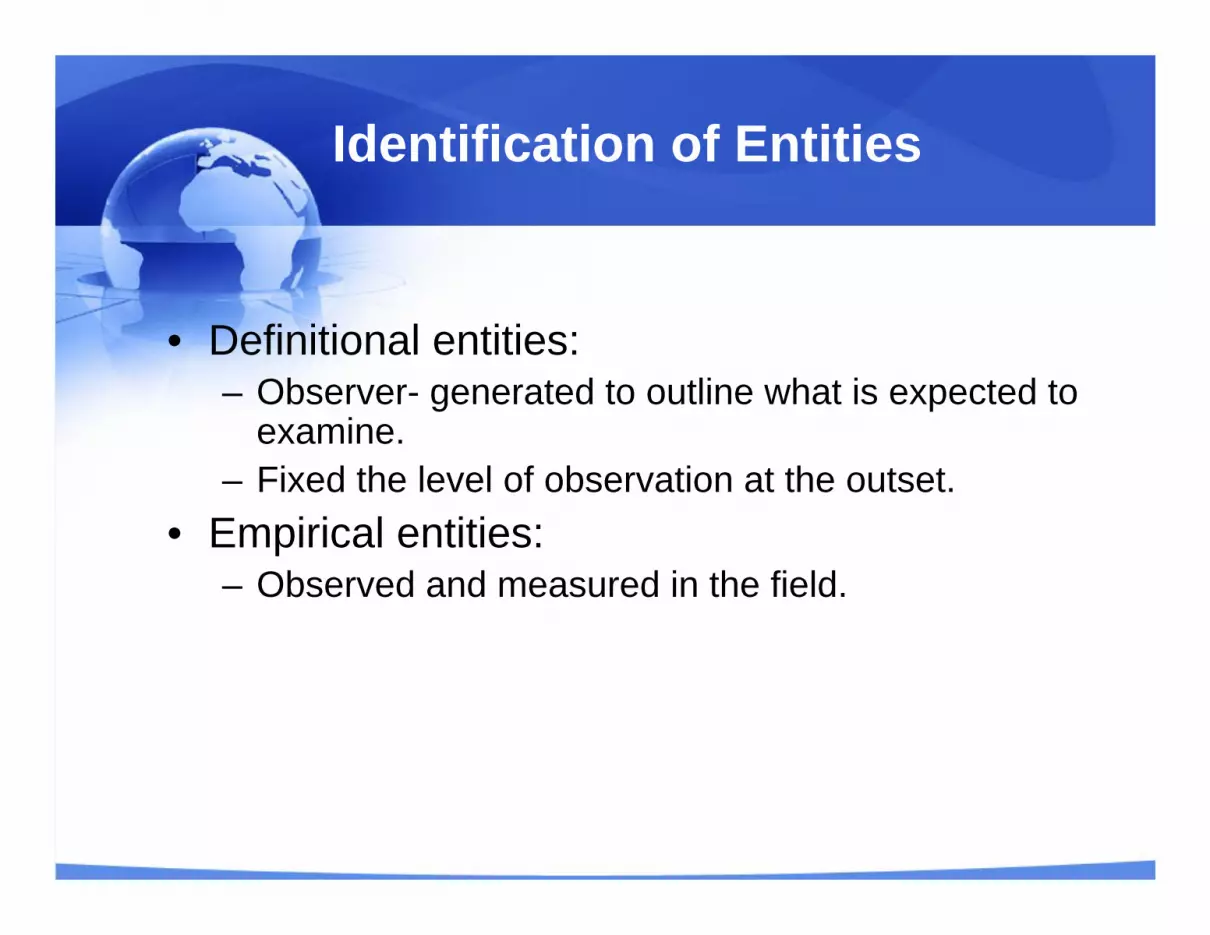
Identification of Entities
• Definitional entities: – Observer- generated to outline what is expected to
examine.– Fixed the level of observation at the outset.
• Empirical entities:– Observed and measured in the field.
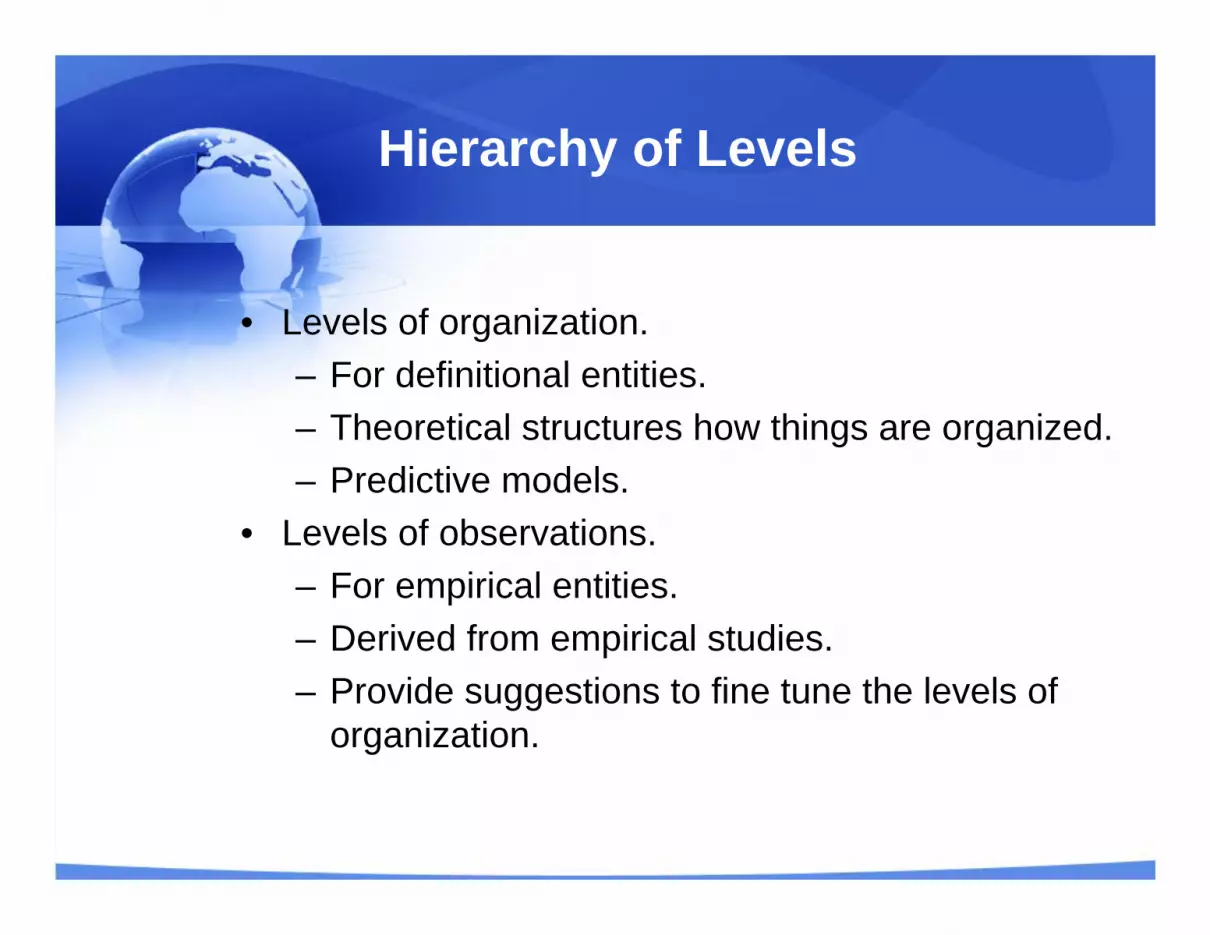
Hierarchy of Levels
• Levels of organization.– For definitional entities.– Theoretical structures how things are organized.– Predictive models.
• Levels of observations.– For empirical entities.– Derived from empirical studies.– Provide suggestions to fine tune the levels of
organization.
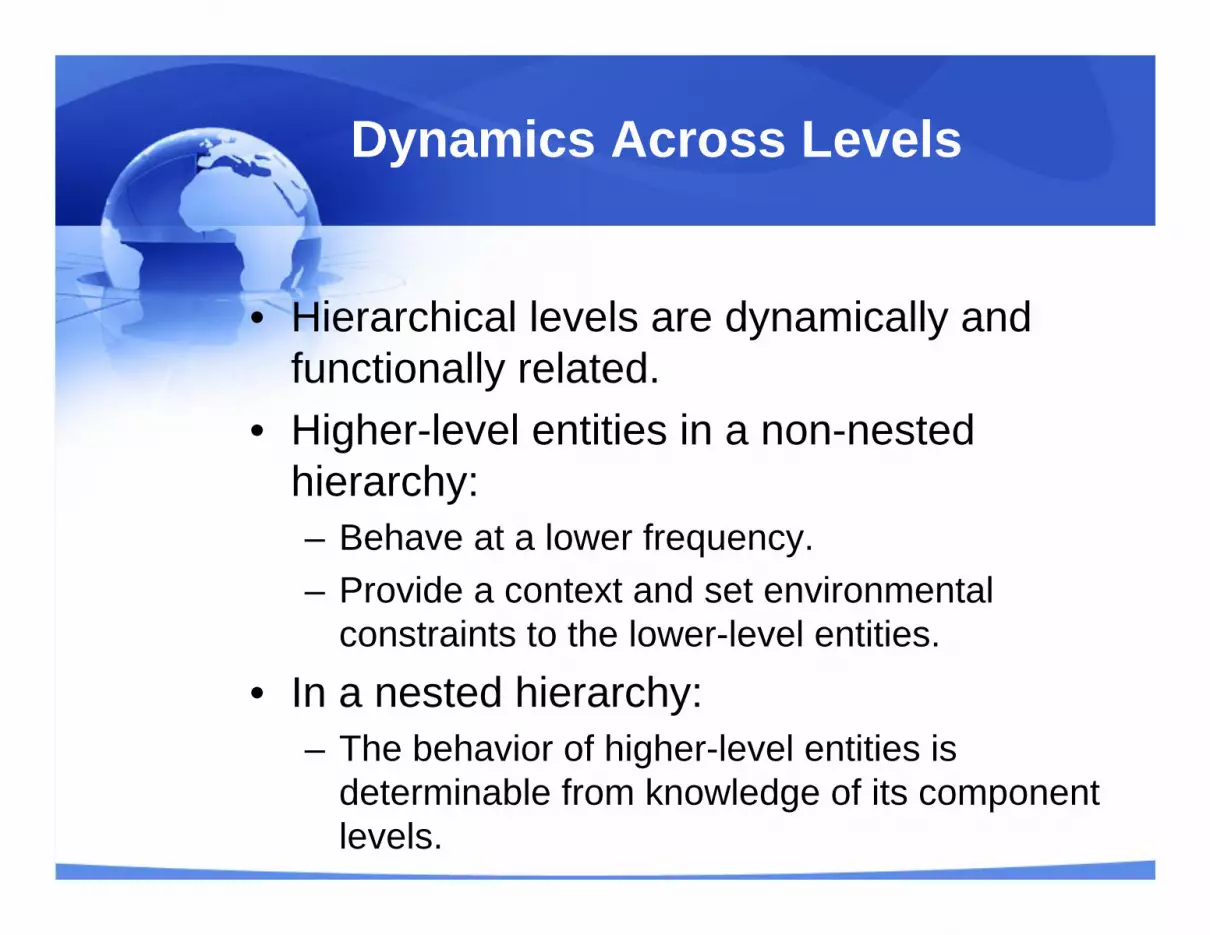
Dynamics Across Levels
• Hierarchical levels are dynamically and functionally related.
• Higher-level entities in a non-nested hierarchy:– Behave at a lower frequency.– Provide a context and set environmental
constraints to the lower-level entities.• In a nested hierarchy:
– The behavior of higher-level entities is determinable from knowledge of its component levels.
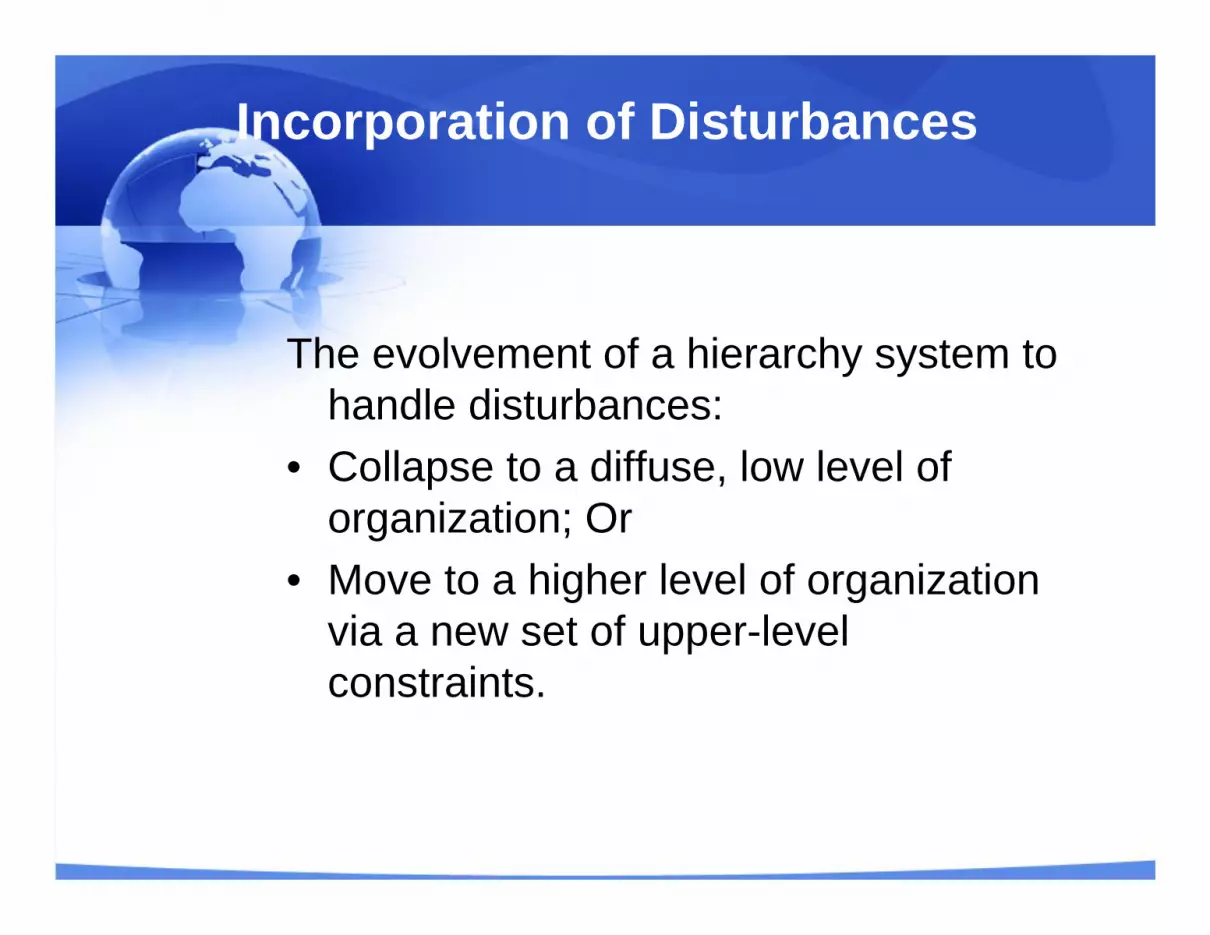
Incorporation of Disturbances
The evolvement of a hierarchy system to handle disturbances:
• Collapse to a diffuse, low level of organization; Or
• Move to a higher level of organization via a new set of upper-level constraints.
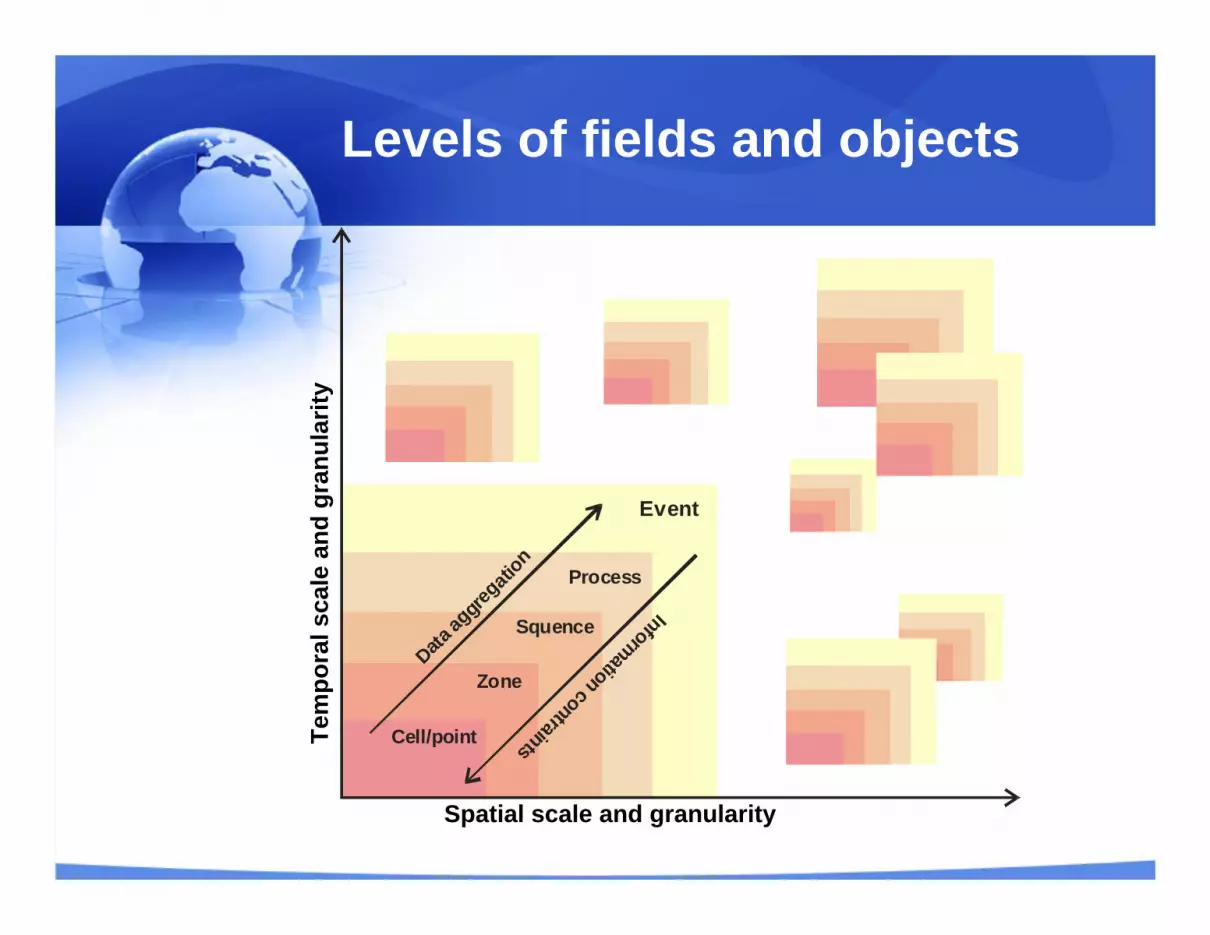
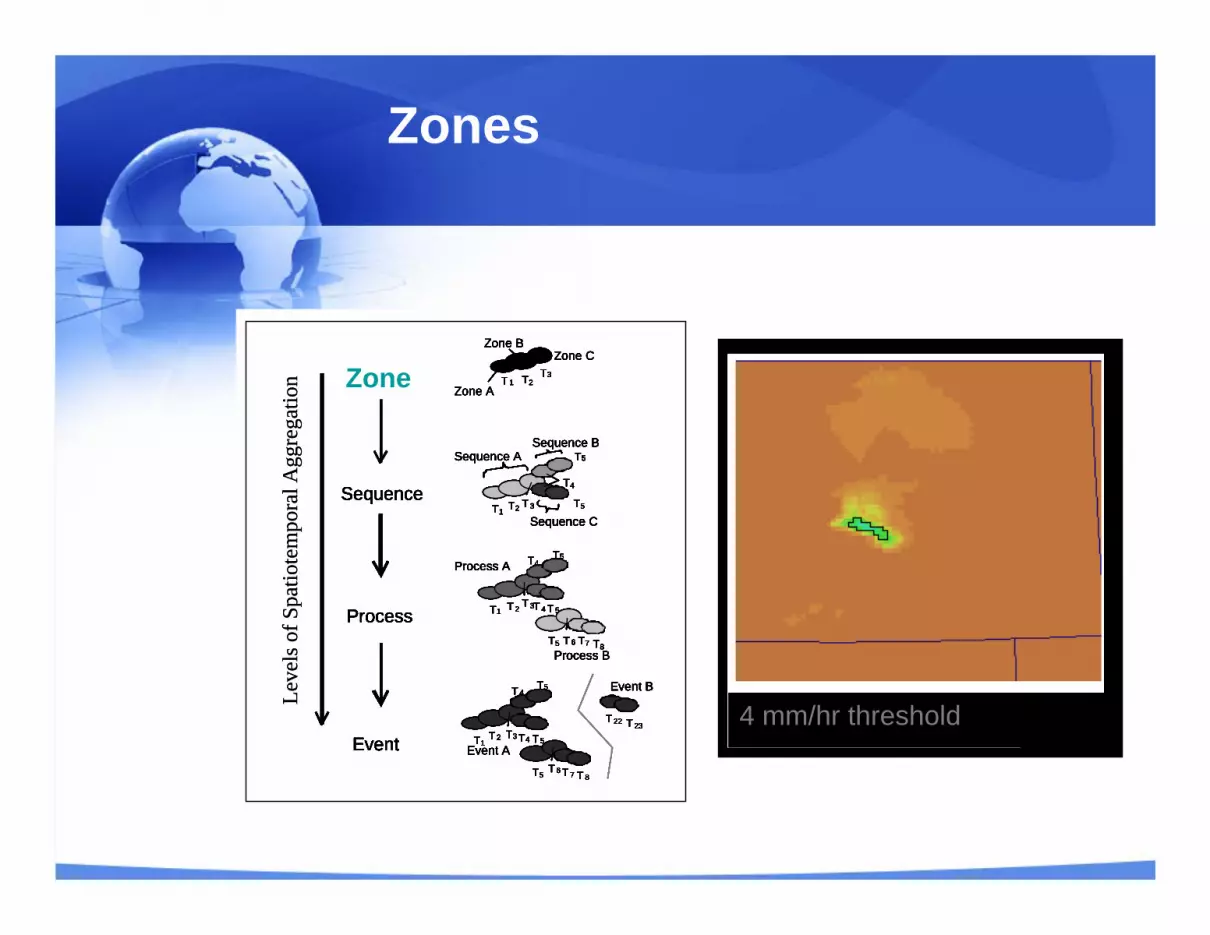
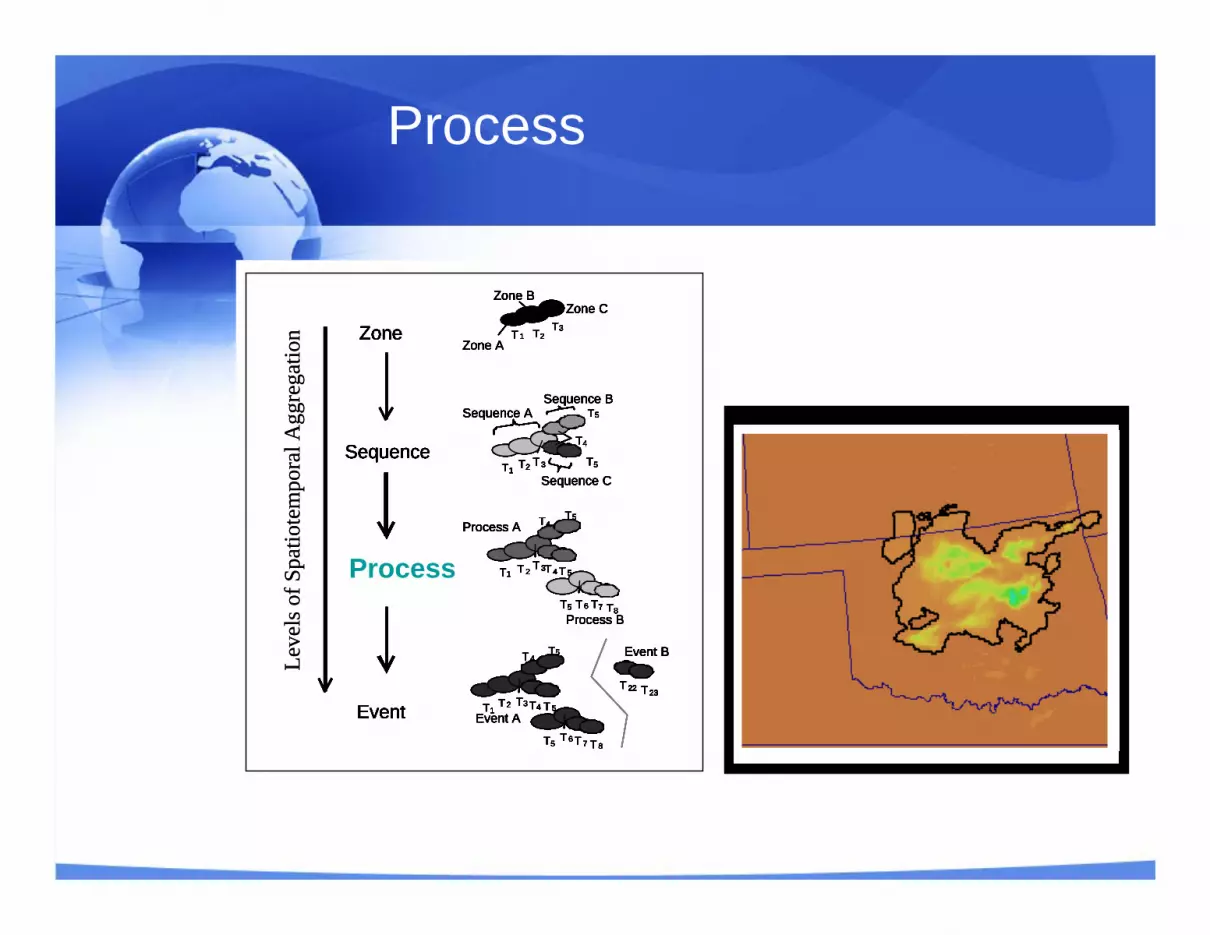
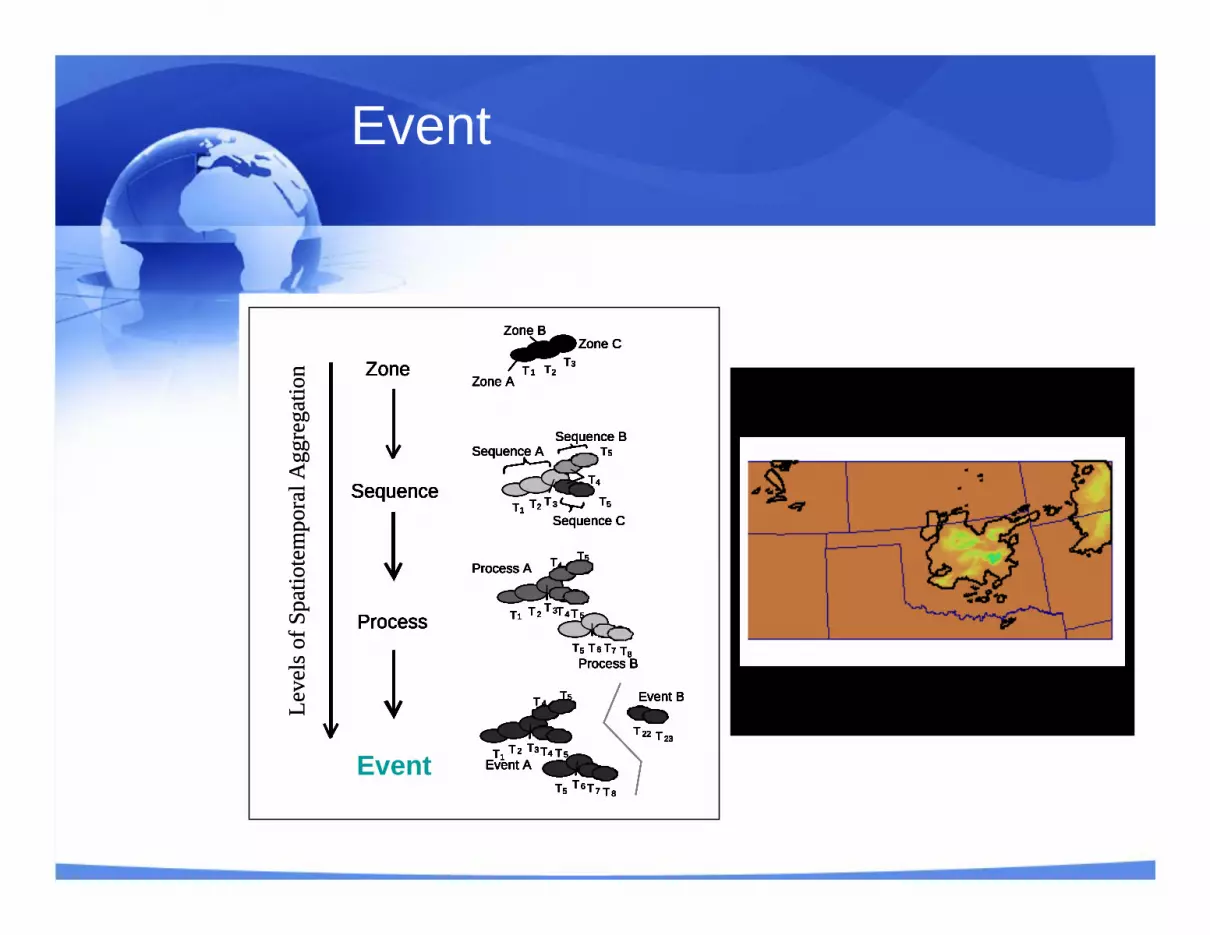
Levels of fields and objects
Information contraintsCell/point
Zone
Squence
Process
Data ag
gregati
on
Event
Spatial scale and granularity
Tem
pora
l sca
le a
nd g
ranu
larit
y
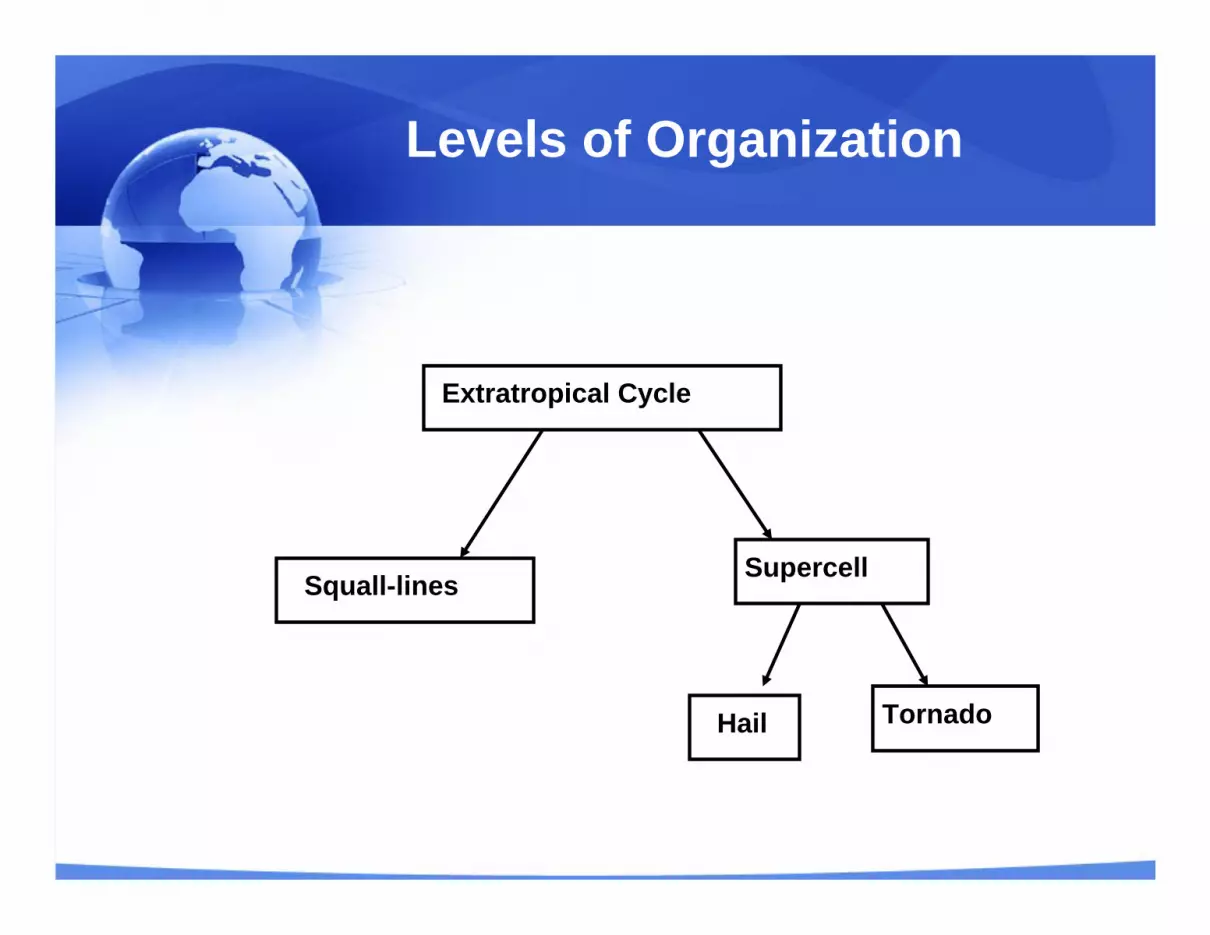
Levels of Organization
Extratropical CycleExtratropical Cycle
SquallSquall--lineslines SupercellSupercell
HailHail TornadoTornado
Data, States, Processes, and Events
Event
Process
Sequence
Zone
Event
Process
Sequence
Zone
Event
Process
Sequence
Zone
Event
Process
Sequence
Zone
Event
Process
Sequence
Zone
Event
Process
Sequence
Zone
Leve
ls o
f Spa
tiote
mpo
ral A
ggre
gatio
n
Event
Process
Sequence
Zone
Event
Process
Sequence
Zone
Event
Process
Sequence
Zone
Event
Process
Sequence
Zone
Event
Process
Sequence
Zone
Event
Process
Sequence
Zone
Process B
Process A
T1 T 2T 3T 4
T4T5
T 5
T5 T 6 T8T7
Event AT1
T 2 T3 T4
T 4T5
T 5
T5T 6 T 8T 7
Event B
T 23T 22
Sequence BSequence A
Sequence CT1
T2 T 3
T4
T5
T5
Zone A
Zone BZone C
T 1 T2T3
Process B
Process A
T1 T 2T 3T 4
T4T5
T 5
T5 T 6 T8T7
Process B
Process A
T1 T 2T 3T 4
T4T5
T 5
T5 T 6 T8T7
Event AT1
T 2 T3 T4
T 4T5
T 5
T5T 6 T 8T 7
Event B
T 23T 22
Event AT1
T 2 T3 T4
T 4T5
T 5
T5T 6 T 8T 7
Event B
T 23T 22
Sequence BSequence A
Sequence CT1
T2 T 3
T4
T5
T5
Sequence BSequence A
Sequence CT1
T2 T 3
T4
T5
T5
Zone A
Zone BZone C
T 1 T2T3
Zone A
Zone BZone C
T 1 T2T3
Process B
Process A
T1 T 2T 3T 4
T4T5
T 5
T5 T 6 T8T7
Event AT1
T 2 T3 T4
T 4T5
T 5
T5T 6 T 8T 7
Event B
T 23T 22
Sequence BSequence A
Sequence CT1
T2 T 3
T4
T5
T5
Zone A
Zone BZone C
T 1 T2T3
Process B
Process A
T1 T 2T 3T 4
T4T5
T 5
T5 T 6 T8T7
Process B
Process A
T1 T 2T 3T 4
T4T5
T 5
T5 T 6 T8T7
Event AT1
T 2 T3 T4
T 4T5
T 5
T5T 6 T 8T 7
Event B
T 23T 22
Event AT1
T 2 T3 T4
T 4T5
T 5
T5T 6 T 8T 7
Event B
T 23T 22
Sequence BSequence A
Sequence CT1
T2 T 3
T4
T5
T5
Sequence BSequence A
Sequence CT1
T2 T 3
T4
T5
T5
Zone A
Zone BZone C
T 1 T2T3
Zone A
Zone BZone C
T 1 T2T3
Process B
Process A
T1 T 2T 3T 4
T4T5
T 5
T5 T 6 T8T7
Event AT1
T 2 T3 T4
T 4T5
T 5
T5T 6 T 8T 7
Event B
T 23T 22
Sequence BSequence A
Sequence CT1
T2 T 3
T4
T5
T5
Zone A
Zone BZone C
T 1 T2T3
Process B
Process A
T1 T 2T 3T 4
T4T5
T 5
T5 T 6 T8T7
Process B
Process A
T1 T 2T 3T 4
T4T5
T 5
T5 T 6 T8T7
Event AT1
T 2 T3 T4
T 4T5
T 5
T5T 6 T 8T 7
Event B
T 23T 22
Event AT1
T 2 T3 T4
T 4T5
T 5
T5T 6 T 8T 7
Event B
T 23T 22
Sequence BSequence A
Sequence CT1
T2 T 3
T4
T5
T5
Sequence BSequence A
Sequence CT1
T2 T 3
T4
T5
T5
Zone A
Zone BZone C
T 1 T2T3
Zone A
Zone BZone C
T 1 T2T3
Process B
Process A
T1 T 2T 3T 4
T4T5
T 5
T5 T 6 T8T7
Event AT1
T 2 T3 T4
T 4T5
T 5
T5T 6 T 8T 7
Event B
T 23T 22
Sequence BSequence A
Sequence CT1
T2 T 3
T4
T5
T5
Zone A
Zone BZone C
T 1 T2T3
Process B
Process A
T1 T 2T 3T 4
T4T5
T 5
T5 T 6 T8T7
Process B
Process A
T1 T 2T 3T 4
T4T5
T 5
T5 T 6 T8T7
Event AT1
T 2 T3 T4
T 4T5
T 5
T5T 6 T 8T 7
Event B
T 23T 22
Event AT1
T 2 T3 T4
T 4T5
T 5
T5T 6 T 8T 7
Event B
T 23T 22
Sequence BSequence A
Sequence CT1
T2 T 3
T4
T5
T5
Sequence BSequence A
Sequence CT1
T2 T 3
T4
T5
T5
Zone A
Zone BZone C
T 1 T2T3
Zone A
Zone BZone C
T 1 T2T3
Leve
ls o
f Spa
tiote
mpo
ral A
ggre
gatio
n Zone
0 mm/hr threshold2 mm/hr threshold4 mm/hr threshold
Zones
Event
Process
Sequence
Zone
Event
Process
Sequence
Zone
Event
Process
Sequence
Zone
Event
Process
Sequence
Zone
Event
Process
Sequence
Zone
Event
Process
Sequence
Zone
Leve
ls o
f Spa
tiote
mpo
ral A
ggre
gatio
n
Event
Process
Sequence
Zone
Event
Process
Sequence
Zone
Event
Process
Sequence
Zone
Event
Process
Sequence
Zone
Event
Process
Sequence
Zone
Event
Process
Sequence
Zone
Process B
Process A
T1 T 2T 3T 4
T4T5
T 5
T5 T 6 T8T7
Event AT1
T 2 T3 T4
T 4T5
T 5
T5T 6 T 8T 7
Event B
T 23T 22
Sequence BSequence A
Sequence CT1
T2 T 3
T4
T5
T5
Zone A
Zone BZone C
T 1 T2T3
Process B
Process A
T1 T 2T 3T 4
T4T5
T 5
T5 T 6 T8T7
Process B
Process A
T1 T 2T 3T 4
T4T5
T 5
T5 T 6 T8T7
Event AT1
T 2 T3 T4
T 4T5
T 5
T5T 6 T 8T 7
Event B
T 23T 22
Event AT1
T 2 T3 T4
T 4T5
T 5
T5T 6 T 8T 7
Event B
T 23T 22
Sequence BSequence A
Sequence CT1
T2 T 3
T4
T5
T5
Sequence BSequence A
Sequence CT1
T2 T 3
T4
T5
T5
Zone A
Zone BZone C
T 1 T2T3
Zone A
Zone BZone C
T 1 T2T3
Process B
Process A
T1 T 2T 3T 4
T4T5
T 5
T5 T 6 T8T7
Event AT1
T 2 T3 T4
T 4T5
T 5
T5T 6 T 8T 7
Event B
T 23T 22
Sequence BSequence A
Sequence CT1
T2 T 3
T4
T5
T5
Zone A
Zone BZone C
T 1 T2T3
Process B
Process A
T1 T 2T 3T 4
T4T5
T 5
T5 T 6 T8T7
Process B
Process A
T1 T 2T 3T 4
T4T5
T 5
T5 T 6 T8T7
Event AT1
T 2 T3 T4
T 4T5
T 5
T5T 6 T 8T 7
Event B
T 23T 22
Event AT1
T 2 T3 T4
T 4T5
T 5
T5T 6 T 8T 7
Event B
T 23T 22
Sequence BSequence A
Sequence CT1
T2 T 3
T4
T5
T5
Sequence BSequence A
Sequence CT1
T2 T 3
T4
T5
T5
Zone A
Zone BZone C
T 1 T2T3
Zone A
Zone BZone C
T 1 T2T3
Process B
Process A
T1 T 2T 3T 4
T4T5
T 5
T5 T 6 T8T7
Event AT1
T 2 T3 T4
T 4T5
T 5
T5T 6 T 8T 7
Event B
T 23T 22
Sequence BSequence A
Sequence CT1
T2 T 3
T4
T5
T5
Zone A
Zone BZone C
T 1 T2T3
Process B
Process A
T1 T 2T 3T 4
T4T5
T 5
T5 T 6 T8T7
Process B
Process A
T1 T 2T 3T 4
T4T5
T 5
T5 T 6 T8T7
Event AT1
T 2 T3 T4
T 4T5
T 5
T5T 6 T 8T 7
Event B
T 23T 22
Event AT1
T 2 T3 T4
T 4T5
T 5
T5T 6 T 8T 7
Event B
T 23T 22
Sequence BSequence A
Sequence CT1
T2 T 3
T4
T5
T5
Sequence BSequence A
Sequence CT1
T2 T 3
T4
T5
T5
Zone A
Zone BZone C
T 1 T2T3
Zone A
Zone BZone C
T 1 T2T3
Process B
Process A
T1 T 2T 3T 4
T4T5
T 5
T5 T 6 T8T7
Event AT1
T 2 T3 T4
T 4T5
T 5
T5T 6 T 8T 7
Event B
T 23T 22
Sequence BSequence A
Sequence CT1
T2 T 3
T4
T5
T5
Zone A
Zone BZone C
T 1 T2T3
Process B
Process A
T1 T 2T 3T 4
T4T5
T 5
T5 T 6 T8T7
Process B
Process A
T1 T 2T 3T 4
T4T5
T 5
T5 T 6 T8T7
Event AT1
T 2 T3 T4
T 4T5
T 5
T5T 6 T 8T 7
Event B
T 23T 22
Event AT1
T 2 T3 T4
T 4T5
T 5
T5T 6 T 8T 7
Event B
T 23T 22
Sequence BSequence A
Sequence CT1
T2 T 3
T4
T5
T5
Sequence BSequence A
Sequence CT1
T2 T 3
T4
T5
T5
Zone A
Zone BZone C
T 1 T2T3
Zone A
Zone BZone C
T 1 T2T3
Leve
ls o
f Spa
tiote
mpo
ral A
ggre
gatio
n
Sequence
Sequences
Event
Process
Sequence
Zone
Event
Process
Sequence
Zone
Event
Process
Sequence
Zone
Event
Process
Sequence
Zone
Event
Process
Sequence
Zone
Event
Process
Sequence
Zone
Leve
ls o
f Spa
tiote
mpo
ral A
ggre
gatio
n
Event
Process
Sequence
Zone
Event
Process
Sequence
Zone
Event
Process
Sequence
Zone
Event
Process
Sequence
Zone
Event
Process
Sequence
Zone
Event
Process
Sequence
Zone
Process B
Process A
T1 T 2T 3T 4
T4T5
T 5
T5 T 6 T8T7
Event AT1
T 2 T3 T4
T 4T5
T 5
T5T 6 T 8T 7
Event B
T 23T 22
Sequence BSequence A
Sequence CT1
T2 T 3
T4
T5
T5
Zone A
Zone BZone C
T 1 T2T3
Process B
Process A
T1 T 2T 3T 4
T4T5
T 5
T5 T 6 T8T7
Process B
Process A
T1 T 2T 3T 4
T4T5
T 5
T5 T 6 T8T7
Event AT1
T 2 T3 T4
T 4T5
T 5
T5T 6 T 8T 7
Event B
T 23T 22
Event AT1
T 2 T3 T4
T 4T5
T 5
T5T 6 T 8T 7
Event B
T 23T 22
Sequence BSequence A
Sequence CT1
T2 T 3
T4
T5
T5
Sequence BSequence A
Sequence CT1
T2 T 3
T4
T5
T5
Zone A
Zone BZone C
T 1 T2T3
Zone A
Zone BZone C
T 1 T2T3
Process B
Process A
T1 T 2T 3T 4
T4T5
T 5
T5 T 6 T8T7
Event AT1
T 2 T3 T4
T 4T5
T 5
T5T 6 T 8T 7
Event B
T 23T 22
Sequence BSequence A
Sequence CT1
T2 T 3
T4
T5
T5
Zone A
Zone BZone C
T 1 T2T3
Process B
Process A
T1 T 2T 3T 4
T4T5
T 5
T5 T 6 T8T7
Process B
Process A
T1 T 2T 3T 4
T4T5
T 5
T5 T 6 T8T7
Event AT1
T 2 T3 T4
T 4T5
T 5
T5T 6 T 8T 7
Event B
T 23T 22
Event AT1
T 2 T3 T4
T 4T5
T 5
T5T 6 T 8T 7
Event B
T 23T 22
Sequence BSequence A
Sequence CT1
T2 T 3
T4
T5
T5
Sequence BSequence A
Sequence CT1
T2 T 3
T4
T5
T5
Zone A
Zone BZone C
T 1 T2T3
Zone A
Zone BZone C
T 1 T2T3
Process B
Process A
T1 T 2T 3T 4
T4T5
T 5
T5 T 6 T8T7
Event AT1
T 2 T3 T4
T 4T5
T 5
T5T 6 T 8T 7
Event B
T 23T 22
Sequence BSequence A
Sequence CT1
T2 T 3
T4
T5
T5
Zone A
Zone BZone C
T 1 T2T3
Process B
Process A
T1 T 2T 3T 4
T4T5
T 5
T5 T 6 T8T7
Process B
Process A
T1 T 2T 3T 4
T4T5
T 5
T5 T 6 T8T7
Event AT1
T 2 T3 T4
T 4T5
T 5
T5T 6 T 8T 7
Event B
T 23T 22
Event AT1
T 2 T3 T4
T 4T5
T 5
T5T 6 T 8T 7
Event B
T 23T 22
Sequence BSequence A
Sequence CT1
T2 T 3
T4
T5
T5
Sequence BSequence A
Sequence CT1
T2 T 3
T4
T5
T5
Zone A
Zone BZone C
T 1 T2T3
Zone A
Zone BZone C
T 1 T2T3
Process B
Process A
T1 T 2T 3T 4
T4T5
T 5
T5 T 6 T8T7
Event AT1
T 2 T3 T4
T 4T5
T 5
T5T 6 T 8T 7
Event B
T 23T 22
Sequence BSequence A
Sequence CT1
T2 T 3
T4
T5
T5
Zone A
Zone BZone C
T 1 T2T3
Process B
Process A
T1 T 2T 3T 4
T4T5
T 5
T5 T 6 T8T7
Process B
Process A
T1 T 2T 3T 4
T4T5
T 5
T5 T 6 T8T7
Event AT1
T 2 T3 T4
T 4T5
T 5
T5T 6 T 8T 7
Event B
T 23T 22
Event AT1
T 2 T3 T4
T 4T5
T 5
T5T 6 T 8T 7
Event B
T 23T 22
Sequence BSequence A
Sequence CT1
T2 T 3
T4
T5
T5
Sequence BSequence A
Sequence CT1
T2 T 3
T4
T5
T5
Zone A
Zone BZone C
T 1 T2T3
Zone A
Zone BZone C
T 1 T2T3
Leve
ls o
f Spa
tiote
mpo
ral A
ggre
gatio
n
Process
Process
Event
Process
Sequence
Zone
Event
Process
Sequence
Zone
Event
Process
Sequence
Zone
Event
Process
Sequence
Zone
Event
Process
Sequence
Zone
Event
Process
Sequence
Zone
Leve
ls o
f Spa
tiote
mpo
ral A
ggre
gatio
n
Event
Process
Sequence
Zone
Event
Process
Sequence
Zone
Event
Process
Sequence
Zone
Event
Process
Sequence
Zone
Event
Process
Sequence
Zone
Event
Process
Sequence
Zone
Process B
Process A
T1 T 2T 3T 4
T4T5
T 5
T5 T 6 T8T7
Event AT1
T 2 T3 T4
T 4T5
T 5
T5T 6 T 8T 7
Event B
T 23T 22
Sequence BSequence A
Sequence CT1
T2 T 3
T4
T5
T5
Zone A
Zone BZone C
T 1 T2T3
Process B
Process A
T1 T 2T 3T 4
T4T5
T 5
T5 T 6 T8T7
Process B
Process A
T1 T 2T 3T 4
T4T5
T 5
T5 T 6 T8T7
Event AT1
T 2 T3 T4
T 4T5
T 5
T5T 6 T 8T 7
Event B
T 23T 22
Event AT1
T 2 T3 T4
T 4T5
T 5
T5T 6 T 8T 7
Event B
T 23T 22
Sequence BSequence A
Sequence CT1
T2 T 3
T4
T5
T5
Sequence BSequence A
Sequence CT1
T2 T 3
T4
T5
T5
Zone A
Zone BZone C
T 1 T2T3
Zone A
Zone BZone C
T 1 T2T3
Process B
Process A
T1 T 2T 3T 4
T4T5
T 5
T5 T 6 T8T7
Event AT1
T 2 T3 T4
T 4T5
T 5
T5T 6 T 8T 7
Event B
T 23T 22
Sequence BSequence A
Sequence CT1
T2 T 3
T4
T5
T5
Zone A
Zone BZone C
T 1 T2T3
Process B
Process A
T1 T 2T 3T 4
T4T5
T 5
T5 T 6 T8T7
Process B
Process A
T1 T 2T 3T 4
T4T5
T 5
T5 T 6 T8T7
Event AT1
T 2 T3 T4
T 4T5
T 5
T5T 6 T 8T 7
Event B
T 23T 22
Event AT1
T 2 T3 T4
T 4T5
T 5
T5T 6 T 8T 7
Event B
T 23T 22
Sequence BSequence A
Sequence CT1
T2 T 3
T4
T5
T5
Sequence BSequence A
Sequence CT1
T2 T 3
T4
T5
T5
Zone A
Zone BZone C
T 1 T2T3
Zone A
Zone BZone C
T 1 T2T3
Process B
Process A
T1 T 2T 3T 4
T4T5
T 5
T5 T 6 T8T7
Event AT1
T 2 T3 T4
T 4T5
T 5
T5T 6 T 8T 7
Event B
T 23T 22
Sequence BSequence A
Sequence CT1
T2 T 3
T4
T5
T5
Zone A
Zone BZone C
T 1 T2T3
Process B
Process A
T1 T 2T 3T 4
T4T5
T 5
T5 T 6 T8T7
Process B
Process A
T1 T 2T 3T 4
T4T5
T 5
T5 T 6 T8T7
Event AT1
T 2 T3 T4
T 4T5
T 5
T5T 6 T 8T 7
Event B
T 23T 22
Event AT1
T 2 T3 T4
T 4T5
T 5
T5T 6 T 8T 7
Event B
T 23T 22
Sequence BSequence A
Sequence CT1
T2 T 3
T4
T5
T5
Sequence BSequence A
Sequence CT1
T2 T 3
T4
T5
T5
Zone A
Zone BZone C
T 1 T2T3
Zone A
Zone BZone C
T 1 T2T3
Process B
Process A
T1 T 2T 3T 4
T4T5
T 5
T5 T 6 T8T7
Event AT1
T 2 T3 T4
T 4T5
T 5
T5T 6 T 8T 7
Event B
T 23T 22
Sequence BSequence A
Sequence CT1
T2 T 3
T4
T5
T5
Zone A
Zone BZone C
T 1 T2T3
Process B
Process A
T1 T 2T 3T 4
T4T5
T 5
T5 T 6 T8T7
Process B
Process A
T1 T 2T 3T 4
T4T5
T 5
T5 T 6 T8T7
Event AT1
T 2 T3 T4
T 4T5
T 5
T5T 6 T 8T 7
Event B
T 23T 22
Event AT1
T 2 T3 T4
T 4T5
T 5
T5T 6 T 8T 7
Event B
T 23T 22
Sequence BSequence A
Sequence CT1
T2 T 3
T4
T5
T5
Sequence BSequence A
Sequence CT1
T2 T 3
T4
T5
T5
Zone A
Zone BZone C
T 1 T2T3
Zone A
Zone BZone C
T 1 T2T3
Leve
ls o
f Spa
tiote
mpo
ral A
ggre
gatio
n
Event
Event
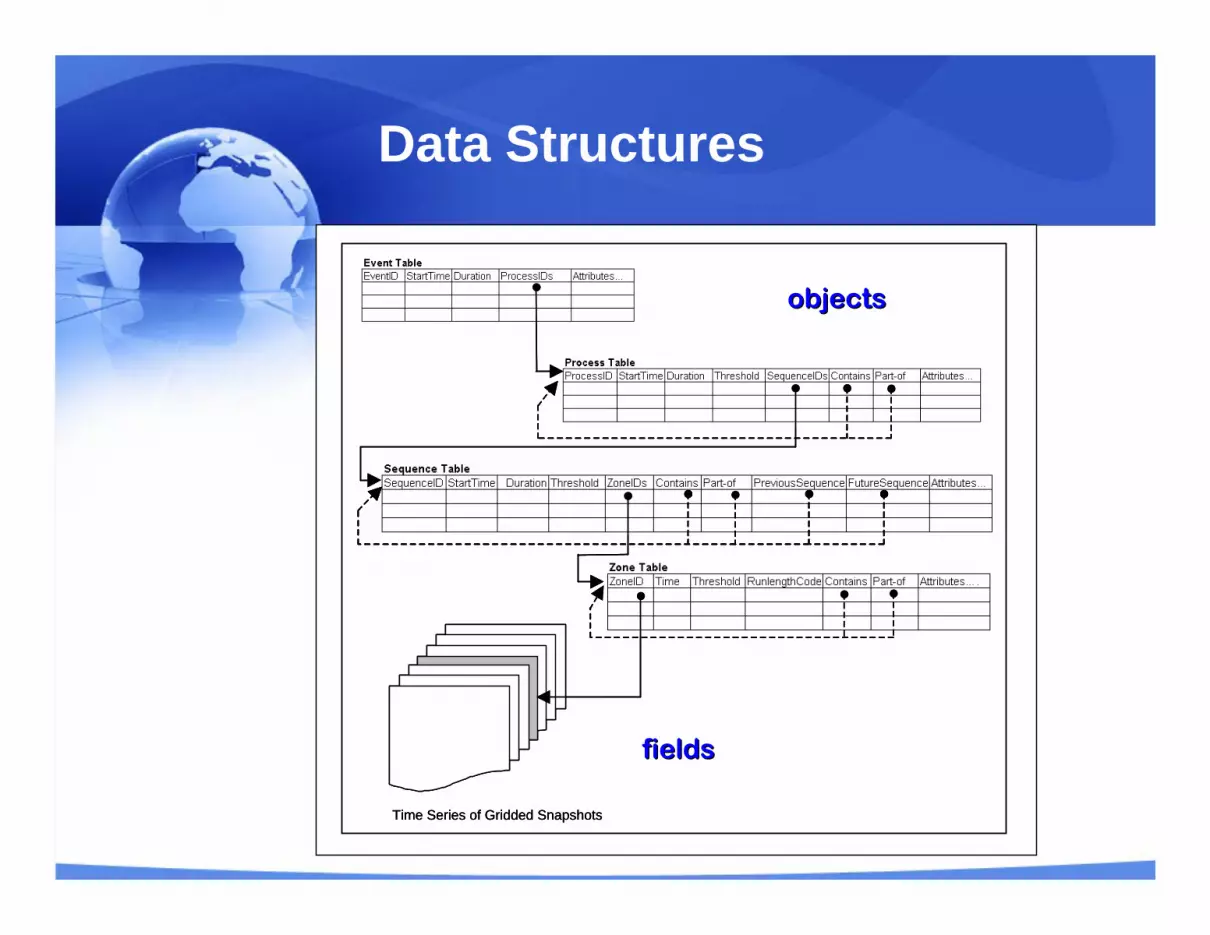
Data Structures
Time Series of Gridded SnapshotsTime Series of Gridded SnapshotsTime Series of Gridded Snapshots
fieldsfields
objectsobjects

Discover Geographic Dynamics
Collaborator: John McIntosh
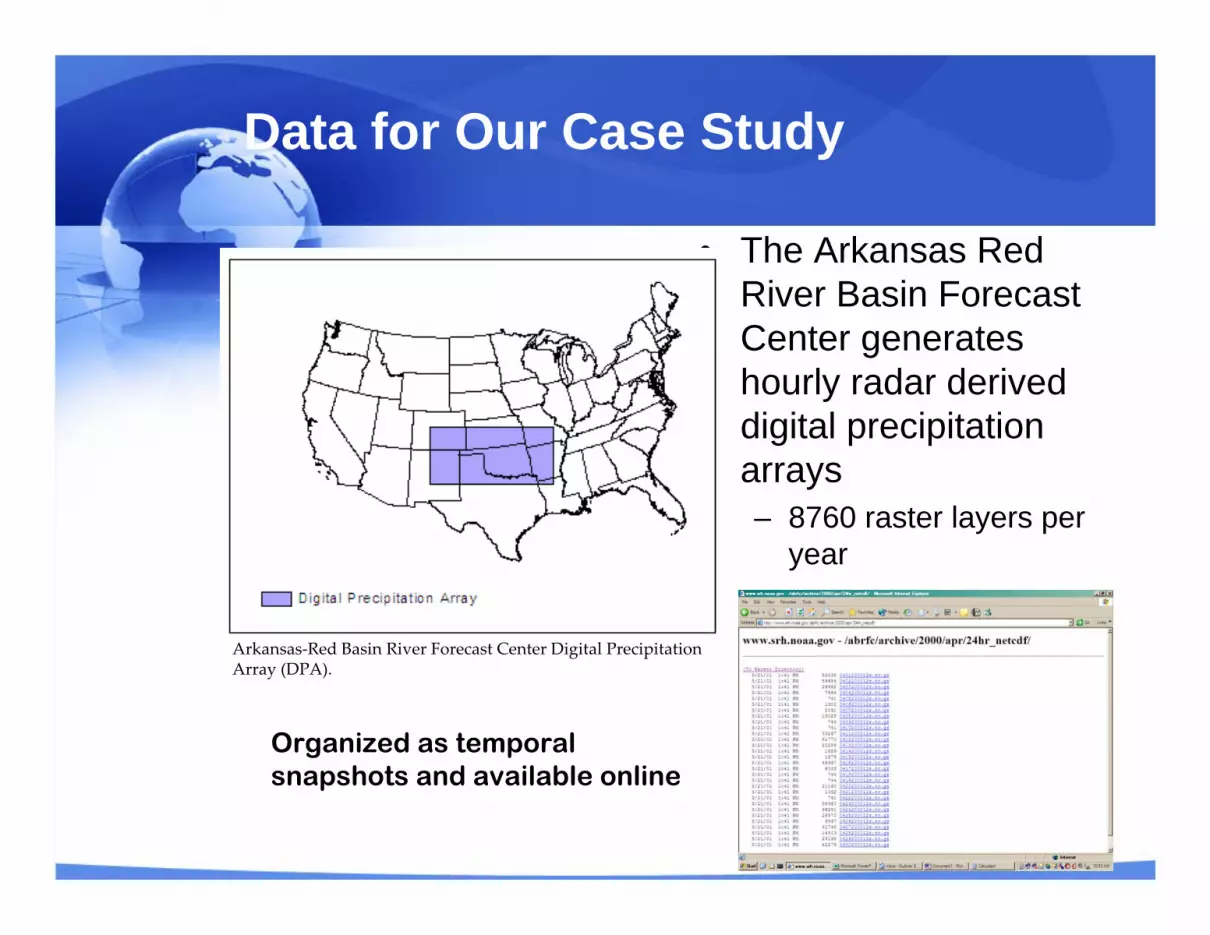
Data for Our Case Study
• The Arkansas Red River Basin Forecast Center generates hourly radar derived digital precipitation arrays– 8760 raster layers per
year
Arkansas‐Red Basin River Forecast Center Digital Precipitation Array (DPA).
Organized as temporal snapshots and available online
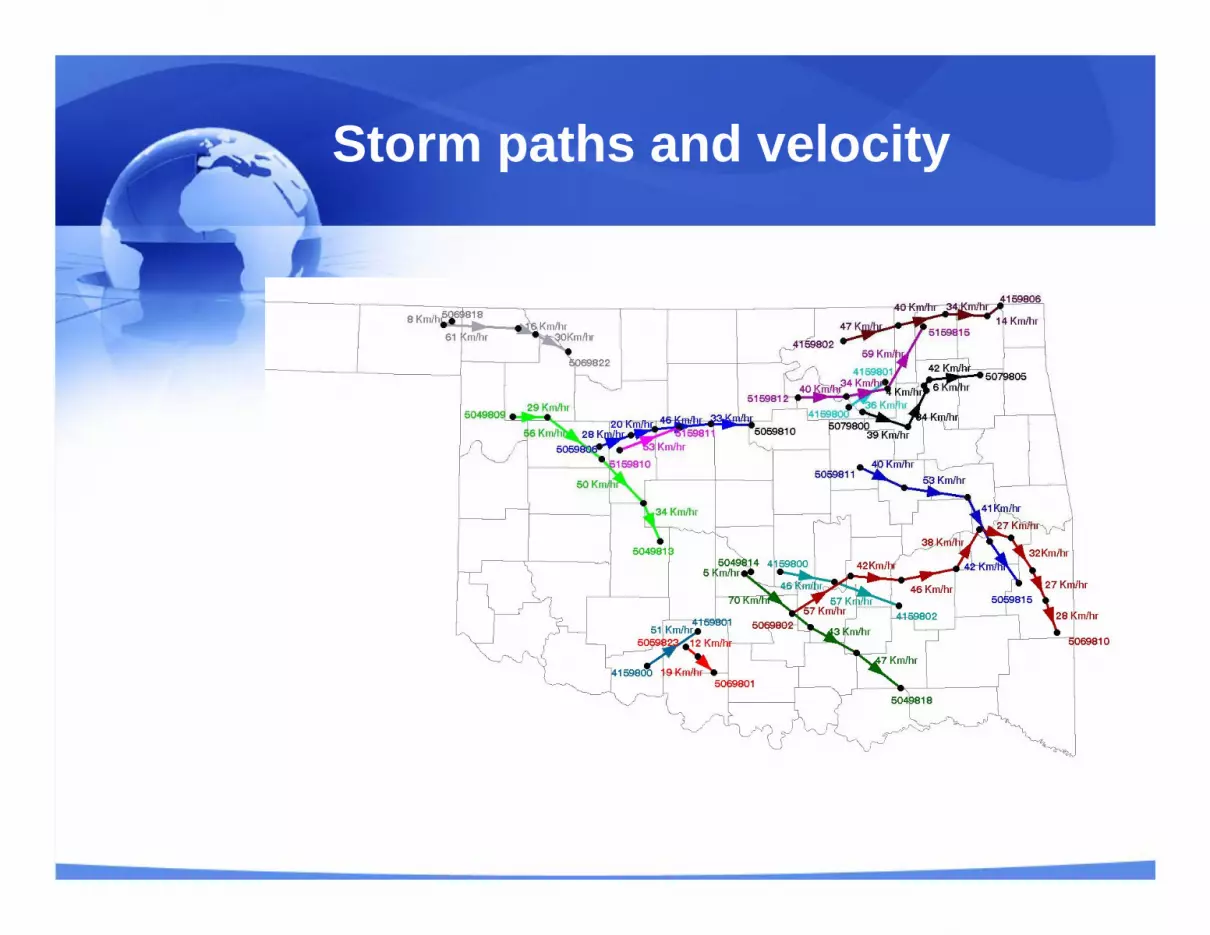
Storm paths and velocity
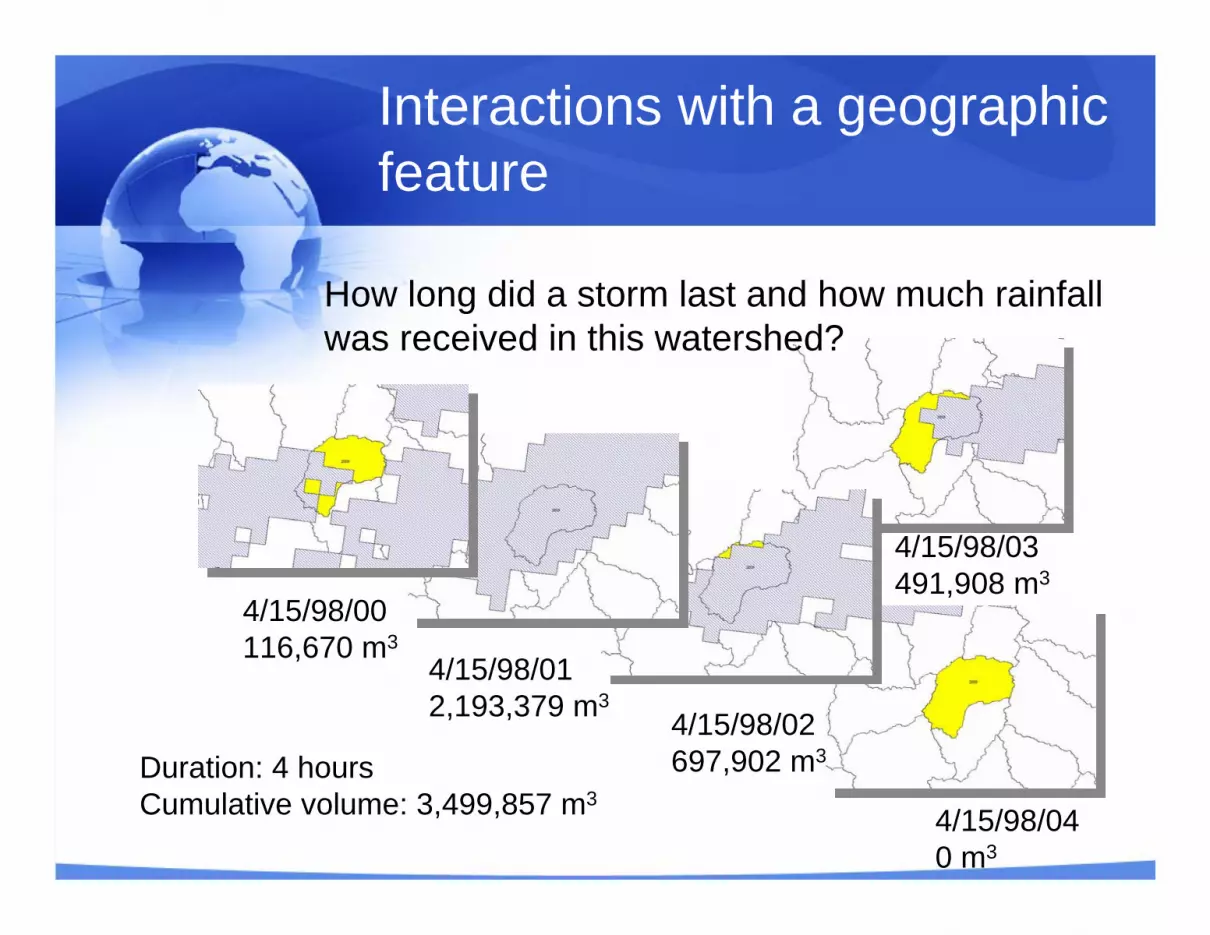
4/15/98/040 m3
4/15/98/00116,670 m3
4/15/98/012,193,379 m3
4/15/98/02697,902 m3
4/15/98/03491,908 m3
Duration: 4 hoursCumulative volume: 3,499,857 m3
How long did a storm last and how much rainfall was received in this watershed?
Interactions with a geographic feature
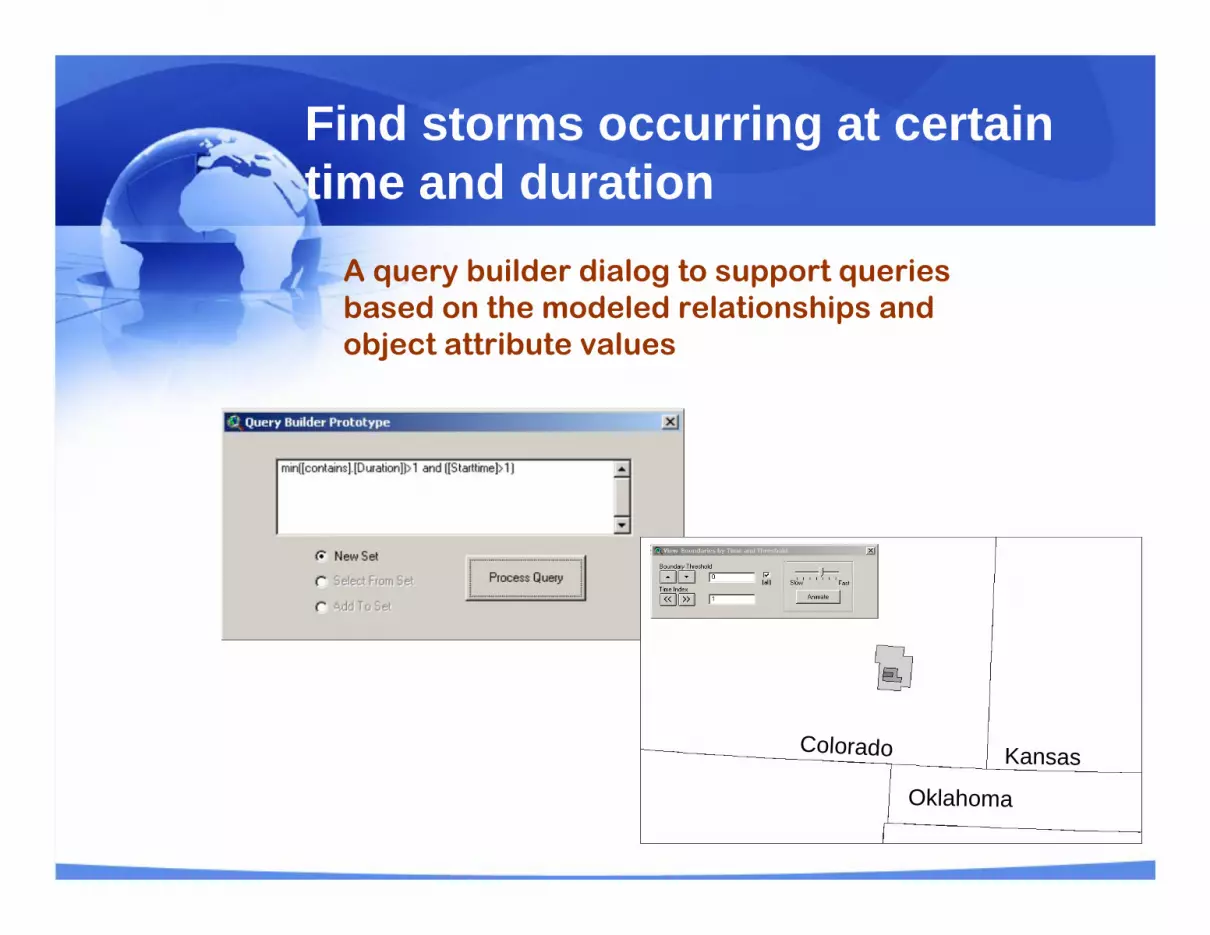
Find storms occurring at certain time and duration
A query builder dialog to support queries based on the modeled relationships and object attribute values
Colorado
Oklahoma
KansasColorado
Oklahoma
Kansas
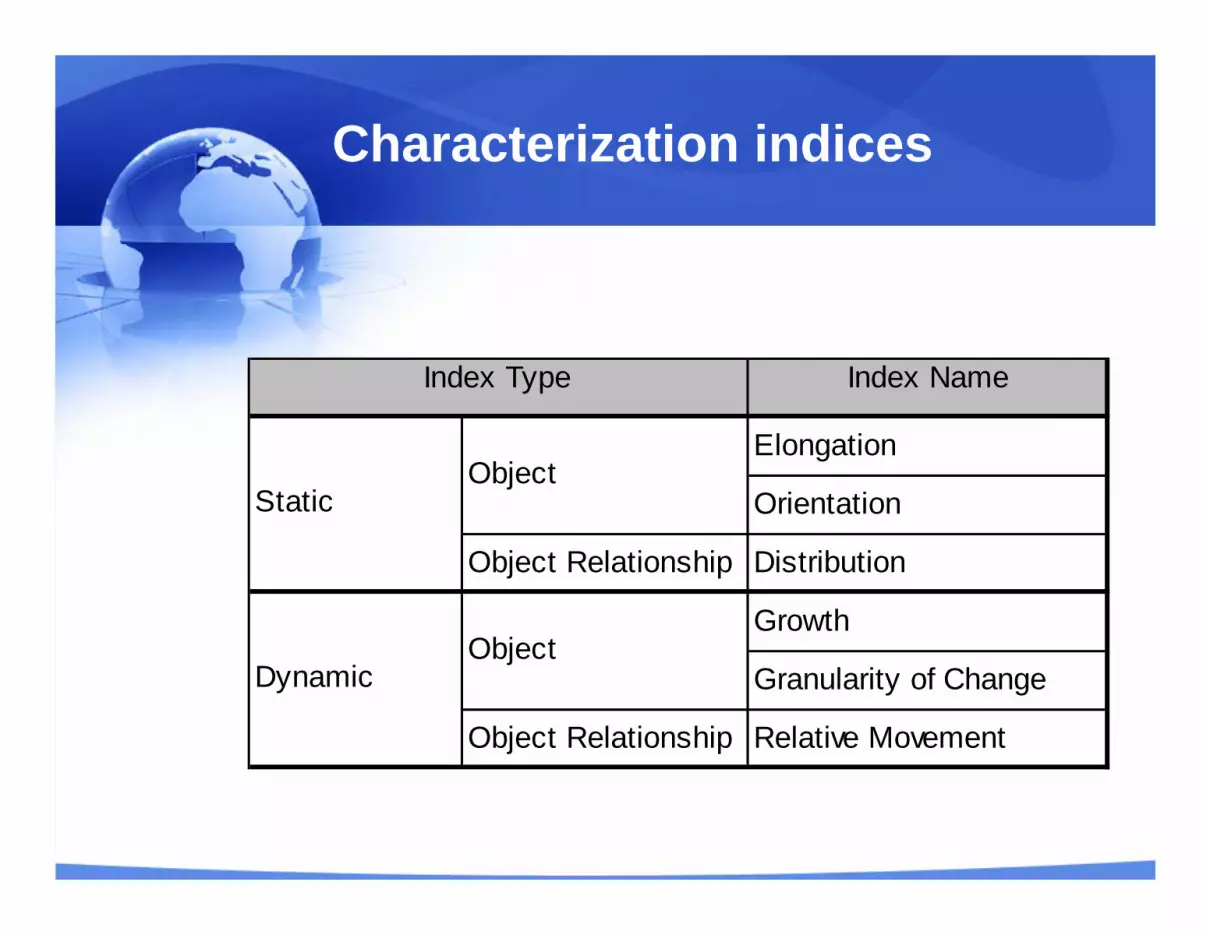
Characterization indices
Index Name
Elongation
Orientation
Object Relationship Distribution
Growth
Granularity of Change
Object Relationship Relative Movement
Index Type
Object
Object
Static
Dynamic

Elongation
• Elongation and absolute orientation are calculated using the Moments of Inertia method (Gardoll et al 2000)
• Elongation is determined using the maximum and minimum inertia
∑=
=n
iii zrI
1
2θ
)()(
MinMax
MinMax
IIIIE
+−
=
Relative Orientation
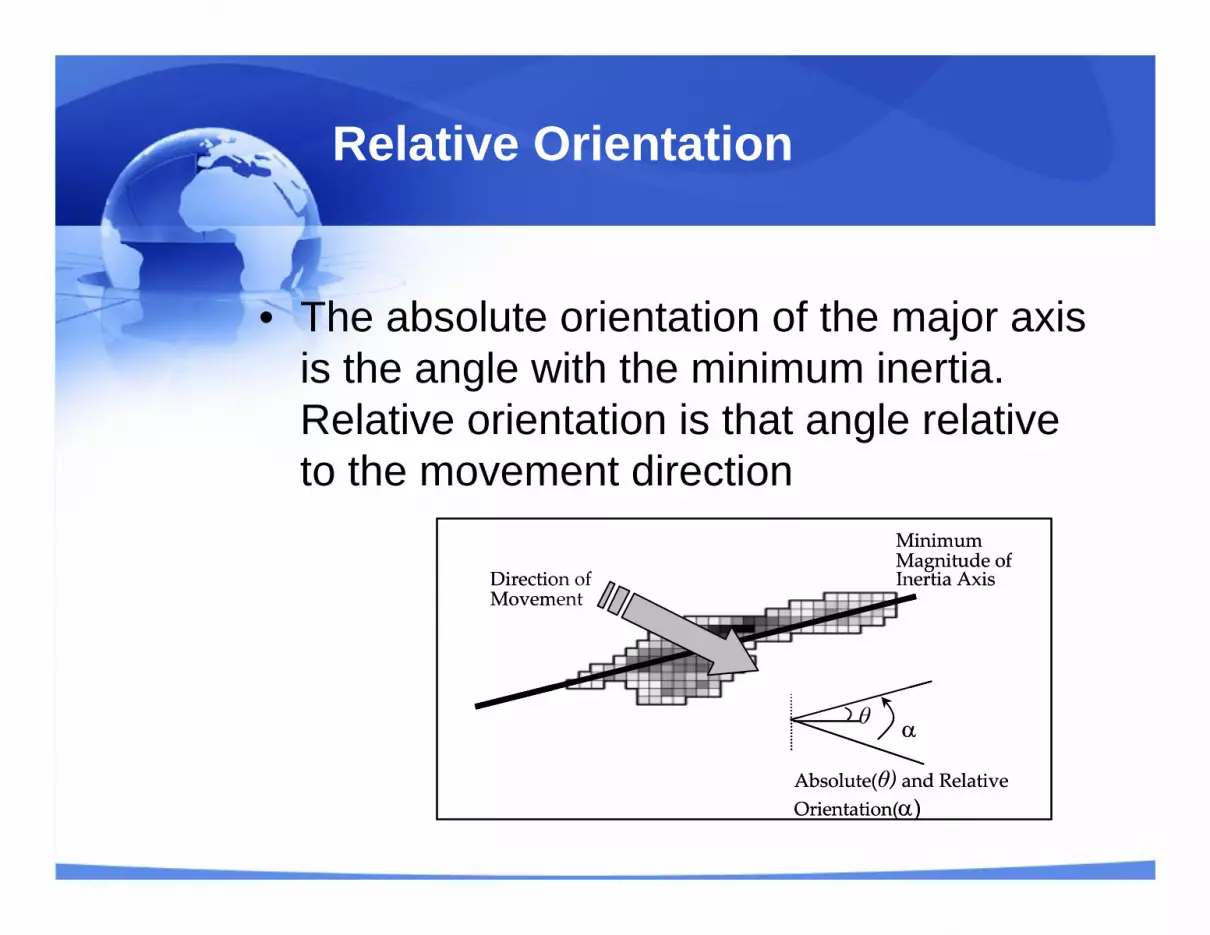
• The absolute orientation of the major axis is the angle with the minimum inertia. Relative orientation is that angle relative to the movement direction
MinimumMagnitude ofInertia Axis
Absolute(θ) and Relative Orientation(α)
Direction ofMovement
θ α
MinimumMagnitude ofInertia Axis
Absolute(θ) and Relative Orientation(α)
Direction ofMovement
θ α
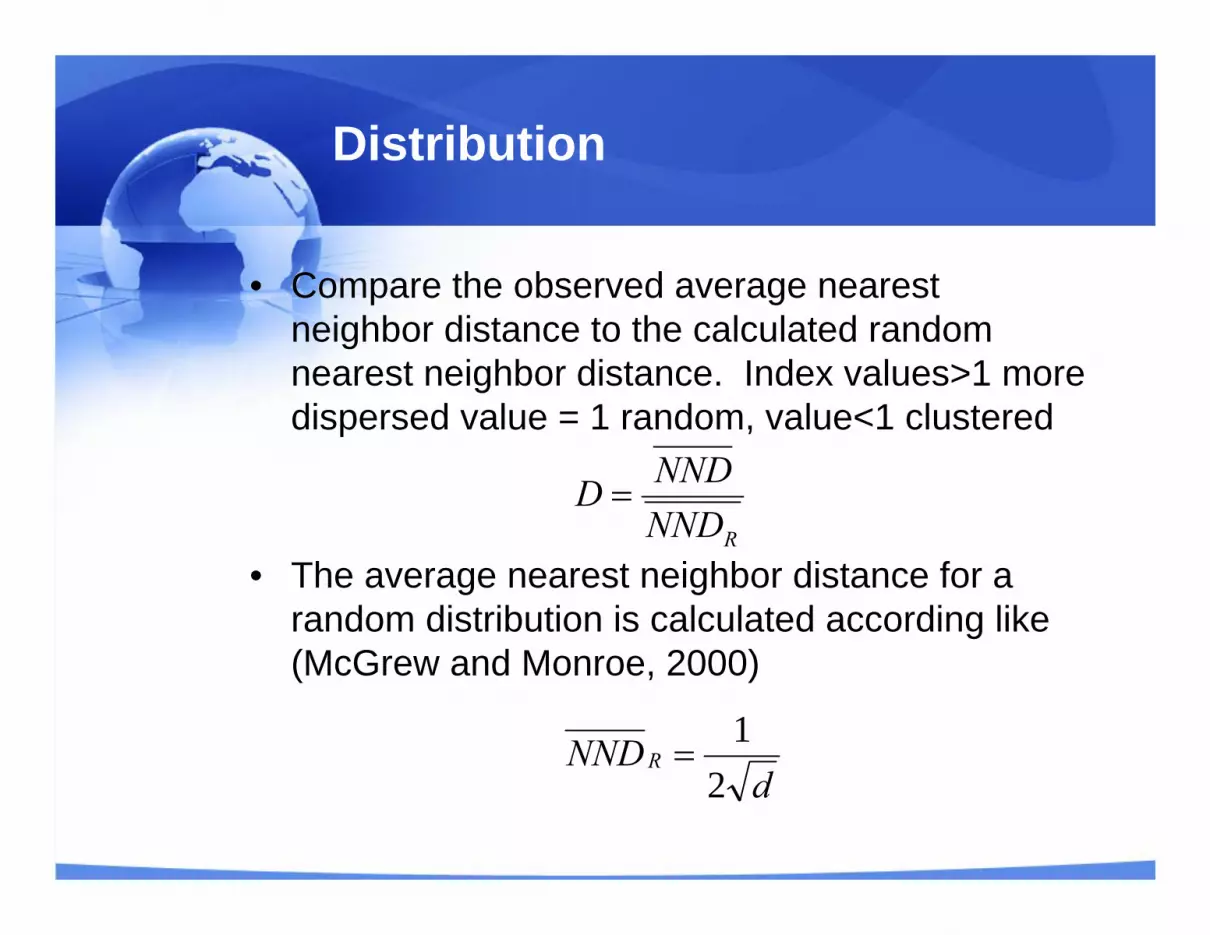
Distribution
• Compare the observed average nearest neighbor distance to the calculated random nearest neighbor distance. Index values>1 more dispersed value = 1 random, value<1 clustered
• The average nearest neighbor distance for a random distribution is calculated according like (McGrew and Monroe, 2000)
RNNDNNDD =
dNNDR
21
=
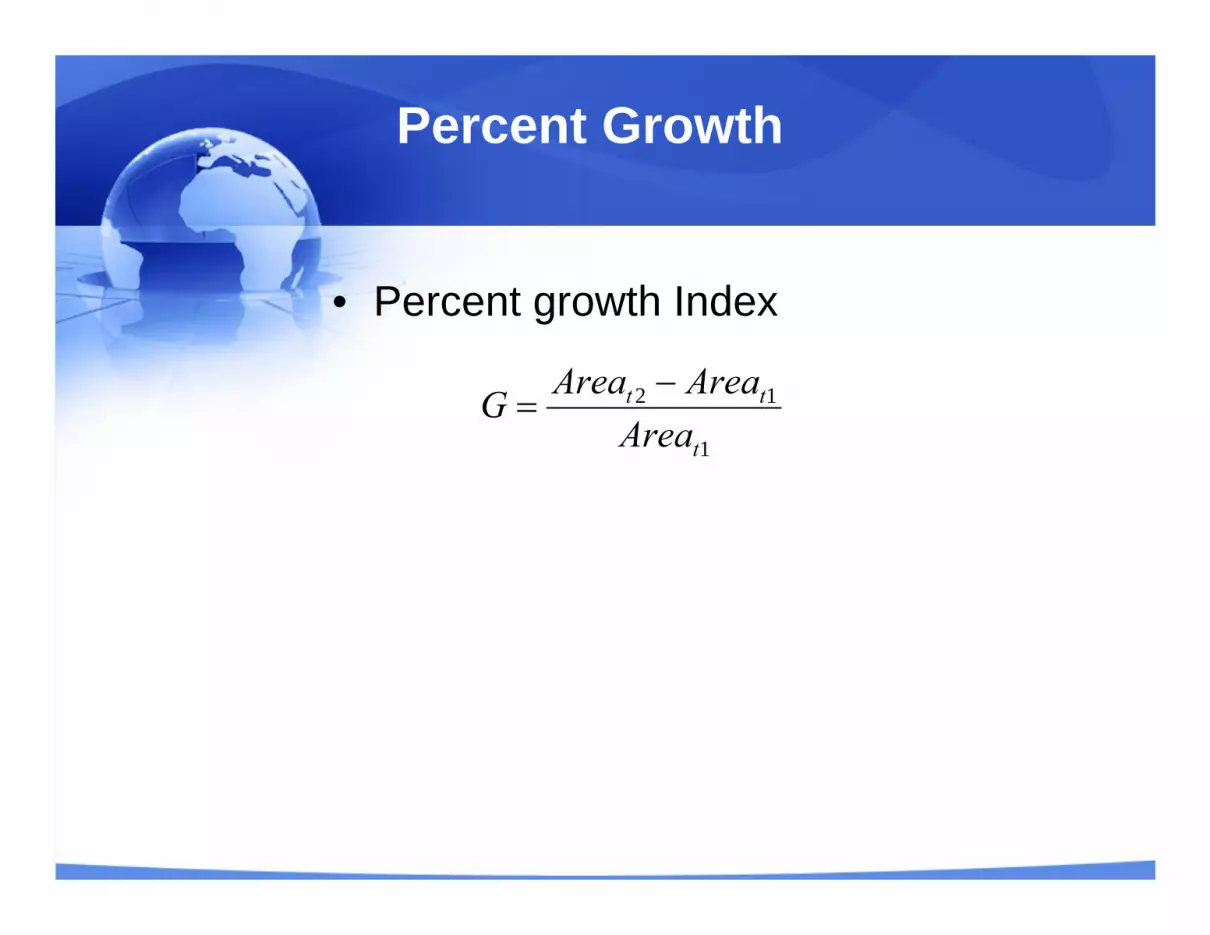
Percent Growth
• Percent growth Index
1
12
t
tt
AreaAreaAreaG −
=
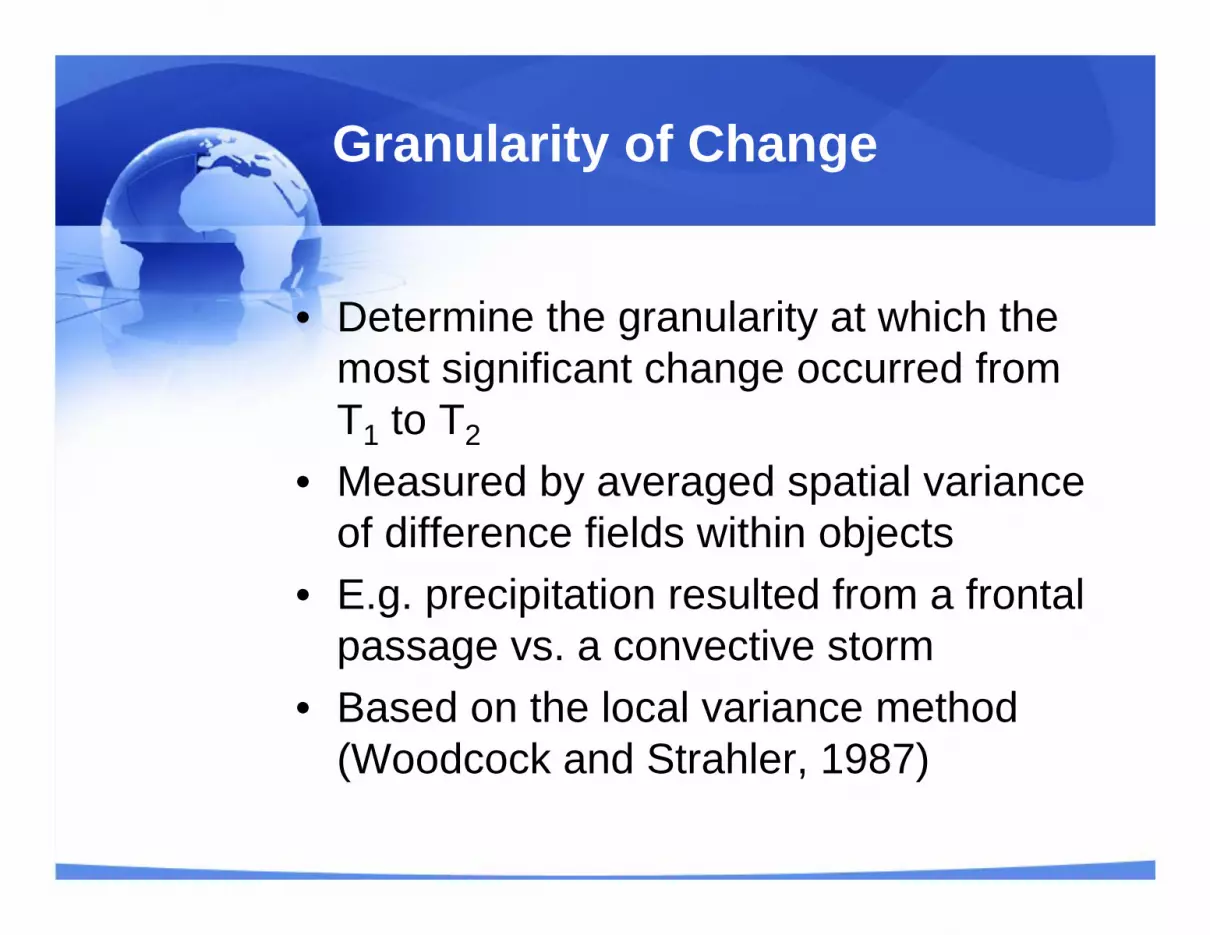
Granularity of Change
• Determine the granularity at which the most significant change occurred from T1 to T2
• Measured by averaged spatial variance of difference fields within objects
• E.g. precipitation resulted from a frontal passage vs. a convective storm
• Based on the local variance method (Woodcock and Strahler, 1987)
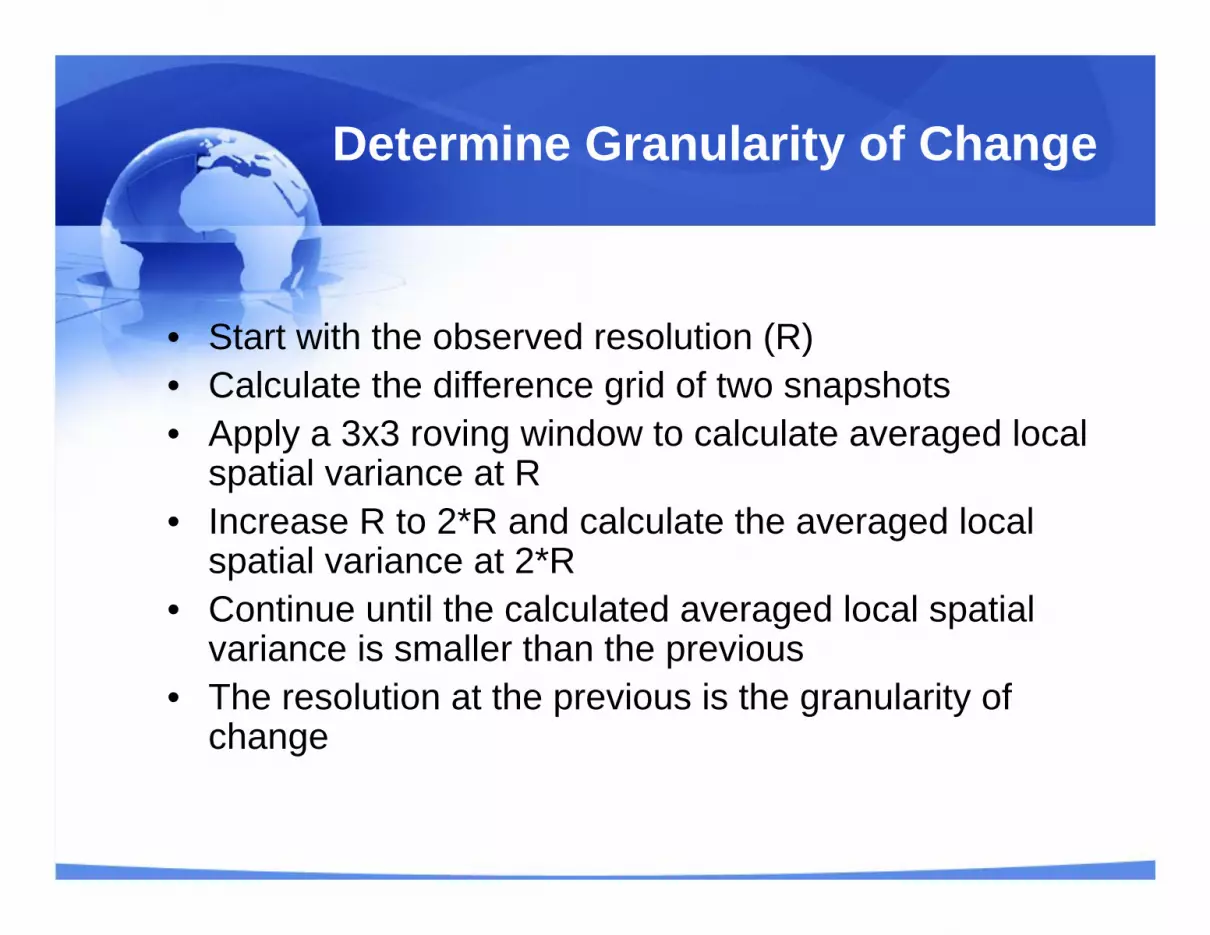
• Start with the observed resolution (R)• Calculate the difference grid of two snapshots• Apply a 3x3 roving window to calculate averaged local
spatial variance at R• Increase R to 2*R and calculate the averaged local
spatial variance at 2*R• Continue until the calculated averaged local spatial
variance is smaller than the previous• The resolution at the previous is the granularity of
change
Determine Granularity of Change
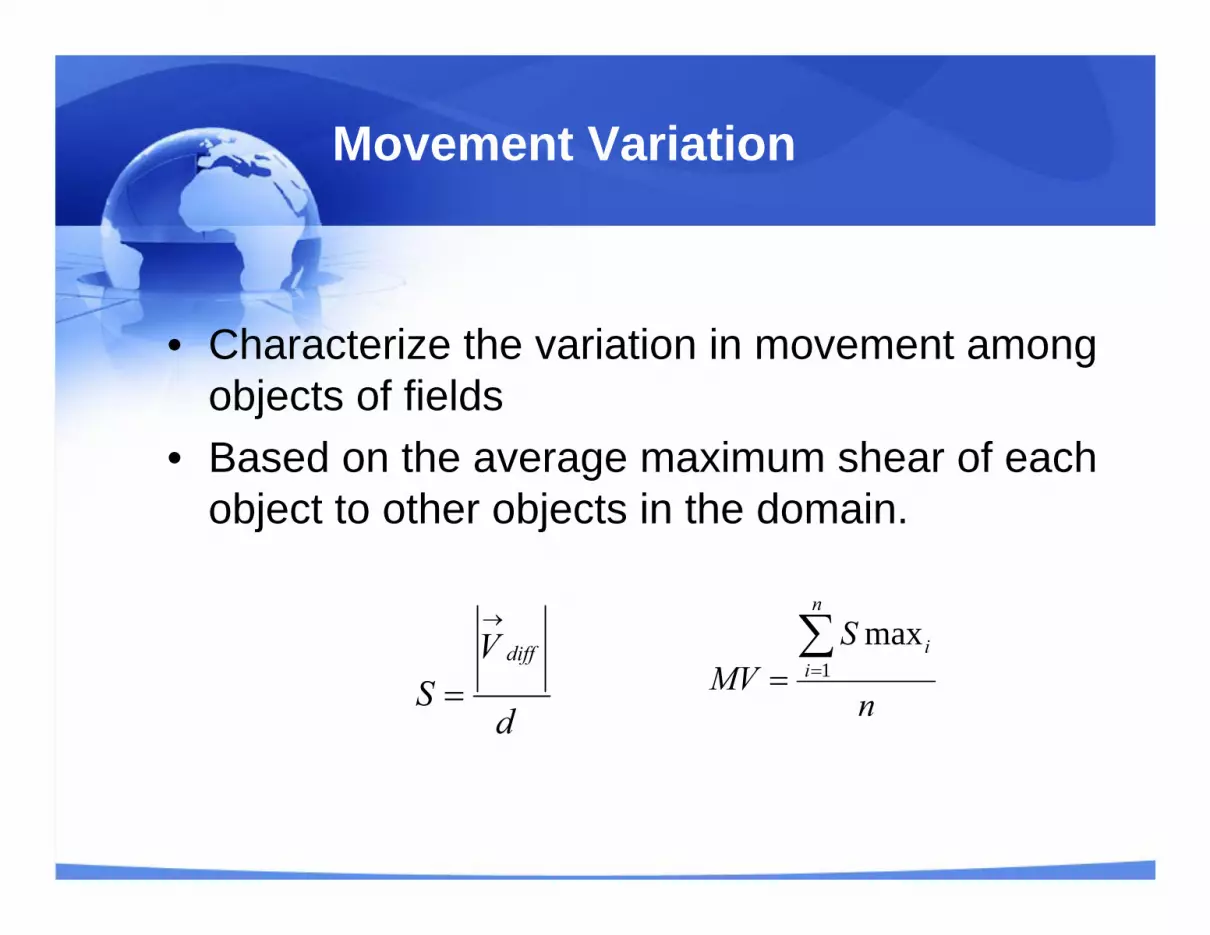
Movement Variation
• Characterize the variation in movement among objects of fields
• Based on the average maximum shear of each object to other objects in the domain.
d
VS
diff
→
= n
SMV
n
ii∑
== 1max
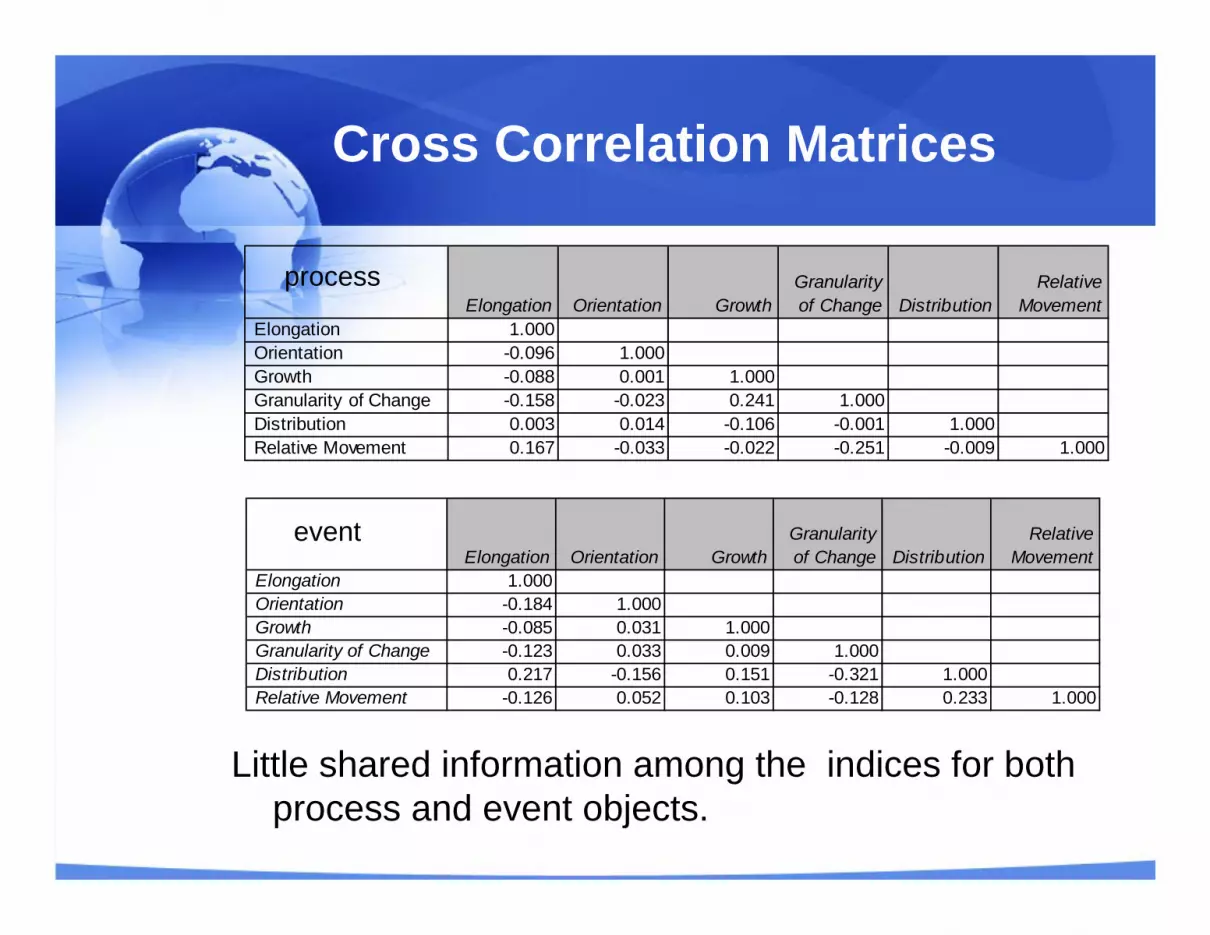
Cross Correlation Matrices
Little shared information among the indices for both process and event objects.
Elongation Orientation Growth Granularity of Change Distribution
Relative Movement
Elongation 1.000 Orientation -0.096 1.000 Growth -0.088 0.001 1.000 Granularity of Change -0.158 -0.023 0.241 1.000 Distribution 0.003 0.014 -0.106 -0.001 1.000 Relative Movement 0.167 -0.033 -0.022 -0.251 -0.009 1.000
Elongation Orientation Growth Granularity of Change Distribution
Relative Movement
Elongation 1.000 Orientation -0.184 1.000 Growth -0.085 0.031 1.000 Granularity of Change -0.123 0.033 0.009 1.000 Distribution 0.217 -0.156 0.151 -0.321 1.000 Relative Movement -0.126 0.052 0.103 -0.128 0.233 1.000
process
event
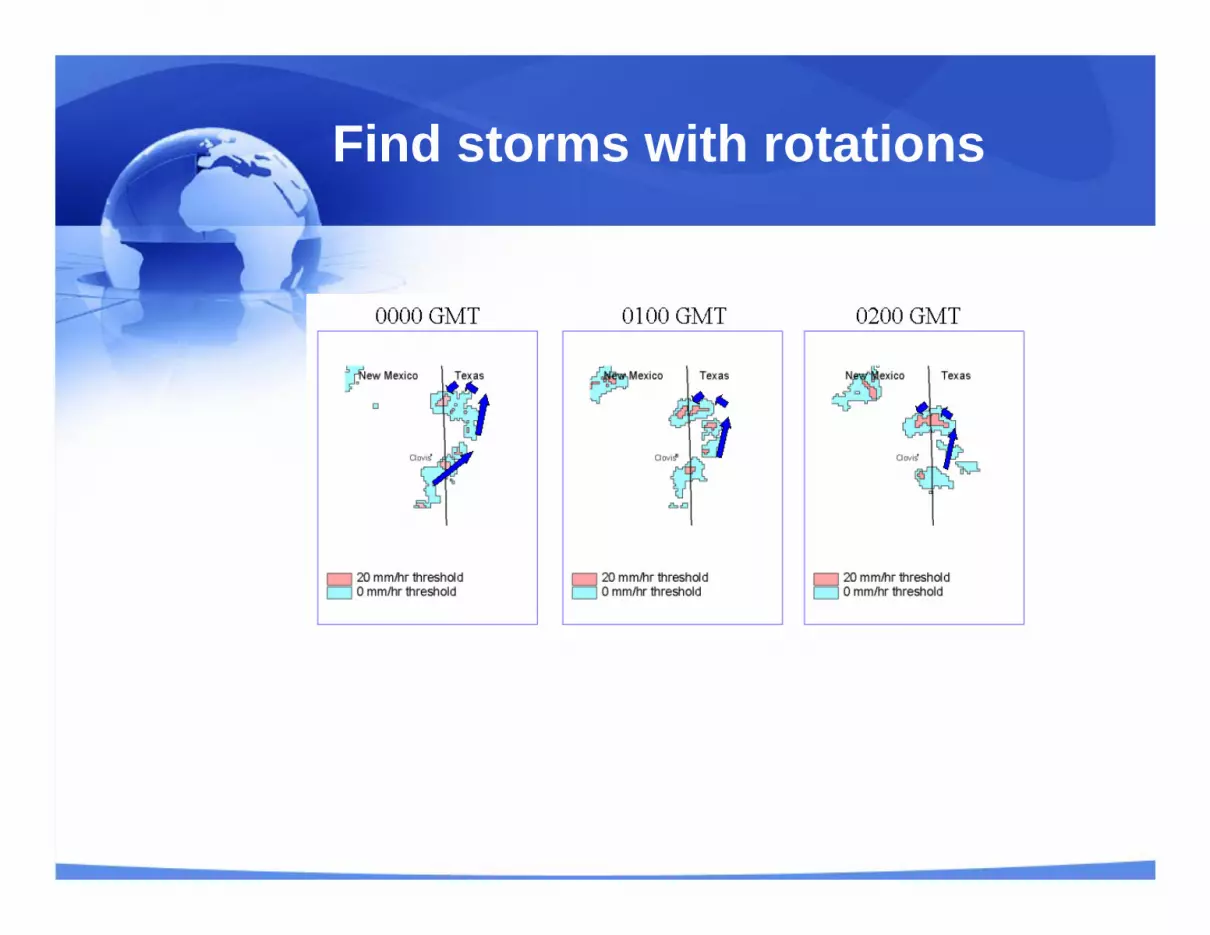
Find storms with rotations
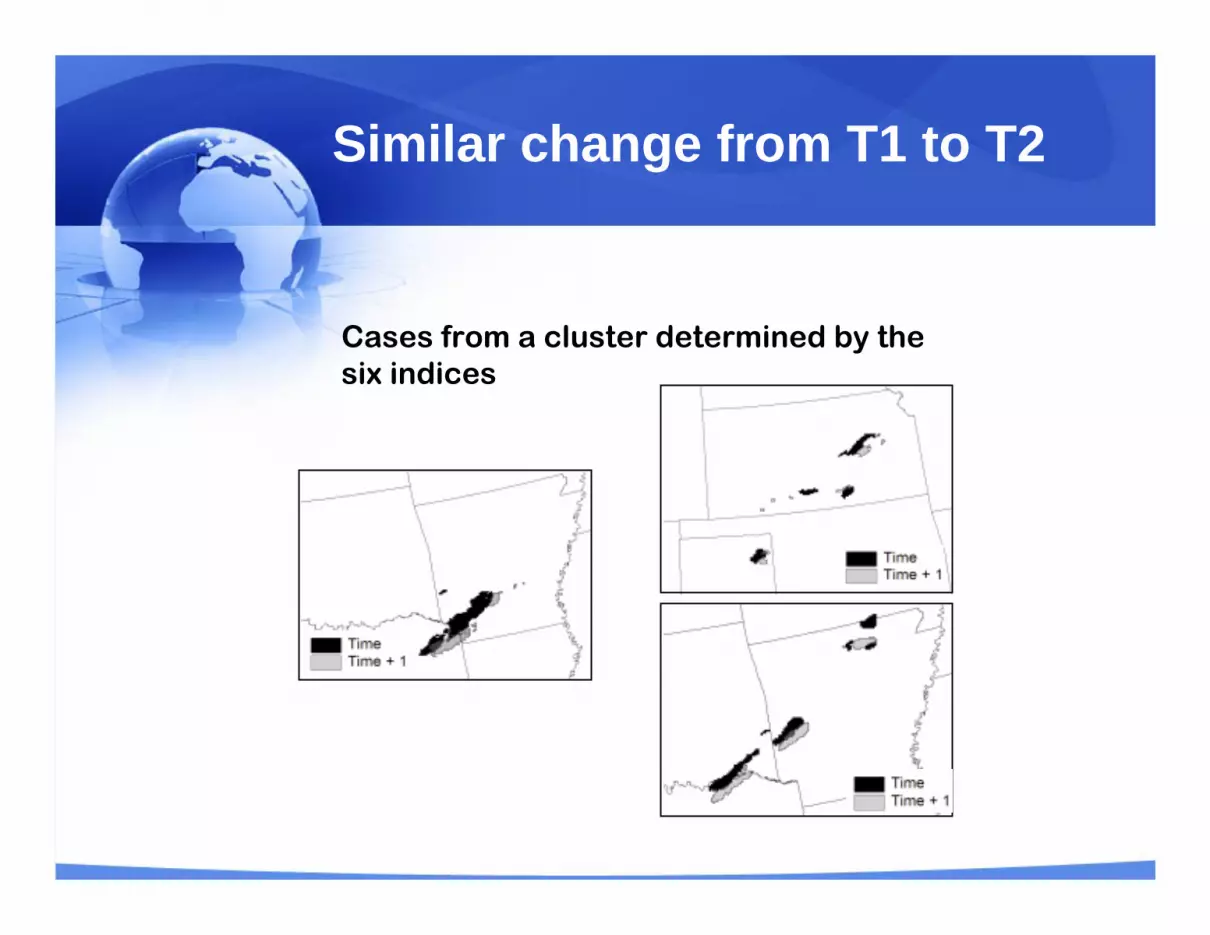
Similar change from T1 to T2
Cases from a cluster determined by the six indices
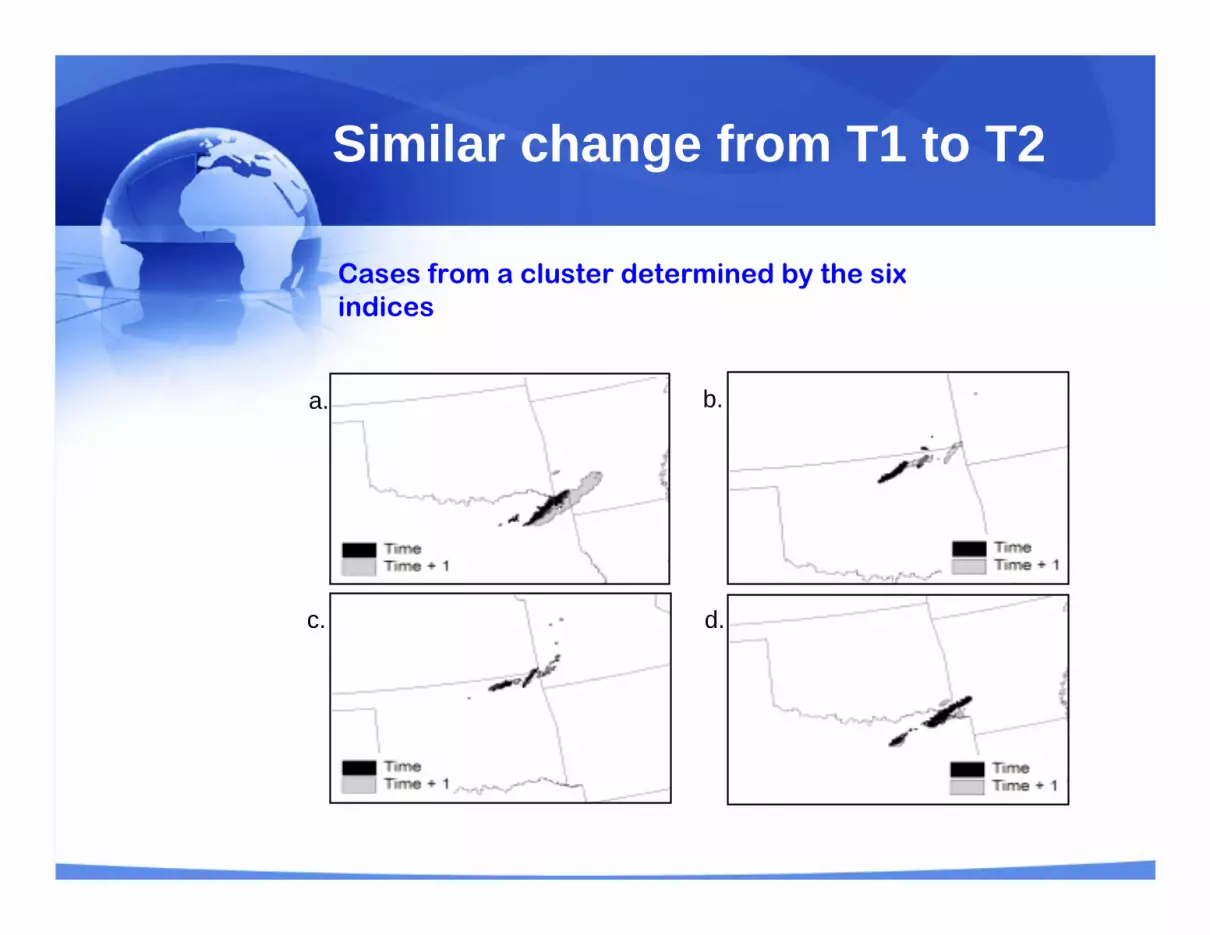
Similar change from T1 to T2
a.
c.
b.
d.
Cases from a cluster determined by the six indices
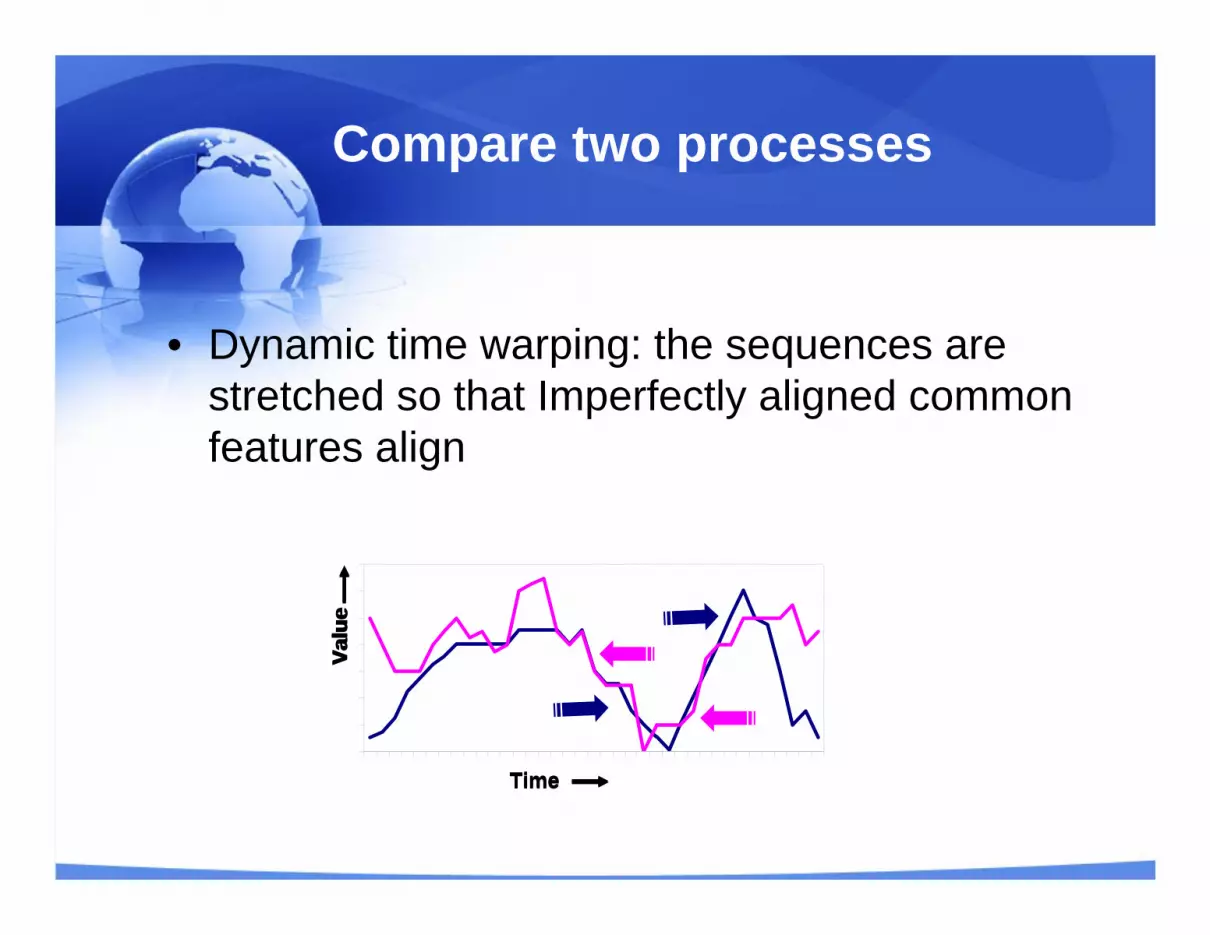
Compare two processes
• Dynamic time warping: the sequences are stretched so that Imperfectly aligned common features align
Time
Valu
e
Time
Valu
e
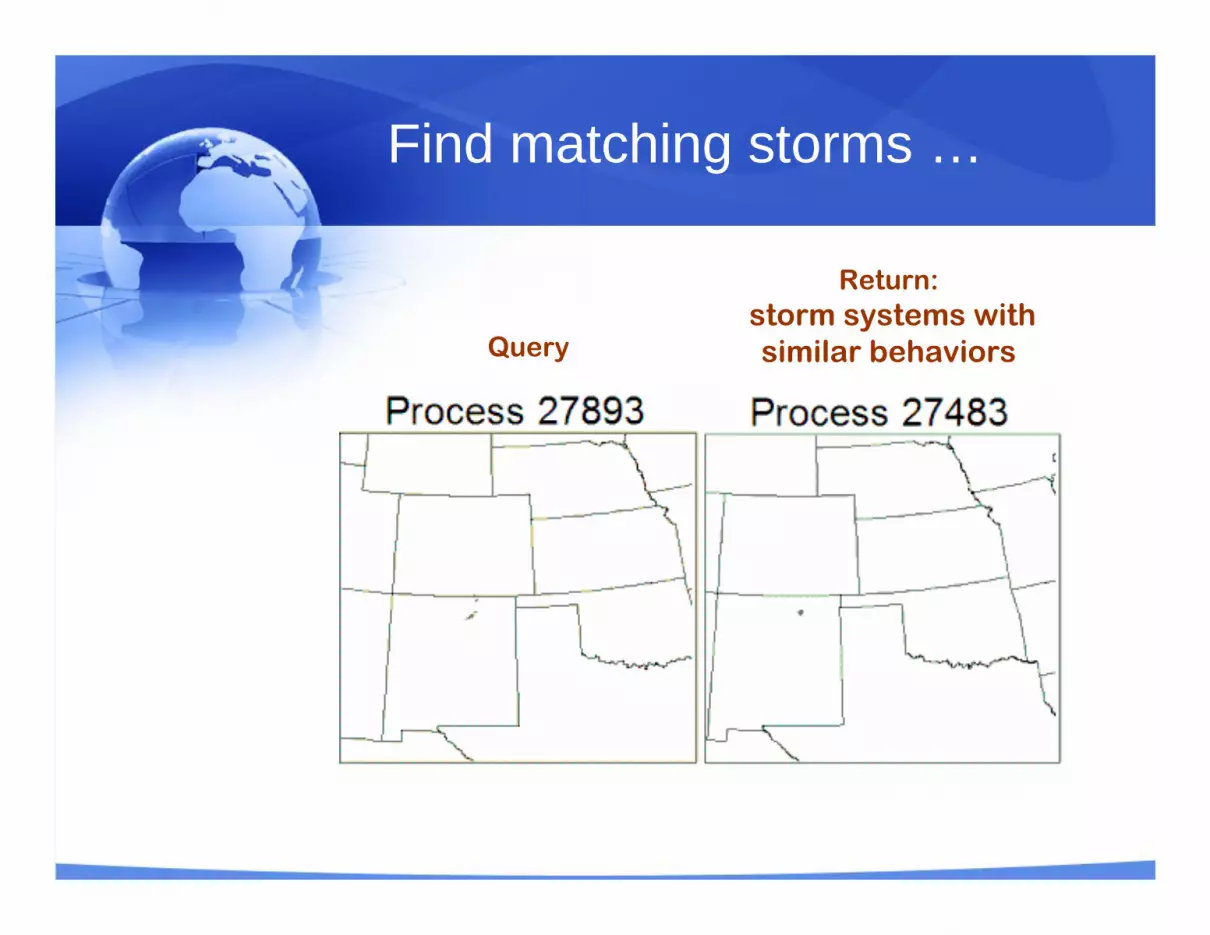
Return:storm systems with similar behaviors
Find matching storms …
Query
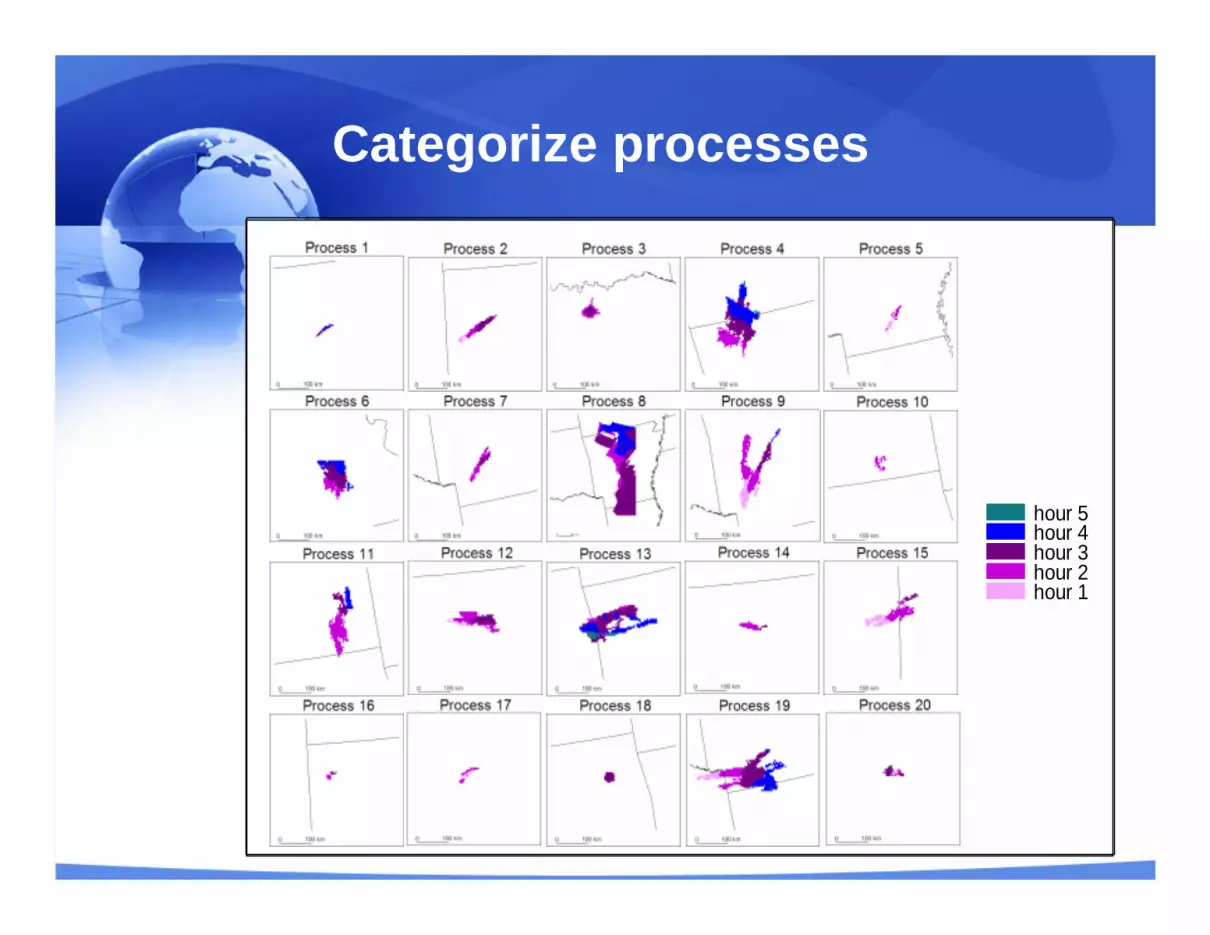
Categorize processes
hour 1hour 2hour 3hour 4hour 5
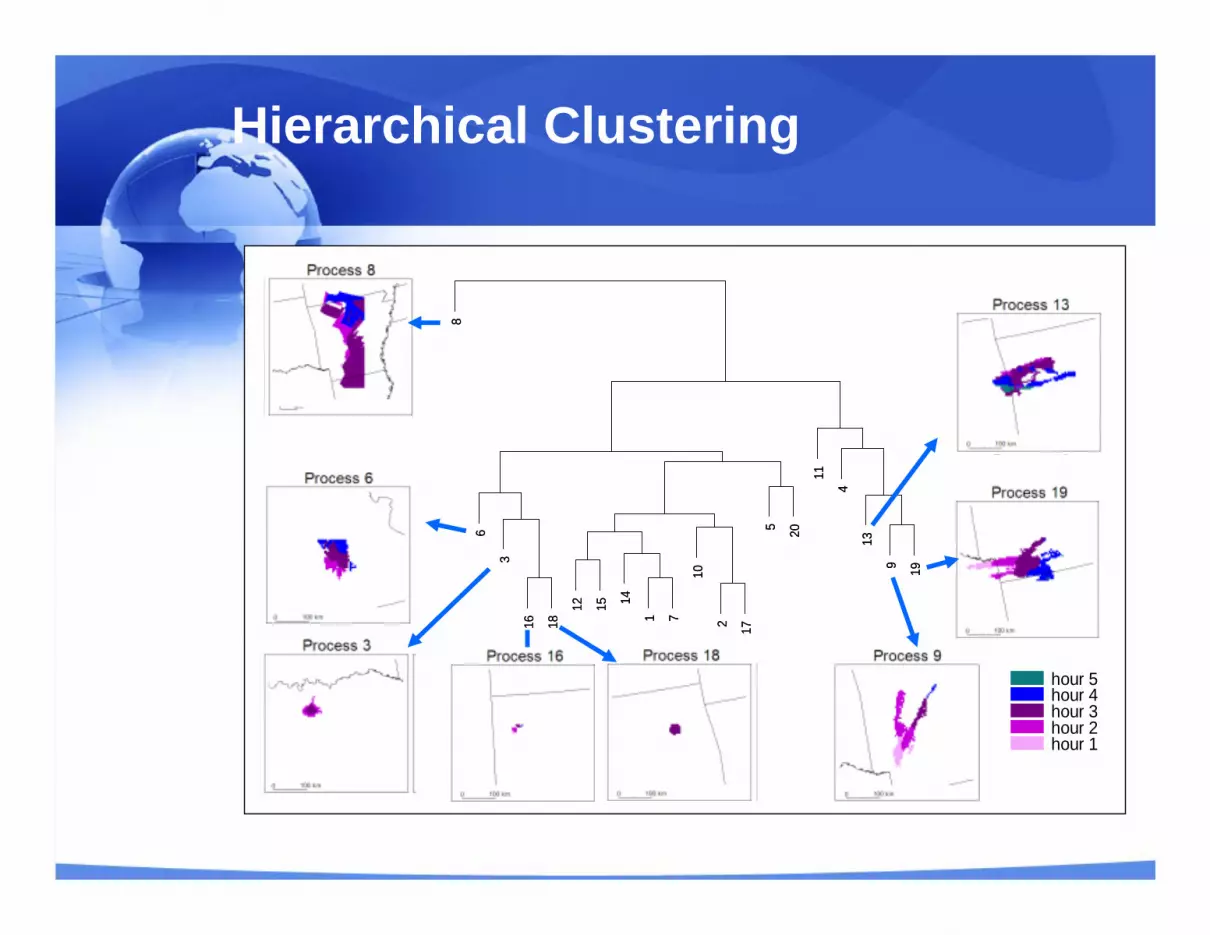
Hierarchical Clustering
1 2
3
4
56
7
8
9
10
11
12
13
1415
16 1718
19
20
1 2
3
4
56
7
8
9
10
11
12
13
1415
16 1718
19
20
hour 1hour 2hour 3hour 4hour 5
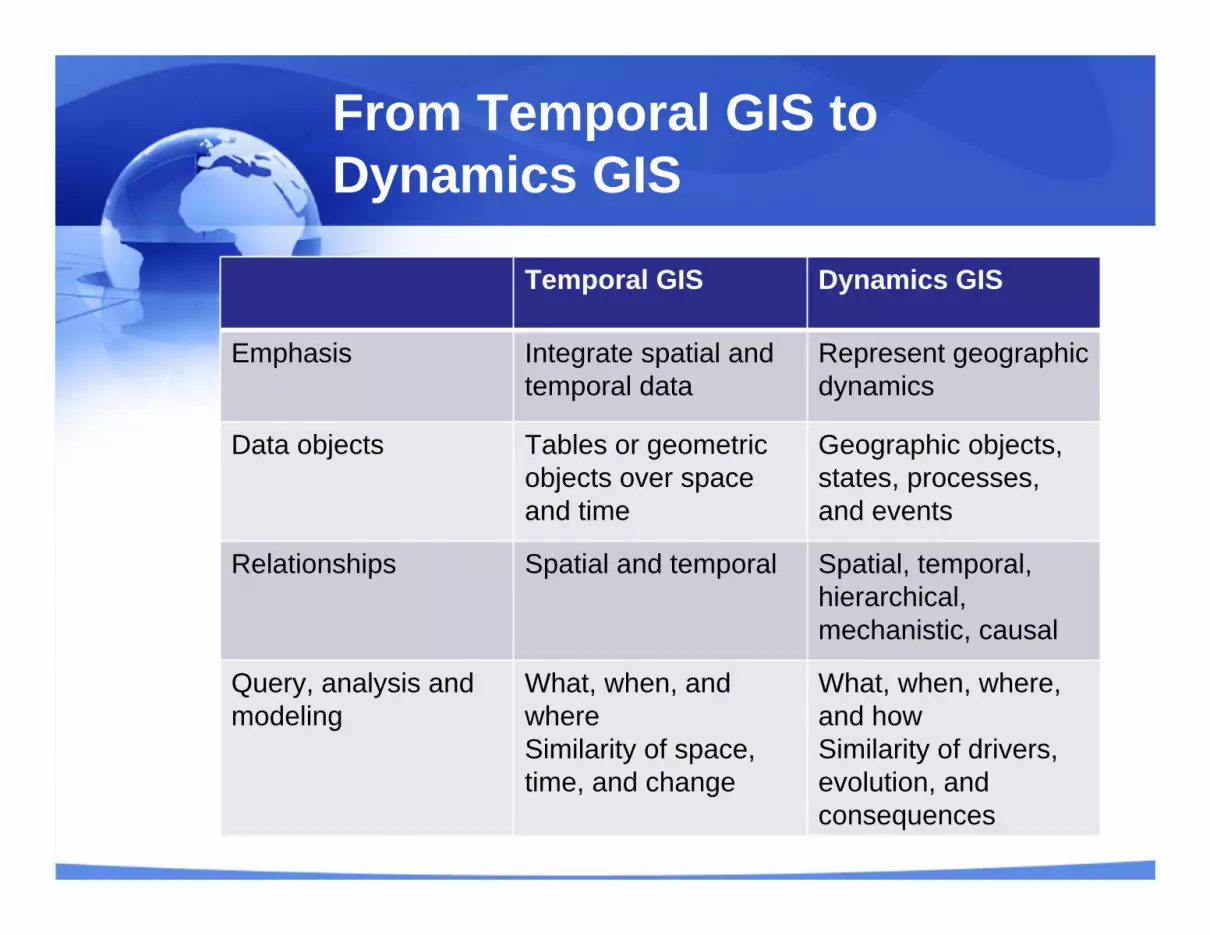
From Temporal GIS to Dynamics GIS
Temporal GIS Dynamics GIS
Emphasis Integrate spatial and temporal data
Represent geographic dynamics
Data objects Tables or geometric objects over space and time
Geographic objects, states, processes, and events
Relationships Spatial and temporal Spatial, temporal, hierarchical, mechanistic, causal
Query, analysis and modeling
What, when, and whereSimilarity of space, time, and change
What, when, where, and howSimilarity of drivers, evolution, and consequences

Questions, Comments?