analytical studies on honey - ep:wp
TRANSCRIPT
ANALYTICAL STUDIES ON HONEY
A Thesis submitted to the University of Salford
in candidature for the Degree of
Doctor of Philosophy
by
Ramchandra Parshotam Mistry
Department of Biological Sciences, Biochemistry Section, University of Salford, Salford M5 4WT July 1987

ST COPY
AVAILA L
Variable print quality
To UMA - for her inspiration.
-i-
DECLARATION
I hereby declare that the work contained herein, now submitted as
a thesis for the degree of Doctor of Philosophy of the University of
Salford is the result of my own investigations. The work was carried
out in the Department of Biological Sciences, Biochemistry Section,
University of Salford, under the supervision of Dr. R. J. Washington
and Dr. L. R. Croft.
I certify that this work has not been submitted for any other
degree and that it is not being currently presented for any other
degree.
CANDIDATE:
SUPERVISOR:
SUPERVISOR: oe.
DATE:
cm A"
- ii -
ACKNOWLEDGENENTS
I would like to express my profound gratitude and sincere thanks
to Dr. R. J. Washington for his advice, guidance and suggestions
throughout this investigation. My thanks are also due to Dr. L. R. Croft
for his help in this investigation. A formal thanks are due to
Dr. D. A. Duddell for his guidance on computation and to Dr. J. Pemberton
for his advice and interpretation of the statistical analysis. Thanks
are due to Mrs. H. Thompson for operating the automatic amino acid
analyser.
I would like to acknowledge with sincere gratitude the provision
of honey samples from the members of the British Beekeepers Association
who participated in this project, without which I could not have been
able to carry out this investigation. I would also like to thank
Manley Ratcliffe Limited, Berinsfield, Oxford, for their participation
and donation of honey samples.
I wish to recognise the care and attention with which Mrs. M. Trotman
typed this thesis. The patience and encouragement of my family is
acknowledged with deep appreciation.
- iii -
C0NTENTS
Paste
DECLARATION
ACKNOWLEDGMENTS
CONTENTS
ABSTRACT vii
CHAPTER 1-INTRO. -D UCT10N-H0NEY 1
The Amino Acid Composition of Nectar and Honeydew 3
Processing of Nectar into Honey by the Honeybee 8
Extraction and Processing of Honey 9
Honey Production and Trade 11
Honey Plants 14
Honey Composition 15
Honey Proteins 23
Honey Amino Acids 29
Honey Pollens 36
Mellissopalynology 40
Honey Adulteration 46
Honey Toxins 52
Aims 55
CHAPTER2 -, EXPERIMENTAL
Equipment and Materials 56
METHODS 57
Preparation of Honey Samples for Analysis 57
Subjective Analysis and Evaluation 60
The Isolation and Concentration of Proteins in Honey 61
- iv -
Paize
Quantitative Estimation of Proteins in Residues from 62 Ultrafiltration of Honey
The Determination of Proteins in Honey 64
Determination of the Free Ninhydrin Positive Substances of Honey 72
Separation and Concentration of the Free Ninhydrin Positive Substances of Honey 72
Examination and Identification of the Ninhydrin Positive Substances by a Combination of Paper Electrophoresis and Chromatography 79
Quantitative Analysis of the Free Amino Acids Using the Automatic Amino Acid Analyser 84
Quantitative Microscopical Analysis of Honey 86
Computation 91
Statistical Aýalysis 93
CHAPTER3 - RESULTS
The Colour and Aroma of Honey 99
Analysis of-Proteins 101
Isolation, Concentration and Estimation of Proteins in Honey 101
Analysis of Ninhydrin Positive Substances and Pollens Present in Honey of Known Origin
Amino Acids in the United Kingdom Samples Arranged in Order of Pollen Types 124
Amino Acids in the Foreign and Commercial Samples Arranged in Order of Stated Country Sources 184
Computer Processing of Analytical Data 209
Analysis of Samples from the United Kingdom Survey Honeys 211
Analysis of Samples from the Foreign and Commercial Honeys 237
Evaluation of Analytical Data of Honey Samples from all Sources 248
-v-
Page
CHAPTER 4-DI S' CUS. S10N
PRELIMINARY SUBJECTIVE EXAMINATION OF HONEY SAMPLES 253
ASSESSMENT OF PRESENT WORK 255
Proteins 255
Enzymes 263
Ninhydrin Positive Substances 265
Pollens 280
PROCUREMENT OF EXPERIMENTAL HIVE ON UNIVERSITY CAMPUS 283
Computation and Statistical Analysis 284
EVALUATION OF PRESENT WORK 290
Proteins 290
Enzymes 293
Ninhydrin Positive Substances 294
Pollens 298
Statistical Analysis 298
ENVIRONMENTAL AND PROCESSING FACTORS AFFECTING HONEY 301
SIGNIFICANCE OF PRESENT WORK 312
FUTURE WORK 313
BIBL1 0G RAPHY 318
APPEN DI CES
APPENDIX I LIST OF HONEY SAMPLES 330
APPENDIX II QUESTIONNAIRE 339
APPENDIX III DETERMINATION OF THE AMINO ACID CONCENTRATION IN A HONEY SAMPLE 340
APPENDIX IV COMPUTATION 343
- vi -
PaRe
APPENDIX V-A DISCRIMINANT ANALYSIS 345
APPENDIX VI - DISCRIMINANT ANALYSIS OF THE U. K. SURVEY HONEYS 350
APPENDIX VII - DISCRIMINANT ANALYSIS OF THE FOREIGN AND COMMERCIAL HONEYS 356
APPENDIX VIII IDENTIFIED POLLEN GRAINS 359
APPENDIX IX LIST OF PUBLICATIONS 364
- vii -
ABSTRACT
The floral and the geographical origins of honey can be determined
by microscopic examination of the pollen present, however this tedhnique
cannot be applied to highly strained or pollen free honeys. Thus,
there is a need for a chemical technique that can be applied to such
samples. This present work was undertaken with the help of the British
Beekeepers Association and their members, who provided honey samples
of known origin within the United Kingdom for chemical evaluation
and comparison.
There were 192 samples of English honey from the U. K. survey
and an additional 69 samples including those of foreign origin obtained
from various sources.
A selection of 11 foreign and 5 English honeys were examined
for proteins present by the technique of polyacrylamide gel electro-
phoresis in the presence of sodium dodecyl sulphate. This approach
was abandoned since preliminary studies indicated that a correlation
between the proteins and the geographical origin was not possible.
For 256 samples out of the 261, the free amino acids and the
pollens present were examined.
The free ninhydrin positive substances were separated by ion-
exchange chromatography and then concentrated. Forty ninhydrin positive
substances were detected by a combination of paper electrophoresis
and chromatography and 28 of these compounds were identified. quantitative
measurements of the concentration of 13 detectable amino acids were
made on an automatic amino acid analyser. The average concentration
of the 13 amino acids of the 191 samples of the U. K. survey and those
of the 5 predominant pollens of the U. K. have been given in Table A.
- viii -
TABLE A
Average concentration of thirteen free amino acids
Sources- Average concentration floral
(nMoles per g of honey)
Amino I
acids 123456
Lysine 123 170 122 78 107 133
Aspartic acid 90 167 170 124 146 136
Threonine 63 86 110 42 60 92
Serine 70 120 112 62 90 100
Glutamic acid 144 335 298 126 220 246
Proline 2,000 4,090 3,250 1,870 3,230 3,140
Glycine 44 76 100 46 66 67
Alanine 73 150 132 70 114 118
Valine 46 76 65 33 82 66
Isoleucine 43 107 62 30 70 67
Leucine 40 92 80 33 58 60
Tyrosine 55 238 100 120 75 120
Phenylalanine 170 312 180 110 218 208
Sample Number 44 29 17 8 8 191
1- Brassica
2- Trifolium repens
3- Castanea
4- CaUuna
5- Myosotis
6-U. K. survey
- ix -
The major floral sources of-each honey were confirmed by quantitative
pollen analysis of the original sample.
It was found that by performing discriminant analysis using
the computer package Statistical Package for Social Sciences (SPSS)
that the amino acid concentration measurements could be correlated
to the floral source of the samples examined, provided the sub-group
samples were sufficiently large. The overall pattern of floral sources
coupled with the detection of ninhydrin positive substances can be
used successfully to categorise unspecified samples. This is then
followed by correlation, in some cases, with amino acid concentration
measurements using the SPSS to predict a definite geographical region.
The potential role of using the SPSS predictive classifications
to evaluate the following aspects of honey production were indicated
to be successful. These aspects were: honeydew and nectar honeyst
feeding sugar to honeybees, the effects of heating honey, adulteration
especially with foreign honeys and/or commercial sugar products, commercial
processing methods and floral source with reference to plant family.
INTR0DUCT10N
CHAPTER 1
1.
INTR0DUCT10N-H0NEY.
CHAPTER 1
The definition of honey according to Pearson (1976) is: 'Honey
is the saccharine product gathered by the bees from the nectar of
flowers'. This definition is in agreement with those regulations
issued by the United Kingdom and the European Economic Comninity.
Inter-relationship of species of honeybees and their products
There have been several entomological studies on the honeybee
and one such investigation was by Richards and Daves (1977). Within
the order of Hymenoptera representing those insects with membranous
wings there is the AcuZeata family. The ants, bees and wasps are
me#ers of this family and are characterised by having their ovipositor
modified to form a sting. This family includes three genii, the
Apia, Bombidea and MeZipona. The Apia genus has four species of
honeybees and these are the Apia cerena, the Apia dorsata, the Apia
fZorea and the well-known Apia meUifera. The Banbidea genus includes
the bumblebee (Bombus) species. The MeZipona genus or the stingless
bees as they are commonly known consist of two genera and these are
the 1! rigona and the MeZipona.
In the present text unless stated otherwise the honeybee referred
to will be the Apia meUifera.
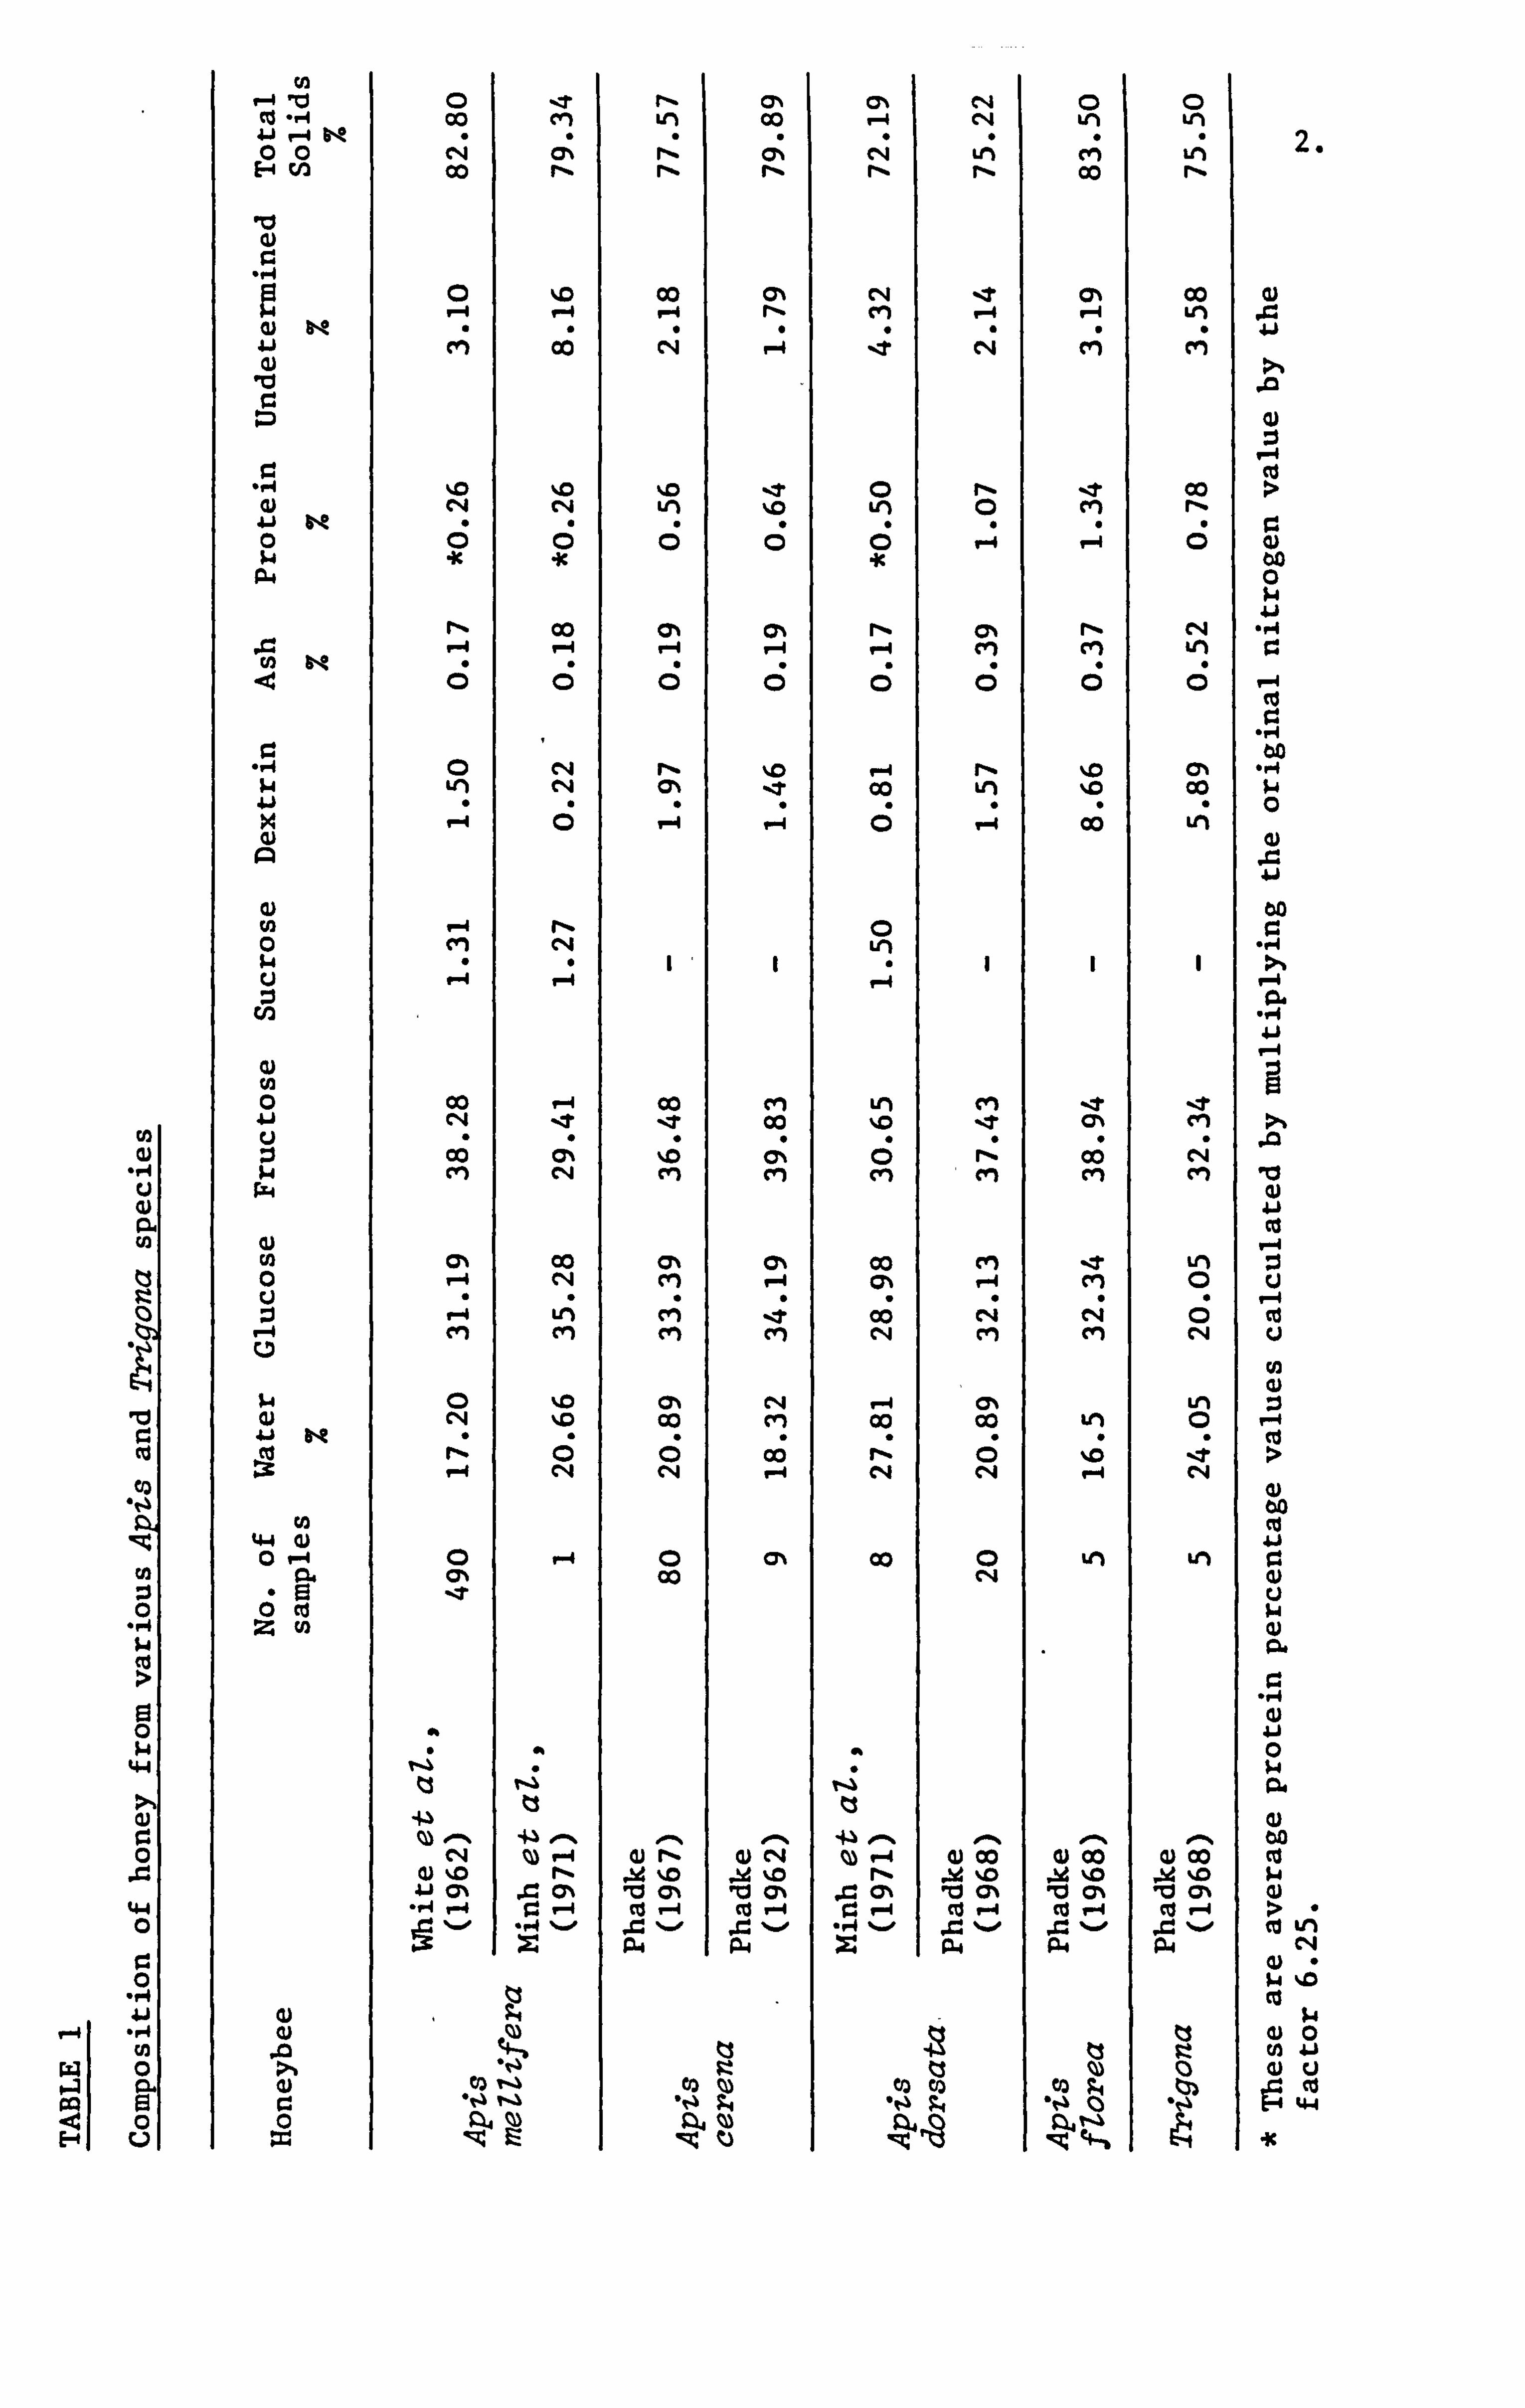
Analytical data on the honey obtained from the four Apia species
and also one Trigona according to various literature sources are
given in Table 1.0. The variation in the composition of the honeys
rA
Co
m
Ei
44
4.4 0
r. 0
. ri 41
Co
W r4 "o 1* ., 4 41 P-4 " 00 E-A rn
10
-, 4
10
U)
$4
u :3
cn
0) rA 0
rn 0
rA tw 0 0 V-4 c24
0 Co Z Co
a) 0)
0 c9 (N 00
ic
r%
00
l"! 00
rz
-e M
ýD
li Co
ic
00
Co
, ýl! LM
c4
r-4
44 04 Z
4) -. 0 r%%
Z4 Z ,:; g Eý
%0
Co
ri
cm CIM
00
Cj% 00
CD
ci
(N
12 00 P. -4
m
,a CN "a (n Cd -4 "4
I= -" 04
C% P-4
c4 Fl.
CN ei
0
L2
cyl
Co lý
Co
tN C14
CN
0
14
0
C'n li C14
C*4
0 C14
Z P-4 gi 00 rl% "bd %D
.= CY% 10 CY*t r. V-4 Co P-4
-r4 %-., = %.. 0
cm
00 M
M
Ln
0) 00 21 j0 10 (A Co P-4
,c %-, p4
tz
00
L2 ri
00 rý CD
eN1
Co
0
Ln
Q) 00 jh4 %D '0 (A ce
p4
. t41
2.
ý4
60 ., 4 $4 0
00 0
-, 4
r-4
Aj
10 Q) A. j Cd
(i r-4 Cd ci
rA
0) u
P.
0 ý4
k4 %0 ce
w
(U 0 cn 41 a) u
Co
Ic
3.
produced by these species of honeybees arises not only due to their
genii but also from the environmental conditions. Vorwohl (1968)
reported that the amylase activity of the Apia cerena honeys were
lower than those of the Apia meUifera honeys obtained from the same
locality. Davies (1975) reported that the honey from Apia cerena
indica had a low proline content compared to that of the Apia melZifera-
Klemarewski (1976) observed that the activities of the enzymes amylase
and invertase were higher in the honeys produced by the Apia =Uifera
meZZifera than those collected by the Apia meUifera caucasia and
the Apia meUifera carnica. Wakhle and Desai (1983) reported that
honey produced by Apia cerena, Apia dorsata, Apia fZorea and Trigona
iridipennis had a high invertase content but low diastase, catalase
and glucose oxidase content in comparison with reported values for
Apia meZlifera honeys. Also Apia dorsata honey had the highest content
values for diatase, invertase and catalase and Txýona iridipennis
had the least but displayed highest glucose oxidase activity compared
to the others.
The Amino Acid Composition of Nectar and Honeydew
The raw materials for the production_of honey by the honeybee
are nectar and honeydew. Nectar is secreted by the plant glands
situated in the region of the flowers or in other parts of the plant
called 'floral' and 'extrafloral' nectaries, respectively. Honeydew
is secreted by the plant-sucking insects such as aphids, coccoids,
leaf hoppers feeding on the phloem, or sap of plants and trees.
4.
The free amino acids of nectar
Mostowska (1965) reported the presence of the following amino
acids in the nectars of Brassica napus var- oleifera, Robinia
pseudbacacia, TiZia cordata, TrifoZium repens, PhaceZia tanacetifoZia
and CaUuna vulgaris. These amino acids were: alanine, arginine,
aspartic acid, glutamic acid, histidine, leucine, lysine, ornithine,
phenylalanine, proline, threonine tyrosine and valine. He found
that the amino acid content of nectar ranged from 0.002 to 4.786 mg
per 100g of dry matter.
Hanny and Elmore (1974) used the technique of gas- and thin-
layer chromatography and identified twenty amino acids from the extra-
floral nectar of cotton (Gossipium hirsut=). These amino acids
were: alanine, a-amino adipic acid, y-aminobutyric acid, arginine,
asparagine, aspartic acid, cysteine, 2,4-diaminobutyric acid, glutamic
acid, glutamine, glycine, isoleucine, leucine, lysine, methionine,
ornithine, proline, serine, tyrosine and valine. These-researchers
noted that the quantitative amino acid composition of the cotton
extrafloral nectar fluctuated because of the environmental conditions
but the qualitative composition was constant. The percentage nitrogen
due to the amino acids constituted on average 0.04% of the extrafloral
nectar of cotton.
Baker and Baker-(1975) reviewed the constitution of nectar and
reported that alanine, aspartic acid, glutamic acid, glycine and
serine appeared to be the commonest amino acids of nectar.
Baker, Opler and Baker (1978) reported that the amino acids
asparagine, cysteine, lysine and tyrosine were more frequently
5.
represented in the extrafloral nectar whereas these amino acids are
only moderately represented in the floral nectar.
Inouye and Inouye (1980) reported the presence of a total of
twenty four amino acids in the extrafloral nectar of HeZiantheUa
quinquenervia more than has been reported for any other extrafloral
nectar. These amino acids were: a- and 0-alanine, a-amino adipic
acid, a- and y-aminobutyric acid, arginine, asparagine, aspartic
acid, glutamic acid, glutamine, glycine, histidine, isoleucine, leucine,
lysine, methionine, phenylalanine, phosphoserine, proline, serine,
threonine, tryptophan, tyrosine and valine.
Gilliam, McCaughey and Wintermute (1980) reported that the nectar
of citrus cultivars contained from 7.5 to 79.1 mg of amino acids
per 100g of nectar and that unlike most plants Citma had low level
of proline in its pollen and high level in its nectar. Gilliam,
McCaughey and Moffett (1981) compared their results on the composition
of amino acids in the floral nectar of cotton (Gossypiwn hirsutum)
with those of the extrafloral nectar of cotton as reported by Hanny
and Elmore (1974). Gilliam, McCaughey and Moffett reported that
the predominant amino acids in the floral nectar were aspartic acid,
serine, glutamic acid and threonine; whereas glutamic acid and its
amide were dominant in the extrafloral nectar. Thus, confirming
the findings of Baker, Opler and Baker (1978) that extrafloral nectar
was significantly different in composition from that of floral nectar.
Baker and Baker (1982) analysed the constituents of nectar from
over a thousand species of flowering plants and reported that the
amino acid composition to have a taxonomic and phylogentic significance
6.
and to be of benefit to both the plants and their pollinators.
Freeman, Reid and Zaun (1983) reported the presence of
asparagine, glutamine, phosphoserine, phosphoethanolamine, ornithine
and taurine in nectars of four species of Agave (Agavaceae). These
amino acids have as yet not been reported to be present in nectars.
These researchers also found variation in the detection of several
amino acids within species.
Pais et aZ., (1986) reported that the amino acid content of
Limodoxvm abortivum (Orchidaceae) and Epipactis atropurpurea nectars
and the entantiomoric composition of the particular amino acids indicate
evolutionary differences of both nectaries.
Bahadur, Chaturvedi and Swamy (1986) examined the nectars of
one hundred Indian plant species representing eighty three genera
from thirty four families of angiosperms and they reported that eighty
five species contained a-amino acids. These research workers observed
that the nectar of Hybanthus ennaespermus (Violaccae) exhibited a
high amino acid content and out of the seven amino acids valine,
leucine and glutamic acid were essential for insect nutrition. The
nectar of Spathodea campanuZata (Bignoniaceae) had only two amino
acids alanine and isoleucine of which the latter was essential for
insect nutrition. The 142mera subuZata (Turneraceae) nectar was
characterised by five to seven amino acids of which leucine, isoleucine,
tryptophan and phenylalanine were essential for insect nutrition.
7.
The free amino acids of Honeydew
Mittler (1953) reported that the number and amount of amino
acids in honeydew depended on the extent to which these amino acids
were present in the phloem sap of the plant. Morgenthaler (1955)
has discussed the origins of honeydew and concluded that the raw
materials for honeydew were exactly the same as that for nectar.
Ewart and Metcalf (1956) have reviewed the literature on amino acids
present in honeydew. Mittler (1958) reported that the number and
concentration of amino acids and amides in the phloem sap and honeydew
fluctuated with the seasonal development of the host plant.
Auclair (1963) has given general references on the composition
of honeydew.
Srivastava and Vaishney (1966) using the technique of paper
partition chromatography identified seventeen free amino acids and
amides in the honeydew exr-reted by Kerria Zacea. These amino acids
were: a- and a-alanine, arginine, asparagine, aspartic acid, glutamic
acid, glycine, histidine, homoserine, isoleucine, leucine, lysine,
methionine, proline, serine, threonine, tyrosine and valine. These
researchers found that the eight amino acids from arginine to tyrosine
were absent from the plant sap of Maghania maerpphyUa on which the
insects were reared. They suggested that this difference could presumably
be due to the action of proteolytic enzymes present in the insect
gut. These findings were later confirmed by Salama and Rizk (1969).
Saleh and Salama, (1971) reported that the amino acids in the
honeydew came directly from the ingested sap and were not the product
of either protein breakdown as suggested by Auclair (1963) or
8.
atmospheric nitrogen fixation as suggested by Kennedy and Mittler
(1953).
i Noda, Sogawa and Saito (1973) found that when insects were reared
on distilled water, only traces of amino acids were secreted.
Hertel and Kunkel (1977) noted the variation in the amino acid
concentration in the changes of water supply or the phloem sap content
which influenced the honeydew of AVzus persicae.
Lombard, Rossetti and Buffa (1981) detected seventeen free amino
acids and one ninhydrin-reactive substance in the honeydew of
EucaUupterus tiZiae but only fourteen free amino acids and two ninhydrin-
reactive substances in the TiZia cordata leaf extract. These researchers
observed that the honey derived from linden honeydew contained fourteen
amino acids and small amounts of proline compared to that of the
nectar honey.
Processing of Nectar into Honey by the Honeybee
The way in which nectar is transferred by the forager bee to
the housebee and how the housebee is then actively and passively
engaged in the processing'of nectar into honey has been described
in detail by Maurizo (1980a).
The active part played by the housebee involves the concentration
of nectar by rapidly pumping out from the honeystomach a thin film
of liquid onto the end of its proboscis, thereby exposing the nectar
to the warm dry air of the hive for evaporation. When the concentration
of the sugars in the nectar reaches approximately 60% (w/v) it is
then deposited into the cells of the comb (Park 1933). This-is then
referred to as unripened honey.
9.
The passive part played by the housebee involves the evaporation
of the excess water from this unripened'honey in the combs. It takes
on average one to three days for the water content of the ripening
honey to reach 20% or less. This depends on the level of cells filled,
the amount of air movement, temperature and the relative humidity
of the hive (Park 1927,1928,1933). The housebee then seals the
cells with an airtight wax capping to prevent the re-absorption of
water from the surrounding air and thus eliminating the risk of
fermentation.
It is known that the housebee adds the enzymes diastase, invertase
and glucose oxidase (Rinaudo et aZ., 1973a and 1973b and Bergett
1974), and these will be reviewed elsewhere in the introduction.
Extraction and Processing of Honey
The techniques available for the extraction and processing of
the honey to the amateur and the semi-commercial beekeeper in Europe
and the United States of America have been described by many authors;
for example Morse (1974), Hooper (1976), Smith (1980) and Townsend
(1980). The description given by these authors refer to the modern
moveable frame hive. Although several types of hives, namely National,
W. B. C., Dadant, Langstroth, Smith and Commercial exist which vary
somewhat in size, use and regional popularity. All consist of the
following components: a set of frames up to ten made of wood or
plastic on which honey comb is constructed, brood chamber for queen
and colony, extension boxes or supers for the bulk of the combs and
honey, crown board, floor and roof. In addition there are sundry
traps to control access of bees. Some tropical honeys are gathered
lo.
from either wild colonies or from crude straw skips, hollowed logs
or clay containers which are smashed and colonies destroyed once
harvesting is complete.
The extraction of the honey from the combs involves the removal
of the honey combs from the hives, the uncapping of the honey combs;
followed by the removal of honey from the uncapped honey combs often
with the aid of centrifuges. Then finally the honey is strained
to remove the wax bits and extraneous material that may have entered
the honey during the extraction process. The normal straining process
used by the amateur beekeeper is to warm the honey to 35 0C and then
strain through a cloth (54 mesh to 1 inch) or a nylon strainer. The
semi-commercial beekeeper utilizes high pressure mechanical strainers
on a large commercial scale. This process of filtering or polishing
with very efficient filter presses can result in the honeys being
almost free of pollen (Hicks, 1969).
The processing of the extracted honey involves controlled heating
to destroy the yeast present and to dissolve the glucose monohydrate
crystals, combined with fine straining or pressure filtration.
Hooper (1976) has described in detail the various methods used
for processing extracted honey by the amateur beekeeper. White (1978),
Townsend (1980) and Dyce (1980) have given extensive detailed accounts
of the processing, packaging and storage of honey for the commercial
producer.
Heather honey from ling (caZluna vuZgaris) forms a gelatinous
state upon standing due to its unusually high content of a thixotropic
protein which imparts this thioxotropic property on it. Hence the
ii.
extraction and processing of heather honey is different from that
mentioned above. The honey is extracted either by stirring with
mechanical probes or needles inserted into cells of the combs before
being spun out in the usual way or the honey is pressed out of the
combs with the aid of a heather press. The extracted honey can then
be heated for two or three days at 400C before bottling in the usual
manner (Hooper, 1976). However, on the other hand combs containing
the heather honey can be cut out into convenient sizes and sold as
'cut comb honey' in plastic containers provided there are sufficient
comm rcial outlets to justify the extra care and attention required
to ensure perfect combs.
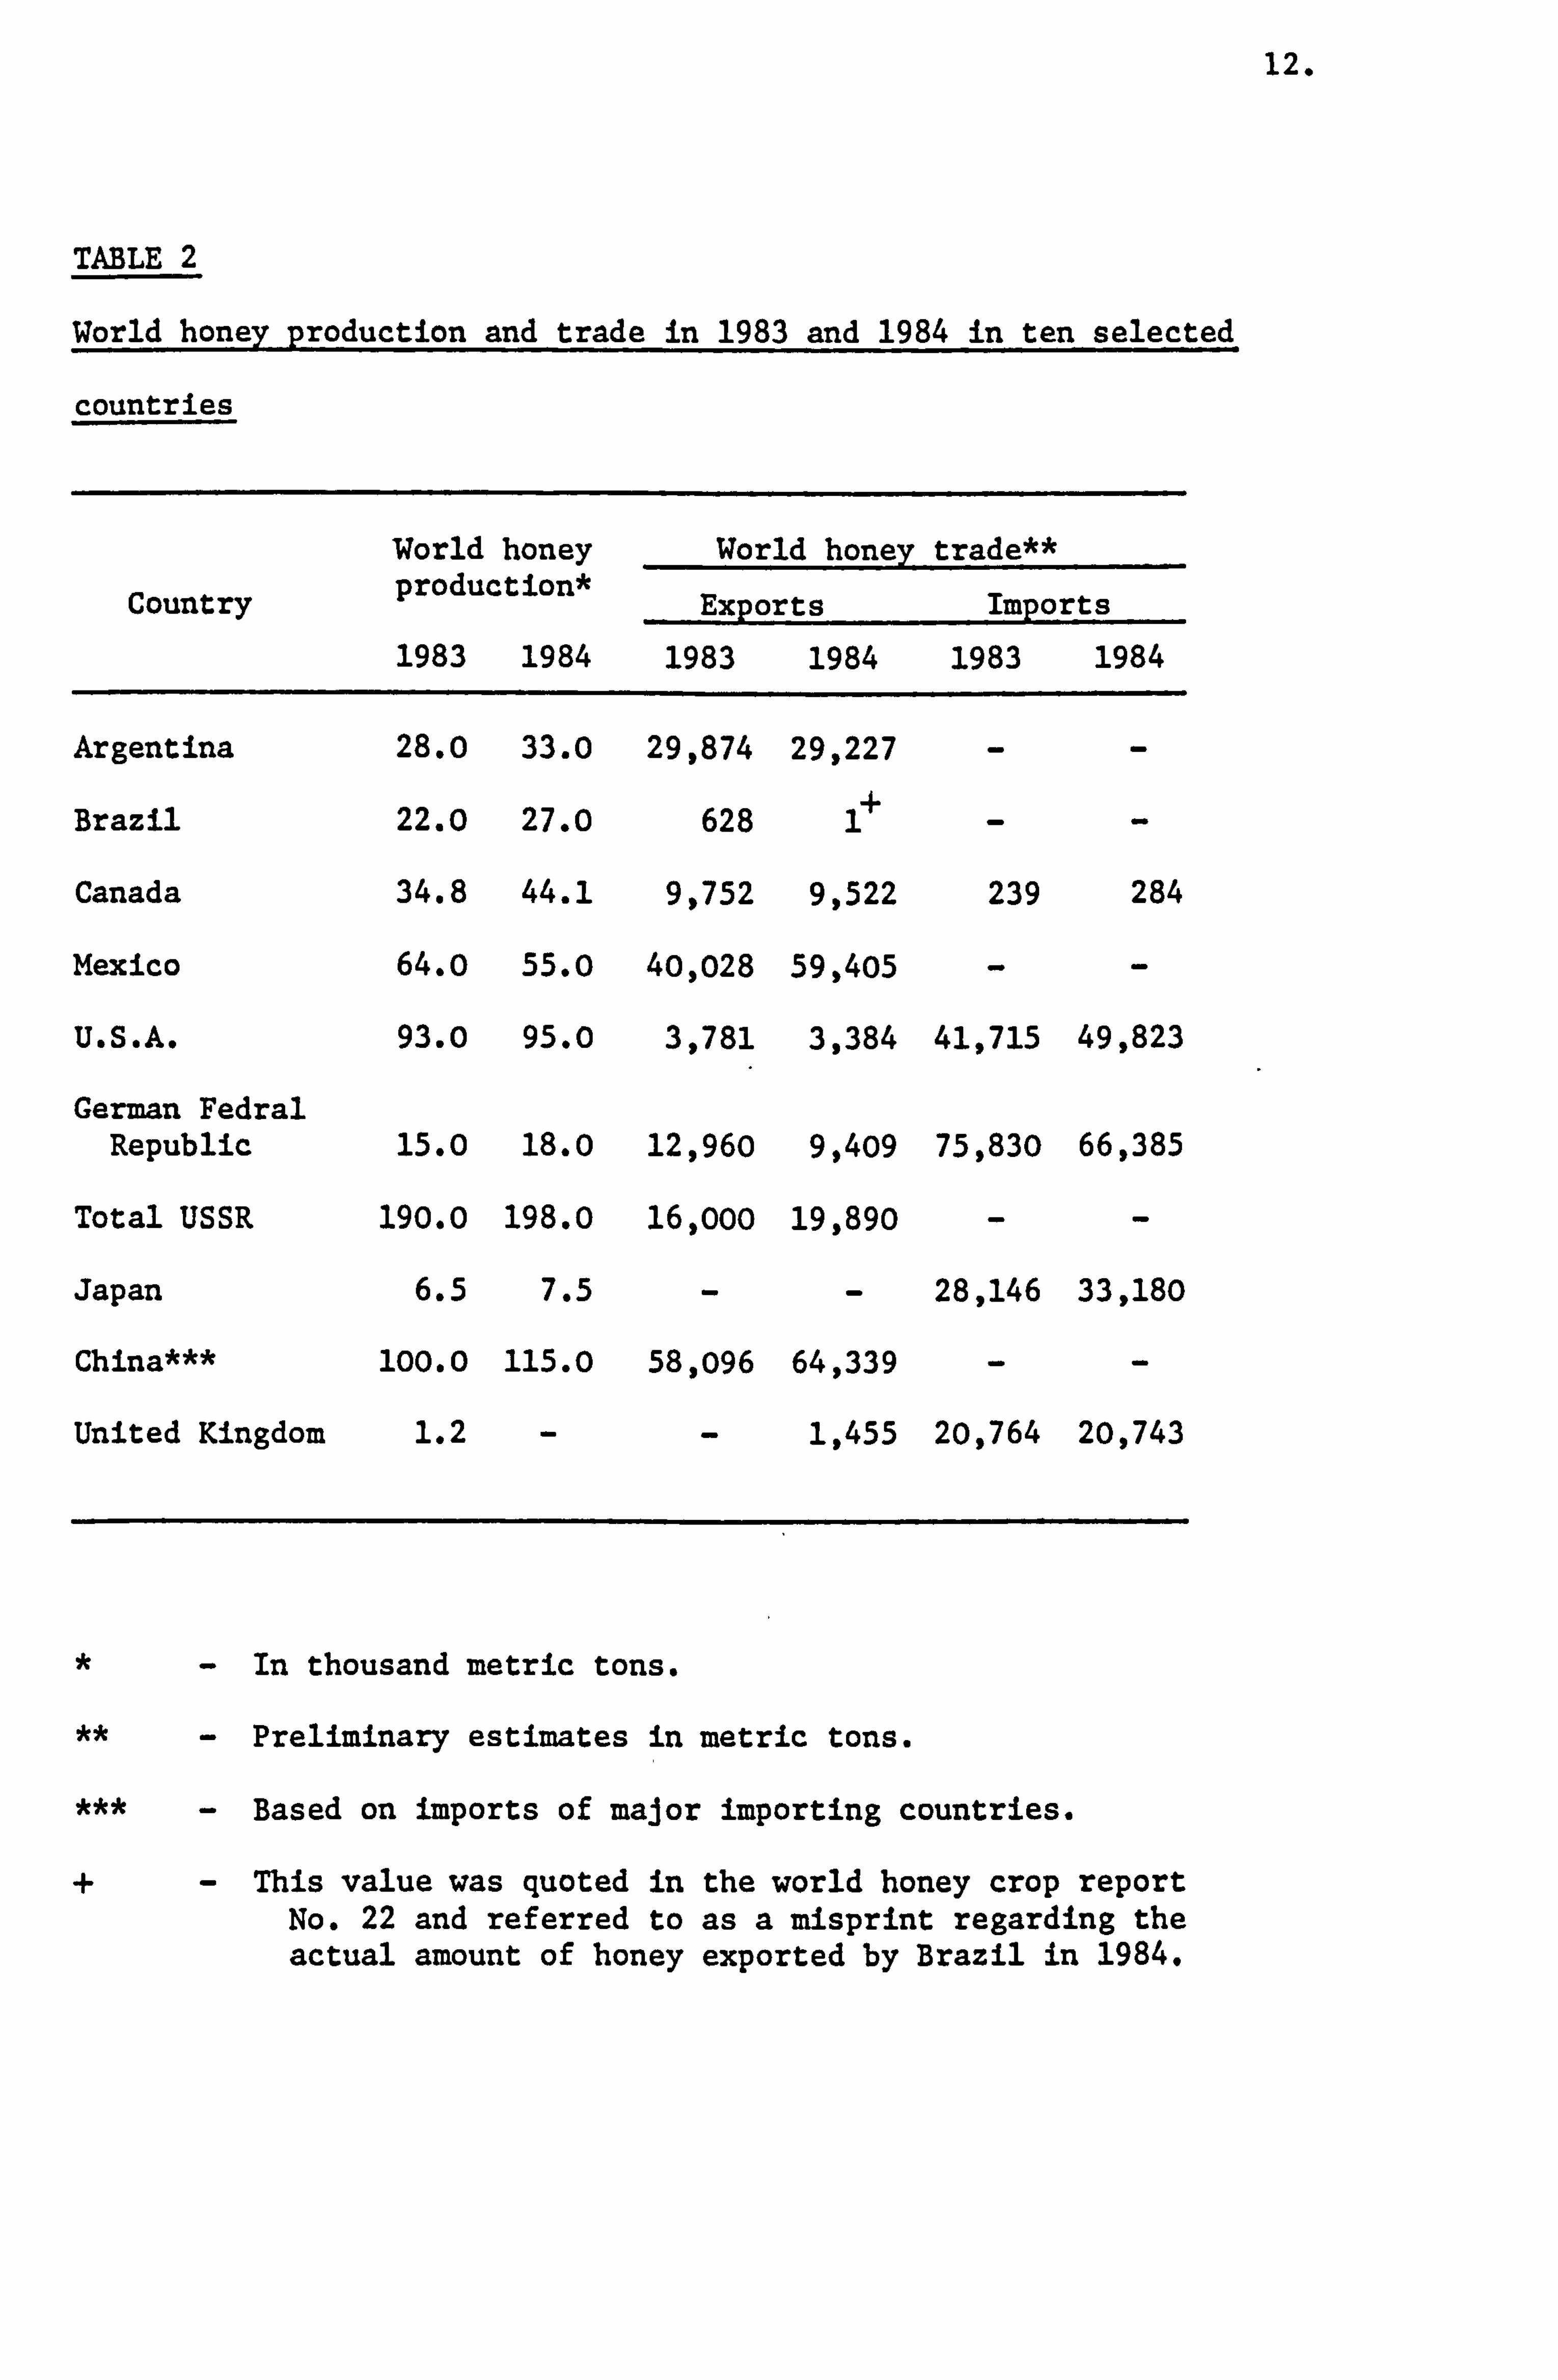
Honey Production and Trade
Estimated figures of the world honey production and trade for
the years 1983 and 1984 were obtained from the World Honey Crop Reports
No. 21 and 22. The reports list the actual or estimated production
from sixty one countries world-wide covering the Americas, Europe,
Australasia, Africa and the tropical islands.
Production
In 1983 there was 934,100 metric tons of honey and in 1984 an
estimated 940,000 metric tons of honey harvested world-wide.
The estimate of honey production of ten individual countries
in 1983 and 1984 have been shown in Table 2.0. The continued trend
of a small annual increase in world honey production was reported.
This could be attributed to the increase in the number of colonies
of the major producers such as the USSR, the improved yield per
12.
TABLE 2
World honey production and trade in 1983 and 1984 in ten selected
countries
Country
World honey production*
1983 1984
World honey
Exports
1983 1984
trade**
Imports
1983 1984
Argentina 28.0 33.0 29,874 29,227 - -
Brazil 22.0 27.0 628 1+ - -
Canada 34.8 44.1 9,752 9,522 239 284
Mexico 64.0 55.0 40,028 59,405 - -
U. S. A. 93.0 95.0 3,781 3,384 41,715 49,823
German Fedral Republic 15.0 18.0 12,960 9,409 75,830 66,385
Total USSR 190.0 198.0 16,000 19,890 - -
Japan 6.5 7.5 - - 28,146 33,180
China*** 100.0 115.0 58,096 64,339 - -
United Kingdom 1.2 - - 1,455 20,764 20,743
- In thousand metric tons.
- Preliminary estimates in metric tons.
- Based on imports of major importing countries.
+- This value was quoted in the world honey crop report No. 22 and referred to as a misprint regarding the actual amount of honey exported by Brazil in 1984.
13.
colony in countries such as Canada and Brazil and favourable weather
conditions in countries such as Argentina and Brazil. A considerable
proportion of the honey produced was for consumption within the country
and these countries may not export much surplus honey.
Trading in honey
In 1983 a significant increase in exports of honey was observed
in countries such as Russia by 42%, Mexico by 48% and France by 90%.
Also, an increase in imports of honey was observed in countries
such as the United States of America by 19% and Japan by 18%. Preliminary
estimates of honey exports and imports in 1983 and 1984 for ten countries
have been shown in Table 2. The largest net importers of honey were
the European Economic countries such as the German Federal Republic
and the United Kingdom followed by the United States of America and
Japan.
Crane (1980) and Willson (1980) have also given figures for
the world production and trading in honey.
Manufactured products that use honey, wax or other bee products
are numerous and range from mead, cake, candles, cosmetics to health
foods. Also there is a wide spread inclusion of honey into
pharmaceutical products such as cough syrups. Some honey is also
used directly as a therapeutic agent see, for example, Steyn (1973),
Willson and Crane (1980). Therein are given examples of minority
but still important users of honey and the whole aspect of honey
from analysis to archaeology to legend have been covered in the extensive
treatise by Crane (1980) and will not be further mentioned.
14.
Honey Plants
Crane (1980) has listed the important plant species which contribute
as a source of honey on a world scale. She has also discussed their
characteristics and distribution, the characteristics of the honey
from them, and their economic significances. Other authors such
as White (1978) and Howes (1979) list and discuss the major honey
plants in Britain, Europe, United States of America and the rest
of the world.
In Britain, honey from clover (TrifoZium sp. ) constitutes about
75% of the total honey produced. While honey from lime (Tilia sp. )
accounts for the greater part of the remainder. Honey from heather
(CaUuna sp. ) in the British Isles is widely recognised as a unique
table honey. Oil seed rape (Brassica sp. ) is fast becoming a major
honey crop in Britain (Sims, 1984). * Fruit blossom Mrunus/pyrus)
is another source of nectar and is useful to the beekeeper for brood
rearing if not for surplus honey. Apple (MaZus) and cherry (Prunus)
are most valuable nectar producers among the fruit trees.
Large quantities of honey from clover are produced by countries
such as Canada, Northern United States of America, New Zealand, Australia
and Tasmania. Honey from acacia (Robinia paeudoacacia) produced
in countries such as Hungary, Rumania and Yugoslavia are rated as
an equal, in terms of quality, to that of the clover. Buckwheat
honey (Fagopyrum sp. ) is also produced in large quantities in North-
eastern United States of America, Russia, China and in parts of Europe.
Honey from citrus fruits are well known to Spain and California.
Thyme and pine forest honeydew honey from Greece, Also Eucalyptus
15.
from Australia and mixed floral honeys from Mexico.
Crane, Walker and Day (1984) have identified four hundred and
sixty seven plants to be a major source of honey produced in the
world. For each plant these authors have noted the following available
information: the botanical and comm n names and the plant family;
the form of plant, its distribution and environmental conditions;
economic importance and uses; potential hazards such as toxins; nectar
rating and honeybee species in a country; the time of the year of
flowering, nectar flow and composition; honey yield and chemical
composition; honeydew production; recommendations of planting to
increase honey production in a country; and the composition and properties
of the honey produced.
Moreover, the sources of honey in the Uniýed States of America,
Europe, Australia, Canada are well documented compared with the other
honey producing countries, although such documentation that exists
is kept on file at the International Bee Research Association with
the United Kingdom and by national organisations elsewhere.
Honey Composition
In the following section and other sections covering perpherial
topics only the major literature reviews of importance to the particular
subject will be briefly reviewed. However, for major topics of importance
to the present study relevant published research will be described
and reviewed in detail.
16.
Factors affecting composition
White (1980c) has reviewed the literature on the composition
of honey and suggests that the honey composition is dependent upon
the origin of the nectar. Also, that the internal and external factors
which influence the production of nectar are important contributory
factors to the honey composition.
Maurizo (1980a) has extensively reviewed the literature and discussed
in detail how these internal and external factors influence the production
of nectar. She has suggested that the size of the flower and the
nectary surface, the age and maturity of the flower on the planto
the species, variety or cultivated races to which the plant belongs
are some of the internal factors. External factors such as the soil
humidity, the type- of soil and the use of fertilizers, the temperature
and the wind, the time of the day and year, the length of the day
and sunshine are also important. Similarly, Shuel (1982) has also
outlined the internal and external factors that influence the secretion
of nectar.
The affects of beekeeping techniques, extraction and processing
of honey either by the beekeeper or by the commercial producer, on
the composition of honey have been described by Hooper (1976) and
Morse (1974), respectively. Also other factors encountered during
the commercial processing have been described by Rodgers (1980) and
Townsend (1980). The conditions of storage have a considerable influence
on the composition of honey and the changes induced by storage have
been described by White, Kushnir and Subers (1964), Echigo, Takenaka
and Ichimura (1974) and White (1978).
17.
Physical properties of honey
White (1980d) has extensively reviewed the literature on the
physical properties of honey. Honey is a supersaturated solution
of carbohydrates in water, with normally only 15% - 17% water.
Moisture content
White et aZ., (1962) showed that the average moisture content
of four hundred and ninety samples of honey was 17.2%. The amount
of water present in honey determines its stability against fermentation
and granulation (Dyce, 1980). The determination of moisture content
has been reviewed extensively by White (1969).
Colour
Brice et aZ., (1956) showed that the colourants of honey, marple
syrup, caramel solution and other sugar products are similar. These
researchers have also carried out an extensive physical examination
of the colour of honey.
Wootton, Faraji-Haremi and Johnson (1976) reported that when
six Australian honeys were stored at 500C, darkening of honey colour
was not accompanied by appreciable changes in the total nitrogen
content. Wootton, Edwards and Faraji-Haremi (1976) reported that
changes in the amount of sugars and free amino acids in honey were
not clearly related to the extent of darkening. -
White (1980d) has reviewed the effects of storage temperatures
on the colour of honey.
CrXstallisation
It is basically the crystallisation of the glucose present in
honey to its monohydrate form. The presence or absence of nuclei
18.
influences the onset of crystallisation but its extent and speed are
dependent upon the glucose/water ratio (White, 1980d). The major
problem which results from crystallisation is the increase in moisture
content of the liquid phase above the crystals. This creates ideal
conditions for the yeast present to ferment the honey.
The factors affecting crystallisation were studied and reviewed
by Dyce (1931). Later on Austin (1958) proposed the use of the
[glucose]/water ratio for predicting the crystallisation tendency
of honey. It was White et al., (1962) who suggested the use of Austin's
ratio as being highly significant as a measure of tendency towards
crystallisation. Furthermore, these research workers regarded this
ratio as being equivalent to the [glucose]-water/[fructose] ratio
employed by Jackson and Silsbee (1924). White et al., (1962) on
the basis of Austin's ratio reported that values of 1.7 and lower
were generally associated with non-granulation of honeys, whereas
values of 2.1 and higher would predictably lead to rapid granulation
to a solid. These values were based on the measurements carried
out on four hundred and ninty samples of honey they examined.
There are exceptions for non-crystallising honey types such
as tupelo, acacia which are low in glucose content and high in fructose.
The subjects of crystallisation of honey have been reviewed by Doner
(1977), White (1978), White (1980) and Landis and Kevin (1982).
Thixotropic properties
Pryce-iones (1944) studied the thixotropy in ling (CaUuna sp. )
honey in that the honey mobilised upon stirring from its gelatinous
solid state. Pryce-Jones isolated by alcohol precipitation a material
19.
which caused the thixotropic property in heather honey. Further,
he demonstrated that by adding this material to clover honey thixotropic
properties were imparted to the clover. honey. One sample of heather
honey was found to contain 1.86% of the protein, whereas other samples
contained about 1.5% total protein.
According to White (1978) Pryce-jones also observed thixotropy
in Manuka (Leptospermium scopatium) honey of New Zealand. Deodikar
et aZ., (1957) reported similar thixotropy in Karvi (Cmvi caUoso)
honey of India. Subsequent project work at Salford over the period
1984 - 1987 has established that the thixotropic agent in heather
honey is indeed a protein of molecular weight 50,000. Hamilton
(1987)*
Chemical composition of honey
Honey contains nearly two hundred compounds which can be arranged
into the following major groups: carbohydrates, amino acids, proteins,
minerals, vitamins, acids, esters and volatile components, hydroxy-
methylfurfural, lipids, and pollen. on rare occasions toxic compounds
can be present in low concentrations.
The amino acids, proteins, pollens and toxic substances will
be reviewed later on in the introduction.
Carbohydrates
Glucose and fructose constitute about 85% of the honey solids.
The presence of sugars such as erlose, isomaltose, maltulose, turanose,
nigerose, kijibose, a, ý-treholose, gentibiose, laminarebose, sucrose
and maltose have been reported by White and Maher (1953), White
and Hoban (1959), Watanabe and Aso (1960) and Siddiqui and Furgala (1967).
20.
Siddiqui and Furgala (1968) reported the presence of ten honey
trisaccharides, one tetrasaccharide and one pentasaccharide. These
researchers also identified melizitose, 3-a-isomaltosylglucose,
maltotriose, isomaltotriose, 1-kestose, panose and isomaltopentose.
The sugars of honey have been reviewed extensively by Thawley (1969),
Siddiqui (1970), Doner (1977), White (19800 and by Prince (1982).
Minerals
The three aspects of the ash content of honey are: the amount
of total ash, the amount of principal constituents and the identities
of minor metallic constituents, which occur in extremely minute
amounts.
Schuette and his colleagues (1932,1937,1938,1939) reported
the presence of mineral elements in honey and suggested a relationship
with the degree of pigmentation. This relationship was confirmed
by White et aZ., (1962) in that, honey of light colour classes has
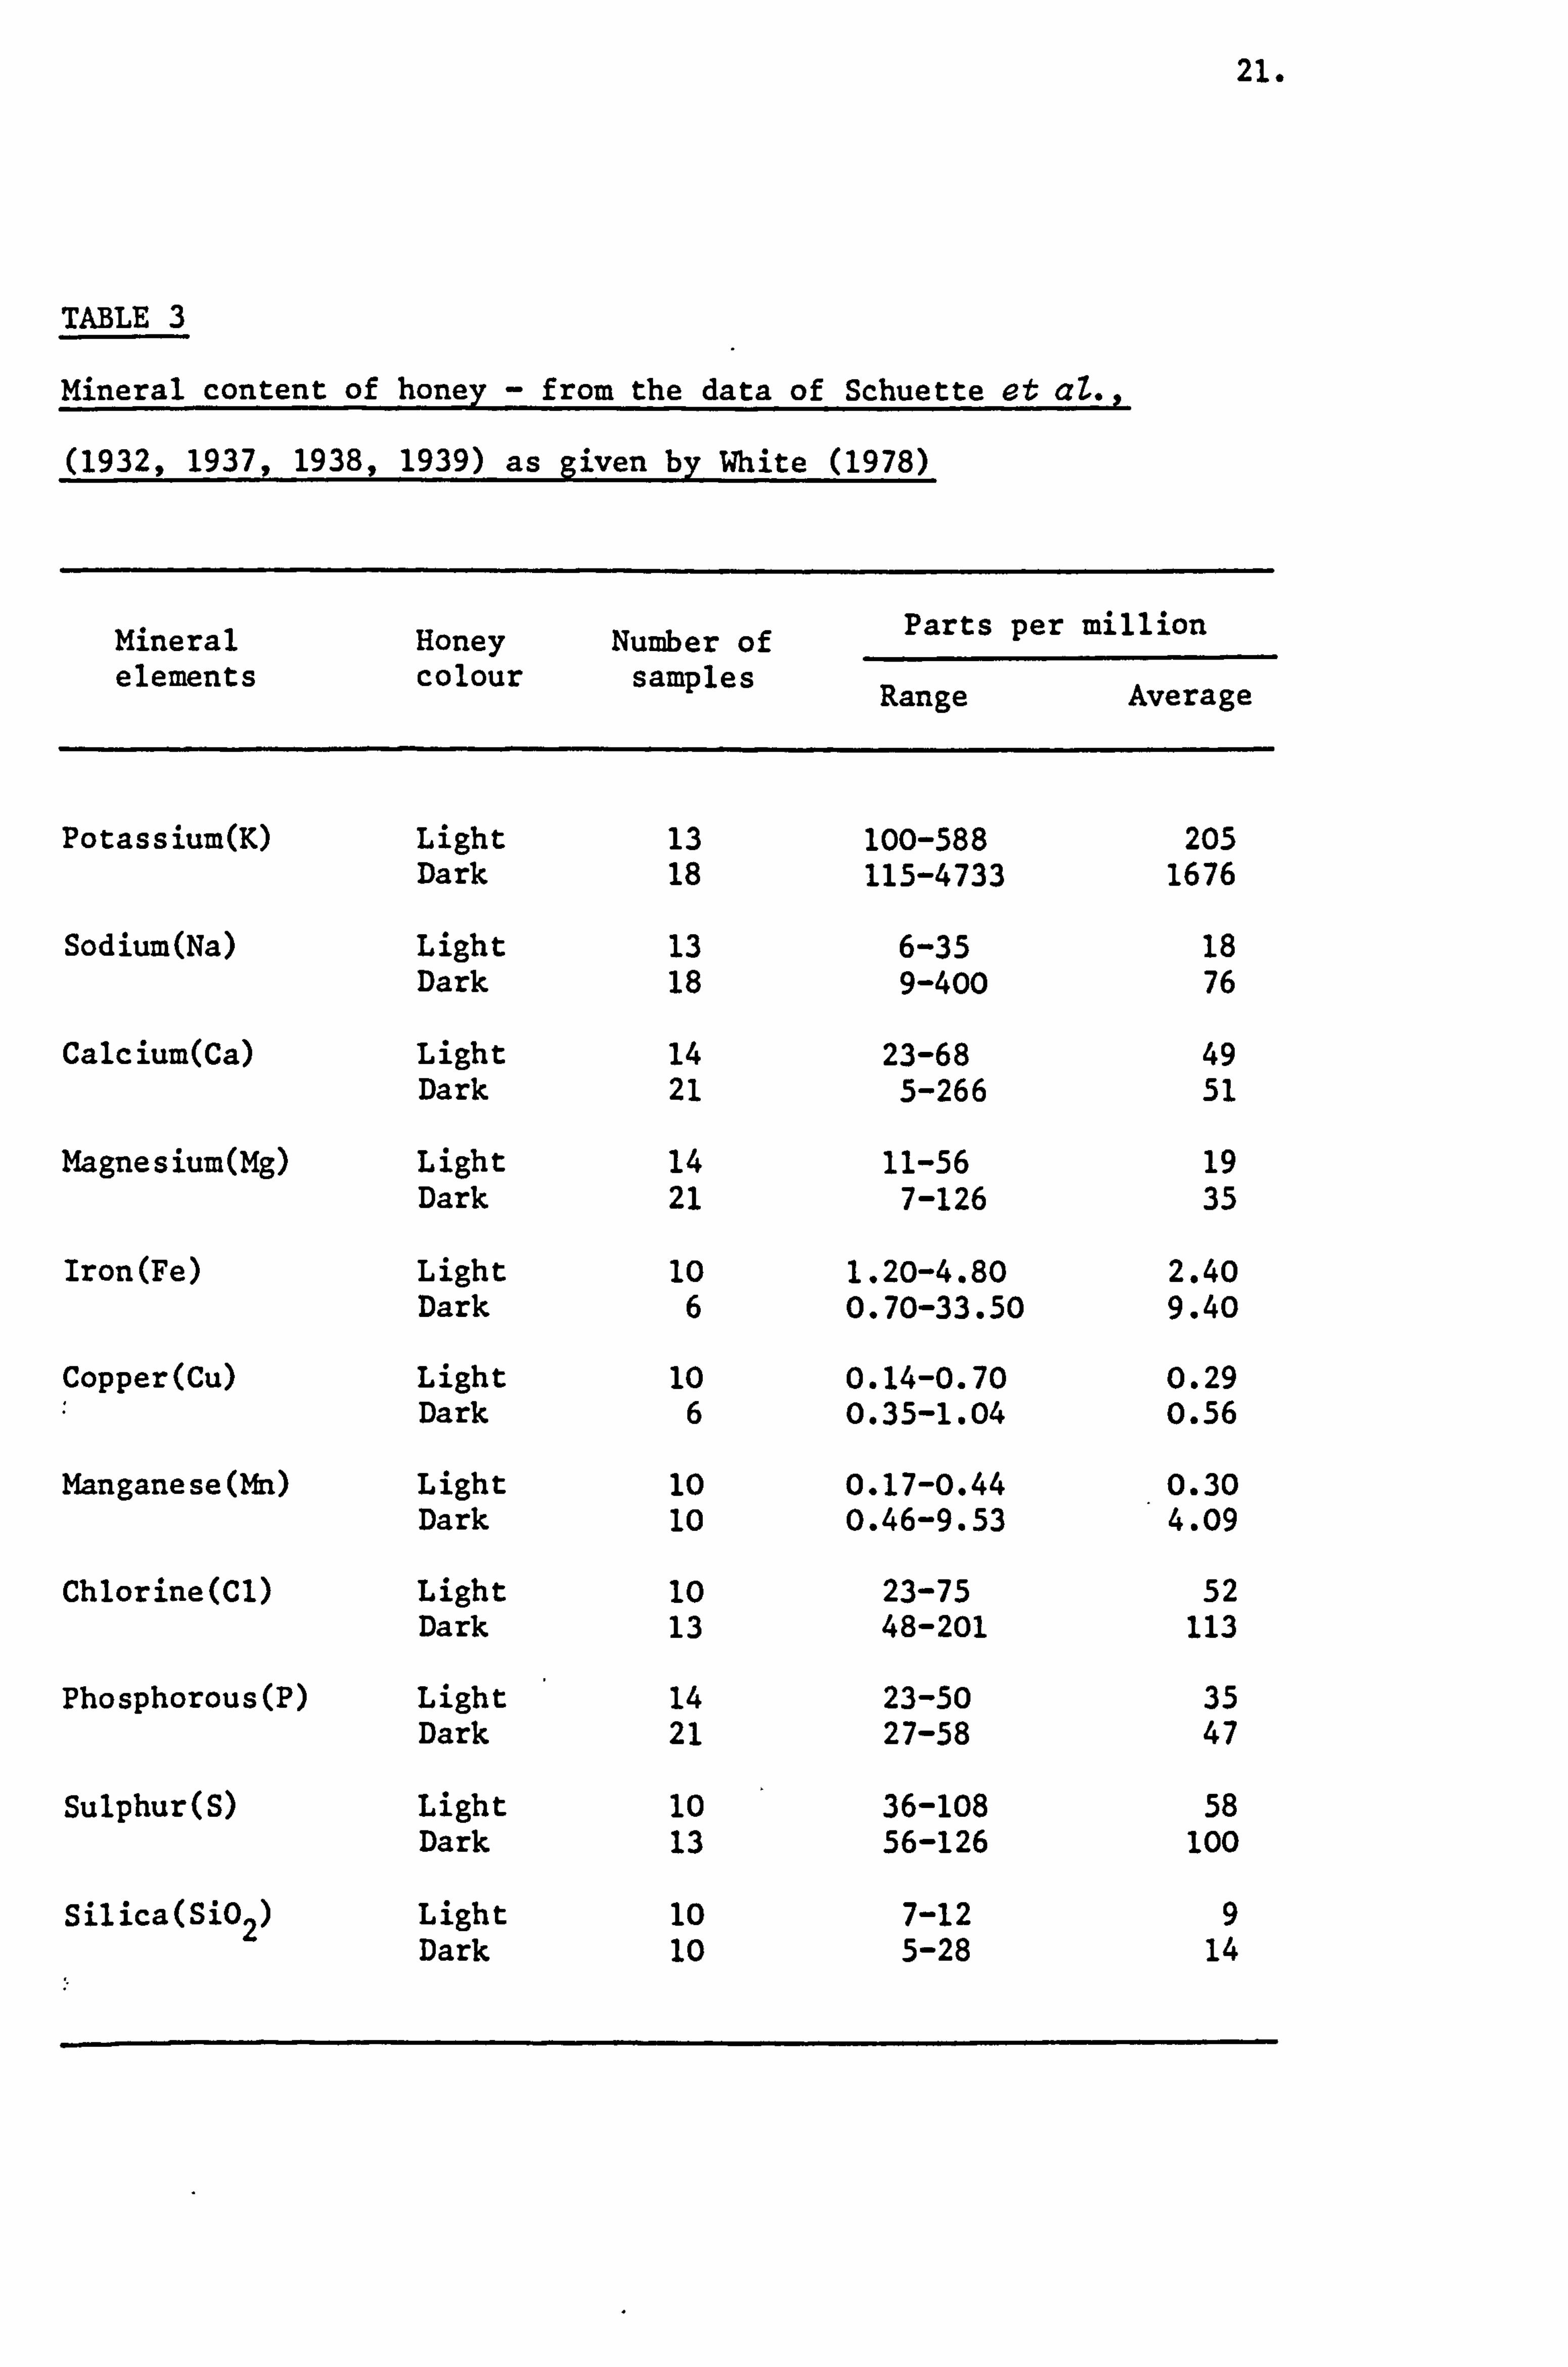
a lower mineral content than those of darker honey types. Table 3
summnrises the findings of Schuette and his colleagues as presented
by White (1978). McLellan (1975) reported that there was generally
more potassium in honey than calcium, magnesium or sodium due to
the rapidity of potassium secretion by the plant.
Vitamins
The following vitamins have been reported to occur in honey:
thiamine, niacin, riboflavin, ascorbic acid, pyridoxine, panthothenic
acid, biotin, folic acid and vitamin K. The amount of vitamins
vary to a large extent between samples of similar honey and also
of different honey types. The occurrence of vitamins in honey have
been reviewed by White (1978 and 198W).
21.
TABLE 3
Mineral content of honey - from the data of Schuette et aZ.,
(1932,1937,1938,1939) as given by White (1978)
Mineral elements
Honey colour
Number of samples
Parts per
Range
million
Average
Potassium(K) Light 13 100-588 205 Dark 18 115-4733 1676
Sodium(Na) Light 13 6-35 18 Dark 18 9-400 76
Calcium(Ca) Light 14 23-68 49 Dark 21 5-266 51
Magnesium(Mg) Light 14 11-56 19 Dark 21 7-126 35
Iron(Fe) Light 10 1.20-4.80 2.40 Dark 6 0.70-33.50 9.40
Copper(Cu) Light 10 0.14-0.70 0.29 Dark 6 0.35-1.04 0.56
Manganese(Mn) Light 10 0.17-0.44 0.30 Dark 10 0.46-9.53 4.09
Chlorine(Cl) Light 10 23-75 52 Dark 13 48-201 113
Phosphorous(P) Light 14 23-50 35 Dark 21 27-58 47
Sulphur(S) Light 10 36-108 58 Dark 13 56-126 100
Silica(S'02) Light 10 7-12 9 Dark 10 5-28 14
22.
Acids
The acids of honey contribute towards its stability against
micro-organisms and its flavour. Gluconic acid, the product of
an enzyme catalysed reaction of glucose oxidase on glucose of honey,
is the predominant acid. The acid composition of honey has been
reviewed by Thawley (1969), Stenikraus et aZ., (1971) and White
(1978).
Volatiles
The volatiles of honey which contributes towards its characteristics
such as aroma and flavour, has been little studied. However, with
the introduction of the technique of gas liquid chromatography a
number of volatile components have been identified.
Ten-Hoopen (1963) reported the presence of formaldehyde,
acetylaldehyde, acetone, isobutyraldehyde and diacetyl in greater
quantities in rape and clover honey than in thyme. Hadorn (1964)
reported the presence of methyl anthranilate in lavender honey.
Cremer and Riedmann (1965) identified over half of the one hundred
and twenty compounds they separated from honey. These researchers
reported an increase in pentanol, 2-methyl-l-butanol, 3-methyl-
1-butanol and n-propanol, upon storage and suggested these could
be the products of ester hydrolysis or may arise from corresponding
amino acids. Bicchi, Belliardo and Frattini (1983) analysed Multifloral
and unifloral honey for compounds responsible for their flavour
and identified fifty two compounds. These researchers used the
technique of gas liquid and combination of gas liquid chromatography
and mass spectroscopy. Bonaga and Giumanini (1986) using the combination
of a gas chromatography and a mass spectrometer isolated fifty volatile
23.
components from a unifloral chestnut (Castanea sativa) honey. These
researchers reported that ninteen of these components had not been
previously reported to be present in honey. They suggested that the
main component of the mixture (3-aminoacetophenone) may be specific
for floral source.
Hydroxymethylfurfuralý
5-Hydroxymethylfurfural (HMF) results from the acid catalysed
dehydration and heat treatment of fructose present in honey.
Schade, Marsh and Eckert (1958) using Winkler's (1955) method
for quantifying HMF in honey demonstrated the variability amongst
honeys of the effect of storage and heating, and conformational
factors influencing HMF formation. White, Kushnir and Subers (1964)
showed that fresh honey contains between 0.06 to 0.20 mg of HIIF
per 100g of honey. White (1978) reported that heat treatment during
processing of honey should be limited as excessive amounts of HMF
are indicative of the loss of freshness and overheating. White
(1980a) reported an average HMF content for one thousand seven hundred
and twenty eight samples of commercial honey to be 1.24 mg per 100g
of honey. This was based on the data published by Duisberg and
Hadron (1966) and Chandler et aZ., (1974). White (1980a) has reviewed
the subject in detail.
Honey Proteins
The nitrogen content of honey is due mainly to the presence
of proteins and small amounts of amino acids, and other nitrogen
compounds. A considerable portion of honey protein is due to the
presence of'enzymes. The isolation, characterisation and properties
of proteins will now be reviewed.
24.
Proteins
The protein content of honey was initially utilized to distinguish
honey from artificial admixtures and blends. The assessment of
precipitates of proteinaceous material by tannin solution,
phosphotungstic acid or by alcohol, immunological tests or by assignment
to solubility groups have been described by White (1978 and 1980c).
Paine et aL., (1934) studied the colloidal material separated
from honey by the technique of ultrafiltration. Helvey (1953) detected
three collodial components present in buckwheat honey by the techniques
of ultracentrifugation and moving boundary electrophoresis. Of
these three components two were proteins of approximate molecular
weights 146,000 and 73,000 and the third was a polysaccharide of
molecular weight of about 9,000.
White et al., (1962) reported an average value corresponding
to a protein content of 0.25% for four hundred and ninety samples
of honey.
White and Kushnir (1967b) separated between four to seven protein
fractions by the technique of gel filtration, starch-gel electrophoresis
and ion-exchange chromatography. These researchers used the crude
protein preparations from eleven floral honeys and honey produced
by sugar-feeding to the bees. From these results the above authors
deduced that four protein fractions appeared to originate from the
bee and two of these had molecular weights of 40,000 and 240,000.
While those fractions that originated from the plant were of 98,000
or greater than 400,000 molecular weight.
25.
Bergner and Diemar (1975b) separated the honey proteins into
five distinct peaks by chromatography on Sephadex G200 gel. These
researchers reported that of these five components, three originated
from the bee and were identified to be enzymes invertase, diastase
and glucose oxidase. While the two that originated from the plant
were not identified.
White and Rudyj (1978) determined the proteins for seven hundred
and forty samples of honey using the Lowry photometric analysis.
These researchersIreported a mean value of 169 mg of protein per
100g of honey.
Bagdanov (1981) used the Bradford/Bio-rad colour reagent method
to determine the proteins of eighteen Swiss honeys and sixteen foreign
honeys. These researchers reported an average protein content of
129 mg per 100g of honey and noted that there was no significant
differences between ten honeydew and twenty four floral honeys.
Croft, Histry and Washington (1986) were able to resolve as
many as eleven protein bands on 10% polyacrylamide gel in the presence
of sodium dodecyl sulphate. These researchers were unable to characterise
any particular honey sample with regard to its likely geographical
origin on the basis of presence or absence of any of these eleven
protein bands. They also noted the technique was useful in detection
of adulteration and its sensitivity enabled detection of honey that
had been obtained from bees fed on pollen substitutes.
Reeder, Richie and Guenther (1986) separated honey proteins
by the technique of ultra-thin layer isoelectric focussing and scans
for band pattern and intensity were analysed by a chemometrics programme
26.
on a mainframe computer. These researchers reported that the clustering
of patterns revealed the ability to distinguish honey based on the
geographical location of collection.
Enzymes
The enzymes of honey have up to now been studied predominantly
from the view point of quality and destruction of enzymes by heat
and other adverse factors. The presence of enzymes such as diastase,
invertase, glucose oxidase and catalase in honey have been confirmed.
The trivial and systemmatic name of enzymes, type of enzyme activity
and kinetic properties together with appropriate references for
each of these enzymes have been tabulated in Table 4. Other enzymes
such as acid and alkaline phosphatases have been shown to be present
in honey but have as yet not been well characterised and therefore
will not be reviewed. White (1978) has extensively detailed and
reviewed the literature on the enzymes present in honey. White
(1980c) has also noted the presence of enzymes such as esterases
which have not been studied in detail.
The origins of the enzymes listed above have been identified
as being chiefly the honeybee Ammon (1949), Schepartz and Subers
(1964), Rinaudo et aZ., (1973a and 1973b) and Stadelmeier and Bergner
(1986). Other sources such as pollen and nectar have been suggested
by Vansell and Freeborn (1929), Bergner and Sabir (1977), Giri (1938)
and ZaleWski (1965).
.0
44 0
(A
;l 0) 1 .44
14
15 0
di 41
cc
1: 6 1p
0
U,
0 14 d) co a ýl -cl
4c to., 41
Cd
44 0
w
o w
NW
cn MI, 44 0
a) u cl w
93 93 -H 0
-0
4. A -0 co ý4
V
A
mu0 D., 64 ()
14 Cd :1 0 41 ý4 Q. 0 CID
00 in Ln LM II %T 1.4 .1
V4 ýr
LM
8§ cli e
A 6r.,
9: 41 -0 cd C: V u009 0 ci Ww
14 r. IAD w ý4 co
j V4 ýq ý4 I
Fs
ts X1
to w (A (a ; ý. >ý 0 4)
.. A "4 ja m 000a, 64 Ow $4 u0
-0 00
ý4
en
43 ýo
90
04 0 u0 N4 u
1! ý 90 Z 0 41 -4 c2, m 00
0 -0 > >, 4) 0
. 92
0m4.1 41 0 ý4
gi
ÖD 00 g",
c: u
M tu U -0
v tw 0 0 to u) 0 41 ic W 00
10000 00 0) r. .2A w >, fi "4
10 ýq Q ei Co >, 0cCZr
= 92. to 41 uM
04
en
@M
14
w
0- 0H
Z ,r i. If
4) 00
6 ý7
Ilý LM
+
gd 0
Co Co
Co %w
0
+
10 Z 4) 00 00
-4
C"4
%D
0
0 44 14 w
41 91
w rn 44
cu
%0
%0 e4
In
en
li 0 0
LD
4) 0 to 14
Wm
0 U
tm en
en
n %0
10
lý
'0
'-4 K
"4c
M*I. F, In
30
40 to g 6: cý 41 in 010 93 1
Cd tr,
00C ý4 4j .0
-04 "4 -, 4 r. cl 0 g3 0) .. 44 C) 0
6: H1 ý4 0 %0 M ý-4
14 0 -0 C. 0 c; 0 4) 0 fi 0,, 41 m> zi 4xb.
4
14 0 ý4 -1 Ai 0 .., 0 4.1 "4 di bo Co 0 41 = cl -H u 05 ýI A bw 41 C P. ll j-- Z01,
>, pl 93
27.
-r4 m 0
Cw
0) bo 0
n co
Ln W! .4
14
N
)o 0
0
c4
j 0-
-0
0) .0
Co
10 r. 00
Co IN
0)
Vý z
28.
Key to references and notes regarding Table 4
Key to references
1. White and Kushnir (1967a)
2. Lampitt, Hughes and Rooke (1930)
3. Rina do et aZ., (1973b)
4. White and Kushnir (1967a)
5. Rina do et aZ., (1973a)
6. Takenaka and Echigo (1975)
7. Takenaka and Echigo (1978)
8. Schepa, and Subers (1964)
9. Schepartz (1965a)
10. Schepartz (1966a)
11. White and Subers (1964)
12. Schepartz (1966b)
13. Stadelmeier and Bergner (1986)
Notes
Enzyme No. Systematic Name Trivial Name
3.2.1.2 a-1,4-glucan 4-gluconoý a-amylase hydrolyase
3.2.1.2 a-1,4-glucan maltohydrolase $-amylase
3.2.1.20 a-D-glucoside glucohydrolase a-glucosidase
1.1.3.4 O-D-glucose: 02 oxido- Glucose oxidase reductase
1.11.1.6 H202 :H202 oxido reductase Catalase
Obtained from Commission on Enzymes, 1961.
a-glucosidase -I Name allocated to enzyme by researchers 4+ a-glucosidase - II
I
Takenaka and Echigo, 1978.
(1) Temps = Temperature
(2) Refs = References
0
29.
Honey Amino Acids I
A relatively small portion of the nitrogen content of honey
is ascribed to the free amino acids present in honey. Several workers
have attempted to utilize the amino acids of honey in order to determine
its authenticity. These workers were: Tillmans and Kiesgen (1927),
Schuette and Templin (1930), Schuette and Baldwin (1944) and Vavruch
(1952).
Komamine (1960) using the technique of paper chromatography
detected the presence of the following. twelve amino acids in Finnish
and imported honeys. These amino acids were: a- and a-alanine,
aspartic acid, cysteine, glutamic acid, glycine, lysine, proline,
serine, threonine, tyrosine and valine. Apart from these amino
acids the Finnish honey also contained arginine, ethanolamine and
methionine and the imported samples contained y-aminobutyric acid,
asparagine and glutamine. He also noted the presence of proline
to be the highest in both sets of samples.
Phadke (1962) reported that the dark colour classes of honey
produced by Apia cerena contained tryptophan and tyrosine whereas
the honey graded into the light colour classes did not contain these
amino acids.
Kalimi and Sohonie (1964) observed some variation in four
Mahabaleshwar (India) honeys, in that, proline, serine'and tyrosine
were absent in the Gela and Harda honeys. Histidine was absent
in both the Gela and Jambul honeys. Isoleucine was not present
in any of the honeys.
30.
Petrov (1971) using the technique of ion-exchange and paper
chromatography was able to detect the presence of sixteen amino
acids in three samples of Australian honeys; stingy bark (EucaZyptus
macrorrhyncha), red gum (EucaZyptus camaZduZensis) and white clover
(TrifoZium repens). These amino acids were: alanine, arginine,
aspartic acid, cysteine, glutamic acid, glycine, histidine,
hydroxyproline, leucine, lysine, 'phenylalanine, proline, serine,
threonine, tyrosine and valine. In comparing his results with those
of Kal-imi and Sohonie (1964) Petrov noted that the Indian honey
did not contain cysteine, hydroxyproline, phenylalanine or threonine,
whereas isoleucine and methionine were not detected in the Australian
honey. In comparing the Australian honey with those of the Italian
(Curti and Riganti, 1966) Petrov found that the Italian honey contained
most of the amino acids that were present in the Australian honey
but not arginine and cysteine.
Bergner and Hahn (1972) reported that using sugar fed bees
whilst the amounts of amino acids varied widely, presumably due
to the differing content of honeybee secretions, the pattern of
amino acids was remarkably similar. The content of the total free
amino acids varied from 2,000 to 17,000 nanomoles per g of honey.
Petrov (1974) using an automatic amino acid analyser estimated
quantitatively the presence of seventeen amino acids in six Eucalyptus
and one Trifolium honeys. This researcher observed the variation
in the amounts'of different amino acids and also between different
species. He suggested that this variation was due to the amounts
of amino acids collected in the nectar, those secreted by the bee
31.
and those formed as degradation products of pollen.
Davies (1975) carried out an extensive survey of the amino
acids in ninty eight samples of honey and eight samples of non-
honey sugar products. He was the first to suggest that certain
ratios of amino acids could be used to determine the geographical
source of a honey sample as well as the species of bees. Davies
reported that non-honey sugar products could be easily recognised
particularly by their lower proline content since honeys generally
have a high proline content. Davies also suggested that the bees,
nectar and honeydew, were the major sources of amino acids in honey.
Later on in 1976, Davies used the amino acid analysis to characterise
honey from four geographical areas by a selection of sixty amino
acid ratios. He was able to show that while there are variations
in the ratios between samples of the same area, the variation between
sources is much greater. Thus, Davies proposed that the amino acid
analysis could be used as an instrumental method for the determination
of the geographical sources of honey, in place of the highly subjective
method of pollen analysis. He suggested that further work was required
before the method could be recommended for official use.
Wootton, Edwards and Faraji-Haremi (1976) reported that the
total free amino acid content decreased during storage of all the
honeys they examined, except the honey obtained from the tea tree.
These researchers also observed that the amount of some individual
amino acids increased in some honeys and they suggested that changes
due to protein breakdown more than balanced any loss of amino acids
by condensation reactions.
32.
The use of gas chromatography technique to determine the free
and protein amino acids of honey were carried out by Bosi and
Battaglini (1978). These research workers analysed twenty four
nectar and four honeydew honeys and observed differences in the
total amino acid content, in the ratio between the amounts of free
and protein amino acids, and in the proportions of different amino
acids. They concluded that the amino acid spectrum of a honey
sample could not be used to characterise honey.
Gilbert et at., (1981) analysed forty five samples of honey
obtained from the United Kingdom, Australia, Argentina and Canada.
These workers analysed their results statistically using the canonical
variates analysis. They were able to show good discrimination between
groups of samples from Australia, Argentina and Canada. They observed
that the United Kingdom group occurred between the Argentinian and
the Canadian groups and could only be discriminated by omitting
the Australian group. Gilbert et aZ., suggested that the free amino
acid analysis method must be employed in conjunction with another
technique in order to obtain a reliable identification of the
country of origin.
Siddiqi (1981) analysed ninty samples of honey using a combination
of paper electrophoresis and chromatography. Some samples were
also analysed on the automatic amino acid analyser and this technique
confirmed the semi-quantitative assessment used for all samples.
She was able to demonstrate the presence of pipecolic acid in honey
by the technique of mass spectroscopy. Other amino acids grouped
as unusual such as citrulline, hydroxypipecolic acid, kynurine
33.
and methyl-histidine were identified from their R ARG values and
use of standards. She also demonstrated that a honey sample could
be characterised on the basis of its amino acid patterns and their
relative proportions obtained following paper electrophoresis and
chromatography. Emphasis was placed on the importance of paper
electrophoresis and chromatography methods owing to the fact that
it not only provided a characteristic pattern but also revealed
the presence of trace amounts of amino acids not detected by the
automatic amino acid analyser. Furthermore, her technique could
be applied in the field by scientifically trained beekeepers with
little capital outlay.
Kanematsu et aZ., (1982) analysed one hundred and twelve honey
samples and was able to demonstrate that by plotting ratios of
amino acids against one another, honeys from various origins could
be distinguished. These research workers showed that by plotting
proline/aspartic acid ratio against the total amino acid content
the clover and acacia honeys could be distinguished. Also the
Chinese milk vetch (AstergaZus sinicus) honeys originating from
Japan and China were distinguished by plotting the isoleucine/leucine
ratio against proline/phenylalanine ratio. By plotting the isoleucine/
leucine ratio against the proline/glutamic acid ratio acacia honeys
from Japan, China, Rumania and Hungary were differentiated.
Davies and Harris (1982) demonstrated that by use of complex
statistical analysis of amino acids that it was possible to correctly
classify between British and Foreign honeys. These researchers
found-that the results of identity testing by the ratio method
was poor compared to the success of the canonical variates analysis
34.
for the twenty five samples they used. They suggested that the
results could not be used more widely without having collected
further data to test for the variation due to factors such as season,
climate, sampling and laboratory.
Palma, Fontanarrosa and Vigil (1982) reported that their findings
conformed with those observed by Petrov (1971). These researchers
found that the Indian honeys did not contain cysteine, hydroxyproline,
phenylalanine and threonine but contained isoleucine and methionine
which were not present in the Australian honeys. They also noted
that the Japanese honeys contained methionine and tryptophan in
addition to the sixteen amino acids they identified in the Australian
honeys.
El-Sayed (1982) reported that the clover honeys examined were
representative, and that these samples had a relatively high content
of aspartic acid and glutamic acid. This author suggested that
certain amino acid ratios could be used for identification of country
of origin.
Carter (1983) studied the variation in the free amino acid
composition of honey from a single hive during the summer season
of 1982. This researcher reported that honey from a mixed floral
source is different in terms of its amino acid composition than
that of a unifloral source namely Epilobium auguatifolium. He
also noted the variation in the amino acid content during the season.
Carter also made calculations to the effect that the contributions
of individual amino acids made by the pollens in a jar of honey
are negligible in respect to its overall amino acid composition.
However, considering a mass of 1 to 2 Kg of pollen which is usually
35.
present in a hive could most certainly influence the amino acid
composition of the final honey produced.
Poncini, Wimmer and Vakamoce (1983) reported the presence
of sixteen of the twenty seven common amino acids in varying amounts
of Fiji honeys. They also noted that leucine, tyrosine, valine,
threonine and glycine were found in highest amounts, and cystine
and cysteine in lowest amounts.
Chepurnoi (1983) reported that the main amino acids present
in the following monofloral honeys were: alanine, asparagine,
glutamic acid, glutamine, histidine, leucine, lysine, methionine,
phenylalanine, proline, serine, threonine, tyrosine and valine.
These monofloral honeys were: lime (Tilia sp. ), sanifoin (Onobrychis
viciifoZia), Robinia pseudoacacia, sunflower (HeZianthus annuus),
buckwheat (. Fagopyrum sp. ) and PhaceZia tanacetifoZia. Chepurnoi
observed that threonine was an important free amino acid of light
colour class honeys compared to those of the dark colour class
honeys, e. g. buckwheat and Phacelia. In contrast proline was more
evident in dark colour class honeys than in the light colour class
honeys.
Campus, Madau and Solinas (1983) examined twenty six Sardinian
honeys and reported that on average these honeys contained 73.42 mg
of amino acids per 100g of dry matter. They also observed that
proline constituted on average 69% of the total amino acids and
that cysteine, methionine and tryptophan were present in very small
amounts.
Bonafaccia et aZ., (1984) reported that commercial honey samples
of dubious origin contained less total free amino acid and less
36.
proline than the genuine honey samples although the free amino
acid composition was similar.
Barnard (1986) using the technique of high speed liquid
chromatography and fluorescence detection was able to separate
o-phthaladehyde derivatives of amino acids in honey. This researcher
reported that sixteen amino acids were detected within twenty minutes
of sample application, however, the presence of proline, hydroxyproline,
cysteine and cystine could not be determined. This was because
o-phthaldehyde does not react with the imino acids and gave low
fluorescence yields with cysteine and cystine.
Speer and Montag (1986) examined forty five individual honey
samples from the following sources for the presence of free amino
acids using the technique of ion-exchange chromatography. The
sources were: Chestnut, acacia, rape, dandelion, clover, Tasmanian
leatherwood and heath. These research workers reported that heath
honey had the highest level of free amino acids. They also reported
that amino acid ratios, proline/phenylalanine and proline/tyrosine,
could be used to distinguish French and German heath honeys.
Honey Pollens
Pollen is the chief source of proteins for both the larval
and adult bees. Without the proteins the honeybee cannot develop
and grow (Howells, 1969). The collection of pollen by the honeybee
has been discussed in detail by Free (1970) and Butler (1972).
The chemical composition of pollen obtained from different
kinds of flowers varies enormously. Analysis of pollen from thirty
two different plant species carried out by Todd and Bretherick (1942)
37.
revealed that pollen contained 21% proteins, 11% water, 30% carbohydrates,
about 5% fats, oils and waxes and mineral elements such as potassium,
phosphorous, calcium, magnesium and iron were also shown to be
present. The presence of other constituents such as amino acids,
organic acids, sterols, nucleic acids and pigments, and those listed
above have been reviewed in detail by Stanley and Linskens (1974).
Crane, Walker and Day (1984) have listed the colour, grain, yield
and chemical composition of pollens for four hundred and sixty
seven plants which are a major source of honey produced in the
world. However, only the amino acid composition of pollens will
be considered here in detail.
The Free Amino Acids of Pollens
Nielsen, Grommer and Lunden (1955) reported the presence of
a-aminobutyric acid and hydroxyproline in Zea mays pollen. Virtanen
and Kari (1955) noted the presence of hydroxyproline and pipecolic
acid in the pollen of six wind pollinated plants.
Britikov and Musatova (1964) reported an extraordinarily high
amount of proline in the pollen from sixty four plant families
they examined. Shellard and Jolliffe (1968) reported that there
was no species difference in the amino acid content of eleven grass
pollens which they examined.
Lotti and Anelli (1972) using an automatic amino acid analyser
determined the free amino acid composition of twenty hand harvested
pollens belonging to fourteen botanical families. These research
workers reported that the free amino acid nitrogen represented
a high fraction, up to 95% of soluble nitrogen content of the pollens.
38.
Gilliam,, McCaughey and Wintermute (1980) reported that aspartic
acid and glutamic ac id were the predominant amino acids in the
pollens from citrus cultivar flowers. These researchers also noted
that stored pollen contained higher amounts of proline than the
flower pollen.
Kauffeld (1980) showed that the following ninteen amino acids
were present in the pollen collected by Apis meUifera. These amino
acids were: a- and 0-alanine, arginine, aspartic acid, glutamic
acid, glycine, histidine, hydroxyproline, isoleucine, leucine,
lysine, methionine, phenylalanine, proline, serine, threonine,
tryptophan, tyrosine and valine. This researcher noted that the
amino acids glycine, lysine, phenylalanine and proline showed
considerable variation throughout a year.
Ceausescu and-Mosarie (1981) identified ten amino acids by
the technique of paper chromatography in the monofloral pollens
collected by Apis meUifera carpatica. These research workers
reported that Omipositae pollen contained alanine, aminobutyric
acid, arginine, glutamic acid, hydroxyproline, lysine, methionine,
norvaline, proline and serine; Ranunclaceae pollen contained alanine,
aminobutyric acid, glutamine, glycine, hydroxyproline, leucine,
lysine, phenylalanine, proline and valine; and Jaglandaceae pollen
contained arginine, cysteine, hydroxyproline, leucine, methionine,
proline, serine, threonine, tryptophan and tyrosine.
Zhu and Jiang (1982) observed that the free amino acid content
of pollen showed species variation, in that, pollen of Pinus eUiottii
contained arginine and valine whereas pollen of Ginko biZoba contained
serine and tyrosine.
39.
Nadezhdin et aZ., (1983) reported that the free amino acid
constituted approximately 43% of the total pollen amino acid. These
researchers noted that the Siberian larch pollen contained more
free amino acids than the pollen of the other conifers.
Baruch and Sharma (1984) observed wide variation in the number
and type of amino acids in the pollen from ninteen plants they
examined.
Naumkin (1984) showed the presence of alanine, arginine, asparagine,
glutamic acid, glycine, histidine, isoleucine, leucine, lysine,
methionine, phenylalanine, proline, serine, threonine, tyrosine
and valine in the pollen of the following plants., These plants
were: buckwheat (Fagopyrum ap. ), raddish (Raphanus sativue), cornflower
(Centaura sp. ), red clover (TrifoZium pr-atense), sow-thistle (Sonchus
sp. ), codlins-and-cream (EpiZobiwn hirsut=), burdock (Archium
sp. ) and musk-thistle (Carduus sp. ). This researcher reported
that raddish pollen was found to be the richest in amino acids
whereas the buckwheat and musk-thistle were found to be the poorest.
Wang et aZ., (1985) found that the free amino acid content
of linden pollen was high compared to that of rape pollen.
Feo et aZ., (1985) reported that proline was found in large
amounts in both the pollens of Cunninghamia ZanceoZata and Cephalotaxua
dmpacea and ý-alanine was found in trace amounts in the former
pollen.
Rayner and Langridge (1985) examined the amino acid content
of bee-collected pollen from ten indigenous and sixteen exotic
Australian plants. These researchers noted that the amino acid
pattern for pollen from both these plant sources indicated that,
4o.
generally, the level of amino acids in the pollens were above bee
requirements. They also reported that the amino acid tryptophan
whose low concentration had been found to be rate limiting for
the honeybee! s nutrition.
Mellissopalynology
The way in which pollen grains and other microscopical particles
such as root, dust, yeast, spores and other constituents enter
the honey have been discussed by Maurizo (1980). It is the microscopical
analysis of these elements found in honey which is known as
'mellissopalynology'. Typical authorities on the practice of mellissopaly-
nology are Louveaux, Maurizo and Vorwohl (1970 and 1978) and Sawyer
(1975).
This microscopical analysis of honey not only reveals the
botanical and geographical origin but also the presence of honeydew,
adulteration and the extraction techniques. This was demonstrated
by LQuveaux, Mmrizo and Vorwohl (1970 and 1978).
Much of the development of the pollen analysis techniques
had been carried out in Europe during the pre-war period 1930 -
1940. The International Commission for Bee Botany (1953) published
a method for pollen analysis of honey and this method was revised
and reviewed in 1962. Louveaux, Maurizo and Vorwohl (1970) established
the present method of melissopalynology and this technique was
later (1978) up-dated to include the 'acetolysis' method recommended
for use on honey. Briefly, the procedure involved the addition
of a mixture containing sulphuric acid (1 ml) and acetic anhydride
(9 ml) to the sediment obtained after centrifugation (2,500 revolutions
41.
per minute) of honey diluted with water (w/v 3: 5) to remove carbohydrates,
and the resulting mixture was then incubated at 70 0 C, centifuged
and the supernatant removed. This sediment was re-suspended in
a mixture of distilled water and detergent, and this supernatant
was decanted and the final sediment was mixed with a medium containing
glycerine/gelatin prior to mounting. There are many variations
in the procedure of acetolysis chiefly to accommodate various
aspects of palynological investigations such as fossils, archaeology,
pollen allergy and forensic science. Usually these acetolysis
procedures are preceeded or in some cases succeeded by a clarification
step. This step involves the removal of extraneous matter, complex
acidic components present in soil or cellulose or lignin from
plants structures (Faegri and Iverson, 1975).
In the first extensive survey of honey produced in the British
Isles, Deans(1957) carried out pollen analysis on eight hundred
and fifty four samples of honey in order to establish the source
of honey. This author recorded the presence of sixty six species
of pollen in honey samples he examined. He reported that the
most wide spread important honey sources in the British Isles
in 1952 were the White clover M-ifotium repens), fruit (Prunuslpyrus),
raspberry/blackberry (Rubus) and heather (CaUuna).
Chaubal and Deodikar (1965) carried out an extensive morphological
characterisation of pollen grains of some major, minor and accessory
bee plants from the western regions of India. These researchers
also determined the seasonal variation in the pollen composition
of honey during the successive honey flows in the annual cycle.
An extensive list of the pollen grains which were identified has
42.
also been presented.
Howells (1969) examined the pollens from seventy two Welsh
honeys and reported that the TrifoZium repens occurred as a major
source of pollen in 64% of the samples followed by Brassica pollen
in 18% of the samples. While Prunus/pyrus ranked third with
15% of the samples. However, Prunuslpyrus also ranked as the
most important secondary source with 48% of the samples.
James (1969) reported that the classification of honey pollens
was not difficult at the plant family level. However, an exact
identification at species level was more demanding and complicated
further by the commercial practice of filtering honey.
Lieux (1972) identified fifty eight different pollen types
in fifty four commercial Louisiana honeys. This author reported
that the honeys collected from different regions of Louisiana were
not easily distinguished from one another geographically by pollen
types, except in a few instances. The major honey plants from
this region were of the Fabaceae family, predominantly-TrifoZium
repens, Rubus, Berchemia scandens and'SaZix.
Sawyer (1975) analysed the pollen grains of one hundred and
twenty eight samples of imported honey in England. He described
the major common pollen grains that are characteristic of the
individual countries.
Adams, Smith and Townsend (1979) carried out pollen analysis
of samples of nectar shaken from the combs at frequent intervals
throughout a season. These researchers identified thirteen taxa
in the honey samples collected at the end of the season, whereas
43.
a cumalative total of sixty two were found in the nectar samples.
In this way they were able to obtain a much more complete picture
of the nectar sources used by a colony over its active season.
Adams and Smith (1981) suggested that a study of the variations
of pollen pattern with season of a given nectar source and of
the associated honey derived therefrom would be beneficial. The
lack of such information at present indicated the need for further
investigations to justify the reliability of pollen analysis as
a sole indicator of floral source.
Sawyer (1981) has described a relatively simple method of
microscopical identification of pollen grains present in honey
using key index cards and microphotographs of two hundred and
fifty four pollen grains. He has also given an identification
key for the pollen grains of one hundred and thirty four plant
species, describing their size, shape, aperture number and type,
surface and structural features and the exine section.
Weber (1982) used a light microscope and also a scanning
electron microscope in order to identify the presence of tricolporate
pollen grains belonging to the Fagaleae, Quercus group in eleven
orange honeys from the East coast of Spain. Only three honey
samples out of the eleven were considered as orange honeys whereas
the other eight samples contained more Quercus iZex pollen than
the citrus. Weber concluded that because of the sweet smell of
orange blossom these samples contained large quantities of citrus
nectar.
44.
Porras (1982) studied the pollen spectrum of the sediments
of one hundred samples of honey obtained from the Sierra of Aracena,
Spain. This researcher reported that the most characteristic
botanical species of honey survey belonged to the EuCaZyptus,
Cistus, Erica and Echium pollen types. The honeys examined were
of nectar origin as evaluated by their pollen content.
Varis, Helnuis and Koivulehta (1982) analysed the-pollen
spectrum of one hundred and sixty samples representing the whole
beekeeping area of Finland in the years 1977 and 1978. The Brassicaceae
pollen grains were the most frequent and abundant type. These
pollen grains were: TrifoZium repens and TrifoZium hybridium,
saZix spp.; The Rosaceae group that is, Prunus, MaZus, Sorbus
spp.; Apiaceae and MipenduZa uZwria. These researchers were
able to explain the seasonal variation in spectrum caused by weather
conditions.
Feller-Demalsy (1983) examined one hundred and sixty four
samples of honey from Quebec, Canada, which had been collected
in 1977 and 1978. This author reported that the pollen species
most frequently represented in these honeys were: TrifoZium
(hybridium and/or repens), Vicia cracca, Rubus ep., TrifoZium
pratense, SoUdago, SaZix sp. and MeZiZotus sp.
Moar (1985) carried out pollen analysis on one hundred and
ninteen samples of New Zealand honey. He reported that Trifolium
repens (White clover) is the most important nectar source available
to bees in New Zealand and its pollen occurred as a dominant,
secondary and minor type. This researcher found that there were
45.
generally more pollen-types derived from wind pollinated plants
in honeydew honey than in floral honey. Also noted was that wind
pollinated plants such as grass, plantain and Coprosma were worked
by bees for pollen. Moar observed that honey originating from
a particular district of New Zealand could be determined within
limits of pollen analysis but such deductions were dependent upon
careful pollen identification together with a sound background
knowledge of flora and vegetation of New Zealand.
The Characteristics of Pollens in Honey
Pollen grains from different plants vary considerably in
their size, shape and structure. These variations have to be
taken into account during pollen analysis. The smallest pollen
grains that are found in honey are those of the AVosotis arvensis
(the common forget-me-not). These grains are only 6 Mm in size.
The largest are the Abies. (Fir) occurring up to 145 pm in size,
(Sawyer, 1981).
However, if the same number of two different pollen grains
are to be found in a honey sample this does not mean that the
same amount of nectar from the two plants was collected. Moreover,
due to their size the small pollen grains of AVosotis arvensis,
Castanea sativa, Cynoglossum officinale and Mimosa pudia are known
to be 'over-represented' in honeys. Whereas, on the other hand
'under-representation' may be due to the bees deliberately dusting
off the pollen after collecting the nectar, those of Tilia (Lime)
pollen (Howells; 1969). In some citrus varieties the anthers
are almost sterile and hence only ten to twenty percent of the
46.
citrus pollen may be present in a honey sample. The pollens of
Robinia pseudoacacia, chamaencrion, Banksia, Curcurbitaceae, EpZiZobium
and Rosmarinus are known to be under-represented (Louveaux, Maurizo
and Vorwohl, 1970 and 1978). The pollens from thyme (Thymus vuZgaria,
citrus and rewarewa (Knightia) were under-represented in New Zealand
honey. Whereas pollen from manuka (Liptospermum) and kamahi
(Weinmannia) were over-represented in New Zealand honey (Moar,
1985).
Honey Adulteration
Honey being essentially a flavoured sugar solution now much
higher in price than other sweetening agents leads to the temptation
of possible adulteration. Under this broad heading one can group
misrepresentation, adverse processing conditions, bad practice
by the beekeeper and finally delibrate addition of water, glucose
or fructose syrups and especially of high fructose syrup, or of
artificial essences. It is important to distinguish these adulterated
products sold as honey from the artificial honeys deliberately
made and sold as such to provide a 'honey flavourl for the catering
and confectionary trades. The various aspects associated with
each of the four defects have been shown in Figure 1. Reports
found in the literature pertaining to the various aspects of defects
in the production of honey have also been shown. Usually these
practices lead to the lowering of the quality of honey.
Various techniques have been developed and utilized to determine
the extent and degree of these practices. At first the technique
developed were aimed at the addition of acid inverted syrups. The
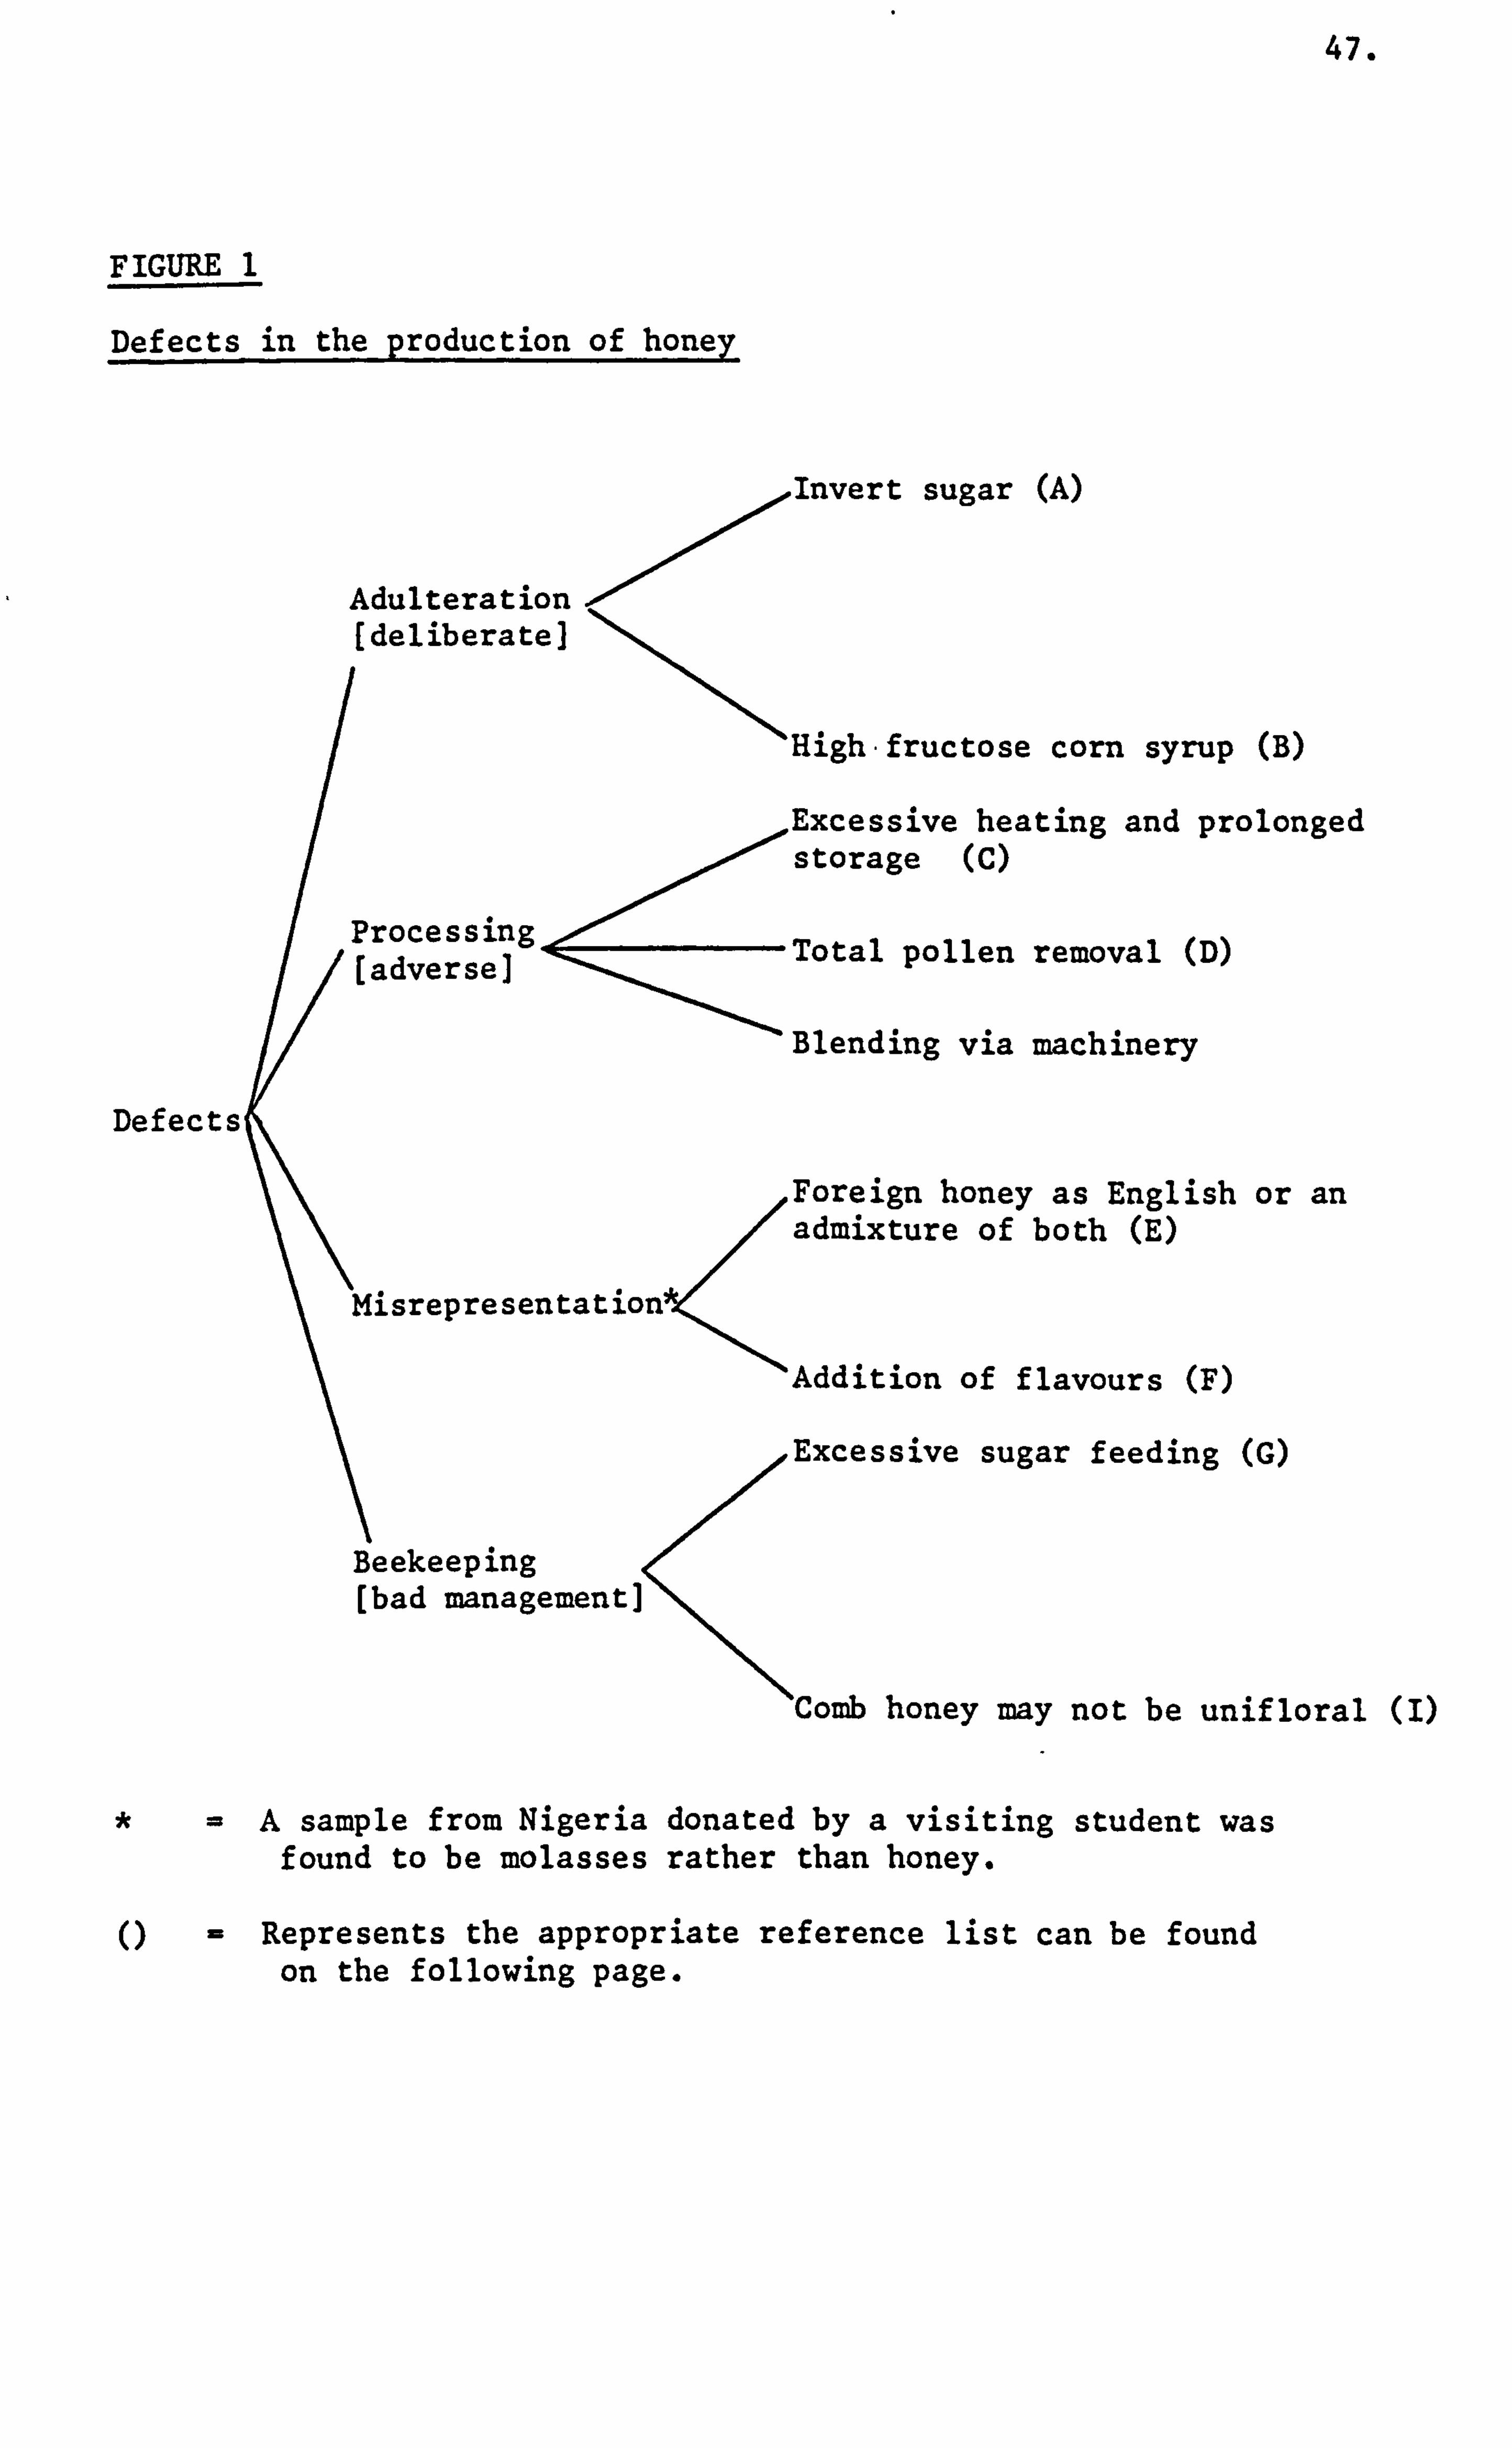
47.
FIGURE 1
Defects in the production of honey
Invert sugar (A)
Adulteration [deliberate]
I NN, --ýHigh-fructose
corn syrup (B)
Excessive heating and prolonged
Processing
storage (C)
[adverse] Total pollen removal (D)
Blending via machinery
Defects
Foreign honey as English or an admixture of both (E)
resentation *11
Addition of flavours (F)
Excessive sugar feeding (G)
Beekeeping [bad management]
honey may not be unifloral (I)
A sample from Nigeria donated by a visiting student was found to be molasses rather than honey.
Represents the appropriate reference list can be found on the following page.
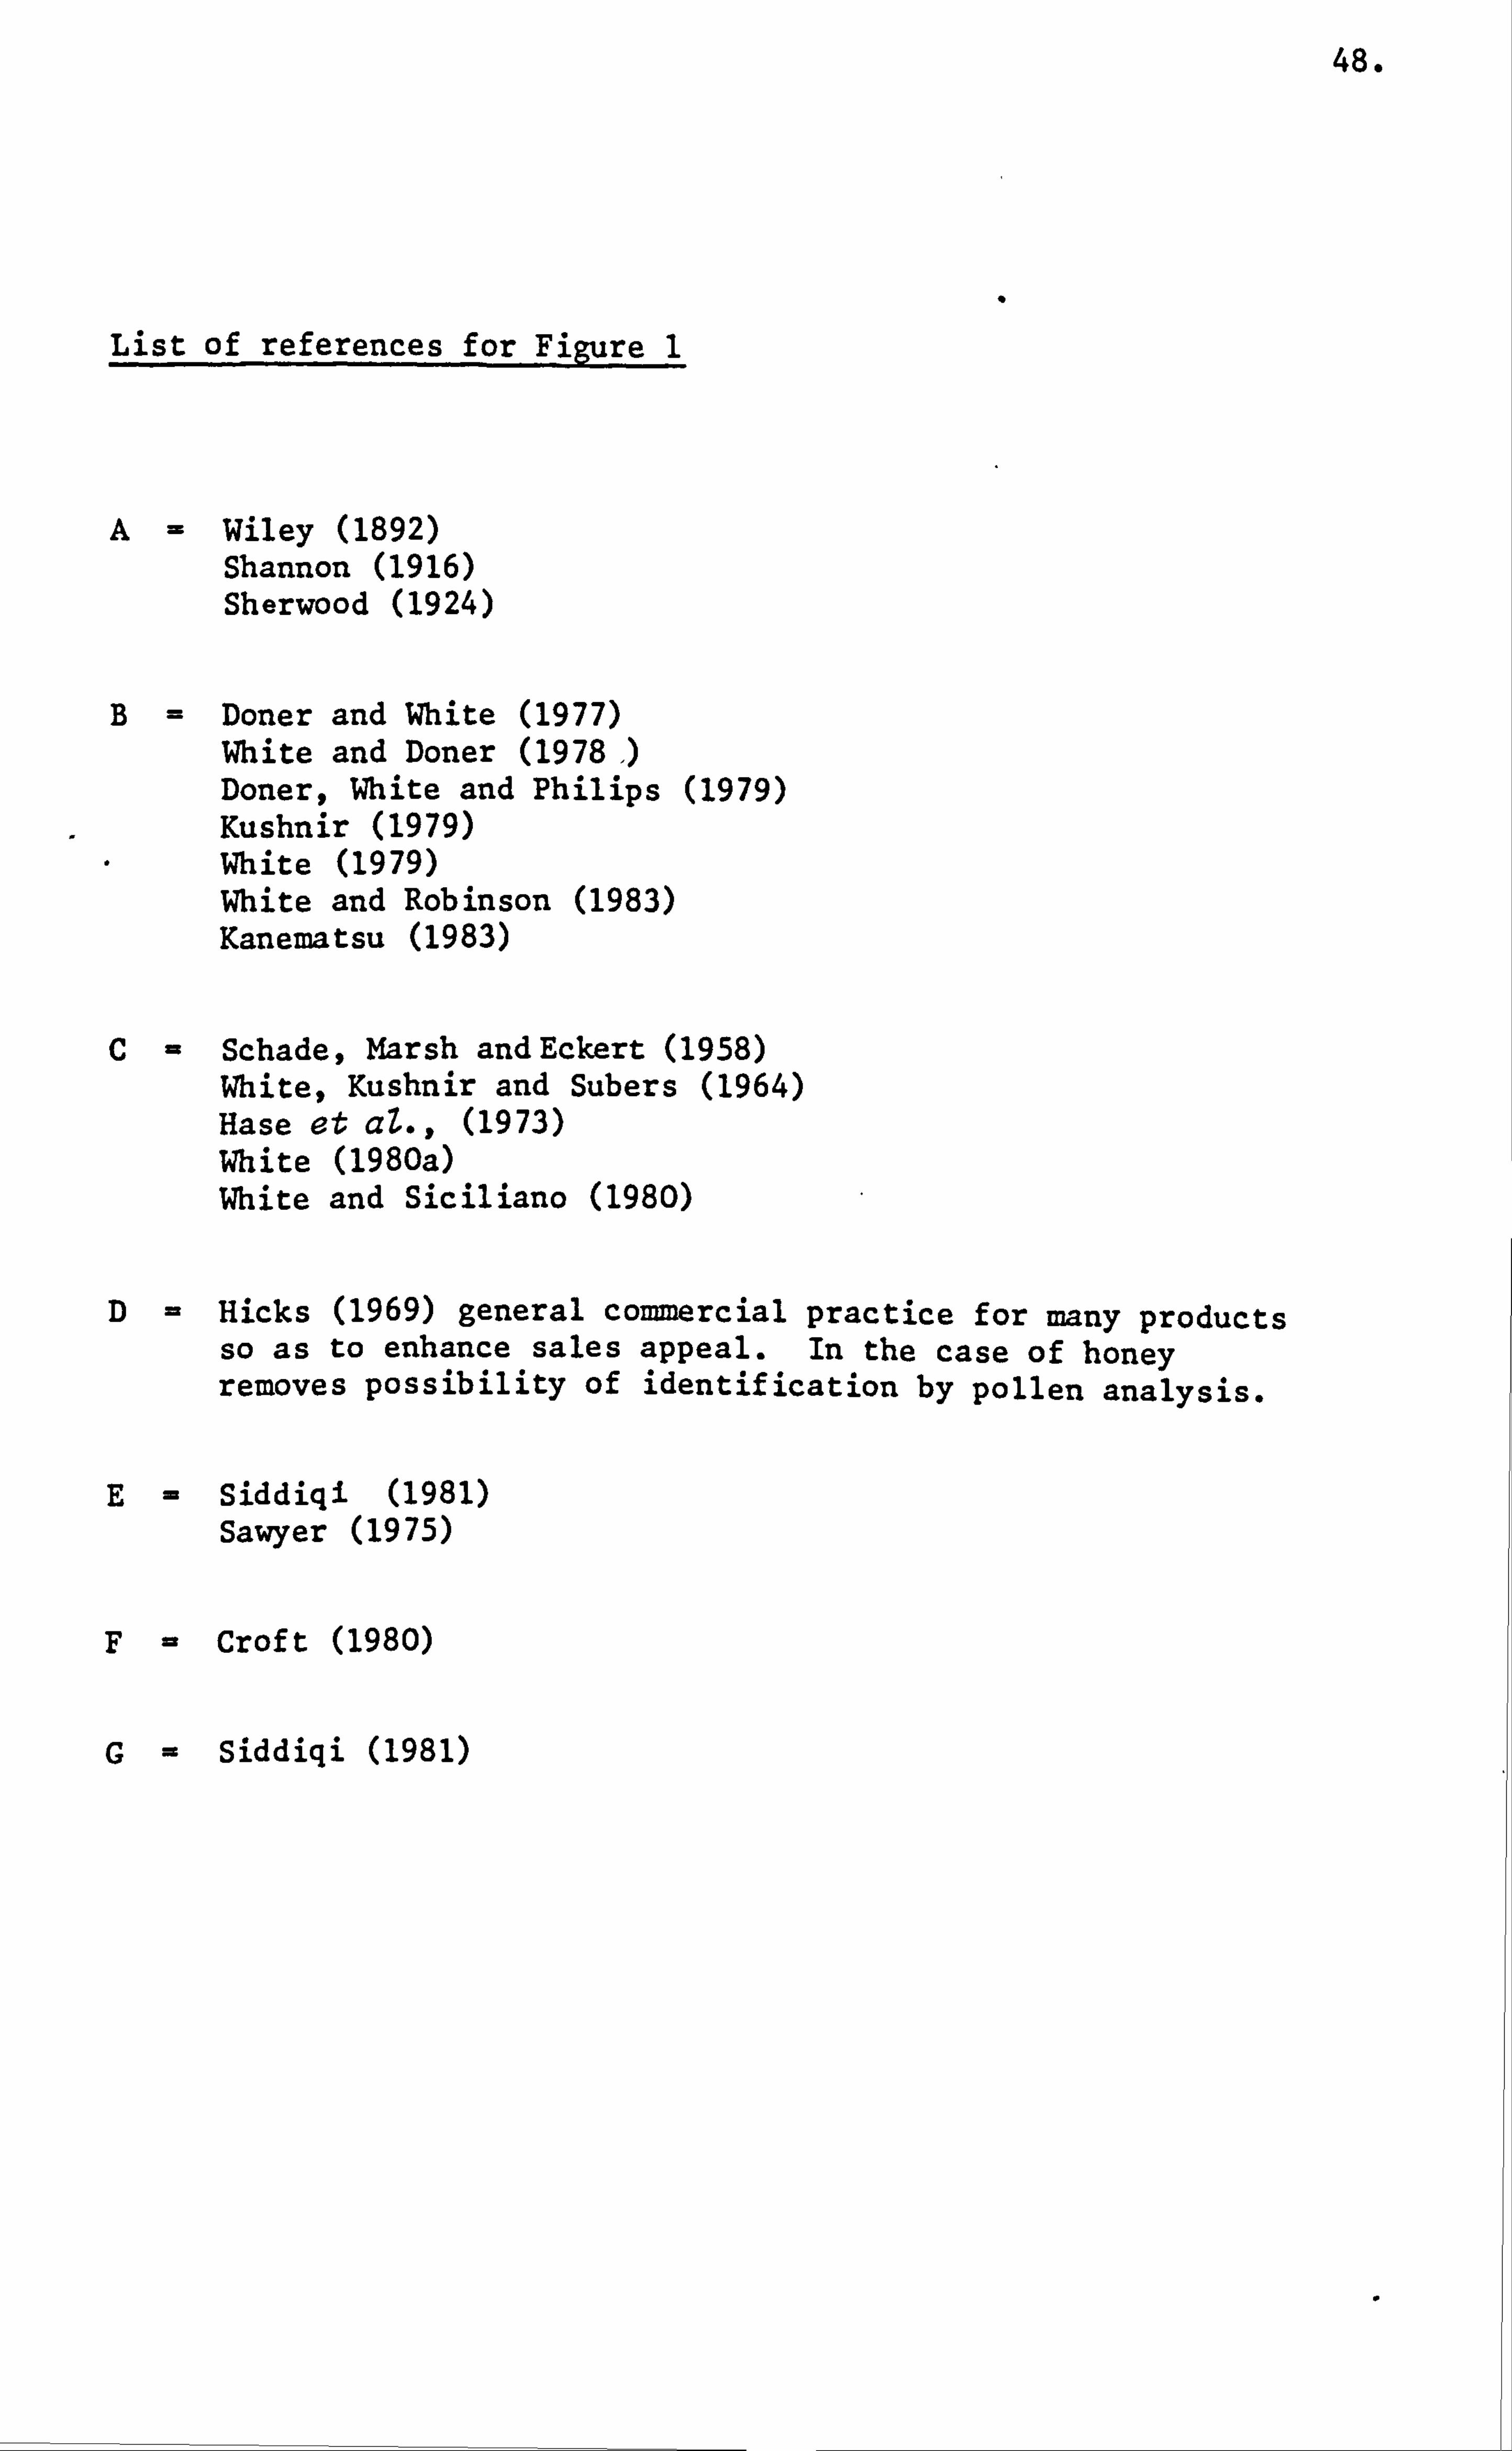
48.
List of references for Figure 1
A- Wiley (1892) Shannon (1916) Sherwood (1924)
B= Doner and White (1977) White and Doner (1978) Doner, White and Philips (1979) Kushnir (1979) White (1979) White and Robinson (1983) Kanematsu (1983)
C= Schade, Marsh and Eckert (1958) White, Kushnir and Subers (1964) Hase et aZ., (1973) White (1980a) White and Siciliano (1980)
D= Hicks (1969) general commercial practice for many products so as to enhance sales appeal. In the case of honey removes possibility of identification by pollen analysis.
E- Siddiqi (1981) Sawyer (1975)
F= Croft (1980)
G- Siddiqi (1981)
49.
resorcinol (Fiche) Test (1908) and aniline (Feder) te'st (1911)
have since then been intensively studied and modified. The measurements
of the levels of hydroxymethy1furfural as an indication of addition
of invert syrup have proven to be inadequate. This was due to
the fact that the hydroxymethy1furfural levels increase during
prolonged storage at high ambient temperatures or that the honey
has been subjected to excessive heating (Schade, Marsh and Eckert,
1958, White, Kushnir and Subers, 1964 and White, 1978). The measurement
of the amount of sediment obtained during the extraction of honey
for the purpose of pollen analysis have been reported by Louveauxt
Maurizo and Vorwohl (1970). These researchers suggested that
low amounts of sediment indicate that either the honey was naturally
poor in pollen or that the honey had been excessively filtered,
or sugar-fed. The, apicultural and botanical factors that are
involved in the detection of misrepresentation of honey have been
reported by Sawyer (1975). Maurikos et aZ., (1978) reported inconsistent
patterns of free amino acids during two dimensional paper or thin
layer chromatography in honey adulterated with invert sugar.
High fructose corn syrup (HFCS) has become a major source
of possible honey adulterant. This is because HFCS can be produced
relatviely cheaply and in bulk by using immobilised glucose isomerase
enzymes (Mermelstein, 1975). Instrumental methods have been examined
and developed to determine the presence of HFCS in adulterated
honeys. A method has become predominant in the detection of HFCS
in honey. This method utilizes a highly specialised isotope ratio
mass spectrometer to detect the presence of stable carbon isotopes
of atomic mass 12 and 13 (Horwitz, 1980).
50.
In order to explain that there is a difference in utilization
of isotopes of carbon 12 and 13 by plants which can be measured,
although very expensively in a mass spectrophotometer, it is necessary
to briefly review current biochemical theory.
It is known that the major sources of nectar of the honeybee
are the three-carbon plants (C 3) and the high fructose corn syrup
obtained from corn (maize) is known to be a four-carbon plant
(C 4 ), using the terminology as used by Edwards and Walker (1983).
The differences in the C3 and C4 plants is in the assimilation
of atmospheric carbon dioxide.
In C3 plants the atmospheric carbon dioxide is taken up by
the Bassham-Benson-Calvin cycle. Here the CO 2 is first bound
to ribulose-1,5-diphosphate by the enzyme ribulose-1,5-diphosphate
carboxylase present in the chloroplasts. The resulting six-carbon
compound is immediately converted to two molecules of the three-
carbon compound, 3-phosphoglycerate (Prince, 1983).
In C4 plants the atmospheric carbon dioxide is taken up by
the Kartschak-Hatch-Slack cycle. In this case the Co 2 is first
bound to phosphoenolpyruvate by the enzyme phosphoenolpyruvate
carboxylase present in the mesophyll cells. The immediate product
is the four-carbon compound oxaloacetate. This compound oxaloacetate
is then transferred from the mesophyll cells to the bundle sheath'
cells and thence to the chloroplasts therein. 'A decarboxylating
enzyme releases the carbon dioxide molecule bound to form the
oxaloacetate, to reform-phosphoenolpyruvate The released carbon
dioxide then enters the Bassham-Benson-Calvin cycle as described
above (Prince, 1983).
51.
This difference in the metabolism between the C3 and C4 plants
results in the phenomenon known as isotope enrichment. Since
atmospheric carbon dioxide contains approximately 1% 13 CO 2 and
the remainder is 12 CO 2* The differences in the isotope abundance
is expressed by the isotope ratio 6 13 C expressed as parts per
thousand (0/oo) (Edwardsand Walker, 1983). It is known that the
enzyme ribulose-1,5-diphosphate carboxylase discriminates against 13 co 2 more than the enzyme phosphoenolpyruvate carboxylase. The
net effect is that the C3 plants produce sugar with a6 13 C value
of -28.30/oo whereas the C4 plants produce sugar with a6 13 C value
of -9.00/oo (Prince, 1983 and Croft, 1987).
White and Doner (1978 ) showed that honey has a6 13 C value
of -25.4 0 /oo with a range of -22.5 to -27.40/oo and high fructose
corn syrup has a6 13 C value of -9.70/oo with a range of -9.5 to
-9.80/oo. Hence the carbon isotope method can be used to detect
honey adulterated with high fructose corn syrup. Invert sugar
produced from'sugar cane can also be distinguished since it has
a6 13 C value of -11.00/oo (Edwards and Walker, 1983).
Other methods have also been developed to detect honey adulterated
with high fructose corn syrup. These are: the thin layer chromatography
on silica gel (Kushnir, 1979) and high pressure liquid chromatography
(Kanematsu et aZ.,, 1983).
Serra and Gomez (1986) applied four different methods to
detect adulteration of honey with four different sugar products.
These methods and sugar products were: the determination of hydroxy-
methy1furfural enabled the detection of invert sugar adulterant
at a level of 5% or more; the adulterant common glucose syrup at a
53.
in honey from New Zealand have been extensively studied by Hodges
and White (1966), Turner and Clinch (1968) and Clinch and Turner
(1968 and 1975). Palmer-Jones (1968) reported that nectar from the
Karaka tree (Corynocarpus caevigata) was only poisonous to the
adult worker bees.
Scott et aZ., (1971) reported the presence of graynotoxin
II and III in a honey sample from the region of Grouse Mountain
in the province of British Colombia in Canada. These two compounds
are closely related to graynotoxin I (andromedotoxin) which was
not found in this honey sample.
White (1973) has extensively reviewed the literature on toxic
honey and has listed the reported symptoms after the consumption
of poisonous honeys by animals and humans.
Jachimowic, z and El-sherbiny (1975) reported that invert sugar
containing 30 mg of hydroxymethylfurfural per 100g of honey was
toxic when fed to the honeybee.
Majak, Neufeld and Corner (1980) reported that the nectar
of AstragaZus miser v. serotinus was found to contain a misertoxin,
a nitropropanol glycocide which resulted in the poisoning of the
honeybees.
White (1981) has reviewed the literature on the occurrence
and identification of the toxic compounds in honey. This author
has described the symptoms of poisoning by these compounds in
experimental animals and human subjects. The structure of six
of these toxic compounds, that is, acetylandromedol, andromedol,
anhydroandromedol, gelsemine, tutin and hyenanchin have also been
given.
54.,
Atkins (1982) has discussed in detail the effects of poisoning
of the honeybees by pesticides and has also listed the plants
which are poisonous to them. These plants are: the california
buckeye (AescuZus caZifornica), black night shade (SoZanum nigrum),
death carnas(Zygadenus venenosus), dodder (Cuscuta sp. ), summer
titi or leather-wood (CyriZZa racimifZora), locoweeds (AstragaZus
sp. ), mountain laurel (KaZmia ZatifdZia), seaside arrowgrass
MýZochin rwritima), whorled milkweed (AscZepias subnerticiUata),
western false hellebore (Veretum caZifornicum), hellebore (Veretum
aZbum), henbane (Eyoscyamus niger), horse chestnut (AescuZus hippocastanwn)
and rhododendrons (Rhododendron sp. ) and its hybrids.
With the increased use of pesticides and insecticides to
deter insects that cause damage and/or destruction of crops are
also liable to have similar effects on the honeybee. The spraying
of crops with these insecticides or pesticides must be carried
out so that the mortality rate of the individual honeybees or
the honeybee colony is negligible or minimised. The effects of
insecticides on the honeybee have been studied by Arzone (1984)
and Homan and Baird (1983).
Apart from the presence of toxic compounds in low concentrations,
honey is also subject to unpleasant flavours and aroma or bitter
tasting. The main origins of these characteristics are due to
source of nectar collected by the honeybees. In the British Isles
honey from ragwort (Senecio sp. ) has been described by Howes (1979)
to have a strong flavour and aroma which is somewhat nauseous.
Also, honey from privet (Ligustr-um sp. ) has been described to
have a distinctly bitter taste and was quoted to be quite uneatable.
55.
Further, it was pointed out by Hooper (1976) that these offensive
flavours and aroma are often lost when crystallisation and processing
are completed. Howes (1979) also noted that honeydew from lime
has been reported to have caused fatalities amongst honeybees
working limes such as TiZia petioZaris, TiZia tomentosa and TiZia
orbicuZaris flowering late in the season. In other parts of the
world, Europe, Americas, Australia, honeys from Agave, Hezianthus
annuus, Senecio jacobaea and Castanea sativa plant species have
been reported to have unpleasant flavours, strong aroma and possess
a bitter taste (Crane, 1980) and other sources have been listed
by Crane, Walker and Day (1984).
AIMS
1. To determine selected chemical components of honey and to
show the variation of such compounds with floral or geographical
source.
2. The determination of the free amino acids of honey and the
use of this information to aid identification as to source
even in highly strained pollen-free samples.
3. The correlation of chemical methods with the traditional
pollen analysis and with computer predictions.
4. To explore the possible uses of chemical identification to
detect adulteration, misrepresentation and gross mishandling
of honey.
EXPERIMENTAL
CHAPTER 2
56.
EXPERIMENTAL
CHAPTER 2
Equipment
Amicon Standard cell No. 402, filtration unit and a UM10 membrane
filter to exclude material below 10,000 daltons molecular weight were
purchased from Amicon Ltd., High Wycombe, Bucks.
Electrophoresis tank, PAGE and 'tent' tanks, 'Shandon' chromatank
and the 'Shandon' vokam power pack, 400V output were purchased from
Shandon Southern Instruments Ltd., Carnerley, Surrey.
Olympus FHT microscope fitted with triocular head, eyepiece X10
and objectives X10 and X40, were purchased through Gallenkamp (London).
Olympus OM2 camera was fitted with microscope adaptors and was
used to record pollen grains at the recommended magnification of X400.
Technicon TSM1 Multisampler amino acid analyser was purchased
from Technicon Instruments Ltd., Hailton Close,, Basingstoke, Hants.
Gel scanner Model UA-5 was purchased from Instrumentation
Specialities Company, Lincoln, Nebraska, Ti. S. A.
sp8-500 UV/VIS Spectrophotometer PYE Unicam was purchased from
PYE UNICAM Ltd., York Street, Cambridge.
Plastic bottles (100 mls) were purchased from Kartell Plastics
(UK) Ltd., Unit 2, Broad Lane, Cottenham, Cambridge.
Materials
Normal laboratory chemicals of analytical reagent quality and
distilled water were used as required. Given below is a partial
listing of chemicals used. These were:
57.
Bovine serum albumin, Invertase grade V free of catalase and
a-galactosidase-activity, 30 - 50 units per mg of solid, Bakers yeast
and Folin. Ciocalteau. 's reagent were purchased from Sigma Chemical
Company, London.
Acrylamide, NON'-methyl-bis-acrylamide, sodium dodecyl sulphate,
Coomassie Brilliant Blue and Dowex resin 50-X8.20 - 50 Us Mech (Na)
were purchased from BDH Chemicals Ltd., Poole.
N, N', N", N"I-tetr;;. methylenediamine and 0-mercaptoethanol were
purchased from Koch Light Laboratory Ltd., Colubrook, Buckinghamshire.
Napthalene Black 12B, propanr2-ol analar grade and Basic fushin
were purchased from Hopkin and Williams, Chadwell, Health, Essex.
Most of the honeys received were samples provided through the
courtesy and arrangements made by the British Beekeepers Association
who also made a donation towards the cost of the survey. These survey
samples were of known origin and provenance.
Many of the honeys of foreign origin were samples taken from the
bulk containers as shipped and provided by Manley Ratcliffe Ltd.,
Berinsfield, oxford. Other 1 lb jars of various honeys were either
donated by named individuals or by retail purchase.
All the honey samples received were catalogued and listed in
Appendix I. according to the label or information provided.
METHODS
Preparation of Honey Samples for Analysis
All the honey samples apart from the China Buckwheat, Code No. 209,
which was stored at 40C, were stored at room temperature, 18 - 22 0 C.
Honey samples that were received in pieces of combs or containing comb
58.
fragments and wax were first strained before any analysis could be
performed on them. Also those samples which were soft-set or creamed
required thorough stirring. Those samples that had crystallised or
were solid upon receiving required gentle warming at 400C with
stirring to dissolve the crystals.
Preparation of the China buckwheat Honey (Code No. 209)
The China buckwheat honey when received in a fifty pound plastic
container contained bees and bee fragments, comb fragments and wax, and
above all most of it had crystallised. This plastic container was
placed in an oven maintained at 45 0 C, for twenty four hours. This
honey was then strained through. a layer of mesh and*bench cloth. The
debris on the sieve cloth and the remaining crystallised honey was
warmed at 550C and stirring thoroughly to break up the crystals. This
semi-solid honey was left at this temperature, overnight. Before
straining the honey was again stirred to ensure that all the crystalline
honey had dissolved. The remaining debri on the sieve cloth was discarded.
Both these portions of strained China buckwheat honey were pooled and
collected in ten plastic containers (500 mls), and the remainder in its
original cleaned plastic container. This honey was then stored at 40C
until required.
Prep ration of the United Kingdom survey honeys
These honey samples were received in plastic containers (100 mls).
Those samples that were received within pieces of combs or with fragments
of combs and wax were first strained before being analysed. These
samples were strained through a mesh cloth placed over the mouth of a
beaker (100 mls) and then left in an oven maintained at 40 0C for an hour.
59.
Crushing the combs with the aid of a glass rod often facilitated the
straining process. Occassionally it was necessary to stir the crushed
comb and honey on the mesh cloth. The comb fragments with the residue
honey that remained on it were discarded. This strained honey was then
collected in a clean plastic bottle (100 mls). Honey samples that were
soft-set or crystalline were treated as described above before being
analysed.
Preparation of English Chorley Honey (Code No. 261)
This honey was donated by Dr. Croft who upon request ensured that
during its removal from the combs it was carefully manipulated with
minimal heating. This was done so that the honey was subjected to
conditions which would have little or no overall effect on the honey's
consistituents and composition and this sample when received was
stored at 4 OC.
A portion equivalent to one-third of the total amount of honey
received was subjected to the following conditions. These conditions
mimicked those encountered after the normal extraction from the hive
and thereafter processing by the beekeeperv followed by the commercial
producer before bottling. This one-third portion of honey after
removal from storage at 40C was equilibrated to room temperature over a
period of two hours. Then the honey was strained through cheese cloth
with gentle heating as described previously. Vigorous stirring of the
strained honey was carried out with the aid of a spatula for about two
to three minutes and then allowed to settle for a period of one hour.
After this the honey was warmed at 60 0C for a period of twenty four
hours.
60.
The remaining two-thirds of the English Chorley honey that was not
subjected to the conditions just described above was used as a control
for the heat treated sample.
For the purpose of identification the heat treated one-third portion
of English Chorley honey will be referred to by the Code No. 261a.
Whereas the not heat treated two-third portion of English Chorley
honey will be referred to by its original Code No. 261.
Subjective Analysis-and Evaluation
The colour, appearances and odour of the U. K. survey and foreign
and commercial samples were determined by sensory examination. The
colours of the honeys ranged from a soft pale white crystalline
appearance of the Brassica honeys to the dark brown almost black of
the China buckwheat. Nearly all the samples received were either
soft-set or crystalline with only a few that were liquid.
In general, the aroma of the samples ranged from a gentle pleasing
fragrance of flowers and fruit blossom, especially the light colour
honey, to the strong unpleasant of the dark colour honeys. The sign
of fermentation was evident in some of the sugar fed samples and in
some of the bulk honeys by the distinct smell of alcohol. An odour
characteristic of hydroxymethy1furfural was evident in some commercial
samples.
The honey samples were not tasted as the laboratory was within a
building especially designed for radioactive analysis and any mouth
pipetting or tasting was forbidden.
Furthermore, considerable experience was required in recognising
the different aromas and flavours.
61.
An example of the questionnaire sent to the participating
beekeepers is given in Appendix II and their replies to questions
No. 2,3,4,5 and 6 have been given under their appropriate sections.
The Isolation and Concentration. of Proteins in Honey
Ultrafiltration
The basic principle involved the separation of soluble low
molecular weight components those less than 10,000 daltons from a
solution containing both micromolecules and macromolecules. This
separation is based on the use of a controlled pore membrane which
permits passage of a defined range of molecular sizes. This separation
is achieved by applying a positive pressure on the solution above a
semi-permeable membrane.
The concentration of proteins present in honey was achieved by
accelerated ultrafiltration using Positive nitrogen pressure in an
Amicon Standard cell, Model 402 of 400 ml capacity, fitted with a
UM10 semi-permeable membrane filter whose molecular weight exclusion
limit is 10,000 daltons.
Representative honeys from the foreign and commercial samples were
examined for protein content; these samples were: Australia Banksia.
(Code No. 194), Canada (199), Chile (214), Hungary Polyflora. (222),
Mexico Yucatan (227) , New Zealand (229) , Yellow Box (246) and English
pure Staffordshire (248).
Procedure
The procedure used by Bergner and Diemar (1975a) was followed with
a few modifications. A sample of honey (25g) was weighed out and then
diluted with 0.033M sodium phosphate buffer (50 mls) at pH 6.5.
62.
This honey mixture was transferred to the Amicon standard cell. A
pressure of four hundred and four-teen kilo Pascals (sixty pounds per
square inch) was applied using a nitrogen cylinder. Portions (20 mls)
of buffer were added when the solution in the Amicon standard cell
reached 10 to 15 mls. This process was repeated until the filtrate
gave a negative result on testing with Benedict's solution. This
indicated that the reducing sugars and other soluble components
including macromolecules of less than 10,000 daltons had been removed.
The solution within the Amicon-standard cell was concentrated to a
volume of 10 mls. This protein concentrate from honey was then
freeze-dried and the weight of the solid product was noted.
This dried residue was stored iti vacuo in the presence of phosphorous
pentoxide to prevent the process of hygroscopicity and microbial
contamination.
It was found necessary to perform the filtration process at 40C
in order to minimize the risk of bacterial contamination of the honey
solution.
Quantitative Estimation of Proteins in Residues from
Ultrafiltration of Honey
The Lowry Method
Proteins when reacted with Folin-Ciocalteau's reagent in the
presence of alkaline copper solutions, that is, under conditions given
by Lowry et aZ., (1951) bring about a reduction of the phosphomolybdic-
tungstic mixed acid by the loss of up to three oxygen atoms from the
tungstate and/or molybdate ions. This mixed acid is the final chromagen
and involves the following chemical species:
63.
3H 2 O-P 205 -13Wo3*5Moo3o 10H 20
and
3H 2 O-P 205 -14WO 3' 4Moo 3* 10H 20
The result is the production of one or more of several possible
reduced species which have a characteristic blue colour (X max ,
745 -
750 rm and Xmin 405 rm). The copper ions present form chelates with
the peptide bonds of the proteins thereby facilitating the transfer
of electrons to the mixed acid chromagen, particularly in the vicinity
of the amino acid functional groups. Thus increasing the sensitivity
of the proteins. Hence, as the amino acids alter in concentration for
each protein,. so does the response. It is conventional to use a soluble
protein-serum albumin as standard (Peterson, 1979).
Preparation of solutions and reagents
Solution A consisted of 2% (w/v) bisodium carbonate dissolved in
O. lM sodium hydroxide solution.
Solution B1 consisted of, l% . (W/V) copper sulphate (CuSO 4' 5H 2 0).
Solution B2 consisted of 2% (w/v) sodium potassium tartarate.
Reagent B was obtained by mixing equal volumes of solution B1 and
B2.
Reagent C was obtained by mixing solution A with reagent B by
the ratio 50: 1 (v/v) and was freshly made when required.
Reagent D was obtained by mixing 1 volume of Folin-Ciocalteau's
reagent with 2 volumes of water.
64.
Procedure
The method of Lowry et aZ., (1951) was used. Bovine serum albumin
was used to"prepare a series of protein standards covering the range
from 20 to 260 ug of protein per ml. Portions of the residues from
ultrafiltration of honey (0.1g) was weighed and dissolved in distilled
water (5 mls) and each 1 ml of this solution was further diluted to
5 mls. Aliquotes (0.5 mls) of each of these diluted solutions, that
is, the protein standards and honey concentrates were mixed with
reagent C (5 mls) and left for ten minutes at 23 0 C, before adding
reagent D (0.5 ml) and mixing immediately. After being allowed to
stand at room temperature for thirty minutes, the absorbance of each
solution relative to a blank, that is, all reagents but no protein, was
read at a wavelength of 500 nm using a spectrophotometer, -Furthermore,
for protein standards at 20 ug per ml concentration and for honey
samples with absorbance values of less than 0.04 at wavelength 500 M,
were also re-read at a wavelength of 750 =. This was done to check
for accuracy of concentration determined at the 500 nm measurements,
A standard calibration curve was obtained by plotting the
absorbance measurements for each of the protein standards against their
appropriate known concentration values. The concentration of proteins
in the diluted honey residues after ultrafiltration were obtained from
the standard curve.
The Detemination of Proteins in Honey
Disc-Gel Electrophoresis
Proteins always contain amino acid residues with acidic and basic
groups projecting from the polypeptide structure and these polar groups
65.
ionise in aqueous solutions. At any given pH for the solution, the
charge on'the protein will depend on the number and pKa of the various
side chains on the surface of the protein. The process of migration
of the protein towards the electrodes, their direction and relative
mobility when an electric field is applied is known as electrophoresis.
The term relative mobility is a complex function including factors
such as net charge, molecular size, and gel cross-linking. The effect
of all these factors can only be determined by prior calibration.
Polyacrylamide gels are formed by the polymerisation of acrylamide
monomer (CH 2n CH-CONH 2) in the presence of a co-monomer methylenebis-
acrylamide (BIS) (CH2 w CO-NH-CH 2 *NH-CO-CH - CH 2) which acts as a
cross-linking agent. Polymerisation only occurs after initiation by
free radicals formed from ammonium persulphate, riboflavin or other
compounds. N, N, N", N"'-tetramethylenediamine is added as an accelerator.
Different pore sizes can be produced by varying the total acrylamide
concentration, that is, the degree of polymerisation or chain length
and also by varying the degree of cross-linking through changing the
proportions of acrylamide and bisacrylamide. Electrophoresis carried
out on these mixed polymers is referred to as polyacrylamide gel
electrophoresis (PAGE).
Protein movement in individual gels is detected by staining with
a suitable protein stain such as napthalene black or coomassie blue
and then destaining by thorough washing of each gel with the appropriate
media. Thus the relative movement of the proteins to the bromophenol
blue dye can be measured before and after staining (Smith, 1976).
66.
Preparation of buffers
Electrophoresis buffer consisted of Tris(hydroxymethyl)-methyl-
amine (28.8g) dissolved in distilled water to a final volume of 100 mls
at pH 8.5.
Gel buffer (0.38M tris-HC1, pH 8.9) consisted of tris (4.5g)
dissolved in distilled water (50 mls) and adjusted to pH 8.9 and then
made up to 100 mls.
Procedure
The procedure of Sargent and George (1975) was followed with a
few modifications. Acrylamide (6.28g) and N, N'-methylene-bis-acrylamide
(0.1428g) were dissolved in gel buffer (99 mls). N, N1, N", N"'-
tetramethylene diamine (30 ul) was added and the solution was mixed
and filtered. Polymerisation was catalysed by the addition of a
freshly prepared 7% (w/v) solution of ammonium persulphate (1 ml).
This gel solution was carefully pipetted into the electrophoresis tubes
to within 0.5 cm from the top. These tubes were maintained in a
vertical position with their lower ends sealed with serum caps.
Distilled water was then carefully layered above the gel so as to
exclude air and also to obtain a flat surface. The process of gelling
was, normally, completed in thirty minutes and gel formation was evident
when a distinct division appeared between the upper water layer and the
gel below. The water layer was removed and replaced by the electrophoresis
buffer. These tubes were then placed in the electrophoresis tank taking
care to exclude air bubbles from the bottom of each of the tubes.
Electrical connections were so arranged that the upper surface of the
67.
tube was the cathode. Each buffer compartment was filled with
electrophoresis buffer (250 mls). The residue from ultrafiltration of
honey (0.01g) Was dissolved in distilled water (5 mls), and 100 jil of this
solution was applied together with one drop of glycerol and a drop of
0.05% (w/v) bromophenol blue solution. Electrophoresis was performed
under conditions of constant current at 50 volts initially to allow
the sample to enter the gel. The voltage was then increased so as to
maintain a current of 4 milliamps per tube for a period of one hour.
After electrophoresis the, gels were removed from the tube by
rimming. This involved forcing water round the circumference of the
cast gel using a hypodermic needle and syringe. The cast gels were
then transferred to a staining solution of napthalene black 12B (w/v)
in 7% acetic acid for thirty minutes. The stained gel was carefully
washed in distilled water and then destained in 10% acetic acid
solution. The regions not containing the protein became clear. The
destained gels were stored in 10% acetic acid solution. The distance
moved by the protein bands, bromophenol blue and the gel length were
measured for each gel.
Detection of Honey Enzyme Activity on Polyacrylamide Gels
The presence of enzymes such as diastase, glucose oxidase and
invertase in honey samples was investigated by performing polyacrylamide
gel electrophoresis as described above except that the stage involving
the application of marker dye bromophenol blue and staining of the gels
with'napthalene black was not carried out. Instead picric acid was
used as an indicator for the presence or absence of glucose. Glucose
will bring about the reduction of the yellow picric acid to the
68.
orange red picramic acid. During the catalytic action of the enzyme
glucose oxidase, glucose is consumed where as glucose is a by-product
resulting from the catalytic action of the enzymes diastase and
invertase on their substrates starch and sucrose, respectively.
Hence, after electrophoresis the replicate gels containing the honey
proteins were incubated in either 1% solutions of starch, glucose or
sucrose at 37 0C for a period of one hour. Also samples of the enzymes
mentioned above were obtained from microorganisms or other sources
commonly used in biochemistry laboratories were also applied to the
gels on their own and also mixed with honey sample. These gels were
incubated in their appropriate carbohydrate solution as described above.
After incubation the gels were removed from their carbohydrate solution
and washed with distilled water to remove excess carbohydrate solution.
These gels were then immersed in a dilute solution of picric acid and
two drops of 4M sodium hydroxide polution was added. The tubes
containing the gels and picric acid were warmed gently in a water bath
at 600C for twenty minutes. After this period of warming the tubes were
removed from the water bath and the changes in colour on the gels in
the form of bands were noted.
Sodium Dodecyl Sulphate-Polyacrylamide Gel Electrophoresis
By including detergents such as sodium dodecyl sulphate (SDS)
during electrophoresis better results are obtained in terms of
fractionation, resolution and most importantly the ability of the
proteins'that are now proportional to molecular weight. The polyacrylamide
gel electrophoresis with SDS will be referred to as SDS-PAGE. At neutral
pH, in a 1% SDS solution which was also OAM with respect to mercaptoethanol,
most proteins bind to SDS and dissociate, disulphide linkages are broken
69.
by the mercaptoethanol, secondary structure is lost and the complexes
consisting of protein subunits and SDS assume a random-coil
configuration.
Protein treated in this way behave as though they have a uniform
shape and an identical charge to mass ratio. This is because the
SDS bound per unit weight of protein is constant: 1.4g of SDS per g
of protein. The charge on the protein is in fact determined by the SDS
rather than the intrinsic charge of the amino acid residues. Thus the
effective mobility is related only to molecular weight because of the
molecular sieving property of the gel. By varying the amount of
acrylamide and bisacrylamide the desired pore size can be obtained
enabling the separation of molecules of molecular weight ranging from
lo, 000 to 100,000 daltons for 10% T cross-linking to 20,000 to 350,000
daltons for 5% T cross-linking (Sargent and George, 1975 and Smith,
1976).
Preparation of buffer and solutions
Gel buffer consisted of 0.2M sodium phosphate buffer at pH 7 and
0.2% sodium dodecyl sulphate.
sample buffer consisted of 0.01M sodium phosphate buffer at pH 7
and 1% sodium dodecyl sulphate together with 1% 0-mercaptoethanol.
Electrophoresis buffer consisted of gel buffer diluted 1: 1 with
distilled water.
Acrylamide solution (10V consisted of acrylamide (22.2g) and
N, N'-methylene-bis-acrylamide (0.6g) both of these were dissolved in
distilled water (100 mls) and stored in a dark brown bottle at 40C.
5% acrylamide solution was prepared by diluting the 10% acrylamide
solution 1: 1 with distilled water.
70.
Procedure
The procedure of Weber and Osborn (1969) was followed with a few
modifications. It was found that raw honey (2g) dissolved in sample
buffer (4 mls) was suitable and this solution was incubated at 37 0C
for a period of two hours, to ensure complete cleavage by $-mercapto-
ethanol of all the disulphide bonds present in the honey proteins.
Moreover, it was found that residues from ultrafiltration of honey
(0.05g) dissolved in sample buffer (I ml) and then incubated at 37 0C
for two hours, were also suitable.
Gel buffer (15 m1s) was mixed with acrylamide solution (13.5 mls)
and deareated. 1% ammonium persulphate solution (1.5 mls) freshly
prepared was added, followed by N, N', N", N""-tetramethylenediamine
(25 pl) and mixed thoroughly. This gel solution was activated and
cast as previously described.
Solutions of sample buffer and English Chorley honeys Code Nos.
261 and 261a were prepared as described above and also similar solutions
of raw honey and residues from ultrafiltration of honey (100 Ul) were
each mixed with a drop of 0.05% bromophenol blue solution together
with a drop of glycerol, were then applied to the gels.
Electrophoresis was performed at a constant current of 2 milliamps
per tube for a period of forty minutes in order to allow the sample
to enter the gel. Then the current was increased so as to maintain
a constant current of 6 milliamps per tube for a period of four hours.
After electrophoresis and the removal of the gels, the distance
moved by the marker was measured. The gels were stained in a solution
of coomassie brilliant blue (1.25g) dissolved in a mixture of 50%
71.
methanol (454 mls) and glacial acetic acid (46 mls), overnight. The
gels were then washed with distilled water and destained in destaining
solution. This being a mixture of glacial acetic acid (75 mls) and
methanol (50 mls) and water (895 mls). Frequent changes of destaining
solution were made until the regions not containing the proteins
became clear. Then the length of each gel was measured and the
distances moved by the protein bands were also measured from the top
of the gels. The resolution of the stained protein bands were sharp
and the bands occuring close together, that is, separated by a distance
of 0.1 cm were clearly visible. For broad bands, 0.5 cm and wider,
the position of greatest density was obtained by averaging the distances
moved by the leading and trailing edges of the protein band. The
accuracy of measurement of distances moved by the bands was on average
±0.1 cm.
Gel scanning
The destained gels were placed-in gel scanning tubes. These
tubes were then filled with distilled water. Before sealing the tubes
with rubber stoppers it was ensured that there were no air bubbles
present. The air bubbles were removed by gently tapping the tubes and
topping up with distilled water. The tubes were then sealed with
rubber stoppers. These tubes containing the gel were then placed
horizontally on the scanner, usually with the top of the gels entering
the scanner first. Prior to this the gel scanner was allowed to warm
up and the necessary adjustments made as described by the manufacturers
manual. The gels were then scanned at a wavelength of 560 nm and at
a speed of 6.33 mm per minute. The absorbance values for each band as
72.
displayed by the absorbance meter were noted on the chartpaper. Gels
were usually scanned a week after the destaining process was completed.
The relative position of the protein bands obtained on the gels
suggest that the molecular weights of nearly all the proteins present
in the honeys examined ranged from 60,000 to 20,000. However, in
some honeys there were bands which occurred very near the top of the
gels thus suggesting the presence of high molecular weight proteins.
Determination of the Free Ninhydrin Positive
Substances-of Honey
Although the presence of free amino acids in honey have been
reported by various researchers, the presence of amines, amides, imino
acids, small peptides and other substances forming ninhydrin positive-
complexes have also been reported, Davies (1975) and Siddiqi (1981).
Hence in the present study these compounds will be referred to as
ninhydrin positive substances. However, of these, the free amino acids
are considered to be of major importance.
Separation and Concentration of the Free Ninhydrin Positive Substances
of Honey
Ion-exchange chromatography
The principle of ion-exchange chromatography is that charged molecules
absorb onto an ion-exchanger reversibly so that molecules can be bound
or eluted by changing the ionic or pH environment,
An ion-exchanger is usually a three dimensional network or matrix
that contains covalently linked charged groups to which counter ions
are electrostatically bound using conditions that give stable and tight
73.
binding. Then using a different ionic and/or pH conditions the ions
are eluted off the ion-exchanger according. to their extent of charge.
Cation exchangers contain Resin-SO 3H and counter ions such as H0
Na + etc., are retained and eluted with alkaline buffer. Anion
exchangers contain Resin-quantanary basis and similarly, counter ions
such as OH Cl etc., are retained and eluted with acid buffers.
Procedure
The procedure for the separation and concentration of amino acids
from a honey sample as described by Siddiqi (1981) was adopted and
several modifications and improvements were incorporated to ensure
quantitative determinations. The modifications were made as a result
of preliminary trials and recovery experiments. This final modified
procedure was then applied to solutions containing known amounts of
amino acid standards or honey plus amino acid standards in order to
check for recovery. The composition and concentration of these
solutions are given in Table 5. The assessment of recovery of amino
acid from the ion-exchange resin was carried out by applying the
modified method in whole or in part to the amino acid solutions A and
B as given in Table 6. These solutions A, B and S1 contained known
weighed amounts of thirteen amino acids dissolved in either 10% (v/v)
propan-2-ol/0.5M hydrochloric acid or a carbohydrate solution containing
33% glucose and 33% fructose.
Once satisfactory recoveries were obtained the modified procedure
was then applied individually to all the two hundred and fifty six
samples of honey, in a like manner. Further, for a few randomly chosen
honey amino acid concentrates were preliminarily checked for the presence
74.
TABLE 5
Concentration-of amino acids. in solutions A, B and Sl
Concentration of, amino acids in solution as prepared by weighing
Amino acids (nMoles per ml) (nMoles per 0.6 mls) (nMoles per ml A* B** Sl*** Bl****
Lysine 394 394 1180 483
Aspartic acid 418 418 1250 513
Threonine 502 502 1510 616
Serine 380 380 1140 466
Glutamic acid 596 596 1790 730
Proline 4960 4960 14880 6080
Glycine 618 618 1850 757
Alanine 474 474 1420 580
Valine 324 324 970 397
Isoleucine 398 398 1190 488
Leucine 388 388 1160 476
Tyrosine 650 650 1950 797
Phenylalanine 814 814 2440 998
Solution A was made up in 10% propan-2-ol/0.5M hydrochloric acid solution.
Solution B was made up in 33% glucose plus 33% fructose solution. Solution S1 was made up in 10% propan-2-ol/0.5M hydrochloric acid solution.
Solution Bl concentration values given are those from the total 10.6 ml, that is, Solution B (10 mls) + Solution S1 (0.6 m1s).
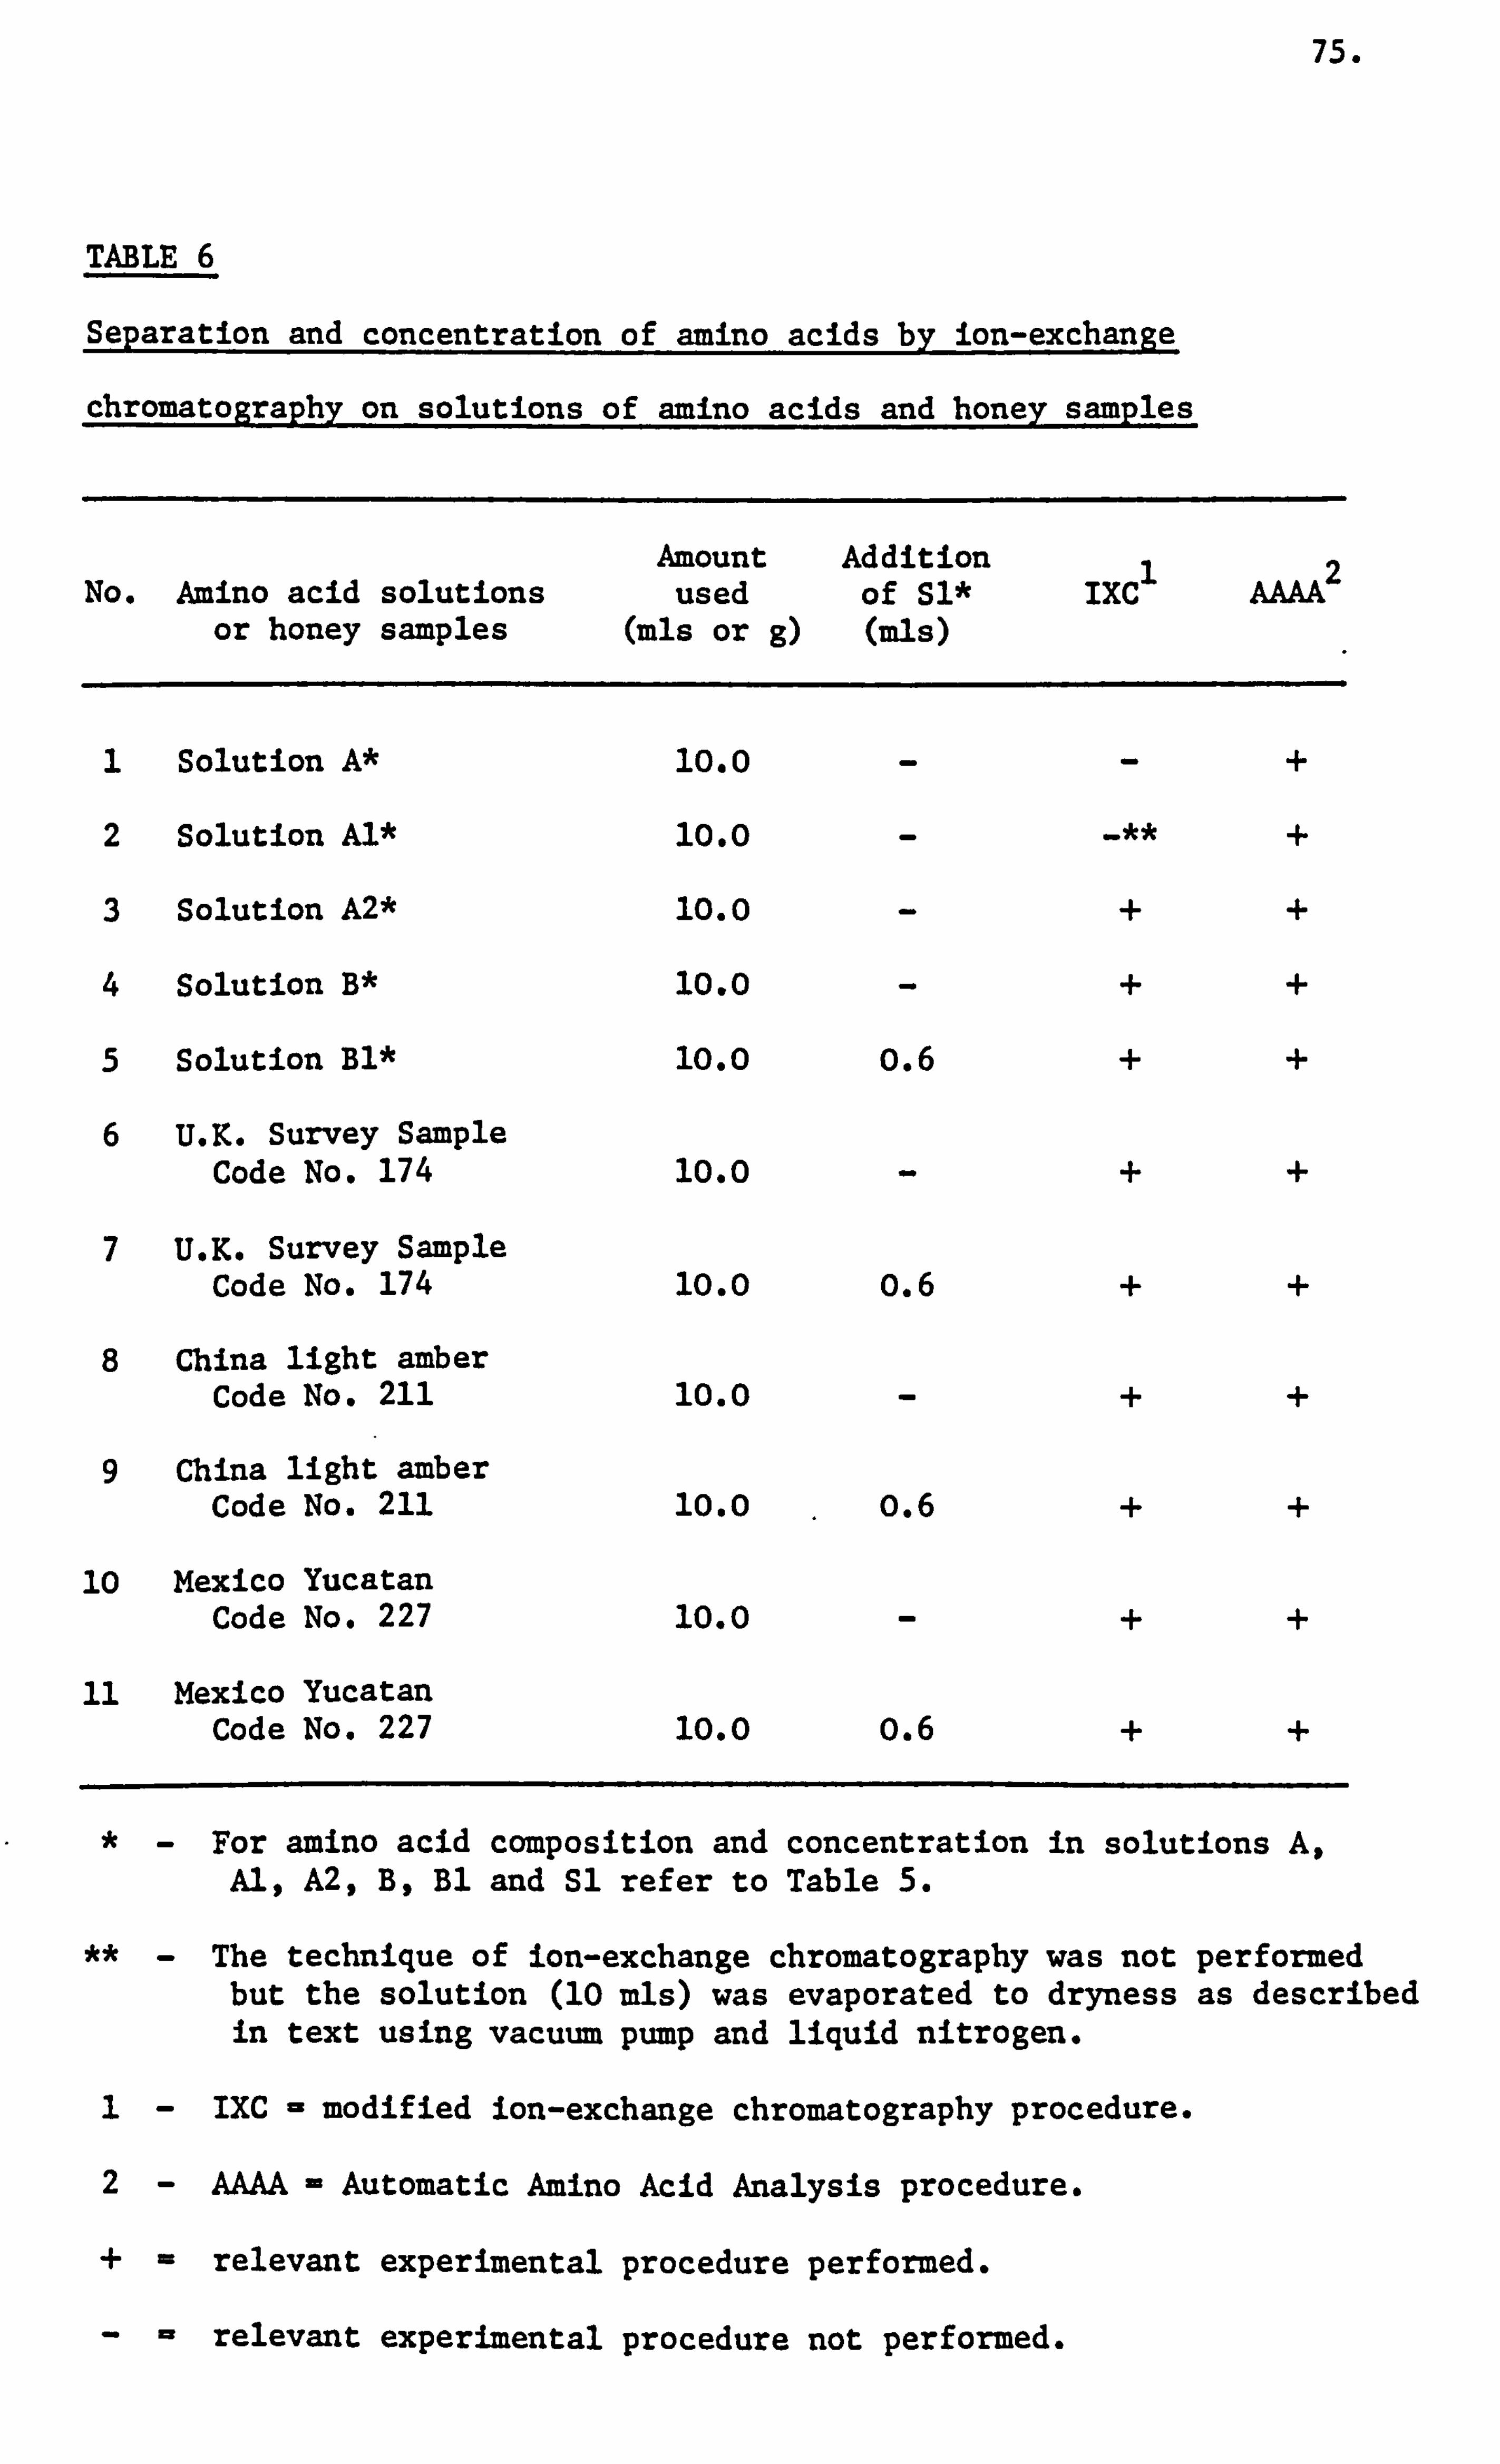
75.
TABLE 6
Separation and concentration of amino acids by ion-exchange
chromatography on solutions of amino acids and honey samples
Amount Addition 12 No. Amino acid solutions used of Sl* IxC AAAA or honey samples (mls or g) (mls)
1 Solution A* 10.0 +
2 Solution Al* 10.0 +
3 Solution A2* 10.0 + +
4 Solution B* 10.0 + +
5 Solution Bl* 10.0 o. 6 + +
6 U. K. Survey Sample Code No. 174 10.0 + +
7 U. K. Survey Sample Code No. 174 10.0 o. 6 + +
8 China light amber Code No. 211 10.0 - + +
9 China light amber Code No. 211 10.0 0.6 + +
10 Mexico Yucatan Code No. 227 10.0 - + +
11 Mexico Yucatan Code No. 227 10.0 o. 6 + +
For amino acid composition and concentration in solutions A, Al, A2, B, Bl and S1 refer to Table 5.
The technique of ion-exchange chromatography was not performed but the solution (10 mls) was evaporated to dryness as described in text using vacuum pump and liquid nitrogen.
1 - IXC - modified ion-exchange chromatography procedure.
2 - AAAA - Automatic Amino Acid Analysis procedure.
+ - relevant experimental procedure performed.
- - relevant experimental procedure not performed.
76.
of proteins using the Bio/Rad micro assay. This involved the addition
of 1 ml of coomassie Blue G-250 based reagent to 1 ml of honey amino
acid concentrates. Then absorbances measurements at 595 nm were obtained.
Similarly, absorbance measurements at 595 = were also obtained for
amino acid concentrates of amino acid solutions A and B, Table 5.
A standard reference protein,., bovine serum albumin, at 20 pg per ml
concentration was also similarly assayed. All assays were carried out
in duplicate. The results indicated that a de-proteinization step
was not required.
Furthermore, at random periodical intervals during the processing
of honey samples, recoveries from solutions of amino acids of similar
composition as those given in Table 5 were checked to ensure similar
consistency. Also, thirteen amino acids of solution Sl was added to
honey samples to check for recoveries and the effects of other honey
consistituents on the added amino acids.
Preparation of Resin for Binding
The viscous property of honey required the use of a large mesh
size cation exchange resin, Dowex 50-X8 20 - 50 US mesh (Na). This
resin facilitated the binding of the free amino acids and other
similar compounds present in honey. This resin was initially washed
in portions (500 mls) of distilled water until the eluents were no
lon ger coloured by the resin. This suspension was then allowed to
settle and stored in distilled water (500 mls). To this washed resin
(10g) 6M hydrochloric acid was added and the mixture was stirred for
ten minutes to protonate the resin. The protonated resin was washed
with several portions of distilled water (100 mls) until the washings were
no longer acidic.
77.
Ion-exchange Chromatography Procedure
A prepared sample of honey as described before was used. Honey
(10.0g) was weighed accurately and mixed thoroughly with distilled
water (10 mls) with the aid of a glass rod. Thorough mixing was ensured
by gentle warming to a temperature not exceeding 40 0 C. This honey
solution was then added to the. protonated resin until no more honey
solution could be transferred by means of droplets. The beaker and the
glass rod were then washed with distilled water (2 mls) and transferred
by means of droplets until no more greasy traces of honey were left
in the beaker or on the glass rod. This was repeated once more with
a2 ml portion of distilled water. Thus, quantitative transfer was
ensured. The resin and honey mixture was stirred with the aid of a
magnetic stirrer for fifteen minutes, for effective binding of the free
amino acids to the resin. The supernatant containing the carbohydrates
and other components of honey was removed carefully with the aid of a
pasteur pipette to ensure no loss of resin. The amino acid bound resin
was washed with distilled water (10 mls) with stirring for ten minutes
and the supernatant'removed by pipette. This process was repeated
twice and all the supernatants were discarded.
A 7M ammonium hydroxide solution (5 mls) was added to the washed
amino acid bound resin. This mixture was then stirred for ten minutes
and then the supernatant was carefully pipetted off and retained. This I
process was repeated twice more. The resin was then washed twice with
distilled water (2 mls) and all the supernatants collected were pooled.
The pooled supernatants were then evaporated to dryness using a
vacuum oil pump at 1= of mercury pressure with the aid of a microsplash
head fitted to a B14 cone (Washington, 1966). Liquid nitrogen was used
78.
as a coolant in the vacuum pump traps to prevent the evaporated
ammonia and water from contaminating the vacuum oil. The ammonia
contamination of the extracted amino acids was reduced to a minimum.
This was done by rinsing the microsplash head with distilled water
(0.5 mls) twice to remove any splashings into the flask and evaporated
in the usual manner. The final dried product was left overnight
in vacuo at a pressure of 0.5 am of mercury. Sodium hydroxide pellets
were used as desiccant.
It was found that the dried product could not be effectively
removed from the flask by physical manipulation. In order to ensure
quantitative transfer of all the dried product the following procedure
was utilized. Initially, 1 ml of 10% propan-2-ol/0.5M hydrochloric
acid solution was added to the dried product flask and brought into
contact with all the accessible inside glass wall of the flask.
Dissolution was ensured with gentle warming and transferred to a clean
pre-weighed 2.5 cm 3 drum vial with the aid of a pasteur pipette. All
the solution in the flask that could be sucked up by the pasteur pipette
was transferred and any solution that could be discharged from the
pipette was discharged into the vial until no more visible traces were
left either in the flask or on the inside glass walls of the pipette.
This process was then repeated by adding 0.3 mls and finally by 0.2 mls
of 10% propan-2-ol/0.5M hydrochloric acid to the flask and transferring.
The 2.5 cm 3 drum vial containing the dried product - 10% propan-2-ol/
0.5M hydrochloric acid (1.5 ml) mixture was weighed and-the weight of
the concentrated honey amino acid solution determined.
Each of these concentrated honey amino acid samples thus prepared
were then stored in a refrigerator at 40C until required. After use
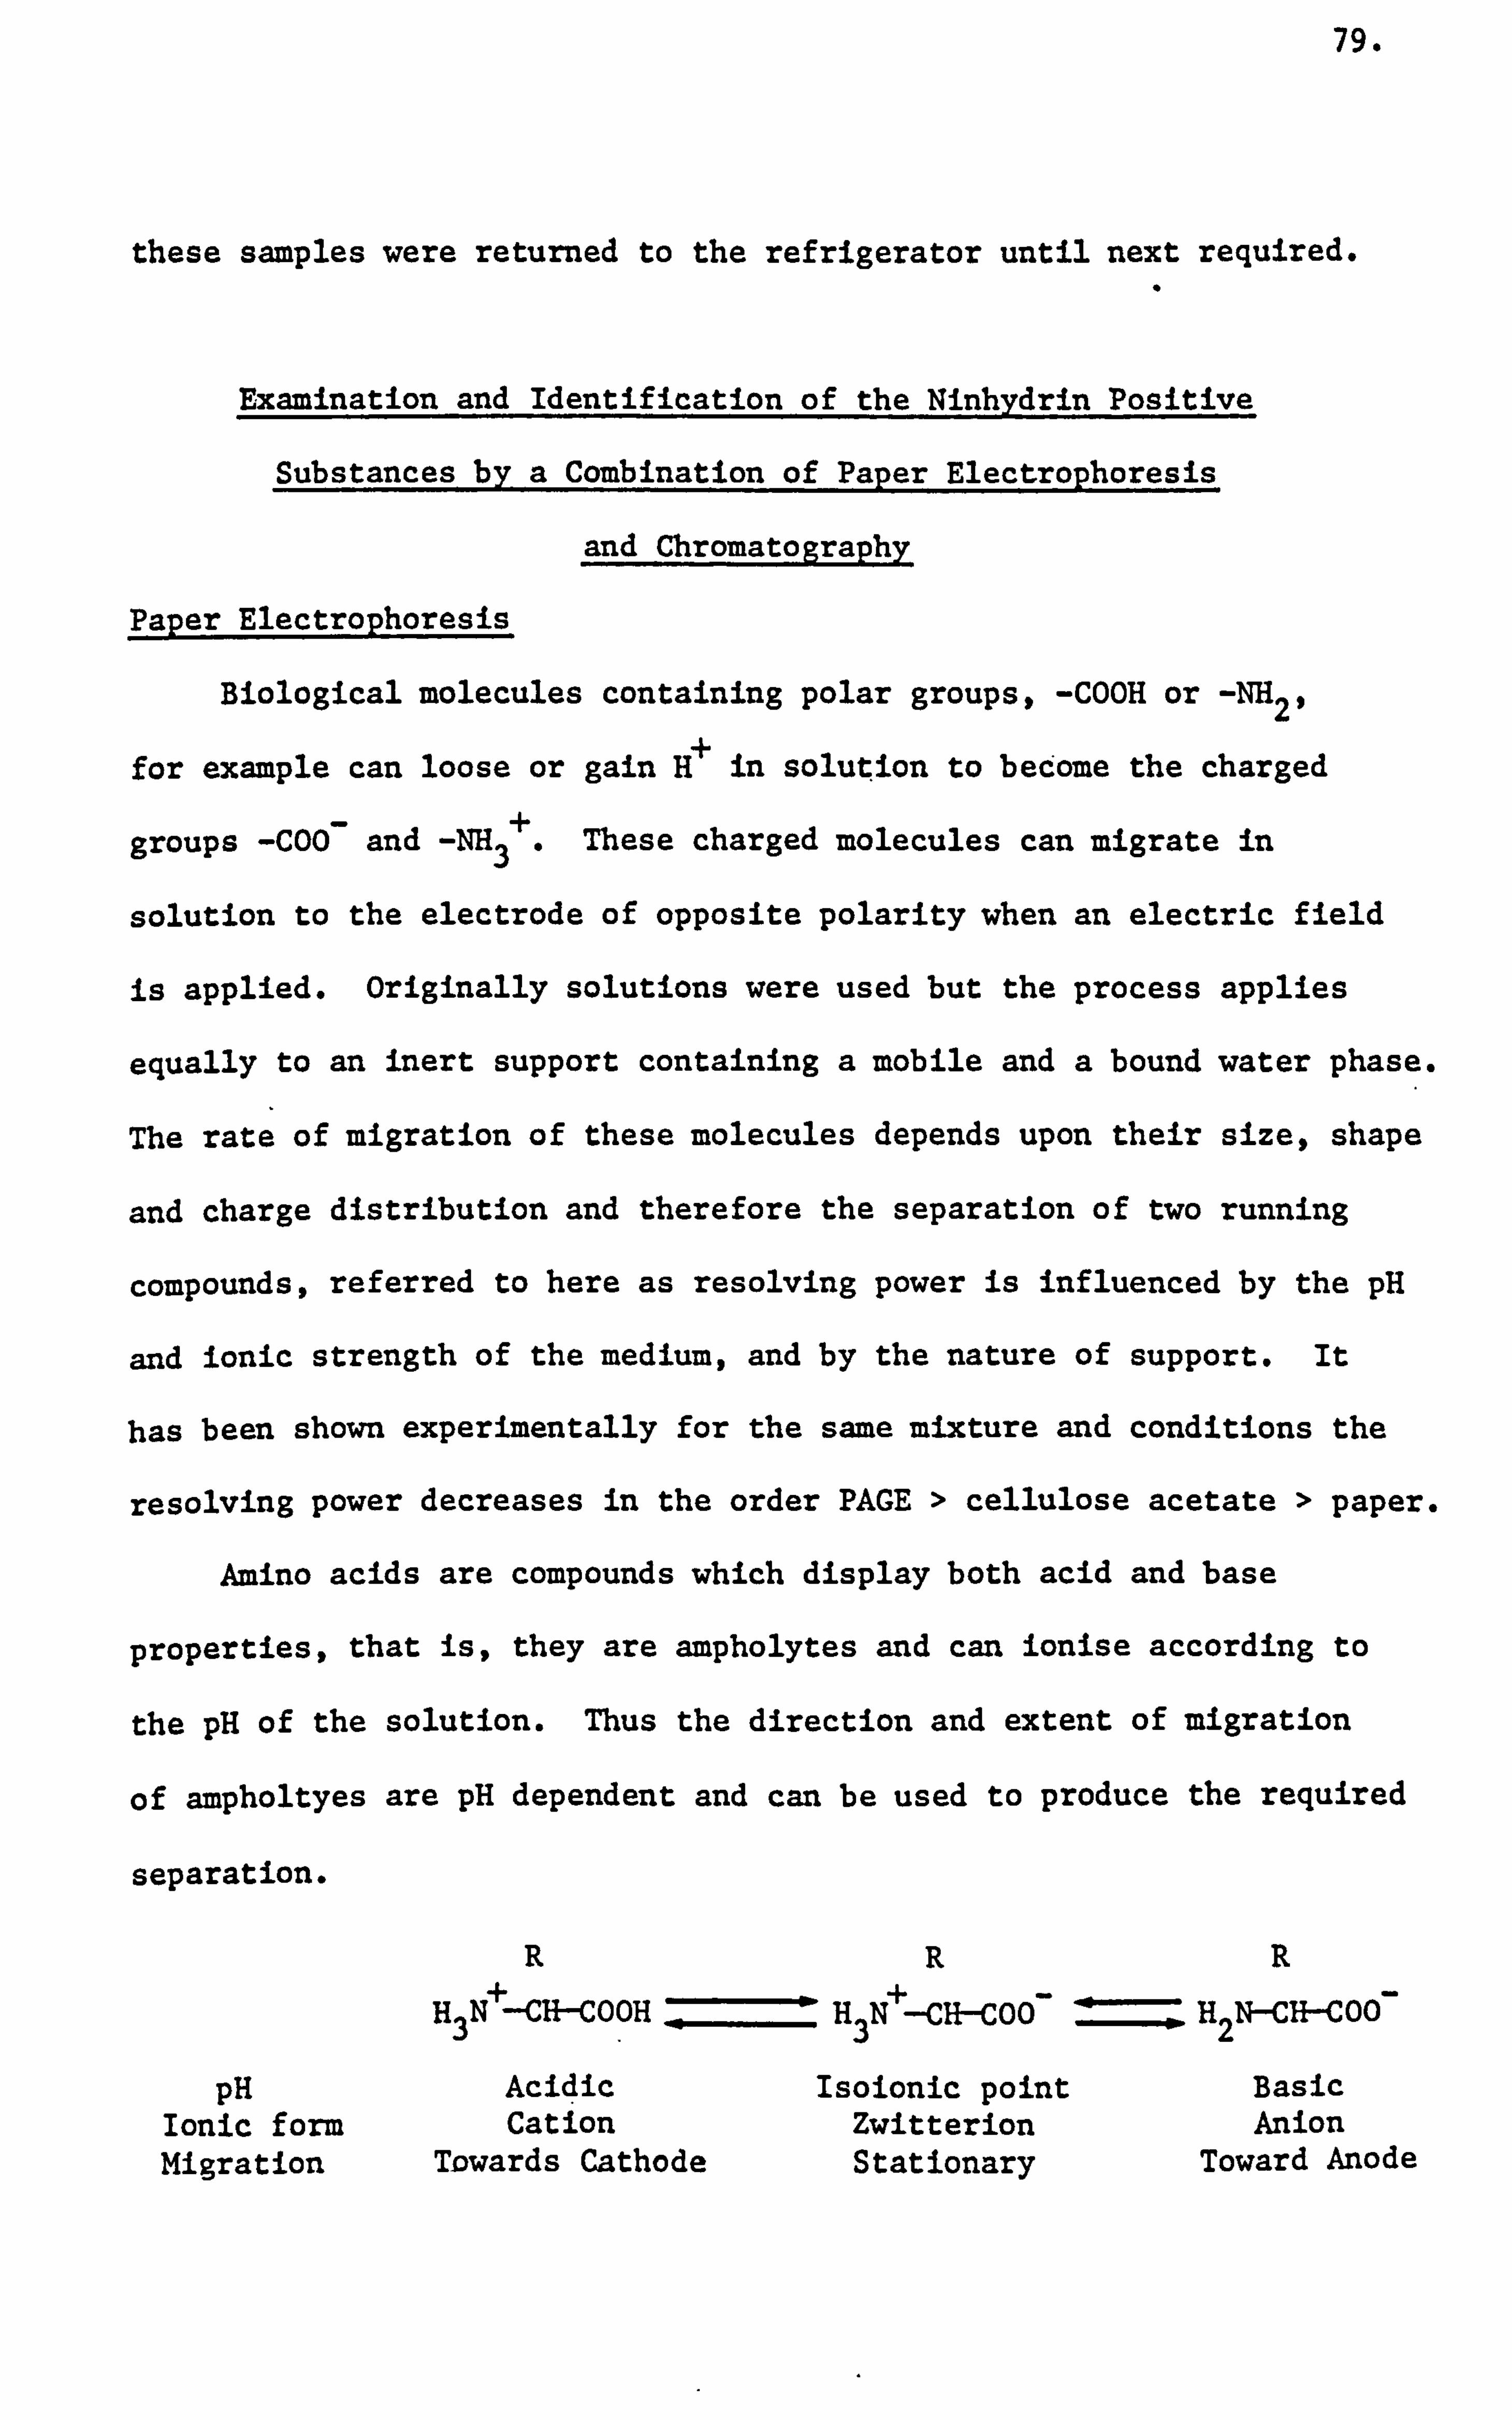
79.
these samples were returned to the refrigerator until next required.
Examination and Identification of the Ninhydrin Positive
Substances by a Combination of Paper Electrophoresis
and Chromatography
Paper Electrophoresis
Biological molecules containing polar groups, -COOH or -NH 21
for example can loose or gain H in solution to become the charged
groups -COO and -NH 3 These charged molecules can migrate in
solution to the electrode of opposite polarity when an electric field
is applied. Originally solutions were used but the process applies
equally to an inert support containing a mobile and a bound water phase.
The rate of migration of these molecules depends upon their size, shape
and charge distribution and therefore the separation of two running
compounds, referred to here as resolving power is influenced by the pH
and ionic strength of the medium, and by the nature of support. It
has been shown experimentally for the same mixture and conditions the
resolving power decreases in the order PAGE > cellulose acetate > paper.
Amino acids are compounds which display both acid and base
properties, that is, they are ampholytes and can ionise according to
the pH of the solution. Thus the direction and extent of migration
of ampholtyes are pH dependent and can be used to produce the required
separation.
RRR
H N+-CH-COOH H N+--Clt--COO- ==; H N-CH-COO- 332
pH Acidic Isoionic point Basic Ionic form Cation Zwitterion Anion Migration Towards Cathode Stationary Toward Anode
80.
By employing electrophoresis at pH 1.9 all the natural amino
acids except for the oxidation product cysteic acid exist as cations
and therefore migrate towards the cathode. Cysteic acid has not been
reported to be found in honey. The basis for the other part, of the
technique, paper chromatography, is given after the paper electrophoresis
procedure.
Preparation of buffer
Electrophoresis buffer so-called consisted of a mixture of (98% -
100%) formic acid (104 mls) and glacial acetic acid (58 mls) and with
distilled water was made up to two litres. The pH was checked and
adjusted if needed to pH 1.9 ± 0.1.
Procedure
A sheet of T&atman No. 20 chromatography paper, 46 x 57 cm, was
cut to give a sheet with the dimensions 40 x 57 cm and arranged with
the longer edge on the right. The paper was then supported on glass
rods to avoid contamination or contact with the bench whilst the honey
concentrate or amino acid sample (25 jil) was applied by a micropipette,
in stages with drying in between so as to maintain a constant minimum
spot size of 0.5 cm diameter. The origin for the sample application
was 10 cm from the 40 cm side and 14 cm from the 57 cm edge.
Electrophoresis buffer (250 mls) was placed in each of the buffer
compartments. The loaded paper was then arranged in the electrophoresis
tank so that the longer 57 cm edges dipped into the buffer compartments.
The 57 cm edge nearest the origin of sample application was ensured
to become the positive terminal when connected to the Vokam power pack.
After moistening the paper evenly with electrophoresis buffer applied by
a pasteur pipette all the electrical connections were made.
81.
Electrophoresis was carried out at 250 volts for a period of
four hours. The paper was carefully removed from the electrophoresis
tank and then hung in a fume cupboard to dry at room temperature.
To this dried electrophoresis paper, thirty ninhydrin positive
substances which according to the literature have been found to occur
in honey were applied in solutions as reference standards. These
solutions were spotted in two applications and dried so that the spot
did not exceed 0.5 cm in diameter. The solutions, 25 pl of each of
the ninhydrin positive substances, of different groups of standards
arranged according to their RF values were applied at intervals of
1.5 cm on the 10 cm line between the sample origin and the 57 cm edge
of the paper. These standard ninhydrin positive substance groups
were:
(a) arginine, a-alanine, tyrosine, valine and phenylalanine;
(b) histidine, gýycine, proline, methionine and leucine;
(c) lysine, serine, glutamic acid, tryptophan and isoleucine;
(d) Cysteine, aspartic acid and threonine;
(e) asparagine, hydroxyproline, y-aminobýtyric acid and pipecolic
acid;
(f) ornithine and 0-alanine;
(g) glucosamine, ' citruline, glutamine and a-aminobutyric acid;
(h) kynurine and 0-aminobutyric acid.
Paper Chromatograp
The technique of chromatography depends upon partition of a given
compound between a stationary phase which is polar and a mobile covalent
phase. At any instant, an equilibrium is set up and then displaced
82.
until the tendency of the mobile phase to carry the components forward
due to its solubility is balanced by the various attractive forces of
the stationary phase and its solid support. On paper the major forces
of attraction include hydrogen bonding and a weak ion-exchange
mechanism involving hydroxyl and other groups on the cellulose.
The initial capillary attraction of the dry paper is responsible
for the first 2 cm of solvent movement and thereafter in descending
chromatography solvent movement is aided by gravity (Smith and Seakins,
1976 and Hais and Macek, 1963).
Preparation of solvent
The butanol-acetic acid-water solvent mixture (BAW) was prepared
according to Siddiqi (1981). This solvent mixture consisted of
butan-l-ol (200 mls) and glacial acetic acid (30 mls) and distilled
water (75 mls) at pH 4.3.
Procedure
Descending chromatography was performed in a direction at right
angles to the origianl electrophoresis using a Shandon Chromatank.
The BAW salvent (150 mls) was placed in the solvent compartment and the
bottom short end of the paper was dipped into the solvent. The
chromatography paper was then hung in the chromatank and development
with this solvent was allowed for twenty four hours. The paper was
removed and then hung to dry in a fume cupboard, overnight.
Detection of the Ninhydrin Positive substance
The formation of colour derivatives by the reaction between amino
acid and ninhydrin is a universal method for detecting the presence of
amino acids and similar related compounds. The reaction mechanism of
83.
the colour formation has been disputed by various research workers
proposing different pathways for the formation of the colour
derivatives (Hais and Macek, 1963 and Metzler, 1977).
The use of metal chelates enables the enhancement of sensitivity
and stability of the formation of colour complexes (Haworth and
Heathcote, 1969).
Preparation of solutions
The ninhydrin reagent was prepared according to Haworth and
Heathcote (1969).
Cadmium acetate stock solution was prepared by dissolving cadmium
acetate (2g) in glacial acetic acid (40 mls) and distilled water
(200 mls). Ninhydrin reagent was prepared by dissolving ninhydrin (2g)
in cadmium acetate stock solution (24 mls) and propanone (200 mis).
This mixed reagent was stored in a refrigerator until required and in
any case not longer than seven days.
Procedure
Ninhydrin positive substances were detected on the chromatogram
by dipping it in the cadmium acetate-ninhydrin reagent. The chromatogram
was then hung in a fume cupboard to dry at. room temperature. After
some three hours the spots due to the high concentration of ninhydrin
positive complexes became visible and these were outlined. The
chromatogram was then stored in a dark sealed cylinder with a test tube
of concentrated sulphuric acid (5 mls), to achieve an ammonia free
environment. Each sheet was then examined every day for the next three
days and then a week later to record the colour and position of the
resulting ninhydrin positive complexes. This chromatogram was either
84.
photographed or traced. Considerable experience was required to
recognise the patterns of the ninhydrin positive complexes as these
differed in kind and concentration. .
Quantitative Analysis of the Free Amino Acids Using
the Automatic. Amino Acid Analyser
Amino Acid Analysis
The technique of ion-exchange chromatography followed by the
identification and quantitative determination of individually eluted
ninhydrin positive compounds can be automated. The quantitative
determination of individual amino acid can be evaluated photoelectrically
by measuring the absorbance of the ninhydrin-amino acid colour complex
formed at a given wavelength. This being 570 nm for amino acids and
440 nm for imino acid, proline. The absorbance measurement can then
be compared with that obtained with a corresponding amino acid. standard
of known concentration.
It is essential to prevent diffusion and mixing after separation
on a capillary column filled with high resolution ion-exchange resin
spheres of diameter 6x 10- 6 m. In general the separation or resolution
is proportional to the column length and inversely proportional to the
cross-sectional area and bead diameter. However, as the bead diameter
decreases, the applied pressure needs to be increased substantially
in order to maintain an adequate flowrate. The other majorrequirements
are repetitive and constant sample application, consistent mixing of
reagents and sample especially as the coloured products of the reaction
may be measured before a true equilibrium is reached. These conditions
are approximately satisfied in most commercial instruments.
85.
. Procedure
To the concentrated honey amino acid sample (25 V1) an internal
standard solution of norleucine (25 nMoles) in O. lM hydrochloric acid
buffer was added. From this mixture duplicate samples (20 Ul each)
were applied to the analyser by first being loaded onto an equilibrated
cartridge containing resin. The samples were then eluted on to a. two
column system containing ion-exchange resin. One column separates
the basic amino acids while the other separates the acidic and neutral
amino acids. Citrate buffer pH 5.25 for the basic amino acids and
pH 3.25 and pH 4.25 for the. acidic and neutral amino acids, were pumped
at high pressure by means of two positive displacement pumps through
these columns. These columns were operated at constant temperature
of 600C by means of a-water bath and a circulator.
The samples once eluted off the column were then mixed in a mixing
coil with discrete quantitites of 1% ninhydrin-hydrazine reagent. This
was then passed through a heating coil maintained at 95 0C for the
colour reactions to take place. This solution was finally passed through
the colorimeter which housed two flow cell assemblies with mounted
interference filters of different wavelengths at 570 nm and at 440 rm.
The output from the colorimeter was then recorded on a chart recorder
in the form of peaks which are characteristics for each different amino
acids. The normal run detecting seventeen standard amino acids at
25 nMoles concentration, each programmed cycle was completed in
approximately two hours.
The concentration (nMoles) of each amino acid was then determined
from the area under the trace response curve in comparison with the
known standards obtained on chart paper. This was done by using the
86.
formulae derived as shown in Appendix III. Hence, the concentration
of amino acids per unit sample weight was calculated.
Quantitative Microscopical Analysis of Honey
Microscopical Analysis
The mature pollen grain is usually characteristic of its floral
source, and differences between grains as to size, shape, surface
contours and apertures can lead to identification. See, for example,
Faegri and Iverson (1975), Moore and Webb (1978) and Sawyer (1981).
Light microscopy at a medium magnification of about 40OX, is
made easier by enhancement of the pollen grain features by. selective
staining with dyes, for example, basic fushin. Research has shown
that this dye selectivity stains the polymerised series of hydroxy-
carboxylic acids found in the exine sporopollenin of pollen (Stanley
and Linskins, 1974). However, exines of different species vary*in their
response to stain. This suggests that sporopollenin is variable
either in relative proportions. of different moieties, or in the degree
of cross-linking, or in the extent of the masking of reactive groups
(Heslop-Harrison, 1971).
Moreover, identification of pollen source to the species level is
not always possible even under ideal conditions. For pollen that has
been collected by the bee stored in the hive and subject to great
osmotic pressures generated by honey ready identification to genus
level is possible (Howells, 1969). Also in some cases, especially
pollen in honey of foreign origin, identification was possible to plant
family level only (James, 1969).
87.
P-ent-atIliv-gs
The method for the preparation of the microscope slides of
pollen grains for the microscopical examination of honey, was according
to those techniques described by Louveaux, Maurizo and Vorwohl (1970)
and Sawyer (1981).
Preparation of the glycerine gelatin stains
Gelatin (7g) was dissolved in distilled water (42 mls) by warming
on a hot water bath. To this gelatin solution glycerine (50 mls) and
phenol (0.5g) was added with stirring.
Basic fuschin (0.1g) was dissolved in 70% ethanol (I ml) and
distilled water (160 mls).
Two grades of stained glycerine gelatin were prepared in the
following way. To one glycerine gelatin (30 mls) basic fuschin solution
(1.5 mls) was added and labelled as the 'Light coloured' stain.
The other glycerine gelatin (30 mls) basic fuschin solution (3.0 mls)
was added and labelled as the 'Dark coloured' stain.
Preparation of the microscope slides of the pollen grains
Honey (10g) was dissolved in distilled water (20 mls) by gentle
warming. This honey solution was then centrifuged at 2500 revolutions
per minute for ten minutes. The supernatant was decanted off carefully
ensuring no loss of sediment. The sediment was dispersed in distilled
water (10 mls) and re-centrifuged so as to remove traces of honey sugars.
The supernatant was carefully pipetted off using a pasteur pipette.
The sediment was transferred on to a microscope slide, as completely
as possible, and spread over an area 15 x 15 mm by means of the tip of
a pasteur pipette. The microscope slide with the pollen smear was then
placed in an oven maintained at 40 0 C, to dry.
88.
Staining and mounting of the pollen smear
After drying the pollen smear was stained with two drops of the
basic fuschin stain. Pollen smears containing little pollen were
stained with the light coloured stain. For pollen smears containing
a lot of pollen the dark coloured stain was used. Moreover, for the
intermediate pollen smears a combination of both the light and dark
coloured stains were used.
A coverslip was carefully positioned near the edge of the pollen
smear and lowered carefully with the help of a pair of twizzers. In
this way no air bubbles should become trapped between the coverslip
and the slide. A uniform distribution of the stain between the coverslip
and the slide was ensured by placing the slide in an oven maintained
at 400C for ten minutes. Excess stain was removed by gently pressing
the coverslip with a tissue paper and left overnight to set.
The coverslip was then sealed along the edges with a clear nail
varnish to prevent the glycerine gelatin stain from becoming infected
with bacteria or fungus.
Identification of Pollen Grains
Pollen grains were identified by using reference slides prepared
by Ray Williamson containing thirty four different pollen grains, in
conjunction with the identification key, index cards and microphotographs
of pollen grains prepared by Sawyer (1981) and diagrams of pollen grains
by Sawyer (1975). Also fresh pollen from known sources were obtained
and standard reference sample slides were prepared.
The full list of all the pollen grains that were identified in the
two hundred and fifty six samples of honey have been given in Appendix VIII.
89.
In this list the identity of each pollen was specified to three
classification levels, that is plant family followed by genus and
then the species. Also given in this list for each pollen botanical
name the equivalent cormon English name. In most cases the identity
to a group of related plant species was possible, that isi. genus;
for example the Brassica related species pounded considerable problems
of identifying species by pollen alone. Listed in Table 7 are the
six European Brassica species out of the nine described by Crane,
Walker and Day (1984) as important world honey sources. Pollen grains
from closely related species cultivated nearby are likely to be present
in a honey sample. For this reason and others discussed elsewhere,
pollen identity were limited to genus only and were quoted as such
throughout the present analysis. However, an exception was made for
the nearly related. TrifoZiwn species whose distinctive pollen grains
were readily identifiable. Pollens especially in the foreign honeys
whose identity could not be determined even at plant family level were
classed as unidentified.
Counting of Pollen Grains
Pollen grains were counted in the visual field as seen through the
objective eyepieces of the microscope. Counting was carried out usually
near the edge of the pollen smear with at least two counts minimim at
or near the centre. Between 200 - 300 total pollen grains were counted
and presented into frequency classes for each samples of honey. This
was according to Louveaux, Maurizo and Vorwohl (1970). The pollen grains
identified were then distributed according to their percentages into
frequency classes. The following terms were used for expressing the
90.
TABLE 7
List of common European species of the genus Brassica
Species Plant Genus family Botanical English*
name name
Cruciferae Brassica Campestris Field Cabbage
it juncea Chinese Mustard
napus var, Shaljam napobrasswa.
napus var** Oilseed Rape oZeifera
nigra** Black Mustard
rapa Winter Rape
There are other English names besides the common names,, these names have been listed by Crane, Walker and Day, 1984.
Adequate honey yields are obtained from these plants.
91.
frequency classes. These were: 'Predominant Pollen', which represented
forty five percent and over pollen present, 'Secondary Pollen'
represented pollen present between sixteen and forty five percent,
'Important Minor Pollen' represented pollen present between three
percent and fifteen percent and 'Minor Pollen' represent less than
three percent pollen present.
Computation
The experimental data gathered for each of the two hundred and
fifty six samples warranted the use of a computer for statistical
analysis and interpretation. The Salford Prime 750 computer has
available the Statistical Package for Social Sciences (SPSS) version
9. This package comprises of statistical programs for data analysis
and was written for social sciences (Nie et aZ., 1975 and Hadlaihull
and Nie, 1981).
The SPSS package on the Salford prime computer reads from a file
and writes to a file. The data information and the SPSS commands
contained in such files were typed in at the available visual display
units (VDU) terminal (Noland, 1982 and Eckersley, 1982 and 1984). The
procedure for access to the prime computer, files, editing and carrying
out the statistical analysis using the SPSS package have been listed
below:
By pressing the RETURN key a few times the ISALFORD PRIME LOGIN
PLEASE' appears on the screen. The user name followed by the
password are typed. When the OK, appears on the screen access to
the prime system is then available.
92.
2. By. typing ED and obtaining INPUT on the screen has enabled a file
to be opened. Then the information to be entered into this file
can be typed in a pre-determined order. The format of the
arrangement of the data in the data files have been. described
in detail in Appendix IV.
3. When all the relevant data have been entered into the file.
After the last line, by pressing the RETURN key and then once more
the EDIT appears on the screen. At this point the filename is
typed, for example, DATl-UK. Then OK, appears on the screen
4. A print-out of the contents of this file can be obtained by typing
in 'SPOOL DATl-UK, -AT, LEAR' the computer will transfer the contents
of DAT1-UK file to the Lear-Siegler line printer for printing.
5. Any errors in the DATl-UK file can then be located on the print-out.
Ammendments to the DAT1-UK file in the computer can be made by
typing ED DAT1-UK which displays the contents of the file on the
screen. By using the editor commands TOP, BOTTOM, NEXT, LOCATE9
PRINT the errors can be rectified. When all the corrections have
been made the file can be closed as described previously except
the filename need not be typed.
6. Another file, the SPSS control file was created by following the
opening of a file procedure as described for DATl-UK. The structure
and format of a SPSS controlfile has been given in Appendix VI(b)
and the filename was TEST1. This SPSS control file contains a
series of control statements, each specifies a command which is
recognised and obeyed by the SPSS.
93.
7. The TEST1 file can also be checked for errors and corrections
made by using the SPOOL and EDIT c mands as described previously.
8. The statistical analysis detailed in the SPSS control file TEST1
were carried out by typing 'SPSS TEST1, -LISTINGS RESULTV. The
-LISTINGS RESULT1 is defined as the output file which contains
the results of the statistical analysis and is printed at the
Lear-Siegler line printer. When the terminal session is completed
by typing the command LO after an OK, on the screen the computer
will log out the user from the prime system.
Hence in this way two'data files were compiled, one contained the one
hundred and ninty two samples of the United Kingdom survey honeys
arranged in the numerical order of the code number given in Appendix I.
The other contained the sixty four samples of foreign and commercial
honeys arranged in an alphabetical order according to their known
country of origin as given in Appendix I.
Statistical Analysis
In order to obtain understandable biochemical information from
the vast amount of numerical data collected for the two hundred and
fifty six samples of honey, the use and application of statistics was
considered appropriate with reference to Davies (1975 and 1976),
Gilbert et aZ., (1981) and Davies and Harris (1982). Since the subject
of statistics was not my field of expertise, the experience and advice
of Dr. Pembertont Department of Mathematics, University of Salford was
sort to process the analytical information gathered.
94.
After familiarisation with the relevant aspects of both biochemistry
and statistics the use and application of Discriminant analysis was
recommended by Dr. Pemberton. A subprogramme 'DISCRIMINANT' was
available on the SPSS package for calculation of Mahalanobis distance
between populations such as pollen groups. After my initial attempt
using raw data as collected with one modification (refer to Appendix
VI(b)) which specified the SPSS to classify honey samples into nine
predominant type pollen groups, was considered to require much needed
improvements. Upon the recommendations of Dr. Pemberton, modifications
and improvements which enhanced the predictive classification of the
SPSS considerably were carried out. These modifications and improvements
were: square root transformation of amino acid concentration measurements
and removal of small sample number groups, that is, less than ten samples
per group and defining of unifloral and multifloral subclasses were carried
out as described in Appendix V(a).
Copies of the raw data file labelled 'DAT1-UK' and the SPSS control
file labelled as 'TESTV (Appendix VI) were obtained by using the command
'COPYF filename 1, filename 2. Relevant changes to each of the copy
SPSS control files was made by replacement of appropriate commands
which enabled random selection of samples in a particular group for
processing and classification (Appendix VI(c)), recoding of sample
groups (Appendix VI(d)) and selection and allocation of honey samples
into appropriate groups (Appendix VI(d)(ii), (e), (f) and Appendix VII)'.
The details of these modifications, improvements and changes of command
carried out in SPSS control file have been detailed in Appendix V and
briefly outlined below.
95.
Discriminant Analysis on the United Kingdom Survey Honeys
As it is understood in the application of computers to statistical
problems the following definitions are accepted. Discriminant analysis
is the process of computation which enables calculation of group
boundaries within a multi-dimensional space which will minimise error
of allocating a honey sample of unknown origin to a group. One.
specialised section of this field is that of canonical variates
analysis. Canonical variates analysis is the determination of Fisher's
linear discriminant functions which are linear combinations of amino
acid concentrations. A number of these linear combinations are known
as canonical variates, these give varying degrees of group separation.
Thus, each sample has a value on each canonical variate which can be
plotted on co-ordinate axis. The maximisation of the minimum distance
between groups is defined by the complex variable known as Mahalanobis
distance. This is a stepwise statistical method developed by Mahalanobis
and is described by the term 'MAHAL' which is recognised and obeyed by
the SPSS (Appendix VI(a)).
The U. K. survey data file containing all the biochemical and
analytical information for each of the one hundred and ninety two samples
of honey was required. The SPSS control file described and detailed in
Appendix VI(c) was used for carrying out the discriminant analysis.
The SPSS was initiated as described earlier.
From the microscopical estimation and subsequent classification of
the distribution of the pollen grains in a honey sample were used for
allocating samples into nine predominant frequency class pollen groups.
The SPSS then predicted classification of honey samples on the basis of
their amino acid concentration measurements.
96.
In order to improve the classification of'samples the n=ber of
major pollen groups were reduced from nine to five and modifications
performed on the original amino acid concentration values. In the
five major pollen groups, those honey samples representing unifloral
pollen were also evaluated. .
Discriminant analysis was performed on the honey samples
representing each of the three major sources of honey in the United
Kingdom. These three major sources were: Brassica4 TrifoZium repens I
and CaZZuna.
Discriminant analysis was also performed on the honey samples
harvested in the years 1981 and 1982; samples which were heated or
otherwise and samples which were sugar-fed or otherwise. Moreover,
these three analyses were also performed on honey samples representative
of the five individual pollen groups. Similar analysis was also performed
on the combined effects of heating and sugar feeding on a sample of
honey.
The details of the procedure of the statistical analysis listed
above have been described in Appendix V(a).
Discriminant Analysis on the Foreign and Commercial Honeys
Discriminant analysis was performed using the subprogram 'DISCRIMINANT'
on the foreign and comercial honey samples. The foreign and commercial
data file containing all the biochemical and analytical information for
each of the sixty four samples of honey was required.
For the United Kingdom the major sources of imported honey are the
following countries: Australia, Canada,, Mexico and New Zealand and
sometimes China. Discriminant analysis was performed on the samples of
97.
honey originating from the first four countries together with English
honey samples. The SPSS control file detailed and described in. Appendix
VII(a) and the control statements given in Appendix VII(b) were used
to perform discriminant analysis on the foreign and commercial samples.
Discriminant analysis was also performed to distinguish between
the following groups: nectar and honeydew honeys; honeys containing
pollen originating from the same plant family; samples whose country
of origin was not known but were allocated a country code from which
they were most likely to have originated on the basis of their pollen
content and amino acid patterns and samples that were or were not
processed.
The details of the procedure of the statistical analysis listed
above have been described in Appendix V(b).
Discriminant Analysis on the Combined Honeys of the United Kingdom
Survey and the Foreign and Commercial
The United Kingdom survey honey samples and the foreign and
commercial honey samples were pooled together in a sequential order.
The data file containing the foreign and commercial honey samples
was appended onto the tail end of the U. K. survey data file by typing
the command 'COPYF FOREIGN AND COMMERCIAL DATA FILE, UK SURVEY DATA
FILE (APPEND)', in at a visual display unit terminal.
In this statistical analysis either of the SPSS control files
detailed in Appendix V(a) and VII(b) could be used. The only modifications
required were to change the number of cases to 256 and to replace the
five 'IF' control statements. These control statements were 56 and 60 in
Appendix VI(c) and 54 to 59 in Appendix VII(c).
98.
Discriminant analysis was performed to distinguish between the
United Kingdom and the foreign and commercial honeys; between the
U. K. survey and six other country groups; and between the three pollen
groups Brassica, TrifoZiwn repens and Castanea common to the combined
samples.
The details of the procedure of the statistical analysis listed
above have been described in Appendix V(c).
Note that the commands used to initiate the SPSS which were typed
in at a visual display unit terminal were correct up to the end of
July 1983. However, some of these commands have changed in context
and format due to the updating and revision of the computer systems
carried out at regular intervals.
RESULTS
CHAPTER 3
99.
RESULTS
CHAPTER 3
The Colour and Aroma of Honey
The colour and aroma were assessed for the honey samples that were
examined.
In assessing the colours of the various honey samples numerical
values were not obtained via a spectrophotometric method as this was
considered not suitable. The colours of the honeys were therefore determined
by visual inspection and in this investigation covered a broad spectrum.
Arranged in the order of increasing colour one has the nearly water
white honeys produced by the plant genera of Brassica, 7rifoZium repen4,
Rubus and Robinia. These were followed by the white to light golden
colours of the Echium honey and then the light ambers of the Impatiens
and Prunuslpyrus honeys. The light to medium ambers were distinctive
of 'Viguieral and Lotus honeys. The Castanea and the Vicia and also
the honeydew honey were associated with light to dark amber colours.
The golden yellow to dark amber were distinctive colours of the
Helianthus honeys. The heather honeys were characteristically dark
reddish brown in colour. While those of the Fagopy2ýum honeys were rather
dark brown almost black in colour. Furthermore, some of the Australia,
China, Chile, Hungary, India, Mexico and Spain honeys, the colours ranged
from the extra light ambers to the medium and then to the dark red brown
ambers.
Characterisation of the aroma of honeys proved difficult to define
as considerable experience was required in judging the various fragrances.
However, it was not the purpose of the present study to assess
honeys by sight and smell, although identification of source can be
100.
quickly established to the satisfactign of a honey show judge seeing
hundreds of samples of a variety at a time. Moreover, numerical values
could not be evaluated since not all the volatiles and the non-volatiles
associated with honey aroma have as yet not been isolated and identified.
Nevertheless, it was found that the light colour class honeys had
sweet pleasant smell compared to the strong and characteristic smell
of the darker honeys. Moreover, some honeys had distinct fragrances
such as those of apples, garden flowers and citrus fruits. Some of
the Australia, China and other foreign honeys had a distinct fragrance
associated with eucalyptol. The aroma of pine and fir trees similar
to that of turpentine was evident in some of the European honeys suggesting
the presence of terpenes. A distinct aroma associated with wet wood
or saw dust was evident in some of the U. K. survey samples. One of
the Indian samples had a characteristic smell of sulphur compounds such
as sulphur dioxide. It is known that in some countries the practice
of burning sulphur to destroy colonies and then collecting the honey
is still performed. Some of the honeys did not have any characieristic
aromas while others were marred by the distinct smell of fermentation
or that of burnt wax. Yet in others and especially in some commercially
produced samples the aroma of hydroxymethylfurfural was evident. one
sample which was commercially processed and of a controversial nature,
had an aroma which was characteristic of engine oil used for lubricating
machinery.
These personal observations were the impressions on initial
examination of samples as received and may not be true for the sample
as collected from the hive or yet from the sample after long term
storage.
101.
ANALYSIS OF PROTEINS
Isolation, Concentration and Estimation of Proteins in Honey
The presence of proteins in the honey residues after concentration
of a sample of honey (25g) by the technique of ultrafiltration was
determined by the method of Lowry et aZ., (1951). The concentration
of proteins in the honey residues were determined from the calibration
curve obtained for the standard reference protein, bovine serum albumin
as shown in Figure 2. The amount of protein present in the honey samples
prior to concentration were evaluated and are given in Table 8.
The use of polyacrylamide gels was disappointing as most of the
honeys gave a similar unresolved band about 4 cm long. Also, in cases
of China buckwheat honey Code No. 209 and other relatively high protein
honeys the whole gel became stained not due to overload. This technique
was not suitable for further-investigations. Therefore, the only use
of straight PAGE was for location of enzyme activity in unstained gels.
The application of purified laboratory grade enzymes on polyacrylamide
gels and then location with napthalene black stain resulted in sharp
definite bands. These enzymes were diastase, glucose oxidase and
invertase. Similar band pattern was also observed for a mixture containing
honey and the standard laboratory grade enzymes. The position and distance
moved by each of these bands were measured from the top of the gels
and have been given in Table 9.
Moreover, the presence of enzyme activity due to diastase, glucose
oxidase andinvertase in honey applied to polyacrylamide gels was examined
by using picric acid as an indiactor as described. However, the presence
of an orange red band due to the formation of picramic acid was detected
on gels to which standard laboratory grade enzymes diastase and invertase
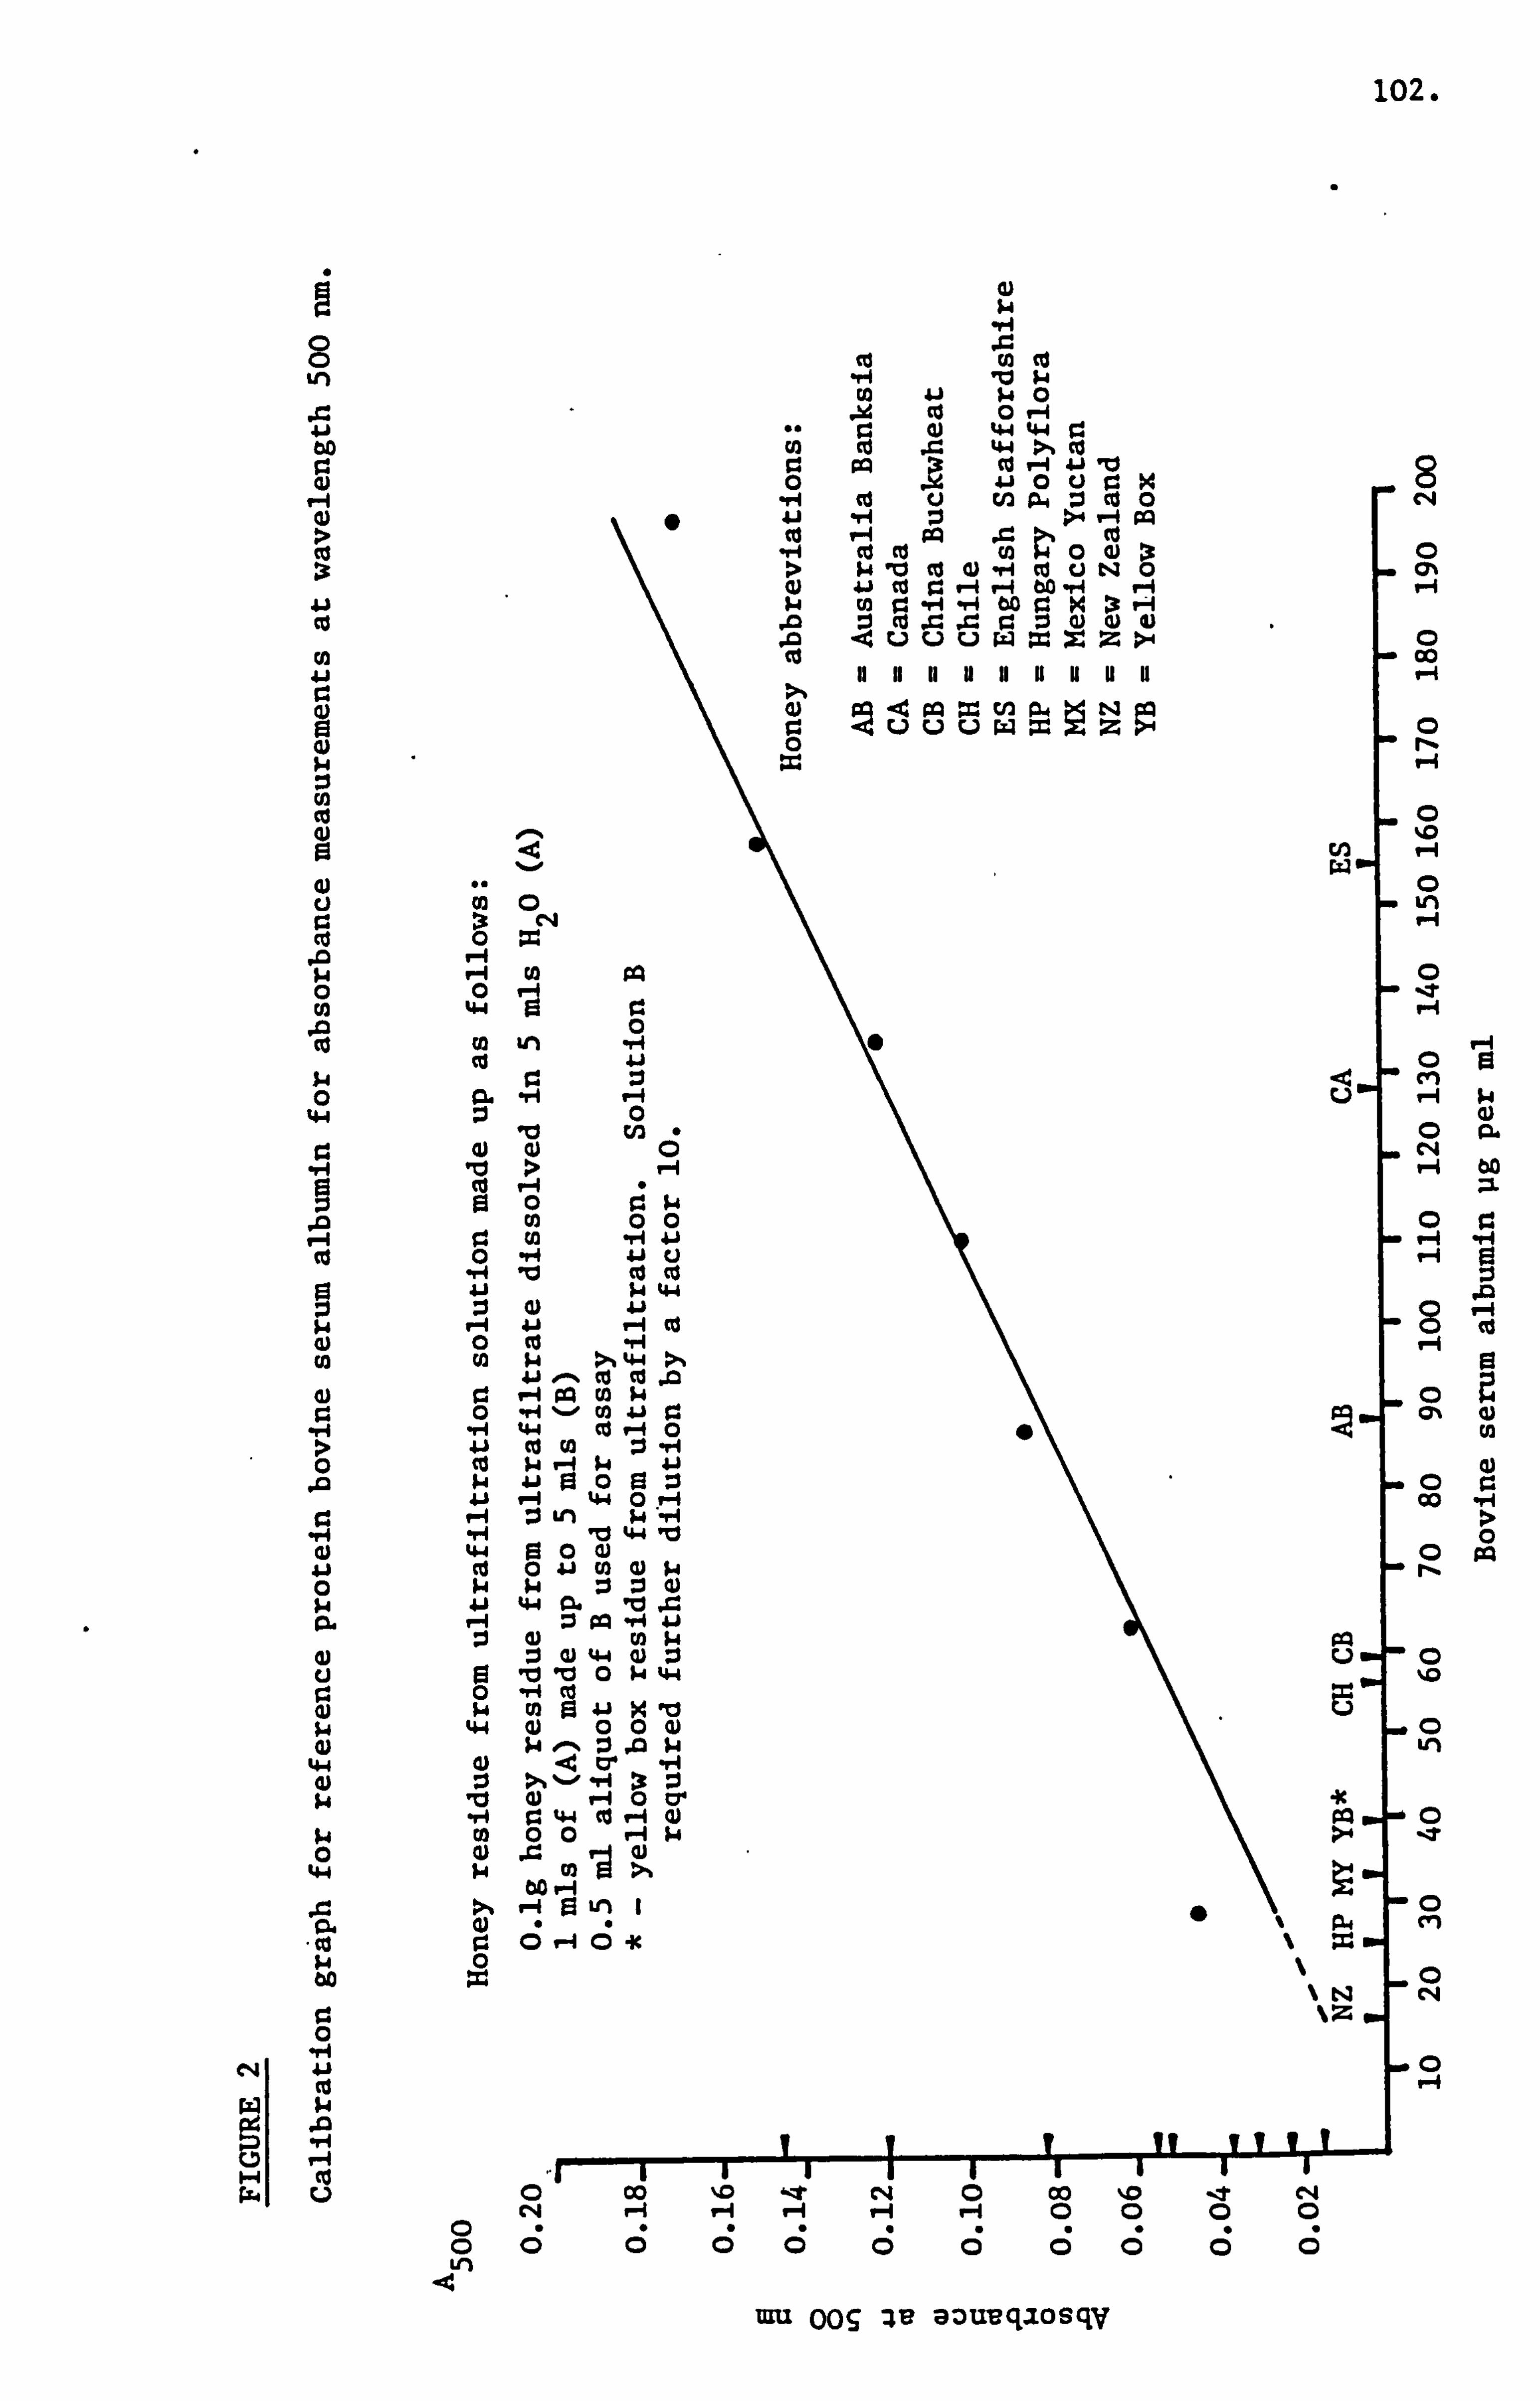
102.
0)
Co rA 41
C Co Co gi
ce
0 44
ce
44
14 0
44
A 0.
w
Ni p . im
9
V-1 rA PQ 0
0 V) _H tu
0 ,0 u2
4) (L) c5 10 > H Co P-4 0
0 Cw 00
-r-4 41 0 41 u
4-4 10 CO tu 41 $4 44 :1 0) 41
F-1 41 P-1 Cd 0 Co H rA w >t 4-1 >%
4j Co 0 ci P-4 w 0 H- Co 41 0
-ri 4.4 cu P-4 0 41 M0 :1H Co 1.4 PH w 41 ß4 0 0 :1 41 4-4 0 P-4 P-1 :i LM w «". 4 ri 10 44 10
44 13 00 0 0 41 (0 0 $. 4 w w :i :1 (1) 4j 44 IZJ J.,
4.1
Q) 44 0 :1 ICJ 0 W 4-4
0
*rl W ul 1 0 0 Q)
0) V-4 0c ri 93 44 ce P-4 Q) Co 00 Hw
0) r. 04 (ý « 0 Z. 4
0 ce Co 41 W0
tu 0 r-i (V 44 w Co jl. 44 >% 0 pp M V-4 41 lu A 8 0
.H 0 41 0 t) x uMP., :10 C, 4 41 H :i>. # V-4 gq Co V-4 gp 4 ýt tu -v-f ce cu 00 Q) > 0 > N4 10 to 0 _H Co uN0 (A
rý r-i r-f to H F-4 1-4 ei 4-4 bo ýi x :3H
Co
%0
Co r4
CD
%0 6 w.
CD
0
% P., c9 %
0 V-4
a co %D 'IT C14 0 00 %0 --T N C*4 r-I
0 Ln
mu OOS : Ile az)u-eqaosqV
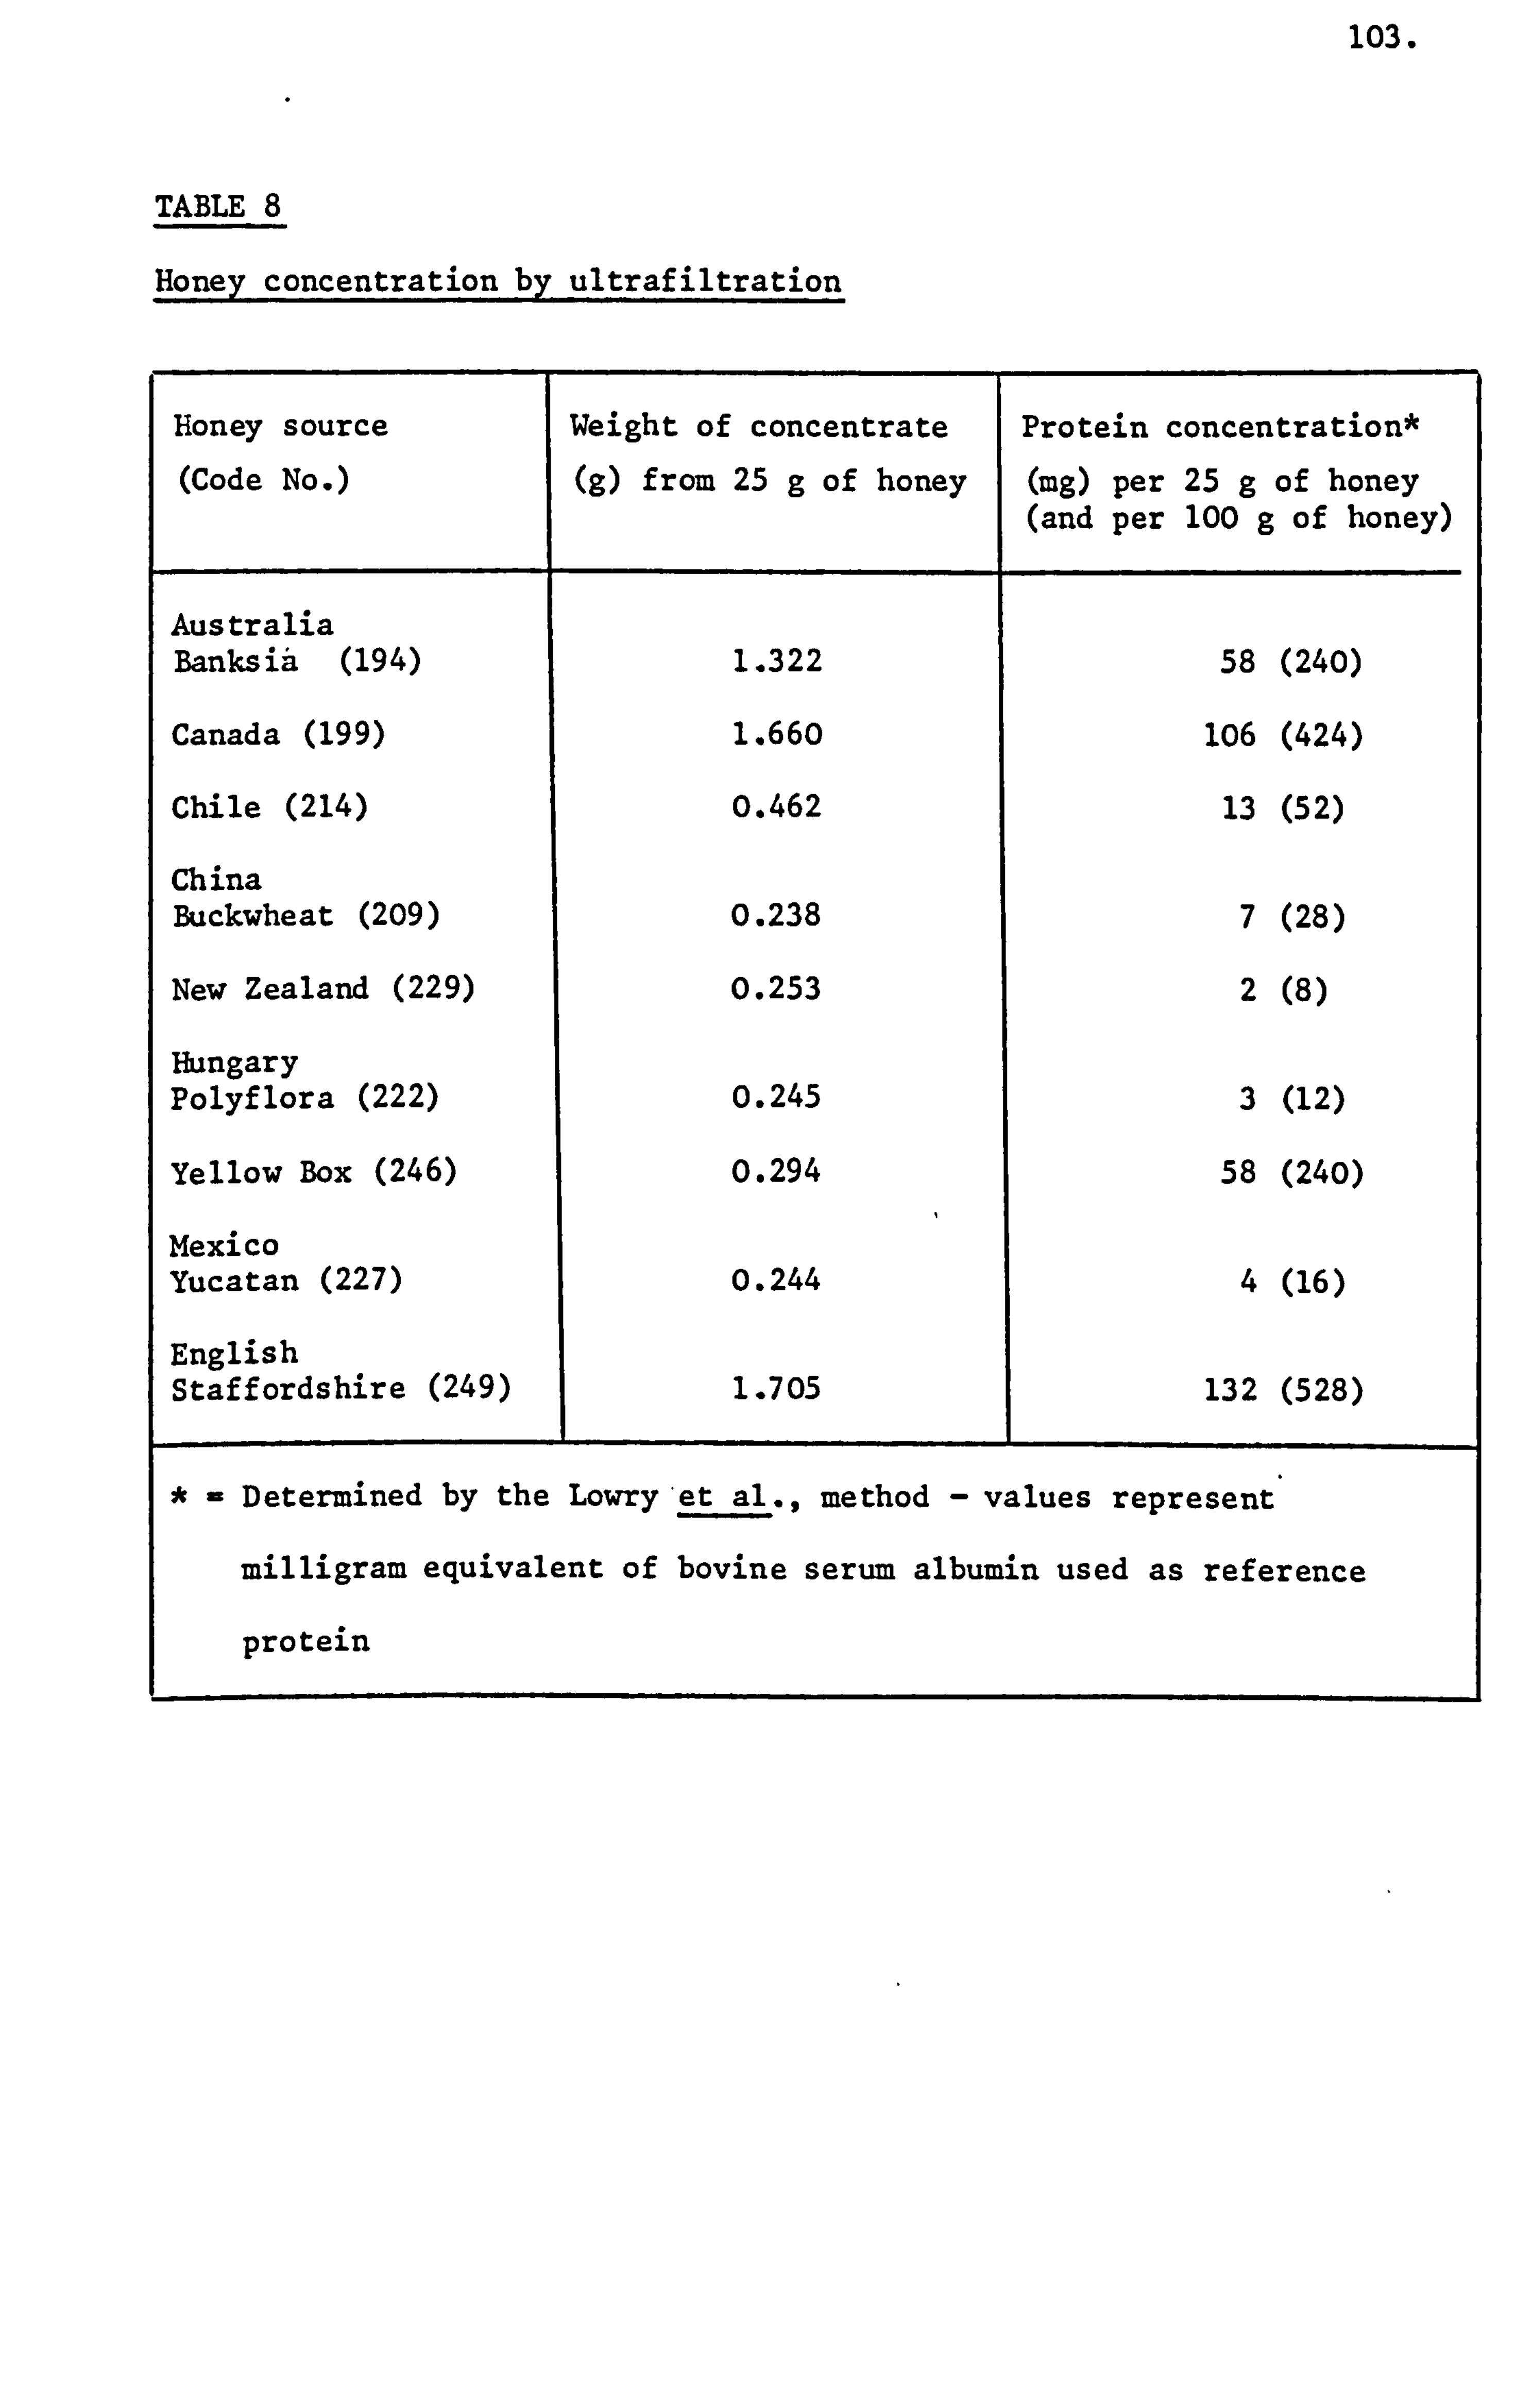
103.
TABLE 8
Honey concentration by ultrafiltration
Honey source (Code No. )
Weight of concentrate (g) from 25 g of honey
Protein concentration* (mg) per 25 g of honey (and per 100 g of honey)
Australia Banksi. i (194) 1.322 58 (240)
Canada (199) 1.660 106 (424)
Chile (214) 0.462 13 (52)
China Buckwheat (209) 0.238 7 (28)
New Zealand (229) 0.253 2 (8)
Hungary Polyflora (222) 0.245 3 (12)
Yellow Box (246) 0.294 58 (240)
Mexico Yucatan (227) 0.244 4 (16)
English Staffordshire (249) 1.705 132 (528)
Determined by the Lowry*et al., method values represent
milligram equivalent of bovine serum albumin used as reference
protein
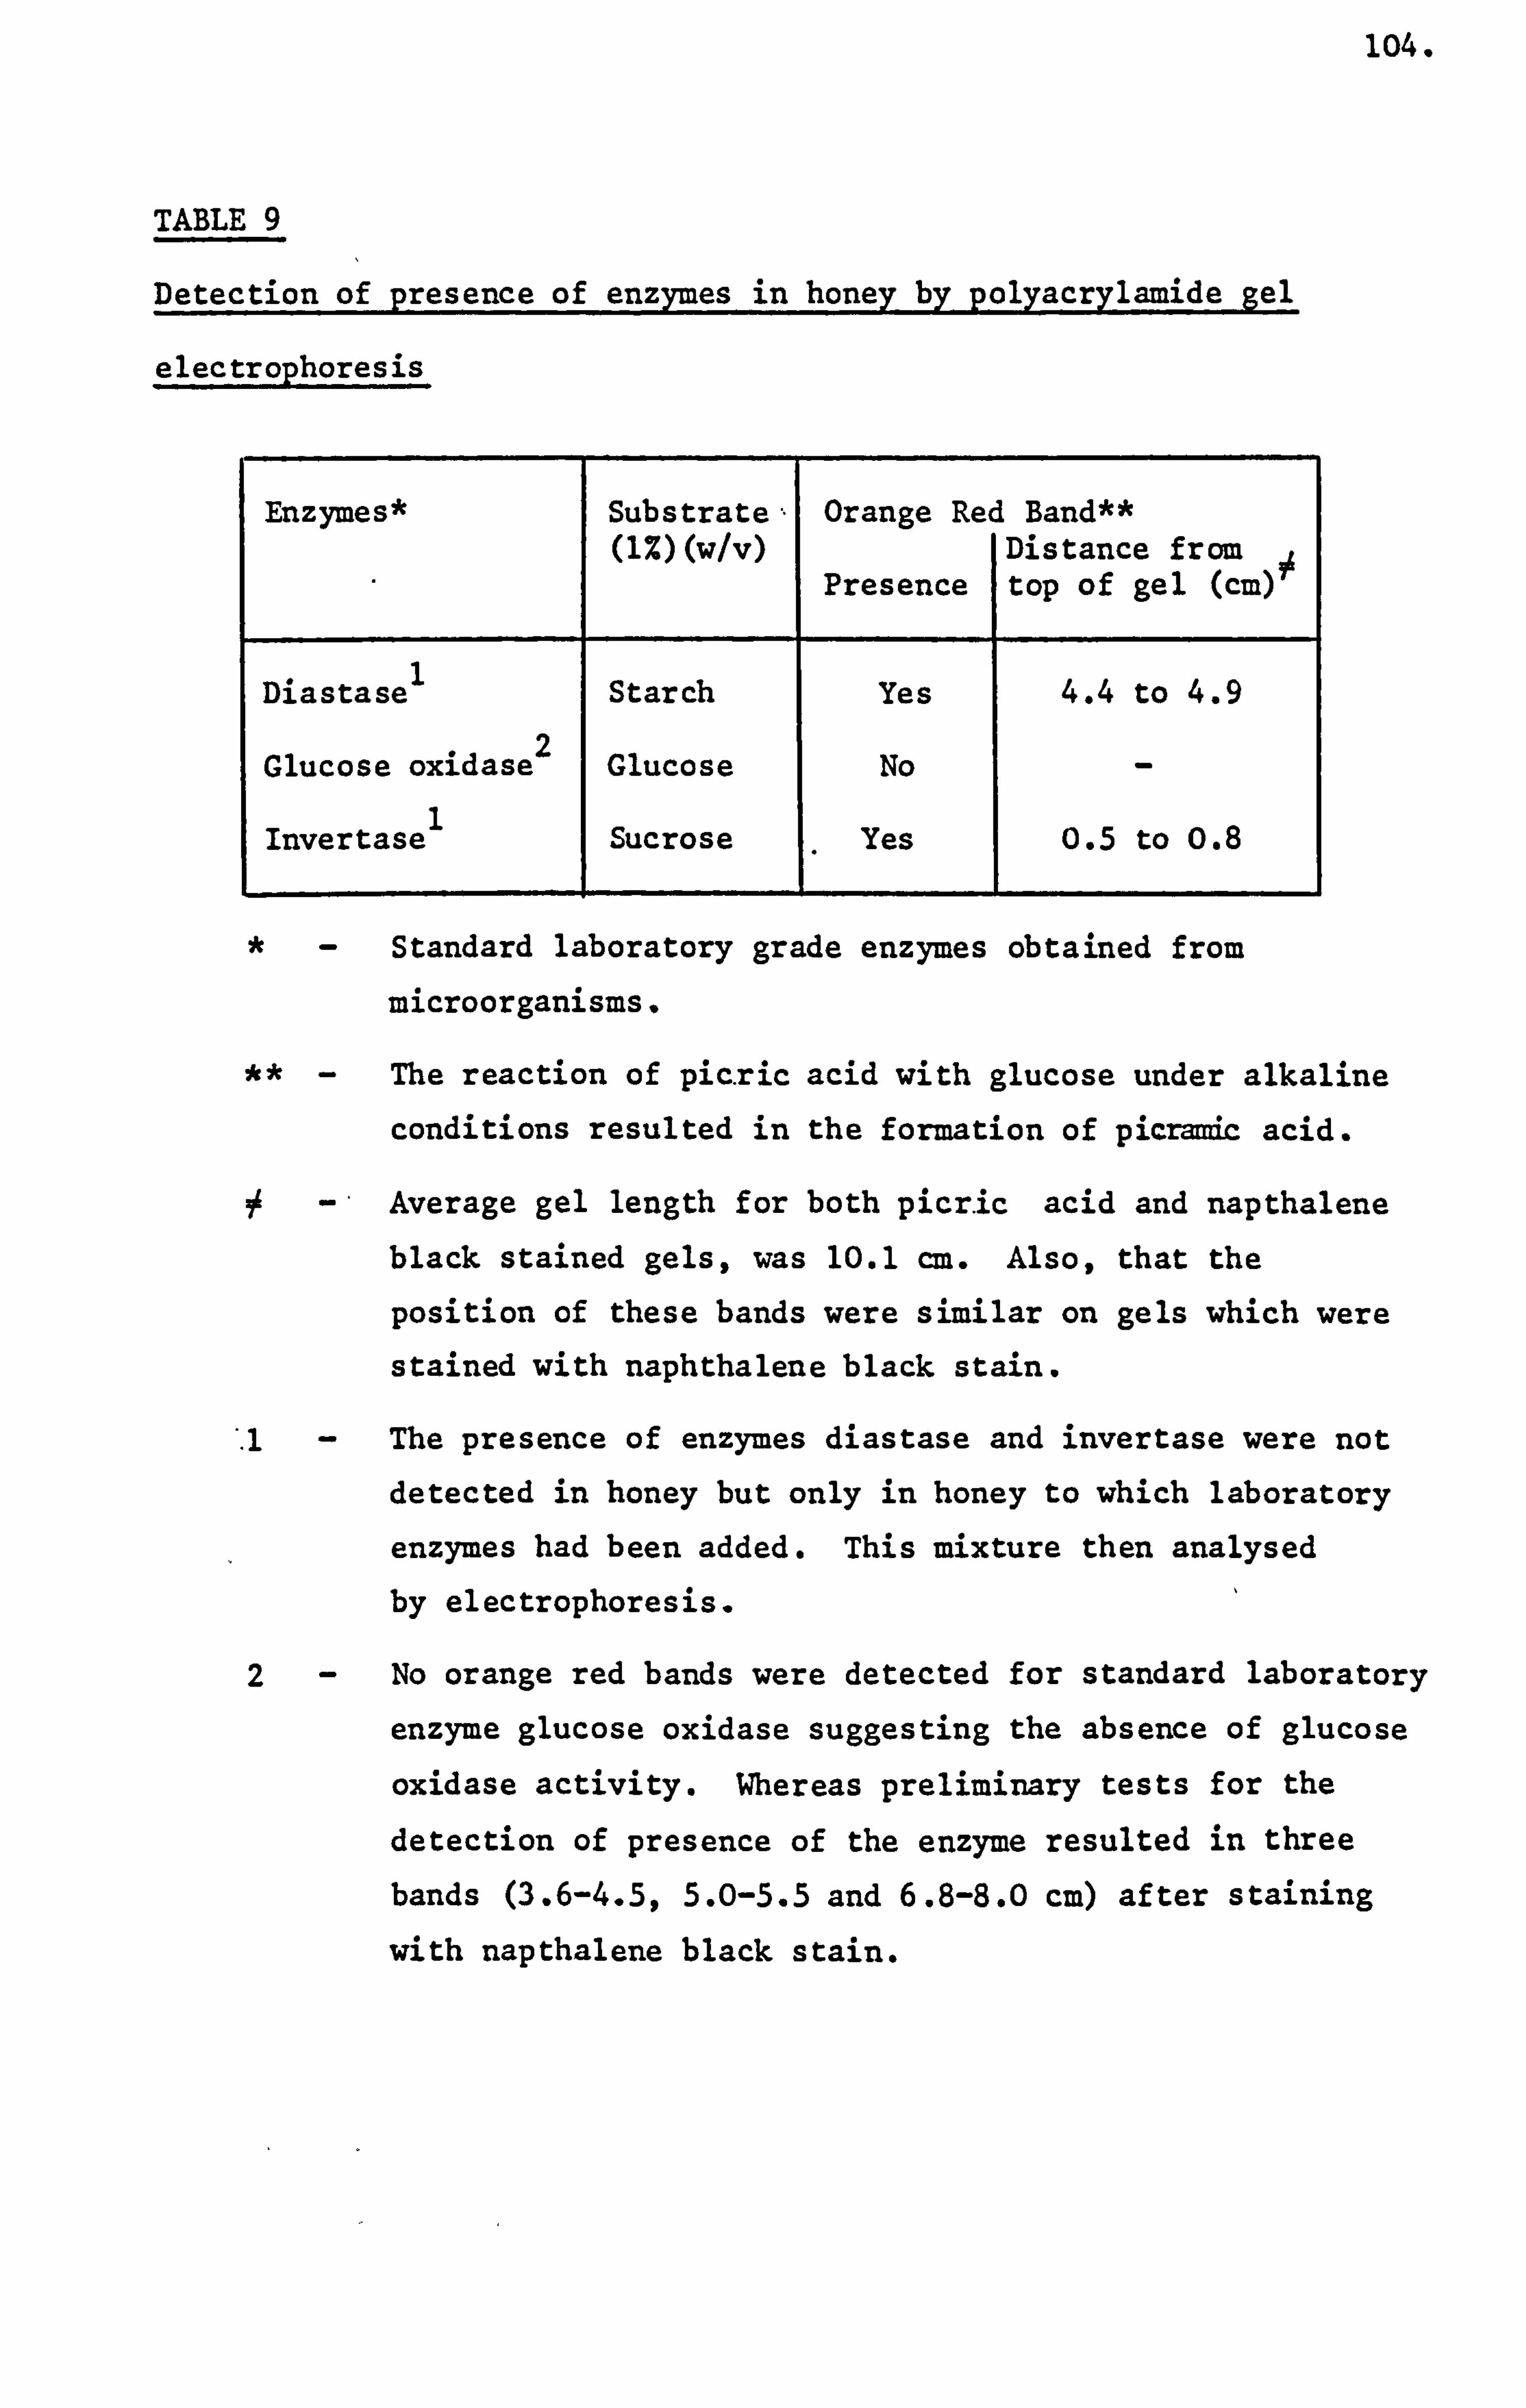
104.
TABLE 9
Detection of presence of enzymes in honey by polyacrylamide gel
electrophoresis
Enzymes* Substrate, Orange Red Band** (1%)(w/v) Distance from
Presence top of gel (cm)
Diastase Starch Yes 4.4 to 4.9
Glucose oxidase 2 Glucose No
Invertase Sucrose Y910 es 0.5 to 0.8
Standard laboratory grade enzymes obtained from
microorganisms.
The reaction of pic. ric acid with glucose under alkaline
conditions resulted in the formation of picramic acid.
Average gel length for both picrIc acid and napthalene black stained gels, was 10.1 cm. Also, that the
position of these bands were similar on gels which were
stained with naphthalene black stain.
The presence of enzymes diastase and invertase were not detected in honey but only in honey to which laboratory
enzymes had been added. This mixture then analysed by electrophoresis. I
2 No orange red bands were detected for standard laboratory
enzyme glucose oxidase suggesting the absence of glucose
oxidase activity. Whereas preliminary tests for the
detection of presence of the enzyme resulted in three
bands (3.6-4.5,5.0-5.5 and 6.8-8.0 cm) after staining
with napthalene black stain.
105.
had been applied but not however on gels to which glucose oxidase was
applied. Although the orange red band was not evident on gels to which
honey was applied, the orange red band was however detected on gels
to which a mixture containing both the honey and standard laboratory
enzymes were applied. The position and distance moved by these orange
red bands were similar to those bands obtained as gels stained with
napthalene black stain. These have been given in Table 9.
The presence of proteins in raw honey (2g) was detected by the
technique of polyacrylamide gel electrophoresis in the presence of sodium
dodecyl sulphate. After electrophoresiS and staining the protein bands
which appeared on gels to which honey samples that were either heat
treated or otherwise have been shown in Figure 3 and Tables 10 and 11.
The position and distance moved by protein bands which appeared after
staining on 5% and 10% polyacrylamide gels were measured from the top
of the gel, this being the cathode or the negative end as shown in Figure
3. The protein bands were labelled alphabetically from the top. These
bands corresponded to proteins whose molecular weights were largely
between 60,000 daltons and 20,000 daltons, compared against reference
standard proteins. An unusual pattern of the protein bands from that
given in Figure 3 was observed on the SDS-polyacrylamide gels of national
honey show sample Code No. 252, China buckwheat Code No. 209 and soyolk
(soyabean protein). The unusual pattern has been shown in Figure 4.
The polyacrylamide gels after staining were also scanned on a gel
scanner at wavelength 560 nm as described. A typical scan recorded
onto a chart paper for both the 5% and 10% polyacrylamide gels have
been shown in Figures 5 and 6 respectively. The relative position of
the protein bands have also been labelled alphabetically according to
those already shown in Figure 3.
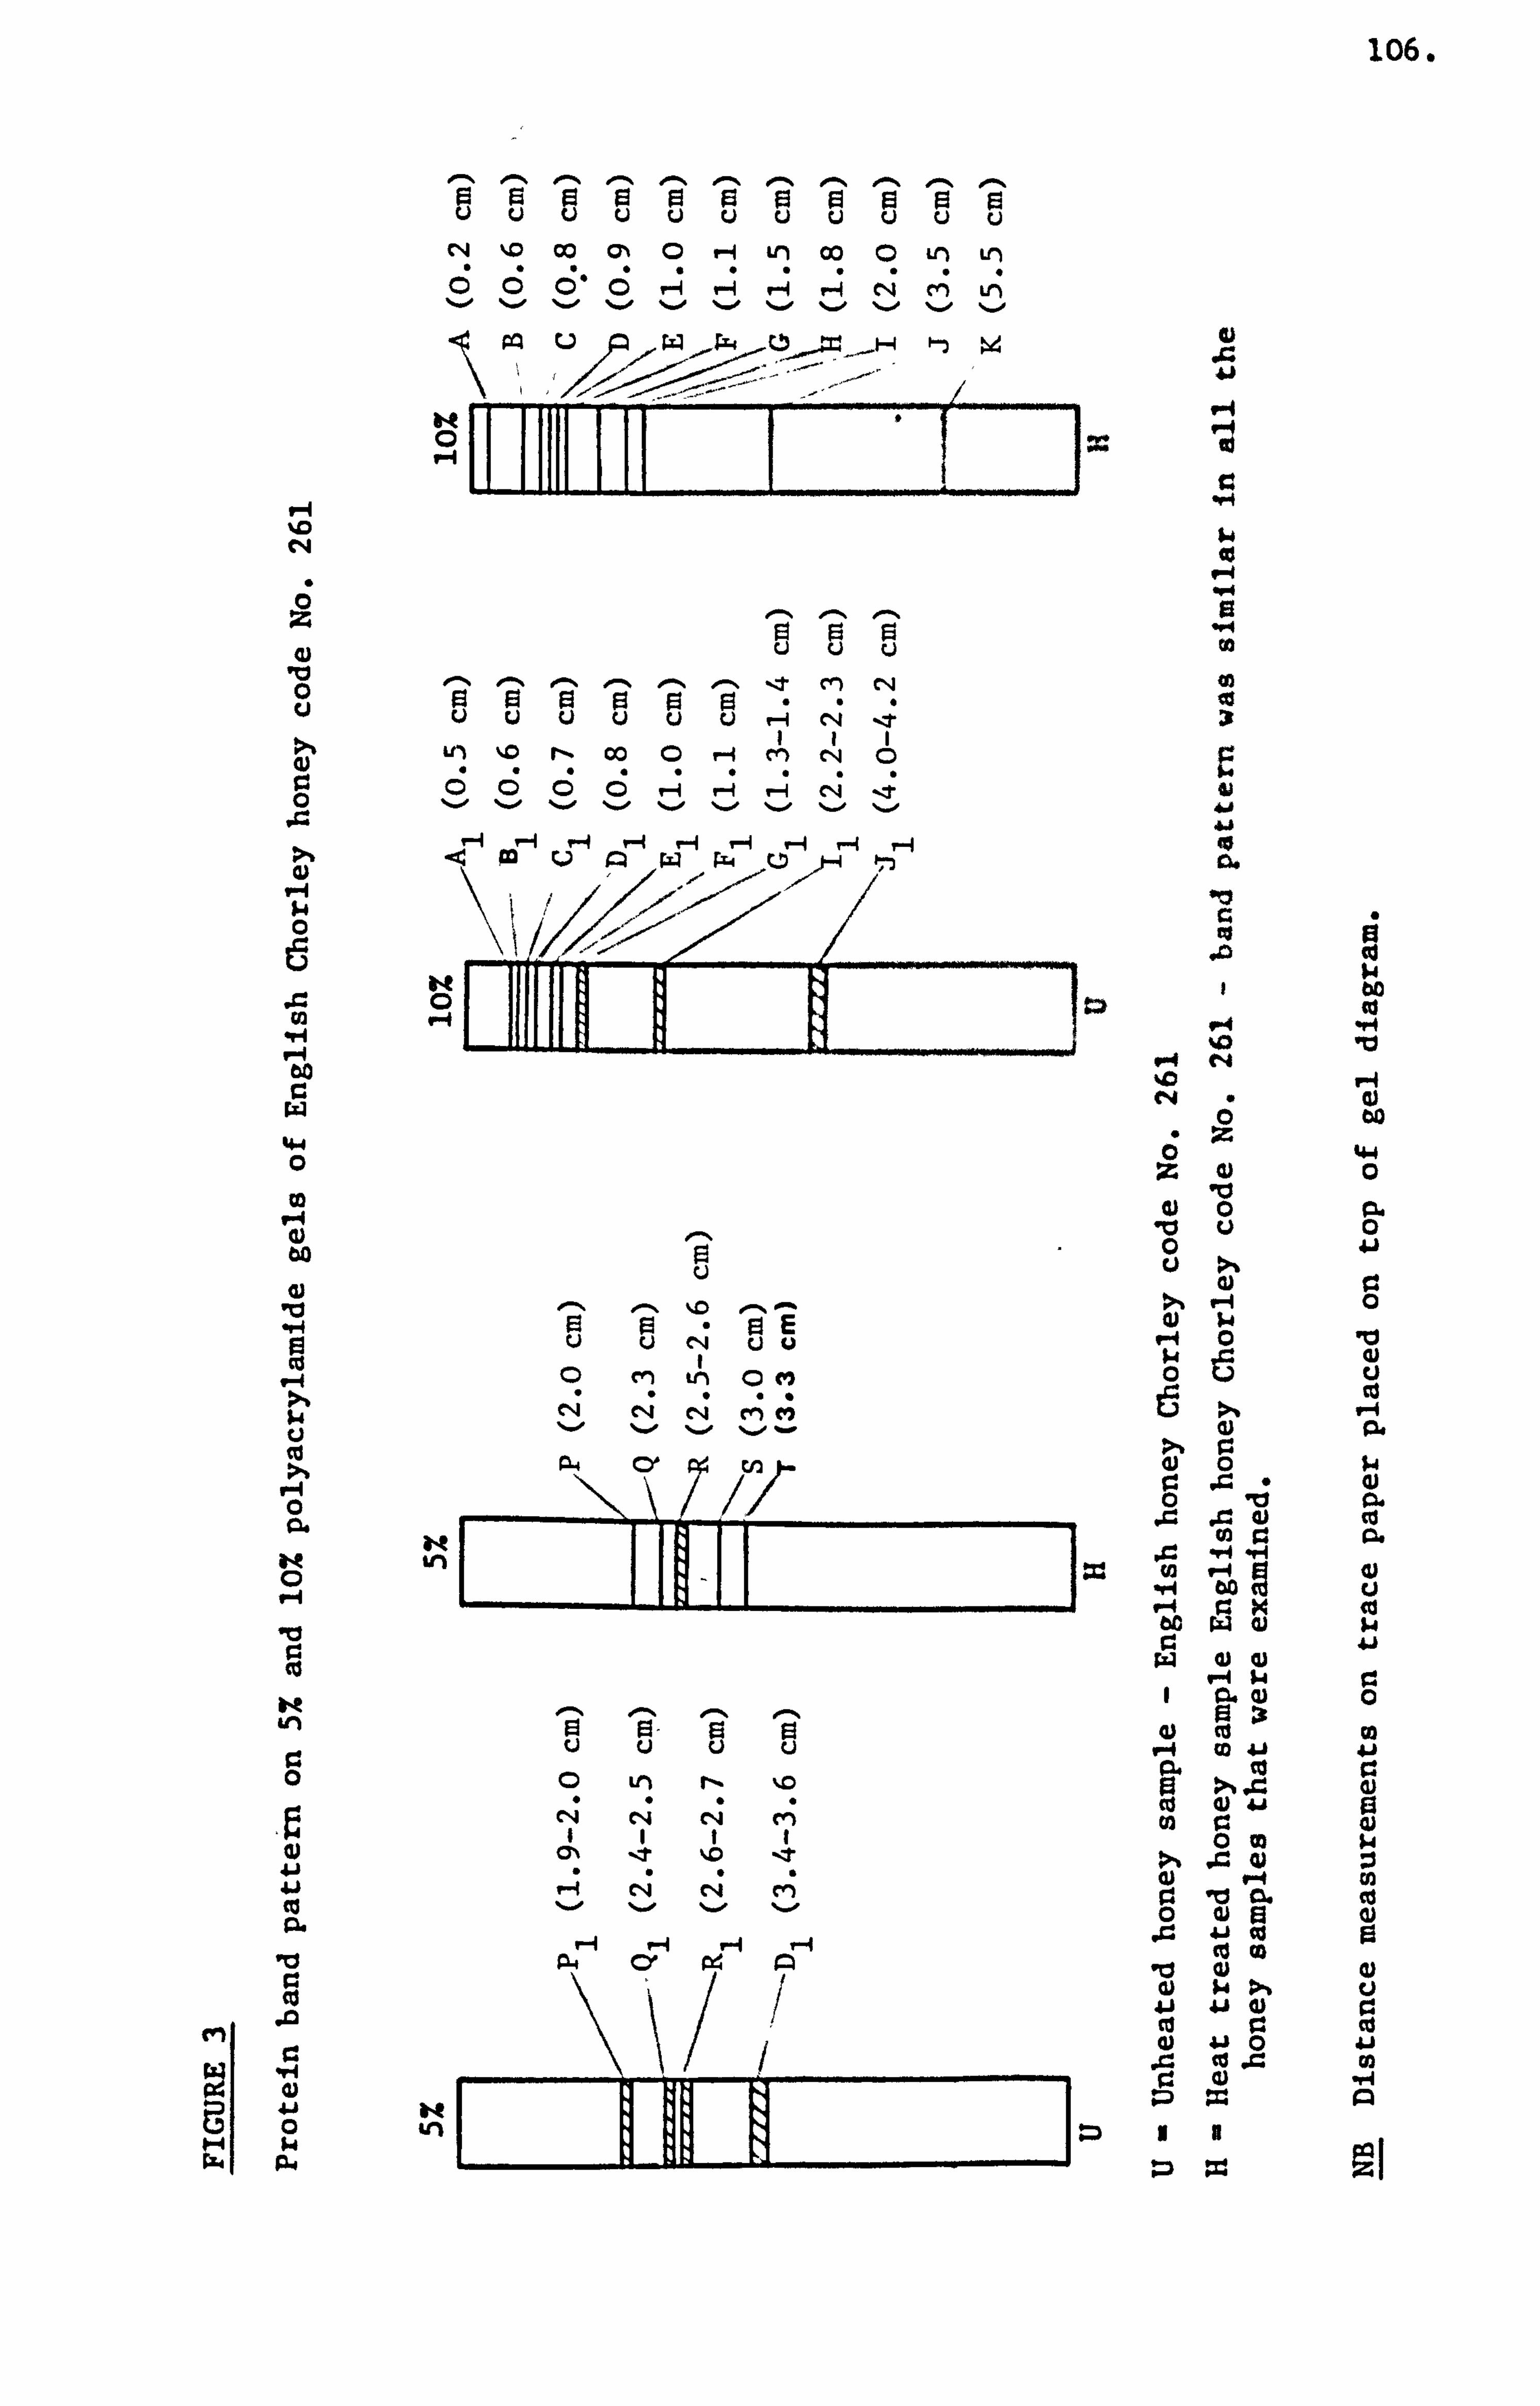
lo6.
CVI
C, 4
,0 0
0
0
Co
lu
0
10 r.
0
ýe ei 41 41 tö 91.
10 C Co
.M
0 W
P. o
0, -ý o-, O-N 0-% -, o-, .. % o-,
E3 F1 F1 000 uuuu co (n 0H Ln OC) Ln
c) PQ u
II'I 1= O-N 0-1 01% 0-% 1ý Cý Cl!
cel
to C14 'T
rý 0ý --i en C-q o r-I r4 r4 C4 r-ý
44
IM c, L1111 11 ýýHI
el%
u
C, 4 uu I C) th am
C4 C4 V4 C; PL4 C). 'o
in
0-1 El u
0 Ln r- %. o
C4 C4 C4 14
tri
4) J. - 41
1-4
to
Co
40 c>A
r. re
.0d
10 a) 0 0.
lu u 0
Co
a) 0 r. 40
Ici 0. a) Co
Co r,
0 ce 90 W-4 CD 41 41
01 e 0) 0m
0 10 c2.0 00 Ei 13)
A 41 Co 0
00 0C0
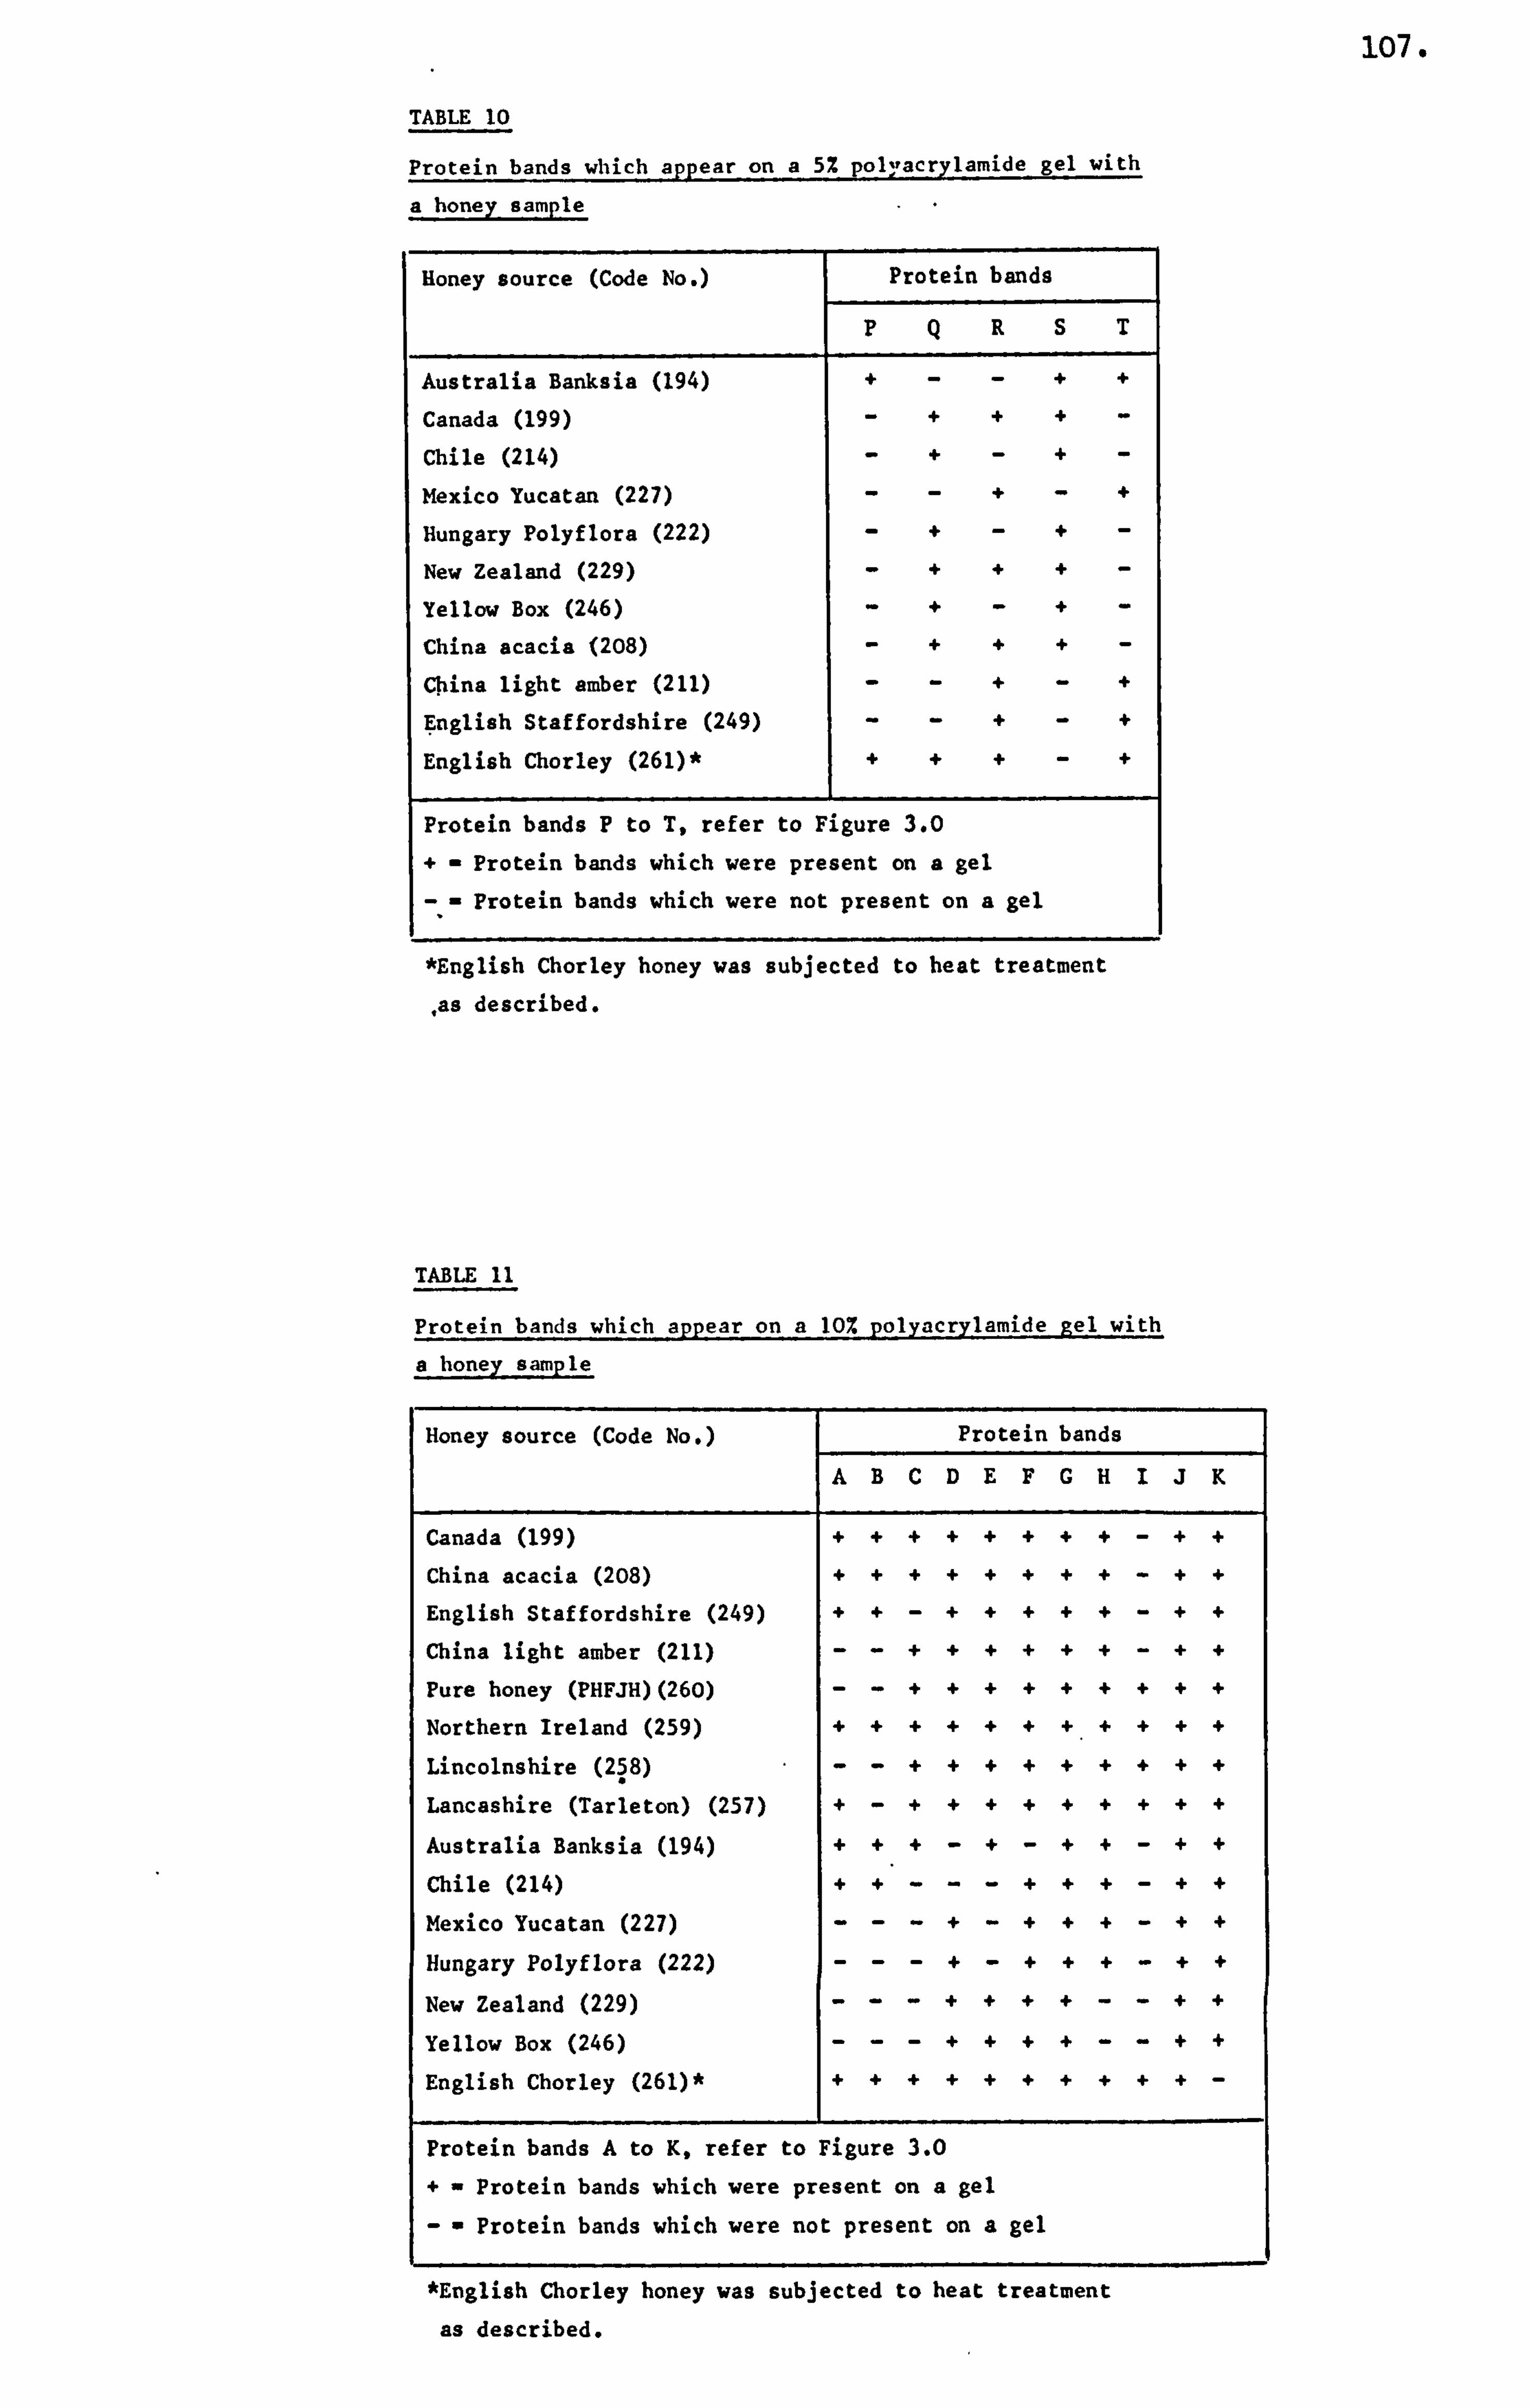
107.
TABLE 10
Protein bands which appear on a 5% polyacrylamide gel with
a honey sample
Honey source (Code No. ) Protein bands
PQ R S T
Australia Banksia (194) +- - + +
Canada (199) -+ + +
Chile (214) -+ - +
Mexico Yucatan (227) -- + +
Hungary Polyflora (222) -+ - +
New Zealand (229) -+ + +
Yellow Box (246) -+ - +
China acacia (208) -+ + +
Cbina light amber (211) -- + +
English Staffordshire (249) -- + +
English Chorley (261)* ++ + +
Protein bands P to T, refer to Figure 3.0
+- Protein bands which were present on a ge l
Protein bands which were not present on a gel
*English Chorley honey was subjected to heat treatment
, as described.
TABLE 11
Protein bands which appear on a 10% polyncrylamide Rel with
a honey sample
Honey source (Code No. ) Protein bands
AB C D E F G H I J K
Canada (199) .. . . . . . . . . .
China acacia (208) .. . . . . . . . . . English Staffordshire (249) .. . . . . . . . . .
China light amber (211) .. . . . . . . . . .
Pure honey (PHFJH)(260) .. . . . . . . . . .
Northern Ireland (259) .. . . . . .. . . . .
Lincolnshire (258) .. . . . . . . . . .
Lancashire (Tarieton) (257) .. . . . . . . . . .
Australia Banksia (194) ++ + - + - + + - + +
Chile (214) . .. . . . . . . . . .
Mexico Yucatan (227) .. . . . . . . . . .
Hungary Polyflora (222) .. . . . . . . . . .
New Zealand (229) .. . . . . . . . . .
Yellow Box (246) .. . . . . . . . . .
English Chorley (261)* .. . . . . . . . . .
Protein bands A to K, refer to Figure 3.0
+- Protein bands which were present on a gel
-- Protein bands which were not present on a gel
*English Chorley honey was subjected to heat treatment
as described.
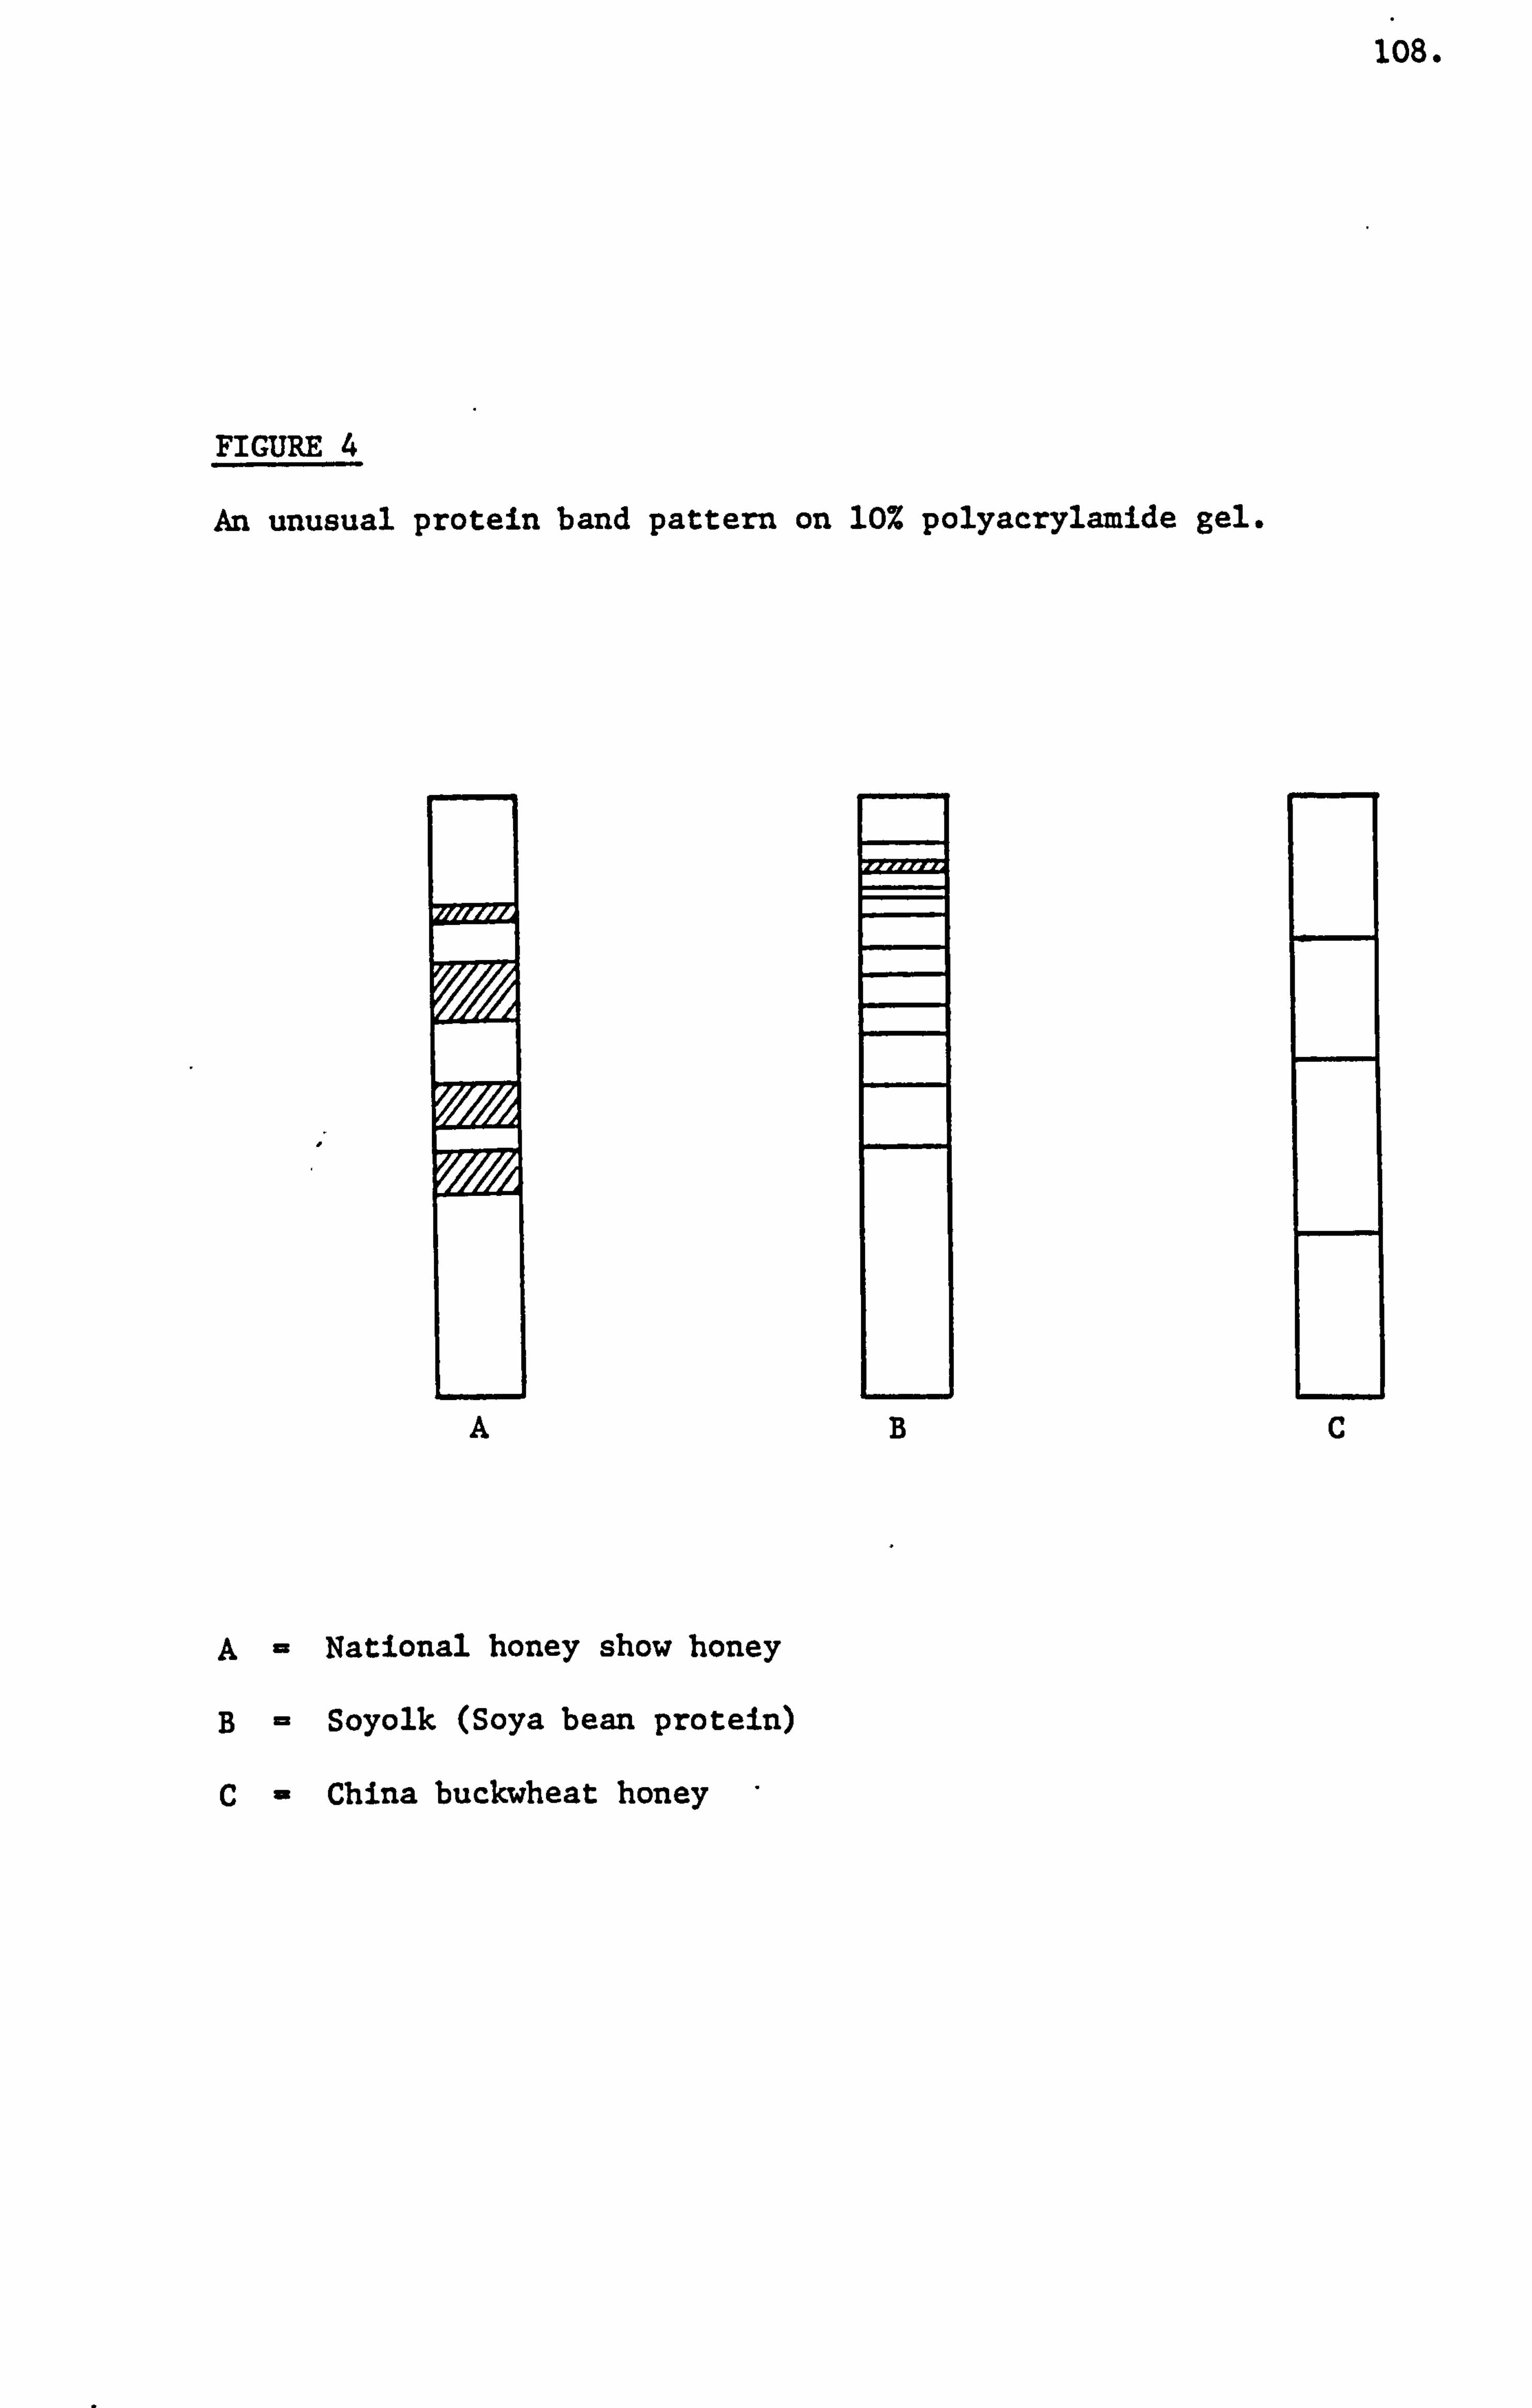
108.
FIGURE 4
An unusual protein band pattern on 10% polyacrylamide gel.
ABC
A- National honey show honey
B- Soyolk (Soya bean protein)
C- China buckwheat honey
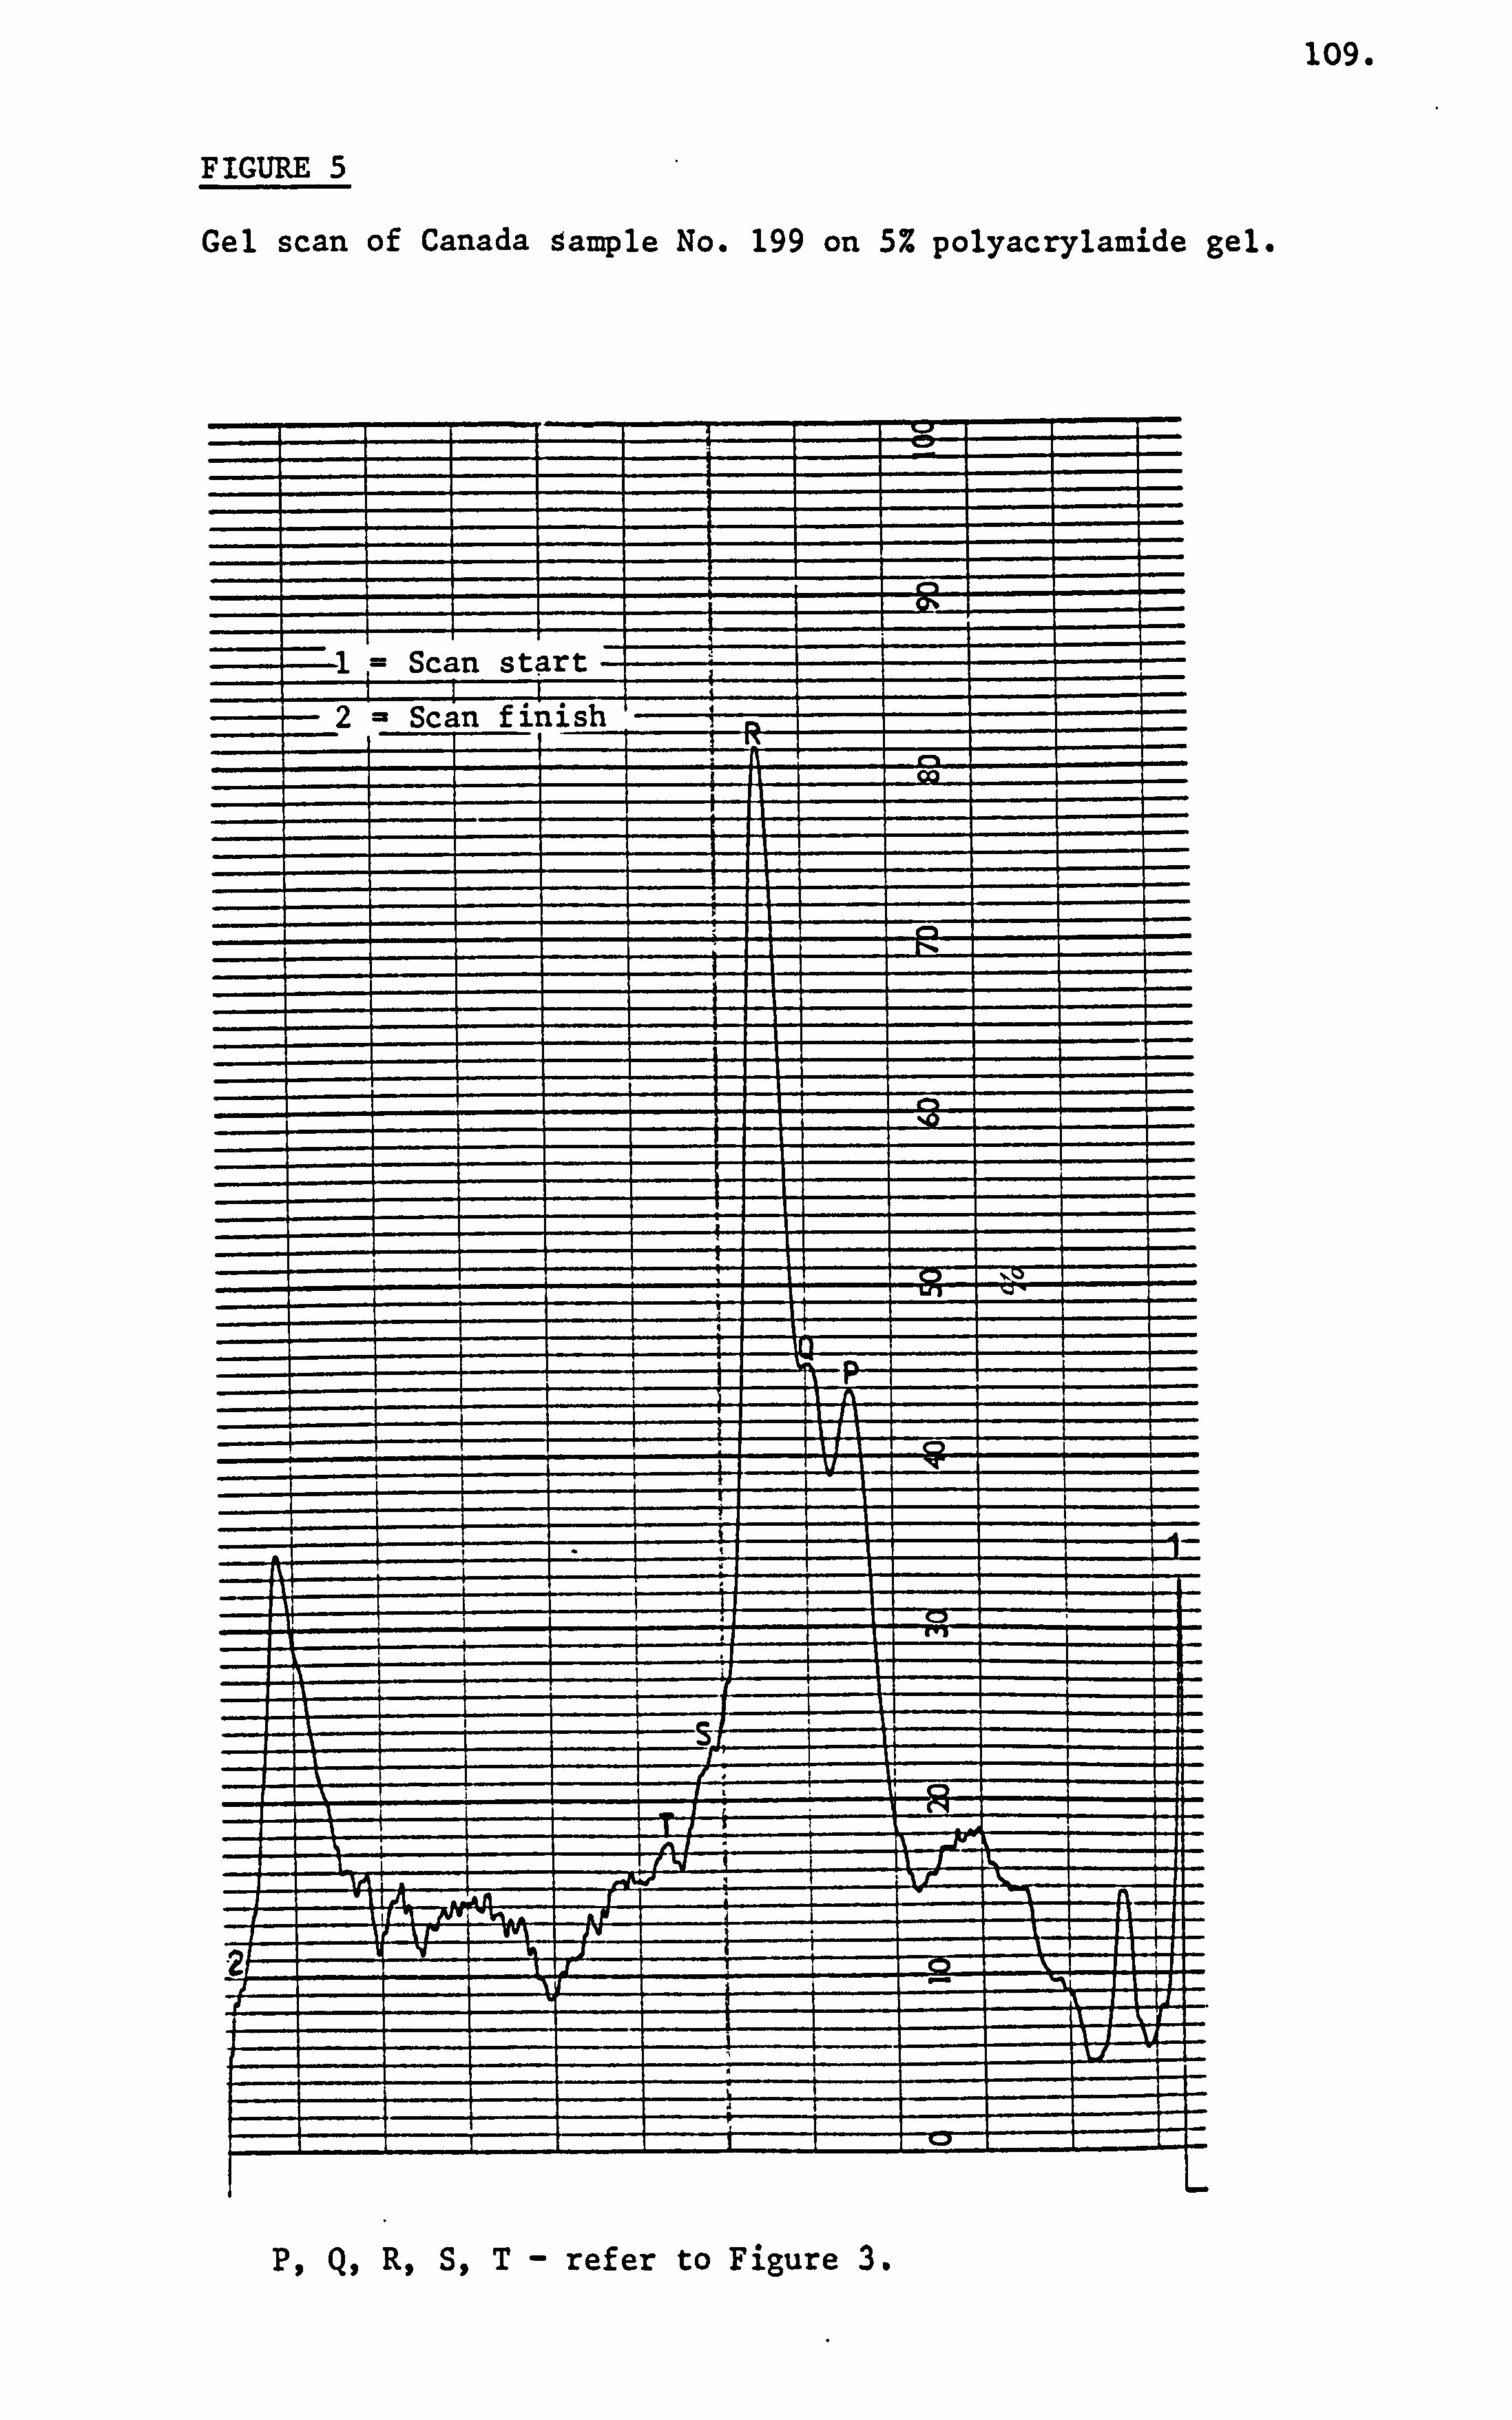
109.
FIGURE 5
Gel scan of Canada sample No. 199 on 5% polyacrylamide gel.
P, Q, R, S, T- refer to Figure 3.
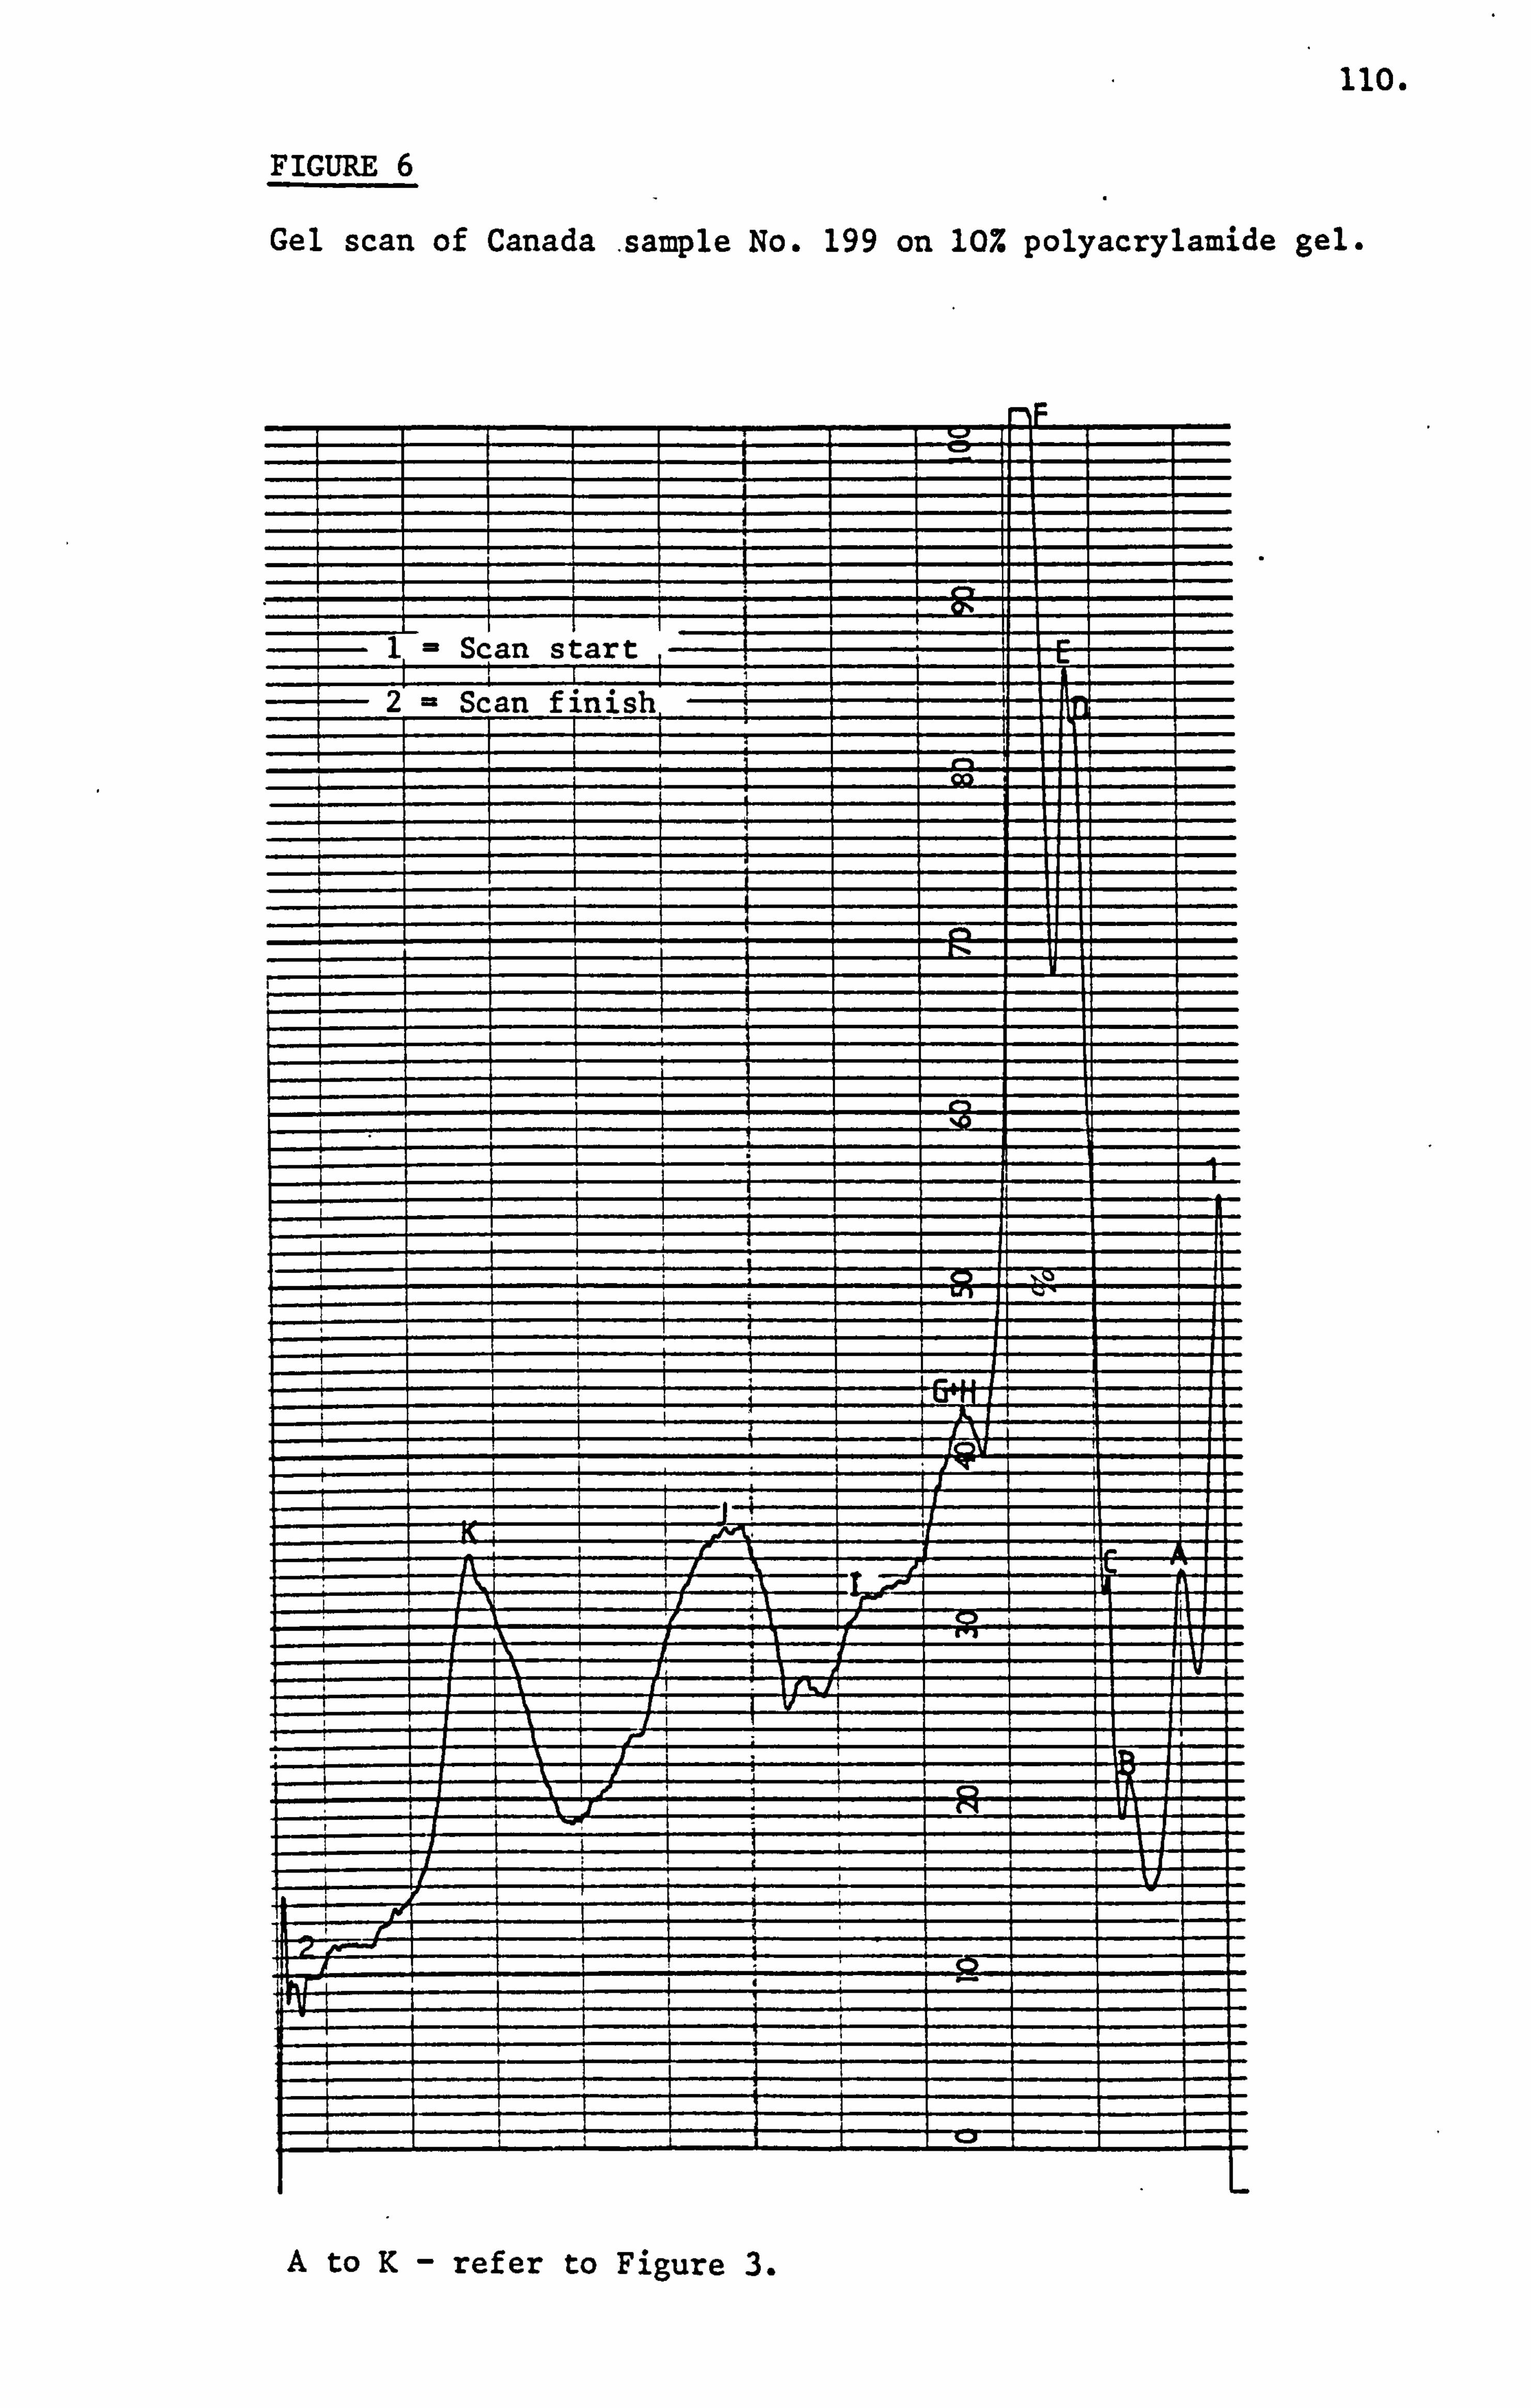
110.
FIGURE 6
Gel scan of Canada sample No. 199 on 10% polyacrylamide gel.
A to K- refer to Figure 3.
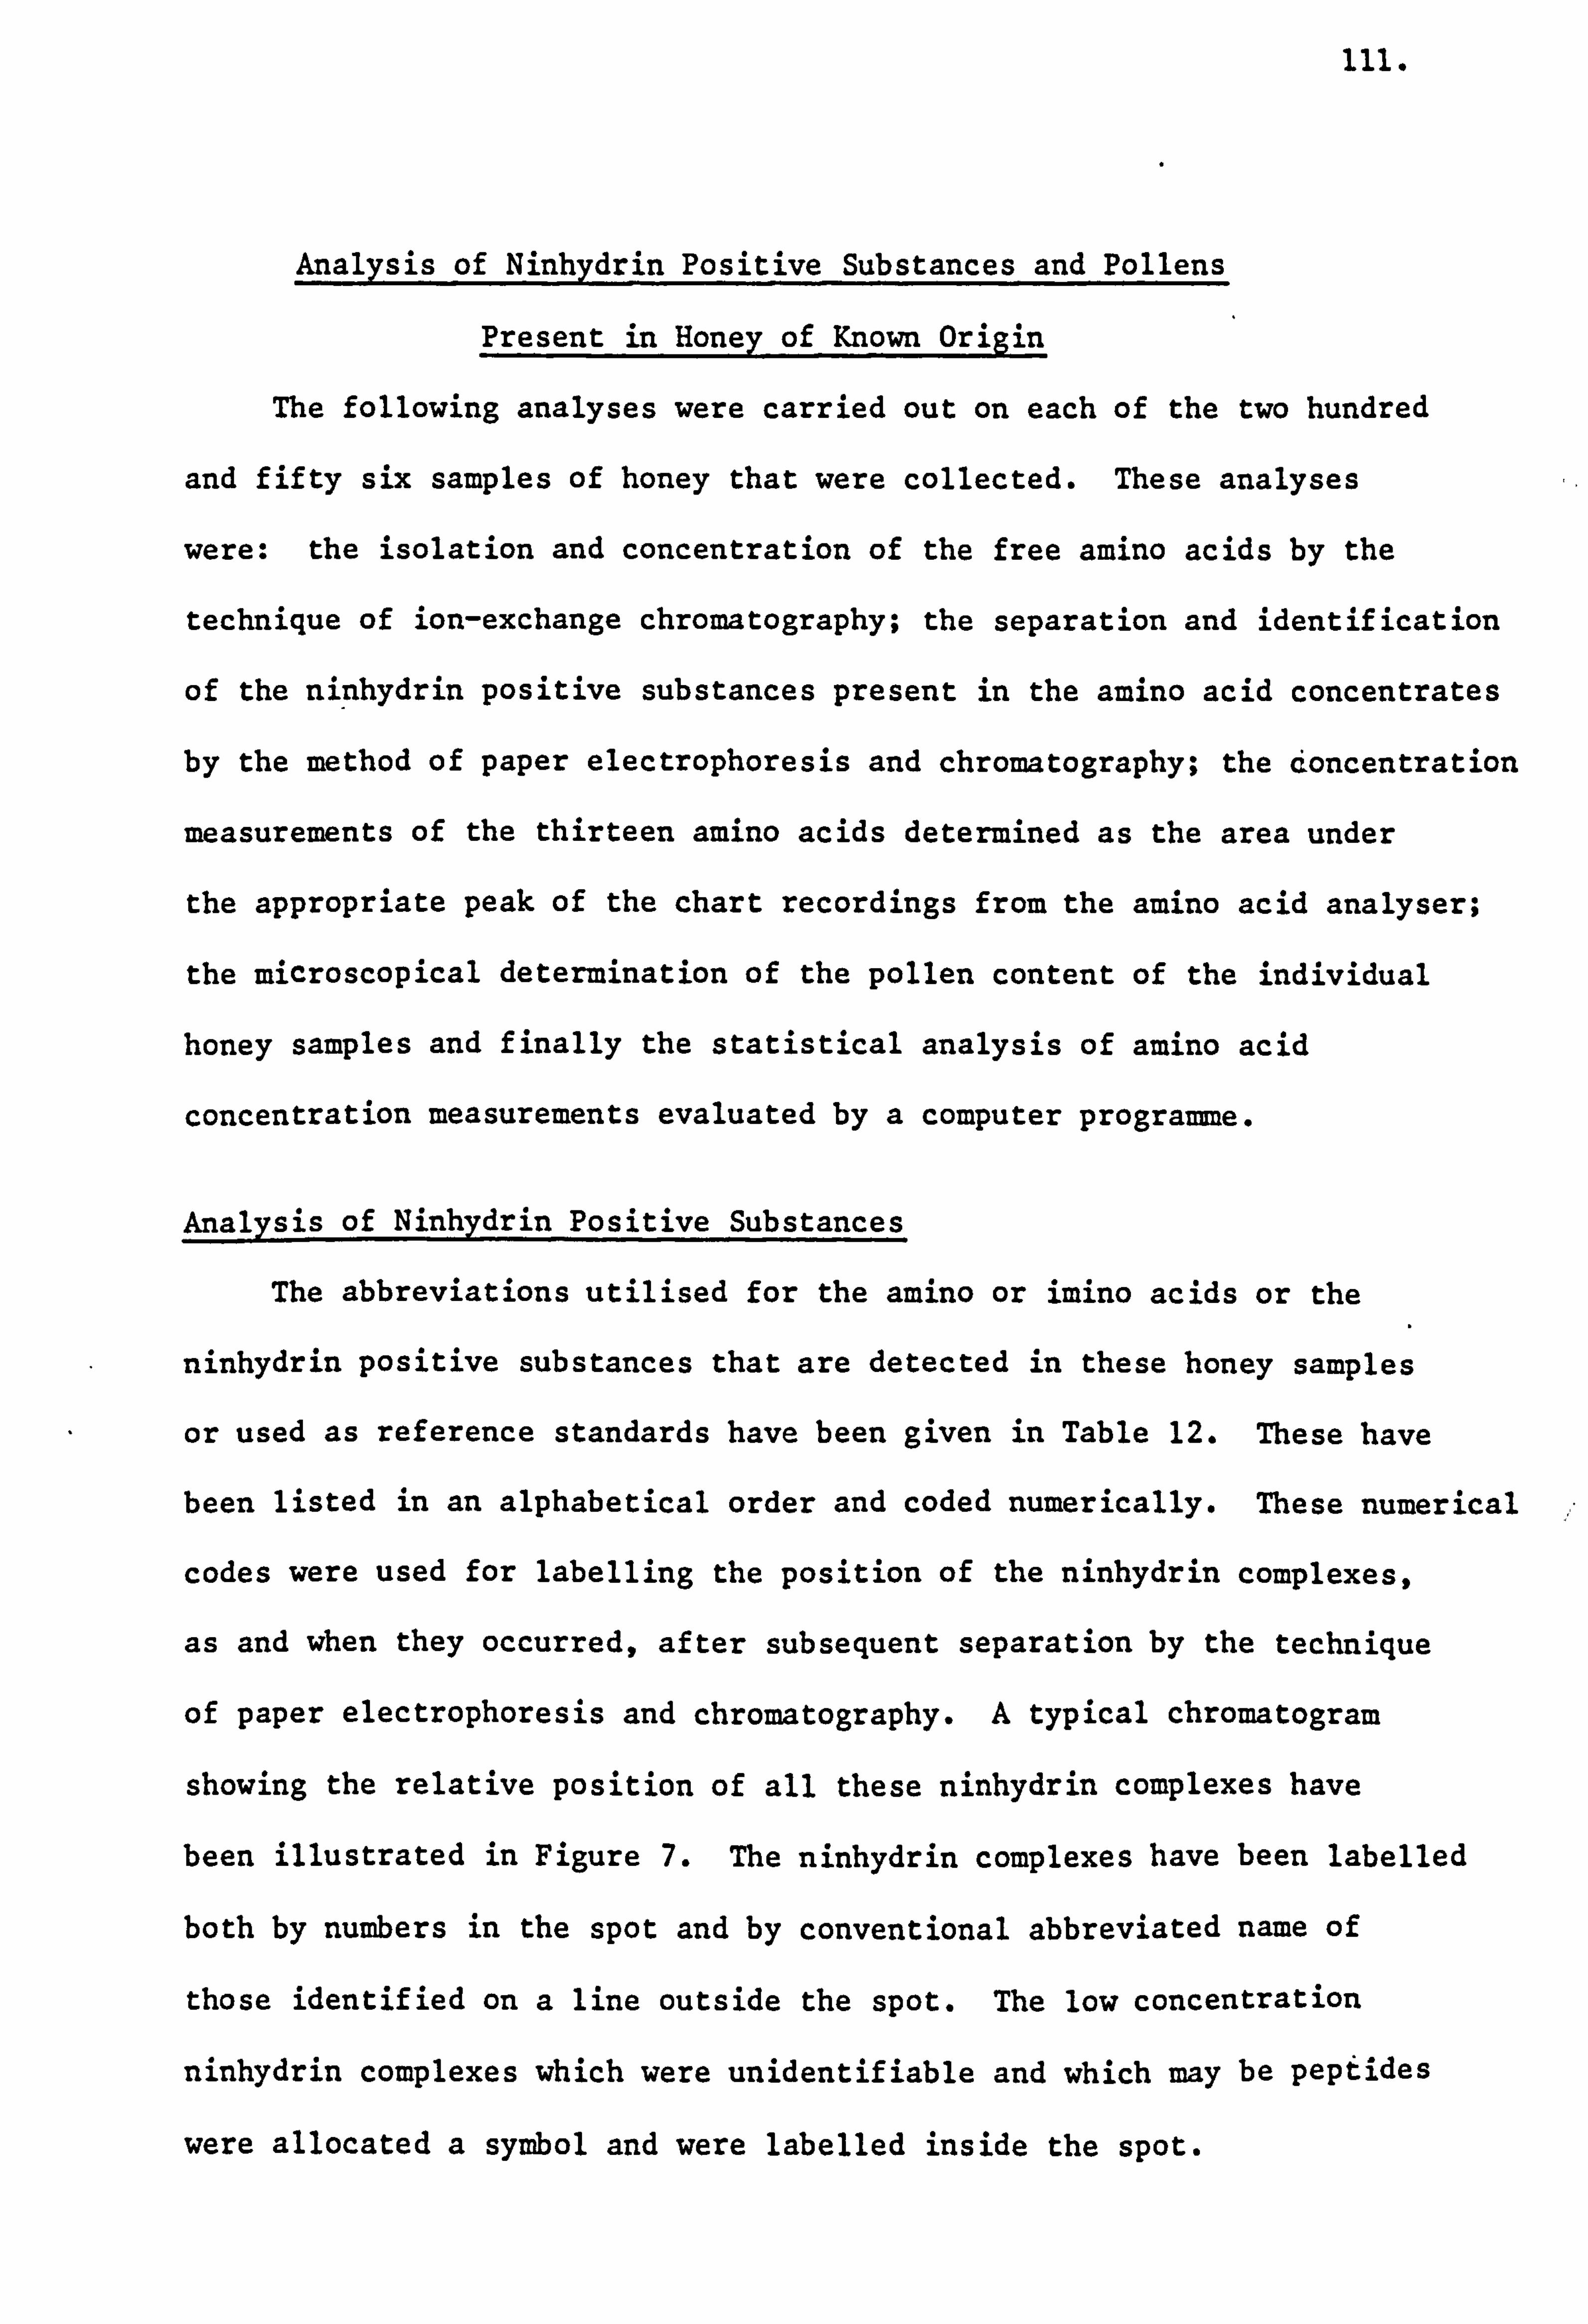
ill.
Analysis of Ninhydrin Positive Substances and Pollens
Present in Honey of_Known Origin
The following analyses were carried out on each of the two hundred
and fifty six samples of honey that were collected. These analyses
were: the isolation and concentration of the free amino acids by the
technique of ion-exchange chromatography; the separation and identification
of the ninhydrin positive substances present in the amino acid concentrates
by the method of paper electrophoresis and chromatography; the d'oncentration
measurements of the thirteen amino acids determined as the area under
the appropriate peak of the chart recordings from the amino acid analyser;
the microscopical determination of the pollen content of the individual
honey samples and finally the statistical analysis of amino acid
concentration measurements evaluated by a computer programme.
Analysis of Ninhydrin Positive Substances
The abbreviations utilised for the amino or imino acids or the
ninhydrin positive substances that are detected in these honey samples
or used as reference standards have been given in Table 12. These have
been listed in an alphabetical order and coded numerically. These numerical
codes were used for labelling the position of the ninhydrin complexes,
as and when they occurred, after subsequent separation by the technique
of paper electrophoresis and chromatography. A typical chromatogram
showing the relative position of all these ninhydrin complexes have
been illustrated in Figure 7. The ninhydrin complexes have been labelled
both by numbers in the spot and by conventional abbreviated name of
those identified on a line outside the spot. The low concentration
ninhydrin complexes which were unidentifiable and which may be pepýides
were allocated a symbol and were labelled inside the spot.
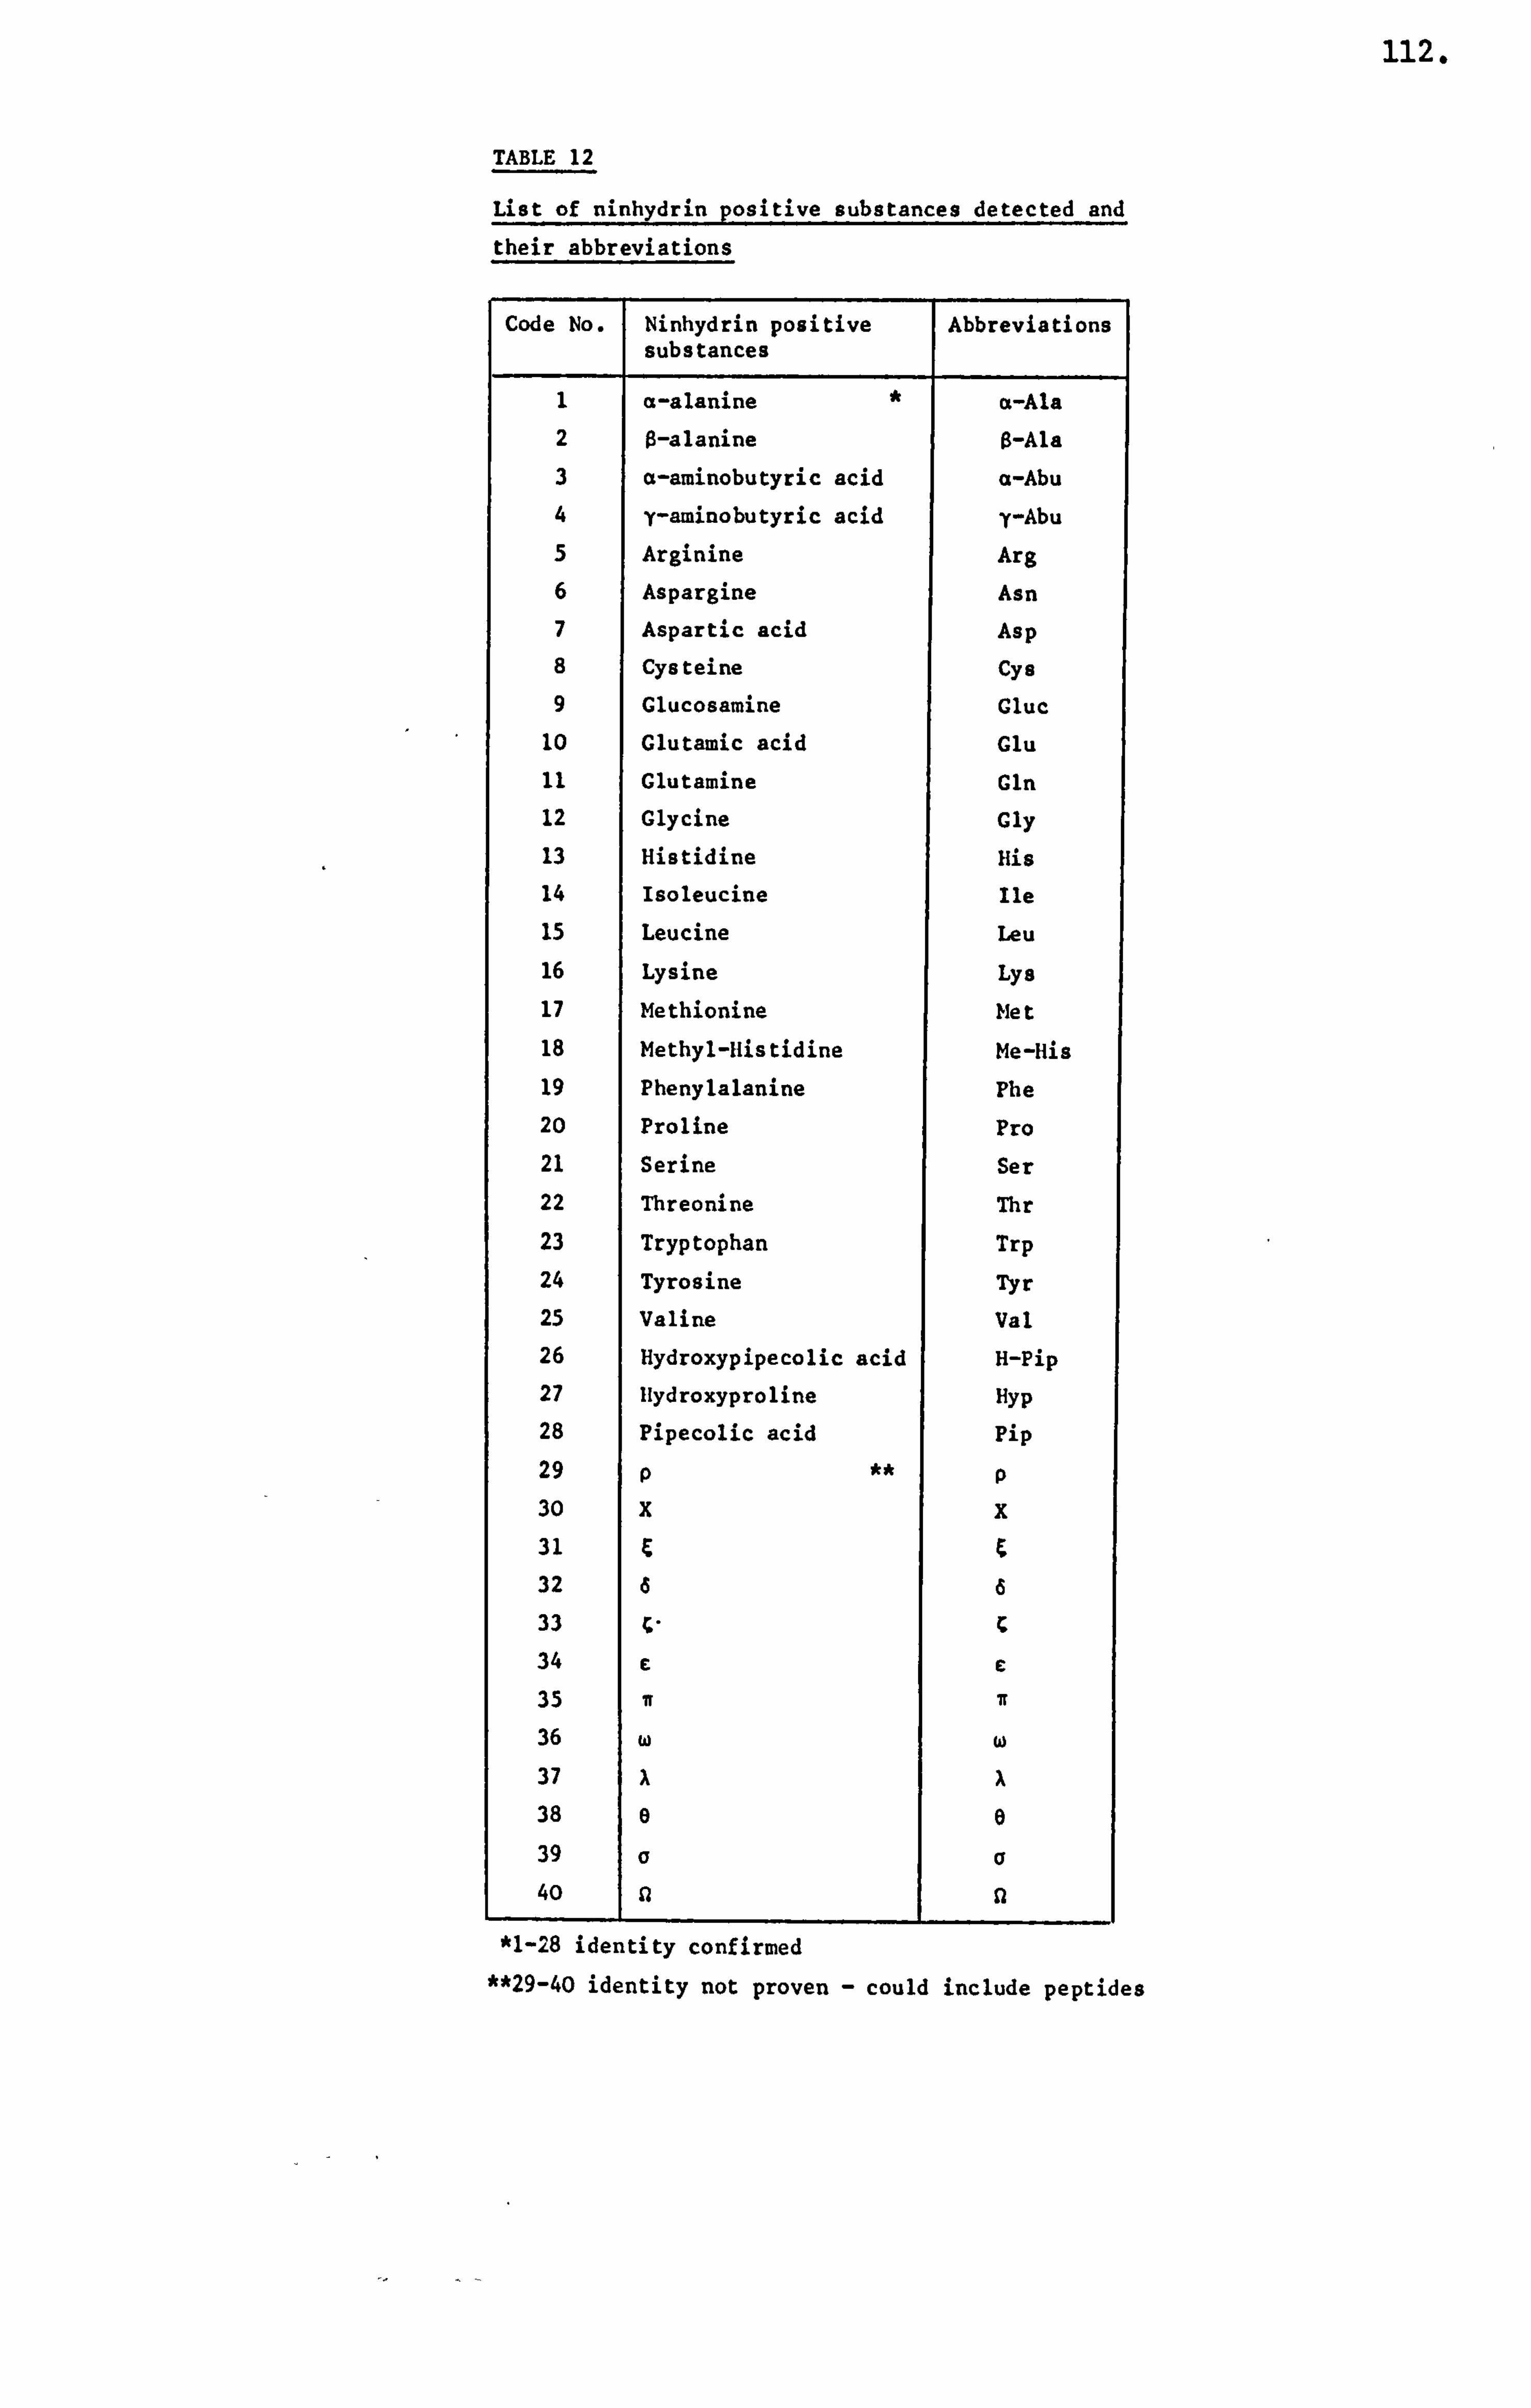
112.
TABLE 12
List of ninhydrin positive substances detected and their abbreviations
Code No. Ninhydrin positive substances
Abbreviations
1 a-alanine ot-Ala 2 0-alanine $-Ala 3 a-aminobutyric acid a-Abu 4 y-aminobutyric acid y-Abu 5 Arginine Arg 6 Aspargine Asn 7 Aspartic acid Asp 8 Cysteine Cys 9 Clucosamine Cluc
10 Clutamic acid Glu 11 Glutamine Gln 12 Glycine Cly 13 Histidine His 14 Isoleucine Ile 15 Leucine Leu 16 Lysine Lys 17 Methionine Met 18 Methyl-Histidine Me-His 19 Phenylalanine Phe 20 Proline Pro 21 Serine Ser 22 Threonine Thr 23 Tryptophan Trp 24 Tyrosine Tyr 25 Valine Val 26 Hydroxypipecolic acid H-Pip 27 Hydroxyproline Hyp 28 Pipecolic acid Pip 29 P P 30 x x 31
32
33
34 C C 35 ff 7r
36 w w 37
38
39 a a 40 11 1 0
*1-28 identity confirmed **29-40 identity not proven - could include peptides
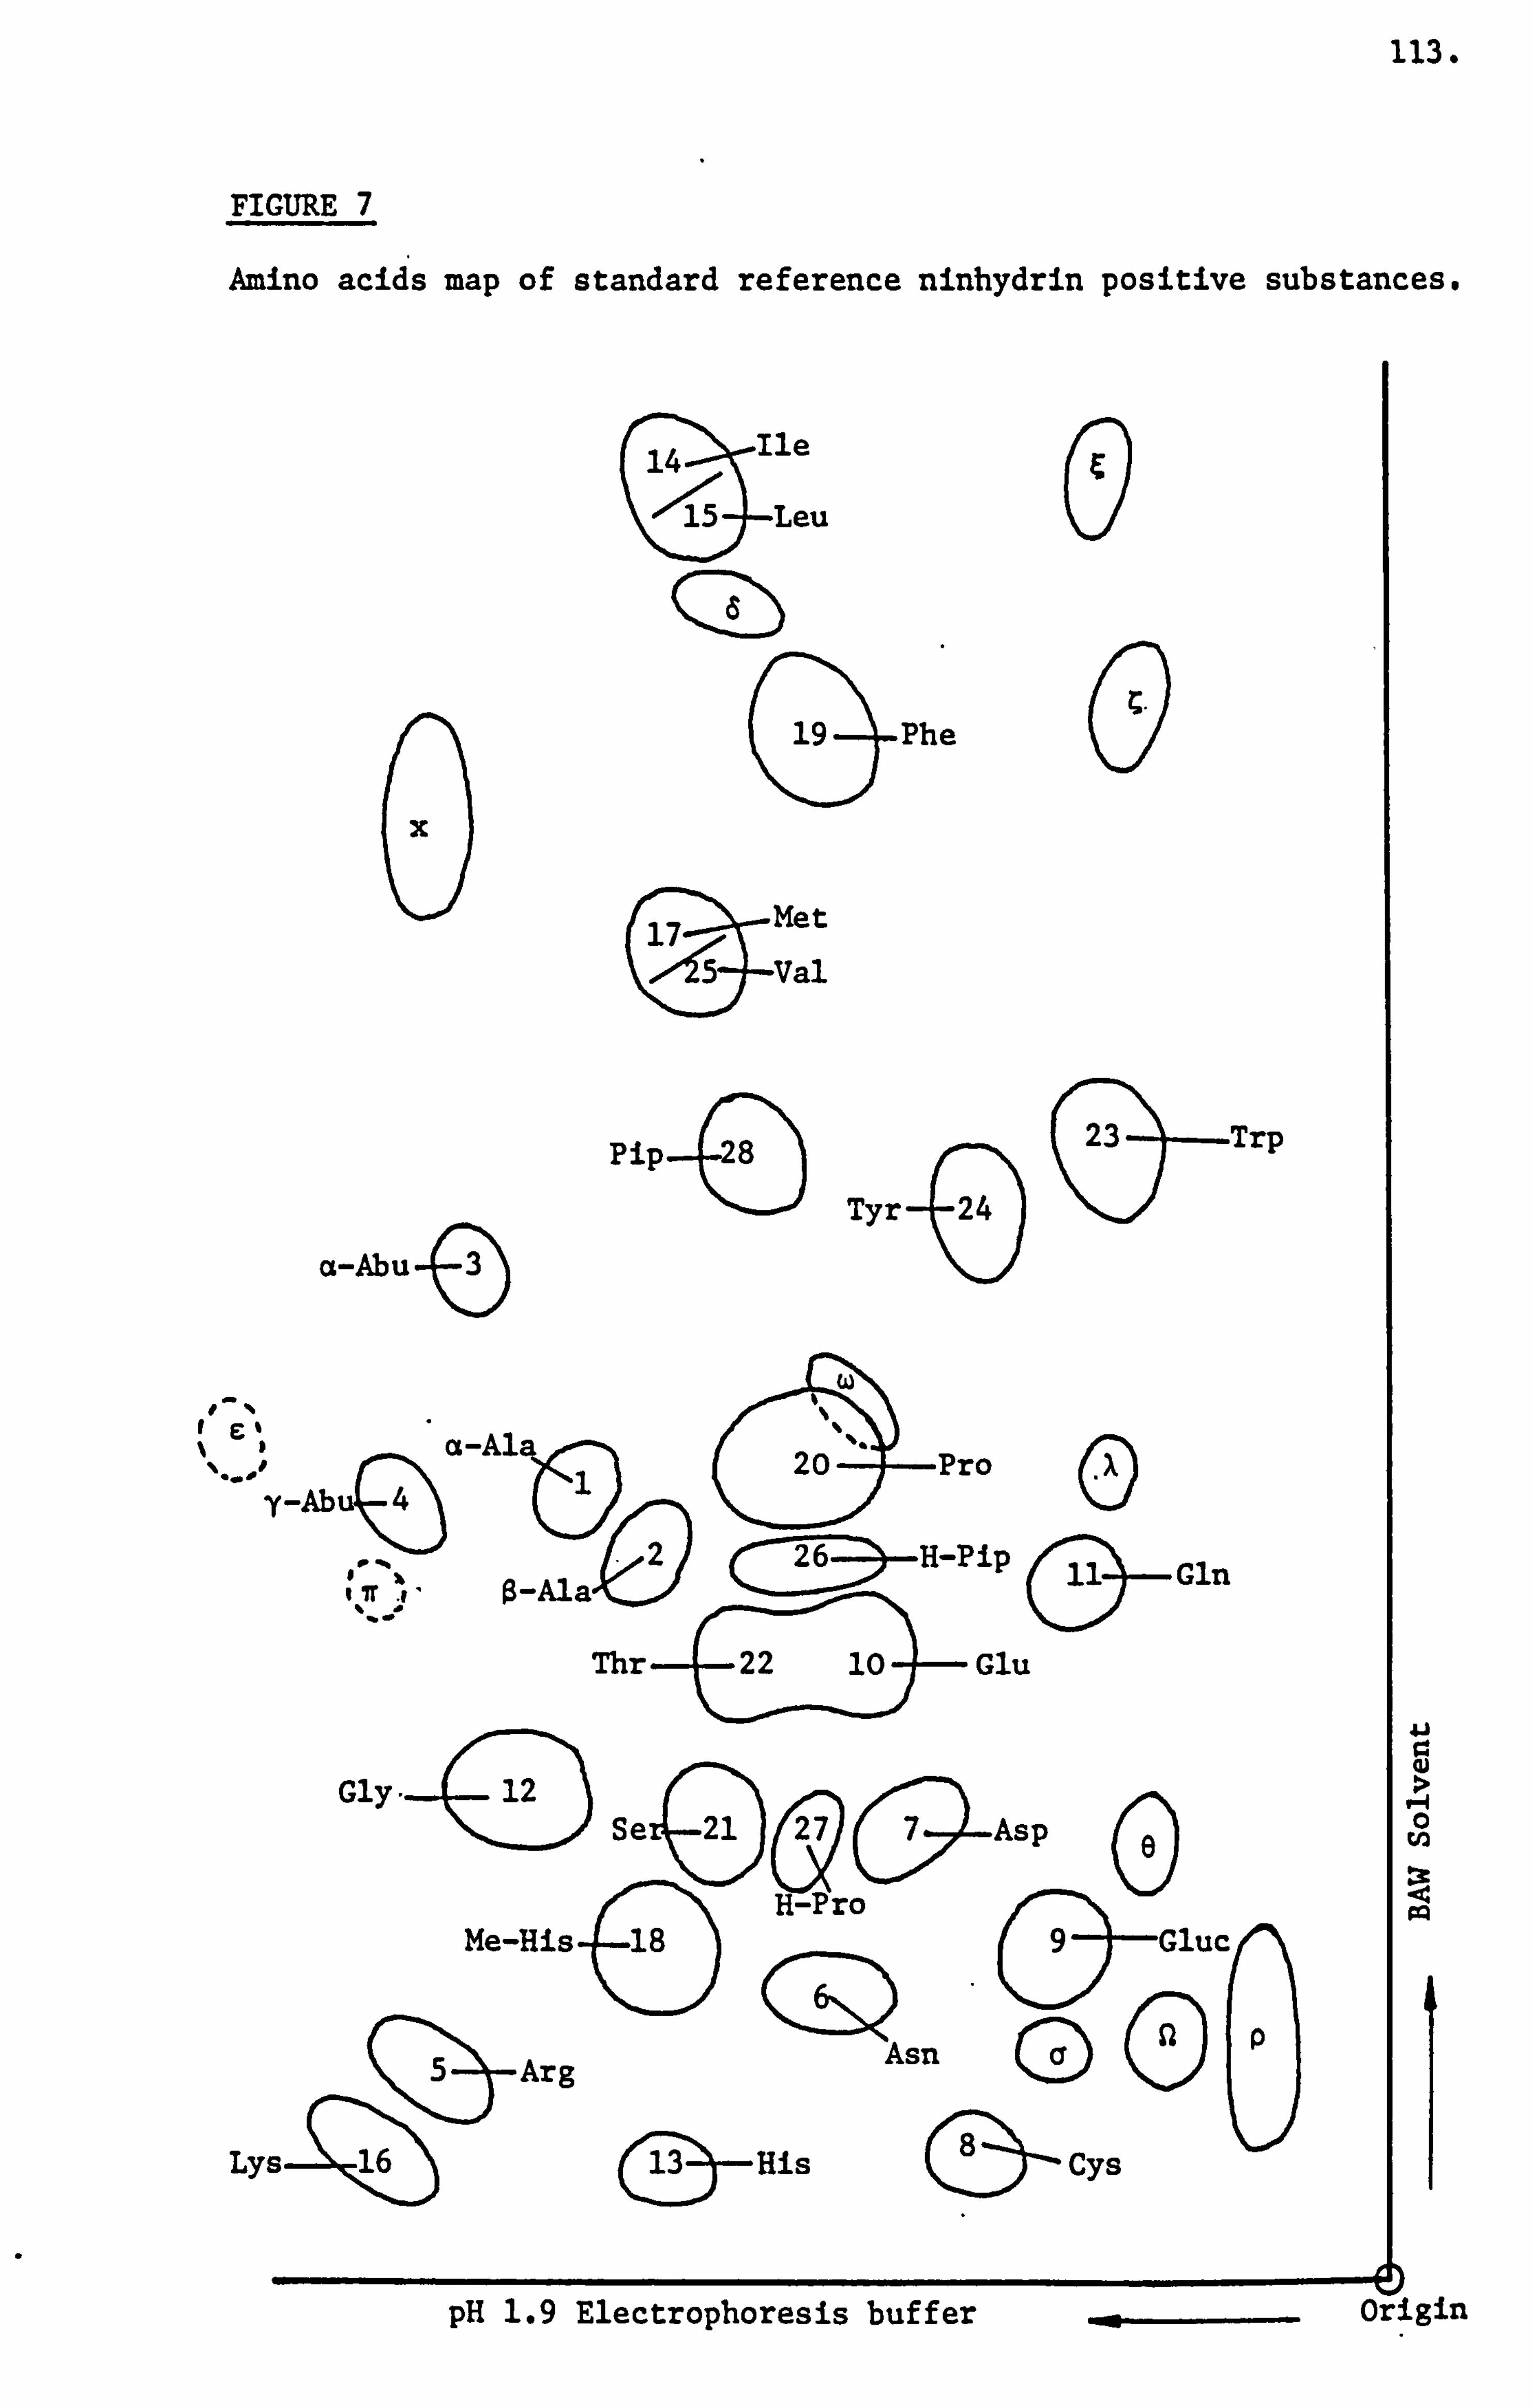
113.
FIGURE 7
Amino acids map of standard reference ninhydrin positive substances.
14 Ile
15 Leu
Qý)
0( 19 Phe
x
17 Met
5 Val
0 0
p ip- e
Tyr4 24
23 -Trp
a-Abu 4
(A)
I F_ ý %I -Al
. _'. 4 1 20 Pro y-Abu(
c0
2 H-Pip 2-6 11 - Gln 7r $-Ala,
Thr 22 10 Glu
Gly SezeN7 Asp
\ ñPro
5 Arg Asn (D(. 9 u
Lys-ý16 (25-His 3-
Cys
Me-His t, ý)
sn
0
:x 04 pq
pH 1.9 Electrophoresis buffer Origin
ý-01
Gluc
114.
A series of experiments were carried out tn check for the precision
of the amino acid extraction method used and the recovery of amino acids
from solutions containing known amounts of amino acids, refer to Table
5, and from randomly chosen honey samples. The amino acid concentration
measurements were determined from the area under the response curve
obtained on chart paper from the amino acid analyser. The initial area
for a specific peak response curve for a given amino acid was estimated
as being an equivalent to that of a triangle. The area of such a triangle
was calculated as peak height multiplied by the width at half-height
and for example of its use and for calculations, see Appendix III. Each
chart was correlated with two or more calibrated solutions. It was
usual to carry out a calibrating run then f ive samples and then a further
calibration. All these were correlated to a constant internal standard
level (norleucine). Discussion of the merits of this procedure and
possible use of alternative internal standards are dealt with in the
discussion. For reasons of brevity only the final results in terms
of nanomoles per g of honey are presented for all the amino acid analyser
determinations.
The amino acid concentration and percentage recovery values for
each of the amino acid solutions and honey samples listed in Table 6
have been given in Tables 13 to 22. Also the amino acid concentrations
and percentage recovery values for known amounts of amino acids added
to the three honey samples are given in Tables 23 to 29. For reasons
of clarity of presentation it was considered necessary that in the replicate
analysis of all the honey samples examined, the average concentration
values given were rounded off to the nearest whole number for values
less than 500 nmoles per g of honey and to the nearest ten unit for
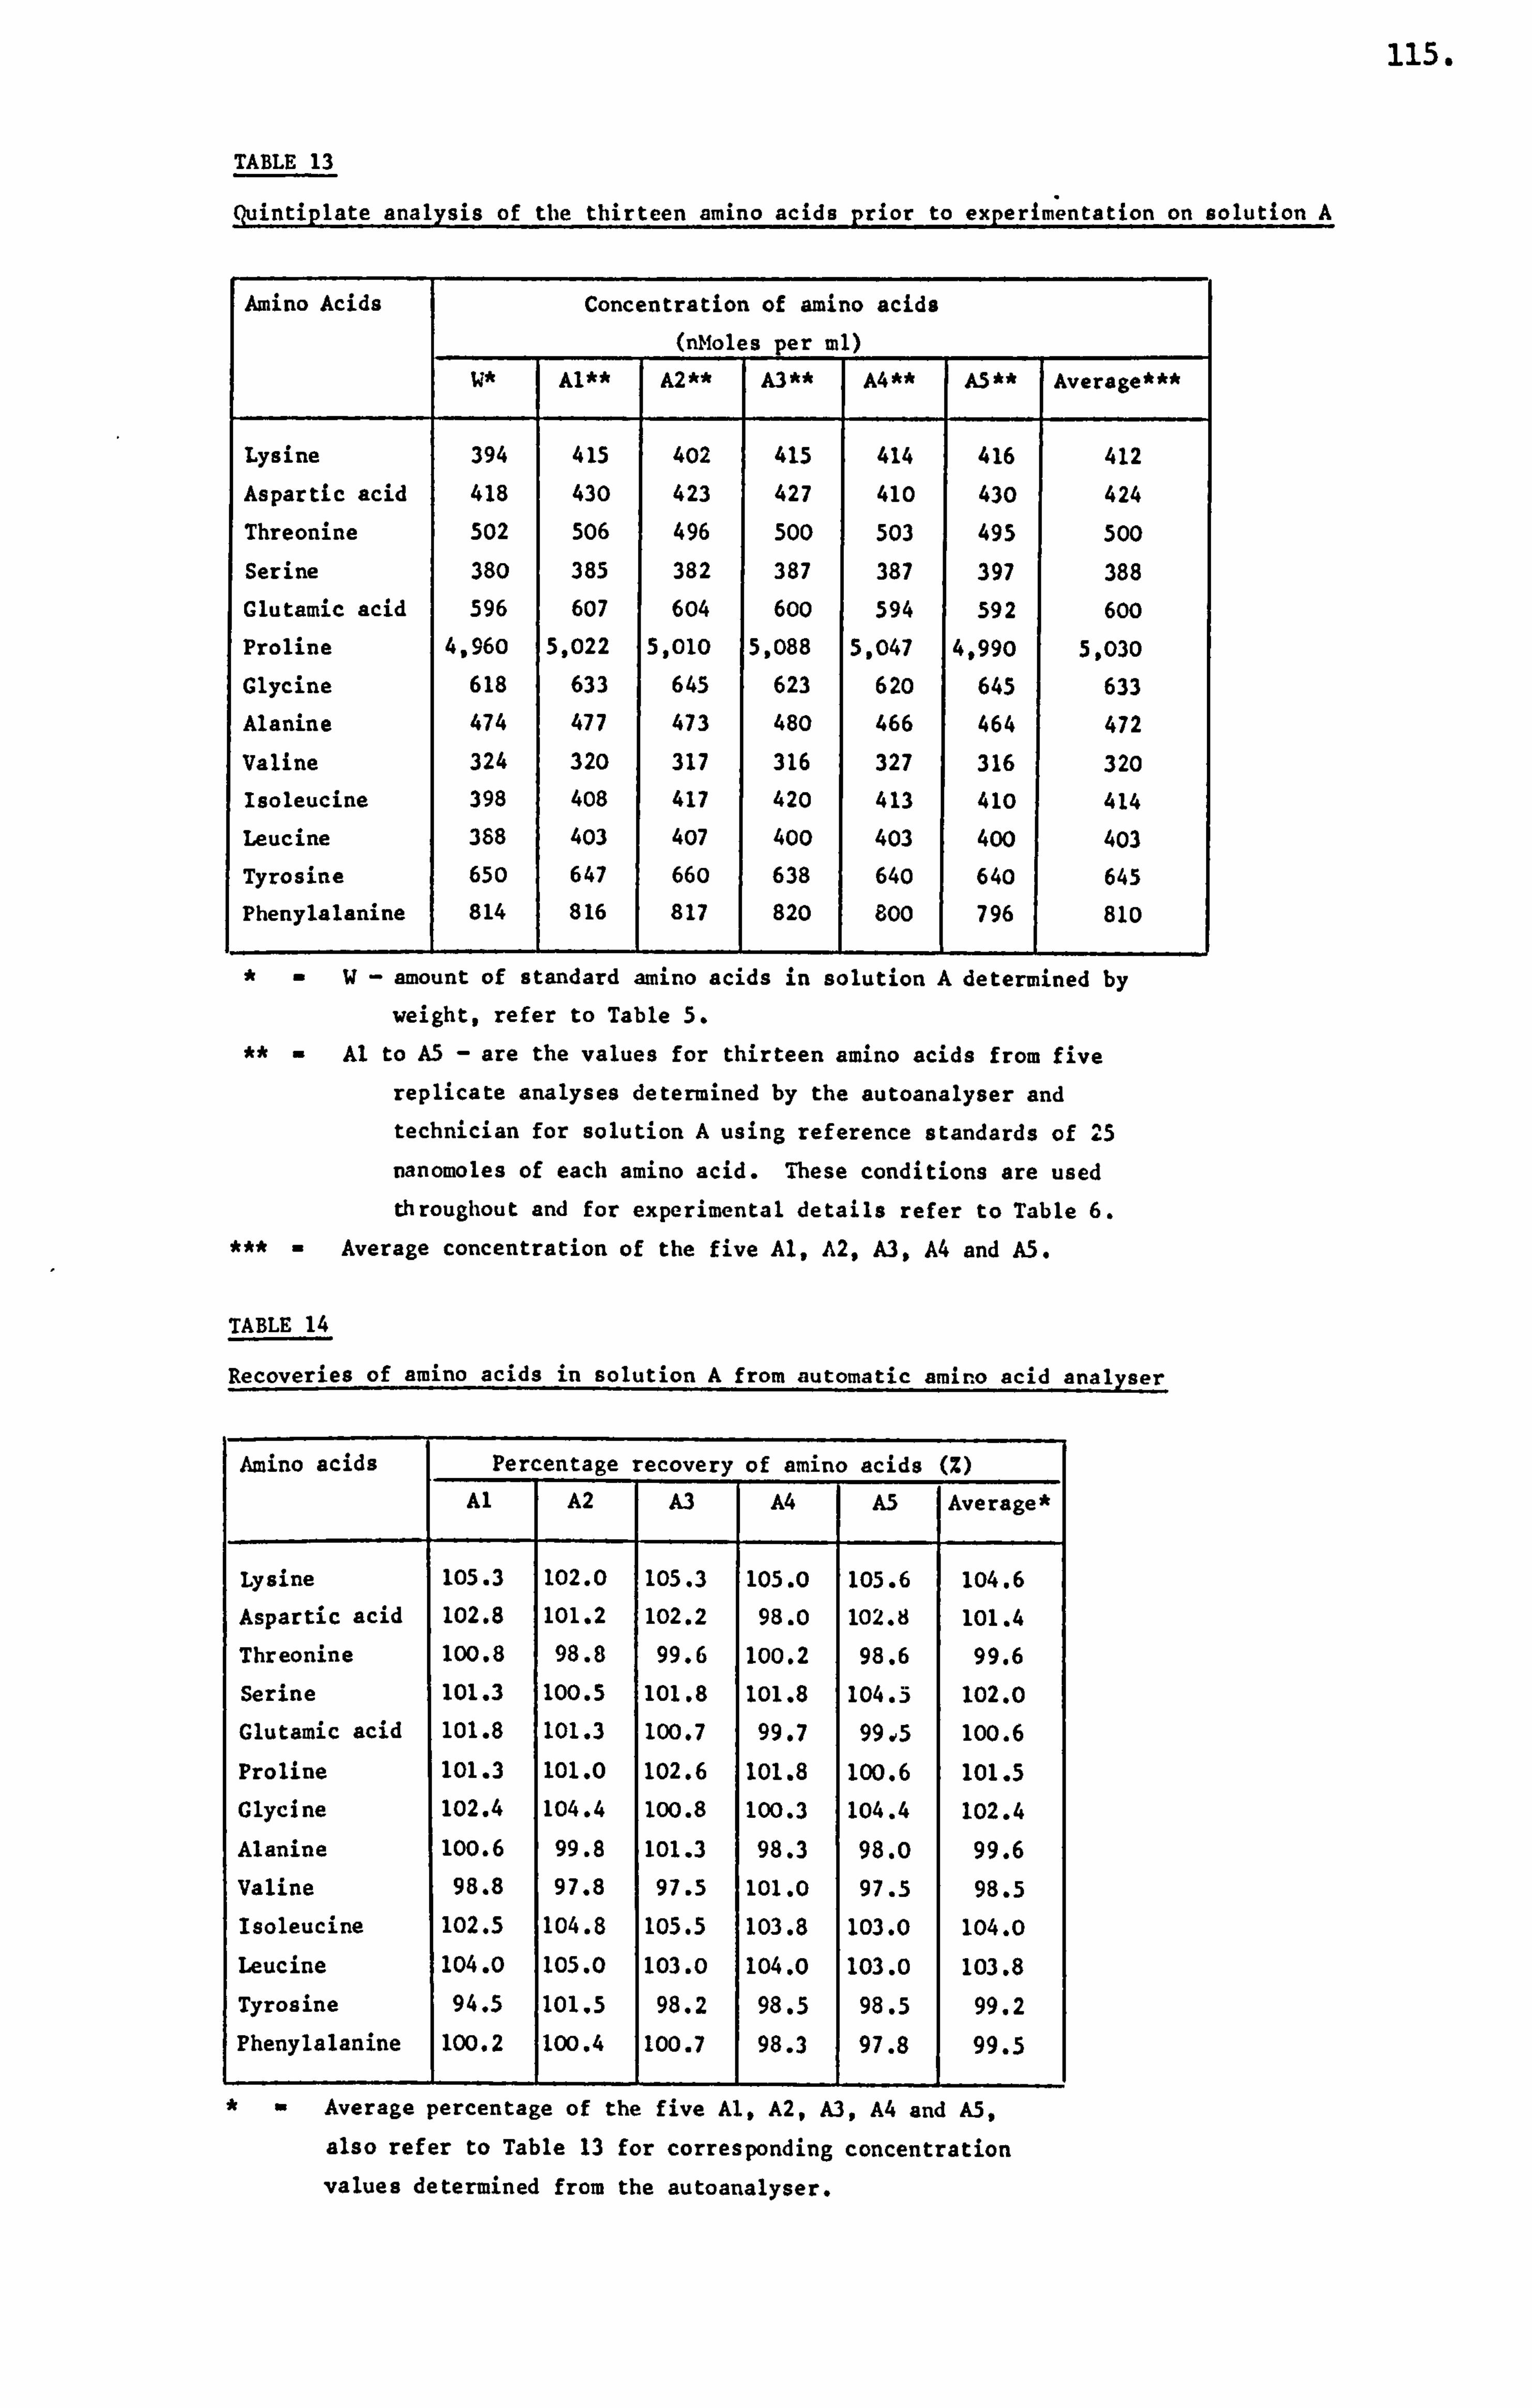
115.
TABLE 13
Quintiplate analysis of the thirteen amino acids prior to experimentation on solution A
Amino Acids Concentration of amino acids (nMoles per ml)
W* Al** I A2** A3** A4** AS** Average***
Lysine 394 415 402 415 414 416 412
Aspartic acid 418 430 423 427 410 430 424
Threonine 502 506 496 500 503 495 500
Serine 380 385 382 387 387 397 388
Clutamic acid 596 607 604 600 594 592 600
Proline 4,960 5,022 5,010 5,088 5,047 4,990 5,030
Glycine 618 633 645 623 620 645 633
Alanine 474 477 473 480 466 464 472
Valine 324 320 317 316 327 316 320
Isoleucine 398 408 417 420 413 410 414
Leucine 388 403 407 400 403 400 403
Tyrosine 650 647 660 638 640 640 645
Phenylalanine 1
814 1
816 1
817 1
820 1
800 1
796 810
W- amount of standard amino acids in solution A determined by
weight, refer to Table 5.
Al to A5 - are the values for thirteen amino acids from five
replicate analyses determined by the autoanalyser and technician for solution A using reference standards of '15
nanomoles of each amino acid. These conditions are used throughout and for experimental details refer to Table 6.
Average concentration of the five Al, A2, A3, A and A5.
TABLE 14
Recoveries of amino acids in solution A from automatic amino acid analyser
Amino acids Percentage recovery of amino acids (%)
Al A2 A3 A4 A5 Average
Lysine 105.3 102.0 105.3 105.0 105.6 104.6
Aspartic acid 102.8 101.2 102.2 98.0 102.8 101.4
Threonine 100.8 98.8 99.6 100.2 98.6 99.6
Serine 101.3 100.5 101.8 101.8 104.5 102.0
Glutamic acid 101.8 101.3 100.7 99.7 99., 5 100.6
Proline 101.3 101.0 102.6 101.8 100.6 101.5
Glycine 102.4 104.4 100.8 100.3 104.4 102.4
Alanine 100.6 99.8 101.3 98.3 98.0 99.6
Valine 98.8 97.8 97.5 101.0 97.5 98.5
Isoleucine 102.5 104.8 105.5 103.8 103.0 104.0
Leucine 104.0 105.0 103.0 104.0 103.0 103.8
Tyrosine 94.5 101.5 98.2 98.5 98.5 99.2
Phenylalanine 1 100.2 1 100.4 1 100.7 1 98.3 97.8 99.5
Average percentage of the five Al, A2, A3, A4 and A5,
also refer to Table 13 for corresponding concentration
values determined from the autoanalyser.
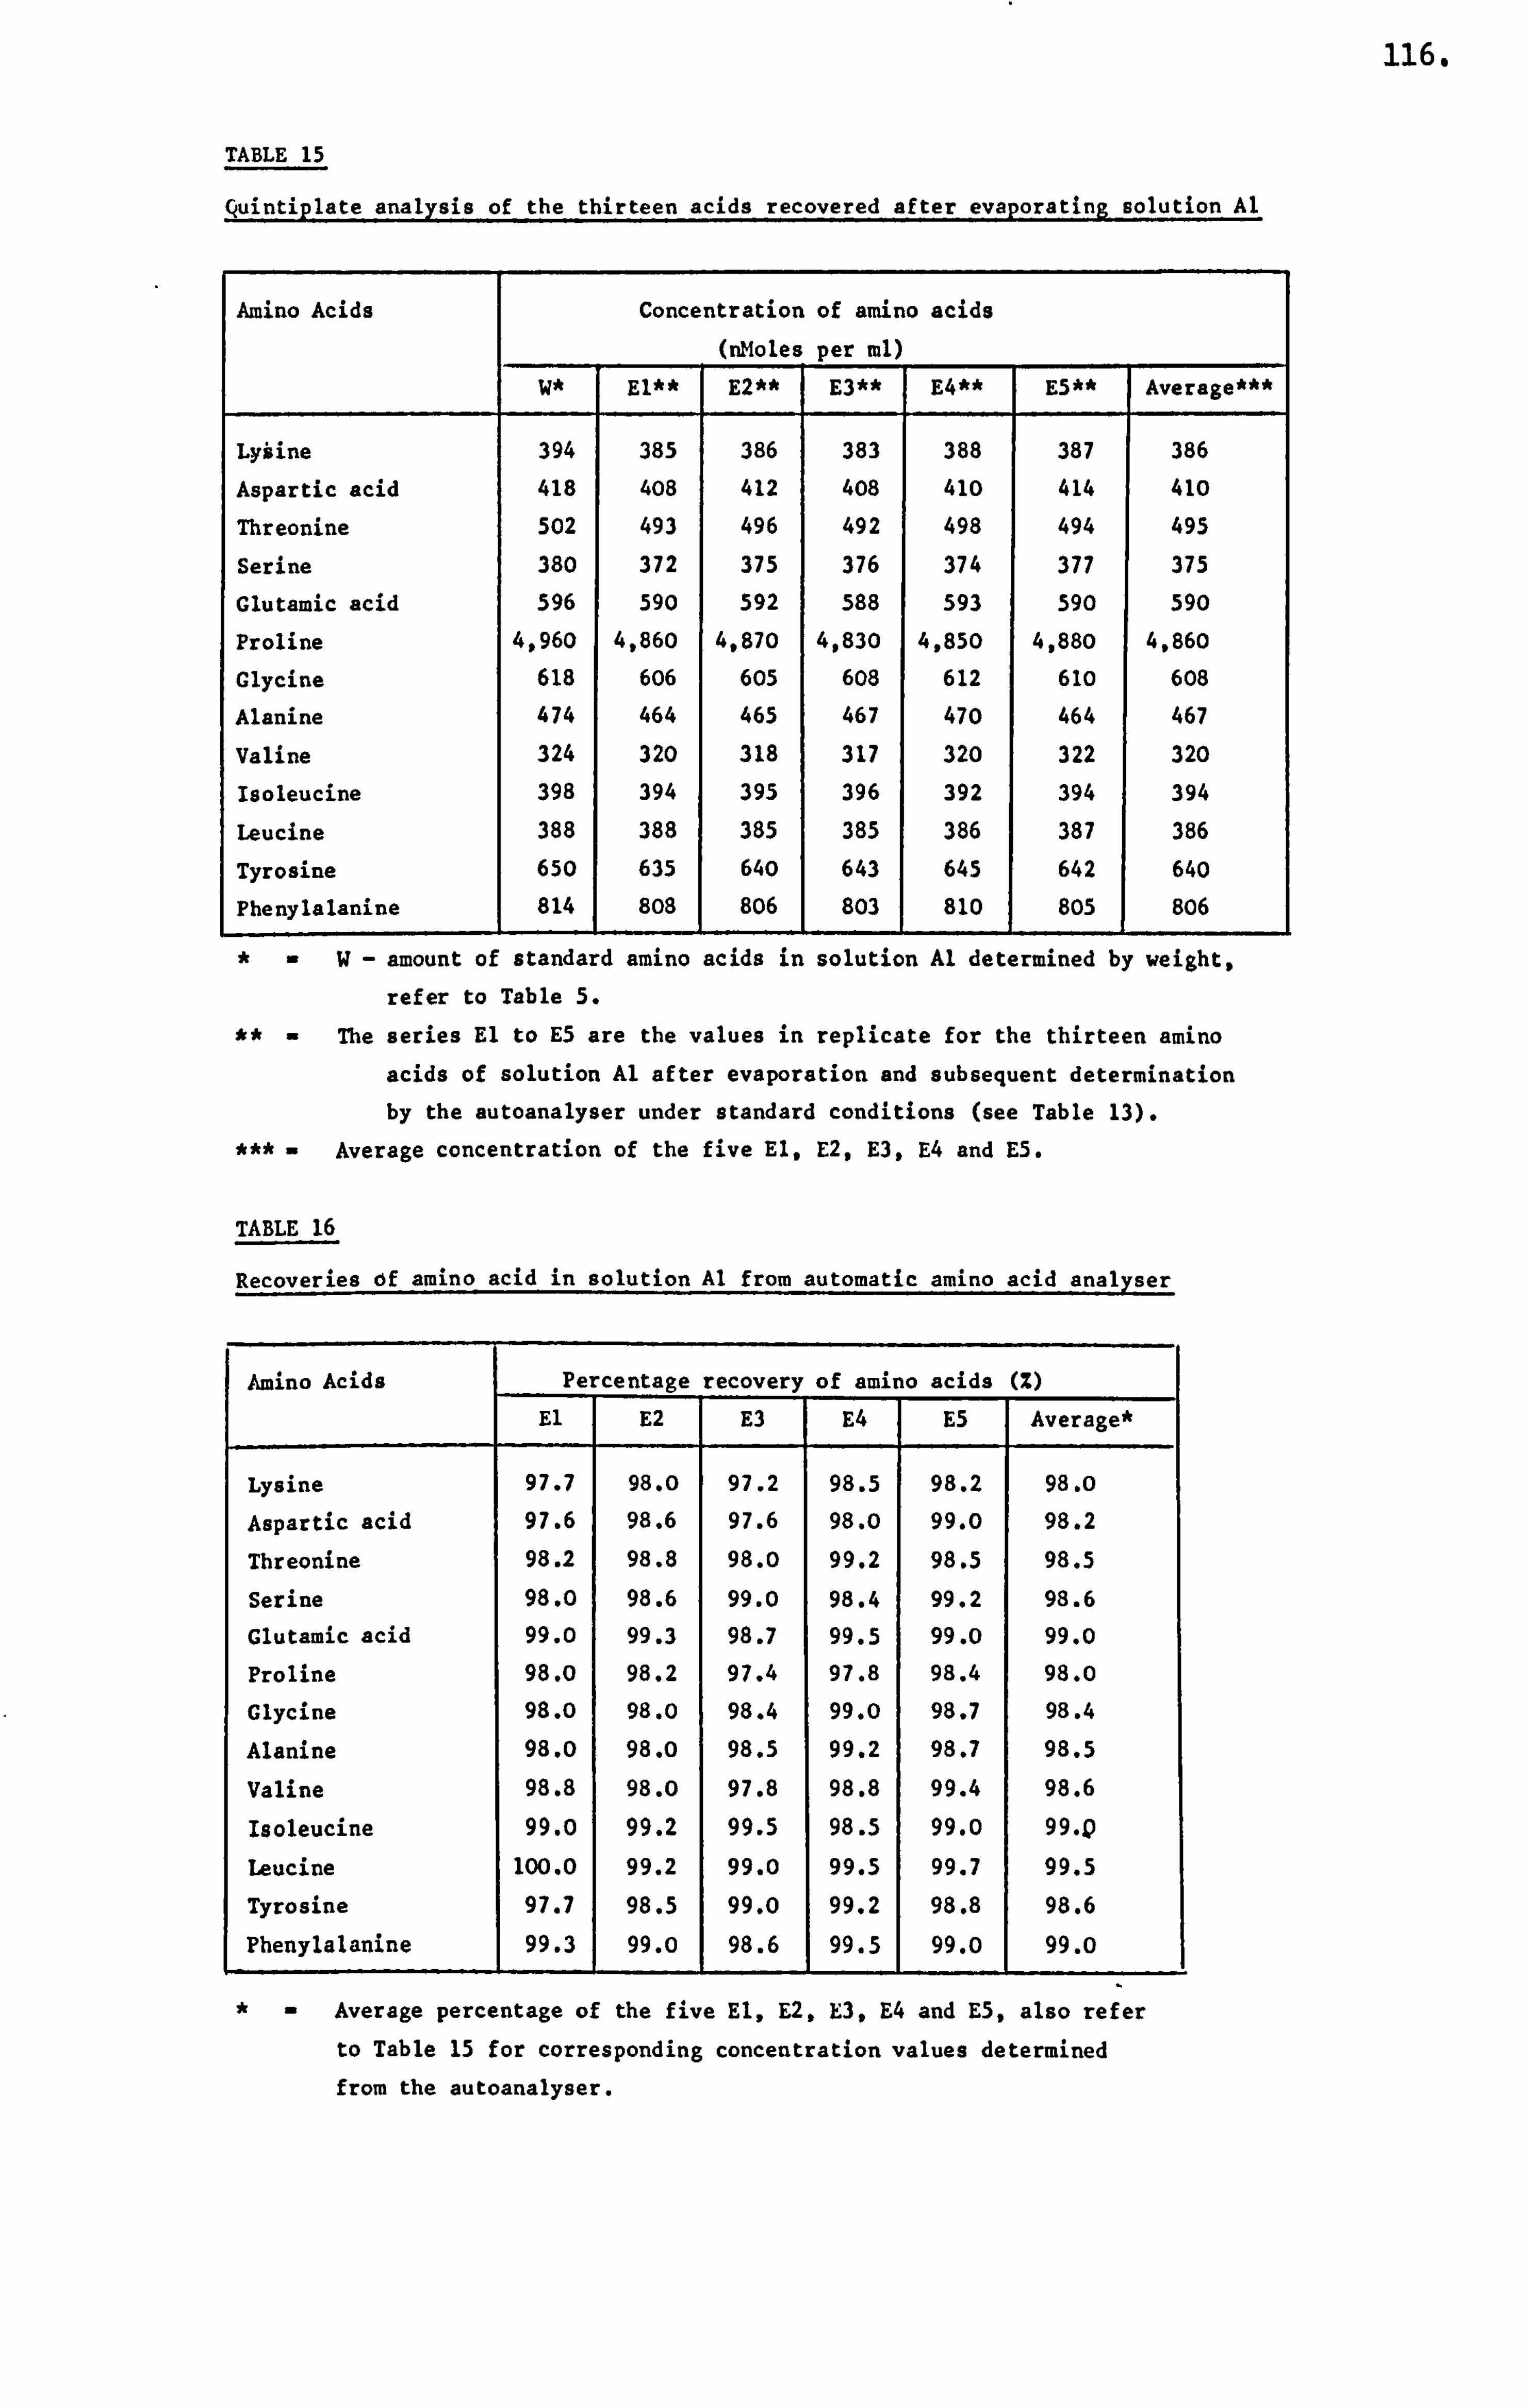
116.
TABLE 15
quintiplate analysis of the thirteen acids recovered after evaporating solution Al
Amino Acids Concentration of amino acids (nMoles per ml)
W* El** E2** E3** E4** I E5** Average***
Lyiine 394 385 386 383 388 387 386
Aspartic acid 418 408 412 408 410 414 410
Threonine 502 493 496 492 498 494 495
Serine 380 372 375 376 374 377 375
Glutamic acid 596 590 592 588 593 590 590
Proline 4.960 4,860 4,870 4,830 4,850 4,880 4,860
Glycine 618 606 605 608 612 610 608
Alanine 474 464 465 467 470 464 467
Valine 324 320 318 317 320 322 320
Isoleucine 398 394 395 396 392 394 394
Leucine 388 388 385 385 386 387 386
Tyrosine 650 635 640 643 645 642 640
Phenylalanine 814 1
808 1
806 1
803 1 810 805 806
W- amount of standard amino acids in solution Al determined by weight,
refer to Table 5.
The series El to E5 are the values in replicate for the thirteen amino
acids of solution Al after evaporation and subsequent determination
by the autoanalyser under standard conditions (see Table 13).
Average concentration of the five El, E2, E3, E4 and E5.
TABLE 16
Recoveries of amino acid in solution Al from automatic amino acid analyser
Amino Acids Pe centage recovery of amino acids (Z)
El E2 E3 E4 E5 Average*
Lysine 97.7 98.0 97.2 98.5 98.2 98. o
Aspartic acid 97.6 98.6 97.6 98.0 99.0 98.2
Threonine 98.2 98.8 98.0 99.2 98.5 98.5
Serine 98.0 98.6 99.0 98.4 99.2 98.6
Glutamic acid 99.0 99.3 98.7 99.5 99.0 99.0
Proline 98.0 98.2 97.4 97.8 98.4 98.0
Glycine 98.0 98.0 98.4 99.0 98.7 98.4
Alanine 98.0 98.0 98.5 99.2 98.7 98.5
Valine 98.8 98.0 97.8 98.8 99.4 98.6
Isoleucine 99.0 99.2 99.5 98.5 99.0 99. Q
leucine 100.0 99.2 99.0 99.5 99.7 99.5
Tyrosine 97.7 98.5 99.0 99.2 98.8 98.6
L Phenylalanine 99.3 1 99.0 1 98.6 1 99.5 1 99.0 99.0
Average percentage of the five El, E2, E3, E4 and E5, also refer to Table 15 for corresponding concentration values determined
from the autoanalyser.
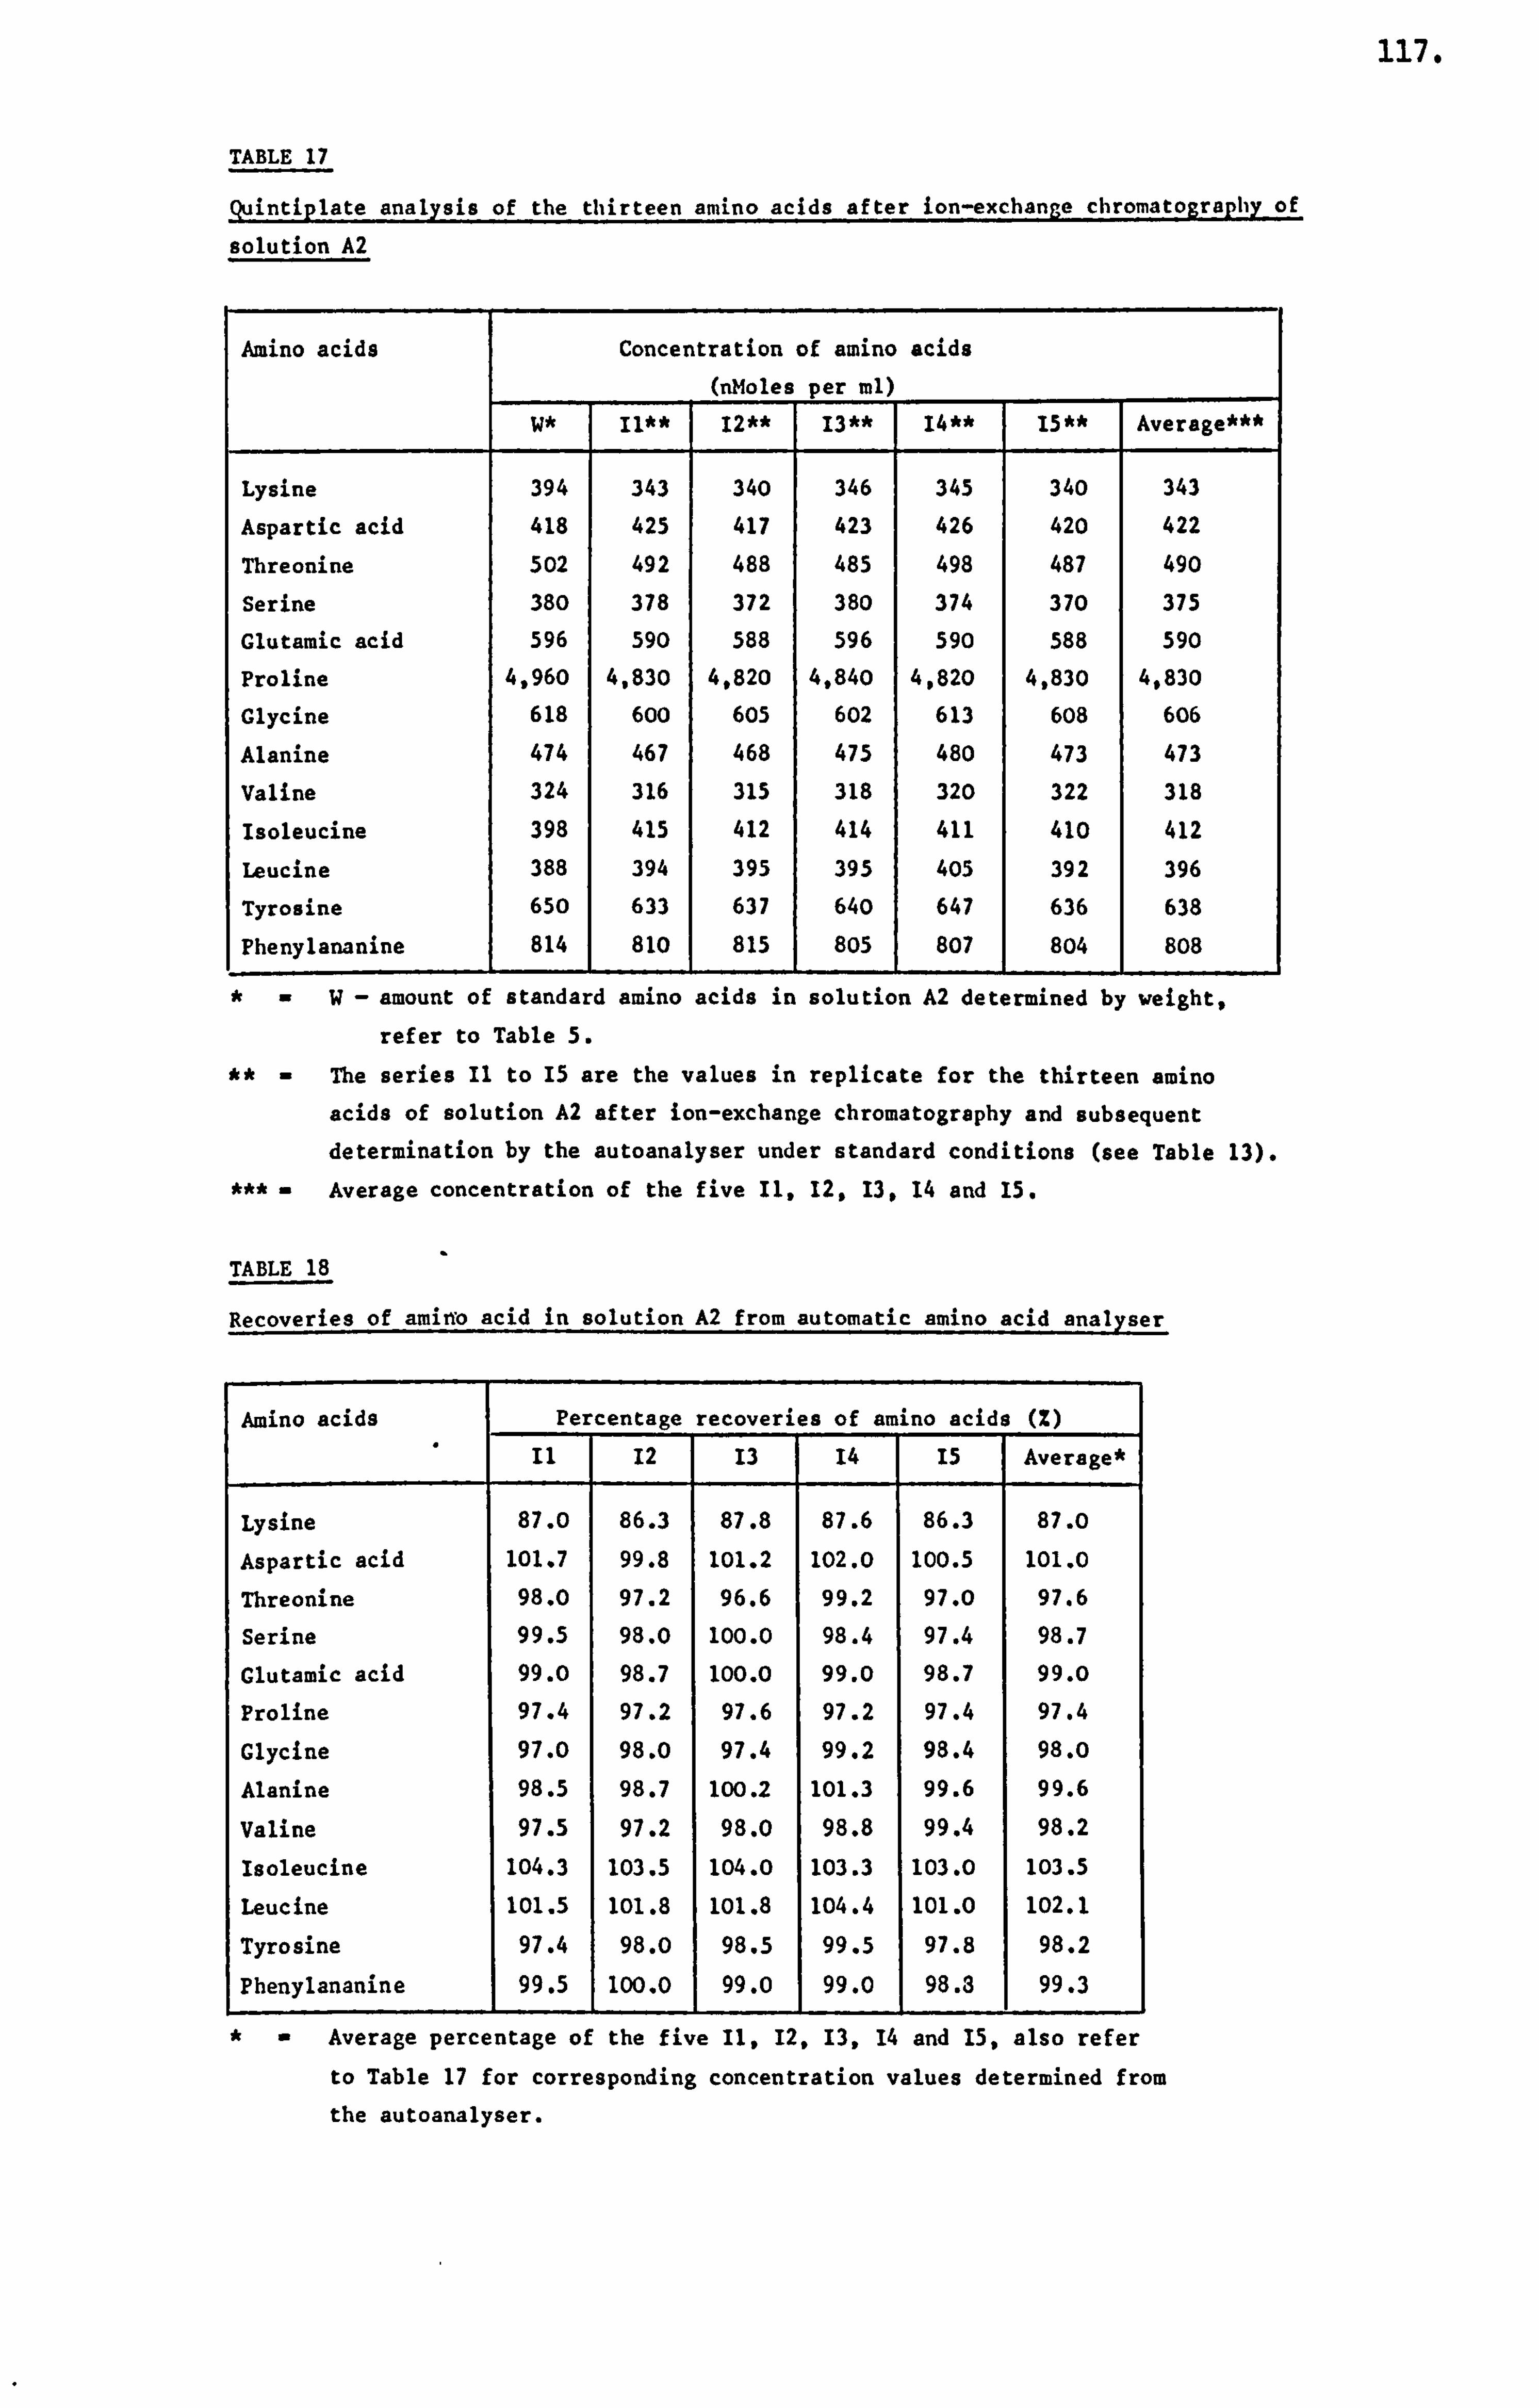
117.
TABLE 17
quintiplate analysis of the thirteen amino acids after ion-exchange chromatography of
solution A2
Amino acids Concentration of amino acids (nMoles per ml)
W* Il** 12** 13** 14** 1 15** Average***
Lysine 394 343 340 346 345 340 343
Aspartic acid 418 425 417 423 426 420 422
Threonine 502 492 488 485 498 487 490
Serine 380 378 372 380 374 370 375
Glutamic acid 596 590 588 596 590 588 590
Proline 4,960 4,830 4,820 4,840 4,820 4,830 4,830
Glycine 618 600 605 602 613 608 606
Alanine 474 467 468 475 480 473 473
Valine 324 316 315 318 320 322 318
Isoleucine 398 415 412 414 411 410 412
i, eucine 388 394 395 395 405 392 396
Tyrosine 650 633 637 640 647 636 638
Phenylananine 814 810 815 805 807 804 808
W- amount of standard amino acids in solution A2 determined by weight,
refer to Table 5.
The series Il to 15 are the values in replicate for the thirteen amino
acids of solution A2 after ion-exchange chromatography and subsequent determination by the autoanalyser under standard conditions (see Table 13).
Average concentration of the five 11,12,13,14 and 15.
TABLE 18
Recoveries of amiTTo acid in solution A2 from automatic amino acid analyser
Amino acids Percentage recoveries of amino acids (2)
11 12 13 14 15 1 Average*
Lysine 87.0 86.3 87.8 87.6 86.3 87.0
Aspartic acid 101.7 99.8 101.2 102.0 100.5 101.0
Threonine 98.0 97.2 96.6 99.2 97.0 97.6
Serine 99.5 98.0 100.0 98.4 97.4 98.7
Clutamic acid 99.0 98.7 100.0 99.0 98.7 99.0
Proline 97.4 97.2 97.6 97.2 97.4 97.4
Glycine 97.0 98.0 97.4 99.2 98.4 98.0
Alanine 98.5 98.7 100.2 101.3 99.6 99.6
Valine 97.5 97.2 98.0 98.8 99.4 98.2
Isoleucine 104.3 103.5 104.0 103.3 103.0 103.5
Leucine 101.5 101.8 101.8 104.4 101.0 102.1
Tyrosine 97.4 98.0 98.5 99.5 97.8 98.2
Phenylananine 99.5 1 100.0 99.0 99 10 98.3 99.3
Average percentage of the five 11,12,13,14 and 15, also refer to Table 17 for corresponding concentration values determined from
the autoanalyser.
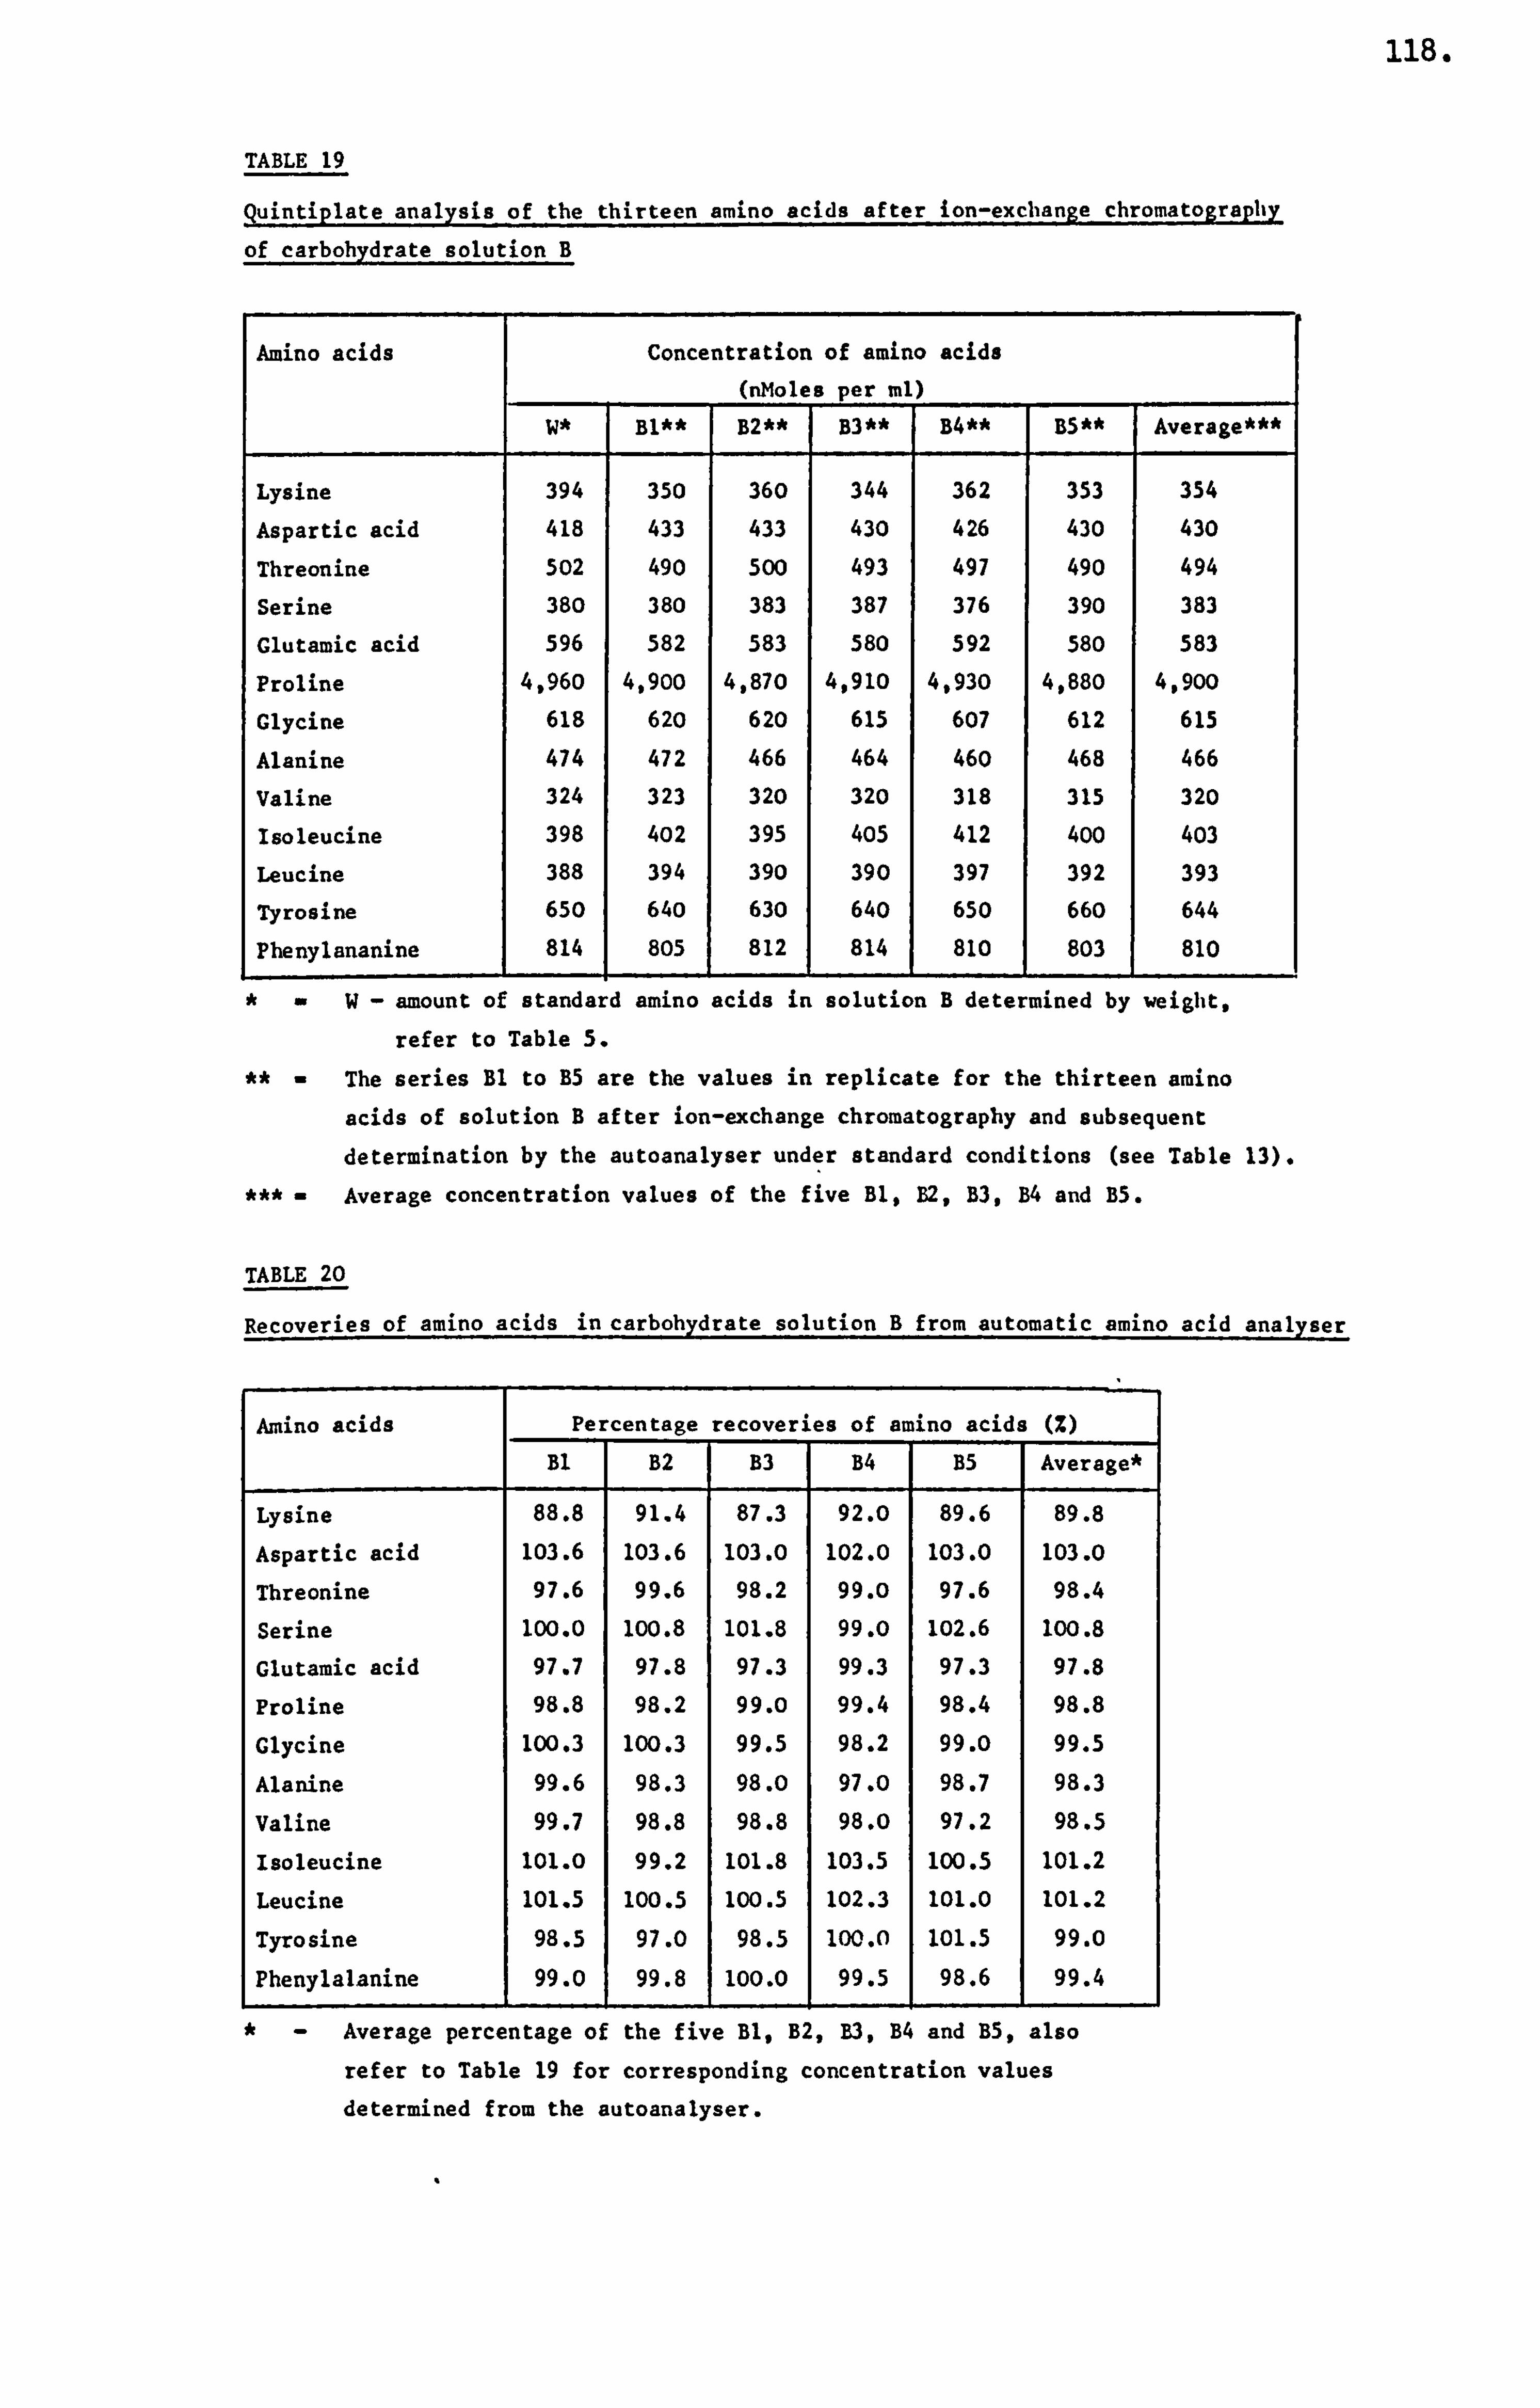
118.
TABLE 19
quintiplate analysis of the thirteen amino acids after ion-exchange chromatography
of carbohydrate soluti2n B
Amino acids Concentration of amino acids (nMoles per ml)
W* Bl** B2** B3** B4** BS** Average***
Lysine 394 350 360 344 362 353 354
Aspartic acid 418 433 433 430 426 430 430
Threonine 502 490 500 493 497 490 494
Serine 380 380 383 387 376 390 383
Glutamic acid 596 582 583 580 592 580 583
Proline 4,960 4,900 4,870 4,910 4.930 4,880 4,900
Glycine 618 620 620 615 607 612 615
Alanine 474 472 466 464 460 468 466
Valine 324 323 320 320 318 315 320
Isoleucine 398 402 395 405 412 400 403
Leucine 388 394 390 390 397 392 393
Tyrosine 650 640 630 640 650 660 644
Phenylananine 814 1
805 1
812 1
814 1
810 1
803 810
W- amount of standard amino acids in solution B determined by weight.
refer to Table S.
The series Bl to B5 are the values in replicate for the thirteen amino
acids of solution B after ion-exchange chromatography and subsequent determination by the autoanalyser under standard conditions (see Table 13).
Average concentration values of the five Bl, B2, B3, B4 and B5.
TABLE 20
Recoveries of amino acids in carbohydrate solution B from automatic amino acid analyser
Amino acids Percentage recoveries of amino acids (Z)
Bl B2 B3 B4 B5 Average*
Lysine 88.8 91.4 87.3 92.0 89.6 89.8
Aspartic acid 103.6 103.6 103.0 102.0 103.0 103.0
Threonine 97.6 99.6 98.2 99.0 97.6 98.4
Serine 100.0 100.8 101.8 99.0 102.6 100.8
Glutamic acid 97.7 97.8 97.3 99.3 97.3 97.8
Proline 98.8 98.2 99.0 99.4 98.4 98.8
Glycine 100.3 100.3 99.5 98.2 99.0 99.5
Alanine 99.6 98.3 98.0 97.0 98.7 98.3
Valine 99.7 98.8 98.8 98.0 97.2 98.5
Isoleucine 101.0 99.2 101.8 103.5 100.5 101.2
Leucine 101.5 100.5 100.5 102.3 101.0 101.2
Tyrosine 98.5 97.0 98.5 100.0 101.5 99.0
Phenylalanine 99.0 1 99.8 1 100.0 99.5 1 98.6 99.4
Average percentage of the five Bl. B2, B3, B4 and B5, also
refer to Table 19 for corresponding concentration values determined from the autoanalyser.
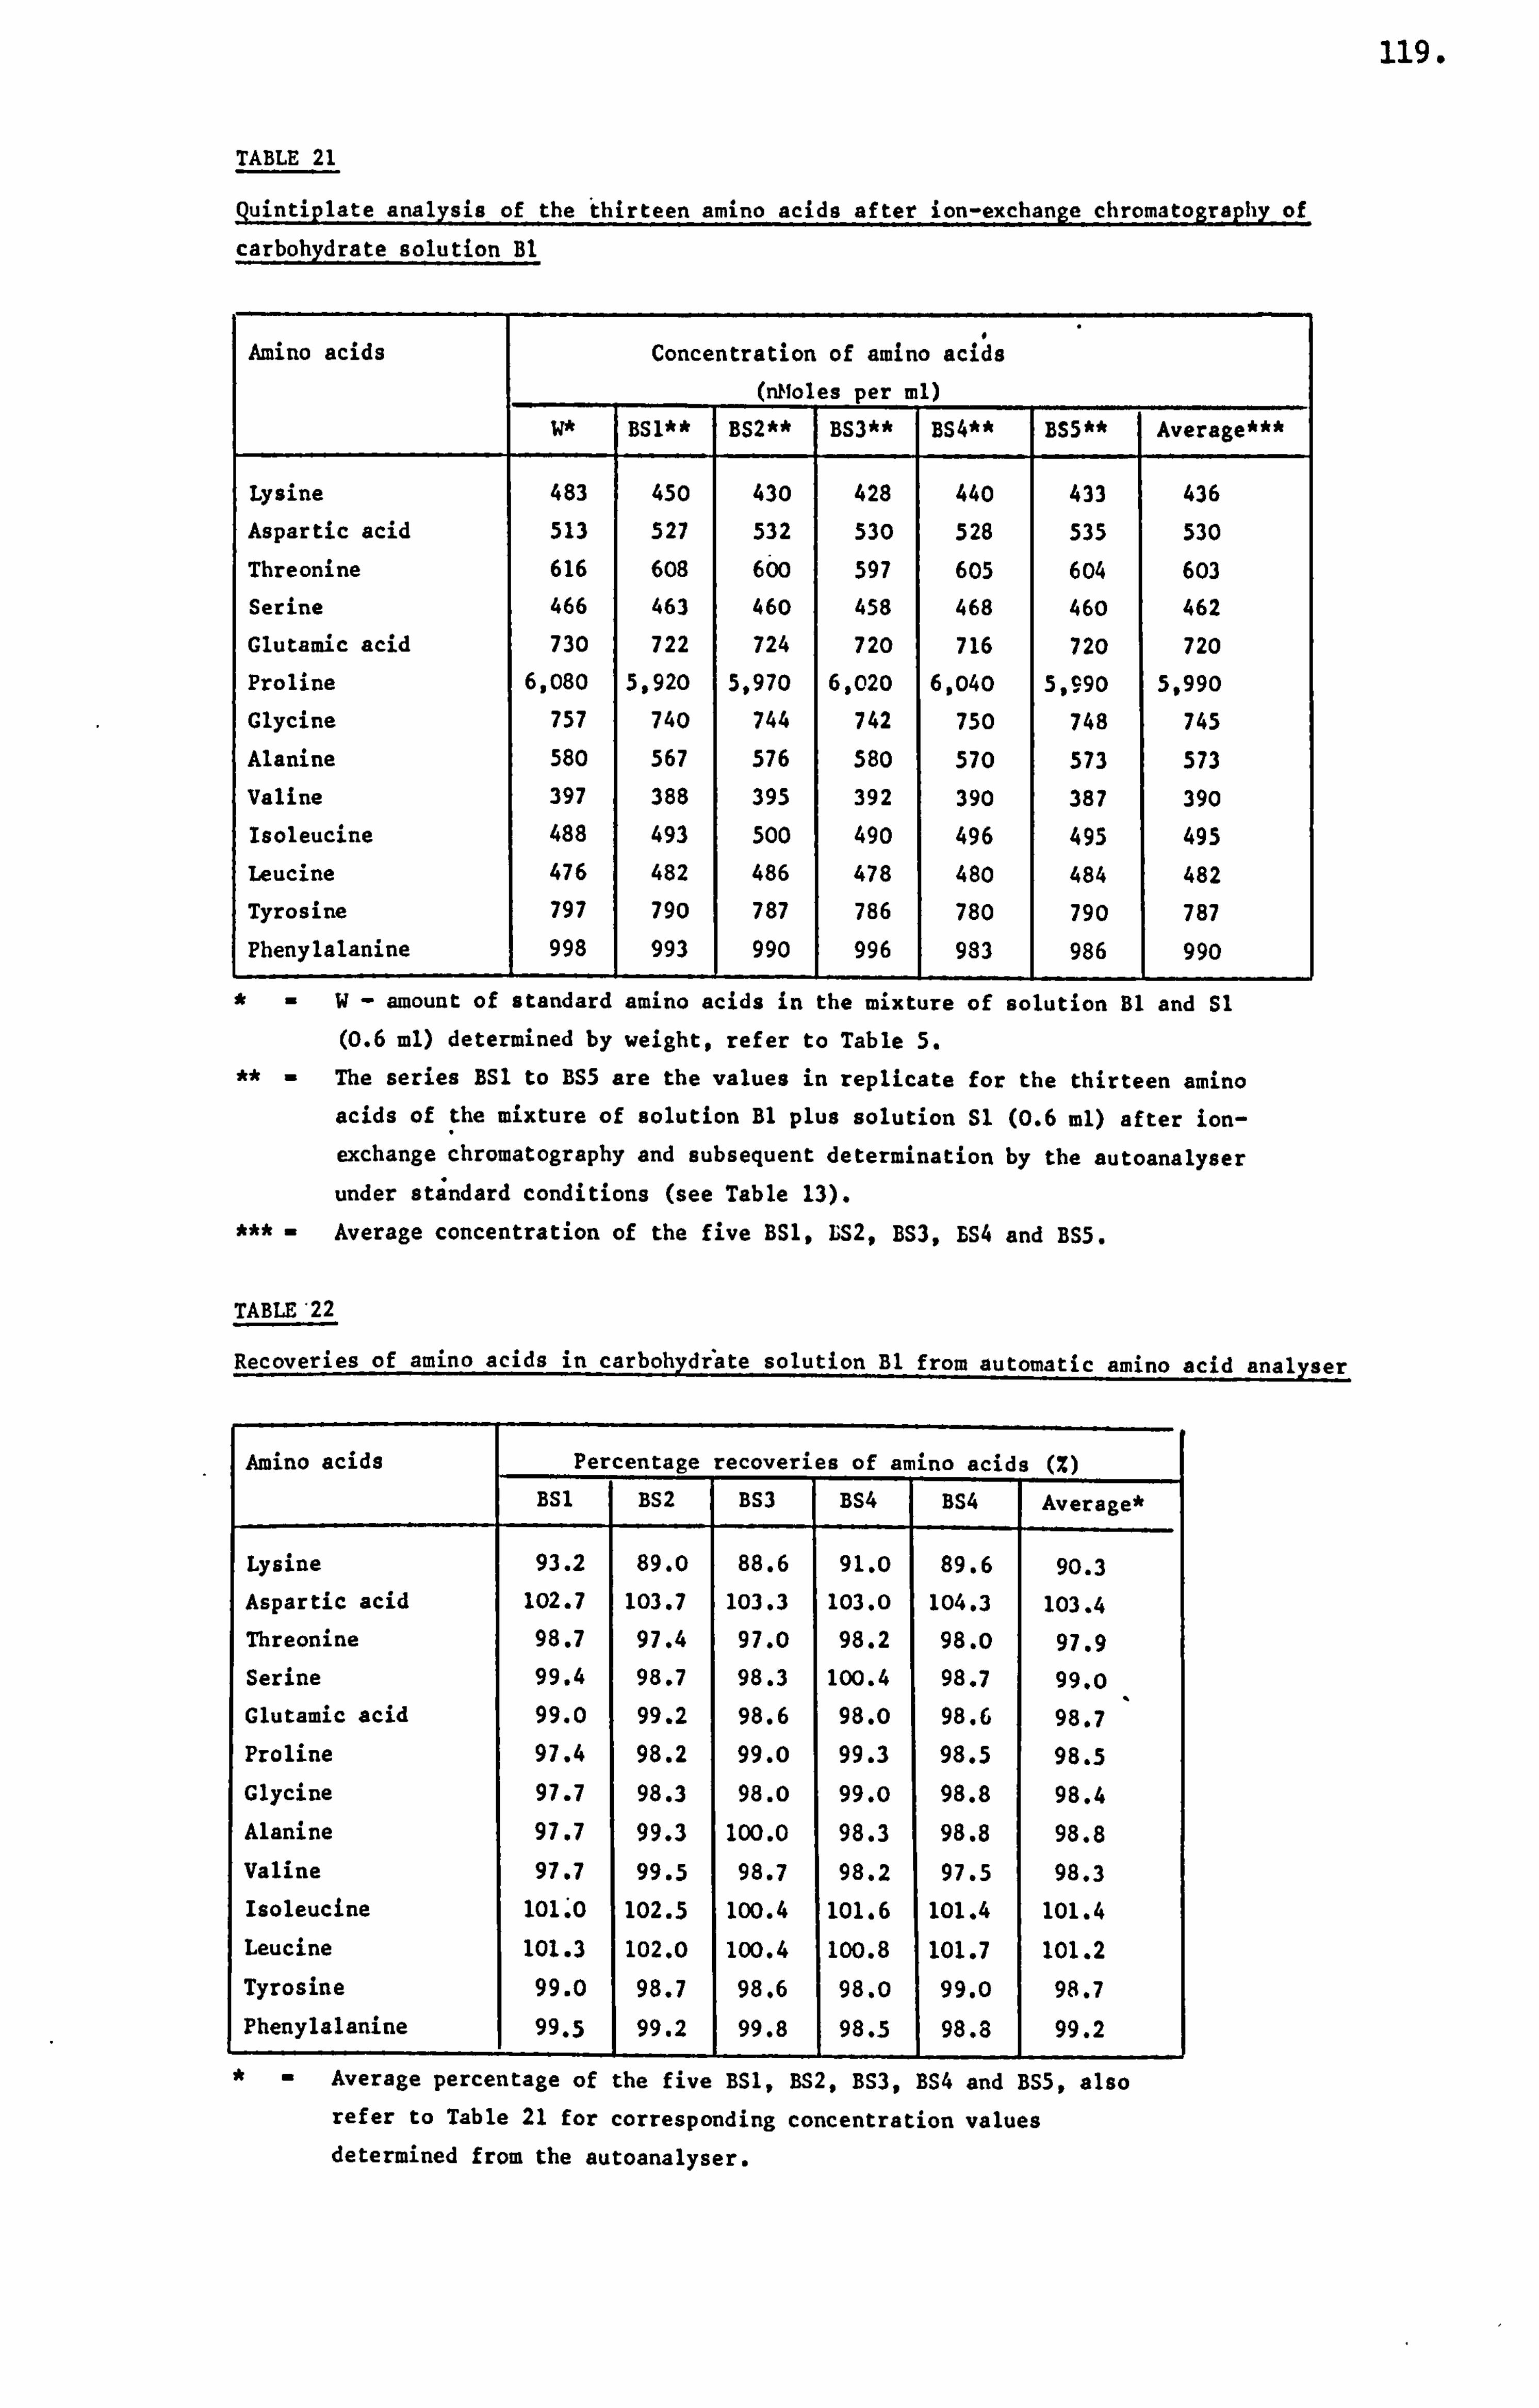
119.
TABLE 21
Quintiplate analysis of the ihirteen amino acids after ion-exchange chromatography of
carbohydrate solution BI
Amino acids Concentration of amino ac6,
(Moles per ml)
W* BS1** BS2** BS3** BS4** BSS** Average***
Lysine 483 450 430 428 440 433 436
Aspartic acid 513 527 532 530 528 535 530
Threonine 616 608 600 597 605 604 603
Serine 466 463 460 458 468 460 462
Glutamic acid 730 722 724 720 716 720 720
Proline 6,080 5,920 5,970 6,020 6,040 5,990 5,990
Glycine 757 740 744 742 750 748 745
Alanine 580 567 576 580 570 573 573
Valine 397 388 395 392 390 387 390
Isoleucine 488 493 Soo 490 496 495 495
Leucine 476 482 486 478 480 484 482
Tyrosine 797 790 787 786 780 790 787
Phenylalanine 998 993 990 996 983 986 990
W- amount of standard amino acids in the mixture of solution Bl and Sl (0.6 ml) determined by weight, refer to Table S.
The series BSI to BS5 are the values in replicate for the thirteen amino acids of the mixture of solution BI plus solution Sl (0.6 ml) after ion-
exchange chromatography and subsequent determination by the autoanalyser
under stindard conditions (see Table 13).
Average concentration of the five BS1, LS2, BS3, LS4 and BS5.
TABLE'22
Recoveries of amino acids in carbohydiate solution Bl from automatic amino acid analyser
Amino acids Percentage recoveries of amino acids (%)
BSI BS2 BS3 I BS4 BS4 Average*
Lysine 93.2 89.0 88.6 91.0 89.6 90.3 Aspartic acid 102.7 103.7 103.3 103.0 104.3 103.4 Threonine 98.7 97.4 97.0 98.2 98.0 97.9 Serine 99.4 98.7 98.3 100.4 98.7 99.0 Glutamic acid 99.0 99.2 98.6 98.0 98.6 98.7 Proline 97.4 98.2 99.0 99.3 98.5 98.5
Glycine 97.7 98.3 98.0 99.0 98.8 98.4
Alanine 97.7 99.3 100.0 98.3 98.8 98.8
Valine 97.7 99.5 98.7 98.2 97.5 98.3
Isoleucine 101.0 102.5 100.4 101.6 101.4 101.4
Leucine 101.3 102.0 100.4 100.8 101.7 101.2
Tyrosine 99.0 98.7 98.6 98.0 99.0 98.7
Phenylalanine 99.5 99.2 99.8 1 98.5 98.8 99.2
Average percentage of the five BS1, BS2, BS3, BS4 and BS5, also refer to Table 21 for corresponding concentration values determined from the autoanalyser.
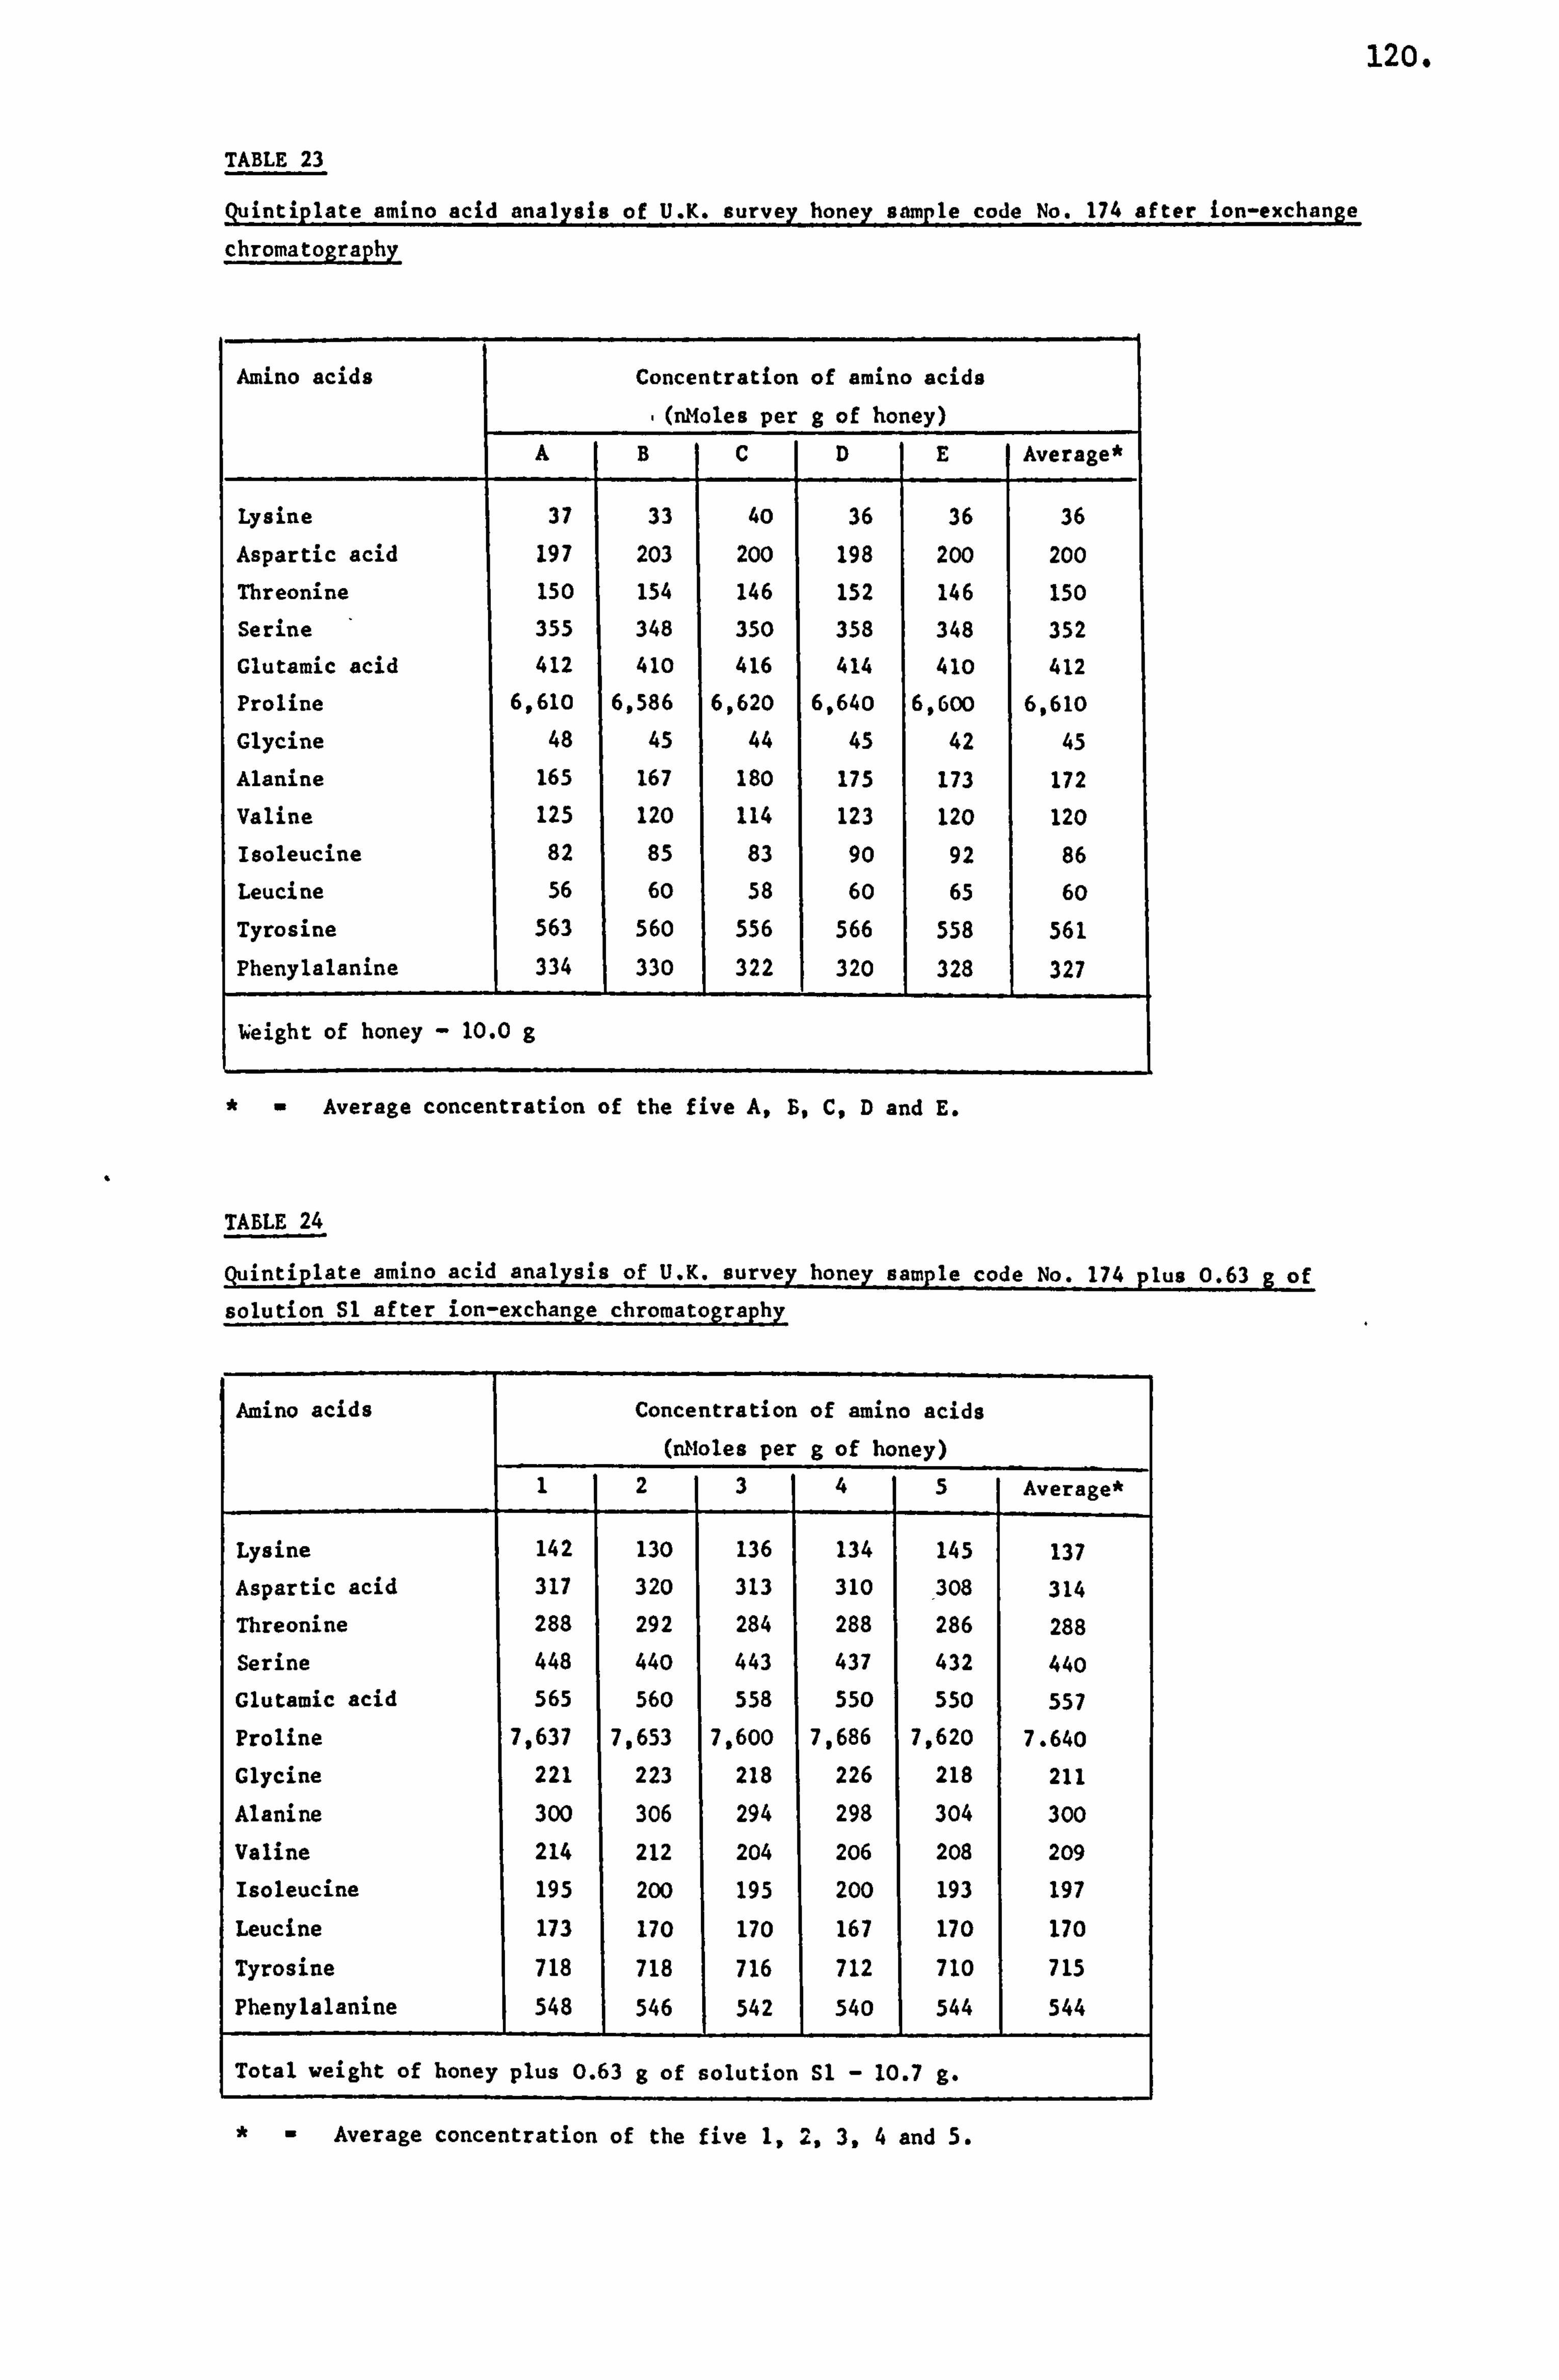
120.
TABLE 23
Quintiplate amino acid analysis of U. K. survey honey sample code No. 174 after ion-exchange
chromatography
Amino acids Concentration of amino acids
. (Moles per g of honey)
A B C D E Average*
Lysine 37 33 40 36 36 36
Aspartic acid 197 203 200 198 200 200
Threonine 150 154 146 152 146 150
Serine 355 348 350 358 348 352
Glutamic acid 412 410 416 414 41o 412
Proline 6,610 6,586 6,620 6.640 6,600 6,610
Glycine 48 45 44 45 42 45
Alanine 165 167 180 175 173 172
Valine 125 120 114 123 120 120
Isoleucine 82 85 83 90 92 86
Leucine 56 60 58 60 65 60
Tyrosine 563 560 556 566 558 561
Phenylalanine 334 1 330 1 322 1 320 328 327
'Weight of honey 10.0 g
*. Average concentration of the five A, B, C, D and E.
TABLE 24
Quintiplate amino acid analysis of U. K. survey honey sample code No. 174 plus 0.63 g of solution Sl after ion-exchange chromatography
Amino acids Concentration of amino acids (nMoles per g of honey)
1 2 3 4 5 Average*
Lysine 142 130 136 134 145 137
Aspartic acid 317 320 313 310 308 314
Threonine 288 292 284 288 286 288
Serine 448 440 443 437 432 440 Glutamic acid 565 560 558 550 550 557
Proline 7,637 7,653 7,600 7,686 7,620 7.640
Clycine 221 223 218 226 218 211
Alanine 300 306 294 298 304 300
Valine 214 212 204 206 208 209
Isoleucine 195 200 195 200 193 197
Leucine 173 170 170 167 170 170
Tyrosine 718 718 716 712 710 715
Phenylalanine 548 546 1 542 1 540 1 544 544
Total weight of honey plus 0.63 g of solution S1 - 10.7 g.
*. Average concentration of the five 1,2,3,4 and 5.
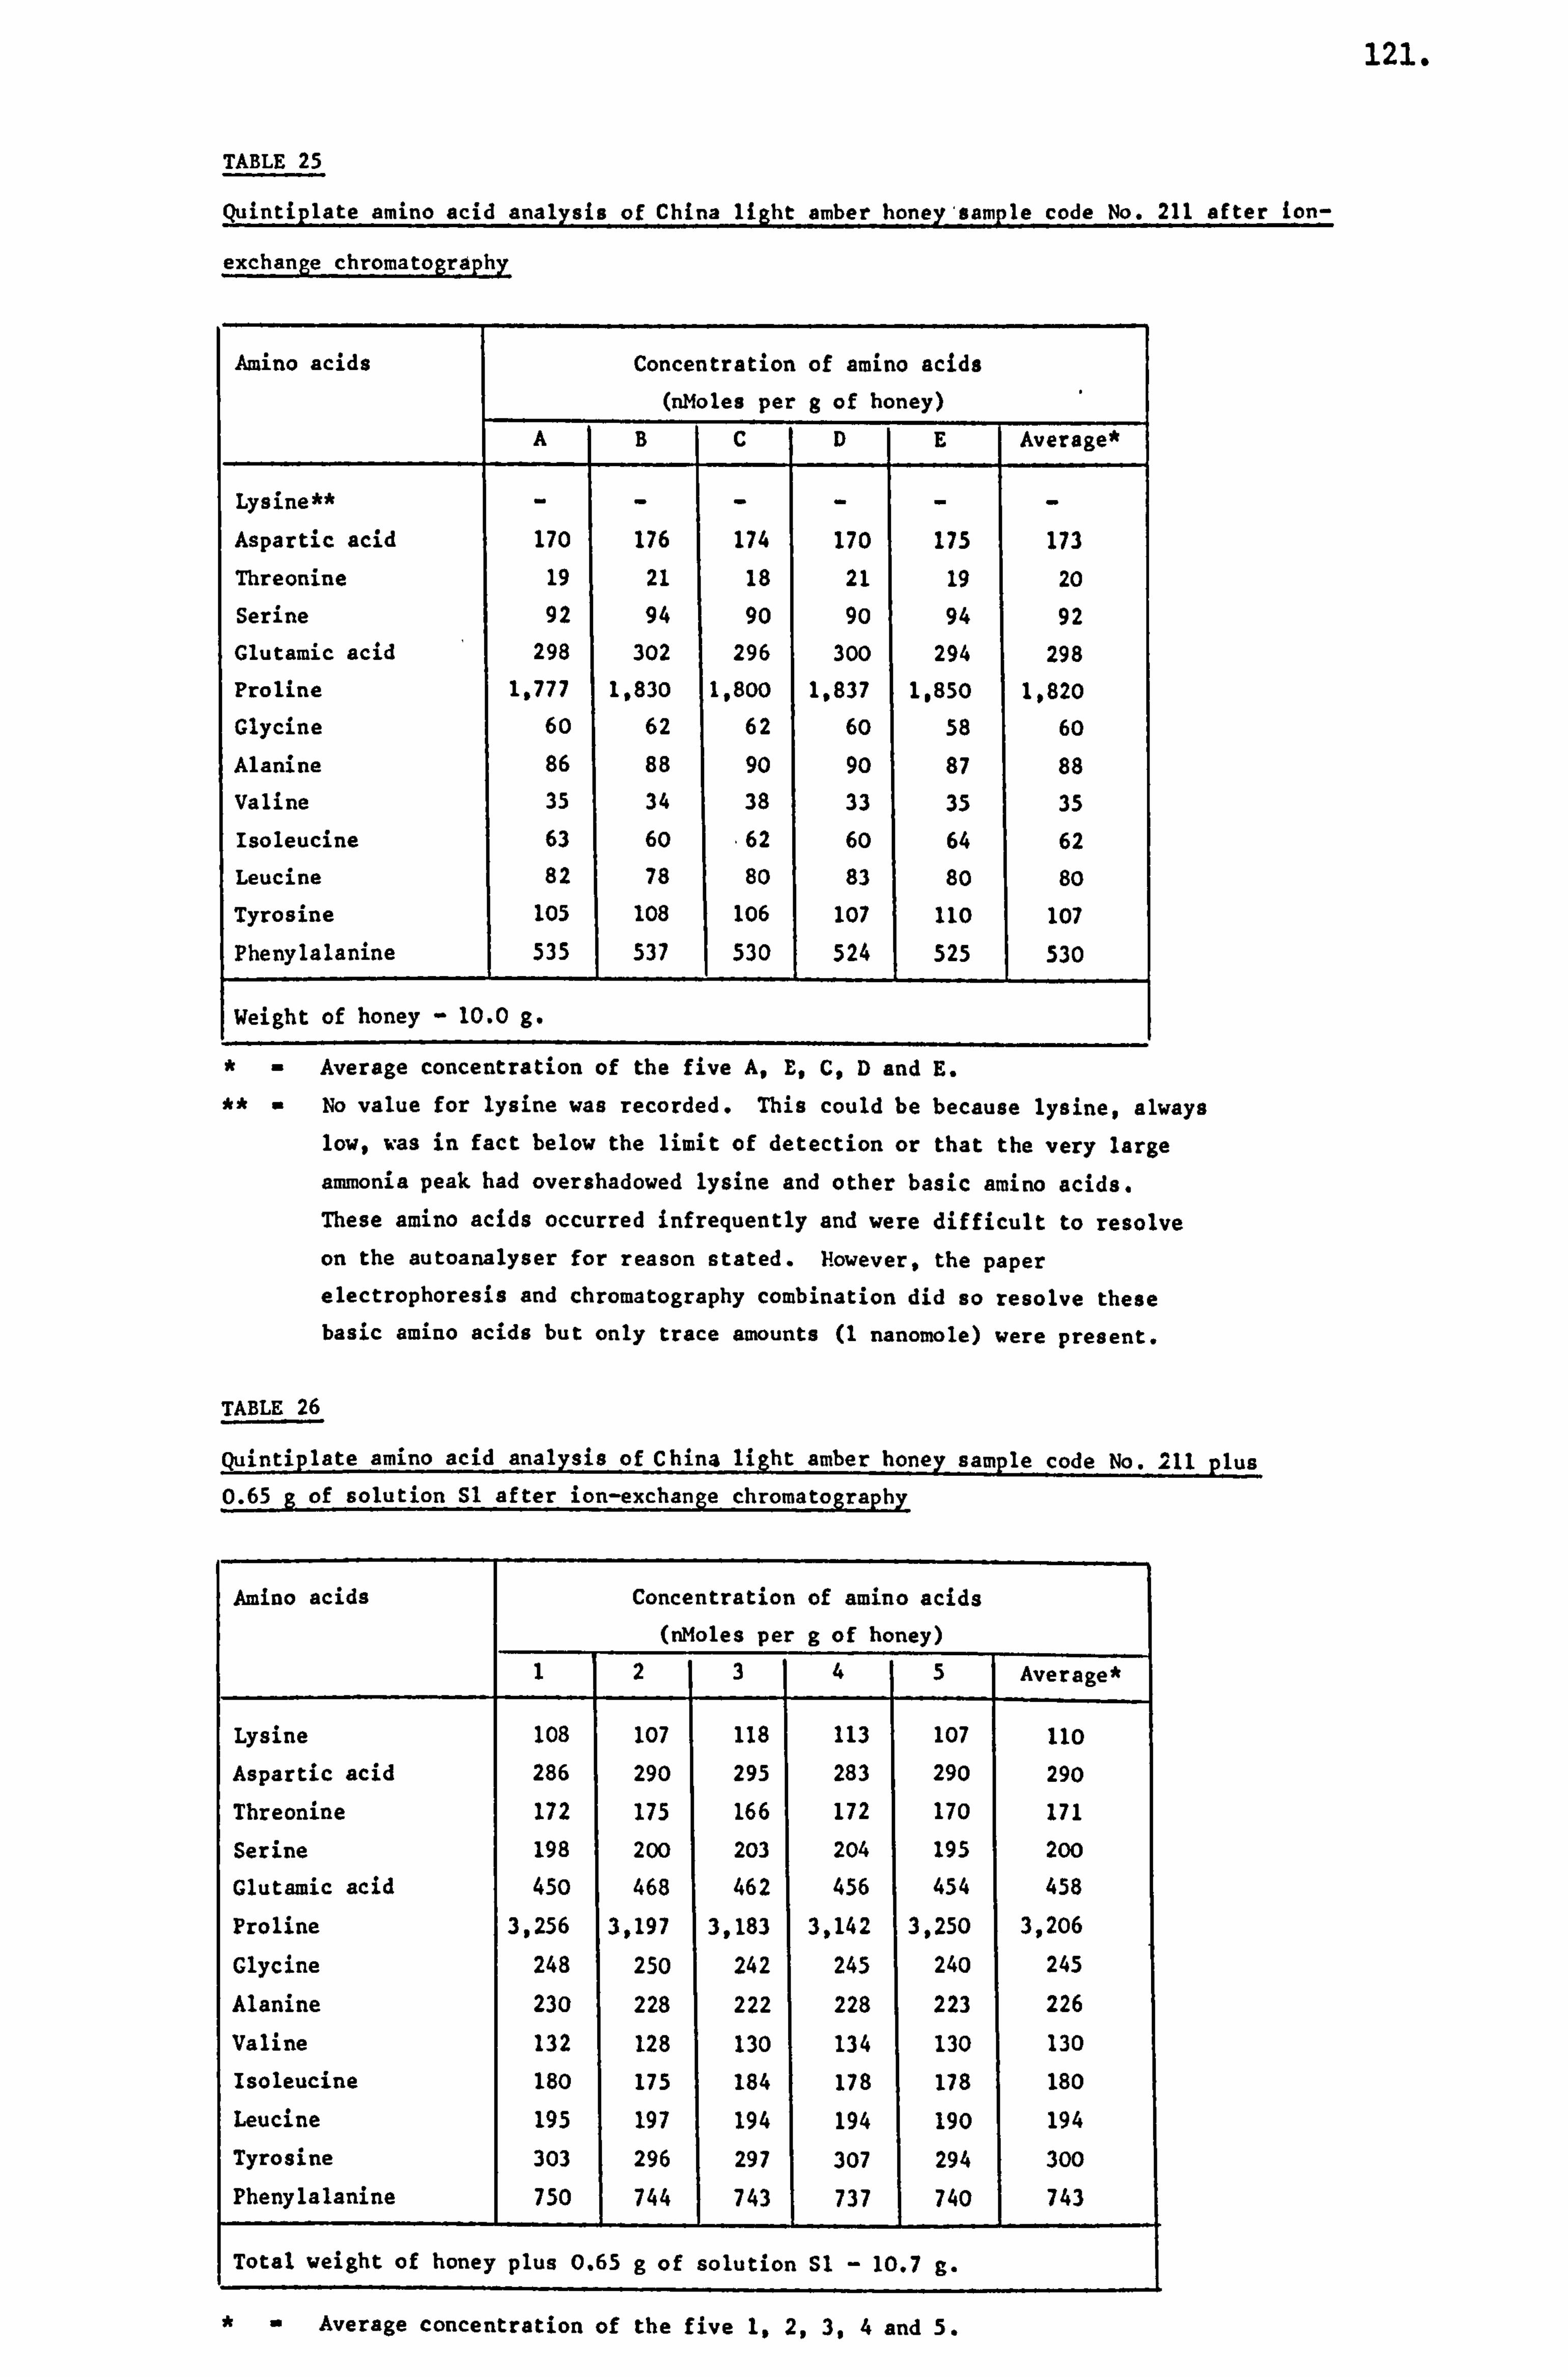
121.
TABLE 25
Quintiplate amino acid analysis of China light amber honey'sample code No. _211
after ion-
exchange chromatography
Amino acids Concentration of amino acids (nMoles per g of honey)
A B C D E Average*
Lysine** - - - - - - Aspartic acid 170 176 174 170 175 173
Threonine 19 21 18 21 19 20
Serine 92 94 90 90 94 92
Glutamic, acid 298 302 296 300 294 298
Proline 1,777 1,830 1,800 1,837 1,850 1,820
Glycine 60 62 62 60 58 60
Alanine 86 88 90 90 87 88
Valine 35 34 38 33 35 35
Isoleucine 63 60 . 62 60 64 62
Leucine 82 78 80 83 80 80
Tyrosine 105 108 106 107 110 107
Phenylalanine 1 535
1 537
1- 530
1 524 1 525 1 530
Weight of honey - 10.0 g.
Average concentration of the five A, E, C, D and E.
vo value for lysine was recorded. This could be because lysine, always low, was in fact below the limit of detection or that the very large
ammonia peak had overshadowed lysine and other basic amino acids. These amino acids occurred infrequently and were difficult to resolve on the autoanalyser for reason stated. 14owever, the paper electrophoresis and chromatography combination did so resolve these basic amino acids but only trace amounts (1 nanomole) were present.
TABLE 26
Quintiplate amino acid analysis of China light amber honey sample code No. 211 plus 0.65 g of solution Sl after ion-exchange chromatography
Amino acids Concentration of amino acids (riMoles per g of honey)
1 2 3 4 5 Average*
Lysine 108 107 118 113 107 110
Aspartic acid 286 290 295 283 290 290
Threonine 172 175 166 172 170 171
Serine 198 200 203 204 195 2oo
Clutamic acid 450 468 462 456 454 458
Proline 3,256 3,197 3,183 3,142 3,250 3,206
Clycine 248 250 242 245 240 245
Alanine 230 228 222 228 223 226
Valine 132 128 130 134 130 130
Isoleucine 180 175 184 178 178 180
Leucine 195 197 194 194 190 194
Tyrosine 303 296 297 307 294 300
Phenylalanine 750- 1 744 1 743 737 1 740 743
Total weight of honey plus 0.65 g of solution Sl - 10.7 g.
*. Average concentration of the five 1.2,3,4 and 5.
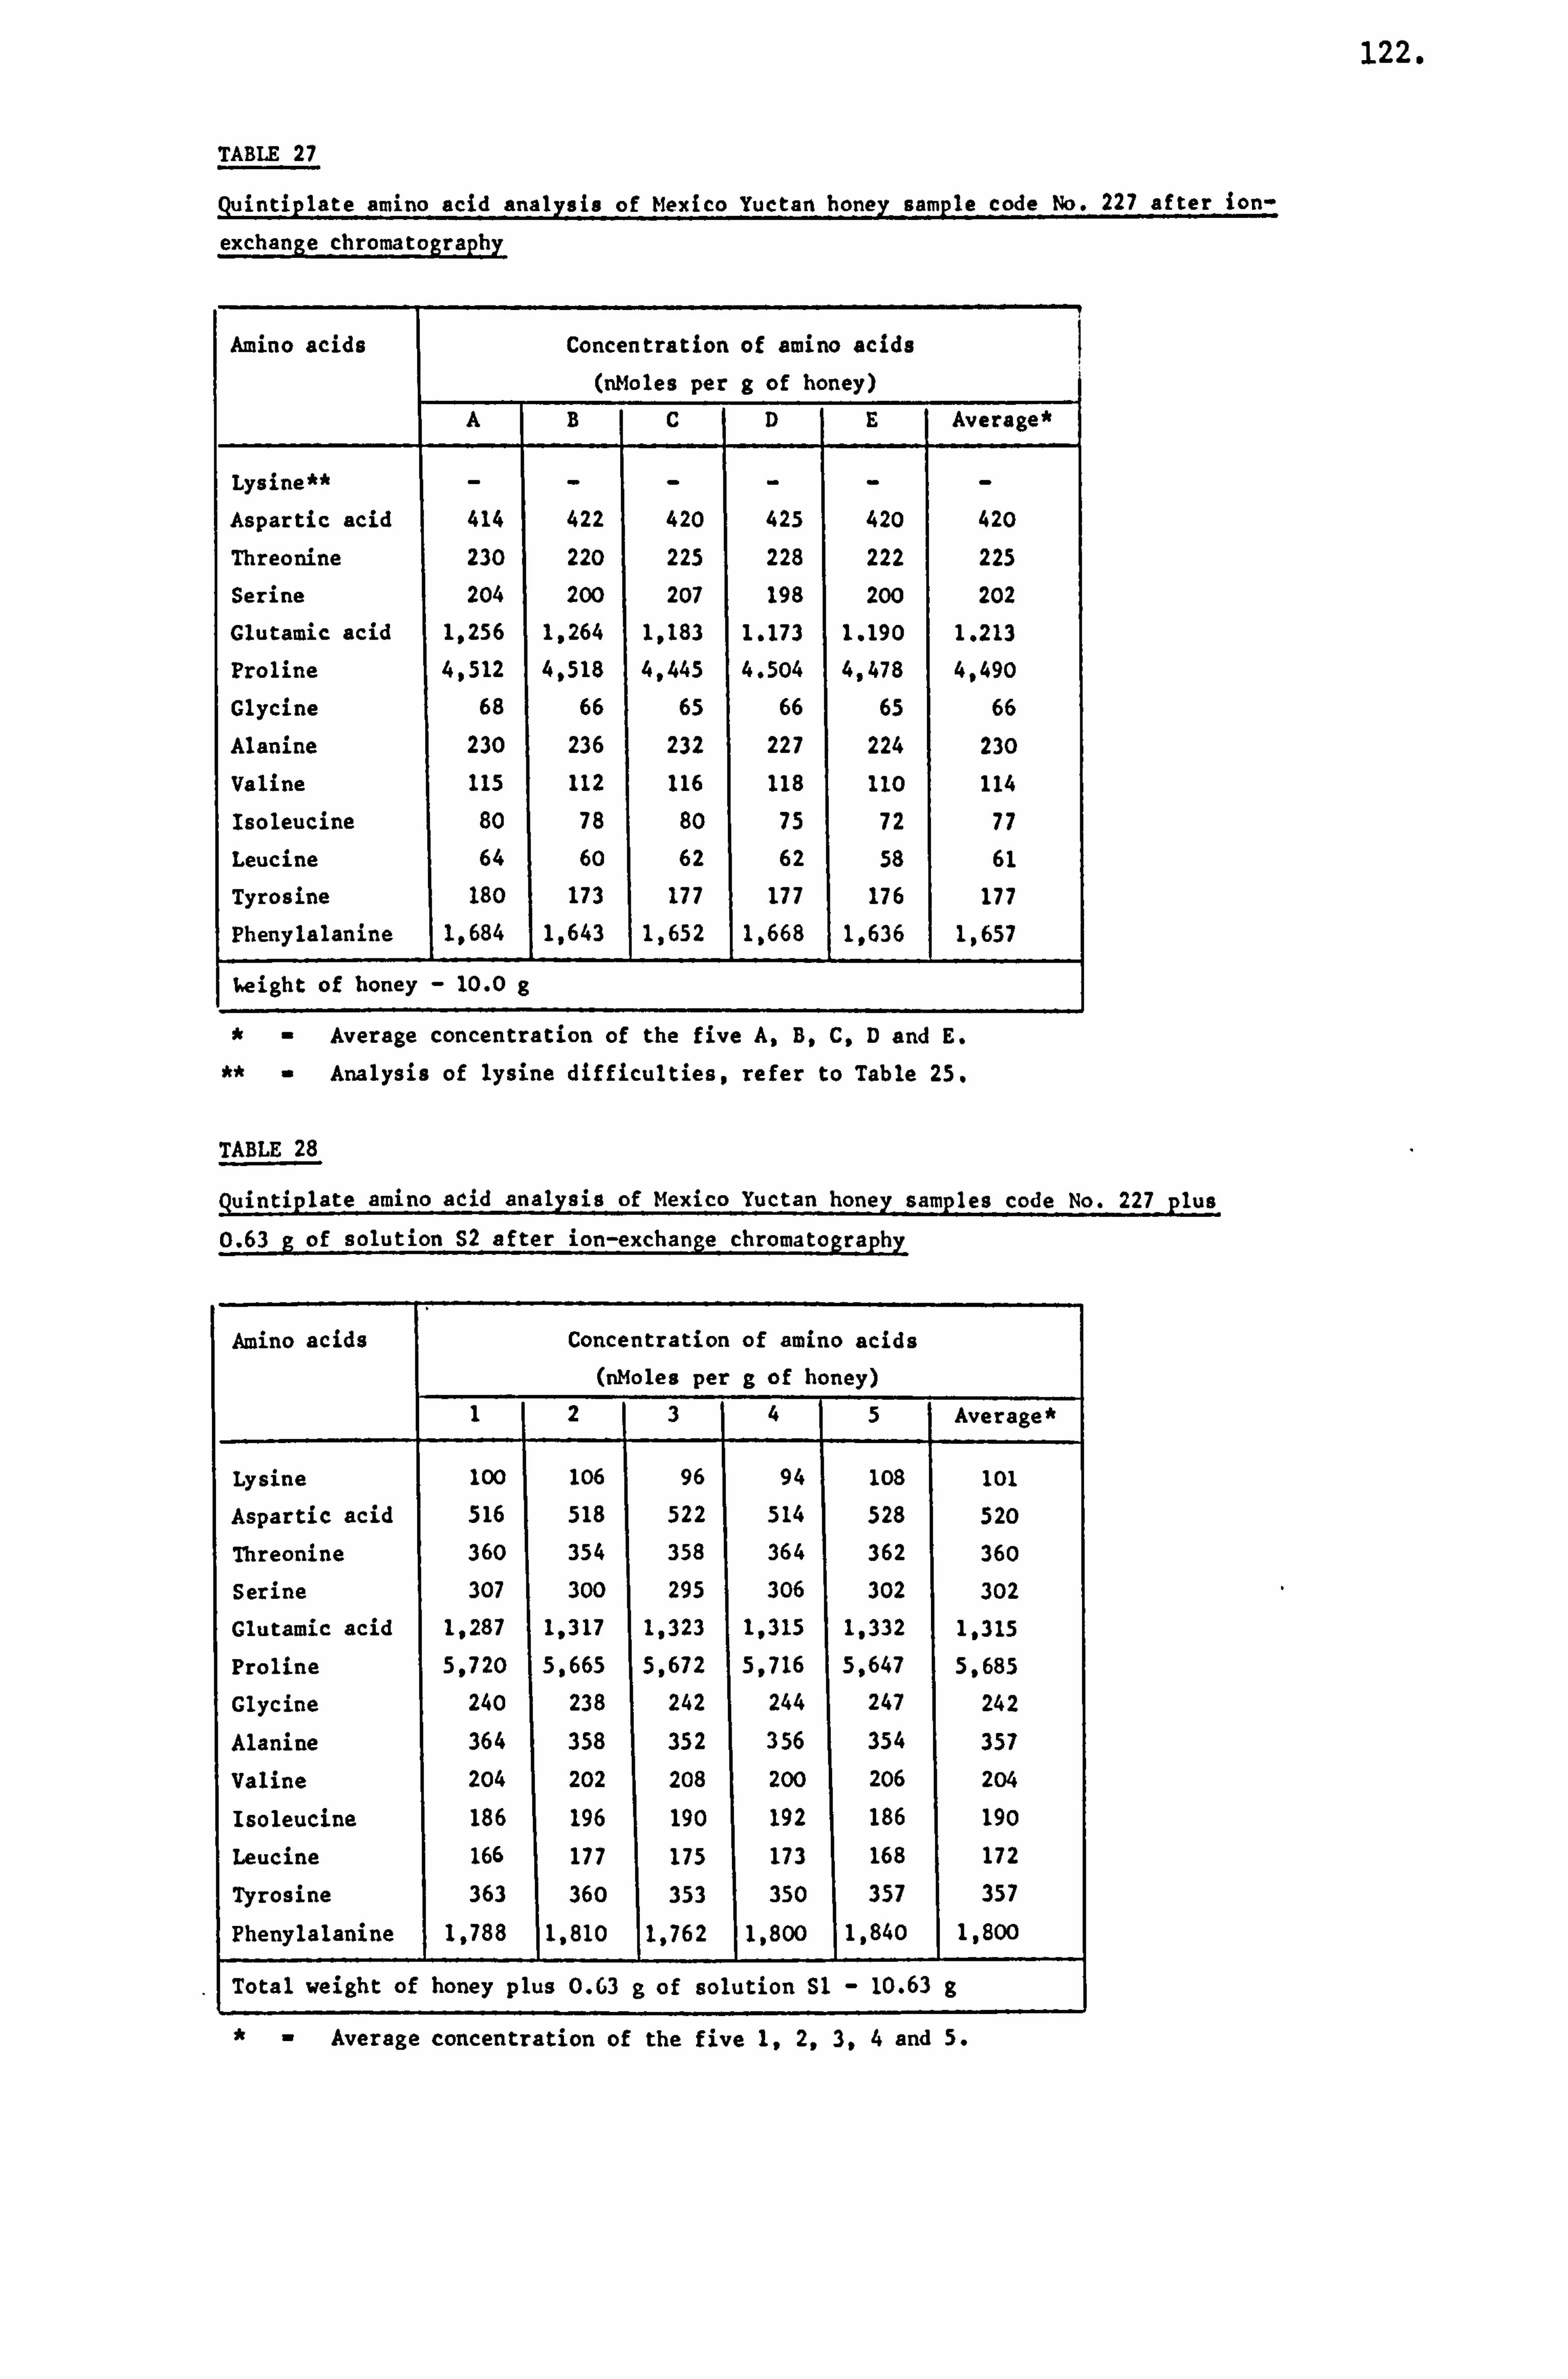
122.
TABLE 27
Quintiplate amino acid analysis of Mexico Yuctan honey sample code No. 227 after ion-
exchange chromatography
Amino acids Concentration of amino acids (nMoles per g of honey)
A B C D E Average*
Lysine** - - - - - - Aspartic acid 414 422 420 425 420 420
Threonine 230 220 225 228 222 225
Serine 204 200 207 198 200 202
Glutamic acid 1,256 1,264 1,183 1.173 1.190 1.213
Proline 4,512 4,518 4,445 4.504 4,478 4,490
Glycine 68 66 65 66 65 66
Alanine 230 236 232 227 224 230
Valine 115 112 116 118 110 114
Isoleucine 80 78 80 75 72 77
Leucine 64 60 62 62 58 61
Tyrosine 180 173 177 177 176 177
Phenylalanine 1 1.684
1 1,643
1 1,652
1 1,668
1 1,636
1 1,657
Ueight of honey - 10.0 9 71
Average concentration of the five A, B9 C, D and E.
Analysis of lysine difficulties, refer to Table 25.
TABLE 28
Quintiplate amino acid analysis of Mexico Yuctan honey samples code No. 227plus
0.63 g of solution S2 after ion-exchange chromatography
Amino acids Concentration of amino acids (nMoles per & of honey)
1 2 3 4 5 Average*
Lysine 100 106 96 94 108 101
Aspartic acid 516 518 522 514 528 520
Threonine 360 354 358 364 362 360
Serine 307 300 295 306 302 302
Glutamic acid 1,287 1,317 1,323 1,315 1,332 1,315
Proline 5,720 5,665 5,672 5,716 5,647 5,685
Glycine 24o 238 242 244 247 242
Alanine 364 358 352 356 354 357
Valine 204 202 208 200 206 204
Isoleucine 186 196 190 192 186 190
Leucine 166 177 175 173 168 172
Tyrosine 363 360 353 350 357 357
Phenylalanine 1,788 1 1,810 1 1,762 1 1,800 1 1,840 1,800
Total weight of honey plus 0.63 g of solution Sl - 10.63 g
*- Average concentration of the five 1,2,3,4 and 5.
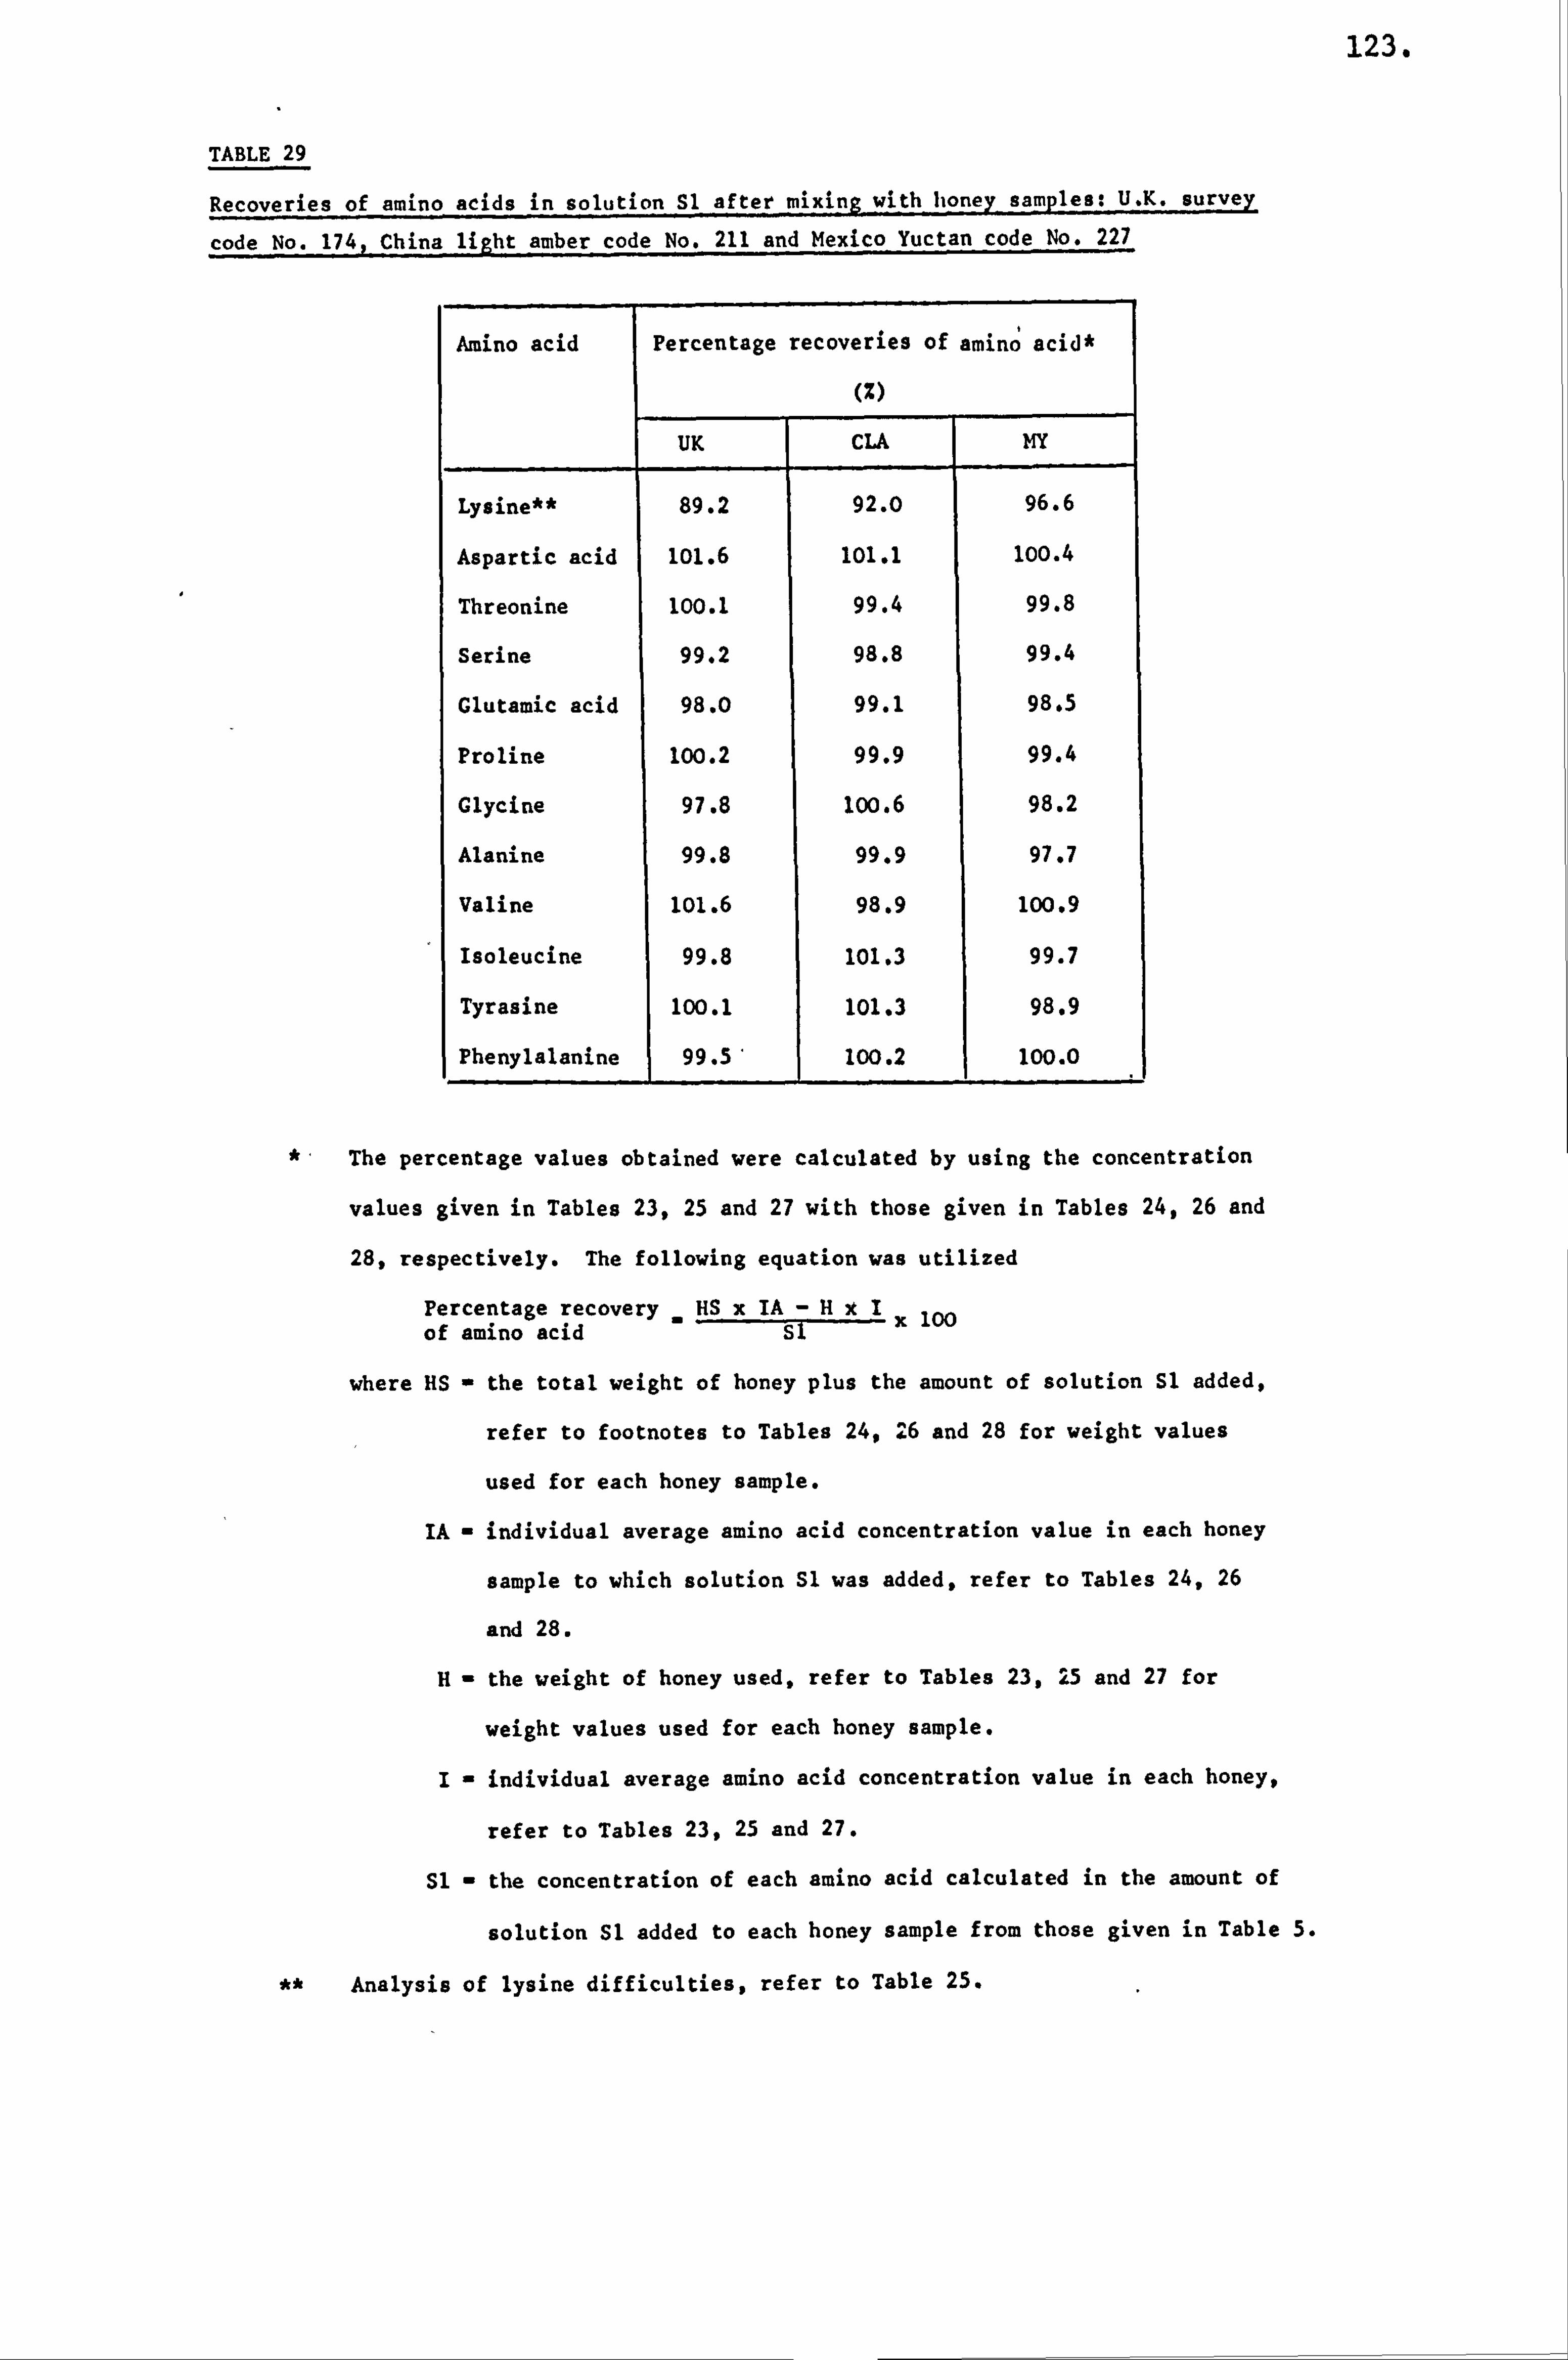
123.
TABLE 29
Recoveries of amino acids in solution Sl after mixing with honey samples: U. K. survey
code No. 174, China light amber code No. 211 and Mexico Yuctan code No. 227
Amino acid Percentage recoveries of aminý acid*
(Z)
UK CLA MY
Lysine** 89.2 92.0 96.6
Aspartic acid 101.6 101.1 100.4
Threonine 100.1 99.4 99.8
Serine 99.2 98.8 99.4
Glutamic acid 98.0 99.1 98.5
Proline 100.2 99.9 99.4
Glycine 97.8 loo. 6 98.2
Alanine 99.8 99.9 97.7
Valine 101.6 98.9 100.9
Isoleucine 99.8 101.3 99.7
Tyrasine 100.1 101.3 98.9
Phenylalanine 1 99.5, 100.2 100.0
*ý The percentage values obtained were calculated by using the concentration
values given in Tables 23,25 and 27 with those given in Tables 24,26 and
28, respectively. The following equation was utilized
rercentage recovery . HS x IA -HxIx 100
of amino acid sl
where HS - the total weight of honey plus the amount of solution Sl added,
refer to footnotes to Tables 24,26 and 28 for weight values
used for each honey sample.
IA - individual average amino acid concentration value in each honey
sample to which solution S1 was added, refer to Tables 24,26
and 28.
H- the weight of honey used, refer to Tables 23,25 and 27 for
weight values used for each honey sample.
I- individual average amino acid concentration value in each honey,
refer to Tables 23,25 and 27.
SI - the concentration of each amino acid calculated in the amount of
solution Sl added to each honey sample from those given in Table 5.
Analysis of lysine difficulties, refer to Table 25.
124.
values greater than 500 nmoles per g of honey.
Replicate recovery analysis agreed to within ±1% to ±5% of the
average values.
Mellissopalynology
The pollen content of a honey sample was determined microscopically
as described. The pollen grains which were identified usually at both
plant family and genus level as detailed in Table 7 and Appendix VIII.
The pollen grains were then counted and presented in terms of frequency
class for each honey sample as described. The data and characteristics
from the predominant and secondary frequency classes of pollen grains
was utilised for statistical analysis and were numerically coded as
required by the computer software package - Statistical Package for
Social Sciences for ease of differentiation between different grains.
The numerical codes together with the botanical names, English names
and plant family for a partial list of predominant and secondary pollen
grains have been given in Table 30, and for the complete list of identified
pollen grains are given in Appendix VIII. Some of the identified pollen
grains were photographed at X400 magnification and these have been shown
in Figure 8.
Amino Acids in the United Kingdom Samples
Arranged in Order of Pollen Types
After evaluation and subsequent classification of the pollen grains
into frequency classes for each sample of honey, the one hundred and
ninty two honey samples of the United Kingdom survey were grouped into
four pollen groups. These were: the predominant, secondary, secondary
multiple and the unidentified type.
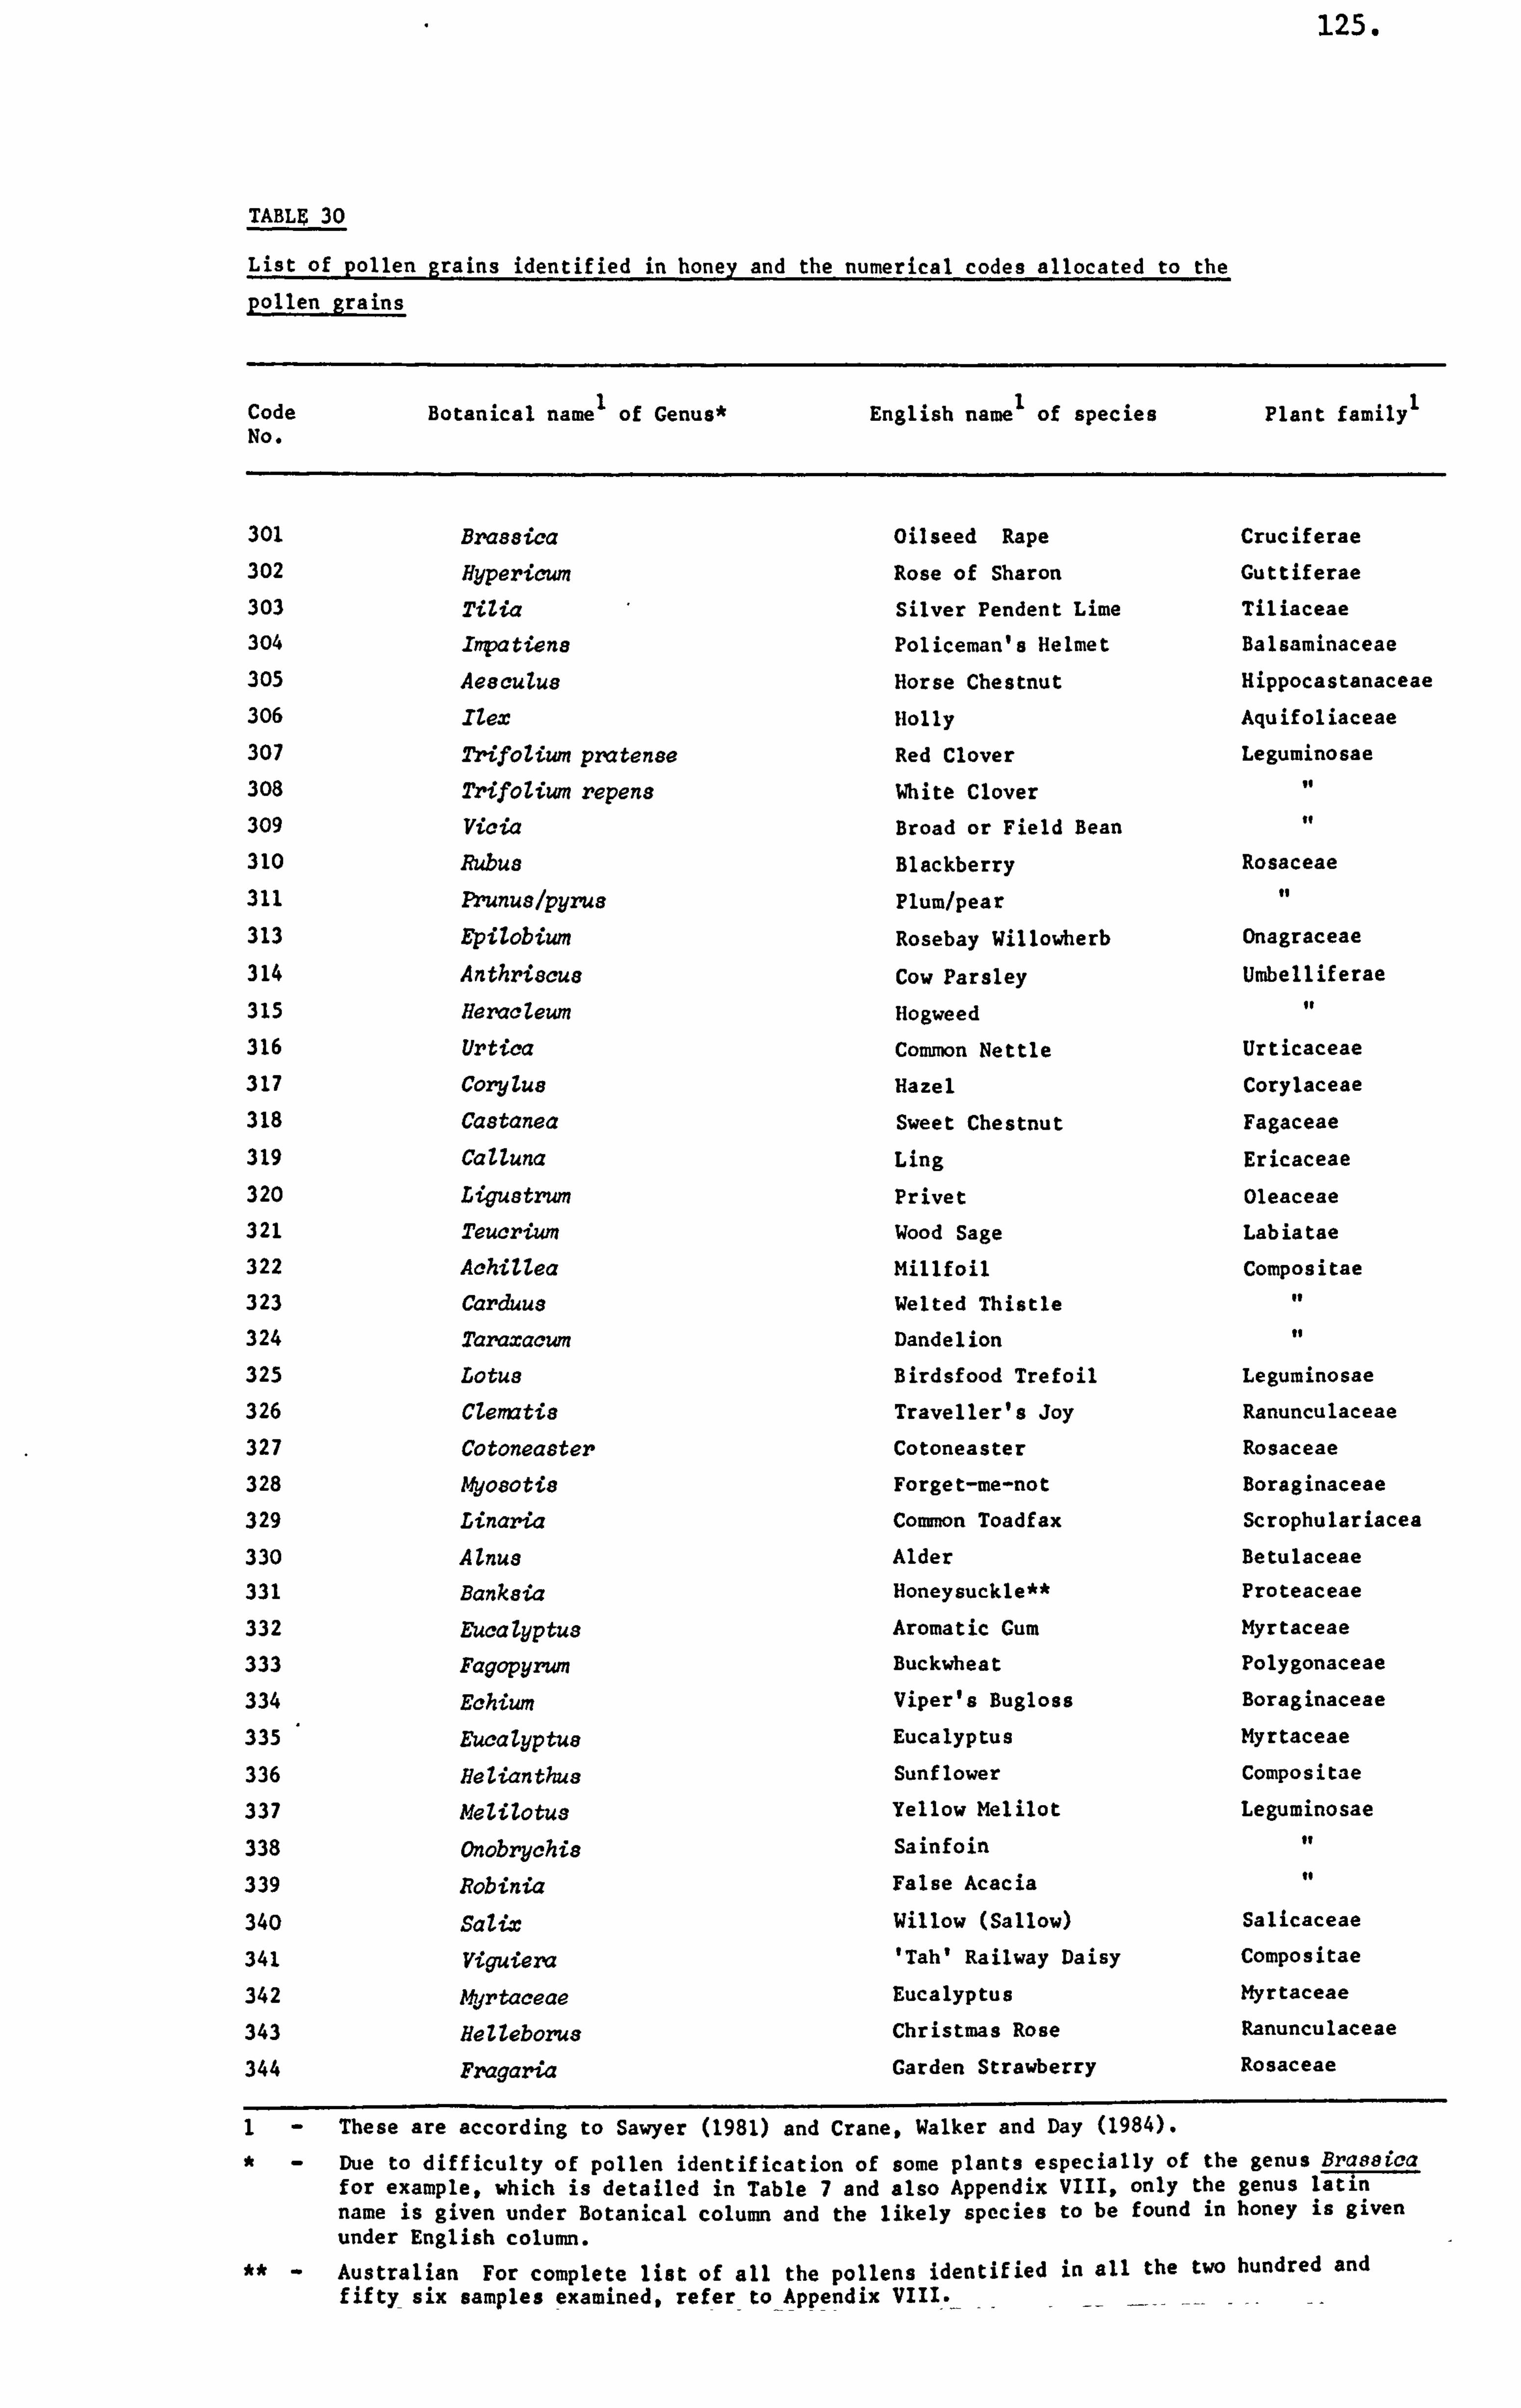
125.
TABLý 30
List of pollen grains identified in honey and the numerical codes allocated to the
pollen rains
Code No.
Botanical name' of Genus* English name I
of species Plant family
301 Brassica Oilseed Rape Cruciferae 302 Hypericum Rose of Sharon Guttiferae 303 TiZia Silver Pendent Lime Tiliaceae 304 Inpatiens Policeman's Helmet Balsaminaceae 305 Aeaculus Horse Chestnut Hippocastanaceae 306 IZex Holly Aquifoliaceae 307 TrifoZiwn praten8e Red Clover Leguminosae 308 TrifoZiwn repens White Clover if
309 Vicia Broad or Field Bean to
310 Rubus Blackberry Rosaceae
311 Prunus/pyrus Plum/pear to
313 Epilobium Rosebay Willowherb Onagraceae
314 Anthz-iscue Cow Parsley Umbelliferae
315 Heracleum Hogweed to
316 Urtica Common Nettle Urticaceae
317 CornjZus Hazel Corylaceae 318 Castanea Sweet Chestnut Fagaceae 319 CaZluna Ling Ericaceae 320 Ligustrwn Privet Oleaceae 321 Teucrium Wood Sage Labiatae 322 AchiZlea Millfoil Compositae 323 Carduu8 Welted Thistle is
324 Taraxacum Dandelion to
325 Lotus Birdsfood Trefoil Leguminosae 326 Mematis Traveller's Joy Ranunculaceae
327 Cotoneaster Cotoneaster Rosaceae
328 114yosotis Forget-me-not Boraginaceae
329 Linaria Common Toadfax Scrophulariacea
330 AZnus Alder Betulaceae 331 Banksia Honeysuckle** Proteaceae
332 Eucalyptus Aromatic Gum Myrtaceae
333 Fagopyr-um Buckwheat Polygonaceae
334 Echium Viper's Bugloss Boraginaceae
335 Eucalyptus Eucalyptus Myrtaceae
336 Relianthus Sunflower Compositae
337 Mezilotus Yellow Melilot Leguminosae
338 Onobrychis Sainfoin It
339 Robinia False Acacia to
340 SaUx Willow (Sallow) Salicaceae
341 Viguiera 'Tah' Railway Daisy Compositae
342 Ahjrtaceae Eucalyptus Myrtaceae
343 ReZZeborus Christmas Rose Ranunculaceae
344 Fragaria Carden Strawberry Rosaceae
1 These are according to Sawyer (1981) and Crane, Walker and Day (1984).
Due to difficulty of pollen identification of some plants especially of the genus Brassfca for example, which is detailed in Table 7 and also Appendix VIII, only the genus latin name is given under Botanical column and the likely species to be found in honey is given under English column. Australian For complete list of all the pollens identified in all the two hundred and fifty six samples examined, refer_to
_Appendix VIII_.
__
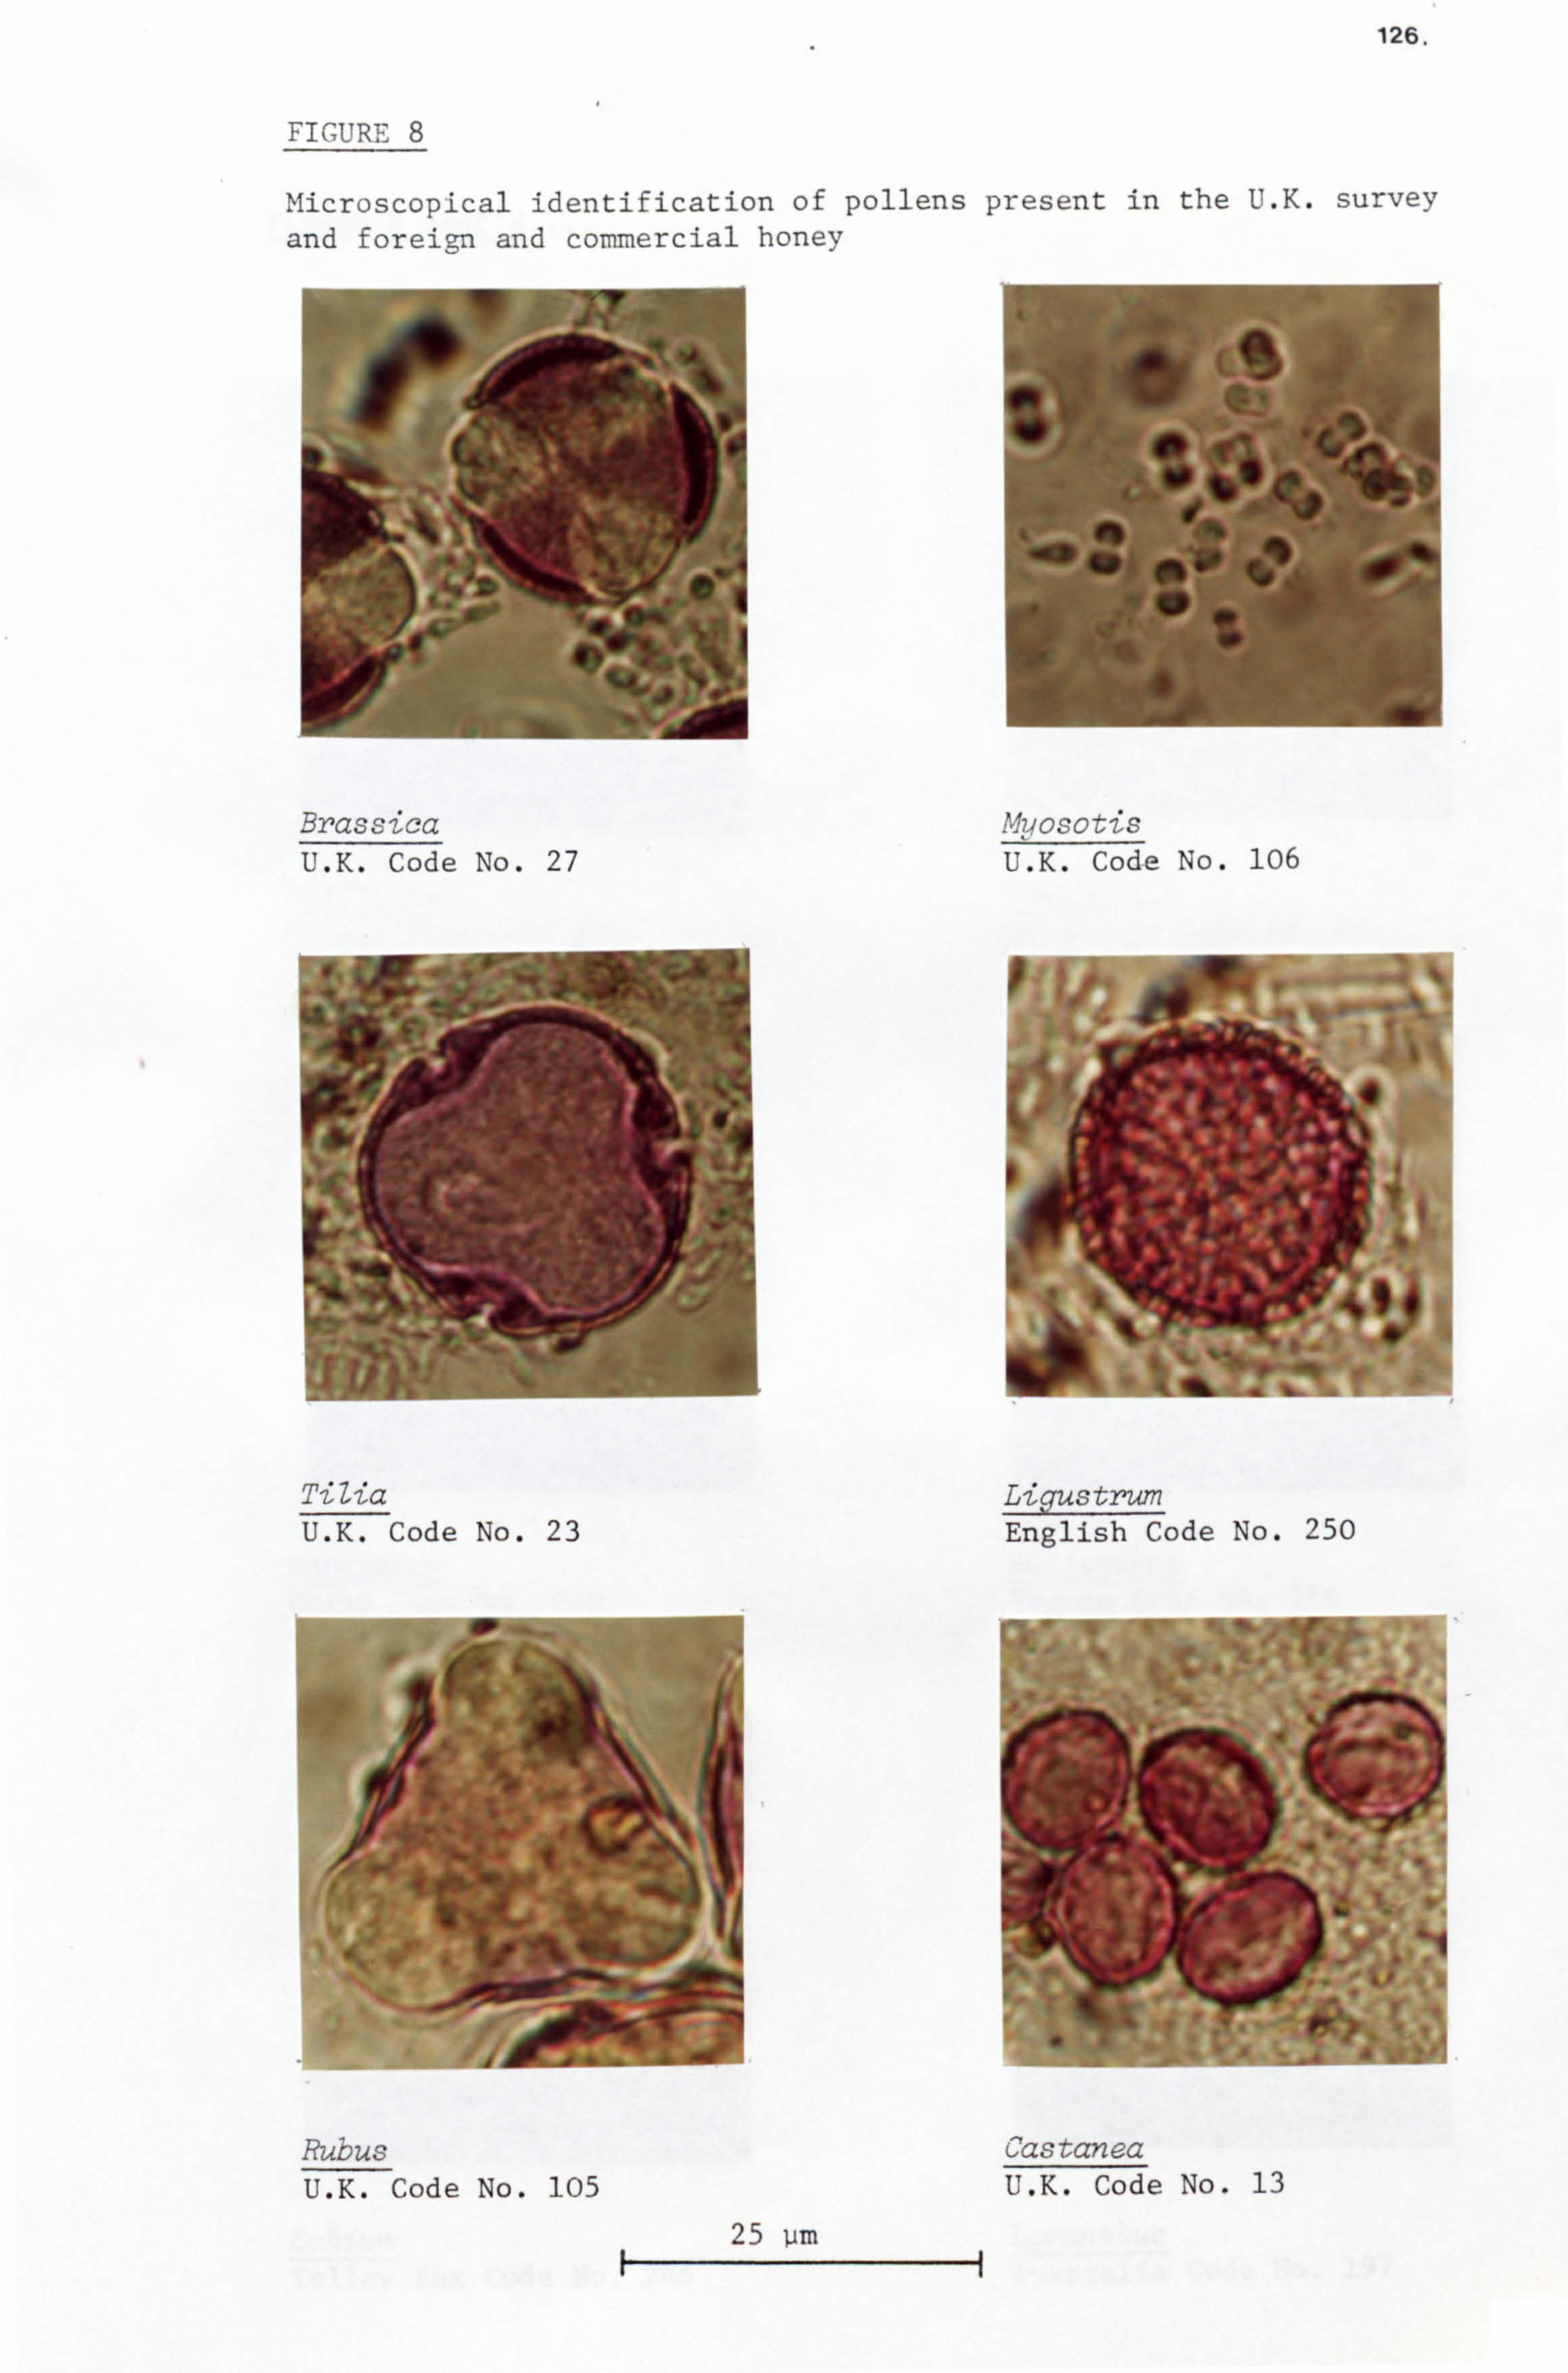
126.
FIGURE 8
Microscopical identification of pollens present in the U. K. survey and foreign and commercial honey
J6
Brassica U. K. Code No. 27
Ti Zia U. K. Code No. 23
Rubus U. K. Code No. 105
00e Olt
lb dio
d, Ilb
400 410 olb V 117 40 4k
AP'losotis
U. K. Code No. 106
. 0& %ý -
Ligustrum English Code No. 250
p
Castanea U. K. Code No. 13
25 ijm
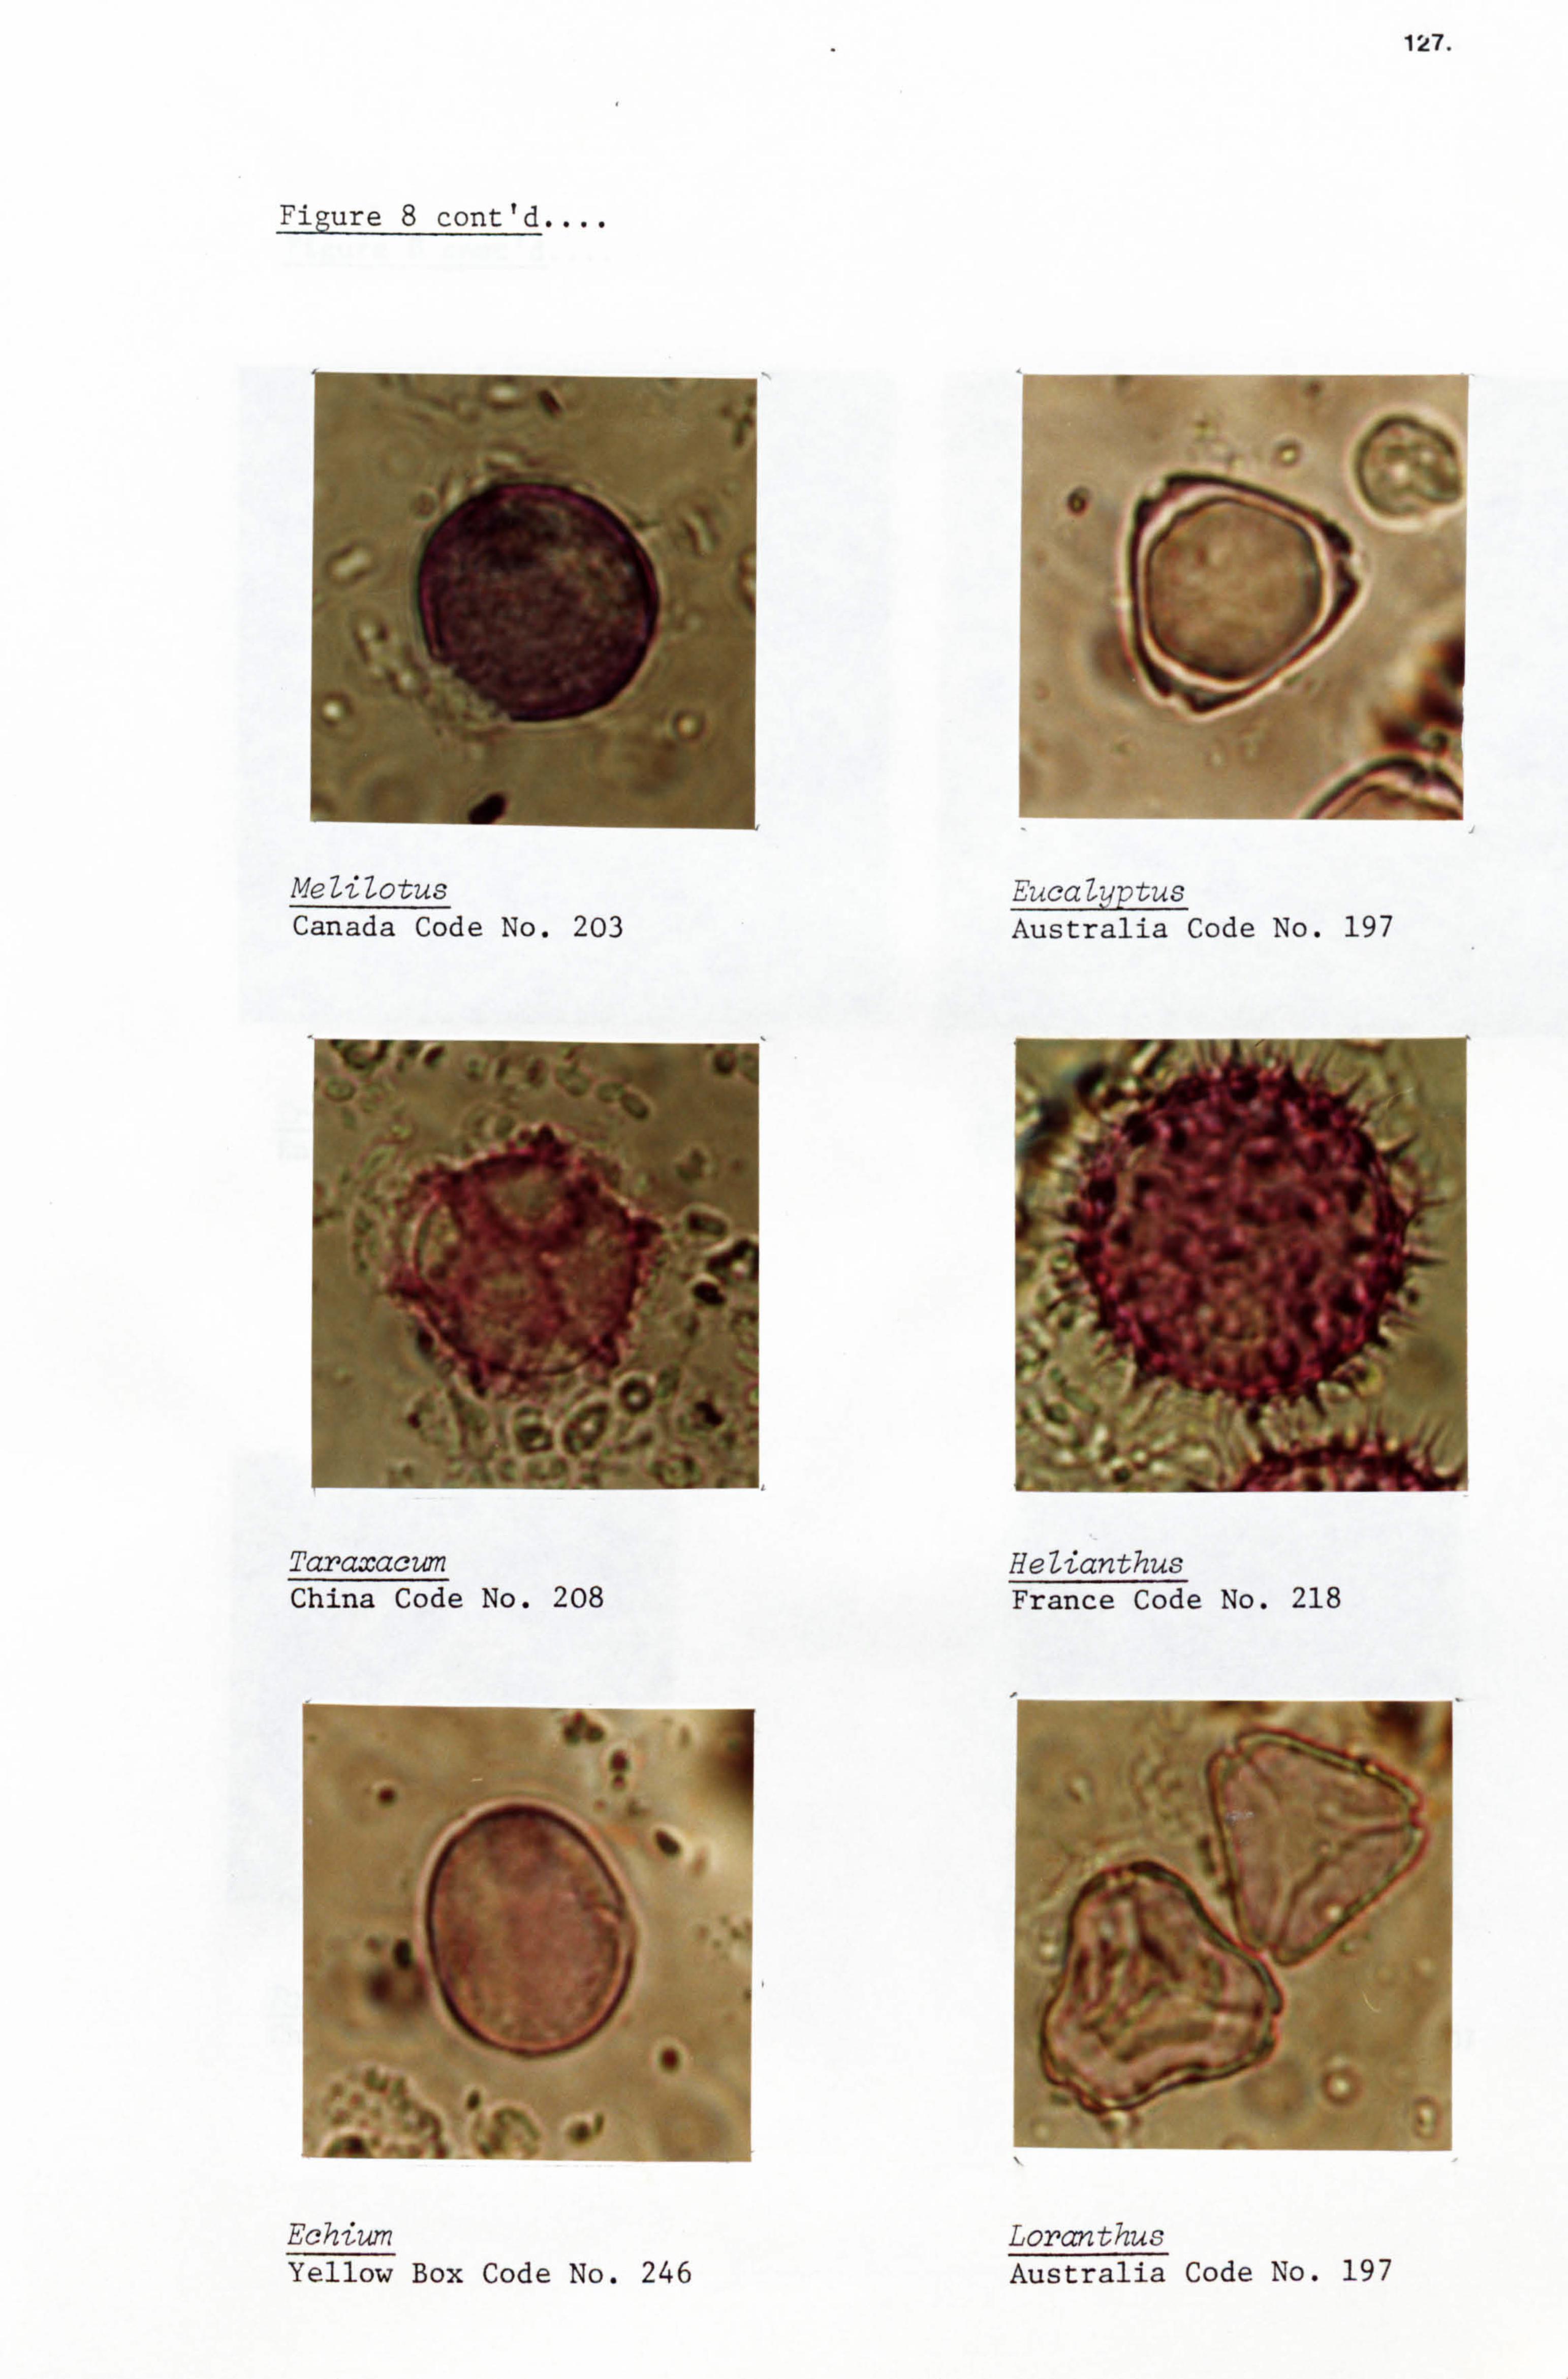
Figure 8 cont'd
; 6.1w
40 MeliZotus Canada Code No. 203
7- -- r
dO
$ 10 .
0
Taraxacum China Code No. 208
'0
Echium Yellow Box Code No. 246
I
0
127.
EucaZyptus Australia Code No. 197
HeZianthus France Code No. 218
0
Loranthus Australia Code No. 197
cri V* 4-
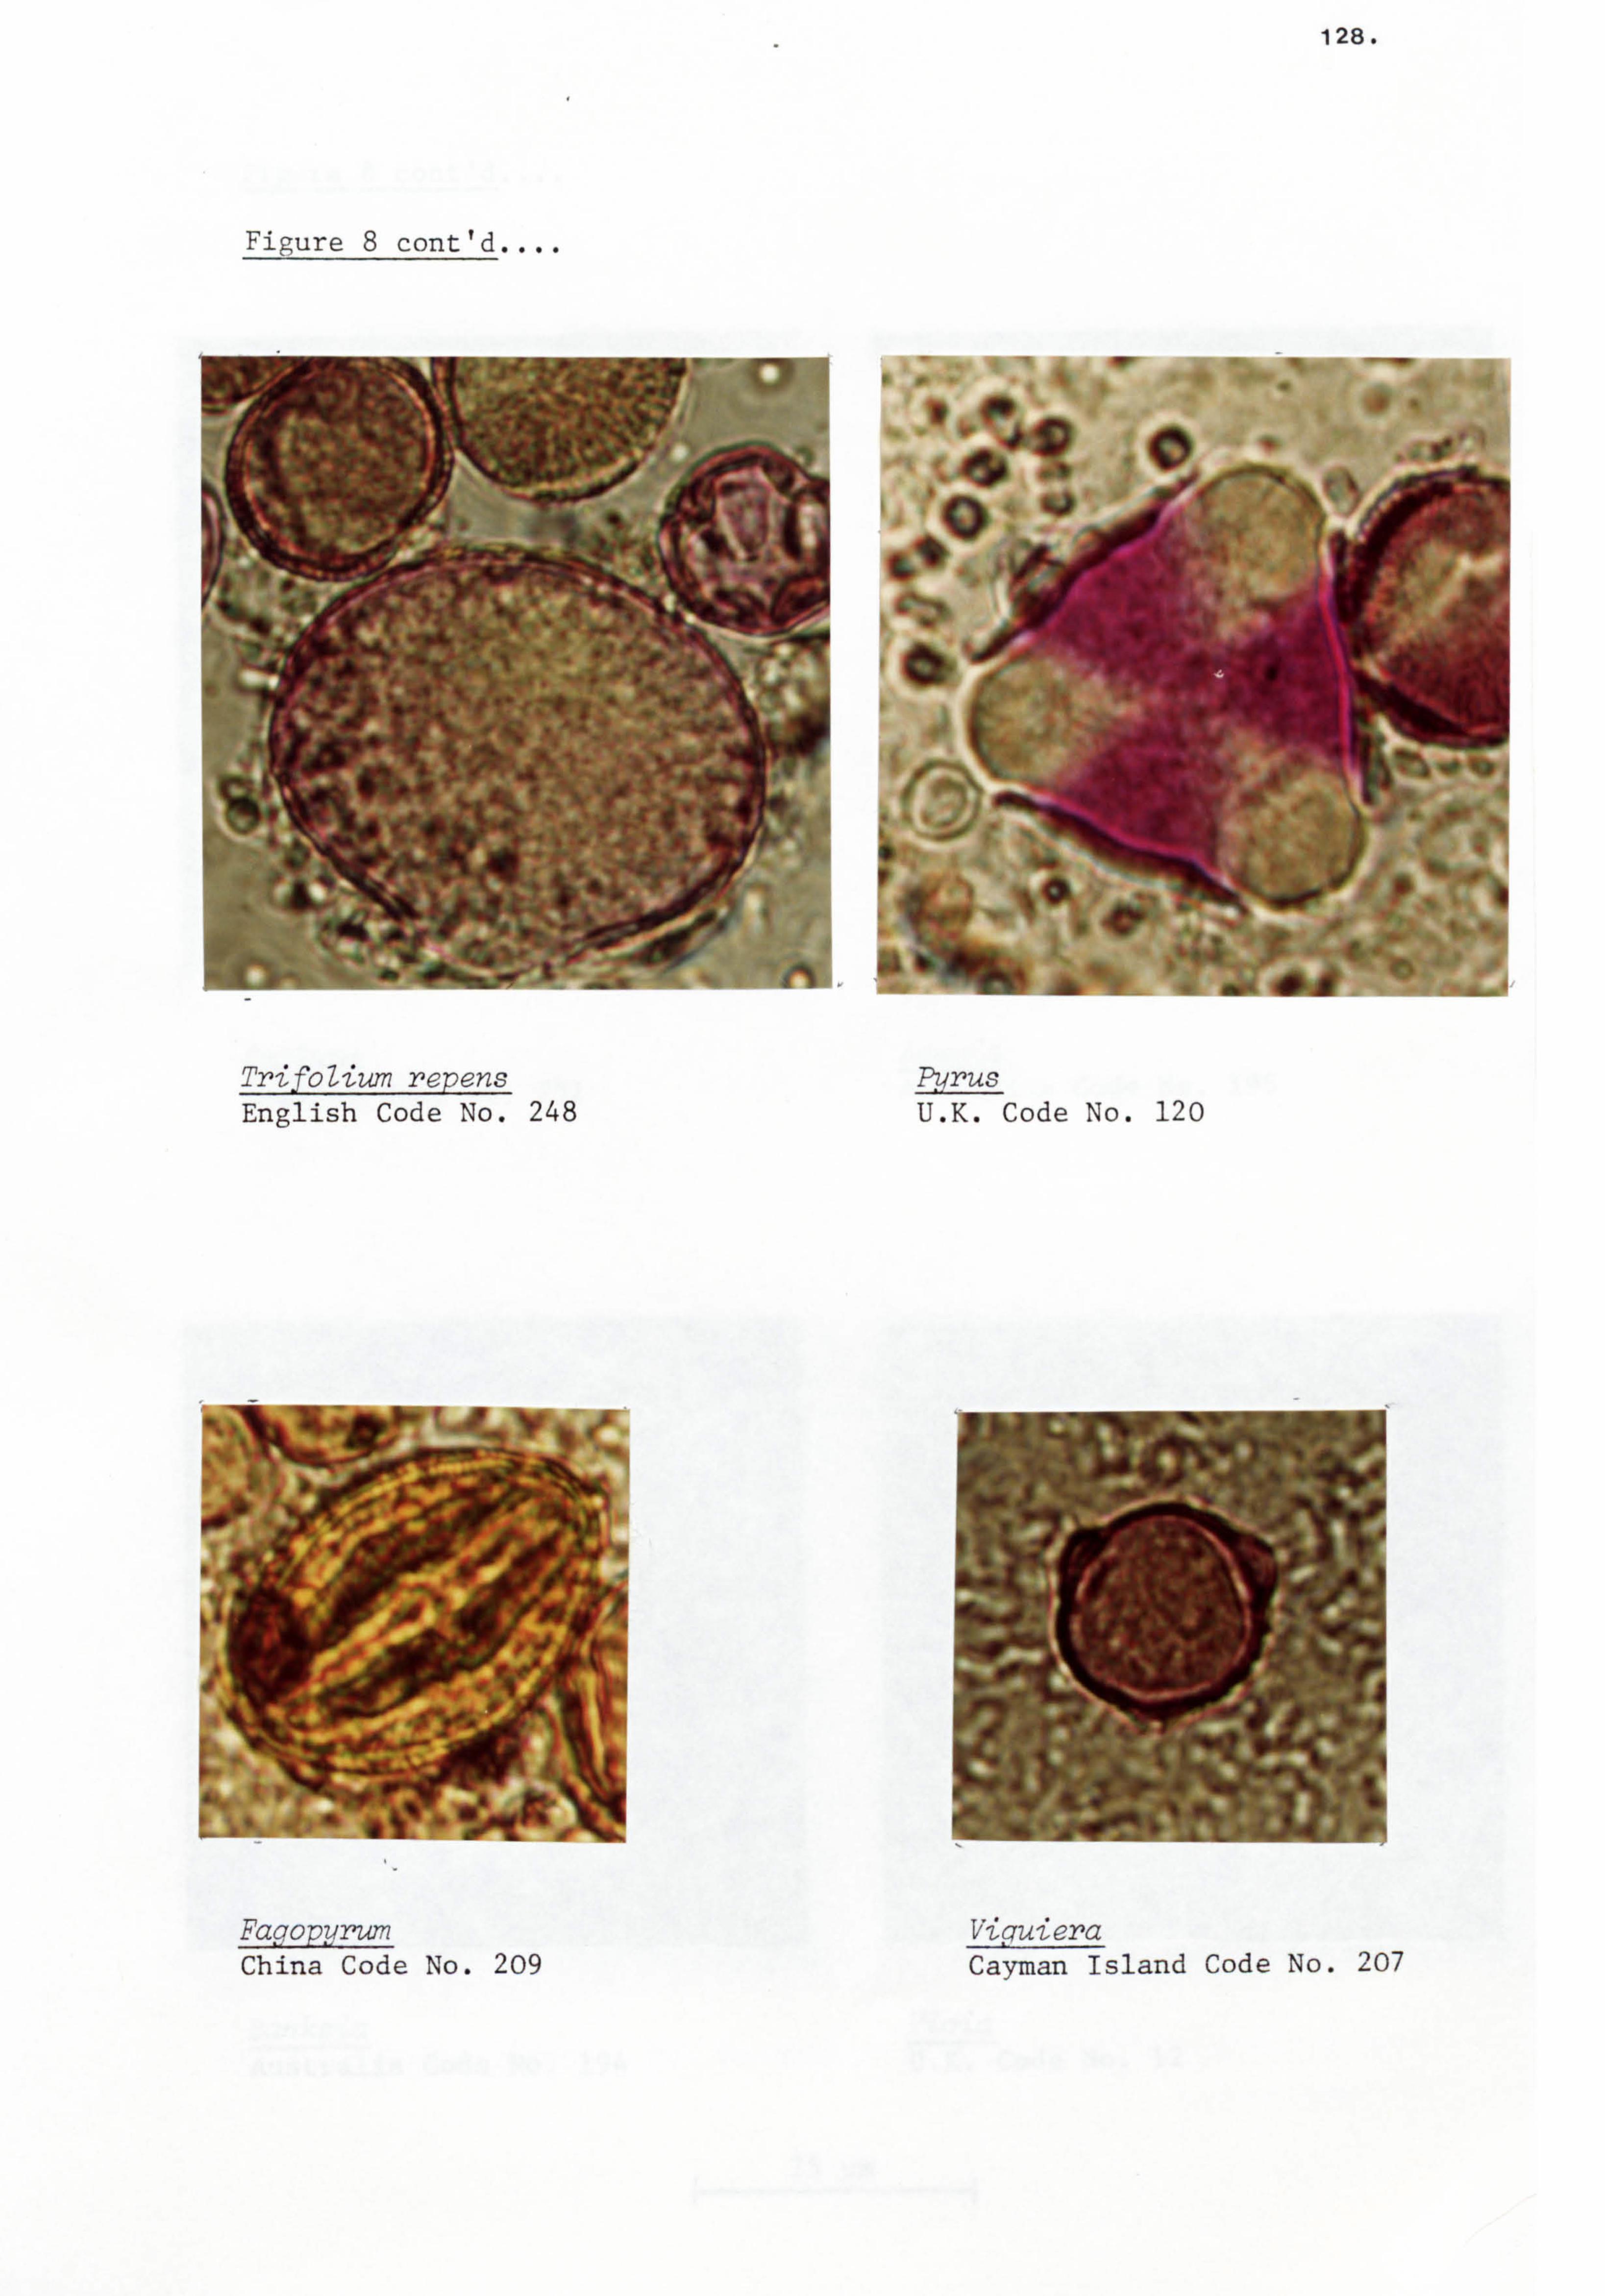
Figure 8 cont'd
I
"A
TrifoZium repens English Code No. 248
A
128.
Iß in ,
Purus U. K. Code No. 120
a qll if it I
Fagopyrum Viguiera China Code No. 209 Cayman Island Code No. 207
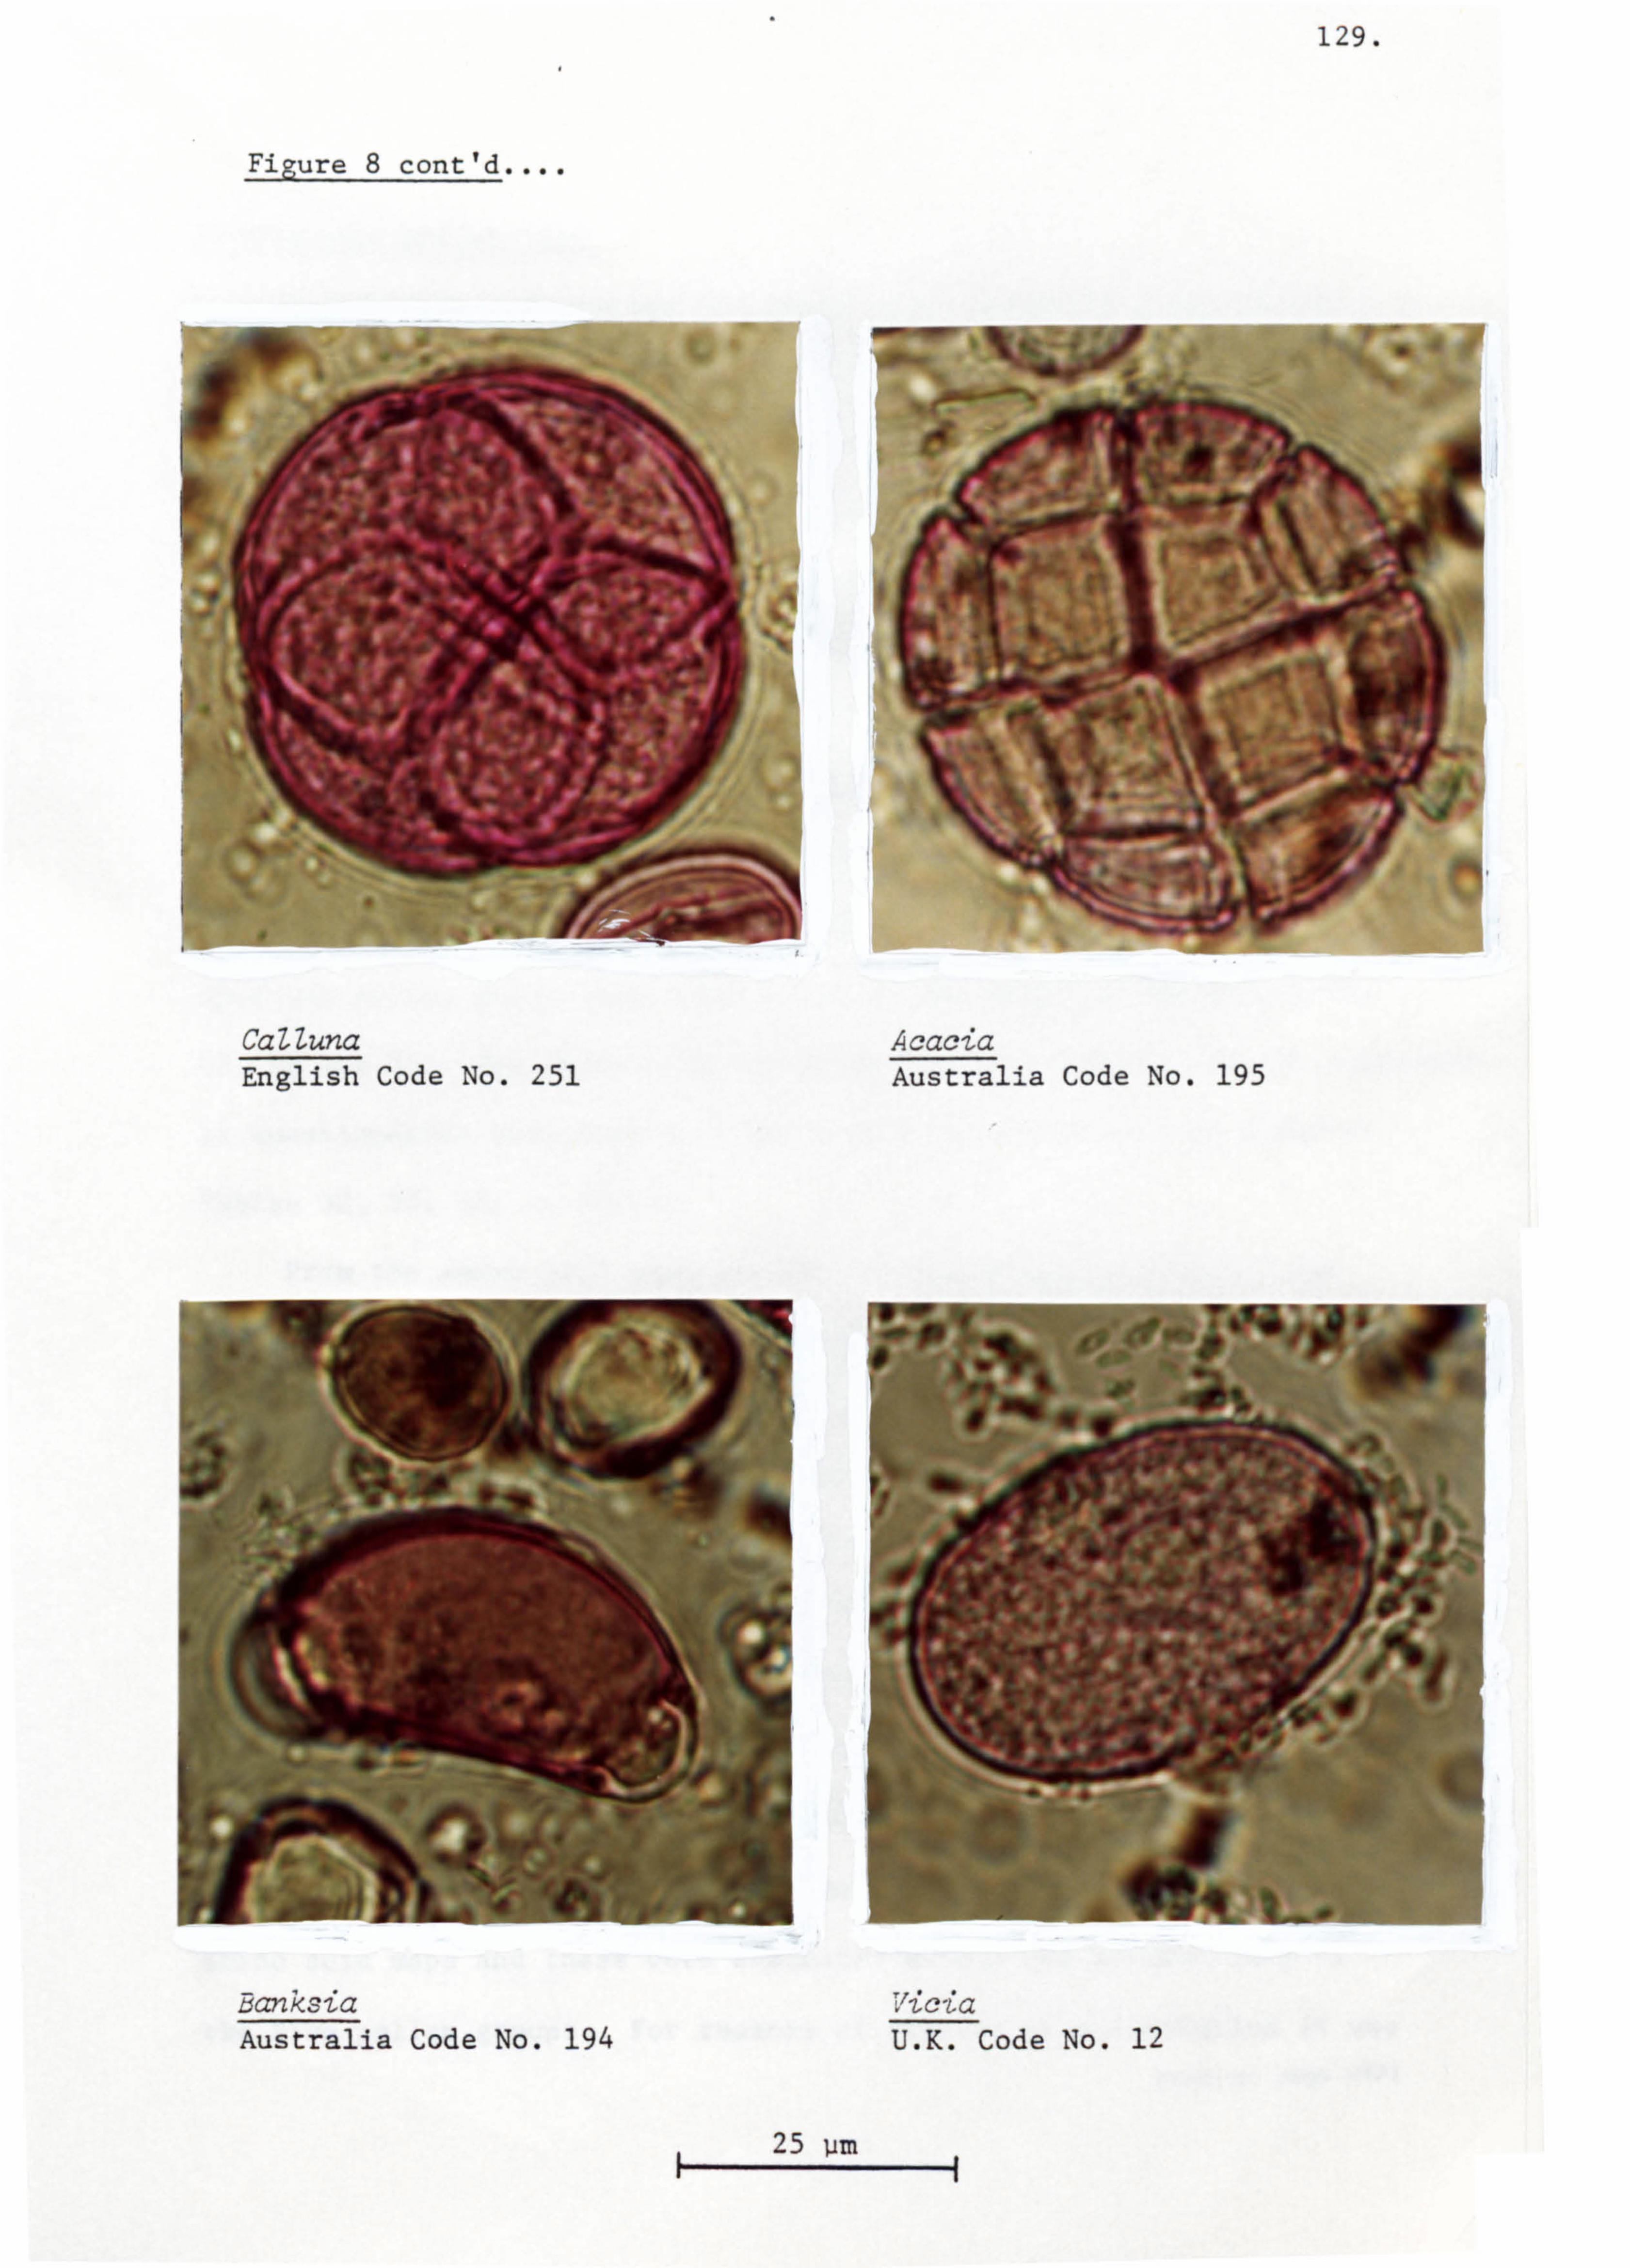
129.
Figure 8 cont'd....
I- di
A
Ca Z Luna English Code No. 251
fA. 41
31 do
w
*4
Banksia Australia Code No. 194
Vicia U. K. Code No. 12
25 im
Acacia Australia Code No. 195
130.
Predominant pollen type
Honey samples containing the predominant frequency class pollen,
that is, those containing over 45% pollen were allocated to this category.
There were one hundred and thirteen honey samples that accounted for
nine predominant floral pollens. Pollens from five major floral sources
Brassica, TrifoZium repens, 'Castanea, CaUuna and ltosotis were
responsible for one hundred and six honey samples.
The honey samples in each of the five pollen groups were arranged
in a decreasing order of pollen percentages. The pollen content and
the response to questionnaire question 4, for each sample belonging
to these five named Brassica, TrifoZium repens, Castanea, CaUuna and
Itosotis pollen groups have been lised in the order of Tables 31,34,
37,40 and 43. The amino acid concentration measurements and the responses
to questionnaire questions 3,5 and 6 have been given in the order of
Tables 32,35,38,41 and 44.
From the amino acid maps similar to that shown in Figure 7 the
following ninhydrin positive substances were identified using reference
standards in each honey sample within each of the five pollen groups.
These ninhydrin positive substances were: a- and $-alanine, a- and y-
aminobutyric acid, arginine, asparagine, aspartic acid, cysteine,
glucosamine, glycine, glutamine, glutamic acid, histidine, hydroxyproline,
isoleucine, leucine, lysine, methionine, methyl-histidine, phenylalanine,
pipecolic acid, proline, serine, threonine, tryptophan, tyrosine, valine
and the two unidentified spots labelled as 'x' and 'p'. Differences
in occurrence of ninhydrin positive substances were observed on the
amino acid maps and these were evaluated within and between each of
the five pollen groups. For reasons of clarity of presentation it was
(next on page 162)
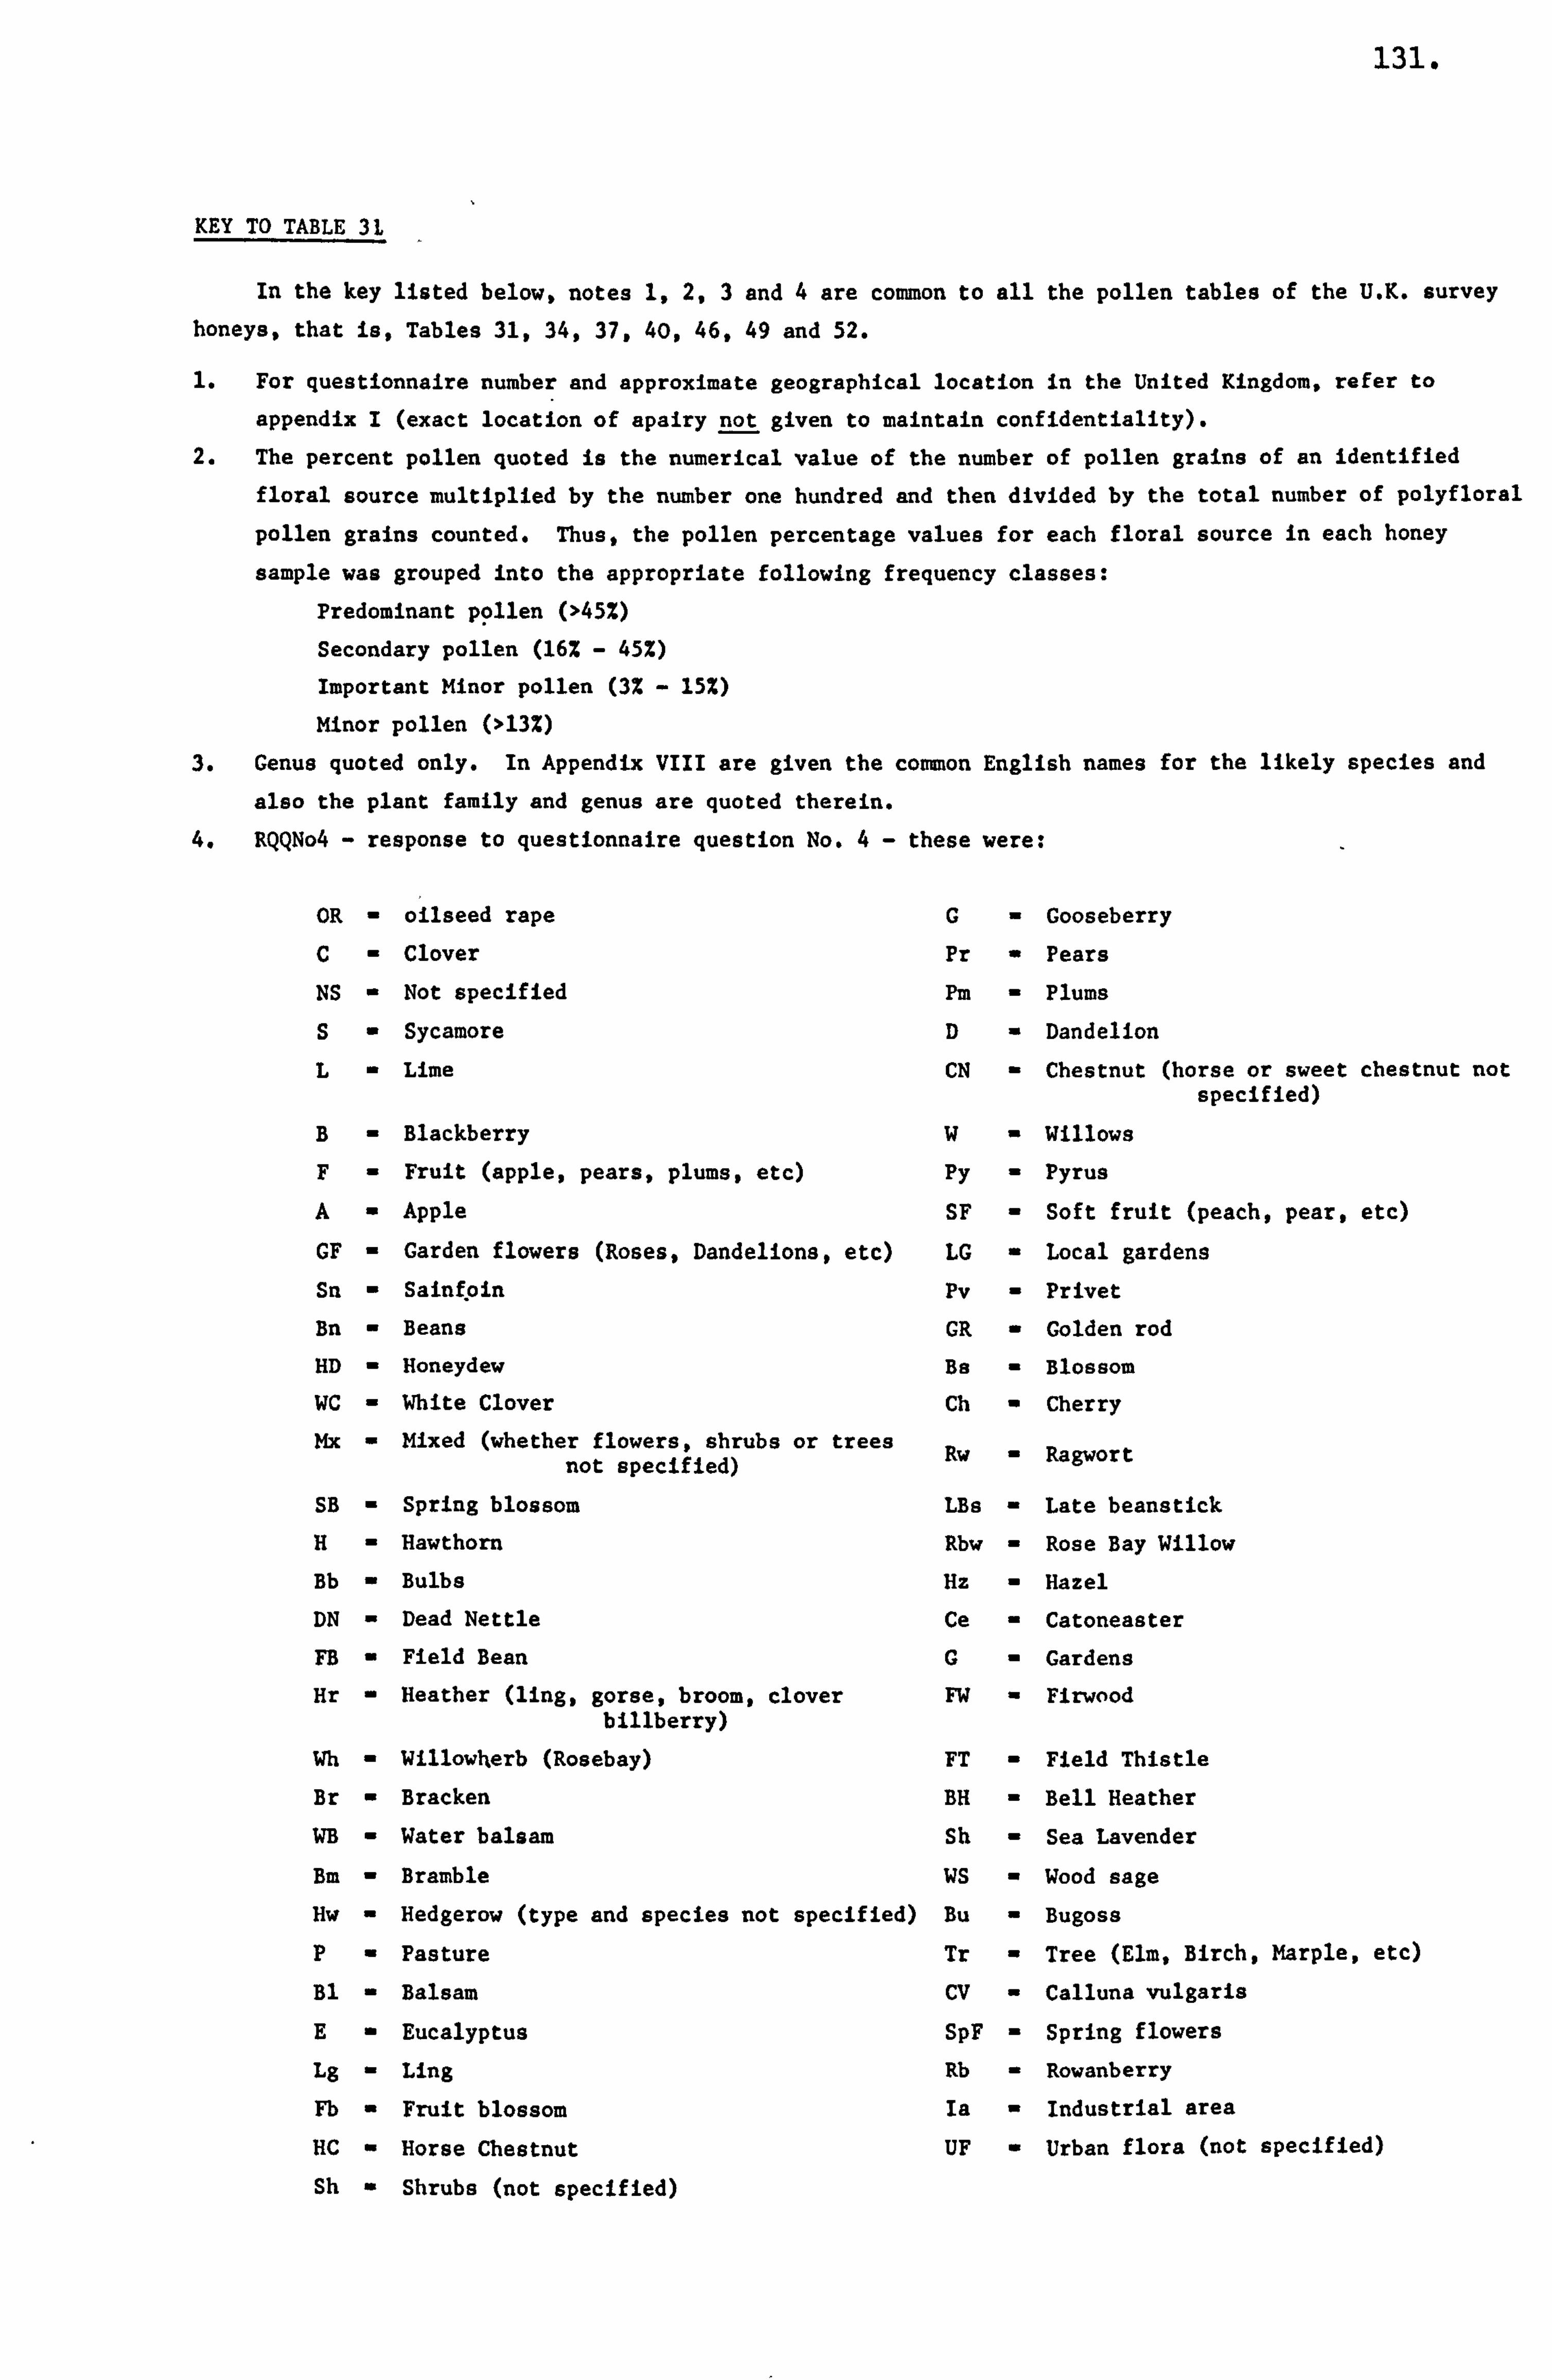
131.
VVV Irr% MAVTV ')I
In the key listed below, notes 1,2,3 and 4 are common to all the pollen tables of the U. K. survey honeys, that is, Tables 31,34,37,40,46,49 and 52.
1. For questionnaire number and approximate geographical location in the United Kingdom, refer to
appendix I (exact location of apairy not given to maintain confidentiality). 2. The percent pollen quoted is the numerical value of the number of pollen grains of an identified
floral source multiplied by the number one hundred and then divided by the total number of polyfloral
pollen grains counted. Thus, the pollen percentage values for each floral source in each honey
sample was grouped into the appropriate following frequency classes: Predominant p9llen (>45%)
Secondary pollen (16% - 45%)
Important Minor pollen (3% - 15%)
Minor pollen (>13%)
3. Genus quoted only. In Appendix VIII are given the common English names for the likely species and
also the plant family and genus are quoted therein. 4. RQQNo4 - response to questionnaire question No. 4- these were:
OR - oilseed rape G- Gooseberry
C - Clover Pr - Pears
NS - Not specified PM - Plums
S - Sycamore D- Dandelion
L - Lime CN - Chestnut (horse or sweet chestnut not specified)
B - Blackberry W- Willows
F - Fruit (apple, pears, plums, etc) Py - Pyrus
A - Apple SP - Soft fruit (peach, pear, etc) CP - Carden flowers (Roses, Dandelions, etc) LG - Local gardens Sn - Sainf. oin Pv - Privet
Bn - Beans GR - Golden rod HD - Honeydew Ba - Blossom WC - White Clover Ch - Cherry
Hx - Mixed (whether flowers, shrubs or trees not specified)
Rw - Ragwort
SB - Spring blossom LBs - Late beanstick
H- Hawthorn Rbw - Rose Bay Willow
Bb - Bulbs Hz - Hazel
DN - Dead Nettle Ce - Catoneaster
FB - Field Bean G- Gardens
Hr - Heather (ling, gorse, broom, clover FW - Firwood billberry)
Wh - Willowherb (Rosebay) FT - Field Thistle
Br - Bracken BH - Bell Heather
WB - Water balsam Sh - Sea Lavender
Bm - Bramble WS - Wood sage Hw - Hedgerow (type and species not specified) Bu - Bugoss
P- Pasture Tr - Tree (Elm, Birch, Marple, etc) B1 - Balsam CV - Calluna vulgaris E- Eucalyptus SPF - Spring flowers
Lg - Ling Rb - Rowanberry
Fb - Fruit blossom Is - Industrial area
HC - Horse Chestnut UF - Urban flora (not specified)
Sh - Shrubs (not specified)
132.
Key toTable 31 Contd The responses listed on the previous page were those quoted
by the participating beekeeper. Some of the responses were vague,
ambigucus and unclear in definition, in that, the type and species
of plants, shrubs and trees were not specified. In these cases
it was assumed that the quoted responses were those which one would
generally associate with the common known plant, shrubs and trees
of the U. K. (some examples have been given in parenthases).
A full list of all floral genera that have been observed in
the samples examined are given in Appendix VIII. For reasons of
clarity in presentation it was necessary in Tables 31 - 60 to
omit column entries where there is no pollen representation of the
species concerned.
133.
TABLE 31
Frequency of distribution of pollen grains in samples of Bras8ica honeys (ex. U. K. survey)
Pollen M 2.3
Floral Honey sample code No genus
27 108 58 56 61 26 64 180 66 8 153 155 150 151 67
Acer M
B=88ica 92.5 89.0 89.7 88.0 88.0 87.0 86.4 86.3 85.8 84.7 84.7 84.1 83.4 82.6 82.2
Castanea
Her-acleum o. 3 0.9
Hyperiom
Liguatrwn 0.1
onobrychi8
Pinus
Prunus/Pyru8 1.7 4.1 1.7 2.2 3.0 3.8 4.7 2.4 0.2 5.8 6.2 4.9 4.4
Rubus o. 7 2. o 1.1 1.0 0.3 1.2
Taraxacum
TrifoZiwn pratense 1.2 o. 6
Trifolim repene o. 8 1.1
Urtica
Vicia 6.7
Shrivelled pollen 6.0 5.2 5.7 6.5 4.6 7.0 11.5 7.1 7.5 3.0 5.7 6.1 6.5 8.0 11.8
unidentified pollen 0.8 1.7 1.2 1.7 3.0 1.7 0.9 2.7 1.7 8.0 2.6 4.1 3.8 4.5 1.5
Total pollen 548 345 577 460 408 756 339 337 359 419 387 295 337 288 338 grains counted
RQQNo4 4
OR OR OR OR OR OR OR OR OR, S OR NS NS C WS S, OR C, L, B
The notes to key 1,2.3 and 4 are given on the key sheet.
134.
Table 31 cont'd
Pollen M 2,3
Floral Honey sample code No genus
182 140 135 54 68 143 118 138 137 132 145 124 114 115 175
Acer
Bras8ica 81.6 81.3 80.3 80.0 79.3 78.7 78.1 77.6 77.3 75.4 74.4 73.9 73.0 72.8 67.5
Ca8tanea 2.2
HeracZewn
Hypericum
Ligu8trwn
onobrychi8
Pinu8
Prunuslpyru8 5.1 2.7 3.8 10.5 6.9 4.0 6.4 2.9 0.9 16.7 11.3 0.9 4.4
Rubus o. 4 7.6 6.9 2.8
Taraxacum o. 4
Trifolium pratense o. 4
TrifoZium repen8 2.2 2.9
Urtica
Vicia 0.9 4.7 3.5 1.2
Shrivelled pollen 6.8 11.3 11.0 7.7 10.0 9.9 9.7 14.8 16.4 10.4 4.9 8.7 10.3 20.3 14.2
Unidentified pollen 4.2 4.7 4.8 1.8 2.3 4.4 3.5 3.8 5.3 1.9 3.9 6.9 5.3 4.7 11.0
Total pollen 354 257 290 506 261 272 310 344 225 317 305 230 300 320 317 grains counted
RQQNo4 4
OR OR OR OR OR F'S, A, G, OR OR OR OR OR, CN, S, py OR OR OR Pr, Pm S, W, A OR D
135.
Table 31 cont'd
Pollen (Z) 2,3
Floral genus
Honey sample code No 1
92 88 51 188 162 74 11 42 131 144 110 185 179 87
Acer 5.3
Bras8ica 66.9 66.0 64.5 63.5 60.3 56.1 56.0 55.2 54.1 53.0 51.2 47.9 45.2 45.1
Ca8tanea 1.8 4.6
Heracleum 2.4 3. o
Hypericwn 2.1
Ligustrwn 5.8
onobrychis 11.3
Pinus 0.4
Prunuslpyrus 10.0 2.4 11.4 28.9 4.0 1.8 20.1 6.8
Rubus 3.8 3.2 26.9 5.9 0.6 17.8 3.2
Taraxacm 2.5
TrifoZium praten8e
TrifoZium repene 5.3 1.3 3.4
Urtica 4.4 26.0
Vicia 2.7 17.5 3.7 o. 8 18.4 11.7 13.4 3.0 5.4
Shrivelled pollen 11.4 11.3 6.4 23.2 22.5 15.6 7.1 23.0 14.6 20.4 13.7 12.1 23.8 17.3
Unidentified pollen 5.2 2.0 1.8 7.2 6.5 2.5 5.7 5.2 5.1 16.0 5.5 6.4 18.2 3.0
Total pollen 290 406 482 293 262 237 421 221 294 328 324 313 369 466 grains counted
RQQNo4 4 OR, S OR OR B S C'L. OR Sn Bn ED, : L SB S, ; NS UN, B FB SF, GF WC Mx Hq p R. L .C BD, DN
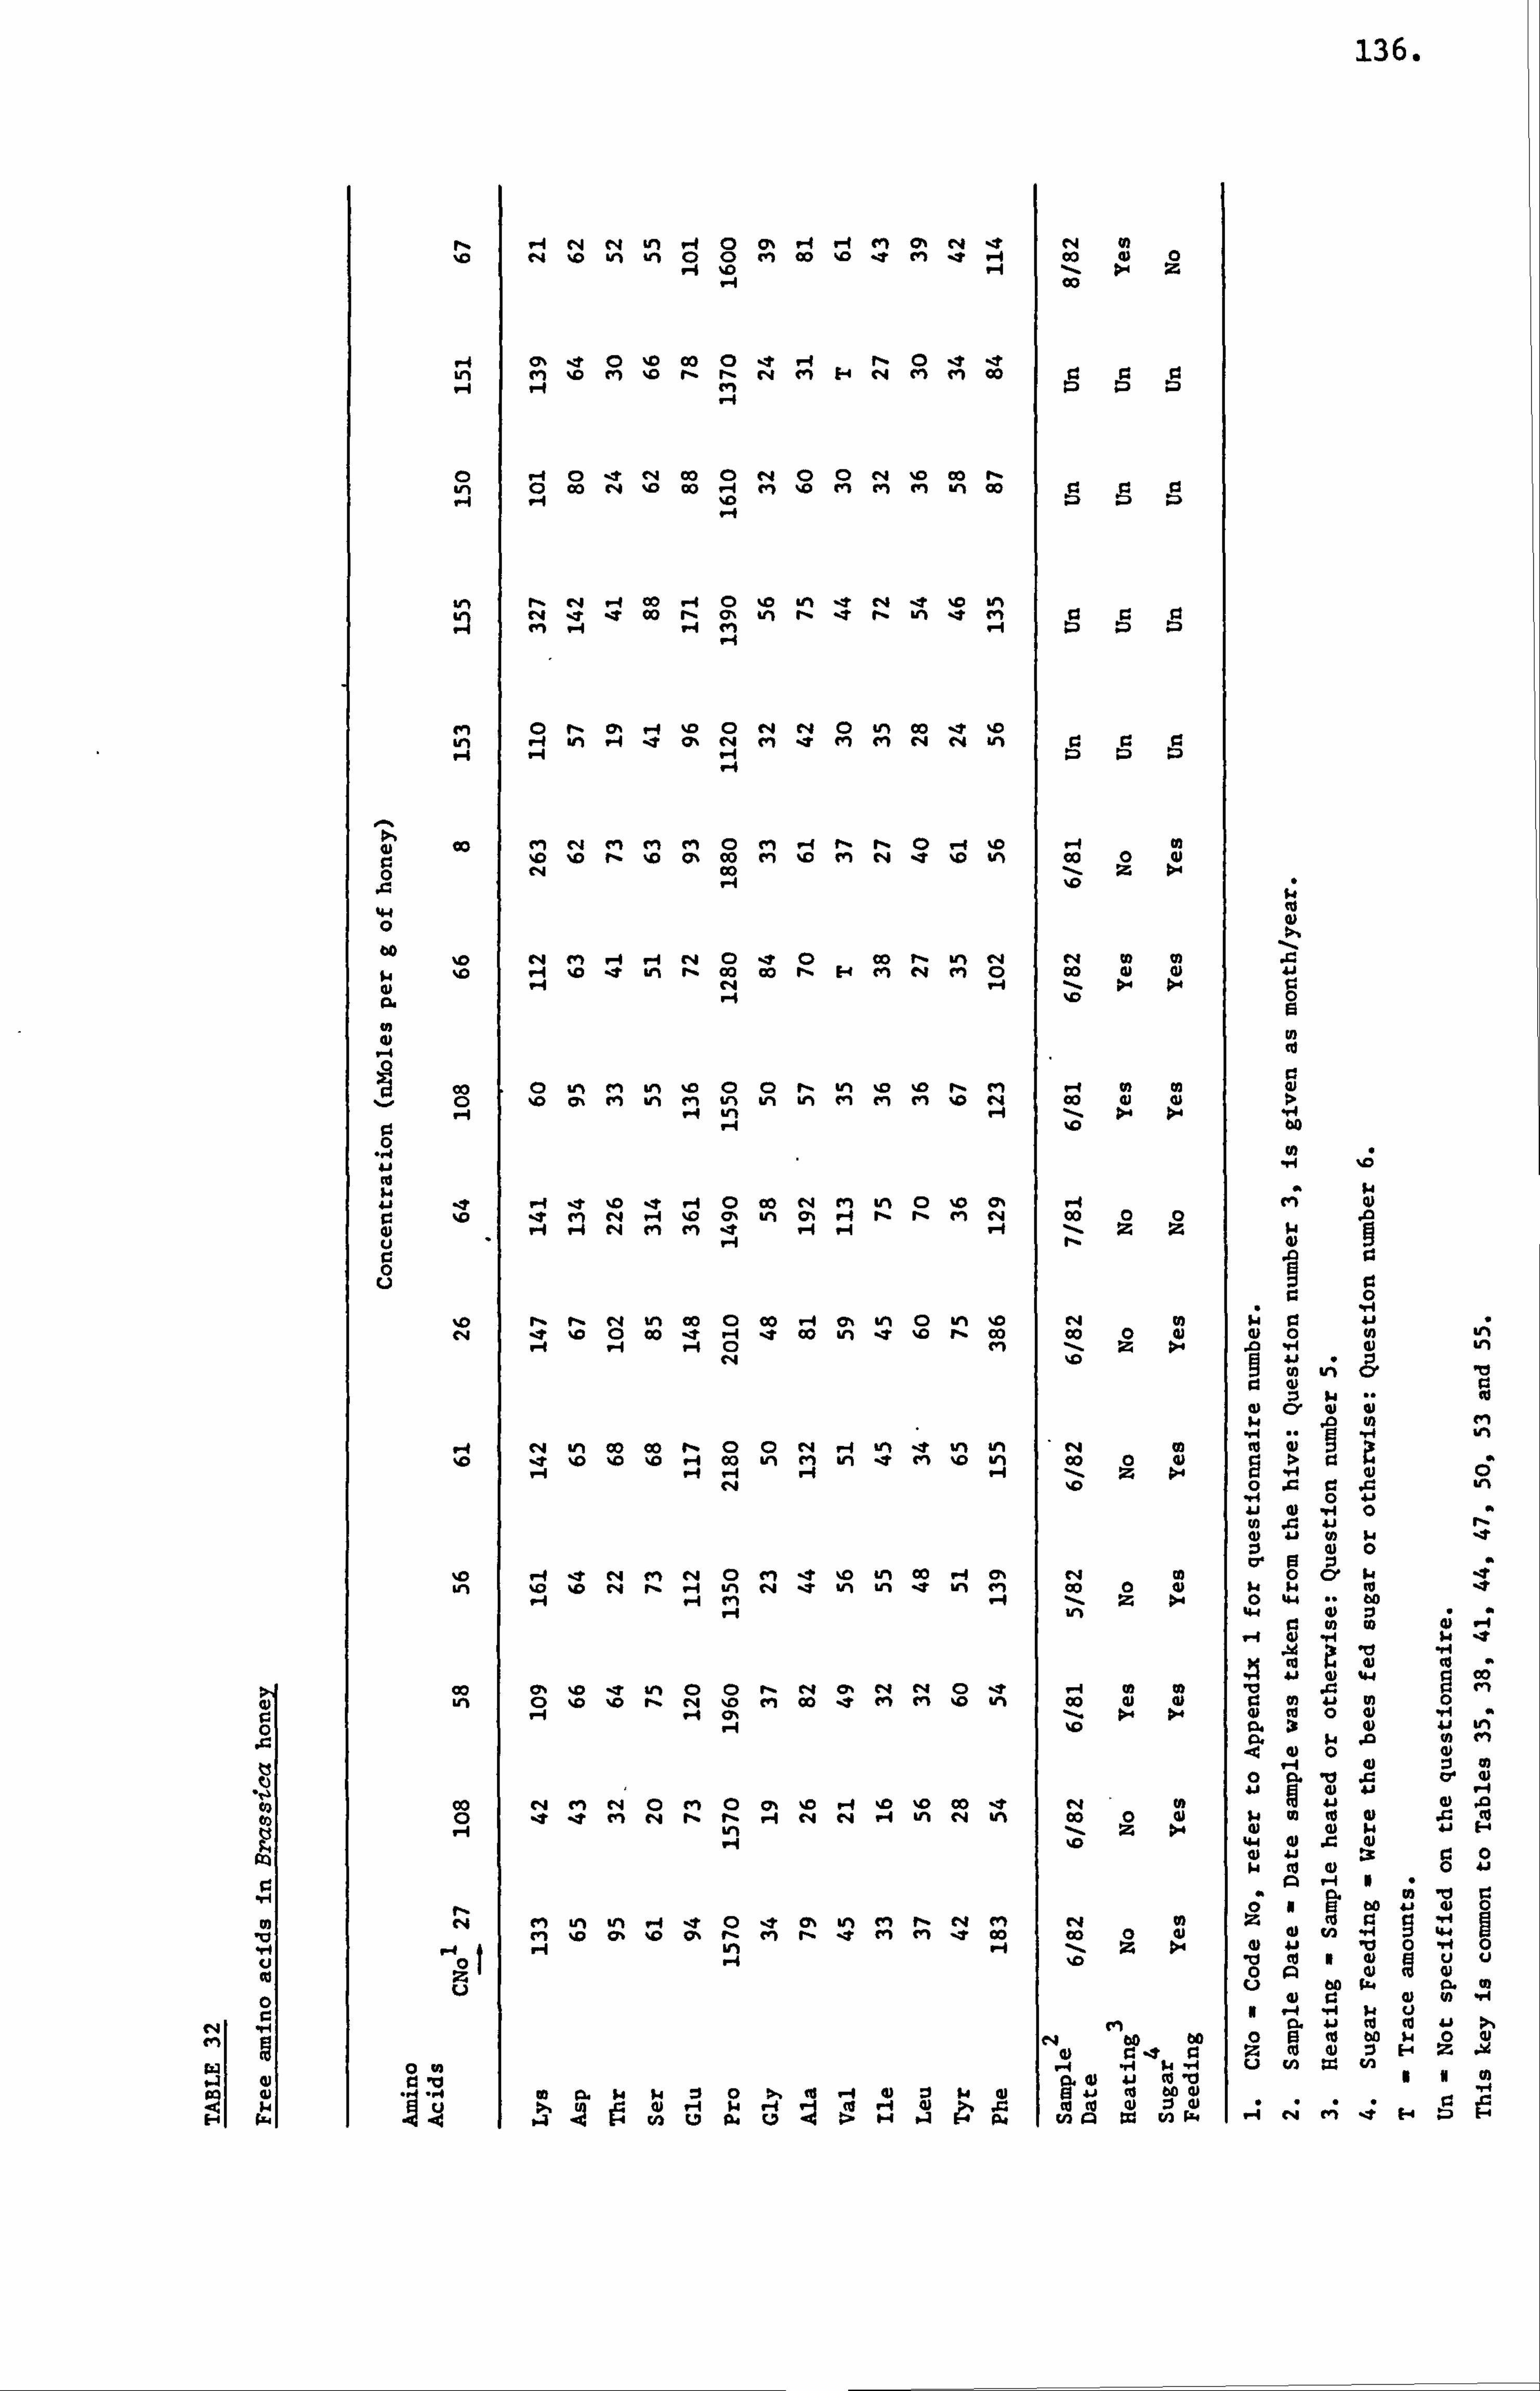
136.
rý ý4 N H "t ei 0% N 11 rq 0 10 e4 km OD %D IT en IT -4 Co 0) 0
>ý Z 00
14 -4 rý 0 't t
Ln ri %0 C" %0 rý rý " M 1-4 C, 4 cm cm 02 91 Z: ) "i H m
ýi
0 ý4 0 & e4 Co 0 44 0 0 r4 10 Co rý 0 Co r4 %0 00 -4 m %0 ri en m -n 00 r. 93
ull r- r4 ý-4 00 -f 0 %0 -M -t r4 't 10 U'%
e4 7 t co K cy, tei rý -t rZ Ln e t"
cm 0 rý m H %D 0 t4 e4 0 ulý 00 -e 10 LM A an ýI 1 0, C'4 m 7 (n en A C-4 in
>, 4) 00 C" c4 m m cn 0 m -f fl r, 0 -f 10 H ei 0 %D %D rý %D 0% CO M %D M N e %0 V) Co 0 0) 0 - Z >-
A j 44 0
CM -4 -1 r4 0 Co r, -1 r4 $4 %0 ýq %0 11 LM rý cla Co rý H M c4 ell 0 Co cu 0 41 w ý4 r. clw 0
13 en 0)
Cd 0
tn cm gr% 10 0 0 r, %n 10 0 r, m ý4 0) vi al
cy, M ým cm vý tn KM cn en t" 10 C, 4 00 (U 0 > vi "f ý4
0 .w
,. le H 't ýD 't 11 0 02 C*q ti Ul% 0 %0 cý ý4 cm 0) r4 -4 %0 c7, Ln CYN -4 r- r. rl C, 4 00 0 0 rq cm fi e
u
0
%0 r- rý e4 tri OD 0 Co H cr, tel 0 %M %D rq 9) w 0 0 CY t %0 0 Co t -4 2 CO %n -t %0 r. Co Co 0 4) (L) 0 (0
-1 -4 "f 0 CI) Z >- H w kn
ý4 4 Uli ý4 c4 vi Co Co rý 0 0 c4 -4 wlý ýt in Irt
w e4 0
) Co
10 t 0 %0 Z0 4 Co ul cm vi -4 m 0 i Co 0 4
41
43) ä 0 w (L) 0
10 H e c4 fm " 0 cn IT %0 tm 00 H CY, cq 0 0 (D, 1- e ul 0 %o rq r. -4 ul e4 t vl ýn ýt ul el Co 0 tu w w 0 't
1-4 ý4 g" ýA Z : 0 44 -. bo -i Ulb 44 0 :1 . .
2 in 0 4) -4 ý4
(U Co .
41 0 44 0 , 00
Ln 01 0
10 %D
T 10
U ' rý
0 r4
0 ID
r, cm
e4 Co
CY, e
e4 M
e4 m
0 10
't W%
ý4 09
0 cu
in (U
', 0 en 41 m 0
v3 14 A (Y, >- >ý 9) tu 0 iv H . 0 14 %0 c2. j 9) 41 km
4) C 9 0 Iti J., e 0) . ll 41 0 41 ý4 Co Co e4 vi e4 0 t" 0 CY, 0 lf ýD %D Co -t r4 0 0 10 63 0 1 IT cm c4 rý rý H c4 c4 ý4 kn C, 4 %n Co 0 0 si 0 to 4) Z a
4 vi -- Z >4 0 4-1 0)
4) Z
w al
J
4) 41 tg 9 0 to a) 41 P 1-4 0 .
- e di 4) r, N ein LM Ul -4 't p 't m 61 tn r- N m r4 0
:2 ri %0 CY, 10 0% r, cm rý IT rn cn -e Co Co 0 0 tn ý4 44 -H ý4 -i vi 1. f 1- Z > 43) 41 -0 0 -1.4 0 U
t 0 9 u U Co 0 qi
W 0 g Co to N 0
« 8 8 0 .A 0 r 10 0) 41 (0 o
0 921 w )4 C 0 (d ýI 4) :1 ß4 4) 41 C0
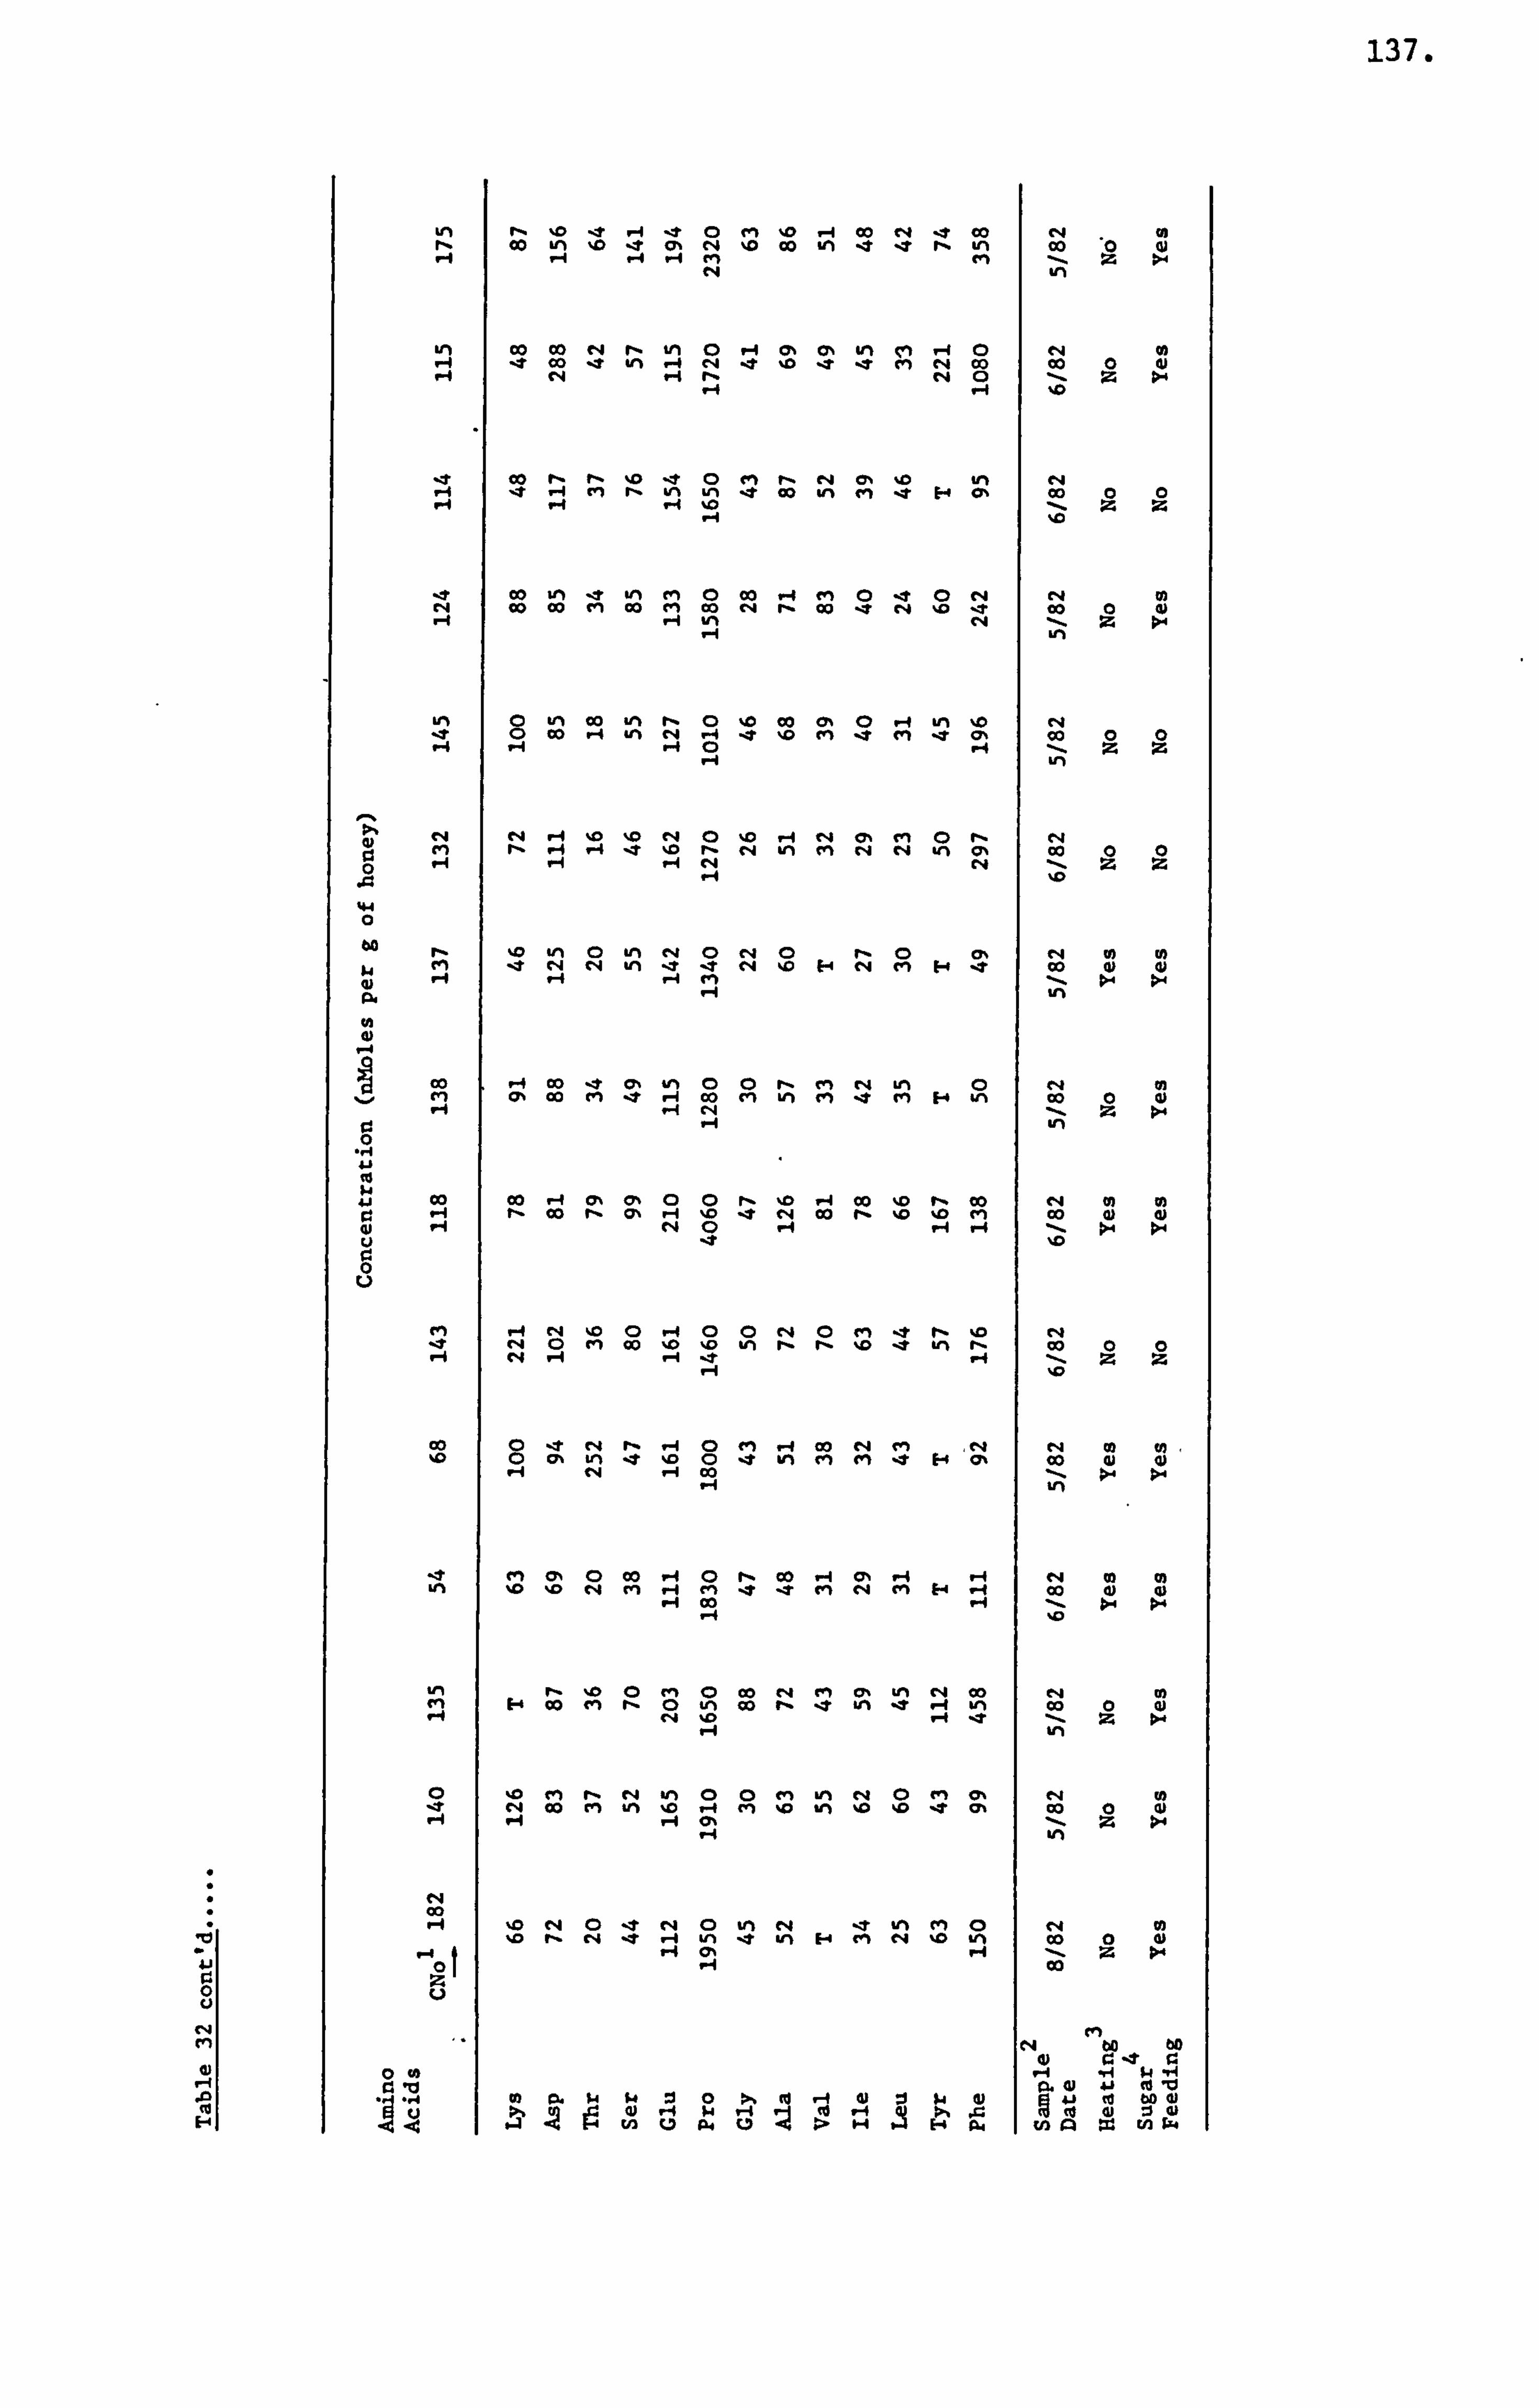
137.
0 u
cli P,
j2 Co
E4
LM r, 10 't ý4 't 0 cm %0 -4 00 c4 * Co c4 . 0) r, Co LM %D 't cý N %D Co it) i ýT r, Ln Co 0
rm -- Z c4 tri
CO Co r4 rý tel 0 "j 0% CY% %M gn -4 0 e4 0 e 00 17 tn ý4 ed e 10 t IT cm 94 Co Co 0 (U
-2 Co r- r, %0 't 0 cm r, " CY, 10 Ul% t4 14 ýr ý4 en r- Kn ým 't 00 gn cm 't H ch Co 0 0
ýA %0
le Co in -e er% cm 0 Co 1-4 en 0 e 0 r4 0 r4 Co 00 ri Co ei Co e4 r- Co 17 r4 10 't 00 0)
1.1 in c4 14 VI
0 km 00 eN rý 0 %0 Co CYN 0 -f LM 10 c4 0 Co H 4n t4 -i -e 10 rn -7 cm ýI 0% Co 0 0
>ý Q) c4 " ýI 10 10 r4 0 10 ýA r4 cr, ri 0 r, 93 M r- ý4 -1 17 10 rý c4 km cm rq c4 ýn g% Co 0 0
c4 t4 -- Z Z
44 0
rý 10 tn 0 Ul% c4 0 " 0 r- 0 (: e4 0) 0) cm 11 N C, 4 ul 17 -7 c4 e H c4 ri 14 t 00 0) w
9) ýA rb >- >ý P. 14 in
m 4)
-4 Co 't CY% ulý 0 0 r, m " Lr% c4 in M (71 00 cm 11 ýd 00 tn Uli M 11 g" F. $ 4n Co 0 0
41 Co Co -f m 0% 0 C) rý 10 14 00 %D rý Co cq 0 0 93 -4 f- 00 r, 0% H 10 -4 C, 4 Co r. %D %D cn 00 4) ei (V
0 Z)
ein H r4 ýo 0 1-4 0 0 " 0 (" t r' %D r4 17 e4 0 ri Co 0 ýD wl r. rý %o i Ln rý Co
00 0 -t t4 rý -1 0 cm 14 clo r4 m r4 0 0 ýc 0 0% LM .7 'm CD -4 im m im i H 0% Co w 0)
V4 -4 co 11 ;.. >- Ul
CY, 0 -4 CY, -4 ý4 eq 0 0) 10 cq cm cq cm b4 -4 00 0 0
m Co >- >- 4
ým r- 10 0 m 0 Co e4 cm CY, Uli t4 Co 0) cm &4 Co cm r, 0 vi Co r, 7 km -3 -4 im Co 0 Q)
0 10 cli rý r4 Ulb 0 0 m m 0 m (21 rq 0 e " 00 cm tn ID -f C" 10 trt ID IT (n Co 0 w
00 H 10 c4 0 't r4 0 tn c4 't in cm 0 c4 0
,D r- r4 -e -I Ln i u'% E4 r') e4 %D V't 00 0 0
0) 93 -t r 0 Co ý4 H s4 -14
41 41 Co 10
0 H w "i Co
e
te 0 :10 ul ci P. 0 > ZA n :c gn k.
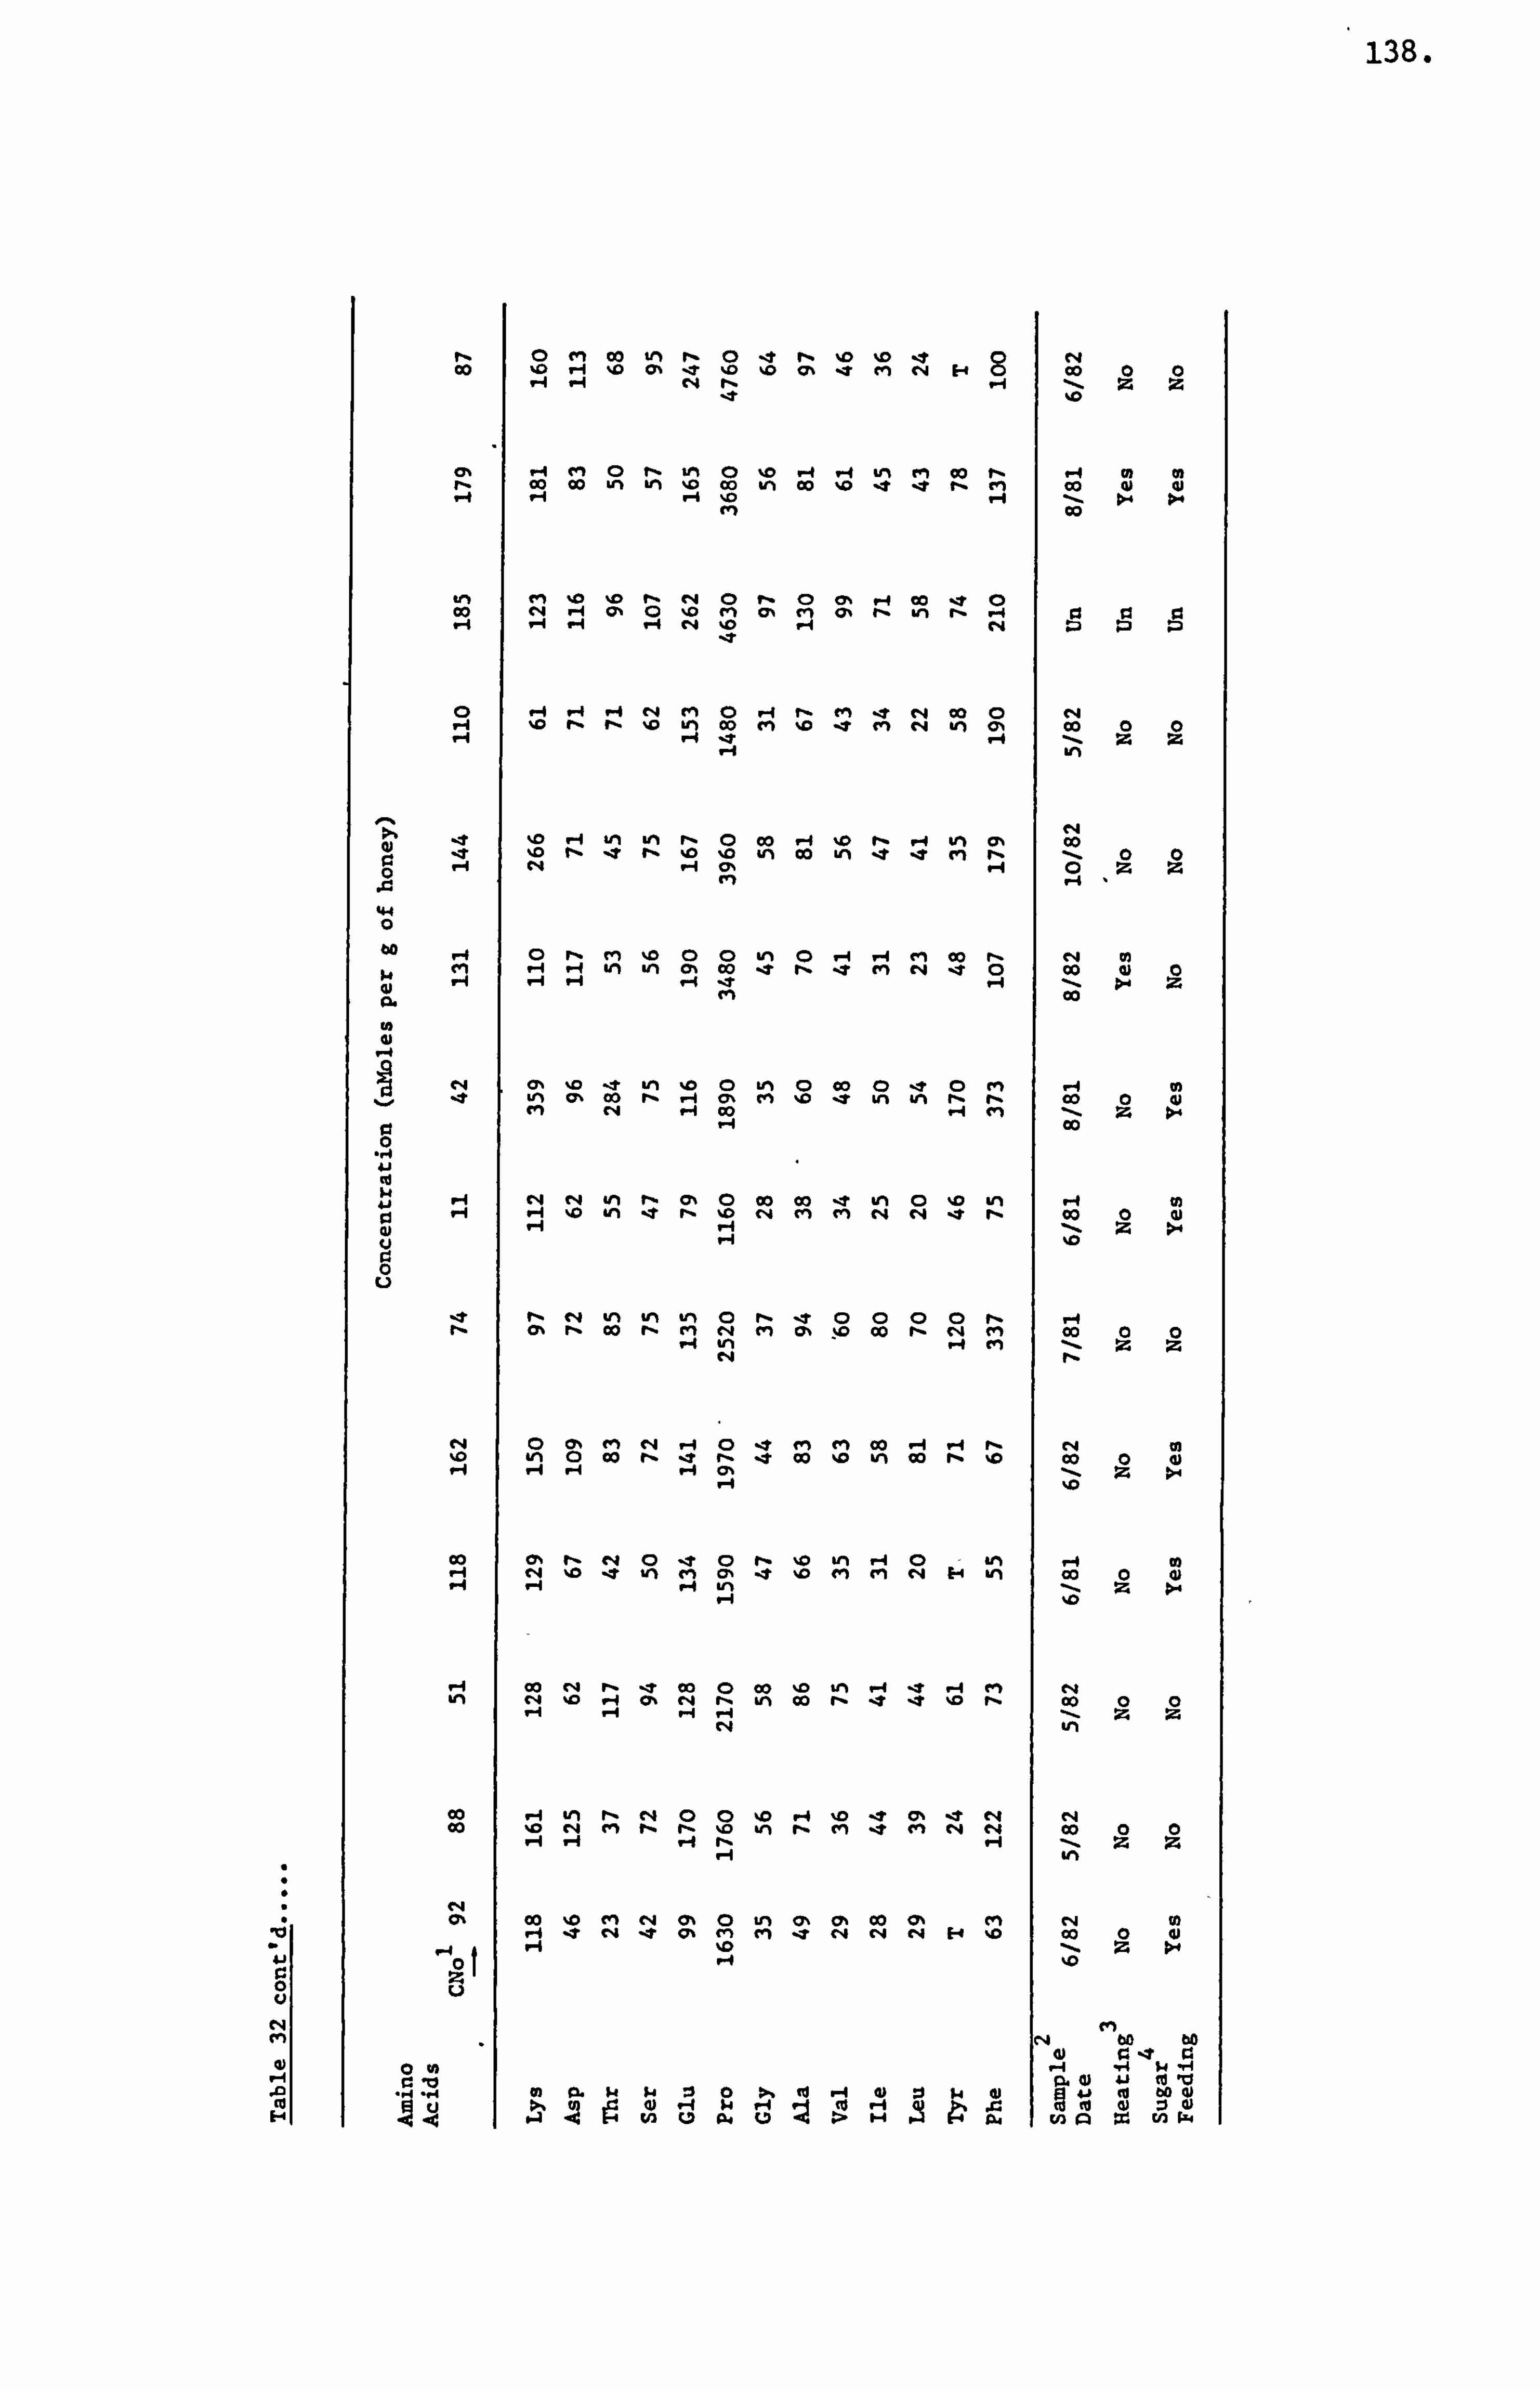
138.
u
Co E4
rý 0 t" Co in rý 0 11 rý %D ýD 11 e4 00 0 ýI %0 CYN T 0 0 0% 7 en Cq E-4 Co Z Z
ýA m 0 r- tm 0 %0 .. t 1.4 LM ein Co f- H 9) m 00 00 An LM 0 Co %ei Co 0 -1 -4 r- cm Co 0) QI
00
r4 0 rý 0 C> "-f Co -7 Co ei 0, CD 0 rn cn ri cý 4- vi r- ý4 c4 10 ýI 44
't
0 ý4 H ýi e4 en 0 H rý ein t c4 00 0 C, 4 ýi %D r- r, 10 Uli Co cm %D ýT m e4 61 ON Co 0 0
10 %D
m r-
tn %M rý 00 in
ý4 10 rý 4 vli CYN Co
CY, g"
44 0
r. ri ým KM -4 1-4 en cio r, (4 ei cm -4 H ki vi Cl% 00 IT rý t cm rq e 0 Co 0 0 ýI -4 ý4 ý4 ýt ý4 : Z
0. m 00
(71 ým 't LM 10 0 LM Q Co 0 le 0 rn -f 0) ulý CY% 00 rý 14 0% M 10 -e Ln &A rý rý Co 0 cu M c4 Co (n H Co
41 e4 0 00 0 %D vi C-4 in cn r4 rq 't r- 00
Z
fi H %D 9
rý c4 vý in tn CD rý t 0 0 0 0 rý -f (: r, Co rý ri r4 cn cl% ýQ 00 r- c, 1 cm 00 0 0 , -i tri ý4 en Z Z
r4 0 CY% cm c4 "l 0 1 g" t" Co 1-1 ýI r- c4 Co %0 4q 0 Co rZ i r, e Co 0 Ul Co rý %0 Co 0 di
-1 %0
00 cý r- c4 0 t CD r- %0 tm ý4 0 -f Co 4 cq %0 7 tn cm (7, 1 ýD cm cm c4 61 Co 0 4) Z :
bi c4 ýD -4 Ch " r, LM Co r- -e -4 - r- 00 0 0 U-1
vi rý c4 0 e ý4 e4 c4 Co ýo c4 m rý rý 10 vi rý ri t M e4 c4 CO 0 0
0% 00 0 m rq 0% 0 vi (: 0% 00 cm r4 A e ei t c% m m t c4 c4 r4 H %0 Co 0 41
-4 t 0
4) 41
41 ed
10 -0 bo 0
13) -4 w 14 1 C -1 % p Z tu (V C0
ul u P. fi H ý 0. u3 cý = cn ký
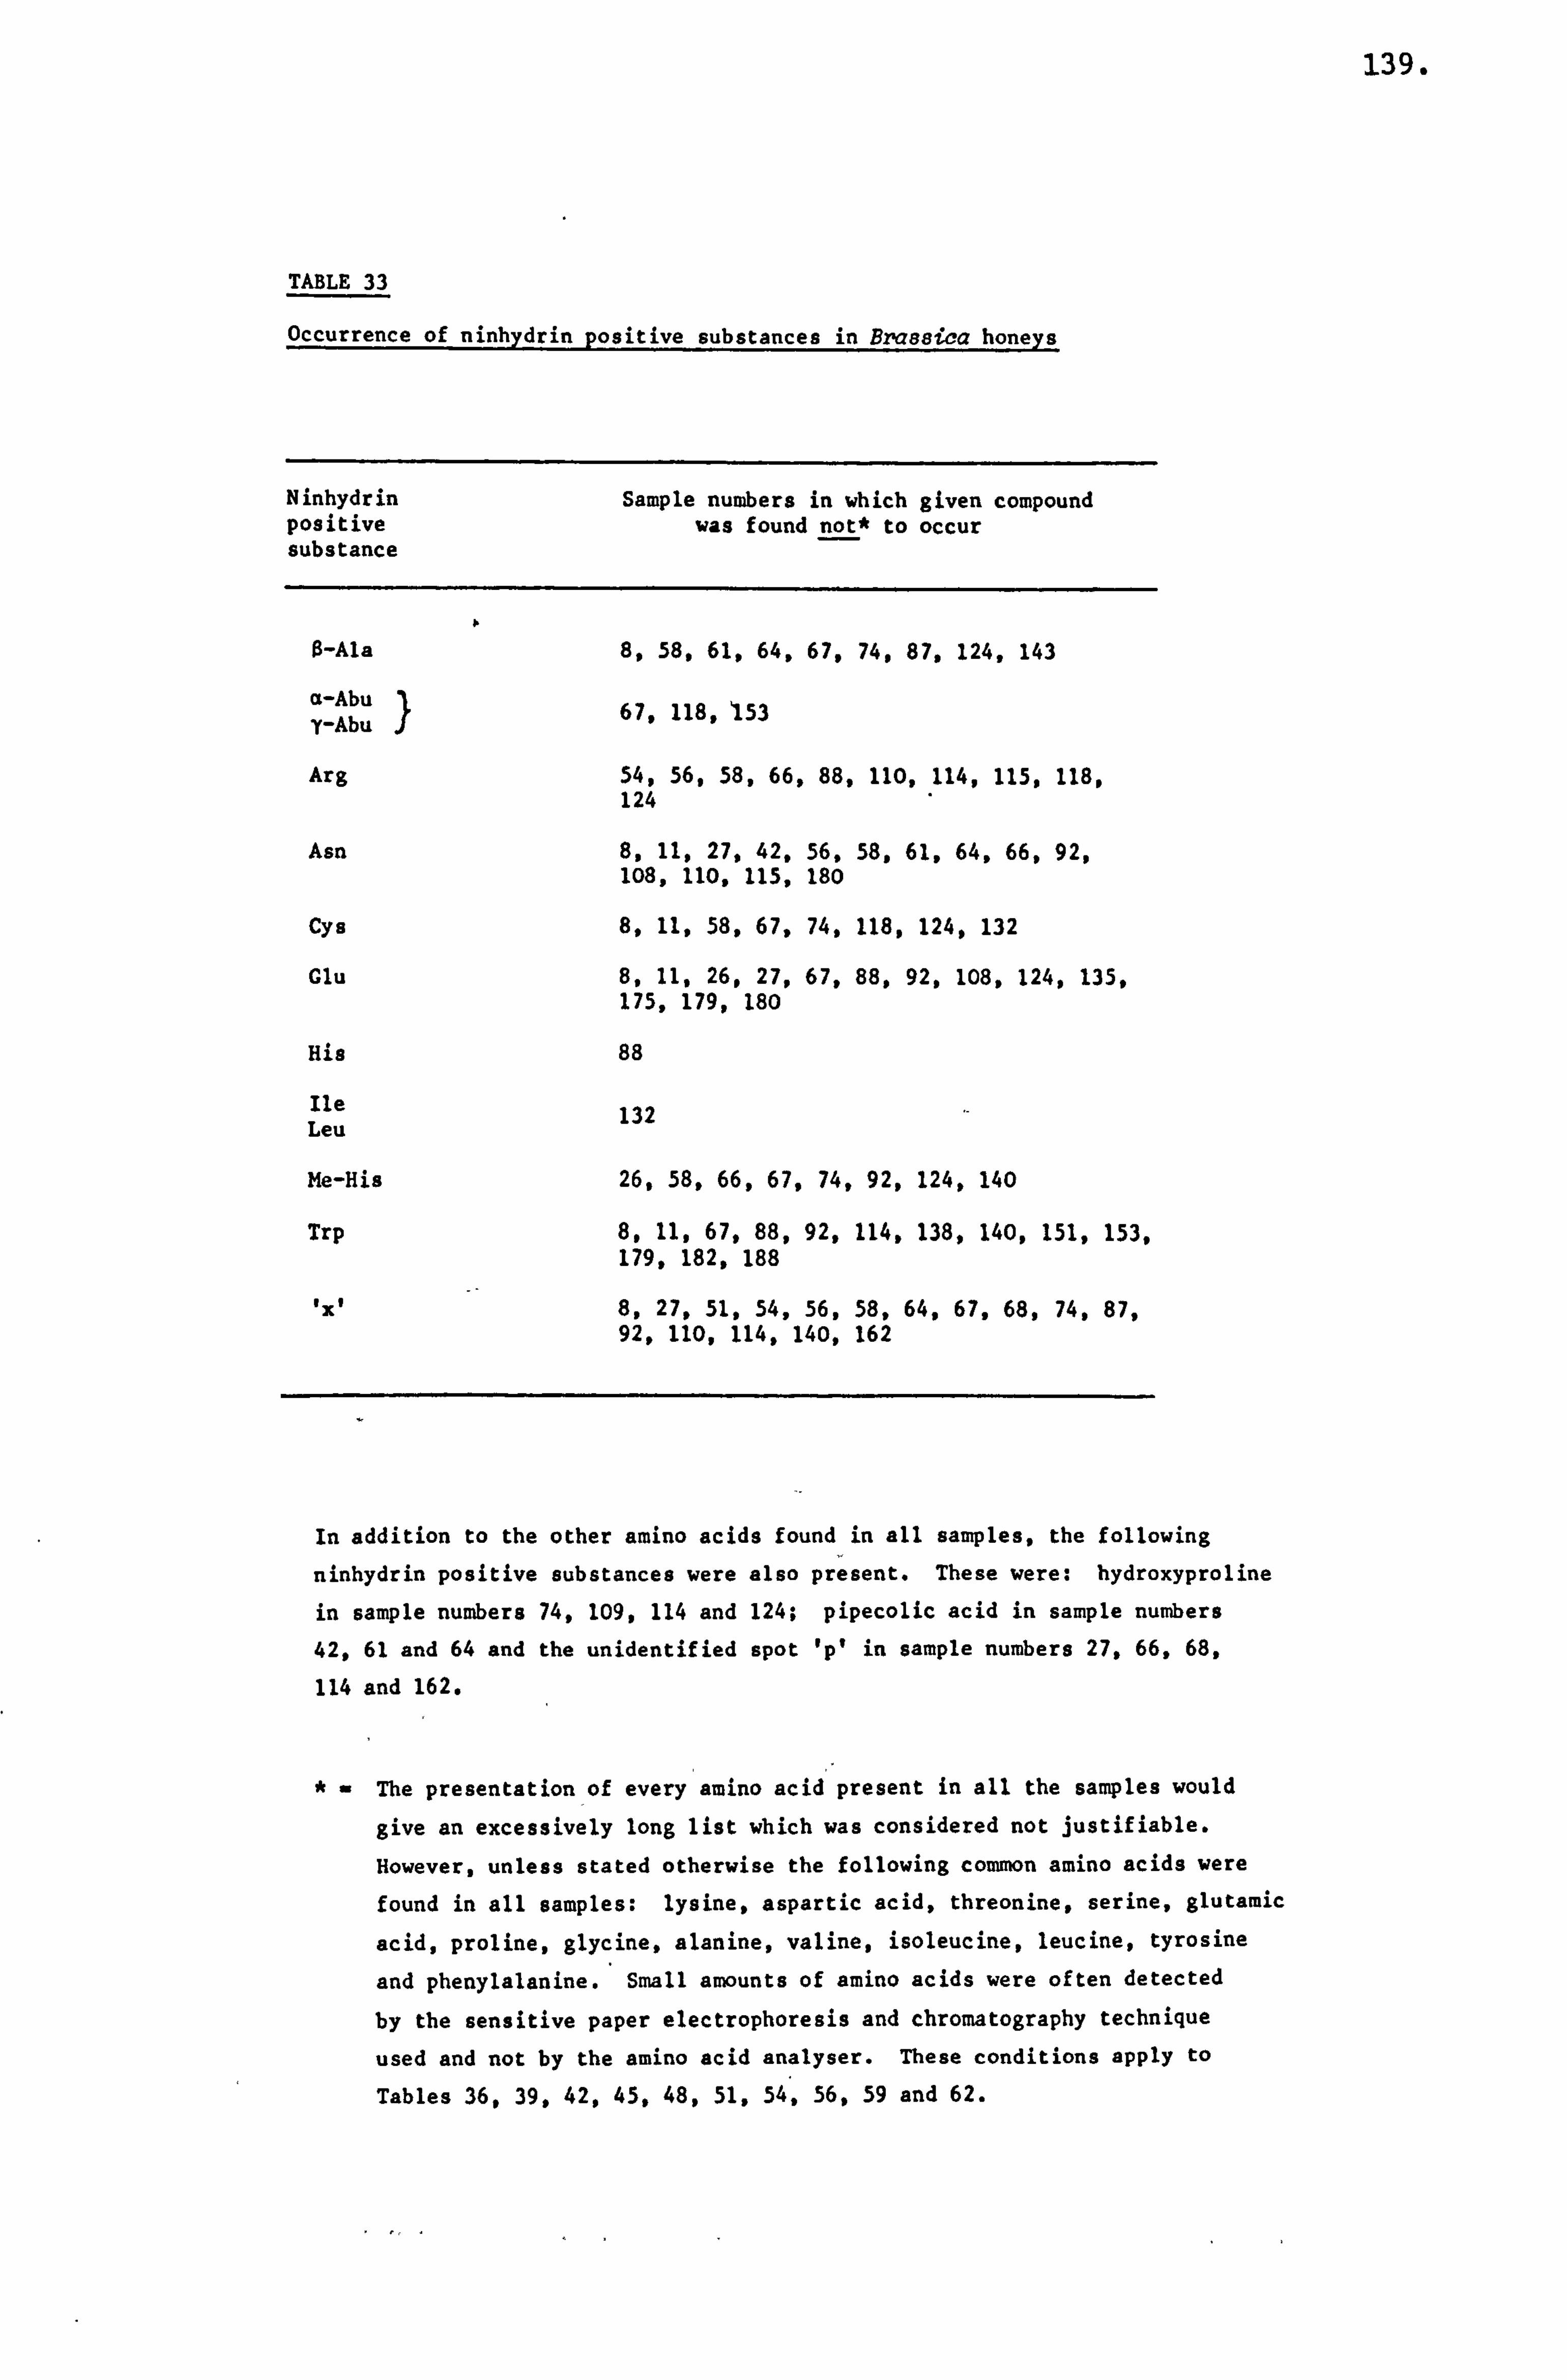
139.
TABLE 33
Occurrence of ninhydrin positive substances in Brassica honeys
Ninhydrin positive substance
Sample numbers in which given compound was found not* to occur
O-Ala 8,58,61,64, 67, 74,87,124,143
a-Abu ) 67,118,153 y-Abu.
Arg 54,56,58,66, 88, 110,114,115,118, 124
Asn 8,11,27,42, 56, 58,61,64,66,92, 108,110,115, 180
Cys 8,11,58,67, 74, 118,124,132
Glu 8,11,26,27, 67, 88,92,108,124,135, 175,179,180
His 88
Ile 132 Leu
Me-His 26,58,66,67, 74, 92,124,140
Trp 8.11,67,88, 92, 114.138,140,151,153, 179,182,188
1XV 8,27,51,54, 56, 58,64,67,68,74,87, 92,110,114,1 40, 162
In addition to the other amino acids found in all samples, the following
ninhydrin positive substances were also present. These were: hydroxyproline
in sample numbers 74,1099 114 and 124; pipecolic acid in sample numbers 42,61 and 64 and the unidentified spot 'p' in sample numbers 27,66,68,
114 and 162.
The presentationof every amino acid present in all the samples would
give an excessively long list which was considered not justifiable.
However, unless stated otherwise the following common amino acids were
found in all samples: lysine, aspartic acid, threonine, serine, glutamic
acid, proline, glycine, alanine, valine, isoleucine, leucine, tyrosine
and phenylalanine. Small amounts of amino acids were often detected
by the sensitive paper electrophoresis and chromatography technique
used and not by the amino acid analyser. These conditions apply to
Tables 36,39,42,45,48,51,54,56,59 and 62.
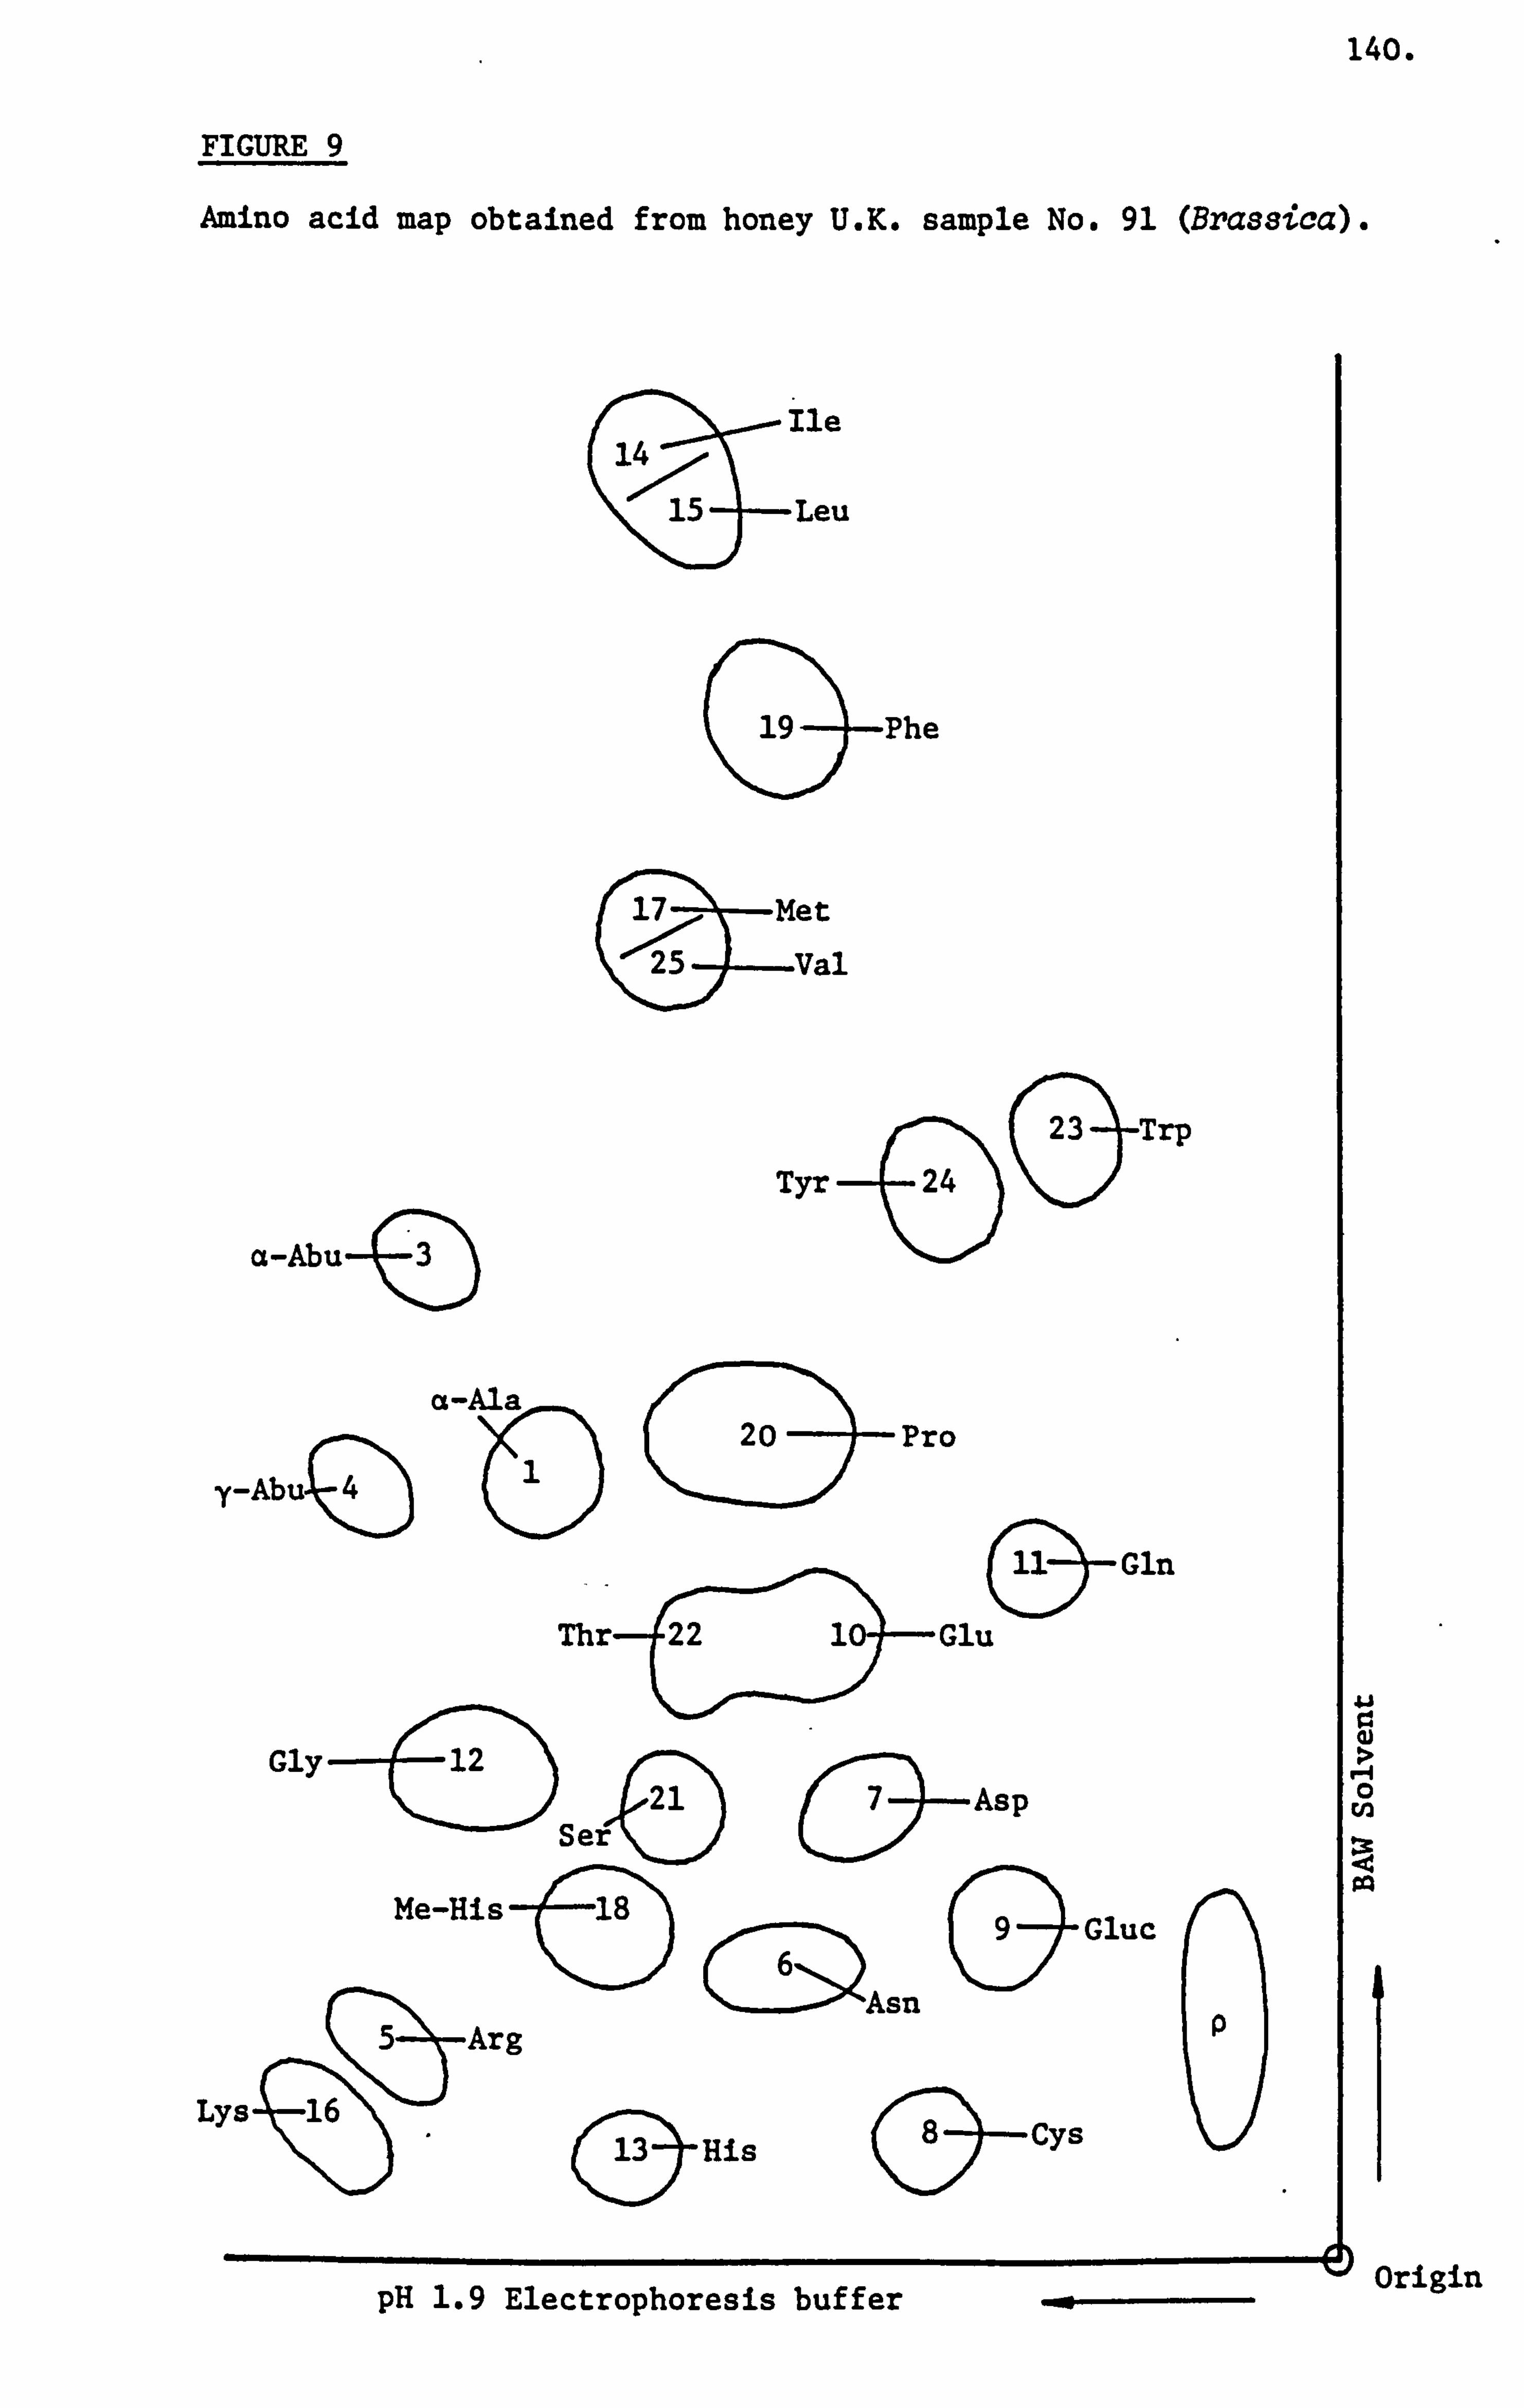
140.
FIGURE 9
Amino acid map obtained from honey U. K. sample No. 91 (Brassica).
Ile (14
15 Leu
(
19 -Phe
a-Abu4
23 Trp
Tyr -( 24 )
(3
a-Ala 20 Pro
y-Abuý )
0(
)_ Gln
Thr-ý 22 1 Glu
Gly 12 21
.e Ser - N%"
Me-His4ý1'83
Arg
Lysý 16
@1:! et
25 Val
'*,. ---ýýAsn
OHis
&
Gluc
& Cys 0 pH 1.9 Electrophoresis buffer
O-Asp 0
rn
Origin
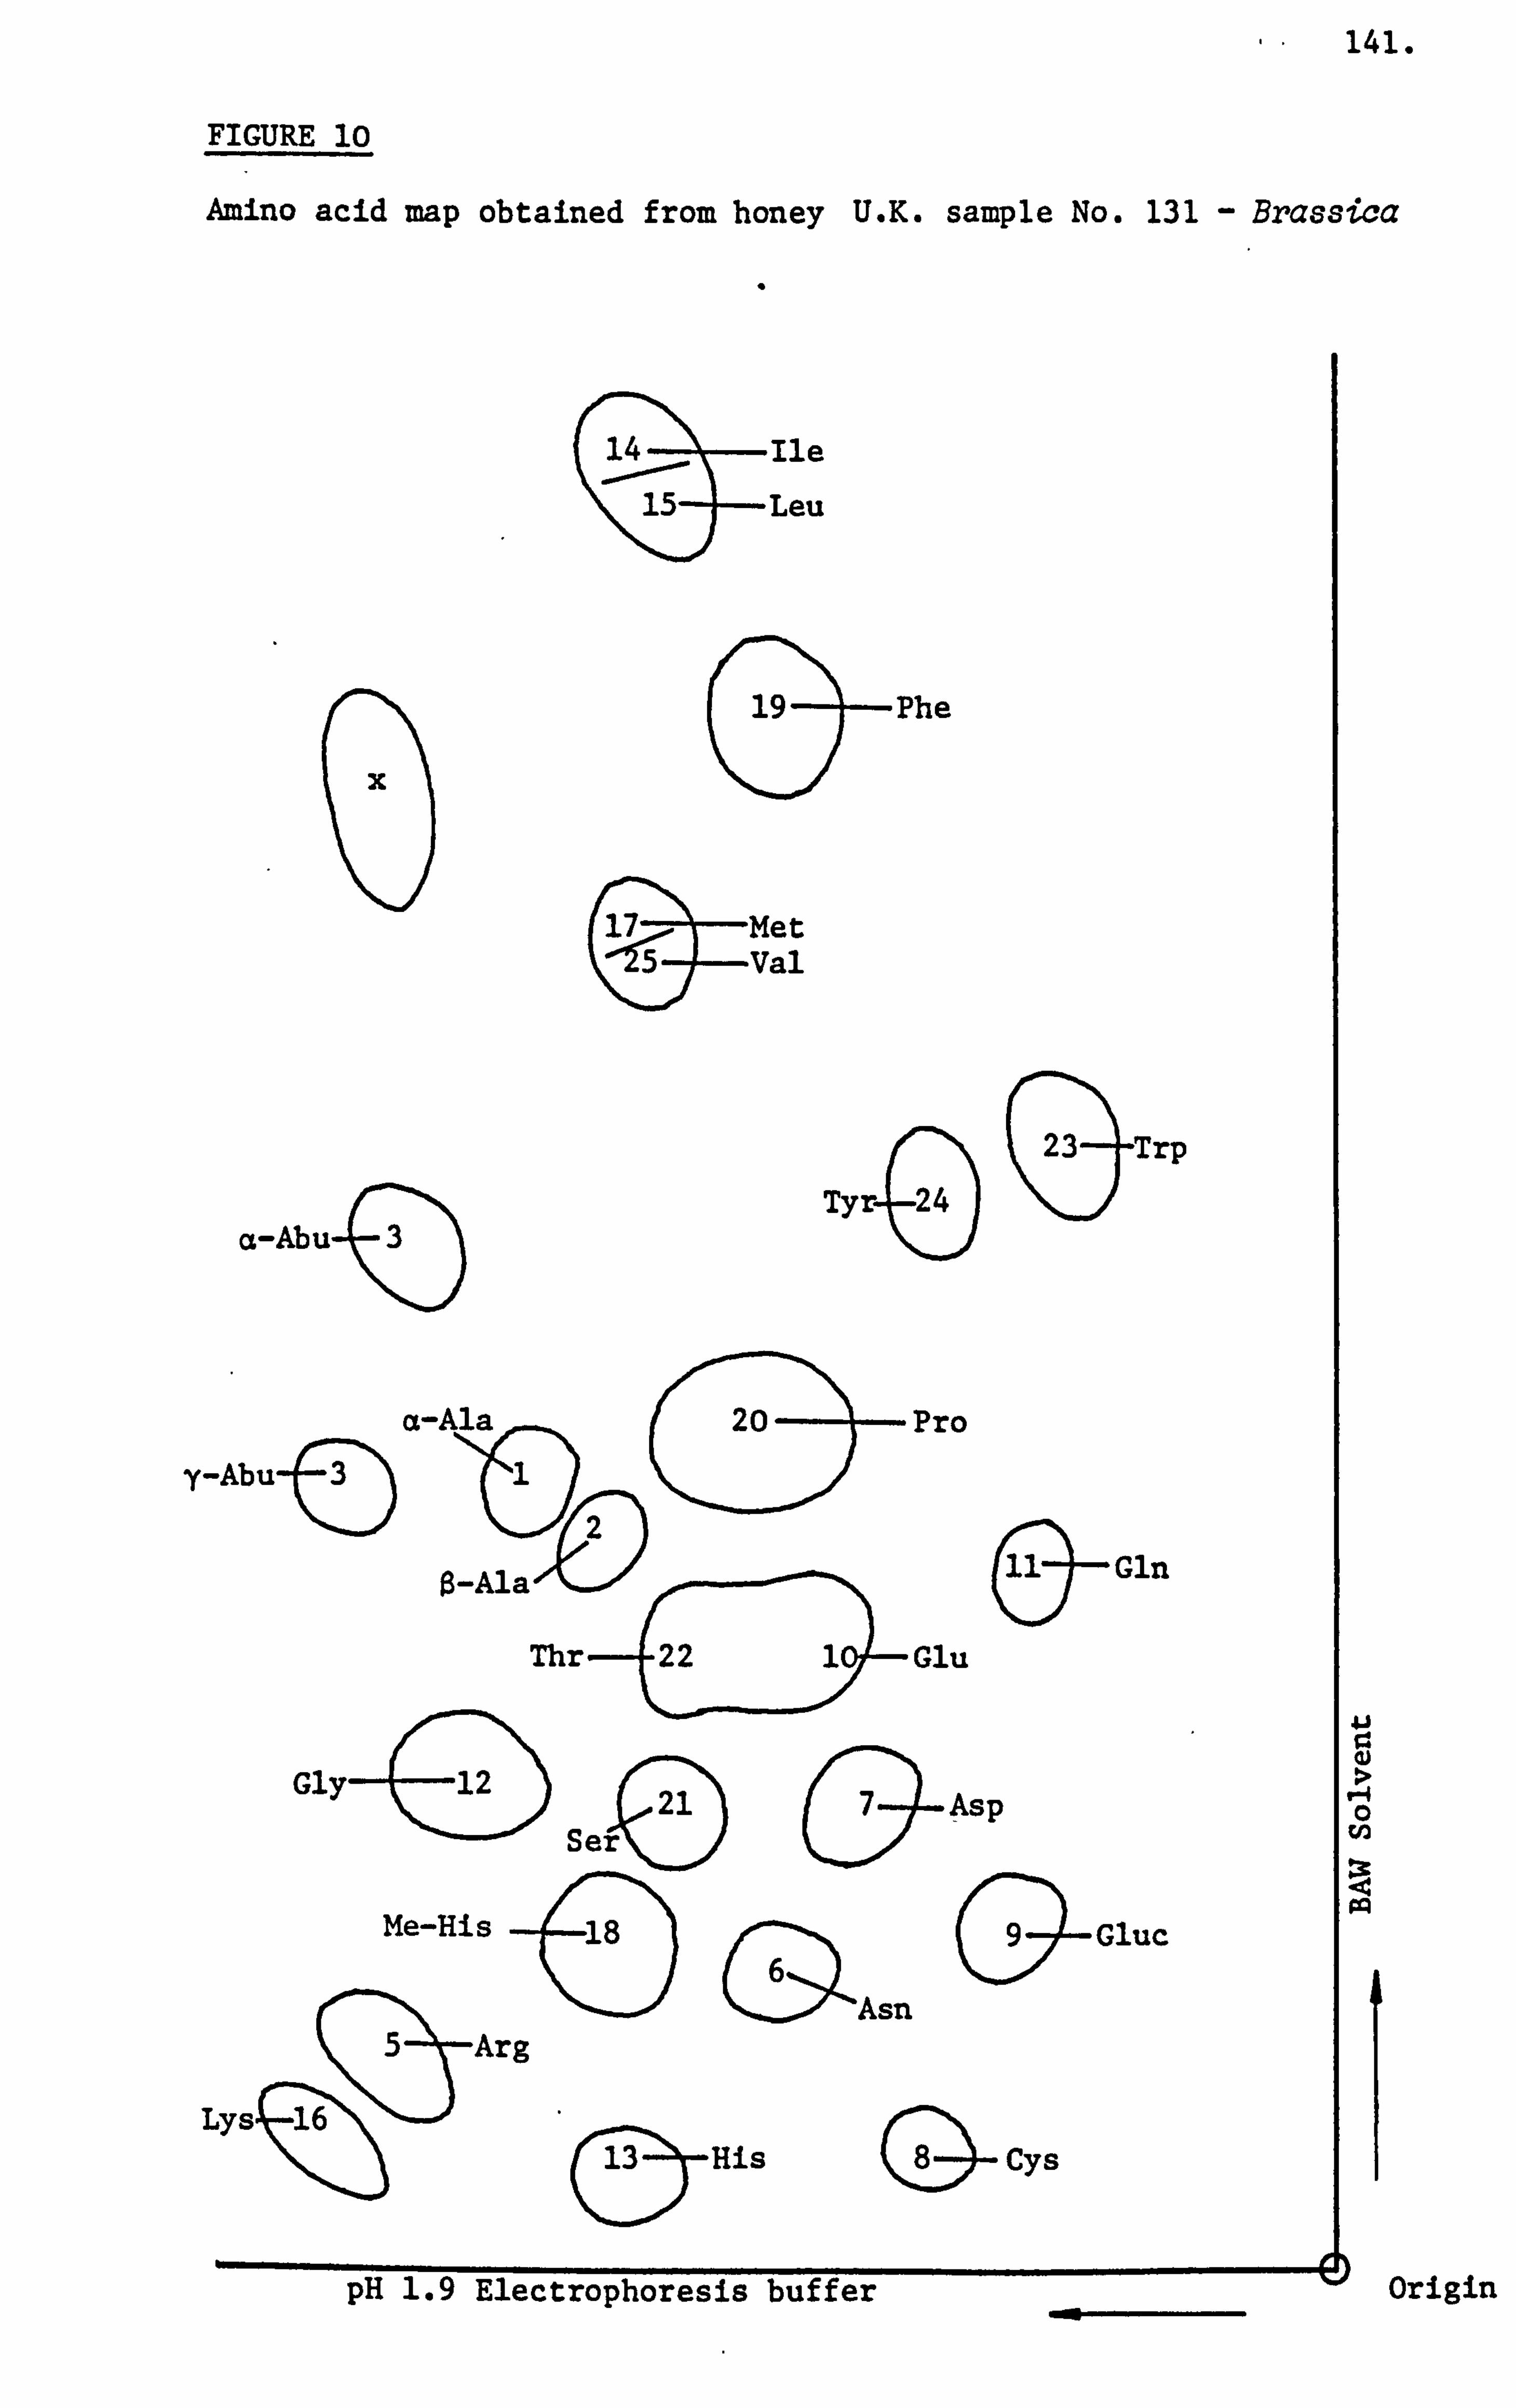
141.
FIGURE 10
Amino acid map obtained from honey U. K. sample No. 131 - Brassica
Q 14 Ile
15 F-Leu
19 Phe
x&
@ 17 -Met
5 -Val
a-Abu-ý Tyr
G24 (
23 Trp
y-Abu
a-Ala 1
20 Pro
2
$-Ala
Thr- 22 1 Glu
(9-Gln
Gly4 12 )
Ser 21 Asp
(D a
Me-His 8 Sý GlGluc
_6
Asn Arg
Lys 16
T S
(2 r His Cys
pH 1.9 Electrophoresis bu
r-4 0
cn
Origin
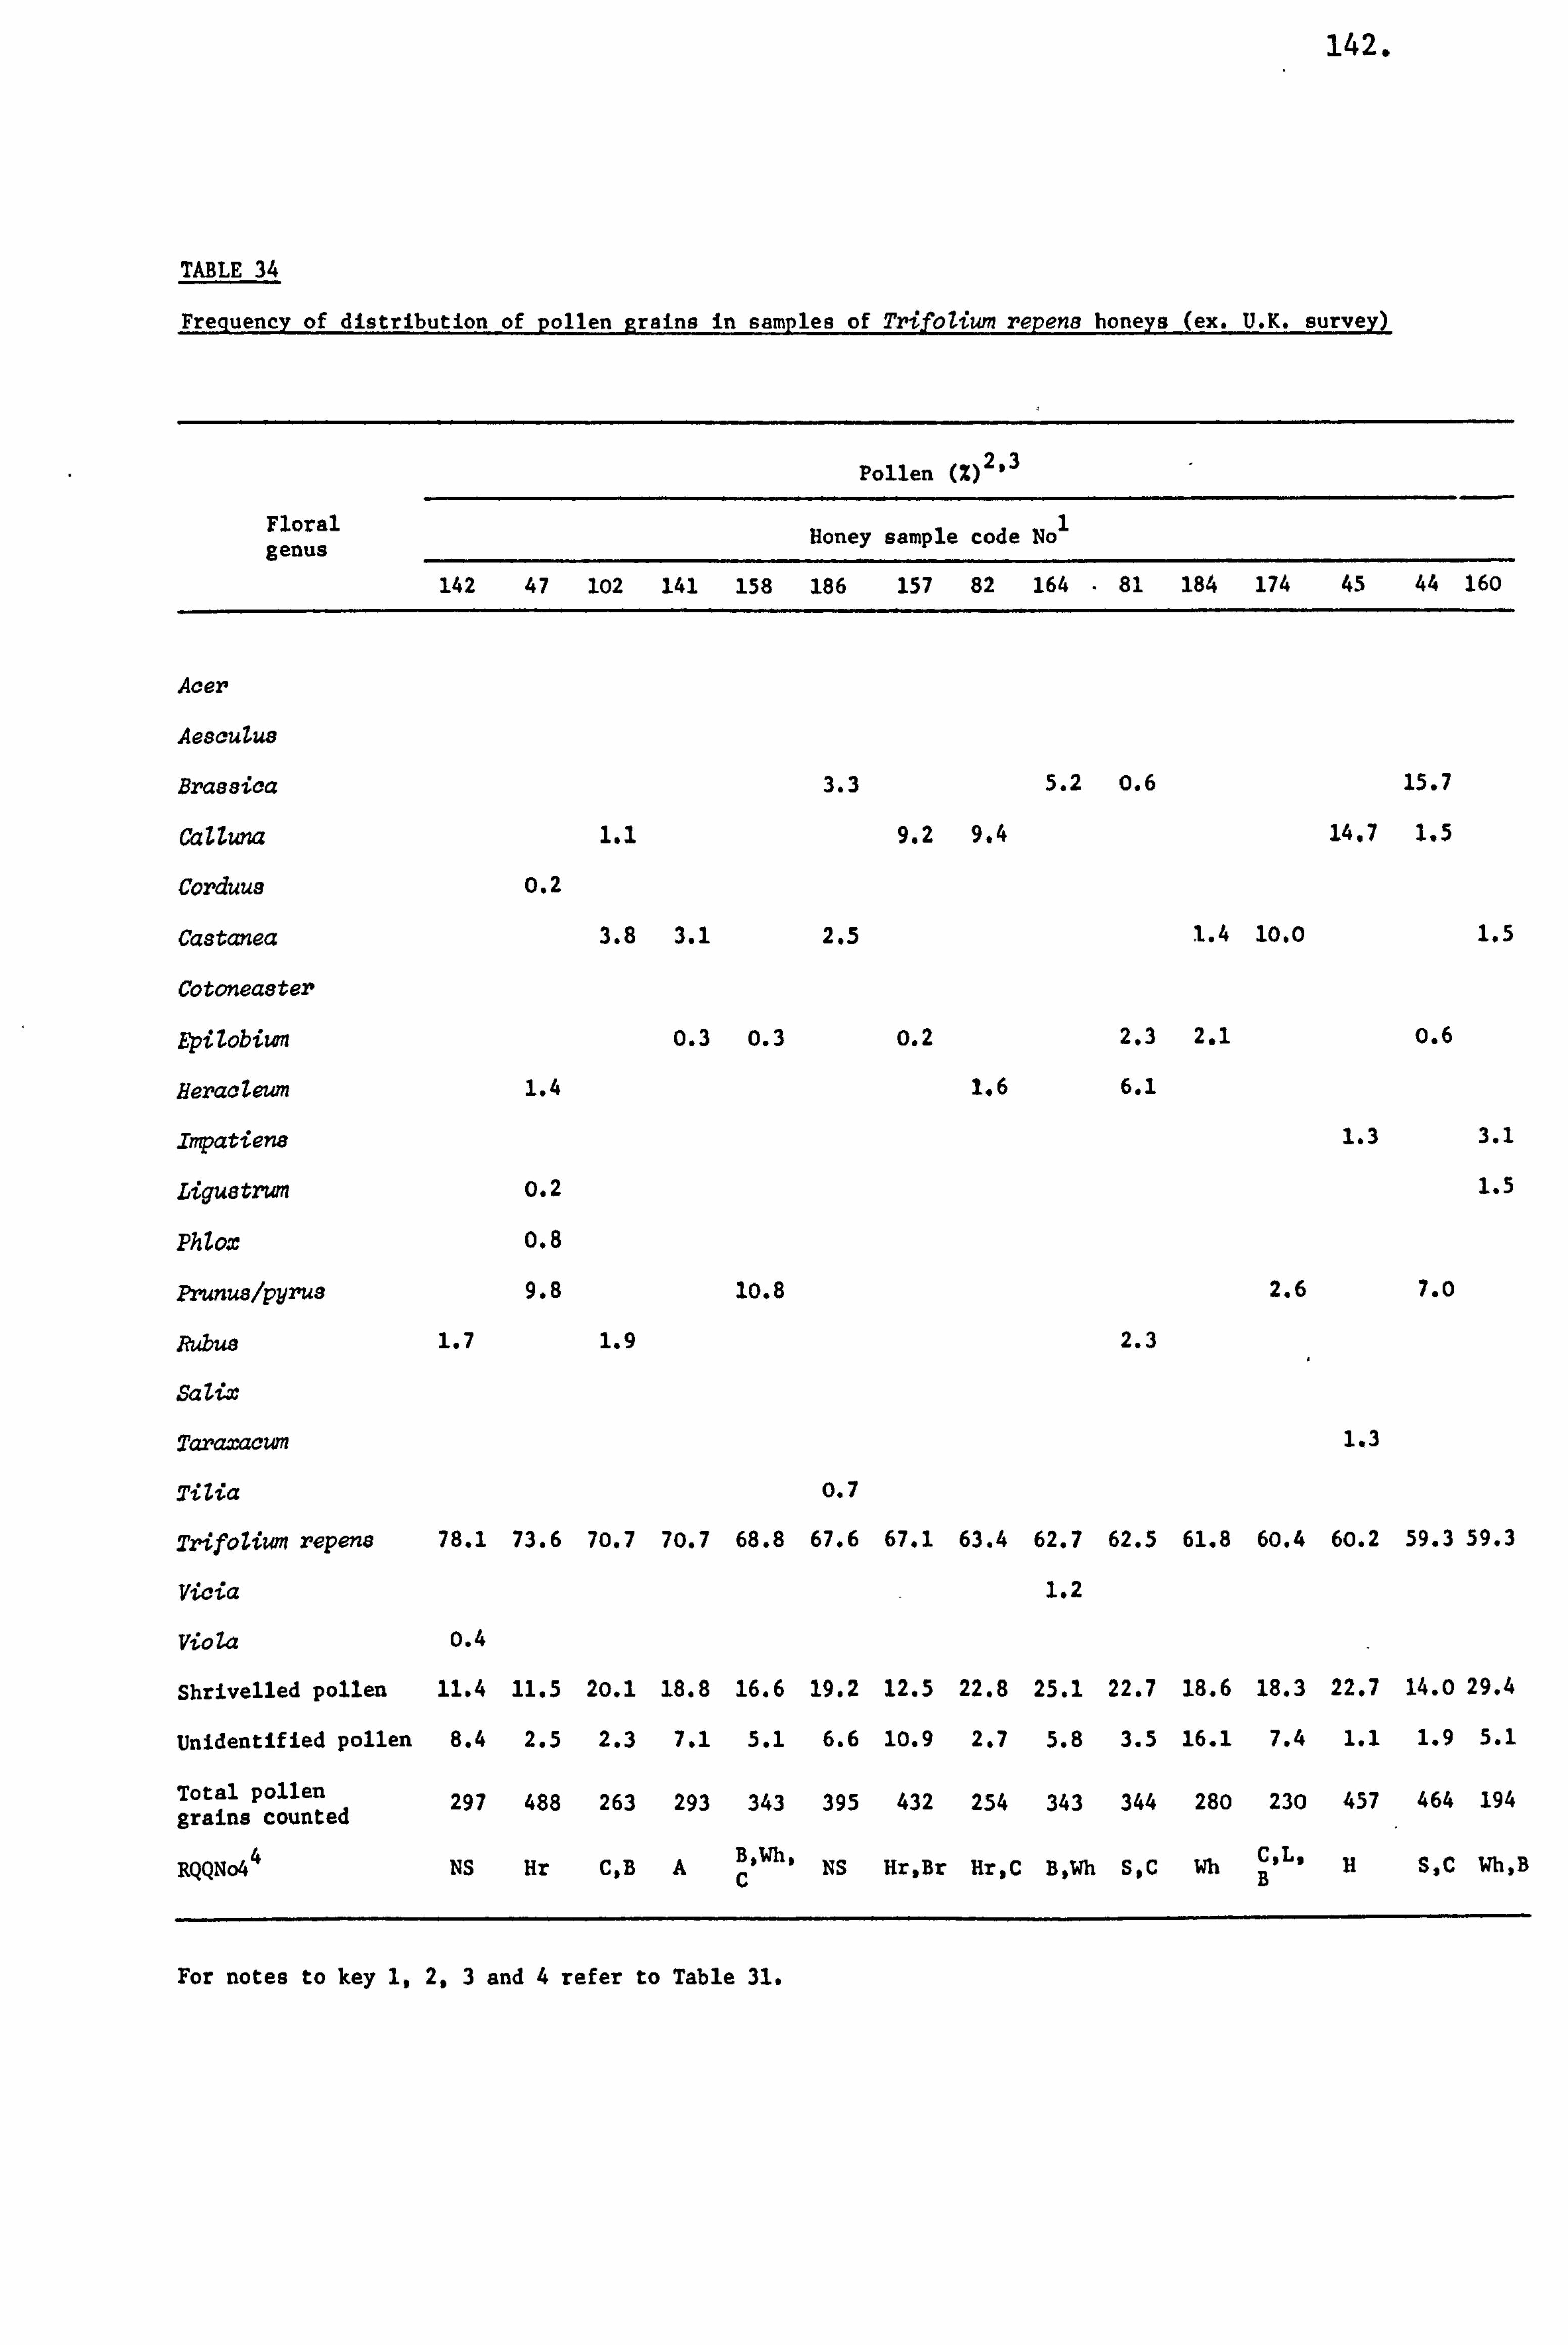
142.
TABLE 34
Frequency of distribution of pollen Rrains in samples of Trifolium repens honeys (ex. U. K. survey)
Pollen M 2.3
Floral Hone sample code No 1 genus y
142 47 102 141 158 186 157 82 164 - 81 184 174 45 44 160
Acer
Aesculus
Brassica 3.3 5.2 0.6 15.7
Calluna 1.1 9.2 9.4 14.7 1.5
Corduus 0.2
Castanea 3.8 3.1 2.5 1.4 10.0 1.5
Cotoneaeter
gpilobiwn 0.3 0.3 o. 2 2.3 2.1 o. 6
HeracZeum 1.4 1.6 6.1
Impatiens 1.3 3.1
Ligustrum o. 2 1.5
Phlox o. 8
Pmnus/pyrus 9.8 10.8 2.6 7. o
Rubus 1.7 1.9 2.3
Sazix
Taraxacwn 1.3
TiZia M
TrifoZivm repens 78.1 73.6 70.7 70.7 68.8 67.6 67.1 63.4 62.7 62.5 61.8 60.4 60.2 59.3 59.3
Vicia - 1.2
Viola o. 4
Shrivelled pollen 11.4 11.5 2o. 1 18.8 16.6 19.2 12.5 22.8 25.1 22.7 18.6 18.3 22.7 14.0 29.4
Unidentified pollen 8.4 2.5 2.3 7.1 5.1 6.6 10.9 2.7 5.8 3.5 16.1 7.4 1.1 1.9 5.1
Total pollen 297 488 263 293 343 395 432 254 343 344 280 230 457 464 194 grains counted
RQQNo4 4 NS Hr C, B A B, Wh, NS Hr, Br Hr, C B, Wh S, C Wh C, L, H S, C Wh, B
C B
For notes to key 1,2,3 and 4 refer to Table 31.
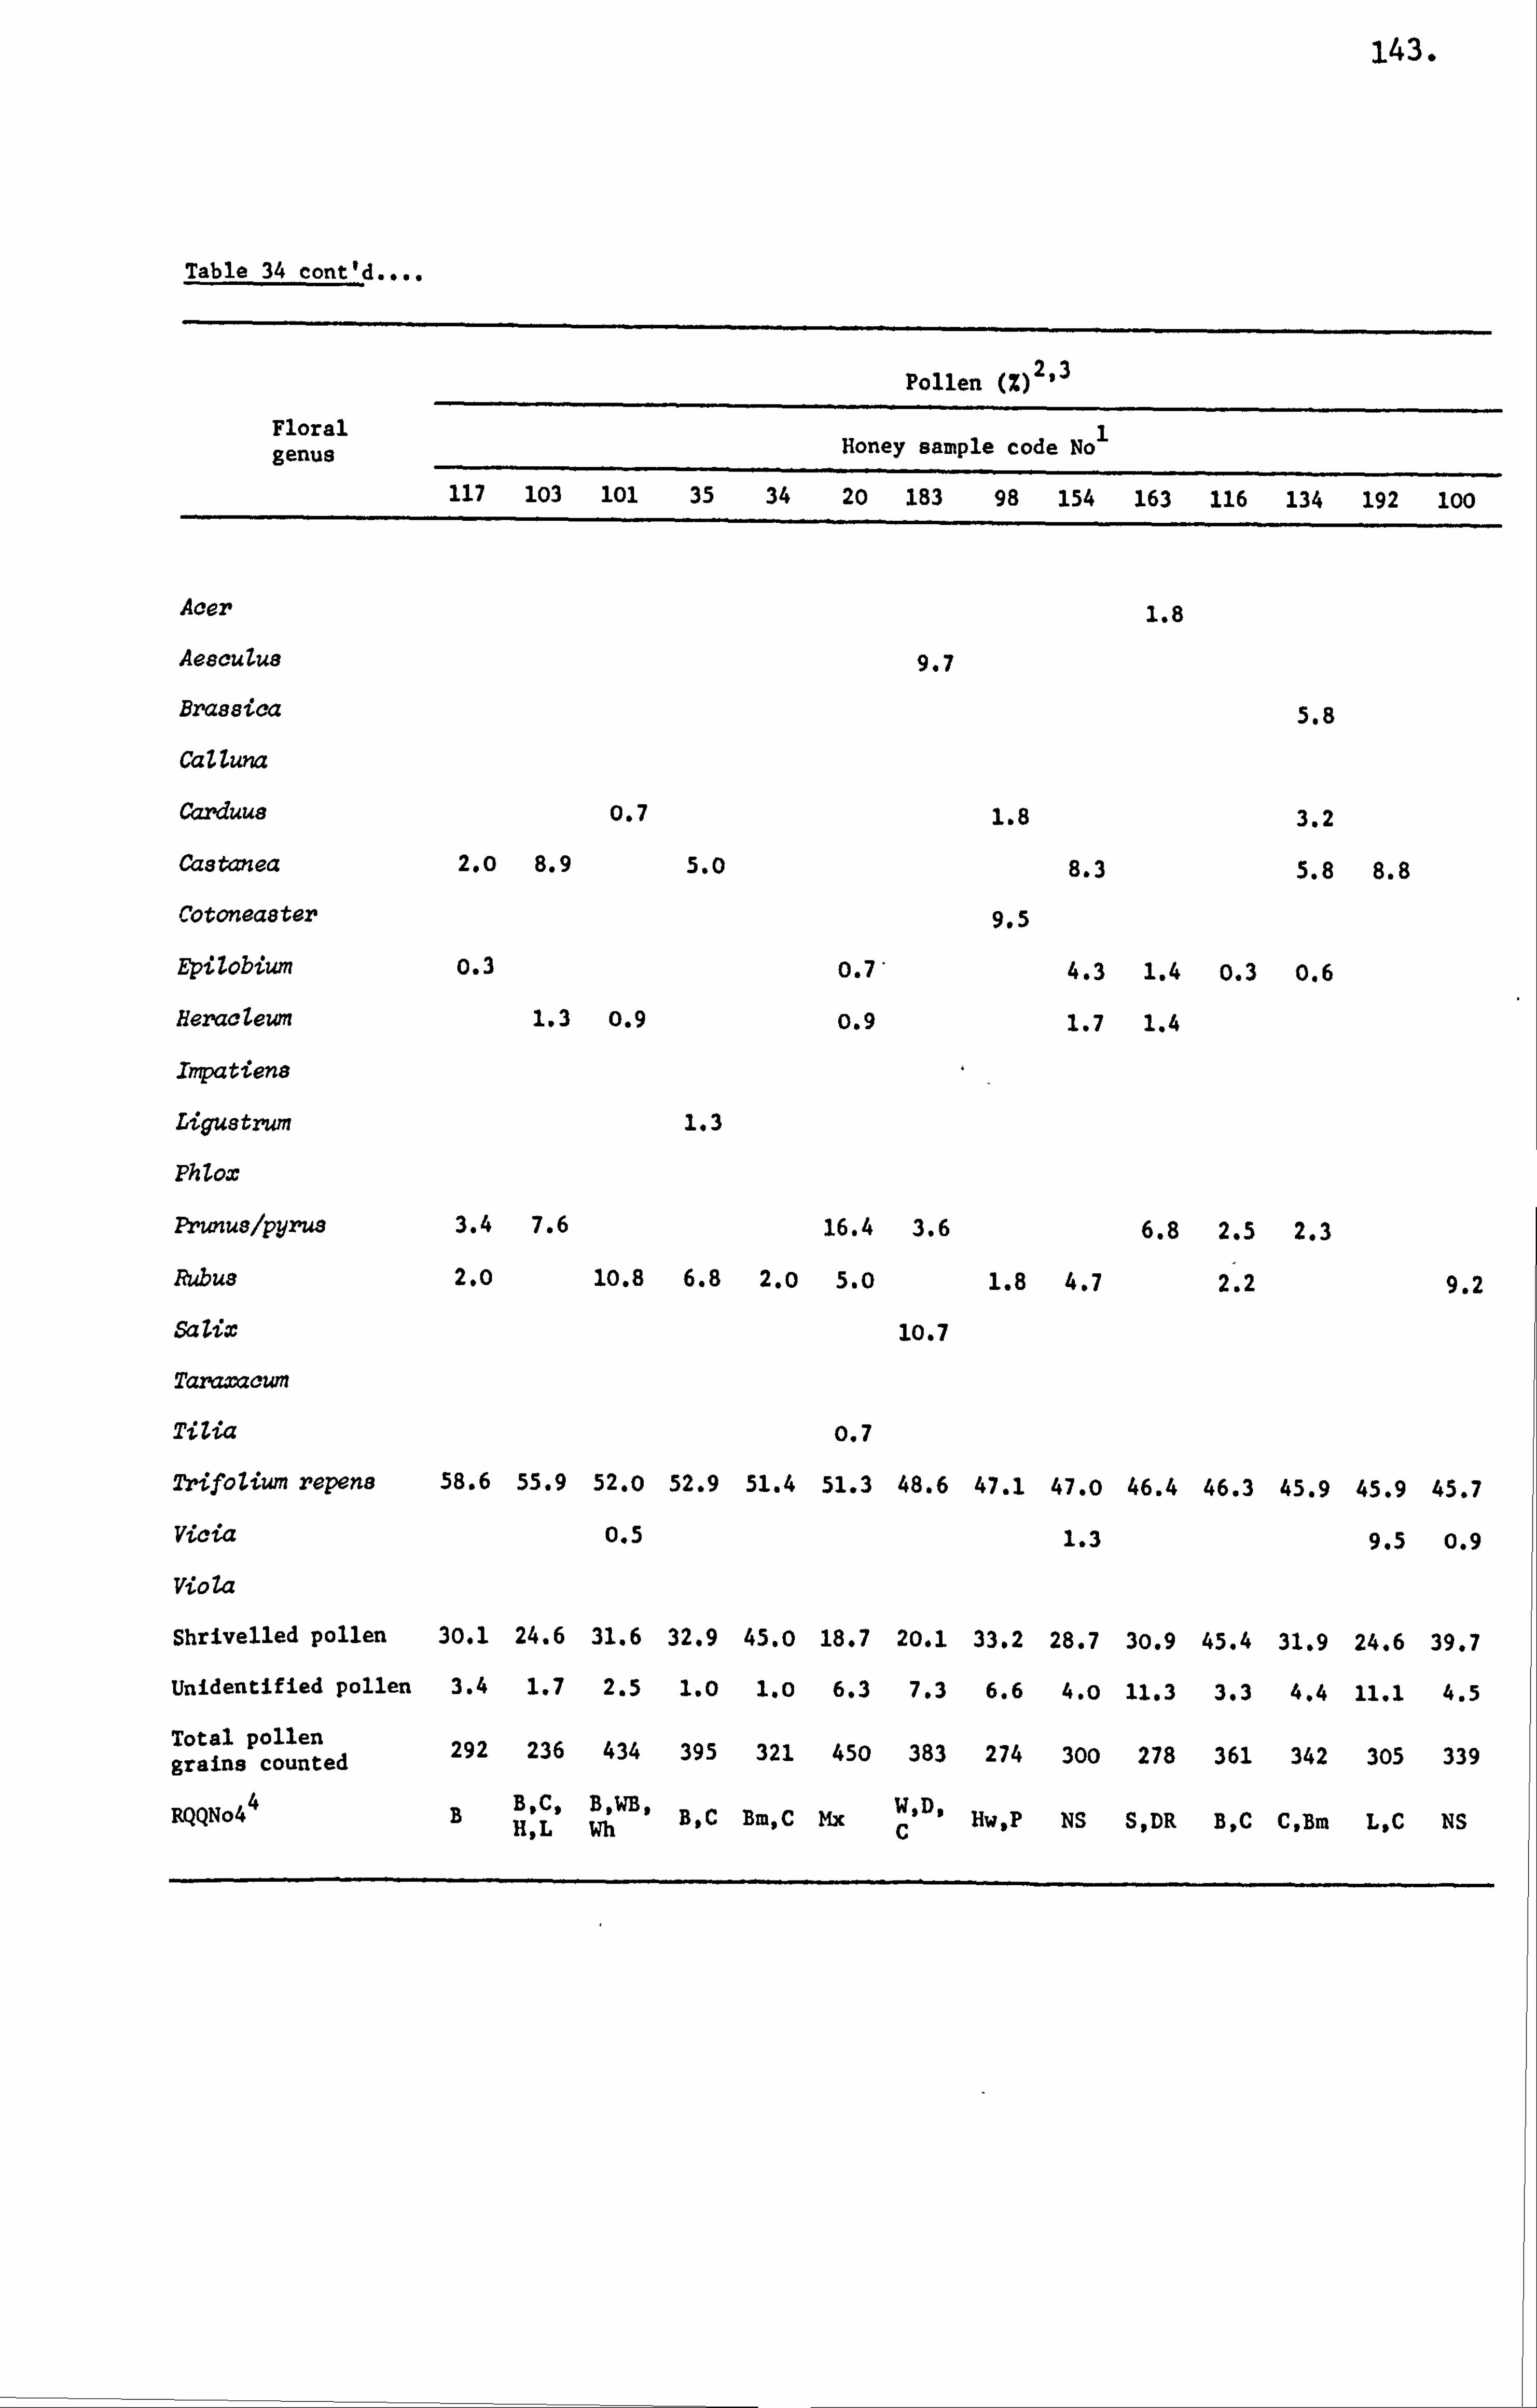
143.
Table 34 cont'd
Pollen (Z) 2,3
Floral genus Honey sample code No'
117 103 101 35 34 20 183 98 154 163 116 134 192 100
Acer 1.8
Aeeculua 9.7
Brassica 5.8
CaUuna
Carduua 0.7 1.8 3.2
Castanea 2.0 8.9 5.0 8.3 5.8 8.8
Cotoneaster 9.5
EpiZobium o. 3 0.7* 4.3 1.4 0.3 0.6
Heractewn 1.3 0.9 0.9 1.7 1.4
Impatiens
Ligustrum 1.3
PhzOx
Prunus/pyru3 3.4 7.6 16.4 3.6 6.8 2.5 2.3
Rubus 2. o 10.8 6.8 2.0 5.0 1.8 4.7 2'. 2 9.2
Salix 10.7
Taraxacum
TiZia 0.7
Trifolium repens 58.6 55.9 52. o 52.9 51.4 51.3 48.6 47.1 47.0 46.4 46.3 45.9 45.9 45.7
Vicia 0.5 1.3 9.5 0.9
VioZa
Shrivelled pollen 30.1 24.6 31.6 32.9 45.0 18.7 20.1 33.2 28.7 30.9 45.4 31.9 24.6 39.7
Unidentified pollen 3.4 1.7 2.5 1.0 1.0 6.3 7.3 6.6 4.0 11.3 3.3 4.4 11.1 4.5
Total pollen grains counted
292 236 434 395 321 450 383 274 300 278 361 342 305 339
RQQNo4 4
B B C, H: L
B, WB, Wh B, C Bm, C Mx W, D,
C 11W. P NS S, DR B, C C, Bm L. C NS
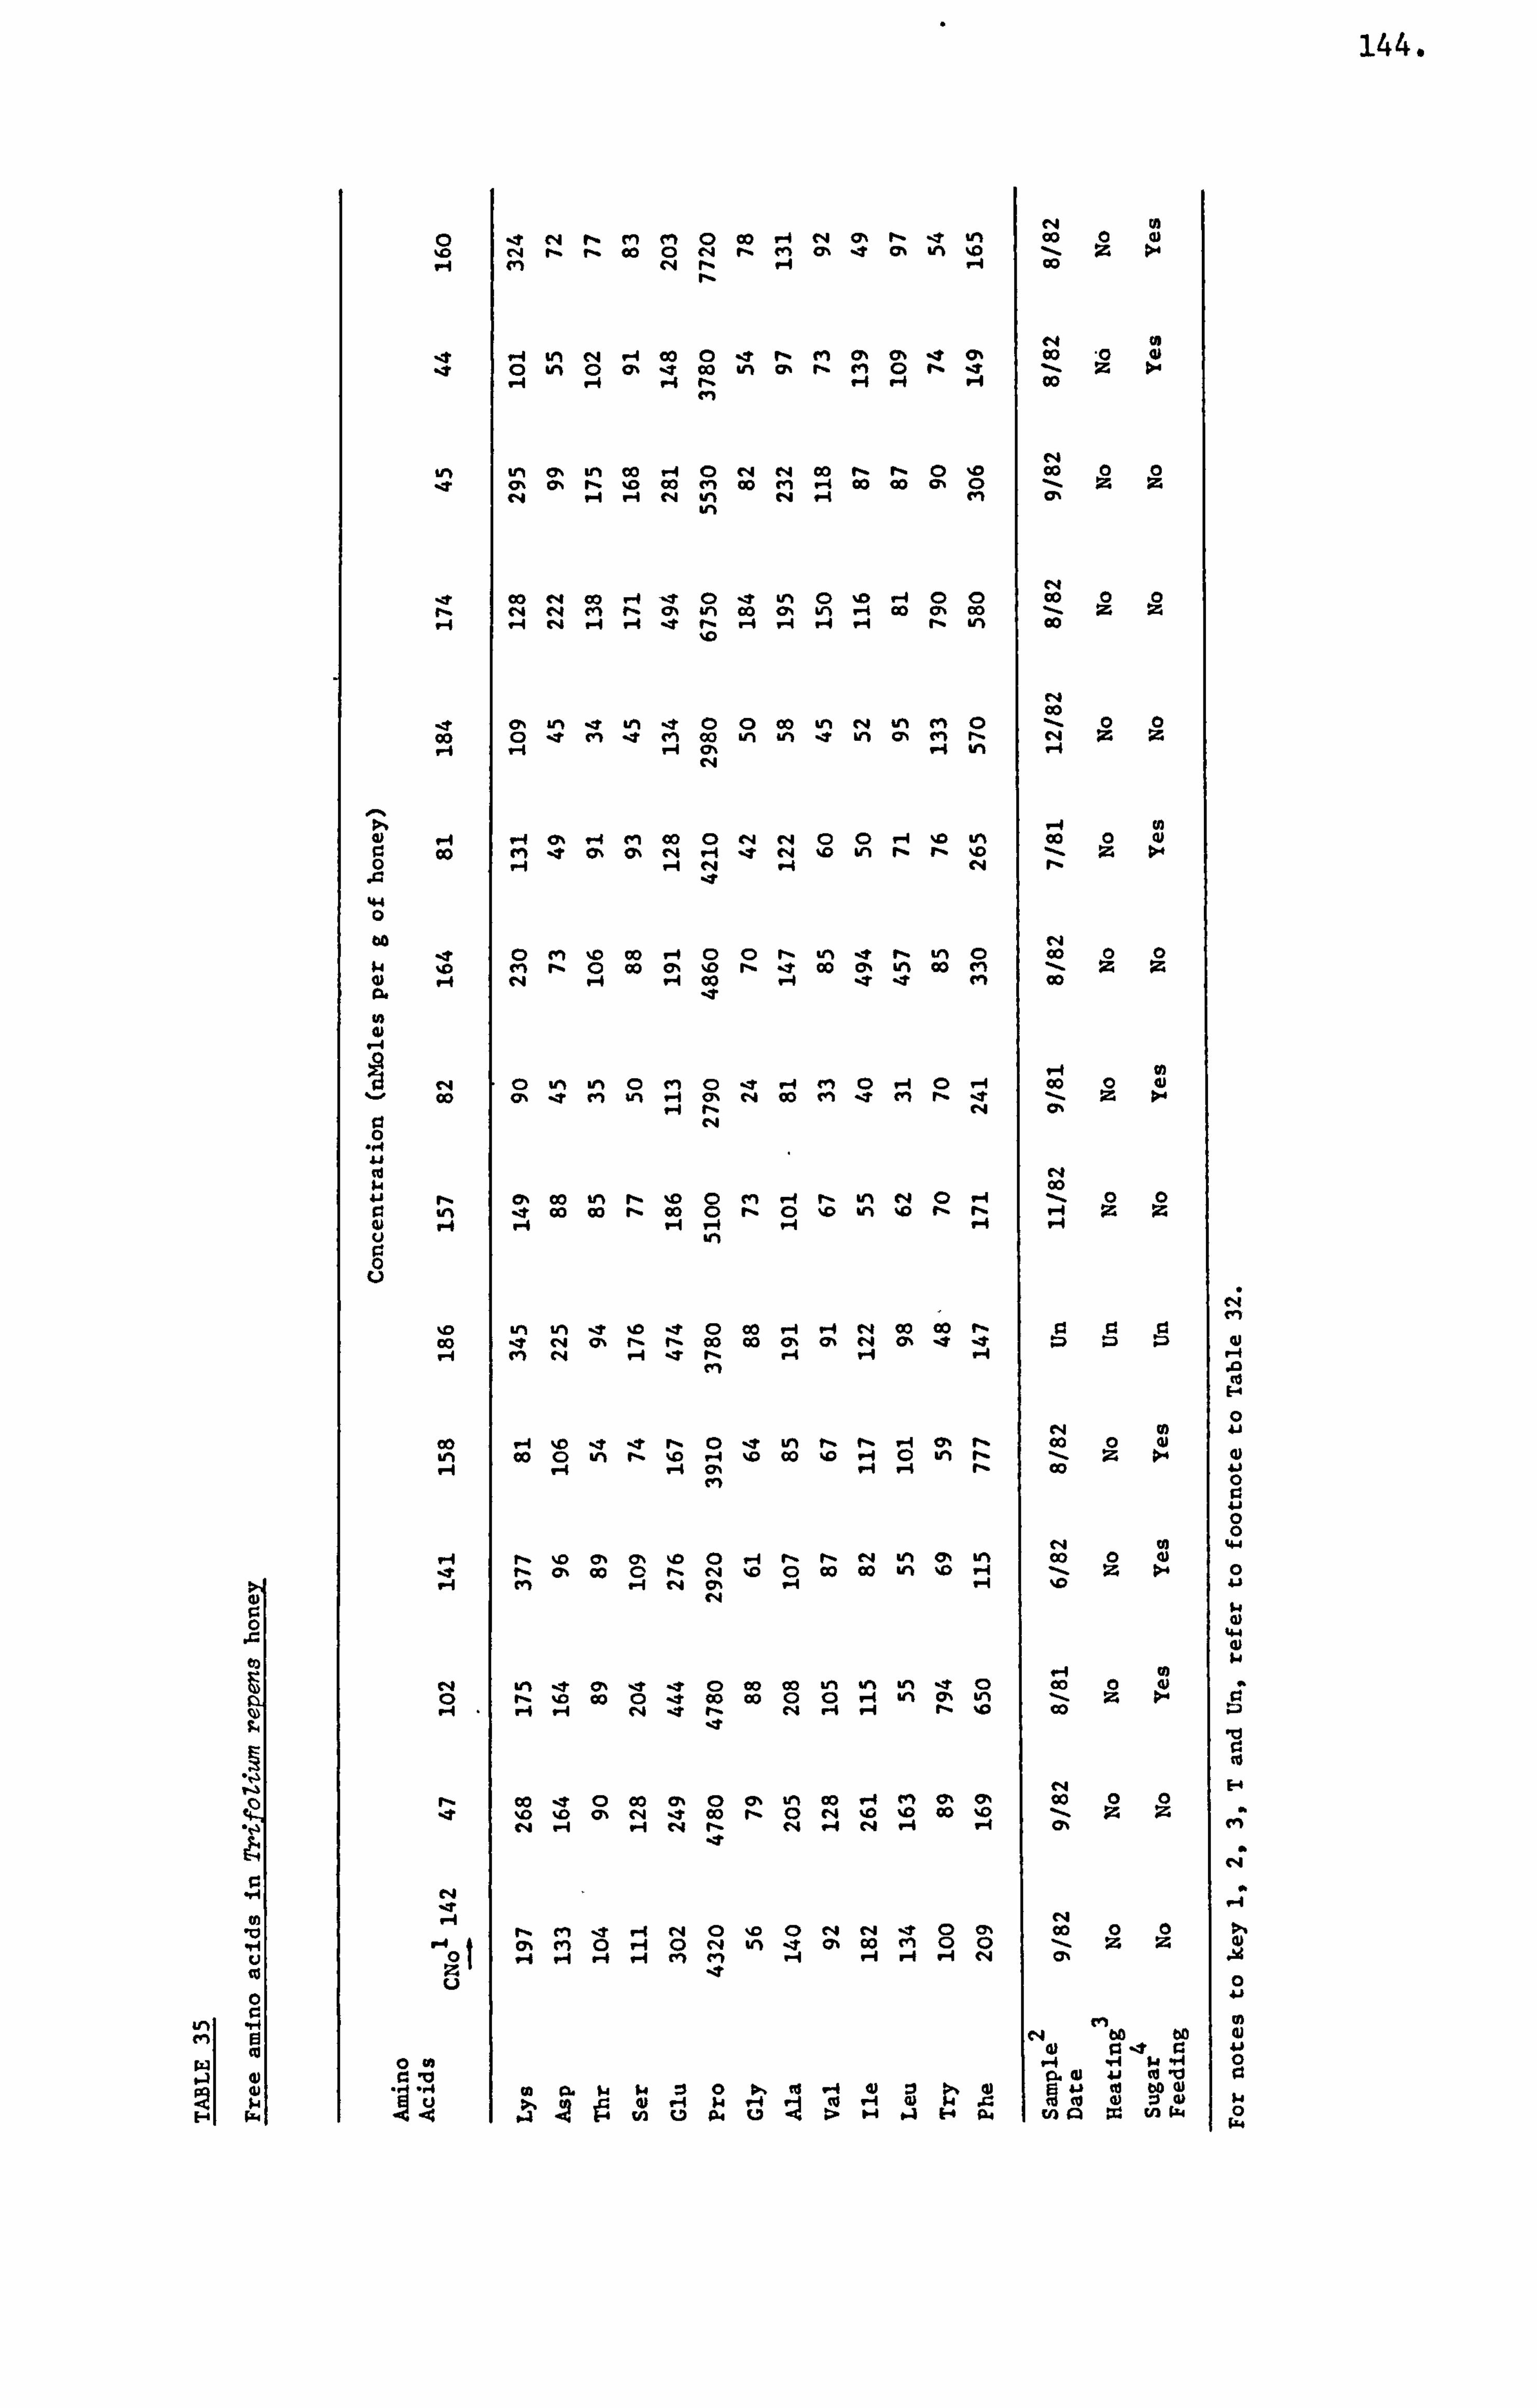
144.
in en
N U) 0 -ýr N rl mm0 co 1.4 C4 ch P, -ýr In OD a a) 10 C4 rý r. 00 0 C14 rl cn 0% .4 CA in ýo z >4 1.4 (n C14 rl ý-q r-4 Go
rl
C4 'A ý4 tn cli ý4 Go 0 -ýT rl en Cy% (A .4 (A OD .0 0)
.10 %n 0 0% -4 00 in cy, rý M0 11 -4 z : 0-- ý4 rl If ý-l 00
C4 In tn CY, tn co ý4 0 C14 r4 co r- r- 0 10 00 00 IT a, ON r- 10 00 M 00 cn -4 00 (a 47,0 zz
C4 14 ý4 C14 %n " 14 cn C7% tn
C4 -T co eq co r4 11 0 1? Ln 0 10 ý4 00 co 0 rý 04 C4 en r, ON 4n 00 ON Ln -4 Go ol co -z
ý4 C14 ý4 r4 .4f, -4 ý4 ý4 ý4 rý in co
C4 co
. ýr ch An . 4t Ln -ýr 00 00 tn c4 in (n 000 00 0 -. T cn 'T cn 00 Ln in 4 Ln c7N en r, c4 zz
ý4 r4 0% ý4 in 14
4) 1-4 -4 ON ý4 cn co 0" C4 00 ý4 ýo &A co 0 0) 0 co cn . 4.0ý 0% " 1-4 -ýt eq %D in rý rý %D z tý- 0 r-I ý4 C4 -4 C4 r%
.0 ýl
44 0
40 eq
It 0 cn 'D co r-I 00 rý Ln 'T t, tn c) co 00 $4 ýD en rý 0 co a, %D rl -T co ON LM 00 vi -- zz w ý-f C4 r-4 r4 co ýq IT fn 00 C6
L9 W
r4
0 Ul LIN 0 cn -ýr ý4 fn 0 14 0 -4 co 0 4) OD (71 -4T en %n ý4 0% C*4 00 cn 11 cn r, IT -z
1.4 rý C4 0% C4
0
00 rý 0% CO tn rl %D 0 en 4 r- Ln Cla 0 .400
In It Go co rý 00 0 r% 0 IV %n %D rl r, 14 zz wHHH -4 ý4 H
0
10 Ln in :r 'D -* 0 co q4 e4 co Go rý 0 93 93 co I? CIA C% f- 1- 00 co 0% 0% C14 0ý -S -.?
eq r4 -. T rl ý4 H cn
00 ýj %p zr -ýr Pý C) -ýr Ln r, r- ý4 ty, r, co 0 41 Ln co o in rý 'D r4 Q co 'D ýq 0 Lm r- I- z 01. 1-1 1-4 -4 ON 114 r4 r, co
cr)
c4 to 1-4 r, ND CIN m ýo 0 -4 r.. r.. " Ln ON LM co 0 4)
11 rý 0% co 0 rl c4 %0 0 co co &n %0 ý4 z ;H 14 cn t4 0% ý4 14 %0
C'4
c4 LM 't 0, -1 0 co co Ln %m Ln 'T a co 0 4) 0 r- %D co 0 It co co 0a ý4 4n a, Ln z .4 ý4 C4 11 rý V4 r-4 14 %0 co
C*4 r, co IT 0 co (7% 0 0% in Go ý4 m 0% a, co 00 :r 10 10 (A C14 .2 co rý 0 C4 10 %0 co %0 zz
C-A -4 1-4 eq r- C4 ý4 C'I ý4 ý4 0%
V4 ýT eq
rý en IT 4 C-4 0 10 0 e4 C-4 -ýr 0m co 00 0% en 0 14 0" tn -T CA 00 en 00zz
0 Cl) ý4 ý4 r4 ý4 C*4 cy, z IT u
en ell bo two
93 It 93 0 D) ý4 s4 -ý4 93 10 al 4j to .0
M 04 $ý :30 01, tl 14 0) 0ý to 4j cd bo w Au...
ý4 ica
. :3. -. 4
!ý .4 f4 ... u
:ý ý-. "0 t-4 a. tn Q :4 tn W
CVI
qp
0
0 93 41 0 0
44
0 41
4.
0,
$4
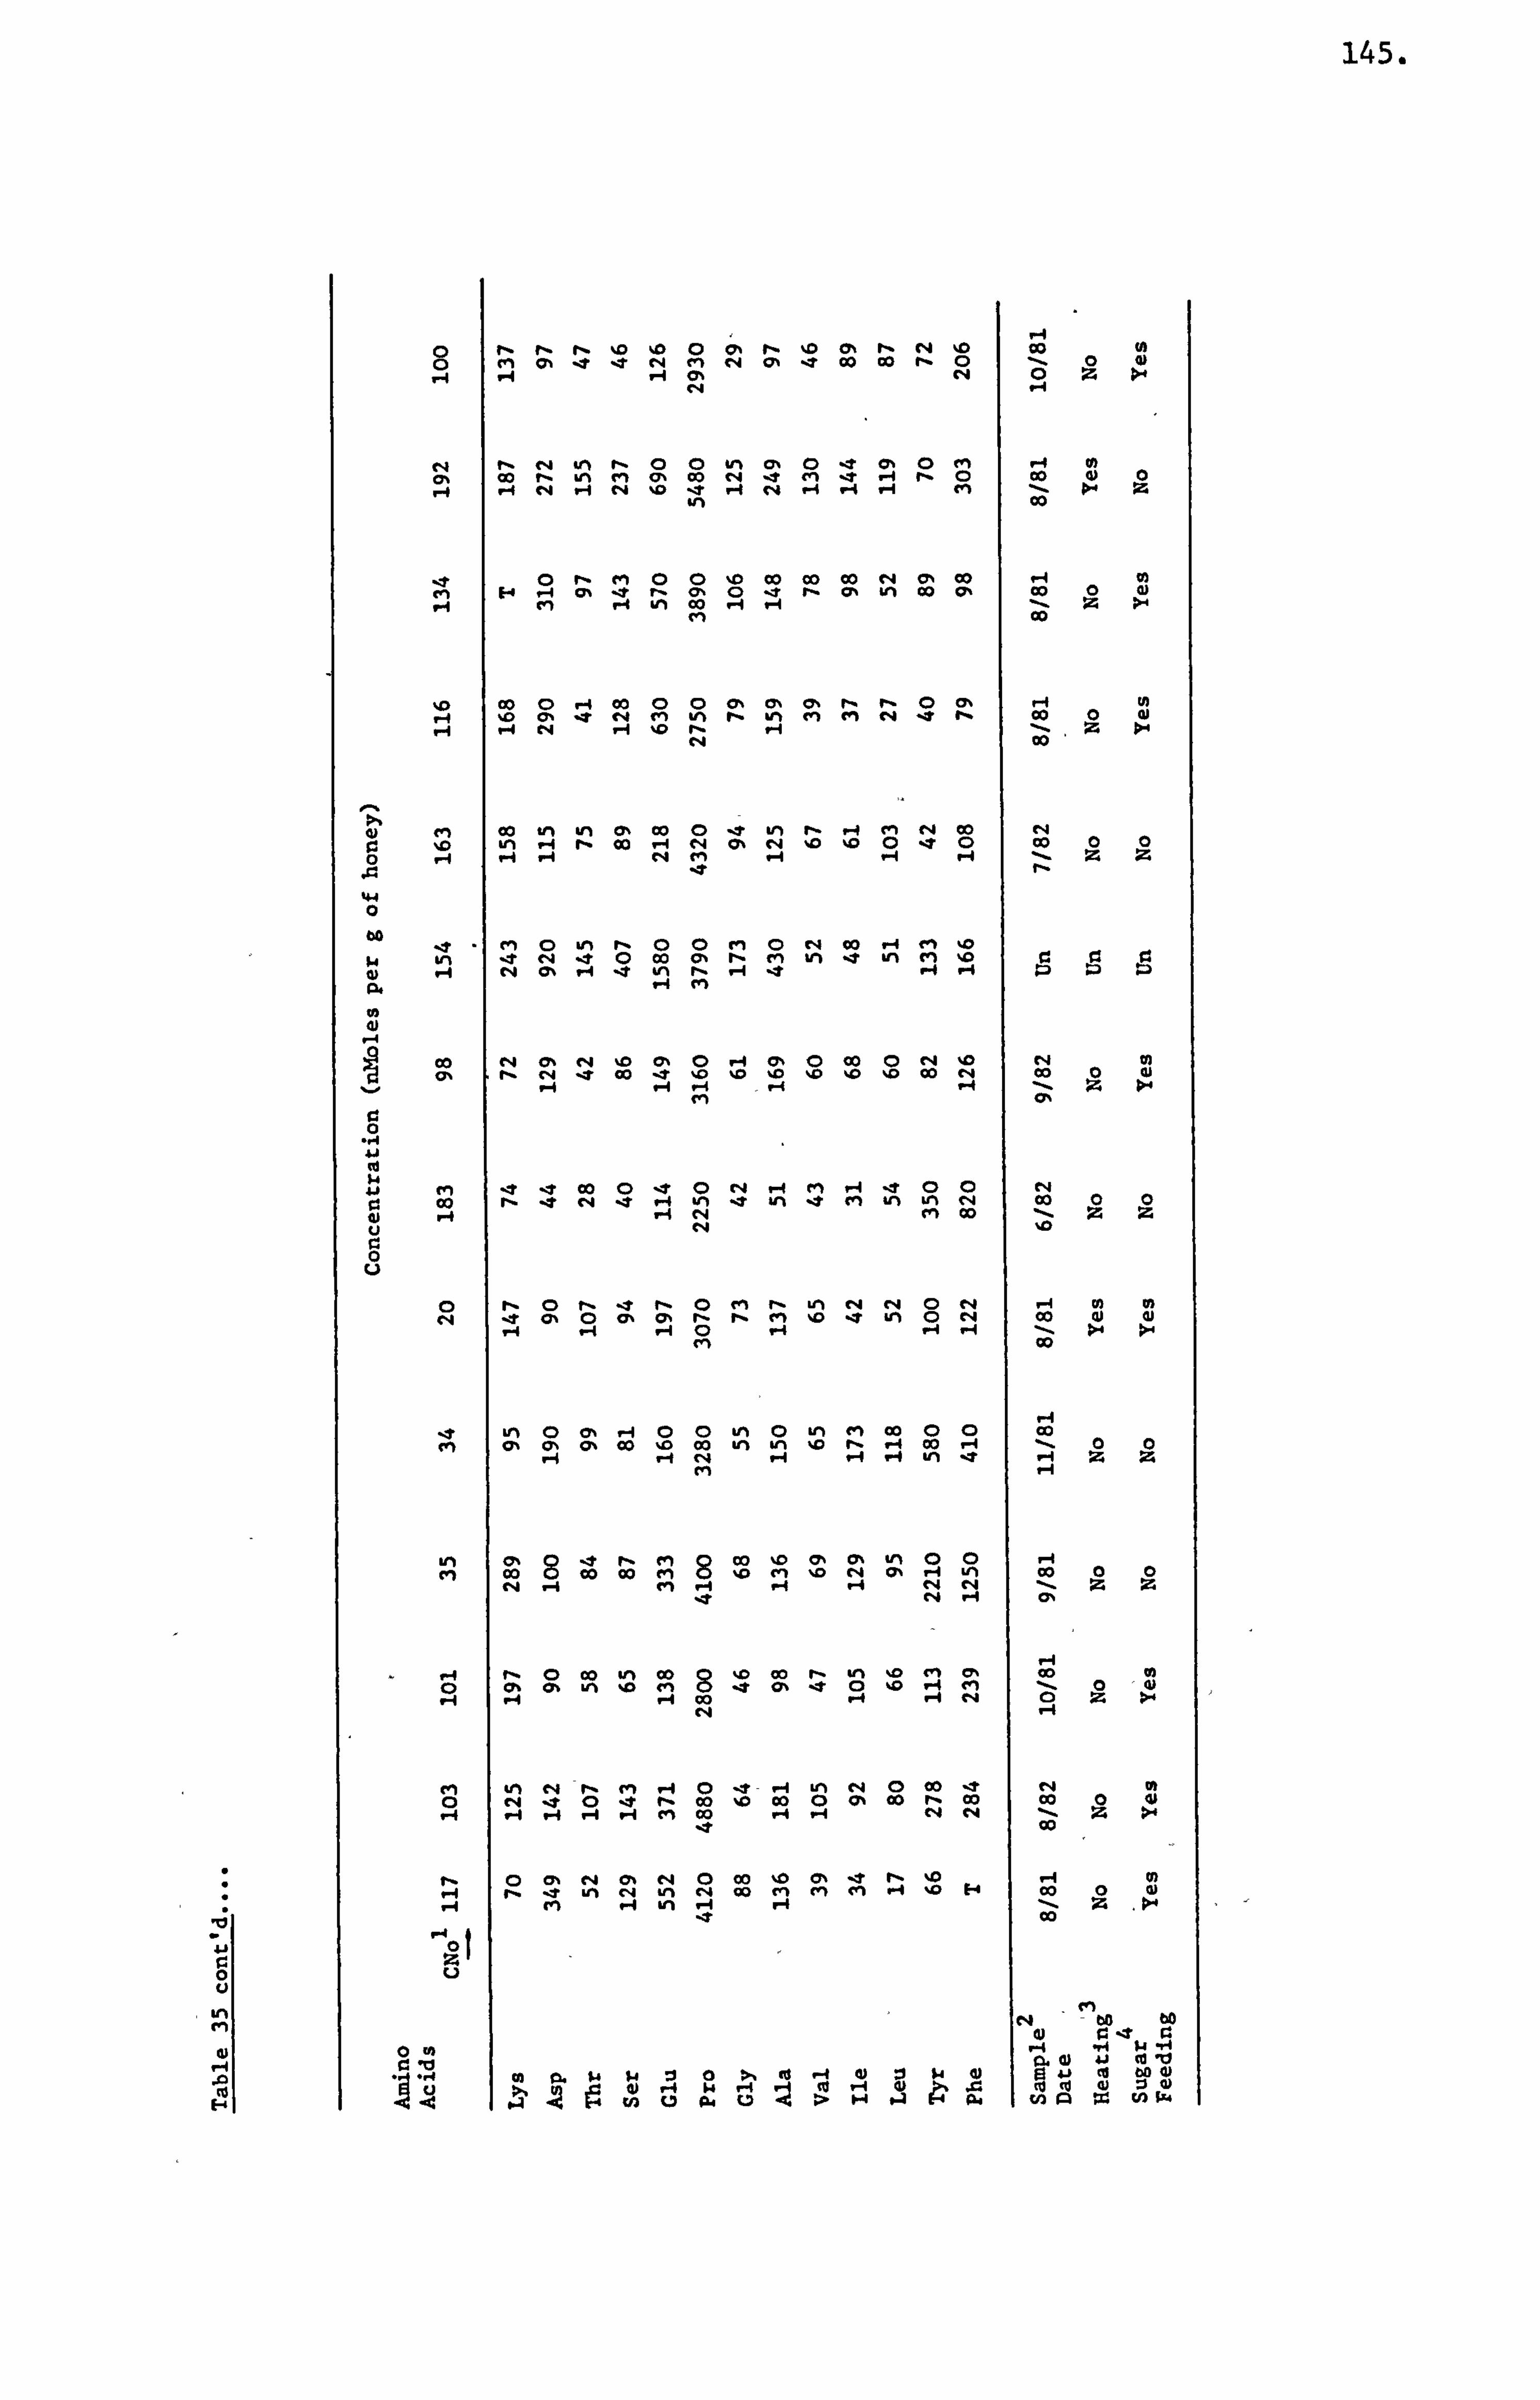
145.
-Ki
cm
a)
00 (ý rý o cy, r, r4 o 90 (A cm Ch ýT 't r4 tn c4 0% 17 Co Co r- 00 4)
(Y, 0Z: c4
c4 rý tq vlý r- 0 ult CA 0% 0 CM 1.4 0) CY, 00 rý Ul% ri v% Co c4 11 tn 't ý4 rý 0 Co Q) 0 ,f ý4 c4 "f C, 4 %0 't -t C, 4 ý4 ýi "l cm >- Z
ul 00
le 0 r. ein 00 %D Co Co Co t4 0% Co H Co (Y, 0 11 rý 0% kn 00 0 (L)
%D Co 04 00 00 Ch c> CY, rý r, 01 T" tn tn rý Uli m cm r4 ýT Co 0 c4 H ýD r- 14 Z
C. A Co
M co trt ul Cl% Co 0 ý& LM rý 1-4 cn Co e4
0 %D Ln 4 r. Co A c4 CY% rq 0 %0 0e0 Co 00 0
44 0
11 - ri 0 ulý r- 00 ri 0 r4 00 ýI f" 10 Ul tA10 Co cy, r- cm in -4 wi ri 0 ". 4 c4 (: AJ in rý -4 1 1-4 1.4
Co 0% r4 ID 0% 0 ý4 C% 00 e4 ýo rq In (71 c4 17 00 ýT 10 ýo 10 10 ID 00 c4 Co 0
gd w
cm -4 11 cio 0 't 0 r4 H rm ý4 -2 00 rq
Co r. eA7 ý4 vi ýi In e cm in KM CN cýo 00 4) -f H r4 m Co ZZ
c 0 u
0 rý 0 fl -4 f- 0 rm r- ým c4 e4 0 t4 ý4 ei U) c4 't 01 0 CA 0% r- rý t" %D e LM 0 e4 00 w di
1-4 -4 1. -1 C -4 14 14 >ý >ý M 90
le LM 0 0% H00 LA 0 LM cn 00 00 OD 0, cy, Co 0 00 bri tn D rý ý4 00 -4 00
c4 In 17
In 0% 8er, cm 8 Co ID (71 0% trN 00 11 cm 00 Co 00 ein 10 t" 10 e4 CM 14 V) Co e14
-f fl 0 Co Km Co 80 00 rý en 0 cy, 0
ei 0 Ch 0% ýn 10 M ýt (2% e0 ýc en (1)
tm e4 rý m -1 0 ýe "4 LM cla 0 05 -e r4 0) 0 e4 11 0 't r- Co %0 Co 0 Ch 00 r- Cla Co 4)
f- 0 (: cq 0% eq 0 00 %0 cm ýt r, 0 ýA 0) ým cq ýn c4 Co el m «1 0 00
Ln 00
0 Z
cm
0) ae r 0 U) -i HM ýi
-Ki 4) 41 0 lu s4 t4 :30 >% tu 41 Co bo 4)
0 "4 w 't . te "-1 0 r. e0v :10
A ý4U . 2ý .2 19 ta 0 sä. Uý>H4 c--4 0. cn p= U) w
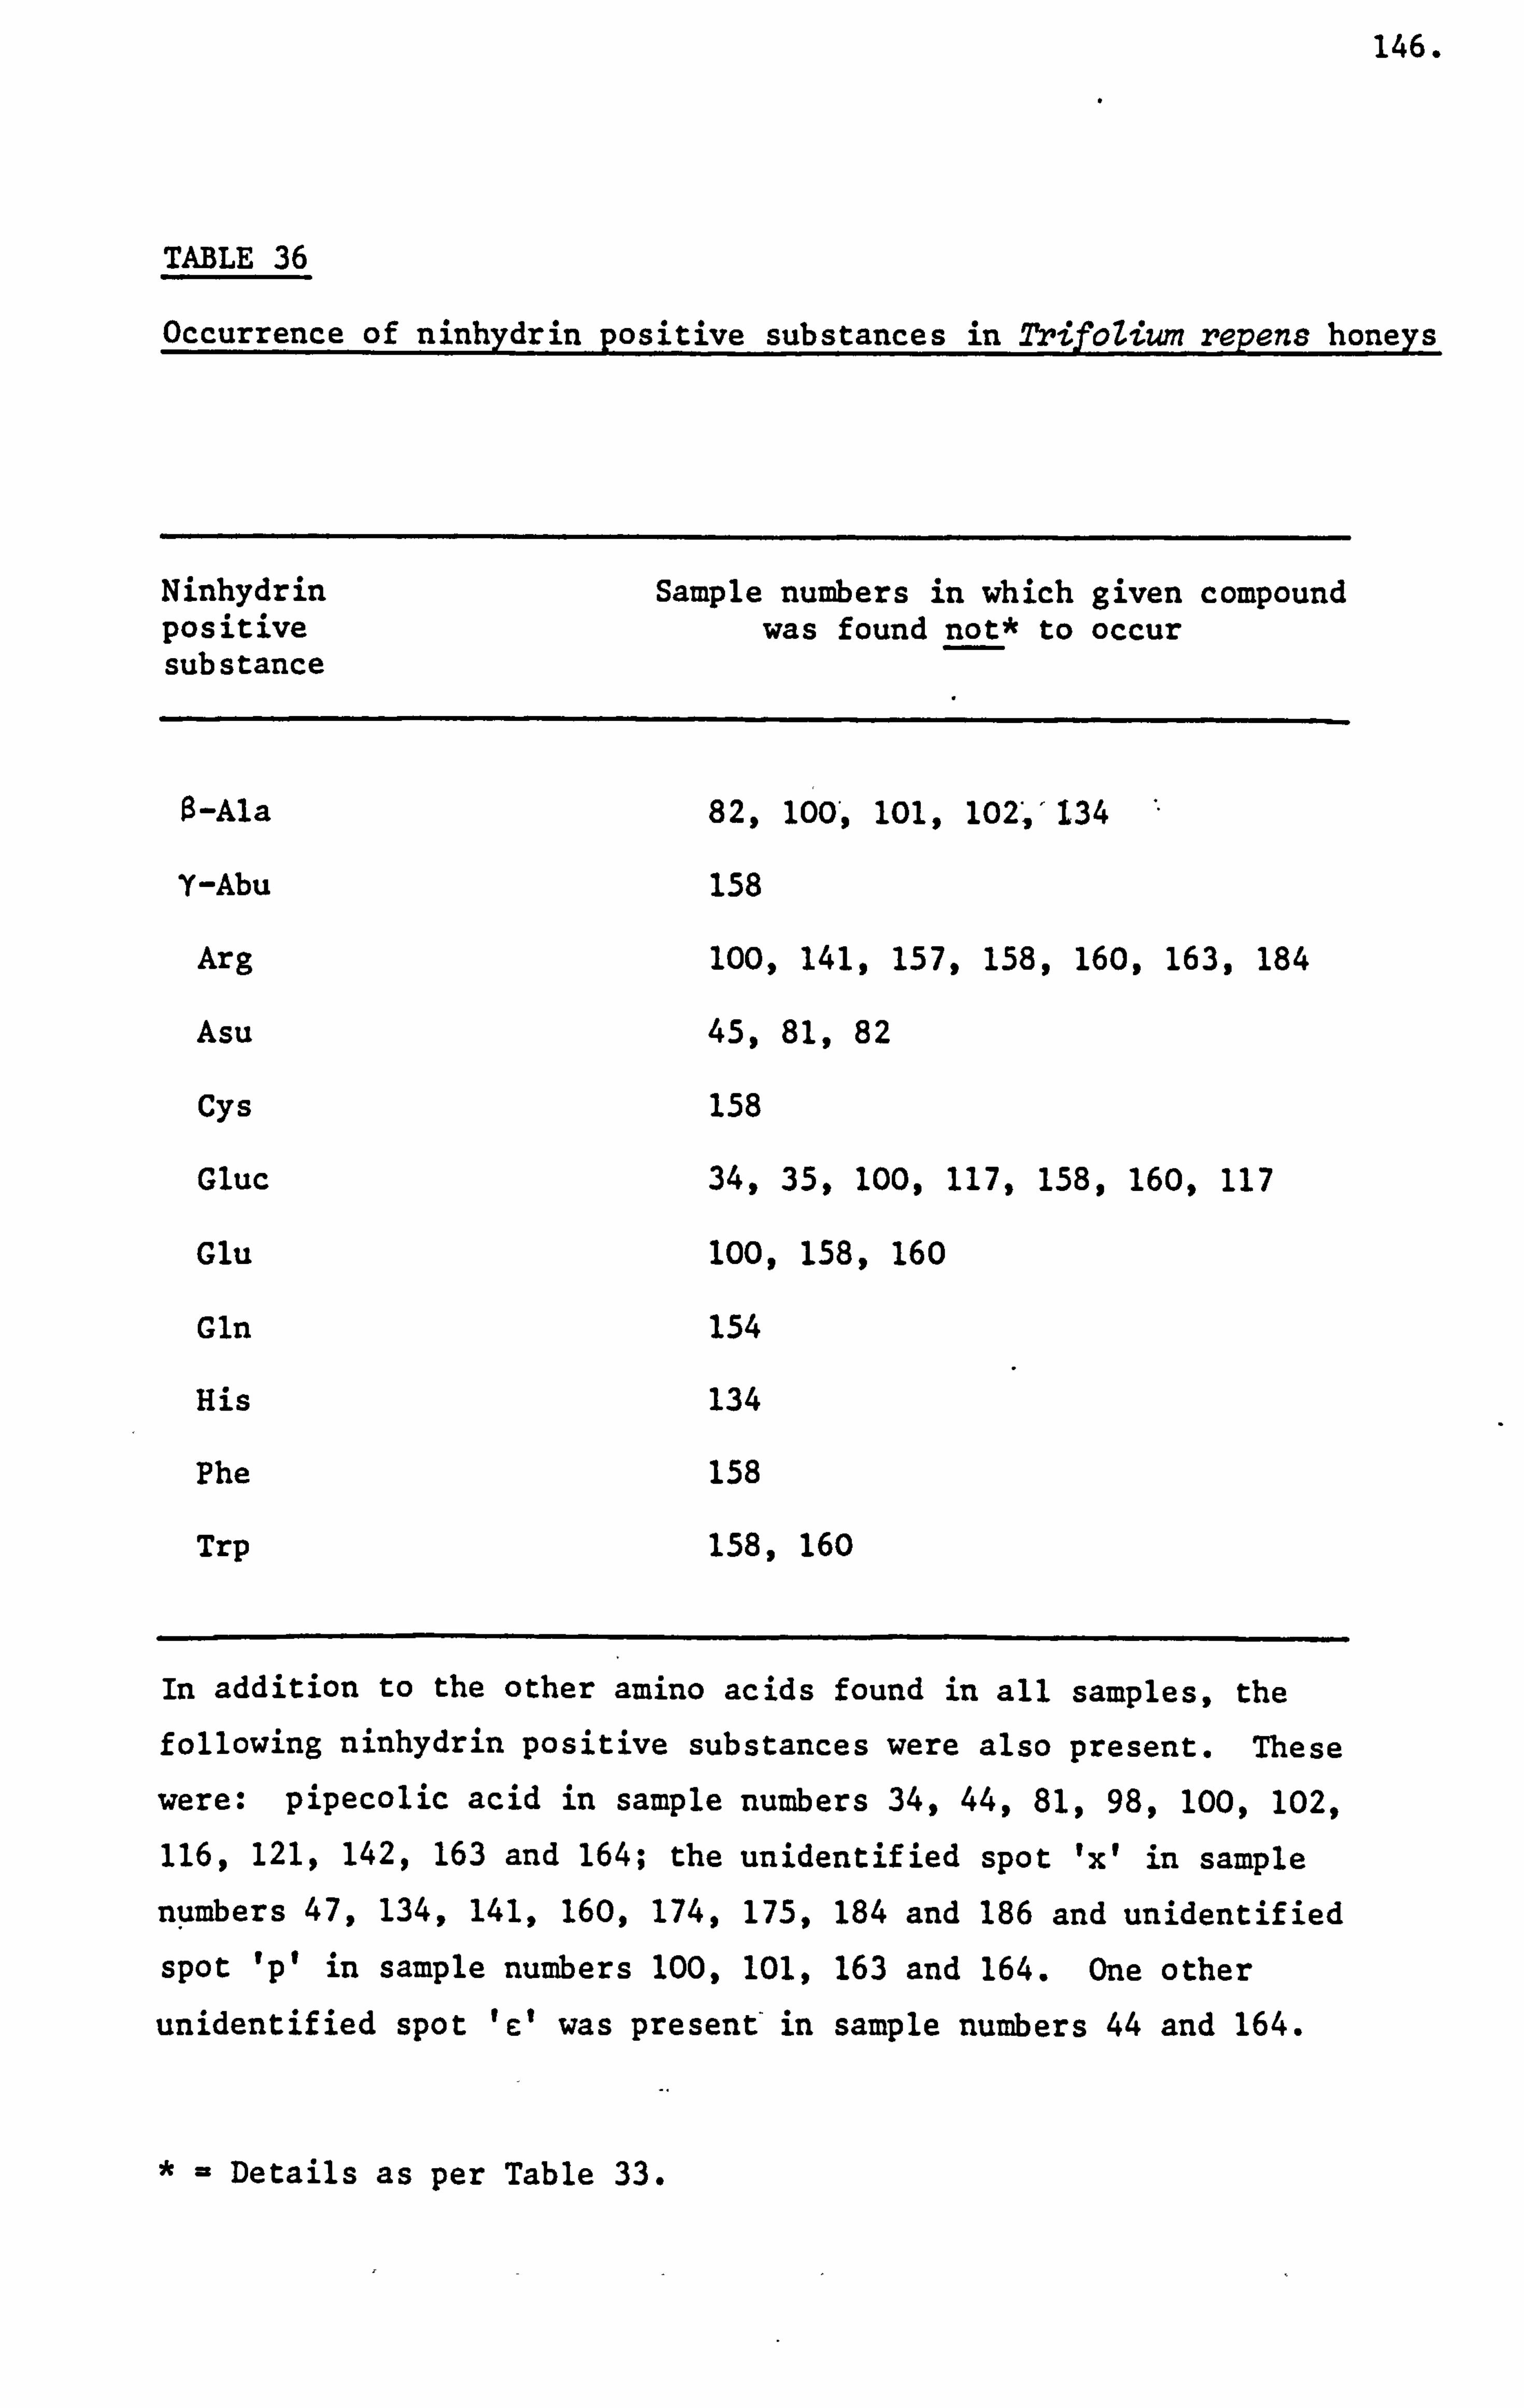
146.
TABLE 36
Occurrence of ninhydrin positive substances in TrifoZium repens honeys
Ninhydrin Sample numbers in which given compound positive was found not* to occur substance
$-Ala 82,100', 101,102'g'134
Y-Abu 158
Arg 100,141,157,158,160,163,184
Asu 45,81,82
Cys 158
Gluc 34,35,100,117,158,160,117
Glu 100,158,160
Gln 154
His 134
Phe 158
Trp 158,160
In addition to the other amino acids found in all samples, the following ninhydrin positive substances were also present. These
were: pipecolic acid in sample numbers 34,44,81,98,100,102,
116,121,142,163 and 164; the unidentified spot IxI in sample
numbers 47,134,141,160,174,175,184 and 186 and unidentified
spot 'p' in sample numbers 100,101,163 and 164. One other
unidentified spot 'E' was present-in sample numbers 44 and 164.
*- Details as per Table 33.
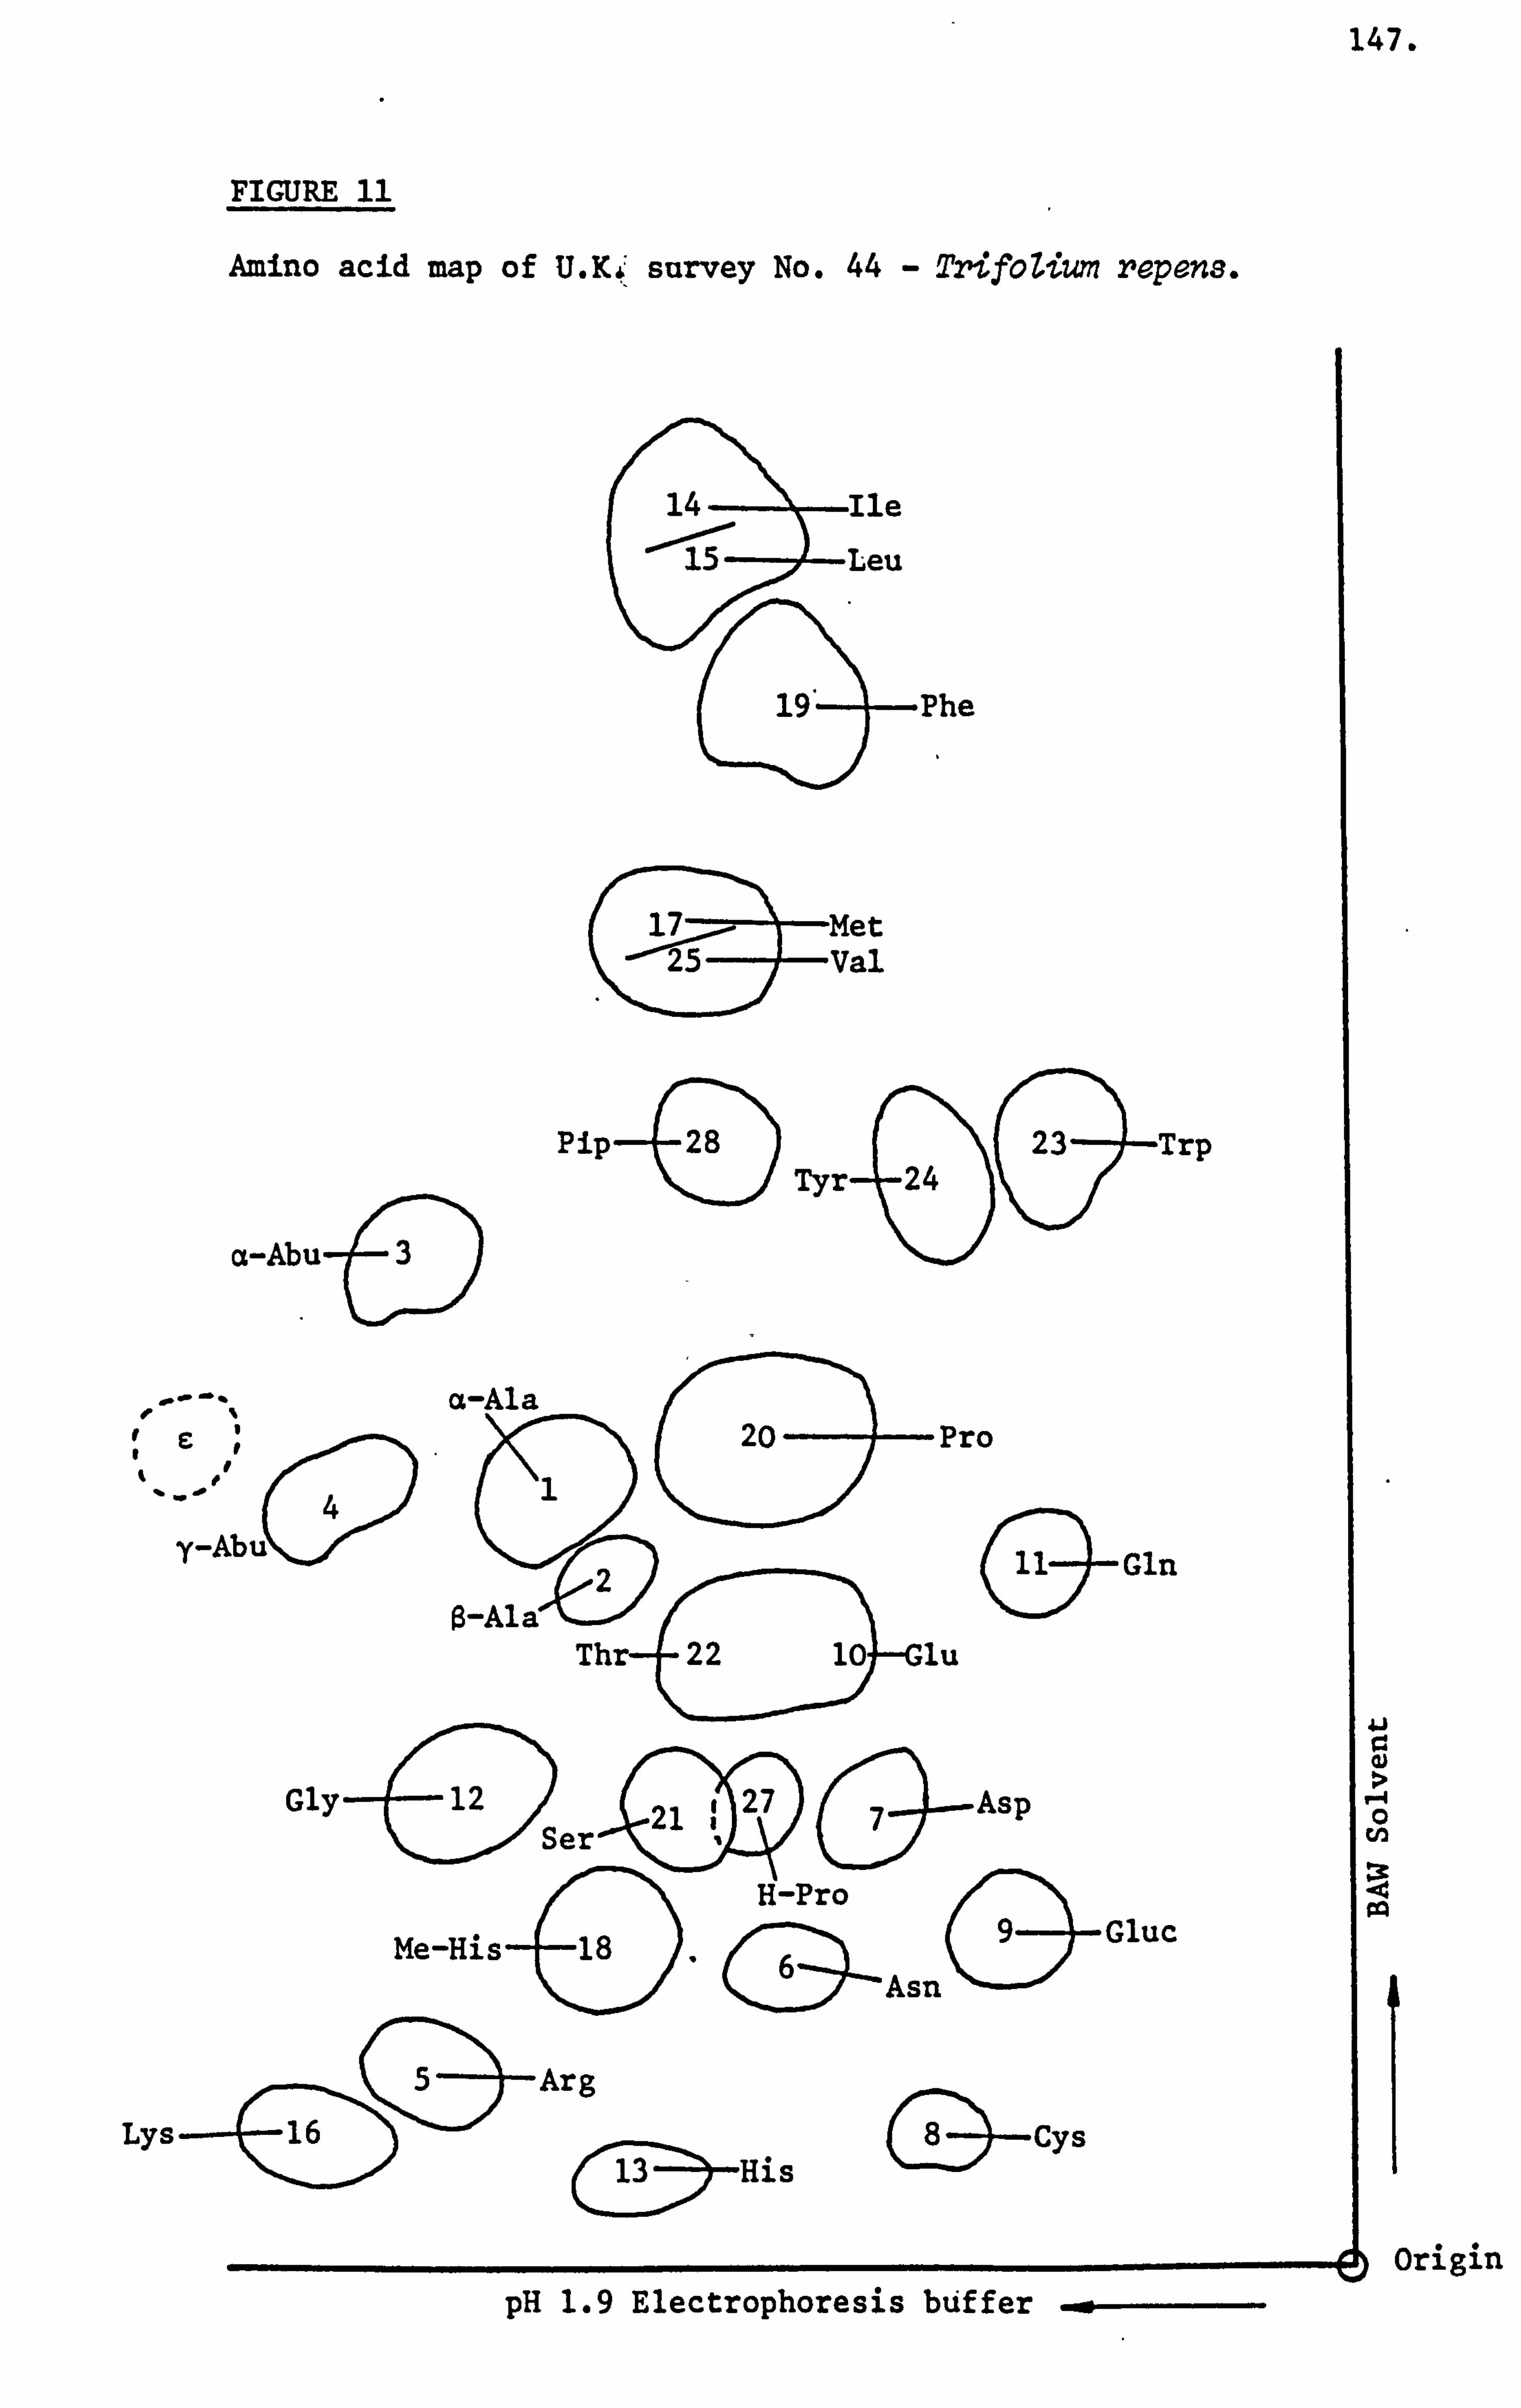
147.
PTr. TTRV. 11
Amino acid map of U. K+' survey No. 44 - Trifotium repens.
14 Ile 15 Leu
19 Phe
JL i -riet -Val
a-Abu-0
P: Lp--e Tyr- 24
) &23Trp
e
y-Abu
U
i Gly- 12 27 G-Asp
-21 Ser H-Pro
Me-His 18 Asn
&
Gluc -G) (SL-
5 Arg
Lys 16 Gý--Cys
-6 (EýýHis
20 Pro
&Gln
U
w
�-4 0
ý1:
origin pH 1.9 Electrophoresis btiffer -
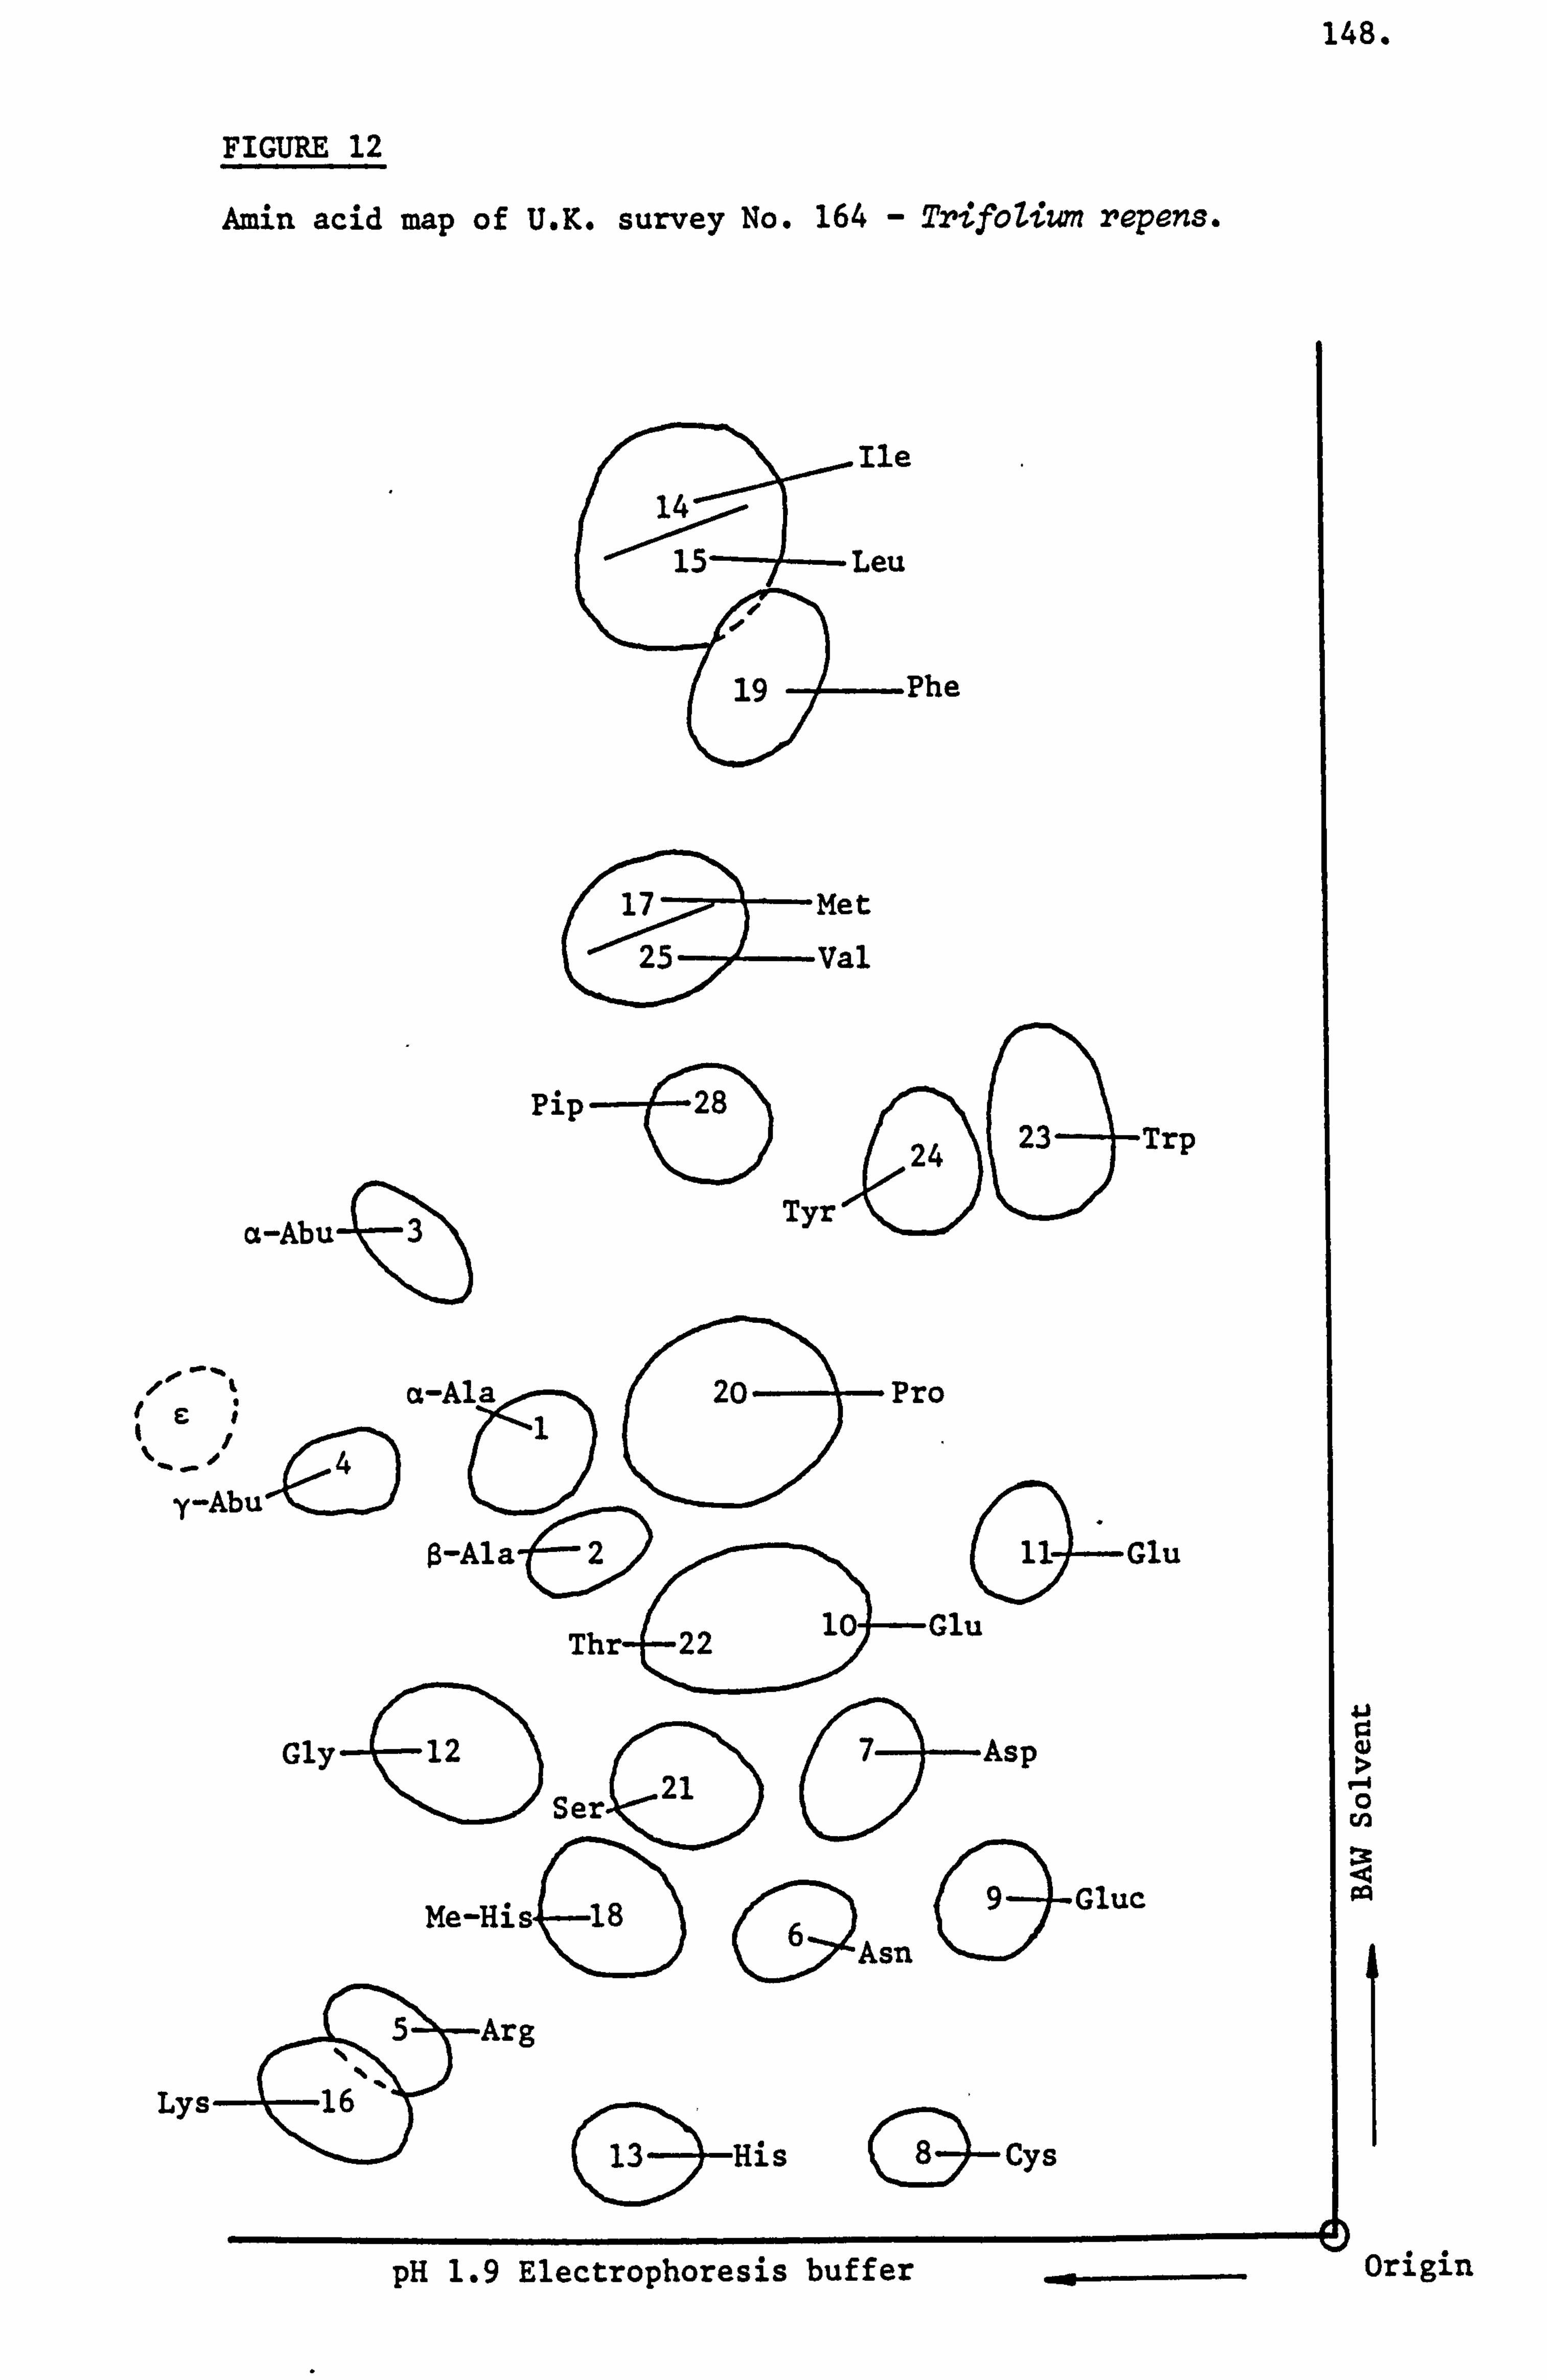
148.
FIGURE 12
Amin acid map of U. K. survey No. 164 - TrifoZium repens.
Ile 14
-ýl ý5
Leu
19 4 Phe
a-Abu4
Met
-Val
pip ( f)
24
923-Trp
Tyr
e
1. e t a-Ala 2o- Pro F-
y-Abu ß-Alal 2 G* Glu
aAsp Gly 4 12 C21 7
Ser.
5 Arg
T Lys
Thr_(ýýGlu
His Gý-Cys
Me-His 18 Asn
&Gluc
0)
cn m
pH 1.9 Electrophoresis buffer origin
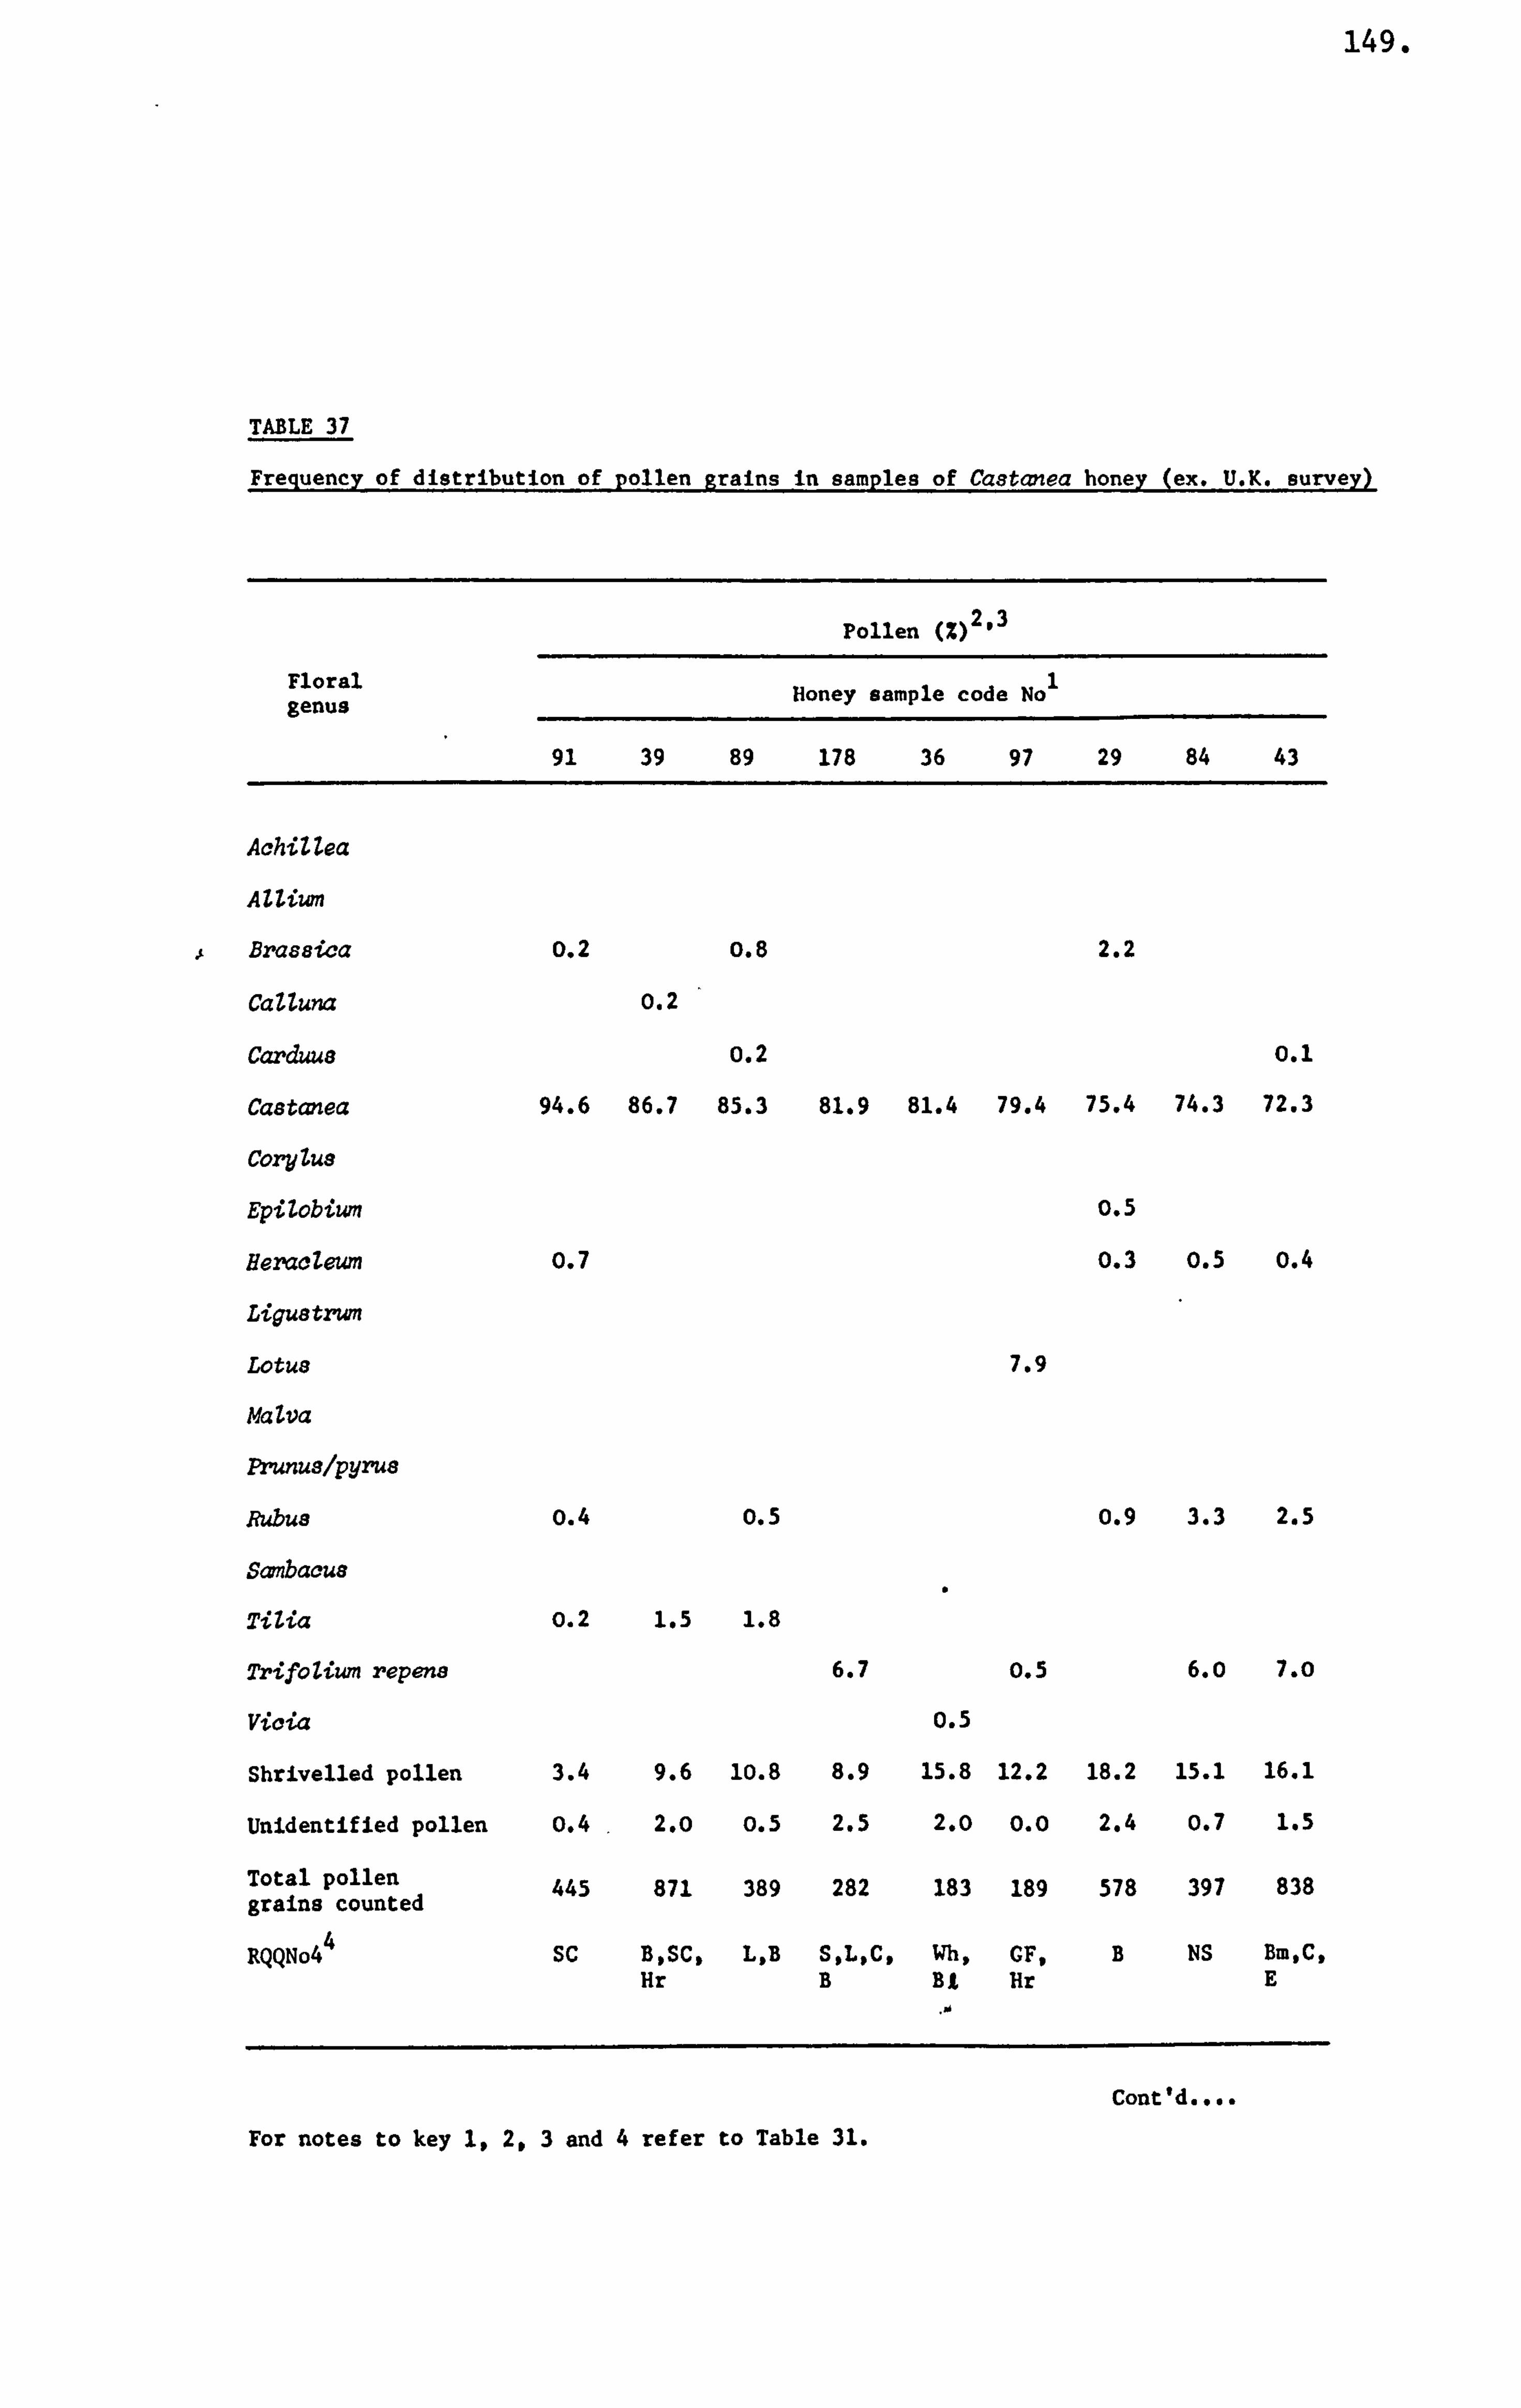
149.
TABLE 37,
Frequency of distribution of pollen grains in samples of Castanea honey (ex. U. K. survey)
Floral genus
Pollen %213
Honey sample code No
91 39 89 178 36 97 29 84 43
AchiZZea
AlZiwn
Brasaica o. 2 0.8 2.2
CaUuna 0.2
Carduue o. 2 0.1
Castanea 94.6 86.7 85.3 81.9 81.4 79.4 75.4 74.3 72.3
CoryZue
Epilobiwn 0.5
HeracZeum o. 7 o. 3 0.5 o. 4
Ligustrwn
Lotus 7.9
Malva
Prunualpyrus
Rubus o. 4 0.5 0.9 3.3 2.5
Sanbacus
Tilia o. 2 1.5 1.8
Trifolium repens 6.7 0.5 6. o 7. o
Vicia 0.5
Shrivelled pollen 3.4 9.6 10.8 8.9 15.8 12.2 18.2 15.1 16.1
Unidentified pollen 0.4 2. o 0.5 2.5 2.0 0.0 2.4 o. 7 1.5
Total pollen 445 871 389 282 183 189 578 397 838 grains counted
RQQNo4 4 SC B, SCO L, B S, L, C, Wh, CF, B NS Bm, C,
Hr B BA Hr E
Cont'd....
For notes to key 1,20 3 and 4 refer to Table 31,
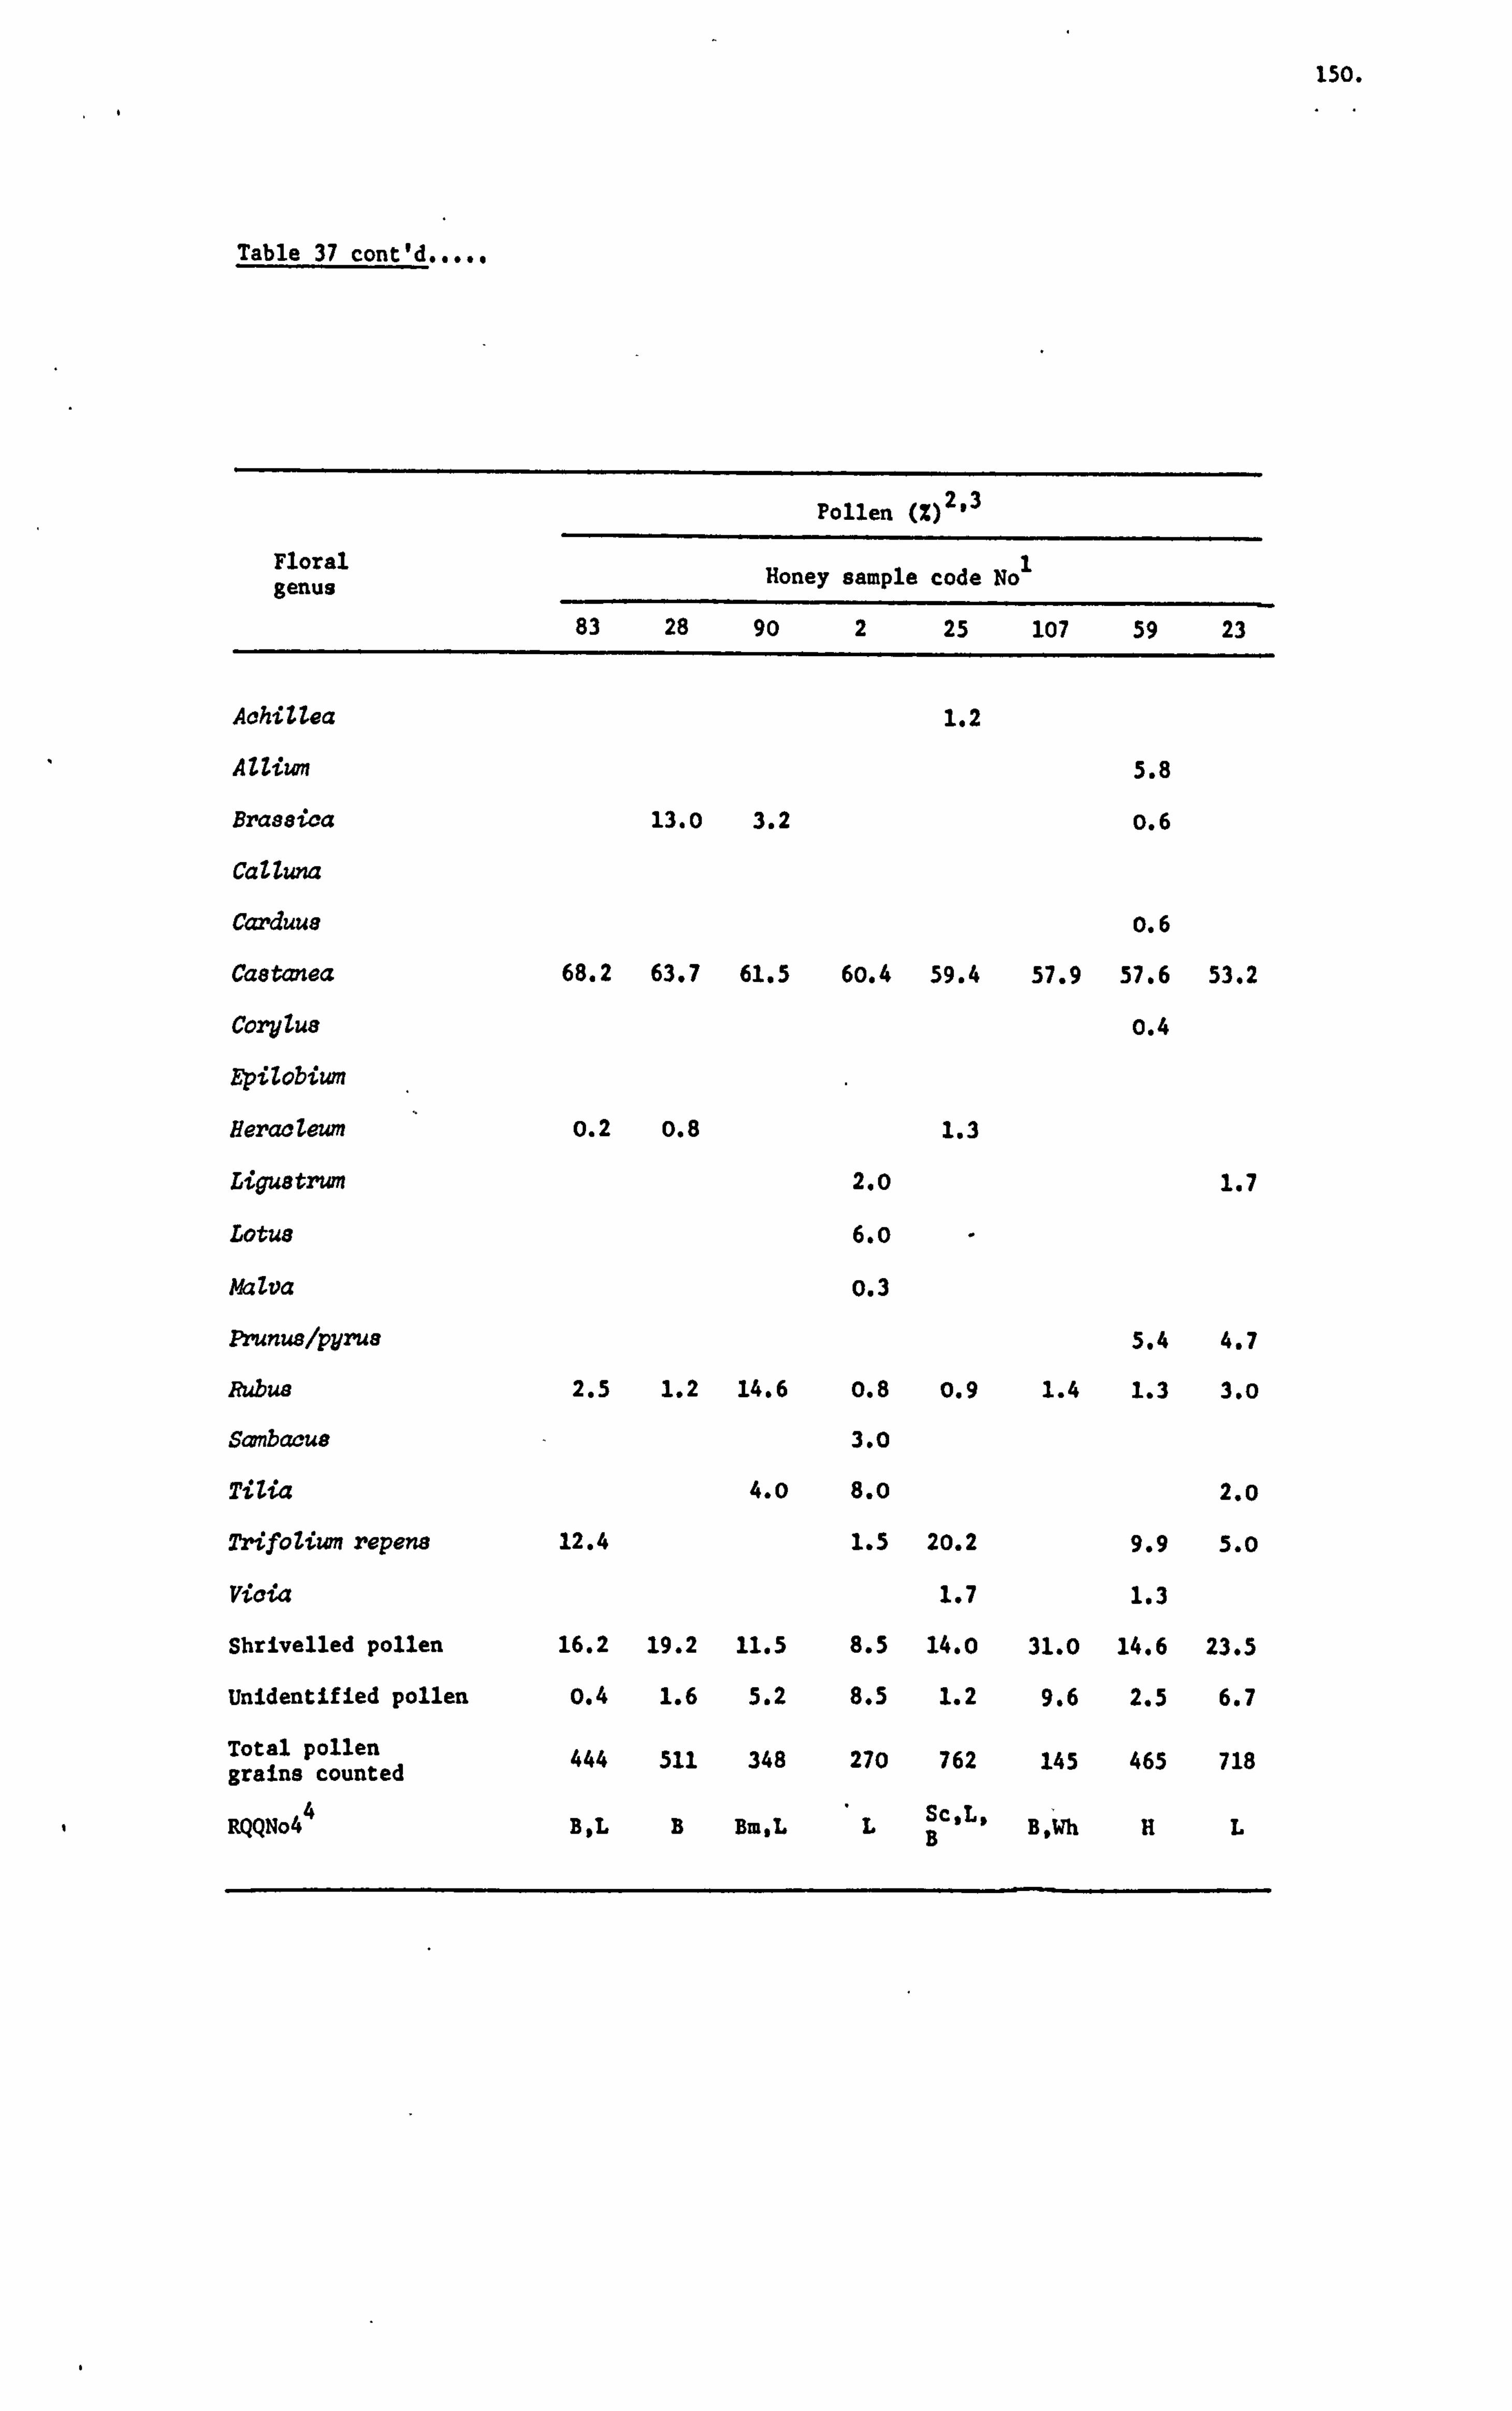
150.
Table 37 cont'd
Pollen (Z) 2,3
Floral Honey sample code No genus 83 28 90 2 25 107 59 23
AchilZea 1.2
AZZiwn 5.8
Braseica 13.0 3.2 o. 6
CaZIuna
Carduue 0.6
Ca8tanea 68.2 63.7 61.5 60.4 59.4 57.9 57.6 53.2
Corylus o. 4
Epilobium
Heraclewn o. 2 M 1.3
Liguatrum 2.0 1.7
Lotus 6. o
MZva o. 3
Prunue/pyrus 5.4 4.7
Rubua 2.5 1.2 14.6 M 0.9 1.4 1.3 3. o
S=bacue 3.0
TiZia 4. o 8. o 2.0
TrifoZiwn repena 12.4 1.5 20.2 9.9 5. o
Vicia 1.7 1.3
Shrivelled pollen 16.2 19.2 11.5 8.5 14. o 31.0 14.6 23.5
Unidentified pollen o. 4 1.6 5.2 8.5 1.2 9.6 2.5 6.7
Total pollen 444 511 348 270 762 145 465 718 grains counted
RQQNo4 4
B, L B Bm, L L Sc, L, B B, 'Wh H L
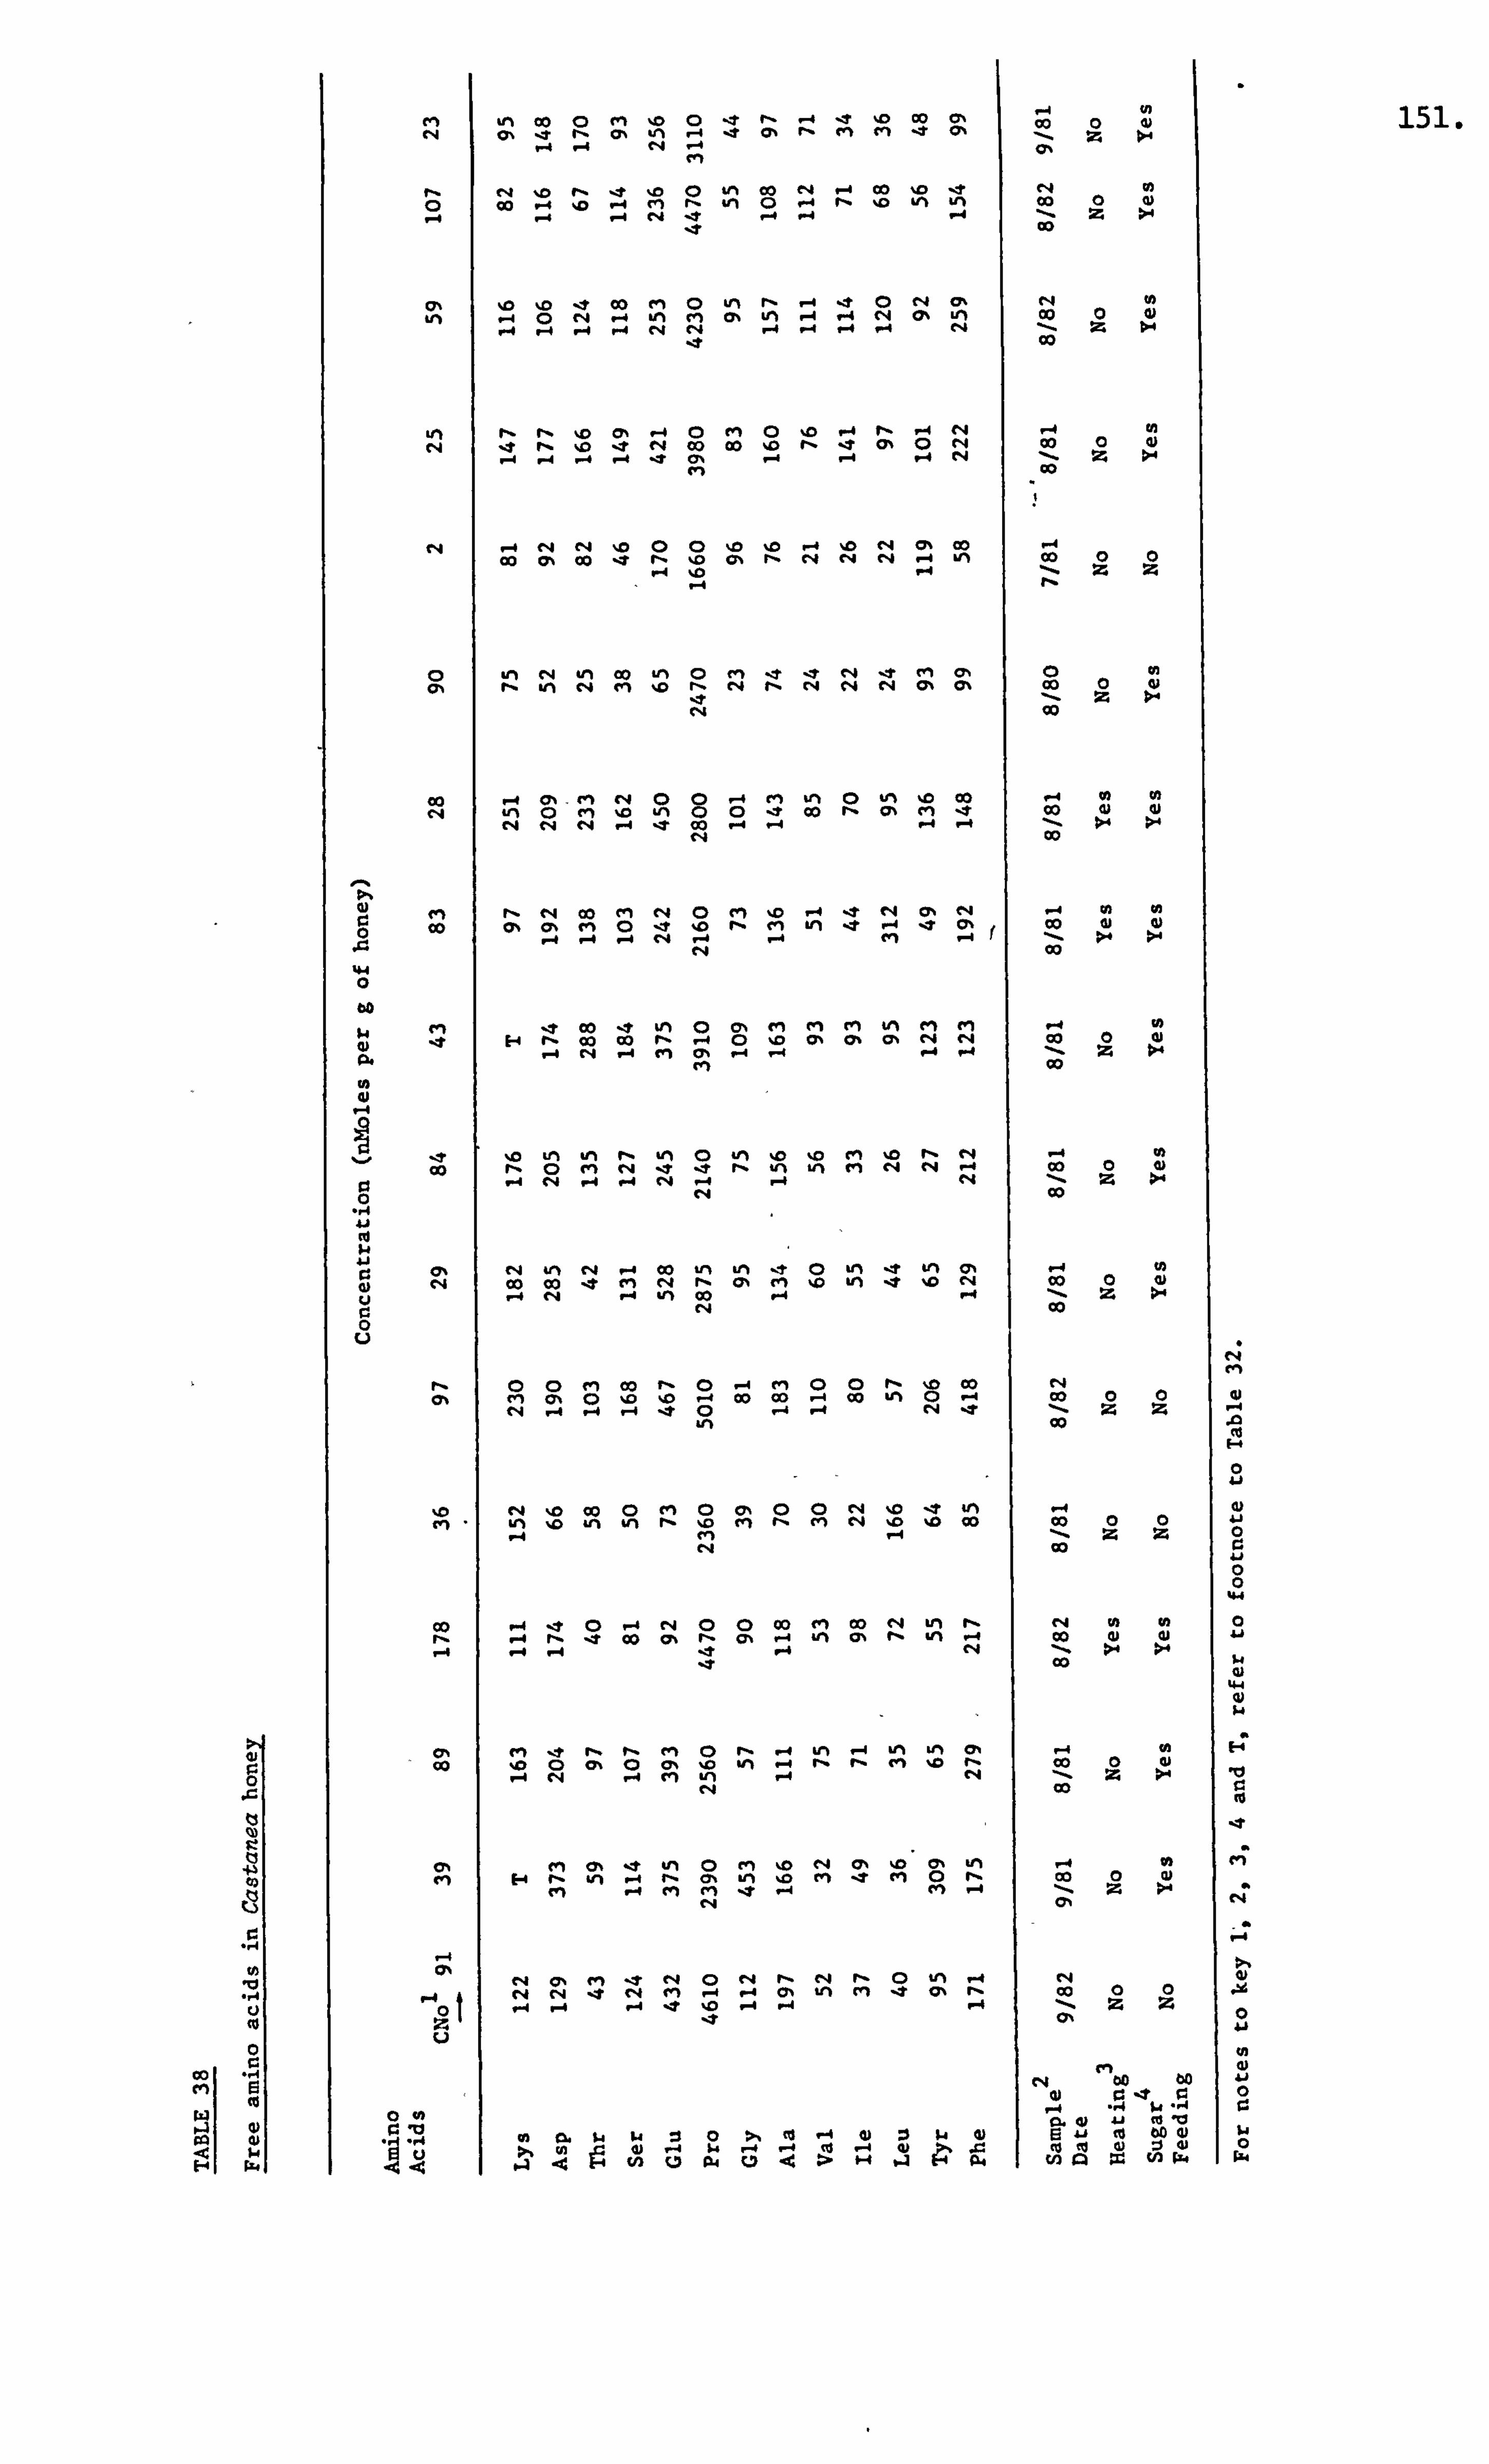
ei Vl% rm 10 0 't f- -4 le 10 00 tr, ý4 Co 0
0 0)
r4 o, CYN In l t Ch rý m t" ýT (: ý Z
" 10 r, 't 10 0 U», Co e4 ýd CO 10 't 0 00 -4 0 1 CM r, irl C) ý4 rý 10 4n Kn Co 0 0)
Z >4 Co
0% %D 11 Co ein 0 LM r, -4 11 0 r4 t> r4 9)
in 4 r4 ý4 w% pl cl% LM ý4 4 t4 0% wl Co 0 0
14 -4 ý4 ýd t4 " ý4 14 ý4 A Z >4
.t
0 cm 0
Co Co 10 r- -7 ,4 4 ý -4 ý7 (21 -4 "4 r4 Z >4
ri Co
f4 ý4 f4 r4 %0 0 0 10 10 -4 10 c4 cn Co ý4 cla CYN Co 17 10 CA r, e4 t4 cýJ -4 ým Co
10 ýd Z Z
qi
C, 4 Co
00 ý-4 Ch - t" cli 0 0 -4 m V) 0 U'% 10 00 -4 0) 01
e4 r% 0 en 0 ýn 0 0 t co r- Ch el 't Co cu qi c4 rq c4 ý4 IT Co ý4 -4 -f ý-4
cq 00
a r, rq 02 cm e4 0 M ID -4 't f4 CIN c4 -4 in 0 0 Co (2% Ch e% 0 le ýD r- en LM 't ý4 i CY, f 00 0) 0
w M 't Co 11 tn 0 cý ri cm cm tm m cm -4 0
4) 11 E-4 r- Co 00 rý --4 0 0 (71 ON 9% r4 C-4 Co P. ". 4 r4 "4 4n (3% .4 4 14 ý4
cn Co
e , Co '. rý , 0 , m , " -M 17 0 IT
ulb rý
0 ýn
0 ýn
cm ri
0 "
r- e4
f4 ý4
0 0)
93 .4 c4 .4 ý-4 e4 ý -4 c4 Z >-
c4 Co
M gd 8- 41
(Y, C, 4 4m " .4 CO ým ým t 0 u, % t tn c% -4 0 ei Co Co 't cm " r- oý cm 10 LM 11 %D " 00
l 0 w
l Z :
0
0 0 ri 00 0 -4 g" 0 0 Co (> C" CY% 0 ID 10 ý4 Co Co ý4 Co U') 0 ý Co 0 0 0)
,4 4 "" -, *t c) ý4 -q r4 IT Z Z .n 90 0
10 r4 10 00 0 cm 0 0% 0 0 CI) , tn 10 ri ul% r, 10 en r, cm C, 4 10 10 W Co 0
0 (1) -1 Z Z e4 90
0 0
44
Co 0 lý N 0 0 M cm M 'N 'm (4 (4 U) 0 r- 17 Co CY% r, (71 "4 m cy% rý ýn Co Q) cu 41
44
>, gi CY, cm 't rý fl cm 0 r. -4 ult -4 ým U'% ON ý4 en E-r
- 0 ,
0% 0 0% 10 V
KM r- rý c9 %0 rý c4
00 0 0 -to C 4 ri i
Co 0 10
4 ti 3 cm en CY% t Ul 0 en 10 r4 C% 10 0%
c2 ri C. -4 r, kn ýI r, cy, ým 0 rn t en 0 r- 00 0 w
c4 CYN
th -ci
CY% c4 e4 cq r4 r- 0 trN ý4 c4
0 Ad ,4 " cq f4
4 fn
0 .4
4 CYN
4 tr) pl 17 0% r-
4 Co 1-1
0 Z Z
u ,
0 1.4 -4 ý 't 1 - ý - (A 0
Co Z 't -
Co cm
rz ., l Ei
M ÖD 60 0 I
ý4 .2 Itt- -ý 13
4) 00
0 w Z 0 fý 0) m
te M -0 bo 0
0 p4 0 4
151.
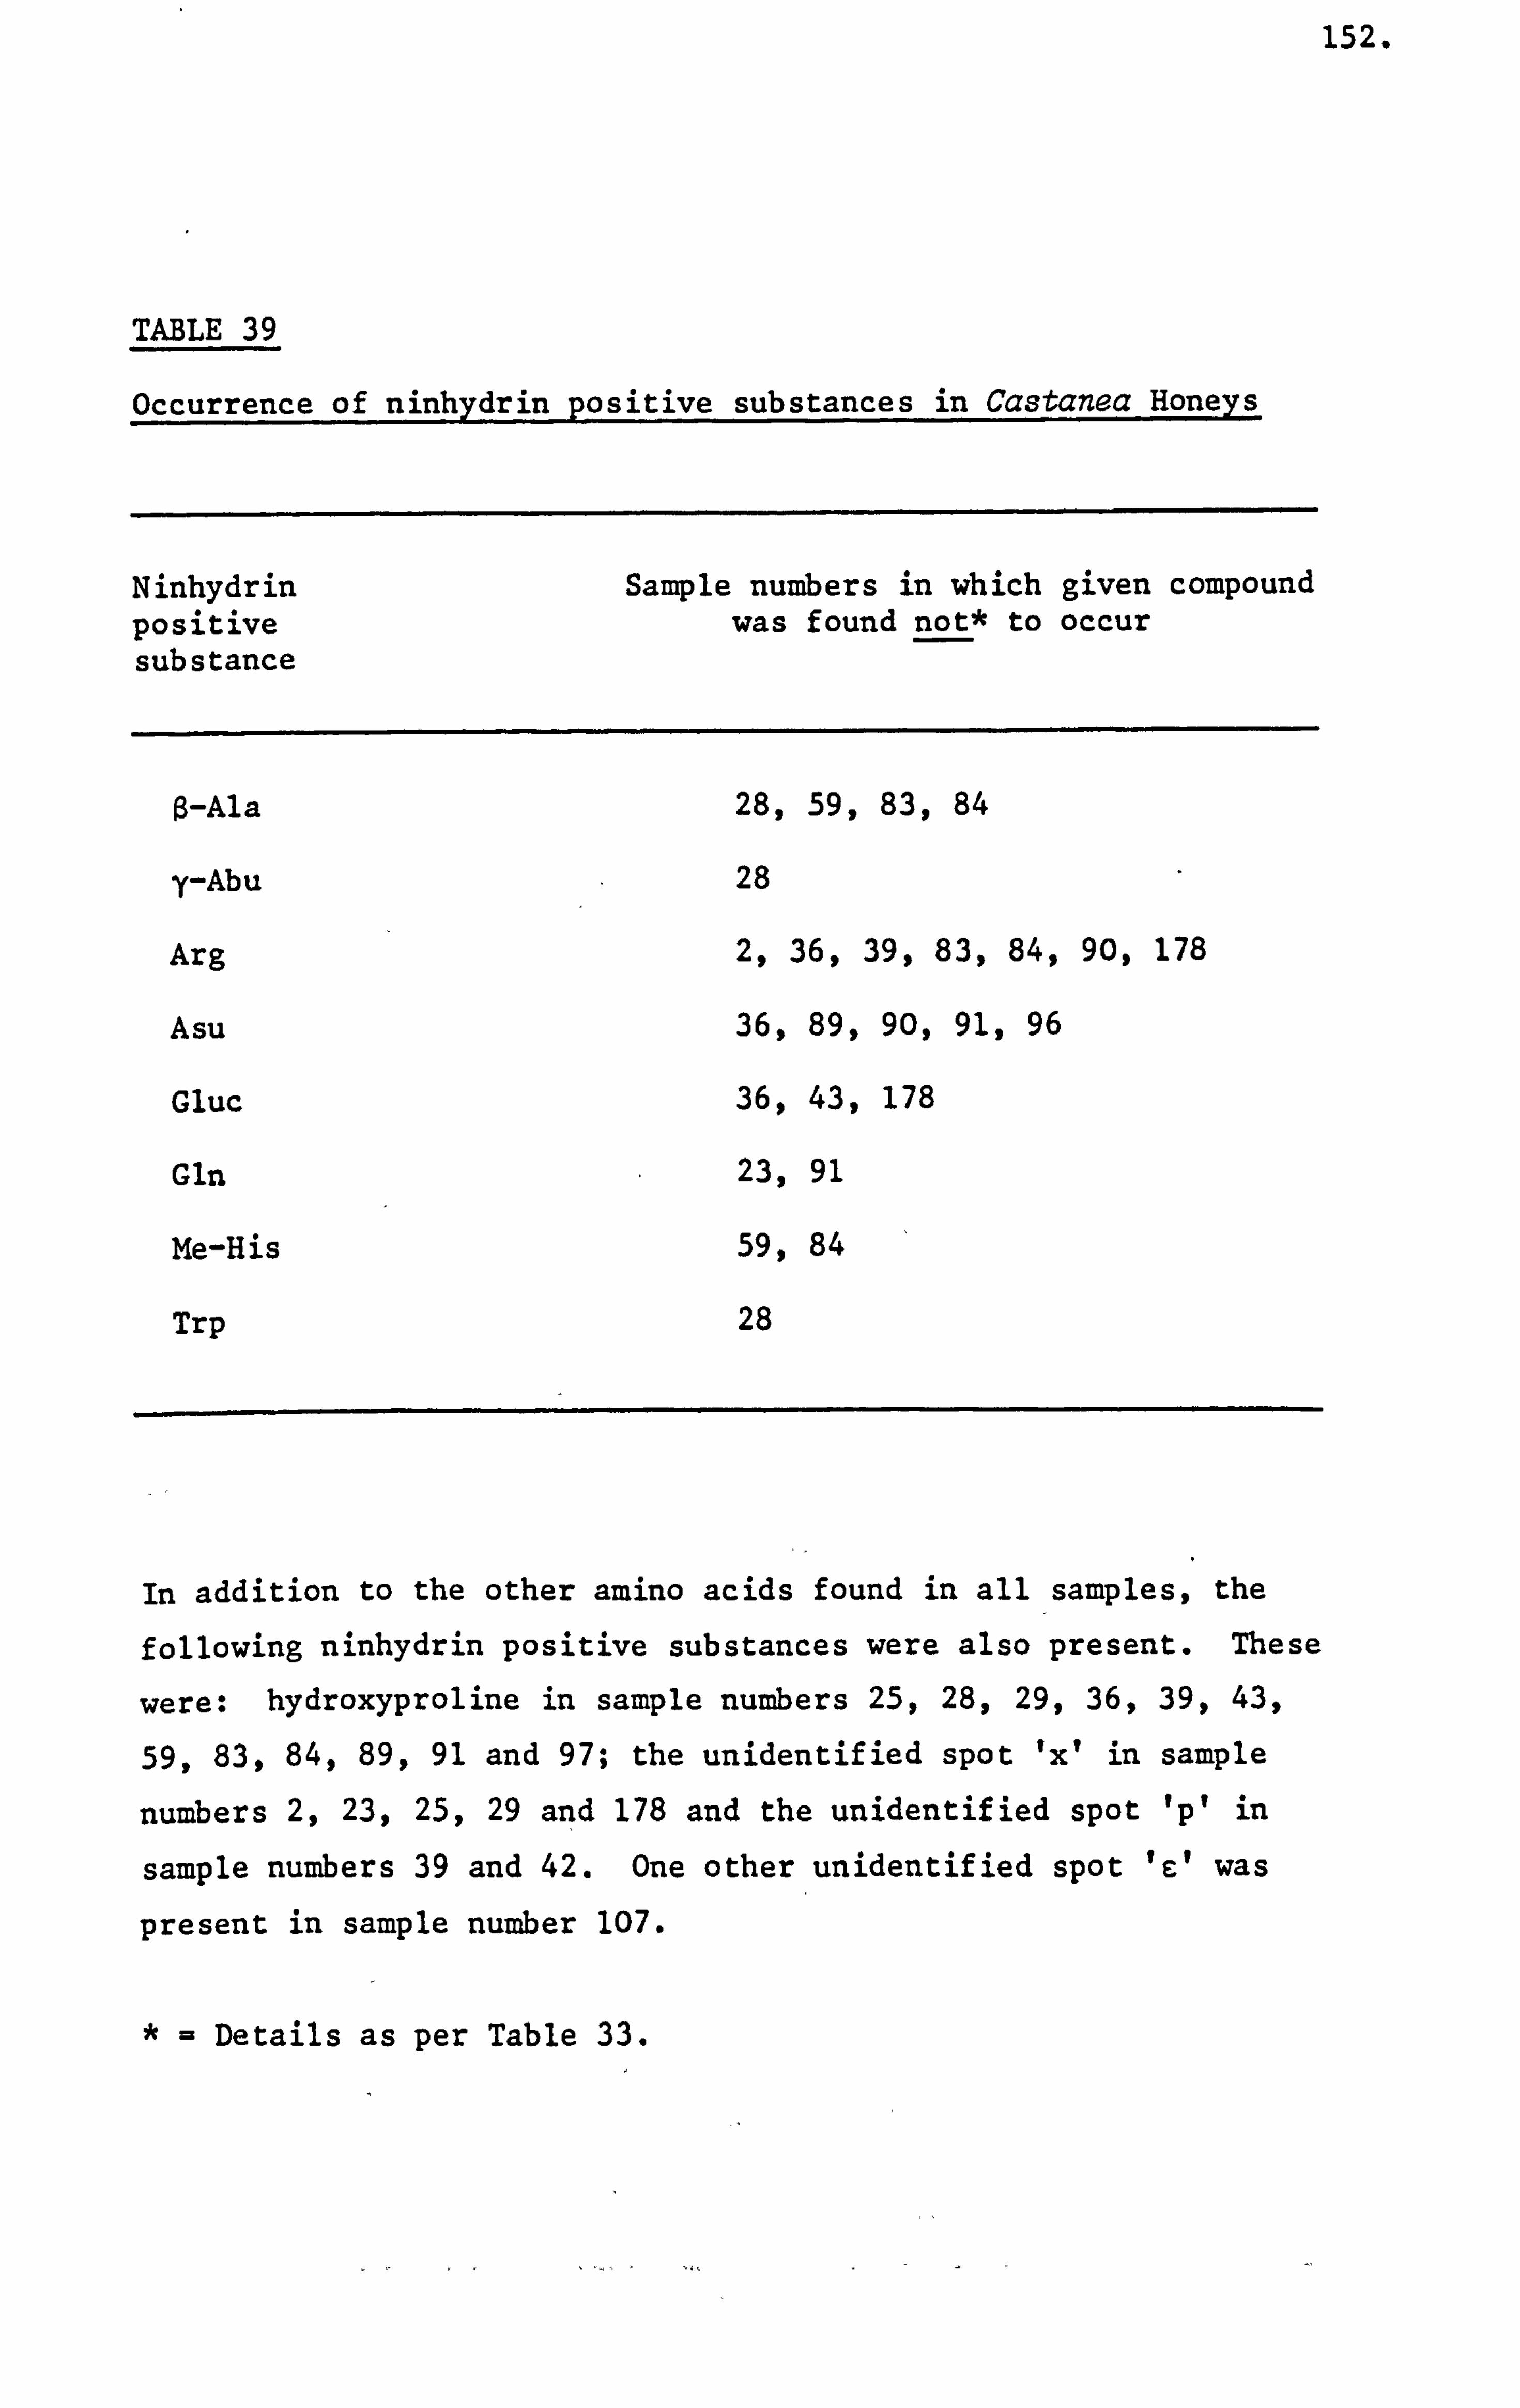
152.
TABLE 39
Occurrence of ninhydrin positive substances in Castanea Honeys
Ninhydrin Sample numbers in which given compound positive was found not* to occur substance
ß-Ala 28, 59,83,84
y-Abu 28
Arg 2, 36,39,83,84,90,178
Asu 36, 89,90,91,96
Gluc 36, 43,178
Gln 23, 91
Me-His 59, 84
Trp 28
In addition to the other amino acids found in all samples, the
following ninhydrin positive substances were also present. These
were: hydroxyproline in sample numbers 25,28,29,36,39,43,
59,83,84,89,91 and 97; the unidentified spot 'x' in sample
numbers 2,23,25,29 and 178 and the unidentified spot 'p' in
sample numbers 39 and 42. One other unidentified spot 'e' was
present in sample number 107.
*= Details as per Table 33.
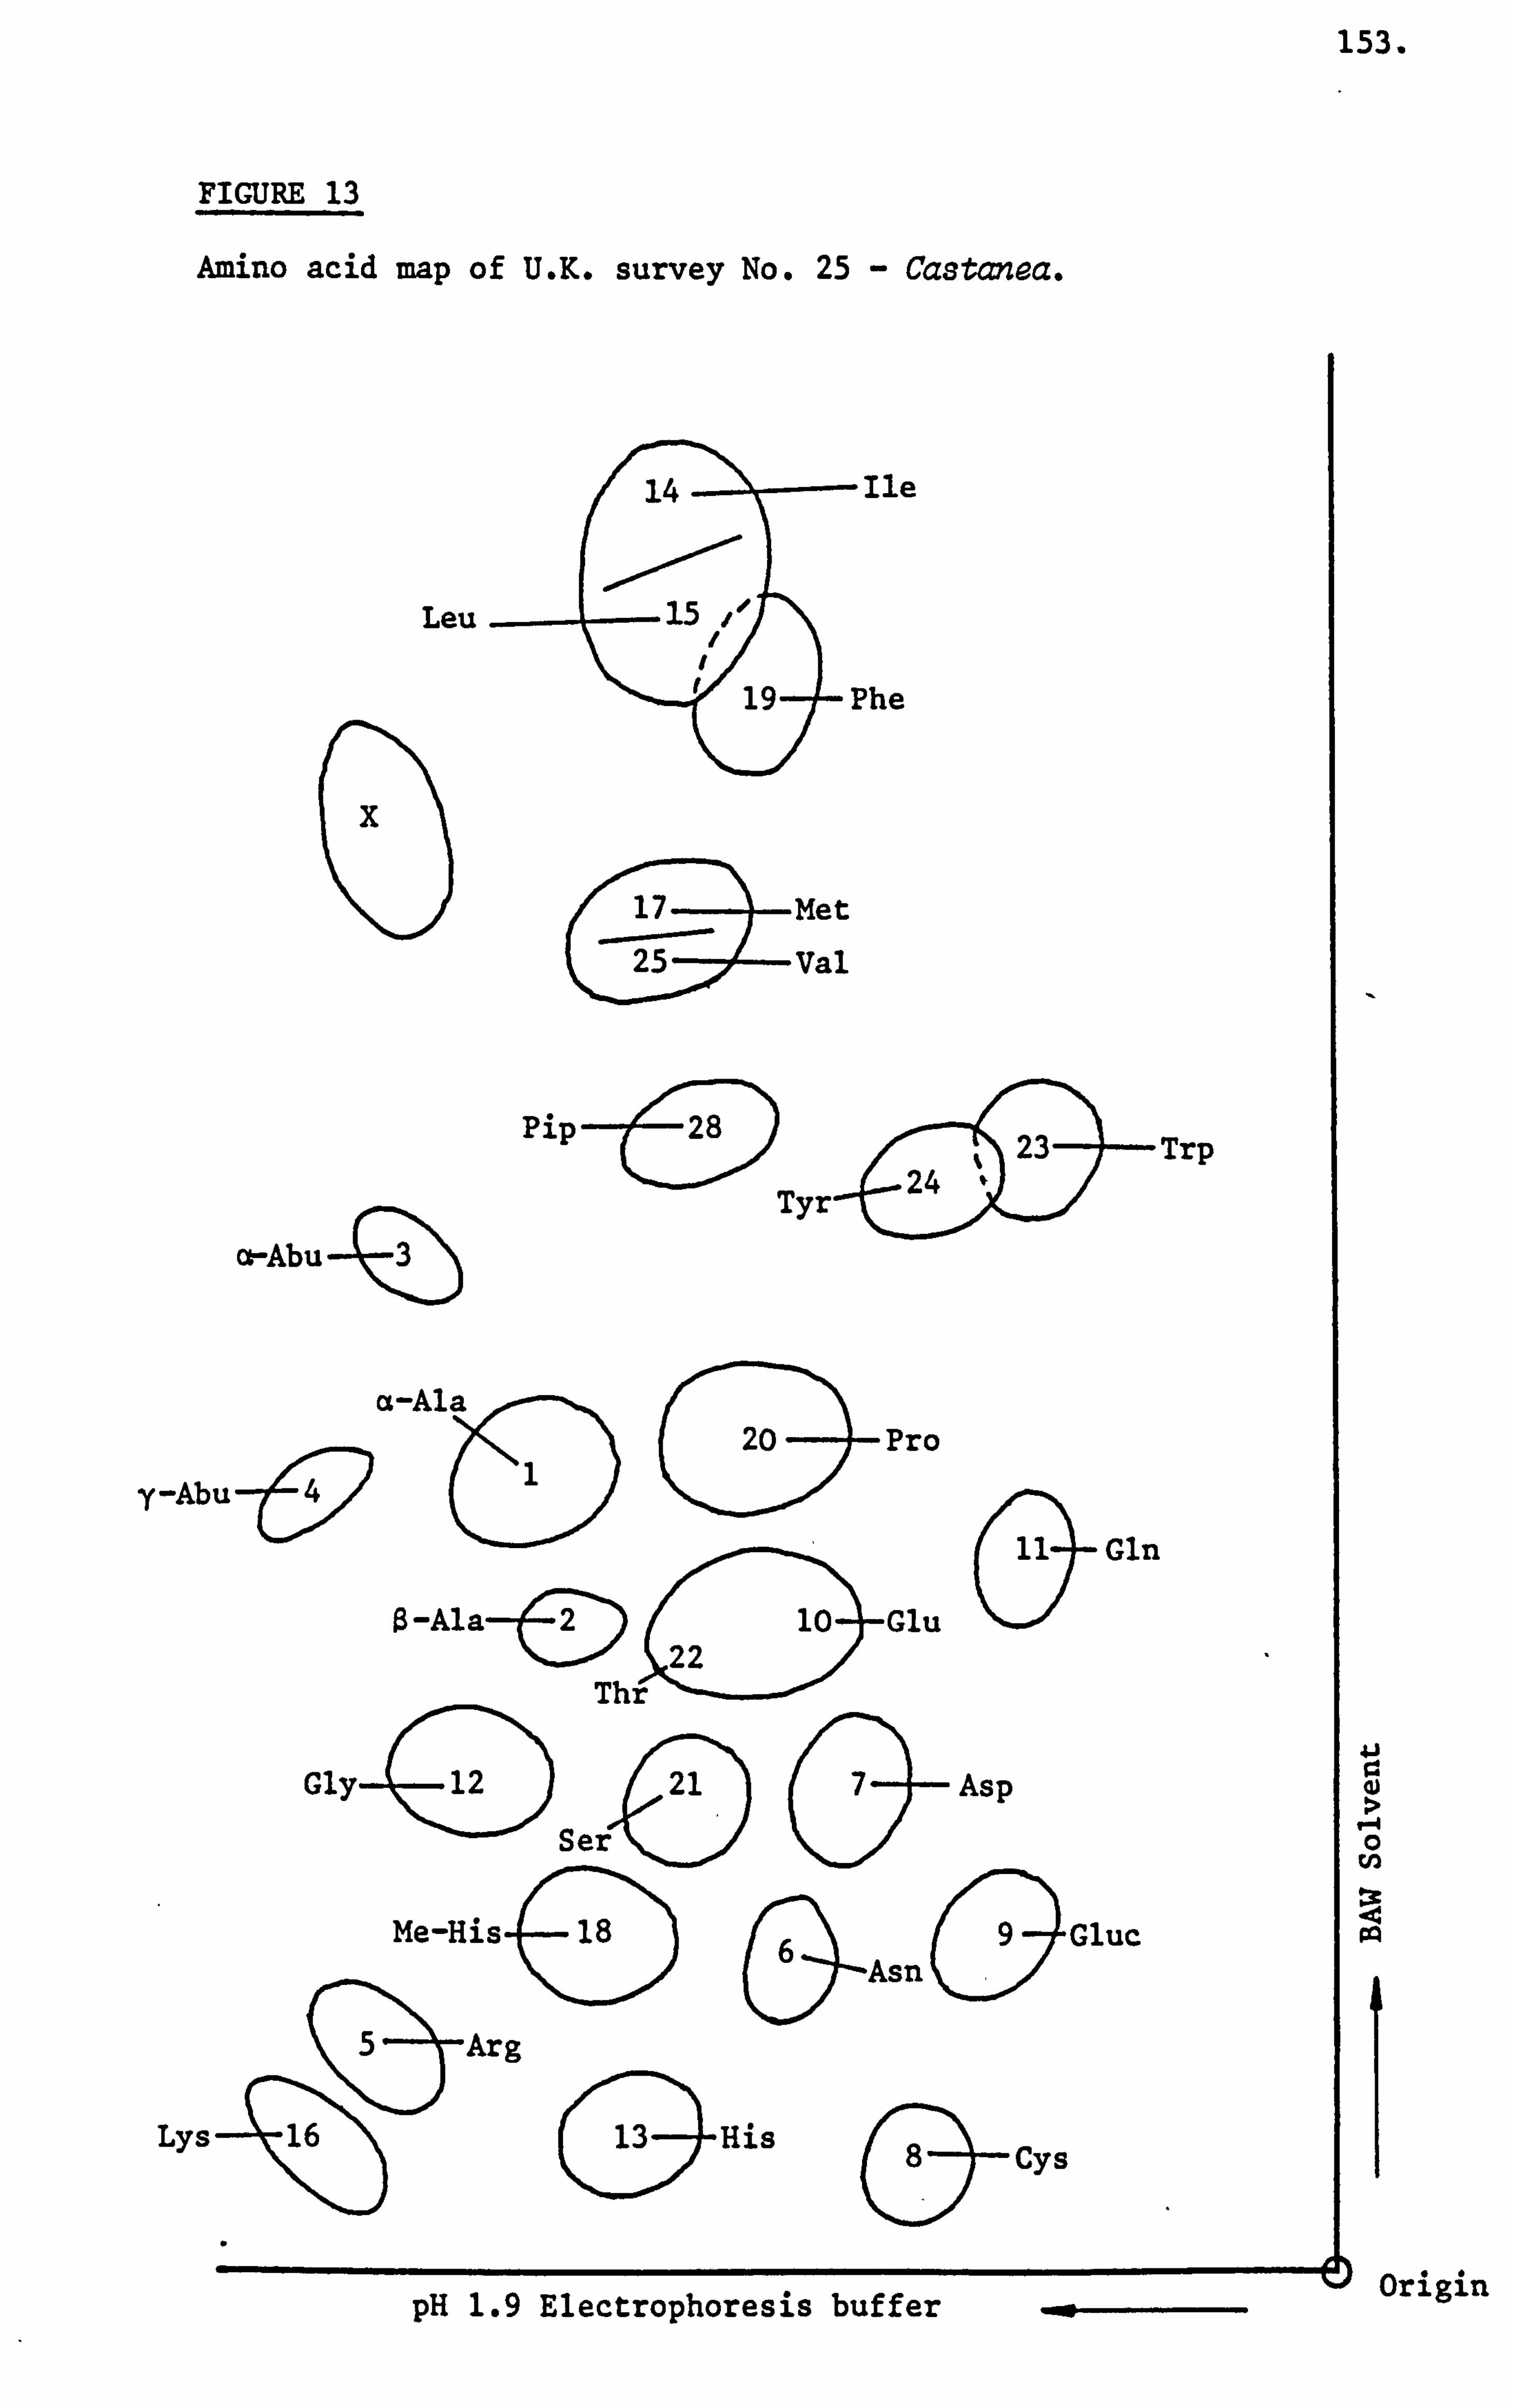
153.
FIGURE 13
Amino acid map of U. K. survey No. 25 - Castanea.
Leu
ot-Abu -(
17 Met 25 Val
Ile
? he
pip---o
Tyr4 24 t
'. 23 Trp
a-Ala 20 Pro
y-Abu- 11 Gln
O-Ala-oý 22
1 Glu
Tr hr
Gly4 12D 21 7 Asp
Ser
Me-His-( 18D Asn
09
Gluc
5 Arg
Lys 4
16
OHis acys
pH 1.9 Electrophoresis buffer
0 rn m pq
origin
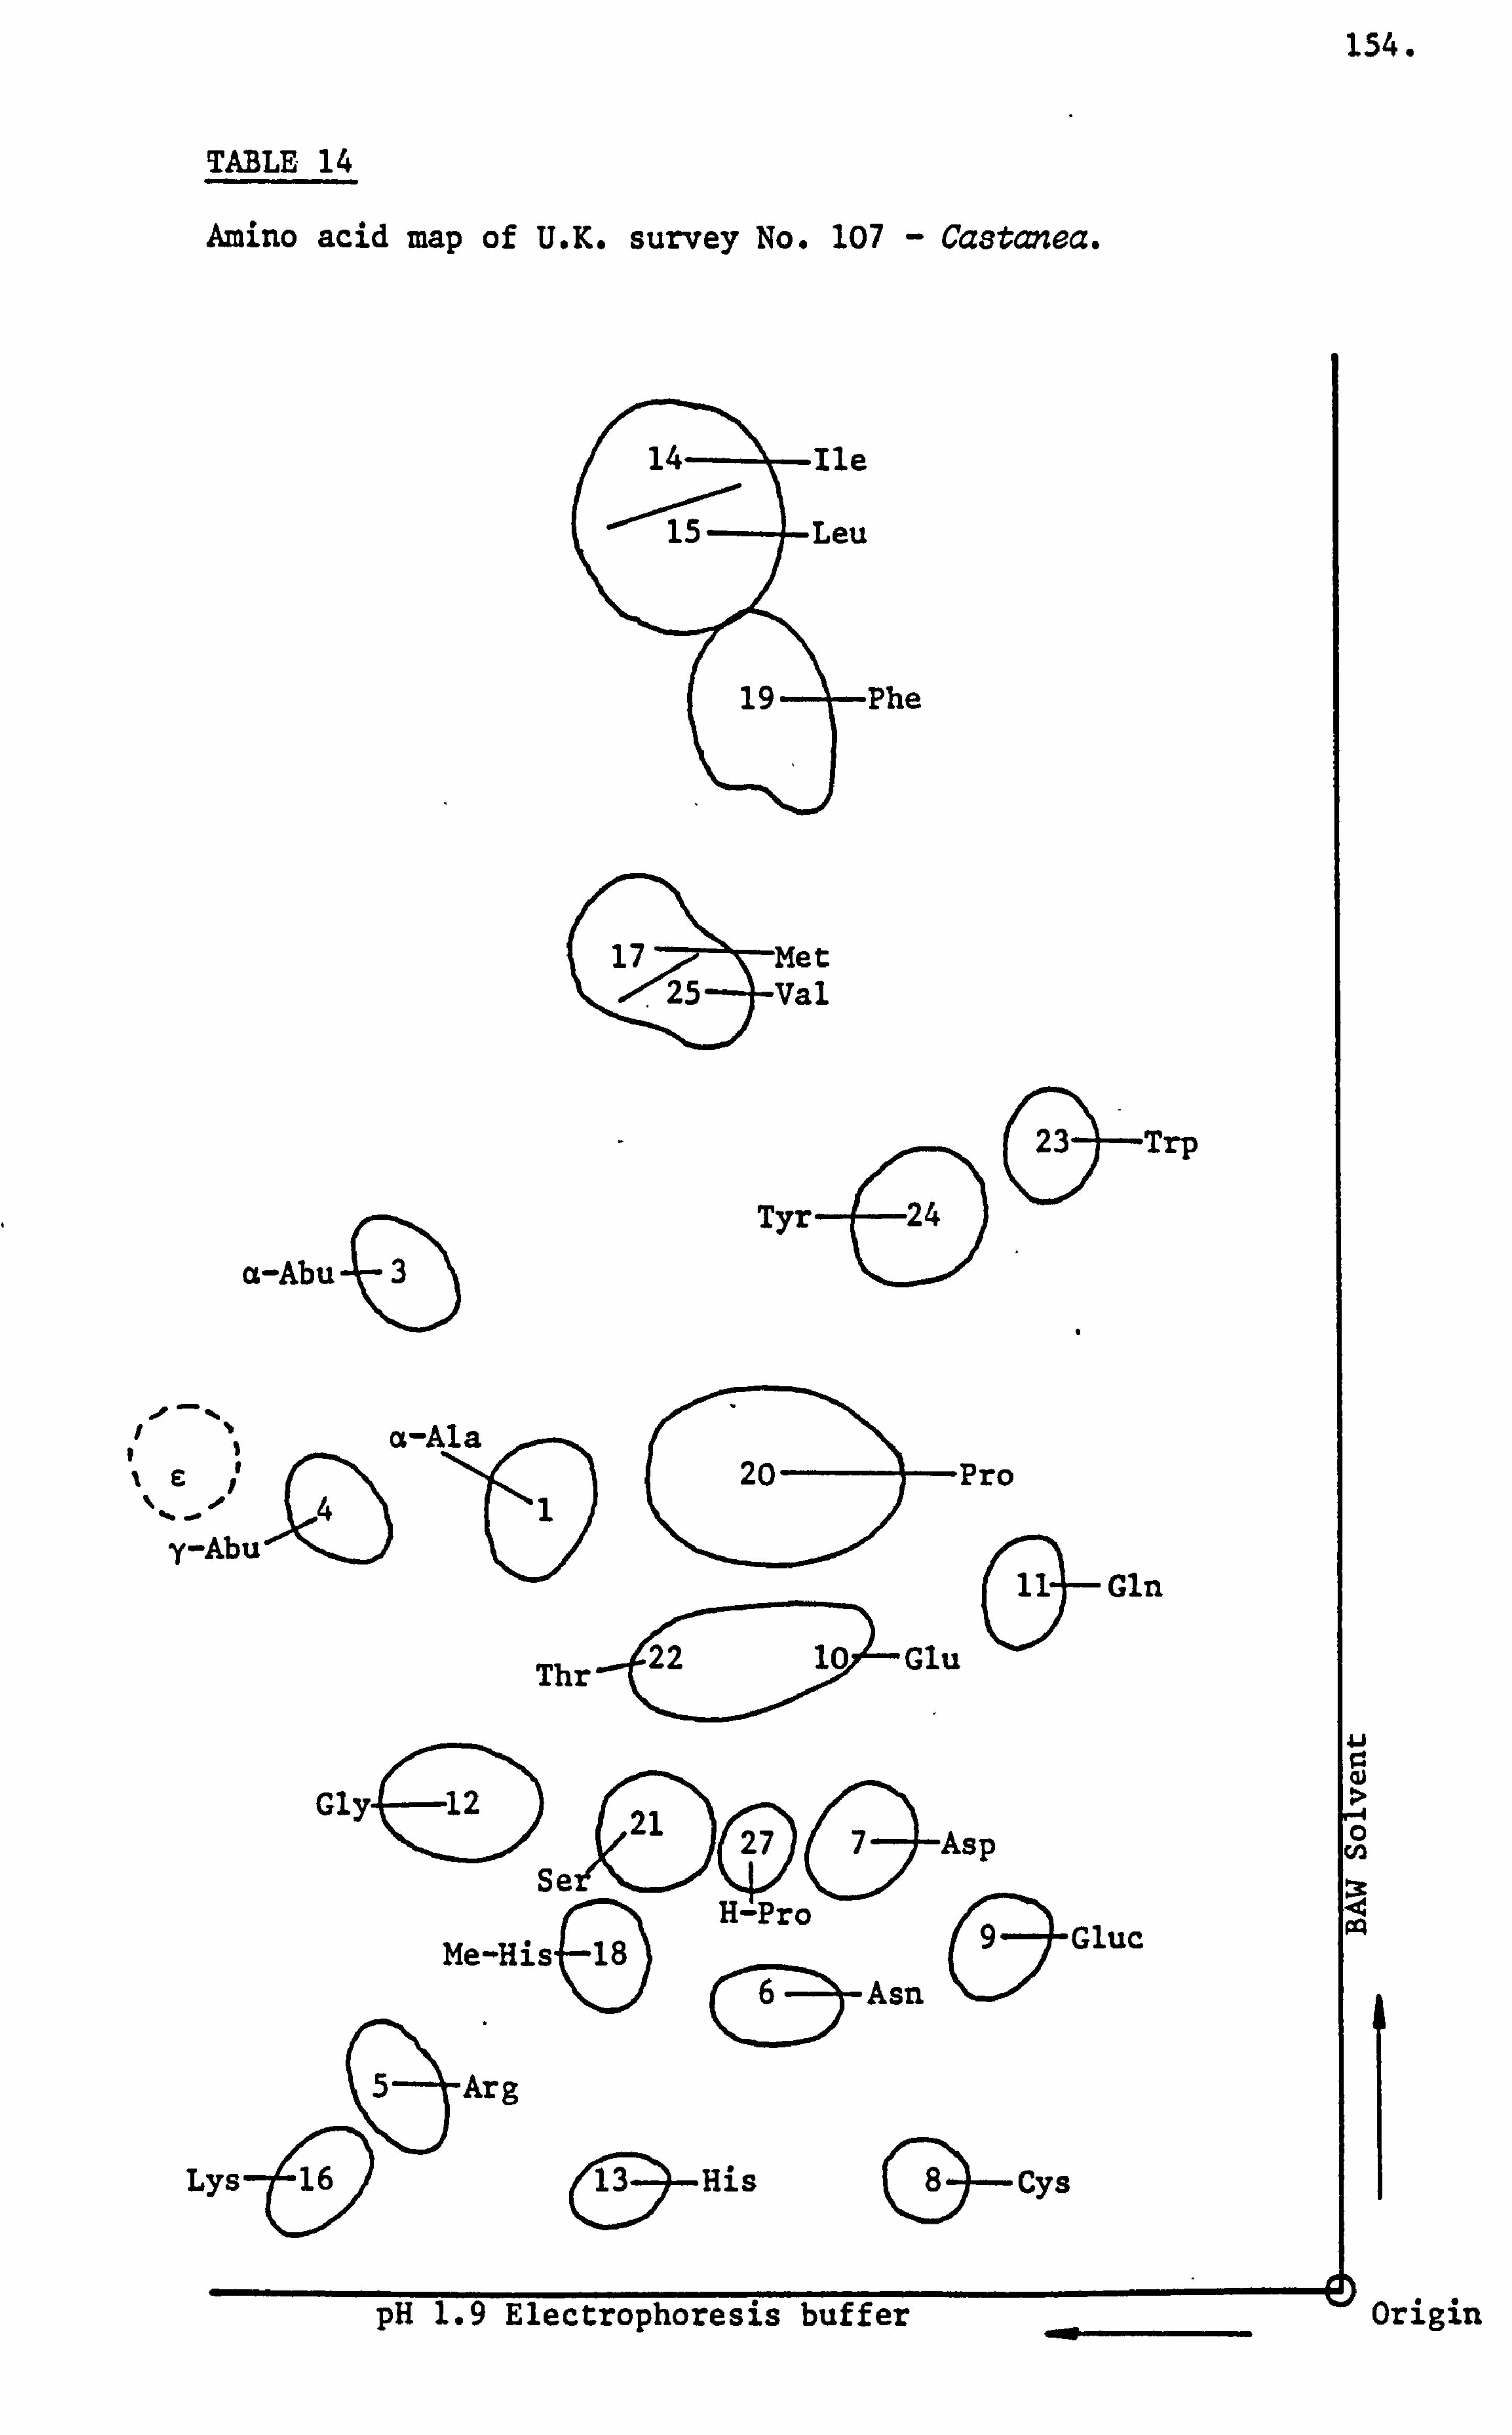
154.
TABLE 14
Amino acid map of U. K. survey No. 107 - Castanea.
14 Ile
15- Leu
19 k Phe
(
17 Met 25 Val
Tyr 24
-Trp
a-Abu ý3) -(E)
a-Ala F- -Pro
y-Abu--
Thr Glu
& Gln
GlyýCU > 0
Se)O( 27
&7Asp
W
Me-His. e H-Pro
-Asn
a Gluc pq
CD
5 Arg
I
b Lys 16 His Cys -0 (5-
&-i
pH 1.9 Electrophoresis buffer a-
' Origin
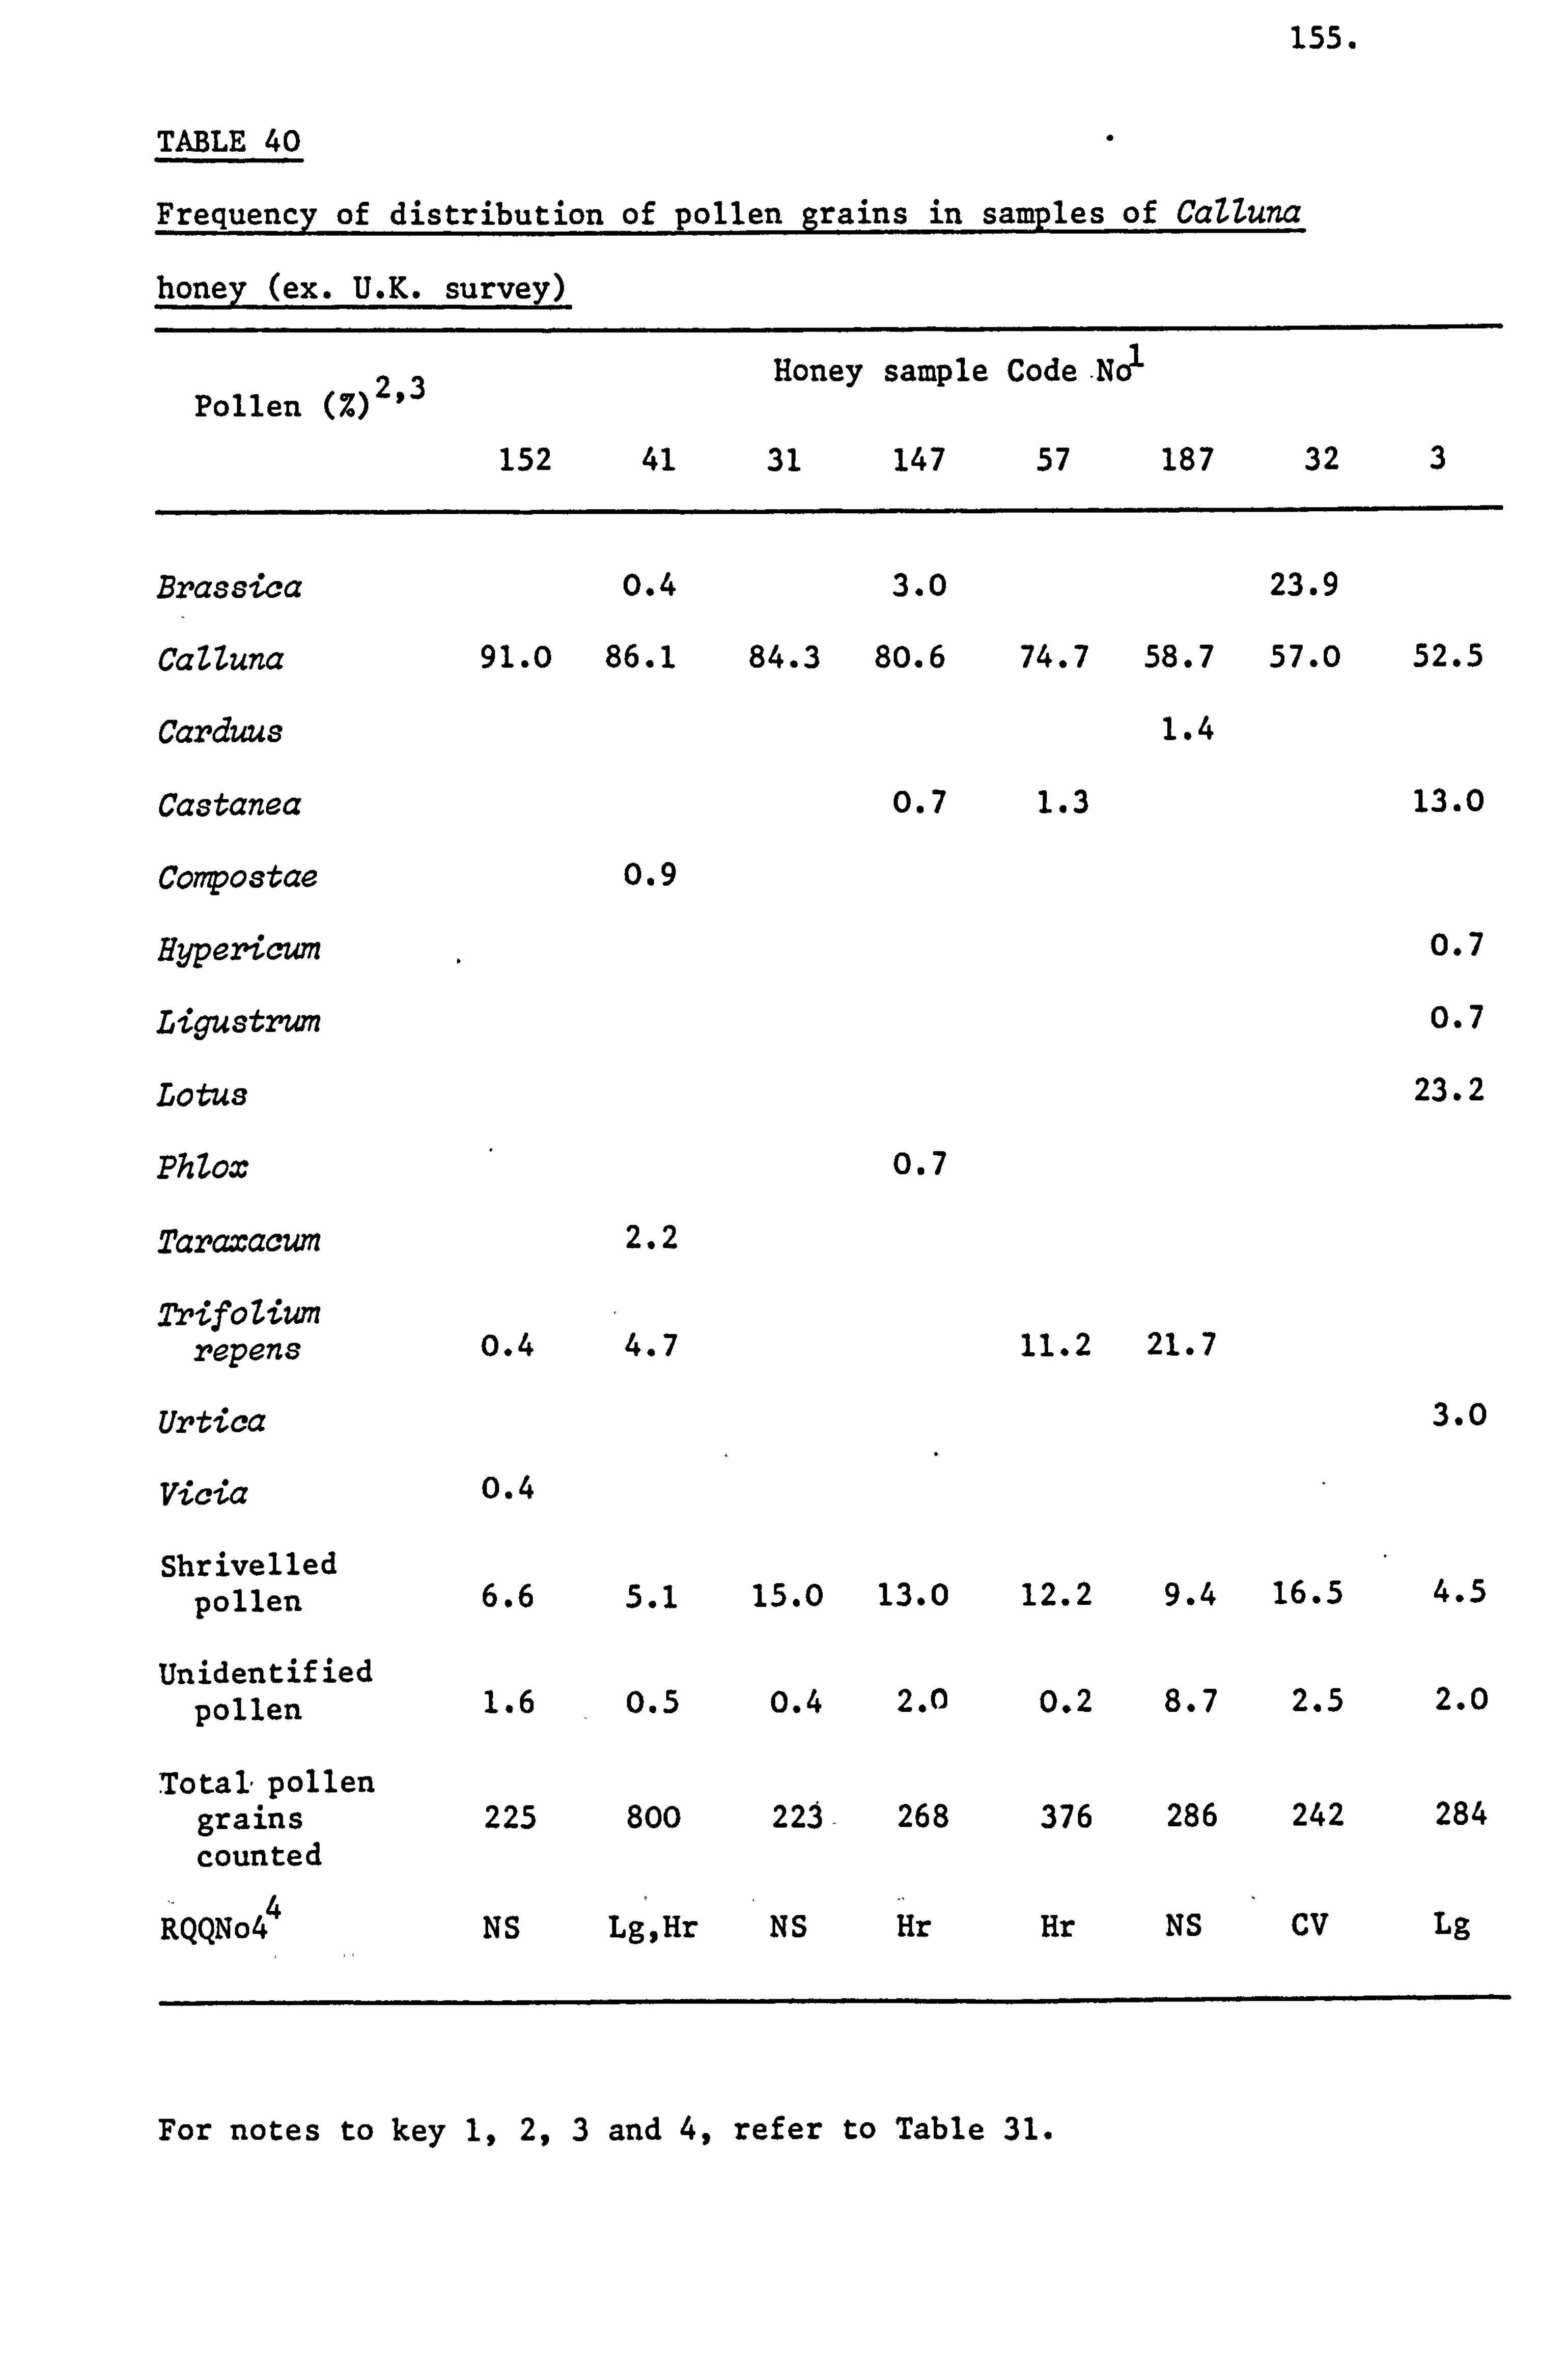
155.
TABLE 40
Frequency of distribution of pollen grains in samples of CaZluna
honey (ex. U. K. survey)
Pollen M23
152 41
Honey
31
sample
147
Code.
57
NJ
187 32 3
Brassica o. 4 3.0 23.9
CaZZuna 91.0 86.1 84.3 80.6 74.7 58.7 57.0 52.5
carduus 1.4
Castanea M 1.3 13.0
Conpostae 0.9
Hypericum M
Ligustrwn 0.7
Lotus 23.2
Phlox M
Taraxacum 2.2
Trifozium repens o. 4 4.7 11.2 21.7
Urtica 3. o
Vicia o. 4
Shrivelled pollen 6.6 5.1 15.0 13.0 12.2 9.4 16.5 4.5
Unidentified pollen 1.6 0.5 o. 4 2.0 0.2 8.7 2.5 2.0
Total, pollen grains 225 800 22j- 268 376 286 242 284 counted
4 RQQNo4 NS Lg, Hr NS Hr Hr NS CV Lg
For notes to key 1,2,3 and 4, refer to Table 31.
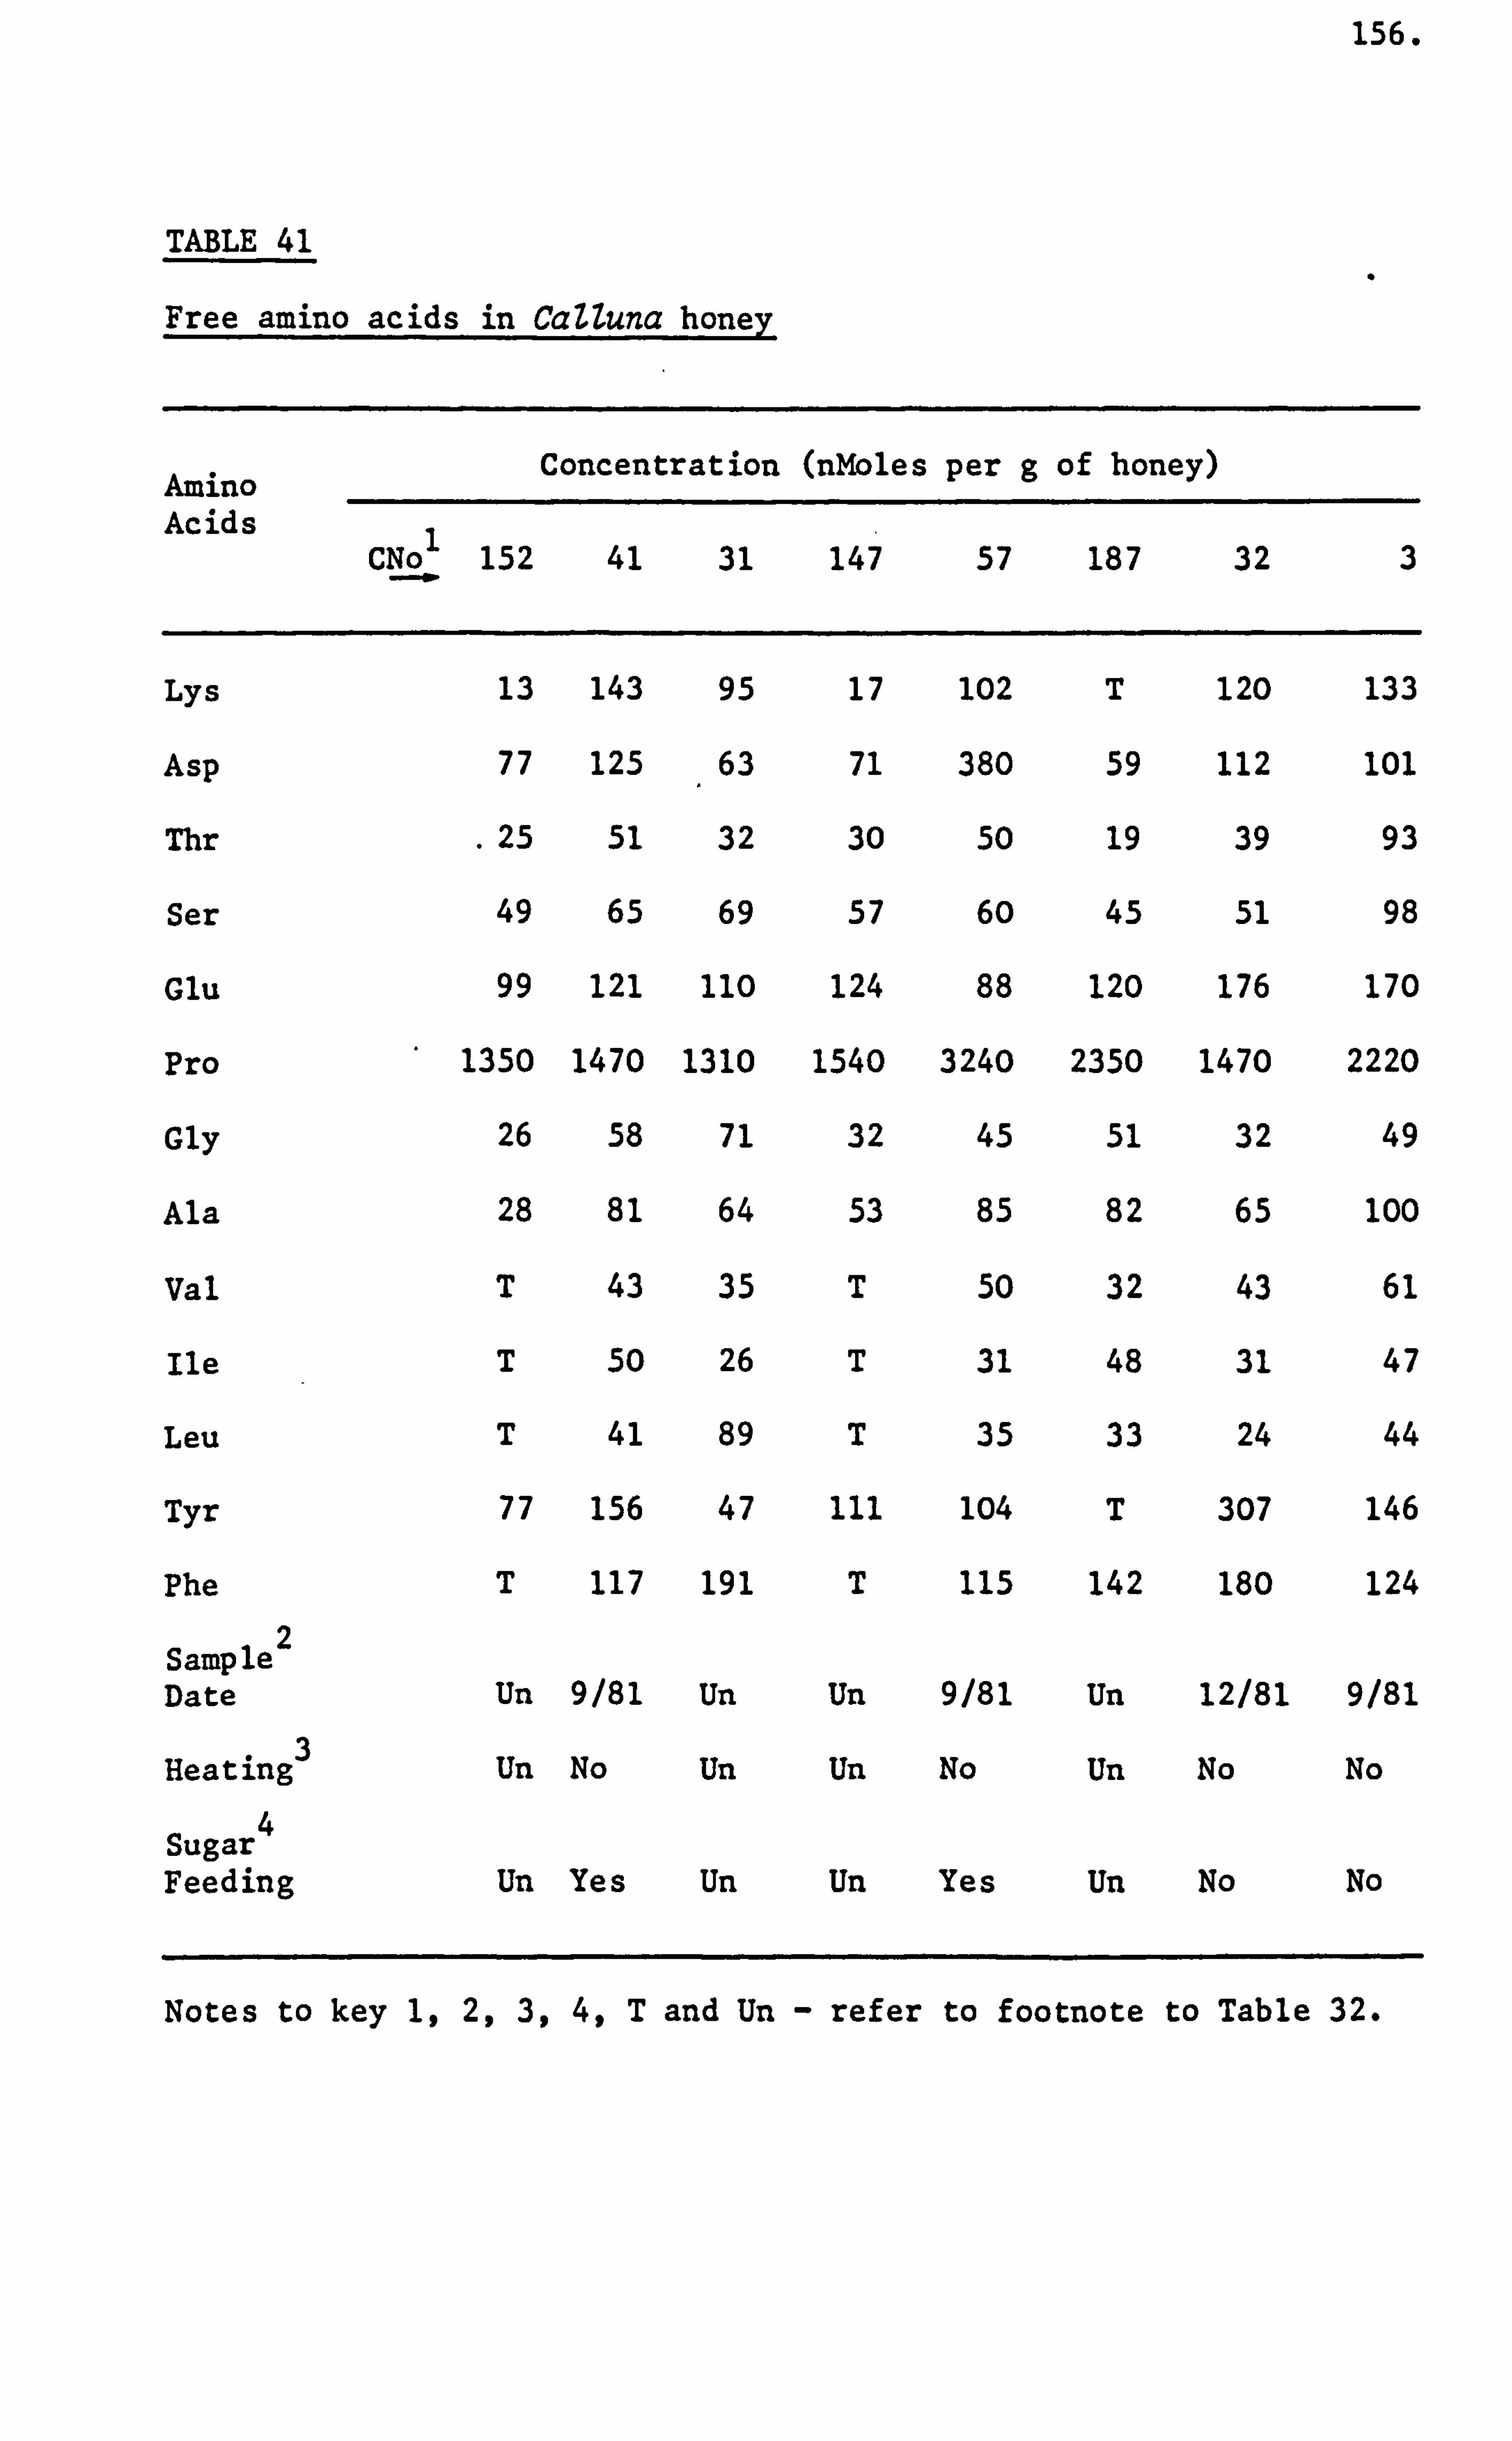
156.
TABLE 41
Free amino acids in CaZZuna honey
Amino Concentration (nMoles per g of honey)
Acids 1 Mo 152 41 31 147 57 187 32 3
Lys 13 143 95 17 102 T 120 133
Asp 77 125 63 71 380 59 112 101
Thr . 25 51 32 30 50 19 39 93
Ser 49 65 69 57 60 45 51 98
Glu 99 121 110 124 88 120 176 170
Pro 1350 1470 1310 1540 3240 2350 1470 2220
Gly 26 58 71 32 45 51 32 49
Ala 28 81 64 53 85 82 65 100
Val T 43 35 T 50 32 43 61
Ile T 50 26 T 31 48 31 47
Leu T 41 89 T 35 33 24 44
Tyr 77 156 47 ill 104 T 307 146
Phe T 117 191 T 115 142 180 124
Sample 2
Date Un 9/81 Un Un 9/81 Un 12/81 9/81
Heating 3 Un No Un Un No Un No No
4 Sugar Feeding Un Yes Un Un Yes Un No No
Notes to key 1,2,3,4, T and Un - refer to footnote to Table 32.
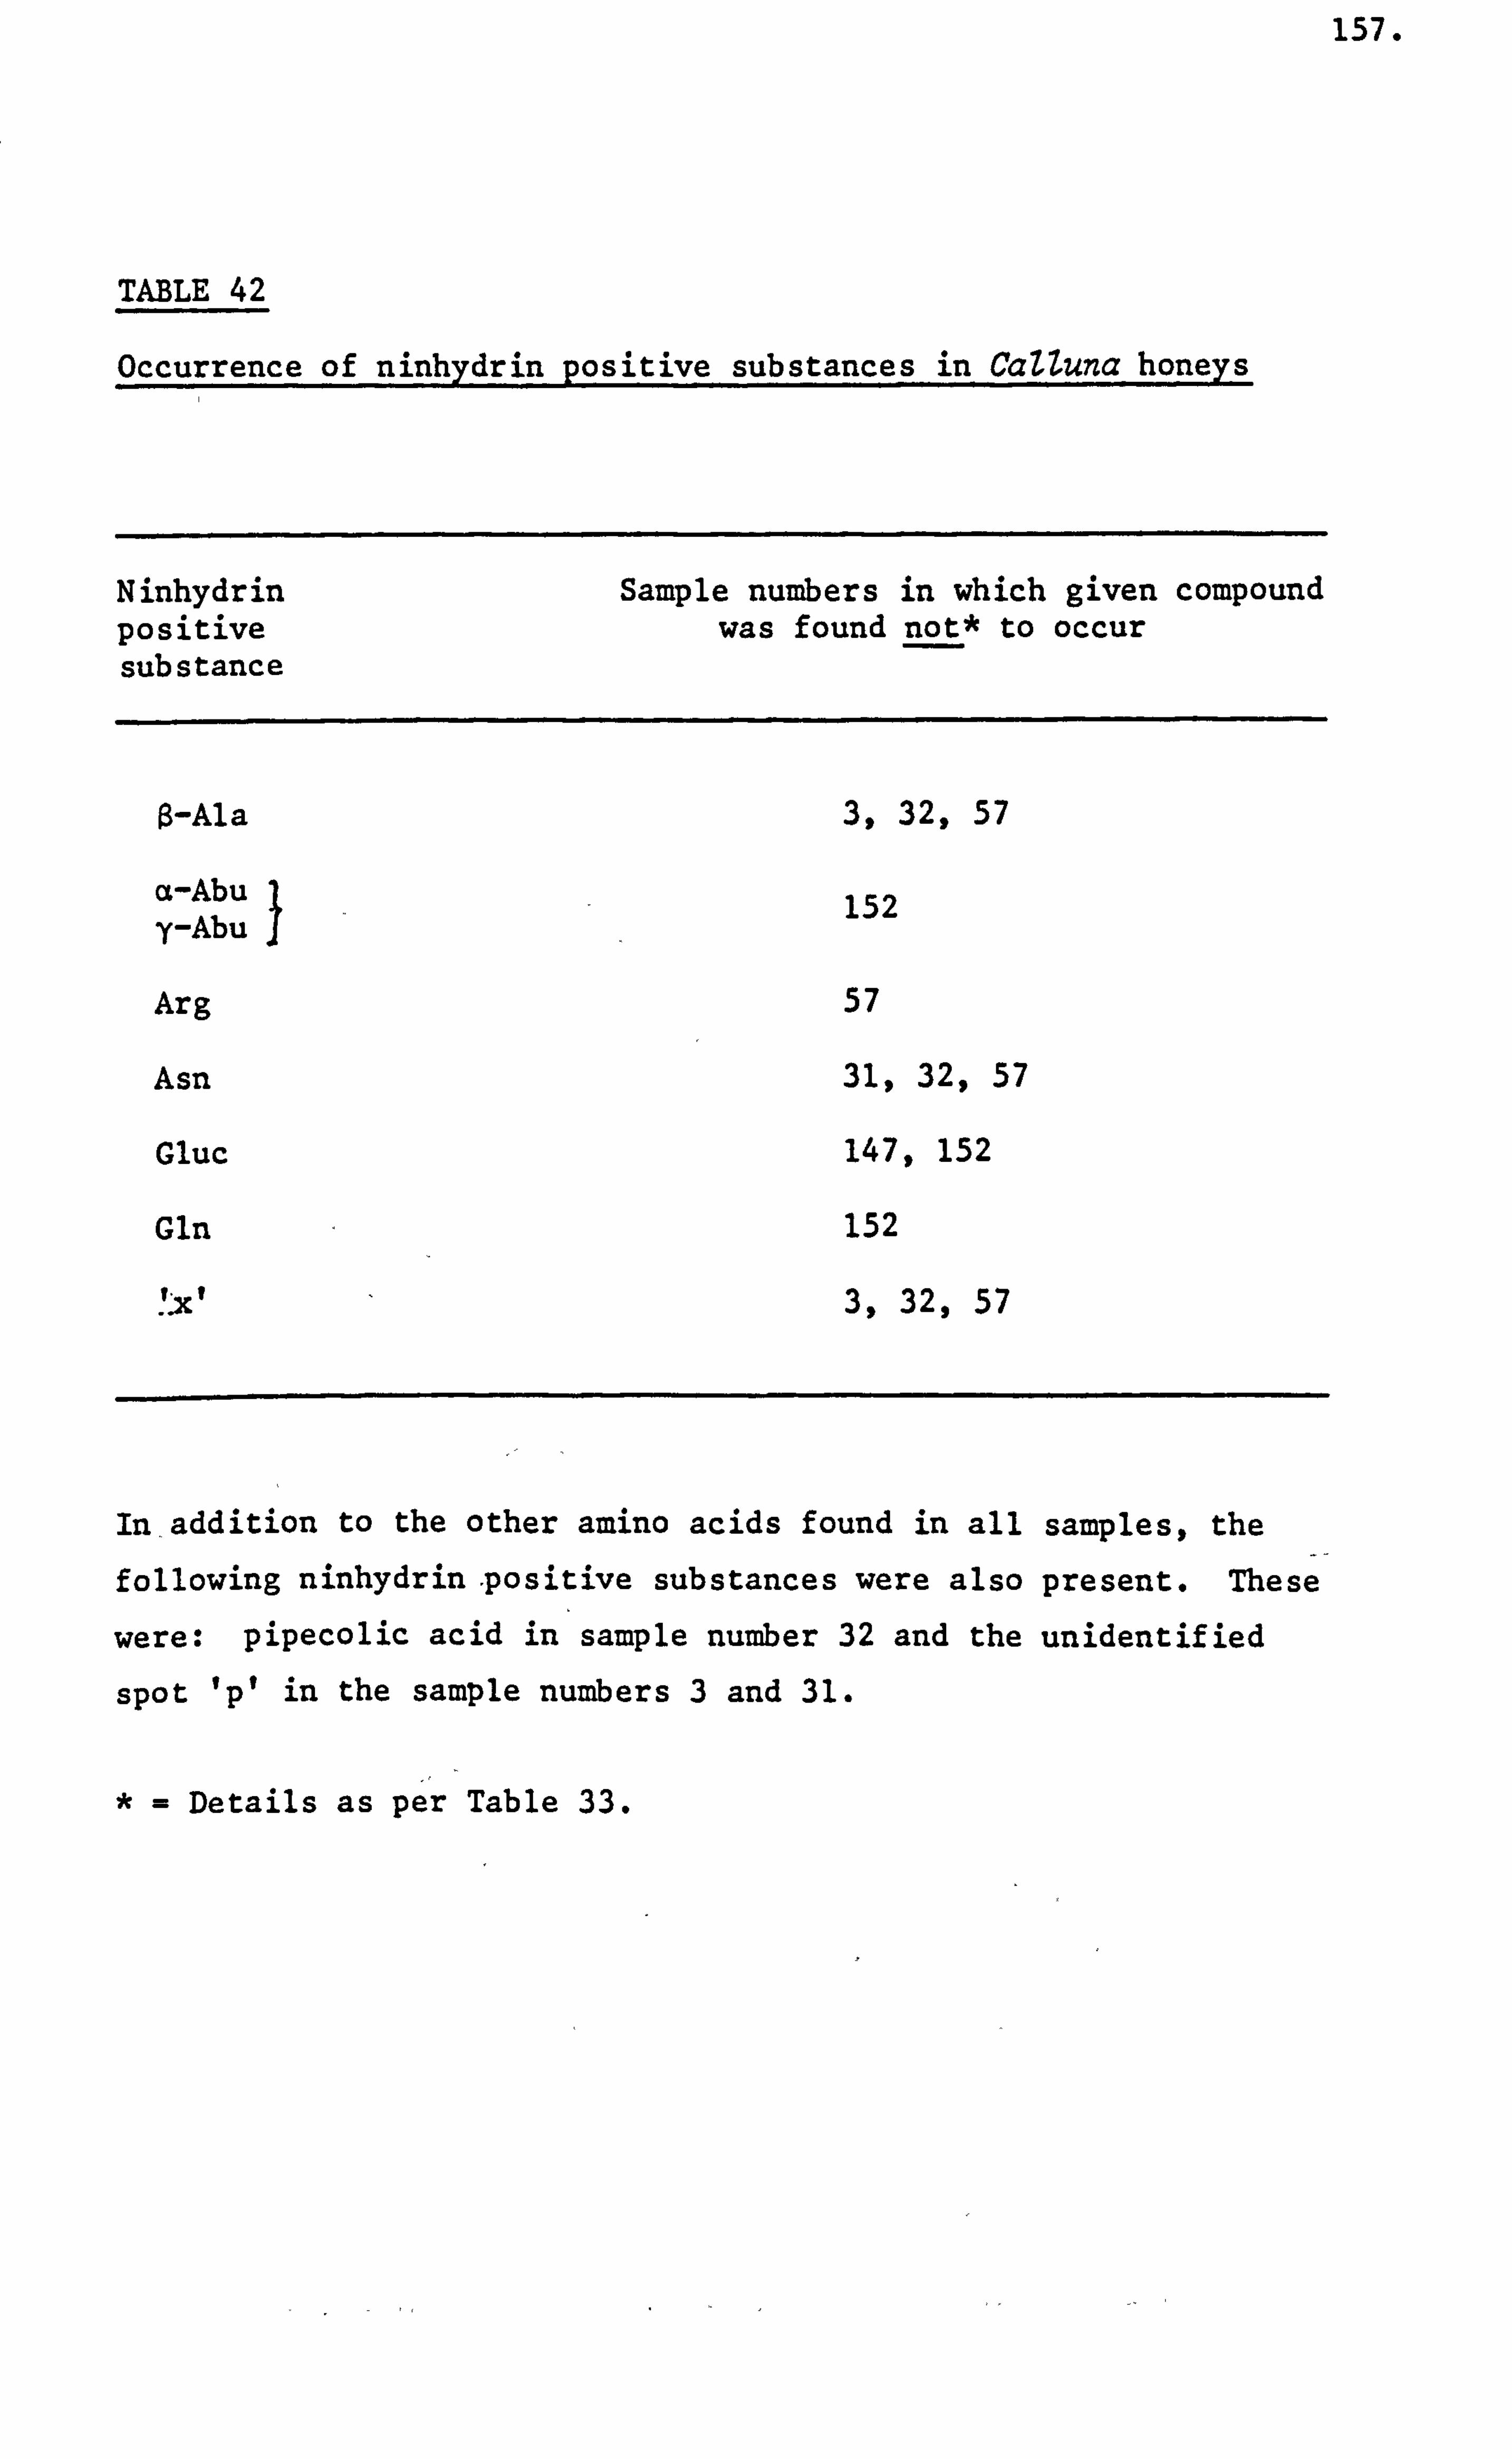
157.
TABLE 42
Occurrence of ninhydrin positive substances in CaZZuna honeys I
Ninhydrin Sample numbers in which given compound positive was found not* to occur substance
$-Ala 3,32,57
a-Abu 152 y-Abu
Arg 57
Asn 31,32,57
Gluc 147,152
Gln 152
I. X 1 3,32,57
In-addition to the other amino acids found in all samples, the
following ninhydrin-positive substances were also present. These
were: pipecolic acid in sample number 32 and the unidentified
spot 'PI in the sample numbers 3 and 31.
Details as per Table 33.
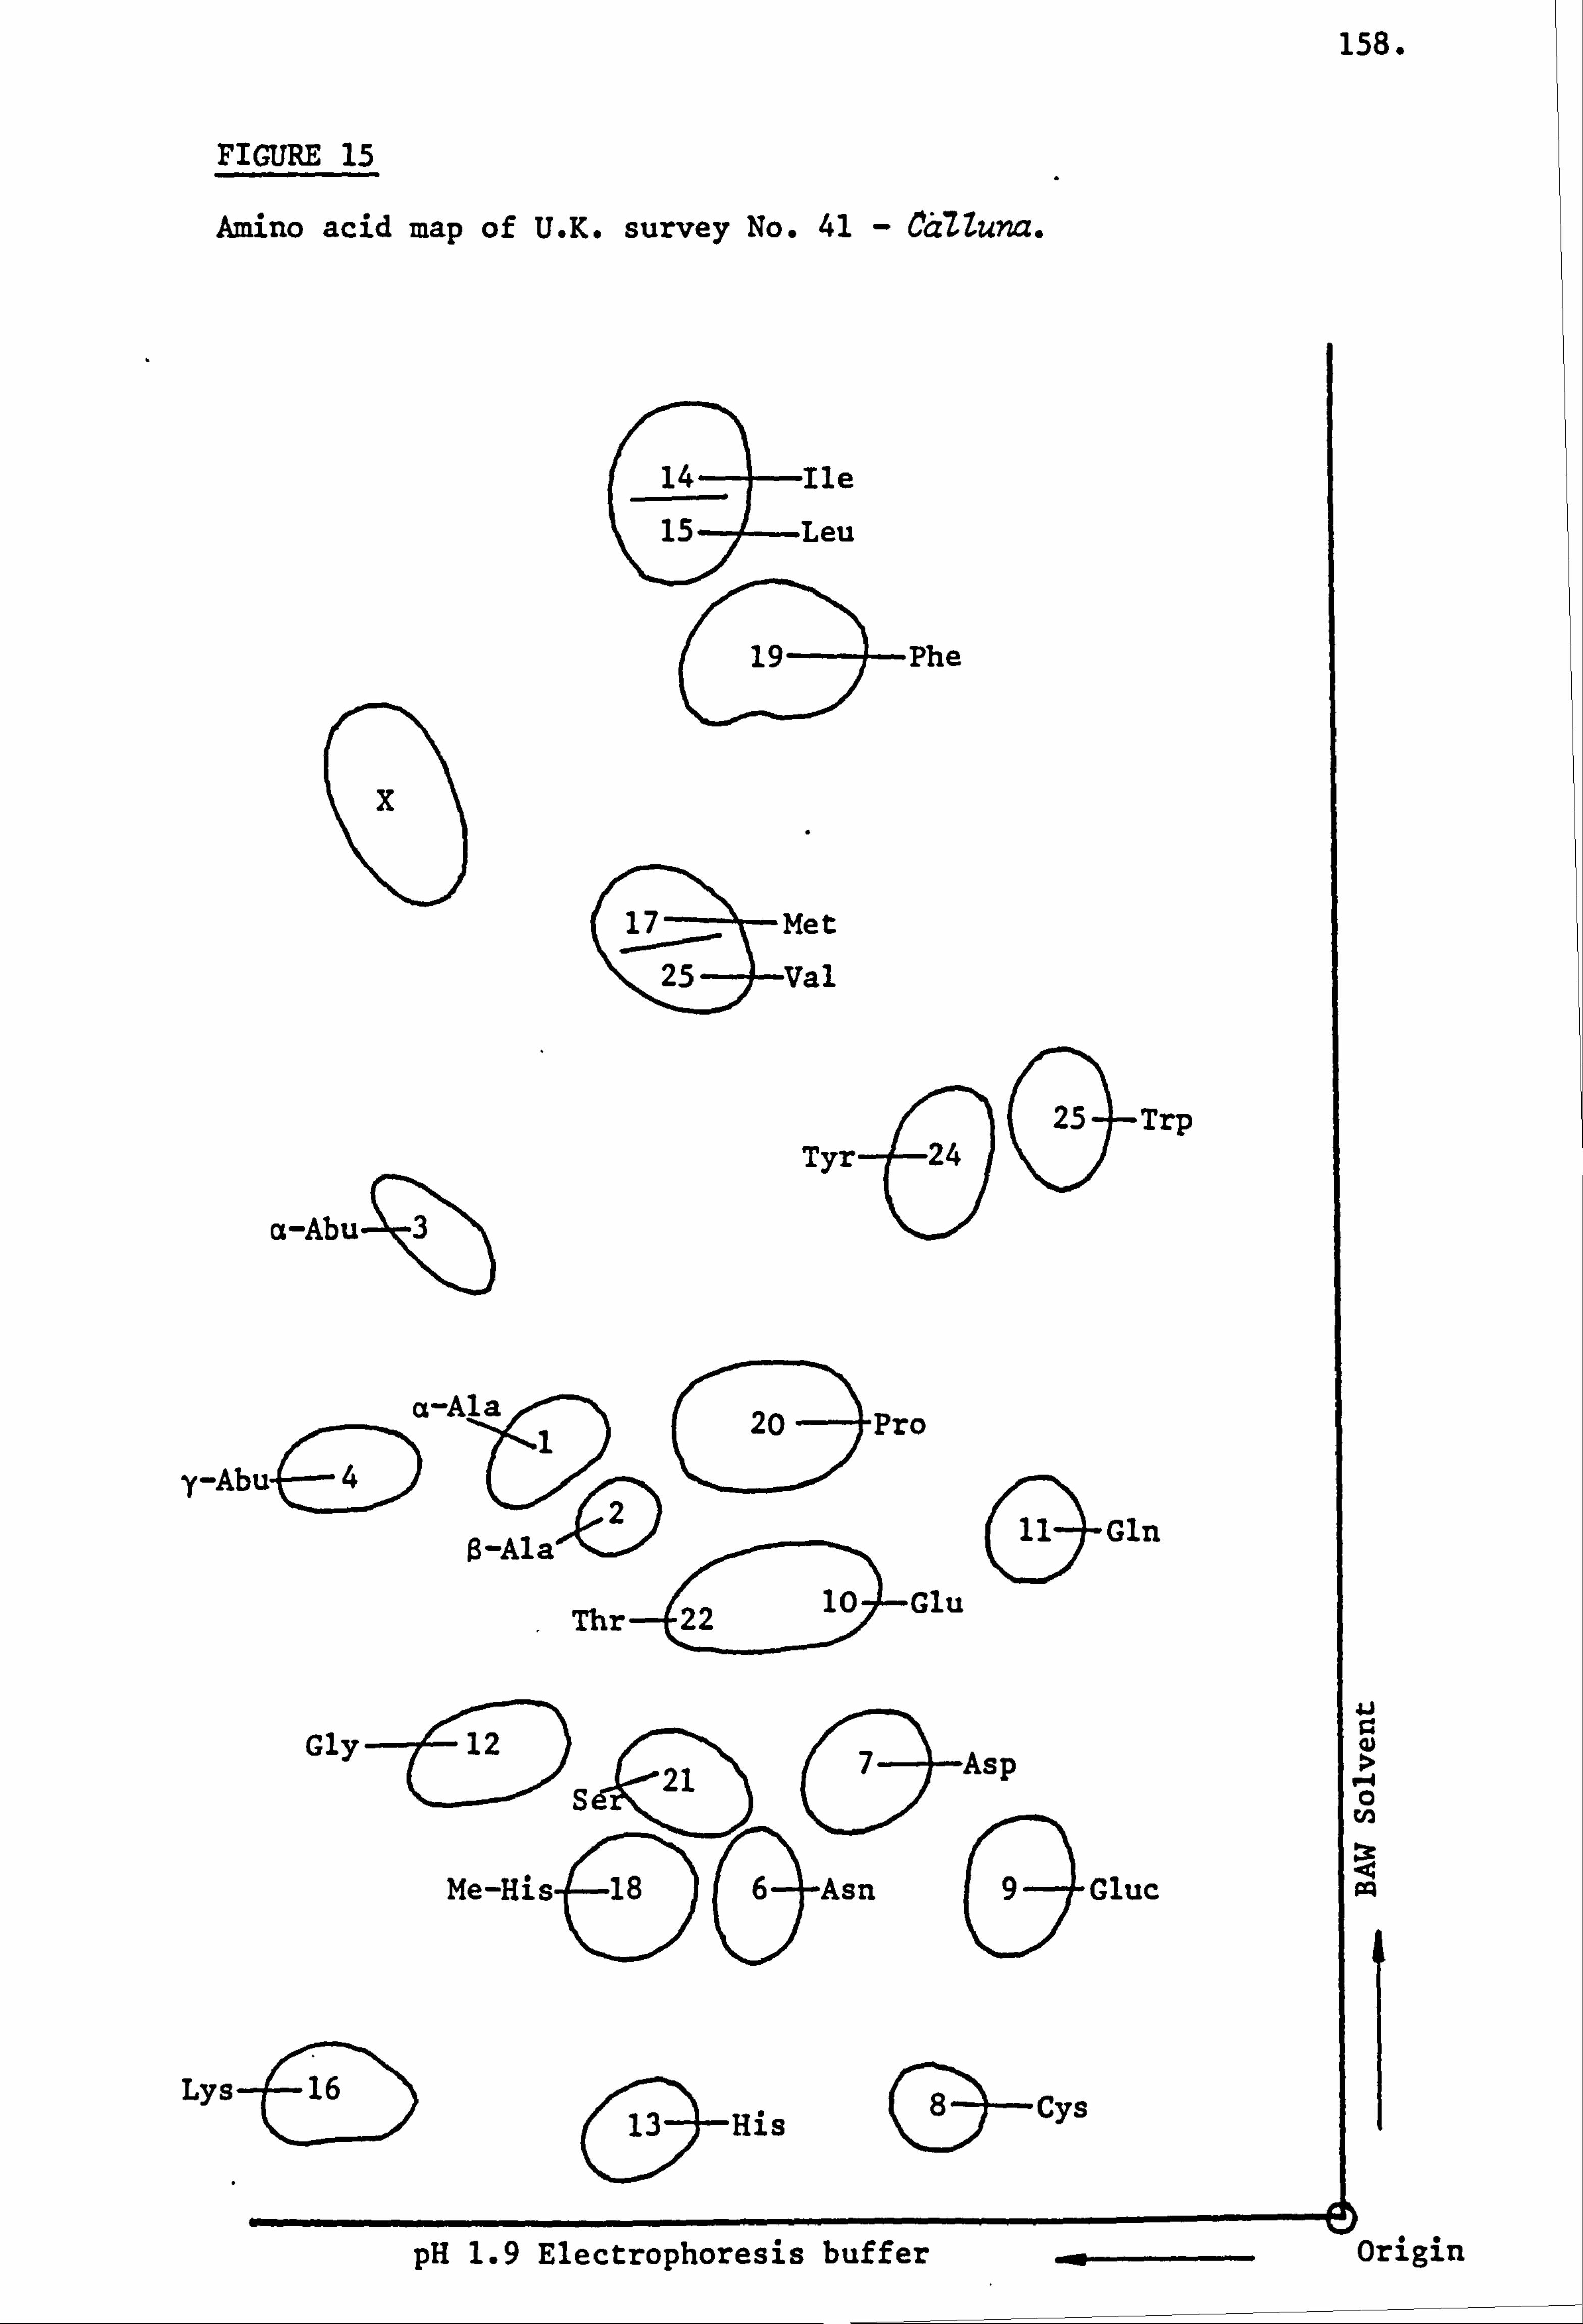
158.
FIGURE 15
Amino acid map of U. K. survey No. 41 - CLMuna.
a-Abu
25 Trp Tyr-624
&
a-Ala 1 20 Pro
y-Abu-(ýý 2
CD
ß- la
. Thrý<22
10 Glu
Gly -t : )S
Me-His 18 _S
Lys ýD allis
qGln
(3-Asp
ýAsn 99Gluc
)-Cys
14 Ile 15 Leu
19- Phe
: 17 Met :
25- Val
U
w 0
pH 1.9 Electrophoresis buffer origin
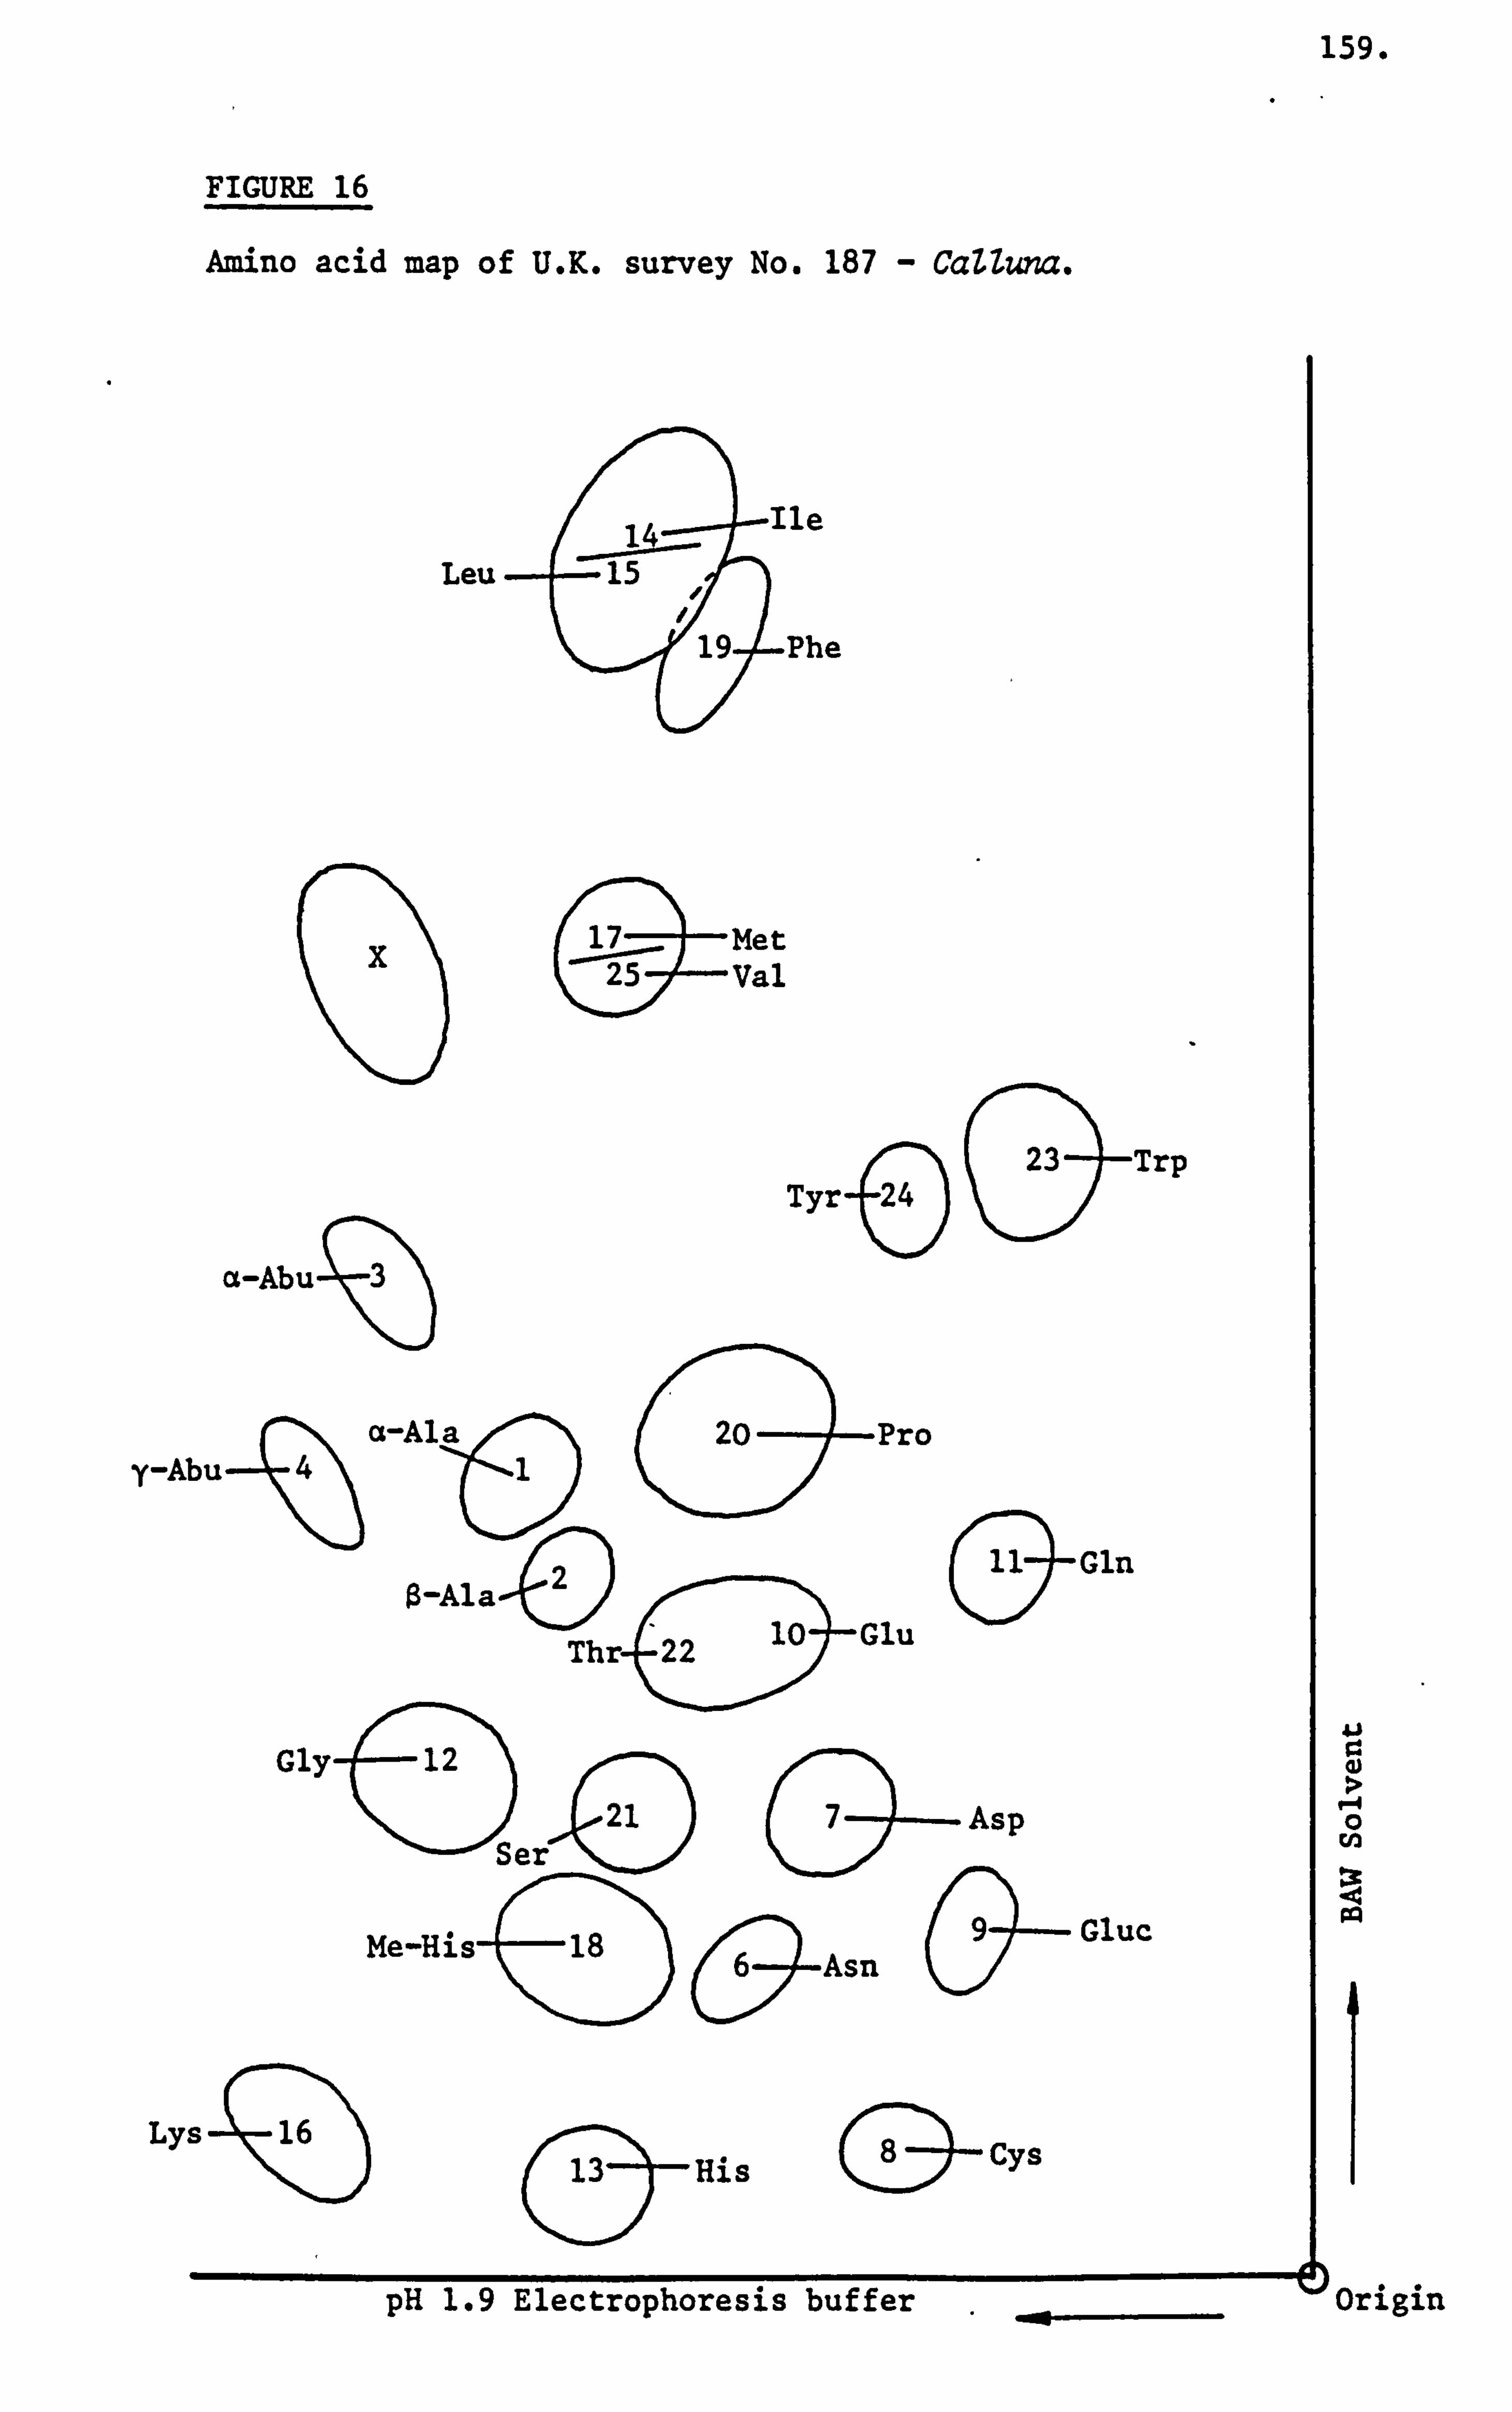
159.
FIGURE 16
Amino acid map of U. K. survey No. 187 - CaUuna.
14 --
Ile
Leu 15 4
-3 n19
Phe
x 17 Met 25 Val
23
a-Abuý 3
Tyr-6
&Trp
20 y-Abu-1ý4
a-Ala 12
Pro
& Gln
O-Ala
Th '22 10 Glu
Gly 12
17 Asp Ser
Me-His 18 6A nc-
Gluc
Lys 16 ) ( )-
His (ýý
Cys
�-4 0
pH 1.9 Electrophoresis buffer 'Origin
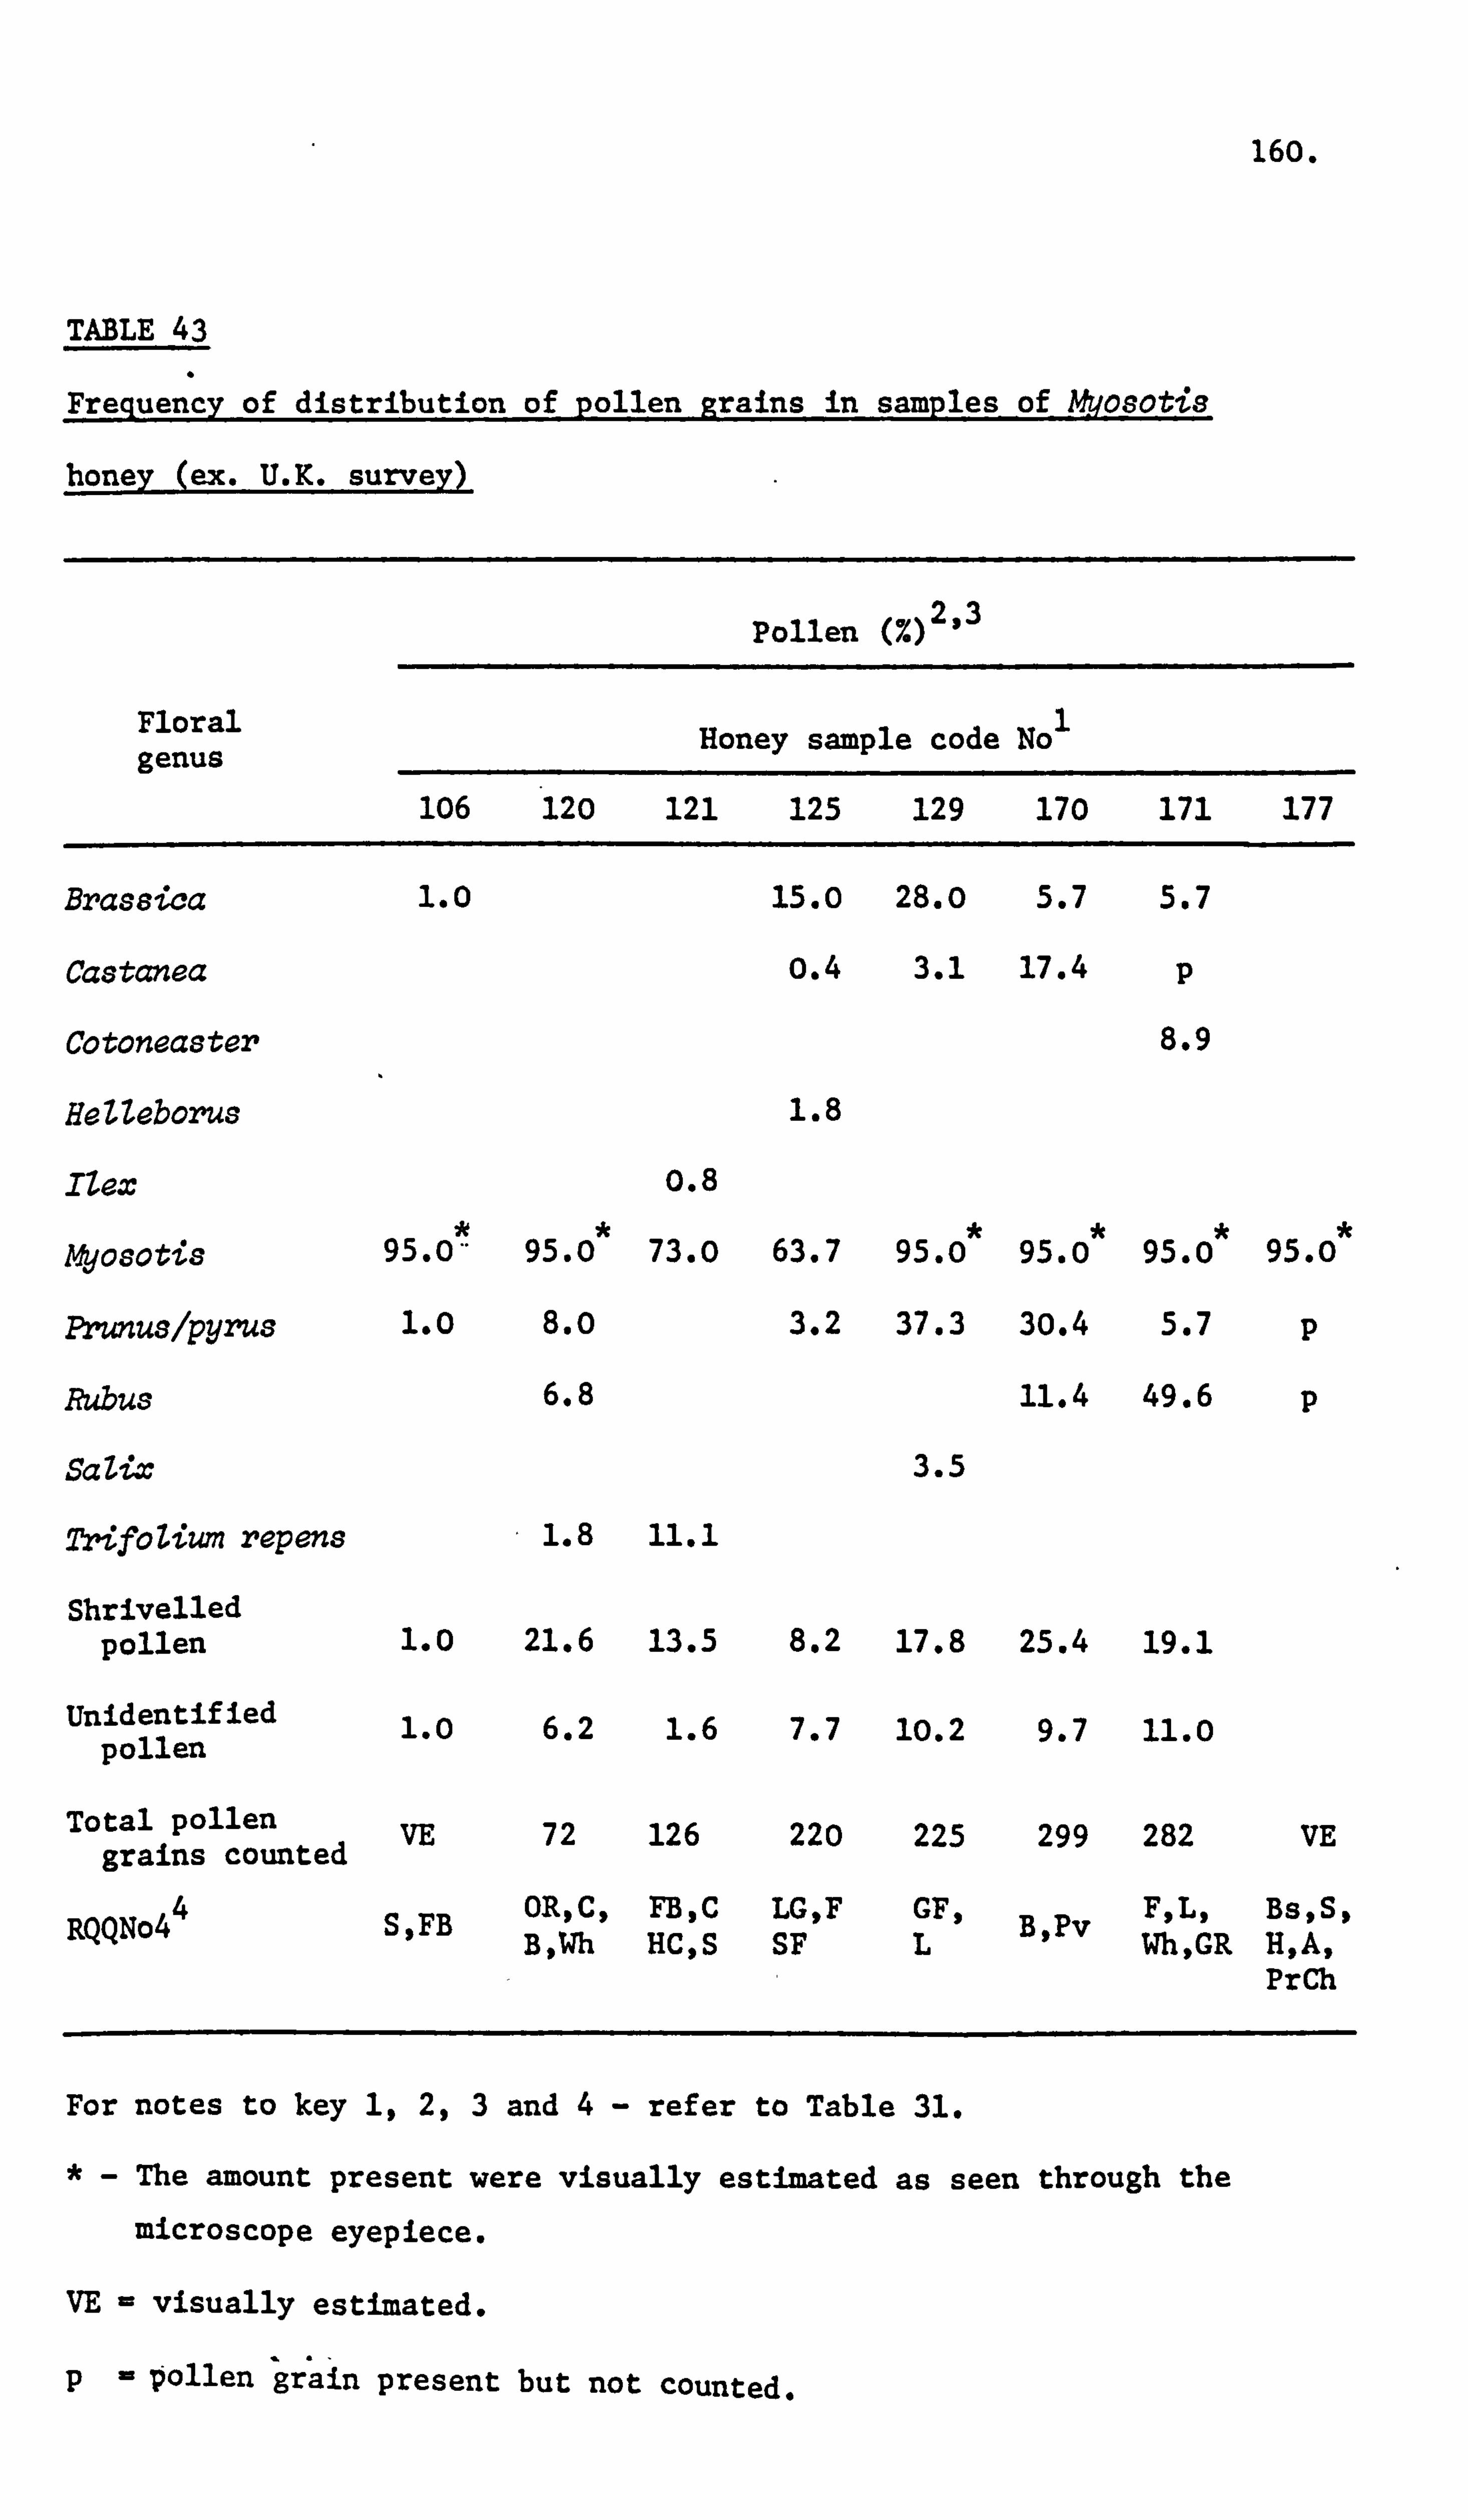
160.
TABLE 43
Frequency of distribution of pollen grains in samples of Myosotis
honey (ex. U. K. survey)
Floral genus
106 120
Pollen (%) 2,3
Honey sample code
121 125 129
No 1
170 171 177
Brassica 1.0 15.0 28.0 5.7 5.7
Castanea o. 4 3.1 17.4 p
Cotoneaster 8.9
HeZleborus 1.8
IZex 0.8
AV080tis 95.0" 95.0 73.0 63.7 95.0 95.0 95.0 95.0
Prunuslpyrus 1.0 8. o 3.2 37.3 30.4 5.7 p
Rubus 6.8 11.4 49.6 p
Salix 3.5
TrifoZium repens 1.8 11.1
Shrivelled pollen 1.0 21.6 13.5 8.2 17.8 25.4 19.1
Unidentified 1.0 6.2 1.6 7.7 10.2 9.7 11.0 pollen
Total pollen VE 72 126 220 225 299 282 VE grains counted
RQQNo4 4 SqFB ORpC, FB, C LGF GF, B, Pv F, L, Bs, S,,
B, Wh HC, S SF L Wh, GR H, A, PrCh
For notes to key 1,2,3 and 4- refer to Table 31.
The amount present were visually estimated as seen through the
microscope eyepiece.
VE - visually estimated.
p- pollen grain present but not counted.
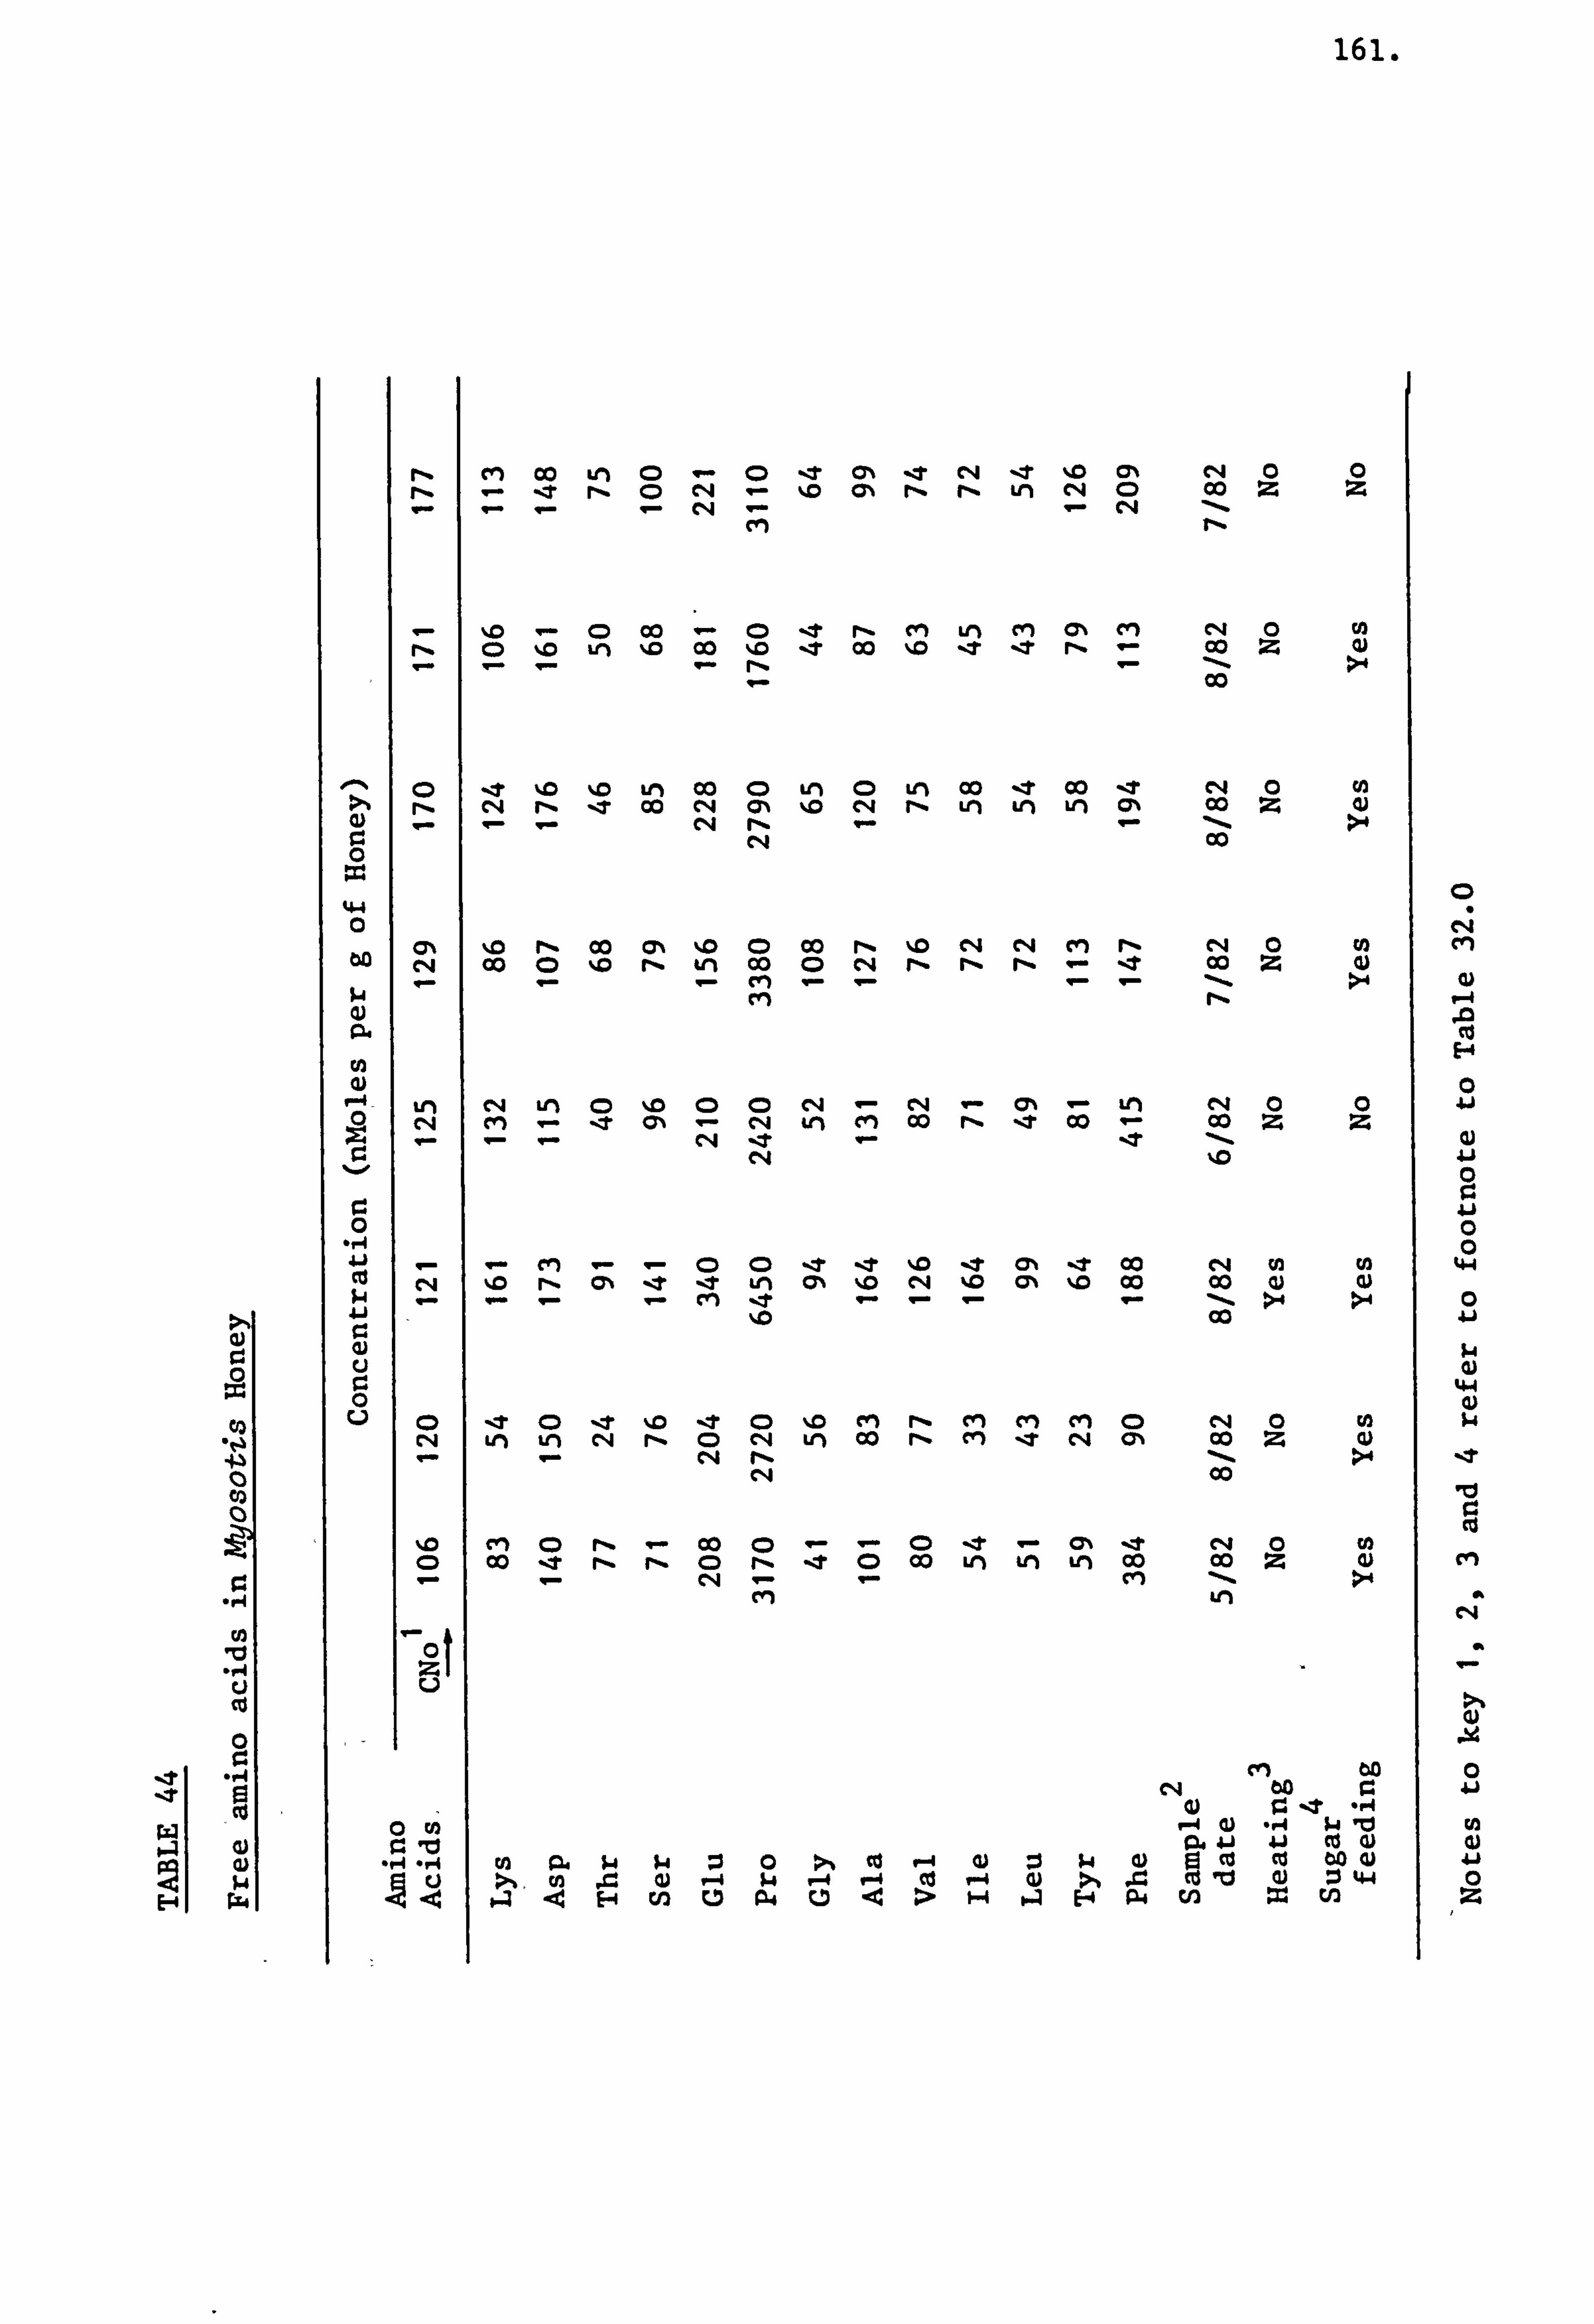
0 , r4
0 r.
-P4
- co
E-4
1-
0 W4
44 0
-r4
$4
rl% 01
C14 'I'll
Ln CN
0
%0
r. 0 . r4 . "4 ýu
161.
LM 0ý0 ýt (A t rq -4t %0 CY% (1q r, CD c4 - 'm CY% r, r, vi rq CD 00
rýA r-A cm Tý-
0 Co -0 ýt r-. m Lr% ei C% M c*II 0 Co
Ln %o co %o t co %o -t t r, - Co Z0
-t %In %0 LM 00 0 vi 0 Lei Co -t OD -t c4 00 c114 r- ZT Co CN J% ZD CN r, Ln LM Lei CY% 00 Z 0)
r14 00
%0 r*ý Co CA %0 0 Co r% %0 c4 r-4 ci r- c*II 00 Co (D %0 r- tn CO CD r-4 r- r, - rý. - -t Co Z0
ri r*%
Cq LM 0Z00 C'4 ,Ný c% - LM e4 Cm "t C% ý cq LM cn 00 rl% ýt 00 ý 00 ZZ
N %D
--00 ýt ýt %D ýt c> ýt CO c114 00
-t Ze %o cq co 00 0w >4 Co
't 0 't %0 -t 0 %D rm r- (" M ci 0 C, 4 0 rh LM in A r, CD fi Ln CO rý. M t Cý4 C% 00 Z 0)
CN 00
cm (D r% CO (D t c4 0 00 t r, r. (D r, 0 Co LM LM LM 00 00 Z
cn 00 C'4 60 r.
0) 0 %'T -, 4 "4 4) -A
04 41 "
tn C)4 $4 14 ;j0 >ý Cd 9-4 4) 00 co Cd CIO >%
ý ta 4W P-4 14 ý4 r-4 ca -4 0) >. * .0 cd %I (U 0 4.4
04 .4E. 4 w0 134 04> 1-4 ý4 E-4 N Ul = C/3
0 (14 en
0 4, J
Q) 41 0 0 41 0 0
4-4
0 Aj
1.14
10 r. C13
cn
0 41 W
0 z
162.
considered necessary to list those samples which did not contain a
particular amino acid within a pollen group as those present would result
in excessively long lists. These differences in occurrence of ninhydrin
positive substances have been listed in the order of Tables 32,36,
39,42 and 45. Also due to the sensitivity of the paper electrophoresis
and chromatography combination basic amino acids such as arginine, histidine
and others such as methionine were more evident on chromatograms even
at low levels of concentration not detected by the automatic amino acid
analyser. Typical examples of two amino acid chromatograms for each
of the pollen groups have been shown in Figures 9 to 18.
The remaining four pollen groups of thenine major floral sources,
that is, AescuZus, Inpatiens, Vicia and Mewtis accounted for the
remaining predominant pollen of only seven samples. The format of
arrangement of these honey samples was the same as described previously.
The pollen content and the responses to questionnaire question 4 have
been listed in Table 46. The amino acid concentration measurements
and responses to questionnaire questions 3,5 and 6 have also been given
in Table 47. The following ninhydrin positive substances were detected
on the amino acid maps. These were: a- and 0-alanine, a- and y-
aminobutyric acid, arginine, asparagine, aspartic acid, cysteine, glucos-
amine, glutamine, glutamic acid, glycine, histidine, hydroxypipecolic
acid, hydroxyproline, isoleucine, leucine, lysine, methionine, methyl-
histidine, phenylalanine, pipecolic acid, proline, serine, threonine,
tryptophan, tyrosine, valine and unidentified spot Ix'. The differences
in occurrence of ninhydrin positive susbtances have been given in Table
48.
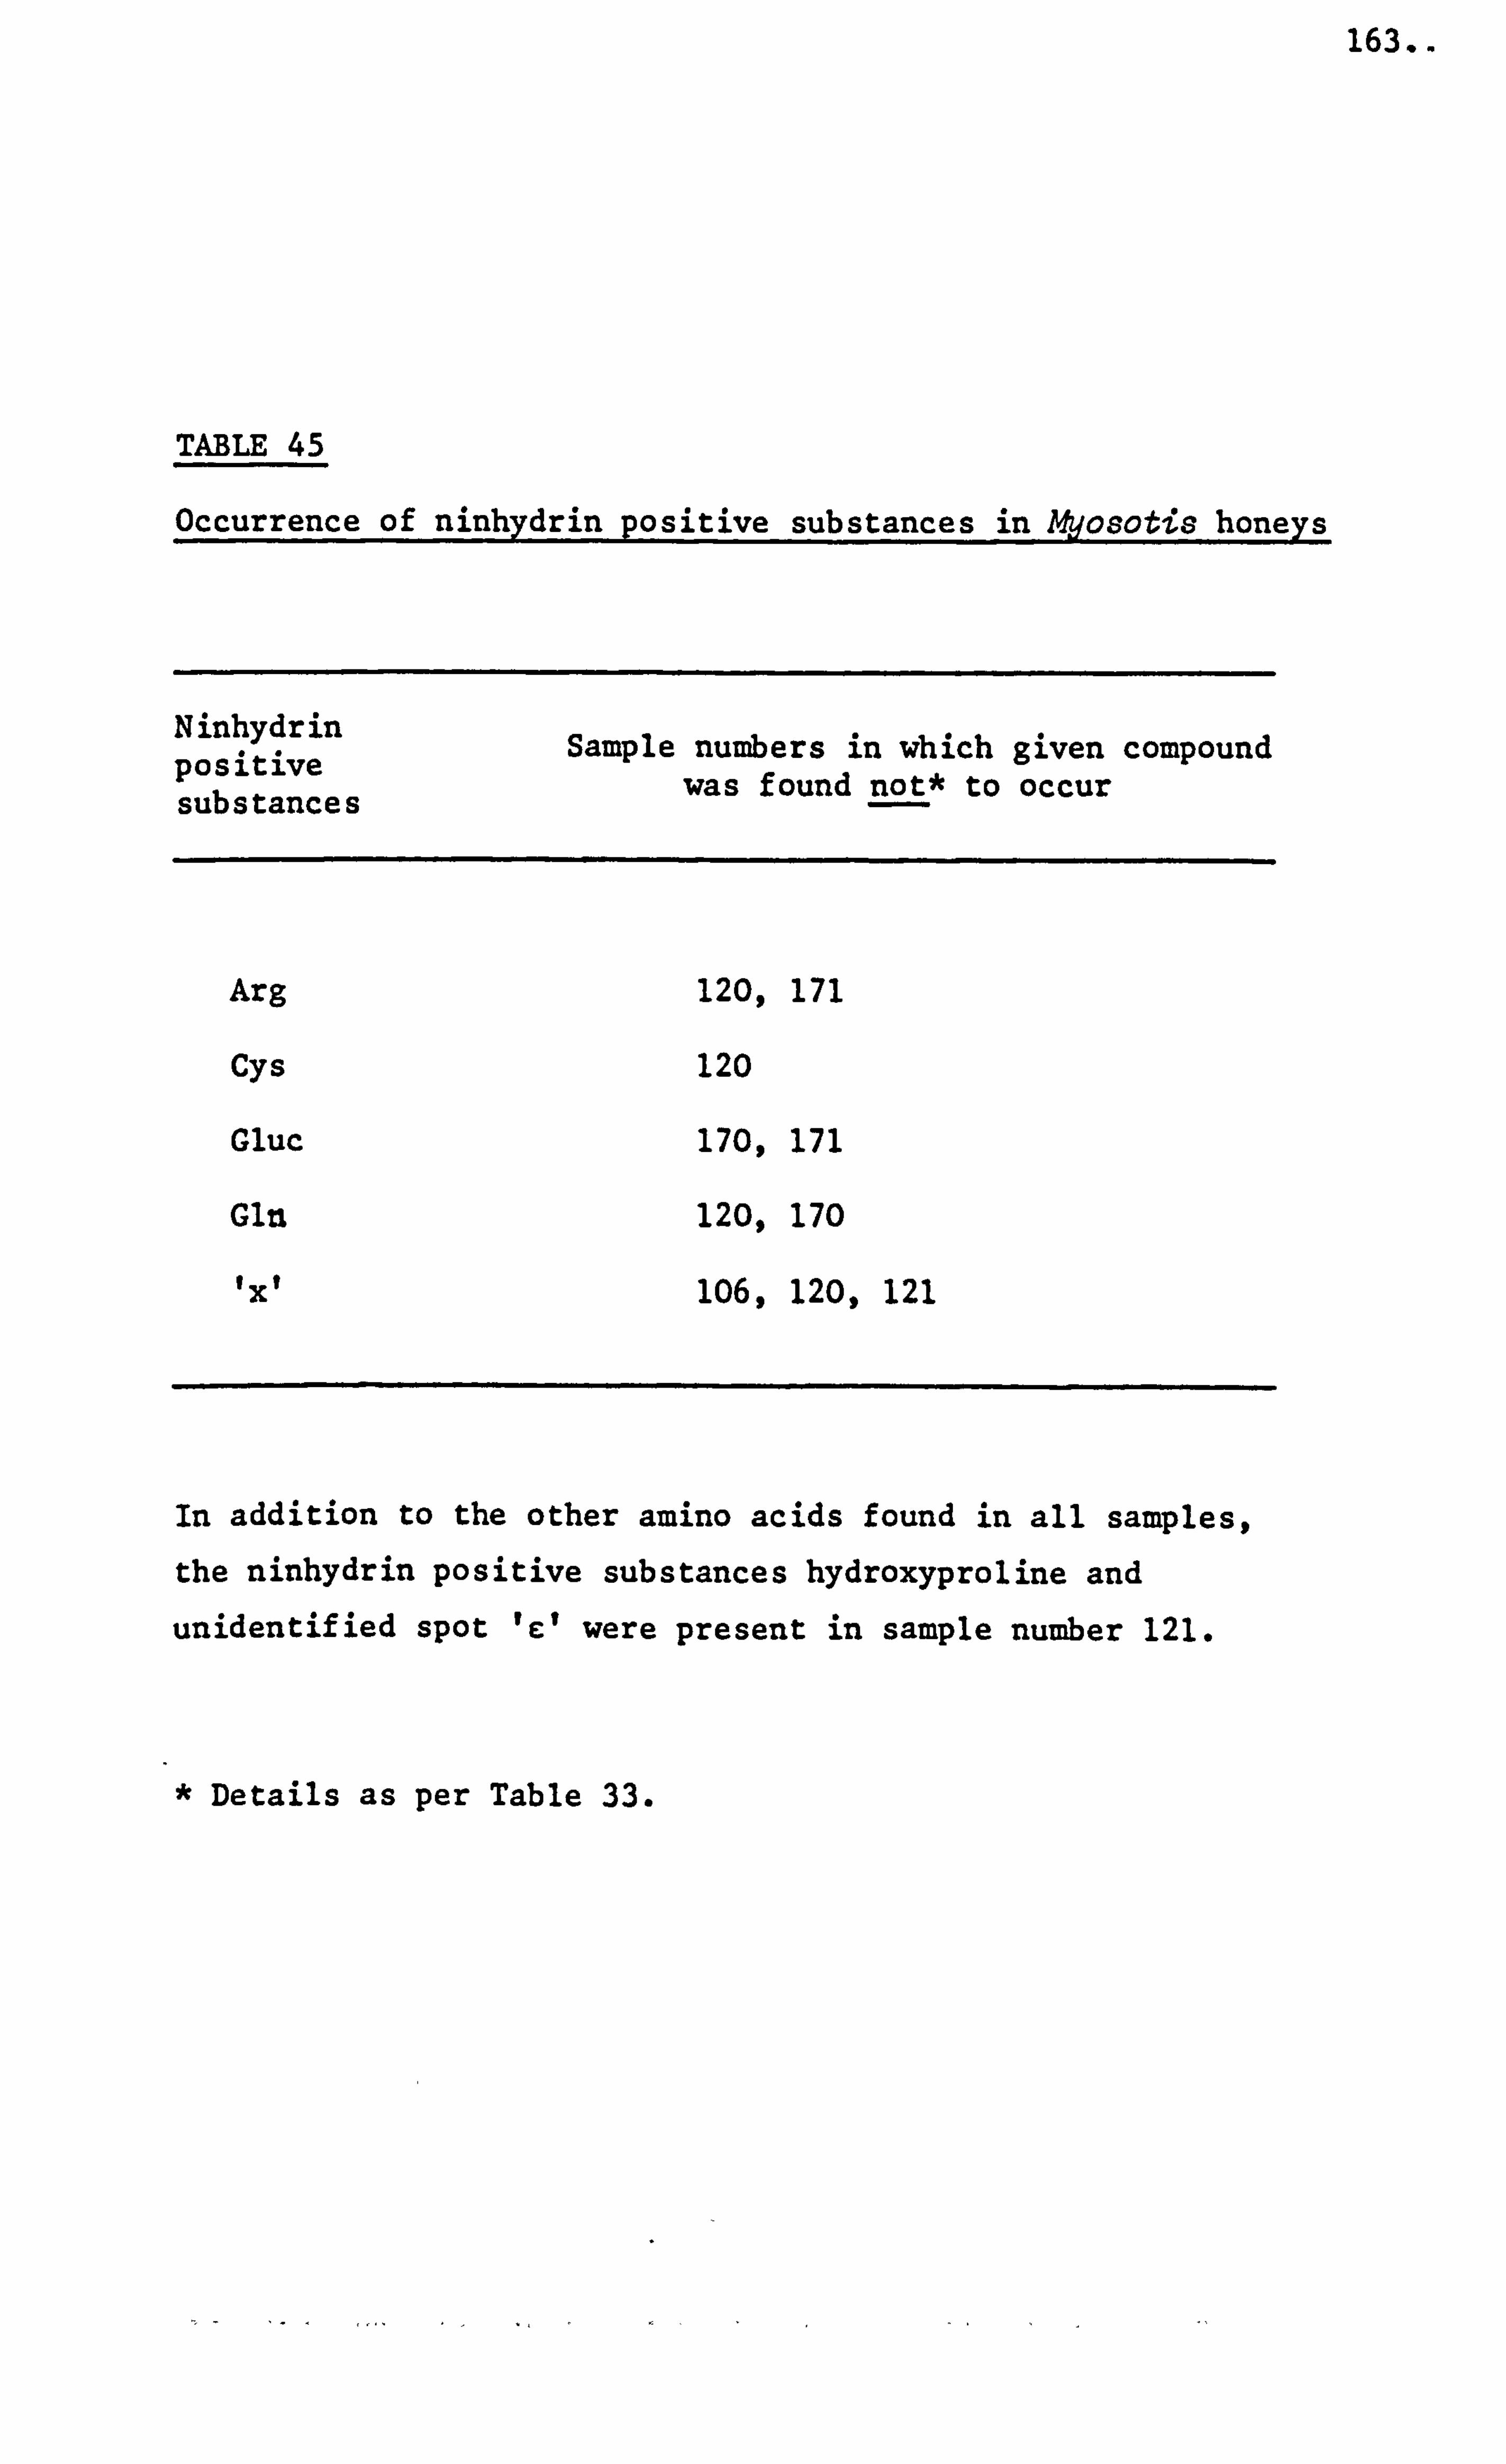
163..
TABLE 45
Occurrence of ninhydrin positive substances in Myosotis honeys
Ninhydrin Sample numbers in which given compound positive was found not* to occur substances
Arg 120, 171
Cys 120
Gluc 170, 171
Gln 120, 170
txt 106, 120,121
In addition to the other amino acids found in all samples, the ninhydrin positive substances hydroxyproline and
unidentified spot 'e' were present in sample number 121.
* Details as per Table 33.
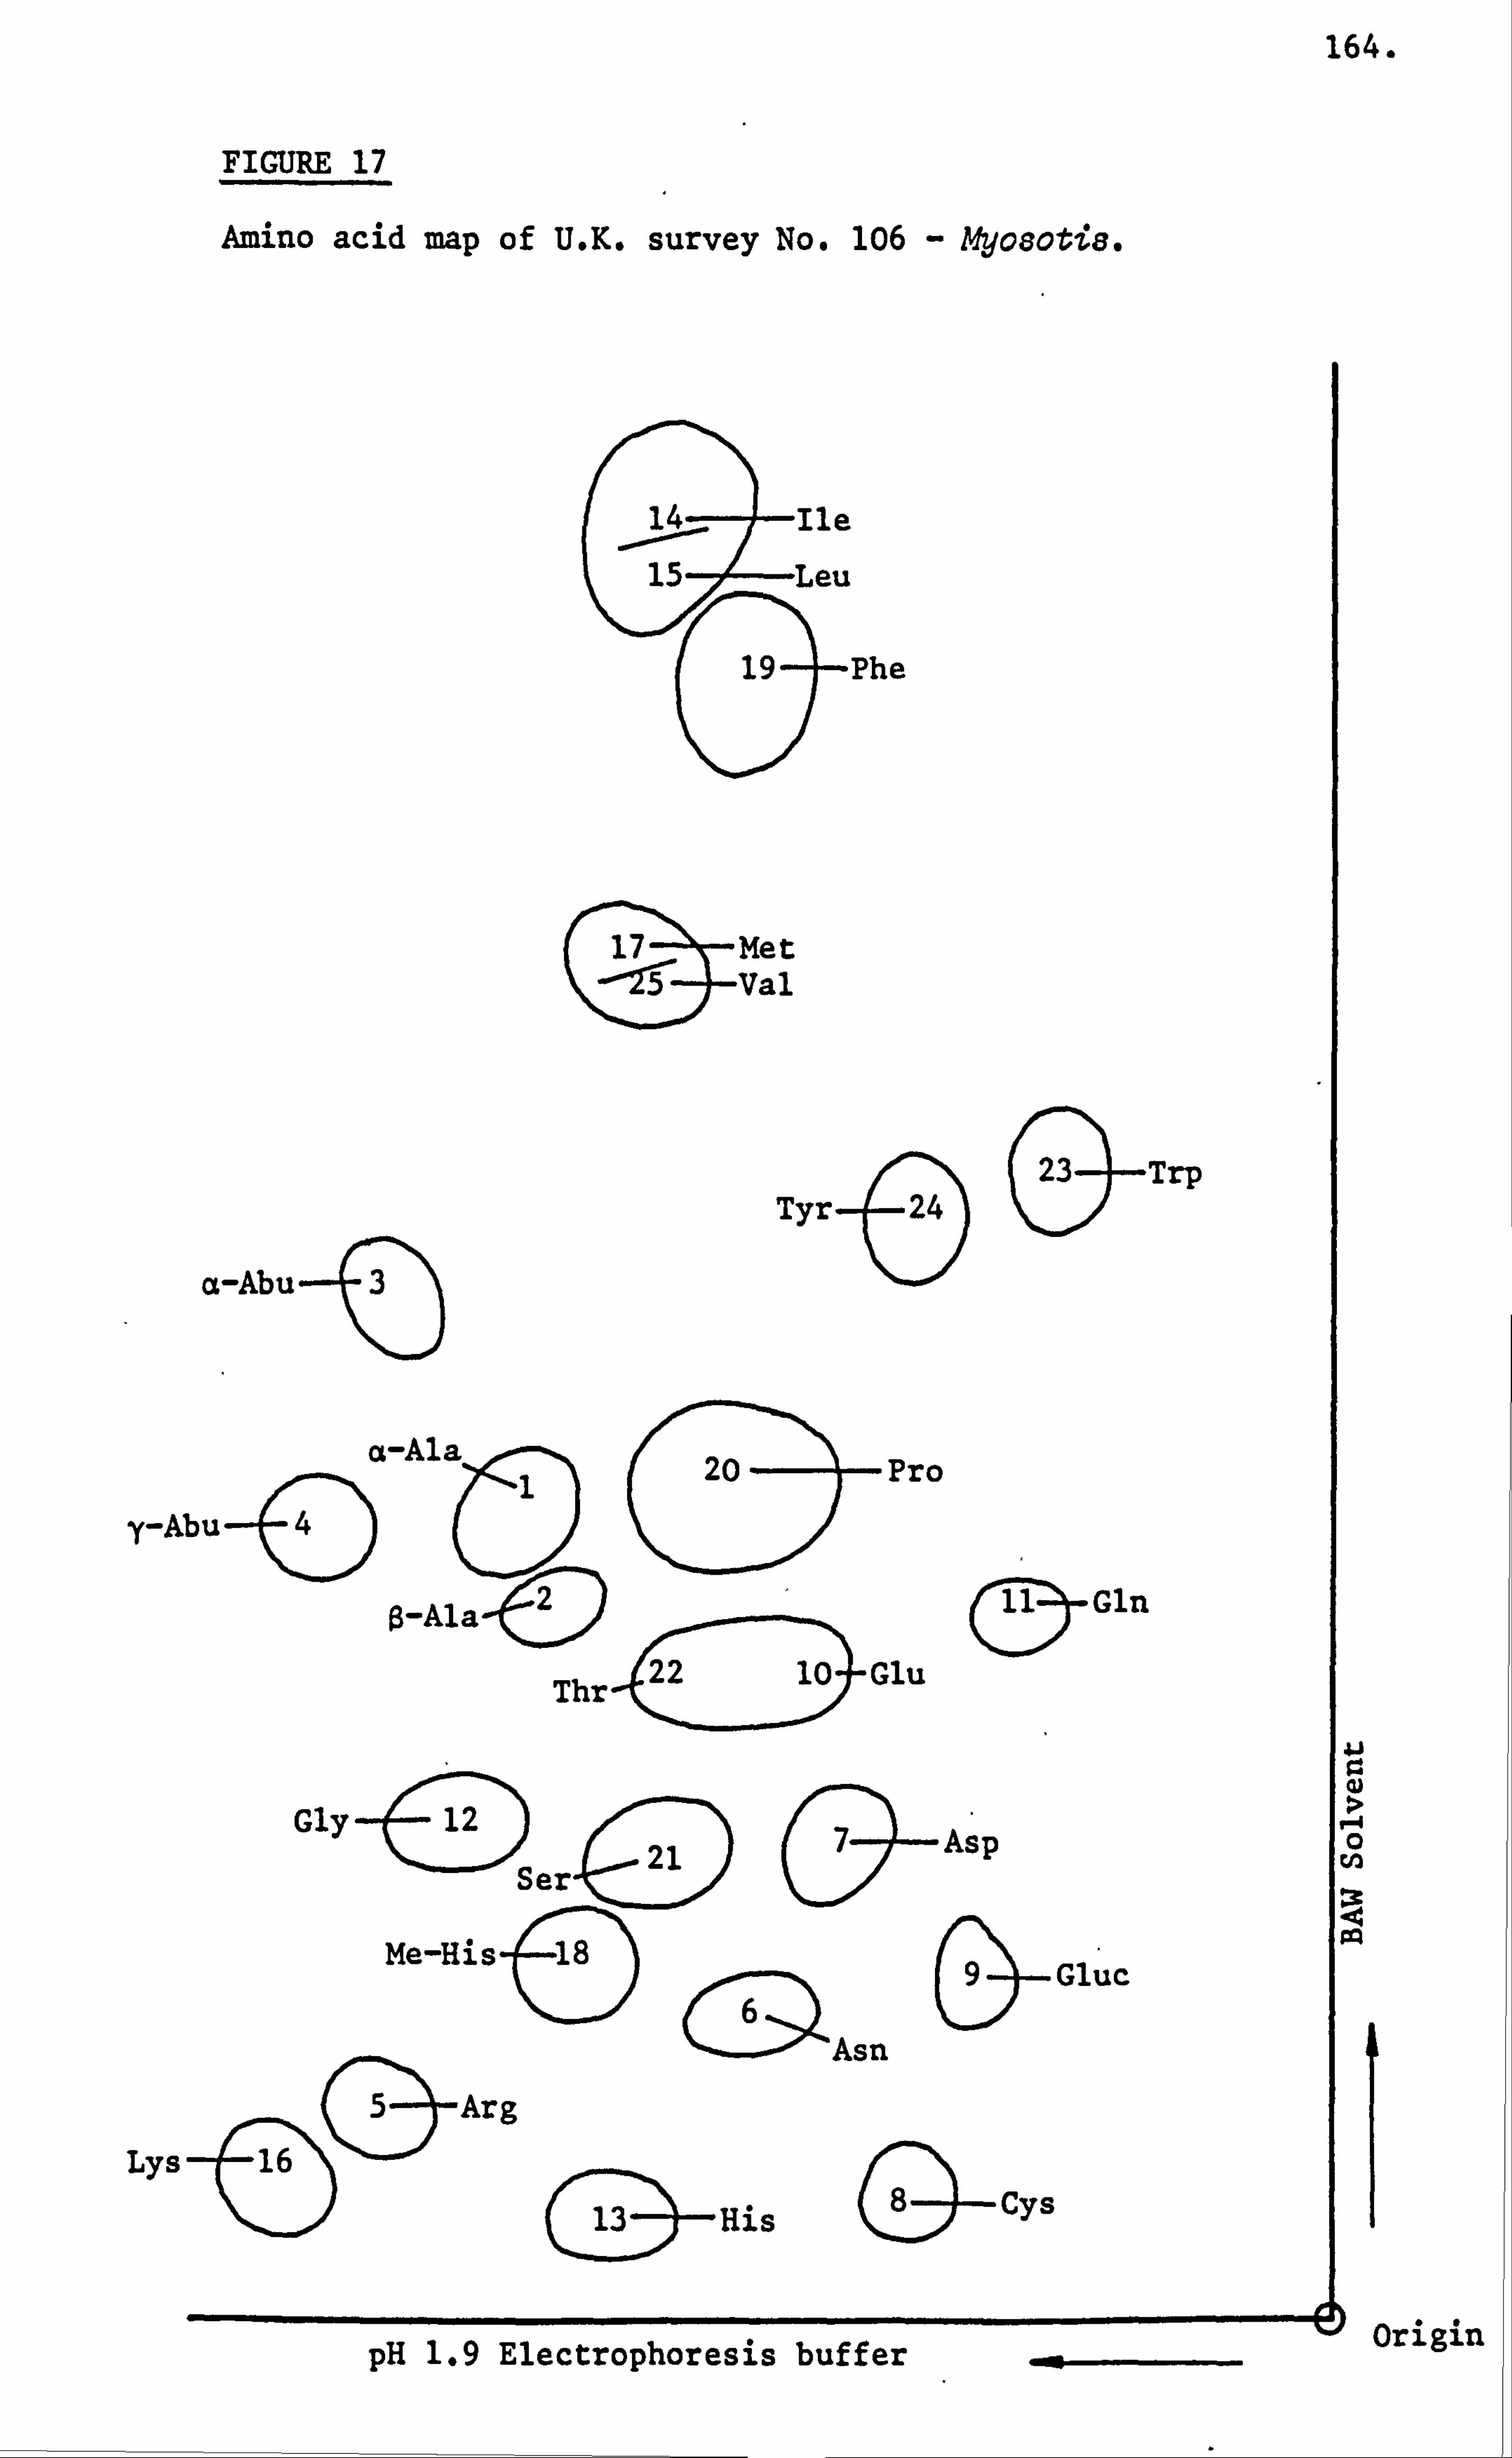
164.
FIGURE 17
Amino acid map of U. K. survey No. 106 - AVosotia.
P Met Val
Phe
Trp Tyr 24
a-Abu-, Ql -e
a-Ala 20 Pro
y-Abu -(D 9ý, (D
, ß-Ala 2 Gln : E) (3-
Thr Glu
Gly -ý Ser
21
Me-His
P aAsp
5 -Arg Lys 16 1,
"*ýýAsn
Gluc
(Dý--His G-cys
pH 1.9 Electrophoresis buffer
4J
0
Origin
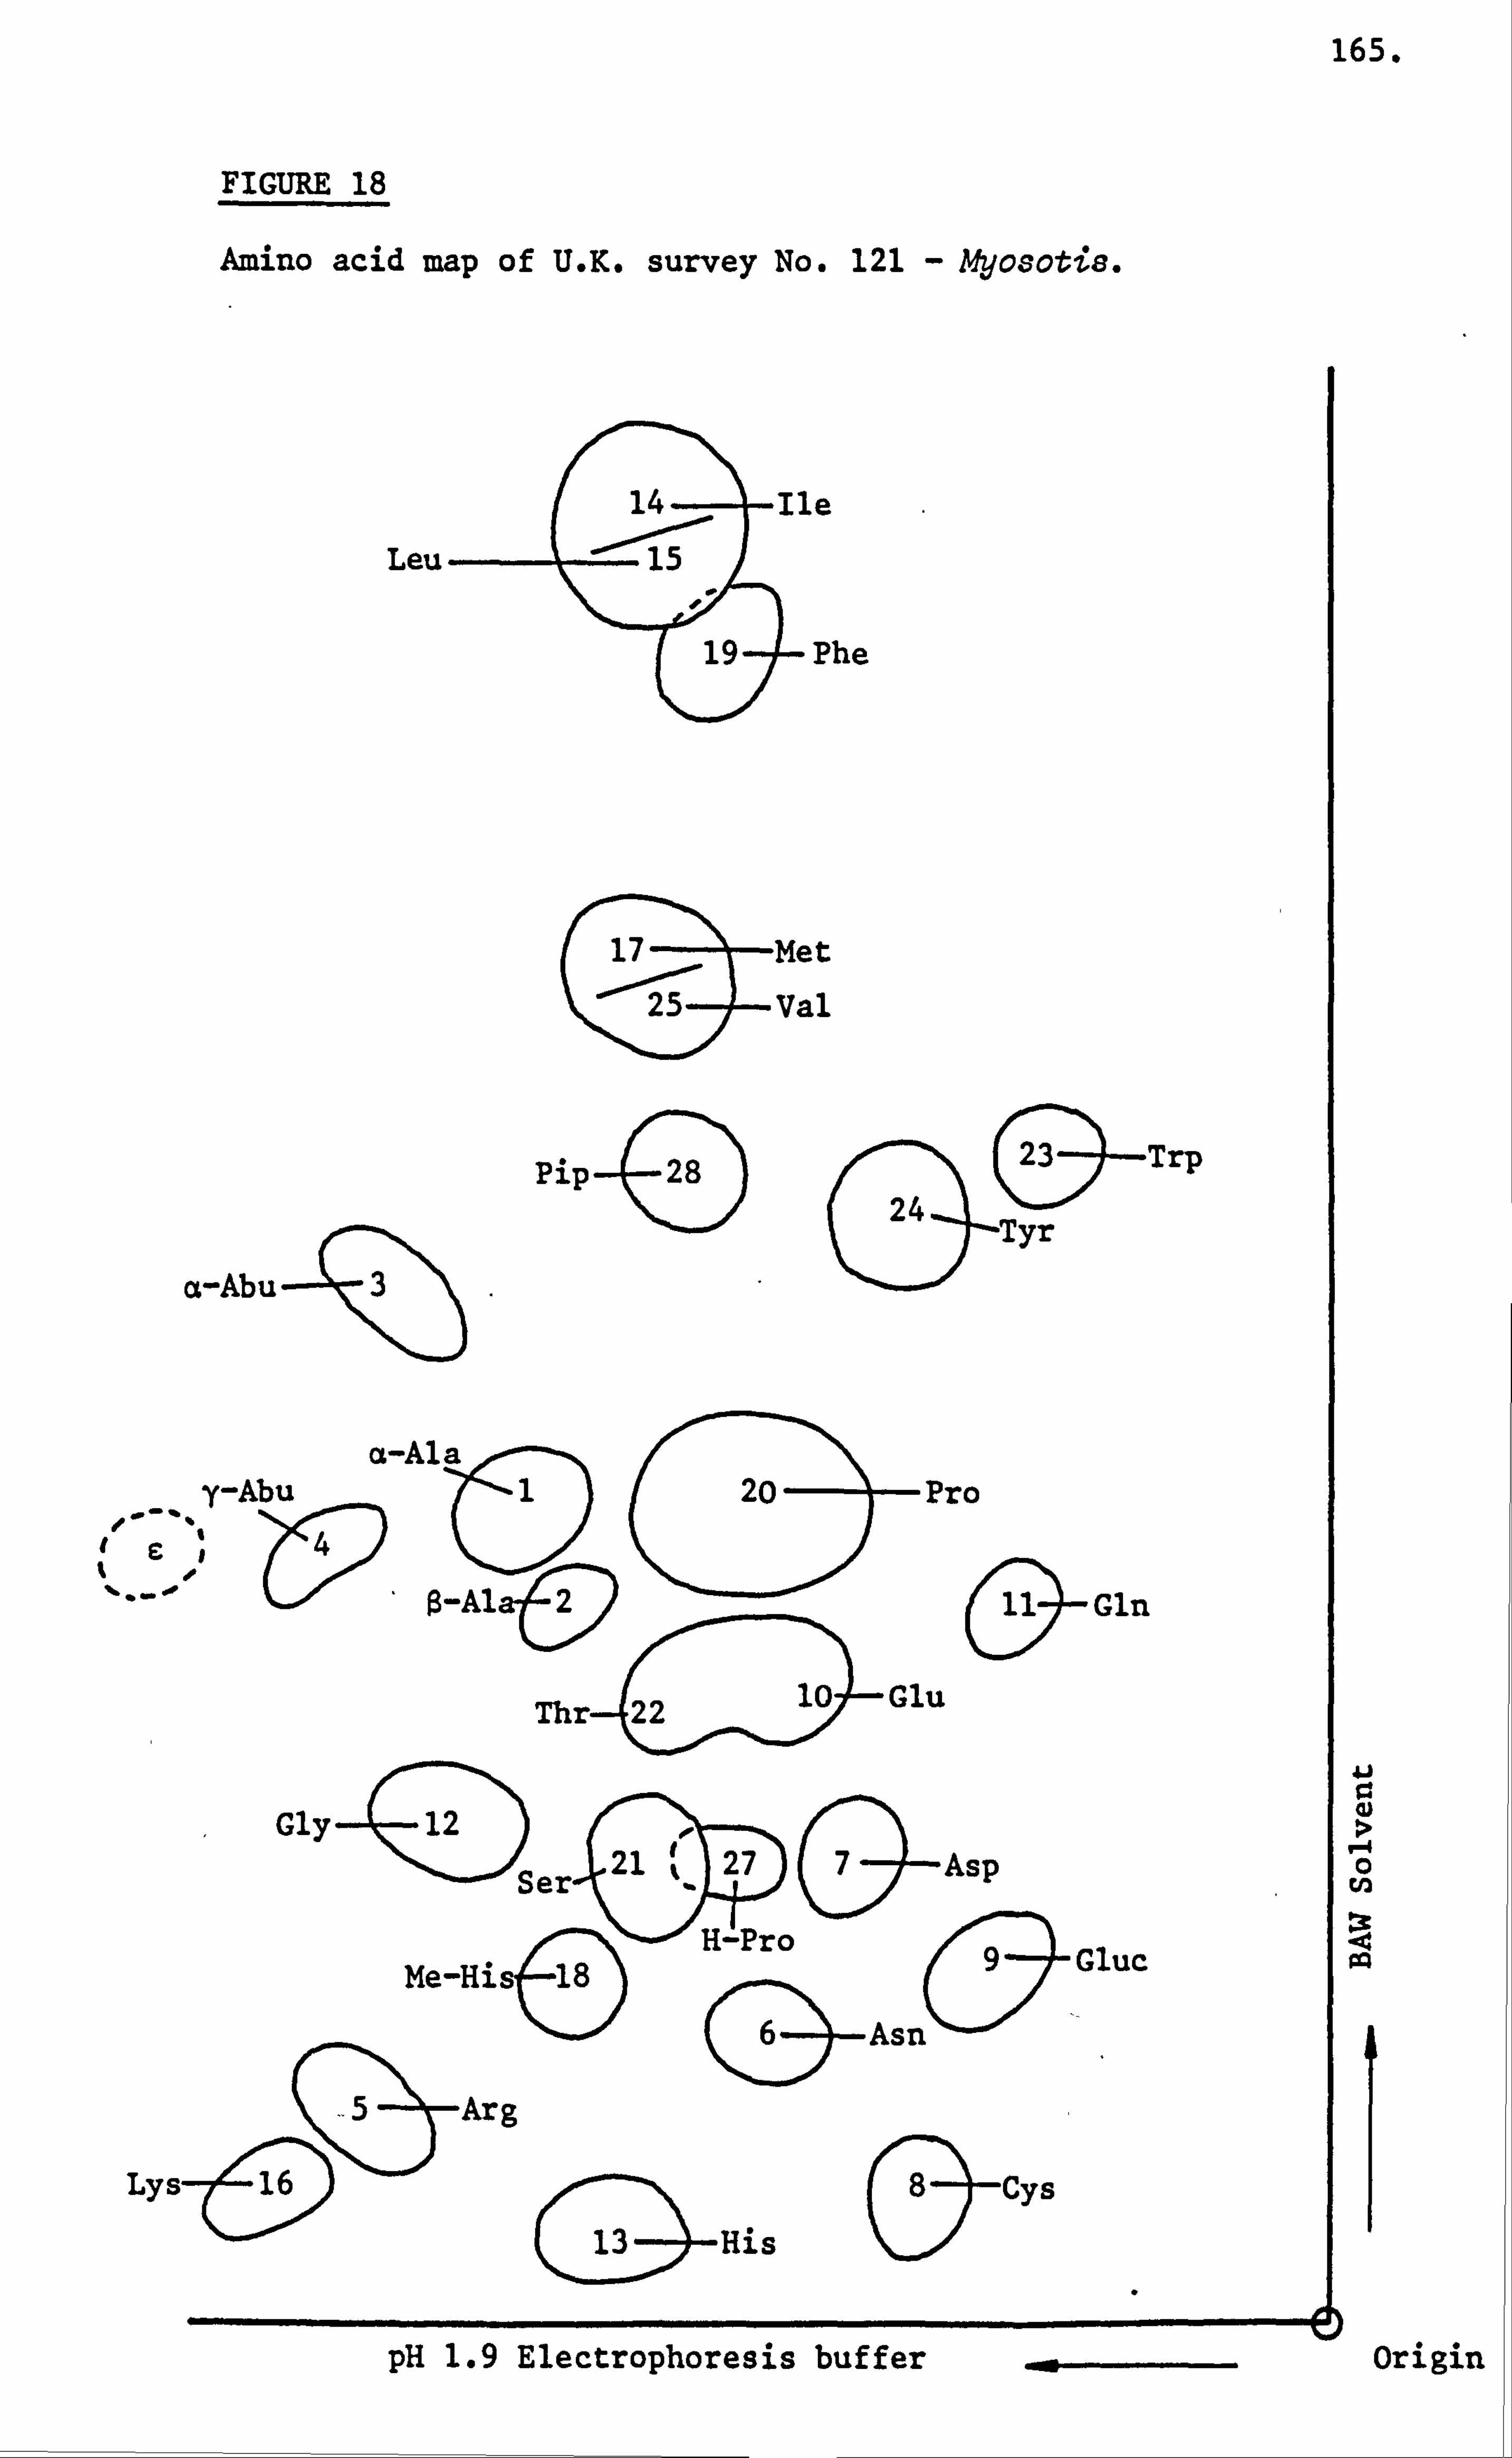
165.
FIGURE 18
Amino acid map of U. K. survey No. 121 - AVosotie-
14::: Ile Leu -
'15 ý
19 -4- Phe
Cl 7 -Met
___ 25 - Val
Pip 24
( 3ý-Trp
a-Abu4 3). .0
Tyr
y-A a-Ala
1
C20)
- Pro
O-Alý 2 Gln
Thr 22 10 Glu
Gly 21 1% #0 27 Asp
c
)Ser &
-C. ". H-Pro Is 9 Gluc
J;. AsnO
Me-His 18
G- -5 Arg
Ly s-( 16 (:
lD3ý-His
Cys
cl
�-I 0
: 3: ýcc go
pH 1.9 Electrophoresis buffer Origin
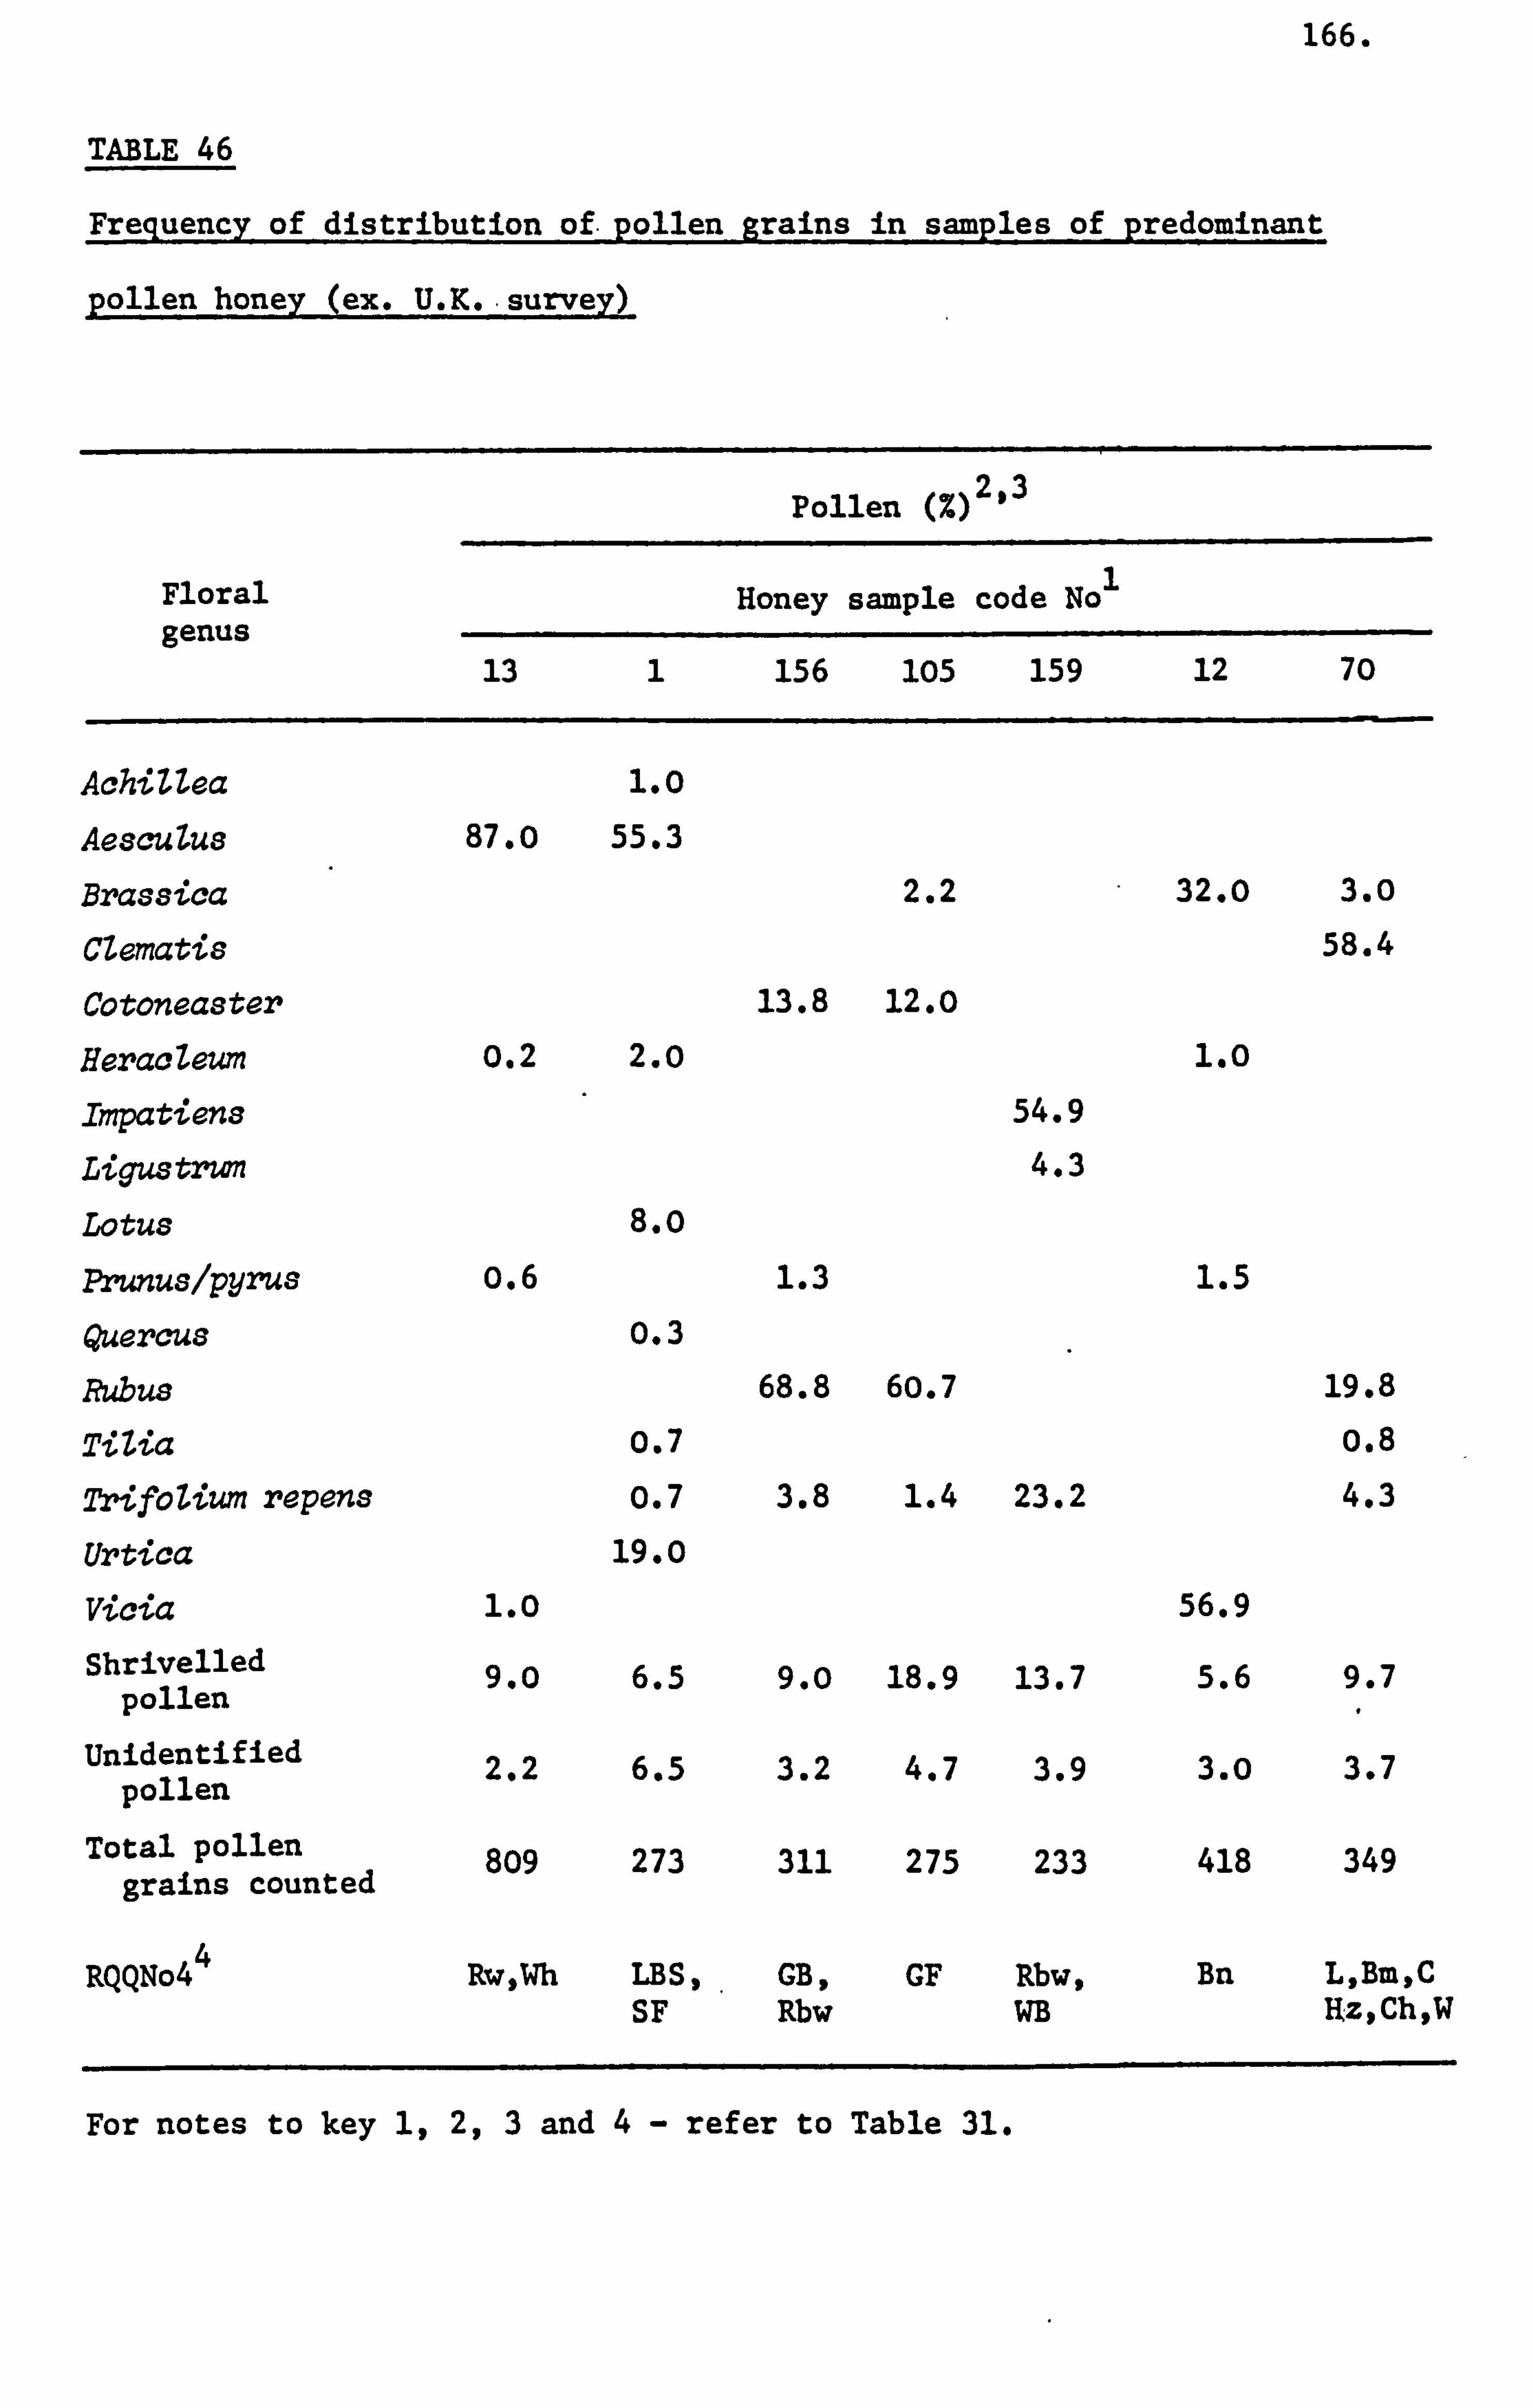
166.
TABLE 46
Frequency of distribution of. pollen grains in samples of predominant-
pollen honey (ex. U. K.. survey)
Floral genus
13 1
(7 Pollen )2,3
Honey sample code No
156 105 159 12 70
AchiUea 1.0
AescuZus 87.0 55.3
Brassica 2.2 32.0 3. o
Mematis 58.4
Cotoneaster 13.8 12.0
HeracZeum o. 2 2. o 1.0
Impatiens 54.9
Ligustrum 4.3
Lotus 8. o
Prunus/pyrus o. 6 1.3 1.5
Quercus o. 3
Rubus 68.8 60.7 19.8
TiZia M o. 8
Trifolium repens o. 7 3.8 1.4 23.2 4.3
Urtica 19.0
Vicia 1.0 56.9
Shrivelled 9.0 6.5 9.0 18.9 13.7 5.6 9.7 pollen
Unidentified 2.2 6.5 3.2 4.7 3.9 3. o 3.7 pollen
Total pollen 809 273 311 275 233 418 349 grains counted
RQQNo4 4 RwjWh LBS9. GB, GF Rbw, Bn L, Bm,, C
SF Rbw WB Ijz, Ch, W
For notes to key 1,2,3 and 4- refer to Table 31.
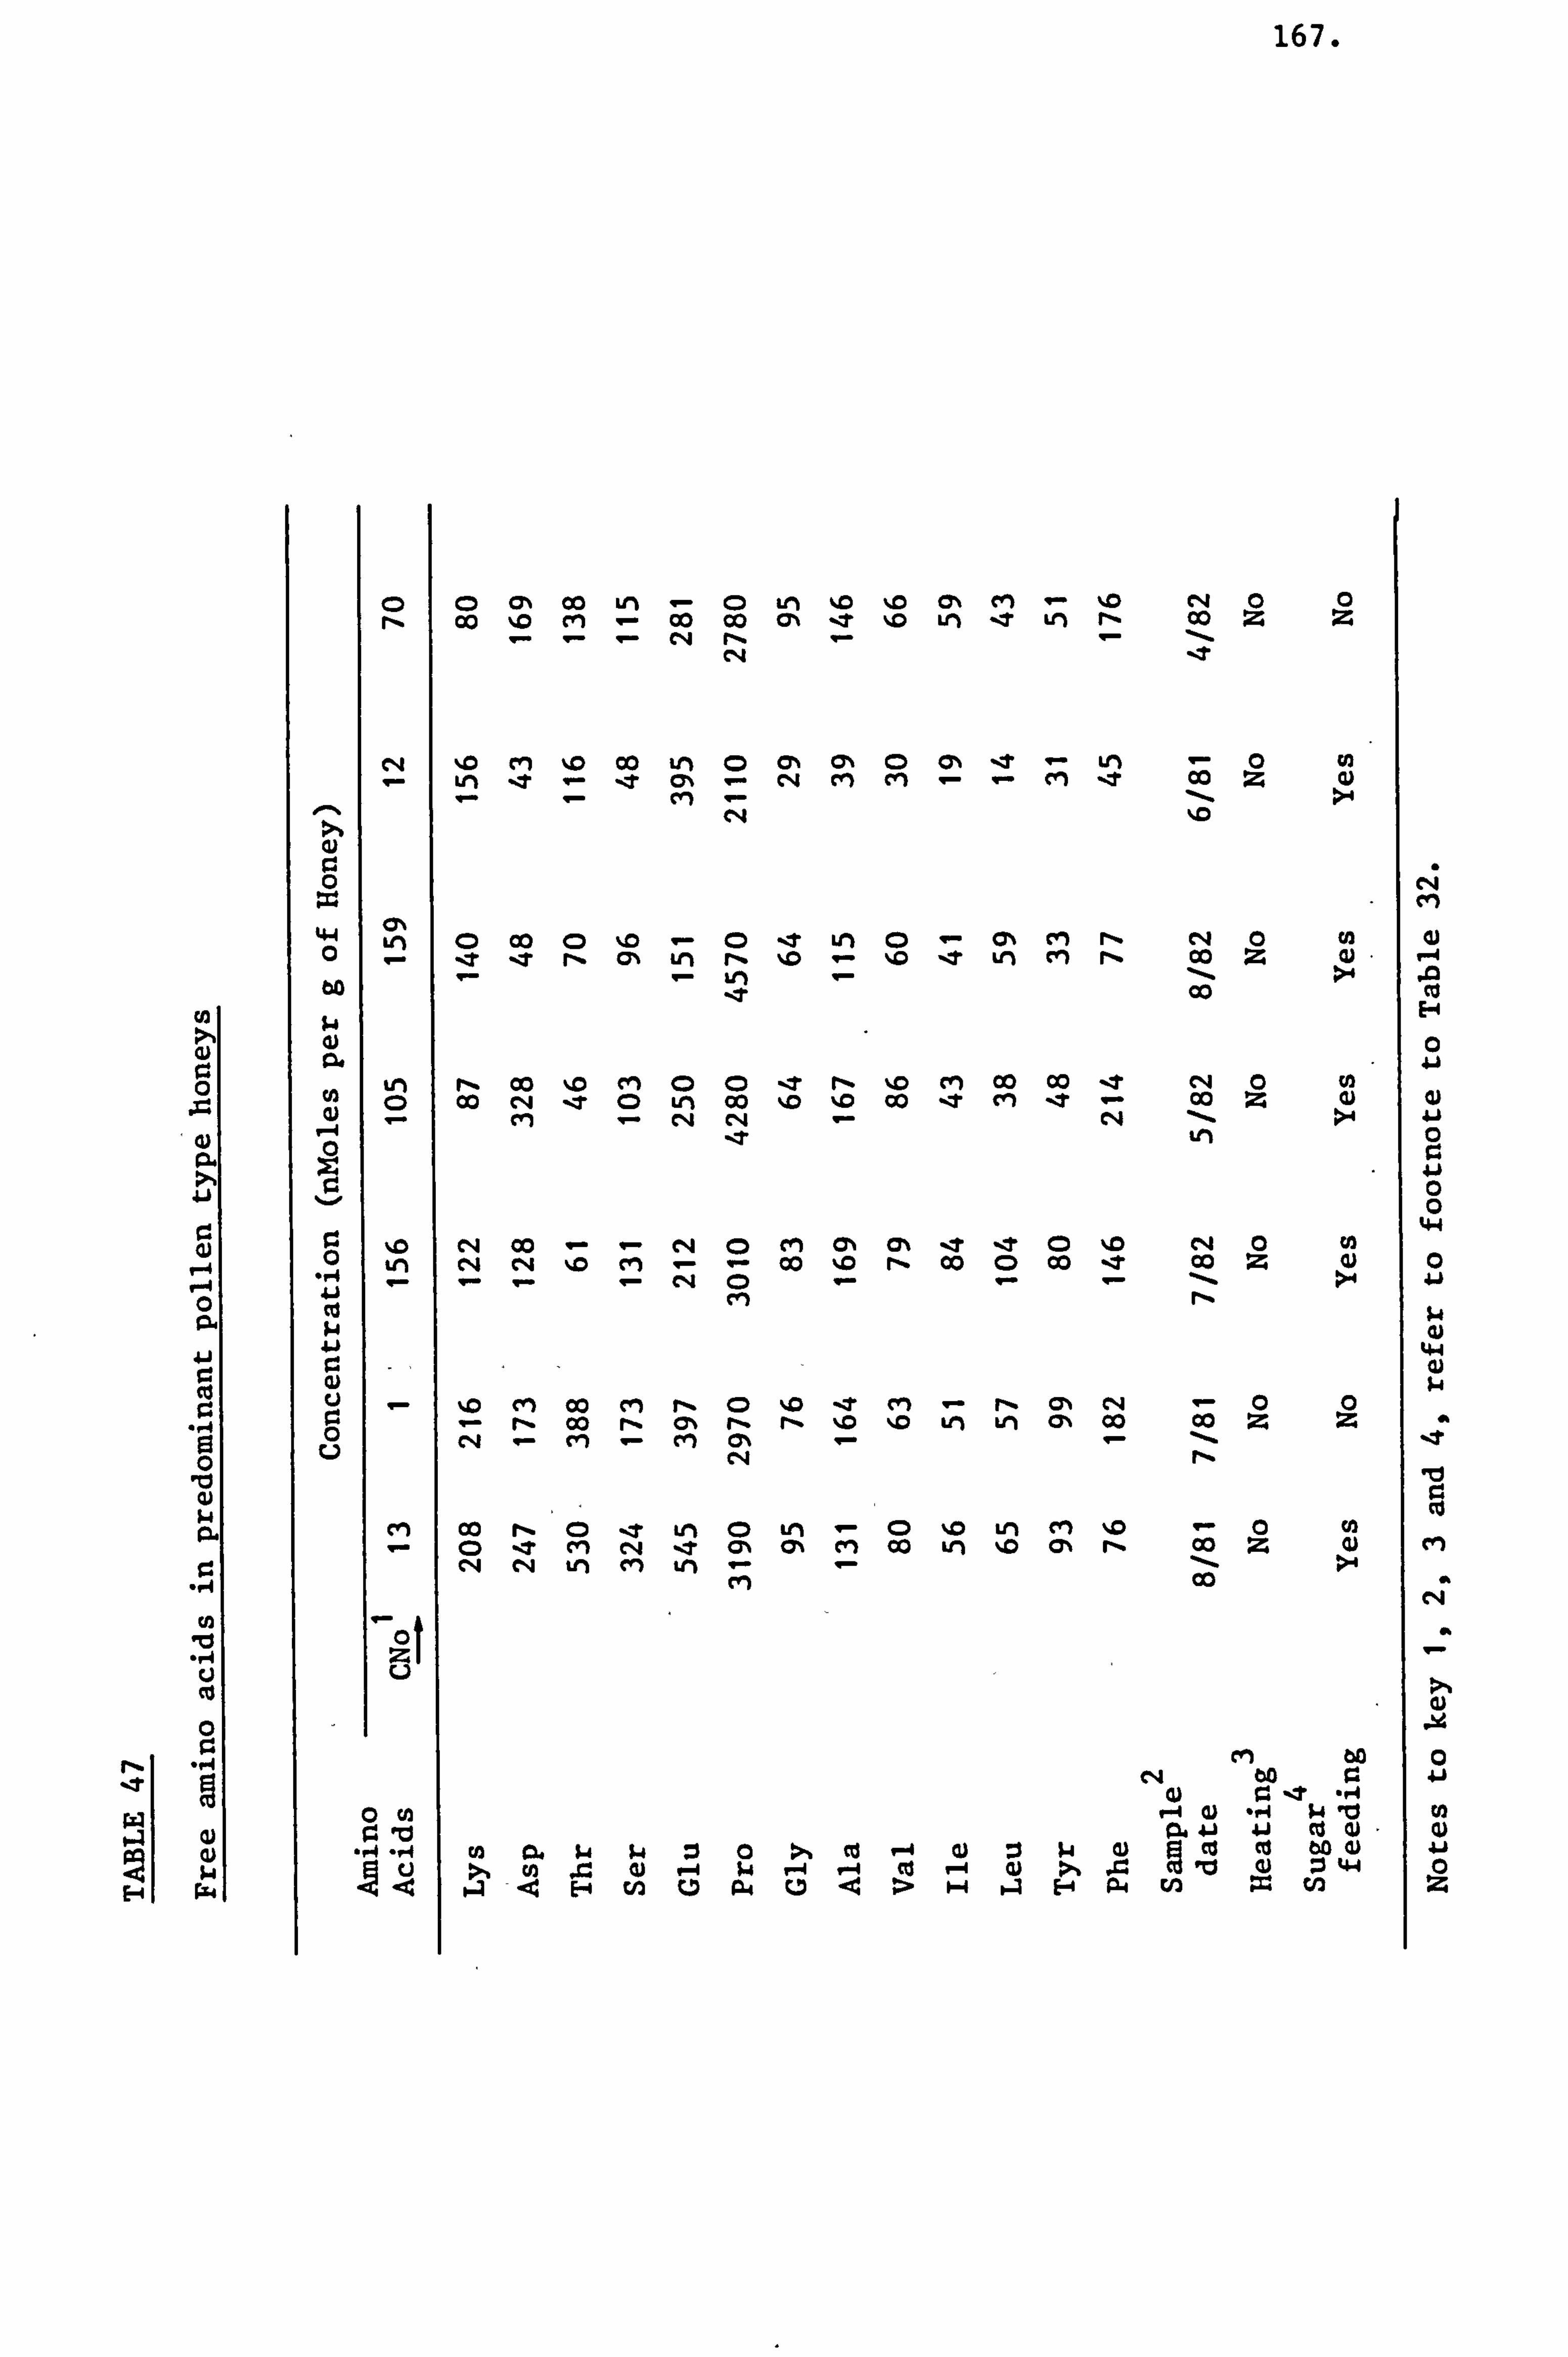
4)
0
C: -r4
cn 10 -, 4 u co
0 P:
94
E-4 rz4
44
r. D 0
cm
0
0 cn
CD c> 00 LM - CD LM ý0 %0 (: en - %0 r4 Co %0 cm - Co 00 CY% -t D Lri 't LM r- 00
- c4 rý -- C, 4 _T
167.
a z
%D cl ýo CO In C) cyý ON 0 c> 't ý V) - c> cn ;r Q) Cl
C%4 %D
a 00 0 %D -a-, t Ln 0- ON cn rý C14 0 CA r -ýr r, a% Ln r, %. o ,Zt Ln cn rý 00 z 4)
Ln >4
T co
r-. Co %D cm 00 't r- %ID cm 00 00 _T CN 0 (0 Co rq 't (D LM 00 %0 'D 00 t cn -t - 00 (L)
c4 V-1
N 00 --N0 CM C% C% tt0 %D C, 4 0 c4 %0 cm -- Co %0 r- Co 0 00 -t Co
- CN 0-
cm rlý
%0 CYI 00 rl rý- 0 %0 t CM ý rý (IN CN
r- 00 r, cl% r, r, %0 %0 LM Ln cl% 00 Co
Co r, CD t LM 0 Lti CD -0 Lri cm "D CD %t M (*, j -, t ON C% Cl 00 vi ZO c% r, Co A CN tn en LM - - 1. ý
ri Co
cm ÖD
P-4 0 p4 W Iti 0,41 41 cu 0) ý
rA 04 ww :i to --4 (L) :ip cu 9 (13 ce bo gi Co il. 0) $4 V-4 p-, tu 4
E-4 cn P-4 C< 12,4
cz M
0
0
0 0
4-4
0
44
cm
0) 4. 0
Z
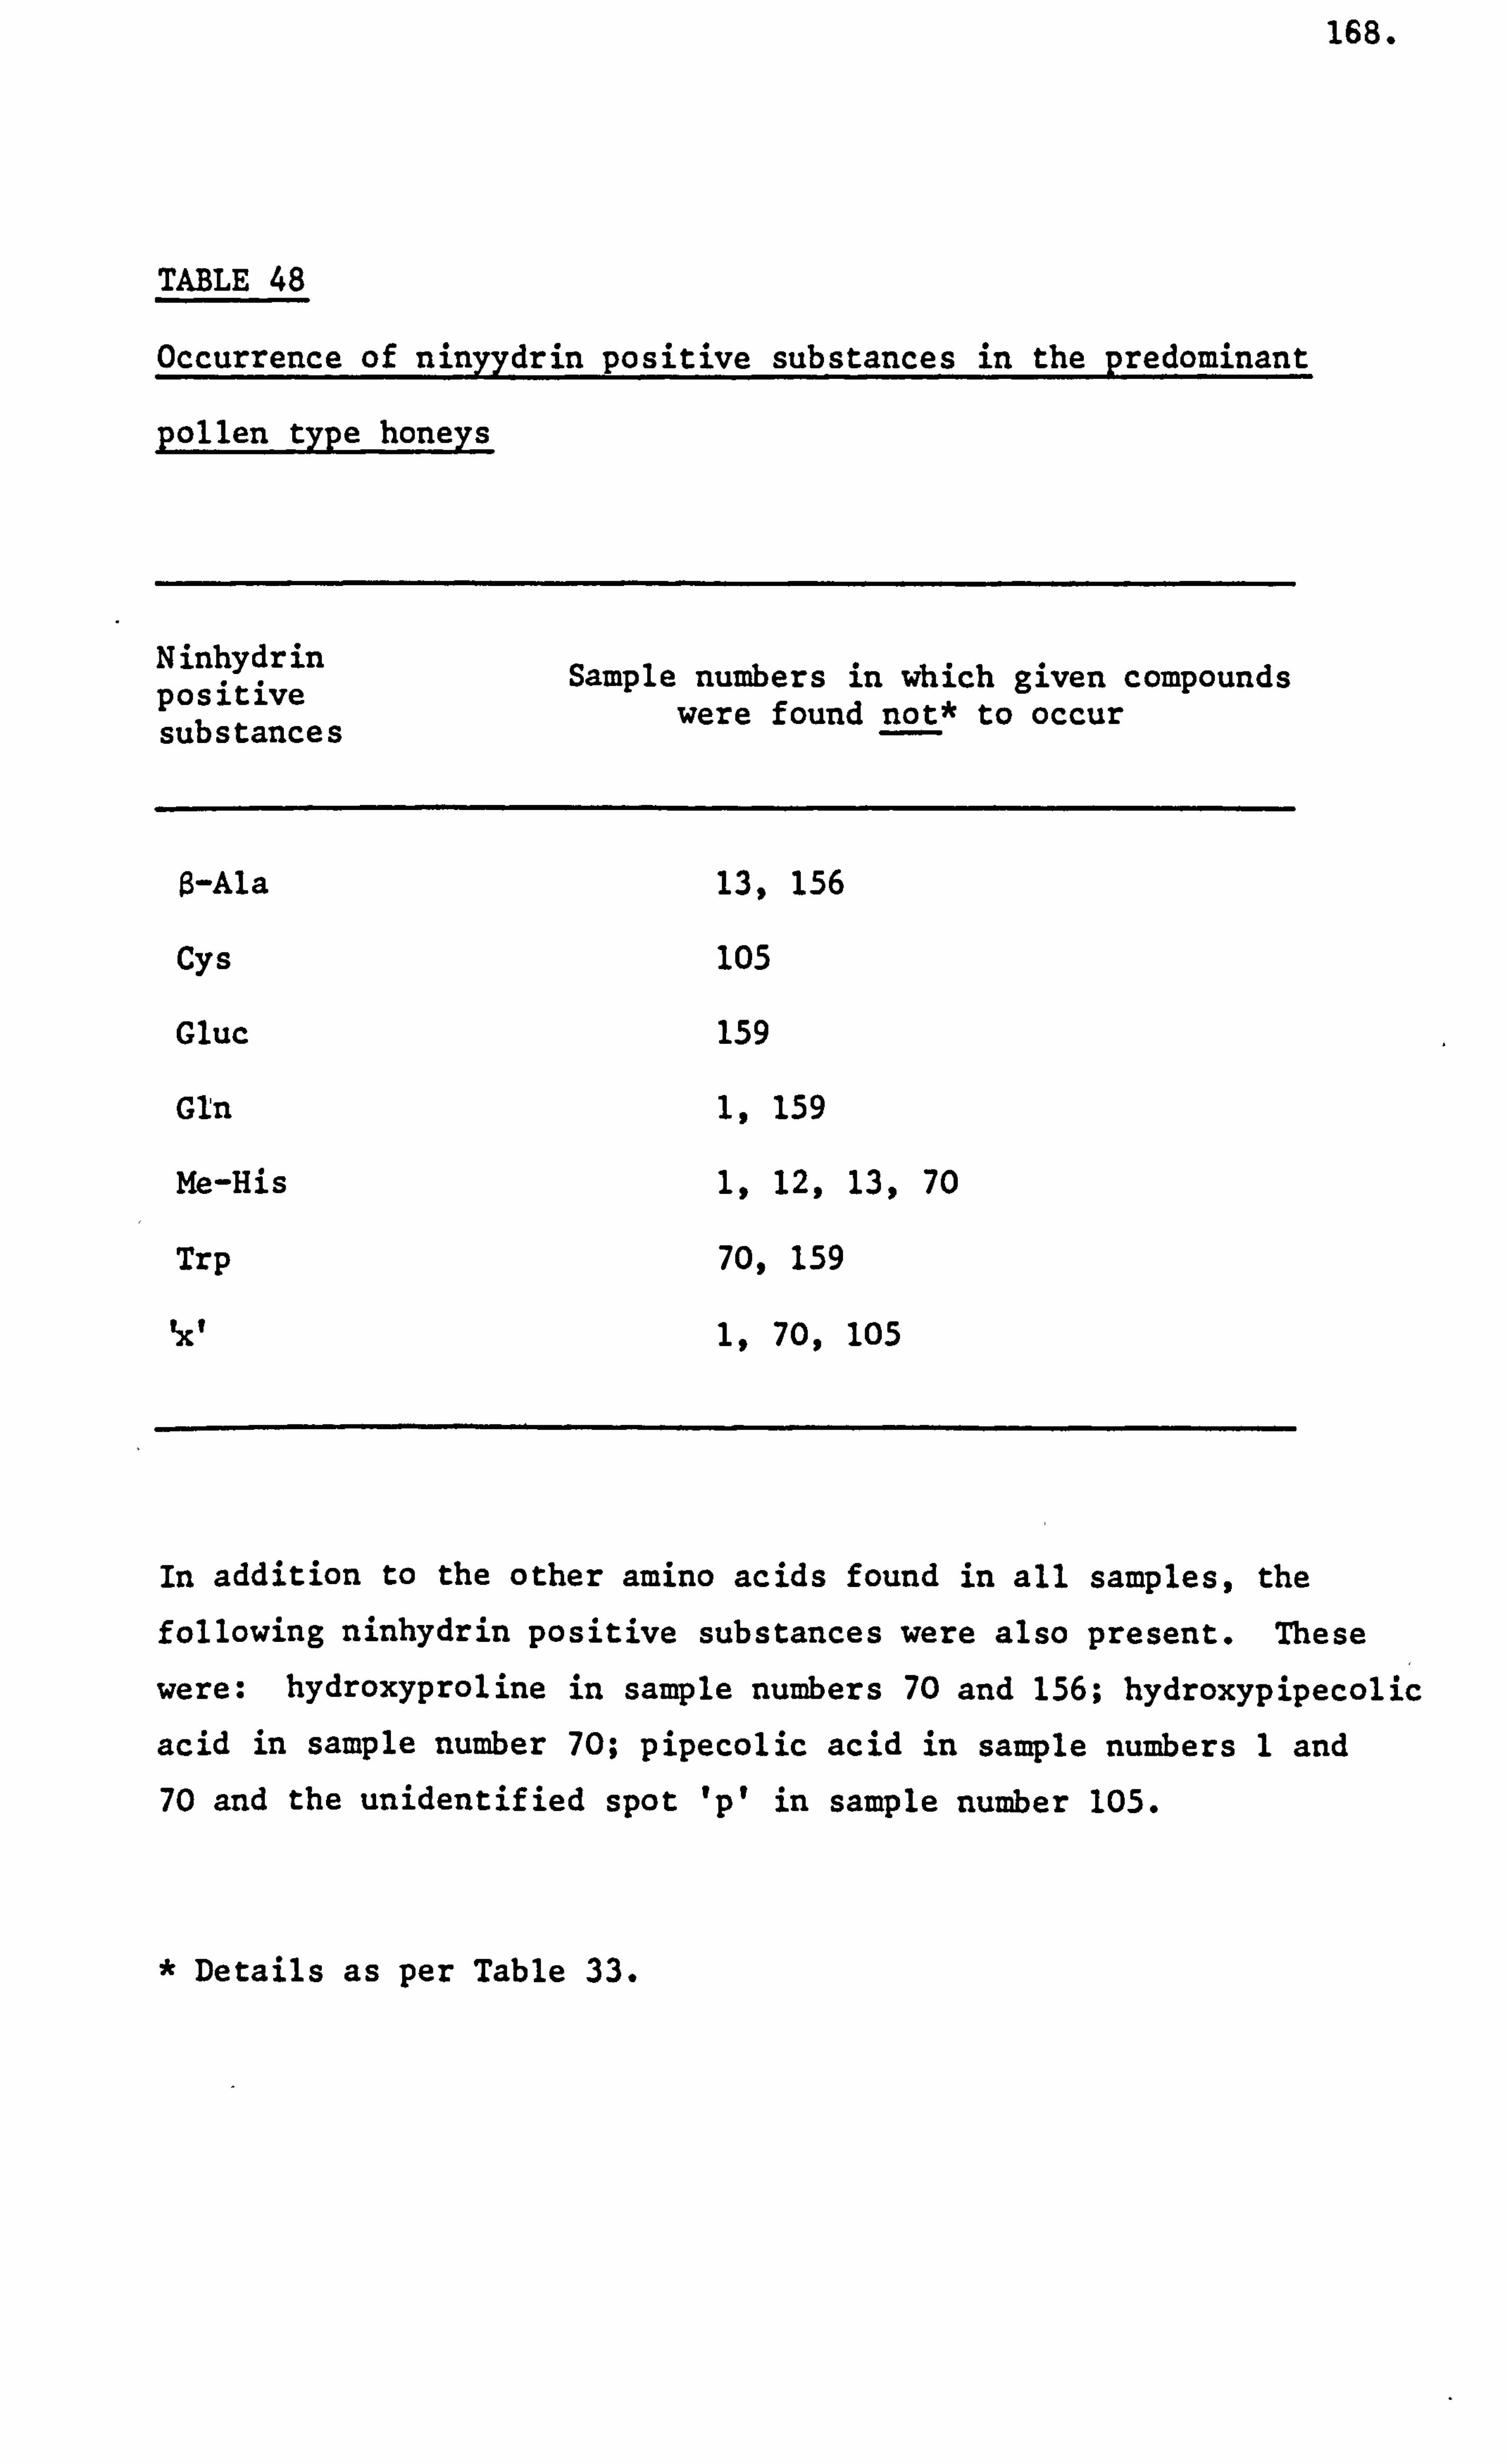
168.
TABLE 48
occurrence of ninyydrin positive substances in the predominant
pollen type honeys
Ninhydrin Sample numbers in which given compounds positive were found not* to occur substances
O-Ala 13,156
Cys 105
Gluc 159
Gln 1,159
Me-His 1,12,13,70
Trp 70,159
Ixt 1,70,105
In addition to the other amino acids found in all samples, the
following ninhydrin positive substances were also present. These
were: hydroxyproline in sample numbers 70 and 156; hydroxypipecolic
acid in sample number 70; pipecolic acid in sample numbers 1 and 70 and the unidentified spot 'pl in sample number 105.
* Details as per Table 33.
169.
Secondary pollen type
Honey samples containing the secondary frequency class pollen,
that is, those containing between 16% and 45% pollen were allocated
in this category. There were twenty one samples that accounted for
seven secondary floral pollens. These seven pollens were: Brassica,
Aesculus, Trifolium repens, Rubus, Castanea., Teucrium and AZnue.
The format of arrangement of these honey samples was the same as described
before. The pollen contents and the response to questionnaire question
4 have been listed in the order as given in Table 49. The amino acid
concentration measurements and the responses to questionnaire questions
3,5 and 6 have been listed in the order as given in Table 50.
The ninhydrin positive substances detected on the amino acid maps
were: a- and 0-alanine, a- and y-aminobutyric acid, arginine, asparagine,
aspartic acid, cysteine, glucosamine, glutamine, glutamic acid, glycine,
hydroxyproline, histidine, isoleucine, leucine, lysine, methionine,
methyl-histidine, phenylalanine, pipecolic acid, proline, serine, threonine,
tryptophan tyrosine, valine and the two unidentified spots 'x' and
I pl, The differences in occurrence of ninhydrin positive substances
were evaluated within and between each pollen group and these have been
listed in Table 51. Further, there were two other unidentified ninhydrin
positive substances detected in sample code number 169 and these were
labelled as '0' and 'a'. Their position of occurrence relative to the
other spots have been shown in Figure 19.
Secondary multiple pollen type
Honey samples which contained two or more secondary frequency class
pollens were allocated to this category. There were forty nine honey
samples which accounted for twelve pollen groups listed in the order
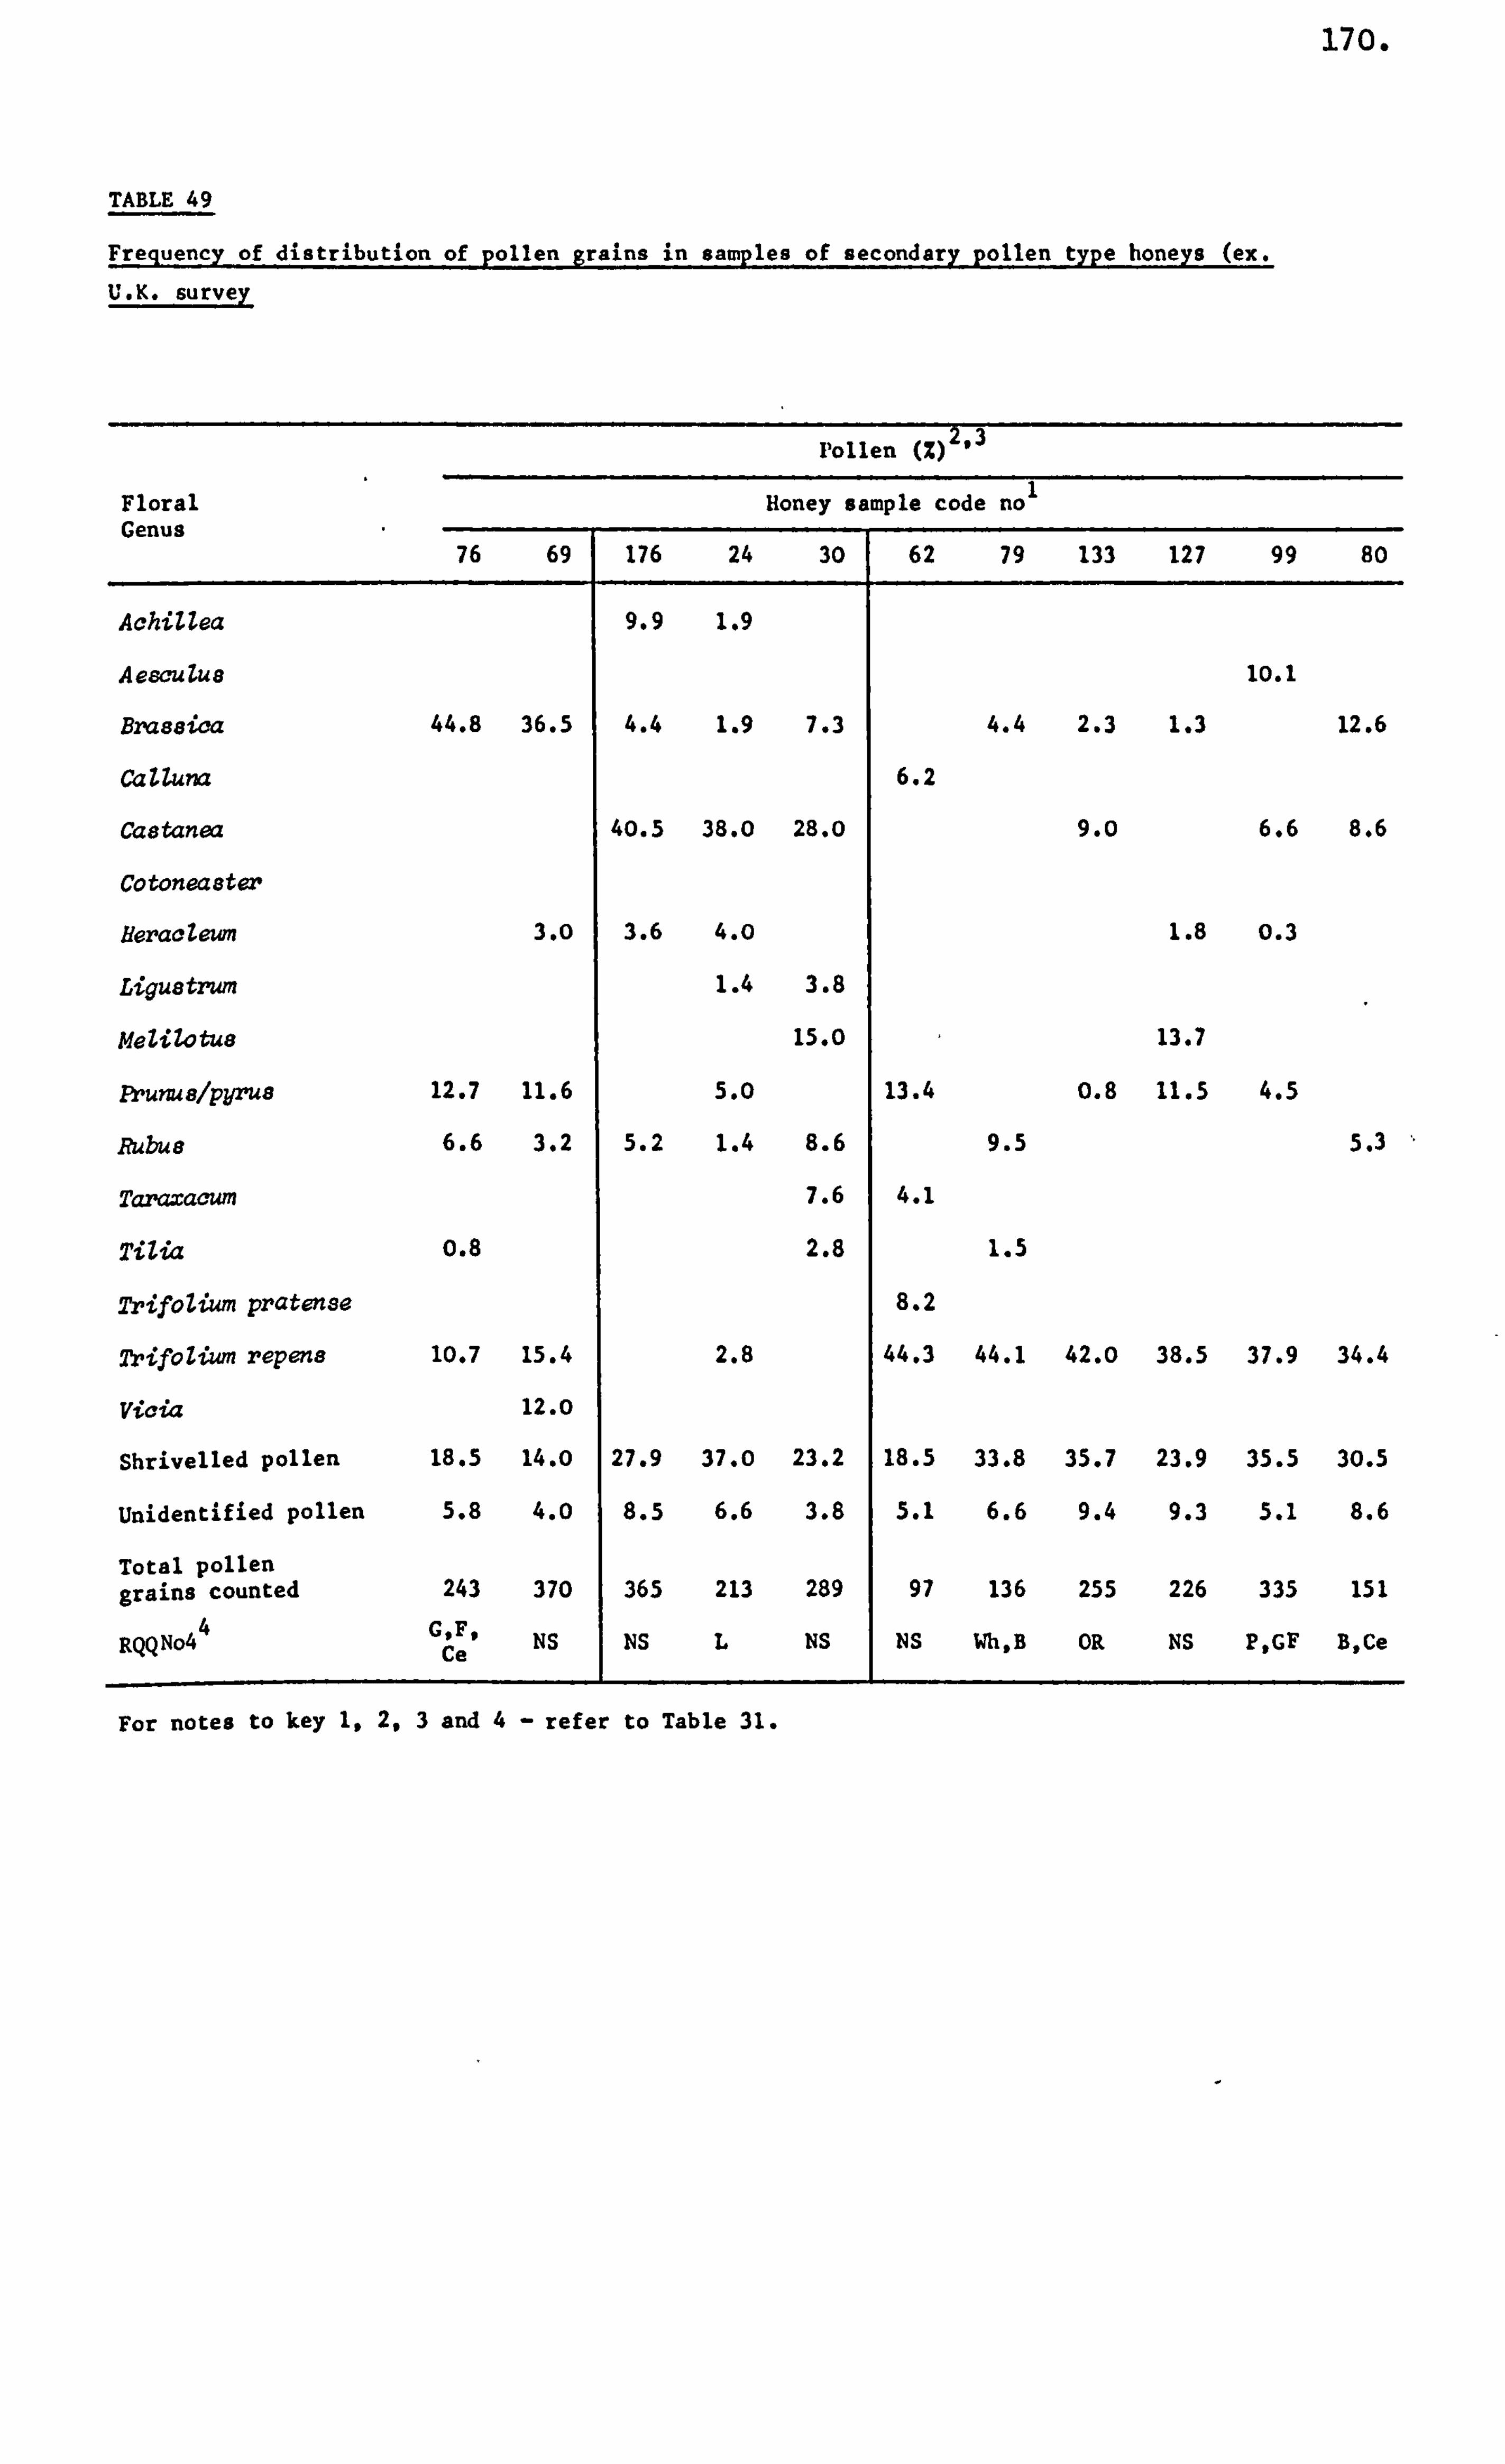
170.
TABLE 49
Frequency of distribution of pollen grains in samples of secondary pollen type honeys (ex.
U. K. survey
Floral Genus
76 69 176 24
Pollen (Z) 2.3
Honey sample code no 1
30 62 79 133 127 99 80
AchiZZea 9.9 1.9
Aewulu8 10.1
Brassica 44.8 36.5 4.4 1.9 7.3 4.4 2.3 1.3 12.6
CaUuna 6.2
Caotanea 40.5 38.0 28.0 9.0 6.6 8.6
Cotonea8ter
YeracZewn 3. o 3.6 4.0 1.8 0.3
Ligu8tz, um 1.4 3.8
MeliZOtU8 15.0 13.7
Prunuelpyrua 12.7 11.6 5.0 13.4 0.8 11.5 4.5
Rubus 6.6 3.2 5.2 1.4 8.6 9.5 5.3
Tar=acum 7.6 4.1
TiZia M 2.8 1.5
Trifolium pratense 8.2
2'rifoliwn repens 10.7 15.4 2.8 44.3 44.1 42.0 38.5 37.9 34.4
Vicia 12.0
Shrivelled pollen 18.5 14.0 27.9 37.0 23.2 18.5 33.8 35.7 23.9 35.5 30.5
Unidentified pollen 5.8 4. o 8.5 6.6 3.8 5.1 6.6 9.4 9.3 5.1 8.6
Total pollen grains counted 243 370 365 213 289 97 136 255 226 335 151
RQQNo4 4 C, F,
Ce NS NS L NS NS Wh, B OR NS P, GF B, Ce
For notes to key 1,2.3 and 4- refer to Table 31.
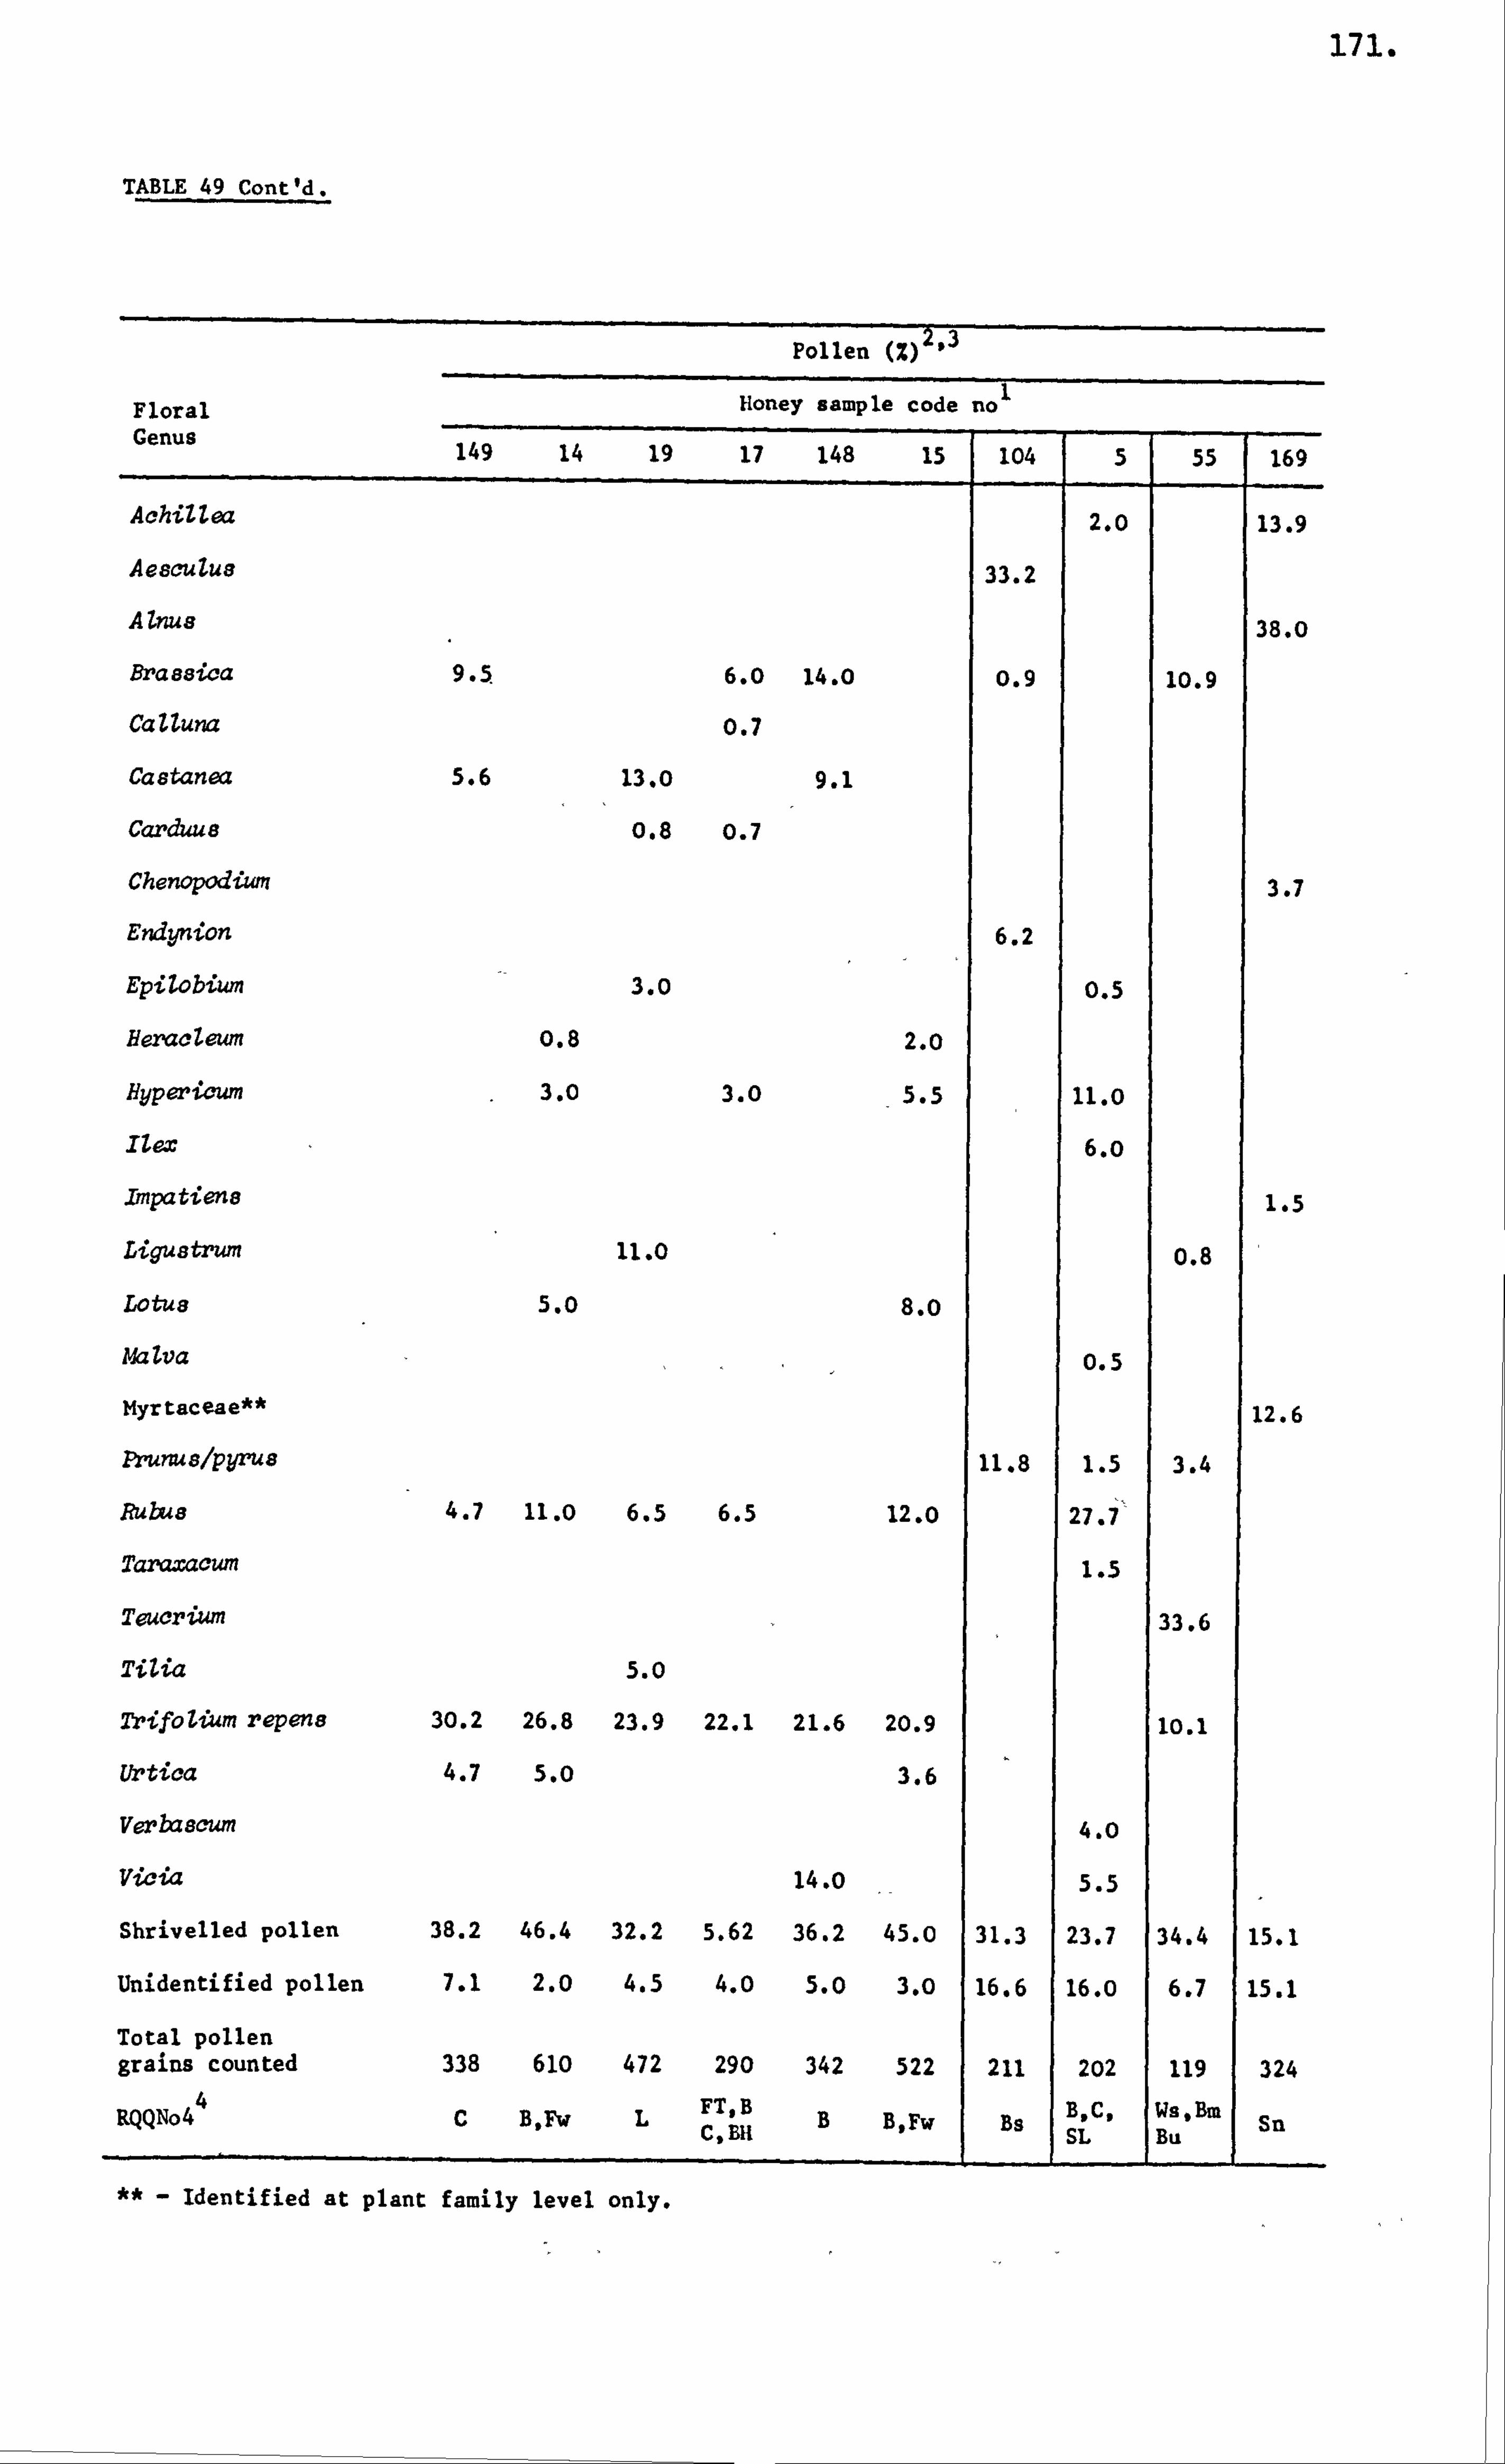
171.
TABLE 49 Cont'd.
Floral Genus
149 14 19
Pollen (2) 2.3
Honey sample code no 1
17 148 is 104 5 55 169
AchiZZea 2.0 13.9
Aesculus 33.2
Alnus 38.0
Brassica 9.5. 6.0 14.0 0.9 10.9
CaZZuna 0.7
Castanea 5.6 13.0 9.1
Carduus 0.8 0.7
Chenopodiwn 3.7
Endynion 6.2
Epizobium 3.0 0.5
HeracZeum 0.8 2.0
Hyperioum 3.0 3.0 5.5 11.0
Ilex 6. o
Impatieng 1.5
Ligustrum 11.0 0.8
Lotus 5.0 8.0
Iva Iva 0.5
Myrtaceae** 12.6
Prunus/pyrus 11.8 1.5 3.4
Rubus 4.7 11.0 6.5 6.5 12.0 27.7'
Taraxacum 1.5
Teucrium 33.6
TiZia 5.0
Trifolium repene 30.2 26.8 23.9 22.1 21.6 20.9 10.1
Urtica 4.7 5.0 3.6
Verbascum 4.0
Vicia 14.0 5.5
Shrivelled pollen 38.2 46.4 32.2 5.62 36.2 45.0 31.3 23.7 34.4 15.1
Unidentified pollen 7.1 2.0 4.5 4. o 5.0 3.0 16.6 16.0 6.7 15.1
Total pollen grains counted 338 610 472 290 342 522 211 202 119 324
RQQNo4 4
C B, Fw L FT, B B B Fw Bs B, C, Ws. Bm
Sn C, BII , SL Bu
** - Identified at plant family level only.
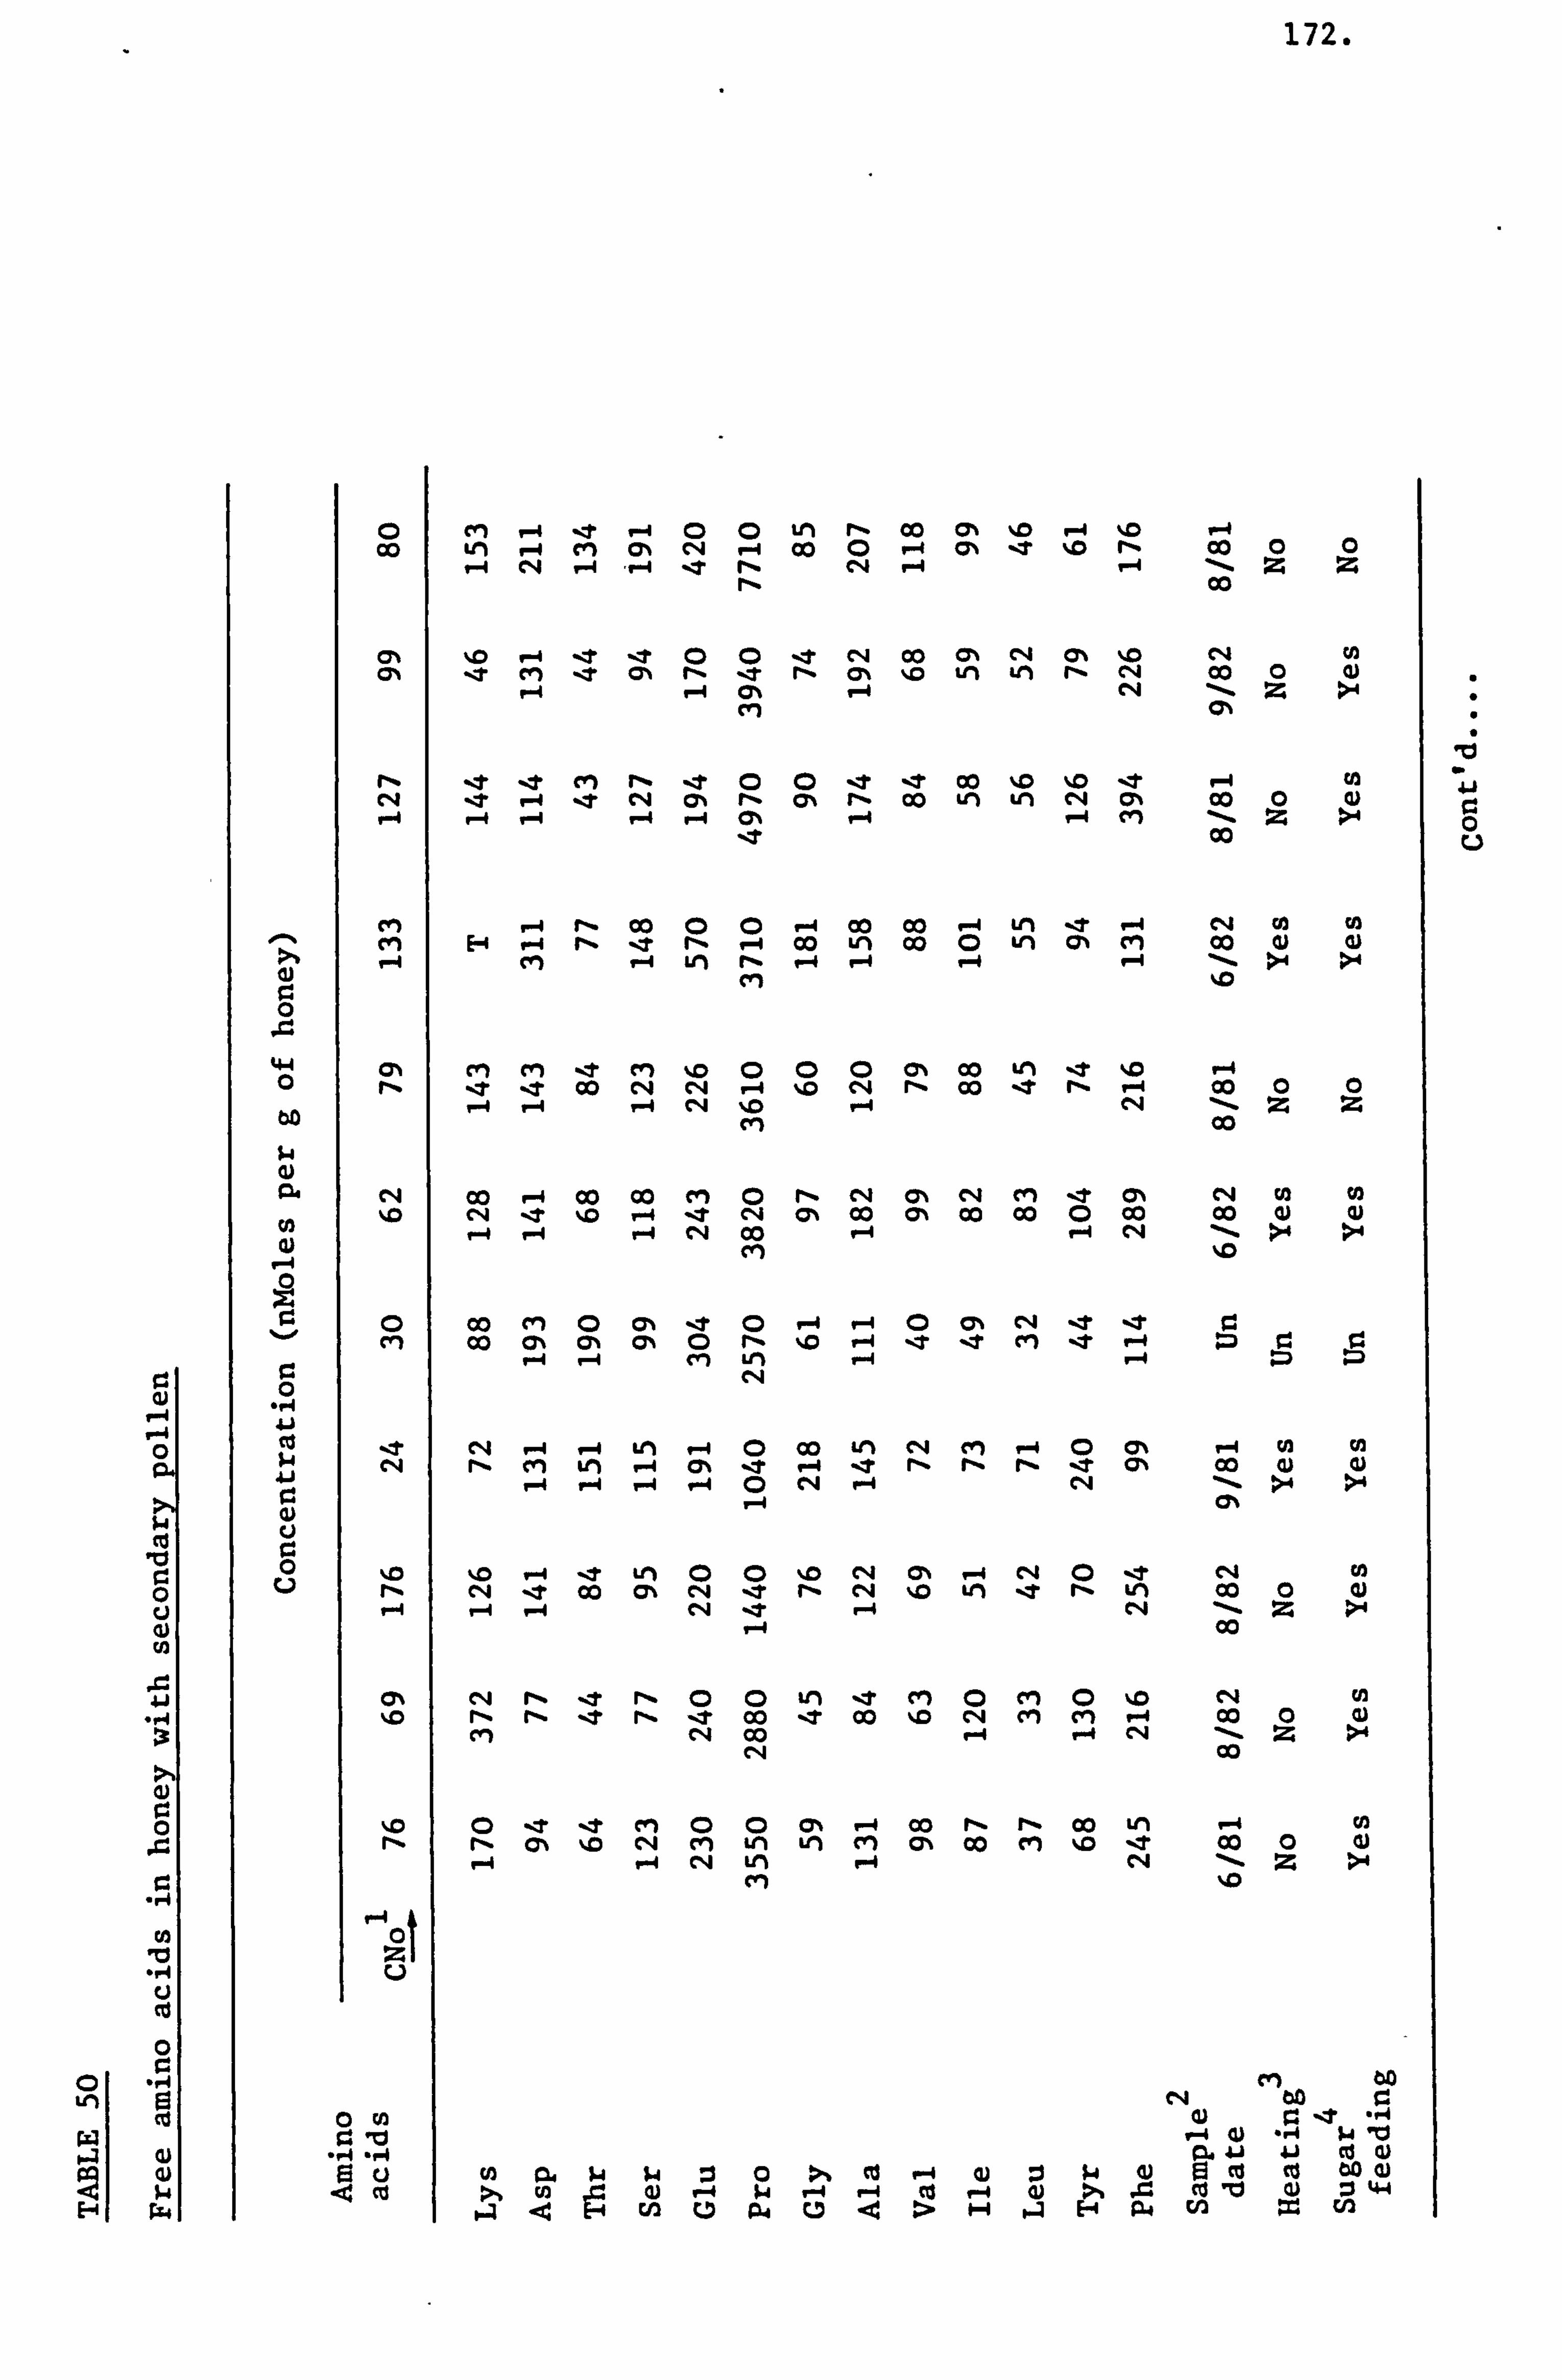
r-4
Co Iti r.
Ln
w 1-41 0)
E-4 rz4
0 00
. -% M >lb "4
0 . r.
4-4 CN 0
0 %In
Q)
0
% -. m
%0
"p4 .4 Eci
172.
ei P-4 -, t "-4 0 0 tri r- 00 CY% %0 V. -4 N'm p4 Kri -i A aý rq Z 00 0 ý-4 c% ZT %0 r, Co 0 0
V-4 c4 9-4 A-4 IT rý c*II P-4 P-4 -. Z Z
.t ei t 0% r, t r, a% ZO im LM r, C-4 00 0 F-4 P-4
-t -t CIM r- -t 0 0 -t _T 00 %0 %0 -t e P-4 .t C'4 cylt r, ý 0% rý 00 Ul Ul c4 CY% 00 0 Q) P-4 V-1 9-4 P-4 CY% V-1 9-4 M --. Z >4
_T Co
. -1 r, 00 0 0 -4 Co 00 ý4 tn ýt -4 c", 4 0 0 E-1 --4 r. t rý -4 Co Ln 00 0 Ln C7N cm 00 w 0
1-4 LM rl% V--4 1--4 ýi P-4 --- >. 4 : cm 10
M -t rn %D 0 0 CD O's 00 61 ýt %, D "4 ýT 00 C*4 c4 V-4 %D C, 4 r- 00 -t r- P--1 00 0 0
P-4 P-4 ýi CNA %0 P-4 c"i --. Z Z ri
00 F-4 00 00 CM 0 rlý CN Cj% c14 M t C% C, 4 't %D 7--4 -t Cli C% 00 C% 00 00 (D 00 00 0) Q) 1-4 1-4 P-4 C-4 00 P-4 v--4 CN >4 :
cm NID
Co cri 0 c% %t CD "-4 P-4 0 C% r*4 -e _T r. 00 C% CYN aN CD rý %0 P-4 ýt ýt M ýt P-4 :m r. r.
P-4 r-4 erl LM P-4 C, 4
N P-4 "-4 LM P-4 0 Co LM c14 M "4 CD Cj% V-4 rA rA r, % Cm Ul P-4 (A ýt P-1 ýT rý- rý rý t 0% 00 0 4)
V-4 F-4 "4 V-4 0 rq P-4 cq --. >4 >. 4
elli ýt 00 Q% e4 IT r- rq %0 LM IT r_ V) Co 0 Q) P-4 P-4 rq 't ý4 CN -ý Z >4
V-4 00
r- CD 0 V) cm 0 M 0 c4 rA r- r, - ýt rý IT 00 't 00 %M rq cm cwi P-4 00 0 0 cyl C*14 00 P-4 P-4 CN Z >d
c"i Co
0 ýt ýt CM CD CD C% ý4 CO rý rý 00 Lri ý4 rA
r. c% %m C*4 CY) LM 61 (VI cl% 00 cri N'm t 00 0 (V P-4 P-4 c4 Lt) F-4 c4 -. Z :
ci %0
C14 -P4
,4 4) . 10 Aj 41 Cd Q)
14 0 >% Cd P-4 4) 14 4) Cd cl 00 a) Q) w r-4 ý4 f. -4 >, 4 "o Q) :1 44
In P4 0 . 94 HP P4 In = En
U 0 0
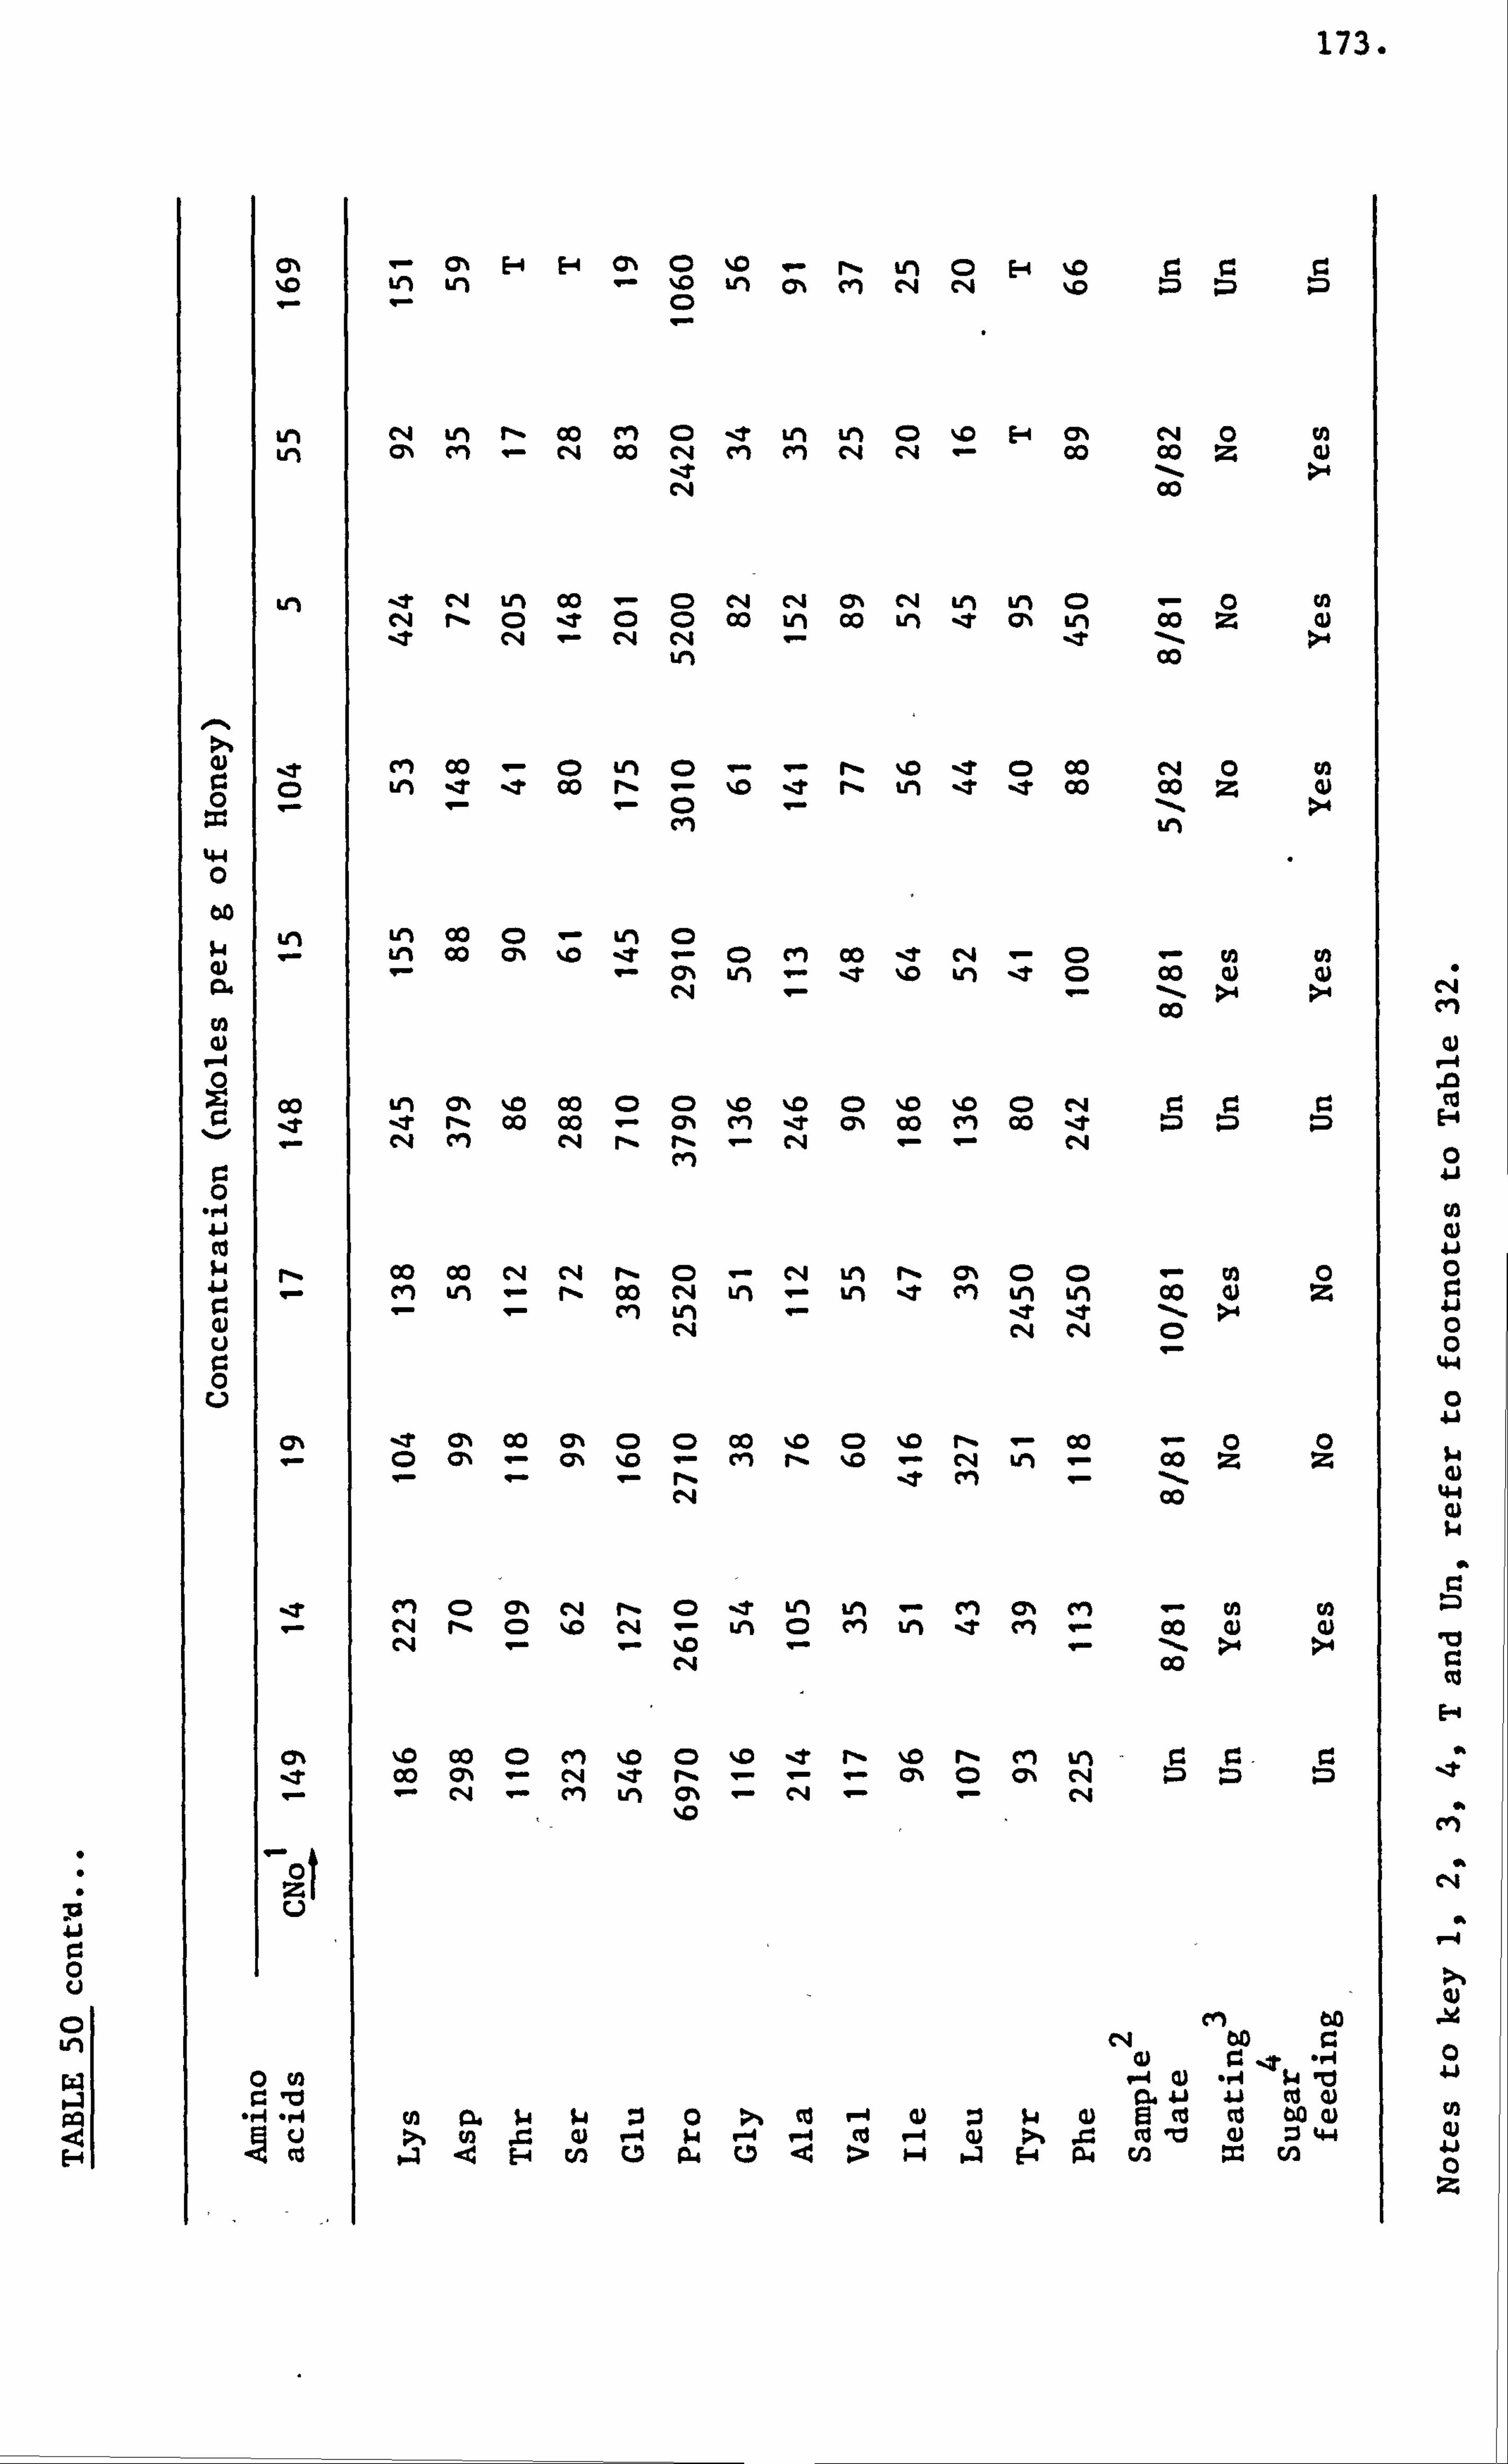
173.
0
E-4
1- CY% E-4 H C% (D %0 - r-ý tr% 0 E-4 'i0 rm r. r. Lri Ln ý %0
CD Ln 0-% ci rq C-4 %0 ZD Z: ) Z)
th cq Lr) r, 00 cyl CD t LM LM (D E-4 0% elli 0 vi 0% cn , c, 4 00 CN C, 1 Cl cq r4 Co Co Z
t 1-.
C, 4 00
Ln ,t e4 tn Co - CD t, 1 c9 CY% C'4 LM Ln CD - 0 0 cq rý CD t (D CD Co V, 1 Co Ln -t (n Ln Co Z gi
cm Co - CD Ln 0 - - r- %0 -r 0 00 c9 0 (0 te) t t 00 r% - %0 -t r- tr) -t -t CO 00 Z (L) 0
: 131 CD
44 0
öo Ln Co CD - ul CD
9) LM 9-
CO CA %0 ýT ý
- C%
CD Cm CO 't C'4 - CD Co 0 0) 924 CN -ý. >I >I Co
00 vi CY% %0 00 0 CD %D %D CD 'M ýo 0 'ý'4 r. Z: 't r, Co Co ý c% m -t cy., Co cn CO -t c4 M C, 4 rý r-
cyl 0
., 4 41 0 w r- Co Co r4 N r- CD N LM r- c% (D CD 0 Ai q- ci ul ý r, Co c4 Ln - Ln t ci ul LA 00 0) Z
C. 4 c114 CD
t Cl% 00 CYN CD (D 00 %D (D %D rý 00 0 0 CD 0% - 0% N'm - CM rý %0 ý C'4 - Co Z Z
- r, - -t CIM CNJ 00
cm CD c7% cq rý c> t Ln Ln ý M C% CM 0 CN rý CD %, 0 cq - Kn CD en tn -t cn - 00 0
%In . >4 >4
(> ý. 0 Co CD cm 1.0 CD %D -t r- ,0 r*- ri V) - r. rý - r: -t CO 0% t r, CN : Z) :D
c4 rq
0
0 Co
. r4 ., 4 rA g2. s4 si :1 0 >% Co -4 0 u ý >b in j-- Qj -4 W P-4 v--1 CO P-4 (L) >% J'. 0 'U a) :3 44 cu 4 9 H rn u P. 4 0 < > 1-4 4 H P. 4 cn = cn
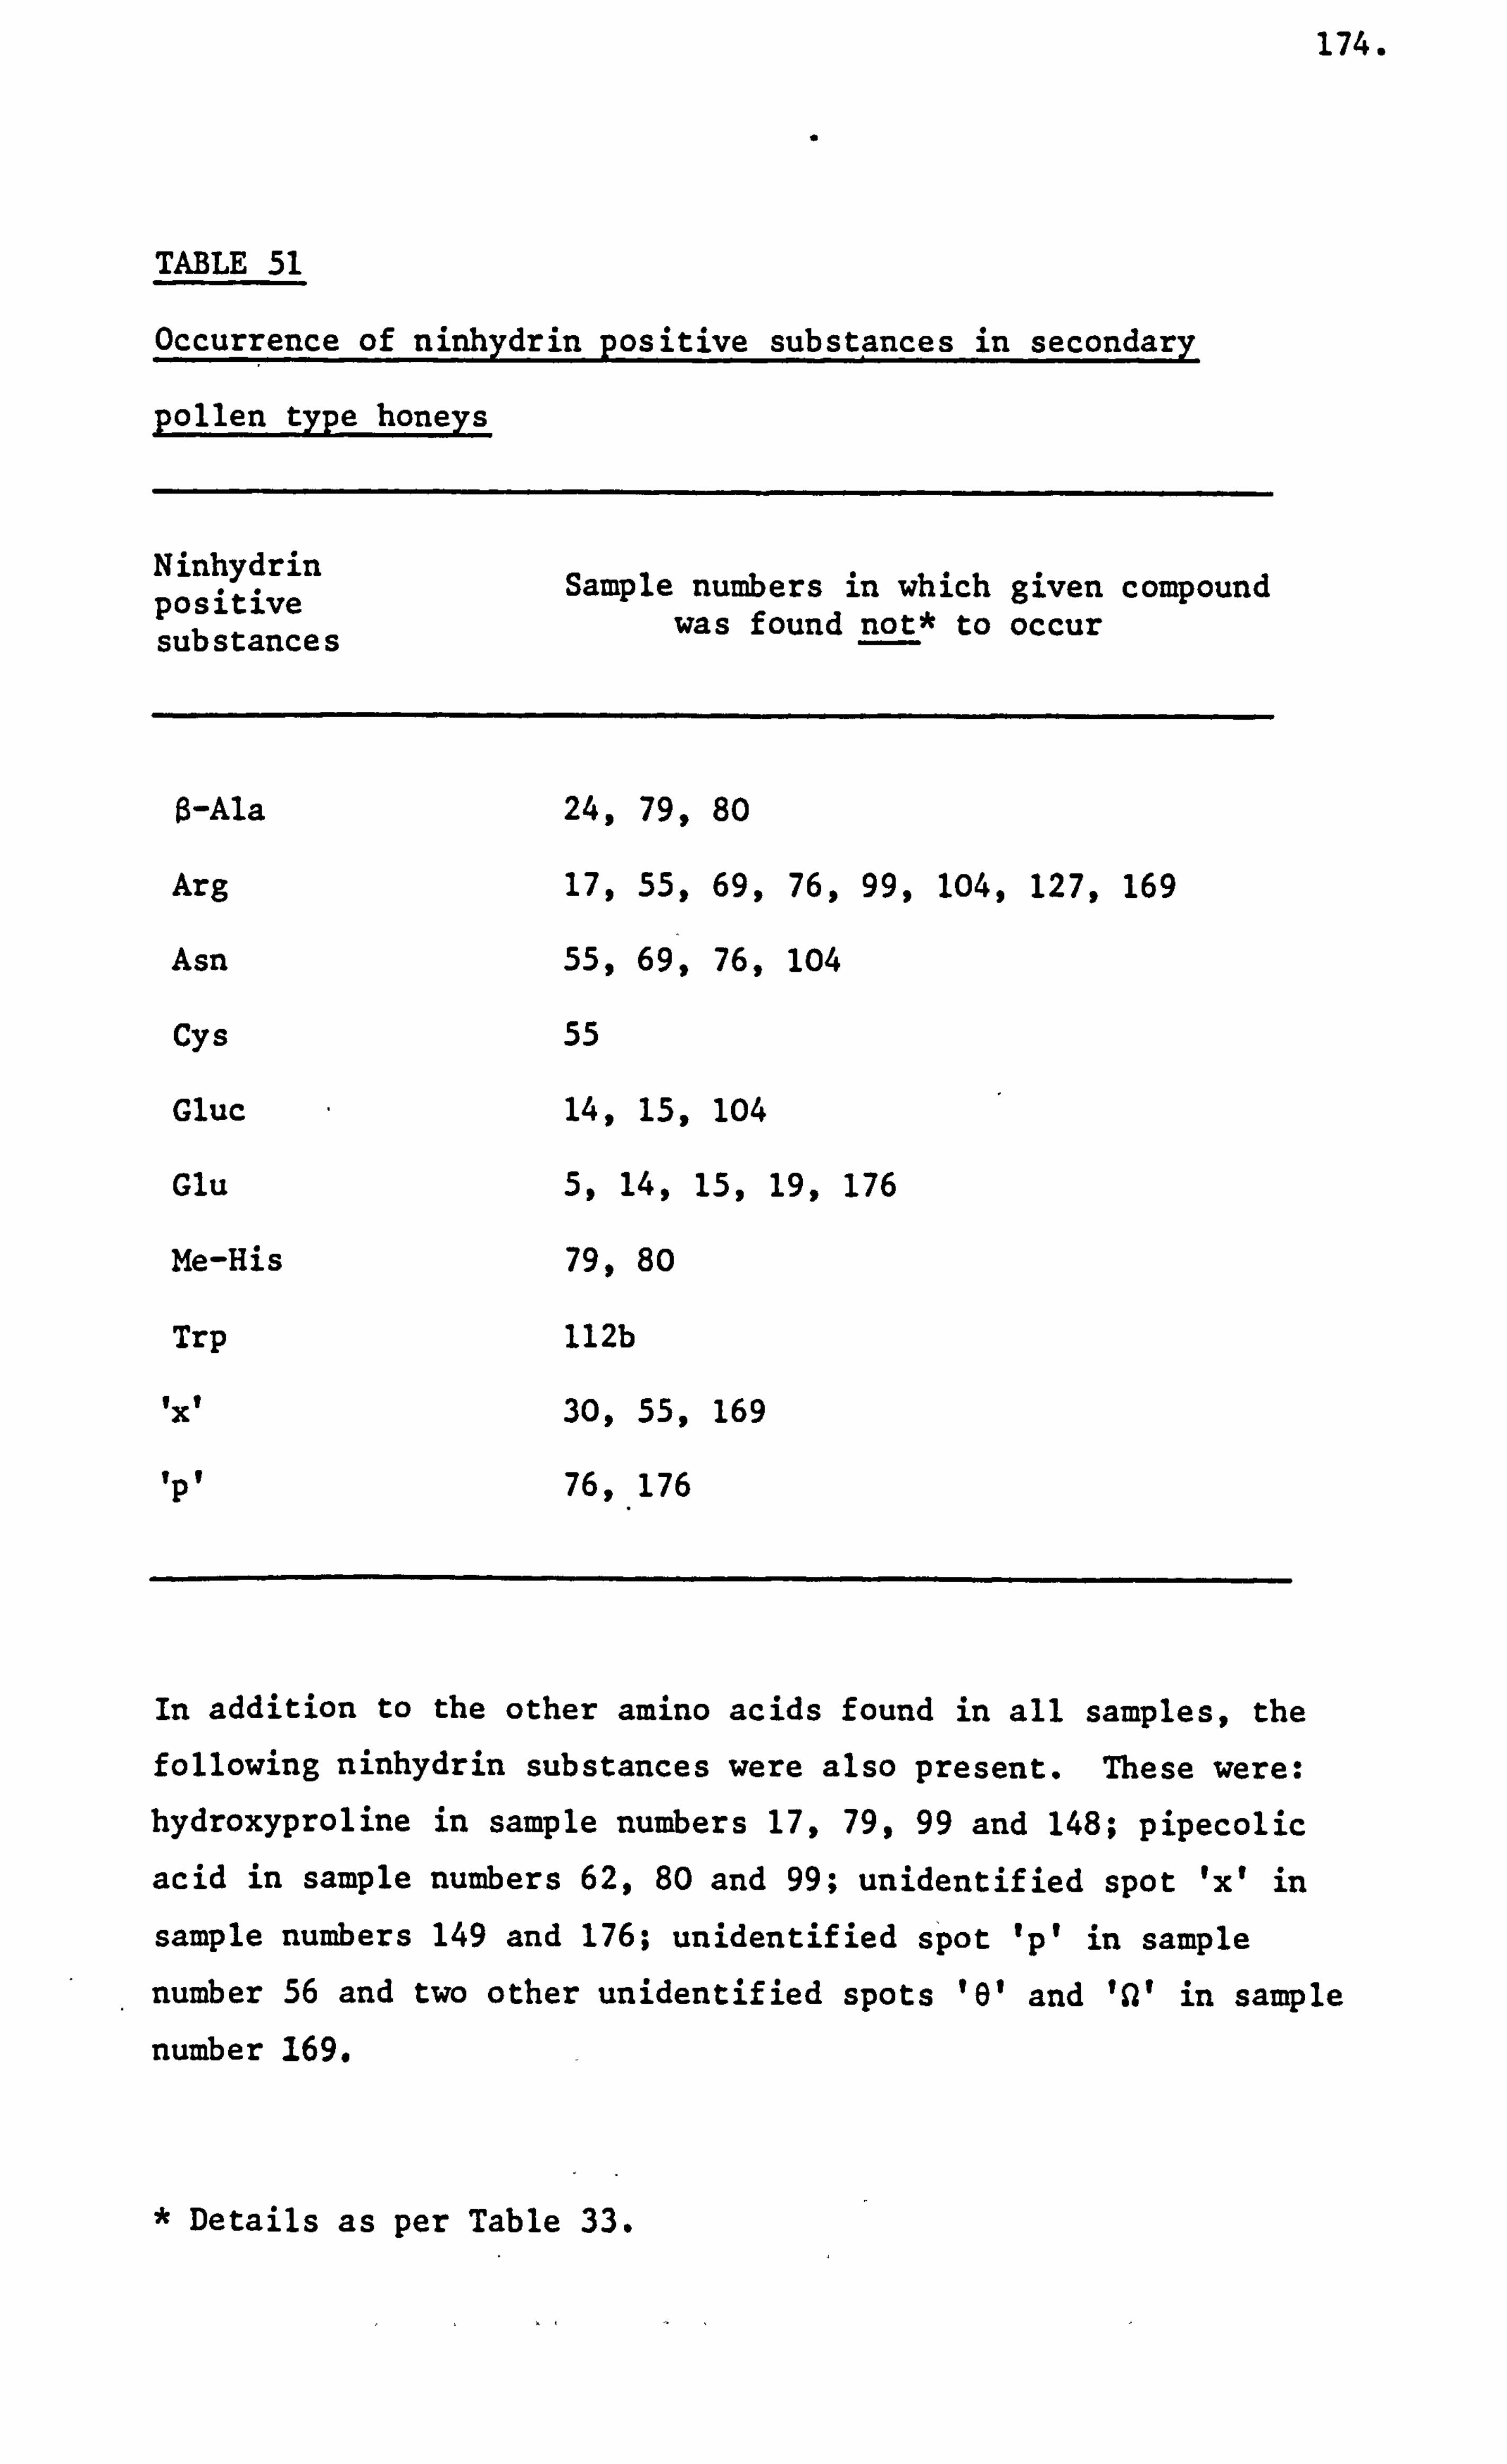
174.
TABLE 51
Occurrence of ninhydrin positive substances in secondary
pollen tyPe honeys
Ninhydrin Sample numbers in which given compound positive was found not* to occur substances
ß-Ala 24, 79, 80
Arg 17, 55, 69,76,99,104,127,169
Asn 55, 69, 76,104
Cys 55
Gluc 14,15,104
Glu 5,14,15,19,176
Me-His 799 80
Trp 112b
Ixt 30,55,169
1p1 76,176
In addition to the other amino acids found in all samples, the following ninhydrin substances were also present. These were: hydroxyproline in sample numbers 17,79,99 and 148; pipecolic
acid in sample numbers 62,80 and 99; unidentified spot 'x' in
sample numbers 149 and 176; unidentified spot lp' in sample
number 56 and two other unidentified spots 16' and 'a' in sample
number 169.
* Details as per Table 33.
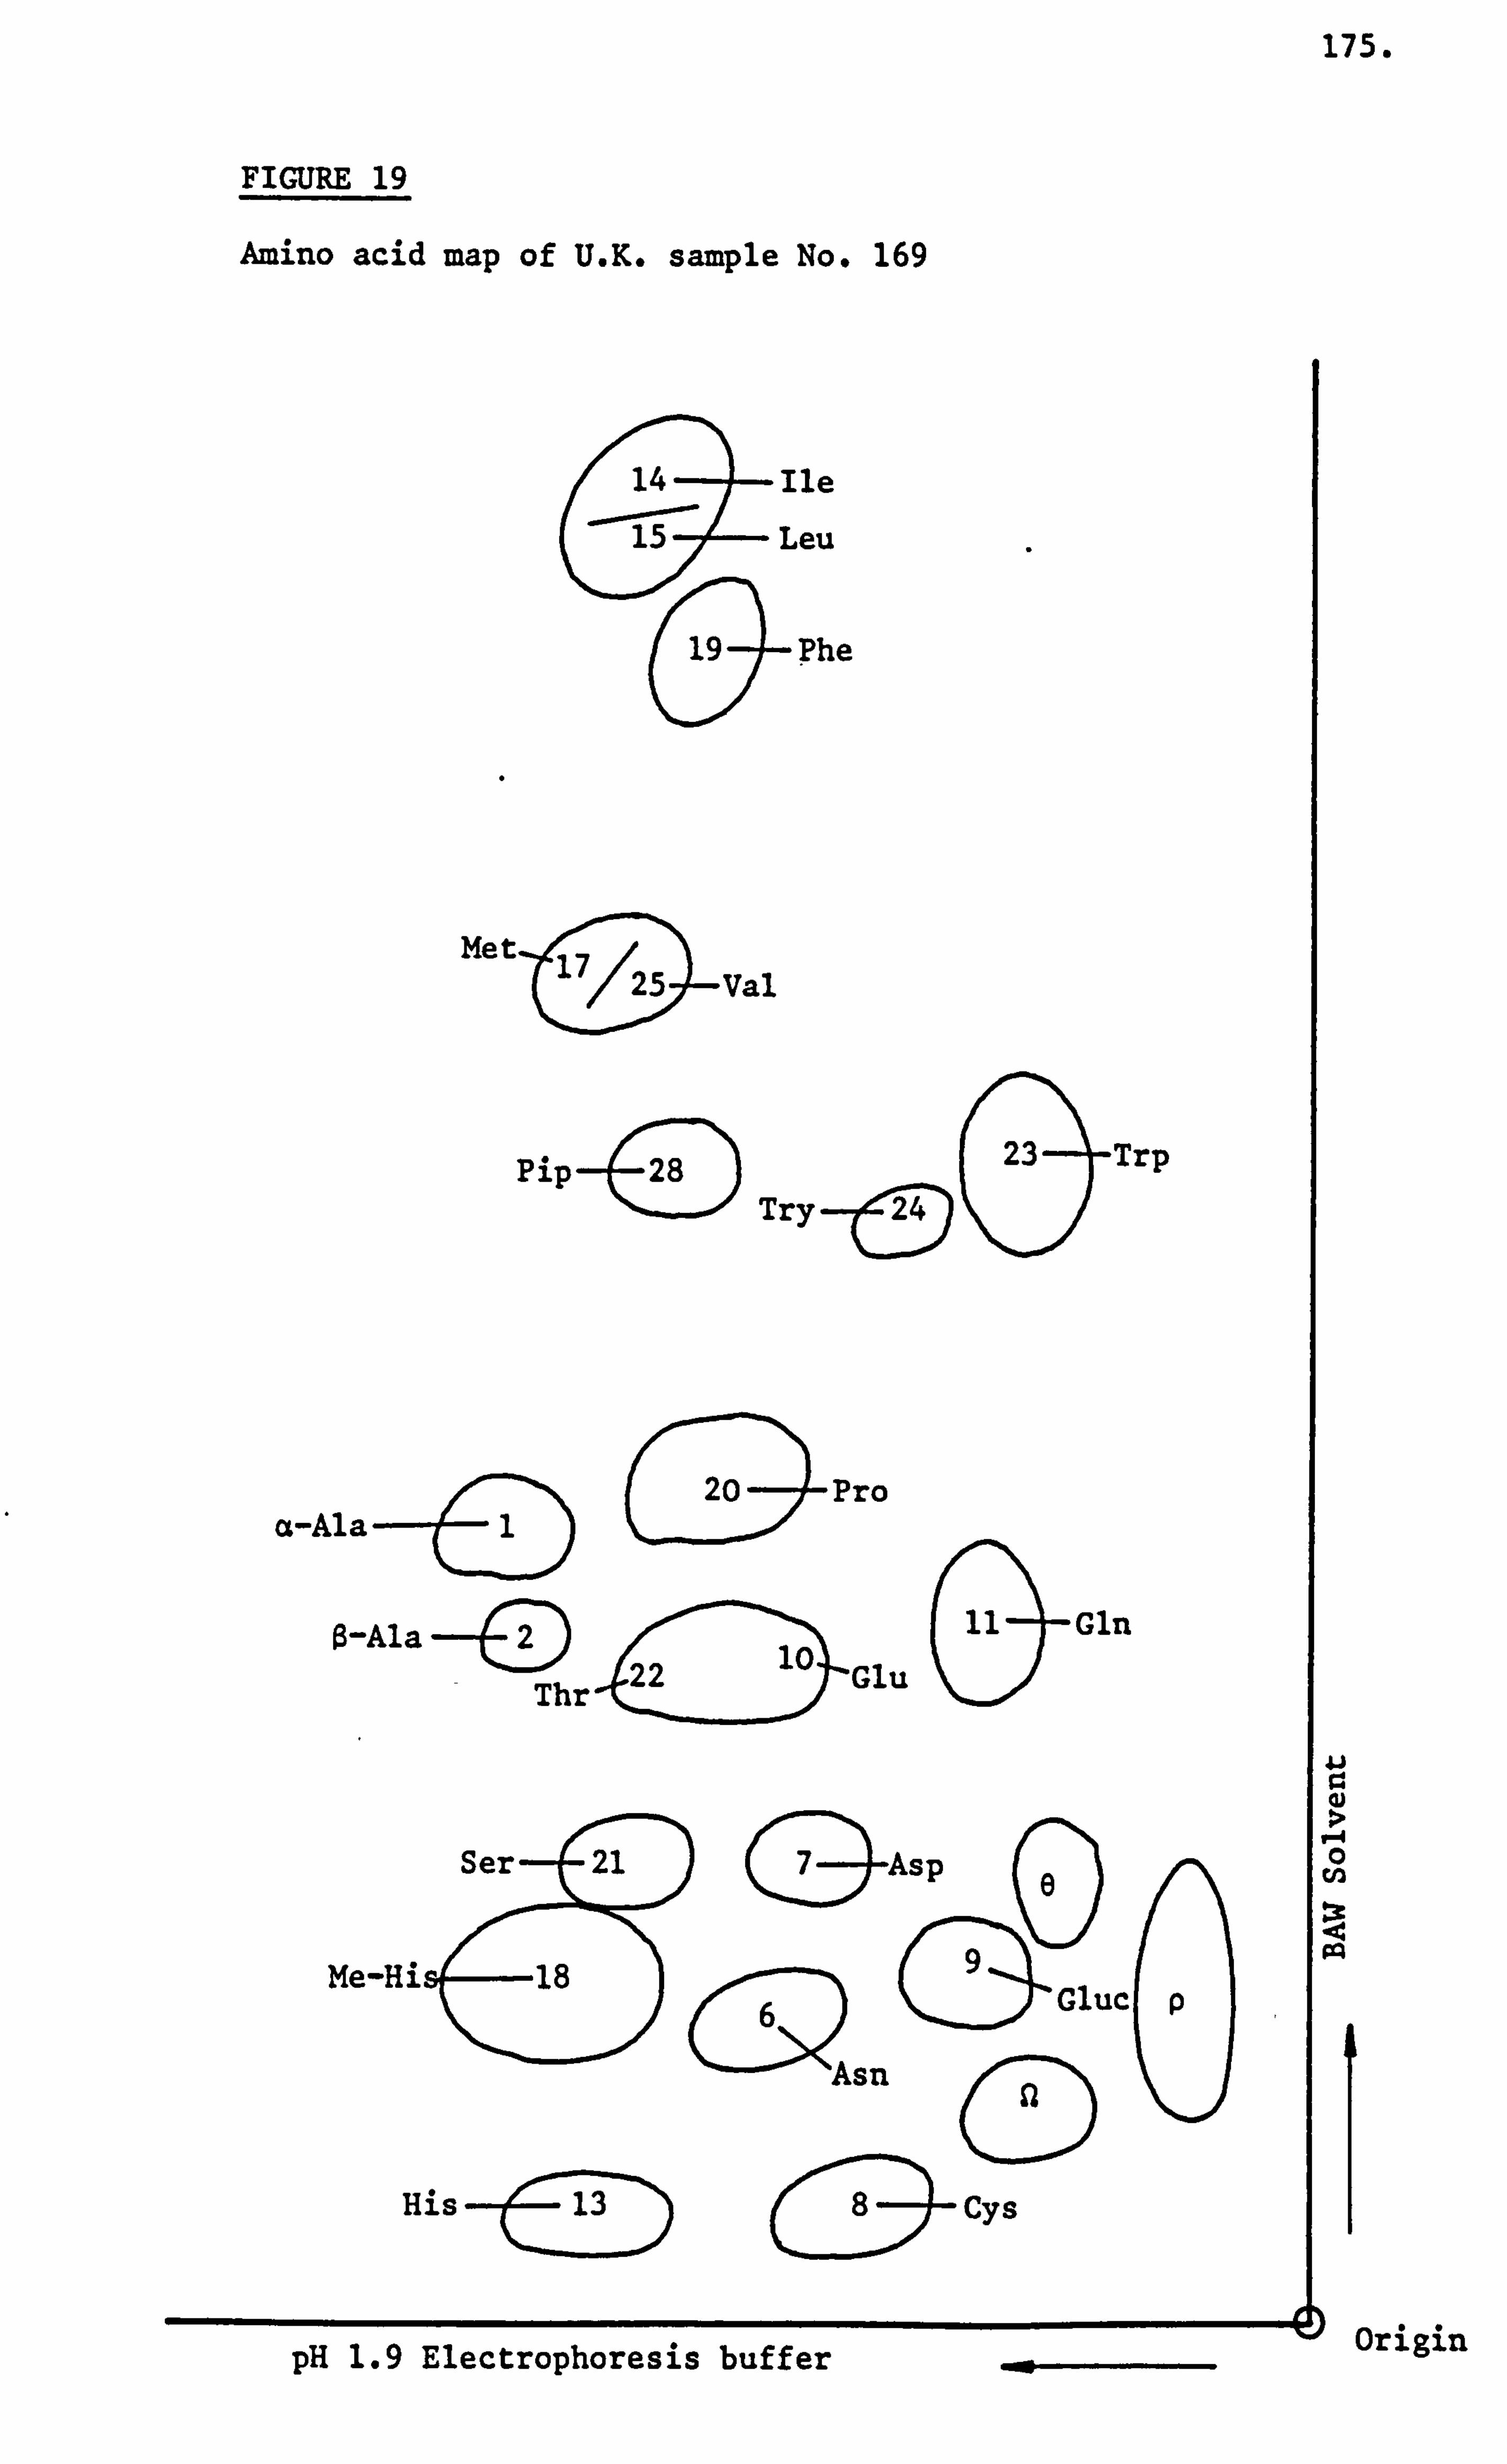
175.
FIGURE 19
Amino acid map of U. K. sample No. 169
14 Ile 15 Leu
Phe
a
19
Met 17 /25 Val
23 Trp
Try
a-Ala_ý
C20
Pro
$-Ala _(D _ý2. ' Glu
11 Gln
Thr
&
Me-H
'Asn
( NIJ D
Gluc
ý-71)
u
His
Cys pH 1.9 Electrophoresis buffer
Asp ne /-\
U
aJ
�-4 0
origin
176.
as given in Table 52. From the two pollens identified in each sample,
the pollen with the highest percentage value was used for arranging
the samples in the format described previously. The pollen contents
and responses to questionnaire question 4 have been listed in Table
52. The amino acid concentration measurements and the responses to
questionnaire questions 3,5 and 6 have been given in Table 53 in the
order shown in Table 52.
The ninhydrin positive substances detected on the amino acid maps
were: a- and 0-alanine, a- and y-aminobutyric acid, arginine, asparagine,
aspartic acid, cysteine, glucosamine, glutamine, glutamic acid, glycine,
hydroxypipecolic acid, hydroxyproline, histidine, isoleucine, leucine,
lysine, methionine, methyl-histidine, phenylalanine, pipecolic acid,
proline, serine, threonine, tryptophan, tyrosine, valine and the two
unidentified spots 'xl and 'p'. The differences in occurrence of ninhydrin
positive substances were evaluated within each pollen group and these
have been listed in Table 54. There were two honey samples which did
not belong to the secondary multiple pollen type category, because these
two samples contained important minor frequency class pollen, that is,
those samples containing between 3% and 15% pollen. It was considered
appropriate to insert these two samples Code Nos. 16 and 33 at the end
of the secondary multiple pollen group list rather than base a section
on two samples which were inadequate in number for floral categorisation.
Unidentified pollen type
There were eight honey samples which did not contain enough honey
for pollen extraction and subsequent identification and these were
allocated to this category. The amino acid concentration measurements
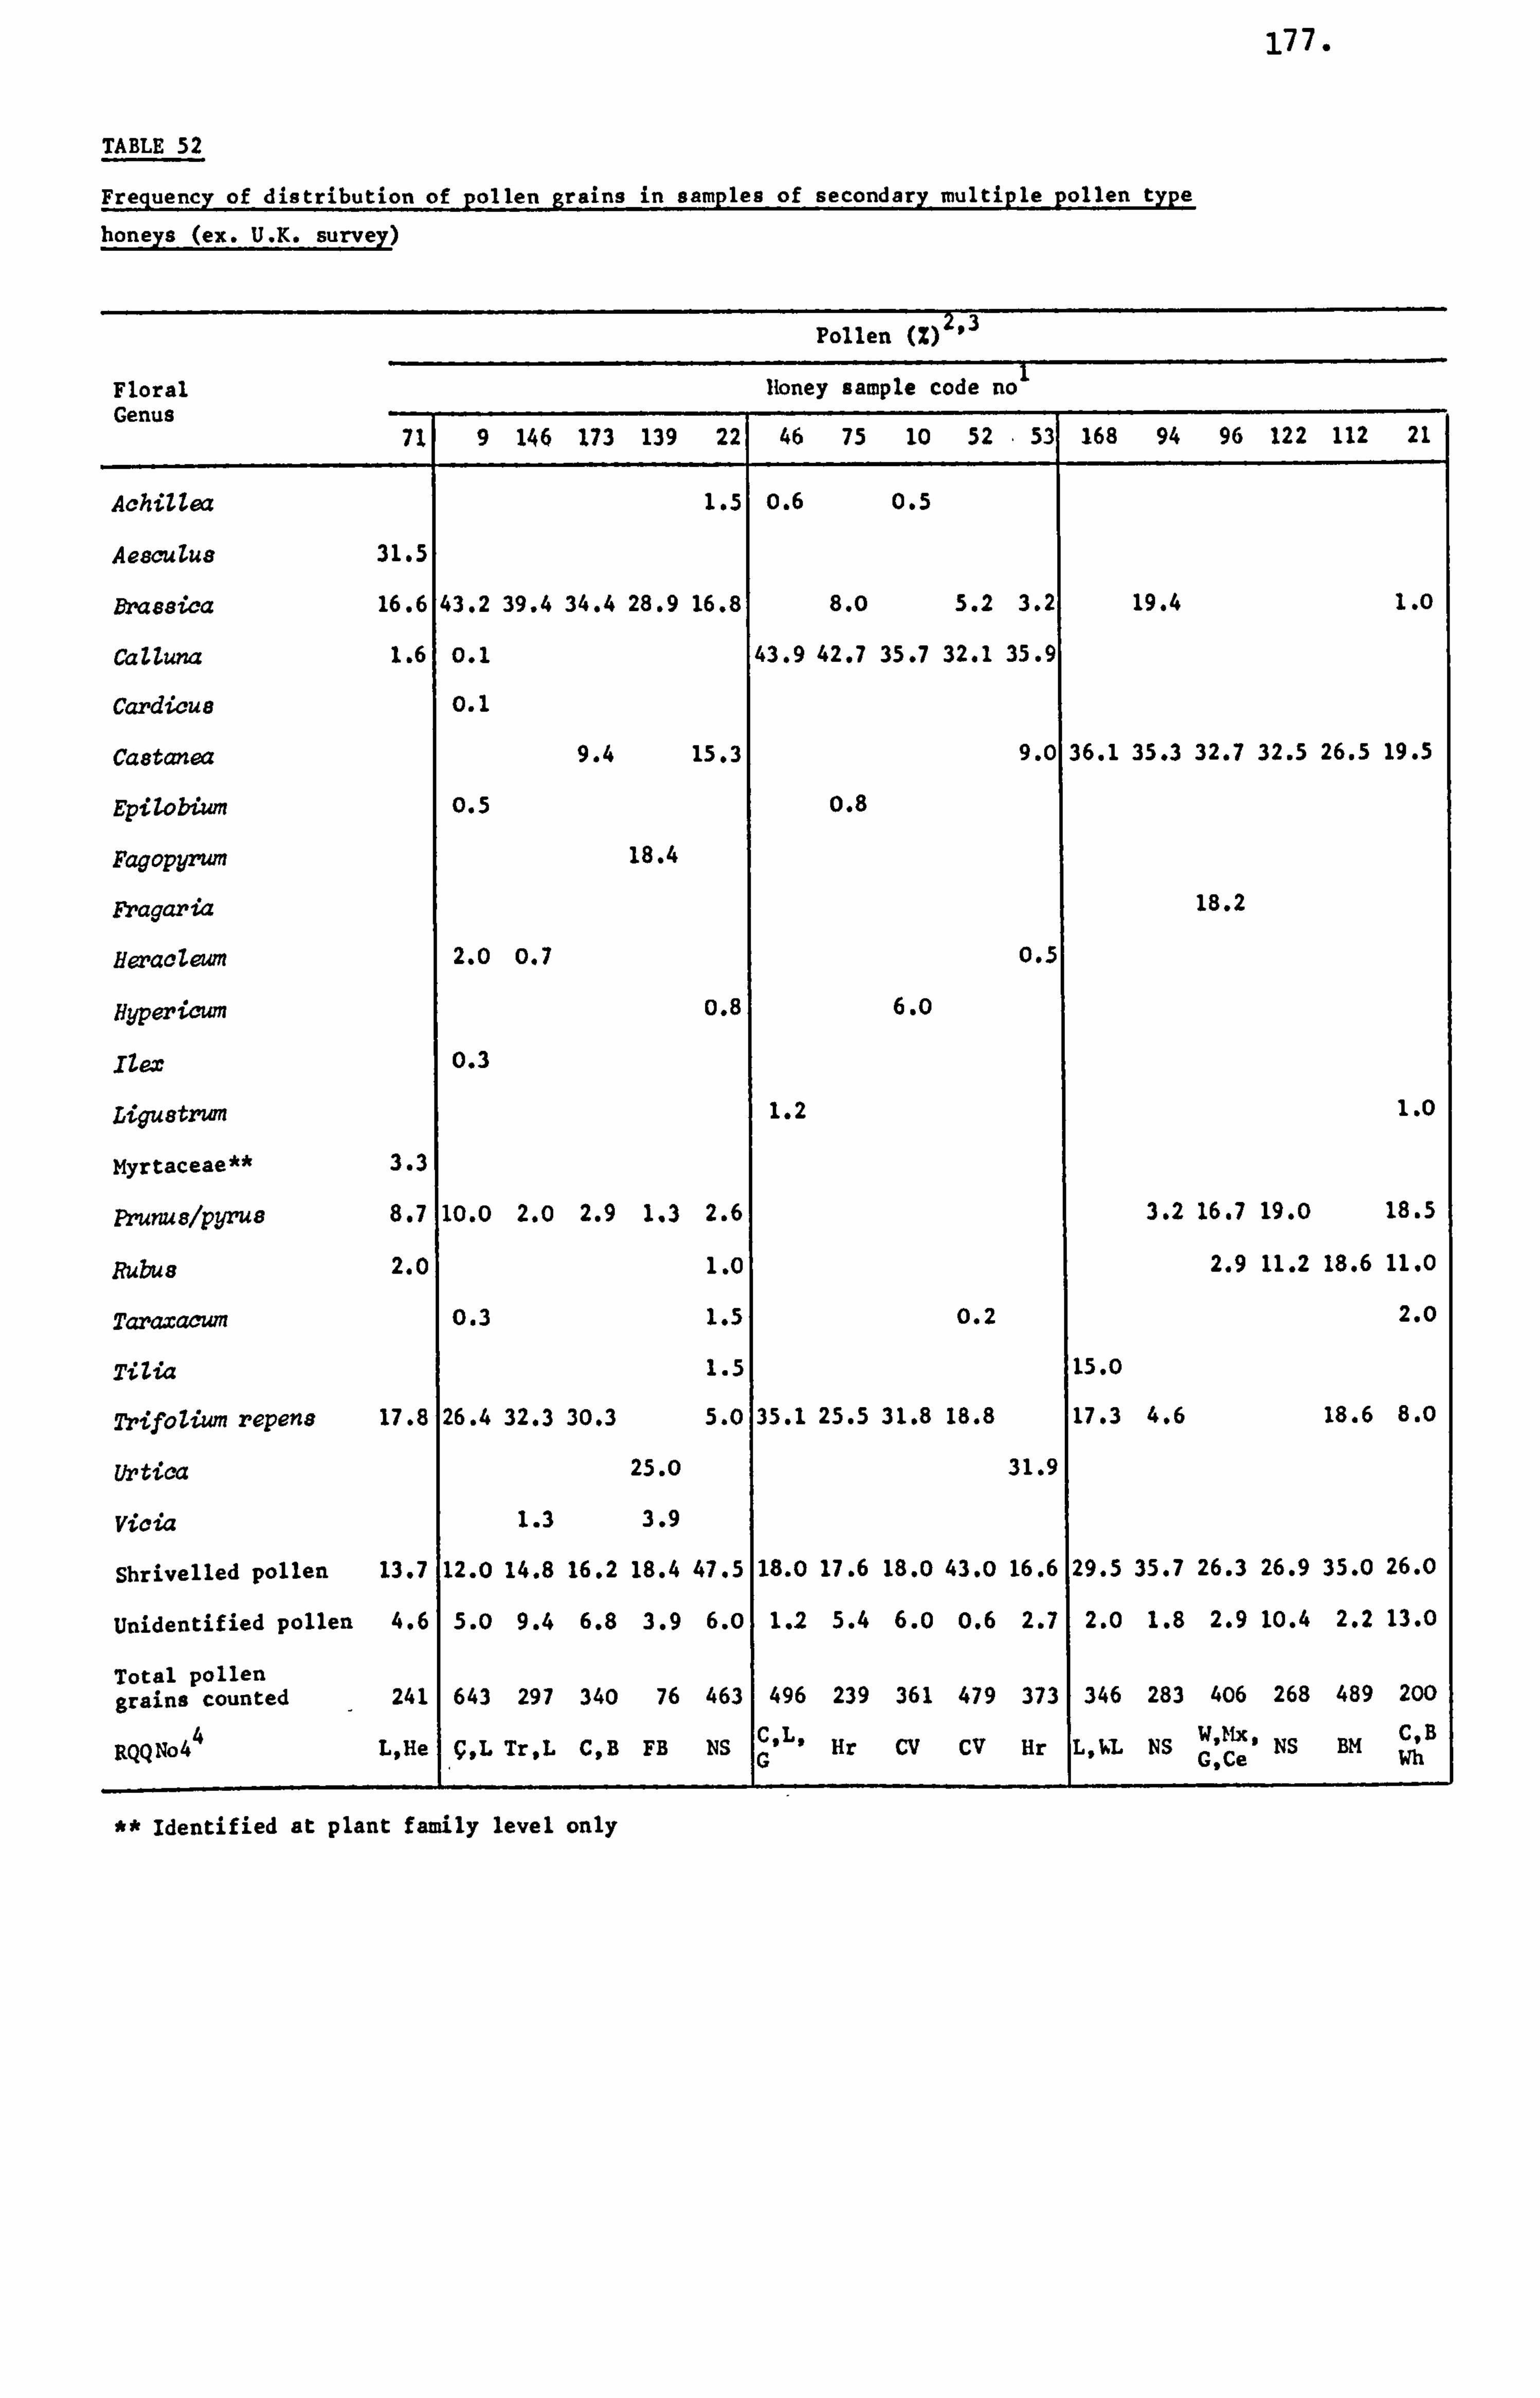
177.
TABLE 52
Frequency of_distribution of pollen grains in samples of secondary multiple pollen type
honeys (ex. U. K. survey)
Pollen (A 2,3
Floral lioney sample code no Genus
711 9 146 173 139 221 46 75 10 52 . 531 168 94 96 122 112 21
AchilZea 1.5 0.6 0.5
Aesculus 31.5
Bras8ica 16.6 43.2 39.4 34.4 28.9 16.8 8.0 5.2 3.2 19.4 1.0
CalZu 1.6 0.1 43.9 42.7 35.7 32.1 35.9
Cardicue 0.1
Ca8tanea 9.4 15.3 9.0 36.1 35.3 32.7 32.5 26.5 19.5
Epilobium 0.5 0.8
Fagopyr, um 18.4
Fragaria 18.2
Heraclewn 2.0 0.7 0.5
Hypericum o. 8 6. o
IZex 0.3
Ligu8trwn 1.2 1.0
Myrtaceae** 3.3
Fý, unuslpyrus 8.7 10.0 2.0 2.9 1.3 2.6 3.2 16.7 19.0 18.5
Rubus 2.0 1.0 2.9 11.2 18.6 11.0
Taraxacwn 0.3 1.5 0.2 2.0
TiZia 1.5 15.0
TrifoZium repens 17.8 26.4 32.3 30.3 5.0 35.1 25.5 31.8 18.8 17.3 4.6 18.6 8.0
Urtica 25.0 31.9
Vicia 1.3 3.9
Shrivelled pollen 13.7 12.0 14.8 16.2 18.4 47.5 18.0 17.6 18.0 43.0 16.6 29.5 35.7 26.3 26.9 35.0 26.0
Unidentified pollen 4.6 5.0 9.4 6.8 3.9 6.0 1.2 5.4 6.0 0.6 2.7 2.0 1.8 2.9 10.4 2.2 13.0
Total pollen grains counted 241 643 297 340 76 463 496 239 361 479 373 346 283 406 268 489 200
RQQNo4 4 L, He V, L Tr, L C, B FB lis C, L ' Hr CV CV Hr L, I%L NS W ttx' NS BM C, B
G G: Ce Wh
** Identified at plant family level only
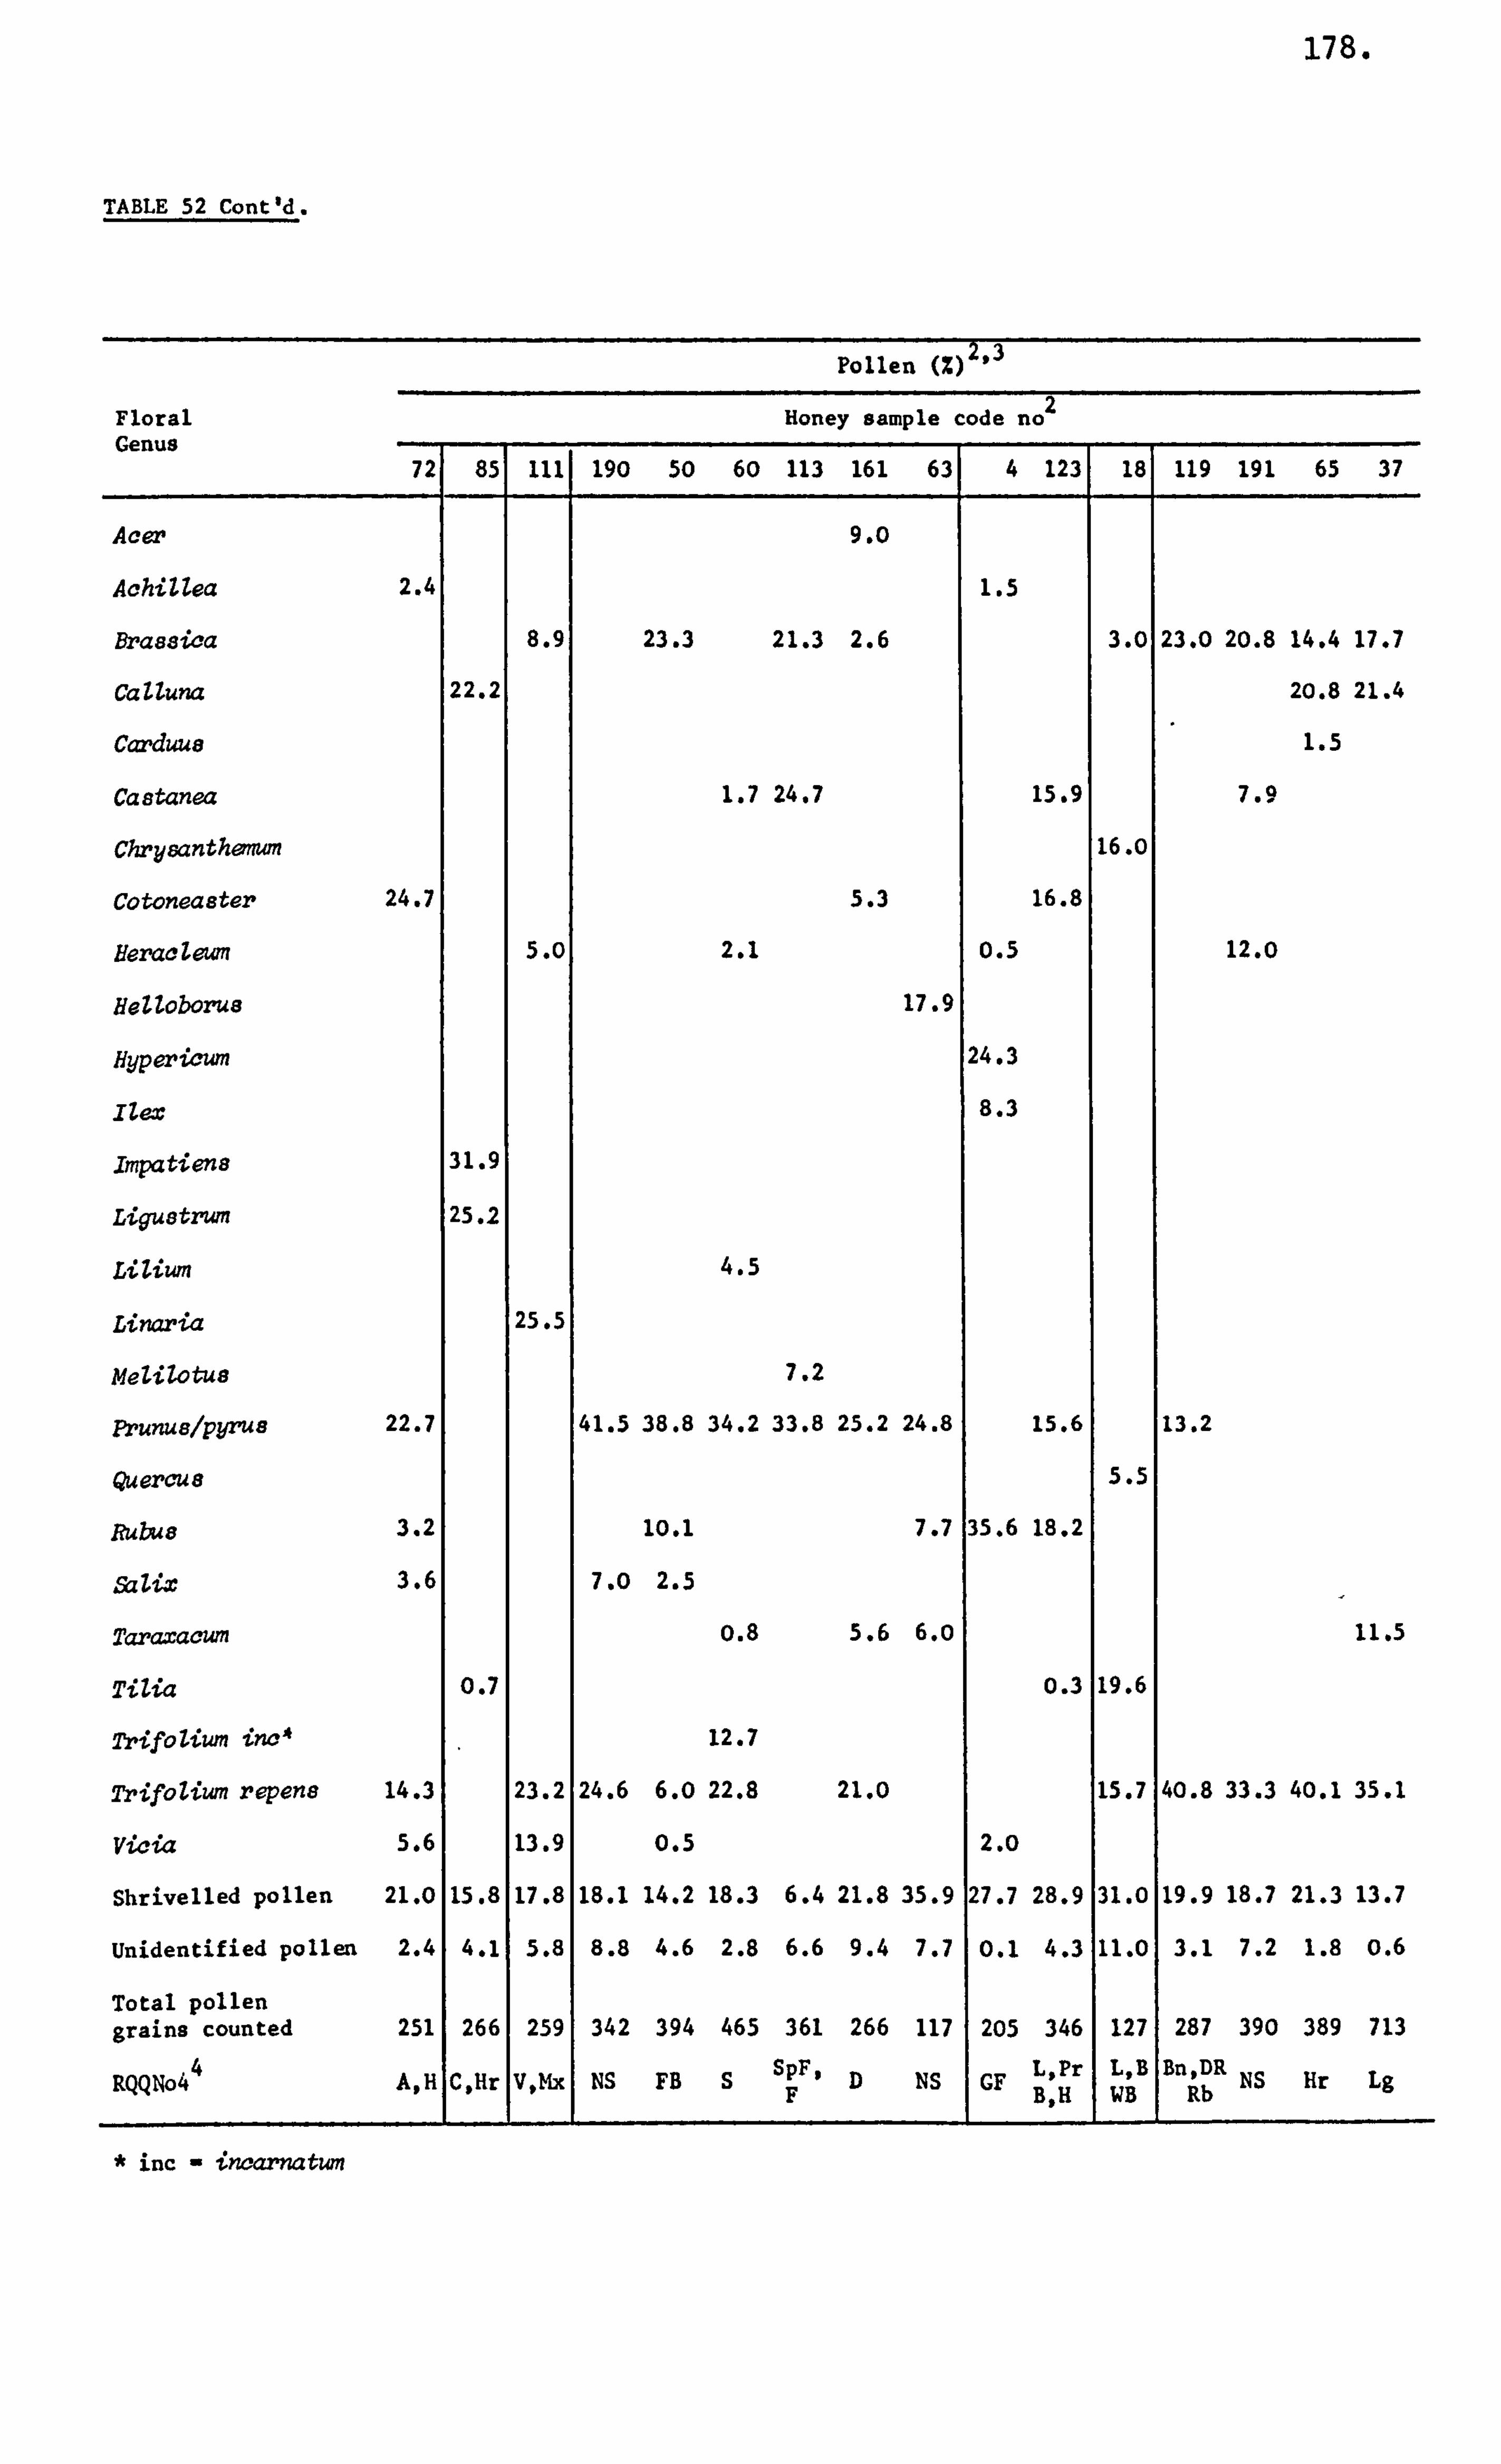
178.
TABLE 52 Contd.
Pollen M 2,3
Floral Honey sample code no 2
WOULMU
72 85 Ill 190 50 60 113 161 63 4 123 18 119 191 65 37
Acer 9.0
Achi I lea 2.4 1.5
Brassica 8.9 23.3 21.3 2.6 3.0 23.0 20.8 14.4 17.7
Calluna 22.2 20.8 21.4
Carduue 1.5
Castanea 1.7 24.7 15.9 7.9
Chrysanthenwn 16.0
Cotoneaster 24.7 5.3 16.8
Heraclew? i 5. o 2.1 0.5 12.0
Helloborus 17.9
Hypericum 24.3
Vex 8.3
. Impatiens 31.9
Liguatzrum 25.2
LiZium 4.5
Linaria 25.5
Melilotus 7.2
Prunus/pyrus 22.7 41.5 38.8 34.2 33.8 25.2 24.8 15.6 13.2
Quer=8 5.5
Rubus 3.2 10.1 7.7 35.6 18.2
52lix 3.6 7.0 2.5
Tar=acum 0.8 5.6 6.0 11.5
Tilia 0.7 0.3 19.6
Trifolium inc* 12.7
TrifoZiwn repene 14.3 23.2 24.6 6.0 22.8 21.0 15.7 40.8 33.3 40.1 35.1
Vicia 5.6 13.9 0.5 2. o
Shrivelled pollen 21.0 15.8 17.8 18.1 14.2 18.3 6.4 21.8 35.9 27.7 28.9 31.0 19.9 18.7 21.3 13.7
Unidentified pollen 2.4 4.1 5.8 8.8 4.6 2.8 6.6 9.4 7.7 0.1 4.3 11.0 3.1 7.2 1.8 0.6
Total pollen grains counted 251 266 259 342 394 465 361 266 117 205 346 127 287 390 389 713
RQQNo4 4 A, H C, Hr V, Mx NS FB S SPF , D NS CF L, Pr L, B Bn, DR NS Hr Lg
F B, H WB Rb
* inc - incarnatwn
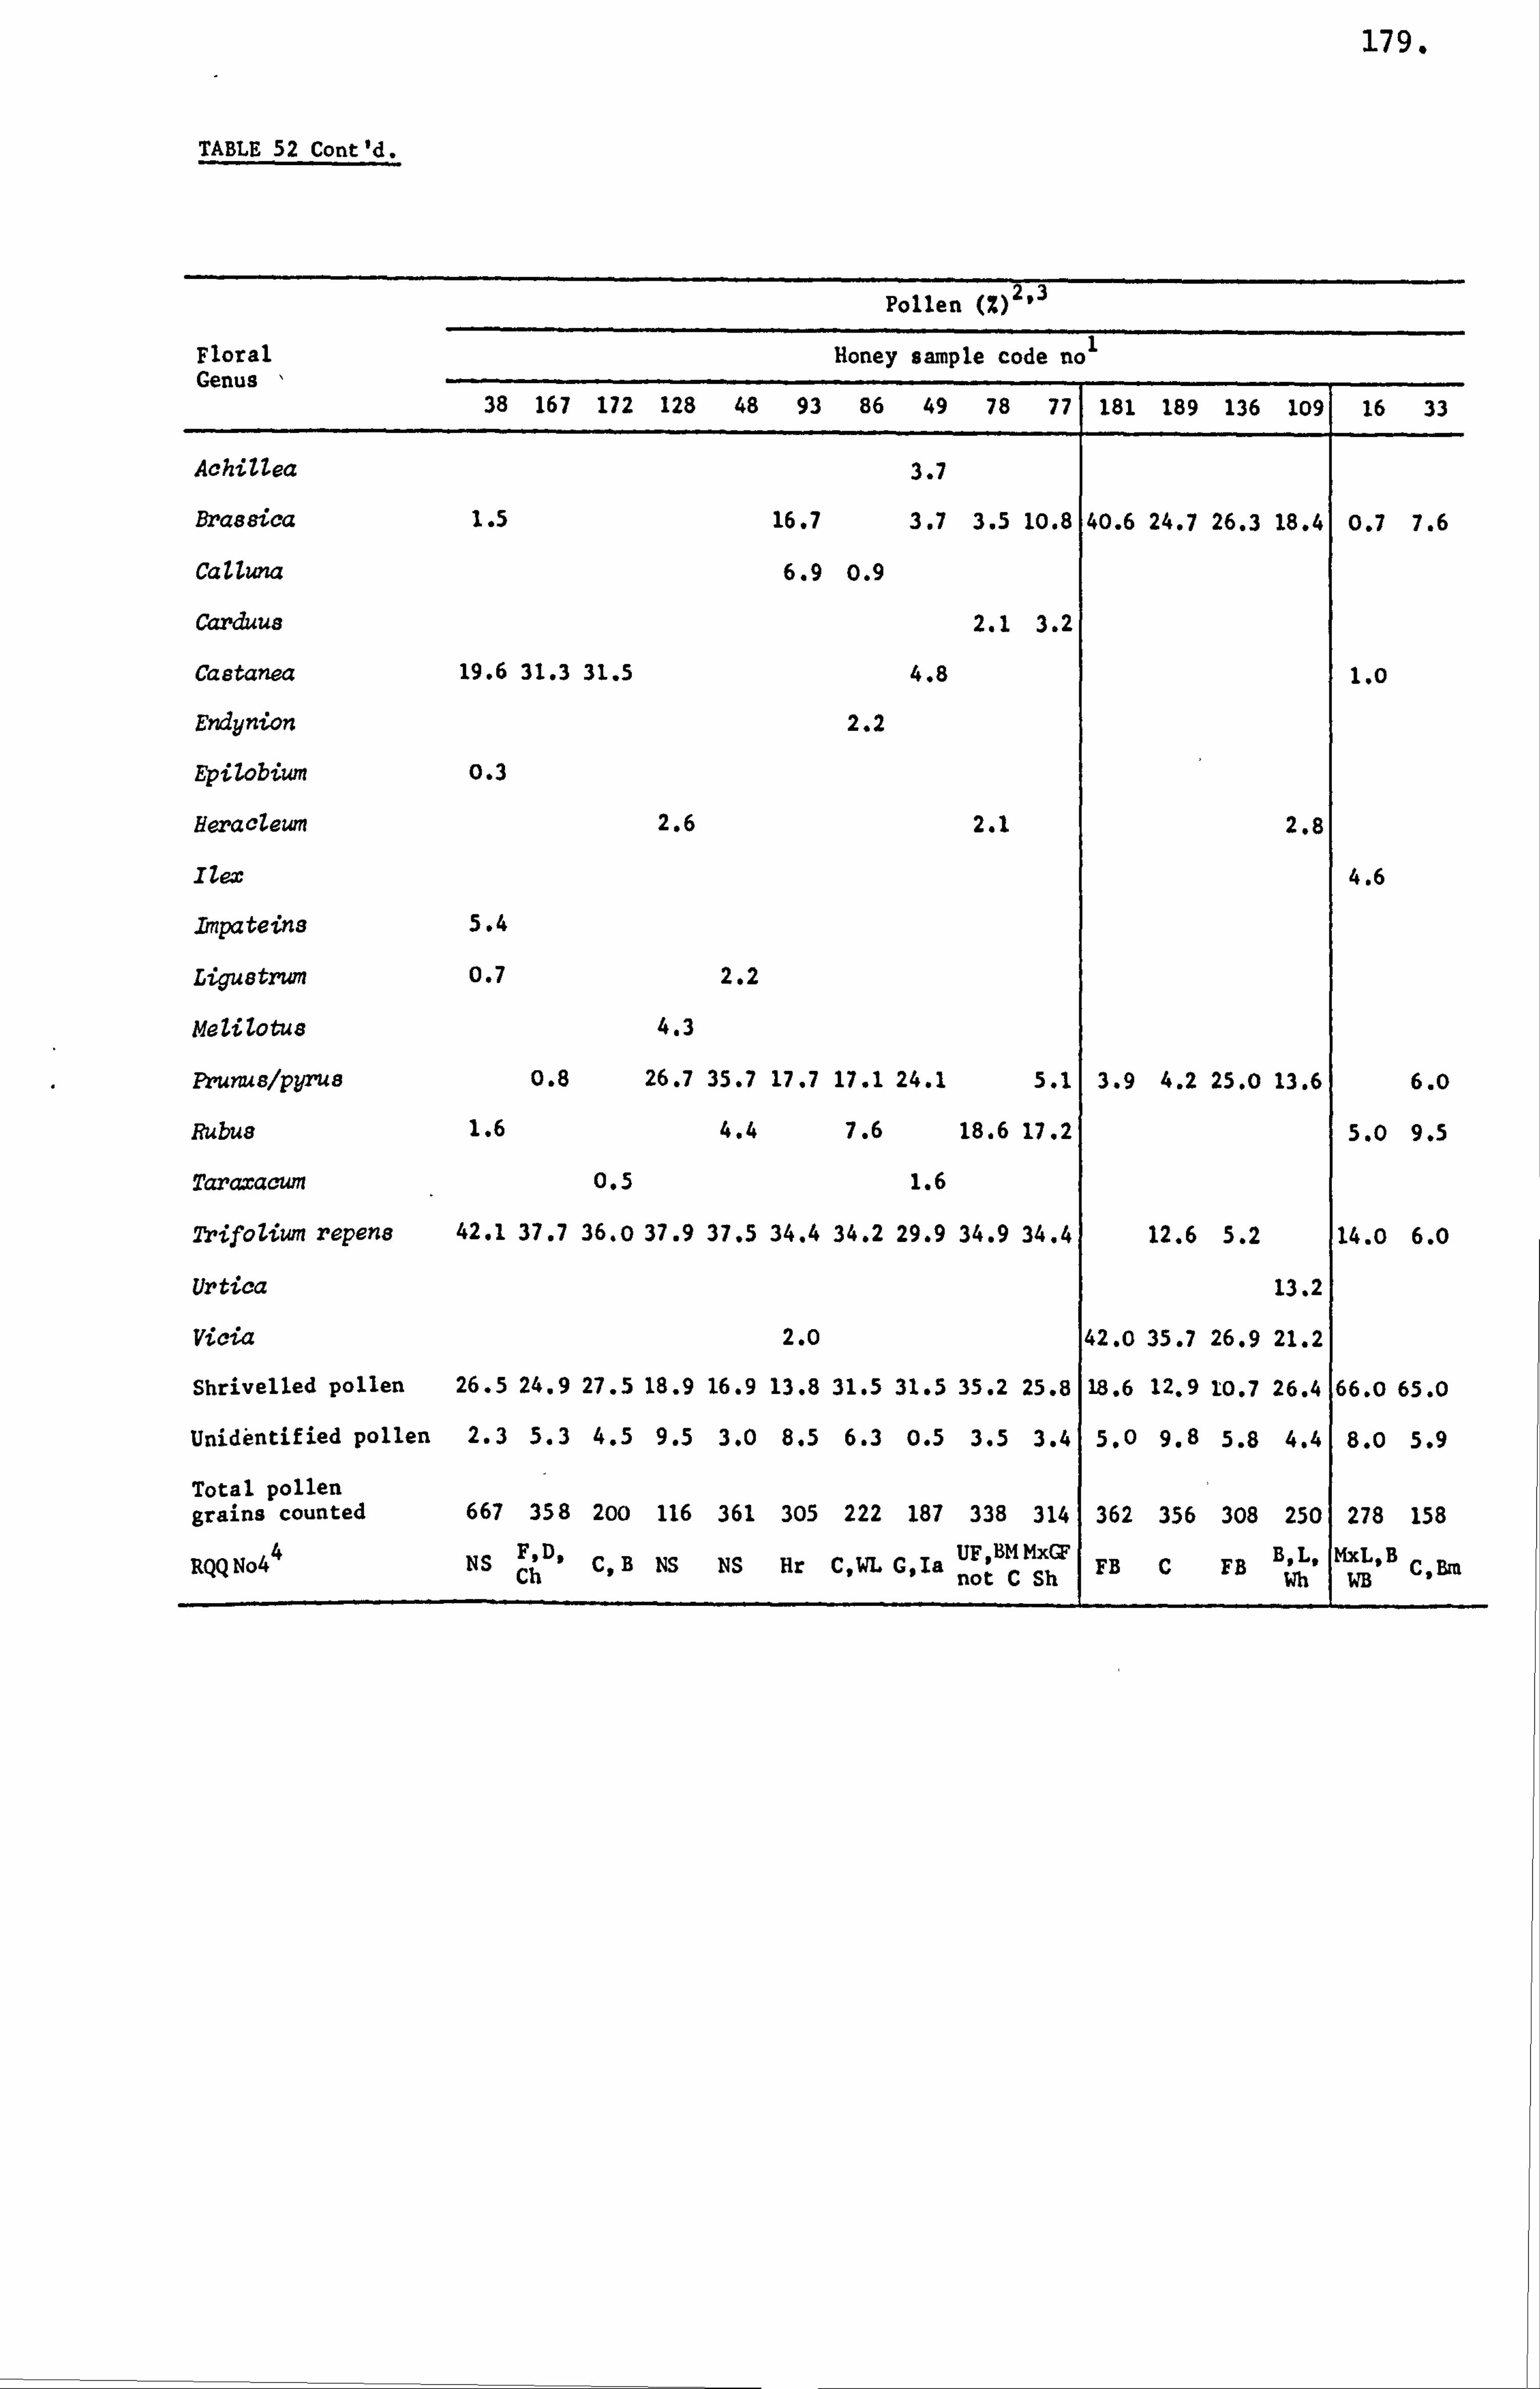
179.
TABLE 52 Cont'd.
Pollen (%) 2.3
Floral Honey sample code no' Genus
38 167 172 128 48 93 86 49 78 771 181 189 136 1091 16 33
AchiZZea 3.7
Brassica 1.5 16.7 3.7 3.5 10.8 40.6 24.7 26.3 18.4 0.7 7.6
CaUuna 6.9 0.9
Carduus 2.1 3.2
Castanea 19.6 31.3 31.5 4.8 1.0
Endynion 2.2
EpiZobium o. 3
HeracZezan 2.6 2.1 2.8
Ilex 4.6
rmpateins 1 5.4
Ligustrwn 0.7 2.2
MeZitotus 4.3
Prunualpyrus 0.8 26.7 35.7 17.7 17.1 24.1 5.1 3.9 4.2 25.0 13.6 6. o
Rubus 1.6 4.4 7.6 18.6 17.2 5.0 9.5
Tar=acum 0.5 1.6
2ýrifoliwn repens 42.1 37.7 36.0 37.9 37.5 34.4 34.2 29.9 34.9 34.4 12.6 5.2 14.0 6.0
Vrtica 13.2
Vicia 2. o 42.0 35.7 26.9 21.2
Shrivelled pollen 26.5 24.9 27.5 18.9 16.9 1348 31.5 31.5 35.2 25.8 18.6 1249 10.7 26.4 66.0 65.0
Unid6ntified pollen 2.3 5.3 4.5 9.5 3.0 8.5 6.3 0.5 3.5 3.4 5.0 9.8 5.8 4.4 8.0 5.9
Total pollen grains counted 667 358 2oo 116 361 305 222 187 338 314 362 356 308 250 278 158
RQQNo4 4 NSF, D, C, B Ch NS NS Hr C, WL C, Ia UF, BM MxCF
not C Sh FB C FB B, L, Wh
MxL, B WB C, Bm
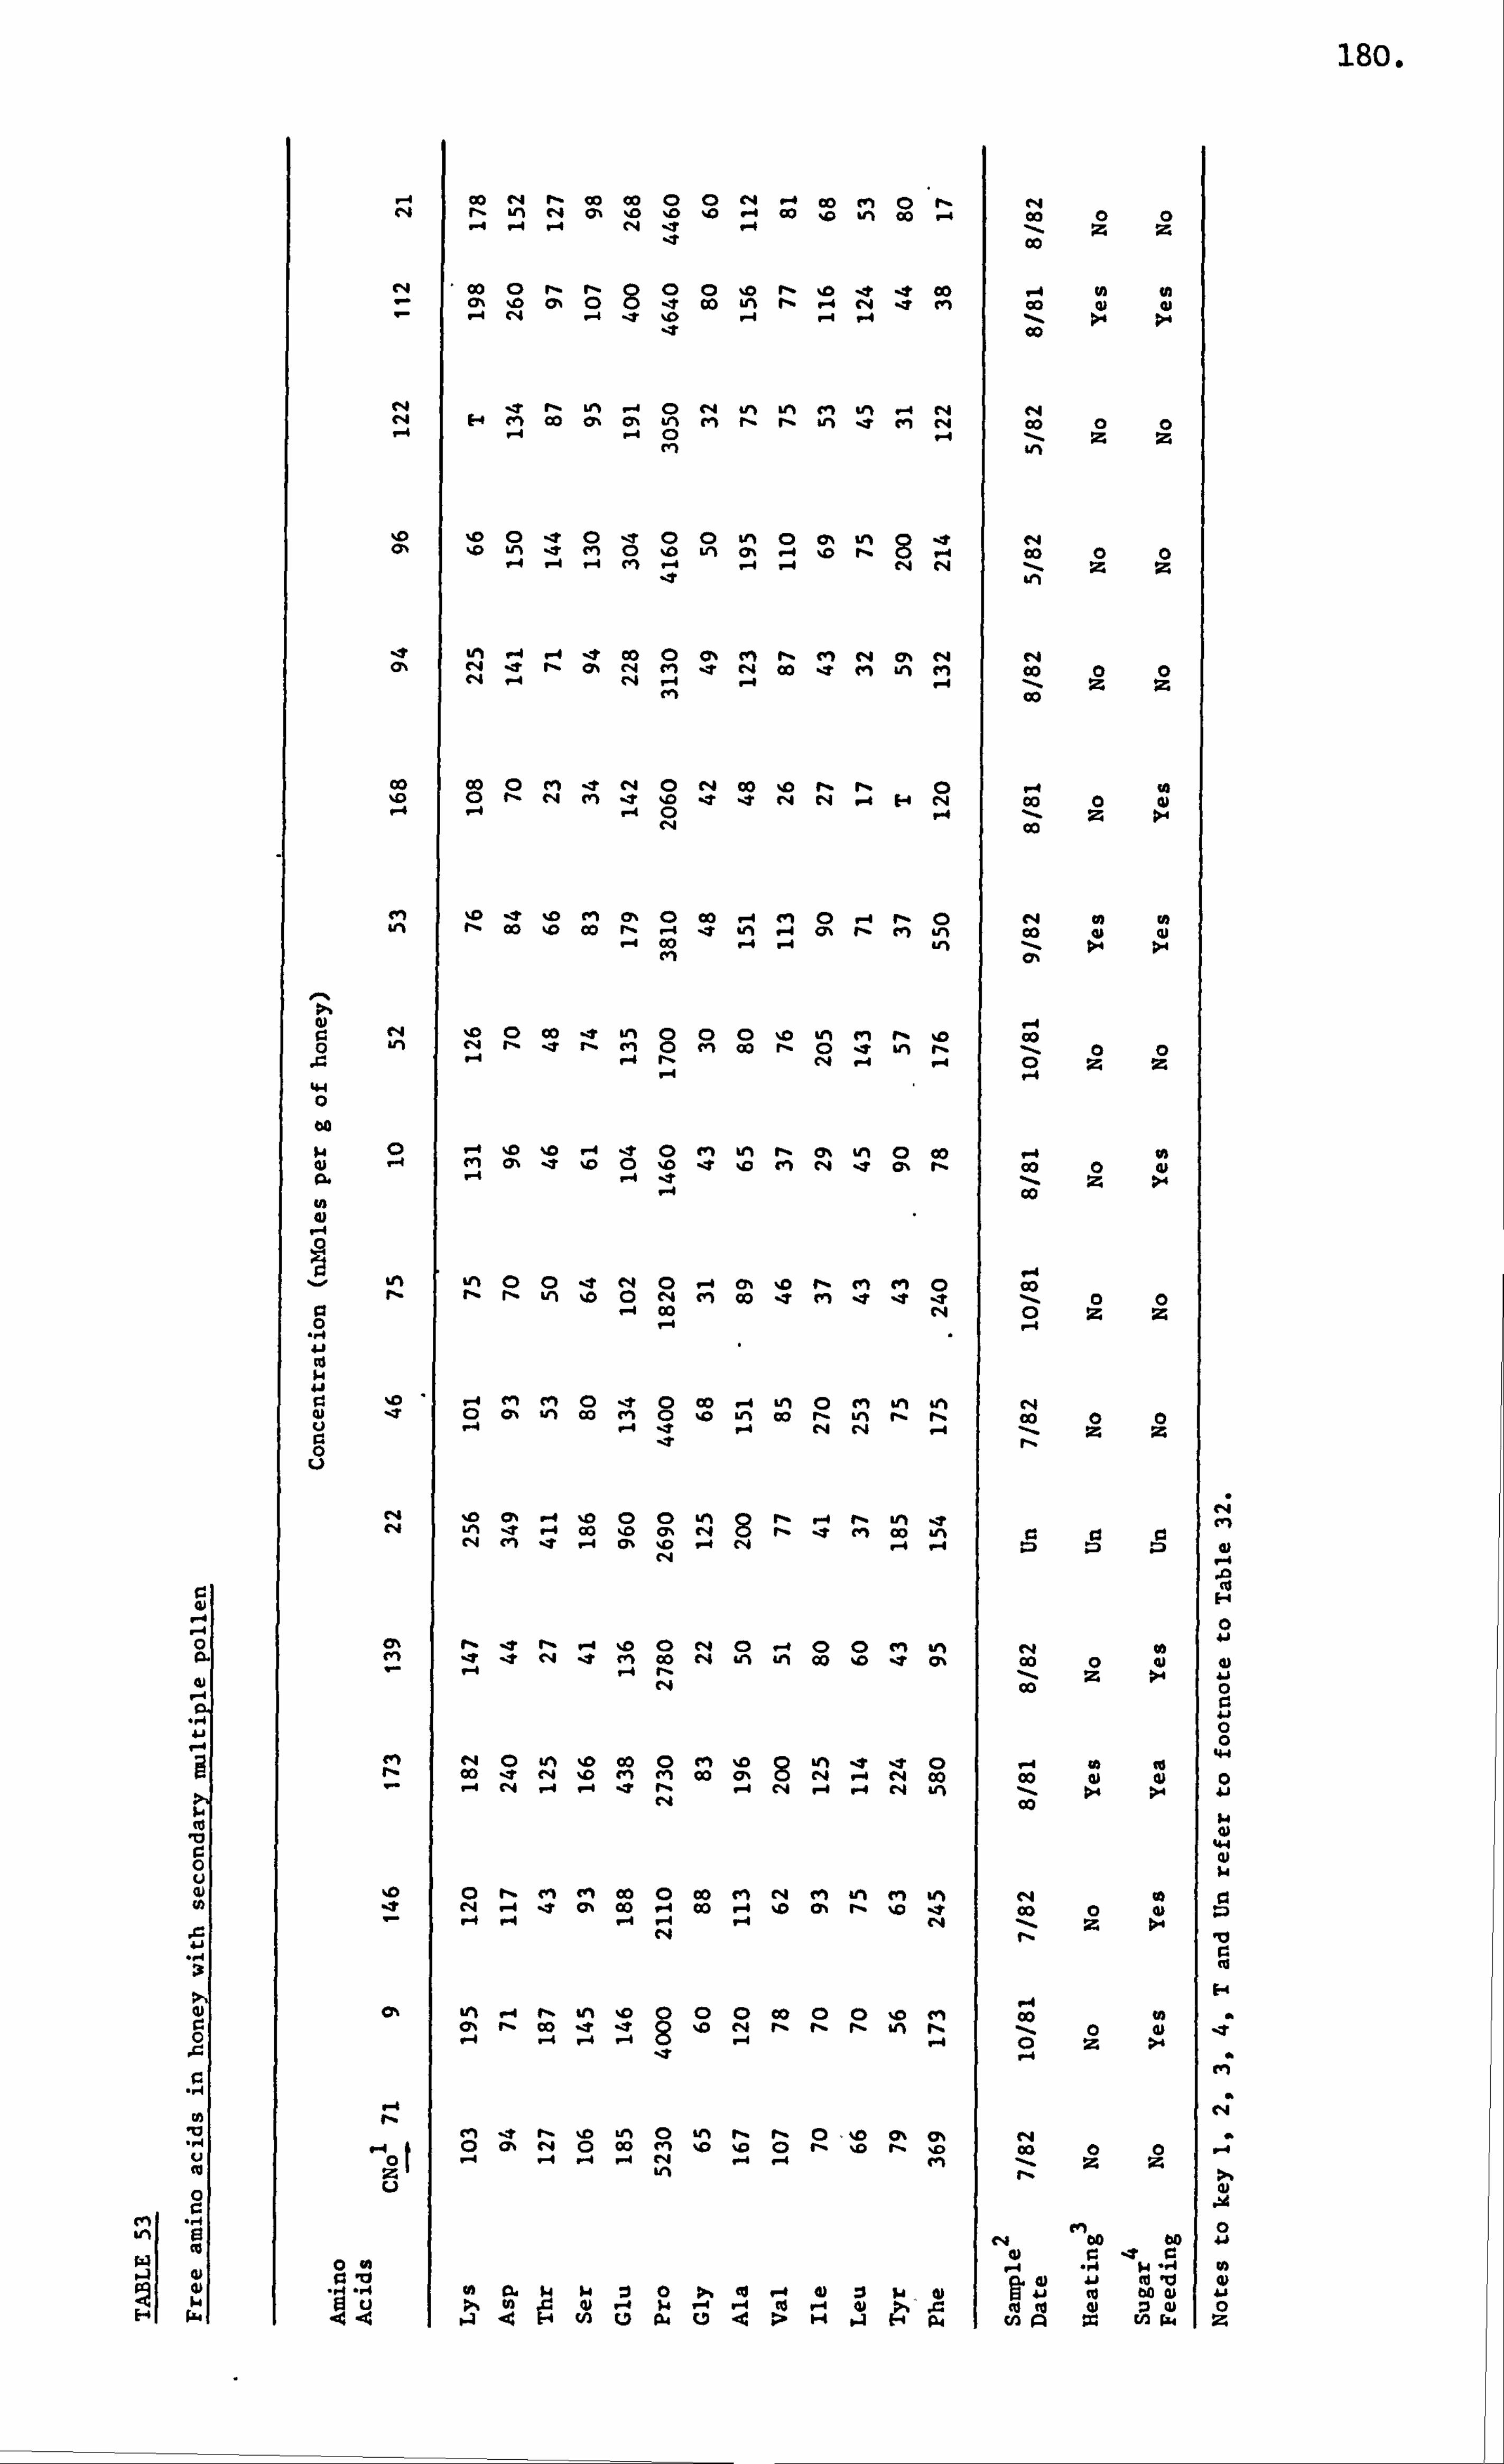
180.
CO cn r- f- Ul c4 0% 0 0 0 .4 CK) 0 ul 00 _, 00 0 0 ý 1.4 -q c4 11 -4 Z Z
zr 00
' 2, CO "4 rA
CY, 10 C3N 0 t CO cm Co 0 ý4 c4 -4 ý7 17 Co r4 IT r- -IN ý 0 e4 ým WN m Ul% ý4 94 e4 E, CM CO 0, Ch ýn M rý r. tn e Cm Co 0 0
ýD ýo 0 t 0 -t 0 0 tn CYN Ln « ' (21 19) ým -4 t" 0 0 Ln Cm
0 rý Z c o 0 0
-t Co 0 c% cm r, t" c4 cy% e4 r4 (A r4 e r- - - cm ýT " Co 7 ei A en Co 0 0 c4 "4 r4 -4 -1 -f Z Z
cm Co
Co CO 0 cm _T C, 4 0 " Co 10 fl rý 0 ý4 M ID 0 r- c*A cn i ýD ýT 7 r4 rq -4 H C. 4 Co 0 4) ý4 -4 ý4 C: ) lý Z >-
c4 00
t" 10 e 0 en cy, Co -4 cm -4 rý 0 r4 0) 0 VN r- 00 0 Co rý 0
ý4 Co >4
10 (D CO -t in 0 0 0 0 tm m rý 0 Co ul " r, -7 r- en 0 C" 00 rý 0 17 ki rý 0 0
44 0
0 1-4 r, CY% t %0 0 0 ýT ýD en " i (: r, Co 0 4) gl. -4 -4 't ll Z : ul lý Co 4u
ult ýn 0 0 e cq 0 -. (� 0 r, ' cm 0 Co rý rý fl U) 0 0 C*4 cn Co e m 11 11 't 0 0 0 ý4 Co r4 0 Z Z 0
r. 10 - - 0 -t 0 Co -4 m 0 gn bri tn r4 0 17 0% Wý CO r*I 0 0 ým Co r- Ln r. r, Co
el 0 CYN --4 0 CD 0 ým r- ý4 r- LM t c4 Lm 't 4 co o ', ' 4 't ' c, j, r. r4 ei -e -4 c% lo 14
0 t> t' -e rý 4 0 0 e4 0 -4 0 0 m tn e4 t2ý gn e -4 <4 -1 cm Co " ýn ým Co 10 17 0% Co 0) c4 Co
r, a ein
rý rq 02 in ýD c» 0 ein 0 8 u-, t e 0 ý4 0 o
- ý4 C, 4 e4 14
D -4
m *
en rý
Co 0, -4 c4
" -f
ý 4
e4 rq
CO ýn
Co 0 w >, W c4 Co
10 0 - - - - 0 Co cm rq m) tn m A eq 0 t r4 -I le 0% Co ýI Co -4 10 CY, rý %0 't Co 0 .
CY% LM ý4 r, tn 0 0 0 0 Co 0 0 0 «m Co Co CY% rý Co 't IT f
8 10 ell r, rý r. in rý 0 4) -4 14 -
-4 Co rý
-u g" t rý b Ln (D ým rý r, 0, %D cy% c, % r4 u tu
-4 t o
0 CY, rl K4
0 m
Co 0 Z
0 ;4
vý E3 c4 ein
C. 0 bo
k
f3 Ici
re 4 4)
a) 41
)
to -v
D0 im 9 <
ý A Pd
3 cn
A 4 = In PW
0
0 0 0 0 4-4
0 41
4.4
0)
0 z
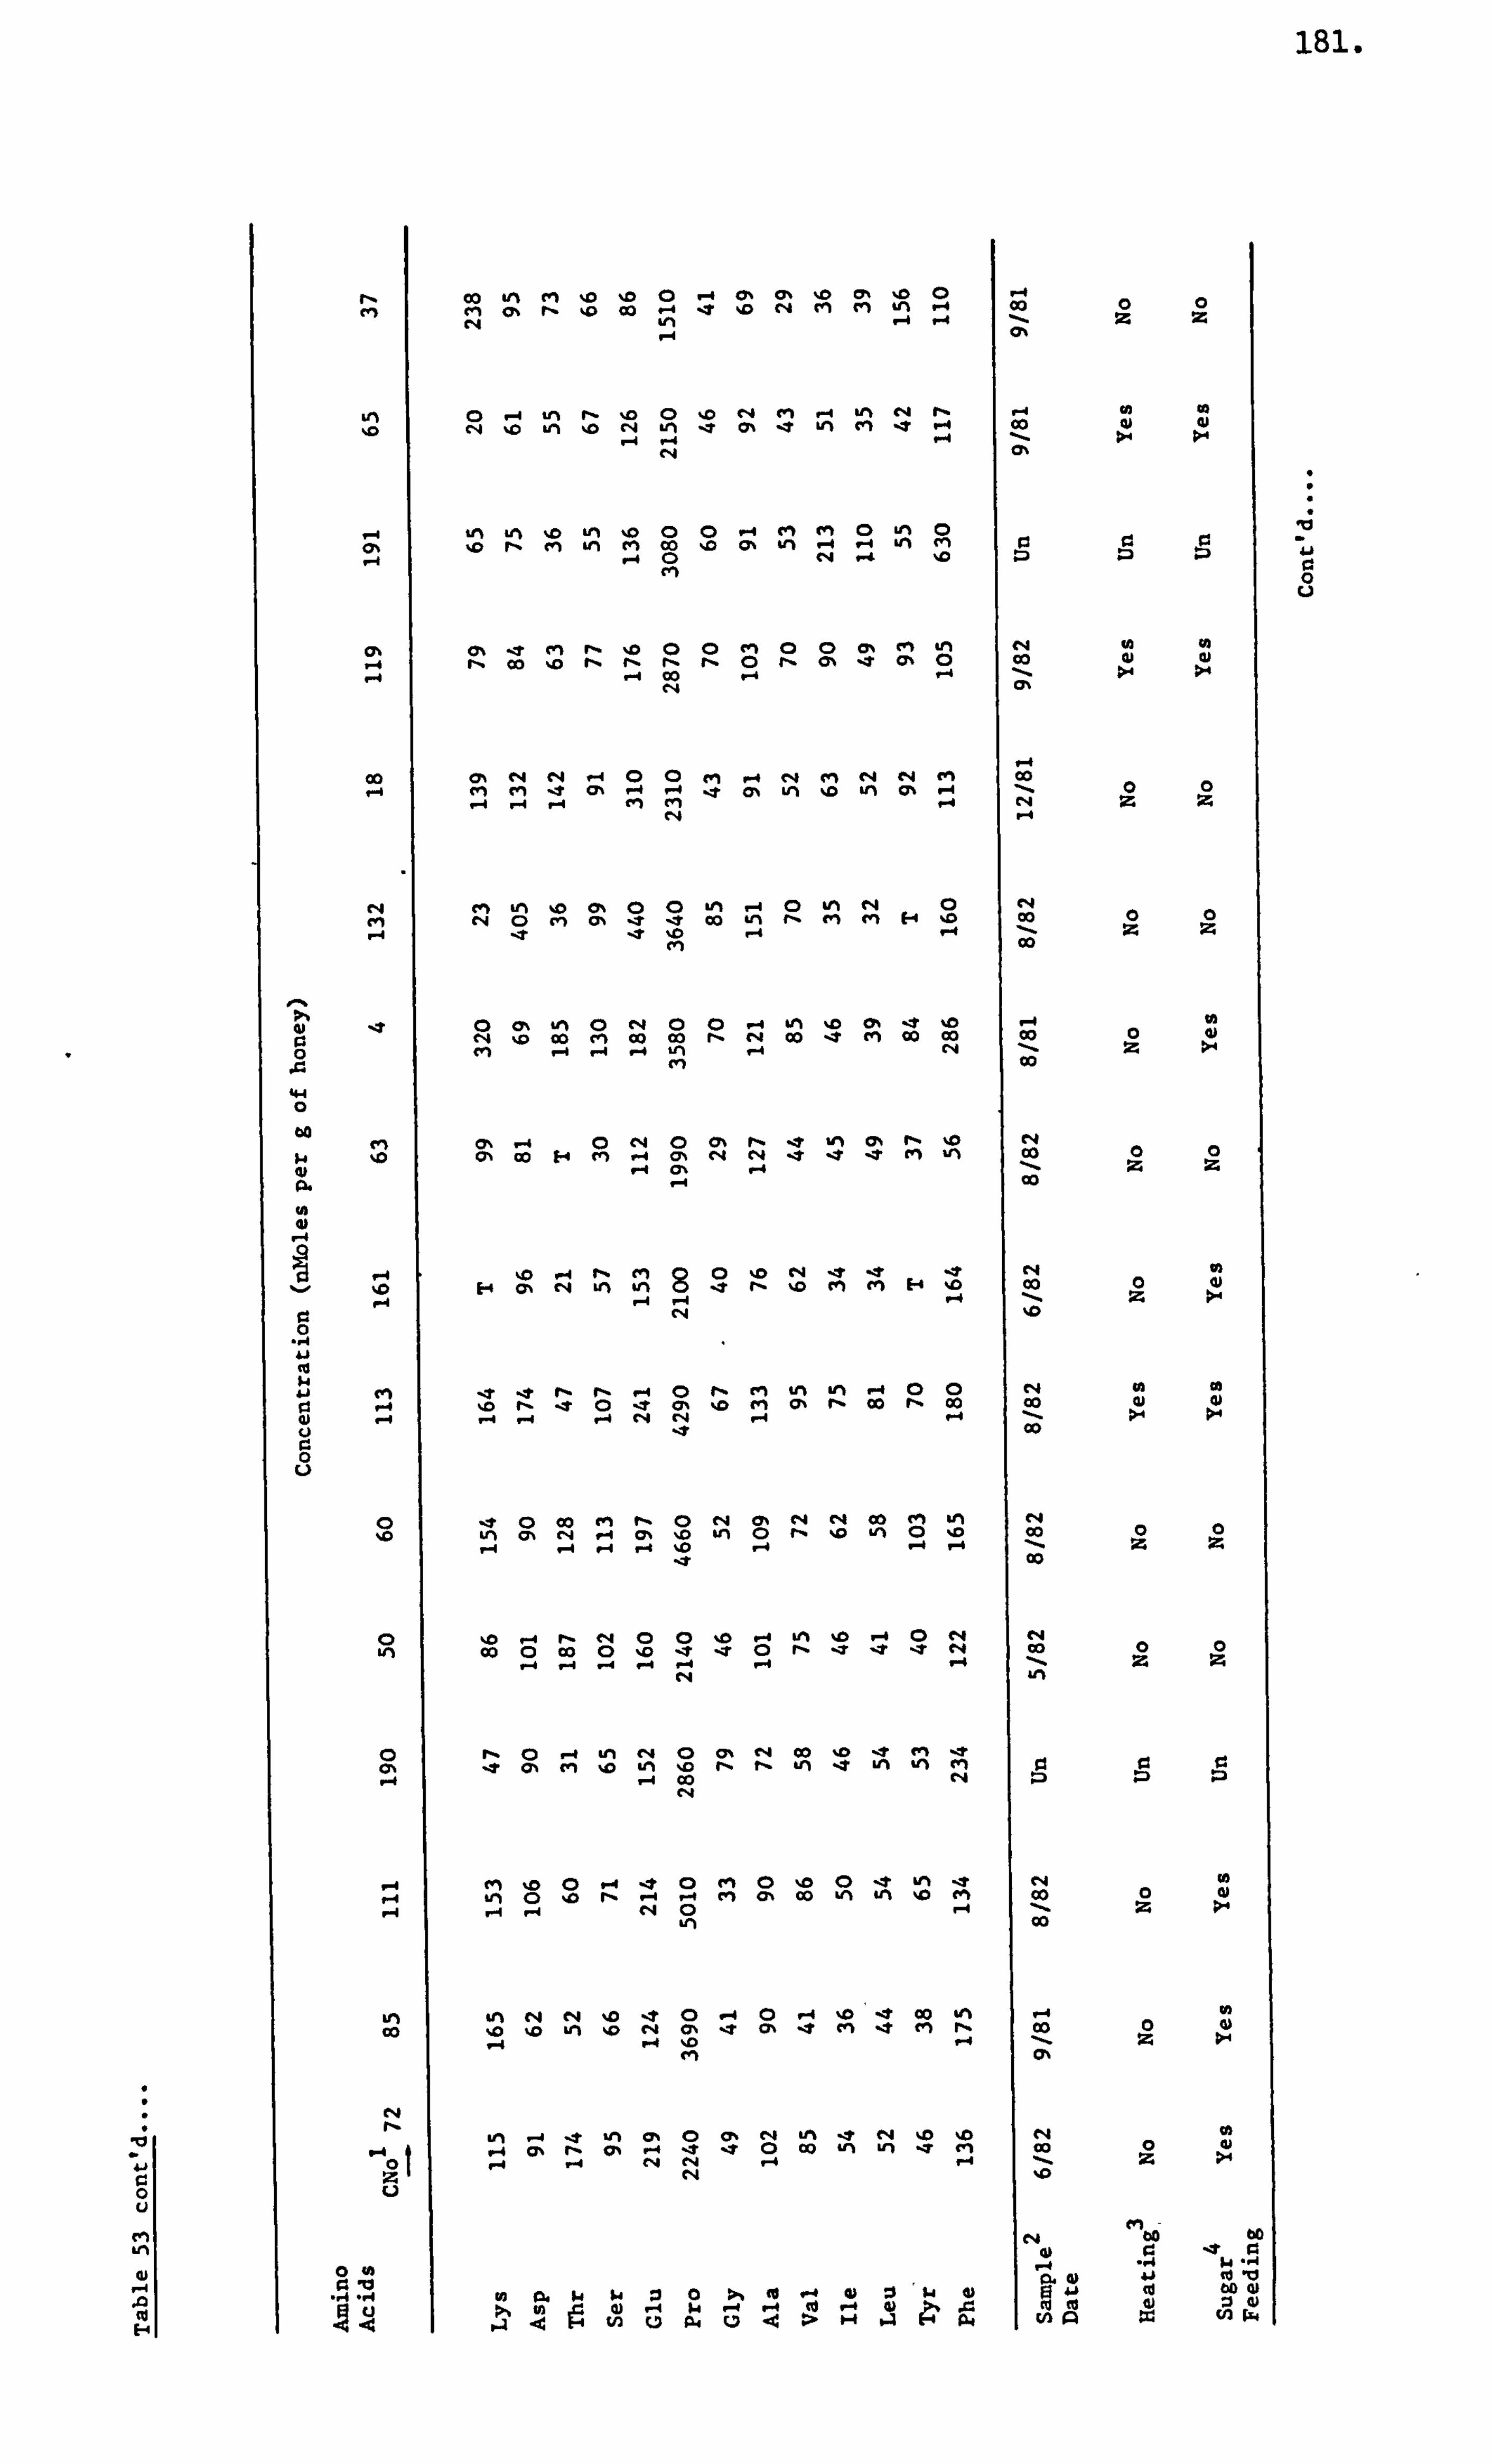
181.
-Ki
0 u
cm
Co an cm ID 10 0 ý4 Ch cr, 10 CM Cy% rý 10 CO ý4 l 10 c4 Pl
c> 10 0 rl 4n 14
-t 00 0 0
A 0 -4 0" 1-4 -l' " rý 4
4 Co
Co ei
10 " 10 Zm CY% Ln cm eý
C, 4 C%
-4 CY%
Wý Le% 10 10 rý ri
LM 10 0 LM m co
0 ý-4 t" (" In 0% tn -4
0 u. % 0
-4 ým (n 92 93
14 ý4 0 c4 ý4 ID :D t2 :D
0% 0 00 cu 0 -4 r, 00 10 rý (1 r,
4 CO rý 0 rý CY% 17
ý4 >- : ý4
00 CYN c4 M -4 00 4 4 CM 4 cýI (" . fq e4 m d Co 0 0 ý4 CM rl -t
-4 ýd f Cy% ý -
cm C" %0 t (7, U ul cy% ý
ý-4 c4 Z Z
m LM 10 CF% 00 ýA -4 0 %A ee ý r
fq 0 mH 10
C, 4 00 0 0
C" r4 0m 0% -7 't t ID
m , Co t ý4 Z Z
-4 IT ' (n -
Co
4) 17 0 CY% -1 0"0 0 14 4A 10 ch le 10 -4 0
bl 4)
0 e4 0 Co eý Co Co 21 rý r4 Co i
4 cm cio Co Co Z >4 C" -4 ýd -4
gn "
00 4 44
ri 4 0 c4 0 0% rý 't ým ON rý 10 1
e4 0 10 OD H tn -4 (A c4 c4 tt .3 rm 1 ) Co
4 Co 0. -
01
e - 10 ý4 r, CM 8 0 10 N ýT el
H D r4 Co 0
03 4) 10 H CY, r4 LM #n 7 r' 10 M I M
r. C, 4 %D 0
41
0 cm tn -M -f 00 c4 40
't 0 't cr, 10 rm CM r. cio rý 00 00 w >ý
0 p-
u ý4 c4 rq
't ýd "4
Co
0 00 C" rý 0 rq CY, c4 c4 Co M vi Cli 0 %D Ln c% c4 ýd CY, 5 U-1 0 rý ZO vi 0D Co 0
10 ý4 rý c4 00 10 ý4 KM 10 -4 0 c4 c4 Co 0 Co 0 10 -t
4 ýT 0 rý 17
4 't t e4
-4 Co
Z Z ý4 4 ýýý
c4 1
CD% 't Ch cn 0
10 -1 In CY% e4 rý fl ým 17 Ln "i cm 93 93 r.
-4 00 c4 :a D P
c4
-4 m ýo 0 ý4 *0 cm 0 10 0 -e LM 't C, 4 0 ýI ým 0Z rý Aý m 0% Co ýn #A 0 cm
1 Co 0
Z w >- 14 1.4 ý4 cq 0
vi "
LM gn 44 c4 10 't 0 -4 0 ý4 10 -4 Co A l 0 4) 00 10 10 W) 10 r4 (Y, 17 CY% 11 cm i r, 11 f
4 Co
Z >4 "4 ý. 4 ID
cm " CY%
ým -A ýt ýn 91 0 Ch r4 V% t e4 ID 10 e4 0 -4 cm r- cn ý4 ZT 't 0 Co ým u-i ZT el
4 Co 0
Z v
>l
Z ý4 ý4 e4 eN
N -4 "
10
0) j2. k wc0 to ýd 4) Cw0 Cd (L)
bo 0 :i lu
H c--4 p In x ch w %A 4
-u �I
0 U
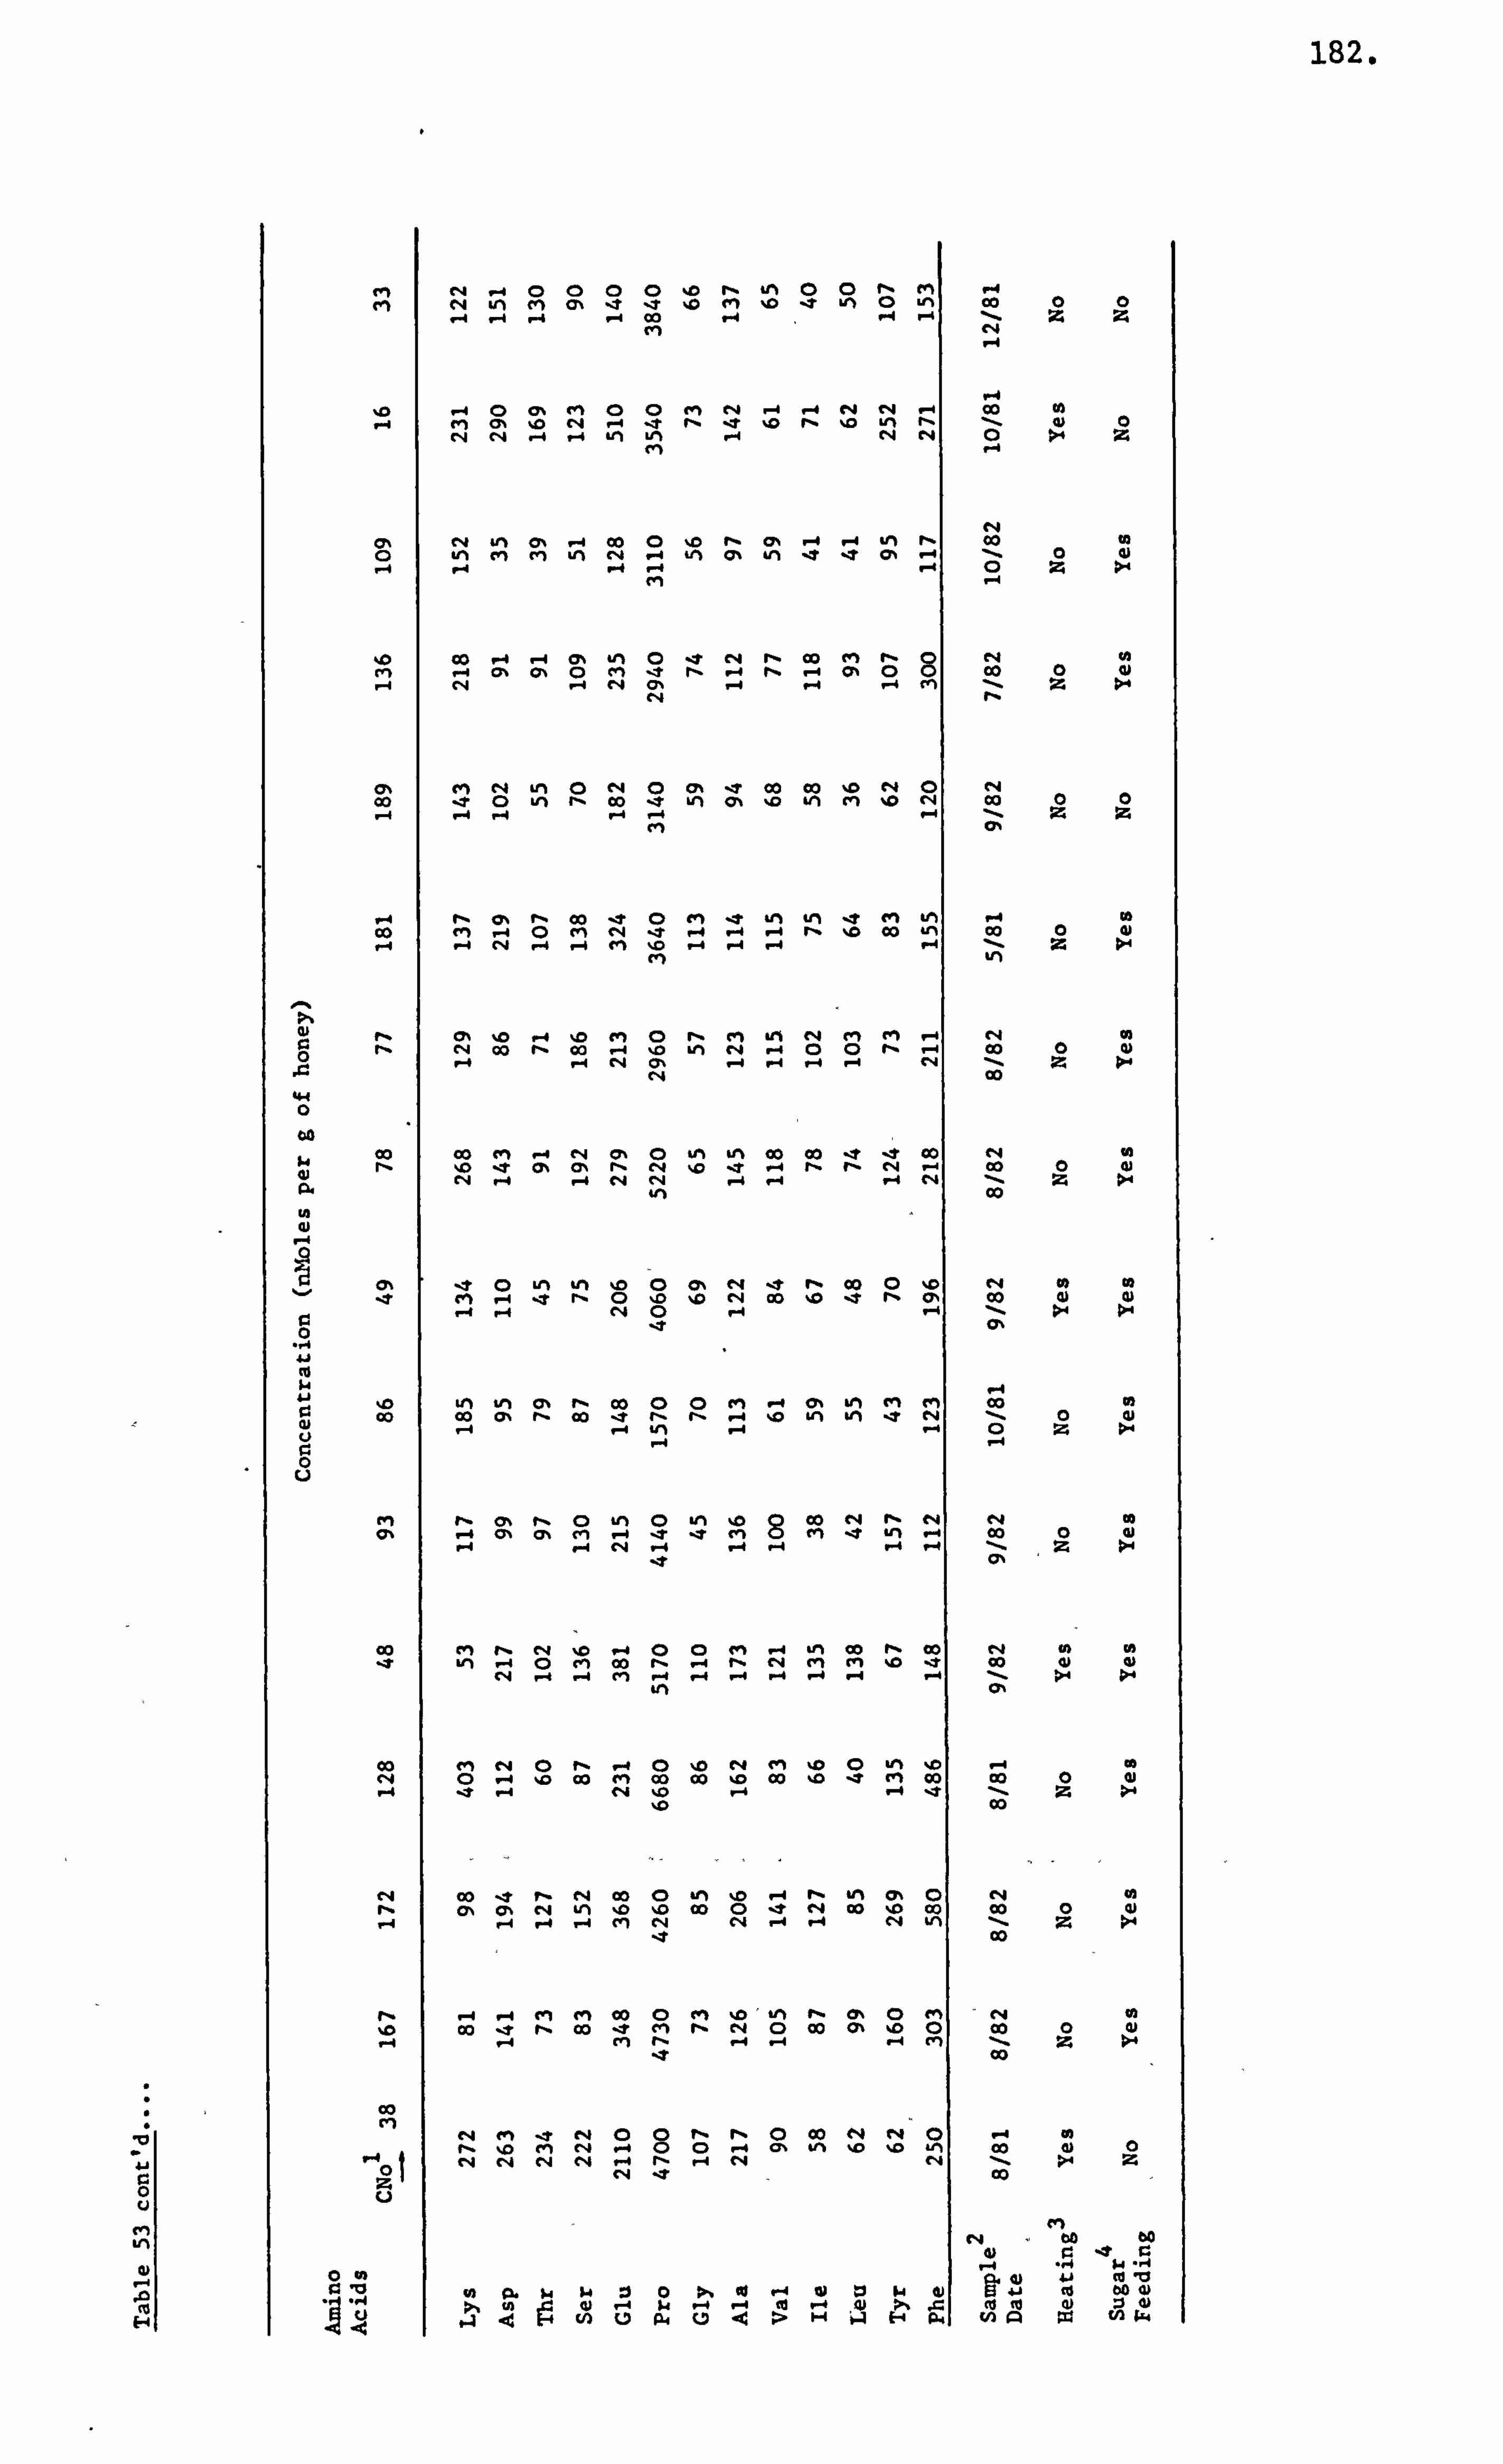
182.
0 u
tvi
A
fn C4 4 0 0 0 0 'D r, 41) 0 0 f, M 14 m C4 in cl (7% 1 ZI 'D in 'D 'T vi 0 in co 0 0
ý4 ý4 ý4 ý4 00 ,4 1- z z
cn 04 ,4
,4 10 ý4 0 0% C" 0 0 en 04 ý4 14 C4 eq ý co to
ý4 M m %0 " ý IT rl Ir 10 rl 10 Ln 11 13) 0 C-4 C'l -4 ý4 LM Ln ý4 N c4 0 >4 z
N CIN c4 in (Y% -1 co 0 'o rý c7% 4 ý4 Ln r, co to 0 in cn Cn Ln F4 ý4 A C% in 'T 'T 4m -4 0 4)
ý4 4 0 z >. 4
10 co -4 -4 m In 0 11 C4 r, co C" rl 8 N ta rn ý4 0% ON 0 m -4 rl ý4 rl ý4 Ch 0
00 0 41 ý4 C4 14 C14 C% -4 m z
C14 rl
CN N Ln a N 0 CF% 'T co co 'D C'4 N co -0 0 Ln F, OD .4 Ln o% 'D in C', %0 C14 00 0 0 -4 ý4 r-4 ý4 -4 z z
(n ON
14 rl ON r- Go -ýr 0 en * LM LM IT en Lf) ý4 to co en -4 0 en eq 'T ý4 ý4 ý4 r, ýo Go 'n co 0 4) ý4 -4 C-4 ý -4 ell 10 4 4 4 4 z
Ln
cu a rý Ch 10 P-4 10 en 0 rý Cn Lil C4 (n m ý4 C4 m
0 11 CN 00 r, 00 ý4 10 Ln C-4 ý4 0 0 r, ý4 co 0 Q) 4 -4 C-4 ol r4 4 -4 r4 CN z
cli co 44 0
ca
w co co m 14 " a, 0 km kn co co It IT co c4 to 4) r, 10 'T Ch ON rl C4
- C) IT ý4 11 rl C4 ý
I co 0 4)
ý4 C4 C 4 ý4 ý4 ý4 C S z Go
ta
--t (n
0 -4
Ln It
tn r,
'D 0 0 ID
(IN ýo
eq N
I w
r, ýo
co IT
0 r%
'D Ch
C4 co
w (D
w 0)
0
0
to
10 LM in Ch f% 00 0 0 cn -1 (7% Ln Cn en co co GO a, r- co .4 1ý r- ý4 'o Ln W) -ýr V4 0 w
-4 Ln ý4 z P4
0 u
en r- 0% f-, 0 in 0 Ln 'o 8 co e4 r. c4 to a% -4 C% 0% c1l r4 `ý 4 C', cn * Ln oo 0 w 14 ý4 c*4 4 1-4 ý4 ý4 ý4 z ;. 4
cn
GO cn r, cl Q -4 0 rN ý4 'm co F, co u) W 4r Ln 14 0 cn Go rl f, 04 cn cvl 10 IT co 4) w
cla -4 ý4 cn ý4 -4 ý4 -4 4 in Ch
00 en ell 0 f, 14 0 10 c4 en 10 0 WN 10 ý4 co c4 0 'D co 4" co co 'D oo 'D 'T cn co co 0 0 ý4 -ýT c4 lo -1 z >-
10 00
C14 co N Go 0 -n 10 1-4 r- in Ch 0 C4 'A m 6% C'4 Ln 'D 'o OD 0 * r4 Go Zo co co 0 9)
4 4 r4 M 04 ý-4 C14 LI) 00
f- -4 -4 C-1 cn co 0 tn 'D , -n rý CYN 0 m - C14 'A 10 00 lzr rl 00 -zr m r, LN 0 co 41% 10 a co 0 W 14 r, ý4 -4 4 cn z
co
Go cn
C*4 en IT " a 0 T, rý 0 co N r4 0 .4 0 ýo en V4 0 0 ý4 C7, A 'o %0 co 4) 0
14 Cq cli CN C*4 ý4 r- ý4 cli C4 z
0 C-4 Ir co t. 0 t. 0
4) 4 '1 4: ý4 " 4
0 0) 93 -0 0
R ' " , 'Co 00 DOT
.4 0 S. w Q) :1 4 o k P, ý 4 - Id 0 . 0 4) w P w g . W i 'd %I a, 4) m
.4 4 -4 En u N 0 < ý- H w P. U3 p M: ' 94
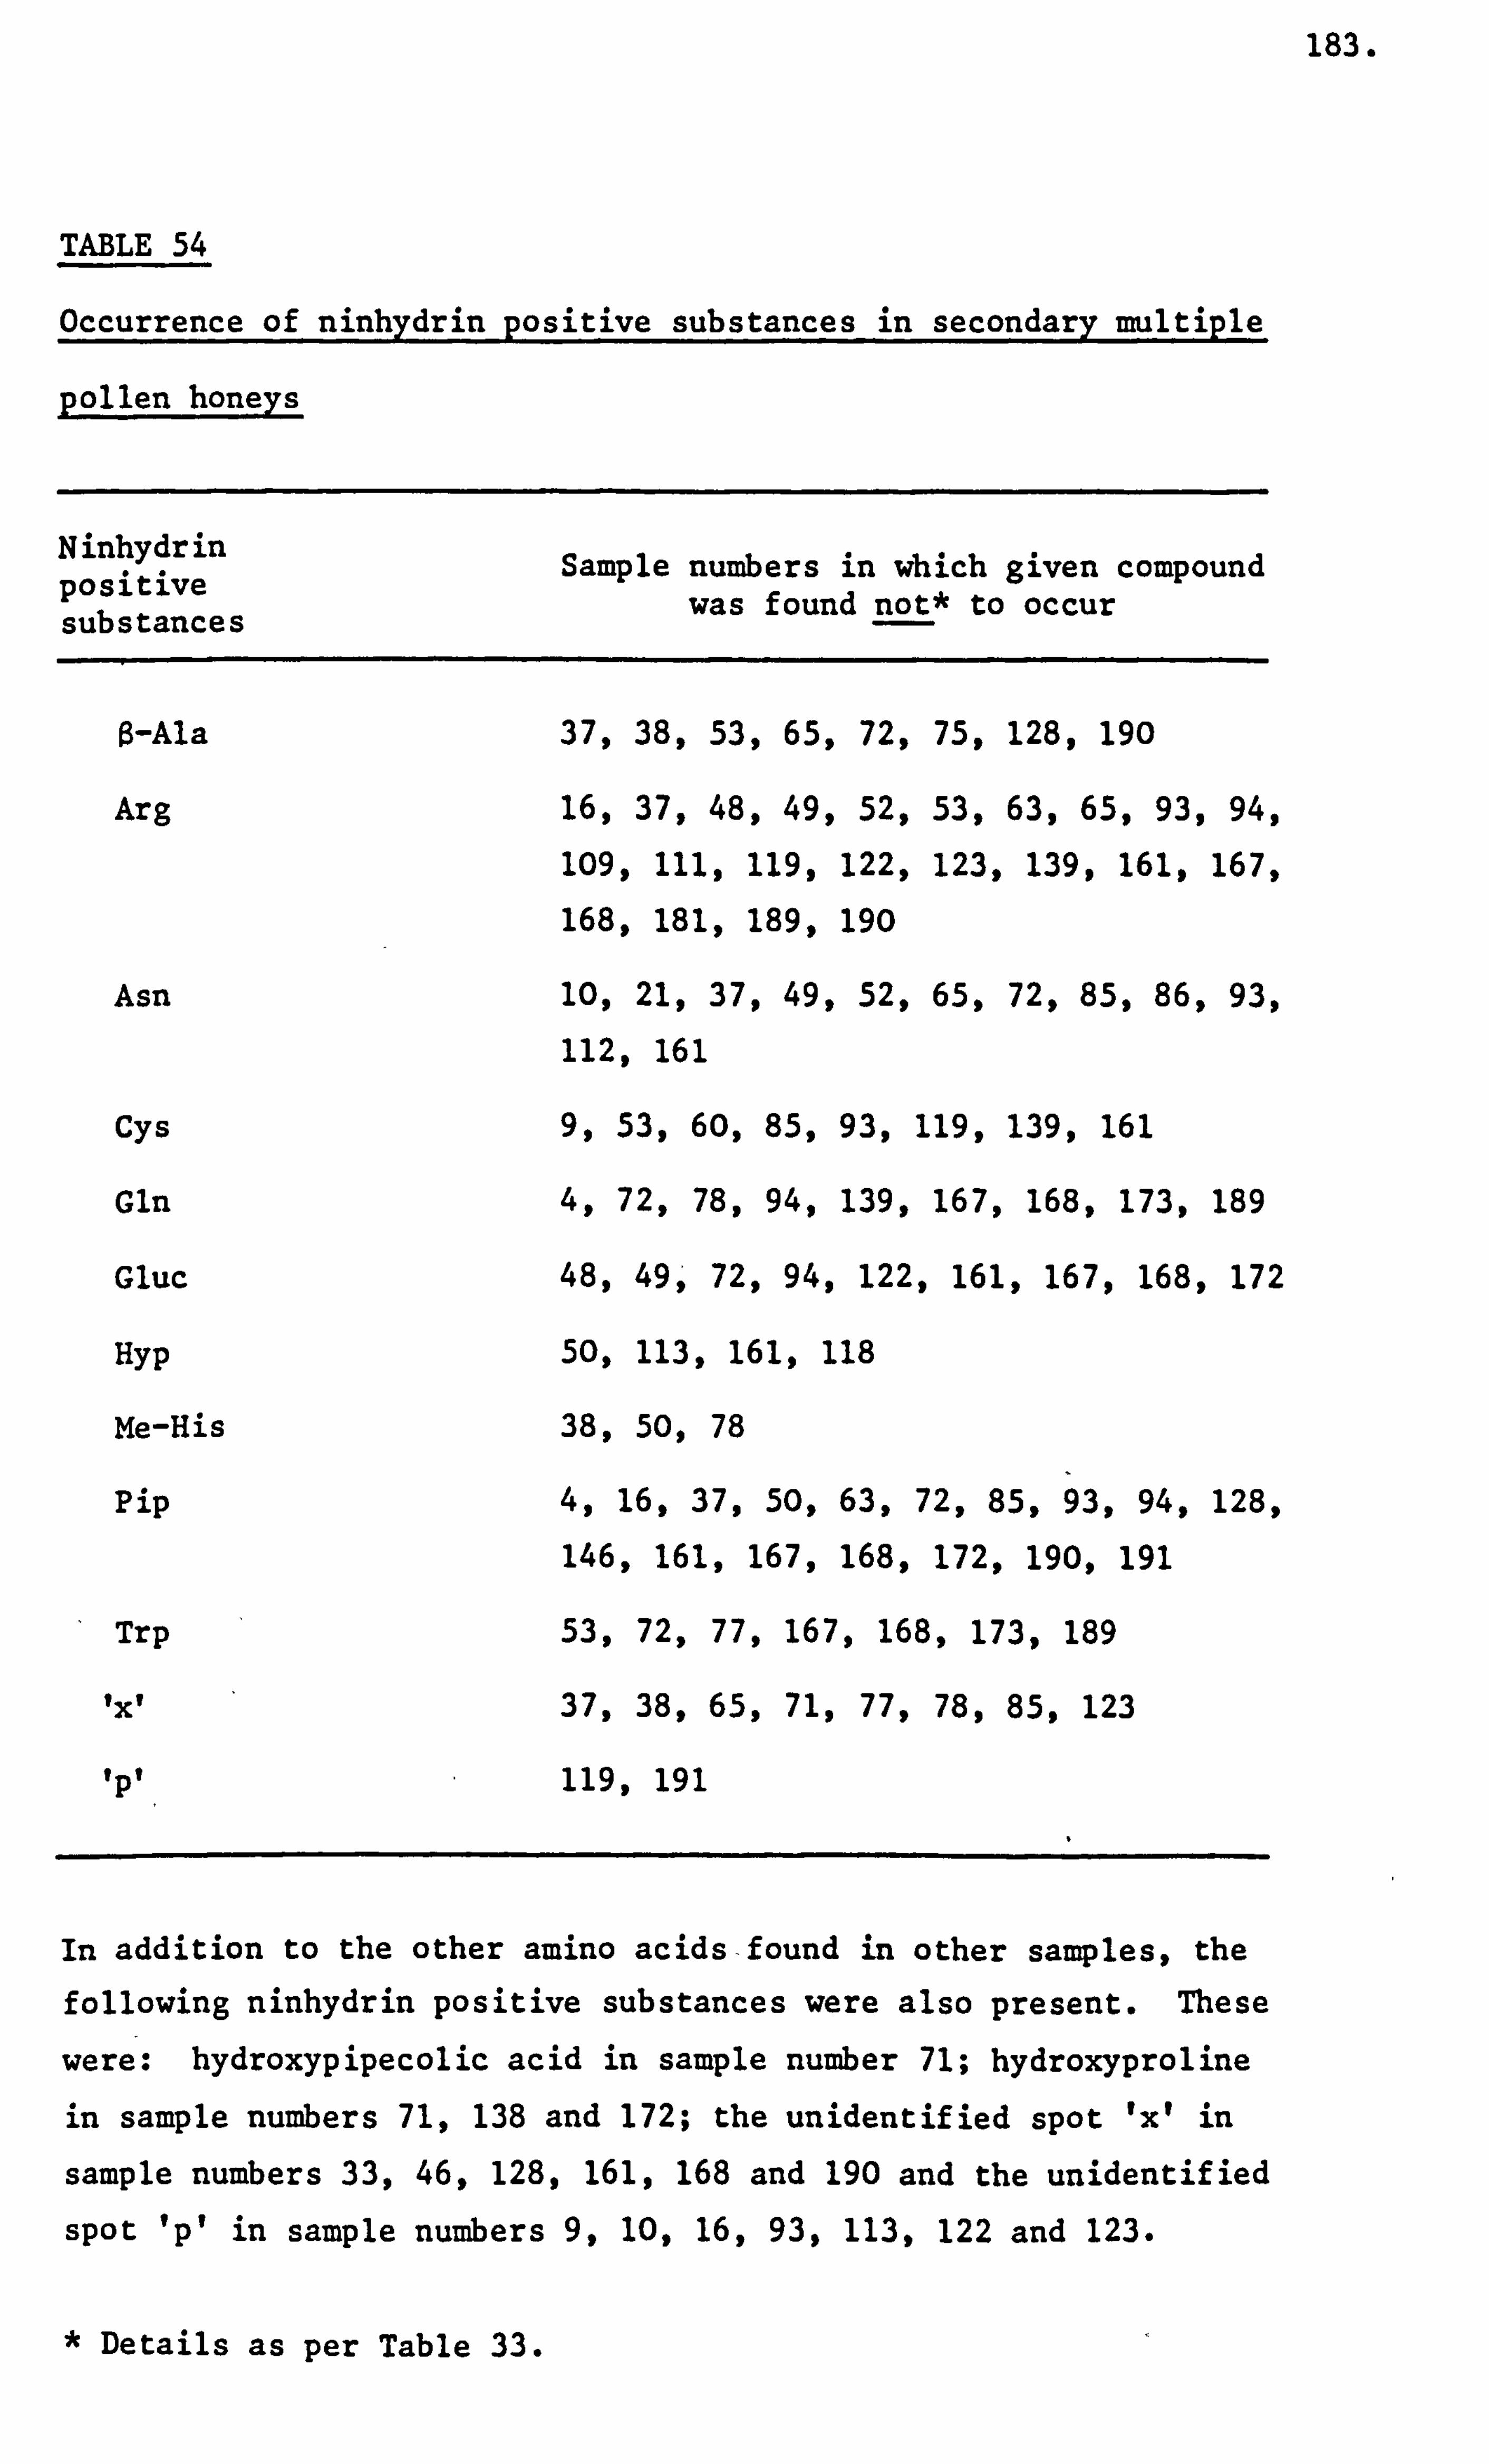
183.
TABLE 54
Occurrence of ninhydrin positive substances in secondary multiple
pollen honeys
Ninhydrin Sample numbers in which given compound positive was found not* to occur substances
B-Ala 37,38,53,65,72,75,128,190
Arg 16,37,48,49,52,53,63,65,93,94,
109,111,119,122,123,139,161,167,
168,181,189,190
Asn 10, 21,37, 49, 52,65,72,85,86,93,
112 , 161
Cys 9, 53,60, 85, 93,119,139,161
Gln 4, 72,78, 94, 139,167,168,173,189
Gluc 48, 499 72, 94, 122,161,167,168,172
Hyp 50, 113,16 1,1 18
Me-His 38,50,78
Pip 4,16,37,50,63,72,85,93,94,128,
146,161,167,168,172,190,191
Trp 53,72,77,167,168,173,189
1xv 37,38,65,71,77,78,85,123
Ipt 119,191
In addition to the other amino acids-found in other samples, the foll owing ninhydrin positive substances were also present. These
were: hydroxypipecolic acid in sample number 71; hydroxyproline
in sample numbers 71,138 and 172; the unidentified spot 'xl in
sample numbers 33,46,128,161,168 and 190 and the unidentified
spot 'p' in sample numbers 9,10,16,93,113,122 and 123.
* Details as per Table 33.
184.
and responses to questionnaire questions 3,5 and 6 have been listed
in Table 55. The ninhydrin positive substances identified were: a-
and 0-alanine, a- and y-aminobutyric acid, arginine, asparagine, aspartic
acid, cysteine, glucosamine, glutamine, glutamic acid, glycine, histidine,
isoleucine, leucine, lysine, methionine, methyl-histidine, phenylalanine,
proline, serine, threonine, tryptophan, tyrosine, valine and the two
unidentified spots 'x' and 'p'. The differences in occurrence of ninhydrin
positive substances have been given in Table 56.
Moreover, sample Code No. 126 was not analysed as described because
this honey was received in pieces of comb. There was not enough honey
extracted from the combs for either amino acid or pollen analysis.
Amino Acids in the Foreign and Commercial Samples
Arranged in Order of Stated Country Sources
The foreign and commercial honey samples were categorised according
to their known country of origin, commercial processing and commercial
sugar products rather than on the basis of their pollen content. The
sixty four honey samples were allocated into three categories and these
were known country; unknown country; suspect origin and English commercial
and sugar products types.
Known Country Type
Honey samples in this category were grouped according to their stated
country of origin. There were sixteen countries and between them they
accounted for forty one samples of honey. These samples were arranged
into sixteen country groups in an alphabetical order as listed in Table
IB in Appendix I. The pollen contents of each honey sample belonging
to each of these sixteen country groups have been given in Table 57.
The amino acid concentration measurements and the information regarding
185.
ril 0)
1-4
rn
10 ci
-, 4 114 -, 4
It
Ln
CL E-4
ll-ý >1
0
44 0
to
w 0) 914
W 0i
0
0 -, 4 41 co p
0 C-)
%. 0 '10 1
0 C,,
Ln as
(" 1 r, -
0
rý
%0
0
0 ri)
CD M -t - Cy% CD CD (A E-4 cl t LM CYN cq Ln cm
r4 c4 %D 0 (D E-4 C4 00 Z1
1--
(N rý ýt rq rý 00 rlý -00M 00 N0 C, 4 %0 ýt (A (Ylt M %ID t r-. %0 %D 0 CY% 00 Z
%D -e rý - ýt 0 r*. cyý LM 00 r- 0 c4 0 CD OD C% r_ -t cm Co OD ýT m -t CD OD Z
N 00
c> c% %m cn r. ot Ln - co cn c% CN 00
cm r, -o vi cm t- rý r, Ln o 00 ZZ Le)
ý rq ý 'm 00t0 C-4 00 00 0 LM ý rA ýt rý %Im t*% 0 U) %0 0 %0 rl c41 rlý C, 4
-t (A
Ul ý " Cl - 0 00 0 t (: %, 0 %D CM - t4 :t %D -t %t 0 - CM r% Cl N cl CD 00 00
ýt CO C, 4 CD km LM CN cm e c4 ýt e -
P-4 0 r4 W "0 41 41 cu 0) cu cu ÖD 0
>% to 40 ýd ýA ý4 v--4 Ce P-4 0 >% c cu -0 0) :) 4-4 A<H cn u g24 u9> N-4 4 E-4 P-4 cn = U)
186.
TABLE 56
Occurrence of ninhydrin positive substances in unidentified
honey samples
Ninhydrin Sample numbers in which given compounds positive was found not* to occur substance
a-Ala 7,40,166
A -r 0, -o 6,40,95,165,166
Asn 40,73
Cys 7,40
Gluc 95,130
Trp 165
IXI 165,166
In addition to other other amino acids found in all samples,
the ninhydrin positive substance hydroxyproline was present in sample number 73.
* Details as per Table 33.
187.
TABLE 57
Frequency of distribution of pollen grains in samples of known country type honeys (ex. foreign
and commercial).
Floral Genus
193 194 195 196
Pollen (Z) 2,3
Honey sample code No
197 i 198 199 200 201 202 203. 204 205 206
Acacia 0.3
Bank8ia 21.9 0.3 0.6 55.3
Brassica 3.9 5.2 2.0 46.8 27.7 61.5 70.7 25.3
Castanea 63.9
Cireiwn 2.9 1.1 3.2 4.1 1.7
Echiwn 6.0 78.2 73.8 8.0 13.9
Erica 1.9
L'ucaZyptus 53.3 2.7 4.9 40.5 21.6 12.1 10.0 5.2
Liliwn 0.3
Loz-anthua 5.6 14.1 P
Melizotue 34.3 25.7 21.6 13.6 85.8
Myrtaceae** 8.7 18.3 33.1 1.6
TrifoZium pratense 1.6 3.2 11.8
Trifolim mpene 44.7 13.0
Shrivelled pollen 10.4 7.3 7.0 9.1 19.5 13.2 14.7 8.7 11.5 9.8 13.2 10.0 8.6
Unidentified pollen 20.6 7.6 3.3 6.7 8.3 14.7 2.6 5.4 3.8 1.9 1.0 7.4 6.0
Total pollen grains counted 374 383 298 329 323 347 312 404 314 317 296 0* 351 347
For notes to key 1.2 and 3- refer to Table 31.
Sample examined for pollen but not present
Identified to plant family level only.
P Pollen grain present but not counted.
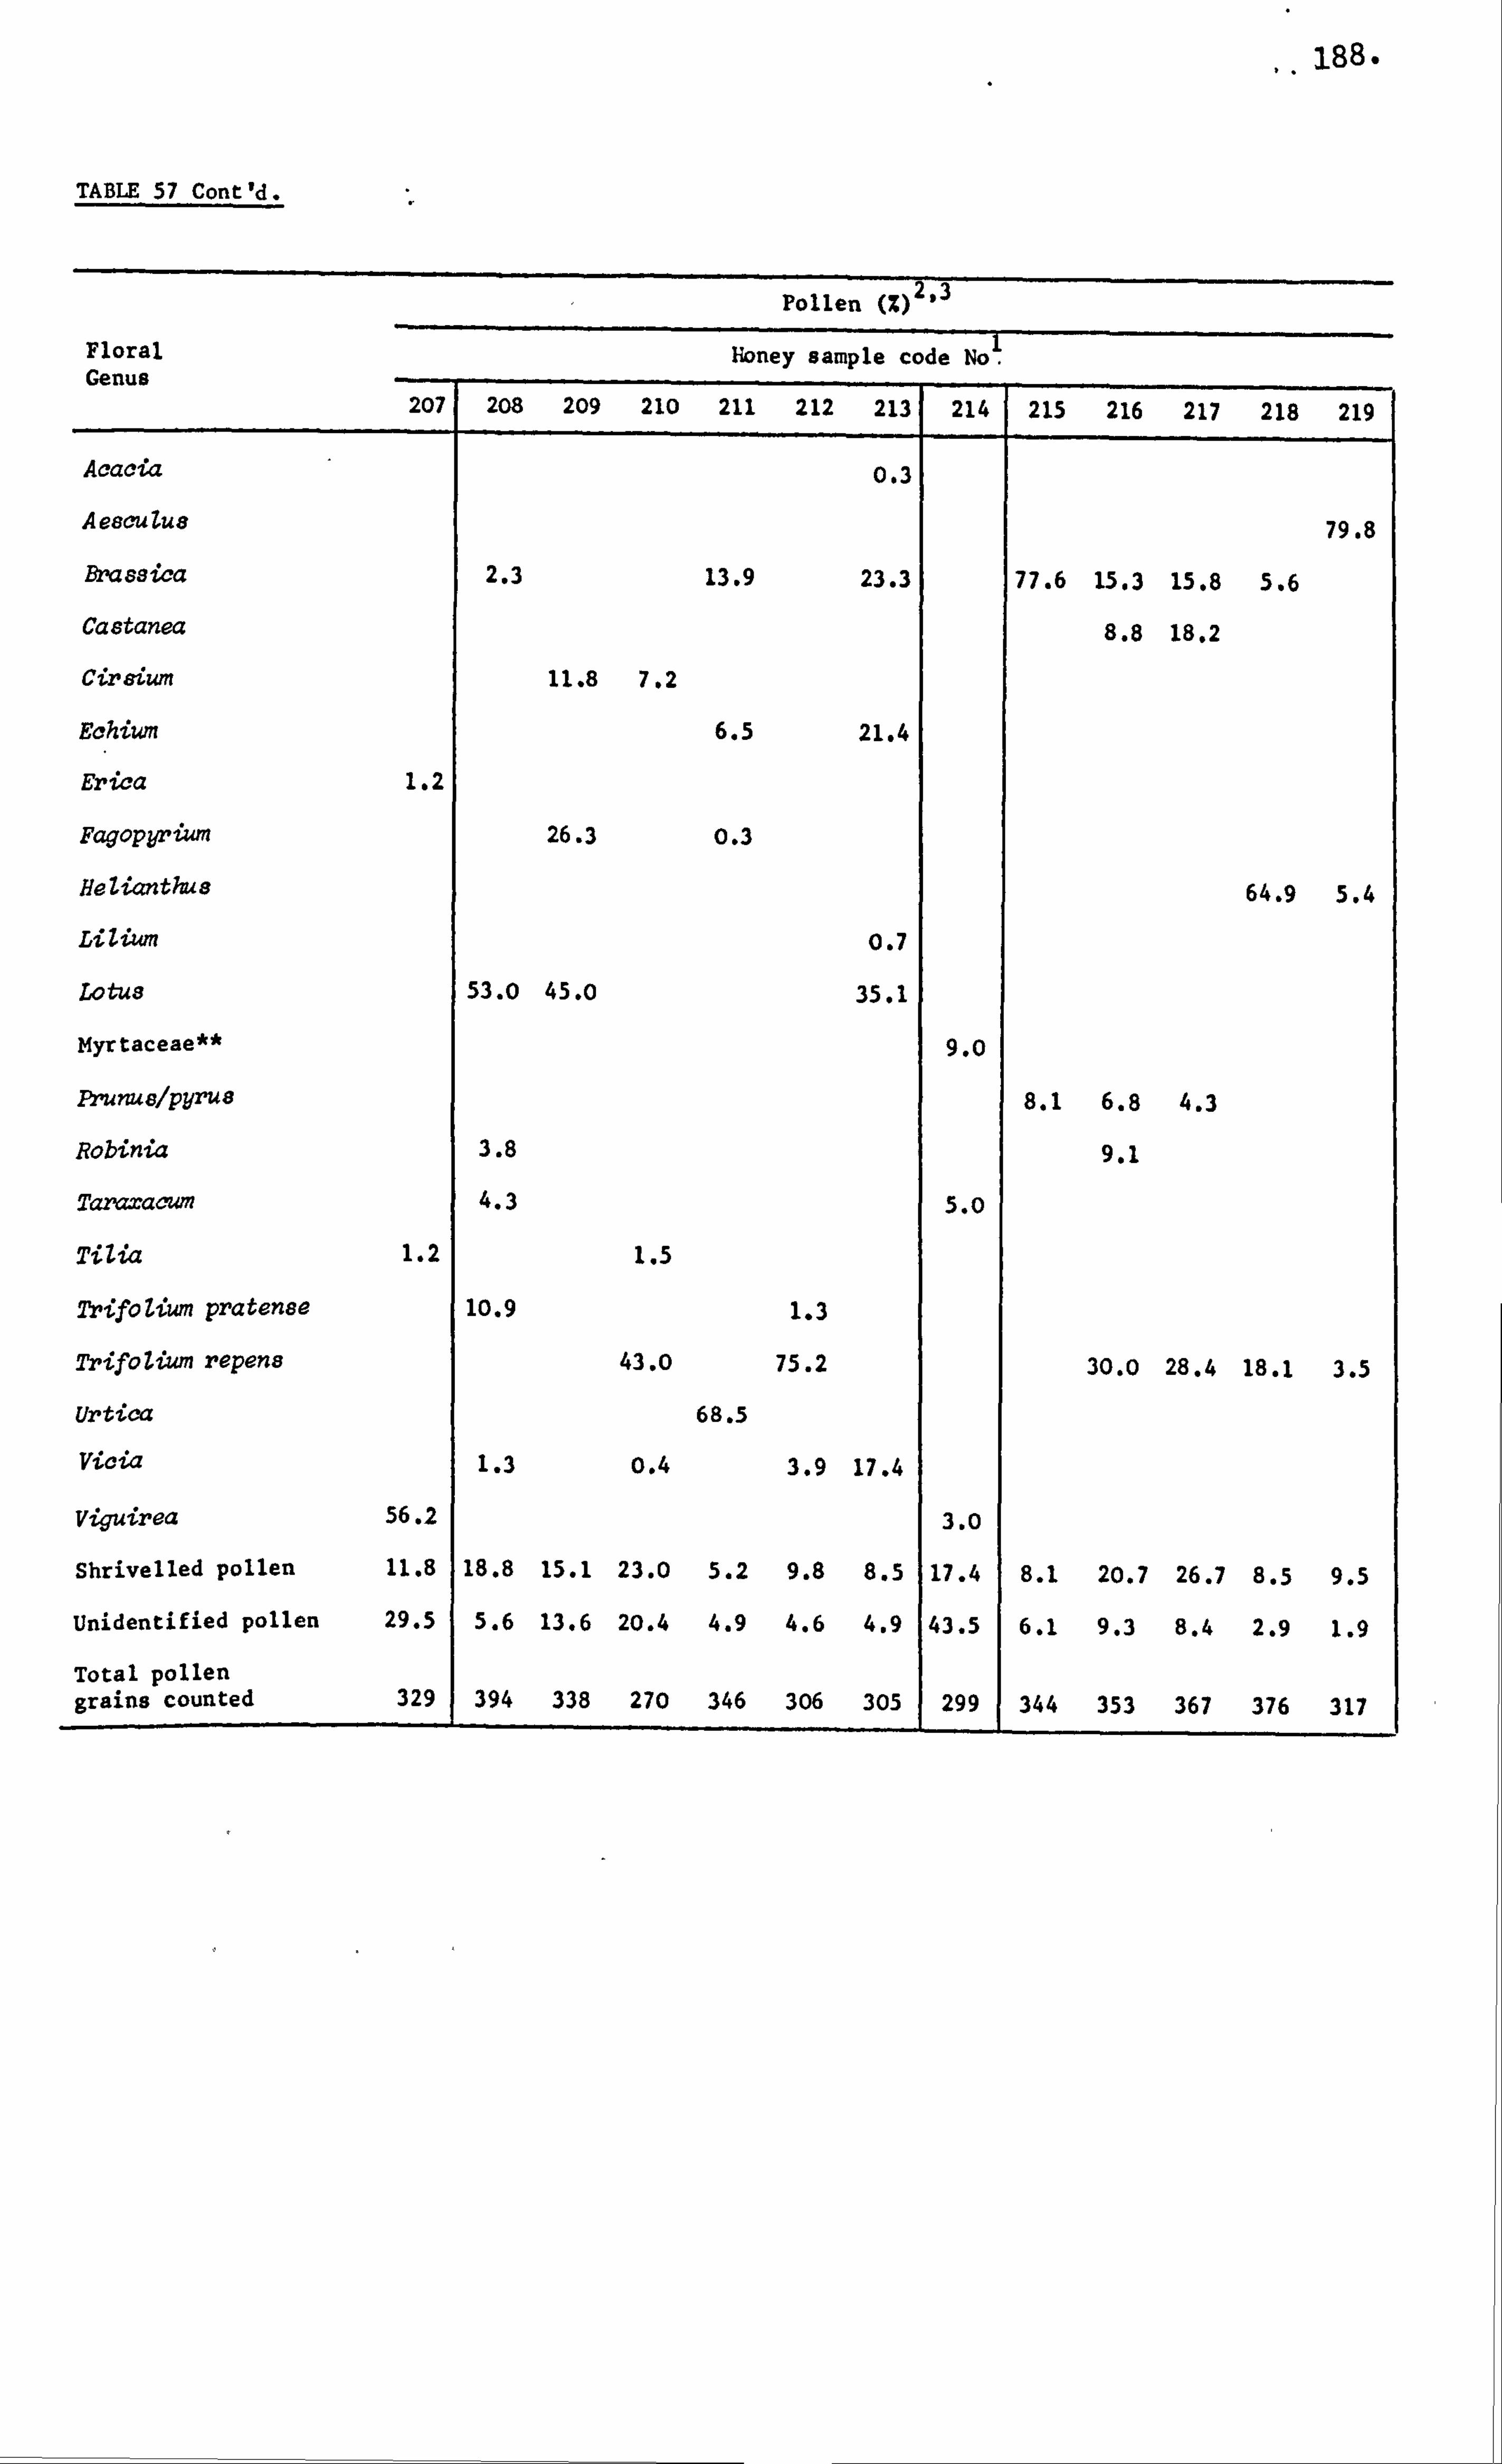
188.
TABLE 57 Cont'd
Floral Genus
207 208 209 210
Pollen (Z) 2.3
honey sample code Noý
211 212 213 214 215 216 217 218 219
Acacia 0.3
Aesculue 79.8
Brassica 2.3 13.9 23.3 77.6 15.3 15.8 5.6
Castanea 8.8 18.2
Cir8iuM 11.8 7.2
Echium 6.5 21.4
Erica 1.2
Fagopyrium 26.3 0.3
ReZianthus 64.9 5.4
Lilium 0.7
Lotus 53.0 45.0 35.1
Myrtaceae** 9.0
Prunuelpyrua 8.1 6.8 4.3
Robinia 3.8 9.1
Taraxacum 4.3 5. o
Tilia 1.2 1.5
Trifozium pratense 10.9 1.3
Trifolium repens 43.0 75.2 30.0 28.4 18.1 3.5
Urtica 68.5
Vicia 1.3 0.4 3.9 17.4
viguirea 56.2 3.0
Shrivelled pollen 11.8 18.8 15.1 23.0 5.2 9.8 8.5 17.4 8.1 20.7 26.7 8.5 9.5
Unidentified pollen 29.5 5.6 13.6 20.4 4.9 4.6 4.9 43.5 6.1 9.3 8.4 2.9 1.9
Total pollen grains counted 329 394 338 270 346 306 305 299 344 353 367 376 317
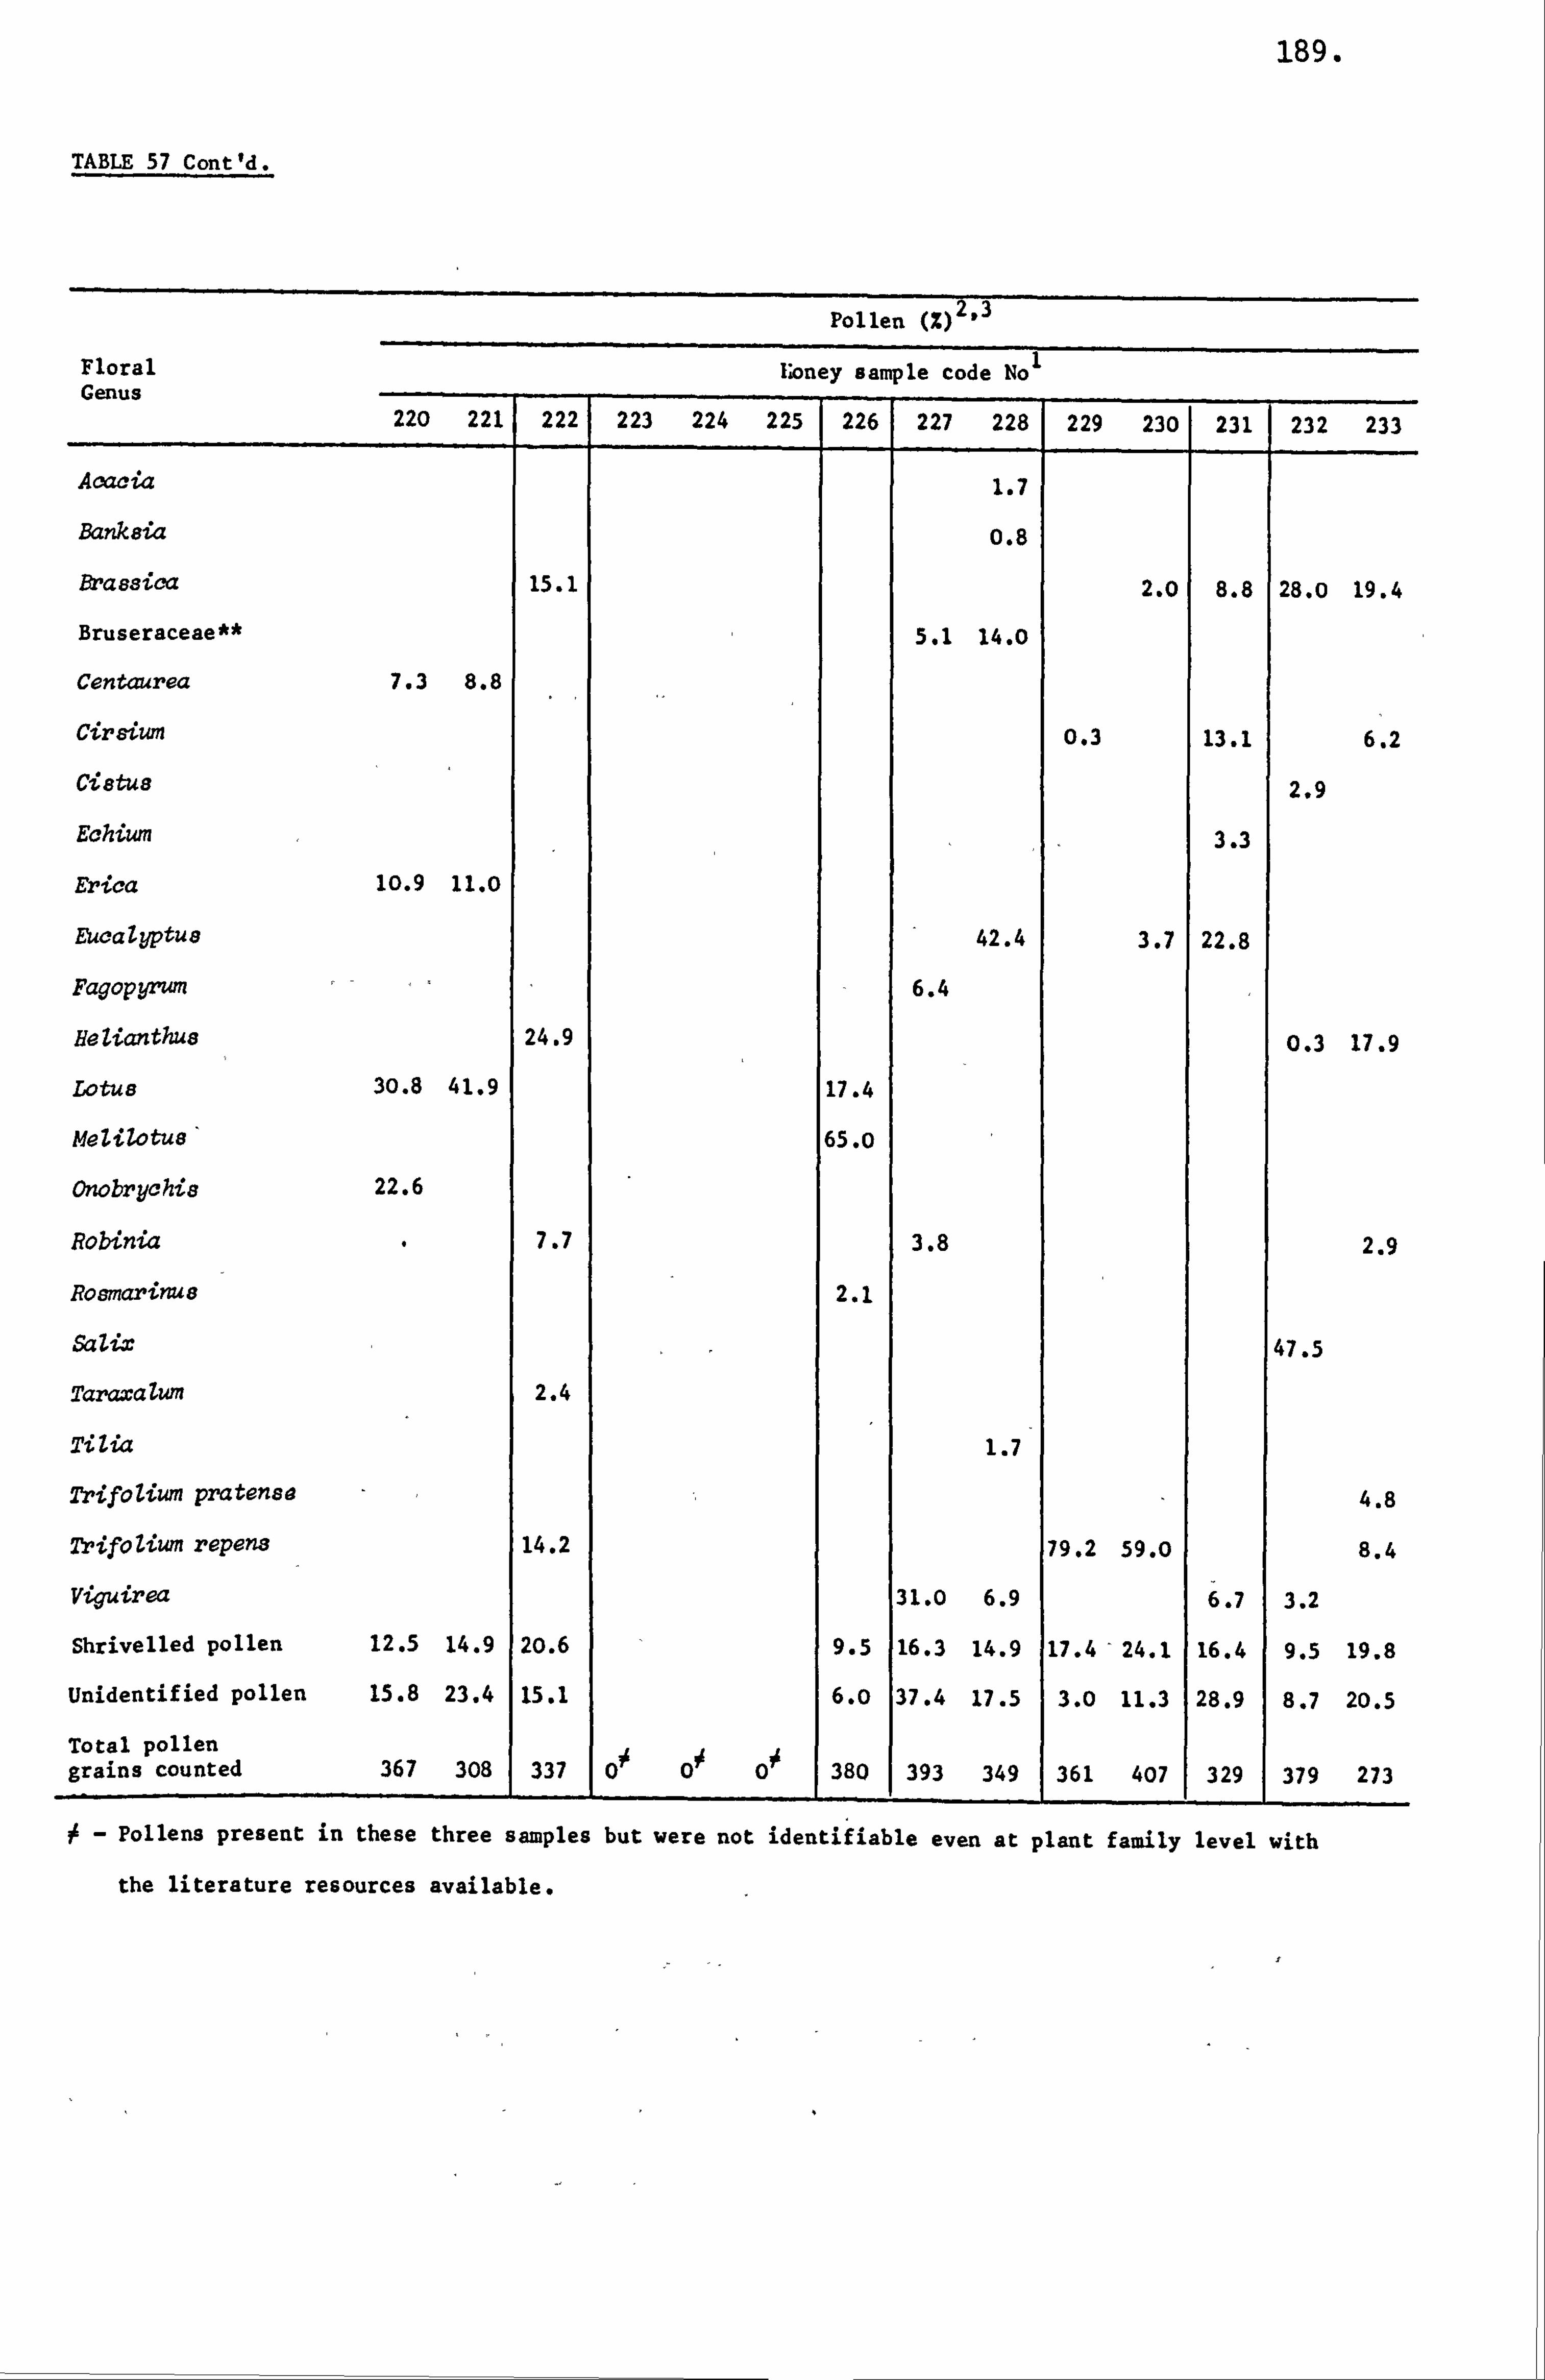
189.
TABLE 57 Cont'd.
Pollen (2) 2.3
Floral Loney sample code No
220 221 222 223 224 225 226 227 228 229 230 1 231 232 2 33
Acacia 1.7
Banksia 0.8
Brassica 15.1 2.0 8.8 28.0 19.4
Bruseraceae** 5.1 14.0
Centaurea 7.3 8.8
Cir6iwn 0.3 13.1 6.2
Ci8tus 2.9
Echim 3.3
Erica 10.9 11.0
Eucalyptus 42.4 3.7 22.8
Fagopyrw? z 6.4
Helianthus 24.9 0.3 17.9
Lotus 30.8 41.9 17.4
Melilotus' 65.0
Onobrychis 22.6
Robinia 7.7 3.8 2.9
Roamarinue 2.1
SaZix 47.5
. TaraxaZum 2.4
TiZia 1.7
Trifolium pratensa 4.8
Trifozium repens 14.2 79.2 59.0 8.4
Viguirea 31.0 6.9 6.7 3.2
Shrivelled pollen 12.5 14.9 20.6 9.5 16.3 14.9 17.4 '24.1 16.4 9.5 19.8
Unidentified pollen 15.8 23.4 15.1 6.0 37.4 17.5 3.0 11.3 28.9 8.7 20.5
Total pollen i d 367 3 t 8 0
gra ns coun e 0 337 000 380 393 349 361 407 329 379 273
Pollens present in these three samples but were not identifiable even at plant family level with
the literature resources available.
190.
whether the samples were commercially processed, that is, bottled or
otherwise have been given in Table 58.
From the amino acid maps similar to that shown in Figure 7, the
following ninhydrin positive substances were identified using reference
standards in each honey sample within each of the sixteen country groups.
These ninhydrin positive substances were: a- and $-alanine, a- and y-amino-
butyric acid, arginine, asparagine, aspartic acid, cysteine, glucosamine,
glutamine, glutamic acid, glycine, histidine, hydroxypipecolic acid,
hydroxyproline, isoleucine, leucine, lysine, methionine, methyl-histidine,
phenylalanine, pipecolic acid, proline, serine, threonine, tryptophan,
tyrosine, valine and the two unidentified spots IxI and Ip'. Differences
in occurrence of ninhydrin positive substances were observed in the amino
acids maps and these were evaluated within and between each country group.
These differences have been listed in Table 59. Moreover, there were
other compounds which gave ninhydrin positive complexes whose identity
could not be established using reference standards. Also these compounds
were present in trace amounts which could not be eluted off from the
cut-outs of the paper chromatograms for subsequent identification by
mass spectroscopy. However, these compounds were labelled as C, 6,
eq w, w, X, e, a and SI. The'relative position of occurrence of these
complexes to those identified have been shown in Figures 20 to 25.
Country of Origin Unknown, Suspect Origin and English Honey_Types
Honey samples in this category were allocated into three groups
and these were: samples whose country of origin was not stated on the
bottle label or were obtained from comb of unspecified origin or were
known. by their floral names; samples whose identity of country source
was suspected*to be difference by their donors and samples of English
191.
KEY - To Table 58
The key given below is also common to Table 61.
1. CNo - Code No., refer to Appendix I for country source.
2. CP - Commercially produced or otherwise.
T- Trace amounts.
Up - Raw hive honey or comb honey, or honey strained by cloth
or processed by beekeeper or bulk honey from shipment
container.
Pr - Commercially processed into bottles, Jars, etc.
+- Information regarding the commercially processing or
otherwise was not available.
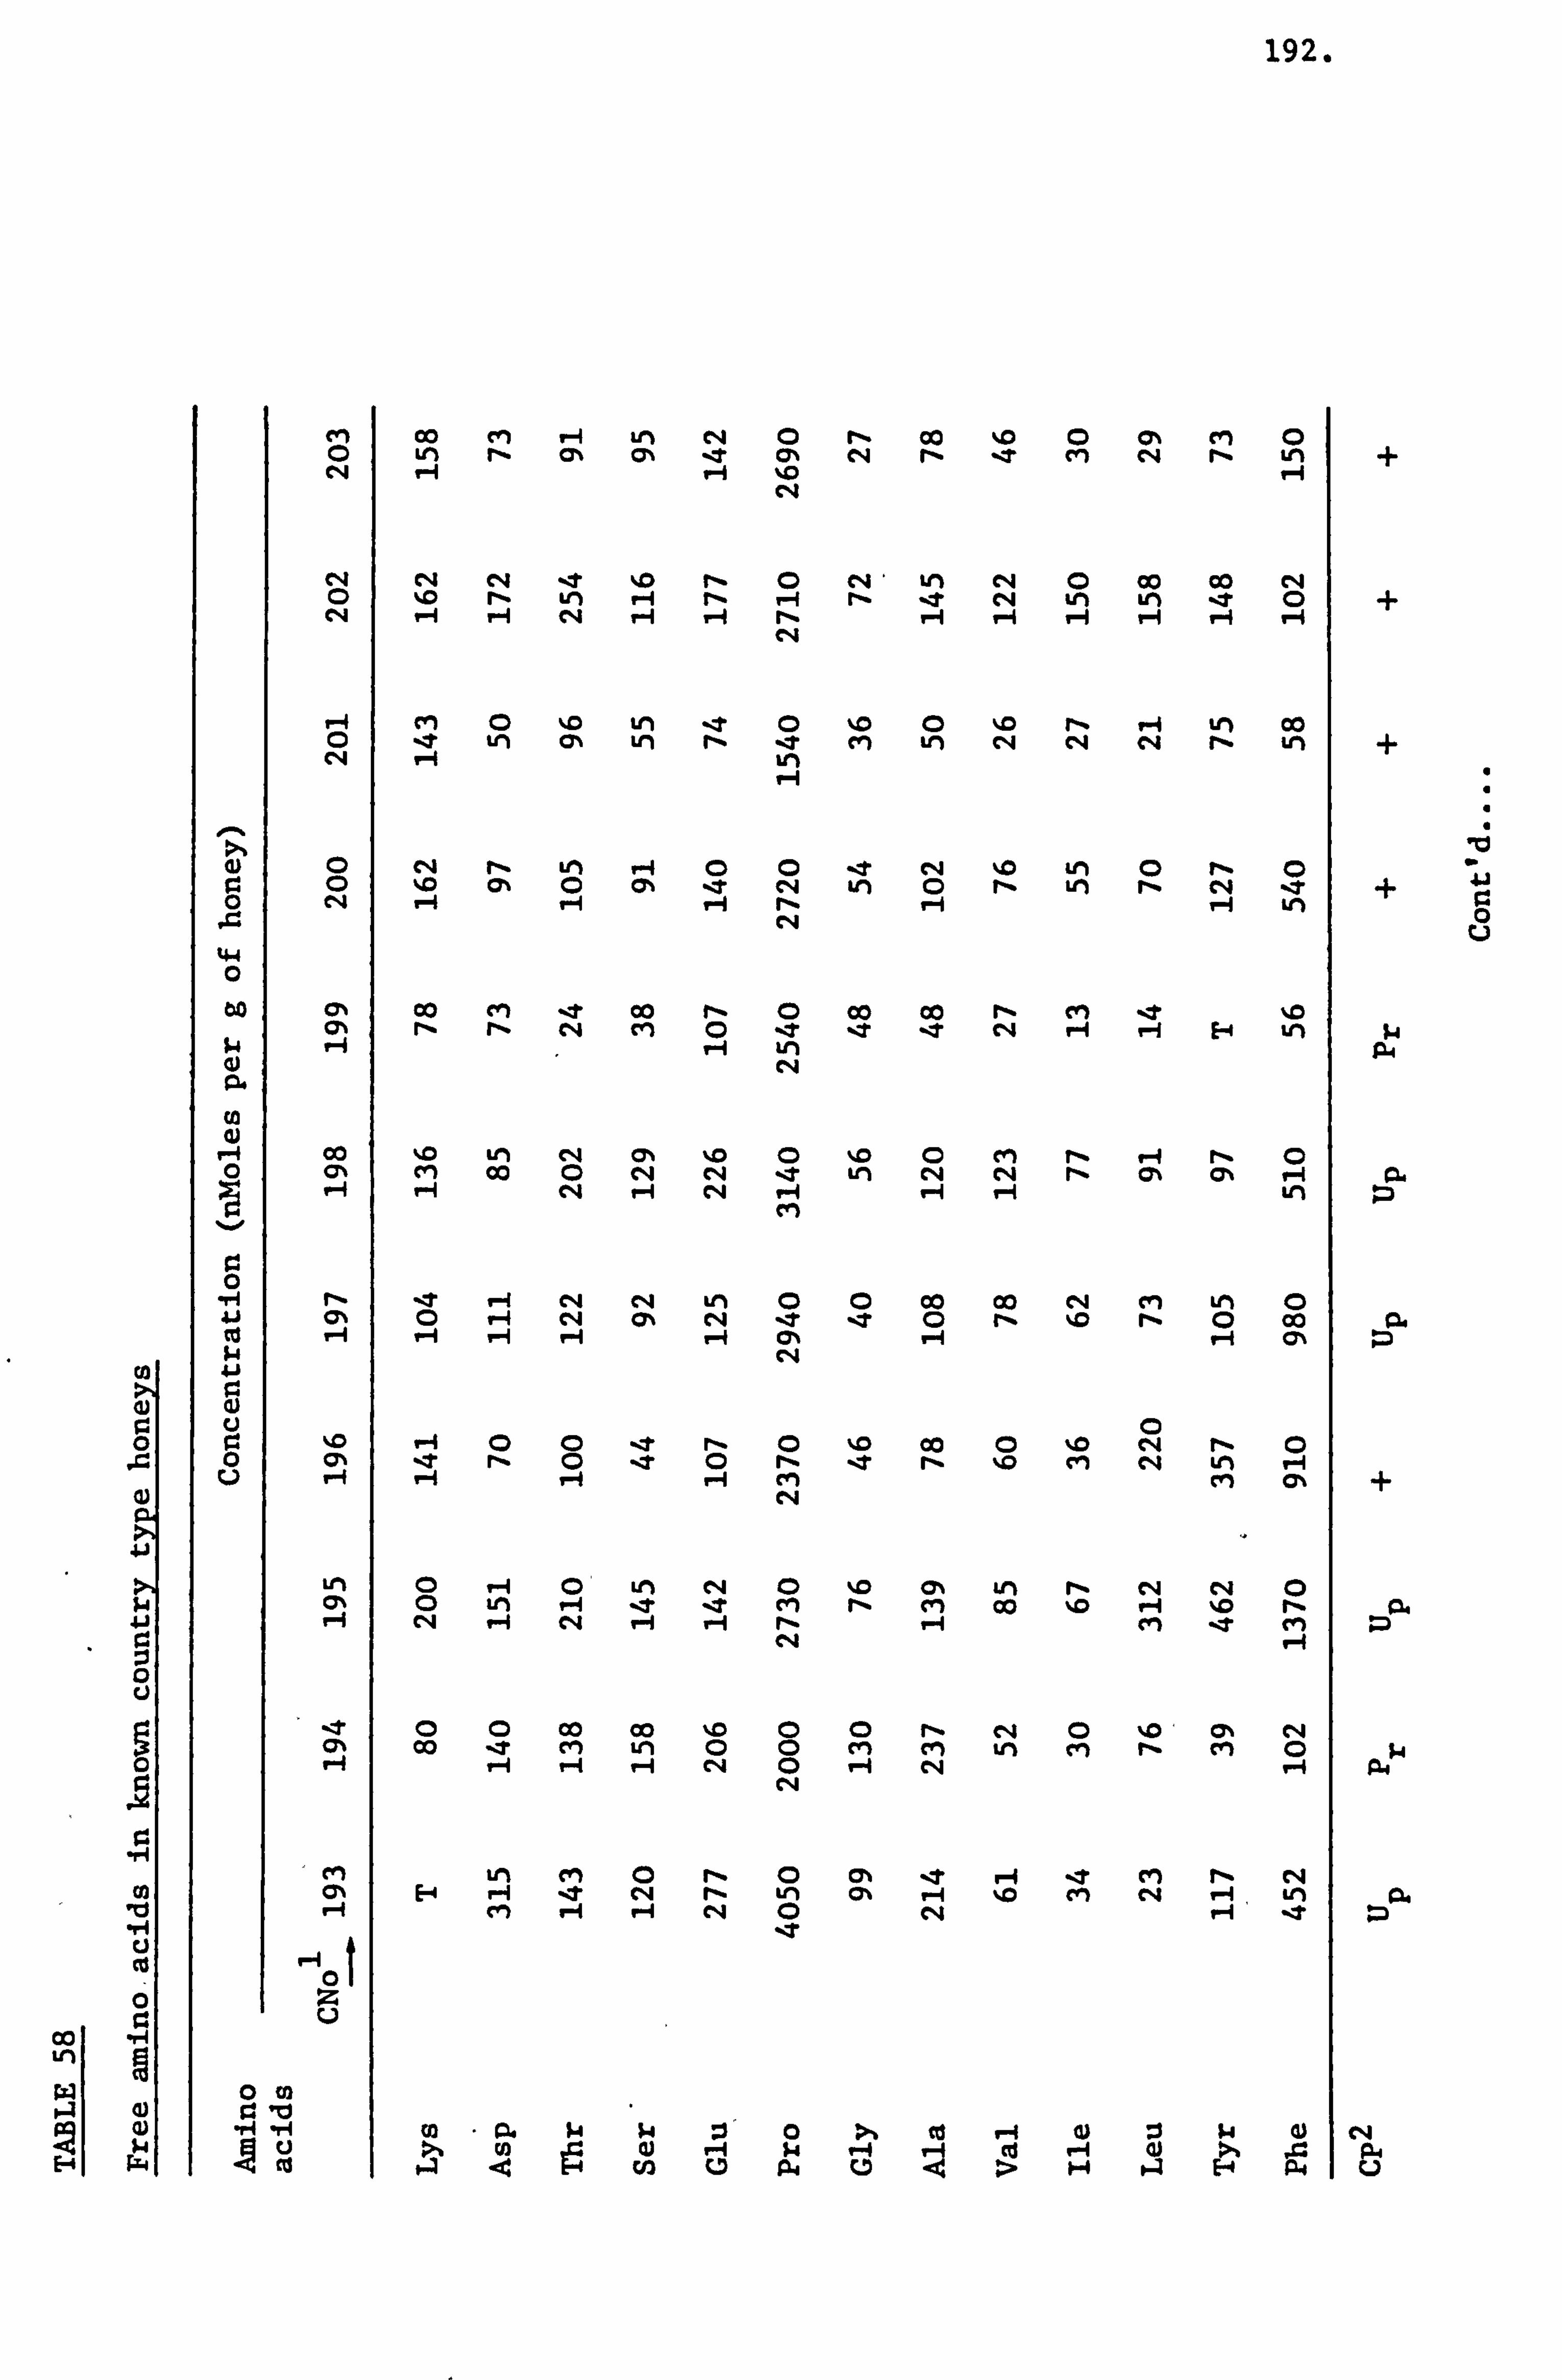
192.
W1
ei 00 M P-ý LM N 0 rý Co %D 0 CY% M 0 0 -t CYN N r- --t M
C, 4 cq cq It %0 r_ 0 C, 4 ' LM CN 0 Co Co cq 0 %D r- LM H r- 1--f r- -t C, 4 V) LM 't 0 +
r1. H cli
H M 0 %D LM -t 0 %0 0 %D rý V-4 LM 00 0 .t Ln Cy% Lri -t fi LM c14 C, 4 cq r- im + C, 4 vi
a) Le) V-4 0 0 _T c14 %0 LM 0 r-. CD l r. 0 %10 c2% (D -t rq Ul 0 r- A rlý C, 4 -t i 0 r1. r-i T-4 LA rq
öo CYN Co M ýt 00 r_ 0 Co Co r- cm --t %D C% r- r% C%4 cn (D -t %t -t C, 4 r-1 T-4 E. 4 LM p
LA 12.4 rq
r-i 00 %0 LM C%4 Cl% %D (D %D CD cm rl% P-4 r% 0 C% M Co 0 N C*4 %T tn C, 4 c"i r- CY% CYN V-4
C, 4 H rq "-i P-1 r-i m
0 _H r- -t r-i cli N LM 0 0 00 00 CM CVI LM 0 41 CY% CD 1-4 (A r4 -t %T CD rý. rý. 0 00 no
W-1 P-1 CY*, c4
r. %D 1-4 0 (D ýt rý 0 %D Co 0 %D c4 r- 0 0 CY% .t rý CD -e 0 rý %t r- %0 cm c4 LM P-4 r-f P-4 M CM cIt +
CN
LM C, 4 %D CY% in r4 c4 (7% 0 tm "-i -t ýT ri r- (n 00 %0 H %D rý t24
M -t CIM ZD
0 Co 00 %D N CY% 00 -t cm LM CD 0 M CIM tri en r- cm CD ýA r4 "-i V-4 V-1 rq 0 r-i clq V-4 P. 4
C%l
tn CIM 0 r-. 0 m -t F-4 -7 ci r- rq E-4 H ýT c4 r- vi Ch P-1 ý-0 m
cm r-1 1
0
0 m ci lu
_H _H Co - P. w w : J' 0 >% tu V-4 0 :1 w 0 cq u 9) r-4 W H !i 0 4) >% P. 4 tu cn 0 Pd u > 4 E-4 u
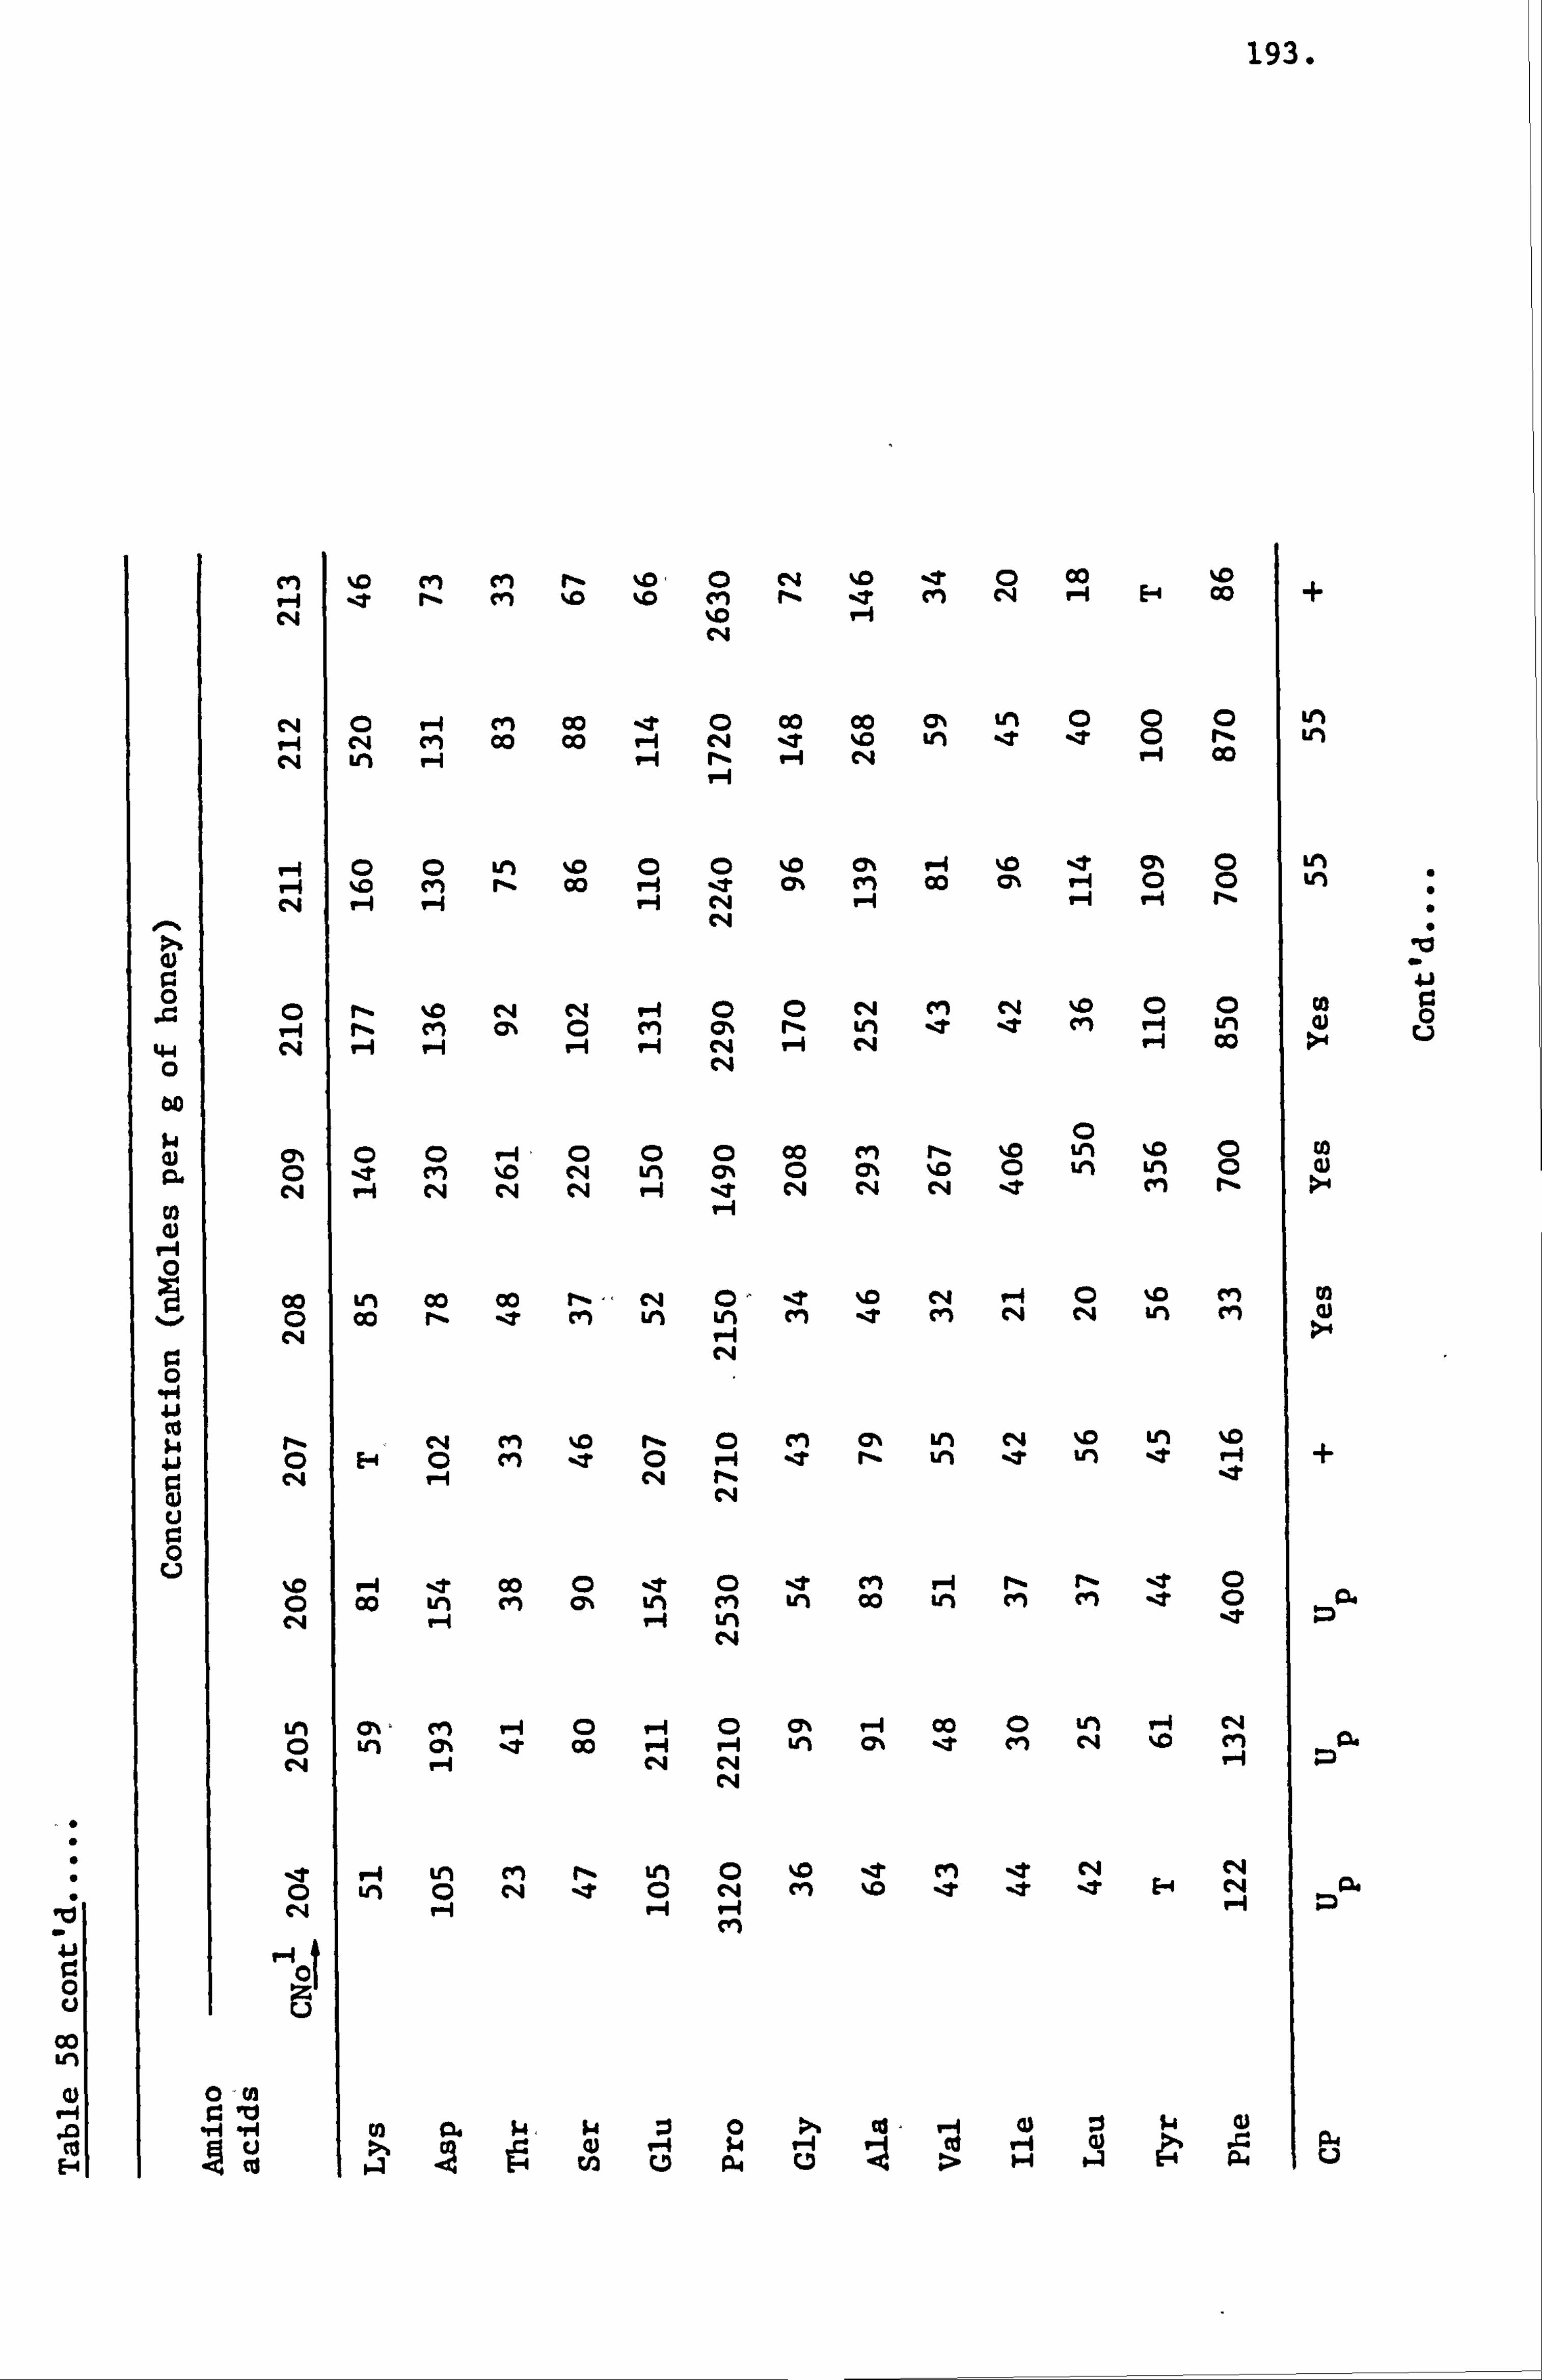
193.
10
00
ci %0 ri M r- %0, 0 C, 4 %D ýt 0 Co i E-4
%D CO + P-4 %t rl% m %D %0 cn rlý _T cn N e
%0 P-1 C, 4
N 0 r-i cm Co ýT Co 00 (A LM 1-4 c4 M Co Co 1-4 -7 %0 V) LM c4 P-4 Co
1-4 0 0 LM %0 CD 0 %D Ci% P-4 %M _T c> 0 LM V-f %0 M rý 00 P-4 -t Cl% CVI 00 C% H C: ) 0 V) 0 C*4 P-4 P-4
C, 4
41
0 r-. %0 C*4 CN H 0 0 e4 cm CN %0 0 0 Co r. cn C% 0 M C% r- LA -t _T r-i
-4 Lli Co
0) : 1
lu (7% 0 0 Hý 0 0 0 Co M :. %0 LM %0 (D 0 92. CD ýt M %0 C*4 LM CZN CD CYN ND CD LA gn CD
rq 1-4 CN rq rq P-4 -t cq c"i CN _T cm r- Co V-4 9)
V-4 0 00 LM 00 00 rlý cq (D , ýt %D P-4 0 %D m 0 00 r- _T CIM A Lri cm <r r4 c4 Ln cli c4 P-1
0
w r- C, 4 m %0 r*ý 0 CVI CY% Lm c4 %D Lri %0 0 E-4 CD cl _T 0 c4 V-4 C, 4
c4
CD 0 .t M F-4 r- 0 0 00 Lri cm C% ki cm LM 00 tn cyl cli -t 0 934 C, 4
LM CY%, CIM (A "-1 00 0 tr% "4 c4 0 Lri CY% -7 CO V-4 P-4 Lri CYN ýT en c4 %D t" t2. r4 P-4 C, 4 cq
cq
_T r4 LM en r- tm 0 0 --t cm _T c4 C, 4 CD LA (D C, 4 -t 0 c4 CN C, 4 P-1 H
CVI
0
0 -(A
. r4 Iri HH 03 od wý k4 :1 0 >% cd , 1 0 :J
0) 1-4 C)
J - g14 u
e >-. g q) V-4 $. 4 9-4 11 ei A 17 . 41 ci
tu A l W u rw u > H 4
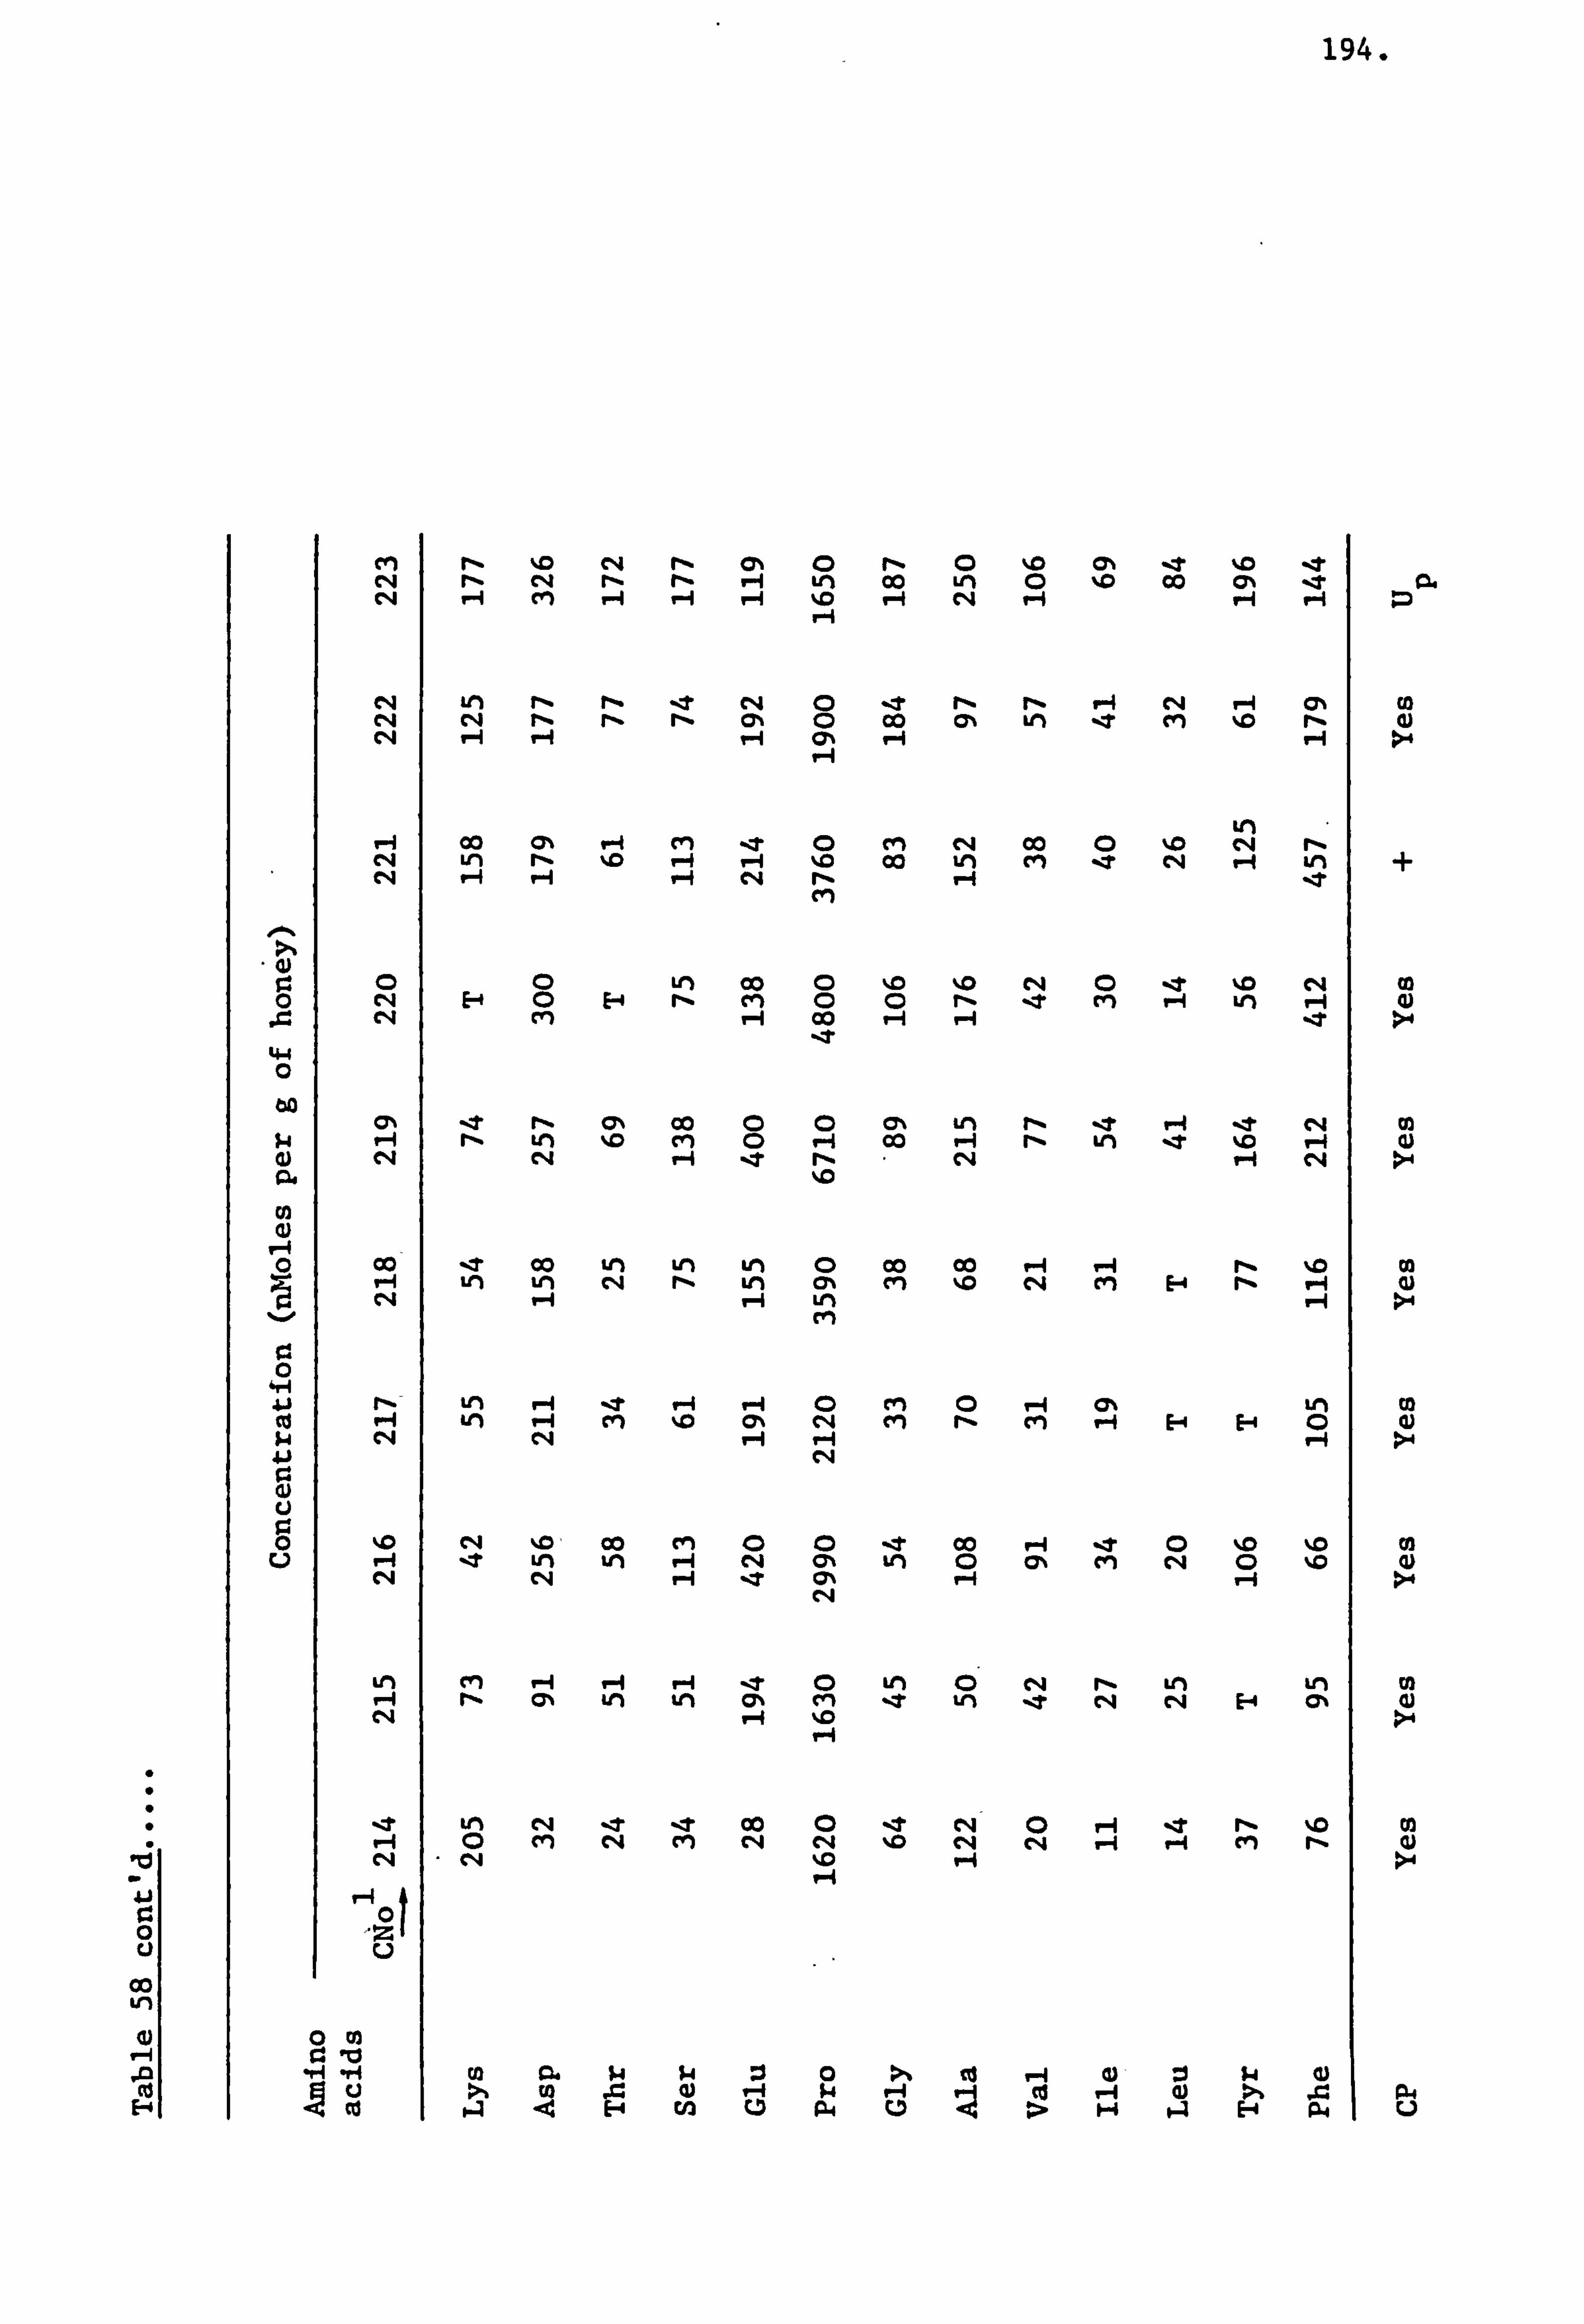
194.
00
cm r- %D CYN 0 r_ 0 %0 CD% -t %D --t C, 4 r- CN H LM 0 %D 92. C%j H cm P-4 c4 H
r-i
r4 U) fl% r% _T C, 4 0 ýt r1. fl% P-4 cq P-4 C% Co
rq c"i r% r- rý Cl% CD Co C% LM -7 m %D r- 0 C*4 0% P-4
P-4
00 (: 1-4 M IT 0 cm cq 00 0 %0 r4 r*. clq Lri r- 1-4 7-4 %D 00 C*q C, 4 r-
cli
r. (D 0 LM 00 C: ) %0 %0 rq 0 -zt %D ei Co H 0 E-4 r_ M C CD r_ -t cn "q vi P-4 Q)
J. - C, 4 m H Co H r-4 -7 >O
ý4 H rlý LM %0 cyl 0 r-i Co P-A r- LM -t %D V-4 0 G) c4 C, 4 H -t r. c*II "-i C, 4 >f 924 %D
92 0
r-i - Co --T 00 LM LM U) 0 00 Co P-1 V-4 r1. %0 Co 1-4 vi Ul cli rlý Ln 0% cn %0 c4 en E-4 r- 1-4 a) c4 V-4 1-4 LM W-1 >q
% ý, cm
e 0 S-4 41 - r- tn W-4 _T V-4 V-4 0 rn 0 H (A Ln Co 0 1. -4 LM V-4 ci %D c> c114 en r- cm H E-4 E-4 (D iv iw c4 H H >. 4 CN
CN ýM, 00 M 0 0 -t 00 P-4 ýt 0 %D %D 01 P-4 -t Ln LM c4 C% LM C: ) (7% cli CNI (D %0 (1) cq 0%
Lri ell Lt) LM 9-4 r- C% vi LM (A Cil -t Ln _T rq cq 4) c*II P-1 %D >4
Lr% ýt ýT Co 0 ýt c4 0 H -2 r- %0 02 0 N m e4 e4 -0 clq (114 P-4 P-4 cm r- 0)
0 01
Co 91. p ý4 :1 0 u >% tu ý4 P-4 1 cu 1--1 0) >% P-4 Cd 4 cn p4 ci > H 4 E-4 p4 u
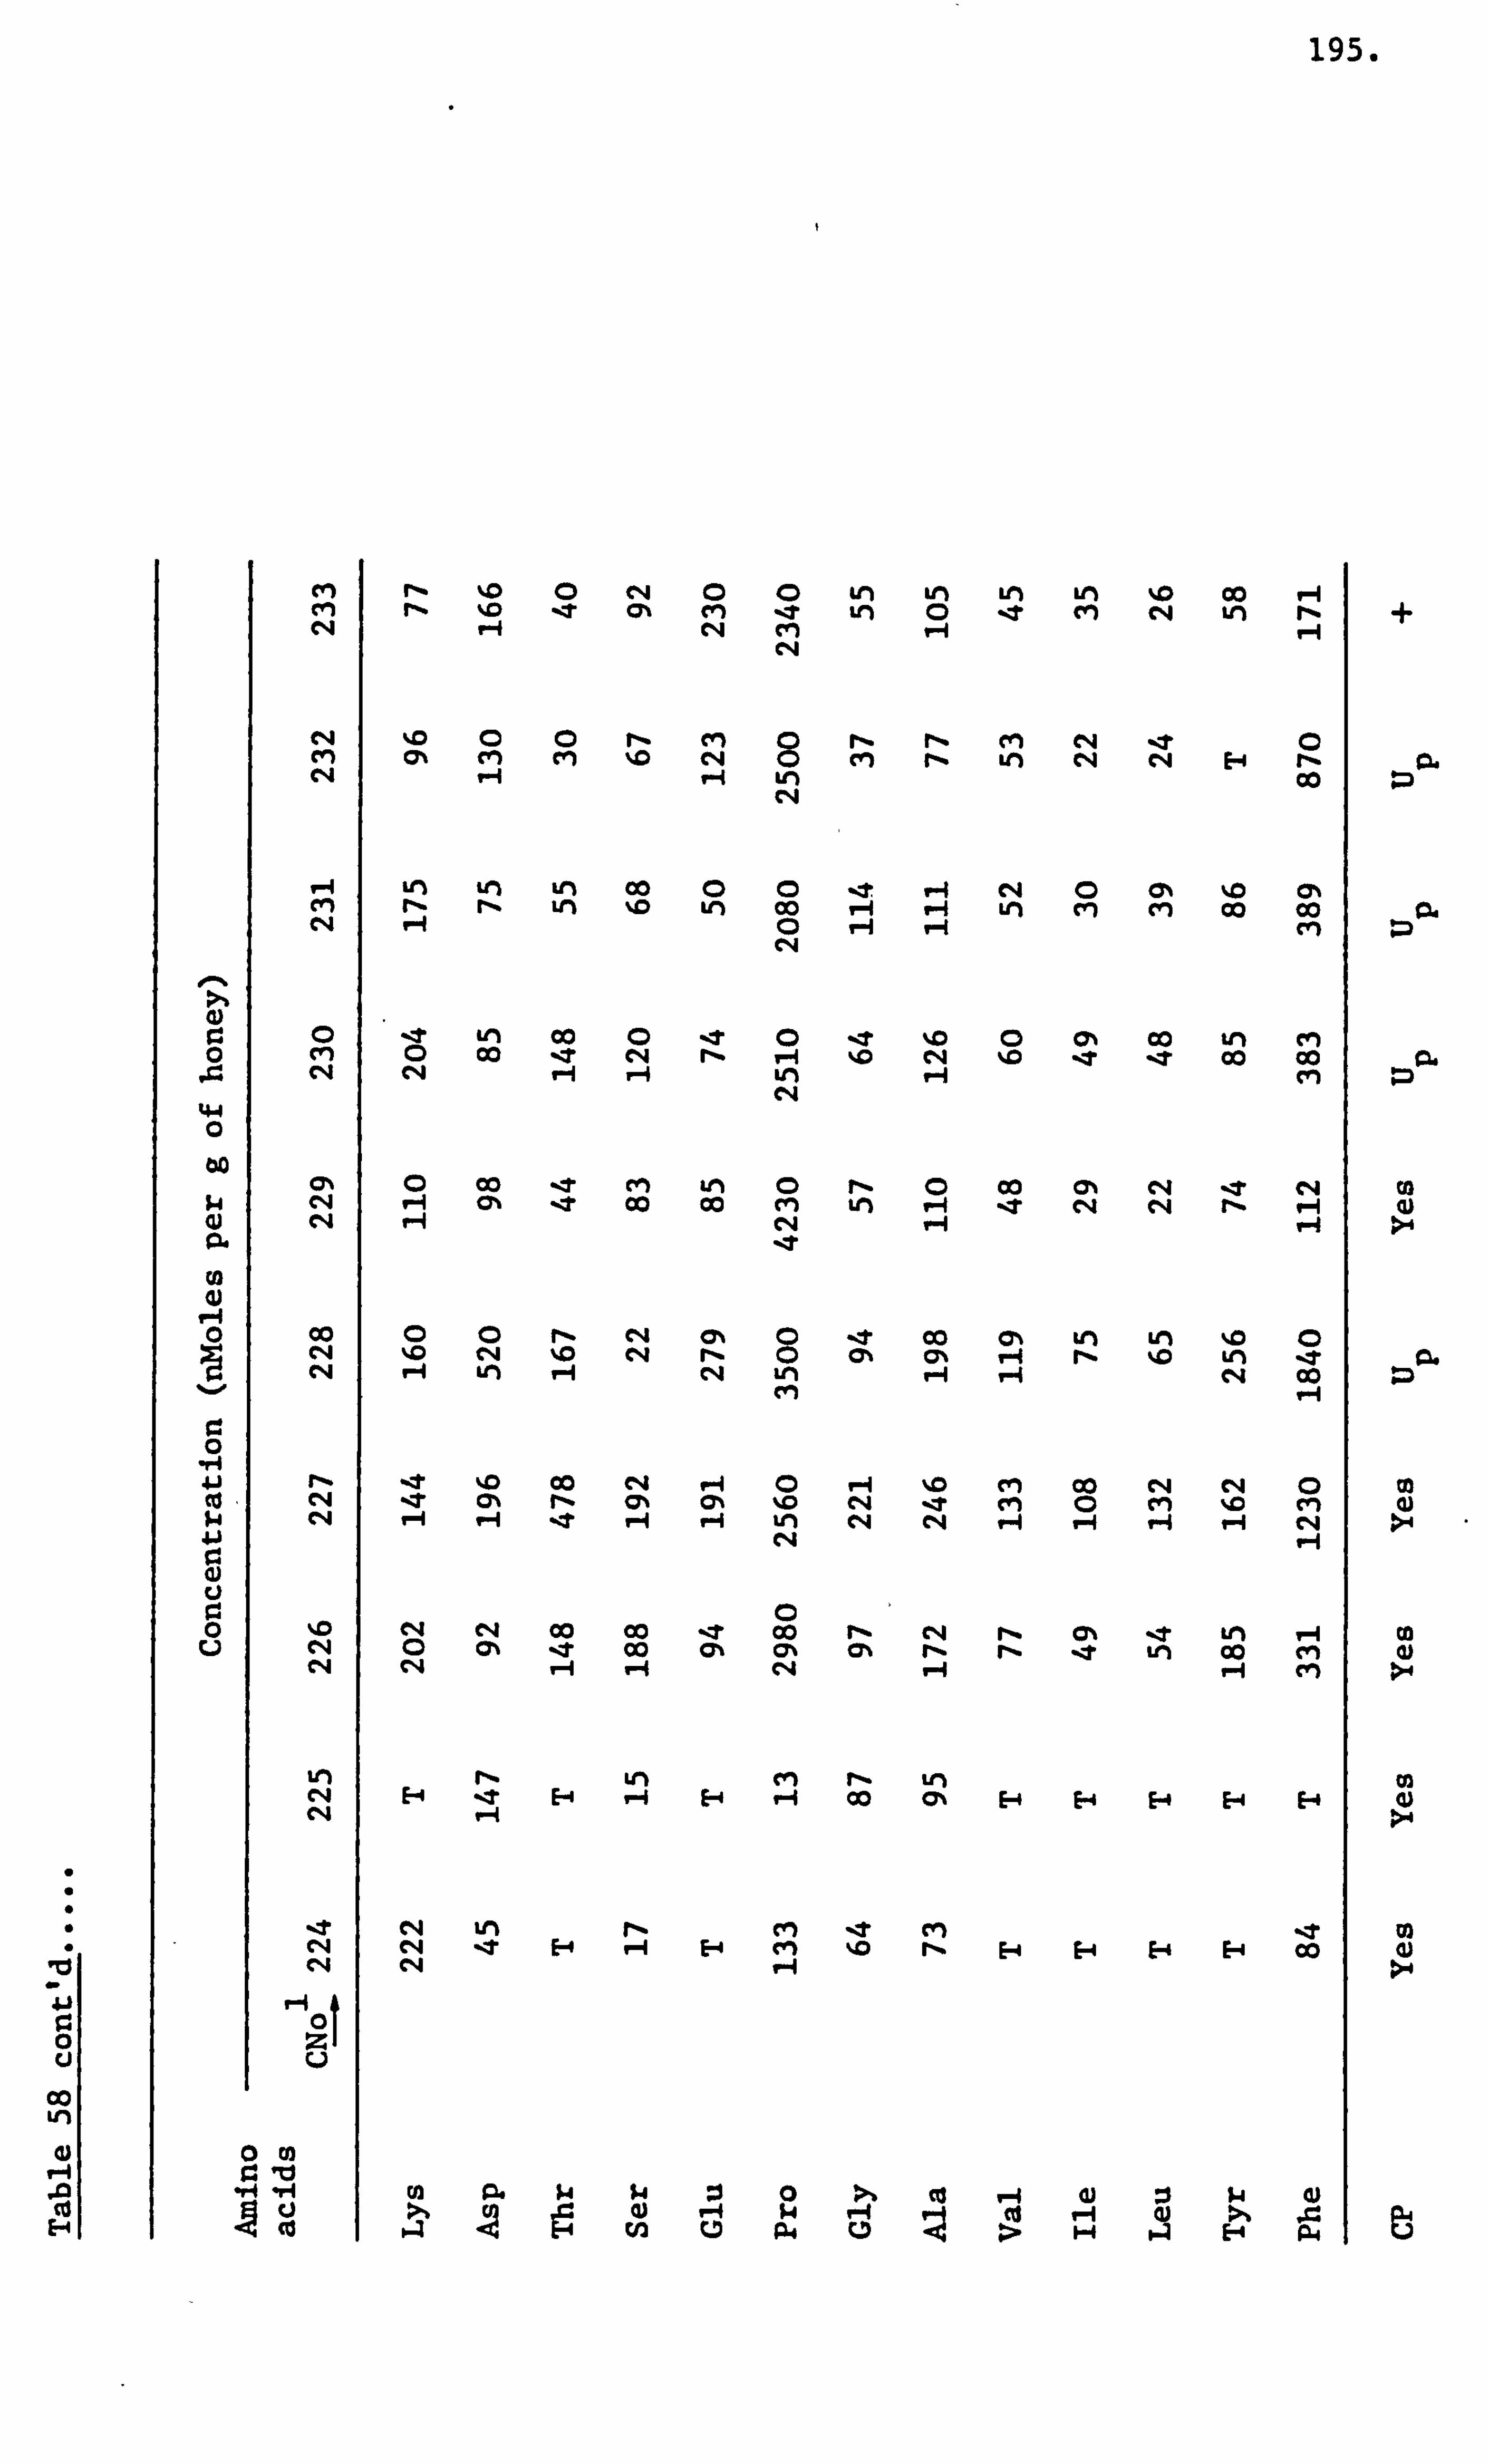
195.
I
0 ci
00 VI 9)
cm rý %D 0 0 0 ul LI) %D OD H cm rlý qm _T t" %t im r-
C, 4 P-4 rq M r-1 cq
C, 4 %D CD 0 r- cm 8 r- rlý cyl C, 4 _T 0 ci 0% CN C" r- LM clq r_ C, 4 Lri 00
C, 4
V-4 Im in LM 00 0 CD -2 P-f cq 0 CYN %0 Cj% cm r- r1. Lri %D Ln 00 V-1 P-4 A ci (n Co 00 C, 4 0 H H m
cq
r. 0 -t LM 00 0 -t 0 _T %0 0 0% Co tn cm M 0 00 _T clq V-4 %0 c*II %D _T _T 00 Co C, 4 c4 M
Co ýT cm an C) f- CD Co 0, % cq _T C»4 w N V-4 (: -t Co Co M tn 1-4 _T c4 c4 rlý H
00 (D 0 cli Co C% Lri LM %D
e cq %0 C, 4 C, 4 CY% P-4 r- %0 Ln rq P-4 LM H N L') r-4 V-4 c4 00 %. 10 cm V. -1
c:
41 r% -t %0 Co cq P-4 F-1 %0 M 00 CN1 CN (D Co ý eq %T (IN r- 0% CY% cý4 %t CM CD M %D ell 1.4 C, 4 P-1 tn C, 4 CN V-4 V-4 "-1 1. -4 C, 4
e4 c4 00 Co _T 00 r_ C, 4 rý. c> -t LM 7-1 N CD .t 00 (: C% C% r- r- _T vi 00 cyl c4 C, 4 H H c4 P-4 P-4 CIM
LM r- Ln cm r- Ln c4 E--4 ýt E-1 00 C% E-4 H E4 E-4 H c"i P-4
-t N LM r- M ýt cm -2 cq c4 _T E-4 P-4 E-4 cm %0 r1. H E-4 E-4 Co C, 4 c4 P-4
r-i 0
0 Co r 4 Ili ai
Co
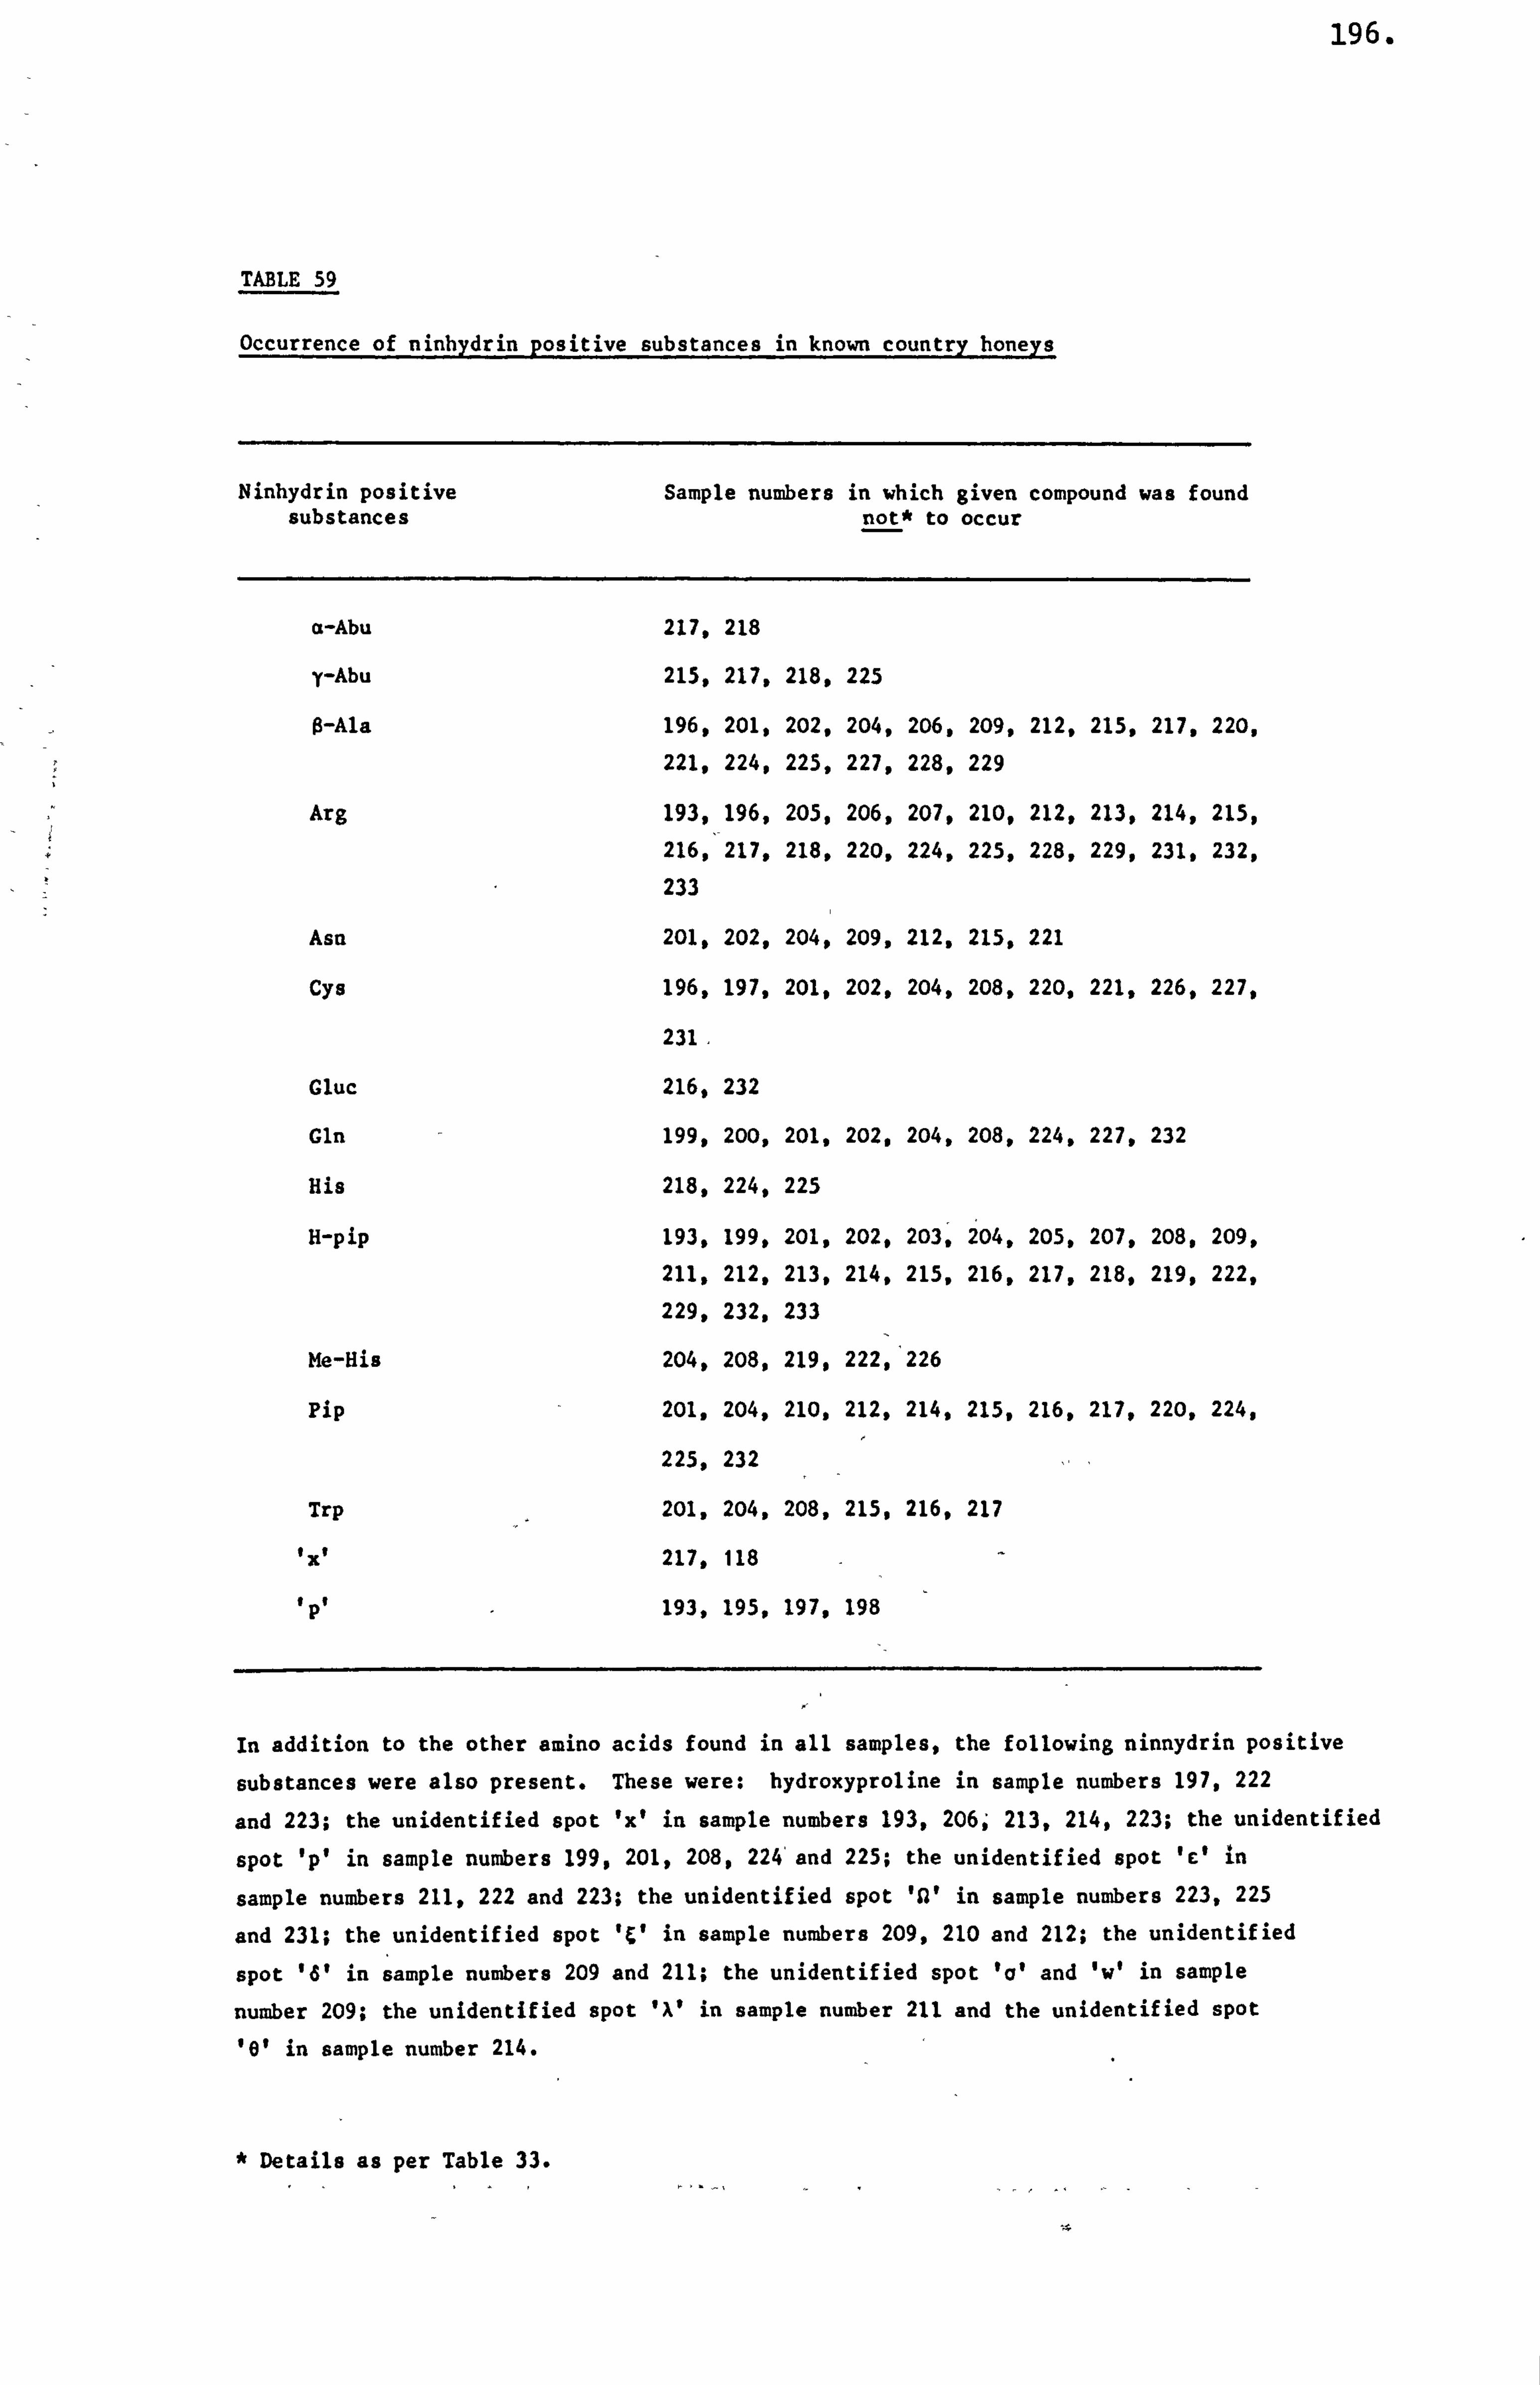
196.
TABLE 59
Occurrence of ninhydrin positive substances in known country honeys
Ninhydrin positive substances
Sample numbers in which given compound was found not* to occur
cc-Abu 217, 218
y-Abu 215, 217, 218, 225
O-Ala 196, 201, 202, 204, 206, 209, 212, 215, 217. 220,
221, 224, 225, 227, 228, 229
Arg 193, 196, 205, 206, 207, 210, 212, 213, 214, 215,
216, 217, 218, 220, 224, 225, 228, 229, 231, 232,
233
Asn 201, 202, 204v 209, 212, 215, 221
Cys 196, 197, 201, 202, 204, 208, 220, 221, 226, 227,
231,
Gluc 216, 232
Gln 199, 200, 201, 202, 204, 208, 224. 227, 232
His 218, 224, 225
H-pip 193, 199, 201, 202, 203, 204, 205, 207, 208, 209,
211, 212, 213, 214, 215, 216, 217, 218, 219, 222,
229, 232, 233
Me-His 204, 208, 219, 222, 226
Pip 201, 204, 210, 212, 214, 215, 216, 217, 220, 224,
225, 232
Trp 201, 204, 208, 215, 216, 217
ext 217, 118
p 193, 195, 197, 198
I In addition to the other amino acids found in all samples, the following ninnydrin positive
substances were also present. These were: hydroxyproline in sample numbers 197,222
and 223; the unidentified spot 'x' in sample numbers 193,206ý 213,214,223; the unidentified
spot 'p' in sample numbers 199,201,208,224'and 225; the unidentified spot 10 in
sample numbers 211,222 and 223; the unidentified spot 'A' in sample numbers 223,225
and 231; the unidentified spot 'C' in sample numbers 209,210 and 212; the unidentified
spot '61 in sample numbers 209 and 211; the unidentified spot 'a' and V in sample
number 209; the unidentified spot 'A' in sample number 211 and the unidentified spot 'e' in sample number 214.
* Details as per Table 33.
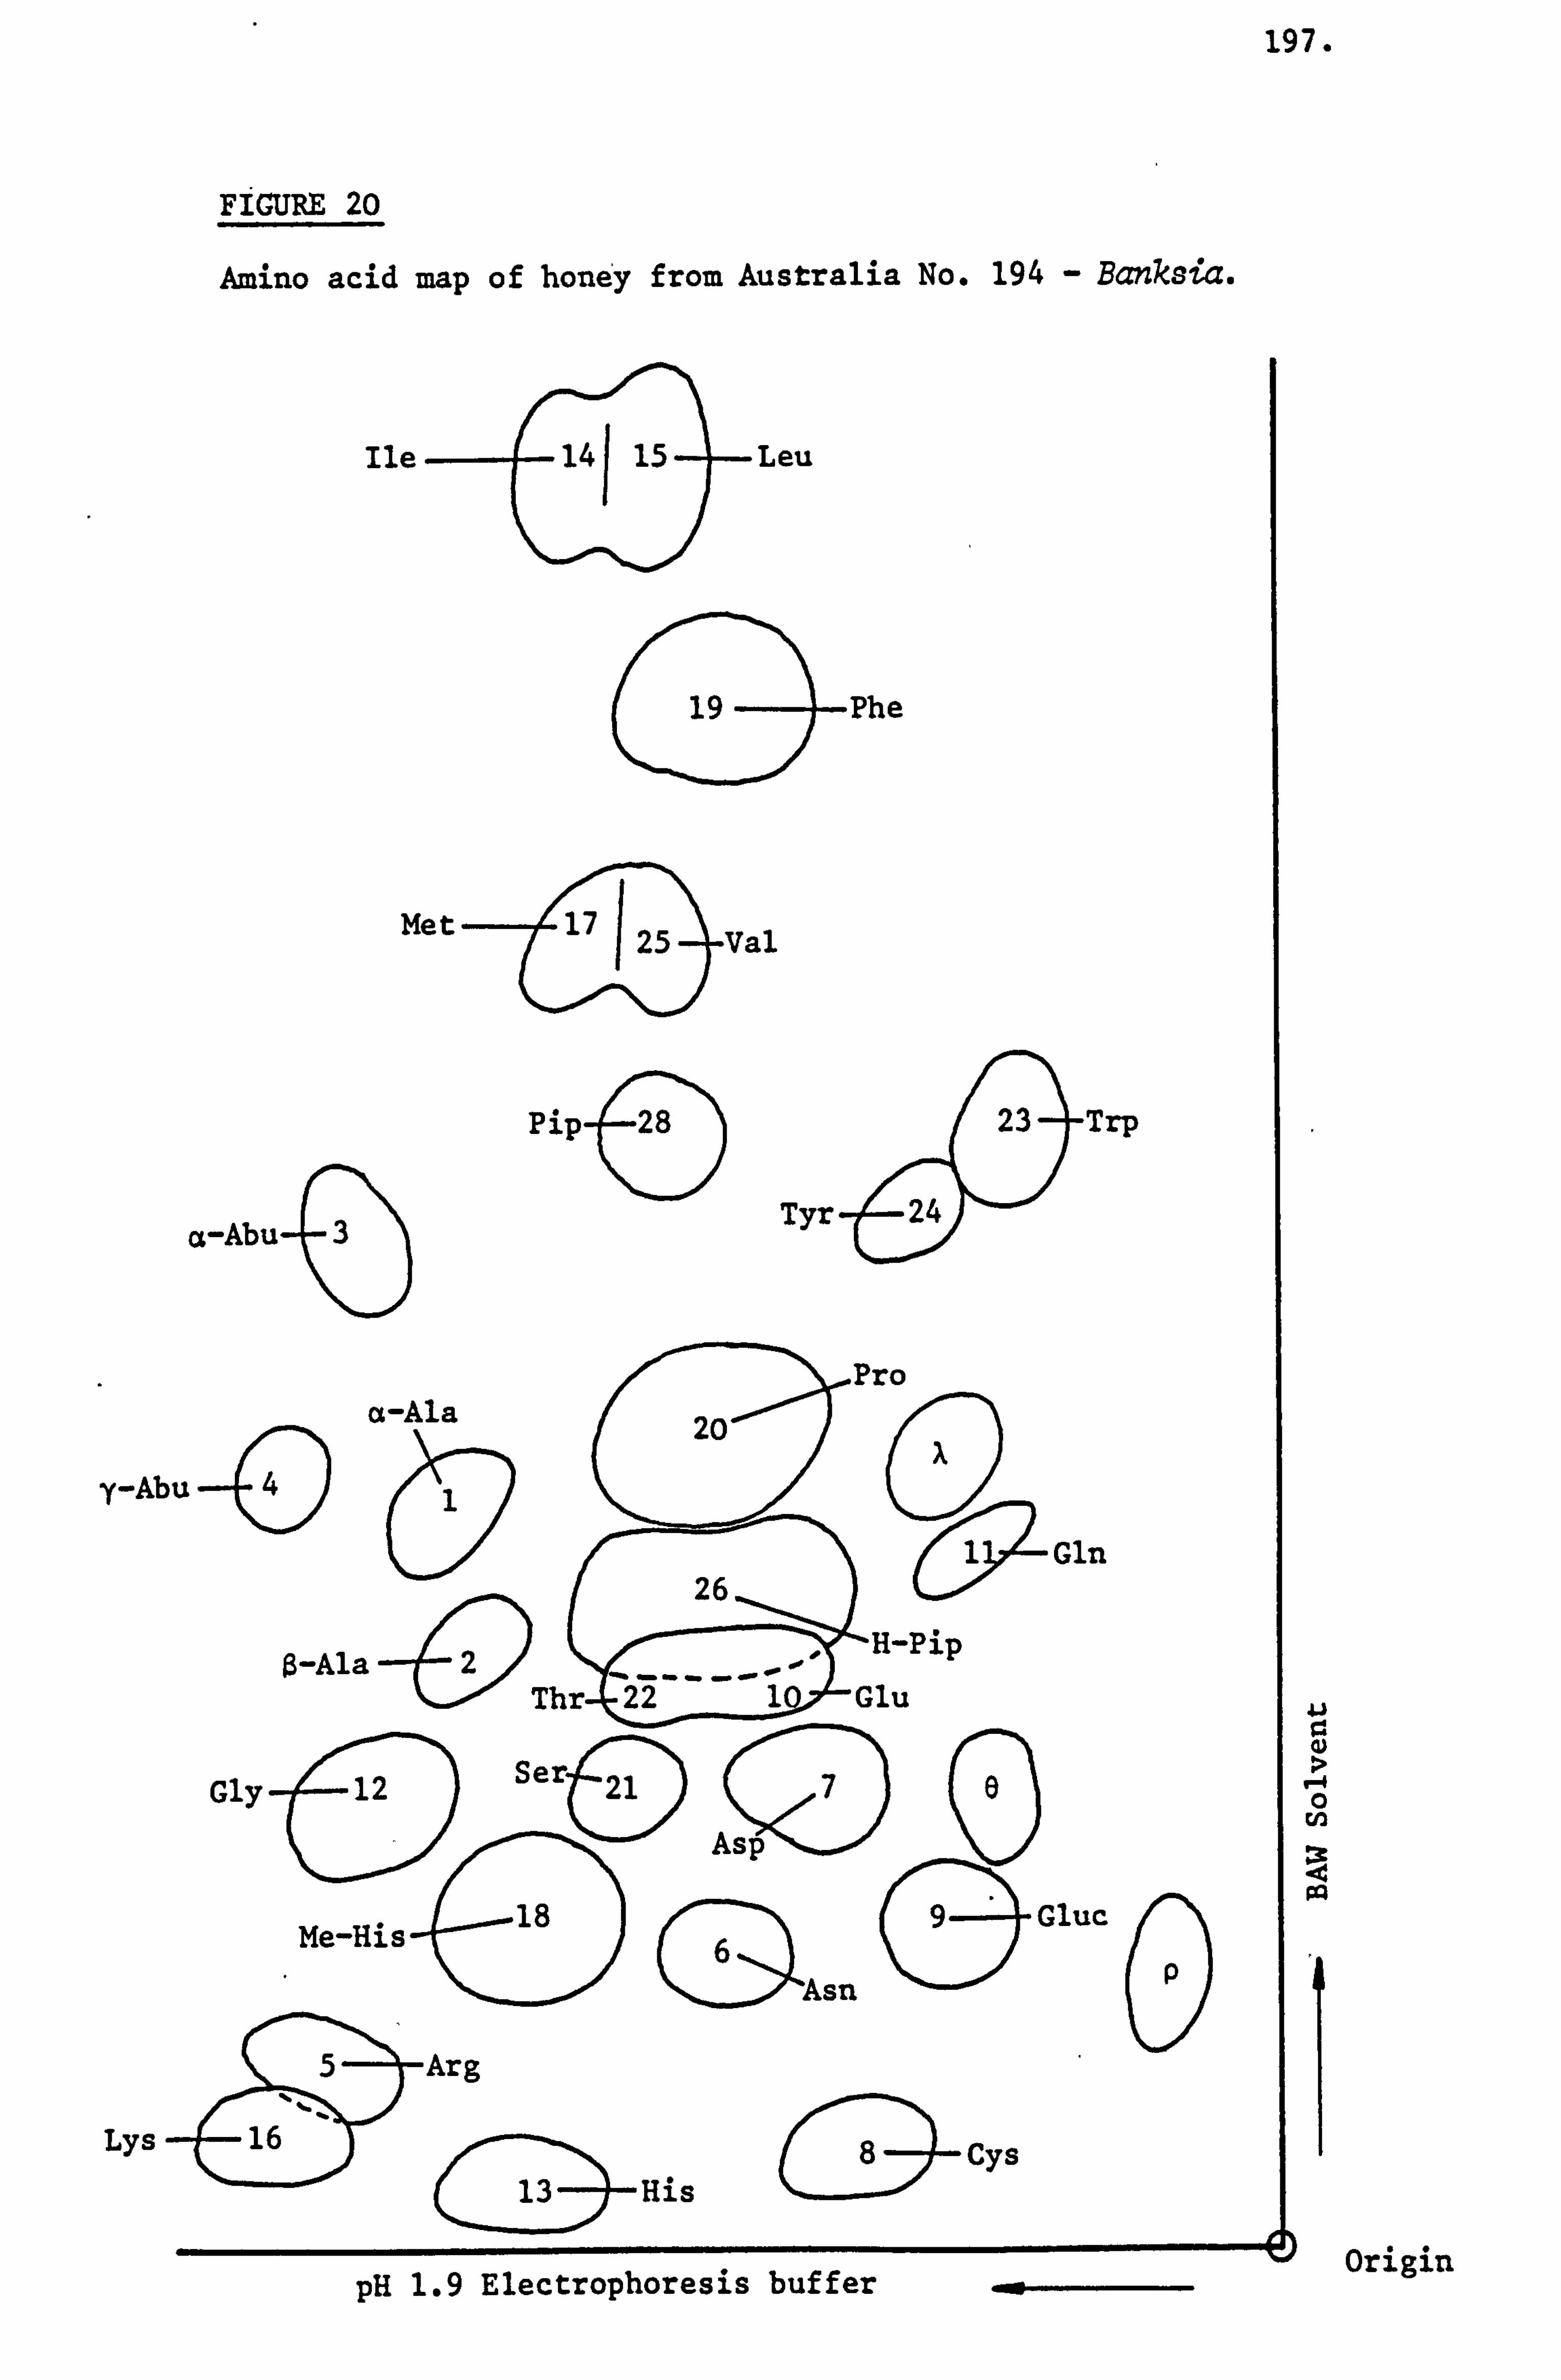
FIGURE 20
Amino acid map of hone'y from Australia No. 194 - Banksia.
Ile Leu
(
19 Phe
Met - 17 125
Val
a-Abu-( 3
cL-Ala
y-Abu --0 (9
Pip 28 -e
O-Ala-0,
Tyr
20
1 Gln 26
51
-u Pip
Ser Gly 12
(D 76 21
Asp
Me-His 18 9 Gluc
e
(DAsn
G
5- Arg
Lys 16
His
(Sý Cys
C pH 1.9 Electrophoresis buffer
197.
I-I 0
pq
Origin
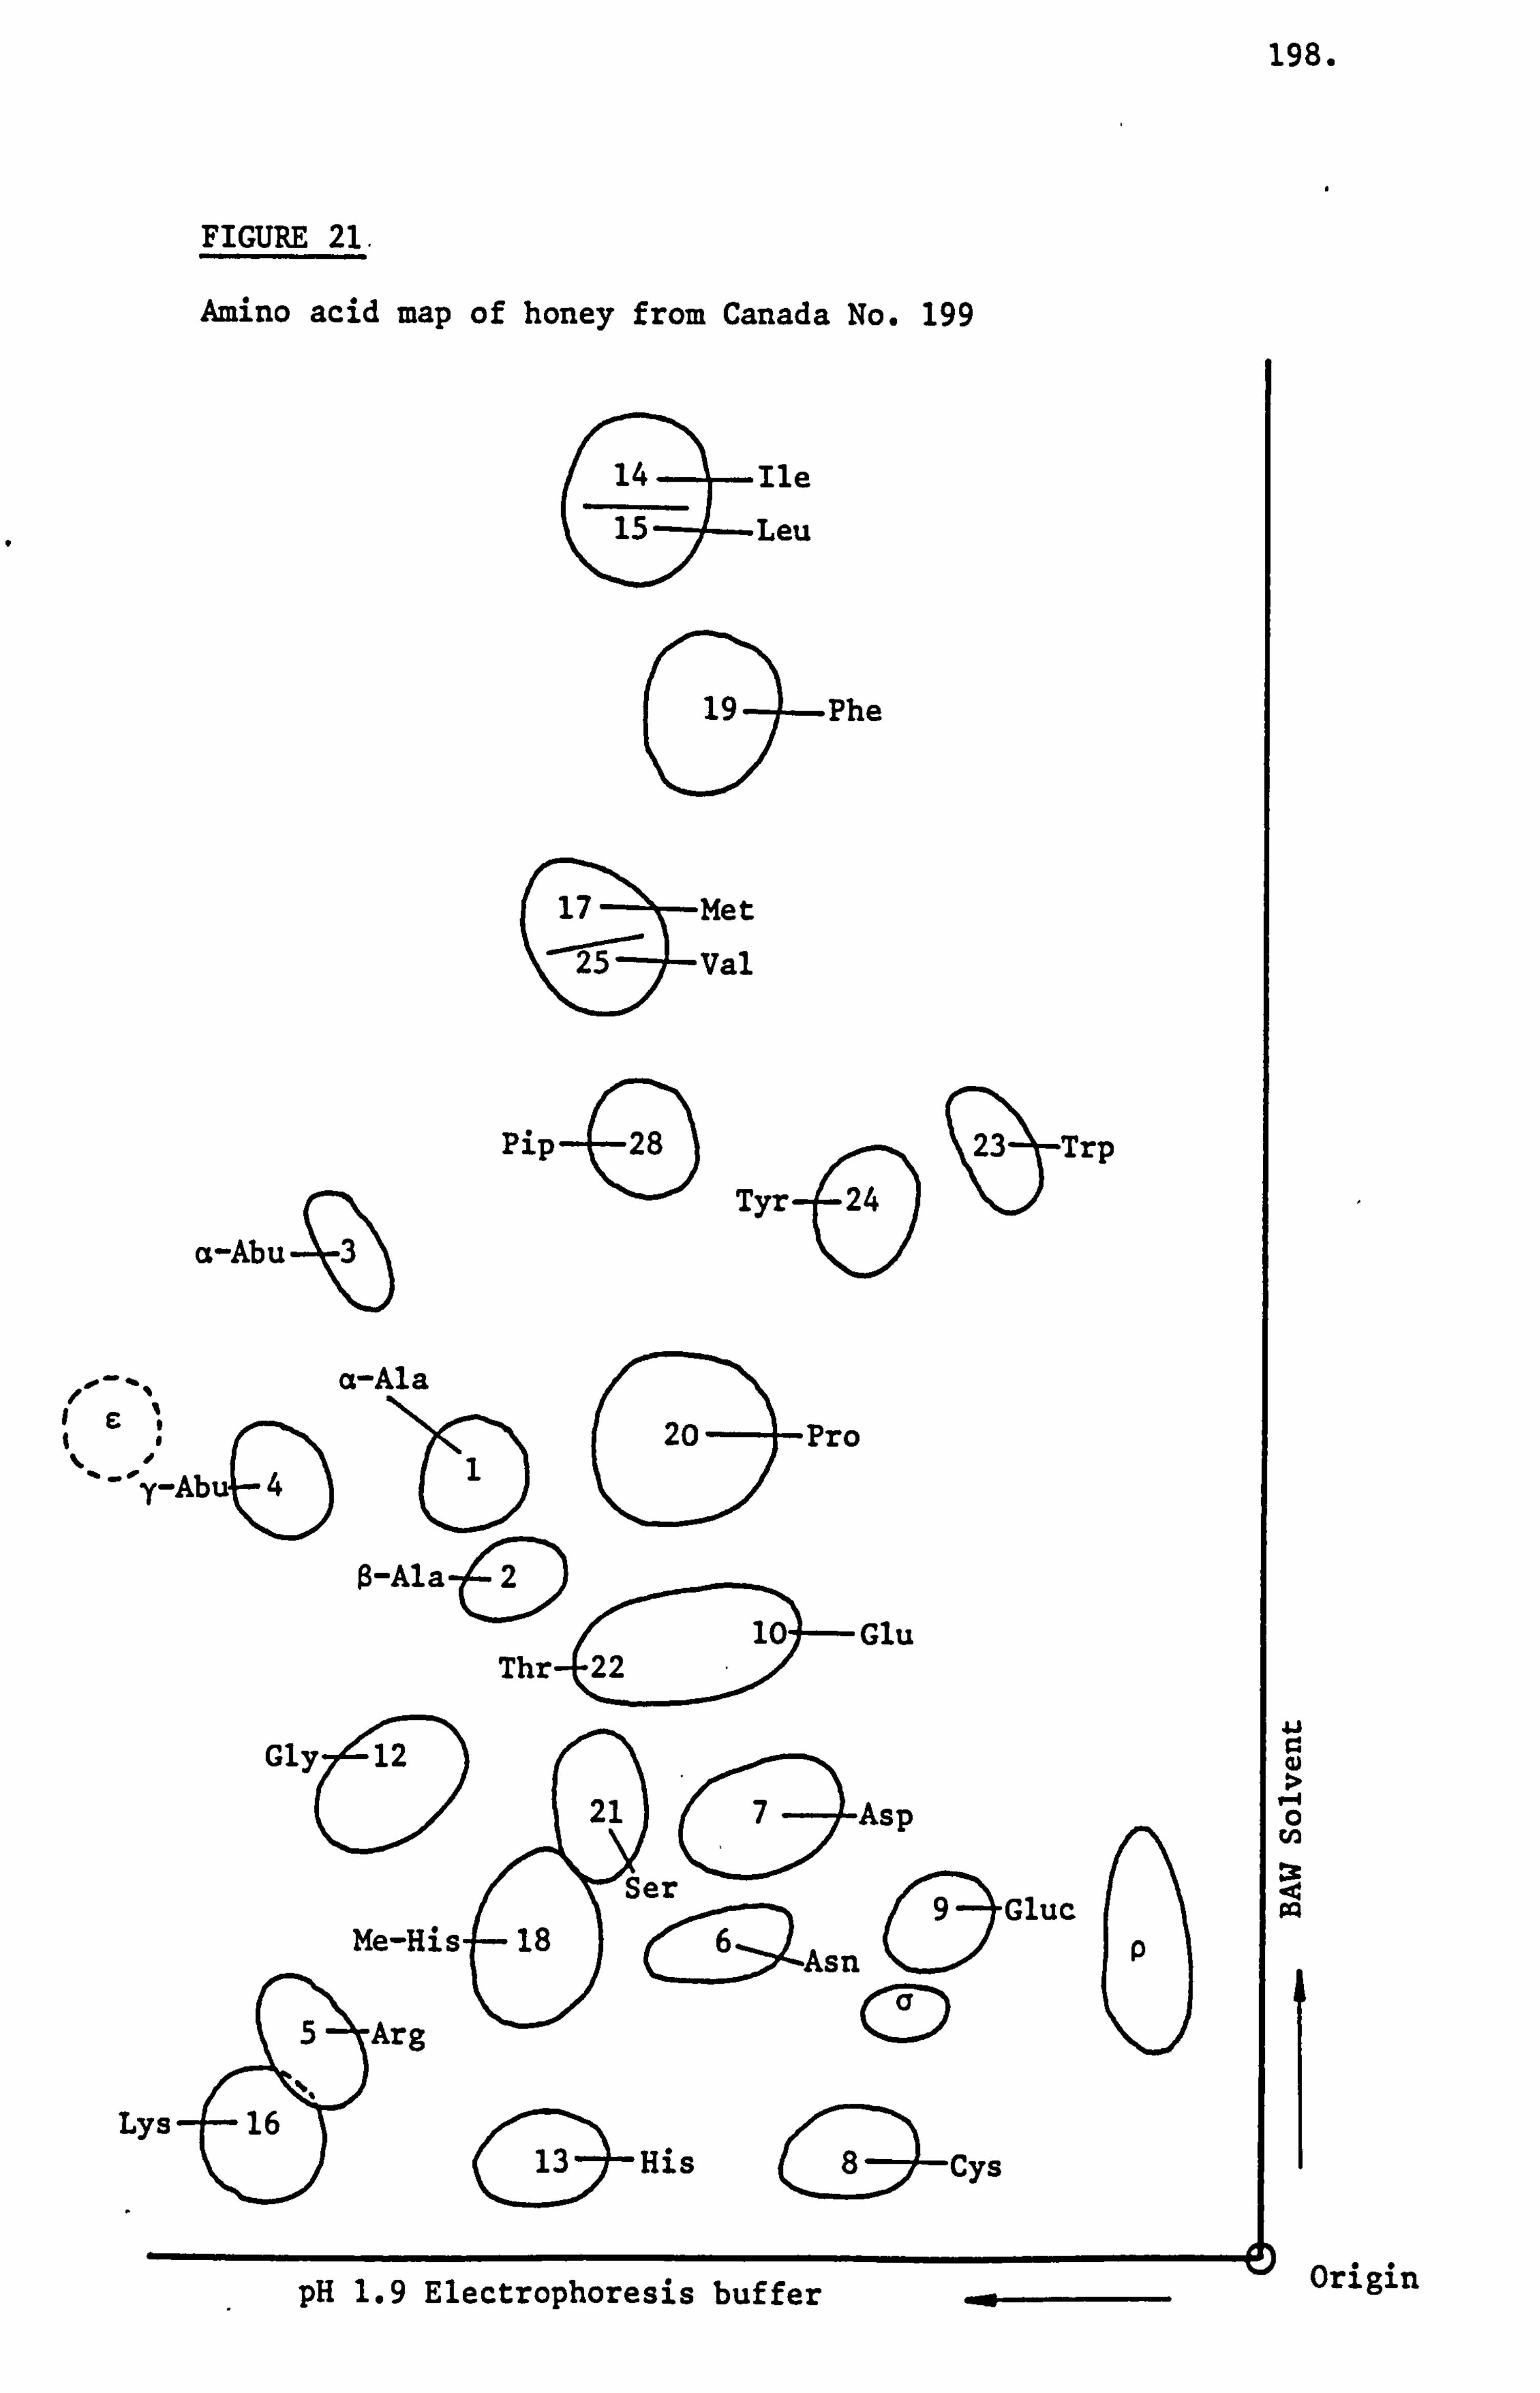
198.
FIGURE 21.
Amino acid map of honey from Canada No. 199
14 Ile 15 Leu
139 -Phe
17 Met 25 Val
24
a-AJ 3
Pip -G Tyr-(5
Trp
a-Ala 20 Pro
Y-Abuja D $-Ala 2 -0
10 Glu Thr 22
er Me-His
(
18
7
(: SlAsn
0 Gluc
5 Arg \ý
5.
Lys 16
6
(: 31- His
(D
Cys
Gly 12 97
21
si
Asp
er
0 rn D: 94 pq
pH 1.9 Electrophoresis buffer Origin
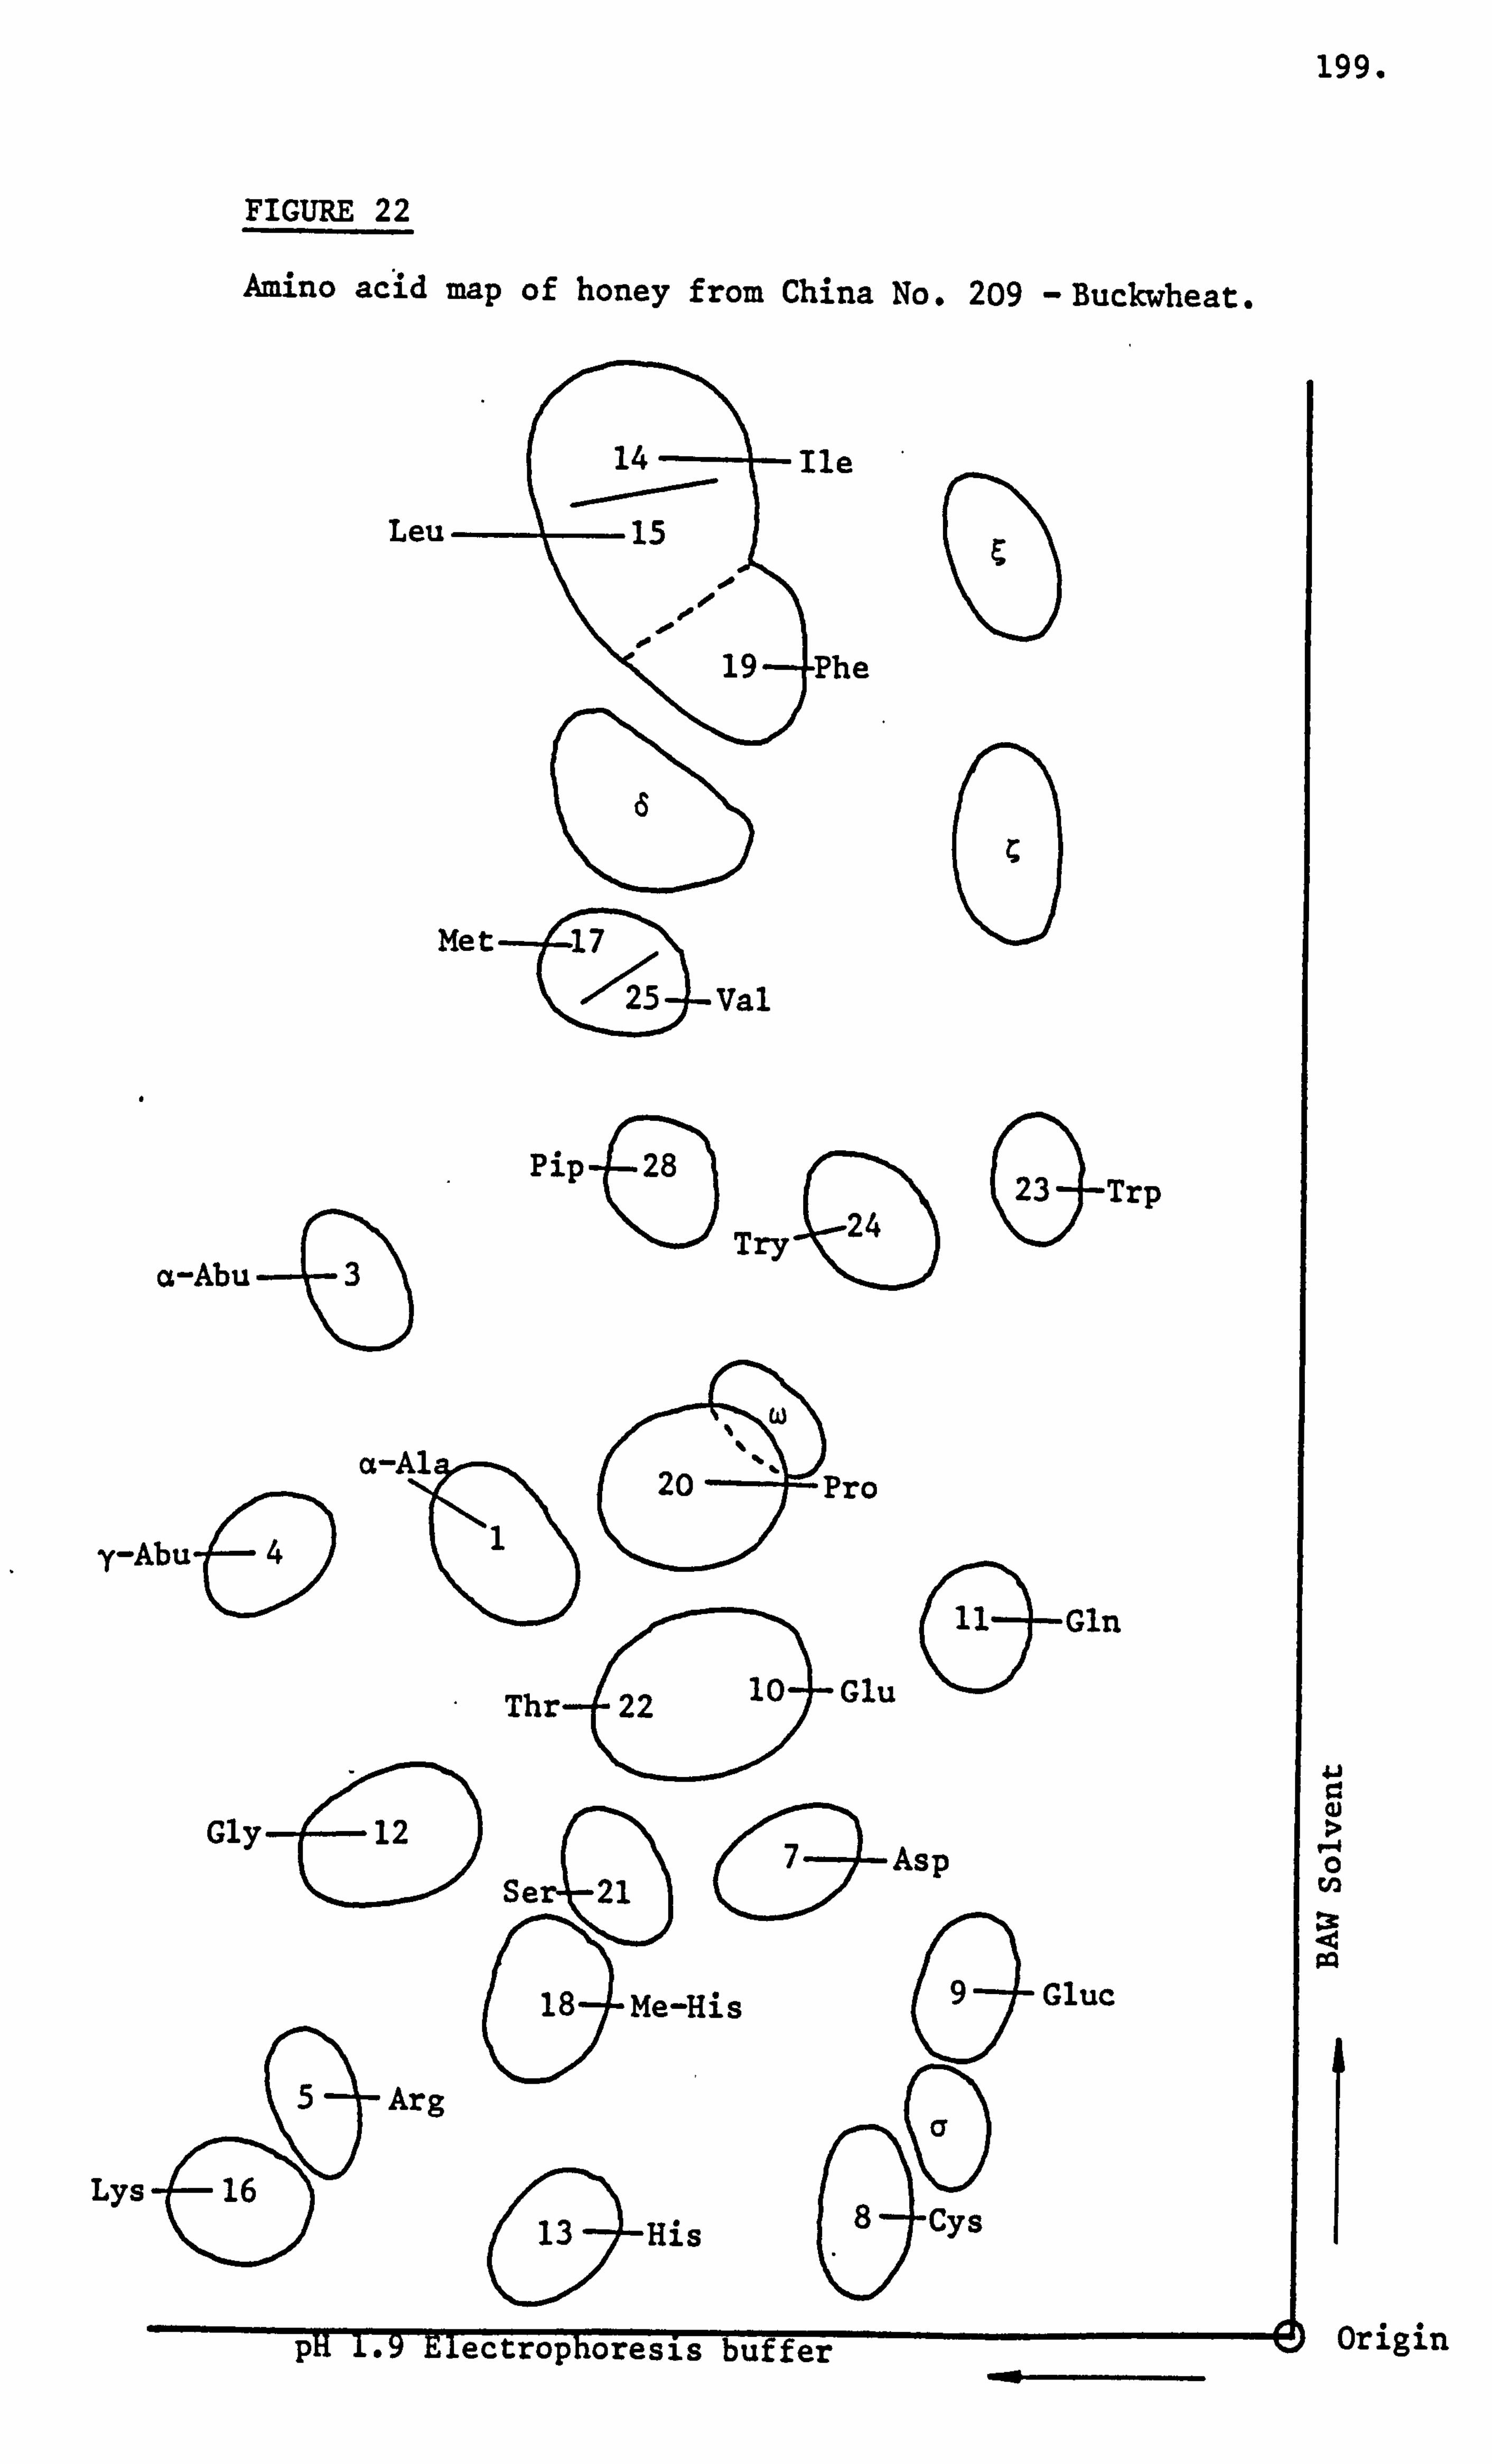
199.
Leu
a-Abu -3)
e)
0 Pip 28
23 -Trp -e
Try 24 )9
a-Al
y-Abu-e4 1
20 Pro
Gly
Lys
Arg a
ýu
13 His 8 Cys
FIGURE 22
Amino acid map of honey from China No. 209 - Buckwheat.
Thr-1(22 10 Glu
12 J
(aGIn
Se 21 Asp
9 18 Me-His Gluc
.9 Electrophoresis buffer
Ile
The
1.1
w �-4 0
: 3: 44 PO
origin
Met-7(225
Val
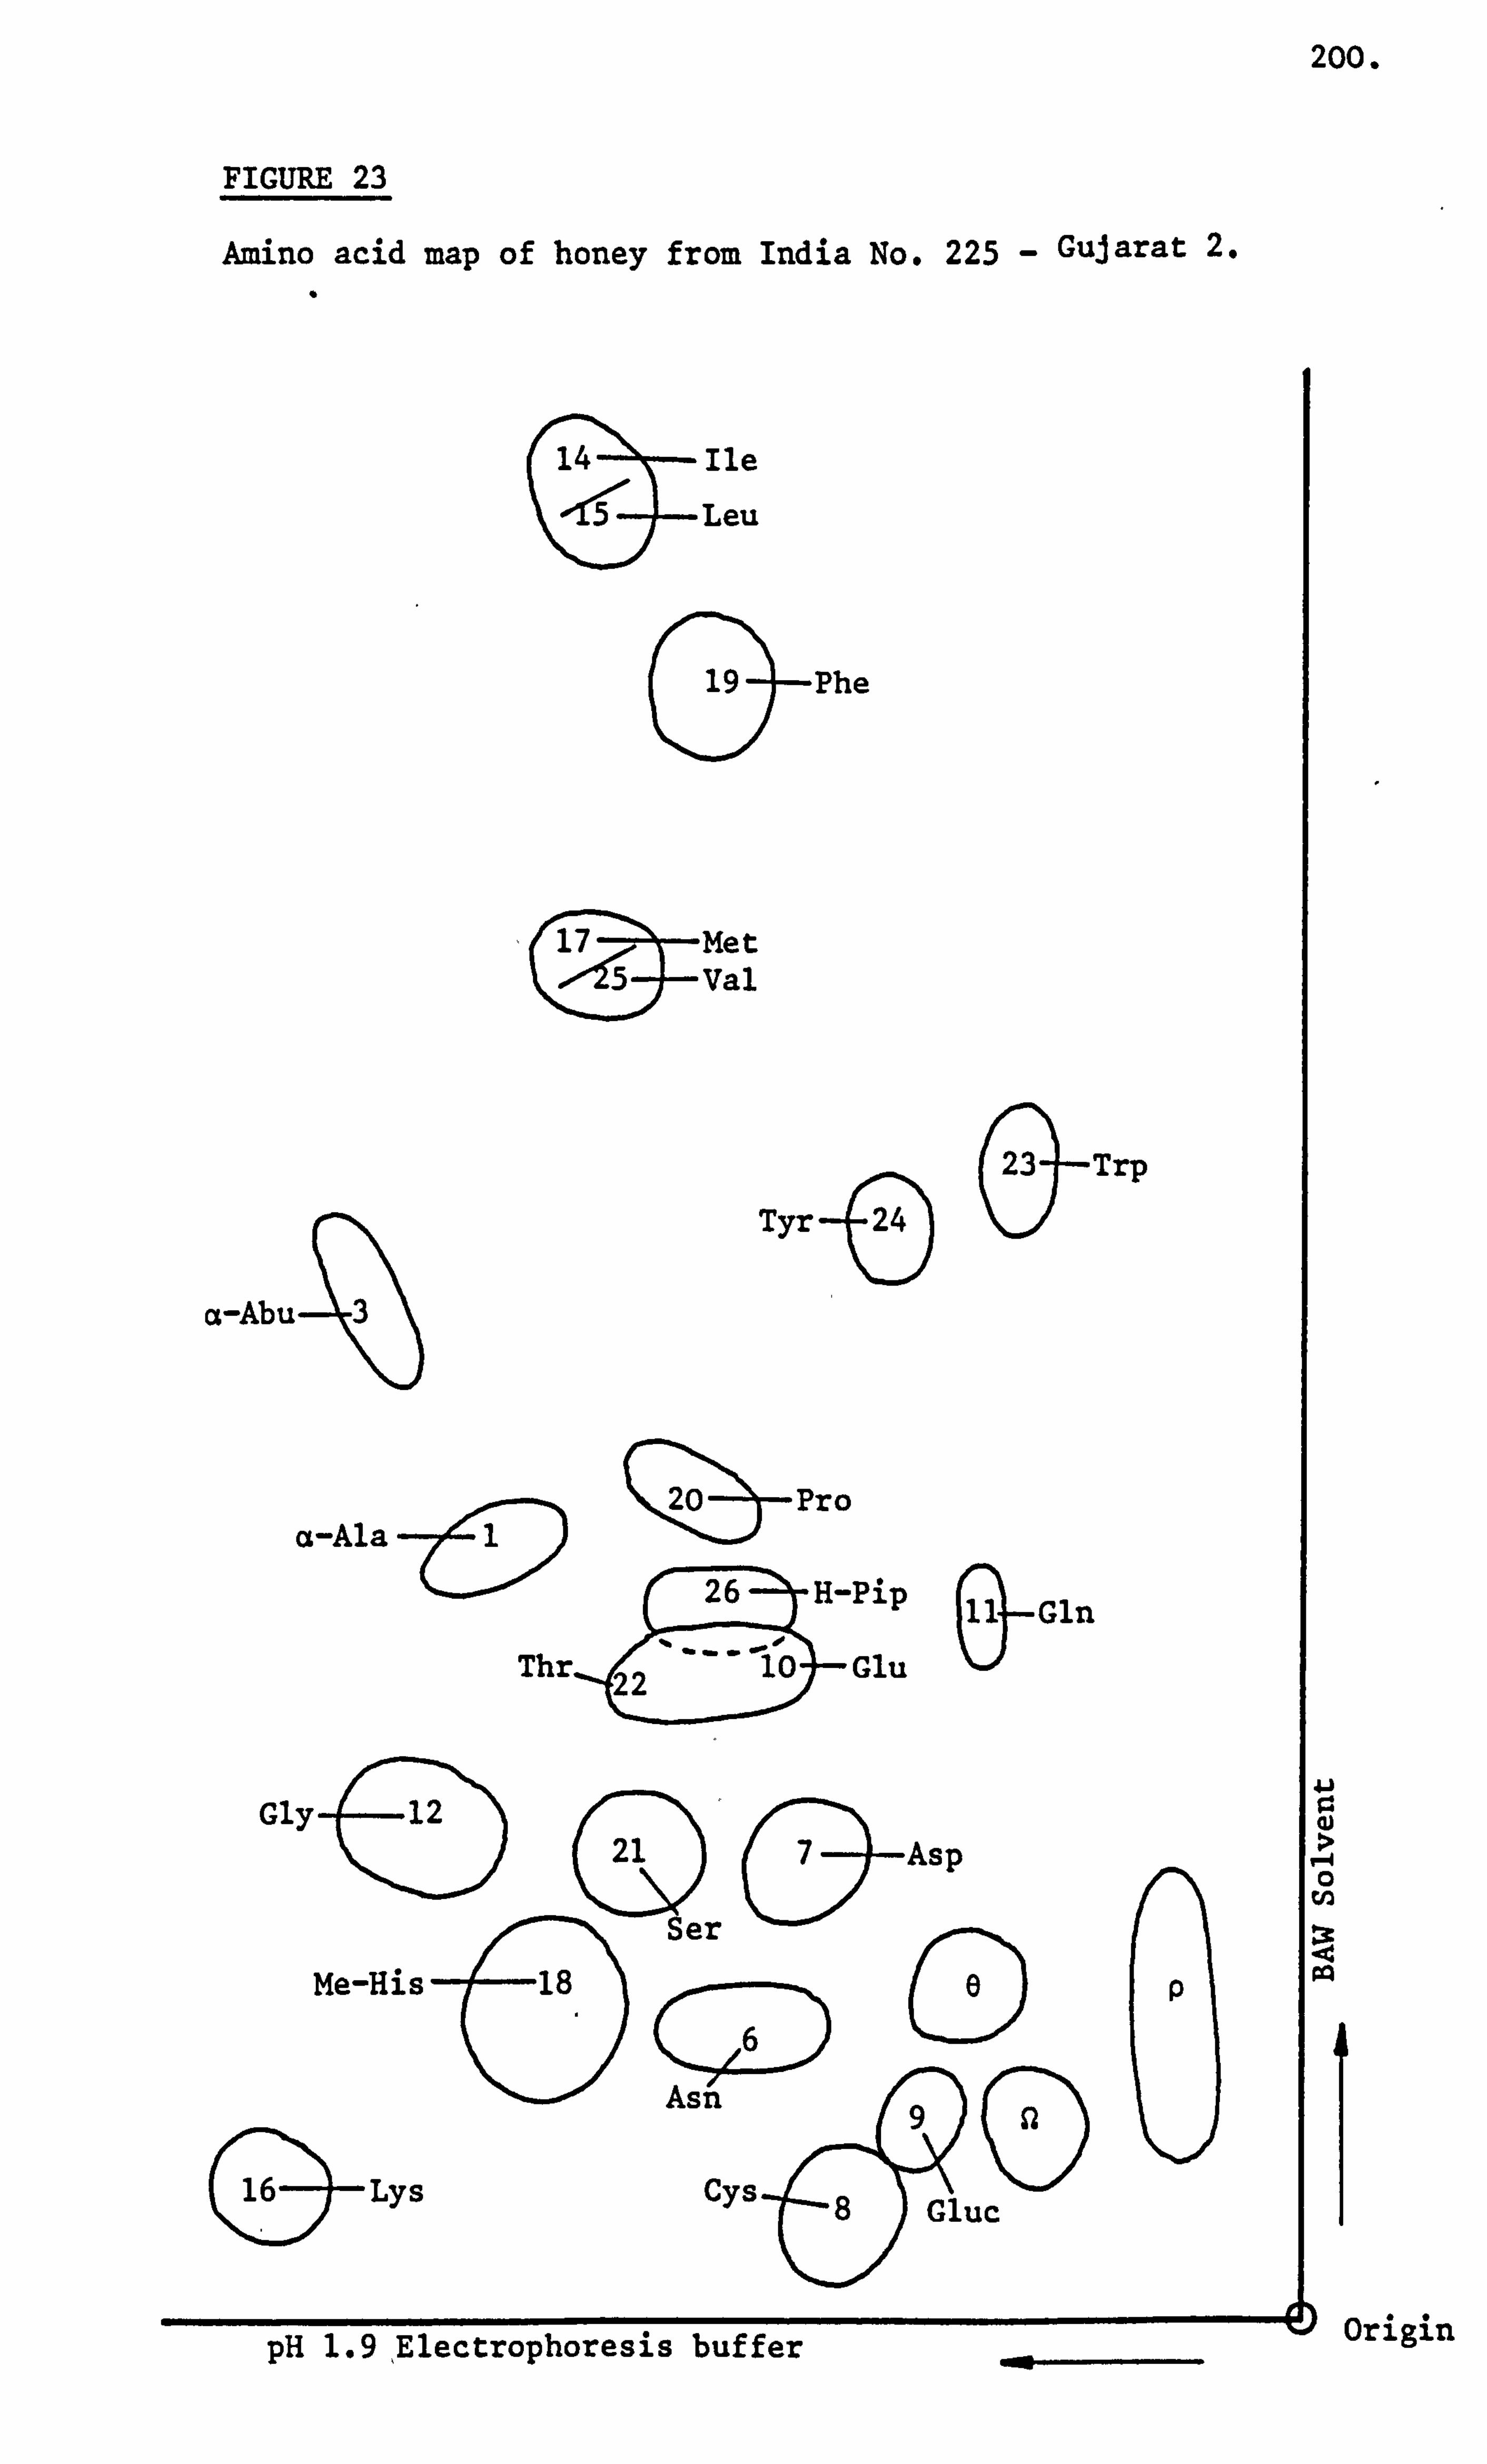
200.
FIGURE 23
Amino acid map of honey from India No. 225 - Gujarat 2.
14 Ile Leu
&19
Phe
Met Val
a-Abu- 3
Tyr
&23Trp
Q Pro
26-2ývH-Pin a-Ala
O-Gln
Thr-_, Glu
Gly 12 21
Ser
O-Asp
Me-His 18 CD
16
Ast 9 (D Lys Cys 8 Gluc 0
w 0
pH 1.9, Electrophoresis buffer origin
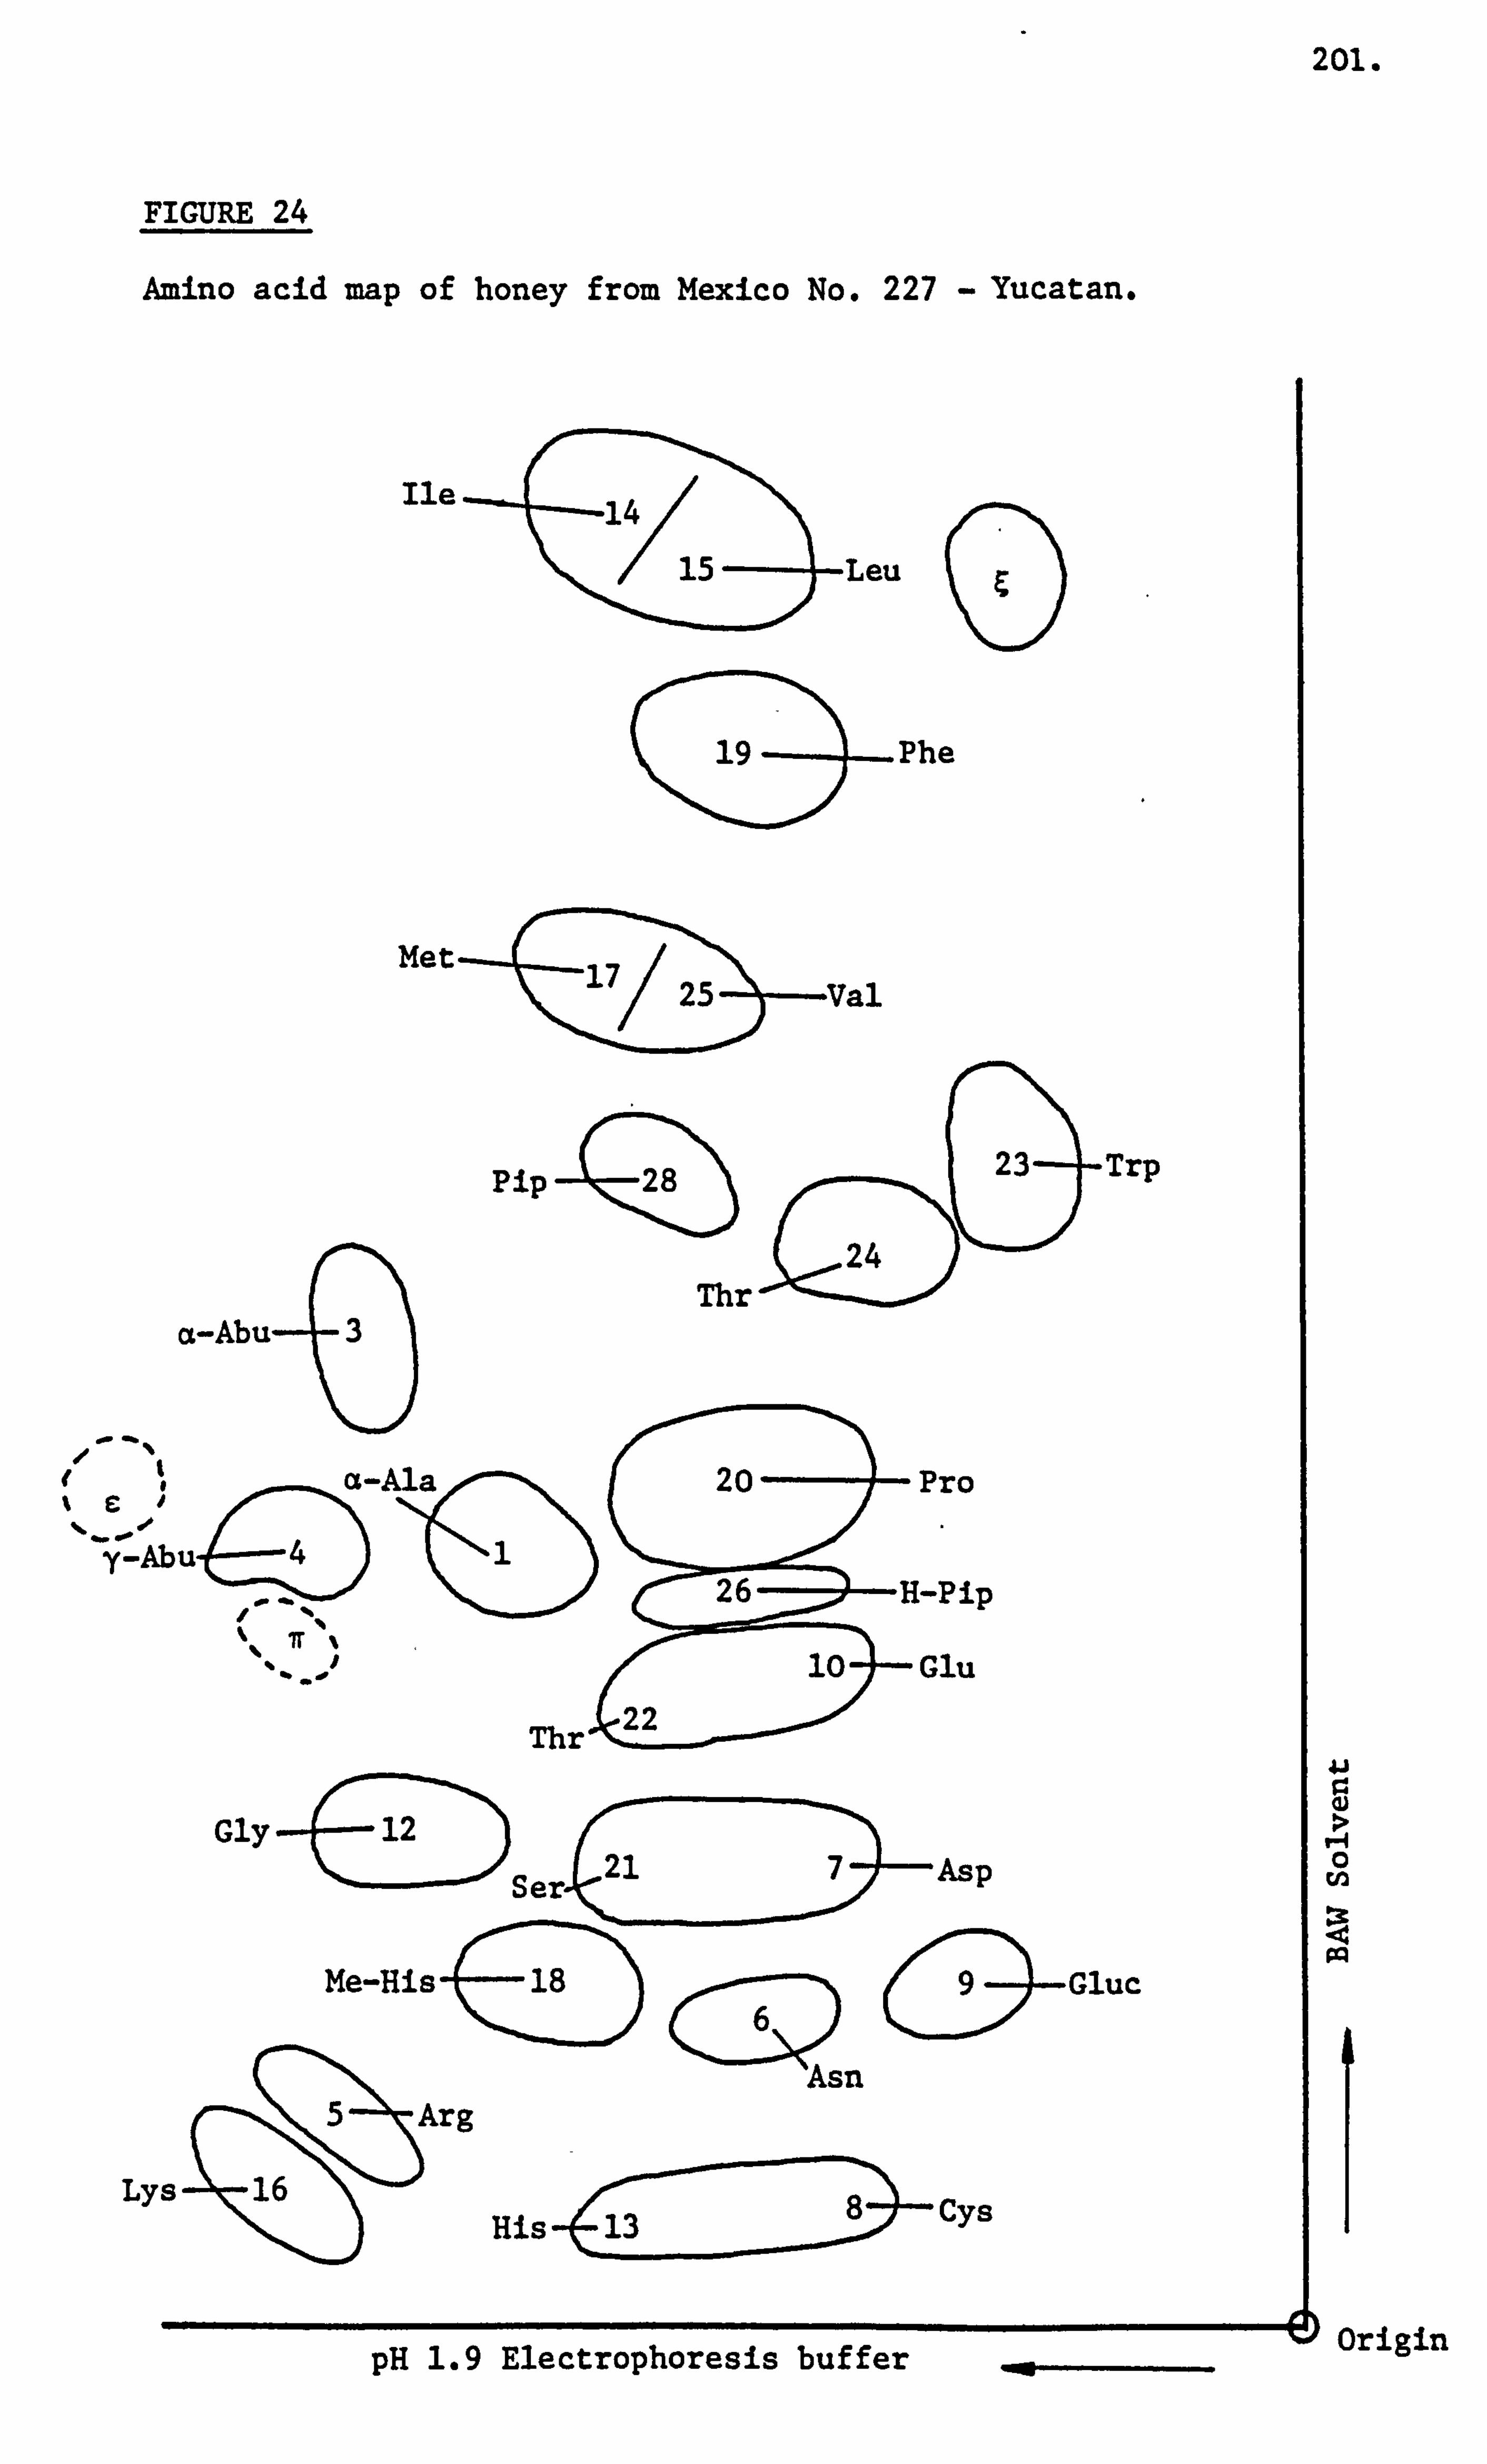
201.
FIGURE 24
Amino acid map of honey from Mexico No. 227 - Yucatan.
Ile 1
15 Leu
Q
19 Phe
Met-- iv 25 Val
Pip 4)
a-Abu- 30
11 a-Ala
y-Abu-ý 4
% 7r % %.
_ýI
Thr t<22
Thr
20 i Pro
26=; ) H-Pip
10 -f- Glu
Gly 7 Asp
5 Arg
Lys 16
Asn
His -(ý13: Cys
pH 1.9 Electrophoresis buffer
Trp
6D Jý, Me-His 18D
)-Gluc
U
0
m ; C4 pq
Origin
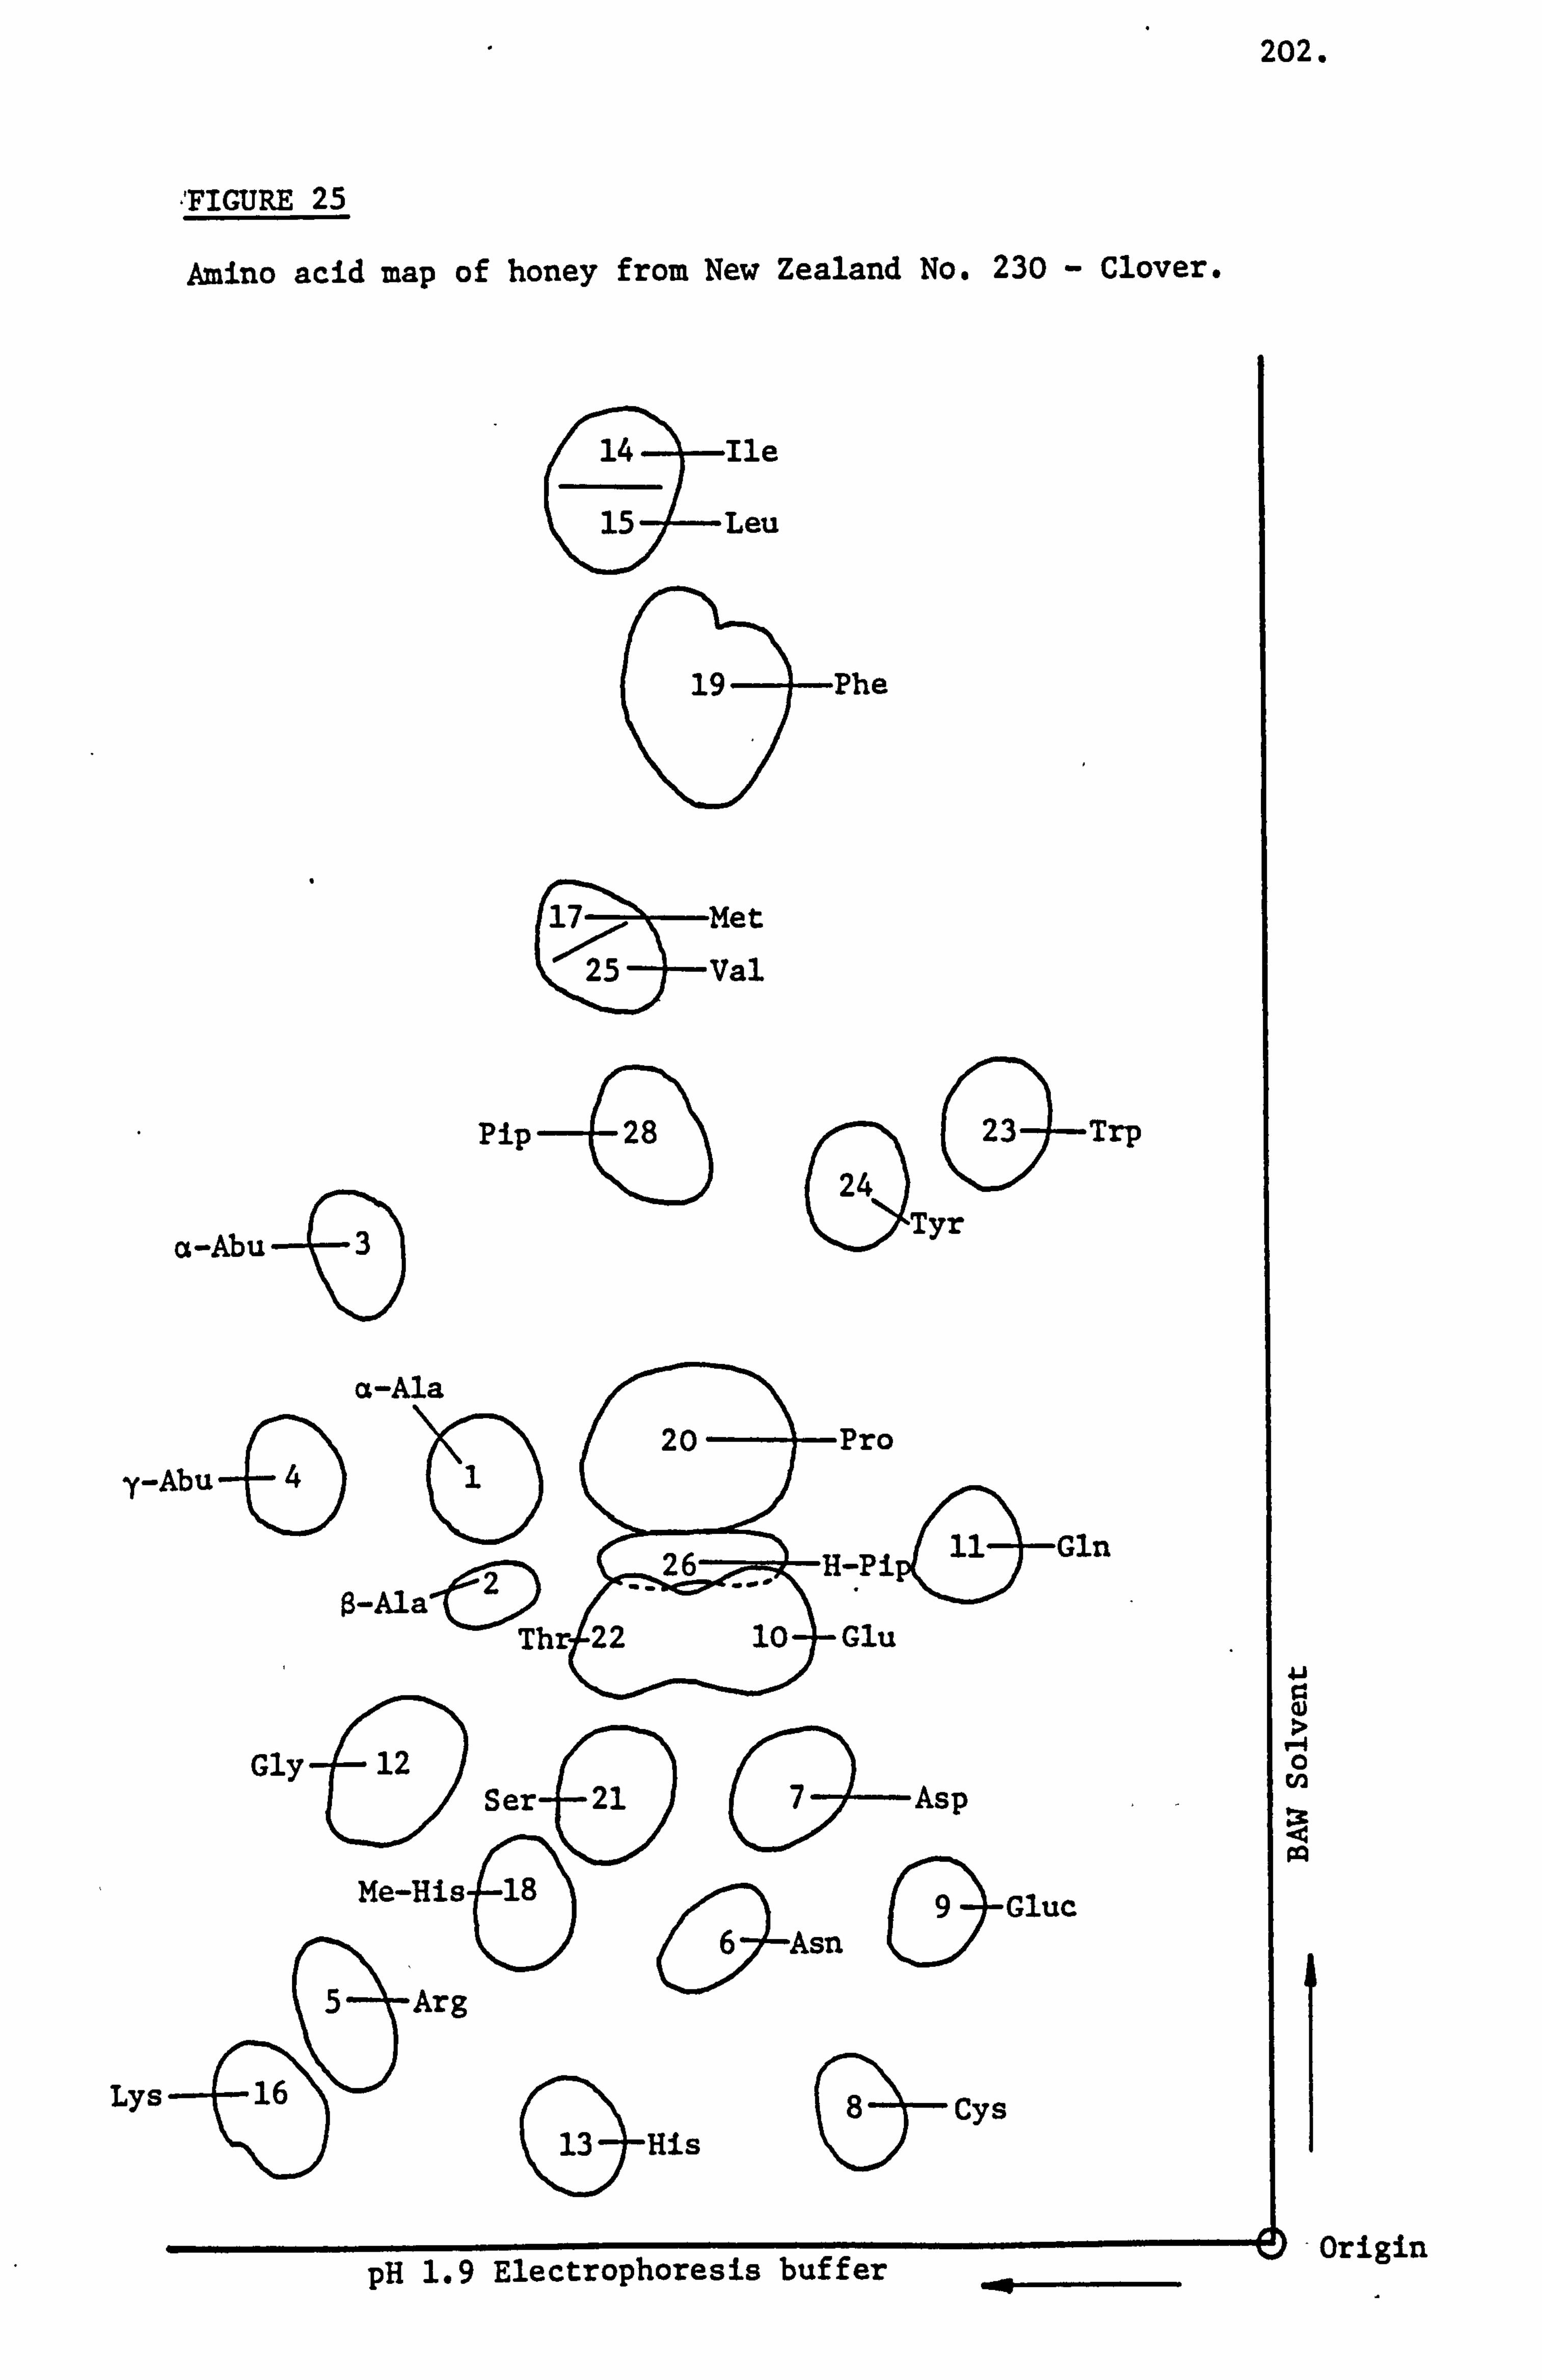
202.
TIGURE 25.
, knino acid map of honey from New Zealand No. 230 - Clover.
@ 14 Ile
Leu 15
( 17 Fet 25 Val
3 a-Abu-6
Pip - 28)
a-Ala 20
-y-Abu
G
-0 1
ß-AlalDThr 22
__26
Phe
C)
G2)3-Trp
24 Tyr
Pro
H-P, P&Gln
10 Glu
12 Gly-o Ser 21
G)-Asp
Me-His 18 Gluc
5 'Arg
-6 J-Asn
16 Lys-Q GHis Cys
pH 1.9 Electrophoresis buffer
. 1-I
�-4 0
Origin
203.
honey that were processed by the beekeeper or by commercial producers.
There were twenty one honey samples that accounted for these three groups.
The pollencontent of each sample of honey in the three groups have been
given in Table 60. The amino acid concentration measurements and the
information whether the samples were commercially processed, that is,
bottled or otherwise have been given in Table 61.
The following ninhydrin positive substances were identified on the
amino acid maps using reference standards in-each of the honey samples
within each of the three groups. These ninhydrin positive substances
were: a- and 0-alanine, a- and y-aminobutyric acid, arginine, asparagine,
aspartic acid, cysteine, glucosamine, glutamine, glutamic acid, glycine,
histidine, hydroxypipecolic acid, isoleucine, leucine, lysine, methionine,
methyl-histidine, phenylalanine, pipecolic acid, proline, serine, threonine,
tryptophan, tyrosine and valine. The differences in occurrence of the
ninhydrin positive substances on the amino acid maps were evaluated wihin
and between each of the three groups. These differences have been given
in Table 62.
Sugar Product Type
Comm rcially refined sugar products were allocated into this category
and accounted for two samples, one sample Code No. 255 was derived from
potato starch and was being sold as man made honey. The other sample
Code No. 256 was a standard sugar syrup sold at various commercial
retailers. These sugar samples did not contain pollen. The amino acid
concentration measurements have been given in Table 61.
There were no ninhydrin positive substances detected on the replicate
amino acid maps of sample Code No. 255. The following ninhydrin positive
substanceswere detected and identified on the replicate amino acid maps
of the sugar syrup sample Code No. 256 using reference standards. These
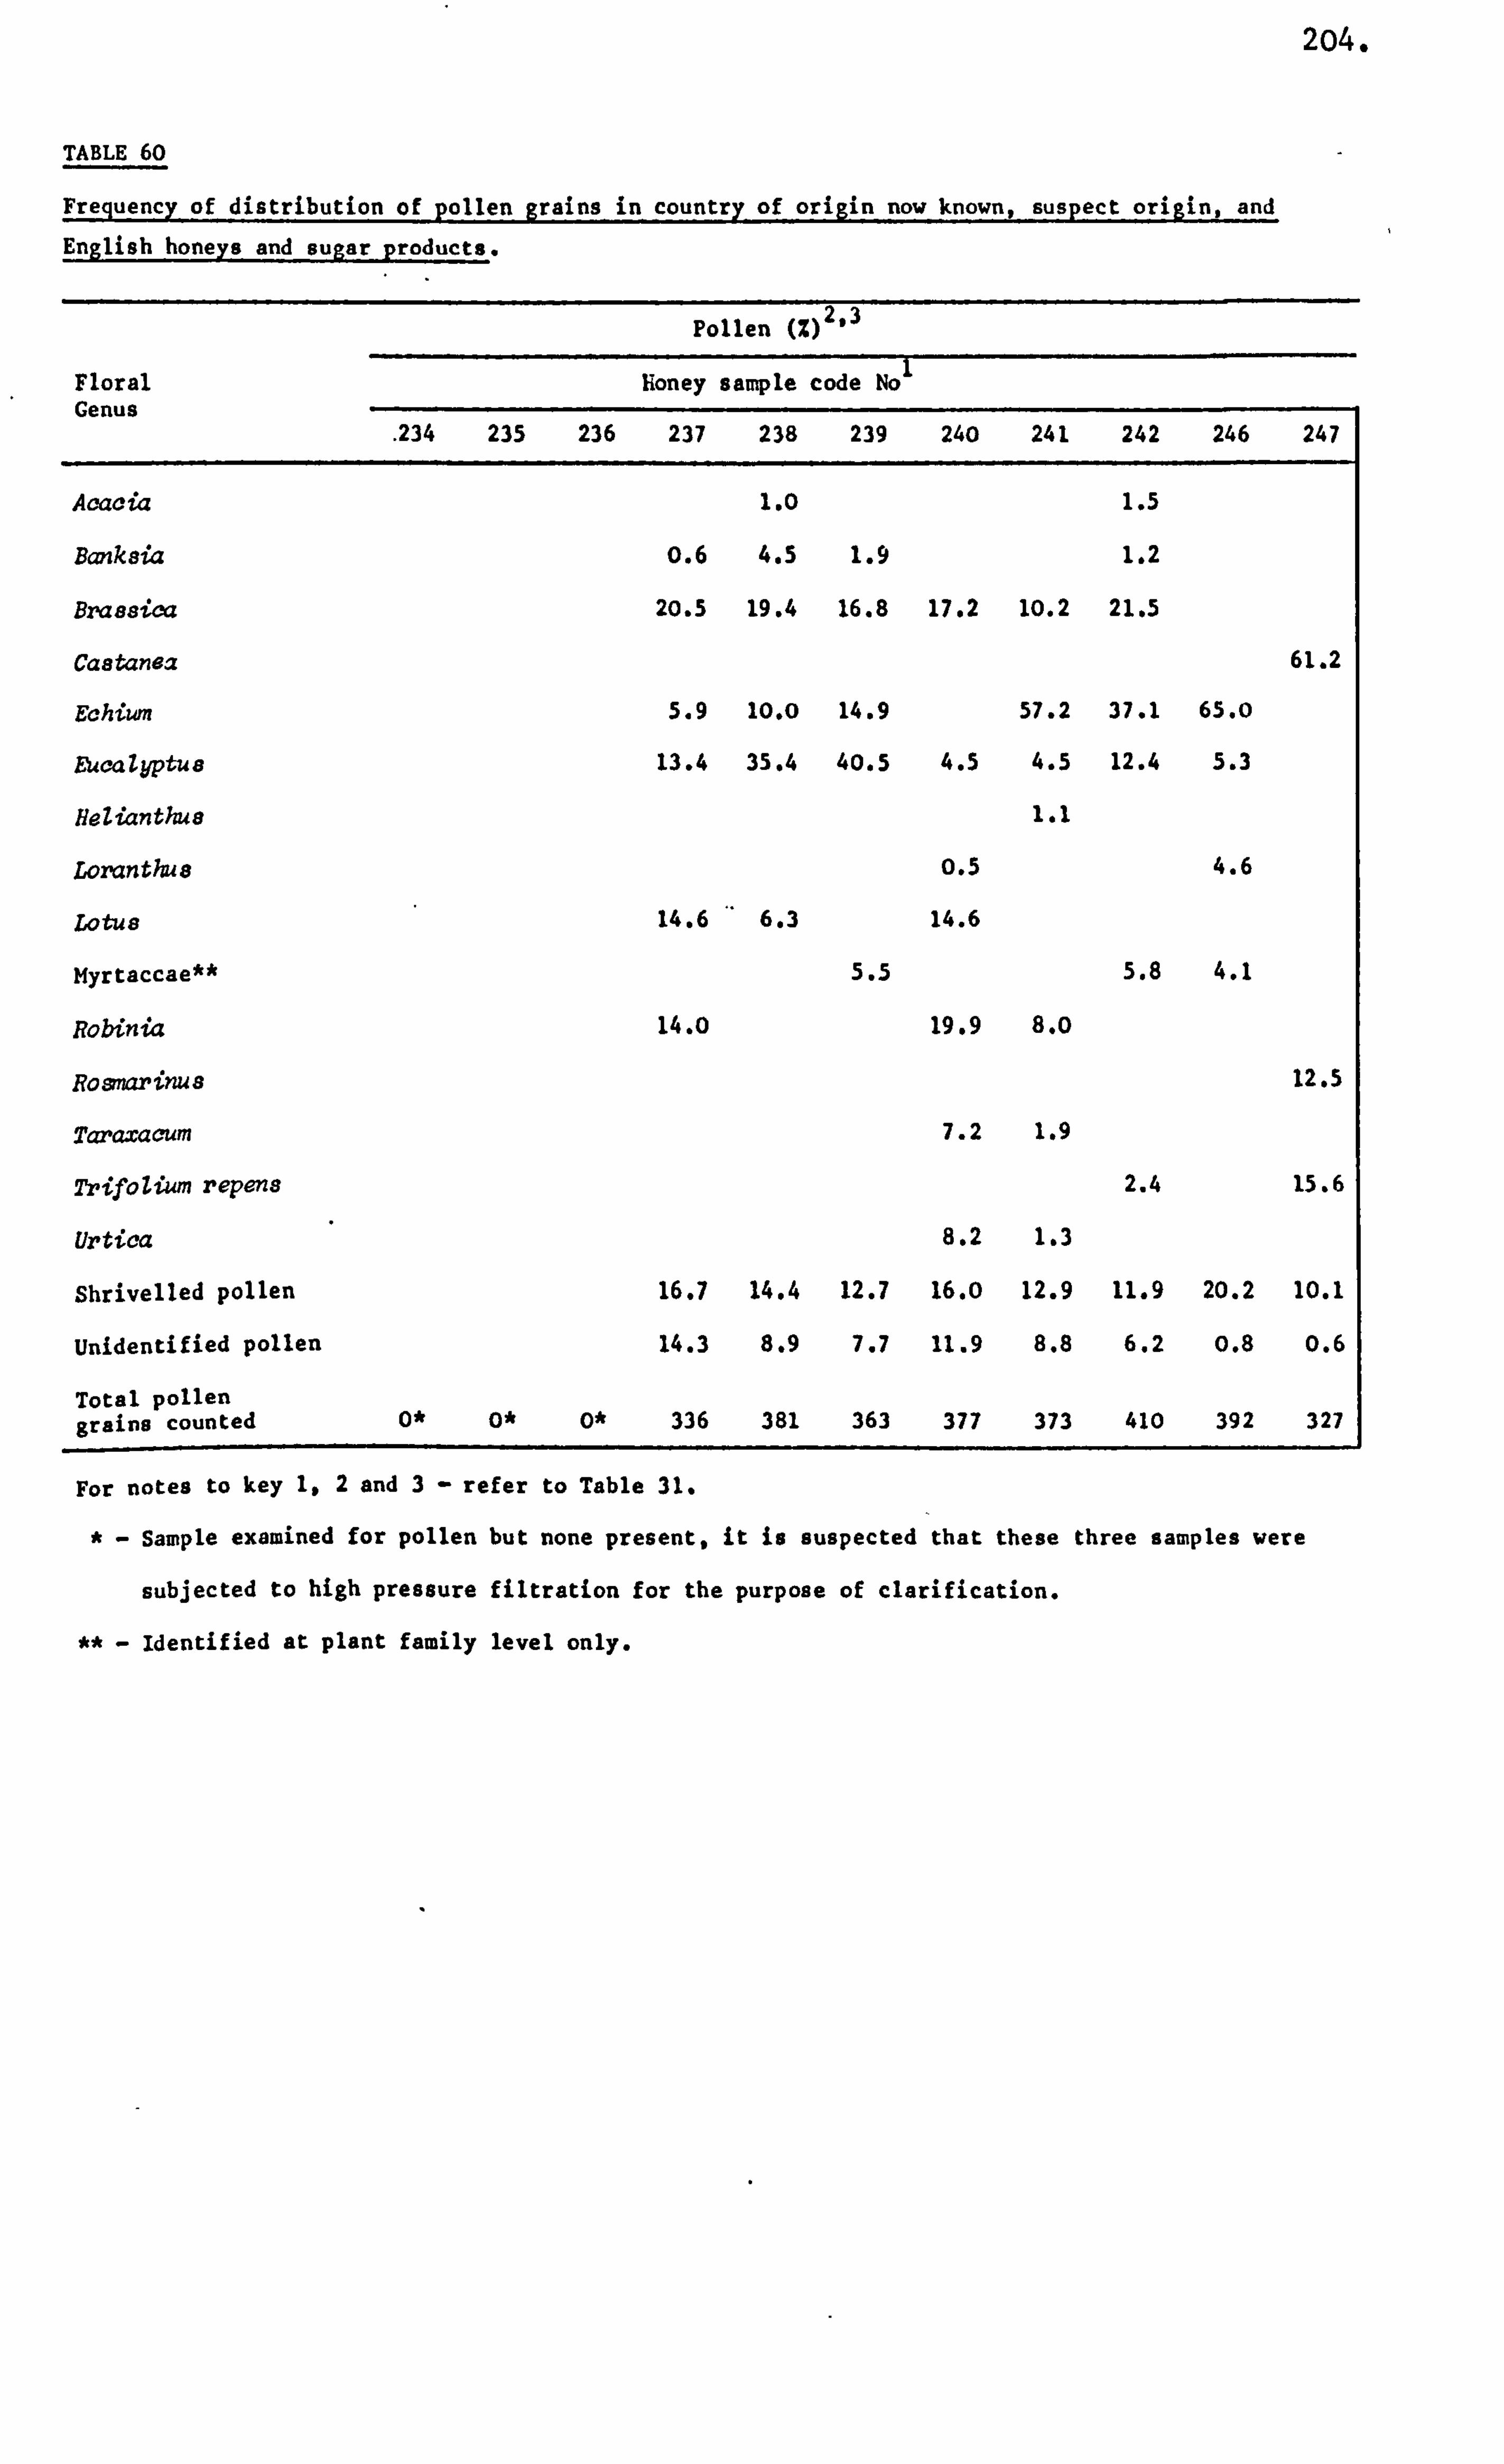
2o4.
TABLE 60
Fr"uency of distribution of pollen grains in country of origin now known, suspect origin, and
English honeys and sugar products.
Pollen Z23
Floral honey sample code No Cenus
. 234 235 236 237 238 239 240 241 242 246 247
Acacia 1.0 1.5
Banksia M 4.5 1.9 1.2
Braasica 20.5 19.4 16.8 17.2 10.2 21.5
Castanea 61.2
Echium 5.9 10.0 14.9 57.2 37.1 65.0
BucaZyptua 13.4 35.4 40.5 4.5 4.5 12.4 5.3
Helianthue 1.1
Loranthus 0.5 4.6
Lotus 14.6 6.3 14.6
Myrtaccae** 5.5 5.8 4.1
Robinia 14.0 19.9 8.0
Rosmarinus 12.5
Taraxacum 7.2 1.9
Trifolium repens 2.4 15.6
Urtica 8.2 1.3
Shrivelled pollen 16.7 14.4 12.7 16.0 12.9 11.9 20.2 10.1
Unidentified pollen 14.3 8.9 7.7 11.9 8.8 6.2 M 0.6
Total pollen grains counted 0* 0* 0* 336 381 363 377 373 410 392 327
For notes to key 1,2 and 3 refer to Table 31.
Sample examined for pollen but none present, it is suspected that these three samples were
subjected to high pressure filtration for the purpose of clarification.
Identified at plant family level only.
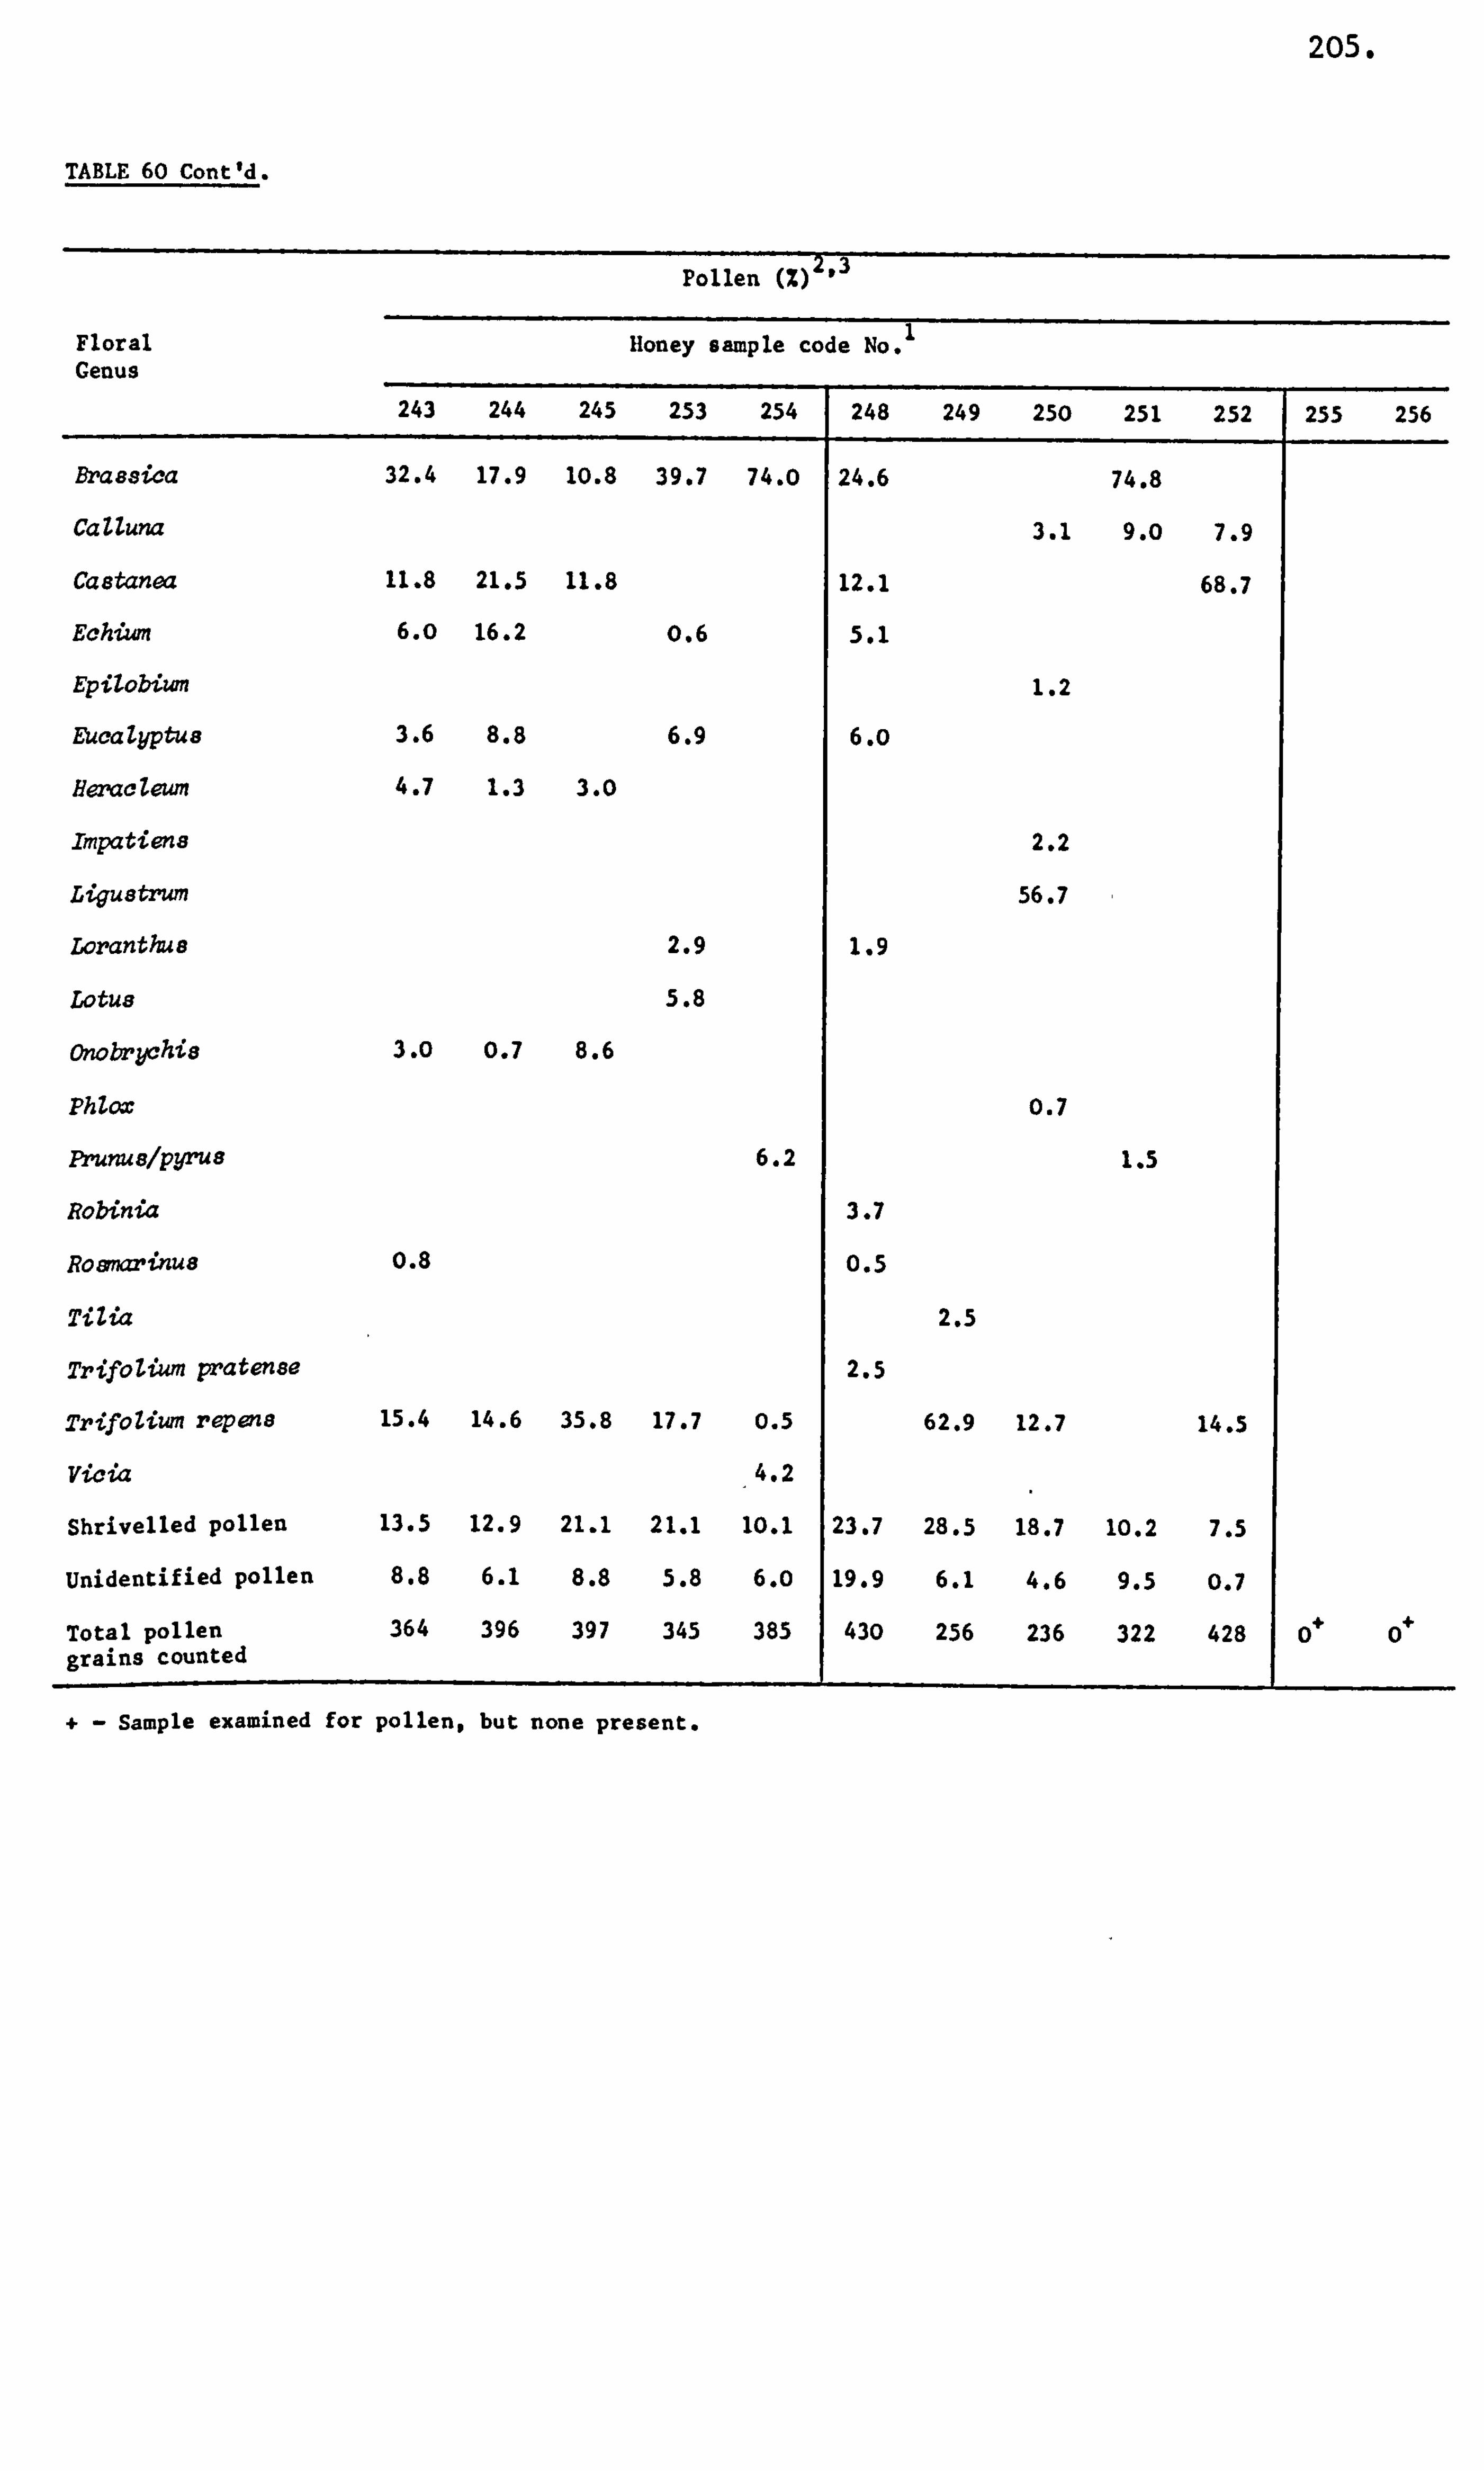
205.
TABLE 60 Cont'd.
Pollen M 2,3
Floral Honey sample code No. '
Genus
243 244 245 253 254 248 249 250 251 252 255 256
Brassica 32.4 17.9 10.8 39.7 74.0
124.6
74.8
1
CaZluna 3.1 9.0 7.9
Ca8tanea 11.8 21.5 11.8 12.1 68.7
Echium 6.0 16.2 0.6 5.1
Epilobium 1.2
Eucalyptus 3.6 8.8 6.9 6. o
Beracleum 4.7 1.3 3.0
Impatiens 2.2
Ligustrum 56.7
Loranthu8 2.9 1.9
Lotus 5.8
onobrychis 3. o 0.7 8.6
PhZox 0.7
Prunualpyru8 6.2 1.5
Robinia 3.7
Rowkwinua 0.8 0.5
TiZia 2.5
TrifoZium pratense 2.5
TrifoZium repen8 15.4 14.6 35.8 17.7 0.5 62.9 12.7 14.5
Vioia 4.2
Shrivelled pollen 13.5 12.9 21.1 21.1 10.1 23.7 28.5 18.7 10.2 7.5
Unidentified pollen 8.8 6.1 8.8 5.8 6.0 19.9 6.1 4.6 9.5 0.7
Total pollen 364 396 397 345 385 430 256 236 322 428 0+0+ grains counted
+- Sample examined for pollen, but none present,
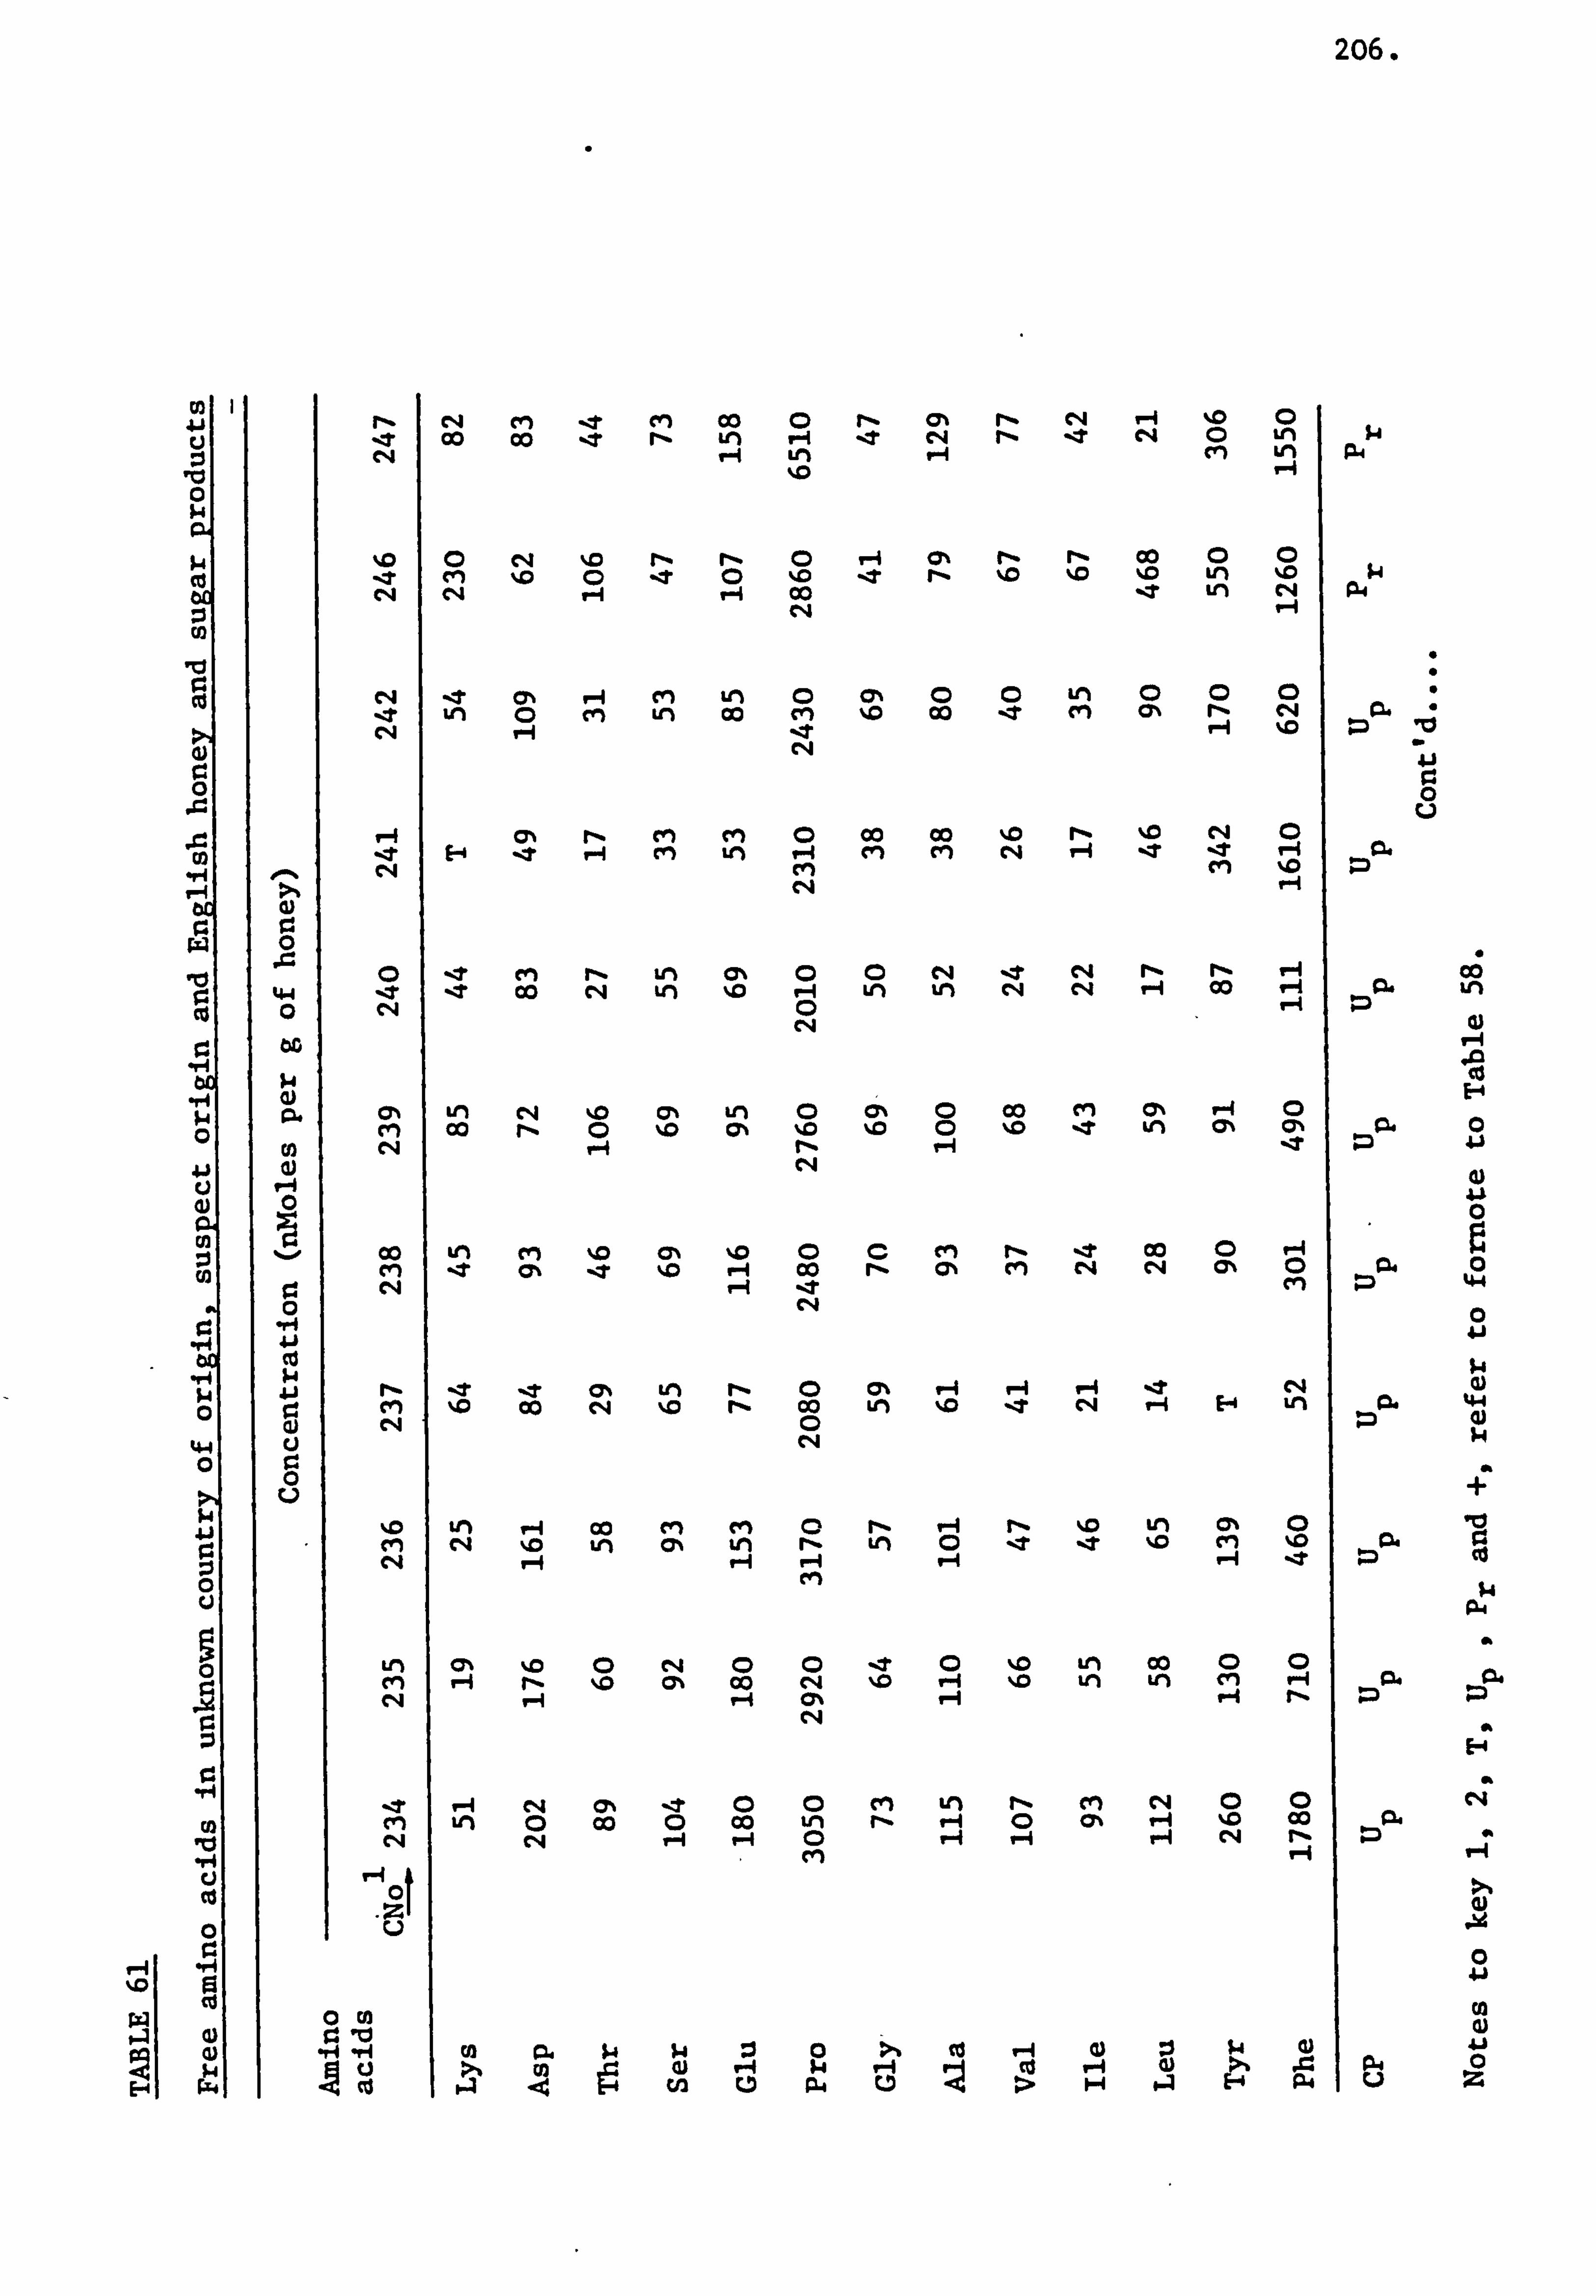
206.
03 1
Ici 0 N4
Co
10
r. co a
ý4 0
w 0
44 0
0
0
Co Iti H u 0
0
P-4 %0 9
ß4
0 A
044 0
14
0) a)
0 -H 41 co w
ci r. 0
ci
r-
C'4
eq -: r 04
v-4 _d*
C14
C7% m C*4
00 M
%D cm ed
Lr% M
1-4 01
0
e Co
rq en -t M 00 0 r_ C% r- C*4 r-i %0 0 00 Co -t r- in 7-4 _T r4 r- -t N0 LM w
P-4 LM p4
0N %0 r- rý 000 %D CD _T 0 %D in %D w
C%i r-i P-4 00 in cq P. 4
0 CD 0 in (D CIM Ln Co cm 00 -e M Cj% r- cq
1-1 -t H %0 rq
(DN r- CM cm 0 Co 00 %D rl% %0 cq 0 E-4 rHM LM 9-4 M ri NH %T -t H Ow
M CVI %D ZD
ýT 00 c4 in %D H LM im c4 c4 V-4 00 V-4 P. Ln 0
Ln cq %M C% Ln CD CY% 0 00 en c> P-4 0 00 r- CD %0 CY% %0 %0 CD %D _T km C% C% od 0
0
LM C% 10 e it C% -7 %0 P-4 Co r- cyý ci C, 4 cq C% 0 04 0
P-4 -t CVI ZD 4-4 cli 0
%0 Co r4 %0 r- 00 Ln %D _T clq V-1 H Ln 92.4-1 CD
tn P-1 Co CVI cm 0 r_ V-4 r- %D vi 0% Ici C, 4 %0 ul CIN vi r- Ln CD -t -t %0 ri ci. ci
F-4 H Co cn 1.4
P.,
C% %0 00 CD 't CD %D LM 00 00 r-i r- %0 00 c"i %D 7-4 ýo tn Ln MH 04 t2.
V-1 00 cm Ln r*ý cm rA 00 tn 0 Co CD Co vi r- 1-1 (D CY% V-1 NID Co P.
C, 4 P-f P-1 0 r-i V-4 r-4 CN r-
v-; ci V-4
0 41
rA
:100 00 W-4 wH ce 1-4
9 >b 4
4 el cn 0 914 u1> 1-4 AH p4
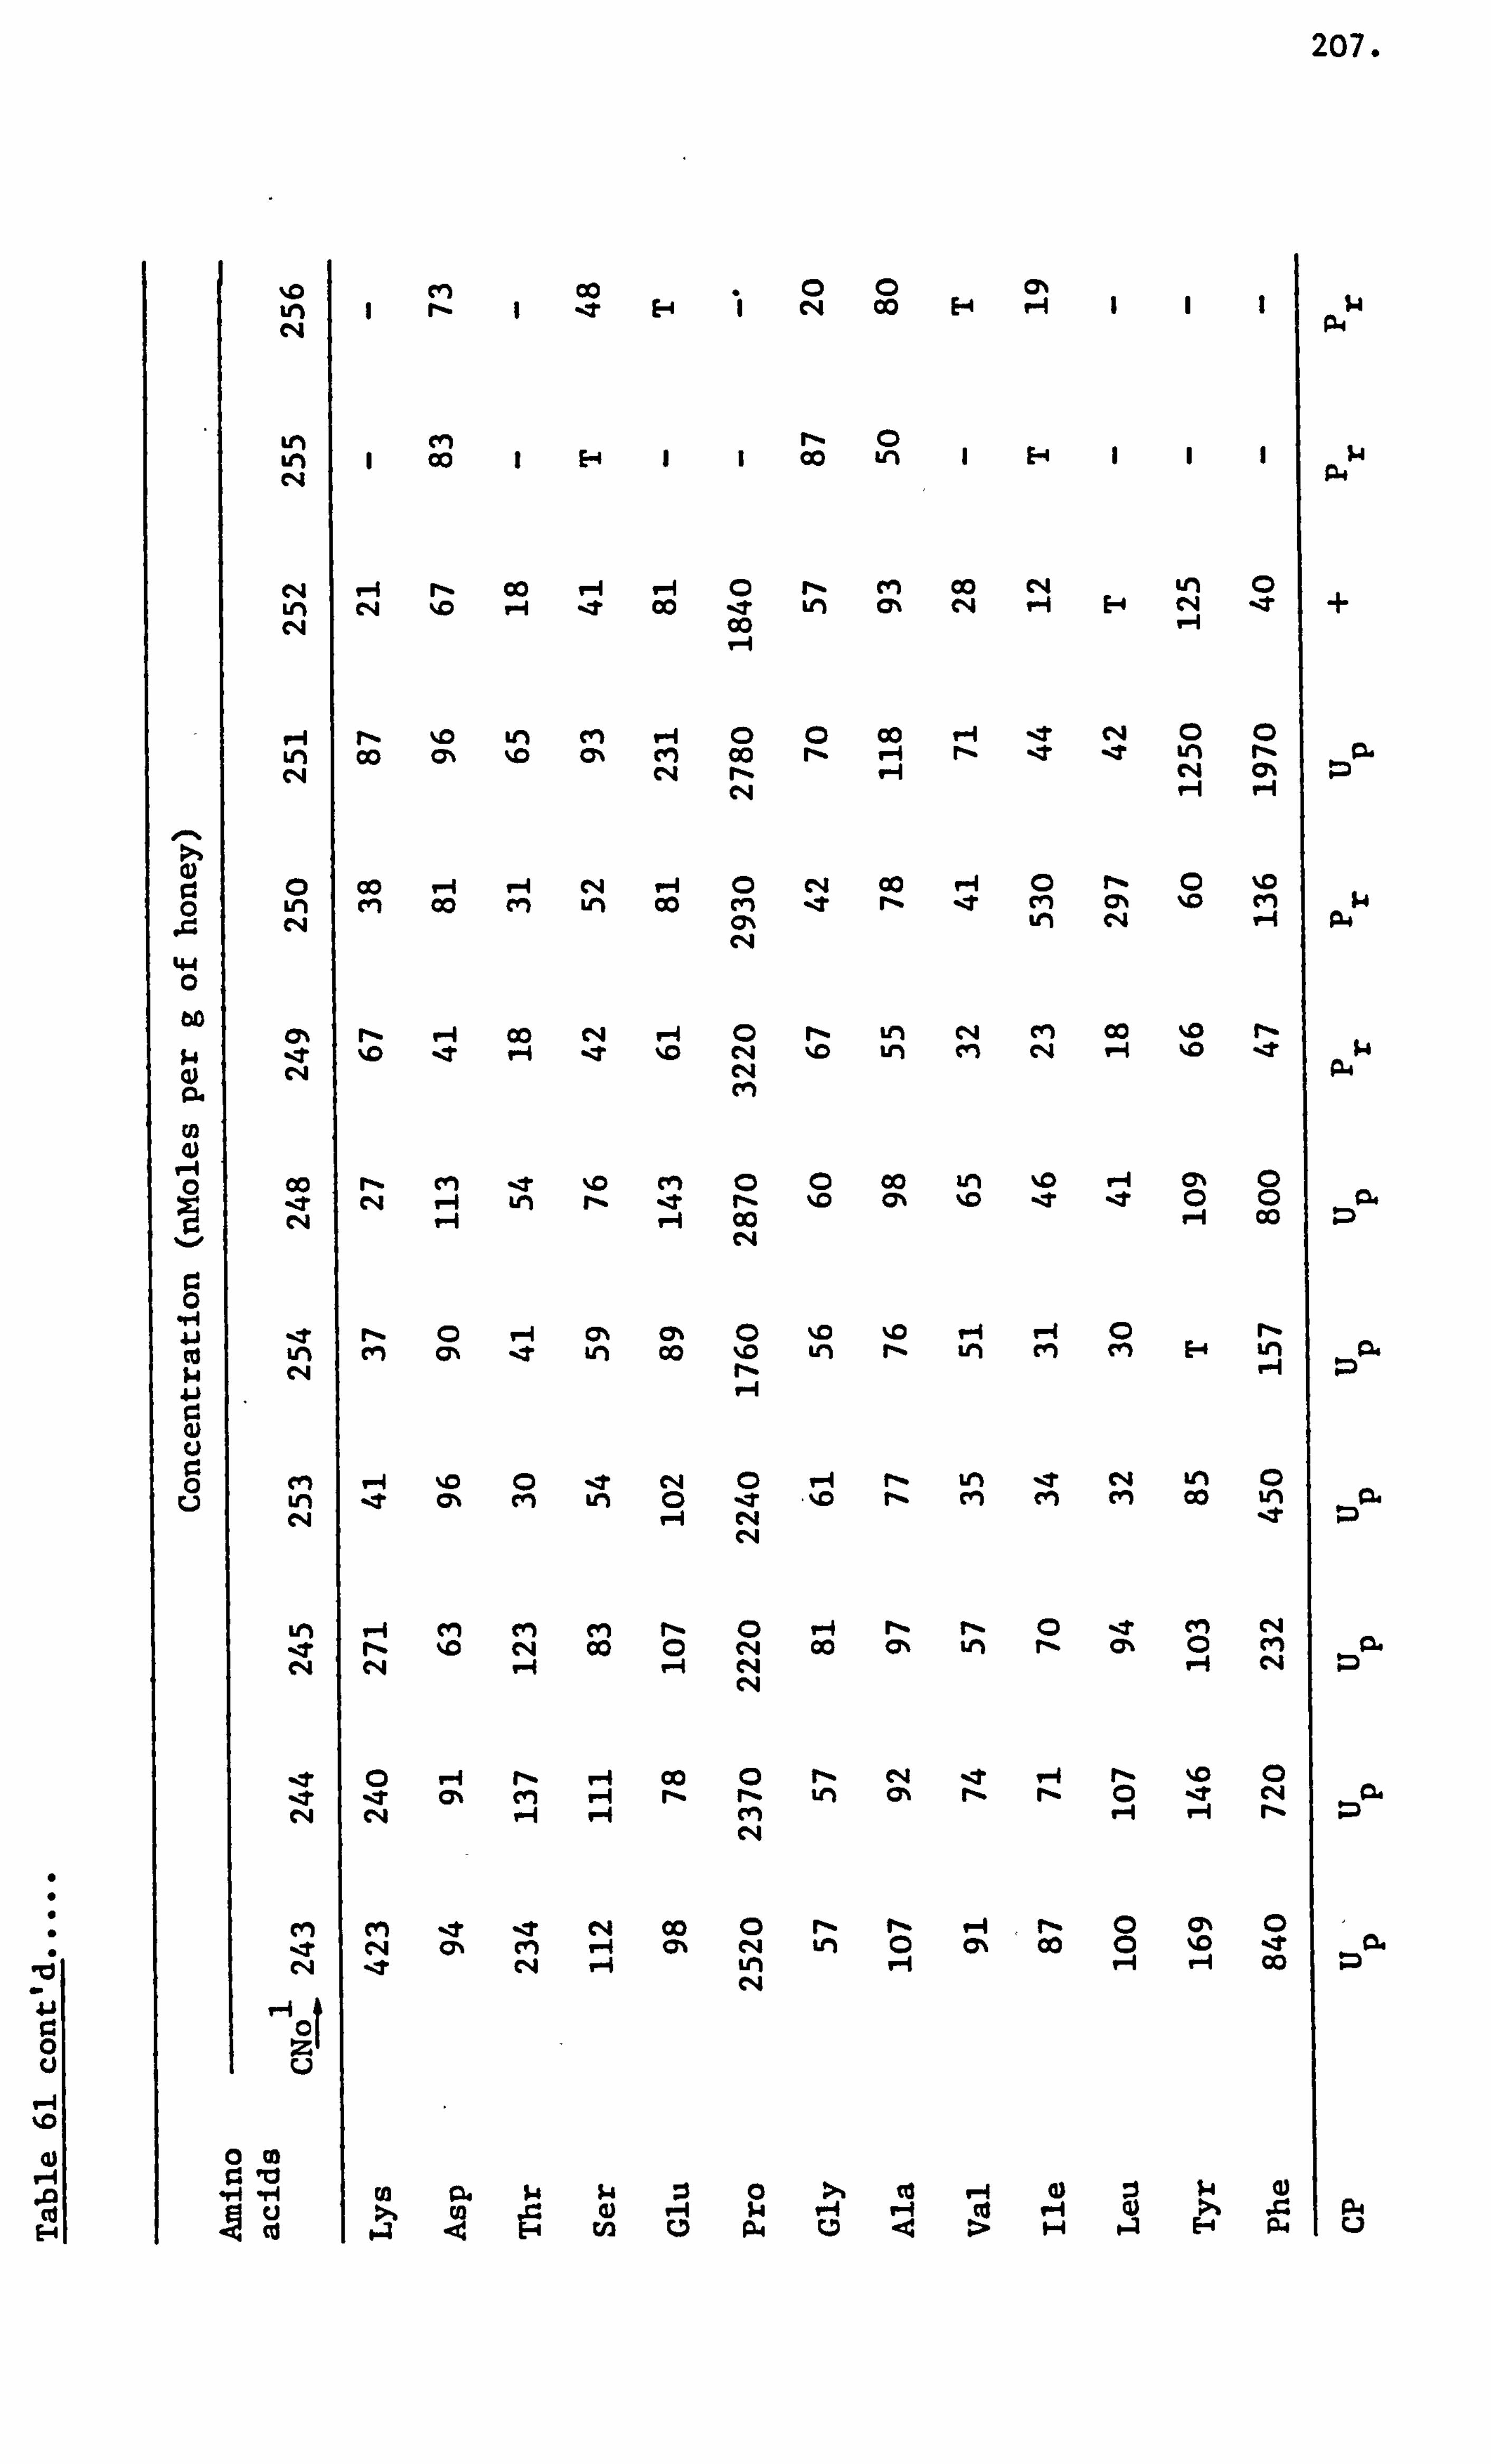
207.
IM
ai
0 A
44 0
Q.
w 4)
1-4 0
0 -rq Ai
4)
0 u
%0 tn c4
Lt) LM r-A
eli LM cq
P-1 gn C, 4
0
LM C, 4
r4
CO e
CN
M 't C, 4
r4 lii
c4 00 E-4 14 P. 4
cm rlý 0 1 Co 1 E-4 1 1 Co tn 1 E-4 1 1 1 N4
r-i r- 00 V-4 P-A 0 r_ en Co C, 4 Kri 0 ýt 00 -t Le) C% clq P-1 E-4 N -t +
00 V-1 V-1
r- %D LM M P-1 0 0 00 --t C, 4 0 0 00 C% %D C% (n 00 r- r-i -t _T Lri r_ 93.
C, 4 rlý C, 4 0% ZD clq H H
00 V-1 P-4 clq P-1 0 c14 Co 0 %0 M 00 M Ln 00 M _T r- -t M C7N %0 ri w
(2% V) C*4
r- Co rq P-4 0 r_ Ln M Co %D r- %D H _T %D e4 %D Ln M cli V-4 %D -zt w
C%i P. 4 ci
r- M ýT %D cm 0 0 Co km %D P-4 C% 0 cq ýT r- %D 0 (D
P-4 00 r-4 00 c4
rý CD P-4 CY% Cj% 0 %D %0 P-l ei CD r- M CD, % -t wi 00 %0 vi r- Lri cm cm E-4 Ln 93-
r-
t (3% M Lri 0 IT . %0 r- cm cm cm 00 Lm 0. f-4 r14 -t :D
r- %D C, 4 00 0 C, 4 Co C% tri fl- C% 0 cyl 92. CN 1-4 P-4 C, 4 H c%& :D
CN
0 P-4 r- r4 00 0 r- cq -t V-4 r- 10 0 zr Cl% M H r- rý tn t2.
CN cm c4
cm -4 -e N 00 0 r- rý --1 , r- 0 C% cq (: cm P-4 0% C*4 LM 0 0% Co 0 Im
LM C, 4
:1 0 Co r-4 0 :1 >% ril 0 P-1 ý4 P-4 H Co V-4 0 :, 4 p4 A < 19 rn 0 p4 u 9 H e2 E-4 p4 ci
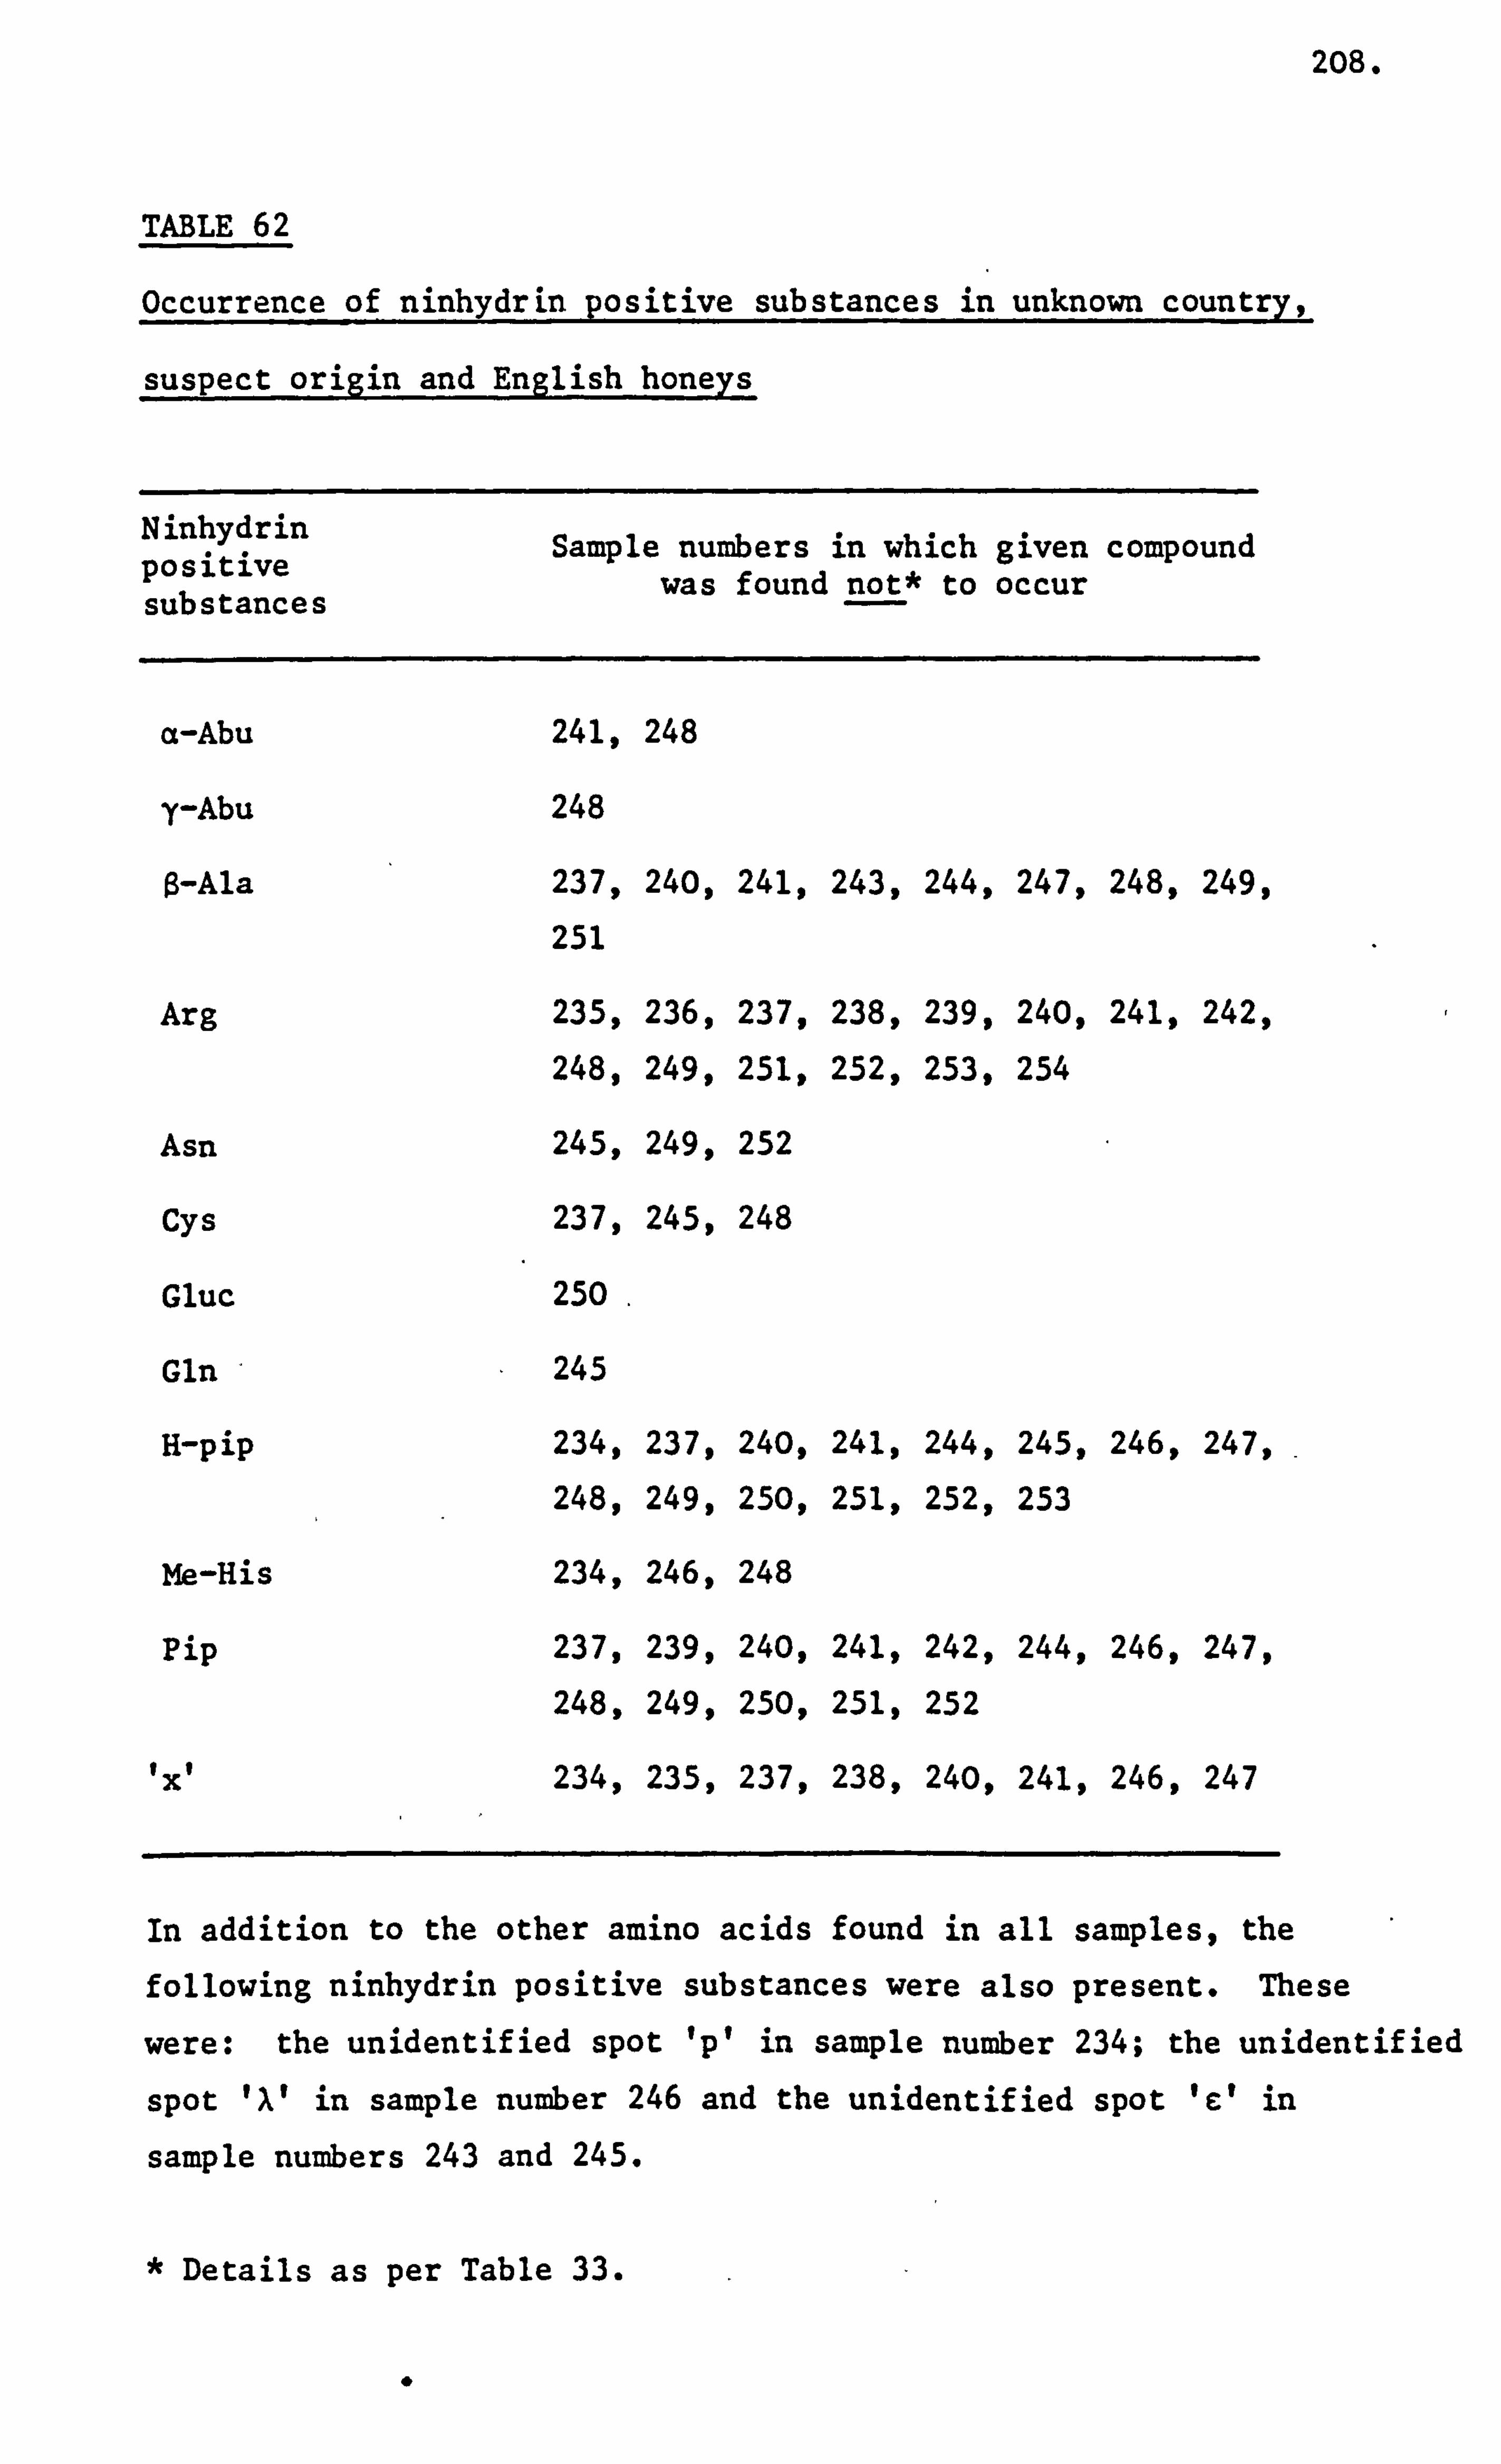
208.
TABLE 62
Occurrence of ninhydrin positive substances in unknown country,
suspect origin and English honeys
Ninhydrin Sample numbers in which given compound positive was found not* to occur substances
a-Abu 241,248
y-Abu 248
a-Ala 237,240,241,243,244,247,248,249,
251
Arg 235,236,237,238,239,240,241,242,
248,249,251,252,253,254
Asn 245,249,252
Cys 237,245,248
Gluc 250 .
Gln 245
H-pip 234,237,240,241,244,245,246,247,
248,249,250,251,252,253
Me-His 234,246,248
Pip 237,239,240,241,242,244,246,247,
248,249,250,251,252
1XI 234,235,237,238,240,241,246,247
In addition to the other amino acids found in all samples, the following ninhydrin positive substances were also present. These
were: the unidentified spot 'p' in sample number 234; the unidentified
spot 1XI in sample number 246 and the unidentified spot 'c' in
sample numbers 243 and 245.
* Details as per Table 33.
.
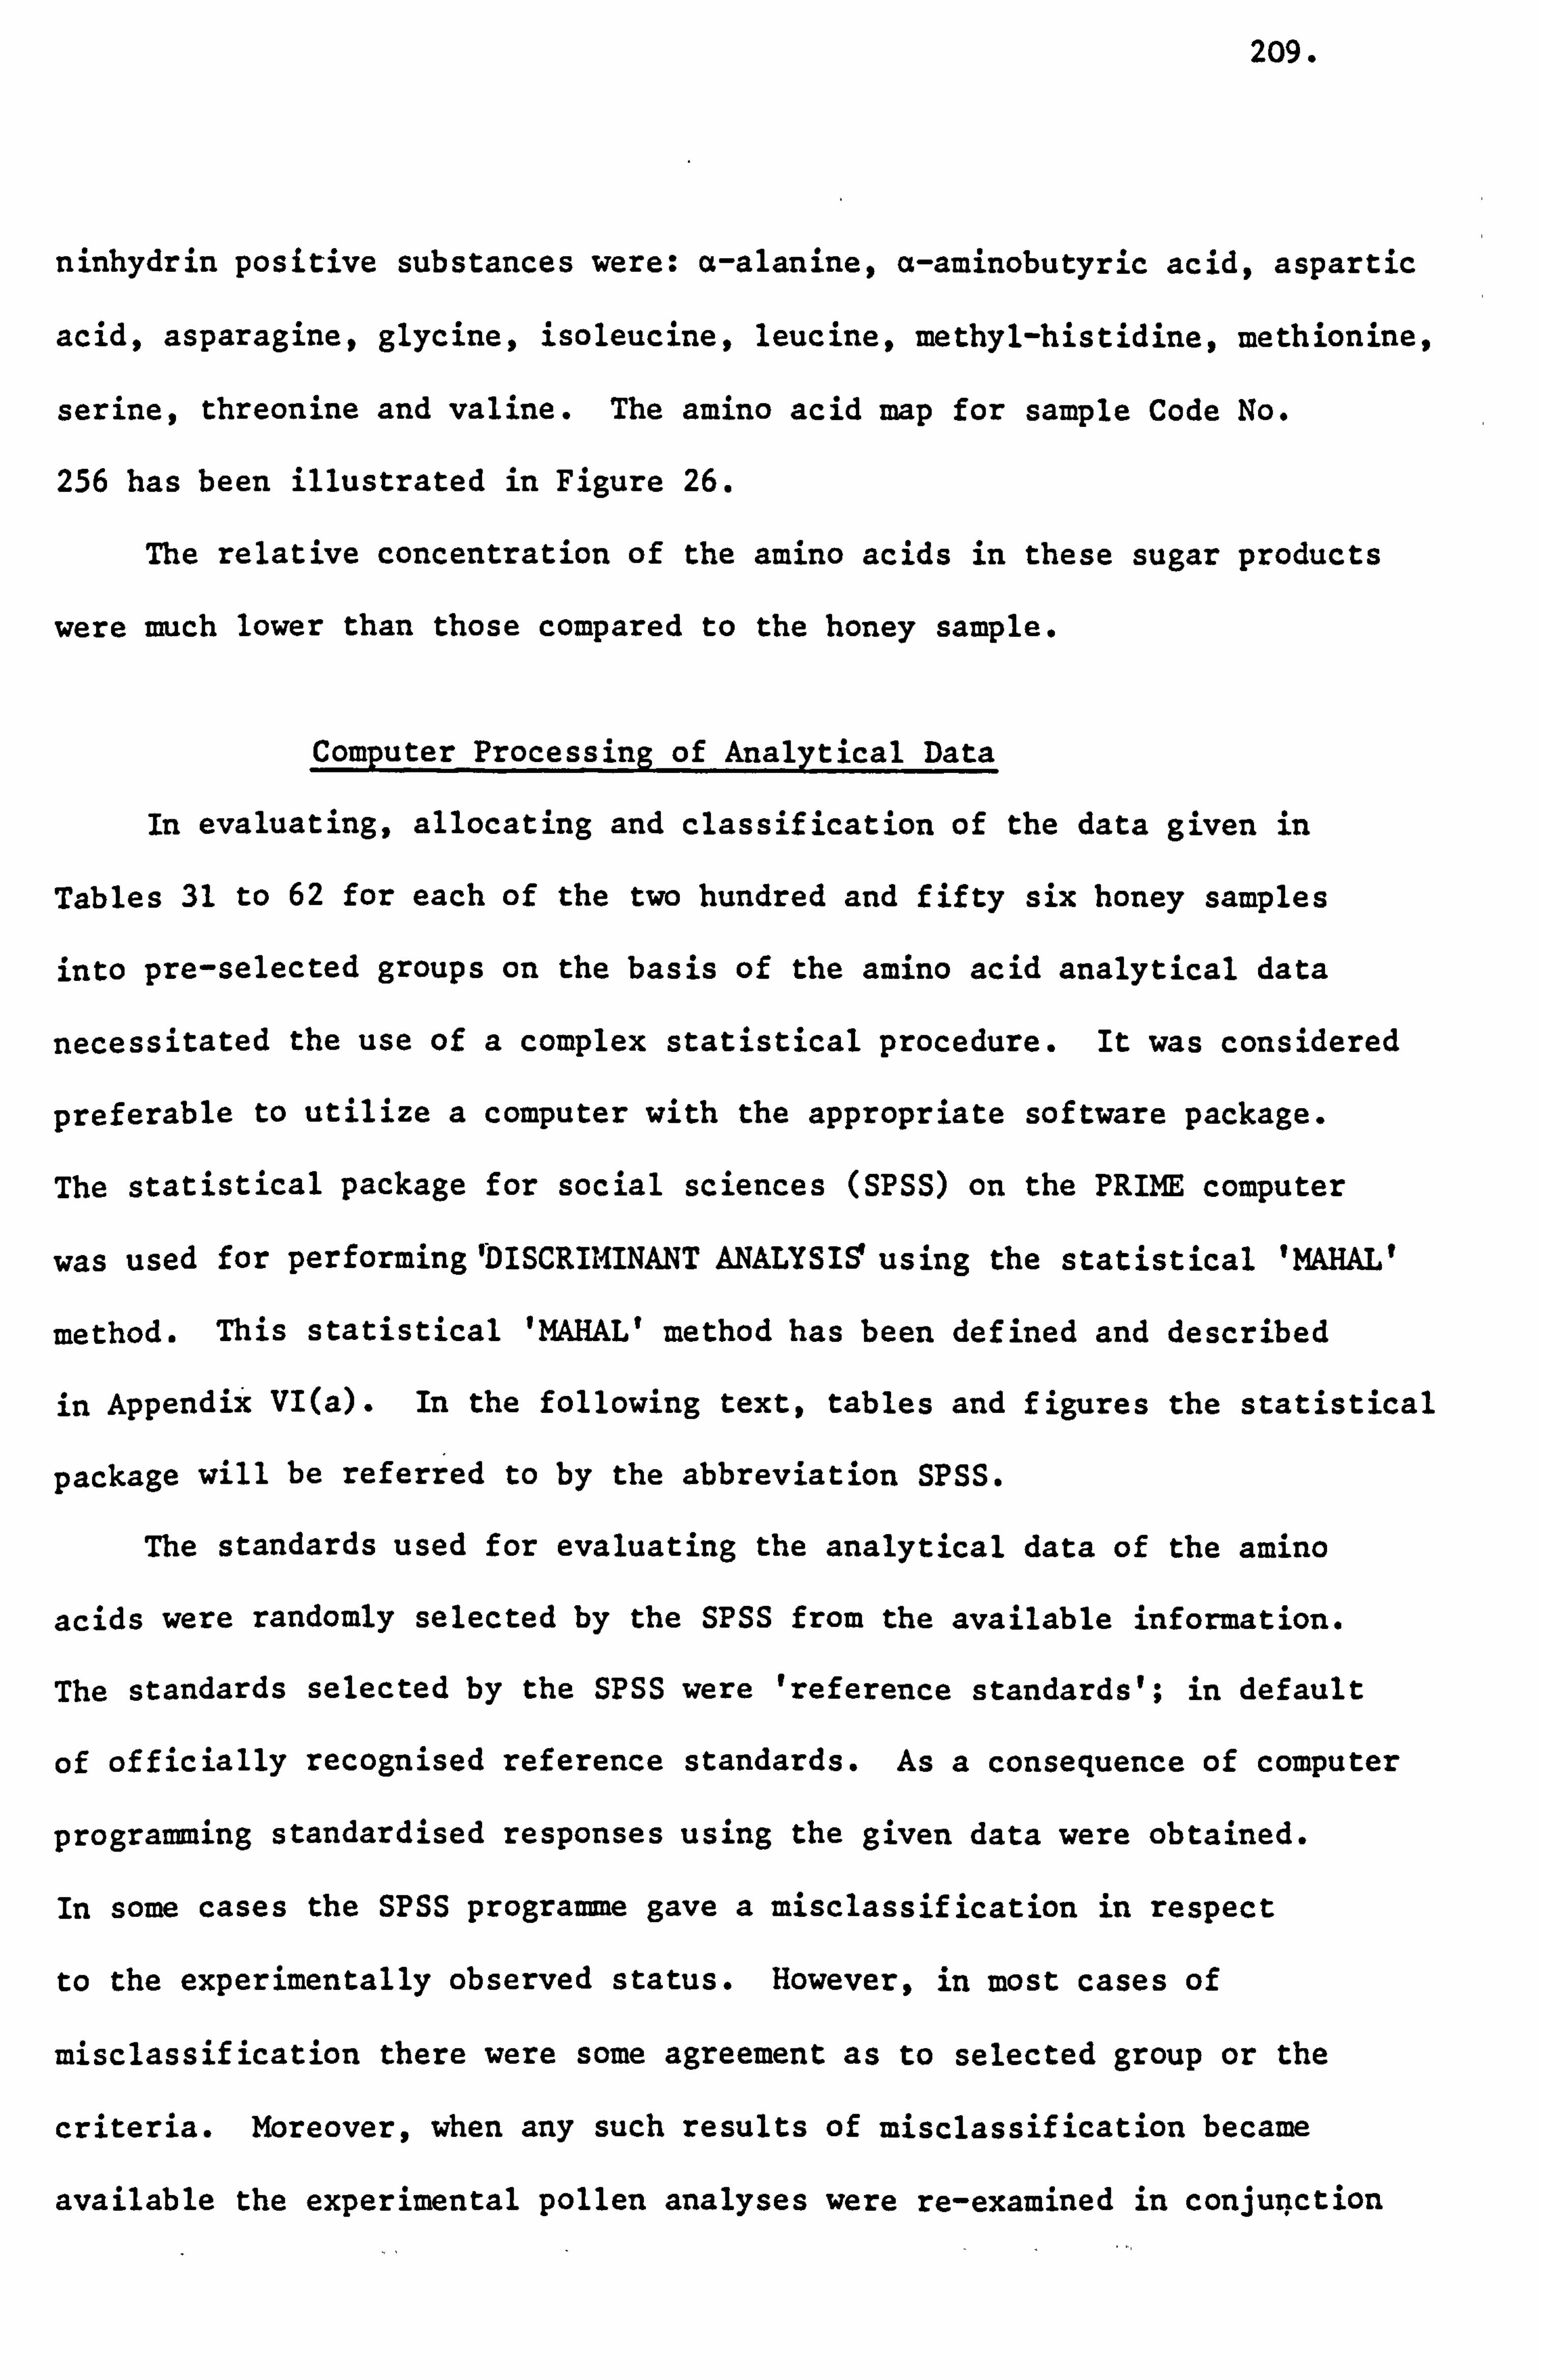
209.
ninhydrin positive substances were: a-alanine, a-aminobutyric acid, aspartic
acid, asparagine, glycine, isoleucine, leucine, methyl-histidine, methionine,
serine, threonine and valine. The amino acid map for sample Code No.
256 has been illustrated in Figure 26.
The relative concentration of the amino acids in these sugar products
were much lower than those compared to the honey sample.
Computer Processing of Analytical Data
In evaluating, allocating and classification of the data given in
Tables 31 to 62 for each of the two hundred and fifty six honey samples
into pre-selected groups on the basis of the amino acid analytical data
necessitated the use of a complex statistical procedure. It was considered
preferable to utilize a computer with the appropriate software package.
The statistical package for social sciences (SPSS) on the PRIME computer
was used for performing'DISCRIMINANT ANALYSIS! using the statistical 'MAHAL'
method. This statistical 'MAHAL' method has been defined and described
in Appendix VI(a). In the following text, tables and figures the statistical
package will be referred to by the abbreviation SPSS.
The standards used for evaluating the analytical data of the amino
acids were randomly selected by the SPSS from the available information.
The standards selected by the SPSS were 'reference standards'; in default
of officially recognised reference standards. As a consequence of computer
programming standardised responses using the given data were obtained.
In some cases the SPSS programme gave a misclassification in respect
to the experimentally observed status. However, in most cases of
misclassification there were some agreement as to selected group or the
criteria. Moreover, when any such results of misclassification became
available the experimental pollen analyses were re-examined in conjur)ction
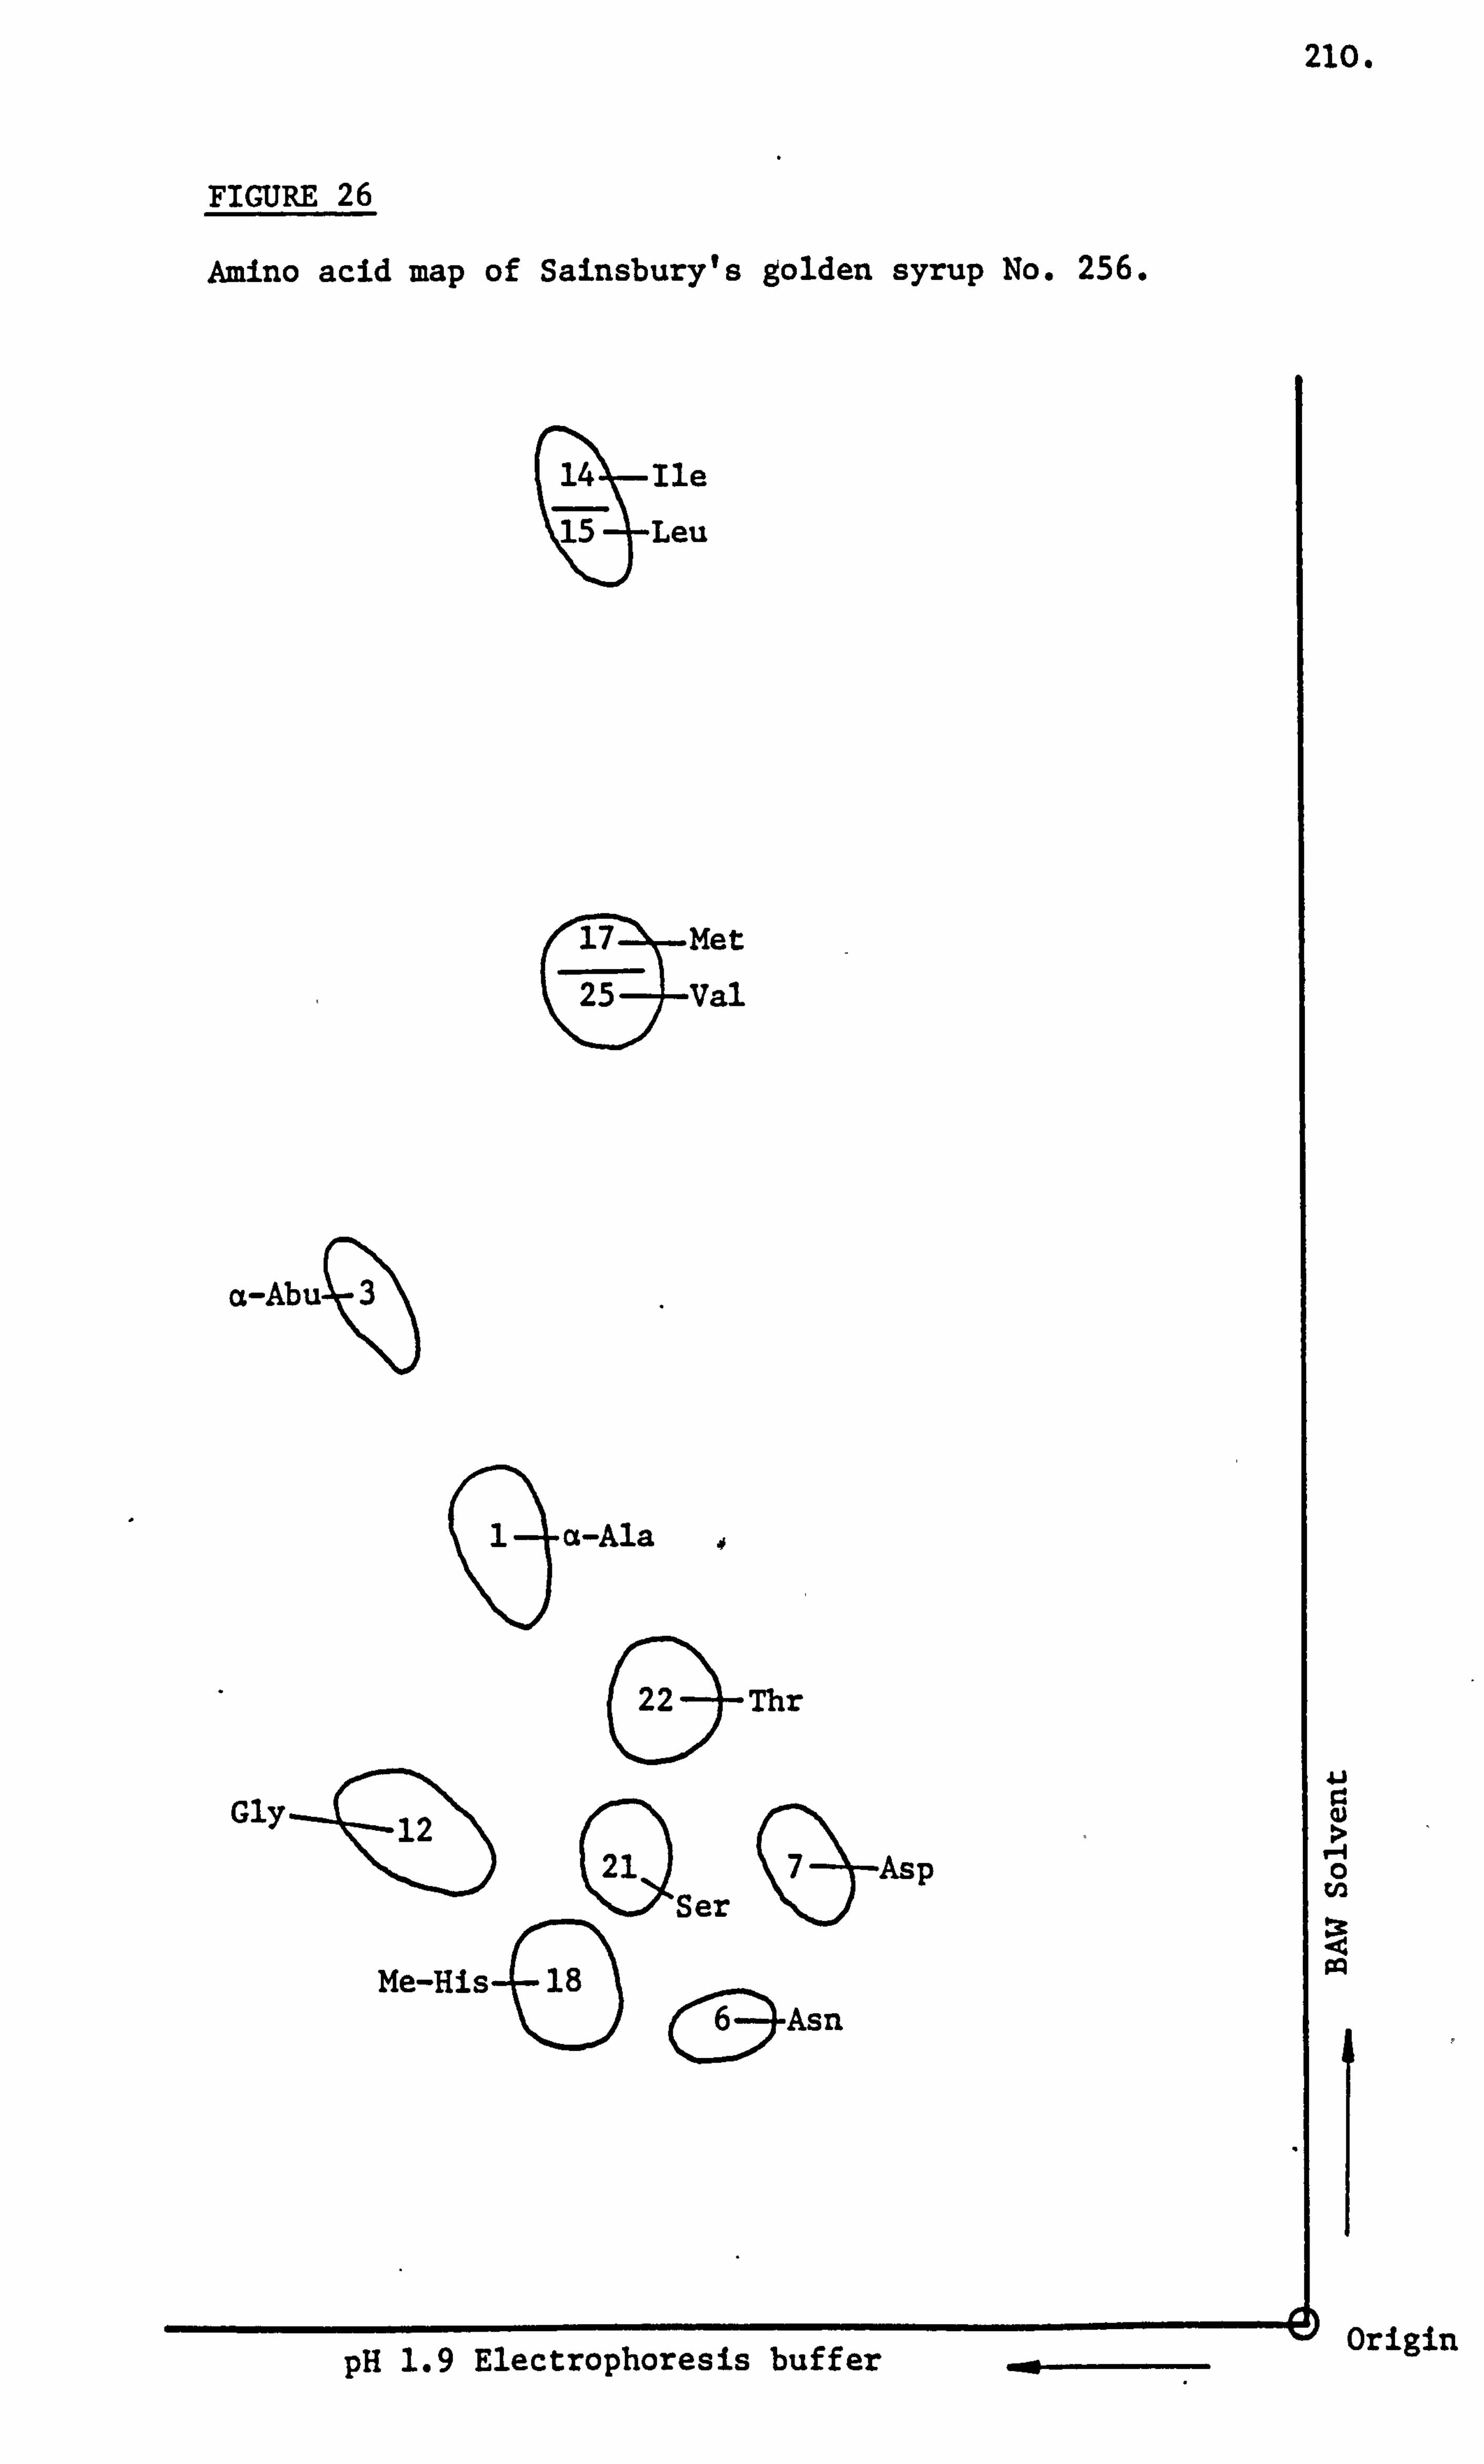
210.
FIGURE 26
Amino acid map of Sainsbury's golden syrup No. 256.
0
Origin pH 1.9 Electrophoresis buffer
211.
with the paper electrophoresis and chromatography amino acid patterns,
which were not given to the computer becuase of their qualitative nature.
The experimental origins take account of any such reassessment and are
as stated.
The merits of this SPSS predictive classification and the present
dangers of misclassification by the SPSS have been dealt with in the
discussion.
Analyses of Samples from the United Kingdom Survey Honeys
Computer placements of honey samples into pollen groups
Honey samples of*ýthe predominant pollen type were selected for
discriminant analysis using the specifications listed in control
statements 55 to 63 of the SPSS control file given in Appendix IV(b).
A selected range of amino acid concentration measurements were allocated
an arbitary number so as to reduce the number of variables processed
by the SPSS as detailed in Appendix VI(b). The predicted classification
of the predominant pollen type honey samples into nine groups by the
SPSS have been given in Table 63. These samples were classified on the
basis of the amino acids for which the Fisher's linear discriminant functions
were calculated and then these amino acids were entered into the discriminant
analysis. These amino acids were: aspartic acid, serine, glutamic acid,
proline, glycine, alanine, valine, isoleucine, leucine, phenylalanine
and a constant derived by the SPSS. The SPSS selected one hundred and
four honey samples and of these only 45.2% were correctly classified
into their respective pollen groups.
-The amino acid measurements were modified as described and the pollen
groups containing inadequate sample numbers were ommited from analysis.
Hence, five pollen groups thought to contain adequate sample numbers
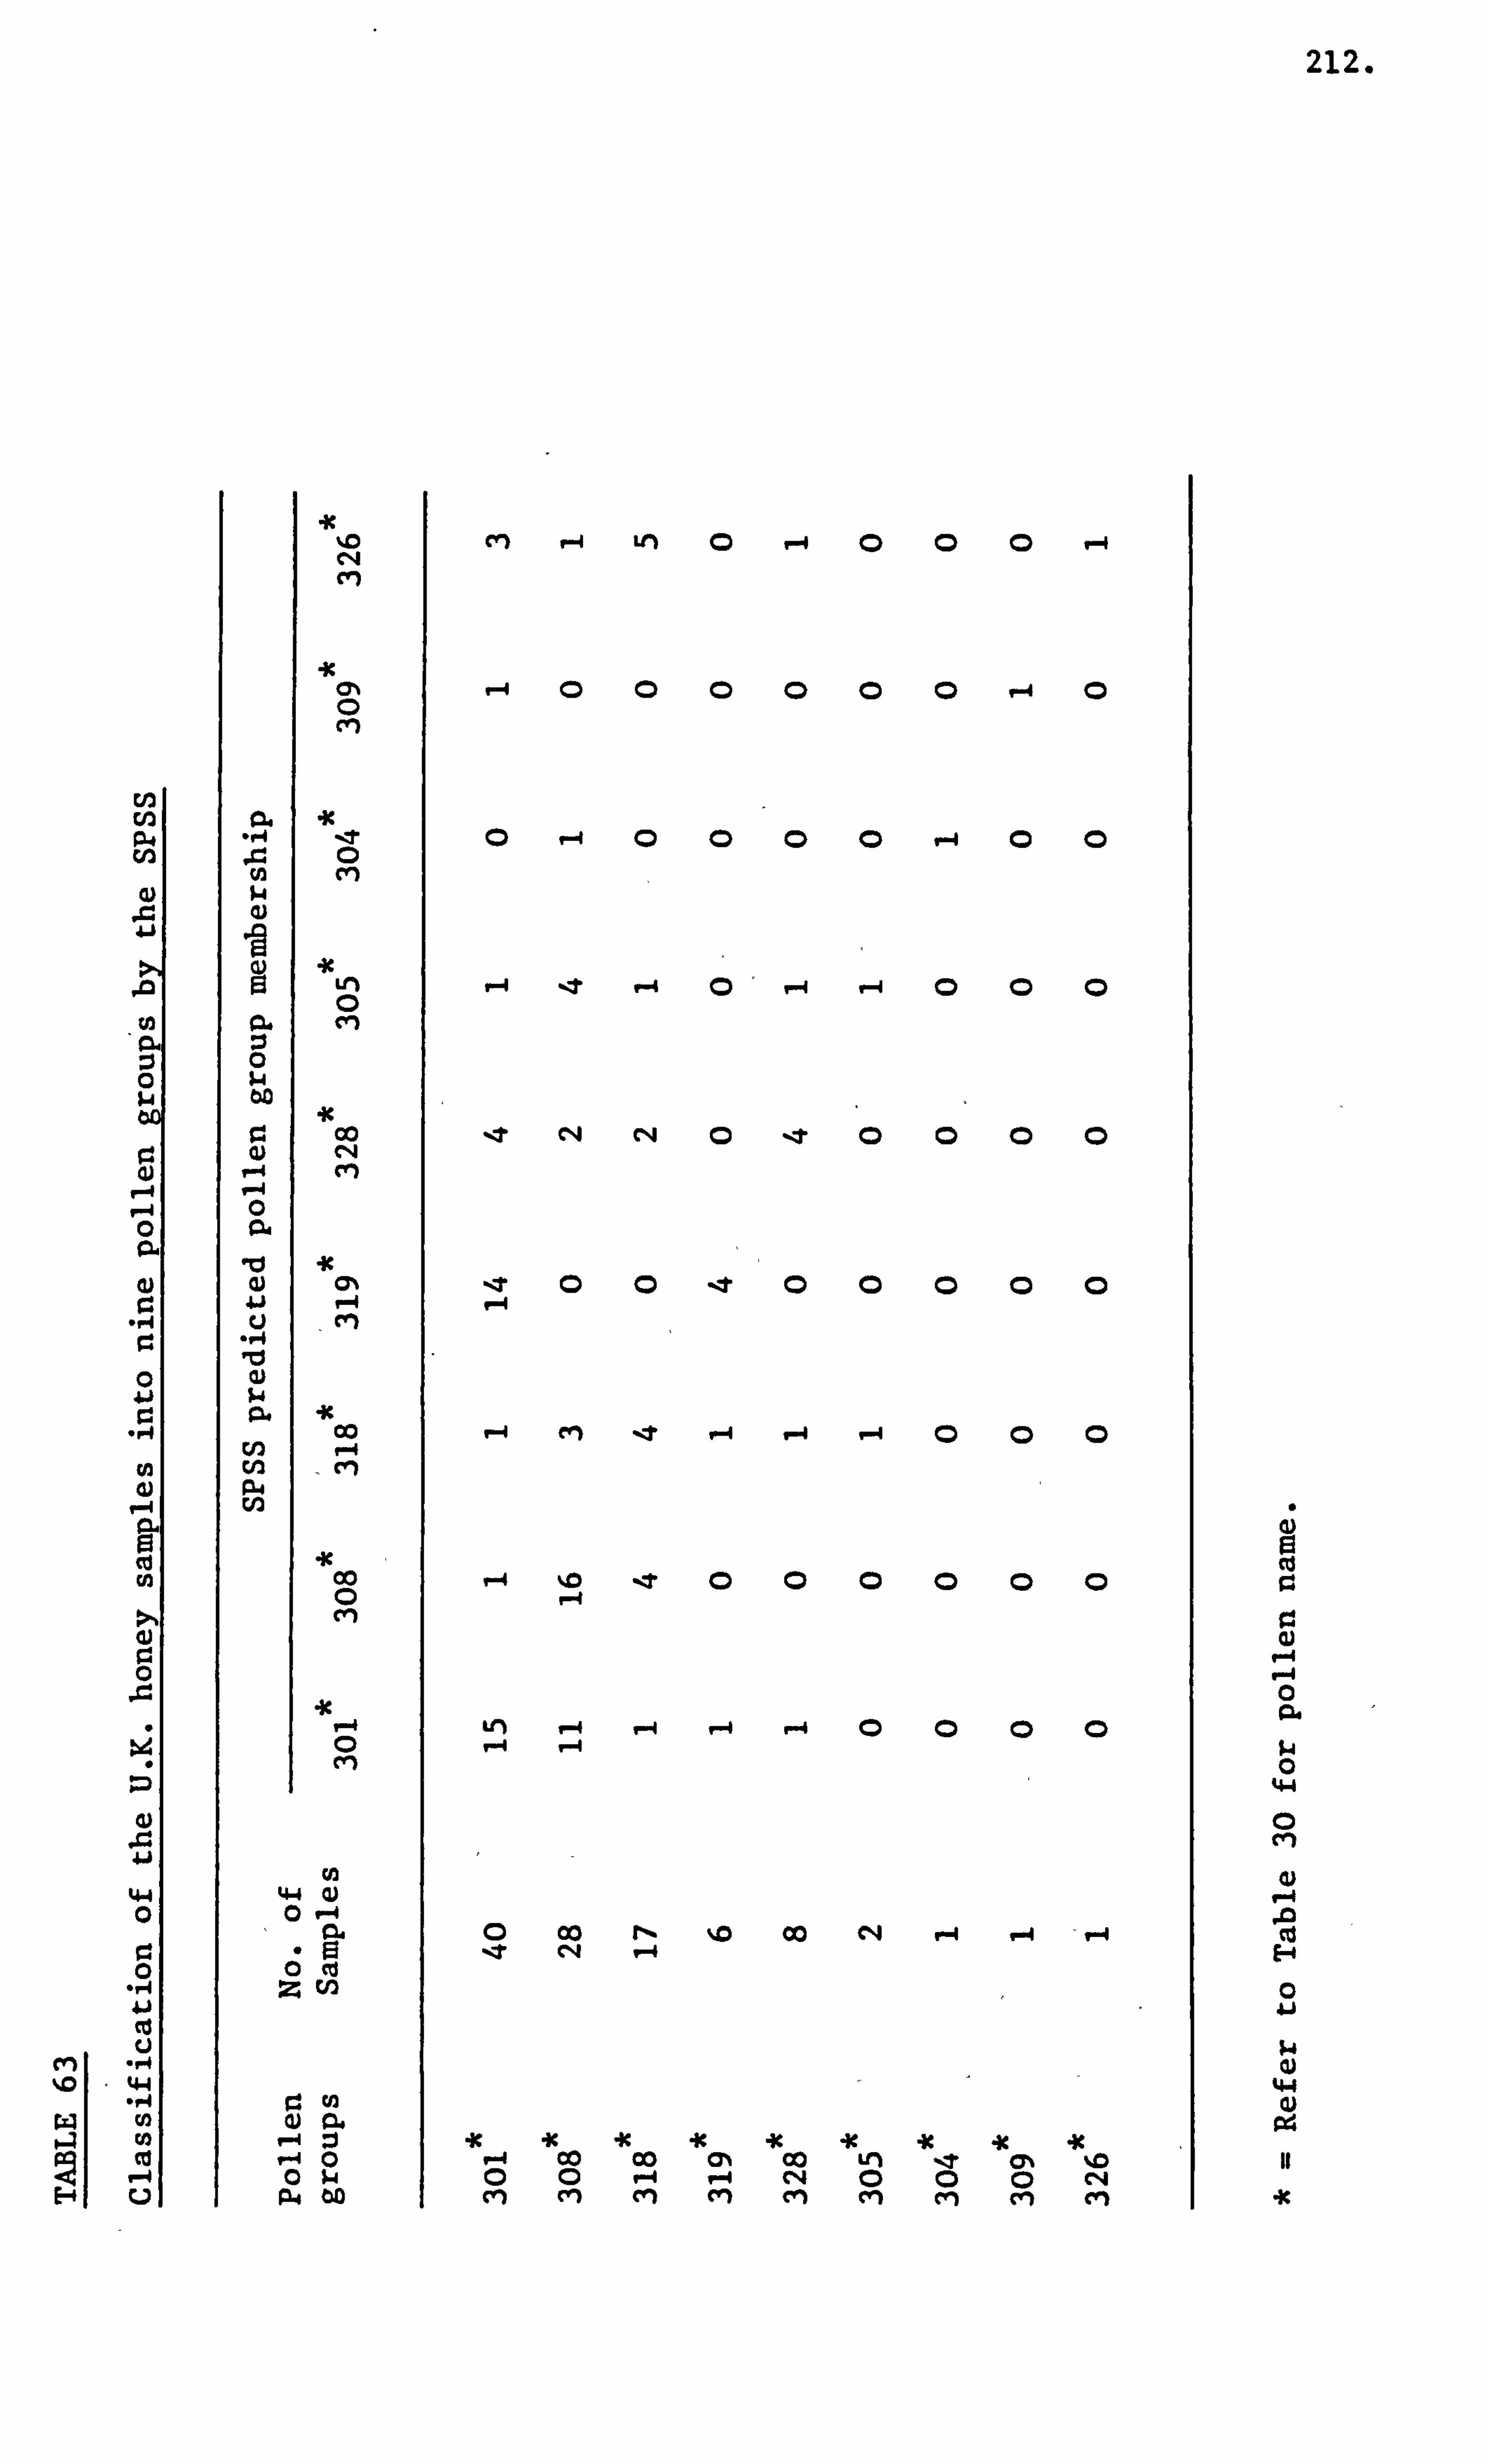
212.
92.
Ixi gi
%0
-x
Co r4 cm
00 V--f
ri
44 0
Z
tn v-4 r-4 0 0w
P., to
CY) P-4 Ln 0 V-4 9-4
r4 000000 9-4 0
040000 v-4
V-4 -: T r-4 V-4
Nt C14 C14 0 -ýT 000
-T 00 -T 0 P-4
9-4 cm -t P-4 V-4 9--4 000
P-4 %M -t 000000 P-4
Ln 1-4 r-q r-4 T-4
0 00 r- %0 00 N P-4 1-4 - V-4 zr c4 P-4
ic « « « « -x "4 00 Co (n 00 0 0 P-4 P-4 CN 0 0 c4 cli cyl cyl M cn en cli C"
z 19
"4
14 0
44
a
r-4 .0 Cd E-4 0 Aj
44 0)
W4
4c
213.
were examined. The unifloral and multifloral subclAsses were determined
for each of the four pollen groups namely Brassica TrifoZium repens,
Castanea and CaUuna, as detailed previously. The fifth pollen group,
Myosotis did not require sub-classification since the honey samples were
predominantly unifloral being greater than 95% pollen of one species.
The results of the computer classification of honey samples into each
subclass for the above pollen groups were found to be similar. However,
the point at which the overlap between the two subclasses was eliminated,
varied for each of the pollen groups. These points were: Brassica group
at 80% and over, for TrifoZium repens and Castanea groups at 75% and
over, and for'CaUuna group at 70% and over. As a typical example the
results obtained in the form of a histogram fýr the Brassica group has
been shown in Figure 27. The results of the classification for the ungrouped
honey samples by the SPSS have also been shown. The peaks of the two
subclasses for the ungrouped samples follow a similar pattern to that
of the Brassica samples. Thus, having defined the unifloral subclass
as those samples containing 70% pollen and over for the four pollen groups.
The classification of the honey samples into-the five pollen groups
was carried out using the modified SPSS control file given in Appendix
VI(c). The honey samples in each of the five pollen groups were divided
into two subsets by the SPSS. In one subset of honey samples the Fisher's
linear discriminant functions were calculated for the following amino
acids which were entered into the analysis. These were: proline, glycine,
valine, isoleucine and a constant derived by the SPSS. The SPSS selected
twenty nine honey samples in this subset and of these only 89.7% were
correctly classified into their respective pollen groups. These results
have been shown in Table 64.
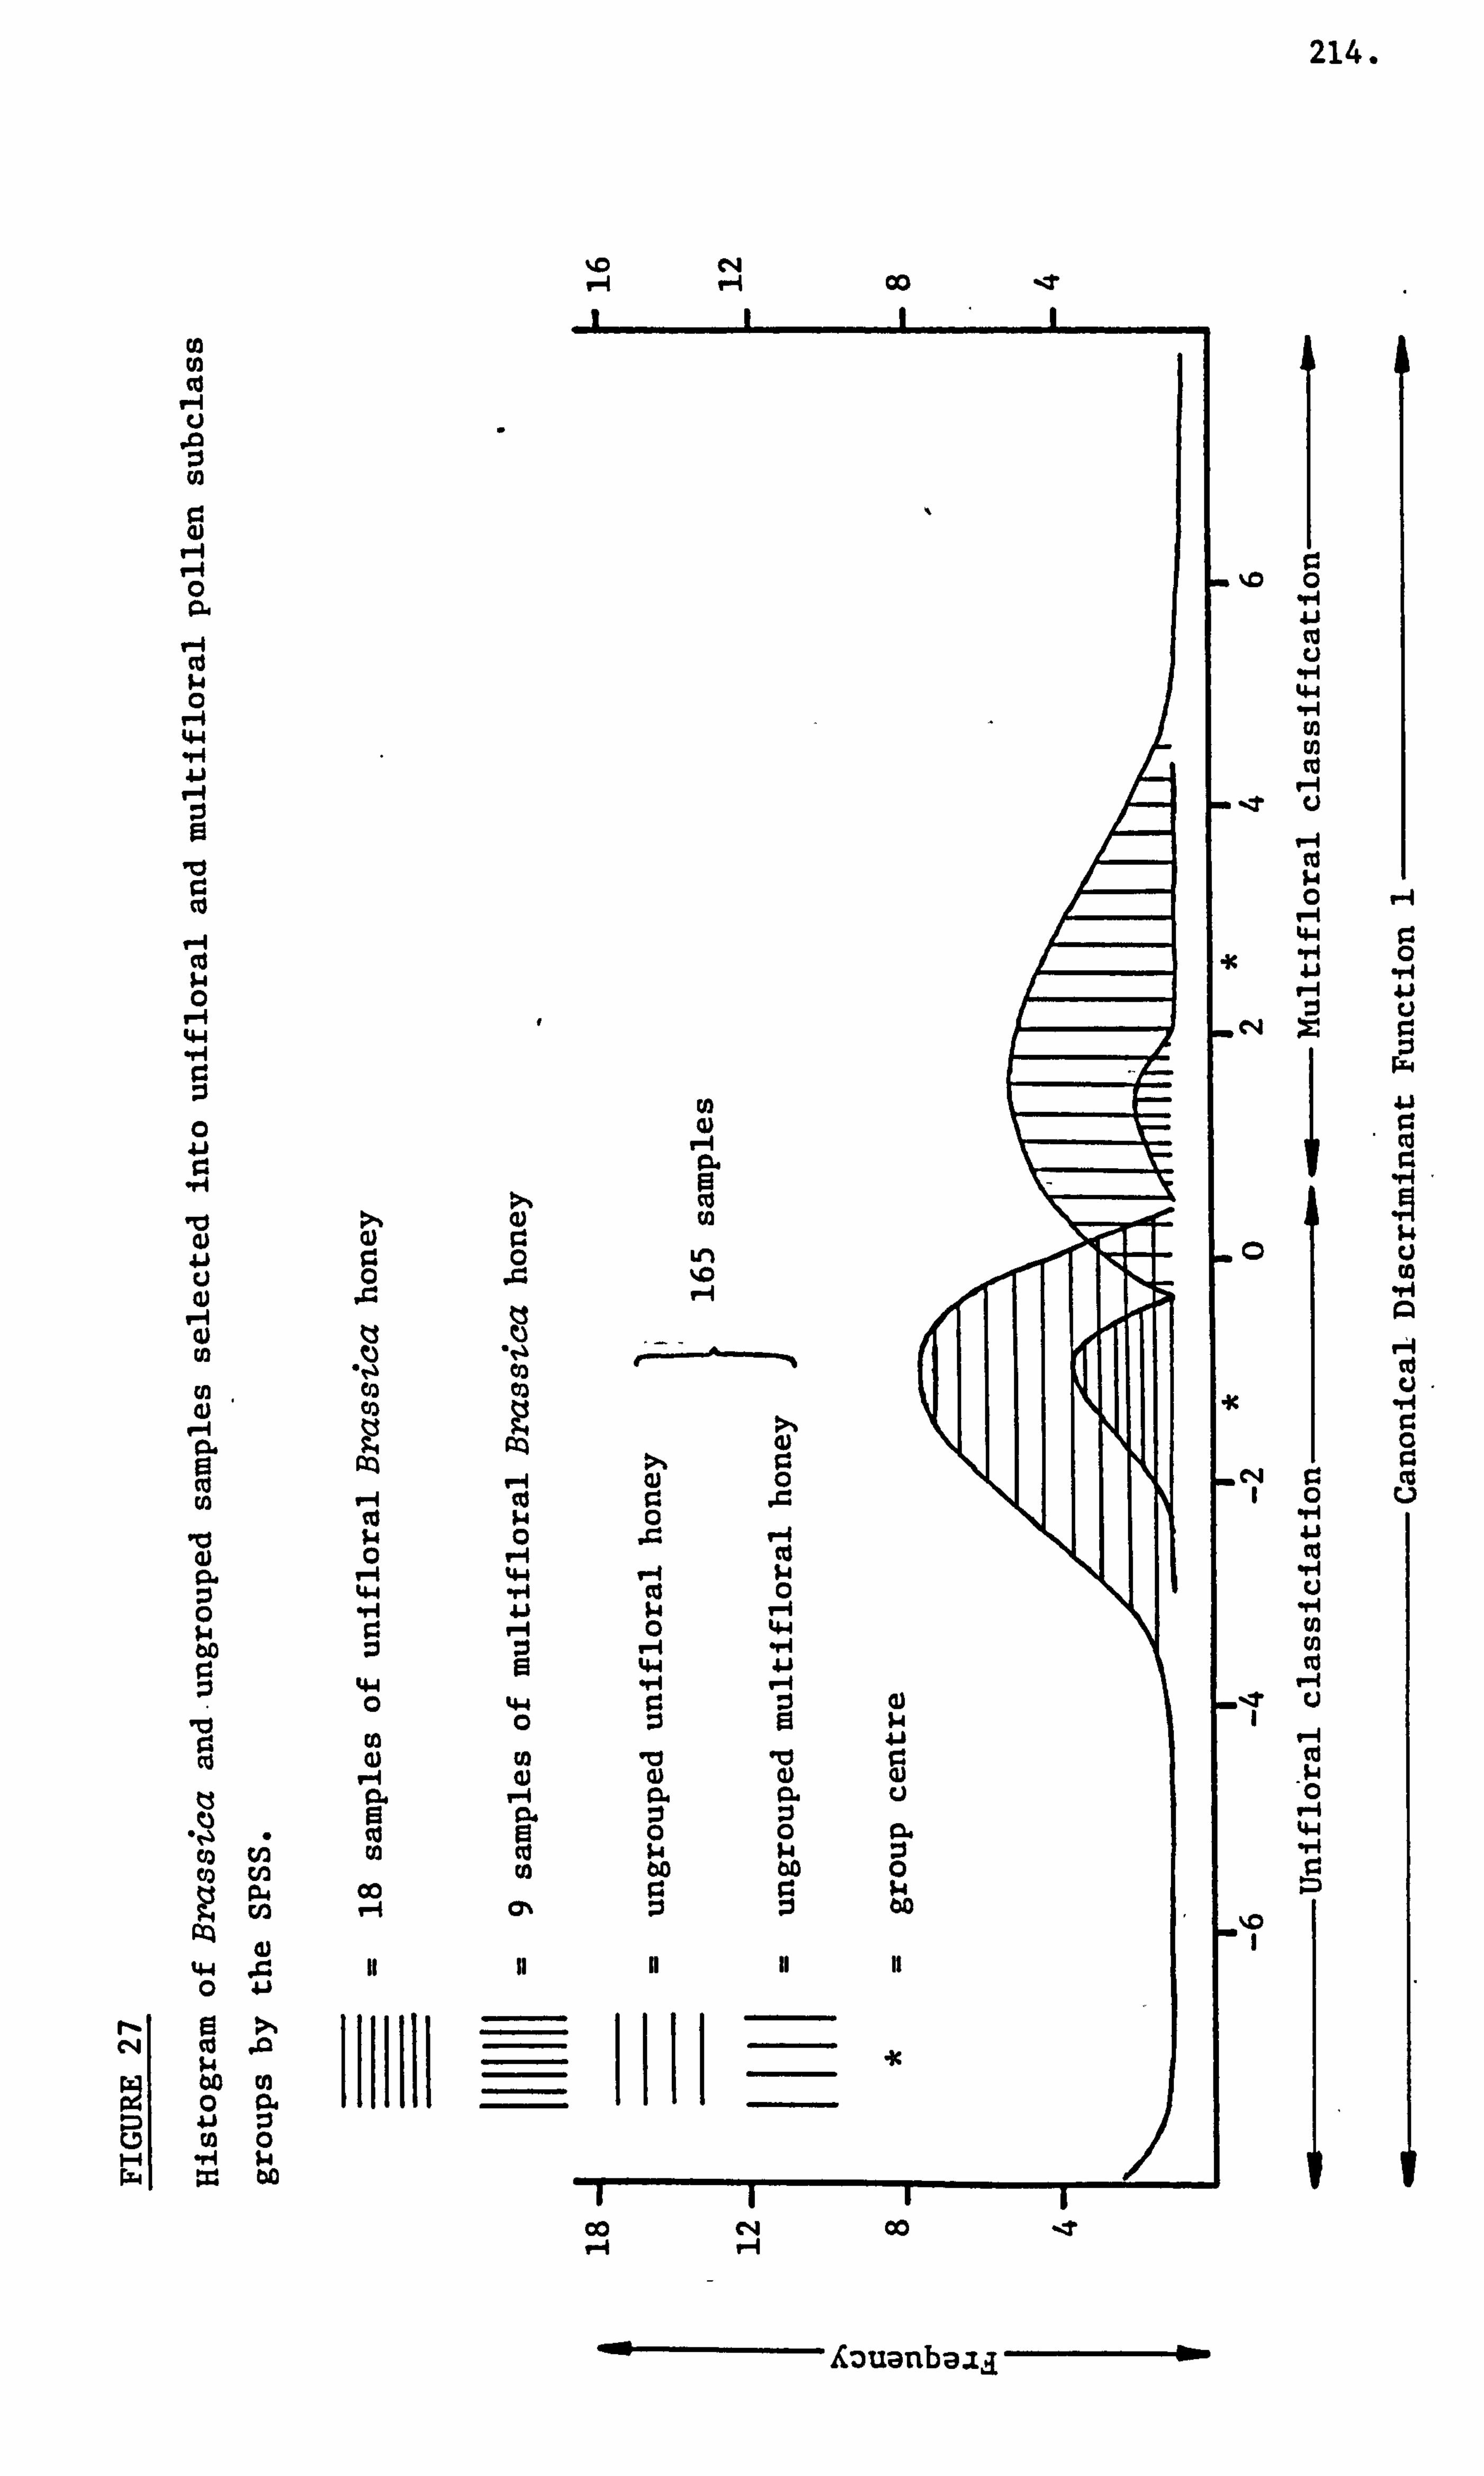
0
0 P. V-1 W w 0 r-i 4-4 . r4 ji
Ici
0 H 4.4
0
Ici 4)
0
0
,0 0 ce 12 ei Co cn Co cn
44 0 41
r-I 9 >-. C'4 In
bo 0 'l 0 od
Co
PCZ 0
44 0
00
H C%
ý. o 04 r-4 9-4 Qo %T
A: )uanbaza a-
214.
u -H 44
cli
0 r-i 4-4
z
P-ý Co N4 0
P-4 44
r-q r. 0
. r4
0
PA 0 t) -
0 0 Co
u
00 C, 4 00 -t V-4 H
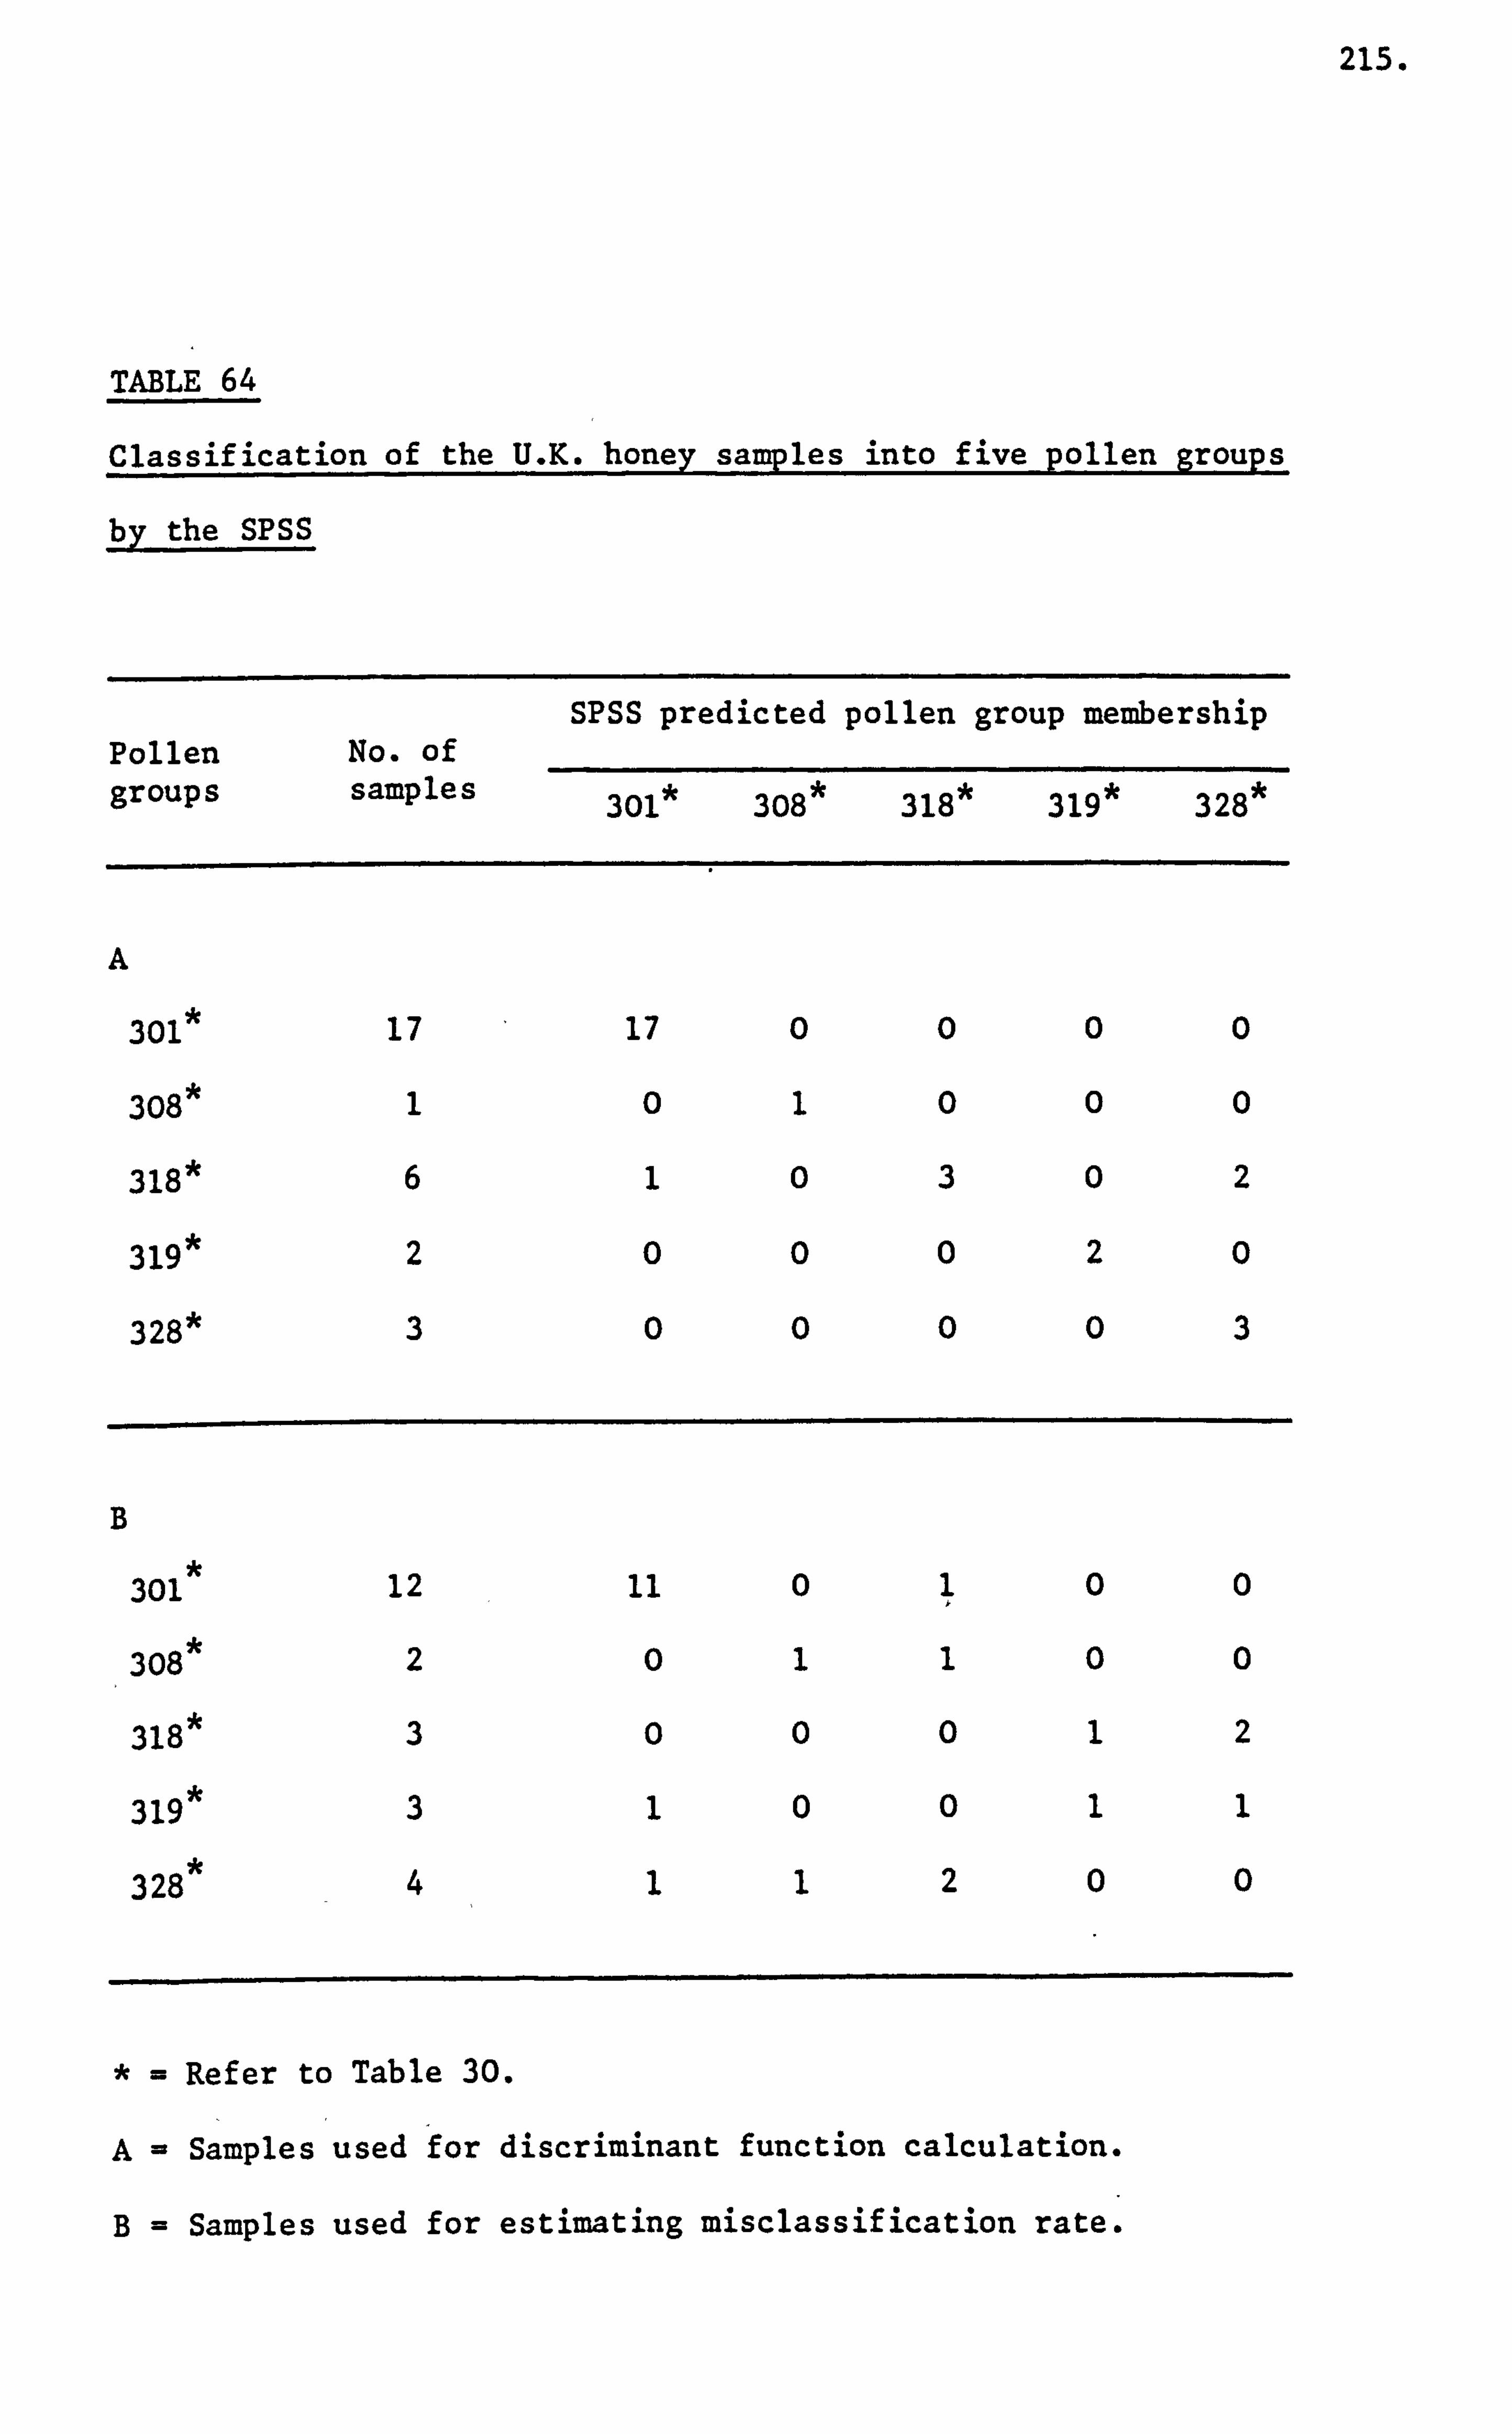
215.
TABLE 64
Classification of the U. K. honey samples into five pollen groups
by the SPSS
SPSS predicted pollen group membership Pollen groups
No. of samples 301 308 318 319 328
A
301 17 17 0 0 0 0
308 1 0 1 0 0 0
318* 6 1 0 3 0 2
319 * 2 0 0 0 2 0
328* 3 0 0 0 0 3
B
301 12 11 0 0 0
308 2 0 1 1 0 0
318 3 0 0 0 1 2
319 3 1 0 0 1 1
328 4 1 1 2 0 0
Refer to Table 30.
A= Samples used for discriminant function calculation.
B= Samples used for estimating misclassification rate.
216.
There were six honey samples selected in the Castanea group and
the SPSS misclassified three samples. The SPSS correctly predicted the
presence of Brassica pollen in sample Code No. 89 but was incorrect for
the samples Code No. 28 and 36.
In the other subset of honey samples, twenty four samples were used
by the SPSS for estimating the misclassification rate and of these only
54.2% of the samples were correctly classified into their respective
pollen groups.
There were eleven samples misclassified in this subset and the SPSS
correctly predicted the presence of the pollen in eight samples Code
Nos. 39,41,102,106,118,121,171 and 177, for which these samples
were predicted to contain. The remaining three samples Code Nos. 57,
84 and 91 did not agree as to the pollen predicted to be present.
Graphical representation of the classification of the honey samples
has been shown in Figure 28. This scatterplot of the canonical discriminant
function 1 against canonical discriminant function 2 was derived by the
SpSS. The samples identified above as _misclassified
have been outlined.
The computer classification of honey samples into the three major
pollens identified in the present survey of the United Kingdom have been
given in Table 65. The SPSS selected eighteen samples of honey for
calculating the Fisher's linear discriminant functions and the following
amino acids were entered'into the analysis. These were: lysine, aspartic
acid, threonine, glutamic acid, proline, glycine, alanine, isoleucine,
leucine, tyrosine and a constant derived by the SPSS. The honey samples
were all 100.0% correctly classified into their respective pollen groups.
The SPSS then selected ninteen samples for which it estimated the
misclassifiation rate and of these only 68.4% were correctly classified
"I I
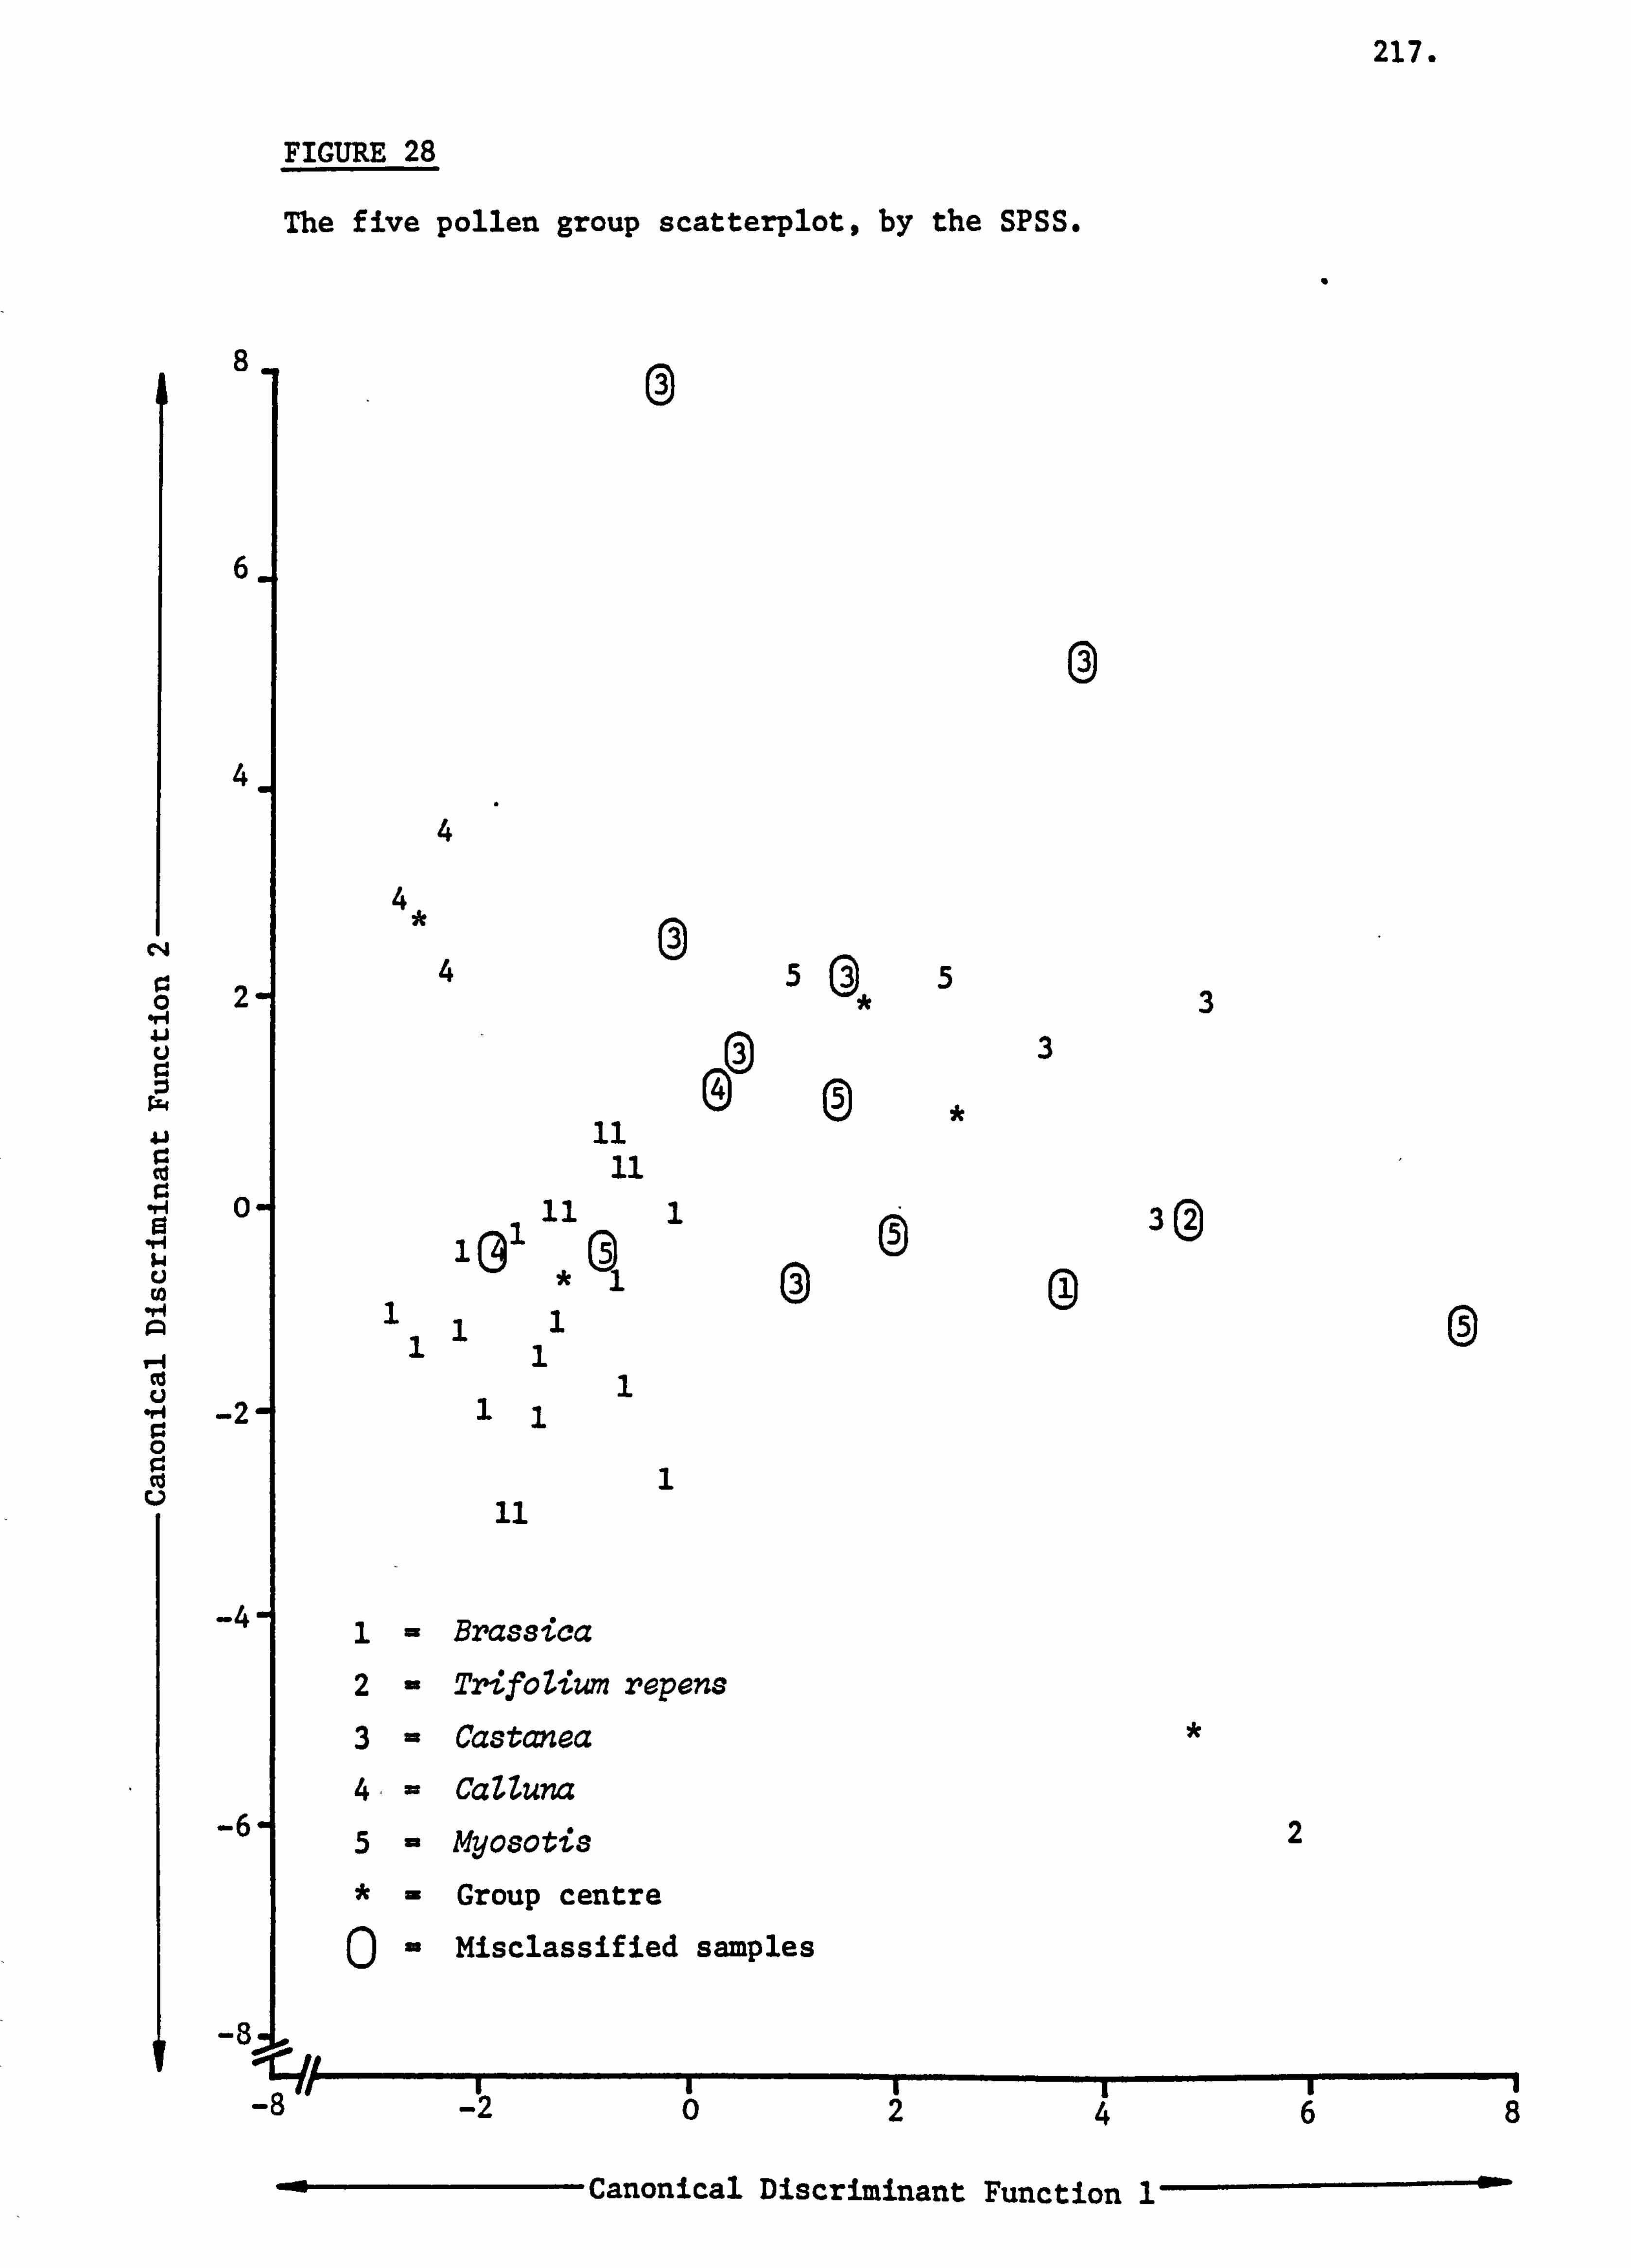
217.
FIGURE 28
The five pollen group scatterplot, by the SPSS.
8
6
4
rd 0 . r4 41 u
. Ni Z
0
0 r.
-4
-6
-8
Canonical Discriminant Function 1
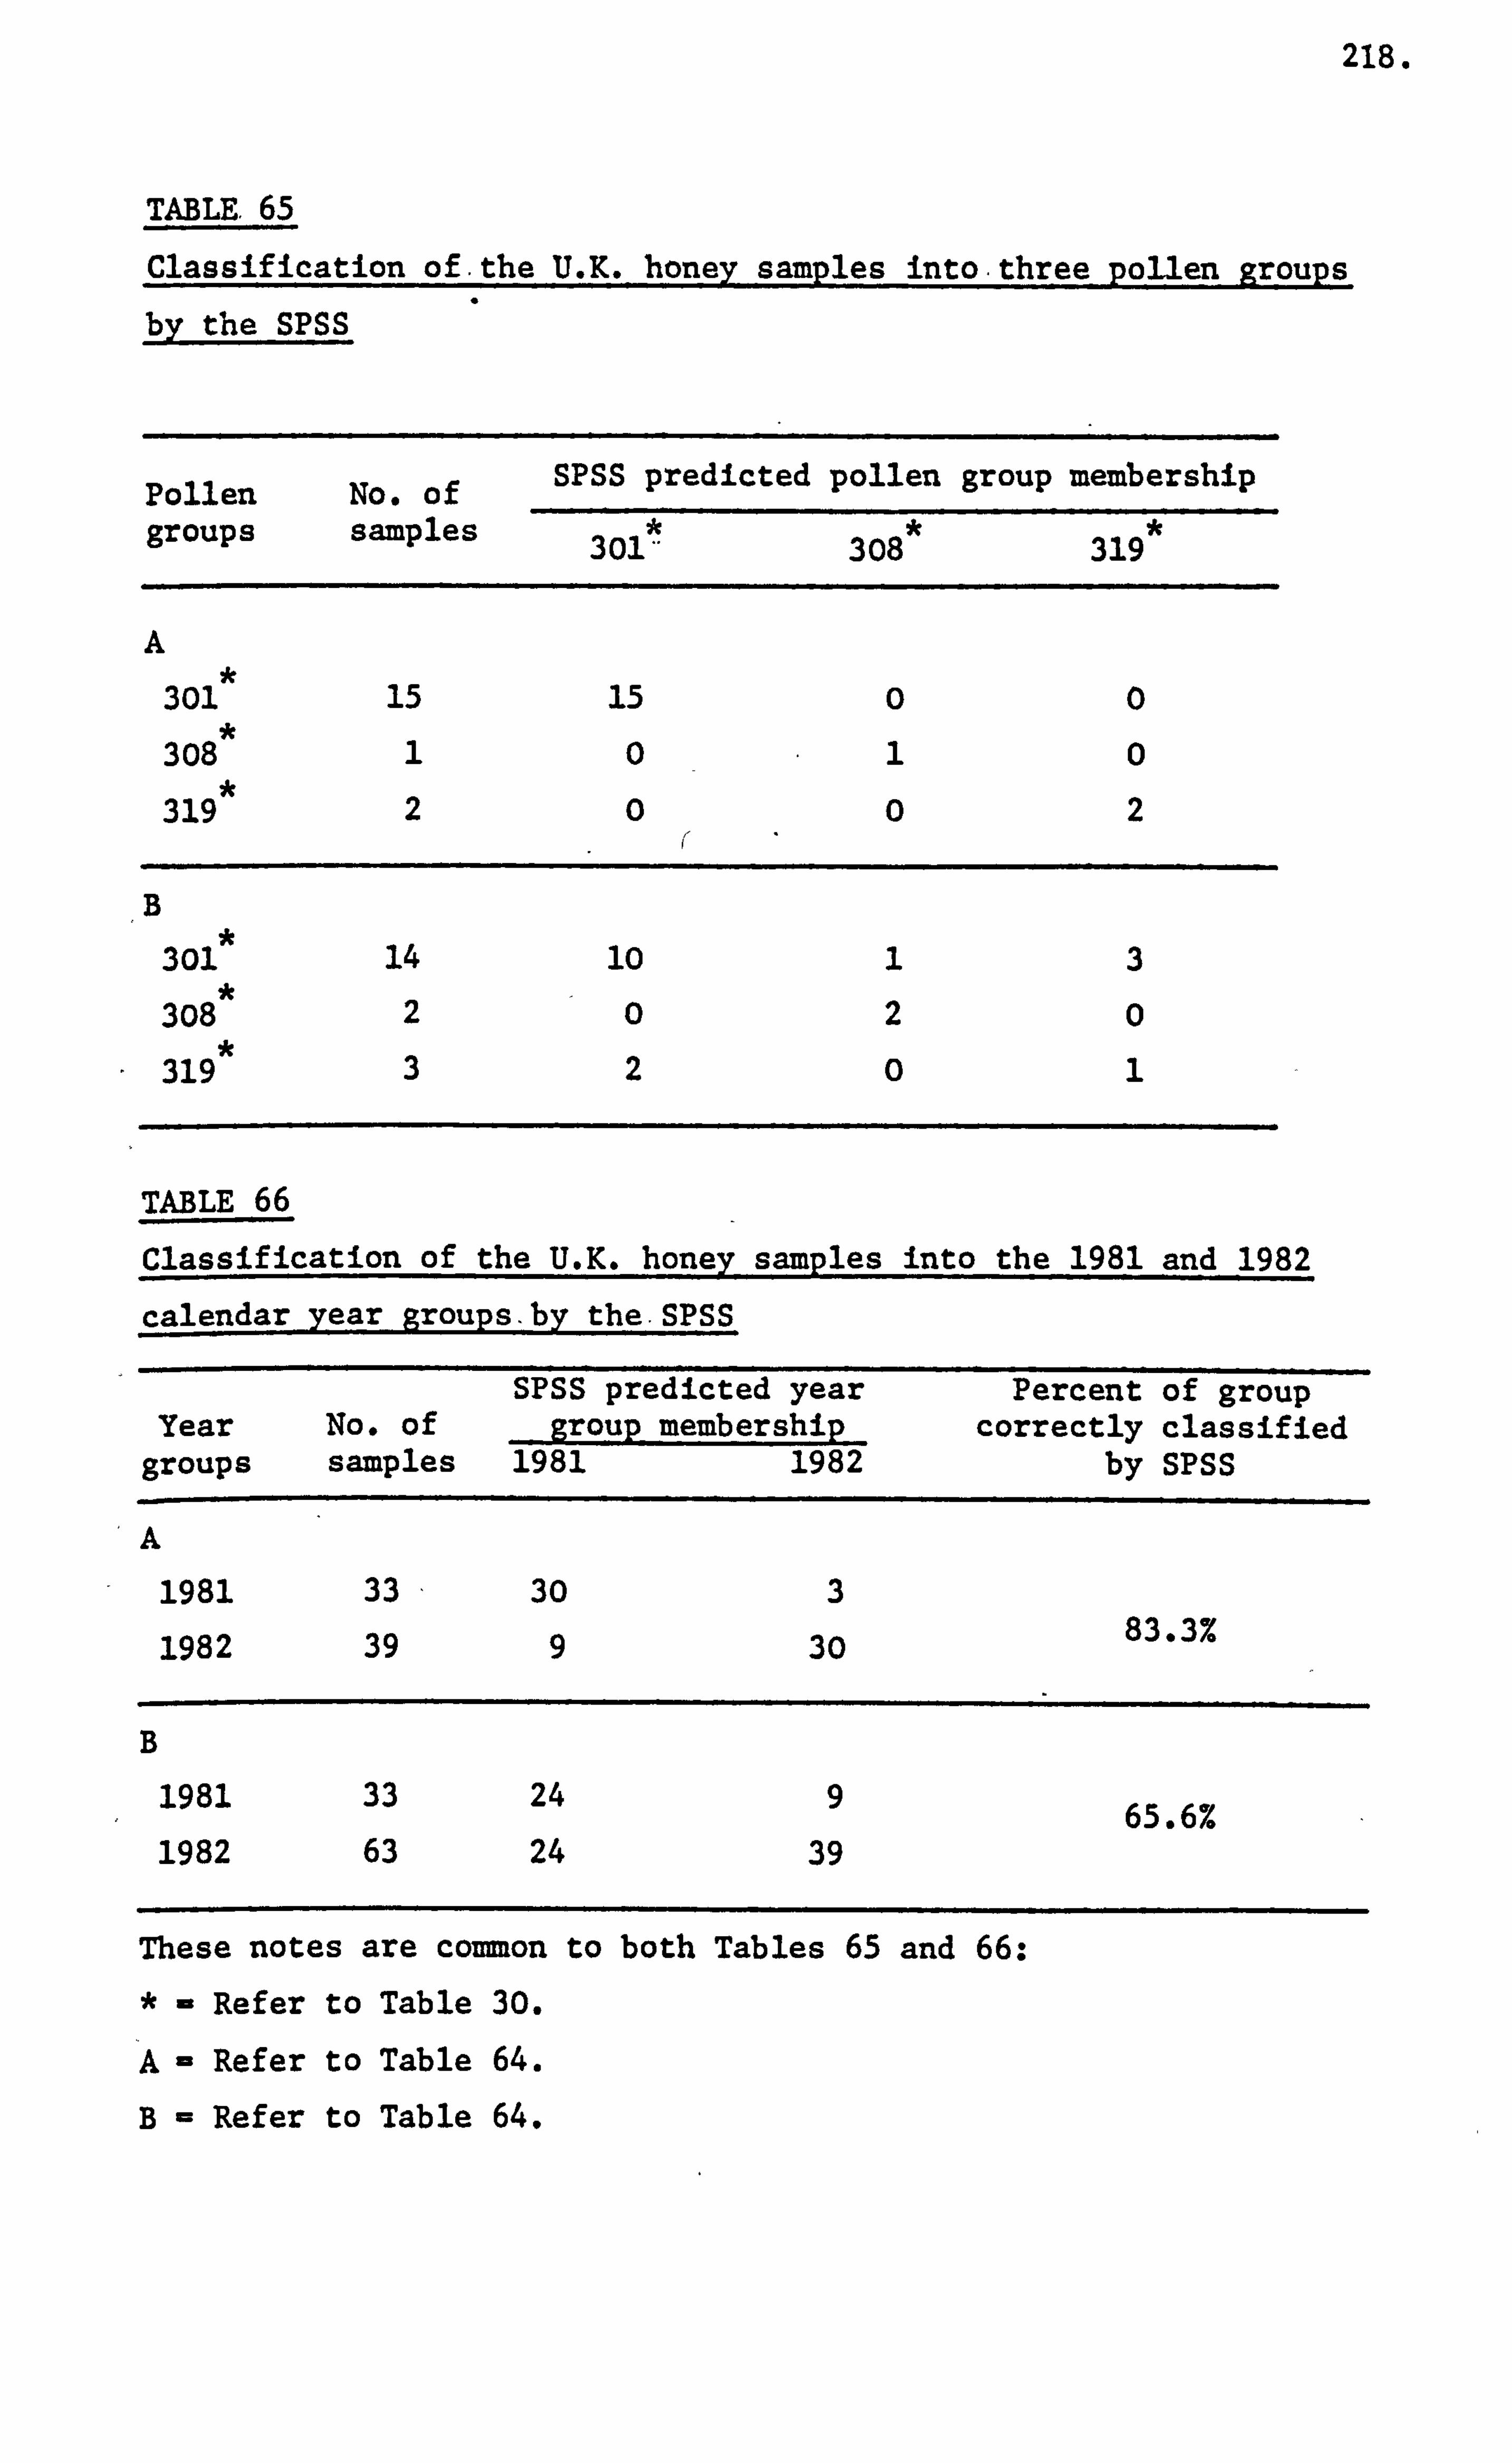
218.
TABLE. 65
Classification of. the U. K. honey samples into. three pollen groups by the SPSS
Pollen No. of SPSS predicted pollen group membership
groups samples 301 * 308 * 319 *
A
301 15 15 0 0
308 1 0 1 0
319 2 0 0 2
B
301 14 10 1 3
308 2 0 2 0
319 3 2 0 1
TABLE 66
Classification of the U. K. honev samvles into the 1981 and 1982
calendar year group s, by the. SPSS
SPSS predicted year Percent of group Year No. of
-group membership correctly classified groups samples 1981 1981 by SPSS
A
1981 33 30 3
1982 39 9 30 83.3%
B
1981 33 24 9 65.6% 1982 63 24 39
These notes are comon, to both Tables 65 and 66:
Refer to Table 30.
A- Refer to Table 64.
B- Refer to Table 64.
219.
into their respective pollen groups.
There were six samples misclassified in this subset and the SPSS
correctly predicted the presence of the pollen in three samples Code
Nos. 118,147 and 152 for which these samples were predicted to contain.
The remaining three samples Code Nos. 66,115 and 145 did not agree as
to the pollen predicted to be present.
Computer placements of honey samples into 1981 and 1982 calender groups
In accordance with the responses recieved to questionnaire question
number 3 the SPSS was specified as described to allocate honey samples
into the two calender year groups. The predicted classification of
one hundred and sixty eight selected samples have been given in Table
66. The Fisher's linear discriminant functions were calculated for the
following amino acids which were entered into the analysis. These were:
lysine, aspartic acid, threonine, proline, alanine, valine and a constant
derived by the SPSS.
Using the control statements given in Appendix VI part (dii)
1,2,3,4 and 5 representing the five pollen groups, the
SPSS allocated samples which satisfied these criteria for each of the
pollen groups into the two calendar year groups. The results were obtained
for only three of the pollen groups and these were Brassica, Trifozium
repens and Castanea. The predicted classification of the seventy five
honey samples selected by the SPSS have been given in Table 67.
The amino acids for which the Fisher's linear discriminant functions
were calculated differed in these three pollen groups. These differences
were: in the Brassica group, the amino acids used were valine, isoleucine,
tyrosine, phenylalanine and a constant derived by the SPSS; in the
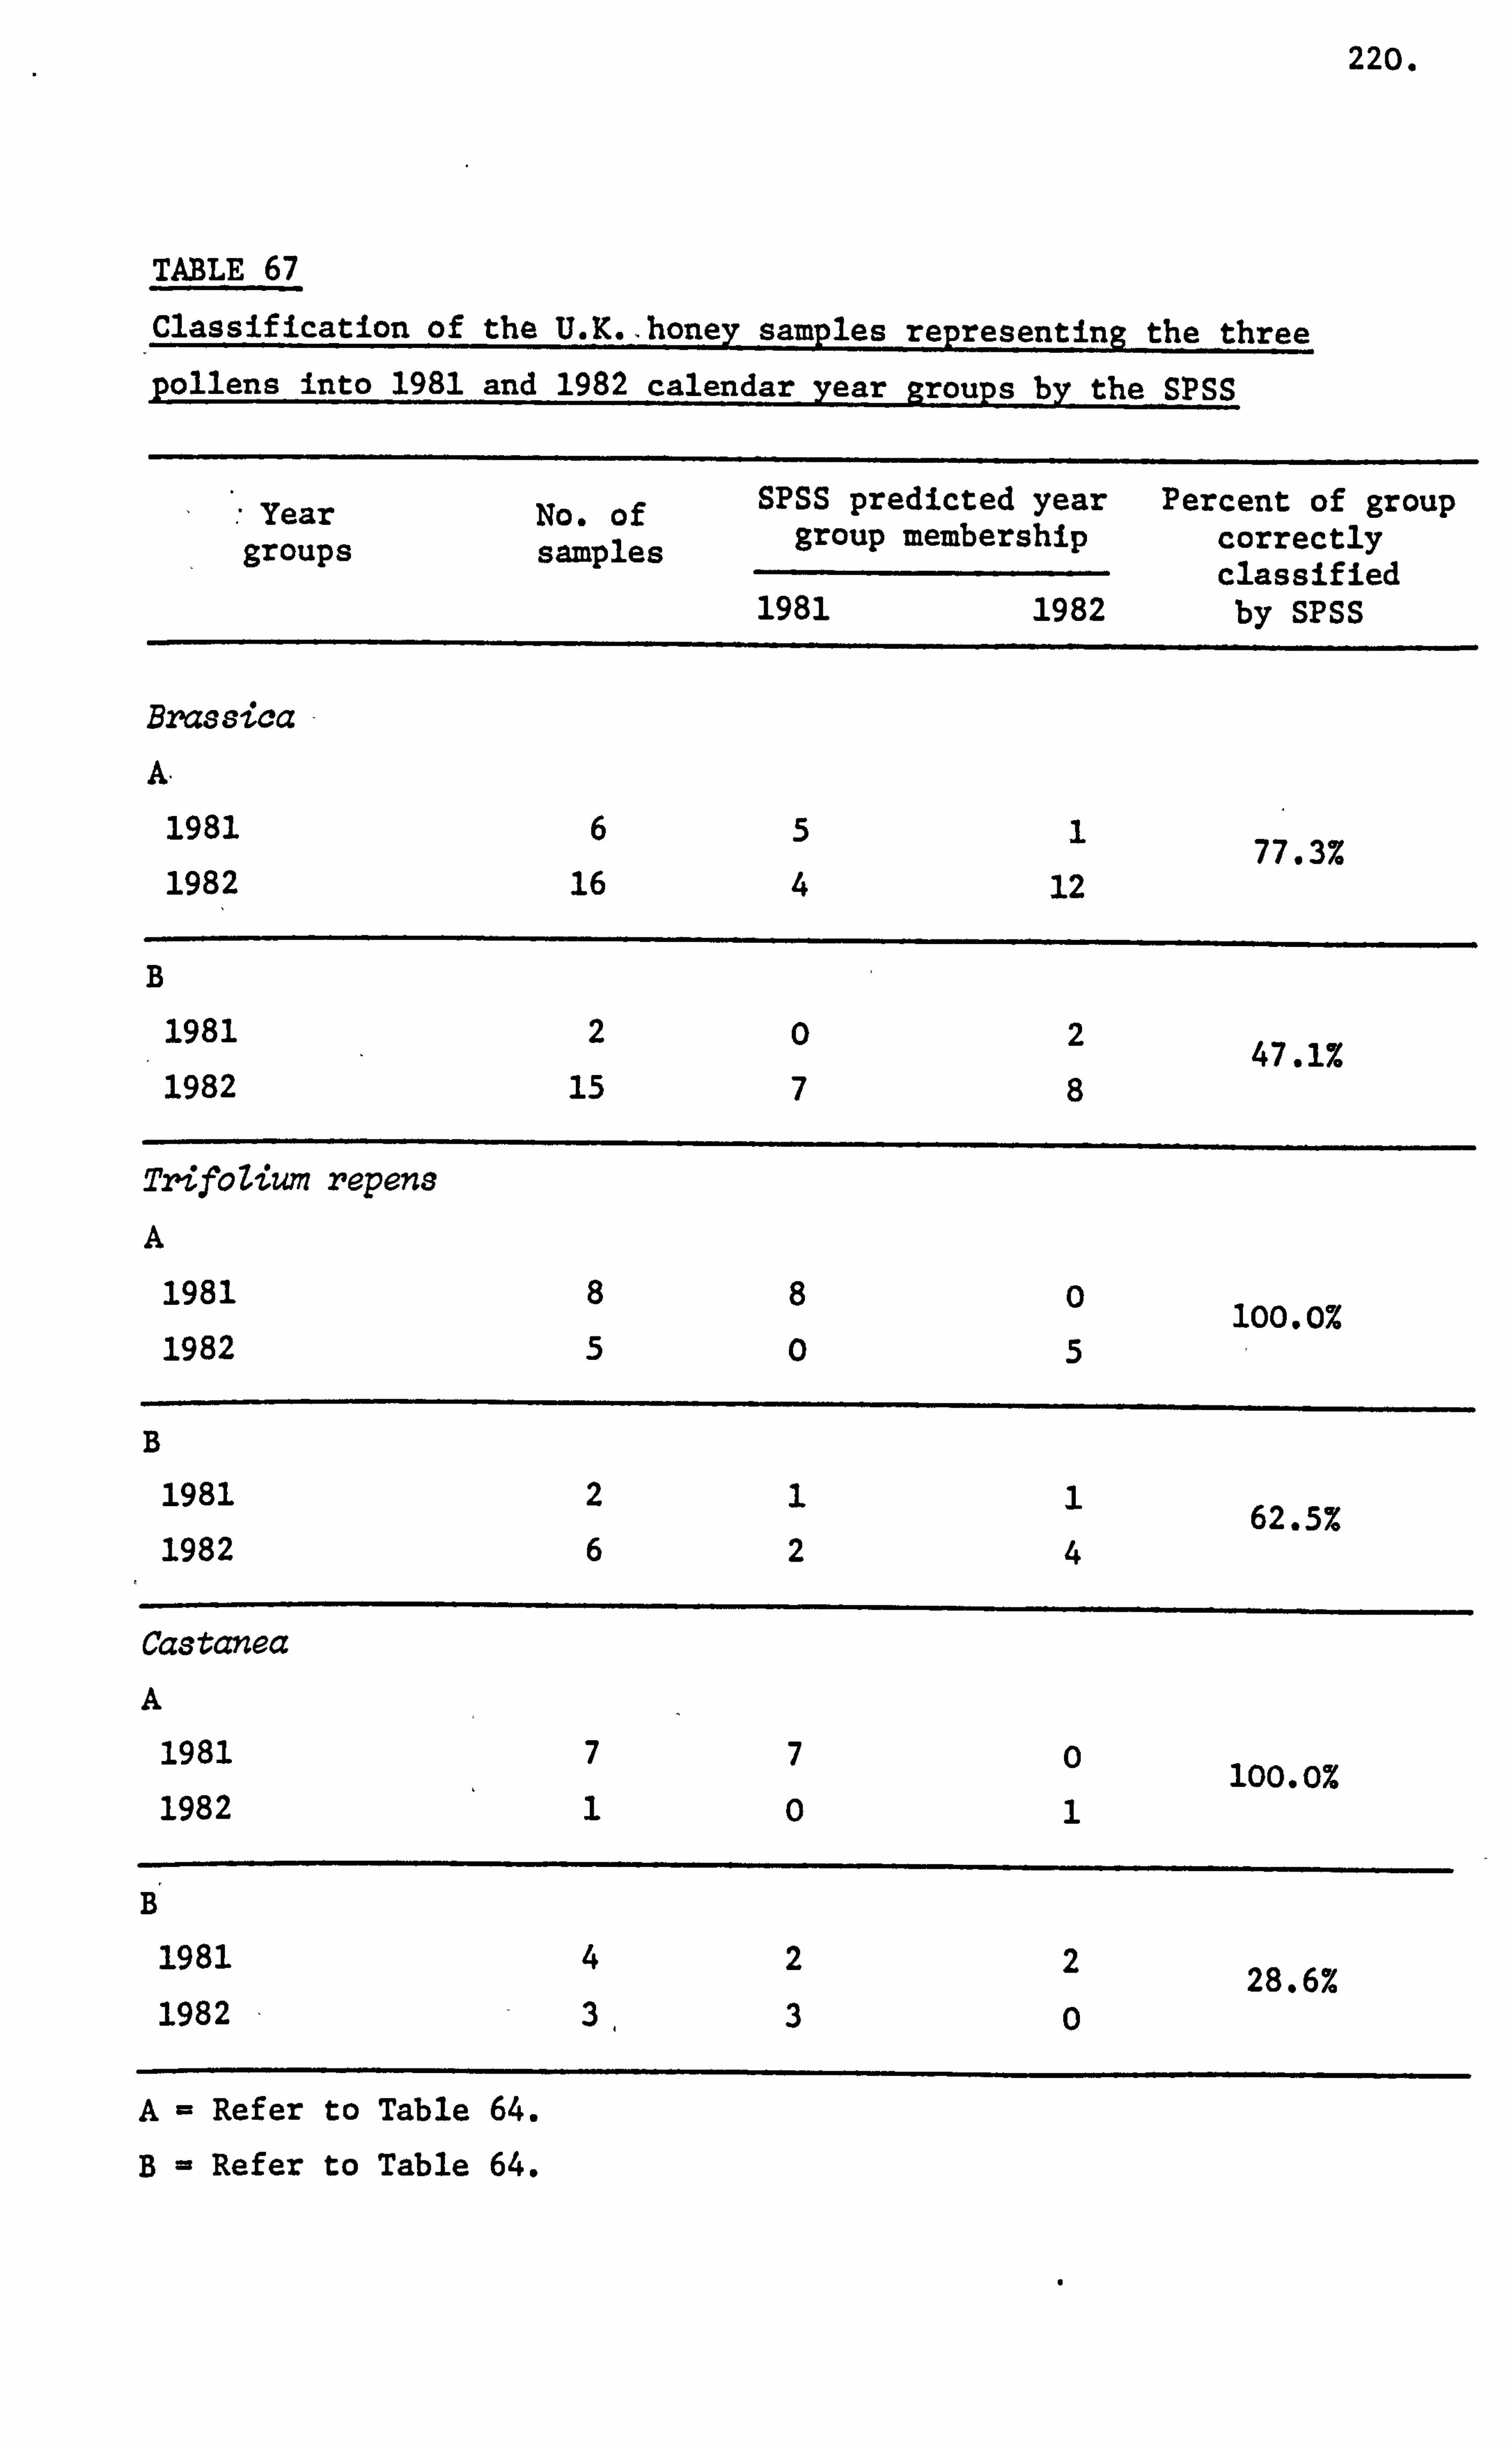
220.
TABLE 67
Classification of the U. K.. honey samples representing the three
pollens into 1981 and 1982 calendar year groups by the SPSS
Year No. of SPSS predicted year Percent of group
groups samples group membership correctly classified
1981 1982 by SPSS
Brassica
A.
1981 6 5 1 77.3% 1982 16 4 12
B 1981 2 0 2 47.1% 1982 15 7 8
TrifoZium repens A
1981 8 8 0 100.0% 1982 5 0 5
B 1981 2 1 1 62.5% 1982 6 2 4
Castanea A
1981 7 7 0 100.0% 1982 1 0 1
B
1981 4 2 2 28.6% 1982 3ý 3 0
Refer to Table 64.
Refer to Table 64.
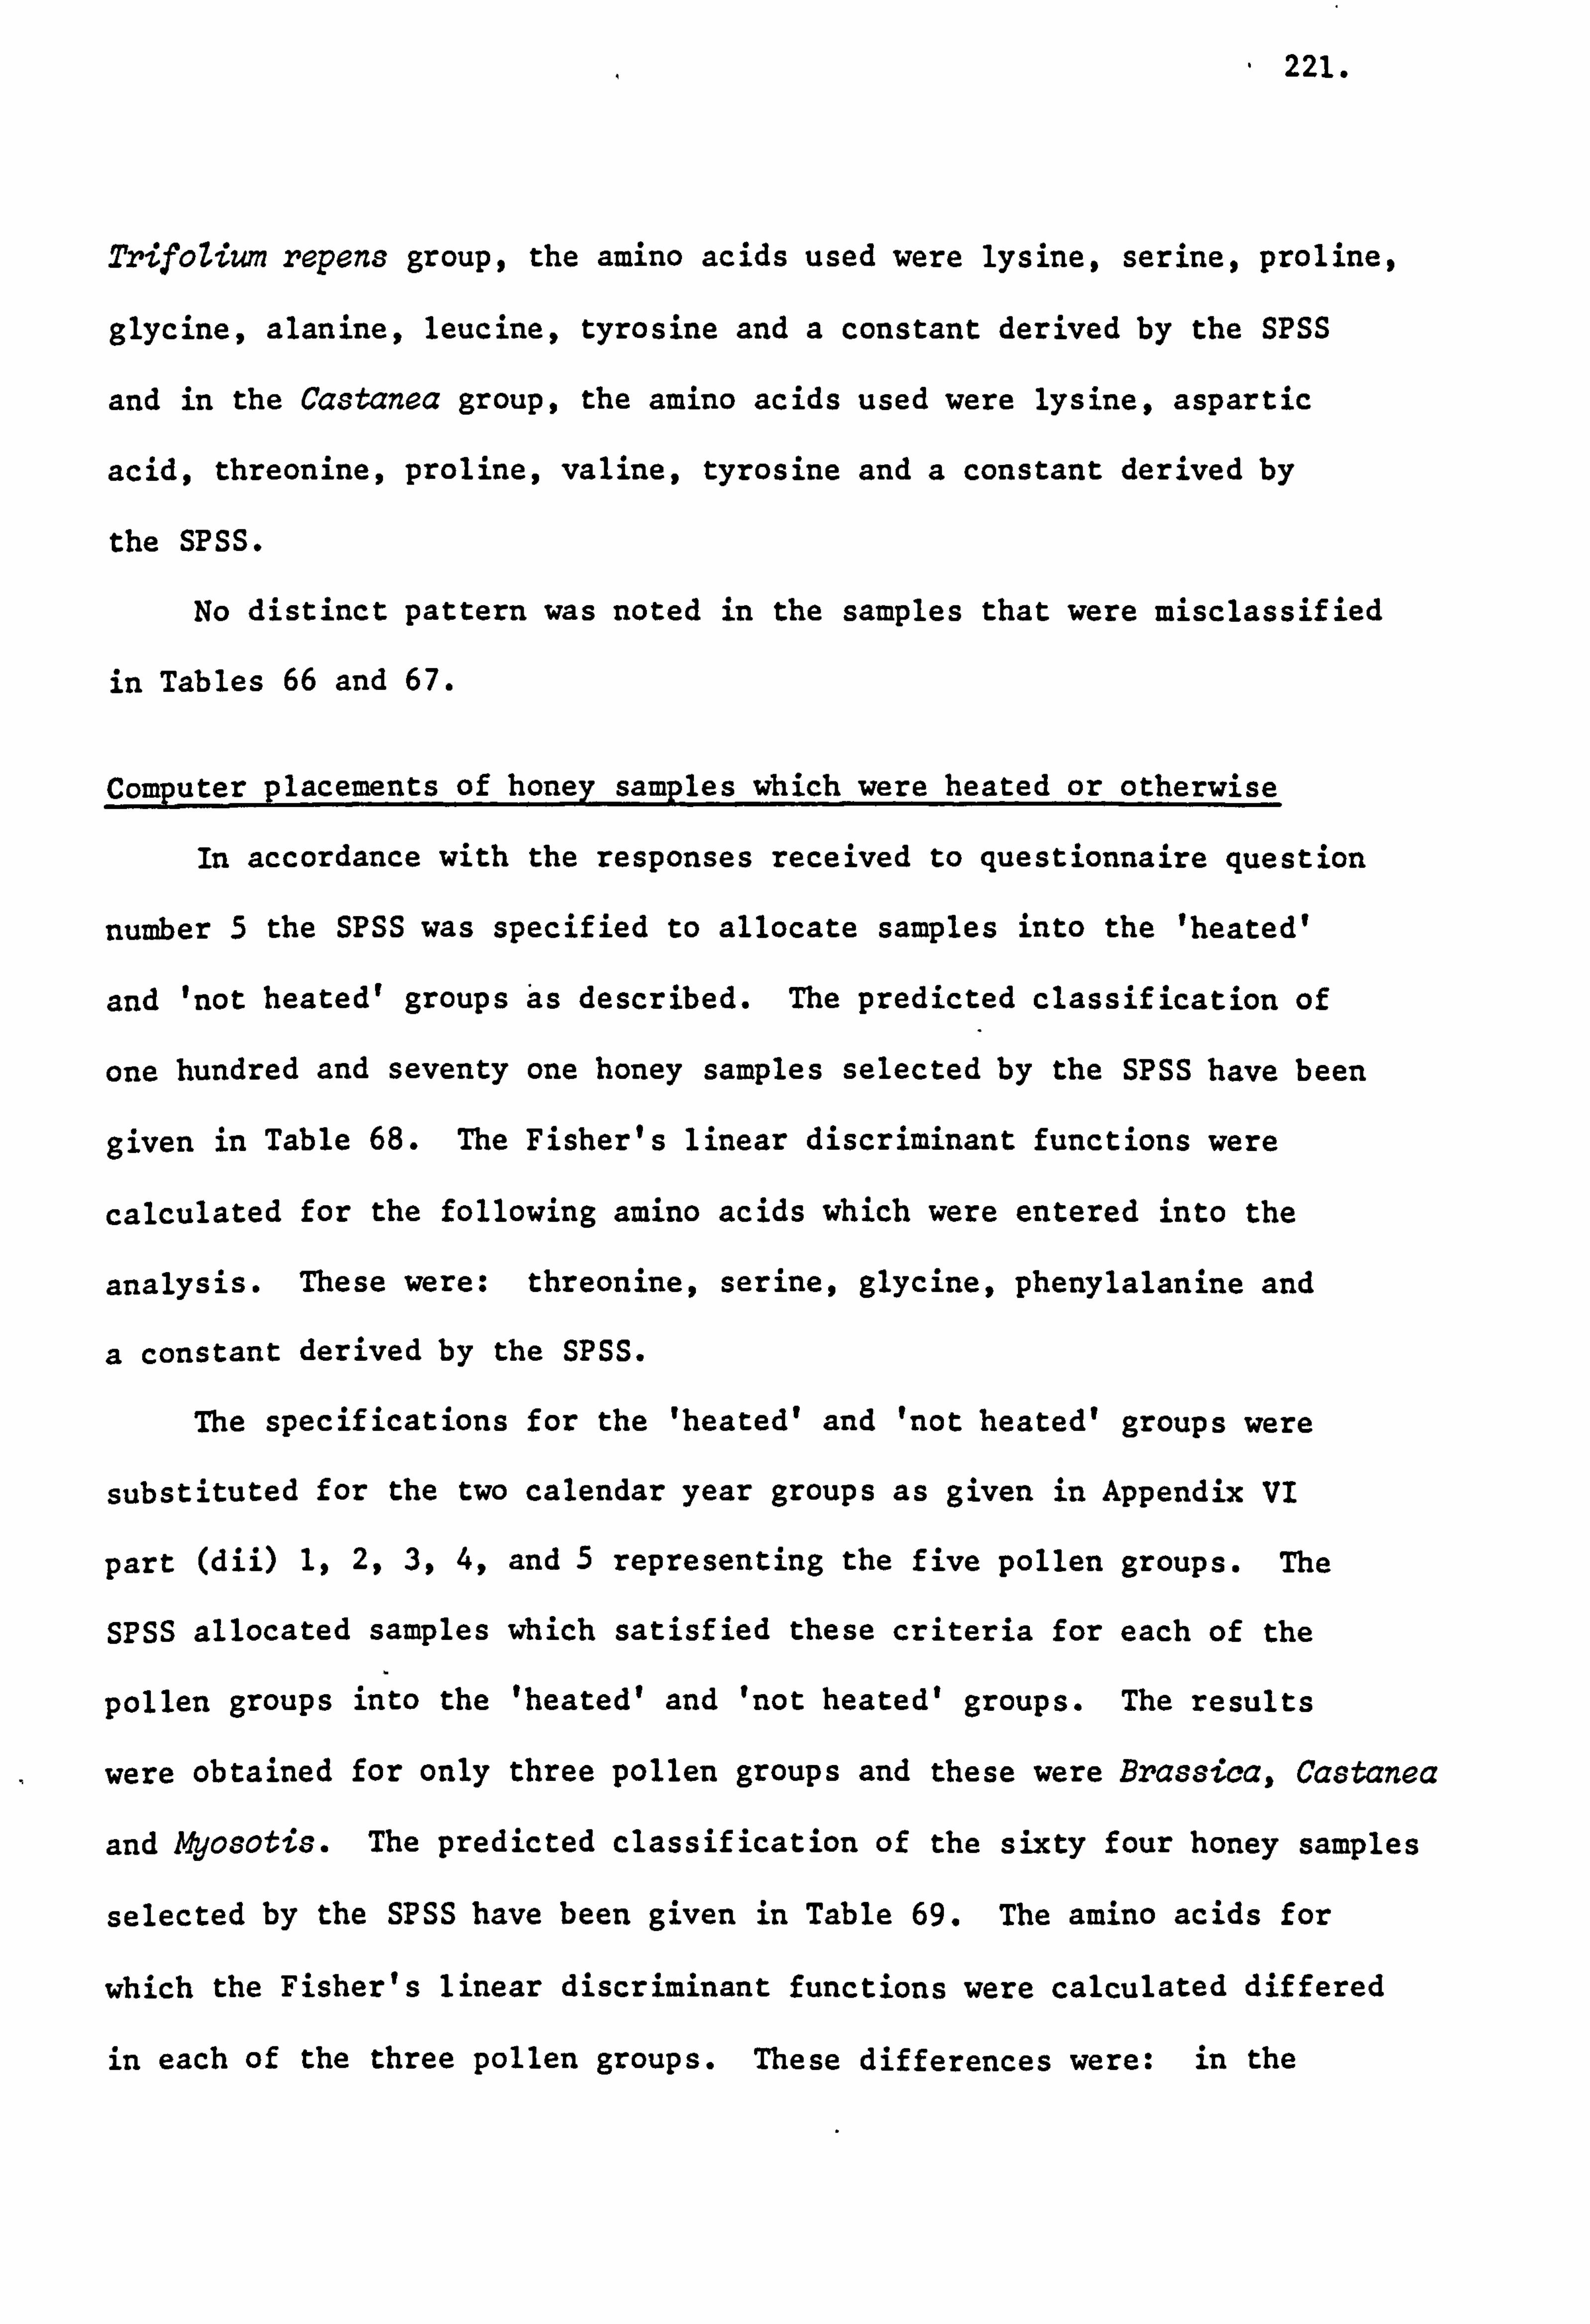
- 221.
TrifoZium repens group, the amino acids used were lysine, serine, proline,
glycine, alanine, leucine, tyrosine and a constant derived by the SPSS
and in the Castanea group, the amino acids used were lysine, aspartic
acid, threonine, proline, valine, tyrosine and a constant derived by
the SPSS.
No distinct pattern was noted in the samples that were misclassified
in Tables 66 and 67.
Computer placements of honey samples which were heated or otherwise
In accordance with the responses received to questionnaire question
number 5 the SPSS was specified to allocate samples into the 'heated'
and 'not heated' groups ais described. The predicted classification of
one hundred and seventy one honey samples selected by the SPSS have been
given in Table 68. The Fisher's linear discriminant functions were
calculated for the following amino acids which were entered into the
analysis. These were: threonine, serine, glycine, phenylalanine and
a constant derived by the SPSS.
The specifications for the 'heated' and 'not heated' groups were
substituted for the two calendar year groups as given in Appendix VI
part (dii) 1,2,3,4, and 5 representing the five pollen groups. The
SPSS allocated samples which satisfied these criteria for each of the
pollen groups into the 'heated' and 'not heated' groups. The results
were obtained for only three pollen groups and these were Brassica, Castanea
and Myosotis. The predicted classification of the sixty four honey samples
selected by the SPSS have been given in Table 69. The amino acids for
which the Fisher's linear discriminant functions were calculated differed
in each of the three pollen groups. These differences were: in the
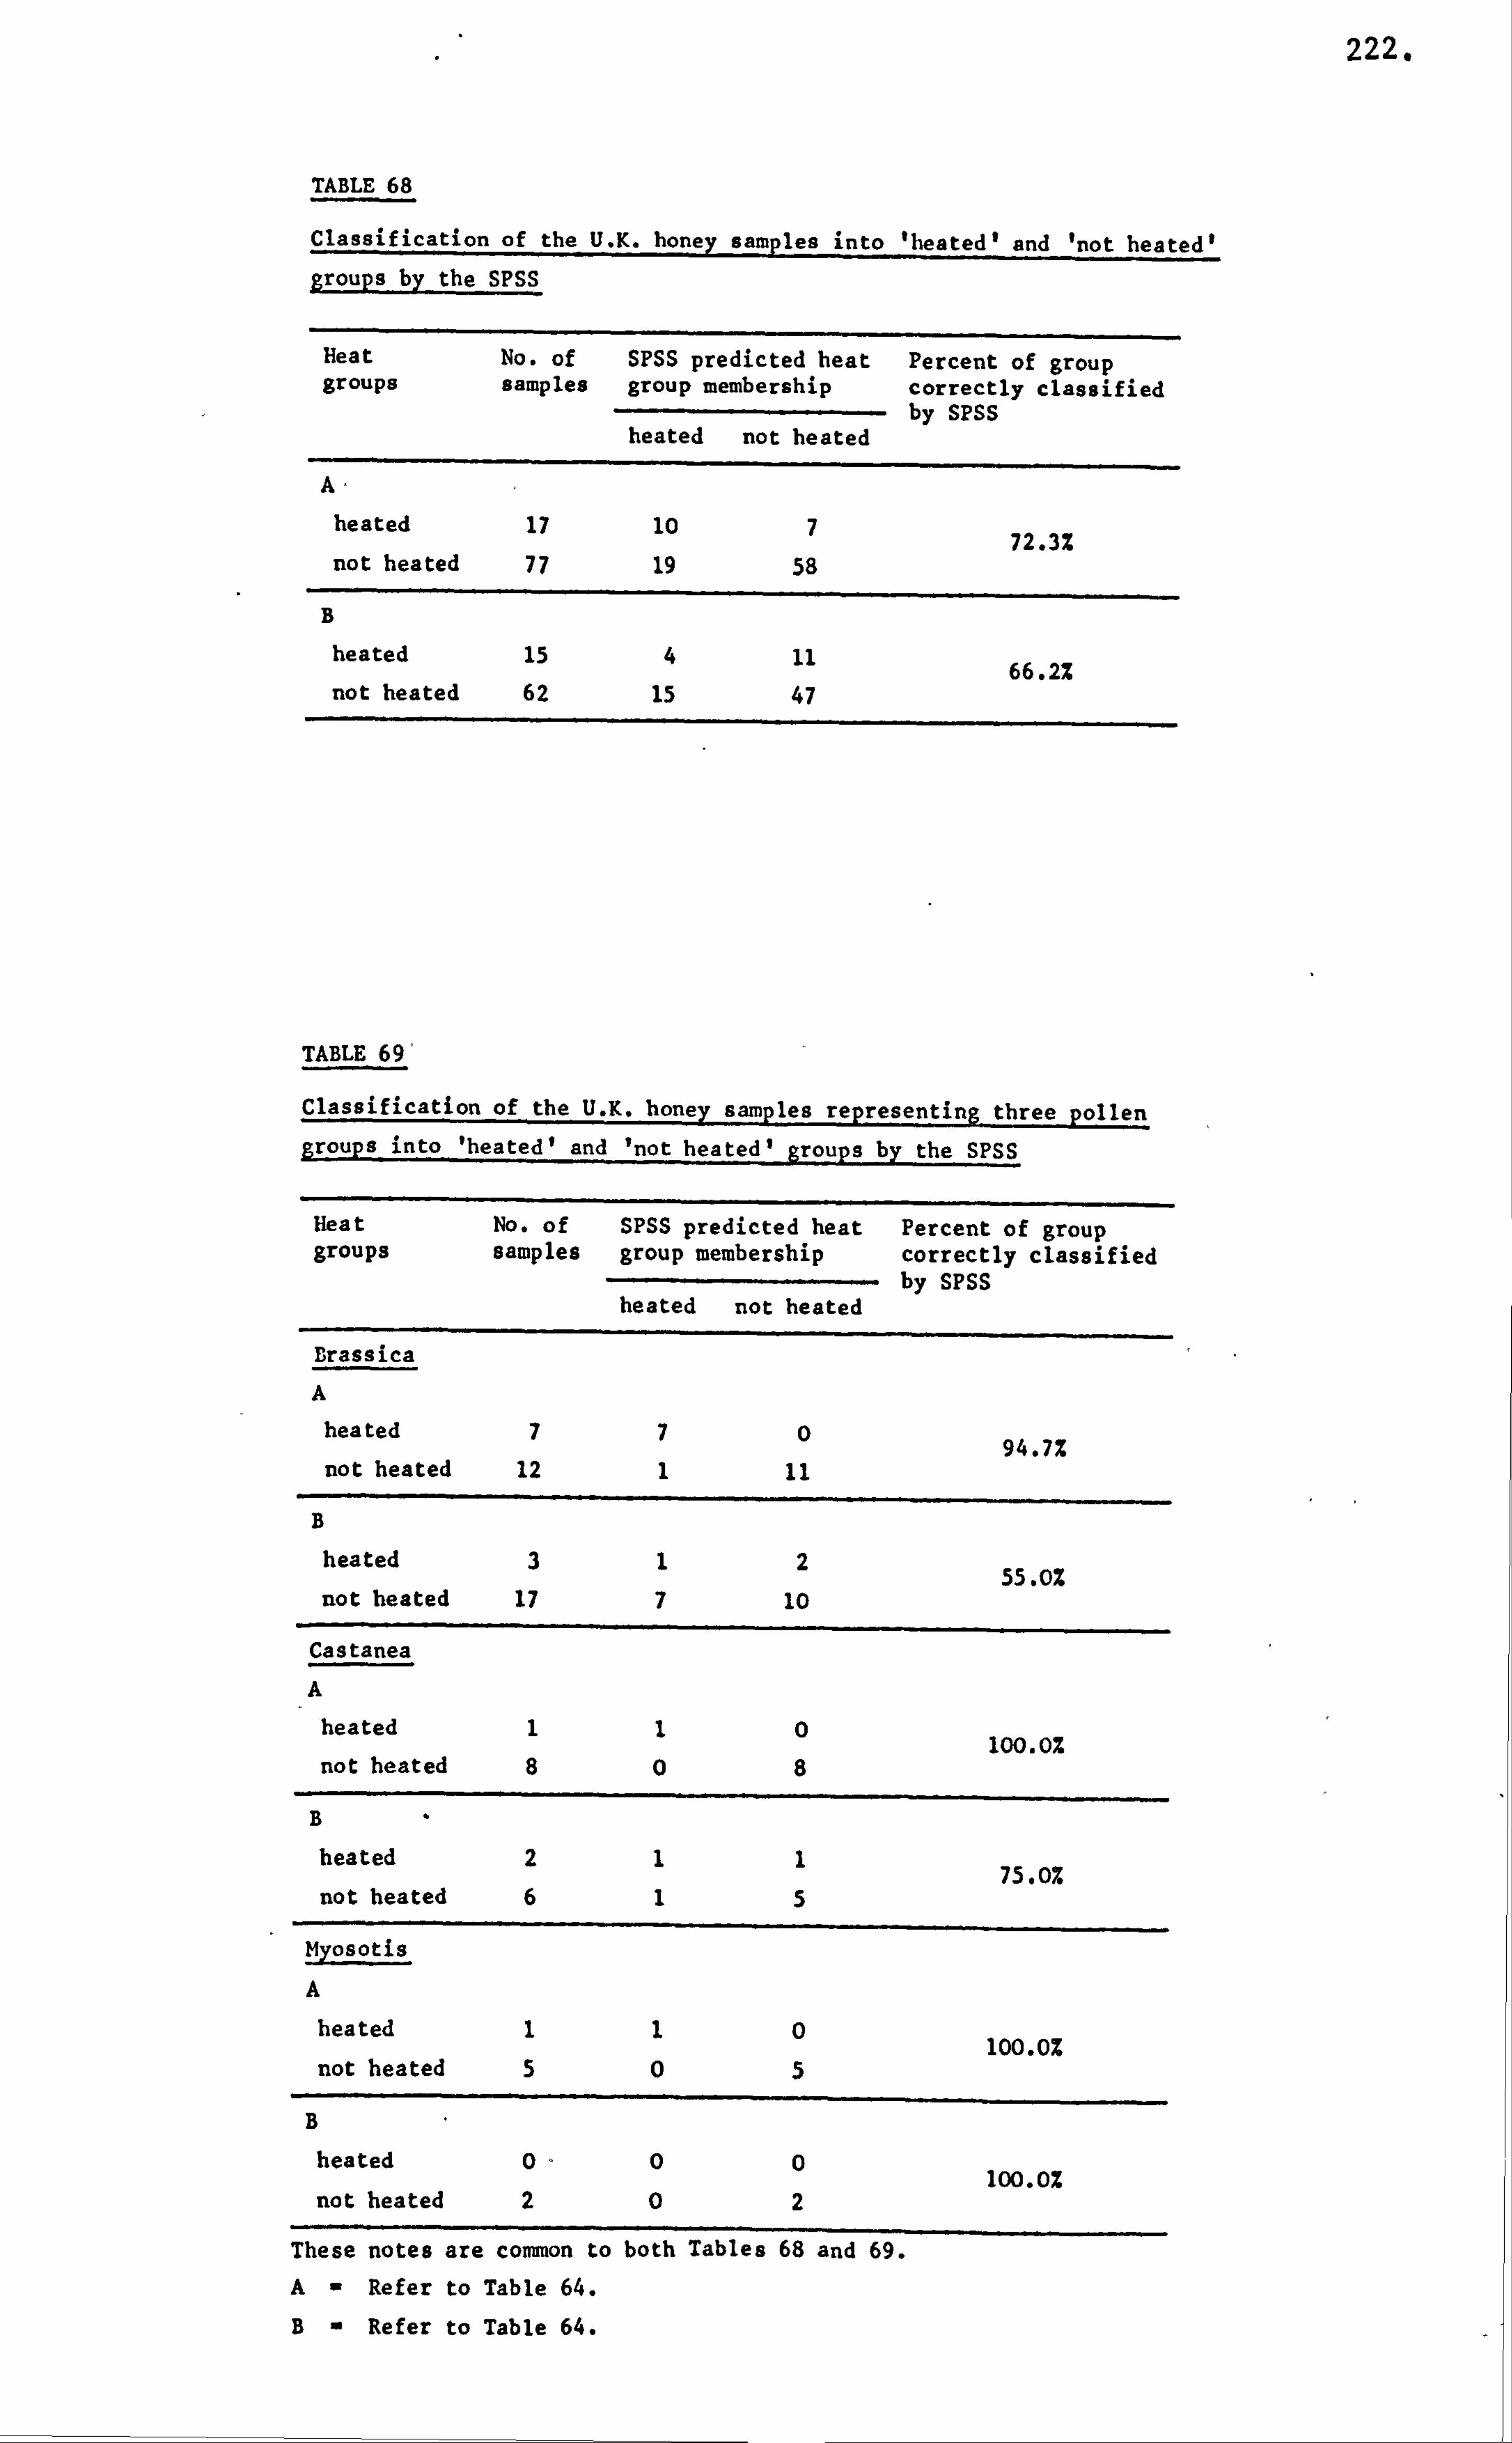
222.
TABLE 68
Classification of the U. K. honey samples into 'heated' and 'not heated'
groups by the SPSS
Beat No. of SPSS predicted heat Percent of group groups samples group membership correctly classified
by SPSS heated not heated
A-
heated 17 10 7 72.3% not heated 77 19 58
B heated is 4 11 66.2% not heated 62 15 47
TABLE 69
Classification of the U. K. honey samples representine three Dollen groups into 'heated' and 'not heated' groups by the SPSS
Heat No. of SPSS predicted heat Percent of group groups samples group membership correctly classified
by SPSS heated not heated
Drassica
A heated 770
94.7% not heated 12 1 11
B
heated 312 55. OZ
not heated 17 7 10
Castanea
A heated 110
100.0% not heated 808
B
heated 211 75.0%
not heated 615
Myosotis
A
heated 110 100.0%
not heated 505
B
heated 0-00 100.0%
not heated 202
These notes are common to both Tables 68 and 69. A- Refer to Table 64.
B- Refer to Table 64.
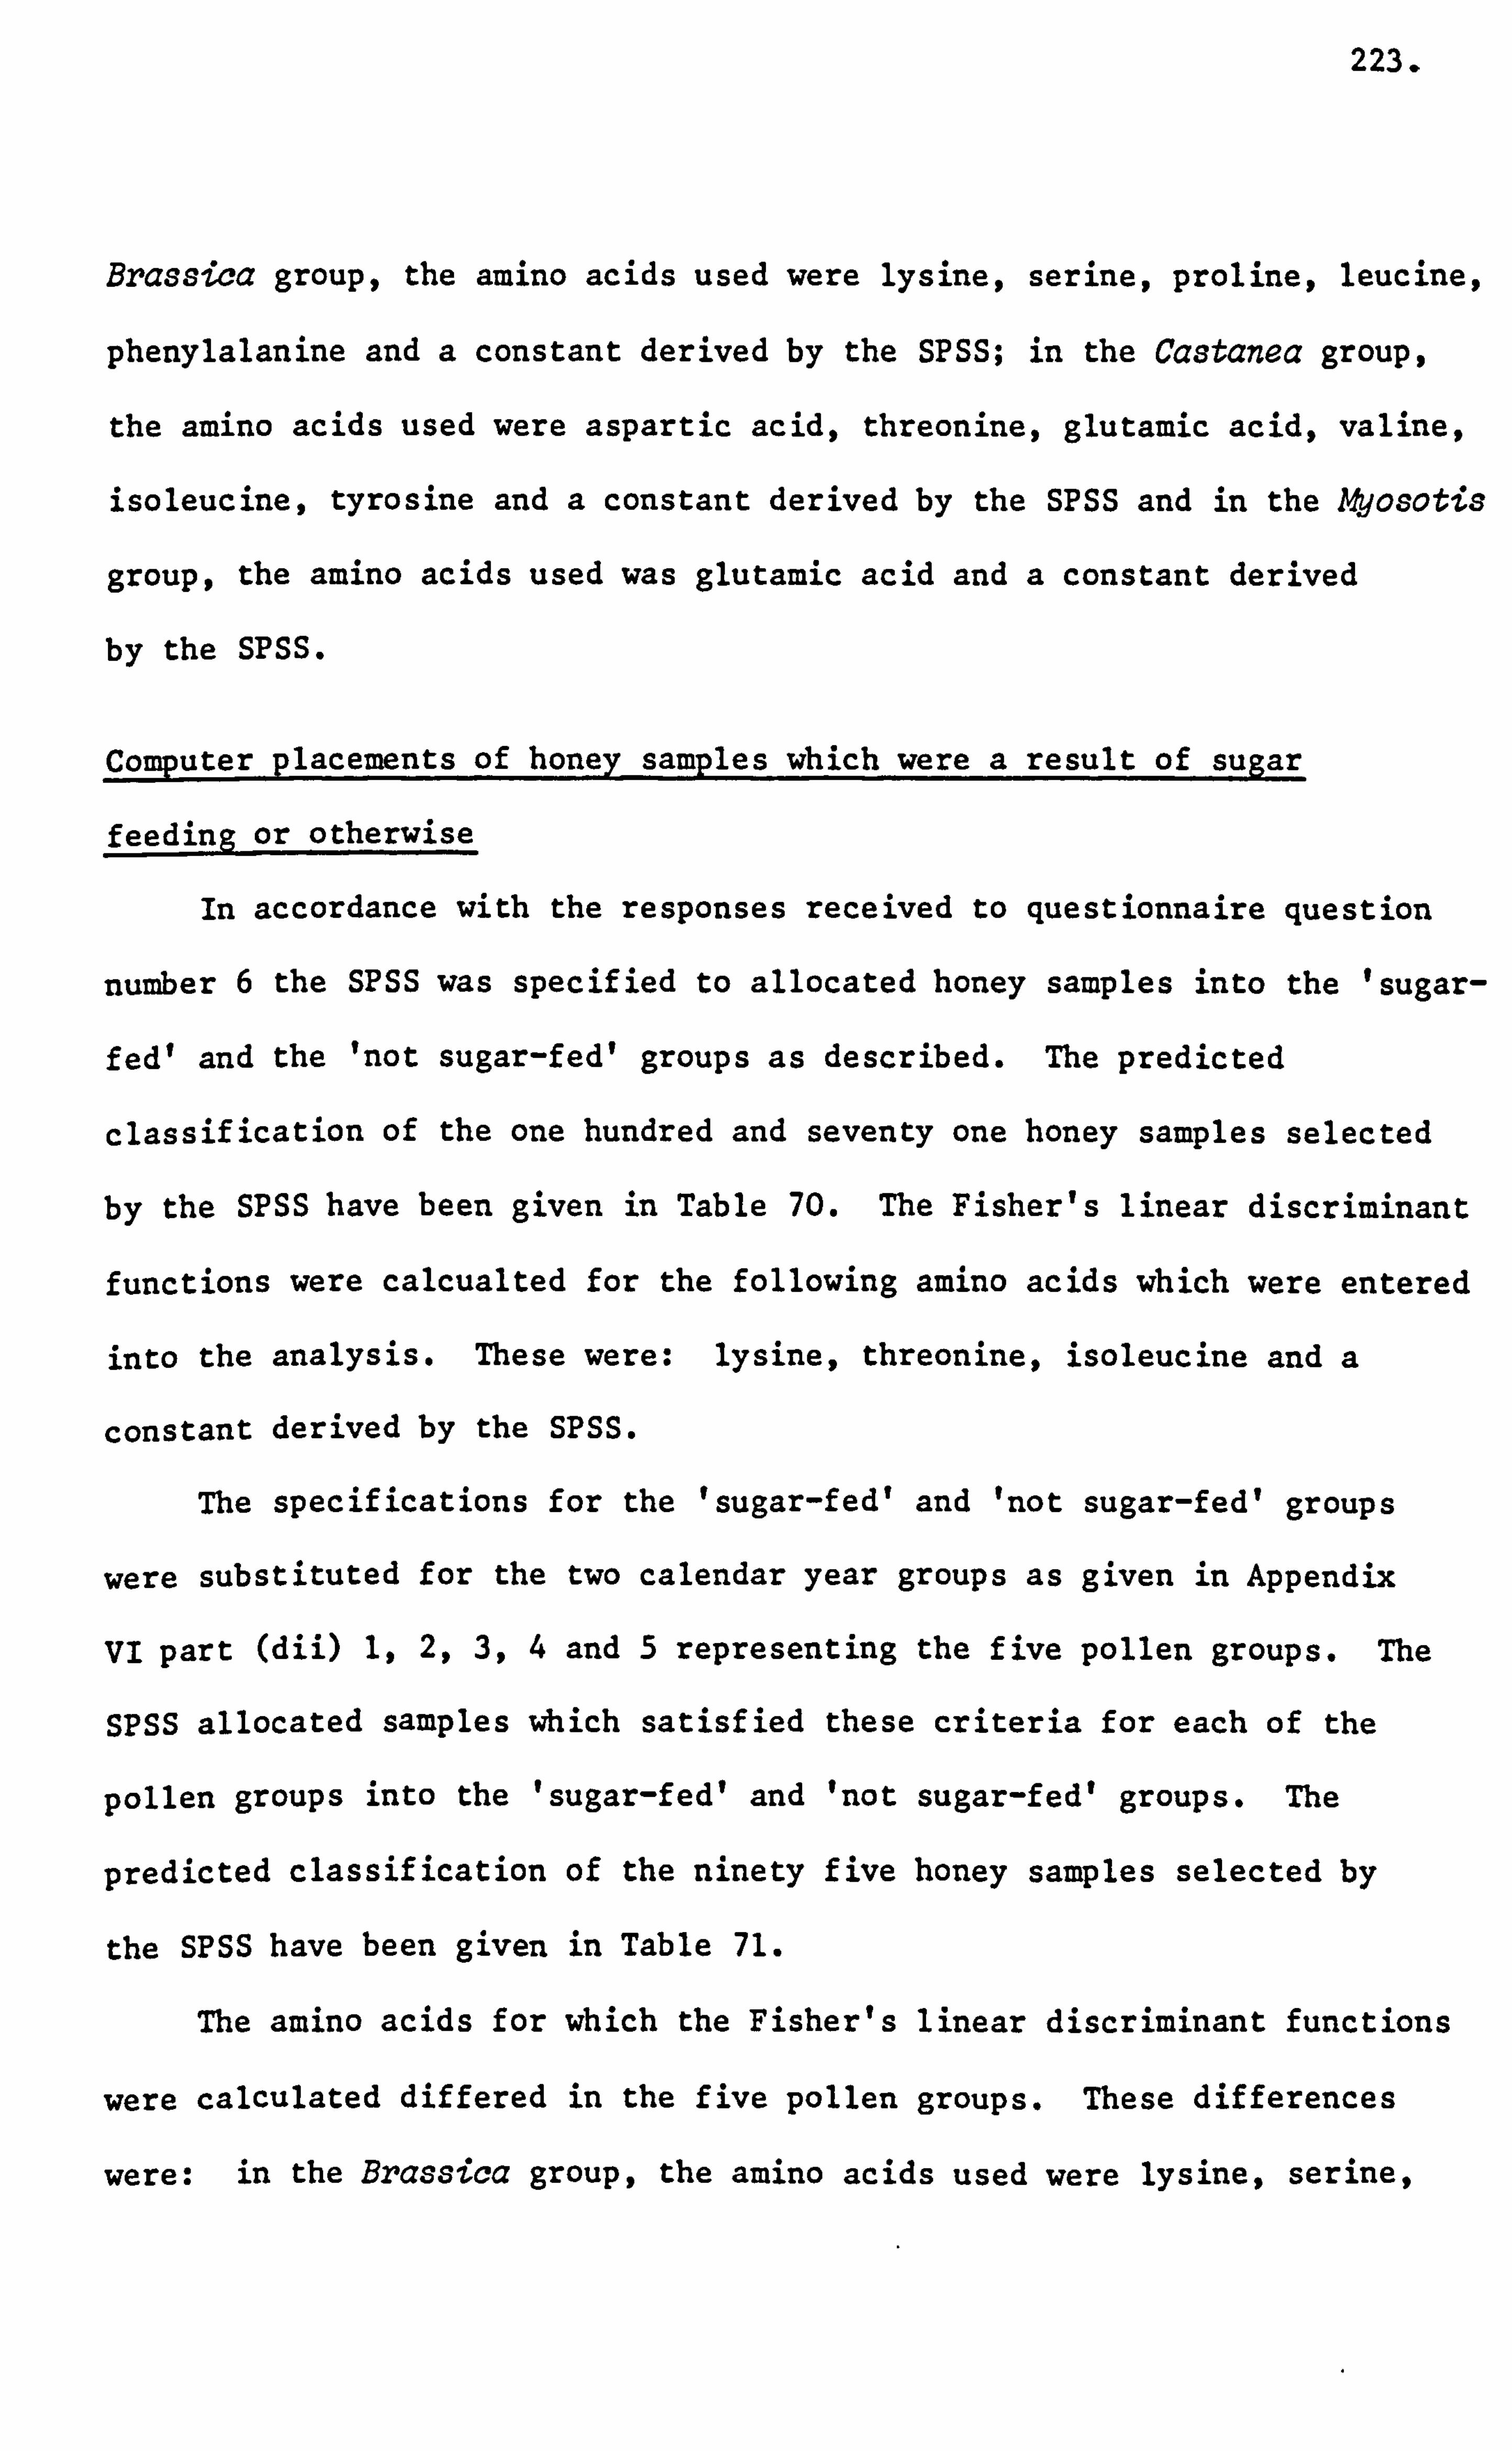
223.
Brassica group, the amino acids used were lysine, serine, proline, leucine,
phenylalanine and a constant derived by the SPSS; in the Castanea group,
the amino acids used were aspartic acid, threonine, glutamic acid, valine,
isoleucine, tyrosine and a constant derived by the SPSS and in the A&osotis
group, the amino acids used was glutamic acid and a constant derived
by the SPSS.
Computer placements of honey samples which were a result of sugar
feeding or otherwise
In accordance with the responses received to questionnaire question
number 6 the SPSS was specified to allocated honey samples into the 'sugar-
fed' and the 'not sugar-fed' groups as described. The predicted
classification of the one hundred and seventy one honey samples selected
by the SPSS have been given in Table 70. The Fisher's linear discriminant
functions were calcualted for the following amino acids which were entered
into the analysis. These were: lysine, threonine, isoleucine and a
constant derived by the SPSS.
The specifications for the 'sugar-fed' and 'not sugar-fed' groups
were substituted for the two calendar year groups as given in Appendix
VI part (dii) 1,2,3,4 and 5 representing the five pollen groups. The
SPSS allocated samples which satisfied these criteria for each of the
pollen groups into the 'sugar-fed' and 'not sugar-fed' groups. The
predicted classification of the ninety five honey samples selected by
the SPSS have been given in Table 71.
The amino acids for which the Fisher's linear discriminant functions
were calculated differed in the five pollen groups. These differences
were: in the Brassica group, the amino acids used were lysine, serine,
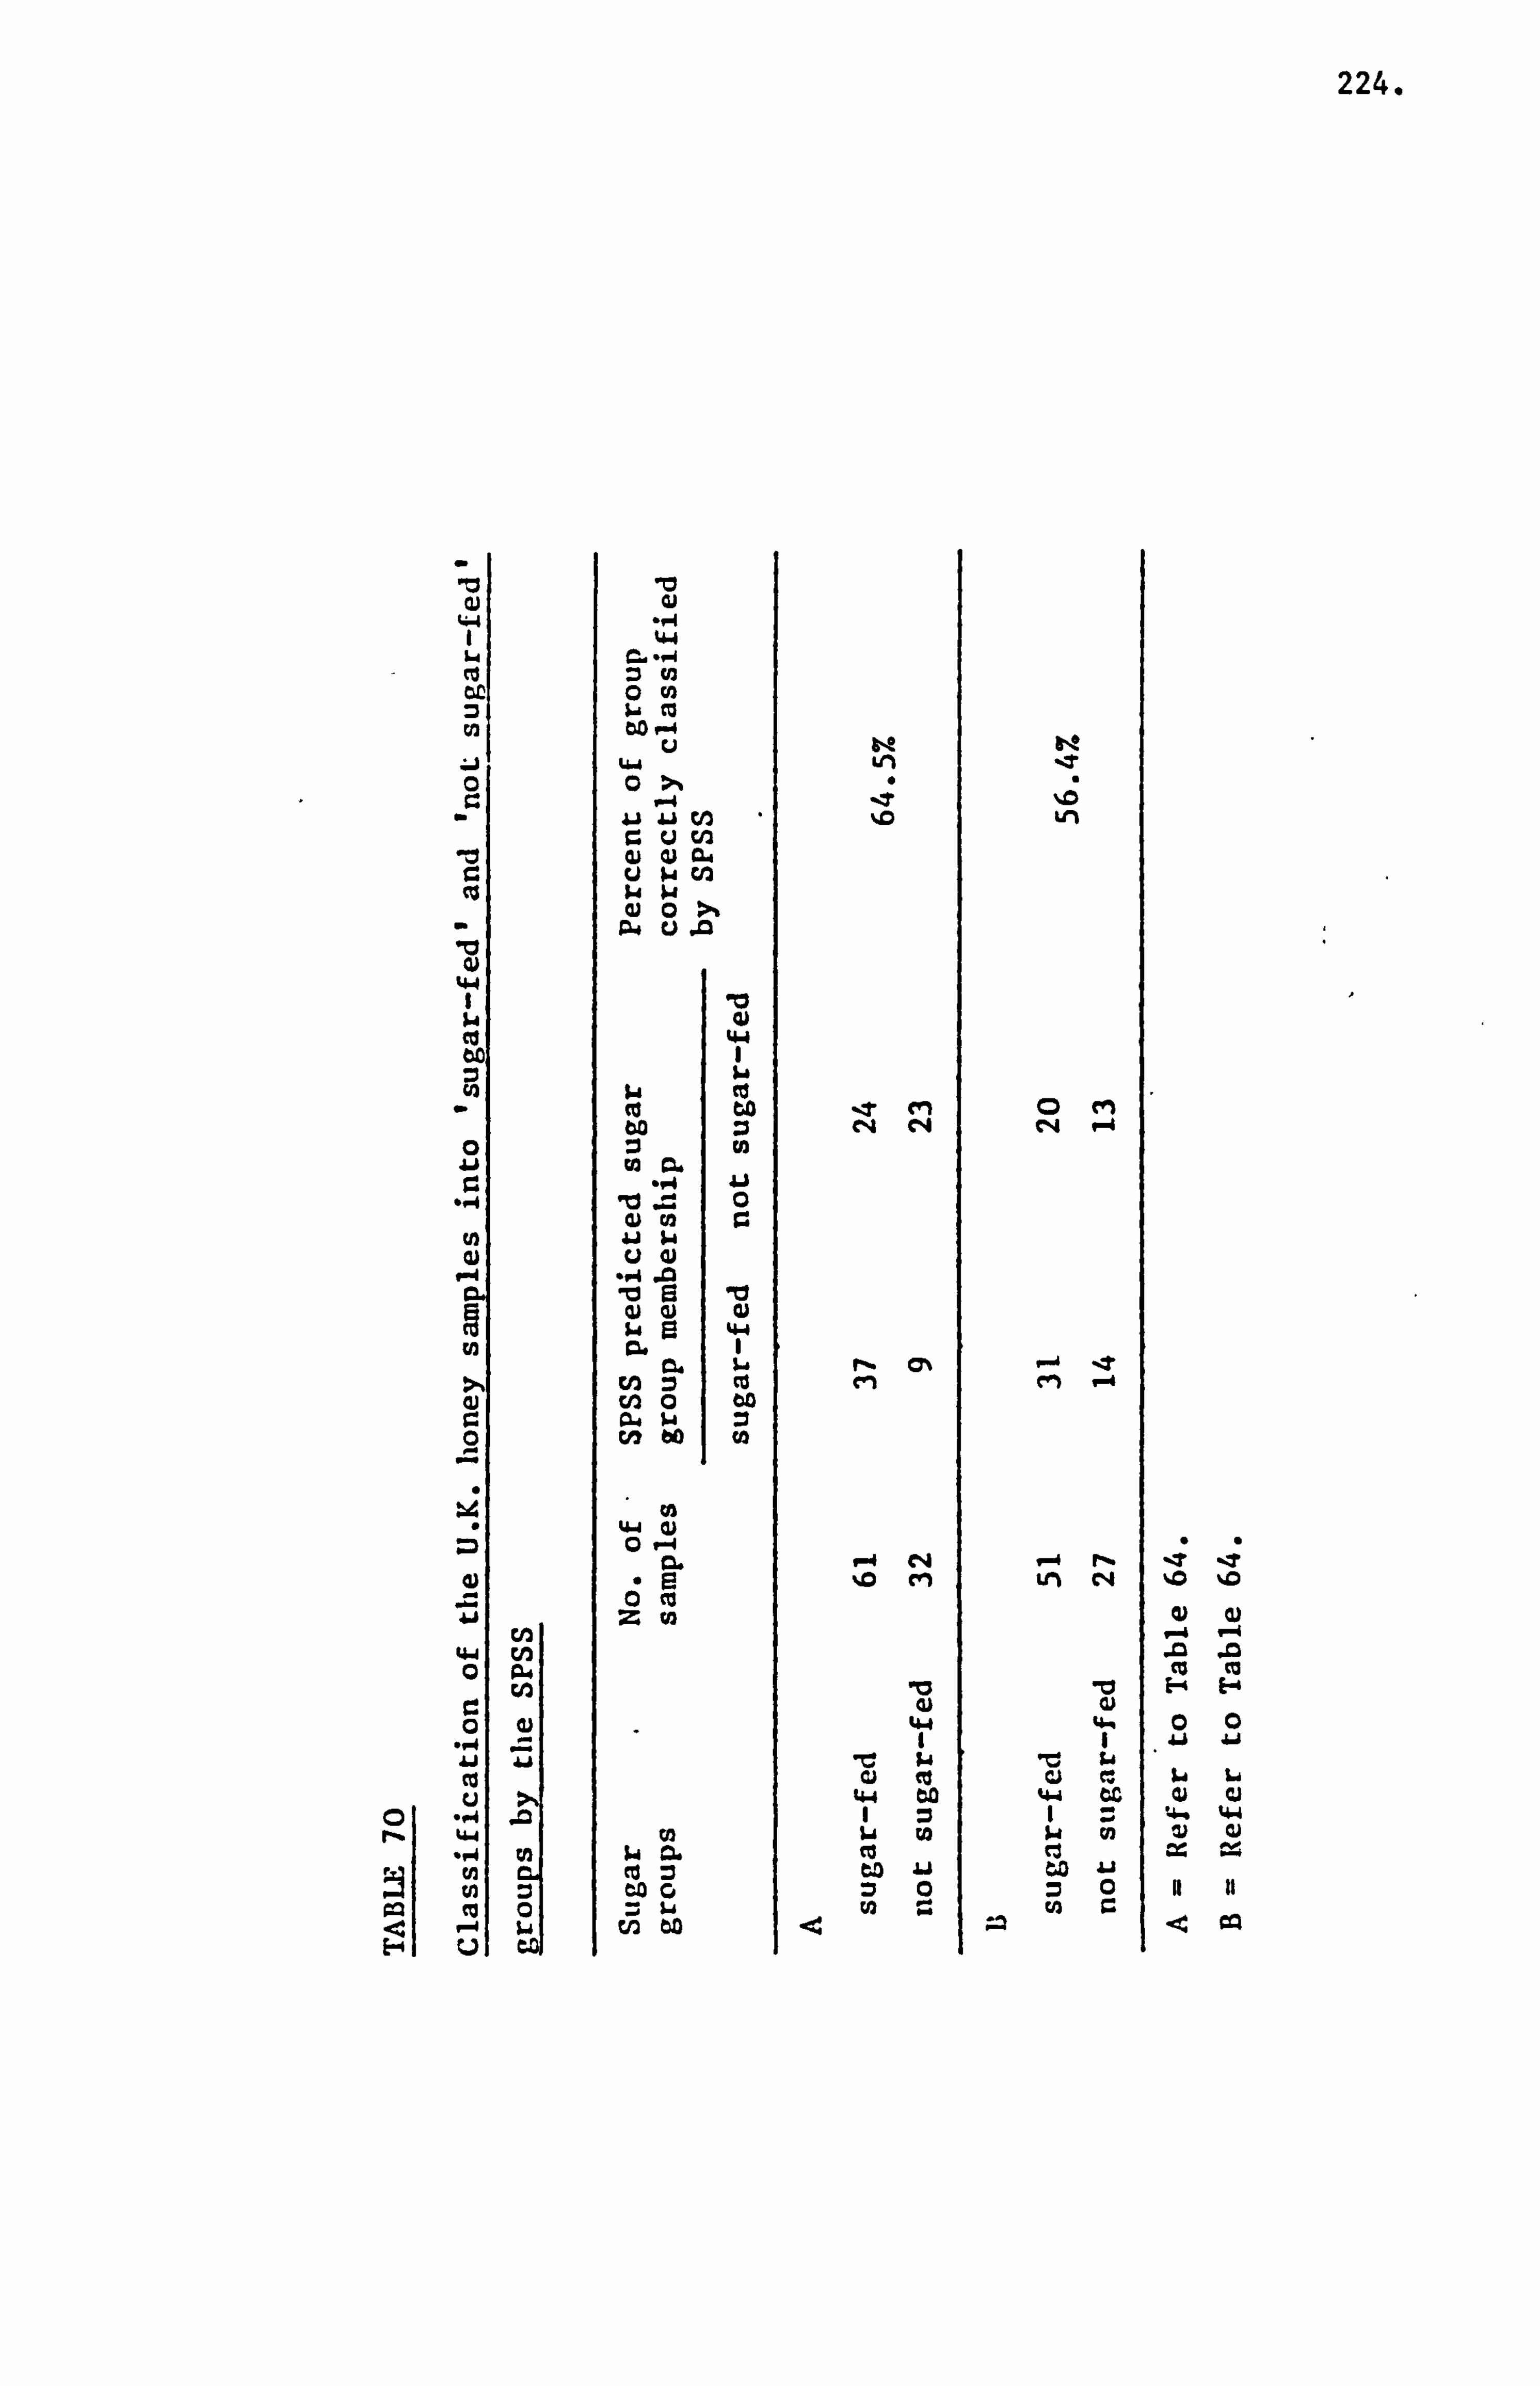
224.
:6 cu
0) 44 1
0
C',
En
a) 0
0 p4
ýi
E--4 u=
10 gi
cu cn ci Q) CL4 uw cn k4 w ei 0
94 u
w ce
. ýi ,, 0 ý; , Ni w
Qi Q) 54 0 gl.
m tio
.0
ce
rA w 12. cu =
to
41
wý co
X
c4 C, 4
P% 0% 1 en
P. 4 c4 ý %0 M
10 Q)
cli
jj
%Z Ln
0 cm C, 4 "d
"" ýt (IM ýt
V-4 LM
cJ c
0
ýc %0
. 12 iz c13 m
1-4 &4
0
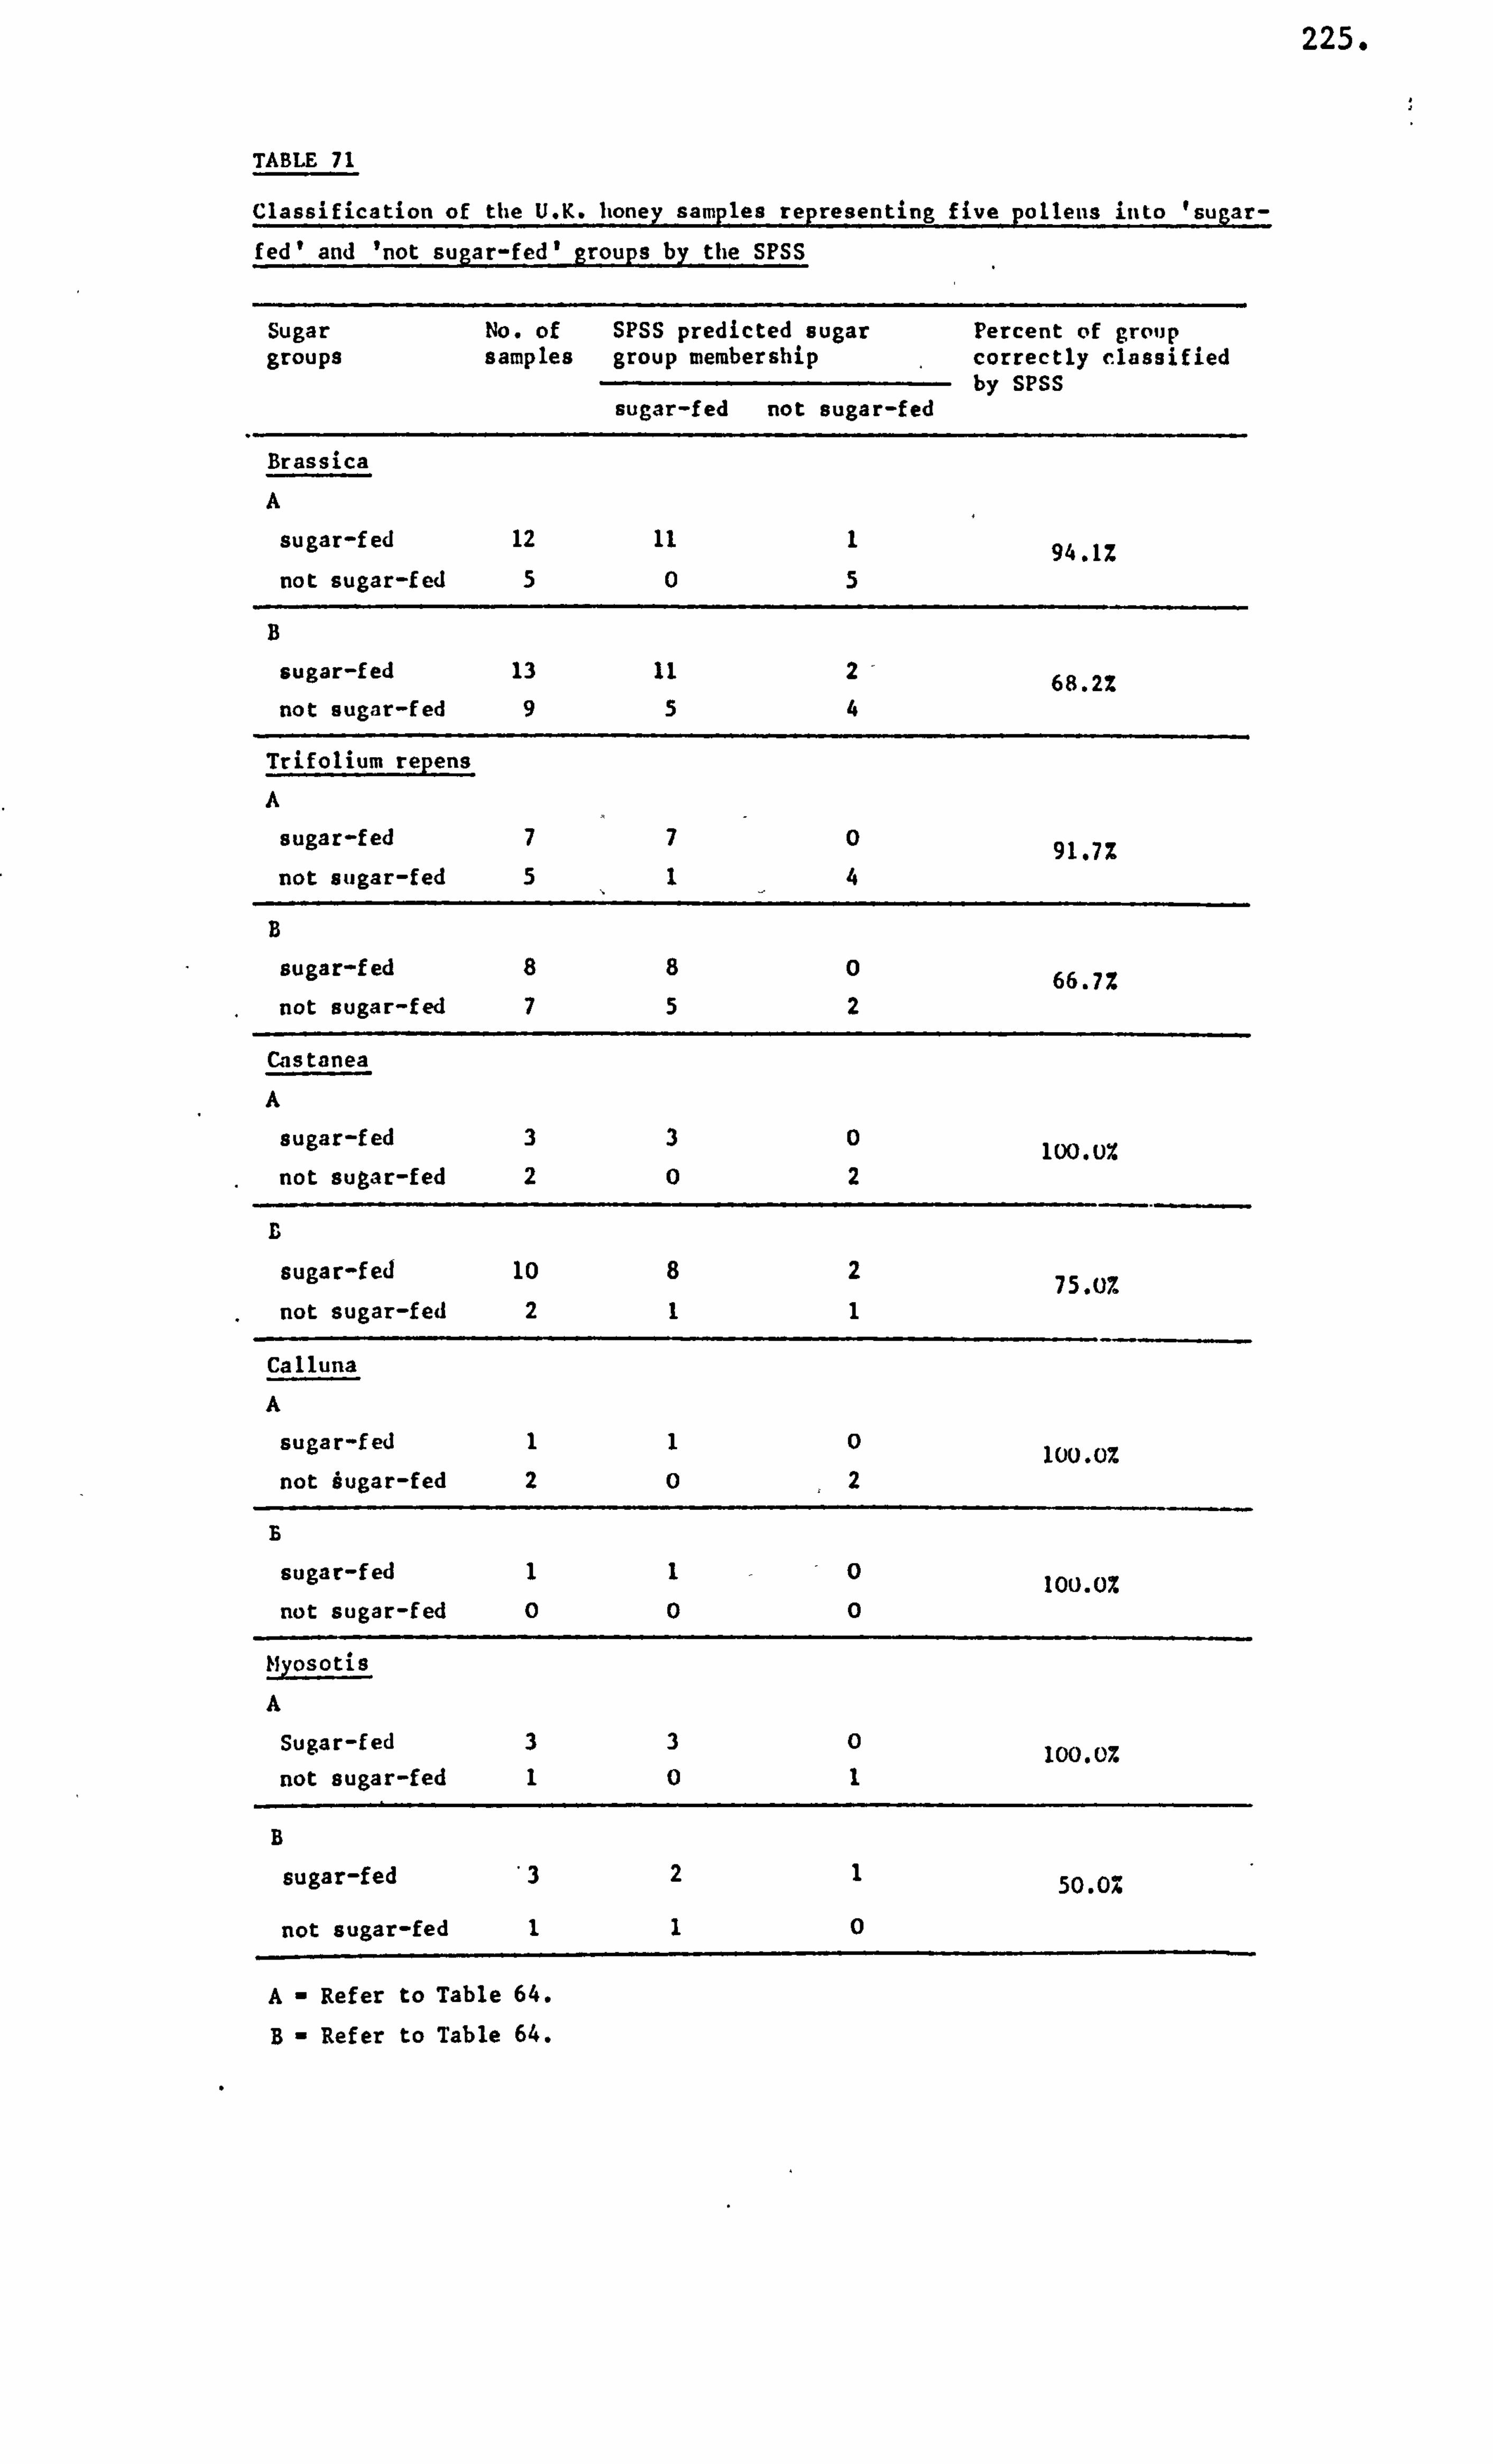
225.
TABLE 71
Classification of the U. K. honey samples representing five pollens into 'sugar-
fed' and 'not sug ar-fed' g roups by the SPSS
Sugar No. of SPSS predicted sugar Percent of group groups samples group membership correctly classified
by SPSS sugar-fed not sugar-fed
Brassica
A
sugar-fed 12 11 1 94AZ not sugar-fed 5 05
B
sugar-fed 13 11 2 68.2% not sugar-fed 9 54
Trifolium repens A
sugar-fed 770 91.7% not sugar-fed 514
B
sugar-fed 880 66.72 not sugar-fed 752
Castanea
A
sugar-fed 3 3 0 100. U% not sugar-fed 2 0 2
D
sugar-fed 10 8 2 75.0% not sugar-fed 2 1 1
Calluna
A
sugar-fed I 1 0 IOU. 0% not iugar-fed 2 0 2
B
sugar-fed I 1 0 100.0% not sugar-fed 0 0 0
Myosotis
A
Sugar-fed 3 3 0 100.0% not sugar-fed 1 0 1
B
sugar-fed 3 2 1 50.0%
not sugar-fed I 1 0
A- Refer to Table 64.
B- Refer to Table 64.
226.
glutamic acid, alanine, leucine and a constant derived by the SPSS; in
the TrifoZiwn repens group, the amino acids used were leucine, tyrosine
and a constant derived by the SPSS; in the Castanea group, the amino
acids used were aspartic acid, serine, alanine and a constant derived
by the SPSS; in the CaUuna group, the amino acid used was glutamic acid
and a constant derived by the SPSS and in the Myosotis group, the amino
acids used were serine, valine and a constant derived by the SPSS.
The results of feeding sugar to the honeybees in the winter and
in the spring months were assessed in the following manner. The autumn
fed samples were allocated into the 'not sugar-fed' group and the
statistical analysis performed in the usual way. The predicted
classification of the one hundred and seventy one honey samples selected
by the SPSS have been given in Table 72. The Fisher's linear discriminant
functions were calculated for the following amino acids. These were:
lysine, serine, glycine, tyrosine, phenylalanine, and a constant derived
by the SPSS-
As before the SPSS was specified to select samples into the 'sugar-
red' and 'not sugar-fed' groups representing the five pollen. The
predicted classification of the ninety honey samples selected by the
SPSS have been given in Table 73.
The amino acids for which the Fisher's linear discriminant functions
were calculated differed in four pollen groups. These differences were:
in the Brassica group, the amino acids used were lysine, aspartic acid,
threonine, glycine, alanine, isoleucine, leucine and a constant derived
by the SPSS; in the TrifoZium repens group, the amino acids used were
lysine, isoleucine and a constant derived by the SPSS; in the Castanea
group, the amino acids used were proline, glycine, alanine, leucine,
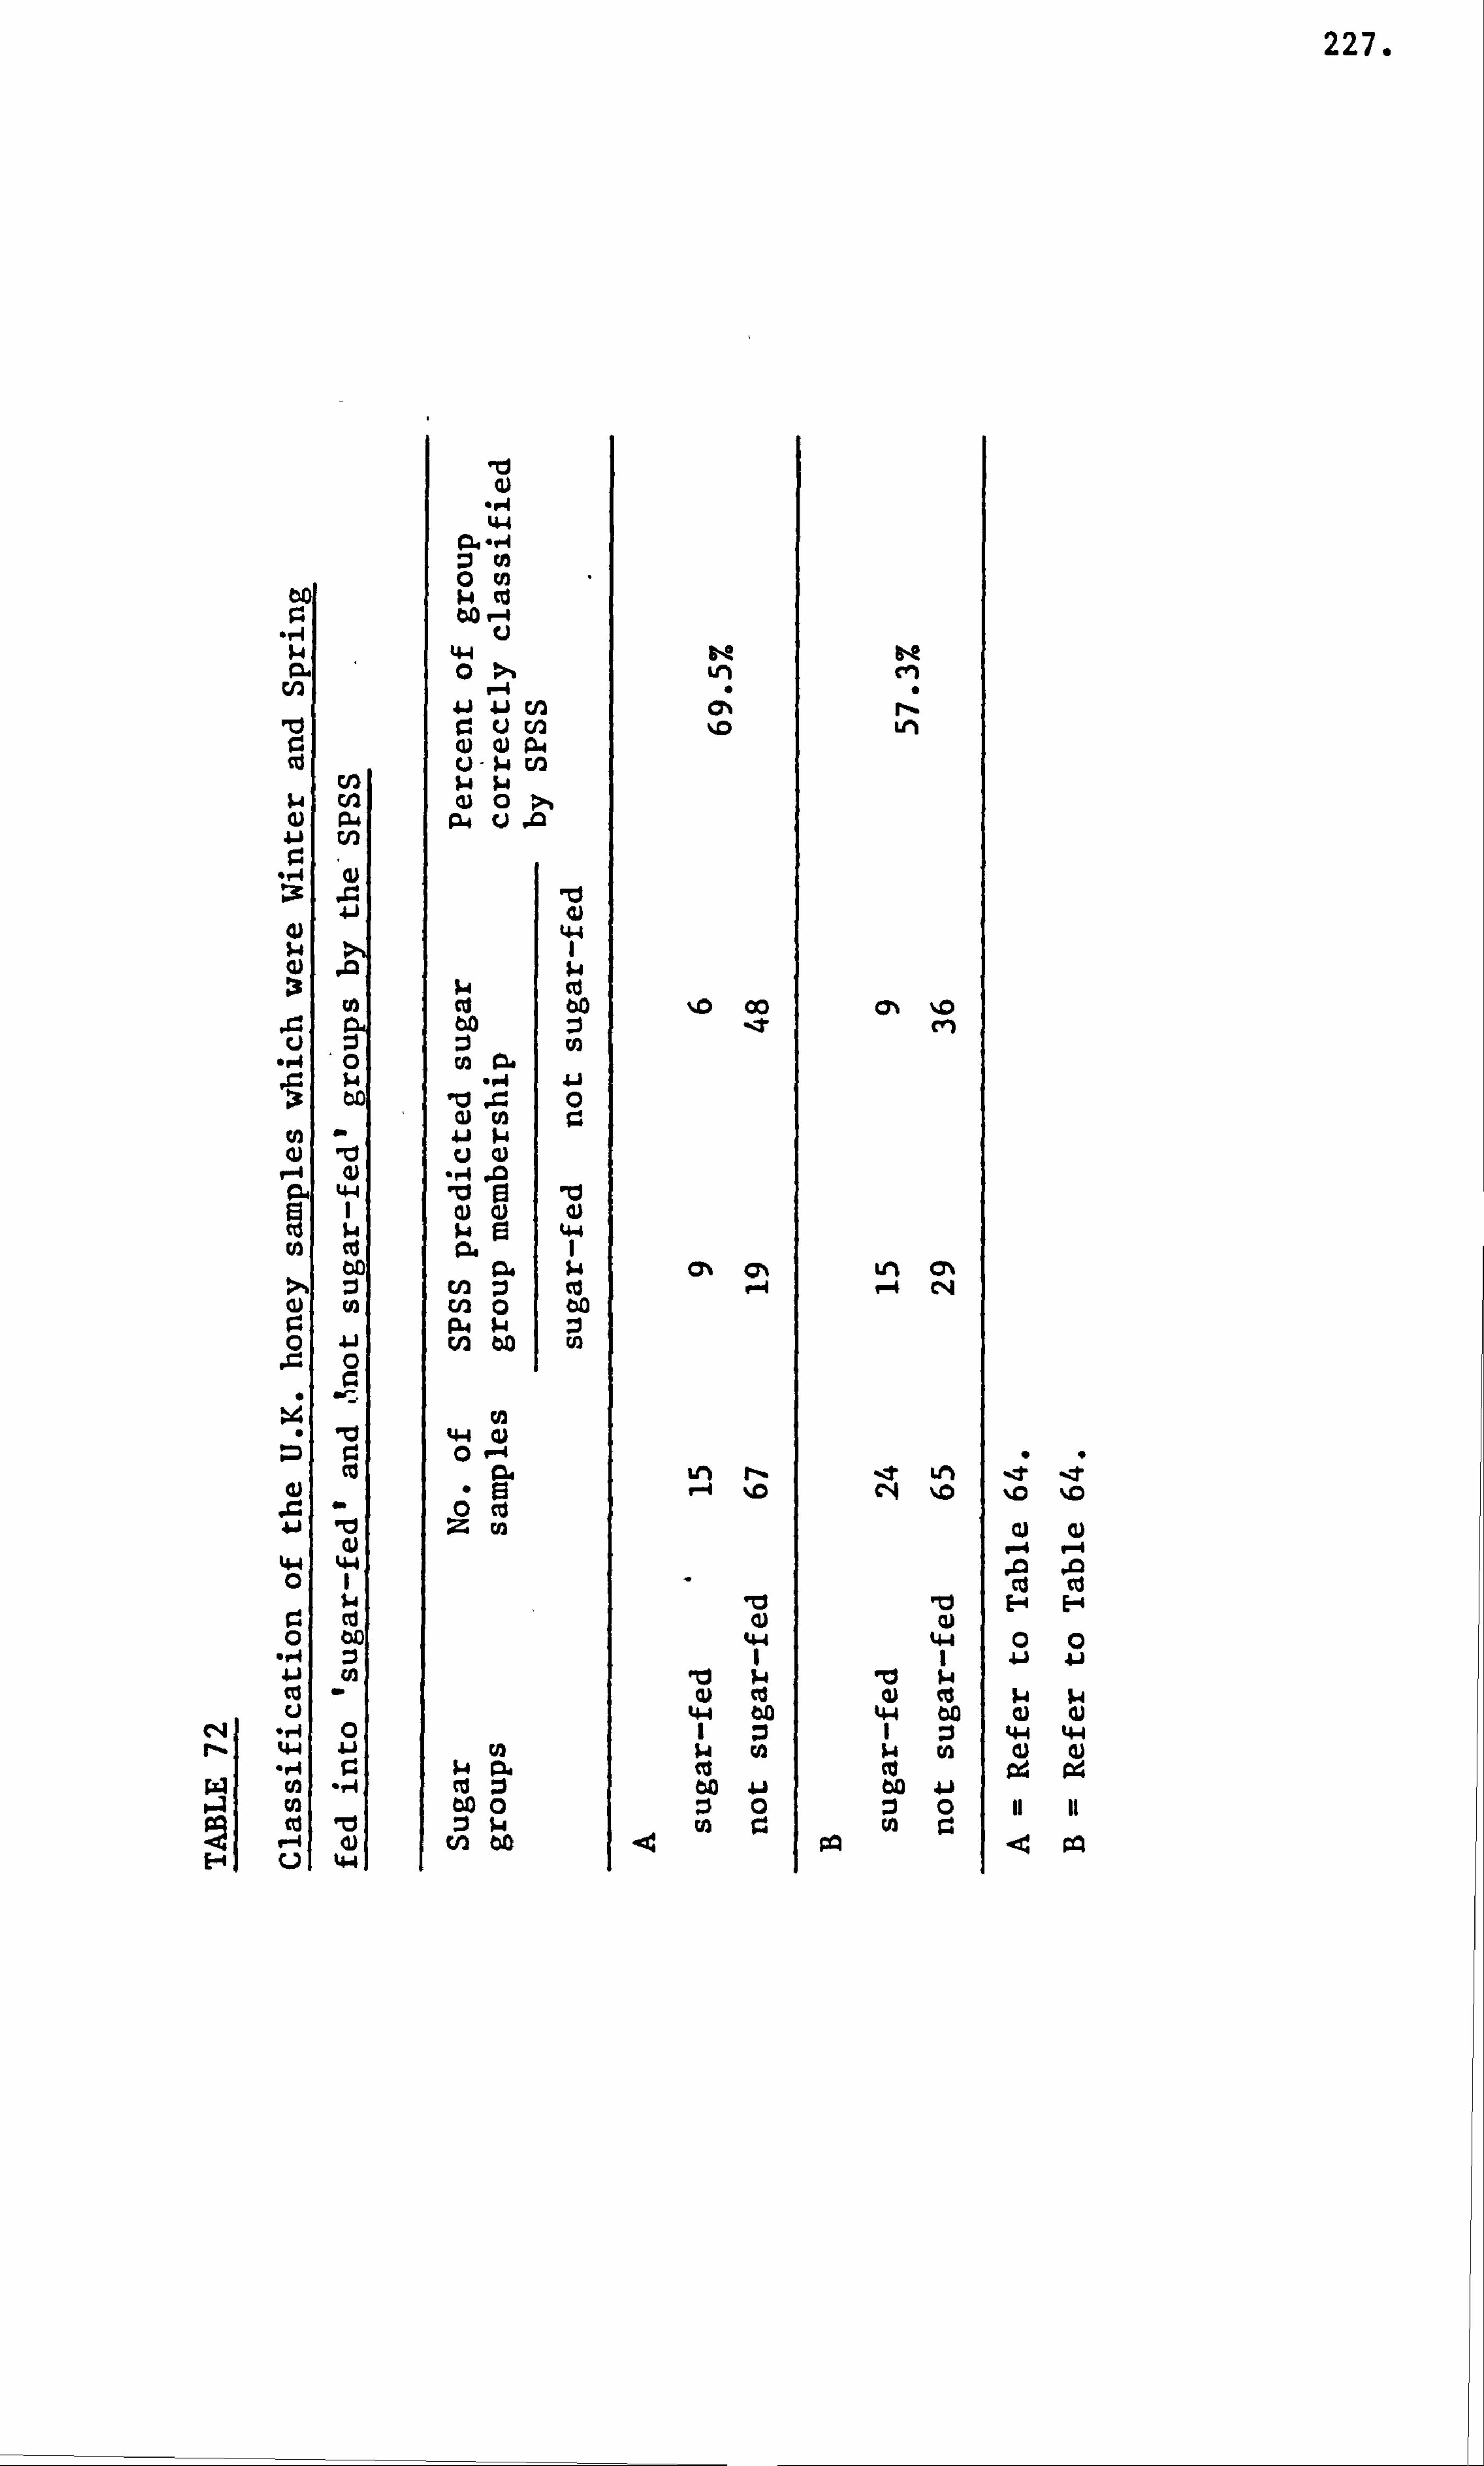
227.
"�.
C V Ir
"l. -
:3
U-
tv
C14
rZ rx ct
E-4
M cn
. 0)
4
0
rn
41
10 r.
0)
Ici 9)
4.4
0 w cu
44 0
41 tn
00
Ici a)
:i
. f4 41 li J., 0 a) rA r.
lii Ei 10
cn 0 bo P. 4 $W :i cn to
rA 44 W 0 9-4
lu
U) 14
to 0 :3 $4
W bo
N Ln
%0 00 -t
c'c'
LM rý
10 gi ,
CY) 9
Ln
ON z cn
ull (7% 7-4 C14
ýT tn c4 10
Ici w 10 ý-4 0) ce
4.4
rA
41
rn r, PQ
E-4 E-4
00
44 4-4 a) CL)
pel Pd
. 94 pq
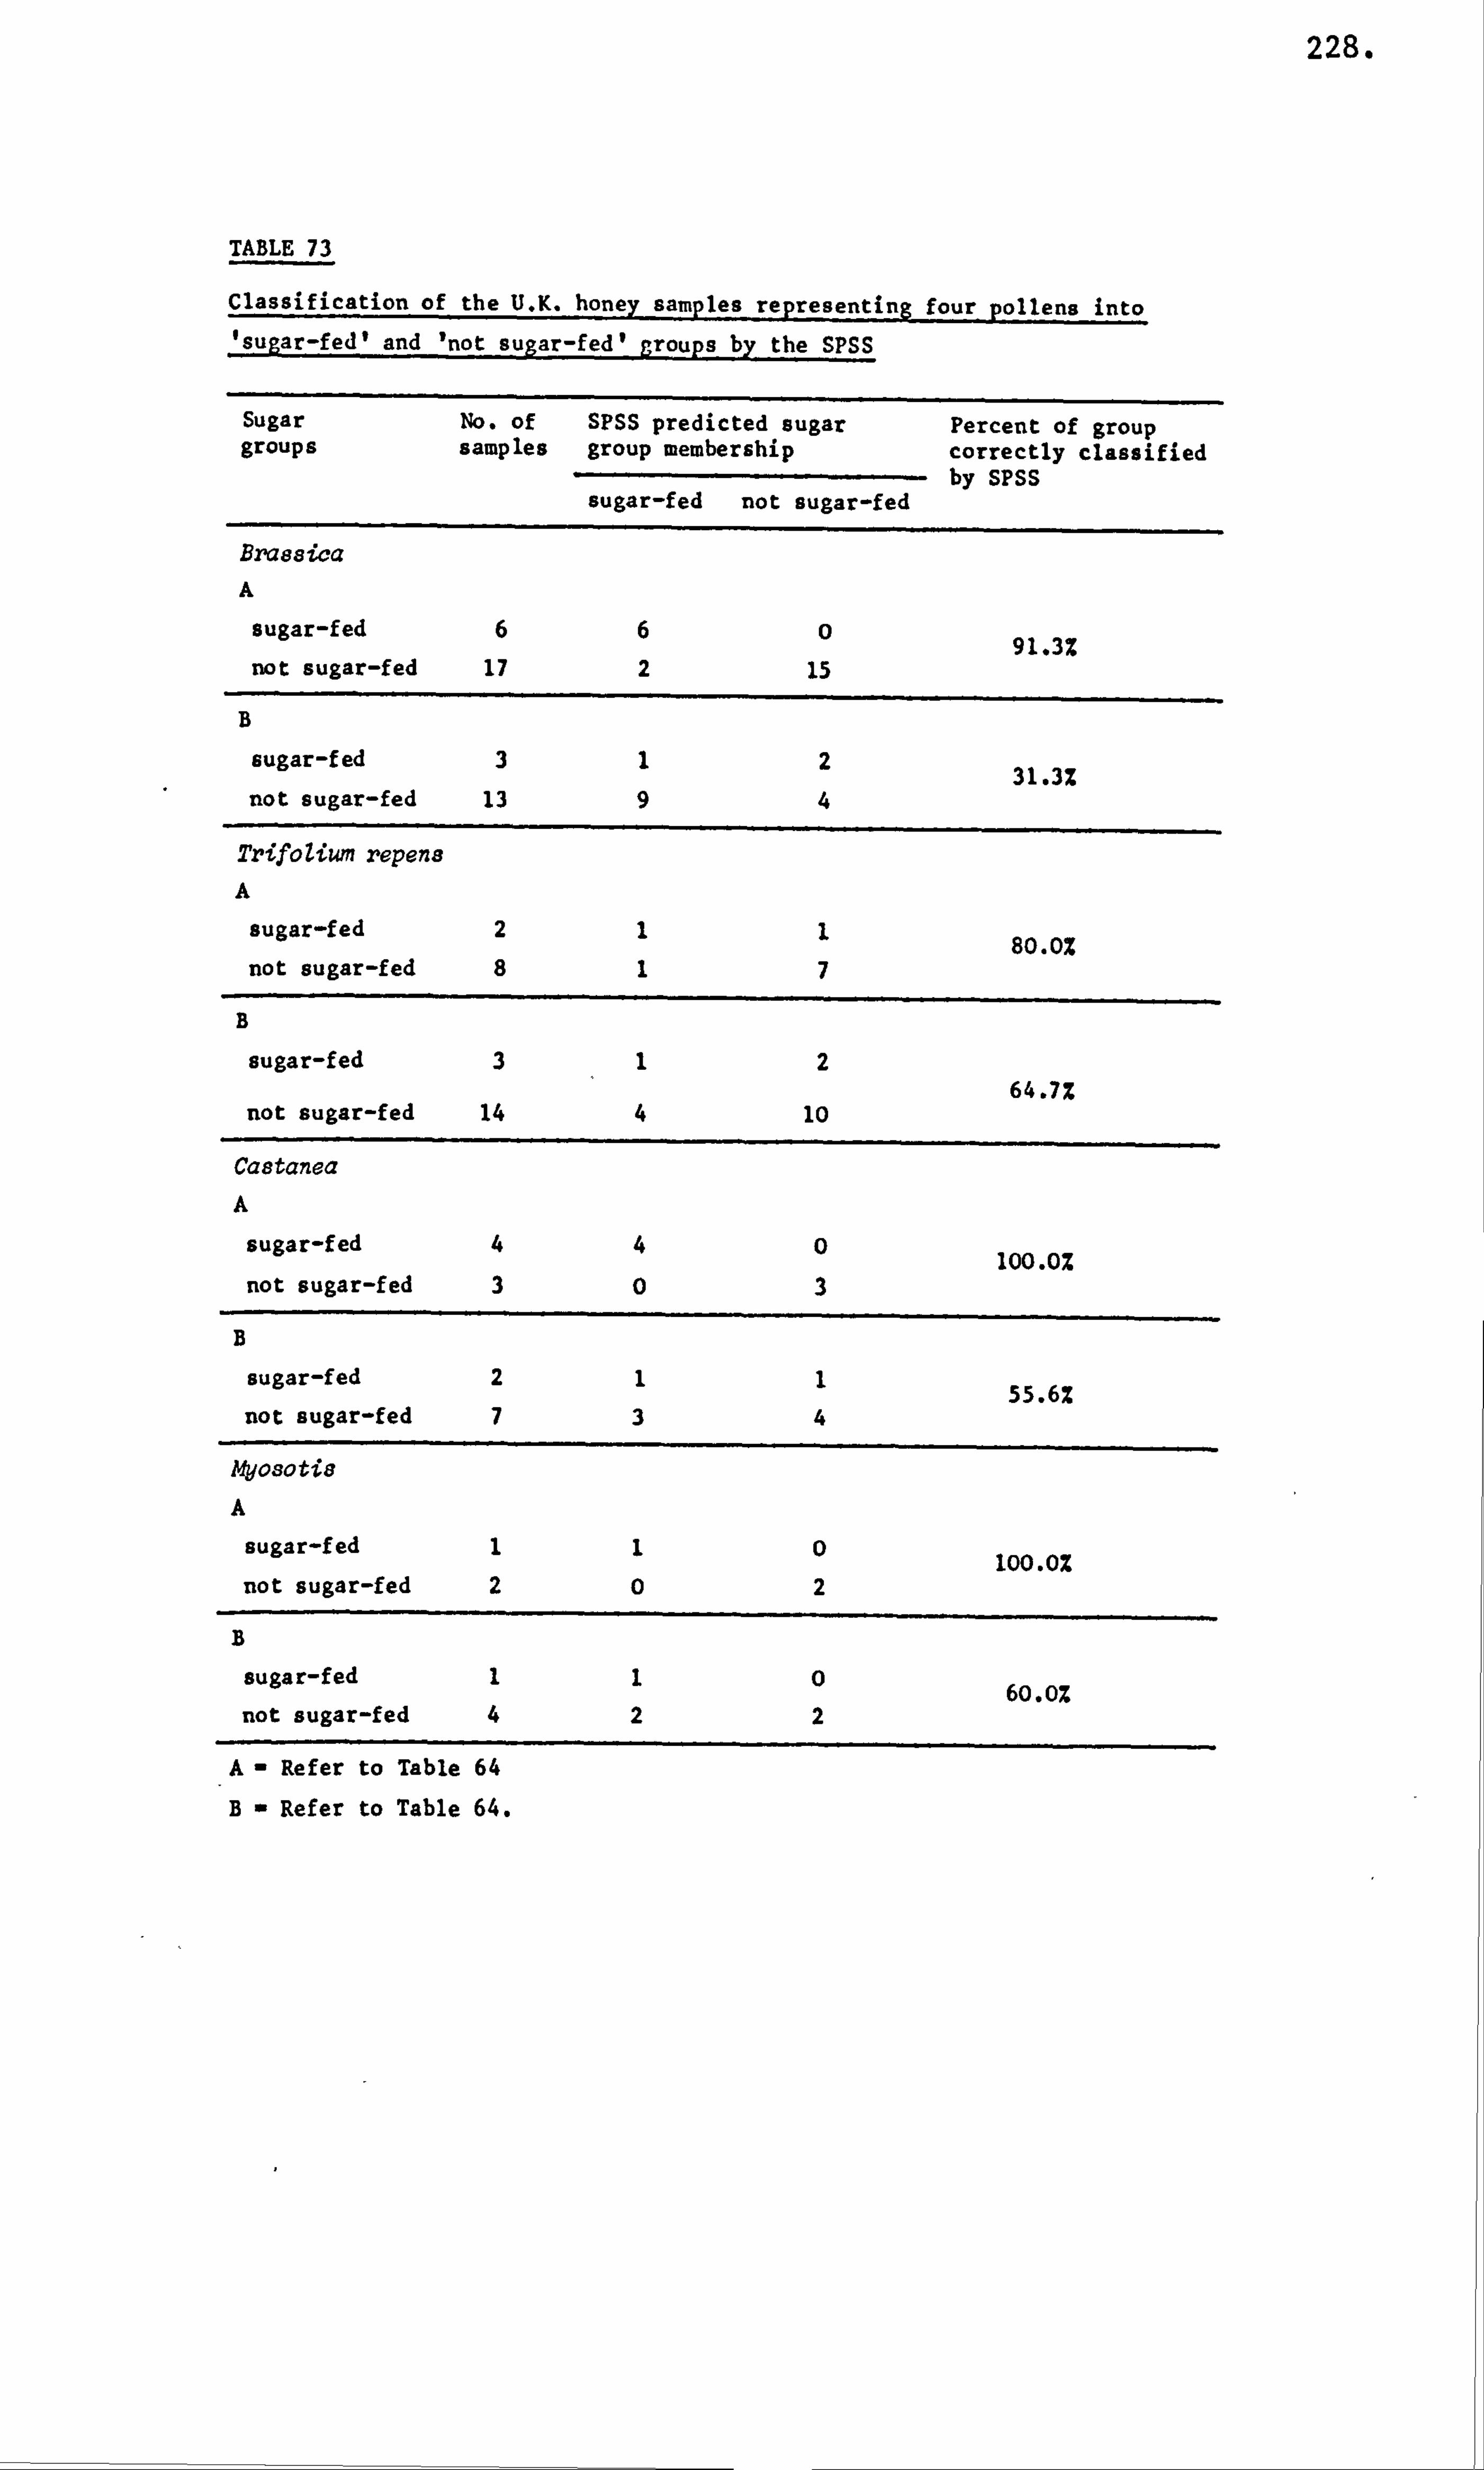
228.
TABLE 73
Classification of the U. K. honey samples representing four pollens into 'sugar-fed' and 'not sugar-fed' groups by the SPSS
Sugar No. of SPSS predicted sugar Percent of group groups samples group membership correctly classified
-- by SPSS sugar-fed not sugar-fed
Bras8ica
A
sugar-fed 6 6 0 91.3% not sugar-fed 17 2 15
B
sugar-fed 3 1 2 31.3% not sugar-fed 13 9 4
Trifolium repens A
sugar-fed 2 1 1 80.0% not sugar-fed 8 1 7
B
sugar-fed 3 1 2 64.7%
not sugar-fed 14 4 10
Castanea
A
sugar-fed 4 4 0 100.0% not sugar-fed 3 0 3
B
sugar-fed 2 1 1 55.6% not sugar-fed 7 3 4
AV030tis
A
sugar-fed 1 1 0 100.0% not sugar-fed 2 0 2
B
sugar-fed 1 1 0 60.0% not sugar-fed 4 2 2
A- Refer to Table 64
B- Refer to Table 64.
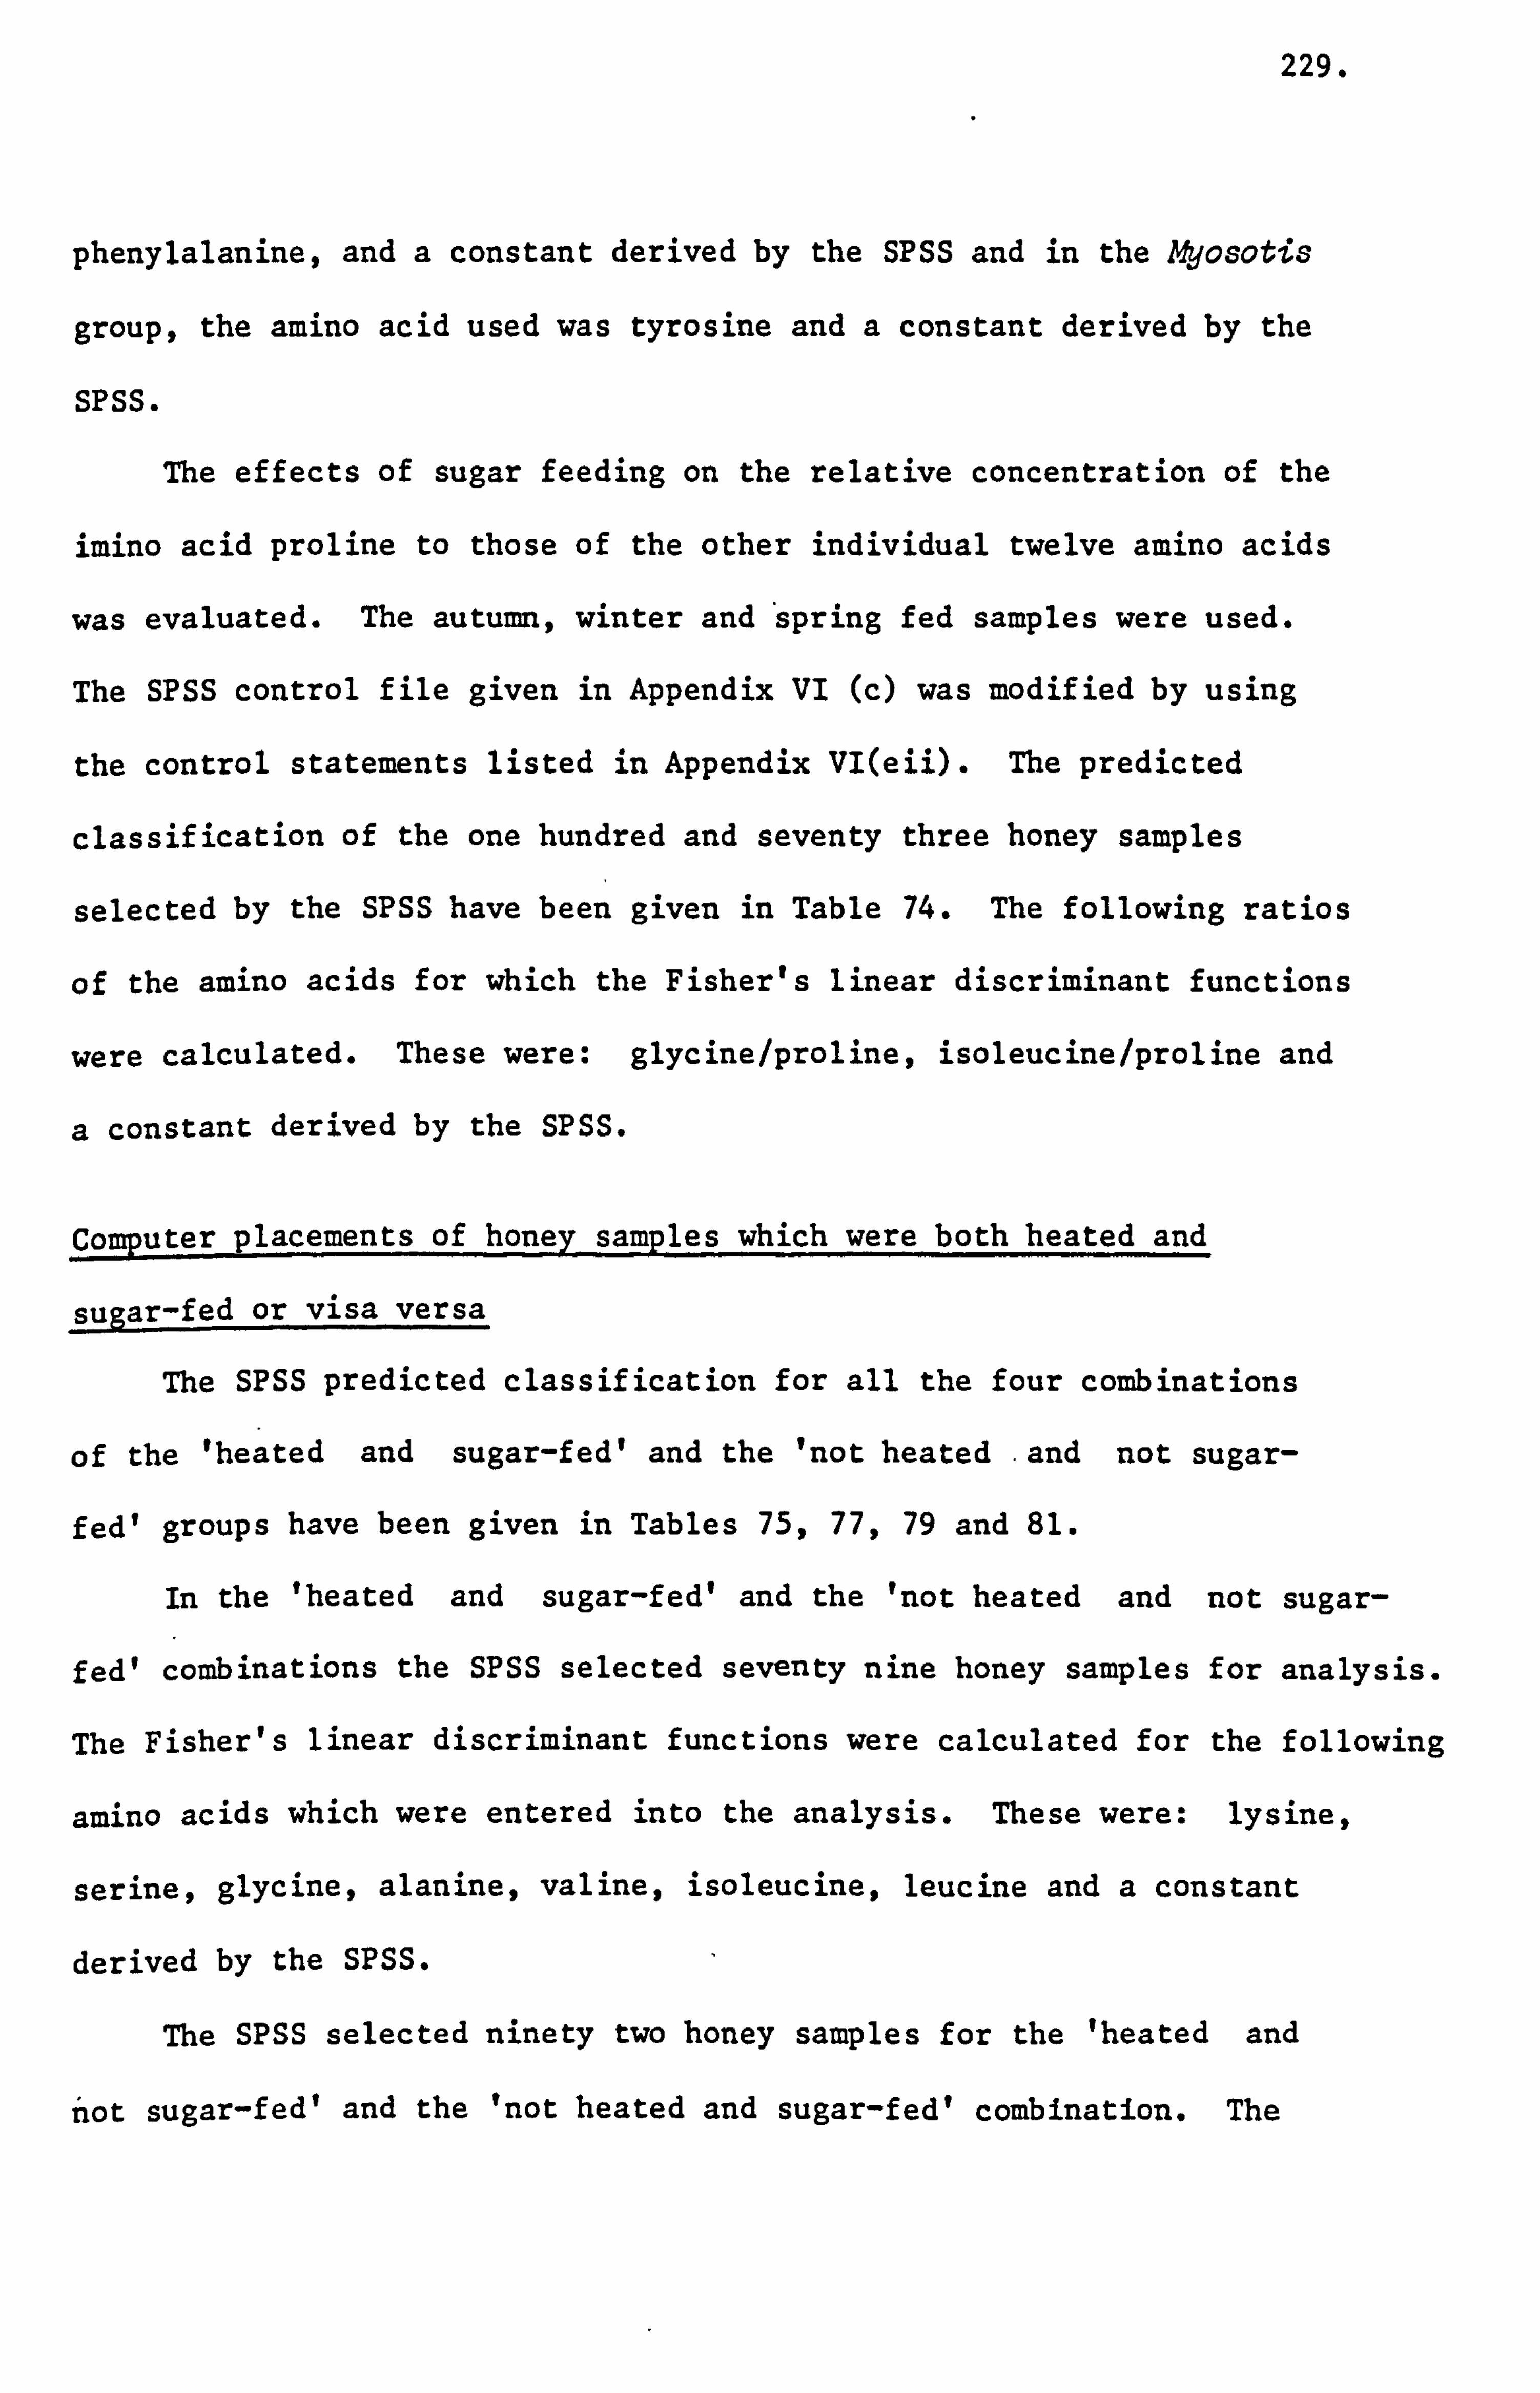
229.
phenylalanine, and a constant derived by the SPSS and in the Myosotis
group, the amino acid used was tyrosine and a constant derived by the
SPSS.
The effects of sugar feeding on the relative concentration of the
imino acid proline to those of the other individual twelve amino acids
was evaluated. The autumn, winter and 'spring fed samples were used.
The SPSS control file given in Appendix VI (c) was modified by using
the control statements listed in Appendix VI(eii). The predicted
classification of the one hundred and seventy three honey samples
selected by the SPSS have been given in Table 74. The following ratios
of the amino acids for which the Fisher's linear discriminant functions
were calculated. These were: glycine/proline, isoleucine/proline and
a constant derived by the SPSS.
Computer placements of honey samples which were both heated and
sugar-fed or visa versa
The SPSS predicted classification for all the four combinations
of the 'heated and sugar-f edl and the 'not heated -and not sugar-
fed' groups have been given in Tables 75,77,79 and 81.
In the 'heated and sugar-fed' and the 'not heated and not sugar-
fed' combinations the SPSS selected seventy nine honey samples for analysis.
The Fisher's linear discriminant functions were calculated for the following
amino acids which were entered into the analysis. These were: lysine,
serine, glycine, alanine, valine, isoleucine, leucine and a constant
derived by the SPSS.
The SPSS selected ninety two honey samples for the 'heated and
not sugar-fed' and the 'not heated and sugar-fed' combination. The
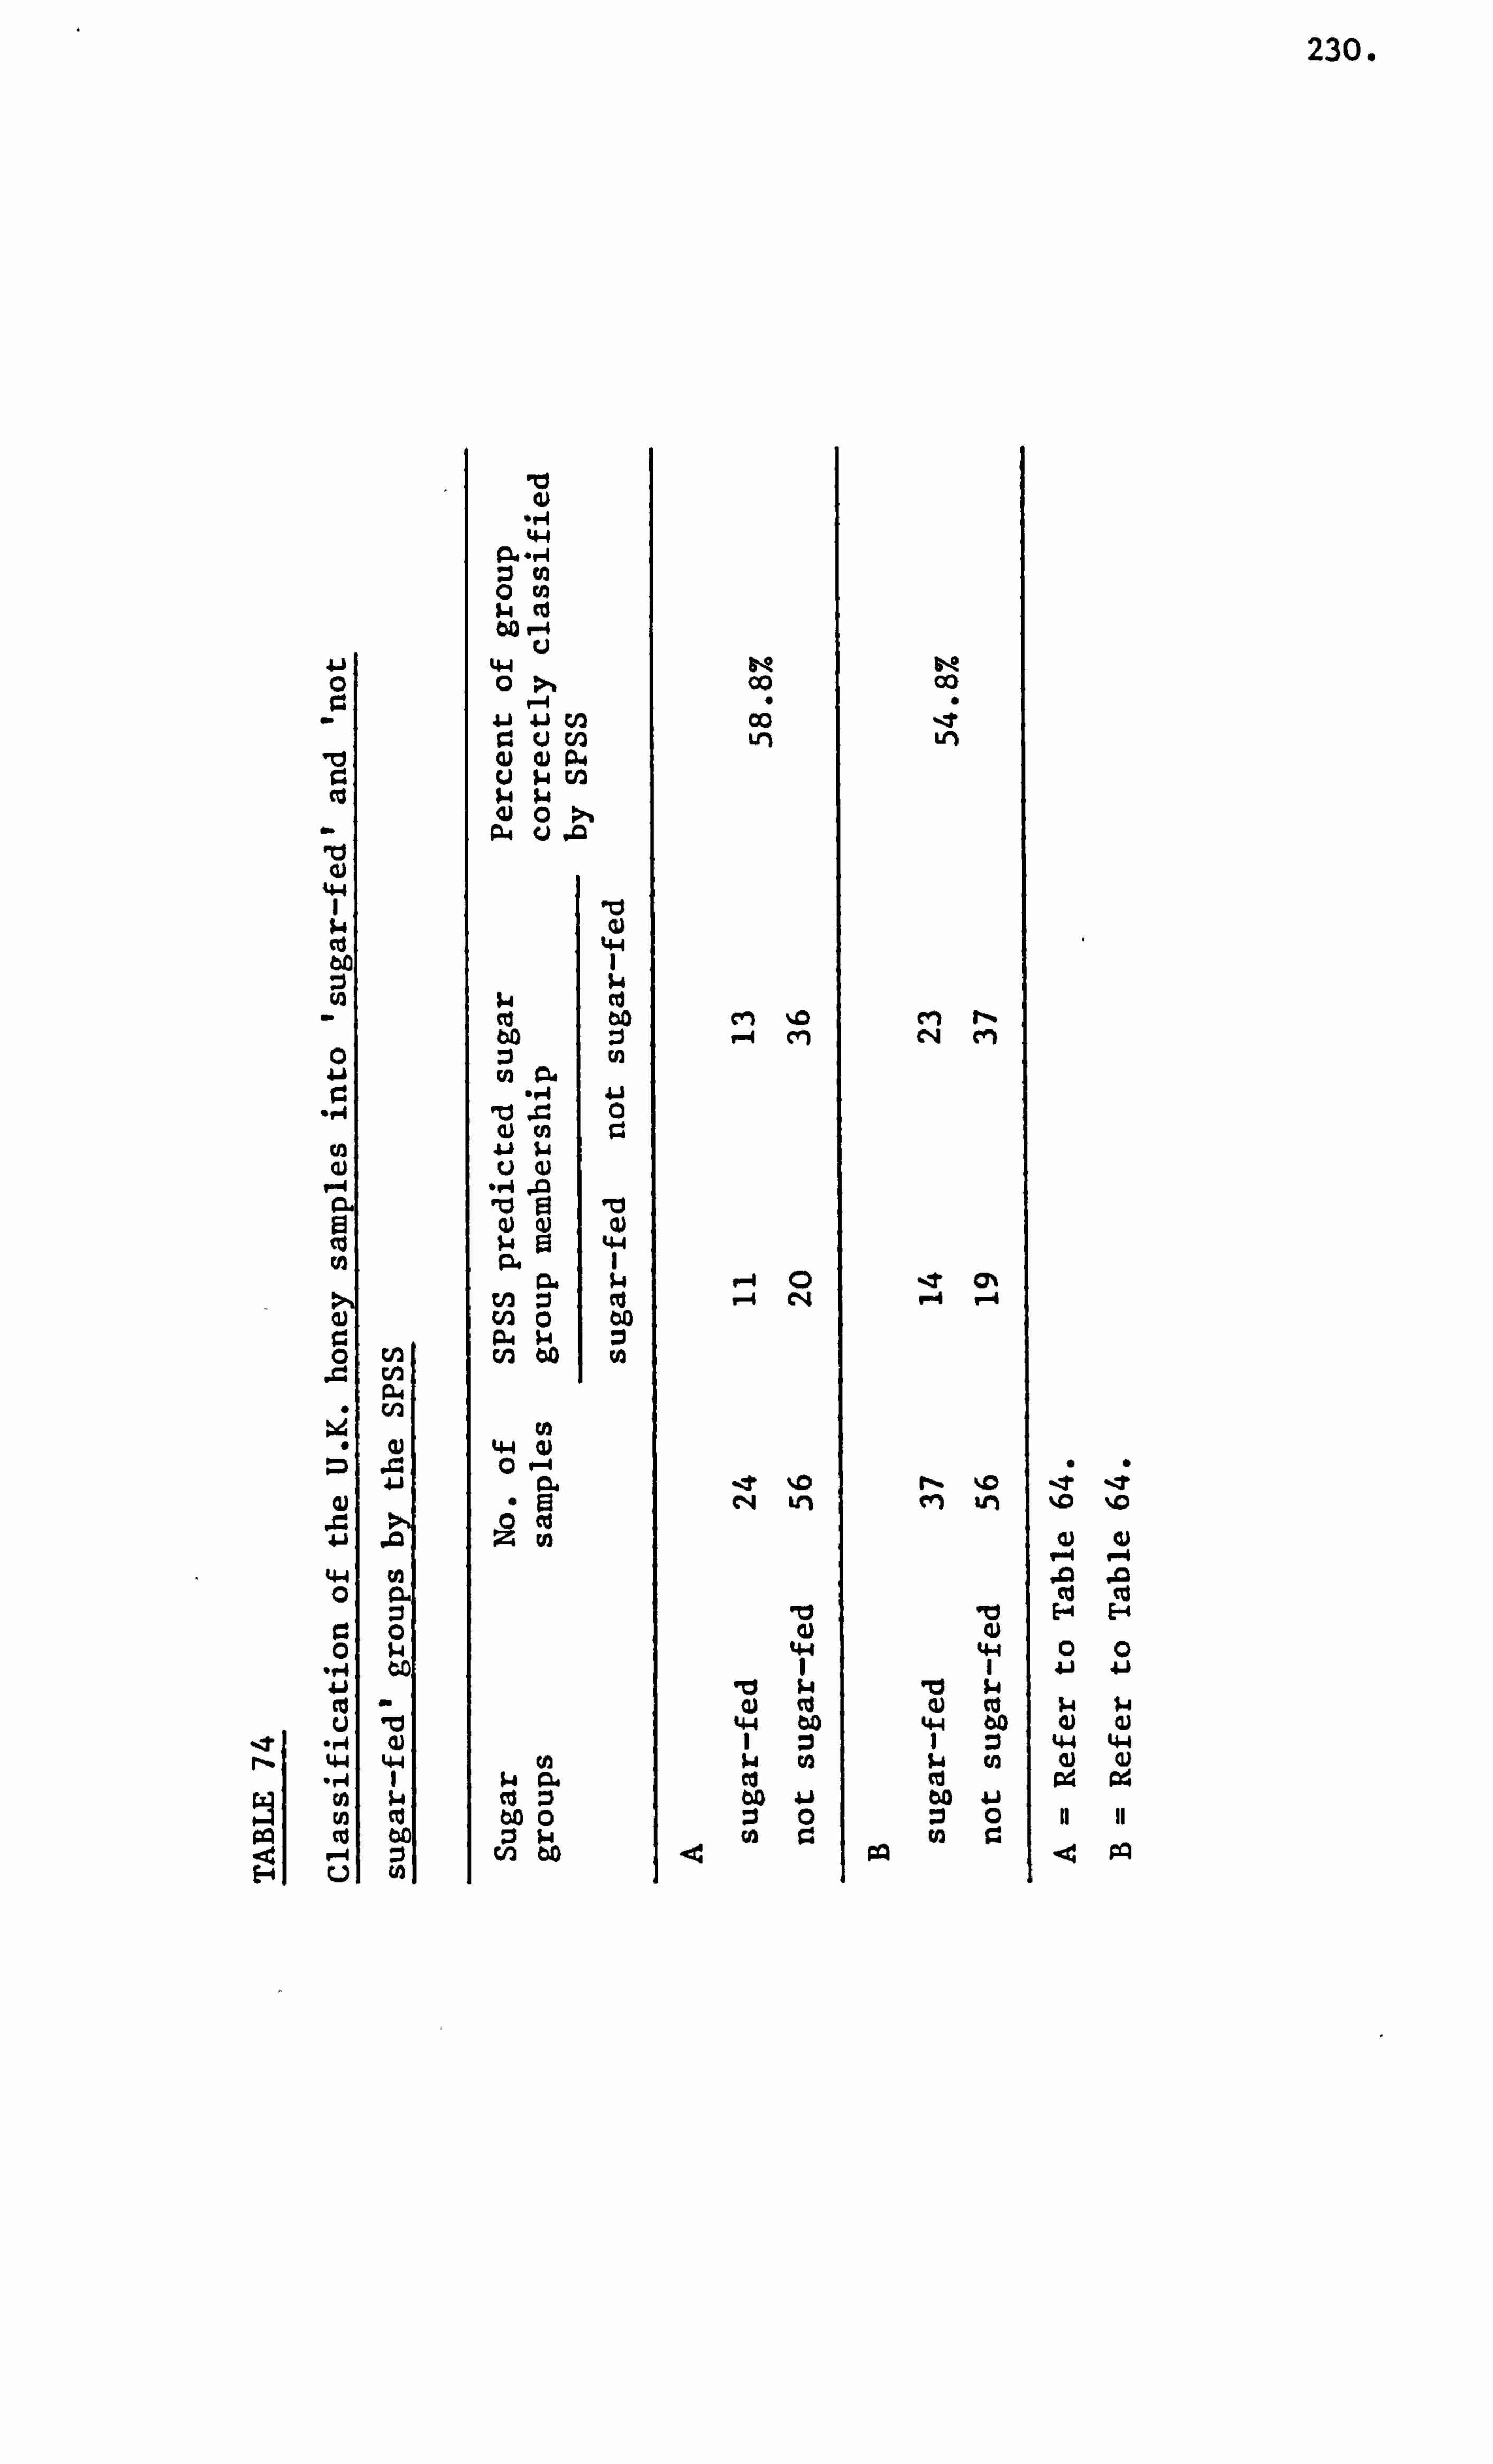
230.
Aj
0
"1-4
14.4 0
C: 0
., 4 41 0 u
pq co
IW
Od -r4 :30 00 W CO 60 r-4
44 0
r4 41 -W W
ci C/3 a) P-4
ci $4 U3 pw 01 0
CX4 Q
ý4 ce
lu Ei Q) Q) w 91 Pt
Ci. cn :i cn 0 P. 4 w
(n to
0
0 Cd Z rn
bo 0 :3w
cn to
10 ü)
Co to
41 0 r3
Iri 9)
X Co
cý LM
cm %D ý P-4 ci
Mo CC)
Ln
ri rl% 1 cq M
, -4 0 ýT CYN ý4 P-4 r-4
It rý I'D C14 Ln cn tn
10 Q)
10 $. 4 Q)
4-4
Co w 41 :10
Iti ci 10 w Q) ce
Z N. 4 Co Co u Ai :10
ý; 1; %. D %D
1w 0) P-4 r-4 .0 .0 Cd Cd E-4 E-4
00 Aj 41
ti, 4uI (1) 0)
Pd P4
-4 pq
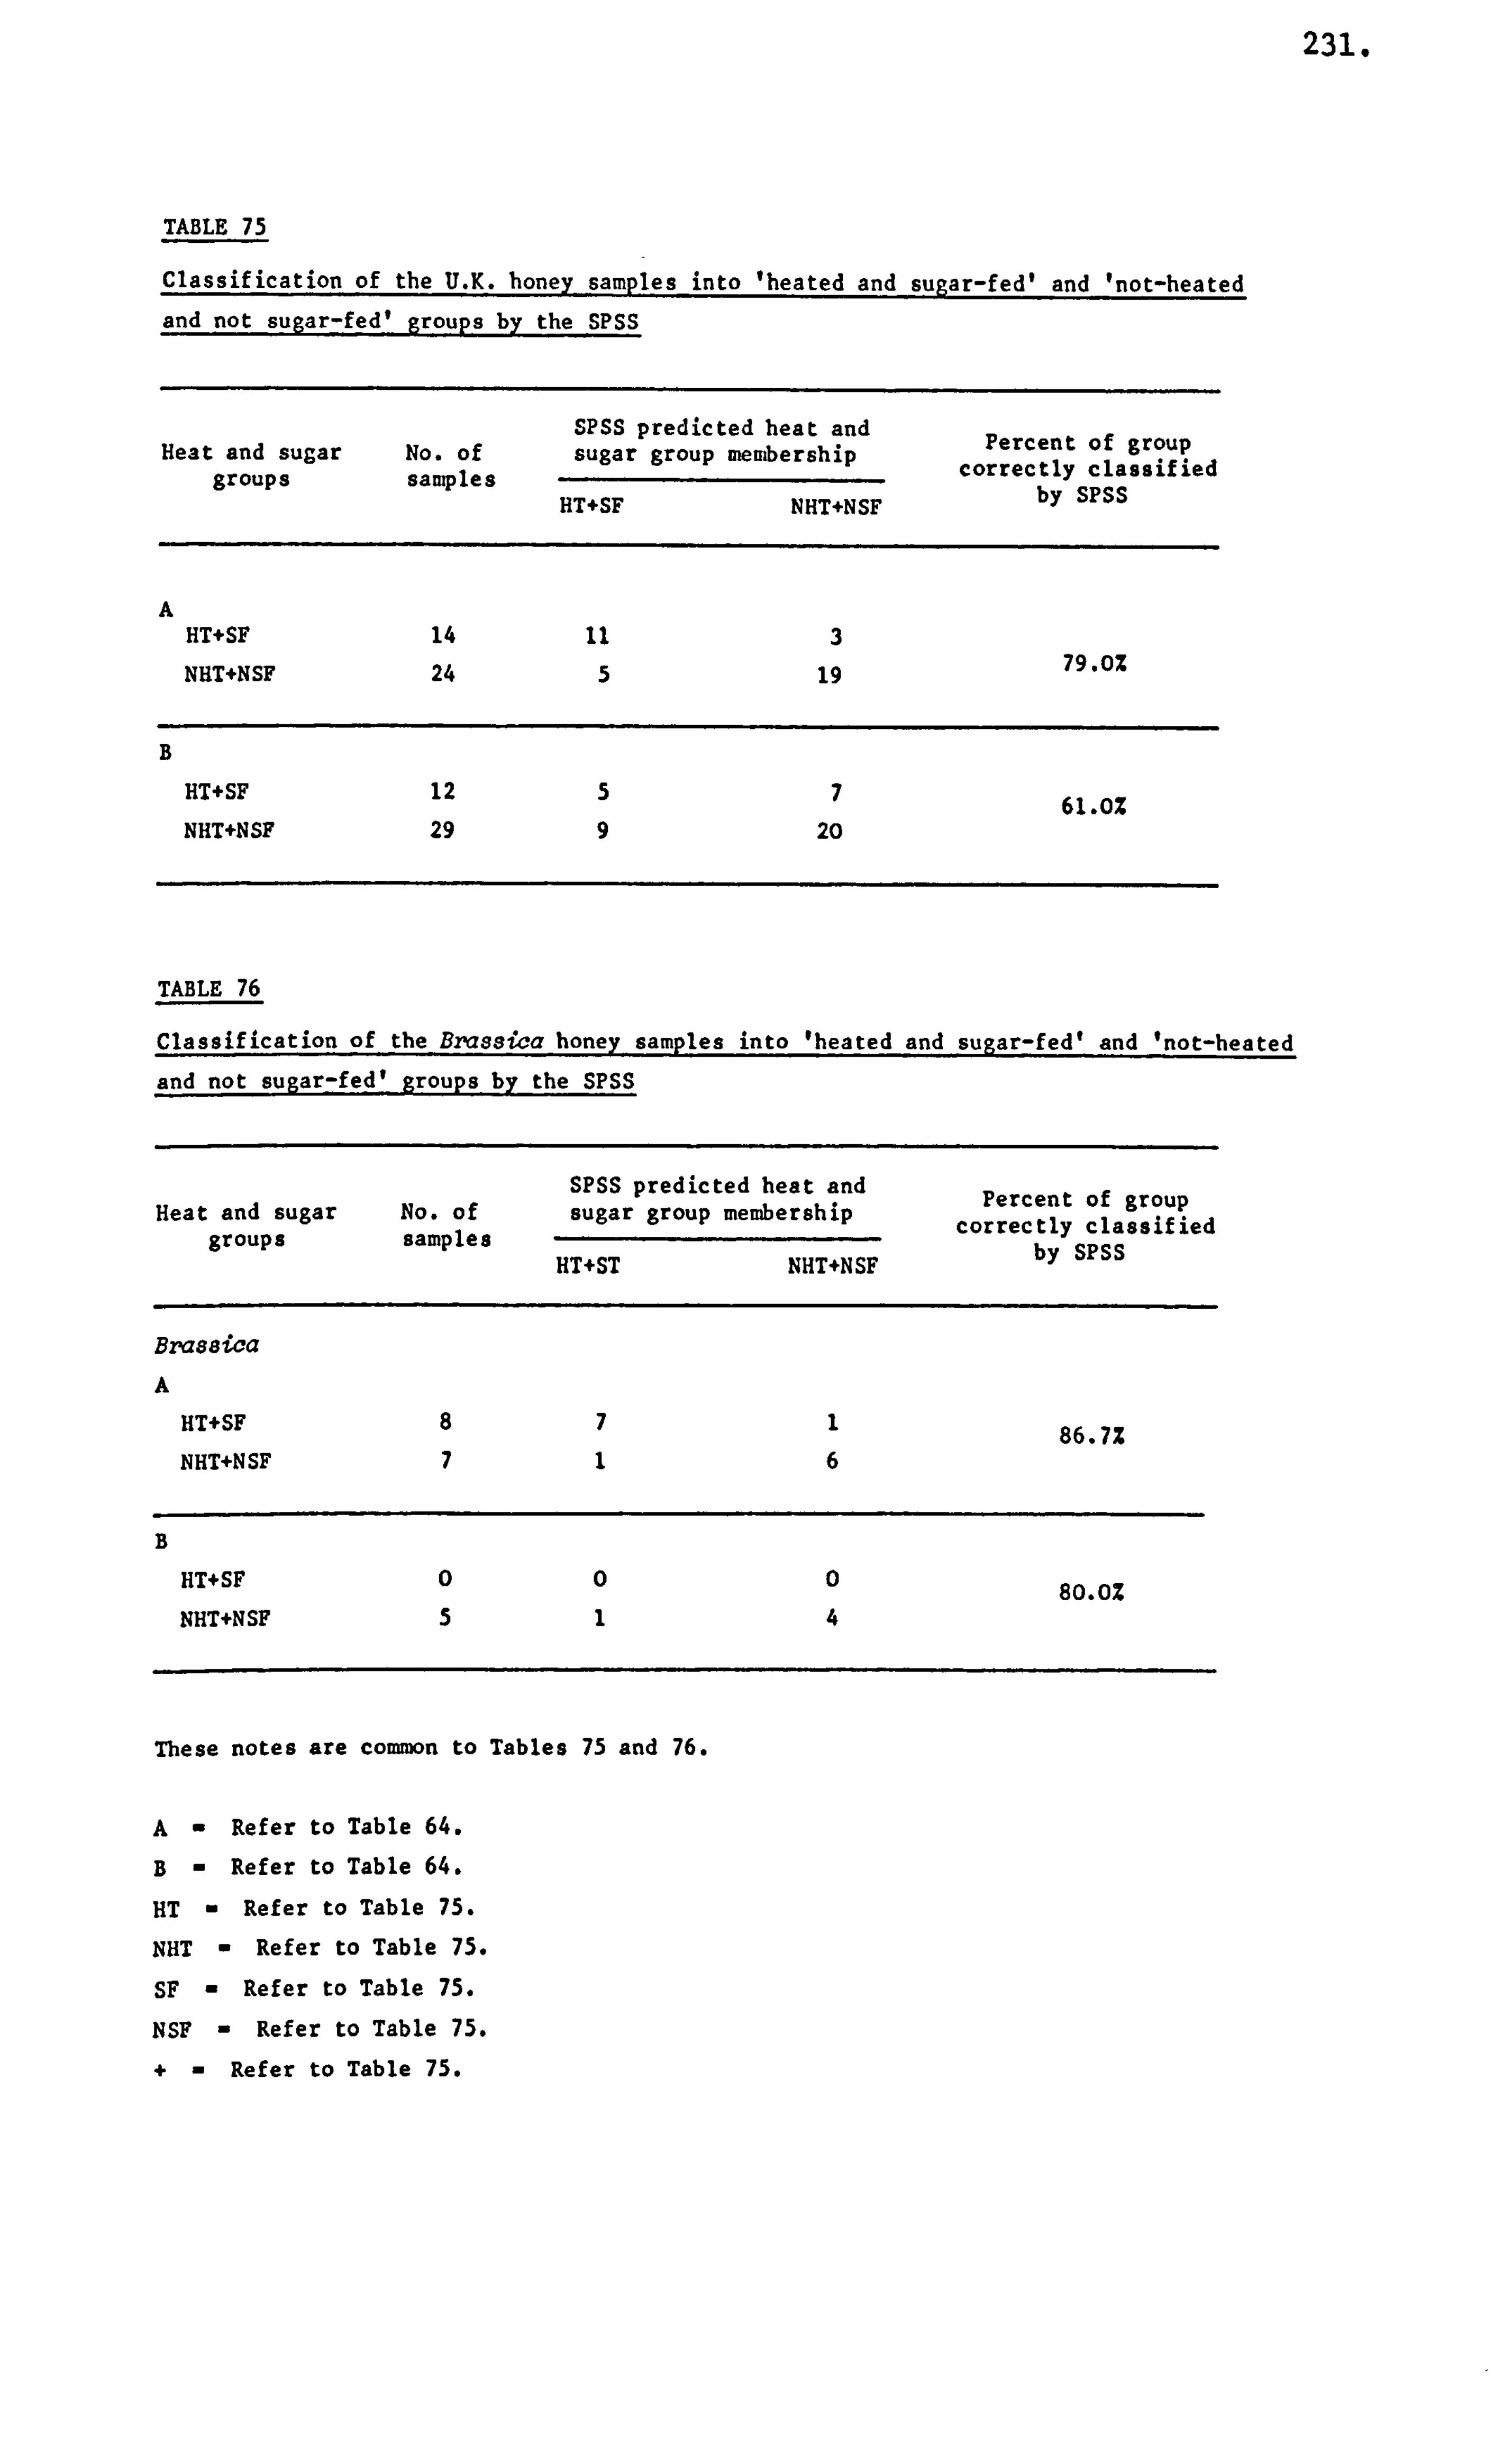
231.
TABLE 75
Classification of the U. K. honey samples into 'heated and sugar-fed' and 'not-heated
and not sugar-fed' groups by the SPSS
SPSS predicted heat and Heat and sugar No. of sugar group membership
Percent of group groups samples correctly classified
HT+SF NHT+NSF by SPSS
A HT+SF 14 11 3
NHT+NSF 24 5 19 79.0%
B
HT+SF 12 57 61. OZ NHT+NSF 29 9 20
TABLE 76
Classification of the Bra8sica honey samples into 'heated and suRar-fed' and 'not-heated
and not sugar-fed' groups by the SPSS
SPSS predicted heat and Heat and sugar No. of sugar group membership
Percent of group correctly classified groups samples by SPSS HT+ST NHT+NSF
Bra88ica
A
HT+SF 8 71 86.7% NHT+NSF 7 16
B
HT+SF 0 00 80.0% NHT+NSF 5 14
These notes are common to Tables 75 and 76.
A- Refer to Table 64.
B- Refer to Table 64.
HT - Refer to Table 75.
NHT - Refer to Table 75.
SF - Refer to Table 75.
NSF - Refer to Table 75.
+- Refer to Table 75.
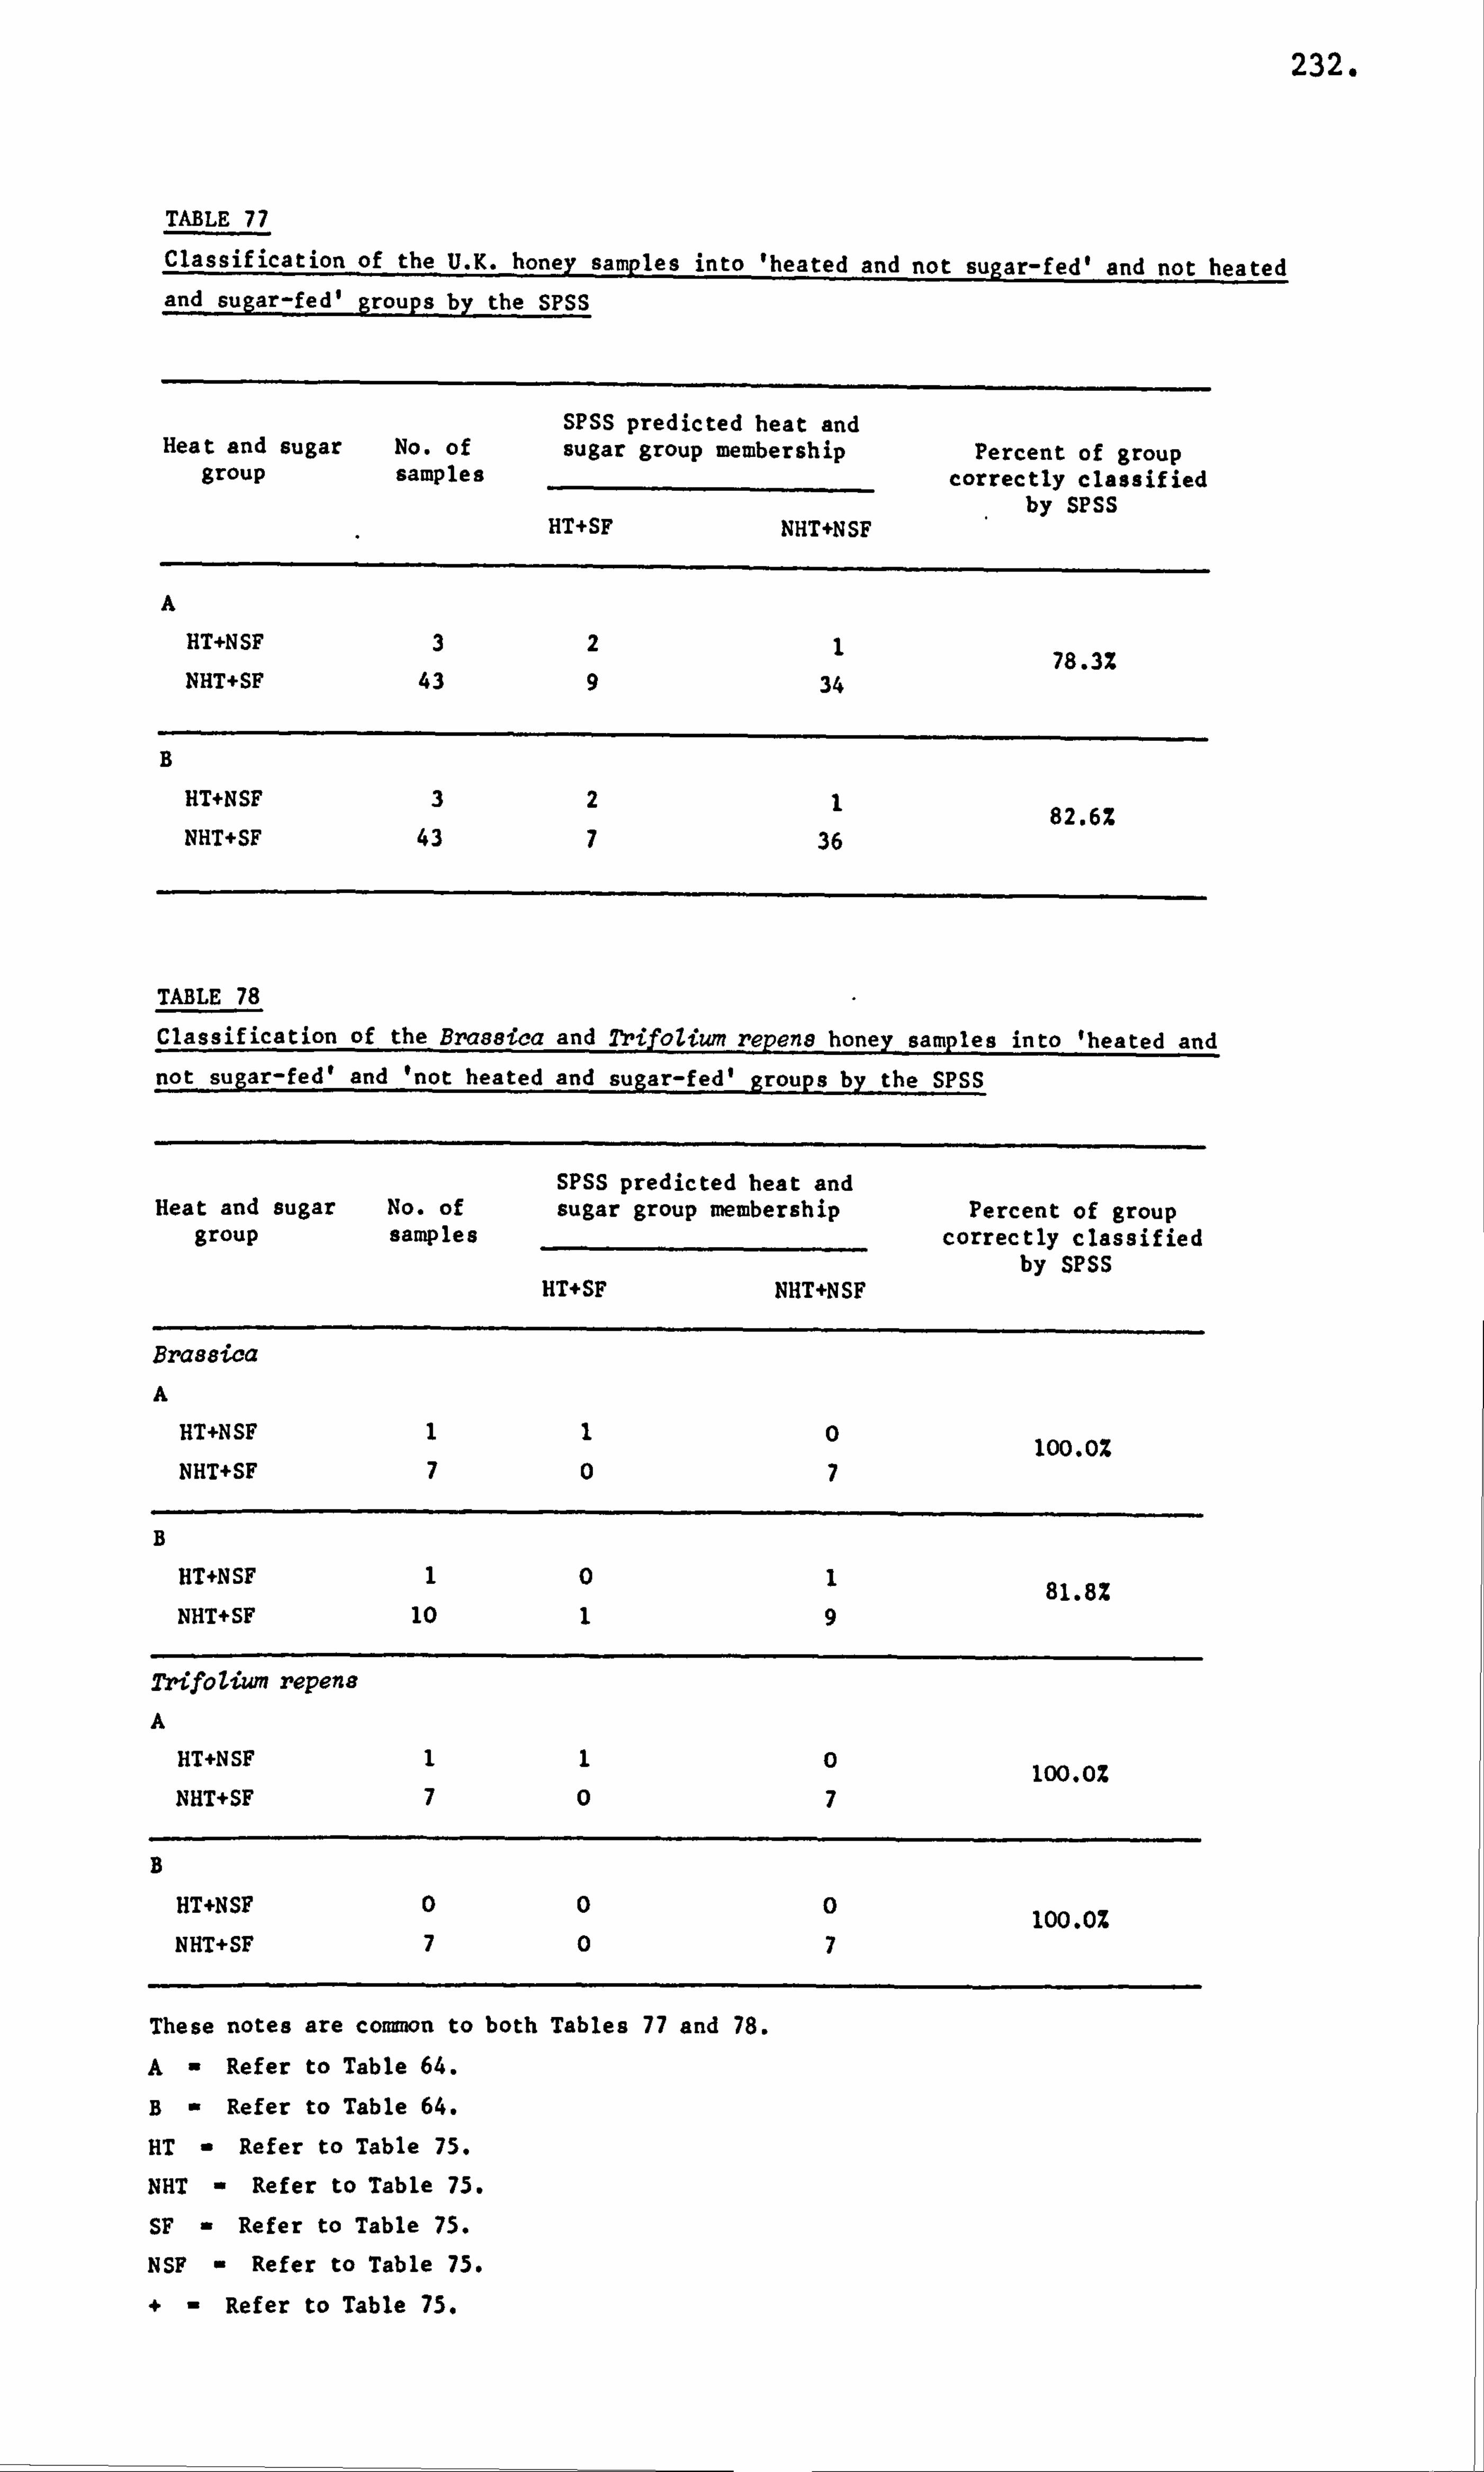
232.
TABLE 77
Classification of the U. K. honey samples into 'heated and not sugar-fed, and not heated and sugar-fed groups by the SPSS
SPSS predicted heat and Heat and sugar No. of sugar group membership Percent of group
group samples correctly classified by SPSS
HT+SF NHT+NSF
A
HT+NSF 3 2 1 78.3% NHT+SF 43 9 34
B
HT+NSF 3 2 1 82.6% NHT+SF 43 7 36
TABLE 78
Classification of the Bras8ica and Trifolium repens honey samples into 'heated and not sugar-fed' and 'not heated and sugar-fed' groups by the SPSS
SPSS predicted heat and Heat and sugar No. of sugar group membership Percent of group
group samples correctly classified by SPSS
HT+SF NHT+NSF
Bras8ica
A
HT+NSF 1 1 0 100.0% NHT+SF 7 0 7
B HT+NSF 1 0 1 81.8% NHT+SF 10 1 9
2'rifoZium repene A
HT+NSF 1 1 0 100.0% NHT+SF 7 0 7
B
HT+NSF 0 0 0 100.0% NHT+SF 7 0 7
These notes are common to both Tables 77 and 78.
A- Refer to Table 64.
B- Refer to Table 64.
HT - Refer to Table 75.
NHT - Refer to Table 75.
SF - Refer to Table 75.
NSF - Refer to Table 75.
+- Refer to Table 75.
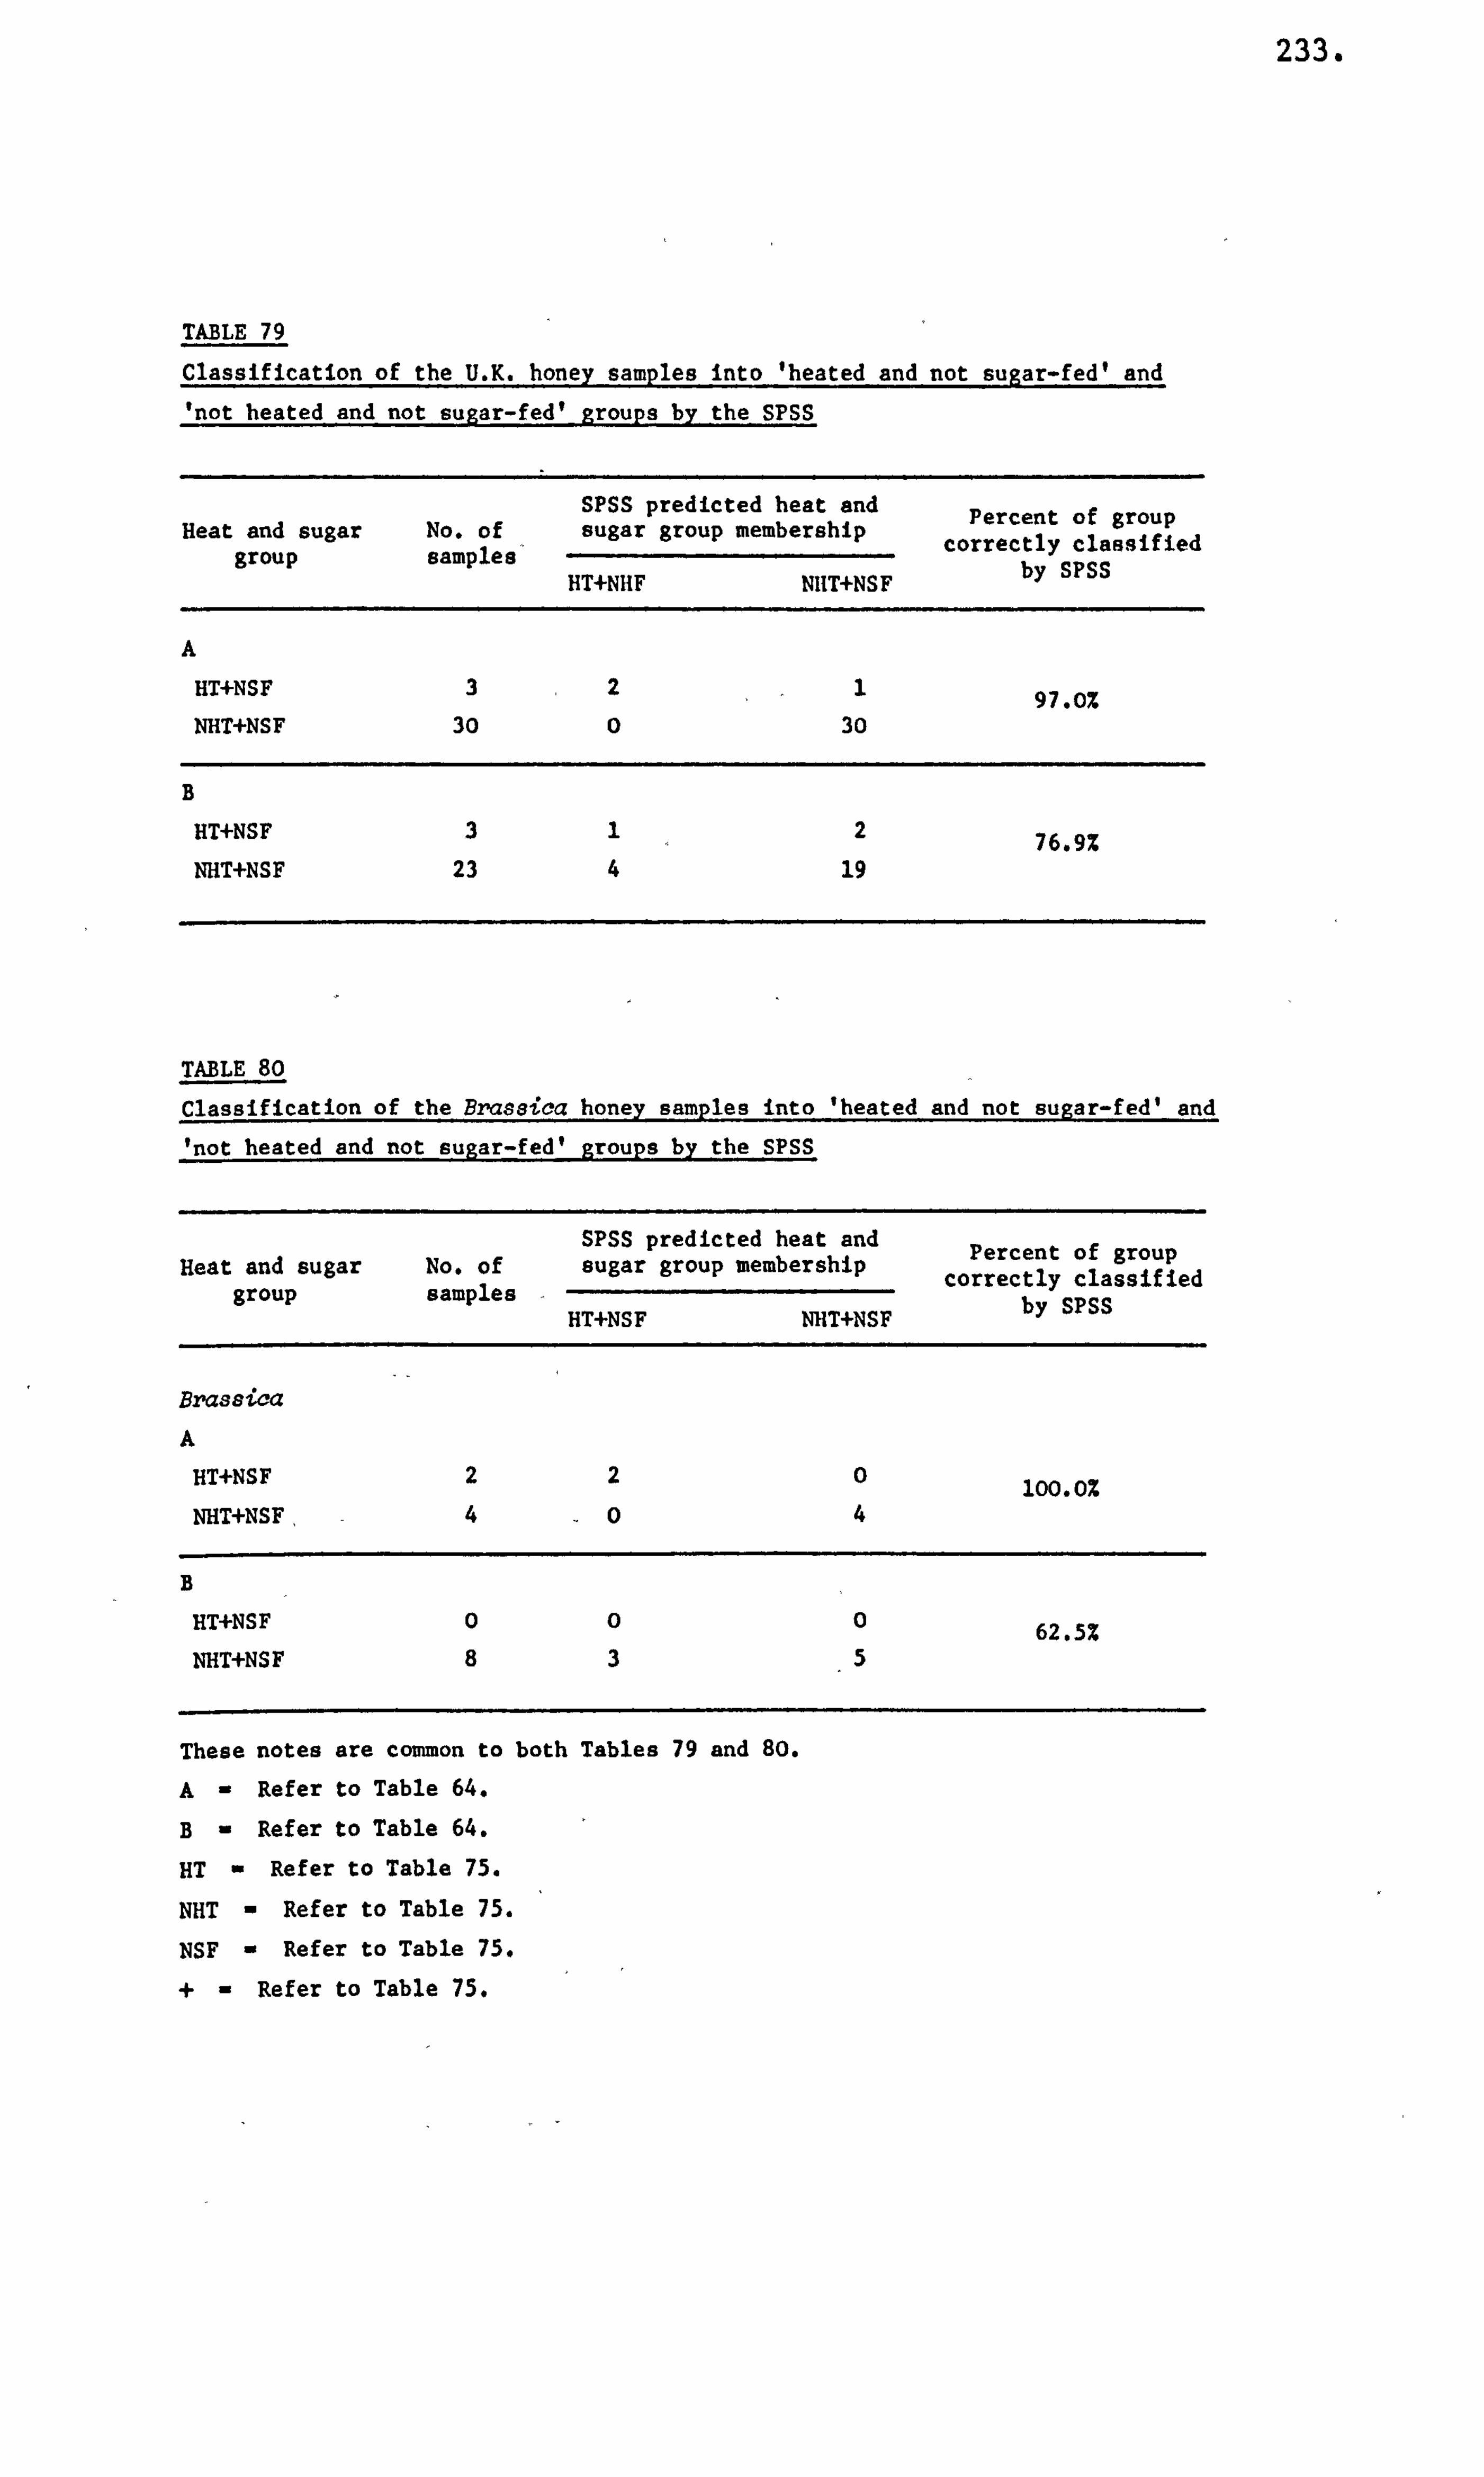
233.
TABLE 79
Classification of the U. K. honey samples into 'heated and not sugar-fed' and 'not heated and not sugar-fed' groups by the SPSS
SPSS predicted heat and Percent of group Heat and sugar No. of sugar group membership correctly classified group samples' HT+NHF NHT+NSF by SPSS
A
HT+NSF 32 97.0% NHT+NSF 30 0 30
B
HT+NSF 312 76.9% NHT+NSF 23 4 19
TABLE 80
Classification of the Brasaica honey samples into 'heated and not sugar-fed' and 'not heated and not sugar-fed' groups by the SPSS
SPSS predicted heat and Percent of group Heat and sugar No. of sugar group membership correctly classified group samples -
HT+NSF NHT+NSF by SPSS
Brassica
A
HT+NSF 220 100.0% NHT+NSF, 404
B
HT+NSF 000 62.5% NHT+NSF 835
These notes are common to both Tables 79 and 80.
A- Refer to Table 64.
B- Refer to Table 64.
HT Refer to Table 75.
NHT Refer to Table 75.
WSF Refer to Table 75.
+ Refer to Table 75.
234.
Fisher's linear discriminant functions were calculated for the amino
acid glutamic acid and a constant derived by the SPSS.
For the combination of 'heated and not sugar-fed' and 'not heated
and not sugar-red', the SPSS selected fifty nine honey samples. The
following amino acids were used for calculating the Fisher's linear
discriminant functions. These were: aspartic acid, serine, glutamic
acid, proline, tyrosine, phenylalanine and a constant derived by the
SPSS.
In the final combination of the four,, that is, the 'heated and sugar-
fed' and 'not heated and sugar-red', the S'.
twelve honey samples. The Fisher's linear
calculated for the following amino acids.
glycine, valine, isoleucine, phenylalanine
the SPSS.
For each of the four combinations the
honey samples representing the five pollen
In the first of the four combinations
PSS selected one hundred and
discriminant functions were
These were: lysine, serine,
and a constant derived by
SPSS was specified to select
groups.
listed above the predicted
classification was obtained for the Brassicq group only. The results
have been given in Table 76. In this group the SPSS selected twenty
honey samples and the Fisher's linear discriminant functions were
calculated for the following amino acids. These were: lysine, aspartic
acid, phenylalanine and a constant derived by the SPSS.
In the second combination, the predicted classification were obtained
for two pollen groups and these were: the Brassica and TrifoZium repens.
The results have been given in Table 78. In the Brassica group, the
SPSS selected nineteen honey samples and the Fisher's linear discriminant
functions were calculated for the following amino acids. These were:
235.
aspartic acid, threonine, proline, valine, leucine, tyrosine and a constant
derived by the SPSS. In the TrifoZium repens group, the SPSS selected
fifteen honey samples and the Fisher's linear discriminant functions
were calculated for the following amino acids. These were: threonine,
alanine, tyrosine, phenylalanine and a constant derived by the SPSS.
In the third combination, the predicted classification was obtained
for Brassica group only. The results have been given in Table 80. The
SPSS selected fourteen honey samples and, the Fisher's linear discriminant
functions were calculated for the following amino acids. These were:
aspartic acid, glycine, isoleucine, phenylalanine and a constant derived
by the SPSS-
In the fourth of the four combinations there were only two pollen
groups for which the predicted classification were obtained. These were:
the Brassica and Castanea. The results for these two pollen groups have
been given in Table 82. In the Brassica group, the SPSS selected twenty
five honey samples and the Fisher's linear discriminant functions were
calculated for the following amino acids. These were: alanine, tyrosine
and a constant derived by the SPSS. In the Castanea group, thirteen
honey samples were selected by the SPSS and the Fisher's linear discriminant
functions were calculated for the following amino acids. These were:
aspartic acid, serine, proline, leucine, tyrosine and a constant derived
by the SPSS.
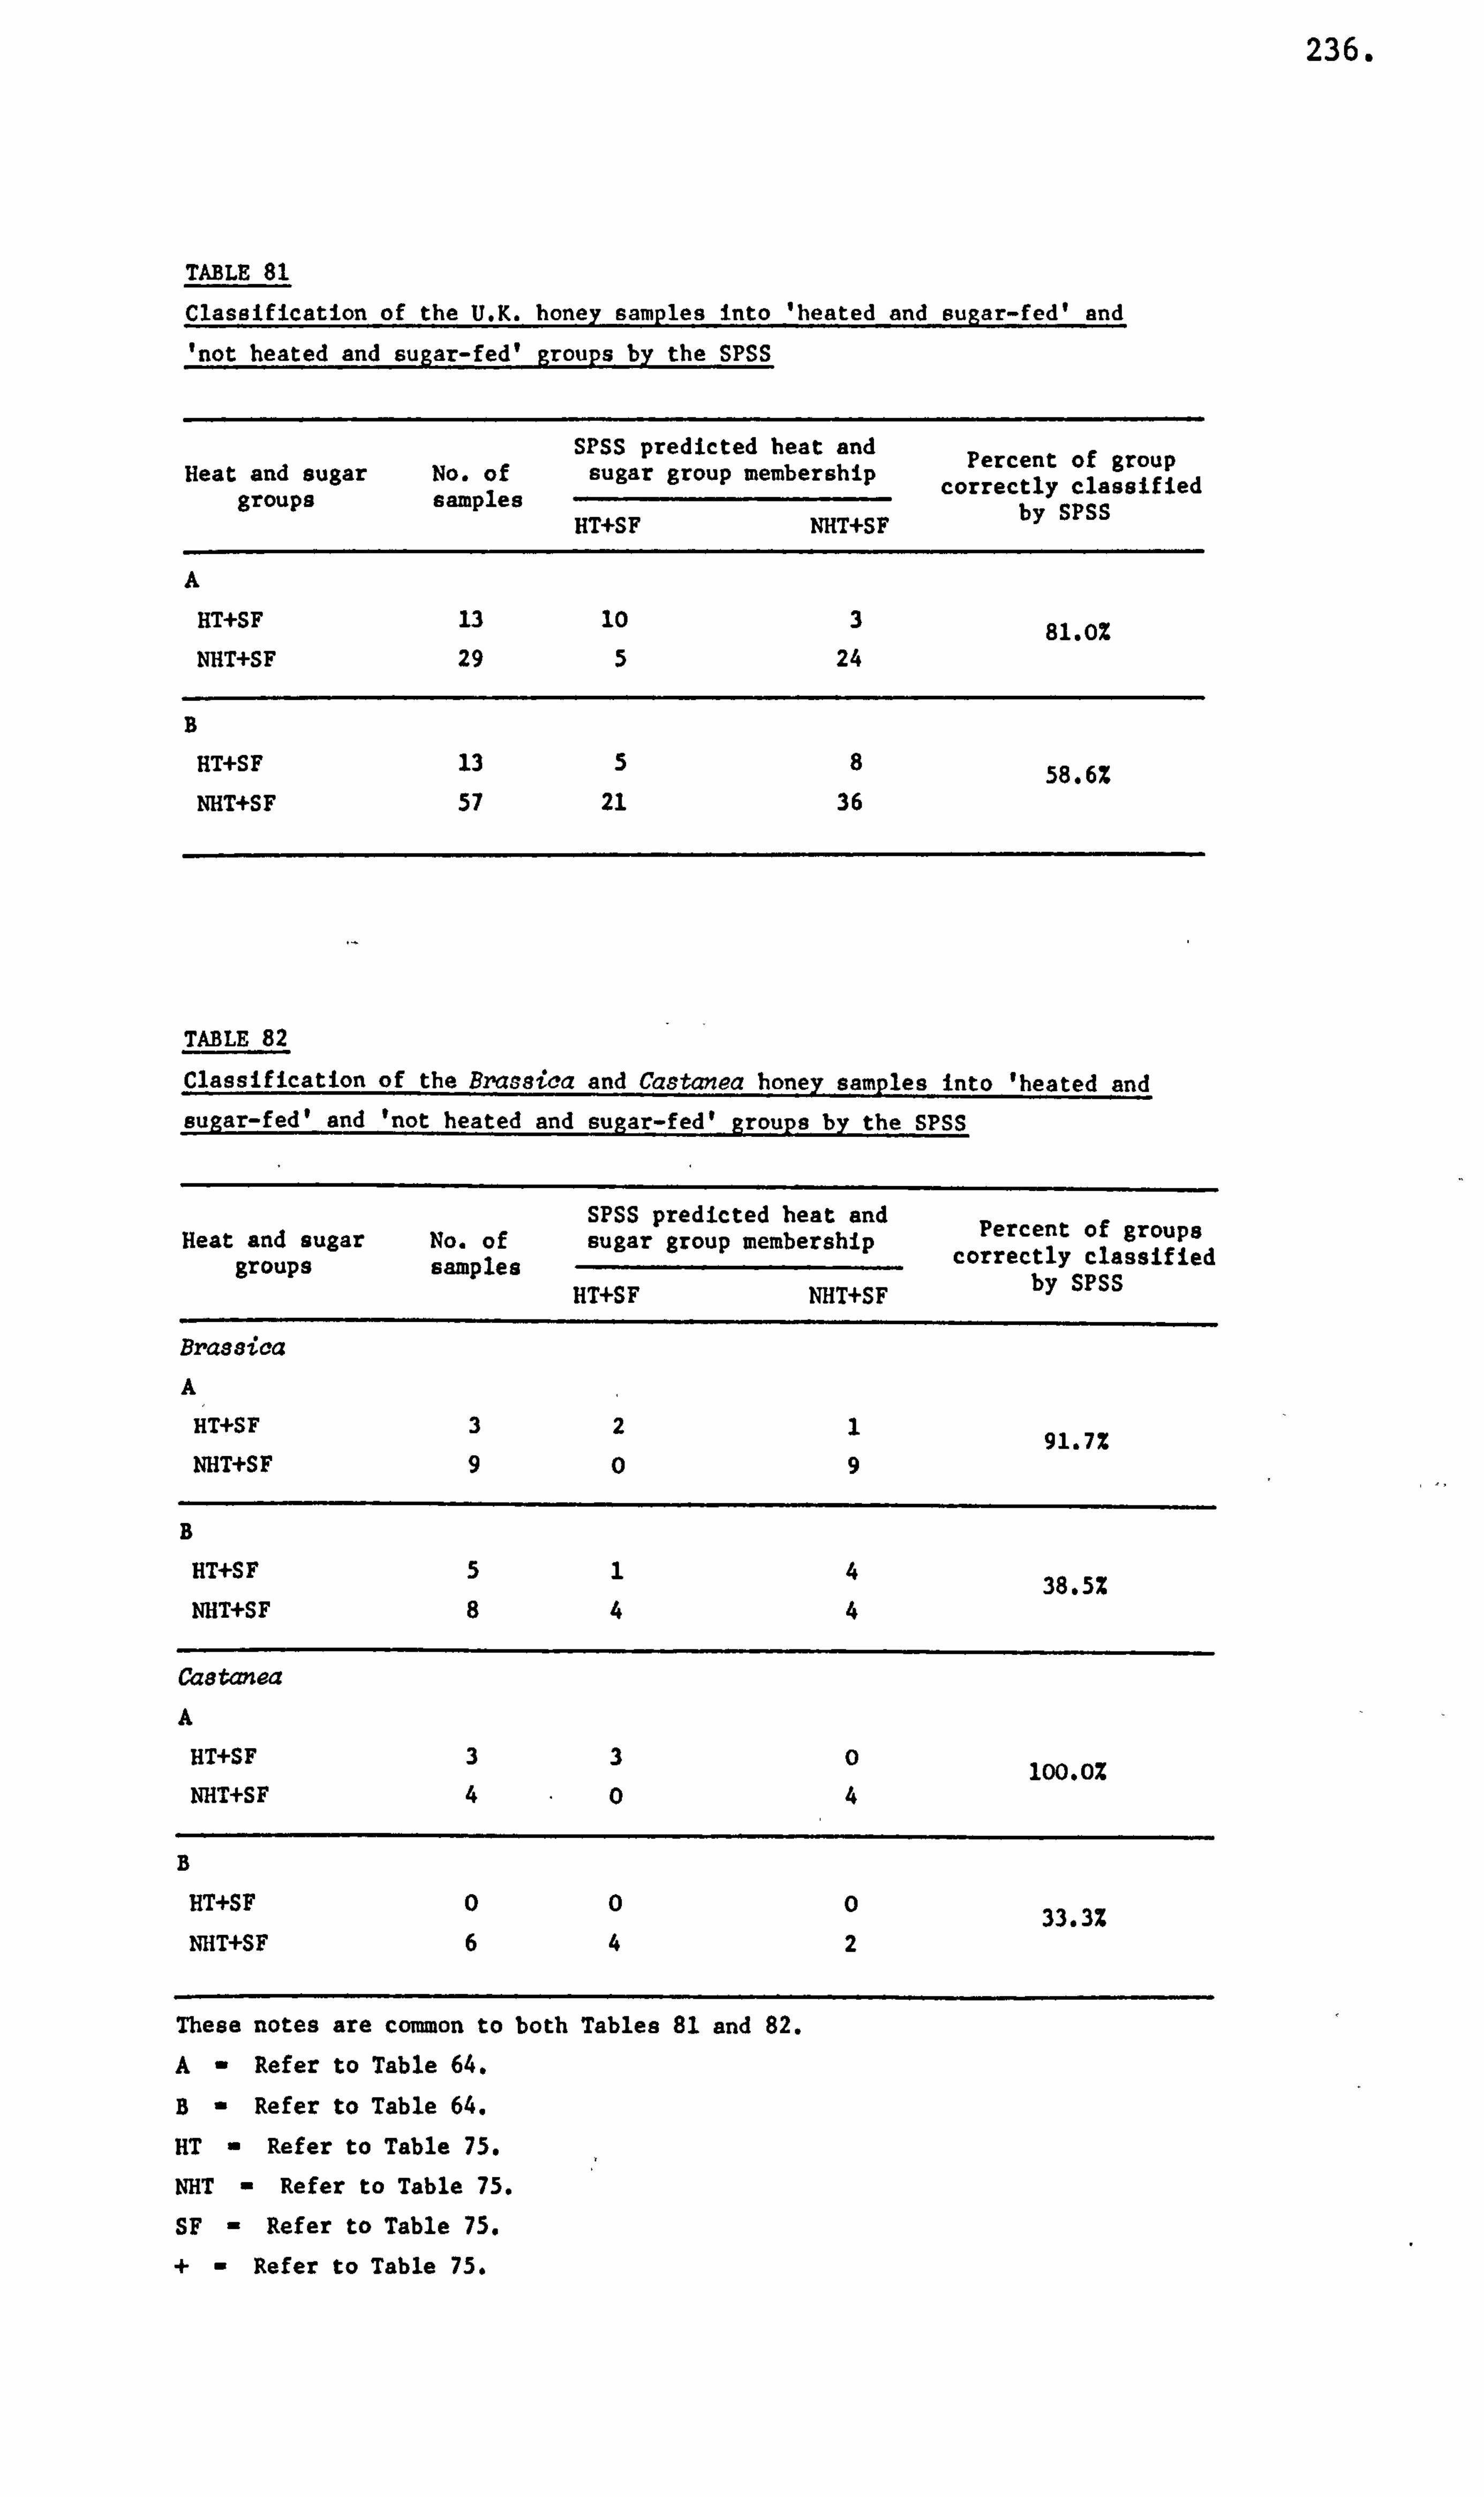
236.
TABLE 81
Classification of the U. K. honey samples into 'heated and sugar-fed' and 'not heated and suear-fed' erouvs bv the SPSS
SPSS predicted beat and Percent of group Heat and sugar No. of sugar group membership correctly classified groups samples by SPSS HT+SF NHT+SF
A
HT+SF 13 10 3 81.0% NHT+SF 29 5 24
B
HT+SF 13 58 58.6% NHT+SF 57 21 36
TABLE 82
Classification of the Brassica and Castanea honey samples into 'heated and sugar-fed' and 'not heated and sugar-fed' g roups by the SPSS
SPSS predicted heat and Heat and sugar No. of sugar group membership
Percent of groups groups samples correctly classified
HT+SF NHT+SF by SPSS
Bras8ica
A
HT+SF 3 2 1 91.7% NHT+SF 9 0 9
B
HT+SF 5 1 4 38.5% NHT+SF 8 4 4
Caetanea
A
HT+SF 3 3 0 100.0% NHT+SF 4 0 4
B
HT+SF 0 0 0 33.3% NHT+SF 6 4 2
These notes are common to both Tables 81 and 82.
A- Refer to Table 64.
B- Refer to Table 64.
HT - Refer to Table 75.
NHT - Refer to Table 75.
SF - Refer to Table 75.
+- Refer to Table 75.
237.
Analyses of Samples from the Foreign and Cammercial Honeys
Computer placement of honey samples into country groups
Discriminant analysis similar to that of the U. K. survey was performed
on the modified amino acid concentration measurements of the sixty four
foreign and commercial honey samples using the 'MAHAL' method. The SPSS
allocated honey samples to the appropriate country group according to
the criteria specified in the control statements 54 to 60 listed in Appendix
VII(a). The predicted classification of the twenty three honey samples
selected by the SPSS into the Australia, Canada, Mexico, New Zealand
and English groups have been given in Table 83. The honey samples in
each of the five country groups were divided into two subsets by the
SPSS.
In one subset, the Fisher's linear discriminant functions were calculated
for the following amino acids which were entered into the analysis. These
were: lysine, serine, glutamic acid, glycine, valine, leucine, tyrosine
and a constant derived by the SPSS. The twelve honey samples selected
by the SPSS were 100.0% correctly classified into their appropriate country
groups.
In the other subset, eleven honey samples were selected for estimating
the misclassification rate and of these only 45.5% were correctly classified
by the SPSS into their respective country groups.
There were six samples (Code Nos. 194,195,203,204,229 and 249)
misclassified by the SPSS and these were experimentally shown to come
from countries Australia, Canada, England, Mexico and New Zealand; the
computer predictions suggested that five samples excluding 204 originated
from Australia, Mexico and New Zealand. This is a reasonable predictive
mistake because the pollen groups from families Cruciferae and Leguminosae
238.
are in fact common to all these countries. The omitted sample 204 was
experimentally shown to have no detectable pollen present.
The following predicted classification was obtained by the SPSS
when the English commercial samples were omitted from the previous analysis.
The results have been shown in Table 84. The nine honey samples selected
for Fisher's linear discriminant function calculation were 100.0% correctly
classified. The following amino acids were entered into the analysis.
These were: lysine, aspartic acid, glutamic acid, proline, alanine,
phenylalanine and a constant derived by the SPSS. There. were seven samples
selected by the SPSS for estimating the misclassiciation rate and-only
42.9% of the samples were correctly classified.
There were four samples (C6de Nos. 195,202,227 and 228) misclassified
by the SPSS. It should be pointed out that the pollen composition of
195 and 202 were similar to that expected from their predicted countries
namely Canada and New Zealand, respectively. The computer predicted
227 was from Canada and 228 from New Zealand and pollen patterns were
not dissimilar to those expected if the predicted origins were correct.
When the China honey samples were included in the above analysis
the predicted classifications shown in Table 85 were obtained by the
SPSS. The nine honey samples selected for calculating the Fisher's linear
discriminant functions were 100.0% correctly classified. The following
amino acids were entered into the analysis and these were: glutamic
acid, alanine, valine, tyrosine, phenylalanine and a constant derived
by the SPSS. There were thirteen honey samples selected for estimating
the misclassification rate and of these pnly 15.4% were correctly
classified.
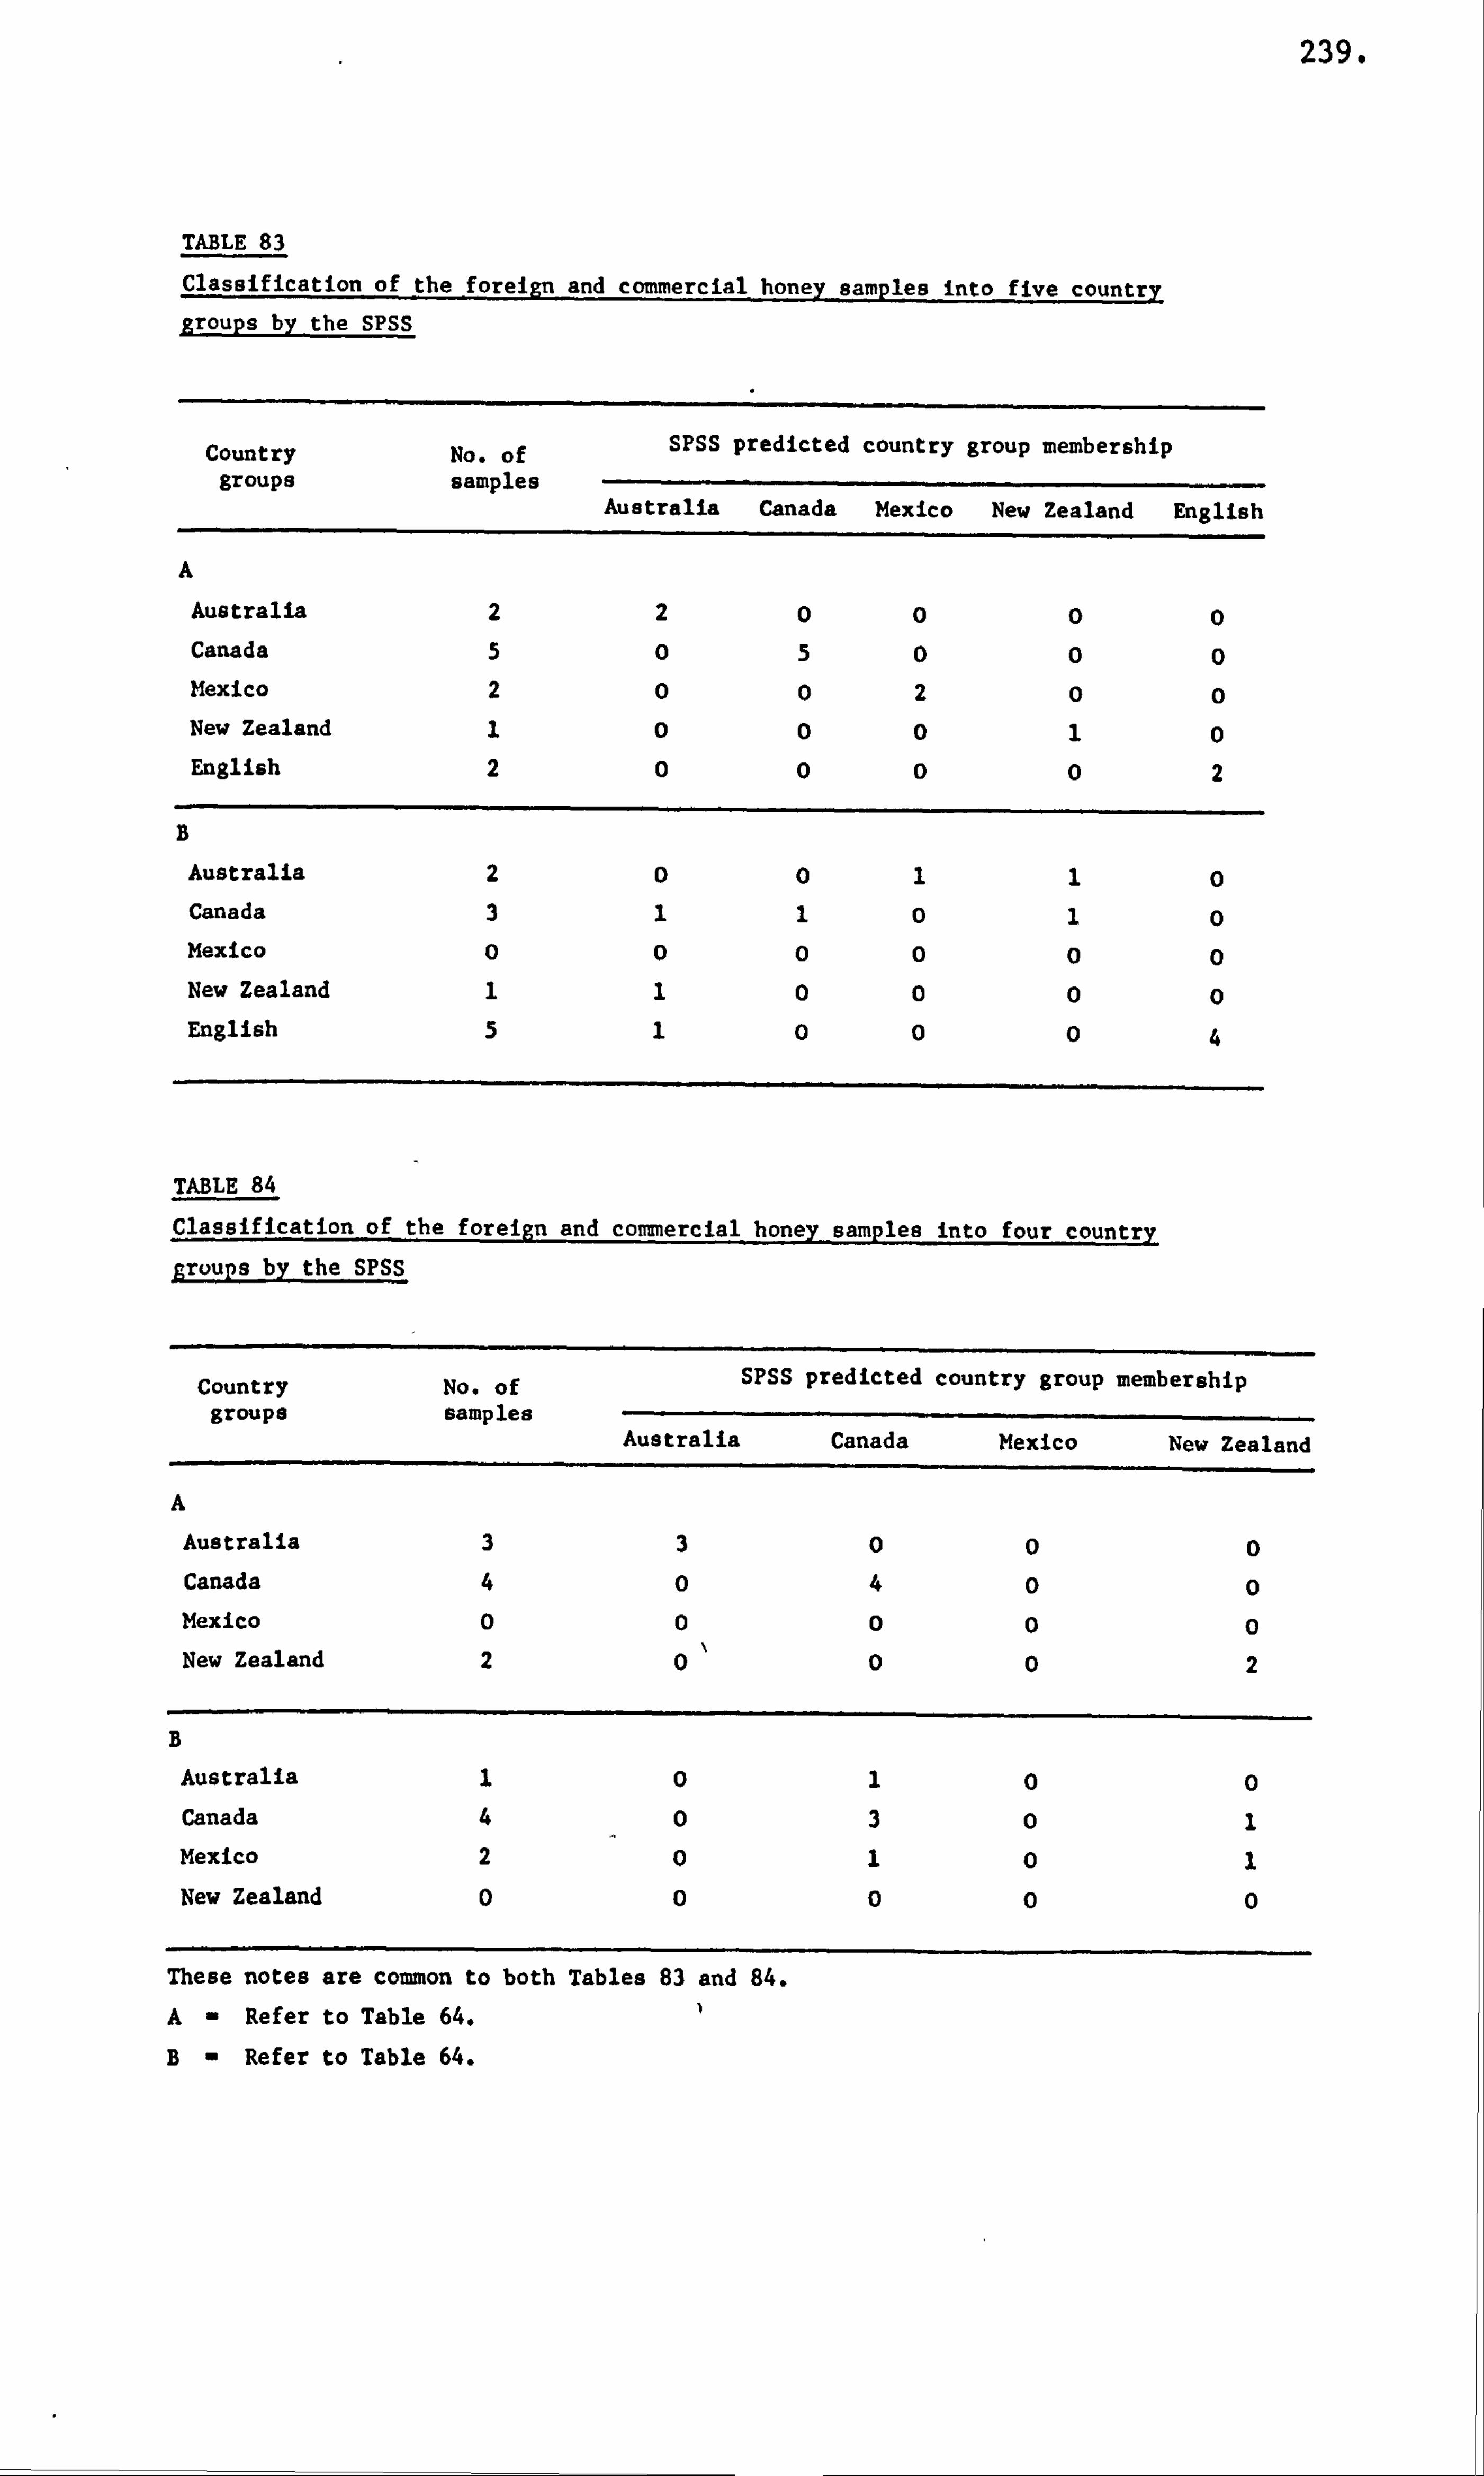
239.
TABLE 83
Classification of the foreign and commercial honey samples into five country groups by the SPSS
Country groups
No. of samples
SPSS
Australia
predicted
Canada
country
Mexico
group membership
New Zealand English
A
Australia 2 2 0 0 0 0 Canada 5 0 5 0 0 0 Mexico 2 0 0 2 0 0 New Zealand 1 0 0 0 1 0 English 2 0 0 0 0 2
B
Australia 2 0 0 1 0 Canada 3 1 1 0 0 Mexico 0 0 0 0 0 0 New Zealand 1 1 0 0 0 0 English 5 1 0 0 0 4
TABLE 84
Classification of the foreign and commercial honey samples into four country groups by the SPSS
Country groups
No. of samples
SPSS
Australia
predicted
Canada
country group
Mexico
membership
New Zealand
A
Australia 3 3 0 0 0 Canada 4 0 4 0 0 Mexico 0 0 0 0 0 New Zealand 2 0 0 0 2
B
Australia 1 0 1 0 0 Canada 4 0 3 0 Mexico 2 0 0 New Zealand 0 0 0 0 0
These notes are common to both Tables 83 and 84.
A- Refer to Table 64.1
B- Refer to Table 64.
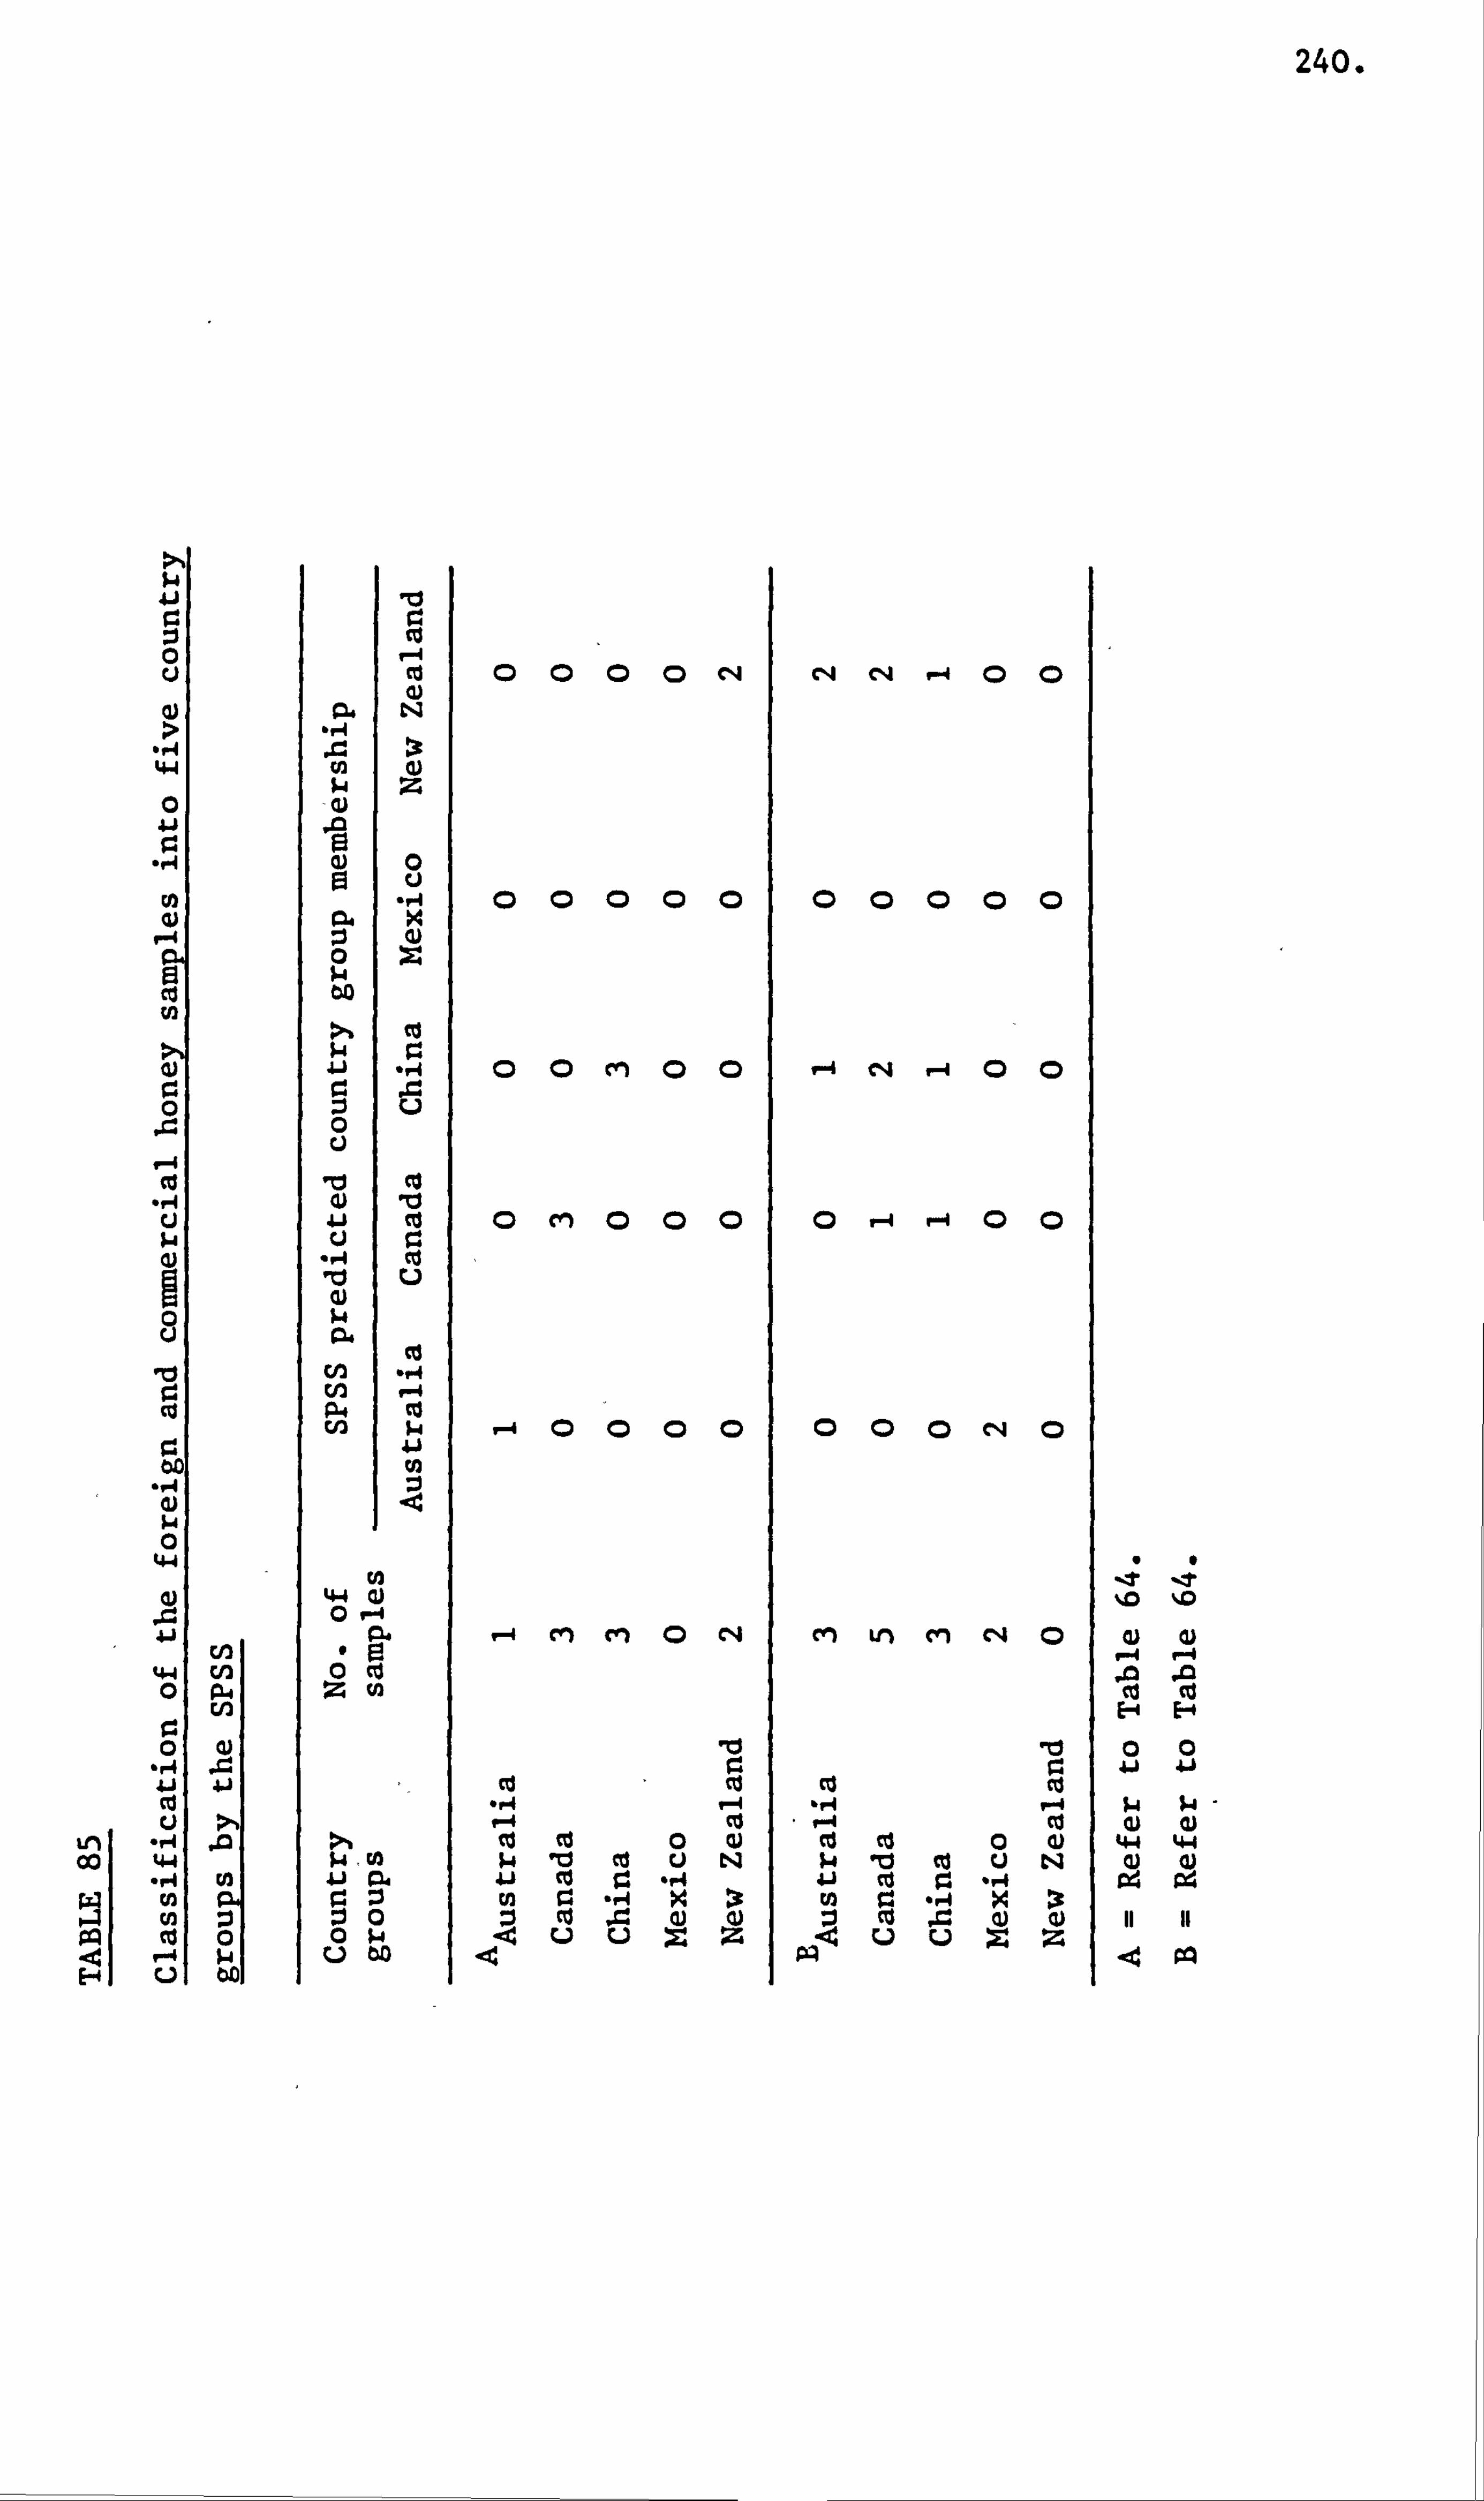
240.
4-4
0 41 0
. r4
ul
ý4 cl
., 4 ci
110 C:
0
44 0
0 0
-, 4 A-i Cd u
00 44
M pq
E: 4
En cn P4
En
rA
0
04
-, 4
$4
-0) Xl
CIO
:j 0 $4
$4
0 u
10 0)
10
Q) w 04
P4 V)
lu
Iri
rA
(4 44
P., ý4,0
000 C14
0a00
00 cli 00
0 cn 0001
_00 OO
ý4 M cn 0 C14
w "0 cu u N 41
u w
C14 " r4
0000
P-4 C14 r4
0 v-4 r-4
0 C, 4 a
cn Ln cn C*4
10 r. Cd
"4 co Cd cl 0 0) $4 10 0 ci N 4j 0 9: -, 4 W 0 -, 4
ALI z z
1; 1; %D %IM
Q) (L) P-4 ý-4 .0M cu Co E-4 E-4
00
4-4 44 Q) 0
c4 p4
. ý4 Po
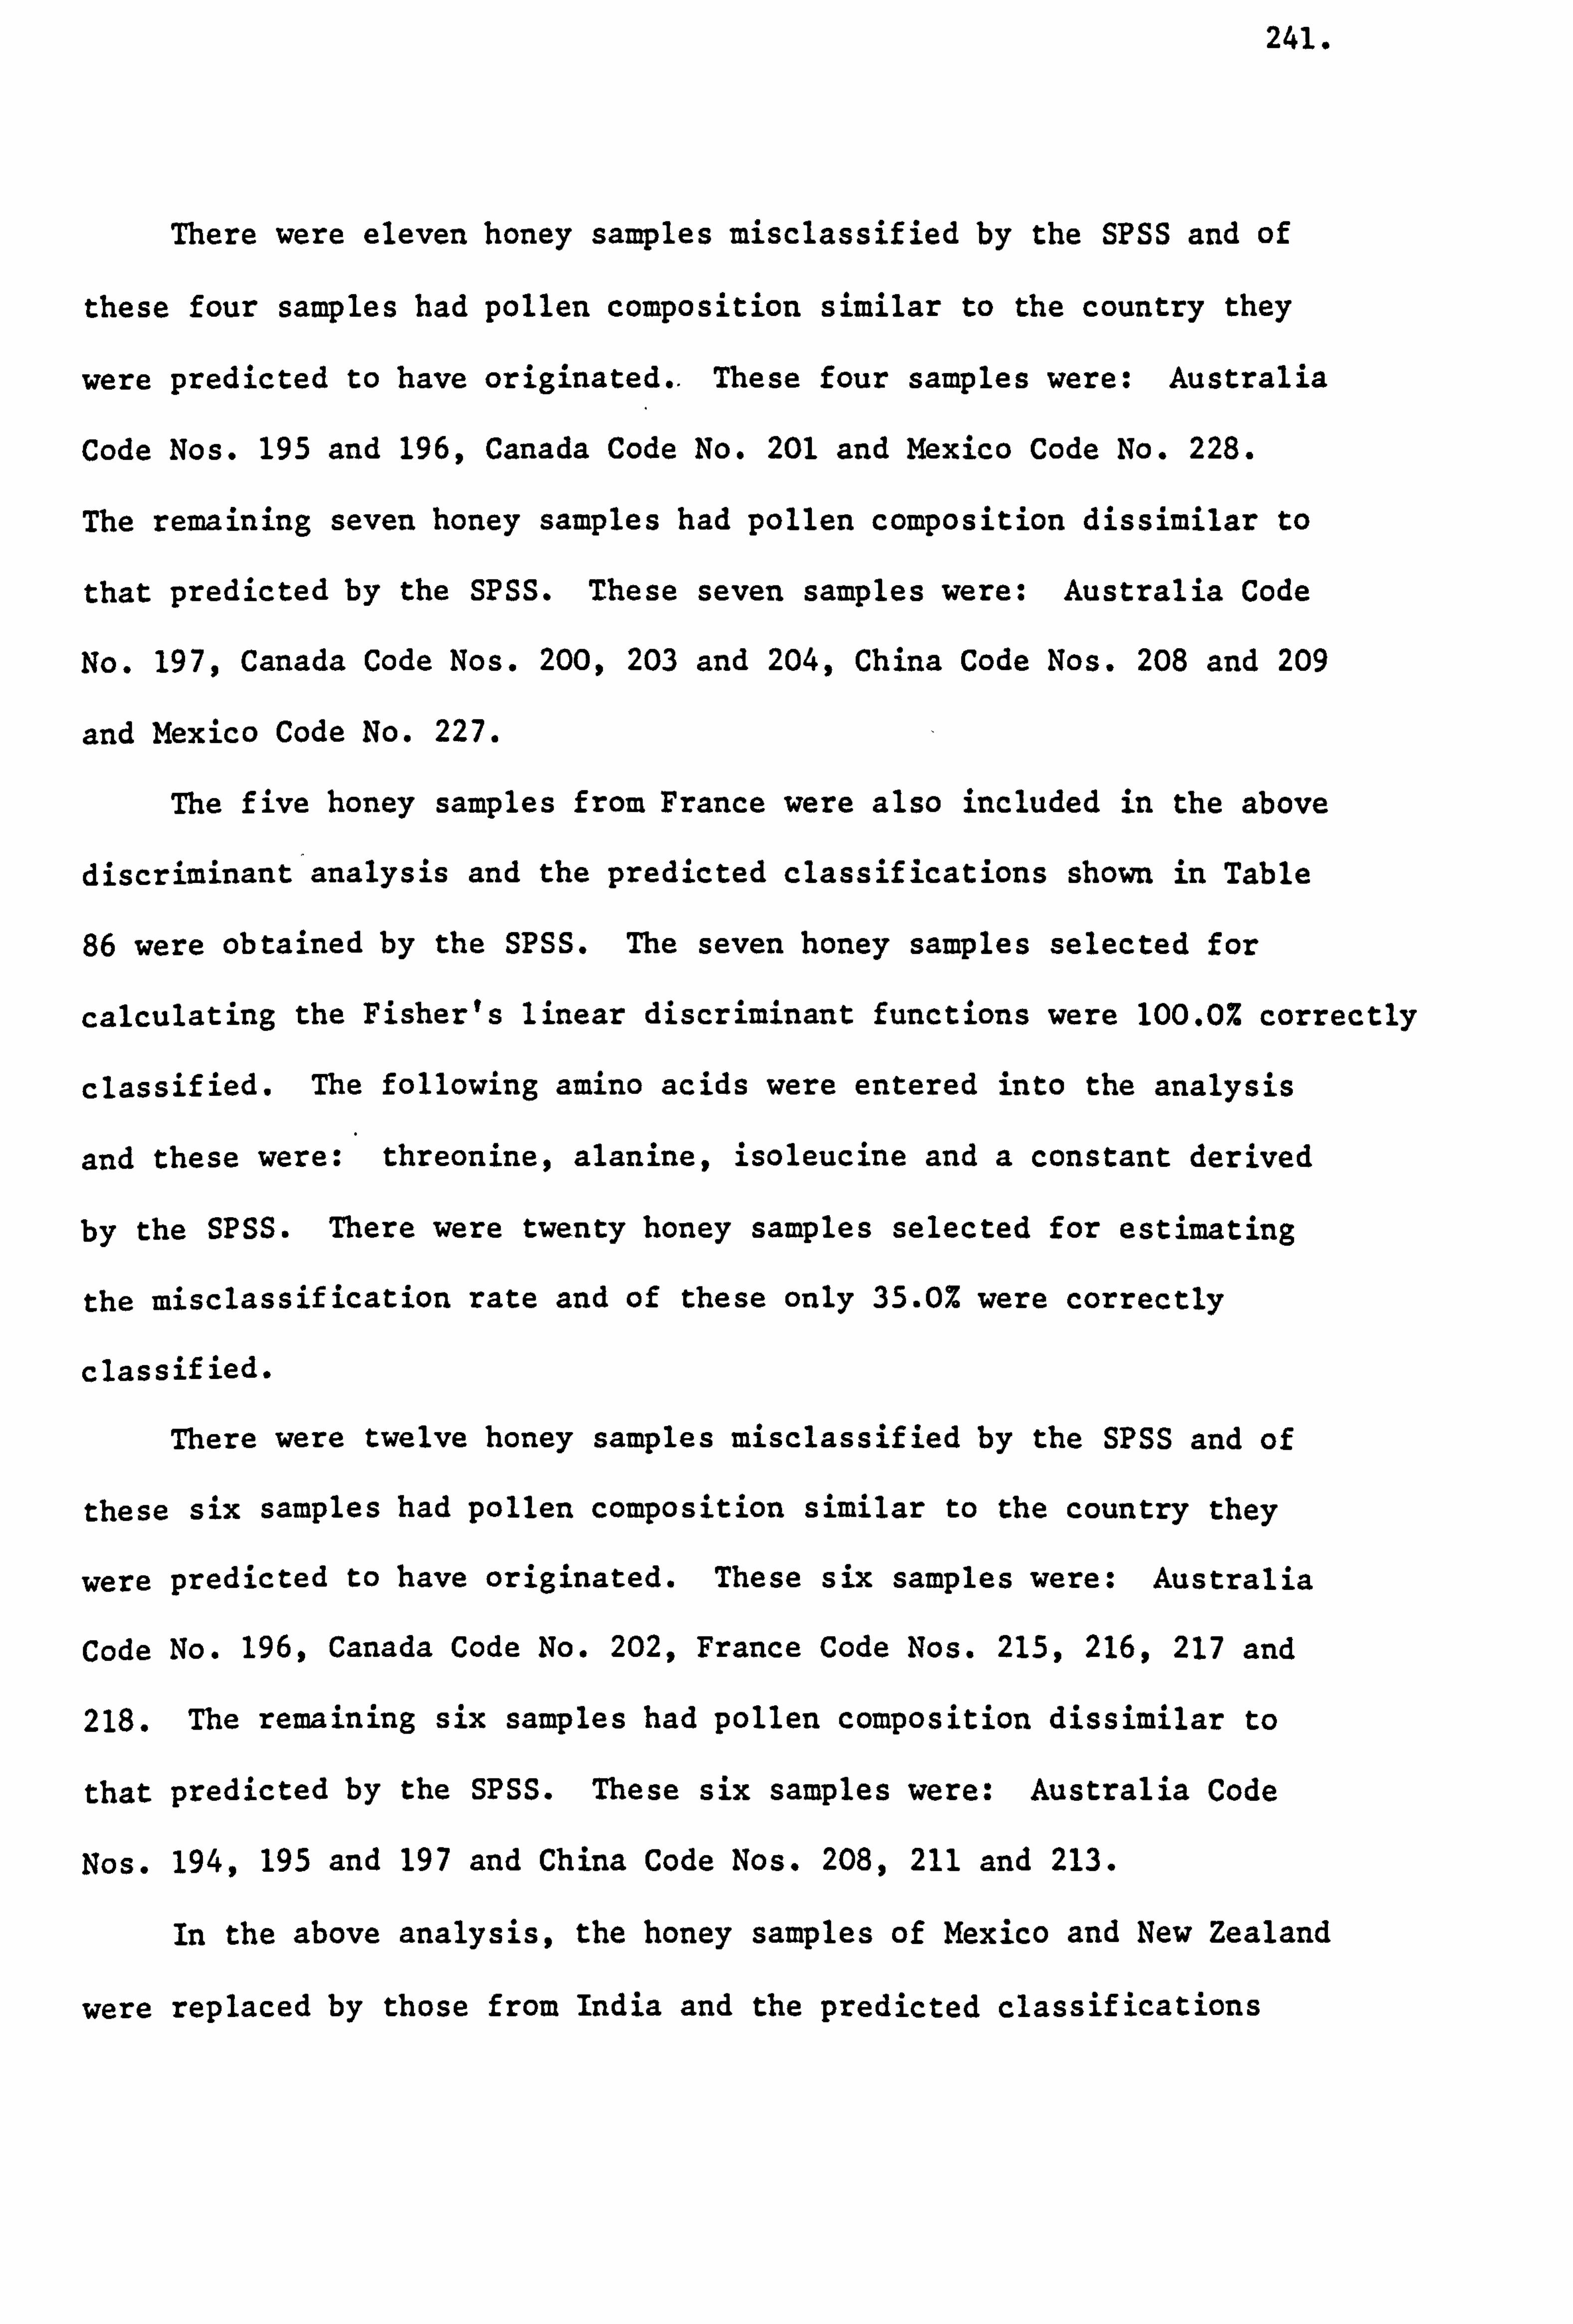
241.
There were eleven honey samples misclassified by the SPSS and of
these four samples had pollen composition similar to the country they
were predicted to have originated.. These four samples were: Australia
Code Nos. 195 and 196, Canada Code No. 201 and Mexico Code No. 228.
The remaining seven honey samples had pollen composition dissimilar to
that predicted by the SPSS. These seven samples were: Australia Code
No. 197, Canada Code Nos. 200,203 and 204, China Code Nos. 208 and 209
and Mexico Code No. 227.
The five honey samples from France were also included in the above
discriminant analysis and the predicted classifications shown in Table
86 were obtained by the SPSS. The seven honey samples selected for
calculating the Fisher's linear discriminant functions were 100.0% correctly
classified. The following amino acids were entered into the analysis
and these were: threonine, alanine, isoleucine and a constant derived
by the SPSS- There were twenty honey samples selected for estimating
the misclassification rate and of these only 35.0% were correctly
classified.
There were twelve honey samples misclassified by the SPSS and of
these six samples had pollen composition similar to the country they
were predicted to have originated. These six samples were: Australia
Code No. 196, Canada Code No. 202, France Code Nos. 215,216,217 and
218. The remaining six samples had pollen composition dissimilar to
that predicted by the SPSS. These six samples were: Australia Code
Nos. 194,195 and 197 and China Code Nos. 208,211 and 213.
In the above analysis, the honey samples of Mexico and New Zealand
were replaced by those from India and the predicted classifications
242.
cn En P-4
rn 4) 4
0
0 u
M -, 4 W
0 . &j 0
W 0)
I. A
Iti r.
0
0
r41 0
., 4 41 cu u
%0 . '. 1 00 44
E-4
04
bo
w
0 u
10 Q)
10 4) w Ind
En
M
4-4
"0 r. tu
1-4
N
"0
czi . p4 P-4
3
>0 $4
0 0w
u to
00000 C*4
0000 M4 0
000000
00N000
a C14
000000
0 04 N0 "4 C14
"0 0
cu
4) 0 0 w u ce u U N 41 tu 0 Z: ., 4 rA 0 . ý4 tu X Dc
tu = w Q) Q)
-e u u Pw Z Z
14 ý4 4 ý4 001
00 1-4 1-4 ý4
I
, -4 o --4 ooI
C-4 Ln 4 cn 001
I
_T %D -t LA V-4 0ý
"0 r2
co (d -, 4
0) 0 a) llý ed ci u N
Aj 0 r4 Cd N 1- (1)
44 z z
ý; 1; ý-o %10
W 4) r-4 ý4 4 .0 (a Cd E-4 E-4
00 41 41
14 54 (1) (U
4.4 44 cu CD
94 1: 4
-4 FA
243.
obtained by the SPSS have been shown in Table 87. The eleven honey
samples selected for calculation of the Fisher's linear discriminant
functions were 100.0% correctly classified. The following amino acids
were entered into the analysis and these were: glutamic acid, proline,
glycine, isoleucine, leucine, phenylalanine and a constant derived by
the SPSS. There were fifteen honey samples selected for estimating the
misclassification rate and of these 40.0% were correctly classified.
There were nine honey samples misclassified by the SPSS and of these
five had pollen composition similar to the country they were predicted
to have originated. These five samples were: Canada Code Nos. 200 and
206, China Code No. 208, France Code Nos. 215 and 216. The remaining
four samples had pollen composition dissimilar to that predicted by the
SPSS. These four samples were: Australia Code No. 197, Canada Code
Nos. 202 and 203 and China Code No. 209.
Discriminant analysis was carried out between the English and the
European sample. The European samples included the honeys from France
and Spain. The predicted classifications obtained by the SPSS have been
shown in Table 88. The seven samples selected for calculation of the
Fisher's linear discriminant functions were 100.0% correctly classified.
The following amino acids were entered into the analysis. These were:
threonine, glutamic acid, valine, phenylalanine and a constant derived
by the SPSS. There were seven samples selected for estimating the
misclassification rate and of these only 71.4% were correctly classified.
There were two samples (Code Nos. 216 and 232) which were
misclassified by the SPSS, however their pollen composition was similar
to that expected from their predicted origins.
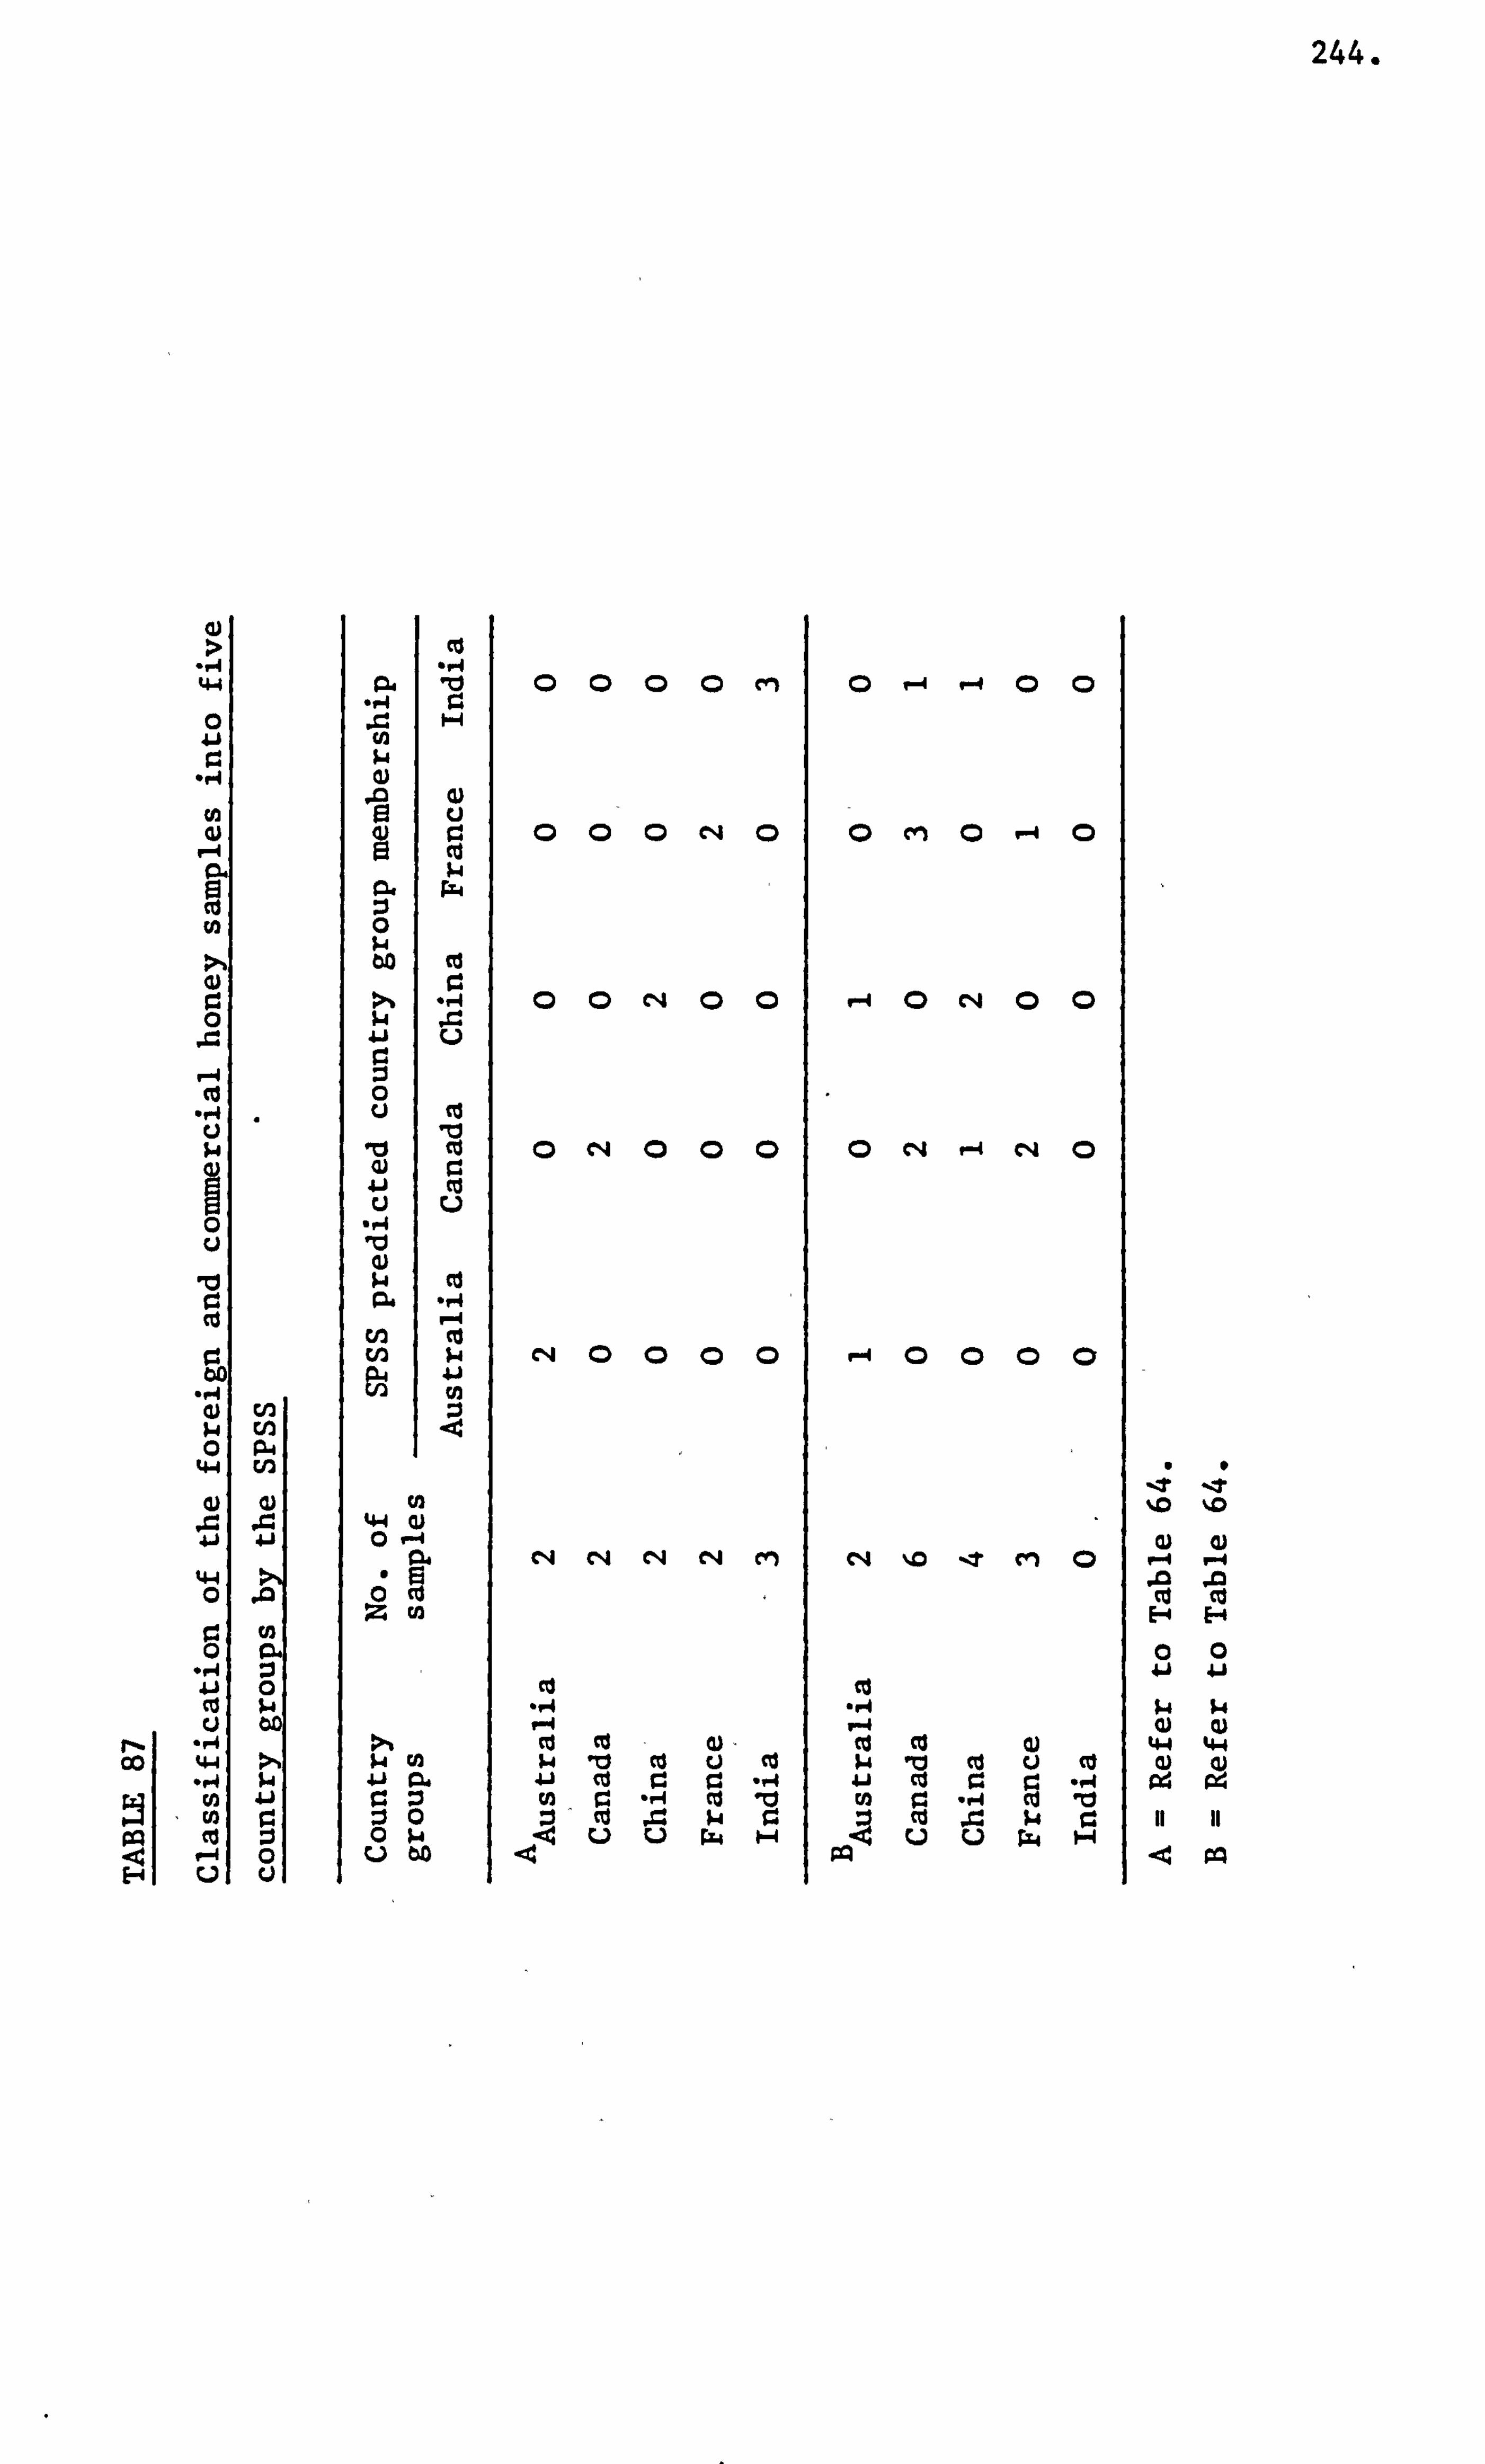
244.
. r.
ce.
ct
c 4-
aj
Ic
c
r. c
00 4-ý
co
E-4 u
a.
w 4-J
0)
0 cil
134
ni G)
10
cn cn
44 0
&I
ce . "d 10
cu N4
PW
Co
"0
0
P rA
:30 0P
u to
0000 cm
000"
00 C14 00
0 C14 000
C14 0
C14 C4 N C14 On
$4 Itl co ci Cd 4-J (Is 0 0 P4 CA 0 -P4 Cd 10 0, Cd 4 ý4 r.
0 v-4 r-4
cm 0 P-4 0ý
r-4 0 C-4 0
C14 r-4 "0
F-4
C14 %D -: T (n 0
Co .,. 4 7--4 CO ce W lu cu u ce
41 cu rý ., 4 0 . p4
9 10
%0 %. 0
Q) (1) P-4 ýi .Z In ce 0 E-4 H
00 41
-4 pq
245.
Computer placements of honey samples into the honey source. groups
The SPSS was specified to recode and allocate honey samples according
to their appropriate honey source groups by replacing the control statements
given in Appendix VII(a) by those given in Appendix VII(bvi) as described.
The predicted classification obtained by the SPSS have been shown in
Table 89. The ten honey samples selected and then divided into the two
subsets were 100.0% correctly classified. The Fisher's linear discriminant
functions were calculated for the following amino acids which were entered
into the analysis. The amino acids were: glutamic acid, phenylalanine
and a constant derived by the SPSS.
Computer placements of honey samples into pollen groups
The control statements given in Appendix VII(bvii) were used in
the following analysis by replacing those given in Appendix VII(a) as
described. The predicted classification of the honey samples into the
TrifoZium repens and MeZiZotus groups by the SPSS have been shown in
Table 90. The three honey samples selected for calculation of the Fisher's
linear discriminant functions were 100.0% correctly classified. The
amino acid serine and a constant derived by the SPSS were entered into
the analysis. There were three honey samples selected for estimating
the misclassification rate and of these only 66.7% were correctly classified.
The misclassified New Zealand sample Code No. 230 did not contain
the pollen predicted by the SPSS.
Including the honey samples containing the Lotus pollen in the above
analysis, that is, discriminating between pollen groups originating
from the Leguminosae plant family. The predicted classification obtained
by the SPSS have been shown in Table 91. The three samples selected
246.
TABLE 88
Classification of the English and European honev samples bv the SPSS
Country groups
No. of samples
SPSS predicted
France
country
Spain
group membership
English
A France 3 3 0 0 Spain 1 0 1 0 English 3 0 0 3
B France 2 0
Spain 1 0 0 1 English 4 9 0 4
TABLE 89
Classification of the floral honey samples by the SPSS
Floral No. of SPSS predicted floral group membership
groups samples Honeydew Nectar
A Honeydew 220
Nectar 202
Honeydew 1-10
Nectar 505
TABLE 90
Classification of the Trifoliwn repen8 and Melilotus honey samples by the SPSS
Pollen groups
No. of samples
SPSS predicted pollen group membership
308* 337*
A
308* 2 20
337* 1 01
B 308* 2
337* 1 01
TABLE 91
Classification of the honey samples belonging to the Papilionaceae plant famlly by-the SPSS_
Pollen groups
No. of samples
SPSS predicted pollen group membership
325* 337* 308*
A
325* 1 100
337* 0 000
308* 2 002
B
325* 1 001
337* 2 101
308* 2 002
These notes are common to Tables 88,89,90 and 91.
A- Refer to Table 64.
B- Refer to Table 64.
*- Refer to Table 30.
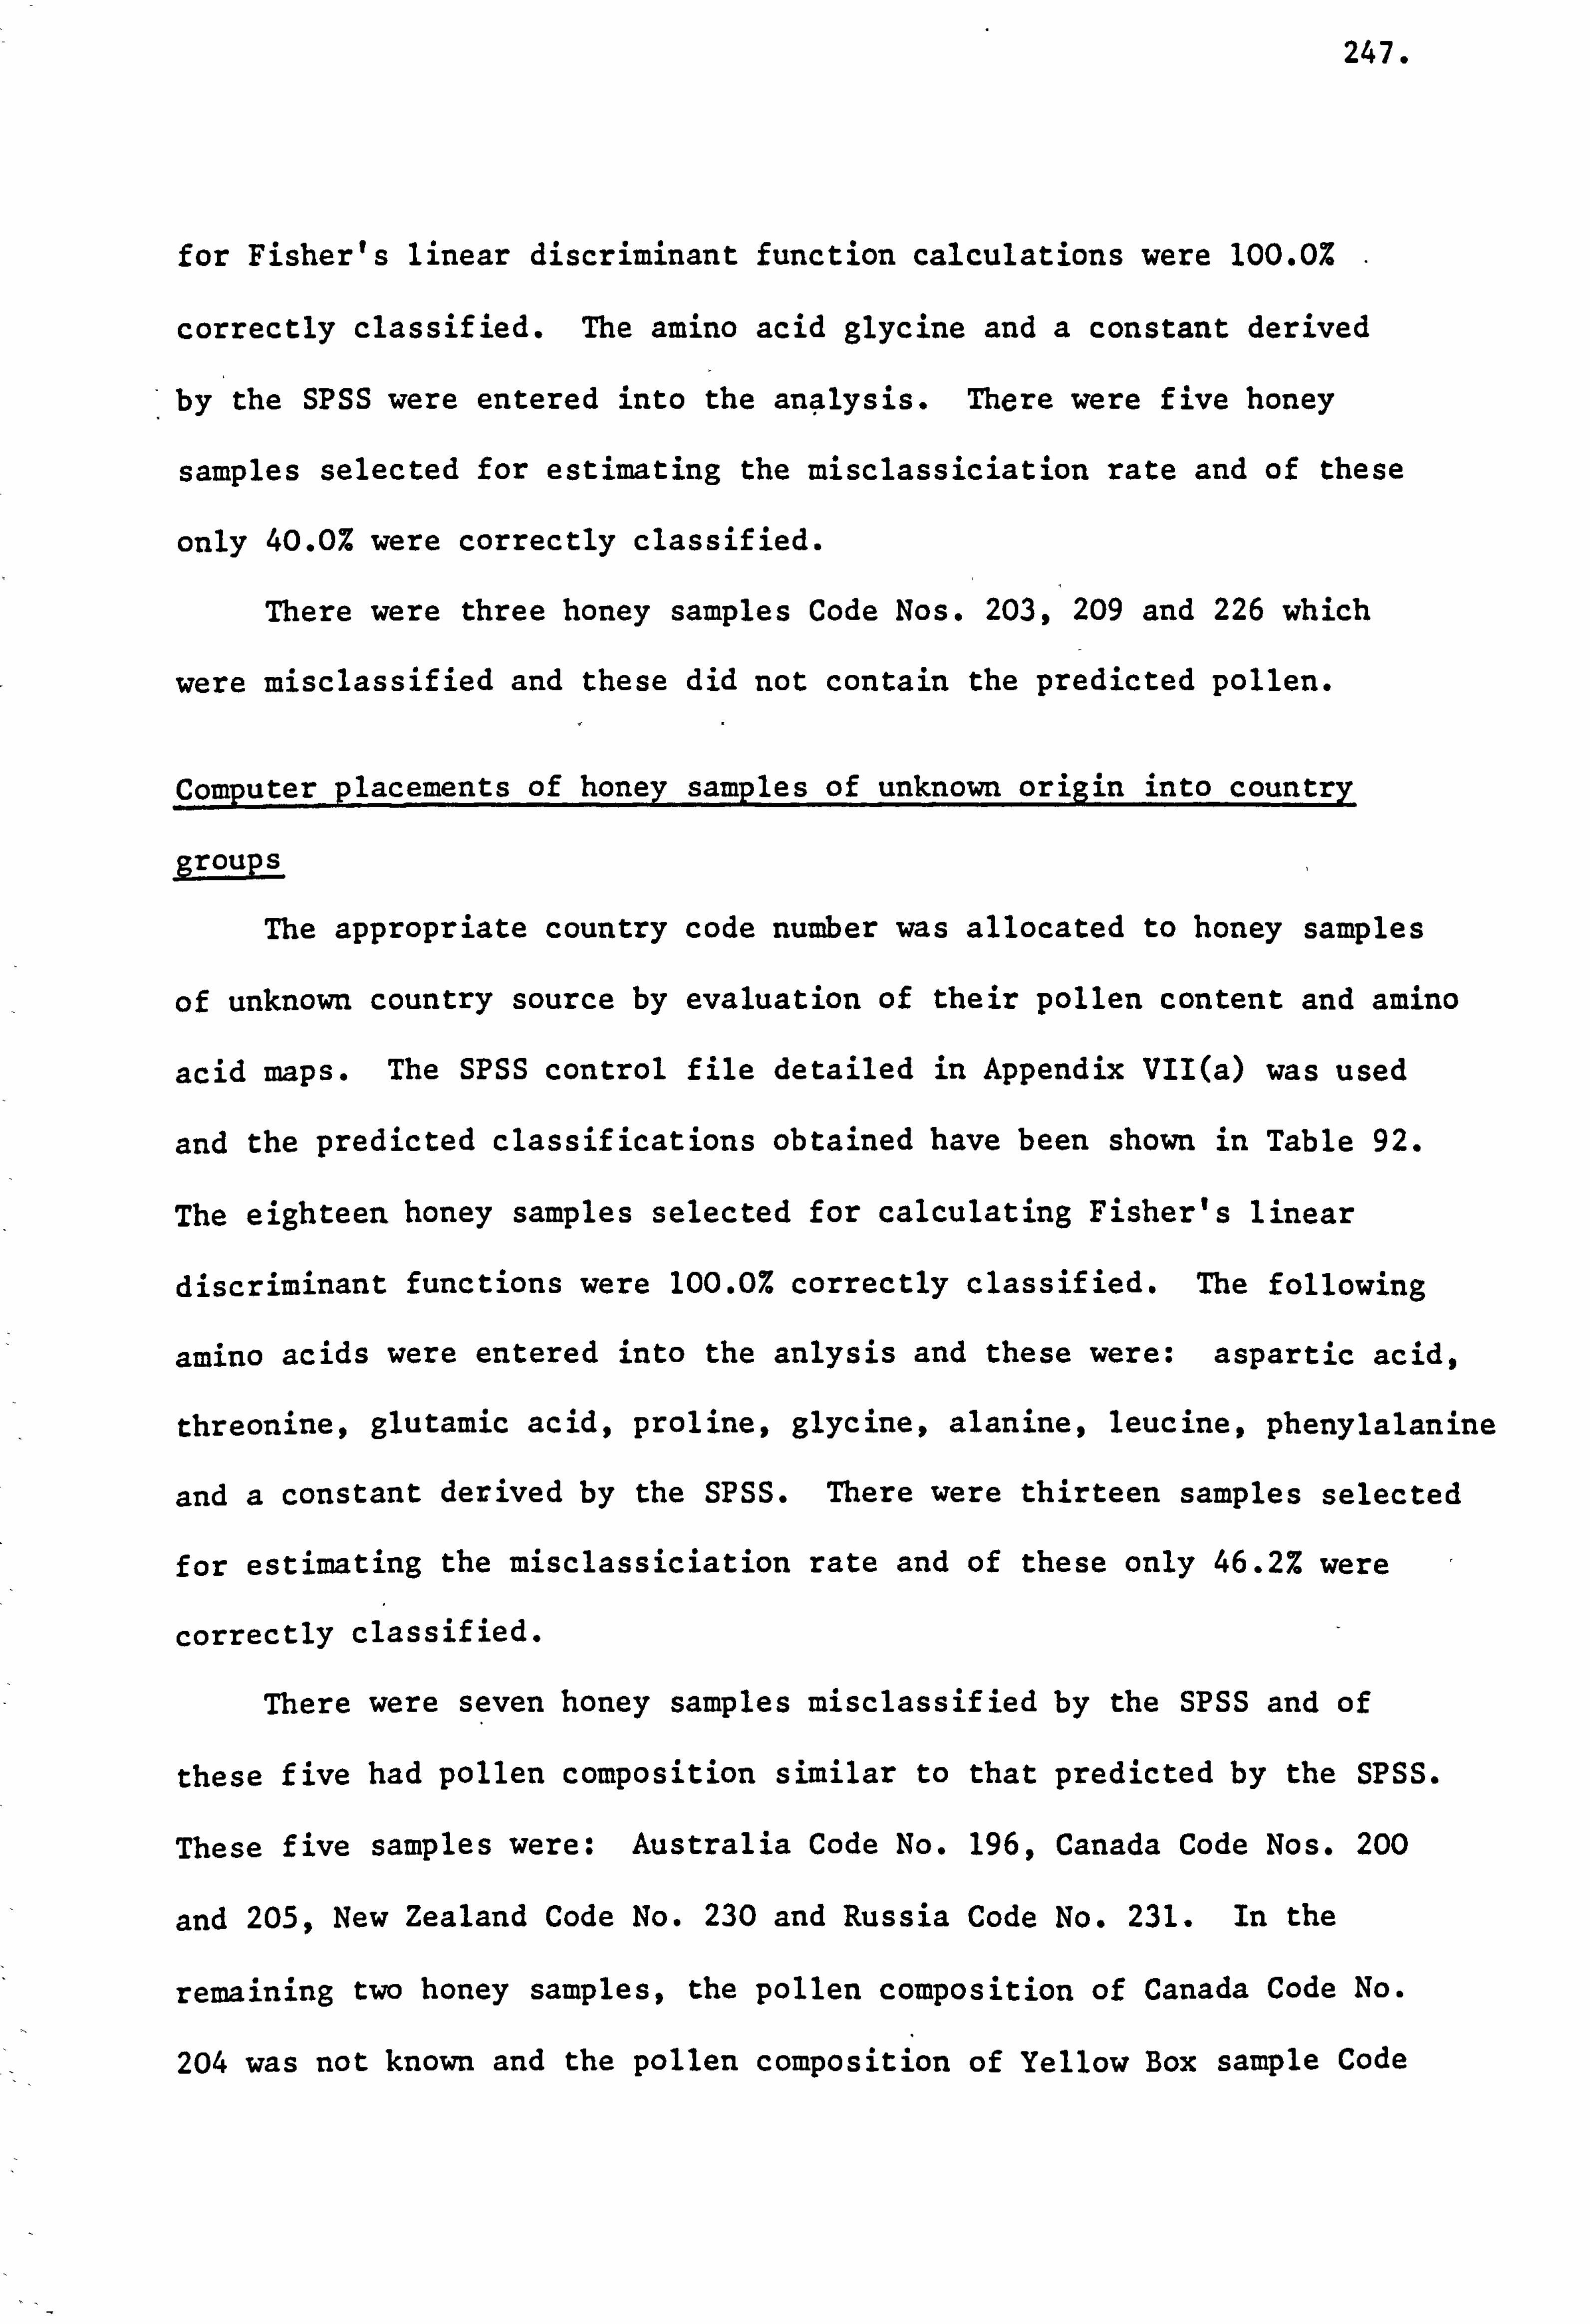
247.
for Fisher's linear discriminant function calculations were 100.0% -
correctly classified. The amino acid glycine and a constant derived
by the SPSS were entered into the an4lysis. There were five honey
samples selected for estimating the misclassiciation rate and of these
only 40.0% were correctly classified.
There were three honey samples Code Nos. 203,209 and 226 which
were misclassified and these did not contain the predicted pollen.
Computerplacements of honey samples of unknown origin into country
groups
The appropriate country code number was allocated to honey samples
of unknown country source by evaluation of their pollen content and amino
acid maps. The SPSS control file detailed in Appendix VII(a) was used
and the predicted classifications obtained have been shown in Table 92.
The eighteen honey samples selected for calculating Fisher's linear
discriminant functions were 100.0% correctly classified. The following
amino acids were entered into the anlysis and these were: aspartic acid,
threonine, glutamic acid, proline, glycine, alanine, leucine, phenylalanine
and a constant derived by the SPSS. There were thirteen samples selected
for estimating the misclassiciation rate and of these only 46.2% were
correctly classified.
There were seven honey samples misclassified by the SPSS and of
these five had pollen composition similar to that predicted by the SPSS.
These five samples were: Australia Code No. 196, Canada Code Nos. 200
and 205, New Zealand Code No. 230 and Russia Code No. 231. In the
remaining two honey samples, the pollen composition of Canada Code No.
204 was not known and the pollen composition of Yellow Box sample Code
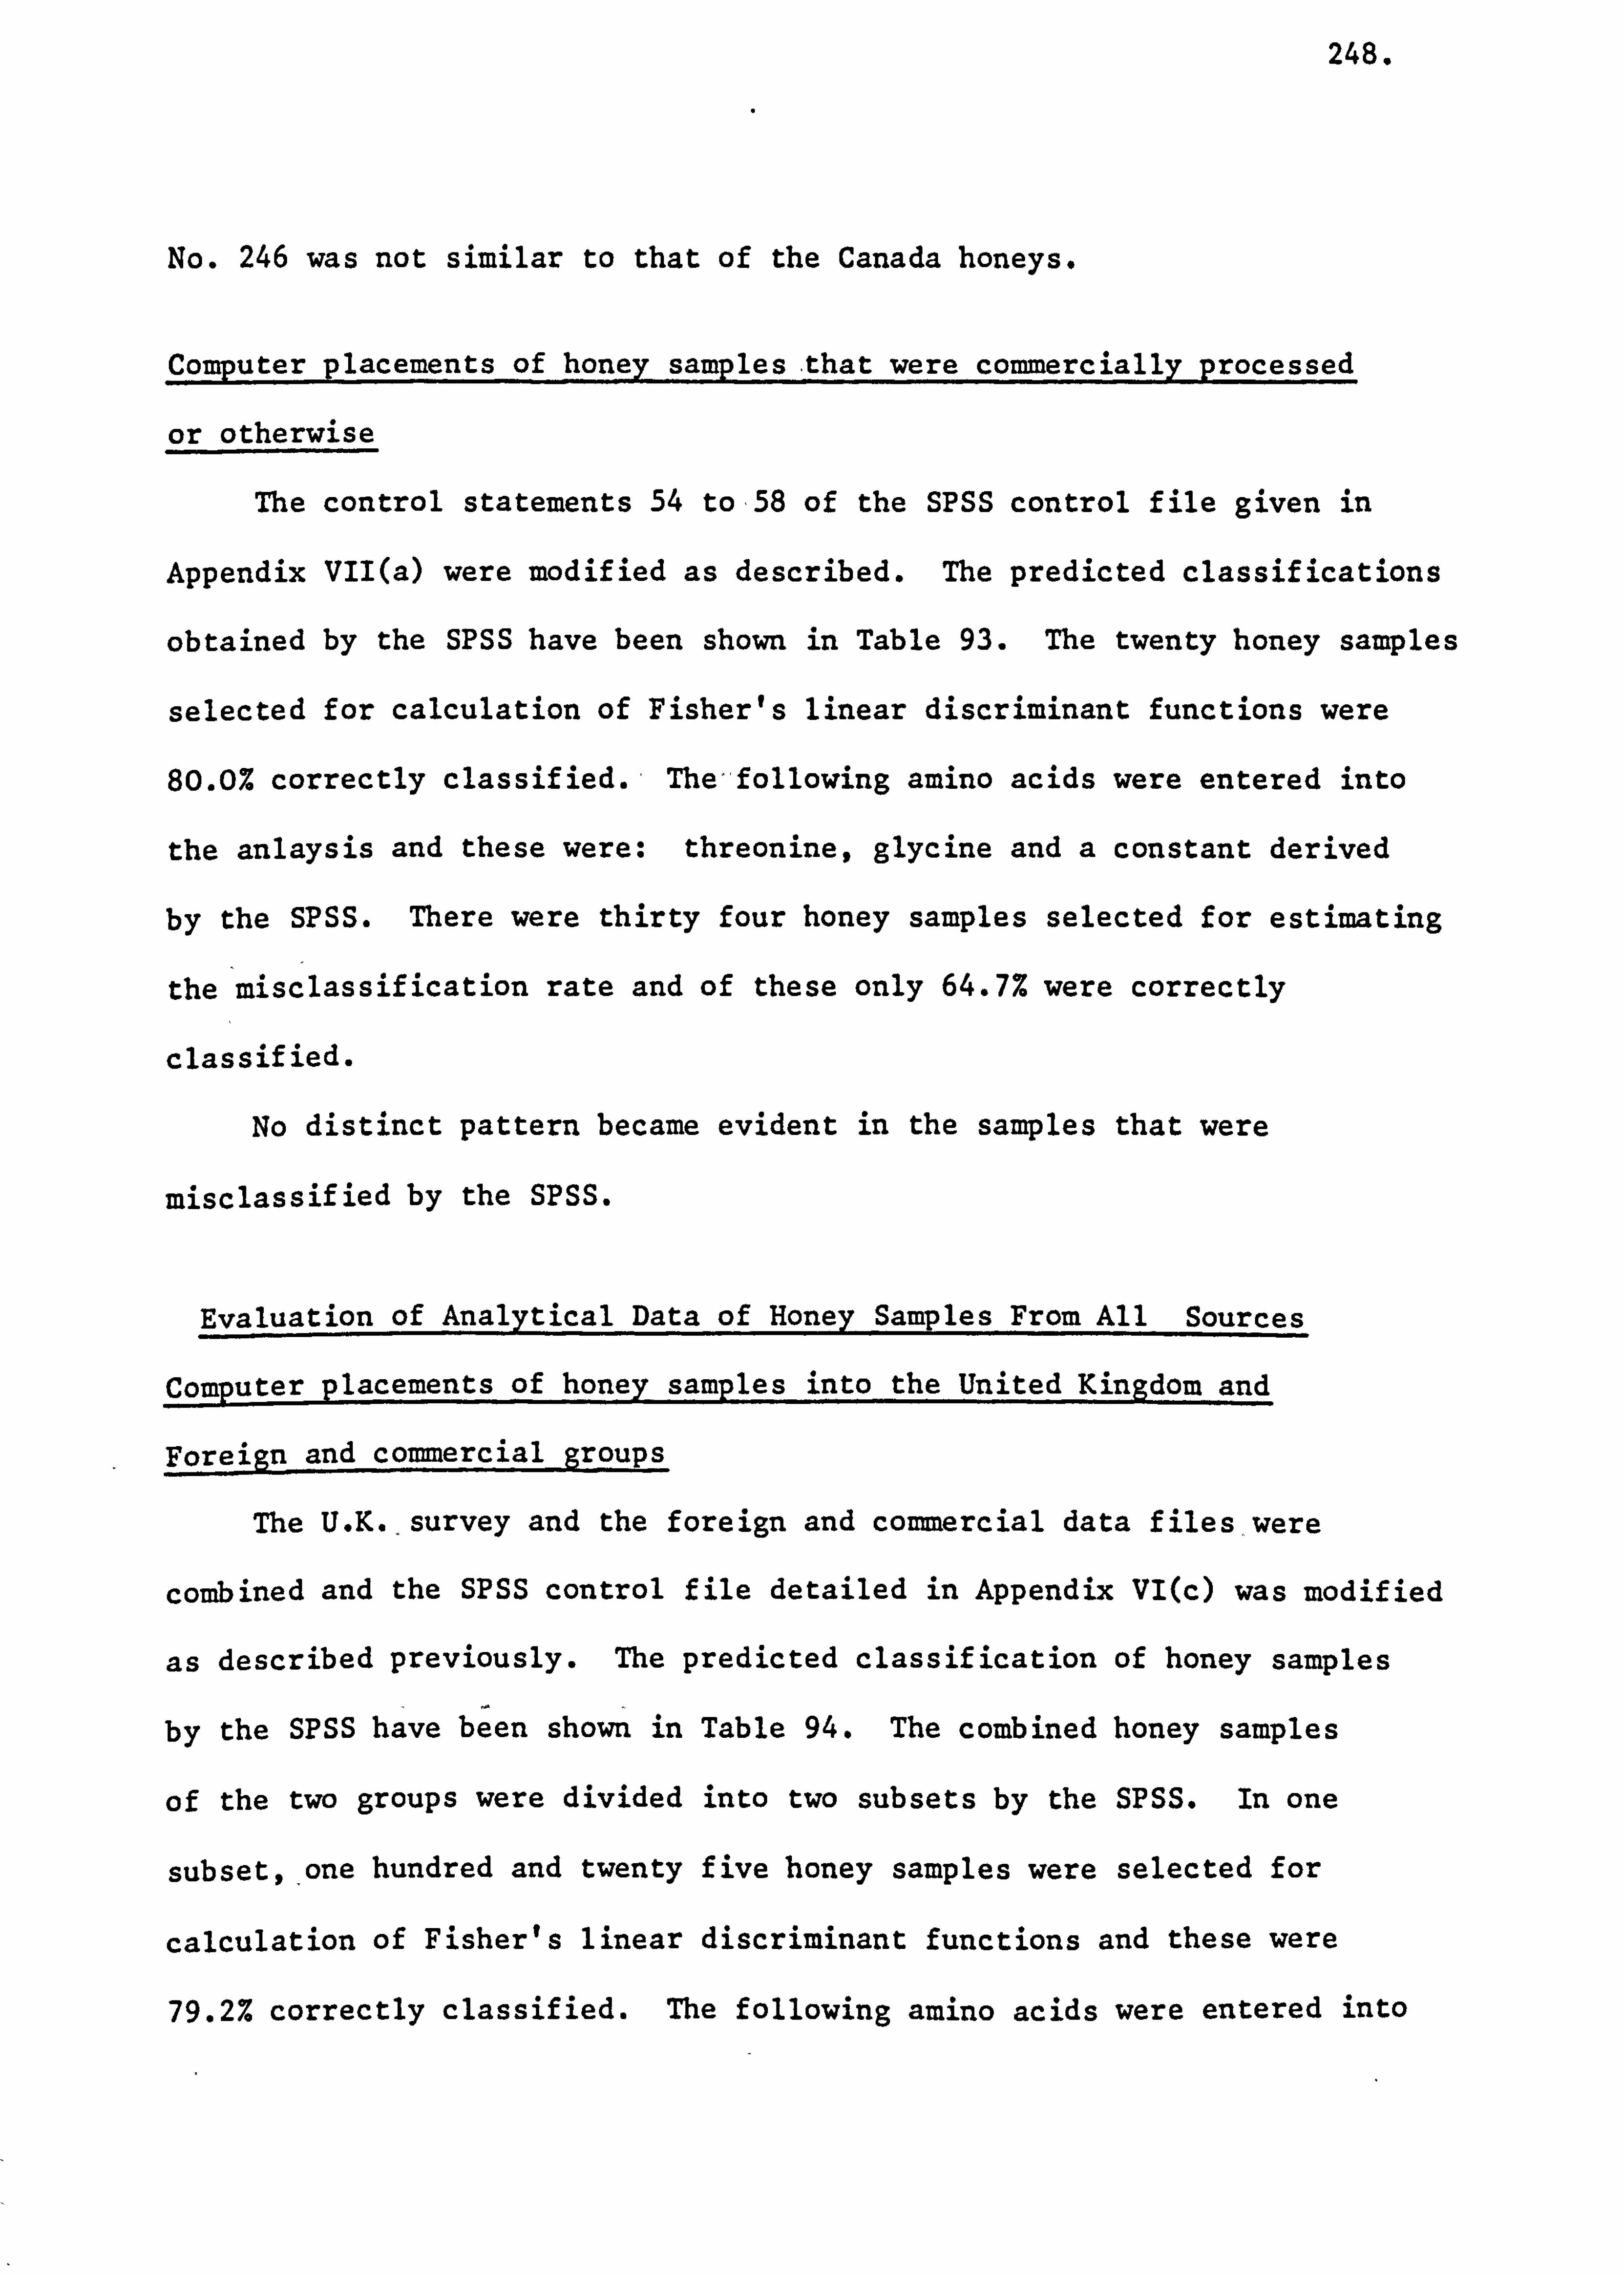
248.
No. 246 was not similar to that of the Canada honeys.
Computer placements of honey samples
or otherwise
The control statements 54 to, 58
Appendix VII(a) were modified as des,
obtained by the SPSS have been shown
selected for calculation of Fisher's
, that were commercially processed
of the SPSS control file given in
aribed. The predicted classifications
in Table 93. The twenty honey samples
linear discriminant functions were
80.0% correctly classified. ý The, following amino acids were entered into
the anlaysis and these were: threonine, glycine and a constant derived
by the SPSS. There were thirty four honey samples selected for estimating
the misclassification rate and of these only 64.7% were correctly
classified.
No distinct pattern became evident in the samples that were
misclassified by the SPSS.
Evaluation of Analytical Data of Honey Samples From All Sources
Computer placements of honey samples into the United Kingdom and
Foreign and commercial groups
The U. K., survey and the foreign and commercial data files1were
combined and the SPSS control file detailed in Appendix VI(c) was modified
as described previously. The predicted classification of honey samples
by the SPSS have been shown in Table 94. The combined honey samples
of the two groups were divided into two subsets by the SPSS. In one
subset, one hundred and twenty five honey samples were selected for
calculation of Fisher's linear discriminant functions and these were
79.2% correctly classified. The following amino acids were entered into
249.
TABLE 92
Classification of the unknown country of origin honey samples into
country groupsby the_SPSS
Country No. of SPSS predicted country group membership groups samples '
Australia Canada Mexico New Zealand
A
Australia 7 7 0 0 0
Canada 4 0 4 0 0
Mexico 5 0 0 5 0
New Zealand 00
B
Australia 6 4 2 0 0
Canada 3 2 1, 0 0
Mexico 3, 1 1 0
New Zealand 1 0 0 0
TABLE 93
Classification of the foreign and commercial honey samples into
'processed' and 'unprocessed' groups by the SPSS
Process No. of SPSS predicted process group membersh. ip groups samples
Processed Unprocessed
A
Processed 11 10 1
'Unprocessed 9- 36
B
Processed 19 15 4
Unprocessed 15 8 7
These notes are common to Tables 92 and 93.
A= Refer to Table 64.
B= Refer to Table 64.
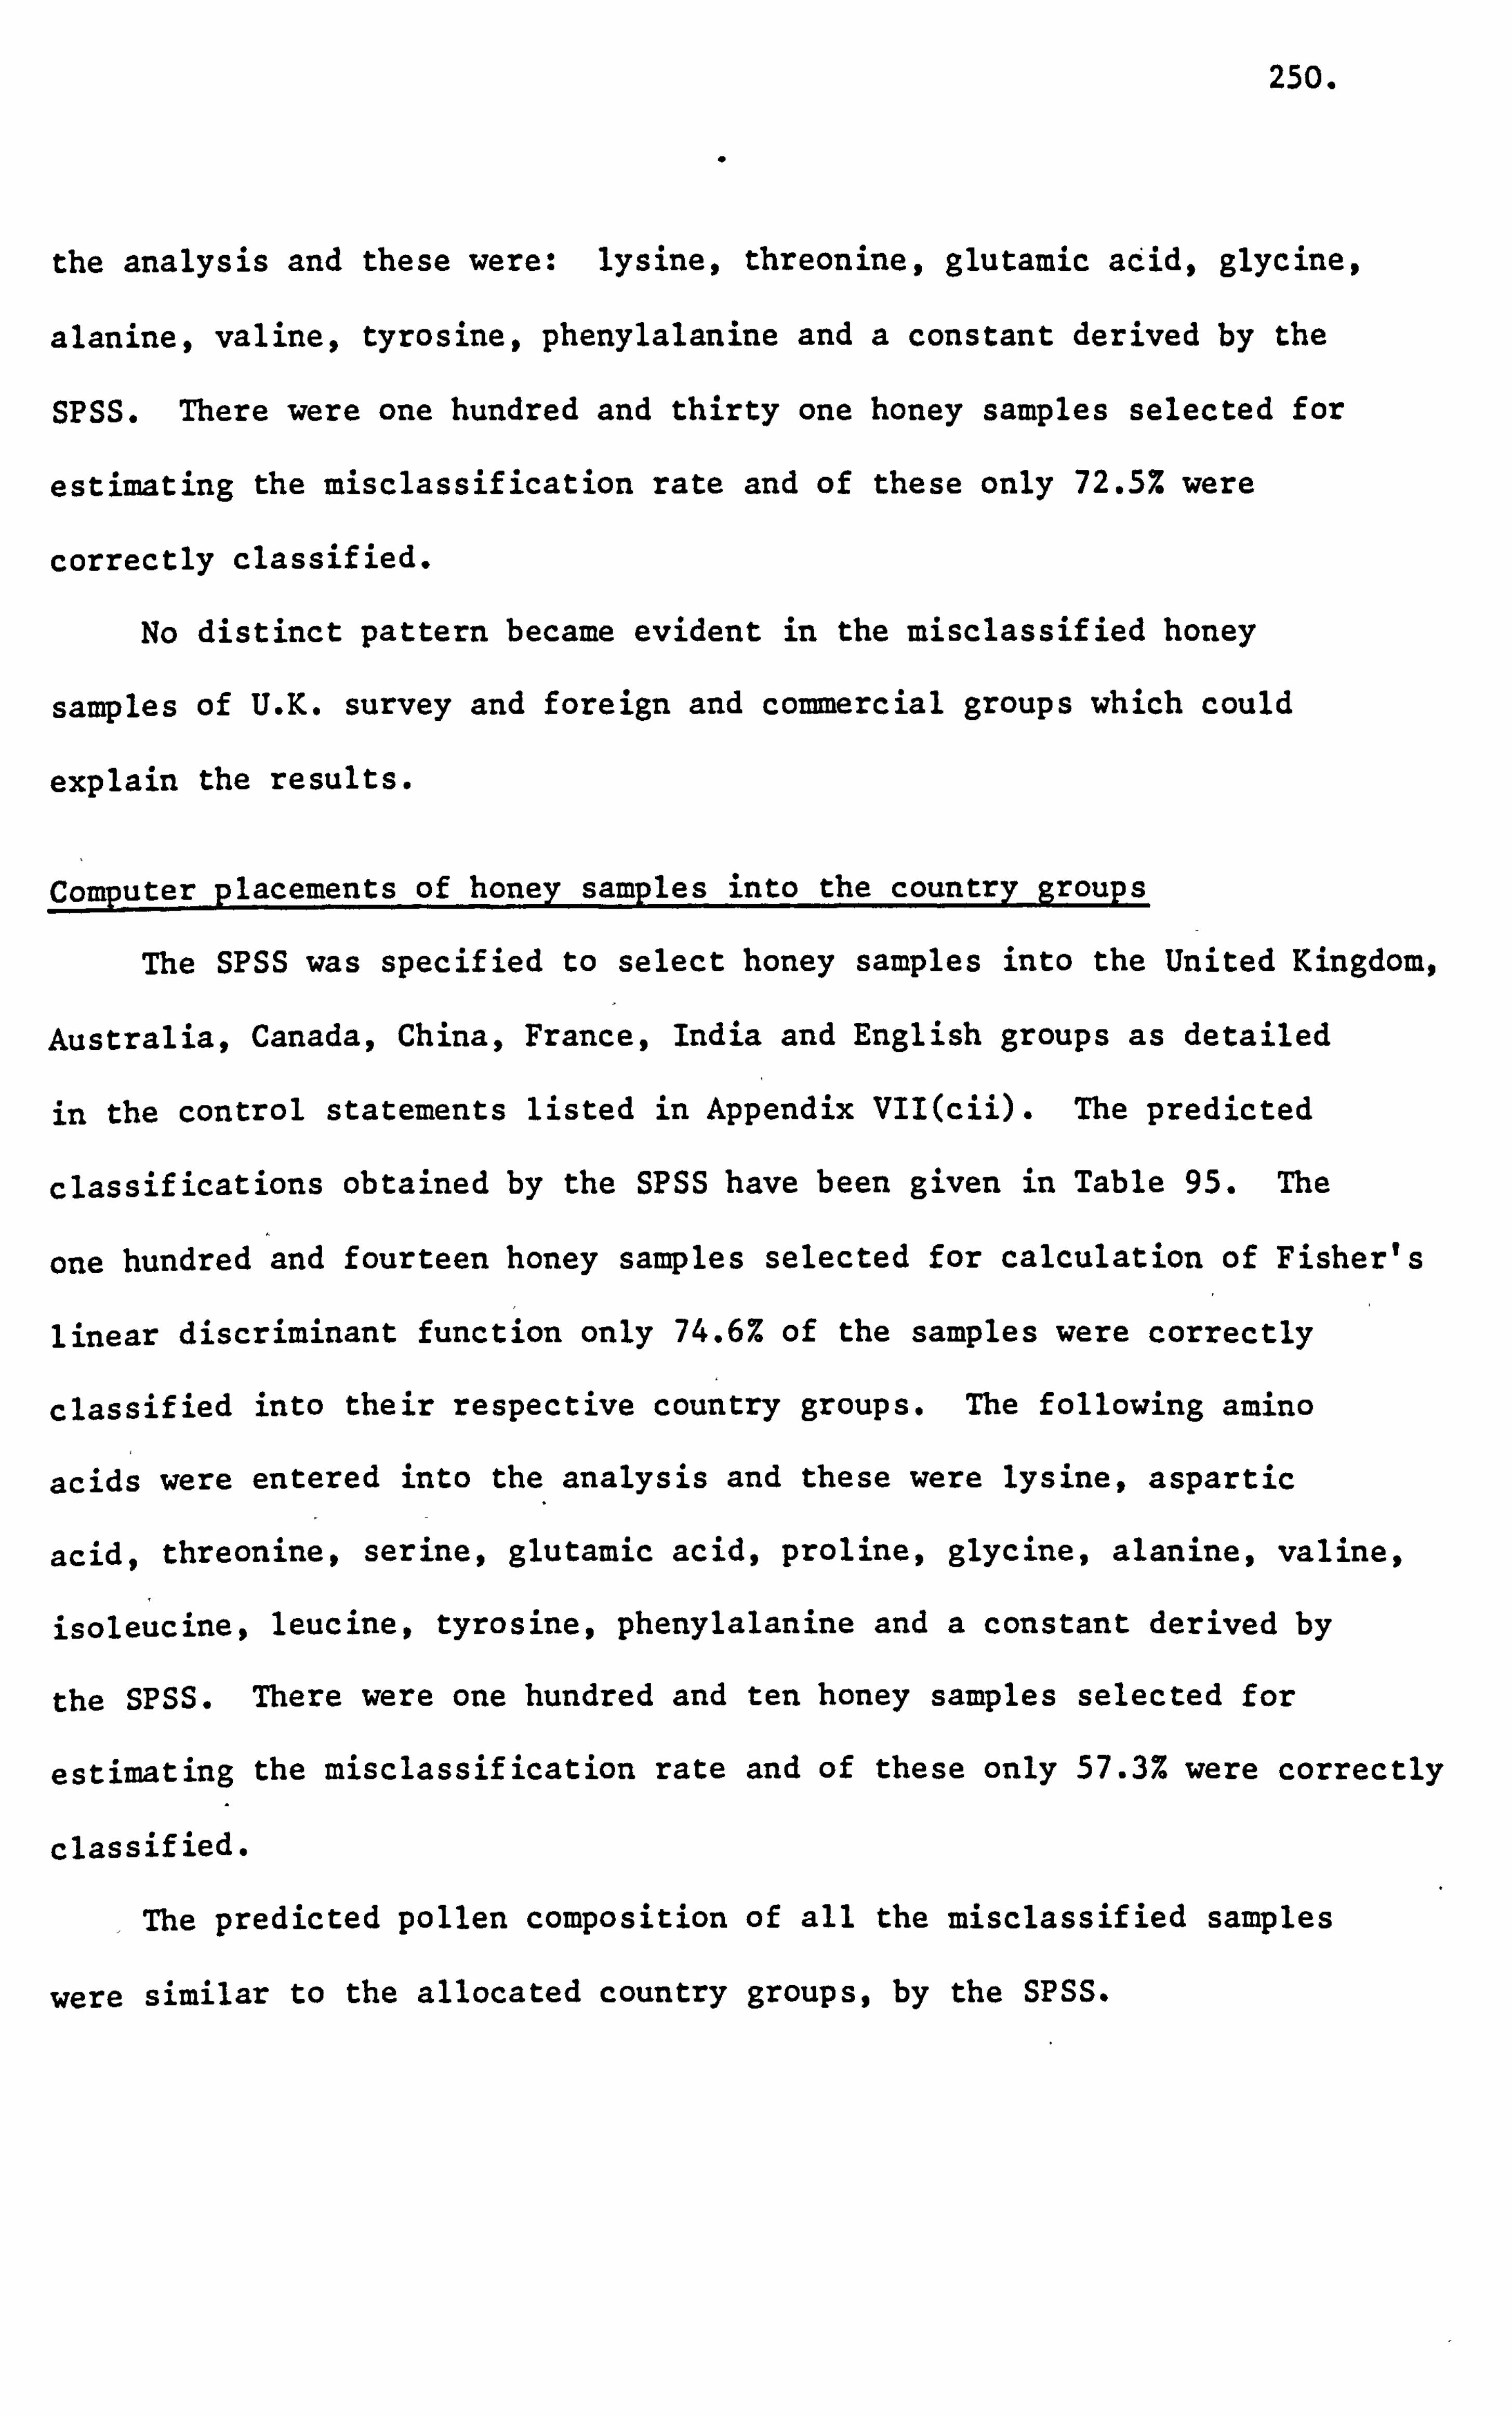
250.
the analysis and these were: lysine, threonine, glutamic adid, glycine,
alanine, valine, tyrosine, phenylalanine and a constant derived by the
SPSS. There were one hundred and thirty one honey samples selected for
estimating the misclassification rate and of these only 72.5% were
correctly classified.
No distinct pattern became evident in the misclassified honey
samples of U. K. survey and foreign and commercial groups which could
explain the results.
Comput r placements of honey samples into the country groups
The SPSS was specified to select honey samples into the United Kingdom,
Australia, Canada, China, France, India and English groups as detailed
in the control statements listed in Appendix VII(cii). The predicted
classifications obtained by the SPSS have been given in Table 95. The
one hundred and fourteen honey samples selected for calculation of Fisher's
linear discriminant function only 74.6% of the samples were correctly
classified into their respective country groups. The following amino
acids were entered into the analysis and these were lysine, aspartic
acid, threonine, serine, glutamic acid, proline, glycine, alanine, valine,
isoleucine, leucine, tyrosine, phenylalanine and a constant derived by
the spSS. There were one hundred and ten honey samples selected for
estimating the misclassification rate and of these only 57.3% were correctly
classified.
. The predicted pollen composition of all the misclassified samples
were similar to the allocated country groups, by the SPSS.
251.
Computer placements of honey samples into pollen groups
The SPSS was specified to allocate honey samples into the Brassica,
TrifoZium repens and Castanea pollen groups as described. The SPSS
selected forty seven honey samples out of the two hundred and fifty six
samples to perform discriminant analysis. The predicted classifications
obtained by the SPSS have been shown in Table 96. The twenty two samples
selected for calculating Fisher's linear discriminant functions were
100.0% correctly classified. The following amino acids were entered
into the analysis and these were: lysine, threonine, glutamic acid,
alanine, isoleucine, leucine, tyrosine, phenylalanine and a constant
derived by the SPSS. There were twenty five honey samples selected for
estimating the misclassification rate and of these only 68.0% were
correctly classified.
There were seven honey samples misclassified by the SPSS and the
presence of TrifoZium repens pollen was correctly predicted to be present
in the U. K. sample Code No. 178. The remaining six samples, U. K.
survey Code Nos. 26,39,64,68,102 and the Canada Code No. 202 the
pollen composition predicted did not agree with that present in these
samples.
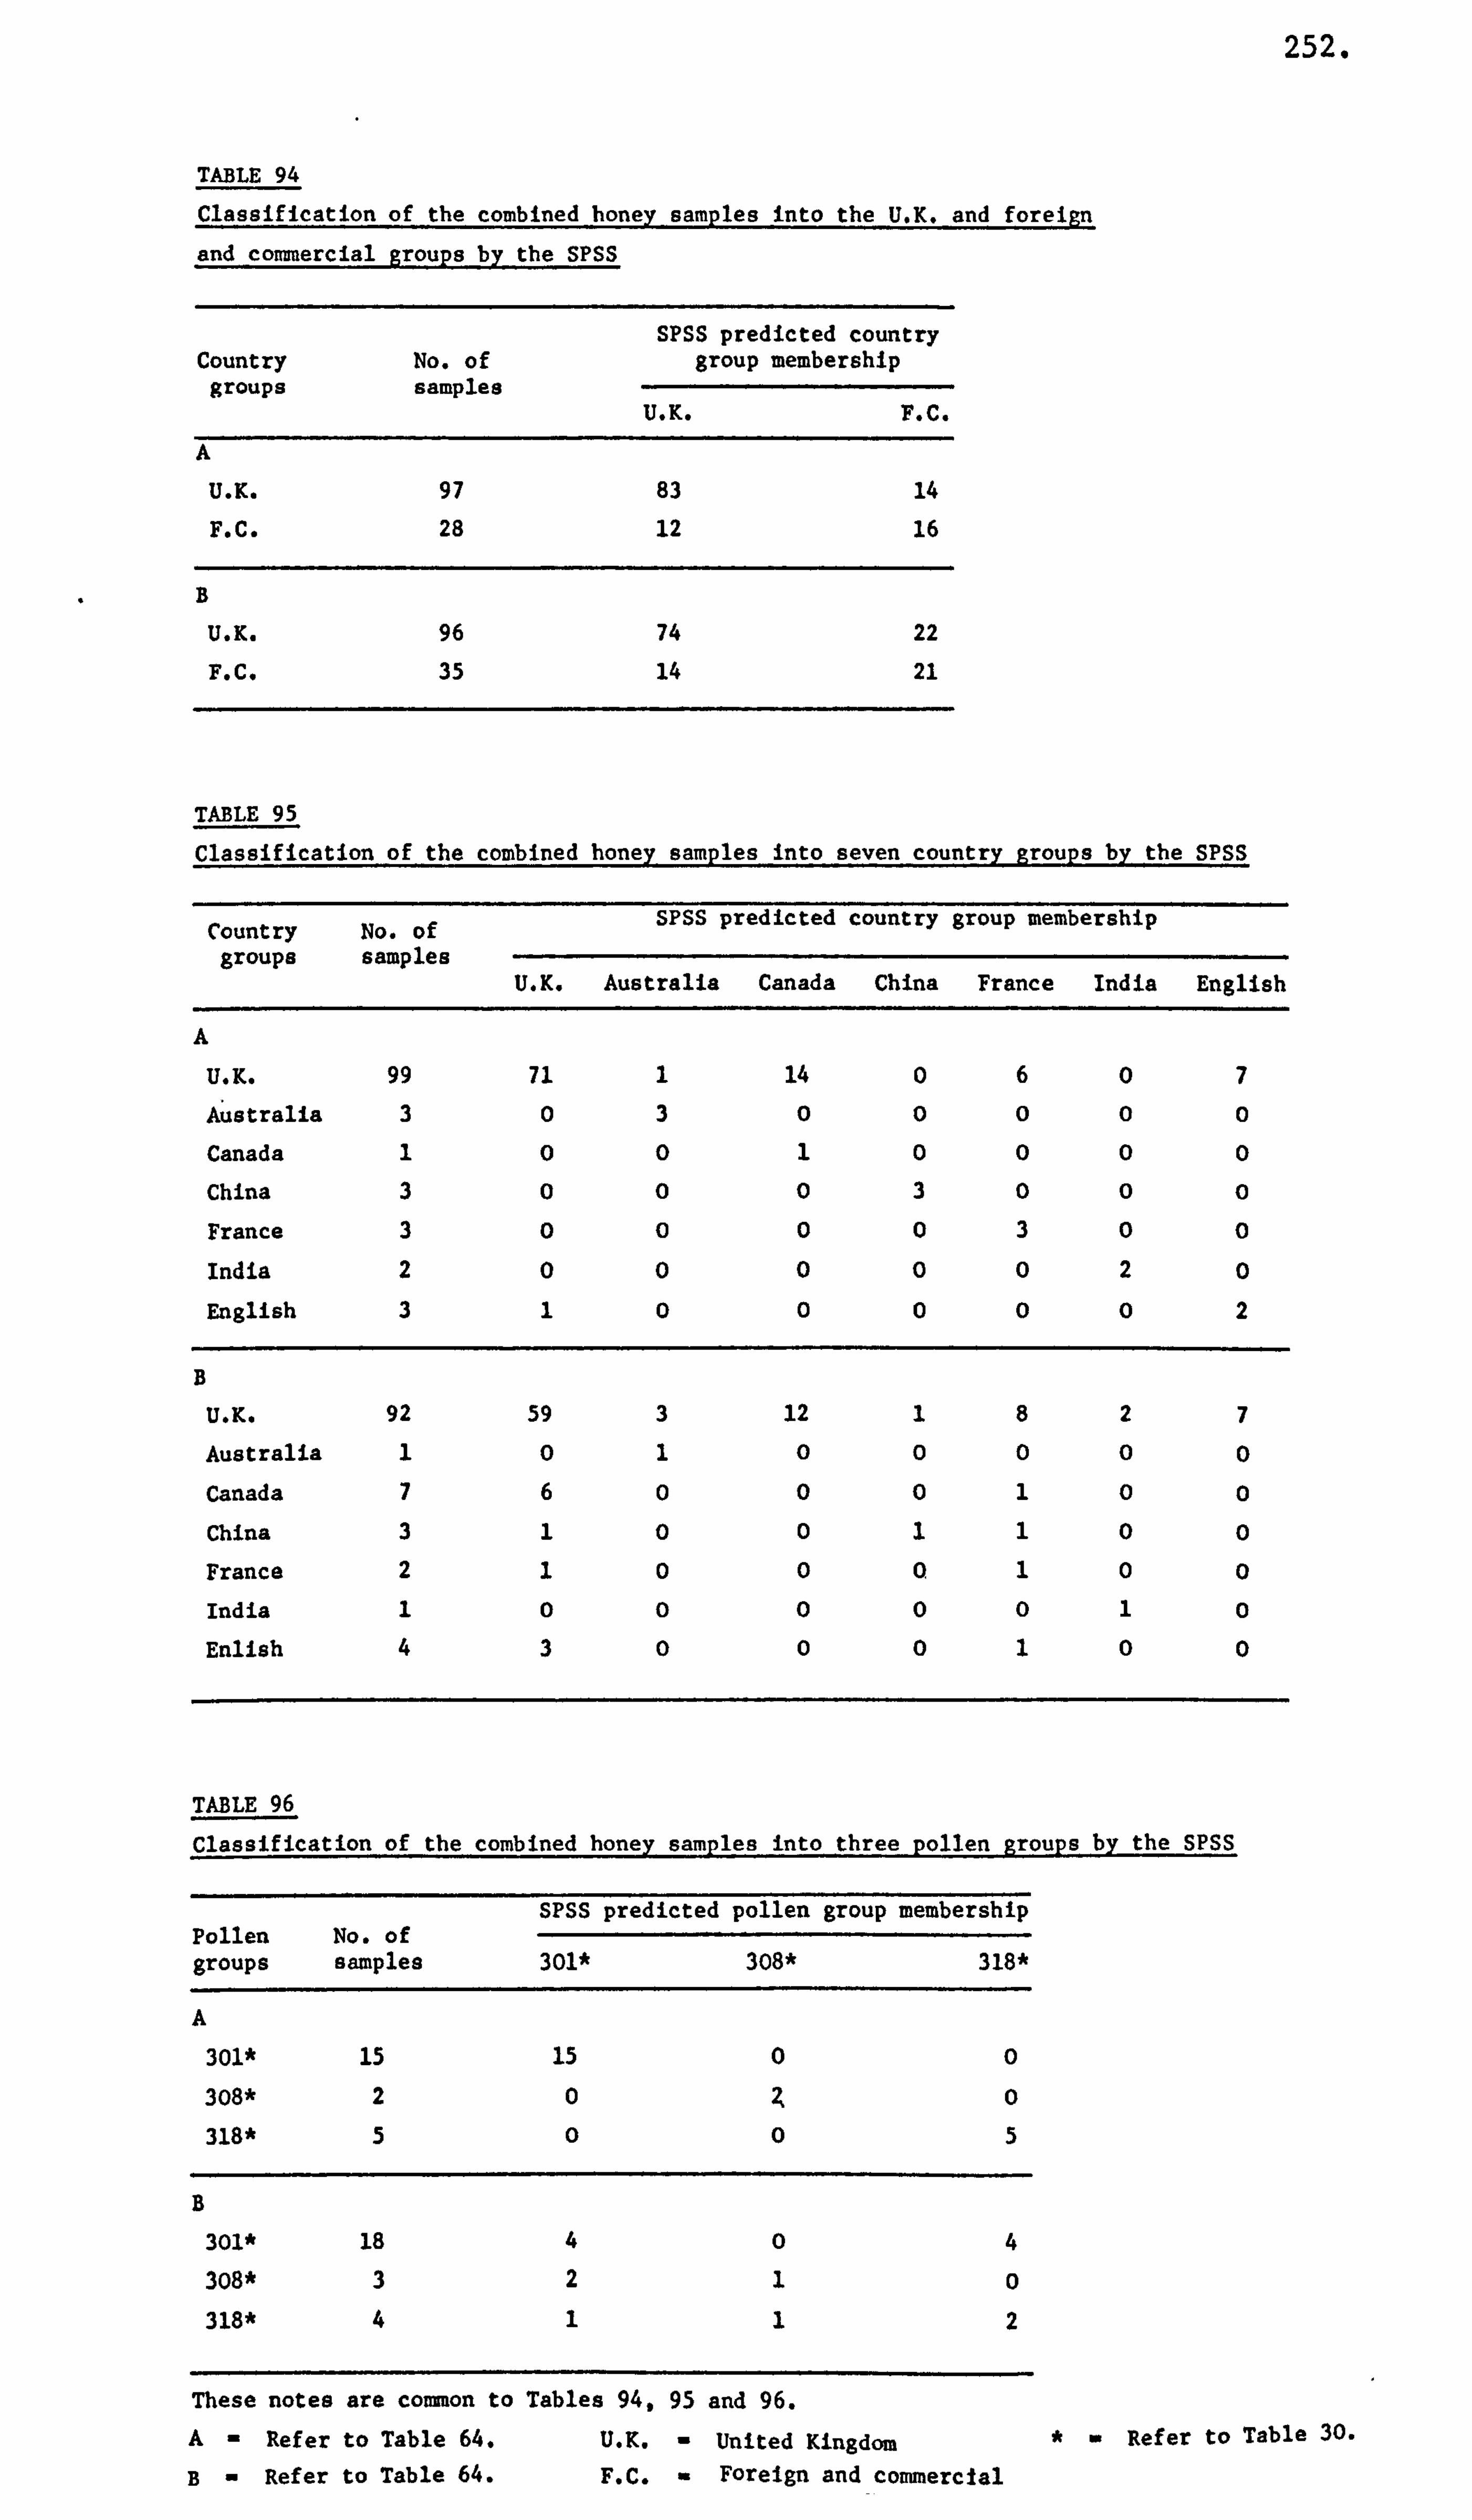
252.
TABLE 94
Classification of the combined honev samples into the U. K. and foreiRn
and commercial groups by the SPSS
SPSS predicted country Country No. of group membership
groups samples U. K. F. C.
A
U. K. 97 83 14
F. C. 28 12 16
B
U. K. 96 74 22
F. C. 35 14 21
TABLE 95
Classification of the combined honey samples into seven country groups by the SPSS
Country groups
No. of samples
U. K.
SPSS predicted
Australia Canada
country
China
group membership
France India English
A
U. K. 99 71 1 14 0 60 7
Australia 3 0 3 0 0 00 0
Canada 1 0 0 1 0 00 0
China 3 0 0 0 3 00 0
France 3 0 0 0 0 30 0
India 2 0 0 0 0 02 0
English 3 1 0 0 0 00 2
B
U. K. 92 59 3 12 1 82 7
Australia 1 0 1 0 0 00 0
Canada 7 6 0 0 0 10 0
China 3 1 0 0 1 10 0
France 2 1 0 0 0 10 0
India 1 0 0 0 0 01 0
Enlish 4 3 0 0 0 10 0
TABLE 96
Classification of the combined honey samples into three pollen Rroups by the SPSS
SPSS predicted pollen group membership Pollen No. of groups samples 301* 308* 318*
A
301* 15 15 00
308* 20z0
318* 5005
B
301* 18 404
308* 3210
318* 4112
These notes are common to Tables 94,95 and 96.
A- Refer to Table 64. U. K. - United Kingdom Refer to Table 30.
B- Refer to Table 64. F. C. - Foreign and commercial

ISCUSS10N
CHAPTER 4
253.
ISC U'S S10N
CHAPTER 4
PRELIMINARYSUBJECTIVE EXAMINATION OF HONEY SAMPLES
The quality of honey is generally assessed on the'basis of its
colour and flavour. The light colour class honeys are usually
associated with a mild flavour while the dark colour class honeys with
strong flavours. The colour and flavour-of a honey are different to
the plant from which the nectar was originally gathered by the honeybee.
However, these two properties of honey are greatly influenced by a
number of factors. These are beekeeping, 'handling, processing and
storage. It has been generally reported by various researchers that
heating and storage of honey under unfavourable conditions results in
an increase in the darkening, loss of flavour and an increase in its
hydroxymethy1furfural content. These researchers were: White, Kushnir
and Subers (1964); Echigo, Takenaka and Ichimura (1974) and White (1978).
Blending of honeys also effects its colour. It was reported by Milium
(1939) that combination of tannates and polyphenols with iron from
containers and processing equipment results in colour formation during
storage. The formation of formaldehyde derivatives and changes due to
heating and caramelisation are contributing factors. Also, factors such
as the non-enzymic browning reactions involving the Maillard and other
reactions which usually'lead-to the production of reactive intermediates
such as Schiff's bases and subsequent further reactions should also be
considered. The enzyme browning reaction using the enzymes and phenols
derived from the original nectar would also be expected to contribute
in unheated honey samples. The absence of significant amounts of the
254.
aromatic amino acids such as tryptophan and tyrosine in light colour
class honeys and their presence in dark colour class honeys were noted
by Phadke (1962). It was reported by Browne (1908) that dark coloured
honeys gave intense colour reactions when tested for polyphenolic
compounds. Further, some of the constituents named above such as
various carbohydrates, amino and other acids, tanins and minor non-
volatiles contributes towards the aroma and flavours of honey. Other
components such as alkaloids, aromatic compounds, aldehydes, esters,
alcohols, phenylethyl and benzyl alcohols have been reported present
in honey by Ten-Hoopen (1963) and Cremer and Riedmann (1965). Most of
these compounds are the resultant of the process of degradation or
reactions of amino acids with other constituents of honey. Compounds
such as methyl anthranilate have been isolated from orange and lavender
honey which gives these honeys their characteristic aroma. Other factors
could also influence the flavgur and colour of honey. These factors
could be introduced into the honey from the gathering of nectar by the
honeybee and during the ripening, extraction of honey and the manipulations
to achieve the final bottled product. These factors could be compounds
such as pesticides; honeybee repellants such as smoke, benzylaldehyde
or sulphur dioxide; burnt wax resultant of excessive heating which also
causes an increase in hydroxymethy1furfural content; fermentation occuring
from addition of water or blending with high yeast content honeys,
honeydew or foreign honeys and even lubricating oil from machinery
during processing.
In the present study most of the foreign honeys, especially the
Mexican, had very high phenylalanine content followed by Australia,
china, Yellow Box and samples of Gale honey. Also, some of the
255.
U. K. survey honey had high phenylalanine content. These were:
sample nos. 53,1580 1729 1739 1749 183,184 and 191. This phenylalanine
high content could be a result of protein breakdown due to excessive
heating and storage in unfavourable conditions, especially the foreign
honeys. The depression of the other amino acids could be the result of
condensation reaction with other honey constituents especially the
sugars. It is suggested that these high phenylalanine honeys should
not be consumed by persons who suffer from the genetic disorder of
phenylketonuria which affects the phenylalanine metabolism.
ASSESSMENT OF PRESENT WORK
-Proteins
Isolation
Due to the very viscous nature of honey a given sample of honey
had to be diluted (1: 2) with distilled water before any attempt could
be made to concentrate and then isolate the proteins present. Several
standard techniques for separating proteins were considered for use on
honey and these were: dialysis, gel filtration (sephadex), ion-exchange
chromatography and ultrafiltration. The advantages and disadvantages
of application of each of these methods were evaluated for honey.
Dialysis
The advantages of the dialysis procedure are that it is a gentle
process which can, if desired, be conducted at a low temperature and
usually results in a2-3 fold increase of the protein solution.
However, with this method the disadvantages outweigh the advantages
256.
in that the procedure requires the use of large volumes of solutions
and thus, another separate method is needed to reduce the final volume.
The complete procedure of dialysis takes a long time in order of days,
four to five, to separate proteins from dialysable smaller molecular
weight material and then the protein solution has to be concentrated
as a separate step. This length of experimental time also presents
risks due to microbial contamination of the dialysis tubing and the
diluted honey solutions.
Gel filtration
The technique of gel filtration using sephadex as medium is
considered to'be an efficient technique and would result in the
separation of proteins from carbohydrates. The advantage of this
method over dialysis is that it enables desalting as well as protein
concentration. However, the disadvantages of using sephadex gel
filtration on honey are that this technique ideally requires small
amounts of pure protein mixtures containing a number of different sized
molecules eluting at different positions. Due to the presence of
carbohydrates the dilution of honey was a must and therefore, large
quantities of solutions are needed for filtration. This can be
overcome by performing the technique of gel filtration under pressure
but would result in the compression of the gel bed. Further, this
method only separates according to molecular size and presence of
polysaccharides would create problems such as distortion of protein
elution. Furthermore, the sephadex is liable to irreversible absorption
of Small amounts of proteins and losses increased as the amount of
protein approached milligram quantities would lead to significant
errors in the final calculations of recoveries (Washington, 1966).
257.
Ion-exchange chromatography
Due to the viscosity of honey a large. mesh size resin would be
required and the technique of ion-exchange chromatography-was found
to be advantageous in the separation of amino acids and peptides.
Thorough washing after binding results in the loss of-all the
carbohydrates and proteins thus,. enabling the elution of the amino
acids using 7M ammonium hydroxide solution. If proteins only were
required to be eluted than inevitably. amino acids would be present
in the final extract. Therefore, the total isolation of proteins by
ion-exchange would be difficult. Another reason for this difficulty
would be the poor absorption onto the ion-exchange resin partly due to
sizes of the protein molecules and also because proteins are weakly
charged molecules. Moreover, the stability of the protein molecules
in the separating media whether be it acidic or alkaline would result
in the elution of proteins just after the polysaccharides and
carbohydrates. This would lead to trailing throughout the column.
Furthermore, if separation of proteins is to be efficient a loosely
cross-linked resin of x2 or x4% divinylbenzene is needed rather than
the more rigid x8% cross-link of resin routinely used for amino acids.
Also due to the restricted applications of these loosely cross-linked
resins they are often only available for high resolution techniques
utilizing chromatographic grgde resin of approximately 400 mesh. This
factor would preclude use for honey as done in the present study. It
was reported, by Schepartz and Subers (1964) that some of the honey
enzymes such as glucose oxidase were binding irreversibly or not binding
at all with ion-exchange media such as DEAE- and CM-cellulose,
respectively. Therefore, losses similar to that encountered with basic
258.
amino acids would also result here.
Ultrafiltration
For the reasons given above. the technique of ultrafiltration was
selected for concentrating the proteins present in honey. The
advantages of this technique are that the volumes of protein solutions
remain approximately unchanged and the process seems to be reasonably
quick for normal protein solutions at room temperature. The main
reason for choosing this technique was that it enabled the selection
of a filter membrane with a specific pore size so that molecules above
a specific molecular size can be retained. Assuming that the proteins
used for initial industrial calibration were similar to those of honey,
but there is no evidence on this point.
Howevert during ultrafiltration it was observed that the through
put of the honey solution in the amicon cell was much slower, resulting
in three to four days for the removal of all the soluble filterable
components. The reasons for this could be due to:
1. the presence of large inclusions in honey, even after clarification,
could be blocking the pores of the UM10 filter membrane even
though stirring was available to minimise this effect;
2. the fact that even after dilution the honey solution still
possessed considerable viscosity when compared to water or
dilute solutions.
It was also found that even though precautions were taken to perform
the ultrafiltration procedure at a temperature of 40C discolouration
due to microbial contamination of the inner walls of the amicon cells
and the outlet tubing usually occurred after the third day of the
259.
experiment. An odour similar to that of alcohol was evident when
buffer solutions were added to the concentrated solution in the
amicon cell.
The residue retained by the UM10 disc consists of those molecules
whose average molecular size was above the 10,000 dalton cut off
limit of the filter membrane. Depending on how the filter membrane
was calibrated not all the material retained may have a molecular
weight above 10,000, and molecular size and shape are equally important
especially if polysaccharides are Involved. After freeze-drying the
residue above the membrane, it was necessary to store in a dessicator
over phosphorous pentoxide to prevent access of moisture to this
hygroscopic material. Even with precautions some of the protein
concentrates were usually gummy and sticky perhaps due to traces of
polysaccharides which may be present. It was becau. se of this that the
protein concentration was determined by the Lowry et aZ., (1951) method
within a week. after freeze-drying.
Concentration Measurements
The method of Lowry et aZ., (1951) for many years was extensively
used to measure protein concentration in a sample relative to a standard,
usually albumin. However, this method has several disadvantages
including that of complicated labile reagents, unstable colour and
more importantly proteins of different-composition give a very different
response than did the standard at equal concentration of-proteins. For
these reasons Bradford (1976) searched for a different technique free
of these errors and was successful in developing a dye-protein method
and this was taken up commercially as kits. Typical kits such as that
260.
by 'Pierce' are one-step procedures,, giving a stable colour and giving
similar responses for most proteins, even at low concentrations. The
method relies on a shift in absorbance of the acidic Coomassie Brilliant
Blue G250 from free to protein bound state. This reagent is regarded
as being extremely sensitive to low protein concentrations, unaffected
by interferring substances and is stable for months.
Preliminary comparisons of the Lowry and dye-binding methods as
applied to the honey protein concentrates showed that the latter method
was atypically erratic with inconsistent absorbance valves on replicates.
In contrast the Lowry reagent gave reasonable and reproducible absorbance
measurements. On the basis of this the Lowry method was adopted for
use on honey concentrates. The reason for the Pierce reagent being
unsuitable for use on honey concentrates could be due to honey components
such as gum, polysaccharides, residual wax, pollen or spores. one
explanation could be that the acidic coomassie brilliant blue could be
reacting with the pollen exine in a similar manner to that of basic
fushin. The differences in amount and distribution of sporopollinin
on the surface of pollen exine between different species could be
responsible for the inconsistent absorbance measurements.
Polyacrylamide Gel Electrophoresis
Examination of honey concentrates by PAGE or SDS-PAGE gave protein
bands (Figure 3) however, the variation in the position of the protein
bands precluded using this technique for honey proteins as a means of
detecting sample source chemically rather than by pollen estimation.
Furthermorev very recently it was shown by Reeder, Richie and Guenther
(1986) that it was possible to distinguish honey based on geographical
261.
location of collection using state of the art technology. This
advanced technology incorporated ultra-thin layer isoelectric
focusing, laser scanner and a chemometric programme on a mainframe
computer. Moreover, this form-of technology may be available at
nationally or more likely at internationally based research centres
and the application of such technology to only a few honeys is not
only uneconomical but, would not justify such equipment because of the
accumulated data to form a data bank. Therefore, it is considered
economically necessary to either improve the precision of existing
commonly used laboratory techniques such as PAGE or investigate other
minor constituents of honey such as amino acids. This was one of the
aims of the present study as pollens present can be partially or
completely removed by pressure filtration in the commercial interest
of presenting a crystal clear product of extended shelf-life and good
appearance. In the absence of pollen conventional identification is
impossible.
Heating of honey for liquification or other commercial treatment
usually results in the coagulation and/or denaturation of the proteins
present. This was evident in the protein band patterns observed on
the 5% and 10% SDS-PAGE gels of the not heat treated and heat treated
samples of English Chorley honey No. 261, see Figure 3. Further, the
fact that the protein band pattern of the heat treated sample No. 261
and, the commercial samples (fourteen) used in this analysis, refer
to Tables 10 and 11, suggests that the normal processing method after
extraction was effecting the nature of the honey proteins. Furthermore,
262.
the effects of heating honey were observed when the China Buckwheat
honey sample Code No. 209 of necessity was subjected to heating upon
receiving in order to remove glucose monohydrate crystals and debri
such as bee fragments and wax. The prepared sample was applied to the
SDS-PAGE gels. The polyacrylamide gels loaded with China Buckwheat
showed a very high background of protein even after sufficient-dilution
of the original honey applied. This suggests that the coagulated
proteins were infact precipitating followed by dissolution of the
precipitates during electrophoresis. When both the raw honey-and honey
concentrates were examined by applying to straight PAGE, the protein
bands obtained could not be reproduced accurately. This lack of
reproducibility suggests that the proteins present in the honey
examined were either coagulated or proteolysis had occurred at some
stage of sample preparation. However, the protein bands obtained on
the 5% and 10% SDS-PAGE gels showed consistency in the patterns
suggesting that the honeys examined were subjected to some degree of
heating and excessive heating prior to being rece ived in the laboratory
as was the. case with China buckwheat honey.
The scanning of the stained polyacrylamide gels was relatively
simple. Tears in gels were usually recorded as peaks and were easily
recognised. Gels scanned against a clear background, the peaks
obtained due to the protein bands were usually sharp and well defined,
refer to Figures 5 and 6.
263.
Enzymes
For convenience proteins with catalytic powers namely enzymes are
dealt with below. Enzymes and proteins are denatured in SDS-PAGE b; It
the enzyme activity is retained on PAGE gels alone. This latter technique
was used to particularly separate enzymes and other compounds. Their
existence was subsequently sort by incubating the completed gels with
the appropriate substrate. Although pilot studies with laboratory
enzymes were successful, the definite existence of the following enzymes
in honey, that is, diastase, glucose oxidase and invertase was not
successful. The sort looked for detection of honey enzymes on PAGE
gels may not have been successful for the following reasons:
1. The laboratory standard enzymes obtained from micro-organisms
have different characteristic properties compared to those found
in honey, although they catalyse the same substratp.
2. The raw honey applied (100 pl) although at the volume limit handled
by these gels may not have sufficient enzyme or enzyme aqitvity
to indicate their presence by the technique employed.
Even if sufficient enzymes were present in the amount of honey
applied, the enzymes could have leached out from their position
on the gels during incubation.
This could explain why the presence of the standard laboratory glucose
oxidase enzyme and its activity were not detected on the appropriate
gels.
Furthermore, the U. K. survey samples were not subjected to PAGE
after the completion of amino acid and pollen analyses for the following
reasons:
1. The U. K. survey was scheduled from October 1981 through to October
1982 but even with pre-paid mailing service the samples came in
very erratically and a substantial number were still coming in
264.
even as late as 1984.
2. It was not possible to attempt correlation between variables until
all the samples had been analysed and the final finite number
of variables involved for correlation had been determined. The
major variables considered were the quantitative individual concentration
measurements for thirteen amino acids, the qualitative presence
or absence of seventeen amino acids, heating of honey or otherwise,
feeding of sugar to honeybees or otherwise, addition of sugar
compounds such as syrups, floral sources as suggested by the beekeepers,
or confirmed by pollen analysis, pollen type including the dangers
of under- or over-representation as given by Sawyer (1975),
commercial processing or otherwise and other information. This
range of factors could not be handled by a simple micro-computer
such as an Apple or BBC1, therefore, a Prime mainframe computer
had to be used.
3. Furthermore, due to the large number of factors and consequent
small numbers in each sub group special modifications to the SPSS
package had to be made initially by the statistician, and subsequently
further modifications to the treatment of data to prevent under-
weighting of small sub groups involved.
4. The modifications that became necessary both initially and after
the programme had been running for some time were-such that they
could not be dealt with within the simple operating programme
that was being used. Therefore, I had to await the availability
of the statistician who was experienced in the aspects of computer
orientated statistics.
265.
N*i'nhydrin Positive Substances
Covered under this section are the -amino acids, amines including
amino sugars, amides and small polypeptides. For reasons explained
previously most of the present work was concerned with the free amino
acids. It was because of this that the following procedures given
in the sequence and order of stages were necessary so that analysis
such as detection, identification and quantitation could be carried
out. The sequence and order of the ion-exchange procedure were:
protonation of the ion-exchange resin, binding of the amino acids
to the resin, removal of carbohydrates, elution of the amino acids,
evaporation under reduced pressure, desiccation under vacuum, re-constitution
and then storage. Extracts were analysed by paper electrophoresis
plus chromatography, automatic amino acid analyser, pollen analysis
and computational analysis.
Ion-exchange Chromatography
The viscosity of honey necissitated the use of a large mesh cation
ion-exchange resin for the isolation of ninhydrin Positive substances.
The feasibility of column chromatography or continually stirred batchwise
operation of the large mesh resin was considered. The procedure of
column chromatography was assessed to be too slow in view of the two
hundred and fifty six samples. If column chromatography was used
excessive dilution in the order of ten times or more was found to be
necessary to be able to establish a reasonable flow rate. This also
meant that large volumes of eluents would be required to be concentrated
by evaporating under reduced pressure. Furthermore, the column
chromatography technique was found to be prone to leakages and especially
clogging of the tubing, nylon mesh filter and the resin column itself
266.
by large particulates such as pollen, spores, soot, dust and other
inclusions normally present in honey. This was considered to be a
time consuming process with risk of loss of components. On the other
hand the technique of batchwise extraction enabled controlled and
sufficient dilution with stirring to enable effective binding of
ninhydrin positive substances. Thus, the volume of eluents required
for evaporation were about or less than one-fifth of those obtained
for column chromatography. This is turn, also enabled accurate and
quantitative determinations to be carried out.
The ion-exchange chromatography technique devised by Siddiqi
(1981) was modified and improved to ensure optimum quantitative
determination. The final method was assessed for the precision and
reproducibility using solutions A2 and Sl. These solutions. contained
known amounts of thirteen amino acids in the appropriate media. Further,
solutions B and BI contained amino acids plus sugars - glucose and
fructose to provide a suitable standard for honey samples. The thirteen
amino acids were: lysine, aspartic acid, serine, threonine, glutamic
acid, proline, glycine, aianine, valine, isoleucine, leucine, tyrosine
and phenylalanine; and these solutions were deliberately standardised
so as to represent the concentration of amino acids found in a typical
honey. The loss of amino acids may occur at the following stages of
the isolation procedure: preparation of honey samples, transfer to
the resin, binding of the amino acids to the resin, washing to remove
carbohydrates and other components, elution of amino acids from the
resin, collection and evaporation under reduced pressure, desiccation,
re-constitution, storage of prepared extract, operational loss for
paper electrophoresis and chromatography and operational loss for the
automatic amino acid analyser.
267.
Due to the multiple stages involved and possible adverse effects
of carbohydrates, it was essential to formulate recovery experiments
which covered each stage separately as far as possible. These recovery
experiments, Tables 13 to 29 show, with a few exceptions, that the
recovery and total were satisfactory with recoveries greater than 98.8%.
These aspects mentioned above will be reviewed separately.
Quantitative determination of amino acids
Once these standards were prepared by weighing, it was essential
to verify that no gross errors had occurred and concentrations were
as expected. For this reason these were submitted to automatic amino
acid analysis which had been made ready and pre-calibrated with commercial
standards as described. This solution A was shown to be satisfactory
and gross errors due to dampness and incorrect weighing were not presentl
and recoveries of 101.3% were obtained within the guidelines of Moore
and Stein (1951). Furthermore, the autoanalyser was satisfactory for
the range and concentration of the amino acids expected in honeys.
The standards in the various media and stages were likewise individually
examined and were controls for each stage.
Due to the varying nature of the work load related to the numbers
of samples received per week a rigid recovery schedule could not be
operated. However, periodic checks were carried out on all aspects
of the final procedure.
The final extract was found to be free of protein and therefore,
these extracts were not furthered to a deproteinisation step. This
step was not only unnecessary but had the danger of carrying down traces
of amino acids, other ninhydrin positive substances and other components
present in such extracts, with the precipitate.
268.
Preparation, application and'elution from 'the resin and concentration
stages
The individual recoveries for each stages were negligible and
the net recoveries from stage one through to stage four were within
the acceptable range. The problem of the variable recoveries of basic
amino acids especially lysine was (±11%) also as noted by Moore and
Stein (1951) was also found in the present study.
As a formal statement of the individual recoveries found for solutions
A2, B and Bl were 98.4%, 98.9% and 98.7%, respectively, relevant data
for quintiplate analysis are given in Table 97, and these contrasted
with the figure of 94.6% found by Siddiqi (1981).
For reasons discussed elsewhere the amino acids arginine, cysteine,
histidine and methionine were not included in the present study.
Choice of Desiccants (Stage 5)
Normally little thought is given to the choice of dehydrating
agents used to remove the final traces of moisture. However, certain
adverse experiences in the present study have indicated that in this
context the choice of desiccant is of more than normal importance.
Although Siddiqi (1981) reported that the use of concentrated
sulphuric acid as a desiccant was suitable for honey amino acid
concentrate, several other compounds such as phosphorous pentoxide,
sodium hydroxide and potassium hydroxide were examined for suitability.
This evaluation was undertaken because preliminary experiments had
shown that the honey amino acid concentrate became discoloured into
a blackmass in the presence of concentrated sulphuric acid and under
conditions which precluded accidental spillage. In a few samples of
foreign origin predominantly Mexican it was noticed that these were
269.
TABLE 97
Average recovery of thirteen synthetic amino acids after quintiplate
analysis of amino acid solution
Amino acid Addition 2 Percentage No. solutions (10 mls) or of Sl* IxC AAAA recovery#
honey sample (10g) (MIS) M
1 Solution A + 101.3
2 Solution Al + 98.8
3 Solution A2 + + 98.4
4 Solution B + + 98.9
5 Solution Bl o. 6 + + 98.7
6 U. K. survey sample Code No. 174 o. 6 + + 99.0
7 China Light Amber Code No. 211 o. 6 + + 99.5
8 Mexico Yucatan Code No. 227 0.6 + + 98.4
For notes to key *, **, 1 and 2 refer to Table 6.
The average percentage values quoted are those of the average
recovery percentage values obtained after quintiplate analysis
of the 13 amino acids, of amino acid solutions given in Table 6.
The concentration measurements and percentage recovery for these
amino acid solutions are given in Tables 13 to 29.
270.
stored in vacuo in the presence of phosphorous pentoxide the whole
concentrate became purplish-red far removed from their original colour.
This may be due to volatile matter being present interacting with and
being dehydrated by phosphorous pentoxide. For these reasons neither
concentrated sulphuric acid nor phosphorous pentoxide should be used
as desiccant under vacuum condition for honey amino acid concentrates.
This unexpected dehydration and other complex series of reactions
could involve the sugars of honey or the catalytic action of polyphosphoric
acids produced on the surface of the excess phosphorous pentoxide
(Partington, 1961). Due to the risk of pollution by dust and other
adverse environmental factors present in the laboratory atmosphere
many precautions were taken to prevent such contamination from taking
place; for example, no honey sample was left uncovered and no vessels
were left unstoppered when not in use. Additional precautions were:
covering the reaction vessels with parafilm, evaporation under reduced
pressure and the use of a thoroughly cleaned desiccator with trap to
prevent dust entering when re-pressuring. It was observed that when
concentrated sulphuric acid was used for preventing access of ammonia
to the closed vessels used for storing paper chromatograms, this
dehydrating agent became discoloured after a period of about seven
days. This could be one aspect of the phenomenon mentioned above.
However, it was found that no such problems were encountered with either
sodium hydroxide or potassium hydroxide used in the pellet form. As
a matter of choice sodium hydroxide was used in the present study.
At the end of the desiccation stage it was essential to have the dry
residue concentrated in one area of the vessel and not spread over
all available surfaces.
271.
Re-constitution (Stage 6)
A bacterial resistant media - propan-2-ol/HC1 mixture was used
and steps were taken to ensure that the dry residue was uniformly wetted
and transferred. Also, that there was no loss of small volumes used
elsewhere on the glass surface. It was essential to ensure all glassware
used in the extraction and transfer were completely grease free.
Storage (Stage 7)
The use of bacterio-stat media at temperature of 00 to 40C was
sufficient to prevent bacterial or mould growth. Frequent visual checks
were made and no deterioration of the extract was noted.
Paper Electrophoresis and Chromatography (Stage 8)
The combination of paper electrophoresis and chromatography
technique enabled greater sensitivity in the detection of low
concentration ninhydrin positive substances and greater selectivity
amongst the major amino acids. However, the effects of the residual
levels of ammonia in the final extracts were evident in the slight
discolouration of the background of the amino acid maps and the need
to wait overnight for some of the low concentration spots to appear.
Sometimes the effects of ammonia were compounded further by presence
of ammonia generally found in analytical laboratories. Even with great
care some amino acid maps were adversely affected and the relevant
extracts were re-examined. Usually the mild effects often resulted
in the backgrounds of the amino acid maps becoming pink after staining,
especially when the laboratory temperature conditions were high, between
220C and 28 0 C. The faint spots which resulted due to low concentrations
of ninhydrin complexes were sometimes difficult to distinguish from
the usual pink background. 'The paper electrophoresis and chromatography
272.
experiments were repeated at low laboratory temperature conditions
between 150C and 20 0 C, for comparison. Also, the recognition of closely
occurring or overlapping ninhydrin complexes presented problems at
first but were overcome with experience. This was the case for
isoleucine-leucine, methionine-valine, threonine-glutamic acid and
sometimes arginine-lysine. The cluster of ninhydrin complexes serine,
aspartic acid and asparagine were not always separated but usually
their boundaries could be outlined. If hydroxyproline was present,
then if this ninhydrin complex was not recognised by its characteristic
yellow coloured complex similar to that of proline in the first hour
or so after staining, then its presence would usually go undetected.
Therefore, the amino acid maps were checked at intervals of approximately
fifteen minutes for the first three hours after staining with the ninhydrin
reagent. Further, the RF values for the ninhydrin complex spots were
not calculated as there was variation in the movements of the spots
relative to the solvent front. It was observed that in high laboratory
temperature conditions, the solvent front had migrated very near to
the top of the paper whilst under cold temperature conditions the solvent
front travelled only two thirds of this distance. These conditions
resulted in improved and impaired resolutions, respectively. Also
cold temperatures impaired staining and it took up to two hours for
some of the coloured complexes to appear. Some such as glucosamine,
glutamine, 0-alanine, a- and y-aminobutyric acid and the two unidentified
spots 'PI and 'xI usually took one to three days depending on their
concentrations to become sufficiently visible to be outlined. Others
such as pipecolic acid and hydroxypipecolic acid if present in low
concentrations usually took a day before the spots became visible.
Whereas in the case of Australia banksia sample No. 194, hydroxypipecolic
acid was present in large amounts and became visible only two hours
273.
after staining. This spot overlapped with the surrounding spots of
pioline, threonine and glutamic acid as shown in Figure 20. The entire
technique of paper electrophoresis and chromatography, staining and
the identification of ninhydrin spots required about one week per sample,
although more than one sample per week could be examined.
It became evident from amino acid maps that asparagine, glutamine
and tryptophan were also present in the final extract. It is likely
that o-esters of serine and threonine, and other compounds such as
amines, amino sugars and peptides may be present. Attempts were made
to determine the identity of the unknown ninhydrin complex spots Ip',
IxIq CO C", ICI, I . ff 19, IwI, IV, 'G'j, 'a' and In' detected
on some of the amino acid maps. By comparing the relative positions
of the ninhydrin positive substances on the amino acid maps obtained
in this study and with those of Siddiqi (1981)9 it was thought that
the identity of the unidentified ninhydrin positive substance labelled
as IwI could be kynurine. When co-developed with standard kynurine
the identity for the spot IwI and also for other unidentified spots
could not be confirmed. Similarly,. small amounts of other reference
compounds were procured for similar studies and these compounds included
kynurine, citrulline, ornithine and 0-aminobutyric acid. The relative
position of these reference compounds did not correlate to those of
the unknown and their low levels precluded extraction from the paper
chromatograms and subsequent total hydrolysis to confirm or otherwise
their peptide nature. Moreover, the identification was further compounded
by the fact that these unknown ninhydrin positive substances were always
present in low concentrations estimated visually to be about 0.5 nMoles.
Hence, the spot was observed to develop slowly after staining and the
spots were very faint compared to the other identified compounds. At
this low concentration level the trace curve peaks of those unidentified
274.
ninhydrin substances would mearge into the baseline obtained on the
autoanalyser chart recording and therefore none were detected.
Attempts to isolate some of these unidentified ninhydrin complexes
from amino acid maps to which fifteen to twenty times the normal honey
amino acid concentrates had been applied, were not successful. This
was because the overloading not only resulted in overlapping of closely
occurring spots but also streaking of all the spots due to overlapping
and diffusion. Hence, the outlining of the spot in question was often
difficult to judge. However, some of these ninhydrin complex spots
were cut-out of the overloaded amino acid maps and eluted with acetone.
The invisible residue obtained after evaporating off the acetone, was
subjected to the technique of mass spectroscopy as described by
Siddiqi (1981). The result indicated that no compounds were present
in these residues. The most likely explanation as to the identity of
these compounds could be that they are peptides. Moreover, the*presence
of peptide like compounds were detected by performing the technique of
paper electrophoresis and chromatography in the presence of pyridine.
Those compounds that were separated on the paper chromatograms after
complexing with ninhydrin reagent were yellow in colour and fluorescent
when examined under ultraviolet light. The pattern of these separated
spots could not be reproduced in a like manner to that of the amino
acids.
Automatic Amino Acid Analyser (Stage 9)
From the present work and recent past reviews (Siddiqi, 1981 and
Carter, 1983) on the world literature on the free amino acids present
in honey, it has been reported that upto thirty two different ninhydrin
positive substances have been identified to be present in honey.
275.
However, some of these ninhydrin positive substances are very infrequent
in occurrence perhaps in only one sample, for example, the unidentified
ninhydrin positive substance labelled as'Ofound in Indian CuJarat 2
sample. No. 225, and always in low concentration. Some of the remainder
could only be detected semi-quantitatively by paper electrophoresis and
chromatography technique and not all on a quantitative basis by the
auto-analyser system employed. The remaining number of amino-acids in
honey approximated to the seventeen used routinely as standards to
calibrate the technicon auto-analyser at the 25 nanomole level, corresponding
to a chart peak height from 7 cm to 15 cm depending on the amino acid.
When some of the honeys had been examined in a preliminary manner, it
became obvious that four amino acids arginine, cysteine, histidine and
methionine were not present in every sample and often if present gave
tiny peaks Just 0.5 cm above the baseline on the chart. At this level,
about 2 nanomoles of amino acid, the measurements of the peak height and
half peak width was grossly in error. This left some thirteen amino
acids of reasonable concentration and chart peak size; although that
for lysine was always small and not always present in every sample.
Due consideration was taken into account of the amount of final
concentrate used in the auto-analyser for concentration measurements.
Owing to the nature of the construction of the auto-analyser there
are two columns and two resin filled cartridges for dispensing the
amino acid solutions into the two columns. One cartridge is for the
basic, amino acids such as lysine, histidine and arginine and also a
very large ammonia peak. The other cartridge is for the longer column
on which the acid and neutral amino acids are separated and eluted in
the order of elution. These amino acids are: aspartic acid, glutamic
acid, serine, threonine, proline, glycine, alanine, cysteine, methionines
276.
leucine, isoleucine, tyrosine and phenylanine. The total amount of
liquid added to each cartridge cannot exceed an upper limit of 60. pl,
that is, a factor of three times that which was used for every sample
loaded. Since sample loading of 40.1il gave decreased resolution and
gross distortion due to high ammonia and major amino acids being off
the chart scale. Hence, the particular upper limit with consideration
for other amino acids was considered to be up to 30 ul per cartridge.
Also, it was normal procedure to mix the amino acid solution with an
internal standard norleucine of constant amount to compensate for
variations due to instrumentation. Therefore, in the present study, it
was found that by mixing 25 V1 of the final concentrate with 25 ill of
internal standard norleucine and then applying 20 ul of this mixture
to each of the cartridges resulted in acceptable chart recordings.
In general the requirements of an internal standard are that it
has a constant value and not normally present in the analysis. This is
because it can be used to correct variations; for example, of pump
diameter, of the extent of reaction of ninhydrin and other minor
instrumental irregularities which could not be either predicted or
closely controlled. In the above study norleucine is used and the
response in terms of area under the eluted peak is calculated to the
norleucine equivalent for all the chart sets. This has the advantage
that it does appear at approximately the mid position and is therefore
assumed to provide an average type of correction for the common amino
acid pattern. However, in the case of honey where the aminoacid
pattern is not that of a typical protein hydrolysate the use of known
artificial honeys of defined amino acid composition is essential. The
possible use of other pairs of internal standards such as arginine for
the short column and cysteic acid and tryptophan for the other column.
These would appear at the extremes of the elution pattern which is
277.
desirable but not possible. This additional control with paired
internal standards was not possible in the present study.
Considerations were. given to the use of electrical amplification
to boost the height of small peaks on the baseline. This, however,
resulted in the amplification of not only the peaks in question but
also the baseline. This generalised baseline or noise could not be
significantly reduced due to its operation in a general laboratory and
also to instrument age.
The average percentage recovery value obtained for the thirteen
amino acids of solution A applied to the auto-analyser before ion-
exchange chromatography can be explained as due to two factors. One
that the moisture content and the homogeneity of the amino acid solids
used in the preparations of solutions A, B and_Sl could not be ensured.
This is in contrast to the specially purified dose samples supplied in
sealed vials by the commercial firm. For reasons already explained,
the standards containing 25 nanomoles of some seventeen amino acids
would not be suitable to prepare artificial honey solutions of similar
composition to the real sample. The other reason, could be due to
bvman factor in the normal operational procedure practised by the
technician in the use of the auto-analyser which was not in continual
use, especially as there were never sufficient departmental samples
to ensure maximum efficiency and the down time was considerable.
The auto-analyser column on which the basic amino acids lysine,
histidine and arginine are separated also eluted'a very large peak
for ammonia in spite of the precautions taken to eliminate its presence
in the final extract. The conversion from a 7M. ammonia solution to a
residual of 10 pmoles in the final extract proved to be impossible to
achieve and therefore the residual ammonia always present adversely
278.
affected not only the accuracy of estimation of lysine but also the
detection of histidine and arginine. Fortunately, however, the amino
acids arginine and histidine were found to be present only in low
concentrations and not in every honey sample by the technique of paper
electrophoresis and chromatography.. It was estimated that arginine was
present at about a concentration of approximately 2 nanomoles or less.
For this reason the peak for arginine was hardly ever seen on the chart
recordings. Histidine and to some extent methyl-histidine were
identified by Siddiqi (1981) and in the present work by the technique
of paper electrophoresis and chromatography. This histidine level was
always low and was detected by this technique in perhaps one quarter
of the samples and methyl-histidine was comparable. Histidine rarely
could be identified in the auto-analyser charts and the situation for
arginine has already been mentioned. Furthermore the peak for lysine
was far removed from the ammonia peak as compared against the histidine
and arginine peaks occurring closely on either side of the ammonia
peak. Lysine was found to be present in many of the honey samples and
could also be measured quantitatively. The error of estimation for
lysine was found to be ±11.0%.
Another reason for the relatively low concentration levels of
these basic amino acids in the final extracts could be attributed to
their R-groups. As it can be seen from the pI R values given in
Table 98 the degree and extent with which the R-group of each basic
amino acid is likely to effects its binding and elution from the resin.
Hence, arginine with a pI R value of 10.77 will be followed by lysine
of PI R value 9.31 and finally histidine of pI R value 7.59. These basic
amino acids would tend to adhere to the ion-exchange resin and it was for
this reason the ammonia solution concentration was raised over that
used by Siddiqi (1981).
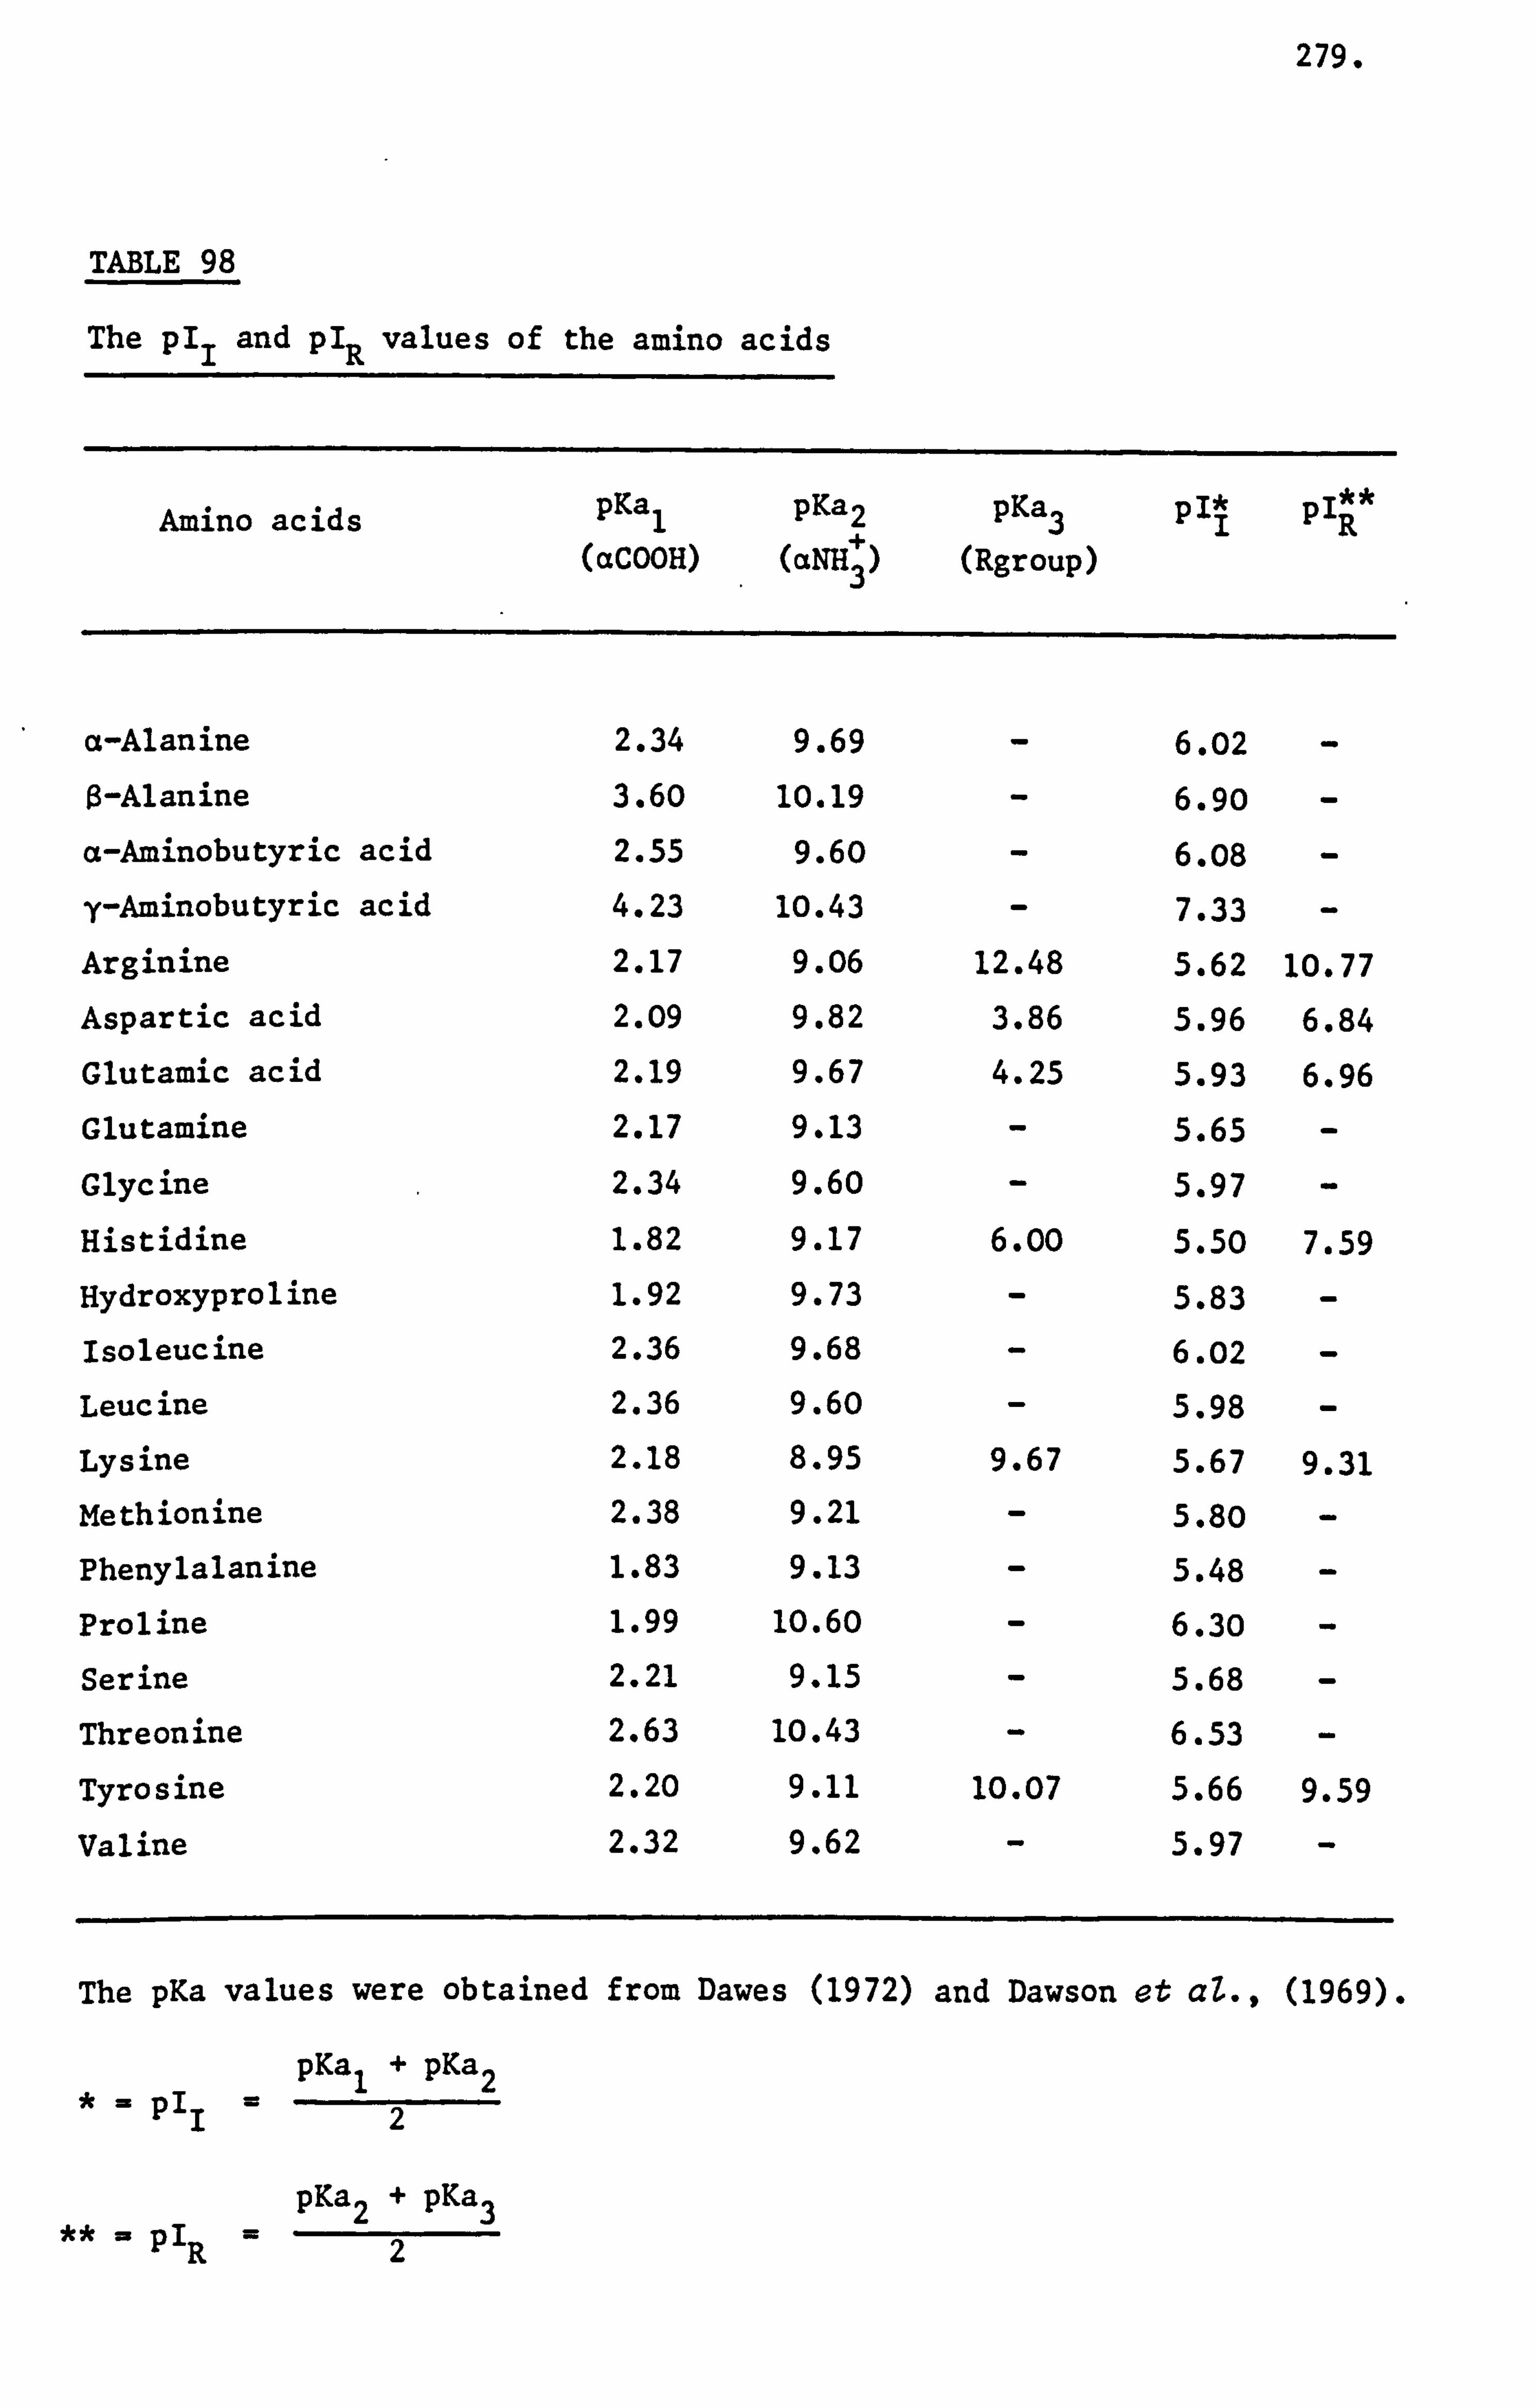
279.
TABLE 98
The pI I and pI R values of the amino acids
Amino acids pKa 1 pKa2 pKa 3 PI* PI** (aCOOH) (aNH + (Rgroup) 3
a-Alanine 2.34 9.69 6.02 O-Alanine 3.60 10.19 6.90
a-Aminobutyric acid 2.55 9.60 6.08
y-Aminobutyric acid 4.23 10.43 - 7.33 Arginine 2.17 9.06 12.48 5.62 10.77 Aspartic acid 2.09 9.82 3.86 5.96 6.84 Glutamic acid 2.19 9.67 4.25 5.93 6.96
Glutamine 2.17 9.13 - 5.65 - Glycine 2.34 9.60 - 5.97 - Histidine 1.82 9.17 6.00 5.50 7.59
Hydroxyproline 1.92 9.73 - 5.83 - Isoleucine 2.36 9.68 6.02 - Leucine 2.36 9.60 - 5.98 - Lysine 2.18 8.95 9.67 5.67 9.31 Methionine 2.38 9.21 - 5.80 - Phenylalanine 1.83 9.13 - 5.48 - Proline 1.99 10.60 - 6.30 - Serine 2.21 9.15 - 5.68 - Threonine 2.63 10.43 - 6.53 - Tyrosine 2.20 9.11 10.07 5.66 9.59
Valine 2.32 9.62 - 5.97 -
The pKa values were obtained from Dawes (1972) and Dawson et aZ., (1969).
PI pKa 1+ pKa 2
2
PI pKa 2+ pKa 3
R2
280.
On the chart recordings of the auto-analyser it was generally
observed that low concentration-amino acids were indicative of small
broad curve peaks, whereas the reverse was true for amino acids present
in high concentrations. Some slight overlapping of elution peaks was
observed in samples for closely eluting amino acids'on the chart
recordings. These were: serine and threonine, glycine and alanine,
and isoleucine and leucine. The average total recovery of these amino
acid pairs were found to be consistent. The imino acid proline was
present in very high concentrations in-nearly all the samples examined.
The eluted chart peak for cysteine was observed only in China buckwheat
sample No. 209 but its presence in low concentrations was evident in
many samples by the technique of paper electrophoresis and chromatography.
The quantitative determination of amino acid methionine could not be
effected since the measured peak height was observed to be below 0.5 cm
from the baseline in most of the samples.
Pollens
The microscopical examination of pollens present in honey termed
Imellissopalynology' by Louveaux, Maurizo and Vorwohl (1970) was
evaluated using the technique described by Sawyer (1981) and Louveaux,
Maurizo and Vorwohl (1970). For reasons quoted by these authors the
majority of the isolated pollens were distorted due to the process of
diffusion and/or osmosis. It was partly due to this reason that the
classical pollen analysis could not be applied. Also, attempts at some
of the more difficult pollen analyses were not carried out since these
methods required prior knowledge of botany which was not within my
expertise. Further, the application of specialised methods such as
acetolysis for pollen in peat are designed to remove that type of
281.
contamination from pollen samples so obtained. Furthermore, acetolysis
procedure results in the destruction of algae cells which characterise
honeydew honeys, and therefore this technique is limited in this
respect (Moar, 1985). If these. methods were applied to the already
fragile pollen grains then these. grains would sustain further damage
thus reducing the possibility of identification. Furthermore, in view
of the large number of samples that had to be examined to verify or
otherwise the casual observations by beekeepers as to source. It was
essential to use a simple reliable method such as that recommended by
Louveaux, Maurizo and Vorwohl (1970) and hence this was done. A
similar but simplified method was advertised and advocated at a
sumner school at Cardiff 1981 for the purpose of pollen identification.
The method outlined in the present work utilised basic fushin
stain to enhance recognition and then eventual identification. The
contents of isolated pollen ranged from that of almost no pollen to
that which required two or three microscope slides to contain the
pollen. The degree with which pollens from different genera were
stained became apparent very early. For example, pollen as those of
EucaZyptus, Loranthus, Pinus and generally of Myrtaceae family were
difficult to stain. Pollen grains of TrifoZium, Vicia and MeZiZotus
stained lightly whereas those of Brassica, EpiZobiwn, CaUuna,
castanea., Tilia, Prunus/pyrus and some of the unidentified pollen of
some foreign honeys stained with relative ease.
The identity of different species of pollen in a particular genus
could not always be distinguished since perfect pollen from flowers
concerned were unavailable. It was noticed that pollens of Aescuzus,
Castanea and Lotus were particularly troublesome as these have similar
features. This was also evident for pollens of Echiwn genera in the
282.
foreign samples. Therefore, in order to prevent confusion the identified
pollens were quoted by their genus, as given in Table 7 and Appendix
VIII.
The classification of identified pollen grains counted in each
sample was according to that suggested by Louveaux, Maurizo and
Vorwohl (1970). The counting of 1,200 grains per sample as recommended
by U. K. and EEC regulations where triplicate counting is required was
not carried out. This was because of the small amount of samples sent,
there was sometimes only sufficient material for one amino acid
extraction and one pollen estimation and also because of the time factor.
Further, it was considered normal practice to re-evaluate pollen grains
on a microscope slide if doubt regarding pollen content was experienced.
Such doubts were either low pollen count for visually estimated high
pollen content slide or an adverse computer report. However, since
only limited counting was carried out the average percentage values
obtained for the frequency classes were not adjusted for any digit
after the decimal point. The accuracy of the expressed frequency class
percent is likely to be in error with a range of not more than 2% to
4%. -
This situation was the same but somewhat complicated for foreign
honeys as they were sent and known only by their commercial description
or port of departure. Most of the commercial samples had been collected
from wild and/or semi-wild colonies by unskilled labourers so that the
true knowledge of the major floral species could not be obtained. The
only retrospective guideline was that given by Crane, Walker and Day (1984).
The major species were indexed but this work did not appear till all the
practical work and most of the thesis had been completed.
283.
This comment could be remedied if every country had an efficient
bibliography and documentation of floral souces. Although the
International Bee Research Association is moving towards such an ideal
this is a long way from realisation and it is another reason for having
a data bank of floral sources and full composition available at sometime
in the future.
Procurement of'Experimental Hive on University Campus
At the onset of the present investiation period it was thought
desirable for reasons listed below that there should be an acqiiisition
of an experimental hive sited on the University campus. Such a hive
would have enabled the study of:
1. The effects of environmental and seasonal changes on the
composition and production of honey over a period starting
from 1981 - 1984.
2. Whether the secretions of honeybee have a significant effect
on the overall ninhydrin positive substance composition of
honey.
3. Whether the ninhydrin positive substances of pollen injested
contribute to the final ninhydrin positive substance composition
of. honey extracted.
4. To what degree and extent does the feeding of pollen supplement
contribute to the final ninhydrin positive substance and also
pollen composition of extracted honey.
5. Feeding a sugar product containing known amounts of amino acids
and determining the ninhydrin positive substance composition
of honey thus produced.
284.
To establish the variation, if any, of the floral sources
v1sited by honeybee from nectar deposited in cells and of
combs during and at the end of the season, similar to that
reported by Adams, Smith and Townsend (1979).
7. Whether the pollen obtained from pollen traps contribute
amino acids to an amino acid free carbohydrate solution
(33% glucose plus 33% fructose) and/or a honey of known
amino acid composition over a period of one to two years.
This latter item can be devisable because of the previous
work of Carter (1983).
However, this was not done because suitable sites for a hive on
campus were investigated over a period of years, but proved very
difficult as the urbanised neighbourhood raised questions-about
liability if passersby or students were stung. The very few possible
sites were also rendered impractical either by lack of bee access or
forage or open to vandalism. The Head of Department, and the University
could be separately and collectively liabl e in any legal action and
the authority were naturally prudent against any future adverse
circumstances.
Computation and Statistical Analysis
Compilation of all the data gathered for each honey sample in an
orderly fashion into an SPSS data file required maticulous care and
attention. Execution of the statistical analysis and interpretation
of the results obtained demanded prior extensive specialised knowledge
in statistical methods in relation to computer programming. This was
overcome with the help of a statistician, Dr. Pemberton of the
University Mathematics Department. It was upon his recommendations
285.
that the following modifications and improvements were carried out and
adhered to throughout the present analyses. These were:
1. the removal of groups containing less than ten sample numbers;
2. the transformation of the individual amino acid concentration
measurements into their square roots and natural logrithms, and
3. the random selection of samples for estimation of misclassiciation
rate.
The accuracy of the predicted classification results obtained from
the SPSS increased as the number of samples per group increased, that
is, from ten onwards. Modifcation of the amino acid data, that is,
square root transformation of the concentration terms rather than
natural logrithm transformation enabled the minimisation of the effects
of sample variation and to stabilise variation in the amino acid data,
itself.
From a biological view point there should be variation in -the
amino acid data due to the following factors even if in the unlikely
event of a continuous supply of one floral source was available.
These factors are: a single cell of a comb, all the cells of a comb,
all the combs from a super, all the combs from a hive and the
combination of several hives. The real life situation is more
complicated due to the free ranging nature of the foraging bee and
the instinctive use of floral source at her whim. The pattern of
visitations to a particular floral source is maintained over a period
of several hours. One should also consider the effects of manipulation
of honey during extraction and processing followed by storage leading
up to the time of analysis and the effects of the analysis on the amino
acid composition. It was because of this reason that statistical
calculations such as "student-t" or the "Hotterlings-T" were not
performed.
286.
Floral Source
Pollen
The initial attempt at discriminating between nine pollen groups
using the SPSS indicated the need for amino acid data modification such
as that given in Appendix IV(b). The outcome of such an analysis, refer
to Table 63, suggested the need for statistical expertise and upon the
suggestions of Dr. Pemberton the modifictions and improvements given
above were utilized. The effects of such modifications and improvements
resulted in the maximisation of the minimum Mahalanobis distance between
groups, refer to Tables 64 and 65 and Figure 28.
However, due to the non-uniformity in thenumber of samples in
the five pollen groups, refer to Table 64, to some extent influenced
the success rate of the classiciation of the honeys. Most of the
misclassified samples agreed as to the pollen content for which they
were predicted to contain by the SPSS. This indicated that the SPSS
predictions are accurate to some extent in evaluating the floral
source of a honey sample. The accuracy with which these predictions
can be relied upon is determined by two. factors:
1. the re-definition of the unifloral pollen subclass group to
contain pollen 90% and over, and
2. the inclusion of fifty or more unifloral samples per pollen
group.
The reason for the remaining misclassified samples did not contain the
pollen they were predicted to comprise of by the SPSS could be due to
the similarity in the amino acid concentration measurements of the
misclassified samples with those of the predicted pollen group. This
similarity in the amino acid concentration measurements could be the
product of:
287.
1. honey gathered from several hives each of different unifloral
and/or multifloral sources, and
2. honeybees from a single hive foraging pollen from one plant
and nectar from another plant species. *
It was noted in the present study that the replies received to
questionnaire question 4 differed significantly in nearly all the
samples from the microscopical observations by the technique of pollen
analysis. This difference suggests that many of the honest observations
of the beekeeper of an individual honeybee flights to specific flowers
could be misleading as to source when whole frames or hives representing
many thousands of flights are examined. The replies to questionnaire
question 4 have been given in Tables 31,34,37,40,43,46,49 and 52
but the name and addresses of participant beekeepers have not been
disclosed so as to retain confidentiality. In addition, two added
complications should be considered:.
that of merging of early spring and autumn harvests if only one
collection per year is practised as was the case with some of
the participant beekeepers, and
2. that of fascination of some crops such as Brassica or TiZia or
CaUuna for the honeybees could result in misleading observations
even if a good crop of TrifoZium may occur near the hive.
The use of discriminant analysis available on the SPSS package
was successful to some extent in differentiating between the three
pollens, that is Brassica, Trifotium repens and Castanea which were
found to be common to following countries. These were: Canada, China*
France and the United Kingdom. The significance of the results obtained
in Table 96 can be given to question because there were only two samples
288.
available for analysis in each of the first three countries. On the
basis of this result, the findings do not agree with those of
Kanematsu et aZ., (1982) who used amino acid ratios to distinguish
between honey samples from different countries but contained the same
pollen species. Further, the amino acid ratios utilized by Siddiqi
(1981) with some success in her analysis were also applied with other
combination ratios in the interim report 1981-82 sent to the beekeepers
during this study period. However, in view of the large number of honey
samples and the instability of the variance-covariance matrix of the
amino acid ratios during computation precluded their use for SPSS
predictions.
Nectar or honeydew
A literature survey showed that the amino acid composition of
honeydew as compared to that of nectar was generally reported to be higher
both in terms of number and concentration of amino acids. Therefore, it is
obvious from this that the honey amino acids could indicate its possible
honeydew or nectar origins provided that a wide range of samples,..
seasonal and yearly variations of many specimens of honey provenance
and furthermore, that the increase in honeydew honeys consistently
exceed these other seasonal variations of the nectar honeys. Such an
ideal state is not yet possible. However, statistical analysis of honey
from the two limited groups resulted in the successful discrimination,
refer to Table 89. However, due to the available samples in both these
groups numbered ten the SPSS classification can be utilized as indicative
of the usefulness of the chemical technique in distinguishing between
honeydew and nectar honeys.
289.
Geographical Source
When discriminating honeys from different countries it would have
been ideal if authentic verified reference samples were-first statistically
analysed. This would then be followed by statistical verification of
unknown or suspect samples with the reference honeys. However, due to
the relatively limited number of foreign honey samples available for
analysis of which reliable information as to source were available only
for one or two samples. These were used for reference samples in default
of verified official samples mentioned above which were not available.
Moreover, the authenticity of these reference samples could not be
verified with certainty as to the country they were alleged to have
originated. Nonetheless, with the available samples the predictive
classification results obtained by the SPSS as shown in Tables 83 to
88,92,95 and 96 indicate that the honeys were classified on the
basis of the floral origin of the samples rather than geographical
source.
The statistical results obtained from the SPSS progranne in the
present work suggests that there is a need for investigation of all the
factors mentioned above and elsewhere in this thesis. Thereaftert the
predicted classification from such an SPSS programme could be effectively
used by a Public Analyst to determine the origins of a honey sample.
Moreover, as suggested before, a data bank containing many unifloral
honeys for the SPSS programme howsoever modified so as to provide a
genuine useful searching and indexing system giving highly accurate
predictions and fulfilling its undoubted potential.
The boundary between aspects of assessment and evaluation were
somewhat arbitary. In general the self criticism and likely errors
are dealt with in this assessment, section. Whereas the evaluation of
290.
the present results are reserved for the following section, 'Evaluation
of Present Work. Where necessary the relevant literature was quoted.
EVALUATION OFTRESENT WORK
Proteins
At the time of honey protein investigation, literature survey
showed that the proteins had not been used for characterising honeys.
However, the correlation of honey protein types with geographical source
which is of course one of the present aims but was not possible because
of the present conditions. The American authors Reederg Richie and Guenther
(1986) accomplished this objective only by using highly sophisticated
and expensive technology which included techniques such as ultra-thin
layer isoelectric focusing, laser scanner and chemometrics programme
on mainframe computer. Also, this technology was applied to a
geographically favoured and contained region. However, this form of
technology was not possible at Salford and a less expensive but more
restrictive survey was carried out on raw honey and protein concentrates
prepared by ultrafiltration. This was followed by examination using
SDS-PAGE on cylindrical gels.
The concentration of proteins in the honey concentrate obtained
after ultrafiltration and then freeze-drying was determined by the
Lowry et aL., (1951) method. The average value of 172 mg of protein
per loog of honey was obtained from nine samples of honey examined.
This average value compares suitably with that of 169 mg per 190g of
honey reported by White and Rudyj (1978). Dialysis and ultrafiltration
being the two most common methods employed to date for honey protein
concentration were compared by White (1978), to determine the loss
of nitrogen components during the period of operation of these two
291.
procedures. He reported that the ultrafiltration technique employed
by Bergner and Diemar (1975a) using filter membranes to retain molecules
of 10,000 daltons and above, encountered loss of nitrogen components
of between 33% - 45%. White (1978) calculated that 55% of the soluble
filterable nitrogen components were lost by the ultrafiltration procedure
used by Paine et aL., (1934). However, the dialysis technique used by
White and Kushnir (1967b) was estimated to have losses between 40% - 60%
as a percentage of total soluble nitrogen components. In the present
study the loss of filterable nitrogen components during ultrafiltration
were indicated to be comparable with those encountered by Bergner
and Diemar (1975a). Therefore, the use of a filter membrane with
calibrated pore size can be employed to determine the molecular size
of proteins present in honey.
It was not known at the time of the present honey protein analysis
that Bagdanov (1981) had used the Bradford/Bio-rad protein-dye binding
technique to determine protein concentration in honey. It would have
been of value to have assessed the suitability of two such diverse
methods of protein determination using the nine samples available at the
time of the investigation. This comparison was not evaluated later on
during the research period because of the aim to utilise chemical analysis
to determine source and it was found that after three months work that
the proteins were not uniquely defined. This has been discussed in the
previous section. Therefore, the emphasis changed to an examination
of the free amino acids. However, the average value of 129 mg of proteins
per 100g of honey reported by Bagdanov (1981) is rather low. compared to
that reported by White and Rudyi (1978) and to that found in the present
study.
292.
Protein Band Patterns
The protein band pattern obtained on the SDS-PAGE gels to which
raw honey had been applied was consistent in the fifteen commercial samples
examined. The band pattern consistency observed on the heat treated
sample No. 261 (English Chorley honey) and also for the remaining
fourteen samples indicated the likelihood of denaturation and/or
coagulation of the proteins present in these samples. The lack of
providence on the prior treatment of these fourteen samples before receiving
them indicated that heating or pasteurisation at an industrial level
presents a barrier not only to source of geographical identification
but also to, the determination of enzymes present in honey. Moreover,
the unusual protein band pattern observed on the 10% SDS-PAGE gels of
the national honey show sample No. 252, Figure 4, as compared to those
observed in Figure 3 could be due to two reasons:
1. that this sample No. 252 had been subjected to uncharacteristic
heating for the purpose of clarification with prcbable addition of
flavours so that such honey, of transleucent quality and delicate
flavour, can be presented for competition at events such as National
honey shows. This possibility could/could not be verified
because if the outcome was true then this would implicate the owner
in malpractice for financial and reputable advantages, or
2. more likely that honeybees were fed on a pollen substitute such
as soya bean protein. This possibility was sought, in this case
the unusual bands weremot-due to soya. protein.
These results of honey proteins on PAGE gels were presented as a
poster session at the'Fifth Meeting of the International Electrophoretic
I Society, in London (1986).
293.
Other unusual proteins that have been noticed are the proteins
associated with thixotropy in heather honey -and these have been
evaluated briefly by Pryce-Jones (1944) and more recently at Salford'.
Current work (Hamilton, 1987) shows that proteins which migrate as one
peak on sephadex with a molecular weight of about 50,000 was infact
resolved by gradient pore electrophoresis into two closely associated
proteins of similar weight. Also other unusual proteins can occur
being dependent on the exposure of the bee or honey to unusual conditions.
Enzymes
Generally, the proteins of normal honey constitute less than 1%
of the total composition of honey (White et aZ. . 1962). Thixotropic
honeys predominantly heather and manuka have additional protein (1.5%)
(Pryce-iones, 1944) and these specific proteins have infact been
characterised as mentioned above. It is because of this low level of
proteins and consequently even lower levels of active proteins namely
enzymes that their detection in honeydemandan elaborate, maticulous
and lengthy procedures. These procedures are necessary to ensure adequate
quantities of active enzymes since honey enzymes have been shown to
display unique and unusual characteristic properties compared to
similar enzymes from other sources catalysing the same substrate. The
honey enzymes under investigation, described in general in Table 4
were: diastase, glucose oxidase and invertase. (White, 1952; White
and Maherv 1953; Schepartz and Suber, 1964 and 1966; White, 1966;
Rinaudo et aZ., 1973(a) and (b) and Takenaka and Echigo, 1975).
Furtherv the presence of these active enzymes in honey would be expected
to be minimal due to the commercial processing of honey. Hence, in that
connection the presence of hydroxymethy1furfural would be a crude
294.
indicator of heating. Therefore, a special honey was obtained by the
courtsey of Dr. Croft whose sample - English Chorley. honey Code No. 261
had not been heated so as to minimise loss of enzyme activity. Suitable
comparisons could not be made with commercial honey enzymes because
these were not available. Hence, comparison had to be made using standard
laboratory enzymes of different characteristic properties. As expected
enzyme activity was observed, except for glucose oxidase, on PAGE gels
to, which standard laboratory enzymes were applied. Such activity was
not observed on gels to which only honey was applied. The reasons for
this have been discussed in the previous section.
The main aim of the present work was to develop a chemical method
which would adequately characterise even a pollen-free honey as to
source. For this reason, the major components of honey such as
carbohydrates were not investigated. However, constituents of honey
present in small amounts or trace amounts were considered worthy of
investigation. Proteins were initially selected for this purpose and
the results indicated that the native proteins were too susceptible to
heating and other pre-treatments to be of value in the present context,
Therefore, interest centred on amino acids for both floral and
geographical determinations.
Ninhydrin Positive Substances
The range of compounds within this overall title with the exception
of amino acids could not be examined quantitatively and were present
in very low and erratic amounts.
295.
Ion-exchange Chromatography
The viscous nature of honey demanded the need for a large mesh
size resin which after removal of fine resin particles followed by
regeneration from its Na + form to the H+ form was found to be suitable
for use on honey.
The lower but respectable recovery values (. 94.6%) reported by
Siddiqi (1981) for the thirteen synthetic amino acid mixture as
compared for the same thirteen amino acid mixture (98.6%) obtained in
the present study could be due to:
1. Her not using 7M a=onium hydroxide solution for elution of
the ninhydrin positive substances after binding to the Dowex
resin as described by Bosi and Battaglini (1978) and in the
present investigation.
2. The technique employed for the removal of excess ammonia.
Siddiqi used a steam bath and pressurized air to facilitate
rapid evaporation. However, this procedure was found to be liable
to contamination in spite of precautions and was also prone to sample
loss when regulating air flow. Moreover, this procedure was found
to be slow compared to the enclosed low pressure evaporation method
employed in the present analysis and which was not subject to
sample loss or. contaimination.
Further, Siddiqi (1981) did not assess the effects of the
predominant sugars of honey namely glucose and fructose, and also of
the effects of honey constituents on addition of amino acids to honey.
However, she assessed the effects of glucose (20% w/v) ashaving no
adverse effects on the amino acid analyser results'. Moreover, in
assessing the effects of the predominant sugars of honey and honey
296.
constituents on amino acids it was observed, Table 97, that these
components of honey slightly enhanced the recovery of the-amino acids
from the Dowex resin.
Paper Electrophoresis and Chromatography
The method of paper electrophoresis and chromatography followed
by staining was used for the qualitative determination of a wide
range of ninhydrin positive substances not only those quantitatively
determined by the auto-analyser but others not detected by the automatic
instrument. However, the paper electrophoresis and chromatography
technique was not utilised for semi-quantitative. estimation of the
detected ninhydrin positive substances as evaluated by Siddiqi (1981).
For reasons already given in the previous section it was considered
that visual determination of the amount of the ninhydrin positive
substances could lead to both over- and/or under-estimation. Therefore,
the method of paper electrophoresis and chromatography was used as
an alternative to and/or in conjunction with pollen analysis to assess
the origins of both pollen-free and pollen containing honey samples.
Using the paper electrophoresis and chromatography technique -Siddiqi
(1981) was able to detect the presence of thirty three ninhydrin
positive substances as compared against the forty separated from the
honeys examined. Moreover, she identified the presence of 0-aminobutyric
acid, citrulline, kynurine and ornithine. The presence of these four
ninhydrin positive substances could not be confirmed by co-developing
with procured reference standards for reasons already given in the
previous section. However, the reasons for this was due to biological
variation and that the samples were not identical as discussed in the
previous sect. ion. Hence, there can be no guarantee that these
identified and/or unidentified ninhydrin positive substances would be
297.
present in every samplq and was in fact occurring very rarely,
particularly in individual samples.
AutomAtic'Amino Acid Ahalyser
With biological fluids such as honey containing different types
and amounts of ninhydrin positive substances it is possible that the
presence of amides, amines, amino sugars and small Peptides, could
co-elute with any of the other thirteen amino acids. This was
particularly noted by Davies (1975), in that, the asparagine, glutamine,
threonine and serine eluted into one peak. This was not observed
with the auto-analyser system employed in this work, although the
threonine and serine elutions often overlapped to some extent but
these peaks could be clearly distinguished. Davies (1975) carried
out direct application of the diluted honey solutions to the columns
of the amino acid analyser. After calibration, Davies was able to
detect the presence of twenty two amino acids and seven unknowns.
This direct application of diluted honey was not carried out because
it was feared by the technician operating the auto-analyser system
that honey constituents such as spores, yeast, pollen, dust*and similar
large inclusions present even after clarification could block the
columns and tubings of the analyser. The amino acid analyser used
in the present study was calibrated to detect the following seventeen
amino acids on a two hour programmed cycle. These amino acids were:
lysine, histidine, arginine, aspartic acid, threonine, serine, glutamic
acid, proline, glycine, alanine, cysteine, valine, methionine, isoleucine,
leucine, tyrosine and phenylanine, in the order given. For this reason
and those quoted in the previous section quantitative measurements
were determined for only thirteen amino acids with the exclusion of
298.
histidine, arginine, cysteine and methionine.
P6110-ns
The diversity of the floral sources utilized by the honeybees
in the British Isle for the production of honey can be seen from the
variety of different pollen genera identified in the U. K. survey samples.
The major and rare pollen types identified in this study are in good
agreement with the major floral sources of honey as listed by Crane,
Walker and Day (1984), and those given by Sawyer (1981), refer to
Appendix VIII. The occurrence of pollen such as Brassica, TrifoZiwn,
EucaZyptus, Cirsiwn and MeZiZotus was evident in most of the samples
examined. The presence of pollen which are not common to the country
from which the honeys were stated to have originated was evident in
three commercial samples namely MR68 (Code No. 243), English pure
(248) and English clover (254). These three samples were described
as of English origin and their pollen content agree with those
identified by Sawyer (1975) in honeys that had been imported from
other countries of the world.
Statistical Analysis
The transformation of the amino acid concentration measurements
utilised by Gilbert et al., (1981) and Davies and Harris (1982) was
not carried out in this study because it did not result in the successful
stabilisation of the variance-covariance matrix. This transformation
was the dividing of the individual amino acid measurement by the total
content and then multiplying by the number one thousand. Howevero
the square root transformation adopted in the present analyses stabalised
the variance-covariance matrix and coupled with pollen analysis enabled
299.
the correct classification of honey samples without the ommission of
outliners as reported by Gilbert et aZ., (1981). Other overall
modifications such as:
1. the redution in the number of sample groups,
2. the defining of unifloral pollen subclass, and
3- the random selection of samples per group for predictive classification
and estimation of misclassification rate.
These modifications vastly improved the maximisation of the minimum
Mahalanobis distance, that is, discrimination between sample groups.
However, the limited and inconsistent number of samples per group to
some extent limited the predictive capability of the SPSS. The use
of amino acid ratios was attempted as described in the British Beekeepers
Association interim report 1981 - 1982 and also those used by the Japanese
authors Kanematsu et aL., (1982) were not found to have any statistical
advantage over the square root transformation. Therefore, the amino
acid ratios were not adopted for statistical analysis in this study.
Furtýhermore, Gilbert and co-workers used data in such a way that on
a substantially standardised SPSS packageg so as to produce defined
boundaries round sample groupings in two dimensions. It should be
pointed out that they used large groupings of unconfirmed floral sources
and few experimental variables were considered. In the present study
since all factors were considered and each sub-group was independently
verified by pollen analysis. These factors lead to a multiplicity
of small sub-groups and a consequent randomness of data, so that boundaries
could not be drawn in the present work. To overcome the lack of boundaries
the SPSS was heavily modified with consequential improvements in
300.
discrimination but still not significantly to draw the 95% confidence
boundary.
Nonetheless, the predictive classification and misclassification
computed by the SPSS programme suggests that the honeys in this
investigation were classified on the basis of floral origin of sample
rather than geographical sources. These findings do not confirm with
those reported by Gilbert et aZ., (1981). The reason for this could be
that Gilbert et aZ., did not verify the floral origins of their samples
by pollen analysis, but relied upon the description given to them by
their donors. It is a well known fact that commercial labelling of
honey containers has an eye for sales appeal and therefore, the labels
can often deliberately mislead as to the true source of the honey in
the containers; for example, English Penine Heather honey sample No.
251 was found to contain 75% Brassica pollen. This in turn could
explain why some -data of Gilbert et aZ. , (1981) were omitted as outliners.
Also coupled with the instability of variance-covariance matrix that
the U. K. samples were incorrectly classified by these authors for samples
of Argentinian and Canadian origins, by their SPSS programme.
In the present study, the modified SPSS programme was also able to
distinguish between the U. K. survey and foreign, refer to Table 94,
and also between English and European honey, refer to Table 88. These
findings were in conformity with those reported by Davies and Harris
(1982). Further, the similarity of-pollen composition especially between
the English and European honeys seems to indicate that the composition
of honey amino acids is determined to a large extent by its floral
source. However, the lack of background knowledge related to each
foreign honey would seem to disprove these findings. It was not possible
to obtain official verified samples from research stations of each
301.
country nor was sufficient time or resources available for such a
programne to be attempted no matter how desirable.
Nevertheless, the present work embodied in this thesis indicates
that the credibility of the SPSS predictions were governed by the number
of samples available for a particular analysis, for example, the
success of Brassica honey classification was due to the sample size.
Further, in spite of the lack of adequate sample numbers per group the
SPSS classifications gave every indication of the potential use and
application of this chemical technique to various aspects of honey
production.
It is suggested that with the increased use of computers there is
a need to validate the application of this chemical technique as an
official method. Before this can be done it is however, necessary to
establish a reciprical relationship with two or more independent methods
with those utilised in this investigation. A great body of evidence
can then be compiled by various research workers in other laboratories
collaborating with Public Analyst's and this would then justify the use
of such a chemical technique.
ENVIRONMENTAL AND PROCESSING FACTORS AFFECTING HONEY
The following topics will now be considered individually and these
are: Adulteration, Sugar-feeding of honeybees. - Heating of honey,
Seasonal variations, Major honey sources and agricultural practices
in British Isles, Toxic honeys and Honeybee species.
Adulteration
It is known that English honeys command a high price in the honey
market because it is considered as being unique. This has lead. to the
temptation of adulteration via adulterants such as commercial invert
302.
and glucose syrups, high fructose corn syrup and cheap low grade foreign
honeys. Various techniques have been developed by interested analysts
-to detect the presence of these adulterants in honey. The most commonly
. used techniques are:
1. Monitoring increased levels of hydroxymethylfurfural (HMF) and
maltodextrin due to the addition of commercial invert syrup and
glucose syrups, respectively (Serra and Gomez, 1986). It is
known that adverse heating and storage conditions also gives rise
to HMF levels in honey (White, 1980a).
2. The detection of blending honeys with high fructose corn syrup
(HFCS) requires the use of an expensive technique namely Stable
Isotope Ratio Mass Spectrometry (Doner and White 1977; White and
Doner 1978). This technique can differentiate between C3 and C4
plants which employ different photosynthetic pathways. Honey is
the product from C3 plant secretions, whereas HFCS is obtained
from C4 plants (Edwards and Walker, 1983 and Prince, 1983).
3. The use of pollen analysis can reveal the presence of pollen not
found in the British Isles has been reported by Sawyer (1975).
However, the use of high pressure filtration by commercial producers
enables the total removal of pollen. Thus, invalidating the use
of pollen analysis on such honeys (James, 1969).
In the present study, pollen analysis of honey sample No. 204
(Canada Samantha Clover) revealed that no pollen was present. This
sample was suspected to have been subjected to high pressure filtration.
Further, the absence of pollen in sample Nos. 234,235 and 236 were
suspected to have been similarly processed. Both the quantitative and
qualitative amino acid analysis of sample No. 204 revealed low levels
303.
of amino acids as compared against other honeys of Canadian origin.
Inquiries by Drs. Croft and Washington revealed that this particular
honey was rejected by a supermarket retailer for its low grade quality
and was purchased by another. It was suspected that sample 204 was
then blended with a sugar based syrup whose identity could not be
established with the available resouces and sold relatively cheaply
compared to other foreign honeys. It. is known from the present investiga-
tions and that of Davies (1975) that amino acid constituents of sugar
syrups do not significantly affect the overall amino acid composition
of adulterated honey. Howevert the amino acids concentrations levels
are known to be reduced depending upon the amount of adulterant added.
Furthermore, the true origins of four English samples suspected
of being adulterated with foreign honey was established with the aid of
pollen analysis, amino acid maps and predictive classification by the
spSS. It was found that sample No. 243 was estimated to be one-half
English and one-half Mexican, and sample No. 244 was also estimated
to be one-quarter English and three-quarters Mexican. Whereas, sample
Nos. 253 and 254 were found to contain pollen normally found in Australian
honey but the amount of Australian honey added could not be established.
All these four honeys were quoted as being English and were sold as
such. These findings were later confirmed by the sample donors and
court action by Public Analyst resulted in the successful prosecution
of the commercial producers involved. This form of fraudulence has been
termed as misrepresentation by Sawyer (1975). The possible presence
of these foreign pollens in English honeys could be due to:
The result of unfortunate mixing with leftover honey in the
machinery after a batch of honey from a particular country has
been processed.
304.
2. The fact that not all the pollens filtered out can be successfully
removed from the filters.
3. The delibrate mislabelling for. financial advantage.
In a sample of honey containing cut comb it was noted that honey
from the comb and that in the jar were different. This was confirmed
not only by pollen analysis and amino acid maps but also by the
predictive classification by the SPSS, refer to Table 92. The honey in
the comb was thought to have originated from Mexico and that in the jar
from Australia. The identities of these sources could not be confirmed
from the commercial producer.
These findings agree with that suggested by Siddiqi (1981) that
honey amino acids can be used for determining the authenticity of
suspected samples. Also, indications were noted that this chemical
technique could be used to determine the degree of blending.
Sugar Feeding of Honeybees
The artificial feeding of honeybees with sugar syrup is normally
carried out to compensate for deficiencies in available nectar source
and for prolonged periods of bad weather (Croft, 1986). Although this
is a recommended practice for beekeepers however, this can lead to
temptations of overfeeding and the resultant honey can be classed as
adulterated. Some of the U. K. survey honeys received were observed to
be unusually 'thin and runny' in nature compared to other honeys.
From the replies received to questionnaire question number 6 it was
noted that most of this 'thin runny' honey had been the product of
feeding sugar to honeybees. Further, it was considered that some of
these 'thin runny' honeys could be the result of collecting unripened
honey but this could not be verified.
305.
The reason for the limited success in discriminating honey samples
which were products of feeding sugar to honeybees and those that were
not, was mainly due to the variation in amount and different types of
sugar products utilized by the participating beekeepers, refer to
Tables 70,71,72 and 73. This hindered the purpose of establishing
the effects of feeding sugar syrup to honeybees on the amino acid
composition of honey-obtained from such colonies, refer to Table 74.
3: t was known from the quantitative determination of amino acids of
commercial sugar syrups in this study, Table 61, and from that of
Davies (1975) that the feeding of sugar should not have a significant
effect on the overall proportion of amino acids. Further, it was
expected that the content of imino acid proline relative to the other
amino acids should be higher in terms of concentration. This was
evident in most of the sugar fed samples examined in this study but was
noted to be dependent upon the degree, extent and type of sugar fed.
This was reflected on the results obtained in Table 74, which was not
as entirely expected. This evaluation was based on the findings of
Bergner and Rahn (1972) that proline is added to honey in an amount by
far the largestýcompared to the other amino acids by the Apia meZZifera
honeybee and later reported by Siddiqi (1981).
The general guidelines suggested by Croft (1986) on feeding sugar
to honeybees is both to be encouraged and recommended. However, it is
not considered worthy to recommend a product obtained from a colony
to which 10 kg of sugar per hive is fed, although this is a reconmended
practice for autumn feeding, but to quote 'honey yield' of 20 kg of
honey per hive. This would lead one to believe that such honeys are
practically sugar with vastly reduced or no intrinsic value at all and
probatily closely akin to sugar syrup in composition. In this connection
306.
the ready availability of high fructose syrup can offer temptations of
illegal blending or addition of pollens to confuse the Public Analyst.
Such practices if they become prevelant in the U. K. could be detected
by amino acid composition or by very expensive mass spectral measurements.
Heating of Honey
The extent of heating honey is usually determined by following the
rise in 5-hydroxymethylfurfural (HMF) content, However, discriminant
analysis indicated that heating honey has some effect on its amino acid
composition. The degree and extent of this effect could not be evaluated
as it was noted from replies received to questionnaire question 5, the
non-uniformity with which the honeys examined were heated. Further, in
selective qua . litative screening of random samples it was apparent that
the U. K. survey honeys were subject to minimal heating. This was
evident by the amount of colour formation with aniline as compared to
that obtained with commercial samples. This was due to the nature of
processing techniques to which honeys are usually subjected to at
industrial level. The responses to questionnaire question number 5
suggest that most of the beekeepers adhere to the general recommendations
of heating honey. However, it was noted that heat treatment at a
temperature of 48.9C (120 0 F) for some fifty hours X2 would not only
result in a flavourless poor quality honey, but also reflect on the
reputation of beekeepers in this country.
Statistical analysis of samples subjected to both heating and
were a product of sugar feeding could not be evaluated with any
certainty by predictive classification aspects of the SPSS. This was
due to the inconsistency of heating and sugar-feeding and also of
sample numbers per group, refer to Tables 75 to 82.
307.
Seasonal Variations
Changes in seasonal climatic conditions and for that matter year
to year, can influence the availability of nectar and to some extent
pollen and their constituents. This in turn reflects on the production
of honey and its quality (White, 1980c and Maurizo, 1980). It has
been reported by Carter (1983) that the amino acid composition of honey
could be a function of the amino acid composition of pollen ingested
by the honeybee. He also pointed out that the contribution of the
amino acids from pollen present in a jar of honey is negligible but
significant when considering the amount of pollen that may be present
in a hive. It was observed by Adams, Smith and Townsend (1979) that
honey from different floral sources during seasonal changes may be
present on a comb and that for the comb to become nearly unifloral an
extended flowering period is required before the deposition of unifloral
honey can be acheived on a comb. Similarly, seasonal changes can be
prevalent on the production of honeydew and its constituents as reported
by Mittler (1958), Noda, Sogawa and, Saito (1973) and Hertel and Kunkel
(1977).
Discriminant analysis of honey harvested in the calender years 1981
and 1982, did to some extent confirm the possibility of seasonal changes
influencing the honey amino acid composition, refer to Tables 66 and 67.
Also, it could not be established whether seasonal changes influenced
the total amino acid content or proportion of the different amino acids
present in honey. It was also noted from the available information
regarding each honey sample of the U. K. survey that the conditions to
which some of the honeys were subjected played an important part in the
outcome of the statistical analysis. This can be overcome by obtaining
honey from newly established control hives that have had no honey or
308.
pollen stores and has a fresh brood chamber. Such control hives should
be placed alongside existing colonies and both these should be carefully
monitored with annual changes of the control hives over a period of
perhaps eleven years attributed to the solar activity cycle. This would
establish the pattern of seasonal changes influencing not only the
production of honey but also. its constituents for the major honey sources
worldwide.
Major Honey Sources and Agricultural Practice in the British Isles
Referring to the major survey of honey sources in the U. K. carried
out by Deans(1957) it can be seen from the predominant pollen types
identified in the U. K. survey honeys that there have been a significant
changes in the agricultural practices in the British Isles. These
changes have been shown in Table 99. Comparing the list of pollens
identified both in the U. K. survey and the foreign honeys as given in
Appendix VIII it can be seen that there is good agreement between the
pollens identified and the major honey sources catalogued by Crane,
Walker and Day (1984).
Toxic Honeys
The most likely source of toxic compounds in honey could originate
from the plant - nectar and honeydew or during extraction, processing
and storage and also from the environment.
In the United Kingdom honey from nectars of Rhododendron plant or
AescuZus especially AescuZus hippocastanum and TiZia such as Tilia
petioZasis, TiZia OrbicuZar and TiZia tomentosa are known to contain
toxic compounds which have been reported to be injurious to both
consumers - humans and honeybees. Nectar from TiZia and also the
honey from these species are reported to be harmful to bees. Palmer-Jones
309.
TABLE 99
Mal or honey sources in the United Kingdom
Plant Deans
Species Howells Mistry England Scotland Wales U. K.
1952 1 1952 1 1969 2 1987 2
Brassica 452 1
CaUuna 4 4
Castanea 7 3
Ivosotis 5
prunualpyrus 2 2 3
Rubus 3 3 4 6*
. Trifolium repens 1 1 12
Vicia 8 10 7**
Aescu4us - - 6
1- Ranked as plant importance in survey
2= Ranked as percentage of honey samples recieved
Ranked in position with AescuZus plant
Ranked in position with Impatiens and Mematis plants.
310.
(1947) , Howes (1979) , Kerkvleit (1981) and Atkins (1982). Honeydew
from limes has been reported to be harmful to bees. This is mainly due
to the presence of physiologically harmful sugars (Crane, 1980).
Also honey from Ligustrum (privit) and Senecio (ragwort) are known
to give rise to distinctly bitter tasting and strong aroma and flavoured
honeys (Howes, 1979).
The presence of compounds introduced into honey during extraction,
processing and storage can also contribute to the bitter taste or
strong flavour of honeys. These compounds could be benzaldehyde and
smoke used for repelling honeybees from comb or metallic residues
resultant of storage in metal containers, (Hooper, 1976 and Morse, 1974).
Honey with high phenol content has been reported to be bitter tasting
(Campus, Madau and Solinas, 1983).
The use of chemicals to control pests and insects in the environment
have also contributed to the increase in the mortality rate of honeybees.
This is especially evident during and after spraying crops with such
compounds contrary to the advice of Ministry of Agriculture and Food
directives.
In the present investigation, there were four honeys - one U. K.
survey sample No. 38 was described by its donor to have an obnoxious
flavour and was suspected to contain compounds which could cause
symptoms of poisoning or that of nausea. The other three honeys were
U. K. survey sample Nos. 89,90 and 91 and were described by their donor
to have a bitter taste. The distribution of pollen in each of these
f our samples showed the presence of Castanea (Sweetchestnut) pollen.
Further, the presence of other pollen such as Ligustrvm (privit),
EeracZewn (Hogweed) and TiZia (lime) were also noted. Honeys obtained
from such plants have been reported to give rise to bitter flavoured
311.
honeys (Crane, Walker and Day, 1984).
The amino acid maps, pollen content and predictive classification
by the SPSS indicated that U. K. survey sample No. 38 was similar in
composition to that of U. K. survey sample No. 36 (same donor). Also,
the U. K. survey samples No. 89,90 and 91 displayed similarity in
composition. However, the bitter tasting nature of these four honeys
could not be confirmed because the present study was conducted in a
building designed for radioactive research where such sensory examinations
are forbidden. Further, such subjective evaluation is only reliable
with considerable experience, a non-fatigued pallate and many similar
samples collected at one time. Furthermore, such observations conducted
by a tasting panel are not based on one individuals assessment. The
detection and identification of the presence of compounds reported to
occur in bitter tasting or strong flavour honey was not carried out.
This was because such compounds would only be detected in very fresh
honeys obtained within days of occurrence and examined for the presence
of these compounds with the sensitive gas-liquid chromatography technique.
This was not possible in the present investigation.
Honeybee Species
The low proline content of honey produced by Apia cerena indica
compared to that by Apia melZifera was used by Davies (1975) as an
indication of honeybee species. Amino acid analysis of four honeys
received from the Indian sub-continent revealed that-two samples Nos.
224 and 225 were of very low proline content and the other two samples
Nos. 169 and 233 had proline content similar to that of honey produced
by Apia meUifera. It is known that both samples, Nos. 224 and 225,
were the product of nectar gathered by either Apia cerena or Apia fZorea.
312.
On the other hand sample No. 233 was known to be an admixture with
other products whose identities were not known. It was not known whether
sample No. 169 was either an admixture or the result of nectar gathered
by Apia meUifera or similar product to that sample No. 233.
SIGNIFICANCE OF PRESENT WORK
In view of the relative ease with which pollen can be removed from
honey to comply with commercial interests. Therefore, as stated in the
aims that there was a need to establish a chemical technique to identify
the floral and geographical source of honey. In the absence of pollen
a chemical technique such as that described here would become of
valuable analytical importance.
Although the separation and patterns of proteins are a possibility
for geographical and floral source, the resolution with present
equipment precluded the use of proteins for this purpose. The present
study is therefore concerned with predominant use of amino acids and
their changing pattern with source.
Even though this is the first national survey which attempted to
compare conventional microscopical evaluation - pollen analysis with
the corresponding amino acid pattern. This correlation was not as close
as desired due to the lack of unifloral source as this aspect is
discussed elsewhere.
The feasibility of catogarising honeys using pollen analysis and
then correlating the quantitative amino acid measurements by the application
of statistical analysis using the SPSS proved successful in the identifica-
tion as to source. It was established that the predictive classification
aspect of the discriminant analysis was based on floral source rather
than on geo-political boundaries. From the evaluation of the present
313.
work it was concluded that the potential of such a chemical technique
is still in the embryonic stage but it also has the capacity to be able
to differentiate the various aspects of honey production. These aspects
are: honeydew and nectar honeys, feeding sugar to honeybees, heating,
commercial processing, adulteration especially with foreign honeys and
floral sources of different pollen species belonging to the same plant
family*
Further, the application of paper electrophoresis and chromatography
technique in association with that of pollen analysis for the purpose
of verifying the geographical source of a sample proved useful, especially
for pollen-free honeys. Also, the application of this technique proved
useful in distinguishing the following: between honeybee species - the
Eastern honeybee Apia cerena and Western honeybee Apia meZZifera;
adulteration with foreign honey and to some extent sugar products, and
honeys the result of moderate to excessive sugar feeding of honeybees.
A brief but concise account of the application of this chemical
technique f or use on honey was presented at the 11st Bee Research Workers
Colloquia'in London, 1986. A report on this work was presented to the
British Beekeepers Association and also it has been acknowledged by the
International Bee Research Association, 1986.
FUTURE WORK
The following needs to be assessed and evaluated:
On the predictive classification and data handling aspect of the
suitably modified SPSS programme, this can be used to full
advantage if the following conditions can be achieved such as:
(a) Obtaining honey samples of known provenance.
(b) Obtaining large sample numbers per group, at least fifty.
314.
(c) Using unifloral honeys containing over 90% pollen from
one floral source.
(d) Perfo=ing quantitative dete=ination of all the detectable
and identifiable ninhydrin positive substances.
The advantages ofensuring these conditions, as deduced from the
present work, would be to:
Improve the potential of sub-group allocation followed
by identification and correct classification of unifloral.
sources.
(ii) Ease the recognition of causes of misclassification.
(iii) Enable the characterisation of unusual ninhydrin positive
substances with source both floral and geographical.
(iv) Produce statistically significant-information.
(v) Establish a framework to base predication of uncatogarised
samples.
However, the disadvantages of certifying these conditions would
be:
(i) The difficulty of co-ordinating a uniform nationally
based programme of pre-treatment of hives, feeding of
colonies and monitoring to avoid mixing of early and
late samples or seasonal changes or honey subjected to
commercial practices or cheap foreign honey.
(ii) The siting of hives where availability of one floral
species is artificially established over an area covering
a radius of at least five miles from a hive. Since even
a good natural heather honey contains wild clover and
other species to perhaps within 10% of the total.
315.
The monitoring and recording of sample treatment before
receiving for analysis.
(iv) The modification of the amino acid'analyser to be able to
allow overloading to enhance the measurement of trace
components, hydrolysiso identification of peptides and
other compounds.
(v) The capacity to handle and analyse this sort of information
would and could be conducted at a suitably equipped National
research centres.
2. It would be necessary to monitor the qualitative and quantitative
composition of honeys from a significant number of colonies on the
same site and concurrently from up to one hundred similar sites
elsewhere. The data so obtained can be used to determine the
f ollowing:
(a) The composition of nectar, honeydew and pollens visited by
the honeybee.
(b) The composition of secretions provided by the forager honeybee.
(c) The changes in composition of nectar deposited in the hive
through to full ripened honey and subsequent capping.
(d) The variation if any in composition from cell to cell, comb
to comb and of a hive at a given site. Also important is
the time lag between flowering time and first and last
appearance of a given nectar and pollen source in the hive
as discussed by Carter (1983).
(e) A quantitative assessment of the location and floral species
visited and the comPosition of the final honey, such as that
reported by Adams, Smith and Townsend (1979).
316.
(f) The effect of human intervention,, honey extraction and
blending at both amateur and professional scales. Furthermore,
to establish whether the separate composition of two unifloral
honeys are additive when these honeys are mixed.
(g) The effects of variation with a common sourceý for example,
due to an apairy, seasonal changes, soil composition and
the average levels of special protein fed as supplement.
(h) The effect of restricting bee food source to just one,
especially sugar products and/or protein supplement.
(i) Compilation of relevant data for major and minor honey sources
worldwide.
In addition to the above listed research it would be of use if the
reduction of variable in the statistical data could be accomplished
by obtaining the answers to the following questions:
(a) Does the previous years stored pollen affect and influence
the ninhydrin positive substance composition of honey
harvested the following year?
(b) To what degree and extent does the contribution of ninhydrin
positive substances of 'Important Minor and Minor frequency
class pollen' affect the overall composition of unifloral
honeys?
(c) Does the feeding of pollen substitutes have, if any,
significant effect on the ninhydrin positive composition
cifsuch honeys produced? -If so, to what degree and extent?
(d) The identification of pollen grains to species level by
conventional light microscopy using fresh and reference
pollens as appropriate. Further, examination of suspect
317.
pollen using the much higher magnification (20K) so that
fine surface details essential for species identification
of the Brassica genus can easily be accomplished. The labour
of such searches can be eased and to some extend automated
by using scanning image retrival. This procedure can only
be done on perfect pollen and may not be successful on
osmotically damaged and uncleaned pollen found in honey.
If this can be done for one country then similar analysis will be
necessary for each individual honey producing country of the world.
Thus, enabling the -compilation of an international data bank containing
information on at least a thousand plus verified reference samples per
country. This would then serve not 'only as an indexing system, but also
as a reference system for ascertaining the floral and/or geographical
source of a sample by the application. of this chemical technique.
In the present work the feasibility of chemical verification of
floral source, especially with regard to amino acids has been accomplished.
The other aims of detection of adulteration, misrepresentation have been
shown to be possible and the application and future potential of computers
has been investigated.
The way forward over perhaps the next ten years has been indicated
but future achievements must await their turn. Upto the present, June
1987, none of these ideas have yet appeared in print.
IBL10GRAPHY
318.
IBL10GRAPHY
AA Great BritAin Road Atlas, (1982) Pub. Automobile Association,
Basingstoke, Hampshire. pp. 1-95.
Adams, R. J. and Smith, M. V. (1981) J. Apic. Res., 20(4), 243-248.
Adams, R. J., Smith, M. V. and Townsend, G. F. (1979) J. Apic. Res.,
18(4), 292-297.
Ammon, R. (1949) Biochem. Z., 319,295-299.
Arzone, A. (1984) Apicoltore Moderno, 75(3) 117-131. Apic. Abst.,
(1985), 36(3), 981/85.
Atkins, L. E. (1982) Injury to honeybees by poisoning. pp. 665-695.
In "The Hive and the Honeybee". Ed. and Pub., Dadant and Sons,
Hamilton, Illinois.
Auclair, J. L. (1963) Ann. Rev. of Ent., 8,439.
Austin, G. H. (1958) Proc. Int. Congr. Entomol., 10th, Montreal, (1956)
4,1101-1106.
Bagdanov, S. (1981) Mitt. Gib. Lebensmittelunters Hyg., 72(4), 411-417;
Chem. Abst., 98,87730h.
Bahadur, B., Chaturvedi, A. and Swamy, N. R. (1986) Proc-Indian Acad.
Sci., Plant Sci., 96(l), 41-48; Chem. Abst., 105,187648u.
Baker, H. G. and Baker, 1. (1975) Coevolution of Animals and Plants.
Ed. Gilbert, L. E. and Raven, P. H. pp. 100-140.
Baker, H. G. and Baker, 1. (1982) Biochem. Aspects Evol. Biol., (Proc.
Ann. Spring Syst., 4th 1981 Pub. 1982) Ed. Nitecki, M. H., pp. 131-171.
Univ. Chicago Press.
Baker, H. G., Opler, P. A. and Baker, 1. (1978) Bot. Gaz., 1390), 322-332.
Barnard, M. (1986) The Analytical Report, No. 9, pp. 15-17.
Baruch, P. and Sharma, G. C. (1984) J. Polynol., 20(l), 31-6.
Bergner, K. and Diemar, S. (1975a) Z. Lebensm. Unters. -Forsch., 157,
1-6.
Bergner, K. and Diemar, S. (1975b) Z. Lebensm. Unters. -Forsch., 157,
7-13.
Bergner, K. G. and Dlawar, M. S. (1979) Z. Lebensm. Unters. -Forsch., 169,
159-164.
Bergner, K. and Sabir, M. S. (1977) Z. Lebensm. Unters. -Forsch., 165,
85-86.
319.
Bergner, K. G. and Hahn, H. (1972) Apidologie, . 1(1), 5-34; Chem. Abst.,
77,99809v.
Bicchi, C., Belliardo, F. and Frattini, C. (1983) j. Apic. Res., 22(2),
130-136.
Bonafaccia, G., Chirico, M., Stacchini, P. and Zanasi, F. (1984) Riv.
Soc. Ital. Sci. Aliment. 9 L3(l), 47-50; Chem. Abst., . 102,61048t.
Bonaga, G. and Giumanini, A. G. (1986) J. Apic. Res., 25(2), 113-120.
Bosi, G. and Battaglini, M. (1978) J. Apic. Res., 170), 152-166.
Bradford, M. (1976) Anal. Biochem., 72,248.
Brice, B. A., Turner, A. Jr. and White, J. W. Jr. (1956) J. Ass. Off.
Agric. Chem., 39(4), 919-937.
Britikov, E. A. and Musatova, N. A. (1964) Fixiol. Rast., 11(3), 464-472.
Browne, C. A. (1908) Bull. U. S. Bur. Chem., No. 110.
Burgett, D. M. (1974) Ann. Entmol. Soc. Am., 67(4), 545-546.
Butler, C. G. (1972) "The World of the Honeybee". Revised Ed. Pub.
Collins, St. James's Place, London.
Carey, F. M., Lewis, J. J., MacGregor, J. L. and Martin-Smith, M. (1959)
J. Pharm. Pharmac., 11,269T.
Campus, R., Madau, G. and Solinas, B. (1983) Tecologie Alimentari, 6(10),
10-15, Apic. Abst., 986/86.
Carter, J. M. (1983) M. Sc. Thesis, University of Salford.
Ceausescu, S. and Mosarie, L. (1981) An. Univ. Bucuresti Biol., 30,
101-103; Chem. Abst., 96,82764w.
Chandler, B. V., Fenwick, D., Orlora, T. and Reynolds, T. (1974) Tech.
Paper, CSIRO, Australia No. 38,39 pp. Ex. White (1980a).
Chaubal, P. D. and Deodikar, G. B. (1965) Indian Bee J., 27,1-28.
Chepurnoi, I. P. (1983) Pchclovodstro,. 12,28-29, Apic. Abst., 283/86.
Clinch, P. G. and Turner, J. C. (1968) NZ. Jl. Sci., 11,346-351.
Clinch, P. G. and Turner, J. C. (1975) NZ. Jl. Sci., 18,323-328.
commission on Enzymes of the International Union of Biochemistry, (1961)
Pub. Pergamon Press, Oxford.
Crane, E. (1980) In "Honey: a Comprehensive Survey". Ed. E. Crane
pp. 115-156, Pub. Heinmann, London.
Crane, E. (1982) Bee Wld., 63(4), 174-177.
Crane, E., Walker, P. and Day, R. (1984) In "Directory of Important
World Honey Sources". Pub. International Bee Research Assoc.,
Gerrards Cross, Buckinghamshire.
320.
Croft, L. R. (1980) British Bee J., 12,231-232.
Croft, L. R. (1986) "Profitable Beekeeping". Pub. Elmwood Books,
Chorley, Lancashire.
Croft, L. R. (1987) Trans. in Analytical Chemistry. In press.
Croft, L. R., Mistry, R. P. and Washington, R. J. (1986) "Fifth Meeting
of The International Electrophoretic Society, London. Pub.
Electrophoresis, 1986. VCH Verlangsgesellschaft.
Cremer, E. and Riedmann, M. (1965) Mh. Chem., 96(2), 364-368.
Curti, R. and Riganti, V. (1966) Rass. Chim., L8(6), 278-282. Ex. Petrov
(1971).
Davies, A. M. C. (1975) J. Apic. Res., 14(l), 29-39.
Davies, A. M. C. (1976) J. Fd. Tech., 11(5), 515-523.
Davies, A. M. C. and Harris, H. G. (1982) J. Apic. Res., 210), 168-173.
Dawes, E. A. (1972) In "Quantitative Problems in Biochemistry" 5th Ed.
Pub. The Williams and Wilkins Co., Baltimore.
Dawson, R. M. C., Elliot, D. C., Elliot, W. H. and Jones, K. M. (1969)
"Data for Biochemical Research" 2nd Ed. Univ. Press Oxford.
Deans, A. S. C. (1957) "Survey of British Honey Sources", Bee Research
Assoc., Publication BRA142, Gerrards Cross.
Deodikar, G. B., Thakar, C. V., Phadke, R. P. and Shah, N. P. (1957) Indian
Bee J., 19,71-72.
Doner, L. W. (1977) J. Sci. Fd. Agric., 18,443-456.
Doner, L. W. and White, J. W. Jr. (1977) Science,. 197,891-892.
Doner, L. W., White, J. W. Jr. and Phillips, J. G. (1979) J. Assoc. Off.
Anal. Chem., 62(l), 186-189.
Duisberg, H. and Hadron, H. (1966) Mitt. Geb. Lebensmittel-Unters. U.
Hyg., 57(5), 386-407. Ex. White, (1980a).
Dycep E. J. (1931) J. Econ. Ent., 24,597-602.
Dyce, E. J. (1980) In "Honey: A Comprehensive Survey", Ed. Grane, E.
pp. 293-306, Pub. Heinmann, London.
Echigo, T., Takenaka, T. and Ichimura, M. (1974) Nippon Shokuhin
Kogyogakkaishi, 21(5), 223-227.
Eckersley, D. (1982) "Users Guide Running Fortran77 Program on the Prime",
Pub. Computing Laboratory, University of Salford.
Eckersleyq D. (1984) "A Short Guide to Using the Prime Systed', Pub.
computing Services Section, University of Salford.
321.
Edwards, G. and Walker, D. A. (1983) -% 3' C 4': Mechanisms and Cellular
and Enviromental Regulation of Photosynthesis", Pub. Blackwell
Scientific, Oxford.
Edwards, R., Faraji-Haremi, R. and Wootton, M. (1975) J. Apic. Res.,
14(l), 47-50.
El-Sayed, A. H. (1982) Res. Bull. Fac. Agric. Ain Shams Univ., (1931)
pp. 11.
Ewart, W. H. and Metcalf, R. L. (1956) Ann. Ent. Soc. Am., 49,441-447.
Faegri, K. and Iverson, J. (1975) "Textbook of Pollen Analysis", Pub.
Munksgaard, Copenhagen.
Feder, E. (1911) Z. Unters, Nahr. -U. Genussmittel., 22,412-413, Ex.
White, (1978).
Feller-Demalsy, M. U. (1983) Apidologie, L4(3), 147-174, Apic. Abst., 609/85.
Feo, V., De Russis, A., Episodio, S. and Senatore, E. (1985) Boll. Soc. Ital. Biol. Sper., ý1(8), 1083-1085; Chem. Abst., 103,211172r.
Fiche, J. (1908) Z. Unters. Nahr. -U. Genussmittel., 15,429-493., Ex.
White,, (1978).
Free, J. (1970) "Insect Pollination of Crops", Pub. Academic Press,
London.
Freeman, C. E., Reid, W. H. and Zaun, J. W. (1983) Southwestern Naturalist, 28(l)v 113-115.
Gilbert, J., Shepherd, M. J., Wallwork, M. A. and Harris, R. C. (1981) J. Apic. Res., 20(2), 125-135.
Gilliam, M., McCaughey, W. F. and Moffett, J. 0. (1981) Apidologie, 12(2), 125-132; Chem. Abst., 96,29644f.
Gilliam, M., McCaughey, W. F. and Wintermute, B. (1980) J. Apic. Res., 19(l), 64-72.
Giri, K. V- (1938) Madras Agric. J., 26,68-72.
Gnandesikan'9 R. (1977) "Methods of Statistical Data Analysis of Multivariate Analysis", Pub. John Wiley and Sons Ltd., London.
Hadlaihullq C. and Nie, N. H. (1981) "SPSS Update 7-9 New Procedures
and Facilities for Release 7-9", Pub. MacGraw-Hill Book Co.,
London.
Hadorn, H. (1964) Ann. Abeille, 7(4), 311-320.
Hais, I. M. and Macek, K. (1963) "Paper Chromatography: A Comprehensive
Treatise". Pub. Academic Press, London.
322.
Hamilton, L. G. (1987) Final Year B. Sc., Dissertation (May, 1987).
Hanny, B. W. and Elmore, C. D. (1974) J. Agric. Food Chem., 22(3), 476-478.
Hase, S., Odate, M., Kurabayashi, A. and Suzuki, S. (1973) Nippon Shokuhin Kogyo Gakkaishi, 20(6), 257-264.
Helvey, T. C. (1953) Food Res., 18(2), 197-205.
Hertel, R. and Kunkel, H. (1977) Apidologie, 8(4), 427-436.
Heslop-Harrison (1971) "Pollen: Development and Physiology", Ed.
Heslop-Harrison, Pub. Butterworths.
Hodges, R. and White, E. P. (1966) NZ. Jl. Sci., 9,233-235.
Ten-Hoopen, J. J. G. (1963) Z. Lebensmitt., 119(6), 478-482.
Hicks, C. P. (1969) Process Biochemistry, 4(9), 41-43.
Homan, H. W. and Baird, L. R. (1983) Current Information Series, Agricultural Experimental Station,. Univ. of Idaho, No. 458,4pp; Apic. Abst., 590L/85.
Hooper, T. (1976) "Guide to Bees and Honey". Pub. Blandford Press
Ltd., Poole.
Horwitz, W. (1980) "Official Methods of Analysis of the Association of Official Chemists". Ed. Horwitz, W., Pub. Ass. Off. Anal. Chem.,
Washington, D. C.
Haworth, C. and Heathcote, J. G. (1969) J. Chromatog., 41,380-385.
Howells, V-W`- (1969) J. Assoc. Publ. Analysts., 7,88-93.
Howes, F. N. (1949) Fd. Mf., 24,459-462.
Howes, F. N. (1979) "Plants and Beekeeping", New and Revised Ed. Pub.
Faber and Faber, London.
Inouye, D. W. -and Inouye, R. S. (1980) Am. J. Bot., 67(9), 1394-1396.
International Commission for Bee Botany (I. U. B. S. ) (1953) Bee Wld., 34, 48-51.
International Commission for Bee Botany (1962) Bee Wld., 43(4), 122-123.
Ivanov, Ts. (1981) Zhivotnovud Nauki., 18(6), 119-125; Chem. Abst.,
96,179755g.
Jachimowicz, T. and El-Sherbiny, G. (1975) Apidologie, 6(2), 121-143;
Chem. Abst., 83,191722h. I
Jackson, R. F. and Silsbee, C. G. (1924) U. S. Dep. Commer., Technol.
Pap.; Bur. Stand., 18,277-304. Ex. White (1978).
James, V. (1969) J. Assoc. Publ. Analysts., 7,128-132.
Kalimi, M. Y. and Sohonie, K. (1964) J. Nutr. Diltet., 1,261-264.
Kanematsu, H., Aoyama, M., Maruyama, T. and Niiya, T. (1982) Eiyo To
Shokuro, 35(4), 297-303.
323.
Kanematsu, H., Ushikusa, T., Maruyama, T.., Niiya, T., Aida, Y. and Ohnishi, M. (1983) J. of Japanese Soc. Nut. Food Sci., 38(6),
518-522. Apic. Abst., 1985,36(l), 273/85.
Kauffeld, N. M. (1980) Apidologie, 11(l), 47-55.
Kendall, M., Stuart, A. and Ord, J. K. (1976) "The Advanced Theory of Statistics". 4th Ed. Vol. 3, Pub. Charles Griffin and Co. Ltd.,
London.
Kennedy, J. A. and Mittler, T. E. (1953) J. Exptl. Biol., 171,528.
Kerkvliet, J. D. (1981) J. Apic. Res., 20(4), 249-253.
Klemarewski, J. (1976) Pszczelnicze Zesz. Nauk., 20,171-179; Chem.
Abst., 86,154150m.
Komamine, A. (1960) Acta. Chem. Fenn., B33,185-187.
Krinitz, B. and Franco, V. (1976) Lab. Info. Bull., No. 1891 Foods 1-9.
Kushnir, 1. (1979) J. Assoc. Off. Anal. Chem., 62(4), 917-920.
Lampitt, L. H., Hughes, E. B. and Rooke, H. S., (1930) Analyst, London,
55,666-672.
Landis, P. W. and Kevin, H. B. (1982) Food Carbohydr. (pap symp), Ed.
D. Lineback, et al., pp. 74-122.
Lehninger, A. L. (1975) "Biochemistry", 2nd Ed. Pub. Worth Publishers
Inc., New York.
Lieux, M. H. (1972) Rev. Palaeobot. Palynol., 13,95-124.
Lombard, A., Rossetti, V. and Buffa, M. (1981) Boll. Chim. Unione. Ital.
Lab. Prov. Parte. Sci., 32(S4), 161-166; Chem. Abst., 96,5158z.
Lotti, G. and Anelli, G. (1972) Indian Agric.,. ýQ), 239-245.
Louveauxp J., Maurizo, A. and Vorwohl, G. (1970) Bee Wld., 51(3)9 125-138.
Louveaux, J., Maurizo, A. and Vorwohl, G. (1978) Bee Wld., 59(4),
139-157.
Lowry, O. H., Rosebrough, N. J., Farr, A. L. and Randall, R. J. (1951) J.
Biol. Chem., 193,265-275.
Majak, W., Neufeld, R. and Corner, J. (1980) J. Apic. Res., L90),
196-199. -
Mason, 0. (1981) "Bartholomew Gazetteer of Britain", Pub. John
Bartholomew and Son Ltd., Edinburgh.
Maurikos, P. T., Daratsianos, I. N., Katsonlis, M. T. and Marketos, D. G.
(1978) Chem. Chron.,. 1(1), 33-37; Chem. Abst-., 89,106069g.
Maurizo, A. (1980a) In "Honey: A Comprehensive Survey", Ed. Crane, E.
pp. 77-105, Pub. Heinmann, London.
324.
Maurizo, A. (1980b) In "Honey: A Comprehensive Survey". Ed. Crane, E.
pp. 240-257, Pub. Heimann, London.
McLellan, A. R. (1975) J. Apic. Res. . 14(2), -97-61. Mermelstein, N. H. (1975) Food Technol., 29(6), 21-25.
Metzler, D. E. (1977) "Biochemistry". Pub. Academic Press,, London.
Milium, V. G. (1939) Am. Bee J., 79(9), 445-447.
Minh, H. V., Mendoza, B. V., Laigb, F. M., Morse, R. A. and Steinkraus, K. H.
(1971) J. Apic. Res., 10(2), 91-97.
Mistry, R. P., Washington, R. J. and Croft, L. R. (1986) - (Lecture)
llst Bee Research Workers Colloquial, London.
Mittler, T. E. (1953) Nature, 172t 207.
Mittler, T. E. (1958) J. Exp. Bio., 35,626-638.
Moar, N. T. (1985) New Zealand J. of Agric. Res., 28,39-70.
Moore, S. and Stein, W. H. (1951) J. Biol. Chem., L92(2), 663-681.
Moore, P. D. and Webb, J. A. (1978) "An Illustrated Guide to Pollen Analysis".
Pub. Hodder and-Stoughton, London.
Morgenthaler, 0. (1955) Glean. Bee Cult., 671.
Morse, R. A. (1974) "The Complete Guide to Beekeeping", New, Revised
Ed. Pub. E. P. Dutton: arid Co., New York.
Mostowska, 1. (1965) Zesz. Nauk. Wyzsz. Szk. Roln. Olsztyn., 20(3),
417-432; Chem. Abst., 64,20529a.
Nadezhdin, V. V., Alarkon, N. L., Mitrofanova, T. K. and Tolkachev, O. N.
(1983) Lesove dinie,. j, 71-73; Chem. Abst., 99,191683b.
Naumkin, E. P. (1984) Pchclovodstvo,. 10,23-24, Apic. Abst., (1986);
37 (1) , 306/86.
Nie, N. H., Hadlaihull, C., Jenkins, J. G., Steinbrenner, K. and Bent, D. H.
(1975) "Statistical Package for Social Sciences", 2nd Ed. Pub.
McGraw-Hill Book Co., London.
Nielsen, N., Grommer, J. and Lunden, R. (1955) Acta Chem. Scand.,
1100-1106.
Noda, H., Sogawa, K. and Saito, T. (1973) Appl. Ent. Zool., E(3).
191-197.
Noland, G. S. (1982) "Introduction to SPSS" 5th Ed. Pub., Regional
Computer Centre, University of Manchester.
Paine, H. S., Gertler, S. I. and Lothrop, R. E. (1934) Ind. Engng. Chem.
Ind., 26,373-381.
325.
Pais, M., Salome, S., Chave das Neves, H. J. and Vasconcelos, A. M. P. (1986) Apidologie, 17(2), 125-36; Chem. Abst., 105,. 168975g.
Palma de, M. S., Fontanarrosa, M. E. and Vigil, J. B. (1982) Rev. Fac.
Ing. Quim. (Univ. 'Nac. Litoral. ), A5(l), 73-80; Chem. Abst.,. 299,
86700g.
Palmer-Jones, T. (1947) NZ. Jl. Sci. Technol., 29,107-114.
Palmer-Jones, T. (1968) NZ. Jl. Sci. Agric., 177,77.
Papadakis, P. E. (1929) J. Biol. Chem. , 83,561-568.
Park, O. W. (1927) J. Econ. Ent., 20,510-556.
Park, O. W. (1928) J. Econ. Ent., 21,882-887.
Park, O. W. (1933) J. Econ. Ent., 26,188-193.
Partington, J. R. (1961) "A Textbook of Inorganic Chemistry", 6th Ed.
MacMillan and Co. Ltd., London.
Pearson, D. (1976) "The Chemical Analysis of Foods", 7th Ed. Pub.
Churchill Livingstone, London.
Peterson, G. L. (1979) Anal. Biochem., 100,201-220.
Petrov, V. (1971) J. Apic. Res., 10(3), 153-157.
Petrov, V. (1974) J. Apic. Res., 13(l), 61-66.
Phadke, R. P. (1962) Indian Bee J., 24(7-8), 59-65.
Phadke, R. P. (1967) Indian Bee J., 29,14-26.
Phadke, R. P. (1968) Indian Bee J., 30(l), 3-8.
Poncini, L., Wimmer, F. L. and Vakamoce, V. (1983) Fiji Agric. J., 45(2), 65-70.
Porras, E. T. (1982) Archivos de Zootecnia, 31(121), 293.
Prince, R. C. (1982) Am. Bee J., 122,817-819.
Prince, R. C. (1983) Am. Bee J., 123,21-24.
Pryce-Jones (1944) Scottish Beekeeper, 118-131.
Rayner, C. J. and Langridge, D. F. (1985) Aust. J. Exp. Agric., 25(3),
722-726; Chem. Abst., 104,165378h.
Reeder, D. J., Richie, K. L. and Guenther, F. R. (1986) 'FifthMeeting of
the International Electrophoretic Society', London. Pub. Electro-
phoresis, 1986. VCH Verlagsgesellschaft.
Report of the Commission of Enzymes (1961) Int. Union Biochem. Symp.,
Series Vol. 20, Pub. Pergamon Press, London.
Richards, O. W. and Daves, R. G. (1977) "Imms' General Textbook of
Entomology" 10th Ed. Pub. Chapman and Hall, London.
326.
Rinaudo, M. T., Ponzetto, C.,, Vidano, C. and Marletto,. F. (1973a) Comp.
Biochem. Physiol., 46B,. 245-251.
Rinaudo, M. T.,, Ponzetto, C., Vidano, C. and Marletto, F. (1973b) Comp.
Biochem. Physiol., 46B, 253-256.
Rodgers, P. E. W. (1980) In "Honey: A Comprehensive Survey", Ed. Crane, E.
pp. 314-328, Pub. Heinmann, London.
Salama, H. S. and Rizk, A. M. (1969) J. Insect Physiol., 15,1873.
Saleh, M. and Salama, H. S. (1971) J. Insect Physiol., 17,1661-1663.
Sargent, J. R. and George, S. G. (197.5) "Methods in Zone Electrophoresis",
3rd Ed. Pub. BDH Chemicals Ltd., Poole.
Sawyer, R. W. (1975) J. Assoc. Publ. Analysts,. 13,64-71.
Sawyer, R. W. (1981) "Pollen Identification for Beekeepers", Ed. Pickard, R. S.
Pub. Univ. College Cardiff Press, Cardiff.
Schade, J. E., Marsh, G. L. and Eckert, J. E. (1958) Fd. Res., 23(9), 446-
463.
Schepartz, A. I. (1965) Biochim. Biophys. Acta, 26,334-336.
Schepartz, A. I. (1966a) Biochim. Biophys. Acta, L18,637-640.
Schepartz, A. I. (1966b) J. Apic. Res., 5(3), 167-176.
Schepartz, A. I. and Subers, M. H. (1964) Biochem. Biophys. Acta, ý5,
228-237.
Scott, P. M., Coldwell, B. B. and Wilberg, G. S. (1971) Fd. Cosmet. Toxicol.,
9,179-184.
Schuette, H. A. and Baldwin, C. R. Jr. (1944) Fd. Res., 2., 244-249.
Schuette, H. A. and Hueniuk, D. J. (1937) Fd. Res.,. j, 529-538.
Schuette, H. A. and Remy, K. (1932) J. Amer. Chem. Soc., 54,2909-2913.
Schuette, H. A. and Templin, V. (1930) J. Assoc. Off. Agric. Chem., 2: 3,
136-142.
Schuette, H. A. and Triller, R. E. (1938) Fd. Res.,. 1(5), 543-547.
Schuette, H. A. and Woessner, W. W. (1939) Fd. Res.,. L(4), 349-353.
Seera, B. J. and Gomez, P. A. (1986) Aliment. Equipos Technol.,. 1(4),
143-147; Chem. Abst., 106,4020m.
Shannon, F. L. (1916) J. Assoc. Off. Agric. Chem., . 1,169-174.
Shellard, E. J. and Jolliffe, G. H. (1968) J. Chrom., 18,257-266.
Sherwood, J. (1924) J. Assoc. Off. Agric. Chem., 2., 345-349.
Shuel, R. W. (1982) "The Production of Nectar", pp. 265-278 in "The
Hive and the Honeybee", Ed. and Pub. Dadant, and Sons, Hamilton,
Illinois.
327.
Siddiqi, M. A. (1981) M. Sc. Thesisq University of Salford, Salford.
Siddiqui, I. R. (1970). Adv. Carbohydr. Chem. Biochem., 25,285-309.
Siddiqui, I. R. and Furgala, B. (1967) J. Apic. Res., A(3), 139-145.
Siddiqui, I. R. and Furgala, B. (1968) J. Apic. Res.,. 1(1), 51-59.
Sims, D. (1984) Bee Wld., 65(l), - 6-12.
Smith, F. G. (1980). In "Honey: A Comprehensive Survey", Ed. Crane, E.,
pp. 106-114, Pub. Heinmann, London.
Smith, 1. (1976) "Chromatographic and Electrophoretic Techniques",
. 4th Ed. Vol. II, William Heinemann, Medical Books Ltd., London.
Smith, I. and Seakins, J. W. T. (1976) "Chromatographic and Electrophoretic
Techniques", 4th Ed. Vol. 1, William Heinemann Medical Books Ltd.,
London.
Speer, K. and Montag, A. (1986) Dtsch. Lebensm. -Rundsch., 82(8),
248-53; Chem. Abst., 105,224923c.
Srivastava, P. N. and Varshney, R. K. (1966) Ent. Exp. and Appl.,
209-212.
Stadelmeier, M. and Bergner, K. G. (1986) Z. Lebensm, -Unters. Forsch.,
- 182(3), 196-199; Chem. Abst., 104,164139u.
Stanley, R. G. and Linskens, H. F. (1974) "Pollen", Pub. Springer-Verlag,
Berlin.
Steinkraus, K. H., Morse, R. A., Minh, H, V., Mendoza, B. V. and Laigo, F. M. (1971 ) Bee Wld., 52(3), 122-127.
Steyn, D. G. (1973) Internal Journal, Pub. University of Pretoria,
South Africa. Ex. quoted by Croft, L. R., (1987) Honey and Health.
Pub. Thorsons Publishing Group, Rochester.
Takenaka, T. and Echigo, T. (1975) Bull. Fac. Agr. Tamagawa Univ.,
15,30-36.
Takenaka, T. and Echigo, T. (1978) Tamagawa Daigaku Nogakubu Kenkyu
Hokoku, 18,22-31; Chem. Abst., 91,86208n.
Thawley, A. R. (1969) Bee Wld., 50(2), 51-60.
Tillmans, J. and Kiesgen, J. (1927) Z. Unters. Lebensm., 53,131-137.
Todd, F. E. and Bretherick, D. (1942) J. Econ. Ent., 35,312-313.
Townsend, G. F. (1980) In "Honey: A Comprehensive Survey", Ed. Crane, E.
pp. 269-292, Pub. Heinmann, London.
Turner, J. C. and Clinch, P. G. (1968) NZ. Jl. Sci., 11,342-345.
Vansell, G. H. and Freeborn, S. B. (1929) J. Econ. Entomol., 22,922-927.
328.
Varis, A. L., Helenius, J. and Koivulehto,. D. (1982) J. Sci. Agric. Soc.,
54,403-420.
Vavruch, 1. (1952) Chemicke Listy,, A6(2), 116-117. Ex. Siddiqi, (1981).
Virtanen, A. I. and Kari, S. (1955) Acta. Chem. Scand., . 1,1548-1551.
Vorwohl, G. (1968) Z. Bienenforsch., 9(5), 232-236. Ex. White, (1980).
Wakhle, D. M. and Desai, D. B. (1983) "In Proceedings of the Second
International Conference on Apiculture in Tropical Climate", New
Delhi, pp. 703-710. Apic. Abst., (1985). 26(3), 782/85.
Wang, X., Deng, S., Wu, L., Yang, j,,, Gao, L., Wang, H., Zhou, L. and Ma, Y. (1985) Zhougyao Tongbao,.. 10(2), 78-80; Chem. Abst., 103,
57184r.
Washington, R. J. (1966) Ph. D. Thesis, University of Salford, Salford.
Washington, R. J., Croft, L. R. and Mistry, R. P. (1986) - Report to the 'International Bee Research Association', Cardiff.
Watanabe, T. and Aso, K. (1960) Tohoku J. Agric. Res., 11,109-115.
Weber, M. O. (1982) Apidologie, 13(4), 369-381.
Weber, K. and Osborn, M. (1969) J. Biol. Chem., L44(16), 4406-4412.
White, J. W. Jr. (1969) J. Assoc. Off. Anal. Chem., 12,729-737. Ex.
White, (1978).
White, J. W. Jr. (1973) Toxic Honeys in "Toxicants Occurring Naturally
in Foods", pp. 495-507. Comm. Food Proct. Natl. Acad. Aci.,
Washington, D. C.
White, J. W. Jr. (1978) Adv. Fd. Res., 24.
White, J. W. Jr. (1980a) Bee Wld., 61(l), 29-37.
White, J. W. Jr. (1980b) J. Assoc. Off. Anal. Chem., 63(l), 11-18.
White, J. W. Jr. (1980c) Chapter 5, in "Honey: A Comprehensive'Survey",
Ed. Crane, E., pp. 157-206, Pub. Heinmann, London.
White, J. W. Jr. (1980d) Chapter 6 in "Honey: A Comprehensive Survey",
Ed. Crane, E., pp. 207-239, Pub. Heinmann, London.
White, J. W. Jr. (1981) Bee Wld., 62(l), 23-28.
White, J. W. Jr. (1983) J. Assoc. Off. Anal. Chem., ý6(1), 1-3.
white, J. W. Jr. and Doner, L. W. (1978) J. Apic. Res., 17(2), 94-99.
White, J. W. Jr. and Hoban, N. (1959) Arch. Biochem. Biophys., 80(2),
386-392.
White, J. W. Jr. and Kushnir, 1. (1966) Anal. Biochem., 16,302-313.
White, J. W. Jr. and Kushnir, I. (1967a) J. Apic. Res., ý(2), 69-89.
329.
White, J. W. Jr. and Kushnir, I. (1967b) J. Apic. Res., A(3), 163-178.
White, J. W. Jr., Kushnir, I. and Subers, M. H. (1964) Fd. Technol.,
18(4), 153-156.
White, J. W. Jr. and Maher, J. (1953) Arch. Biochem. Biophys., 42,
360-367.
White, J. W. Jr., Meloy, R. W., Probst, J. L. and Huser, W. F. (1986) J.
Assoc. Off. Anal. Chem., 69(4), 652-654; ý Chem. Abst., 105,113748e.
White, J. W. Jr. and Robinson, F. A. (1983). J. Assoc. Off. Anal. Chem., 66(l), 1-3.
White, J. W. Jr. and Rudyj, O. N. (1978) J. Apic. Res., 17(4), 234-238.
White, J. W. Jr., Riethof, M. L., Subers, M. H. and Kushnir, 1. (1962)
Tech. Bull. U. S. Dept. Agric., No. 1261.
White, J. W. Jr. and Siciliano, J. (1980) J. Assoc. Off. Anal. Chem.,
63(l), 7-10.
White, J. W. Jr. and Subers, M. H. (1964) J. Food. Sci., 29,819-828.
Wiley, H. W. (1892) Bull. U. S. Agric. Div. Chem., No. 13(6), 633-874.
Willson, R. B. (1980) In "Honey: A Comprehensive Survey", Ed. Crane, E.,
pp. 355-377, Pub. Heirmann, London.
Willson, R. B. and Crane, E. (1980) Chapter 15, In "Honey: A Comprehensive
Survey", Ed. Crane, E. pp. 378-390, Pub. Heinmann, London.
Winkler, 0. (1955) Z. Lebensm. -Untersuch. -Forsch., 102(3), 161-167.
Ex. White, (1978).
Wootton, M., Edwards, R. A. and Faraji-Haremi, R. (1976) J. Apic. Res.,
15(l), 29-34.
Wootton, M., Faraji-Haremi, R. and Johnson, A. T. (1976) J. Apic. Res.,
15(l), 23-28.
World Honey Crop Reports, No. 21 (1984) Bee Wld., 65(2), 58-61.
World Honey Crop Reports, No. 22 (1985) Bee Wld., 131-133.
Zalewski, W. (1965) Pszczelnicze Zesz. Nauk.,. 1(1-2), 1-34. Ex. White,
(1978).
Zhu, J. and Jiang, H. (1982) Linye Kexue, 18(l), 80-84; Chem. Abst.,
97,52500k.

APPENDICES
330.
APPENDIX I
LIST OF HONEY SAMPLES
Honey samples listed in Table IA are those obtained within
the United Kingdom survey and were received over a period of
12 months commencing from October 1981 to October 1982. However,
several samples were still being received upto September 1983
from members of the British Beekeepers Association. There were
192 honey samples eventually available for analysis and these were
catalogued.
In Table IA:
Column one = the questionnaire number allocated to each
individual beekeeper.
Column two = the approximate location of the hive as
supplied by the beekeeper.
Column three - the map grid reference of the hive.
Column four the code number allocated to each sample
and serves to identify the sample throughout
the analysis.
Honey samples listed in Table IB are those of foreign origin
or as specified on the label. Nearly all these samples were
commercially processed either at port of shipment or at the U. K.
packers. There were 64 samples available for analysis and these
were catalogued.
331.
In Table IB:
Column one = the name and country of origin of a honey
sample.
Column two = the name of the packer or the supplier as
specified on the label or the name of the
donator.
Column three - the code number allocated to each sample and
serves to identify the sample throughout the
analysis.
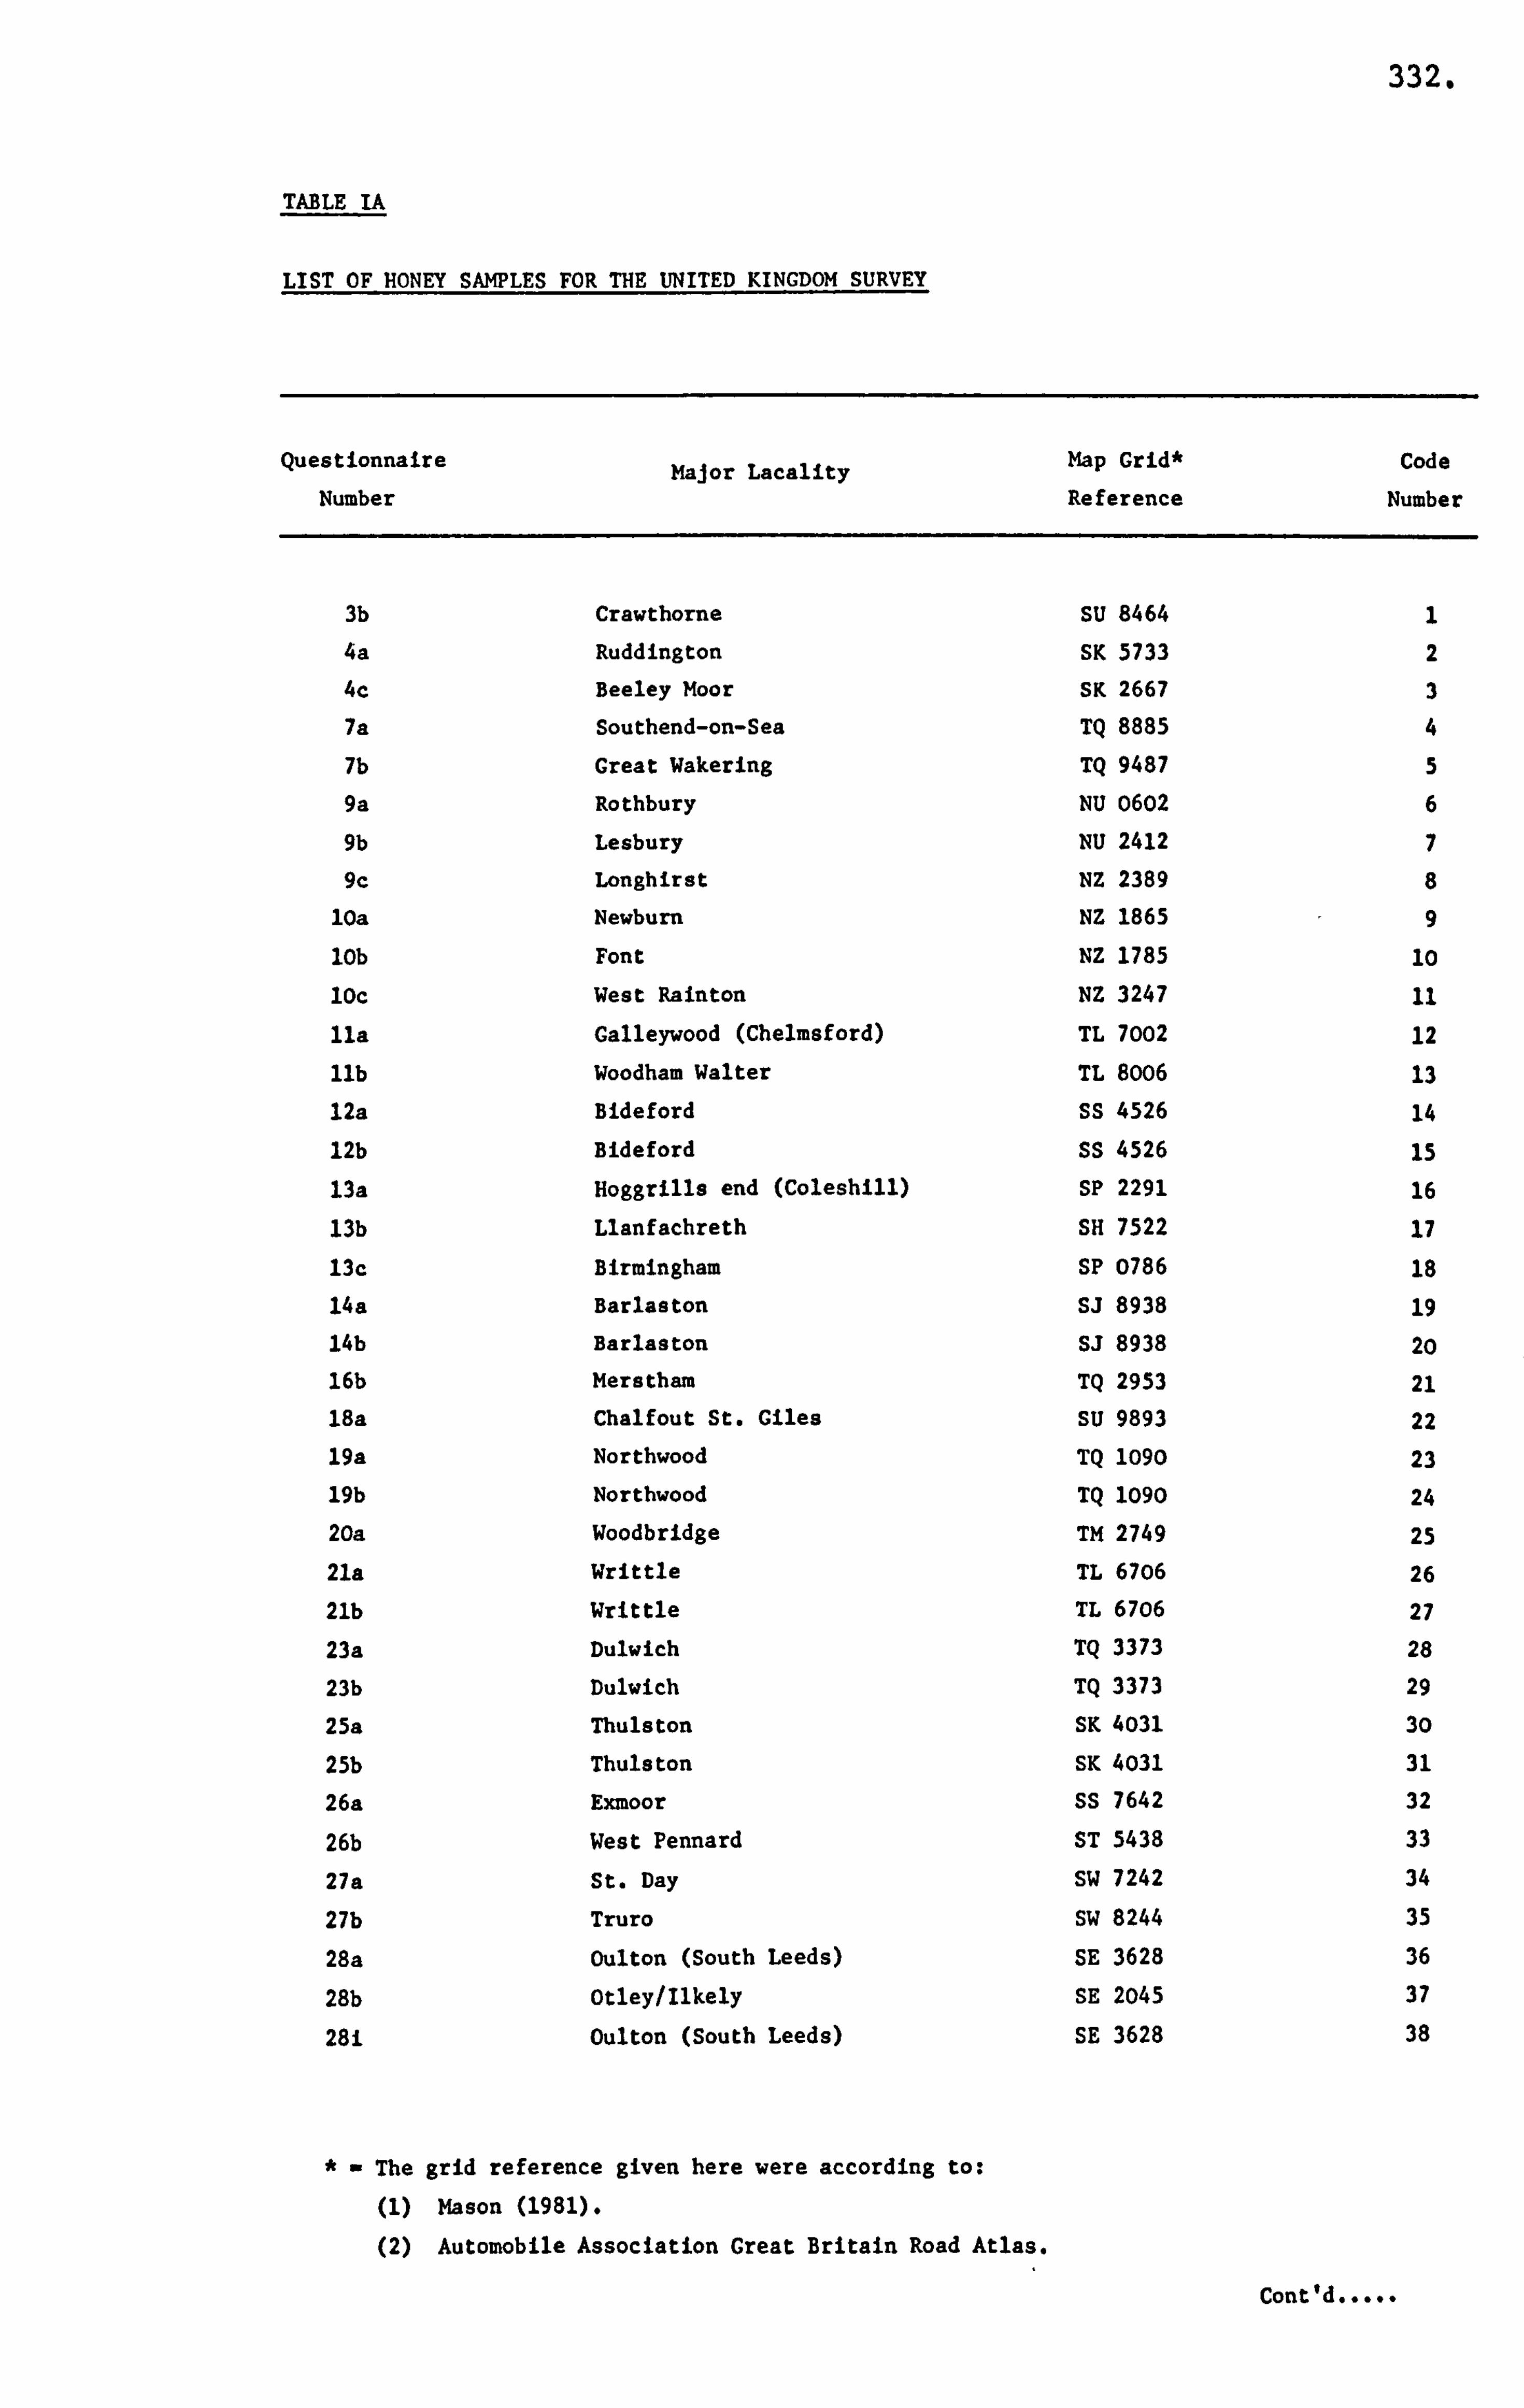
332.
TABLE IA
LIST OF HONEY SAMPLES FOR THE UNITED KINGDOM SURVEY
Questionnaire Major Lacality Map Grid* Code Number Reference Number
3b Crawtborne SU 8464
4a Ruddington SK 5733 4c Beeley Moor SK 2667
7a Southend-on-Sea TQ 8885
7b Great Wakering TQ 9487
9a Rothbury NU 0602
9b Lesbury NU 2412
9c Longhirst NZ 2389
10a Newburn NZ 1865
10b Font NZ 1785
loc West Rainton NZ 3247
lla Galleywood (Chelmsford) TL 7002
llb Woodham Walter TL 8006
12a Bideford SS 4526
12b Bideford Ss 4526
13a Hoggrills end (Coleshill) SP 2291
13b Llanfachreth SH 7522
13c Birmingham SP 0786
14a Barlaston SJ 8938
14b Barlaston SJ 8938
l6b Merstham TQ 2953
18a Chalfout St. Giles SU 9893
19a Northwood TQ 1090
19b Northwood TQ 1090
20a Woodbridge TM 2749
21a Writtle TL 6706
21b Writtle TL 6706
23a Dulwich TQ 3373
23b Dulwich TQ 3373
25a Thulston SK 4031
25b Thulston SK 4031
26a Exmoor SS 7642
26b West Pennard ST 5438
27a St. Day SW 7242
27b Truro SW 8244
28a Oulton (South Leeds) SE 3628
28b Otley/Ilkely SE 2045
281 Oulton (South Leeds) SE 3628
The grid reference given here were according to: (1) Mason (1981).
(2) Automobile Association Great Britain Road Atlas.
Cont'd
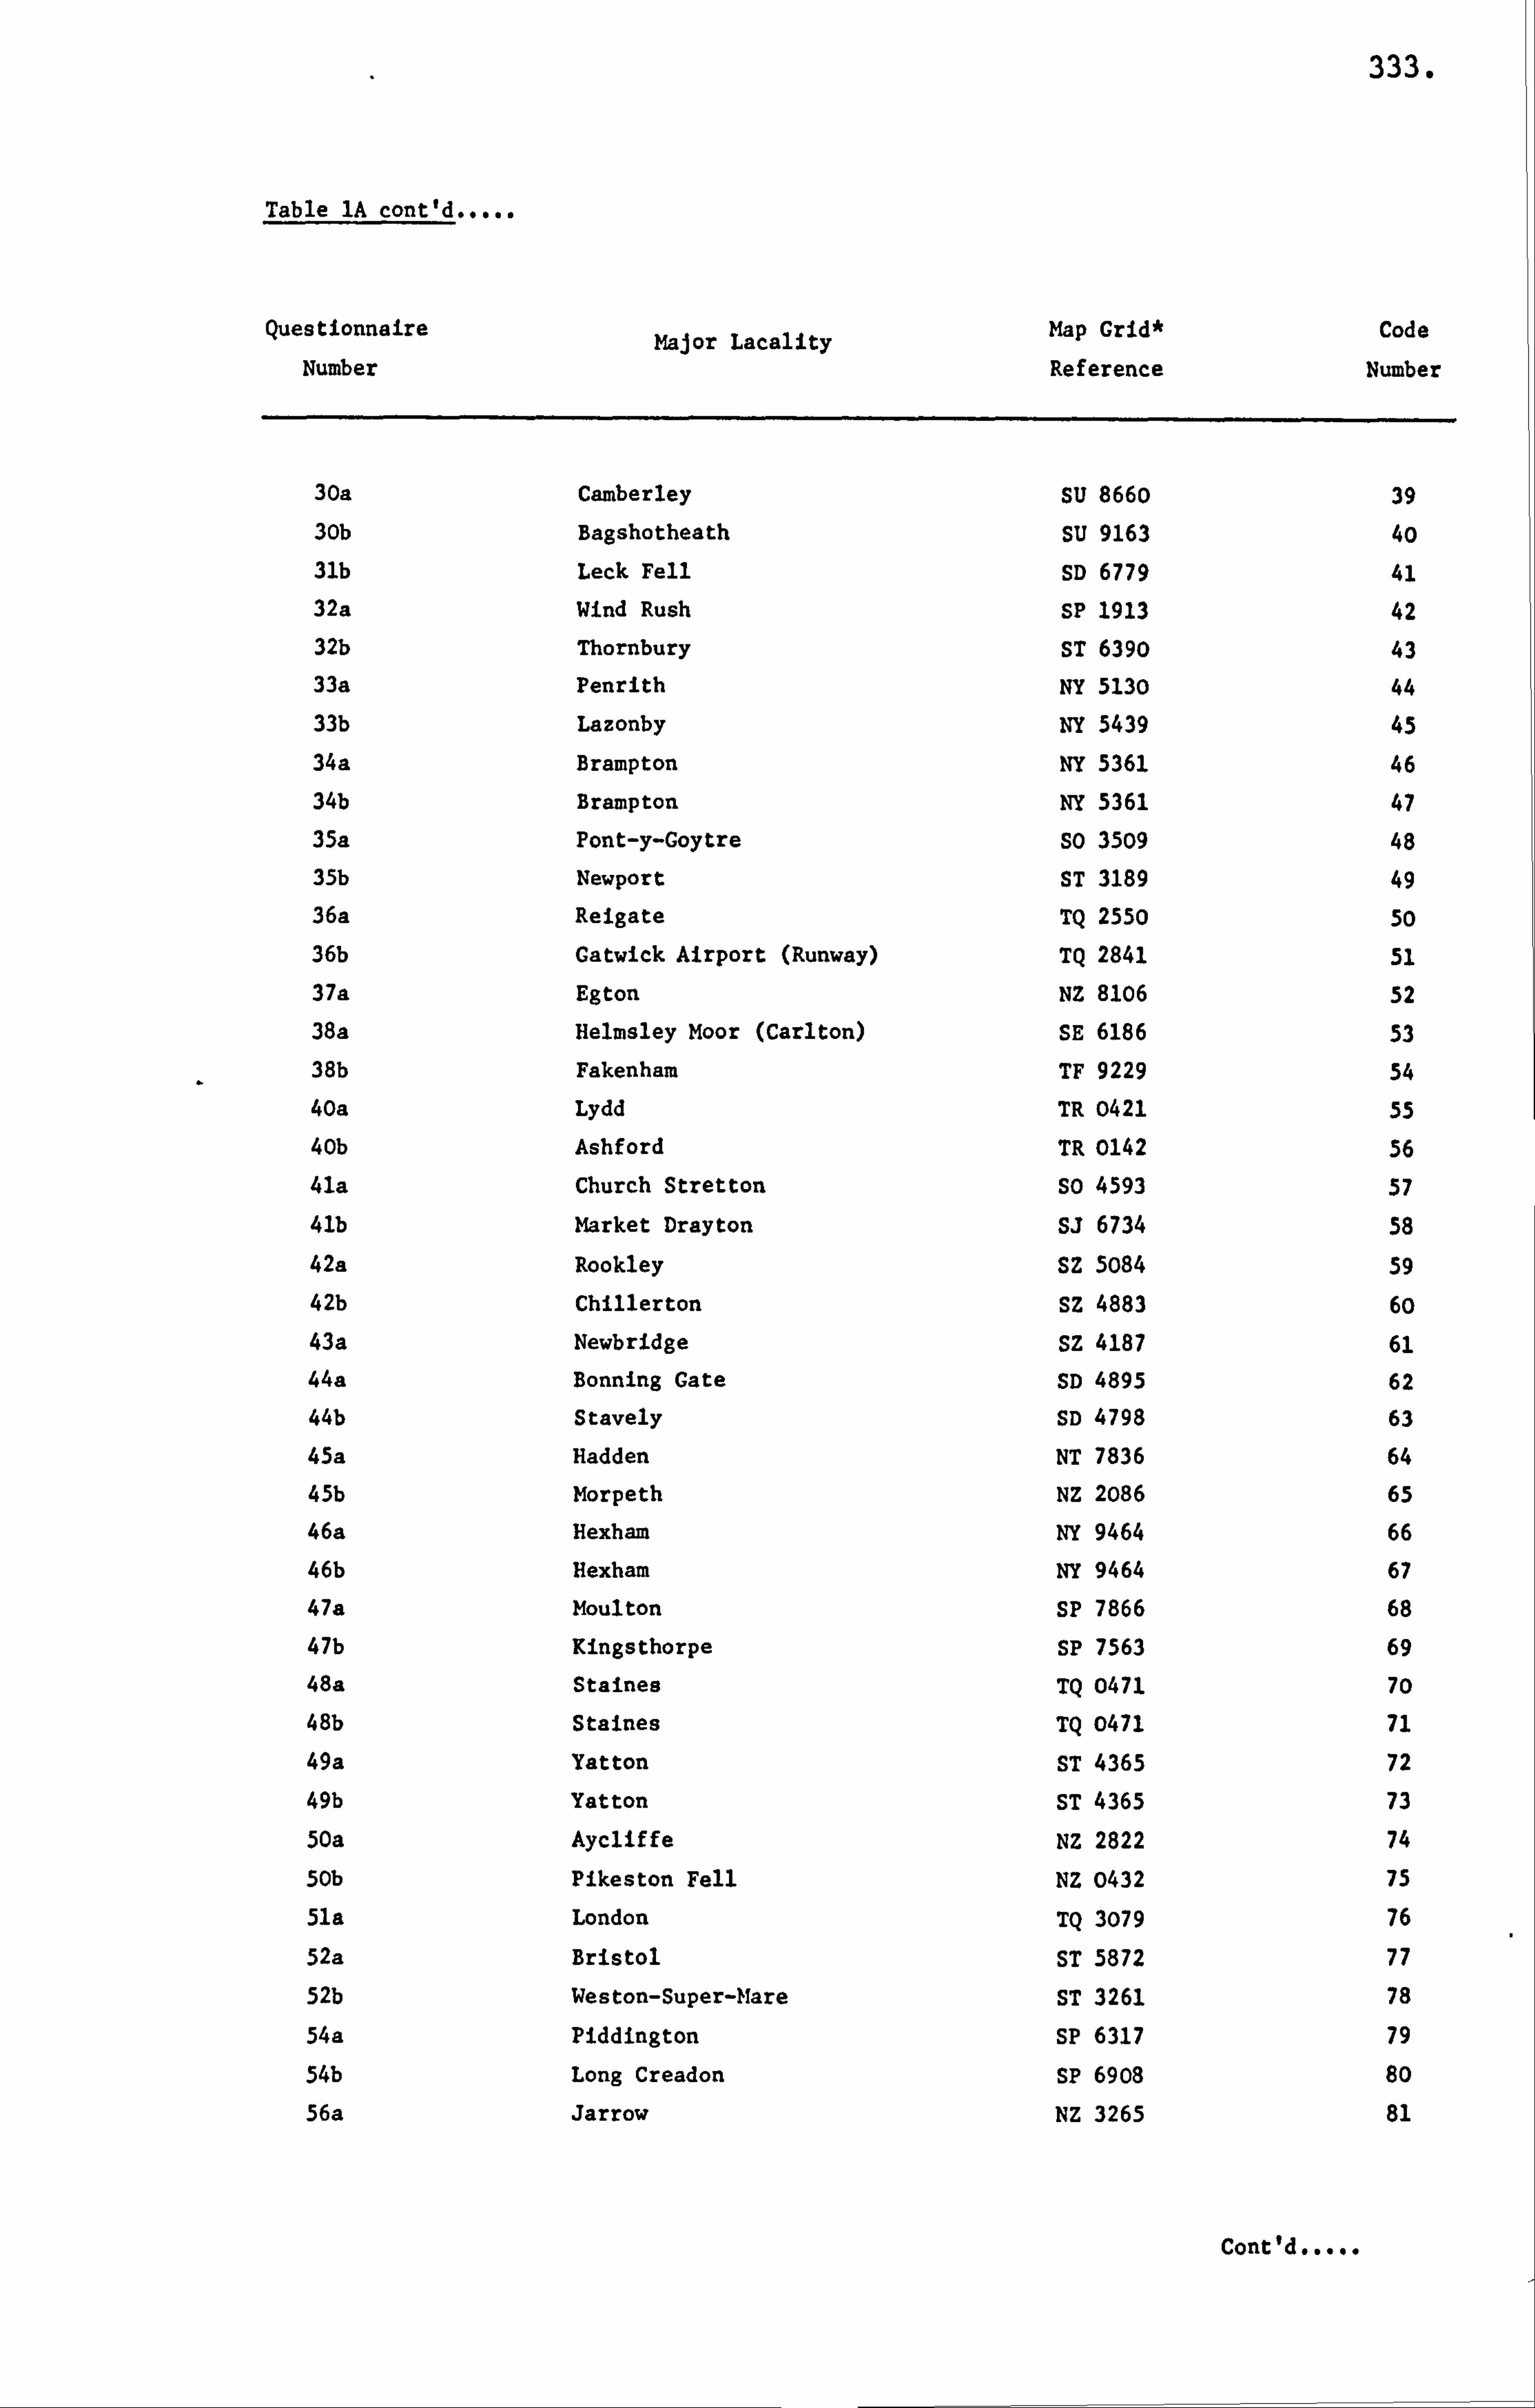
333.
Table 1A cont'd
Questionnaire Major Lacality Map Grid* Code
Number Reference Number
30a Camberley SU 8660 39 30b Bagshotheath SU 9163 0
31b Leck Fell SD 6779 41 32a Wind Rush SP 1913 42 32b Thornbury ST 6390 43 33a Penrith NY 5130 44 33b Lazonby NY 5439 45
34a Brampton NY 5361 46
34b Brampton NY 5361 47
35a Pont-y-Goytre So 3509 48 35b Newport ST 3189 49 36a Reigate TQ 2550 50 36b Gatwick Airport (Runway) TQ 2841 51 37a Egton NZ 8106 52 38a Helmsley Moor (Carlton) SE 6186 53 38b Fakenham TF 9229 54 40a Lydd TR 0421 55 40b Ashford TR 0142 56 41a Church Stretton so 4593 57
41b Market Drayton S3 6734 58
42a Rookley SZ 5084 59 42b Chillerton Sz 4883 60 43a Newbridge Sz 4187 61 44a Bonning Gate SD 4895 62 44b Stavely SD 4798 63
45a Hadden NT 7836 64
45b Morpeth NZ 2086 65
46a Hexham NY 9464 66
46b Hexham NY 9464 67
47a Moulton SP 7866 68
47b Kingsthorpe SP 7563 69
48a Staines TQ 0471 70 48b Staines TQ 0471 71
49a Yatton ST 4365 72
49b Yatton ST 4365 73
50a Aycliffe NZ 2822 74
50b Pikeston Fell NZ 0432 75
51a London TQ 3079 76
52a Bristol ST 5872 77
52b Weston-Super-Mare ST 3261 78
54a Piddington SP 6317 79
54b Long Creadon SP 6908 80
56a Jarrow NZ 3265 81
Cont'd
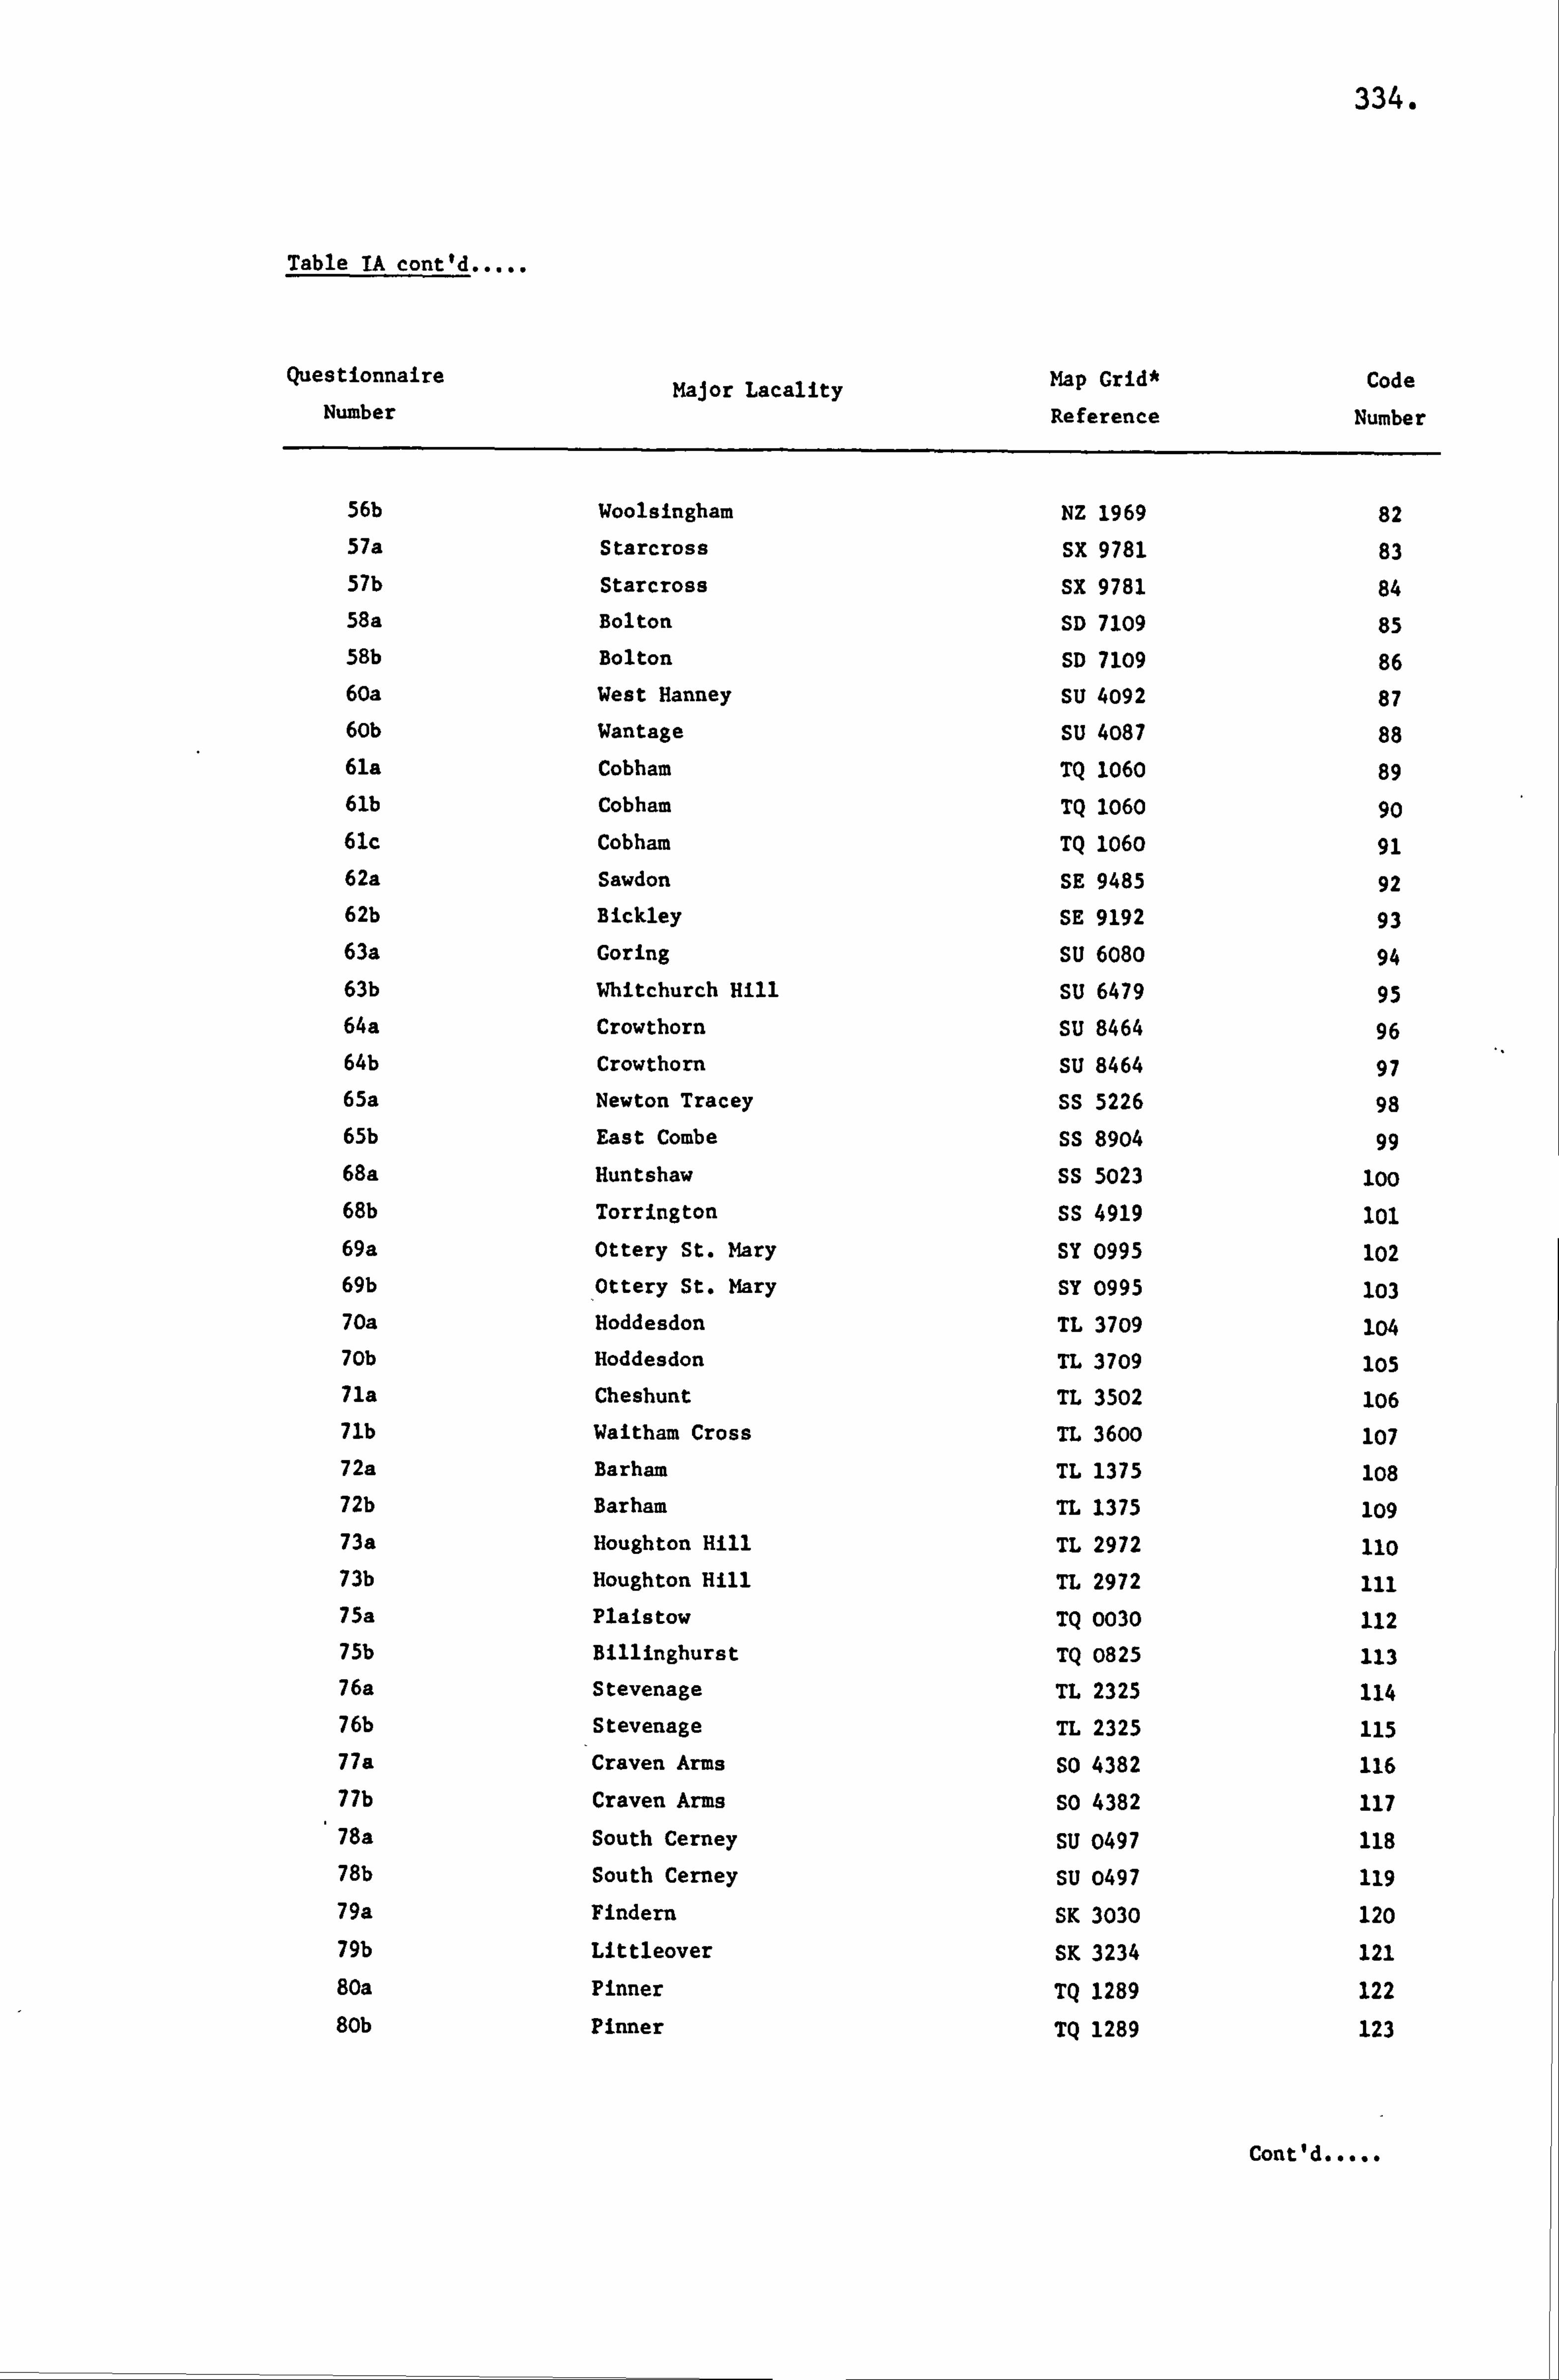
334.
Table TA cont'd
Questionnaire
Number Major Lacality Map Grid*
Reference
Code
Number
56b Woolsingham NZ 1969 82 57a Starcross SK 9781 83 57b Starcross SX 9781 84 58a Bolton SD 7109 85 58b Bolton SD 7109 86 60a West Hanney SU 4092 87 60b Wantage SU 4087 88 61a Cobham TQ 1060 89 61b Cobham TQ 1060 90 61c Cobham TQ 1060 91 62a Sawdon SE 9485 92 62b Bickley SE 9192 93 63a Goring SU 6080 94 63b Whitchurch Hill SU 6479 95 64a Crowthorn SU 8464 96 64b Crowthorn SU 8464 97 65a Newton Tracey SS 5226 98 65b East Combs SS 8904 99 68a Huntshaw SS 5023 100 68b Torrington SS 4919 101 69a Ottery St. Mary SY 0995 102 69b Ottery St. Mary SY 0995 103 70a Hoddesdon TL 3709 104 70b Hoddesdon TL 3709 105 71a Cheshunt TL 3502 106 71b Waitham Cross TL 3600 107 72a Barham TL 1375 108 72b Barham TL 1375 109 73a Houghton Hill TL 2972 110 73b Houghton Hill TL 2972 ill 75a Plaistow TQ 0030 112 75b Billinghurst TQ 0825 113 76a Stevenage TL 2325 114 76b Stevenage TL 2325 115 77a Craven Arms SO 4382 116 77b Craven Arms so 4382 117 78a South Cerney SU 0497 118 78b South Cerney SU 0497 119 79a Findern SK 3030 120 79b Littleover SK 3234 121 80a Pinner TQ 1289 122 80b Pinner TQ 1289 123
Cont'd
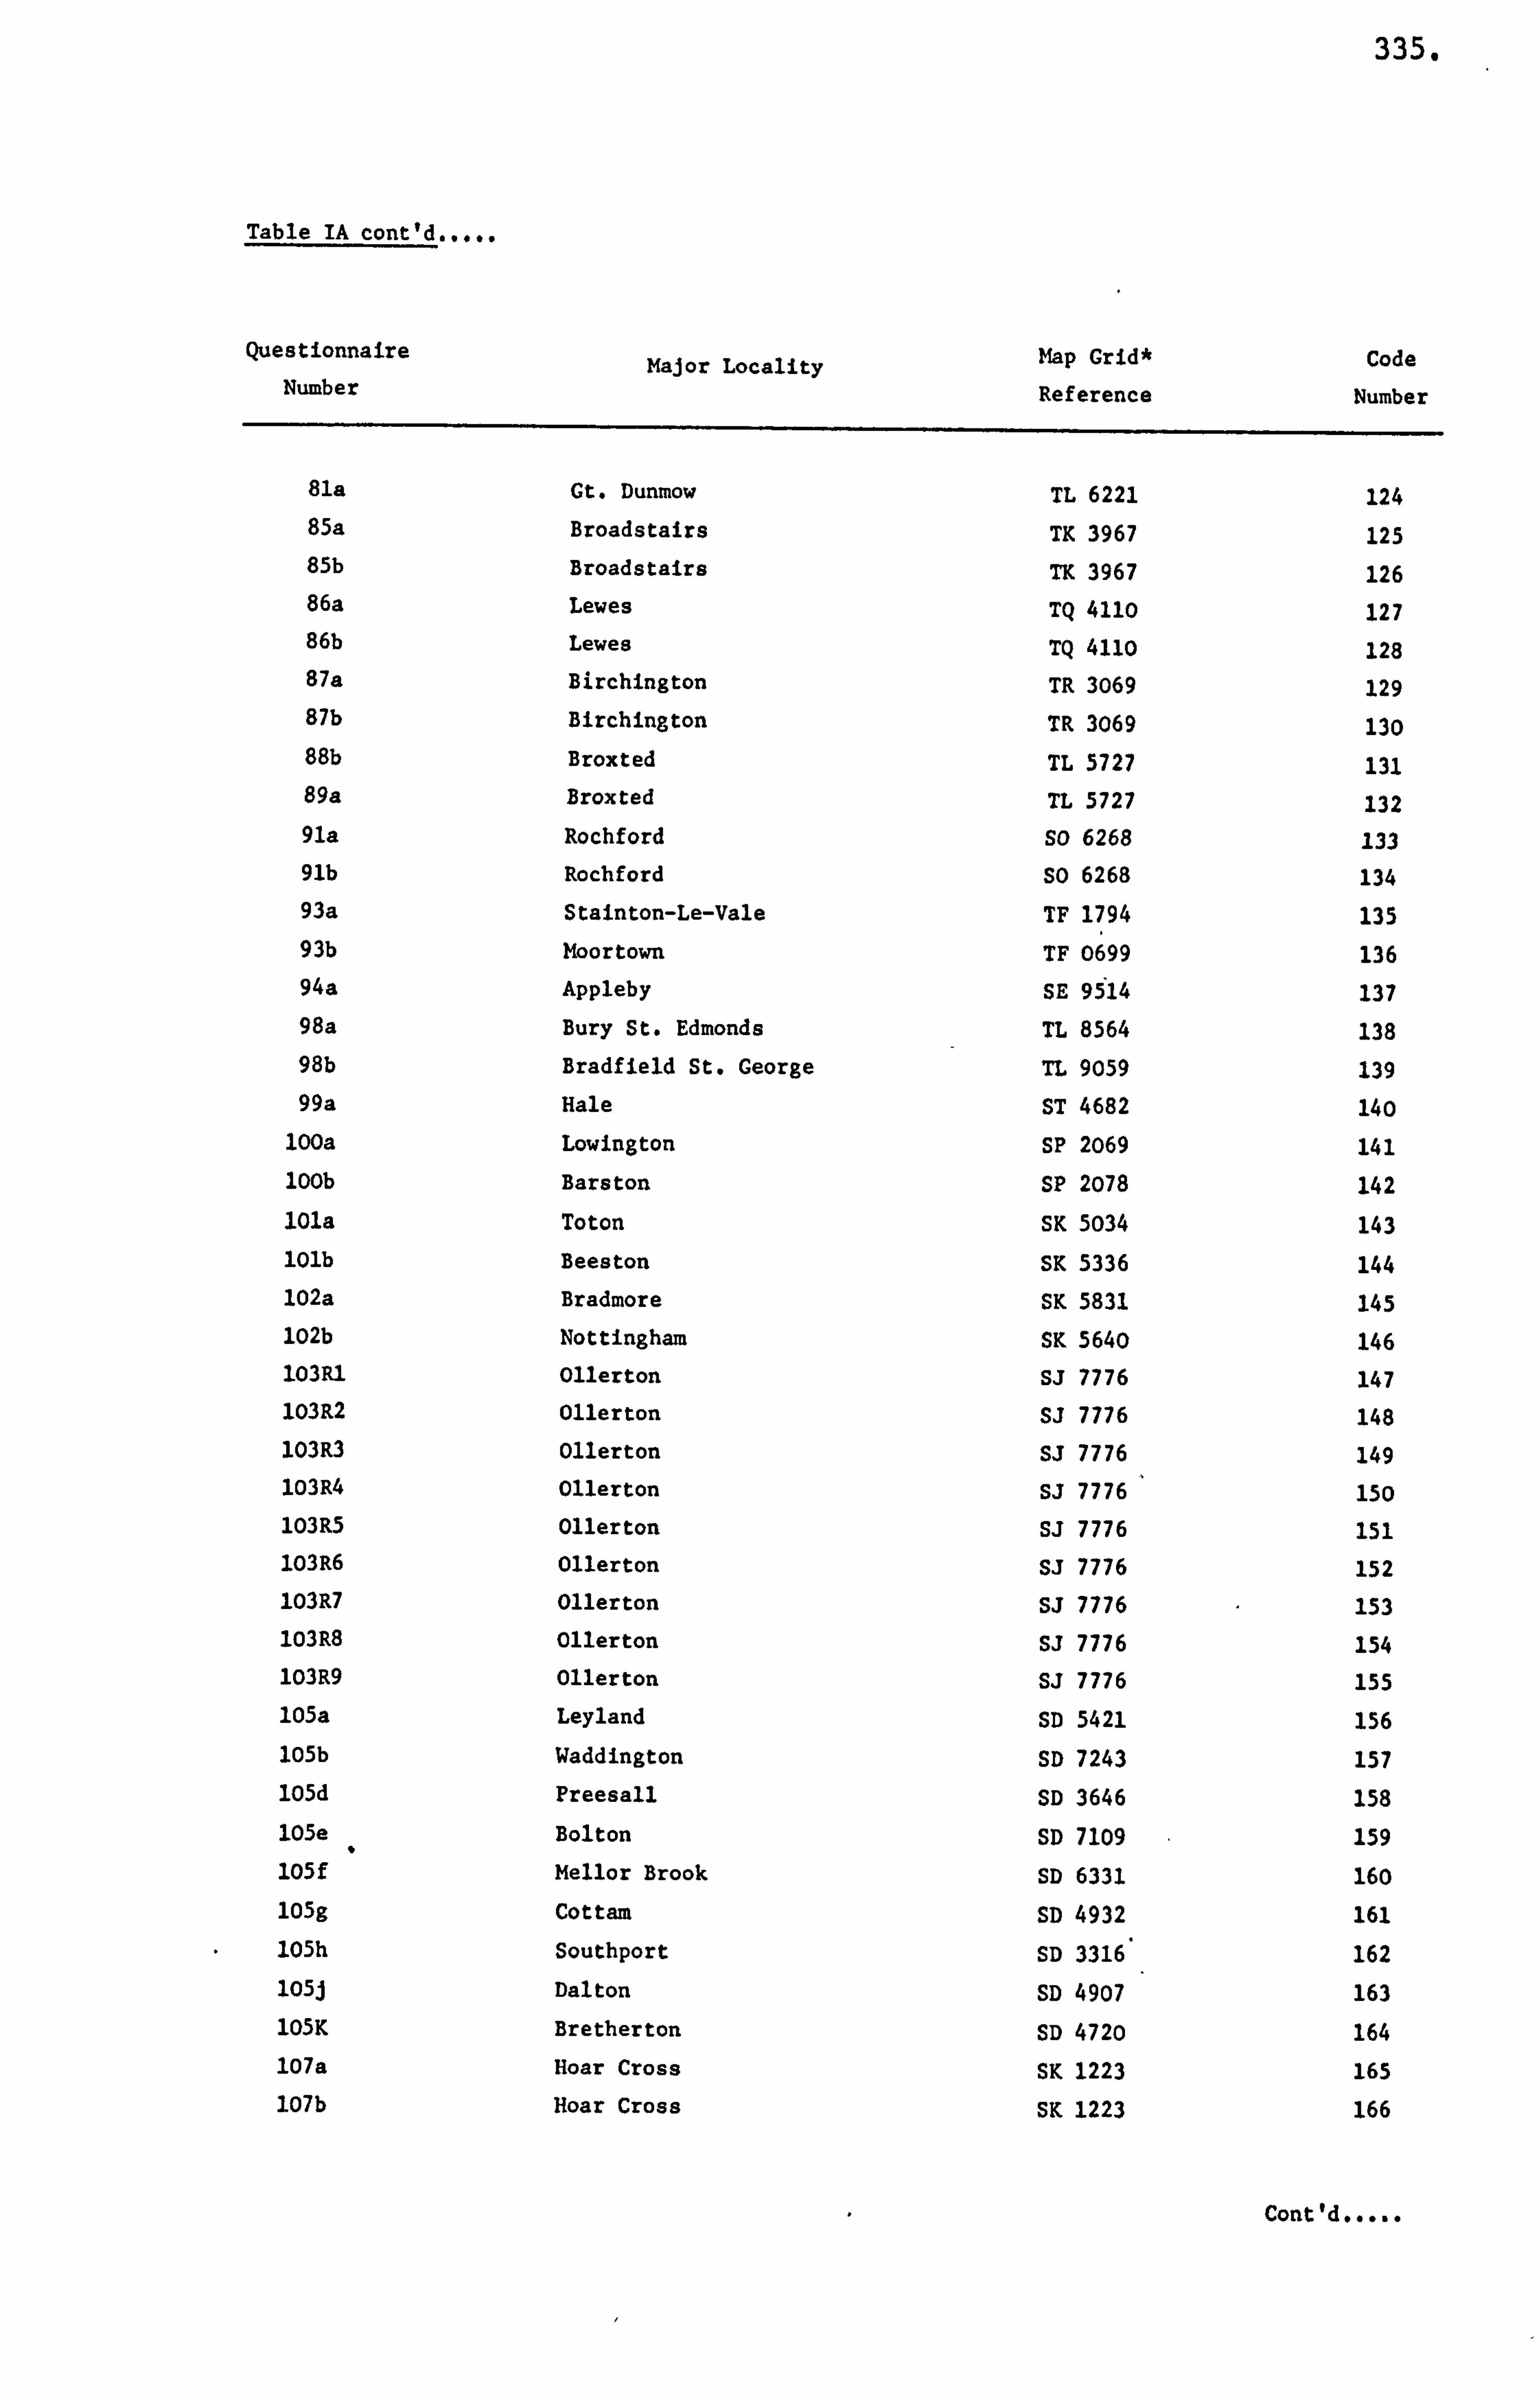
335.
Table IA cont'd
Questionnaire Number
Major Locality Map Grid* Reference
Code Number
81a Gt. Dunmow TL 6221 124 85a Broadstairs TK 3967 125 85b Broadstairs TK 3967 126 86a Lewes TQ 411o 127 86b Lewes TQ 4110 128 87a Birchington TR 3069 129 87b Birchington TR 3069 130 88b Broxted TL 5727 131 89a Broxted TL 5727 132 91a Rochford So 6268 133 91b Rochford so 6268 134 93a Stainton-Le-Vale TF 1794 135 93b Moortown TF 0699 136 94a Appleby SE 9ý14 137 98a Bury St. Edmonds TL 8564 138 98b Bradfield St. George TL 9059 139 99a Hale ST 4682 14o
100a Lowington SP 2069 141 100b Barston SP 2078 142 101a Toton SK 5034 143 101b Beeston SK 5336 144 102a Bradmore SK 5831 145 102b Nottingham SK 5640 146 103R1 Ollerton Si 7776 147 103R2 Ollerton SJ 7776 148 103R3 Ollerton SJ 7776 149 103R4 Ollerton SJ 7776 150 103R5 Ollerton SJ 7776 151 103R6 Ollerton Si 7776 152 103R7 Ollerton SJ 7776 153 103R8 Ollerton SJ 7776 154 103R9 Ollerton SJ 7776 155 105a Leyland SD 5421 156 105b Waddington SD 7243 157 105d Preesall SD 3646 158 105e Bolton SD 7109 159 105f Mellor Brook SD 6331 160 105g Cottam. SD 4932 161 105h Southport SD 3316 162 105J Dalton SD 4907 163 105K Bretherton SD 4720 164 107a Hoar Cross SK 1223 165 107b Hoar Cross SK 1223 166
Cont'd
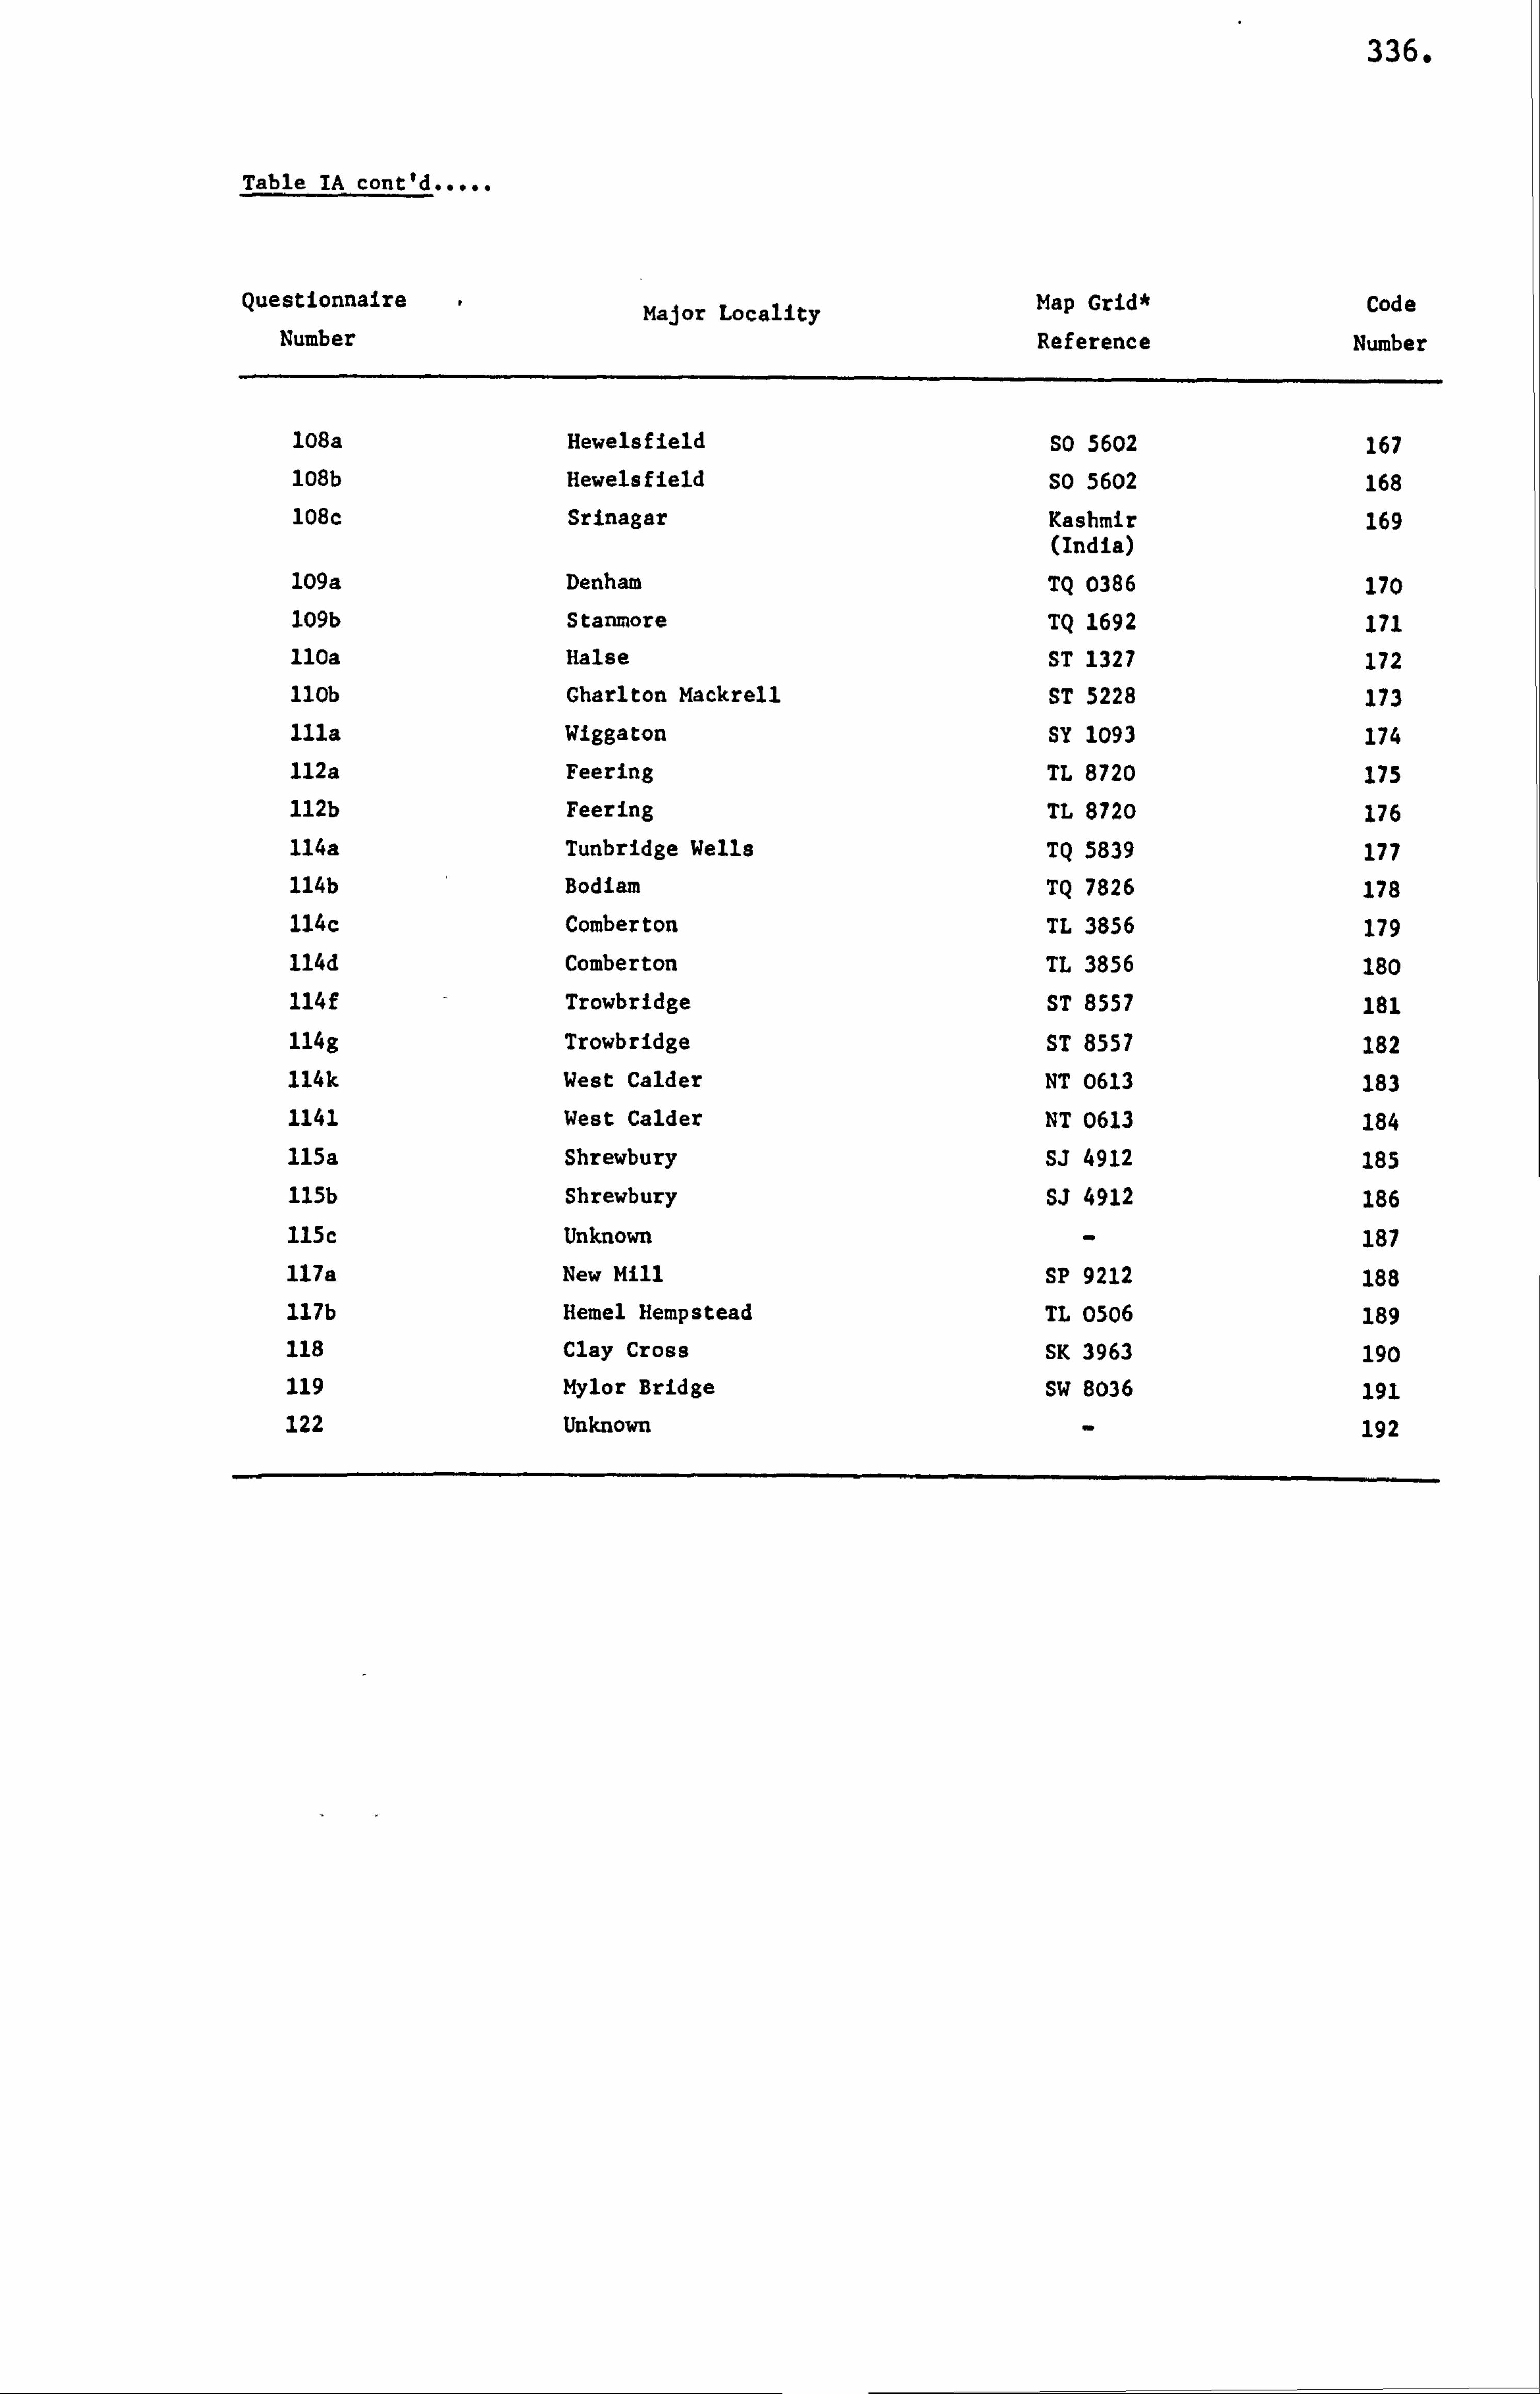
336.
Table IA cont'd
Questionnaire Major Locality Map Grid* Code Number Reference Number
108a Hewelsfield SO 5602 167 108b Hewelsfield SO 5602 168 108c Srinagar Kashmir 169
(India)
109a Denham TQ 0386 170 109b Stamore TQ 1692 171 110a Halse ST 1327 172 110b Charlton Mackrell ST 5228 173 111a. Wiggaton SY 1093 174 112a Feering TL 8720 175 112b Feering TL 8720 176 114a Tunbridge Wells TQ 5839 177 114b Bodiam TQ 7826 178 114c Comberton TL 3856 179 114d Comberton TL 3856 180 114f Trowbridge ST 8557 181 114g Trowbridge ST 8557 182 114k West Calder NT 0613 183 1141 West Calder NT 0613 184 115a Shrewbury SJ 4912 185 115b Shrewbury SJ 4912 186 115C Unknown - 187 117a New Mill SP 9212 188 117b Hemel Hempstead TL 0506 189 118 Clay Cross SK 3963 190 119 Mylor Bridge SW 8036 191 122 Unknown - 192
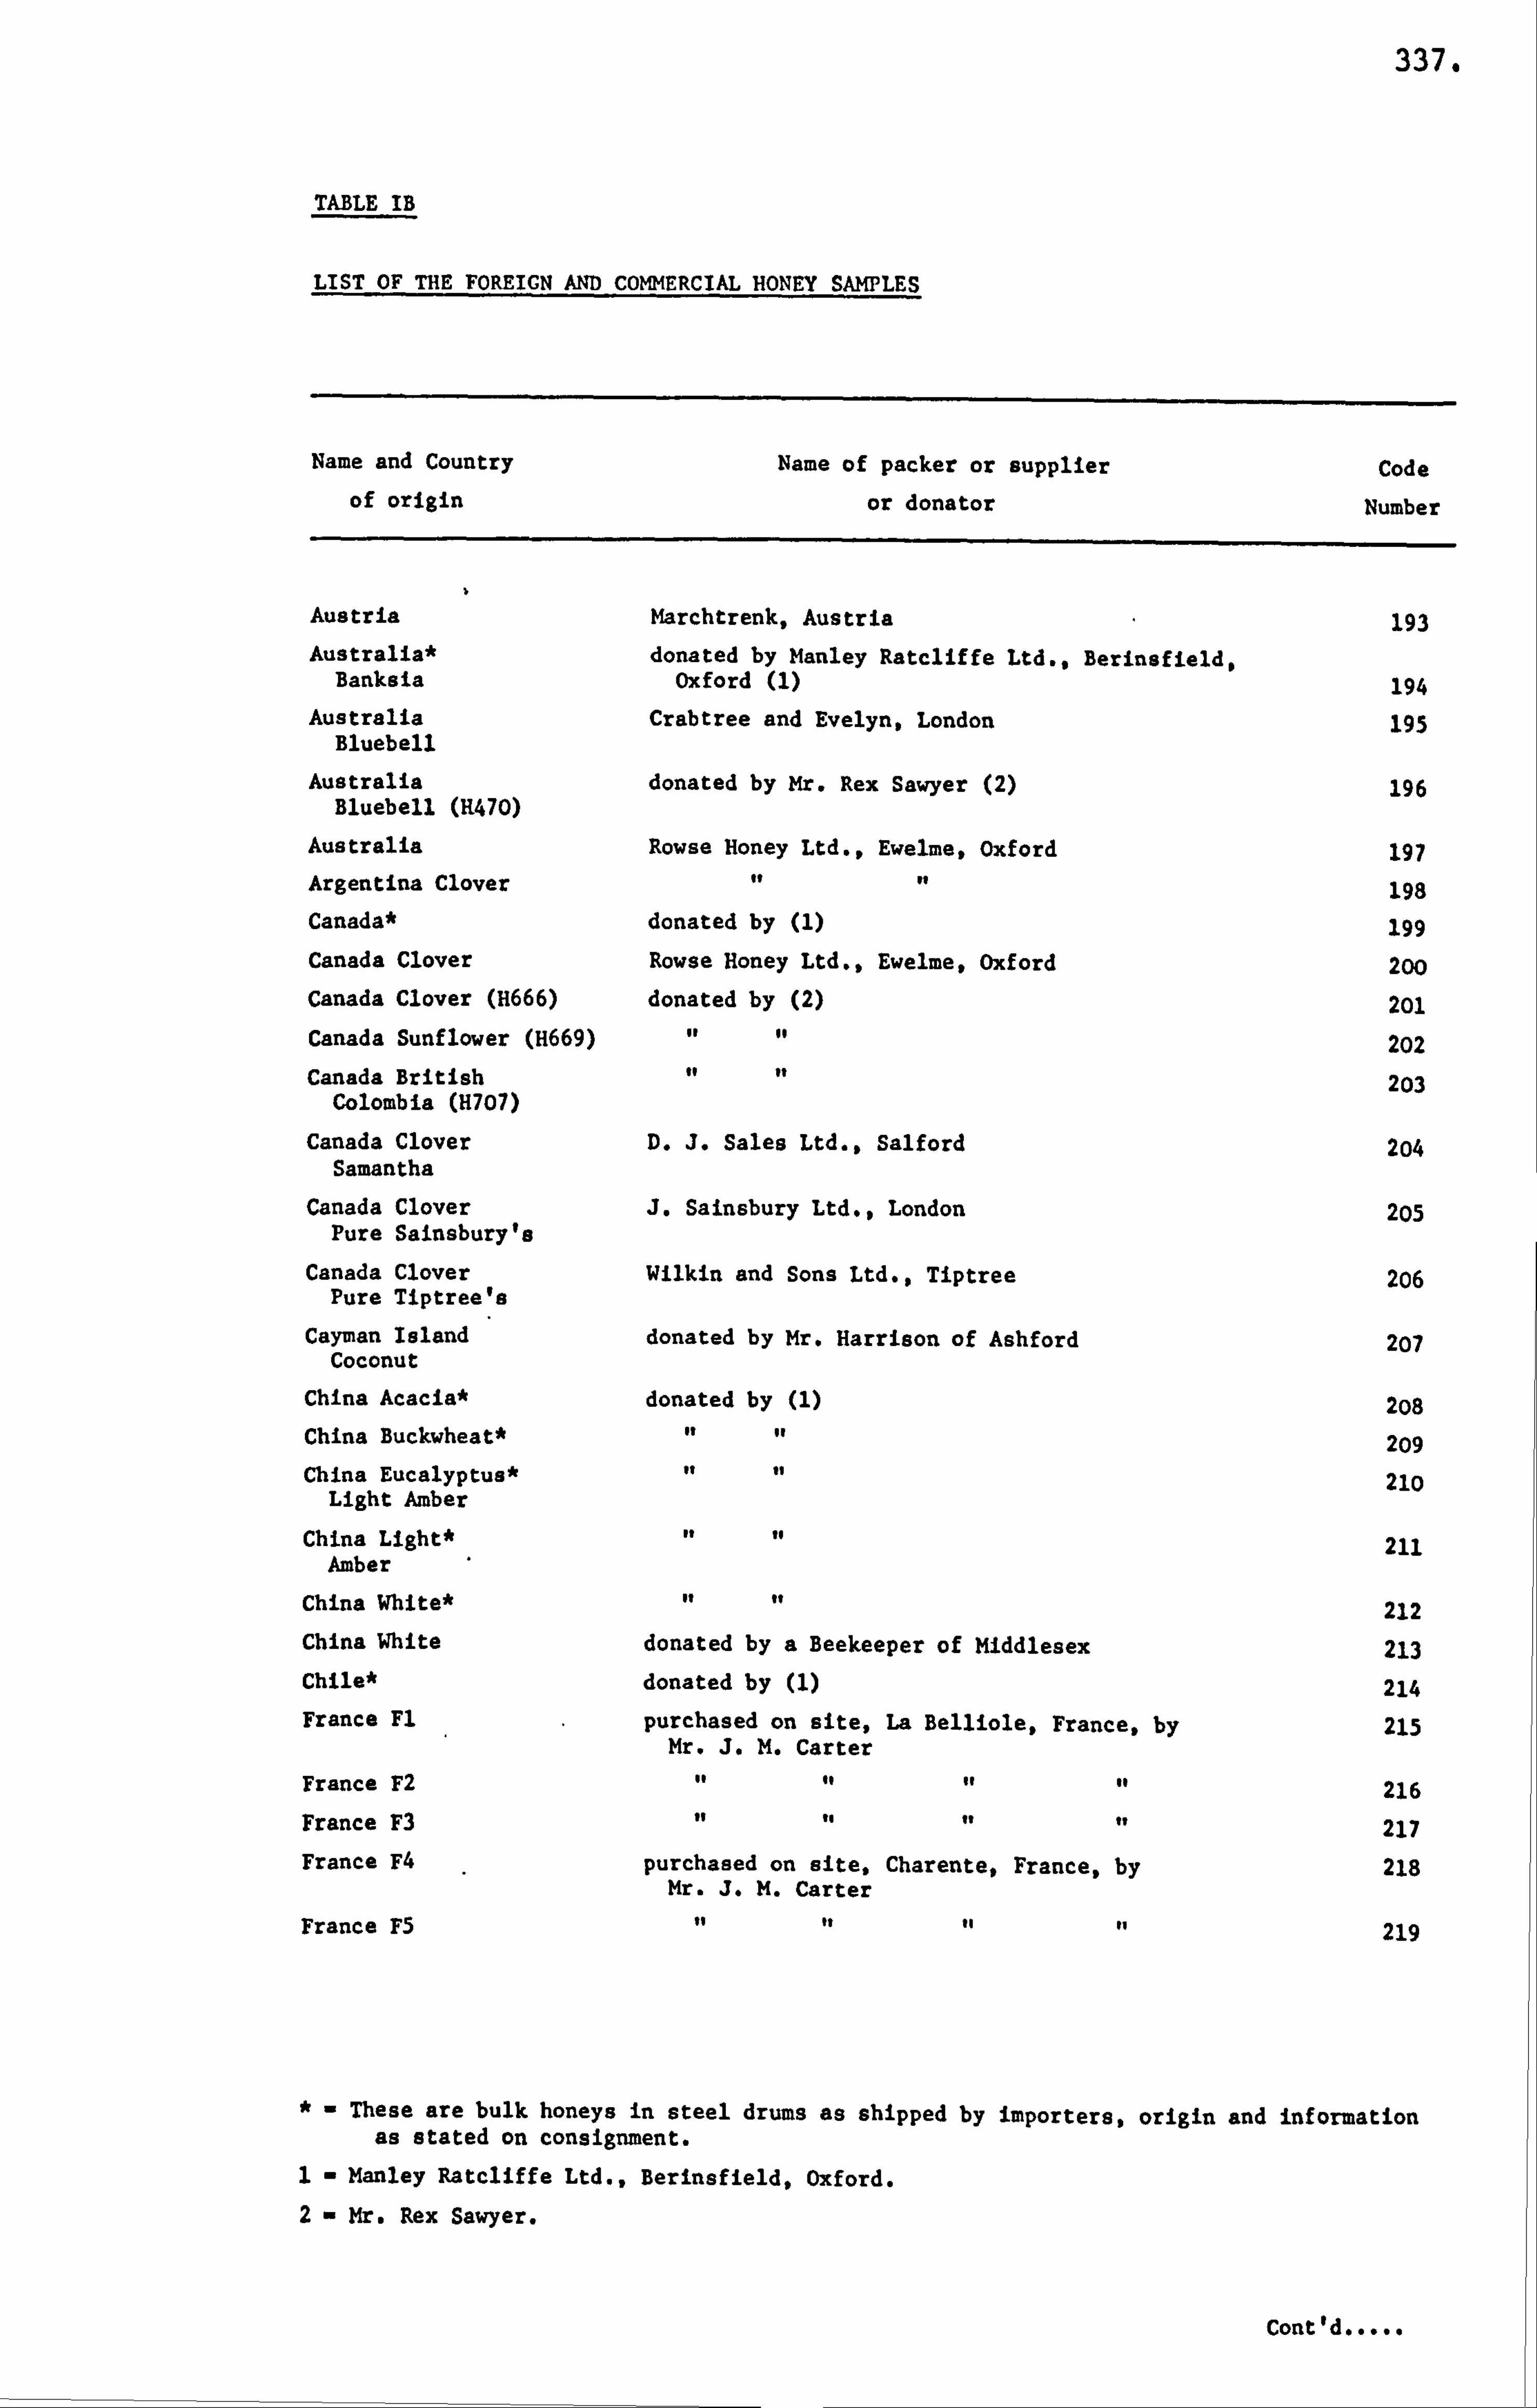
337.
TABLE IB
LIST OF THE FOREIGN AND COMMERCIAL HONEY SAMPLES
Name and Country Name of packer or supplier Code of origin or donator Number
Austria Marchtrenk, Austria 193 Australia* donated by Manley Ratcliffe Ltd., Berinsfield,
Banksia Oxford (1) 194 Australia Crabtree and Evelyn, London 195
Bluebell
Australia donated by Mr. Rex Sawyer (2) 196 Bluebell (H470)
Australia Rowse Honey Ltd., Ewelme, Oxford 197 Argentina Clover to It 198 Canada* donated by (1) 199 Canada Clover Rowse Honey Ltd., Ewelme, Oxford 200 Canada Clover (H666) donated by (2) 201 Canada Sunflower (H669) of of 202 Canada British it of 203
Colombia (H707)
Canada Clover D. J. Sales Ltd,, Salford 2o4 Samantha
Canada Clover J. Sainsbury Ltd., London 205 Pure Sainsbury's
Canada Clover Wilkin and Sons Ltd., Tiptree 206 Pure Tiptree's
Cayman Island donated by Mr. Harrison of Ashford 207 Coconut
China Acacia* donated by (1) 2o8 China Buckwheat* It of 209 China Eucalyptus* of to 21o
Light Amber
China Lightolo 91 to 211 Amber
China Whiteot 212 China White donated by a Beekeeper of Middlesex 213 Chileok donated by (1) 214 France Fl purchased on site, La Belliole, France, by 215
Mr. J. M. Carter
France F2 of It 216 France F3 to to 217 France A purchased on site. Charente, France, by 218
Mr. J. M. Carter
France F5 to tt to It 219
These are bulk honeys in steel drums as shipped by importers, origin and information as stated on consignment.
Manley Ratcliffe Ltd., Berinsfield, Oxford.
Mr. Rex Sawyer.
Cont'd
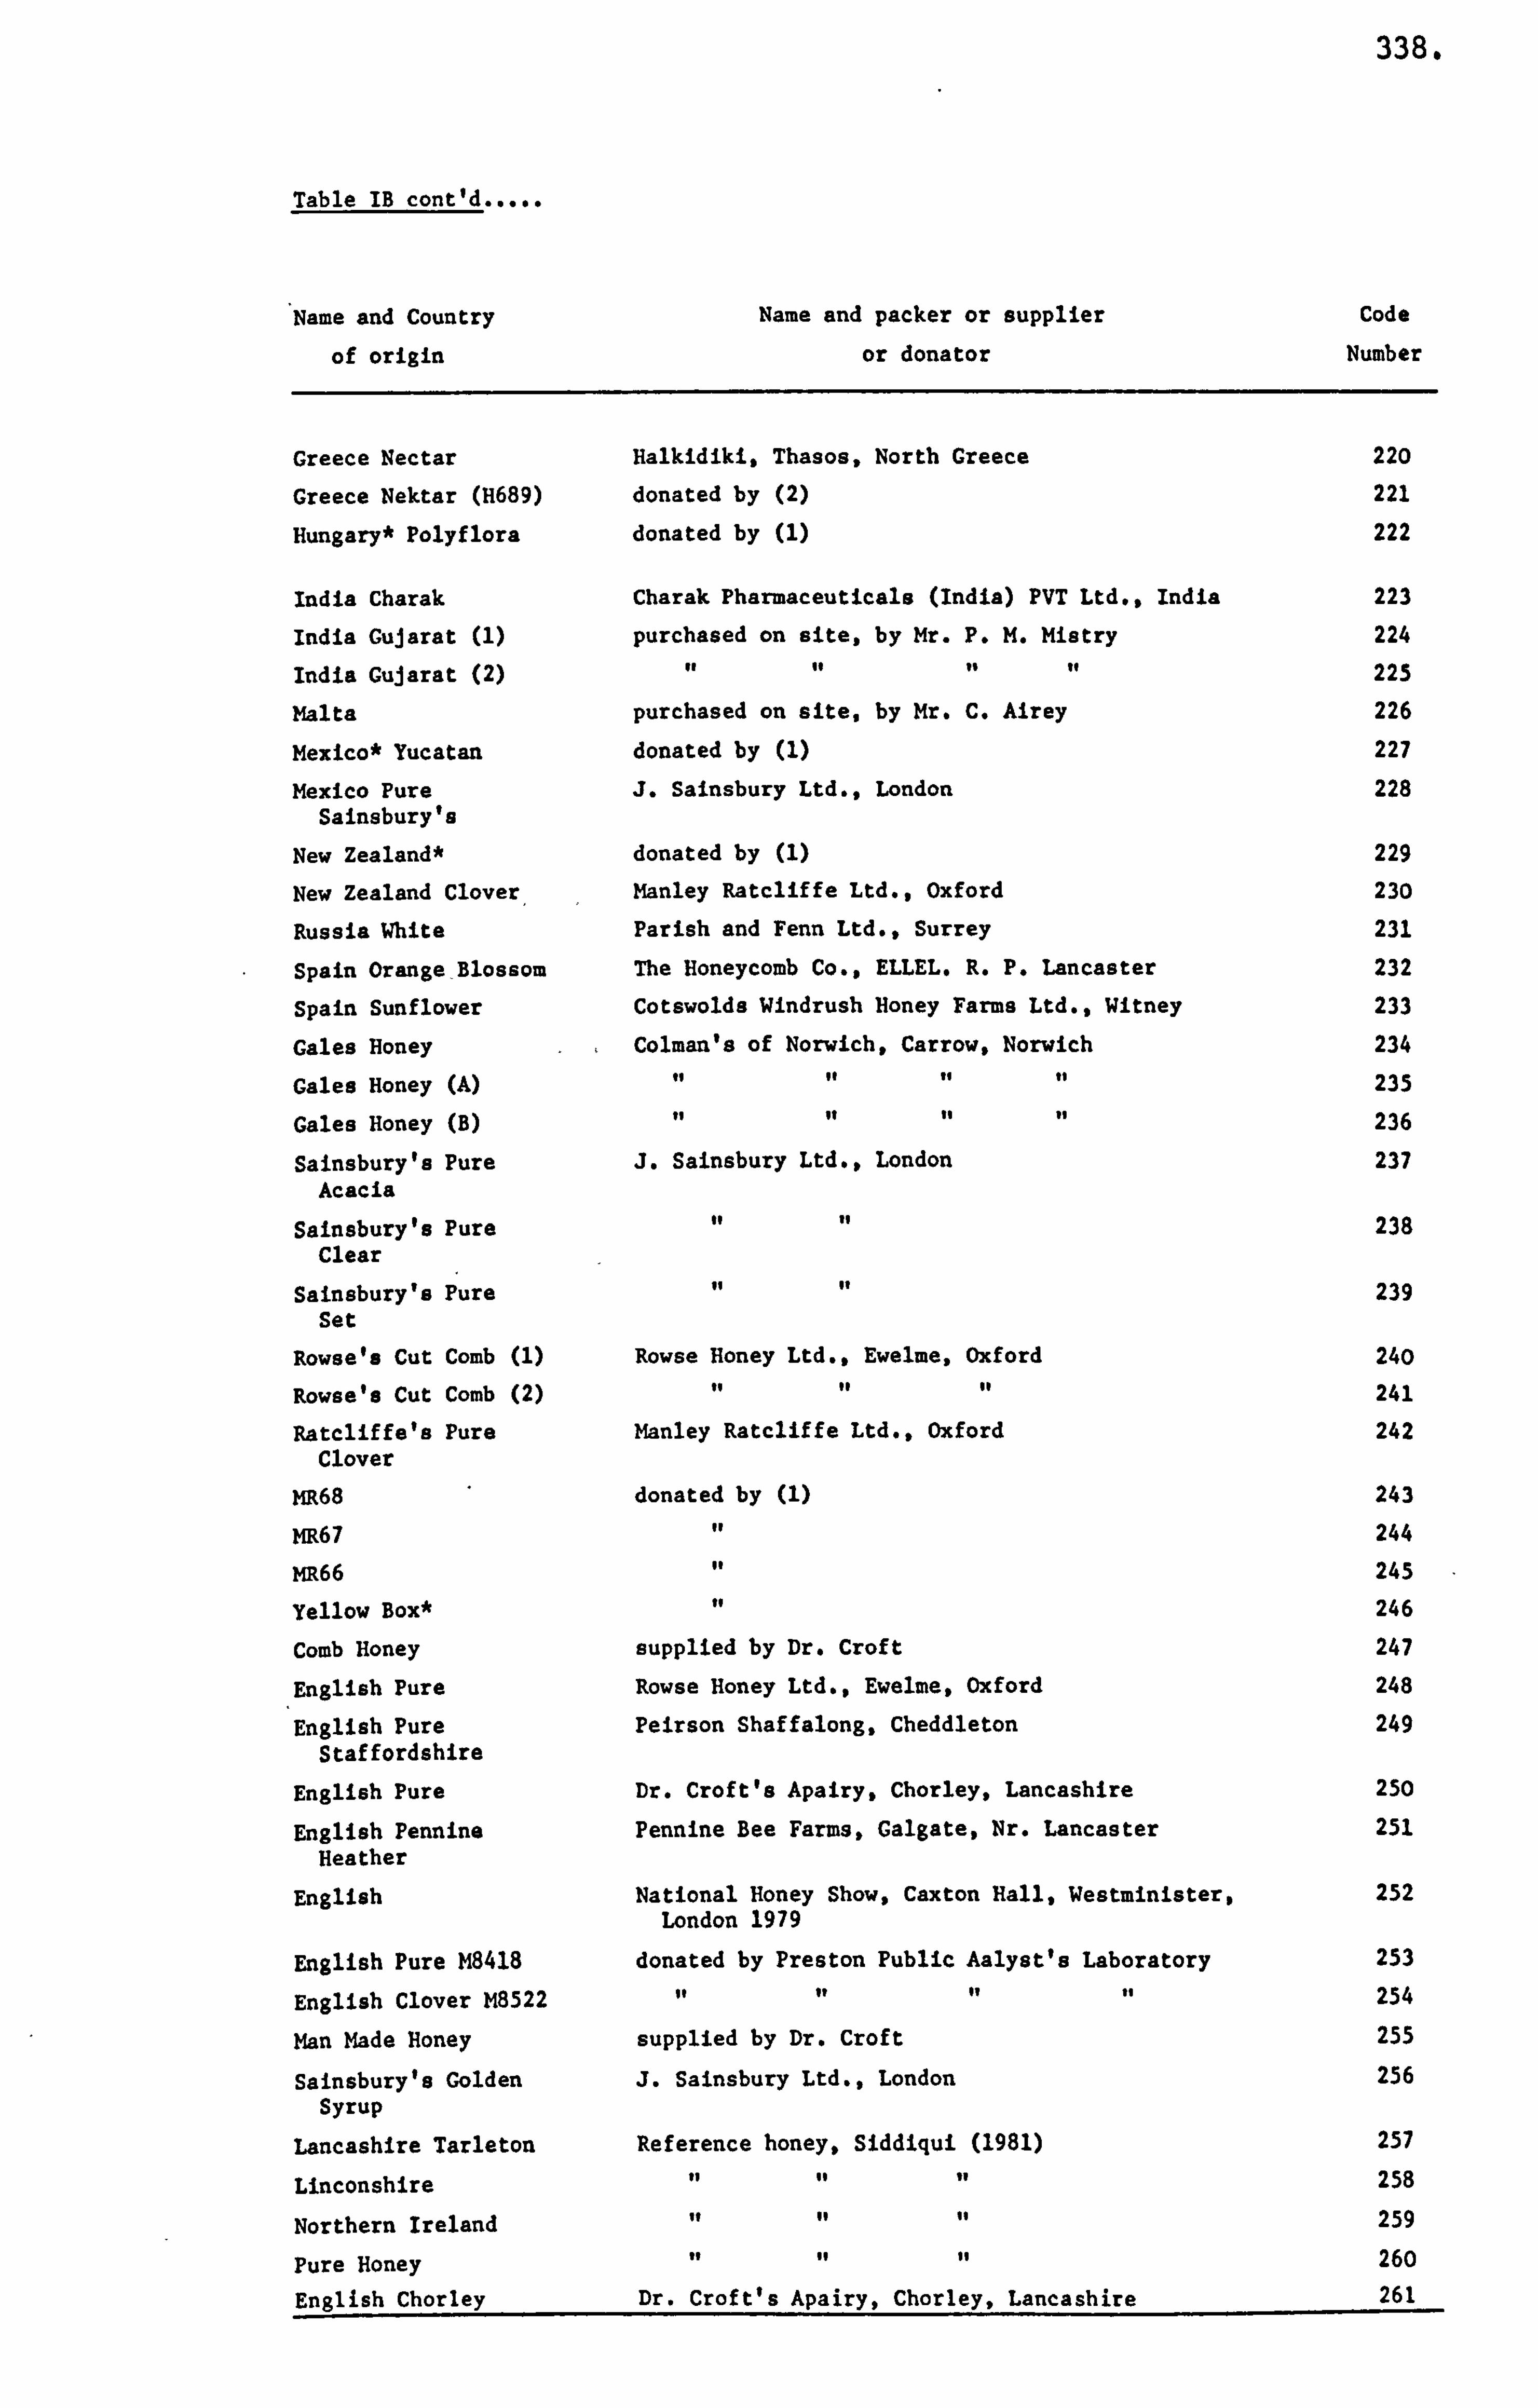
338.
Table IB cont'd
Name and Country
of origin
Name and packer or supplier
or donator
Code
Number
Greece Nectar Halkidiki, Thasos, North Greece 220
Greece Nektar (H689) donated by (2) 221
Hungary* Polyflora donated by (1) 222
India Charak Charak Pharmaceuticals (India) PVT Ltd., India 223
India Gujarat (1) purchased on site, by Mr. P. M. Mistry 224
India Gujarat (2) of of is to 225
Malta purchased on site, by Mr. C. Airey 226
Mexico* Yucatan donated by (1) 227
Mexico Pure J. Sainsbury Ltd., London 228 Sainsbury's
New Zealand* donated by (1) 229
New Zealand Clover Manley Ratcliffe Ltd., Oxford 230
Russia White Parish and Fenn Ltd., Surrey 231
Spain Orange-Blossom The Honeycomb Co., ELLEL. R. P. Lancaster 232
Spain Sunflower Cotswolds Windrush Honey Farms Ltd., Witney 233
Gales Honey Colman's of Norwich, Carrow, Norwich 234
Gales Honey (A) to of to to 235
Gales Honey (B) to Is of is 236
Sainsbury's Pure J. Sainsbury Ltd., London 237 Acacia
Sainsbury's Pure 238 Clear
Sainsbury's Pure 239 Set
Rowse's Cut Comb (1) Rowse Honey Ltd., Ewelme, Oxford 240
Rowse's Cut Comb (2) to of go 241
Ratcliffe's Pure Manley Ratcliffe Ltd., Oxford 242 Clover
mR68 donated by (1) 243
mR67 it 244
mR66 of 245
Yellow Box* to 246
Comb Honey supplied by Dr. Croft 247
English Pure Rowse Honey Ltd., Ewelme, Oxford 248
English Pure Peirson Shaffalong, Cheddleton 249 Staffordshire
English Pure Dr. Croft's Apairy, Chorley, Lancashire 250
English Pennine Pennine Bee Farms, Galgate, Nr. Lancaster 251 Heather
English National Honey Show, Caxton Hall, Westminister, 252 London 1979
English Pure M8418 donated by Preston Public Aalyst's Laboratory 253
English Clover M8522 of 11 01 to 254
Man Made Honey supplied by Dr. Croft 255
Sainsbury's Golden J. Sainsbury Ltd., London 256 Syrup
Lancashire Tarleton Reference honey, Siddiqui (1981) 257
Linconshire 11 of 11 258
Northern Ireland it of of 259
Pure Honey 99 it of 260
English Chorley Dr. Croft's Apairy, Chorley, Lancashire 261
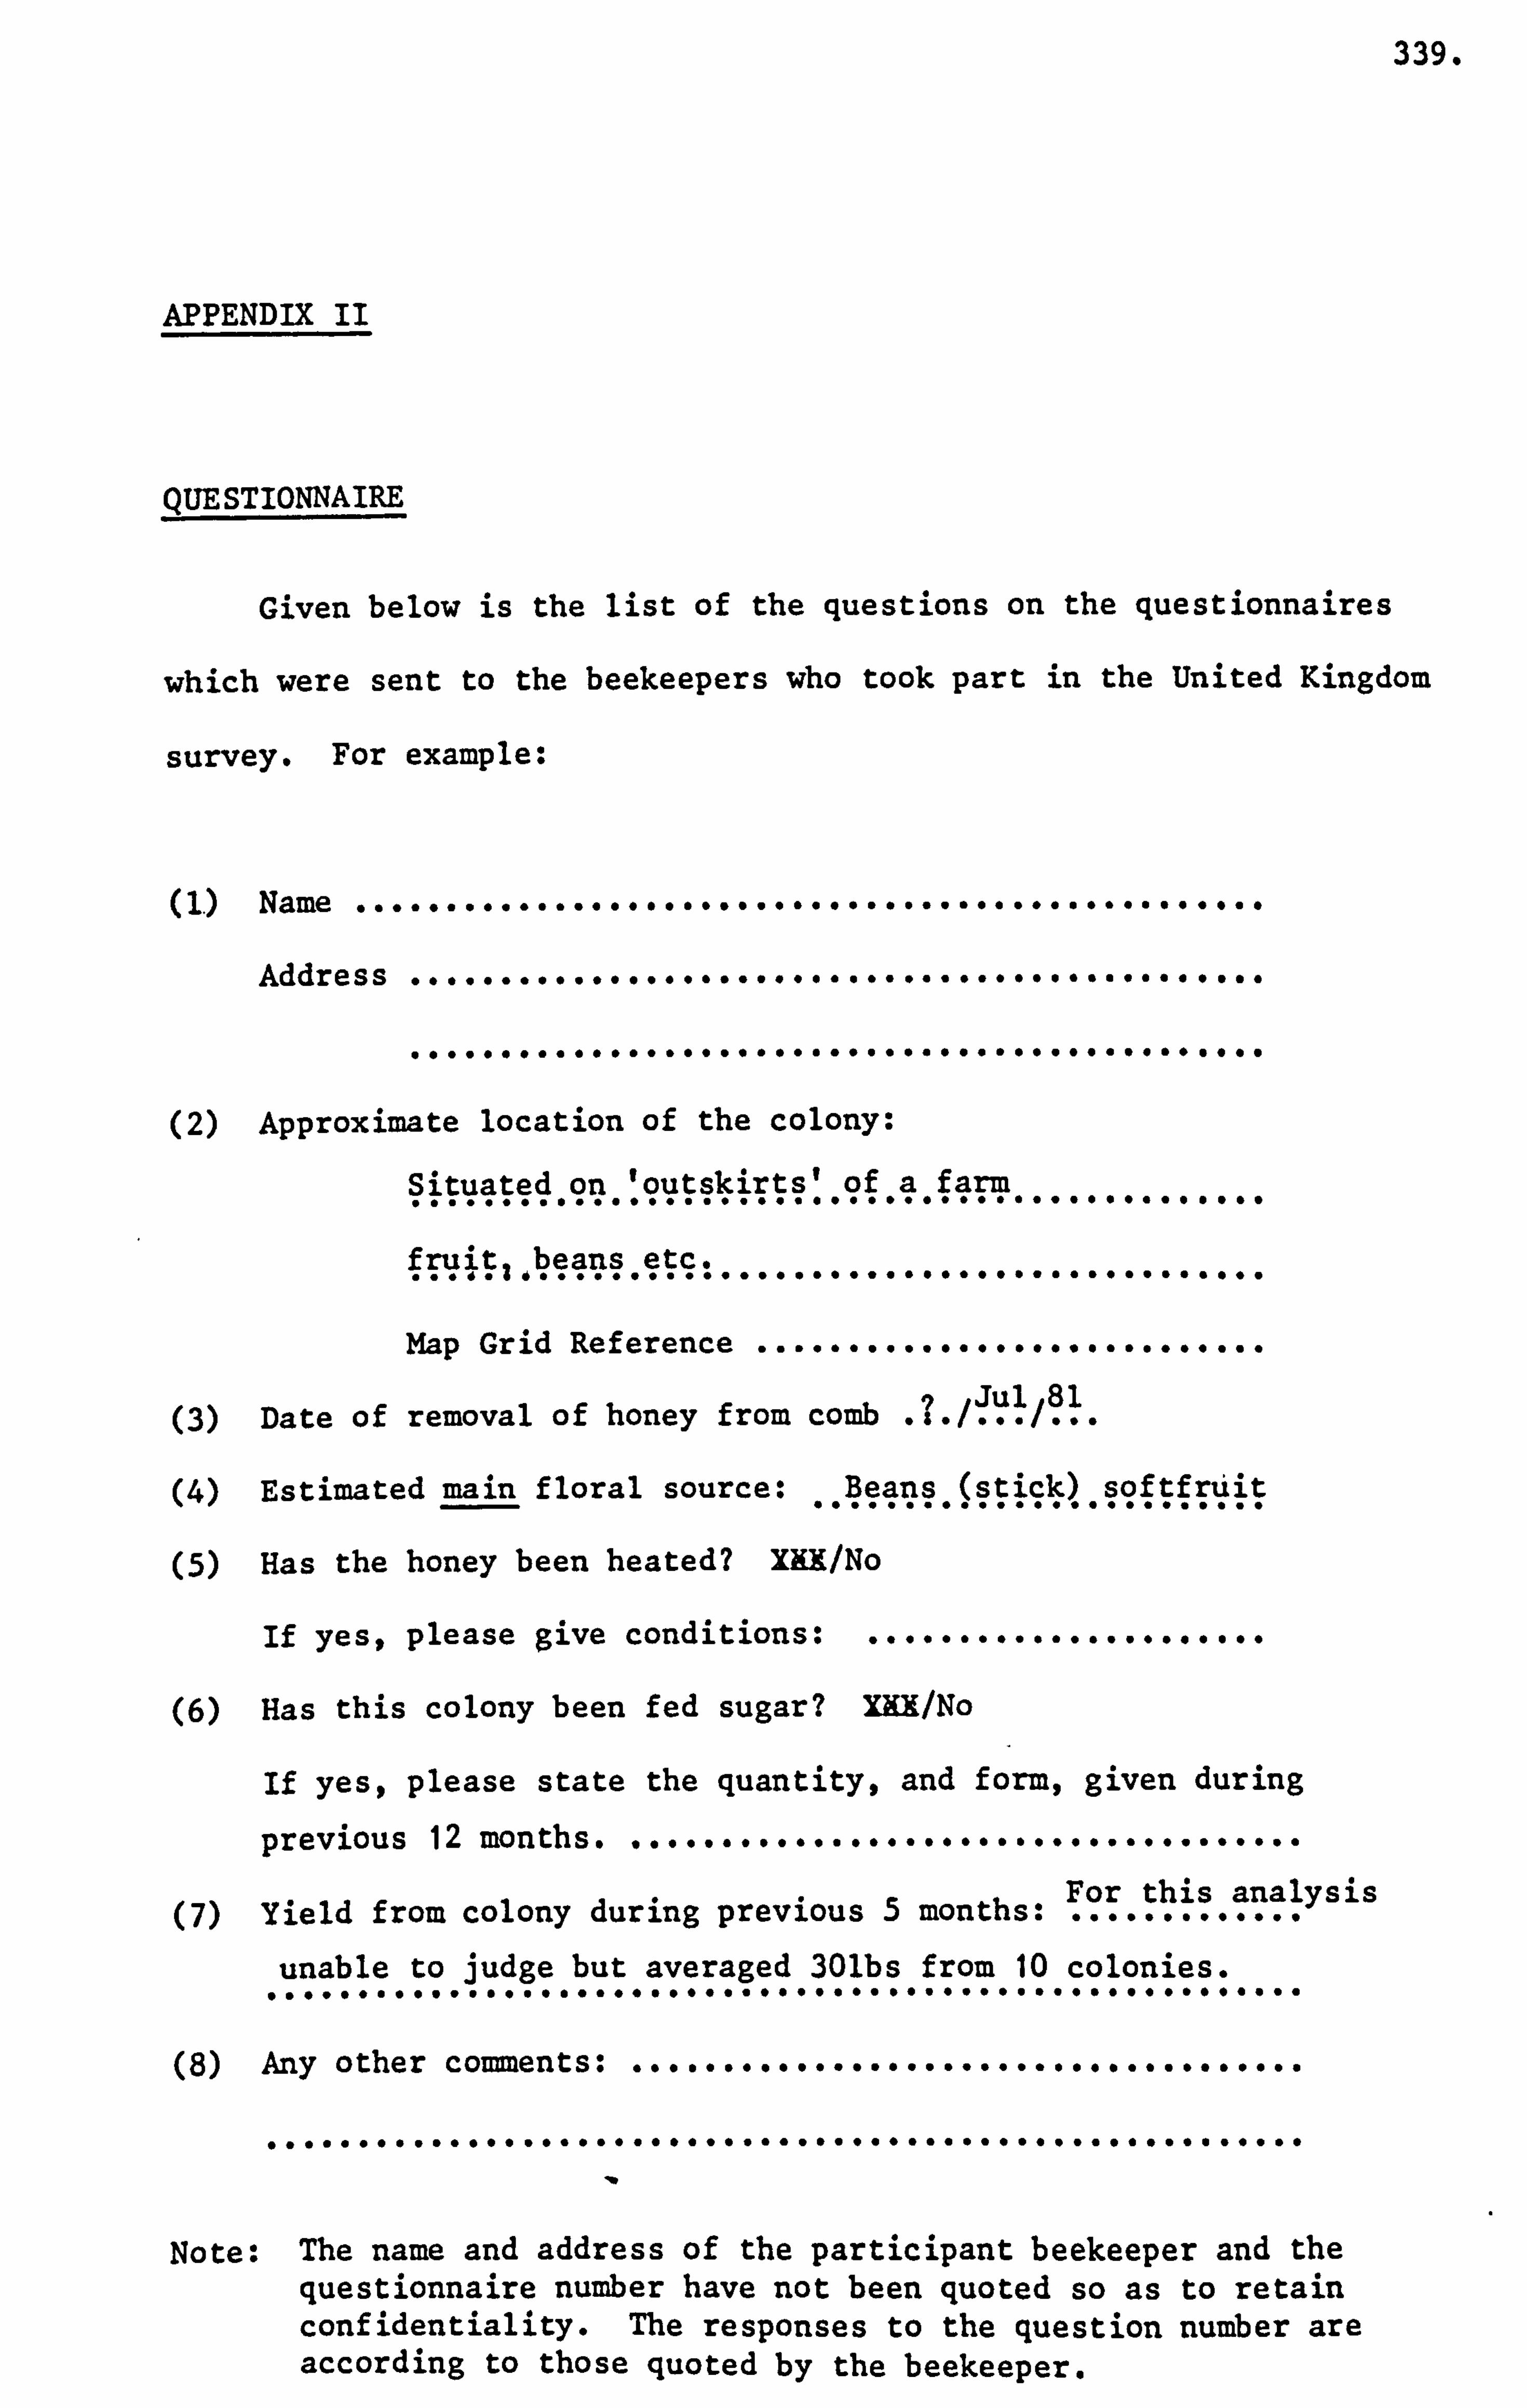
339.
APPENDIX II
QUESTIONNAIRE
Given below is the list of the questions on the questionnaires
which were sent to the beekeepers who took part in the United Kingdom
survey. For example:
(1. ) Name ..................................................
Address ........................................... 0000
.0.. 000.. *0000.0.00.. 0.00.. 00.00.0060a000
(2) Approximate location of the colony:
Situated on 'outskirts' of a farm ..... oo. 0 ... 00 ...
faili'llwals: .............................. Map Grid Reference .......... 0.0900000 000
Date of removal of honey from comb
Estimated main floral source: .. Beans. (stick) softfruit ..... .................
Has the honey been heated? XKX/No
If yes, please give conditions: 0-0 0000000
(6) Has this colony been fed sugar? M INo
If yes, please state the quantity, and form, given during
previous 12 months. For this analysis (7) Yield from colony during previous 5 months: .....
unable to judge but averaged 30lbs from 10 colonies.
Any other comments:
000000000000a00000000.0000000a000000000
Note: The name and address of the participant beekeeper and the questionnaire number have not been quoted so as to retain confidentiality. The responses to the question number are according to those quoted by the beekeeper.
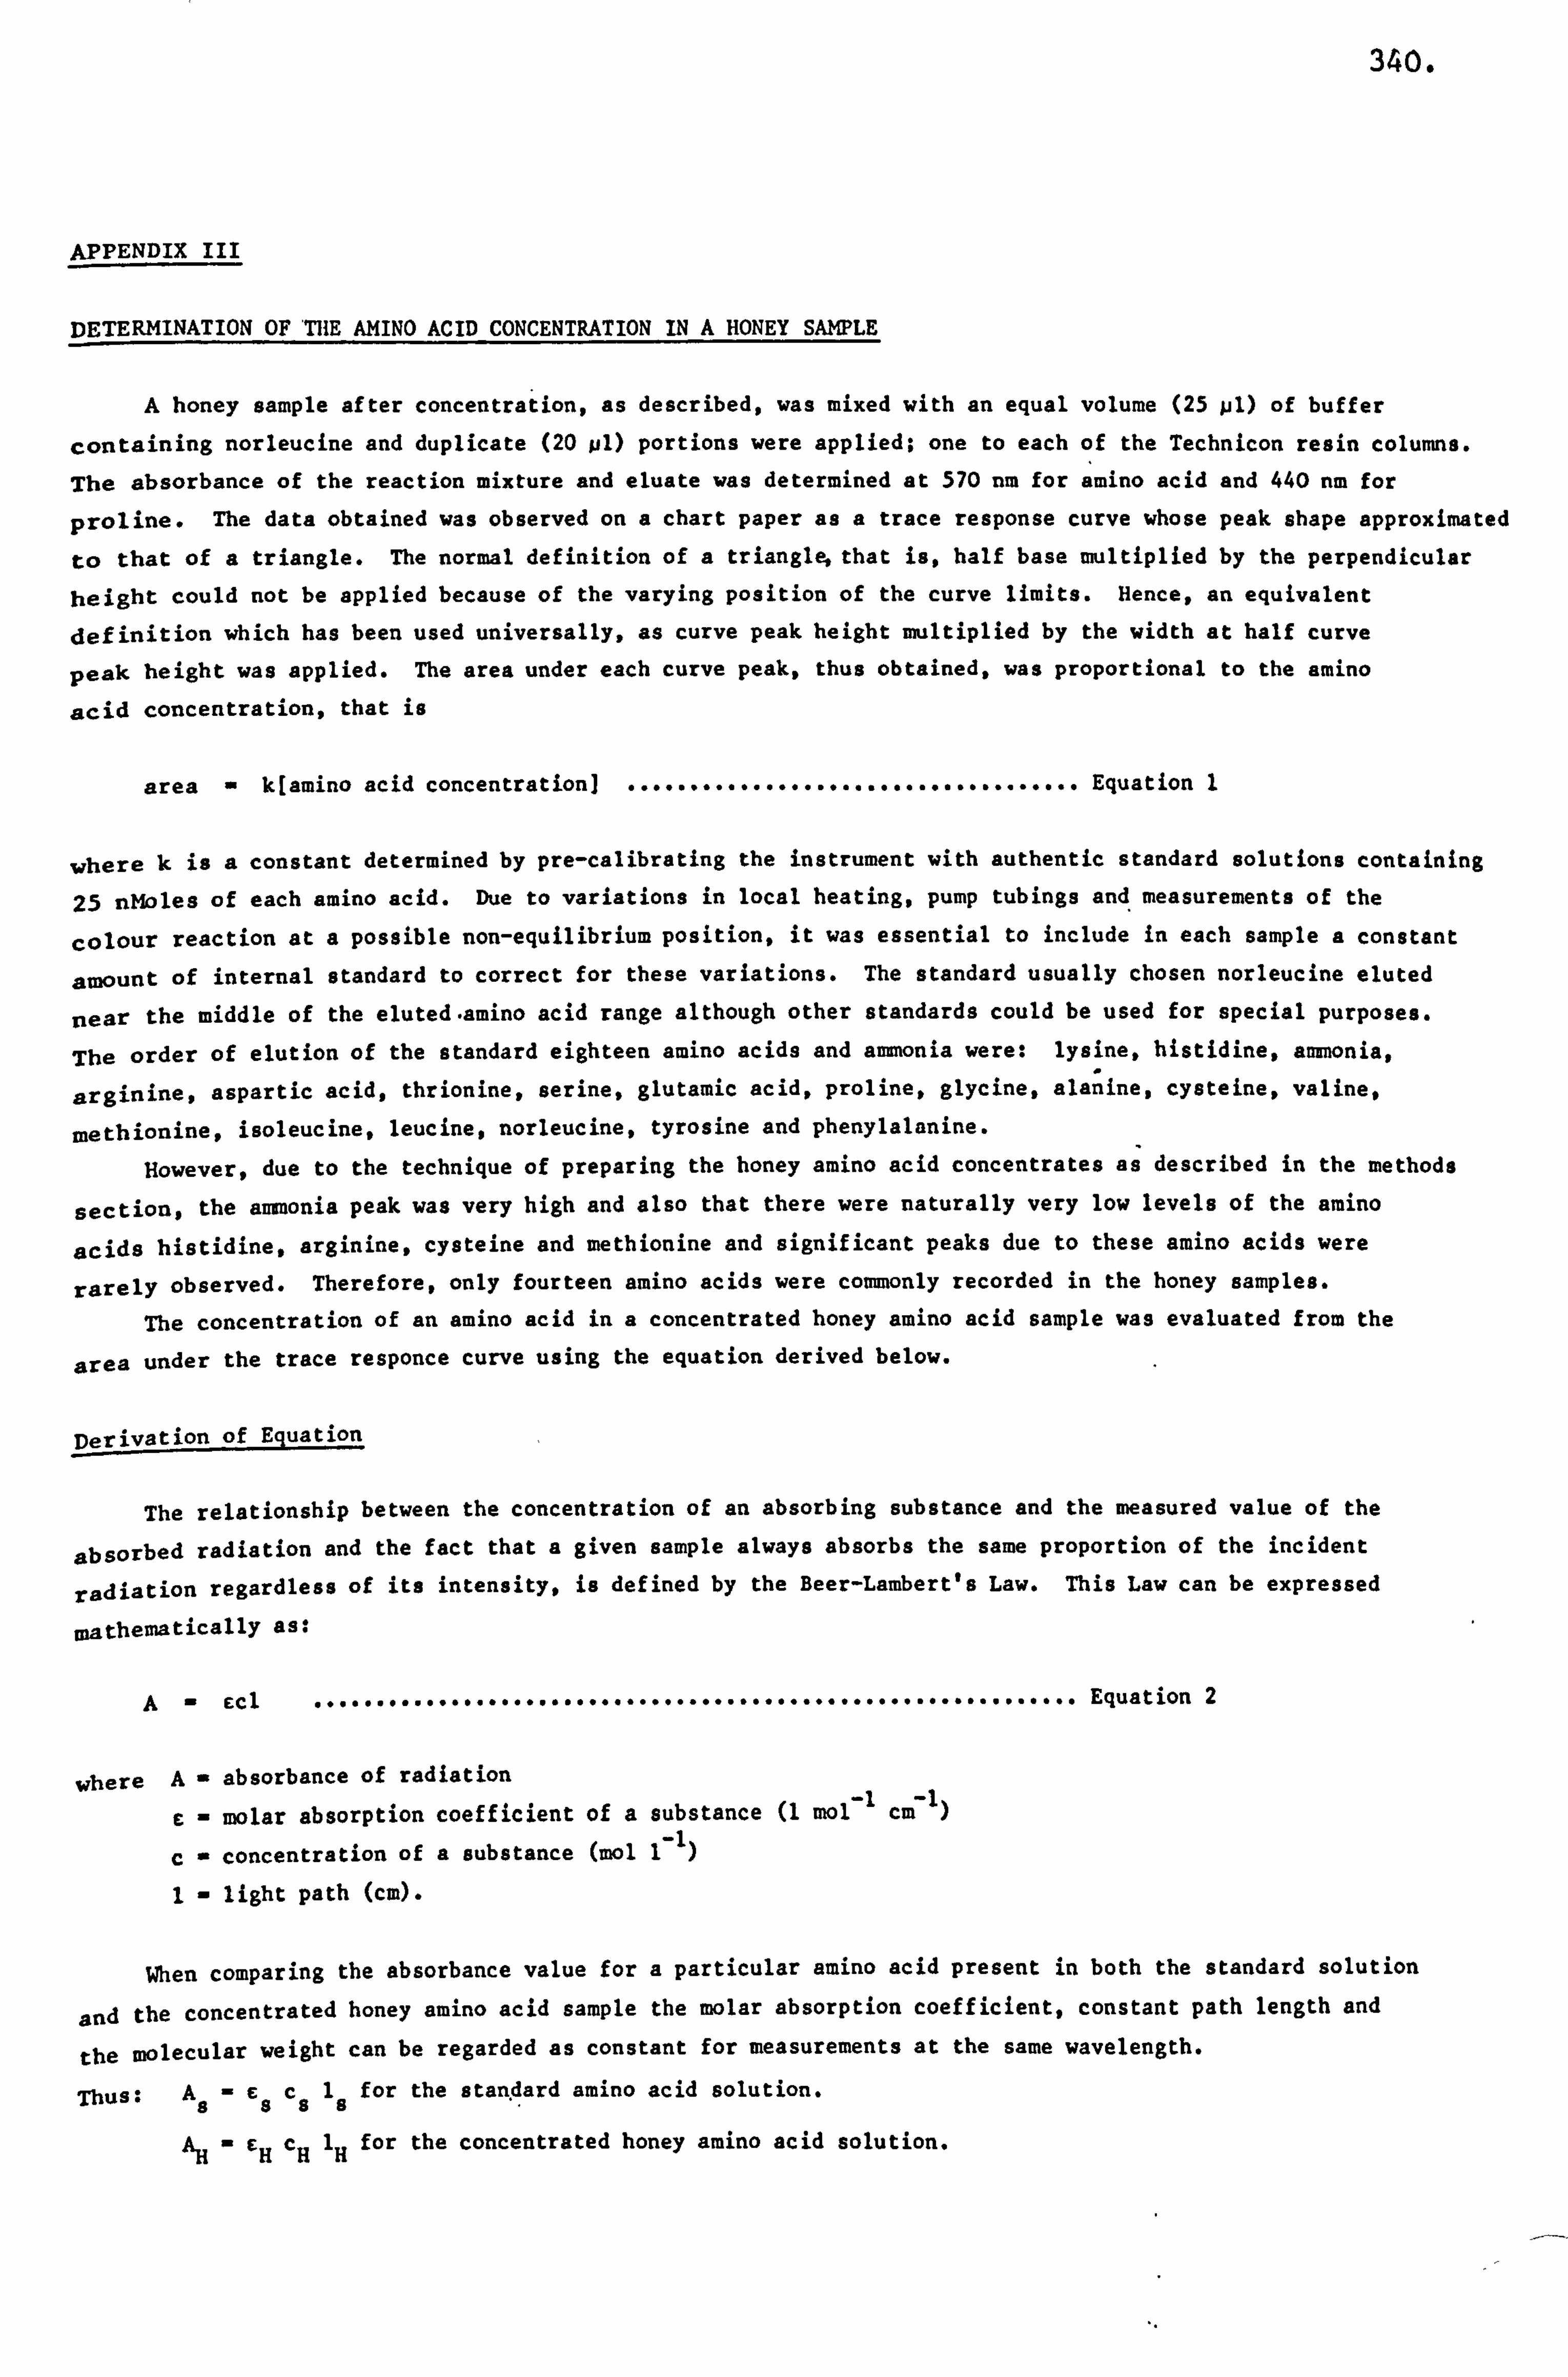
340.
APPENDIX III
DETERMINATION OF THE AMINO ACID CONCENTRATION IN A HONEY SAMPLE
A honey sample after concentration, as described, was mixed with an equal volume (25 pl) of buffer
containing norleucine and duplicate (20 pl) portions were applied; one to each of the Technicon resin columns.
The absorbance of the reaction mixture and eluate was determined at 570 nm for amino acid and 440 nm for
proline. The data obtained was observed on a chart paper as a trace response curve whose peak shape approximated
to that of a triangle. The normal definition of a triangle, that is, half base multiplied by the perpendicular
height could not be applied because of the varying position of the curve limits. Hence, an equivalent
definition which has been used universally, as curve peak height multiplied by the width at half curve
peak height was applied. The area under each curve peak, thus obtained, was proportional to the amino
acid concentration, that is
area - k[amino acid concentration] .................................... Equation I
where k is a constant determined by pre-calibrating the instrument with authentic standard solutions containing
25 nMoles of each amino acid. Due to variations in local heating, pump tubings and *
measurements of the
colour reaction at a possible non-equilibrium position, it was essential to include in each sample a constant
amount of internal standard to correct for these variations. The standard usually chosen norleucine eluted
near the middle of the eluted-amino acid range although other standards could be used for special purposes.
The order of elution of the standard eighteen amino acids and ammonia were: lysine, histidine, ammonia,
arginine, aspartic acid, thrionine, serine, glutamic acid, proline, glycine, ala; ine, cysteine, valine,
methionine, isoleucine, leucine, norleucine, tyrosine and phenylalanine.
However, due to the technique of preparing the honey amino acid concentrates as described in the methods
sections the ammonia peak was very high and also that there were naturally very low levels of the amino
acids histidine. arginine, cysteine and methionine and significant peaks due to these amino acids were
rarely observed. Therefore, only fourteen amino acids were commonly recorded in the honey samples.
The concentration of an amino acid in a concentrated honey amino acid sample was evaluated from the
area under the trace responce curve using the equation derived below.
Derivation of Equation
The relationship between the concentration of an absorbing substance and the measured value of the
absorbed radiation and the fact that a given sample always absorbs the same proportion of the incident
radiation regardless of its intensity, is defined by the Beer-Lambert's Law. This Law can be expressed
mathematically as:
A Ccl ............................................................. Equation 2
where A absorbance of radiation
C molar absorption coefficient of a substance (I mol
C concentration of a substance mol 1 -1
1 light path (cm).
When comparing the absorbance value for a particular amino acid present in both the standard solution
and the concentrated honey amino acid sample the molar absorption coefficient, constant path length and
the molecular weight can be regarded as constant for measurements at the same wavelength.
Thus: As -ESca16 for the standard amino acid solution.
AH'EHcH1H for the concentrated honey amino acid solution.
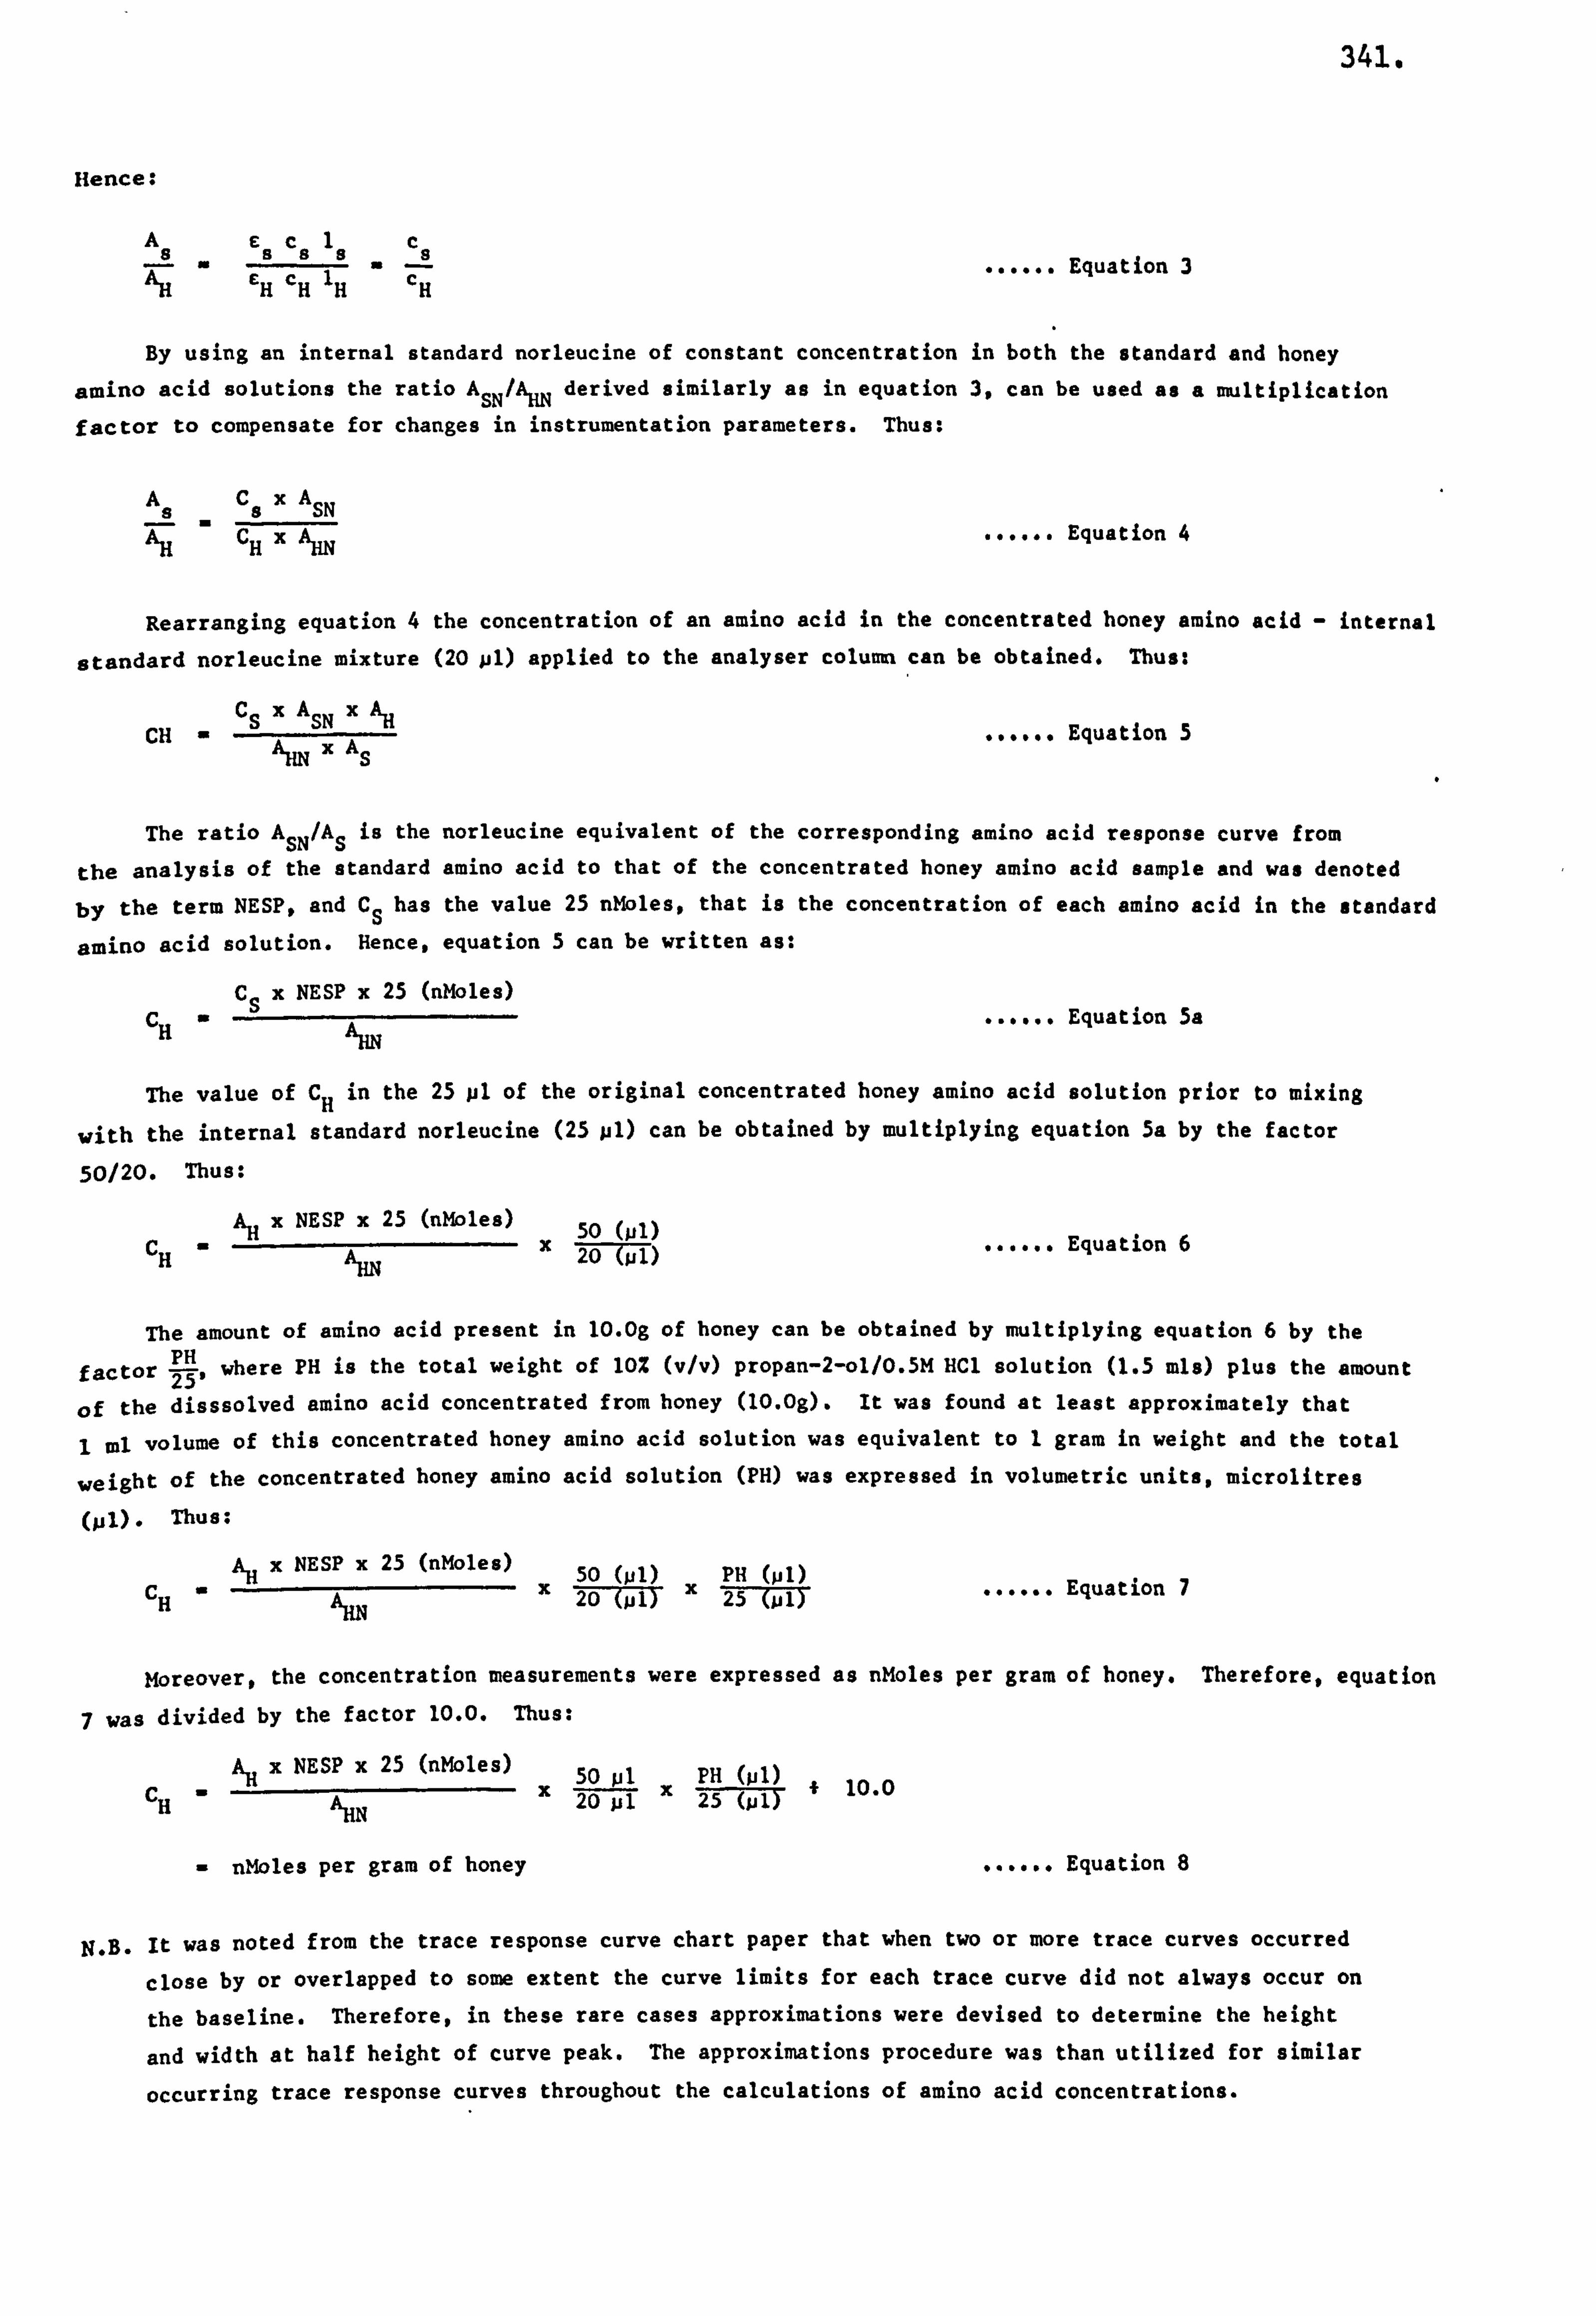
341.
Hence:
ECIc sa9
EHcHIHcH Equation 3
By using an internal standard norleucine of constant concentration in both the standard and honey
amino acid solutions the ratio A SN /A
HN derived similarly as in equation 3, can be used as a multiplication factor to compensate for changes in instrumentation parameters. Thus:
ACxA -A
s SN AHcHxA HN
Equation 4
Rearranging equation 4 the concentration of an amino acid in the concentrated honey amino acid - internal
standard norleucine mixture (20 jil) applied to the analyser column can be obtained. Thus:
CH csxA SN xAH......
Equation 5 A HN xAs
The ratio A SN /A
S is the norleucine equivalent of the corresponding amino acid response curve from
the analysis of the standard amino acid to that of the concentrated honey amino acid sample and was denoted
by the term NESP, and CS has the value 25 nMoles, that is the concentration of each amino acid in the standard
amino acid solution. Hence. equation 5 can be written as:
csx NESP x 25 (nMoles)
AHN Equation 5a
The value of CH in the 25 pl of the original concentrated honey amino acid solution prior to mixing
with the internal standard norleucine (25 pl) can be obtained by multiplying equation 5a by the factor
50/20. Thus:
A,, x NESP x 25 (nMoles) 50 (ol) HA HN 20-Tpl) Equation 6
The amount of amino acid present in 10. Og of honey can be obtained by multiplying equation 6 by the
factor . 1-H,
where PH is the total weight of 1OZ (v/v) propan-2-ol/O. SM HCJ solution (1.5 mls) plus the amount 25
of the disssolved amino acid concentrated from honey (10.0g). It was found at least approximately that
lml volume of this concentrated honey amino acid solution was equivalent to 1 gram in weight and the total
weight of the concentrated honey amino acid solution (PH) was expressed in volumetric units, microlitres
(Iji). Thus:
c A. x NESP x 25 (nMoles)
x 50 (PI)
x PH (PI)
...... Equation 7 H' ARN 20 7-; jlT 25 (jil)
Moreover, the concentration measurements were expressed as nMoles per gram of honey. Therefore, equation
7 was divided by the factor 10.0. Thus:
c AH x NESP x 25 (nMoles)
x 50 jil x
PH (lil) f 10.0
AHN 10- -ju 1 -25 (-ju -IT
- nMoles per gram of honey Equation 8
N. B. It was noted from the trace response curve chart paper that when two or more trace curves occurred
close by or overlapped to some extent the curve limits for each trace curve did not always occur on
the baseline. Therefore, in these rare cases approximations were devised to determine the height
and width at half height of curve peak. The approximations procedure was than utilized for similar
occurring trace response curves throughout the calculations of amino acid concentrations.
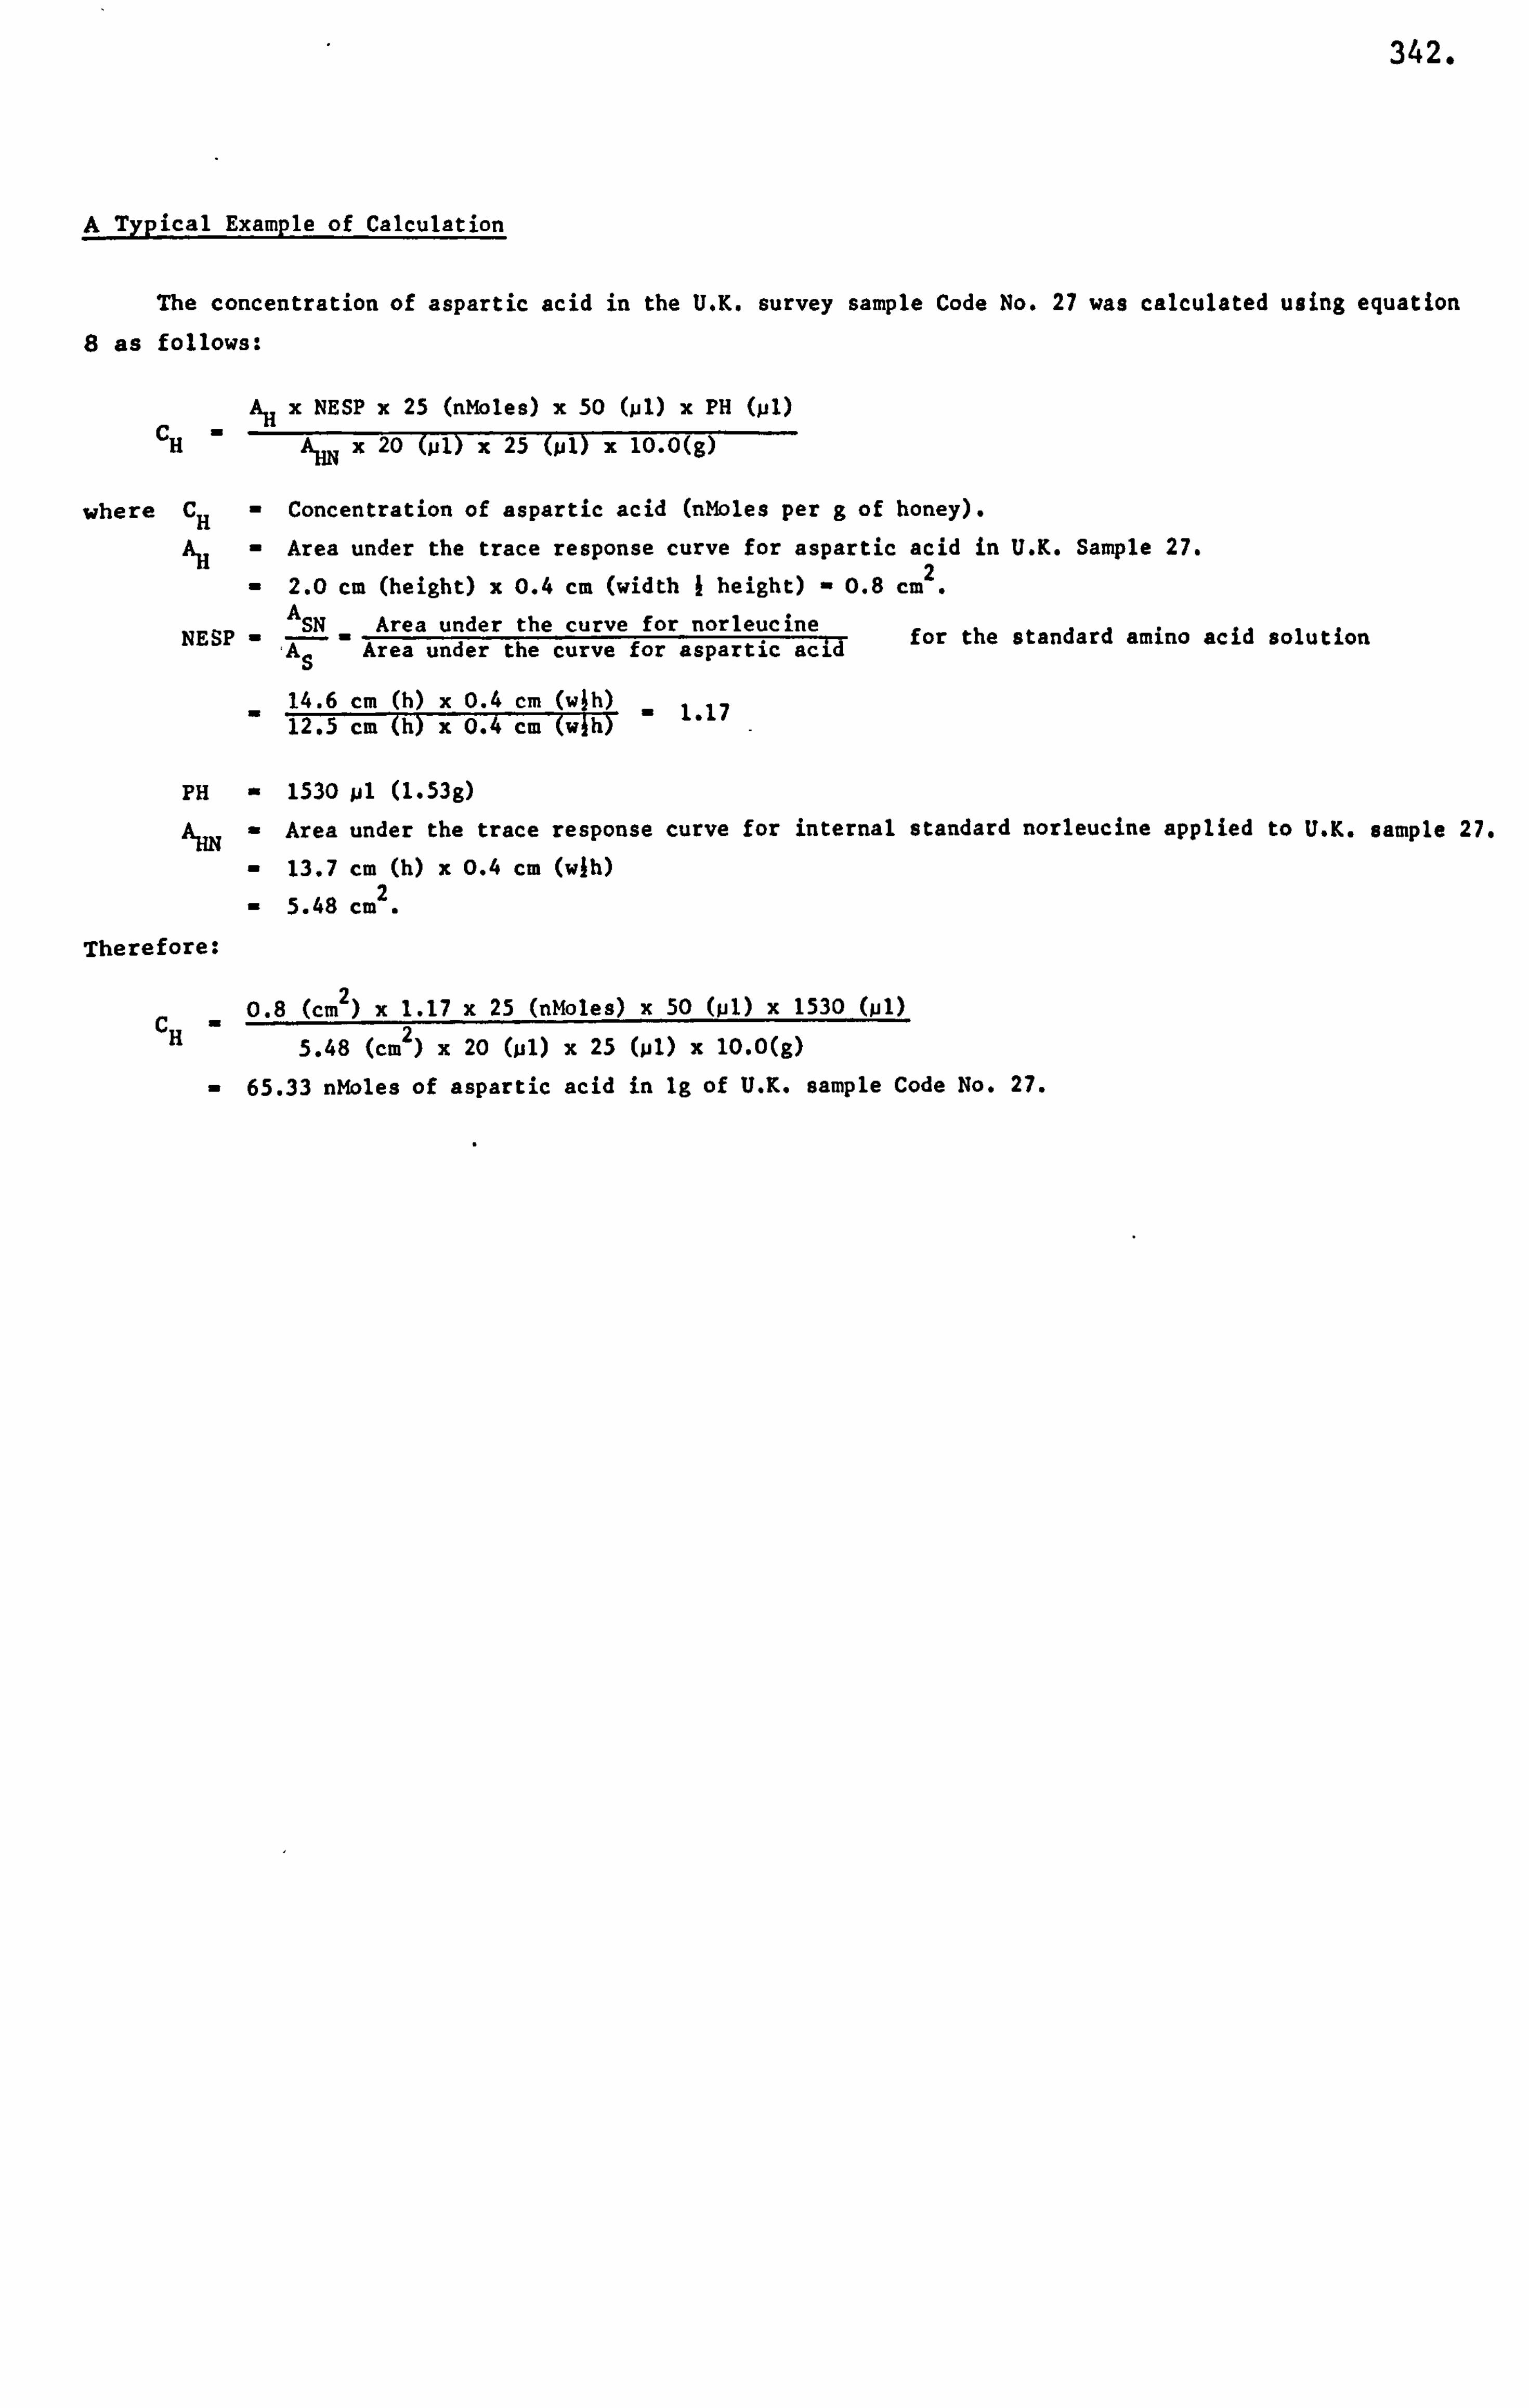
342.
A Typical Example of Calculation
The concentration of aspartic acid in the U. K. survey sample Code No. 27 was calculated using equation 8 as follows:
AH x NESP x 25 (nMoles) x 50 (jil) x PH (pl) CH A
HN x 20 (Ml) x 25 (MI) x 10.0(g)
where CH , Concentration of aspartic acid (nMoles per g of honey).
AH - Area under the trace response curve for aspartic acid in U. K. Sample 27. 2
- 2.0 cm (height) x 0.4 cm (width I height) - 0.8 cm
NESP -A SN Area under the curve for norleucine for the standard amino acid solution AS Area under the curve for aspartic acid
14.6 cm (h) x 0.4 cm (w1h) . 1.17 12.5 cm (h) x 0.4 cm (w1h)
PH - 1530 yl (1.53g)
AHN - Area under the trace response curve for internal standard norleucine applied to U. K. sample 27.
- 13.7 cm (h) x 0.4 cm (w1h)
- 5.48 cm 2.
Therefore:
C 0.8 (cm 2)x1.17 x 25 (nMoles) x 50 (pl) x 1530 (ml)
H 5.48 (cm 2)x 20 (ml) x 25 (pl) x 10.0(g)
- 65.33 nMoles of aspartic acid in lg of U. K. sample Code No. 27.
343.
APPENDIX IV
COMPUTATION
Described below is the format of the data arranged in the U. K. survey and the foreign and commercial data files. This format is as follows:
The concentration of the free amino acids used were those calculated from the area under the
trace response curves on the chart paper output as detected by the amino acid analyser. There were
seventeen amino acids detected and of these only thirteen whose curve peaks could be adequately measured
were considered. These thirteen amino acids were: lysine, aspartic acid, threonine, serine, glutamic acid, proline, glycine, alanine, valine, isoleucine, leucine, tyrosine and phenylalanine
in that order. The questionnaire as sent to the beekeepers contained eight questions of which the stated responses
toquestion numbers, 3,5 and 6 were used here. The relevant questions were: 'Date of removal of honey from comb'?, question 3; 'Has the honey been heated'? Yes or No, question 5; and 'Has this
colony been fed sugar'? Yes or No, question 6.
The classification of the distribution of the pollen grains into frequency classes for each sample
of honey was used. Out of the four pollen classes only the predominant and the secondary pollen classes
were considered. Honey samples containing a given pollen which occurred over 45% of the total pollen
counted were allocated into the predominant pollen class. Those honey samples whose pollen content
ranged between 16% and 45% were allocated into the secondary pollen class. Furthermore, in this case for honey samples which occurred in the secondary pollen class; only the first two pollens in decending
order of percentage were considered. All the two hundred and fifty six samples of honey contained
either the predominant or the secondary pollens. The pollen content, that is, the amount of pollen grains present on the prepared microscope pollen
slides was determined q'uantitatively by visual microscopical examination. Values on an arbitrary
scale of one to five were selected, where one represented the lowest or zero pollen content and five
represented the highest pollen content. The intermediate numbers 2,3 and 4 represented the intermediate
pollen contents of low, medium and high, respectively.
The occasional presence of fifteen other amino acids besides the thirteen amino acids which were
quantitatively estimated by the amino acid analyser and common to all the samples were also detected
by the technique of paper electrophoresis and chromatography. Besides these twenty eight amino acids
eleven other ninhydrin complex colour spots whose identity could not be ascertained were also occasionally found to be present. These fifteen amino acids and the eleven unidentified ninhydrin complex colour
spots thus detected were used for qualitative analysis on the computer. The identity of the thirteen
amino acids has*been given above. The other fifteen amino acids were identified to be: o- and y- amino butyric acid, arginine, asparagine, cysteine, glucosamine, glutamine, histidine, methionine, tryptophan.
hydroxyproline, hydroxypipecolic acid, methyl-histidine, 0-alanine and pipecolic acid. The unidentified
twelve ninhydrin complex spots vere labelled as ps Xo Ct as to es now, X9 0. a and 0.
All this data were compiled in the order listed above into a data file for each individual honey
sample. There were two data files compiled, one contained the United Kingdom survey while the other contained
the foreign and commercial honeys.
In each of these two data files, for each sample of honey the data mentioned above were arranged
into four lines. Each line composed of eighty characters, one character representing a column. The
first two lines of the four lines contained the concentration values of the thirteen free amino acids
quoted to two decimal places. These two lines were divided into sixteen columns, eight columns per
line. Each column composed of ten characters. The first line contained the concentration values
of the first eight amino acids of the thirteen. These eight amino acids were: lysine, aspartic acid,
threonine, serine, glutamic acid, proline, glycine and alanine, in that order. The second line contained
the concentration values of the remaining five amino acids valine, isoleucine, leucine, tyrosine and
phenylalanine, in that order. Line three of the four lines was divided into thirteen columns of five
344.
characters each except for column twelve which was of one character. This third line contained the
answers to questionnaire questions 3,5 and 6. This was followed by the predominant pollen and its
percentage value and then by the first secondary pollen and its percentage value. This was then
followed by the second secondary pollen and its percentage value. This was in turn followed by the
unidentified and shrivelled pollen percentage values, quoted to one decimal place and then finally
by the pollen content. The last line contained the information on the presence of the fifteen amino
acids and the two unidentified ninhydrin complex spots. This fourth line was divided into seventeen
columns of three characters each. These fifteen amino acids were listed in the following order:
a-. and y-aminobutyric acid, arginine, asparagine, cysteine, glucosamine, glutamine, histidine,
methionine, tryptophan, hydroxyproline, hydroxypipecolic acid, methylThistidine, 0-alanine, pipecolLe
acid and the unidentified spots 'p' and 'x'.
Moreover, in the second data file which contained all the data for the sixty four foreign and
commercial honey samples the data were arranged in a similar manner to that of the United Kingdom
survey data file. The only difference in this second data file was that there were no questionnaire
quetions 3t 5 and 6 apart from these questionnaire questions all the other data were exactly the
same as those in the United Kingdom survey file. These questionnaire questions were replaced by
information regarding the country of origin and the commercial processing of the honey samples. Hence,
question 3 was replaced by the information regarding the country of origin for each sample. The
column representing the question 5 was left blank. Question 6 was replaced by the following question: 'Has this sample of honey been commercially processed'? Yes or No.
It is generally required by the SPSS to code the data. The code can take the form of words,
letters or numbers. The words or letters can often complicate an SPSS command and also some procedures in the SPSS require numerical data values. Hencet a numerical coding scheme was adopted. The numerical
codes used in this case are given in the control statement 'VALUE LABEL' shown in Appendix V (b).
The numerical codes used for identifying pollen grains are given in Table 30. Actual numbers such
as the amino acid concentration values and the pollen percentage values did not require coding.
345.
APPENDIX V
A DISCRIMINANT ANALYSIS
Described below is the order in which the DISCRIMINANT analysis on the one hundred and ninety two samples of the U. K. survey honeys, the sixty four samples of the foreign and commercial honeys and also on both the combined honeys was performed using the SPSS.
(a) United Kingdom Survey Honey Samples
The results of the microscopic examination and evaluation of the distribution of pollens in
each of the samples of the U. K. survey showed that there were nine major pollens which occurred in the predominant frequency class. When specified the SPSS allocated one hundred and four
samples of honey which were classified into one of the pollen groups specified. The remaining samples were not dealt with because these had either missing or out of range amino acid concentration
values, or they were composed of secondary or multiple pollen. I
In order to improve the percentage of correct classification of the honey samples in each of the pollen groups, a number of factors were considered. These factors were: a transformation
of the original amino acid concentration valuesq reducing the number of pollen groups and to
minimise the effects of the presence of other pollens besides the predominant pollen which may
cause overlapping between pollen groups.
Two transformations of the original amino acid concentration values were chosen. These transformations
were the natural logarithms and the square root. The square root transformation improved the discrimination better than the natural logarithms. This square root transformation makes the
variance-covariance matrix of the amino acid concentration data vector more nearly equal across the pollen groups. Therefore, the square root transformation was chosen and adhered to throughout
the following analyses.
The four pollen groups, Aesculus, Inpatiens, Vicia and Clemantes, contained only five samples
of honey between them. This number of honey samples for the four pollen groups were considered to be inadequate to produce a valid discriminant analysis. Therefore, these four pollen groups were not included in any of the following analysis.
Further, in the predominant pollen frequency class there were a number of honey samples which
contained both the predominant pollen as well as the secondary pollen. These samples of honey
were found to occur in the 45% to the 60% region of the predominant poilen frequency class. Discriminant analysis was performed to check whether the presence of these secondary pollen
or the presence of the other pollens in the important minor pollen frequency class were affecting the discrimination between the pollen groups. Thus, the predominant pollen class was further
divided into two subclasses. These two subclasses were labelled as the unifloral and the multifloral
pollen subclasses. Preliminary tests using the discriminant analysis was carried out on four
pollen groups to discriminate between the unifloral and the multifloral pollen subclasses. The
four pollen groups were: rrassica, 2YifoZiumrepens, Castanea and Calluna. The Ahjosotis pollen
group was considered as the unifloral pollen subclass since the amount of this pollen present in each of these honey samples was over 95%.
In all six preliminary tests were carried out and in each of these tests the unifloral pollen
subclass group was defined as those honey samples containing pollen over 60%, 702,75%, 801
and 852. The multifloral pollen subclass group was defined as those honey samples containing
pollen present between 45% and 60%, 45% and 652,45Z and 70%, 45% and 75%, 45% and 80% and 45%
and 85%, respectively. The results showed that there was considerable overlap in each of the
six tests between the unifloral and multifloral subclass pollen groups.
346.
In order to minimise this overlap between the unifloral and multifloral pollen groups, the multifloral
pollen group was defined as those honey samples containing pollen present between 45% and 60Z
only. The unifloral pollen group was defined as those honey samples containing pollen present
over 702. Intrýduction of this 10% gap between the two pollen subclasses reduced to a certain
extent the overiap effect of the honey samples containing pollen present between 6OZ and 65%,
65% and 70%.
Further tests were carried out using the discriminant analysis to eliminate the overlap betweeý
the unifloral and multifloral pollen subclasses in each of the four pollen groups. In these
tests the multifloral subclass pollen group was defined as mentioned before. The unifloral
subclass pollen group were defined as those honey samples containing pollen present over 75%.
80% and 85%. The results showed that as the gap between the multilloral and the unifloral subclass
pollen groups was increased, the overlap between these two pollen groups was eliminated. Typically,
Figure 27 (results) the histogram obtained for the Brassica pollen group show the elimination
of overlap between the two pollen groups.
These results also showed that as the percentage of the pollen present in the unifloral subclass
pollen group was increased to eliminate overlapping the number of samples in each of the four
pollen groups decreased from forty six at 702 pollen to twenty seven at 8OZ pollen. Therefore,
it was considered that when discriminating between the five pollen groups honey samples which
contain pollen present over 70% would be considered as unifloral honeys. This 70% limit was
chosen because each of the five pollen groups contained adequate number of honey samples which
would give valid discriminant analysis. The SPSS control file described and detailed in Appendix
VI (c) was used to initiate the SPSS as mentioned previously. In this analysis. the honey samples in each of the pollen groups were divided into two subsets. One subset. was used for calculating
the Fisher's linear discriminant functions and the other for estimating the misclassification
rate, however, all the samples were classified. This dividing of the honey samples into two
subsets was also used in all the following analyses.
In the United Kingdom, honey from the Brassica, 2! rifoZium repen8 and Catluna plants are the
major sources of honey. The honey from these three plants are of considerable importance to
the beekeepers of the United Kingdom. Discriminant analysis was performed on the honey samples
representing each of these three pollen groups. The SPSS control file detailed in Appendix
VI (c) was used to initiate the SPSS. In this analysis, the Castanea and Myosotis pollen groups
were ommitted from analysis, in that, control statements 58 and 60 were deleted from the SPSS
control file.
From the response received to questionnaire question 3 which requested the 'Date of removal
of honey from the comb' it was observed that nearly all the honey samples were either harvested
in the crop year 1981 or 1982. Discriminant analysis was performed to check whether there were
any significant differences in the amino acid composition of the honeys produced during these
two crop years. The SPSS control file detailed in Appendix VI (c) was used to initiate the
SPSS as mentioned previously. In this analysis, the control statements 56 to 60 were replaced
by those given in Appendix VI (d)(i).
Similar discriminant analysis to that of above was also performed on honey samples representatives
of the individual pollen groups which were harvested in the crop years 1981 and 1982. The five
pollen groups chosen in the previous analysis were used. The control statements 56 to 60 of
Appendix VI(c) were replaced by those given in part (d)(HA-5. Statistical results were obtained
for only three of these pollen groups. These three pollen groups were Brasaica, 2ý-ifolium repene
and Castanea. For the other two pollen groups there were not enough samples of honey in either
of the years specified and hence, statistical analysis for these two pollen groups could not
be computed.
347.
From the response received to questionnaire question 5 which requested whether the honey had
been heated or not. Discriminant analysis was performed to test whether heating a sample of honey effects its amino acid compositions. The SPSS control file detailed in Appendix VI (c)
was used to initiate the SPSS. In this analysis, the control statements 56 to 60 were replaced by those given in Appendix VI (e)(i). Similar discriminant analysis to that of above were performed
on honey samples representative of the individual pollen groups which were either heated or
not heated. The five pollen groups chosen in the previous analysis were used. Statistical
results were obtained for only three of these pollen groups. These three pollen groups were: Braasica, Castanea and 10josotia. For the other two pollen groups there were not enough samples
of honey in either of the 'heat' groups and hence, statistical analysis for those two pollen
groups could not be computed.
From the response received to questionnaire question 6 which requested whether the colony had
been fed sugar. Discriminant analysis was performed to test whether feeding sugar to a colony
of bees during autumn, winter and spring effect the overall amino acid composition of honey
from that colony. The SPSS control file detailed in Appendix VI (c) was used to initiate the
SPSS. In this analysis, again the control statements 56 to 60 were replaced by those given in Appendix VI (e) (ii).
Similar discriminant analysis to that of above was performed on honey samples representatives
of individual pollen groups which were collected from colonies that had been fed sugar or otherwise. The five pollen groups chosen in the previous analysis were used. Statistical results were
obtained for all five pollen groups.
In order to assess whether the honey stores from colonies that had been fed sugar in the autumn
months are stored and subsequently harvested in the New Year's crop. Those samples which were
autumn fed were regarded as samples which had not been fed sugar. Discriminant analysis as
mentioned previously for the autumn, winter and spring fed was carried out on the winter and
spring fed samples. The SPSS control file detailed in Appendix VI (C) was used with the modified
control statements 56 to 60.
Similar discriminant analysis to that of above was also performed on honey samples representatives
of the individual pollen groups which were collected from colonies that had been either sugar fed or otherwise. The five pollen groups considered in the previous analysis were chosen: Statistical results for the Calluna pollen group could not be computed due to the lack of honey
samples in either of the 'SUGAR' groups.
Furthermore, verifýcation of sugar feeding to colonies of bees was determined by testing the
relative concentration of the amino acid proline to that of the other amino acids. The honey
samples used in this case were the autumn, winter and spring fed. The SPSS control file detailed
in Appendix VI (c) was used to initiate the SPSS. In this case, the control statements 56 to
60 were replaced by those given in Appendix VI (e)(ii). Since the results did not show any improvements in this classification analysis. The analysis of the five pollen groups was not
performed.
From the responses of questionnaire questions 5 and 6. it was observed that some of the honey
samples were both heated and from colonies that had been fed sugar and visa versa. There are
four possible combinations of these two questionnaire questions differentiated into two groups.
These four combinations are given in Appendix VI M. Discriminant analysis was performed on
each of these four combinations. The SPSS control file detailed in Appendix VI (c) was used.
In these analysis, the control statements 56 to 60 were replaced by one of the four combination
statements given in Appendix VI M.
Similar discriminant analysis was performed to that of above on honey samples representatives
of the individual pollen groups for each of the four combinations.
348.
(b) Foreign and Commercial Honey Samples
Discriminant analysis was performed on the samples of honey originating from Australia. Canada,
Mexico, New Zealand and the English commercial samples. The SPSS control file detailed and described
in Appendix VII (a) was used to initiate the SPSS.
In the next analysis. the English commercial samples were omitted. Discriminant analysis was performed
on the four foreign country group samples, Australia, Canada, Mexico and New Zealand. The SPSS control file detailed in Appendix VII (a) was used. The control statements 54 to 58 were replaced by those given in Appendix VII (b)(i). Further, the samples of honey from China were also included in the above analysis. Discriminant analysis was performed as mentioned previously. The SPSS control file detailed in Appendix
VII (a) was used. The control statements 54 to 58 were replaced by those given in Appendix VII (b)(ii).
From the foreign and commercial honey samples that were available. Discriminant analysis was performed
on honey samples from six selected countries. These countries were the same as those mentioned in the
previous -analysis except that the France honey samples were also included. The control statements 54
to 58 of the SPSS control file detailed in Appendix VII (a) were replaced by those given in Appendix
VII (b)(iii).
In the next analysis the Mexico and New Zealand honey samples were replaced by those samples originating from India. The control statements 54 to 58 of the SPSS control file in Appendix VII (a) were replaced by those given in Appendix VII (iv).
From the microscopical examination and evaluation it was noticed th4t the pollen contents of the English,
France and Spain honey samples showed considerable similarities. Hence, discriminant analysis was
carried out to test whether there are any differences in the amino acid composition between the Enq ' lish
and European honeys. The control statements 54 to 58 of the SPSS control file in Appendix VII (a) were
replaced by those given in Appendix VII (b)(v).
Also it was noticed during the microscopical examination that the Austria and Greece honey samples
contained algael cells and other unidentifiable microscopical elements. It was considered that these
samples may be of honeydew origin. Thus, discriminant analysis was performed on honey samples of European
origin, that is, Austria, France, Greece and Spain. Further the honey samples of Austria and Greece
were considered to originate from honeydew and hence the code for Greece was changed to that of Austria.
The honey samples of France and Spain was considered to originate from nectar and hence, the code for
Spain was changed to that of France. The control statements 54 to 58 in the SPSS control file detailed
in Appendix VII (a) were replaced by those given in Appendix VII (b)(vi).
It was also noticed during the microscopical examination that the pollen grains of TrifoZium repens
and Melilotu8 had very similar features. It was also noted that these two pollen grains belonged to the
sample plant family. Leguminosae.. Discriminant analysis was performed to test whether there are any differences in the amino acid composition of these honeys. The control staiemente 54 to 58 of the SPSS
control file detailed in Appendix VII (a) were replaced by those given in Appendix VII (b)(vii).
Further, it was also noticed that the pollen grain of Lotus also belonged to the Leguminosaa plant family. The honey samples containing this pollen were also included in the previous analysis. Refer
to Appendix VII (b)(viii) for the control statements used.
Since there were fourteen samples in the foreign and commercial honeys whose country of origin was not knowng It was thought that on the basis of their pollen content these samples be allocated the code for
the country which they were most likely to have originated from. Thus, sample numbers 237,238,239
and 242 were allocated the code for Australia; the sample numbers 240,241,243,244 and 246 were
allocated the code for Mexico and the sample number 247 was allocated the code for New Zealand. Further.
sample number 205 was predicted by the SPSS in a previous analysis to have originated from Australia
and was allocated the appropriate code. Similarly, sample number 231 whose pollen content was similar
to that of the Mexico samples was also allocated the appropriate code. Also, the sample number 253
whose authenticity was suspect and from its pollen content it was attributed the code for Australia.
The sample number 234,235 and 236 from their amino acid maps were thought to have originated from
Australia and were allocated the appropriate code. The SPSS control file given in Appendix VII (a)
with the replaced control statements 54 to 58 by those listed in Appendix VII (b)(i) was used.
349.
Some of the samples received had been commercially processed and bottled, while others were not. Discriminant analysis was performed using the SPSS control file detailed in Appendix VII (&)- The
control statements 54 to 58 were replaced by those listed in Appedix VII (b)(ix).
(c) Combined Honey Samples of the United Kingdom Survey and the Foreign and Commercial
Discriminant analysis was performed on the two hundred and fifty six honey samples to test whether there were any differences in the amino acid composition of the United Kingdom and foreign and commercial
samples. Hence, in this analysis, the five 'IF' control statements 56 to 60 of Appendix VII (a) were replaced by those given in Appendix VII (c)(i). The SPSS was initiated as mentioned before.
Discriminant analysis was performed to discriminate between the U. K. survey, Australia, Canada, China,
France. India and England samples. The control statements given in Appendix VII (c) (ii) were used.
From the evaluation of the distribution of the pollen grains it was observed that both the United
Kingdom survey and the foreign and commercial honey samples contained the Braeaica, TrifoZium repene
and Castanea pollen in the unifloral subclass group. Discriminant analysis was performed using the SPSS control file detailed in Appendix VII (a). In this case, the control statements 59 to 60 were
omitted.
350.
APPENDIX VI
DISCRIMINANT ANALYSIS OF THE U. K. SURVEY HONEYS
(a) Definition of Discrimination and Mahalanobis Distance
Discrimination, in this case, for example, is between the pollen groups. A sample of honey can be
allocated to one of a number of groups or population according to the pollen it contains. For each honey sample the concentration of the thirteen free amino acids were measured. It is on the basis
of these thirteen measurements that a honey sample of unknown floral origin is allocated to a pollen
group.
For each honey sample the thirteen free amino acid measurements can be thought of as co-ordinates in a thirteen dimensional space. Thus, in one pollen group the honey samples from that particular
pollen group will form a cluster of points. The problem is to define a boundary in this space to
separate the different groups. Once the boundaries have been chosen a honey sample of unknown floral origin can then be allocated to a pollen group. Since there will be no true boundaries (due
to randomness in the measurements), that is, the populations 'over ýap' in this space. errors will
sometimes be made when allocating a honey sample to a group. The staýistical methods of 'Discriminant
analysis' have been developed to select boundaries which will minimise the probability of making these
errors. One such procedure is to use the Fisher's discriminant function. This function is obtained by choosing a linear combination of the amino acid concentratiors which defines the direction of maximal
group separation in the sense that the means of the projections of the honey samples from the pollen
groups are maximally apart (relative to the variance of the projections around their respective means). A number of linear combinations are known as discriminant co-ordinates or canonical variates. These
give varying degrees of separation. Usually the first two or three are sufficient for separating the
groups, which give a simple graphical representation, each sample having a value on each canonical
variate these being plotted on co-ordinate axes. The group separations can be seen immediately and
stray observations picked out. Not all of the thirteen measurements may be used in the analysis.
The (sample) Mahalanobis distance between two groups is the square root of-
; Oll
where ý19 and x are the (vector) sample means of the two groups and is a matrix of elements describing .2
the variability of all the measurements (sample variance-covariance matrix). The SPSS 'MAHAL' option
selects the amino acids one at a time, calculates the Mahalanobis distance between each pair of groups
and finds the minimum value. This is then compared with the default value of 1.0 to enter without
the new variable and if it has not increased, this new variable is discarded (Gnandesikan, 1977 and Kendall, Stuart and Ord, 1976).
(b) A Typical SPSS Control File for the U. K. Survey Honeys
Given below is an example of a typical Statistical Package for Social Sciences (SPSS) control file.
This particular SPSS control file contained seventy four control statements or cards. Each control
statement of card is divided into two distinct fields. A field being a part of a statement or a line
which is composed of eighty characters or columns. The control field contains the command names
starting from column one and ends at column fifteen of a line. The specification field contains the
extra information needed for the command to operate the routine or functions defined by the control
field. This specification field starts from column sixteen and ends at column eighty of a line.
The control statements of an SPSS control file are divided into three types. These are data definition,
task definition and read data statements.
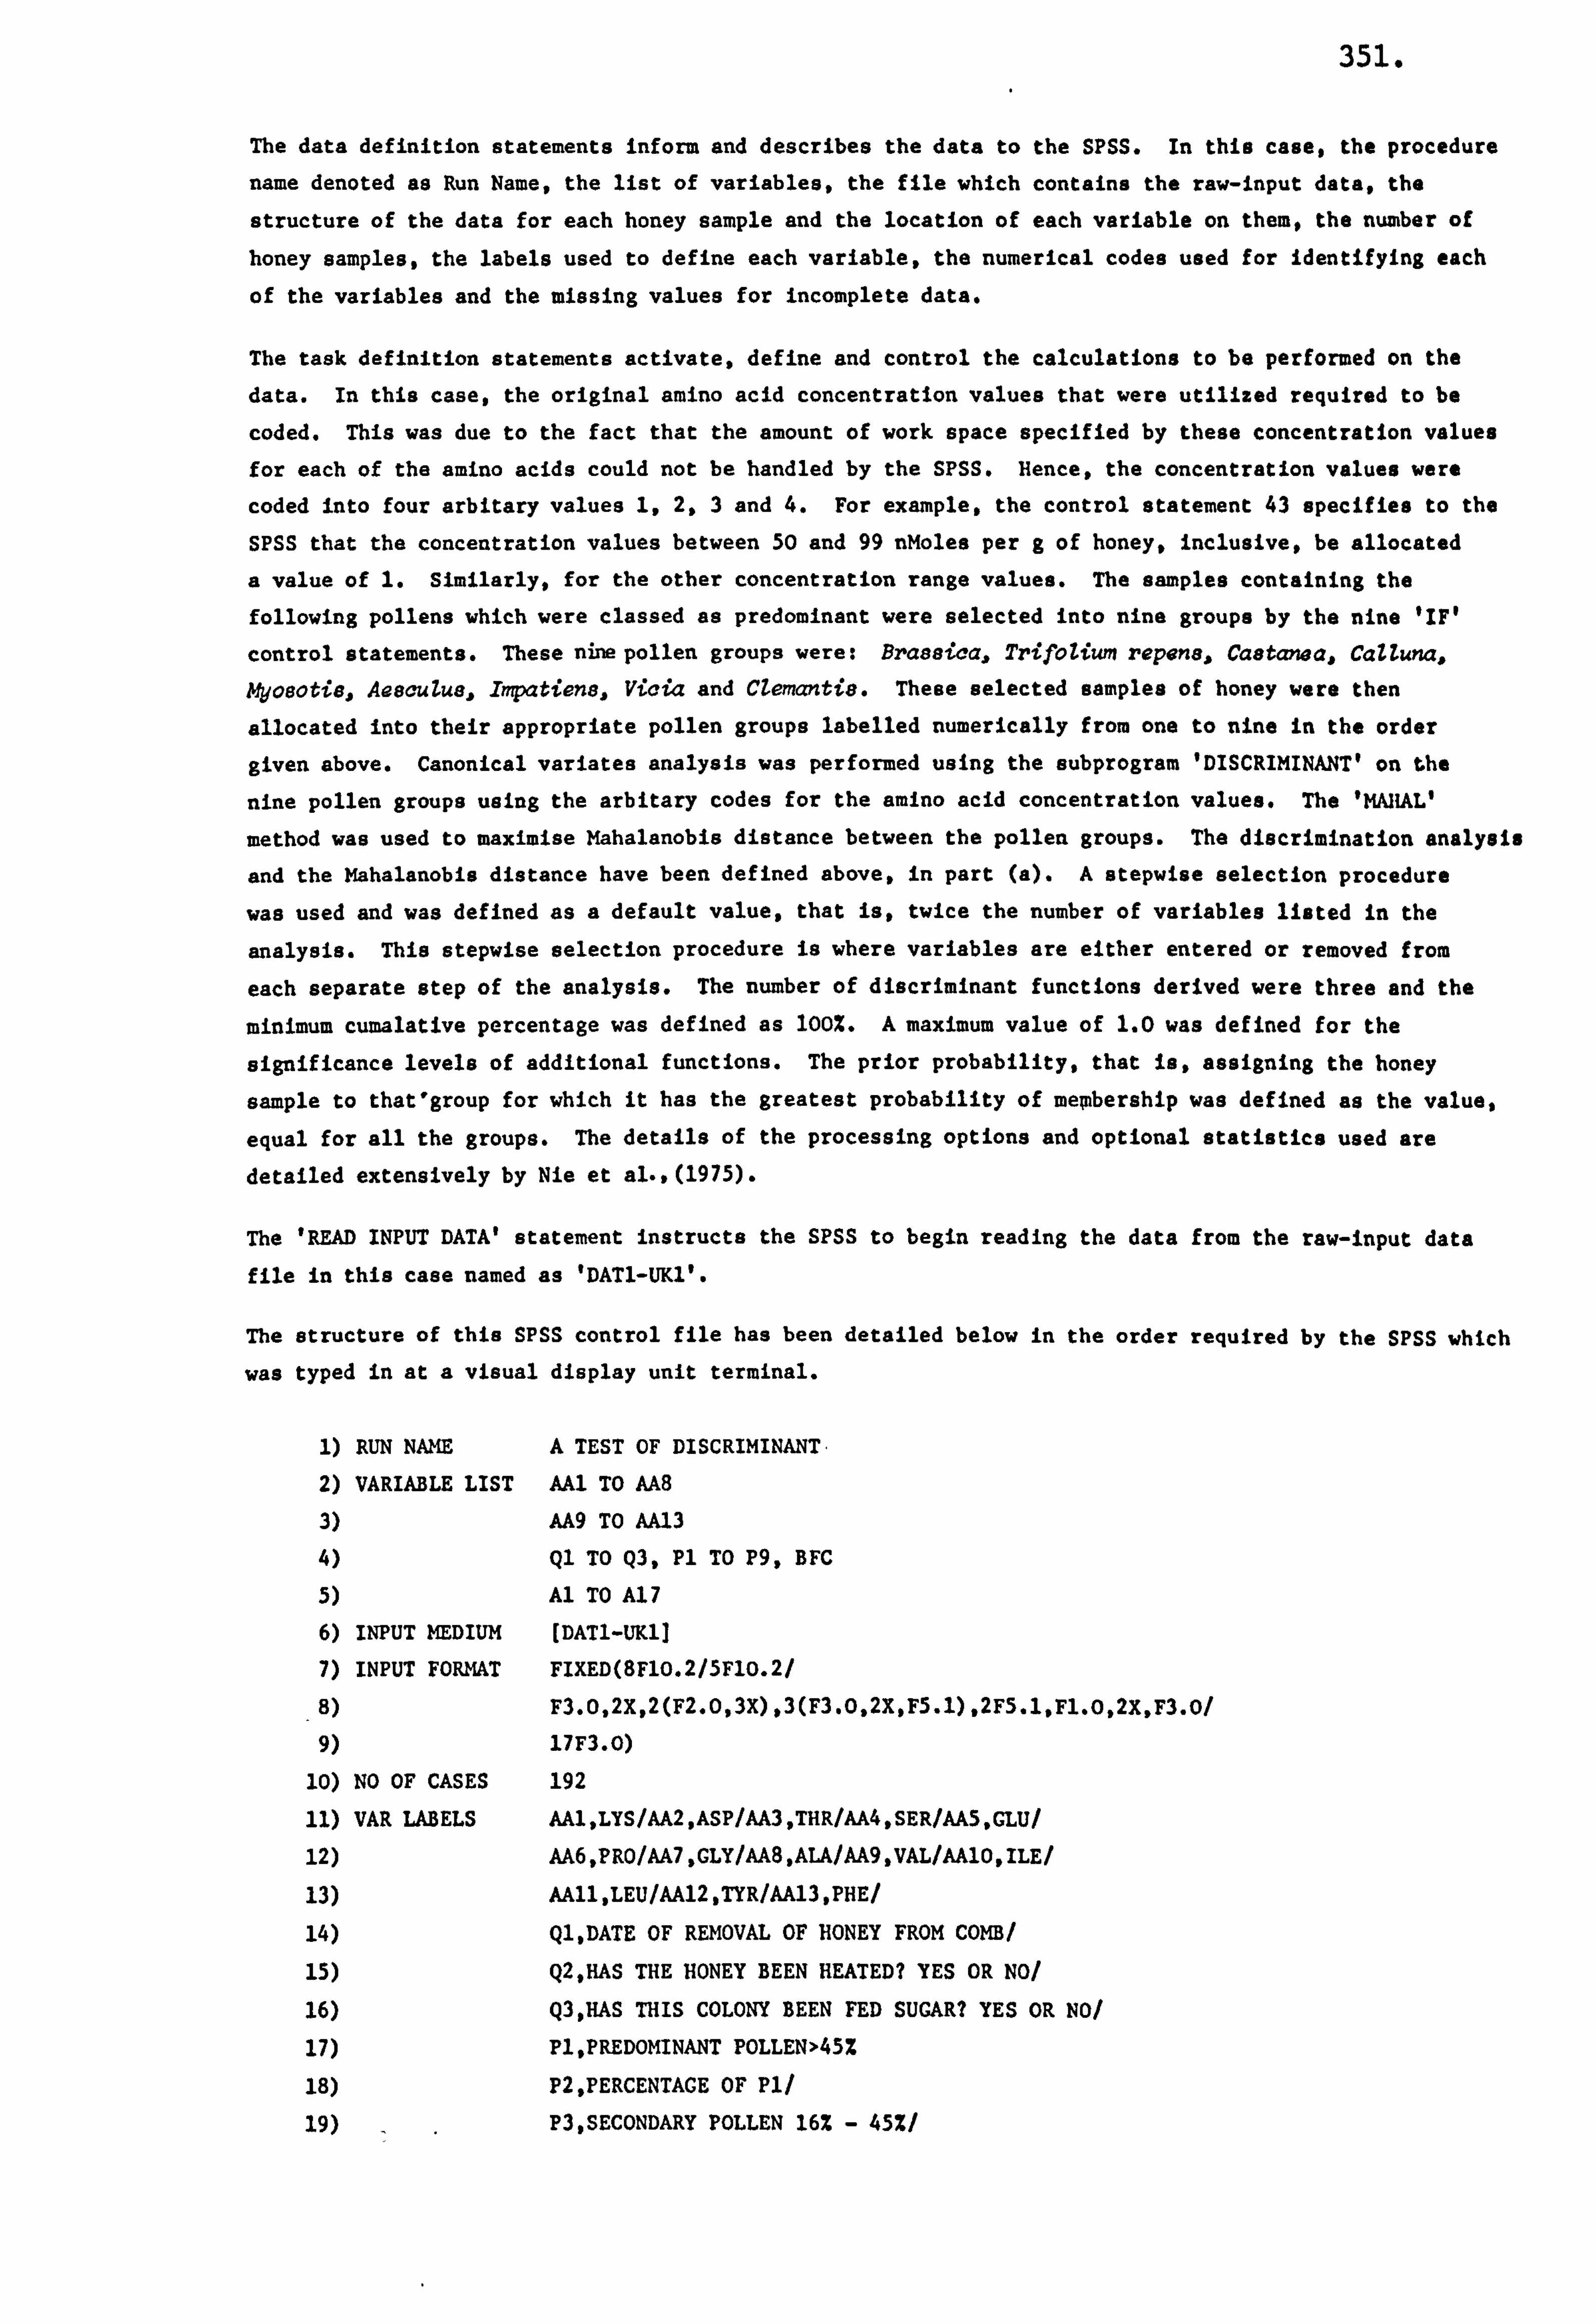
351.
The data definition statements inform and describes the data to the SPSS. In this case, the procedure
name denoted as Run Name, the list of variables, the file which contains the raw-input data, the
structure of the data for each honey sample and the location of each variable on them, the number of honey samples, the labels used to define each variable, the numerical codes used for identifying each
of the variables and the missing values for incomplete data.
The task definition statements activate, define and control the calculations to be performed on the
data. In this case, the original amino acid concentration values that were utilized required to be
coded. This was due to the fact that the amount of work space specified by these concentration values for each of the amino acids could not be handled by the SPSS. Hence, the concentration values were
coded into four arbitary values 1,2,3 and 4. For example, the control statement 43 specifies to the
SPSS that the concentration values between 50 and 99 nMoles per g of honey, inclusive, be allocated
a value of 1. Similarly, for the other concentration range values. The samples containing the
following pollens which were classed as predominant were selected into nine groups by the nine 'IF'
control statements. These nine pollen groups were: Brasaica, Trifolium repens, Chatanea, Calluna,
4oeotie, AeocuZus, Impatiens, Vicia and Memantia. These selected samples of honey were then
allocated into their appropriate pollen groups labelled numerically from one to nine in the order
given above. Canonical variates analysis was performed using the subprogram 'DISCRIMINANTO on the
nine pollen groups using the arbitary codes for the amino acid concentration values. The 'MAHALI
method was used to maximise Mahalanobis distance between the pollen groups. The discrimination analysis
and the Mahalanobis distance have been defined above, in part (a). A stepwise selection procedure
was used and was defined as a default value, that is, twice the number of variables listed in the
analysis. This stepwise selection procedure is where variables are either entered or removed from
each separate step of the analysis. The number of discriminant functions derived were three and the
minimum cumalative percentage was defined as 100%. A maximum value of 1.0 was defined for the
significance levels of additional functions. The prior probability, that is, assigning the honey
sample to that'group for which it has the greatest probability of membership was defined as the value,
equal for all the groups. The details of the processing options and optional statistics used are detailed extensively by Nie et al.. (1975).
The 'READ INPUT DATA' statement instructs the SPSS to begin reading the data from the raw-input data
file in this case named as 'DAT1-UK1'.
The structure of this SPSS control file has been detailed below in the order required by the SPSS which was typed in at a visual display unit terminal.
1) RUN NAME A TEST OF DISCRIMINANTý
2) VARIABLE LIST AA1 TO AA8
3) AA9 TO AA13
4) Ql TO Q3, Pl TO P9, BFC
5) Al TO A17
6) INPUT MEDIUM [DAT1-UK11
7) INPUT FORMAT FIXED(8FlO. 2/5FIO. 2/
_8) F3.0,2X, 2(F2.0,3X). 3(F3.0,2X, F5. l), 2FS. 1. Fl. 0,2X, F3.0/
9) 17F3.0)
10) NO OF CASES 192
11) VAR LABELS AA1, LYS/AA2, ASP/AA3, THR/AA4, SER/AAS, CLU/
12) AA6, PRO/AA7. GLY/AA8, ALA/AA9, VAL/AA10, ILE/
13) AA11, LEU/AA12, TYR/AA13, PHE/
14) Ql, DATE OF REMOVAL OF HONEY FROM COMB/
15) Q29RAS THE HONEY BEEN HEATED? YES OR NOI
16) Q3, HAS THIS COLONY BEEN FED SUGAR? YES OR NOI
17) Pl, PREDOMINANT POLLEN>45%
18) P2, PERCENTACE OF Pl/
19) P3, SECONDARY POLLEN 16% - 45%/
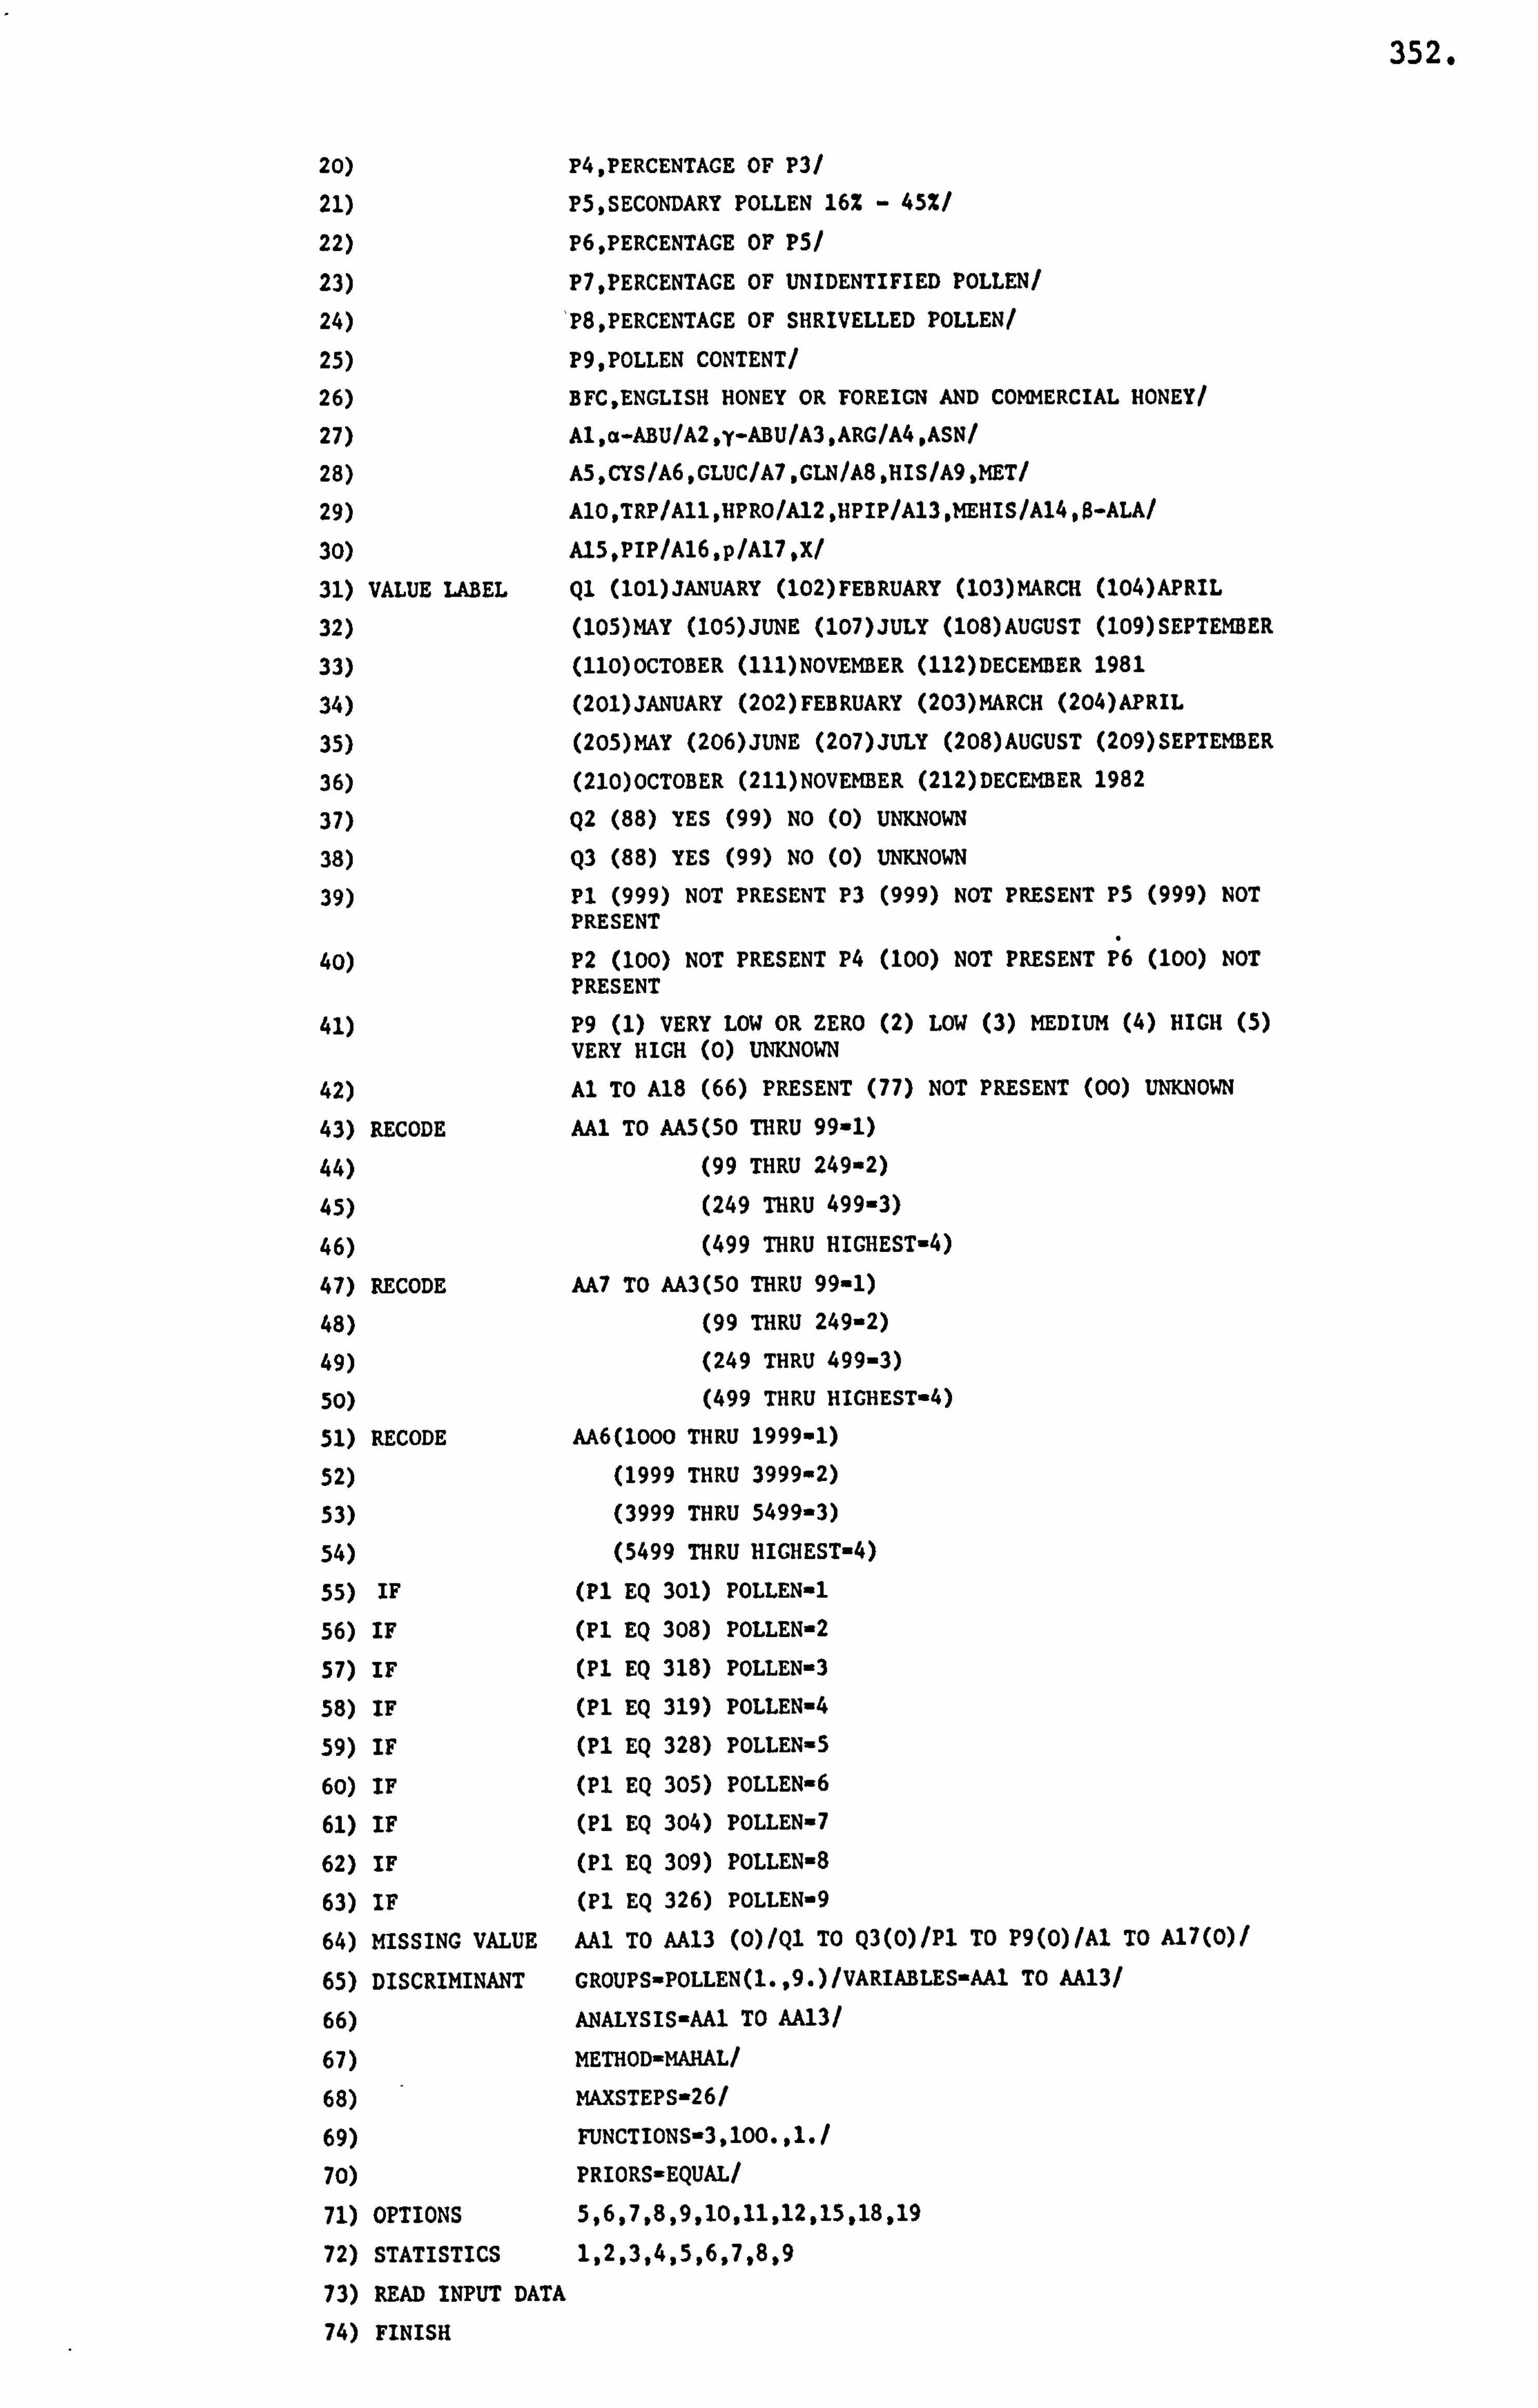
352.
20) P4, PERCENTACE OF P3/
21) P5, SECONDARY POLLEN 16% - 45%/
22) P6, PERCENTACE OF P5/
23) P7, PERCENTACE OF UNIDENTIFIED POLLEN/
24) 'P8, PERCENTACE OF SHRIVELLED POLLEN/
25) P9, POLLEN CONTENT/
26) BFC, ENCLISH HONEY OR FOREIGN AND COMMERCIAL HONEY/
27) Al, a-ABU/A2, y-ABU/A3, ARC/A4, ASN/
28) A5, CYS/A6, CLUC/A7, GLN/A8, HIS/A9, MET/
29) A10, TRP/All, HPRO/Al2, HPIP/Al3, MEHIS/Al4, $-ALA/
30) A15, PIP/Al6, p/Al7, X/
31) VALUE LABEL Ql (101)JANUARY (102)FEBRUARY (103)MARCH (104)APRIL
32) (105)MAY (105)JUNE (107)JULY (108)AUCUST (109)SEPTEMBER
33) (110)OCTOBER (111)NOVEMBER (112)DECEMBER 1981
34) (201)JANUARY (202)FEBRUARY (203)MARCH (204)APRIL
35) (205)MAY (206)JUNE (207)JULY (208)AUGUST (209)SEPTEMBER
36) (210)OCTOBER (211)NOVEMBER (212)DECEMBER 1982
37) Q2 (88) YES (99) NO (0) UNKNOWN
38) Q3 (88) YES (99) NO (0) UNKNOWN
39) Pl (999) NOT PRESENT P3 (999) NOT PRESENT PS (999) NOT PRESENT
40) P2 (100) NOT PRESENT P4 (100) NOT PRESENT P6 (100) NOT PRESENT
41) P9 (1) VERY LOW OR ZERO (2) LOW (3) MEDIUM (4) HIGH (5) VERY HIGH (0) UNKNOWN
42) Al TO A18 (66) PRESENT (77) NOT PRESENT (00) UNKNOWN
43) RECODE AA1 TO AA5(5O THRU 99-1)
44) (99 THRU 249-2)
45) (249 THRU 499-3)
46) (499 THRU HICHEST-4)
47) RECODE AA7 TO AA3(50 THRU 99-1)
48) (99 THRU 249-2)
49) (249 THRU 499-3)
50) (499 THRU HICHEST-4)
51) RECODE AA6(1OOO THRU 1999-1)
52) (1999 THRU 3999-2)
53) (3999 THRU 5499-3)
54) (5499 THRU HICHEST-4)
55) IF (Pl EQ 301) POLLEN-1
56) IF (PI EQ 308) POLLEN-2
57) IF (Pl EQ 318) POLLENm3
58) IF (Pl EQ 319) POLLEN-4
59) IF (Pl EQ 328) POLLEN-5
60) IF (PI EQ 305) POLLEN-6
61) IF (Pl EQ 304) POLLEN-7
62) IF (Pl EQ 309) POLLEN-8
63) IF (Pl EQ 326) POLLEN-9
64) MISSING VALUE AAl TO AA13 (0)/Ql TO Q3(O)/Pl TO P9(0)/Al TO A17(0)/
65) DISCRIMINANT CROUPS-POLLEN(l., 9. )/VARIABLES-AAl TO AA13/
66) ANALYSIS-AAl TO AA131
67) METHOD-MAHAL/
68) MAXSTEPS-26/
69) FUNCTIONS-3,100., ld
70) PRIORS-EQUAL/
71) OPTIONS 5,6,7,8,9,10,11,12,15,18,19
72) STATISTICS 1,2,3,4,5,6,7,8.9
73) READ INPUT DATA
74) FINISH
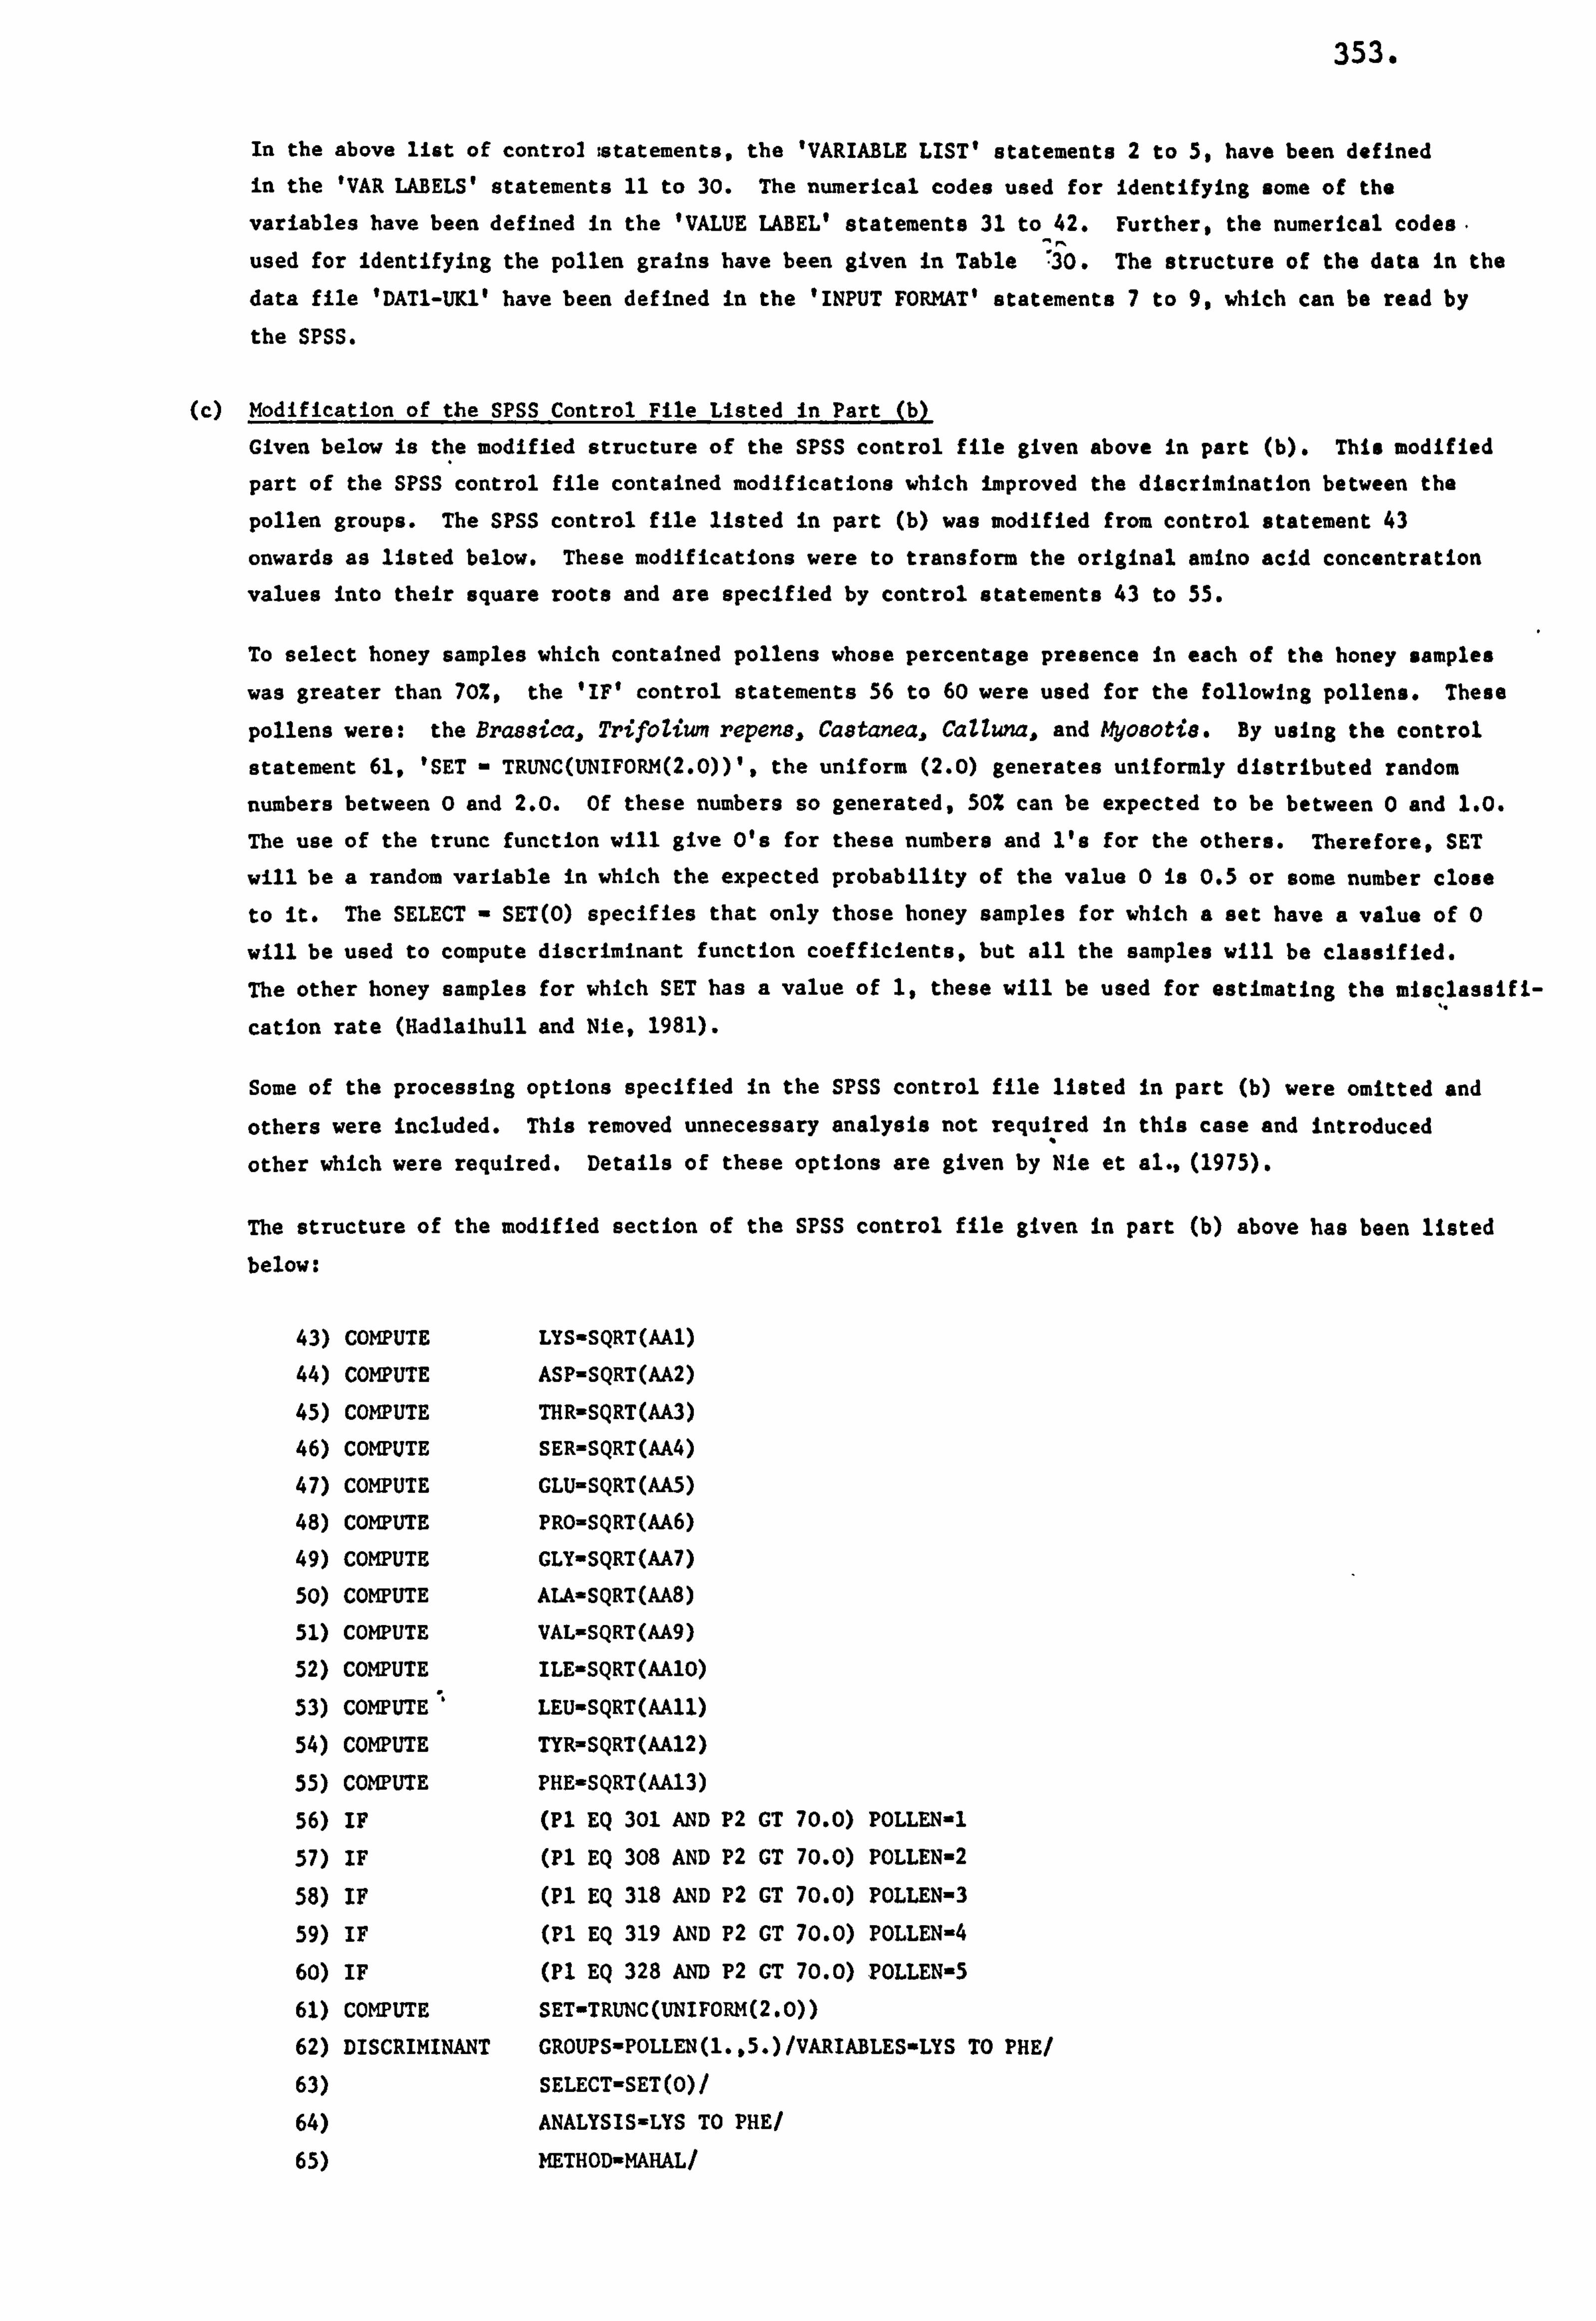
353.
In the above list of control : statements, the 'VARIABLE LIST' statements 2 to 5, have been defined in the 'VAR LABELS' statements 11 to 30. The numerical codes used for Identifying some of the
variables have been defined in the 'VALUE LABEL' statements 31 to 42. Furthers the numerical codes
used for identifying the pollen grains have been given in Table . 30. The structure of the data in the data file 'DAT1-UK1' have been defined in the 'INPUT FORMAT' statements 7 to 9, which can be read by
the SPSS.
(C) Modification of the SPSS Control File Listed In Part (b)
Given below is the modified structure of the SPSS control file given above in part (b). This modified
part of the SPSS control file contained modifications which improved the discrimination between the
pollen groups. The SPSS control file listed in part (b) was modified from control statement 43
onwards as listed below. These modifications were to transform the original amino acid concentration
values into their square roots and are specified by control statements 43 to 55.
To select honey samples which contained pollens whose percentage presence in each of the honey samples
was greater than 70%, the 'IF' control statements 56 to 60 were used for the following pollens. These
pollens were: the Brassica, TrifoZiwn repens, Castanea, CaUuna, and Afyosotie. By using the control
statement 61, 'SET - TRUNC(UNIFORM(2.0))', the uniform (2.0) generates uniformly distributed random
numbers between 0 and 2.0. Of these numbers so generated, 50% can be expected to be between 0 and 1.0.
The use of the trunc function will give O's for these numbers and I's for the others. Therefore, SET
will be a random variable in which the expected probability of the value 0 is 0.5 or some number close to it. The SELECT - SET(O) specifies that only those honey samples for which a set have a value of 0
will be used to compute discriminant function coefficients, but all the samples will be classified. The other honey samples for which SET has a value of 1, these will be used for estimating the misclassift-
cation rate (Hadlaihull and Nie, 1981).
Some of the processing options specified in the SPSS control file listed in part (b) were omitted and
others were included. This removed unnecessary analysis not required in this case and introduced
other which were required. Details of these options are given by Nie et al., (1975).
The structure of the modified section of the SPSS control file given in part (b) above has been listed
below:
43) COMPUTE LYS-SQRT(AAl) 44) COMPUTE ASP-SQRT(AA2)
45) COMPUTE THR-SQRT(AA3) 46) COMPUTE SER-SQRT(AA4) 47) COMPUTE GLU-SQRT(AA5)
48) COMPUTE PRo-sQRT(AA6) 49) COMPUTE GLY-SQRT(AA7)
50) COMPUTE ALA-SQRT(AA8)
51) COMPUTE VAL-SQRT(AA9)
52) COMPUTE ILE-SQRT(AA10)
53) COMPUTE LEU-SQRT(AA11)
54) COMPUTE TYR-SQRT(AA12)
55) COMPUTE PHE-SQRT(AA13)
56) IF (Pl EQ 301 AND P2 GT 70.0) POLLEN-1
57) IF (Pl EQ 308 AND P2 GT 70.0) POLLEN-2
58) IF (Pl EQ 318 AND P2 GT 70.0) POLLEN-3
59) IF (Pl EQ 319 AND P2 GT 70.0) POLLEN-4
60) IF (Pl EQ 328 AND P2 GT 70.0) POLLEN-5
61) COMPUTE SET-TRUNC(UNIFORM(2.0))
62) DISCRIMINANT GROUPS-POLLEN(1.. 5. )/VARIABLES-LYS TO PHE/
63) SELECT-SET(O)/
64) ANALYSIS-LYS TO PHE/
65) METHOD-MAHAL/
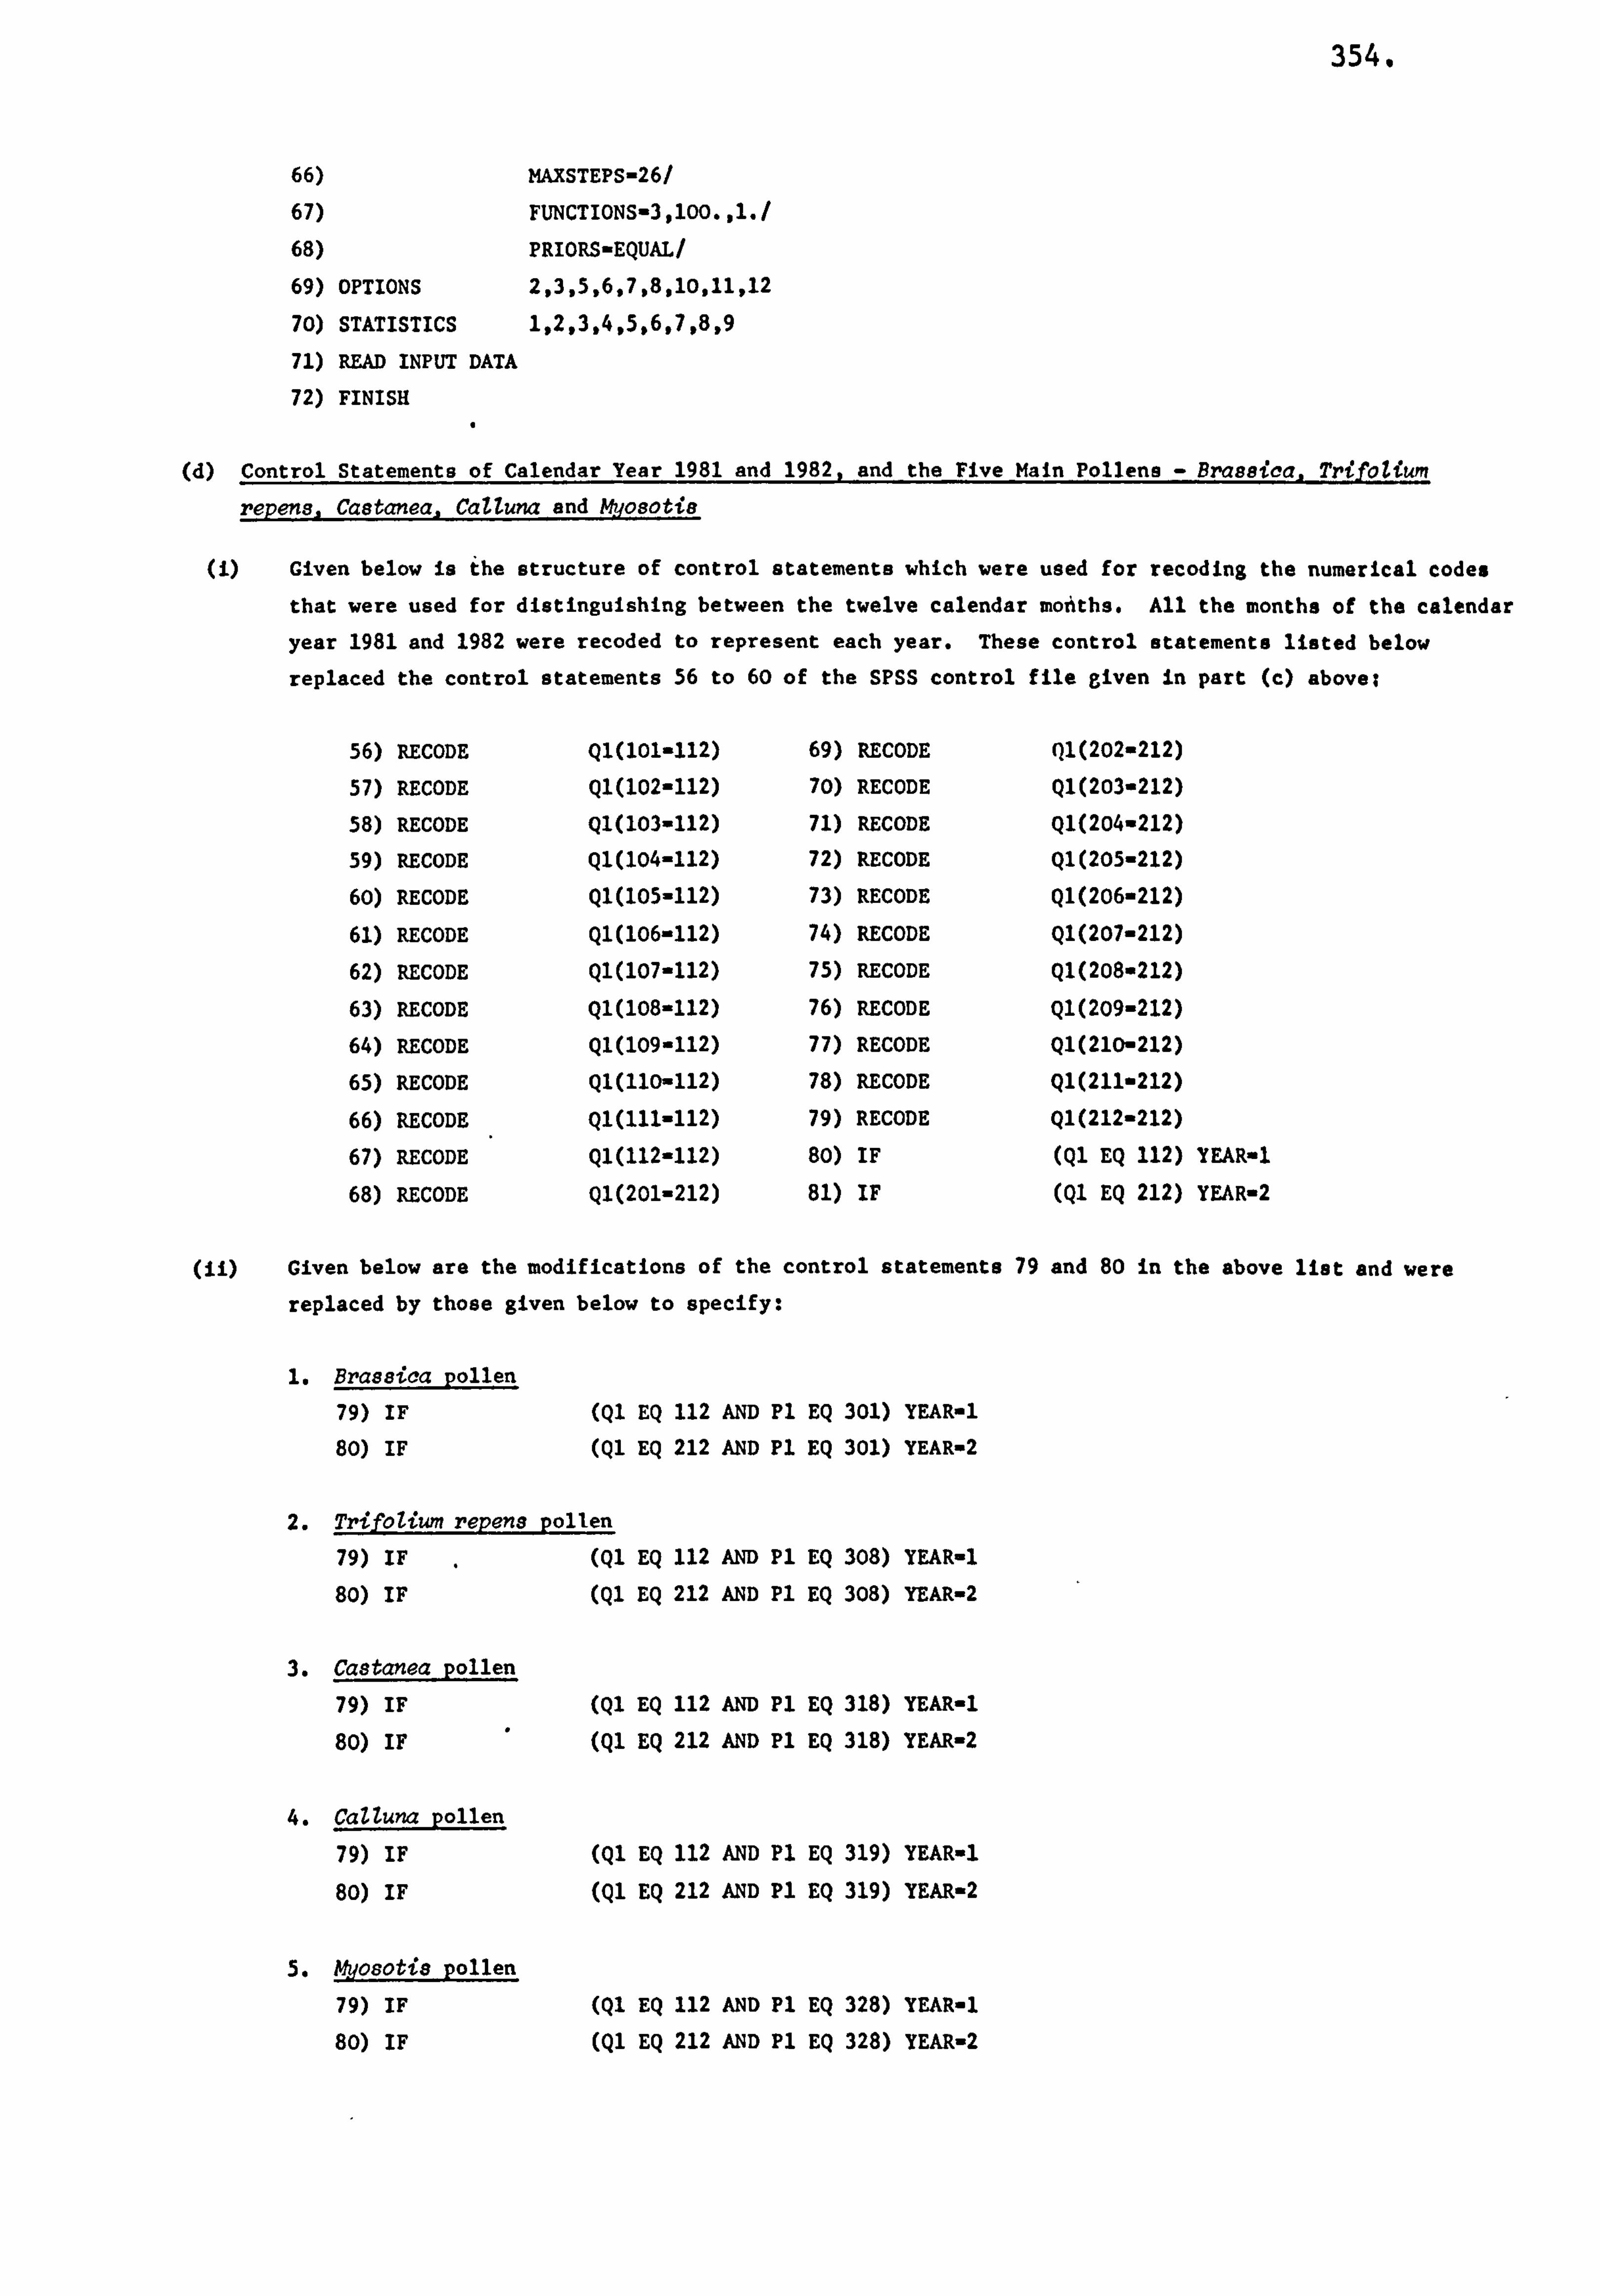
354.
66)
67)
68)
69) OPTIONS
70) STATISTICS
71) READ INPUT DATA 72) FINISH
MAKSTEPS-26/
FUNCTIONS-3,100., l. /
PRIORS-EQUAL/
2,3,5,6,7,8,10,11,12
1.2,3.4,5,6,7,8,9
(d) Control Statements of Calendar Year 1981 and 1982, and the Five Main Pollens - Brassica. Tri-foZium
repens, Castanea, Calluna and MyosotiB
Given below is the structure of control statements which were used for recoding the numerical codes
that were used for distinguishing between the twelve calendar months. All the months of the calendar
year 1981 and 1982 were recoded to represent each year. These control statements listed below
replaced the control statements 56 to 60 of the SPSS control file eiven in part (c) abovel
56) RECODE Ql(101-112) 69) RECODE Ql(202-212)
57) RECODE Ql(102-112) 70) RECODE Ql(203-212)
58) RECODE Ql(103-112) 71) RECODE Ql(204-212)
59) RECODE Ql(104-112) 72) RECODE Q1(205-212)
60) RECODE Ql(105-112) 73) RECODE Ql(206-212)
61) RECODE Ql(106-112) 74) RECODE Ql(207-212)
62) RECODE Ql(107-112) 75) RECODE Ql(208-212)
63) RECODE QI(108-112) 76) RECODE Ql(209-212)
64) RECODE Ql(109-112) 77) RECODE Ql(210-212)
65) RECODE Ql(110-112) 78) RECODE Ql(211-212)
66) RECODE Ql(111-112) 79) RECODE Ql(212-212)
67) RECODE Ql(112-112) 80) IF (Ql EQ 112) YEAR-1
68) RECODE Ql(201-212) 81) IF (Ql EQ 212) YEAR-2
(ii) Given below are the modifications of the control statements 79 and 80 in the above list and were
replaced by those given below to specify:
1. Brassica pollen
79) IF (Ql EQ 112 AND Pl EQ 301) YEAR-1
80) IF (Ql EQ 212 AND PI EQ 301) YEAR-2
2. Trifolium repens pollen
79) IF (Ql EQ 112 AND Pl EQ 308) YUR-1
80) IF (Ql EQ 212 AND Pl EQ 308) YEAR-2
3. Castanea pollen 79) IF (Ql EQ 112 AND Pl EQ 318) YEAR-1
80) IF (Ql EQ 212 AND Pl EQ 318) YEAR-2
4. CaZZuna pollen 79) IF (Ql EQ 112 AND Pl EQ 319) YEAR-1 80) IF (Ql EQ 212 AND PI EQ 319) YEAR-2
5. ld. ýosoti8 pollen
79) IF (Ql EQ 112 AND Pl EQ 328) YEAR-1
80) IF (Ql EQ 212 AND Pl EQ 328) YEAR-2
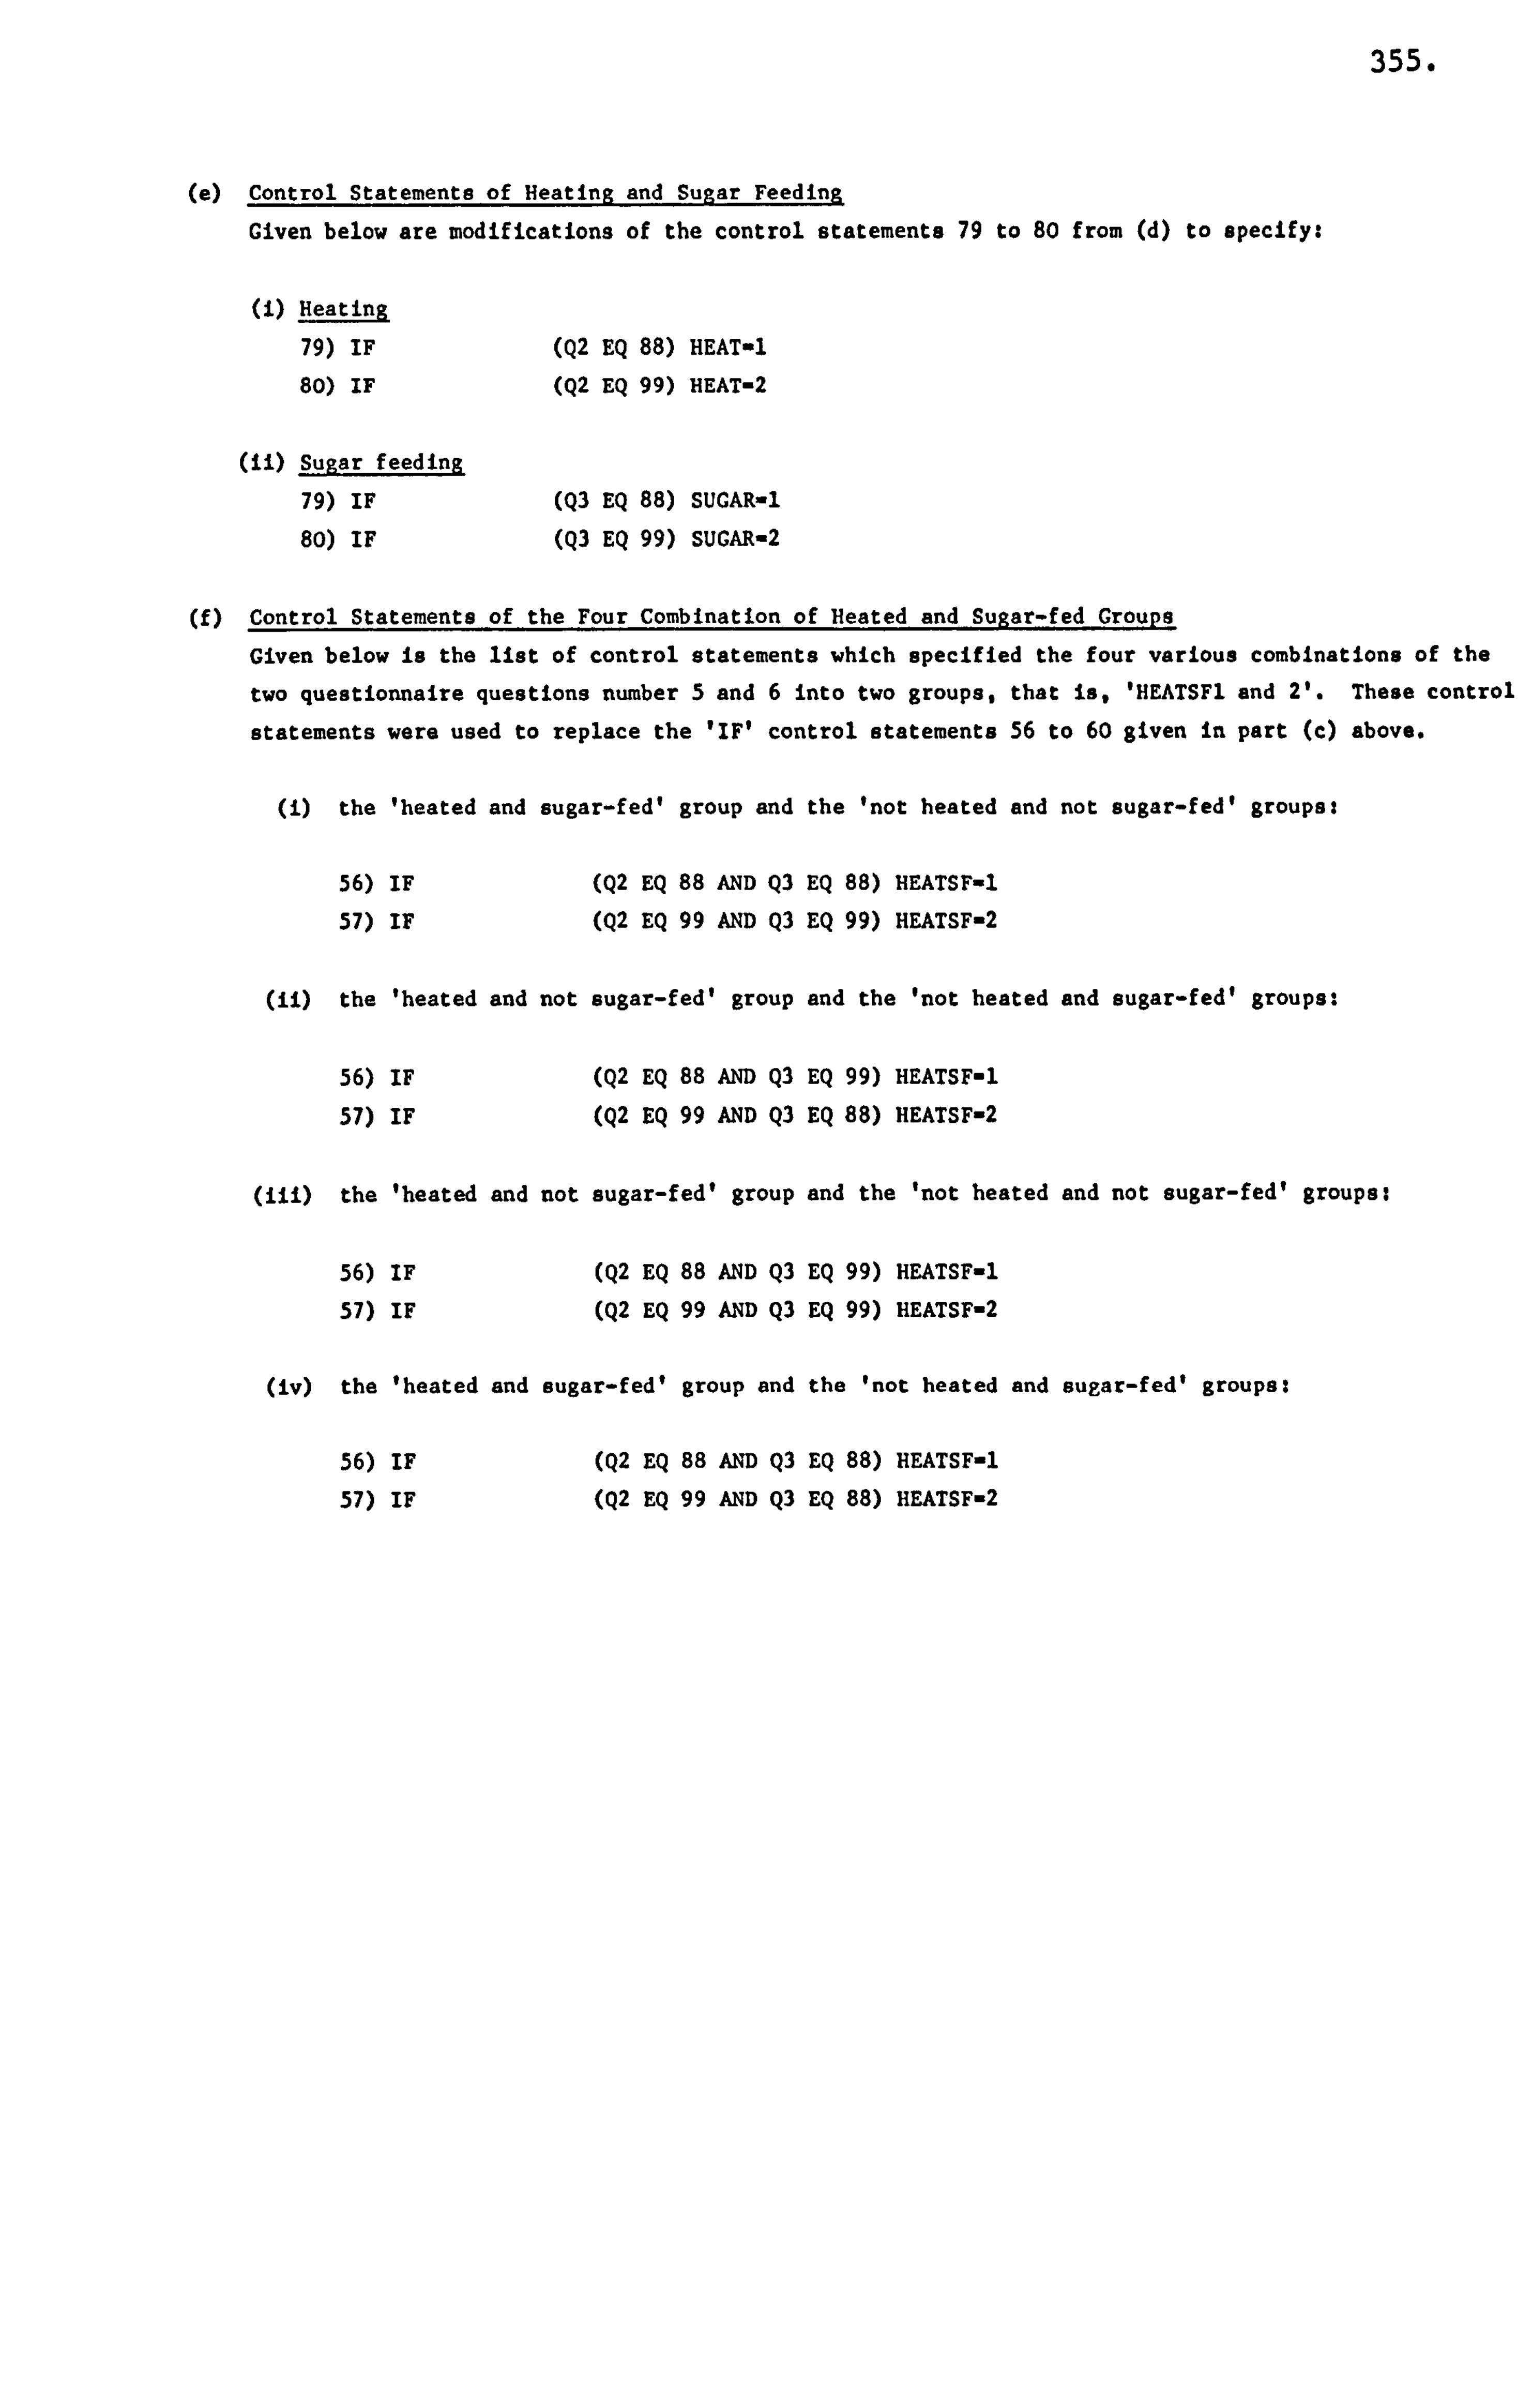
355.
(a) Control Statements of Heating and Sugar Feeding
Given below are modifications of the control statements 79 to 80 from (d) to specify:
Heating
79) IF
80) IF
(ii) Sugar feeding
79) IF
80) IF
(Q2 EQ 88) HEAT-1
(Q2 EQ 99) HEAT-2
(Q3 EQ 88) SUCAR-1 (Q3 EQ 99) SUCAR-2
(f) Control Statements of the Four Combination of Bested and Sugar-fed Groups
Given below is the list of control statements which specified the four various combinations of the
two questionnaire questions number 5 and 6 into two groups, that is, 'HEATSF1 and 2'. These control
statements were used to replace the 'IF' control statements 56 to 60 given in part (c) above.
(i) the 'heated and sugar-fed' group and the tnot heated and not sugar-fed' groups:
56) IF (Q2 EQ 88 AND Q3 EQ 88) HEATSF-1
57) IF (Q2 EQ 99 AND Q3 EQ 99) HEATSF-2
(ii) the 'heated and not sugar-fed' group and the 'not heated and sugar-fed' groups:
56) IF (Q2 EQ 88 AND Q3 EQ 99) HEATSF-1
57) IF (Q2 EQ 99 AND Q3 EQ 88) HEATSF-2
(iii) the 'heated and not sugar-fed' group and the 'not heated and not sugar-fed' groups:
56) IF (Q2 EQ 88 AND Q3 EQ 99) HEATSF-1
57) IF (Q2 EQ 99 AND Q3 EQ 99) HEATSF-2
(iv) the 'heated and sugar-fed' group and the 'not heated and sugar-fed' groups:
56) IF (Q2 EQ 88 AND Q3 EQ 88) HEATSF-1
57) IF (Q2 EQ 99 AND Q3 EQ 88) HEATSF-2
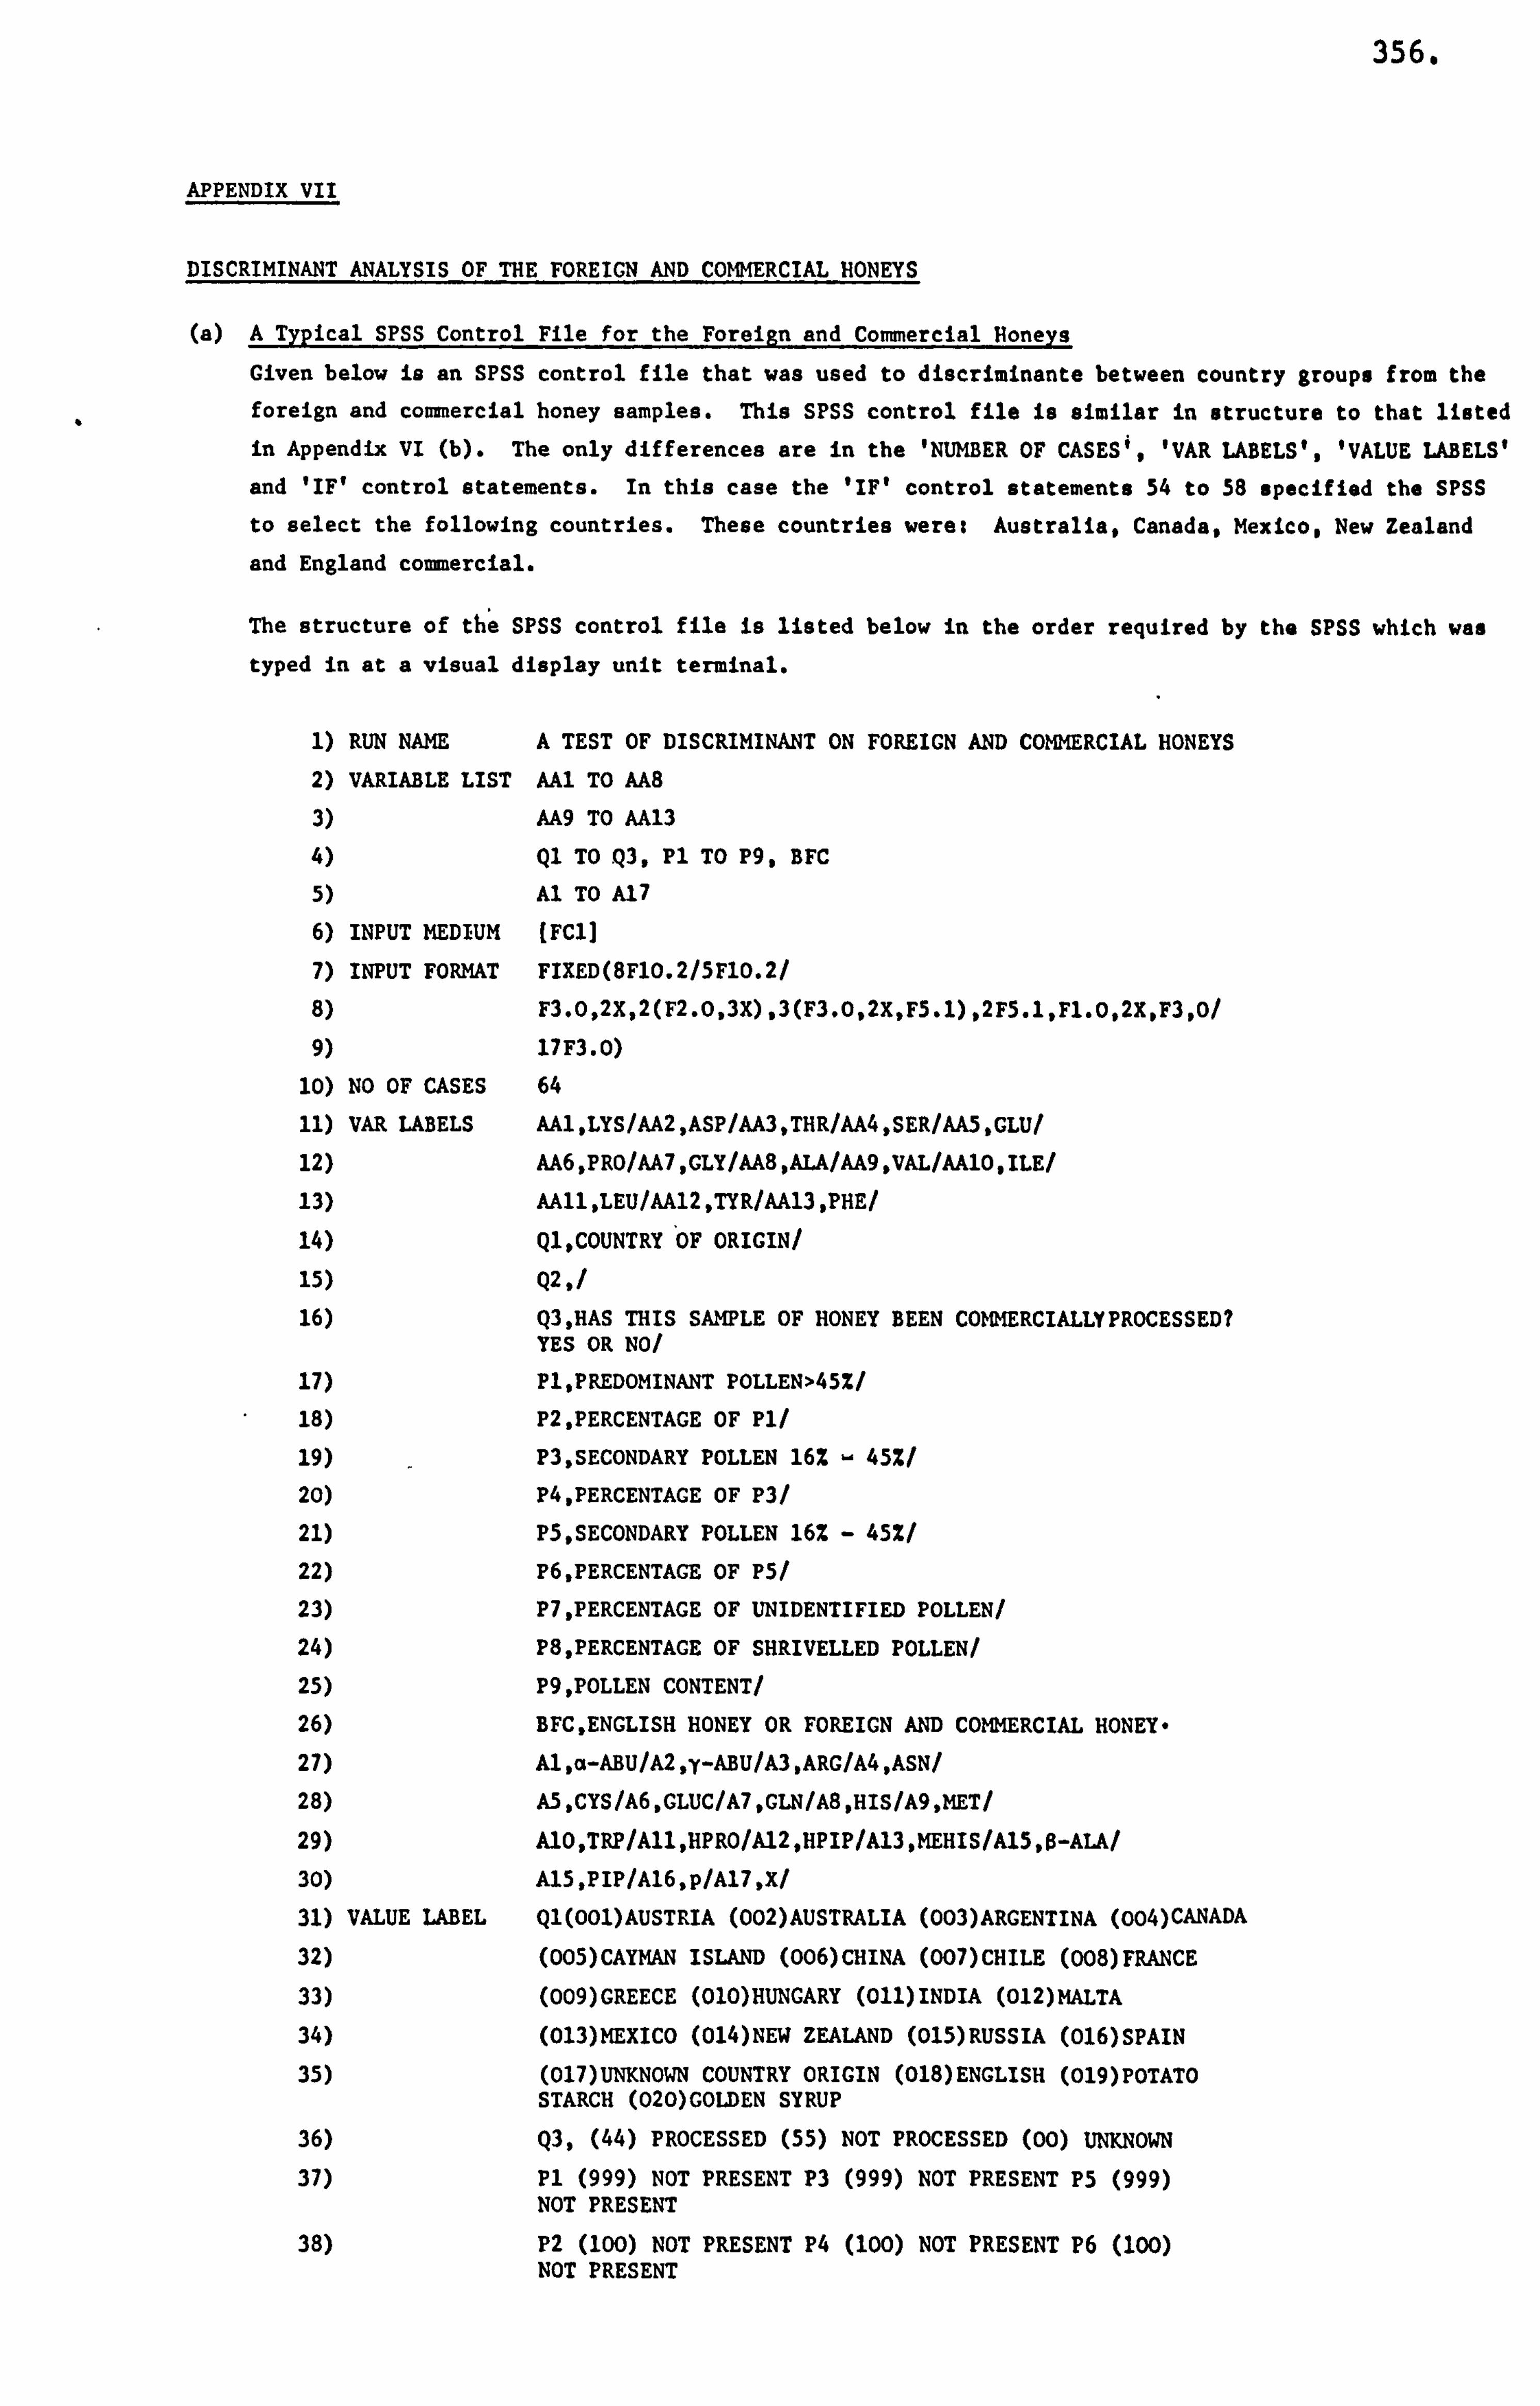
356.
APPENDIX VII
DISCRIMINANT ANALYSIS OF THE FOREICN AND COMMERCIAL HONEYS
(a) A Typical SPSS Control File for the Foreign and Commercial Honeys
Given below is an SPSS control file that was used to discriminante between country groups from the foreign and commercial honey samples. This SPSS control file is similar in structure to that listed
in Appendix VI (b). The only differences are in the 'NUMBER OF CASES's 'VAR LABELS', 'VALUE LABELS'
and 'IF' control statements. In this case the 'IF' control statements 54 to 58 specified the SPSS
to select the following countries. These countries were: Australia, Canada, Mexico, New Zealand
and England commercial.
The structure of the SPSS control file is listed below in the order required by the SPSS which was typed in at a visual display unit terminal.
1) RUN NAME A TEST OF DISCRIMINANT ON FOREIGN AND COMMERCIAL HONEYS
2) VARIABLE LIST W TO AA8
3) AA9 TO AA13
4) Ql TO Q3, Pl TO P9. BFC
5) Al TO A17
6) INPUT MEDIUM IFC11
7) INPUT FORMAT FIXED(SF10.2/5FlO. 2/
8) F3.0,2X, 2(F2.0,3X), 3(F3.0,2X, F5.1), 2F5.1, Fl. 0,2X, F3,0/
9) 17F3.0)
10) NO OF CASES 64
11) VAR LABELS AA1, LYS/AA2, ASP/AA3, THR/AA4, SER/AA5. GLU/
12) AA6, PRO/AA7, GLY/AA8, ALA/AA9, VAL/AA10, ILE/
13) AA11, LEU/AA12, TYR/AA13, PHE/
14) Ql, COUNTRY OF ORIGIN/
15) Q2, /
16) Q3, HAS THIS SAMPLE OF HONEY BEEN COMMERCIALLYPROCESSED? YES OR NOI
17) PI. PREDOMINANT POLLEN>45%/
18) P2, PERCENTAGE OF Pl/
19) P3, SECONDARY POLLEN 16% 45%/
20) P4, PERCENTAGE OF P3/
21) P5, SECONDARY POLLEN 16% 45%/
22) P6, PERCENTAGE OF P5/
23) P7, PERCENTAGE OF UNIDENTIFIED POLLEN/
24) P8, PERCENTAGE OF SHRIVELLED POLLEN/
25) P9, POLLEN CONTENT/
26) BFC, ENGLISH HONEY OR FOREIGN AND COMMERCIAL HONEY-
27) Al, a-ABU/A2, y-ABU/A3, ARG/A4, ASN/
28) A5, CYS/A6, CLUC/A7, GLN/A8, HIS/A9, MET/
29) A109TRP/All, HPRO/Al2, HPIP/Al3, MEHIS/Al5,0-ALA/
30) AlS, PIP/Al6, P/Al7, X/
31) VALUE LABEL Ql(OO1)AUSTRIA (002)AUSTRALIA (003)ARGENTINA (004)CANADA
32) (005)CAYMAN ISLAND (006)CHINA (007)CHILE (008)FRANCE
33) (009)GREECE (01O)HUNGARY (011)INDIA (012)MALTA
34) (013)MEXICO (014)NEW ZEALAND (015)RUSSIA (016)SPAIN
35) (017)UNKNOWN COUNTRY ORIGIN (018)ENGLISH (019)POTATO STARCH (020)GOLDEN SYRUP
36) Q3, (44) PROCESSED (55) NOT PROCESSED (00) UNKNOWN
37) Pl (999) NOT PRESENT P3 (999) NOT PRESENT P5 (999) NOT PRESENT
38) P2 (100) NOT PRESENT P4 (100) NOT PRESENT P6 (100) NOT PRESENT
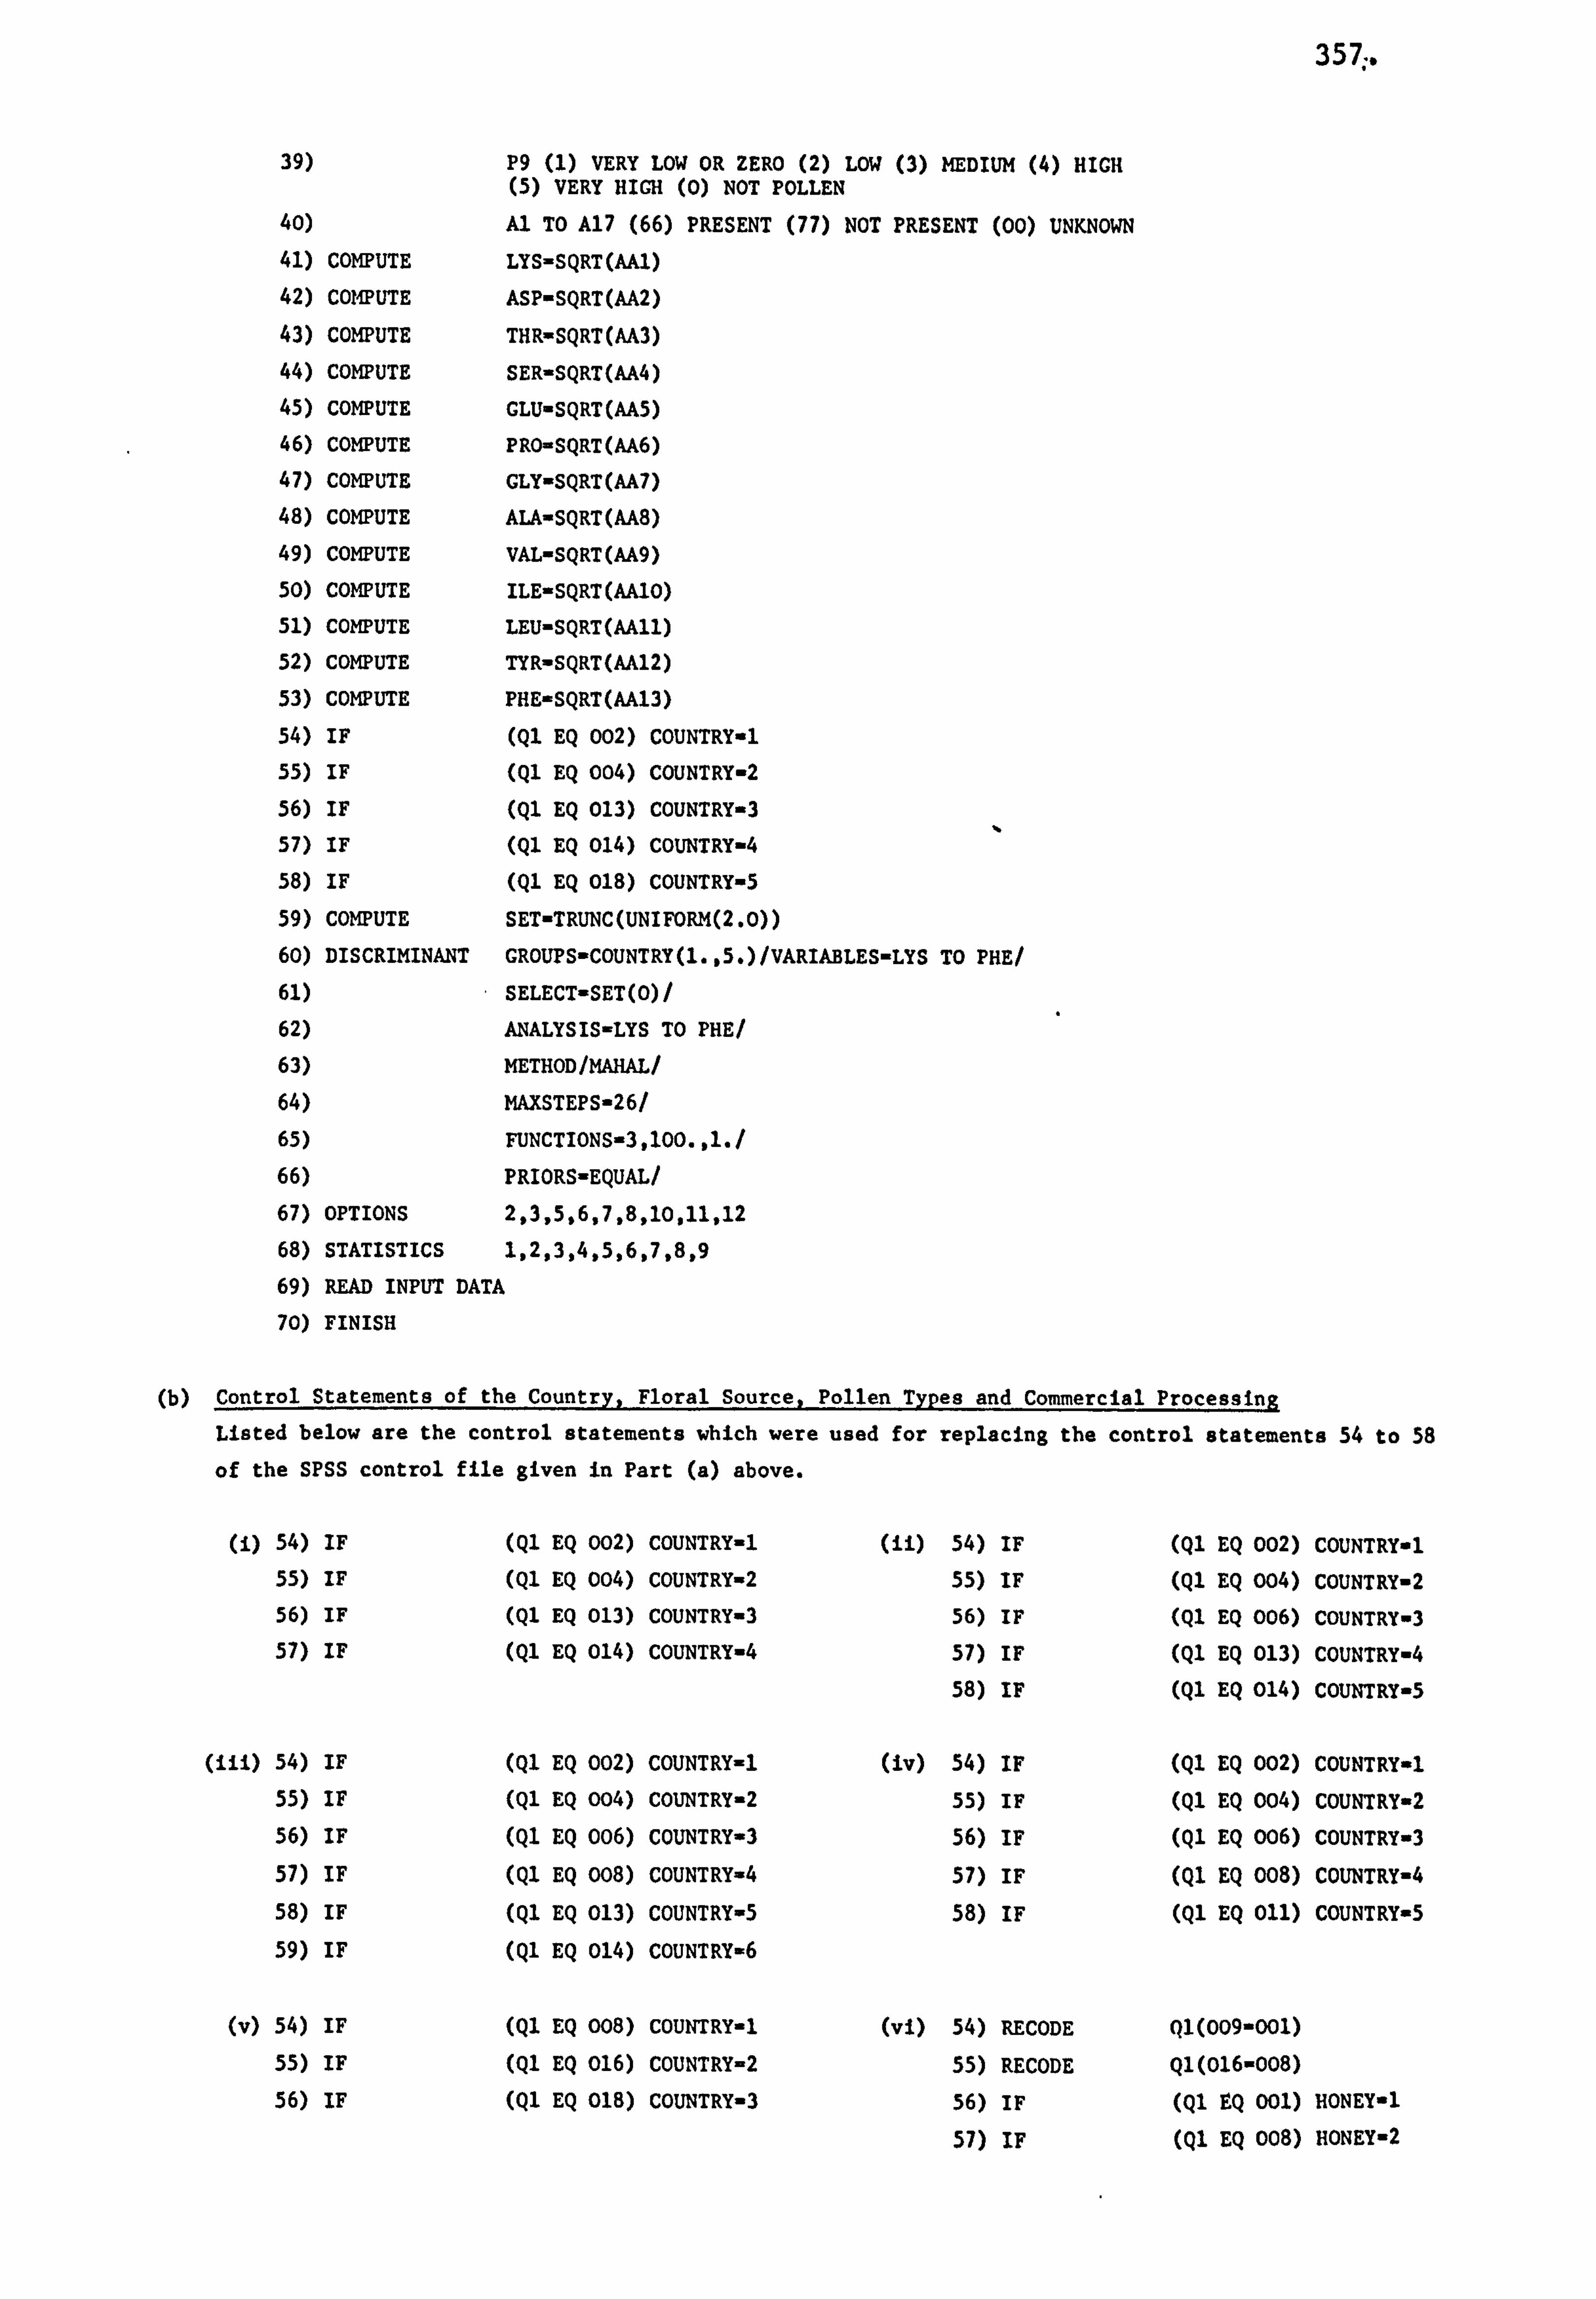
357...
39) P9 (1) VERY LOW OR ZERO (2) LOW (3) MEDIUM (4) HIGH (5) VERY HIGH (0) NOT POLLEN
40) Al TO A17 (66) PRESENT (77) NOT PRESENT (00) UNKNOWN 41) COMPUTE LYS-SQRT(AAl) 42) COMPUTE ASP-SQRT(AA2) 43) COMPUTE THR-SQRT(AA3) 44) COMPUTE SER-SQRT(AA4) 45) COMPUTE GLU-SQRT(AA5) 46) COMPUTE PRO-SQRT(AA6) 47) COMPUTE GLY-SQRT(AA7) 48) COMPUTE AIA-SQRT(AA8)
49) COMPUTE VAL-SQRT(AA9) 50) COMPUTE ILE-SQRT(AA10) 51) COMPUTE LEU-SQRT(AA11) 52) COMPUTE TYR-SQRT(AA12) 53) COMPUTE PHE-SQRT(AA13)
54) IF (Ql EQ 002) COUNTRY-1 55) IF (Ql EQ 004) COUNTRY-2
56) IF (Ql EQ 013) COUNTRY-3 57) IF (Ql EQ 014) COUNTRY-4 58) IF (Ql EQ 018) COUNTRY-5
59) COMPUTE SET-TRUNC(UNIFORM(2.0))
60) DISCRIMINANT GROUPS-COUNTRY(1., S. )/VARIABLES-LYS TO PHE/ 61) SELECT-SET(O)/
62) ANALYSIS-LYS TO PHE/ 63) METHOD/MAHAL/ 64) MAXSTEPS-26/
65) FUNCTIONS-3,100., l. /
66) PRIORS-EQUAL/
67) OPTIONS 2,3,5,6,7,8,10,11,12
68) STATISTICS 1,2,3,4,5,6,7,8,9
69) READ INPUT DATA
70) FINISH
(b) Control Statements of the Country, Floral Source, Pollen Types and Commercial Processing
Listed below are the control statements which were used for replacing the control statements 54 to 58
of the SPSS control file given in Part (a) above.
(1) 54) IF (Ql EQ 002) COUNTRY-1 55) IF (Ql EQ co4) COUNTRY-2 56) IF (Ql EQ 013) COUNTRY-3 57) IF (Ql EQ 014) COUNTRY-4
(111) 54) IF (Ql EQ 002) COUNTRY-1 55) IF (Ql EQ 004) COUNTRY-2
56) IF (Ql EQ 006) COUNTRY-3
57) IF (Ql EQ 008) COUNTRY-4
58) IF (Ql EQ 013) COUNTRY-5
59) IF (Ql EQ 014) COUNTRY-6
(11) 54) IF (Ql EQ 002) COUNTRY-1 55) IF (Ql EQ 004) COUNTRY-2 56) IF (Ql EQ 006) COUNTRY-3 57) IF (Ql EQ 013) COUNTRY-4 58) IF (Ql EQ 014) COUNTRY-5
(iv) 54) IF (Ql EQ oo2) COUNTRY-1
55) IF (Ql EQ 004) COUNTRY-2 56) IF (Ql EQ 006) COUNTRY-3
57) IF (Ql EQ 008) COUNTRY-4
58) IF (Ql EQ 011) COUNTRY-5
(v) 54) IF (Ql EQ 008) COUNTRY-1
55) IF (Ql EQ 016) COUNTRY-2
56) IF (Ql EQ 018) COUNTRY-3
(vi) 54) RECODE Ql(009-001)
55) RECODE Ql(016-008)
56) IF (Ql EQ 001) HONEY, l
57) IF (Ql EQ 008) HONEY-2
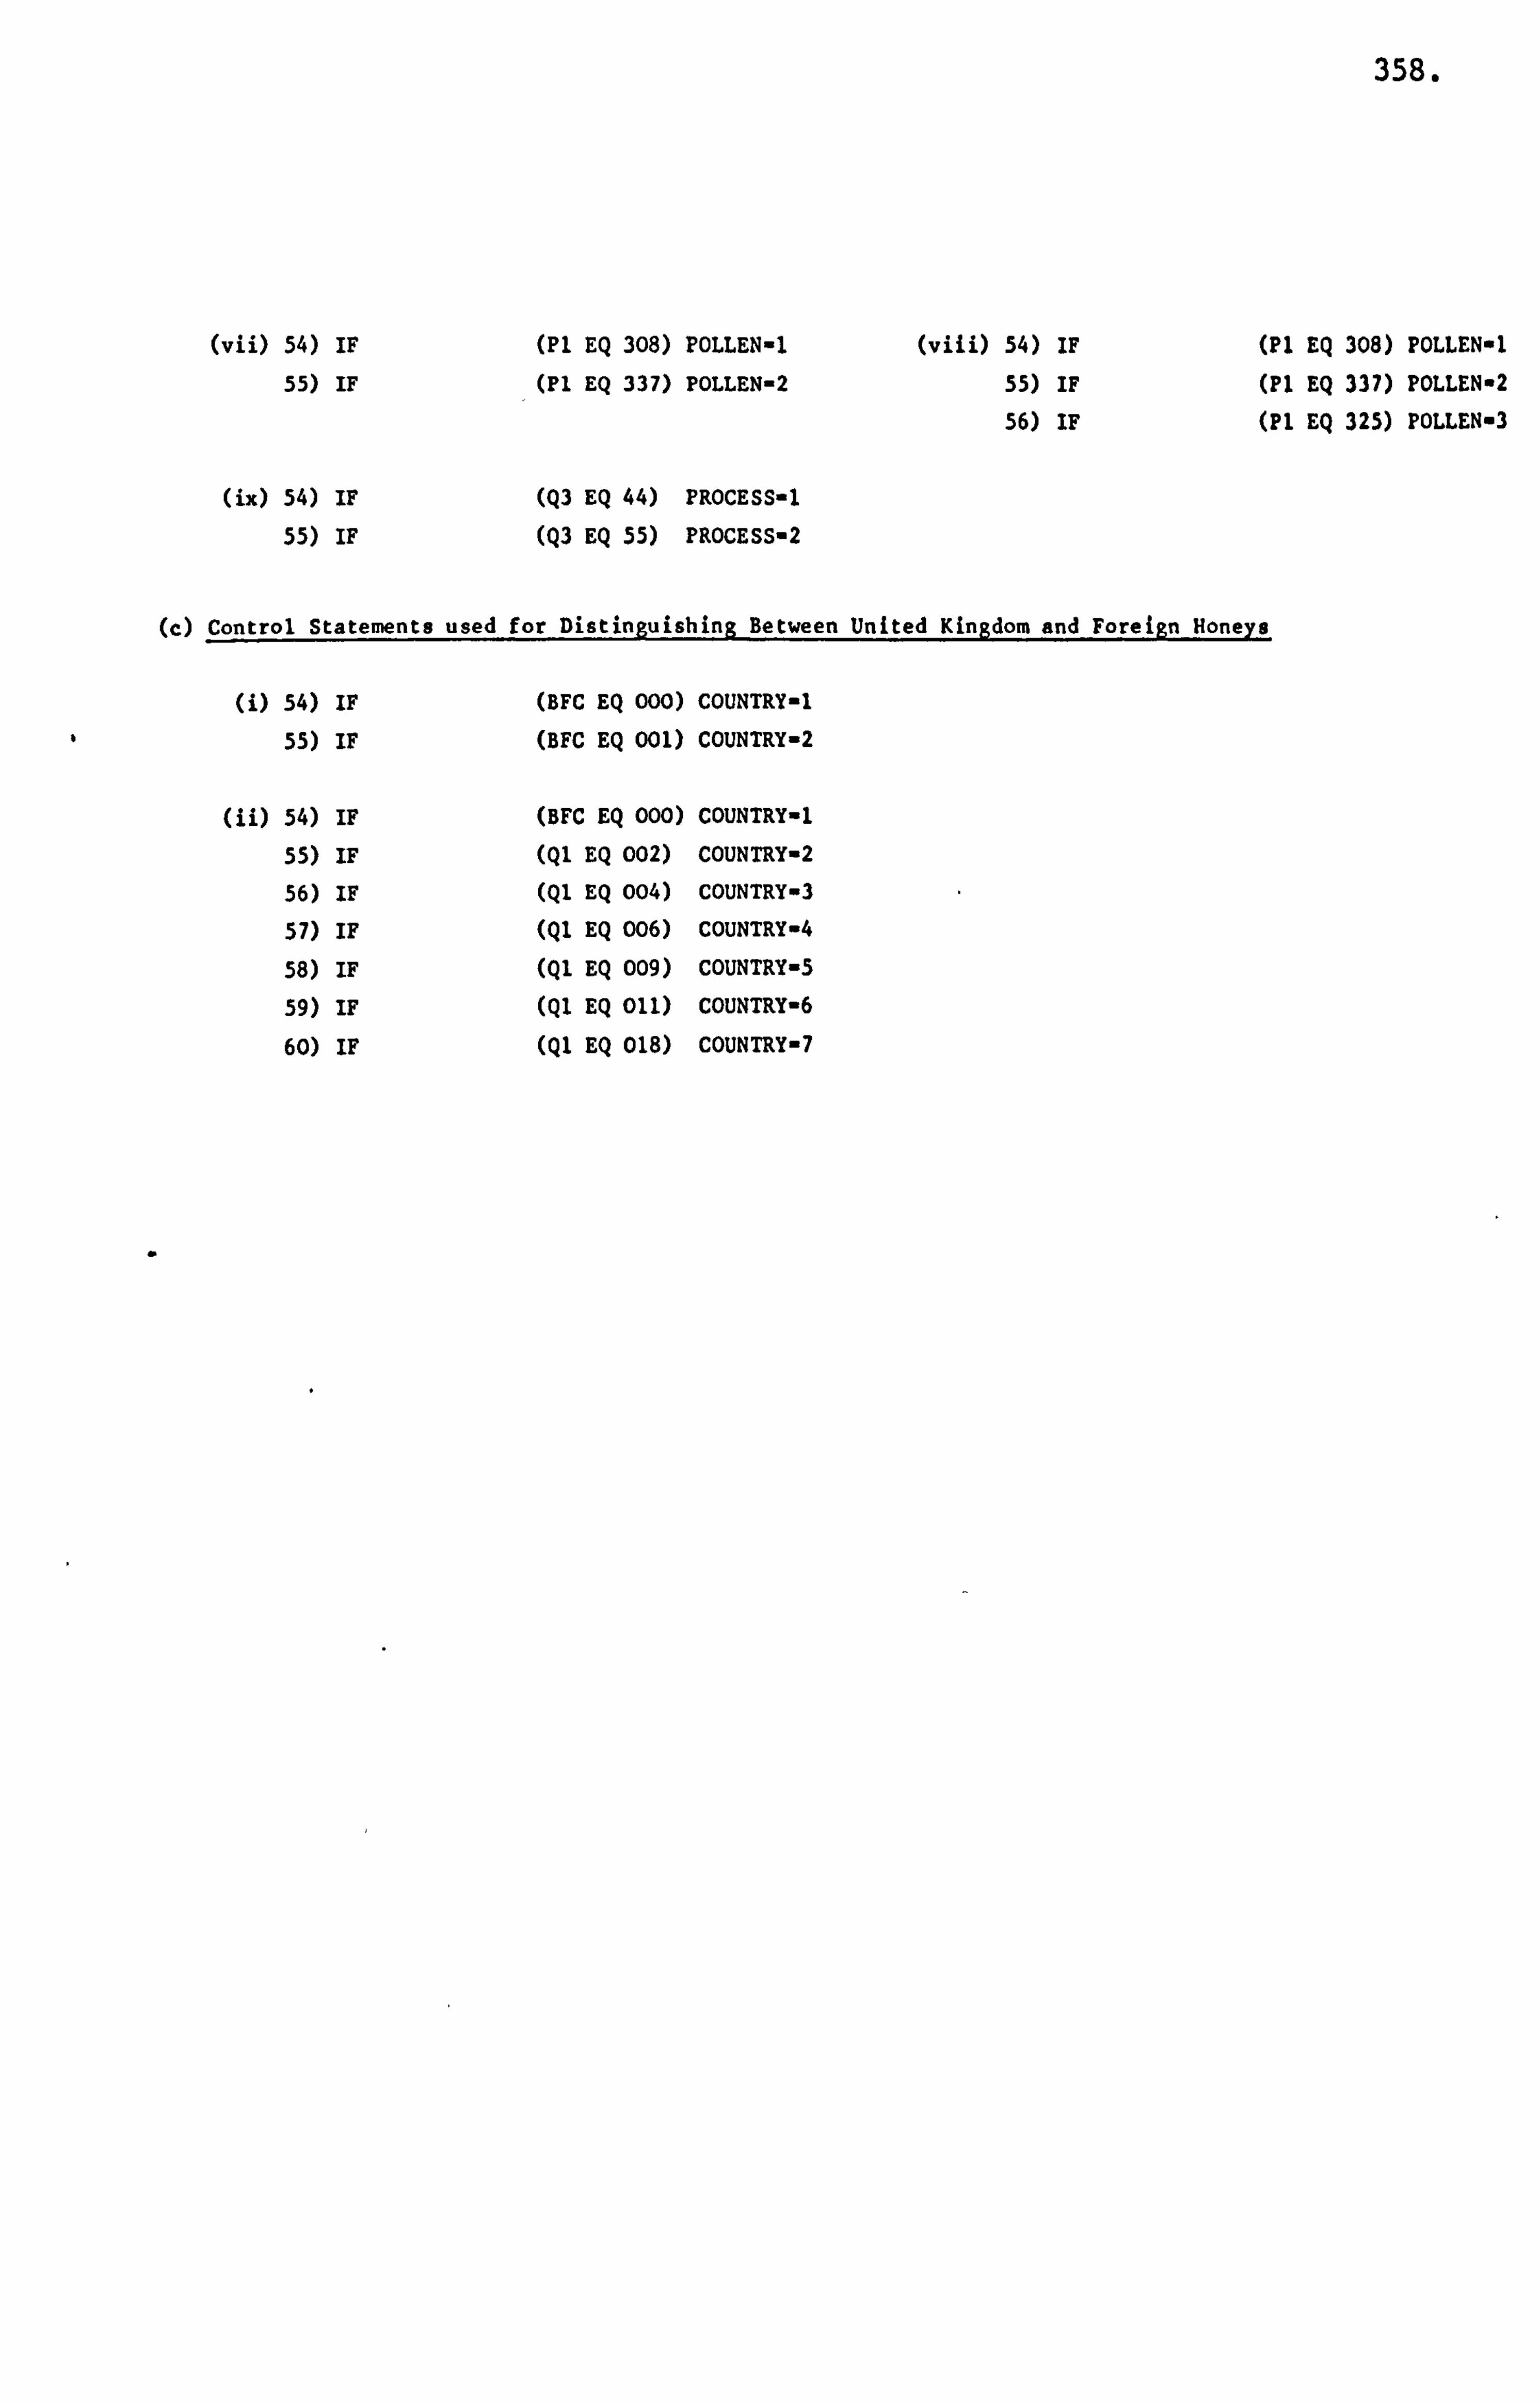
358.
0
(vii) 54) IF (Pl EQ 308) POLLEN-1 (viii) 54) IF
55) IF (Pl EQ 337) POLLEN-2 55) IF
56) IF
(Pl EQ 308) POLLEN-1
(PI EQ 337) POLLEN-2 (Pl EQ 325) POLLEN-3
(ix) 54) IF
55) IF
(c) Control Statements
(Q3 EQ 44) PROCESS-1 (Q3 EQ 55) PROCESS-2
used for Distinguishing Between United Kingdom and Foreign Honeys
(1) 54) IF (BFC EQ 000) COUNTRY-1
55) IF (BFC EQ 001) COUNTRY-2
(ii) 54) IF (BFC EQ 000) COUNTRY-1
55) IF (Ql EQ 002) COUNTRY-2
56) IF (Ql EQ 004) COUNTRY-3
57) IF (Ql EQ 006) COUNTRY-4
58) IF (Ql EQ 009) COUNTRY-5
59) IF (Ql EQ 011) COUNTRY-6
60) IF (Qj EQ 018) COUNTRY-7
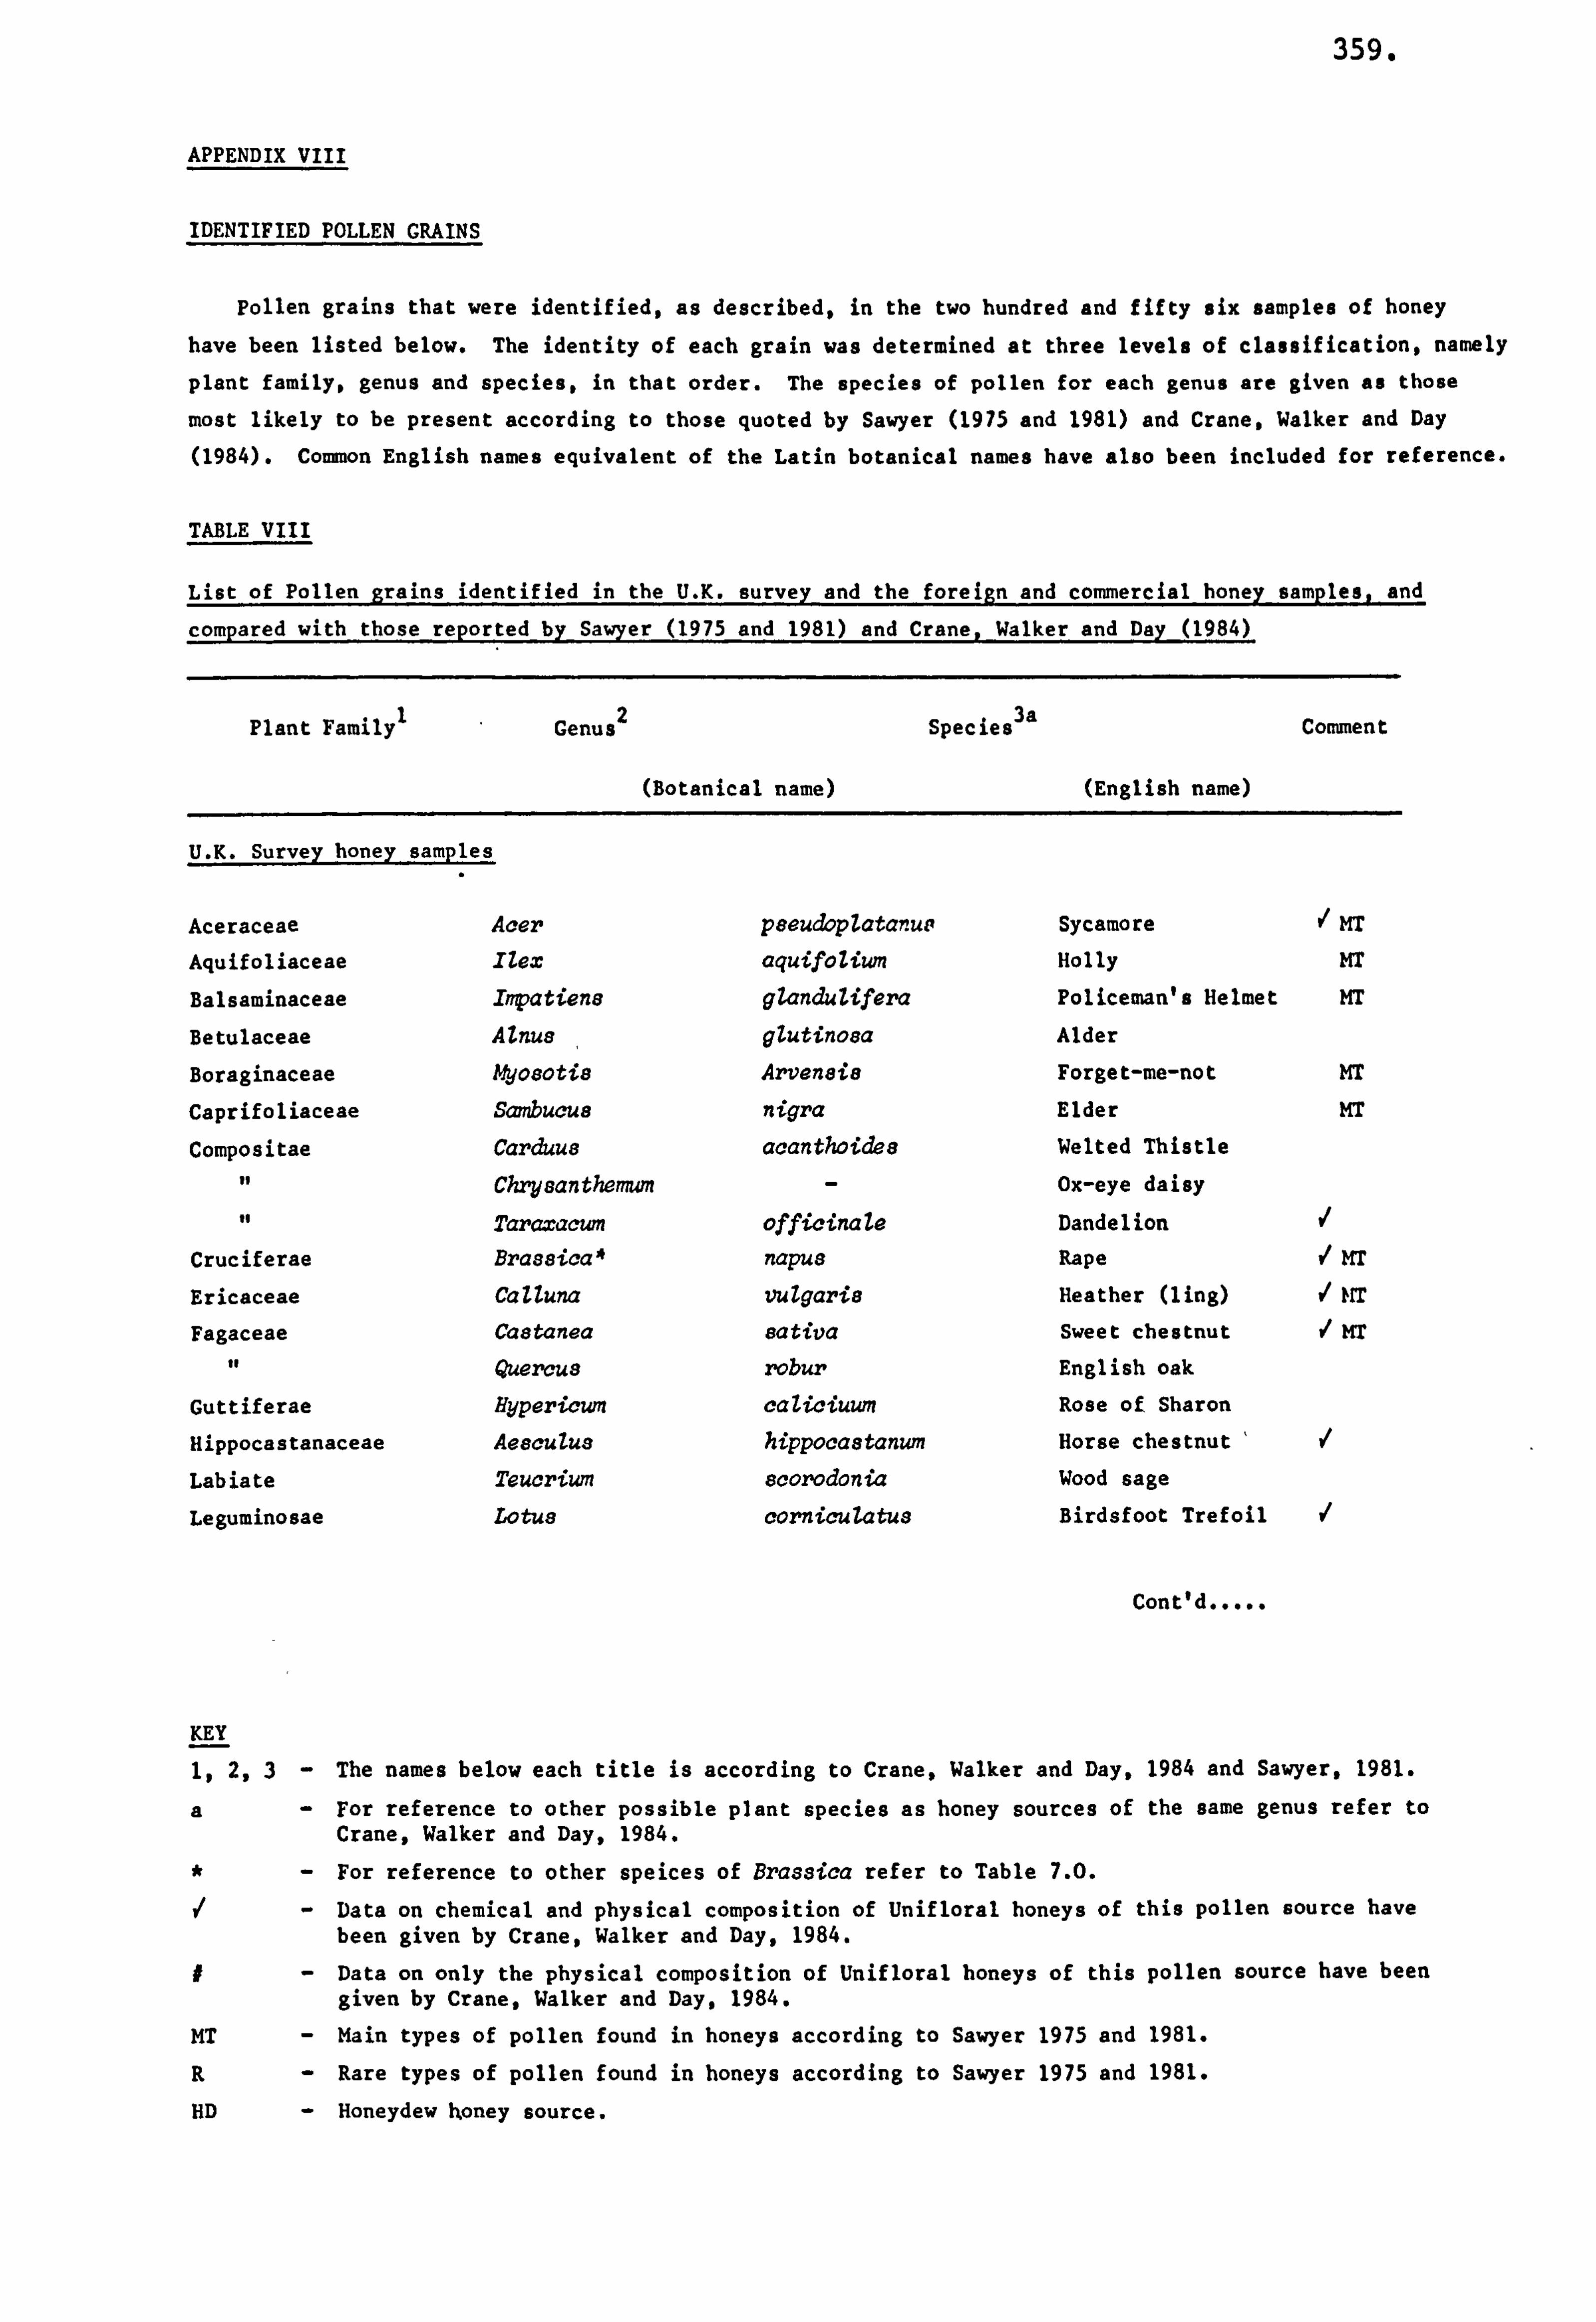
359.
APPENDIX VIII
IDENTIFIED POLLEN CRAINS
Pollen grains that were identified, as described, in the two hundred and fifty six samples of honey
have been listed below. The identity of each grain was determined at three levels of classification, namely
plant family, genus and species, in that order. The species of pollen for each genus are given as those
most likely to be present according to those quoted by Sawyer (1975 and 1981) and Crane. Walker and Day
(1984). Common English names equivalent of the Latin botanical names have also been included for reference.
TABLE VIII
List of Pollen grains identified in the U. K. survey and the foreign and commercial honey samples, and
compared with those reported by Sawyer (1975 and 1981) and Crane, Walker and Day (1984)
Plant Family 1 Genus 2 Species 3a Comment
(Botanical name) (English name)
U. K. Survev honev samples
Aceraceae Acer paeudopZatanue Sycamore MT
Aquifoliaceae IZex aquifoZiwn Holly Mr
Balsaminaceae Impatiene glanduZifera Policeman's Helmet MT
Betulaceae AZnus ,
gZutinosa Alder
Boraginaceae 14yosoti8 Arvensis Forget-me-not MT
Caprifoliaceae sambucus nigra Elder MT
Compositae Carduu8 acanthoidea Welted Thistle
to Chrysanthemum Ox-eye daisy
if Taraxacwn officinale Dandelion
Cruciferae Bras8ica* napus Rape MT
Ericaceae CaZZuna vuZgari8 Heather (ling) nr
Fagaceae Ca8tanea eativa Sweet chestnut VMT to Quercus robur English oak
Guttiferae Bypericum caZiciuum Rose of Sharon
Hippocastanaceae AeocuZu. 9 hippoca8tanum Horse chestnut
Labiate Teucrium scorodonia Wood sage
Leguminosae Lotus cornicuZatu8 Birdsfoot Trefoil I/
Cont'd
KEY
1,2,3 - The names below each title is according to Crane, Walker and Day, 1984 and Sawyer, 1981.
a- For reference to other possible plant species as honey sources of the same genus refer to Crane, Walker and Day, 1984.
- For reference to other speices of Brassica refer to Table 7.0.
- Data on chemical and physical composition of Unifloral honeys of this pollen source have been given by Crane, Walker and Day, 1984.
- Data on only the physical composition of Unifloral honeys of this pollen source have been
given by Crane, Walker and Day, 1984.
MT - Main types of pollen found in honeys according to Sawyer 1975 and 1981.
R- Rare types of pollen found in honeys according to Sawyer 1975 and 1981.
HD - Honeydew honey source.
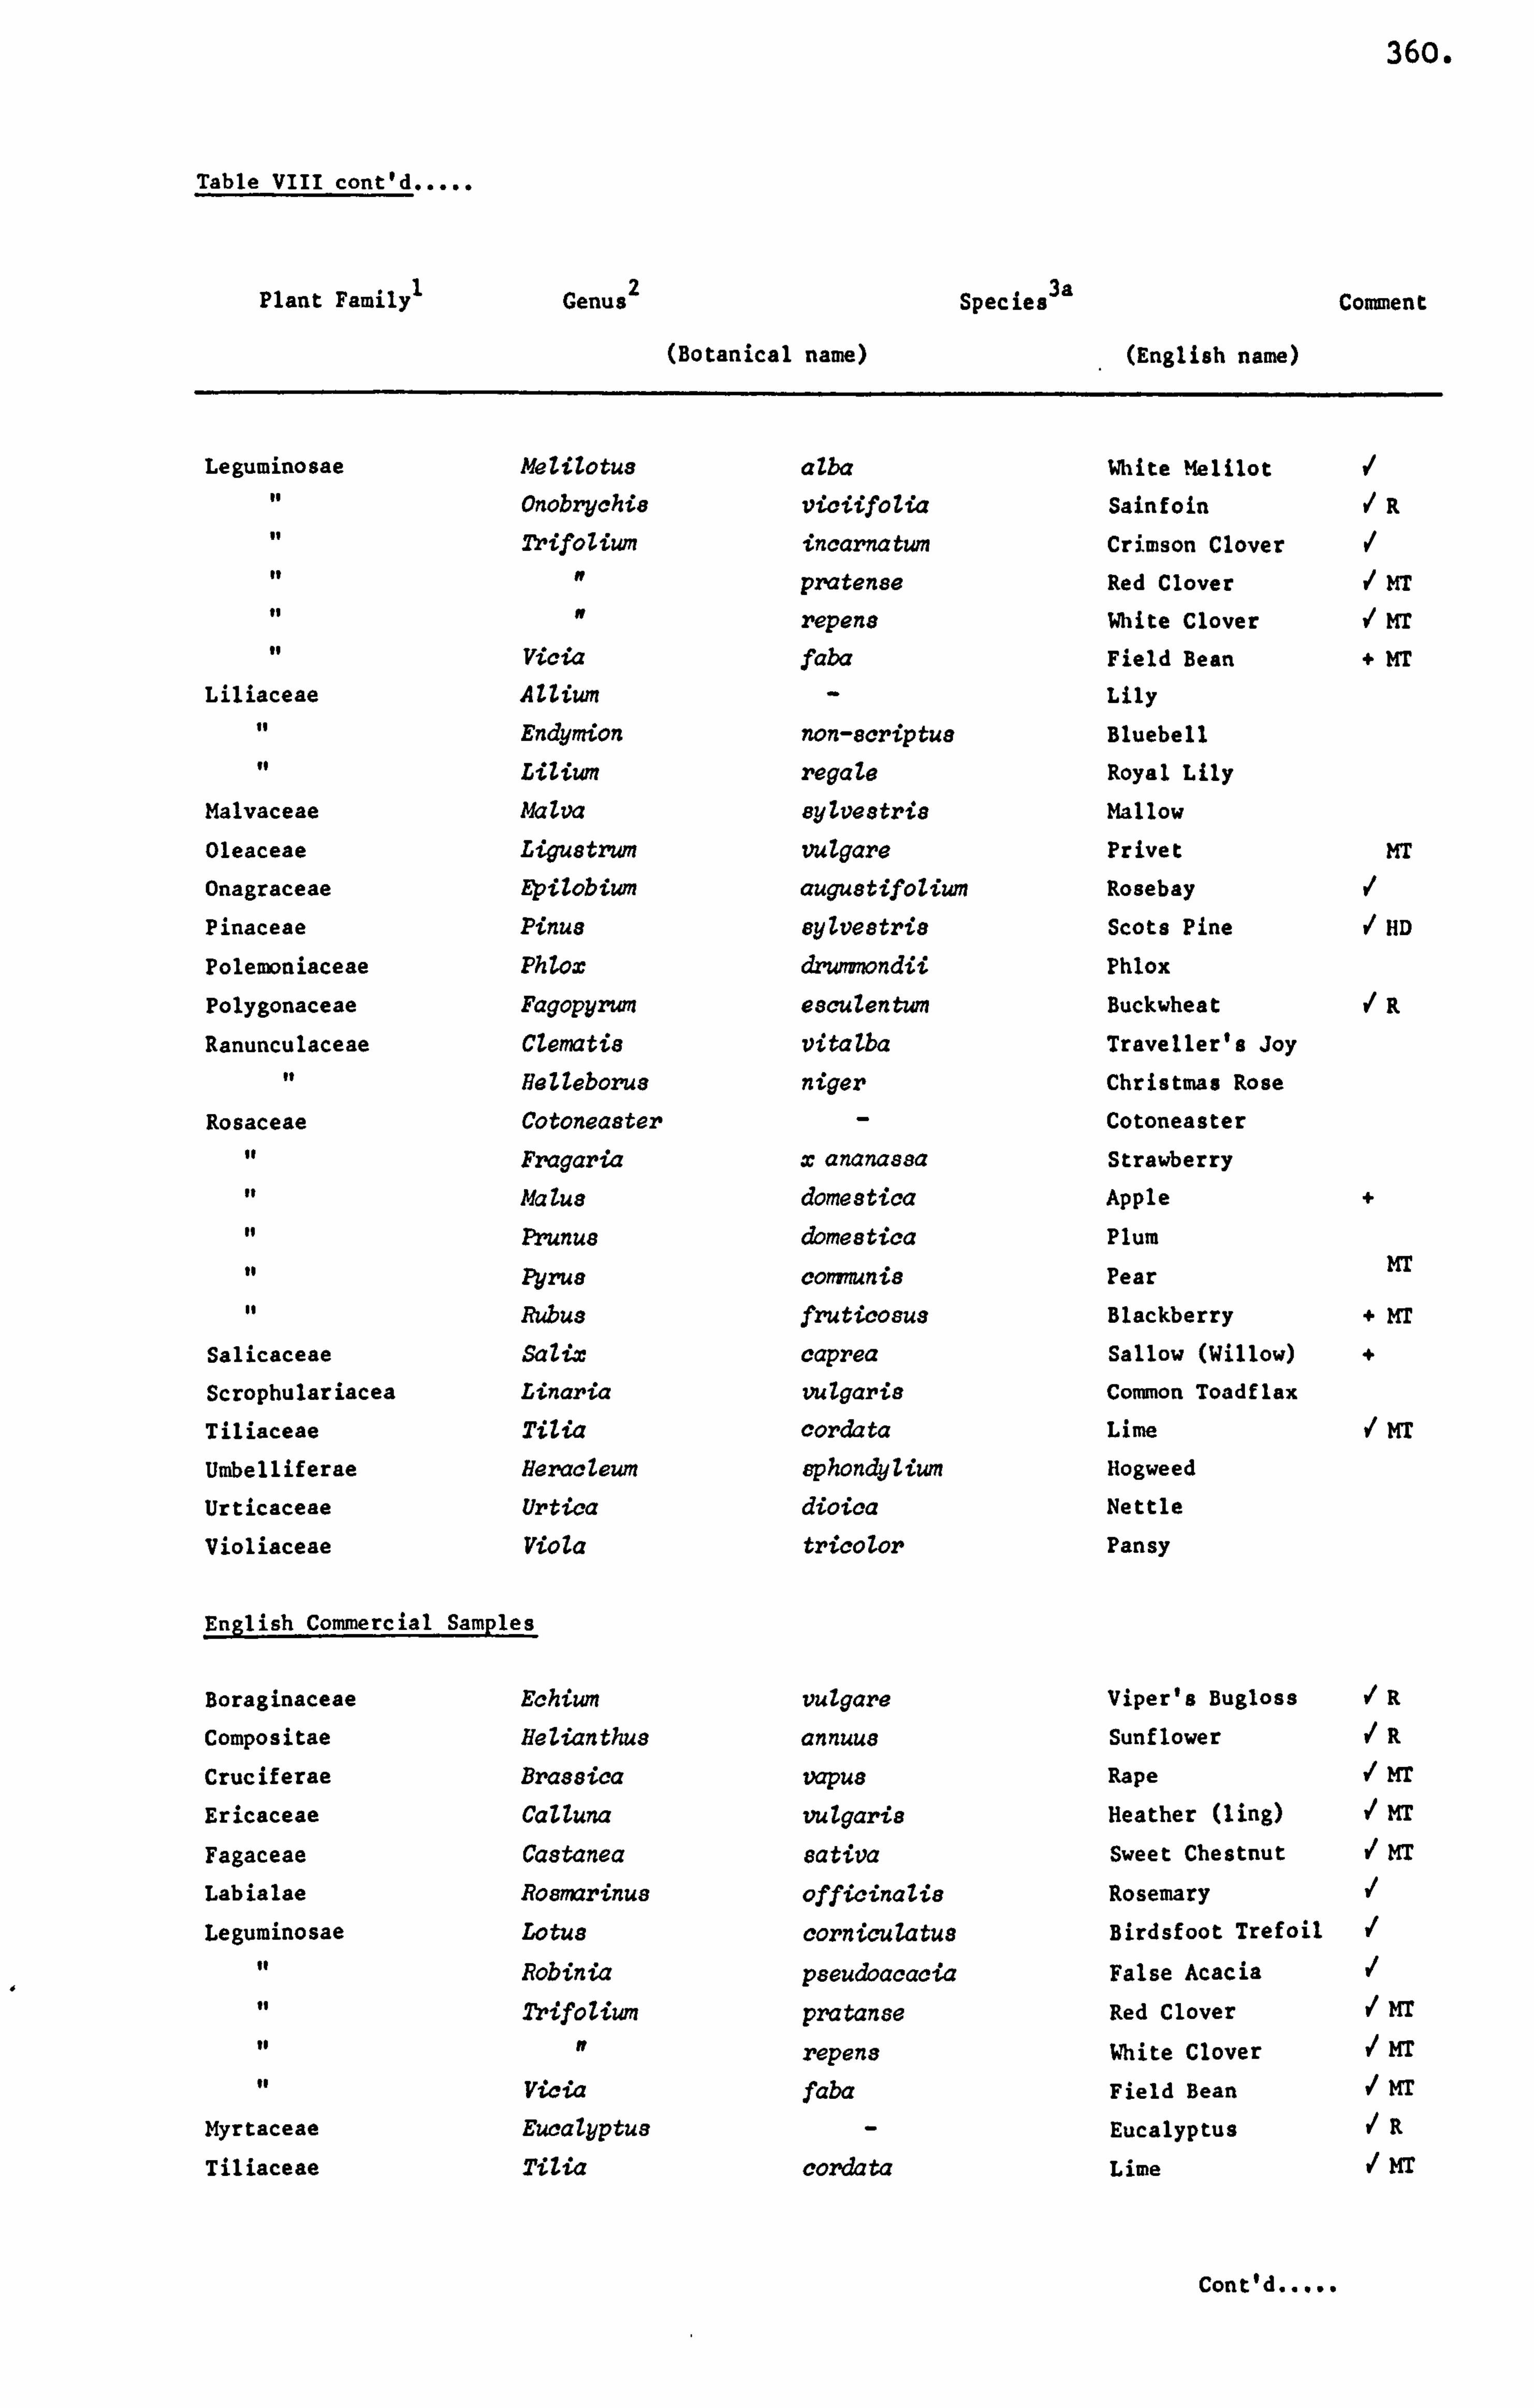
360.
Table VIII cont'd
Plant Family' Genus 2 Species 3a Comment
(Botanical name) (English name)
Leguminosae MeZitotua aZba White Melilot V to Onobrychia viciifoZia Sainfoin VR
11 2! r-ifOziW? I incarnatum Crimson Clover it N praten8e Red Clover MT
to ff repene White Clover MT
to Vicia faba Field Bean + MT
Liliaceae AZliwn Lily
if Endymion non-scriptue Bluebell
to Lilium regale Royal Lily
Malvaceae Malva eyZve8tri8 Mallow
Oleaceae Ligu8trum vuZgare Privet MT
Onagraceae Epilobium augu8tifolium Rosebay
Pinaceae Pinus eylve8tri8 Scots Pine HD
PolemDniaceae Phlox drummondii Phlox
Polygonaceae Fagopyrwn e8cuZentwn Buckwheat R
Ranunculaceae Mematis vitalba Traveller's Joy
it HelZeborus niger Christmas Rose
Rosaceae Cotoneaster Cotoneaster
of Fragaria x ananassa Strawberry
it MaZue domestica Apple +
of Frunu, s domestica Plum
to Pyrue commnis Pear MT
if Rubus fruticosus Blackberry + MT
Salicaceae SaZix caprea Sallow (Willow) +
Scrophulariacea Linaria vulgaris Common Toadflax
Tiliaceae Tilia cordata Lime MT
Umbelliferae Heracteum ephondyliwn Hogweed
Urticaceae Vrtica dioica Nettle
Violiaceae Viola tricolor Pansy
English Commercial Samples
Boraginaceae Schiwn vulgare Viper's Bugloss VR
Compositae Helianthus Qnnuus Sunflower R
Cruciferae Bra8sica vapus Rape MT
Ericaceae CaUuna vulgaris Heather (ling) MT
Fagaceae Castanea sativa Sweet Chestnut MT
Labialae Roamrinus officinaZie Rosemary
Leguminosae Lotus corniculatus Birdsfoot Trefoil
of Robinia pseudoacacia False Acacia
to 2rifoZiwn pratanse Red Clover MT
to ff repens White Clover MT
of Vicia faba Field Bean MT
Myrtaceae EucaZyptua Eucalyptus R
Tiliaceae TiZia cordata Lime MT
Cont'd
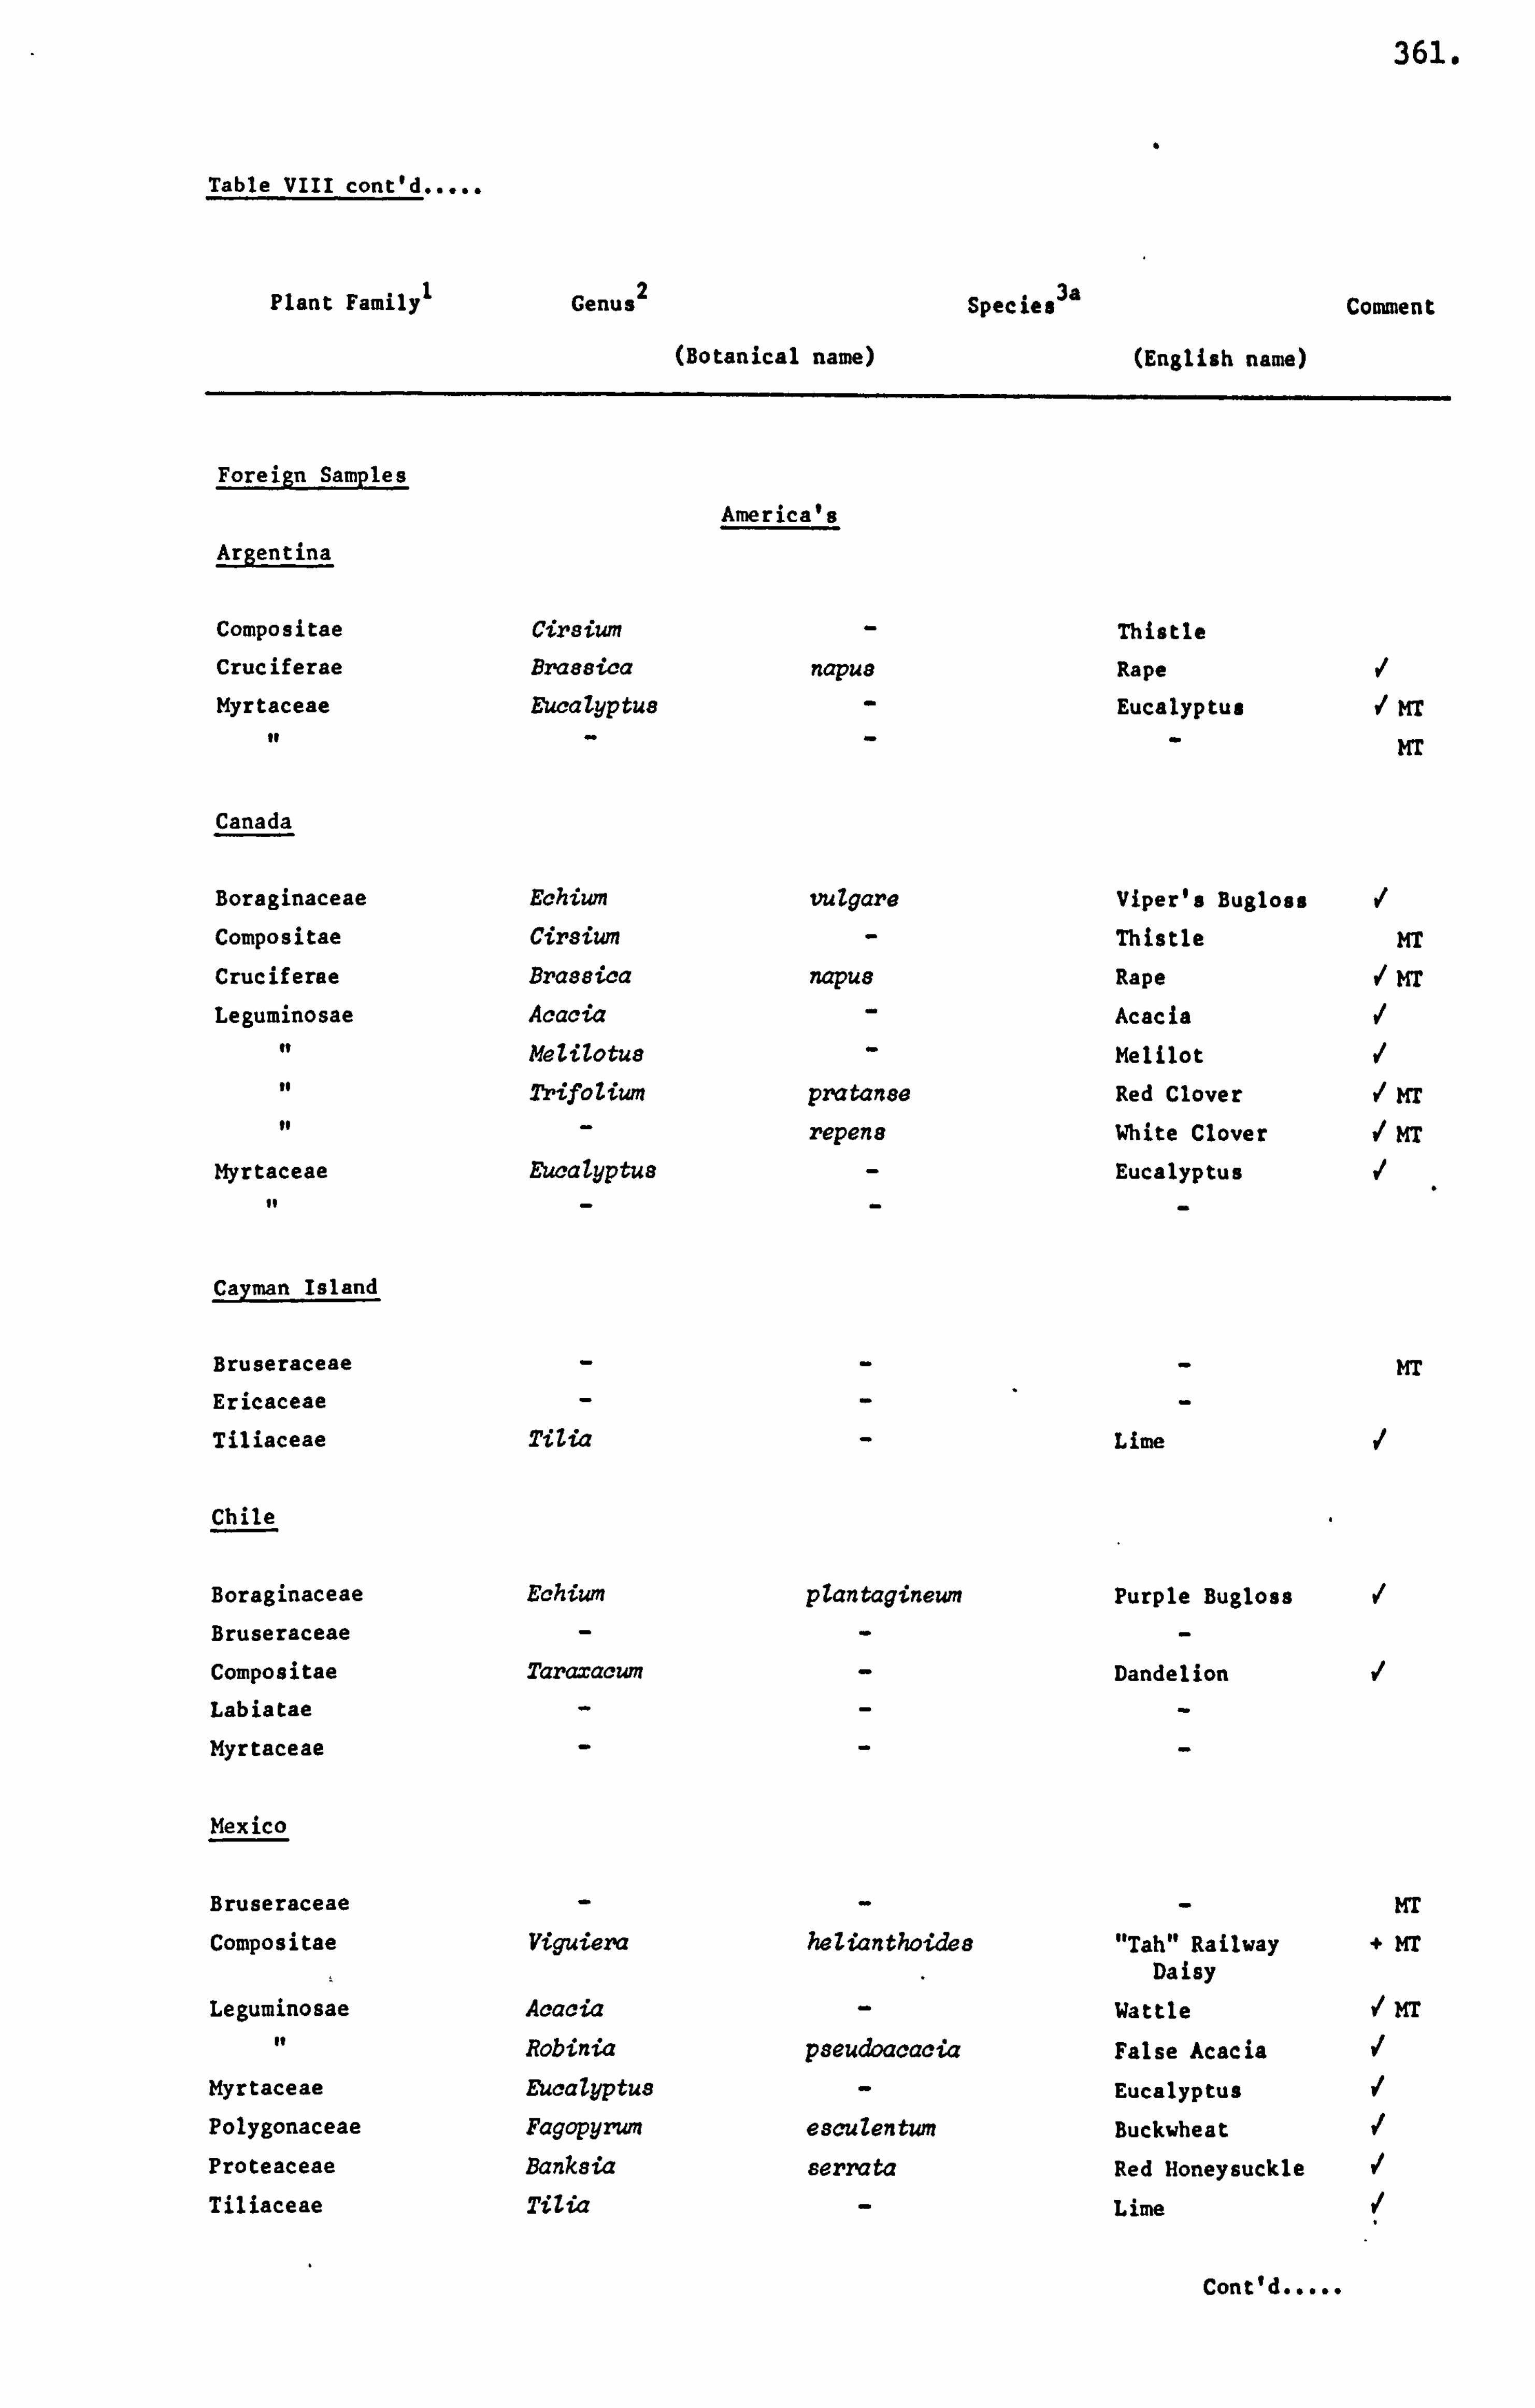
361.
Table VIII cont'd
Plant Family 1 Genus 2
(Botanical name)
Species 3a Comment
(English name)
Foreign Samples
America's
Argentina
Compositae Cirsium Thistle
Cruciferae Braesica napue Rape
Myrtaceae Sucalyptus Eucalyptus it MT
to - - - MT
Canada
Boraginaceae Echium vulgare Viper's Bugloss of Compositae Cirsium Thistle MT
Cruciferee Braseica napu8 Rape MT
Leguminosae Acacia Acacia
it MeZilotus Melilot
to Zrifozium pratanse Red Clover MT
to - repen8 White Clover MT
Myrtaceae Eucalyptus Eucalyptus
Cayman Island
Bruseraceae MT
Ericaceae
Tiliaceae filia Lime
Chile
Boraginaceae Echium pZantagineum Purple Bugloss
Bruseraceae
Compositae Taraxacum Dandelion
Labiatae
Myrtaceae
Mexico
Bruseraceae MT
Compositae Viguiera heZianthoidee "Tah" Railway + MT Daisy
Leguminosae Acacia Wattle It MT
It Robinia pseudoacacia False Acacia
Myrtaceae Eýucalyptus Eucalyptus
Polygonaceae Fagopyrum esculentum Buckwheat
Proteaceae Banksia serrata Red Honeysuckle
Tiliaceae TiZia Lime
Cont'd .....
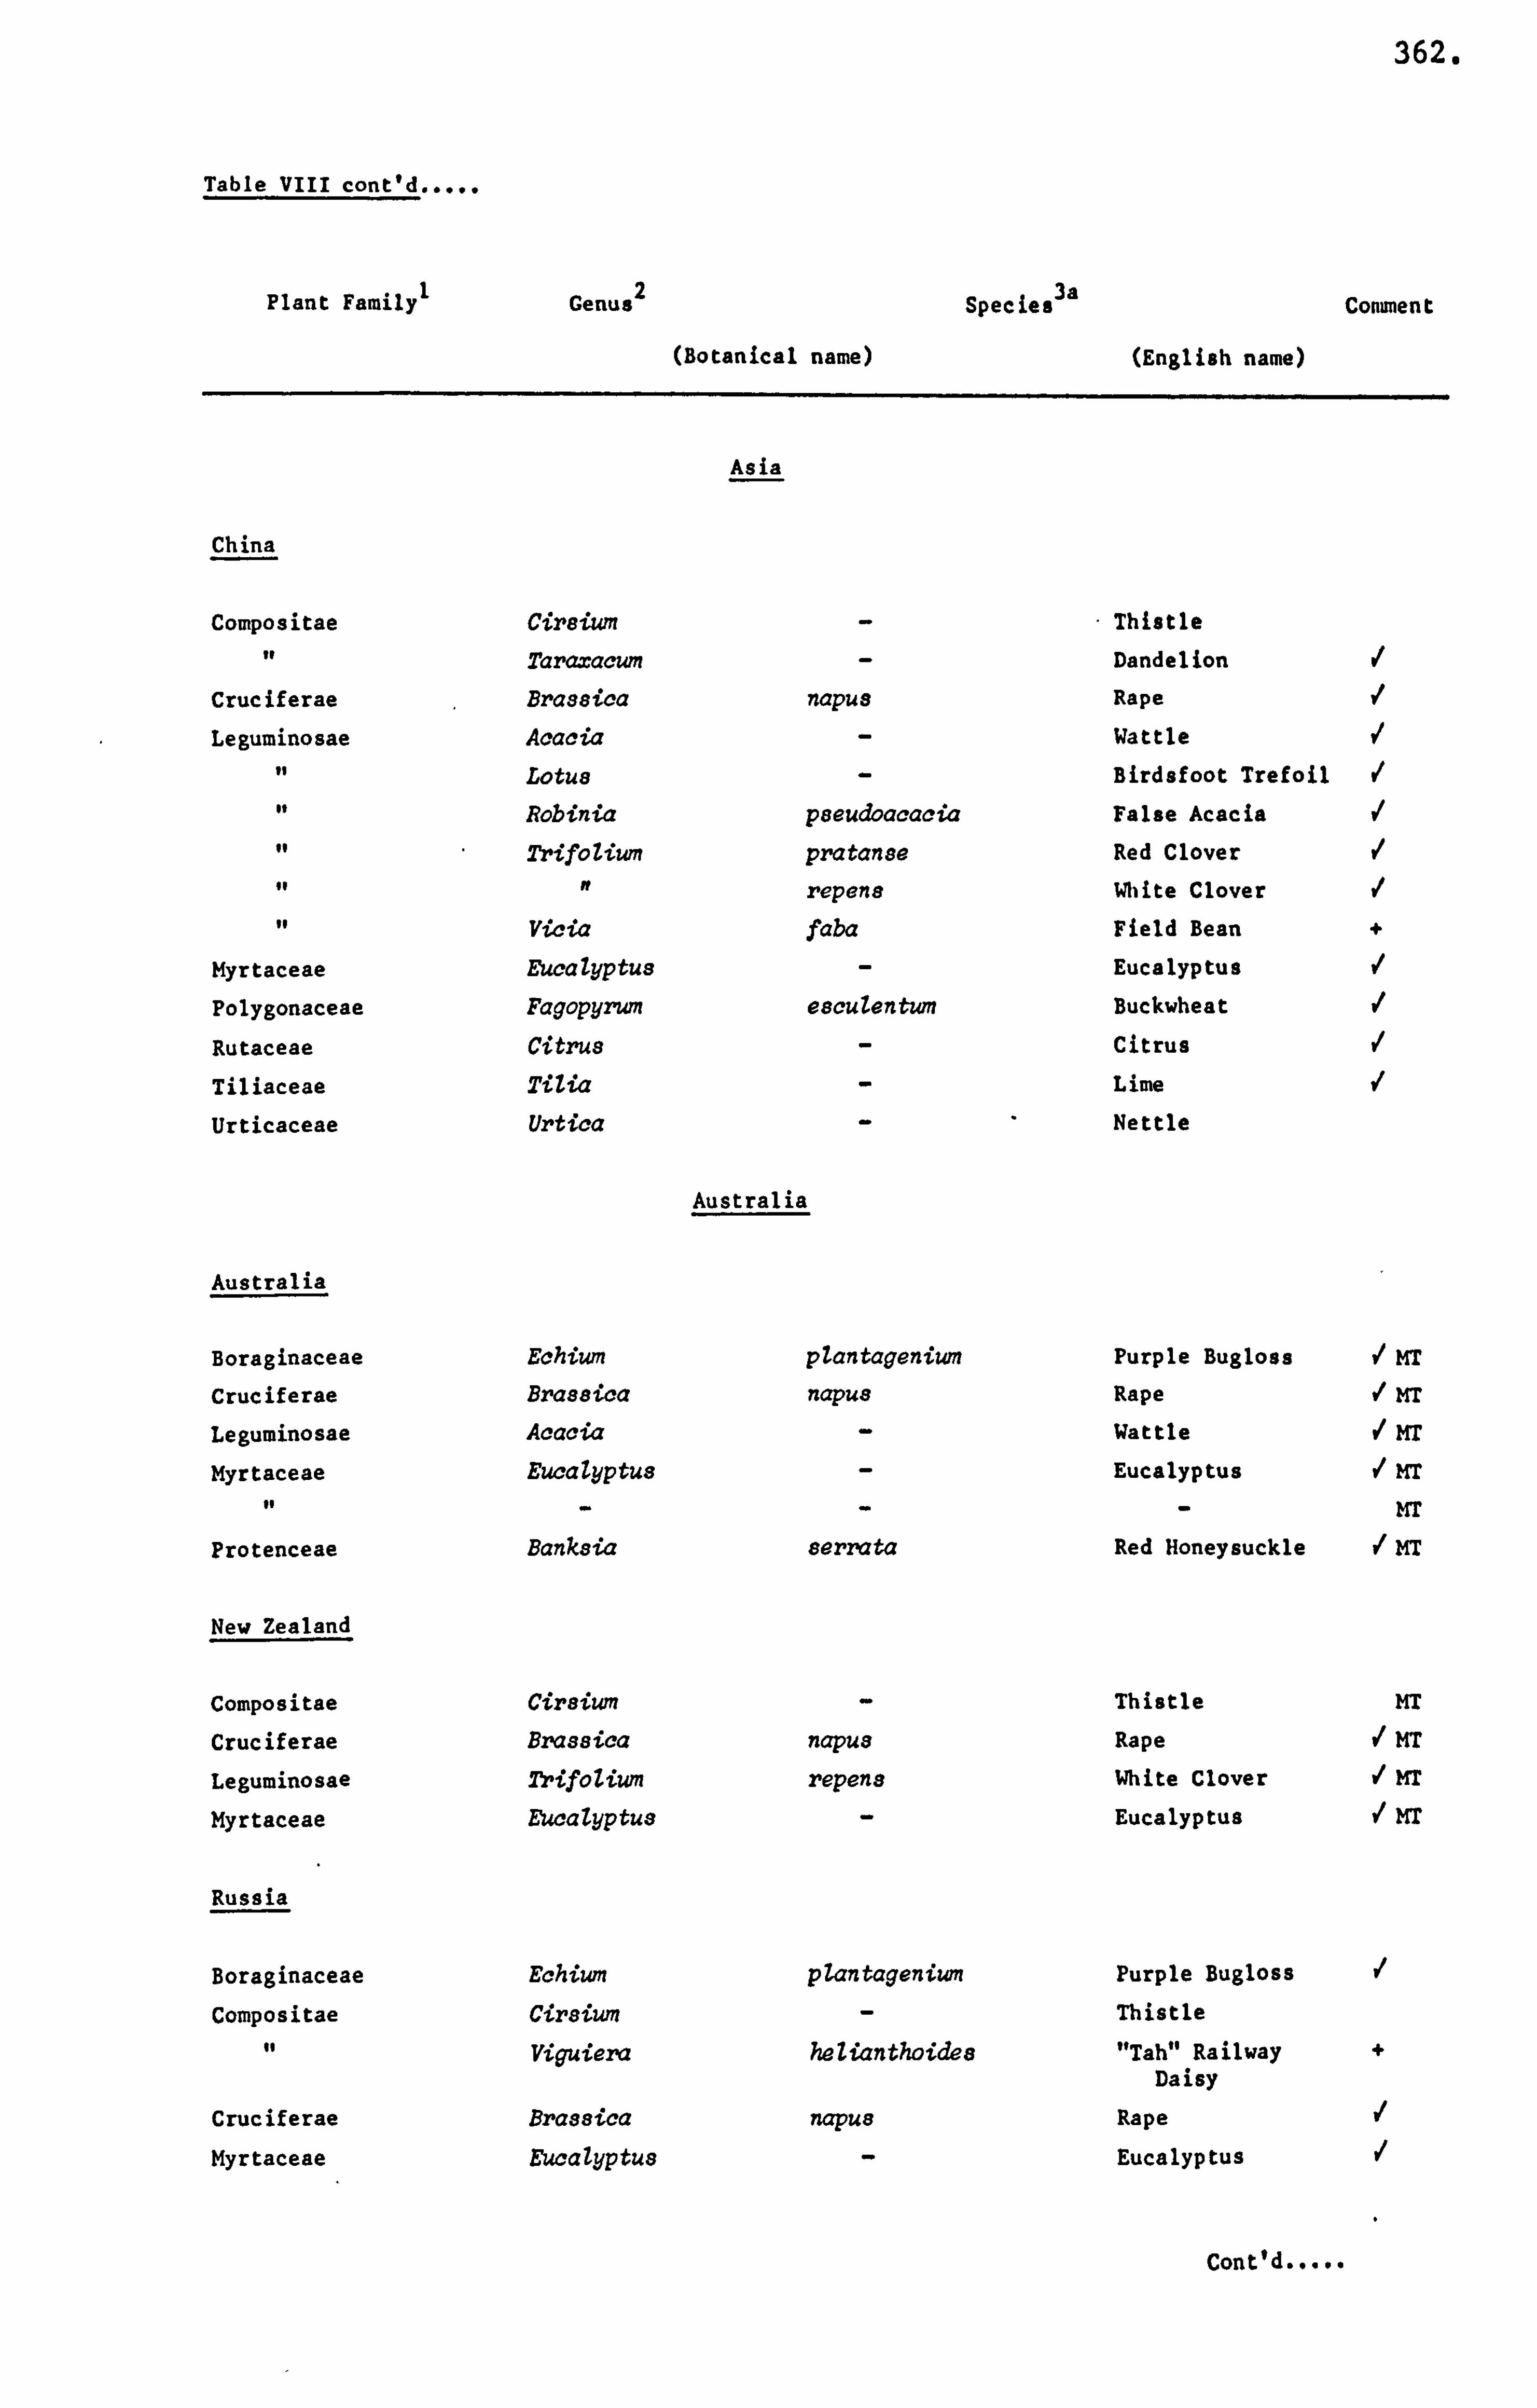
362.
Table VIII cont'd
Plant Family 1 Genus 2 Species 3a
(Botanical name) (English name)
Comment
Asia
China
Compositae Cirsium Thistle
it Yaraxacum Dandelion
Cruciferae Bras8ica napus Rape
Leguminosae Acacia Wattle
go Lotus Birdsfoot Trefoil
It Robinia p8eudbacacia False Acacia
of 2rifoZium pratanse Red Clover
of It repens White Clover
of Vicia faba Field Bean +
Myrtaceae Eucalyptus Eucalyptus
Polygonaceae Fagopyrum eacuZentwn Buckwheat
Rutaceae Citrus Citrus
Tiliaceae TiZia Lime
Urticaceae Urtica Nettle
Australia
Australia
Boraginaceae Echium pZantagenium Purple Bugloss MT
Cruciferae Brasaica napus Rape MT
Leguminosae Acacia Wattle MT
Myrtaceae EucaZyptus Eucalyptus MT
to - - - MT
Protenceae Banksia eerrata Red Honeysuckle MT
New Zealand
Compositae Cirsium Thistle MI
Cruciferae Brassica napua Rape MT
Leguminosae 2yifozium repens White Clover MT
Myrtaceae Eucalyptu8 Eucalyptus MT
Russia
Boraginaceae Echium pZantageniwn Purple Bugloss
Compositae Cir8iwn Thistle
of Viguiera heZianthoides "Tah" Railway + Daisy
Cruciferae Bra8sica napue Rape
Myrtaceae EucaZyptus Eucalyptus
Cont'd .....
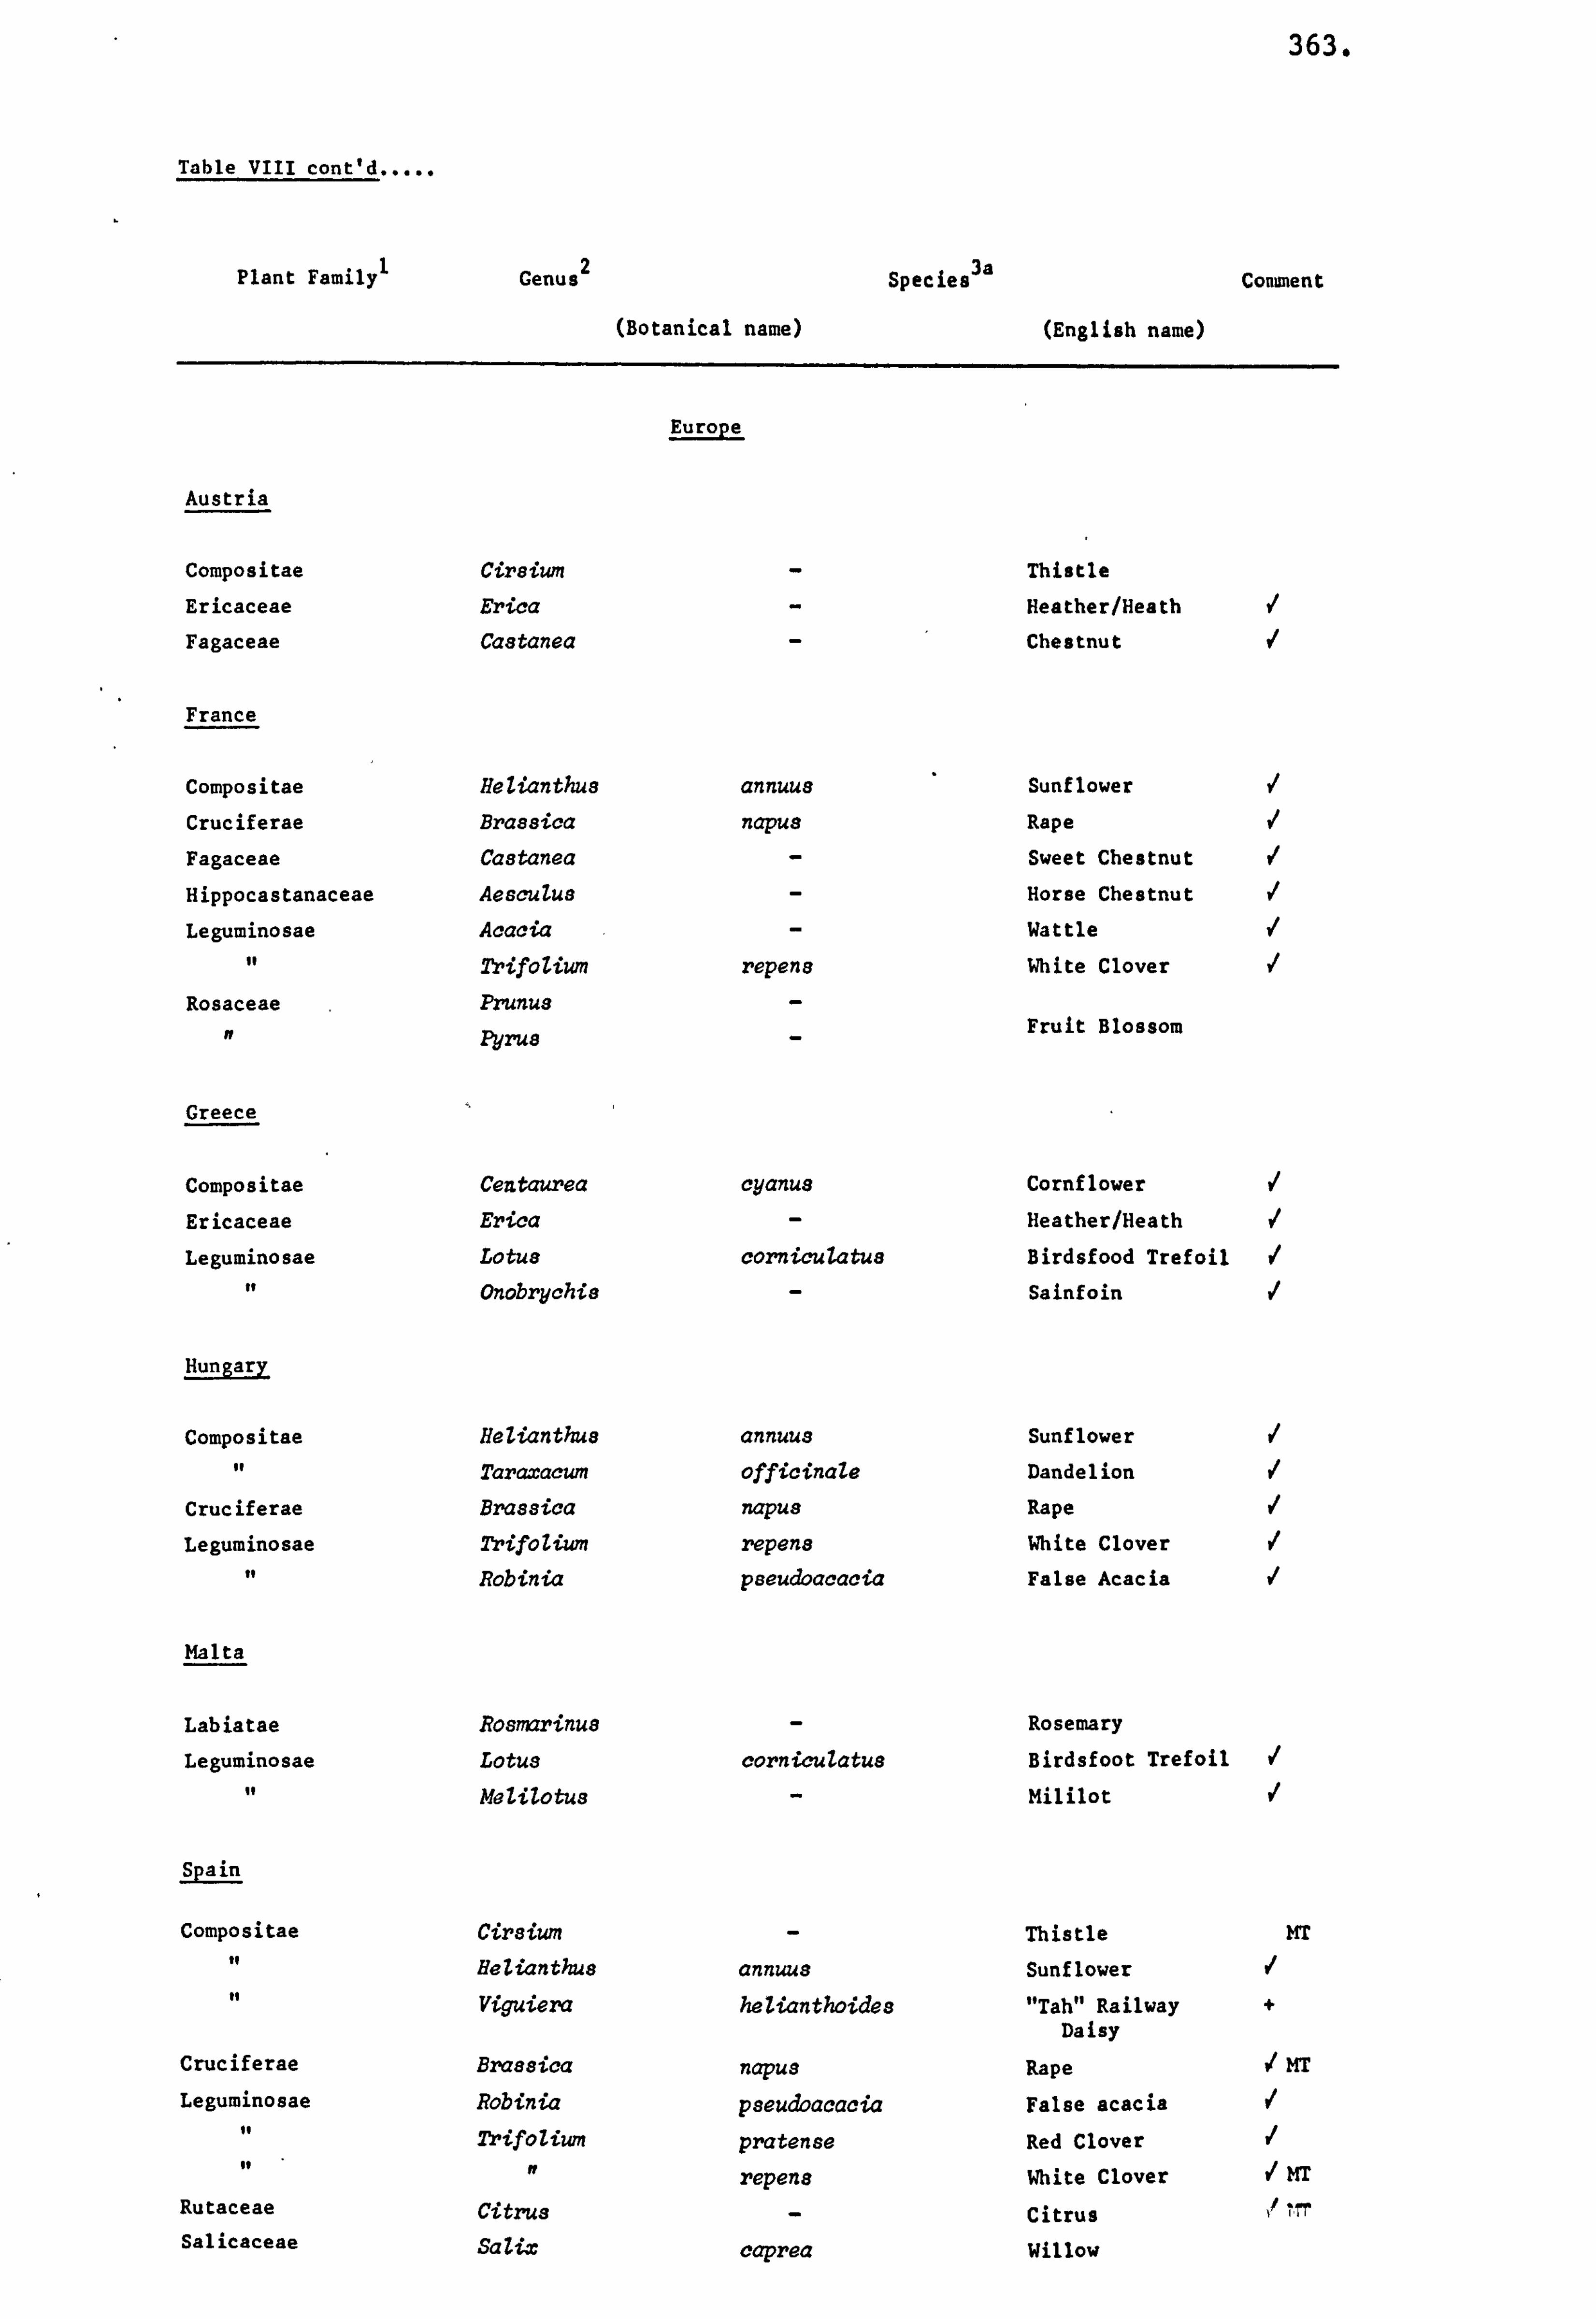
363.
Table VIII cont'd .....
Plant Family' Genus 2 Species 3a
(Botanical name) (English name)
Comment
Europe
Austria
Compositae Cirsium Thistle
Ericaceae Erica Heather/Heath
Fagaceae Ca8tanea Chestnut
France
Compositae Helianthus annuus Sunflower
Cruciferae Bra8sica napus Rape
Fagaceae Castanea Sweet Chestnut 11 Hippocastanaceae AescuZus Horse Chestnut VI Leguminosae Acacia Wattle
of 2rifoZium repene White Clover
Rosaceae Prunus
IF Pyrus Fruit Blossom
Greece
Compositae Centaurea cyanus Cornflower
Ericaceae Erica Heather/Heath
Leguminosae Lotus cornicuZatus Birdsfood Trefoil of Onobrychis Sainfoin V,
Hungary
Compositae Relianthua annuus Sunflower
of Taraxacum officinale Dandelion
Cruciferae Brassica napus Rape
Leguminosae 2-rifoZium repens White Clover to Robinia paeudoacacia False Acacia
Malta
Labiatae Ro8marinua Rosemary
Leguminosae Lotus corniculatus Birdsfoot Trefoil
it MeZilotus Mililot V,
IEILin
Compositae Cirsium Thistle MT
to HeZianthu8 annuus Sunflower of Viguiera heZianthoides "Tah" Railway +
Daisy Cruciferae Bras8ica napus Rape MT
Leguminosae Robinia pseudoacacia False acacia ot $I 2rifolium pratense Red Clover It IF repene White Clover MT
Rutaceae Citrus Citrus rr Salicaceae SaZix caprea willow
364.
APPENDIX IX
LIST OF PUBLICATIONS
1. Croft, L. R., Mistry, R. P. and Washington, R. J. (1986) -
'Analysis of the Proteins in Honey by Gel Electrophoresis'
(presented as poster session) at the 'Fifth Meeting of the
International Electrophoretic Society' in London.
2. Mistry, R. P., Washington, R. J. and Croft, L. R. (1986)
'Correlation of Amino Acids with Pollen Analysis' (lecture)
at the 'lst Bee Research Workers Colloquia' in London.
3. Washington, R. J., Croft, L. R. and Mistry, R. P. (1986)
'Analytic Studies on Honey' International Bee Research
Association, Cardiff.
POSSIBLE CONMBUTION TO BEE WORTD
At the first Bee Research Colloquium held at London on 19th
February 1986j, papers were read by R. J. Washington, R. P. Mistry and
S. Slight on behalf of work carried out by the Departnent of
Biological Sciences, University of Salford.
Since 1975,, scine 27 graduate students have been involved, under
our supervision, with the analysis of hive products. 7he major
eaphasis has been on the amino acids of pollen and of honey (Mr. J. M.
Carter), the relationship of amino acid patterns to floral -source
(Miss M. A. Siddiqui) and,, most recently,, quantitation of free amino
acid levels with determined floral sources and ccrrputer predictions
(Mr. R. P. Mistry). He also carried out a honey sanple survey of UK
ýYs for the BBKA. ' '7bis technique was -shown to be feasible even
fOr rxallen-freel saffriples.
Progress was also made on the characterisation of the protein
responsible for thixotrophy in heather honey.
As well as an interest in the detection of adulteration and mis-
representation of honey, there is work progressing on the toxicity of
RW (Mr. S. Lee), a field which has been neglected. He showed that,
in vitro, the upper limit of 9 mg HMF -per ml of fluid prevented all
protein synthesis.
The mechanism of action of bee venom, principally melittin, on
lens protein synthesis is being investigated by Mr. S. Slight. He
Showed, in vitro, that levels of 10 ug per ml of bee vencm injected,
arrested protein synthesis in the eye lens and caused irreversible
changes to lens structure,, resulting in opacity.
R. J. Washington
L. R. Croft
Washington, R. J., Croft, L. R. and Piistry,, R. P. (1986) Analysis of honey. Paper presented, Iv-don, 19th February
Croft# L. R. 'j %shingtont R. J. and Kistryl R. P. J1986) Final report.: Amlysis of honey. The -British Reekeepers'-A"oci&Uon Yiar Book, June, p2O
Croft, L. It-# Kistryt R. F. and Wshingtont R. J. (1986) Arýalysis of the Proteins of honey by gel electr6phorasis. _' SO Int. Conf. ýbri. Electrcphoresiss Icndbnl September (to be- pub: 'Springer-Werlag)
the 4,6a-e
'07( lvl, -- R. P. M; s Mi pill h re
c4lf-Plo"
te yp. tv, 4.4 4
7W7/f'7
ANALYSIS OF THE PROTEINS IN MONEY BY GEL ELECTROPHDRESIS , -.
L. R. Croft, R. P. Pistry and R. J. Washington 77
Department of Biological Sciences, Vniversity of Salford. Salford N5 4WT. U. K.
I INTRODUCTION
The adulteration and misrepresentation of honey ari major threats to the viability of the apicultural industry (1). At this present time honey may be subject to adulteration with high fructose syrups. Although-these may be-detected in honey by stable isotope analysis. the Instrumentation necessary Is-extremely tostly bind not*
'read - ily available to many public analysts (2). In addition the technique is not
able to detect the presence of high fructose syrups prepared from C3 Plants (3)'.
On the other hand. misrepresentation of honey may -be V*odflydetected--by-fwlfsslý-ýI
palynology (4). but this is not so if the honey ýduring prockssine-hat'b"n"hioly-
sieved so that most of the pollen has been nmwve;. '-
Money is known to contain apýr; 'xiýýiely 0.5% protein. : These. include specific.
enzymes derived directly from the bee, hence reducedlevels of these are i go , od ih-
dication that adulteration has Occurred- Other ptDteins ate also present, 'These,
In the mai n, are deri ved f rom the pol I en, or pi ant- i-Octar%, and SW strve iks 'the- basi s-,
for the determination Of the floral, and so, geogriphic4l to-igin of'the h6nVy.
Our proc*4riA-4j-JwmIYes. jmAIysis by PAGE -el ectrophoresi &: of j protei rv concentrates - derived from honey and is a simple and effective means-forldetetting bdultersti=-`and-`ý
misrepiesenution.
2 METHODS
The proteins pýesent-16 i-sample of honey are concentrated by ultrafiltration (Amicon Standard cell fitted with a UKID membrane). - This process. which is carried
out at 40C, is continued. after repeated dilution -of the swiple, until the
is negative for sugar. The resulting, mainly protein toncentiate! iS-freeii-dried. "'*-'
polyscrylamid,. gel electrophoresis of the samples is Cor&cted in, the presence of
sodium dodecyl sulphate (6). Gels are stained with-Commassit. brilliant-Blue and
after destaining are scanned on on ISCO model 659 scanner. '- '.. , --I ýt---ý
3 RESULTS
Because of the low levels of proteins in honey it was found to be necessary to
submit the sWles to a preliminary concentration .- ýý AX
separation of the proteins in the concentrates was ochievedIX-eloctrophoresis. in, the presence of SDS, on 10% polyacryl&mide gels.
In this way it was found that as many as eleven protein bonds could be rtsolved in the honey samples. The presence or absence of any of these bands was used to characterize *- j:: II ir-honey simple with regard to its likely geographical origin.
The technique is also &ble. to detect adulteration and in fact is so sensitive as to detect honeys that had been obtained from bees fed on -pollen substitutes.
4 ACKNDWLEDGEW-WT-ý-ý-u-ýý='ý-ý'-ý
We wDuld like to thank the British Beekeepers' Asoclation. for fl. n#ncipl support.
5 REFERENCES
(1) L. R. Craft, tritish see a. JOB (19BO) 231-234- -_ :: --. 1ý -. I-- -ý%- I
J. W. White, L. W. Boner, J. Assoc. Off. lknal. Chm... fil _11978.
) 7ýk-750.,. ,_-, - _ L- .
J. W. Trumpeterjjwr, -kt-4.,, a2j (1981) 857-W,,
(4) R. W. Sawyer, Pollen Identification for Beekeepers, Ujversity- of-, Cardiff 1981.
(5) R-P- MistrY, Ph. D. Thesis. University of Salford, 1986..
(6) K. Weber, -_, #L. Chem. 244 (1969). 4406-4412, e.