an optimal multiedge detector for sar image segmentation
TRANSCRIPT

IEEE TRANSACTIONS ON GEOSCIENCE AND REMOTE SENSING, VOL. 36, NO. 3, MAY 1998 793
An Optimal Multiedge Detectorfor SAR Image Segmentation
Roger Fjørtoft, Armand Lopes, Philippe Marthon,Associate Member, IEEE, and Eliane Cubero-Castan
Abstract—Edge detection is a fundamental issue in imageanalysis. Due to the presence of speckle, which can be modeledas a strong, multiplicative noise, edge detection in syntheticaperture radar (SAR) images is extremely difficult, and edgedetectors developed for optical images are inefficient. Severalrobust operators have been developed for the detection of isolatedstep edges in speckled images. We propose a new step-edgedetector for SAR images, which is optimal in the minimum meansquare error (MSSE) sense under a stochastic multiedge model. Itcomputes a normalized ratio of exponentially weighted averages(ROEWA) on opposite sides of the central pixel. This is done inthe horizontal and vertical direction, and the magnitude of thetwo components yields an edge strength map. Thresholding ofthe edge strength map by a modified version of the watershedalgorithm and region merging to eliminate false edges completean efficient segmentation scheme. Experimental results obtainedfrom simulated SAR images as well as ERS-1 data are presented.
Index Terms—Edge detection, multiedge model, region merg-ing, segmentation, speckle, synthetic aperture radar (SAR), wa-tershed algorithm.
I. INTRODUCTION
SEGMENTATION is the decomposition of an image inregions, i.e., spatially connected, nonoverlapping sets of
pixels sharing a certain property. A region may, for example,be characterized by constant reflectivity or texture. Region-based segmentation schemes, such as histogram thresholdingand split-and-merge algorithms, try to define regions directlyby their content, whereas edge-based methods try to identifythe transitions between different regions.
In images with no texture, an edge can be defined as anabrupt change in reflectivity. In the case of optical images, anedge is usually defined as a local maximum of the gradientmagnitude in the gradient direction, or equivalently, as azero-crossing of the second derivative in the direction ofthe gradient. Smoothing is necessary prior to derivation, as
Manuscript received December 30, 1996; revised August 13, 1997. Thiswork was supported by the French Space Agency (CNES) under Contract833/CNES/94/1022/00.
R. Fjørtoft and A. Lopes are with the Centre d’Etudes Spatiales de laBiospere (CESBIO), UMR 5639 CNES/CNRS/UPS, 31401 Toulouse, France(e-mail: [email protected]; [email protected]).
P. Marthon is with the Laboratoire d’Informatique et de Math´ematiquesAppliquees (LIMA), Ecole Nationale Superieure d’Electrotechnique,d’Electronique, d’Informatique et d’Hydraulique de Toulouse (ENSEEIHT),Institut de Recherche en Informatique de Toulouse (IRIT), UMR 5505UPS/INP/CNRS, 31071 Toulouse, France (e-mail: [email protected]).
E. Cubero-Castan is with the French Space Agency (CNES),DGA/T/SH/QTIS, 31401 Toulouse, France (e-mail: [email protected]).
Publisher Item Identifier S 0196-2892(98)01195-4.
differential operators are sensitive to noise. The smoothingand differentiation operations are merged and implemented bytwo-dimensional (2-D) filters. Gradient-based edge detectionbasically consists of calculating thedifferenceof the localradiometric means on opposite sides of the central pixel. Thisis done for every pixel position in the vertical and horizontaldirection, and the magnitude of the components is computed.Finally, local maxima of the gradient magnitude image areextracted.
Owing to the multiplicative nature of speckle, edge detec-tors, based on the difference of average pixel values, detectmore false edges in areas of high reflectivity than in areasof low reflectivity in synthetic aperture radar (SAR) images[1]. Certainly, other measures than the difference can be usedto identify abrupt transitions. Several edge detectors withconstant false alarm rates (CFAR’s) have been developedspecifically for SAR images, e.g., based on a ratio of averages[1], [2] or a likelihood ratio [3], [4]. However, these operatorsuse the arithmetic mean for the estimation of local meanvalues, which is optimal only in the monoedge case. Segmen-tation schemes based on region growing [5], [6], histogramthresholding [7], and simulated annealing [8] have also beenproposed for SAR images.
In this article, we concentrate on the spatial aspect ofedge detection, based on a multiedge model. We incorporatethe specific properties of SAR images and develop a linearminimum mean square error (MMSE) filter for the estimationof local mean values. In this way, we obtain a new edgedetector with improved noise suppression and edge detectionproperties. Section II explains the principle of monoedge de-tection in SAR imagery. In Section III, we develop an optimalmultiedge detector and propose a thresholding method thatextracts closed, skeleton boundaries. The use of region merg-ing to eliminate false edges is also described. Experimentalresults obtained from simulated SAR images and ERS-1 dataare presented in Section IV. We discuss theoretical aspectsand experimental results in Section V and end with someconcluding remarks in Section VI.
II. M ONOEDGE DETECTION IN SAR IMAGES
Speckle is a deterministic effect common to all imagingsystems relying on coherent illumination. It is due to theconstructive and destructive interference of the responses ofthe different elementary scatterers of a resolution cell. In themeasured intensity image, speckle is well modeled as amultiplicative random noise , which is independent of the
0196–2892/98$10.00 1998 IEEE
Authorized licensed use limited to: INP TOULOUSE. Downloaded on May 12,2010 at 11:11:12 UTC from IEEE Xplore. Restrictions apply.

794 IEEE TRANSACTIONS ON GEOSCIENCE AND REMOTE SENSING, VOL. 36, NO. 3, MAY 1998
Fig. 1. One-dimensional monoedge model.
radar reflectivity [9]
(1)
The transfer function of the SAR system is designed to vary aslittle as possible over the bandwidth of interest. It is known tohave negligible influence on the spectrum of the ideal image,but to limit the bandwidth of the noise spectrum. This effectis incorporated here in the term. Fully developed speckleis Gamma distributed with mean value 1 and variance
, where is the equivalent number of independentlooks (ENIL) of the image [9].
Several CFAR edge detectors have been developed for SARimages based on the monoedge model, which supposes thatonly one step edge is present in the analyzing window (Fig. 1).For example, Touziet al. showed that edge detectors based onthe ratio of averages (ROA) have CFAR because the standarddeviation is proportional to the mean intensity [1]. Theratio is normalized to lie between zero and one
(2)
where and are the arithmetic mean intensities of thetwo halves of a window of fixed size. The normalized ratiois calculated in four (or more) directions by splitting theanalyzing window along the horizontal, vertical, and diagonalaxes. The minimum of the four values thus obtained isfinally compared to an edge detection threshold, which is setaccording to the accepted probability of false alarm (PFA),i.e., the probability of detecting an edge in a zone of constantreflectivity. The principle of the likelihood ratio (LR) detectoris to estimate the ratio of the probability that the analyzingwindow covers two regions separated by a given axis to theprobability that the entire window belongs to one single region.Transforming the LR for edge detection in SAR images intoa log-likelihood difference yields [4]
edge (3)
where is the order parameter of the Gamma distributionof the SAR image, , , , and are the numberof pixels and the arithmetic mean values of the two halfwindows, and and are the corresponding parametersfor the entire window. Oliveret al. recently showed that theROA operator coincides with the LR operator if only theaverages are estimated on equally sized halves of the slidingwindow [4].
Fig. 2. One-dimensional multiedge model.
The unbiased maximum likelihood (ML) estimator of themean value of a Gamma distributedstationaryprocess is thearithmetic mean [4]. The ROA and LR operators both use thisestimator. It is optimal under the monoedge model, i.e., aslong as the width of each half window does not exceed theminimum distance between significant edges. In SAR images,the SNR is very low, typically 0 dB for single-look images. Tosufficiently reduce the influence of the speckle, an importantnumber of pixels must be averaged in each half window. Thus,there is a conflict between strong speckle reduction and highspatial resolution, and the chosen window size constitutes acompromise between these two requirements. This illustratesthe limitations of the monoedge model.
III. M ULTIEDGE DETECTION IN SAR IMAGES
For most scene types, the large windows that we use todetect edges in SAR images are likely to contain severaledges simultaneously. In fact, we need to estimate thelocalmean values of a signal that undergoes abrupt transitionswith random intervals. The monoedge hypothesis is generallynot verified, and the arithmetic mean is no longer optimal.Estimators with nonuniform weighting should therefore beconsidered. The filter coefficients decide the weighting of thepixels as a function of the distance to the central pixel. Forour application, they should optimize the tradeoff betweennoise suppression and spatial resolution, based ona prioriknowledge of image and noise statistics.
A. Multiedge Model
We restrict ourselves to a separable image model. In thehorizontal as well as in the vertical direction, we supposethat the reflectivity image (ideal image) is a stationaryrandom process composed of piecewise constant segments ofreflectivity , with mean value and standard deviation
. The localization of the reflectivity jumps follows aPoisson distribution with parameter corresponding to themean jump frequency, i.e., the probability ofjumps in theinterval is given by
The reflectivities and the jump localizations aresupposed to be independent. Hence and .Fig. 2 illustrates the multiedge model in the one-dimensional
Authorized licensed use limited to: INP TOULOUSE. Downloaded on May 12,2010 at 11:11:12 UTC from IEEE Xplore. Restrictions apply.
FJØRTOFTet al.: OPTIMAL MULTIEDGE DETECTOR FOR SAR IMAGE SEGMENTATION 795
(1-D) case. Although it is idealized, this model is a goodapproximation for important scene types, such as agriculturalfields.
It can easily be shown that the autocovariance function ofthe reflectivity is [10]
The ideal image is thus a separable first-order Markov processwith parameter . The power spectral density, which we heredefine as the Fourier transform of the autocovariance function,is then
(4)
B. Linear MMSE Filter
Let us now develop the linear MMSE filter for the es-timation of the local mean under the stochastic multiedgemodel and the multiplicative noise model. It should not beconfused with an adaptive speckle filter [11], which restoresthe reflectivity of a pixel based on the local statistics. TheMMSE filter will be split along the vertical and horizontalaxes, and the weighted means estimated in the differenthalf windows will be used for edge detection. To facilitatethe implementation, we suppose the filter to have separableimpulse response and first considerthe 1-D case. The best unbiased linear estimator of thereflectivity is of the form [12]
(5)
Minimizing the mean square error yieldsthe transfer function [12]
(6)
The autocovariance function of the speckle decreases veryrapidly [9]. As an approximation, will be considered aswhite noise here
By substituting the power spectral densities and mean valuesinto (6) and taking the inverse Fourier transform, we obtainthe optimal impulse response
where
(7)
and is a normalizing constant. From the multiplicative noisemodel (1), we have and
which can be estimated from the speckled image. The averageregion width can be evaluated visually, or we can estimate
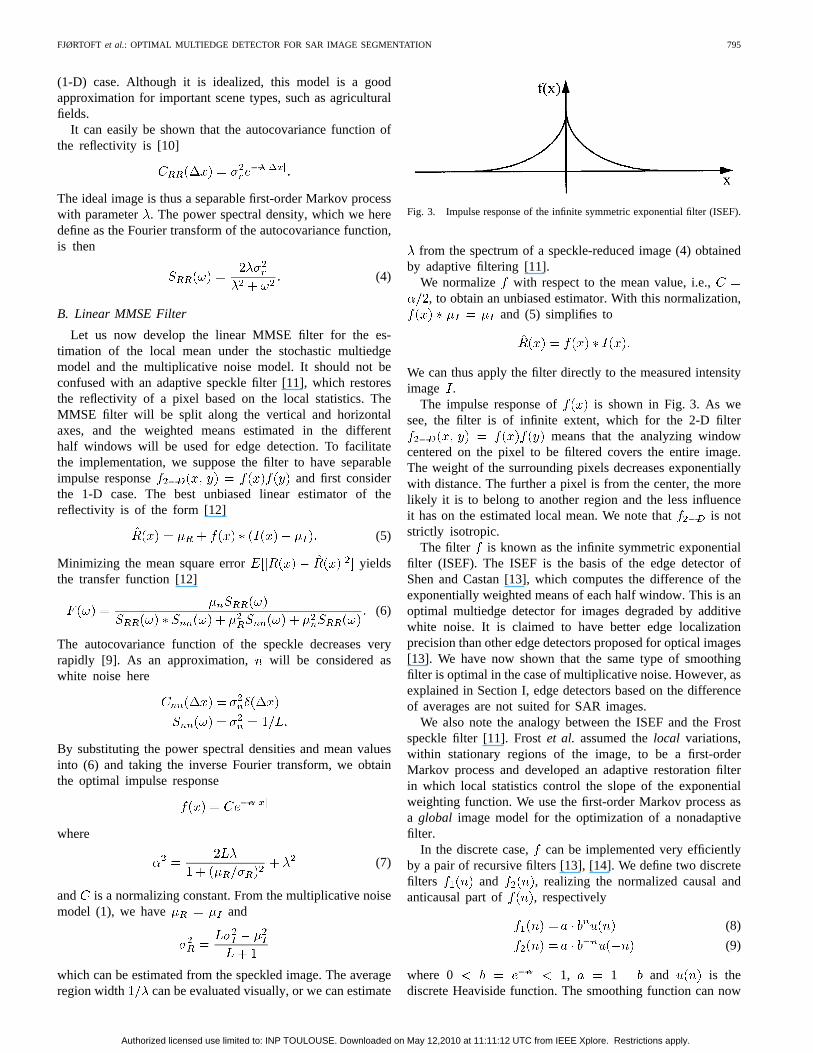
Fig. 3. Impulse response of the infinite symmetric exponential filter (ISEF).
from the spectrum of a speckle-reduced image (4) obtainedby adaptive filtering [11].
We normalize with respect to the mean value, i.e.,, to obtain an unbiased estimator. With this normalization,
and (5) simplifies to
We can thus apply the filter directly to the measured intensityimage .
The impulse response of is shown in Fig. 3. As wesee, the filter is of infinite extent, which for the 2-D filter
means that the analyzing windowcentered on the pixel to be filtered covers the entire image.The weight of the surrounding pixels decreases exponentiallywith distance. The further a pixel is from the center, the morelikely it is to belong to another region and the less influenceit has on the estimated local mean. We note that is notstrictly isotropic.
The filter is known as the infinite symmetric exponentialfilter (ISEF). The ISEF is the basis of the edge detector ofShen and Castan [13], which computes the difference of theexponentially weighted means of each half window. This is anoptimal multiedge detector for images degraded by additivewhite noise. It is claimed to have better edge localizationprecision than other edge detectors proposed for optical images[13]. We have now shown that the same type of smoothingfilter is optimal in the case of multiplicative noise. However, asexplained in Section I, edge detectors based on the differenceof averages are not suited for SAR images.
We also note the analogy between the ISEF and the Frostspeckle filter [11]. Frostet al. assumed thelocal variations,within stationary regions of the image, to be a first-orderMarkov process and developed an adaptive restoration filterin which local statistics control the slope of the exponentialweighting function. We use the first-order Markov process asa global image model for the optimization of a nonadaptivefilter.
In the discrete case, can be implemented very efficientlyby a pair of recursive filters [13], [14]. We define two discretefilters and , realizing the normalized causal andanticausal part of , respectively
(8)
(9)
where 0 1, 1 and is thediscrete Heaviside function. The smoothing function can now
Authorized licensed use limited to: INP TOULOUSE. Downloaded on May 12,2010 at 11:11:12 UTC from IEEE Xplore. Restrictions apply.

796 IEEE TRANSACTIONS ON GEOSCIENCE AND REMOTE SENSING, VOL. 36, NO. 3, MAY 1998
be rewritten as
where .By taking the -transform of (8) and (9), we obtain
In terms of the spatial index, convolution with andcorresponds to the following simple recursions:
(10)
(11)
Here and are the inputs and and arethe outputs of and , respectively. To minimize the numberof multiplications, we may rewrite (10) and (11) as
The computational cost for and for is thus one multiplica-tion per pixel. Due to the normalizing factors,necessitatesfour multiplications per pixel.
C. ROEWA Operator
Based on the linear MMSE filters described above, wepropose a new ratio-based edge detector: theratio of expo-nentially weighted averages(ROEWA) operator. The expo-nentially weighted averages and are normalized to beunbiased, and we show in the Appendix that their variance isproportional to the variance of the raw image. The standarddeviation remains proportional to the mean value, so theROEWA operator has CFAR [1]. As opposed to Touziet al.(2), we normalize the ratio to be superior to one
(12)
The two approaches are of course equivalent. Our choice ismotivated by the particular algorithm that we use in the edgeextraction step.
To compute the horizontal edge strength component, theimage is first smoothed column by column using the 1-D smoothing filter . Next, the causal and anticausal filtersand are employed line by line on the result of the smoothingoperation to obtain and
Here denotes convolution in the horizontal direction anddenotes convolution in the vertical direction. The normalized
ratio is found by substituting andinto (12). The vertical edge strength component
is obtained in the same manner, except that the directions areinterchanged
Finally, with analogy to gradient-based edge detectors foroptical images, we take the magnitude of the two components
In the edge strength map thus obtained, a high pixel valueindicates the presence of an edge. For each pixel, this impliesa total of 14 multiplications, an average of three divisions,and one square root operation.
D. Edge Extraction
By thresholding the edge strength map, we obtain pixelsthat, with a certain PFA, belong to edges. If the thresholdis set too high, we miss important edges, and if it is settoo low, we detect a lot of false edges. Plain thresholdingwill in general produce several pixels wide, isolated edgesegments. The edges can be thinned to unity width by usingmorphological closing [1]. The problem of forming closedboundaries from spatially separated edge segments is quitecomplicated. If the edges are not closed, they do not define asegmentation of the image.
The watershed algorithm[15] is a simple and efficientedge detection method that gives closed, skeleton boundaries.The edge strength map is considered as a surface, and thealgorithm detects local maxima by immersion simulation.In its original form, the watershed algorithm retains all ofthe local maxima of the edge strength map, which separatedifferent basins. It unfortunately tends to produce massivelyoversegmented images. We have chosen to introduce an edgedetection threshold in the algorithm [16]. Only edge strengthmagnitudes over the chosen threshold are considered. Localmaxima with lower magnitudes are supposed to be due tonoise. With this modification, the algorithm detects, thins,and closes significant edges in one operation. The modifiedwatershed algorithm is illustrated in Fig. 4.
We do not have any analytical expression for the distributionof the exponentially weighted means. When the slope of theexponential function is moderate, however, we may suppose aGaussian distribution, according to the central limit theorem.The variance of the distribution as a function of the variance ofthe raw image, the speckle correlation, and the filter parameter
is given in the Appendix. The relation between detectionthreshold and PFA can be established theoretically for theROEWA operator, based on the Gaussian hypothesis. In fact,as the Gamma distribution fits a Gaussian distribution veryclosely when the ENIL is a few tenths or higher, the PFAcomputed for the ROA operator [1] can also be used for theROEWA for typical values of. The ENIL of the exponentiallyweighted mean is equal to the ENIL of the raw imagemultiplied by the equivalent number of independent pixels in
Authorized licensed use limited to: INP TOULOUSE. Downloaded on May 12,2010 at 11:11:12 UTC from IEEE Xplore. Restrictions apply.

FJØRTOFTet al.: OPTIMAL MULTIEDGE DETECTOR FOR SAR IMAGE SEGMENTATION 797
(a)
(b)
Fig. 4. (a) Initial state of the modified watershed algorithm shown on across section of an edge strength map. (b) Skeleton boundaries detected aftercomplete immersion.
the half window, which is given in the Appendix. The PFAapplies to the vertical or horizontal edge strength component,but only as an approximation to their magnitude. Moreover,watershed thresholding reduces the PFA, as compared to plainthresholding, as also false edges are thinned to unity width.The effect of this nonlinear operation is difficult to quantify.With our approach, the theoretical PFA for a given thresholdcan therefore only serve as a rough indication.
A particularity of watershed thresholding is that the wholeedge is eroded if the edge strength magnitude of one singleedge pixel is below the detection threshold. Consequently,the threshold must be set relatively low for the algorithm toform meaningful boundaries, but then we are bound to detectnumerous false edges as well.
E. Postprocessing
Spurious edges can be eliminated by merging adjacentregions whose reflectivities are not significantly different.Several merging criteria have been proposed, including theStudent’s -test [6] and the unequal variance Student’s-test[14]. The LR of Oliver et al. [4] can also be used to decidewhether two regions should be merged and again constitutesan optimal criterion. In fact,merge edge(3)
merge (13)
Thus, merge ≤ 0, and a value close to zero suggests thatthe two regions together form a Gamma-homogeneous region.
It should be noted, however, that we in many applicationsseek a thematic segmentation, so that weak textures within theregions can be accepted. In practice, negative thresholds areused. The more irregularities we accept within the regions, thefurther the threshold can be from zero. Again, the thresholdcan be related to the PFA [4].
Geometrical considerations, such as region size [14] andedge regularity [6], may also be taken into account in themerging process, based ona priori knowledge about the sizeand shape of the regions. The order in which the regions aremerged has a strong influence on the final result. Finding theglobally optimal merging order requires much time-consumingsorting. Theiterative pairwise mutually best merge criterion[17] is a locally optimal approach that is much quicker. First,all regions are compared with their neighbors in terms of themerging criterion and the results are stored in a dynamic array.The array is then traversed sequentially, and a regionismerged with an adjacent regionif and only if is the closestneighbor of , according to the merging criterion, and if isalso the closest neighbor of. When two regions are merged,the local statistics of the resulting region must be updated andthe comparison with all its neighbors must be redone beforecontinuing. The array is traversed repeatedly until no adjacentregions satisfy the merging criterion.
IV. EXPERIMENTAL RESULTS
The novelty of our detector is that it relies on weightedmeans rather than on the arithmetic means used by other CFARdetectors. To study the influence of the nonuniform weighting,we compare the ROEWA operator with the ROA operator.For both detectors, the normalized ratio is computedvertically and horizontally and the magnitude of the two com-ponents constitutes the edge strength map. We use the modifiedwatershed algorithm for thresholding because it directly yieldsskeleton boundaries localized on local maxima of the edgestrength map. This property facilitates the subsequent tests.
A quantitative comparison of edge detectors can only beeffectuated on simulated images, as we need to know theexact position of the edges in advance. Let us first considera “cartoon image,” composed of vertical bands of increasingwidth, from 2 to 18 pixels. The ratio between the reflectivitiesof the bright and the dark lines is 12 dB. This reference imagewas multiplied with a simulated single-look speckle image.The correlation coefficients of the speckle is 0.42,
0.03, and 0, , in azimuth as well as inrange. The ideal image and its single-look speckled counterpartare shown in amplitude in Fig. 5(a) and (b), respectively. Edgestrength maps were calculated on the speckled image with bothoperators. Single-look images are extremely noisy, so strongsmoothing is necessary. The ROEWA operator with 0.9produced a very regular edge strength map, giving rise to fewfalse edges. To obtain the same reduction of speckle variancewith a half window for both operators and thus the same falsealarm rate for a given detection threshold, the window size forthe ROA operator was set to 39 39 (see the Appendix). Athreshold of 1.85 provided the best compromise between thedetection of real edges and the suppression of false ones.
Authorized licensed use limited to: INP TOULOUSE. Downloaded on May 12,2010 at 11:11:12 UTC from IEEE Xplore. Restrictions apply.

798 IEEE TRANSACTIONS ON GEOSCIENCE AND REMOTE SENSING, VOL. 36, NO. 3, MAY 1998
(a) (b)
(c) (d)
Fig. 5. (a) Ideal image consisting of vertical lines of width 2–18 pixels. (b) The simulated single-look speckled image. (c) The segmentation obtained withthe ROA edge detector and watershed thresholding. (d) The segmentation obtained with the ROEWA edge detector and watershed thresholding.
The resulting segmentations are shown in Fig. 5(c) and (d).The ROEWA operator gives a systematic detection of edgesfor bands of width eight or higher, whereas the ROA operatordetects systematically only from a width of 13. Some spuriousedges are present near the edges in the case of the ROAoperator. The experiment indicates that the ROEWA operatorhas better spatial resolution than the ROA operator for a givenspeckle reduction capacity. However, we have chosen a verystrong smoothing to place ourselves in a multiedge situation.We could of course use a smaller window and detect edgesat finer scales with the ROA operator, at the risk of a higherfalse alarm rate.
Let us now examine a more realistic case. We synthesizedthe cartoon image shown in amplitude in Fig. 6(a) by a first-order Markov random field with four classes. The reflectivityratio between subsequent classes is 6 dB. This image ap-proximately corresponds to the multiedge model presented inSection III-A. The mean region width 13.4 pixels.Fig. 6(b) shows the same image multiplied with single-lookspeckle. The correlation properties of the speckle are the sameas in the previous example. To compare the performance ofthe edge detectors, we use Pratt’s figure of merit [18]
where is the number of ideal edge pixels, is thenumber of detected pixels, and is the distance between theth detected edge pixel and the closest true edge pixel.is
a calibration constant that is usually set to one. However, asthe edges are dense in our test image so that the nearest ideal
edge pixel never is far away, we set 2 for a strongerpenalization of misplaced edge pixels. We accept the closestpixel on each side of a transition as an ideal edge pixel, i.e.,
0 for every pixel having at least one pixel belongingto another region in its four-neighborhood. The distancetoan ideal edge for the remaining pixels is obtained as follows:
1 is attributed to all remaining pixels having one or morepixels with 0 in their four-neighborhood. Among thepixels not yet attributed, 2 is set for every pixel havingat least one pixel with 1 in its four-neighborhood, andso forth.
Edge strength maps were computed by the ROA operatorwith window sizes from 3 3 to 19 19 and by theROEWA operator with the parametervarying over the range0.1–0.8. For each edge strength map, the detection thresholdmaximizing Pratt’s figure of merit was determined. Fig. 7shows the result. The unit along the horizontal axis is theequivalent number of independent pixels in each half of theanalyzing window, in terms of the speckle reduction obtainedby smoothing (see the Appendix). This allows us to comparethe results obtained with the ROA operator with differentwindow sizes, with those obtained by the ROEWA operatorusing exponential weighting functions of varying slope. FromFig. 7, we see that the ROEWA operator yields a betterscore than the ROA operator over most of the parameterrange. However, the difference is relatively small near themaximum of the graphs, and for one window size (77),the ROA operator performs even better than the ROEWAoperator. The difference in favor of the ROEWA operatorincreases with stronger smoothing. This reflects the fact that
Authorized licensed use limited to: INP TOULOUSE. Downloaded on May 12,2010 at 11:11:12 UTC from IEEE Xplore. Restrictions apply.

FJØRTOFTet al.: OPTIMAL MULTIEDGE DETECTOR FOR SAR IMAGE SEGMENTATION 799
(a) (b)
Fig. 6. (a) Ideal image synthesized by a first-order Markov random field. (b) The corresponding single-look speckled image.
Fig. 7. Pratt’s figure of merit for the ROA edge detector with varyingwindow size, and for the ROEWA edge detector with varying slope, appliedto the single-look speckled Markov random field image.
the multiedge model is more relevant the larger the analyzingwindow. The ROA operator is optimal in the monoedgecase, which is more frequently encountered when using smallwindows. The localization of the maxima of the graph shouldnot be taken too literally. Such a weak smoothing generallyimplies an important number of false edges due to speckle.A stronger smoothing gives more meaningful boundaries. Thetheoretical optimum for the ROEWA operator, according to(7), is 0.74, which corresponds to about 30 independentpixels in each half window.
Results on real-world data are a useful supplement tosimulations, but here only a visual appreciation can be given.
A multitemporal series of three-look ERS-1 images of anagricultural scene near Bourges, France, was used to testedge detectors and postprocessing. An extract of a colorcomposition of three dates acquired with monthly intervalsis shown in Fig. 8. Note the close resemblance between thisscene and the simulated image in Fig. 6. The edge strengthmaps of the different dates were averaged, supposing that nogeometrical changes took place between the acquisitions andthat the images are perfectly registered. Our strategy is toallow a strong oversegmentation in the edge detection stepand then rely on subsequent merging to eliminate false edges.The best results were obtained with a 1313 window for theROA operator and with 0.73 for the ROEWA operator.Given the speckle correlation, the two detectors have aboutthe same speckle reduction capacity with these parameters.Visual inspection of the segmentations revealed only slightdifferences in favor of the ROEWA operator. We shall usethis image to illustrate how complementary postprocessing canimprove the final result. Fig. 9 shows the initial segmentation,obtained with the ROEWA operator with parameter 0.73and the modified watershed algorithm with threshold 1.53.The threshold was deliberately set very low to make surethat practically all significant edges are detected, resulting ina massively oversegmented image. All three merging criteriamentioned in Section III-E were compared. The LR measure(13) gave the result that agreed best with our conception ofthe regions. The unequal variance Student’s-test gave similarresults, whereas the classic Student’s-test performed poorly.In the final segmentation shown in Fig. 10, the number ofregions has been reduced from over 5000 to about 600. Adja-cent regions for which the log-likelihoodmerge forall three dates were merged. The threshold indicates that we
Authorized licensed use limited to: INP TOULOUSE. Downloaded on May 12,2010 at 11:11:12 UTC from IEEE Xplore. Restrictions apply.

800 IEEE TRANSACTIONS ON GEOSCIENCE AND REMOTE SENSING, VOL. 36, NO. 3, MAY 1998
Fig. 8. Extract of a color composition of three SAR images of an agriculturalscene near Bourges, France,c ESA—ERS-1 data—1993, Distribution SPOTImage.
accepted some irregularities within the regions. In addition,regions containing only one pixel were supposed to be due tospeckle and thus eliminated. The merging order was definedby the iterative pairwise mutually best merge criterion. Almostall regions that we can distinguish by eye have been detected.Some regions still seem to be split in several parts, the edgesare sometimes irregular due to speckle, and the corners areslightly rounded due to the strong smoothing used by the edgedetector. It is, nevertheless, a remarkably good SAR imagesegmentation.
V. DISCUSSION
The estimator of local means used by the ROEWA operatoris optimized for a stochastic multiedge model. We have shownthat an exponentially weighted mean with a correctly adjustedslope gives the optimal tradeoff between localization precisionand speckle suppression when the reflectivity jumps followa Poisson distribution. This multiedge model is primarilyadapted to describe scenes composed of distinct regions ofrelatively uniform reflectivity, but of strongly varying size.Exponential weighting is strictly optimal only for scene typesthat correspond exactly to the stochastic image model. More-over, we supposed uncorrelated speckle. Equivalent estimatorsfor other scene models and for correlated speckle can bedeveloped by substituting the appropriate spectral densityfunctions into (6), but the impulse response will in general notbe any simple, analytic function like the one that we foundhere.
The arithmetic mean, used by the ROA operator, is the MLestimator of the mean value for a stationary process. The ROAoperator is hence spatially optimal in a monoedge context, i.e.,when the distance between edges is larger than the width of
Fig. 9. Oversegmented image obtained by the ROEWA operator and water-shed thresholding.
Fig. 10. Segmentation obtained by the ROEWA operator, watershed thresh-olding, and region merging.
a half window. If the regions are generally big, as comparedto the window size that is necessary to obtain a sufficientspeckle suppression, the ROA operator is bound to performbetter than the ROEWA operator.
To decide whether the ROEWA operator can bring animprovement, as compared to the ROA operator for a givenimage, several factors must be considered: the average regionsize and the variations in region size, the contrast betweendifferent regions, the ENIL, and the speckle correlation. The
Authorized licensed use limited to: INP TOULOUSE. Downloaded on May 12,2010 at 11:11:12 UTC from IEEE Xplore. Restrictions apply.

FJØRTOFTet al.: OPTIMAL MULTIEDGE DETECTOR FOR SAR IMAGE SEGMENTATION 801
ROEWA should theoretically perform better than the ROAoperator when the reflectivity approximately corresponds tothe multiedge model, the mean region width is small, and theENIL is low. With increasing ENIL or mean region width,the monoedge model becomes more appropriate and the ROAoperator can be expected to perform better.
The experimental results confirm the theoretical discussionabove. Edge detection on a single-look image composed ofvertical bands of gradually increasing width indicate that theROEWA detector permits a strong speckle reduction withoutdegrading the spatial resolution as much as the ROA operator.Here we have deliberately placed ourselves in a rather extrememultiedge situation.
On another simulated single-look image, where the reflec-tivity closely approximates the proposed multiedge model, theROA and ROEWA detectors were compared over a wide rangeof window sizes and corresponding slopes of the exponentialweighting function, in terms of Pratt’s figure of merit. Forthe smallest windows, the monoedge hypothesis is generallyverified and the superiority of the ROA operator is con-firmed, even though the scores are very close. With strongersmoothing corresponding to larger windows, the multiedgemodel becomes more relevant and the performance differencein favor of the ROEWA operator increases steadily. Strongsmoothing is necessary here to avoid numerous false edges,due to speckle, the low ENIL, and the high speckle correlation.
A hybrid segmentation scheme, which combines the pro-posed edge detection method with LR region merging, wasshown to give excellent results on multitemporal ERS-1 im-ages of an agricultural scene. The difference between theresults obtained by the ROA and ROEWA operators was small.This reflects the fact that typical regions are so large thatthe monoedge model is just as appropriate as the multiedgemodel for the window size used. Such segmentations can beused to improve thematic classifications [19]. It should bestressed that this is a very rapid segmentation method. Ona Silicon Graphics INDY workstation with a MIPS R4400200-MHz CPU and 64 MB of memory, the ROEWA operator,the watershed thresholding, and the LR region merging neededonly 12 s to process three channels of 512512 pixels,producing the result in Fig. 10. This makes our method morethan an order of magnitude faster than another sophisticatedSAR segmentation scheme, the RWSEG algorithm [5], whichis implemented in the CAESAR module of the ERDASIMAGINE software package. The quality of the results arecomparable.
VI. CONCLUSION
In this article, we propose a new CFAR edge detector forSAR images, which is optimal under a stochastic multiedgemodel. It has been shown to perform better than the ROA oper-ator for images that closely approximate the multiedge model,especially when the average region width is small and theENIL is low. The ROEWA operator, watershed thresholding,and LR region merging constitute a very efficient segmentationscheme. The watershed thresholding can be replaced by more
advanced edge extraction methods, based on the powerfulconcepts of basin dynamics [20] and edge dynamics [21].
The ROEWA operator is a simple, nonadaptive edge de-tector. There are several other approaches to edge detectionand segmentation in a multiedge context. Multiresolution ROAoperators [22] combine the ratios computed with differentwindow sizes according to their statistical significance. Theideal solution would be a spatially adaptive LR operator,which varies the window size, the window form, and the wayit is split, so that the local arithmetic means are estimatedon complete, uniform regions. However, these perfectly ho-mogeneous zones are unknown and difficult to identify inthe presence of speckle. The practical solution is to try toiterate toward the best segmentation. The RWSEG algorithm[5], for example, combines edge detection and region growingiteratively. Stochastic methods based on Markov random fieldsand simulated annealing [8] iterate toward a segmentation thatminimizes a global cost function. Such methods may give evenbetter results, at the cost of a higher computational complexity.
APPENDIX
Let us suppose the intensity to be a wide-sense station-ary process. Taking the block-average of pixels
reduces the variance with a factor if thepixels are uncorrelated
If the pixels are correlated
(14)
where and ≥ 0, are the autocorrelation coefficients.In SAR images, the speckle correlation typically becomes
insignificant for distances superior to 2 or 3 pixels. Moregenerally, we may suppose 0, , and ,so that (14) can be rewritten as
(15)
The factor with which the variance is reduced gives us theequivalent number of independent pixels in the analyzingwindow. Let us now consider the speckle reduction obtainedby one half window of the ROEWA operator. We first employthe ISEF in one direction
Authorized licensed use limited to: INP TOULOUSE. Downloaded on May 12,2010 at 11:11:12 UTC from IEEE Xplore. Restrictions apply.

802 IEEE TRANSACTIONS ON GEOSCIENCE AND REMOTE SENSING, VOL. 36, NO. 3, MAY 1998
The normalized causal filter in the perpendicular directiongives
The equivalent number of independent pixels in a half windowof the ROEWA operator is thus , which can becompared to the corresponding number for a half window ofthe ROA operator obtained by employing (15) in the horizontaland vertical direction.
ACKNOWLEDGMENT
The authors acknowledge the valuable contributions of F.Lebon, N. Mauduit, F. Sery, J. Cabada, C. Lemarechal, C.Fortier, and T. Rabaute.
REFERENCES
[1] R. Touzi, A. Lopes, and P. Bousquet, “A statistical and geometricaledge detector for SAR images,”IEEE Trans. Geosci. Remote Sensing,vol. 26, pp. 764–773, Nov. 1988.
[2] A. C. Bovik, “On detecting edges in speckle imagery,”IEEE Trans.Acoust., Speech, Signal Processing,vol. 36, pp. 1618–1627, Oct. 1988.
[3] V. S. Frost, K. S. Shanmugan, and J. C. Holtzman, “Edge detectionfor synthetic aperture radar and other noisy images,” inProc. IGARSS,Munich, Germany, June 1982, sec. FA2, pp. 4.1–4.9.
[4] C. J. Oliver, D. Blacknell, and R. G. White, “Optimum edge detection inSAR,” Inst. Elec. Eng. Proc. Radar Sonar Navigat.,Feb. 1996, vol. 143.
[5] R. G. White, “Change detection in SAR imagery,”Int. J. RemoteSensing,vol. 12, no. 2, pp. 339–360, 1991.
[6] R. Cook and I. McConnell, “MUM (Merge Using Moments) segmenta-tion for SAR images,” inProc. EurOpto SAR Data Processing RemoteSensing,Rome, Italy, 1994, vol. SPIE 2316, pp. 92–103.
[7] D. M. Smith, “Speckle reduction and segmentation of synthetic apertureradar images,”Int. J. Remote Sensing,vol. 17, no. 11, pp. 2043–2057,1996.
[8] R. Cook, I. McConnell, D. Stewart, and C. J. Oliver, “Segmentationand simulated annealing,” inProc. EurOpto SAR Image Analysis andModeling II, Taormina, Italy, Sept. 1996, vol. SPIE 2958, pp. 30–37.
[9] F. T. Ulaby, R. K. Moore, and A. K. Fung,Microwave Remote Sensing,vol. 3. Dedham, MA: Artech House, 1986.
[10] J. Stern, J. de Barbeyrac, and R. Poggi,Methodes Pratiques d’Etude desFonctions Aleatoires. Paris, France: Dunod, 1967.
[11] V. S. Frost, K. S. Shanmugan, and J. C. Holtzman, “A model for radarimages and its application to adaptive filtering of multiplicative noise,”IEEE Trans. Pattern Anal. Machine Intell.,vol. 4, pp. 165–177, Mar.1982.
[12] J. W. Woods and J. Biemond, “Comments on ‘A model for radar imagesand its application to adaptive filtering of multiplicative noise’,”IEEETrans. Pattern Anal. Machine Intell.,vol. PAMI-6, pp. 658–659, Sept.1984.
[13] J. Shen and S. Castan, “An optimal linear operator for step edgedetection,” CVGIP: Graph. Models Image Processing,vol. 54, pp.112–133, Mar. 1992.
[14] R. Fjørtoft, P. Marthon, A. Lop`es, and E. Cubero-Castan, “Edgedetection in radar images using recursive filters,” inProc. ACCV,Singapore, Dec. 1995, vol. 3, pp. 87–91.
[15] L. Vincent and P. Soille, “Watersheds in digital spaces: An efficientalgorithm based on immersion simulations,”IEEE Trans. Pattern Anal.,Machine Intell.,vol. 13, pp. 583–598, May 1991.
[16] P. Marthon, B. Paci, and E. Cubero-Castan, “Finding the structure ofa satellite image,” inProc. EurOpto Image Signal Processing RemoteSensing,Rome, Italy, 1994, vol. SPIE 2315, pp. 669–679.
[17] A. Baraldi and F. Parmiggiani, “Segmentation driven by an iterativepairwise mutually best merge criterion,” inProc. IGARSS,Firenze, Italy,July 1995, pp. 89–92.
[18] W. K. Pratt,Digital Image Processing. New York: Wiley, 1978.
[19] F. Sery, A. Lopes, D. Ducrot-Gambart, R. Fjørtoft, E. Cubero-Castan,and P. Marthon, “Multisource classification of SAR images with theuse of segmentation, polarimetry, texture and multitemporal data,” inProc. EurOpto Image Signal Processing Remote Sensing,Taormina,Italy, Sept. 1996, vol. SPIE 2955, pp. 186–197.
[20] M. Grimaud, “A new measure of contrast: Dynamics,” inProc. ImageAlgebra Morphol. Processing,San Diego, CA, July 1992, vol. SPIE1769, pp. 292–305.
[21] L. Najman and M. Schmitt, “Geodesic saliency of watershed contoursand hierarchical segmentation,”IEEE Trans. Pattern Anal. MachineIntell., vol. 18, pp. 1163–1173, Dec. 1996.
[22] R. Fjørtoft, A. Lopes, P. Marthon, and E. Cubero-Castan, “Differentapproaches to multiedge detection in SAR images,”Proc. IGARSS,Singapore, Aug. 1997.
Roger Fjørtoft received the M.Sc. degree from theDepartment of Telecommunications, Norwegian In-stitute of Technology (NTH), Trondheim, Norway,in 1993. He is currently pursuing the Ph.D. degree atthe Ecole Nationale Superieure d’Electrotechnique,d’Electronique, d’Informatique et d’Hydraulique deToulouse (ENSEEIHT), Toulouse, France, and at theCentre d’Etudes Spatiales de la Biosph`ere (CES-BIO), Toulouse, France.
His main research interests are in segmentationand multiresolution analysis of SAR images.
Armand Lop es received the engineering de-gree from the Ecole Nationale Superieure del’A eronautique et de l’Espace (Sup’Aero), Toulouse,France, and the Ph.D. degree from the UniversitePaul Sabatier (UPS), Toulouse, in 1983.
He was the Maıtre de Conferences at UPS, wheretaught physics. At the Centre d’Etude Spatiale desRayonnements (CESR), he studied the microwaveextinction and scattering by vegetation, the SARand scatterometer image processing. Since 1995,he has been with the Centre d’Etudes Spatiales
de la Biosphere (CESBIO), where his main activities concern SAR imagepostprocessing.
Philippe Marthon (A’90) received the engineer-ing degree and the Ph.D. degree in computerscience from the Ecole Nationale Superieured’Electrotechnique, d’Electronique, d’Informatiqueet d’Hydraulique de Toulouse (ENSEEIHT),Toulouse, France, in 1975 and 1978, respectively,and the Doctorat d’Etat degree from the InstitutNational Polytechnique de Toulouse (INPT) in1987.
He is currently Maıtre de Conferences atENSEEIHT and a Research Scientist at the Institut
de Recherche en Informatique de Toulouse (IRIT). His research interestsinclude image processing and computer vision.
Eliane Cubero-Castan received the Ph.D. degreein computer science software engineering from theUniversite Paul Sabatier (UPS), Toulouse, France,in 1984.
She is now with the Space Image Quality andProcessing Division, French Space Agency (CNES),where she has the onus of research and developmentproject management in the field of informationextraction (classification, segmentation, and networkand urban area extraction) from optical, radar, andmultisensor remote-sensing data.
Authorized licensed use limited to: INP TOULOUSE. Downloaded on May 12,2010 at 11:11:12 UTC from IEEE Xplore. Restrictions apply.