combining lidar, insar, sar and sar-simulation for change detection applications in cloud-prone...
TRANSCRIPT
The First International Symposium on Cloud-prone And Rainy Areas Remote Sensing (1st CARRS)
68
COMBINING LIDAR, INSAR, SAR AND SAR-SIMULATION FOR CHANGE DETECTION APPLICATIONS IN CLOUD-PRONE
URBAN AREAS
Timo Balz¹, Norbert Haala¹, Uwe Soergel²¹Institute for Photogrammetry, University of Stuttgart
Geschwister-Scholl Str. 24D, 70174 Stuttgart, GermanyTel.: +49-711-121-3383Fax: +49-711-121-3297
[email protected]@ifp.uni-stuttgart.de
²FGAN-FOM, Research Institute for Optronics and Pattern Recognition, Gutleuthausstr. 1, 76275 Ettlingen, Germany
ABSTRACTCloud-prone urban environments are very difficult areas for remote sensing using traditional sensors operating with short wavelength signals in the visible or infrared domains. Due to their all-weather capability, SAR systems are a suitable alternative for time-critical change-detection applications in these areas. However, the inherent side-looking sensor principle of SAR is disadvantageous for the mapping of urban areas. 3D-city models can be reconstructed based on data of different spectral domains and techniques, such as EO image analysis by photogrammetric methods, laser range measurements (LIDAR) or interferometric processing of SAR imagery (InSAR),. These city models can be used as ground-truth for change-detection applications. For time-critical change-detection applications, such as disaster management, SAR is sometimes the only useable data source, especially in cloud-prone areas. Using an existing city model, which was e.g. derived from LIDAR or InSAR data, heavily damaged or collapsed buildings can be found by comparing the SAR information with a SAR simulation of the existing 3D-city model.
1. INTRODUCTIONIn cloud-prone urban environments traditional remote sensing techniques by
electro-optical (EO) sensors are often not suitable, because of the strong atmospheric signal attenuation. Because already more than 50% of mankind live in cities (UNCHS, 2001), the urban environment is of the utmost importance for human society. Therefore, it is important to be able to use remote sensing in these areas. Because many very fast growing urban areas in less developed countries reside in cloud-prone and rainy areas, methods for remote sensing of such areas have to be developed.
For time-critical change-detection applications in cities located in cloud-prone areas, SAR systems are normally the only alternative. But using SAR in urban areas is difficult, due to the side-looking and run-time properties of SAR. The occlusions and ambiguities hinder the interpretation of the data. Beside that, due to the dense placement of the buildings, high-resolution SAR systems are needed, to differentiate between the buildings. Modern airborne SAR-systems are capable of delivering data with resolutions up to 10cm (Ender & Brenner, 2003), and future SAR-satellite systems, like TERRA-SAR X, will deliver 1m resolution images (Werninghaus et al, 2004). These systems are therefore useable for remote sensing applications in urban environments.

The First International Symposium on Cloud-prone And Rainy Areas Remote Sensing (1st CARRS)
69
SAR has some advantages, especially in cloud-prone and rainy areas. These advantages are related to the capability of these systems to operate at day and night and under nearly all weather conditions, because of the larger signal wavelength compared to EO sensors. Unfortunately, SAR has also a lot of disadvantages, especially while using it in urban environments. These disadvantages are related to the run-time geometry and side-looking properties of the SAR system, leading to occlusions and ambiguities. In very dense urban environments, containing tall buildings, it is some-times impossible to observe some areas at all. Because of these disadvantages normally SAR is not used for data collections in urban environments. Especially for the time-independent data-collection, like for the reconstruction of 3D-city models, LIDAR is the better alternative (Haala & Brenner, 1999). In continuously cloud-prone areas, InSAR is also a possible data source for the reconstruction of city models (Soergel, 2003).
For change detection applications based on different types of sensors, the individual sensor properties have to be taken into account. Using SAR data in a time-critical application, like change detection, the 3D-models can be simulated according to the sensor properties of the newly acquired data. Changes in the 3D-city model are detected by comparing the SAR simulated image of the 3D-model with the real SAR image. The simulated image represents the expected value. Differences be-tween the expectations, derived from the simulation, and the real SAR image are supposed to be caused by changes, although these differences may have other reasons, too.
2. DATA COLLECTION
2.1. Reconstruction of 3D-city models using LIDAR dataIn principle stereo image data is sufficient for the three-dimensional acquisition of
buildings; a human operator is able to extract and reconstruct visible buildings solely using this data source. However due to the great complexity of image data the automation of this process poses many problems. Grey values are influenced by the object geometry but also by factors like illumination, surface material or texture. The large amount of information which is contained in images and the numerous factors influencing a grey value or a colour value make it very difficult to separate important information from irrelevant details in the framework of an automatic interpretation process. Automatic reconstruction from aerial images has shown promising results, however one has to note that often special image material has been used which is not available in general, for example large scale, multiple overlap, or colour images, or additional height models. Even then, the reliable fully automatic extraction of buildings in densely build-up areas has not been demonstrated yet.
One approach to simplify the interpretation process required for 3D building reconstruction is to use alternative data sources. These data sources are Digital Surface Models (DSM) and - at least for highly developed countries - existing 2D GIS information on the geometry and usage of buildings. One possible approach to use this information is the reconstruction based on rectangular ground plan decomposition (Haala & Brenner, 1999).
A high percentage of buildings can be modeled using a small number of building primitives like flat boxes, boxes with saddleback and hipped roofs and other geometric primitives like cylinders and cones. Even if one considers only primitives based on rectangular ground shapes, still the majority of buildings can be modeled. Thus, one

The First International Symposium on Cloud-prone And Rainy Areas Remote Sensing (1st CARRS)
70
approach to reconstruct buildings when 2D ground plans are available can be sketched as follows:
Try to infer (in 2D) from the ground plan how the building can be subdivided into primitives.
Select each primitive based on additional information, e.g. an aerial image or a DSM. Determine the dimensions by a measurement process.
Assemble all primitives to obtain a single body representing the building.For example, for a simple L-shaped building the first step would select two
rectangles to cover the 2D ground plan, the second step would select hipped roofs on each of those rectangles and estimate the eaves and ridge heights and the third step would finally merge both volumetric primitives.
This approach has been used in several projects, combining 2D ground plans with DSMs from laser scanning. Its main advantage is that by the use of digitized ground plans, interpreted information is “injected” into the reconstruction process which makes it relatively simple and reliable. On the other hand, since the selection of primitives is guided by analyzing the ground plan, the final reconstruction is strongly coupled to the ground plan shape. For example, roof structures like dormer windows will not appear in the result as long as there is no corresponding hint in the ground plan. This situation can be improved by interactive modeling tools, however.
A second disadvantage is, that while most simple buildings lend themselves well to a subdivision into primitives, there are always buildings present which cannot be modeled properly or for which a subdivision into primitives is not very natural and thus modeling becomes involved. In those cases, other approaches which allow specifying the roof topology directly would be more desirable.
2.2. Reconstruction of 3D-city models using InSAR dataThe analysis of single SAR images is usually restricted to the signal amplitude but
for interferometric SAR processing (InSAR) two complex SAR images are required, which were taken from different positions (Bamler & Hartl, 1998). Due to the geometric displacement, the distances from the sensors to the scene differ, which results in a phase difference in the interferogram. Elevation differences in the scene are approximated by a linear function with these phase differences.
The building recognition is performed in an iterative manner (Soergel, 2003). The workflow is illustrated in Figure 1. At least one InSAR data set is required. The pre-processing of the InSAR data, e.g. smoothing and speckle reduction (Desnos & Matteini, 1993), is the first step. In the subsequent segmentation step primitive objects are extracted from the original slant range InSAR data. From primitive objects more complex objects (building hypotheses) are assembled in the detection module.
After projection of coordinates of these building candidates from slant range into the world coordinate system, a building recognition step follows. In this module model knowledge is exploited, e.g. the rectangular shape of buildings or their preferred parallel alignment along roads. Intermediate results are used for a simulation of the InSAR DEM, layover, shadow, and dihedral corner reflectors. The simulation results are re-projected to the SAR geometry and compared with the real data. Differences between the simulation and the real data control the update of the process: new buildinghypotheses are generated and false ones eliminated. Hence, the resulting scene description is expected to converge to the real 3D objects in the scene with increasing number of cycles. The processing stops either after a given maximum number of

The First International Symposium on Cloud-prone And Rainy Areas Remote Sensing (1st CARRS)
71
iterations or if the RMS of the difference between the simulated and the real InSAR DEM is smaller than a given threshold. If available, multi-aspect InSAR data should be used for the reconstruction of 3D-city models, in order to further improving the results. Analyzing several InSAR data sets, the results are fused. Occluded areas are filled and layover effects are compensated.
Results of the approach are illustrated in Figure 2. InSAR data of a rural scene taken from three directions (one from north and two from south with different incidence angle) have been analyzed.
In Figure 2a, the result of an analysis based alone on the data set acquired from the north direction after three iterations is shown in red, while the ground truth building footprints are depicted in white. No false positives have been detected. All the detected buildings were reconstructed as flat roof buildings. Due to disturbed height data –probably caused by dominant scattering – the building B was not reconstructed correctly. The small building part C2 of the building group C was not detected. But, this building part is not detectable in the data even for a human observer. Both elements of the building group D were detected. However, the reconstruction of the footprints was topologically incorrect (rectangular building D1 was reconstructed with a small annex and the annex of building D2 is missing). But the affected building area is small in both cases.
InSAR data
Pre-Processing
Segmentation
Detection
Reconstruction
Fusion
Simulation
2D SAR geometry
iconic level
3D world coordinates
symbolic level
Figure 1: Workflow of InSAR building reconstruction

The First International Symposium on Cloud-prone And Rainy Areas Remote Sensing (1st CARRS)
72
d
Figure 2: Final results: a) analysis of data set measured from north alone; b) result for multi-aspect data; 3D visualisation of b) with surrounding trees; reconstructed buildings (grey)
superimposed with the LIDAR data in green.
The result of the multi-aspect analysis is illustrated in Figure 2b. The main improvement is that building B was now detected properly and reconstructed correctly as gabled roof building. The roof structure was derived mainly from the shadow analysis in this case. A 3D visualization of this result is shown in Figure 2c together with surrounding trees from the InSAR NDEM. The RMS of the corners of the building footprints is smaller than 3m in x and y direction. The RMS of the mean elevation is about 1.5 m. Figure 2d depicts the reconstructed buildings (grey) superimposed with the LIDAR data (green). The approach works satisfactory in rural and suburban areas. In built-up areas results are worse, because of layover and occlusion phenomena.
3. SAR SIMULATION A SAR simulator is an important tool for the interpretation of SAR images (Leberl
& Bolter, 2001). The simulator is also useful during mission planning, for choosing the optimal SAR acquisition parameters and avoiding occlusions in the area of interest, especially in urban environment (Soergel et al, 2003).
a b
c
d

The First International Symposium on Cloud-prone And Rainy Areas Remote Sensing (1st CARRS)
73
a b
Figure 3: a) Subset of a DOSAR image of Karlsruhe b) Simulated SAR image of the same area
Figure 3a, shows a DOSAR image of an area of the city of Karlsruhe in Germany. DOSAR is the multifrequency polarimetric airborne SAR system of the EADS Dornier GmbH (Hoffmann & Fischer, 2002). The flight direction is 90.05°, the off-nadir angle is 70°, the pixel grid is 0.26m and the 3dB-resolution is about 0.57m. In Figure 3b, the result of the SAR simulation based on a 3D-city model of Karlsruhe is shown, using the SARView Light SAR simulator (basis version) of the EADS Dornier GmbH. Comparing Figure 3a and 4b, the great differences between the simulation and the reality are getting obvious. These large differences are mostly related to the incompleteness of the 3D-city model used for the simulation, due to generalization effects. But beside the missing object details, the appearance of the main building structures is quite similar. Hence, the results of the SAR simulation can be used to analyze the differences between the real SAR image and the 3D-city model.
4. SIMULATION BASED GEO-REFERENCINGThe prerequisite for change detection is a reliable geo-referencing of the data. The
data analyzed for changes and the newly acquired data must be co-registered, which is not a trivial task, because it requires attention to the specific sensor properties.
For the automated geo-referencing of SAR data, 3D-data as ground-truth is most beneficial. But 3D-city models are not widely available. Therefore, in the approach, described in this paper, street data is used as ground-truth for the geo-referencing, which is later locally refined with 3D-data for the change detection. Standard street datasets, like the GDF-street vectors, are e.g. provided for car-navigation systems. GDF-street vectors are commonly available and are covering a huge area. They have an accuracy of around ±3m (Walter, 1997). The street vectors are transformed to a consistent map projection, for example the UTM coordinate system. Afterwards, the street vectors are SAR simulated.
Streets in SAR images appear dark, because the street surface is very smooth and reflects the SAR beam away from the sensor, so less energy is reflected back to the sensor. Strong reflecting objects atop the street, like cars and signs, are not taken into consideration in this approach. It is assumed, that streets can be found by their network

The First International Symposium on Cloud-prone And Rainy Areas Remote Sensing (1st CARRS)
74
structure.The flight direction and the rough position of the SAR image, which should be
delivered as meta-information together with the SAR image, have to be known for further processing. The initial coordinates of the DOSAR flight over Karlsruhe men-tioned above, have an offset of about 150m. Obviously the data cannot be used directly for change detection purposes with such an offset.
The basic idea is to extract subsets from the street dataset. These subsets are SAR simulated and the results of the SAR simulation is compared to the real SAR image. This comparison should lead to correspondences between the SAR image and the street data. The algorithm searching for correspondences is comparable to a correlation. It assumes that streets are dark areas in the image, while the surrounding areas are relatively bright.
For a stable geo-referencing, the search areas should be evenly spread across the real SAR image. To find and assign correspondences correctly and stable, the chosen subsets should include many streets and junctions. Unfortunately, the streets and junc-tions are normally not evenly spread across SAR images, making it a trade-off between the required spreading of the correspondences and the required amount of street junc-tions per subset.
Figure 4: Footprint of the SAR image and the search areas
In Figure 4, the footprint of the SAR image (grey), the GDF-data and the search areas are visible. Obviously the corresponding points are not very well distributed. This is due to the concentration of the algorithm on areas with many junctions and streets, mainly found in the city area. This results in points, which are not evenly spread. Another problem is the unfavourable distribution of the points. The selected points reside mainly on one line, because of the quite large search area used for the analysis. Therefore, the small strip-width forces the algorithm to search for corresponding points near mid-range, which yields to a high sensibility for errors in range direction. Unfortunately, the overall error in range direction is influenced by the near range displacement of the assumed street position in SAR images, especially in inner city areas, as depicted in Figure 5.
Figure 5: Assumed street position shifted in near range

The First International Symposium on Cloud-prone And Rainy Areas Remote Sensing (1st CARRS)
75
Streets are assumed to be dark areas in SAR images, thus can not be distinguished from shadows and vice versa. Buildings next to streets influence the appearance of the street, due to shadow and layover. The dark area in the SAR image, assumed to be the street, can be a shadow, whereas the bright area of the building layover may be situated atop the street. This leads to a misinterpretation of the street position. The street seems to be closer to near range.
In Figure 6, the resulting differences caused by the near range shift can be seen. Three search area mapping results overlaid to a DOSAR image. The results mainly differ in range direction, while their positioning in azimuth matches quite well. The length of the shift depends on the height of the neighbouring buildings and the incident angle. The differences in range appear to be mainly caused by the shift, shown in Figure5. The overall positioning although is rather good.
Figure 6: Three search area mapping results overlaying a DOSAR image
Outside of inner city areas, the automated geo-referencing method described in this paper has some problems, since only very few streets occur in this patch. Additionally, the small contrast between streets and the surrounding area is another problem.
Obviously there is some shift in the data of Figure 7a, mainly caused by the shadow of the forest area. But the position is still approximately correct. The position, in Figure 7b, is apparently totally wrong. The problem is not only the lower contrast, but also the small amounts of streets and junctions in the area. Because of the possible erroneous matching result and the near range shift of the correspondences, more correspondences than needed for the transformation must be found. By overestimating the transformation, some of the erroneous correspondences can be removed and the influence of the near range shift on the final result can be reduced.
a b
Figure 7: Erroneous mapping results overlaying a DOSAR image
An accuracy of the overall spatial reference of around 6m is achieved by the
The First International Symposium on Cloud-prone And Rainy Areas Remote Sensing (1st CARRS)
76
method described above. This error is caused by the inaccurate street data, as well by the shifting of the streets as shown in Figure 5. Erroneous corresponding points are furthermore causing a lot of problems. Therefore the overall accuracy is not high enough to use this geo-referencing method for automatic change detection applications. But it can be useful for manual change detection and it may be used as rough geo-referencing method for the whole image, which should be refined during the change detection process for a local area.
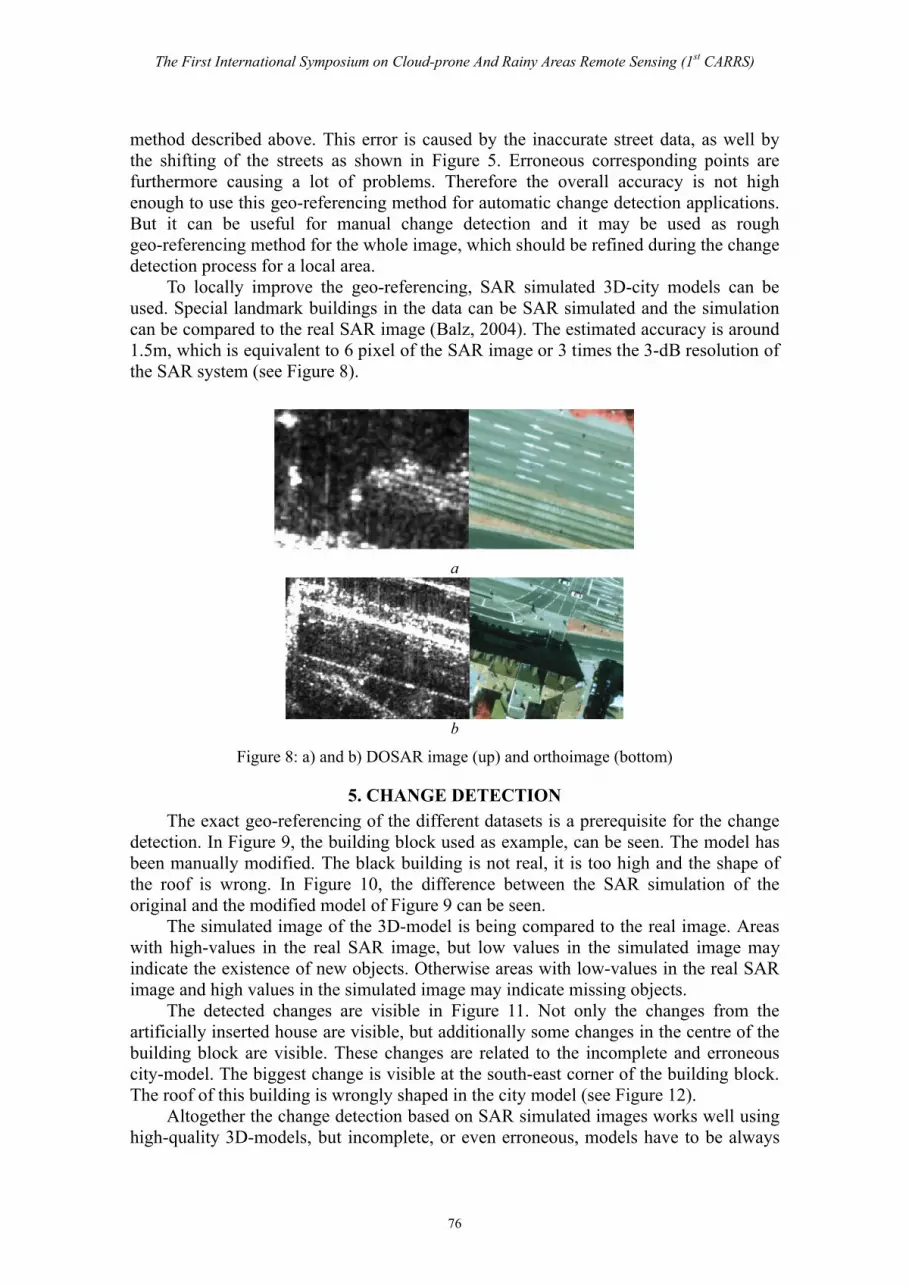
To locally improve the geo-referencing, SAR simulated 3D-city models can be used. Special landmark buildings in the data can be SAR simulated and the simulation can be compared to the real SAR image (Balz, 2004). The estimated accuracy is around 1.5m, which is equivalent to 6 pixel of the SAR image or 3 times the 3-dB resolution of the SAR system (see Figure 8).
a
b
Figure 8: a) and b) DOSAR image (up) and orthoimage (bottom)
5. CHANGE DETECTIONThe exact geo-referencing of the different datasets is a prerequisite for the change
detection. In Figure 9, the building block used as example, can be seen. The model has been manually modified. The black building is not real, it is too high and the shape of the roof is wrong. In Figure 10, the difference between the SAR simulation of the original and the modified model of Figure 9 can be seen.
The simulated image of the 3D-model is being compared to the real image. Areas with high-values in the real SAR image, but low values in the simulated image may indicate the existence of new objects. Otherwise areas with low-values in the real SAR image and high values in the simulated image may indicate missing objects.
The detected changes are visible in Figure 11. Not only the changes from the artificially inserted house are visible, but additionally some changes in the centre of the building block are visible. These changes are related to the incomplete and erroneous city-model. The biggest change is visible at the south-east corner of the building block. The roof of this building is wrongly shaped in the city model (see Figure 12).
Altogether the change detection based on SAR simulated images works well using high-quality 3D-models, but incomplete, or even erroneous, models have to be always

The First International Symposium on Cloud-prone And Rainy Areas Remote Sensing (1st CARRS)
77
taken into account. This most certainly disturbs the automatic change detection and leads to a lot of manual rework, or to unacceptable results. Under these circumstances, tools for operator assisted building reconstruction based on SAR simulation, are more suitable for a fast reconstruction (Balz & Haala, 2003).
Figure 9: Changed 3D-model
a b
Figure 10: a) Simulated image of the original 3D-model b) and of the modified 3D-model
Figure 11: Detected changes of the building block overlaying a DOSAR image

The First International Symposium on Cloud-prone And Rainy Areas Remote Sensing (1st CARRS)
78
a b
Figure 12: a) Orthoimage b) erroneously shaped 3D-model
6. CONCLUSIONCloud-prone and rainy urban areas are maybe the most difficult areas in the field of
remote sending. The combination of different remote sensing systems is the most promising approach for successful applications. Change detection is often used in time-critical applications, therefore weather independent sensors, like SAR, are most useful, especially in cloud-prone and rainy areas. The change detection is based on a database which is considered as ground truth. The creation of this database is normally not time-critical. For the collection of this ground truth data, like a 3D-city model, different sensors can be used. 3D-city models reconstructed from LIDAR data can be used as ground truth. 3D-city models reconstructed from InSAR data can also be used, but are normally not as accurate and reliable as 3D-city models reconstructed from LIDAR.
A prerequisite of every change detection operation is the geo-referencing of the different datasets. Combining data acquired by different sensors, the geo-referencing of these different data types is problematic. SAR systems are side-looking systems with run-time geometry. Therefore, the geometry of SAR images differs a lot from optical images, LIDAR data or GIS datasets. The different imaging properties have to be considered. Time-critical change detection for disaster management relies on the fast availability of actual data. There is no time to wait for the perfect sensor or a good satellite constellation. There are better ways for change detection, than using single SAR images. LIDAR is more suitable (Voegtle & Steinle, 2004), but problematic for cloud-prone or smoke covered areas. InSAR data is useful here, but often no single-path InSAR data source is available, whereas high-resolution single SAR images are more often available. Therefore, single SAR images may be the only fast available data source. A SAR simulator can be used to transform the reconstructed 3D-models into the SAR image space. Comparing the real SAR image and the simulated SAR image of the 3D-model, meaningful change detection is possible. In this context, it is most useful to rely the detection on 3D-data, instead of using 2D-data. Due to the side-looking property of a SAR system, it is most important to regard the 3D-shape of the analyzedobject. The simulated image of the 3D-models, created by a SAR simulator, can be compared to the real SAR image and as a result of this comparison changes may be detected automatically. The final result of the change detection depends on the quality and completeness of the 3D-model simulated for the comparison. Furthermore errors in the real image and during the SAR simulation can disturb the result of the change

The First International Symposium on Cloud-prone And Rainy Areas Remote Sensing (1st CARRS)
79
detection.
ACKNOWLEDGEMENTSWe thank the EADS Dornier GmbH for providing us with the simulated and real SAR data and Dr. Schmid (Swiss Defence Procurement Agency) for providing the InSAR and LIDAR data.
REFERENCEBalz, T., Haala, N., 2003. SAR-based 3D-reconstruction of complex urban
environments. In: IAPRS Vol. 34, Part 3/W13, Workshop on 3-D reconstruction from airborne laserscanner and InSAR data, Dresden.
Balz, T., 2004. SAR simulation based change detection with high-resolution SAR images in urban environments. In: IAPRS Vol. 35, Part B, Istanbul.
Bamler, R., Hartl, P., 1998. Synthetic aperture radar interferometry. In: Inverse Problems, 14 (4), pp. 1-54.
Desnos, Y.-L., Matteini, V., 1993. Review on Structure. Detection and Speckle Filtering on ERS-1 Images. In: EARSeL Advances in Remote Sensing, 2 (2), pp. 52-65.
Ender, J.H.G., Brenner, A.R., 2003. PAMIR - a wideband phased array SAR/MTI system. In: IEE Proceedings - Radar, Sonar and Navigation, 150 (3), pp. 165-172.
Haala, N., Brenner, C., 1999. Extraction of buildings and trees in urban environments. In: ISPRS Journal of Photogrammetry and Remote Sensing, 54 (2-3), pp. 130-137.
Hoffmann, K., Fischer, P., 2002. DOSAR: A Multifrquency Polarimetric and Interferometric Airborne SAR-System. In: 2002 International Geoscience and Remote Sensing Symposium and the 24th Canadian Symposium on Remote Sensing, Toronto, Canada.
Leberl, F.W.,Bolter, R.,2001. Building reconstruction from Synthetic Aperture Radar images and interferometry. In: Baltsavias, E.P., Grün, A., Gool, L.v.: Automatic Extraction of Man-Made Objects From Aerial and Space Images (III). Lisse, pp. 281-290.
Soergel, Uwe, 2003. Iterative Verfahren zur Detektion und Rekonstruktion von Gebäuden in SAR- und InSAR-Daten. PhD-Thesis, University of Hannover.
Soergel, U., Schulz, K., Thoennessen, U., Stilla, U., 2003. Event-driven SAR Data Acquisition in Urban Areas Using GIS. In: GIS, 16 (12), pp. 32-37.
UNCHS, 2001. The State Of The World's Cities Report 2001. United Nations Center for Human Settlement, Nairobi, Kenya.
Voegtle, T., Steinle, E., 2004. Detection and Recognition of Changes in Building Geometry Derived from Multitemporal Laserscanning Data. In: IAPRS Vol. 35, Part B, Istanbul.
Walter, V., 1997. Zuordnung von raumbezogenen Daten - am Beispiel ATKIS und GDF. Deutsche Geodätische Kommission (DGK), München.
Werninghaus, R., Balzer, W., Buckreuss, J.M., Mühlbauer, P., Pitz, W., 2004. The TerraSAR-X Mission. In: Proceedings 5th European Conference on Synthetic Apertur Radar, Ulm.