afsaneh sedaghatkish - bac-lac.gc.ca
TRANSCRIPT

The genomic structure and management of Plasmodiophora brassicae
by
Afsaneh Sedaghatkish
A Thesis
presented to
The University of Guelph
In partial fulfilment of requirements
for the degree of
Doctor of Philosophy
in
Plant Agriculture
Guelph, Ontario, Canada
© Afsaneh Sedaghatkish, March 2020

ABSTRACT
THE GENOMIC STRUCTURE AND MANAGEMENT OF PLASMODIOPHORA BRASSICAE
Afsaneh Sedaghatkish
University of Guelph, 2019
Advisors:
Dr. Mary Ruth McDonald
Dr. Bruce D Gossen
Plasmodiophora brassicae is an obligate soil-borne pathogen and the (cause of clubroot on
canola (Brassica napus)) and other Brassica crops. It is genetically diverse, as exemplified by
numerous pathotypes. Whole-genome sequences for collections of P. brassicae from Canada, the
USA, and China were developed based on Illumina sequencing technology. The whole genome
sequences of 43 P. brassicae of these isolates were compared at the SNP level. The strains from
Canada separated into four clades. Strains from the USA and two strains from China were
grouped with strains from Canada. Three strains from China formed a separate clade. Strains
were mostly grouped based on geographic location and not the pathotype or host. At sites in
Ontario and Quebec where the dominant pathotype changed or resistance had broken down, the
SNPs differed in about half of the genome between strains before and after the change. This
study indicated that rare pathotypes were maintained in the population at very low frequency,
maintained through balancing selection, and increased rapidly in response to selection from
repeated exposure to host resistance. Micro-manipulation was used to obtain single-spores of the
pathogen. The amplification of the DNA of five single spores collected from a single club was
attempted to sequence the genome. However, most of the genome was not sequenced in this
assessment. Two management methods were assessed: mycorrhizal fungi to protect plants from
infection, and grass cover crops to reduce pathogen levels in soil. Some cultivars of cover crops
showed promising results in spore reduction in soil.

iii
ACKNOWLEDGEMENTS
This journey would not have been possible without the support of my family, professors and
mentors, and friends. To my family, thank you for encouraging me in all of my pursuits and
inspiring me to follow my dreams. I am especially grateful to my parents, who supported me
emotionally and financially. Words cannot express how grateful I am to my mother and father
for all of the sacrifices that they’ve made on my behalf.
I would like to express my sincere appreciation to my academic advisors Dr. Mary Ruth
McDonald and Dr. Bruce Gossen for creating this opportunity and providing such a priceless
time and effort devoted to the direction of this project. This study would not have been possible
without your constant guidance from start to the end. I would like to thank you for encouraging
my research ideas and for allowing me to grow as a scientist. Your contribution was essential for
planning of the experiments, interpretation of the results and writing of this thesis. I extend my
gratitude to Dr. Hugh Earl who served as a member of my PhD committee and provided valuable
comments on my work. I also thank Drs. Istvan Rajcan and Timothy Daniel Murray who
evaluated this thesis. I would also like to thank Dr. Fadi Al Daoud who has always been willing
to share his vast experience and has been there to offer his help throughout my laboratory
experimentation process. I would also like to thank Dr. Jaswant Singh for taking the valuable
time to train me to work with the micromanipulator. I would especially like to thank Dr. Davoud
Torkamaneh for help with the bioinformatic analysis of my project.
This project would not have been possible without the financial assistance provided by
Agriculture and Agrifood Canada.

iv
Finally, I would like to thank Ashkan, Arash, and Shermineh for supporting me for everything,
and especially for encouraging me throughout this experience, and of course, my lab mates for
their encouragements throughout the study.

v
TABLE OF CONTENTS
Abstract ........................................................................................................................................... ii
Acknowledgements ........................................................................................................................ iii
Table of Contents ............................................................................................................................ v
List of Tables .................................................................................................................................. x
List of Figures ................................................................................................................................ xi
1 Literature review ..................................................................................................................... 1
1.1 Brassica crops in Canada.................................................................................................. 1
1.2 Brassica vegetables .......................................................................................................... 2
1.3 Canola............................................................................................................................... 3
1.4 Clubroot ............................................................................................................................ 5
1.4.1 Causal agent and taxonomy ...................................................................................... 5
1.4.2 Symptoms ................................................................................................................. 6
1.4.3 Life cycle .................................................................................................................. 7
1.4.4 Host range and pathotype ........................................................................................ 10
1.4.5 Worldwide distribution ........................................................................................... 14
1.4.6 Transmission pattern ............................................................................................... 16
1.4.7 Detection and quantification ................................................................................... 18
1.5 Genomics ........................................................................................................................ 19
1.6 Tissue culture ................................................................................................................. 21
1.6.1 Recombination in P. brassicae ............................................................................... 23
1.6.2 Biochemical function of P. brassicae genes ........................................................... 24
1.7 Effects of environmental factors on clubroot development ........................................... 24
1.7.1 Temperature ............................................................................................................ 25

vi
1.7.2 Soil pH .................................................................................................................... 26
1.7.3 Soil moisture ........................................................................................................... 26
1.7.4 Soil nutrients ........................................................................................................... 27
1.7.5 Resting spore concentration .................................................................................... 28
1.8 Clubroot forecasting models .......................................................................................... 29
1.9 Host-pathogen interaction .............................................................................................. 30
1.9.1 Compatible interaction ............................................................................................ 30
1.9.2 Incompatible interaction ......................................................................................... 33
1.10 Management of clubroot ............................................................................................. 34
1.10.1 Host resistance..................................................................................................... 34
1.10.2 Cultural and physical management strategies ..................................................... 38
1.10.3 Synthetic fungicides ............................................................................................ 40
1.10.4 Biological control ................................................................................................ 40
1.11 Research objectives .................................................................................................... 43
2 Genomic study of Plasmodiophora brassicae ...................................................................... 46
2.1 Introduction .................................................................................................................... 46
2.2 Materials and methods ................................................................................................... 50
2.2.1 Clubroot material and plant inoculation ................................................................. 50
2.2.2 Dual callus cultures ................................................................................................. 51
2.2.3 Confocal microscopy .............................................................................................. 52
2.2.4 Pathotyping ............................................................................................................. 52
2.2.5 DNA extraction ....................................................................................................... 55
2.2.6 DNA sequencing and identification of DNA variants ............................................ 56
2.2.7 Phylogenetic tree ..................................................................................................... 57
2.2.8 Population structure and principal component analysis.......................................... 57

vii
2.2.9 Nucleotide diversity, and Tajima’s neutrality test .................................................. 58
2.2.10 Linkage disequilibrium ........................................................................................... 58
2.3 Results ............................................................................................................................ 58
2.3.1 Dual callus cultures ................................................................................................. 58
2.3.2 Confocal microscopy .............................................................................................. 59
2.3.3 DNA variant information ........................................................................................ 60
2.3.4 Phylogenetic tree ..................................................................................................... 62
2.3.5 Population structure and principal component analysis.......................................... 68
2.3.6 Genomic diversity ................................................................................................... 69
3 Micromanipulation and whole-genome sequence of single spores ...................................... 83
3.1 Introduction .................................................................................................................... 83
3.2 Materials and methods ................................................................................................... 87
3.2.1 Sample preparation ................................................................................................. 87
3.2.2 Single spore micromanipulation and inoculation ................................................... 88
3.2.3 Whole genome amplification from a single spore .................................................. 90
3.2.4 Library construction, whole genome sequencing, and assembly ............................ 91
3.3 Results ............................................................................................................................ 92
3.3.1 Single spore isolation and inoculation .................................................................... 92
3.3.2 Whole genome amplification and sequencing ........................................................ 92
3.4 Discussion ...................................................................................................................... 95
4 Effect of grass crops on resting spore concentration ............................................................ 99
4.1 Introduction .................................................................................................................... 99
4.2 Materials and methods ................................................................................................. 101
4.2.1 Grass cover crops .................................................................................................. 101
4.2.2 Application of inoculum to soil- Study 1 .............................................................. 102

viii
4.2.3 Application of inoculum to soil - Studies 2 and 3 ................................................ 104
4.2.4 DNA extraction and quantification ....................................................................... 105
4.2.5 Statistical analyses ................................................................................................ 106
4.3 Results .......................................................................................................................... 107
4.3.1 Spore concentration - Study 1 ............................................................................... 107
4.3.2 Spore concentration - Studies 2 and 3................................................................... 108
4.4 Discussion .................................................................................................................... 112
5 Evaluation of Piriformospora indica and other mycorrhizal fungi on clubroot of canola . 115
5.1 Introduction .................................................................................................................. 115
5.2 Materials and methods ................................................................................................. 117
5.2.1 Seed treatment ....................................................................................................... 117
5.2.2 Root colonization .................................................................................................. 118
5.2.3 Growth room studies 1 and 2 ................................................................................ 118
5.2.4 Field trial ............................................................................................................... 122
5.2.5 Outdoor pot trial .................................................................................................... 123
5.2.6 Statistical Analysis ................................................................................................ 124
5.3 Results .......................................................................................................................... 125
5.3.1 Root colonization .................................................................................................. 125
5.3.2 Growth room studies ............................................................................................. 125
5.3.3 Field trial ............................................................................................................... 135
5.3.4 Outdoor pot trial .................................................................................................... 136
5.4 Discussion .................................................................................................................... 137
6 General discussion .............................................................................................................. 140
References ................................................................................................................................... 145
Appendix ..................................................................................................................................... 163

ix
Appendix 1: Supplemental tables and figures, Chapter Two ..................................................... 163
Appendix 2: Supplemental tables and figures, Chapter Three ................................................... 180
Appendix 3: Supplemental tables and figures, Chapter Four ..................................................... 181
Appendix 4: Supplemental tables and figures, Chapter Five ...................................................... 190

x
LIST OF TABLES
Table 1-1 Published pathotypes of Plasmodiophora brassicae in Canada................................... 14
Table 2-1 Field and single-spore isolates of Plasmodiophora brassicae used for whole-genome
sequencing..................................................................................................................................... 54
Table 2-2 Nucleotide diversity (π). The average pairwise divergence within a subpopulation (θπ)
was estimated for the whole genome among different subpopulations using VCFtools. ............. 70
Table 2-3 Top three proteins aligned to two 1000 bp window of P. brassicae sequence
containing SNP variance hotspots using BLAST. ........................................................................ 71
Table 2-4 Molecular markers previously identified to distinguish P4, P9, and P11 from China. 72
Table 3-1 Number of reads (150-bp) gained by Illumina HiSeq. ................................................. 94
Table 4-1 Effect of grass species and cultivar on root weight and the concentration of resting
spores of Plasmodiophora brassicae in soil after 8 weeks of growth based on estimates from
PMA-qPCR under controlled conditions (n = 6). ....................................................................... 108
Table 4-2 Effect of grass species and cultivar on root weight and the resting spore concentration
of Plasmodiophora brassicae in soil in Studies 2 and 3, based on estimates from PMA-qPCR (n
= 6). ............................................................................................................................................. 109
Table 4-3 Effect of grass species and cultivar on spore concentration of Plasmodiophora
brassicae in soil, analyzed separately for Studies 2 and 3 and assessed at 8 weeks after seeding (n
= 6). ............................................................................................................................................. 110
Table 5-1 Species of mycorrhizal fungi and concentration in the Root Rescue product. ........... 120
Table 5-2 Treatments and concentration of resting spores applied to canola seed in the two
growth room studies. ................................................................................................................... 121
Table 5-3 Treatments of Root Rescue (a commercial mixture of mycorrhizal fungi plus clay, kelp
extract and humate) and components applied to canola seed at a muck soil site naturally infested
with Plasmodiophora brassicae at the Muck Crops Research Station, Holland Marsh, ON in
2017............................................................................................................................................. 123
Table 5-4 The effect of Pirformospora indica and Root Rescue mycorrhizal formulation on
clubroot severity (disease severity index, DSI) on canola in two growth room studies. Treatments
that were the same in both studies at the inoculum concentration of 5 x 10 4 were pooled (n = 8).
..................................................................................................................................................... 127
Table 5-5 Effect of seed treatment with Root Rescue (RR) on canola biomass (fresh and dry
weight) of shoots and roots in a field trials at the Muck Crop Research Station in 2017. .......... 136

xi
LIST OF FIGURES
Figure 1-1. The ancestral relationship among Brassica spp. (Nagaharu 1935). ............................. 2
Figure 2-1 Stages of the life cycle of Plasmodiophora brassicae observed in callus culture. ..... 60
Figure 2-2 DNA variant distribution (%) in genic and intergenic regions of 43 strains of
Plasmodiophora brassicae............................................................................................................ 61
Figure 2-3 (a) Variant type (%) and (b) distribution in coding and non-coding regions (%). ...... 62
Figure 2-4 SNP-based phylogenetic tree of Plasmodiophora brassicae based on whole-genome
alignment of 43 P. brassicae strains. ............................................................................................ 66
Figure 2-5 The ratio of homogenous to heterogeneous SNPs. A SNP frequency range of 25–75%
was used; any SNP at lower than 75% is most likely a heterozygous SNP. ................................. 67
Figure 2-6 Heat maps of SNPs distribution in Plasmodiophora brassicae. ................................. 67
Figure 2-7 Principal component analysis of 43 strains of Plasmodiophora brassicae................. 68
Figure 2-8 Population structure analysis of 43 strains. Admixtures are represented by two colors
in a column. Values of K (optimum number of clusters) is demonstrated. .................................. 68
Figure 2-9 Nucleotide diversity across the genome of the 43 strains of Plasmodiophora
brassicae. ...................................................................................................................................... 70
Figure 2-10 Heat map of SNPs in gene codoning for benzoic acid/salicylic acid
methyltransferase in the 43 isolate Plasmodiophora brassicae collection, based on Euclidean
distance metric and centroid linkage. ............................................................................................ 72
Figure 2-11 LD decay (squared allele frequency correlation, r2) against the distance between
polymorphic sites: (A)Pop 1 (Clades 1 and 2), in Pop 2 (Clades 3 and 4). (B) all populations
(Clades 1 to 5) of 43 collections of P. brassicae. ......................................................................... 73
Figure 3-1 A schematic of multiple displacement amplification (MDA) for precise amplification
of small targets such as single cells (Liang et al. 2014). ............................................................... 87
Figure 3-2 Micromanipulator setup: (A) inverted fluorescent microscope, (B) glass micropipette,
and C. micromanipulator. ............................................................................................................. 89
Figure 3-3 Single spore inoculation procedure: (A) each drop contains a single spore, (B) 5-day-
old seedlings inoculated with a single spore and grown in Hoagland's solution. ......................... 90
Figure 3-4 Micromanipulation of a single spore: (A) selection of a single isolated spore (arrow),
(B) collection of a single spore in a micropipette tip, and (C) placement of a single spore. ........ 90

xii
Figure 3-5 Clubroot symptoms on seedlings of Brassica rapa grown for 9 weeks after
inoculation: (A and B) inoculated with single spore, and (C) positive control inoculated with 100
μL of spore suspension. ................................................................................................................ 92
Figure 3-6 Gel electrophoresis of the DNA amplified from single spores of Plasmodiophora
brassicae. The amplified DNA from 10 spores and extracted DNA of 100 mg clubbed root were
added as positive controls. ............................................................................................................ 93
Figure 4-1 Bromegrass, perennial ryegrass, meadow bromegrass, and Shanghai pak choi, plants
grown for 8 weeks in soil inoculated with 5 x10⁵ resting spores of Plasmodiophora brassicae per
g soil. ........................................................................................................................................... 109
Figure 5-1 Colonization of roots of 6-day-old canola seedlings by Piriformospora indica. ...... 125
Figure 5-2 Colonization of roots of 7-day-old canola seedling by Piriformospora indica. A, no
colonization in non-treated control, and B, roots showing colonization following treatment with
Root Rescue, stained with aniline blue. ...................................................................................... 126
Figure 5-3 The effect of seed treatment of canola with mycorrhizal fungi on clubroot incidence
and severity when inoculated with Plasmodiophora brassicae at A, 5 x 10⁴ spores; B, 5 x 10⁵; C,
5 x 10⁶ resting spores mL-1 based on Tukey’s test at P > 0.05 (n = 4). Treatment: Control = non-
treated, Control UofA = seed from University of Alberta, Glomus = Glomus intraradices, P.
indica = Piriformospora indica, RR= Root Rescue. ................................................................... 128
Figure 5-4 Effect of canola seed treatment with mycorrhizal fungi on fresh and dry weight of
canola roots, based on Tukey’s test (P > 0.05). .......................................................................... 130
Figure 5-5 The effect of seed treatment of canola with mycorrhizal fungi on clubroot incidence
and severity. A, 5 x 10⁴; and B, 5 x 10⁵ resting spores mL-1 based on Tukey’ test (P>0.05). . 132
Figure 5-6 The interaction of seed treatment with mycorrhizal fungi and inoculation with rates of
resting spores mL-1 of P. brassicae on fresh and dry weight of canola shoots (A and B) and roots
(C and D) at with 5 x 10⁵ resting spores mL-1 (B and D) and 5 x10⁴ spores mL-1 (A and C) based
on Tukey’s test at P > 0.05). ....................................................................................................... 134
Figure 5-7 Assessment of Root Rescue application to canola seed planted on a naturally infested
muck soil at Muck Crops Research Station, Holland Marsh, ON in 2017. ................................ 135

1
CHAPTER ONE
1 Literature review
1.1 Brassica crops in Canada
The Brassicaceae family (formerly Cruciferae; common name, mustard) is a cosmopolitan
family composed of angiosperms in the order Brassicales. It is characterized by flowers with
four petals in a cross-shaped corolla (Franzke et al. 2011; Schulz 1957). The flowers have two
large and two short stamens and produce pod-like fruits known as siliques. The family contains
51 tribes, 340 genera, and around 3,840 species distributed throughout the world, except for
Antarctica (Chen et al. 2016; Al-Shehbaz et al. 2014; Chen et al. 2016; Franzke et al. 2011;
Warwick et al. 2006). The Brassicaceae family contains important oil crops, vegetables,
condiments, fodder crops, ornamentals, and even species used in phytoremediation and
biofumigation (Szczyglowska et al. 2011). Most of the crops in this family are members of the
genus Brassica (Al-Shehbaz et al. 2006; Nishio 2014). Arabidopsis thaliana (L.) Heynh, an
intensively studied model plant, is also a member of this family.
Six Brassica spp. are especially important as crops around the world (Figure 1-1). The
three diploid species are B. oleracea L. (n = 9), B. rapa L. (n = 10), and B. nigra L. (n = 8)
(Nagaharu 1935). The three tetraploid species (carrying the diploid genomes from two of these
three species) are B. napus L. (n = 19), B. carinata L. (n = 17), and B. juncea L. (n = 18)

2
(Nagaharu 1935). The relationship between diploid and tetraploid species is presented in the
triangle of U (Figure 1-1).
Figure 1-1. The ancestral relationship among Brassica spp. (Nagaharu 1935).
1.2 Brassica vegetables
Brassica vegetables, also known as cruciferous vegetables, provide high amounts of vitamin C,
soluble fiber, and carotenoids when consumed, and contain nutrients with antiviral, antibacterial,
and anticancer properties (Farnham and Kopsell 2009). Brassica vegetables are used as human
food and fodder throughout the world (Dixon 2007). They are morphologically diverse, with a
wide range of plant parts (roots, stems, leaves, seeds, flowers and sprouts) used in various
species (Dixon 2007). The most widely grown vegetable Brassica spp. in the world are B.
oleraceae, B. rapa, B. napus, and B. juncea. Brassicae oleraceae includes crops such as cabbage,
broccoli, cauliflower, kale, kohlrabi and Brussels sprouts; B. rapa (also known as Asian brassica
vegetables) includes pak choy, Chinese cabbage and turnip; B. napus includes oilseed swede
rape and rutabaga; and B. juncea includes mustard seed and Asian greens (Al-Shehbaz 2003).

3
1.3 Canola
Canola is a quality standard for oilseed rape (B. napus) developed and first achieved in the 1970s
by Canadian plant breeders Dr. Baldur R Stefansson from the University of Manitoba and Dr.
Keith Downey of Agriculture and Agri-Food Canada (Stefansson et al. 1961; Stefansson and
Downey 1995). Since then, canola has become a significant oilseed crop around the world and an
agricultural success in Canada. Canola oil must contain less than 2% erucic acid and the seed
must contain less than 30 μmol g-1 of glucosinolates in the air-dried oil-free meal. Erucic acid is
naturally present at high concentration in the seed of Brassicaceae species. Glucosinolates are
secondary plant metabolites that break down when seeds are crushed to release unstable
byproducts. Both erucic acid and glucosinolate byproducts may be toxic to humans and animals
(Tripathi and Mishra 2007).
The oil from canola seed is extracted for use in salad oils, margarine, and shortenings, and
the remaining meal is used primarily for livestock feed. In recent years, oil from B. carinata was
developed for use as an alternative to petroleum-based lubricants and biofuels (Hayward 2012).
Canola has recently become the most valuable crop in Canada. It is mainly cultivated in
Saskatchewan, Alberta and Manitoba, with small acreages in Ontario, Quebec, and British
Columbia (Statistics Canada 2015). In 2015, 17.2 million tons (MT) of canola seed was grown in
Canada, with 8.8 MT in Saskatchewan, 5.4 MT in Alberta, and 2.9 MT in Manitoba (Statistics
Canada 2015). The national average yield of canola was 38.0 bushels per acre in 2015 (Statistics
Canada 2015). Growers can seed canola in the spring or fall, depending on the climate of the

4
region. In Canada, canola is mainly seeded in spring, as the winters in the prairie provinces are
too harsh for survival of winter canola.
A study of the economic impact of the canola industry released in 2017 showed that
Canadian-grown canola contributed $26.7 billion/year to the Canadian economy. The crop also
contributes to 250,000 Canadian jobs and $11.2 billion in wages (Canola Council of Canada
2017).
The development of the canola plant was first described in a descriptive key (Berkenkamp
1973) and an illustrative key (Harper 1973) of the growth stages of B. rapa (syn. B. campestris),
which were later combined to describe the growth stages of B. rapa and B. napus (Harper and
Berkenkamp 1975). The revised key has five stages: pre-emergence (0), seeding (1), rosette (2),
bud (3), flower (4), and ripening (5). Seedlings develop into a rosette stage with cotyledons and
true leaves. Each canola plant generally produces 9–30 leaves depending on the cultivar and
weather conditions. The vegetative phase includes the stages from seed germination to stem
elongation. Buds form in racemes and flowers consist of four yellow petals, which fall after
pollination. Pods form on the lowest one-third of the branches on the main stem. Finally, when
all seeds in each pod turn black and hard, the plant dies and are ready for the harvest (Harper and
Berkenkamp 1975).

5
1.4 Clubroot
1.4.1 Causal agent and taxonomy
Plasmodiophora brassicae Woronin is a soil-borne, obligate, eukaryote pathogen that causes the
development of characteristic clubs in the roots of many species of the Brassicaceae family
(Schwelm et al. 2015; Buczacki and Ockendon 1979). The disease caused by P. brassicae is
known in English as clubroot, finger-and- toe, and hernia (Dixon 2009; Karling 1968).
Plasmodiophora brassicae was identified as the cause of the disease by Mikhail S. Woronin
(Woronin 1878). This pathogen belongs to the domain Eukaryota, kingdom protozoa,
supergroup Rhizaria, phylum Cercozoa, subphylum Endomyxa (Schwelm et al. 2015; Burki et al.
2010; Cavalier-Smith 1998), and order Plasmodiophorales (Bulman et al. 2011; Cavalier-Smith
1981; Cavalier-Smith and Chao 1997; Karling 1968). Plasmodiophorales have an uncommon
form of a nuclear division called cruciform division. They are also characterized by two
whiplash heterocont flagellae per zoospore, multinucleate amoeba-like structures called
plasmodia, long-lived resting spores, and obligate intracellular parasitism (Braselton 1995;
Karling 1968). The family Plasmodiophoraceae has nine genera and 35 species (Bass et al. 2005;
Karling 1968).
Plasmodiophora brassicae was initially classified as both a fungus and a protist
(Castlebury and Domier 1998). The evolutionary position of P. brassicae and the linkage among
the Plasmophorids has changed over time as techniques for identification have improved. The
phylogenic analysis of the ribosomal small subunit gene showed that P. brassicae is more related
to the plasmodiophorids and cercozoas than the fungi, mycetozoa, and rhizopoda (Castlebury and

6
Domier 1998). Actin and ubiquitin protein sequences also support a linkage between the orders
cercozoan and plasmodiophorid (Schwelm et al. 2015; Archibald and Keeling 2004; Bass et al.
2005). Obtaining additional whole-genome sequences of P. brassicae might contribute to more
insight into the ancestry of P. brassicae. DNA sequences, genes and gene orders, and the
genome structures can be compared between P. brassicae and other organisms to reveal the
underlying evolutionary relationships.
1.4.2 Symptoms
Plasmodiophora brassicae causes both root hair (primary infection) and cortical infection
(secondary infection) and root swelling in almost all species in the Brassicaceae family (Dixon
2009). Secondary infection by P. brassicae results in hyperplasia and hypertrophy in the root
cortical cells and disruption of the vascular tissues, which interferes with the uptake of nutrients
and water (Karling 1968).
Clubroot reduces plant growth and yield (Dixon 2009). Disruption of the vascular tissue in
the root results in the above-ground symptoms of clubroot including chlorosis, wilting, early
flowering, and premature ripening (Diederichsen et al. 2009; Wallenhammar 1996), which may
look like physiological disorders such as drought stress and lack of nutrients (Howard et al.
2010). Severe symptoms may cause plant death (Karling 1968). Clubroot decreases the quality of
seed and oil in canola (Dixon 2009). Clubroot may have additional symptoms, depending on the
species infected. For example, small swellings and necrotic spots form on roots of radish,
whereas large clubs form on both the main root and lateral roots of B. oleraceae. In other
species, such as tall tumble mustard (Sisymbrium altissimum L.), clubs form only on the main

7
root. However, in hedge mustard (Sisymbrium officinale L.) and wormseed mustard (Erysimum
cheiranthoides L.), clubs usually develop on lateral roots. Sometimes clubs form only on the
lower part of the root, while the upper part is unchanged, as in garden cress (Lepidium sativum
L.) (Karling 1968).
1.4.3 Life cycle
The generalized life cycle of P. brassicae involves root hair and cortical infection, (Tommerup
and Ingram 1971). Root hair infection is not limited to host species, but cortical infection only
rarely occurs except in hosts of P. brassicae (Ludwig-Müller and Schuller 2008).
The details of infection and symptom development are generally well known. Resting
spores in soil produce the primary inoculum. The haploid spores germinate, often in response to
plant root exudates, and liberate a single small (2.8–5.9 μm), spindle-shaped or pyriform, haploid
primary zoospore. Each primary zoospore has two whiplash flagella. The zoospore swims
towards and attaches onto a root hair, with attachment occurring opposite the point of flagellar
insertion (Williams et al. 1971; Ayers 1944). When the concentration of resting spores in the soil
is > 103 resting spores/g soil, root hair infection generally occurs consistently and at a high
frequency (Naiki et al. 1984).
Each attached zoospore produces a cyst with a tubular structure (the rohr) holding a
projectile-like structure (a stachel, used to penetrate the wall of the root hair) and an adhesorium
that holds the spore onto the root hair (Ludwig-Müller and Schuller 2008; Braselton 1995). After
the root hair wall is breached, the zoospore injects its protoplast into the root hair and forms an
amoeba-like structure called a primary plasmodium. The plasmodium grows quickly, and several

8
nuclear divisions occur before it differentiates into zoosporangia and secondary zoospores
(Ludwig-Müller and Schuller 2008; Williams et al. 1971). After only a few days, 4 to 16
secondary zoospores are released back into the soil (Ingram and Tommerup 1972). The optimum
temperature for root hair infection and development i 25°C and it takes 6 days from inoculation
to the release of secondary zoospores (Sharma et al. 2011).
Secondary zoospores released from root hairs can reinfect root hairs or attack the epidermal cells
and root cortex (Naiki et al. 1984). As a result, the pathogen can multiply rapidly in root hairs to
increase cortical infection (Ludwig-Müller and Schuller 2008).
The second phase of the life cycle is cortical infection and development. Primary
zoospores likely cannot infect the cortical cells (Dobson and Gabrielson 1983). When the
secondary zoospores penetrate the root cortex, myxamoebae are formed, which differentiate into
binucleate secondary plasmodia (Ingram and Tommerup 1972). The secondary plasmodia grow
rapidly, reorganize the host metabolism, and disrupt tissue development and organization, which
interferes with the absorption of water and nutrients (Ingram and Tommerup 1972). The mitotic
division of nuclei happen in the binucleate secondary plasmodium, producing multinucleate
secondary plasmodia (Ludwig-Muller 2009).
Observation of suspension cell cultures indicated that the secondary zoospores develop into
amoeboid cells called myxamoeba upon penetration, which move from the epidermal cells to the
vascular stele by cell wall breakage via enzyme-mediated cell wall degradation (Asano and
Kageyama 2006; Mithen and Magrath 1992). Myxamoebae quickly develop into secondary
plasmodia, which may spread in the cortical tissue by cytoplasmic streaming concurrent with

9
host-cell division. The movement of plasmodia by cytoplasmic streaming increases the number
of infected cells during cell division (Kageyama and Asano 2009). The pathogen may also move
through plasmodesmata, since cell wall thickening related to plasmodesmata has been observed
in resistant lines of B. oleracea (Donald et al. 2008). As symptoms develop, the mature
secondary plasmodia initiates spore production (Schuller and Ludwig-Muller 2016; Ingram and
Tommerup 1972). Cleavage of the cytoplasm of the mature plasmodium and cell wall formation
around each nucleus results in the formation of resting spores (Schuller and Ludwig-Muller
2016; Ingram and Tommerup 1972). The optimal temperature for root cortex infection is 25°C
and the resting spores were formed 10 DAI under optimal temperature (Sharma et al. 2011).
However, it is not clear at which stage nuclear fusion to produce a dikaryote and karyogamy to
produce haploid resting spores occurs (Ludwig-Müller and Schuller 2008). Meiotic division may
occur in the diploid plasmodia, reproducing the haploid plasmodia before producing the resting
spores (Schwelm et al. 2015; Buczacki 1983). The resting spores are attached to each other by a
‘gluey’ material that later disappears, and the resting spores are released into the soil when the
infected root rots and breaks down (Tommerup and Ingram 1971).
The timing of karyogamy is not known. It is not clear if the secondary zoospores fuse
before infection (Schwelm et al. 2015; McDonald et al. 2014; Ludwig-Müller and Schuller 2008;
Tommerup and Ingram 1971). The fusion of secondary zoospores was proposed by Tommerup
and Ingram, but they did not observe this phenomenon. One study claimed that binucleate
zoospores were formed in vitro by the fusion of two separate zoospores (Kageyama and Asano
2009), and not by nuclear division (Ingram and Tommerup 1972; Tommerup and Ingram 1971).
However, the fusion of genetically different zoospores of P. brassicae cannot be necessary for

10
infection, since inoculation with a single resting spore can result in infection and club formation
(Xue et al. 2008; Narisawa et al. 1996).
Secondary zoospores are not visually different from primary zoospores (Kageyama and
Asano 2009), but the two types of zoospores may have different roles. Feng (Feng et al. 2013b)
suggested that the primary zoospores are able to directly infect the cortical cells (Feng et al.
2013b). However, secondary zoospores can infect both root hairs and the root cortex. Also,
primary infection induced both a resistance response in an incompatible interaction and a
susceptible response in a compatible interaction. This indicated that initial infection of root hairs
is important in the initiation of a defense (McDonald et al. 2014).
1.4.4 Host range and pathotype
Many of the 330 genera and 3700 species of Brassicaceae are hosts of P. brassicae (Hwang,
Strelkov, et al. 2012). However, most studies have focused on three genera: Brassica, Raphanus,
and Arabidopsis (Dixon 2009). The host range of P. brassicae include all types of B. oleracea
(broccoli, Brussels sprouts, cabbage, cauliflower, culinary and fodder kale, kohlrabi), B. rapa
(var. chinensis or Chinese cabbage, var. pekinensis, sarson turnip, turnip rape), and B. napus,
(canola, fodder rape, mustard, oilseed rape, swede turnip and rutabaga). In addition, non-crop
species in the Brassicaceae are also hosts, including weedy species such as shepherd's purse
(Capsella bursa-pastoris L. Medik.), bitter cress (Cardamine flexuosa), and stinkweed (Thlaspi
arvense L.), decorative ornamentals including stocks (Matthiola spp.),wallflower (Cheiranthus
cheiri), and Arabidopsis (Ahmed, et al. 2012; Dixon 2009; Tanaka et al. 2006; Buczacki and
Ockendon 1979).

11
The identification and characterization of the predominant pathotype(s) (a subdivision of a
pathogen species characterized by its pattern of virulence or avirulence on a defined group of
differential hosts. Cultivars of P. brassicae in a region is necessary for breeding and resistance
management. Various sets of differential hosts have been used to identify the pathotypes of
clubroot throughout the world, such as the Williams’ differential set (Williams 1966), the
European Clubroot Differential set (Buczacki et al. 1975), the Somé set (Some et al. 1996), the
Kuginuki set (Kuginuki et al. 1999), and Canadian Clubroot Differential (CCD) set (Strelkov et
al. 2018).
The first differential set developed by Williams (1966) was, based on the resistance
reaction of two cabbage cultivars and two rutabaga cultivars to P. brassicae collections. The
European Clubroot Differential (ECD) set used the reaction of five cultivars each of B. rapa,
B. napus, and B. oleracea (Buczacki et al. 1975) to identify clubroot pathotypes in Europe. The
Somé differential set characterized pathotypes based on cultivars of B. napus (Some et al. 1996)
with a focus on collections in France. The Kuginuki set characterized pathotype using clubroot-
resistant (CR) F1 hybrid cultivars and lines of B. rapa (Kuginuki et al. 1999), primarily for use in
Japan. The Williams pathotype classification system was initially the main differential system
used in Canada. Recently, the Canadian Clubroot Differential (CCD) set was developed, which
included the clubroot reaction of 13 hosts (Strelkov et al. 2018). The CCD includes the
differential lines of the Williams’ and Somé sets, plus some hosts of the European Clubroot
Differential Set, and four B. napus cultivars (Brutor, Mendel, Westar and 45H29) (Strelkov et al.
2018). The CCD can be used to characterize the virulent pathotypes that have recently come to
the fore in Canada (Strelkov et al. 2018).

12
Some pathotypes are widespread in the world. In the United States, for example, Williams’
pathotypes 6 (Hawaii, Wisconsin, and Ohio ), and 7 (California and Wisconsin) have been
widespread in the USA (Williams 1966), but there are no recent studies of their distribution to
confirm that this is still the case. Pathotype 2 was predominant in Finland (Linnasalmi and
Toivianen 1991) and pathotype 4 in Japan (Tanaka et al. 1998). In Korea, pathotype 8 was the
most prevalent (Cho et al. 2003). In Australia, ECD codes 16/3/12, 16/3/31, and 16/2/31 were the
most prevalent (Donald, Porter, et al. 2006). The pathotypes identified from each location can
vary depending on the evaluation system and the threshold used to characterize the response of
the differential lines. In the Czech Republic and Poland, seven pathotypes were identified based
on Williams’ set, five with the set of Somé , and 18 with the ECD, based on an index of disease
of 25%. When the threshold was changed to 50 %, nine pathotypes were identified with the
Williams’s set, four with Somé ., and 15 with the ECD (Ricarova et al. 2016). These inconsistent
results demonstrate that a more efficient classification system is needed to distinguish the
pathotypes of P. brassicae.
Molecular methods that can identify pathotypes would improve studies of the pathotypes
of P. brassicae populations worldwide. A recent study showed that Dot blot hybridization and
PCR could differentiate pathotype 5 (Williams’ system) from pathotypes 3 and 8 in Canada
using primers specific to the Cr811 gene, so Cr811 might serve as a molecular marker for
pathotype 5 (Zhang et al. 2015). A few molecular markers have been recently identified to
distinguish the predominant pathotypes 11, 9, and 4 in China (Zheng et al. 2018) and new
pathotype 5-like strains in canola in Canada (Zhou et al. 2018), but such markers are not yet in
widespread use.

13
A summary of P. brassicae pathotypes in Canada, based on the Williams’ differential set,
is shown in (Table 1-1). Pathotypes 2, 3, 5, and 6 were initially predominant in Canada (Strelkov
et al. 2007; Strelkov, Tewari, et al. 2006). Pathotype 3 was predominant on canola in Alberta
(Rolfe et al. 2016). Pathotype 6 was predominant on vegetables in Ontario and British Colombia
(Strelkov, Tewari, et al. 2006; Reyes et al. 1974; Williams 1966), while pathotype 2 was
common in Quebec, Prince Edward Island, Nova Scotia, and New Brunswick(Ayers 1972).
Since 2013, several new pathotypes of P. brassicae have emerged on canola in Alberta, many of
which have not been characterized in detail (Strelkov et al. 2016). The new strains of P.
brassicae were initially characterized as pathotypes 5 and 3 based on William’s differentials,
with the proviso that they were virulent against all commercial clubroot-resistant canola cultivars
in Canada (Strelkov et al. 2016). Therefore, the Canadian clubroot differential set (CCD) was
developed to characterize the new virulent pathotypes in Canada (Strelkov et al. 2018).

14
Table 1-1 Published pathotypes of Plasmodiophora brassicae in Canada
Williams’
designation
Location Reference
1 Newfoundland (NL), Nova
Scotia (NS), Prince Edward
Island (PEI), Quebec (QC),
McDonald et al., 2020; Hildebrand and
Delbridge 1995; Reyes et al. 1974; Ayers
1972
2 NS, PEI, New Brunswick NB),
QC, Ontario (ON) Alberta (AB),
British Columbia (BC)
Strelkov, Tewari, et al. 2006; Hildebrand
and Delbridge 1995; Reyes et al. 1974;
Ayers 1972; Williams 1966
3 NS, PEI, Saskatchewan (SK),
AB
McDonald et al., 2020; Strelkov et al.
2006; Hildebrand and Delbridge 1995;
Ayers 1972
4 PEI Ayers 1972
5 PEI, QC, ON, Manitoba (MB),
AB
McDonald et al., 2020; Saude et al. 2012;
Cao et al. 2009; Strelkov et al. 2006; Ayers
1972; Williams 1966
6 QC, ON, BC Ayers 1972; Williams 1966
8 AB Xue et al. 2008
5X QC, AB McDonald et al., 2020vv; Strelkov et al.
2016
2X ON McDonald et al., 2020
3X ON, AB McDonald et al., 2020; Strelkov et al. 2016
9 MB McDonald et al., 2020
1.4.5 Worldwide distribution
Clubroot is found wherever brassica crops are cultivated in the world and has been reported in
more than 80 countries (Dixon 2009). However, the center of origin of the pathogen is not
known (Buczacki 1985). There are numerous European reports and illustrations of clubroot in
the 16th and 17th centuries (Dixon 2009). Clubroot incidence increased in the 18th century due to
increased production of root crops such as turnip (Dixon 2009). In the 20th century, clubroot was
first reported in North America and Australia (Dixon 2009). It appears likely that clubroot was
brought to North America from Europe in contaminated animal fodder in the 1920s (Howard et
al. 2010).

15
The importance of clubroot and the frequency of infestation in the world were assessed in
the 1970s on six million hectares of brassicas and related crops (Crête 1981). Total mean
infection of 11% was reported in a survey in B. oleracea in Australia, Canada, Czechoslovakia,
Finland, Germany, Ireland, Netherlands, Norway, Poland, Scotland, and Wales, in B. rapa in
Germany, New Zealand, and the U.S.A. and in B. napus in Finland, New Zealand, Scotland, and
Wales (Crête 1981). Clubroot is also a serious problem on oilseed rape and mustard in India and
on brassica vegetables in Bangladesh, Nepal, Indonesia, and China (Dixon 2009; Timila et al.
2008). Clubroot is also present in several countries in Asia, Africa, Europe, America, Oceania,
and central and south America (Botero et al. 2019; Dixon 2009). Presently, clubroot is
widespread in Canada, Australia, Bulgaria, Denmark, Germany, Ireland, Sweden, Switzerland,
United Kingdom, India (Dixon 2009) and South America. Losses to clubroot in oilseed rape in
Australia have been estimated at around 50% (1.6 t ha−1) (Donald and Porter 2003). A survey of
70 fields of canola in Alberta reported yield loss of about 30% (Tewari et al. 2005), but yield
losses of up to 100% have been reported in Alberta (Howard et al. 2010).
In Canada, clubroot was initially reported on brassica vegetables in British Columbia,
Alberta, Quebec, and the Maritimes in the 1920s (Tewari et al. 2005). There are anecdotal
reports of clubroot on vegetables in the Prairie provinces (Alberta, Manitoba, and Saskatchewan)
(Howard et al. 2010), but clubroot was not detected on canola in Alberta until 2003 (Tewari et al.
2005). The pathogen is spreading quickly on the Canadian Prairies, where canola is a multi-
billion dollar crop (Gossen et al. 2015). For example, 2,443 fields in Alberta were confirmed
infested by clubroot by 2016. The source of the initial infection on canola has never been
determined. Following its initial identification in Alberta in 2003, clubroot on canola was

16
identified in Manitoba in 2009 (Strelkov and Hwang 2014), in Saskatchewan in 2010 (Dokken-
Bouchard et al. 2010), and in Ontario in 2016 (Al-Daoud et al. 2018).
In the USA, clubroot was first reported around New York in 1853 (Watson and Baker
1969) and was identified on canola for the first time in North Dakota in 2013 (Chittem et al.
2014). Recent surveys demonstrated a 5-fold increase in clubroot infested canola fields in North
Dakota from 2017 to 2018 (Chapara et al. 2019). In contrast to the rapid spread of clubroot on
the Prairies and in North Dakota, clubroot is spreading much more slowly in central Canada,
likely due to smaller amounts of inoculum and small, dispersed acreages of susceptible hosts
(Gossen et al. 2015).
China is also a major producer of brassica crops. Clubroot was first reported in Taiwan in
1910 (Huang et al. 1955) and in Fujian province in 1947 (Chai et al. 2014). An outbreak of
clubroot was reported in several southern provinces of China, including Jiangsu and Yunnan in
1962 (Chai et al. 2014). By the 1990s, clubroot was reported in southern, northern, and central
regions (Chai et al. 2014). Recently, clubroot was detected on canola in Anhui, Sichuan, and
Hubei provinces (Chai et al. 2014). Clubroot was initially reported in both Canada and China in
the early 20th century, in which the primary host was brassica vegetables. In both countries,
clubroot has spread to canola in recent years.
1.4.6 Transmission pattern
Understanding the main methods by which P. brassicae is transmitted from field to field is
essential for effective prevention. Clubroot can be transmitted by the movement of infested soil.
In clubroot-infested fields in Alberta, clubroot incidence was generally highest near the field

17
entrances and declined quickly as one moved into the field (Cao et al. 2009). Farming equipment
was shown to often carry large volumes (e.g.,150 kg) of infested soil between fields and deposit
it in a new field, often near the field entrance (Cao et al. 2009; Hwang et al. 2014). Therefore,
sanitation of agricultural machinery could be used to reduce the movement of infested soil.
Resting spores can also move from field to field via other mechanisms. One important
mechanism of both short- and long-distances movement is wind-borne dust (Gossen et al. 2014,
2015; Rennie et al. 2015). Flooding can also move infested soil (Gossen et al. 2015; Chai et al.
2014). In 1954, a massive flood in the Bradford Marsh, Ontario, as the result of Hurricane Hazel,
resulted in the spread of resting spores up to 8 km from a single infested field (Creelman 1958).
Surface contamination of seed by P. brassicae is also possible (Rennie et al. 2011). Levels of P.
brassicae spores on canola, pea, and wheat seed produced in infested fields ranged from non-
detectable (<1.0 x10³) to 3.4 x 10⁴ resting spores per 10 g seeds (Rennie et al. 2011). However,
this level of infestation was not sufficient to cause consistent disease symptoms under optimum
conditions in a growth room. Seed cleaning or seed treatment with fungicides further reduced the
risk of seed to seedling transmission (Rennie et al. 2011).
Soil temperature, soil pH, soil type, and climate can also affect pathogen spread and the
risk of disease development. For example, the interaction of pH, and temperature influences the
development of clubroot (Gossen et al. 2013). The potential distribution of clubroot on the
Canadian Prairies was examined using the CLIMEX V2.0 prediction model. The program
compared climate (temperature and moisture) and soil type in areas of the world where
conditions favor clubroot development with conditions on the Canadian Prairies, to identify areas
at risk of clubroot epidemics (Turkington et al. 2004). The model indicated that the probability of

18
clubroot occurrence was lower in regions with a dry climate, high soil pH and high calcium
levels in the soil. Therefore, in Saskatchewan, conditions were not favorable for pathogen
establishment, but the model indicated that conditions might be more conducive for pathogen
establishment in Manitoba. However, moderate clubroot symptoms can develop under conditions
of neutral or marginally alkaline soil with favorable soil temperature and moisture (Gossen et al.
2013), and clubroot has already spread far beyond the boundaries of the initial estimates.
1.4.7 Detection and quantification
Plasmodiophora brassicae is an obligate pathogen and cannot be grown in pure culture. As a
result, detection of this pathogen has often relied on visual assessment of root symptoms or
microscopic examination of root hair infection (Toxopeus and Janssen 1975). Serological
methods can also be used for clubroot detection (Faggian and Strelkov 2009). However,
serologic assays need to be based on monoclonal antibodies to provide adequate specificity,
which limits its application (Faggian and Strelkov 2009).
New technologies have improved pathogen detection and quantification. Molecular
techniques such as polymerase chain reaction (PCR) are used to detect a broad range of plant
pathogens and reverse-transcription PCR (RT-PCR) has been used for pathogen quantification
due to its high sensitivity (Lopez et al. 2003). Quantitative PCR techniques (qPCR) are a more
precise tool for quantification of clubroot inoculum (Wallenhammar et al. 2012). However,
quantification can be inhibited by numerous factors in soil. Adding a competitive internal
positive control (CIPC) to the TaqMan qPCR assay improved quantification by assessing the
effects of inhibition (Deora et al. 2015). Similarly, pretreatment with propidium monoazide

19
(PMA) allowed differentiation of viable and non-viable spores of P. brassicae with qPCR
(Gossen et al. 2019; Al-Daoud et al. 2017).
1.5 Genomics
Genetic studies of plasmodiophorids are still limited, in large part because these pathogens live
intracellularly within their host throughout their life cycle (Siemens et al. 2009). Resting spores
represent the only source of pure pathogen available. However, the genome of P. brassicae
invariably becomes contaminated with genes from plants and soil microbes when resting spores
are isolated from soil or plant tissue, often resulting in poor yields of nucleic acids (Siemens et
al. 2009).
Initially, chromosomes from 2.2 MB to 680 KB in length were characterized in
P. brassicae (Graf et al. 2001, 2004; Bryan et al. 1996). The total genome was predicted to be
around 20 Mb based on the chromosome number and size using pulse-field gel electrophoresis
(PFGE) studies. However, analysis of the single-spore isolate e3 estimated the total genome size
of P. brassicae to be 25.5 Mb (Schwelm et al. 2015). In another study, the genome sequences of
pathotypes 3 and 6 had a total size of 24.2 Mb (Rolfe et al. 2016).
Analysis of the genome of P. brassicae revealed the absence of genes required for
biosynthesis of thiamine and some amino acids, as well as genes necessary for the uptake and
assimilation of inorganic nitrogen and sulphate. These findings, together with the discovery of
several transport proteins, explain the dependency of P. brassicae on the host for the acquisition
of important nutrients and vitamins (Rolfe et al. 2016). The genome sequence also provided

20
more information about the pathogen’s life cycle and its interaction with hosts (Schwelm et al.
2015), such as the ancestry of chitin synthase. Genes with a potential role in the regulation of the
plant hormones cytokinin, auxin, and jasmonic acid have also been identified (Rolfe et al. 2016;
Schwelm et al. 2015) and the structure of several genes has been investigated (Schwelm et al.
2015; Sundelin et al. 2011; Bulman et al. 2007; Ando et al. 2006; Brodmann et al. 2002). The
genome of P. brassicae is intron-rich and gene-splicing in P. brassicae is similar to other
eukaryotes (Bulman et al. 2007). No TATA box-containing promoters, which specifies where
transcription begins, have been found in P. brassicae. Therefore, transcription in P. brassicae
probably starts from initiator elements (Bulman et al. 2007). In addition, the cDNA structure of
many P. brassicae genes has been identified (Luo et al. 2013; Feng et al. 2013a; Feng, Hwang, et
al. 2012; Sundelin et al. 2011; Bulman et al. 2006; Ando et al. 2006; Graf et al. 2004; Brodmann
et al. 2002; Ito et al. 1998).
Despite these advances, study of the genome of P. brassicae is still in its infancy, so the
isolation of single spores and analysis of the entire genome of selected pathotypes could provide
more insight into P. brassicae genomics (Jones et al. 1982; Fahling et al. 2003; Siemens et al.
2009). In addition, gene expression analysis such as transcriptome analysis and genetic mapping,
could provide insights into the molecular basis of host-P. brassicae interactions and the
mechanisms of resistance (S. W. Chen et al. 2016; Chu et al. 2014; Luo et al. 2013; Siemens et
al. 2006) .

21
1.6 Tissue culture
Tissue culture techniques provide a homogenous system to study plant-pathogen interactions
with reduced risk of contamination by soil microbial and plant DNA, compared to growth room
studies (Bulman et al. 2011). Surface sterilization of clubbed roots reduces but does not eliminate
contamination by soil microbes (Bulman et al. 2006). Therefore, plant tissue culture could be
used to produce contamination-free tissues for studies of the molecular basis of pathogen growth
and development (Vasil 1991).
Although P. brassicae is a biotroph and cannot be cultured in vitro, dual cultures of
P. brassicae and brassica crops have produced promising results. There are three dual culture
methods available for clubroot studies: callus culture, hairy root culture, and suspension cells.
Callus is a growing mass of undifferentiated plant cells derived from plant tissues. Several
studies have used cultured P. brassicae on callus culture of brassica crops to non-destructively
observe the development of P. brassicae within host tissues with minimal contamination by soil
microbes (Ingram 1969; Naiki et al. 1984; Dekhuijzen 1980; Buczacki 1980; Tommerup and
Ingram 1971). Dual callus culture has been used to provide pure samples of DNA for genomic
analysis of other plasmophoroids (Bulman et al. 2011). Although callus culture improved
observation of pathogen growth, it might not represent typical plasmodiophorid development
(Bulman et al. 2011). Moreover, subculturing of dual cultures appeared to reduce pathogenicity
(Asano and Kageyama 2006). However the pathogenicity of Spongospora subterranean did not
change after a year of subculturing on potato callus (Bulman et al. 2011). More studies are
needed to investigate the changes in pathogenicity of P. brassicae after repeated callus culture.

22
Dual culture of hairy roots is another tissue-culture technique that has been developed to
study P. brassicae-host interaction. Initially, a dual culture of P. brassicae and B. napus
containing root-inducing transferred DNA of Agrobacterium rhizogenes was attempted, but no
clubbed roots developed. The formation and development of clubbed roots in hairy root culture
was first reported in B. napus at 5 weeks after inoculation. Club formation and observation of
hairy roots continued to improve (Asano et al. 1999; Mugnier 1987) and in vitro subculture of
hairy roots infected by P. brassicae was reported for the first time in 2006. Hairy roots were
subcultured in vitro two or three times using three single-spore isolates, pathogenicity in
continuous subcultures was retained, and clubs formed 10 weeks after inoculation.
Hairy root culture has some advantages over callus culture. For example, induction of
P. brassicae-infected hairy roots is easier than the induction of P. brassicae-infected callus
(Buczacki 1980). Also, more resting spores are produced from infected roots than in infected
callus (Ikegami 1992). Similarly, in dual culture of P. brassicae and suspension cells, growth and
movement of living secondary plasmodia can be observed (Asano and Kageyama 2006). The
suspension cells may also help to investigate the plant hormone requirements of infected and
healthy host cells (Asano and Kageyama 2006).
All of the dual-culture techniques permit the study of P. brassicae under controlled
conditions, such as temperature, humidity, pH, and nutrients. Dual cultures can also be used to
study pathogenicity and to select plant genotypes that are resistant to a specific isolate (Chorabik
2013). Additionally, the entire genome of A. thaliana (and more recently, several other crop
hosts) has been sequenced, and so can be removed from sequences of dual cultures with A.
thaliana (Bulman et al. 2006, 2007; Kaul et al. 2000).

23
Dual cultures also have disadvantages. Most importantly, they all represent an in vitro
approach, which might differ from in vivo. Moreover, the long time required for culturing might
increase genetic variation in the population. Also, dual culture techniques for P. brassicae are
even more time-consuming than growth room studies. Clubs form after 5 weeks in callus culture
and after 10 weeks in hairy root culture, compared with 6 weeks in the growth room. Despite
these disadvantages, the similarity of results across several studies indicates that the use of in
vitro cultures can be an efficient method for analyses of obligate pathogens such as P. brassicae.
1.6.1 Recombination in P. brassicae
Questions about the occurrence and the frequency of sexual recombination in P. brassicae
genome have not yet been answered definitively (Siemens et al. 2009). Transmission electron
microscopy of P. brassicae has shown that nuclei in plasmodia contain the synaptonemal
complex, which is a protein structure that is formed during meiosis and is correlated with
effective interhomolog crossover formation (Braselton 1982). The synaptonemal complex of P.
brassicae has been used as evidence for crossing-over, resulting in progeny with different
combinations of genes (Siemens et al. 2009; Braselton 1982). However, the attempt to cross two
different single-spore isolates of P. brassicae, ‘e3’ and ‘e6’, did not result in a new sexual
recombinant (Fahling et al. 2004). Nevertheless, a chromosome rearrangement was observed in
one of the new single-spore isolates, indicating that P. brassicae is able to rearrange
chromosomes without sexual recombination (Fahling et al. 2004). Use of molecular markers
should improve studies of the recombination in P. brassicae. New molecular markers can help to
study the recombination of single spore isolates in more detail.

24
1.6.2 Biochemical function of P. brassicae genes
The biochemical functions of P. brassicae genes are only beginning to be investigated. The very
first molecular markers for P. brassicae were identified in infected plants of Arabidopsis.
PbActin and PbGST were expressed at each stage of P. brassicae development and so can be
used as internal controls (Siemens et al. 2009). The expression of some genes has been
monitored at distinct stages of pathogenesis, such as PbBrip9 and PbCC249, PbSTKL1 (possible
kinase function) (Ando et al. 2006), Y10 (Ito et al. 1999), PbTPS (trehalose-6-phosphate
synthase gene) (Brodmann et al. 2002), PbPP2A (protein phosphatase 2A), PbHMG (DNA
binding protein), PbsHSP1, PbGST1, PbSUR2, PbSUNK1, PbSUNK2, and PbSUNK4 (all of
unidentified function) (Sundelin et al. 2011; Bulman et al. 2006). Further research is needed to
gain more insight into the functions and roles of important genes in the development of P.
brassicae.
1.7 Effects of environmental factors on clubroot development
Environmental factors can affect both host susceptibility and the development and spread of
plant pathogens. Since P. brassicae is a soil-borne pathogen, soil conditions such as temperature,
pH, and mineral composition, as well as spore load and light intensity, can influence clubroot
severity (Murakami et al. 2002; Colhoun 1953). However, a high inoculum of P. brassicae in the
soil can compensate for unfavorable conditions (Colhoun 1953).

25
1.7.1 Temperature
Temperature is an important factor in the development of P. brassicae throughout its life cycle,
and soil temperature is highly correlated with clubroot severity (McDonald and Westerveld
2008). In early studies, clubroot developed in a greenhouse at soil temperatures from 15 to 30
°C, but did not develop below 12 °C or above 35 °C (Monteith 1924). Subsequent studies
showed that symptom development was strongly inhibited at all stages of the life cycle of
P. brassicae at temperatures lower than 17 °C (Gossen et al. 2014). A temperature of 24 °C with
a soil pH 6.0–6.7 is optimum for germination of resting spores (Dixon 2009). Similarly, the
activity of Pro1 gene (serine protease), which stimulates the germination of the resting spores,
was the highest at 25 °C and pH 6.0–6.4 (Feng et al. 2010). The maximum cumulative root hair
infection occurred at 26 °C (Sharma et al. 2011). Soil temperatures from 18–25 °C are the most
favorable for P. brassicae development, especially in the first 2–3 weeks of plant growth
(Gossen et al. 2012; Sharma et al. 2011; McDonald and Westerveld 2008). In addition, the effect
of soil temperature on clubroot severity in cabbage, Chinese cabbage, mustard, and radish was
studied under controlled conditions (Thuma et al. 1983). In this study, clubroot severity showed
a bell-shaped curve distribution for all crops. Symptom development occurred at 14 °C and was
maximum at 21–22 °C. At 28 oC, all crops were under stress and severity was reduced. Air
temperature is highly correlated with soil temperature but is easier to measure and data are more
readily available than soil temperature. However, as might be expected, it is less strongly
correlated with severity than soil temperature (McDonald and Westerveld 2008; Thuma et al.
1983).

26
Selection of seeding date to avoid the optimal soil temperature for clubroot development
should be considered as a management strategy in short-season brassica crops (Gossen et al.
2012). Similarly, seeding canola as early as possible can provide more time for plant
establishment and consequently reduce clubroot severity slightly (Hwang, Ahmed, Zhou, et al.
2011; Hwang, Ahmed, Strelkov, et al. 2011).
1.7.2 Soil pH
Soil pH is an important factor in clubroot development. Soil pH higher than 7.0 or 7.2 is
correlated with reduced clubroot incidence and severity (Donald and Porter 2004; Webster and
Dixon 1991) . However, with sufficient soil moisture and ideal temperatures, clubroot symptoms
developed at a pH of 8 (Gossen et al. 2013, 2014). pH of acidic fields can be increased by liming
the soil, which might create unfavorable conditions for resting spore germination and suppress
clubroot (Donald et al. 2006).
1.7.3 Soil moisture
There is a positive correlation between total rainfall and clubroot level (Gossen et al. 2012). The
availability of free water in the soil during primary and secondary infection affects spore
germination and infection by P. brassicae (Gossen et al. 2014), because it is essential for the
movement of the zoospores (Karling 1968; Colhoun 1953). Soil with a water content of 60% to
100% of maximum water holding capacity is optimal for clubroot development and 70% is the
most favorable for the germination of the resting spores as well as root hair infection (Colhoun
1953). A heavy rainfall after brief periods of high moisture provides optimal conditions for
infection (Thuma et al. 1983). In contrast, germination of resting spores is reduced at soil

27
moisture less than 30% (Macfarlane 1952) and high levels of soil moisture at the seedling stage
increased root hair infection (Thuma et al. 1983). Cortical infection might need an even higher
level of soil moisture to develop relative to root hair infection (Dobson and Gabrielson 1983).
The interaction of soil moisture and temperature is an important factor in clubroot severity
(Gossen et al. 2016, 2017; Donald, Porter, et al. 2006).
1.7.4 Soil nutrients
Mineral content in soil and host nutrition can influence clubroot severity. Calcium alters levels of
phenylalanine ammonia-lyase (PAL) enzyme activity in response to P. brassicae, which is
required for cell defense response against clubroot (Takahashi et al. 2001). Calcium is also
essential for programmed cell death, which has been reported in some resistant plants (Takahashi
et al. 2006) but not in canola (Deora et al. 2012). In addition, calcium may reduce resting spore
viability and germination, and so affect root hair infection (Webster and Dixon 1991). Increased
calcium concentration also slows the development of zoosporangia in root hairs (Webster and
Dixon 1991). Calcium concentration in the soil can be increased by liming the soil, which
increase both the calcium ions and soil alkalinity (Donald, Cross, et al. 2006).
Nitrogen, like calcium and boron, prevents the transformation of primary plasmodia into
sporangia (Gossen et al. 2014; Webster and Dixon 1991). Nitrite nitrogen might inhibit the
activity of host RNA polymerase and consequently the transcription of genes essential for
pathogenesis (Webster 1986). Another possible role for nitrite nitrogen is to reduce the
production of NADPH (nicotinamide adenine dinucleotide phosphate), which is necessary for the

28
conversion of nitrite to ammonium, and other processes essential for P. brassicae development
such as photosynthetic rate and sugar production (Webster 1986).
Although much is known about the role of boron in plants, the specific function of boron
in clubroot suppression is not well understood (Dixon and Lim 2006; Webster and Dixon 1991).
Boron can affect plant metabolism, cellular differentiation and lignin synthesis (Webster and
Dixon 1991) and can influence both primary and secondary infections of P. brassicae (Deora et
al. 2011). It can also inhibit the maturation of both primary and secondary plasmodia (Webster
and Dixon 1991). In controlled environmental studies, there was a positive correlation between
boron concentration and clubroot suppression but the timing of boron application had no
measurable impact on clubroot development (Gossen et al. 2014; Deora et al. 2011). Excessive
application of boron results in phytotoxic effects such as leaf necrosis and upward cupping of
leaves (Brown and Shelp 1997). Therefore, the use of boron-tolerant cultivars of canola has been
suggested as a promising tool to reduce the impact of clubroot (Gossen et al. 2014) in situations
where resistant cultivars are not available. At high concentrations of resting spores in soil, boron
and other soil micronutrients have little impact on clubroot development (Gossen et al. 2014).
1.7.5 Resting spore concentration
The resting spore concentration in the soil is positively correlated with clubroot severity in
susceptible brassica crops (Hwang, Ahmed, Zhou, et al. 2011; Dixon and Lim 2006). Increasing
inoculum concentration from 1 x 10⁵ to 1 x 10⁸ resting spores cm-3 showed an increase in
clubroot severity in canola (Hwang, Ahmed, Zhou, et al. 2011). Increasing spore load from 1 ×
103 to 1 × 10⁷ resting spores g-1 of dry soil also augmented clubroot severity in napa cabbage

29
(Hildebrand and McRae 1998). The concentration of 1000 spores g-1 dry soil has been suggested
as the threshold for consistent clubroot infection and yield loss in most susceptible cultivars
under conditions conducive for clubroot (Donald and Porter 2009; Faggian and Strelkov 2009;
Murakami et al. 2002).
Resting spores can be present in the soil profile to depths of at least 102 cm (Cranmer
2015). In a previous study, > 97% of spores were found near the surface (top 0-5 cm of soil)
(Kim et al. 2000).
1.8 Clubroot forecasting models
There is no forecasting model for clubroot incidence and severity on canola. However,
disease-forecasting models have been developed for brassica vegetables to produce risk
assessments based on soil type, crop, and clubroot resting spore numbers. These forecasts focus
on temperature and moisture parameters (Gebbinck et al. 2011; Thuma et al. 1983) as well as
pH, calcium, and magnesium. Soil temperature, rainfall, and the interaction of soil temperature
with soil moisture are highly correlated with clubroot severity, and regression equations were
developed for clubroot prediction on radish based on these factors (Thuma et al. 1983). In a
study of degree-day models, the potential yield losses could be predicted in two short-season
Asian vegetable crops (Moore et al. 2012). Also, clubroot severity was influenced by
temperature and followed a linear model in both canola and Asian vegetables (Gossen et al.
2012; McDonald and Westerveld 2008).

30
A CLIMEX™ model was used to predict the distribution and severity of clubroot of
canola on the Canadian Prairies based on temperature and precipitation, and potential climate
change scenarios. This model showed that a greater economic loss might have resulted from
increases in both temperature and precipitation (Gebbinck et al. 2011). This supported the results
of concurrent studies on the effect of temperature on clubroot described previously.
The effects of diurnal temperature fluctuation and the utility of degree-days were
assessed in field trials on canola and Asian vegetables (Gossen et al. 2017; Gludovacz 2013).
There was a strong correlation between clubroot incidence and severity and rainfall, air and soil
degree-days, and mean soil moisture. This study also confirmed that soil moisture and air
temperature are important factors for disease progress. Mean temperature of 14–18oC at 7 to 21
days after seedings were identified as the minimum thresholds for disease initiation (Gludovacz
2013).
1.9 Host-pathogen interaction
1.9.1 Compatible interaction
The molecular and genomic aspects of resistance to P. brassicae are largely unknown (Feng et
al. 2014). Detailed knowledge of plant defense against P. brassicae is limited to the compatible
response (an interaction that results in disease) and plant hormones (Feng et al. 2014). During
primary infection, P. brassicae colonizes root hairs in both compatible and incompatible
interactions. After primary infection occurs, the host deposits callose between the cell wall and
plasma membrane at the infection site (Williams et al. 1971). In compatible interactions, the

31
defense response mechanism is not activated. In fact, it is actively suppressed (McDonald et al.
2014).
Plasmodiophora brassicae manipulates the host plant’s hormones and metabolism to
obtain nutrients. Auxins and cytokinins become unbalanced, resulting in cell division, cell
expansion and symptoms of hyperplasia, which in turn form clubs on roots (Dekhuijzen and
Overeem 1971). The disorganization of tissues within the clubs disrupts the transport of water
and nutrients (Ludwig-Muller 2009). In addition, the changes in the hormones reprogram the
host’s primary metabolism and assimilates are redirected from the shoots to a strong metabolic
sink in the roots (Ludwig-Muller 2009). Also, cell enlargement and multiplication cause damage
during clubroot infection (Ludwig-Müller and Schuller 2008; Ludwig-Muller 2009). In
compatible interactions, the symptoms including chlorosis, wilting, and early flowering and
ripening (Diederichsen et al. 2009; Wallenhammar 1996).
Auxin (indole-3-acetic acid, IAA) plays an important role in cell expansion and clubroot
development, and auxin levels change during clubroot development (Ludwig-Muller et al. 1993;
Ludwig-Müller et al. 1999). Auxin precursors in the host such asindole-3-acetaldoxime (IAOx),
indole-3-methylglucosinolate (indole GSL) and indole-3-acetonitrile (IAN) increased in B. rapa
following clubroot infection (Rausch et al. 1983; Searle et al. 1982).
Glucosinolate (GSL) and flavonoids are secondary metabolites that are up-regulated
following clubroot infection (Ludwig-Muller 2009). After infection occurs, degradation of
glucosinolates by the enzyme myrosinase results in the release of isothiocyanates and other toxic
and hydrolysis products (Ludwig-Muller 2009). It has been hypothesized that only very limited

32
concentrations of auxin, and therefore GSLs, are needed for clubroot formation (Rausch et al.
1983).
Brassinosteroids (BR) are another group of plant hormone that are involved in club
formation, especially cell division and elongation, xylogenesis, and plant defense reactions
(Schuller et al. 2014).
Cytokinins are plant hormones that induce cell division and are associated with club
formation (Dekhuijzen 1980; Siemens et al. 2006). Plasmodiophora brassicae manipulates the
synthesis of cytokinins by the host (Dekhuijzen 1980; Hildebrand and Delbridge 1995). It might
also produce cytokinins itself to promote club formation (Hildebrand and Delbridge 1995;
Dekhuijzen 1980). Cytokinins act as signals to increase sugar and starch metabolisms in host
cells (Ludwig-Müller 2014) (Figure 1 3). Cytokinins also play a role in nutrient redirection
towards roots and plasmodia (Ludwig-Müller and Schuller 2008; Keen and Williams 1969).
The cytology of clubroot infection and development was investigated in resistant and
susceptible canola (B. napus) cultivars (Deora et al. 2013). In an incompatible interaction,
primary infection occurred as normal but secondary infection was inhibited. Only a few
binucleate plasmodia were observed at the early stages of clubroot development. In contrast, all
stages of clubroot development were observed in compatible interactions. In addition, reactive
oxygen species (ROS) were observed for a longer time in resistant cultivars. However, no
specific point of ROS accumulation was detected (Deora et al. 2013).

33
1.9.2 Incompatible interaction
In the incompatible response (results in little or no disease), defense response is typically
initiated during primary infection (McDonald et al. 2014). This response includes the deposition
of callose, and the metabolism and signaling of jasmonate, ethylene, and the endole-containing
compounds (Chu et al. 2014; McDonald et al. 2014). In a resistant cultivar, primary infection
occurs at levels similar to a susceptible cultivar, but secondary infection is limited. In a
moderately resistant canola cultivar, primary infection, partial secondary infection and limited
resting spores typically develop (Deora et al. 2012).
When the role of primary and secondary infection was studied, inoculation with avirulent
secondary zoospores resulted in formation of small, spindle-shaped clubs, while inoculation with
virulent secondary zoospores produced slightly lower clubroot severity than inoculation with
virulent resting spores. The authors concluded that infection was detected and the defense
response was initiated during primary infection, and that bypassing this step delayed disease
response, resulting in secondary infection by avirulent secondary zoospores (McDonald et al.
2014).
In an incompatible interaction, the jasmonic acid and ethylene pathways may be
differentially regulated but each play a role in host defense (Grsic et al. 1999). Jasmonate could
regulate invertase activity and therefore IAA levels (Ludwig-Müller and Schuller 2008).
Salicylic acid also can act as a signaling molecule to activate plant defense responses such as
systemic acquired resistance (SAR). SAR is not up-regulated in clubroot-infected hosts and the
role of SA is not clear (Lovelock et al. 2016; Ludwig-Muller 2009). SA might be inactivated by

34
methylation to form methyl salicylate (MeSA) (Seskar et al. 1998). In a recent study, a
methyltransferase (PbBSMT) was identified in P. brassicae with homology to plant
methyltransferases. PbBSMT might inactivate the SA in the susceptible host by methylation
(Ludwig-Muller et al. 2015). Therefore, SA molecule would be unable to up-regulate a defense
response. The rapid and localized cell death called hypersensitive response (HR), reactive
oxygen species (ROS), and an increase of phytoalexins (an antimicrobial component) have also
been reported (Ludwig-Muller 2009).
Transcriptome analysis of resistant and susceptible cultivars of B. rapa to assess the
mechanisms of host resistance revealed that genes were differently expressed in resistant
cultivars, including those associated with pathogen-associated molecular patterns (PAMPs) and
effectors recognition, calcium ion influx, hormone signaling, pathogenesis-related (PR) genes,
transcription factors, and cell wall modification. Effector-triggered immunity (ETI) response was
also observed in resistant cultivars (Chen et al. 2016b). In addition, induction of the arginase-
encoding gene ARGAH2, a negative regulator of auxin-induced root development, was reported
(Gravot et al. 2012). Arginase induction was reported to be a response to auxin/cytokinin-
triggered cell proliferation and limits the formation of clubs (Gravot et al. 2012).
1.10 Management of clubroot
1.10.1 Host resistance
It is a significant challenge to manage this pathogen by cultural, chemical, or biological control
measures, in large part because the resting spores of clubroot can survive in soil for many years.

35
Therefore, genetically resistant cultivars have been considered the most effective technique to
manage clubroot (Lee et al. 2016). It is also environmentally friendly and economical. However,
integrated management strategies for clubroot management are needed to increase the durability
of genetic resistance. Also, there is a cost to metabolic resistance in resistant crops that are
exposed to high levels of inoculum in soil. This results in a lower productivity of the plant due
to the repeated expression of resistance genes, and this should not be neglected. The metabolic
cost of resistance can decrease plant growth, delay maturity, and reduce seed production (Gossen
et al. 2017; Peng et al. 2014; Deora et al. 2012).
The capacity to cause disease is controlled by genetic interactions between plants and
pathogens. Pathogens have several classes of genes needed to cause disease (pathogenicity
genes) or for virulence in hosts (virulent genes), and plants have genes that control defense
strategies. Genetically, two types of resistance are described in plants; qualitative resistance,
which is encoded by major R genes (disease or no disease) versus quantitative resistance, which
is generally encoded by several genes with minor effects (minor to severe disease) and is active
against all genotypes of the pathogen (Poland et al. 2009). Qualitative resistance against clubroot
appears to generally follow a gene-for-gene model, where resistance genes (R genes) in the host
are matched with avirulence genes (avr genes) in the pathogen (Flor 1971). R genes can provide
complete resistance to a pathogen (Diederichsen et al. 2009). However, R gene resistance is
often not durable and so can be quickly overcome by a new pathogen genotype (Zhang et al.
2013). Quantitative resistance to clubroot has only rarely been studied (Peng et al. 2019)
For resistance to clubroot, genetic studies of resistance have mostly focused on three
economically important species, B. rapa, B. napus, and B. oleracea (Piao et al. 2009). Generally,

36
dominant genes govern resistance to clubroot, but recessive R genes have been reported in B.
napus (Piao et al. 2009).
Clubroot resistant cultivars were initially developed in Chinese cabbage (Hirai et al. 2004)
and canola (Frauen 1999; Gowers 1982), and carried resistance to pathotypes 1, 2, 6, and 7
(Williams’ system) (Tjallingii 1965; Voorrips and Visser 1993; Toxopeus and Janssen 1975;
Dias et al. 1993). The first canola cultivar with strong resistance to the pathotypes in western
Canada was released in 2009 (Strelkov et al. 2016; Strehlow et al. 2014), which permitted the
continued culture of canola crops even in areas with high levels of P. brassicae (Strelkov et al.
2016).
To develop clubroot-resistant (CR) crops, a variety of genetic sources should be
characterized (Rahman et al. 2013), including European turnip, Chinese cabbage, and rutabaga
(Ayers 1972; Williams 1966). Genetic mapping using molecular markers initially used
techniques such as restriction fragment length polymorphism (RFLP), amplified fragment length
polymorphism (AFLP), and random amplified polymorphic DNA (RAPD), but has now moved
almost exclusively to simple sequence repeats (SSR). Fine mapping and cloning of resistance
genes are also used to improve clubroot resistance in various Brassica spp. The close
evolutionary linkage of Brassicae spp. makes the transfer of resistance possible between species
by interspecific hybridization and gene introgression. Several CR loci in B. rapa (Chu et al.
2014; Kato et al. 2013; Suwabe et al. 2012; Ueno et al. 2012; Saito et al. 2006; Piao et al. 2004),
and multiple quantitative trait loci (QTL) in B. napus (Li et al. 2013, 2016; Manzanares-Dauleux
et al. 2000) and B. oleracea (Lee et al. 2016; Nagaoka et al. 2010; Rocherieux et al. 2004;
Moriguchi et al. 1999; Figdore et al. 1993; Voorrips and Visser 1993) have been identified.

37
Some of these genes have been used for the breeding of clubroot-resistance canola to confer
resistance to the initial generation of clubroot pathotypes (3, 5, 6 and 8) in western Canada
(Rahman et al. 2014). DNA markers linked to CR loci have been established. The number and
location of CR QTLs in specific chromosomes in each species are being investigated by gene
mapping (Piao et al. 2009).
Genome analysis of Brassica species was also compared with the whole-genome analysis
of Arabidopsis thaliana (Jubault et al. 2008). Comparative mapping can provide information
about the candidate genes for clubroot resistance and transcriptome analysis from these candidate
genes can provide a quick approach to clone and characterize more CR genes (Piao et al. 2009).
In recent years, whole-genome backbones of several brassica crops have been completed and are
being used routinely for fine mapping of resistance genes.
To understand how a single resistance gene interacts with avirulence genes in P. brassicae,
gene expression studies can be performed. P. brassicae – host interaction might alter the
expression of downstream genes, which are responsible for clubroot resistance (Lahlali et al.
2014). The genes responsible for plant hormones and defense-related hormones were found to be
differentially regulated in resistant cultivars (Schuller et al. 2014). In addition, more than 2,000
genes were differentially expressed in P. brassicae-resistant and susceptible crops (Chu et al.
2014). Differential expression of hormone-related and stress-related genes have also been
reported during clubroot development (Verma et al. 2014). Several broad-spectrum disease-
resistance genes, specific clubroot-resistant genes, and genes related to IAA, cytokinin, and
myrosinase synthesis were differentially regulated in resistant B. napus (Chen et al. 2016)

38
Strong resistance to P. brassicae is generally not durable and is quickly overcome (Zhang
et al. 2013). Resistance in the clubroot- resistant winter canola cultivar, Mendel (Frauen 1999)
broke down in the UK after only 4 years. Recently, patches of infected plants were observed in
the fields of CR canola in western Canada (Strelkov et al. 2016). Pathotype 5X of P. brassicae
was able to overcome genetic resistance in canola in Alberta (Strelkov et al. 2016). In addition,
recent results showed that the pathotype has changed in the Muck Crops Research Station
located in the Bradford/ Holland Marsh, Ontario (Al-Daoud et al. 2018). Future study is needed
to increase the durability of resistant cultivars, possibly by pyramiding different CR genes.
1.10.2 Cultural and physical management strategies
Cultural and physical management strategies are usually environmentally friendly and
affordable. These strategies generally focus on the primary inoculum of P. brassicae, but there is
no single approach that consistently suppresses clubroot. Therefore, integrated strategies are
essential for effective clubroot management (Diederichsen et al. 2009; Donald, Porter, et al.
2006). The most effective strategies include crop rotation, avoidance of pathogen spread via
transplanted crops or contaminated irrigation sources, and sanitation of farm equipment (Donald
et al. 2006).
Crop rotation can reduce the initial inoculum up to 10-fold after 2 or 3 years of rotation
(Gossen et al. 2019; Peng et al. 2014). A 2-year break from canola reduced the concentration of
the resting spores by 98% and increased seed yield (Peng et al. 2019). However, the
concentration of resting spores was still high enough to cause severe clubroot. Soil solarization

39
(Donald and Porter 2009; Porter and Merriman 1983) and early seeding into cool soils (Gossen
et al. 2012; McDonald and Westerveld 2008) can also reduce clubroot severity.
A number of soil amendments have been investigated for the reduction of resting spore
populations and clubroot severity. High calcium and pH can reduce clubroot severity when there
are low levels of inoculum (Donald and Porter 2009; Porter and Merriman 1983). However,
when the temperature and moisture levels are optimal for P. brassicae development, raising pH
is less effective (Gossen et al. 2013). The application of calcium as lime increases pH and
reduces clubroot (Murakami et al. 2002). However, it is not an economically viable option for
entire canola fields (Howard et al. 2010) and the effect of application might differ from year to
year (McDonald et al. 2014).
Boron reduces clubroot development in brassica crops (Donald and Porter 2009). There
was a positive correlation between drench application of boron and clubroot reduction (Deora et
al. 2011). Drench application of boron requires a high volume of water and is not economical for
canola growers, but boron can be applied in combination with other fertilizers (Deora et al.
2011). Boron application reduced clubroot incidence by up to 50% and increased yield by 30%
(Gossen et al. 2014; Dixon 1996).
Other options are also under consideration. Magnesium has a pH-dependent inhibitory
effect (Myers 1985). Calcium cyanamide is a nitrogen fertilizer and herbicide that has been
shown to delay root hair colonization and maturation of resting spores (Webster and Dixon 1991)
and can suppress clubroot (McDonald et al. 2014). Some grass crops, such as perennial ryegrass,
might reduce resting spore populations (Schroth 1964). Plasmodiophora brassicae can cause

40
root hair infections in plants in the families of Poaceae, Rosaceae, and Papaveraceae (Dixon and
Lim 2006). Secondary infection was reported in ryegrass in family Poaceae (Feng, Hwang, et al.
2012; Macfarlane 1952; Webb 1949) but formation of resting spores was not observed (Feng,
Hwang, et al. 2012). Thus, cultivation of a grass cover crop could be used to reduce the
concentration of resting spores in small patches of infestation (McDonald et al. 2014).
1.10.3 Synthetic fungicides
When a pathogen cannot be effectively managed using cultural approaches, synthetic fungicides
are often used. There are two fungicides registered for management of P. brassicae in Canada,
fluazinam (Allegro) for use on vegetables and cyazofamid (Ranman) for use on canola and
vegetables, but the high cost and difficulty of application make them uneconomical for canola on
a field scale (Howard et al. 2010). A drench application of Allegro 500F and Ranman 400SC, or
of the biofungicides Mycostop and Actinovate, was effective in clubroot reduction on pak choi in
controlled environment studies (Kalpana et al. 2009). Fluazinam targets the metabolic pathways
in mitochondria (Mitani et al. 2003; Guo et al. 1991) and cyazofamid prevents resting spore
germination (Mitani et al. 2003). Neither provides effective reduction of clubroot when resting
spore concentration in the soil is high (Peng et al. 2014; Tanaka et al. 1999). However,
fungicides have been used as seed treatments and to manage localized infected areas in Australia
(Donald and Porter 2009). In addition, a number of surfactants suppressed clubroot, but some
were phytotoxic (Hildebrand and McRae 1998).
1.10.4 Biological control
Biological control agents (BCA) are generally environmentally friendly, but low efficiency under

41
field conditions often limits the use of BCA in field crops. Several BCA have been identified that
reduced infection success of P. brassicae through antibiosis and by colonizing canola roots,
which resulted in induced host resistance (Peng et al. 2014; Lahlali et al. 2013). Several fungi,
especially Trichoderma spp., and bacteria, including Streptomyces spp. and Bacillus subtilis,
have activity against clubroot on vegetables (Cheah et al. 2006). Also, endophytes such as
Acremonium alternatum (Jaschke et al. 2010) and Heteroconium chaetospira (Narisawa et al.
2000) provide some suppression of infection by stimulating the defense response of the host
(Lovelock et al. 2013). Inoculation with H. chaetospira up-regulated genes responsible for
jasmonic acid, ethylene, and auxin biosynthesis (Lahlali et al. 2014). Some organic plant growth
stimulants, such as Fructigard and PlasmaSoil (TILCO, Biochemie) containing algal extracts,
amino acids and phosphonate, might also have potential for use against clubroot (Kammerich et
al. 2014). It has been suggested that BCAs and biofungicides might protect the host for a longer
time compared to synthetic fungicides (Peng et al. 2014; Lahlali et al. 2013). However, no BCA
is registered for use on clubroot in Canada.
Selected commercial biofungicides that are available in Canada have been tested for their
impact on clubroot, and several, including Mycostop (S. griseoviridis) (Verdera Oy, Finland),
Actinovate (S. lydicus) (Natural Industries, USA), Root Shield (T. harzianum) (BioWorks Inc.
USA), Prestop (Gliocladium catenulatum syn. Clonostachys rosea f. catenulate) (Verdera Oy)
and Serenade (Bacillus subtilis QST713) (Bayer CropScience, Germany) reduced clubroot levels
in some situations (Peng et al. 2014). Serenade and Prestop were evaluated on susceptible and
resistant cultivars in two trials in infested canola fields, but neither one provided effective
reduction of clubroot (Peng et al. 2014). However, Serenade reduced clubroot severity by 90%

42
when applied as a soil drench under controlled conditions (Peng et al. 2014). In a different study,
Prestop (Clonostachys rosea) was more effective than Serenade in clubroot reduction in plants
grown in peat and mineral soils under controlled condition but neither were effective in sand
(Gossen et al. 2016). The environment also plays an important role in the efficiency of biological
control, so efficacy might vary among crops, sites and years. A formulation that can reduce the
effect of environmental stress might provide more consistent results under field conditions. Also,
biological control of clubroot is not effective in soils with a high concentration of resting spores
(Narisawa et al. 2005).
Many plants can also acquire disease resistance by forming mycorrhizal associations.
Mycorrhizal fungi colonize plant roots and form symbiotic associations that contribute to plant
nutrition, growth and disease resistance (Jung et al. 2012; Augé 2001; Friese and Allen 1991).
Currently, there are no reports on clubroot reduction by mycorrhizae. Brassicaceae members lost
their ability to form a symbiotic relationship with Glomeromycota arbuscular mycorrhizal fungi,
which form symbiotic relationships with many plant species (Ludwig-Muller 2009; Demars and
Boerner 1996). However, some Brassica spp. such as Arabidopsis and Chinese cabbage (B. rapa
L. ssp. chinensis) can be colonized by Piriformospora indica (Vahabi et al. 2015; Lee et al.
2011; Sun et al. 2010). Piriformospora indica is a root colonizing endophytic basidiomycete
fungus that promotes plant growth and stress tolerance by directly manipulating plant hormone-
signaling (Vahabi et al. 2015, 2016; Lee et al. 2011; Sun et al. 2010). A recent study on
Arabidopsis showed that P. indica promotes plant growth and resistance to abiotic and biotic
stress by up regulating the pathogenesis-related genes in roots and by downregulating the

43
defense-related accumulation of jasmonic acid (Vahabi et al. 2016). Therefore, it might be of
interest to explore the potential of Piriformospora indica in clubroot resistance.
1.11 Research objectives
Significant knowledge gaps still exist in clubroot biology and management, especially on the
long-term cost benefit of different approaches and suitable management strategies. A serious
limitation in advancing clubroot research is the lack of a reliable and efficient method for the
isolation of P. brasscae cells and identification of pathotypes. The accurate identification of the
pathotype is an important step for the prevention and management recommendations to the
growers. So far, only one molecular marker has been developed for the identification of a P.
brassicae pathotype in Canada, while several pathotypes might be present in fields. The
development and application of new technologies for the isolation and identification of P.
brassicae are essential. Furthermore, new pathotypes are emerging rapidly in fields of resistant
canola that are virulent on all canola cultivars on the market. Further research is needed to better
understand the emergence of new virulent pathotypes, the amount of diversity in the population,
and the genetic similarity among the pathotypes. Genetic information from different isolates can
be placed in a phylogenetic tree that can help us to understand the origin, distribution, and the
similarities of clubroot strains in Canada. For growers, the use of resistant cultivars is the most
effective management strategy. However, to sustain the efficacy of resistant canola cultivars, the
population of P. brassicae should be kept at low levels to prevent the breakdown of the
resistance. Therefore, alternative management strategies such as biological and cultural controls
should be tested and evaluated for recommendations to the growers.

44
The overall goal of this research is to advance the genomic and molecular knowledge of P.
brassicae to improve prevention and management strategies for clubroot on canola in order to
reduce loss of canola yield. This study utilizes different approaches to achieve four primary
objectives:
1- To investigate the genome structure of P. brassicae single-spore isolates and field
collections from locations in Canada, the USA, and China to obtain information on the
following:
a. The genomic structure of P. brassicae populations in Canada
b. The origin of the initial population in selected Canadian provinces
c. The effect of selection pressure related to host and host resistance on changes in
genotype and pathotype over time
Hypotheses:
• The collections will be grouped based on geographic locations and the dissimilarity
will be low between new and old pathotypes as a result of small changes (single
point mutation or mutations) in the genome.
2- To develop a whole-genome amplification from a single resting spore and use this approach
as follows:
a. To assess the similarity of single spores produced by a single club
b. To provide the first isolation of pure P. brassicae genome
Hypothesis:
• The similarity will be very high among single spores collected from a single club.

45
3- To assess the ability of grass cover crops to reduce the concentration of resting spores of
P. brassicae in soil. The trial will be conducted under controlled conditions to answer the
following questions.
a. Do non-host grass species reduce the concentration of resting spores in the soil?
b. Which non-host grass species is more efficient in spore reduction?
Hypothesis:
• Cover crops will stimulate the germination of the resting spores but not support the
production of new resting spore, which will result in a reduction of resting spore
numbers in soil.
4- To investigate the effect of different mycorrhiza species on clubroot growth and
development on canola.
a. Confirm that Piriformospora indica colonized the roots of canola grown from
inoculated seed
b. Does Piriformospora indica reduce the incidence and severity of clubroot?
c. Are there other species of mycorrhizal fungi that can reduce the incidence and
severity of clubroot?
Hypothesis:
• Mycorrhizal fungi such as Piriformospora indica and Root Rescue can reduce
clubroot incidence and severity

46
CHAPTER TWO
Published in a modified format (Sedaghatkish, A., Gossen, B. D., Yu, F., Torkamaneh, D., and
McDonald, M. R. 2019. Whole-genome DNA similarity and population structure of
Plasmodiophora brassicae strains from Canada. BMC Genomics. 20:744.
2 Genomic study of Plasmodiophora brassicae
2.1 Introduction
Genetic resistance to P. brassicae is essential for economic production of canola in fields that are
heavily infested with the pathogen, and more than 20 canola cultivars registered in Canada carry
clubroot resistance. However, the source of the resistance in these cultivars is not in the public
domain (Strelkov et al. 2018). The molecular mechanisms of clubroot resistance can be complex
(Chu et al. 2014) and interpretation of the host-pathogen interaction is difficult because
information on the genetic makeup of the pathogen is limited. Recently, new virulent pathotypes
of P. brassicae have emerged in Canada that can overcome the resistance genes available in the
‘first generation’ of resistant canola. These virulent pathotypes are spreading rapidly (Strelkov et
al. 2018). Knowledge of the genetic similarity and population structure of P. brassicae in Canada
could contribute to the understanding of why and how these new virulent pathotypes have
emerged so quickly.
The main reason that there are relatively few genomic studies of P. brassicae is that the
organism is an obligate pathogen (cannot be cultured outside a living host), so obtaining clean
samples of pathogen DNA is difficult (Siemens et al. 2009a). Only a few isolates of P. brassicae
have been sequenced to date (Holtz et al. 2018; Rolfe et al. 2016; Schwelm et al. 2015). The

47
entire genomes of five single-spore isolates representing the original predominant pathotypes
(Williams’ system) from Canada (pathotypes 2, 3, 5, 6, and 8) were sequenced in 2016 (Rolfe et
al. 2016). In another study, twenty one single-spore isolates and field collections (collectively
referred to as strains in this thesis) from Alberta were sequenced (Holtz et al. 2018). An
understanding of the genome and genomic structure of P. brassicae is critical for successful
management of clubroot. However, the small number of strains and localized distribution of the
strains assessed means that the existing sequences were not sufficient for assessing the
population genomics of P. brassicae in Canada.
Whole-genome sequencing and the construction of a phylogenetic tree are the first steps in
studying the genetics of P. brassicae and determining the similarity among strains of the
pathogen. There are several methods that can be used to construct a phylogenetic tree, including
parsimony, genetic distance, maximum likelihood, and Bayesian inference methods. Genetic
distance and maximum likelihood are the methods most commonly used in evolutionary analysis
(Kaul et al. 2000). Distance methods are constructed on genetic distances between sequence
pairs, and are suitable for a large data set (Saitou and Nei 1987). Maximum likelihood
maximizes the probability of observing a given branch on a particular tree. Its use is often
limited to smaller number of sequences where some understanding of the evolutionary model is
already available (Felsenstein 1981). To accurately estimate evolutionary relationships, it is
important to choose the right method and to evaluate the results with further analysis such as
principal components analysis (PCA) and population structure analysis (Kaul et al. 2000).
PCA analysis is a statistical approach to representing the variation in whole-genome
sequences by summarizing the dimensionality of the data set into two or three dimensions. This

48
allows complex data to be summarized and analyzed in detail. PCA transforms the sequence data
into a small number of independent variables, which are called principal components (Revell
2009). Each principal component axis is an eigenvector in the direction of greatest remaining
variance.
Although PCA analysis is a powerful tool to support and detect phylogenetic signals and
allows the visualization of the underlying population structure, it cannot be used on its own to
identify admixtures in a population. However, model-based tools such as STRUCTURE
(Pritchard et al. 2000) use the Hardy-Weinberg equilibrium assumptions (no mutation, random
mating, no gene flow, infinite population size, and no selection) and linkage equilibrium between
genotyped loci to overcome this limitation and accurately explain the structure underlying the
data (Pritchard et al. 2014). Aside from statistical methods, visualization tools such as heat maps
can be also used for visualization and interpretation of whole-genome SNP data.
Genome diversity in plant pathogen populations is the result of migration, random genetic
drift, mutation, recombination, and natural selection (Milgroom and Peever 2003).
Plasmodiophora brassicae is a soil-borne pathogen, so migration and gene flow among regional
populations almost certainly occurs most frequently as the result of human activities (Gossen et
al. 2015). Lack of information about the mutation and recombination rates of P. brassicae and
about the effect of selection on the pathogen population restricts our understanding of changes in
the population. Direct estimation of the mutation rate for P. brassicae is not possible because the
pathogen cannot be grown in pure culture, and progeny counts and assessment in each generation
are not feasible. However, information about recombination and selection in the population can
be obtained using whole genome analysis.

49
Linkage disequilibrium, which is the non-random association of alleles at different loci,
has been used to study recombination in populations of other microbes because recombination
breaks down non-random associations and linkage disequilibrium (Feldman et al. 1980). Linkage
between two loci decays gradually in proportion to the recombination rate and over time.
Linkage disequilibrium decay is measured by determining the distance between polymorphic
sites at which the LD is halved when using the 50 % of the squared allele frequency correlation
(r2), as an estimator for LD decay.
Other statistical methods, such as nucleotide diversity (measures the degree of
polymorphism within a population) and Tajima’s test of neutrality (compares the average
number of pairwise differences with the number of segregating sites to detect selection within a
population) (Tajima 1989), can be used to study the population genomics of P. brassicae. The
capacity for populations to sustain variation depends on the population size and the mutation
rate. The amount of variation carried in a population can be mathematically calculated from
genome sequences of representatives of that population. If a deviation from the expected
variation is observed, it indicates that a particular form of selection is present. Tajima’s test of
neutrality (D) detects selection based on within population polymorphism. Tajima’s D value can
be positive (the observed variation is higher than the expected level) or negative (the observed
variation is lower than expected).
The main objective of the study was to compare the genome of strains of P. brassicae from
locations across Canada and from selected hosts to assess the genetic variation present in the
pathogen population. This analysis might also provide insights into the origin of the initial source
of infection on canola in Alberta. Another objective was to study the population genetics of the

50
pathogen to provide insights into the rapid emergence of new pathotypes on canola in Canada.
These insights could be used to improve breeding efforts to manage clubroot and potentially
accelerate the development of molecular markers to identify specific pathotypes. Much of the
information in this chapter has already been published (Sedaghatkish et al. 2019).
2.2 Materials and methods
2.2.1 Clubroot material and plant inoculation
Samples of the pathogen that have not been converted to single-spore isolates are referred to as
collections, and single-spore isolates and collections together as strains. Fifty-two strains of
P. brassicae, were obtained in clubbed roots representing a range of pathotypes collected from
brassica vegetables and canola from across Canada, together with a small number of collections
from China and the USA. Single-spore isolates and the original source collections from Alberta
were provided by Dr. S.E. Strelkov at the University of Alberta (Table 2-1).
To increase inoculum for the study, seed of Shanghai pak choy (B. rapa var. chinensis) cv.
Mei Quing Choi (Stokes Seeds, St. Catharines, ON) was planted and grown for 7 days in
Sunshine #4 soilless mix (Sun Gro Horticulture, MA) in tall plastic pots (Stuewe and Sons Inc.,
OR), with two seeds per pot and seven pots per replicate. The plants were maintained at 25°/20°
C day/night, with 16-hr photoperiod and 65% relative humidity, and thinned to one seedling per
pot. Each 7-day-old seedling was inoculated at the base of the stem with 5 mL of resting spore
suspension (106 to 108 spores mL-1) of selected strains following the method of Sharma et al.
(2011). Controls were inoculated with 5 mL water. Four to 6 weeks after inoculation, the plants

51
were uprooted, and clubbed root samples were taken for either tissue culture propagation or
direct DNA extraction. The clubbed roots were also used for the production of single-spore
isolates, which is described in chapter 3.
2.2.2 Dual callus cultures
Infected roots from 4- to 6-week-old inoculated plants were washed and surface sterilized as
follows: the outer layer of each root was trimmed off, then a short length of trimmed root was
surface-sterilized with 95% ethanol for 1 min, 30% household bleach (Clorox) for 20 min, and
2% chloramine T biocide for 10 min. Each root piece was then washed three times with sterile
deionized water (Bulman et al. 2011) and cut aseptically into thin cross-sectional pieces. Each
piece was placed individually on agar medium [5 mL of Murashige and Skoog (MS) medium
(Murashige & Skoog, 1962) including Gamborg vitamins (Gamborg et al. 1968) (Sigma Aldrich,
Mississauga, ON) plus 3% sucrose, 300 mg.L-1 Timentin (Thomas Scientific, Swedesboro, NJ),
and 0.8% Gelrite (Sigma Aldrich) in 90-mm-dia. Petri dishes]. The infected root pieces were
incubated for 3-4 weeks at 21° C in darkness. Where Plasmodiophora-induced callus cultures
developed, they were maintained by transfer to fresh medium every 2 weeks. After two transfer
cycles (callus > 0.5 cm), the callus was cut from the infected root pieces and transferred to MS
media that did not contain antibiotic. At the end of this last cycle, each culture was assessed for
contamination using bright field microscopy and only clean cultures were transferred to fresh
medium.
To produce a callus control in the absence of P. brassicae, seeds of B. rapa were
disinfected in 10% household bleach for 10 min, rinsed several times in sterile water and placed

52
on filter paper in sterile Petri dishes at room temperature for 6 days. Hypocotyl, cotyledons,
leaves, and roots of 6-day-old seedlings were cut into 5-mm pieces and placed on MS media
containing Gamborg vitamins to produce callus cells that could be used as a noninfected control
and incubated as described above.
2.2.3 Confocal microscopy
Confocal microscopy was conducted to determine which growth stages of the pathogen were
present in the infected callus tissue. A staining solution was produced by dissolving Nile Red
powder (Thermo Fisher Scientific, Altham, MA, USA) in methanol (1 mg mL-1). The resulting
15 µM staining solution of Nile Red was applied directly to the material to be stained. Thin
sections of callus from strains AB1.ss1-C-P3, AB15-C-P3, NF2- P1, and AB8- P2 were cut by
hand and placed in a drop of Nile Red staining solution on a glass microscope slide using a
sterile scalpel blade. A drop of ProLong™ Gold antifade reagent with DAPI (Thermo Fisher
Scientific) was added and samples were incubated at room temperature for >5 min. Samples
were photographed using an inverted Zeiss 510-Meta confocal laser scanning microscope (Zeiss,
Oberkochen, Germany). For fluorescence imaging, DAPI was excited using a laser diode (λ =
405 ηm) and emission spectra were captured in the 420–470 ηm range. Nile Red excitation used
an argon laser (λ = 488 ηm) and emission spectra were captured in the 585–615 ηm range.
2.2.4 Pathotyping
The clubroot inoculum from SK, BC, PEI, NF, and QC were increased on cv. ‘Mei Qing Choi’.
Six weeks after inoculation, clubbed roots were harvested and frozen for 3 days. The frozen
clubs were transferred to the fridge for 5 to 7 days to maximize the maturation of the resting

53
spores (F. Al-Daoud. pers. comm.). Pathotyping experiments were conducted as a randomized
complete block design with four replicates and 10 plants per replicate. The differential hosts of
Williams (Williams 1966a) (source: S.E. Strelkov, University of Alberta), Mei Qing Choi as a
susceptible control, and the clubroot-resistant canola cv. 45H29 (source: Pioneer) were used to
assess the pathotypes. Two collections from British Colombia, three collections from
Saskatchewan, two collections from Newfoundland, and one collection from Quebec were grown
in 24-cell seed nursery trays. The plants were watered daily with a water-white vinegar solution
(pH 6.0) and fertilized weekly with 0.1% nitrogen, phosphate, potassium (20-20-20; Plant
Products, ON) supplemented with magnesium sulphate (K+S; Kali GmbH, Germany). One-
week-old plants were inoculated with 5 mL of 107 resting spores mL-1 as described in Al-Daoud
et al. 2018. Plants were harvested 6 weeks after inoculation and were rated for clubroot
symptoms using a 0–3 scale. A host was resistant if DSI ± 95% confidence interval was less than
50; otherwise it was susceptible (Strelkov et al. 2016).
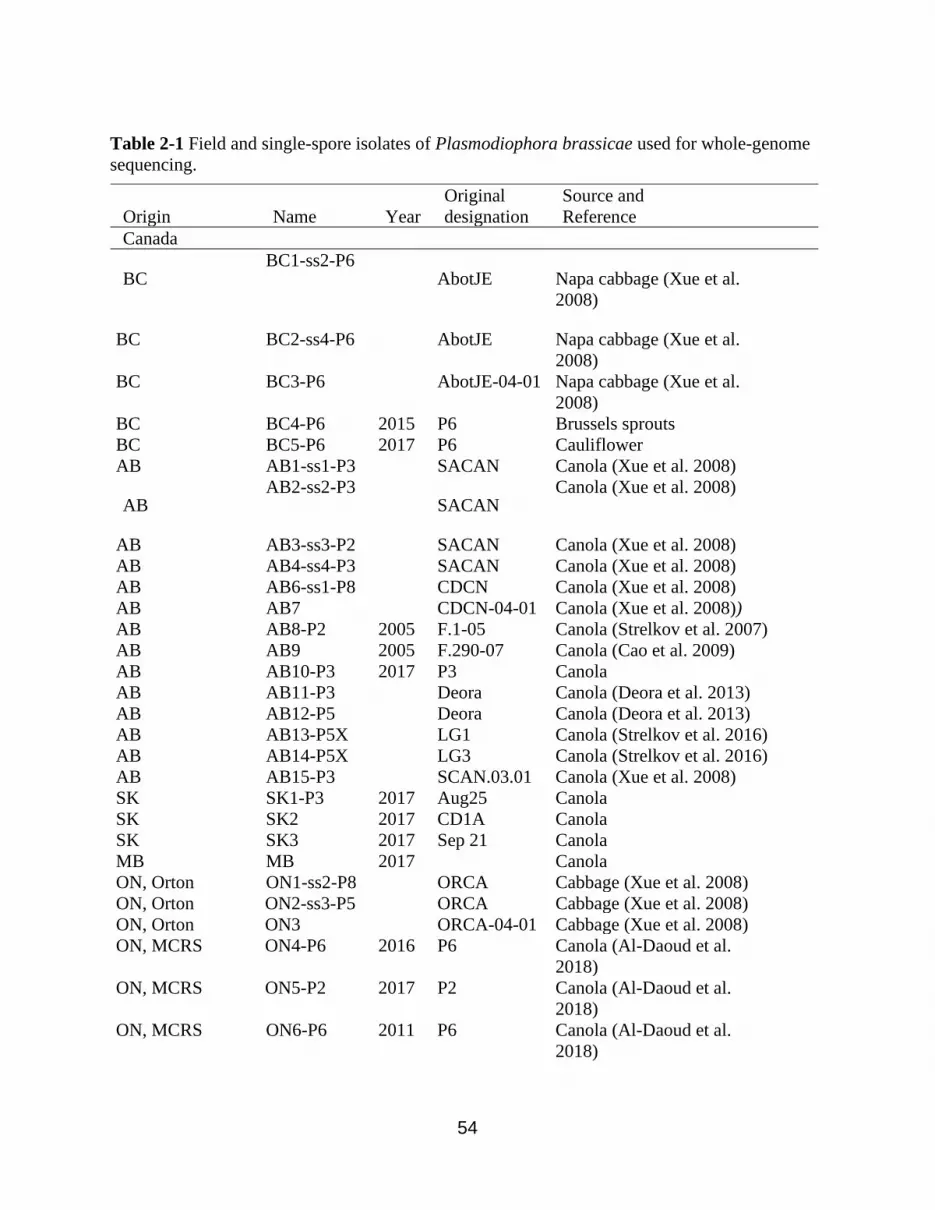
54
Table 2-1 Field and single-spore isolates of Plasmodiophora brassicae used for whole-genome
sequencing.
Origin Name Year
Original
designation
Source and
Reference
Canada
BC BC1-ss2-P6
AbotJE Napa cabbage (Xue et al.
2008)
BC BC2-ss4-P6 AbotJE Napa cabbage (Xue et al.
2008)
BC BC3-P6 AbotJE-04-01 Napa cabbage (Xue et al.
2008)
BC BC4-P6 2015 P6 Brussels sprouts
BC BC5-P6 2017 P6 Cauliflower
AB AB1-ss1-P3 SACAN Canola (Xue et al. 2008)
AB AB2-ss2-P3
SACAN Canola (Xue et al. 2008)
AB AB3-ss3-P2 SACAN Canola (Xue et al. 2008)
AB AB4-ss4-P3 SACAN Canola (Xue et al. 2008)
AB AB6-ss1-P8 CDCN Canola (Xue et al. 2008)
AB AB7 CDCN-04-01 Canola (Xue et al. 2008))
AB AB8-P2 2005 F.1-05 Canola (Strelkov et al. 2007)
AB AB9 2005 F.290-07 Canola (Cao et al. 2009)
AB AB10-P3 2017 P3 Canola
AB AB11-P3 Deora Canola (Deora et al. 2013)
AB AB12-P5 Deora Canola (Deora et al. 2013)
AB AB13-P5X LG1 Canola (Strelkov et al. 2016)
AB AB14-P5X LG3 Canola (Strelkov et al. 2016)
AB AB15-P3 SCAN.03.01 Canola (Xue et al. 2008)
SK SK1-P3 2017 Aug25 Canola
SK SK2 2017 CD1A Canola
SK SK3 2017 Sep 21 Canola
MB MB 2017 Canola
ON, Orton ON1-ss2-P8 ORCA Cabbage (Xue et al. 2008)
ON, Orton ON2-ss3-P5 ORCA Cabbage (Xue et al. 2008)
ON, Orton ON3 ORCA-04-01 Cabbage (Xue et al. 2008)
ON, MCRS ON4-P6 2016 P6 Canola (Al-Daoud et al.
2018)
ON, MCRS ON5-P2 2017 P2 Canola (Al-Daoud et al.
2018)
ON, MCRS ON6-P6 2011 P6 Canola (Al-Daoud et al.
2018)

55
ON, Verner ON7-P2 P2 Bok choi (Al-Daoud et al.
2018)
QC, Normandin QC1-P5X 2017 P5X Canola (Al-Daoud et al.
2018)
QC, Normandin QC2-P2 2012 P2 Canola (Cao et al. 2009)
PEI PEI1-P5 2017 P5 Canola
NF NF1 2016 DD1 Vegetable
NF NF2-P1 2016 DD2A Vegetable
USA
ND ND1-P8 NDCR1
ND ND2-P8 NDCR4
China (CH)
Jiangsu, Ganyu CH1-P1 4 Gailan
Yunnan, Muding CH2 8 Chinese cabbage
Yunnan, Muding CH3 11 Chinese cabbage
Yunnan, Lufong CH4 12 Cabbage
Hebei, Kuyuang CH5 28 Broccoli
2.2.5 DNA extraction
Genomic DNA was extracted from 100 mg of freeze-dried clubs or 100 mg of callus tissue.
Clubs were disinfected with 30% household bleach for 10 min, 90% ethanol for 1 min and 2%
chloramine T for 20 min prior to freezing dry for 72 hr. DNA was extracted using a modified
CTAB method, which was selected because it resulted in higher concentrations of pathogen
DNA than other methods in preliminary assessments. The tissue was homogenized for 3 x 1 min
at 20 revolutions s-1 using a Qiagen Tissue lyser II with MP BIOMEDICALS Lysing Matrix A
tubes. Homogenized tissue was resuspended in 500 µL cetyltrimethylammonium bromide
(CTAB) buffer (2M Tris pH 8.0, 0.5M EDTA, 5M NaCl and 2% CTAB) plus 2 µL of 2-
mercaptoethanol (Sigma Aldrich) for each sample and incubated at 65 °C for 1 hr. The solution
was extracted once with 500 µL chloroform and precipitated in 250 µL of 2-propanol. DNA was
resuspended in water and treated with RNase. Extracted DNA was quantified using a Qubit
fluorometer (Life Technologies, Eugene, OR).

56
2.2.6 DNA sequencing and identification of DNA variants
The production of genomic libraries and DNA sequencing were carried out at the National
Research Council of Canada, Saskatoon, using Illumina HiSeq 2500 paired-end read (2 x 125
cycles) technology (average 200 million reads). The host DNA was removed by mapping the
DNA-seq libraries to the e3 reference genome of P. brassicae (assembly GCA_001049375.1)
using the SeqMan NGen assembly program of the Lasergene 15 software package (DNAStar,
Madison, WI). The e3 reference is a single-spore isolate from field collection ‘e’ of P. brassicae
from Germany, Europe. The ArrayStar program of the Lasergene package was used for analysis
of single nucleotide polymorphisms (SNPs).
Assembly and variant parameters were as follows: mer size, 21; minimum match, 93%;
minimum read depth, 5; P not ref (fixed), 10; minimum variant count, 2; minimum base quality
score, 15; alignments cut-off, 200; maximum gap size, 6; minimum aligned length, 35; match
score, 10; mismatch penalty, 20; gap penalty, 50; gap extension penalty, 5; auto trim reads, true;
variant detection mode, haploid; minimum variant 15. In total, 43 of the original 52 isolates and
about 10,000 SNPs were used in the subsequent phylogenetic analyses. Data filtering was
performed using VCFtools (Danecek et al. 2011). Variants were removed if: i) they had more
than two alleles (this removes a high frequency of genotyping errors, and is also required for
subsequent analysis of factors such as structure), ii) an allele was not supported by reads on both
strands, iii) the overall quality (QUAL) score was <32, or iv) the mapping quality (MQ) score
was <30.

57
2.2.7 Phylogenetic tree
Evolutionary distances among the strains were computed using three methods; neighbor joining,
maximum likelihood, and Euclidean hierarchical distance. The initial phylogenetic tree in
FastME v2.0 was made using p-distance model and 1000 bootstrap replicates (Lefort et al.
2015). It was compared with a phylogenetic tree based on the maximum likelihood method
produced from the recoded alignments using RAxML (Stamatakis 2014) under the
GTRGAMMA model and 1000 bootstrap replicates. Euclidean hierarchical distance was
analyzed using selected subroutines in R; dendrograms were plotted using ggdendro, extended
using dendextend, and the phylogenetic tree was plotted using ggplot2.
Heat maps based on genome-wide SNPs were constructed using Euclidean hierarchical
distance with centroid linkage as the clustering algorithm in ArrayStar of the Lasergene 15
software package (DNAStar, Madison, WI).
2.2.8 Population structure and principal component analysis
The population structure, based on genome-wide SNPs, was determined using the STRUCTURE
program. Population structure was estimated using the variational Bayesian inference software in
fastSTRUCTURE (Pritchard et al. 2014). Ten runs were performed for each number of
populations (K) set from 1 to 12. The most likely K value was determined by the log probability
of the data (LnP(D)) and delta K, based on the rate of change in LnP(D) between successive K
values. The model complexity that maximized marginal likelihood = 8 and the model
components used to explain structure in data = 5. Principal-component analysis was performed
using TASSEL (Jeffrey et al. 2014) and plotted using the PCA3D package in R.

58
2.2.9 Nucleotide diversity, and Tajima’s neutrality test
Nucleotide diversity (π) and Tajima’s neutrality test (D) were measured in sliding windows of 1
kb across the genome using VCFtools (Danecek et al. 2011). The average pairwise divergence
within a clade (θπ) was estimated for the whole genome. A sliding window of 1 kb with 90%
overlap between adjacent windows was used to estimate θπ for the whole genome.
2.2.10 Linkage disequilibrium
Genome-wide pairwise linkage disequilibrium analysis (r2 and D´) was performed on all DNA
variants using PLINK (Purcell et al. 2007). The average r2 value was calculated for each length
of distance (<1000 bp), and linkage disequilibrium decay calculated and plotted using
PopLDdecay.
2.3 Results
2.3.1 Dual callus cultures
Dual callus cultures of P. brassicae with B. rapa were established on MS media for about 50%
of the strains assessed. White callus cells grew from the edges of the root tissue after 2 weeks.
Only clean (non-contaminated) cultures were transferred to fresh media. In general, callus
formed more frequently from roots harvested 4 weeks after inoculation compared with 6 weeks.
Twenty of the 52 P. brassicae strains produced clean callus cultures.
Hypocotyl, cotyledons, leaves, and roots of B. rapa were tested for their potential to
produce callus in the absence of P. brassicae, to identify a source of materials that could be used

59
as a noninfected control. Calli were small, formed infrequently, only formed from B. rapa root
cultures, and generally developed in response to wounding, which was not a useful approach for
the purpose of this experiment.
2.3.2 Confocal microscopy
Callus from strains AB1.ss1-C-P3, AB15-C-P3, NF2- P1, and AB8- P2 were examined using
confocal microscopy. All stages of the P. brassicae life cycle were visible in the callus (Figure
2-1) stained with Nile Red plus DAPI. Nile Red stained the lipid droplets in P. brassicae cells
and DAPI stained the nucleus. The plasmodia were identified based on the size and resting
spores were observed in secondary plasmodia. Older calli were mostly filled with resting spores.
There were no differences among calli produced from single spores or field collections.

60
Figure 2-1 Stages of the life cycle of Plasmodiophora brassicae observed in callus culture.
Each row represents a single image, seen in bright field illumination and then using specific laser
illumination to excite Nile Red and DAPI staining. Lipid droplets stained with Nile Red and
nuclei stained with DAPI and can be seen in (A) zoosporangia, (B) plasmodia, and (C) resting
spores.
2.3.3 DNA variant information
Nine samples that did not meet the requirement for minimum template coverage of 90% per
strain were not included in the analysis. The mean template coverage of included strains was
91.9% per isolate. In total 149,774 variants were identified, with 142,640 SNPs and 6,218 Indels.
The variant type and distribution were as follow: 58% of the variants identified in genic regions
occurred in coding regions (exons) and 42% in non-coding regions (introns); 58% of variants
20 µm
10 µm
Bright Field Nile Red DAPI Nile Red + DAPI
10 µm
A
B
C

61
were transition, 36% transversion, 3% deletion, and 3% inversion types. Also, 18% of variants
were synonymous, while 12% were non synonymous (Figure 2-2 and Figure 2-3). Variants were
more common in intergenic regions (> 40%) than in genic regions (< 5%). In 42 of 43 strains,
more than 75% of the SNPs were homozygous (Figure 2-5), but one collection from Alberta
(AB9-C-P5) appeared to be heterozygous (possibly a mixed isolate), with 25–75% of SNPs being
heterozygous and different from the other 42 strains.
Figure 2-2 Frequency (%) of DNA variants in genic and intergenic regions of 43 strains of
Plasmodiophora brassicae.
11
31
18
12 119
3 30.9 0.17 0.16 0.11 0.09 0.06 0.05 0.04 0.03 0.03 0.02 0.02 0.01
0
5
10
15
20
25
30
35
Vari
an
t fr
equ
ency
(%
)

62
Figure 2-3 (A) Variant type (%) and (B) distribution in coding and non-coding regions (%).
Trans = transitions (interchanges of two purine or two pyrimidine bases. Transv = transversions
(interchanges of purine to pyrimidine bases).
2.3.4 Phylogenetic tree
Phylogenetic trees were constructed using three clustering methods; neighbor joining (Figure
2-4), maximum likelihood (Figure A1-1), and Euclidean hierarchical distance (Figure A1-2). The
trees produced by all three methods were very similar. Only the position of Clade 2 moved in the
maximum likelihood and Euclidean hierarchical distance trees, which did not change the
conclusion of phylogeny. The neighbor joining tree was used for further analysis because the
neighbor joining method is better-suited to large data sets compared with the maximum
likelihood, which is more suited to small data sets (Felsenstein 1981). In addition, the neighbor
joining method has previously been used to develop phylogenetic trees for P. brassicae (Holtz et
al. 2018; Rolfe et al. 2016b). The neighbor joining tree developed using genome-wide SNPs
(total = 13 K SNPs) of 43 strains grouped the strains into five clades, which coincided with the
results from PCA analysis and FastStructure. The proportion (%) of 1000 bootstrap pseudo-
58%
36%
3%3%
Variant types
trans transv
A
58%
42%
Variant distribution in coding and
non-coding regions
Coding regions Non-coding regions
B

63
replicates that supported each joining (Nei and Kumar 2000; Felsenstein 1985) is shown above
each node (Figure 2-4) .
The strains from Canada clustered into Clades 1, 2, 4 and 5. Clade 1 consisted of the
strains from British Colombia, Newfoundland, Ontario, and Quebec, mainly from vegetable
brassicas (Figure 2-4). Interestingly, a pathotype 3 collection from Alberta in 2008 (predominant
pathotype in Alberta, collected before clubroot-resistant cultivars were commercially available)
was also allocated to Clade 1. Clade 2 consisted mainly of collections from canola in Prince
Edward Island, Ontario (Al-Daoud et al. 2018) and North Dakota. Three of the five strains from
China clustered together in Clade 3. Strains from the Prairies mostly clustered into Clades 4 and
5. Clade 4 consisted of the new, virulent pathotypes from Alberta (AB13-C-P5X and AB14-C-
P5X), a single recent collection (SK3-C) from Saskatchewan, and collection of pathotype 5
(AB9-C-P5) from Alberta. It was interesting that the new virulent pathotypes (5X) from AB
clustered in Clade 4, while the other collections from AB are placed in Clade 5. Two strains from
canola in Saskatchewan and the strain from canola in Manitoba, which represent a recent
expansion of the geographic distribution of the pathogen, clustered together with the older strains
from canola in Alberta in Clade 5, along with strains from vegetables in Ontario and British
Columbia. Two collections from China (one each from Jangsu and Hubei province) also
clustered in Clade 5 (Figure 2-4).
Within Clade 5, the sequences of single-spore isolate ON1-ss2-V-P8 and its original source
collection ON3-V-P6 were almost identical, so they were immediate neighbors in the
phylogenetic tree. This is very interesting as the collection was 6 but the single spore isolates
from this collection were different (pathotypes 8 and 5, respectively). Although pathotype 6 and

64
5 are common pathotypes in Ontario, pathotype 8 has not yet been found in the fields in Ontario.
Similarly, single-spore isolates AB1-ss1-C-P3, AB2-ss2-C-P3, AB3-ss3-C-P2, AB4-ss4-C-P3,
AB6-ss1-C-P8 and ON2-ss3-V-P5 differed by only 1.5–3% in SNPs from their source collection,
AB15-C-P3 and AB7-C-P5. This demonstrate a high similarity between different pathotypes
from a source collection.
At the AAFC research farm at Normandin QC, genetic resistance had broken down and
pathotype 2 had been replaced by pathotype 5X. Similarly, at the Muck Crops Research Station
in Ontario, pathotype 6 had been replaced by pathotype 2. The initial collections from both sites
clustered in Clade 1, and samples collected after the change of pathotype clustered in Clade 2.
Based on this result, samples that had been collected before and after breakdown in resistance or
that were associated with the change of pathotype from the two sites (Al-Daoud et al. 2018) were
compared using heat map analysis. SNP polymorphisms were present in more than half of the
9,727 genes in the genome between samples collected before and after the change of pathotype at
each site (Figure 2-6a). Similarly, SNP polymorphisms were present in more than 3,000 genes
between the Chinese collections from Clade 3 (CH2-V, CH3-V, and CH4-V) and the Chinese
collections from Clade 5 (CH1-V- P1 and CH5-V) (Figure 2-6b). In addition, pathotype 5x from
Quebec (Clade 1) was very different from pathotype 5x from AB (Clade 4), which demonstrate
that the similarity between these similar pathotypes was low. However, we did not have the
Canadian clubroot differential set to test if these 5X pathotypes are the same virulent pathotypes.
DNA samples extracted from both a callus and a frozen club of SK3-C were sequenced and
compared to assess the reproducibility of the sequencing. The two samples of SK3-C clustered in
the same clade, with only 3% difference in gene similarity between the two samples. This

65
difference may have been associated with trace amounts of microbial contamination in the
sample taken directly from the clubbed root, or inherent variability among strains of the
pathogen in a single club.
Collection BC3-V-P6 and single-spore isolate BC1-ss2-V-P6 from British Columbia
clustered with the other strains from vegetable crops in British Columbia in Clade 1. However,
single-spore isolate BC2-ss4-V-P6 clustered with strains from canola on the Prairies in Clade 5.
A similar pattern was observed in samples from Ontario. Single-spore isolates ON1-ss2-V-P8
and ON2-ss3-V-P5 from Ontario differed from their source collection, ON3-V- P6, and clustered
with strains from the Prairies in Clade 5, while other strains from Ontario clustered in Clades 1
or 2. Also, the pathotypes of these two single-spore isolates differed from that of the source
collection.

66
Figure 2-4 SNP-based phylogenetic tree of Plasmodiophora brassicae based on whole-genome
alignment of 43 P. brassicae strains.
Strains from Canada, China, and the USA were mapped against e3 from Europe. The scale
represents the evolutionary distances, assessed as genetic dissimilarity. The percentage of
bootstrap trials (1000 replicates) are shown above the branches. Strain details are summarized in
their names: location by province (e.g., AB = Alberta), Williams’ pathotype (e.g., P3) where
available, and SS = single-spore isolate, V= vegetable host, and C= canola host.

67
Figure 2-5 The ratio of heterozygous to homozygous SNPs for each collection. A SNP frequency
range of 25–75% was considered to be heterozygous; any SNP at higher than 75% is likely a
homozygous SNP.
Figure 2-6 Heat maps of SNPs distribution in Plasmodiophora brassicae.
Strains from (A) Normandin and MCRS before and after the change of pathotype, and (B)
Chinese strains were compared. Each horizontal lane represents one gene. The total gene number
in the genome is 9727.
0.0
0.5
1.0
1.5
2.0
2.5
3.0
AB
10-c
-P3
ON
5-c
-P2
ON
4-c
-P6
ON
6-c
-P6
PE
I- C
-P5
ON
3-v
-P6
AB
14-c
-P5X
AB
13-c
-P5X
SK
3
BC
5-v
-P6
AB
4-s
s4-c
-P3
BC
2-s
s4-v
-P6
ON
1-s
s2-v
-P8
BC
3-v
-P6
AB
15-c
-P3
AB
7-c
ND
1-v
-P8
ND
2-v
-P8
CH
4-v
CH
2-v
SK
2-c
BC
2-s
s2-v
-P6
AB
5-C
-P2
NF
2-P
1
SK
3-c
SK
1-c
-P3
AB
12-c
-P5
Ab11
-c-P
3
CH
3-v
CH
5-v
ON
7-c
-P2
NF
1
AB
9-c
QC
2-c
-P2
QC
1-c
-P5
X
MB
-c
AB
1-s
s1-c
-P3
AB
6-s
s1-c
-P8
BC
4-v
-P6
CH
1-v
-P1
AB
2-s
s2-c
-P3
AB
3-s
s3-c
-P2
ON
2-s
s3-v
-P5Rat
io h
eter
ozy
go
us
SN
P
/ ho
mo
zyg
ou
s S
NP
A B
ON
6—
C-P
6
QC
2-
C-P
2
ON
4-C
-P2
ON
5-C
-
P2
QC
1-C
-
P5
X CH
1-V
-
P1
CH
15
-V
CH
12
-V
CH
14
-V
CH
13
-V

68
2.3.5 Population structure and principal component analysis
Principal component analysis (Figure 2-7) and population-structure analysis of 43 P. brassicae
strains were used to determine the composition of the populations and the number of the clades.
The optimal value of K 5, the number of clades that make up the total population, was based on
fastSTRUCTURE analysis (Figure 2-8). This was consistent with separation into five clades in
the phylogenetic tree (Figure 2-4). Population-structure analysis indicated that collections AB9-
C-P5 from Alberta, NF2-P1, and NF1 from Newfoundland, and ND1-V-P8 from North Dakota
were admixtures of two genotypes (Figure 2-8).
Figure 2-7 Principal component analysis of 43 strains of Plasmodiophora brassicae.
Collections within the same clade are represented by the same color.
Figure 2-8 Population structure analysis of 43 strains of Plasmodiophora brassicae. Admixtures
are represented by two colors in a column. The optimum number of clusters (K = 5) is presented.

69
2.3.6 Genomic diversity
Genome-wide nucleotide diversity was calculated by examining the DNA sequences to quantify
the degree of polymorphism in 43 strains of P. brassicae at a nucleotide level and was used to
determine the DNA divergence between subpopulations. Nucleotide diversity is the average
number of pairwise nucleotide differences between sequences and depends on the number of
polymorphic sites and their relative frequencies. Genome-wide nucleotide diversity was
estimated based on sliding windows of 1 kb across the 43 strains. The mean nucleotide diversity
(θπ) was higher in Clades 1 and 3 (θπ1 = 0.0011, θπ3 = 0.0011) compared with Clades 2, 4 and 5
(θπ2 = 0.00097, θπ4 = 0.00084, and θπ5 = 0.00084). The average θπ across the whole genome of
all strains was 0.00095 (Table 2-2 and Figure 2-9). When the evolutionary distance between
clades was computed, the distance was largest between Clades 1 (older Canadian collections)
and 3 (collections from China), and smallest between strains that included collections from the
Prairies (Clades 4 and 5) and Clade 3.
Linkage disequilibrium decay was measured in 43 P. brassicae collections. The average
distance over which LD decayed to half of its maximum was at ~29 kb. The decrease of linkage
disequilibrium was slower in strains from the Prairies compared with strains from the rest of
Canada (Figure 2-11).
Tajima’s D value was 0.73 when calculated across the 43 P. brassicae strains. A positive
value for D indicates balancing selection, while a negative value indicates purifying selection or
a recent population expansion.

70
Table 2-2 The average pairwise divergence within a subpopulation (θπ) based on nucleotide
diversity (π) was estimated for the whole genome among clades using VCFtools.
Population θπ
Clade-1 1.12E-03
Clade-2 9.69E-04
Clade-3 1.11E-03
Clade-4 8.42E-04
Clade-5 8.44E-04
All 9.45E-04
Sixteen hot spots of nucleotide diversity (π), located based on a 1 kb sliding window of the
43 collections (Table A1-2), were identified and then used to search for similar sequences in
other organisms (Figure A1-6). Most of these hotspots were located in intergenic regions and so
do not represent areas of particular interest for this analysis. However, three putative conserved
domains were identified with 32 and 22 variants when compared with genes and protein
sequences in NCBI database using Blast (Table 2-3).
Figure 2-9 Nucleotide diversity across the genome of the 43 strains of Plasmodiophora brassicae.

71
For window of 9001–10000 bp located on contig 16, CemA protein super family (e value =
8.67e-03) was detected (Table 2-3). Members of this family are putative integral membrane
proteins (Marchler-Bauer et al. 2011, 2015) whose molecular function is unknown. For window
of 909001–910000 bp on contig 1, two protein superfamilies were detected. Cid1 family poly A
polymerase (specific hit, e value = 1.49e-08) and COG5260, DNA polymerase sigma (non-
specific hit, e value = 9.03e-08).
In addition, a phylogenetic tree was made from the 1000 bp window with the largest
number of SNPs to see if the collections would be grouped based on the pathotype. The SNPs in
this window did not group the collection based on pathotype (Figure A1-3).
Table 2-3 Top three proteins aligned to two 1000 bp window of Plasmodiophora brassicae
sequence containing SNP variance hotspots using BLAST.
Contig BIN_
START
BIN_
END
variants θπ Locus
tag
Hits in Blast E value
16 9001 10000 32 0.007 PBRA_
009649
Superfamily CemA 8.6E-03
1 909001 910000 22 0.007 PBRA_
000406
Specific hit: Cid1
family poly A
polymerase
1.4E-08
Non-specific hit:
DNA polymerase
sigma
9.0E-08
The sequence of five molecular markers previously used to differentiate P4, P9, and P11
from China (Zheng et al. 2018) did not group Canadian collections based on the pathotype for
any of the markers (Table 2-4). Therefore, these markers cannot be used to differentiate the
common pathotypes in Canada (data not shown). The benzoic acid/salicylic acid
methyltransferase-encoding gene (PbBSMT) was also compared among the 43 collections.

72
PbBSMT is the first and only well-characterized putative effector for P. brassicae (Ludwig-
Muller et al. 2015). It is suggested that PbBSMT inactivates the SA signaling and defence
response in a susceptible host (Ludwig-Muller et al. 2015). PbBSMT divided the collections into
2 groups; Clade 1 and the rest of the collections (Figure 2-10).
Table 2-4 Molecular markers to distinguish pathotypes 4, 9, and 11 from China (Zheng et al.
2018).
Gene name scaffold Contig Base pair
PBRA_002543 6 CDSF01000122.1: 1..778K 778307
PBRA_007750 35 CDSF01000096.1: 1..203K 203435
PBRA_008439 47 CDSF01000109.1: 1..128K 128288
PBRA_009348 78 CDSF01000142.1: 1..46K 45635
PBRA-000444 1 CDSF01000001.1: 1.0M..1.0M 1186
Figure 2-10 Heat map of SNPs in the gene coding for benzoic acid/salicylic acid
methyltransferase in 43 isolates pf Plasmodiophora brassicae, based on Euclidean distance and
centroid linkage.

73
Linkage disequilibrium (LD), which is the nonrandom association of alleles at different
loci, was used to analyze the population history of the 43 collections /isolates. LD decay was
estimated by the squared allele frequency correlation (r2) against the distance between
polymorphic sites in collections from eastern Canada and British Columbia (black) compared to
collections from the Prairie provinces (blue) (Figure 2-11). LD decay was slow in collections
from Prairie provinces (blue) compared with collections from eastern Canada and BC (black).
This demonstrate a lower recombination event in collections from the Prairie provinces. The LD
decay was also measured in all 43 P. brassicae collections to have an estimation of
recombination in P. brassicae. The value for 50% reduction of LD (LD50) across all 43
collections was 29.
Tajima’s test of neutrality (D), which detects selection from within population
polymorphism, was 0.73 in the 43 P. brassicae populations, indicating that balancing selection is
present in the population. Balancing selection maintains the variation in the gene pool of a
population.
Figure 2-11 LD decay (squared allele frequency correlation, r2) against the distance in Kb
between polymorphic sites: (A) Pop 1 (Clades 1 and 2, representing mostly Eastern Canada), in
Pop 2 (Clades 4 and 5, mostly Western Canada), and (B) all populations (Clades 1 to 5, includes
collections from China) of 43 collections of Plasmodiophora brassicae.

74
In the current study, the genetic similarity of P. brassicae strains from across Canada and three
locations in China, and from North Dakota, USA, were assessed using whole-genome DNA
sequences and compared with a published genome sequence of an isolate from Europe. A
phylogenetic tree that consisted of five clades was developed based on SNP polymorphisms and
validated using several approaches.
Clade 1 consisted of collections from vegetables from British Columbia and canola from
Ontario, with one collection from canola in Alberta. Clade 2 consisted of the two collections
from North Dakota, plus canola from Ontario and one collection from canola on Prince Edward
Island. Three of five collections from China, which were all from the Yunnan province clustered
together in Clade 3, which was substantially different from strains in North America and the
single-spore isolate from Europe. Strains from canola on the Prairies mostly clustered into
Clades 4 and 5 except for one isolate in Clade 1 that was pathotype 3 from Alberta. The isolates
in clades 1 and 2 differed even more from the cluster of new, virulent pathotypes that are
currently increasing in the Prairie region (Clade 4). A separate clade consisting of collections
from China was expected, given the relatively long period of geographic separation and
differential selection between the pathogen populations in North America and China. The
observation that 2 of 5 collections from China clustered with the original strains from canola in
Alberta suggests that selection pressure exerted by canola may be driving both populations in a
similar direction. However, there were also several collections from vegetables in Clade 5.
In the current study, collections AB13-C-P5X and AB14-C-P5X (new pathotype 5X from
Alberta) were very different from the older collections from Alberta, with SNPs in thousands of

75
genes. It is unlikely that this new, virulent pathotype could have accumulated thousands of
mutations since the initial registration of a clubroot-resistant canola cultivar in 2009.
Similarly, genetic diversity was high between collections taken before and after a change
of pathotype at sites in Quebec and Ontario. The high diversity between these collections
indicated that there was a very low likelihood that the new pathotypes developed from the
original pathotypes. These results indicated that the ‘new’ pathotypes were the result of selection
of pre-existing genotypes that were present at low levels in the population, rather than
developing from a mutation that increased virulence that then increased rapidly in response to
selection, first on a new host and later on resistant cultivars.
Population-structure analysis was also used to identify the migrants between two
populations. Population-structure analysis indicated that collections AB9-C-P5 from Alberta,
NF2-P1 and NF1 from Newfoundland, and ND1-V-P8 from North Dakota were admixtures of
two populations. Admixtures are generally the result of directional selection due to migration and
isolation (Sung et al. 2012). NF2-P1 and NF1 strains were found in clade 2 but were also slightly
assigned to clade 1 and 5. NF2-P1 and NF1 strains are from Newfoundland, which may explain
their admixture genotype since admixture genotypes can be the results of isolated and genetically
differentiated populations Ab9-C-P5 was an admixture of clades 4 and 5, while ND1-V-P8 from
North Dakota was an admixture of clades 2 and 4 based on the structure analysis.
Nucleotide diversity (π), measures the degree of polymorphism in a population depends on
factors such as population size, mutation rate, and reproduction states (Sung et al. 2012).
Nucleotide diversity is used to determine the DNA divergence between subpopulations. A

76
previous study estimated nucleotide diversity per site of 0.32 for P. brassicae collections in
Alberta (Holtz et al. 2018). In the current study, diversity was high between collections from the
Prairies and the rest of Canada; for the whole genome, θπ = 0.0009, and for average diversity per
site, π = 0.22. The nucleotide diversity of P. brassicae was in the range of other plant pathogens.
The nucleotide diversity (θπ) of Phytophthora infestans was as low as zero for clonal populations
(Cárdenas et al. 2011; Abbott et al. 2010) and as high as 0.01 for non-clonal populations (Abbott
et al. 2010).
Sixteen of the 1 kp windows with the largest number of variants were aligned against the
NCBI data base using BLAST to determine gene function from these highly variable sequences.
Three putative proteins were associated with the aligned hot spots: Cid1, COG5260, and CemA.
Cid is a yeast protein required for the replication checkpoint (S-M checkpoint) control
when DNA polymerase delta or epsilon is inactivated. The S-M checkpoint is considered to
inhibit mitosis when replication is incomplete (Enoch et al. 1992).
The Cid1 domain in poly (A) polymerases has polynucleotide adenylyltransferase activity
(Marchler-Bauer et al. 2011, 2015) and members of this family are involved in cell cycle
regulation (Lunde et al. 2012). Also, the Cid1 family is involved in S-M phase transition control,
and the cell cycle arrest. (Lunde et al. 2012) The Cid1 protein in Fusarium graminearum reduced
growth rate and virulence (Zhou et al. 2010). The high occurrence of variants in this gene might
affect cell cycle regulation in P. brassicae, which is an important factor in disease progress. The
protein COG5260, also known as DNA polymerase sigma, is involved in replication,
recombination, and repair of DNA (Marchler-Bauer et al. 2011, 2015). The function of the

77
CemA Superfamily is not known. CemA proteins are predicted to be haem-binding, but this has
not been demonstrated experimentally (Marchler-Bauer et al. 2011, 2015).
A SNP polymorphism in the gene encoding PbBSMT was assessed because it alters
methylation of SA, benzoic acid, and anthranilic acid, which may suppress salicylic acid-induced
defense in susceptible plant hosts (Ludwig-Muller et al. 2015). The collections separated into
two groups; Clade 1 versus the rest. Study of the effect of mutation in PbBSMT might improve
understanding of how newer collections of P. brassicae overcome plant defenses.
Sexual recombination is another important reason for genetic variation, which shapes the
impact of selection in the genome. The timing and occurrence of sexual reproduction, if it occurs
in the life cycle of P. brassicae, is not well understood (Ludwig-Müller and Schuller 2008). It
has been suggested that secondary zoospores may fuse before the cortical infection phase
(Narisawa et al. 1996; Ayers 1944) but no such fusion has actually been reported and none was
observed in a recent study of secondary zoospores (Ludwig-Müller and Schuller 2008). Sexual
reproduction between different genotypes is clearly not an absolute requirement for infection by
P. brassicae, since inoculation of a host with a single resting spore can result in infection and
symptom development (Xue et al. 2008). Also, no sexual recombination was detected in a recent
study with repetitive molecular probes (Fahling et al. 2004). However, non-meiotic
recombination processes such as gene conversion and mitotic crossing-over can occur in plant
pathogens that reproduce asexually and have been previously reported during infection in
P. brassicae (Fahling et al. 2004). To gain more knowledge about the occurrence of
recombination in P. brassicae, linkage disequilibrium was calculated. Linkage disequilibrium
generally represents a pronounced deviation from the random pattern associated with sexual

78
reproduction (Milgroom and Peever 2003). Linkage disequilibrium can be also caused by
migration, genetic drift, selection, or other factors (Montgomery 2008). Linkage disequilibrium
between collections from the Prairies and the rest of Canada was assessed to better understand
the genetic forces contributing to the development of new pathotypes (Table A1-2).
Disequilibrium was higher in strains from the Prairies relative to strains from the rest of Canada.
This demonstrated that fewer genetic changes had occurred in Prairie populations compared with
those in the other provinces in Canada. This is consistent with the recent introduction of clubroot
in the Prairies and their shorter time for evolutionary changes.
The rate that linkage disequilibrium decays with time over generations is influenced by
recombination frequency. In self-fertile plants, linkage disequilibrium decays more slowly and at
a large genetic distance (up to 20 cM) (Remington et al. 2001) than in outcrossing species. In
contrast, decay occurs faster (within 100–1500 bp) in a heterozygous background with several
recombination events (Kraakman et al. 2004). One approach used to estimate linkage
disequilibrium decay is to find the distance at which half of the maximum linkage disequilibrium
has decayed (Vos et al. 2017; Sung et al. 2007). The half-decay of disequilibrium occurred at 29
kb when measured across all 43 P. brassicae strains. This value was in the range that has been
reported for 10 fungal species, in which the half-decay value was 110 bp for species with a
mixed reproductive mode and > 100 kb for clonal species (Nieuwenhuis and James 2016).
Relatively rapid decay of linkage disequilibrium in P. brassicae populations indicated a high
frequency of recombination in the population, which in turn supports the hypothesis that P.
brassicae is not a clonal species.

79
Tajima’s test of neutrality was performed to determine if balancing selection was apparent
in the P. brassicae strains. When balancing selection is present, populations maintain variation,
so alleles with low frequency or that are less fit are not removed from the population
(Charlesworth and Charlesworth 2016; Charlesworth 2006). Balancing selection might help the
population adapt to a sudden change, such as exposure to a new host. Tajima’s D was 0.73 for 43
P. brassicae strains. The positive value of D indicated that balancing selection was present in
these populations. This supported the observations of several previous studies (Strelkov et al.
2018; Strelkov and Hwang 2014; Manzanares‐Dauleux et al. 2001), which reported a high
percentage of diversity and the preservation of rare pathotypes in P. brassicae populations. The
unique infection process of P. brassicae, which starts with thousands or millions of separate
infections of root hairs from individual resting spore that collectively result in production of one
or a few large clubs, appears to be suited to result in balancing selection. There are some studies
that show that infection by a virulent pathotype can induce susceptibility to other previously
avirulent pathotypes (McDonald et al. 2014), which explains how the low frequency pathotypes
could be maintained in a population. At present, no information is available on the mutation rate
of P. brassicae. Random genetic drift is unlikely to result in rapid genome variation of P.
brassicae because of the large populations of long-lived resting spores in soil.
Only a limited number of studies of genetic diversity among regional populations of
P. brassicae are available, generally based on partial genome sequences rather than the entire
genome. Populations of P. brassicae were highly diverse among regions of Germany (Strehlow
et al. 2014), and among fields and even years at a single site in north western France
(Manzanares‐Dauleux et al. 2001). In contrast, there was limited diversity among collections
80
from Japan (Yang et al. 1992), and diversity was so low among 21 isolates from Alberta that the
authors concluded that the population was clonal (Holtz et al. 2018). None of these studies found
a correlation of DNA pattern with host source or virulence of P. brassicae (Manzanares‐Dauleux
et al. 2001; Crute et al. 1983), which is consistent with the current study.
In a recent study of the entire genomes of five single-spore isolates from Canada,
pathotypes 2, 3, 5, 6, and 8 were compared with the e3 isolate from Europe. Pathotypes 2 and 3
from canola were very similar, but differed from pathotypes 5 and 8, also from canola. Pathotype
6, which was collected from a brassica vegetable, differed from the other four isolates but was
similar to e3 from Europe (Rolfe et al. 2016). Three of the five isolates from this earlier study
were included in the current study and similar results were obtained. However, the DNA
sequences from the previous study were not yet available in GenBank when the sequences for
the current study were analyzed.
In another study, a single-spore isolate from vegetables in British Columbia (ABOT-JE
ss1) also differed substantially from 20 field collections and single-spore isolates in Alberta
(Holtz et al. 2018). ABOT-JE ss1 was not available for the current study, but the original field
collection BC3-V-P6 (ABOT-JE-04-01) and two single-spore isolates from the same initial
collection (BC1-ss2-V-P6 and BC2-ss4-V-P6) were included. Field collection BC3-V-P6 and
single-spore isolate BC1-ss2-V-P6 were very similar to e3 from Europe, which is in consistent
with the previous study (Rolfe et al. 2016).
Genetic similarity with e3 from Europe was high for Clades 1 and 4, and much lower for
Clades 2 and 5. This same pattern was apparent in the lack of similarity between pathotypes

81
present before and after resistance breakdown, as illustrated both in the phylogenetic tree and in
heat map analysis. Both of these broad patterns support the hypothesis that pathotype 3 had
likely been present in the initial population(s) introduced to North America from Europe but was
present only at very low levels on brassica vegetables on the Prairies. Pathotype 3 became
dominant on canola in Alberta only after repeated exposure (and selection for pathotypes virulent
on) to a new host, canola. Prior to the release of the first clubroot-resistant canola cultivar in
2009, all canola cultivars on the Prairies were susceptible to pathotype 3. Currently, selection
pressure from the widespread use of clubroot-resistant canola has resulted in the increase of
numerous new pathotypes capable of overcoming the genetic resistance available in the initial
generation of clubroot-resistant canola cultivars. The diversity and rapid development of these
new, virulent pathotypes (Strelkov et al. 2018) further supports this conclusion. It also indicates
that there may be many pathotypes still to be found among the quadrillions of resting spores
currently present in the soil on the Prairies.
The current study demonstrated that genetic diversity is high in P. brassicae populations in
Canada. This high diversity may be largely the result of two conflicting forces: balancing
selection in P. brassicae, which results in the maintenance of a wide variety of genetic lineages
in the pathogen population, and selection pressure associated with differences in host and source
of genetic resistance. Genetic diversity in P. brassicae was lower on the Prairies, where the
pathogen encounters a narrow host range (primarily canola and susceptible weeds) relative to
other production areas where the pathogen encounters a broad range of brassica vegetables.
Collections from North Dakota were placed in clade 2 and different from collection from
Manitoba in clade 5. This reject the hypothesis that P. brassicae in North Dakota is originated

82
from Manitoba. The similarity of collections from North Dakota with samples from eastern
Canada in clade 2 suggest that P. brassicae in North Dakota was earlier present on Brassica
vegetables in the USA.
It is not known when the pathogen was introduced to Alberta, but data from the current
study support the hypothesis that pathotypes virulent on canola likely took many years to build
up to detectable levels because they occurred at low levels in the initial populations introduced to
the region on brassica vegetables. In addition, new pathotypes appeared on the Prairies as a result
of selection pressure from the widespread use of resistant canola cultivars. Each clade in the
phylogenetic tree contained multiple pathotypes and strains from various hosts, which indicated
that pathotype and host were not the only factors in grouping the strains. For example, the single
spore isolates and their original source from Ontario were very similar but were assigned to a
different pathotype. Moreover, pathotype 5 was different from the new pathotype 5x in clade 4.
Although pathotype 6 was detected only on vegetables, the rest of the pathotypes don’t seem to
be host specific. Overall, the level of the genetic diversity detected in our study was not enough
to pull out the differences between the pathotypes. More samples from each pathotype are
needed to perform the association study and detect the differences among the pathotypes.
Finally, the current study demonstrated that dual tissue cultures provided an excellent source of
DNA for sequencing of this difficult and unique pathogen.

83
CHAPTER THREE
3 Micromanipulation and whole-genome sequence of single spores
3.1 Introduction
There have been several recent studies to investigate the genome of P. brassicae (Holtz et al.
2018; Rolfe et al. 2016; Schwelm et al. 2015), but little is known about the genome size, gene
number, and base composition. Whole-genome sequencing is a powerful tool that can reveal
useful information. The whole-genome sequences available for P. brassicae are based on
samples taken from soil, which are accompanied by soil microbes. The first step for most
genomic and molecular studies is extraction of pure nucleic acids, which represents a challenge
for an obligate pathogen like P. brassicae. Most studies of P. brassicae, by necessity include the
host, P. brassicae, and at least some microbial contamination (Holtz et al. 2018; Rolfe et al.
2016; Schwelm et al. 2015), which can result in problems with critical information about the
pathogen. The disinfection of clubs prior to DNA extraction reduces contamination by soil
microbes but it does not eliminate it completely because the microbes are often present inside the
clubs. Also, there may be several pathotypes of the pathogen in a single club (Xue et al. 2008;
Strelkov et al. 2018). Therefore, samples taken from clubs for extraction and whole genome
sequencing likely contain several genotypes, as well as contamination.

84
Production of single-spore isolates of P. brassicae based on serial dilution prior to
inoculation have been used to examine pathogen diversity (Holtz et al. 2018; Rolfe et al. 2016;
Schwelm et al. 2015; Xue et al. 2008). However, most attempts to efficiently produce single-
spore isolates have not been successful (Voorrips 1996; Jones et al. 1982; Tinggal and Webster
1981; Buczacki 1977). In addition to the low success rate, isolation of single-spores of P.
brassicae is resource-intensive and might be accompanied by microbial contamination.
Single-spore isolates have been used recently for whole genome sequencing of some
pathotypes of P. brassicae by removing the host sequences (Holtz et al. 2018; Rolfe et al. 2016;
Schwelm et al. 2015). Still, no method exists to completely remove the soil microbes from the
host-P. brassicae DNA that is extracted. The genome of dual P. brassicae-Brassica callus
cultures developed and used in Chapter 2 were slightly different from clubbed tissues collected
from the field. It demonstrated that despite careful surface disinfection of the clubs, microbial
contamination is often present inside clubs.
An automatic system for transferring single spores (Trancell model TS008) was
developed by Narisawa et al. (1996) to facilitate single-spore inoculation, but this method has not
been used since. Mechanical micromanipulation is a precise and efficient option for isolating
microorganisms. it uses a micropipette controlled by a hydraulic arm to collect a single cell from

85
a cell suspension and to confirm the presence of single cells in the pipette visually under a
microscope (Wang and Song 2017). The disadvantage of micromanipulation is that it requires a
skilled operator and there is potential for misidentification of cells by an inexperienced operator.
Several techniques to assess the viability of the resting spores have been developed, which could
be used to increase the efficiency of single spore inoculation (Narisawa et al. 1996; Lahlali et al.
2011) by allowing the selection of only viable spores.
Single-cell sequencing (SCS) is a novel approach for assessment of biological diversity.
In recent years, SCS has been used in research on cancer, immunology, microbiology,
neurobiology, and embryogenesis (Wang and Song 2017; Hou et al. 2012; Xu et al. 2012; Navin
et al. 2011). For P. brassicae, isolating single spores from a clubbed root mass is the key step for
SCS. Isolating single spores by serial dilutions is simple but not precise or consistent, and so is
rarely used for SCS (Wang and Song 2017). Micromanipulation represents a superior source of
single cells for SCS. The successful isolation of a single cell can provide a unique and
homogenous genome of a microorganism for sequencing. However, the amount of DNA per cell
(less than 6 pg in a diploid cell) is not sufficient for next generation sequencing.
Whole-genome amplification (WGA) solves the problem of low quantities of DNA by
amplifying the DNA of very small or precious samples such as single cells (Zhang et al. 2016;

86
Van Loo and Voet 2014). Multiple Displacement Amplification (MDA) is a non-PCR method
used for WGA of single cells (Dean et al. 2001), MDA combines the enzyme Phi 29 polymerase
with a gentle alkaline denaturation step to provide highly uniform and accurate SCS from a
single cell (Figure 3-1) (Liang et al. 2014; Dean et al. 2001). Phi 29 polymerase is a DNA
polymerase with 3'→5' prime exonuclease activity derived from a phage. MDA is a simple and
reliable method to achieve accurate amplification of DNA directly from single cells. Random
hexamers bind to denatured DNA, followed by strand displacement synthesis, which results in
40 µg DNA yield (Liang et al. 2014; Dean et al. 2001). To date, WGA has been performed only
on one plant pathogen, Puccinia striiformis f. sp. tritici (Wang et al. 2009), while SCS has not
yet been attempted for any plant pathogen. The objective of this study was to collect single
spores of P. brassicae for amplification of high-quality DNA for SCS, and to use the single
spores to assess the genomic diversity among single spores collected from a single club using
SCS.
The hypothesis for this study is that the genome of single spores taken from a single are not
identical. However, high genome similarity among single spores is expected. We hypothesize
that the differences will be found in pathogenicity related genes and not in the genes responsible
for regulatory functions, which are expected to be highly conserved.

87
Figure 3-1 A schematic of multiple displacement amplification (MDA) for precise amplification
of small targets such as single cells (Liang et al. 2014).
3.2 Materials and methods
3.2.1 Sample preparation
Seed of the highly clubroot-susceptible B. rapa spp. chinensis var. communis cv. Mei Qing Choi
(Stokes Seeds Ltd.) were disinfected in 10% household bleach for 10 min and rinsed several
times with deionised water. The seed was placed on sterile filter paper in Petri dishes and kept at
room temperature for 3 days. Four-day-old seedlings were placed in 1.5 mL Eppendorf tubes
containing half strength Hoagland's solution (Thermo Fisher Scientific).

88
One club per collection of pathotypes 2 and 5 from Normandin (Quebec) and pathotypes 2
and 6 from the Muck Crops Research Station (Ontario) were selected for the study. Spore
suspensions were prepared using a blender and filtration through cheesecloth (Sharma et al.
2011). Each spore suspension was passed through a filter with 50 μm pore size and then
centrifuged at 1000g for 10 min to remove plant debris and soil particles. The pellet was
suspended in ChloramineT (Bio acid disinfectant) for 20 min. The ChloramineT suspension was
centrifuged at 1000g for 5 min. The supernatant was discarded, and the pellet was resuspended in
deionized water and centrifuged to remove any remaining ChloramineT. The supernatant was
discarded, and the pellet was resuspended in deionized water.
3.2.2 Single spore micromanipulation and inoculation
An aliquot (6 µL) of diluted Hoagland's solution containing filtered spores was placed in the
middle of a gridded Petri dish with 6-µL drops of polyvinylpyrrolidone (PVP) around it. The
dish was covered with mineral oil to prevent evaporation of the small droplets. Single spores
were isolated from the spore droplet under a microscope using a 8 μm glass micropipette
controlled using a Leica micromanipulator (Figure 3-2 and Figure 3-4).

89
Figure 3-2 Micromanipulator setup: (A) inverted fluorescent microscope, (B) glass micropipette,
and C. micromanipulator.
Each single spore was placed into one PVP droplet on the dish and checked with a
microscope to confirm that only one spore was present. Each single spore was then transferred
into a 1.5 mL tube containing 1/10 strength Hoagland's solution media and a 3-day-old seedling
(Figure 3-3). Each droplet was checked microscopically for spores that had stayed on the dish.
Seedlings that had not received a spore were discarded. At 7 days after inoculation, each
inoculated seedling was transferred to a 25 mL tube containing Hoagland's solution or a tall
plastic pot containing soilless mix, and then grown in growth room as described previously.
Plants were uprooted at 7 to 9-wk post inoculation and roots were assessed for the clubbing
symptoms characteristic of clubroot.

90
Figure 3-3 Single spore inoculation procedure: (A) each drop contains a single spore, (B) 5-day-
old seedlings inoculated with a single spore and grown in Hoagland's solution.
Figure 3-4 Micromanipulation of a single spore: (A) selection of a single isolated spore (arrow),
(B) collection of a single spore in a micropipette tip, and (C) placement of a single spore.
3.2.3 Whole genome amplification from a single spore
For single-cell amplification, 4 µL PBS solution was used as the holding media instead of 6 µL
1.5% PVP. Single spores were isolated using a micromanipulator as described previously and
placed in 4 µL PBS solution droplets. Each droplet that contained a single spore was placed in a
1.5 mL RNase-free, DNase-free centrifuge tube. Single spores were treated with DNase before
amplification using RQ1DNase kit (Promega, ON). Each single spore was incubated in 10 µL of
DNase digestion reaction at 37o C for 30 min. DNase stop solution was added according to the
manufacture’s protocol. DNase was deactivated at 65°C prior to spore lysis and DNA

91
amplification. The DNase enzyme was used to remove possible contaminating genomic DNA
present on the exterior of the spore or in the 4 µL PBS solution droplets.
Whole-genome amplification was performed using a REPLI-g Single Cell DNA Library
Kit (Qiagen, Mississauga, ON) as recommended by the manufacturer with a modification in the
cell lysing step. The spores were incubated overnight in the lysis buffer at 4°C, with several
freeze and thaw cycles in the lysis buffer. Amplified DNA was quantified using Taqman qPCR
for detection of P. brassicae (Al-Daoud et al. 2017). A forward (DC1F) and reverse primer
(DC1mR) and a probe (PB1) with the 5′ end FAM reporter dye and 3′ NFQ-MGB quencher
were used for accurate quantification of P. brassicae (Deora et al. 2015). The quality of the
amplified DNA was confirmed using a Qubit fluorometric quantification (Thermo Fisher
Scientific).
3.2.4 Library construction, whole genome sequencing, and assembly
The genomic libraries were constructed using shotgun DNA library preparation (NEB Ultra II).
Six single spores were sequenced using a Illumina 2500 HiSeq PE150 sequencing lane via a
contract with Genome Quebec, Montreal. Reads were cleaned based on quality and length using
Trimmomatic (Bolger et al. 2014). Trimmed reads were used for a de novo genome assembly
using SPAdes genome assembler (Bankevich et al. 2012) with a linear mode of k-mer size (21-
33) and SOAPdenovo2 genome assembler (Luo et al. 2012) with a linear mode of k-mer size
(21-33). The reads were mapped against two version of the P. brassicae reference genome
(pbe3.h15 (EnsemblProtists) and Pldbra_eH_r1 (NCBI) as well as Brassica napus (AST-

92
PRJEB5043-v1) reference genome (EnsemblProtists) using Burrows-Wheeler Aligner (Li and
Durbin 2010).
3.3 Results
3.3.1 Single spore isolation and inoculation
Infection success was 5% for pathotype 5X from Normandin, 8% for pathotype 2 from
Normandin, 2% for pathotype 2 from MCRS and 0% for pathotype 6 from MCRS.
Figure 3-5 Clubroot symptoms on seedlings of Brassica rapa grown for 9 weeks after
inoculation: (A and B) with single spore, and (C) positive control inoculated with 100 μL of
spore suspension.
3.3.2 Whole genome amplification and sequencing
The presence of P. brassicae DNA was confirmed in 18 of 20 amplification tubes using qPCR.
The quality and quantity of the amplified DNA was high when visualized on gel electrophoresis
(Figure 3-1). The DNA of only one single spore treated with DNase (Single spore 1) was
detected by qPCR. The five additional samples that were used for sequencing (Single spore 2 to
6) were not treated with DNase.

93
Figure 3-6 Gel electrophoresis of the DNA amplification products from single spores of
Plasmodiophora brassicae. The amplified DNA from 10 spores and extracted DNA of 100 mg
clubbed root were included as positive controls.
A large number of reads were obtained for each single spore by (150-bp) Illumina HI
Sequencing (Table 3-1). Reads were cleaned based on quality and length using Trimmomatic.
Trimmed reads were used for a de novo genome assembly using SPAdes, an assembly algorithm
for single cell sequencing with a linear mode of k-mer size (21-33). Resulted assemblies
(different samples and different k-mers) were compared with the P. brassicae e3 reference
genome. No overlap was found between the assembled genome and P. brassicae reference
genome. This raised the question of whether the assembly pipeline was effective for this
analysis. In a second attempt, de novo assembly of the genomes was done using SOAPdenovo2,
an improved de novo assembler with a linear mode of k-mer size (21-33). Again, the resulted
assemblies (different samples and different k-mers) showed no overlap with P. brassicae
reference genome.

94
Table 3-1 Number of reads (150-bp) produced by Illumina HiSeq sequencing
Treatment No. of reads
Single spore 1 122,994,964
Single spore 2 61,065,709
Single spore 3 68,856,660
Single spore 4 70,526,255
Single spore 5 62,072,611
Single spore 6 53,225,822
To investigate if the reads are really derived from P. brassicae, the reads were mapped
against two version of P. brassicae reference genome (pbe3.h15 (EnsemblProtists) and
Pldbra_eH_r1 (NCBI)) using Burrows-Wheeler Aligner (Li and Durbin 2010). Only 2% of the
reads were successfully mapped. Reads were then mapped against a Brassica napus reference
genome and more than 92% were successfully mapped.

95
3.4 Discussion
Genome information for most obligate plant pathogens, including clubroot of canola, is
extremely limited because they cannot be cultured in vitro. Whole genome sequencing is a
powerful tool that can reveal useful information about the genome and the biology of the
organism, but the extraction of pure DNA of obligate pathogens is challenging and problematic.
A new method to obtain pure DNA for next-generation sequencing was developed. This study
demonstrated that single spores of the clubroot pathogen can be obtained via micro-
manipulation. These single spores can be used for single spore inoculation and differential
pathogenicity of the isolates as well as genomic studies.
Four single-spore isolates were produced using micromanipulation of resting spores.
Despite fast and accurate micromanipulation and inoculation of the resting spores, the infection
rate was not high. The low rate of infection success from single spore inoculation may have
occurred because many of the spores did not germinate. Single-spore isolation of P. brassicae
using other methods, such as serial dilutions of spore suspension, is time consuming, has a low
frequency of success, and may not consistently result from only a single spore (Voorrips 1996;
Jones et al. 1982; Tinggal and Webster 1981; Buczacki 1977). Several attempts and hours of
microscopy work is needed to isolate a single spore with the traditional method. A skilled
micromanipulator can isolate about 50 single spores in one hour. This method also offers
superior precision and quality of single spore isolation and application. The addition of a
viability staining method such as Evan’s blue to test resting spore viability (Al-Daoud et al.
2017; Harding et al. 2019) might increase the efficiency of single spore inoculation by allowing
the selection of only viable resting spores. Single spores obtained through micromanipulation

96
were also used for the amplification of genomic DNA and whole genome sequencing. Although
the qPCR assay used the P. brassicae primer and probes (Al-Daoud et al. 2017) and detected and
quantified a high concentration of P. brassicae DNA in selected samples, less than 10% of the
reads of sequencing were resulted from P. brassicae.
It was surprising to see that in single spore sample 1, which was treated with DNase, more
than 90% of the reads were from B. napus. This indicates that the DNA surrounding the spore
was not completely degraded by DNase. It is also possible that the digested fragments of DNA
were still amplified by Phi 29 polymerase. Clearly, optimizing the DNase concentration and
digestion time is critical for the success of single cell sequencing. DNase treatment can be used
on spore suspensions prior to micromanipulation and the fragmented DNA can be separated from
the spores by density or sucrose gradient methods. The low percentage of P. brassicae DNA in
the sequencing reads also indicated that the cell wall of the resting spores was not fully lysed. To
confirm the presence and quality of the DNA, we used qPCR assays with P. brassicae primers
and probes, which is a common method used for P. brassicae quantification and identification
(Al-Daoud et al. 2017). The high quantity of P. brassicae DNA detected by qPCR in each tube
gave us the confidence that the cell wall was digested and the DNA of P. brassicae was
amplified. However, the sequencing results showed that less than 10% of P. brassicae genome
was sequenced. It is possible that the cell wall was not digested and only the free P. brassicae
DNA in the liquid was amplified. Since this amplification method is developed for human cells,
which lack a cell wall, some additional steps were added: incubating the spores in lysing buffer
overnight and freeze and thaw cycles in the lysis buffer to improve the lysis digestion of the cell
wall. It is possible that chemical cell wall lysing, or more vigorous lysing steps are needed to

97
assure the digestion of the cell wall. The compete digestion of the cell wall should be optimized
in the future, using spore suspensions of P. brassicae. The treatment of lysed spores and non-
lysed spores with viability stains such as Evan’s blue could also be used to examine the optimal
lysing method for single cell DNA amplification.
Additional future research could involve sequencing of several single spores with a low
read depth by a MiSeq sequencer and then choosing the samples in which the whole genome is
present. Later, the genome of selected samples can be used for HiSeq sequencing with a greater
read depth, to compare the genome similarity.
Sequencing single spores of a plant pathogen had not been attempted until we tried to
sequence the whole genome of single resting spores of P. brassicae. The first attempt failed but
provided some important lessons for future studies. With some optimization and additional tests,
we believe that the whole genome of a single cellof a plant pathogen can be sequenced. Rapid
and reliable sequencing of the DNA of single spores will facilitate assessment of the differences
in the genome among individual spores.
Whole genome sequencing of single spores could enhance our understanding of obligate
plant pathogens and the diseases they cause. For example, identification of suitable molecular
markers could be used for rapid, consistent and specific identification of pathotypes. This could
be used to facilitate the optimum deployment of resistance genes in a crop or region where
pathogen immigration from other regions is limited. Sequence data could be used to identify
pathogenicity–related factors for plant breeding programs and to identify molecular markers
associated with pathotypes (Nadeem et al. 2018).

98
In addition, single-spore isolates of each pathotype or race could be developed using
micro-manipulation that would provide a more consistent disease reaction than existing
collections, many of which are highly diverse and susceptible to genetic drift over time. This
would reduce the variability and increase the selection specificity in breeding for resistance
(Sedaghatkish et al. 2019).

99
CHAPTER FOUR
4 Effect of grass crops on resting spore concentration
4.1 Introduction
Several strategies used to manage clubroot in vegetable crops including liming, soil amendments,
and fungicide application (Mitani et al. 2003; Murakami et al. 2002; Webster and Dixon 1991)
are generally considered to be too costly for use in canola (Howard et al. 2010). Cultivar
resistance is the main approach to manage clubroot in canola, but single gene resistance can be
overcome quickly, likely as the result of the high levels of genetic variation in the P. brassicae
population. New pathotypes capable of overcoming clubroot resistance in existing canola
cultivars have been reported recently (Strelkov et al. 2016). Novel techniques and strategies that
can be used as components of an integrated pest management approach for clubroot are required.
To maintain the durability of resistance, the concentration of P. brassicae in soil should
be kept at low levels. The loss of resting spores that occurs in the first 2 to 3 years after a
susceptible crop (Gossen et al. 2019; Peng et al. 2014) is very important in reducing spore levels
in soil, even though some resting spores are very long-lived (Wallenhammar 1996).
Resting spores remain dormant in the soil in the absence of a suitable host and favorable
environmental conditions (Dixon 2009). They germinate in response to root exudates of both
Brassica spp. and non-brassica plants, and release short-lived primary zoospores (Suwabe et al.
2012) that infect the root hairs of Brassica spp. and many other crops in the families Poaceae,
Rosaceae, and Papaveraceae (Feng et al. 2012; Dixon and Lim 2006; Ludwig-Müller et al. 1999;
Macfarlane 1952; Webb 1949). Later, cortical infection was identified in several non-host

100
species using scanning electron microscopy (Ludwig-Muller et al. 1999). The development of
secondary plasmodia has been reported in perennial ryegrass (Lolium perenne), but resting
spores were not formed (Feng et al. 2012).
If the pathogen cannot finish its life cycle within non-host plants, stimulating resting
spore germination should result in a reduction of resting spore populations in soil (Schroth
1964). Therefore, cover crops that stimulate resting spore germination might be used to reduce
the population of resting spores in the soil and decrease inoculum pressure on the subsequent
host crop.
Studies on the effect of grass cover crops on reduction of resting spores have been
inconclusive. Perennial ryegrass resulted in reduced spore numbers in one 3-year field trial (Rod
and Robak 1995). However, it was not effective in another 3-year field trial or when a low
inoculum level (5 × 10⁴ spores g-1) was assessed in a greenhouse study (Friberg et al. 2006).
Cover crops produced only a small reduction in spore number and clubroot severity when tested
in a controlled environment and no effect in a field study in Canada (Ahmed et al. 2011). One of
the important drawbacks of almost all initial studies of resting spore reduction was the high
initial level of spores assessed (Ahmed et al 2011; Friberg et al. 2006), which may have
influenced their conclusions that the cover crops were not effective based on bioassay analysis.
A concentration as low as 1000 spores g-1 dry soil has been suggested as the threshold for
consistent clubroot infection in most susceptible cultivars under conditions conducive for
clubroot (Donald and Porter 2009; Faggian and Strelkov 2009; Murakami et al. 2002). High
initial spore levels made detection of even substantial changes in spore concentration difficult to

101
detect in a bioassay. Furthermore, the visual spore counts that were used in previous studies for
quantification of spores in soil are not reliable (Gossen et al. 2019). Quantitative PCR (qPCR) is
a highly sensitive tool for quantification of clubroot inoculum (Wallenhammar et al. 2012;
Gossen et al. 2019). Also, treatment of the soil suspension with propidium monoazide (PMA),
which penetrates dead cells and binds to DNA to prevent amplification, can be used to quantify
only viable spores of P. brassicae in soil (Al-Daoud et al. 2017). Use of qPCR should permit a
more accurate assessment of the efficacy of grass crops to reduce resting spores concentration in
the soil.
The objective of the current study was to investigate the effect of grass crops on resting
spore concentration in soil under controlled conditions. A growth room study was conducted to
quantify the effect of selected grass cover crops on the concentration of resting spores of
P. brassicae in soil. The cover crops were chosen to represent the range of grass cover crops
used in Western Canada. Assessment of the impact of standard rotation crops and of grass crops
in the field was conducted in parallel with these studies but were not a part of this thesis project.
4.2 Materials and methods
4.2.1 Grass cover crops
Growth room studies were conducted at the University of Guelph. In the initial experiments,
cultivars Signal and Radisson of smooth bromegrass (Bromus inermis L.), cultivar Norlea of
perennial ryegrass (Lolium perenne L.), and cultivars Boreal and Gunne of creeping red fescue
(Festuca rubra var. rubra L.) were evaluated using seed provided by the Forage Breeding

102
program of the University of Saskatchewan, Saskatoon, SK. Each experiment was laid out in a
randomized complete block design with six replicates. The plants were maintained at 25°/20° C
day/night, 18 hr photoperiod, and 65% relative humidity, and watered daily with water adjusted
to pH 6.5 using commercial white vinegar.
4.2.2 Application of inoculum to soil- Study 1
Mineral field soil that was free of clubroot resting spores was collected near Simcoe, ON in
October 2016 (pH 6.3, organic matter 2.4%), mixed 2:1:1 by volume with Sunshine #4 soil-less
mix and non-calcareous granitic sand (Hutcheson sand and mixes, ON).
The resting spore suspension of 5 x 10⁵ resting spores g-1 soil of pathotype 2 collected
from the Muck Crop Research Station was prepared following the methods of Sharma et al.
(Sharma et al. 2011). Sixty grams of clubbed tissue were homogenized in 300mL of autoclaved
water for 2 minutes. The spore number was calculated by a hemocytometer. Pathotype 2 can
cause clubroot on both canola and brassica vegetables (Strelkov, Tewari, et al. 2006; Williams
1966; Ayers 1972; Hildebrand and Delbridge 1995; Reyes et al. 1974). Twenty kg of the soil mix
was inoculated with 2 L of spore suspension prepared to deliver a final concentration of
containing 5 x 10⁵ resting spores g-1 of soil. To get the final concentration of 5 x 10⁵ resting
spores g-1 of soil, a total number of 10 x 109 resting spores for 20kg of soil (5 x 105 x 20,000 g =
10 x 109) was needed. Therefore, 125 mL of the stock suspension containing 8 x 10⁷ resting
spores mL-1 was calculated to contain the total of 10 x 109 resting spores to apply to for 20kg of
soil (10 x 109 / 8 x 107 = 125). Sterile water (1.875 L) was added to 125 mL of the stock

103
suspension to reach the total volume of 2 L. Shanghai pak choi cv. Mei Qing Choi was included
as a susceptible (positive) control, and a bare soil treatment was included as a negative control.
The soil was placed in a plastic storage bin (30L) (Walmart, CA). The spore suspension
was mixed and poured gradually from a 2 L beaker onto the 20kg bulk soil and the soil was
mixed by hand carefully. Aliquots (~ 400 g) of inoculated soil mix were placed in each
disposable plastic cups (~16 oz). Soil samples (100 mg) were taken from each cup for analysis of
spore viability following the method of Al-Daoud et al. (2017). Each sample was treated with
propidium monoazide (PMA) The PMA treatment was used to inhibit the amplification of DNA
from dead or immature spores of P. brassicae, and so only DNA from viable resting spores
would be quantified. Then, DNA was extracted as described below using a DNeasy power soil
kit (Qiagen, CA) and the spore concentration was assessed using Taqman qPCR (Al-Daoud et al.
2017).
Disposable plastic cups (~16 oz) with drain holes punched in the bottom were used as
pots. Each cup was an experimental unit, planted with 20 seeds per cup and thinned to 10
seedlings at 5 days after emergence. A high seeding rate was selected so roots could fill the pot
to stimulate the germination of all resting spores. The seed of Boreal and Gunne did not
germinate, and germination of the other cultivars was low.
The study was ended at 8 weeks after seeding. The foliage was removed, and the roots
were harvested. The soil from each cup was placed in open Ziploc plastic bags and allowed to
dry at room temperature for about a month. The roots were washed, fresh weight was taken, then

104
the roots were placed in paper bags and dried at 60 °C for 3 days and weighed to determine dry
weight.
The air-dried soil was ground with a mortar and pestle, weighed, and subsamples (1 g)
were weighed and oven-dried at 80ºC for 24 hr to determine soil moisture. A small sample (100
mg) of the air-dried, ground soil from each cup was treated with propidium monoazide (PMA) as
describe below) and the spore concentration was quantified using TaqMan qPCR (Al-Daoud et
al. 2017).
4.2.3 Application of inoculum to soil - Studies 2 and 3
The second and third repetitions of the spore concentration study used the same management and
assessment techniques as the initial study with the following changes. The grass species assessed
in Study 1 were replaced with smooth bromegrass cv. Signal, perennial ryegrass cvs. Fiesta, and
All Star, and meadow bromegrass cv. Fleet. Perennial ryegrass Norlea was also included in these
trials. All the seed was from Early’s Farm and Garden Center in Saskatoon, SK. This change was
made to ensure that the seed of each cultivar in the study had strong and consistent germination.
As in the initial study, Shanghai pak choi cv. Mei Qing Choi was included as a positive control
and a bare soil treatment was included as a negative control.
Analysis of DNA concentration in Study 1 indicated that the variability in the spore
distribution within the soil was very high, despite rigorous mixing by hand. To maximize the
uniformity of spore distribution throughout the soil, changes were made in the inoculation
protocol as follows: the dry soil mix was divided into 2 kg units (enough for one replicate) and
each was placed in a clean storage tray. The thickness of the soil in the tray was about 2cm. Then

105
200 mL of spore suspension (to achieve 5 x 10⁵ resting spores g-1 of P. brassicae) per rep was
sprayed with a spray bottle (Fisher scientific, CA) gradually onto the 2kg soil and it was being
thoroughly mixed by hand, to maximize the number of soil particles that came into contact with
the inoculum as it was being applied. The inoculum concentration of 5 x 10⁵ resting spores g-1
soil was prepared at the same time for Studies 2 and 3. Fifty mL of 2 x 10⁸ resting spores mL-1
stock suspension was taken to get 10 x 109 resting spores for 20kg of soil. Autoclaved water
(1.950 L) was added to 50 ml of the stock suspension to reach the total volume of 2 L. Half of the
inoculum was incorporated as described previously into the soil for Study 2 on the same day.
The rest of the inoculum was placed in a refrigerator at 5°C and was used to inoculate the soil for
Study 3 two days later.
In Study 1, weeds germinated in the bare soil treatment and possibly stimulated the
germination of resting spores. Therefore, for repetitions 2 and 3, each cup was inspected every
second day and weed seedlings were removed. The experiments were terminated after 8 weeks
of growth. Root weight shoot weight, and assessment of DNA concentration were as described
for Study 1. The foliage was removed and the soil plus the roots were left to dry at room
temperature for a month. When the soil was dry, the roots from each cup were separated from
soil by sieving, washed with tap water, oven dried at 80ºC for 24 hr and weighed.
4.2.4 DNA extraction and quantification
The air-dried soil from each cup was ground with a mortar and pestle and 100mg of soil was
taken for propidium monoazide (PMA) treatment. The soil samples were treated with PMA or
DEPC water (Invitrogen, CA) following the method of Al-Daoud et al. (Al-Daoud et al. 2017).

106
One gram of air-dried soil was placed in a 50mL tube and 50 mL deionized water was added for
Study 1. The samples were mixed by vortex for 2 minutes. This step was optimized for studies 2
and 3 by decreasing the water volume to 5 mL. Moreover, the tubes were vortexed and kept at
room temperature overnight. For all studies, 94μL of soil suspension was taken 4 times and
placed in 4 tubes of 2mL. In two tubes, 6μL of PMA and in the other two, 6μL of deionized
water were added. The samples were vortexed and spinned quickly and were covered with
aluminum foil and were shaken for 30 minutes at 300 rmp. The samples were placed horizontally
on ice. The samples were exposed to a 500-W halogen light (Globe Electric Company) at 20cm
distance for 15 min to activate the PMA prior to flash freezing for DNA extraction. DNA was
extracted from air dried soil using DNeasy power soil kit (Qiagen, CA) and the spore
concentration was quantified by qPCR using TaqMan qPCR (Al-Daoud et al. 2017)
4.2.5 Statistical analyses
The spore concertation and dry root weight data were analyzed using SAS 9.4 (SAS Institute,
Cary, USA). The data were log transformed to satisfy normality assumptions, and a Type 1 error
estimate of P = 0.05 was used as a cut-off criterion for all statistical tests. The spore
concentration studies were analyzed as a factorial design in analysis of variance withPMA (or
water) and cover crops as the two factors in the analysis. The variance was partitioned into fixed
effects (PMA, grass species and cultivar) and random effects (blocks). Distribution of the data
was assessed using Shapiro-Wilk test of normality and scatterplots. The assumptions were met
once the data were log transformed to satisfy normality assumptions. Three outliers from study 3
were identified (Fiesta and All star in rep 6 and Norlea in rep 5) using Studentized residual
analysis and removed. The spore concentration data from Studies 2 and 3 were tested to see if

107
they could be pooled for analysis. There was no interaction between Studies 2 and 3, so the data
from these two studies could be pooled. However, they were assessed separately because there
was a substantial difference in spore counts between the two studies. The PMA mean did not
differ from the water mean. There was no interaction between the PMA/water treatment and
cover crop treatment, so these data were considered subsamples and least square means were
compared only among grass species using Tukey’s test in PROC GLIMMIX. The coefficient for
regression was calculated between spore concentration and root dry weight variables using
Microsoft Excel through the Regression function.
4.3 Results
4.3.1 Spore concentration - Study 1
In the initial study to assess the effect of selected grass crops on the concentration of resting
spores in soil, severe clubroot (100% for both incidence and severity) developed on Shanghai
pak choi. When the study was terminated at 8 weeks after inoculation, the clubbed roots of the
Shanghai pak choi plants were already decayed, so plant weight could not be measured
accurately. No clubroot symptoms developed on the grasses.
The concentration of total and viable resting spores in soil was estimated using qPCR.
There was no difference between PMA and non PMA-treated in the positive or negative (no
plant) control treatments. The preplant resting spore concentration was lower than expected
(actual = 4.9 x 10⁴ spores g-1, target = 5 x 10⁵ spores (Table 4-1), but all of the estimates for the
cover crop treatments were consistent with this original quantity. There was no change in resting

108
spore concentration in the soil only and Norlea treatments compared with the initial spore
concentration incorporated into the soil. Smooth bromegrass cvs. Signal and Radisson resulted in
reduced spore concentration compared with the initial spore concentration, but only Radisson
had significantly lower spore concentration compared with soil only control (Table 4-1).
Table 4-1 Effect of grass species and cultivar on root weight and the concentration of resting
spores of Plasmodiophora brassicae in soil after 8 weeks of growth, based on estimates from
PMA-qPCR under controlled conditions (n = 6).
Treatment Grass cultivar Mean spore conc.
(x104 spore g -1 soil) 1
Root dry wt
(g pot -1)
Initial spore conc. 4.9 a2
Soil only (control) 3.0 ab
Perennial ryegrass Norlea 3.1 a 0.87 ns
Smooth bromegrass Signal 2.4 bc 1.67
Smooth bromegrass Radisson 1.2 c 1.46
1 Spore estimates were log-transformed prior to analysis but untransformed data are presented. 2Means followed by the same letter do not differ based on Tukey’s test at P < 0.05.
4.3.2 Spore concentration - Studies 2 and 3
In Studies 2 and 3, the grass seedlings were also grown for 8 weeks (Figure 4-1 and Table 4-2)
and clubs developed only on pak choi. The spore concentration experiments were analyzed as a
factorial arrangement for analysis of variance. PMA and cover crop treatment were the two
factors in the analysis. There was no interaction between PMA and cover crops so the PMA and
water data were assessed as subsamples of each cover crop treatment. Also, there was no
treatment by run interaction between Studies 2 and 3, so these data were pooled for analysis.

109
Meadow bromegrass cv. Fleet, common seed of smooth bromegrass, and perennial ryegrass cv.
Fiesta resulted in reduced the spore concentration relative to the bare soil control (Table 4-2).
Figure 4-1 Bromegrass, perennial ryegrass, meadow bromegrass, and Shanghai pak choi grown
for 8 weeks in soil inoculated with 5 x 10⁵ resting spores of Plasmodiophora brassicae per g soil.
Table 4-2 Effect of grass species and cultivar on root weight and resting spore concentration of
Plasmodiophora brassicae in soil, based on estimates from PMA-qPCR (Studies 2 and 3, n = 6).
Treatment Grass cultivar Mean spore conc.
(spores g-1 soil) 12
Root dry wt.
(g pot-1)
Pre-plant soil 1.6 x 10⁶
No plant (control) 1.2 x 10⁶ a
Perennial ryegrass Norlea 5.9 x 10⁵ a 6.35 a
All Star 4.9 x 10⁵ a 6.32 a
Fiesta 2.7 x 10⁵ b 2.73 b
Meadow bromegrass Fleet 5.0 x 10⁵ b 6.44 a
Smooth bromegrass Common seed 4.6 x 10⁵ b 3.85 b
1Spore estimates were log transformed prior to analysis but untransformed data are presented. 2Means followed by the same letter do not differ based on Tukey’s test at P < 0.05

110
Although there was no interaction between Studies 2 and 3, the data were also analyzed
separately for each study. The initial spore concentration incorporated into the soil (5 x10⁵
resting spores mL-1 of P. brassicae) was close to the spore concentration detected by qPCR (4.6
x105 resting spores g-1) after application in Study 2 (Table 4-3). However, the spore
concentration detected in soil after inoculation (2.8 x 10⁶ resting spores g-1) in study 3 was higher
than the target application concentration. When each study was analyzed separately, there were
no differences in Study 2, but Fiesta resulted in reduced spore numbers in Study 3. However, the
same trends were observed in the individual studies as in the pooled data, with perennial ryegrass
cv. Fiesta and the common seed of smooth bromegrass having numerically low spore
concentration (Table 4-3).
Table 4-3 Effect of grass species and cultivar on resting spore concentration of Plasmodiophora
brassicae in soil and assessed at 8 weeks after seeding for Studies 2 and 3 separately (n = 6).
Crop Cultivar Mean spores per g1
Study 2 Study 3
Pre-Plant soil 4.6 x 10⁵ ns 2.8 x 10⁶ a
No plant (control) 2.4 x 10⁵ 2.2 x 10⁶ a
Perennial ryegrass Norlea 3.0 x 10⁵ 8.7 x 10⁵ a
All Star 1.4 x 10⁵ 8.4 x 10⁵ a
Fiesta 1.2 x 10⁵ 4.5 x 10⁵ b
Meadow bromegrass Fleet 2.0 x 10⁵ 8.0 x 10⁵ a
Smooth bromegrass Common seed 1.0 x 10⁵ 8.2 x 10⁵ a
1Spore estimates were log transformed prior to analysis but untransformed data are presented.
ns Not significant based on Tukey’s test at P < 0.05.
There was no study x spore interaction effect on root weight, so the data were pooled for
analysis. Fiesta and the common seed of smooth bromegrass had lower root weight relative to the

111
other grass species / cultivars (Table 4-2). There was not a significant relationship between root
dry weight and reduction in resting spores in Studies 2 and 3. The correlation coefficient was 0.7
and 0.6 in Studies 2 and 3, respectably. R2 was 0.5 in Study 2 and 0.3 in Study 3.

112
4.4 Discussion
This study demonstrated that grass species reduced resting spore concentration over the 8-week
period of the studies under controlled conditions. The reduction in spore numbers associated with
all of the grass crops examined indicated that these species / cultivars might have stimulated the
germination of P. brassicae resting spores in soil. Plasmodiophora brassicae does not complete
its life cycle on these crops, so germination of resting spores resulted in a reduction of resting
spore populations (Schroth 1964). Smooth bromegrass cv. Radisson in Study 1 and meadow
bromegrass cultivar Fleet, common seed of smooth bromegrass, and perennial ryegrass cultivar
Fiesta in the pooled results of Studies 2 and 3, all reduced the concentration of resting spores in
soil compared to bare soil. Smooth bromegrass cv. Signal did not reduce spore numbers in soil in
any study despite a consistent numerical reduction, but this was likely due to the high variability
in the data rather than a differential effect of cultivar on spore reduction.
A few other studies have investigated the efficacy of bait crops for clubroot reduction.
There was only a small reduction in clubroot severity following cover crops when tested under
controlled conditions (Ahmed et al. 2011; Rod and Robak 1995) and no reduction in field studies
(Ahmed et al. 2011; Friberg et al. 2006). The authors concluded that cover crop species do not
reduce clubroot (Ahmed et al. 2011; Friberg et al. 2006). Similarly, non-cruciferous crops (red
clover, perennial ryegrass, orchardgrass, bentgrass, barley, wheat) had no effect on clubroot
severity in an assessment of bait crops in Alberta, although there was a small reduction in spore
concentration in some treatments in both growth room and field studies at sites where the initial
spore concentration in the soil was moderate (9.4 x 10⁶ resting spores g-1 soil) (Ahmed et al.
2011). In most or all of these studies, even a massive (e.g., 95%) reduction in spore concentration

113
by the cover crop might not have been adequate to result in low clubroot severity in subsequent
bioassays. The concentration of 1000 spores g-1 dry soil has been suggested as the threshold for
consistent clubroot infection and yield loss in most susceptible cultivars (Donald and Porter
2009; Faggian and Strelkov 2009; Murakami et al. 2002).
Eight weeks was selected for the duration of the growth room studies to provide time for
the roots to penetrate most or all of the soil in each sample. Grass crops are usually grown for
several years in the field. The longer the grass crop is allowed to remain in a field, the more root
hairs and root exudates it will produce. Also, roots will penetrate deeper in the soil. Resting
spore concentration was highest in the top 0 to 30 cm of soil in two recently infested fields in
Alberta, but large numbers of resting spores were present at depths 50 cm or more within the soil
profile at three sites in Ontario where the pathogen has been present for many years (Cranmer et
al. 2017). We hypothesize that root access to resting spores throughout the soil profile will
increase over time and enhance the efficacy of clubroot reduction. However, field trials to assess
the effect of grass crops over several years are required to validate this hypothesis.
In Study 3, spore numbers detected in the soil were larger than the target application,
despite careful preparation of the inoculum for the repetition. The inoculum for Studies 2 and 3
was prepared together, then divided into two for the two Studies and applied to each Study in a
similar way. The inoculum for Study 2 was applied at the same day that the inoculum was
prepared, and the inoculum for Study 3 was refrigerated and applied 2 days later. Resting spores
of P. brassicae tend to clump rapidly and drop out of suspension. It is possible that when the
spore suspension was divided, some spores were already sinking out of suspension, resulting in

114
more spores in Study 3 relative to Study 2. For future work, we conclude that it is very important
to keep the suspension agitated.
Even if the grass crops had produced no reduction in resting spore concentrations, they
would still be important for clubroot management because they minimize soil movement by
holding the topsoil in place, and thus limit the spread of P. brassicae resting spores. Reduction in
resting spore concentration is a bonus to the main benefit of holding the soil in place.
In summary, the results of the current study showed that grass crops have potential to
reduce resting spore concentration in soil, in addition to their main role in limiting the movement
of the soil out of existing patches of clubroot infestations. This result contradicts much of the
literature on assessment of grass crop efficiency in clubroot reduction. Therefore, the efficiency
of grass crops and other non-hosts on resting spore concentration needs to be further assessed
and validated at field sites with low levels of spore concentration. Crops used in rotation with
canola, such as wheat, barley, oat and soybean, also need to be tested for spore reduction. Also, a
spore concentration lower than 5 × 10⁴ resting spores g-1 soil could be tested in growth room
studies to assess if a measurable reduction in clubroot severity is observed. A longer duration for
growth room studies might be used to assess the longer-term effects of these crops in spore
reduction.

115
CHAPTER FIVE
5 Evaluation of Piriformospora indica and other mycorrhizal fungi
on clubroot of canola
5.1 Introduction
The mycorrhizal fungus, Piriformospora indica, was first isolated in association with Glomus
mosseae in the 1990s in Rajasthan, India from the rhizosphere of shrubs (Verma et al. 1998).
Unlike most mycorrhizal fungi in the phylum Glomeromycota, P. indica is in the phylum
Basidiomycota, order Sebacinales, and can colonize the roots of brassica plants (Vahabi et al.
2015, 2016; Lee et al. 2011; Sun et al. 2010). Piriformospora indica promotes growth of roots
and shoots, and root hair and lateral root formation in Chinese cabbage (Brassica campestris
subsp. chinensis) (Lee et al. 2011; Sun et al. 2010). It also increased the uptake of nitrogen in
plants treated with P. indica, which resulted in plant growth promotion (Das et al. 2014; Kumar
et al. 2011; Shahollari et al. 2007). It did not promote plant growth, however, when Arabidopsis
plants were grown in nitrogen deficient media (Banhara et al. 2015).
In studies of colonization of Chinese cabbage by P. indica, auxin levels were two times
higher in inoculated Chinese cabbage compared to the non-treated control. Also, the genes
responsible for cell wall acidification, intercellular auxin transport carrier proteins, and auxin
signal proteins were up-regulated (Lee et al. 2011), whichindicated that auxin biosynthesis and
signaling in Chinese cabbage were affected by P. indica. In addition, P. indica increased the
activity of antioxidant enzymes responsible for drought tolerance (Sun et al. 2010). Another
study demonstrated that P. indica upregulated genes involved in various types of transport,
carbohydrate metabolism, auxin signaling, cell wall metabolism, and root development in

116
Chinese cabbage (Dong et al. 2013). These findings demonstrate a mutualistic relationship
between this Brassica spp. and P. indica. Studies at the University of Alberta on abiotic stress
showed that colonization by P. indica increased canola growth and yield (Zwiazek 2016).
Piriformospora indica also induced resistance in several crops such as barley, wheat, and tomato,
and even Arabidopsis against a wide range of diseases. These included powdery mildew
(Blumeria graminis) (Stein et al. 2008; Serfling et al. 2007; Waller et al. 2005), fusarium root rot
(Fusarium graminearum and F. culmorum) (Deshmukh and Kogel 2007; Serfling et al. 2007;
Waller et al. 2005), root rot (Cochliobolus sativus) (Waller et al. 2005), maize root disease
(Fusarium verticillioides) (Kumar et al. 2009), yellow leaf mosaic (Pepino mosaic virus) (Fakhro
et al. 2010), eyespot (Pseudocercosporella herpotrichoides) (Serfling et al. 2007), and
verticillium wilt (Verticillium dahlia) (Fakhro et al. 2010). The resistance to biotic stresses
promoted by P. indica indicated that it may also stimulate resistance to clubroot in canola and
other brassica crops. If P. indica is approved for use on canola to increase crop growth, it will be
useful to know if this unusual mycorrhizal fungus also suppresses clubroot.
Ectomycorrhizal fungi such as Laccaria bicolor (Maire) P.D. Orton, are known to regulate
auxin homeostasis in Arabidopsis (Felten et al. 2009). Laccaria bicolor transfers the auxin
hormone to root apices and blocks the transport and accumulation of polar auxin (Felten et al.
2009). Since auxin accumulation is essential for the development of P. brassicae,
ectomycorrhizal fungi might be also able to affect clubroot development. Ectoycorrhizal fungi
are cam also provide a physical barrier to infection (Zak 1964), so P. indica might limit
penetration of zoospores into the root cortex.

117
An unpublished study in our laboratory investigated the effects of P. indica and Root
Rescue (Environmental Products Inc. Waterdown, ON), a commercial formulation that is a
mixture of ecto- and endomycorrhizal species, on clubroot in a clubroot-susceptible canola line,
ACS N39. Four treatments were compared: 1) seed treatment with P. indica, 2) seed inoculated
with Glomus intraradices Schenk and Smith (AGTIV, Premier Tech, Québec), 3) Root Rescue
(commercial formulation), and 4) a nontreated control. The seedlings were inoculated with 0, 5 x
105, 1 x 10⁶, or 1 x 10⁷ spores of P. brassicae mL-1. Clubroot severity was slightly reduced by P.
indica (69 ± 7%) and Root Rescue (66 ± 6%) treatments relative to the control (80± 4%) when
seedlings were inoculated with 5 x 10⁵ spores mL-1 but not at higher concentrations (Fadi Al-
Daoud, personal communication). This suggested that P. indica and Root Rescue might reduce
clubroot severity under low disease pressure.
The resistance to biotic stresses promoted by P. indica in other crops indicated that it may
stimulate resistance to clubroot by promoting plant growth as well as modifying cell walls, auxin
metabolism and levels. The objective of this study was to evaluate the efficacy of P. indica and
other mycorrhizal fungi to reduce the severity of clubroot on canola.
5.2 Materials and methods
5.2.1 Seed treatment
Seed of canola breeding line ACS N39 (AAFC, Saskatoon Research and Development Centre)
were coated with P. indica using a proprietary process at the Agricultural Life and
Environmental Sciences Department at the University of Alberta by Dr. J. Zwiazek. Non- treated

118
and disinfected seeds that underwent the same process at the University of Alberta, and non-
treated and non-disinfected seed were used as controls.
5.2.2 Root colonization
Twenty canola seeds coated with P. indica were plated on yeast extract malt extract agar media
containing 4 g yeast extract, 10 g malt extract, 4 g glucose, and 20 g agar per liter and compared
to 20 untreated seeds After 4 to 6 days, roots were removed and cleared by boiling in 10% (w:v)
KOH for 5 min following the method of Vierheilig et al. (Vierheilig et al. 1998). The roots were
washed several times with tap water, and the cleared roots were boiled for 3 min in 10% Shaeffer
Black ink solution in 25% acetic acid (Vierheilig et al. 1998). Roots were washed in tap water
acidified with a few drops of vinegar for at least 20 min. Stained roots were observed for growth
of the P. indica using a bright field microscope (Nikon Eclipse 50i microscope) and 40x
magnification of the objective lens.
5.2.3 Growth room studies 1 and 2
Seed coated with P. indica were planted into tall, narrow plastic pots (conetainers, Steuwe and
Sons, CO) filled with soil-less mix (Sungro LA4). There were two control treatments: non-
treated canola seed and seed treated using the proprietary process at the University of Alberta but
not inoculated with P. indica. Each pot was planted with two seeds and thinned to one seedling
prior to inoculation. The experiment was conducted in a randomized complete block design with
four replicates, three plants per experimental unit, and 16 treatments. Each pot was inoculated
with 5 mL of water (mock inoculation), or 5 mL of resting spore suspension of P. brassicae (5 x
104, 5 x 10⁵, or 5 x 10⁶ resting spores mL-1) applied at the stem base at 1 week after seeding.

119
There were six treatments to evaluate the commercial formulation of mycorrhizal fungi, Root
Rescue, which consisted of canola seed inoculated with 1 g (20 mL of a 50 g L-1 suspension) of
Root Rescue full formulation (Table 5-1) that included kelp extract and humate, Root Rescue full
formulation without the humate (20 mL of a 25 g L-1 suspension), and Root Rescue clay (20 mL
of a 25 g L-1 suspension). The two final treatments consisted of canola seed inoculated with 100
spores of Glomus intraradices on each seed for a total of 200 spores per pot. Study 2 assessed
the same treatments as Study 1, with the addition of a treatment with 10 mL of 2.45 g L−1
nitrogen (17.5 g KNO3 L-1 ) to assess the effect of high nitrogen on P. indica efficacy (Table
5-2).
Plants were grown in a growth room maintained at 25°/20° C day/night, 18 hr
photoperiod, and 65% relative humidity. The plants were watered daily with tap water adjusted
to pH 6.5 using commercial white vinegar. Six-wk-old plants were uprooted and examined for
clubbing symptoms. Clubroot incidence and severity (0–3 scale) were assessed, a disease
severity index (DSI) was calculated as described previously and shoot dry and fresh weights
were measured.

120
Table 5-1 Species of mycorrhizal fungi and concentration in the Root Rescue product.
Genus and species Propagules g-1
Glomus intraradices 18
G. mosseae 18
G. aggregatum 18
G. etunicatum 18
G. clarum 14
G. deserticola 14
Gigaspora margarita 14
Paraglomus brasilianum 14
G. monosporum 14
Rhizopogon villusolus 104,000
R. luteolus 104,000
R. amylopogon 104,000
R. fulvigleba 104,000
Pisolithus tinctorius 626,000
Laccaria bicolor 42,000
L. laccata 41,750
Suillus granulates 130,000
S. punctatapies 130,000

121
Table 5-2 Mycorrhizal treatments of Piriformospora indica and Root Rescue, challenged with
selected concentration of resting spores of Plasmodiophora brassicae (Pb) applied to canola seed
in two growth room studies.
Treatments, Study 1 Spores
Pb mL-1
Treatments, Study 2 Spores
Pb mL-1
Non-inoculated control 0 Non-inoculated control 0
Non-inoculated control (U of A) 0 Non-inoculated control 0
Inoculated control (U of A) 5 x 10⁴ Inoculated control (U of A) 5 x 10⁴
nd Inoculated control (U of A) 5 x 10⁵
nd nd
nd Inoculated control 5 x 10⁴
Inoculated control 5 x 10⁵ Inoculated control 5 x 10⁵
Inoculated control 5 x 10⁶ nd
Piriformospora indica 5 x 10⁴ P. indica 5 x 10⁴
P. indica 5 x 10⁵ P. indica 5 x 10⁵
P. indica 5 x 10⁶ nd
nd P. indica + N 5 x 10⁴
nd P. indica+ N 5 x 10⁵
Root Rescue (RR), no humate 5 x 10⁴ RR, no humate 5 x 10⁴
RR, no humate 0 nd
RR, clay only 5 x 10⁴ RR, clay only 5 x 10⁴
RR, clay only 0 nd
RR 5 x 10⁴ RR 5 x 10⁴
RR 0 RR 0
nd RR, humate only 5 x 10⁴
Glomus intraradices 5 x 10⁴ nd
G. intraradices 0 nd
Each pot was inoculated with 5 mL of water (non-inoculated control), or 5 mL of a resting spore
suspension of P. brassicae. The ingredients of Root Rescue, G. intraradices, P. indica, P. indica
+ N, and were applied at seeding. Non-treated canola seed and treated canola seed from the
University of Alberta were included as controls.

122
5.2.4 Field trial
A field trial was established to assess the effect of Root Rescue on clubroot reduction. Soil
samples were taken from range 4 of the Muck Crop Research Station to identify a location with a
moderate spore load of P. brassicae for the trial. Samples were collected from the front, middle,
and back of range 4, dried at room temperature, DNA was extracted and spore concentration was
quantified using PMA-PCR (Al-Daoud et al. 2017). Plasmodiophora brassicae spore
concentration was 5 x 10⁵ spores in the front, 5 x 10⁶ in the middle, and 2 x 10⁵ per g soil in the
back of range 4. The back of range 4 was chosen for the field trial. Canola line ACS N39 was
seeded on organic soil (pH ≈ 6.2, organic matter ≈ 70%) on 15 June, 2017 in a randomized
complete block design with four blocks, six treatments, and four 5-m-long rows per plot.
Treatments were applied at seeding at 60 mL water m-1 row and consisted of: 1) non-treated
control, 2) the recommended rate of Root Rescue (0.6 g L-1 suspension, 0.002 g seed-1), 3) 0.5X
rate of Root Rescue (0.3 g L-1 suspension, 0.001 g seed-1), 4) 2X rate of Root Rescue (1.2 g L-1
suspension, 0.004 g seed-1), 5) 1X of Root Rescue clay only, and 6) 1X rate of Root Rescue,
without the kelp extract and humate found in the commercial formulation.
An Earthway push seeder fitted with an Earthway 1002-9 disc was used with the back
chain tied up to leave the seed exposed on top of the soil until the treatments were applied.
Treatments were applied on the same day as seeding with a single TecJet yellow 8002 nozzle
calibrated to deliver 250 L ha-1. The seed was then covered with soil manually. Six days after
seeding, samples were taken to assess the colonization of the seedling roots using a light
microscope. At 6 wk after seeding, 100 plants from the two center rows of each plot were
uprooted and plant fresh and dry weight were measured.

123
Table 5-3 Treatments of Root Rescue (a commercial mixture of mycorrhizal fungi plus clay,
kelp extract and humate) and components applied to canola seed at a muck soil site naturally
infested with Plasmodiophora brassicae at the Muck Crops Research Station, Holland Marsh,
ON in 2017.
5.2.5 Outdoor pot trial
Piriformospora indica is not (to our knowledge) registered for use in the field in Canada. A pot
study was established to assess the fungus under conditions that would mimic the field as closely
as possible. A pot trial was established in outdoor microplots at the Muck Crops Research
Station (MCRS), King, ON. Canola line ACS N39 was seeded on organic soil (pH ≈ 6.2, organic
matter ≈ 70.4%) June 15, 2017, in a randomized complete block design with six blocks of three
treatments and 10 pots per experimental unit. Treatments were: 1) seed treated with P. indica at
the University of Alberta, 2) control U of A (seed treated at U of A, but not inoculated with
P. indica), and 3) control (seed not treated or inoculated). Canola seeds were planted into 20 cm
× 15 cm dia. pots filled with muck soil containing P. brassicae pathotype 2 collected from range
4 at the MCRS. Each pot was planted with four seeds and watered once per week. Six-week-old
plants were uprooted and examined for clubbing. Clubroot incidence and severity (0-3 scale)
were assessed as described previously. All soil was autoclaved following the study.
Treatment Rate per seed
Nontreated control 0 (5 mL of water)
Root Rescue (RR) 0.001 g (0.3 g L-1 suspension)
0.002 g (0.6 g L-1 suspension)
0.004 g (1.2 g L-1 suspension)
Clay only 0.002g (0.6 g L-1 suspension)
RR, no kelp or humate 0.002g (0.6 g L-1 suspension)

124
5.2.6 Statistical Analysis
Clubroot incidence (CI), severity (DSI), and fresh and dry shoot weight data were analyzed using
SAS 9.4 (SAS Institute, Cary, USA) in a factorial analysis of variance. Inoculation with
P. brassicae and treatment with mycorrhizal fungi were the two factors in the analysis. A mixed
model analysis was conducted using the PROC GLIMMIX procedure. A Type 1 error threshold
of 0.05 was used for all statistical tests. The dependent variables were CI and DSI. The variance
of DSI and CI was partitioned into fixed effects (mycorrhizae, P. brassicae inoculum
concentration, and mycorrhizae × P. brassicae inoculum concentration) and random effects
(blocks). Least square means were compared pairwise using Tukey’s test. The pdmix800.sas
macro was used to convert the pairwise differences into letter codes. The assumptions underlying
analysis of variance are that the model effects are additive, and that errors are independent of
model effects, normally distributed, random, have a mean of zero and are homogenous over the
level of factors. The assumption of normality was tested using Shapiro-Wilk test and scatterplots.
The remaining assumptions of the analysis of variance was tested using plots of Studentized
conditional and marginal residuals. No pattern of deviation from these assumptions was
observed.

125
5.3 Results
5.3.1 Root colonization
Colonization of roots by P. indica was assessed by microscopy in 4- to 7-day-old canola
seedlings grown in vitro on yeast extract malt extract agar media. The roots were colonized by
P. indica, and characteristic chlamydospores formed after 6 days (Figure 5-1).
Figure 5-1 Colonization of roots of 6-day-old canola seedlings by Piriformospora indica:
A, non-treated control, B and C, roots with characteristic chlamydospores of P. indica, stained
with aniline blue, and D, seedlings grown from P. indica treated seed.
5.3.2 Growth room studies
The colonization of canola roots by P. indica, G. intraradices, and Root Rescue were examined
on canola plants grown in a controlled environment. Six 7-day-old seedlings per treatment were
uprooted, washed, and observed by microscopy using a 40X objective lens. The hyphae and
chlamydospores of P. indica were observed in P. indica treated canola roots (Figure 5-1 and
A B
C D

126
Figure 5-2). Roots treated with Root Rescue were colonized by ectomycorrhizal fungi. However,
hyphae, arbuscules, and vesicles of G. intraradices were not found in canola roots. This
demonstrated that G. intraradices did not colonize canola roots, which was consistent with many
reports that brassica plants cannot be colonized by Glomeromycetes fungi.
Figure 5-2 Colonization of roots of 7-day-old canola seedlings by Piriformospora indica:
A, no colonization in non-treated control, and B, roots showing colonization following treatment
with Root Rescue and stained with aniline blue.
Clubroot incidence and severity were assessed on 6-week-old canola plants and fresh
weight and dry weights were measured. The DSI data from treatments included in both Studies 1
and 2 were pooled and analyzed as a factorial. The concentration of inoculum of P. brassicae
and mycorrhizae treatments were the two factors, with study as a third factor. The inoculum x
study interaction was significant. Therefore, the different inoculum levels could not be pooled
across studies. When treatments with inoculum level of 5 x 10 4 spores were analyzed, there was
no study x treatment interaction. When analyzed without including inoculum level as a factor,
Root Rescue resulted in reduced DSI compared with the control inoculated with 5 x 10 4 spores
(Table 5-4).

127
Table 5-4 The effect of seed treatment with Pirformospora indica and Root Rescue mycorrhizal
formulation on clubroot severity (disease severity index, DSI) on canola in two growth room
studies. Treatments that were the same in both studies and at the inoculum concentration (5 x 10
4 spores mL-1) were pooled (n = 8).
Treatment Mean DSI ^
Root Rescue, no humate 70 a
P. indica 64 a
Root Rescue clay 62 a
Control, U of A 61 a
Root Rescue full 51 b
^ Means followed by the same letter do not differ based on Tukey’s test at P < 0.05.

128
5.3.2.1 Growth room Study 1
Based on factorial analysis, there was a significant treatment x inoculum concentration
interaction for both clubroot incidence and severity. There were no differences in incidence
among treatments (Figure 5-3) (Table 5-2). A significant difference in disease severity was
observed between plants treated and non-treated with P. indica when plants were inoculated with
5 x 10⁵, but not 5 x 10⁴ resting spores mL-1 of P. brassicae (Figure 5-3, B and C). There was
0
20
40
60
80
100
Control UofA Glomus P. indica RR full RR w/o
humate
RR clay
5 x 10^4 CI DSI
ns
ns
0
50
100
150
Control P. indica
5 x 10^6
a a
a a
0
50
100
150
Control P. indica
5 x 10^5
a b
a a
A B
C
Figure 5-3 The effect of seed treatment of canola with mycorrhizal fungi on clubroot incidence
(CI) and severity (DSI) when inoculated with Plasmodiophora brassicae at A, 5 x 10⁴ spores;
B, 5 x 10⁵; C, 5 x 10⁶ resting spores mL-1 based on Tukey’s test at P > 0.05 (n = 4).
Treatments: Control = non-treated, Control UofA = seed from University of Alberta, Glomus =
Glomus intraradices, P. indica = Piriformospora indica, RR = Root Rescue.

129
high variability in the results and the second study was conducted with five repetitions, an
increase from four repetitions in Study 1.
The root and shoot weight of the same treatments for all the concentrations of resting
spores from Studies 1 and 2 were pooled and analyzed. There were no differences among the
treatments in fresh or dry root weight.
The fresh weight and dry weight of canola roots treated and non-treated with mycorrhizae from
Study 1 were also analyzed separately. There were no difference in fresh or dry weight among
treatments when plants were inoculated with 5 x 10⁵ or 5 x 10⁶ resting spores mL-1 of
P. brassicae, or in fresh weight at 5 x 10⁴ (Figure 5-4). However, plants treated with the Root
Rescue full formulation, Root Rescue clay, and Root Rescue without humate had a lower dry
weight compared with plants treated with G. intraradices. Plants treated with Root Rescue
products had poorer germination (6 to 7 plants out of 10), germinated later than other treatments
and generally looked unhealthy.

130
Figure 5-4 Effect of seed treatment with mycorrhizal fungi on fresh and dry weight of
canola roots, when inoculated with Plasmodiophora brassicae at 5 x 10⁴ spores, 5 x 10⁵
and, 5 x 10⁶ resting spores mL-1 based on Tukey’s test (P > 0.05).
Control = non-treated, Control UofA = seeds from University of Alberta, Glomus =
Glomus intraradices, P. indica = Piriformospora indica, RR = Root Rescue.

131
5.3.2.2 Growth room Study 2
The second growth room study repeated many of the treatments in the first study, with a few
additions: an inoculated control at 104 and 105 spores mL-1, P. indica + N (10 mL of 500 mg L−1
N) inoculated with 104 spores mL-1, P. indica + N inoculated with105 spores mL-1, and Root
Rescue humate inoculated with 104 spores mL-1 (Table 5-2). The inoculum concentration of 106
spores mL-1 was removed and 104 spores mL-1 was applied to control and P. indica to test the
efficacy of mycorrhizae when disease pressure was low. The treatment with 500 mg L−1 N
(Banhara et al. 2015) was added to test the effect of high nitrogen on P. indica efficacy. Clubroot
incidence and severity were assessed and analyzed in a factorial analysis. There were no
differences in incidence and severity when plants were inoculated with 5 x 10⁵ resting spores
mL-1 of P. brassicae. The only difference was a decrease in DSI with the Root Rescue full
formulation compared with inoculated control at 5 x 10⁴ resting spores mL-1 of P. brassicae
(Figure 5-5).

132
Figure 5-5 The effect of seed treatment with mycorrhizal fungi on clubroot incidence and
severity on canola under controlled conditions in Study 2:
A, 5 x 10⁴; and B, 5 x 10⁵ resting spores mL-1 based on Tukey’s test (P > 0.05).
Treatment are: Control = non-treated seeds, Control UofA= seed from University of Alberta,
Glomus = Glomus intraradices, P. indica = Piriformospora indica, P. indica+ N =
Piriformospora indica and nitrogen, RR = Root Rescue.
0
20
40
60
80
100
Clu
bro
ot
level
5 x 10^4
CI DSIns a ab ab
ab
0
20
40
60
80
100
Control Control UofA P. indica P.indica+N
Clu
bro
ot
level
5 x 10^5
ns ns
a
A
B
a ab b

133
The fresh weight and dry weight of canola shoots and roots were also measured. Plants
treated with P. indica + N had a greater shoot fresh weight compared with controls or P. indica-
treated plants inoculated with 5 x 10⁵ resting spores mL-1 of P. brassicae. Shoot dry weight was
greater in P. indica + N treated plants compared with the control disinfected at the University of
Alberta (Figure 5-6, B).
Root dry weight was greater in plants treated with P. indica + N compared with controls
inoculated with 5 x 10⁴ resting spores mL-1 of P. brassicae, but there were no differences in root
fresh weight (Figure 5-6, C). When plants were inoculated with 5 x 10⁵ resting spores mL-1 of
P. brassicae, both fresh and dry weight of roots were greater in plants treated with P. indica+N
than with P. indica alone (Figure 5-6, D). However, there was no N only control with no P.
indica to compare with the P. indica+N treatment (Table 5-2).

134
Figure 5-6 The interaction of seed treatment with mycorrhizal fungi and inoculation with rates
of resting spores mL-1 of Plasmodiophora brassicae on fresh and dry weight of canola shoots
(A and B) and roots (C and D) at with 5 x 10⁵ resting spores mL-1 (B and D) and 5 x10⁴ spores
mL-1 (A and C) based on Tukey’s test at P > 0.05).
Control = non-treated seed, Control UofA = seed treated at University of Alberta, Glomus =
inoculated with Glomus intraradices, P. indica = inoculated with Piriformospora indica,
P. indica+N = P. indica plus nitrogen, inoculated with RR = Root Rescue.

135
5.3.3 Field trial
A field trial was conducted to assess the effect of Root Rescue on clubroot severity. One hundred
canola plants per plot were uprooted at 6 weeks after seeding, and clubroot incidence and
severity were assessed (Figure 5-7). There were no differences in incidence or severity among
treatments because CI and DSI were 100% in all the treatments.
Figure 5-7 Trial to assess Root Rescue application to canola seed planted on a naturally
clubroot-infested muck soil at Muck Crops Research Station, Holland Marsh, ON in 2017.
The fresh weight and dry weight of canola shoots and roots treated and non-treated with
different concentrations of Root Rescue full formulation, Root Rescue clay, and Root Rescue
without humate and grown in the field were measured. There were no differences in shoot or root
dry and fresh weight among treatments (Table 5-5).

136
Table 5-5 Effect of seed treatment with Root Rescue (RR) on canola biomass (fresh and dry
weight) of shoots and roots in a field trials at the Muck Crop Research Station in 2017.
Treatments Rate
(g/L)
Shoot biomass (g) Root biomass (g)
Fresh SE Dry SE Fresh. SE Dry. SE
Control 9.6 ns 3.9 1.1 ns 0.4 3.7 ns 0.9 0.5 ns 0.1
RR 0.12 6.4 1.9 0.7 0.2 3.0 0.6 0.2 0.0
RR 0.6 4.6 2.3 0.7 0.2 2.6 0.8 0.4 0.0
RR 0.3 6.1 1.6 0.8 0.2 3.1 0.5 0.5 0.0
RR, clay only 0.6 3.3 0.2 0.5 0.0 2.7 0.3 0.3 0.0
RR, no humate 0.6 6.3 1.7 0.7 0.1 3.0 0.4 0.4 0.0
ns = not significant based on Tukey test (P > 0.05) (n = 4).
5.3.4 Outdoor pot trial
A pot trial was established to assess the effect of P. indica under conditions that would mimic the
field. The emergence of canola seeds was low due to flooding that occurred 5 days after seeding,
but CI and DSI were 100% for all treatments. The germination rate was only 3% for P. indica-
treated seeds (8 plants), 28% for control UofA (76 plants), and 31% for control (69 plants) This
trial was not repeated because the growth room studies showed little or no effect of P. indica.

137
5.4 Discussion
In previous studies with commercial biocontrol agents, clubroot severity was consistently
reduced under controlled conditions, but only occasionally reduced in the field (Peng et al.
2014). In another study, treatment with Heteroconium chaetospira root colonizing fungi showed
52–97% clubroot reduction in the field (Narisawa et al. 2000). Currently, there is no commercial
biological control recommended for clubroot management in Canada. Priformospora indica
showed promising results for improving canola yield under stress conditions (Vahabi et al. 2015,
2016; Lee et al. 2011; Sun et al. 2010) and increasing resistance to several pathogens in
Arabidopsis (Vahabi et al. 2016). However, there have been no previous studies on the effects of
mycorrhizae against clubroot.
Controlled environment studies, a pot trial and field trials were conducted to evaluate the
efficacy of P. indica, G. intraradices, and Root Rescue,found no reduction in clubroot .
Symptom reduction by P. indica was observed in one controlled environment study when plants
were inoculated with 5 x 10⁵ spores mL-1 of P. brassicae, but not at 5 x 10⁴ or 5 x 10⁶ spores mL-
1. Symptom reduction by Root Rescue was observed only when plants were inoculated with 5 x
104 resting spores mL-1 of P. brassicae.
The ceectomycorrhizal fungi in Root Rescue formulation may be responsible for the
reduction in clubroot severity in canola since G. intraradices, which is an important vesicular
mycorrhizal species in the mixture, did not have an effect on clubroot severity. Ectomycorrhizal
fungi such as Laccaria bicolor present in Root Rescue might have a role in clubroot reduction
because it has been shown to alter the biosynthesis of auxin in plants (Felten et al. 2009). Also,
ectomycorrhizal fungi could limit the penetration of zoospores by occupying infection sites and

138
acting as a physical barrier to infection. It is interesting to note that clubroot severity was lower
on control (nontreated) seed pretreated in the proprietary process at the University of Alberta
relative to control seed that did not undergo the proprietary process.
These results were not consistent with results previously obtained in our laboratory, where
P. indica and Root Rescue reduced clubroot severity in plants inoculated with 5 x 10⁵ resting
spores mL-1 of P. brassicae. The high clubroot pressure in Study 2 may have overwhelmed the
effect of mycorrhizal fungi. Root Rescue only reduced clubroot severity when seeds were
inoculated with the lowest rate (5 x 10⁴) resting spores mL-1 of P. brassicae, but none of the
components that were assessed separately had any effect.
In the current study, treating seed with P. indica did not promote growth of canola, based
on assessment of fresh and dry weight of roots and shoots. This did not support the results of
previous studies at the University of Alberta, which reported improvements in the growth of
canola with P. indica (Zwiazek 2016). Application of nitrogen with P. indica in the current study
increased shoot and root growth, as observed previously (Das et al. 2014; Kumar et al. 2011;
Shahollari et al. 2007), but there was no N control so it is not possible to determine if the effect
was solely because of the additional N or if P. indica was more effective in the presence of high
N.
Application of mycorrhizal fungi (Root Rescue or P. indica) had no effect on plant growth
or clubroot severity in pot or field trials, possibly because disease pressure was high in the field.
This is consistent with research on other biological controls, such as Heteroconium chaetospira,
which were not effective at high concentrations of resting spores (Lahlali et al. 2014; Narisawa et

139
al. 2005). Generally, environmental conditions play an important role in the success of biological
control agents. Many are not effective under field conditions or high disease pressure, which is
consistent with the current research.
This study was initiated to extend research on the growth-promoting qualities of P. indica
on canola conducted at the University of Alberta (Zwiazek 2016). If P. indica became a standard
seed treatment for canola, it would be useful to know if there could also be a benefit in
suppressing clubroot. The results of the current work demonstrate that P. indica will likely not
reduce clubroot severity in the field. However, mixtures of ectomycorrhiza and P. indica might
yield better results because ectomycorrhizal fungi such as L. bicolor regulate auxin homeostasis
(Felten et al. 2009), which is an important component of pathogenesis in P. brassicae. Since the
accumulation of auxin is essential for P. brassicae, ectomycorrhizal fungi might affect clubroot
development.

140
6 General discussion
Clubroot is an important disease of canola and other brassica crops around the world. In
Canada, genetic resistance has been an effective approach to managing clubroot on canola, but
new virulent pathotypes that have overcome existing resistance are increasing rapidly and some
of these new pathotypes will be more difficult to manage with existing genetics than the first
generation of pathotypes in Western Canada. More information about the biology and genomics
of P. brassicae is required to develop and enhance prevention and management strategies for this
important disease.
The primary objective of the study described in chapter 2 to was to identify differences and
similarities among the genotypes of P. brassicae from across Canada. The information would
help identify where the pathogen might have been introduced from, and to assess the relatedness
of P. brassicae populations in Canada. It could also be used to assess the effect of selection
pressure related to host and host resistance on changes in genotype and pathotype over time. This
is the first study of whole-genome similarity of collections and isolates of P. brassicae.
The pathogen cannot be cultured in vitro and there may be many pathotypes in a single
club (Xue et al. 2008). This has made it difficult to study the genome and transcriptome of
P. brassicae and to conduct genome-wide association studies to identify molecular markers. In
the current study, dual tissue cultures (host + pathogen) and an innovative micro-manipulation
technique were combined for the first time to produce clean DNA samples of single-spore
isolates of P. brassicae. Dual callus cultures of P. brassicae - B. rapa were produced for 20
clubroot field collections and a modified CTAB method was used to produce high-quality DNA

141
for analysis. Whole-genome sequences were developed for 52 field collections and single-spore
isolates. The sequences of 43 were mapped to the e3 P. brassicae reference genome available in
GenBank and SNPs were identified. Three phylogenetic trees were developed using different
algorithms and all three algorithms provided a similar pattern of results. This demonstrated that
there were five clades in the phylogenetic tree for these collections of P. brassicae.
The collections did not group based on the pathotype or host. Geographic location had
some influence on the groupings, but the effect was not consistent. It was not possible to identify
sequences that differentiated pathotypes, probably due to the relatively small number of samples
assessed. Many more single-spore isolate samples from each pathotype need to be sequenced to
achieve an adequate sample number for genome-wide association studies to find genetic
variations associated with pathotypes.
Assessment of genetic diversity indicated that the ‘new’ virulent pathotypes recently
identified on canola in western Canada (Strelkov et al. 2016) had likely been present in the
pathogen population at a very low level, were maintained through balancing selection, and
became dominant due to selection associated with a change in host or host resistance genes. For
example, clubroot samples taken from fields in central Canada before and after the change of
pathotype differed in more than half of the genes. Such a large shift in the predominant genotype
of the pathogen population cannot have occurred so quickly based solely on mutation. High
variation in the pathogen population ensures that adaptive phenotypes are available within the
population, ensuring that some can infect and reproduce on a new hosts or cultivars. Crop
rotation is essential to keep the resting spore population in a field low and slow or halt the rapid
development of new, virulent pathotypes. Canola fields where resistant cultivars are grown with

142
a short crop rotation interval should be monitored frequently for the presence of the patches of
new virulent pathotypes, and these should be managed to keep spore levels low. The second
objective was to evaluate potential practices for clubroot management. The two approaches
assessed were the use of grass crops to stimulate resting spore germination and thus reduce
resting spore concentration in soil and treating the seed or soil with mycorrhizal fungi as a
biological control strategy. Smooth bromegrass (Bromus inermis) reduced the concentration of
resting spores relative to bare soil. Therefore, smooth bromegrass might be a good choice of
grass crop to use to reduce resting spore numbers in clubroot patches in fields. Another
advantage is that sod-forming grasses also minimize the spread of clubroot infested soil within
and among fields.
A commerical formulation of end and ectoe of mycorrhizal fungi,Root Rescue, and also
Pirformospora indica, a fungus in the Phylum Basidiomycota, were evaluated for their potential
to protect canola from clubroot. These fungi did not consistently reduce clubroot incidence or
severity under controlled conditions or in the field.
The results of these studies can benefit both researchers and growers. The sequencing reads
developed in the current study have been deposited in GenBank
(https://www.ncbi.nlm.nih.gov/genbank/) (SubmissionID# SUB5045217, BioProject
ID# PRJNA515478). This work is, by far, the most comprehensive study of the genome of P.
brassicae undertaken to date. This was the first study to analyses the genome similarity of P.
brassicae collections from a wide geographic range, different pathotypes, and hosts. The
findings demonstrated that host selection pressure was main factor in selecting pathotypes that
probably existed in low numbers and allowing these to increase rapidly to become the dominant

143
pathotype. This was the first study that provided evidence of balancing selection and the ability
of the population to maintain the rare genotypes. Recognizing the balancing selection in the
population is very important for understanding of the emergence of pathotypes that can rapidly
increase due to host pressure. This can inform the recommendations for suitable management
strategies, such as monitoring fields of resistant canola for the emergence of the new pathotypes
and applying crop rotations to suppress the pathotypes. In addition, new patches of soil infested
with P. brassicae and the field entrances can be planted to grass crops to hold the soil in place
while reducing the concentration of resting spores.
There is still much to discover about the biology of P. brassicae. Molecular markers to
identify pathotypes are needed. More pathotypes of P. brassicae need to be sequenced to
perform linkage and association studies to map disease-associated genes. Potential variants and
SNP hot spots need to be identified for further studies of gene expression and to find breeding
targets in the genome. The efficacy of more crops and other members of Poaceae for clubroot
reduction needs to be evaluated. In addition, the potential of field crops commonly used for crop
rotation could be investigated to determine their effects on spore reduction in soil.
Currently, pathotypes are identified based on whether clubroot symptoms are produced on
selected differential hosts. This is time consuming and resource intensive and does not always
produce consistent results. Molecular markers for rapid and precise identification of pathotypes
are needed. The techniques developed in this work may be useful in developing molecular
methods to identify pathotypes. Information on the genetic diversity and variability of
P. brassicae from this study could be used as a small step towards molecular identification and
characterization of pathotypes by looking at the associations between the genomic variation and

144
pathotypes in several samples. When completed, that would facilitate rapid and accurate
molecular monitoring of changes in the predominant pathotype in the pathogen population within
a region or even a field. Monitoring is needed to identify the predominant pathotypes in a region
to permit breeding for resistance that will be effective against the predominant pathotype. This
could be used to extend the useful life of these resistance genes and so maximize their impact on
crop production.
The battle lines between pathogens and plants are constantly changing. It is important to
have more knowledge about pathogen diversity and changes in pathogen populations to stay
ahead of crop diseases. The results of this study demonstrated the importance of host selection on
the emergence of virulent pathotypes. This knowledge can help to predict future changes in the
population and prevent the breakdown of resistance by limiting host selection pressure on
P. brassicae population. This work also identified grass crops that effectively reduced the resting
spore concentration in soil, providing an effective new IPM tool for clubroot management.
However, P. indica hasn’t shown promising results in clubroot reduction under optimal
conditions and its potential to be used as a seed treatment for canola needs to be further
investigated under stress conditions.

145
References Abbott, C. l., Gilmore, S. R., Lewis, C. T., Chapados, J. T., Peters, R. D., Platt, H. W., et al.
2010. Development of a SNP genetic marker system based on variation in microsatellite flanking
regions of Phytophthora infestans. Can. J. Plant Pathol. 32:440–457.
Ahmed, H. U., Hwang, S. F., Strelkov, S. E., Gossen, B. D., Peng, G., Howard, R. J., et al. 2011.
Assessment of bait crops to reduce inoculum of clubroot (Plasmodiophora brassicae) of canola.
Can. J. Plant Sci. 91:545–551.
Al-Daoud, F., Gossen, B. D., Robson, J., and McDonald, M. R. 2017. Propidium monoazide
improves quantification of resting spores of Plasmodiophora brassicae with qPCR. Plant Dis.
101:442–447.
Al-Daoud, F., Moran, M., Gossen, B. D., and McDonald, M. R. 2018. First report of clubroot
(Plasmodiophora brassicae) on canola in Ontario. Can. J. Plant Pathol. 40:96–99.
Al-Shehbaz, I. A. 2003. Cruciferae. In Eco-physiology of Wild and Cultivated Forms in Brassica
and Allied genera, ed. K Kubitzki. Berlin: Springer, p. 75– 174.
Al-Shehbaz, I. A., Beilstein, M. A., and Kellogg, E. A. 2006. Systematics and phylogeny of the
Brassicaceae (Cruciferae): an overview. Plant Syst. Evol. 259:89–120.
Al-Shehbaz, I. A., German, D. A., Mummenhoff, K., and Moazzeni, H. 2014. Systematics, tribal
placements, and synopses of the Malcolmia S.L. Segregates (Brassicaceae). Harvard Pap. Bot.
19:53–71.
Ando, S., Tsushima, S., Tagiri, A., Kamachi, S., Konagaya, K., Hagio, T., et al. 2006. Increase in
BrAO1 gene expression and aldehyde oxidase activity during clubroot development in Chinese
cabbage ( Brassica rapa L.). Mol. Plant Pathol. 7:223–234.
Archibald, J. M., and Keeling, P. J. 2004. Actin and ubiquitin protein sequences support a
cercozoan/foraminiferan ancestry for the plasmodiophorid plant pathogens. J. Eukaryot.
Microbiol. 51:113–118.
Asano, T., and Kageyama, K. 2006. Growth and movement of secondary plasmodia of
Plasmodiophora brassicae in turnip suspension-culture cells. Plant Pathol. 55:145–151.
Asano, T., Kageyama, K., and Hyakumachi, M. 1999. Surface disinfestation of resting spores of
Plasmodiophora brassicae used to infect hairy roots of Brassica spp. Phytopathology. 89:314–
319.
Augé, R. M. 2001. Water relations, drought and vesicular- arbuscular mycorrhizal symbiosis.
Mycorrhiza. 11:3–42.
Ayers, G. W. 1972. Races of Plasmodiophora brassicae. infecting crucifer crops in Canada.
Plant Dis. Surv. 52:77–81.
Ayers, G. W. 1944. Studies on the life history of the club root organism, Plasmodiophora
brassicae. Can. J. Res. 22c:143–149.
Banhara, A., Ding, Y., Kühner, R., Zuccaro, A., and Parniske, M. 2015. Colonization of root
cells and plant growth promotion by Piriformospora indica occurs independently of plant
common symbiosis genes. Front. Plant Sci. 6:667.
Bankevich, A., Nurk, S., Antipov, D., Gurevich, A. A., Dvorkin, M., Kulikov, A. S., et al. 2012.
SPAdes: A new genome assembly algorithm and its applications to single-cell sequencing. J.
Comput. Biol. 19:455–477.
Bass, D., Moreira, D., Lopez-Garcia, P., Polet, S., Chao, E. E., Von Der Heyden, S., et al. 2005.
Polyubiquitin insertions and the phylogeny of Cercozoa and Rhizaria. Protist. 156:149–161.

146
Berkenkamp, B. 1973. Growth-stage key for rape. Can. J. plant Sci. 53:413.
Bolger, A. M., Lohse, M., and Usadel, B. 2014. Trimmomatic: A flexible trimmer for Illumina
sequence data. Bioinformatics. 30:2114–2120.
Botero, A., García, C., Gossen, B. D., Strelkov, S. E., Todd, C. D., Bonham‐Smith, P. C., et al.
2019. Clubroot disease in Latin America: distribution and management strategies. Plant Pathol.
68:827–833.
Braselton, J. P. 1995. Current status of the Plasmodiophorids. Crit. Rev. Microbiol. 21:263–275.
Braselton, J. P. 1982. Karyotypic analysis of Plasmodiophora brassicae based on serial thin
sections of pachytene nuclei. Can. J. Bot. 60:403–408.
Brodmann, D., Schuller, A., Ludwig-Muller, J., Aeschbacher, R. A., Wiemken, A., Boller, T., et
al. 2002. Induction of trehalase in Arabidopsis plants infected with the trehalose-producing
pathogen Plasmodiophora brassicae. Mol. Plant-Microbe Interact. 15:693–700.
Brown, P., and Shelp, B. 1997. Boron mobility in plants. Plant Soil. 193:85–101.
Bryan, R. J., Trese, A. T., and Braselton, J. P. 1996. Molecular karyotypes for the obligate,
intracellular, plant pathogens, Plasmodiophora brassicae and Spongospora subterranea.
Mycologia. 88:358–360.
Buczacki, S. T. 1980. Culture of Plasmodiophora brassicae in host callus tissue. In Tissue
Culture Methods For Plant Pathologists, eds. D S Ingram and J P Helgeson. Oxford: Blackwell
Scientific, p. 145–150.
Buczacki, S. T. 1983. Plasmodiophora: an inter-relationship between biological and practical
problems. In Zoosporic Plant Pathogens, ed. S T Buczacki. London: Academic Press, p. 161–
191.
Buczacki, S. T. 1977. Root infections from single resting spores of Plasmodiophora brassicae.
Trans. Br. Mycol. Soc. 69:328–329.
Buczacki, S. T. 1985. Some comments on the early history of clubroot disease in Britain. Arch.
Nat. Hist. 12:51–58.
Buczacki, S. T., and Ockendon, J. G. 1979. Preliminary observations on variation in
susceptibility to clubroot among collections of some wild crucifers. Ann. Appl. Biol. 92:113–
118.
Buczacki, S. T., Toxopeus, H., Mattusch, P., Johnston, T. D., Dixon, G. R., and Hobolth, L. A.
1975. Study of physiologic specialization in Plasmodiophora brassicae: proposals for attempted
rationalization through an international approach. Trans. Br. Mycol. Soc. 65:295–303.
Bulman, S., Candy, J. M., Fiers, M., Lister, R., Conner, A. J., and Eady, C. C. 2011. Genomics
of biotrophic, plant-infecting Plasmodiophorids using in vitro dual cultures. Protist. 162:449–
461.
Bulman, S., Ridgway, H. J., Eady, C., and Conner, A. J. 2007. Intron-rich gene structure in the
intracellular plant parasite Plasmodiophora brassicae. Protist. 158:423–433.
Bulman, S., Siemens, J., Ridgway, H. J., Eady, C., and Conner, A. J. 2006. Identification of
genes from the obligate intracellular plant pathogen, Plasmodiophora brassicae. Fems
Microbiol. Lett. 264:198–204.
Burki, F., Kudryavtsev, A., Matz, M., Aglyamova, G., Bulman, S., Fiers, M., et al. 2010.
Evolution of Rhizaria: new insights from phylogenomic analysis of uncultivated protists. BMC
Evol. Biol. 10:377.
Cao, T., Manolii, V. P., Hwang, S. F., Howard, R. J., and Strelkov, S. E. 2009. Virulence and

147
spread of Plasmodiophora brassicae [clubroot] in Alberta, Canada. Can. J. Plant Pathol. 31:321–
329.
Cárdenas, M., Grajales, A., Sierra, R., Rojas, A., González-Almario, A., Vargas, A., et al. 2011.
Genetic diversity of Phytophthora infestans in the Northern Andean region. BMC Genet. 12:23.
Castlebury, L. A., and Domier, L. L. 1998. Small subunit ribosomal RNA gene phylogeny of
Plasmodiophora brassicae. Mycologia. 90:102–107.
Cavalier-Smith, T. 1998. A revised six-kingdom system of life. Biol. Rev. 73:203–266.
Cavalier-Smith, T. 1981. Eukaryote kingdoms: Seven or nine? BioSystems. 14:461–481.
Cavalier-Smith, T., and Chao, E. E. 1997. Sarcomonad ribosomal RNA sequences, rhizopod
phylogeny, and the origin of euglyphid amoebae. Arch. Fur Protistenkd. 147:227–236.
Chai, A. L., Xie, X. W., Shi, Y. X., and Li, B. J. 2014. Special Issue: Research status of clubroot
(Plasmodiophora brassicae) on cruciferous crops in China. Can. J. Plant Pathol. 36:142–153.
Chapara, V., Kalwar, N., Lubenow, L., and Chirumamilla, A. 2019. Prevalence of clubroot on
canola in North Dakota. HSOA J. Agron. Agric. Sci. 2:8.
Charlesworth, B., and Charlesworth, D. 2016. Population genetics from 1966 to 2016. Heredity
(Edinb). 118:2–9.
Charlesworth, D. 2006. Balancing selection and its effects on sequences in nearby genome
regions. PLoS Genet. 2:64.
Cheah, L. H., Gowers, S., and Marsh, A. T. 2006. Clubroot control using Brassica break crops.
Acta Hortic. 706:329–332.
Chen, H., Deng, T., Yue, J., Al-Shehbaz, I. A., and Sun, H. 2016. Molecular phylogeny reveals
the non-monophyly of tribe Yinshanieae (Brassicaceae) and description of a new tribe,
Hillielleae. Plant Divers. 38:171–182.
Chen, S. W., Liu, T., Gao, Y., Zhang, C., Peng, S. D., Bai, M. B., et al. 2016. Discovery of
clubroot- resistant genes in Brassica napus by transcriptome sequencing. Genet. Mol. Res. 15.
Chittem, K., Mansouripour, S. M., and Mendoza, L. E. D. 2014. First report of clubroot on
canola caused by Plasmodiophora brassicae in North Dakota. Plant Dis. 98:1438.
Cho, W., Kim, W. G., and Takahashi, K. 2003. Occurrence of clubroot in cruciferous vegetable
crops and races of the pathogen in Korea. Plant Pathol. 19:64–68.
Chorabik, K. N. 2013. The use of interactions in dual cultures in vitro to evaluate the
pathogenicity of fungi and susceptibility of host plant genotypes. In Biochemistry, Genetics and
Molecular Biology “Environmental Biotechnology- New Approaches and Prospective
Applications,” INTECH Open Access Publisher.
Chu, M. G., Song, T., Falk, K. C., Zhang, X. G., Liu, X. J., Chang, A., et al. 2014. Fine mapping
of Rcr1 and analyses of its effect on transcriptome patterns during infection by Plasmodiophora
brassicae. BMC Genomics. 15:1166–1166.
Colhoun, J. 1953. A study of emidemiology of clubroot disease of brassicae. Ann. Appl. Biol.
40:262–283.
Cranmer, T. J. 2015. Vertical distribution of Plasmodiophora brassicae resting spores in soil and
the effect of weather conditions on clubroot development. M.sc. thesis. University of Guelph.
Guelph, On. Canada.
Cranmer, T. J., Al-Daoud, F., Gossen, B. D., Deora, A., Hwang, S. F., and McDonald, M. R.
2017. Vertical distribution of resting spores of Plasmodiophora brassicae in soil. Eur. J. Plant
Pathol. 149:435–442.

148
Creelman, D. W. 1958. Diseases of vegetables and field crops. Can. Plant Dis. Surv. 38:62–63.
Crête, R. 1981. Worldwide importance of clubroot. Clubroot Newsl. 11:6–7.
Crute, I. R., Phelps, K., Barnes, A., Buczacki, S. T., and Crisp, P. 1983. The relationship
between genotypes of three Brassica species and collections of Plasmodiophora brassicae. Plant
Pathol. 32:405–420.
Danecek, P., Auton, A., Abecasis, G., Albers, C. A., Banks, E., DePristo, M. A., et al. 2011. The
variant call format and VCFtools. Bioinformatics. 27:2156–2158.
Das, J., Ramesh, K. V., Maithri, U., Mutangana, D., and Suresh, C. K. 2014. Response of aerobic
rice to Piriformospora indica. Indian J. Exp. Biol. 52:237–251.
Dean, F. B., Nelson, J. R., Giesler, T. L., and Lasken, R. S. 2001. Rapid amplification of plasmid
and phage DNA using Phi 29 DNA polymerase and multiply-primed rolling circle amplification.
Genome Res. 11:1095–1099.
Dekhuijzen, H. M. 1980. The occurrence of free and bound cytokinins in clubroots and
Plasmodiophora brassicae infected turnip tissue cultures. Physiol. Plant. 49:169–176.
Dekhuijzen, H. M., and Overeem, J. C. 1971. The role of cytokinins in clubroot formation.
Physiol. Plant Pathol. 1:151–161.
Demars, B. G., and Boerner, R. J. 1996. Vesicular arbuscular mycorrhizal development in the
Brassicaceae in relation to plant life span. Flora. 191:179–189.
Deora, A., Gossen, B. D., Amirsadeghi, S., and McDonald, M. R. 2015. A multiplex qPCR assay
for detection and quantification of Plasmodiophora brassicae in soil. Plant Dis. 99:1002–1009.
Deora, A., Gossen, B. D., and McDonald, M. R. 2013. Cytology of infection, development and
expression of resistance to Plasmodiophora brassicae in canola. Ann. Appl. Biol. 163:56–71.
Deora, A., Gossen, B. D., and McDonald, M. R. 2012. Infection and development of
Plasmodiophora brassicae in resistant and susceptible canola cultivars. Can. J. Plant Pathol.
34:239–247.
Deora, A., Gossen, B. D., Walley, F., and McDonald, M. R. 2011. Boron reduces development
of clubroot in canola. Can. J. Plant Pathol. 33:475–484.
Deshmukh, S., and Kogel, K. 2007. Piriformospora indica protects barley from root rot caused
by Fusarium graminearum. J. Plant Dis. Prot. 114:263–268.
Dias, J. S., Ferreira, M. E., and Williams, P. H. 1993. Screening of portuguese cole landraces
(Brassica oleracea L.) with Peronospora parasitica and Plasmodiophora brassicae. Euphytica.
67:135–141.
Diederichsen, E., Frauen, M., Linders, E. G. A., Hatakeyama, K., and Hirai, M. 2009. Status and
perspectives of clubroot resistance breeding in crucifer crops. J. Plant Growth Regul. 28:265–
281.
Dixon, G. R. 2007. Origins and diversity of Brassica and its relatives. In Vegetable Brassicas
and Related Crucifers, Wallingford, UK : CABI, p. 1–33.
Dixon, G. R. 2009. Plasmodiophora brassicae in its Environment. J. Plant Growth Regul.
28:212–228.
Dixon, G. R. 1996. Repression of the morphogenesis of Plasmodiophora brassicae Wor. by
boron. Acta Hortic. 407:393–401.
Dixon, G. R., and Lim, Y. P. 2006. The biology of Plasmodiophora brassicae Wor. - A review
of recent advances. Acta Hortic. 706:271–282.
Dobson, R. L., and Gabrielson, R. L. 1983. Role of primary and secondary zoospores of

149
Plasmidiophora brassicae in the development of clubroot in Chinese cabbage. Phytopathology.
73:559–561.
Donald, C., and Porter, I. 2003. Clubroot (Plasmodiophora brassicae) an imminent threat to the
Australian canola industry. In 13th Biennial Australian Research Assembly on Brassicas, New
South Wales Agriculture, p. 114–118.
Donald, C., and Porter, I. 2009. Integrated control of clubroot. J. Plant Growth Regul. 28:289–
303.
Donald, E. C., Cross, S. J., Lawrence, J. M., and Porter, I. J. 2006. Pathotypes of
Plasmodiophora brassicae, the cause of clubroot, in Australia. Ann. Appl. Biol. 148:239–244.
Donald, E. C., Jaudzems, G., and Porter, I. J. 2008. Pathology of cortical invasion by
Plasmodiophora brassicae in clubroot resistant and susceptible Brassica oleracea hosts. Plant
Pathol. 57:201–209.
Donald, E. C., and Porter, I. J. 2004. A sand-solution culture technique used to observe the effect
of calcium and pH on root hair and cortical stages of infection by Plasmodiophora brassicae.
Australas. Plant Pathol. 33:585–589.
Donald, E. C., Porter, I. J., Faggian, R., Lancaster, R. A., and Lim, Y. P. 2006. An integrated
approach to the control of clubroot in vegetable Brassica crops. Acta Hortic. 706:283–300.
Dong, S., Tian, Z., Chen, P. J., Senthil Kumar, R., Shen, C. H., Cai, D., et al. 2013. Maturation
zone is an important target of Piriformospora indica in Chinese cabbage roots. J. Exp. Bot.
64:4529–4540.
Enoch, T., Carr, A. M., and Nurse, P. 1992. Fission yeast genes involved in coupling mitosis to
completion of DNA replication. Genes Dev. 6:2035–2046.
Faggian, R., and Strelkov, S. E. 2009. Detection and measurement of Plasmodiophora brassicae.
J. Plant Growth Regul. 28:282–288.
Fahling, M., Graf, H., and Siemens, J. 2004. Characterization of a single-spore isolate population
of Plasmodiophora brassicae resulting from a single club. J. Phytopathol. 152:438–444.
Fahling, M., Graf, H., and Siemens, J. 2003. Pathotype separation of Plasmodiophora brassicae
by the host plant. J. Phytopathol. Zeitschrift. 151:425–430.
Fakhro, A., Andrade-Linares, D., Bargen, S., Bandte, M., Büttner, C., Grosch, R., et al. 2010.
Impact of Piriformospora indica on tomato growth and on interaction with fungal and viral
pathogens. Mycorrhiza. 20:191–200.
Fang, Y., and Ramasamy, R. P. 2015. Current and prospective methods for plant disease
detection. Biosensors. 5:537–561.
Farnham, M. W., and Kopsell, D. A. 2009. Importance of genotype on carotenoid and
chlorophyll levels in broccoli heads. HortScience. 44:1248–1253.
Feldman, M. W., Christiansen, F. B., and Brooks, L. D. 1980. Evolution of recombination in a
constant environment. Proc. Natl. Acad. Sci. 77:4838–4841.
Felsenstein, J. 1985. Confidence limits on phylogenies: An approach using the bootstrap.
Evolution. 39:783–791.
Felsenstein, J. 1981. Evolutionary trees from DNA sequences: A maximum likelihood approach.
J. Mol. Evol. 17:368–376.
Felten, J., Kohler, A., Morin, E., Bhalerao, R. P., Palme, K., Martin, F., et al. 2009. The
ectomycorrhizal fungus laccaria bicolor stimulates lateral root formation in poplar and
arabidopsis through auxin transport and signaling. Plant Physiol. 151:1991–2005.

150
Feng, J., Cao, T., Rennie, D. C., Strelkov, S. E., and Hwang, S. F. 2014. Special Issue: Host-
parasite interactions in clubroot of crucifers. Can. J. Plant Pathol. 36:113–121.
Feng, J., Hwang, R., Hwang, S. F., Strelkov, S. E., Gossen, B. D., Zhou, Q. X., et al. 2010.
Molecular characterization of a serine protease Pro1 from Plasmodiophora brassicae that
stimulates resting spore germination. Mol. Plant Pathol. 11:503–512.
Feng, J., Hwang, S. F., and Strelkov, S. E. 2012. Analysis of expressed sequence tags derived
from a compatible Plasmodiophora brassicae-canola interaction. Can. J. Plant Pathol. 34:562–
574.
Feng, J., Hwang, S. F., and Strelkov, S. E. 2013a. Assessment of gene expression profiles in
primary and secondary zoospores of Plasmodiophora brassicae by dot blot and real-time PCR.
Microbiol. Res. 168:518–524.
Feng, J., Hwang, S. F., and Strelkov, S. E. 2013b. Studies into primary and secondary infection
processes by Plasmodiophora brassicae on canola. Plant Pathol. 62:177–183.
Feng, J., Xiao, Q., Hwang, S. F., Strelkov, S. E., and Gossen, B. D. 2012. Infection of canola by
secondary zoospores of Plasmodiophora brassicae produced on a nonhost. Eur. J. Plant Pathol.
132:309–315.
Figdore, S. S., Ferreira, M. E., Slocum, M. K., and Williams, P. H. 1993. Association of RFLP
markers with trait loci affecting clubroot resistance and morphological characters in Brassica
oleracea L. Euphytica. 69:33–44.
Flor, H. H. 1971. Current status of the gene-for-gene concept. Annu. Rev. Phytopathol. 91:275–
296.
Franzke, A., Lysak, M. A., Al-Shehbaz, I. A., Koch, M. A., and Mummenhoff, K. 2011.
Cabbage family affairs: the evolutionary history of Brassicaceae. Trends Plant Sci. 16:108–116.
Frauen, M. 1999. A new clubroot resistant variety in winter oilseed rape. In Proceedings 10th
International Rapeseed Congress, Canberra, Australia.
Friberg, H., Lagerlöf, J., and Rämert, B. 2006. Usefulness of nonhost plants in managing
Plasmodiophora brassicae. Plant Pathol. 55:690–695.
Friese, C. F., and Allen, M. F. 1991. The spread of Va mycorrhizal fungal hyphae in the soil:
inoculum types and external hyphal architecture. Mycologia. 83:409–418.
Gamborg, O. L., Miller, R. A., and Ojima, K. 1968. Nutrient requirements of suspension cultures
of soybean root cells. Exp. Cell Res. 50:151–158.
Gebbinck, H. K., Turkington, T. K., Olfert, O. O., Weiss, R. M., Kriticos, D., Kutcher, H. R., et
al. 2011. Forecast distribution and severity of clubroot of canola in the Canadian prairies under
incremental temperature and precipitation, and potential climate change scenarios. Can. J. Plant
Pathol. 33:268–296.
Gludovacz, T. V. 2013. Clubroot in canola and cabbage in relation to soil temperature, plant
growth and host resistance. M.sc. thesis. University of Guelph. Guelph, On. Canada.
Gossen, B. D., Adhikari, K. K. C., and McDonald, M. R. 2012. Effect of seeding date on
development of clubroot in short-season Brassica crops. Can. J. Plant Pathol. 34:516–523.
Gossen, B. D., Al‐Daoud, F., Dumonceaux, T., Dalton, J. A., Peng, G., Pageau, D., et al. 2019.
Comparison of techniques for estimation of resting spores of Plasmodiophora brassicae in soil.
Plant Pathol. 68:954–961.
Gossen, B. D., Dalton, J. A., Al-Daoud, F., and McDonald, M. R. 2017. Metabolic cost of
resistance in clubroot-resistant canola and napa cabbage. Can. J. Plant Pathol. 39:25–36.

151
Gossen, B. D., Deora, A., Peng, G., Hwang, S. F., and McDonald, M. R. 2014. Special Issue:
Effect of environmental parameters on clubroot development and the risk of pathogen spread.
Can. J. Plant Pathol. 36:37–48.
Gossen, B. D., Kasinathan, H., Cao, T., Manolii, V. P., Strelkov, S. E., Hwang, S. F., et al. 2013.
Interaction of pH and temperature affect infection and symptom development of
Plasmodiophora brassicae in canola. Can. J. Plant Pathol. 35:294–303.
Gossen, B. D., Kasinathan, H., Deora, A., Peng, G., and McDonald, M. R. 2016. Effect of soil
type, organic matter content, bulk density and saturation on clubroot severity and biofungicide
efficacy. Plant Pathol. 65:1238–1245.
Gossen, B. D., Strelkov, S. E., Manolii, V. P., Rennie, D. C., Cao, T., Hwang, S. F., et al. 2015.
Spread of Plasmodiophora brassicae on canola in Canada, 2003-2014: Old pathogen, new home.
Can. J. Plant Pathol. 37:403–413.
Gowers, S. 1982. The transfer of characters from Brassica campestris L. to Brassica napus L.:
Production of clubroot-resistant oil-seed rape (B. napus ssp oleifera). Int. J. Plant Breed. 31:971–
976.
Graf, H., Fahling, M., and Siemens, J. 2004. Chromosome polymorphism of the obligate
biotrophic parasite Plasmodiophora brassicae. J. Phytopathol. 152:86–91.
Graf, H., Sokolowski, F., Klewer, A., Diederichsen, E., Luerssen, H., and Siemens, J. 2001.
Electrophoretic karyotype of the obligate biotrophic parasite Plasmodiophora brassicae Wor. J.
Phytopathol. 149:313–318.
Gravot, A., Deleu, C., Wagner, G., Lariagon, C., Lugan, R., Todd, C., et al. 2012. Arginase
induction represses gall development during clubroot infection in Arabidopsis. Plant Cell
Physiol. 53:901–911.
Grsic, S., Kirchheim, B., Pieper, K., Fritsch, M., Hilgenberg, W., and Ludwig‐Müller, J. 1999.
Induction of auxin biosynthetic enzymes by jasmonic acid and in clubroot diseased Chinese
cabbage plants. Physiol. Plant. 105:521–531.
Guo, Z. J., Miyoshi, H., Komyoji, T., Haga, T., and Fujita, T. 1991. Uncoupling activity of a
newly developed fungicide, fluazinam [ 3-chloro-N-(3-chloro-2,6-dinitro-4-
trifluoromethylphenyl)-5-trifluoromethyl-2-pyridinamine]. Biochim. Biophys. Acta. 1056:89–92.
Harding, M. W., Hill, T. B., Yang, Y., Daniels, G. C., Hwang, S. F., Strelkov, S. E., et al. 2019.
An improved Evans blue ataining method for aonsistent, accurate assessment of Plasmodiophora
brassicae resting spore viability. Plant Dis. 103:2330–2336.
Harper, F. R. 1973. key to standardize the description of growth stages in turnip rape, Brassica
campestris. Can. plant Dis. Surv. 53:93–95.
Harper, F. R., and Berkenkamp, B. 1975. Revised growth- stage key for Brassica campestris and
Brassica napus. Can. J. plant Sci. 55:657–658.
Hayward, A. 2012. Introduction—Oilseed Brassicas. In Genetics, Genomics and Breeding of
Oilseed Brassicas, eds. Edwards D, Batley J, Parkin I, and Kole C. Berlin: Springer, p. 1–13.
Hildebrand, P. D., and Delbridge, R. W. 1995. Race survey of Plasmodiophora brassicae in
Nova Scotia. Can. plant Dis. Surv. 75:170.
Hildebrand, P. D., and McRae, K. B. 1998. Control of clubroot caused by Plasmodiophora
brassicae with nonionic surfactants. Can. J. Plant Pathol. 20:1–11.
Hirai, M., Harada, T., Kubo, N., Tsukada, M., Suwabe, K., and Matsumoto, S. 2004. A novel
locus for clubroot resistance in Brassica rapa and its linkage markers. Int. J. Plant Breed. Res.

152
108:639–643.
Holtz, M. D., Hwang, S. F., and Strelkov, S. E. 2018. Genotyping of Plasmodiophora brassicae
reveals the presence of distinct populations. BMC Genomics. 19:254.
Hou, Y., Song, L., Zhu, P., Zhang, B., Tao, Y., Xu, X., et al. 2012. Single-cell exome sequencing
and monoclonal evolution of a JAK2-negative myeloproliferative neoplasm. Cell. 148:873–885.
Howard, R. J., Strelkov And, S. E., and Harding, M. W. 2010. Clubroot of cruciferous crops -
New perspectives on an old disease. Can. J. Plant Pathol. 32:43–57.
Huang, Q. W., Ouyan, L., and Wang, Y. J. 1955. Occurrence and prevention of clubroot disease
on cruciferous crops in Jiangxi. Bull. Plant Prot. 8:1–4.
Hwang, S. F., Ahmed, H. U., Strelkov, S. E., Gossen, B. D., Turnbull, G. D., Peng, G., et al.
2011. Seedling age and inoculum density affect clubroot severity and seed yield in canola. Can.
J. Plant Sci. 91:183–190.
Hwang, S. F., Ahmed, H. U., Zhou, Q., Strelkov, S. E., Gossen, B. D., Peng, G., et al. 2012.
Assessment of the impact of resistant and susceptible canola on Plasmodiophora brassicae
inoculum potential. Plant Pathol. 61:945–952.
Hwang, S. F., Ahmed, H. U., Zhou, Q., Strelkov, S. E., Gossen, B. D., Peng, G., et al. 2014.
Efficacy of Vapam fumigant against clubroot (Plasmodiophora brassicae) of canola. 63:1374.
Hwang, S. F., Ahmed, H. U., Zhou, Q., Strelkov, S. E., Gossen, B. D., Peng, G., et al. 2011.
Influence of cultivar resistance and inoculum density on root hair infection of canola (Brassica
napus) by Plasmodiophora brassicae. Plant Pathol. 60:820–829.
Hwang, S. F., Strelkov, S. E., Feng, J., Gossen, B. D., and Howard, R. J. 2012. Plasmodiophora
brassicae: a review of an emerging pathogen of the Canadian canola (Brassica napus) crop. Mol.
Plant Pathol. 13:105–113.
Ikegami, H. 1992. Proliferation and pathogenicity of Plasmodiophora brassicae in infected
callus tissue (studies on the clubroot of cruciferous plants X). Annu. Rep. Kansai Plant Prot. Soc.
34:17–28.
Ingram, D. S. 1969. Growth of Plasmodiophora brassicae in host callus. J. Gen. Microbiol.
55:9–18.
Ingram, D. S., and Tommerup, I. C. 1972. The life history of Plasmodiophora brassicae Woron.
Proc. R. Soc. London. Ser. B. Biol. Sci. 180:103–112.
Ito, S., Ichinose, H., Yanagi, C., Tanaka, S., Kameya-Iwaki, M., and Kishi, F. 1999.
Identification of an in planta-induced mRNA of Plasmodiophora brassicae. J. Phytopathol.
147:79–82.
Ito, S., Nakamura, T., Matsumoto, T., Maehara, T., Tanaka, S., Kameya-Iwaki, M., et al. 1998.
Characterization of DNA sequences cloned from resting spores of Plasmodiophora brassicae. J.
Phytopathol. 146:143–147.
Jaschke, D., Dugassa-Gobena, D., Karlovsky, P., Vidal, S., and Ludwig-Muller, J. 2010.
Suppression of clubroot (Plasmodiophora brassicae) development in Arabidopsis thaliana by
the endophytic fungus Acremonium alternatum. Plant Pathol. 59:100–111.
Jeffrey, C. G., Terry, M. C., Fei, L., James, H., Robert, J. E., Qi, S., et al. 2014. TASSEL-GBS: a
high capacity genotyping by sequencing analysis pipeline. PLoS One. 9:e90346.
Jones, D. R., Ingram, D. S., and Dixon, G. R. 1982. Characterization of isolates derived from
single resting spores of Plasmodiophora brassicae and studies of their interaction. Plant Pathol.
31:239–246.

153
Jubault, M., Lariagon, C., Simon, M., Delourme, R., and Manzanares-Dauleux, M. 2008.
Identification of quantitative trait loci controlling partial clubroot resistance in new mapping
populations of Arabidopsis thaliana. Int. J. Plant Breed. Res. 117:191–202.
Jung, S., Martinez-Medina, A., Lopez-Raez, J., and Pozo, M. 2012. Mycorrhiza- induced
resistance and priming of plant defenses. J. Chem. Ecol. 38:651–664.
Kageyama, K., and Asano, T. 2009. Life cycle of Plasmodiophora brassicae. J. Plant Growth
Regul. 28:203–211.
Kalpana, K. C., McDonald, M. R., Gossen, B. D., and Peng, G. 2009. Efficacy of biofungicides
and fungicides on clubroot in Shanghai pak choy grown in controlled environment. Pest Manag.
Res. Rep. 35:104–106.
Kammerich, J., Beckmann, S., Scharafat, I., and Ludwig-Muller, J. 2014. Suppression of the
clubroot pathogen Plasmodiophora brassicae by plant growth promoting formulations in roots of
two Brassica species. Plant Pathol. 63:846–857.
Karling, J. S. 1968. The Plasmodiophorales. 2nd ed. New York: Hafner Publishing Company
Inc.
Kato, T., Hatakeyama, K., Fukino, N., and Matsumoto, S. 2013. Fine mapping of the clubroot
resistance gene CRb and development of a useful selectable marker in Brassica rapa. Breed. Sci.
63:116–124.
Kaul, S., Koo, H. L., Jenkins, J., Rizzo, M., Rooney, T., Tallon, L. J., et al. 2000. Analysis of the
genome sequence of the flowering plant Arabidopsis thaliana. Nature. 408:796–815.
Keen, N. T., and Williams, P. H. 1969. Synthesis and degradation of starch and lipids following
infection of cabbage by Plasmodiophora brassicae. Phytopathology. 59:778–785.
Kim, C.-H., Cho, W.-D., and Kim, H.-M. 2000. Distribution of Plasmodiophora brassicae
causing clubroot disease of Chinese cabbage in soil. Plant Dis. Res. 6:27–32.
Kraakman, A., Niks, R., Stam, P., and Van Eeuwijk, F. 2004. Linkage disequilibrium mapping of
yield and yield stability in modern spring barley cultivars. Genetics. 168:435–446.
Kuginuki, Y., Yoshikawa, H., and Hirai, M. 1999. Variation in virulence of Plasmodiophora
brassicae in Japan tested with clubroot-resistant cultivars of Chinese cabbage (Brassica rapa L.
ssp. pekianensis). Eur. J. Plant Pathol. 105:327–332.
Kumar, M., Yadav, V., Kumar, H., Sharma, R., Singh, A., Tuteja, N., et al. 2011. Piriformospora
indica enhances plant growth by transferring phosphate. Plant Signal. Behav. 6:723–725.
Kumar, M., Yadav, V., Tuteja, N., and Johri, A. 2009. Antioxidant enzyme activities in maize
plants colonized with Piriformospora indica. Microbiology. 155:780–790.
Lahlali, R., McGregor, L., Song, T., Gossen, B. D., Narisawa, K., and Peng, G. 2014.
Heteroconium chaetospira induces resistance to clubroot via upregulation of host genes involved
in jasmonic acid, ethylene, and auxin biosynthesis. PLoS One. 9:e94144.
Lahlali, R., Peng, G., Gossen, B. D., McGregor, L., Yu, F. Q., Hynes, R. K., et al. 2013.
Evidence that the biofungicide Serenade (Bacillus subtilis) suppresses clubroot on canola via
antibiosis and induced host resistance. Phytopathology. 103:245–254.
Lahlali, R., Peng, G., McGregor, L., Gossen, B. D., Hwang, S. F., and McDonald, M. R. 2011.
Mechanisms of the biofungicide Serenade (Bacillus subtilis QST713) in suppressing clubroot.
Biocontrol Sci. Technol. 21:1351–1362.
Lee, J., Izzah, N. K., Choi, B. S., Joh, H. J., Lee, S. C., Perumal, S., et al. 2016. Genotyping-by-
sequencing map permits identification of clubroot resistance QTLs and revision of the reference

154
genome assembly in cabbage (Brassica oleracea L.). DNA Res. 23:29–41.
Lee, Y. C., Johnson, J. M., Chien, C. T., Sun, C., Cai, D., Lou, B., et al. 2011. Growth promotion
of chinese cabbage and Arabidopsis by Piriformospora indica is not stimulatedby mycelium-
synthesized auxin. Mol. plant-Microbe Interact. 24:421–431.
Lefort, V., Desper, R., and Gascuel, O. 2015. FastME 2.0: A comprehensive, accurate, and fast
distance-based phylogeny inference program. Mol. Biol. Evol. 32:2798–2800.
Li, H., and Durbin, R. 2010. Fast and accurate long-read alignment with Burrows-Wheeler
transform. Bioinformatics. 25:1754–1760.
Li, L., Luo, Y., Chen, B., Xu, K., Zhang, F., Li, H., et al. 2016. A genome-wide association study
reveals new loci for resistance to clubroot disease in Brassica napus. Front. Plant Sci. 30:1483.
Li, Y. R., Ma, W. X., Che, Y. Z., Zou, L. F., Zakria, M., Zou, H. S., et al. 2013. A highly-
conserved single-stranded DNA-binding protein in Xanthomonas functions as a harpin-like
protein to trigger plant immunity. PLoS One. 8:e56240.
Liang, J., Cai, W., and Sun, Z. 2014. Single- cell sequencing technologies: Current and future. J.
Genet. Genomics. 41:513–528.
Linnasalmi, A., and Toivianen, A. 1991. Occurrence of clubroot and Plasmodiophora brassicae
Wor. races in Finland. J. Agric. Sci. Finl. 63:415–434.
Lopez, M. M., Bertolini, E., Olmos, A., Caruso, P., Gorris, M. T., Llop, P., et al. 2003.
Innovative tools for detection of plant pathogenic viruses and bacteria. Int. Microbiol. 6:233–
243.
Lovelock, D. A., Donald, C. E., Conlan, X. A., and Cahill, D. M. 2013. Salicylic acid
suppression of clubroot in broccoli (Brassicae oleracea var. italica) caused by the obligate
biotroph Plasmodiophora brassicae. Australas. Plant Pathol. 42:141–153.
Lovelock, D. A., Šola, I., Marschollek, S., Donald, C. E., Rusak, G., Van Pée, K., et al. 2016.
Analysis of salicylic acid‐ dependent pathways in Arabidopsis thaliana following infection with
Plasmodiophora brassicae and the influence of salicylic acid on disease. Mol. Plant Pathol.
17:1237–1251.
Ludwig-Muller, J. 2009. Plant defence- what can we learn from clubroots? Australas. Plant
Pathol. 38:318–324.
Ludwig-Muller, J., Bendel, U., Thermann, P., Ruppel, M., Epstein, E., and Hilgenberg, W. 1993.
Concentrations of indole- 3- acetic acid in plants of tolerant and susceptible varieties of Chinese
cabbage infected with Plasmodiophora brassicae Woron. New Phytol. 125:763–769.
Ludwig-Muller, J., Bennett, R. N., Kiddle, G., Ihmig, S., Ruppel, M., and Hilgenberg, W. 1999.
The host range of Plasmodiophora brassicae and its relationship to endogenous glucosinolate
content. New Phytol. 141:443–458.
Ludwig-Muller, J., Julke, S., Geiss, K., Richter, F., Mithofer, A., Sola, I., et al. 2015. A novel
methyltransferase from the intracellular pathogen Plasmodiophora brassicae methylates salicylic
acid. Mol. Plant Pathol. 16:349–364.
Ludwig-Müller, J., Pieper, K., Ruppel, M., Cohen, J. D., Epstein, E., Kiddle, G., et al. 1999.
Indole glucosinolate and auxin biosynthesis in Arabidopsis thaliana ( L.) Heynh. glucosinolate
mutants and the development of clubroot disease. Int. J. Plant Biol. 208:409–419.
Ludwig-Müller, J., and Schuller, A. 2008. What can we learn from clubroots: alterations in host
roots and hormone homeostasis caused by Plasmodiophora brassicae. Eur. J. Plant Pathol.
121:291–302.

155
Lunde, I. G., Aronsen, J. M., Kvaløy, H., Qvigstad, E., Sjaastad, I., Tønnessen, T., et al. 2012.
Cardiac O-GlcNAc signaling is increased in hypertrophy and heart failure. Physiol. Genomics.
44:162–72.
Luo, R., Liu, B., Xie, Y., Li, Z., Huang, W., Yuan, J., et al. 2012. SOAPdenovo2: An empirically
improved memory-efficient short-read de novo assembler. Gigascience. 1:1–6.
Luo, Y. L., Yin, Y. P., Liu, Y., Pei, X. T., Wang, Z. K., Fan, Y. H., et al. 2013. Identification of
differentially expressed genes in Brassica juncea var. tumida Tsen following infection by
Plasmodiophora brassicae. Eur. J. Plant Pathol. 137:43–53.
Macfarlane, I. 1952. Factors affecting the survival of Plasmodiophora brassicae Wor. in the soil
and its assessment by a host test. Ann. Appl. Biol. 39:239–256.
Manzanares-Dauleux, M. J., Delourme, R., Baron, F., and Thomas, G. 2000. Mapping of one
major gene and of QTLs involved in resistance to clubroot Brassica napus. Int. J. Plant Breed.
Res. 101:885–891.
Manzanares‐Dauleux, M. J., Divaret, I., Baron, F., and Thomas, G. 2001. Assessment of
biological and molecular variability between and within field isolates of Plasmodiophora
brassicae. Plant Pathol. 50:165–173.
Marchler-Bauer, A., Derbyshire, M. K., Gonzales, N. R., Lu, S., Chitsaz, F., Geer, L. Y., et al.
2015. CDD: NCBI’s conserved domain database. Nucleic Acids Res. 43(Database issue):D222-
6.
Marchler-Bauer, A., Lu, S., Anderson, J. B., Chitsaz, F., Derbyshire, M. K., DeWeese-Scott, C.,
et al. 2011. CDD: A Conserved Domain Database for the functional annotation of proteins.
Nucleic Acids Res. 39(Database issue):D225-9.
McDonald, M. R., Al-Daoud, F., Sedaghatkish, A., Moran, M., Cranmer, T. J., and Gossen, B.
D. 2020. The expanding range and changing virulence of Plasmodiophora brassicae across
Canada. Plant Dis Notes. submitted.
McDonald, M. R., Sharma, K., Gossen, B. D., Deora, A., Feng, J., and Hwang, S. F. 2014. The
role of primary and secondary infection in host response to Plasmodiophora brassicae.
Phytopathology. 104:1078–1087.
McDonald, M. R., and Westerveld, S. M. 2008. Temperature prior to harvest influences the
incidence and severity of clubroot on two asian brassica vegetables. HortScience. 43:1509–1513.
Milgroom, M., and Peever, T. 2003. Population biology of plant pathogens: The synthesis of
plant disease epidemiology and population genetics. Plant Dis. 87:608–617.
Mitani, S., Sugimoto, K., Hayashi, H., Takii, Y., Ohshima, T., and Matsuo, N. 2003. Effects of
cyazofamid against Plasmodiophora brassicae Woronin on Chinese cabbage. Pest Manag. Sci.
59:287–293.
Mithen, R., and Magrath, R. 1992. A contribution to the life history of Plasmodiophora
brassicae: secondary plasmodia development in root galls of Arabidopsis thaliana. Mycol. Res.
96:877–885.
Monteith, J. 1924. Relation of soil temperature and soil moisture to infection by Plasmodiophora
brassicae. J. Agric. Res. 28:549–562.
Montgomery, S. 2008. Linkage disequilibrium- understanding the evolutionary past and mapping
the medical future. Nat. Rev. Genet. 9:477.
Moore, J. L., Liang, S., Akullian, A., and Remais, J. V. 2012. Cautioning the use of degree-day
models for climate change projections in the presence of parametric uncertainty. Ecol. Appl.

156
22:2237–2247.
Moriguchi, K., Kimizuka-Takagi, C., Ishii, K., and Nomura, K. 1999. A genetic map based on
RAPD, RFLP, isozyme, morphological markers and QTL analysis for clubroot resistance in
Brassica oleracea. Breed. Sci. 4:257–265.
Mugnier, J. 1987. Infection by Polymyxa betae and Plasmodiophora brassicae of roots
containing root-inducing transferred DNA of Agrobacterium rhizogenes. Phytopathology. 4:539–
542.
Murakami, H., Tsushima, S., and Shishido, Y. 2002. Factors affecting the pattern of the dose
response curve of clubroot disease caused by Plasmodiophora brassicae. Soil Sci. Plant Nutr.
48:421–427.
Myers, D. F. 1985. Lime and the control of clubroot of crucifers: effects of pH, calcium,
magnesium, and their Interactions. Phytopathology. 6:670–673.
Nadeem, M. A., Nawaz, M. A., Shahid, M. Q., Doğan, Y., Comertpay, G., Yıldız, M., et al.
2018. DNA molecular markers in plant breeding: current status and recent advancements in
genomic selection and genome editing. Biotechnol. Biotechnol. Equip. 32:261–285.
Nagaharu, U. 1935. Genome-analysis in Brassica with special reference to the experimental
formation of B. napus and peculiar mode of fertilization. J. JPN Bot. 7:389–452.
Nagaoka, T., Doullah, M. A. U., Matsumoto, S., Kawasaki, S., Ishikawa, T., Hori, H., et al.
2010. Identification of QTLs that control clubroot resistance in Brassica oleracea and
comparative analysis of clubroot resistance genes between B. rapa and B. oleracea. Theor. Appl.
Genet. 120:1335–1346.
Naiki, T., Kawaguchi, C., and Ikegami, H. 1984. Root hair reinfection in chinese cabbage
seedlings by the secondary zoospores of Plasmodiophora brassicae woronin. JPN J.
Phytopathol. 96:877–885.
Narisawa, K., Kageyama, K., and Hashiba, T. 1996. Efficient root infection with single resting
spores of Plasmodiophora brassicae. Mycol. Res. 100:855–858.
Narisawa, K., Ohki, K. T., and Hashiba, T. 2000. Suppression of clubroot and Verticillium
yellows in Chinese cabbage in the field by the root endophytic fungus, Heteroconium
chaetospira. Plant Pathol. 49:141–146.
Narisawa, K., Shimura, M., Usuki, F., Fukuhara, S., and Hashiba, T. 2005. Effects of pathogen
density, soil moisture, and soil pH on biological control of clubroot in Chinese cabbage by
Heteroconium chaetospira. Plant Dis. 89:285–290.
Navin, N., Kendall, J., Troge, J., Andrews, P., Rodgers, L., McIndoo, J., et al. 2011. Tumour
evolution inferred by single-cell sequencing. Nature. 472:90–94.
Nei, M., and Kumar, S. 2000. Molecular evolution and phylogenetics. Oxford ; New York:
Oxford University Press.
Nieuwenhuis, B. P. S., and James, T. Y. 2016. The frequency of sex in fungi. Philos. Trans. R.
Soc. Lond. B. Biol. Sci. 371:1706.
Nishio, T. 2014. Genomics and breeding of Brassicaceae crops. Breed. Sci. 64:1.
Peng, G., Lahlali, R., Hwang, Sheau Fang, Pageau, D., Hynes, R. K., McDonald, M. R., et al.
2014. Crop rotation, cultivar resistance, and fungicides/biofungicides for managing clubroot
(Plasmodiophora brassicae) on canola. Can. J. Plant Pathol. 36:99–112.
Peng, G., Lahlali, R., Hwang, S F, Pageau, D., Hynes, R. K., McDonald, M. R., et al. 2014.
Special Issue: Crop rotation, cultivar resistance, and fungicides/biofungicides for managing

157
clubroot (Plasmodiophora brassicae) on canola. Can. J. Plant Pathol. 36:99–112.
Peng, Y., Gossen, D. B., Huang, Y., Al-Daoud, F., and McDonald, M. R. 2019. Development of
Plasmodiophora brassicae in the root cortex of cabbage over time. Eur. J. Plant Pathol. 154:727–
737.
Piao, Z., Deng, Y., Choi, S., Park, Y., and Lim, Y. 2004. SCAR and CAPS mapping of CRb , a
gene conferring resistance to Plasmodiophora brassicae in Chinese cabbage (Brassica rapa ssp.
pekinensis ). Int. J. Plant Breed. Res. 108:1458–1465.
Piao, Z. Y., Ramchiary, N., and Lim, Y. P. 2009. Genetics of clubroot resistance in Brassica
species. J. Plant Growth Regul. 28:252–264.
Poland, J. A., Balint-Kurti, P. J., Wisser, R. J., Pratt, R. C., and Nelson, R. J. 2009. Shades of
gray: the world of quantitative disease resistance. Trends Plant Sci. 14:21–29.
Porter, I. J., and Merriman, P. R. 1983. Effects of solarization of soil on nematode and fungal
pathogens at two sites in Victoria. Soil Biol. Biochem. 15:39–44.
Pritchard, J. K., Stephens, M., and Raj, A. 2014. fastSTRUCTURE: Variational inference of
population structure in large SNP data sets. Genetics. 197:573–589.
Production of principal field crops. 2015. Available at: http://www.statcan.gc.ca/daily-
quotidien/151204/dq151204c-eng.htm.
Purcell, S., Neale, B., Todd-Brown, K., Thomas, L., Ferreira, M., Bender, D., et al. 2007.
PLINK: A tool set for whole- genome association and population- based linkage analyses. Am. J.
Hum. Genet. 81:559–575.
Rahman, H., Peng, G., Yu, F., Falk, K. C., Kulkarni, M., and Selvaraj, G. 2014. Genetics and
breeding for clubroot resistance in Canadian spring canola (Brassica napus L.). Can. J. Plant
Pathol. 36:122–134.
Rausch, T., Butcher, D. N., and Hilgenberg, W. 1983. Indole‐3‐methylglucosinolate biosynthesis
and metabolism in clubroot diseased plants. Physiol. Plant. 58:93–100.
Remington, D. L., Thornsberry, J. M., Matsuoka, Y., Wilson, L. M., Whitt, S. R., Doebley, J., et
al. 2001. Structure of linkage disequilibrium and phenotypic associations in the maize genome.
PNAS. 98:11479–11484.
Rennie, D. C., Holtz, M. D., Turkington, T. K., Leboldus, J. M., Hwang, S. F., Howard, R. J., et
al. 2015. Movement of Plasmodiophora brassicae resting spores in windblown dust. Can. J.
Plant Pathol. 37:188–196.
Rennie, D. C., Manolii, V. P., Cao, T., Hwang, S. F., Howard, R. J., and Strelkov, S. E. 2011.
Direct evidence of surface infestation of seeds and tubers by Plasmodiophora brassicae and
quantification of spore loads. Plant Pathol. 60:811–819.
Revell, L. J. 2009. Size-correction and principal components for interspecific comparative
studies. Evolution. 63:3258–3268.
Reyes, A. A., Davidson, T. R., and Marks, C. F. 1974. Races, pathogenicity, and chemical
control of Plasmodiophora brassicae in Ontario. Phytopathology. 64:173–177.
Ricarova, V., Kaczmarek, J., Strelkov, S. E., Kazda, J., Lueders, W., Rysanek, P., et al. 2016.
Pathotypes of Plasmodiophora brassicae causing damage to oilseed rape in the Czech Republic
and Poland. Eur. J. Plant Pathol. 145:559–572.
Rocherieux, J., Glory, P., Giboulot, A., Boury, S., Barbeyron, G., Thomas, G., et al. 2004.
Isolate- specific and broad- spectrum QTLs are involved in the control of clubroot in Brassica
oleracea. Int. J. Plant Breed. Res. 108:1555–1563.

158
Rod, J., and Robak, J. 1995. The effect of some crops on inactivation of clubroot
(Plasmodiophora brassicae) in soils. Ochr. Rostl. 30:267–272.
Rolfe, S. A., Strelkov, S. E., Links, M. G., Clarke, W. E., Robinson, S. J., Djavaheri, M., et al.
2016. The compact genome of the plant pathogen Plasmodiophora brassicae is adapted to
intracellular interactions with host Brassica spp. BMC Genomics. 17:272–272.
Saito, M., Kubo, N., Matsumoto, S., Suwabe, K., Tsukada, M., and Hirai, M. 2006. Fine
mapping of the clubroot resistance gene, Crr3, in Brassica rapa. Int. J. Plant Breed. Res. 114:81–
91.
Saitou, N., and Nei, M. 1987. The neighbor- joining method: A new method for reconstructing
phylogenetic trees. Mol. Biol. Evol. 4:406.
Saude, C., McKeown, A., Gossen, B. D., and McDonald, M. R. 2012. Effect of host resistance
and fungicide application on clubroot pathotype 6 in green cabbage and napa cabbage.
Horttechnology. 22:311–319.
Schroth, M. N. 1964. Influence of plant exudates on root-infecting fungi. Annu. Rev.
Phytopathol. 2:101–132.
Schuller, A., Kehr, J., and Ludwig-Muller, J. 2014. Laser microdissection coupled to
transcriptional profiling of Arabidopsis roots inoculated by Plasmodiophora brassicae indicates
a role for Brassinosteroids in clubroot formation. Plant Cell Physiol. 55:392–411.
Schuller, A., and Ludwig-Muller, J. 2016. Histological methods to detect the clubroot pathogen
Plasmodiophora brassicae during its complex life cycle. Plant Pathol. 65:1223–1237.
Schulz, O. E. 1924. Cruciferae- Sisymbrieae. In: Engler, Das Pflanzenreich [Heft 86] IV. 105.
Leipzig: Verlag von Wilhelm Engelmann.
Schwelm, A., Fogelqvist, J., Knaust, A., Julke, S., Lilja, T., Bonilla-Rosso, G., et al. 2015. The
Plasmodiophora brassicae genome reveals insights in its life cycle and ancestry of chitin
synthases. Sci. Rep. 5:11153.
Searle, L. M., Chamberlain, K., Rausch, T., and Butcher, D. N. 1982. The conversion of 3-
indolylmethylglucosinolate to 3-indolylacetonitrile by myrosinase, and its relevance to the
clubroot disease of the cruciferae. J. Exp. Bot. 33:935–942.
Sedaghatkish, A., Gossen, B. D., Yu, F., Torkamaneh, D., and McDonald, M. R. 2019. Whole-
genome DNA similarity and population structure of Plasmodiophora brassicae strains from
Canada. BMC Genomics. 20:744.
Serfling, A., Wirsel, S. G. R., Lind, V., and Deising, H. B. 2007. Performance of the biocontrol
fungus Piriformospora indica on wheat under greenhouse and field conditions. Phytopathology.
97:523–531.
Seskar, M., Shulaev, V., and Raskin, I. 1998. Endogenous methyl salicylate in pathogen-
inoculated tobacco plants. Plant Physiol. 116:387–392.
Shahollari, B., Vadassery, J., Varma, A., and Oelmüller, R. 2007. A leucine-rich repeat protein is
required for growth promotion and enhanced seed production mediated by the endophytic fungus
Piriformospora indica in Arabidopsis thaliana. Plant J. 50:1–13.
Sharma, K., Gossen, B. D., and McDonald, M. R. 2011. Effect of temperature on primary
infection by Plasmodiophora brassicae and initiation of clubroot symptoms. Plant Pathol.
60:830–838.
Siemens, J., Graf, H., Bulman, S., In, O., and Ludwig-Muller, J. 2009. Monitoring expression of
selected Plasmodiophora brassicae genes during clubroot development in Arabidopsis thaliana.

159
Plant Pathol. 58:130–136.
Siemens, J., Keller, I., Sarx, J., Kunz, S., Schuller, A., Nagel, W., et al. 2006. Transcriptome
analysis of Arabidopsis clubroots indicate a key role for cytokinins in disease development. Mol.
Plant-Microbe Interact. 19:480–494.
Some, A., Manzanares, M. J., Laurens, F., Baron, F., Thomas, G., and Rouxel, F. 1996. Variation
for virulence on Brassica napus L. amongst Plasmodiophora brassicae collections from France
and derived single‐ spore isolates. Plant Pathol. 45:432–439.
Stamatakis, A. 2014. RAxML version 8: A tool for phylogenetic analysis and post-analysis of
large phylogenies. Bioinformatics. 30:1312–1313.
Stefansson, B. R., and Downey, R. K. 1995. Rapeseed. In Harvest of gold: the history of field
crop breeding in Canada, eds. Slinkard A E and Knott D R. Saskatoon: University of
Saskatchewan Extension Press, p. 140–152.
Stefansson, B. R., Hougen, F. W., and Downey, R. K. 1961. Note on the isolation of rapeseed
plants with seed oil free from erucic acid. Can. J. Plant Sci. 41:218–219.
Stein, E., Molitor, A., Kogel, K. H., and Waller, F. 2008. Systemic resistance in Arabidopsis
conferred by the mycorrhizal fungus Piriformospora indica requires jasmonic acid signaling and
the cytoplasmic function of NPR1. Plant Cell Physiol. 49:1747–1751.
Strehlow, B., De Mol, F., and Struck, C. 2014. History of oilseed rape cropping and geographic
origin affect the genetic structure of Plasmodiophora brassicae populations. Phytopathology.
104:532.
Strelkov, S. E., Cao, T., Manolii, V., Smith-Degenhardt, E., Orchard, D., and Tewari, J. P. 2006.
Incidence of clubroot on canola in Alberta in 2005. Can. J. Plant Pathol. 28:320.
Strelkov, S. E., and Hwang, S. F. 2014. Special Issue: Clubroot in the Canadian canola crop: 10
years into the outbreak. Can. J. Plant Pathol. 36:27–36.
Strelkov, S. E., Hwang, S. F., Manolii, V. P., Cao, T., and Feindel, D. 2016. Emergence of new
virulence phenotypes of Plasmodiophora brassicae on canola (Brassica napus) in Alberta,
Canada. Eur. J. Plant Pathol. 145:517–529.
Strelkov, S. E., Hwang, S. F., Manolii, V. P., Cao, T., Fredua-Agyeman, R., Harding, M. W., et
al. 2018. Virulence and pathotype classification of Plasmodiophora brassicae populations
collected from clubroot resistant canola (Brassica napus) in Canada. Can. J. Plant Pathol.
40:284–298.
Strelkov, S. E., Manolii, V. P., Cao, T., Xue, S., and Hwang, S. F. 2007. Pathotype classification
of Plasmodiophora brassicae and its occurrence in Brassica napus in Alberta, Canada. J.
Phytopathol. 155:706–712.
Strelkov, S. E., Tewari, J. P., and Smith-Degenhardt, E. 2006. Characterization of
Plasmodiophora brassicae populations from Alberta, Canada. Can. J. Plant Pathol. 28:467–474.
Sun, C., Johnson, J. M., Cai, D., Sherameti, I., Oelmüller, R., and Lou, B. 2010. Piriformospora
indica confers drought tolerance in Chinese cabbage leaves by stimulating antioxidant enzymes,
the expression of drought- related genes and the plastid- localized CAS protein. J. Plant Physiol.
167:1009–1017.
Sundelin, T., Jensen, D. F., and Lubeck, M. 2011. Identification of expressed genes during
infection of Chinese cabbage (Brassica rapa subsp pekinensis) by Plasmodiophora brassicae. J.
Eukaryot. Microbiol. 58:310–314.
Sung, K., Vincent, P., Tina, T. H., Christopher, T., Richard, M. C., Stephan, O., et al. 2007.

160
Recombination and linkage disequilibrium in Arabidopsis thaliana. Nat. Genet. 39:1151.
Sung, W., Ackerman, M. S., Miller, S. F., Doak, T. G., and Lynch, M. 2012. Drift- barrier
hypothesis and mutation- rate evolution. PNAS. 109:18488.
Suwabe, K., Suzuki, G., Nunome, T., Hatakeyama, K., Mukai, Y., Fukuoka, H., et al. 2012.
Microstructure of a Brassica rapa genome segment homoeologous to the resistance gene cluster
on Arabidopsis chromosome 4. Breed. Sci. 62:170–177.
Szczyglowska, M., Piekarsaka, A., Konieczka, P., and Namiesnik, J. 2011. Use of brassica plants
in the phytoremediation and biofumigation processes. Int. J. Mol. Sci. 12:7760–7771.
Tajima, F. 1989. Statistical method for testing the neutral mutation hypothesis by DNA
polymorphism. Genetics. 123:585–595.
Takahashi, H., Ishikawa, T., Kaido, M., Takita, K., Hayakawa, T., Okazaki, K., et al. 2006.
Plasmodiophora brassicae-induced cell death and medium alkalization in clubroot-resistant
cultured roots of Brassica rapa. J. Phytopathol. 154:156–162.
Takahashi, H., Muraoka, S., Ito K. Mitsui, T., Hori, H., and Kiso, A. 2001. Resting spore of
Plasmodiophora brassicae proliferates only in the callus of clubroot disease-susceptible turnip
but increases the PAL activity in the callus of clubroot disease-resistant turnip. Plant Biotechnol.
18:267 – 274.
Tanaka, S., Fujijiyama, S., Shigemori, S., Nakayama, A., Ito, S., and Kameya-Iwaki, M. 1998.
Pathogenesis of isolates of Plasmodiophora brassicae from Japan. 1: Race and pathogenesis in
clubroot resistant cultivars. Kyushu Plant Prot. Res. 44:15–19.
Tanaka, S., Kochi, S., Kunita, H., Ito, S., and Kameya-Iwaki, M. 1999. Biological mode of
action of the fungicide, flusulfamide, against Plasmodiophora brassicae (clubroot). Eur. J. Plant
Pathol. 105:577–584.
Tanaka, S., Mizui, Y., Terasaki, H., Sakamoto, Y., and Ito, S. I. 2006. Distribution of clubroot
disease of a cruciferous weed, Cardamine flexuosa, in major isolated islands, Hokkaido and
Okinawa in Japan. Mycoscience. 47:72–77.
Tewari, J. P., Strelkov, S. E., Orchard, D., Hartman, M., Lange, R. M., and Turkington, T. K.
2005. Identification of clubroot of crucifers on canola (Brassica napus) in Alberta. Can. J. Plant
Pathol. 27:143–144.
Thuma, B. A., Rowe, R., and Madden, L. V. 1983. Relationships of soil temperature and
moisture to clubroot (Plasmodiophora brassicae) severity on radish in organic soil. Plant Dis.
67:758–762.
Timila, R. D., Correll, J. C., and Duwadi, V. R. 2008. Severe and widespread clubroot epidemics
in Nepal. Plant Dis. 92:317.
Tinggal, S. h., and Webster, J. 1981. Technique for single spore infection by Plasmodiophora
brassicae. Trans. Br. Mycol. Soc. 76:187–190.
Tjallingii, F. 1965. Testing clubroot- resistance of turnips in the netherlands and the physiologic
specialization of plasmodiophora brassicae. Int. J. Plant Breed. 14:1–22.
Tommerup, I. C., and Ingram, D. S. 1971. The life- cycle of Plasmodiophora brassicae Woron.
in brassica tissue cultures and in intact roots. New Phytol. 70:327–332.
Toxopeus, H., and Janssen, A. M. P. 1975. Clubroot resistance in turnip II. The ‘slurry’
screening method and clubroot races in the Netherlands. Euphytica. 24:751–755.
Tripathi, M. K., and Mishra, A. S. 2007. Glucosinolates in animal nutrition: A review. Anim.
Feed Sci. Technol. 132:1–27.

161
Turkington, T. K., Olfert, O. O., Weiss, R. M., Clear, R. M., Xi, K., Tewari, J. P., et al. 2004.
Forecasting the potential distribution and abundance of plant diseases Using CLIMEXTM
modelling with historical and potential weather scenarios associated with climate change. In
Manitoba: Manitoba Agronomy Conference Proceedings, p. 99–110.
Ueno, H., Matsumoto, E., Aruga, D., Kitagawa, S., Matsumura, H., and Hayashida, N. 2012.
Molecular characterization of the CRa gene conferring clubroot resistance in Brassica rapa.
Plant Mol. Biol. 80:621–629.
Vahabi, K., Dorcheh, S. K., Monajembashi, S., Westermann, M., Reichelt, M., Falkenberg, D., et
al. 2016. Stress promotes arabidopsis - Piriformospora indica interaction. Plant Signal. Behav.
11:e1136763.
Vahabi, K., Sherameti, I., Bakshi, M., Mrozinska, A., Ludwig, A., and Oelmüller, R. 2015.
Microarray analyses during early and later stages of the Arabidopsis/ Piriformospora indica
interaction. Genomics Data. 6:16–18.
Van-Loo, P., and Voet, T. 2014. Single cell analysis of cancer genomes. Curr. Opin. Genet. Dev.
24:82–91.
Vasil, I. K. 1991. Plant tissue culture and molecular biology as tools in understanding plant
development and in plant improvement. Curr. Opin. Biotechnol. 2:158–163.
Verma, S. S., Rahman, M. H., Deyholos, M. K., Basu, U., and Kav, N. N. V. 2014. Differential
expression of miRNAs in Brassica napus root following infection with Plasmodiophora
brassicae. PLoS One. 9:e86648.
Verma, S., Varma, A., Rexer, K. H., Hassel, A., Kost, G., Sarbhoy, A., et al. 1998.
Piriformospora indica, gen. et sp. nov., a new root- colonizing fungus. Mycologia. 5:896–903.
Vierheilig, H., Coughlan, A. P., Wyss, U., and Piche, Y. 1998. Ink and vinegar, a simple staining
technique for arbuscular-mycorrhizal fungi. Appl. Environ. Microbiol. 64:5004.
Voorrips, R. E. 1996. Production, characterization and interaction of single-spore isolates of ,
Plasmodiophora brassicae. Eur. J. Plant Pathol. 102:377–383.
Voorrips, R., and Visser, D. 1993. Examination of resistance to clubroot in accessions of
Brassica oleracea using a glasshouse seedling test. Netherlands J. Plant Pathol. 99:269–276.
Vos, P., Paulo, M., Voorrips, R., Visser, R., Eck, H., and Eeuwijk, F. 2017. Evaluation of LD
decay and various LD- decay estimators in simulated and SNP- array data of tetraploid potato.
Theor. Appl. Genet. 130:123–135.
Wallenhammar, A. C. 1996. Prevalence of Plasmodiophora brassicae in a spring oilseed rape
growing area in central Sweden and factors influencing soil infestation levels. Plant Pathol.
45:710–719.
Wallenhammar, A. C., Almquist, C., Soderstrom, M., and Jonsson, A. 2012. In-field distribution
of Plasmodiophora brassicae measured using quantitative real-time PCR. Plant Pathol. 61:16–
28.
Waller, F., Achatz, B., Baltruschat, H., Fodor, J., Becker, K., Fischer, M., et al. 2005.
Endophytic fungus Piriformospora indica reprograms barley to salt- stress tolerance, disease
resistance, and higher yield. PNAS. 102:13386–13391.
Wang, J., and Song, Y. 2017. Single cell sequencing: a distinct new field. Clin. Transl. Med.
6:1–11.
Wang, Yanchun, Zhu, M., Zhang, R., Yang, H., Wang, Yang, Sun, G., et al. 2009. Whole
genome amplification of the rust Puccinia striiformis f. sp. tritici from single spores. J.

162
Microbiol. Methods. 77:229–34.
Warwick, S., Francis, A., and Al-Shehbaz, I. 2006. Brassicaceae: Species checklist and database
on CD- Rom. Plant Syst. Evol. 259:249–258.
Watson, A. G., and Baker, K. F. 1969. Possible gene centers for resistance in the genus Brassica
to Plasmodiophora Brassicae. Econ. Bot. 23:245–252.
Webb, P. C. R. 1949. Zoospores, believed to be those of Plasmodiophora brassicae in the root
hairs of non-cruciferous plant. Nature. 163:608.
Webster, M. A. 1986. pH and nutritional effects on infection by Plasmodiophora brassicae Wor.
and on clubroot symptoms. Ph.D. thesis. University of Aberdeen. Aberdeen, UK.
Webster, M. A., and Dixon, G. R. 1991. Calcium, pH and inoculum concentration influencing
colonization by Plasmodiophora brassicae. Mycol. Res. 95:64–73.
Williams, P. H. 1966. A system for the determination of races of Plasmodiophora brassicae that
infect cabbage and rutabaga. 56:624–626.
Williams, P. H., Aist, S. J., and Aist, J. R. 1971. Response of cabbage root hairs to infection by
Plasmodiophora brassicae. Can. J. Bot. 49:41–47.
Woronin, M. S. 1878. Plasmodiophora brassicae, Urheber der Kohlpflanzen-Hernie. 11:548–
574.
Xu, X., Hou, Y., Yin, X., Bao, L., Tang, A., Song, L., et al. 2012. Single-cell exome sequencing
reveals single-nucleotide mutation characteristics of a kidney tumor. Cell. 148:886–895.
Xue, S., Cao, T., Howard, R. J., Hwang, S. F., and Strelkov, S. E. 2008. Isolation and variation in
virulence of single-spore isolates of Plasmodiophora brassicae from Canada. Plant Dis. 92:456–
462.
Yang, Y. H., Zhang, X. F., and Zou, L. J. 1992. Studies of the occurrence of Chinese cabbage
clubroot in Changsha. J Hunan Agric Univ. 18:854–858.
Zak, B. 1964. Role of mycorrhizae in root disease. Annu. Rev. Phytopathol. 2:377–392.
Zhang, H., Feng, J., Manolii, V. P., Strelkov, S. E., and Hwang, S. F. 2015. Characterization of a
gene identified in pathotype 5 of the clubroot pathogen Plasmodiophora brassicae.
Phytopathology. 105:764–770.
Zhang, X., Marjani, S. L., Hu, Z., Weissman, S. M., Pan, X., and Wu, S. 2016. Single- cell
sequencing for precise cancer research: progress and prospects. Cancer Res. 76:1305–1312.
Zhang, Y., Lubberstedt, T., and Xu, M. 2013. The genetic and molecular basis of plant resistance
to pathogens. J. Genet. Genomics. 40:23–35.
Zheng, J., Wang, X., Li, Q., Yuan, S., Wei, S., Tian, X., et al. 2018. Characterization of five
molecular markers for pathotype identification of the clubroot pathogen Plasmodiophora
brassicae. Phytopathology. 108:1486–1492.
Zhou, Q., Hwang, S. F., Strelkov, S. E., Fredua‐Agyeman, R., and Manolii, V. P. 2018. A
molecular marker for the specific detection of new pathotype 5‐like strains of Plasmodiophora
brassicae in canola. Plant Pathol. 67:1582–1588.
Zhou, X., Heyer, C., Choi, Y. E., Mehrabi, R., and Xu, J. R. 2010. The CID1 cyclin C-like gene
is important for plant infection in Fusarium graminearum. Fungal Genet. Biol. 47:143–151.
Zwiazek, J. 2016. Fungal endophyte can improve canola yield. Canola Dig. Available at:
https://canoladigest.ca/science-edition-2016/fungal-endophyte-could-improve-canola-yield/.

163
Appendix
Appendix 1: Supplemental tables and figures, Chapter Two

164
Table A1.1. Pathotyping results for collections from Saskatchewan, British Colombia, and
Newfoundland

165
Rep Inoculum 0 1 2 3 Total Arcsine
CI
Arcsine
DSI
CI DSI Mean
Pak Choi 1 Aug-25 0 0 0 10 10 1.5 1.5 100 100 100
Pak Choi 2 0 0 0 10 10 1.5 1.5 100 100
Pak Choi 3 0 0 0 9 9 1.5 1.5 100 100
Pak Choi 4 0 0 0 10 10 1.5 1.5 100 100
Laurentien 1 0 1 0 7 8 1.5 1.1 100 91 91
Laurentien 2 0 2 0 8 10 1.5 1.0 100 86
Laurentien 3 0 0 1 7 8 1.5 1.2 100 95
Laurentien 4 0 0 0 9 9 1.5 1.5 100 100
ACDE 10 1 9 0 0 1 10 0.1 0.1 10 10 10
ACDE 10 2 8 0 0 1 9 0.1 0.1 11 11
ACDE 10 3 8 0 0 2 10 0.2 0.2 20 20
ACDE 10 4 10 0 0 0 10 0 0 0 0
ACDE 11 1 10 0 0 0 10 0 0 0 0 0
ACDE 11 2 9 1 0 0 10 0.1 0 10 3
ACDE 11 3 8 1 1 0 10 0.2 0.1 20 10
ACDE 11 4 9 0 0 0 9 0 0 0 0
ACDE 13 3 0 2 0 8 10 1.5 1.0 100 86 88
ACDE 13 4 0 1 1 8 10 1.5 1.1 100 90
45H29 1 8 0 0 2 10 0.2 0.2 20 20 20
45H29 2 6 0 0 3 10 0.3 0.3 30 30
45H29 3 8 0 0 0 8 0 0 0 0
45H29 4 4 0 0 4 10 0.4 0.4 40 40
Pak Choi 1 NF DD1 0 0 0 12 12 1.5 1.5 100 100 100
Pak Choi 2 0 0 0 12 12 1.5 1.5 100 100
Pak Choi 3 0 0 0 12 12 1.5 1.5 100 100
Pak Choi 4 0 0 0 8 8 1.5 1.5 100 100
Laurentien 1 0 0 0 10 10 1.5 1.5 100 100 100
Laurentien 2 0 0 0 10 10 1.5 1.5 100 100
Laurentien 3 0 0 0 10 10 1.5 1.5 100 100
Laurentien 4 0 0 0 10 10 1.5 1.5 100 100
ACDE 10 1 0 0 0 8 8 1.5 1.5 100 100 100
ACDE 10 2 0 0 0 10 10 1.5 1.5 100 100
ACDE 10 3 0 0 0 10 10 1.5 1.5 100 100
ACDE 10 4 0 1 0 9 10 1.5 1.2 100 93
ACDE 11 1 7 3 0 0 10 0.3 0.1 30 10 10
ACDE 11 2 7 3 0 0 10 0.3 0.1 30 10
ACDE 11 3 5 4 0 0 9 0.4 0.1 44 14
ACDE 11 4 6 4 0 0 10 0.4 0.1 40 13
ACDE 13 1 0 0 0 10 10 1.5 1.5 100 100 100
ACDE 13 2 0 0 0 10 10 1.5 1.5 100 100
ACDE 13 3 0 0 0 10 10 1.5 1.5 100 100
ACDE 13 4 0 0 0 10 10 1.5 1.5 100 100

166
45H29 1 8 0 0 1 9 0.1 0.1 11.1 11.1 11.1
45H29 2 8 0 0 1 9 0.1 0.1 11.1 11.1
45H29 3 6 0 0 2 8 0.2 0.2 25 25
45H29 4 10 0 0 0 10 0 0 0 0
Pak Choi 1 BC
Brussel
0 0 0 9 9 1.5 1.5 100 100 100
Pak Choi 2 0 0 0 10 10 1.5 1.5 100 100
Pak Choi 3 0 0 0 10 10 1.5 1.5 100 100
Pak Choi 4 0 0 0 10 10 1.5 1.5 100 100
Laurentien 1 10 0 0 0 10 0 0 0 0 0
Laurentien 2 10 0 0 0 10 0 0 0 0
Laurentien 3 10 0 0 0 10 0 0 0 0
Laurentien 4 8 0 0 0 8 0 0 0 0
ACDE 10 1 0 0 0 0 10 0 0 0 0 0
ACDE 10 2 0 0 0 0 10 0 0 0 0
ACDE 10 3 0 0 0 0 10 0 0 0 0
ACDE 10 4 0 0 0 0 10 0 0 0 0
ACDE 11 1 10 0 0 0 10 0 0 0 0 0
ACDE 11 2 8 2 0 0 10 0.2 0.0 20 6
ACDE 11 3 10 0 0 0 10 0 0 0 0
ACDE 11 4 10 0 0 0 10 0 0 0 0
ACDE 13 1 0 0 0 10 10 1.5 1.5 100 100 100
ACDE 13 2 1 0 0 9 10 1.1 1.1 90 90
ACDE 13 3 0 0 0 8 8 1.5 1.5 100 100
ACDE 13 4 0 0 0 10 10 1.5 1.5 100 100
45H29 1 10 0 0 0 10 0 0 0 0 0
45H29 2 10 0 0 0 10 0 0 0 0
45H29 3 9 0 0 0 9 0 0 0 0
45H29 4 9 0 0 0 9 0 0 0 0
45H29 4 10 0 0 0 10 0 0 0 0
Pak Choi 1 BC Cauli 0 0 0 10 10 1.5 1.5 100 100 100
Pak Choi 2 0 0 0 10 10 1.5 1.5 100 100
Pak Choi 3 0 0 0 10 10 1.5 1.5 100 100
Pak Choi 4 0 0 0 10 10 1.5 1.5 100 100
Laurentien 1 6 2 0 0 14 0.1 0.0 14 4 4.7
Laurentien 2 8 4 1 1 14 0.4 0.2 42 21
Laurentien 3 10 2 0 2 14 0.2 0.1 28 19
Laurentien 4 13 1 0 0 14 0.0 0.0 7 2
ACDE 10 1 10 0 0 0 10 0 0 0 0 0
ACDE 10 2 10 0 0 0 10 0 0 0 0
ACDE 10 3 9 0 0 0 9 0 0 0 0
ACDE 10 4 10 0 0 0 10 0 0 0 0
ACDE 11 1 5 5 0 0 10 0.5 0.1 50 16 16
ACDE 11 2 5 4 0 1 10 0.5 0.2 50 23

167
ACDE 11 3 5 5 0 0 10 0.5 0.1 50 16
ACDE 11 4 7 3 0 0 10 0.3 0.1 30 10
ACDE 13 1 0 0 0 8 8 1.5 1.5 100 100 100
ACDE 13 2 0 0 0 10 10 1.5 1.5 100 100
ACDE 13 3 0 0 0 10 10 1.5 1.5 100 100
ACDE 13 4 0 0 0 10 10 1.5 1.5 100 100
45H29 1 8 0 0 2 10 0.2 0.2 20 20 20
45H29 2 9 1 0 0 10 0.1 0 10 3
45H29 3 8 0 0 0 8 0 0 0 0
45H29 4 9 0 0 0 9 0 0 0 0
ACDE 11 1 5 5 0 0 10 0.5 0.1 50 16 16
ACDE 11 2 5 4 0 1 10 0.5 0.2 50 23
ACDE 11 3 5 5 0 0 10 0.5 0.1 50 16
ACDE 11 4 7 3 0 0 10 0.3 0.1 30 10
ACDE 13 1 0 0 0 8 8 1.5 1.5 100 100 100
ACDE 13 2 0 0 0 10 10 1.5 1.5 100 100
ACDE 13 3 0 0 0 10 10 1.5 1.5 100 100
ACDE 13 4 0 0 0 10 10 1.5 1.5 100 100
45H29 1 8 0 0 2 10 0.2 0.2 20 20 20
45H29 2 9 1 0 0 10 0.1 0 10 3
45H29 3 8 0 0 0 8 0 0 0 0
45H29 4 9 0 0 0 9 0 0 0 0

168
Figure A1-1 Molecular phylogenetic analysis by Maximum Likelihood method using Mega7.
The percentage of 1000 bootstrap trials (1000 replicates) are shown above the branches. Strains
details are summarized in the names: location by province (e.g., AB = Alberta), William`s
pathotypes (e.g., P3) where available, and SS = single-spore isolate, V = vegetable host, and C =
canola host.

169
Figure A1-2 Molecular phylogenetic analysis by Euclidian hierarchical distance method using R
packages. The height of the fusion, presented on the horizontal axis, indicates the dissimilarity
between two strains. The larger the height of the fusion, the less similar the strains are. Strains
details are summarized in the names: location by province (e.g., AB = Alberta), William`s
pathotypes (e.g., P3) where available, and SS = single-spore isolate, V = vegetable host, and C =
canola host.

170
Figure A1-3 Neighbor joining distance tree of 1000 bp windows where the highest number of
SNPs were detected.

171
Figure A1-4 Timetree analysis inferred using the RelTime method and user-supplied branch
lengths. Evolutionary analyses were conducted in MEGA7.

172
Figure A1-5 Linkage disequilibrium (LD) matrix summarizing pairwise measures of LD made
by TASSEL for all 43 strains. The x axis and y axis both represent all of the strains. The LD is
shown throughout the genome of Plasmodiophora brassicae containing more than 13000 SNPs.
The LD plot shows the r2 values above the diagonal and the corresponding P-values below the
diagonal. Two pairs of marker sites are compared in each cell for the detection of significant
linkage disequilibrium and are presented with the color codes. Colored bar code for the
significance threshold levels in both diagonals is shown.

173

174

175

176

177

178
Figure A1-6 Blast nucleotide comparison of P. brassicae PBRA-000406 protein containing
using NCBI data base.

179
Figure A1-6 Association study between pathotype and SNPs among 43 P. brassicae collections.

180
Appendix 2: Supplemental tables and figures, Chapter Three

181
Appendix 3: Supplemental tables and figures, Chapter Four
Root hair infection
To examine root hair infection in grass crops, two seeds were planted in sand in 50mL tubes and
thinned to one seedling per tube. Seven-day-old seedlings were inoculated with 5 mL of resting
spore suspension of 1 x 10⁵ resting spores -1 of P. brassicae pathotype 6 following the method of
Sharma et al. (Sharma et al. 2011), as described previously. Five-day-old seedlings were
examined for root hair infection. (Sharma et al. 2011). 4-day-old seedlings grown in sand were
washed and observed using a light microscope at 40X magnification of the objective lens. Root
hair infection was not observed in any grass species nor Shanghai pak choi grown in sand. The
acidity of the sand was assessed as pH 6, which should be suitable for club formation. The
experiment was repeated yet the root hair infection was not observed. Thus, some ingredient in
the sand mix, not associated with pH, might have interfered with club formation.
Table A3-1 The spore concentration of Plasmodiophora brassicae after 8 weeks of growth of
grass species / cultivar based on estimates from qPCR and PMA-qPCR under controlled
conditions (n = 6) in 2016.
Cover crop Treatment block Spore concentration per g soil
Soil only PMA 1 16340
Soil only PMA 2 63180
Soil only PMA 3 20597
Soil only PMA 4 22759
Soil only PMA 5 32878
Soil only PMA 6 16836
Norlea PMA 1 31871
Norlea PMA 2 42953
Norlea PMA 3 20543
Norlea PMA 4 32150
Norlea PMA 5 11973
Norlea PMA 6 21354
Radisson PMA 1 2777
Radisson PMA 2 8466
Radisson PMA 3 3457
Radisson PMA 4 1312
Radisson PMA 5 8348
Radisson PMA 6 5178
Signal PMA 1 .
Signal PMA 2 2018
Signal PMA 3 5973
Signal PMA 4 21897
Signal PMA 5 38635
Signal PMA 6 3205

182
Pre plant PMA 1 .
Pre plant PMA 2 20979
Pre plant PMA 3 90836
Pre plant PMA 4 39960
Pre plant PMA 5 164914
Soil only H2O 1 53820
Soil only H2O 2 12104
Soil only H2O 3 31307
Soil only H2O 4 25120
Soil only H2O 5 50850
Soil only H2O 6 18502
Norlea H2O 1 23321
Norlea H2O 2 20475
Norlea H2O 3 58203
Norlea H2O 4 47566
Norlea H2O 5 22698
Norlea H2O 6 42946
Radisson H2O 1 2161
Radisson H2O 2 30794
Radisson H2O 3 53409
Radisson H2O 4 17834
Radisson H2O 5 3197
Radisson H2O 6 5766
Signal H2O 1 7494
Signal H2O 2 3170
Signal H2O 3 3056
Signal H2O 4 8154
Signal H2O 5 73093
Signal H2O 6 103419
Pre plant H2O 1 82326
Pre plant H2O 2 100437
Pre plant H2O 3 54232
Pre plant H2O 4 121905
Pre plant H2O 5 89962
Table A3-2 The spore concentration of Plasmodiophora brassicae after 8 weeks of growth of
grass species / cultivar based on estimates from qPCR and PMA-qPCR under controlled
conditions (n = 6) in 2018.
Cover crop Trial Treatment Block Mean spores per g soil
Allstar 1 H2O 1 348744
Allstar 1 H2O 2 218020
Allstar 1 H2O 3 128761

183
Allstar 1 H2O 4 77476
Allstar 1 H2O 5 137383
Allstar 1 H2O 6 185348
Allstar 1 PMA 1 104921
Allstar 1 PMA 2 98013
Allstar 1 PMA 3 119628
Allstar 1 PMA 4 64340
Allstar 1 PMA 5 102373
Allstar 1 PMA 6 148716
Fiesta 1 H2O 1 163602
Fiesta 1 H2O 2 84690
Fiesta 1 H2O 3 .
Fiesta 1 H2O 4 94730
Fiesta 1 H2O 5 184045
Fiesta 1 H2O 6 79024
Fiesta 1 PMA 1 141396
Fiesta 1 PMA 2 178362
Fiesta 1 PMA 3 .
Fiesta 1 PMA 4 121860
Fiesta 1 PMA 5 179873
Fiesta 1 PMA 6 96199
Fleet 1 H2O 1 31236
Fleet 1 H2O 2 355308
Fleet 1 H2O 3 31352
Fleet 1 H2O 4 199704
Fleet 1 H2O 5 231021
Fleet 1 H2O 6 464971
Fleet 1 PMA 1 6203
Fleet 1 PMA 2 37761
Fleet 1 PMA 3 .
Fleet 1 PMA 4 367886
Fleet 1 PMA 5 194361
Fleet 1 PMA 6 392963
Soil only 1 H2O 1 290105
Soil only 1 H2O 2 451762
Soil only 1 H2O 3 40919
Soil only 1 H2O 4 252573
Soil only 1 H2O 5 211171
Soil only 1 H2O 6 117984
Soil only 1 PMA 1 510451
Soil only 1 PMA 2 436217
Soil only 1 PMA 3 26808

184
Soil only 1 PMA 4 339891
Soil only 1 PMA 5 189614
Soil only 1 PMA 6 101404
Norlea 1 H2O 1 49698
Norlea 1 H2O 2 108491
Norlea 1 H2O 3 121359
Norlea 1 H2O 4 252215
Norlea 1 H2O 5 2162954
Norlea 1 H2O 6 153753
Norlea 1 PMA 1 27607
Norlea 1 PMA 2 145086
Norlea 1 PMA 3 118728
Norlea 1 PMA 4 232960
Norlea 1 PMA 5 153767
Norlea 1 PMA 6 101404
Smooth 1 H2O 1 9623
Smooth 1 H2O 2 245462
Smooth 1 H2O 3 2823
Smooth 1 H2O 4 129215
Smooth 1 H2O 5 143467
Smooth 1 H2O 6 138819
Smooth 1 PMA 1 42668.8
Smooth 1 PMA 2 218037
Smooth 1 PMA 3 18731
Smooth 1 PMA 4 76459
Smooth 1 PMA 5 94037
Smooth 1 PMA 6 128323
Allstar 2 H2O 1 1042514
Allstar 2 H2O 2 173244
Allstar 2 H2O 3 209451
Allstar 2 H2O 4 227830
Allstar 2 H2O 5 1419593
Allstar 2 H2O 6 1388327
Allstar 2 PMA 1 1075597
Allstar 2 PMA 2 181948
Allstar 2 PMA 3 177225
Allstar 2 PMA 4 299207
Allstar 2 PMA 5 1419593
Allstar 2 PMA 6 2578712
Fiesta 2 H2O 1 406807
Fiesta 2 H2O 2 129417
Fiesta 2 H2O 3 108660

185
Fiesta 2 H2O 4 307863
Fiesta 2 H2O 5 1043325
Fiesta 2 H2O 6 319794
Fiesta 2 PMA 1 423348
Fiesta 2 PMA 2 113613
Fiesta 2 PMA 3 158068
Fiesta 2 PMA 4 400960
Fiesta 2 PMA 5 688470
Fiesta 2 PMA 6 1305578
Fleet 2 H2O 1 855088
Fleet 2 H2O 2 40903
Fleet 2 H2O 3 127908
Fleet 2 H2O 4 180624
Fleet 2 H2O 5 1490781
Fleet 2 PMA 1 766374
Fleet 2 PMA 2 67429
Fleet 2 PMA 3 100320
Fleet 2 PMA 4 135761
Fleet 2 PMA 5 463956
Soil only 2 H2O 1 637888
Soil only 2 H2O 2 220503
Soil only 2 H2O 3 200855
Soil only 2 H2O 4 288775
Soil only 2 H2O 5 4120456
Soil only 2 H2O 6 10279376
Soil only 2 PMA 1 595750
Soil only 2 PMA 2 249891
Soil only 2 PMA 3 316355
Soil only 2 PMA 4 366234
Soil only 2 PMA 5 1727606
Soil only 2 PMA 6 7930394
Norlea 2 H2O 1 1720989
Norlea 2 H2O 2 106952
Norlea 2 H2O 3 10057
Norlea 2 H2O 4 325716
Norlea 2 H2O 5 1899015
Norlea 2 H2O 6 1415527
Norlea 2 PMA 1 1655996
Norlea 2 PMA 2 140062
Norlea 2 PMA 3 7557
Norlea 2 PMA 4 428528
Norlea 2 PMA 5 1367438

186
Norlea 2 PMA 6 1462854
Smooth 2 H2O 1 858487
Smooth 2 H2O 2 108784
Smooth 2 H2O 3 53336
Smooth 2 H2O 4 278155
Smooth 2 H2O 5 704823
Smooth 2 H2O 6 3327207
Smooth 2 PMA 1 1080635
Smooth 2 PMA 2 109970
Smooth 2 PMA 3 54055
Smooth 2 PMA 4 248049
Smooth 2 PMA 5 975934
Smooth 2 PMA 6 2066152
Table A3-3 Dry weight of grass roots grown in soil inoculated with 5 x 10⁵ spores of
Plasmodiophora brassicae g-1 soil under controlled conditions in 2017.
Cover crop Block Root wt. (g)
Norlea 1 0.26
Norlea 2 0.05
Norlea 3 0.79
Norlea 4 0.73
Norlea 5 2.06
Norlea 6 0.86
Radisson 1 0.94
Radisson 2 0.85
Radisson 3 1.77
Radisson 4 1.22
Radisson 5 1.62
Radisson 6 2.4
Signal 1 2.17
Signal 2 1.61
Signal 3 0.36
Signal 4 2.24
Signal 5 1.39
Signal 6 2.26
Table A3-4 Dry weight of grass roots grown in soil inoculated with 5 x 10⁵ spores of
Plasmodiophora brassicae g-1 soil under controlled conditions in 2018.
Cover
crop
Trial Block Root wt. (g)
Fiesta 1 1 2.1
Fiesta 1 2 1.6
Fiesta 1 3 1.9

187
Fiesta 1 4 1.8
Fiesta 1 5 3.1
Fiesta 1 6 2.4
Fleet 1 1 5.4
Fleet 1 2 6.8
Fleet 1 3 8.2
Fleet 1 4 5.8
Fleet 1 5 5.7
Fleet 1 6 4.8
Smooth 1 1 4.5
Smooth 1 2 3.4
Smooth 1 3 5.5
Smooth 1 4 3.2
Smooth 1 5 4.4
Smooth 1 6 3.7
All star 1 1 4.2
All star 1 2 11.9
All star 1 3 4.9
All star 1 4 5.6
All star 1 5 3.7
All star 1 6 3.2
Norlea 1 1 3.9
Norlea 1 2 5.4
Norlea 1 3 11.1
Norlea 1 4 5.7
Norlea 1 5 3.4
Norlea 1 6 4.4
Fiesta 2 1 2.6
Fiesta 2 2 3.3
Fiesta 2 3 6.2
Fiesta 2 4 1.4
Fiesta 2 5 1.1
Fiesta 2 6 5.3
Fleet 2 1 7.6
Fleet 2 2 4.5
Fleet 2 3 2.6
Fleet 2 4 6
Fleet 2 5 8.8
Fleet 2 6 11.1
Smooth 2 1 5.2
Smooth 2 2 2.1
Smooth 2 3 5

188
Smooth 2 4 2.1
Smooth 2 5 2
Smooth 2 6 5.1
All star 2 1 8
All star 2 2 6.7
All star 2 3 4.2
All star 2 4 5
All star 2 5 8.1
All star 2 6 10.4
Norlea 2 1 8.8
Norlea 2 2 5.5
Norlea 2 3 5.4
Norlea 2 4 5.6
Norlea 2 5 9.6
Norlea 2 6 7.4
Table A3-4 REML covariance parameter estimates for disease severity of Study 1 for five cover
crops grown in soil infested with P. brassicae.
Covariance Parameter Estimate Standard Error
Rep 0. .
Residual 0.8757 0.1983
Effect Num DF Den DF F value Pr > F
Plant 3 34 7.28 0.0007
PMA 1 34 2.65 0.1129
Plant*PMA 3 34 0.43 0.7345
Table A3-5 REML covariance parameter estimates for disease severity of Studies 2 and 3 for
seven cover crops grown in soil infested with P. brassicae.
Covariance Parameter Estimate Standard Error
Rep(trial) 0.9758 0.4631
Residual 0.6521 0.0900
Effect Num DF Den DF F value Pr > F
Trial 1 10 4.98 0.0497
Treatment 5 105 4.00 0.0023
Trial*Treatment 5 105 1.11 0.3602
PMA 1 105 0.37 0.5442
Trial*PMA 1 105 0.45 0.5035
Treatment*PMA 5 105 0.60 0.6986
Trial*Treatment*PMA 5 105 0.34 0.8867

189
Table A3-6 REML covariance parameter estimates for root weight of the Study 2 for seven
cover crops grown in soil infested with P. brassicae.
Covariance Parameter Estimate Standard Error
Rep 0.6721 0.7500
Residual 1.9232 0.7023
Effect Num DF Den DF F value Pr > F
Treatment 3 15 9.99 0.0007
Table A3-7 REML covariance parameter estimates for root weight of Study 3 for seven cover
crops grown in soil infested with P. brassicae.
Covariance Parameter Estimate Standard Error
Rep 0.71 1.18
Residual 4.22 1.54
Effect Num DF Den DF F value Pr > F
Treatment 3 15 5.70 0.0082

190
Appendix 4: Supplemental tables and figures, Chapter Five
Table A4-1 Clubroot incidence and severity in Study 1. Plants treated with mycorrhizae or water
and inoculated with 0, 5 x 10⁴, 5 x 10⁵, and 5 x 10⁶ resting spores resting spores of
Plasmodiophora brassicae mL-1 applied at the stem base at 1 week after planting.
Treatment Block Inoculum 0 1 2 3 Total Arcsine
CI Arcsine
DSI CI DSI
control 1 5x10^4 4 4 3 0 11 0.69 0.31 63.64 30.30
control 2 5x10^4 3 4 4 1 12 0.85 0.43 75.00 41.67
control 3 5x10^4 3 7 0 1 11 0.81 0.31 72.73 30.30
control 4 5x10^4 9 1 2 0 12 0.25 0.14 25.00 13.89
Glomus 1 5x10^4 3 3 5 0 11 0.81 0.40 72.73 39.39
Glomus 2 5x10^4 2 5 2 1 10 0.93 0.41 80.00 40.00
Glomus 3 5x10^4 7 2 1 0 10 0.30 0.13 30.00 13.33
Glomus 4 5x10^4 3 6 3 0 12 0.85 0.34 75.00 33.33
P. indica 1 5x10^4 2 7 2 0 11 0.96 0.34 81.82 33.33
P. indica 2 5x10^4 1 4 7 0 11 1.57 0.58 100.0 54.55
P. indica 3 5x10^4 5 5 0 1 12 0.52 0.22 50.00 22.22
P. indica 4 5x10^4 5 6 1 0 12 0.62 0.22 58.33 22.22
RR full 1 5x10^4 6 2 0 0 8 0.25 0.08 25.00 8.33
RRfull 2 5x10^4 4 7 1 0 12 0.73 0.25 66.67 25.00
RRfull 3 5x10^4 8 4 0 0 12 0.34 0.11 33.33 11.11
RR full 4 5x10^4 1 8 2 0 11 1.14 0.37 90.91 36.36
RRclay 1 5x10^4 2 7 1 0 10 0.93 0.30 80.00 30.00
RRclay 2 5x10^4 1 9 1 0 11 1.14 0.34 90.91 33.33
RRclay 3 5x10^4 5 2 2 0 9 0.46 0.22 44.44 22.22
RRclay 4 5x10^4 4 5 1 2 12 0.73 0.37 66.67 36.11
RR no-
humate
1 5x10^4 1 5 0 0 6 0.99 0.28 83.33 27.78
RR no-
humate
2 5x10^4 3 7 1 0 11 0.81 0.28 72.73 27.27
RR no-
humate
3 5x10^4 0 8 4 0 12 1.57 0.46 100.0 44.44
RR no-
humate
4 5x10^4 4 8 0 0 12 0.73 0.22 66.67 22.22
control 1 5x10^5 0 3 4 5 12 1.57 0.81 100.0 72.22
control 2 5x10^5 0 0 6 6 12 1.57 0.99 100.0 83.33
control 3 5x10^5 0 0 4 8 12 1.57 1.09 100.0 88.89
control 4 5x10^5 0 1 7 3 11 1.57 0.81 100.0 72.73
P. indica 1 5x10^5 0 3 6 2 11 1.57 0.69 100.0 63.64
P. indica 2 5x10^5 0 3 6 2 11 1.57 0.69 100.0 63.64
P. indica 3 5x10^5 0 5 3 4 12 1.57 0.69 100.0 63.89
P. indica 4 5x10^5 2 4 4 2 12 0.99 0.52 83.33 50.00

191
control 1 5x10^6 0 0 3 8 11 1.57 1.14 100.0 90.91
control 2 5x10^6 0 0 2 10 12 1.57 1.24 100.0 94.44
control 3 5x10^6 0 0 7 4 11 1.57 0.91 100.0 78.79
control 4 5x10^6 0 0 3 9 12 1.57 1.16 100.0 91.67
P. indica 1 5x10^6 0 1 6 4 11 1.57 0.86 100.0 75.76
P. indica 2 5x10^6 0 2 4 6 12 1.57 0.89 100.0 77.78
P. indica 3 5x10^6 0 0 4 8 12 1.57 1.09 100.0 88.89
P. indica 4 5x10^6 0 2 5 4 11 1.57 0.81 100.0 72.73
Table A4-2 Clubroot incidence and severity in Study 2. Plants treated with mycorrhizae or water
and inoculated with 0, 5 x 10⁴, 5 x 10⁵, and 5 x 10⁶ resting spores resting spores of
Plasmodiophora brassicae mL-1 applied at the stem base at 1 week after planting.
Treatment Bloc
k
Inoculum 0 1 2 3 Tota
l
Arcsine
CI
Arcsin
e DSI
CI DSI
control 1 0 14 0 0 0 14 0 0 0 0
control 2 0 14 0 0 0 14 0 0 0 0
control 3 0 14 0 0 0 14 0 0 0 0
control 4 0 14 0 0 0 14 0 0 0 0
control 5 0 14 0 0 0 14 0 0 0 0
control
UofA
1 0 14 0 0 0 14 0 0 0 0
control
UofA
2 0 14 0 0 0 14 0 0 0 0
control
UofA
3 0 14 0 0 0 14 0 0 0 0
control
UofA
4 0 14 0 0 0 14 0 0 0 0
control
UofA
5 0 14 0 0 0 14 0 0 0 0
RR full 1 0 13 0 0 0 13 0 0 0 0
RR full 2 0 14 0 0 0 14 0 0 0 0
RR full 3 0 13 0 0 0 13 0 0 0 0
RR full 4 0 14 0 0 0 14 0 0 0 0
RR full 5 0 14 0 0 0 14 0 0 0 0
control 1 5x10^4 0 0 4 10 14 1.57 1.13 100 90.48
control 2 5x10^4 0 0 3 11 14 1.57 1.19 100 92.86
control 3 5x10^4 0 0 0 14 14 1.57 1.57 100 100
control 4 5x10^4 0 0 0 14 14 1.57 1.57 100 100
control 5 5x10^4 0 0 0 12 12 1.57 1.57 100 100
control
UofA
1 5x10^4 0 1 6 7 14 1.57 0.94 100 80.95
control
UofA
2 5x10^4 0 0 2 12 14 1.57 1.26 100 95.24

192
control
UofA
3 5x10^4 0 0 1 11 12 1.57 1.33 100 97.22
control
UofA
4 5x10^4 0 0 4 9 13 1.57 1.11 100 89.74
control
UofA
5 5x10^4 0 0 0 13 13 1.57 1.57 100 100.00
P. indica 1 5x10^4 0 0 5 9 14 1.57 1.08 100 88.10
P. indica 2 5x10^4 0 1 2 9 12 1.57 1.09 100 88.89
P. indica 3 5x10^4 0 0 3 11 14 1.57 1.19 100 92.86
P. indica 4 5x10^4 0 0 0 14 14 1.57 1.57 100 100
P. indica 5 5x10^4 0 0 0 11 11 1.57 1.57 100 100
RR clay 1 5x10^4 0 0 3 11 14 1.57 1.19 100 92.86
RR clay 2 5x10^4 0 1 3 10 14 1.57 1.08 100 88.10
RR clay 3 5x10^4 0 0 1 12 13 1.57 1.34 100 97.44
RR clay 4 5x10^4 0 1 1 11 13 1.57 1.18 100 92.31
RR clay 5 5x10^4 0 0 0 14 14 1.57 1.57 100 100
RR full 1 5x10^4 0 1 3 10 14 1.57 1.08 100 88.10
RR full 2 5x10^4 0 4 5 4 13 1.57 0.73 100 66.67
RR full 3 5x10^4 0 1 6 6 13 1.57 0.92 100 79.49
RR full 4 5x10^4 0 0 1 12 13 1.57 1.34 100 97.44
RR full 5 5x10^4 0 2 4 8 14 1.57 0.94 100 80.95
RR -
humate
1 5x10^4 0 1 2 11 14 1.57 1.13 100 90.48
RR -
humate
2 5x10^4 0 0 0 13 13 1.57 1.57 100 100
RR -
humate
3 5x10^4 0 0 1 13 14 1.57 1.35 100 97.62
RR -
humate
4 5x10^4 0 0 0 14 14 1.57 1.57 100 100
RR -
humate
5 5x10^4 0 0 1 13 14 1.57 1.35 100 97.62
RR - no
humate
1 5x10^4 0 0 5 9 14 1.57 1.08 100 88.10
RR - no
humate
2 5x10^4 0 0 1 13 14 1.57 1.35 100 97.62
RR - no
humate
3 5x10^4 0 0 1 13 14 1.57 1.35 100 97.62
RR - no
humate
4 5x10^4 0 0 0 14 14 1.57 1.57 100 100
RR - no
humate
5 5x10^4 0 0 0 14 14 1.57 1.57 100 100
P. indica 1 5x10^4+
N
0 0 2 12 14 1.57 1.26 100 95.24

193
P. indica 2 5x10^4+
N
0 7 2 4 13 1.57 0.63 100 58.97
P. indica 3 5x10^4+
N
0 1 6 7 14 1.57 0.94 100 80.95
P. indica 4 5x10^4+
N
0 1 2 11 14 1.57 1.13 100 90.48
P. indica 5 5x10^4+
N
0 0 2 12 14 1.57 1.26 100 95.24
control 1 5x10^5 0 0 2 11 13 1.57 1.25 100 94.87
control 2 5x10^5 0 0 0 14 14 1.57 1.57 100 100
control 3 5x10^5 0 0 0 14 14 1.57 1.57 100 100
control 4 5x10^5 0 0 0 14 14 1.57 1.57 100 100
control 5 5x10^5 0 0 0 13 13 1.57 1.57 100 100
control
UofA
1 5x10^5 0 0 0 14 14 1.57 1.57 100 100
control
UofA
2 5x10^5 0 0 0 14 14 1.57 1.57 100 100
control
UofA
3 5x10^5 0 0 0 14 14 1.57 1.57 100 100
control
UofA
4 5x10^5 0 0 0 14 14 1.57 1.57 100 100
control
UofA
5 5x10^5 0 0 0 13 13 1.57 1.57 100 100
P. indica 1 5x10^5 0 0 0 14 14 1.57 1.57 100 100
P. indica 2 5x10^5 0 0 0 14 14 1.57 1.57 100 100
P. indica 3 5x10^5 0 0 0 14 14 1.57 1.57 100 100
P. indica 4 5x10^5 0 0 0 12 12 1.57 1.57 100 100
P. indica 5 5x10^5 0 0 0 14 14 1.57 1.57 100 100
P. indica 1 5x10^5+
N
0 0 1 13 14 1.57 1.35 100 97.62
P. indica 2 5x10^5+
N
0 0 0 13 13 1.57 1.57 100 100
P. indica 3 5x10^5+
N
0 0 0 14 14 1.57 1.57 100 100
P. indica 4 5x10^5+
N
0 0 0 13 13 1.57 1.57 100 100
P. indica 5 5x10^5+
N
0 0 0 13 13 1.57 1.57 100 100

194
Table A4-3 Fresh and dry weight (g/plant) of canola roots treated and non-treated with
mycorrhizal fungi and grown under controlled condition in trial 1.
Treatment Inoculum Block Fresh wt. Dry wt.
control 0 1 1.96 0.49
control 0 2 1.71 0.71
control 0 3 2.67 0.48
control 0 4 3.08 0.64
control UofA 0 1 2.09 0.41
control UofA 0 2 1.96 0.39
control UofA 0 3 3.33 0.7
control UofA 0 4 2.32 0.45
Glomus 0 1 2.17 0.48
Glomus 0 2 1.73 0.41
Glomus 0 3 2.71 0.62
Glomus 0 4 2.96 0.37
RR clay 0 1 1.91 0.45
RR clay 0 2 1.51 0.38
RR clay 0 3 2.79 0.6
RR clay 0 4 3.1 0.58
RR full 0 1 2.02 0.44
RR full 0 2 2.2 0.46
RR full 0 3 2.35 0.5
RR full 0 4 2.87 0.51
RR no - humate 0 1 2.15 0.47
RR no - humate 0 2 3.05 0.57
RR no - humate 0 3 2.78 0.58
RR no - humate 0 4 3.31 0.64
control UofA 5x10^4 1 1.89 0.4
control UofA 5x10^4 2 3.18 0.55
control UofA 5x10^4 3 2.64 0.56
control UofA 5x10^4 4 2.24 0.48
Glomus 5x10^4 1 1.89 0.44
Glomus 5x10^4 2 2.78 0.56
Glomus 5x10^4 3 3.08 0.61
Glomus 5x10^4 4 2.83 0.58
P. indica 5x10^4 1 1.72 0.38
P. indica 5x10^4 2 1.99 0.39
P. indica 5x10^4 3 2.04 0.4
P. indica 5x10^4 4 2.73 0.52
RR clay 5x10^4 1 1.04 0.28
RR clay 5x10^4 2 1.57 0.32
RR clay 5x10^4 3 3.4 0.58

195
RR clay 5x10^4 4 2.37 0.45
RR full 5x10^4 1 1.37 0.32
RR full 5x10^4 2 1.64 0.35
RR full 5x10^4 3 2.19 0.4
RR full 5x10^4 4 2.86 0.44
RR no - humate 5x10^4 1 1.65 0.31
RR no - humate 5x10^4 2 1.78
RR no - humate 5x10^4 3 1.82 0.38
RR no - humate 5x10^4 4 3.06 0.5
control 5x10^5 1 1.45 0.3
control 5x10^5 2 1.71 0.34
control 5x10^5 3 2.34 0.43
control 5x10^5 4 1.98 0.37
P. indica 5x10^5 1 1.52 0.34
P. indica 5x10^5 2 1.26 0.25
P. indica 5x10^5 3 2.08 0.42
P. indica 5x10^5 4 3.01 0.5
control 5x10^6 1 1.32 0.3
control 5x10^6 2 1.93 0.31
control 5x10^6 3 1.88 0.39
control 5x10^6 4 1.76 0.36
P. indica 5x10^6 1 1.32 0.27
P. indica 5x10^6 2 1.52 0.3
P. indica 5x10^6 3 1.93 0.32
P. indica 5x10^6 4 1.98 0.32
Table A4-4 Fresh and dry weight of canola roots (g/plant) treated and non-treated with
mycorrhizal fungi and grown under controlled condition in trial 2.
Treatment Inoculum Block Shoot
fresh wt
Root
fresh wt
Shoot
dry wt
Root
dry wt
control 0 1 3.85 1.78 0.73 0.38
control 0 2 2.895 1.3 0.56 0.32
control 0 3 3.06 0.9 0.57 0.26
control 0 4 2.23 1 0.29 0.52
control 0 5 2.03 1.06 0.45 0.32
control 5x10^4 1 2.19 2.28 0.34 0.4
control 5x10^4 2 1.44 2.25 0.25 0.4
control 5x10^4 3 1.17 1.75 0.06 0.29
control 5x10^4 4 1 2 0.19 0.36
control 5x10^4 5 0.71 2.03 0.125 0.33
control 5x10^5 1 0.91 1.68 0.13 0.25
control 5x10^5 2 1.25 2 0.19 0.31

196
control 5x10^5 3 0.98 2.07 0.135 0.32
control 5x10^5 4 0.73 1.9 0.16 0.32
control 5x10^5 5 0.34 1.64 0.07 0.26
control UofA 0 1 2.98 1.25 0.61 0.25
control UofA 0 2 2.76 1.4 0.52 0.34
control UofA 0 3 3.06 1 0.57 0.31
control UofA 0 4 2.3 1.09 0.42 0.27
control UofA 0 5 1.75 0.89 0.54 0.34
control UofA 5x10^4 1 2.07 2.58 0.4 0.47
control UofA 5x10^4 2 1.64 2.42 0.27 0.43
control UofA 5x10^4 3 1.6 2.35 0.25 0.36
control UofA 5x10^4 4 0.7 1.55 0.03 0.26
control UofA 5x10^4 5 0.67 1.73 0.16 0.31
control UofA 5x10^5 1 1.41 1.87 0.13 0.32
control UofA 5x10^5 2 0.98 2.06 0.12 0.3
control UofA 5x10^5 3 0.94 2.11 0.14 0.32
control UofA 5x10^5 4 0.5 1.79 0.11 0.29
control UofA 5x10^5 5 0.57 1.73 0.12 0.29
P. indica 5x10^4 1 2.31 3.31 0.43 0.55
P. indica 5x10^4 2 1.82 1.92 0.31 0.35
P. indica 5x10^4 3 1.78 2.27 0.15 0.32
P. indica 5x10^4 4 1.05 2.13 0.13 0.33
P. indica 5x10^4 5 0.95 1.91 0.26 0.4
P. indica 5x10^5 1 1.02 1.5 0.36 0.92
P. indica 5x10^5 2 1.185 2.24 0.16 0.32
P. indica 5x10^5 3 0.89 1.85 0.1 0.26
P. indica 5x10^5 4 0.43 1.67 0.07 0.25
P. indica 5x10^5 5 0.48 1.73 0.1 0.27
P. indica + N 5x10^4 1 4.04 4.55
P. indica + N 5x10^4 2 5.7 3.54 0.84 0.67
P. indica + N 5x10^4 3 4.2 4.57 0.55 0.88
P. indica + N 5x10^4 4 1.63 4.47 0.27 0.73
P. indica + N 5x10^4 5 1.61 4.43 0.3 0.72
P. indica + N 5x10^5 1 4.22 5.111 0.58 0.83
P. indica + N 5x10^5 2 2.94 3.49 0.28 0.5
P. indica + N 5x10^5 3 2.75 4.32 0.08 0.62
P. indica + N 5x10^5 4 2.05 5.07 0.36 0.8
P. indica + N 5x10^5 5 1.79 4.77 0.26 0.7
RR humate 5x10^4 1 1.91 2.42 0.27 0.41
RR humate 5x10^4 2 1.93 2.85 0.32 0.51
RR humate 5x10^4 3 1.4 2.49 0.09 0.31
RR humate 5x10^4 4 0.54 1.84 0.25 0.41

197
RR humate 5x10^4 5 0.88 2.3 0.22 0.45
RR clay 5x10^4 1 2.07 1.42 0.25 0.36
RR clay 5x10^4 2 1.61 2.77 0.31 0.46
RR clay 5x10^4 3 1.26 2.15 0.23 0.4
RR clay 5x10^4 4 1.11 1.32 0.21 0.26
RR clay 5x10^4 5 1.02 2.3 0.22 0.42
RR full 0 1 3.42 1.25 0.66 0.36
RR full 0 2 5.2 2.84 0.87 0.46
RR full 0 3 4.82 1.38 0.93 0.38
RR full 0 4 2.1 0.53 0.46 0.25
RR full 0 5 2.1 0.7 0.42 0.29
RR full 5x10^4 1 2.2 2.37 0.36 0.47
RR full 5x10^4 2 2.58 2.06 0.42 0.41
RR full 5x10^4 3 1.01 1.63 0.21 0.32
RR full 5x10^4 4 1.13 2.04 0.23 0.39
RR full 5x10^4 5 1.25 1.78 0.31 0.4
RR no -
humate
5x10^4 1 1.5 1.9 0.23 0.31
RR no -
humate
5x10^4 2 1.68 2.39 0.28 0.42
RR no -
humate
5x10^4 3 1.19 2 0.178 0.34
RR no -
humate
5x10^4 4 1.2 2.74 0.25 0.47
RR no -
humate
5x10^4 5 0.9 2.35 0.2 0.4
Table A4-5 Fresh and dry weight of canola shoots and roots treated and non-treated with
mycorrhizal fungi and grown in the field.
Treatment Block Shoot
fresh wt
Shoot
dry wt
Root
fresh wt
Root dry wt
RR full 0.6g 1 1.02 0.46 1.22 0.41
RR full 0.3 g 1 3.91 0.51 2.37 0.53
RR full 0.12 g 1 7.44 1.31 2.71 0.19
RR clay 1 2.82 0.67 2.97 0.36
RR no -
Humate
1 3.1 0.46 1.99 0.32
water 1 5.24 0.59 2.64 0.39
RR full 0.6g 2 2.69 0.37 2.47 0.35
RR full 0.3 g 2 10.83 1.53 4.67 0.68
RR full 0.12 g 2 12.53 0.84 5.57 0.26
RR clay 2 3.28 0.43 2.18 0.32

198
RR no -
Humate
2 3.71 0.48 3 0.44
water 2 7.12 0.93 3.51 0.51
RR full 0.6g 3 10.17 1.37 4.53 0.72
RR full 0.3 g 3 3.75 0.42 2.62 0.39
RR full 0.12 g 3 2.58 0.37 1.81 0.28
RR clay 3 3.83 0.46 1.97 0.35
RR no -
Humate
3 10.07 0.87 3.54 0.54
water 3 21.44 2.49 6.5 0.88
RR full 0.6g 4 4.57 0.61 2.44 0.41
RR full 0.3 g 4 5.94 0.82 2.82 0.5
RR full 0.12 g 4 3.2 0.4 1.93 0.29
RR clay 4 3.48 0.72 3.71 0.38
RR no -
Humate
4 8.64 1.25 3.83 0.6
water 4 4.79 0.61 2.53 0.37
Table A4-6 REML covariance parameter estimates for clubroot severity of the first mycorrhizae
trial of 15 treatments inoculated with or without P. brassicae.
Covariance Parameter Estimate Standard Error
Rep 0.002095 0.002862
Residual 0.01290 0.003649
Effect Num DF Den DF F value Pr > F
Treatment 5 25 2.63 0.0485
Inoculum 2 25 77.61 <.0001
Treatment*Inoculum 2 25 4.32 0.0245
Table A4-7 REML covariance parameter estimates for clubroot severity of the second trial of 16
treatments inoculated with or without P. brassicae.
Covariance Parameter Estimate Standard Error
Rep 0.00552 0.005012
Residual 0.02286 0.004398
Effect Num DF Den DF F value Pr > F
Treatment 8 54 2.23 0.0392
Inoculum 4 54 186.95 <.0001
Treatment*Inoculum 4 54 2.65 0.0432