a bac transgenic hes1-egfp reporter reveals novel expression domains in mouse embryos
TRANSCRIPT

A BAC transgenic Hes1-EGFP reporter reveals novel expressiondomains in mouse embryos
Rasmus Klinck1, Ernst-Martin Füchtbauer2, Jonas Ahnfelt-Rønne1, Palle Serup1, JanNygaard Jensen1, and Mette Christine Jørgensen1
1Department of Beta Cell Regeneration, Hagedorn Research Institute, Niels Steensens Vej 6,DK-2820 Gentofte, Denmark2Department of Molecular Biology, Aarhus University, C. F. Møllers Alle 3 bldg.1130, DK-8000Aarhus C, Denmark
AbstractExpression of the basic helix-loop-helix factor Hairy and Enhancer of Split-1 (Hes1) is requiredfor normal development of a number of tissues during embryonic development. Depending oncontext, Hes1 may act as a Notch signalling effector which promotes the undifferentiated andproliferative state of progenitor cells, but increasing evidence also points to Notch independentregulation of Hes1 expression. Here we use high resolution confocal scanning of EGFP in a novelBAC transgenic mouse reporter line, Tg(Hes1-EGFP)1Hri, to analyse Hes1 expression fromembryonic day 7.0 (e7.0). Our data recapitulates some previous observations on Hes1 expressionand suggests new, hitherto unrecognised expression domains including expression in the definitiveendoderm at early somite stages before gut tube closure and thus preceding organogenesis. Thismouse line will be a valuable tool for studies addressing the role of Hes1 in a number of differentresearch areas including organ specification, development and regeneration.
1. IntroductionHes1 is a basic helix-loop-helix (bHLH) transcriptional repressor which is required fornormal development of several tissues and organs including the nervous system (Ishibashi etal., 1995), the eyes (Tomita et al., 1996), the pancreas (Jensen et al., 2000), the thymus(Tomita et al., 1999) and the lungs (Ito et al., 2000). Hes1 is also expressed in thedeveloping kidneys (Chen and Al-Awqati, 2005; Piscione et al., 2004), the intestine (Jensenet al., 2000) and the stomach (Nyeng et al., 2007). Loss of Hes1 in the developing nervoussystem leads to up-regulation of the neural differentiation factor Mash1 and subsequentlypremature neural differentiation (Ishibashi et al., 1995). Also, the loss of Hes1 results inpremature endocrine differentiation in the developing mouse gut tube as well as in thepancreas, resulting in pancreatic hypoplasia (Apelqvist et al., 1999; Esni et al., 2004;Fujikura et al., 2006; Jensen et al., 2000). Cell culture studies have shown that Hes1 is adownstream target of Notch signalling in some contexts (Jarriault et al., 1995; Jarriault et al.,1998; Ohtsuka et al., 1999), and loss-of-function studies often show similar phenotypes
© 2011 Elsevier B.V. All rights reserved.Corresponding author: Mette Christine Jørgensen, Department of Beta Cell Regeneration, Hagedorn Research Institute, NielsSteensens Vej 6, DK-2820 Gentofte, Denmark. TLF: +45 4443 9132, FAX: +45 4443 8000, [email protected]'s Disclaimer: This is a PDF file of an unedited manuscript that has been accepted for publication. As a service to ourcustomers we are providing this early version of the manuscript. The manuscript will undergo copyediting, typesetting, and review ofthe resulting proof before it is published in its final citable form. Please note that during the production process errors may bediscovered which could affect the content, and all legal disclaimers that apply to the journal pertain.
NIH Public AccessAuthor ManuscriptGene Expr Patterns. Author manuscript; available in PMC 2012 October 1.
Published in final edited form as:Gene Expr Patterns. 2011 October ; 11(7): 415–426. doi:10.1016/j.gep.2011.06.004.
NIH
-PA Author Manuscript
NIH
-PA Author Manuscript
NIH
-PA Author Manuscript
when comparing Hes1 and other Notch pathway null mutants which all result in prematuredifferentiation (Apelqvist et al., 1999; Esni et al., 2004; Fujikura et al., 2006).
In the pancreas, Hes1 regulates endocrine differentiation (Jensen et al., 2000) by inhibitingthe expression of the pro-endocrine differentiation factor Neurog3 (Apelqvist et al., 1999;Fukuda et al., 2006), and studies in cell culture suggest that exocrine differentiation may beregulated by direct interactions between Hes1 and Pancreatic transcription factor 1a (Ptf1a)(Esni et al., 2004; Ghosh and Leach, 2006). In the adult pancreas, Hes1 is restricted to thecentroacinar cells but becomes activated by pancreatic injury, e.g. during chemicallyinduced pancreatitis (Jensen et al., 2005), indicating a possible role in regeneration. Hes1 isalso upregulated during induction of pancreatic cancer (Miyamoto et al., 2003; Pasca diMagliano et al., 2006).
Hence, a key function of Hes1 is to prevent differentiation and keep a pool of progenitorcells in a proliferative state to ensure appropriate growth of the developing tissue. However,more recent studies point to several Notch independent ways of activating Hes1 expression.During somitogenesis, segmentation is controlled by a molecular clock (Pourquie, 2003)where FGF has been shown to induce the oscillations of Hes1 expression (Nakayama et al.,2008), while in retina explants, Sonic hedgehog (Shh) has been demonstrated to regulateHes1 activity in a Gli2 dependent manner (Ingram et al., 2008; Wall et al., 2009).
Previous investigations of Hes1 mutant mice revealed formation of ectopic pancreatic tissuein the common bile duct (Sumazaki et al., 2004), stomach, and duodenum, along with gallbladder agenesis (Fukuda et al., 2006). It has recently been proposed that Hes1 acts inconjunction with the SRY-box containing HMG transcription factor Sox17 to define thepancreato-biliary boundary in the ventral posterior foregut (Spence et al., 2009).
Here, we have used a publicly available BAC-clone from the GENSAT project (Gong et al.,2003), where the coding sequence of Enhanced Green Fluorescent Protein (EGFP) isinserted in the 5′UTR of the Hes1 gene to generate a transgenic mouse line, Tg(Hes1-EGFP)1Hri. We present the analysis of Hes1-EGFP expression in the developing mouseembryo from late streak stage around e7.0 with focus on the pancreas, the intestine, the liver,the kidneys, and the lungs. Our results confirm previous reports on Hes1 expression andreveal novel Hes1 expression domains.
2. ResultsTo investigate the temporal and spatial patterns of Hes1 expression, we performedpronuclear injections to generate a transgenic mouse line expressing EGFP under control ofHes1 regulatory sequences. We used a BAC clone containing more than 224 kb ofchromosome 16 including the Hes1 gene (Fig.1A). The insertion of the whole 224 kbfragment was verified by Southern blots with probes that recognise the ends (Fig. 1B, C).Immunoflourescent stainings for Hes1 and EGFP on adjacent sections confirm co-expression of EGFP with Hes1 in the inner neural layer and the outer pigment layer of thefuture retina in the e10.5 developing eye (Fig. 1D, E), in e10.5 developing pancreasepithelium (but not in the mesenchymal cells) (Fig. 1F, G), in roof plate (but not in theependymal cells) in e14.5 neural tube (Fig. 1I, J), and in e14.5 oesophagus (Fig. 1J, K). Wehave used the Tg(Hes1-EGFP)1Hri mouse line to analyse for EGFP expression at differentstages of development in selected tissues.
2.1 Hes1 promoter-driven EGFP expression at late streak stage and early somite stagesWe first analysed e7.0 and e8.0-e8.5 stage embryos using whole mountimmunohistochemistry. The e7.0 late streak stage embryos show uniform EGFP expression
Klinck et al. Page 2
Gene Expr Patterns. Author manuscript; available in PMC 2012 October 1.
NIH
-PA Author Manuscript
NIH
-PA Author Manuscript
NIH
-PA Author Manuscript

in the endodermal cell layer but is excluded from the mesoderm and ectoderm (Fig. 2A, B).A day later at e8.0-e8.5 just before embryo turning, we find a distinct area of EGFPexpression in the posterior part, and another expression area in the anterior part of theembryo (Fig. 2C). In the tail region, we observe strong expression of EGFP in theneuroepithelium posterior to the forming somites (Fig. 2C, D). In addition, we find EGFP inthe posterior definitive endoderm with an anterior border at the 4th somite pair (Fig. 2E-I),and in the presomitic paraxial mesoderm (Fig. 2C and J). The latter correlates well withprevious data showing that Hes1 is a part of the segmental clock in the presomitic mesoderm(Jouve et al., 2000). Anteriorly, we find EGFP expression in the endoderm of the foregutand in the anterior intestinal portal (AIP) (Fig.2K-M).
2.2 Hes1 promoter-driven EGFP expression at e9.0 and e10.5Analysis of e9.0 embryos by whole mount immunohistochemistry shows continuedexpression of EGFP in the endodermal epithelium of the primitive gut tube. The dorsalPdx1-positive pancreatic primordium shows strong EGFP expression and marks the anteriorborder of the posterior, dorsal endodermal expression domain at the level of the 4th somitepair (Fig. 3A). Only the dorsal part of the gut tube from the pancreas bud to the posteriorpart of the embryo is positive for EGFP, and at the most posterior end we also detect EGFPexpression in the notochord (Fig. 3B). The ventral pancreatic progenitor cells marked byPdx1 expression as well as the ventral part of the primitive gut tube posterior to the Pdx1domain do not express EGFP at this stage (Fig. 3A). However, there is EGFP expression inthe ventral foregut endoderm anterior to the ventral pancreas, but this does not appear to bein liver progenitor cells as there is no overlap between EGFP and the expression of Prox1(Fig. 6A-C) (see section 2.3.3). At e9.0, we also observe Hes1-EGFP expression in themesonephric ridge and the presomitic mesoderm (Fig. 3A). In the head region of theembryo, EGFP expression is detected in the otic pit epithelium (Fig. 3A) demonstratingHes1 expression before the development of the primordial cochlea where expression ofHes1 mRNA has been reported previously (Murata et al., 2009). Additionally, the opticvesicles express EGFP (Fig. 3A), a prelude to the Hes1-EGFP expression previouslydescribed in the mouse e13.5 retina (Ohtsuka et al., 2006). We also find EGFP expression inthe frontonasal process and in the pharyngeal region (Fig. 3A) corresponding to Hes1mRNA expression described by Rochais et al. (Rochais et al., 2009). Moreover, there isEGFP expression in the neuroepithelium of forebrain, midbrain, and hindbrain (Fig. 3A).
Slightly later at e9.5, endodermal EGFP expression becomes confined to the dorsal pancreasanlage (Fig. 3C, D), whereas the more posterior dorsal gut tube epithelium as well as theventral foregut epithelium both have ceased EGFP expression (Fig. 3C, D). EGFPexpression in the mesonephric ridge becomes more pronounced (Fig. 3C).
At e10.5, the formation of many organs is more defined, and Hes1-EGFP expression hasnow become organ specific as seen by expression in the mesonephric tubules and in bothpancreatic buds (Fig. 3E, F, F’). The EGFP expression is less intense in the dorsal pancreasbud compared to the mesonephros and even lower in the ventral pancreas bud (Fig. 3F’,inset). A strong EGFP signal remains in the tail region (Fig 3E), where continued Hes1expression is required in the presomitic mesoderm for normal somite segmentation (Jouve etal., 2000), but also the notochord and the posterior hindgut epithelium show EGFPexpression in the most posterior part of the tail bud (Fig. 3G). Additionally, we see EGFPexpression in the epidermal epithelium of the budding forelimbs (data not shown)corresponding with previous observations for Hes1 mRNA (Rochais et al., 2009). In thehead region of the e10.5 embryo, EGFP expression in the developing eye is now discernableto be in the inner neural layer of the optic cup (Fig. 3E). The neural EGFP expression ismost pronounced in the telencephalic vesicle and the hindbrain, but also the neuroepitheliumof the mesencephalon and the dorsal neural tube show significant EGFP expression (Fig
Klinck et al. Page 3
Gene Expr Patterns. Author manuscript; available in PMC 2012 October 1.
NIH
-PA Author Manuscript
NIH
-PA Author Manuscript
NIH
-PA Author Manuscript
3E). Overall, our findings of neural EGFP expression in e10.5 embryos reflect previouslydescribed neural expression of Hes1 promoter activated EGFP (Ohtsuka et al., 2006).
2.3 Organ specific analysis of Hes1 promoter-driven EGFP expressionHes1 driven EGFP expression in the brain is well described by the GENSAT project(www.GENSAT.org) and in Ohtsuka et al. 2006 (Ohtsuka et al., 2006). We have thereforefocused on the spatiotemporal expression pattern in different organs of the trunk, where theHes1 expression pattern is poorly characterized.
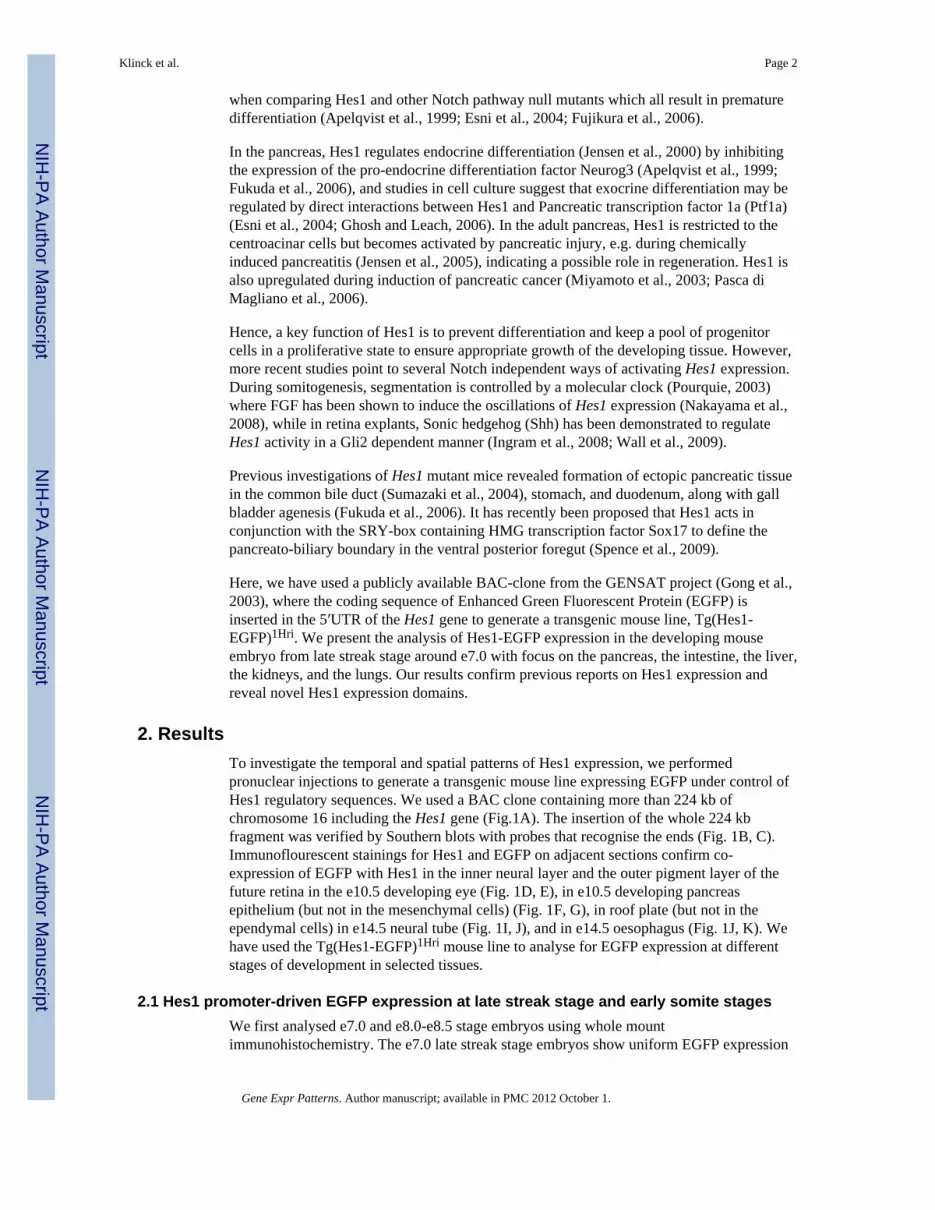
2.3.1 Hes1-EGFP expression in the developing pancreas—At e10.5, the pancreaticstructures are well defined and distinct from the stomach, bile duct, and duodenum. Here,clear EGFP expression is seen in the dorsal pancreatic bud epithelium (Fig. 3F, F’, 4A, D).The ventral pancreatic bud also displays EGFP expression although at a lower level (Fig. 3Finset, 4D). Others have reported Hes1 immunoreactivity in the pancreatic mesenchyme ate11.5 (Seymour et al., 2007) and we see that as well when performing Hes1immunostainings (Fig. 1F), but we do not detect Hes1-EGFP expression in the pancreaticmesenchyme neither at e10.5 nor at e12.5 (Fig. 4A, B, D, E). These data correlate well withprevious in situ hybridisation data (Lammert et al., 2000) demonstrating Hes1 mRNAspecifically in the e10.5 pancreas epithelium. However, we do see scattered EGFPexpressing cells in the mesenchyme surrounding the duodenum (Fig. 4A, D, arrow heads).
At e12.5, EGFP is broadly expressed in the developing pancreas in both Pdx1 positive andPdx1 negative cells (Fig. 4B, C, E) and the expression have reached similar levels in thedorsal and the ventral pancreas (not shown). This is in line with previous data showing co-expression of Hes1 and Pdx1 in mouse e13.5 pancreas (Esni et al., 2004). It has alsopreviously been demonstrated that Hes1 expression is down regulated in glucagon positivecells in the e12.5 pancreas (Jensen et al., 2000), and we can confirm that many glucagonpositive as well as insulin positive cells are negative for EGFP (Fig 4B, E, arrow heads), butwe also see examples of cells double positive for EGFP and glucagon (Fig. 4E, arrow)which can be explained by the longer half life of EGFP compared to endogenous Hes1mRNA and protein (Corish and Tyler-Smith, 1999; Hirata et al., 2002; Jouve et al., 2000). Inthe central epithelium, there is a quite uniform expression of EGFP whereas only a subset ofcells in the tips of the forming branches are EGFP positive (Fig. 4C). We find thatCarboxypeptidase A (Cpa1) is only expressed in tip cells with very low or no EGFP-expression (Fig. 4F). At e14.5, Hes1-EGFP expression is entirely restricted to the trunkepithelium and absent from the forming acini determined to become exocrine cells (Fig. 4G,K, O).
In the e17.5 pancreas, the EGFP expression is primarily observed in the central trunkepithelium, adjacent to insulin and glucagon expressing cells. EGFP is also seen in theexocrine tissue as scattered single cells or small clusters of 2-3 cells (Fig. 4H, L, P). TheseEGFP positive cell clusters all co-express the ductal marker Sox9 (Fig. 4P inset) (Seymouret al., 2007)
At birth (P0), we find most of the EGFP expression located in proximity to the islets ofLangerhans and the pancreatic ducts, but never in the differentiated insulin or glucagonpositive cells (Fig. 4I, M). EGFP positive single cells can be observed in the central part ofmany acini (Fig. 4I, M, U, arrow heads). Eight days after birth (P8), EGFP expression is lostin the ducts and around the islets (Fig. 4J, N) but the single, scattered EGFP positive cellsare still seen at the base of the acini (Fig. 4J, V, arrow heads) and they co-express Sox9 (Fig.4V inset) corresponding to the centroacinar cells in agreement with previous reports(Furuyama et al., 2010; Miyamoto et al., 2003). These cells can still be found in adultpancreas although they are very rare (Fig. 4X, arrow head and inset).
Klinck et al. Page 4
Gene Expr Patterns. Author manuscript; available in PMC 2012 October 1.
NIH
-PA Author Manuscript
NIH
-PA Author Manuscript
NIH
-PA Author Manuscript
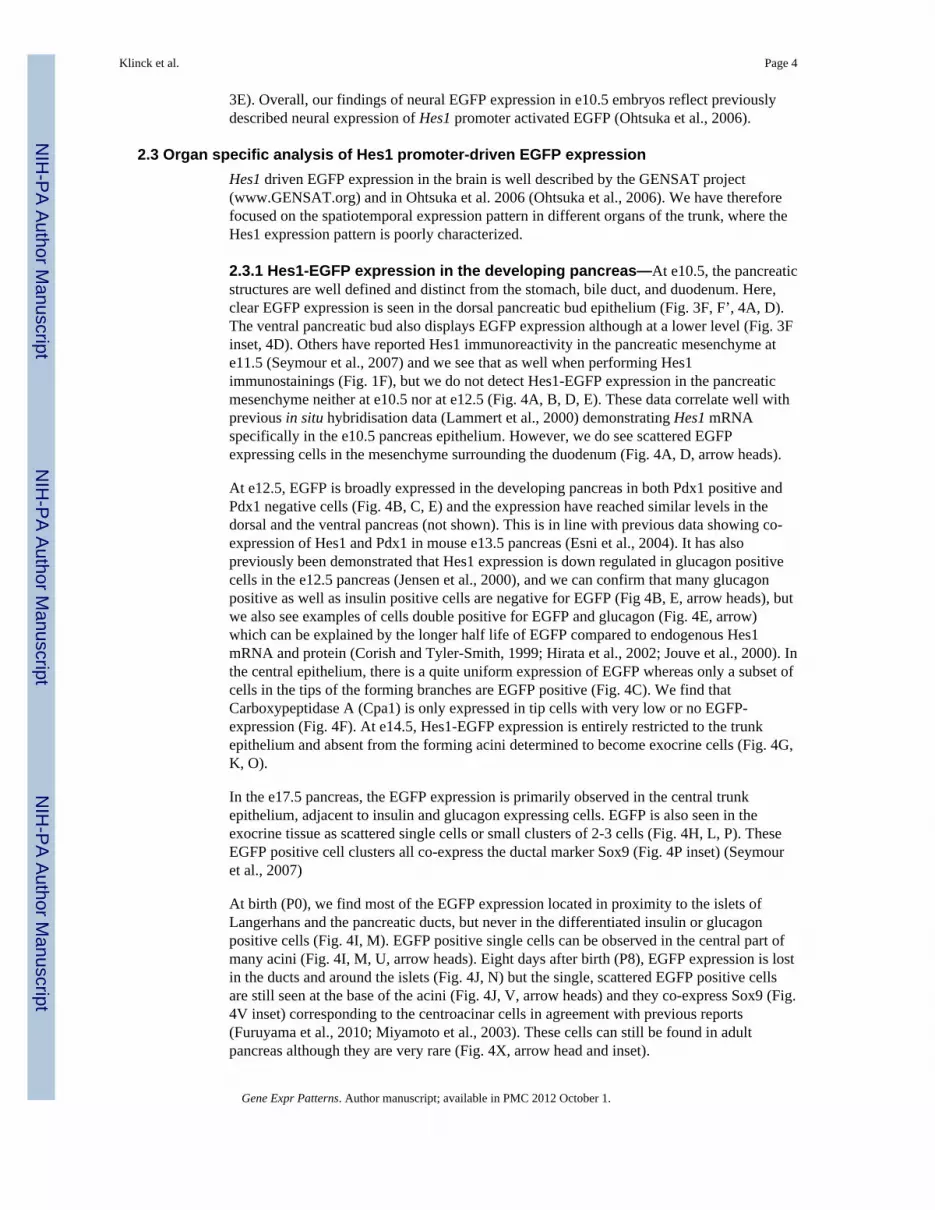
2.3.2 Hes1-EGFP expression in the developing duodenum—Immediately afterclosure of the gut endoderm at e9.0, we observe a Hes1-EGFP positive streak along thedorsal part of the prospective duodenum, posterior to the dorsal pancreas area (Fig. 3A).However, this expression disappears already at e9.5 (Fig. 3C, D), and at e10.5 there is only afew EGFP expressing cells left in the dorsal duodenal epithelium close to the pancreas (Fig.5B), but many dispersed EGFP positive cells in the mesenchyme surrounding the developingduodenum and gut tube (Fig. 5A, B, arrow heads). At e12.5, there is a layer of EGFPexpressing cells peripheral to the duodenal and midgut epithelium (Fig. 5C-E). These cellsare located more peripherally than the smooth musculature marked by the expression ofsmooth muscle actin (Fig. 5C, E). Consistent with an absence of these cells from the e12.5hindgut (data not shown), we observe Hes1 expression to be overlapping with beta-III-tubulin expression, which marks enteric neurons (Fig. 5D).
At e14.5, EGFP expression appears in some but not all cells in the duodenal epithelium, andin the periphery we find a rim of cells with a strong EGFP signal together with a weakerEGFP signal in cells closer to the epithelium (Fig. 5G). We find EGFP expression in thee17.5 epithelium (Fig. 5H) confirming previously published data showing Hes1immunoreactivity in the intestinal villi (Jensen et al., 2000). However, we do not find EGFPexpression restricted to the intervillus regions (future crypts) and within the villusmesenchyme as others have previously detected by in situ hybridisation at e18.5 (Schroderand Gossler, 2002). Also at birth, we observe EGFP expression in cells distributedthroughout the villus epithelium (Fig. 5I), whereas it becomes more intense near the cryptsat postnatal day 8 (Fig. 5J). In adult tissue, we find an irregular distribution of EGFPexpression in the duodenum. Occasionally, there is a single crypt which shows profoundEGFP expression (Fig. 5K), and in other regions we find areas with EGFP expression alongthe villi (Fig. 5L), but parts of the duodenal tissue are negative for EGFP.
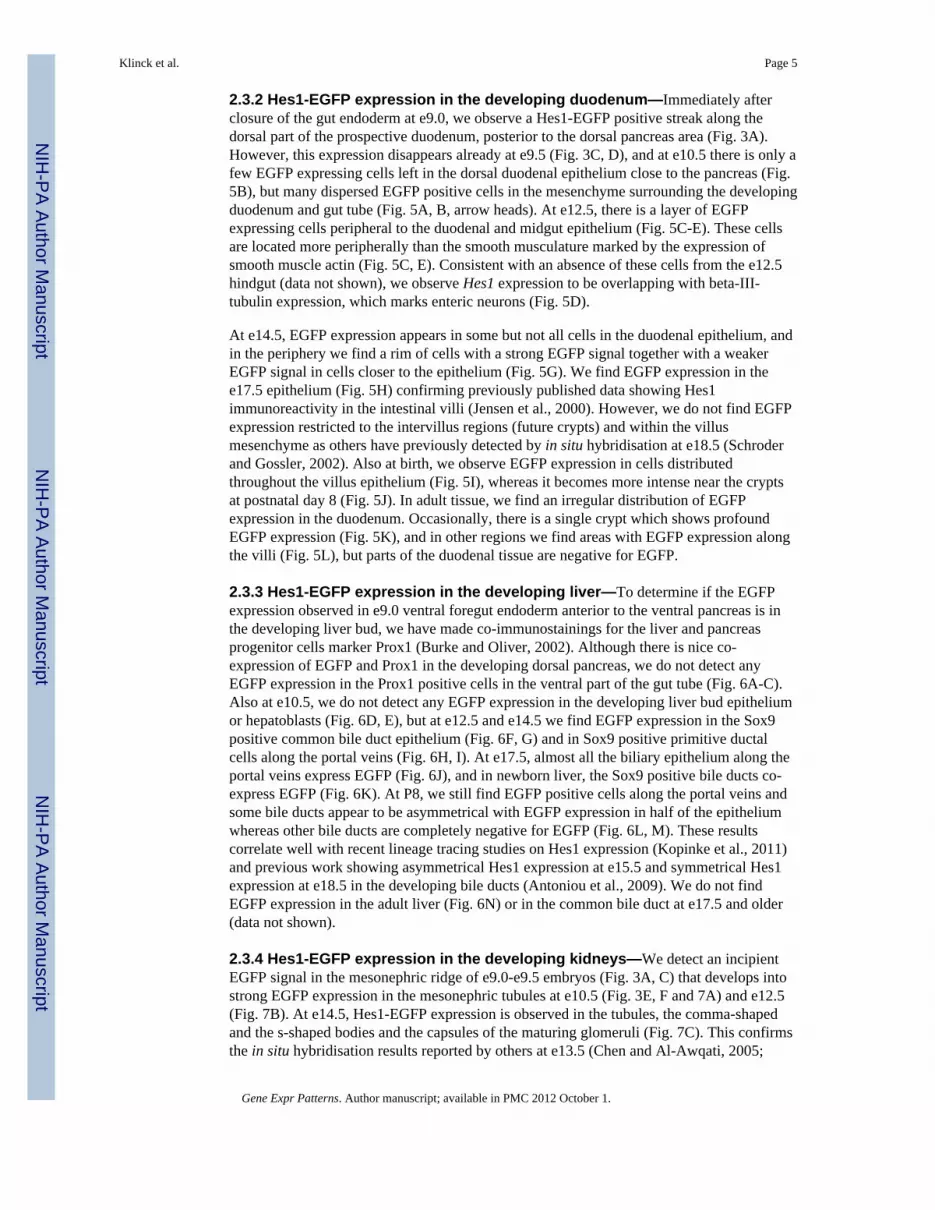
2.3.3 Hes1-EGFP expression in the developing liver—To determine if the EGFPexpression observed in e9.0 ventral foregut endoderm anterior to the ventral pancreas is inthe developing liver bud, we have made co-immunostainings for the liver and pancreasprogenitor cells marker Prox1 (Burke and Oliver, 2002). Although there is nice co-expression of EGFP and Prox1 in the developing dorsal pancreas, we do not detect anyEGFP expression in the Prox1 positive cells in the ventral part of the gut tube (Fig. 6A-C).Also at e10.5, we do not detect any EGFP expression in the developing liver bud epitheliumor hepatoblasts (Fig. 6D, E), but at e12.5 and e14.5 we find EGFP expression in the Sox9positive common bile duct epithelium (Fig. 6F, G) and in Sox9 positive primitive ductalcells along the portal veins (Fig. 6H, I). At e17.5, almost all the biliary epithelium along theportal veins express EGFP (Fig. 6J), and in newborn liver, the Sox9 positive bile ducts co-express EGFP (Fig. 6K). At P8, we still find EGFP positive cells along the portal veins andsome bile ducts appear to be asymmetrical with EGFP expression in half of the epitheliumwhereas other bile ducts are completely negative for EGFP (Fig. 6L, M). These resultscorrelate well with recent lineage tracing studies on Hes1 expression (Kopinke et al., 2011)and previous work showing asymmetrical Hes1 expression at e15.5 and symmetrical Hes1expression at e18.5 in the developing bile ducts (Antoniou et al., 2009). We do not findEGFP expression in the adult liver (Fig. 6N) or in the common bile duct at e17.5 and older(data not shown).
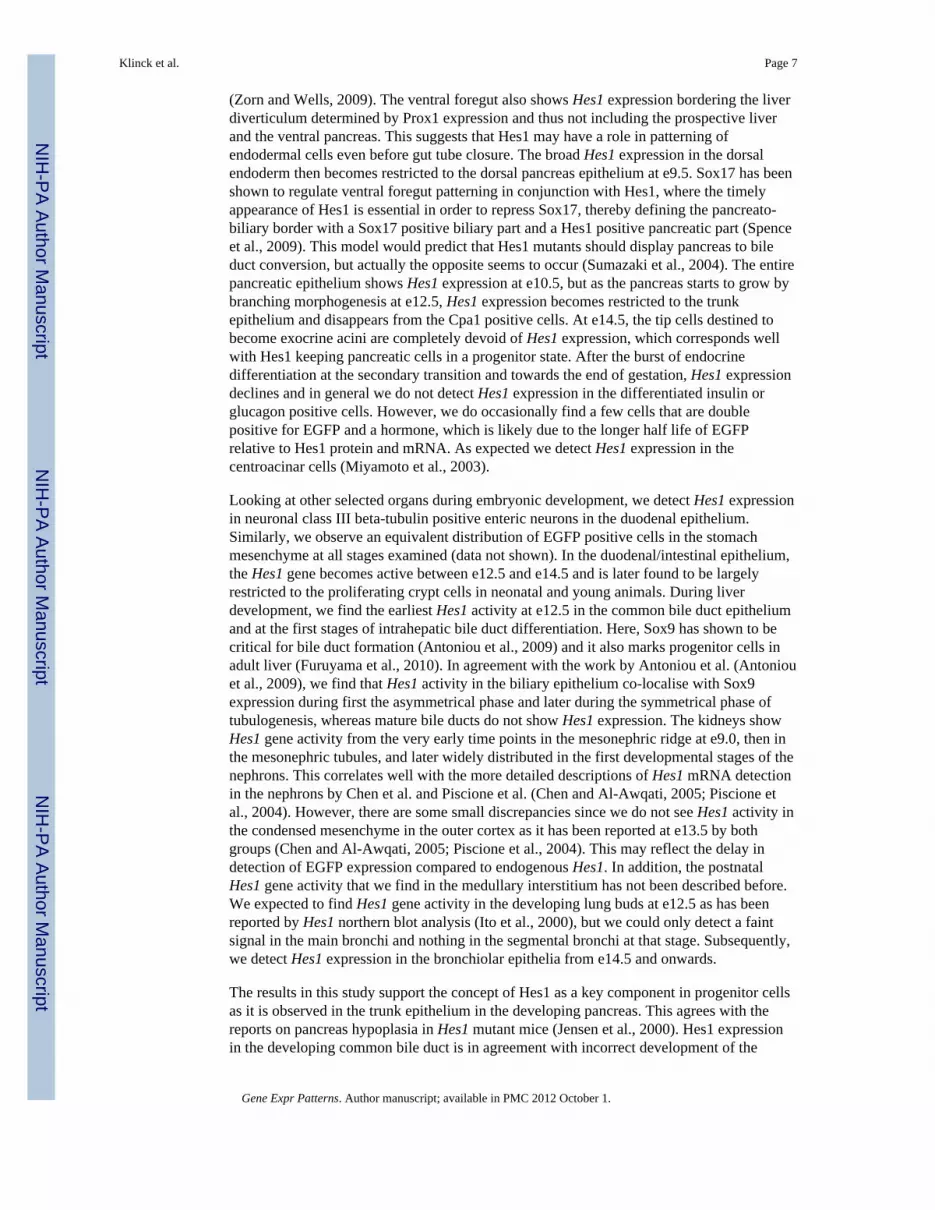
2.3.4 Hes1-EGFP expression in the developing kidneys—We detect an incipientEGFP signal in the mesonephric ridge of e9.0-e9.5 embryos (Fig. 3A, C) that develops intostrong EGFP expression in the mesonephric tubules at e10.5 (Fig. 3E, F and 7A) and e12.5(Fig. 7B). At e14.5, Hes1-EGFP expression is observed in the tubules, the comma-shapedand the s-shaped bodies and the capsules of the maturing glomeruli (Fig. 7C). This confirmsthe in situ hybridisation results reported by others at e13.5 (Chen and Al-Awqati, 2005;
Klinck et al. Page 5
Gene Expr Patterns. Author manuscript; available in PMC 2012 October 1.
NIH
-PA Author Manuscript
NIH
-PA Author Manuscript
NIH
-PA Author Manuscript

Piscione et al., 2004), except that we do not detect any EGFP expression in the condensedmesenchyme. At e17.5 and P0 we find EGFP expression primarily in stage I-III nephrons inthe cortical region and in the collecting ducts, but also among the undifferentiatedmesenchymal cells in the medullary region (Fig. 7D, D’, E, E’).
A shift in Hes1 promoter activity can be observed between P0 and P8 where the EGFPexpression is lost in the nephritic epithelia within the nephrogenic zone as the kidneysbecome close to fully developed. Only the EGFP expressing cells in the medullaryinterstitium remain (Fig 7F, F’). Kidney tissue from adult is completely devoid of EGFPexpression (data not shown).
2.3.5 Hes1-EGFP expression in the developing lungs—Hes1 mRNA expressionhas previously been detected by northern blot in foetal lungs from e12.5 to e18.5 (Ito et al.,2000). We find that the lung buds at e12.5 are mainly negative for EGFP expression exceptfor a weak signal in the main bronchi epithelium (Fig. 8A). However at e14.5 and e17.5, wedetect EGFP in the epithelial cell layer lining the bronchioles (Fig. 8B, C) correlating wellwith reported immunohistochemical detection of Hes1 protein in the bronchiolar epitheliumat e16.5 (Collins et al., 2004). This expression pattern continues through birth (Fig. 8D) andinto adulthood (Fig. 8E, F).
3. DiscussionHes1 is expressed in multiple tissues during development, including organs derived from allthree germ layers such as the brain, kidneys and pancreas (Chen and Al-Awqati, 2005;Jensen et al., 2000; Ohtsuka et al., 2006). In our hands, Hes1 expression is difficult to detectreliably by in situ hybridisation and immunohistochemical techniques, and the reports onHes1 expression are often sparse and incomplete. Here we report a detailed analysis of theTg(Hes1-EGFP)1Hri mouse strain that allows for easy investigation of Hes1 expression. Weassume that most if not all Hes1 regulatory sequences are included in the BAC as it containsapproximately 178 kb genomic sequence upstream and 43 kb downstream of the Hes1coding region. There are small discrepancies between EGFP expression and theimmunohistochemical detection of Hes1 protein, and this can be due to the polyclonalantiserum not being absolutely specific to Hes1, or that it may take longer time for EGFPthan Hes1 to reach detection levels, or the fact that EGFP has a longer half life than thetightly regulated Hes1 transcription factor, or that certain distant regulatory sequences is notincluded in the transgenic mouse. But in general, the results confirm previously describedexpression patterns of Hes1 mRNA and Hes1 protein, indicating that the transgene hasintegrated in a region accessible for transcriptional regulation throughout development.There is no evidence for insertional mutagenesis as the mice breed well and developnormally both as heterozygotes and homozygotes.
In several tissues, Hes1 mRNA and protein levels are tightly regulated and oscillates in atwo hour cycle where Hes1 itself plays a role as a repressor of its own expression (Hirata etal., 2002; Kobayashi et al., 2009). This requires a very short half life of Hes1 compared tothe relatively stable EGFP which has a half life of approximately 26 hours (Corish andTyler-Smith, 1999). Therefore, the EGFP expression in this transgenic mouse line willreflect Hes1 expression sites but not the post-trancriptional regulation.
Our analyses describe previously uncharacterised Hes1 expression in the endoderm of latestreak stage (e7.0) and in 5-6 somite (e8.0) embryos as well as in e9.0 dorsal gut tubeepithelium. There is an anterior border of the caudal expression domain around the 4th
somite pair that seems to stay fixed during growth of the embryo until e9.0 where itcorrelates with the anterior border of Pdx1 expression outlining the foregut/midgut boundary
Klinck et al. Page 6
Gene Expr Patterns. Author manuscript; available in PMC 2012 October 1.
NIH
-PA Author Manuscript
NIH
-PA Author Manuscript
NIH
-PA Author Manuscript
(Zorn and Wells, 2009). The ventral foregut also shows Hes1 expression bordering the liverdiverticulum determined by Prox1 expression and thus not including the prospective liverand the ventral pancreas. This suggests that Hes1 may have a role in patterning ofendodermal cells even before gut tube closure. The broad Hes1 expression in the dorsalendoderm then becomes restricted to the dorsal pancreas epithelium at e9.5. Sox17 has beenshown to regulate ventral foregut patterning in conjunction with Hes1, where the timelyappearance of Hes1 is essential in order to repress Sox17, thereby defining the pancreato-biliary border with a Sox17 positive biliary part and a Hes1 positive pancreatic part (Spenceet al., 2009). This model would predict that Hes1 mutants should display pancreas to bileduct conversion, but actually the opposite seems to occur (Sumazaki et al., 2004). The entirepancreatic epithelium shows Hes1 expression at e10.5, but as the pancreas starts to grow bybranching morphogenesis at e12.5, Hes1 expression becomes restricted to the trunkepithelium and disappears from the Cpa1 positive cells. At e14.5, the tip cells destined tobecome exocrine acini are completely devoid of Hes1 expression, which corresponds wellwith Hes1 keeping pancreatic cells in a progenitor state. After the burst of endocrinedifferentiation at the secondary transition and towards the end of gestation, Hes1 expressiondeclines and in general we do not detect Hes1 expression in the differentiated insulin orglucagon positive cells. However, we do occasionally find a few cells that are doublepositive for EGFP and a hormone, which is likely due to the longer half life of EGFPrelative to Hes1 protein and mRNA. As expected we detect Hes1 expression in thecentroacinar cells (Miyamoto et al., 2003).
Looking at other selected organs during embryonic development, we detect Hes1 expressionin neuronal class III beta-tubulin positive enteric neurons in the duodenal epithelium.Similarly, we observe an equivalent distribution of EGFP positive cells in the stomachmesenchyme at all stages examined (data not shown). In the duodenal/intestinal epithelium,the Hes1 gene becomes active between e12.5 and e14.5 and is later found to be largelyrestricted to the proliferating crypt cells in neonatal and young animals. During liverdevelopment, we find the earliest Hes1 activity at e12.5 in the common bile duct epitheliumand at the first stages of intrahepatic bile duct differentiation. Here, Sox9 has shown to becritical for bile duct formation (Antoniou et al., 2009) and it also marks progenitor cells inadult liver (Furuyama et al., 2010). In agreement with the work by Antoniou et al. (Antoniouet al., 2009), we find that Hes1 activity in the biliary epithelium co-localise with Sox9expression during first the asymmetrical phase and later during the symmetrical phase oftubulogenesis, whereas mature bile ducts do not show Hes1 expression. The kidneys showHes1 gene activity from the very early time points in the mesonephric ridge at e9.0, then inthe mesonephric tubules, and later widely distributed in the first developmental stages of thenephrons. This correlates well with the more detailed descriptions of Hes1 mRNA detectionin the nephrons by Chen et al. and Piscione et al. (Chen and Al-Awqati, 2005; Piscione etal., 2004). However, there are some small discrepancies since we do not see Hes1 activity inthe condensed mesenchyme in the outer cortex as it has been reported at e13.5 by bothgroups (Chen and Al-Awqati, 2005; Piscione et al., 2004). This may reflect the delay indetection of EGFP expression compared to endogenous Hes1. In addition, the postnatalHes1 gene activity that we find in the medullary interstitium has not been described before.We expected to find Hes1 gene activity in the developing lung buds at e12.5 as has beenreported by Hes1 northern blot analysis (Ito et al., 2000), but we could only detect a faintsignal in the main bronchi and nothing in the segmental bronchi at that stage. Subsequently,we detect Hes1 expression in the bronchiolar epithelia from e14.5 and onwards.
The results in this study support the concept of Hes1 as a key component in progenitor cellsas it is observed in the trunk epithelium in the developing pancreas. This agrees with thereports on pancreas hypoplasia in Hes1 mutant mice (Jensen et al., 2000). Hes1 expressionin the developing common bile duct is in agreement with incorrect development of the
Klinck et al. Page 7
Gene Expr Patterns. Author manuscript; available in PMC 2012 October 1.
NIH
-PA Author Manuscript
NIH
-PA Author Manuscript
NIH
-PA Author Manuscript

common bile duct in Hes1 mutant mice (Sumazaki et al., 2004). Also in intrahepatic bileduct development, Hes1 seems to play a role, but it has not been established whether it is ina Notch dependent manner (Antoniou et al., 2009). Along the same lines in the kidneys, itappears that Hes1 primarily is active during development of the tubules, but it is not clearwhich role Hes1 plays here.
The Tg(Hes1-EGFP)1Hri mouse reported on here will be a useful tool to study the role ofHes1 in a number of organ systems also allowing for prospective cell sorting.
4. Experimental proceduresGeneration of Transgenic Mice
From the BACPAC Resources Center (http://bacpac.chori.org/) we obtained a BAC clone,GENSAT1-BX38, deposited by the GENSAT project (http://gensat.org/). The BAC contains224,313 bp of chromosome 16, including 178 kb upstream of the transcriptional start site ofthe Hes1 gene and 43 kb downstream of the Hes1 gene. It also contains a 1.1 kb EGFP-PolyA fragment inserted into the 5′UTR of the Hes1 gene, 27 bp upstream from the Hes1translation start codon. DNA from the BAC clone was prepared from E. coli cells using theNucleoBond® Xtra midi kit (MACHEREY-NAGEL), and purified according to (Nagy,2003). The purified BAC DNA was resuspended in sterile filtered injection buffer (Moreiraet al., 2004) to a final concentration of 1.5 ng/μl, kept on ice until injection, which wasperformed the same day. The DNA was injected into the male pronucleus of B6D2F2zygotes which were then introduced into pseudopregnant NMRI female mice. Tail biopsiesfrom 13 male offspring were positive for EGFP by PCR analysis, and all were mated withC57BL/6 female mice. Germ line transmission of EGFP expression in the embryos wasanalyzed by PCR (Primers: Hes1 5′-UTR: 5′-CGAGCGGTGCCGCGTGTCTCTTCCTCCC-3′; EGFP antisense: 5′-CGGCGAGCTGCACGCTGCCGTCCTC-3′) and visually by fluorescence microcopy. Only one malefounder gave rise to EGFP positive offspring. C57BL/6 female mice were time mated withheterozygous mutant males and EGFP positive embryos were identified by PCR using theprimer pair described above. All mouse work conforms to the European Convention for theProtection of Vertebrate Animals used for Experimental and other Scientific Purposes (ETS123).
Southern BlotsThe two probes for verification of insertion of the BAC ends were amplified by PCR frompurified BAC Hes1-EGFP DNA. Primers: Probe1: 5′-GGA TTG TTT GTC TAG GAT TTGAGG-3′ and 5′-GGA AAG GAC ACT CTG ACC TGT T-3′ (approx. 500 bp). Probe2: 5′-CTT TTT TGA TTT AGT GCA ATG CAC C-3′ and 5′-GGT AGT GCA AGA CAA ACAAAC AAG-3′ (approx. 500 bp). 3μg genomic DNA samples from a wild-type, aheterozygous, and a homozygous mouse were digested with BglII and EcoRV and subjectedto standard Southern blot analysis with 100 ng radio labelled Probe1. Likewise 3μg genomicDNA samples were digested with NdeI and subjected to standard Southern blot analysiswith 100 ng radio labelled Probe2.
Whole Mount Immunoflourescent StainingsWhole mount immunofluorescent stainings were performed according to (Ahnfelt-Ronne etal., 2007) using the antibodies described below.
Immunohistochemical StainingsEmbryos were dissected in cold PBS and fixed O/N at 4°C in Lilly’s formalin buffer, pH 7.4(Bie & Berntsen, Denmark). The embryos were cryo protected O/N at 4°C in 30% sucrose in
Klinck et al. Page 8
Gene Expr Patterns. Author manuscript; available in PMC 2012 October 1.
NIH
-PA Author Manuscript
NIH
-PA Author Manuscript
NIH
-PA Author Manuscript

PBS and then embedded in Tissue-Tek (Sakura, Denmark). The tissue was cryo sectioned at10μm. Immunostainings were performed according to (Klinck et al., 2008) using theantibodies described below.
AntibodiesPrimary antibodies: Rabbit anti-GFP “Living Colors” (Clontech) diluted 1:2000. Goat anti-GFP (Abcam) diluted 1:1000. For the whole mount GFP stainings a Tyramide SignalAmplification (TSA) step was applied (PerkinElmer,USA). Rabbit anti-Hes1 1:800 withTSA (kind gift from Dr. T. Sudo), Goat anti-Sox17 (R&D systems) diluted 1:1000. GuineaPig anti-Insulin (Abcam) diluted 1:500. Goat anti-Pdx1 (kind gift from Chris Wright),diluted 1:10.000. Mouse anti-E-cadherin (BD Biosciences) diluted 1:1000. Rat anti-E-cadherin (R&D Systems) diluted 1:1000. Guinea pig anti-Glucagon (Millipore) diluted1:10000. Goat anti-Carboxypeptidase A (R&D Systems) diluted 1:1000. Mouse anti smoothmuscle actin (DAKO) diluted 1:500. Rabbit anti-beta-III-tubulin (TuJ1) (Bio Site) diluted1:1000. Rabbit anti-Sox9 (Millipore) diluted 1:500. Goat anti-HNF4a (Santa Cruz) diluted1:100. Secondary Antibodies: Whole IgG biotin anti-rabbit (cat. #711-065-152; for TSAamplification), Cy2-anti-goat (cat. #705-225-147), Cy3-anti-rabbit (cat. #711-165-152),Cy3-anti-rat (Cat. No. 712-165-153), Cy5-anti-mouse (cat. #715-175-151), all from JacksonImmunoResearch Laboratories raised in donkey. Diluted 1:500.
Confocal MicroscopyImages were obtained using a Zeiss LSM510 META Axio Imager connected to a LSM 510laser module with the following lasers: Ar laser (488 nm; 50% laser power), He/Ne laser(543 nm), and He/Ne laser (633 nm) (Carl Zeiss; Germany). Embryos stained as wholemount were cleared in BABB (benzyl alcohol:benzyl benzoate1:2) before scanning.Alignment of images to produce the composite e10.5 image was done manually with Canvas9 (ACD systems). List of Objectives: Plan-Neofluar 10x/0.3, WD 5.5 mm; Achroplan 20x/0.5 W Ph2, WD 7.9 mm; Plan-Neofluar 25x/0.8, WD 0,21; EC Plan-Neofluar 40x/1,30 OilDIC, WD 0.21 mm.
AcknowledgmentsWe thank Karsten Skole Marckstrøm, Lene Petersen, Anette Bjerregaard and Lisbeth Ahm Hansen for technicalassistance, Chris Wright for the anti-Pdx1 antibody, and Dr. T. Sudo for the anti-Hes1 antibody. This work wasmade possible by support from the JDRF (10-2008-580 and 1-2009-308), the NIH (DK072495), and the EU 6thFramework Program.
ReferencesAhnfelt-Ronne J, Jorgensen MC, Hald J, Madsen OD, Serup P, Hecksher-Sorensen J. An improved
method for three-dimensional reconstruction of protein expression patterns in intact mouse andchicken embryos and organs. J Histochem Cytochem. 2007; 55:925–930. [PubMed: 17478445]
Antoniou A, Raynaud P, Cordi S, Zong Y, Tronche F, Stanger BZ, Jacquemin P, Pierreux CE,Clotman F, Lemaigre FP. Intrahepatic bile ducts develop according to a new mode of tubulogenesisregulated by the transcription factor SOX9. Gastroenterology. 2009; 136:2325–2333. [PubMed:19403103]
Apelqvist A, Li H, Sommer L, Beatus P, Anderson DJ, Honjo T, Hrabe de Angelis M, Lendahl U,Edlund H. Notch signalling controls pancreatic cell differentiation. Nature. 1999; 400:877–881.[PubMed: 10476967]
Burke Z, Oliver G. Prox1 is an early specific marker for the developing liver and pancreas in themammalian foregut endoderm. Mech Dev. 2002; 118:147–155. [PubMed: 12351178]
Chen L, Al-Awqati Q. Segmental expression of Notch and Hairy genes in nephrogenesis. Am JPhysiol Renal Physiol. 2005; 288:F939–952. [PubMed: 15821257]
Klinck et al. Page 9
Gene Expr Patterns. Author manuscript; available in PMC 2012 October 1.
NIH
-PA Author Manuscript
NIH
-PA Author Manuscript
NIH
-PA Author Manuscript

Collins BJ, Kleeberger W, Ball DW. Notch in lung development and lung cancer Seminars in CancerBiology. 2004; 14:357–364.
Corish P, Tyler-Smith C. Attenuation of green fluorescent protein half-life in mammalian cells. ProteinEng. 1999; 12:1035–1040. [PubMed: 10611396]
Esni F, Ghosh B, Biankin AV, Lin JW, Albert MA, Yu X, MacDonald RJ, Civin CI, Real FX, PackMA, Ball DW, Leach SD. Notch inhibits Ptf1 function and acinar cell differentiation in developingmouse and zebrafish pancreas. Development. 2004; 131:4213–4224. [PubMed: 15280211]
Fujikura J, Hosoda K, Iwakura H, Tomita T, Noguchi M, Masuzaki H, Tanigaki K, Yabe D, Honjo T,Nakao K. Notch/Rbp-j signaling prevents premature endocrine and ductal cell differentiation in thepancreas. Cell Metab. 2006; 3:59–65. [PubMed: 16399505]
Fukuda A, Kawaguchi Y, Furuyama K, Kodama S, Horiguchi M, Kuhara T, Koizumi M, Boyer DF,Fujimoto K, Doi R, Kageyama R, Wright CV, Chiba T. Ectopic pancreas formation in Hes1 -knockout mice reveals plasticity of endodermal progenitors of the gut, bile duct, and pancreas. JClin Invest. 2006; 116:1484–1493. [PubMed: 16710472]
Furuyama K, Kawaguchi Y, Akiyama H, Horiguchi M, Kodama S, Kuhara T, Hosokawa S, ElbahrawyA, Soeda T, Koizumi M, Masui T, Kawaguchi M, Takaori K, Doi R, Nishi E, Kakinoki R, DengJM, Behringer RR, Nakamura T, Uemoto S. Continuous cell supply from a Sox9-expressingprogenitor zone in adult liver, exocrine pancreas and intestine. Nat Genet. 2010; 43:34–41.[PubMed: 21113154]
Ghosh B, Leach SD. Interactions between hairy/enhancer of split-related proteins and the pancreatictranscription factor Ptf1-p48 modulate function of the PTF1 transcriptional complex. Biochem J.2006; 393:679–685. [PubMed: 16201968]
Gong S, Zheng C, Doughty ML, Losos K, Didkovsky N, Schambra UB, Nowak NJ, Joyner A, LeblancG, Hatten ME, Heintz N. A gene expression atlas of the central nervous system based on bacterialartificial chromosomes. Nature. 2003; 425:917–925. [PubMed: 14586460]
Hirata H, Yoshiura S, Ohtsuka T, Bessho Y, Harada T, Yoshikawa K, Kageyama R. Oscillatoryexpression of the bHLH factor Hes1 regulated by a negative feedback loop. Science. 2002;298:840–843. [PubMed: 12399594]
Ingram WJ, McCue KI, Tran TH, Hallahan AR, Wainwright BJ. Sonic Hedgehog regulates Hes1through a novel mechanism that is independent of canonical Notch pathway signalling. Oncogene.2008; 27:1489–1500. [PubMed: 17873912]
Ishibashi M, Ang SL, Shiota K, Nakanishi S, Kageyama R, Guillemot F. Targeted disruption ofmammalian hairy and Enhancer of split homolog-1 (HES-1) leads to up-regulation of neural helix-loop-helix factors, premature neurogenesis, and severe neural tube defects. Genes Dev. 1995;9:3136–3148. [PubMed: 8543157]
Ito T, Udaka N, Yazawa T, Okudela K, Hayashi H, Sudo T, Guillemot F, Kageyama R, Kitamura H.Basic helix-loop-helix transcription factors regulate the neuroendocrine differentiation of fetalmouse pulmonary epithelium. Development. 2000; 127:3913–3921. [PubMed: 10952889]
Jarriault S, Brou C, Logeat F, Schroeter EH, Kopan R, Israel A. Signalling downstream of activatedmammalian Notch. Nature. 1995; 377:355–358. [PubMed: 7566092]
Jarriault S, Le Bail O, Hirsinger E, Pourquie O, Logeat F, Strong CF, Brou C, Seidah NG, Isra l A.Delta-1 activation of notch-1 signaling results in HES-1 transactivation. Mol Cell Biol. 1998;18:7423–7431. [PubMed: 9819428]
Jensen J, Pedersen EE, Galante P, Hald J, Heller RS, Ishibashi M, Kageyama R, Guillemot F, Serup P,Madsen OD. Control of endodermal endocrine development by Hes-1. Nat Genet. 2000; 24:36–44.[PubMed: 10615124]
Jensen JN, Cameron E, Garay MV, Starkey TW, Gianani R, Jensen J. Recapitulation of elements ofembryonic development in adult mouse pancreatic regeneration. Gastroenterology. 2005;128:728–741. [PubMed: 15765408]
Jouve C, Palmeirim I, Henrique D, Beckers J, Gossler A, Ish-Horowicz D, Pourquie O. Notchsignalling is required for cyclic expression of the hairy-like gene HES1 in the presomiticmesoderm. Development. 2000; 127:1421–1429. [PubMed: 10704388]
Klinck R, Serup P, Madsen OD, Jorgensen MC. Specificity of four monoclonal anti-NKx6-1antibodies. J Histochem Cytochem. 2008; 56:415–424. [PubMed: 18212389]
Klinck et al. Page 10
Gene Expr Patterns. Author manuscript; available in PMC 2012 October 1.
NIH
-PA Author Manuscript
NIH
-PA Author Manuscript
NIH
-PA Author Manuscript
Kobayashi T, Mizuno H, Imayoshi I, Furusawa C, Shirahige K, Kageyama R. The cyclic gene Hes1contributes to diverse differentiation responses of embryonic stem cells. Genes Dev. 2009;23:1870–1875. [PubMed: 19684110]
Kopinke D, Brailsford M, Shea JE, Leavitt R, Scaife CL, Murtaugh LC. Lineage tracing reveals thedynamic contribution of Hes1+ cells to the developing and adult pancreas. Development. 2011;138:431–441. [PubMed: 21205788]
Lammert E, Brown J, Melton DA. Notch gene expression during pancreatic organogenesis. Mech Dev.2000; 94:199–203. [PubMed: 10842072]
Miyamoto Y, Maitra A, Ghosh B, Zechner U, Argani P, Iacobuzio-Donahue CA, Sriuranpong V, IsoT, Meszoely IM, Wolfe MS, Hruban RH, Ball DW, Schmid RM, Leach SD. Notch mediates TGFalpha-induced changes in epithelial differentiation during pancreatic tumorigenesis. Cancer Cell.2003; 3:565–576. [PubMed: 12842085]
Moreira PN, Giraldo P, Cozar P, Pozueta J, Jimenez A, Montoliu L, Gutierrez-Adan A. Efficientgeneration of transgenic mice with intact yeast artificial chromosomes by intracytoplasmic sperminjection. Biol Reprod. 2004; 71:1943–1947. [PubMed: 15286029]
Murata J, Ohtsuka T, Tokunaga A, Nishiike S, Inohara H, Okano H, Kageyama R. Notch-Hes1pathway contributes to the cochlear prosensory formation potentially through the transcriptionaldown-regulation of p27Kip1. J Neurosci Res. 2009; 87:3521–3534. [PubMed: 19598246]
Nagy, A.; Gertsenstein, M.; Vinterstein, K.; Behringer, R. Manipulating the Mouse Embryo-ALaboratory Manual. 3rd edn.. Cold Spring Harbor Press; Cold Spring Harbor, New York: 2003.
Nakayama K, Satoh T, Igari A, Kageyama R, Nishida E. FGF induces oscillations of Hes1 expressionand Ras/ERK activation. Curr Biol. 2008; 18:R332–334. [PubMed: 18430630]
Nyeng P, Norgaard GA, Kobberup S, Jensen J. FGF10 signaling controls stomach morphogenesis. DevBiol. 2007; 303:295–310. [PubMed: 17196193]
Ohtsuka T, Imayoshi I, Shimojo H, Nishi E, Kageyama R, McConnell SK. Visualization of embryonicneural stem cells using Hes promoters in transgenic mice. Mol Cell Neurosci. 2006; 31:109–122.[PubMed: 16214363]
Ohtsuka T, Ishibashi M, Gradwohl G, Nakanishi S, Guillemot F, Kageyama R. Hes1 and Hes5 asnotch effectors in mammalian neuronal differentiation. EMBO J. 1999; 18:2196–2207. [PubMed:10205173]
Pasca di Magliano M, Sekine S, Ermilov A, Ferris J, Dlugosz AA, Hebrok M. Hedgehog/Rasinteractions regulate early stages of pancreatic cancer. Genes Dev. 2006; 20:3161–3173. [PubMed:17114586]
Piscione TD, Wu MY, Quaggin SE. Expression of Hairy/Enhancer of Split genes, Hes1 and Hes5,during murine nephron morphogenesis. Gene Expr Patterns. 2004; 4:707–711. [PubMed:15465493]
Pourquie O. The segmentation clock: converting embryonic time into spatial pattern. Science. 2003;301:328–330. [PubMed: 12869750]
Rochais F, Dandonneau M, Mesbah K, Jarry T, Mattei MG, Kelly RG. Hes1 is expressed in the secondheart field and is required for outflow tract development. PLoS One. 2009; 4:e6267. [PubMed:19609448]
Schroder N, Gossler A. Expression of Notch pathway components in fetal and adult mouse smallintestine. Gene Expr Patterns. 2002; 2:247–250. [PubMed: 12617809]
Seymour PA, Freude KK, Tran MN, Mayes EE, Jensen J, Kist R, Scherer G, Sander M. SOX9 isrequired for maintenance of the pancreatic progenitor cell pool. Proc Natl Acad Sci U S A. 2007;104:1865–1870. [PubMed: 17267606]
Spence JR, Lange AW, Lin SC, Kaestner KH, Lowy AM, Kim I, Whitsett JA, Wells JM. Sox17regulates organ lineage segregation of ventral foregut progenitor cells. Dev Cell. 2009; 17:62–74.[PubMed: 19619492]
Sumazaki R, Shiojiri N, Isoyama S, Masu M, Keino-Masu K, Osawa M, Nakauchi H, Kageyama R,Matsui A. Conversion of biliary system to pancreatic tissue in Hes1-deficient mice. Nat Genet.2004; 36:83–87. [PubMed: 14702043]
Klinck et al. Page 11
Gene Expr Patterns. Author manuscript; available in PMC 2012 October 1.
NIH
-PA Author Manuscript
NIH
-PA Author Manuscript
NIH
-PA Author Manuscript

Tomita K, Hattori M, Nakamura E, Nakanishi S, Minato N, Kageyama R. The bHLH gene Hes1 isessential for expansion of early T cell precursors. Genes Dev. 1999; 13:1203–1210. [PubMed:10323870]
Tomita K, Ishibashi M, Nakahara K, Ang SL, Nakanishi S, Guillemot F, Kageyama R. Mammalianhairy and Enhancer of split homolog 1 regulates differentiation of retinal neurons and is essentialfor eye morphogenesis. Neuron. 1996; 16:723–734. [PubMed: 8607991]
Wall DS, Mears AJ, McNeill B, Mazerolle C, Thurig S, Wang Y, Kageyama R, Wallace VA.Progenitor cell proliferation in the retina is dependent on Notch-independent Sonic hedgehog/Hes1activity. J Cell Biol. 2009; 184:101–112. [PubMed: 19124651]
Zorn AM, Wells JM. Vertebrate endoderm development and organ formation. Annu Rev Cell DevBiol. 2009; 25:221–251. [PubMed: 19575677]
Klinck et al. Page 12
Gene Expr Patterns. Author manuscript; available in PMC 2012 October 1.
NIH
-PA Author Manuscript
NIH
-PA Author Manuscript
NIH
-PA Author Manuscript

Research highlights
• We have generated a transgenic Hes1-EGFP reporter mouse line, Tg(Hes1-EGFP)1Hri.
• We present a characterization of Hes1 expression in whole embryos from e7.0-e10.5.
• Detection of Hes1 expression in the definitive endoderm before gut tube closure.
• We provide an analysis of Hes1 expression in selected organs duringdevelopment.
Klinck et al. Page 13
Gene Expr Patterns. Author manuscript; available in PMC 2012 October 1.
NIH
-PA Author Manuscript
NIH
-PA Author Manuscript
NIH
-PA Author Manuscript

Figure 1.The whole BAC Hes1-EGFP sequence is inserted in the genome of the Tg(Hes1-EGFP)1Hri
mouse strain.(A) The BAC Hes1-EGFP construct encompasses more than 224 kb of chromosome 16 frombase pair number 29887283 to 30111596. This fragment includes the Hes1gene with thefour exons shown as black boxes. EGFP shown in green is inserted in the 5′UTR. Restrictionenzymes and the two probes for Southern blot verification of insertion of the BAC Hes1-EGFP ends are indicated (B) Southern blot on genomic DNA from wild-type, heterozygous,and homozygous Hes1-EGFP mice as indicated on the lanes, digested with BglII andEcoRV and hybridised with Probe1. The blot reveals the expected 6023 bp wild-type bandin all three mice and a BAC Hes1-EGFP specific band around 4 kb in the transgenic mice.(C) Southern blot on genomic DNA from wild-type, heterozygous, and homozygous Hes1-EGFP mice as indicated on the lanes, digested with NdeI and hybridised with Probe2. Theblot reveals the expected 4222 bp wild-type band in all three mice and BAC Hes1-EGFPspecific bands of approximately 9 kb and 11 kb in the transgenic mice. (D) Hes1immunofluorescence in the inner and outer layer of the optic cup at e10.5. (E) EGFPimmunofluorescence on the adjacent section to D. (F) Hes1 immunofluorescence in thedorsal pancreas tissue at e10.5. (G) EGFP immunofluorescence on the adjacent section to G.(H) Hes1 immunofluorescence in the neural tube at e14.5. (I) EGFP immunofluorescence onthe adjacent section to H. (J) Hes1 immunofluorescence in the oesophagus at e14.5. (K)EGFP immunofluorescence on the adjacent section to J. il, inner layer of optic cup; ol, outerlayer of optic cup; dp, dorsal pancreas; d, duodenum; cc, central canal; rp, roof plate; el,ependymal layer; oe, oesophagus. Dorsal is towards the top. Scale bars are 50μm.
Klinck et al. Page 14
Gene Expr Patterns. Author manuscript; available in PMC 2012 October 1.
NIH
-PA Author Manuscript
NIH
-PA Author Manuscript
NIH
-PA Author Manuscript

Figure 2.Hes1 is expressed in the endoderm at late primitive streak stage and in the endoderm,presomitic mesoderm, and neuroepithelium in e8.0 mouse embryos.(A) Whole mount immunostaining for EGFP in an e7.0 embryo of the Hes1-EGFP mousestrain. The endodermal cell layer is positive for EGFP expression. (B) An optical section ofthe embryo in A showing that it is only the endodermal cells and not the mesoderm nor theectoderm that express EGFP. (C) Whole mount immunostaining of a 6 somite (e8.0) embryoof the Hes1-EGFP mouse strain. EGFP is in green and the endoderm marker Sox17 is in red.Posterior is to the left and anterior is to the right. It shows the area of strong EGFPexpression in the posterior part of the embryo as well as the anterior expression area at the
Klinck et al. Page 15
Gene Expr Patterns. Author manuscript; available in PMC 2012 October 1.
NIH
-PA Author Manuscript
NIH
-PA Author Manuscript
NIH
-PA Author Manuscript
anterior intestinal portal (AIP). (D) An optical section of another e8.0 embryo showing aventral view of the strong EGFP fluorescence in the neuroepithelium posterior to theforming somites. (E, E’,E”) An optical cross section of the embryo in C showing the EGFPfluorescence in the endodermal cell layer (E), marked by nuclear Sox17 expression in red(E’), and a merged image (E”). The epithelial marker E-cadherin is in blue. Posteriorendodermal EGFP expression is detected from the 4th somite pair to the tip of the tail. (F) Awhole mount image stack of an 8 somite embryo showing a more explicit EGFP expressionin the posterior endoderm marked by Sox17 in red (arrowheads). (G) A highermagnification subset stack of the embryo in F showing more details of the posterior EGFPexpression area. (H) An optical section from the image stack in G showing the EGFPfluorescence in the endodermal cell layer with an anterior border at the 4th somite pair(arrow). Also the expression in the neuroepithelium posterior to the forming somites isshown. (I, I’, I”) An optical section of the embryo in F showing the EGFP fluorescence inthe endodermal cell layer (I), marked by nuclear Sox17 expression in red (I’), and a mergedimage (I”). The epithelial marker E-cadherin is in blue. (J, J’, J”) Another optical section ofthe embryo in F showing the EGFP fluorescence in the presomitic paraxial mesoderm (J),adjacent to the endodermal Sox17 expression in red (J’), and a merged image (J”). Theepithelial marker E-cadherin is in blue. (K) A high magnification image stack showing theanterior expression area in the foregut endoderm and the AIP of the embryo in F. (L) A highmagnification image stack showing the anterior expression area in the foregut endoderm andthe AIP of the embryo in C. (M) An optical cross section from the image stack in L showingthe EGFP expression in the foregut epithelium. The epithelial marker E-cadherin is in blue.nt: neural tube; nf: neural fold; fg: foregut; h: primitive heart. Scale bars are 100μm.
Klinck et al. Page 16
Gene Expr Patterns. Author manuscript; available in PMC 2012 October 1.
NIH
-PA Author Manuscript
NIH
-PA Author Manuscript
NIH
-PA Author Manuscript
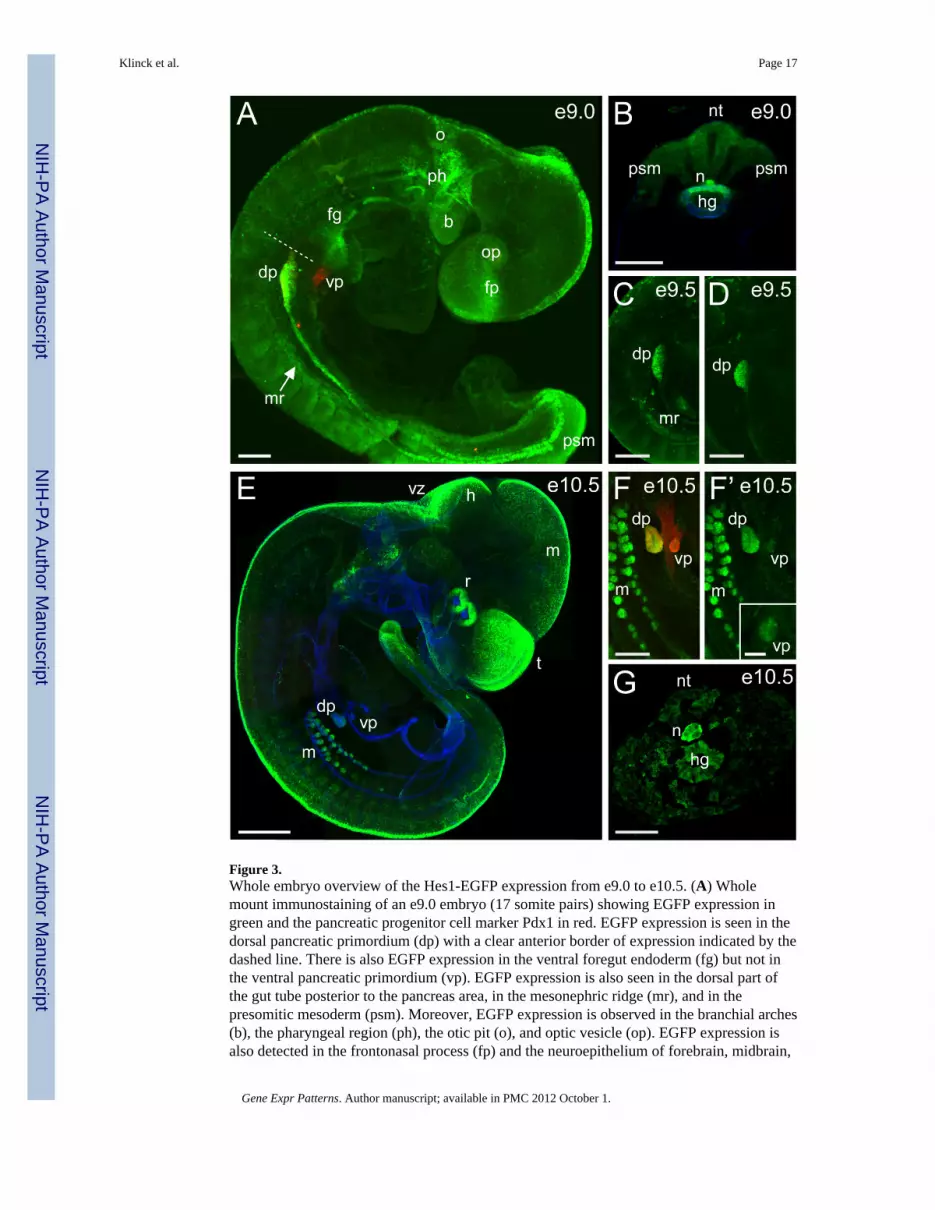
Figure 3.Whole embryo overview of the Hes1-EGFP expression from e9.0 to e10.5. (A) Wholemount immunostaining of an e9.0 embryo (17 somite pairs) showing EGFP expression ingreen and the pancreatic progenitor cell marker Pdx1 in red. EGFP expression is seen in thedorsal pancreatic primordium (dp) with a clear anterior border of expression indicated by thedashed line. There is also EGFP expression in the ventral foregut endoderm (fg) but not inthe ventral pancreatic primordium (vp). EGFP expression is also seen in the dorsal part ofthe gut tube posterior to the pancreas area, in the mesonephric ridge (mr), and in thepresomitic mesoderm (psm). Moreover, EGFP expression is observed in the branchial arches(b), the pharyngeal region (ph), the otic pit (o), and optic vesicle (op). EGFP expression isalso detected in the frontonasal process (fp) and the neuroepithelium of forebrain, midbrain,
Klinck et al. Page 17
Gene Expr Patterns. Author manuscript; available in PMC 2012 October 1.
NIH
-PA Author Manuscript
NIH
-PA Author Manuscript
NIH
-PA Author Manuscript
and hindbrain. Scale bar is 100μm. (B) Cross sectional view of the tail bud at e9.0 (17somite pairs) showing EGFP expression in neural tube (nt) and psm, but also in thenotochord (n) and the dorsal endoderm of the posterior hindgut (hg). Co-immunostaining forthe epithelial cell marker E-cadherin is in blue. Scale bar is 100μm. (C, D) Whole mountimmunostaining at e9.5 (20 somite pairs in C, 26 somite pairs in D) showing EGFPexpression in the dorsal pancreas. Scale bars are 200μm. (E) Whole mount immunostainingat e10.5 showing EGFP expression in green and the epithelial cell marker E-cadherin inblue. EGFP expression is seen in the mesonephric tubules (m), dorsal pancreatic bud (dp),retina (r), the tail bud, the telencephalic vesicle (t), and the neuroepithelium of midbrain (m),hindbrain (h), ventricular zone (vz), and dorsal neural tube. Scale bar is 500μm. (F, F’)Higher magnification images of the pancreas and mesonephros of the e10.5 embryo shownin E. Co-staining for Pdx1 is shown in red. (F’, inset) The ventral bud of the pancreas (vp) isalso positive for EGFP expression when analysed at a higher magnification. Scale bars are200μm and 50μm in inset. (G) Cross sectional view of the tail bud at e10.5 showing EGFPexpression in the notochord (n) and posterior hindgut (hg), but also in the mesoderm and theneural tube (nt). Scale bar is 100μm.
Klinck et al. Page 18
Gene Expr Patterns. Author manuscript; available in PMC 2012 October 1.
NIH
-PA Author Manuscript
NIH
-PA Author Manuscript
NIH
-PA Author Manuscript
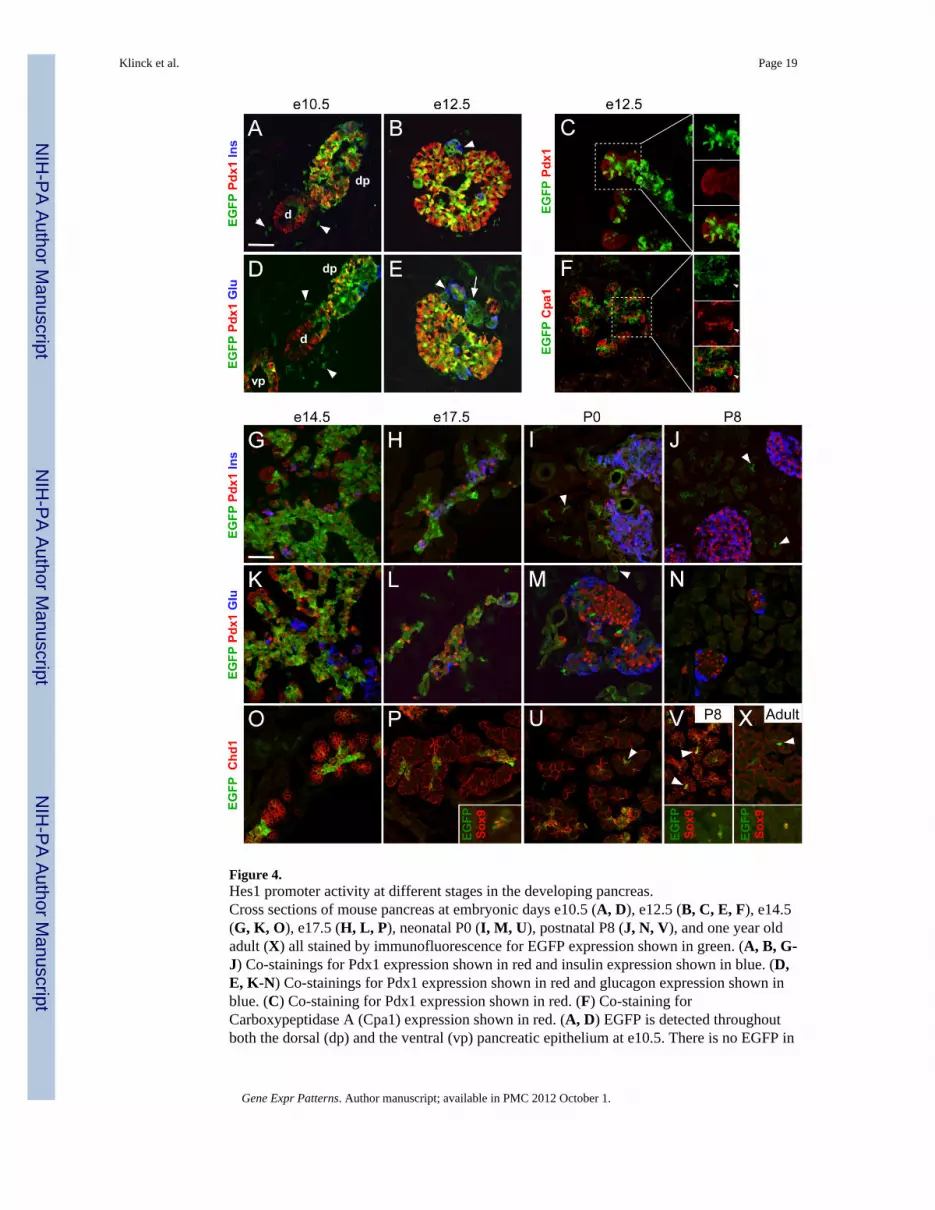
Figure 4.Hes1 promoter activity at different stages in the developing pancreas.Cross sections of mouse pancreas at embryonic days e10.5 (A, D), e12.5 (B, C, E, F), e14.5(G, K, O), e17.5 (H, L, P), neonatal P0 (I, M, U), postnatal P8 (J, N, V), and one year oldadult (X) all stained by immunofluorescence for EGFP expression shown in green. (A, B, G-J) Co-stainings for Pdx1 expression shown in red and insulin expression shown in blue. (D,E, K-N) Co-stainings for Pdx1 expression shown in red and glucagon expression shown inblue. (C) Co-staining for Pdx1 expression shown in red. (F) Co-staining forCarboxypeptidase A (Cpa1) expression shown in red. (A, D) EGFP is detected throughoutboth the dorsal (dp) and the ventral (vp) pancreatic epithelium at e10.5. There is no EGFP in
Klinck et al. Page 19
Gene Expr Patterns. Author manuscript; available in PMC 2012 October 1.
NIH
-PA Author Manuscript
NIH
-PA Author Manuscript
NIH
-PA Author Manuscript

the surrounding pancreatic mesenchyme, while the mesenchyme around the duodenum (d)contains scattered EGFP positive cells (arrow heads). (B, E) EGFP-expression is seen in themajority of the e12.5 pancreatic epithelium, but also Pdx1-negative cells can be found thatexpress EGFP. Cells expressing insulin and glucagon are often negative for EGFP (arrowheads), but we also find EGFP to be co-expressed with the hormones (arrow). (C) In thee12.5 tips of the branching structures, EGFP is only expressed in some of the cells. (F) Cpa1is expressed in the branching tip cells which have very low amounts or no EGFP (smallarrow heads). (G, K, O) At e14.5, the entire central epithelium shows strong EGFPexpression whereas the branching tips are completely negative for EGFP. Insulin andglucagon positive cells are also negative for EGFP. (H, L, P) At e17.5, EGFP expression isfound as large clusters in connection with regions of developing endocrine cells in thecentral areas of the tissue. In the developing exocrine part, small clusters of 2-3 cells orsingle cells that co-express EGFP and Sox9 are observed. (I, M, U) In neonatal pancreastissue (P0), EGFP is detected in and around the ducts and the islets of Langerhans but neveroverlapping with neither insulin nor glucagon. Single EGFP positive cells are often seen inthe centre of the acini (arrow heads). (J, N, V) Eight days after birth (P8), the islets arecompletely devoid of EGFP expression. However, the scattered EGFP positive single cellsamong the exocrine cells remain (arrow heads) and they co-express Sox9 (inset). (X) Veryrarely, EGFP positive single cells among the exocrine cells can be found in adult pancreastissue (arrow heads). They co-express Sox9 (inset). Scale bars are 50 μm.
Klinck et al. Page 20
Gene Expr Patterns. Author manuscript; available in PMC 2012 October 1.
NIH
-PA Author Manuscript
NIH
-PA Author Manuscript
NIH
-PA Author Manuscript

Figure 5.Hes1 promoter activity in the developing duodenum.(A) Whole mount immunostaining showing the duodenal region in a lateral view of an e10.5embryo. E-cadherin (Cdh1) staining in blue outlines the epithelium, and staining for EGFPis in green. The dorsal (dp) and ventral (vp) pancreas epithelia are EGFP positive as well asscattered cells in the duodenal mesenchyme (arrow heads). d: duodenum; gb: gall bladder.(B) Cross section of e10.5 duodenum (d) showing the scattered EGFP positive cells in thesurrounding mesenchyme (arrow heads), but also some EGFP in the dorsal epithelium. (C-F) Cross sections of e12.5 duodenum. (C) Shows a layer of green EGFP positive cells at theperiphery of the mesenchyme. Immunostaining for smooth muscle actin (SMA) in red labels
Klinck et al. Page 21
Gene Expr Patterns. Author manuscript; available in PMC 2012 October 1.
NIH
-PA Author Manuscript
NIH
-PA Author Manuscript
NIH
-PA Author Manuscript
the smooth muscle cells and Cdh1 in blue outlines the epithelium. (D) Immunostaining forthe neuronal marker β-III-tubulin in red on the adjacent section to (C) shows overlappingexpression with EGFP in the enteric neurons. (E, F) Immunostaining for SMA in red andEGFP in green in duodenum in an e12.5 Hes1-EGFP transgenic embryo (E) and a wild-typelittermate (F) showing that the EGFP signal in the enteric neurons is not backgroundfluorescence. (G) At e14.5 there are EGFP positive cells appearing in the duodenalepithelium and in the mesenchyme there is strong EGFP expression in a cell layer in theouter periphery and a weaker EGFP signal in the mesenchyme closer to the epithelium. (H)In e17.5 duodenum, EGFP in green is detectable in the epithelium but no longer in themesenchyme. (I) Staining for EGFP expression in green shows continued Hes1 promoteractivity in the epithelium at P0. (J) At P8, the EGFP expression is less abundant but stillfound in the epithelium and primarily seen in the crypts. (K, L) In one year old adult tissue,a crypt is occasionally found to express EGFP (K), or there are regions with EGFPexpression along the villi (L). In all panels (G-K), EGFP expression is in green and theepithelium is outlined by Cdh1 staining in red. Panel (L) shows a co-staining of EGFP ingreen with Sox9 positive crypt cells in red. Scale bars are 50 μm in A-F and 100 μm in G-L.
Klinck et al. Page 22
Gene Expr Patterns. Author manuscript; available in PMC 2012 October 1.
NIH
-PA Author Manuscript
NIH
-PA Author Manuscript
NIH
-PA Author Manuscript

Figure 6.Hes1-promotor activity in the developing liver.(A, A’, A”) Optical section from a whole mount immunostaining of an e9.0 embryo (17somite pairs) showing EGFP expression in the dorsal pancreas (dp) and the ventral foregut(fg) in (A), expression of Prox1 in the dp and the liver liverticulum (ld) in (A’), and themerged image in (A”). Scale bar is 100 μm. (B, C) Cross sections of e9.0 primitive gut at(B) the most anterior part of the liver diverticulum (ld), and (C) through the middle of the ld.EGFP expression co-localise with Prox1 in the dp but there is no detectable EGFP in theProx1 positive developing liver cells. Scale bars are 100 μm. (D, E) Adjacent sections ofe10.5 liver bud (lb) showing (D) Hnf4a expression in the hepatoblasts (hb) and (E) Sox9 inthe liver bud epithelium. EGFP is expressed together with Sox9 in the dorsal pancreas (dp)but not in the developing liver tissue. (F, G) e12.5 and e14.5 common bile duct (cbd)epithelium co-express Sox9 and EGFP. (H) Two Sox9 positive neighbouring cells along thee12.5 portal vein (pv). One of the two cells is also expresses EGFP. (I) At e14.5, many cellsalong the portal veins co-express EGFP and Sox9. (J, K) At e17.5 and P0, most of thebiliary epithelium co-express EGFP and Sox9. (L, M) There are many EGFP positive cellsalong the portal veins at P8, but regarding the bile ducts there are two different observationswhere (L) shows an asymmetrical bile duct with EGFP expression in half of the epitheliumand (M) shows a bile duct with no EGFP expression. (N) In adult (one year old) liver, wehave not found any EGFP positive cells. Scale bars are 50 μm in (D-N). Asterisks mark thelumen of the bile ducts.
Klinck et al. Page 23
Gene Expr Patterns. Author manuscript; available in PMC 2012 October 1.
NIH
-PA Author Manuscript
NIH
-PA Author Manuscript
NIH
-PA Author Manuscript

Figure 7.Hes1-promotor activity in the developing kidneys.(A) Whole mount immunostaining showing the mesonephros in a lateral view of an e10.5embryo. Hes1 promoter-driven EGFP in green is seen in the mesonephric tubules (mt) butnot in the mesonephric ducts (md). Staining for E-cadherin in red outlines the epithelium.(B) Cross section of e12.5 metanephros showing persistent EGFP expression in the tubules.Co-staining for E-cadherin is shown in red. (C) Cross section of e14.5 metanephros showsEGFP expression in all the epithelialized derivatives of the metanephric mesenchyme. Co-staining for E-cadherin is shown in red. (D, D’, E, E’) Cross sections at e17.5 and P0 showthat there is EGFP expression in stage I-III nephrons in the cortical region and in collectingducts and mesenchymal cells in the medullary region. (F, F’) Cross section at P8 showsEGFP expression in cells only in the medullary interstitium. Scale bars in (A-C) are 50μm.Scale bars in (D-F) are 100 μm.
Klinck et al. Page 24
Gene Expr Patterns. Author manuscript; available in PMC 2012 October 1.
NIH
-PA Author Manuscript
NIH
-PA Author Manuscript
NIH
-PA Author Manuscript
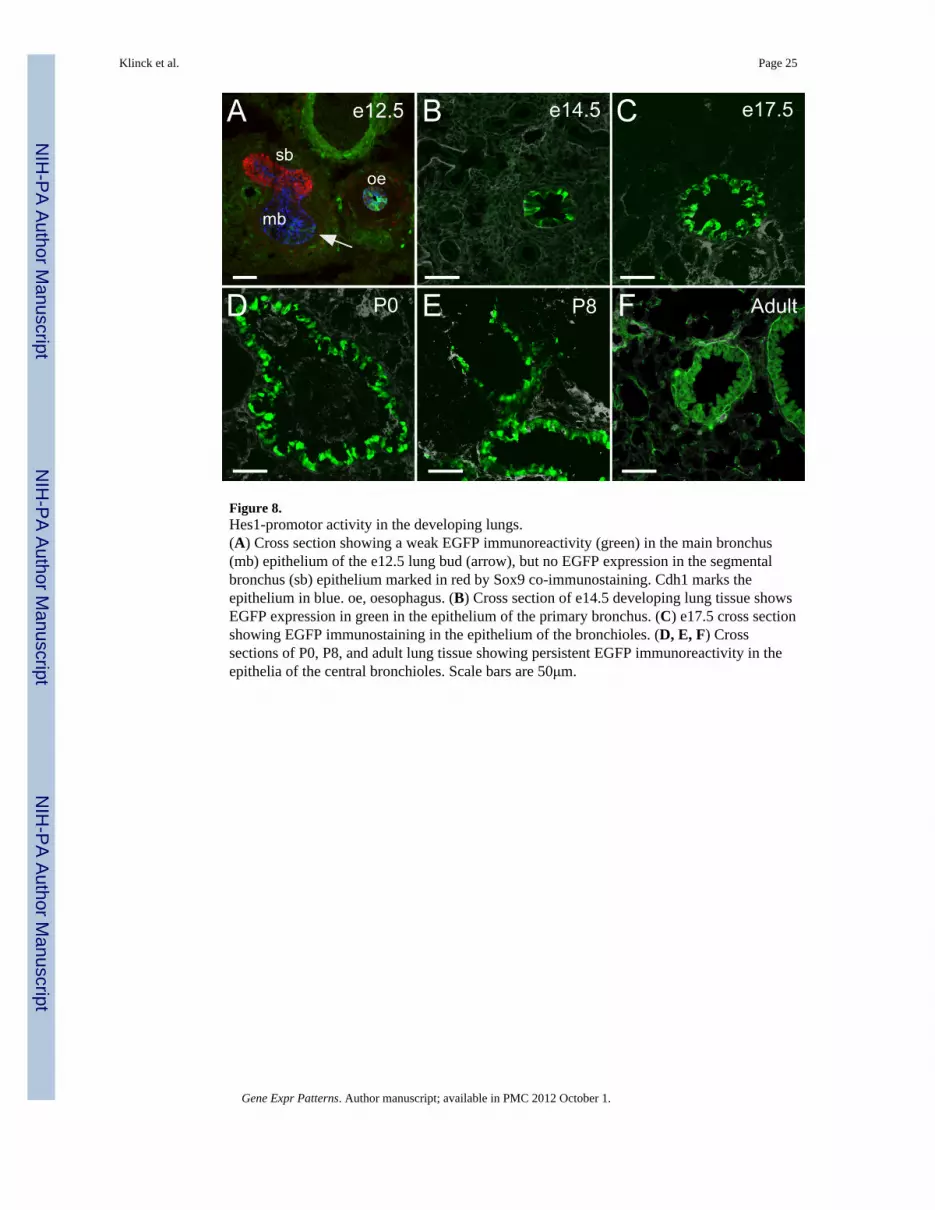
Figure 8.Hes1-promotor activity in the developing lungs.(A) Cross section showing a weak EGFP immunoreactivity (green) in the main bronchus(mb) epithelium of the e12.5 lung bud (arrow), but no EGFP expression in the segmentalbronchus (sb) epithelium marked in red by Sox9 co-immunostaining. Cdh1 marks theepithelium in blue. oe, oesophagus. (B) Cross section of e14.5 developing lung tissue showsEGFP expression in green in the epithelium of the primary bronchus. (C) e17.5 cross sectionshowing EGFP immunostaining in the epithelium of the bronchioles. (D, E, F) Crosssections of P0, P8, and adult lung tissue showing persistent EGFP immunoreactivity in theepithelia of the central bronchioles. Scale bars are 50μm.
Klinck et al. Page 25
Gene Expr Patterns. Author manuscript; available in PMC 2012 October 1.
NIH
-PA Author Manuscript
NIH
-PA Author Manuscript
NIH
-PA Author Manuscript