barcoding-free bac pooling enables combinatorial selective
TRANSCRIPT
arX
iv:1
112.
4438
v1 [
q-bi
o.G
N]
19 D
ec 2
011
Barcoding-free BAC Pooling Enables Combinatorial
Selective Sequencing of the Barley Gene Space
Stefano Lonardi1∗, Denisa Duma1, Matthew Alpert1, Francesca Cordero5,6,
Marco Beccuti5, Prasanna R. Bhat2,3, Yonghui Wu1,4, Gianfranco Ciardo1,
Burair Alsaihati1, Yaqin Ma2, Steve Wanamaker2, Josh Resnik2, Timothy J. Close2
1 Department of Computer Science and Engineering, University of California, Riverside, CA 92521, USA2 Department of Botany & Plant Sciences, University of California, Riverside, CA 92521, USA
3 Monsanto Research Centre, Bangalore, 560092, India4 Google, Inc., Mountain View, CA 94043, USA
5 Department of Computer Science, Universita di Torino, 10149 Torino, Italy6 Department of Clinical and Biological Science, Universit`a di Torino, 10043 Torino, Italy
∗ Corresponding author. Email:[email protected]
Abstract
We propose a new sequencing protocol that combines recent advances in combinatorial pooling
design and second-generation sequencing technology to efficiently approachde novoselective genome
sequencing. We show that combinatorial pooling is a cost-effective and practical alternative to exhaustive
DNA barcoding when dealing with hundreds or thousands of DNAsamples, such as genome-tiling gene-
rich BAC clones. The novelty of the protocol hinges on the computational ability to efficiently compare
hundreds of million of short reads and assign them to the correct BAC clones so that the assembly can
be carried out clone-by-clone. Experimental results on simulated data for the rice genome show that
the deconvolution is extremely accurate (99.57% of the deconvoluted reads are assigned to the correct
BAC), and the resulting BAC assemblies have very high quality (BACs are covered by contigs over about
77% of their length, on average). Experimental results on real data for a gene-rich subset of the barley
genome confirm that the deconvolution is accurate (almost 70% of left/right pairs in paired-end reads are
assigned to the same BAC, despite being processed independently) and the BAC assemblies have good
quality (the average sum of all assembled contigs is about 88% of the estimated BAC length).
Data availability: Barley raw sequencing data for one set of 2,197 MTP gene-enriched BACs can be ob-
tained from NCBI Sequence Read Archive (http://www.ncbi.nlm.nih.gov/sra?term=(SRA047913))
Keywords: genome sequencing and assembly, combinatorial pooling, second-generation sequencing
1
Introduction
The second generation of DNA sequencing instruments currently on the market is revolutionizing the way
molecular biologists design and carry out scientific investigations in genomics and genetics. Illumina, ABI
SOLiD, Helicos, and Ion Torrent sequencing instruments produce billions of sequenced reads at a fraction of
the cost of Sanger-based technologies, but read lengths are100-150 bases, much shorter than Sanger reads
of typically 700–900 bases. While the number (and to a lesserextent the length) of reads keeps increasing at
each update of these instruments, the number of samples thatcan be run has remained small (e.g., two sets
of sevenlaneson the Illumina HiSeq). Since the number of reads produced bythe instrument is essentially
fixed, when DNA samples to be sequenced are relatively “short” (e.g., BAC clones) and the correspondence
between reads and their source has to be maintained, severalsamples must be “multiplexed” on the same
lane to optimize the trade-off between cost and sequencing depth. Multiplexing is traditionally achieved
by adding a DNA barcode to each sample in the form of an additional (oligo) adapter, but this does not
scale readily to thousands of samples. Although it is theoretically possible to barcode such a number of
samples, the procedure becomes unfeasible as the number of sample is in the hundreds: the task is tedious,
time consuming, error-prone, and relatively expensive. While the task could be carried out in principle by
robotic instruments, most facilities do not have access to these devices. Another significant disadvantage of
exhaustive barcoding is called “barcoding bias” which results in very strongly non-uniform distribution of
reads for each barcoded sample (see, e.g., [Alon et al., 2011, Craig et al., 2008]).
In this paper, we demonstrate that multiplexing can be achieved without exhaustive barcoding. We pro-
pose a protocol based on recent advances in combinatorial pooling design. Combinatorial pooling has been
used previously in the context of genome analysis, but this is the first attempt to use it forde novogenome
sequencing. Earlier works are CAPSS and PGI, where BACs are arranged on a 2D matrix, each row and col-
umn of the grid constituting a pool that is then sequenced [Cai et al., 2001, Csuros and Milosavljevic, 2002,
Csuros et al., 2003, Milosavljevic et al., 2005]. However, this simple grid design is very vulnerable to noise
and behaves poorly when several objects are positive; it is also far from optimal in terms of the number
of pools it produces. Later works have combined pooling withsecond-generation sequencing technology
[Prabhu and Pe’er, 2009, Erlich et al., 2009, Hajirasoulihaet al., 2008]. The domain of application of “DNA
Sudoku” is the detection of microRNA targets inArabidopsisand human genes [Erlich et al., 2009], whereas
the pooling strategies discussed in [Prabhu and Pe’er, 2009, Hajirasouliha et al., 2008] are used for targeted
resequencing (i.e., when a reference genome is available).To the best of our knowledge, there is no prior
work on the feasibility of combinatorial pooling and second-generation sequencing technology forde novo
genome sequencing.
In our approach tode novosequencing, subsets of non-redundant genome-tiling BACs are chosen to
form intersecting pools. Each pool is then sequenced individually on a fraction of a flowcell via standard
multiplexing. Due to the short length of a BAC (typically≈130 kb), cost-effective sequencing requires each
BAC pool to contain hundreds or thousands of BACs. We show later in this report that attempting to directly
assemble short reads originating from a mix of hundreds BACsis likely to produce low-quality assemblies,
2
as the assembler is unable to partition the reads to individual BACs. Moreover, it would be impossible to
trace subset of the contigs to a specific BAC address. If instead reads could be assigned (ordeconvoluted) to
individual BACs, then the assembly could proceed clone-by-clone. The goal of assigning sequenced reads to
specific BACs can be achieved if one chooses a pooling strategy in which each BAC is present in a carefully
designed set of pools such that the identity of each BAC is encoded within the pooling pattern (rather than
by its association with a particular barcode). By transitivity, the identity of each read is similarly encoded
within the pattern of pools in which it occurs. Reads that canbe assigned to a given BAC are collected in a
set, which is then individually assembled.
To demonstrate the efficacy and performance of our approach,we apply the proposed sequencing pro-
tocol to two plant genomes, namely rice and barley, using thesame pooling design parameters. For rice, we
started from a fingerprint-based physical map, identified BACs on a minimum tiling path (MTP), pooled the
MTP BACs according to a shifted transversal design [Thierry-Mieg, 2006], generated readsin silico from
the pools (introducing some sequencing errors), deconvoluted the reads to BACs, and finally assembled the
reads clone-by-clone. The sequence of the rice genome is used as the “ground truth” to evaluate the accuracy
of our method. The results of the simulation show that only 18.5% of the short reads do not deconvolute.
The deconvolution process is surprisingly accurate: 99.57% of the deconvoluted reads are assigned to the
original BAC. Most of the non-assignable reads are those that appear in almost every pool, i.e., highly repet-
itive reads. An additional advantage of our approach is protection against these repetitive reads, which can
hamper the assembly. We show that the resulting BAC assemblies have very high quality, with large contigs
covering on average 77% of the rice BAC sequence.
For barley, we also start from a fingerprint-based physical map of gene-enriched BACs, identify BACs
on a minimum tiling path (MTP), then pool subsets of MTP BACs according to a shifted transversal design.
However, for barley we work on the actual clones and generatesequencede novo. We are currently in
the process of sequencing seven sets of BAC pools, for a totalof 14,763 MTP BACs. Here, we report
results on one set of 91 pools representing 2,197 BACs. In barley, a slightly larger number of reads did not
deconvolute due to the higher repeat content and length of this genome: 71.3% of the reads were assigned to
1–3 BACs, for a total of about 87% of the bases. The deconvolution process is also quite accurate on barley:
almost 70% of left/right pairs in paired-end reads are assigned to the same BAC, despite being processed
independently. The assembly statistics for barley show a lower average N50 than rice, but the the average
sum of all assembled contigs is about 88% the estimated BAC length. An objective measure of quality for
barley BAC assemblies is harder to implement due to the absence of the “ground truth”. As a workaround
we measure the degree to which EST consensus sequences (orunigenes) known to be located in these BACs
are represented in the assemblies. The analysis shows that only 10% of the final BAC assemblies miss
the expected unigene. For the remaining 90% of the assemblies which contain the expected unigenes, the
average coverage of those unigenes is about 90% of their length. Finally, we compare barley BAC assemblies
to (1) the assembly of each pool of 169 BACs (before deconvolution), (2) the assembly of the whole set of
91 pools containing a total of 2,197 BACs (before deconvolution) and (3) the assembly of the whole barley
genome via shotgun sequencing (31x coverage). The comparison shows that our BAC-by-BAC protocol is
3
likely to be the most effective strategy to obtain the largest possible N501 for barley.
Results
Protocol overview
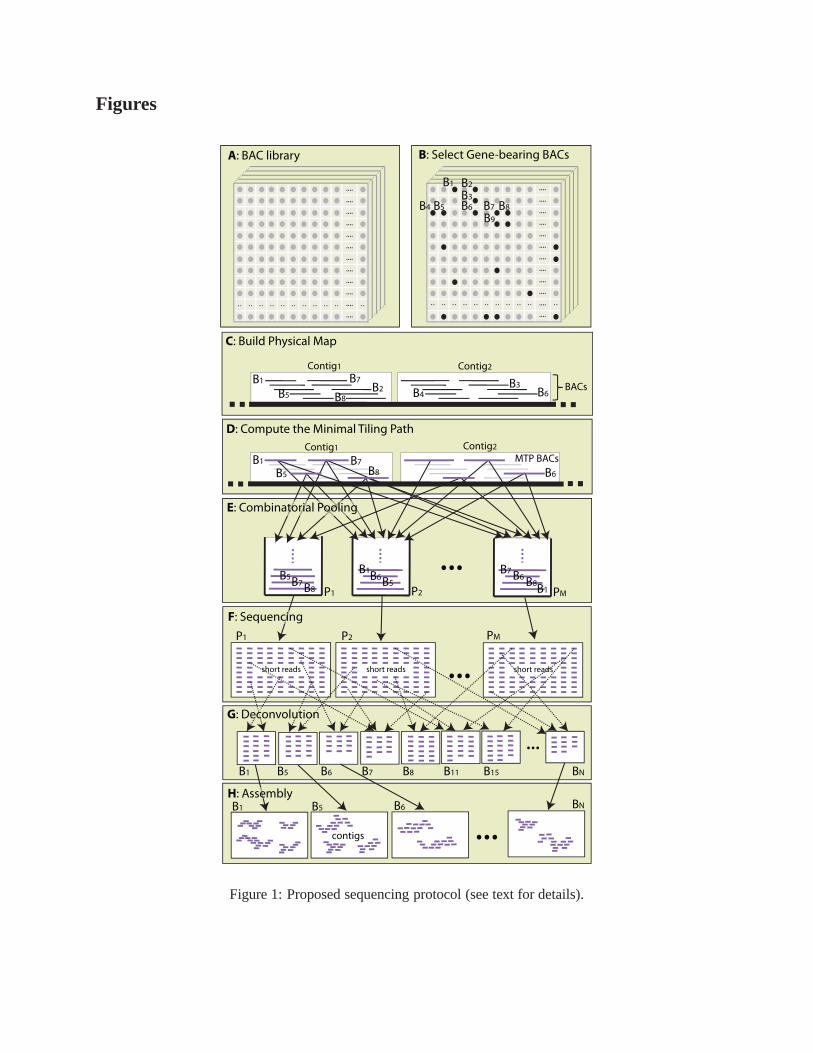
The main steps of ourcombinatorial sequencingmethod are summarized next and illustrated in Figure 1.
More details can be found in the Methods section.
A. Obtain a BAC library for the target organism
B. Select gene-enriched BACs from the library (optional)
C. Fingerprint BACs and build a physical map
D. Select a minimum tiling path (MTP) from the physical map [Engler et al., 2003, Bozdag et al., 2008]
E. Pool the MTP BACs according to the shifted transversal design [Thierry-Mieg, 2006] for an appropriate
choice of(P,L,Γ), so thatPΓ+1 ≥ N , whereN is the number of BACs and⌊(L− 1)/Γ⌋ ≥ 3 (if the
MTP was truly a set of minimally overlapping clones, a two-decodable pooling would be sufficient,
but a three-decodable pooling gives additional protectionagainst errors)
F. Fragment the BACs in each pool, select for size, create a library for sequencing, sequence the DNA in
each pool, trim reads based on quality scores, and removeE. coli and vector contamination
G. Determine thesignatureof each read viak-mer analysis; assign reads to BACs by matching read signa-
tures to BAC signatures
H. Assemble reads assigned to each BAC into contigs using a short-read assembler
Next, we report experimental results on simulated data on the genome ofOryza sativa(rice) and real
sequencing data on the genome ofHordeum vulgare L.(barley).
Simulation results on the rice genome
The physical map forOryza sativawas assembled from 22,474 BACs fingerprinted at AGCoL, and contained
1,937 contigs and 1,290 singletons. From this map, we selected only BACs whose sequence could be
uniquely mapped to the rice genome. We computed an MTP of thissmaller map using our tool FMTP
[Bozdag et al., 2008]. The resulting MTP contained 3,827 BACs with an average length of≈ 150 kb, and
spanned 91% of the rice genome (which is≈ 390 Mb).
We pooledin silico a subset of 2,197 BACs from the set above according to the shifted transversal design
[Thierry-Mieg, 2006]. Taking into consideration the format of the standard 96-well plate and the need for a
1N50 indicates the minimum length of all contig/scaffolds that together account for 50% of the genome.
4
3-decodable pooling design for minimal tiling path BACs, wechose parametersP = 13, L = 7 andΓ = 2,
so thatPΓ+1 = 2,197 and⌊(L − 1)/Γ⌋ = 3. Each of theL = 7 layers consisted ofP = 13 pools, for a
total of 91 BAC pools, which left some space for a few control DNA samples on the 96-well plate. In this
pooling design, each BAC is contained in exactlyL = 7 pools and each pool contains exactlyPΓ = 169
clones. The set ofL pools to which a BAC is assigned, is called theBAC signature. Any two pools can
share at mostΓ = 2 BACs: specifically, 57.9% of the pool pairs have no BAC in common, 30.6% share one
BAC, and 11.5% share two.
The 91 resulting rice BAC pools were “sequenced”in silico by generating one million paired-end reads
of 104 bases with an insert size of 327 bases, and 1% sequencing error distributed uniformly along the read.
A total of 208 million usable bases gave an expected≈ 8x depth of sequencing coverage for a BAC in a
pool. As each BAC is present in seven pools, this is an expected ≈ 56x combined coverage. We did not
generate quality scores or artificially introduced vector contamination, so cleaning stepF was irrelevant for
these data.
The 91 read pools were processed for deconvolution using ourtool HASHFILTER. For each read in the
pool set, this tool first computes the occurrences of all distinct k-mers (k = 26 in our experiments) and
stores them in a hash table. Then it scans all the reads again,this time fetching the set of pools that contain
each constitutivek-mer of a read, i.e., thek-mer signature. HASHFILTER compares eachk-mer signature
against the set of 2,197 BAC signatures: if a match exists, that signature is declaredvalid. Given the set of
valid k-mer signatures for a read, HASHFILTER finally determines the BACs to which the read should be
assigned (see Methods for more details).
The computation was not very time consuming, but required significant amount of memory. On the rice
dataset, the construction of the hash table required about 120 GB of RAM and 164 minutes running on one
core of a Dell PowerEdge T710 server (dual Intel Xeon X5660 2.8Ghz, 12 cores, 144 Gb RAM). For the
deconvolution phase, HASHFILTER took 33 minutes running on 10 cores; sorting the reads into 2,197 files
took 22 minutes (one core).
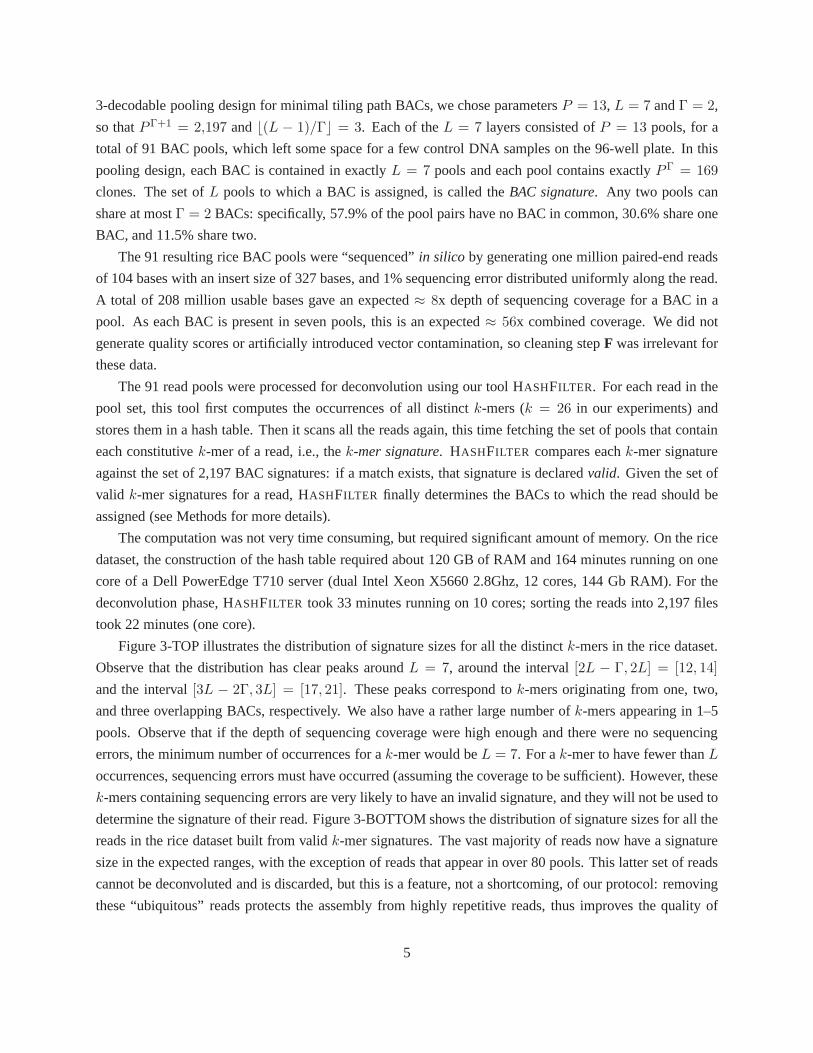
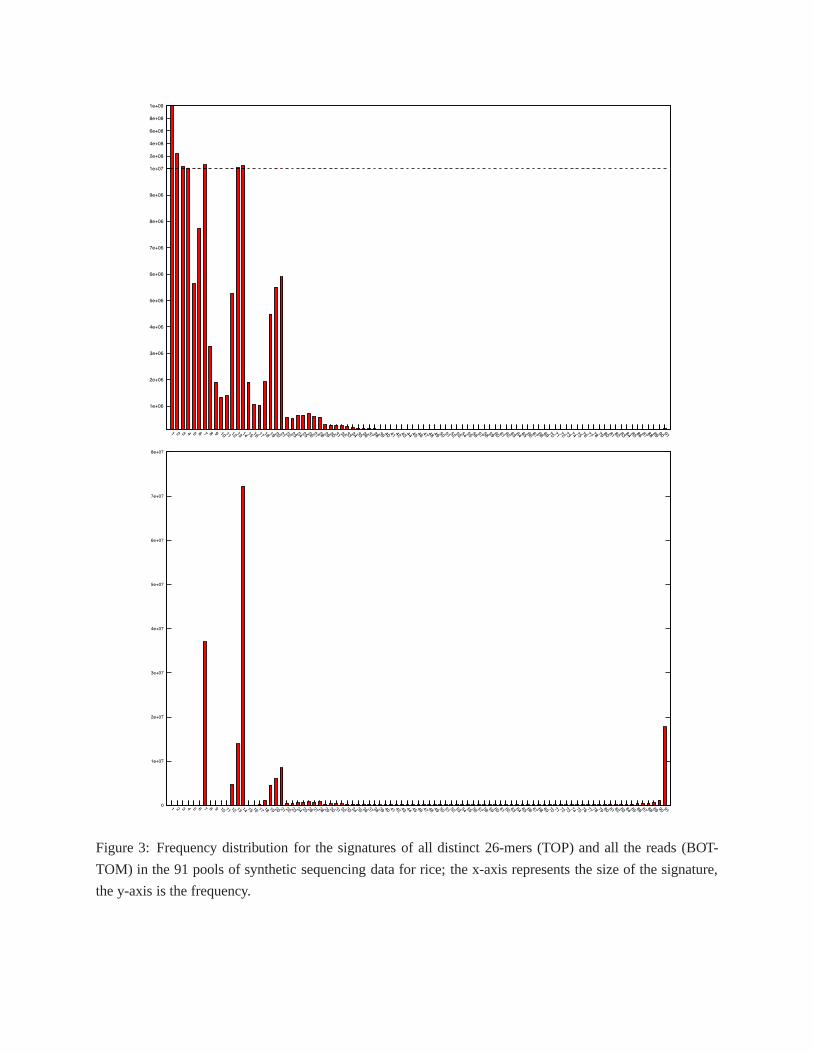
Figure 3-TOP illustrates the distribution of signature sizes for all the distinctk-mers in the rice dataset.
Observe that the distribution has clear peaks aroundL = 7, around the interval[2L − Γ, 2L] = [12, 14]
and the interval[3L − 2Γ, 3L] = [17, 21]. These peaks correspond tok-mers originating from one, two,
and three overlapping BACs, respectively. We also have a rather large number ofk-mers appearing in 1–5
pools. Observe that if the depth of sequencing coverage werehigh enough and there were no sequencing
errors, the minimum number of occurrences for ak-mer would beL = 7. For ak-mer to have fewer thanL
occurrences, sequencing errors must have occurred (assuming the coverage to be sufficient). However, these
k-mers containing sequencing errors are very likely to have an invalid signature, and they will not be used to
determine the signature of their read. Figure 3-BOTTOM shows the distribution of signature sizes for all the
reads in the rice dataset built from validk-mer signatures. The vast majority of reads now have a signature
size in the expected ranges, with the exception of reads thatappear in over 80 pools. This latter set of reads
cannot be deconvoluted and is discarded, but this is a feature, not a shortcoming, of our protocol: removing
these “ubiquitous” reads protects the assembly from highlyrepetitive reads, thus improves the quality of
5
BAC assemblies.
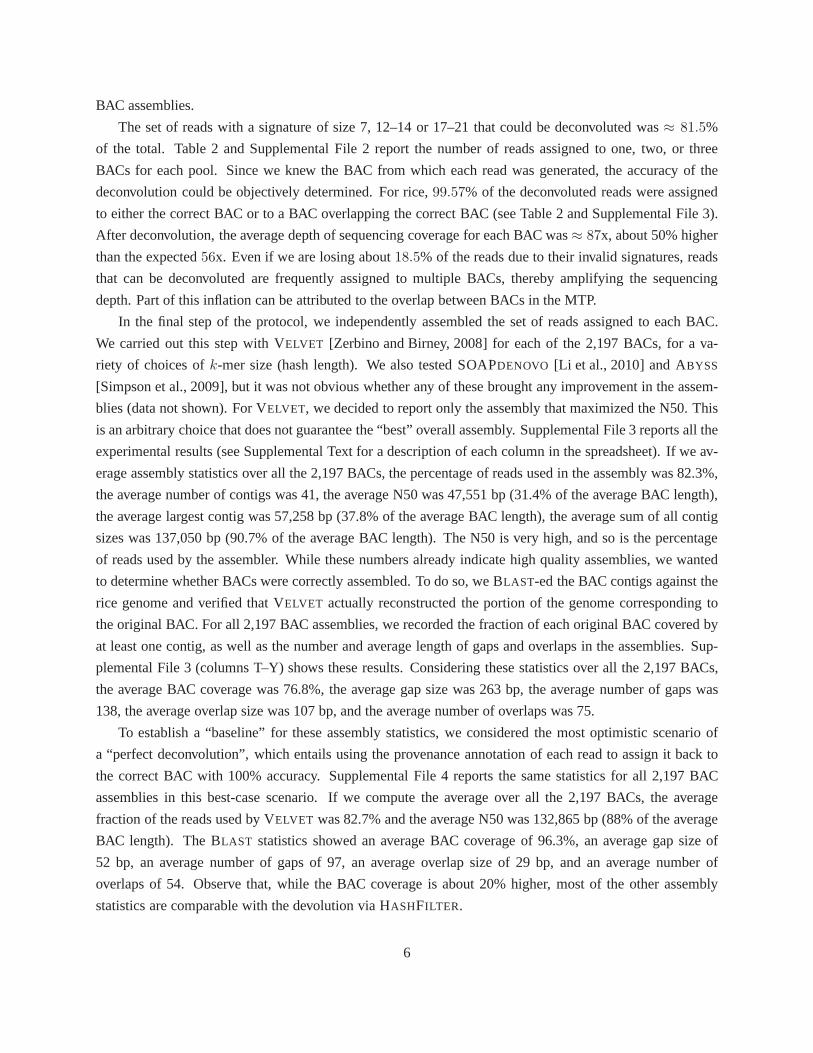
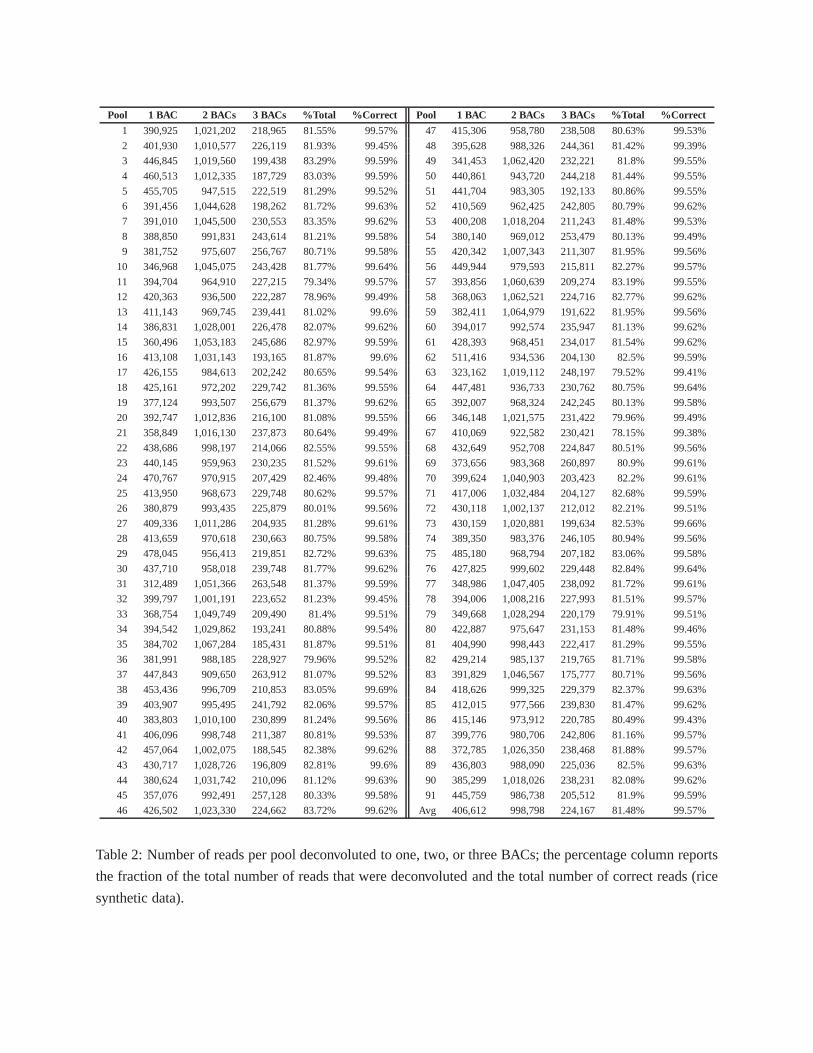
The set of reads with a signature of size 7, 12–14 or 17–21 thatcould be deconvoluted was≈ 81.5%
of the total. Table 2 and Supplemental File 2 report the number of reads assigned to one, two, or three
BACs for each pool. Since we knew the BAC from which each read was generated, the accuracy of the
deconvolution could be objectively determined. For rice,99.57% of the deconvoluted reads were assigned
to either the correct BAC or to a BAC overlapping the correct BAC (see Table 2 and Supplemental File 3).
After deconvolution, the average depth of sequencing coverage for each BAC was≈ 87x, about 50% higher
than the expected56x. Even if we are losing about18.5% of the reads due to their invalid signatures, reads
that can be deconvoluted are frequently assigned to multiple BACs, thereby amplifying the sequencing
depth. Part of this inflation can be attributed to the overlapbetween BACs in the MTP.
In the final step of the protocol, we independently assembledthe set of reads assigned to each BAC.
We carried out this step with VELVET [Zerbino and Birney, 2008] for each of the 2,197 BACs, for a va-
riety of choices ofk-mer size (hash length). We also tested SOAPDENOVO [Li et al., 2010] and ABYSS
[Simpson et al., 2009], but it was not obvious whether any of these brought any improvement in the assem-
blies (data not shown). For VELVET, we decided to report only the assembly that maximized the N50. This
is an arbitrary choice that does not guarantee the “best” overall assembly. Supplemental File 3 reports all the
experimental results (see Supplemental Text for a description of each column in the spreadsheet). If we av-
erage assembly statistics over all the 2,197 BACs, the percentage of reads used in the assembly was 82.3%,
the average number of contigs was 41, the average N50 was 47,551 bp (31.4% of the average BAC length),
the average largest contig was 57,258 bp (37.8% of the average BAC length), the average sum of all contig
sizes was 137,050 bp (90.7% of the average BAC length). The N50 is very high, and so is the percentage
of reads used by the assembler. While these numbers already indicate high quality assemblies, we wanted
to determine whether BACs were correctly assembled. To do so, we BLAST-ed the BAC contigs against the
rice genome and verified that VELVET actually reconstructed the portion of the genome corresponding to
the original BAC. For all 2,197 BAC assemblies, we recorded the fraction of each original BAC covered by
at least one contig, as well as the number and average length of gaps and overlaps in the assemblies. Sup-
plemental File 3 (columns T–Y) shows these results. Considering these statistics over all the 2,197 BACs,
the average BAC coverage was 76.8%, the average gap size was 263 bp, the average number of gaps was
138, the average overlap size was 107 bp, and the average number of overlaps was 75.
To establish a “baseline” for these assembly statistics, weconsidered the most optimistic scenario of
a “perfect deconvolution”, which entails using the provenance annotation of each read to assign it back to
the correct BAC with 100% accuracy. Supplemental File 4 reports the same statistics for all 2,197 BAC
assemblies in this best-case scenario. If we compute the average over all the 2,197 BACs, the average
fraction of the reads used by VELVET was 82.7% and the average N50 was 132,865 bp (88% of the average
BAC length). The BLAST statistics showed an average BAC coverage of 96.3%, an average gap size of
52 bp, an average number of gaps of 97, an average overlap sizeof 29 bp, and an average number of
overlaps of 54. Observe that, while the BAC coverage is about20% higher, most of the other assembly
statistics are comparable with the devolution via HASHFILTER.
6
The gene-space of barley
Barley’s diploid genome size is estimated at≈ 5,300 Mb and it composed of at least 80% highly repet-
itive DNA, predominantly LTR retrotransposons [Wicker et al., 2005]. The number of genes in barley is
uncertain; estimates range from 35,000 to 60,000. Due to itssize and repeat content, a shotgun approach
for de novosecond-generation sequencing would require a very high depth of sequencing, a mix of long
insert paired-end reads of various length, and the longest possible reads. Our protocol allows us to tackle
the assembly problem BAC-by-BAC, thus significantly reducing its complexity and increasing the fidelity
of the resulting assemblies.
We started with a 6.3x genome equivalent barley BAC library created at Clemson University Genomics
Institute which contains 313,344 BACs with an average insert size of 106 kb [Yu et al., 2000]. Nearly
84,000 gene-enriched BACs were identified, mainly by the overgo probing method [Madishetty et al., 2007]
and [unpublished, 2011]. Gene-enriched BACs were fingerprinted at University of California, Davis us-
ing high-information-content fingerprinting [Ding et al.,2001, Luo et al., 2003]. From the fingerprinting of
gene-bearing BACs, we produced a physical map [Bozdag et al., 2007, Soderlund et al., 2000] and derived
a minimal tiling path of about 15,000 clones [Bozdag et al., 2008]. Seven sets ofN = 2,197 clones were
chosen to be pooled according to the shifted transversal design [Thierry-Mieg, 2006], which we internally
call HV3, HV4, . . . , HV9 (HV1 and HV2 were pilot experiments).We used the same pooling parameters
discussed in the previous section (P = 13, L = 7 andΓ = 2). As a consequence we hadPΓ+1 = N and
decodability of⌊(L−1)/Γ⌋ = 3. Recall that in this pooling design, each BAC is contained inexactlyL = 7
pools and each pool contains exactlyPΓ = 169 clones. Any two pools can share at mostΓ = 2 BACs.
Here we are reporting on the HV5 set containing91 pools from a total of 2,197 MTP gene-rich barley
BAC clones. Given the estimated 129.5 kb size of a BAC in the barley MTP (see section “Clone-by-clone
Assembly” for a discussion of the MTP BAC size estimate), thetotal complexity of each pool of 169 BACs
can be estimated at≈ 22 Mb. As each BAC is replicated in seven pools, the total complexity of the 2,197
BACs in HV5 is≈ 286 Mb. To take advantage of the high density of sequencing of theIllumina HiSeq2000,
we multiplexed thirteen pools on each lane using custom multiplexing adapters. The total 91 pools used
seven lanes, or one entire flowcell of the instrument.
After reads were sequenced and demultiplexed, we obtained an average of 12.4 million 94-base paired-
end reads per pool. Reads were end-trimmed using quality scores and kept only if longer than 36 bases, then
cleaned ofE. coli contamination and spurious Illumina adapters. The percentage ofE. coli in this particular
set of BACs was rather high, averaging around 51%. An alternative DNA purification method can lower this
amount to 8-10% (see ‘Barley BAC pooling’ in Methods). Supplemental File 5 reports the number of reads
and bases after each step of the cleaning process.
The average number of usable paired-end reads after cleaning was about 5.5 million per pool with an
average read length of 89 bases. The distribution of the number of paired-end reads in the set of 91 pools
was between about 1M and 5.6M. Figure 1 in Supplemental Text illustrates the number of single-end reads
in each pool. The total number of paired-end reads for HV5 wasabout 250M, for a total of about 44.8 billion
7
usable bases. When compared to the 286 Mb complexity of the sample, the average coverage (assuming a
uniform distribution) was≈157x.
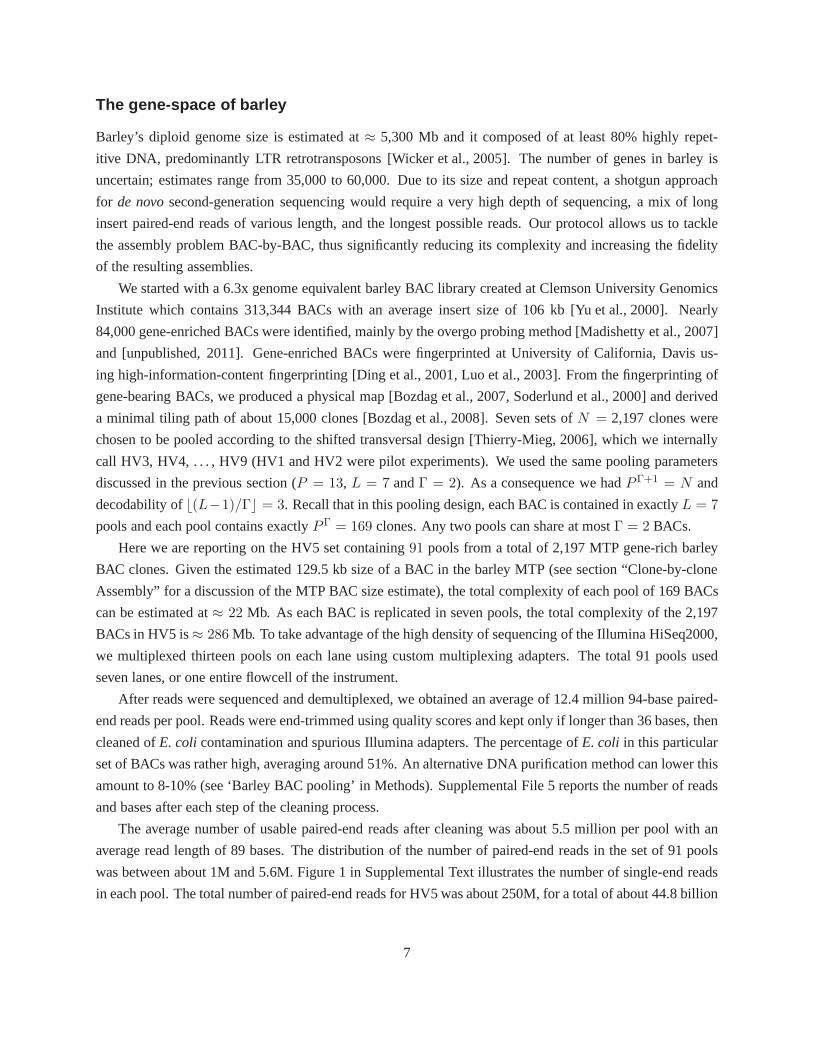
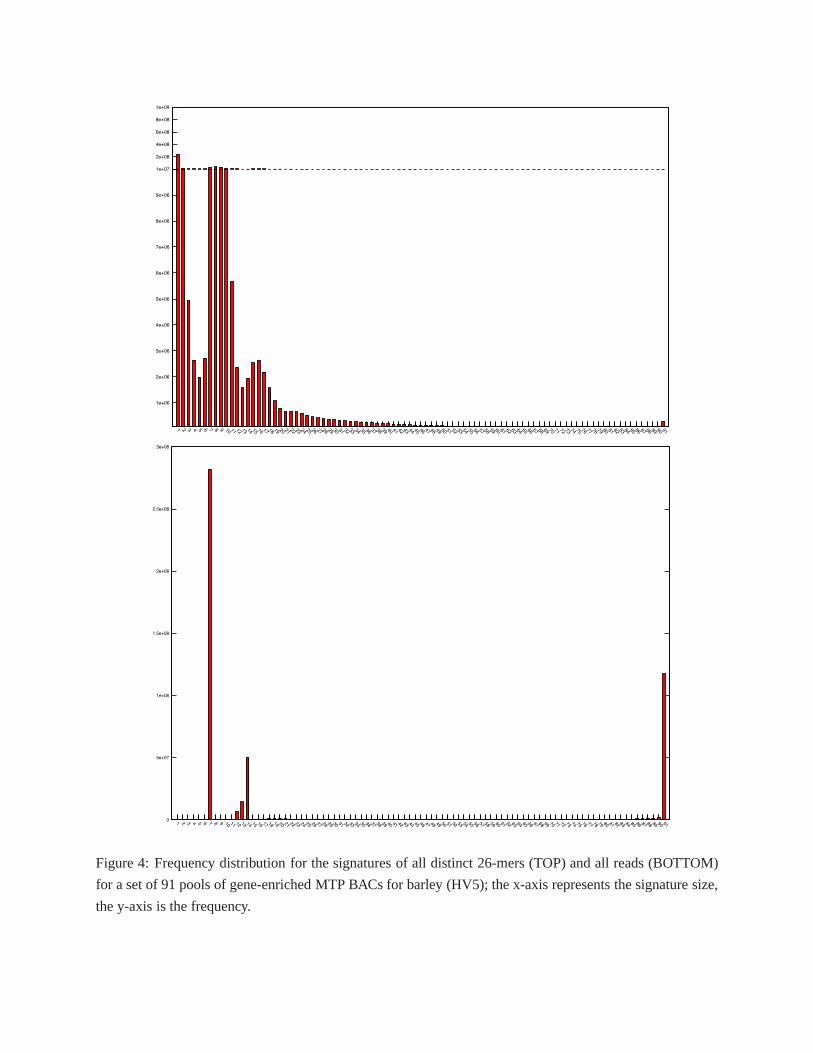
The 91 read pools in the barley HV5 dataset were processed using HASHFILTER, and deconvoluted to
one, two, or three BACs. HASHFILTER built the hash table in about 340 minutes on one core of a Dell
PowerEdge T710 server and used about 43 Gb of RAM. The deconvolution phase took 99 minutes on 10
cores, and the sorting of reads into 2,197 files, one for each BAC, took 37 minutes on one core. Due to
the higher repeat content of the barley genome compared to rice, HASHFILTER was able to deconvolute a
smaller fraction of the reads, about 71.3% (see Table 1 in Supplemental Text and Supplemental File 6). The
total number of bases was about 38.9 billion bases (about 87%of the bases in HV5 before deconvolution),
which translated in an actual average coverage for each BAC of about 137x (see Supplemental File 7,
column I). While we cannot objectively measure the accuracyof the deconvolution for barley, six of the
eight BACs that were assigned less than 20 reads matched exactly the list of BACs that were noted as not
growing during the pooling carried out three years earlier (for a video of the pooling see Supplemental
File 1).
We carried out an analysis of deconvoluted paired-end reads, to determine to what extent the left and
the right mate agreed on their BAC(s) assignment. HASHFILTER treats paired-end as two separate single-
end reads, which are deconvoluted independently. For each paired-end readr, we collected inLr the set of
BACs assigned to the left mate, and inRr the set of BACs assigned to the right mate. UnlessLr andRr were
both empty, whenLr ⊆ Rr or Rr ⊆ Lr we declared the paired-end readr to beconcordant. For barley,
68.7% of the deconvoluted paired-end reads were concordant, which indicates that the deconvolution was
quite accurate (see Supplemental File 6). We note that about22% of the paired-end reads in barley have one
end for which the corresponding BAC set is empty, probably due to sequencing errors or repetitive content.
In this case, HASHFILTER does not deconvolute the mate with the empty BAC set, and the other mate is
assigned to one or more BACs as a single-end read. We could have modified HASHFILTER to exploit the
paired-end association, but that would have prevented us from carrying out this analysis.
We assembled each set of reads assigned to a BAC individuallyusing VELVET [Zerbino and Birney, 2008]
for a variety of choices ofk-mer size. From the assemblies obtained for different choices ofk, we decided to
report in Supplemental File 7 the assembly that maximized the N50 (see Supplemental Text for a description
of each column in the spreadsheet). If we average the assembly statistics over the 2,197 BACs, the number
of reads used in the assemblies was 87.6%, indicating that VELVET took advantage of most of the data; the
average N50 was 7,210 bp (5.6% of the average BAC length); theaverage longest contig was 19,222 bp
(14.9% of the average BAC length); the average sum of all the contigs in each assembly was 113,678 bp
(87.8% of the average BAC length).
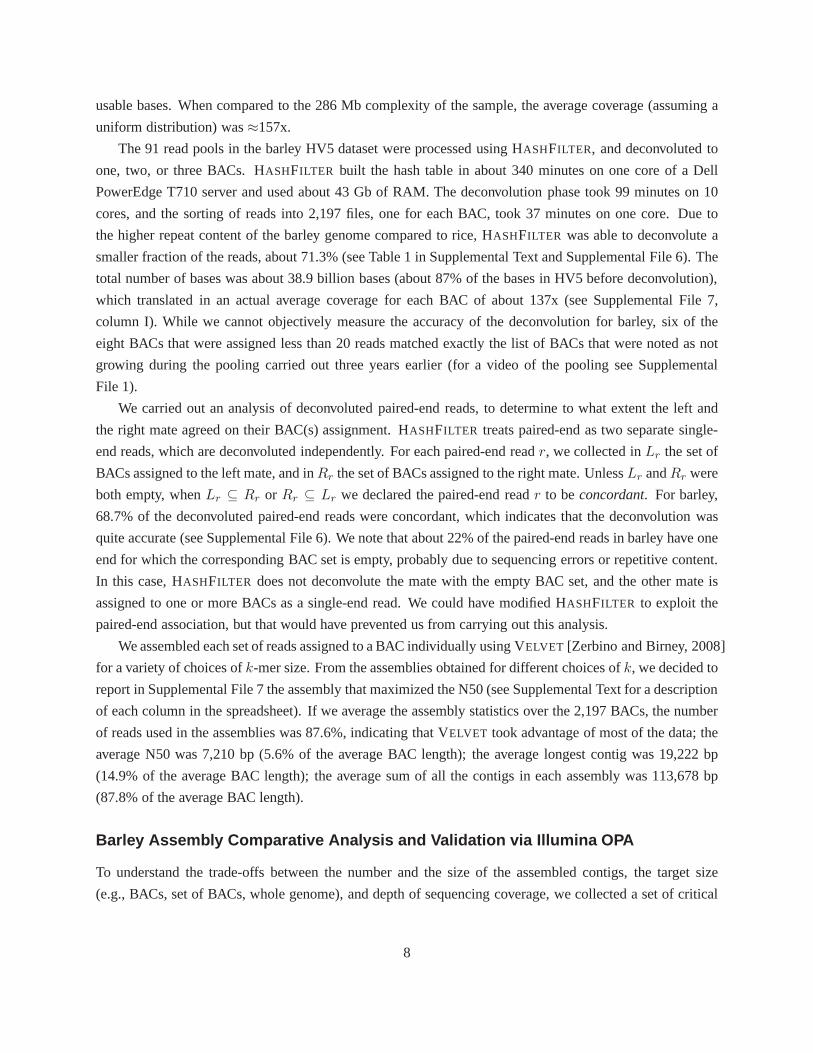
Barley Assembly Comparative Analysis and Validation via Illumina OPA
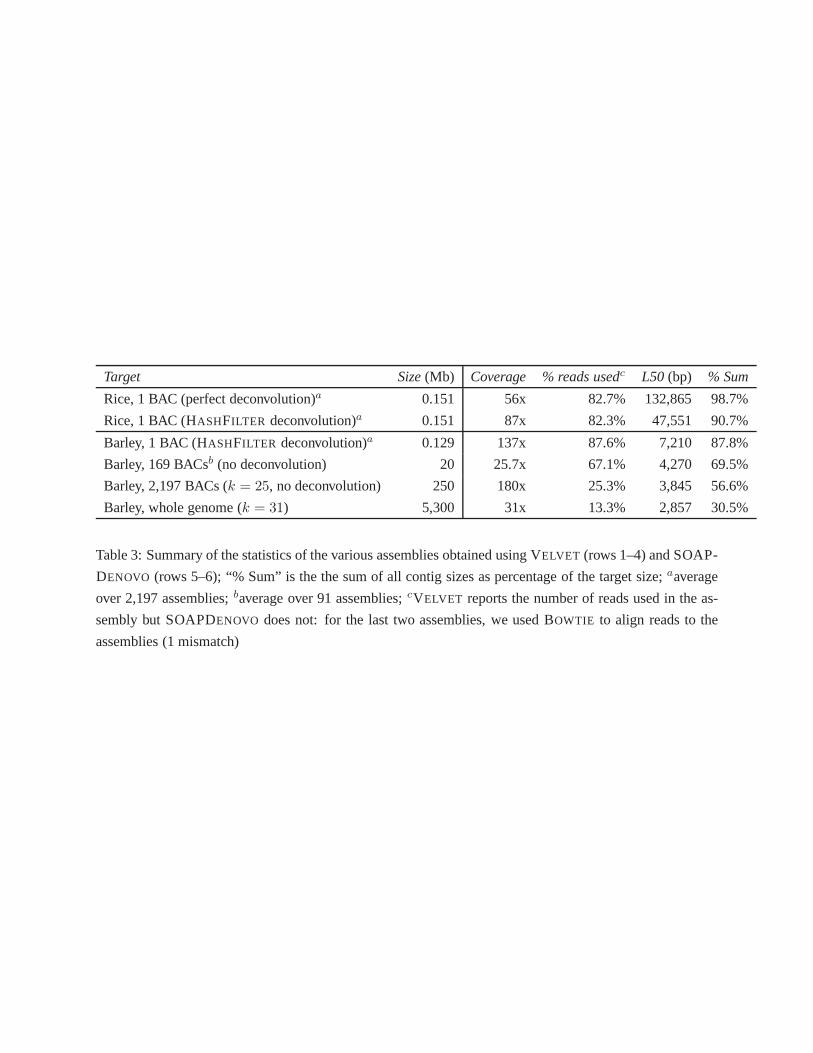
To understand the trade-offs between the number and the sizeof the assembled contigs, the target size
(e.g., BACs, set of BACs, whole genome), and depth of sequencing coverage, we collected a set of critical
8
assembly statistics in Table 3. The first two rows contain average BAC assemblies statistics for rice data,
assuming perfect deconvolution or deconvolution via HASHFILTER.
The average barley BAC assembly statistics are reported on the third row, where reads were assigned to
BACs via HASHFILTER, then individually assembled with VELVET. The next row represents the average
statistics obtained by assembling all the reads in each poolof 169 BACs via VELVET, using thek-mer
size that maximized the N50 (see Supplemental File 7 for details). Recall that each BAC is replicated
in 7 distinct pools, so the depth of sequencing coverage of one BAC in a pool is 1/7 of 180x, which is
the coverage before deconvolution. The fifth row reports theassembly of all the reads in the 91 pools
for HV5 using SOAPDENOVO. Finally, the last row reports the statistics of the whole shotgun assembly
of the barley genome using SOAPDENOVO with k = 31. The whole shotgun sequencing of barley was
carried out at several locations: Ambry Genetics sequencedfive (2×77 bases) paired-end lanes and four
long-insert paired-end (LIPE) lanes (insert size of 2, 3 and5 kb); University of Minnesota (courtesy of Gary
Muehlbauer) sequenced two (2×100 bases) paired-end lanes; University of California, Riverside sequenced
seven (2×100 bases) paired-end lanes. The number of usable paired-end bases after quality-based trimming
was 159.31 Gb and 4.92 Gb of LIPE, for an overall 31x depth of sequencing coverage of the 5.3 Gb barley
genome.
Observe that as the target size increases from one BAC to the whole genome, both the N50 and the
number of reads used by the assembler are monotonically decreasing, and so is sum of all contig sizes
as a fraction of the target size. This clearly indicates thatthe effectiveness of the assembler decreases as
the complexity of the assembly problem increases, which strongly advocates the use of a BAC-by-BAC
approach for the assembly of large, highly repetitive genomes.
Barley BAC assemblies were also compared against BAC-unigene lists obtained using the Illumina
GoldenGate oligonucleotide pool assay (OPA) [Fan et al., 2006] developed for barley [Close et al., 2009].
We used the Illumina OPAs on the same seven sets of barley pools described above (637 pools in total)
and determined which BAC clones were positive for two sets of1,536 SNP loci/unigenes (see Methods for
details).
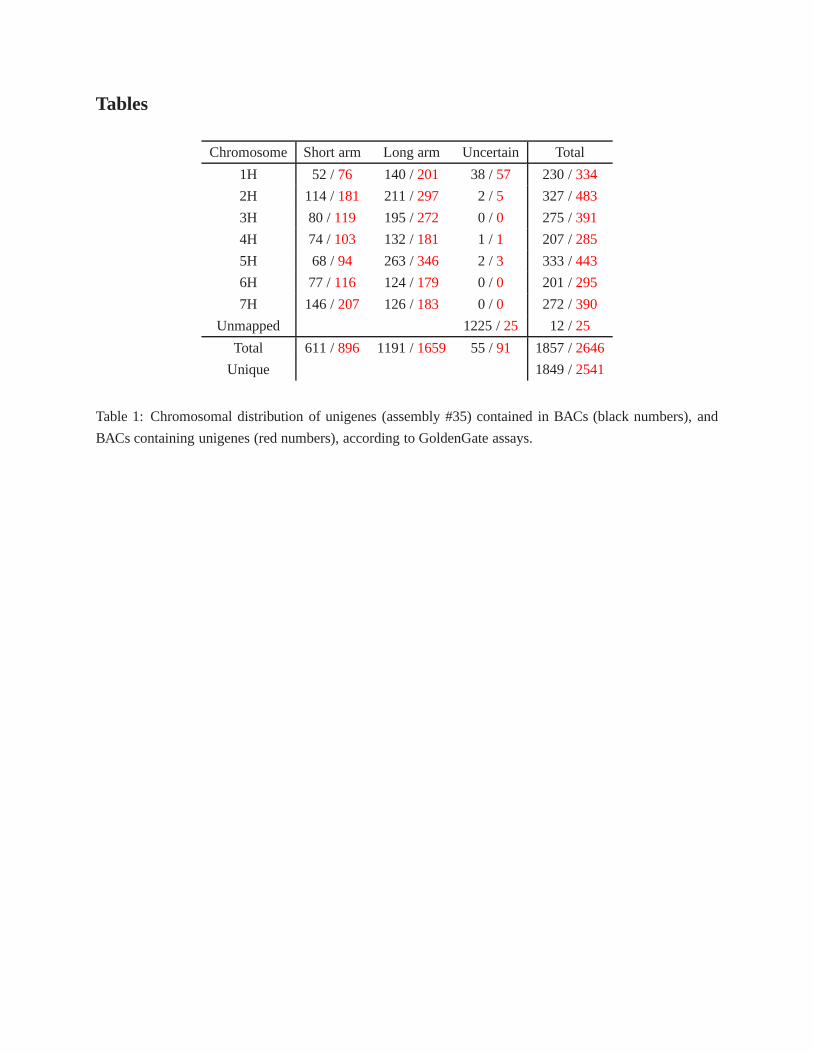
The GoldenGate assays allowed us to uniquely map a total of 1,849 unique unigenes to BACs. Table 1
summarizes the results of unigene-BAC BAC-unigene assignment broken down by chromosome and chro-
mosome arms. The ratio of BACs to unigenes is 1.37, which provides an estimate the amount of overlap
among MTP clones. BACs were anchored to a total of 333 unigenes mapped on barley chromosome 5H,
the maximum of any chromosome. Chromosome arm 5HL carries the maximum number of unigenes to
which BACs were anchored for a single arm at 253 unigenes. Supplemental File 9 contains all the solved
BAC-unigene relationships along with their chromosomal location.
Analysis of the assembly of the 2,197 barley BACs in the HV5 set was carried out by using the results
of the OPA as the “ground truth”. First, we extracted a total of 221 SNP loci/unigenes (assembly B35) that
were mapped to a total of 202 distinct BACs in HV5. We obtainedthe sequence of these 221 unigenes from
HARVEST (http://harvest.ucr.edu) and BLAST-ed them against the HV5 BAC contigs. Out of
202 BACs that were expected to contain those genes, only 20 BAC assemblies (10%) missed entirely the
9
expected SNP loci/unigenes (see Supplemental File 7, columns U–X). For the other 90% of the assemblies
which contained the expected unigenes, the average coverage of those unigenes was about 90% of their
length. This suggests that these BAC assemblies contain themajority of the barley genes.
Discussion
The challenges ofde novosequence assembly originate from a variety of issues, but two are the most
prominent. First, sequencing instruments are not 100% accurate, and sequencing errors in the form of
substitutions, insertion, or deletions complicate the detection of overlaps between reads. Second, large
eukaryotic genomes contains many highly repetitive elements. During the assembly process, all reads that
belong to those repetitive regions getover-compressedand lead to mis-assemblies.
To ameliorate the problems caused by repeats, two strategies can be used, namelypaired-endandclone-
by-clonesequencing. In paired-end sequencing, pairs of reads are obtained from both ends of inserts of var-
ious sizes [Roach et al., 1995, Weber and Myers, 1997]. Paired-end reads resolve repeats during assembly
simply by jumping across them (abandoning the effort to fully resolve them) and disambiguating the order-
ing of flanking unique regions. Combined with shotgun sequencing, this strategy has been successfully used
to assemble several complex genomes, includingH. influenzae[Fleischmann et al., 1995],D. melanogaster
[Myers et al., 2000],H. sapiens[Venter et al., 2001], andM. musculus[Mouse Genome Sequencing Consortium, 2002]
– but with the caveat that the resulting endpoint sequence israrely 100% complete.
In clone-by-clone sequencing, chunks of the genome (100–150 kb) are cloned, typically in BACs, and
then reads are obtained independently from each clone [Green, 2001]. By separating reads into sets that rep-
resent individual BACs, sequences that are repetitive in the context of the whole genome are more likely to
have only a single copy in each BAC; this greatly simplifies the assembly. Hierarchical sequencing was used
to sequence several genomes includingS. cerevisiae[Oliver et al., 1992, Mewes et al., 1997],C. elegans
[The C. elegans Sequencing Consortium, 1998],A. thaliana[The Arabidopsis Genome Initiative, 2000] and
H. sapiens[International Human Genome Sequencing Consortium, 2001].
The second generation of sequencing technologies based on flow cells (e.g., Illumina, Helicos Heliscope
and ABI SOLiD), has significantly reduced the cost of sequencing, but the sequenced reads are much shorter
than Sanger reads. Shorter read length makes the problem ofde novogenome assembly significantly harder.
Although it has been recently demonstrated that whole genome shotgun assembly from short reads of a large
eukaryotic genome (giant panda,Ailuropoda melanoleura) is possible [Li et al., 2010], the contigs produced
are relatively short, even considering the fact that the sequencing depth was over 70x.
To the best of our knowledge, no clone-by-clone sequencing protocol for second-generation instruments
has been proposed so far. We believe that the major technicalhurdle for a clone-by-clone approach is the
limitation of these instruments in handling hundreds or thousand of BACs in a way that would allow reads
to be assigned back to their source. DNA barcoding can be used, but it does not scale well to hundreds or
thousands of samples, in part because an error rate of 0.1 to 1% confounds demultiplexing of incorrectly
read barcode adapters. Here, we have demonstrated an efficient alternative: instead of ligating barcodes
10
to each BAC sample before sequencing, we encode the “signature” of a BAC in the unique set of pools to
which it is assigned. By transitivity, reads belonging to that BAC will also share the same signature.
Although our method is not entirely barcoding-free becausewe multiplexed 13 BAC pools one the same
lane of the sequencing instrument, in principle it could be made completely free of DNA barcodes by pooling
a larger number of BACs and changing the pooling parameters.The decision to pool 2,197 BACs was made
to be compatible with the time required to manually create the pools in one day of work for an average size
lab.
Experimental results on simulated data for rice and actual sequencing data for barley show that the
clone-by-clone approach can be employed with second-generation sequencing instruments. Our method
deconvolutes reads to BAC with very high accuracy (99.57% onrice), and as a consequence the assemblies
of the resulting BAC clones are of high quality. For the synthetic data (containing 1% sequencing errors)
on the rice genome, we were able to reconstruct on average 77%of the BACs content. On the barley data,
the assembly successfully reconstructed 90% of the expected unigenes, with an average coverage of the
unigenes of about 90%. This amount of sequence will be adequate for most practical purposes such as
map-based cloning and nearby marker development for markerassisted breeding.
Combinatorial pooling provides an efficient approach to clone-by-clone sequencing on second-generation
instruments. Clone-by-clone sequencing allows selectivity (e.g., gene-enriched portion of a genome) and en-
ables the distribution of the sequencing work to multiple locations by partitioning the BACs to be sequenced.
It also decreases the sequencing and computational costs needed to produce high quality assemblies, espe-
cially for large highly repetitive genomes. Combinatorialpooling has added benefits which were not obvious
before we started this project. First, the deconvolution process discards highly repetitive reads without any
prior knowledge; these repetitive reads would degrade the assembly quality. Second, pooling enables a very
reliable detection and correction of sequencing errors, a task currently under development in our group.
Methods
The steps in ourcombinatorial clone-by-clone sequencingmethod are illustrated in Figure 1 and described
next is detail.
Pooling (gene-rich) minimum-tiling-path BACs (Steps A-E)
While our method can in general be applied to any set of clonesthat cover a genome or a portion thereof,
the protocol we are proposing here for selective genome sequencing uses a physical map of (gene-bearing)
BACs to identify a set of minimally redundant clones. The construction of a physical library and the selection
of a minimum tiling path are well-known procedures. More details can be found in, e.g., [Ding et al., 2001,
Luo et al., 2003, Soderlund et al., 2000, Bozdag et al., 2007,Bozdag et al., 2008] and references therein.
Once the set of clones that need to be sequenced has been identified, they must be pooled according
to a scheme that allows the deconvolution of the sequenced reads back to their corresponding BACs. In
11
Combinatorics, the design of a pooling method reduces to theproblem of constructing adisjunctivematrix
(see [Du and Hwang, 1993]). Each row of the disjunctive matrix corresponds to a BAC to be pooled and
each column corresponds to a pool. Let us callw a subset of the rows (BAC clones) in the disjunctive matrix,
and let us defineu(w) as the set of pools that contain at least one BAC inw. A design (or a matrix) is said to
bed-decodableif u(w1) 6= u(w2) whenw1 6= w2, |w1| ≤ d, and|w2| ≤ d. The construction ofd-decodable
pooling designs has been extensively studied [Du and Hwang,1993]. The popular 2D grid design is simple
to implement but cannot be used for the purposes of this work because it is only one-decodable.
Recently, a new family of “smart” pooling methods has generated considerable attention [Du et al., 2006,
Thierry-Mieg, 2006, Vermeirssen et al., 2007, Prabhu and Pe’er, 2009, Erlich et al., 2009, Hajirasouliha et al., 2008].
Among these, we selected theshifted transversaldesign [Thierry-Mieg, 2006] due to its ability of handling
multiple positives and its robustness to noise. The parameters of a shifted transversal design pooling are
defined by three integers(P,L,Γ), whereP is a prime number,L defines the number of layers, andΓ is
a small integer. Alayer is a partition of BACs and consists of exactlyP pools: the larger the number of
layers, the higher is the decodability. By construction thetotal number of pools isP × L. If we setΓ to be
the smallest integer such thatPΓ+1 ≥ N whereN is the number of BACs that need to be pooled, then the
decodability of the design is⌊(L− 1)/Γ⌋.
An important property of this pooling design is that any two pools only share at mostΓ BACs. By
choosing a small value forΓ one can make pooling extremely robust to errors. In our experiments, we use
Γ = 2, so that at least ten errors are needed to mistakenly assign aread to the wrong BAC. In contrast, two
errors are sufficient to draw an erroneous conclusion with the 2D grid-design.
Barley BAC pools were obtained as follows.Escherichia colistrain DH10B BAC cultures were grown
individually in 96-well plates covered by a porous membranefor 36 hr in 2YT medium with 0.05% glucose
and 30µg/ml chloramphenicol at 37°C in a shaking incubator. Following combinatorial pooling of 50µl
aliquots from each of 169 BAC cultures, each of 91 collected pools (≈8.3 ml each) was distributed into
five 1.5 ml aliquots and then centrifuged to create cell pellets. The pellets were frozen and then used for
extraction of BAC DNA using Qiagen plasmid DNA isolation reagents. Each BAC pool DNA sample was
then dissolved in 45µl of TE buffer, and the five samples combined for a total of≈225µl at an estimated
final concentration of 20 ng/µl. For gene-BAC assignment using the Golden Gate assays, a total of 10µl
(≈200 ng) of this DNA was then digested for 1 hour at 37°C by using2 units ofNotI enzyme with 100
µg/ml BSA in a volume of 100µl. TheNotI enzyme was then heat inactivated at 65°C for 20 min.
BAC DNAs were prepared using a procedure that yields on average 65% BAC DNA and 35%E. coli
DNA. Although these BAC DNAs performed well for SNP locus detection in the GoldenGate assay, we
were unaware of the extent ofE. coli in the samples until we began BAC pool sequencing, after all BAC
pool DNAs had been prepared. Attempts were made to removeE. coli DNA from the BAC DNA samples
through selective digestion by using exonucleases, and to reduce highly repetitive DNA using a denatura-
tion/renaturation and double strand nuclease method. These procedures provided little or no reduction of
the proportion ofE. coli DNA in the samples. A cost-benefit analysis determined that the cost of replacing
all of the BAC pools by applying an alternative BAC DNA purification procedure yielding an average of
12
94% BAC DNA and 6%E. coli DNA would be no more advantageous than simply repeating the sequenc-
ing of samples for which more DNA sequence information was needed to support the sequence-to-BAC
deconvolution.
A video showing 44 seconds of the pooling process is available as Supplemental File 1.
Sequencing and Processing Paired-end Reads (step F)
Sequencing of the barley BAC pools was carried out on an Illumina HiSeq 2000 at UC Riverside. Paired-
end reads from each pool were quality-trimmed using a sliding window and a minimum Phred quality
of 23. Next, Illumina PCR adapters were removed with FAR (Flexible Adapter Remover, can be ob-
tained fromhttp://sourceforge.net/projects/theflexibleadap/), and discarded either
if shorter than 36 bases or if containing any ‘N’. Finally, reads were cleaned ofE. coli (DH10B) and vector
contamination (pBeloBAC11) using BWA [Li and Durbin, 2009]and additional scripts.
According to our simulations, the depth of sequencing coverage of each BAC after deconvolution is
required to be at least 50x to obtain good BAC assemblies. Theparameters of the pooling design should be
chosen so that the coverage pre-deconvolution is at least 150x-200x, to compensate for non-uniformity in
the molar concentrations of individual BACs within each pool, BAC vector andE. coli contamination, and
loss of reads due to the deconvolution process.
Deconvoluting Paired-end Reads to BACs (step G)
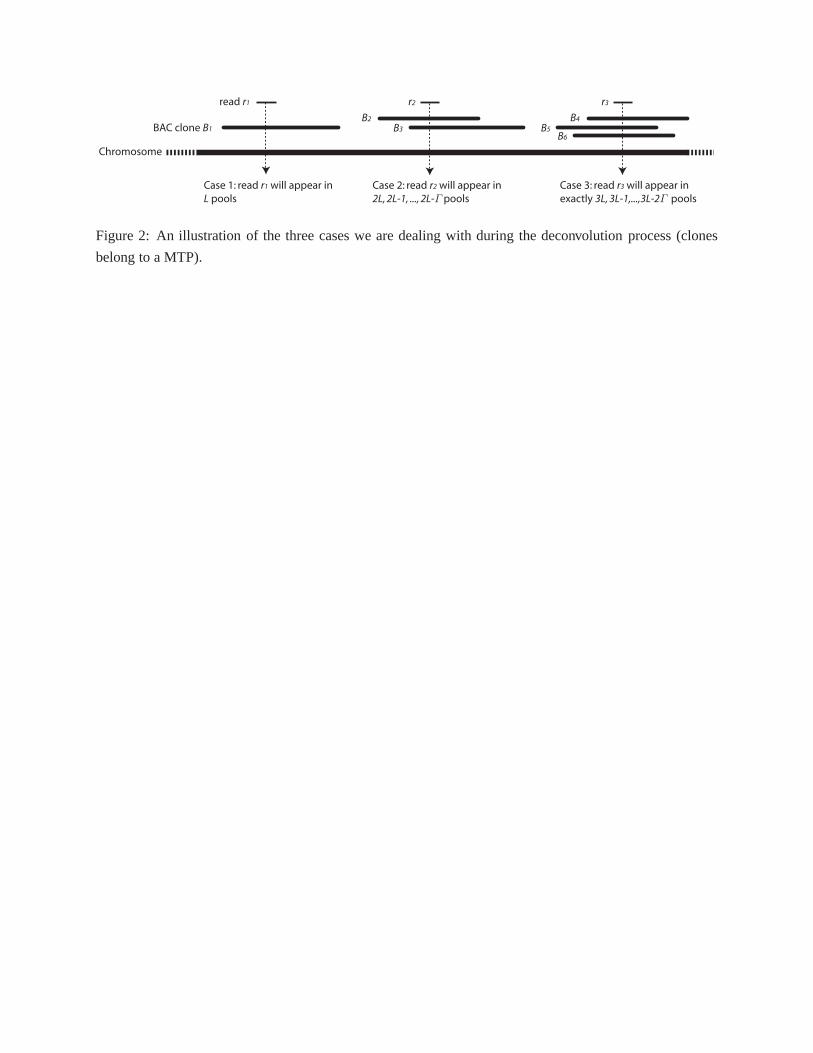
To understand how deconvolution is achieved, let us make fora moment the simplifying assumption that
clones in the MTP do not overlap. i.e., that the MTP BACs form anon-redundant tiling for the genome
under study, or a fraction thereof. Let us pool the MTP BACs according to a shifted transversal design with
L layers and obtain a set of reads from them. Now, consider a read r occurring only once in the portion of
the genome covered by the BACs. If there are no sequencing errors and depth of sequencing is sufficient,
r will appear in the sequenced output of exactlyL pools (see Figure 2, case 1). To determine the BAC to
which a readr should be assigned, search for a BAC signature that matches the list of positive pools forr.
For the most realistic scenario where at mostd MTP clones overlap, the pooling must be at leastd-
decodable for the deconvolution to work. We expect each non-repetitive read to belong to at most two BACs
if the MTP has been computed perfectly, or rarely three BACs when considering imperfections, so we set
d = 3. When a read belongs to the overlap between two clones (againassuming no sequencing errors), it
will appear in the sequenced output for2L, 2L − 1, . . . , 2L − Γ pools (see Figure 2, case 2). The case for
three clones is analogous.
In general, the deconvolution method proceeds as follows. Recall that in stepE the number of pools
is M = P × L. Let us callRi the set of reads obtained by sequencing pooli, for all i ∈ [1,M ]. For
each setRi, we first compute the frequencycounti of all its distinctk-mers. Specifically, for eachk-mer
w ∈ Ri, counti(w) = c if w or its reverse complement occurs exactlyc times inRi. These counts are
stored in a hash table. For each distinctk-merw, the table stores a frequency vector ofM numbers, namely
13
[count1(w), count2(w), . . . , countM (w)]. Once the table is built, we process each read as follows. Given
a readr in a pool, we fetch the frequency vectors for all itsk-mers. Recall that by construction each BAC is
assigned toL pools, thus thesignatureof a BAC is a set ofL numbers in the range[1,M ]. Due to our pooling
design, two BAC signatures cannot share more thanΓ numbers (see Theorem I in [Thierry-Mieg, 2006]).
Eachk-mer signature is matched against the BAC signatures, allowing for a small number of missing/extra
pool entries: if no good match exists, its frequency vector is discarded. At the end of this process, the
frequency vectors with a valid signature are combined to form thesignatureof readr. This signature is
matched again against the BAC signatures to determine the BAC(s) to which it belongs.
This algorithm is implemented in the tool HASHFILTER which has been extensively tested under Linux
platforms. The source code and manual can be downloaded as Supplemental File 11.
Clone-by-clone Assembly (step H)
Once the reads were assigned to individual BACs, sets of single and paired-end reads were assembled
clone-by-clone using VELVET [Zerbino and Birney, 2008]. VELVET requires an expected coverage, which
can be computed using the amount of sequenced bases assignedto each BAC and the estimated BAC size.
For barley, BAC sizes were estimated from the number of bandsin the restriction fingerprinting data.
First, we computed the average number of bands in the 72,055 BACs fingerprinted at University of Cal-
ifornia, Davis using high-information-content fingerprinting [Ding et al., 2001, Luo et al., 2003] (see also
http://phymap.ucdavis.edu/barley/). Assuming that the average BAC length in this set was
106 kb, we computed the multiplier to apply to the number of bands to obtain the estimated BAC length,
which turned out to be 1175 bases. We used that constant to obtain estimated sizes for all BAC in HV5
(see Supplemental File 7, column F). Note that the average size of 129.5 kb is much larger than the library
average size of 106 kb; this indicates that the MTP selectionfavors larger BACs.
We also tested SOAPDENOVO [Li et al., 2010] and ABYSS [Simpson et al., 2009] on simulated data
(data not shown). We evaluated the assembly for several choices of thek-mer (hash) size, but only reported
the assembly that maximized the N50. We recorded the number of contigs, their N50/median/max/sum
statistics, and the number of reads used in the assembly.
For rice assemblies, we BLAST-ed the BAC contigs to the rice genome. We computed the fraction of the
original (source) BAC covered by at least one contig, and thenumber of gaps and overlaps in the assembly.
The parameters used for BLAST are reported in the Supplemental Text.
For barley BAC assemblies, we carried out a validation basedon the known BAC-unigene associations
from the Illumina GoldenGate assay described in the next section. The validation involved BLAST-ing
#35 unigenes (Harvest:Barley assembly #35 unigenes,http://harvest.ucr.edu) against the BAC
assemblies. To reduce spurious hits, we applied three filters. First, we masked highly repetitive regions by
computing the frequency of all distinct 26-mers in the cleaned/trimmed HV5 data, then masking any26-
mers that occurred at least 11,000 times from the assembled contigs by replacing the occurrences of those
k-mers with Xs. Second, we did not consider a hit when a unigenewas covered less than 50% of its length.
14
Third, we excluded from the hit count any unigene that hit more than ten individual BACs overall. We
recorded the number of unigenes hitting a BAC, and compared them with the expected unigenes according
to the Illumina assay.
Barley GoldenGate oligonucleotide pool assay
Samples for the GoldenGate assay were prepared by combining5µl of NotI-digested BAC pool DNA (≈10
ng) with 4µl of sonicatedE. coli DNA pre-dialyzed into TE buffer at a concentration of 500 ng/µl (2000
ng) and 16µl of TE buffer. The final volume of each sample was thus 25µl, composed of≈0.4 ng/µl
of digested BAC pool DNA and 80 ng/µl of additionalE. coli DNA. These DNA samples were provided
to Joe DeYoung at the University of California, Los Angeles,California, or to Shiaoman Chao at the US
Department of Agriculture genotyping facility in Fargo, North Dakota. The DNA concentrations were then
readjusted to 50 ng/µl and a total of 5µl of each DNA sample was used for each GoldenGate assay.
Each Illumina GoldenGate oligonucleotide pool assay (OPA)allows interrogation of a DNA sample
for the presence of 1536 SNP loci. In [Close et al., 2009], fiveOPAs were designed from approximately
22,000 SNPs from EST and PCR amplicon sequence alignments. Details of the development of three
test phase (POPA1, POPA2, and POPA3) and two production scale (BOPA1 and BOPA2) can be found
in [Close et al., 2009].
We genotyped the barley BAC pools described in Section “The gene space of barley” on BOPA1 and
BOPA2. Supplemental File 10 shows which BOPA was applied to which set of barley BACs. The output
from Illumina GoldenGate assay was first converted to binarydata by visual inspection of the theta/R space
in BeadStudio. A positive reading meant that the SNP locus (and its corresponding unigene) is present in at
least one BAC within the pool (refer to Figure 2 in Supplemental Text for an example).
Given the genotyping data for all unigene-pool pairs, we designed an algorithm that computes the op-
timal assignment of unigenes to BACs so that the number of errors is minimized. For a particular unigene
g under consideration, letOg be the signature set of corresponding positive pools. LetS be an arbitrary set
of BACs, where1 ≤ |S| ≤ 3 andUS be the union of the pools that contain at least a BAC clone inS. The
number of errorsES associated with this particular choice ofS is defined to be the number of extra observa-
tions (equal to|US \Og|) plus the number of missing observation (equal to|Og \ US |). Among all possible
choices ofS, we choseS∗ such that the value ofES∗ is minimized. When the number of errors associated
with the final solution was too large (say, more than 3), we declared that unigene to benon-decodable.
This procedure resulted in 1849 unigenes mapped to one, two,or three BACs. As a verification step,
when a unigene was mapped to more than one BAC, we verified thatwith a very low conflict frequency all
those BACs belonged to the same contig in the barley physicalmap [Bozdag et al., 2007, Soderlund et al., 2000].
Using the genetic map developed in [Close et al., 2009, Munoz-Amatriaın et al., 2011] we were also able to
assign these unigene-anchored BACs to a barley genetic map position (Supplemental File 9).
15
Data and Software Access
Barley raw sequencing data for the HV5 set can be obtained from NCBI Sequence Read Archive (direct link
http://www.ncbi.nlm.nih.gov/sra?term=(SRA047913)). When sequencing and analysis
are completed, we plan to release barley BAC assemblies for each set of MTP BACs on HARVEST:BARLEY
(http://harvest.ucr.edu) and GENBANK (http://www.ncbi.nlm.nih.gov/genbank/).
The 31x shotgun genome assembly of barley can be accessed viaour BLAST server hosted at the address
http://www.harvest-blast.org/, by selecting “Barley Genome” from the database menu. This
assembly will be made available on HARVEST:BARLEY (http://harvest.ucr.edu) and GENBANK
(http://www.ncbi.nlm.nih.gov/genbank/). The source code of HASHFILTER is available for
download as Supplemental File 11.
Author Contributions
SL and TJC designed and supervised the project. SL wrote the initial draft of the manuscript. TJC, PRB,
SW, and JR produced the BAC pools for barley. TJC supervised the collection of sequencing and geno-
typing data for barley. DD generated the synthetic data fromthe rice genome, wrote a preliminary version
of the tool to deconvolute reads to BACs and evaluated the accuracy of the deconvolution. TJC called the
Illumina OPA data to assign genes to BACs. MA generated the assemblies for rice and barley using VEL-
VET, SOAPDENOVO, and ABYSS and wrote scripts to evaluate their quality. FC, MB, and GC designed and
implemented the tool HASHFILTER that computes the read signature and deconvolutes of the reads. YW
wrote the tool to deconvolute SNP loci/unigenes to BAC from the Illumina OPA data. BA wrote a prelimi-
nary tool to compute the all-pair prefix-suffix overlap usinghash tables. YM prepared BAC DNA from cell
pellets and produced the sequencing libraries. SW wrote thescripts to demultiplex and clean/trim the barley
sequencing data. All authors read and approved the final manuscript.
Acknowledgments
We thank M. C. Luo (UC Davis) for fingerprinting barley BACs and building an initial physical map, Serdar
Bozday (NIH) for building a compartmentalized physical mapand selecting the MTP clones, Raymond D.
Fenton (UC Riverside) for assistance with BAC pooling and determining gene-BAC relationships using the
Illumina GoldenGate assay, Shiaoman Chao (USDA) and JosephDeYoung (UC Los Angeles, Southern Cali-
fornia Genotyping Consortium) for providing Illumina GoldenGate services, and John Weger (UC Riverside
Institute of Integrative Genome Biology) for Illumina sequencing services. This research was supported in
part by NSF CAREER IIS-0447773, USDA 2009-65300-05645, NSFDBI-1062301, NSF 0321756, and
USDA-CSREES-NRI 2006-55606-16722.
Figures
B1 B5 B6 B7 B8 B11 B15 BN
contigs
B1 B5 B6
...BN
...
.. .. .. .. .. .. .. .. .. .. .. .. .. .. .. .. .. .. .. .. .. ..
P1 P2 PM
B1 B2
B3
B4 B5
B1
B1
B5 B8
B7
B5B7
B8
B5
B7
B8B2
B3
B6 B7 B8
B9
B4 B6
B6
B6B1
B5
B7B6
B8
...
D: Compute the Minimal Tiling Path
C: Build Physical Map
...
A: BAC library B: Select Gene-bearing BACs
BACs
MTP BACsContig1 Contig2
Contig1 Contig2
....
....
....
....
....
....
....
....
....
....
....
....
....
....
....
....
....
....
....
....
....
....
....
....
B1
P1 P2 PM
short reads short reads short reads
G: Deconvolution
H: Assembly
F: Sequencing
E: Combinatorial Pooling
Figure 1: Proposed sequencing protocol (see text for details).
Case 1: read r1 will appear in
L pools
Case 2: read r2 will appear in
2L, 2L-1, ..., 2L-Γ pools
Chromosome
BAC clone B1
read r1
Case 3: read r3 will appear in
exactly 3L, 3L-1,...,3L-2Γ pools
r2 r3
B2
B3
B4
B5
B6
Figure 2: An illustration of the three cases we are dealing with during the deconvolution process (clones
belong to a MTP).
1e+06
2e+06
3e+06
4e+06
5e+06
6e+06
7e+06
8e+06
9e+06
1e+07
1 2 3 4 5 6 7 8 9 10
11
12
13
14
15
16
17
18
19
20
21
22
23
24
25
26
27
28
29
30
31
32
33
34
35
36
37
38
39
40
41
42
43
44
45
46
47
48
49
50
51
52
53
54
55
56
57
58
59
60
61
62
63
64
65
66
67
68
69
70
71
72
73
74
75
76
77
78
79
80
81
82
83
84
85
86
87
88
89
90
91
2e+08
4e+08
6e+08
8e+08
1e+09
0
1e+07
2e+07
3e+07
4e+07
5e+07
6e+07
7e+07
8e+07
1 2 3 4 5 6 7 8 9 10
11
12
13
14
15
16
17
18
19
20
21
22
23
24
25
26
27
28
29
30
31
32
33
34
35
36
37
38
39
40
41
42
43
44
45
46
47
48
49
50
51
52
53
54
55
56
57
58
59
60
61
62
63
64
65
66
67
68
69
70
71
72
73
74
75
76
77
78
79
80
81
82
83
84
85
86
87
88
89
90
91
Figure 3: Frequency distribution for the signatures of all distinct 26-mers (TOP) and all the reads (BOT-
TOM) in the 91 pools of synthetic sequencing data for rice; the x-axis represents the size of the signature,
the y-axis is the frequency.
1e+06
2e+06
3e+06
4e+06
5e+06
6e+06
7e+06
8e+06
9e+06
1e+07
1 2 3 4 5 6 7 8 9 10
11
12
13
14
15
16
17
18
19
20
21
22
23
24
25
26
27
28
29
30
31
32
33
34
35
36
37
38
39
40
41
42
43
44
45
46
47
48
49
50
51
52
53
54
55
56
57
58
59
60
61
62
63
64
65
66
67
68
69
70
71
72
73
74
75
76
77
78
79
80
81
82
83
84
85
86
87
88
89
90
91
2e+08
4e+08
6e+08
8e+08
1e+09
0
5e+07
1e+08
1.5e+08
2e+08
2.5e+08
3e+08
1 2 3 4 5 6 7 8 9 10
11
12
13
14
15
16
17
18
19
20
21
22
23
24
25
26
27
28
29
30
31
32
33
34
35
36
37
38
39
40
41
42
43
44
45
46
47
48
49
50
51
52
53
54
55
56
57
58
59
60
61
62
63
64
65
66
67
68
69
70
71
72
73
74
75
76
77
78
79
80
81
82
83
84
85
86
87
88
89
90
91
Figure 4: Frequency distribution for the signatures of all distinct 26-mers (TOP) and all reads (BOTTOM)
for a set of 91 pools of gene-enriched MTP BACs for barley (HV5); the x-axis represents the signature size,
the y-axis is the frequency.
Tables
Chromosome Short arm Long arm Uncertain Total
1H 52 /76 140 /201 38 /57 230 /334
2H 114 /181 211 /297 2 / 5 327 /483
3H 80 /119 195 /272 0 / 0 275 /391
4H 74 /103 132 /181 1 / 1 207 /285
5H 68 /94 263 /346 2 / 3 333 /443
6H 77 /116 124 /179 0 / 0 201 /295
7H 146 /207 126 /183 0 / 0 272 /390
Unmapped 1225 /25 12 /25
Total 611 /896 1191 /1659 55 /91 1857 /2646
Unique 1849 /2541
Table 1: Chromosomal distribution of unigenes (assembly #35) contained in BACs (black numbers), and
BACs containing unigenes (red numbers), according to GoldenGate assays.
Pool 1 BAC 2 BACs 3 BACs %Total %Correct Pool 1 BAC 2 BACs 3 BACs %Total %Correct
1 390,925 1,021,202 218,965 81.55% 99.57% 47 415,306 958,780 238,508 80.63% 99.53%
2 401,930 1,010,577 226,119 81.93% 99.45% 48 395,628 988,326 244,361 81.42% 99.39%
3 446,845 1,019,560 199,438 83.29% 99.59% 49 341,453 1,062,420 232,221 81.8% 99.55%
4 460,513 1,012,335 187,729 83.03% 99.59% 50 440,861 943,720 244,218 81.44% 99.55%
5 455,705 947,515 222,519 81.29% 99.52% 51 441,704 983,305 192,133 80.86% 99.55%
6 391,456 1,044,628 198,262 81.72% 99.63% 52 410,569 962,425 242,805 80.79% 99.62%
7 391,010 1,045,500 230,553 83.35% 99.62% 53 400,208 1,018,204 211,243 81.48% 99.53%
8 388,850 991,831 243,614 81.21% 99.58% 54 380,140 969,012 253,479 80.13% 99.49%
9 381,752 975,607 256,767 80.71% 99.58% 55 420,342 1,007,343 211,307 81.95% 99.56%
10 346,968 1,045,075 243,428 81.77% 99.64% 56 449,944 979,593 215,811 82.27% 99.57%
11 394,704 964,910 227,215 79.34% 99.57% 57 393,856 1,060,639 209,274 83.19% 99.55%
12 420,363 936,500 222,287 78.96% 99.49% 58 368,063 1,062,521 224,716 82.77% 99.62%
13 411,143 969,745 239,441 81.02% 99.6% 59 382,411 1,064,979 191,622 81.95% 99.56%
14 386,831 1,028,001 226,478 82.07% 99.62% 60 394,017 992,574 235,947 81.13% 99.62%
15 360,496 1,053,183 245,686 82.97% 99.59% 61 428,393 968,451 234,017 81.54% 99.62%
16 413,108 1,031,143 193,165 81.87% 99.6% 62 511,416 934,536 204,130 82.5% 99.59%
17 426,155 984,613 202,242 80.65% 99.54% 63 323,162 1,019,112 248,197 79.52% 99.41%
18 425,161 972,202 229,742 81.36% 99.55% 64 447,481 936,733 230,762 80.75% 99.64%
19 377,124 993,507 256,679 81.37% 99.62% 65 392,007 968,324 242,245 80.13% 99.58%
20 392,747 1,012,836 216,100 81.08% 99.55% 66 346,148 1,021,575 231,422 79.96% 99.49%
21 358,849 1,016,130 237,873 80.64% 99.49% 67 410,069 922,582 230,421 78.15% 99.38%
22 438,686 998,197 214,066 82.55% 99.55% 68 432,649 952,708 224,847 80.51% 99.56%
23 440,145 959,963 230,235 81.52% 99.61% 69 373,656 983,368 260,897 80.9% 99.61%
24 470,767 970,915 207,429 82.46% 99.48% 70 399,624 1,040,903 203,423 82.2% 99.61%
25 413,950 968,673 229,748 80.62% 99.57% 71 417,006 1,032,484 204,127 82.68% 99.59%
26 380,879 993,435 225,879 80.01% 99.56% 72 430,118 1,002,137 212,012 82.21% 99.51%
27 409,336 1,011,286 204,935 81.28% 99.61% 73 430,159 1,020,881 199,634 82.53% 99.66%
28 413,659 970,618 230,663 80.75% 99.58% 74 389,350 983,376 246,105 80.94% 99.56%
29 478,045 956,413 219,851 82.72% 99.63% 75 485,180 968,794 207,182 83.06% 99.58%
30 437,710 958,018 239,748 81.77% 99.62% 76 427,825 999,602 229,448 82.84% 99.64%
31 312,489 1,051,366 263,548 81.37% 99.59% 77 348,986 1,047,405 238,092 81.72% 99.61%
32 399,797 1,001,191 223,652 81.23% 99.45% 78 394,006 1,008,216 227,993 81.51% 99.57%
33 368,754 1,049,749 209,490 81.4% 99.51% 79 349,668 1,028,294 220,179 79.91% 99.51%
34 394,542 1,029,862 193,241 80.88% 99.54% 80 422,887 975,647 231,153 81.48% 99.46%
35 384,702 1,067,284 185,431 81.87% 99.51% 81 404,990 998,443 222,417 81.29% 99.55%
36 381,991 988,185 228,927 79.96% 99.52% 82 429,214 985,137 219,765 81.71% 99.58%
37 447,843 909,650 263,912 81.07% 99.52% 83 391,829 1,046,567 175,777 80.71% 99.56%
38 453,436 996,709 210,853 83.05% 99.69% 84 418,626 999,325 229,379 82.37% 99.63%
39 403,907 995,495 241,792 82.06% 99.57% 85 412,015 977,566 239,830 81.47% 99.62%
40 383,803 1,010,100 230,899 81.24% 99.56% 86 415,146 973,912 220,785 80.49% 99.43%
41 406,096 998,748 211,387 80.81% 99.53% 87 399,776 980,706 242,806 81.16% 99.57%
42 457,064 1,002,075 188,545 82.38% 99.62% 88 372,785 1,026,350 238,468 81.88% 99.57%
43 430,717 1,028,726 196,809 82.81% 99.6% 89 436,803 988,090 225,036 82.5% 99.63%
44 380,624 1,031,742 210,096 81.12% 99.63% 90 385,299 1,018,026 238,231 82.08% 99.62%
45 357,076 992,491 257,128 80.33% 99.58% 91 445,759 986,738 205,512 81.9% 99.59%
46 426,502 1,023,330 224,662 83.72% 99.62%Avg 406,612 998,798 224,167 81.48% 99.57%
Table 2: Number of reads per pool deconvoluted to one, two, orthree BACs; the percentage column reports
the fraction of the total number of reads that were deconvoluted and the total number of correct reads (rice
synthetic data).
Target Size(Mb) Coverage % reads usedc L50 (bp) % Sum
Rice, 1 BAC (perfect deconvolution)a 0.151 56x 82.7% 132,865 98.7%
Rice, 1 BAC (HASHFILTER deconvolution)a 0.151 87x 82.3% 47,551 90.7%
Barley, 1 BAC (HASHFILTER deconvolution)a 0.129 137x 87.6% 7,210 87.8%
Barley, 169 BACsb (no deconvolution) 20 25.7x 67.1% 4,270 69.5%
Barley, 2,197 BACs (k = 25, no deconvolution) 250 180x 25.3% 3,845 56.6%
Barley, whole genome (k = 31) 5,300 31x 13.3% 2,857 30.5%
Table 3: Summary of the statistics of the various assembliesobtained using VELVET (rows 1–4) and SOAP-
DENOVO (rows 5–6); “% Sum” is the the sum of all contig sizes as percentage of the target size;aaverage
over 2,197 assemblies;baverage over 91 assemblies;cVELVET reports the number of reads used in the as-
sembly but SOAPDENOVO does not: for the last two assemblies, we used BOWTIE to align reads to the
assemblies (1 mismatch)
References
[Alon et al., 2011] Alon, S., Vigneault, F., Eminaga, S., Christodoulou, D. C., Seidman, J. G., Church, G. M., and
Eisenberg, E. (2011). Barcoding bias in high-throughput multiplex sequencing of miRNA.Genome Research,
21(9):1506–1511.
[Bozdag et al., 2007] Bozdag, S., Close, T., and Lonardi, S. (2007). A compartmentalized approach to the assembly of
physical maps. InProceedings of IEEE International Symposium on Bioinformatics & Bioengineering (BIBE’07),
pages 218–225.
[Bozdag et al., 2008] Bozdag, S., Close, T. J., and Lonardi, S. (2008). Computing the minimal tiling path from a
physical map by integer linear programming. InProceedings of the Workshop on Algorithms in Bioinformatics
(WABI’08), pages 148–161.
[Cai et al., 2001] Cai, W.-W., Chen, R., Gibbs, R. A., and Bradley, A. (2001). A clone-array pooled strategy for
sequencing large genomes.Genome Research, 11:1619–1623.
[Close et al., 2009] Close, T., Bhat, P., Lonardi, S., Wu, Y.,Rostoks, N., Ramsay, L., Druka, A., Stein, N., Svensson,
J., Wanamaker, S., Bozdag, S., andet al. (2009). Development and implementation of high-throughput SNP
genotyping in barley.BMC Genomics, 10(1):582.
[Craig et al., 2008] Craig, D. W., Pearson, J. V., Szelinger,S., Sekar, A., Redman, M., Corneveaux, J. J., Pawlowski,
T. L., Laub, T., Nunn, G., Stephan, D. A., andet al. (2008). Identification of genetic variants using bar-coded
multiplexed sequencing.Nature Methods, 5(10).
[Csuros et al., 2003] Csuros, M., Li, B., and Milosavljevic,A. (2003). Clone-array pooled shotgun mapping and
sequencing: design and analysis of experiments. InProceedings of GIW.
[Csuros and Milosavljevic, 2002] Csuros, M. and Milosavljevic, A. (2002). Pooled genomic indexing (PGI): mathe-
matical analysis and experiment design. InProceedings of Workshop on Algorithms in Bioinformatics, LNCS 2452,
pages 10–28.
[Ding et al., 2001] Ding, Y., Johnson, M. D., Chen, W. Q., Wong, D., Chen, Y.-J., Benson, S. C., Lam, J. Y., Kim,
Y.-M., and Shizuya, H. (2001). Five-color-based high-information-content fingerprinting of bacterial artificial
chromosome clones using type IIS restriction endonucleases. Genomics, 74(2):142–154.
[Du et al., 2006] Du, D.-Z., Hwang, F., Wu, W., and Znati, T. (2006). New construction for transversal design.Journal
of Computational Biology, 13(4):990–995.
[Du and Hwang, 1993] Du, D.-Z. and Hwang, F. K. (1993).Combinatorial Group Testing and Applications. (Series
on Applied Mathematics). World Scientific Publishing Company.
[Engler et al., 2003] Engler, F. W., Hatfield, J., Nelson, W.,and Soderlund, C. A. (2003). Locating sequence on FPC
maps and selecting a minimal tiling path.Genome Research, 13(9):2152–2163.
[Erlich et al., 2009] Erlich, Y., Chang, K., Gordon, A., Ronen, R., Navon, O., Rooks, M., and Hannon, G. J. (2009).
DNA sudoku – harnessing high-throughput sequencing for multiplexed specimen analysis.Genome Research,
19(7):1243–1253.
[Fan et al., 2006] Fan, J.-B., Chee, M. S., and Gunderson, K. L. (2006). Highly parallel genomic assays.Nat Rev
Genet, 7(8):632–644.
[Fleischmann et al., 1995] Fleischmann, R., Adams, M., White, O., Clayton, R., Kirkness, E., Kerlavage, A., Bult,
C., Tomb, J., Dougherty, B., Merrick, J., andet al. (1995). Whole-genome random sequencing and assembly of
Haemophilus influenzae Rd.Science, 269(5223):496–512.
[Green, 2001] Green, E. (2001). Strategies for the systematic sequencing of complex genomes.Nature Reviews
Genetics, 2:573–583.
[Hajirasouliha et al., 2008] Hajirasouliha, I., Hormozdiari, F., Sahinalp, S. C., and Birol, I. (2008). Optimal pooling
for genome re-sequencing with ultra-high-throughput short-read technologies.Bioinformatics, 24(13):i32–i40.
[International Human Genome Sequencing Consortium, 2001]International Human Genome Sequencing Consor-
tium (2001). Initial sequencing and analysis of the human genome.Nature, 409:860–921.
[Li and Durbin, 2009] Li, H. and Durbin, R. (2009). Fast and accurate short read alignment with BurrowsWheeler
transform.Bioinformatics, 25(14):1754–1760.
[Li et al., 2010] Li, R., Fan, W., Tian, G., Zhu, H., He, L., Cai, J., Huang, Q., Cai, Q., Li, B., Bai, Y., andet al.(2010).
The sequence andde novoassembly of the giant panda genome.Nature, 463(7279):311–317.
[Luo et al., 2003] Luo, M.-C., Thomas, C., You, F. M., Hsiao, J., Ouyang, S., Buell, C. R., Malandro, M., McGuire,
P. E., Anderson, O. D., and Dvorak, J. (2003). High-throughput fingerprinting of bacterial artificial chromo-
somes using the snapshot labeling kit and sizing of restriction fragments by capillary electrophoresis.Genomics,
82(3):378–389.
[Madishetty et al., 2007] Madishetty, K., Condamine, P., Svensson, J. T., Rodriguez, E., and Close, T. J. (2007). An
improved method to identify BAC clones using pooled overgos. Nucleic Acids Research, 35(e5).
[Mewes et al., 1997] Mewes, H., Albermann, K., Bahr, M., Frishman, D., Gleissneer, A., Hani, J., Heumann, K.,
Kleine, K., Maierl, A., Oliver, S., Pfeiffer, F., and Zollner, A. (1997). Overview of the yeast genome.Nature,
387:7–65.
[Milosavljevic et al., 2005] Milosavljevic, A., Harris, R., Sodergren, E., Jackson, A., Kalafus, K., Hodgson, A., Cree,
A., Dai, W., Csuros, M., Zhu, B., de Jong, P., Weinstock, G., and Gibbs, R. (2005). Pooled genomic indexing of
Rhesus macaque. Genome Research, 15(2):292–301.
[Mouse Genome Sequencing Consortium, 2002] Mouse Genome Sequencing Consortium (2002). Initial sequencing
and comparative analysis of the mouse genome.Nature, 420:520–562.
[Munoz-Amatriaın et al., 2011] Munoz-Amatriaın, M., Moscou, M. J., Bhat, P. R., Svensson, J. T., Bartos, J.,
Suchankova, P.,Simkova, H., Endo, T. R., Fenton, R. D., Lonardi, S., Castillo, A. M., Chao, S., Cistue, L.,
Cuesta-Marcos, A., Forrest, K. L., Hayden, M. J., Hayes, P. M., Horsley, R. D., Makoto, K., Moody, D., Sato,
K., Valles, M. P., Wulff, B. B., Muehlbauer, G. J., Dolezel, J., and Close, T. J. (2011). An improved consensus
linkage map of barley based on flow-sorted chromosomes and single nucleotide polymorphism markers.The Plant
Genome, 4:1–12.
[Myers et al., 2000] Myers, E. W., Sutton, G. G., Delcher, A. L., Dew, I. M., Fasulo, D. P., Flanigan, M. J., Kravitz,
S. A., Mobarry, C. M., Reiner, K. H. J., Remington, K. A., andet al. (2000). A whole-genome assembly of
Drosophila.Science, 287(5461):2196–2204.
[Oliver et al., 1992] Oliver, S.G. van der Aart, Q., Agostoni-Carbone, M., Aigle, M., Alberghina, L., andet al.(1992).
The complete DNA sequence of yeast chromosome III.Nature, 357(6373):38–46.
[Prabhu and Pe’er, 2009] Prabhu, S. and Pe’er, I. (2009). Overlapping pools for high-throughput targeted resequenc-
ing. Genome Research, 19(7):1254–1261.
[Roach et al., 1995] Roach, J., Boysen, C., Wang, K., and Hood, L. (1995). Pairwise end sequencing: a unified
approach to genomic mapping and sequencing.Genomics, 26:345–353.
[Simpson et al., 2009] Simpson, J. T., Wong, K., Jackman, S. D., Schein, J. E., Jones, S. J., and Birol, I. (2009).
ABySS: A parallel assembler for short read sequence data.Genome Research, 19(6):1117–1123.
[Soderlund et al., 2000] Soderlund, C., Humphray, S., Dunham, A., and French, L. (2000). Contigs built with finger-
prints, markers, and FPC v4.7.Genome Research, 10(11):1772–1787.
[The Arabidopsis Genome Initiative, 2000] The ArabidopsisGenome Initiative (2000). Arabidopsis thaliana
genome.Nature, 408:791–815.
[The C. elegans Sequencing Consortium, 1998] The C. elegansSequencing Consortium (1998). Genome sequence
of the nematodeC. elegans: A platform for investigating biology.Science, 282:2012–2018.
[Thierry-Mieg, 2006] Thierry-Mieg, N. (2006). A new pooling strategy for high-throughput screening: the shifted
transversal design.BMC Bioinformatics, 7(28).
[Venter et al., 2001] Venter, J., Adams, M., Myers, E., Li, P., Mural, R., andet al.(2001). The sequence of the human
genome.Science, 291(5507):1304–1351.
[Vermeirssen et al., 2007] Vermeirssen, V., Deplancke, B.,Barrasa, M. I., Reece-Hoyes, J. S., Arda, H. E., Grove,
C. A., Martinez, N. J., Sequerra, R., Doucette-Stamm, L., Brent, M. R., and Walhout, A. J. M. (2007). Matrix and
Steiner-triple-system smart pooling assays for high-performance transcription regulatory network mapping.Nat
Meth, 4(8):659–664.
[Weber and Myers, 1997] Weber, J. and Myers, E. (1997). Humanwhole-genome shotgun sequencing.Genome
Research, 7:401–409.
[Wicker et al., 2005] Wicker, T., Zimmermann, W., Perovic, D., Paterson, A., Ganal, M., and Stein, N. (2005). A
detailed look at 7 million years of genome evolution in a 439 kb continuous sequence at the barley Hv-eIF4E locus:
recombination, rearrangements and repeats.The Plant J., 41:184–194.
[Yu et al., 2000] Yu, Y., Tomkins, J. P., Waugh, R., Frisch, D.A., Kudrna, D., Kleinhofs, A., Brueggeman, R. S.,
Muehlbauer, G. J., Wise, R. P., and Wing, R. A. (2000). A bacterial artificial chromosome library for barley
(Hordeum vulgare L.) and the identification of clones containing putative resistance genes.Theoretical and Applied
Genetics, 101(7):1093–1099.
[Zerbino and Birney, 2008] Zerbino, D. and Birney, E. (2008). VELVET: Algorithms forde novoshort read assembly
using de Bruijn graphs.Genome Research, 8(5):821–9.