advances environment
TRANSCRIPT
illllEG97A0008
ADVANCES
8cEnvironment
Volume 2Air QualityWater Quality
96EditorsAbdul Latif E(-SharkawyRalph H. Kummler. r—
1 POOR QUALITY IJ ORIGINAL
VOL 2 8 te 1 4
Preface
Renewable energy sources have received considerable attentionduring the past few decades as an extension to the depletingfossil fuels. In spite of the relative reduction of the petroleumprices, the environmental problems associated with theextensive consumption of fossil fuel added more importance tothe clean sources of energy.
The high development rates needed for the provision of a betterlife style has a direct impact on the environment due to theexcessive use of energy in addition to the direct problemscaused by the industrial waste polluting air, water and soil.
This conference, therefore gives due consideration to bothissues: energy and environment.
This proceedings provides research findings and technicalpapers related to the main objectives of the conference. It isexpected to be a valuable reference for science and technologyin this field.
Conference Chairmen

Volume I
TABLE OF CONTENTS
Solar Thermal
"Solar radiation for sea-water desalination and electric power generation 1via vacuum solar collectors", by : El-Nashar, A., Mottinelli, L., Reali,M., Giusiano, F. and Vigotti, R."No-load unsteady-state thermal performance of parabolic trough solar 13collectors", by : Abdel-Moneim, S.A."Solar assisted R22 and R404a heat pump system for low temperature 35applications", by : Ahmed, M.F., Abou-Ziyan, H.Z., Metwally, M.N. andAbdel-Hameed, H.M."Heat pipe for solar energy application", by : Soliman, H., Abdel-Aziz, 51R.M. and Sakr, R.Y."Thermal performance of a water flat-plate solar collector with a 65serpentine tube", by : Betroni, S.A., Doumaz, M., Fettih, M., Lafri, D.and Ouzzane, M.
"Performance of advanced corrugated-duct solar collectors compared with 73five conventional designs", by : Metwally, M.N., Abou-Ziyan, H.Z. andEl-Lathy, A.M."Design charts of solar heating system for swimming pools", by : Tadros, 89W.H., Eissa, M.A."Drying of food products by solar energy", by : El-Shazly, K.M. 101"Homogeneous and efficient drying in agricultural dryers", by: Khattab, 113N.M." Dual purpose solar system for cooking and drying", by : Tadros, W.H. 125and El-Swify, M.E."Effectiveness of radiation central coatings for the reduction of building 145solar gain and exterior surface temperature", by : Yarbrough, D.W."Use of transparent insulation materials for improving the performance 157of solar water heaters", by : Tayeb, A.
Heat Transfer and Thermal Applications
"The use ol' air flow through water for water evaporation", by : 171Lashin,A., Soliman, H.A. and Abd-Rabbo, M.F."An experimental investigation of heat transfer and pressure drop in 183turbulent dusty-air How in pipes", by Abdel-Moneim, S.A., El-Fawal,M.M., Shafik, N.M. and Osman, A.M.
"An experimental investigation on heat and momentum transfer in the 197decelerated fully turbulent flow over a rough flat plate", by : Abdel-Moneim, S.A., El-Shamy, A.R., Abd-Rabbo, M.F. and Abdel-Salam,M.S."An experimental study on heat transfer in fully turbulent flow over an 211inclined flat plate", by : Abdel-Moneim, S.A."Experimental investigation of natural co.nvection heat transfer in air 225between corrugated and flat plates", by : El-Fawal, MM., Sakr, R.Y.,and Abd-Rabbo, M.F."Numerical study of laminar and turbulent flows above blade riblets", by 241Afify, R.I.Investigation of the performance of air-lift pumps", by : Abed, K.A., El- 259Mallah, A.A.
Storage and Bio-Conversion
"Underground liquid storage of urban and agricultural organic wastes for 269biogas production", by : Toci, F., Modica, G., Reali, M., Meola, G. andMorandi, G."CO2 emission from animal husbandry : A case study for Hungary based 275on production data for 1980", by : Nagy, A.Z., and Gemesi, Z."Combined effect of fluid properties and cavity aspect ratio on thermal 283energy storage performance", by : Bouhdjar, A., Benkhalifa, A. andHarhad, A."An experimental investigation of cement coated Aluminum wire mesh 291as solar storage system", by : El-Sharkawy, A.I., Tadros, W.H. andAbdel-Rcheim, Z.S."Use of some industrial wastes as energy storage media", by : Tayeb, A. 305"Characteristics of rock-bed storage system for various solar 315applications",by :*Heikal, H., Abou-Ziyan, H.Z. and Abdel-Naiem, M. A.
Refrigeration and Air Conditioning
"Minimization of exergy-losses for an air-cooled air conditioning 333system", by Salem, M.I., Mahmoud, N.A. and Gabr, M.H."Gas dynamic analysis for solar ejector refrigeration system", by : 355Badawy, M.T.S. and Abd Rabbo, M.F."Effect of ventilation Sir streams on the location of fire detection 377devices", by : Mahmoud, N.A., El-Baz, A.M. and Ghorap, A.A.E.
"Thermodynamic cycle analysis of a solar powered libr-water absorption 397refrigeration system", by : Bell, I.A., El-Daini, A.J., Abdel-Gayed, R.G.and Duckers, L.
Combustion, Fuels and Engines
"The effect of blending methanol with gasoline on spark ignition engine 409performance and emission", by : Abd-Elgawad, T.A., Soliman, H.A. El-Naggar, Kh.H. and Abd-Rabbo, M.F."Piston-ring assembly friction : A review", By : Stanley, R., Henein, 421N.A. and Ibrahim, R."Gasoline engine performance and exhaust emissions using an induction 441system vortex generator", by : Soliman, H. and El-Beherie, Z."A control system for fuel air mixture quality in spark ignition engines", 451by : Soliman, 11.A., Abd-Rabbo, S.M., Ebied, A.M. and Odat, M.Q."Natural gas transit bus and low emission engine technology", by : 463Youssef, M.F.H."Explosion characteristics of Egyptian coal dust", by : Dahab, O. 473"Energy saving in pusher type reheating furnace", by : El-Bardisi, S. and 489Mansour, B.E."Effect of noise on surface roughness measurements", by : Zahwi, Th. Z. 501and Mekawi, A.M.
Energy and Development
"Correlation between renewable energy sources energy output and load", 513by : Ali, G.E.M. and El-Zeftawy, A.A."Designing of PV rural electrification for small model of tourism village 523in Egypt", by : Fahmy, F.H."Renewable energy in Egypt strategy for the future", Aly, A.A. 534"Velocity-depth ampiguity of reflection traveltime (theory and 555application)", by : El-Nabawy, O.M.
^ u J i ^jjA\ XS- ISJ-J -U-* .i i (OjjJi) oui_jJ-t o^Lsi j» oiUi-i U j»jju)t Sj^ *->jLJI\ 575
^j^ l . J-}}\ -Wji .i . U i l *U»j APUoJl U J j wJUiJi ObuljM jt.yf- j j i j>£j 592

Volume 2
Air Pollution
"N2O:A greenhouse gas released from the combustion of coal in 609fluidized-beds", by : Boavida, D., Gulyurtlu, I., Lobo, L.S. and Cabrita, I."Emission control for preheater cement kilns fabric filters vs. 617electrostatic precipitators, which is best?", by : Caine, John c."Dry cleaning of Al. cell gases by fluidized bed adsorption of HF", by: 623Doheim, M.A., Salem, M, Shafey, H. and Abdel-Latif A.A."Assessment and Monitoring air pollution effects", by : Panzer, K.F., 635Hassan, I.A. and Valissariou, D."Atmospheric turbidity parameters in the high polluted site of Egypt", by 645: Shaltout, M.A.M., Rahoma, U.A."Methodologies for diagnosis of air pollution in plants: A review", by: 659Hassan, I.A., Ashmore, M.R."Development of a GIS model for the impact assessment of air pollution 677structural elements over the greater Cairo area", by: Wishahy, Zeinab."Reduction of Lead pollution from vehicular emissions in Cairo, part 1: 691Comparison of alternative solution", by : El-Kady, M.A., El-Haggar,S.M. and Saleh S.K."Lead Pollution sources and impacts", by : El-Haggar, S.M., Saad, S.G., 705El-Kady, M.A. and Saleh, S.K.
Environmental Protection
"Environmental and safety management of municipal public works and 721utilities: A regulatory overview", by : Yawson, G.E., Kummler, R.H.,And Abraham, G."Protection of environment, health and safety using risk management", 735by : Abraham, G., Kummler, R.H. and Louvar, J."Environmental improvement and heritage protection: Gamalia case 745study", by : Bishay, A. and Ebeid, Magda."Geo-environmental assessment of a historical complex from 12th 757Century", by : El Sohby, M. and Bahr, M.A."Environmental applications research and future plans in plasma arc 767technology at Georgia institute of technology", by : Nemeth, J.
"Example from P2 and energy assessments at small to medium size 777manufacturers", by : Fleischman, M., Waters, J.C., Cobourn, W.G. andCollins, D. J.
Solid & Hazardous Wastes
"Goo synthetic application in landfill design", by : Alshunnar, I. S., Afifi, 793S.S. and Tiseo, B."Development of fibrous oil filter for internal combustion engines in 803desert environment", by : Khattab, A. and Ali, W.Y."Analysis of waste water treatment plant influent data", by : Kummler, 817R.I I., Lin, C.C. and Rhee, Young-Yun."Adsorption dynamics in removal of phenol using stratified tapered 831fixed-bed adsorbers", by : Mathews, A.P."Recovery of Molybdenum and Cobalt powders from spent 839hydrogenation catalyst", by : Rabah, M.A., Hewaidy, I.F. and El-Sarway, A.A."Application of shallow refraction seismic technology for locating site 861suitable for solid waste dumps", by : Seisa, H."Soil water partitioning and mass transfer for 2, 4, 6-Trinitrotoluene gj\contaminated soil", by : Qaisi, K., Constant, W.D., Thibodeaux, L.J., Ro,K.S. Valsaraj, K.T."Biological processes influencing contaminant release from sediments", 877by : Reible, Danny D.
Water ami Wastewater Treatment
"Effect of gas sparging on cementation of copper ions from industrial 893waste water using Zinc bed", by : Abdel-Sattar, A."Control and recovery oi"phosphorous pentoxide emission in rodencide 805production plant", by : Abdel-Salain, O.E. and Abou Elela, S.I."Assessment of pulp and paper sludge adsorptive capabilities for use as a 915barrier material", by : Saleh, II .1., Yong, R.N., Youssef, A. andMohamed A.M.O."Treatment of liquid industrial waste from Kraft pulp and paper mill in 923Egypt", by : Saleh, II. I., El-Awady, M.S., Abdel-Megid, M.H. andZaatout, A.A." The value of environment impact assessment", by Sohocki, D.D. 933"Application of Ozone in industrial effluent treatment", by : El-Abd, H. 943and El-Diwani, G."Future industrial and municipal waste management in Poland-thc Polish 959challenge", by : Nowakowski, J., Sounn, L. and I lusted, J.E."Production of ethanol from cellulosic wastes"', by : El-Nawawi, S A. 971

"Utilization of akalona for ethanol and single cell protein production", by 985: Zayed, G., Safwat, M.S., Ali, E.S. and Z.Elabedeen, N.M."Dye adsorbent-bagasse, A new potential source for energy conversion", 993by : Nassar, M.M., Ashour, E.A. and Magdy, Y.H."Kinetics of thermal degradation of bagasse and flax particle boards", by 1003: Ashour, E.A.
Air Pollution
Proceedings of the Fifth International Conferenceon Energy and Envirorunent, Cairo, Egypt, 1996 EG9700020
N2O: A GREENHOUSE GAS RELEASED FROM THE COMBUSTION
OF COALS IN FLUIDISED BEOS
D. Boavida, I. Gulyurtlu (*), L.S. Lobo and I. Cabritaf)
Universidade Nova de Lisboa, Quinta da Torre, 2825 Monte de Caparica, Portugal.
(•) INETI - ITE - DTC, Estrada do Paco do Lumiar, 1699 Lisboa Codex, Portugal.
Teleph: +351 1 716 52 99, Fax: +351 1 716 46 35, E-mail: [email protected].
Abstract
This paper discusses the results of the experimental work investigating the formation of N2O and
NO during fluidized bed combustion of coals, and of chars and volatiles produced from the pyrolysis of
these coals. Ammonia (NH3) and hydrogen cyanide (HCN) are shown to play important roles as gas-
phase precursors of both NO and N2O. The conversion of fuel-N through NH3 and HCN to N2O and
NO was studied using a fluidized bed combustor in the temperature range between 973 K and 1273
K, for two different coals. The results suggest that the principal contribution to N2O emission
originated from volatile-N, however, char-N could also have an important role, depending upon the
temperature.
1 . INTRODUCTION
The emissions of nitrogen oxides have been identified as one of major environmental problems
originating from the combustion of coals in fluidized bed systems. Nitric oxide (NO) and nitrogen
dioxide (NO2) contribute to the acid rain problem and photochemical smog formation. Nitrous oxide
(N2O) is a greenhouse gas and also acts indirectly in the depletion of stratospheric ozone (1,2].
Nitrogen is present in coal mainly in the form of relatively stable aromatic structures [3] and its
release is delayed until ring structures occurs. Simultaneously, other volatiles are driven off as a result
of the breakup of side chains and aliphatic links. The formation of nitrogen oxides from coal-N during
combustion in a fluidized bed occurs in a co-nplex process involving coal devolatilization,
homogeneous gas-phase reactions and heterogeneous oxidation of char. During devolatilization,
nitrogen in coal is divided between char-N and volatile-N compounds which are mainly released in tars
and as NH3 and HCN. During combustion, the char-N is oxidized to NO and N2O whilst simultaneously
partly reduced to N2, however, small amounts of NH3 and HCN may also be formed [4].
The division of nitrogen between char and volatiles and the type of volatile nitrogen compounds
formed during devolatilization are very important for the eventual fate of coal-N in FBC, because the
-609-
extent of subsequent reactions involving the oxidation of char-N and volatiles-N are dependent on
this division and on the different volatile nitrogen species The speciation of volatile nitrogen
compounds is very important for the formation of NO and N2O, because of the different reactions
pathways for NH3 and HCN. The amounts of NH3 and HCN released during pyrolysis depend on a
number of factors, most importantly coal type, heating rate, final temperature and residence time. A
wide variety of experimental techniques have been used and this may be why the data in literature do
not provide conclusive evidence about the influence of coal type on the formation of NH3 and HCN
during pyrolysis [5].
Calculations, using comprehensive kinetic models, show that the relative amounts of NO and N2O
depend strongly on the relative concentrations of NH3 and HCN [6,7,8]. The formation of N2O
through HCN was strong at 1000 K, and weak at 1200 K, when NO was the major product. NH3 was
not observed to be an intermediate causing significant amounts of N2O production. NO was the main
product from NH3 at 1000 K, together with some N2
There is a general agreement [6,7,8,9] that HCN is a very important precursor for N2O formation in
the range of temperatures used in FBC of coals. The most important reactions were found to be
HCN + O > NCO + H
NCO + NO > N2O + CO
over the combustion temperature range in FBC
This was experimentally shown by Kramlich et al. [9] by injecting NH3, HCN and acetonitrile into the
post-flame gases. The results clearly demonstrated that N2O was preferentially formed from cyano
species, whereas very little N2O was released during NH3 injection.
Recently Hulgaard [10] made extensive plug flow reactor studies on NH3 and HCN oxidation at
temperatures between 900 and 1350 K. His data suggest that HCN produced approximately one
order of magnitude more N2O than NH3 , under similar oxidation conditions.
2. EXPERIMENTAL
Samples
The two coals studied. Cimpor coal and South African coal, were crushed and sieved to a particle
size 0.50 -1.00 mm. Chars were produced in a FBC from coals at three temperatures (1073 K, 1173 K
and 1273 K) and at a heating rate in the order of 104 K/s. The characterization of the samples are given
in Tables I and II.
-610-

Combustion o( chars and coal
The combustion of coals and chars were carried out in an electrically heated lluidised bed
combustor with 80 mm of ID and 500 mm height, as shown in Fig.1. The combustion temperature of
coals and chars was varied in the range of 1000 -1200 K.
Both chars and coals were supplied using a screw-feeder located at the top of the combustor. The
particles were injected through a pipe immersed in the bed which was water- cooled to prevent any
devolatilizalion during feeding. The combustion gases leaving the combustor having been filtered and
dried were constantly analyzed for NO, N2O, CO, CO2 and O2 by specific analyzers .
Analyses of Volatiles
The analyses of hydrogen cyanide (HCN) and ammonia (NH3) in the gases released during the
pyrolysis of coals were carried out The samples were collected by passing the gas sample through a
wash bottle with a 0.01 M NaOH as absorption solution.
The determination of HCN and NH3 were performed with ion-selective electrodes supplied by
ORION. The ammonia electrode (model 95-12) is a gas sensing electrode and the cyanide electrode
(model 94-06) is a solid state electrode. The measures were done with the direct method and
assuming that the efficiency of absorption was 100% and the gases behave as ideal gases.
Combustion of Volatiles
The gases released during the pyrolysis of coals at different temperatures were burned in a second
reactor, at the same temperature that chars preparation was performed. The tube that makes the
connection to the second reactor was isolated with kaolwool to prevent the deposition of tars. The
gases released were constantly analyzed tor NO, N2O, CO, CO2 and O2 by specific analyzers and
HCN and NH3 with ion-selective electrodes, Fig.1.
3 . RESULTS AND DISCUSSION
NO and NoO from coal and char combustion
The results were interpreted based on the assumption that coal-N was divided between the
volatiles (volatile-N) and char (char-N) and they were subsequently converted into NO, N2O and N2
Table 3 provides the distribution of fuel-N in both volatiles and char for the two coals studied and
calculations for the mass balance confirmed the split of fuel-N between volatiles and char. It should be
noted that with temperature, the amount of volatile-N was found to increase which could be due to
higher heating rates which encouraged the greater rate of release ot votatiles from coal particles. The
conversion of both volatile-N and char-N to the products were assumed to be through relatively
independent processes although some reduction of both N2O and NO, once formed, on the char
-611-
surface were expected to occur. Conversions of coal-N and char-N to NaO and NO in percentage by
weight, at different temperatures, are presented in Tables IV and V. The data snowed that the
conversion of nitrogen in coal and char to NO and N2O followed tho seme pattern in which amounts of
N2O and NO formed varied inversely with temperature, which have previously been observed as well
[11,12].
The conversion of coal-N to NO, for both coals, are somewhat similar to those observed with char-
N. These results suggest that the contribution of char-N is primarily responsible for total NO formed.
Regarding coal-N and char-N conversions to N2O the observation is different, and it is apparent that
N2O levels were found to be greater with the higher nitrogen amounts in the parent coat and the
temperature of devolatilisation which was observed to determine the amount of volatUes remained in
chars. It could be seen that lor combustion temperatures higher than 1100 K the char-N conversion to
NO became much greater than the conversion to N2O.
HCN and NH3 in Volatiles
During pyrolysis and combustion of solid fuels, NH3 and HCN are the major nitrogen-containing
precursors [10]. The results of this work demonstrated that the yields of NH3 and HCN for the two
coals responded in a similar way as the temperature ol pyrolysis increased. At higher temperatures, the
yield of NH3 was observed to decrease, as given in Tables VI and VII.
HCN and NH3 were not in significant quantities at temperatures below 1073 K, but the sum of the
yields of HCN and NH3 is similar in both Cimpor coal and in South African coal. Also, it could be seen
that the yields of HCN and NH3 in the gases that leaving the second reactor, following the combustion
of volatiles, decreased and no NH3 was found at temperatures higher than 1173 K. It is interesting to
note that, while the yield of HCN released with the volatiles increased with temperature, the amount of
HCN measured in combustion gases decreased with the temperature of pyrolysis increased. This
suggests that HCN became increasingly more prevailing intermediate for the formation ol NO above
1173 K.
NgO and NO from the combustion of volatiles
Conversions of the volatile-N in percentage by weight to N2O and NO, corresponding to the
temperatures at which chars were prepared are presented in Table VIII. The data show that much
higher conversion to N2O than to NO took place. It is the opinion of the authors that the volatile-N had
a dominating contribution to N2O. With the increase in the char preparation temperature the amount of
NO formed went up whilst the contribution of the volatile-N to N2O decreased.
Upon correlating these results with the yields ot HCN and NH3 observed, it could be concluded
that at temperatures less than 1173 K, HCN was primarily responsible for the formation of N2O.
-612-
4. CONCLUSIONS
The distribution of fuel-N between HCN and NH3 species in the pyrolysis is an important factor in
determining the amounts of N2O and NO formed. It is believed that there is a significant contribution to
the N2O emission that originates from volatile-N but also the char-N has an important share, particularly
at lower devolatilisation temperatures. Char-N is the principal source of NO formed. It is the opinion of
the authors that the determination of HCN and NH3 species in the gases released in the pyrolysis of
coal could help to have a better understanding of the chemical states of nitrogen in coals.
ACKNOWLEDGMENTS
The authors would like to thank the European Union and JNICT, Junta Nacional de Investigacao
Cientifica e Tecnokigica for financing the project.
REFERENCES
1. Levine, J.S., 5tn International Workshop on Nitrous Oxide Emissions, Japan, 1992, pp.KLI-
1/KL1-9.
2. Houghton, J.T., Jenkins, G.J. and Ephraums, J.J., Climate Change: The IPCC Scientific
Assessment, Cambridge University Press, Cambridge, UK, 1990.
3. Davidson, R.M., Nitrogen in coal, IEA Coal Research, IEA per/08, London, UK, 1994.
4. Solomon, PR. and Colket, M.B., Fuel, 57:749-755 (1987).
5. Johnsson, J.E., Fuel, 73:1398-1415 (1994).
6. Kilpinen, P. and Hupa, M., Combust, and Flame. 85:94-104 (1991).
7. Miller, J.A. and Bowman, C.T., Prog. Energy Combustion Sci., 15:287-338 (1989).
8. Glaborg, P., Jonhsson, J.E. and Dam-Johansen, K , Combust, and Flame, 99:523-532
(1994).
9. Kramlich, J.C., Cole J.A., McCarthy, J.M., Lanier, W S. and McSorley, J.A., Combust, and
Flame, 77:375-384(1989).
10. Hukjaard, T., Nitrous oxide from combustion, Ph.D. Thesis, 1991, Lynby, Denmark.
11. Hayhurst, AN. and Lawrence, A.D., Prog. Energy Combustion Sci., 18:529-552 (1992).
12. Kramlich, J.C. and Linak, W.P , Prog. Energy Combustion Sci., 20.149-202 (1994).
-613-
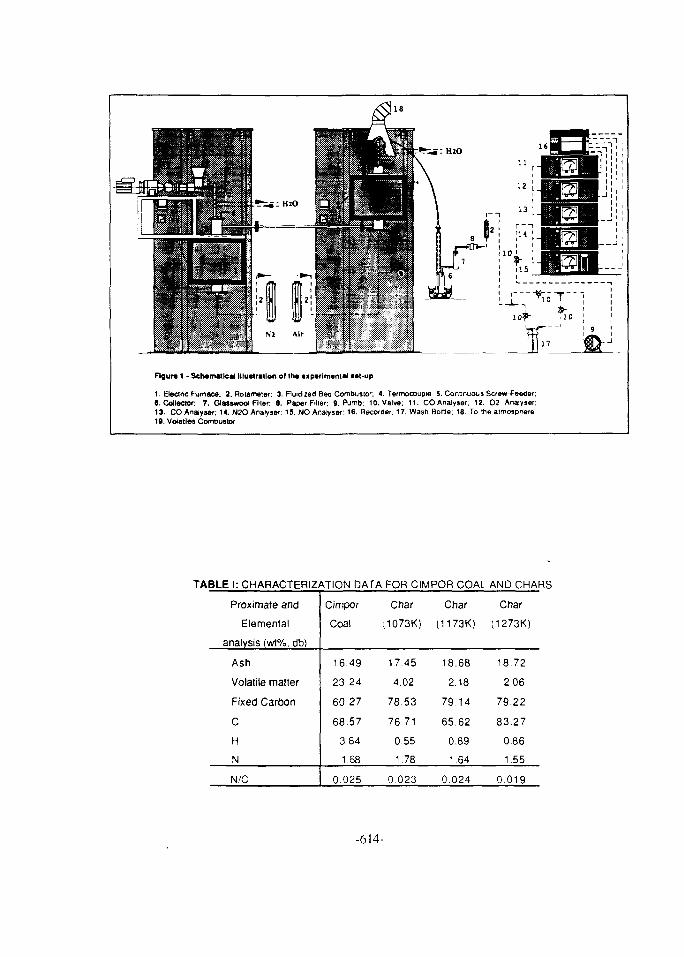
Flgura 1 - Schamatleal Illustration ol th* experimental set-up
1. Electric Furnace; 2. Rotameter; 3. Fluidized Bed Combuslor: 4. Termocouple; 5. Continuous Screw-Feeder;6. Collector 7. Glasswod Filler; 8. Paper Filler; 9. Pumb: 10. Valve; 11. CO Analyser; 12. 02 Analyser.13. CO Analyser; 14. N2O Analyser; 15. NO Analyser; 16. Recorder; 17. Wash Boltle; 18. To the atmosphere19. Volatile* Combustof
TABLE I: CHARACTERIZATION DATA FOR CIMPOR COAL AND CHARS
Proximate and
Elemental
analysis (wt%, db)
Ash
Volatile matter
Fixed Carbon
C
H
N
N/C
Cimpor
Coal
16.49
23.24
60.27
6857
3.84
1.68
0.025
Char
(1073K)
17.45
4.02
78.53
76.71
0.55
1.78
0.023
Char
(1173K)
18.68
2.18
79.14
65.62
0.89
1.64
0.024
Char
(1273K)
18.72
2.06
79.22
83.27
0.86
1.55
0.019
-614-
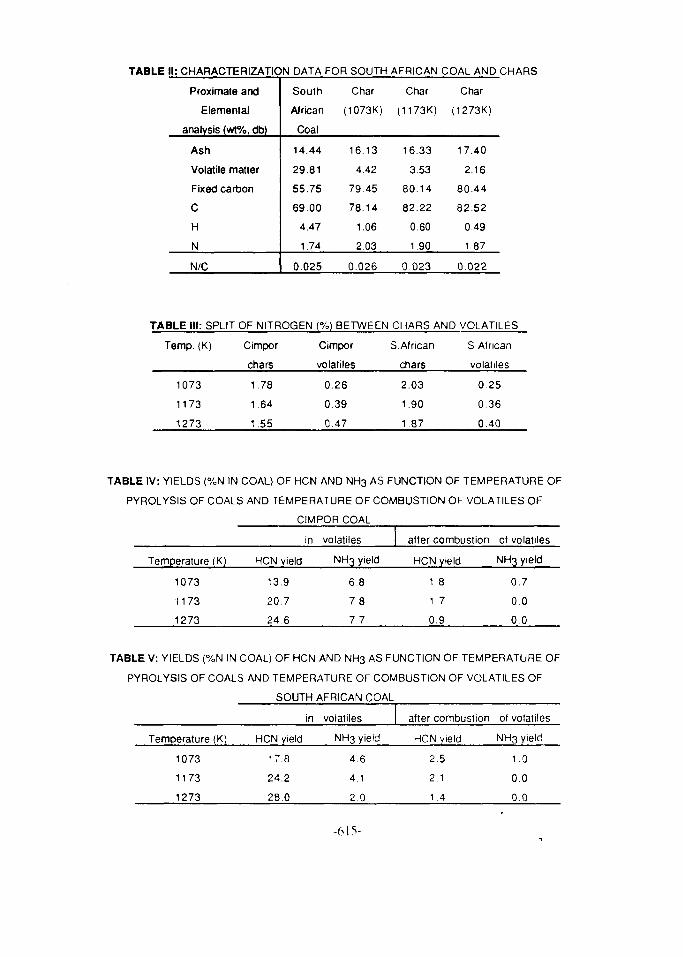
TABLE II: CHARACTERIZATION DATA FOR SOUTH AFRICAN COAL AND CHARS
Proximate and
Elemental
analysis (wt%, db)
Ash
Volatile matter
Fixed carbon
C
H
N
N/C
South
African
Coal
14.44
29.81
55.75
69.00
4.47
1.74
0.025
Char
(1073K)
16.13
4.42
79.45
78.14
1.06
2.03
0.026
Char
(1173K)
16.33
3.53
80.14
82.22
0.60
1.90
0.023
Char
(1273K)
17.40
2.16
80.44
82.52
0.49
1.87
0.022
TABLE III: SPLIT OF NITROGEN (%) BETWEEN CHARS AND VOLATILES
Temp. (K)
1073
1173
1273
Cimpor
chars
1.78
1.64
1.55
Cimpor
volatiles
0.26
0.39
0.47
S.African
chars
2.03
1.90
1.87
S African
volaliles
0.25
0.36
0.40
TABLE IV: YIELDS (%N IN COAL) OF HCN AND NH3 AS FUNCTION OF TEMPERATURE OF
PYROLYSIS OF COALS AND TEMPERATURE OF COMBUSTION OF VOLATILES OF
CIMPOR COAL
in volaliles after combustion of volatiles
Temperature (K) HCN yield NH3 yield HCN yield NH3 yield
1073
11 73
1273
13.9
20.7
24.6
6.8
7.8
7.7
1.8
1 7
0.9
0.7
0.0
0.0
TABLE V: YIELDS (%N IN COAL) OF HCN AND NH3 AS FUNCTION OF TEMPERATURE OF
PYROLYSIS OF COALS AND TEMPERATURE OF COMBUSTION OF VOLATILES OF
SOUTH AFRICAN COAL
in volatiles after combustion of volatilos
Temperature (K) HCN yield NH3 yield HCN yield NH3 yield
1073
1173
1273
17.824.2
28.0
4.6
4.1
2.0
2.5
2.1
1.4
1.0
0.0
0.0
-61V
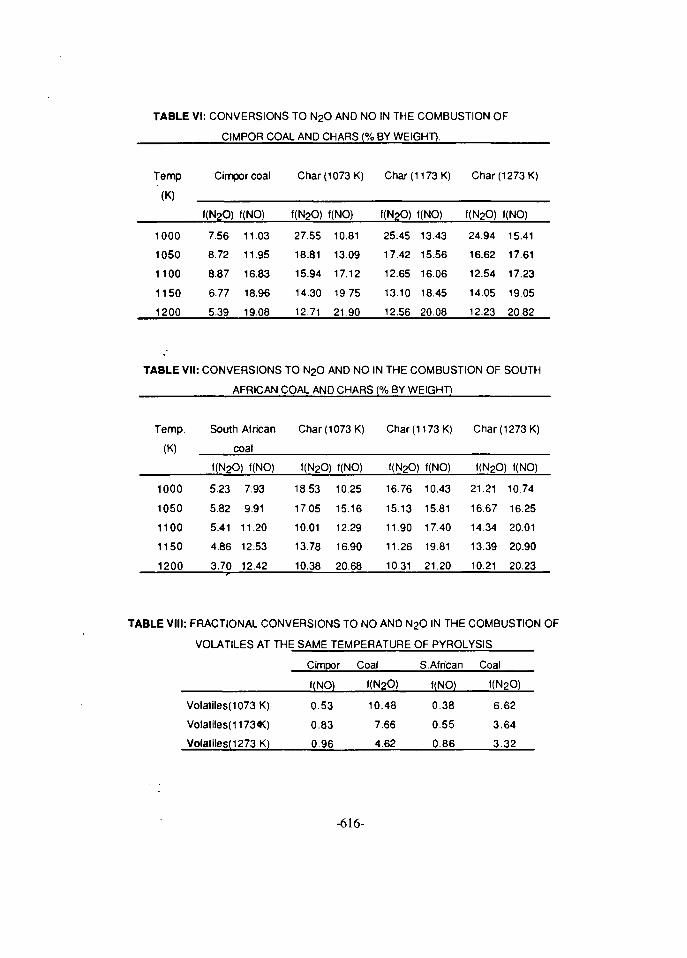
TABLE VI: CONVERSIONS TO N2O AND NO IN THE COMBUSTION OF
CIMPOR COAL AND CHARS (% BY WEIGHT).
Temp
(K)
1000
1050
1100
1150
1200
Cimpor coal
f(N2O) f(NO)
7.56 11.03
8.72 11.95
8.87 16.83
6.77 18.96
5.39 19.08
Char (1073 K)
f(N2O)
27.55
18.81
15.94
14.30
12.71
f(NO)
10.81
13.09
17.12
19.75
21.90
Char (1173 K)
f(N2O)
25.45
17.42
12.65
13.10
12.56
f(NO)
13.43
15.56
16.06
18.45
20.08
Char (1273 K)
f(N2O) f(NO)
24.94 15.41
16.62 17.61
12.54 17.23
14.05 19.05
12.23 20.82
TABLE VII: CONVERSIONS TO N2O AND NO IN THE COMBUSTION OF SOUTH
AFRICAN COAL AND CHARS (% BY WEIGHT)
Temp.
(K)
1000
1050
1100
1150
1200
South
c
i African
;oal
f(N2O) f(NO)
5.23
5.82
5.41
4.86
3.70
7.93
9.91
11.20
12.53
12.42
Char (1073 K)
f(N2O) f(NO)
18.53
17.05
10.01
13.78
10.38
10.25
15.16
12.29
16.90
20.68
Char (1173 K)
f(N2O)
16.76
15.13
11.90
11.26
10.31
f(NO)
10.43
15.81
17.40
19.81
21.20
Char (1273 K)
<(N2O)
21.21
16.67
14.34
13.39
10.21
I(NO)
10.74
16.25
20.01
20.90
20.23
TABLE VIII: FRACTIONAL CONVERSIONS TO NO AND N2O IN THE COMBUSTION OF
VOLATILES AT THE SAME TEMPERATURE OF PYROLYSIS
Cimpor Coal S.African Coal
Volatiles(1073K)
Volatiles(H73*)
Volatiles(i273K)
f(NO)
0.53
0.83
0.96
f(N2O)
10.48
7.66
4 62
f(NO)
0.38
0.55
0.86
f(N2O)
6.62
3.64
3.32
-616-
Proceedings of the Fifth International Conferenceon Energy and Envirorunent, Cairo, Egypt, 1996 "" EG970002i"
EMISSION COKTROL FOR 7REB2ATER CEMBMT KILNSFABRIC FILTER VS. ELECTROSTATIC 9RBCIPITATOR
WHICH IS BEST?
by John Caine and Hark Brugan1 September 1994
It is well known that both fabric filters and electrostatic-precipitators have been used successfully to control emissions fromcement kilns for a number of years. This paper will examine thecurrent status of Freheater kiln and clinker cooler emissioncontrol technology and experience with respect to both fabricfilters and electrostatic precipitators.
H I S T O R Y - Over tha last thirty years, emission control has becomea wide spread concern in many countries where cement kiln outletemissions and opacity requirements have become increasingly morestringent regardless of the country and location. For exampleFigure 1 indicates the trend of how allowed cement kiln outletemissions have been reduced by the U.S. Environmental ProtectionAgency over the last few years. This is increasingly becoming aworld wide trend where, for example, international loan agenciesare requiring at least 50 mg/m3 maximum dust emissions for newprojects.
In the U.S., before approximately I960, only limited emissioncontrol systems were added to wet cement kilns. Later cycloneswere used not only to control emissions but also to protect themain induced draft fan. In 1970, with the passage of the InitialClean Air Act in the U.S., outlet emission requirements werereduced to around 100 mg/Nm3 and, since both electrostaticprecipitators and fabric filters can easily handle these outletemissions cost effectively, both technologies were used on cementkiln through the 1970's. Starting in the 1980's however, when drypreheater/precalciner technology became more widely used and theemission control device (ECD) had to contend with the uniquetemperature, moisture and chemistry problems whichpreheater/precalciner technology brings to the emission controlrequirement, fabric filters began to be the emission controltechnology of choice in the United States.
He will see how these emission control technologies developed inthe U.S., what the implications of fabric filter vs. electrostaticprecipitator are for other countries, and how this relates toemerging trends of more stringent requirement on a global basis.
To begin this comparison, it will be important to have a basicunderstanding of how electrostatic precipitators and fabric filtersare sized and how they operate on cement kiln applications, sinceone of the objectives of this paper is to make a capital and
-617-
operating cost comparison, we can begin with a "typical" kiln size.Given the "typical kiln" off gas conditions, we can develop capitalcosts and estimated operating costs for both Fabric Filter and ESPemission control.
For this "typical" case, we have the design parameters shown inFigure 2.
HOW A PRECIPITATOR IS SIZED
The primary sizing equation for an electrostatic precipitator isthe well known Deutsche-Anderson equation which involves; amigration velocity (based on experience factors), and the requiredefficiency for that particular application as indicated by thefollowing formula.
Eff=l-e(-A/V)W
OR
A/V = 1/W LOG 1/1-Eff
WHERE:
Eff = ESP COLLECTION EFFICIENCY, %wt
A =* COLLECTION SURFACE AREA, M2
V = GAS VOLUME, M3/S
W = MIGRATION VELOCITY, CM/S
It is clear from this equation that as the outlet loadingrequirements are reduced, and the resulting efficiency increased,the size of the precipitator will also necessarily be increased.We can see this graphically represented in Table 1.
For a typical preheater cement kiln application with the abovedesign parameters, and outlet dust load requirement of 25 MG/NMJ.The ESP will have 4 field and 10,000 M3 of collecting surface.
The precipitator operates on the principle that the high coronagenerates negatively charged ions which attach themselves to thedust particles. A potential difference between the negativelycharged dust particle and the positive collecting plate provides anelectrical attraction for the dust particles, which migrate to thecollecting plate, are captured, and eventually rapped into thehopper for ultimate removal. Certain other factors impact theoverall size and performance of the precipitator such as;
• Aspect ratio - electrical field length to field heightratio. Since rapping loss is a problem, as outlet
-618-
emissions are reduced the precipitation length must beincreased. Fig. 3.
• Proper cross sectional area - to provide low gasvelocities through the precipitator, since re-entrainmentis a potential problem,
• High electric power requirements to achieve highefficiencies (low outlet loadings) Figure 4.
• Larger precipitation and high electric power requirementsfor removing fine particulate - since the electricalfield energy requirement is inversely proportional to themean particle size Figure 5.
FABRIC FILTER OPERATION - KILNSFabric filters operate on a totally different principle, especiallythe low ratio, reverse air cleaned fabric filters generally used incement preheater kiln applications and clinker cooler vent systems.These units operate on the principle of inertial impact and captureof dust particles in a filter cake which has been built up on thefilter media. The ability to capture fine particles is a functionof the particle size distribution of the dust particles themselves,hence a fabric filter has an inherent ability to capture extremelyfine particulate (less than 10 microns). The fabric filter issized based on an air-to-cloth ratio, which is essentially thevelocity of gas through the fabric, in MJ/Min. For preheater cementkiln applications, this ratio is approximately:
•0.5 M/Min. (and for cooler systems 1.0-1.2 M/Min.).
With a reverse air cleaned Fabric Filter, typical of those used oncement kilns, the fabric is cleaned intermittently by removing onecompartment from service, stopping the gas flow to that compartmentwith a poppet damper and cleaning the bags with gas in the reversedirection. To accomplish this, the fabric filter must necessarilybe a multi-compartment design as shown in Fig. 6. Typicaloperating pressure drop across the fabric for a properly sizedfabric filter is normally in the 100mm - 150mm W.G. static pressurerange. Fig. 7 details a fabric filter, sized according to theabove listed sizing parameters for the "typical" preheater cementkiln and the cooler application which we have selected.
It is important to note that unlike an ESP, the size of a bagfilter changes little regardless of the required outlet emissionlevel. This ia not true for the ESP which must become increasinglylarger, and more expensive, with lower outlet emission levels(higher efficiencies). Precisely, because of increasingly loweremission requirements, the F/F in recent years has become verycompetitive with ESP's.
-619-
CAPITAL COST COMPARISON
Now that v* have properly sized both an ESP and a Fabric Filter forour application, we can compare th« installed costs of these twotechnologies as seen in Fig. 8.
This shows graphically the point made earlier that a fabric filtercosts less on an installed basis than a properly sized precipitatorfor these design conditions.
OPERATING COSTS
It is now important to compare the operating costs of these twotechnologies; especially relating to operating KW for the mainfilter fan, and reverse air fan, bag replacement costs, andelectric energy costs plus repair parts for the transformerrectifier (T/R) sets.
We show this comparison in Fig. 9. And as we see, even with aslightly lower operating cost for the ESP, there is still a verylong time to pay back compared to a Fabric Filter.
NOTE: We have used the following assumptions in making thesecomparisons:
1. Maintenance costs for the two technologies are equivalent,although as a general rule, bag filters can be maintained bya lower worker skill level.
2. Dust handling requirements from both the ESP and F/F areequivalent.
3. Other aspects of a given project such as foundations,inlet/outlet ductwork, etc., which are the same for the twotechnologies, have not been used as a part of this comparisonand are not expected to have a major input.
OTHER CONSIDERATIONS
For Cement kiln applications there are, however, other aspects ofthe operation of a fabric filter vs. ESP, which should be discussedas follows:
1. CO shutdowns - It is well known that with a precipitator theoperator must pay careful attention to kiln off-gas COconcentrations to prevent explosions. Indeed, preheater kilnswith ESP's utilize Borne type of CO monitoring device, andinterlock, to shut off power to the T/R sets when high COconcentration events occur, obviously, during this time fulldust emissions will exit from the precipitator resulting inhigh stack opacity and the potential for wear on the maininduced draft (I.D.) fan. since it is desirable to keep 0,
-620-
l«v«ls as low as possible for high«r fuel efficiency, it isnot unconnnon to cross the CO shut-off threshold with an ESP.
2. Change over operation - A precipitator operates moreeffectively at lover dust resistivities. During change overoperation, for example, when the raw mill shuts down, it ispossible to create a situation of dust on the collectingplat*, which whan dried out, has a high resistivity. Duringthis "change-over" tine, stack opacities nay exceed allowedvalues and can ba quite visible and objectionable.
3. Ability to handle high dust load - Both technologies can' handle high dust loads in different ways. For theprecipitator it may be necessary to include a precleaner(multi-cyclone) up stream to reduce the inlet dust load, thisdevice will increase pressure drop by (75mm - loomm w.G.static pressure) particularly when th* kiln is operated at thehighest capacity level possible, which is normal, A fabricfilter can handle high dust loads as well but usually will notneed th* precleaner which eliminates this component of systempressure drop. »
4. Considerations of the evaporation cooling tower - Aprecipitator oust ba provided with dust of low resistivity.For a preheater cement kiln, especially in by-pass operation(raw alii down), a spray tower is necessary to reduce the gastemperature to approximately 150*C to insure dust withresistivity below l x 10" ohm Cm for efficient operation of10" the ESP, Fig. 10. By contrast, with «, fabric filterusing fiberglass bags, only a temperature low, enough toprotect the bags (240*C), is necessary. Given this reductionin the amount of water sprayed, it is reasonable to assumethat with a fabric filter, an atomized spray system, using asmaller tower, can be employed ahead of the fabric filter.With the precipitator, especially in an area of high electricpower costs, the use of a hydraulic atomized system (withresulting larger spray tower dimensions and residence time)will be required. This difference may have a significantimpact on where the spray tower can be located, it's installedcost and the increased consumption of water.
5. On-line maintenance - Since a fabric is inherentlycompartnented, so that gas flow can be closed off to a givencompartment during bag cleaning, such a design provides thepossibility of sizing the fabric filter with a built-in "extracompartment" which can allow inspections, bag change out, andother maintenance requirements, "on-line", while the rest ofthe system is in operation. This obviously is not possiblewith a precipitator which, because of the single chamberdesign, oust be shut down for routine maintenance. It istherefore reasonable to project that a fabric filter willoperate with a higher on-line availability than will a
-621-
precipitator.
£. Bag Life - The aspect of baglife also needs to be consideredas a part of this type of overall comparison. Industryexperience projects a three year baglife as reasonable forheavy duty fiber glass bags in a properly designed andoperated fabric filter. Based on their good operatingperformance, the best bag selection in woven, fiberglass bags,with an acid resistant finish.
7. Problems of insufflation - Many plants use insufflation torecycle collected dust to the kiln for reprocessing.- This hasthe tendency to create a higher dust load from the kiln andalso has the tendency to produce a finer average particle sizedistribution. With a fabric filter, this is not as great aproblem as with a precipitator for several reasons:
A. Kith an increase in inlet dust load, the precipitatorefficiency must increase, resulting in a largerprecipitator size.
B. The lower particle size distribution must be addressed insizing the precipitator by adding more power in the unitespecially in the latter fields.
C. With a fabric filter, since neither high dust load norfine particle size greatly affect the filter sieing, onlya small increase in unit size may need to be added toaddress both of these issues.
Given the above, it is becoming more apparent that the decision ofwhich technology is best for dadusting kiln/mill off-gas is tendingmore toward fabric filtration. However, what this paper suggestsis that in every case, it will be important to carefully compareeach technology for your particular situation to make the bestdecision for your plant.
-622-
Proceedings of the Fifth International Conference EG9700022on Energy and Envirorunent, Cairo, Egypt, 1996
DRY CLEANING OF AL-CELL GASES BYFLUIDIZED BED ADSORPTION OF HF
BYM.A.Doheim, M.Salem*, H.Shafey and A.A.Abdellatif
Faculty of EngineeringAssiut Univeristy, Assiut, Egypt
* Aluminium Company of Egypt, Naga Hammadi, EgyptAbstract
The cleaning of Al- cell gases is essential for environmental protection andfluorides recovery. In this work, dry adsorption of HF is carried out in a 25 cmdiameter fluidized bed of smelter-grade alumina. The influence of the followingfactors was studied : distributor design, bed temperature, fluidizing velocity, andbed aspect ratio.
It was found that the scrubbing index increases with temperature then decreaseswith further increase. The effect of fluidizing velocity is a decrease followed byan increase in the index. The index increases with bed height then decreases. Thenozzle distributor gives the best results. The findings indicate that the scrubbingindex is greately affected with the bed conditions i.e. hydrodynamics and transferprocesses.
1. INTRODUCTION
Fluidized bed technology has widespread applications in many fields [1]. One ofthese fields is pollution control.
In Al-industry the cell gases emitted during the electrolytic process containharmful constituents [2,3] which should be treated for environmental protectionand for recovery of fluoride compounds. These gases contain hydrogen fluorideand fluoride compounds. There are generally two methods for achieving this : thewet process and dry process [2,4]. The wet process [2,3,5,6] uses an aqueousalkaline solution (e.g.Na3CO3) to absorb the hydrogen fluoride and sulfer dioxide.The recovered fluorides are recycled to the cell. Corrosion problems are severe inthe wet scrubbing systems. The dry scrubbing system [3,4,7] depends on thechemisorption of hydrogen fluoride on smelter-grade alumina with the recycle ofthe formed aluminium fluoride to the cell. By emploing the dry method, thecorrosion problems and treament of waste water are avoided.
-623-
The present work investigates the effect of some important factors on thechemisorption of HF gas on smelter-grade alumina. The factors include somefluidized bed design and operating variables.
2. EXPERIMENTAL WORK
2.1. Materials
Materials used for adsorption experiments are : (a) Smelter-grade alumina usedfor the production of aluminium, (b) Cell gases
(a) Alumina :The alumina used in the experiments is smelter- grade alumina for producing the
aluminium and represents the adsorbent medium in the adsorption process. Table1 shows the specifications of alumina used. Table 2 shows the size distribution ofalumina.
(b) Cell gases :The cell gases contain HF gas which is to be removed by adsorption process.
The HF contained in the cell gases has an average value as shown by thechemical analysis in Table 3.
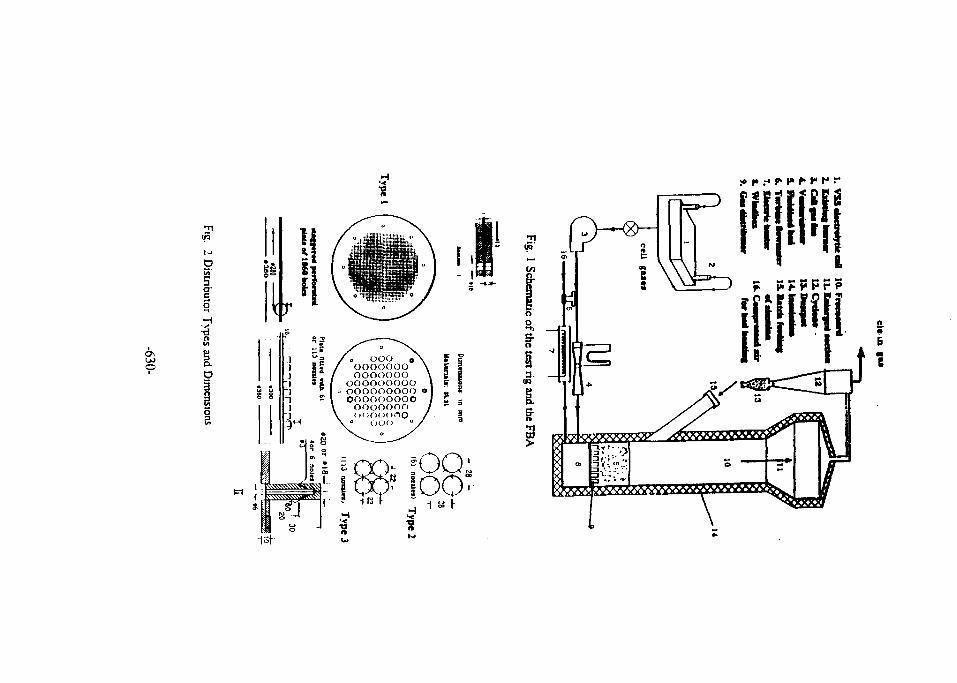
2.2 Apparatus
Fig. 1 shows the apparatus used in this work. The fluidized bed adsorber wasmade of seamless steel pipe of 25 cm inner diameter, 10 mm thickness and 150cm height. The cell gases were withdrawn from the electrolytic cell of VSS anodetype by the draft fan 3 and were introduced directly to the fluidized bed adsorberthrough the windbox 8 and the distributor 9. The freeboard 10 and the enlargedsection 11 (50 cm ID) served to separate the possibly elutriated alumina particlesduring adsorption process. The cyclone 12 by turn served for cleaning the gasesfrom entrained alumina particles. The electric heater 7 is used for heating up thealumina bed to a specified temperature to simulated different temperatures of cellgases when introduce through the alumina bed. Fig. 2 shows the main featuresand dimensions of the three distributors used. They represent different designs ofboth staggered perforated plates and plates fitted with nozzles to give uniformdistribution of gas velocity over the whole section of the bed with goodfluidization characteristics. Fig. 3 shows the sampling method for measuring theHF concentration at two points.
-624-
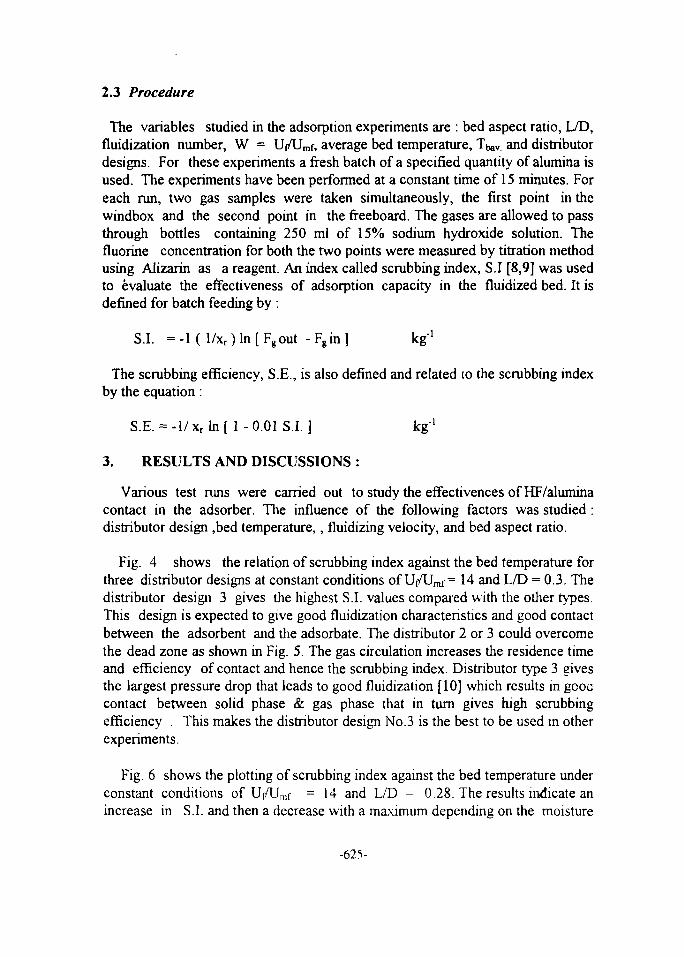
2.3 Procedure
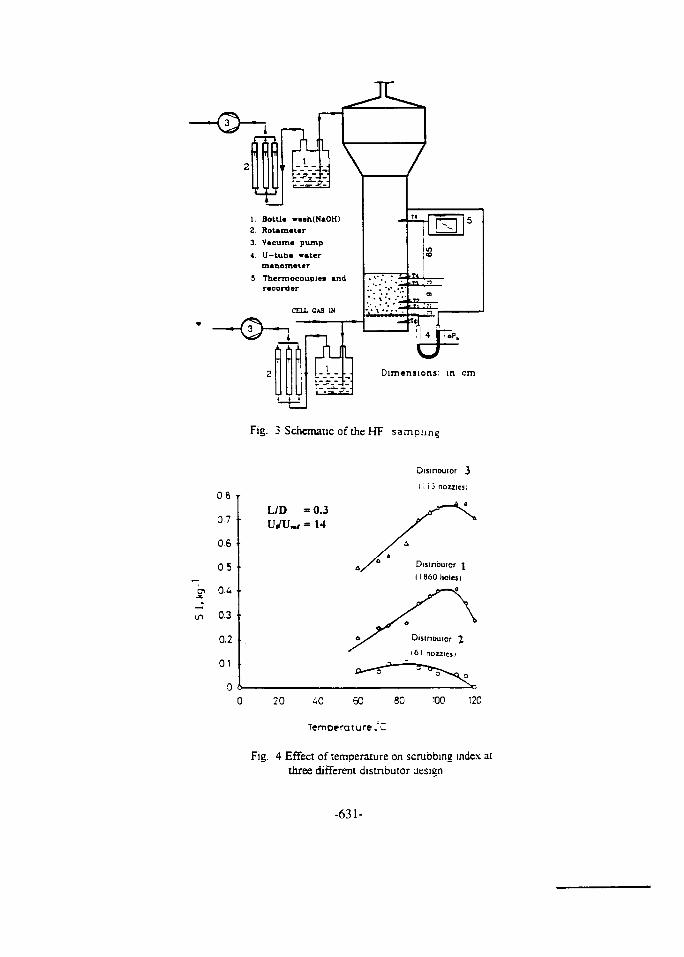
The variables studied in the adsorption experiments are : bed aspect ratio, L/D,fluidization number, W = Uf/Umf, average bed temperature, Tbav. and distributordesigns. For these experiments afresh batch of a specified quantity of alumina isused. The experiments have been performed at a constant time of 15 minutes. Foreach run, two gas samples were taken simultaneously, the first point in thewindbox and the second point in the freeboard. The gases are allowed to passthrough bottles containing 250 ml of 15% sodium hydroxide solution. Thefluorine concentration for both the two points were measured by titration methodusing Alizarin as a reagent. An index called scrubbing index, S.I [8,9] was usedto evaluate the effectiveness of adsorption capacity in the fluidized bed. It isdefined for batch feeding by :
S.I. = -1 ( 1/xr) In [ Fg out - Fg in ] kg1
The scrubbing efficiency, S.E., is also defined and related to the scrubbing indexby the equation :
S.E. = - l / x r l n [ 1-0.01 S.I. ] kg1
3. RESULTS AND DISCUSSIONS :
Various test runs were carried out to study the effectivences of HF/aluminacontact in the adsorber. The influence of the following factors was studied :distributor design ,bed temperature,, fluidizing velocity, and bed aspect ratio.
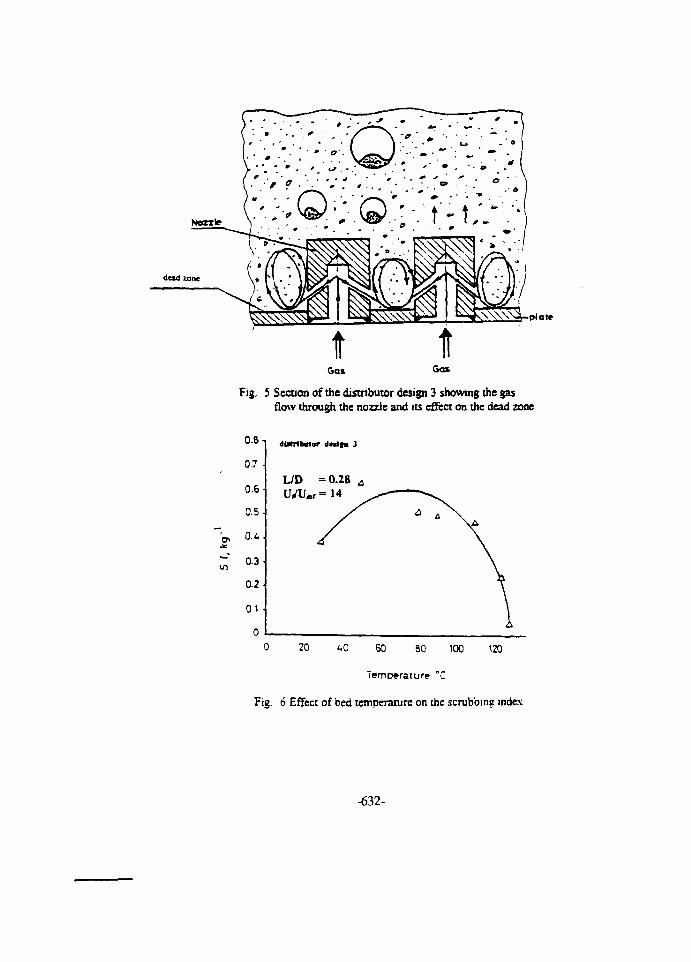
Fig. 4 shows the relation of scrubbing index against the bed temperature forthree distributor designs at constant conditions of Uf/Umf = 14 and L/D = 0.3. Thedistributor design 3 gives the highest S.I. values compared with the other types.This design is expected to give good fluidization characteristics and good contactbetween the adsorbent and the adsorbate. The distributor 2 or 3 could overcomethe dead zone as shown in Fig. 5. The gas circulation increases the residence timeand efficiency of contact and hence the scrubbing index. Distributor type 3 givesthe largest pressure drop that leads to good fluidization [10] which results in gooacontact between solid phase & gas phase that in turn gives high scrubbingefficiency . This makes the distributor design No.3 is the best to be used in otherexperiments.
Fig. 6 shows the plotting of scrubbing index against the bed temperature underconstant conditions of U|/Umf = 14 and L/D = 0.28. The results indicate anincrease in S.I. and then a decrease with a maximum depending on the moisture
-625-
content in alumina and bed temperature. The temperature increase has two- foldeffect on the adsorption of HF on alumina. The adsorption is usually enhanced byincrease in moisture content [11,12,13] up to temperature ~ 80°C. Furtherincrease in temperature decreases the ability of particles for adsorption[ 14,15,16].
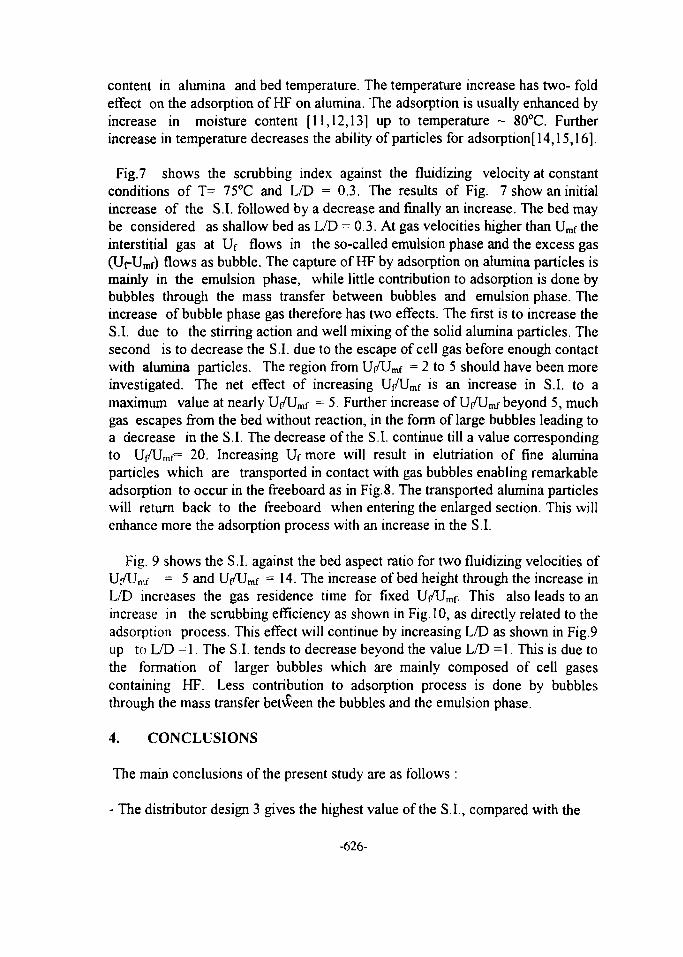
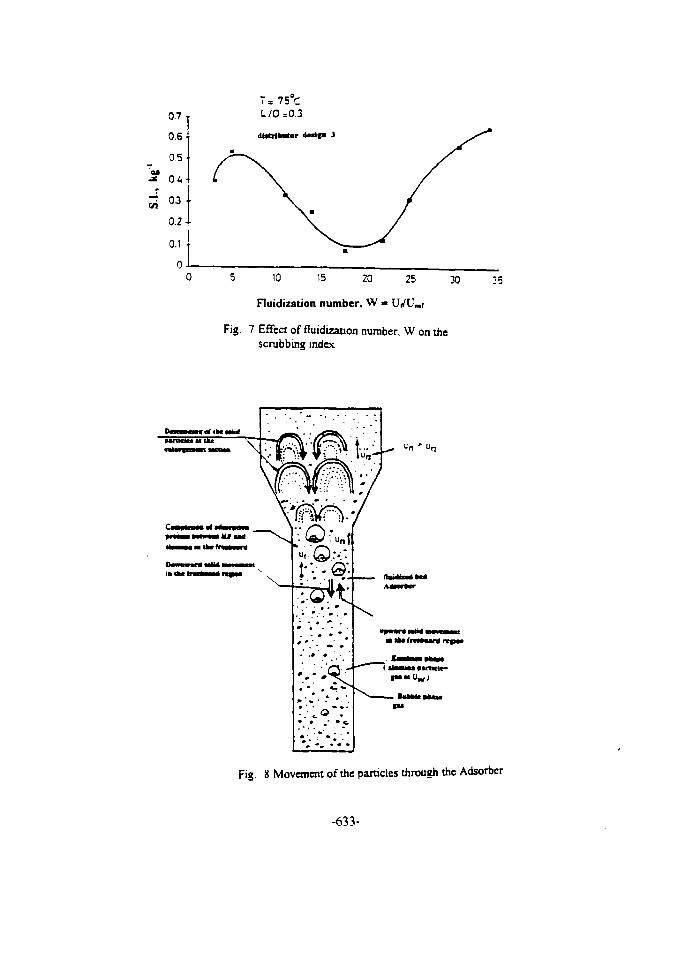
Fig.7 shows the scrubbing index against the fluidizing velocity at constantconditions of T= 75°C and L/D = 0.3. The results of Fig. 7 show an initialincrease of the S.I. followed by a decrease and finally an increase. The bed maybe considered as shallow bed as L/D = 0.3. At gas velocities higher than Umf theinterstitial gas at Uf flows in the so-called emulsion phase and the excess gas(UrUmf) flows as bubble. The capture of HF by adsorption on alumina particles ismainly in the emulsion phase, while little contribution to adsorption is done bybubbles through the mass transfer between bubbles and emulsion phase. Theincrease of bubble phase gas therefore has two effects. The first is to increase theS.I. due to the stirring action and well mixing of the solid alumina particles. Thesecond is to decrease the S.I. due to the escape of cell gas before enough contactwith alumina particles. The region from U(/Umf = 2 to 5 should have been moreinvestigated. The net effect of increasing Uf/Umf is an increase in S.I. to amaximum value at nearly Up/Umf = 5. Further increase of U/Umf beyond 5, muchgas escapes from the bed without reaction, in the form of large bubbles leading toa decrease in the S.I. The decrease of the S.I. continue till a value correspondingto Uf/Umf= 20. Increasing Uf more will result in elutriation of fine aluminaparticles which are transported in contact with gas bubbles enabling remarkableadsorption to occur in the freeboard as in Fig.8. The transported alumina particleswill return back to the freeboard when entering the enlarged section. This willenhance more the adsorption process with an increase in the S.I.
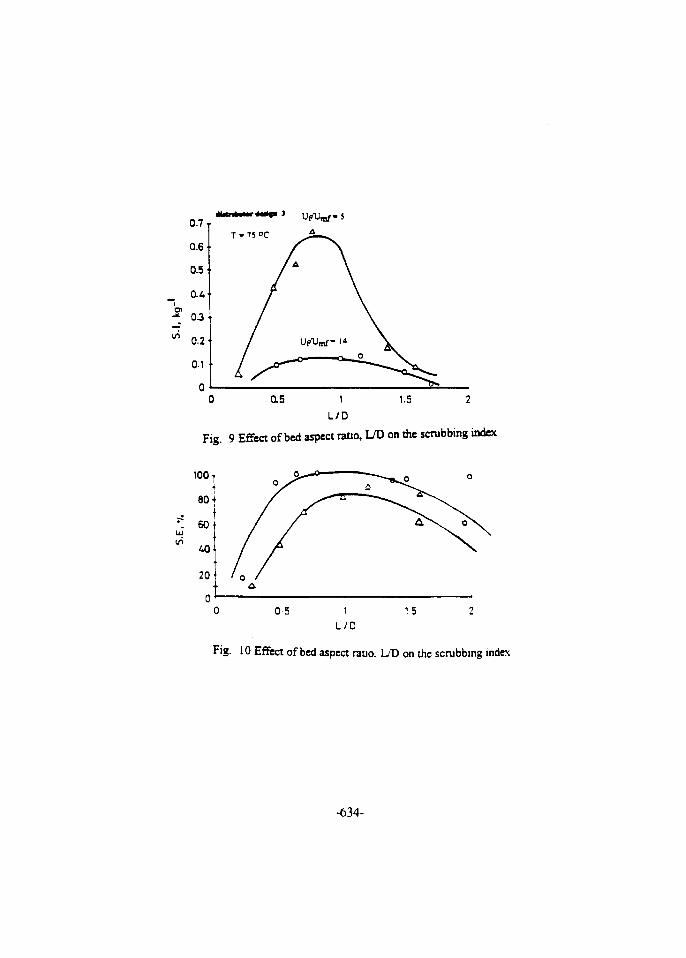
Fig. 9 shows the S.I. against the bed aspect ratio for two fluidizing velocities ofUf/Unu = 5 and UpUmf = 14. The increase of bed height through the increase inL/D increases the gas residence time for fixed U/Umf. This also leads to anincrease in the scrubbing efficiency as shown in Fig. 10, as directly related to theadsorption process. This effect will continue by increasing L/D as shown in Fig.9up to L/D =1. The S.I. tends to decrease beyond the value L/D =1. This is due tothe formation of larger bubbles which are mainly composed of cell gasescontaining HF. Less contribution to adsorption process is done by bubblesthrough the mass transfer between the bubbles and the emulsion phase.
4. CONCLUSIONS
The main conclusions of the present study are as follows :
- The distributor design 3 gives the highest value of the S.I., compared with the
-626-
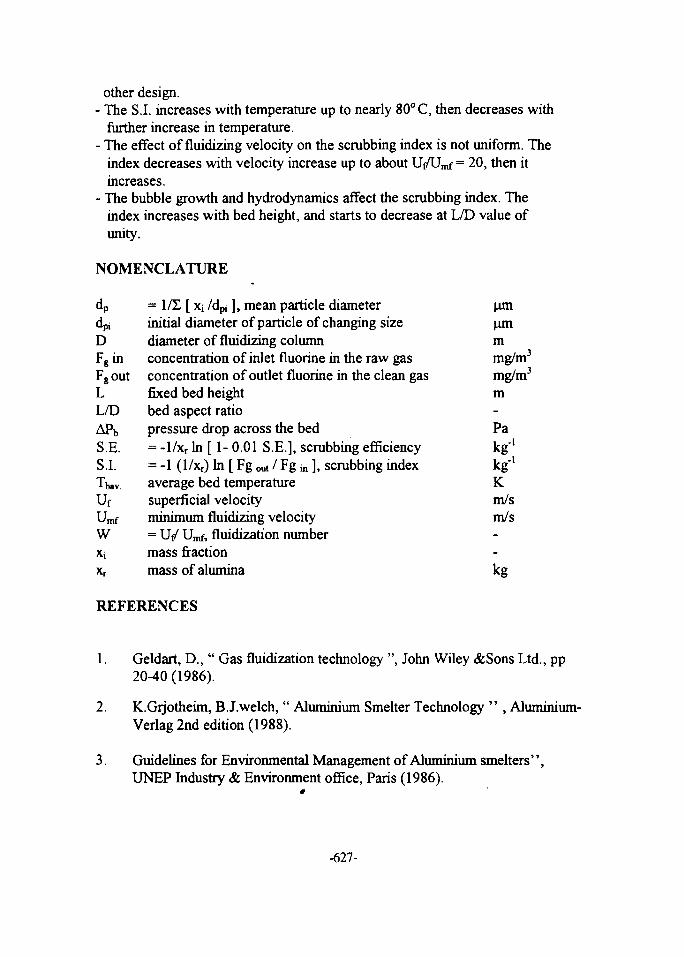
other design.- The S.I. increases with temperature up to nearly 80° C, then decreases with
further increase in temperature.- The effect of fluidizing velocity on the scrubbing index is not uniform. The
index decreases with velocity increase up to about U/Umf = 20, then itincreases.
- The bubble growth and hydrodynamics affect the scrubbing index. Theindex increases with bed height, and starts to decrease at L/D value ofunity.
N O M E N C L A T U R E
dp = \fL [ XJ /dpi ] , mean particle diameter jimdpi initial diameter of particle of changing size jamD diameter of fluidizing column mFg in concentration of inlet fluorine in the raw gas mg/m3
Fg out concentration of outlet fluorine in the clean gas mg/m3
L fixed bed height mL/D bed aspect ratioAPb pressure drop across the bed PaS.E. = - l /x r In [ 1- 0.01 S.E.], scrubbing efficiency k g 1
S.I. = -1 (l/x r) hi [ Fg out / Fg ^ ], scrubbing index kg'1
Tbav. average bed temperature KUf superficial velocity m/sUmf minimum fluidizing velocity m/sW = LV Umf, fluidization numberx, mass fractionxr mass of alumina kg
R E F E R E N C E S
1. Geldart, D., " Gas fluidization technology ", John Wiley &Sons Ltd., pp20-40 (1986).
2. K.Grjotheim, B.J.welch, " Aluminium Smelter Technology " , Aluminium-Verlag 2nd edition (1988).
3. Guidelines for Environmental Management of Aluminium smelters ' ' ,UNEP Industry & Environment office, Paris (1986).
-627-
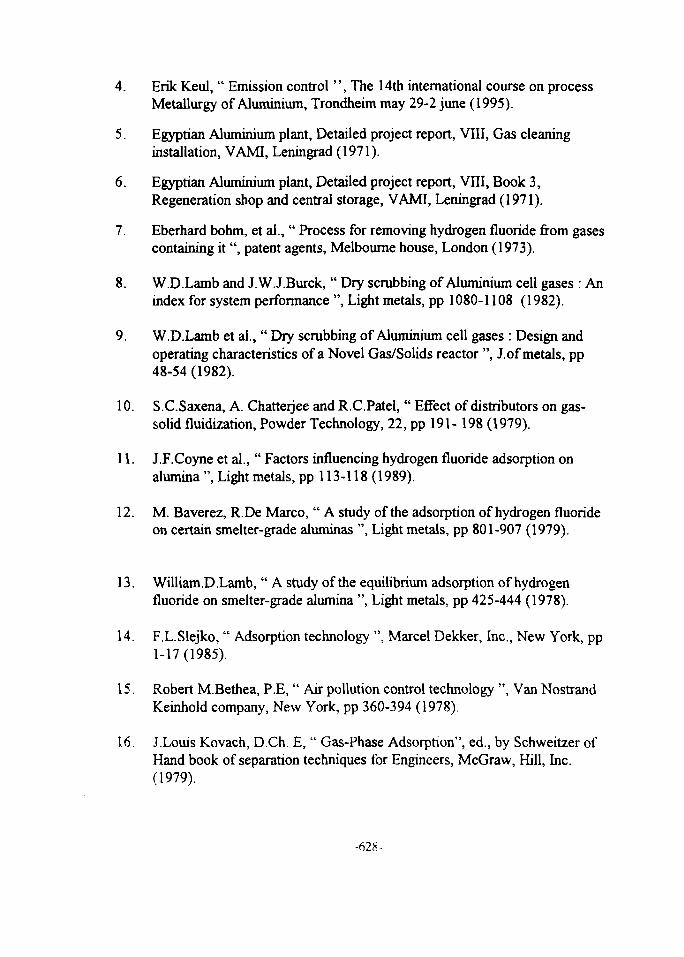
4. Erik Keul, " Emission control " , The 14th international course on processMetallurgy of Aluminium, Trondheim may 29-2 June (1995).
5. Egyptian Aluminium plant, Detailed project report, VIII, Gas cleaninginstallation, VAMI, Leningrad (1971).
6. Egyptian Aluminium plant, Detailed project report, VIII, Book 3,Regeneration shop and central storage, VAMI, Leningrad (1971).
7. Eberhard bohm, et al., " Process for removing hydrogen fluoride from gasescontaining it ", patent agents, Melbourne house, London (1973).
8. W.D.Lamb and J.W.J.Burck, " Dry scrubbing of Aluminium cell gases : Anindex for system performance ", Light metals, pp 1080-1108 (1982).
9. W.D.Lamb et al., " Dry scrubbing of Aluminium cell gases : Design andoperating characteristics of a Novel Gas/Solids reactor ", J.of metals, pp48-54 (1982).
10. S.C.Saxena, A. Chatterjee and R.C.Patel, " Effect of distributors on gas-solid fluidization, Powder Technology, 22, pp 191- 198 (1979).
11. J.F.Coyne et al., " Factors influencing hydrogen fluoride adsorption onalumina ", Light metals, pp 113-118 (1989).
12. M. Baverez, R.De Marco, " A study of the adsorption of hydrogen fluorideon certain smelter-grade aluminas ", Light metals, pp 801-907 (1979).
13. William.D .Lamb, " A study of the equilibrium adsorption of hydrogenfluoride on smelter-grade alumina ", Light metals, pp 425-444 (1978).
14. F.L.Slejko, " Adsorption technology ", Marcel Dekker, Inc., New York, pp1-17(1985).
15. Robert M.Bethea, P.E, " Air pollution control technology ", Van NostrandKeinhold company, New York, pp 360-394 (1978).
16. J.Louis Kovach, D.Ch. E, " Gas-Phase Adsorption", ed., by Schweitzer ofHand book of separation techniques for Engineers, McGraw, Hill, Inc.(1979).
-62K-
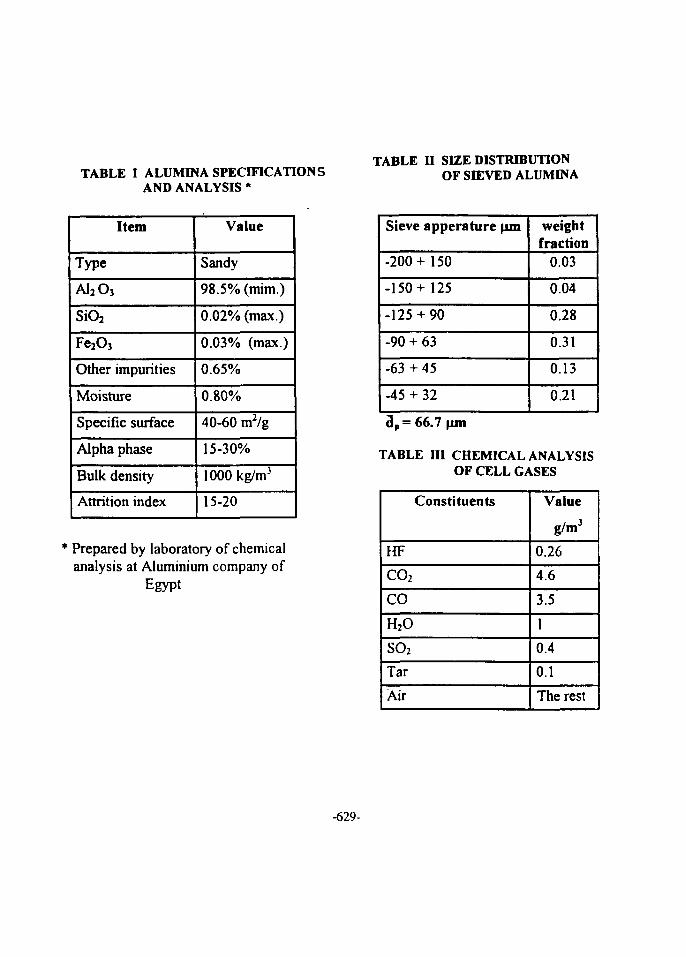
TABLE I ALUMINA SPECIFICATIONSAND ANALYSIS •
TABLE II SIZE DISTRIBUTIONOF SIEVED ALUMINA
Item
Type
Al2Oj
SiO2
Fe2O3
Other impurities
Moisture
Specific surface
Alpha phase
Bulk density
Attrition index
Value
Sandy
98.5% (mim.)
0.02% (max.)
0.03% (max.)
0.65%
0.80%
40-60 m2/g
15-30%
1000 kg/m3
15-20
* Prepared by laboratory of chemicalanalysis at Aluminium company of
Egypt
Sieve apperature pan
-200+ 150
-150+ 125
-125 + 90
-90 + 63
-63 + 45
-45 + 32
weightfraction
0.03
0.04
0.28
0.31
0.13
0.21
3P= 66.7
TABLE III CHEMICAL ANALYSISOF CELL GASES
Constituents
HF
CO2
CO
H2O
SO2
Tar
Air
Value
g/m3
0.26
4.6
3.5
1
0.4
0.1
The rest
-629-
ON
O
co
o5
Icy~&-\
Bfigm? P ? F P r P
o OOOoooooooooooooo
ooooooooooooooooooooooooooonooooon
I
• E W
O.B
0.7
0-6
0.5
OM
0.3
0.2
01
0
1. Bottle wajh(NaOH)2 Rotameter3. Vacume pump4. U-tub« water
manometer
Dimensions: in cm
Fig. 3 Schematic of the HF sampling
Distrmutor 3
1113 nozzles i
L/D = 0.3IVU«, = 14
20 CO 50 80
TemDerature.'C
100
Fig. 4 Effect of temperature on scrubbing index atthree different distributor aesien
-631-
plat*
tGas Gas
Fig. 5 Section of the distributor design 3 showing the gasflow through the nozzle and its effect on the dead zone
0.8 i
07
0.6
0.5
CU.
0.2-
0 1 •
dUtrlbotor dolfn 3
UD =0.28
0 2C AQ 60 80 100 120
Fig. 6 Effect of bed temperature on the scrubbing index
-632-
T= 75°CL/0^0.3
5 10 15 20 25
Fluidization number, W = lVUmr
Fig. 7 EfFea of fluidizanon number. W on thescrubbing index
30 35
Fig. 8 Movement of the parades through the Adsorber
-633-
0.7 T
0.6
0.5
0.4
03
0-2
01
0 tt5 1 1.5 2
L/D
Fig. 9 Effect of bed aspect ratio, L/D on the scrubbing index
100 |
80-
\ 60LJJ
i/i40
20
0 5 1
L/D
15
Fig. 10 Effea of bed aspea rauo. LTD on the scrubbing index
-634-

Proceedings of the Fifth International Conferencer> , r, IIIIIIH Hill Illl Illll mil Illll HIM Hill III
on Energy and Environment, Cairo, Egypt, 1996 EG9700023
ASSESSMENT AND MONITORING OF AJR POLLUTION EFFECTS.POSSIBILITIES AND CONSTRAINTS OF INTERNATIONAL COOPERATION.
K.F.PANZER1, I.A.HASSAN- AND D.A. VEI.LlSARIOf
11 K-dral Research Centre of Forestry, HaHibruy J7*;o S, i-.K.d.,, Department of Botany and Microbiology, i-'aculty of Science, 21526 LI 5hacb>. Alexandria. L i:\pi.,*I Institute or Biological Sciences, University or Athene*, G 10V5, Athenes. (. (recce.
Summary
Under the Geneva Convention on Long-range TransboundaryAir Pollution, an International Cooperative Programme on"Assessment and Monitoring of Air Pollution Effects" hadbeen set-up in 1985. Of the 34 signatory states of theConvention, 28 participate in the implementation of theProgramme. The objective is to assess effects of airpollution on forests in Europe, using a common surveymethod in order to assure comparability of surveyresults. In 1987, 20 countries conducted harmonizedforest health surveys based on the assessment of twovisible symptoms, loss and/or discoloration of foliage.Harmonization of the surveys was quickly achievedbecause of the simplicity of the methodical approach.The price of rapidly obtaining large-area information ondefoliation of forests is, that no distinction can bemade in the assessment process between defoliationcaused by air pollution and defoliation caused bynatural, biotic or abiotic causes.Further improvements of the interpretability of surveyresults can be expected if additional visible symptomscan be defined for the major species in the differentEuropean regions. Possibilities and constraints of in-corporating differentiating symptoms into the annualhealth surveys are discussed.
1 • IntroductionAfter the first signs of forest decline were observed at
the end of the seventies, several European countries startedsurveys of forest health, primarily in conifer forests Onlya few forest experts knew then the phenomen to look fordocumentation of symptoms was sparse, and -thodical ap-proaches to damage assessment differed considerably.
A large number of coniferous trees, predominantly athigher elevations, showed signs of needle loss and discolora-tion, but nobody could say, under given site conditions andprevailing silvicultural practices, what constituted a normal
-635-
and what an anomalous loss or discoloration of foliage. Thislack of base-line data continues to affect the diagnosis andclassification of forest decline.
Today, there is no doubt that certain symptoms observedare not only different from the "traditional smoke damage",but also from known phenomena of abiotic or biotic origin.This is supported by the fact that symptoms of forest declineare also being reported from so-called "clean-air areas".
Early warning of many forest and soil scientists thatincreasing amounts of chemical depositions would eventuallyproduce irreversible effects on forests, soils and ground-water began to be heeded at the political level, nationallyand internationally. The necessity of solving the problems ofdamage assessment and pollution abatement at the inter-national level was finally recognized.
2. International Cooperation and CoordinationUnder the Geneva Convention on Long-range Transboundary
Air Pollution, three Task Force Groups were formed to assessand investigate the effects of air pollution on
- materials and historical buildings- rivers and lakes- vegetation and forests.
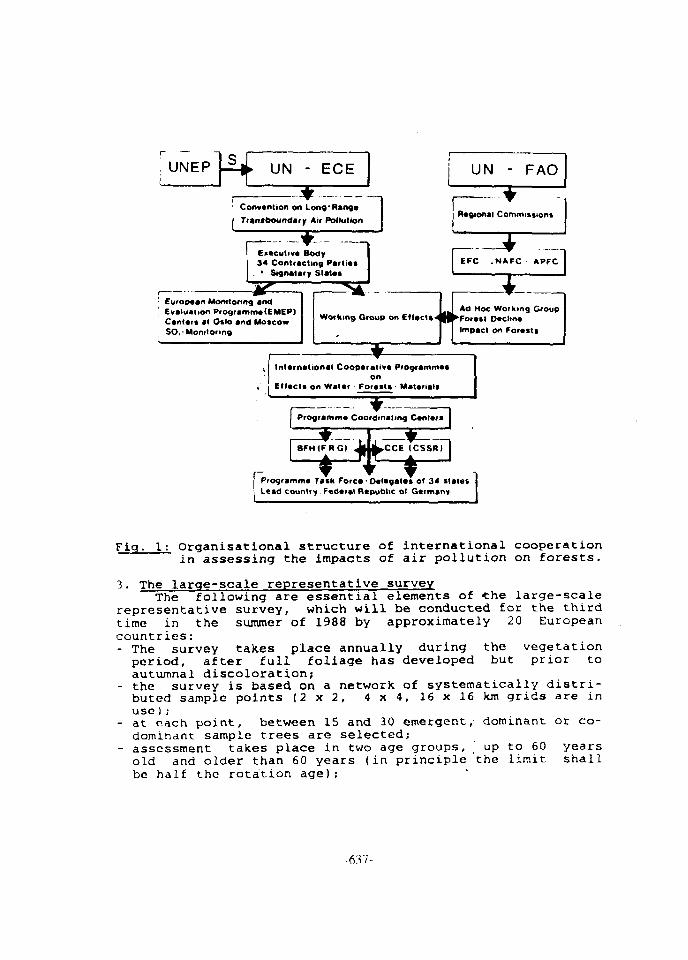
Figure 1 shows the structure of international coopera-tion and coordination under the Geneva Convention and indi-cates also that financial support is provided by the GlobalEnvironmental Monitoring Program of UNEP for the operation oftwo Programme Coordinating Centres at Prague and Hamburg.
The Task Force "Forests" charged with "harmonizingcriteria and methodologies for sampling, assessment and moni-toring of air pollution effects on forests", could base itswork on results elaborated by a group of experts from theworking groups "Effects" of ECE and "Impacts" of FAO.
Thus, in May 1986 the ECE-Manual was adopted as a commonguideline for conducting forest health surveys.The Manual recognizes three levels of activities:1) Large-scale representative surveys2) Intensive investigations on permanent plots3) Special ecosystems analysis(items 2 and 3 represent a combined concept for long-termcause-effect research).
-636-
UNEP UN - ECE
Convention on Long'Rano,*Trantboundmry Air Pollution 1
UN -
Regional Comn
FAO
fissions
Eiecutive Body34 Contracting Parti**• Signatary Slataa
' European Monitoring andi Evaluation Programme(EMEP)
Centers at Oslo and MoscowSO,-Monitoring
Working Group on Effect*
International Cooparativa Programmeson
Effects on Water - Foctili Material!
Programme Coordinating Center*
Programme Task FoLead country Fede
ore*-Delegates of 34 stales Iral Republic ol Germany I
Fig. 1: Organisational structure of international cooperationin assessing the impacts of air pollution on forests.
3. The large-scale representative surveyThe following are essential elements of <he large-scale
representative survey, which will be conducted for the thirdtime in the summer of 1988 by approximately 20 Europeancountries:- The survey takes place annually during the vegetation
period, after full foliage has developed but prior toautumnal discoloration;
- the survey is based on a network of systematically distri-buted sample points ( 2 x 2 , 4 X 4, 16 x 16 km grids are inuse ) ;
- at each point, between 15 and 30 emergent, dominant or co-dominant sample trees are selected;
- assessment takes place in two age groups, up to 60 yearsold and older than 60 years (in principle the limit shallbo half the rotation age);
-637-
- two trained observers, equipped with binoculars, estimatethe loss of foliage and/or the percentage of discoloredneedles or leaves in 5% or 10% steps and record it as suchin the field form. They must agree on the final score. (Theallocation to the respective defoliation or discolorationclasses is made during electronic data processing in theoffice).
Defoliation is classified as follows:loss of foliage
0 - 10 %11 - 25 %26 - 60 %61 % and over
100 *
scoreno defoliation/healthyslightmoderateseveredead
Discoloration is classified as follows: ,class discoloration score
0 0 - 10 % none1 11 - 15 % slight2 16 - 25 % moderate3 26 - 60 % severe
A combined damage class can be optionally determined fortrees having lost foliage and being also partly discolored.The defoliation score is lowered by one or two classes formoderately and severely discolored trees, respectively.
In the classification, no reference is made to assumedcauses unless these are clearly visible in which case theyare recorded (e.g. bark beetle, Rhychaenus fagi, fungi).
4. Possibilities and constraintsThe International Cooperative Programme has been
effective in having 20 countries participate in a survey offorest health based on a common procedure. If a certainconsistency of the results from one year to the other andbetween countries has been achieved, this is due to twofactors: First, very early in 1985, the Commission of theEuropean Communities published a photo-guide containing veryinstructive images of damage in forest trees. For majorconifer and broadleaf species, reference trees (zero damage)and various stages of defoliation, discoloration and symptomsof abiotic and biotic origin are shown.' Only a year later,the Swiss Forest Research Institute published a photo-guidefor montane forests. Nearly at the same time the Institute ofPlant Biology of the University of Florence issued a photo-guide for assenssing trees in north-central Italy. Allpublications have been very useful for training and as areference in field work.
-638-
Second, in 1986 in the CSSR and 1987 in the FederalRepublic of Germany, forest experts from the Task Forcecountries met for three days of field training conducted bythe Forest Research Centre of Baden-Wuerttemberg. Theseoccasions provided ample opportunity for discussing assess-ment problems in the forest with different species. Becauseof existing regional differences in tree crown morphology anddefoliation pattern, two working parties have been set up forMediterranean and alpine forests, respectively. In arrangingthese regional meetings the forestry department of the EC atBrussels and the ECE-Programme Coordinating 'Centre cooperateclosely to assure that common standards are used and thecomparability of data is assured.
In this sense the symptomatology workshop of theDirectorate for Science and Research of ECE contributes tothe improvement of field procedures and to the comparabilityof results by bringing physiologists and biochemists incontact with survey experts. In this kind of survey only suchdifferentiating symptoms can be used which can be clearlyseen and which are unequivocal in their causal origin.
The survey has been designed to provide an impression offorest health and to indicate the frequency and spatialdistribution of damage symptoms. This objective has beenachieved within a short time and with a remarkable degree ofconsistency. In 1986, 80 million hectares of forests havebeen surveyed by assessing nearly 600,000 sample trees on30,000 plots (see also tables 1 + 2 ) . This would have beenimpossible with a more sophisticated, statistically adequatesurvey design.
The limitation of the survey to the subjectiveassessment of to visible symptoms, i.e., defoliation and/ordiscoloration has two inherent drawbacks:- assessments will always differ between crews and they
cannot be repeated objectively;- ^ h e statement that a certain percentage of foliage is lost
or discolored does not allow any conclusion on the causalagents involved. Since biotic and abiotic' natural causesare not excluded, the effects of anthropogenic factors, inparticular air pollutants, cannot be singled out.
Admittedly, the survey staff would be overburdened byhaving to make a differential diagnosis of causes andeffects, involving climatic factors, nutrient deficiencysymptoms and a variety of phenomena caused by insect orfungal infestations. Stand conditions very rarely permit anunimpeded view of the entire tree crown. Also, lookingagainst a bright sky makes the detection of smaller anomaliesextremely difficult. Evidently, the objectives of universalapplicability and simplicity of assessment, procedures areincompatible with the requirement of statistically accuratedifferentiation of causes and effects under the given timeconstraints. Differential diagnosis must therefore be made onpermanent plots as part of long-term observations of foresthealth.
-639-
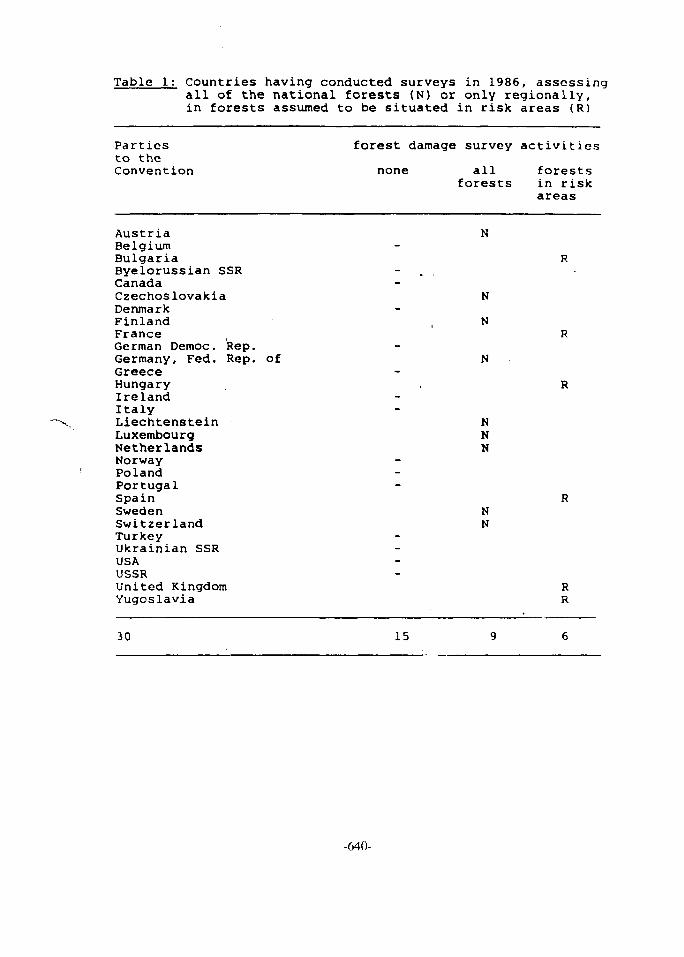
Table 1: Countries having conducted surveys in 1986, assessingall of the national forests (N) or only regionally,in forests assumed to be situated in risk areas (R)
Partiesto theConvention
forest damage survey activities
none allforests
forestsin riskareas
AustriaBelgiumBulgariaByelorussian SSRCanadaCzechoslovakiaDenmarkFinlandFranceGerman Democ. Rep.Germany, Fed. Rep. ofGreeceHungaryIrelandItalyLiechtensteinLuxembourgNetherlandsNorwayPolandPortugalSpainSwedenSwitzerlandTurkeyUkrainian SSRUSAUSSRUnited KingdomYugoslavia
N
N
NNN
NN
RR
30 15
-640-
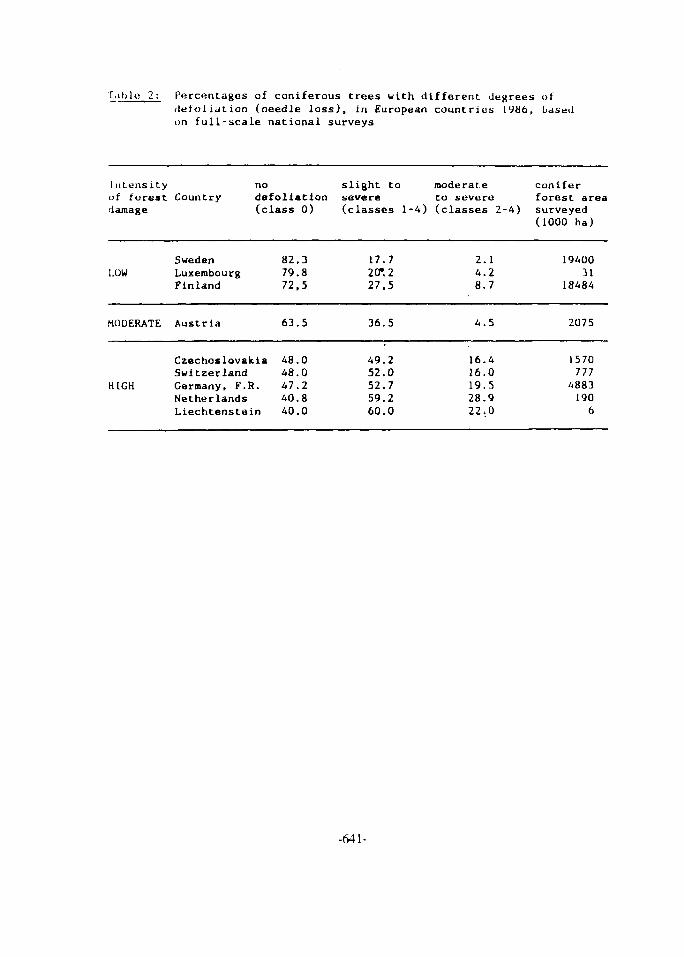
T.ihlc 2: Percentages of coniferous trees with different degrees ofdefoliation (needle loss), in European countries 1986, basedon full-scale national surveys
InLensityof forestdamage
LOW
MODERATE
HIGH
noCountry defoliation
(class 0)
SwedenLuxembourgFinland
Austria
CzechoslovakiaSwitzerlandGermany, F.R.NetherlandsLiechtenstein
82.379.872.5
63.5
48.048.0hi.240.840.0
slight tosevere(classes 1-4)
17.720*. 227.5
36.5
49.252.052.759.260.0
moderateto severe(classes 2-4)
2.14.28.7
4.5
16.416.019.528.922-0
coniferforest areasurveyed(1000 ha)
1940031
18484
2075
157011148831906
-641-
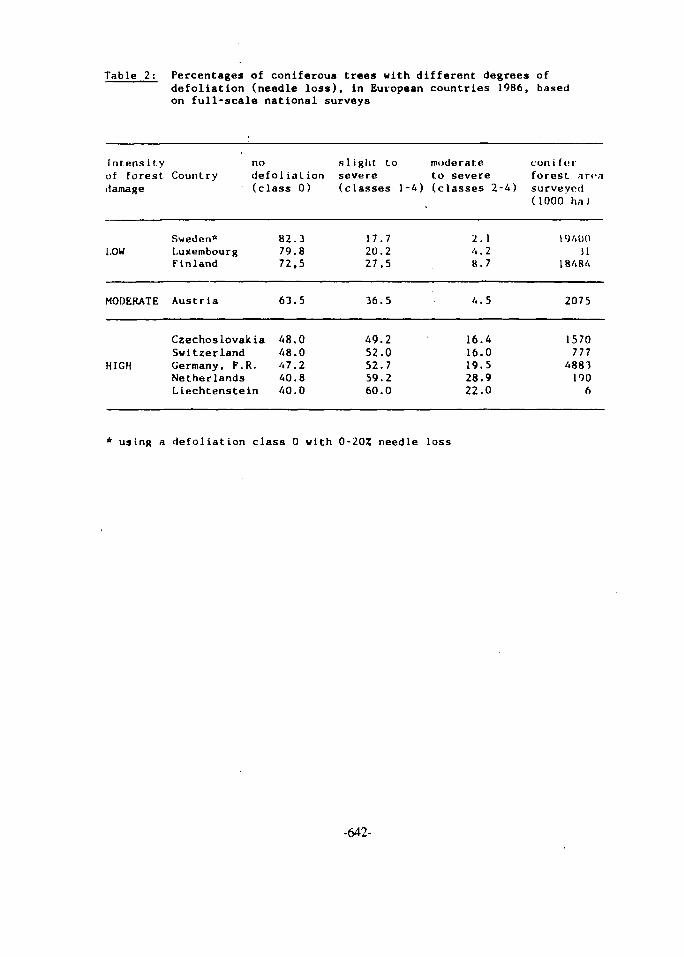
Table 2: Percentages of coniferous trees with different degrees ofdefoliation (needle loss), in European countries 1986, basedon full-scale national surveys
Intensi t.yof forestdamage
LOW
MODERATE
HIGH
noCountry defoliation
(class 0)
Sweden*LuxembourgFinland
Austria
CzechoslovakiaSwitzerlandGermany, F.R.NetherlandsLiechtenstein
82.379.872,5
63.5
48.048.047.240.840.0
slight tosevere(classes 1-4)
17.720.227,5
36.5
49.252.052.759.260.0
moderateto severe(classes 2-4)
2.14.28.7
4.5
16.416.019.528.922.0
con i ft; rforest areasurveyed(1000 h,i)
I9MH)SI
18A84
2075
1570777
4883190
6
* using a defoliation class 0 with 0-20% needle loss
-642-
References
(1) Commission of the European Communities: Diagnosis andclassification of new types of damage affecting forests.Special ed. EEC, AFZ, Brussels-Munich 1986, 20 p.
(2) Draft manual on methodologies and criteria for harmon-ized sampling, assessment, monitoring and analysis ofthe effects of air pollution on forests. Hamburg/Geneva:Programme Co-ordinating Centre, UNEP, UN-ECE 1986, 97 p.= Convention on long-range transboundary air pollution,Internat. Co-oper. Progr. on Assessra. and Monit. of AirPollut.Eff. on Forests.
(3) 1986 Forest damage survey. Bonn: Federal Ministry of:Food, Agricult. and Forestry, Nov. 1986, 69 p.
(4) GELLINI, R., CLAUSER, F.: Prime indagini sul deperimentodei boschi in Italia. Roma: Minist. dell'agricolt. edelle foreste 1986, 99 pag. = Collana Verde, 72/1986.
(5) SANASILVA: Kronenbilder - Couronnes d'arbres, le chiomedegli alberi. Eidgen. Anst. f. Forstl. versuchswesen,Birmensdorf 1986, 98 p.
NEXT PAQE(S)left BLANK
-643-
Proceedings of the Fifth International Conference tvja /0U024on Energy and Environment, Cairo, Egypt, 1996
MKTHOnOUilKS FOR DIAGNOSIS OF AIR POLLUTION ON PLANTS: A REVIEW.
l.A.HASSAN: AND M.K. ASHMORE"
i)cpanment oi Botany and Microbiology, Faculty ot'Science, 21526. El Shatb\. Alexandria. Eg\pt
2!Departmcnt ofBiolotry, Impenal College, London University, London SU"7 2 . \ . \ . L'.K.
1. INTRODUCTIONIn all branches of science, the development of new techniques and
methods of investigation is as central to progress as the formation of newideas and theories. As the study of pollution effects on vegetation hasprogressed, new techniques and new methological approaches have beendeveloped, so that we new have a range of established methods which havebeen used to establish links between pollutant exposure and plantresponse. Nevertheless, progress in identifying the role of airpolluation in the forest declines currently affecting many parts of Europehas not been encouraging; although many hypotheses exist, convincingevidence in support of them is fragmentary. Why is this? Is it that weare faced with a problem of unparalleled complexity, which will takedecades to resolve by whatever method? Or are the methods we are usinginappropriate, and restricting the development of scientificunderstanding?
2. HISTORICAL BACKGROUNDBefore considering the current situation, it may be useful to briefly
consider the historical development of methods of establishing thatsymptoms of plant injury are due to air pollutants. The first cases ofinjury investigated were around individual sources of pollution, whichproduced visible symptoms characteristic of the particular pollutant and,in extreme cases, drastic modifications of the forest ecosystem. ThusGorham & Gorham (1963) found that around a large smelter at Wawa, Ontariospecies number increased with distance downwind frcm the smelter. In thezones in wnich individual species started to survive, characteristicsymptoms of injury due to sulphur dioxide oould be found. In such cases,the clear spatial association between pollutant source and the affectedvegetation and the existence of necrotic symptoms typical of specificpollutants make diagnosis relatively straightforward; certainty inattributing causes can be increased if the opportunity is available toexamine the area before the source is operational.
In such cases, the existence of specific visible necrotic symptomswhich are characteristic of specific pollutants is central to diagnosis.These symptoms, however, are not sufficient in themselves for diagnosis.Symptoms which are superficially similar may be caused by other stressfactors; for example, same symptoms caused by fluoride are similar tosymptcjns produced by de-icing salts, moisture stress, virus infections,certain pesticides and certain nutrient deficiencies (Taylor et al.,1986). [here are also cases in which similar symptoms can be caused bydifferent pollutants. Lewis & Brennan (1978), for instance, showed thatundersurface glazing of leaves of Petunia hybrida, a symptom ccmmonlyattributed to peroxyacetyl nitrate (PAN), could be produced by fumigationwith a combination of ozone (CO and sulphur dioxide (SCO.
To a certain extent, such problems may be resolved by chemicalanalysis of affected tissue (for instance, to demonstrate the presence of
-645-
elevated concentrations of sulphur or fluoride) or by a detailedhistological examination of the affected tissue (e.g. Miller & Evans,1974). However, analysis of spatial and temporal variations in symptomexpression are also important diagnostic tools. The increased prevalenceof symptoms close to a source of pollution, or in areas experiencinghigher concentrations of the suspected pollutant, provides good evidenceto support diagnosis based on visible symptoms. Furthermore, sincevisible symptoms frequently appear immediately after exposure to highconcentrations of the suspected pollutant, links may be established bysimultaneously monitoring symptom occurrence and pollutant concentrations.Thus, in the example quoted above, lewis & Brennan (1978) showed thatPAN-like symptons of undersurface glazing, of petunia developed after theoccurrence of relatively high concentrations of O, and SO- in the field.
3. REGIONAL-SCALE DECLINESAfter the Second World War, cases of forest decline began to develop
which were spread over much wider areas, and which were not associatedwith obvious point sources of pollution. These problems emerged at thesame time as the development of taller stacks to improve dispersal ofpollutants, and the increased importance of secondary pollutants, such asozone. One such problem was the appearance in the 1950s of a new disease,initially called 'X disease', on Pinus ponderosa in the San Bernadinomountains of southern California (Parmeter et al., 1962). At the sametime, the development of post-emergence chronic" tipburn and ch lor oticdwarf of Pinus strobua was giving rise to concern in a number of areas ofthe eastern United States (Berry & Hepting, 1964). In both cases,diagnosis was lengthy and time-consuming, partly because it was notimmediately obvious that pollutants might be involved, and experimentalapproaches were needed. Initially, these included pruning andfertilisation experiments, transplantation of trees in and out of affectedareas, and grafting experiments; such procedures led to the conclusionthat an atmospheric constituent was of central importance (Berry &Hepting, 1964; Parmeter & Miller, 1968). However, it was the use ofcontrolled laboratory fumigation experiments, and the development oftechniques to filter pollutants from the ambient air, that was crucial inidentifying the pollutants involved (Dochinger & Sinclair, 1970; Costonis& Sinclair, 1969; Richards ejt al^, 1968).
The recognition that long-term exposure to relatively lowconcentrations of pollutants could cause adverse effects on plantperformance over wide areas in the absence of any visible symptomsprovided additional impetus to the development" of techniques forexperimental manipulation of the exposure of plants to pollutants. Thepast two decades.have seen the development inter alia of open-top chambersystems to control air pollutant concentrations under environmentalconditions close to ambient; of field fumigation systems for the additionof air pollutants under ambient conditions; of field systems for theaddition of controlled levels of acid rain; and of sophisticatedlaboratory systems allowing , simultaneous control of both pollutantconcentrations and environmental conditions. Many of these developmentshave themselves been dependent on the rapid expansion of ccnputertechnology over thfcs period.
The new wave of forest declines currently affecting Europe, NorthAmerica, and other parts of the world exhibit features which distinguishthem frcm the regional declines described above. Although both affectlarge areas, and both show wide variations in response between adjacenttrees, there appears to be a key difference in the nature of the symptoms
-646-
observed. In these former cases, there was a consistent symptamologyfound at affected sites, which was ascribed to a single major cause, viz.air pollutants. In the present situation, however, most of the reportedsymptoms, such as premature leaf loss, altered branching patterns anddecreased crown density, are not specific, but may be caused by a range ofenvironmental stresses. Furthermore, the visible foliar symptunsexhibited by the same species may differ on different sites; for instance,Hehfeuss (1985) has identified several damage types for Picea dbies inUavaria. Finally, a wide range of tree species are affected.
Cowling (1985) listed seventeen regional-scale declines which havedeveloped in western Europe and North America in this century; he aryuedthat all are the result of several stress factors acting simultaneouslyor sequentially. Manion (1981) developed the concept of multiplecausality by distinguishing three types of stresses which act cumulativelyto send an individual tree into a spiral of decline. The first of theseare predisposing stresses, which have a long-term role in weakening thetree and making it susceptible to short-term inciting factors: theseinciting factors are episodic stresses which induce sudden physiologicalshocks. Finally, contributing factors, such as biotic diseases, mayaccelerate the decline of an affected tree. In these schemes, pollutantsmay generally play the role of either a predisposing or an incitingstress, or indeed both.
4. CHOICE OF METHODOLOGYA range of techniques have been developed to investigate the
relationship between pollutant exposure and plant response. Ihesetechniques can be envisaged as lying along a gradient of decreasingexperimental control and increasing realism. Thus fumigation experimentsunder controlled environmental conditions provide a high certainty ofascribing an observed response to pollutants and provide the opportunityof reproducing these conditions; however, there is uncertainty alxiuL howrelevant these conditions are to the real world. In contrast, lieldobservations provide information under ambient climatic conditions mlwithin the complex interactions of plant communities;' however, ihe lack oiexperimental manipulation makes it more difficult to prove CJUSL- ef r-.:trelationships. Field experiments lie in an intermediate |>)sn inn,depending on the extent of experimental interference wiUi the IH.-,Iecosystem.
The choice of methodology for a particular diagnostic test cannot t«made in isolation; it depends on a number of fact6rs including one'sconceptual understanding of the problem being investigated and the natureof the scientific questions being addressed. Last (1983) has argued thatprocedures analogous to those proposed by Koch for identification of thesymptoms of diseases with pathogenic organisms can be used to test, theinvolvement of pollutants in forest decline. Thus the major tests i > (».•satisfied would be that a particular pollutant (or combination of sttessfactors) must be constantly associated with the symptom in the field, tji.itthe symptom can be reproduced by exposure to the pollutant (or comb in it. ionof stress factors) under controlled conditions, and that. the symjitmt.. • mbe eliminated by removal of the pollutant (or combination n| >I.I.-, .factors).
However, other plant patholog ists have been less convinced ot up-value ot Koch's postulates as a basis tor the diagnosis ot plant 'IISLMV,.hoc instance, Wallace (1978) argued that aLl plant diseases tuwu muii i;>i..-causes, in contrast to Koch's model of a single pathogenic orj.iuisiii. I'm-,
are thought to differ only to the extent ot which they .H"J lumoi
-647-
Lo causal factors; in some cases, one factor is so predominant that it canhe identified as the 'cause', whereas for other cases a larrje number offactors may contribute. Wallace (1978) suggested that for disoasos otcomplex etiolocjy, Koch's postulates were of limited value; in such cases,the major objectives should be to determine the relative importance ofdifferent factors, to understand how they relate to each other and to rti.•• liS'Msu symptoms, and to identify the roles played by different factor-';.il>." argued that the most appropriate initial method of approach is n<^i'<|-»'r iinuntal, but a field-based synoptic approach, 'in which sets of dataon the prevalence of a range of disease symptoms, and on a range I• •iiv ironmental factors, are collected and then related using mul t iv<jr 1 .it »•statistical approaches. This should lead to formulation of hypotnosi'sabout; how these factors are linked which can be- tested in field<;x;>.'r iments.
This analysis of methodological approaches in plant pathology seemsto provide a pertinent analogy for pollution studies, in which cases mayrange from acute visible injury in the vicinity of a single large sourceof: pollution to large scale decline phenomena to which many factors maycontribute. It is highly unlikely that the same methodology will beappropriate in all these cases. For example, in analysis of spatial andtemporal variation in biological response around a single source, spatialMV\ ternporal variation in other environmental factors, e.g. ini: .:• >-J.imate or soil conditions, is treated as 'noise' (Green, 1979).h';>wcv'-r, in multiple stress situations, in which soil conditions,remjx-r.iture, water stress etc. may all contribute to the observedphen.• nKjna, such a method of analysis may longer be useful.' i > i" ntrolled laboratory experiments
P. is possible to diagnose a complex multi-factorial situation bydesigning more and more complex experiments under controlled environmentalconditions? I would argue that this is not likely to be a fruitfular-p! >;-jh for a number of reasons. The results of experiments studying theliiter.-jci ion between just two factors indicate that there are manylinctff.'i! nties about their outcome. The nature of the interaction between: he same two pollutants has been shown to be dependent on theconcentrations in which they are applied and the length of the exposure.!hu-. Mcriowall & Cole (1971) reported that synergistic interactions between
anri S0 0 on Nicotiana tabacum were especially pronounced when both were:;f.;:.in! at close to their threshold doses, while Heagle & Johnson (1979)four*! 'v-jtih synergistic and antagonistic interactions between O, and SO2 oni,iy.->'!<: max, depending on the concentrations used.
Tho time sequence of exposure may be important; thus Hogsett ot al.(I984i found that SO- and NO, reduced the growth of Raphanus sativus whenapplied simultaneously, but not when applied sequentially. Even when only•-.inqlo [xHlutants are involved, the time course of pollutant exposure maybo critical to the outcome. Garsed S> Rutter (1984) compared the effectson Pinus sylvestris of exposure patterns to SO- which provided the samelong-term mean concentration, but different patterns of temporalfluctuation; they found some evidence of greater effects on growth of atreatment providing peaks of 20-30 h duration compared with a treatmentproviding no peaks. Chanway & Runeckles (1984) reported a complexrelationship between the length of exposure of Phaseolus vulgar is to 1<JWconcentrations of ozone and the subsequent impact of an acute dose.
The nature of interactions between pollutant exposure and otherenvironmental factors is also known to show complex relationships withpollutant concentration, exposure duration, and temporal dynamics. For
(•instance, Heggestad et al. (1985) reported that the nature of interactive
-648-
effects between O^ and soil moisture stress on yield of Glycine max variedaccording to the concentration of 0, applied. Rpcent work at ourlaboratory has shown that the growth rate of Aphis fabae on Vicia faba isincreased by exposure of the plants to 100 ppb O3 for' less than 24 hours;however, exposure of the plants to 0, for 24 hours or longer tends toreduce aphid growth rates (Brown, pers. conrn.). The environmentalconditions under which an interaction is studied may also influence theoutcome. Thus, with another aphid/plant system, Cinara pilicornis onPicea sitchensis, Brown (pers. connt.) found that exposure of plants to O,at low temperatures enhanced aphid survival, but at high temperatures theopposite effect was found. Symptom expression may also be affected;Miller & Davis (1981) reported that exposure of Phaseolus vulgaris to<Xj/SO_ mixtures produced O_-type symptoms at 32 C, SO--type symptoms atlaX, and a mixture of symptoms of 24 C.
Finally, there is evidence that plant age and the stage ofdevelopment of individual leaves may influence responses to pollutants.Thus Davis & Wood (1972) reported that needles of sensitive conifers weregenerally most injured by acute doses of O, between. 4 and 10 weeks afterbudbreak, while Evans et al. (1978) reported that simulated acid raincaused more visible lesions on leaves of hybrid clones of Populus whichhad just expanded than on very young or very old leaves. Garsed & Bell(1978) exposed seedlings of Pinus sylvestris ranging in age from 0.6 to3.0 years to SO_, and found the greatest effects on dry weight on theyoungest material. The effects of the much wider difference in agebetween a mature forest tree and the seedlings and saplings which must beused in controlled environment facilities are not certain. Neverthelessit seems inevitable that the major differences between them in, forinstance, hormonal balance, water relations, assimilate partitioning,canopy processes and reproduction must have a major influence on thenature of pollutant effects on tree function.
Clearly, given the complex nature of two-factor interactions, theuncertainty attached to the outcome of four- or five-factor experimentswill be considerable. In such circumstances, experiments involvingdifferent levels of stress and different temporal patterns for each factorwill rapidly become impossibly complicated. The alternative, ofreproducing the precise temporal dynamics of each stress factor observedin the field, in order to ensure that the experiment is carried out at apoint on the response surface which is similar to that observed in thefield, may be technically feasible. However, one must question whetherthe effort expended on reproducing field conditions in this way might notbe tietfeer used in manipulating the field situation in situ, especially asthere are same aspects of the field (e.g. the physical separation betweenroots and leaves, and the population dynamics of major pests) which cannotbe satisfactorily handled in a physically restricted environment,(b) Field observation
Field observations may be used to establish associations in timeand/or space betwen symptom expression and ambient pollution levels. Asindicated above, such associations can provide strong evidence of theadverse effects of a single large source of pollution, as the scale ofspatial or temporal variation in pollution levels is large compared tothat of other factors. However, the value of such an approach inlarge-scale declines, which may have developed over many yedi.s, and inwhich many causal factors may be involved, is less certain.
Although much effort has been spent throughout Europe over the pastfew years in national surveys of tree health, there has been littleattempt to analyse the causes of the observed spatial variation, or to
-649-
test associations with pollutant distribution. In the U.K., djt.i f r «nsurveys in 1984 and 1985 were subjected to a step-wise multiple n<|r«ssn»ianalysis (Binns et al., 1985r 1986). Sulphur deposition was used as avariable alongside climatic factors (such as rainfall) and site factors(such as slope); it was found that for Pinus sylvestris, needle lonrji.-v it ywas increased in areas with higher levels of sulphur deposition. il> M W . T ,is a simple multiple regression technique, which seeks rel.it ionsh i;>sbetween an individual symptom and a limited set of uncorrelat id cius.ilfactors, a useful model for the analysis of complex multi-factor d».'<:lin.>phencmena? When surveys are based on a small number of symptoms, atwhatever level of biological organisation, there is no possibility ofrecognising links between groups of stress factors and groups of plant.responses, and thus the generation of testable hypotheses is unlikely.Similarly, if only one or two stress factors are included, if isimpossible to evaluate the relative importance of different causal a'juntsor to identify critical combinations which may be linked to specificsymptoms. There is thus a need to recognise that the response of theforest ecosystem can best be described by a suite of symptoms, which maybe expressed at different levels of biological organisation, and that alarge number of variables may be required to describe adequately thecausal factors which may be involved.
Implicit in this approach is the use of multivariate techniques, suchas cluster analysis, principal components analysis and discriminantanalysis, for interpretation of field data. Such techniques are routinelyused in the interpretation of data on water pollution and its effects(Green, 1979), but have received surprisingly little attention in theanalysis of the effects of airborne pollutants. Nevertheless, they areexceptionally powerful tools for evaluating complex ecological problems,since they allow relationships between groups and combinations ofvariables to be readily identified. One example of the use of this typeof analysis is the work of Young & Matthews (1981) who exposed Pisumsativum plants at a number of sites in north-east England. They usedcanonical correlation analysis to identify relationships between a set otenvironmental parameters and a set of four parameters describing plantresponse. The analysis allowed identification not only of simplerelationships (e.g. between temperature and plant growth), but alsointeractive effects (e.g. between maximum temperature, minimum temperatureand the fluoride content of plant parts).
The use of field-based observational approaches to seek spati.il <indtemporal associations between symptoms of plant response and air pollutantinputs may be limited by the problems of defining the dose of eachpollutant received by the plant. Where large numbers of sites areinvolved, it rapidly becomes prohibitively expensive to monitorcontinuously all pollutants. It is not always certain what the importanceof occasional episodes of high concentrations is, as opposed to lorvj-t'T-rnmean concentrations which can be determined at lower cost for certainpollutants, e.g. using diffusion tubes (Atkins et al., 1986). In theabsence of on-site measurements, it may be possible to use interpolateddata from monitoring networks (although their accuracy will depend on thedensity of the monitoring stations) or values derived from computermodels. However, local topographic and microclimatic features maysubstantially alter the concentrations and rates of deposition which areactually experienced at an individual site. It is not possible togeneralise; different physical forms and different pollutants exhibitdifferent scales of temporal and spatial variation which influence thecertainty with which their deposition rates at any point can be estimated.
-650-
However, it is clear that better methods of evaluating site-specificpollutant levels need to be developed if data from large-scale £iel<isurveys are to be used to best advantage.
In using temporal associations to establish relationships betweenpollutant exposure and plant response, the use of historical data may beijt considerable value. In the case of lake acidification, the analysis otdiatom assemblages in sediment cores has provided crucial evidence <>£decreases in pH in catchments with different management histories(battarbee & Charles, 1986). More recently, evidence has been obtained ofa reversal of this trend over the past five years (Battarbee et al.,1988), which is associated temporally with the fall in U.K. SO_ emissionssince 1980. Measurements of the growth rings of Picea abies (Kenk e_t al.-,1984) or of annual shoot growth of Fagus sylvatica (Roloff, 1985T hi~veshown that growth rates of trees showing visible symptoms of decline beganto decrease about 20-30 years ago. There have been few attempts in Europeto relate such changes in annual growth rate to environmental parameters.Such a dendrochronological approach has received greater attention in theeastern U.S.A. in relation to declines of Picea rubens and other sjjecies.For example, Cook (1985) developed a model to predict annual ring growthfrom climatic data using information for the period 1890-1950. Subsequentring widths were close to those predicted until 1967, when they began tofall below those predicted. Such results provide evidence of recentchanges in tree growth patterns, but in the absence of good historicalpollution data, it is difficult to provide more rigorous tests of the roleof pollutants in this. The value of such an approach could be enhanced bypaying attention not only to ring width, but also to ring structure, orchemical composition. Fumigation experiments with SO-, for example, haveshown that its effect is mainly on the formation and structure of latewtxxlin both Picea abies and Fagus sylvatica (Keller, 1978; Keller & Beda-Puta,1981). In field studies of Pinus densiflora around an industrial area,Yokobori & Ohta (1983) found that pollutant levels were more closelycorrelated with an index combining ring width with variations in ringdensity than with ring width alone.
It is vital to recognise the importance of the ability of a tree torespond to environmental changes. A range of hcneostatic mechanisms maybe involved in recovery of the organism from the impact of anenvironmental stress, whether it be an episode of high pollutantconcentrations, a severe drought, or a pest outbreak. Thus changes inresponses to environmental stresses may of considerable diagnostic value.There is evidence of this type from dendrochronolog ical studies. Forexample, Mclaughlin et al. (1985) found that the growth of both healthyand declining individuals of Acer saccharum was depressed by an outbreakof forest tent caterpillar in 1975-78, but that the growth of the healthyindividuals recovered to a much greater extent after.the outbreak.
Temporal associations between pollutant input and physiological orbiochemical response may also be of value. Lee et. a_l. (1987) compared theresponses of the substrate enzyme nitrate reductase to episodes of wetdeposition of nitrate in Sphagnum species. Vt\en Sphagnum cuspidatum wastransplated from a relatively unpolluted site to the southern Pennines, anarea of northern England where many Sphagnum species have disappeared, theresponse of nitrate reductase to nitrate deposition was initiallyobserved, but rapidly disappeared. In contrast, populations from thesouthern Pennines showed a very low activity of nitrate reductase, and noresponse to nitrate deposition. These different patterns of responseprovide good evidence of that nitrate deposition is a major factorres[xjnsi!:le for the poor performance of these species in the southern
-651-
Pennines.(c) Field experimentation
Field observations can provide evidence of associations between a sotof causal agents and forest decline symptoms, from which it may bepossible to construct working hypotheses to explain the relationshipsbetween them. If there is evidence that pollutants are involved, is itpossible to test this working hypothesis by manipulating the forest systemin the field to test whether responses consistent with the hypothesisoccur? The need to do this on the scale and level of complexity of ,imature forest raises two major problems. Firstly, can techniquesdeveloped for use with crops or tree saplings simply be scaled up and,secondly, will the requirement for an adequate level of replication in themore variable field environment make the exercise prohibitively expensive:*
Techniques for the application or removal of dry deposited pollutantsoffer a range of possibilities for field studies in mature forestcanopies. One possible approach is the use of outdoor fumigation systems(e.g. Mcleod et al., 1985). Such systems have the major advantage thatthey cause minimal environmental alteration, and thus the responses ofecosystems can be studied in situ. However, the use is limited to theaddition of pollutants to the ambient concentrations; although non-chamberexclusion systems have been constructed (e.g. Olsyk et al., 1986) thelarge air flow required results in their use being limited to low growingcrops. Outdoor fumigation systems have been used effectively with treesaplings (Shaw, 1986) or with rows of fruit trees (de Cornus et al.,1975). Their application, however, in closed forest canopies is lesscertain. A second major type of approach is the use of open-top orsemi-open top chambers to enclose tree saplings or individual specimens.Such chambers have been used to study the effects of both pollutantaddition or removal (e.g. Arndt et al., 1985; Wang et al., 1986).However, the environment within such chambers is inevitably different fromthat outside; temperatures are higher, rainfall is partially excluded, andwind speed and direction are altered. Furthermore, the presence of. pestsand pathogens may be considerably altered. Such chambers were originallydeveloped for use with crops and were restricted in dimensions to 2-3 m.Although it is physically possible to construct larger chambers, it is notyet clear whether the problems of increasing scale will not causeinsuperable problems in terms of greater alteration of environmentalconditions and ensuring air distribution patterns which provide realisticpatterns of pollutant deposition within the tree canopy. A final inethulof approach which may prove valuable in mature canopies is the enclosureof individual branches. The exclusion of ambient pollutants has proved tobe a useful tool, for example, in identifying the cause of necrotic damageto needles of Pinus strobus (Costonis & Sinclair, 1969) or leaf-rollnecrosis of. lilac (Hibben & Taylor, 1974). In the latter case,solar-powered motors were used to provide air circulation through ,tcylinder enclosing individual branches. Treatment of, individual branches,rather than the whole tree, means that only certain questions can beaddressed and the validity of the approach in long-term experimentsdepends on the extent to which individual branches act as autonomous unitsor ..ire influenced by physiological changes in neighbouring branches.Nevertheless, this technique may provide a useful method for examining howpollutant impact is modified by differences in microclimate, and in leafstructure and physiology, through a forest canopy and for testing whetherpollutants contribute to specific leaf symptoms.
Methods for manipulating the wet deposition of pollutants have alsoprimarily been developed for use with crops or with tree saplings; two
-652-
major difficulties arise in increasing the scale of application. Firstly,it ambient rainfall is not excluded additional applications will increasetotal rainfall above that normally received, and in polluted areas asuitable control treatment is not available. If, on the other hand, sanetorm of. permanent shelter is constructed to exclude ambient rainfall, theenvironmental conditions in the experimental area will inevitably bejltered substantially. A valuable campremise is provided by automaticexclusion systems, which allow shelters to be moved into position at theonset of a rain event (e.g. Kuja et al., 1986), but the feasibility ofcontructing such a system for a mature forest system must be doubtful.The second major problem is that of providing a facility thatrealistically simulates the process of interception of wet deposition byforest canopies. This problem may be particularly acute in the case ofwind-driven cloud or mist, which because of their high ionic strength andhigh efficiencies of capture by forest canopies (Lovett, 1984) may make amajor contribution to total wet deposition in many areas.
The technical possibilities of manipulating wet and dry depositionrates of pollutants to a forest canopy all have major disadvantages interms of cost and a requirement for power, which prevents theirapplication at remote sites. However, it is important to recognise thatcomparatively simple manipulative experiments may still provide usefuldiagnostic information. A good example is the use of fertilisationexperiments for the diagnosis of nutrient deficiencies. This approach iswell established in forestry, and has been usefully applied to currentproblems of forest decline. For example, Zoettl S. Huettl (1986) reportedthe results of three diagnostic fertilisation trials, based on analysis ofnutrient contents of needles and soils at sites showing different types offorest decline symptom. At one site, application of zinc, calcium andmagnesium resulted in a greening of chlorotic tips* of older needles ofPicea abies which was associated with increased needle content of theseelements; at a second site, showing needle loss, tinselling and generalchlorosis of the same species, it was application of potassium which ledto an improved green colour and more vigorous growth. Another type ofmanipulative experiment designed to test the role of mineral deficiencesin the development of chlorotic symptoms on the older age classes of PiceaaDies was reported by Lange et al. (1987). This experiment was based onthe observation that chlorosis often developed in late spring when a newtlush o£ green needles was produced, suggesting that a translocation ofcritical mineral elements was responsible. They removed terminal budsfrom branches of both symptomatic and asymptomatic trees; chlorophyllcontents of previous year's needles of asymptomatic trees were notaffected by this procedure, but those in symptomatic trees were ncreasedby removal of the new flush of needles. The relationship of these changesto altered nutrient contents was not clear in this particular experiment,but this experiment shows the importance of retranslocation between olderneedles and new needles in the development of chlorotic symptoms in theformer.
This type of simple manipulation experiment can provide equallyvaluable negative results. Thus Parmeter & Miller (1968) reported thatfertilisation with NPK, or injection of micronutrients into tree stems,hud no effect on chlorotic mottle of l>inus ponderosa. They also usedreciprocal grafting to establish the cause of this symptom. Healthyscions grafted onto diseased trees remained healthy, while scions showingchLorotic nettling continued to exhibit symptoms when grafted onto healthytrees; these results strongly supported the inferen-.. .• hat the observedsymptcnis were due to direct effects of an air pollu.ant, rather than
-653-
inadequate root supply or the presence of a transmissable pathogen.Such techniques do not provide direct tests of the role of particular
pollutants in causing observed symptoms, and clearly cannot provide acomplete diagnosis. Thus, the demonstration of a specific nutrientdeficiency still leaves the question unanswered of why this deficiency hasdeveloped; the roles of, for example forest management, of soilacidification or of enhanced rates of leaching remain to be elucidated.Nevertheless, such simple and inexpensive techniques,, which may providepositive results relatively quickly, may be invaluable in excludingcertain hypotheses, and in identifying critical aspects of the declinephenomenon. As such, they can serve to focus the more elaborate, moretime-consuming and more expensive research programmes on the relevantscientific questions.
It may indeed be possible to develop more specific chemicaltreatments to study the role of specific pollutants at remote fieldlocations. One example is the use of ethylenediurea (ECU), a chemicalwhich protects plants from injury due to ozone. Foliar spraying of EDU onagricultural crops has been shown to reduce visible O- injury and increaseyield (e.g. Bisessar, 1982). The compound has been shown to protect treeseedlings from 0, damage in greenhouse conditions (Roberts et al., 1985)although it has not yet been used with larger trees in the field. Thepotential of this, and other such chemicals, as a diagnostic tool must beconsiderable, as they also offer possibilities of investigatinginteractions between 0, and other stresses in the field.
5. CONCLUSIONSThe Interpretation of observations and experimental manipulations
made under field conditions will require a thorough understanding of thenormal functioning of a forest ecosystem. Since a full diagnosis ofmultiple-stress situation may require unravelling very subtle and complexinteractions between pollutant inputs and the annual patterns of growth,decomposition and nutrient cycling within the forest, it is essential thatgood conceptual models of the system are available. Such models will bean essential tool in the integration of information obtained at differentlevels of biological organisation, as well as in synthesis of the enormousbody of data now being accumulated throughout Europe. Unfortunately,there are many gaps in our knowledge of healthy forest ecosystems. Forexample, understanding of the physiology of trees is not as advanceed asthat of agricultural crops, while understanding of the structure andfunctioning of the rhizosphere, which many results indicate may be acritical area in forest decline, is very limited. There is therefore arequirement for better understanding of the normal situation.
It is clear that field observation, field experimentation andcontrolled environment experimentation can all play an important role inthe diagnosis of forest decline and the identification of the contributionof different pollutants to this phenomenon. Each approach has itsindividual strengths and weaknesses. However, this begs the crucialquestion, i.e. what is the most effective and efficient route to asatisfactory diagnosis? Sigal & Suter (1988) identified four levels ofbiological organisation at which pollutants may act, viz. the individual,the population, the community and the ecosystem. While effects at higherlevels of organisation will only be observed if there is an impact on theindividual organism, these effects on individuals will be integrated athigher levels of organisation to produce responses which may bequalitatively quite different. Two further points are critical in thepresent context. Firstly, there are certain processes, such as
-654-
biogeochemical cycling, which are probably of central importance in forestdecline and which can only be properly considered at the ecosystem level,where biotic and abiotic environments combine. Secondly, for practicalreasons most experimental methods of studying pollutant effects on theindividual have been developed for tree saplings or seedlings, whichdiffer greatly in structure and physiology from the mature trees which are,of more concern at the community or ecosystem level.
These considerations, together with the likely involvement of manycausal factors, leads me to conclude that field-based research must playthe central role in diagnosis. It is essential to design and executefield surveys which take into consideration a wide range of responses atdifferent levels of biological organisation, and as many potentialcontributing factors as possible. Such a comprehensive synoptic approachwill be expensive to carry out, but I believe that it can provide crucialinformation on the relative importance of different factors, orcombinations of factors, in contributing to forest decline, and on howdifferent symptoms interrelate. Wallace (1979) argued, in the context o£plant pathology, that such synoptic studies can be most cost-effectivewhen a multiple-causal situation is suspected, when the disease iswidespread, and when the amount of damage is high; these are all criteriawhich apply very well to forest decline. At the same time, fieldexperiments are essential to provide confirmation . of the role ofpollutants and to test hypotheses which may develop from fieldobservations. Again, integrated research programmes will be required toevaluate the effects of any manipulation of the forest at different levelsof organisation, and to understand how they interrelate. There is a majorneed for technical developments which will allow such experiments to beconducted on an appropriate scale, but in the meantime there is some scopefor simpler manipulative work. Finally, while controlled laboratoryexperiments can never provide a relevant and comprehensive test ofmulti-causal hypotheses at an ecosystem level, they do provide animportant facility in which to test ideas of how individual components ofthe system interrelate in isolation.
Concentration of research effort on large—scale field-based exerciseswill require collaboration of scientists from many different disciplinesto provide the maximum benefit. It will also be essential to provide amethod of integrating the information which is collected; conceptualmodels can provide a framework for this, within which the links betweenresponses to pollutants at different levels of biological organisation,and with the aerial and edophic environments, can be properly understood.By combining several different types of manipulative experiment on asingle site, it may be possible to increase the extent to which the roleof pollutants with the forest ecosystem can be elucidated. Nevertheless,it would be foolish for anyone to propose a rigid scheme for diagnosis, orfor resources to be devoted to one line of approach to the exclusion ofany others. Science often progresses not through rigorous step-by-stepprocedures but through a sudden flash of insight from a totally unexpectedquarter. There may yet be a simple, all-embracing explanation of forestdecline waiting to be stumbled across, but if there are indeed many causalfactors long-term field-based observation and experiment will boessential.
6. REFERENCESARNDT, U., SEUFERT, G., BENDER, J. and JAGER, H.J. (1985). Untersuchurvjon
zuro Stoffhaushalt von Waldbaumen aus belastenten Modellokosystmnen inOpen-top-Kammern. VDI-Berichte 560: 783-803.
-655-
'\SHMORlf., M.R., BELL, J .N.B. and RUTTER, A.J . (1988). Effects of acid n i non t r e e s and higher p l a n t s . In: Acid Rain and B r i t a i n ' s NaturalEcosystems. (Ed. by M.R. Ashmore, J .N.B. Bell & C. Garrot ty) pp.39-54. imperial College Centre for Environmental Technology, London.
ATKINS, D.H.F.:, SANDALLS, J . , HOUGH, A.M. and STEVENSON, K. (1986). Themeasurement of nitro<jen dioxide in the outdoor environment usirvi[vissivo d i f fus ion tube samplers. Rept. AERE R12133. AKHK, l l i r w l l ,Oxlordshire .
HAIMAKHKi:, K.W. and CHARLES, IJ. (1986). Diatom-based pi! n ; c o n s t n r i luns tud ie s of acid lakes in Europe and North America: a syntl,'". i s .Water, Air (. Soi l Po l lu t . 30: 347-354.
BATTARHEE, R.W., FLOWER, R.,1., STEVENSON, A.C., JONES, V . J . , HARRIMAN, H.and APPLK'HY, O.G. (1988). Diatom and chemical evidence firr e v e r s i b i l i t y of a c i d i f i c a t i o n in S c o t t i s h l o c h s . Nature SJ2:530-532.
BERRY, C.R. and HEPTING, G.H. (1964). Injury to eas te rn white pine byuniden t i f i ed atmospheric c o n s t i t u e n t s . Forest Sc i . 10: 2-13.
BINNS, W.O., REDFERN, D.B., BOSWELL, R. and BETTS, A.J.A. (1985). ForestHealth and Air Po l lu t ion . 1984 Survey. Forestry Commission Research& Development Paper no. 142. Forestry Commission, Edinburgh.
IUNNS, W.O., REDFERN, D.B., BOSWELL, R. and BETTS, A.J.A. (1985). ForestHealth and Air Po l lu t ion . 1985 Survey. Forestry Commission Research& Development Paper no. 147. Forestry Commission, Edinburgh.
BISSESAR, S. (1982). Effect of ozone, ant ioxidant p ro t ec t ion , and ea r lyb l i g h t on p o t a t o in t he f i e l d . J . Amer. Soc . Hor t . S c i . 107:597-599.
CHANWAY, C .P . and RUNECKLES, V.C. ( 1 9 8 4 ) . The r o l e of s u p e r o x i d edismutase in the s u s c e p t i b i l i t y of bean leaves t o ozone in jury . Can.J . Bot. 62: 236-240.
COOK, E.R. (1985). The use and l i m i t s of dendrochronology in studying thee f f e c t s of a i r po l l u t an t s on f o r e s t s . In: Effects of Air Po l lu tan t son F o r e s t s , Wetlands and Agr icu l tu ra l Ecosystems. (Ed. by J .C .Hutchison (, K.M. Meema) pp. 277-290. Springer-Verlag, New York.
COSTONIS, A.C. and SINCLAIR, W.A. (1969). Relat ionships of atmosphericozone to needle b l i gh t of ea s t e rn white p ine . Phytopathology 59:1566-1574.
COWLING, E.B. (1986). Regional dec l ines of fo res t s in Europe and NorthAmerica: the poss ib le ro le of a i rborne chemicals . In: Aerosols .(Kd. by S.D. Lee, T. Schneider, L.D. Grant & P . J . Verkerk) pp.855-864. Lewis Publ ishers , Michigan.
DAVIS, D.D. and WOOD, F.A. ( 1 9 7 2 ) . The r e l a t i v e s u s c e p t i b i l i t y ofeighteen coniferous species to ozone. Phytopathology 62: 14-19.
de CORMIS, L. , BONTE, J . and TISNE, A. (1975). Technique e x p e r i m e n t a lpe rmi t t en t l ' e tude de 1 ' incidence sur la vegeta t ion d'une po l lu t ionpar le dioxyde de soufre applique en permanence e t a dosesubnecrot ique. Po l lu t . Atmos. 66: 103-107.
DOCHINGER, L . S . and SELISKAR, C.E. ( 1 9 7 0 ) .c h l o r o t i c dwarf d i sease of ea s t e rn white46-55.
EVANS, L . S . , GMUR, N.F. and da COSTA, F. (1978).clones of hybrid poplar . Phytopathology 68:
GARSED, S.G. and BELL, J .N.B. (1978). Experience gained by long-tormfumigation with low SO2 concen t ra t ions . VDI-Berichte 314: 243-247.
GARSED, S.G. and RUTTER,A.J. ( 1 9 8 4 ) . The e f f e c t s o f f l u c t u a t i n qconcent ra t ions of sulphur dioxide on the growth of Pinus s y l v e s t r i sL. and Picea s i t chena i s (Bong.) Carr . New Phytol . 97: 175-195.
Air pollution and thepine. Forest Sci. 16:
Foliar responses of six847-856.
-656-
GORHAM, A.G. and GORHAM, E. (1963). Ecological effects of air pollutionfrom an iron-sinterirvg plant at Wawa, Ontario. Can. J. Bot. 41:1063-1078.
GREKN, R.H. (1979). Sampling Assign and Statistical Methods forEnvironmental Biologists. John Wiley, New York.
HEAGLE, A.S. and JOHNSTON, J.W. (1979). Variable responses of soybeans tomixtures of ozone and sulfur dioxide. J. Air Pollut. Contr. Assoc.29: 729-732.
HEOiESTAD, H.E., GISH, T.J., LEE, E.H., BENNETT, J.H. and DOUGLAS, L.W.(1985). Interaction of soil moisture stress and ambient ozone ongrowth and yields of soybeans. Phytopathology 75: 472-477.
HIBBEN, C.R. and TAYLOR, M.P. (1974). The leaf roll-necrosis disorder oflilacs: etiological role of urban-generated pollutants. J. Amer.Soc. Hort. Sci. 99: 508-514.
HOGSETT, W.E., HOLMAN, S.R., GUMPERTZ, M.L. and TINGEY, D.T. (1984).Growth response in radish to sequential and simultaneous exposures ofNO, and SO,. Environ, Pollut., Series A 33: 303-325.
KUJA, A7, JONES7 R. and ENYEDI, A. (1986). A mobile rain exclusion canopyand gaseous pollutant reduction system to determine dose-responserelationships between simulated acid precipitation and yield of fieldgrown crops. Water, Air & Soil Pollut. 31: 307-315.
KELLER, T. (1978). Der Einfluss einer SO,-Belastung . zu verschiedenenJahreszeiten auf CO_-Aufnahme und Jahringbau der Fichte. Schweiz. 1.Forstwes. 129: 381-393.
KELLER, T. and BEDA-PUTA, H. (1981). Luf tverunreiningungen undSchneedruck-eine Beobachtung an Buche. Forstarchiv 52: 13-16.
KENK, G., KREMER, W. , BRANDL, H. and BURGBACHER, H. (1984). DieAuswirkungen der Walderkrankungen auf Zuwachs und Reinertrag in einenPlenterwaldbetrieb des Mittleren Schwazwaldes. Allgemeine ForstZeitung 27: 692-695.
LANGE, O.L., ZELLNER, H., GEBEL, J., SCHRAMEL, P., KASTNER, B. and CZYGAN,F.C. (1987). Photosynthetic capacity, chloroplast pigments animineral content of the previous year's spruce needles with andwithout the new flush: analysis of the forest-decline phenomenon otneedle bleaching. Oecologia 73: 351-357.
LAST, F.T. (1983). Direct effects of air pollutants, singly and inmixtures, on plants and plant assemblages.. In: Acid Deposition, aChallenge for Europe. (Ed. H. Ott S. H. Stangl) pp. 105-126.Commision of the European Communities, Brussels.
LEE, J.A., PRESS, M.C., STUDHOLME, C. and WOODIN, S.J. (1988). Effects ofacidic deposition on wetlands. In: Acid Rain and Britain's NaturalEcosystems. (Ed. by M.R. Asnmore, J.N.B. Bell & C. Garretty) pp.27-37. Imperial College Centre for Environmental Technology, London.
LKWIS, F.. and BRENNAN, E. (1978). Ozone and sulfur dioxide mixtures causea PAN-type injury to petunia. Phytopathology 68: 1011-1014.
I-OVKTT, G.M. (1984). Rates and mechanisms of cloud water deposition tosubalpine balsam fir forest. Atmos. Environ. 18: '361-371.
MANION, P.D. (1981). Tree Disease Concepts. Prentice-Hall, Inc.,Knglewood Cliffs, U.S.A.
MclxjWALL, F.D.H. and COLE, A.F.W. (1971). Threshold and synercjisLiciiainage to tobacco by ozone and sulfur dioxide. Atmos. Environ. 5:^3-559.
MCLAUGHLIN, D.L., LINZON, S.N., DIMMA, D.E. and MCILVEEN, W.D. U9a5).Sugar maple decline in Ontario. Report no. ARB-144-85-Phyto.Ontario Ministry of the Environment, Toronto.
-657-
McLEOD, A.R., FACKRELL, J.E. and ALEXANDER, K. (1985). Open-airfumigation of field crops: criteria and design for a new experimentalsystem. Atroos. Environ. 19: 1639-1649.
MILLER, C.A. and DAVIS, D.D. (1981). Response of pinto bean plantsexposed to O,, SO, or mixtures at varying temperatures. Hort.Science 16: 548-550/
MILLER, P.R. and EVANS, L.S. (1974). Histopathology of oxidant injury andwinter fleck injury on needles of western pines. Phytopathology 64:801-806.
OLSZYK, D.M., KATS, G., DAWSON, P.J., BYTNEROWICZ, A., WOLF, J. andTHOMPSON, C.R. (1986). Characteristics of air exclusion systems vs.chambers for field air pollution studies. J. Environ. Qual. 15:326-334.
PARMETER, J.R. Jr., BEGA, R.V. and NEFF, T. (1962). A chlorotic declineof ponderosa pine in southern California. PI. Dis. Reptr. 46:269-273.
PARMETER, J.R. Jr. and MILLER, P.R. (1968). Studies relating to the causeof decline and death of*ponderosa pine in southern California. Pi.Dis. Reptr. 52: 707-711.
REHFUESS, K.E. (1985). On the causes of the decline of Norway spruce(Picea abies Kurst.) in central Europe. Soil Use and Management 1:30-32.
RICHARDS, B.L. Sr., TAYLOR, O.C. and EDMUNDS, G.F. Jr. (1968). Ozoneneedle mottle of pine in southern California. J. Air Pollut. Contr.Assoc. 18: 73-77.
ROBERTS, B.R., JENSEN, K.F. and CATHEY, H.M. (1985). Modification ofozone sensitivity in seedlings by ethylenediurea: soil applicationvs. stem injection. J. Amer. Soc. Hort. Sci.'llO: 178-180.
ROLOFF, A. (1985). Auswirkungen von Imnisionsschaden in Buchenbestanden.Allgemeine Forst Zeitschrift 40: 905-908.
SHAW, P.J.A. (1986). The highliphook forest fumigation experiment:description and project plan. Report no. TPRD/L/2985/R86. CentralElectricity Research Laboratories, Leatherhead, UK.
SIGAL, L.L. and SUTER, G.W. (1988). Evaluation of methods for determiningadverse impacts of air pollution on terrestrial ecosystems.Environmental Management 11: 675-694.
TAYLOR, H.J., ASHMORE, M.R. and BELL, J.N.B. (1986). Air Pollution Injuryto Vegetation. Institute of Environmental Health Officers, London.
WALLACE, H.R. (1978). The diagnosis of plant diseases of complexetiology. Ann. Rev. Phytopathol. 16: 379-402.
WANG, D., BORMANN, F.H. and KAKNOSKY, D.F. (1986). Regional tree growthreductions due to ambient ozone: evidence from field experiments.Environ. Sci. Technol. 20: 1122-1125.
YOKOBORT, M. and OHTA, S. (1983). Combined air pollution and pine ringstructure observed dendorchronologically. Eur. J. For. Path. 13:30-45.
YOUNG, S.E. & MATHEWS, P. (1981). Pollution injury in south-eastNorthumberland: the analysis of field data using canonicalcorrelation analysis. Environ. Pollut., Series B 2: 353-363.
ZOETTL, H.W. and HUEITL, R.F. (19G6). Nutrient supply and forest declinein southwest Germany. Water, Air and Soil Pollution 31: 449-462.
-65S-

EG9700025
Proceedings of (he Fifth International Conferenceon Energy and Environment, Cairo, Egypt, 1996
ATMOSPHERIC TURBIDITY PARAMETERS IN
THE HIGH POLLUTED SITE OF EGYPT
M.A.MOSALAM SHALTOUT, AND U.ALI RAHOMANational Research Institute of Astronomy And Geophysics
Helwan -Cairo -Egypt
ABSTRACT: Monthly variations of Linke, Angstrom and SchDepp turbiditycoefficients and a exponent as well as the influence of climatic factor on themare analyzed. For each of these turbidity coefficients; calculated frommeasurements of broad band filters at Helwan, Egypt, desert climate, arereported. A linear regression model fitted to Angstrom's turbidity coefficint /?and Linke turbidity factor L for Helwan. The calculation showed that, it ishigher values of atmospheric turbidity coefficients due to, both the effect of airpollutants in the Helwan atmosphere from the four cement companies andsome of Heavy industrial factories, and the effect of the former's desertclimate.1- INTRODUCTION
The determination of the turbidity of the atmosphere is becoming increasinglyimportant because it integrates the total loading of aerosol in the atmosphere. Atmosphericturbidity is generally recognized as the extinction of solar radiation by suspended particleswith radii from about 100 to 10 OOOnm. Several turbidiy indices exist, namely the turbidityfactor L of Linke and Boda (1922), the coefficient (3 of Angstrom (1929) and the factor Bdefined by Schuepp (1949) Each index is referred to the extinction at a specificwavelength or spectral interval: L to the spectrum, P to a wavelength of 1 OOOnm and B toa wavelength of 500nm [1].
The solar radiation going through the atmosphere is partially absorbed by itsconstituents, partially reflected back to space and partially diffused, with the remainingreaching the ground as direct solar radiation. In a planetary scale, 17% of solar radiation isabsorbed by the atmosphere, 30 % is reflected by the constituents of the atmosphere, and53% reaches the surface of the earth, 31% of it as direct solar radiation and 22% asdiffuse radiation [2], In addition to the absorption and diffusion of solar radiation by theusual constituents of the atmosphere, aerosol particles and water (liquid or solid) alsoabsorb and cause diffusion of solar radiation quite significantly. Therefore, the percentageof solar radiation finally reaching the surface of the ground depends on the turbidity of theatmospheric mass over the examined area and consequently on the concentration of thepollutant material. The reduction of the solar radiation is very important parameter when itrefers to areas of increased atmospheric pollution such as big cities and industrial areasThe most interesting information is the fact that the atmosphere cannot clean itself when aspecific limit of pollution has been reached [3]
Beginning at 300nm wavelength, there is a broad ozone (O,) absorption bandcalled the Hartly-Huggins band that extents from 35Onm wavelength. The Capuis Ch bandthen extends from 500 to 700nm wavelength V-,'-;-. \ap-v (HiOl absorption occu:...-
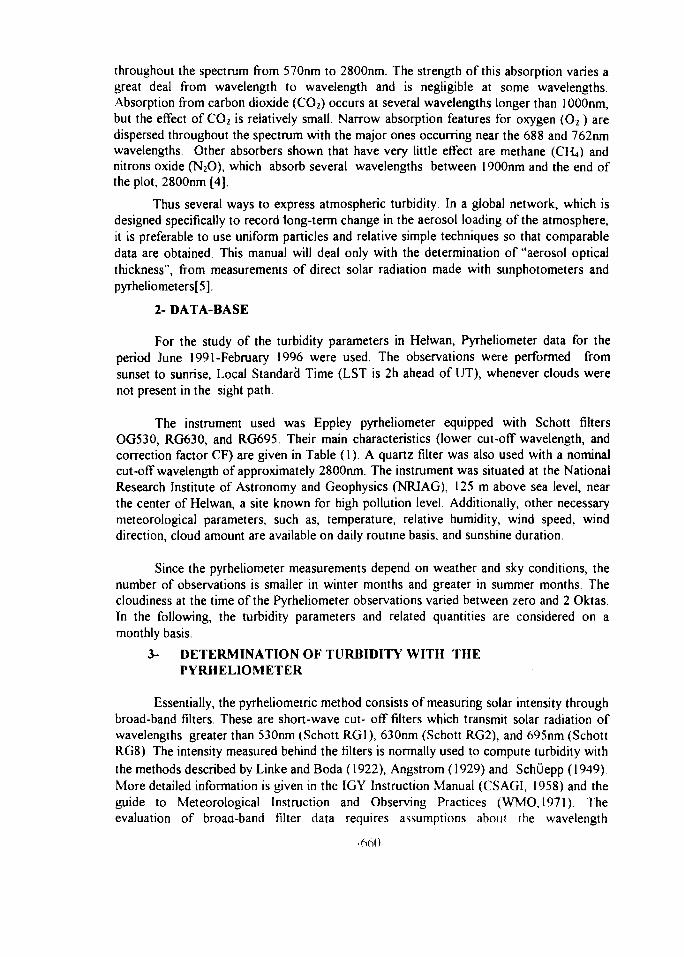
throughout the spectrum from 570nm to 2800nm. The strength of this absorption varies agreat deal from wavelength to wavelength and is negligible at some wavelengths.Absorption from carbon dioxide (CO2) occurs at several wavelengths longer than 1 OOOnm,but the effect of CO2 is relatively small. Narrow absorption features for oxygen (O2) aredispersed throughout the spectrum with the major ones occurring near the 688 and 762nmwavelengths. Other absorbers shown that have very little effect are methane (CK,) andnitrons oxide (N2O), which absorb several wavelengths between 1900nm and the end ofthe plot, 28OOnm [4].
Thus several ways to express atmospheric turbidity In a global network, which isdesigned specifically to record long-term change in the aerosol loading of the atmosphere,it is preferable to use uniform particles and relative simple techniques so that comparabledata are obtained. This manual will deal only with the determination of "aerosol opticalthickness", from measurements of direct solar radiation made with sunphotometers andpyrheliometers[5],
2- DATA-BASE
For the study of the turbidity parameters in Helwan, Pyrheliometer data for theperiod June 1991-February 1996 were used. The observations were performed fromsunset to sunrise, Local Standard Time (LST is 2h ahead of UT), whenever clouds werenot present in the sight path.
The instrument used was Eppley pyrheliometer equipped with Schott filtersOG530, RG630, and RG695. Their main characteristics (lower cut-off wavelength, andcorrection factor CF) are given in Table (1). A quartz filter was also used with a nominalcut-ofF wavelength of approximately 2800nm. The instrument was situated at the NationalResearch Institute of Astronomy and Geophysics (NRIAG), 125 m above sea level, nearthe center of Helwan, a site known for high pollution level. Additionally, other necessarymeteorological parameters, such as, temperature, relative humidity, wind speed, winddirection, cloud amount are available on daily routine basis, and sunshine duration.
Since the pyrheliometer measurements depend on weather and sky conditions, thenumber of observations is smaller in winter months and greater in summer months. Thecloudiness at the time of the Pyrheliometer observations varied between zero and 2 Oktas.In the following, the turbidity parameters and related quantities are considered on amonthly basis.
3- DETERMINATION OF TURBIDITY WITH THEPYRHELIOMETER
Essentially, the pyrheliometric method consists of measuring solar intensity throughbroad-band filters. These are short-wave cut- off filters which transmit solar radiation ofwavelengths greater than 53Onm (Schott RG1), 630nm (Schott RG2), and 695nm (SchottRG8). The intensity measured behind the filters is normally used to compute turbidity withthe methods described by Linke and Boda (1922), Angstrom (1929) and SchOepp (1949)More detailed information is given in the IGY Instruction Manual (CSAGI, 1958) and theguide to Meteorological Instruction and Observing Practices (WMO,1971) Theevaluation of broad-band filter data requires assumptions about the wavelength
-660
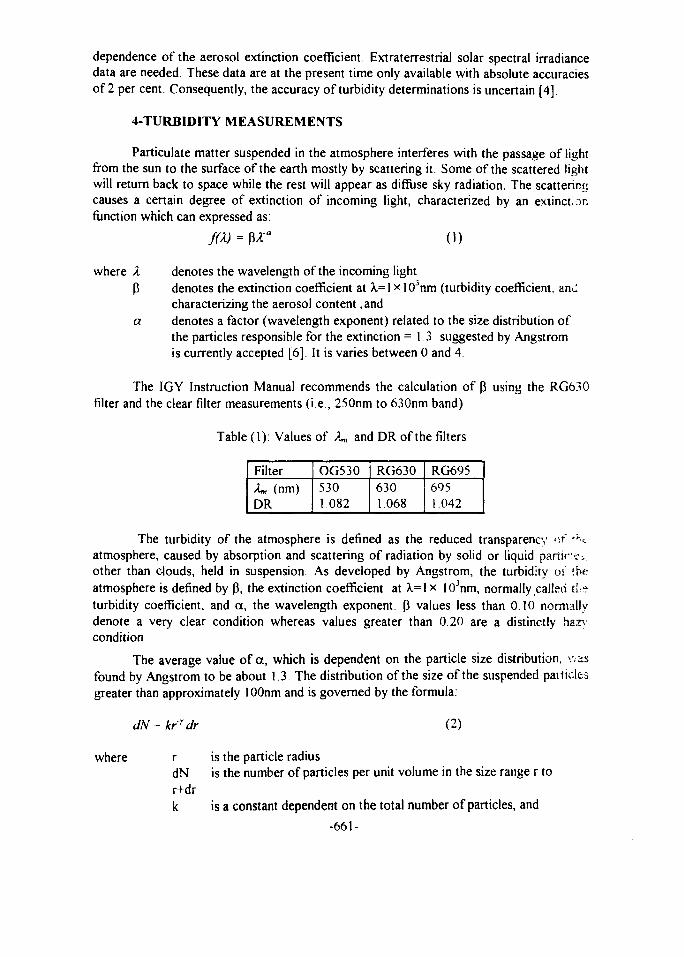
dependence of the aerosol extinction coefficient Extraterrestrial solar spectral irradiancedata are needed These data are at the present time only available with absolute accuraciesof 2 per cent. Consequently, the accuracy of turbidity determinations is uncertain [4]
4-TURBIDITY MEASUREMENTS
Paniculate matter suspended in the atmosphere interferes with the passage of lightfrom the sun to the surface of the earth mostly by scattering it. Some of the scattered lightwill return back to space while the rest will appear as diffuse sky radiation. The scatteringcauses a certain degree of extinction of incoming light, characterized by an extinctionfunction which can expressed as:
W (i)
where A3
a
denotes the wavelength of the incoming lightdenotes the extinction coefficient at X=\ x 103nm (turbidity coefficient, anicharacterizing the aerosol content, anddenotes a factor (wavelength exponent) related to the size distribution ofthe particles responsible for the extinction = 1 3 suggested by Angstromis currently accepted [6], It is varies between 0 and 4.
The IGY Instruction Manual recommends the calculation of 3 using the RG630filter and the clear filter measurements (i.e., 250nm to 630nm band)
Table (1): Values of ^ and DR of the filters
FilterAm (nm)DR
OG5305301.082
RG63O6301.068
RG6956951.042
The turbidity of the atmosphere is defined as the reduced transparency of 'K.atmosphere, caused by absorption and scattering of radiation by solid or liquid par t iesother than clouds, held in suspension. As developed by Angstrom, the turbidity os (heatmosphere is defined by 3, the extinction coefficient at k=lx I03nm, normally called theturbidity coefficient, and a, the wavelength exponent. 3 values less than 0.10 normallydenote a very clear condition whereas values greater than 0.20 are a distinctly hazvcondition
The average value of a, which is dependent on the particle size distribution, w-asfound by Angstrom to be about 1.3. The distribution of the size of the suspended particlesgreater than approximately lOOnm and is governed by the formula.
dN = krr dr (2)
where r is the particle radiusdN is the number of particles per unit volume in the size range r tor+drk is a constant dependent on the total number of particles, and
-661-
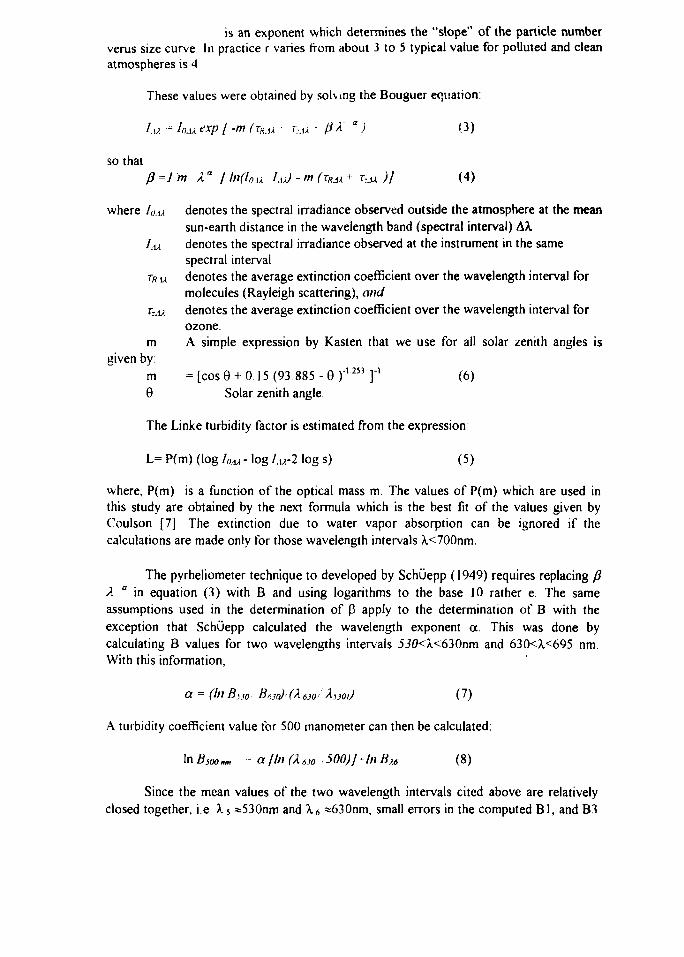
is an exponent which determines the "slope" of the particle numberverus size curve In practice r varies from about 3 to 5 typical value for polluted and cleanatmospheres is 4
These values were obtained by solving the Bouguer equation:
I.u ^ Am *xp / -m (TR.U • r..u - B X " ) (3)
so thatft =lm X" I ln(fou
where Iu.u
- m (TKM )] (4)
mgiven by:
m0
denotes the spectral irradiance observed outside the atmosphere at the meansun-earth distance in the wavelength band (spectral interval) AA.denotes the spectral irradiance observed at the instrument in the samespectral intervaldenotes the average extinction coefficient over the wavelength interval formolecules (Rayleigh scattering), anddenotes the average extinction coefficient over the wavelength interval forozone.A simple expression by Kasten that we use for all solar zenith angles is
= [cos9 + 0 15 (93.885 - 6 ) ' 1 2 " ]"'Solar zenith angle.
(6)
The Linke turbidity factor is estimated from the expression:
L= P(m) (log IOAX - log IM-2 log s) (5)
where, P(m) is a function of the optical mass m The values of P(m) which are used inthis study are obtained by the next formula which is the best fit of the values given byCoulson [7] The extinction due to water vapor absorption can be ignored if thecalculations are made only for those wavelength intervals X.<700nm.
The pyrheliometer technique to developed by Schuepp (1949) requires replacing ftX a in equation (3) with B and using logarithms to the base 10 rather e The sameassumptions used in the determination of P apply to the determination of B with theexception that Schuepp calculated the wavelength exponent a. This was done bycalculating B values for two wavelengths intervals 5J0<X<63Onm and 630<X<695 nm.With this information,
a = (lnBi30 Bf,3a)(X63o> XS3oi) (7)
A turbidity coefficient value for 500 manometer can then be calculated:
In Bsoonn, = a I In (X6)0 500)/+In BM (8)
Since the mean values of the two wavelength intervals cited above are relativelyclosed together, i.e X? *53Onm and X6 «630nm, small errors in the computed Bl, and B3
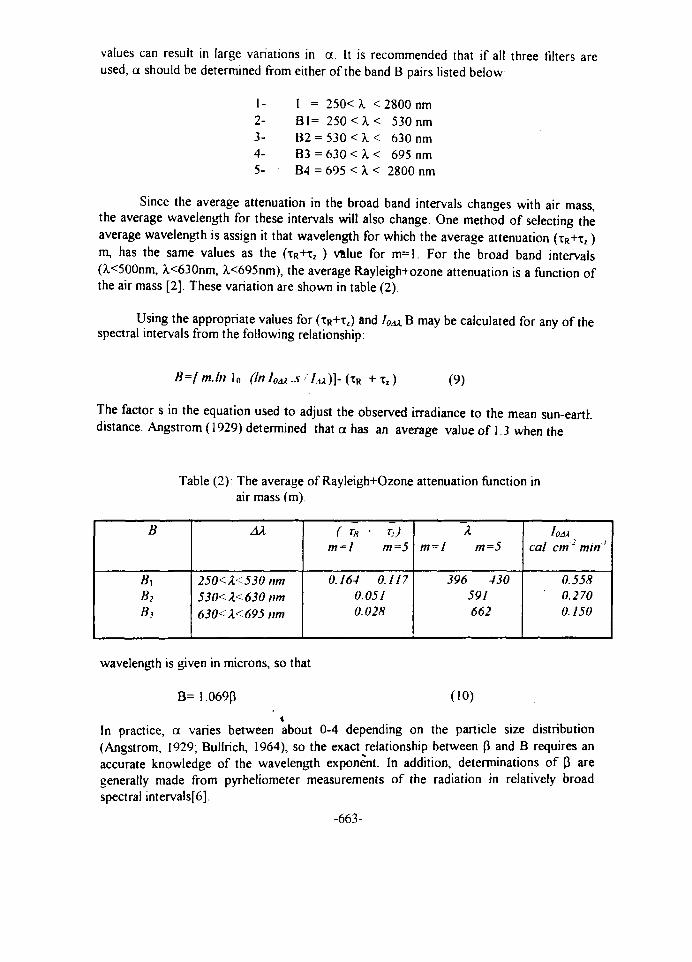
values can result in large variations in a. It is recommended that if all three filters areused, a should be determined from either of the band B pairs listed below:
1-2-3-4-5-
I = 250<^ <2800nmBl= 250 < A. < 530 nmB2 = 53O<A.< 630 nmB3 = 630 < X < 695 nmB4 = 695<X< 2800 nm
Since the average attenuation in the broad band intervals changes with air mass,the average wavelength for these intervals will also change. One method of selecting theaverage wavelength is assign it that wavelength for which the average attenuation (TR+TZ )m, has the same values as the (xR+tz ) value for m=l. For the broad band intervals(X<500nm, A.<630nm, A.<695nm), the average Rayleigh+ozone attenuation is a function ofthe air mass [2]. These variation are shown in table (2)
Using the appropriate values for (TR+TZ) and I OAK B may be calculated for any of thespectral intervals from the following relationship:
B=fm.lnl0 7 . U ) ] - ( T R + T Z ) (9)
The factor s in the equation used to adjust the observed irradiance to the mean sun-earthdistance. Angstrom (1929) determined that a has an average value of 1 3 when the
Table (2): The average of Rayleigh+Ozone attenuation function inair mass (m)
B
Bt
B2
B3
AX
250<X<530 nm530<X<630 nm630<X<695 nm
( TR t- T:)
m=l m=5
0.164 0.1170.0510.028
Xm=l tn=5
396 430591662
loAXcal cm'2 min'
0.5580.2700.150
wavelength is given in microns, so that
B= 1.069(J (10)
In practice, a varies between about 0-4 depending on the particle size distribution(Angstrom, 1929; Bullrich, 1964), so the exact relationship between P and B requires anaccurate knowledge of the wavelength exponent. In addition, determinations of p aregenerally made from pyrheliometer measurements of the radiation in relatively broadspectral intervals[6].
-663-
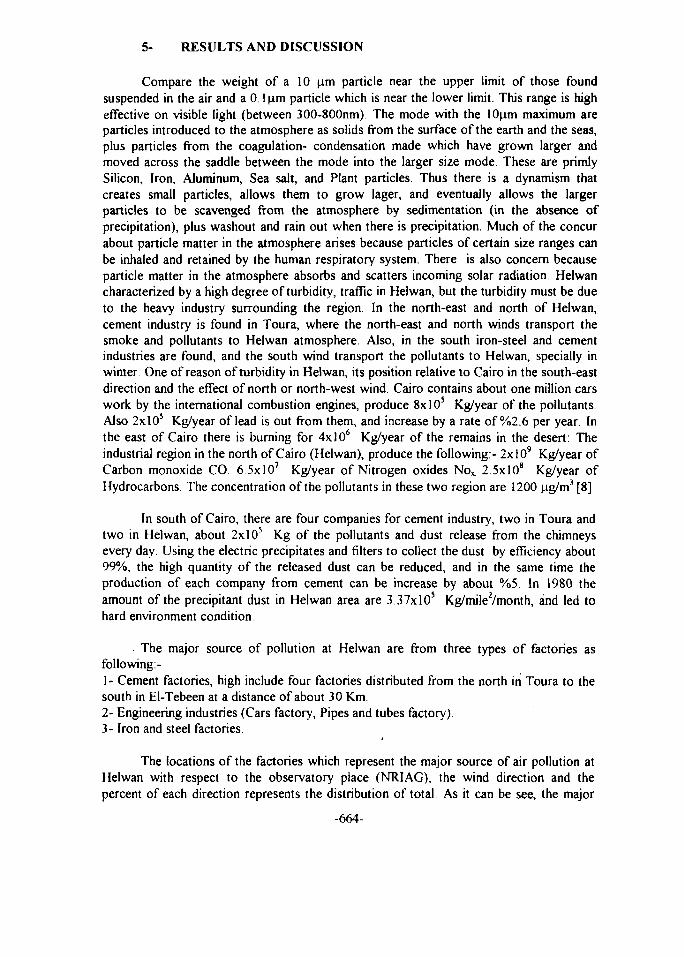
5- RESULTS AND DISCUSSION
Compare the weight of a 10 (am particle near the upper limit of those foundsuspended in the air and a 0 lum particle which is near the lower limit. This range is higheffective on visible light (between 300-800nm) The mode with the lOum maximum areparticles introduced to the atmosphere as solids from the surface of the earth and the seas,plus particles from the coagulation- condensation made which have grown larger andmoved across the saddle between the mode into the larger size mode. These are primlySilicon, Iron, Aluminum, Sea salt, and Plant particles. Thus there is a dynamism thatcreates small particles, allows them to grow lager, and eventually allows the largerparticles to be scavenged from the atmosphere by sedimentation (in the absence ofprecipitation), plus washout and rain out when there is precipitation. Much of the concurabout particle matter in the atmosphere arises because particles of certain size ranges canbe inhaled and retained by the human respiratory system. There is also concern becauseparticle matter in the atmosphere absorbs and scatters incoming solar radiation. Helwancharacterized by a high degree of turbidity, traffic in Helwan, but the turbidity must be dueto the heavy industry surrounding the region. In the north-east and north of Helwan,cement industry is found in Toura, where the north-east and north winds transport thesmoke and pollutants to Helwan atmosphere. Also, in the south iron-steel and cementindustries are found, and the south wind transport the pollutants to Helwan, specially inwinter One of reason of turbidity in Helwan, its position relative to Cairo in the south-eastdirection and the effect of north or north-west wind. Cairo contains about one million carswork by the international combustion engines, produce 8x 10s Kg/year of the pollutants.Also 2xlO5 Kg/year of lead is out from them, and increase by a rate of %2.6 per year. Inthe east of Cairo there is burning for 4xlO6 Kg/year of the remains in the desert: Theindustrial region in the north of Cairo (Helwan), produce the following:- 2xlO9 Kg/year ofCarbon monoxide CO. 6 5xlO7 Kg/year of Nitrogen oxides Nox. 2.5xlO8 Kg/year ofHydrocarbons. The concentration of the pollutants in these two region are 1200 (ig/m3 [8].
In south of Cairo, there are four companies for cement industry, two in Toura andtwo in Helwan, about 2x10⁵ Kg of the pollutants and dust release from the chimneysevery day. Using the electric precipitates and filters to collect the dust by efficiency about99%, the high quantity of the released dust can be reduced, and in the same time theproduction of each company from cement can be increase by about %5. In 1980 theamount of the precipitant dust in Helwan area are 3.37xlO5 Kg/mile2/month, and led tohard environment condition.
The major source of pollution at Helwan are from three types of factories asfollowing-1- Cement factories, high include four factories distributed from the north in Toura to thesouth in El-Tebeen at a distance of about 30 Km.2- Engineering industries (Cars factory, Pipes and tubes factory)3- Iron and steel factories.
The locations of the factories which represent the major source of air pollution atHelwan with respect to the observatory place (NRIAG), the wind direction and thepercent of each direction represents the distribution of total As it can be see, the major
-664-

source of wind direction is from the N and N-E, which represents about 50% of the totaldirection [9].
This means that Toura El-Cement and Helwan Portland cement factories represent50% of the air pollution resources at Helwan. The national cement factory and iron andsteel factories represent about 40% (N-W, S, W, S-W directions) of the total percent ofair pollution resources at Helwan.
Fig.(l) shows the annual variation of the monthly means of intensity of global (G)and direct (I) solar radiation, spectral bands Bl, B2, B3, B4. This result is not surprisingand is in a good agreement with many other studies that mention a pronounced maximumin summer and minimum in winter Fig.(2) shows meteorological parameters (relativehumidity, air temperature, sunshine duration, visibility, and wind speed.
Fig.(3) shows the Linke turbidity factor in Helwan during the period 1915-1921[10], equivalent values during 1934 [11], 1967 [12], and 1991-1995 for different month ofthe year, the lower curve i.e. that of 1915-1921 shows values markedly below that of1934, 1967, and 1991-1995. This is the result of the increased air pollution in the ^readuring recent years, as during the period (1915-1921) the area was nearly free of theindustrial establishment as mentioned before. As a result of the industrialization of the areathe turbidity factor was more than double (fig. 3a). For example the turbidity factor L inJuly 1991-1995, 1967, and 1934 was equal to 6.2, 5.4, 3.2 respectively, while during thesame month in the period 1915-1921 it was 3.1. The curves in the fig (3a) clearly indicatethat the turbidity factor shows slightly monthly variation before industrialization, whilemarked variations are noticed in recent years i.e. after industry has spreader in the region.This is mainly due to monthly variation in pollution levels within the area in recent years.
The monthly values of P and L for Avignon, Dhahran, and Helwan plotted inFig.(3a), indicate that the variation of the turbidity coefficients at Helwan is similar to thatof Avignon and Dhahran. However, the magnitudes of the monthly values of thecoefficients for Helwan are about double those of Avignon and smaller than Dhahrangenerally in Linke turbidity except in winter months that due to, higher values of relativehumidity in winter months. With respect to Angstrom turbidity represent by a higher thanDhahran in all months except winter months because in spring, due to Khamassindispersion with additionaJ to air pollutants . In summer due to higher values of airtemperature and wind speed which caused the diffusion in dust and aerosols from thesource of air pollutants (cement factories). Winds blow from the desert area and are highlyloaded with dust particles especially in spring months that increase the atmosphericturbidity throughout the year with addition to effect of air pollutants from the industrialwastes. On the other hand, Avignon is a semirural site falling in a temperate climate zoneand dominated by vegetation and lack of dust storms.
Fig.(4) shows the rate of variation for Linke and Angstrom turbidity for thespectral distribution in all bands under study: high values are also observed in April, whichdue to the increase of dust concentration due to the occurrence of Khamssin depressions.There is a minimum for L and (3 in March, which characterized by clean atmosphere(especially after passage of the cold front). March can considered as a transitional monthfrom winter regime (extratropical depressions) to spring regime (Khamssin depressions)There is also, a minimum for p in October and November. This is due to inversion of air
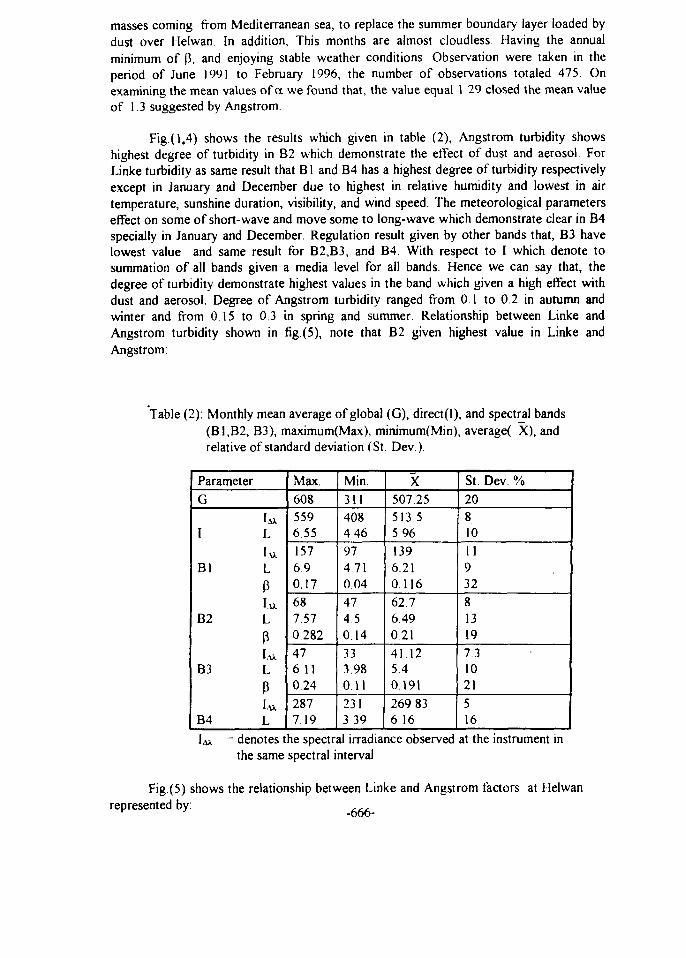
masses coming from Mediterranean sea, to replace the summer boundary layer loaded bydust over Helwan In addition, This months are almost cloudless Having the annualminimum of P, and enjoying stable weather conditions. Observation were taken in theperiod of June 1991 to February 1996, the number of observations totaled 475. Onexamining the mean values of a we found that, the value equal 1.29 closed the mean valueof 1.3 suggested by Angstrom.
Fig.(l,4) shows the results which given in table (2), Angstrom turbidity showshighest degree of turbidity in B2 which demonstrate the effect of dust and aerosol. ForLinke turbidity as same result that Bl and B4 has a highest degree of turbidity respectivelyexcept in January and December due to highest in relative humidity and lowest in airtemperature, sunshine duration, visibility, and wind speed. The meteorological parameterseffect on some of short-wave and move some to long-wave which demonstrate clear in B4specially in January and December. Regulation result given by other bands that, B3 havelowest value and same result for B2,B3, and B4 With respect to I which denote tosummation of all bands given a media level for all bands. Hence we can say that, thedegree of turbidity demonstrate highest values in the band which given a high effect withdust and aerosol. Degree of Angstrom turbidity ranged from 0 1 to 0 2 in autumn andwinter and from 0 15 to 0 3 in spring and summer. Relationship between Linke andAngstrom turbidity shown in fig. (5), note that B2 given highest value in Linke andAngstrom:
Table (2): Monthly mean average of global (G), direct(I), and spectral bands(B1,B2, B3), maximum(Max), minimum(Min), average( X), andrelative of standard deviation (St. Dev.).
Parameter
G
I L
Bl L
PIAX
B2 L
PIAX
B3 L
P
B4 L
Max.
6085596.55157690.17687.570.282476.110.242877.19
Min.311408446974710.0447450.14333.980 11
2313 39
X507.25513.55.961396.210.11662.76.490.2141.125.40191269 836.16
St. Dev. %20810II932813197.31021
516
I x = denotes the spectral irradiance observed at the instrument inthe same spectral interval
Fig.(5) shows the relationship between Linke and Angstrom factors at Helwanrepresented by:
Band
BlB2B3
Equation
p = -0.186-P = -0.270-P = -0.076 H
HO.
1-0.
i-O.
048073049
LLL
CC%
668167
RMS
0 190.240 19
(11)(12)
(13)
The relationship of equ.(9) is similar to the model reported for Avignon(France)[ 13],
P = -0.103 +0.052 L (14)
and to the relationship of Potsdam (Germany)[14],
P =-0.100 +0.05 L (15)
It is observed from Fig.(6) which given monthly mean variation of Angstrom andLinke turbidity at different spectral bands, that medium size particles of the B2 bandcontribute more to the extinction effect, followed by the large particles of the B4 band,and then by other small and medium particles of the bands B2 and B3.
Based on the definitions of G and P & L, a typical was made to correlate themby a Linear regression relation, ff was demonstrate from Fig.(6), found that:
CC% RMS.
IB2B2
L—L=
P=
320
.454
.300
.015
+ 0.+ 0+ 0.
004830082600038
GGG
899089
00.0.
201006400005
(16)(17)(18)
The values of Angstrom and Linke turbidity are high in afternoon than beforenoon,because the source of pollutants almost in North-east and North in wind direction.
6- CONCLUSION
The Linke turbidity factor L, and Angstrom turbidity coefficient (3,were obtainedfrom the spectral measurements of radiation The summer varies of these coefficientswere found to be larger than their winter values. The urban climate represented by Helwanshowed to have higher L and P values compared with the semirural climate represented byAvignon (France) and Lower values of L but the higher order of P compared with thedesert climate represented by Dhahran (Saudi Arabia)
The results reported here suggest that there is a significant decrease in attenuationby aerosols and particles with wavelength The Angstrom turbidity coefficient can be takenequal to the attenuation at the wavelength B2 which ranged fror* 530 to 630nm. TheLinke factor L, and Angstrom coefficient P, were obtained from the radiationmeasurements. The summer values of these coefficients were found to be larger than theirwinter values. The desert climate represented by Helwan showed to have higher L valuecompared with the observations which taken at the same site Spectral distribution of
-667-
different bands from I to B4 showed a variation within the regression coefficients betweenp and L.
The atmospheric turbidity for a Helwan region is highly dependent on wastes ofindustrialization and the weather activities in that region (i.e., wind speed, wind direction,air temperature, and humidity); three factors can be advanced to explain this behavior:Winds origin; north, north-west winds, which are the more turbid are more frequentlyobserved in summer than in winter. The air temperature: higher temperature in summer,enhancing vertical convection and particle, can induce more turbid atmosphere The watervapor content: high humidity can induce growth and development of water droplets. Inour case: air mass origin plays the most important contribution in the atmosphere turbidityand humidity are secondary factors, with only limited effects
It is established that, there are a good relationship between global solar radiationwith Angstrom and Linke turbidity factors at Helwan.
REFERENCES
[I] JM.Pinazo.J.Canada, and J V.Bosca, "A new method to determine Angstrom'sturbidity coefficient: its application for Valencia", Solar Energy, Vol 54, No 4,pp.219-226, (1995)
[2] WD Sellers, "Physical climatology University of Chicago Press, Chicago"(1965).
[3] H.S Sahsamanoglou and A A.BIoutsos, "Cleansing of the atmosphere in theAthens area by means of rainfall and wind: The impact of climate planning andbuilding", Elsevier Sequoia, 125-128 (1982).
[4] MA Abdelrahman, S A.M.Said, and A N.Shuaib,"Comparasion betweenatmospheric turbidity coefficients of desert and temprate climates", Solae Energy,Vol. 40, No.3, pp 219-225(1988)
[5] WMO- "International operations Handbook for measurement of back groundatmospheric pollution", No.491(1978)
[6] WMO "Operations manual for sampling and analysis techniques for chemicalconstituents in air and precipitation". No 299, Geneva- Switzerland (1974).
[7] K.L.Coulson, "Solar and terrestrial radiation", Academic Press, New York(1975).
[8] Moslam Shaltout,"Solar radiation and air pollution in Cairo", Proceedings of thethird Arab International Solar Energy Conference, Baghdad-Iraq, Edited byN.I.Al-Hamadani and et.al., pp.53-58, 21-24, Feb., (1988).
[9] A.H.Hassan, "Environments and their effects on the photovoltaic performances inthe desert climate of Egypt", Ph D Thesis, Faculty of Science, Menofia University(1995).
[10] H Knox-Shaw, "Observations of solar radiation 1915-1921", HelwanObservatory, Physical Department, Fouad University, Egypt BulletinNo23(1951).
II1] A Jaenicke, and F Kasten, "Estimation of atmospheric turbidity from the bumedtraces of the Camplell-Stotokes sunshine recorder", Applied Optics, Vol. 17,No. 16, pp.2617-2621(1978).
[12] N.A Higazy, "Effect of air pollution visibility and penetration of solar ultravioletradiation", PhD Thesis, Faculty of Science, Cairo University (1973)
-668-

[13] M.Katz,A.Baille, and M.Mermier/'Atmospheric turbidity in semi-rural site-1,evaluation and comparison of different of different atmospheric turbiditycoefficients", Solar Energy, Vol. 28, No. 4, pp.323-327 (1982).
[14] H.Hinzpeter, Ueber Trubungsbestimnungen in Postdam in den Jahren 1946 und1947. Zeit. Fur Meteor 4, 1(1950).
-660-
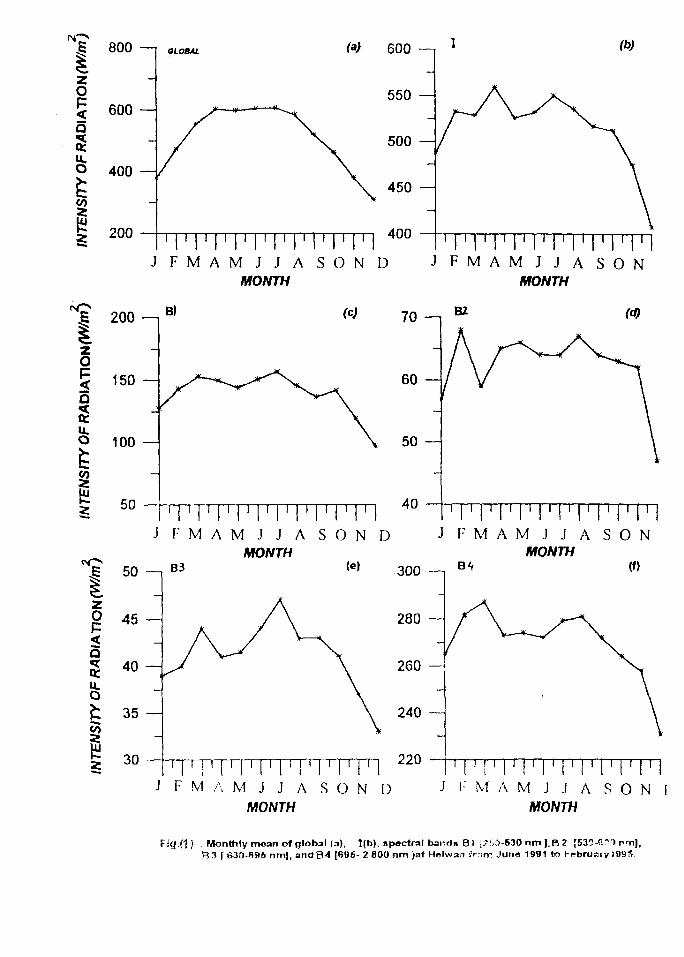
|
o<a5
800 —i
600 —
400 —
CO
200
600 (b)
• I ' l ' l ' l ' l ' l ' l ' l ' l ' l ' lJ F M A M J J A S O N D J F M A M J J A S O N
MONTH MONTH
o<
200 —i
150
100 —
Bl
50
(c) 70 —i
60 —
50
i i i i i Tn M40
Bl (d)
I ' I M I ' I I I I M
J F M A M J J A S O N D J F M A M J J A S O NMONTH MONTH
50 —, B 3 ( e | 300 —,
tZO 4*5
515 40 —
fc 35 —
TTTTTTTTT
J F M A M J J A S O N DMONTH
I I ! r I I ! I I I I I I ! I'l I I I I II i I I I ! I I I I
J 1: M A M J J A S O NMONTH
Fkj.( l) Monthly mean of global (a), l(b), spectral bands B! 17IJ-630 nm J,B2 [630-511 nm),B3 [ 630-686 nmj, andB4 [896- 2 800 nm >at Holwan 1'r >nrr Juna 1991 to February 8995.

SI
40
30 —
S 20 —
10
(a)
i | i j i [ i | i I i I T n
J FMAMJ JAMONTH
S ON D
Q
IiomUJa;OUJQ
75 —j
70 —
65 -
60 —
55 —
50 - M l I I I I I I I I I I I I I I I I I I I
J F M A M J J A S O N DMONTH
I
QO
sUJ0 .V)
§
6.0 - i
5.5 —
§ 5.0 -
4.5THTrTTNTI
J FMAMJ JA S ON DMONTH
|
O
I
Iin
12 -
10 —
8 —
6 —
4 —
I I I I I I [ I [ I [ / | I | I | I | C|
J F M A M J J A S O N DMONTH
12 —|
10 —
8 —
6 -
J F M A M J J A S O N DMONTH
N
NW
5W 5E
Fig.(2) : Monthly mean of meteorological parameter Tempeiature [ C] (a), Humidity [ % ] (b).Visibility [Km] fc), Sunshine duration [ hour] (d), wind sp<*"< xxlei •*) a id winddirection (fj - i ftelwan f iom Juno 1991 to February 1996
-67 I -
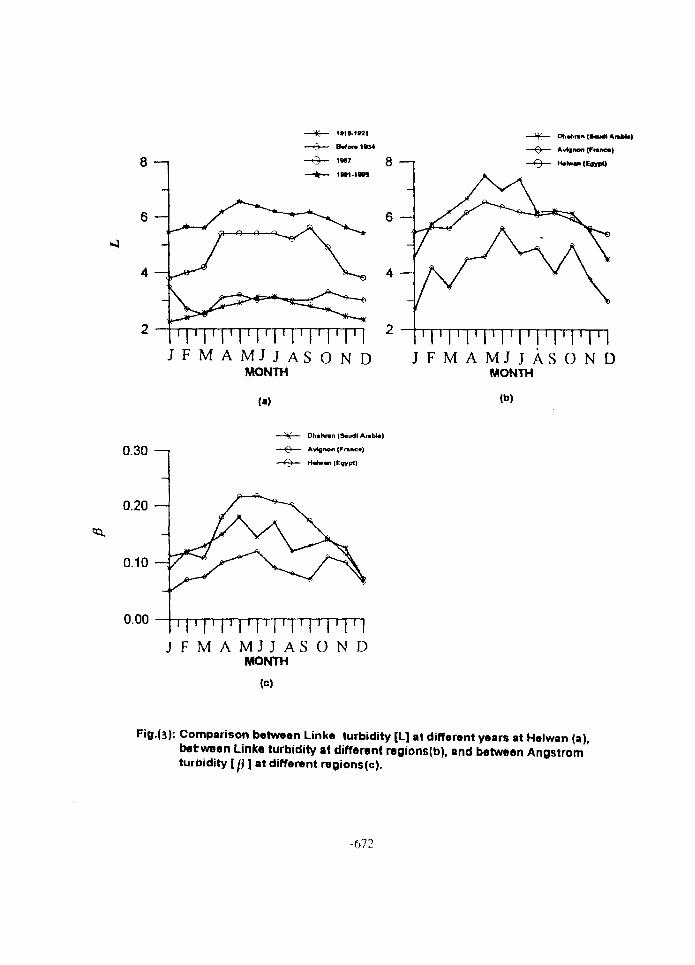
8 —i
6 —
4 -
Ohahnn (Sautfl Arabia)
Avfgnofi (Franoa)
6 —
4 —
TTvrrrrriTiJ F M A M J J A S O N D J F M A M J J A S O N D
MONTH MONTH
(a) (b)
0.30 —i
0.20
0.10 —
Dh.hran iSaudl Anlrfa)
Avignon fFnine*)
». (Egypt)
0.00' I ' l ' l ' l ' l ' l ' l ' l ' l 1 1 ' l
J F M A M J J A S O N DMONTH
(c)
Fifl.(3): Comparison between Linke turbidity [L] at different years at Helwan (a),between Linke turbidity at different regions(b), and between AngstromturDidity [[} ] at different regions(c).
-672-
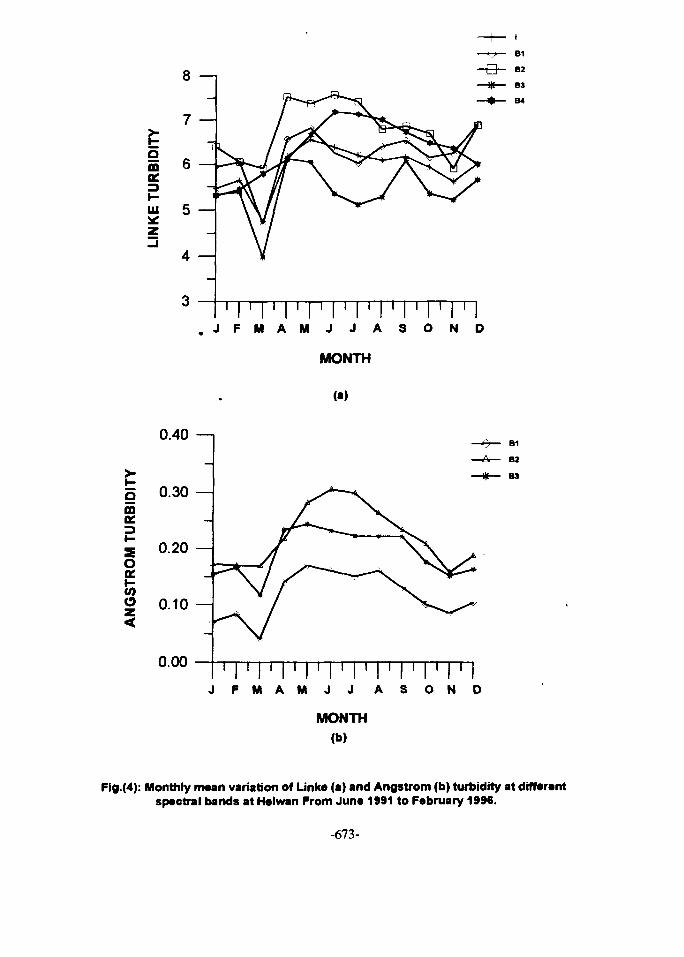
J F M A M J J A S O N D
I
B1
B2
B3
B4
0.40 —
0.00 1 1 ' I ' I ' I ' I ' I ' I ' I • I ' I ' IJ F M A M J J A S O N D
MONTH(b)
Fig.(4): Monthly mean variation of Link* (a) and Angstrom (b) turbidity at differentspectral bands at Helwan From June 1991 to February 1996.
-673-
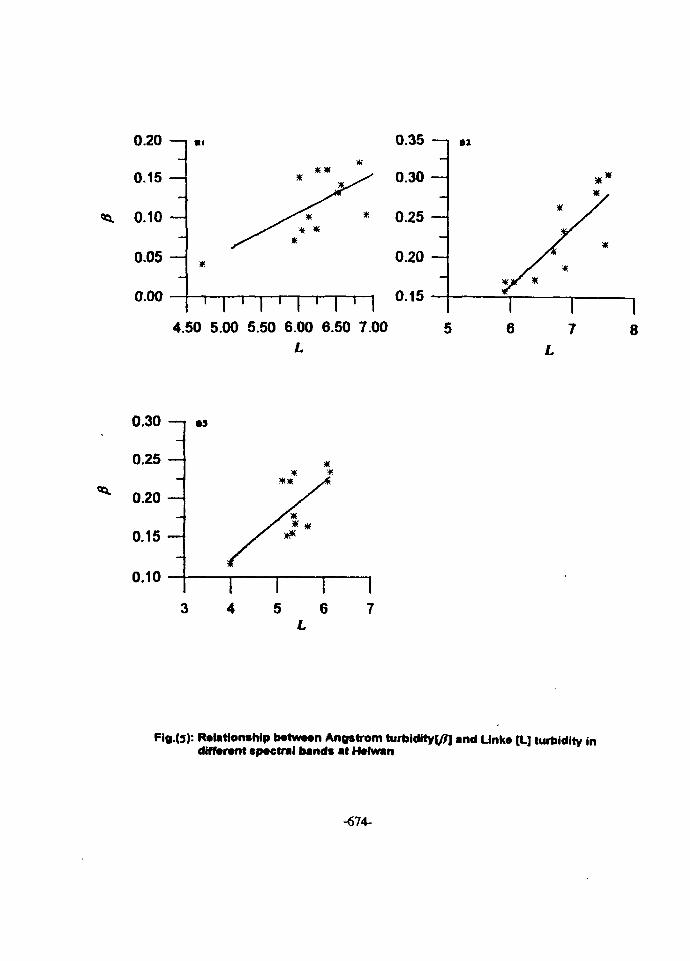
0.20 —|
0.15 —
0.10 -
0.05 H
0.00 -
* *
1 i • i • i • m4.50 5.00 5.50 6.00 6.50 7.00
L
0.15I I6 7
L8
0.30 -
0.25 —
0.20 —
0.15 —
0.10
•3
5 6L
17
Fig.(s): Relationship b«tw*«n Angstrom turbidity^?] and Unka [L] turbidity indifferent spactral bands at Halwan
-674-
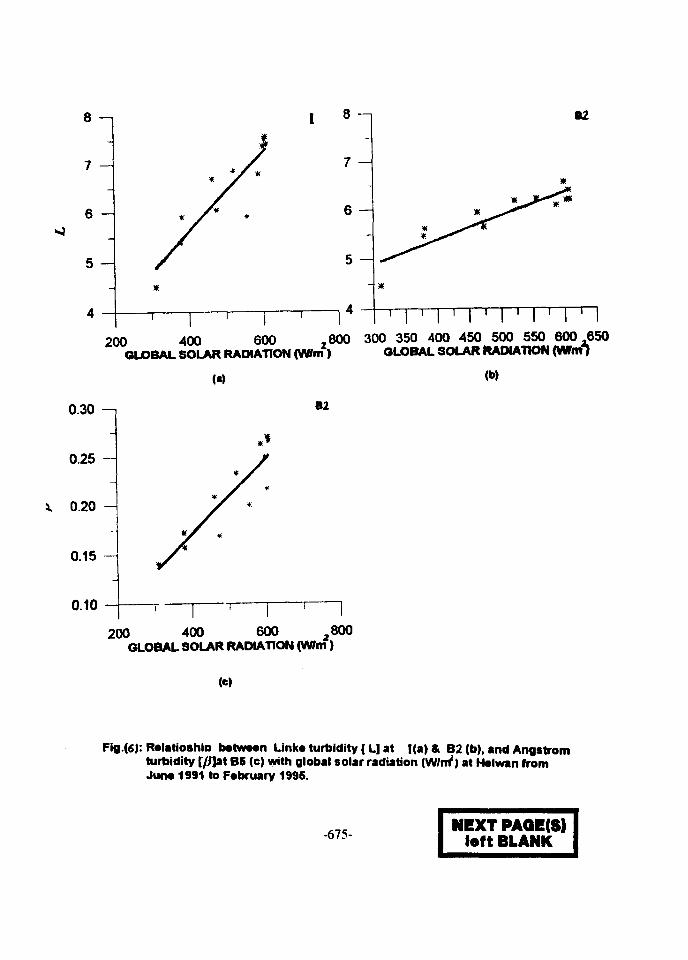
8 —,
7 -\
6-4
5-4
8 - i
7 H
6H
5 H
x T
02
1 I T I T I T I200 400 600
GLOBAL SOLAR RADIATION (VWrn)
.800 300 350 400 450 500 550 600,650GLOBAL SOLAR RADIATION (Weif)
(a)
0.30 - i
0.25 -
0.20 -
0.15
0.10
82
200 400 600 .800
(b)
GLOBAL SOLAR RADIATION (W/m)
(e)
Fig.(6): Rclatioshlo b*tw««n Links turbidity [ L] at |(a) & B2 (b), and Angstromturbidity [[l]at B6 (e) with global solar radiation (V«W| at Hslwan fromJurw 1991 to February 1996.
-675-NEXTPAQE(S)
left BLANK
IhtlllProceedings of the Fifth International Conference EG9709026on Energy and Envirorunent, Cairo, Egypt, 1996
DEVELOPMENT OF A GIS MODEL FOR THE IMPACT ASSESSMENTOF AIR POLLUTANTS ON STRUCTURAL ELEMENTS
OVER THE GREATER CAIRO AREA.
Dr. Zeinab WishahyAssociate Professor
Faculty of EngineeringCairo University
ABSTRACT:
Maintenance of structural elements (i.e. buildings, factories, gaz stations, road structuresand cultural monuments) is one of the major problems in Cairo due to the high degree of airpollution combined with natural phenomena such as dust storms. Economically, this maintenancerepresents a lost in material, money and time which local authorities have to absorb.
Lack of resources and difficulties in foreseeing the impacts of air pollution are graduallyresulting in a deterioration of these structural elements in urban areas. On the other hand, if theimpacts of air pollution on these construction elements could be assessed, the most appropriate andconvenient material could be selected for the maintenance of existing structures, and also for thedesign and building of new ones. This will help in decreasing the overall future maintenance cost,decreasing the lost which occurs over the years as a result of deterioration, thus creating anenvironment more pleasant to the general population.
By developing a prototype Model using GIS technology this paper states a frame of aproject to assess the impact of air pollutants from industrial emissions and other sources onstructural elements over the greater Cairo area. It will provide a guide for the selection of theappropriate material for each element of a structure (external walls, windows, etc .) as a functionof its geographic location, its resistance to specific pollutants prevailing the atmosphere and theirdistributions within the area. The suitability of the material will be presented in terms ofmaintenance cost (materials/sq.m., person-days, etc....). This model will involve the economicalaspect of structural elements maintenance and package it into a procedure for public use.
1. INTRODUCTION:
Geographic Information system (GIS) is an integration technique which collects data basesabout objects of different aspects, then locates the derived statics, analysis and deducedinformation on geographic maps, thus providing a powerful procedure for distinct info-representation which is the key for the right decision.
In this paper, this technology is now adopted to solve problems related to the degradationof the environment using a flexible data base management system (DBMS)to organize the
-677-

dispersion, homogenity of information and the variety of the levels of user sectors by offering anusable output accessible to public use for many locations
The principal core for developing an integrated and coherent GIS software model is thewell construction of its data base constituting its successive layers over geographic maps Thecollection of spatial and non spatial data and their conversion methodology must be performed fordesigning a conceptual GIS data base and its functionalities. Applying the different commands ofthe GIS softwares and overlapping the selected layers provide the output information in therequired form
A large amounts of the data needed to achieve this research were not available to theauthor due to either their non existance for Egypt (ex: updated air pollution) or to the difficulty ofobtaining them regarding the time (years), budget and facilities required for experiments tomeasure the durability of materials.
The numbers used here, either ancient or estimated may be replaced and updated by newones as soon as they will be available.
2. CONSTRUCTION OF THE DATA BASE:
The data base of this project is composed of two major items which are, the degree ofconcentration of air pollution at the located area of the project and the durability of the suggestedmaterial to be used for each element of the structure. In addition to some minor items concerningthe type of project, the structural element and the level of the users sectors.Fig. (1) is a graphical representation of all the items composing the data base of the GIS model anddescribed in the following:
2.1 The Degree of Air Pollution at a Specific Geographic Location: |A|
The first step was the collection of data about the degree and distribution of air pollutantsby designating the locations of the sources of emissions, their amounts and the effect ofmetrological data as winds on their distributions, concentrations and transports
In fact , the updating data about this point were unavailable in Egypt, the documents ofreference [Rl] were the ideal form of data for this research, from which table (1) was deducedshowing the degree of producing the four main influencing pollutants (HC, NO, CO and paniculatematters) over the regions of Cairo expressed by tons/year.The sources of pollution were considered as point source, line source and area sourceFig. (2 & 3) from [R 1] are an example of illustrating the degradation of concentration of theseelements and the effect of metrological data, specially the wind (speed, strength and direction)causing their accumulation or diffusion due to transport or dispersion over the greater Cairo area.
2.2. Type of Protect (PI and Structural Element IS1
The type of the constructed project [P] (ex: industry, factory, school, bridge, buildings,...etc.) implies if other factors will impose their effects which may overcome the effect of [A]. Thesefactors may control the degree of depreciation of the material, the expected time of its damage(duration), or in contrast the required level of finishing and decoration (lux, super lux,moderate... etc.)
The place of the structural elements [S] to be covered by the material is another item to beconsidered. Obviously, the internal elements (walls, floors, columns. ) are less affected thanexterior ones where their directions, if facing the polluted air currents, may be critical.
-678-
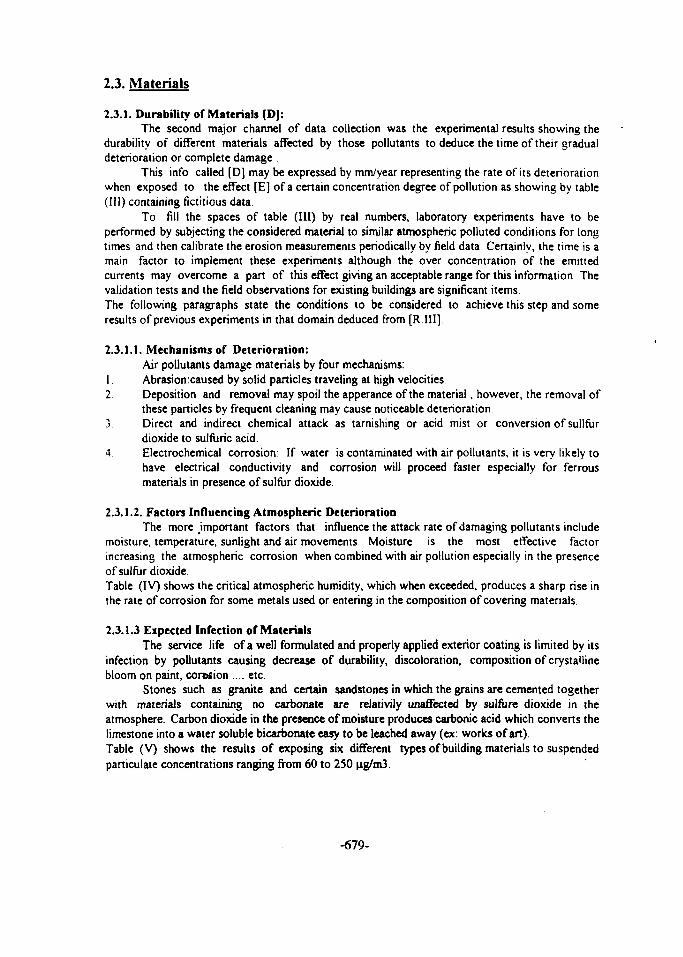
2.3. Materials
2.3.1. Durability of Materials [DJ:The second major channel of data collection was the experimental results showing the
durability of different materials affected by those pollutants to deduce the time of their gradualdeterioration or complete damage
This info called [D] may be expressed by mm/year representing the rate of its deteriorationwhen exposed to the effect [E] of a certain concentration degree of pollution as showing by table(HI) containing fictitious data.
To fill the spaces of table (III) by real numbers, laboratory experiments have to beperformed by subjecting the considered material to similar atmospheric polluted conditions for longtimes and then calibrate the erosion measurements periodically by field data. Certainly, the time is amain factor to implement these experiments although the over concentration of the emittedcurrents may overcome a part of this effect giving an acceptable range for this information Thevalidation tests and the field observations for existing buildings are significant itemsThe following paragraphs state the conditions to be considered to achieve this step and someresults of previous experiments in that domain deduced from [R.III]
2.3.1.1. Mechanisms of Deterioration:Air pollutants damage materials by four mechanisms:
1 Abrasionxaused by solid particles traveling at high velocities.2. Deposition and removal may spoil the apperance of the material, however, the removal of
these particles by frequent cleaning may cause noticeable deterioration3 Direct and indirect chemical attack as tarnishing or acid mist or conversion of sullfur
dioxide to sulfuric acid.4 Electrochemical corrosion: If water is contaminated with air pollutants, it is very likely to
have electrical conductivity and corrosion will proceed faster especially for ferrousmaterials in presence of sulfur dioxide.
2.3.1.2. Factors Influencing Atmospheric DeteriorationThe more important factors that influence the attack rate of damaging pollutants include
moisture, temperature, sunlight and air movements. Moisture is the most effective factorincreasing the atmospheric corrosion when combined with air pollution especially in the presenceof sulfur dioxide.Table (IV) shows the critical atmospheric humidity, which when exceeded, produces a sharp rise inthe rate of corrosion for some metals used or entering in the composition of covering materials
2.3.1.3 Expected Infection of MaterialsThe service life of a well formulated and properly applied exterior coating is limited by its
infection by pollutants causing decrease of durability, discoloration, composition of crystallinebloom on paint, corwion .... etc.
Stones such as granite and certain sandstones in which the grains are cemented togetherwith materials containing no carbonate are relativily unaffected by sulfure dioxide in theatmosphere. Carbon dioxide in the presence of moisture produces carbonic acid which converts thelimestone into a water soluble bicarbonate easy to be leached away (ex: works of art).Table (V) shows the results of exposing six different types of building materials to suspendedpaniculate concentrations ranging from 60 to 250 ng/m3.
-679-
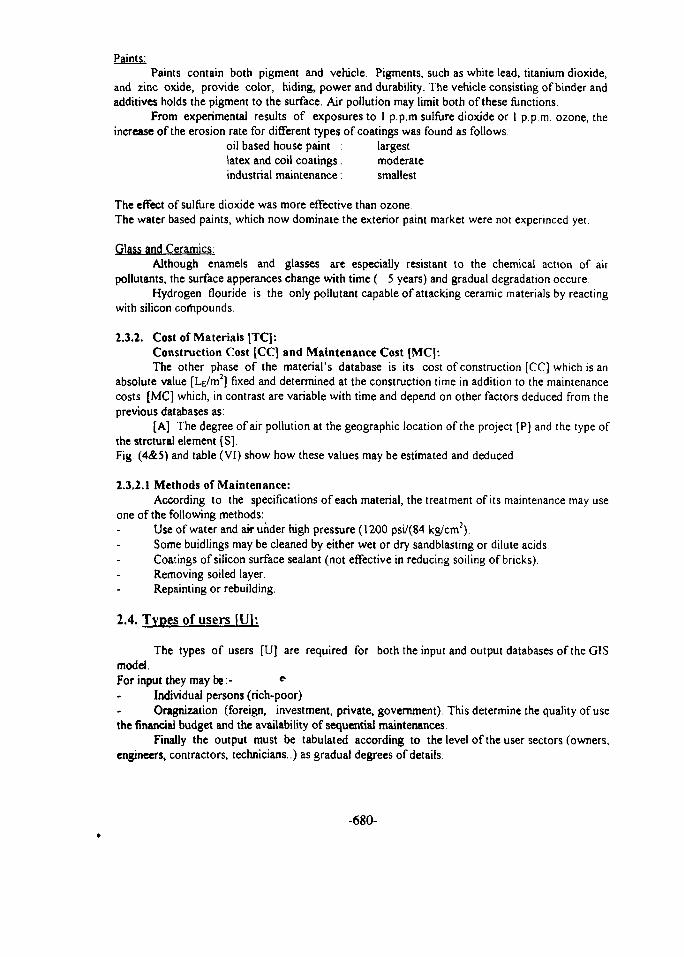
Paints:Paints contain both pigment and vehicle. Pigments, such as white lead, titanium dioxide,
and zinc oxide, provide color, hiding, power and durability. The vehicle consisting of binder andadditives holds the pigment to the surface. Air pollution may limit both of these functions.
From experimental results of exposures to 1 p.p.m sulfure dioxide or 1 p.p.m. ozone, theincrease of the erosion rate for different types of coatings was found as follows:
oil based house paint : largestlatex and coil coatings. moderateindustrial maintenance: smallest
The effect of sulfure dioxide was more effective than ozoneThe water based paints, which now dominate the exterior paint market were not experinced yet
Glass and Ceramics:Although enamels and glasses are especially resistant to the chemical action of air
pollutants, the surface apperances change with time ( 5 years) and gradual degradation occureHydrogen flouride is the only pollutant capable of attacking ceramic materials by reacting
with silicon compounds.
2.3.2. Cost of Materials [TC]:Construction Cost (CC] and Maintenance Cost [MC]:The other phase of the material's database is its cost of construction [CC] which is an
absolute value [LE/m2] fixed and determined at the construction time in addition to the maintenancecosts [MC] which, in contrast are variable with time and depend on other factors deduced from theprevious databases as:
[A] The degree of air pollution at the geographic location of the project [P] and the type ofthe strctural element [S].Fig. (4&5) and table (VI) show how these values may be estimated and deduced
2.3.2.1 Methods of Maintenance:According to the specifications of each material, the treatment of its maintenance may use
one of the following methods:Use of water and air under high pressure (1200 psi/(84 kg/cm2)Some buidlings may be cleaned by either wet or dry sandblasting or dilute acidsCoatings of silicon surface sealant (not effective in reducing soiling of bricks)Removing soiled layer.Repainting or rebuilding.
2.4. Types of use r s [Ul:
The types of users [U] are required for both the input and output databases of the GISmodel.For input they may be: - fr
Individual persons (rich-poor)Oragnization (foreign, investment, private, government). This determine the quality of use
the financial budget and the availability of sequential maintenancesFinally the output must be tabulated according to the level of the user sectors (owners.
engineers, contractors, technicians.) as gradual degrees of details
-680-

Table (VI) is a suggested table for the output which may be provided to contractors andengineers where the total cost after n-years may be estimated as equ. (1) if the assumed squentialperiod is 3 years and the increase of maintenance cost equals 0.2 every 3 years.
TCn = CC + MC3 + 1.2 MC3 + + ( l+-xO 2) MC3 - eq.(l)
Where:TCn = Total cost after n years.CC = Construction cost.MC3= Maintenance cost after 3 years.
3. RELATIONSHIPS BETWEEN SUBDATABASES AND OUTPUTS
Relationships between the experimental results from the material experiments [D],cost ofconstruction [CC] and maintenance [MC] are established as functions of time [T] and geographicloaction and linked to the GIS database to deduce the following outputs:
3.1. The total Cost of Material [TCI
The combination of the three items [A], [P] and [S] provide the final effect [E] of airpollution at the geographic location of the project on the material used or suggested to cover theselected structural element. [E] is the value which must be considered to use table (III) giving thedeterioration rate [D] to extract the numbers of years [T] indicating the maintenance procedure andso the maintenance cost [MC] as shown by Fig. (4).The charts designating the total cost [TC] for each material based on its [CC] and [MC] along 20years. . or more may be designed as Fig.(4).
3.2. The Right Decision IR1:
If the type and level of the user's sectors [U] are taken into consideration with the totalcost [C], the right decision [R] about selecting a certain material for a specific structural element ina project at a located area is achieved:
CONCLUSION:
This paper shows how different branches of engineering may cooperate fruithfully to solvea very severe problem related to the impact of environmental circonstances of air pollution causinggradual deterioration or complete damage of materials used to cover structural elements over thegreater Cairo area.
The outputs: Tables (VI), charts of Fig (4) will present a guide for the selection of theappropriate material for each element of a structure for a certain project as a function of itsgeographic location, its resistance to specific pollutants and their distribution within thearea. Obviously, the right choice is a practical and economic decision to save money andtime in addition of creating an environment more pleasant by keeping the good appearanceof buildings to the general population.
Both private and government sectors, contractors, engineers, industries and the publiceither small or large owners will benefit from this project.
-681-

The experimental results, when achieved, will provide series of tools for evaluating thepotential degradation of materials
Each of the sub-databases used either for input or output for the GIS model represents initself, separate or combined a valuable result which its use may be extended to solve otherproblems such as the problems related to health.
The values of the results of this project will be more significant and the numbers muchreliable and accurate if this procedure will be applicable in well planned cities where regionsare more homogenous (residentials, industries, green land*. ) such as 10th of Ramdan or6th of October
The flexibility of the DBMS will give the opportunity to enlarge the applications either byaggregation (large areas, governorates). or disaggregation - and provide the updating of thetables and outputs by new market prices.
REFERENCES
1- El Kotb. M M & Borman Gary "Air Pollution from Motor Vehicles in the City of CairoSwcond Annual Report. FACU Supremen Council of Universities, Egypt 1985
2- AC. Sterm Air Pollution. Academic Press, 1927
3- National Air Pollution Monitoring Networks Ministry of Health A R E 1991
-682-
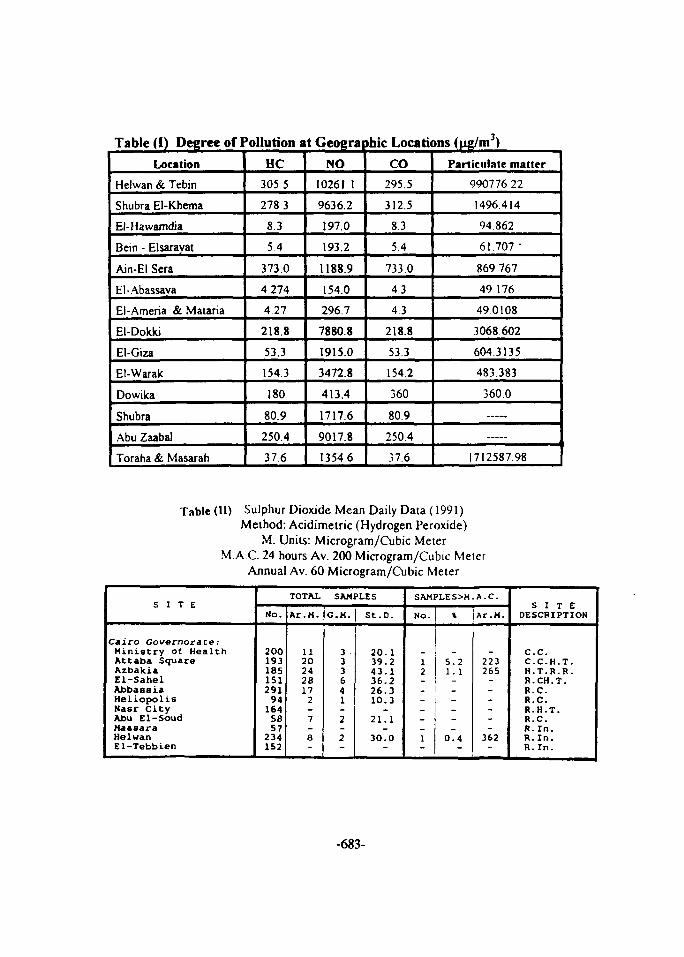
Table (1) Degree of Pollution at GeograiLocation
Helvvan & Tebin
Shubra El-Khema
El-Hawamdia
Bein - Elsarayat
Ain-EI Sera
El-Abassava
El-Ameria & Mataria
El-Dokki
El-Giza
El-Warak
Dowika
Shubra
Abu Zaabal
Toraha & Masarah
HC
3055
2783
8.3
54
373.0
4 274
4.27
218.8
53.3
154.3
180
80.9
250.4
37.6
NO
10261.1
9636.2
197.0
193.2
1188.9
154.0
296.7
7880.8
1915.0
3472.8
413.4
1717.6
9017.8
1354.6
hie Locations (|ig/m )
CO
295.5
312.5
8.3
5.4
733.0
4.3
4.3
218.8
53.3
154.2
360
80.9
250.4
37.6
Particulate matter
99077622
1496.414
94.862
61.707 '
869.767
49 176
490108
3068.602
604.3135
483.383
360.0
1712587.98
Table (II) Sulphur Dioxide Mean Daily Data (1991)Method: Acidimetric (Hydrogen Peroxide)
M. Units: Microgram/Cubic MeterM A C . 24 hours Av. 200 Microgram/Cubic Meter
Annual Av. 60 Microgram/Cubic Meter
S I T E
Cairo Governorat e:Ministry of HealthAttaba SquareAzbakiaEl-SahelAbbaasiaHeliopolisNasr CityAbu El-SoudMaasaraHelwanEl-Tebbien
No.
2 0 01931851512 9 1
94164
58S7
2 3 4152
TOTAL
Ar.M.
112 0242 817
2-7_
a
SAMPLES
C M .
333641-2_2
St.D.
20.139.243.136.226.310.3
21.1_
30.0-
SAMPLES>M.A.C.
No.
12
____1
\
-5 . 21 . 1
-__
__
0 . 4
Ar.M.
-223265
-_---_
362-
S I T EDESCRIPTION
C.C.C . C . H . T .H . T . R . R .R. CH. T.R.C.R.C.R .H.T .R.C.R. I n .R . I n .R. I n .
-683-
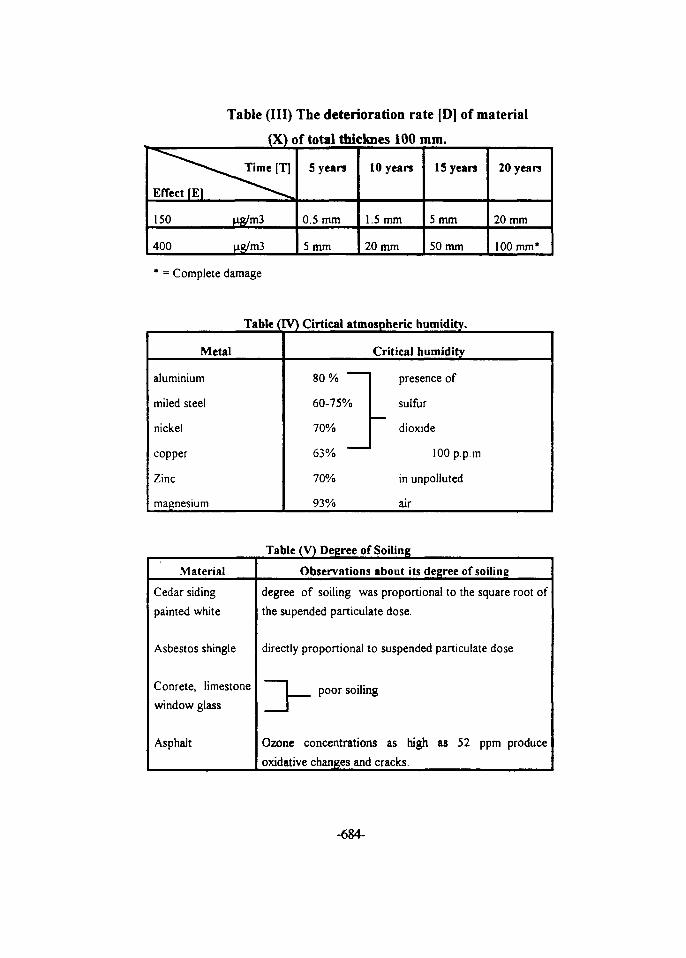
Table (III) The deterioration rate [D] of material
(X) of total thicknes 100 mm.
Effect [E]
150
400
•"^^^ Time
ug/m3
(ig/m3
[T] 5 years
0.5 mm
5 mm
10 years
1.5 mm
20 mm
IS years
5 mm
50 mm
20 years
20 mm
100 mm*
= Complete damage
Table (IV) Cirticai atmospheric humidity.
Metal
aluminium
miled steel
nickel
copper
Zinc
magnesium
Critical humidity
80%
60-75%
70%
63%
70%
93%
presence of
sulfur
dioxide
100 p.p.m
in unpolluted
air
Table (V) Degree of Soiling
Material
Cedar siding
painted white
Asbestos shingle
Conrete, limestone
window glass
Asphalt
Observations about its degree of soiling
degree of soiling was proportional to the square root of
the supended paniculate dose.
directly proportional to suspended paniculate dose
1 poor soiling
Ozone concentrations as high as 52 ppm produce
oxidative changes and cracks.
-684-
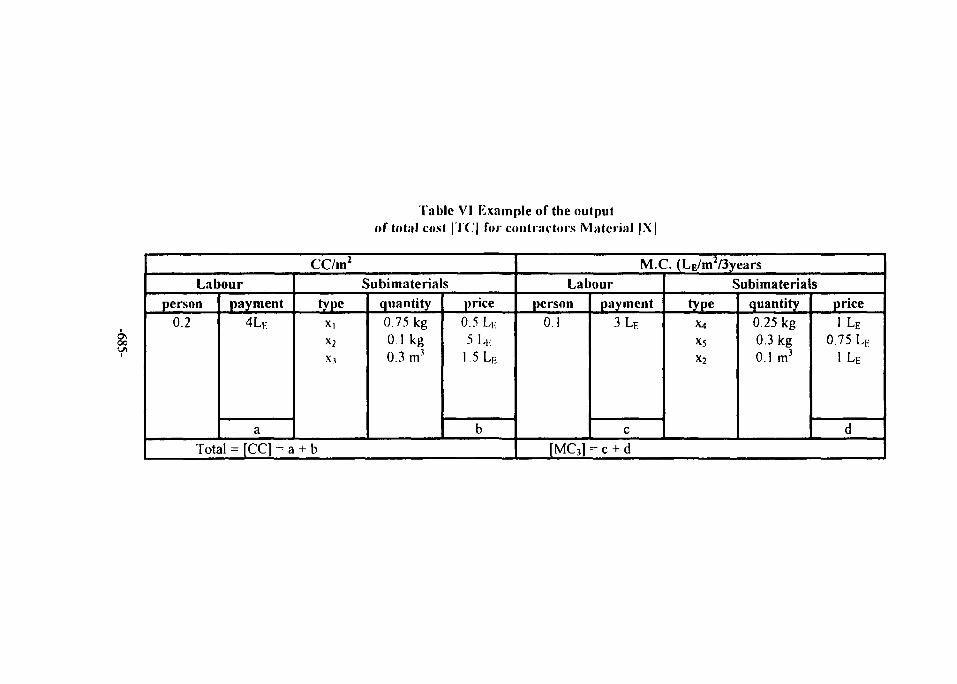
Table VI Kxample of the outputof total cost | rC.'| for contractors M;ileri;il | \ |
6s00
CC/m2
Labour
person0.2
payment
4LK
a
Subimaterials
type
X|
X2
Xi
quantity0.75 kg0.1kg0.3 m3
price
0.5 LH
5 LH
1.5 LE
bTotal = [CC] = a + b
M.C. (LE/m2/3yearsLabour
person
O.Ipayment
3LE
c
Subimaterials
type
X4
x5
X2
quantity0.25 kg0.3 kg0.1 m3
price1LE
0.75 LF
1LE
d[MC3] = c + d
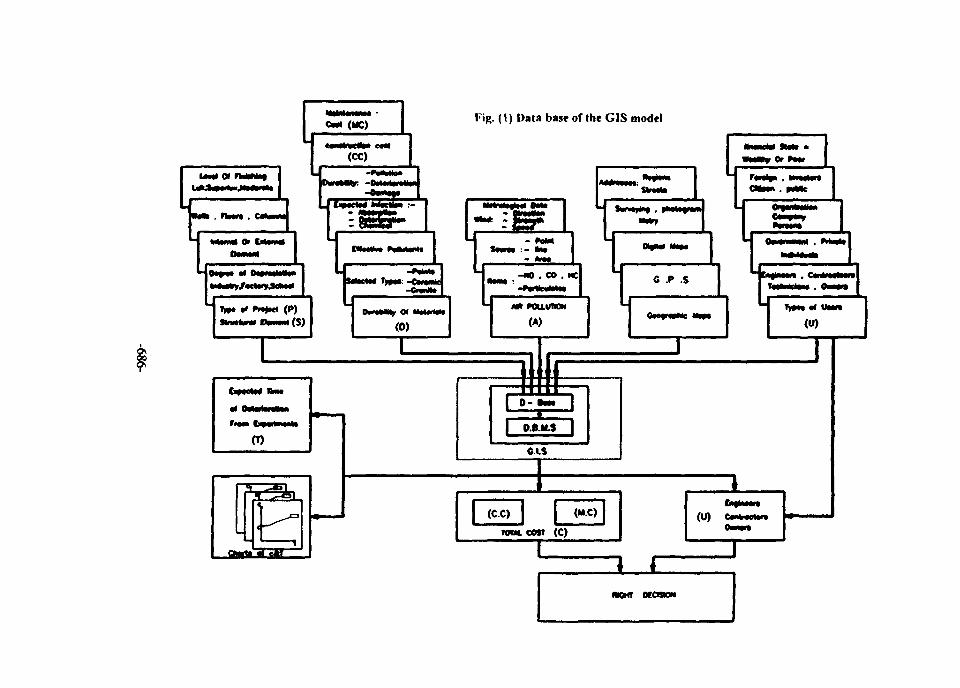
Fig. ( t ) Data base of the GIS model
1(C.C)
mm1
I COSTr(C)
(M.C) | (U)
1 £H
MOMT KCSMN
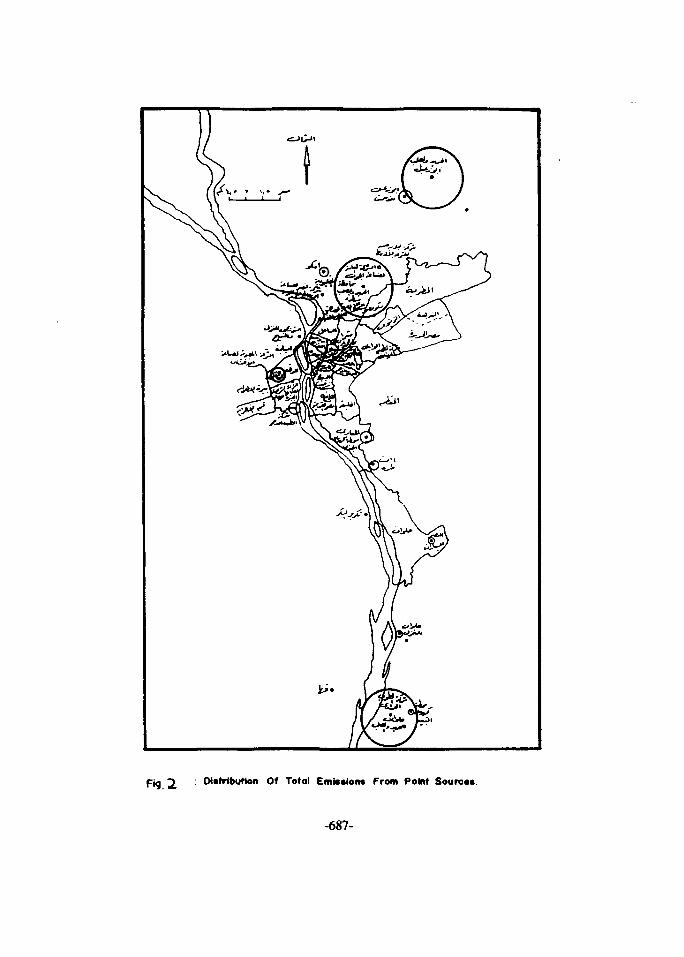
2. : OUfrlbution Of Total Emissions From Point Source*.
-687-
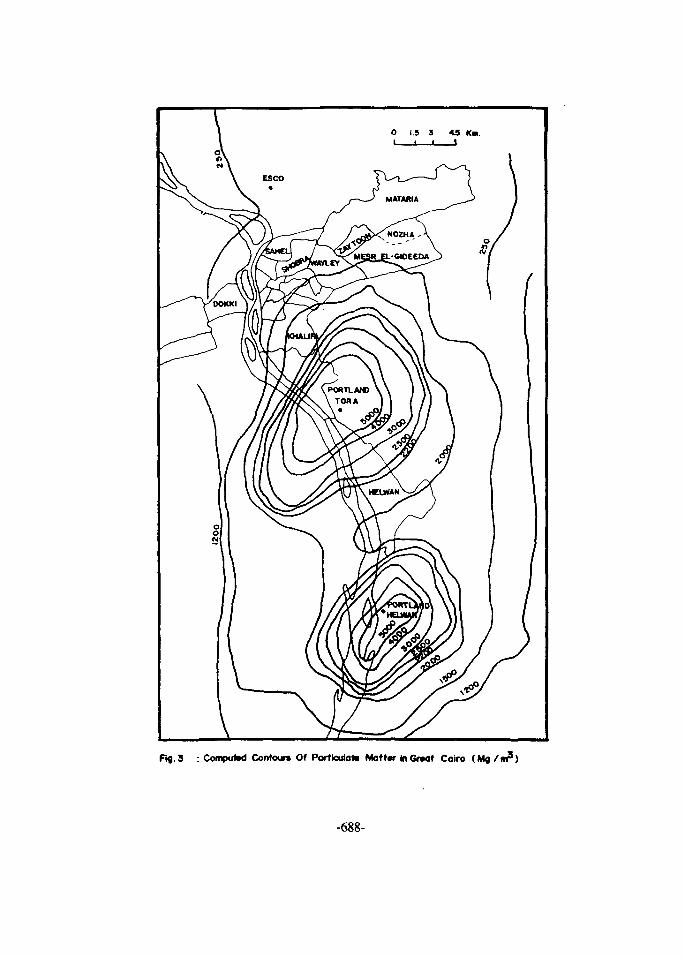
O 1.9 3 49 Km.
Fig. 3 : Computed Contours Of Particular Mattw inGntat Cairo (Mo /m 3 )
-688-
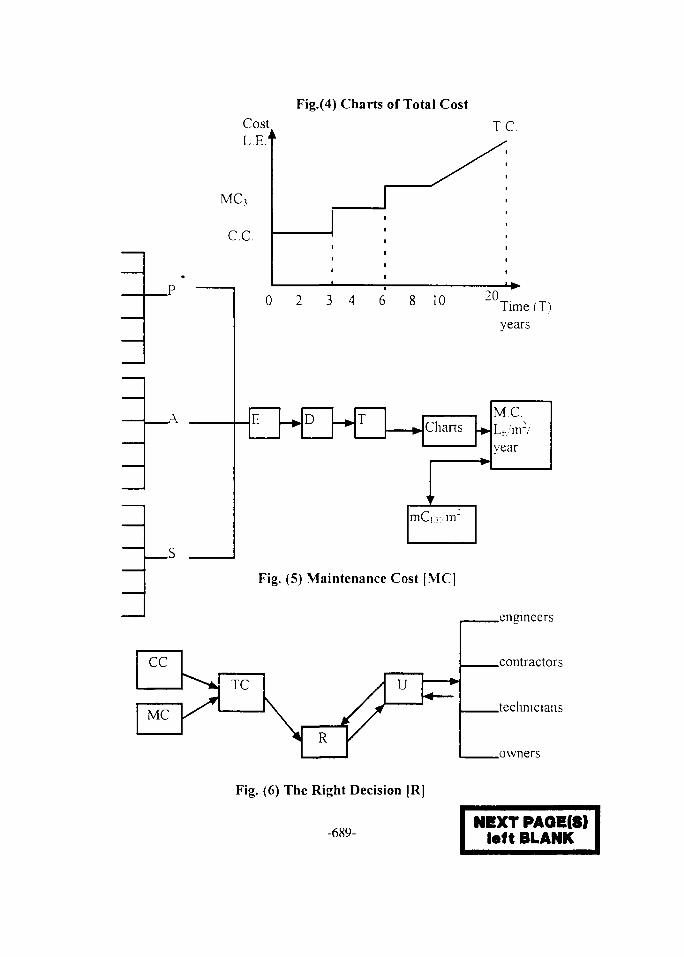
Fig.(4) Charts of Total CostCost T CL.E.'
MC3
C.C.
0 2 3 4 6 10 Time(T)vears
D T Chans
mCi pirr
Fig. (5) Maintenance Cost [MCI
cc
MC y
^ TC
S~\ 1\^ <•\ R /
/ u ^r
.eneineers
.contractors
.technicians
.owners
Fig. (6) The Right Decision |R]
-689-NEXT PAQE(S)
loft BLANK
Proceedings of the Fifth International Conference EG970G027on Energy and Envirorunent, Cairo, Egypt, 1996
REDUCTION OF LEAD POLLUTION FROMVEHICULAR EMISSIONS IN CAIRO
Part 1: Comparison of alternative solutions
M.A.EI-Kady**, S.M.EI-Haggar* and S.K.Saleh*
ABSTRACT
It has been recognized for decades that the major source of lead pollution is lead
additives to automotive fuels. This problem has been countered in most countries in
Europe and USA by introducing alternative anti-knock chemicals and unleaded gasoline.
In Egypt lead is still being added to gasoline in large quantities. However, progress has
been made, and unleaded gasoline is currently being produced in Alexandria.
Nevertheless, the major pollution problem remains in the Greater Cairo region as
indicated by the atmospheric lead levels and the lead blood levels of the children in Cairo.
The aim of the present study is to find an optimum solution to this problem. A
comparison of the different solutions is conducted in order to come up with the most
feasible solution to this urgent problem.
In conclusion it has been demonstrated that the elimination of lead additives, with
its huge positives effects on the country environment, proved to be profitable.
INTRODUCTION
Lead Pollution in Cairo has been found to be very serious problem. Lead toxicity
has adverse effect not only on human health but also on vegitation and welfare [1]. Its
entry to the ecosystem has appreciable effect on the children behaviour and educational
attributes. The major channel through which lead is absorbed is through inhalation of lead
compound present in the atmosphere as a result of vehicular emission.
* The American University In Cairo, Engineering Department , P.O.Box 2511, Cairo,Egypt.* • Vice Dean, Higher Technological Institute, Tenth of Ramadan, Egypt.
-691-
The use of lead compounds as anti-knock additives in gasoline was introduced in
1923 [2]. " Knocking "or detonation is a phenomon related to abnormal combustion and
derives its name from the sound heard 1 om the engine, characteristic to driving in low
gear.
The measure of the anti-knock ability of a fuel is the octane number. Three types
of octane number are commonly used, research octane number (RON), motor octane
number (MON), and road octane number (ON). The reseach octane number is measured
at light working conditions, usually at an engine speed of about 600 rpm. The motor
octane number is associated with heavy conditions at an engine speed of about 900 rpm.
The octane number which is generally used to define a fuel is the road octane number and
is defined as the average of the research and motor octane numbers. The research octane
number is always greater than the motor octane number and the difference between them
(RON-MON) is known as the sensitivity [3],
Three major families of hydrocarbons may be defined as the constituents of
gasoline. Aromatics are known to have a high octane number. Olefms, which are the
major constituents in gasoline, have medium anti-knock abilities, Paraffins have the
lowest octane numbers and therefore the highest potential for knocking [3].
Lead is added to gasoline as tetraethyl or tetramethyl lead. The production of
tetraethyl lead is cheaper and therefore it is more widely used than tetramethyl lead
although the latter has advantages because of its lower boiling point and higher vapor
pressure which enables it to be more evenly distributed among the engine cylinders.
These lead compounds form radicals, under the heat of combustion, which react with the
radicals formed by the burning of gasoline resulting in enhancement of burning rate and
consequently reduces the tendancy of detonation.
The ability of lead to increase the octane number of a fuel is demonstrated in table
1. Obviously the higher the octane number of fuel, the less effect lead will have in
increasing it. For example, lead will have a much greater effect in increasing the ON of
parafine than that of aromatics when added in the same quantity.
There remains the problem of disposing with the lead resulting from the
dissociation of lead compounds due to the heat of combustion. Chlorides or bromides are
usually added to the fuel to oxidize the lead and convert it to an easily disposed of
gaseous form. Seventy to seventy five percent of the gaseous lead thus formed is released
-692-
with the exhaust, about half of which becomes airborne. The remainder is trapped in the
exhaust system and engine oil [4].
Nevertheless, another point of major concern is the effect of lead on catalytic
converters, which have become necessary addition to most automobiles in USA and
Europ. Catalytic converters are devices which utilize a catalyst to promot further
combustion of the exhaust gases of the engine. The result is that exhaust gases such as
corbon monoxide and hydrocarbons, which are resulting from incomplete combustion,
are reburnt and converted to harmless gases which are then exhausted. The point of
concern in this case is that these converters work only with unleaded fuel, since lead
poisons the catalyst involved. The effect of lead on catalytic converters can be seen
clearly in Fig. 3.1, from which it is obvious that leaded fuel drastically alters the
performance of the converters [5].
In order to maintain proper control on the lead quantities emitted, regulations and
laws must be passed limiting both the quantity of lead added to the fuel, and the
concentration of the lead components in the atmosphere.
The United Kingdom was one of the first countries to impose regulations on the
use of lead in gasoline. In 1972, a limit of 0.48 g/1 was set, which was reduced to 0.4 g/1
in 1981, and then to 0.15 g/1 in 1985. In 1982, CLEAR (campaign for lead free air) was
formed,with a target of total removal of lead from gasoline by 1990 [6]. In Germany, a
limit of 0.4 g/| was set in 1978. Extensive forest damage and the use of catalytic
converters induced an early attempt at banning leaded petrol in 1986, closely followed by
Denmark, Holland and Luxembourg. <\ final EEC directive was issued, introducing
unleaded petrol in 1986, but not essentially required till 1989, and limiting the
concentration of lead in air to below 2 micrograms per > ubic meter, to be achieved by
1987 [6], The US Clear Air Acts Amendment of 1970 limited the amount of lead in
gasoline to 0.026 g/1 [7]. In general, lead-free gasoline is defined to be between 0.01 and
0.02 g/1 in Europe, and below 0.0135 g/1 in the USA.
Different trends, however, may still be found in Europe. For example, in 1990, the
sales of unleaded fuel in Italy comprised only 5 % of the total sales as compared to 67 %
in Germany. Table 3.2 shows the maximum allowable lead content and percentage
consumption by unleaded fuel in Western Europe, USA, and Japane.
In Egypt, no specific regulations regarding the lead levels in air or in gasoline
have been set yet. The National Environmental Action Plan, dated March 199? states "
Recognizing the increasingly high leve' of lead in bl-^iH snmples of children ir. urban
-693-
areas and its injurious effects on their health and development, GOE (Government of
Egypt)wishes to discourage the use of high levels of lead in gasoline. A start would be
made by introducing unleaded and low lead gasoline with lead concentration of less than
0.15 g/1. To encourage the use of unleaded gasoline such gasoline will need to be priced
at levels less than leaded gasoline[8J". Although recent efforts have managed to reduce
the levels of lead in some areas to be within the range mentioned above, it must be stated
that in some areas, levels reaching 0.60 g/1, which is four times the figure quoted and
about twenty three times the limit in USA, are still being used.
Possible Alternatives
The function of lead in gasoline is to increase the octane number, and thus
improve the efficiency of combustion. Several alternatives may be used to achieve this
result without lead additives. These may be grouped into two categories : alternative fules
and alternative methods using gasoline.
Alternative fuels
The use of alternative fuels in automobiles would require not only totally new
production units for the fuel, but also new car designs to accomodale the new fuel such as
Diesel, propane, compressed natural gas (CNG), liquified natural gas (LNG), alcohols,
hydrogen....etc. The most common alternative fuels applied in Egypt are Diesel and CNG.
The diesel engine was invented at the end of the 19th century and is used mainly
for large commercial vehicles. The main difference with the diesel engine is the method
of ignition. Diesel engines use much higher compression ratios which cause sufficient
friction between air molecules for spontaneous combustion, i.e. no spark is induced. No
lead is included in the fuel but higher sulfur concentrations exist, leading to larger
emissions of sulfur oxides. However, although the exhaust of diesel fuel seems visibly
much more hazardous than that of Petrol fuels due to the black carbon particulates
emitted, diesel fuel produces less carbon monoxide, and nitrogen oxides[2]. Diesel fuel is
more viscous than gasoline and ignites easily, so that less unburnt hydrocarbons are
produced. The pollution effects of diesel fuel are generally considered to be less than
those of gasoline. A comparison is shown in Figure 3.2[2].
Compresed natural gas (CNG), on the other hand will cost one third to one half
the price of gasoline. Natural gas is composed mainly of methane (CH4), with possibly
some ethane, propane and butane. In conversions from gasoline, a 10 to IS per cent
-694-
power loss has been experienced. Significant reductions in emissions of carbon
monoxide, unburnt hydrocarbons, and nitrogen oxides have been monitored, as well as
the eliminations of lead compounds from the exhaust[9].
Liquified natural gas LNG, is another alternative fuel. The basic operation in
liquified natural gas are gas treatment, liquification and storage. Gas treatment involves
the removal of contaminants such as water, carbon dioxide, sulphur compounds, dust, oil
and heavey hydrocarbones. The natural gas may be liqified by lowering its temperature to
about-162 C.
Storage containers for LNG should have special insulation to maintain the low
temperature vary widely in size and structure. The estimated cost of conversion from
petrol engine to LNG driven one is about $3000 compared with $ 1500 to converted to
CNG engine. Necessary modifications include major fuel tank and electric system
changes. Both the liquifaction unit and refueling stations are very expensive, mainly due
to the necessary preautions involved. The emissions from LNG driven engine are similar
to those from CNG driven ones [10].
Ethanol C2H5OH, and methanol CH3OH may also be used as alternatives to
gasoline. A mixture of ethanol and gasoline is also used, termed gasohol, which requires
only minor modifications to the normal engine. Gasoline octane rating is boosted when
alcohol is mixed with gasoline and higher compression ratios may be used with alcohol
or gashol. The use of alcohols would require majour engine modifications. Besides,
several operating difficulties, such as cold-starting exist with alcohol. Evaporative
emissions from the fuel tank and carborator are much higher than those associated with
gasoline. Also, aldehyde, and nitrogen oxide emissions increase greately when alcohol is
used, while carbon monoxide emissions are reduced [11].
The most environmentally friendly fuel is hydrogen which has been termed thefuel of the 21 st century. The use of hydrogen as a fuel totally eliminate lead,
hydrocarbons, and carbon monoxide emissions. Nitrogen oxide emissions are also
significantly reduced. However, the use of hydrogen as a fuel necessitate modifications to
the gasoline engine include new tank and fuel system, hydrogen detecting devices for
safety and aditional gages and indicators. The liquifaction of hydrogen (must be cooled to
-252 C) is also very expensive and refueling stations require high technology for safetyreasons [12].
-695-
Alternative Solutions Using Gasoline
To accoraodate the use of alternative fuels in order to eliminate the problems
associated with lead additives in gasoline, new production units, distribution networks,
filling stations, and car designs must be implemented. This obviously will lead to
necessary costs which may not be 100% feasible. The alternative is to continue using
gasoline, and introduce solutions to the lead compounds exhausted by the engine such as
lead traps, other additives, unleaded gasoline....etc..
The idea behind a lead trap is to absorb the lead compounds produced during fuel
combustion by introducing a certain material in the exhaust. Studies conducted in
Germany have related the use of lead traps to a 75% decrease in lead emissions over 35
thousand kilometres of testing. Basically, a lead trap is a filter containing steel wool
coated with alumna, and it has the main advantage that no modification is necessary
either to the car design or the refining and distributing processes[7]. The disadvantages of
lead traps, however, are many such as the cost of the trap and its replaceable parts. The
use of such traps produce a back pressure on the exhaust system, which leads to a loss in
engine efficiency. The lead trap does not solve the problem of lead pollution, but merely
transfers it from an atmospheric to a solid waste one[7].
The use of other additives introduces an alternative solution. One of the earliest
compounds used as an anti-knock additive is Fe(CO)5. This shows promise in raising
octane number, especially on paraffinic fuels on which it was first used. However, several
problems including effects on the engine led to the phase out of its use.
Methylcyclopenta-dienyl Manganese Tricarbonyl (MMT) has been used in USA as an
octane booster in recent years[5]. However, MMT works most effectively in the presence
of lead itlkyls, and therefore does not eliminate the problem. Recently, the direction has
been towards using organic substances which may be classified into two families;
aromatics containing nitrogen and oxygen such as amines and caster, and non aromatic
compounds containing oxygen such as alchohols and ethers (oxygenates). Most of these
additives are very expensive, unstable, and environmentally undesirable since they
produce strong odors[5].
Several options may be utilized whereby octane levels can be maintained while
eliminating the lead added to gasoline by changing its composition. This can be achieved
by increasing the use of refinery processes yielding high octane blending components
such as aromatics, olefins or isoparaffins.
-696-
Improvement on octane number of about 20 numbers can be achieved by the
isomarization process (isosive process) which allows the removal of normal paraffin's
but with shrinkage in gasoline volume. To avoid volume shrinkage the isosive process
can be integrated with isomarization to convert C5 and C6 normals to the higher octane
isomers. This integration is marketed as the Total Isomarization Process (TIP) [13]. The
feasibility of implementing refinery processes to boost gasoline octane rating was studied
by the same authors [14].
Alternatives to Lead in Gasoline : A Comparison
The possible methods of eliminating lead compounds in automobile exhaust were
introduced. Each of these methods has advantages and disadvantages in terms of factors
such as cost, performance and environmental effect. In this section, an attempt will be
made to compare between the different methods in such a way as to emerge with an
optimum solution to the lead pollution problem posed by lead additives in gasoline, with
special emphasis on the situation in Egypt.
Break Even Analysis
The break even analysis is one of the simplest ways to provide a logical
comparison between alternatives from the consumer's point of view. A simple break even
analysis between unleaded fuel and lead traps will be conducted, since these are the two
solutions which are widely available in the market. Since these methods have not been
implemented in Egypt, the USA will be taken as the base of the analysis.
Relevant data for the analysis include prices of leaded and unleaded gasoline, cost
of the lead trap, and the expected running cost of replaceable parts needed for the lead
trap. Prices of the gasoline are available per gallon, and it is estimated that the average car
travels 40 kilometers per gallon. The obtained data are as follows:-
Unleaded Gasoline: Initial cost = 0
Running cost = $ 1.07 / gallon
Lead Trap : Initial cost =$110
Running cost (fuel) =$ 0.95/gallon
Running cost (parts) =$ 0.10/gallon
Total running cost =$ 1.05/gallon
-697-

The running cost of replaceable parts is estimated at $ 30 per year for an average
of 1000 kilometers per month. Using the conversion of 40 kilometers per gallon, this cost
is calculated at $ 0.10 per gallon. The initial cost of $ 110 for the trap includes the cost of
the trap and its incorporation into the exhaust system. The break even point (x) is
therefore calculated as follows:-
1.07 X= 110+ 1.05 X X= 5,500 gallons
Again, using the previously estimated value of 40 Kilometers / gallon, the break
even point is found to be at 5,500 X 40 = 220,000 kilometers. This indicates that, for the
consumer, the use of a lead trap will only be cost efficient after 220,000 kilometers which
is more than the average car will ever travel. Figure 3.4 shows the graph of cost versus
kilometers for both alternatives.
Clearly, through this quick calculation, the lead trap has proved to be inefficient in
terms of cost. Since this will obviously be the only factor which will induce a person to
use leaded gasoline with a lead trap in favor of unleaded gasoline, it can only be
concluded that the lead trap does not provide a feasible solution to the lead pollution
problem when compared to the use of unleaded gasoline. Indeed, the use of lead traps has
met with minimal success in both Europe and the United States.
Scoring Matrix Criteria
The scoring matrix criteria provides one of the most efficient methods of
comparing between alternatives. This is achieved by selecting criteria of importance in
the comparison, calculating a weight of importance for each, and assigning relative point
values to the criteria for each alternative. Total scores are reached for the different
alternatives which may then be compared relatively.
The criteria of importance can be defined as environmental impact, cost, required
maintenance, safety, and engine performance or efficiency. The general term 'cost' is
intended to cover both costs related to the production of fuels and necessary
modifications to existing designs, and running costs including costs of raw materials.
The main alternatives which have been chosen for comparison are leaded fuel,
unleaded fuel, leaded fuel using a lead trap and other fuels. Other fuels includes all
alternative fuels discussed previously. Since they are relatively similar with respect to the
chosen criteria, it is possible to group them as a single solution. Similarly, the term
-698-
unleaded fuel comprises the different types discussed previously. Leaded fuel may be
considered as a control alternative for use in comparison. The scoring matrix criteria is
shown in Figure 3.5.
The first step is to obtain the weight of importance for each criterion. To do this .
each criterion is given a number expressing its importance relative to all other criteria.
Four represents major preference, three medium preference, two minor preference, and
one indicates no special preference. The numbers are shown in the intersections between
the criteria. Since this study is conducted from the environmental point of view,
environmental impact was chosen to have minor preference over cost and safety, and
medium preference over maintenance and engine performance. Again, as an example, the
number 1 in the intersection between cost and safety implies that the former has no
preference over the latter. The numbers on each of the slanted rows are then added to give
the score for each criterion, and adjusted on a range of 1 to 10 to give the relative weight
of importance.
The four alternatives are then given scores in each of the different criteria, ranging
from one, which denotes poor, to five, which denotes excellent. These scores arc shown
in each cell below the diagonal line. As an example, leaded fuel scores ' poor' on
environmental impact, and the lead trap scores ' fair* on cost. In terms of environmental
impact, unleaded fuel and other fuels are the best solutions, while leaded fuel is the worst.
The reverse is true for cost. Other fuels score low on safety since most of them are either
very flammable or hazardous to store and handle. Leaded fuel scores highest on engine
performance or efficiency, while the lead trap scores lowest on required maintenance.
In each cell, the number above the diagonal line is simply equal to the number
below the line times the weight of importance for the relative criterion. The final score for
each alternative is the addition of numbers above the diagonals across the row. Unleaded
fuel is seen to score highest (87) due to its good environmental impact, safety and
efficiency, followed by other fuels (72), leaded fuel (70), and finally, the lead trap with a
score of (66). It may seem strange that the lead trap scores lower than leaded fuel.
However, although the lead trap will improve environmental impact when used with
leaded fuel, its poor performance in terms of cost, effects on engine performance, and
required maintenance tends to overshadow this improvement . When the solid waste
problem posed by the lead trap is taken into account along with its financial unfeasibility
from the point of view of the consumer (previously demonstrated in the previous section),
it proves to be a solution which we can safely neglect.
-699-
When deciding on a course action to implement in Egypt, all of the above factors
must be taken into consideration.
The use of alternative fuels will prove to be infusible in the near future due to
several factors, not the least important of which is cost. Availability of raw materials will
also be a problem. Therefore , the only remaining solution is the use of unleaded fuel,
which indeed has proven to be the most practical solution.
CONCLUST1ON
The use of alternative fuels instead of gasoline as a way to reduce the level of lead
and lead compounds emitted from motor vehicles is not completely fesaible. New product
units, distribution networks, filling stations, and engine modifications must be
implemented.
The use of other additives, on the other hand is not an acceptable alternative most
of these additives are expensive, unstable, and environmentally undesirable since they
produce strong odors.
The use of the lead trap does not solve the problem of lead pollution but transfer it
irom an atmospheric to a solid waste one. Besides, the cost of the trap and its replacable
parts, and the negative effects of using the lead trap on engine performance are major
drawback that the lead trap has proven to be inefficient in terms of cost compared with
the use of unleaded fuel. Using the scoring matrix criteria to compare between all
•ihcrnatives proves that the use of unleaded fuel introduces the most feasible solution
when compared with the use of leaded fuel, the use of lead trap, and the use of alternative
fuels.
REFERENCES
1 KI-Haggar, S.G.Saad, M.A.El-Kady, S.K.Saleh,"Lead Pollution Sources and Impacts",
4th international conference on energy and Environment, Cairo, Egypt, June 3-6, 1996.
2 Ismail, M., 1987, "Feasibility study", in Arabic, Dar El-Game'aat El-Masriah,
, Alexandria.
3 The Cairo Oil Refining Co., CORC Report 1994.
4. Milliard, j . ami G. Springer, 1984, "Fuel economy in Road vehicles powered by spark
if1' tion engine? . Plenum Press, New York.
-700-
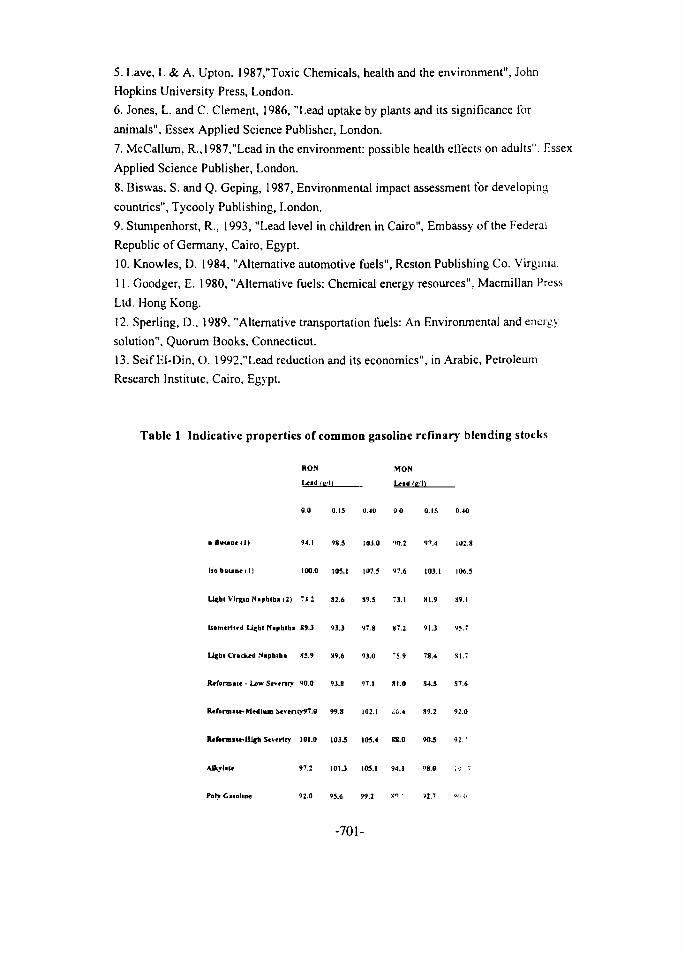
5. Lave, L & A. Upton. 1987,'Toxic Chemicals, health and the environment", John
Hopkins University Press, London.
6. Jones, L. and C. Clement, 1986, "Lead uptake by plants and its significance for
animals", Essex Applied Science Publisher, London.
7. McCallum, R.,1987,"Lead in the environment: possible health effects on adults", Essex
Applied Science Publisher, London.
8. Biswas, S. and Q. Geping, 1987, Environmental impact assessment for developing
countries", Tycooly Publishing, London.
9. Stumpenhorst, R., 1993, "Lead level in children in Cairo", Embassy of the Federal
Republic of Germany, Cairo, Egypt.
10. Knowles, D. 1984, "Alternative automotive fuels", Reston Publishing Co. Virginia.
11. Goodger, E. 1980, "Alternative fuels: Chemical energy resources", Macmillan Press
Ltd. Hong Kong.
12. Sperling, D., 1989, "Alternative transportation fuels: An Environmental and energy
solution". Quorum Books, Connecticut.
13. Seif El-Din, O. 1992,"Lead reduction and its economics", in Arabic, Petroleum
Research Institute, Cairo, Egypt.
Table 1 Indicative properties of common gasoline re fin a ry blending stocks
MON
Lead (a'1)
0.0 0.13 040 1)0 0.15 0.40
o B u U o n l ) 94.1 98.5 103.0 90.2 97.4 102.8
Iso butane i l l 100.0 IO5.1 107.5 97.6 103.1 106.5
Light Virgin Napblba 12) 74.2 82.6 89.5 "3.1 81.9 89.1
Uomcriiril Ll^hl Napblba 89.3 93.3 97.8 87.2 91.3 95.7
Ligbl Cradud Napblba 85.9 89.6 93.0 "5.9 78.4 81.7
R t f o m i u - Low Severity 90 0 93.8 97 1 81.0 S4.5 87.6
Reformate-Medium Severity97.0 99.8 102.1 " - • < 89.2 92.0
Ribrniau-Hlgli Severity 101.0 103.5 105.4 88.0 90.5 92 7
AJkylate 97.2 101.3 105.1 94.1 98.0 ,: '
Poly Caiolinc 92.0 95.6 99.2 S" " '»2.7 ».. o
-701-
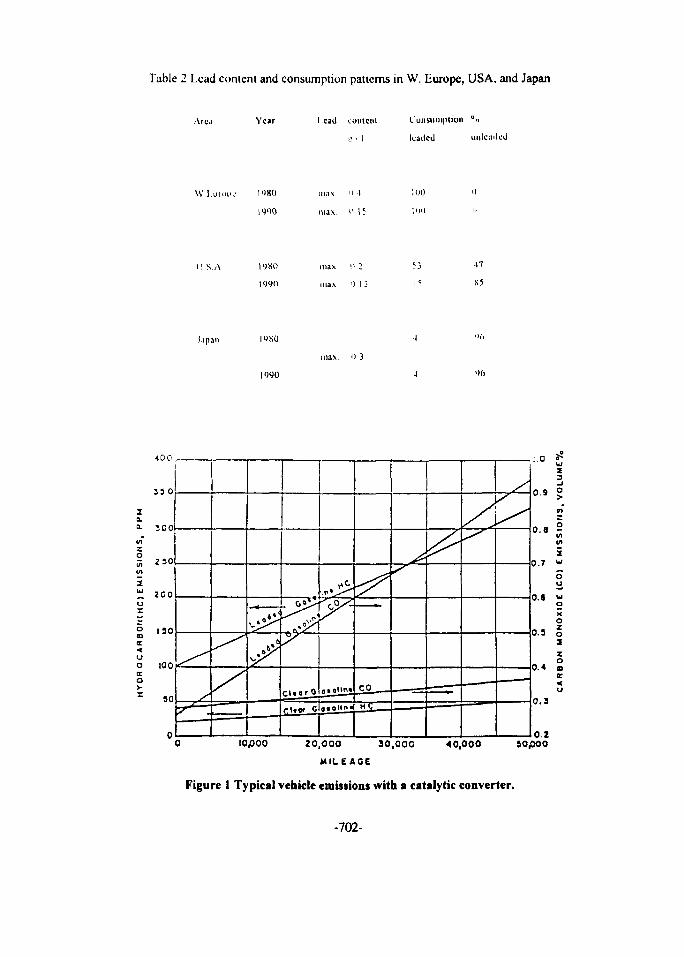
Table 2 Lead content and consumption patterns in W. Europe, USA, and Japan
Area Year Lead tuntciil Consumption %
L' • I leaded uul
W I u t o | ' c I'lKO uux "
max it
100
I IK)
1! S . A 19X0 ma.v "i 2
uia\ ') 15
41
S5
J.ipau I'1X0
4 0 0
33 0
1 0 0
= 2 * 0
Z 200X
uoITO
ISO
max. 0 3
tOpOO 20,000 30,000 40,000 10,000
Figure 1 Typical vehicle emissions with a catalytic converter.
-702-
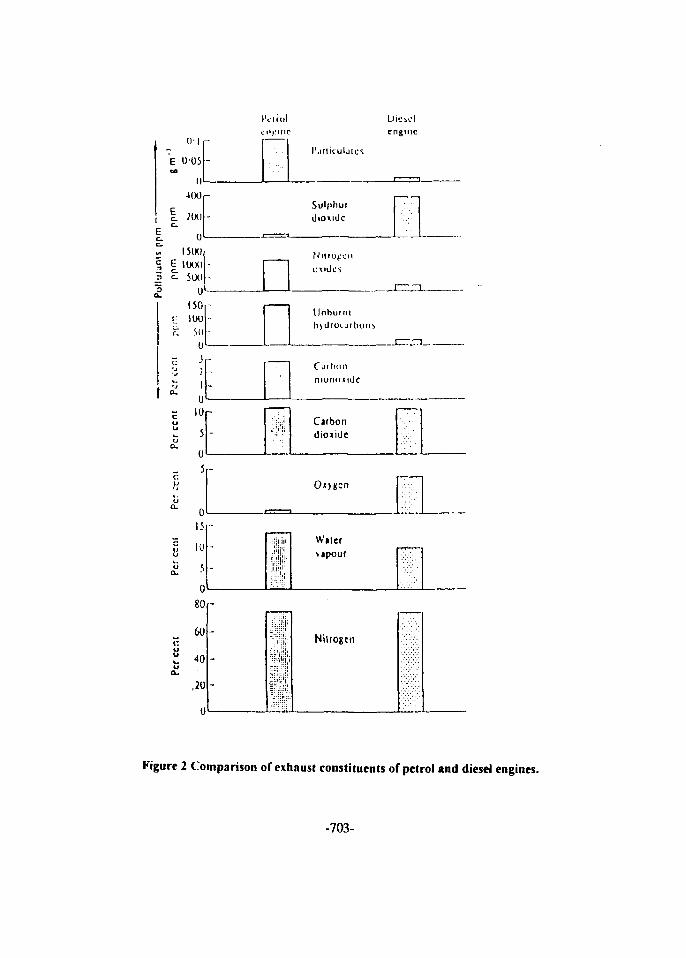
IVuul
1u
10
5 -
05
-
- "•;f«
Cui hurl
nionmitlc
Carbondioxide
080
60KU
Z i ooa.
,20
0
-
' i'l'"''II,!1
Wiiervapouf
-
•V
"• ' • l i ' i ,
Nitrogen
Figure 2 Comparison of exhaust constituents of petrol and diesel engines.
-703-
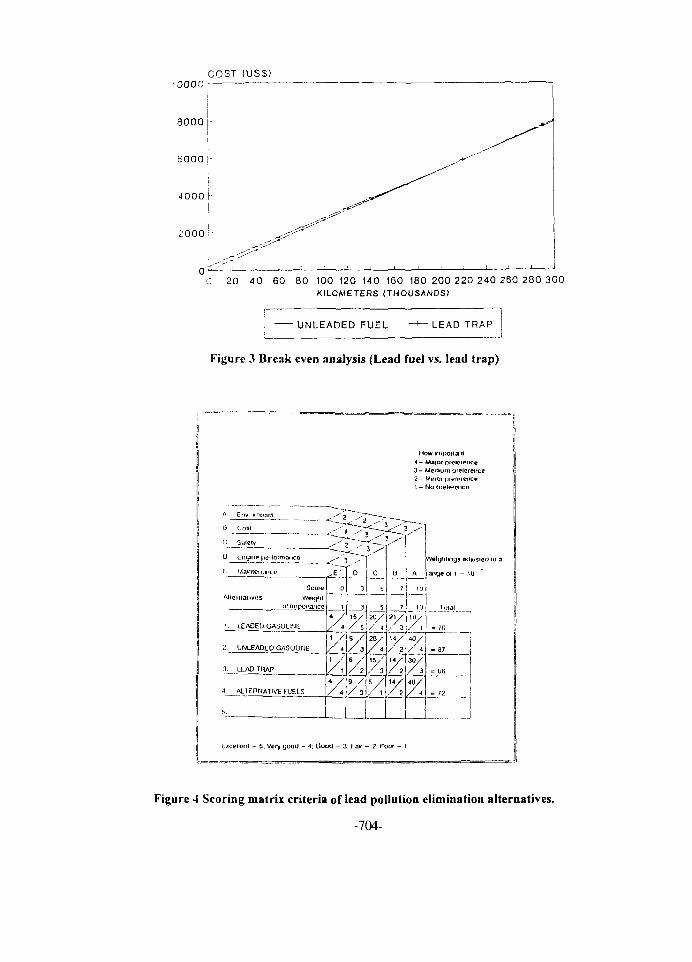
COST (USS)10000
8000
6000 !
4000 h
2000 :-
I I I I
0 20 40 60 80 100 120 140 160 180 200 220 240 260 280 300KILOMETERS (THOUSANDS)
UNLEADED FUEL LEAD TRAP
Figure 3 Break even analysis (Lead fuel vs. lead trap)
How in i pod ail4 - Major picleience3 - Medium prelerence2 - Minor piefomice1 - No pielefence
A Crw impact
adiusiei) lu a
atiueol 1 - lu
Excellent - 5; Very ijooU - 4; Good - 3; Fair - 2. Poof - I
Figure 4 Scoring matrix criteria of lead pollution elimination alternatives.
-704-
Proceedings of the Fifth International Conference t Hlllf I HUf IIII f lift ifflf Ilifl Hilt Illll UIII UN Illlon Energy and Environment, Cairo, Egypt, 1996 I I l l l l l l Hill Mill Hill I l l l l Hill I l l l l IH11IIIH Illl I l l l
EG9700028
LEAD POLLUTION SOURCES AND IMPACTS
by
S.M.El-Haggar*, S.G.Saad*, M.A.E1-Kady** and S.K.Salch*
ABSTRACT
Despite the medical awareness of lead toxicity, and despite legislation designed to reduce environmental
contamination, lead is one of the most widely used heavy metals. Significant human exposure occurs from
automobile exhaust fumes, cigarette smoking, lead-based paints and plumbing systems
Lead spread in the environment can take place in several ways, the most important of which is through
the lead compounds released in automobile exhaust as a direct result of the addition of tetraethyl or tetraethyl lead
to gasoline as octane boosting agents. Of special concern is the effect of lead pollution on children, which affects
their behavioral and educational attributes considerably. The major channel through which lead is absorbed is
through inhalation of Lead compounds in the atmosphere.
Lead is a heavy metal characterized by its malleability, ductility and poor conduction of electricity. So, it
has a wide range of applications ranging from battery manufacturing to glazing ceramics. It is rarely found free in
nature but is present in several minerals and compounds
The aim of this paper is to discuss natural and anthropogenic sources of lead together with its distribution
and trends with emphasis on Egypt. The effects of lead pollution on human health, vegetation and welfare are also
presented.
It could be concluded that, the excessive release of lead into the environment, especially through the
atmosphere, can produce many detrimental and sometimes fatal effects on human, agriculture and zoological life.
Besides, it is very plain that there is a serious problem of pollution by lead in Egypt and specially in Cairo.
* The American University In Cairo, Engineering Department, P.O.Box 2511, Cairo,
Egypt.
** Vice Dean, Higher Technological Institute, Tenth of Ramadan, Egypt
-705-
INTRODUCTION
Means of transportation utilization for energy sources is escalating to meet the
demands of the population growth encountered in Egypt. Mass and privet transportation is
consuming massive amounts of leaded gasoline as the common fuel used in cars and variable
size trucks. Tetraethyl Lead used as anti-knock chemical to improve the octane number of
gasoline is still in use though it is phasing out now in Egypt. Other sources of lead pollution in
the Egyptian environment is localized around its sources of industrial generation and its
combat should be focused in those impacted areas.
Lead is present in two major forms. The first is inorganic lead as various salts and
oxides. The second is alkyl or organic lead, which includes tetraethyl lead. Lead is cumulative
poison affecting multiple systems within the body. Most notably it affects the central and
peripheral nervous system, the kidney, and hematopoieses and heme synthesis. Absorption
varies with age, as adults absorb about 10% of an oral dose while children can absorb up to
50%. Lead is stored in the bone with minimal excretion in the bile and urine. From the kidney,
lead is excreted in the urine and redistributed to other tissues mainly the bones [1].
Lead (Pb) is a soft, silvery-white or grayish metal in Group IVa of the periodic table. It
is very malleable, ductile, dense and a poor conductor of electricity. Known to be the oldest of
metals, lead is highly durable and resistant to corrosion (that is why it was used by the ancient
Romans in the manufacture of water pipes [2]).
Lead is rarely found free in nature, but is present in several minerals, the most
significant of which is the sulfide, PbS, also known as galena or lead glance. This is the major
source of lead production throughout the world. Lead may be extracted by roasting the ore
(healing in a stream of air) in an open -hearth furnace or by roasting and smelting the ore in a
blast furnace. Lead oxidizes quickly, forming a dull gray coating ( a mixture of lead and lead
monoxide, PbO) which protects the metal from further corrosion.
A traditional use of lead is in sheet and pipe, mainly in building and also in chemical
plants. Lead sheets are used in building for roof coverings, in walls to block the transmission of
-706-
sound, in foundations to absorb vibrations from street traffic and other sources. The main use
of lead sheets and pipes in chemical plants is for handling sulfuric acid. However, the demand
for lead pipes used in water and wastewater has decreased drastically due to their substitution
by cheaper alternatives such as plastics.
White Lead (basic lead carbonate) was in the past used as a pigment for paints, mainly
in wood primers, but was weathered and washed away by rain, to be dispersed in the
environment. Red Lead and calcium plumbate are used as rust-inhibiting pigments in primers
for iron and steel. Another important pigment is yellow Lead chromate, used in exterior paints
and plastic compounds for road marking. Lead-pigmented paints tend to be eroded and can
therefore be considered as an added minor source of lead contributing to the environmental
pollution.
Lead bisilicate is widely used in glazing ceramics. Lead compounds go into the
manufacturing of glass, fluorescent lights and television tubes. Small quantities can enter the
environment from these applications, but they are unlikely to cause significant lead
concentrations [3]. Minor cumulative concentration can be leached from lead base glaze when
used in food utensils and oven and table ware, where acidic food is kept for prolonged time.
Many other uses of Lead in metallic form exist, such as lead shot for bullets , but the
most important are lead alloys such as printing metals and solders. It is also used as shielding
around nuclear reactors, particle accelerators and X-ray equipment due to its absorption of
electromagnetic radiation [2].
However, for a long time, the largest application of lead was in cable sheathing, mostly
for cables buried in the ground. Lead sheathing is almost hard to destroy and chances of lead
entry to the environment are slight [3].
Nevertheless, lead batteries for auto industry is a major application of lead. Batteries
are, in fact, enclosed packages of lead which therefore does not enter the environment during
their use. Almost all of the lead used in batteries is recovered and gere back to smelters and
refiners.
-707-
Tetraethyl and tetraethyl lead are added to gasoline since this has always been
considered the most convenient and economic method to improve the anti-knock
characteristics (increasing the octane rating) of gasoline. This application has been the major
source of lead pollution [5].
As it can be seen from figure 1, the production and consumption of lead started rising
steeply starting from around 1950. Consumption continued to grow at a rate of about 3'/J
percent annually and was expected to continue in doing so until the year 2000. Recently,
consumption has slowed down, mainly due to the increased usage of alternative anti-knock
additives in gasoline. Both production and consumption are expected to level off; eventually
mining has also slowed down greatly due to increased recycling [5],
SOURCES AND EMISSION OF LEAD
Lead is a widespread constituent in the earth's crust and has always been present in
soils,, rivers, lakes and seas. It has also been present in the air (following the burning of wood
and coal) and in both edible and inedible plants. Lead in soil ranges from 2 to 200 ppm and
averages 16 ppm. The compounds of lead are generally insoluble, therefore, concentrations of
lead in natural water bodies are usually very low (ranging from 0.001 to 0.01 ppm.)
There are various ways in which lead can enter the environment : from primary and
secondary smelting operations, from fabricating processes, as a result of ways in which it is
used, in the combustion of coal and other natural products, and in the disposal of unwanted
materials containing lead products and combustion of leaded gasoline [5].
The biggest source of Lead emitted into the atmosphere by far, is the combustion of
fuels containing Lead additives [7].
In USA, the lead emission has decreased dramatically in the late 1970's and early
1980's as a direct result of the introduction of unleaded fuel. However, a study conducted in
England shows that in 1976,46% of lead in the atmosphere came from the burning of gasoline
only [3]. Also, for a decrease in lead constituents in petrol of 56%, an average decrease in lead
blood levels was found to be 37% [7].
-708-
Table 1 : Sources and emissions of Lead in USA, million metric ton/year.
source 1975 1984
Transportation
Fuel combustion
Industrial processes
Solid waste
Total
122.6
9.3
10.3
4.8
147.0
34.7
0.5
2.3
2.6
40.1
A very useful study was conducted in the USA to survey the lead sources and emission
for 100 years during 1880-1980 [7]. It was conducted on the Hudson -Raritan river in New
York State and provides an input - output matrix for a material balance method . The matrix
consists of pure sources, intermediate receptors, and retention & final fates.
It was clear from this study that over 54 % of the lead emitted was due to fossil fuel
combustion, the majority of which comes from alkyl - lead compounds in automotive gasoline.
On the other hand, only 1% of the lead came from natural sources, which implies that through
man's activities, the amount of lead in the environment has been increased one hundred fold.
It was obvious that lead may reach the environment through several channels. It is
retained on land and in the soil, and is therefore absorbed by vegetation, and in turn by animals
eating the vegetation. It moves into surface waters, upsetting the ecological balance and having
a toxic effect on marine life.
In Egypt, pollution by lead has reached alarming levels, especially in big cities and
most markedly in Cairo, due to the high population density and the dense traffic in Cairo.
The lead levels in the atmosphere in Cairo were found to be concentrated at street level,
and decrease gradually with altitude. In some areas, the level has reached six times the
allowable ambient level in the USA (0.15 ug/m3), and it is estimated that the average person
living in the crowded regions of Cairo absorbs about 32.5 micrograms of lead per year [9].
-709-
A study was conducted by the Faculty of Medicine (Cairo University) to monitor lead
levels in the atmosphere in Cairo and their effect on traffic Police men in 1986. The level of
lead in the blood was found to range from 8 to 30 micrograms per 100 ml.of blood. In
crowded regions, the average was 62.78 micrograms/100 ml as opposed to 20 micrograms/100
ml which is the maximum limit set by health authorities [10].
Another study conducted by the National Research Center showed that the atmospheric
level of lead reached 3.4 micrograms /mJ in Cairo in 5985 as opposed to a maximum
international limit of 1.5 micrograms /m5 [10].
EFFECTS OF LEAD POLLUTION ON HEALTH
General
The adverse health effects of lead on reproduction has been known since the mid-
1800s. Exposure to lead may decrease fertility in both sexes; it can increase the frequency of
abnormal pregnancy, spontaneous abortion, and stillbirths. The concentration of umbilical cord
blood lead was discovered to be associated, in a dose-related fashion, with an increased risk for
minor anomalies [11]. A higher proportion of retarded infants were bom to women who drank
water containing excessive amounts of lead during pregnancy. It has been suggested that the
teratogenic effects of lead represent a paradigm for transplacental toxicant.
Airborne lead can be inhaled directly, absorbed through the skin or inhaled with dust
particles to which it readily clings [11].
Human exposure to lead in the various ways discussed previously can lead to many
different effects on health. These can be split into acute effects, which arise abruptly, in a few
days or weeks of exposure to relatively high lead levels, and chronic effects, which occur
slowly, getting slightly worse year by year. The latter are associated with long term exposure
to relatively low levels of lead pollution, and are of greater concern because they represent the
majority of poisoning cases, and also because they are difficult to be assessed [7].
-710-

1The threshold limit value of lead in air in the UK and USA is 0.2 mg per cubic meter
[6]. This is considered to be a borderline level for most people who work regularly with lead.
In Russia, the limit is 0.01 mg per cubic meter. Japan has set a threshold value of 0.12 mg per
cubic meter for a 48 to 60 hour working week [3].
Acute lead poisoning produces neurological, blood and kidney effects, which may be
accompanied by headache, dizziness, insomnia, loss of appetite and a metallic taste in the
mouth. Symptoms of neurological damage include weakness, nervous irritability, muscle and
joint pain and tremors. Severe poisoning can result in brain damage leading to coma and death.
Constipation and abdominal cramping are also signs of acute poisoning, sometimes relieved
only by surgery. .
Chronic lead poisoning is evident in blood and neurological disorders. Lead interferes
with the synthesis of hemoglobin, resulting in anemia. Even at very low levels before anemia is
evident, lead inhibits certain enzymes important in the formation of blood components. The
toxic effects of lead on the nervous system vary with the duration and intensity of exposure.
Hearing, eye - hand coordination and muscular strength and endurance are all affected by the
amount of lead in the body. Tremors and psychological symptoms (hostility, aggression and
anxiety) are also evident, indicating that brain and nerve damage result from low - level
exposure to lead. Slow reaction time and slow growth have also been associated with chronic
lead poisoning. [7]
The proportion of lead entering the body through inhalation has been found to be very
high. Figure 2 shows the contribution of airborne lead to total lead intake. Clearly, airborne
lead can reach humans through a variety of channels, but the only direct one is inhalation.
Also, Figure 3 shows the direct and obvious relationship between lead in the air and in blood.
It has been estimated that 20-40 % of inhaled lead settles in the lungs, while 50% or more is
absorbed into the blood and accumulated in the bones. Since it has been proven that the
majority of airborne lead results from that used in petrol, a direct relationship should be
expected to exist between lead in petrol and lead in the human body. This relationship is
demonstrated in Figure 4.
-711-
Children
Children are of particular concern in consideration of lead exposure and effects. Not
only are children exposed to additional sources of lead, but they are more susceptible to its
toxic effects, exhibiting symptoms at lower levels than adults. They are more sensitive to lead
anemia and may experience subtle neurological damage which is very difficult to monitor,
but is evident in loss of motor skills and speech ability. Learning ability may be affected due to
motor in-coordination. Lack of sensory perception, inability to concentrate and kidney disease
have also been found to be more prevalent in children than in adults. It has been estimated that
lead can cause a deficit of 7 IQ (Intelligence quotient) points in children.
In a study conducted in Boston Massachusetts [12], the relationship between lead
levels (measured in the teeth) and behavioral and educational difficulties in school children
was studied. The results are depicted in Figure 5. The following characteristics were found to
have a direct relationship with elevated lead levels: distractible, not persistent, dependent,
unorganized, hyperactive, impulsive, frustrated, daydreamer, unable to follow directions and
sequences and low overall functioning.[12]
In Egypt, a study was conducted [10] in which random samples of children from
different areas of Cairo were tested for lead levels in the blood. It can be seen that the average
lies in the 111-120 micrograms per liter sector, i.e. above the maximum limit. Indeed, the
percentage of children tested between the ages of 0 and 12 whose lead blood level exceeded
the allowable limit was 74%, which is alarmingly high. In Figure 6, the distribution of children
is shown geographically, illustrating the proportion of children between ages 0 and 6 who have
exceeded the allowable blood level in each area. It is very clear that the situation becomes
progressively worse as one moves from Maadi to Zamalek to Mohandessin to Dokki and Giza.
In the latter two, 100% of the children tested had lead blood levels exceeding 100 micrograms
per liter, Fig. 7 [13].
-712-
Lead also affects unborn children whose mothers have high lead blood levels, since it
is readily transferred across the placenta. Therefore, the concentration of lead in the blood of
new bom children will be similar to that of their mothers [8].
EFFECT OF LEAD POLLUTION ON VEGETATION AND ANIMAL LIFE
The movement of lead in the environment results in further accumulation throughout
food chains. Therefore, lead in the atmosphere can be washed down by rain, enter the soil and
be absorbed by plants, which may be consumed by animals, which may in turn be consumed
by human beings. Four barriers restrict the movement of lead otherwise the effects of this chain
would be catastrophic. The first is in the soil, where only a small proportion of the lead is
available to plant roots. The second is in the roots, from which only a small proportion of the
absorbed lead is transported to the shoots. The third is in the intestines of animals, from which
only a small proportion of the ingested lead is absorbed, the remainder being excreted. Finally ,
the fourth barrier results from the partitioning of lead in the tissues of animals where it
accumulates in the bones, and does not therefore contribute significantly to the dietary intake
ofman.[4]
Laboratory and field data have shown that at high concentrations, lead can affect
certain plants and inhibit photosynthesis, reduce growth and alter species composition. It can
also alter the composition of soil microbial communities and inhibit invertebrate activity
resulting in delayed decomposition of organic matter, reduced nutrient supply, and altered soil
properties, such as lower organic content. [4]
Lead is toxic to all Phyla of aquatic biota. Water concentrations as low as 19 mg / liter
have been associated with increased mortality and impaired reproduction in aquatic
invertebrates. Vertebrates (fish) appear to be even more sensitive.[4].
-713-

Lead poisoning in livestock is reported in the vicinity of lead smelting operations and
usually takes place due to the ingestion of lead dust-contaminated foliage, either in the acute or
chronic form.
Acute lead poisoning in cattle is characterized by excessive thirst, salivation, loss of
appetite, constipation, delirium and reduced milk production, which all may lead to death.
Chronic poisoning involves a spectrum of symptoms including diarrhea, colic , nervous
disorders, swollen joints, lethargy, in-coordination, bellowing stupor, tough coats, and
emaciation, as well as a variety of metabolic changes similar to those experienced by human
beings. Lead is retained, as in humans , in increasing quantities by the tissues, particularly in
the bone. [15]
CONCLUSION
It can be seen that the excessive release of lead into the environment, especially
through the atmosphere, can produce many detrimental, and sometimes fatal, effects on human
, agricultural and zoological life, as well as the environment on the whole.
It is clear that there is a serious problem of pollution by lead in Egypt and especially in
Cairo. Keeping in mind that the above statistics are not very recent, and lead levels are
expected to have increased throughout the previous years due to the increase in population
density, number of cars, and overall congestion. Decreased levels of calcium intake and
malnutrition in children exacerbate the lead pollutional health impacts in the children the most
vulnerable category of population to lead poisoning. Parasitic infections predominantly
increasing between Egyptian population is an added contributing factor to children
malnutrition which enhance the negative health impacts of lead on children, and women.
It is seriously needed to monitor continuously the lead level in the crowded urban
centers where large number of people are affected with lead concentration especially if they
are repetitively exposed to it. Emission control devices should be installed on the car exhaust to
limit the environmental health degradation created by the use of unleaded gasoline.
-714-
REFERENCES
1. Tarcher A.B., 1992, "Principles And Practice Of Environmental Medicine",Plenum
Publishing Corporation.N.Y.New York, pages 23,143,421.
2. Encyclopedia Britanica, 1991. V. 7,15th Edition, Library of Congress, USA.
3. McCallum, R.,1987,"Lead in the environment: possible health effects on adults", Essex
Applied Science Publisher, London.
4. Busaiffi, M., 1993, "Monitoring of lead levels from petroleum emissions and reduction of
lead concentration in motor gasoline", Petroleum Research Center, Libya.
5. Stubbs, R., 1989,"Sources of lead in the environment", Essex Applied Science Publishers,
London.
6. Lynn. D. 1976," Air pollution, threat and responses", Adison Wesley Publisher Co.,
USA.
7. Lave, L & A. Upton, 1987,Toxic Chemicals, health and the environment", John Hopkins
University Press, London.
8. Lawther, P.B., Commins and B. Biles, 1985, "Airborne lead and its uptake by inhalation",
Essex Applied Science Publishers, London.
9. UOP, 1991,"The clean air act and the refining industry", USA.
10. Advisory (Shoura) Council, 1992, "Development and Environment problems in
Egypt", In arabic, Al-Shaab press, Cairo.
11. Needleman H.L, Rabinovitz M, Leviton A. et al, 1984 " The Relationship
between Prenatal Exposure To Lead And Congenital Anomalies, JAMA 251,2956
12. EPA Toxic information series: lead, 1994, office of pesticides & toxic substances, TS-
793, USA.
13. Government of Egypt, 1992, National Environmental Action plan", Egypt.
14. Knowles, D. 1984, "Alternative automotive fuels", Reston Publishing Co. Virginia.
15. Jones, L. and C. Clement, 1986, "Lead uptake by plants and its significance for animals",
Essex Applied Science Publisher, London.
-715-
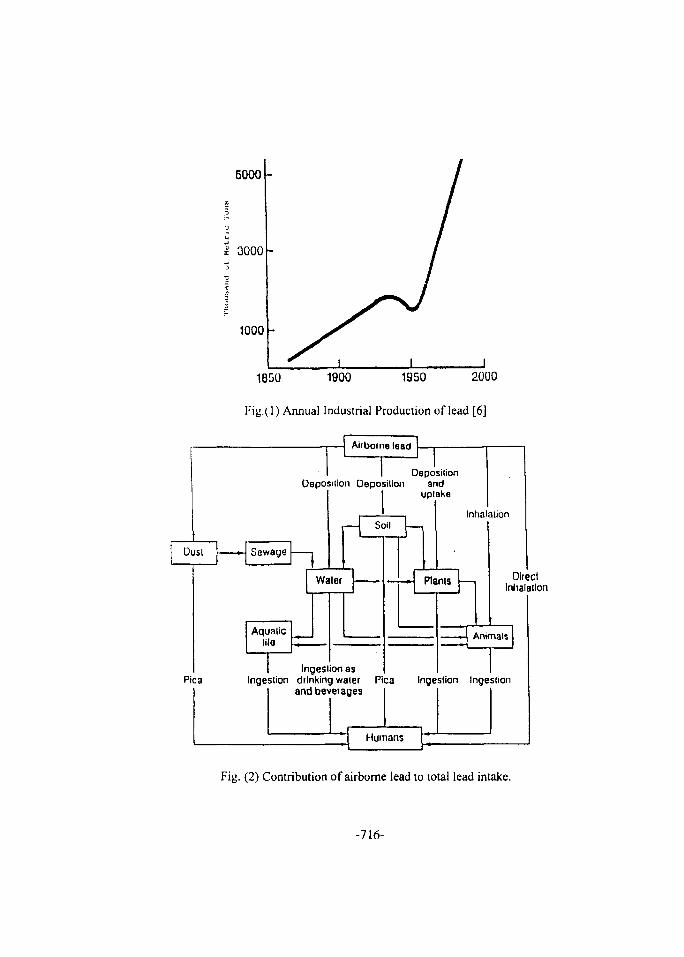
Dusi
Pica
6000 -
3000
1000
I
1850 1900 1950 2000
Fig.(l) Annual Industrial Production of lead [6]
Airborne lead
DeposilionDeposition Oeposilion and
uptake
Sewage n r Soil
Water
Aquaticlife
Inhalation
Plants DirectInhalation
Animals
I IngeslionasIngestion drinking waier Pica Ingeslion Ingesiion
andbeveiagea
Humans
Fig. (2) Contribution of airborne lead to total lead intake.
-716-
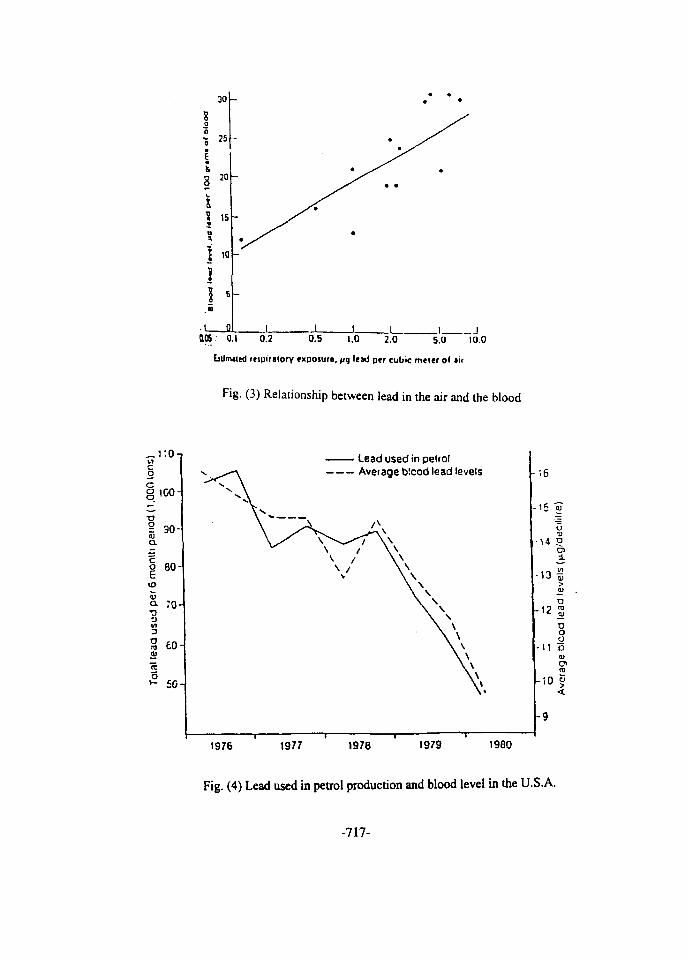
•o
1&'o
m
I8
I\11!
.5
1
30
25
20
IS
10
6
0
-
—
1 1 1105 0.1 0.2 0.5 1.0 2.0 5.0 10.0
1 (eipiratory exposure, *jg lead per cubic meler ol »ir
Fig. (3) Relationship between lead in the air and the blood
co
IOOH
| 80-
:oHP
» eo-0)"reo
so
Lead used in petrolAverage Wood lead levels
15 V
14 5
13 I
h'2 3tJoo
11 5ID
u>ID
r-9
1976 1977 1978 1979 1980
Fig. (4) Lead used in petrol production and blood level in the U.S.A.
-717-
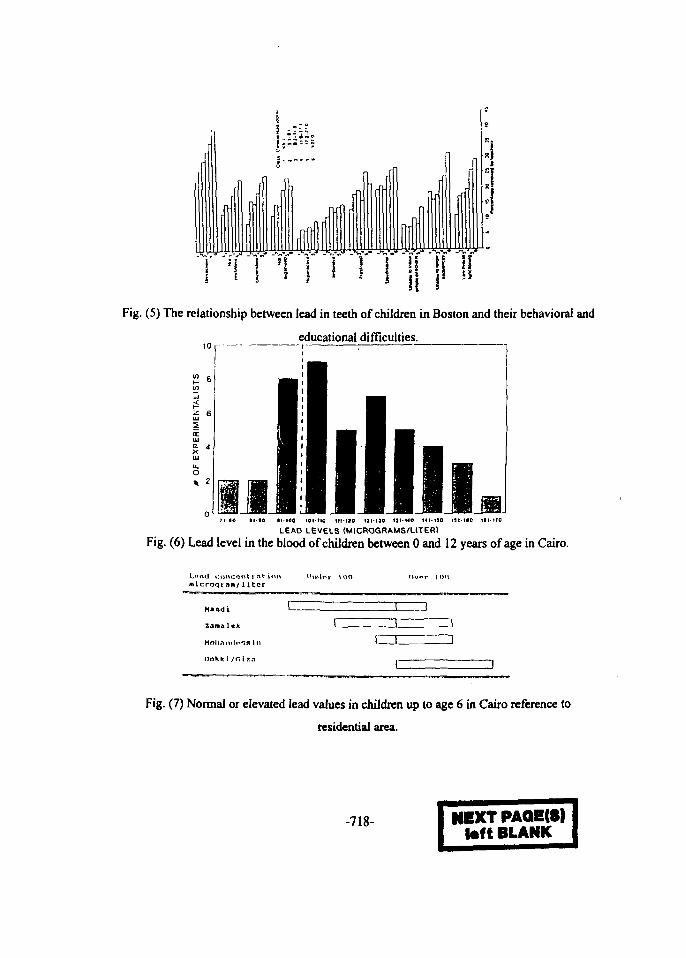
'-itit
J • i| il if
:i
Fig. (5) The relationship between lead in teeth of children in Boston and their behavioral and
educational difficulties.
LEAD LEVELS (MICROGRAMS^LITERI
Fig. (6) Lead level in the blood of children between 0 and 12 years of age in Cairo.
nicroqram/1itcr
Haadi
Zama lcX
Molmnrlnfif; i n
Ootck i /fJ I 7,i
Fig. (7) Nonnal or elevated lead values in children up to age 6 in Cairo reference to
residential area.
-718- NIXTPAQE(S)toft BLANK
Environmental Protection
Proceedings of the Fifth International Conference EG9700029on Energy and Envirorunent, Cairo, Egypt, 1996
Environmental and Safety Management of MunicipalPublic Works and Utilities: A Regulatory Overview
Yawson, G.E., Kummler, R.H.,Department of Chemical Engineering,Wayne State University, Detroit, MI 48202, USA
and
Abraham, G.,Ghafarl Associates, Inc.1710 Michigan AvenueDearborn, Michigan 48126, USA
Abstract
The environmental and safety regulatory compliance aspects of municipal public worksand utilities will be discussed
The functions and typical scope of services and regulatory requirements for divisions of atypical Department of Public Works in a municipality like Street Maintenance, Sanitationand Waste Collection, Water Pollution Control/Sewage Treatment Plant and Facilities,Water Treatment Plants and facilities. Public Works Engineering, Water and SewerageServices, Traffic Operations, Building and Safety Inspection, and Facilities MaintenanceDivisions are included.
The paper also identifies the environmental and safety concerns that impact both employeehealth and safety as well as the environment Statistical information on occupation-relatedinjuries, diseases and fatalities in the United States is provided to underscore theimportance of Environmental Safety and Health Management
Recommendations are also made to aid regulatory compliance and improve worker safetyand health as well as Environmental Safety and Health Program implementation andtraining.
1. Introduction
The United States Congress has mandated a safe environment and safe occupationalworkplaces through a complex network of laws and regulations administered by theEnvironmental Protection Agency (EPA), Occupational Safety and Health Administration(OSHA) and the Departments of Transportation and Interior. These laws and regulationswere initially directed at US Industry, but have become applicable to the Federalgovernment and local government in recent extensions. '
-721-
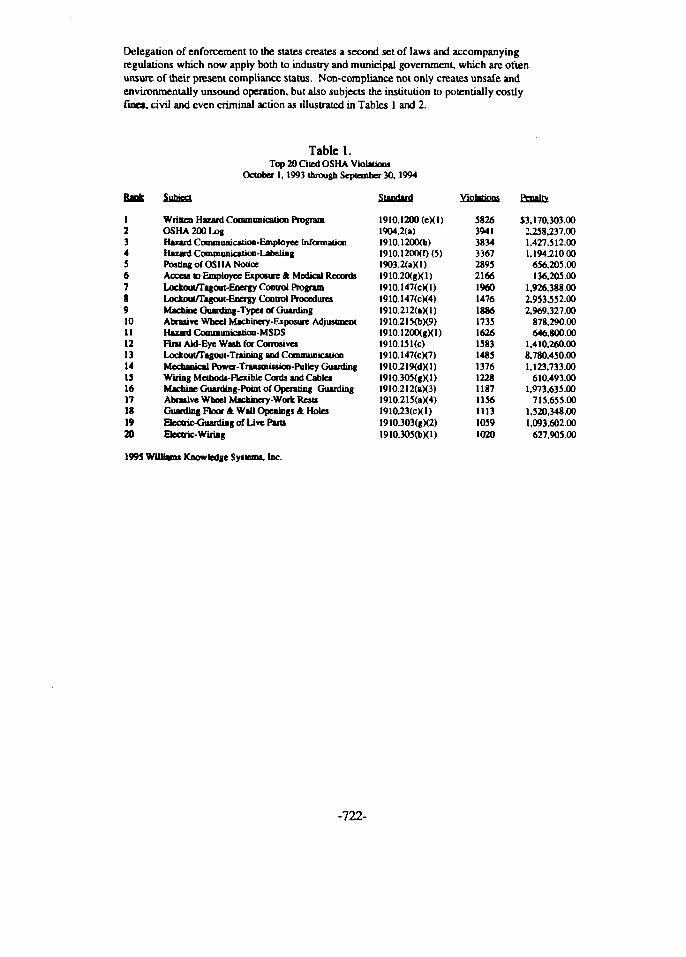
Delegation of enforcement to the states creates a second set of laws and accompanyingregulations which now apply both to industry and municipal government, which are oftenunsure of their present compliance status. Non-compliance not only creates unsafe andenvironmentally unsound operation, but also subjects the institution to potentially costlyfines, civil and even criminal action as illustrated in Tables 1 and 2.
Table 1.Top 20 Cited OSHA Violations
October I, 1993 through September 30,1994
1234567891011121314IS1617181920
Subject
Written Hazard Communication ProgramOSHA 200 LogHazard Communication-Employee InformationHazard Communicauoo-LabclingPosting of OSHA NoticeAccess to Employee Exposure A Medical RecordsLockout/Tagout-Eoergy Control ProgramLockoul/Tagout-Energy Control ProceduresMachine Guarding-Types of GuardingAbrasive Wheel Machinery-Exposure AdjustmentHazard Communicslion-MSDSFust Aid-Eye Wash for CorrosivesLockout/Tagoul-Training and CommunicationMechanical Power-Tmnsmission-Pulley GuardingWiring Methods-Flexible Cords and CablesMachine Guarding-Point of Operating GuardingAbrasive Wheel Machinery-Work RestsGuarding Floor & Wall Openings & HolesElectric-Guarding of Live PansElectric-Wiring
Vinhtinn. Penalty
1910.1200 (eKD19O4.2U)1910.1200<b)1910.1200(0(5)1903.2UXD1910.20(gXl)1910.147(cKD1910.147(cK4)1910.212(aXU1910.215(bX9)1910.1200<gXl)19IO.151(c)1910.147(cX7)!91O.219(dXl)1910.305(gXDI910.212UX3)19lO.215(aX4)1910.23(cXD19IO.3O3(gX2)1910.3O5(bXD
58263941383433672895216619601476188617351626158314851376122811871156111310591020
$3,170,303.002.258.237.001,427.512.001.194.210.00
656.205.00136.205.00
1.926.388.002,953.552.002,969.327.00
878.290.00646.800.00
1,410.260.008.780.450.001,123.733.00
610,493.001,973.635.00
715,655.001,520.348.001,093.602.00
627,905.00
1993 Williams Knowledge Systems, Inc.
-722-

Table 2 documents the maximum fines and criminal penalties possible for violation of thestatutes mandating training requirements.
Table 2. Representative Civil and Criminal Penalties for Federal Environmental Statuteswhich Mandate Training
Law
Dean Water Act
Hazardous and SolidWaste Amendments
Superfund Amendmentsand Reautborizatioo ActHazardous MaterialsTransportation Act
Requirement
TOM. SPCC
RCRA
HAZWOPER
DOT 105(f) unlawfultampering of markings
Civil Penally
$5,000/day
S25.0OO/day
$70,000/offense
S25.000/offense
Criminal Penalty
$250,000 and/or 15yeara$50,000/vk>lationand/or 2 yean or$250,000 and/or 15years
$500,000 or S yean
Inquiries and lost time have had a major inpact on the efficiency of US industry. OSHAkeeps statistics describing these problems. Table 3 documents the problems.
Table 3. WORK RELATED ACCIDENTS in 1993(Source: Accident Facts 1994 Edition - National Safety Council)
Total Cost in 1993 to U.S. Businesses $111.9 Billion
Breakdown of Costs (in Sbillions):Insurance administrative costs $ 14.4Wage and productivity losses $59.9Medical costs $20.7Uninsured costs, e.g. time lost by non-disabledinjured workers, accident investigation costs.reports etc $10.2Fire losses
$3.1Damage to motor vehicles in vehicle accidents $4.1Cost per worker(Value of goods/services per workerneeded to offset cost of workplace injuries) $990Cost per death, excluding properly damage(estimated wage lost medical expenses,insurance administrative costs, uninsured costs) $780,000Cost per disabling injury,excluding property damage(estimated wage lost medical expenses,insurance administrative costs, uninsured costs) $27,000
Total Cost of Work Accidents in 1993 is equivalent to:
Loss in Corporate Dividends to Stockbolden 66 cents per dollar
-723-

2. The Developing Practice of Environmental and Safety Auditing:Overview
Environmental and Safety auditing methods have been developed to assist municipalities in theprocess of the Review, Evaluation. Implementation and Monitoring of environmental andsafety programs and procedures for typical city Departments:
Table 4.
Typical City Departments
Mayor's Office Department of Public Works and Utilities City Attorney s Office
City Council's Office Civil Service Commission Human Relations Commission
City Administrator's Office Community Development Ombudsman Office
Assessment Division Data Processing Parks and Recreation
City Clerk's Office Finance Department Personnel and Labor Relations
Fire Department Court Purchases and Supplies
Police Department Housing Commission Treasury Division
Review
First a thorough review of all aspects of the City's current safety program is conductedThrough meetings, responses to checklists (created and tailored specifically for each of theDepartment), observations, and a careful assessment of all the saferv related documents,an overview of all of safety programs, procedures, and equipment is obtained
Evaluate/Recommend
The audit team typically will consist of engineers, health and hygiene specialists, and legalexperts. A multi-disciplinary team is can bring points of view to the analysis from all ofthe fields that are important to safety. The City's current safety program, procedures, andequipment are compared with the existing federal and state government regulations, aswell as requirements that the regulatory agencies are planning for the future A safetyprogram that will meet all federal and state regulations is then recommended Theprogram must be efficient, economical, and easy to implement and maintain
Implementation
The most crucial phase of the project requires the cooperation of most of the Citv'semployees. This is an area in which a multi-disciplinary team is particularly well suited.With experts from a variety of fields, the team has significant experience in dealing with
-724-

people in a variety of job classifications. In safety development, the team continuallystresses to the employees that while the employer must give the employee proper safetytraining and equipment, it is the employee who is ultimately responsible for his or her ownsafety on the job Typical training will include hazardous materials handling, confinedspace, lock out/tag out, and any other specialized safety information to all personnelwhose job classifications require it. Training materials, procedures for any requiredmonitoring, recordkeeping, and reporting must be set up. A multi-user database to trackall safety records, schedules, audits, programs, and procedures is needed.
Monitor
Lastly, management must provide on-site monitoring and review of the City's newlyimplemented safety program, and keep City personnel abreast of new regulations anddevelopments, as well as providing training to meet new regulations.
3. The Audit Process
Requirements
An initial meeting is held between key members of the project team and keyrepresentatives of the City. The City Safety Officer and representatives from Fire, Police,HealtK and Public Works should be at the initial meeting and form a City Executive SafetyCommittee. At this meeting the requirements of this project are reviewed. A City wideSafety Committee should be established. This Committee will consist of a representativefrom the safety committee of selected Department/Cost Centers listed in Table 4. Theserepresentatives serve as the contacts through which the Consultant sets up individualDepartment meetings, obtain documents, and passes information.
Current Program and Procedures Documentation
After the initial general meeting and the selection of the City Wide Safety Committee,separate meetings with each Department/Cost Center are held. These meetings areattended by the Consultant, the Safety Committee member and any other Department/CostCenter personnel that are knowledgeable about the safety programs and procedures. TheCity Safety Officer is requested to be at all meetings, schedule allowing. To maximize theinformation transfer at the meetings, each representative is given a preliminaryquestionnaire to fill out and return to the Consultant prior to the meeting. This preliminaryquestionnaire consists of general questions about the operation of that Department,existing safety programs, accident records, etc. The questions are structured so thatinformation about that areas compliance with the safety laws can be obtained At themeeting the questionnaire is discussed, questions will be clarified, and any otherinformation needed is obtained The Consultant makes follow-up visits to any Departmentwhere additional information or clarifications are needed.
-725-

Current equipment, training, and familiarization
All information concerning equipment, training, and familiarization obtained through thequestionnaire, meetings, safety records, etc., as discussed in the above section is obtainedby walk through inspections and meetings at the operations level
Report
The Consultant uses the information from the preliminary questionnaire and theinformation obtained at the meeting to write a detailed report on the City's existingcompliance status with safety laws The report is "Safety Regulatory Compliance Agendafor the City: Existing Safety Programs and Procedures Status".
4. Evaluate and Recommendations
Meet with staff for review of compliance status
A meeting is then held with the City Executive Safety Committee, to review thefindings. The Consultant will note any new information, clarifications, questions, andfeedback. The Consultant uses the findings and any information obtained at this meeting tocreate a detailed Safety Inspection Checklist Because the safety needs and concerns of thevarious Departments are different, e.g. Mayor's office versus Public Works, ther,e will bedifferent Safety Inspection Checklists for the different Departments/Cost Centers. Thesechecklists are used to evaluate each Department current safety program status. It consistsof a self audit that an employee can perform on their Department Once the checklists aredeveloped, the Safety Committee member is given the Safetv Inspection Checklist andtraining on its use. The Safety Inspectors use the Checklist to perform a safety inspectionon their respective Department/Cost Center The Consultant will be available to the SafetyInspectors during their inspections to answer questions or give them help as needed
Evaluate and recommend programs and procedures
After safety inspections have been completed, the Consultant meets with each SafetyCommittee member to go over the results. The Consultant compares the findings of theaudit against mandated safety requirements to evaluate the status of compliance
-726-

5. Training: Environmental and Safety Training Requirements
Municipalities are faced with multiple regulatory training and training recordkeepingrequirements, including those related to the environment, employee safety, andtransportation. These explicit training requirements are supplemented by institutionalpractices that translate regulatory standards into municipal department, and facility-levelstandard operating procedures. Together, these requirements and practices must becommunicated to a broad range of employees. Hence, an environmental and Safety auditwill always trigger the need for a major training program.
Content Federal Training Requirements
Table 5 lists the federal environmental, health and safety, and transportation trainingrequirements applicable to municipalities. It includes those requirements applicable to thehandling and management of regulated substances, but excludes those related purely toemployee safety concerns, such as hard-hat or lock-out training. It also excludes anyrelated state or local training requirement.
-727-
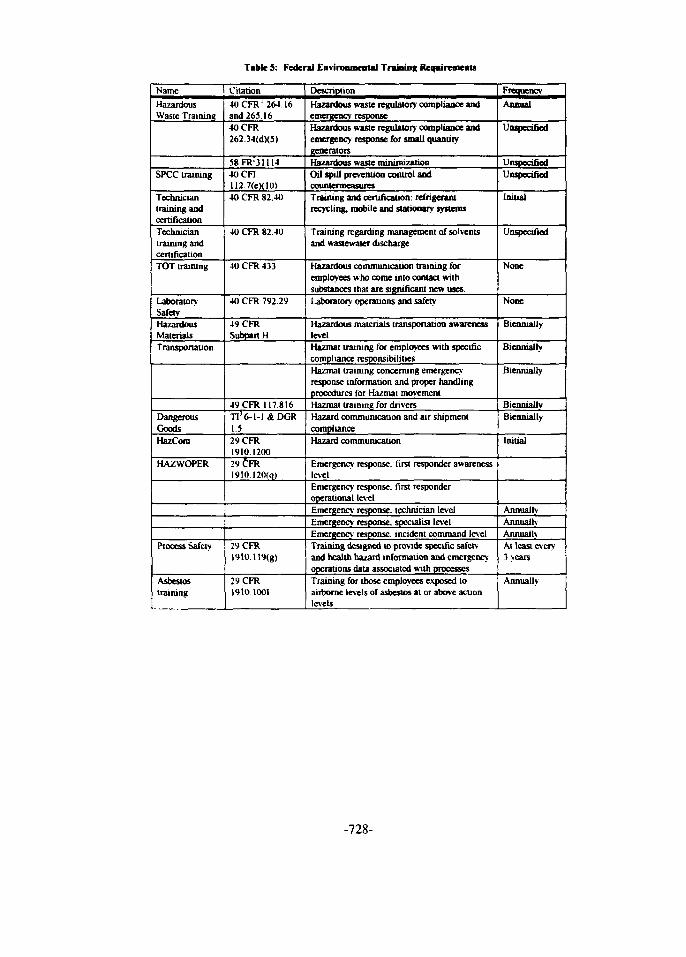
TableS: Federal Envii ital Trainint; Requirements
Name
HazardousWaste Training
SPCC training
Techniciantraining andcertificationTechniciantraining andcertificationTOT training
LaboratorySafetyHazardousMaterialsTransportation
DangerousGoodsHazCom
HAZWOPER
Process Safety
Asbestostraining
Citation
40CFR' 264.16and 265.164OCFR262.34(dX5)
58FR:3111440CFI112.7(eK10)40 CFR 82.40
40 CFR 82.40
40 CFR 433
40 CFR 792.29
49 CFRSubpartH
49 CFR 117.816T1J6-I-1&DGR1.529 CFR1910.120029 CFR1910 12«q>
29 CFR19I0.119(g)
29 CFR1910 1001
Description
Hazardous waste regulatory compliance andemergency responseHazardous waste regulatory compliance andemergency response for small quantitygeneratorsHazardous waste minimizationOil spill prevention control andcountermeasuresTraining and certification: refrigerantrecycling, mobile and stationary systems
Training regarding management of solventsand wastewater discharge
Hazardous communication training foremployees who come into contact withsubstances that are significant new uses.Laboratory operations and safety
Hazardous matenals transportation awarenesslevelHazmat training for employees with specificcompliance responsibilitiesHazmat training concerning emergencyresponse information and proper handlingprocedures for Hazmat movementHazmat training for driversHazard communication and air shipmentcomplianceHazard communication
Emergency response, first responder awarenesslevelEmergency response, first responderoperational levelEmergency' response, technician levelEmergency response, specialist levelEmergency response, incident command levelTraining designed to provide specific safetyand health hazard information and emergencyoperations data associated with processesTraining for those employees exposed toairborne levels of asbestos at or above actionlevels
Frequency
Animal
Unspecified
UnspecifiedUnspecified
Initial
Unspecified
None
None
Biennially
Biennially
Biennially
BienniallyBiennially
Initial
AnnuallyAnnuallyAnnuallyAt least every3 years
Annually
-728-
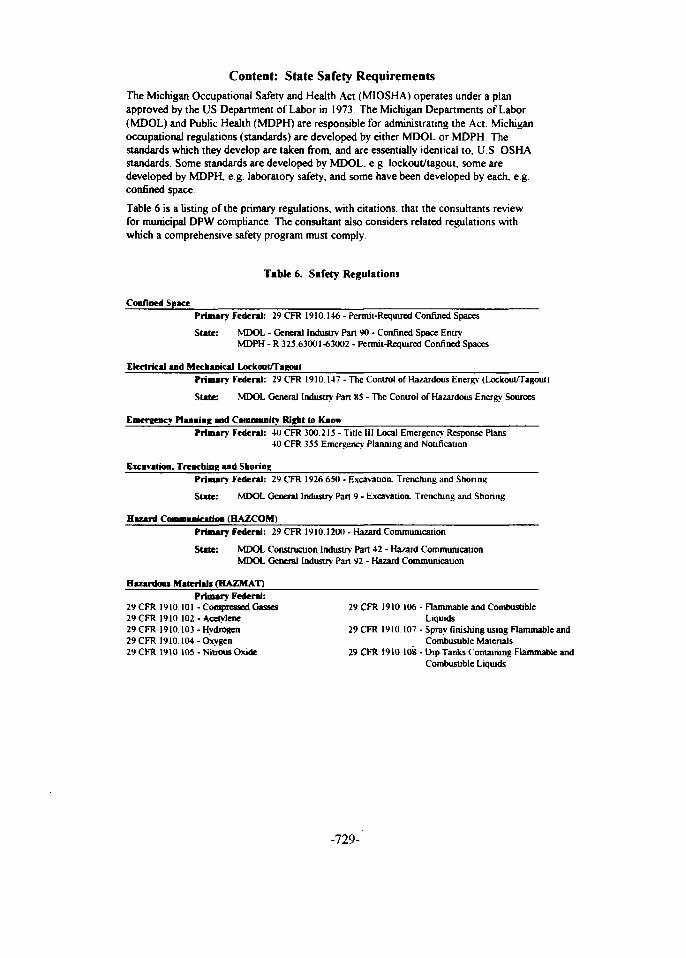
Content: State Safety RequirementsThe Michigan Occupational Safety and Health Act (MTOSHA) operates under a planapproved by the US Department of Labor in 1973. The Michigan Departments of Labor(MDOL) and Public Health (MDPH) are responsible for administrating the Act. Michiganoccupational regulations (standards) are developed by either MDOL or MDPH Thestandards which they develop are taken from, and are essentially identical to, U S OSHAstandards. Some standards are developed by MDOL. e.g. lockout/tagout, some aredeveloped by MDPH, eg. laboratory safety, and some have been developed by each. e.g.confined space.
Table 6 is a listing of the primary regulations, with citations, that the consultants reviewfor municipal DPW compliance The consultant also considers related regulations withwhich a comprehensive safety program must comply.
Table 6. Safety Regulations
Confined SpacePrimary Federal: 29 CFR 1910.146 - Permit-Required Confined Spaces
Slate: MDOL - General Industry Part 90 - Confined Space EntiyMDPH - R 325 63001-63002 - Permit-Required Confined Spaces
Electrical and Mechanical Lockout/TagoutPrimary Federal: 29 CFR 1910 147 - The Control of Hazardous Energy (Lockout/Tagout)
State: MDOL General Industry Part 85 - The Control of Hazardous Energy Sources
Emergency Planning and Co nity Right to KnowPrimary Federal: 40 CFR 300.215 - Title III Local Emergency Response Plans
40 CFR 355 Emergency Planning and Notification
Eicavation, Trenching and ShoringPrimary Federal: 29 CFR 1926.650 - Excavation. Trenching and Shonng
State: MDOL General Industry Part 9 - Excavation. Trenching and Shoring
Hazard Communication (HAZCOM)
Primary Federal: 29 CFR 1910 1200 - Hazard Communication
State: MDOL Construction Industry Part 42 - Hazard CommunicationMDOL General Industry Part 92 - Hazard Communication
Hazardom Material! (HAZMAT)Primary Federal:
29 CFR 1910 101 - Compressed Gasses29 CFR 1910 102 - Acetylene29 CFR 1910.103 - Hydrogen29 CFR 1910 104-Oxygen29 CFR 1910.105 - Nitrous Oxide
29 CFR 1910 106 - Flammable and CombustibleLiquids
29 CFR 1910 107 - Spray finishing using Flammable andCombustible Materials
29 CFR 1910 108 - Dip Tanks Containing Flammable andCombustible Liquids
-729-
29 CFR 1910 KW-Explosives and blastini; agents 29 CFR 1910 115 - Sources ol Standards29 CFR !'M0 I ID - Storage and Handling of Liquefied 29 CFR 1911) 116 - Standards organizations
Petroleum Gnses 29 CFR 1926 250 - Materials handling, storage, use &29 CFR 1910 111 - Storage and Handling of Anhydrous disposal
Ammonia
Slate: MDOL General Industry Part 55-Explosives. MDOL Part 56-LPG. MDOL Pan 69-Compressed Gas. MDOL Pan 75-Flammable and Combusuble Liquids. MDOL Part 78-Ammonia
Hazardous Want Operations and Emergency Response (HAZWOPER)Primary Federal: 29 CFR 1910 120 - Hazardous Waste Operations * Emergency Response
Slate: MDPH Rule 325 52130 - Emergency Response to Hazardous Substance Releases
Laboratory SafetyPrimary Federal: 29 CFR 1911) 1450 - Occupational Exposure lo
Hazardous Chemicals in Laboratories
Slate: MDPH Rule 325 70101 - Laboratory Safety
ProccM Safety ManagementPrimary Federal: 29 CFR 1910 119 - Process Safety Management
State: MDOL General Industry Pan 91 - Process Safety Management
Personal Protective Equipment
Primary Federal:
29 CFR 1910 132 - Personal Protective 29 CFR 1910 137 - Electrical Protective Equipment
Equipmeni - General Requirements 29 CFR 1910 13X - Hand Protection
29 CFR 1910 133 - Eye and Face Protection 29 CFR 1910 139 - Sources of Standards
29 CFR 1910 134 - Respiratory Protection 29 CFR 1910 140 - Standards Organizations
29 CFR 1910 135 - Head Protection
29 CFR 1910 136 - Foot Protection
State: MDOL Construction Operations Pan 6 - Personal Protective EquipmeniMDOL General Industry Pan 33 - Personal Protective EquipmentMDPH R 3501 - Personal Protective EquipmentMDPH R 3502 - General Respiratory Protection
Welding. Cutting, and BrazingFederal:
29CFR 1910251 -Definitions 29CFR 1910 254 - Arc Welding and Cutting29 CFR 1910 252 - General Requirements 29 CFR 1910 255 - Resistance Welding29CFR 1910 253 -Oxygen-Fuel Gas Welding 29CFR 1910 256 - Sources of Standards
and Cutting 29 CFR 1910 257 - Standards Organizations
Stale: MDOL Construction Operations Part 7 - Welding and CuttingMDOL General Industry Part 12 - Welding and Cutting
-730-
Content: Institutional Environmental Training Practices
The following institutional practices that often form the subject of municipal trainingprograms
Name
PCB managementHazardous waste management practicesNon-hazardous waste managementEmpty container managementEmergency preparedness and response practicesContainer and tank management practicesWaste minimization practicesUsed oil management practicesExempt waste management practicesUniversal waste management practicesAsbestosSolid waste management
Audience
The explicit or institutional training requirements affect one of four identifiable categoriesof training:
Awareness Training
Certain training requirements apply to all personnel who come into contact with or workin the vicinity of regulated materials, but do not have anv specific compliance functionbeyond being "aware of the environmental risk associated with the material and to haveknowledge of where to seek help or instructions if questions arise.
Function-Specific Training - Level I
Specialized subgroups within a facility, such as material handlers, electricians, tank farmoperators, etc , have clearly defined environmental responsibilities These employees mustreceive detailed, specific training unique to their "function "
Function-Specific Training - Level II
Each facility maintains individuals who are responsible for facilitv-level compliance (suchas the Environmental Coordinator, the Safety Engineer, or the Shipping Supervisor)
-731-

These individuals must be intimately familiar with the dav-to-day procedures necessary tomaintain facility-wide compliance and reduce future liability
Professional Training
Many individuals within the municipality have responsibility for institution-wideenvironmental decisions, such as corporate-level environmental compliance staff Thisgroup must receive detailed and comprehensive training to alert them to upcomingregulatory shifts, new risk-reduction technologies, and the implications of their actions andpractices.
Record keeping
Most, but not all. regulatory training requirements mandate that records be kept ofemployee statistics, program statistics, and some measure of program success. Regardlessof the mandate, however, it is recommended that records be kept of all environmentaltraining
1. Employee StatisticsSome degree of employee data is normally required, including
Employee name;Social Security number.Job title;Job description;Education prerequisites; andSkill prerequisites
2. Program StatisticsThe program itself should be documented, including
• Time and date of delivery,• Location of delivery;• Methods of instruction and competency analysis ( e g , test, exercises, etc ),• Participant and instructor materials, andInstructor name, qualifications, and contact information
3. Program SuccessMany training standards mandate that some degree of competency be proved. Forexample
• Hazardous waste training requirements state that "facility personnel must successfullycomplete a program that teaches them to perform their duties..." (40 CFR265.16UX1));
• Hazardous materials transportation training requires that each . Hazmat employee istested by appropriate means ..." (49 CFR 172,702(d)); and
-732-
HAZWOPER traininu rules state that employees "shall have sufficient training or have hadsufficient experience to objectively demonstrate competency (29 CFR
Whatever the method of competency analysis used, records must be kept
Current Compliance Status
Some municipalities have developed approaches to develop and implement environmentaltraining programs The audit process will define this status
6. Summary
US Federal Environmental, Health and Safety law now applies to municipalities, and inparticular to their departments of Public Works, which contain water and wastewatertreatment, and other functions which involve chemical and physical safety hazards.Compliance, while new, is mandatory to achieve a clean environmental and safeworkplace as well as to avoid costly injured, fines and penalties. In this paper wedocument the regulations which impact Michigan cities, the audit process necessary toachieve compliance, and the training guidelines which are needed to perform mandatedtraining
I NEXT PAQE(S)left BLANK
mmmmmmmmmmmmmmmm
Proceedings of the Fifth International Conferenceon Energy and Environment, Cairo, Egypt, 1996 "EG97000^in
PROTECTION OF ENVIRONMENT, HEALTH AND SAFETYUSING RISK MANAGEMENT
by
George AbrahamGhafari Associates, Inc.17101 Michigan Avenue
Dearborn, MI 48126-2736USA
Ralph H. KummlerDepartment of Chemical Engineering
Wayne State UniversityDetroit, MI 48202
and
Joseph LouvarResearch ServicesBASF Corporation
Wvandotte. MI 48192
Abstract
Section 304 of the 1990 Clean Air Act Amendments (CAAA) directed the USOccupational Safety and Health Administration <OSHA) to develop a chemical processsafety standard to protect workers on-site from accidents involving hazardous substances.OSHA issued 29 CFR 1910.119. Process Safety management of Highly HazardousChemicals (PSM) in 1992. Section 112r of the CAAA further mandated that a standard bedeveloped to protect the environment from accidental releases of hazardous substances.The US Environmental Protection Agency (EPA) proposed such a standard in 1993 (58FR 54190) and revised their proposal in 1995 (60 FR 13525). The final rule for riskmanagement and accidental release prevention is more comprehensive and extensive thanOSHA's PSM standard. In this paper we will discuss the concepts of both programs, theclasses of substances that would trigger a facility "s need for compliance and review theregulations for risk management.
-735-
1. INTRODUCTION
An estimated 118.000 to 140.000 facilities in the United States will need to comply withthe US Environmental Protection Agency's (EPA) Risk Management Program forAccidental Release Prevention of Toxic. Flammable, and Explosive Substances. Theseinclude facilities that use more than the threshold quantity of regulated "highly hazardouschemicals." including mere drum quantities of such common chemicals as concentratedsulfuric acid and nitric acid. Many of these facilities must also comply with theOccupational Safety and Health Administration's (OSHA) "Process Safety Managementof Highly Hazardous Chemicals" (PSM) [1]. While manufacturers of the highlyhazardous chemicals are the prime target of the proposed rules, nonetheless, all facilitieswith processes utilizing over the threshold quantity of materials need to be in compliance.Facilities with covered processes might include: cold storage units using ammonia as arefrigerant, public drinking water and waste water treatment systems, chemicalwholesalers, propane retailers, and utilities. A process is defined as "any activityinvolving a highly hazardous chemical, including any use, storage, manufacturing,handling or the on-site movement of such chemicals or combination of these activities."OSHA estimates that industry will save over $2 billion during the next decade in reducedaccidents because of these standards [2].
Section 304 of the 1990 Clean Air Act Amendments (CAAA) directed the OccupationalSafety and Health Administration (OSHA) to develop a chemical process safety standard toprotect workers on-site from accidents involving hazardous substances. OSHA issued 29CFR 1910.119. Process Safety Management of Highly Hazardous Chemicals (PSM), onMay 26. 1992. Section 112r of the CAAA further mandated that a standard be developedthat attempts to protect the environment from accidental releases of hazardous substances.The EPA proposed such a standard on October 20, 1993 [3] and revised their proposal onMarch 13. 1995 [4]. On January 22. 1996. the EPA released the following draft documents:"Offsite Consequence Analysis Guidance", "Risk Management Plan Data Elements", and"RMP for Ammonia Refrigeration Facilities"' [5-7]. The final rule is expected to bereleased May 26. 1996. EPA's risk management program for accidental release preventionis even more comprehensive and extensive then OSHA's PSM standard [1]; both resemblethe International Standards Organization's (ISO) 9000 Quality Standards [8].
In this paper we will discuss the classes of substances that would trigger a facility's needfor compliance. Following this we review the EPA regulation. We will compare the EPAregulation with the OSHA PSM regulation. Finally, we comment on dual compliancewith EPA and OSHA.
2. COVERED SUBSTANCES
The list of chemical substances, and their threshold quantities, that are covered by theproposed accidental release prevention program was published as a final rule on January 31,1994 [9]. This list is also found in 40 CFR 68. If a facility uses any of these .substances, inquantities greater than the specified thresholds, then they are regulated under the program.Three classes of compounds are identified: toxics, flammables. and explosives.
-736-
Toxics. The final rule identifies 77 toxic substances and includes organics. inorganics,and organometallics. These substances were selected for their acute toxicity. The criteriaused for selection were:
Inhalation: I.C5n > 0.5 mg/1 of air for 8 hours of exposure
Dermal: LD50> 50 mg/kg of body weight
Oral: LD50 > 25 mg/kg of body weight
LC50 and LDM) are the median lethal concentration and lethal dose at which 50% of thetest animals died in toxicity studies of these compounds.
The EPA decided to use different threshold levels [1] than are used in OSHA's PSMstandard with EPA's generally being higher. For example, chlorine has a threshold valueof 1500 lb. under OSHA's standard but is 2,500 lb. under EPA's standard. This isbecause of the differences in the targets of protection: on the work-site (OSHA) versusoff the work-site (EPA). The EPA used a combination of toxicity and volatility todetermine what threshold level to give each substance. They decided to place each of thechemicals in one of 7 threshold weights. These range from 500 lb., an approximatequantity of material that could be contained in one drum, to 20,000 lb., a quantity ofmaterial typically used in bulk operations. Substances on the list having the greatestcombination of toxicity and volatility are considered the most dangerous and are assignedthe smallest threshold of 500 lb. Substances on the list with lesser combinations oftoxicity and volatility are accordingly given higher thresholds.
A facility is regulated by the program if a single unit in that facility contains more than thethreshold amount of a listed substance. A facility is also regulated by the program if the totalamount of a listed substance contained in connected multiple units exceeds the thresholdquantity. Similarly, the total amount of a listed substance contained in unconnected multipleunits must be considered in the threshold calculation if the potential exists for a joint releaseof material. If. however, the facility can prove that these multiple units cannot be involved ina single release, then the facility would be exempt from the regulation.
If a toxic substance is present in a mixture at a concentration below one percent by weightof the mixture, the amount of the substance in the mixture need not be considered whendetermining whether more than a threshold quantity is present. If the concentration of thetoxic substance in the mixture is one percent or greater, but the owner can demonstrate thatthe partial pressure of the toxic substance in the mixture under handling or storageconditions in any portion of the process is less than 10 mm Hg, the amount of the substancein the mixture need not be considered when determining whether more than a thresholdquantity is present.
Flammables. The most destructive accidents in industry, and those most responsible fordamage extending beyond the work-site, are explosions caused by the sudden release of alarge quantity of a flammable vapor that is then dispersed and ignited. This event called avapor cloud explosion (VCE) has been responsible for numerous losses of lives andsignificant destruction of property. Because of this, the EPA selected those flammablegases and liquids that have the greatest potential for this occurrence. The final rule
-737-
includes 63 flammable substances: 44 gases and 19 liquids. The liquids selected all haveflash points below 23°C (73°F) and boiling points below 38°C (100°F). This is the cntenaused by the U.S. National Fire Protection Association (NFPA) for its highest flammabilityhazard ranking [10].
Because of the lack of information required to determine individual thresholds, a 10.000lb. threshold was set for all flammables. That amount is based on the potential for aserious vapor cloud explosion. This is a conservative value since the 10.000 1b. thresholdrefers to the stored amount and it is unlikely that the entire inventory of material wouldbe released in an accident. This is also the opinion of the EPA as demonstrated in theirdefinition of "worst case" as discussed later in this paper.
If a flammable is present in a mixture at a concentration below one percent by weight of themixture, the mixture need not be considered when determining whether more than athreshold quantity is present. If the concentration of the flammable in the mixture is onepercent or greater by weight, then, for purposes of determining whether more than athreshold quantity is present, the entire weight of the mixture shall be treated as theflammable unless the owner can demonstrate that the mixture itself does not meet thecriteria for flammability of flash point below 23°C (73°F) and boiling point below 38°C(100°F).
Explosives. Explosives classified by DOT as Class 1. Division 1.1 and listed as such in theHazardous Materials Table (49 CFR 172.101) are covered by this rule with a threshold of5.000 lb. The EPA states that "the threshold quantity for explosives was set at 5.000 poundsbecause a detonation of this quantity could yield blast wave overpressures of 3.0 pounds persquare inch (psi) at a distance of 100 meters from the blast site and could have potentiallylethal effects in the community beyond the fence-line."
Mixtures of Division 1.1 explosives listed in 49 CFR 172.101. and other explosives, neednot be included when determining whether a threshold quantity is present in a processwhen: (a) the mixture is intended to be used on-site in a non-accidental release and (b| in amanner consistent with applicable B ATF regulations. Other mixtures of Division 1.1explosives listed in 49 CFR 172.101 and other explosives shall be included in determiningwhether more than a threshold quantity is present in a process if such mixtures would betreated as Division 1.1 explosives under 49 CFR Parts 172 and 173.
3. ACCIDENTAL RELEASE PREVENTION PROGRAM
EPA proposed this regulation on October 20. 1993 [11. 12]. After a period of publiccomment, the EPA modified their proposal in 1995 [4], which significantly changed theoriginal proposed regulation. If a facility contains more than the threshold amount of aregulated substance the proposed regulation requires facilities to:
1. Register with EPA not later than three years after publication of the final rule;
2. Develop and implement a Risk Management Program that includes:
a. A Hazard Assessment with an off-site consequence analyses and afive-vear accident history
-738-
b. A Prevention Program
c. An Emergency Response Program
d. Maintain on-site documentation of the program's implementation
3. Develop and submit to Federal, state, and local authorities a risk managementplan (RMP) that documents the risk management program.
4. l.'pdate the risk management program and plan as required by rule, audit, orprocess or chemical changes at the source.
Risk Management Program
The risk management program has four elements:
Hazard Assessment. The EPA Risk Management Program requires a hazard assessmentunder which facilities must evaluate a range of potential hazardous chemical releases,including the history of such releases at the facility. The releases must include the worstcase and more likely, but significant accident release scenarios. A risk-ranking matrix canbe used to characterize the worst case and more likely scenarios
The EPA originally defined a worst case gas release as an instantaneous release. They arenow defining it as the quantity of a regulated substance released from a vessel or processpiping failure over a 10-minute period under worst-case meteorological conditions (Fstability and 1 meter per second wind speed) at ground level and would consider passivemitigation measures to hold. For liquids, the worst case release is one in which the totalquantity of liquid in the vessel or pipeline forms a pool instantaneously. For a pipelinerelease, pipelines are assumed to be full but the volume of vessels attached to the pipelii::do not need to be considered. The release rate from the pool to the air is determined bythe volatilization rate.
Because many facilities contain several covered similar substances, the EPA hasproposed the following to reduce the redundancy of multiple hazard assessments:
• A single worst-case release scenario would be analyzed for all fiammables on site. on.one flammable substance would be analyzed for other more likely scenarios as we;>-
• A single worst-case release scenario would be analyzed for all explosives on site, onbone explosive substance would be analyzed for other more likely scenarios as well: a:*
• A single worst-case release scenario would be analyzed for all toxic substances at thesource; other more likely release scenarios would be analyzed for each toxicsubstance covered by the rule.
So that facilities will not be required to incur the expense of dispersion modeling, and i;-bring consistency to this information, the EPA has developed "lookup" tables to assistfacilities in determining the impact distances for their release scenarios [5]. The tablesspecify potential impact distances for releases of substances under conditions that arerelevant to dispersion. Sources will only have to define their release scenarios anddevelop the information, such as release rate, needed to use the tables The tables provideimpact distances that sources can then map.
-739-

The proposed rule specifies that sensitive populations potentially affected by a releaseshould be identified. To limit the effort required to define off-site populations. EPA isproposing that off-site populations be defined using available Census data. Informationon the number of children and people over 65 may be considered a proxy for sensitivepopulations. With the assistance of the Bureau of the Census and NOAA. EPA isdeveloping a geographic information system. LandView, that will facilitate analysis ofresident populations.
Prevention Program. The second element of the Risk Management Program is aprevention program. There are 10 elements in the EPA prevention program and 14elements in the OSHA PSM standard with many of the elements being duplicated.Fortunately the EPA made a deliberate attempt to retain the same requirements whereverpossible, although differences exist because the two agencies have differentresponsibilities. The first column below lists each element of the PSM program and thesecond column shows the corresponding element of the prevention program (someelements have no equivalence):
PSM Program (OSHA) Prevention Program (EPA)
Process Safety Information Process Safety InformationProcess Hazards Analysis Hazard EvaluationOperating Procedures Standard Operating ProceduresEmployee Participation (No equivalence)Training TrainingContractors (No equivalence)Pre-start Review Pre-start ReviewMechanical Integrity MaintenanceHot Work Permit (No equivalence)Management of Change Management of ChangeIncident Investigations Accident InvestigationEmergency Planning and Response Emergency ResponseCompliance Audits Safety AuditsTrade Secrets (No equivalence)
As can be seen, many elements of the two regulations are identical.
The hazard evaluation (HE) or process hazard analysis (PHA) requires the most technicalsophistication of the above elements. The American Institute of Chemical Engineers hascreated the Center for Chemical Process Safety to specialize in the prevention ofaccidents and has published an excellent reference on the HE process [13]. This referenceprovides a practical map for complying with both EPA and OSHA regulations. Theydefine a hazard to be "an inherent physical or chemical characteristic that has thepotential for causing harm." A HE is also known as Process Hazard Review. ProcessSafety Review, Process Risk Review. Predictive Hazard Evaluation. Hazard Assessment.Process Risk Survey, or Hazard Study depending on which law or professionalassociation is utilized. These are all organized efforts to identify and analyze thesignificance of hazardous situations that a process or activity might undergo.
-740-

These HE studies are used to identify places in the design and operation of the facilitiesthat could lead to accidental chemical releases, fires or explosions. HE studies focus onprocess safety issues involving either accidental chemical releases or the exposure of plantpersonnel and complement traditional industrial health and safety activities. HE studiesuse qualitative methods to describe potential equipment failures and human errors that arecomponents of accidents. They also examine the management and maintenance systems ofa facility. HE focuses on the consequences of episodic events rather than permittedemissions and hence do not normally consider industrial health and safety issues. Most HEstudies require the combined efforts of a multi-disciplinary team. This typically involvesan engineer, chemist, safety officer, industrial hygienists, maintenance, medical personnel,and an individual knowledgeable in the methodology of HE techniques.
An accident is defined as "a specific unplanned sequence of events that results in anundesirable consequence." Thus the first event in an accident sequence involves aninitiating event, which could include equipment or computer software failures,management system failures, human errors or external events, such as weather, andvandalism or sabotage. Next in the accident sequence there are intermediate events that arecalled promulgating factors such as system safety failure, ignition sources, further humanerror and so called "domino effects." There are also mitigating factors called risk reductionfactors that involve facility responses such as alarms and detection systems, safetysystems, containment systems, emergency plan responses, and training. The accidentsequence presents an outcome that can result in phenomena such as a discharge of highlyhazardous materials, the dispersion of those materials, fires, explosions, and missiles.
The common theme in the development of the HE approach suggests that HE studiesshould be performed throughout the life of a facility. The HE should be built into thedesign and construction, the start up, the operating lifetime and the decommissioning.
While this new science of Hazard Evaluation has come a long way, there are alwayslimitations. There can never be a guarantee that all accident situations and causes can beidentified. There are always assumptions regarding the accident scenario and the endresults will always be subject to different analysis. In some cases it is almost impossibleto know the nature of the accident's cause. The experience and judgment of experts willalways have some limitations.
Emergency Response Program. The third element of the Risk Management Programrequires facilities to have an Emergency Response Program. This program delineates thesteps to be taken by facility employees in response to accidental releases of hazardousmaterials. It also establishes procedures for informing the public and the appropriateemergency response agencies when a release has occurred and must include emergencyhealth care and employee training. The training for all employees includes relevantemergency response procedures together with drills or exercises to test the plan andevaluate its effectiveness. The plan must be revised based on the findings of the drills andexercises. Further, it must be coordinated with local emergency response plans developedby Local Emergency Planning Committees (LEPC) and local emergency responseagencies. As in the case of similar existing OSHA regulations, Resource Conservationand Recovery Act (RCRA), and Spill Prevention Control Encounter Measure
-741-
Requirements under the Clean Water Act. the emergency response plan must bemaintained at the facility and must include descriptions of all mitigating systems in place.
Facilities must already have an "Emergency Action Plan" under 29 CFR 1910.38(a) sothis emergency response plan simply augments what has already been initiated underOSHA. The additional requirements include:
1. Detailed steps for all employees to take when there is an accidental release
2. Protective actions for employees not directly involved in responding to the release.
3. Procedures for employees who are responding to the release and descriptions of allresponse and mitigation technologies available at the facility
4. Procedures for informing the public and emergency response agencies about the releases
Documentation. The program requires that all elements of the risk management programbe documented in writing and be available on-site for inspection.
Risk Management Plan (RMP)
Each of the above steps constitute part of the development of the RMP that must besubmined and registered with EPA. A summary of the program must be submitted to theState Emergency Response Commission, the LEPC and the newly created ChemicalSafety and Hazard Investigation Board. When registering the plan with the EPA. thecompany must certify that the plan has been submitted to all of these authorities.
4. TIERING THE REGULATORY REQUIREMENTS
EPA's original proposal would require every source affected by the rule to complete allspecified activities and submit an RMP. EPA is now proposing to create the followingthree tiers of risk management programs:
Tier I: A brief RMP would demonstrate and certify that the source's worst-case releasewould not reach any public or environmental receptors of concern.
Tier 2: A streamlined risk management program requires sources to conduct an off-siteconsequence analysis, document a five-year accident history, implement prevention steps,have an emergency response plan, and submit an RMP. The rule would not requirespecific steps to comply with the prevention and emergency response programs.
Tier 3: The full risk management program and plan are described in the proposed rule.
In addition to the approach in the proposed rule, EPA has developed two alternativeapproaches to assigning sources to the tiers in a way that takes into consideration risk aswell as differences between types, classes, and kinds of sources:
Approach 1: Sources that could meet the requirements of Tier 1 would comply with Tier1; manufacturers with 100 or more full-time employees (FTEs) producing pulp (SIC code2611), chlor-aikalis (2812), industrial inorganics, not elsewhere classified (nee) (2819),plastics and resins (2821), industrial organics, nee (2869), nitrogen fertilizers (2873),agricultural chemicals, nee (2879), and petroleum refineries (2911) would comply withTier 3 requirements; all other sources would comply with Tier 2 requirements. In
-742-

addition, eight years after the effective date of the rule, sources in SIC codes 2812. 2819.2869. 2873. and 2911 with 20 to 99 FTEs would be required to meet Tier 3 requirements.
Approach 2: Sources that could meet the requirements of Tier 1 would comply with Tier1; other sources with fewer than 100 FTEs would comply with Tier 2 requirements; allother sources would comply with Tier 3 requirements.
5. SUMMARY
Companies have found that OSHA's PSM regulation requires a tremendous effort to developand manage the systems needed for compliance. This same, or possibly a greater, effort willbe needed to fulfill the requirements of EPA's program. It is essential that the facilitiesrecognize and capitalize on the similarities between the OSHA and EPA regulations. If this isdone then facilities will be able to develop effective systems to optimize performance whilecontrolling the overall effort, within the capabilities of most sites.
The benefits of the successful implementation of these programs are obvious: lives saved,injuries prevented, capital equipment and the environment preserved. An added benefit isthat compliance with the requirements of these programs will greatly assist a facility inmeeting the requirements of ISO 9000 and 14000 and thereby assist in international trade.Industry acknowledges that OSHA's PSM regulation is well crafted and it will help industryto improve their on-site performance. Due to its similarity, EPA's risk management programis expected to help industry to improve their off-site performance as well.
-743-
REFERENCES
1. Auger. John E., "Occupational Health and Safety." April (1994) pg. 65.
2. Smith. Douglas and David Heinhold. "Environmental Solutions." August (1994) pg. 53.
3. Federal Register. "Risk Management Programs for Chemical Accidental ReleasePrevention". 58 October (1993), pg. 54190.
4. Federal Register. "Accidental Release Prevention Requirements: Risk Management".60 March (1995), pg. 13525.
5. "Offsite Consequence Analysis Guidance", http://www.epa.gov/swercepp/whatnew.htmlFebruary 26, 1996 update.
6. "Risk Management Plan Data Elements", Ibid.
7. "RMP for Ammonia Refrigeration Facilities", Ibid.
8. Kinder, Duncan. "Occupational Health and Safety.. December (1994), pg. 47
9. Federal Register. "List of Regulated Substances and Thresholds for AccidentalRelease Prevention", 59 January (1994), pg. 4478.
10. National Fire Protection Association. "Fire Protection Guide on HazardousMaterials." 8th Edition (1984)
11. Dennison. Mark. "Occupational Health and Safety." December (1994), pg. 20.
12. Murphy. Michelle R.. "Chemical Engineering Progress." August (1994) pg. 77.
13. Center for Chemical Process Safety, AIChE, "Guidelines for Hazard EvaluationProcedures." Second Edition. April (1995), New York, New York.
-744-
EG9700031Proceedings of the Fifth International Conferenceon Energy and Environment, Cairo, Egypt, 1996
ENVIRONMENTAL IMPROVEMENT & HERITAGE PROTECTION:
Gamalia Case Study
A. Bishay* & M. Ebeitl**
UNDP Sustainable Development Program
Cairo. Egypt
Abstract
A demonstration area covering the vicinity around Tombakshia street. Darb Kormoz and
Sannaneen lane was selected tor this study on Gamalia. Physical, social and environmental surveys
were conducted on all residential, commercial and industrial sites. The plan for upgrading the selected
area was based on three alternative scenarios, namely; the developmental approach : the socio-cultural
approach; and the environmental improvement approach. A hybrid scenario of the three approaches
was adopted by the UNDP Task Force as a preliminary action plan. Three capacity building
workshops were later organized for the community of the selected area; resulting in the information of
a new NGO and the adoption of a community based plan. Alter slight modifications, implementation
was initiated for priority items in the plan, such as garbage collection and the construction of a crafts
training center.
1 . INTRODUCTION:
In 1990, the UNDP sponsored Task Force for sustainable Development was formed from
20 Egyptian scholars who were assigned the task of proposing "Strategies !'or Sustainable
Development for Egypt". The Task Force proposed a framework for sustainable development in
Egypt which was based on a balance between (i) resource management (ii) environmental
protection and (iii) human and economic development While the original framework was mainly
concerned with people living in "modern" rural and urban settings, it was recently modified to
include those living in historical areas where heritage protection and environmental improvement •
Dr. Adli Bishay is Prof. Emeritus. American University in Cairo and Director. UNDP Sustainable Developmem
Program (SDP).
" D r . Magda Ebeid is assistant Prof.. Institute of Environmental Studies and Research. Kin Shams I Iniveristy and
Consultant to SDP.
-745-
are key factors in sustaining these areas. This puts "cultural heritage" as one of the major
resources other than human and natural resources. It also stresses the "built environment" as one
ol ihe components to be protected, other than air. noise, water, soil and waste.
The Task Force was guided by Agenda 21 themes in the development of its program, and
emphasis was given to (i) the management of human settlements and (ii) people's participation &
responsibility. The environmental and development consequences of the breakdown of urban
services, the spread of slums and social decline are enormous. Raising the quality of shelter,
water supply, energy and transportation, and the management of solid wastes and sewage is
essential. Peoples participation and responsibility describes the essential ingredient for success of
these goals and activities. The commitment of the broad participation in all aspects of the decision-
making process will be critical to the effective implementation of the objectives, policies and
mechanisms of sustainable development. Strengthening the role of major groups in realizing
sustainable development should involve fundamental changes in education, public awareness, and
training aimed at placing issues of environment and development at the center of decision making
at ail levels.
While other studies deal with the very important task of upgrading of historical buildings,
our major concern is in the "people" living around these buildings: their quality of life, their
heritage and their participation in the improvement and maintenance of the built environment in
their area whether historical or modem.
Since December 1993. the Task Force activities were directed to sustainable development
concepts, issues and priorities in selected urban centers; notably Gamalia district (Cairo
Governorate) and Rosettacity (BeheiraGovernorate). Emphasis was placed on programs dealing
with environmental improvement and heritage protection in these two areas, both of which contain
much of the cultural heritage of the region and the world. This research activity was made
possible through a cost sharing agreement between the United Nations Development Program
(UNDP), the Urban Management Program (UMP), and recently the Ford Foundation. The long
term objectives of this activity are: 1) Formulate programs and projects that are responsive to the
environmental, socio-economic, and cultural needs and priorities of Rosetta and Gamalia district.
2) Develop a country strategy for the regeneration of Egypt's old city centers, and 3) Mobilize the
resources of the sustainable development task force in alleviating poverty, improving living
conditions and protecting cultural heritage. This paper presents our recent findings in the Gamalia
district. Another paper will deal with the Rosetta study, and a third will present proposed national
strategies for upgrading Egypt's old city centers.
-746-
2 . THE GAMALIA STUDY:
A number of studies and projects pertaining to the planning of Cairo of the middle ages
were reviewed & appraised. The term "al Gamalia area was the name given during the 15th
century to the area between Bab al Nasr and sharia al Tombakshia when Madrasa ot' Gamal al Din
Mahmud al Ustadar. a Mamluk of the Sultan Barquq. was built ai the corner of Sharia al
Tombakshia and Sharia al Gamalia. Today, the term encloses a much larger area, in tact the whole
city of al Qahira (Cairo) built by the Fatimids in 969 and surrounded by a wall In effect, it is the
area between Bab al-Foutuh and Bah al Nasr in the North, and Bab Zuwaila in the South.
While the long term plan is to deal with the whole area described above, the present study is
limited to the area bordered by Darb al Asl'ar-North. Sharia al Gamalia-East. Sharia Bayt al Qadi-
South. and sharia al Mui/z le Din Allah-West. This study area was chosen from among four areas
that encompass (i) historical structures, (ii) housing and demographic activities, and (ni) social
and economic practices.
General physical and social surveys were conducted in the above mentioned area based on
a H)9c sample. However, in order to obtain more reliable data, a demonstration area was chosen
within the above mentioned selected area. The demonstration area covers the vicinity around
Tombakshia street. Darb Kormoz. and Sannaneen lane (Fig. 1). It extends over an area i)i about
27,150 m' (or 6.46 feddan), accommodating 119 families and 165 shops and workshops. The
population density in the area amounts to 81.9 person/feddan. The choice of the area was based
on a number of criteria which favor focusing efforts towards achieving sustainable development.
The most important criteria taken into consideration are: a) This area is well endowed with
excellent examples of Islamic monuments covering the Fatimid, Mamlouki and Osmani erxs b)
The area is not densely populated, thus making it easy to deal with the residents, c) A good
variety of socio-economic activities exist in the area, viz. commercial, services, and workshops,
d). A number of locations within the area are characterized by only few land use activities, thus
making it possible to re-use these locations for other activities, and e) a large percentage of Lhe
population live under low socio-economic standards (poor, very poor or extremely poor).
3 . PHYSICAL SURVEY OF THE DEMONSTRATION AREA:
A questionnaire was designed and used to field-cover the demonstration area. It included
complete information on street names, building and Hat numbers, and data on: present status of
buildings; buildings' heights and use; construction type and building material; ownership;
architectural style; infrastructure; number of units; and surveyor's remarks.
-747-
Various problems were identified in the study through analyzing the different data
collected, namely; poverty; congestion and deterioration of residential buildings; wear and tear o!
sanitation network; accumulation and irregular collection of garbage: noise pollution: absence of
street lights, youth centers, public awareness and participation: utter negligence of historical
buildings (some presently used as warehouses, workshops and commercial shops), and illegal
occupancy of roads (due to the odd mix of human activities especially workshops). In addition to
these problems, the field survey showed that almost 75^ of buildings in the area suffer from
serious deterioration. Some locations house very polluting workshops that generate adverse
impacts on water, air quality, sonic and visual environments, and on the physical structure o(
historical buildings. These adverse impacts decrease the quality of individuals and society's lives.
Fig. 2 shows land-use distribution, conditions of buildings and percentage of different heights in
the demonstration area.
4 . GROUNDWATER:
The problem of undesired quantitative and qualitative changes in water table in Gamalia
district is principally linked to the rapid increase of population in Cairo in general, the consequent
extensive urban expansion, and the resulting extreme demand placed on the aging municipal
infrastructure. The regional subsoil water body moves from areas of higher topographic relief to
those of lower ones. Local leakage's from drinking and sewage systems in the area of Gamalia.
lack of maintenance, and misuse of monuments add to the ground water problems. Those
buildings of historic value that have suffered harmful effects from being in direct contact with the
subsoil water body, require immediate action. This calls for specialized rehabilitation work by
experienced contractors using proper engineering techniques and materials.
5 . SOCIAL SURVEY:
Four tools were used to collect data for the social survey. These were: scheduled
interviews; observations; small group meetings; and visits to the district's institutions and
organizations. The findings revealed a wide range of social problems in terms of: health: nutrition:
illiteracy and low education levels; status of women; high informal employment rates. Examples
of the results of these studies are shown in Fig. # 3. The major characteristics of the study area
have the following trends: 1) Female illiteracy is high and clearly exceeds that of males: 2) The
distribution of the educational level is dominated by the segment of basic education, with a low
representation of university graduates; 3) Female employment is very low: 4) Child labor is very
little represented, and most of the children in the young age brackets are enrolled in schools: 5)
Most employment tends to be related to the special nature of the area as a touristic center and a site
dominated by crafts of silver and gold, as well as other metal and sheisha manufacturers: 6) The
-748-

prevailing socio-economic standard tends to be more on the low side. Social indicators reveal a
culture dominated by poverty, though in different degrees. Some individuals are living under
destitute conditions, both physical and financial.
Analysis of the social survey emphasized approaches for the promotion of popular
participation and self help; promotion of the status of women; non-formal and continuing
education as a vehicle for sustainable development: the upgrading oi educational, health, and
environmental protection programs: and the development of vocational skills and income
generating projects.
6 . ENVIRONMENTAL STUDIES:
In addition to the predominant visual & noise pollutions, the demonstration area showed
three other major environmental hazards; namely: air pollution, garbage, sowers overflow.
a) Air Pollution: is a serious environmental problem that is threatening and detrimental to
the health of the residents especially vulnerable groups like children, pregnant and lactaiing
women. Sources of air pollution include exhaust from workshops that arc using fossil fuels (oil.
coal), congested streets with vehicles that use leaded gasoline spreading iLs exhaust all around the
area, two workshops melting car batteries and spreading their leaded exhausi on the whole
district, as well as bakeries and garbage burning. Children - through adolescence are the first
victims of air pollution, especially because of toxic chemicals lie lead & other heavy metal
pollutants). Mental retardation, learning disabilities, hyperactivity and other forms of health
problems result from such pollution. Identification of sources oi air emissions and monitoring
samples taken from different locations in the demonstration area proved that the average
concentration of air pollutants is about four times that of the Maximum Allowable Concentration
(MAC).
b) Garbage: collection of garbage is efficient and economic and more frequent in higher
income districts where the economic values of garbage recycling is encouraging to ihe Zabbaleen
(garbage collectors). On the other hand, low-income groups usually leave very little of any
recyclable garbage; thus discouraging Zabbaleen from collecting garbage. Most households in the
poor areas dump their garbage in street dumping areas or corners. The municipality's sanitation
department of the district is responsible only for collecting street garbage from haphazardly sited
refuse containers or from scattered street dumps. Very often their men arc absent in such low
income districts. They never go to squatters areas or slums.
-749-
Eighty eight percent of the families reported that they are participants in a system ol
garbage collection managed by an NGO formed by the municipality. According 10 ihis system, the
solid wastes are to be collected from the building's front door daily The system charges the
household two to three pounds monthly. However, residents complain of the irregularuv ol
garbage collection where it may be left lor 2-} days in front ol the building. Ten percent ol the
households carry their garbage to one of the several dumping areas in the street. But again its
collection is not regular. Only one household said that they burn their garbage. This situation
explains the poor management ot the system in which the garbage is always seen scattered all
around the streets of the district.
c) Waste Water System. Although a marked improvement has been observed in the
system as a result of the operation of the " General project for Sanitary Drainage in Greater Cairo"
and the consequent lowering of water levels in all networks, there is still some overflow caused
by the narrowness of the pipes and its blocking due to mal usage and solid wastes thrown into it
This situation is expected to worsen with the increase of the pressures and capacity of the potable
water network and with improvements in the socio-economic status leading lo an increase in the
rates of water consumption expected after the year 2(KX).
The selected area was inspected and problems laced in operation and maintenance were
noted. The areas with repeated blockage and leakage were identified. It was found that most o\ the
pipes are old and of 7" in diameter, and the main line was only 4" which is not satisfactory for the
water disposal quantities coupled with mal use. The proposed plan lor upgrading the sewer
system at the demonstration area included the replacement ot a numner ot •sewer line pipes b\
larger diameter pipes.
7 . PLANNING SCENARIOS:
The physical and social surveys justified the need to prepare more than one alternative
scenario to upgrade the area under issue. This should be dealt with in an integrated and
sustainable manner, taking into consideration urban, environmental, social, demographic, and
tourism aspects. The plan for upgrading the selected area was based on three alternative
approaches, namely: the developmental catalyst approach (scenario 1); me socio-cultural approach
iscenario 11); and the environmental improvement approach (scenario III).
Hie above mentioned alternative approaches were considered by the Task Force who came
to the conclusion that a new scenario should be developed through the hybridization ol scenarios
I. II &. Ill This hybrid (optimumI scenario should be presented to the local residents in order to
create a lorum ot public participation through which realistic planning and developmental options
-750-
may be reached and properly implemented. Furthermore, a feasibility study of this scenario is 10
be prepared in order to test its implementability from an economic perspective, and a clear
definition of the institutional framework, division of responsibility!ics), and beneficiaries should
be undertaken;
The overall target of the optimum scenario is he to achieve sustainable human and
economic development through improving the quality of life in the area. This optimum scenario
should also lead to the support of tourism; with religious, recreational and / or cultural attraction
points, through developing appropriate activity nodes and upgrading the areas environment.
8 . PLAN OF ACTION:
Based on the results of the social, physical and environmental surveys, a structured and
realistic action plan of the optimum scenario was prepared by the Task Force: taking the following
concerns into consideration: proper job creation, mainly for the area's local residents; po verts
alleviation; transparency (enough room of two-way consultation and public participation in the
development planning and implementation processes); creating a market for products oi the
recommended activities: and working towards upgrading and developing the local urban
environment in general.
This was followed by three workshops organized by the "Sustainable Development
Program" for community representatives of different age, sex. background, activity...etc. Issues
of "environment1, "development" and "sustainable development" were discussed, followed by
listing major problems hindering the sustainable development of the area. Based on participatory
interaction, solutions lor these problems were proposed, and a new land-use map was prepared.
At the end of the second workshop, a new NGO named "Sustainable Development Association
for Gamalia (SDAG)" was created. Priorities for implementation activities proposed by SDAG
included (i) proper management for garbage collection, tii) A crafts training center, liii) An area ol
non-polluting workshops for indigenous crafts, (iv) Housing units replacing informal housing.
and (v) A tourist wekala. The COMMUNITY BASED PLAN OF ACTION formulated
during the above mentioned workshop was sligthly modified as a result of discussions at the
Permanent Committee for Antiquities of the Cairo Govemorate (Representatives ol Cairo
Governorate. al Wakf Ministry, Supreme Council for Antiquities and some experts 1. This is
summarized as follows (Fig. 4):
I- Based on the fact that the extremely deteriorated Wekalat Kahla on the Gamalia street (between
Darb Asl'ar south and Bab el Nasr north) belongs to the Cairo Governorate and has no family or
workshop occupancy, it was proposed after a detailed architectural survey, that a would be
cleared from deteriorated structures and upgraded to house non-polluting workshops located al ihe
-751-
Rabae area (El Moez Ic din Allah west and Sannaneen south). Wekalet El Toff ah. Wekalat el
Kharoub. and other workshops at the back side of Al Akmar mosque and #13 Darb Kormo/.
Polluting workshops are to be re-located outside Gamalia. lakiny into consideration the
introduction of techniques which would minimize pollution:
2- Design a number of training courses and programs to serve the residents o! Gamalia. with
priority given to residents of wekalat El-Kharoub as recommended by the social survey studies:
The courses, in addition to serving illiterate women & men. should prepare the residents to work
with indigenous crafts, touristic services & other small project activities. In addition, capacity
building programs will be offered for the local District Council members as well as other
community organizations such as the new NGO established by the project. It is proposed that
these courses and programs be offered at a training and cultural center to be constructed on the
Rah*: area after clearing it of deteriorated workshops and re-locating them to Kahla or outside
Gamalia. A sales outlet for the crafts will also be located at the Rabae Training and Cultural
Center.
3- Upgrade infrastructure and improve basic services (waste water disposal, potable water, road
network and lighting).
4- Following the above, construction will begin ton-
al Housing facilities at Wekaiat al Toffah.
b) A service center (health unit, nursery, library, etc.) at Wekalat El Kharoub.
c) A tourism WekaJat replacing El Kheish Wekaiat.
Acknowledgments:
This paper is the result of work conducted under the auspices of the project entitled:
Environmental Improvement and Heritage Protection originally sponsored by UNDP and UMP
and later by the Ford Foundation. Senior members of the project are : Drs. Sobhy Abdel Hakim.
Bahaa Bakri. Adli Bishay. Magda Ebeid. Osman Farrag. Michel Fouad. Kamal Hefni. Mahmoud
El Howaihy. Hatem Karanshawy, Shahinda Karim. Ishak Mitri, Madiha El Salty. Talaat El
Tablawi.
References:[1] A. Bishay and Co-Workers: "Gamalia I" - Report submitted to UNDP by Sustainable
Development Program in Egypt (1994).
[2] A. Bishay and Co-workers: "Gamalia II" - Report submitted to UNDP by Sustainable
Development Program in Egypt (1995).
[3] A. Bishay. An overview of Public Participation Activities in Gamalia Demonstration Aivu.
Cairo. Egypt", paper presented at NESDA's Fifth Regional workshop. Cape I'own. S. Africa.
23-29 October 1995.
-752-
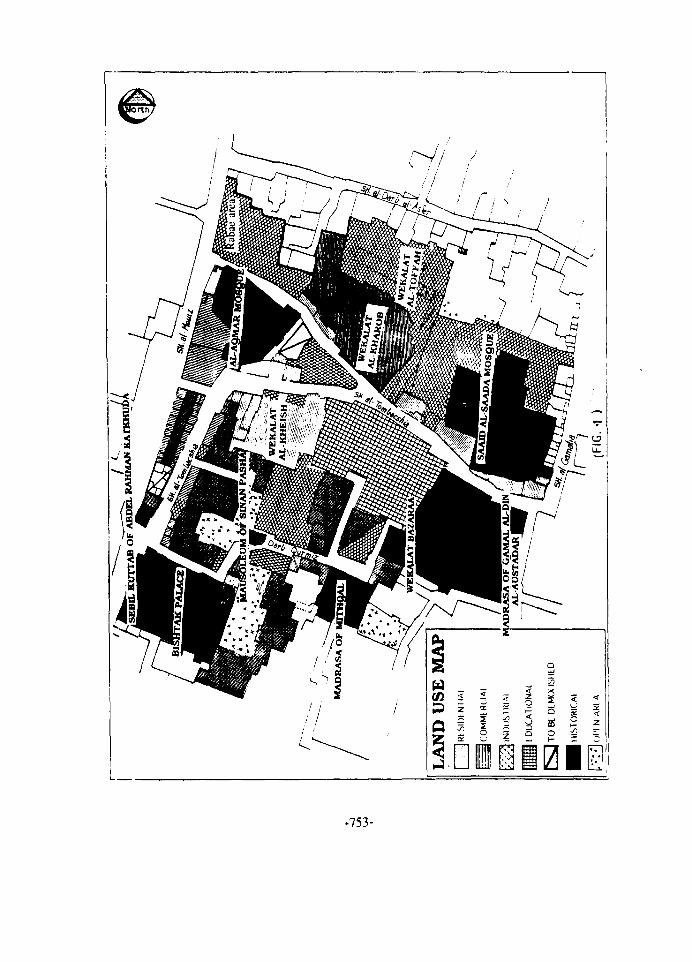
-753-
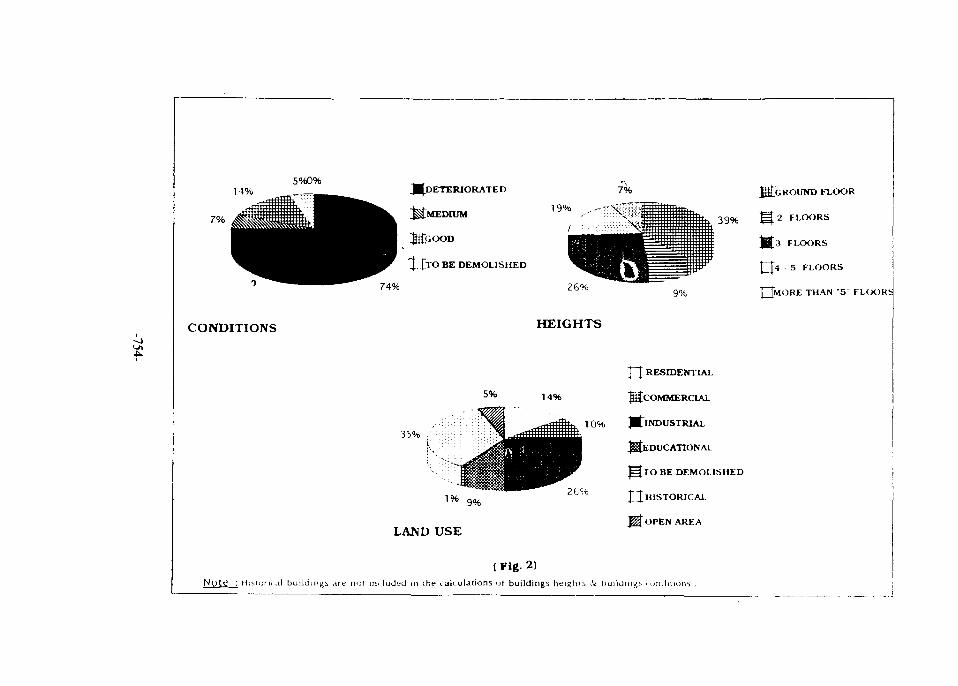
14%5%0%
^ D E T E R I O R A T E D
3UGOOD
"t-.|TO BE DEMOLISHED
74%
CONDITIONS
26%
HEIGHTS
39%
tG ROUND FLOOR
'2 FI.CXJRS
3 FLOORS
J 4 5 FLOORS
* O R E THAN "5 FLCXJKt
5%
35%I
LAND USE
14%
10%
2CH
~l~\ RESmENTIAL
^COMMERCIAL
J^INDUSTRIAL
^EDUCATIONAL
" ^ T O BE DEMOLISHED
J^I HISTORICAL
M"OPEN AREA
( Fig. 2)iiMoru.il buildings are not in* luded in the calculations of buildings heighi:> iSt buildings . oiuimoris .
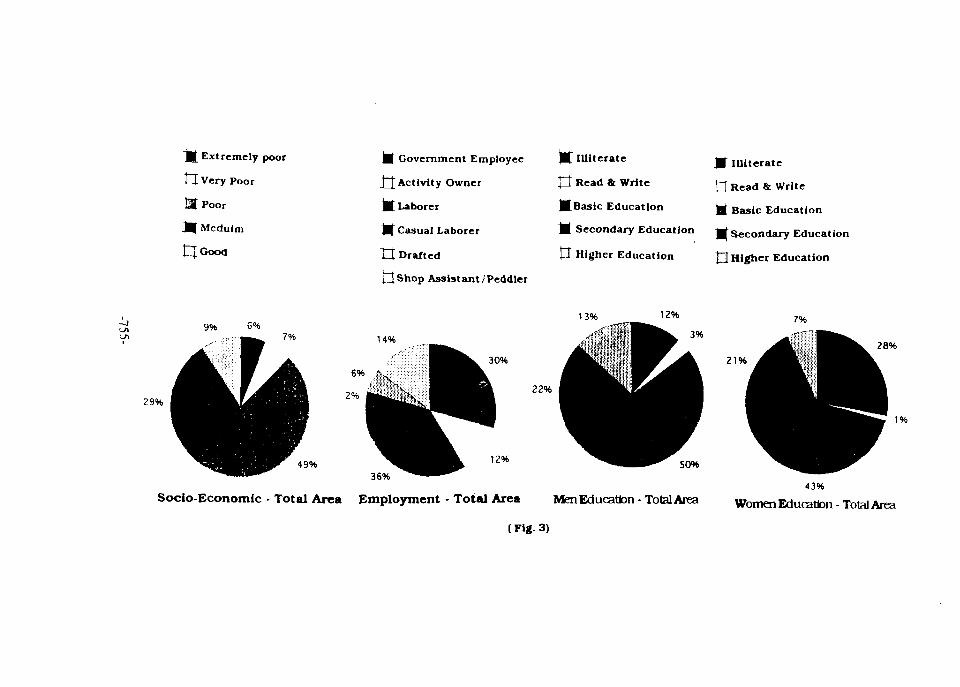
29%
j j Extremely poor
EH Very Poor
l3t Poor
J f Meduim
9% 6%
49%
fc| Government Employee
.tt Activity Owner
• Laborer
H Casual Laborer
tit Drafted
tlshop Assistant/Peddler
fr Illiterate
n Read *MBasic Education
I f Secondary Education
Q Higher Education
H iuiterate
rj Read & Write
^ B a s i c Education
^ Secondary Education
Q Higher Education
13% 12%
14% 3%
30%
22%
12%
21%
50%36%
43%
28%
1%
Socio-Economic - Total Area Employment - Total Area Men Education - Total Area Women Education - Total Area
(Fig. 3)
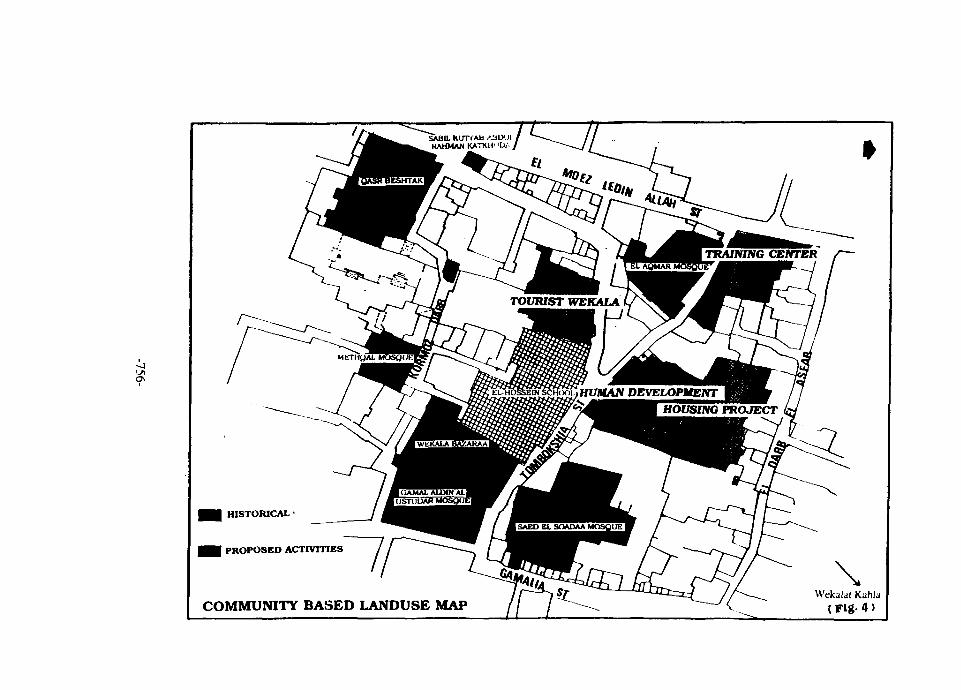
x>i,HUMAN DEVELOPMENT* HOUSING PROJECT
HISTORICAL
PROPOSED ACTIVITIES
COMMUNITY BASED LANDUSE MAPWekalat Kahla
(Fig-4)
EG9700032Proceedings of the Fifth International Conferenceon Energy and Environment, Cairo, Egypt, 1996
GEO-ENVIRONMENTAL ASSESSMENT OFA HISTORICAL COMPLEX FROM 12th CENTURY
Mohamed A. El-Sohby,* Mohamed F. Tarek.** and Mohamed A. Bahr*** Professor. Head of Civil Engineering Department,
Al-Azhar University, Cairo. Egypt**Assistant Professor, ditto.
ABSTRACT
Importance of environmental hazards is now considered as an essential participation
when dealing with the geotechnical aspects of sites in general and especially for the historical
sites and monuments. Therefore, efforts have been made recently by researchers to evaluate
and understand the impact of such environmental effects on the performance of buildings.
The present paper discusses the geo-environmental conditions and properties of the
capital Cairo and its effect on a heritage historical building known by Al-Wafeya complex. An
evaluation for the October 1992 Cairo Earthquake effect as well as the essential demands to be
aid in the survival of this historical complex for protection and preservation are discussed and
addressed.
1. INTRODUCTION
In the last decade the importance of environmental hazards sheds the attention of
engineers. On account of the dramatic increase of environmental agents either human or natural
factors, historical buildings have exhibited a growing sensitivity to geotechnical actions, which
lead to abrupt failure or destruction. Restoration of old buildings is not any more just an artistic
or architectural job, but it requires the understanding of the statical system and the construction
scheme originated in the past (11. Therefore, efforts have been made recently by researchers
1231 'o evaluate, understand and to emphasize the impact of environmental hazards on such
heritage buildings.
After 1992 Cairo earthquake the first and third authors shared as a geotechnical
participants in the after eathquake workshop committee for the purpose of evaluating damages
of some historical buildings (AETR. 1992). Most of deterioration and damages were found to
be regarded to the impact of geo-environmental conditions and assessments. The earthquake
may be shared in enhancing the problems in most of the investigated buildings.
-757-

T h e p r e s e n t p a p e r c o n t r i b u t e s a n d d i s c u s s e d t h e s i t e g e o l o g y c o n d i t i o n s a n d
• • n v i r e n m e n l a l a s p e c t s for o n e of Ihese h e r i t a g e b u l i d i n s s k n o w n h\ A l - W a f ' a e y a c o m p l e x . T h e
s t u d v i n c l u d e s a n e v a l u a t i o n for t h e Ihc e a r t h q u a k e c i i •..-'.( .is - A T ! ! a s t h e s u r r o u n d i n g
•.•nvironmental c o n d i t i o n s w h i c h had e n h a n c e d the r ap id d* i c i c n i i o r <;j the s u e .
:. Al. WAFAFYACOMPI.FX
Al-Wafaeya complex was built in the 12th century .-it'he eastern h^.trdei • nfcetiiL-rai Cairo
•n the toe of the steep cliff of the Moqiiattaiti hill, as iiiai kcci K t hi.- open circle in Fie.. !. The
general layout of the complex and its supplements is shown in Fii: 2 and Fig .3.
Writers and travellers | 4 . 5 | have devoted mnir. p.ig.-s to describe it. The complex
consists ot the main mosque which its area is about 2C' (1 n: x ?"\0 m. and surrounded by
.umbers ot supplements. A remarkable recent occupation lor !hi complex and its supplements
:A' people are sighted as illustrated in the photos of Fig. 4 and f ig. 5 which .<• ere taken outside
and inside the complex respectively.
2.1 (ieotechnical Conditions and Properties
Subsoil condit ions in Cairo is related to topography, geological formation, historical
developments and river Nile changes. The topography of Cairo may be divided into two areas
of aeohistorically different characteristics: the high land and low land | 6 | .
The high land borders ( ' a im and comprises the high and steep cliffs of Muqattam hills to
:he east and the pyramids plateau to the west. The site of Al-Wafaeya complex is located
t -wards the easten side under the Muqattam hill as shown in Fig. 1.
Geologically this area is belonging lo the Hocene-plateau which covers most of the
hgypiian province land on the two banks of the Nile Valley. It is mainly composed of
carbonate sediments of marine deposits. The main rock unit exposed in the area of Al Wafaeya
complex is limestone belonging to the middle hocene age which had deposited under true
marine conditions Toward the end of the upper F.ocene. the basin became shallower and more
Jeterital sandy sedimends are derrived. This is followed by a period of sea regression leading
so errosional unconformity where the basin was dissected by a large number of drainage
systems. These formations were subjected to tetomc movements which became intensive
toward the end of the Oligocene times \~!\.
2.2 Properties of the Site Subsoil and Ground Water
Fig.6 shows the subsoil profile lor depth of 10 meters at the site oi Al-Waiaeya complex,
it consists of alternative layers of yellowish white limestone with interrelation ol clay and silt
The "round water table was found at the site to be near the ground surface at depth of about
0.10 m. Fig.7 shows an in let pupming test performed in the field, it indicates that
hvdraulicallv the subsurface laver has verv low abilitv to adsorb surface w ater.
-758-
The chemical properties of the groundwater are listed in Table ( I ) . The results indicate
that the water alter filteration is transparent and colorless, and the suspended soil and colloids
are dark grey. Also it shows the precense of excessively high concentration of aggressive ionic
of sulphate and chlorides.
2.3- Alter 1992 Cairo Earthquake Investigation
An investigation for the Al-Wafaeya complex after the earthquake showed that the
complex and its supplements are performed well satisfactory except some minor damages to the
wooden elements of its roof and some cracks in its bearing walls. In fact this well performance
could be due to the firm foundation soil formation and the wide spread of supplements around
the mosque with respect to its height.
3. ENVIRONMENTAL HAZARD CONDITIONS
Among the problems associated from the impact of some environmental hazards in the old
city of Cairo area on old historical buildings can be summarized as follows :-
ia) The rising of ground water table which casuses an over moistening of bearing structural
elements ot brick or stone walls, and decay of wooden elements of structure,
(b) Contamination migration into soil water from both industenal and domestic wastes
icl Increasing level of sulphate and chlorides concentrations in both subsoil and ground water
which causes a creation ot chemically aggressive environment in the foundation of these
buildings.
l d) Increasing of illegal man made activities to the historical sites and its surrounding areas in
the absence of the efficiency development of sewage systems.
These effects result in making a considerable amount of historical buildings in the old
Cairo to be in danger conditions of damages and collapse.
For the present case illegal man made activities, contaminat migration into the soil and
stability problems of the surrounding Mouqattum hill emphasizes (he importance of the impact
of such environmental hazards on the buildings.
4. SUGGESTION FOR PROTECTION AND PRESERVATION
A protection program of two phases should be planned and undertaken. The first phase
is a short term planning which considered the comprenhensive protection policy and temporary
remedying methods. The second is concerening with the planning for long term duration
which includes the micro zoning geotechnical maps that assists in establishing the
environmental impact assessment and permanent remedying methods.
-759-
REFERENCES
1- El-Sohby. M.A. and Elleboudy, A.M. (1995). Environmental Impact on the preservation
on Saleh Talat mosque". Proceeding of the Eleventh African Regional Conference on Soil
Mechanics and Foundation Engineering, Cairo. Vol. 2. pp 396-408
2- El-Sohby, M.A. and Mazen. S.O. (19881."Historical development of Greater Cairo
subsoil." Proceeding of the International Symposium on Engineering and Historical Sites.
Athen. pp. 1427-1434
3- El-Sohby, M.A. and Bahr. M.A. (1993). "Impact of environmental condition on
structural damage." Proceeding of the third International Conference on Case Histories in
Geotechnical Engineering. St. l.ouis. Missouri, pp. 909-914
4- Mubark. A. (1880). "The new Tawfikeya plans for Egypt and its famous old cities."
Reprinted in 1980. (in Arabic)
5- Maher. S. (1975). "Mosques of Egypt and their good obeyer of God". Part 4. pp 69-76.
(in Arabic I
6- El-Sohby. M.A, and Ma/en. S.O. ( 1985). "Geological Aspects in Cairo subsoil
development". Proceedinas of the Seventh International Conference on Soil Mechanics and
Foundation Engineering, San Francisco. Vol. 4. pp 2401-2405
7- Shukri. N.M. ( 1953). "The geology of the desert east of Cairo". Bult. Desert Egypt, pp.
89-105
-760-
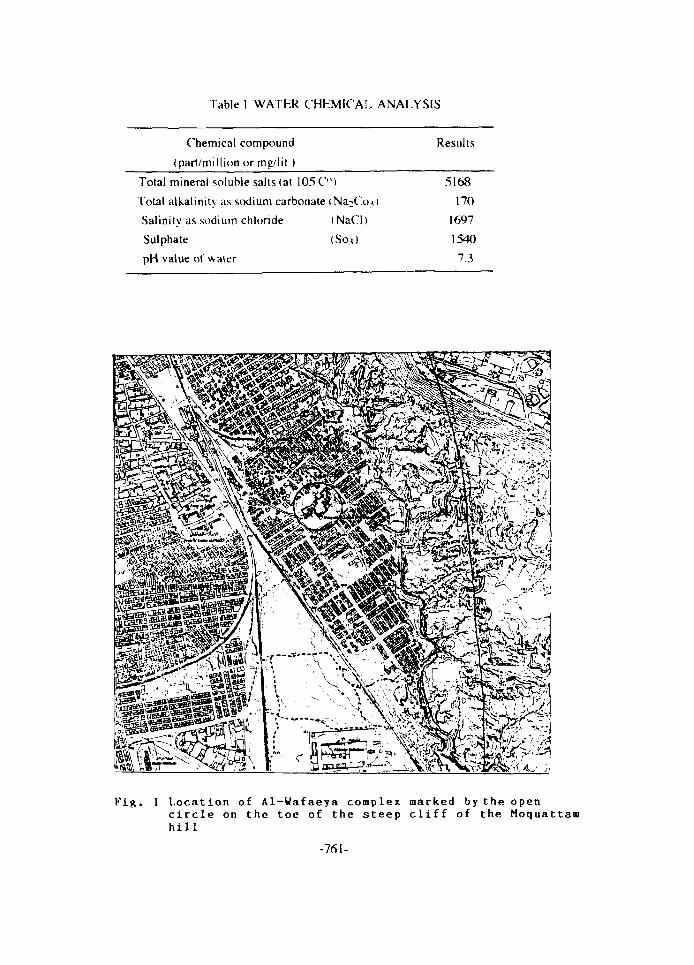
Table 1 WATER CHEMICAL ANALYSIS
Chemical compound
(part/million or mg/lit )
Results
Total mineral soluble salts (at 105 C°)
Total alkalinity as sodium carbonate (Na
Salinity as sodium chloride (NaCl)
Sulphate (So<)
pH value of water
5168
170
1697
1540
7.3
Fig. 1 Location of Al-Wafaeya complex marked by the opencircle on the toe of the steep cliff of the Moquattamhill
-761-

[Initial Ground Water Table = U.' UmFinal Ground Water Table = 0.10m
Depth(•)
1
2
3
4
5
6
7
8
9
10
Soil Profile
*
**
**
i *|*L17
Fill(Yellowish—whiteLimestone, fracture,bricks, silty clay..etc
Yellowish-whiteLimestone, Fracture,some clayey silt
End of Boring
Fig. 6 Summary of Soil Profileat the Area
0.0
0.5
B 1.0ouoi- 1 . 501
2.0
t
•-
PermeabilityAlwafaeya Complex
) 500 1000 1500Time (min.)
Fig. 7 Ability of Subsurface Ground to theIn-let Water Pumping Test
2000
-762-
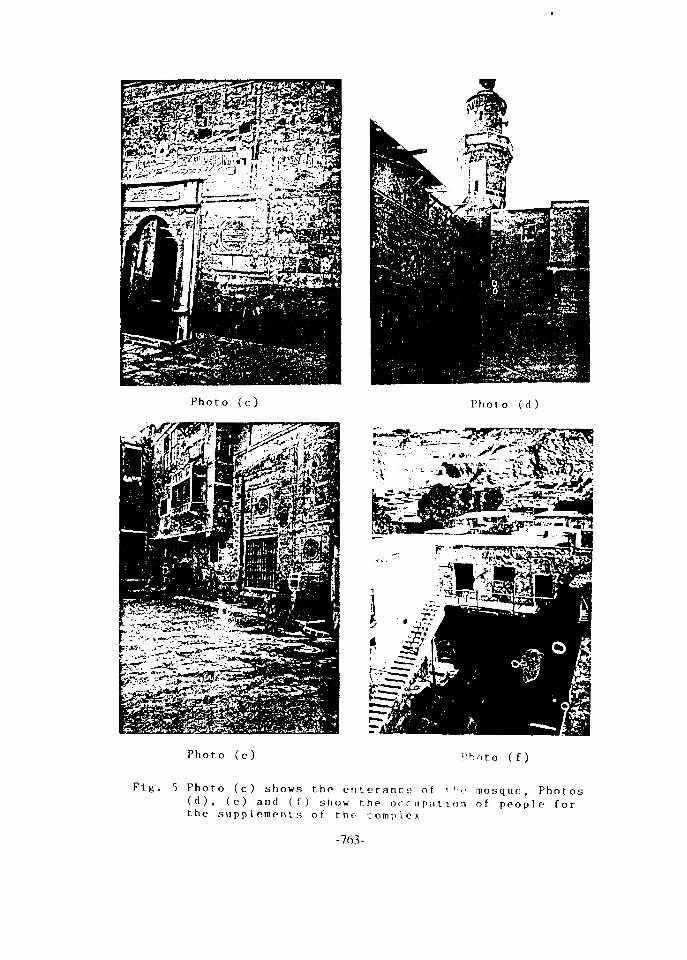
Photo (c)
Photo (e)
Photo (d)
iJhoto (f)
Fig. 5 Photo (c) shows the enterance of r! •>• mosque, Photos( d ) , (e) and (f) show the occupation of people forthe suppJements of the complex
-763-
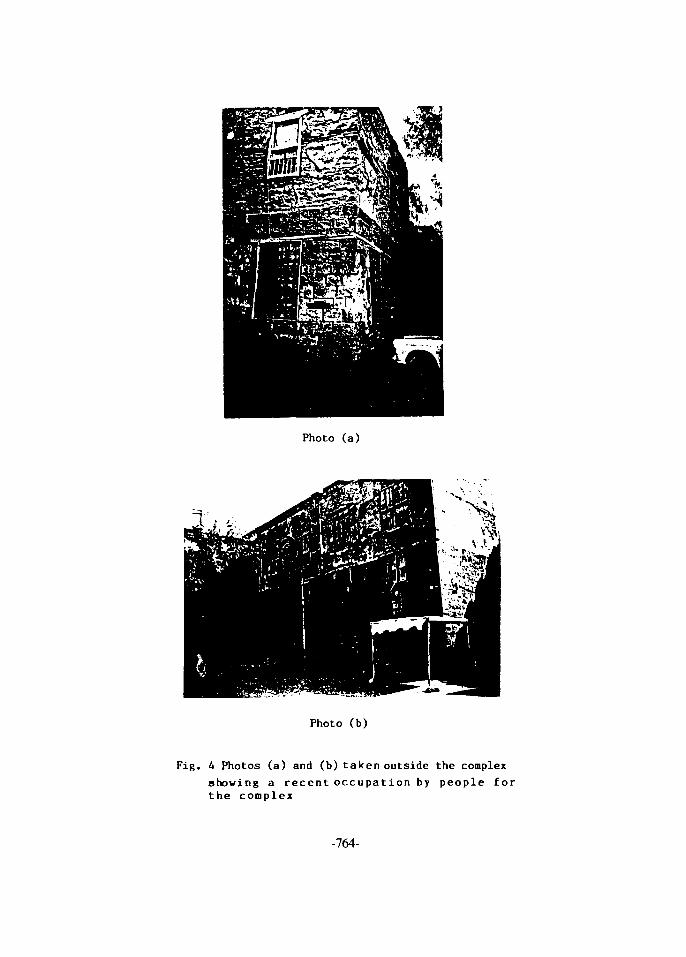
Photo (a)
Photo (b)
Fig. A Photos (a) and (b) taken outside the complex
showing a recent occupation by people forthe complex
-764-

Fig. 2 General layout of Al-Vafaeya coilei
MousqueCourtyard
Supplement
Garden
Fig. 3 Al-Wafaeya mosque and its supplementsand houses occupied by people
-765- NEXT PAQE(S)toft BLANK
Proceedings of the Fifth International Conferenceon Energy and Environment, Cairo, Egypt, 1906 EG9700033
Environmental Applications Research and Future Plans in Plasma ArcTechnology at the Georgia Institute of Technology
John C. Nemeth, Ph.D. CEP, CPSSDirector of Environmental Science & Technology
Georgia Tech Research InstituteAtlanta. Georgia USA 30332
A b s t r a c t
This paper summarizes the facilities and past, current, and future researchefforts at the Georgia Institute of Technology Plasma Arc Research Facility establishedin 1992. This research facility was established specifically to develop and testapplications related to waste management and various remediation concepts. Theresults of research programs in the vitrification of asbestos materials, municipalincinerator ash, and in situ testing programs, including soil remediVion, waste toenergy research, landfill remediation and capacity management. The presentation willalso include conference and symposium announcements and invitations.
1 . INTRODUCTION
In environmental applications, plasma is a new kind of energy for the work ofindustry and is a potential source of solutions to some of the most challengingpollution problems. This paper describes in some detail the work being done in this old,but newly discovered, technology at the Georgia Institute of Technology Plasma ArcResearch Facility (PARF) in Atlanta, Georgia USA.
Research related to plasma torch treatment and destruction of wastematerials and contaminated media has been conducted at the PARF since 1990. Twoplasma heating systems rated at 100 kW and 240 kW are used in experimentalprograms including ex situ destruction of various types of waste materials and insitu remediation of buried contaminants. The torches are stainless steel cylindersthat integrate copper electrodes, insulators, gas injectors, and water dividers. Eachdevice is a non-transferred, reverse-polarity "Camacho" design torch. We have thecapability to video monitor the reaction vessel and instrument the systems tomeasure physical and chemical parameters.
While we are working on a variety of plasma torch applications, our mostintensive efforts are being directed toward in situ applications. In the process of
-767-
attempting to help successfully accomplish the movement of this technology frombench scale through pilot scale to full-field demonstration, we have encountered a fairdegree of opposition and skepticism related to the plasma arc. The contentions arebased upon, previously held biases related to cost-effectiveness and some failures inthe past, but a simple, and often compelling resistance to change, both in theregulatory and consulting communities is perhaps the most prevalent problem - onevery difficult to overcome.
None the less, the plasma arc technology possess characteristics that offer avery attractive array of operating characteristics (Table I). These attributes makethe plasma arc a plausible option in environmental applications because everycontaminated site is unique. Differing in significance and magnitude, depending uponthe specific conditions, sites having such diversity lend themselves to solutions offeredby flexible technologies.
2. GEORGIA TECH PARF: CURRENT RESEARCH INITIATIVES
Today, the PARF is involved in a broad array of research enterprises including:
Characteristics of Vitrified Geomaterials
Asbestos-containing Materials DestructionWaste Materials VitrificationPlasma Remediation of In Situ Materials (PRISM)In Situ Landfill RemediationMunicipal Solid Waste Pyrolysis & Cogeneration of EnergyIncinerator Ash Vitrification
In each general area, our experiments involve testing and development oftechniques and protocols for valorizing/destroying wastes. Georgia Tech researchers[1] have conducted a series of fourteen experiments using a 100 kW and a 240 kWreverse-polarity, nontransferred plasma torches to investigate the meltcharacteristics of soils having a wide variety of minerologies and grain-sizedistribution. Several types of igneous rocks were produced that had properties,including dynamic moduli and compressive strengths, much improved over the parentsoils. In these experiments water content had no apparent influence on thevitrification process, and, using a unit cost rate of $0.05 per kW, the resultingoperating costs were calculated at about $0.12 to $0.26/kg ($308 to $695/m3 or$107 to $241/ton). Such cost ranges are comparable to several of methodstraditionally used in soil improvement.
One highly successful, well known incinerator ash vitrification project, completed
-768-
during 1993. involved our collaboration with the French firm of Europlasma inBordeaux, France. The goal was to vitrify incinerator ash into glassy residue therebyimmobilizing heavy-metal contaminants. Four, two-hour tests vitrifying 100 kg ofincinerator ash were conducted. Off-gas production problems experienced weresolved through modifications of the scrubber. Ultimately, tap design/compositionchanges and operational modifications resulted in a system whose gases and avitrified material fully complied with both French and U.S. emission and leachingstandards. Europlasma and the City of Bordeaux are building a system near theirCENON municipal incinerator plant.
Among the special-waste treatment research projects we have carried out arethe vitrification of asbestos-containing wastes, as well as treatment of other wastesand materials such as circuit boards, soils contaminated with organic liquids andsludges, TyvekTM filter paper, HEPA filters, and composite debris tested surrogatemixed-waste materials to encapsulate of radioactive wastes (2). The results of thisproject, funded by the Savannah River Technology Center, U.S. Dept. of Energy, Officeof Technology Development (SRTC/DOE/OTD), showed strong indications that plasmaprocessing has considerable promise for vitrifying soils, circuit boards and HEPAfilters, as well as treating heterogeneous drummed wastes.
We feel that in situ stabilization options using plasma torch systems couldinclude:
Slopes and LandslidesVertical Cuts and ExcavationsSoil Subject to LiquefactionStructures Subject to Excessive SettlementArtificial Fills: landfills, sludge beds, dredged materials, and mine tailingsFoundations for Structures
Successful research and demonstration could lead to basic improvements in thefield of foundation engineering, where conditions limiting construction operations mightbe overcome or at least at some level made less restrictive, and other situationswhere effective soil stabilization might result in important benefits. For instance,preliminary cost estimates, depending on what percentage of the soil is completelymelted, range between $30-$80/ton. An important research goal is the verification ofcost-benefits for applications in an array of diverse settings.
3. PLASMA REMEDIATION OF IN SITU MATERIALS: PRISM
The next major breakthrough area for environmental applications, we believe, is
-769-
in the in situ use of plasma arc systems. The variety of potential uses and benefitsis truly impressive. As mentioned previously, PRISM is the principal area of researchconcentration for the Georgia Tech PARF. Hazardous/radioactive waste stabilization,landfill waste destruction and capacity conservation, as well as slope stabilization,foundation enhancement, and erosion control are the main interests at this time. Slopestability and erosion control can be important ways of preserving and protectingpeople as well as certain environmentally sensitive areas and valuable real estate.Table II lists many of the advantages that may accrue from PRISM, hopefully making ita technology that is cost-competitive which more traditional approaches. In situuses of plasma arc technology decrease movement and disturbance of wastes andcontaminated media. Thus, exposure to toxics are often lessened.
The primary issues surrounding PRISM that require research and developmentinvolve a host of factors associated with the physicochemical nature of the melt,contaminant behavior, and cost-effectiveness (see Table III).
Tables IV, V, VI, and VII summarize some of the available information on thecharacteristics of various vitrified soils, their leachability, and treatment effectiveness.While there is much to be learned, more to be verified, and a great deal of fielddemonstration to be accomplished, these data and supporting information bode wellfor significant economies that may be achieved in environmental improvement andprotection utilizing plasma arc technology.
In the U. S., one of the most pressing environmental problems (see Table VIII) isthe presence of leaking and potentially leaking landfills. While a great deal of progressis being made in the area of pollution prevention and improved waste management,planners predict that landfills will continue to be constructed, even if at a slower pace.Typical costs cited in Table VIII are tipping fees, not plasma remediation. Of course, inEurope, particularly France, a much higher percentage of municipal waste isincinerated. Thus, the need for additional municipal landfill capacity is anticipated forthe foreseeable future. PRISM may have the facility, through in situ remediation, topositively impact many difficulties associated with landfills including:
Complete RemediationEliminates LeachingCreation of Fuels (Gases)Nearly Impermeable, Rock-Like BottomRecovery of a 60 to 90% of Landfill VolumeReuse/Remediate Landfill Until FullStable Foundation for Construction
-770-
According to Dr. Lou Circeo, PARF Director, costs, not including potential sale of fuelgases, are approximately $50 /ton of landfill material vitrified in situ; whereas, exsitu plasma remediation is estimated at about $75/ton-not including sales incomefrom fuel gases resulting from the process.
Finally, plasma applications to the most recalcitrant of hazardous wastes may be tnemost urgent use for this technology. Table IX. shows a projection of costsassociated with a theoretical hazardous waste contamination site.For comparison, radioactive wastes would probably be around 2 to 3 times the cost($250 to $4007ton) of hazardous chemical waste contamination, and municipal landfihremediation is -$50 /ton. Another cost variable relates to simple, non-wastetreatment soil stabilization operations which are estimated to cost be between $30to $80/ton depending on whether the soil/waste requires complete or only partiallymelting.
In conclusion, PARF engineers and scientists are enthusiastic proponents of theproposition that plasma arc deserves a series of well-defined, research-based proofsof concept, because of its promise and the existence of diverse, difficult, and costlycontamination problems We are in the midst of finalizing further researchdemonstrations, including:
An in situ solid waste treatment research project, funded by a specialappropriation of the State of Georgia Legislature
A research program to evaluate the feasibility of environmentally safe andcost-effective plasma arc technology applied to the disposal of wastes fromthe pulp and paper industry
The SRTC/DOE, OTD at the Savannah River Site has acquired a Russian HybridPlasma Induction-Cold-crucible Melter. The system, currently being located atthe Georgia Tech PARF, will be used to perform research for the optimizationof heterogeneous waste vitrification.
Testing is planned to address concerns of off-gas composition and final-product chemistry and segregation of individual components in the vitrification.of Thorium nitrate, the stored chemical form of 232Th [3]. Stored by theDefense National Stockpile Center. 232Th is being phased out as a fuel to beused in breeder style nuclear reactors. This research is part of the program tcassure proper long-term storage of this long-lived radionuclide.
-771-
We welcome your comments, and would be happy to explore joint participationresearch projects centering upon environmental applications of plasma arctechnology, particularly in situ applications.
REFERENCES
1. Beaver, J.R., and P,W. Mayne. 1995. Plasma Vitrification of Geomaterials. U.S.Dept. of Transportation FHWA Grant No. DTFH61-94-X-00021. 46 pp.
2. Newsom, R.A., L.J. Circeo, MB. Danjaji, A.A. Ramsey. R.F. Schumacher, and T.L.Spatz. 1995. High Temperature Vitrification of Surrogate Savannah River Site(SRS) Mixed Waste Materials. 97th Annual American Ceramic SocietyConference, Environmental and Waste Management Issues, Cincinnati, OH.
3. Hermes, W.H. etal. 1995. Plasma Pyrolysis Vitrification (PPM) TechnologyDemonstration Program as Applied to Defense National Stockpile of ThoriumNitrate. Proceedings of the International Symposium on EnvironmentalTechnologies: Plasma Systems and Applications. October 8-11, 1995 Atlanta,GA. Vol. 2: 369-380.
4. Hansen, J., and Vincent Fitzpatnck. 1989. In Situ Vitrification (U.S. DOE ISVTests), HAZMAT World, pp. 30-34.
-772-

TABLES
TABLE I. PLASMA ARC TECHNOLOGY CHARACTERISTICS
Power Levels - 100 kW to 10mW
Plasma Temperatures - 4,000 C to 7,000 C +No Air RequiredTorch Operates with Any Gas
Note: No air required means that the torches can be operated in subterranean boreholes.
TABLE II. POTENTIAL ADVANTAGES OF PRISM ~
Remediation of a variety of mixed wastes
Minimum exposure to buried contaminantsHigh thermal coupling with soilOperates well under varying ground (subsurface) conditions andmaterialsProcess proceeds from the bottom of the hole to the surfaceHigh rate of vitrification & remediationSignificant cost reduction of remediation
Cost ~= $130/ton for hazardous and toxic wastes
TABLE III. TECHNICAL FEASIBILITY ISSUES.
Melt Behavior and Effects
Radii and Properties of Melt and Adjacent ZonesSpecific Energy Requirements -- KWH/tonFormation of Contiguous MeltsVolatility of ContaminantsComposition of Off-gasesAdaptability of Existing Off-gas Treatment TechnologyTransport of Volatiles into Surrounding MediaComparative Cost EffectivenessHazardous and Mixed WastesNon-hazardous Wastes
-773-
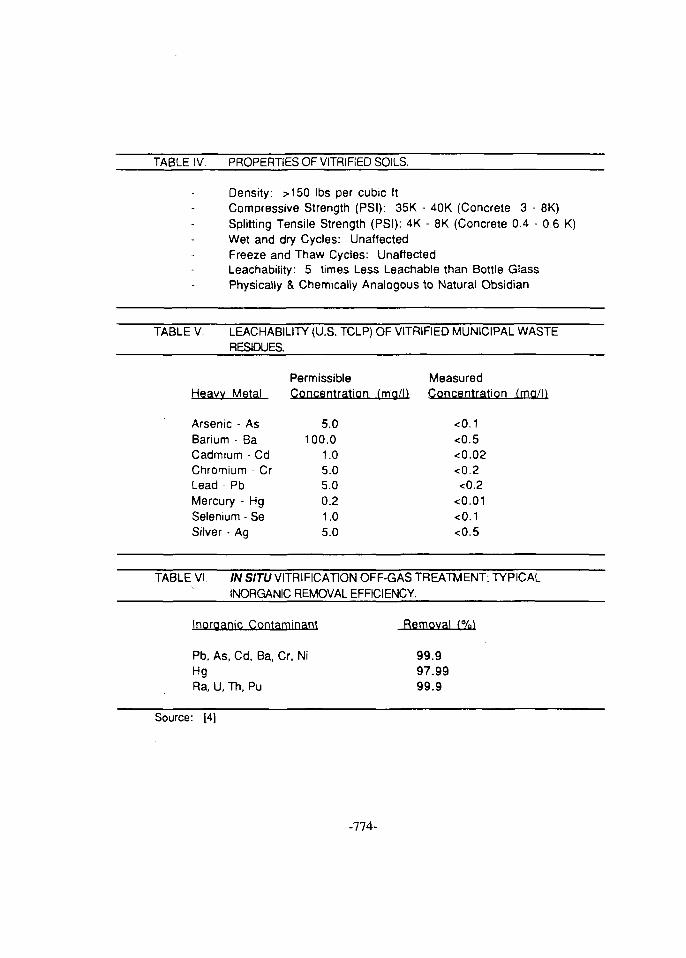
TABLE IV. PROPERTIES OF VITRIFIED SOILS.
Density: >150 lbs per cubic ftCompressive Strength (PSI): 35K - 40K (Concrete 3 - 8K)Splitting Tensile Strength (PSI): 4K - 8K (Concrete 0.4 - 0.6 K)Wet and dry Cycles: UnaffectedFreeze and Thaw Cycles: UnaffectedLeachability: 5 times Less Leachable than Bottle GlassPhysically & Chemically Analogous to Natural Obsidian
TABLE V. LEACHABILITY (U.S. TCLP) OF VITRIFIED MUNICIPAL WASTERESIDUES.
Permissible MeasuredHeavy Metal Concentration (mo/l) Concentration (ma/h
Arsenic - AsBarium - BaCadmium - CdChromium - CrLead - PbMercury - HgSelenium - SeSilver - Ag
5.0100.0
1.05.05.00.21.05.0
<0.1<0.5<0.02<0.2<0.2
<0.01<0.1<0.5
TABLE VI. IN SITU VITRIFICATION OFF-GAS TREATMENT: TYPICALINORGANIC REMOVAL EFFICIENCY.
Inorganic Contaminant Removal (%)
Pb, As, Cd, Ba, Cr, Ni 99.9Hg 97.99Ra, U, Th, Pu 99.9
Source: [4]
-774-
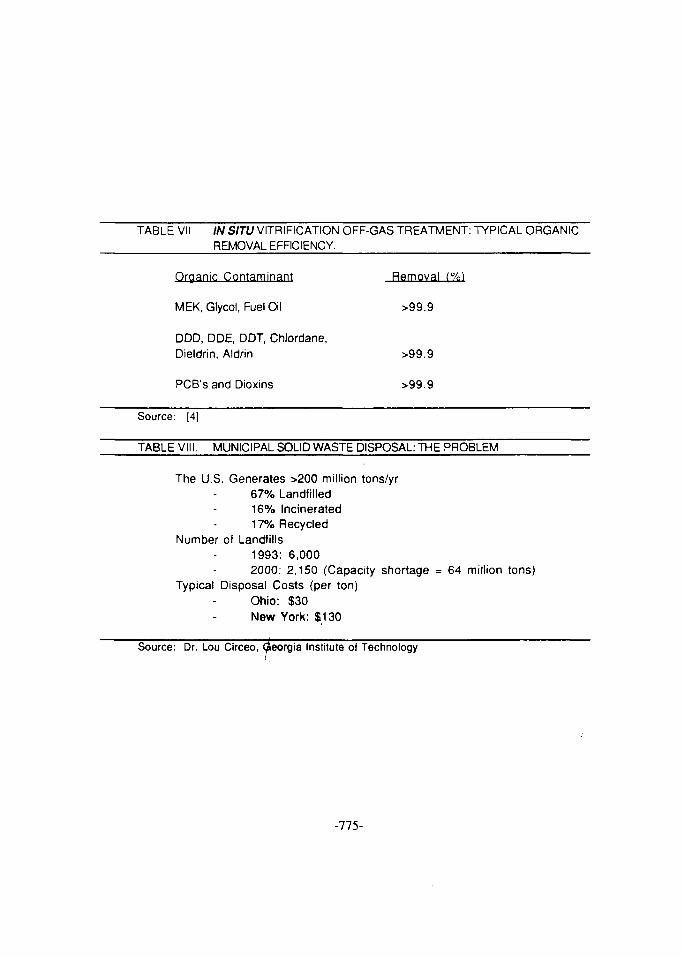
TABLE VII. IN SITU VITRIFICATION OFF-GAS TREATMENT: TYPICAL ORGANICREMOVAL EFFICIENCY.
Organic Contaminant
MEK, Glycol, Fuel Oil
DDD, DDE, DDT, Chlordane,Dieldrin, Aldrin
PCB's and Dioxins
Removal (%)
>99.9
>99.9
>99.9
Source: [4]
TABLE VIII. MUNICIPAL SOLID WASTE DISPOSAL: THE PROBLEM
The U.S. Generates >200 million tons/yr67% Landfilled16% Incinerated17% Recycled
Number of Landfills1993: 6,0002000: 2,150 (Capacity shortage = 64 million tons)
Typical Disposal Costs (per ton)Ohio: $30New York: $130
Source: Dr. Lou Circeo, Georgia Institute of Technology
-775-

TABLE IX. PROJECTED REMEDIATION COSTS: HAZARDOUS/TOXIC WASTECONTAMINATION
Scenario: 1.0 acre contaminated to a depth of 10ft with a 5 MWMobile System
Capital Cost (10 yr life; 6 mo. project) $0.5M2 feet of Overburden & 400 boreholes 0.5MElectric Power (SER = 500 KWH/ton) 0.6MLabor (5-person shift, 2 shifts) 0.9MMaintenance ($100/hr of operation) Q.3M
Total Cost (Cost Per Ton = $130) $2.8M
Source: Dr. Lou Circeo, Georgia Institute of Technology
-776-
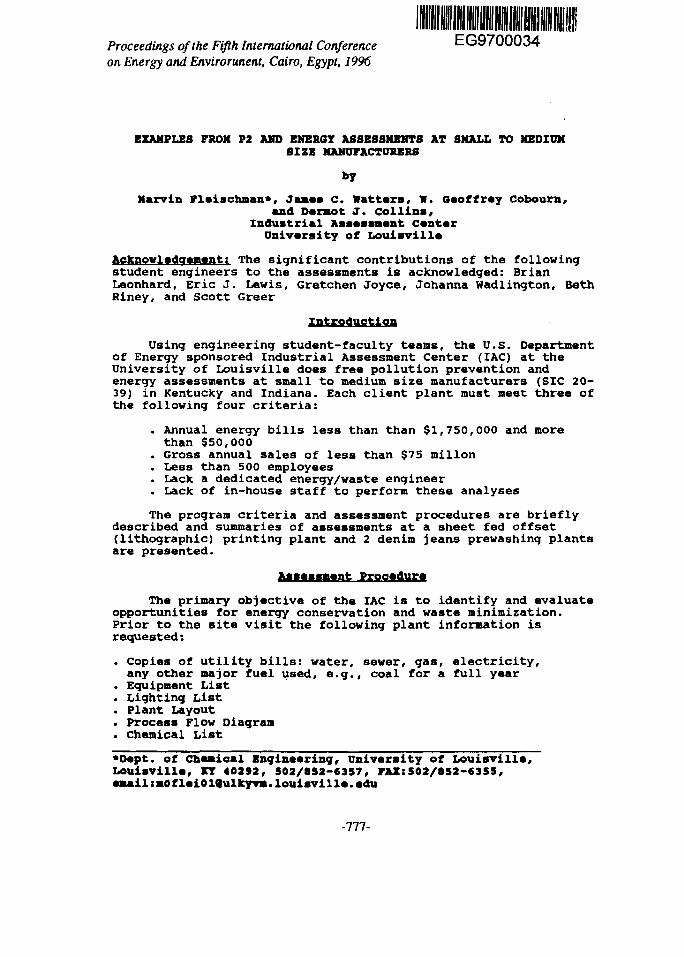
Proceedings of the Fifth International Conference EG9700034on Energy and Environment, Cairo, Egypt, 1996
EXAMPLES FROM P2 AMD ENERGY ASSESSMENTS AT SMALL TO MEDIUMSIZE MANUFACTURERS
by
Marvin Fleischaan*, Jamas C. Wattars, W. Geoffrey Cobourn,and oarmot J. Collins,
Industrial Assessment canterUnivarsity of Louisvilla
Acknowledgement; The significant contributions of the followingstudent engineers to the assessments is acknowledged: BrianLeonhard, Eric J. Lewis, Gretchen Joyce, Johanna Wadlington, BethRiney, and Scott Greer
Introduction
Using engineering student-faculty teams, the U.S. Departmentof Energy sponsored Industrial Assessment Center (IAC) at theUniversity of Louisville does free pollution prevention andenergy assessments at small to medium size manufacturers (SIC 20-39) in Kentucky and Indiana. Each client plant must meet three ofthe following four criteria:
. Annual energy bills less than than $1,750,000 and morethan $50,000
. Gross annual sales of less than $75 millon
. Less than 500 employees
. Lack a dedicated energy/waste engineer
. Lack of in-house staff to perform these analyses
The program criteria and assessment procedures are brieflydescribed and summaries of assessments at a sheet fed offset(lithographic) printing plant and 2 denim jeans prewashing plantsare presented.
Assessment Procedure
The primary objective of the IAC is to identify and evaluateopportunities for energy conservation and waste minimization.Prior to the site visit the following plant information isrequested:
. Copies of utility bills: water, sewer, gas, electricity,any other major fuel used, e.g., coal for a full year
. Equipment List
. Lighting List
. Plant Layout
. Process Flow Diagram
. Chemical List
•Dept. of Chemical Engineering, University of Louisville,Louisville, KY 40292, 502/852-6357, FAX:502/852-6355,
iil:m0flei019ulkyvB.louisville.edu
-777-

. As they apply: Annual hazardous waste generator report,SARA 313 Toxics Release Inventory Form R, Air permits,Wastewater permits. Waste analyses
. Annual quantities and costs for hazardous waste and solid wastetransportation and disposal.
. Other waste management costs, e.g., permit fees, taxes,analyses, maintenance, supplies, labor, & administration forabove wastes, wastewater treatment, air pollution control
If any of the requested data is not readily available oradditional arise, they are obtained or developed during or afterthe site visit.
Generally the energy assessments are primarily prescriptive,while the waste assesssments are primarily descriptive. Data aregathered primarily during a one day site visit which usuallyproceeds as follows:
. Plant overview and briefing, followed by a more intensiveinterview for the waste team.
. Separate guided plant tours for the energy and wasteteams. The waste team tour usually takes longer since thefocus is on the process from raw materials in the door towastes and products leaving the plant. During the tour theservices of plant personnel other than the host(s) may beneeded, e.g., plant electrician to aid in measuringpower factor, operator to collect waste samples,maintenance supervisor to verify operating conditions,etc.
. Obtaining or determining needed data during the planttour by interviewing operators, instrumental energyrelated measurements, and shooting photographs and/orvideo with the client's permission.
. Debriefing meeting with the host(s) following the audit,to discuss preliminary findings and identify additionalinformation needs. Separate meetings may be needed forenergy and waste.
Following the site visit, energy conservation and wastereduction recommendations which look promising are pursued.Additional contact with plant personnel is often necessary toverify data, obtain additional information, etc.
Assessment Recommendations
Assessment recommendations (ARs) for energy conservation andpollution prevention/waste minimization are identified bothduring and following the plant visit. .So far as possible we tryto address the client's priorities. Since site visits are brief,the ARs may be limited in scope. In developing the ARs,literature, vendors, P2tech (listserve), and other resources areused to obtain information on methods, equipment, and costs toevaluate technical and economic feasibility. Capital investment,operating costs, and potential materials and waste management
-778-
savings are estimated, and a simple payback period (no time valueof money) is determined. Sometimes, net positive value is alsoused as an indicator of economic feasibility.
On the waste side, potential savings in most cases addressdirect costs, primarily reduced material requirements and wastedisposal. Labor, maintenance, and supplies, e.g., waste drums,are also estimated as available and/or necessary. Indirect costssuch as record keeping are usually not accounted for in the ARsbecause of the uncertainty in allocating them to specific wastes.Furthermore, many of these costs are not readily attainable andare often unclear as they are often merged with other costs.However, as available, permit fees, taxes and chemical analysiscosts are generally accounted for. Other savings not usuallyquantified include elimination or reduction of a variety offuture possible costs, such as those related to changing emissionstandards and regulations, potential future liability, andimproving general employee safety end health and environmentalquality.
The assumptions, data and calculations used to estimateenergy consumption and waste generation, and costs, savings andpayback for the ARs are reported in detail. Thus changes orcorrections may be easily made should the client not agree withthe data or assumptions. The estimates are intended to beconservative. When suggested ARs involving engineering designand significant capital investment are attractive to the companyand engineering services are not available in-house, it isrecommended that a consulting engineering firm be engaged to dothe detailed design and cost estimating for implementation. Forsome ARs, testing may be appropriate to verify anticipatedperformance of suggested methods. Some ARs may be morespeculative in that research and development may be required.
Additional waste minimization and energy conservationconsiderations are identified and briefly described. These itemsare not presented as ARs due to insufficient time for research,insufficient data, or unfavorable economics. Some of thesemeasures would require relatively long payback periods (>4yrs.)or save less than $200/yr, or were otherwise beyond the scope ofthe assessment.
Assessment at a Printing Plant
The plant does sheet fed lithographic (offset) printingusing soy-based inks to make tray cards for compact discs andlabels for cassette tapes. Production rate is 80 millon units/mo,with annual sales of about $30 millon, with 170 employees. Thecompany is a small quantity hazardous waste generator and doesnot submit SARA 313 Toxic Release Inventory reports. Processwaste water from image processing and fountain tank cleaning aresent directly to the POTW after silver recovery from fixer. TheVOCs consist primarily of aliphatic and aromatic napthas, withblanket wash being the major contributor. Non isopropyl fountain
-779-
solution is primarily used.
Customer provided proofs go through image processing to(presensitized) aluminum plate making. The plates are used inmakeready prior to the actual printing job. Ink is removed fromthe press ink wells afterjob completion, and the wells androllers are cleaned with blanket wash and solvent wetted rags.The rollers are not cleaned when the same colors are to be usedon the next job or the existing job is to be continued on thenext shift. The product is then sent to the bindery for cutting,folding, and stapling, and the packaged product is then shipped.The overall process flow is shown in Figure 1, the energy usagesummarized in Table 1, and the waste generation summarized inTable 3.
The plant has implemented the following waste minimizationefforts: switching from petroleum-based to soy-based inks; VOCreduction by improved production planning and scheduling; reusingplastic wrap from incoming paper shipments; reusing pallets forin-plant storage and product shipments; off-site corrugatedrecycling; silver recovery; mylar film recycling; recycling un-useable aluminum plates; reuse and recyle of plate developingchemical containers; use of make ready waste paper to remove inkfrom presses after job completion; off-site waste paperrecycling; switch from xylene based cleanup solvent to napthabased; just in time and first in-first out inventory control forink; ordering paper cut to size; and changing from a (hazardouswaste) solvent based parts washer to an aqueous biodegradabledetergent.
Recommendations for pollution prevention and wasteminimization are summarized in Table 4. Additional wasteminimization possibilities that were not costed out include:
. Automated ink blending and dispensing
. Testing and reuse of expired ink, possibly by blending
. Ultraviolet curable inks
. Sending metal bands from incoming paper and plateshipments to a scrap metal dealer
. Taking back empty boxes from customers for reuse
. Solvent recovery from rags
. Digital (computerized) image processing
. Enclosed automated blanket wash delivery
Recommendations for energy conservation are summarized inTable 5. Additional energy conservation measures considered butnot costed out include:
. Reduce demand cost on electricity by off-peak hourscheduling of energy intensive operations
. Light timers in areas not always occupied
. Set back thermostats in areas such as offices
-780-
Aaaessaents at 2 Denim Jeans Prewaahina Plants
Both plants perform stone and enzyme washing of jeans fromvarious jeans manufacturers. The plants have annual sales ofabout $4,000,000 (Plant A) and $6,000,000 (Plant B), and about125 and 110 employees, resp. One plant has an adjacent industriallaundry, and the other a commercial dry cleaning-laundryoperation. The industrial laundry has caused Plant A's totaleffluent to exceed the POTWs criteria for oil and grease. At eachplantt the respective effluents from each operation are combinedand sent to a POTW. Between the 2 plants, a combined total ofabout 200 milion gallons/yr. of water are used to process about14 millon pair of jeans. Sewer bills are based on the amount ofwater used rather than the actual effluent discharged to thePOTW. However, a significant amount of incoming water is lost byevaporation in transporting washed jeans to the drier, in thedriers, from the warm wastewater and entrained in the removedlint (as shown in Figure 2).
Both plants pay substantial wastewater BOD. and totalsuspended solids surcharges to their POTWs. Solids are anothermajor waste, primarily consisting of lint from the washers anddryers. Other significant wastes include pit sludge, cardboard,and shrink wrap. Plant A is not a hazardous waste generator;Plant B is because of solvent (PERC) recovery in their drycleaning operation. Neither submits SARA 313 Toxic ReleaseInventory reports. Air permits are required for Plant A for thedryers, but not for Plant B which is in a different state. Pitsludge and washer lint is landfilled as special waste for Plant Aand as ordinary trash for Plant B.
The process is generally similar for both plants as shown inFigure 2 for Plant A. Jeans are delivered by the jeansmanufacturers and then transported to the washers where water andchemicals are added. Jeans are washed according to customerspecifications, i.e., chemicals, cycles, etc. Plant B pays forits washing chemicals, while in Plant A their customers pay.Wastewater from the washers primarily containing dye, lint, androcks (when stone washing is used) is pretreated for suspendedsolids removal before discharge to the POTW. Solids removed fromthe water are landfilled. The washed jeans are dried andparticulates (lint) in the exhaust gas are removed in wet lintcollectors. These solids are landfilled as well. The dried jeansgo to finishing and shipping as needed, and are shipped back tothe jeans manufacturer or directly to retail stores.
The wastewater treatment schemes differ slightly for PlantsA and B, and are shown in Figures 3 and 4. In A, lint, rocks, andother solids are removed from the washwaters in 2 pits and by avibrating screen (30-60 mesh). Settling in the pits is notdesired since their primary purpose is equalization. In plant B,solids are removed from the wastewaters by a 150 mesh screen, avibrating screen, a cyclone and a settling basin in series. Inboth plants, heat is recovered from washwaters in a heat
-781-
reclaimer, to preheat incoming city water.
Each plant has implemented various waste minimizationmeasures. Suppliers take back unused chemicals that previouslywere flushed through the washers to the sewer. Some chemicalsuppliers will take back empty plastic drums which wouldotherwise be landfilled. Plant A has gone to automated chemicalmetering for liquidson all their washers. Plant B uses scoops tometer both liquids and powders from the central chemical storagedrums and transport and add them individual washers, withsignificant spillage occuring at each step.
One manufacturer delivers jeans in heavy duty plasticcontainers, which can be used for weighing and transport in thefinishing process, and for shipping out finished jeans. Theplastic boxes last longer than the "palletainers" with cardboardsides, which eventually are landfilled. In plant A the wet lintcollectors use recycled water following the vibrating screen,instead of fresh city water. City water is recirculated in PlantB's in the dryer wet lint collector. Incoming pallets are usedfor finished jeans shipments and in the respective adjacentindustrial laundry and dry cleaner. Damaged pallets go to areconditioner.
Energy usage is summarized in Table 5 and recommendationsfor energy conservation in Table 6. Additional energyconservation measures considered but not costed out include thosementioned above for the printer and in addition for Plant B:
. Reducing compressed air leaks
. Preheating combustion air or makeup water with stack gasheat recovery
Waste generation is summarized in Table 7 and pollutionprevention/waste minimization recommendations in Table 8.Additional waste minimization possibilities that were not costedout include:
. Improve free and emulsified oil removal from Plant A'sindustrial laundry wastewater prior to combiningwith denim washing effluent to POTW by e.g., dissolved airflotation, coalescing cartridge filter, emulsion breaking,microfiltration or ultrafiltration
. Have Plant A's suppliers ship jeans in heavy duty plasticcontainers rather than palletainers (racks with cardboardsides) and use plastic boxes for jeans weighing andtransport within the plant, and shipping finished jeans
. Replace foldable cardboard boxes used in Plant A forin-plant jeans transport, with stackable or plasticcontainers or canvass bags
. Automate chemical metering and injection in Plant B
. Improve operating practises in Plant B for meteringchemicals to washers
. Reduce suspended solids (and associated BOD) loadings to
-782-

POTW and surcharges by adding coagulation/flocculation,finer mesh backup screen, polishing filter, or replacingvibrating screens with a rotating drum screen or containerfilter.Additional wastewater treatment to reduce BOD and allowfor water reuse by e.g., carbon adsorption or chemicaloxidationSoften incoming waterKeep rainwater out of lint dumpster and allow drainagefrom wet lintRecycle shrink wrap and increase corrugated recycling
-783-
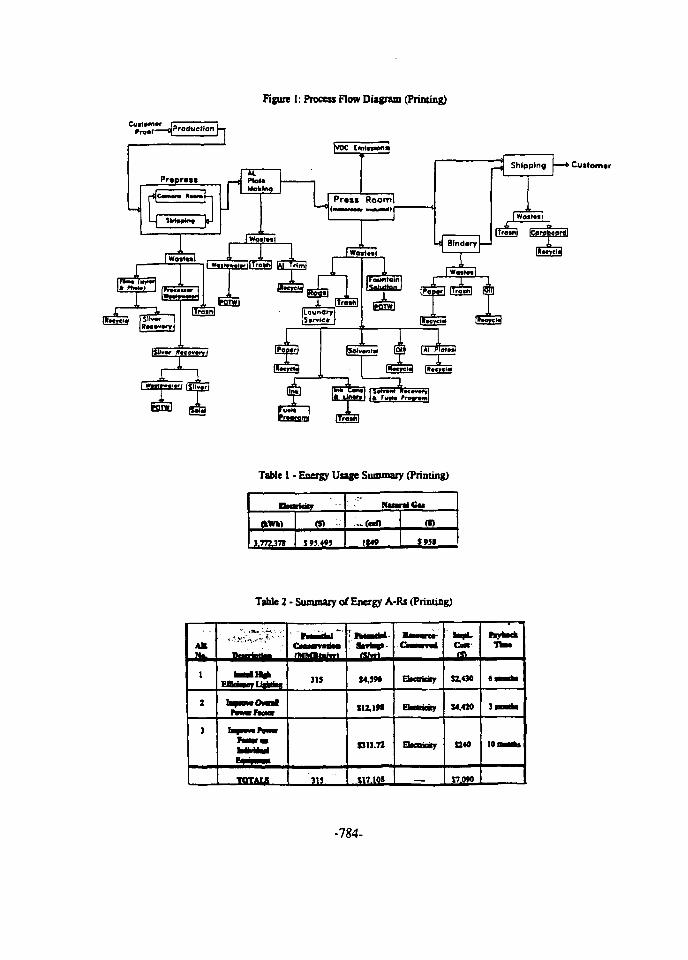
Figure I: Process Flow Diagram (Priming)
|VOC Cn
Press Room)
'1
•J Blndtryi—
_ , Shipping
| Woinir
• Cuitemn
Table 1 - Energy Usage Summary (Printing)
Pmrtutr
(kWM
s n m
-(tell
1M9
( »
J9JI
Table 2 - Summary of Energy A-Rs (Printing)
AK
1
2
I
FBIriTTli,^!
hfmOMri
hwa
TOTALS
Cimniln
313
315
Hi
S4.JM
S12.1M
$313.72
117.101
amid*
Ebetriesy
nwiicky
am
S.430
U.47O
S40
r7.09O
3naki
-784-

Table 3 • Waste Generation (Printing)
AuntQuality Mttfcod 1HA
HA
(tUMt
asn'nm
11332 oaiOHM* »•>
JumOttm
[WJUVw
-785-
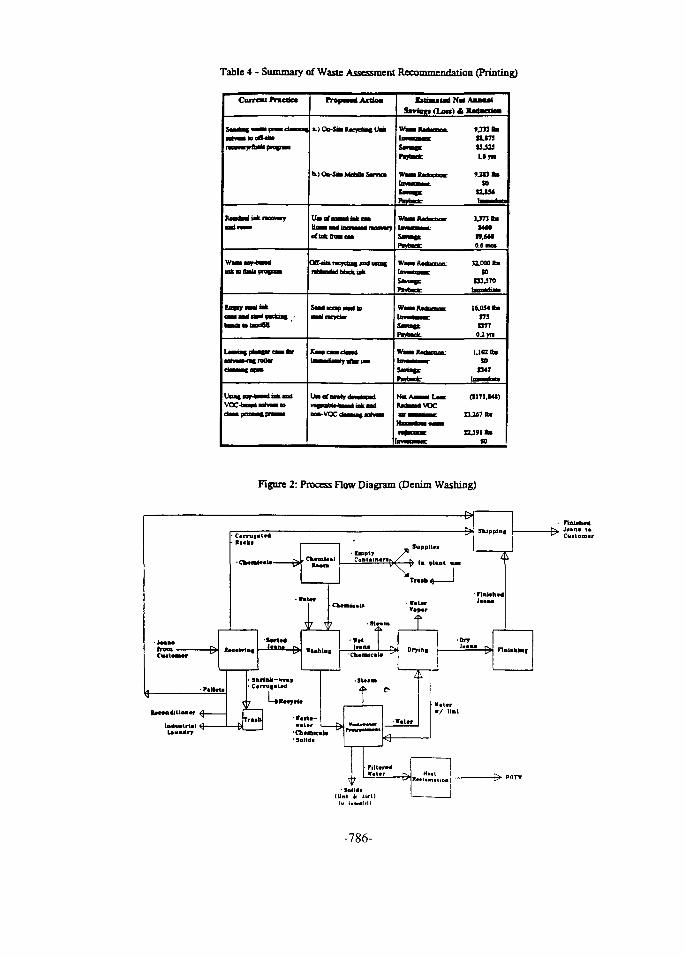
Table 4 - Summary of Waste Assessment Recommendation (Printing)
TropmaiAetkom Euuud N* Anui
b-)Oo-Si»M<*mHS«rv«» 9 J O l10
rflakftoacas«o
St.Ul
)10O0J»JO
DJJ70
I U U 4 b175O77O.Iyn
to
Figure 2: Process Flow Diagram (Denim Washing)
rram-Cuatomar
• ' 4 -
' " " ' t>
Juppll..
V
• rtiomiriilB ^
Water»/ tint.
PilttnW«t«r
, J«*na i»Cuitomcr
-786-
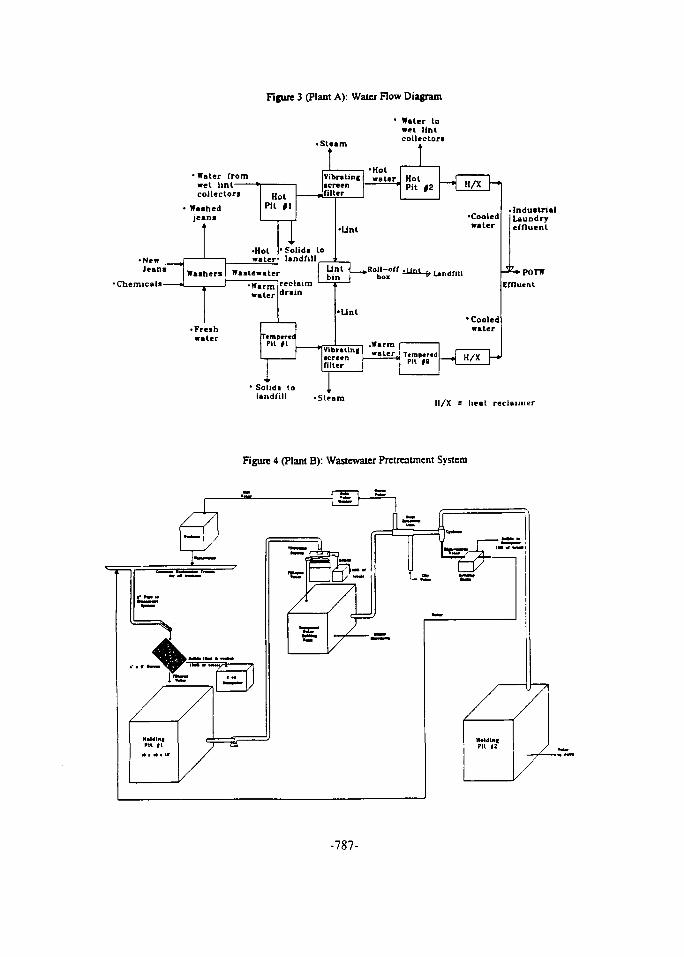
Figure 3 (Plant A): Water Flow Diagram
• Steam
Water towet lintcollectors
•Water fromwet lintcollectors
Washedjeans
HotPit #1
•New _Jeans
•Chemicals —
•Hot
Washers
team *
-I , - H o t IVibrstiniscreenfilter
Solids tolandfill
HotPit #2
•Cooled•lint
Wastewater
•Freshwater
•Warmwater
Lintbin
drain
TemperedPit #1
.Boil -off . Landfill
lint•Cooled
water
Vlbrattniscreenfilter
.WarmTempered
P
• IndustrialLaundryeffluent
Effluent
' Solids to |landfill -Stean Il/X = heal reclaimer
Figure 4 (Plant B): Wastewater Pretreatment System
-787-
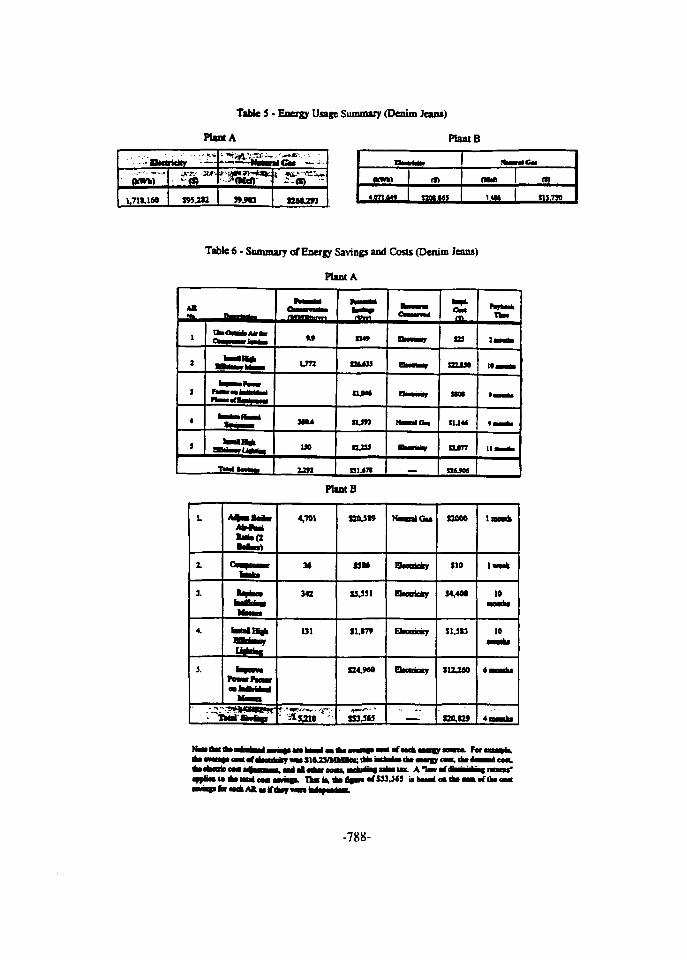
Table 5 • Energy Usage Summary (Denim Jeans)
Plant A Plant B
•' -Plrdrtilty ' " : ~
(KWM
1.711.160 S95JSZ sunjn
H-rt*.
IKWM
R0iJ45 ]4M I1J73O
Table 6 - Summary of Energy Savings and Costs (Denim Jeans)
Plant A
Plant B
L
1
1
4.
J.
M Mlate (2hU
hub
MB Scnbci
4,701
M
Ml
131
' ^5310 -
S t 6
«^M
«.I7»
B4,9«0
NiBilGu
Ehooiar
Ebcmdry
Ekansy
_ _
S2000
S10
14,400
J1.5J3
S12JM
S20.I29
lnoKk
1mA
10
10
tnki
4 M 4 .
T• M p fa Mtk Aft M ifltar
« « SloUVMMBM: Ibh tadod« Ik* aMqgr coa, tk* OMI
Tka b, tkt fi«va of XH.363 ii but* <m tht • • oftka
-788-
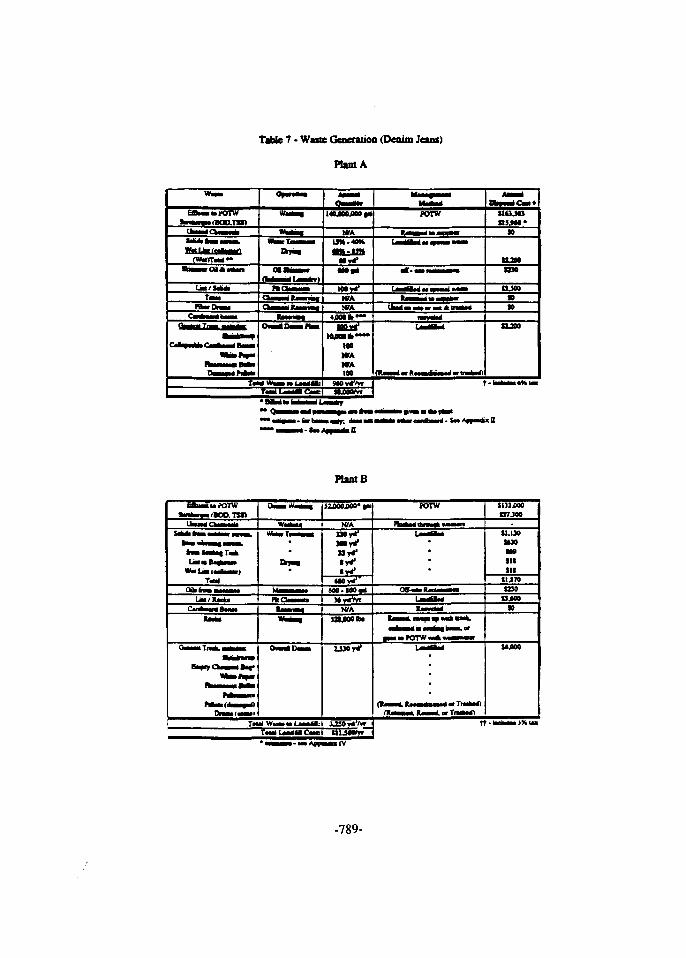
Table 7 • Waste Generation (Denim Jeans)
Plant A
Plant B
• l«i>OTW• <BOO.TSS>
SlUjOMC7J0O
!JMOO«»
-789-
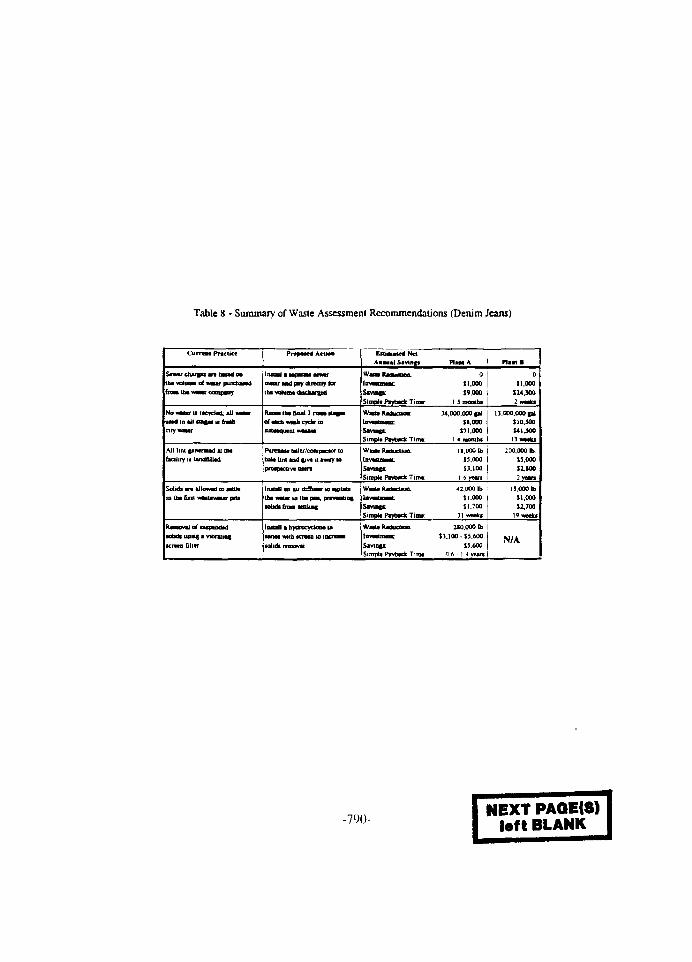
Table 8 • Summary of Waste Assessment Recommendations (Denim Jeans)
CurrcM Pnctict E n i a u u d N oABB—I Saving!
Sewer charge* v t buadosUM volume ri-nMti purcnaaad(ban thaw
Insailaameter Mid pay directly feribe volume dudianKl Smut*
Simple H i n d Tin
011.00019,000
I 5 mom hi
11.000
I24.JO0
Rcuaa ta* 6ml 3 now M
SavingESimptt Paytadt Tim
M.0OO.0O0 |alSI.000
m.oooI 4
13.000.000 cal110.500X4IJO0
All linl generatad * itabaluy it Laadfillad
Puicnatt btlu/comjmaai tobola linl and tMva it awsy topraapacnw aaan
Simple Payback Tim.
11.000 Ib IO.000 |
si.ioo II 6 yean I
200.000 IbS5.00012.100
2 n a n
Solan an alknM to MUaID tba fint >N«na»«nr pro
JtUttll Ul Uf tttAlMaT IO SSItMAtha aaur is Ida p u . pnvottiaj
•obdi fnm tmimt SavtnacSimpla Payback Tit
42,0001b ISl.000SI.70O
31 vmb
13.000 b11.000SI 700
Ramoval of oupkooadaniidi wins a vibrating
•a filter
loatall > bydmcydona in
•anal witli icraao to incrai
k removal
Wailir
Savtagc
Simple Payback Tin
210 0001b
S3.IOC-ii.6001)600
0 6 - 1 4 veare
N/A
-790-NEXT PAGE(S)
left BLANK
Solid & Hazardous Wastes
Proceedings of the Fifth International Conferenceon Energy and Environment, Cairo, Egypt, 1996 EG9700035
GE0SYNTHET1C APPLICATIONS IN LANDFILL DESIGN
Ibraheem S. Alshunnar, P.E.Project Manager. NTH ConsulUnu. Ltd
Farmington Hills. Michigan. U.S.A.
Sherif S. Afifi, Ph D.. P.E.Vice President. NTH Consultants. Ltd.
Farmington Hills. Michigan. U S A .
Benedict Tiseo. P EPresident. NTH Consultants, Lid
Farmington Hills. Michigan. U S A
Abstract
Landfills are designed to contain waste and to provide protection against discharges of leachate into the environment. Maincomponents of a landfill include a liner system, a leachale collection system, and a cover system. Traditional designs havetypically incorporated clay soils for containment and sands with embedded piping for leachate collection As a result ofrecent advances in design, geosynlheuc materials are now widely used for these components While these materials presentcoat and feasibility advantages, they also pose significant challenges in stability evaluations, handling during installation, andquality assurance
This paper presents an overview of applications of geosynthetics in landfill design and construction, including Advantages,disadvantages, design criteria, possible economic benefits of various systems, and related construction considerations
1. GEOSYNTHETIC MATERIALS
Geosynthetics are relatively thin planar products They are manufactured from polymeric materials ()f the monv types orgeosynthetic materials manufactured, geotextiles. geognds, geonels, geomembranes. and geosynthetic clay liners arecommonly used in landfill construction and closure These materials have a wide range of applications A brief descriptionof each material is provided below A summary of their applications in landfills is presented in Table I
GeoteitUes (GT) - Geotextiles are textiles fabricated from synthetic materials such as polypropylene, polvesler. andpoh/amide. The textile consists of porous woven, nonwoven or knitted fibers. Geotextiles are used in multiple applicationsbut they generally serve one of the following functions To provide a separation between two media: to act as a reinforcingstructural member, to filter certain size materials, and to allow effective drainage across the fabric The most importantphysical properties of geotextiles include apparent opening size, permittivity, and tensile strength The fallowings are briefdescriptions of these properties:
Anrtarent Onening Size t AOSV The AOS is defined as the U S standard sieve number that has openings closest in size tothe openings in the geotextile In filtration and separation applications, the AOS is usually specified to provide openingswhich are large enough to allow tluids to tlow through the geotextile and small enough to retain soil particles on us upstreamside. The AOS is measured bv ASTM D 4751
-793-

Permittivity: Permillivity. which is a measurement of flow across the geotexlile. is defined us the cross-plane permeabilityof the geotextile divided by its thickness. Permittivity is a critical parameter in filtration applications In these applications.the permittivity of the geotextile should be sufficiently large that the ilow through the geotextile will not be impeded Thepermittivity of the geotextile is measured by ASTM test method D 44'J I and reported with a unit second ' (S1) Its valueranges from 0.2 to 2.2 S"'.
Tensile Strength,; Tensile strength is the most important property for geotexliles when used in reinforcement applicationsIn landfill applications, shear stresses induced within the liner or cover systems hy drainage or cover soils are transterredinto tension in the high strength geotextiles The tensile strengths of geotexliles van' depending on manufacturing type andmass per unit area. The wide-width tensile strength lest (ASTM D 4595 ) is generally used to estimate the tensile strengthfor design purposes
Gtogrids (GG) - Geognds have a gnd-like configuration with large openings and are made of high-density polyethylene.high-tenacity polyester, or polypropylene These products are manufactured under controlled temperature conditions to avoidany fracturing during creation of the gnd-like formation. Geognds are used pnmanly as reinforcement structural members,occasionally, they are also used as a separation medium The tensile strength of the geognd is its most important properryMost manufacturers use a modified form of ASTMD 4595 test method to measure the tensile strength of the geognd Thetensile strength of geognds ranges from 30 to 200 kn/m width.
Gtonets (GN) - Geonets are manufactured in a net-like formation by extrusion of polymers in ribs at acuie angles so as toform large apertures Geonets are almost exclusively made of polyethylene The thickness of these nets range from 5 0 to7 2 mm. The primary function of a geonet is to convey fluids along a plane; thus transmissivity, which is a measuremeniof flow within (he plane of the geonet. is its most important property It is defined as the inplane pemieabclitv (if the geoneimultiplied hy its thickness The transnussiviry is usually estimated using ASTM D 4716 The test must he performed underconditions simulating field conditions, including gradient and overburden pressure
Geomembranes (CM) - Geomembranes are essenlially impervious thin sheets of rubber or plastic used primarily as abarrier to moisture and vapor At present, almost all geomembranes are made of polymers These materials charactensticallybecome soft and pliable when heated They can be seamed hy heat, extrusion or chemical means and do not experiencesignificant change in properties as they revert to their ongmal properties when cooled. There are several types ofgeomembranes that are manufactured using different polymers, including polyethylene (PE) and polyvinyl chloride (P VC).Based on the densities of the PE geomembranes, they are classified as high density (HD), linear low density (LLD), and lowdensity (LD) PE geomemhranes The most common geomembrane is the high density polyethylene (HDPE) This type iswidely used in liner systems. Linear low polyethylene (LLPE) has a lower density than HDPE and is relatively more flexible.Because of its flexibility. LLPE can accommodate large deformations and is mainly used in cover systems PVL"geomembranes have high flexibility and are also most commonly used in cover systems The width of geomembrane sheetsgenerally vanes from I 8 to 9.2 meters Sheets can be created in a smooth configuration or a roughened configuration toincrease interface factional resistance with other surfaces
Geoaynthetic Clay l i n e n (GCL) - Geosynthetic clav liners are gaining wide acceptance as containment media to replaceclay liners or augment a clav liner Thev are manufactured from factory-fahncaled rolls of bentonite clay attached to ageomembrane or sandwiched between two geotextiles Both woven and nonwoven textiles are used Nonwoven textilesgenerally will not permit hvdrated bentonite to squeeze through the fabne. Woven textiles will permit the squeezing ofhydrated bentonite through the fabric, thus providing a more effective seal. However, tins also has the effect of lubricatingthe interface between the GC'L and the overlying material, thus significantly reducing the interface fnctional resistance Thegeosynthetic clay mats are generally 6 mm in thickness. 4 to 5 m in width and up to 30 to 60 m in length One layer of GCI.is usually used to replace a 3-fool compacted clav layer The permeability of the GCL is one of the important properties inliner application. It is measured as described in ASTM D 5084 and usually ranges from 6 x 10" to 3 x 10"" cm/s.
2. LINER AND COVER SYSTEMS
As the impact of waste disposal on the environment became more understood, the need tn engineer landfilhng becameapparent in the United Stales As a result, it has now become common practice to design landfills in such a way as to isolatethe waste from direct contact with the public and to minimize the release of any waste-generated substances into the
-794-
environment Industrial and household produced wastes, although fundamentally different, will produce leachale when theybecome in contact with water; also, decomposition of most wastes results in gas releases Thus, engineered elements of alandfill facility must include components to encapsulate the waste and minimize generation of leachale and means to collectand handle any generated leachate and decomposition gases. In this section, we will address common design features inwaste containment and leachale generation control, along with design features commonly incorporated to bring leachate toa point where it can be collected Engineered features to collect and utilize landfill gases, as well as features to treat therecovered leachate. are beyond the scope of this paper
In the past, designers relied primarily on low permeability soils to form liner systems to encapsulate waste, and on highpermeability soils or processed rock and piping for collection and removal of leachate. As engineers were faced with thetask of designing more complex (and perhaps more protective) liner and leachate collection systems and as more landfillsites with naturally permeable subsurface were encountered, the need to utilize geosynthetic materials became more and moreobvious In general, it is now agreed among professionals that a liner system combining the use of geosynthetics and naturalsoils is preferred over one which relies on one material only
Liner and drainage units which are currently used in the United States to compose suitable liner or cover systems areillustrated in Figure I A. The system that is ultimately selected must be functional, feasible to construct, protective of theenvironment and, in the United States, must satisfy minimum regulatory requirements
Figure 1 A illustrates three possible units which can be used alone or in combination with others to compose a complete linersystem. These are One or two compacted clay layers, a compacted clav layer underlying a geomembrane; and ageosyntheuc clay liner underlying a geomembrane Figure I A also illustrates three possible drainage units: A gravel layer,a sand layer, and a layer consisting of geonct underlying a geolextile As suggested previously, these individual units areused alone or in combination and other materials may he added to supplement their use For example, a geoiextile wouldbe needed for protection if gravel is placed above a geomembrane
Landfill cover and liner components with varying levels of geosyiithetic use are illustrated m Figure I B These systemsinclude a cover system, a single composite svstem. a double liner system, and a double composite liner svstem. As shown,a cover svstem consists from top to bottom of A iaver of topsail to crow vegetative cover !oi erosion control andlandscaping reasons, a layer of geotextile over geonel (or alternatively sand) for drainage of water Horn infiltration: anda geomembrane over a laver of compacted clay (or alterativelv a GCL) to act as impermeable harrier over a layer of sand,which represents the final laver of daily cover on the finished waste surface This typical cover meets permeabilityrequirements established by regulatory agencies in the United Slates
Figure I B illustrates a single composite liner svstem with two alternative components to handle leachale drainage Bothcontain a GM over a CCL. In one case, leachate drainage is provided through exclusive use of soil I sand and gravei ). inthe other case, drainage is provided through exclusive use of geosynthetics by a geolextile over a geonet
Figure 1 B also illustrates a double liner svstem consisting of two liners designated as primary and secondary liner systemsEach liner may consist of one or more lavers of soils and/or geosynlhelics If each of the primary and secondarv linersystems include a composite liner svstem. the liner is called double composite liner system. As shown, ihe double imersystem includes a leachale collection system and a leak detection system. The purpose of the leak detection svstem is tocollect any tluids that mav leak through the primary liner The purpose of the secondary liner is to contain any leaks lliroughthe primary liner
The single composite liner system shown in Figure I B presents the minimum requirements for solid municipal wastelandfills while the double composite liner system, also shown in Figure I B. presents the minimum requirements for solidhazardous wastes
3. CHALLENGES
l-andfill applications usuie geosvnthelic materials have met mam challenges i hese challenges included developing designmethods that account lot the lime-dependent behavior and long-term pertnnnance of geosynthetics and lor conditions lhat
-795-
may be encountered during their service life in a landfill environment. Cieosynlhetics have visco-elastic characteristics winchchange strength and stifihess over time.
Installation of large thin geosynthetic sheets is also a challenge Detailed specifications must be developed to definesafeguards to he taken to prevent damage during installation or waste filling operations Other challenges include the qualitycontrol and quality assurance lor such materials The variations in the properties within the same product make it necessaryto implement aggressive quality control programs. However, space limitations do not allow discussion of the quality controland quality assurance requirements The current practice in the design and installation of geosynthetics in landfillapplications is summarized below
3.1 Design Issues
In landfill applications, geosynthetics can be used for containment, drainage, filtration, and reinforcement The design bvfunction for each geosynthetic component is summarized below:
Drainage Applications • Cieonets are the most common drainage media used in the landfill industry. As previouslymentioned, they can be used to transfer leachate in the leochale collection systems and percolating rain water in a coversystem. The drainage capacity of a geonet depends on its Ironsmissivity However, the transmissivity of the geonet maybe affected and reduced as a result of the reduction of geonet cross sectional area (flow area), due to one or more of thefollowing conditions: ( I ) Elastic deformation and intrusion of the adjacent geosynlhelics into the geonei; (2) creepdeformation and intrusion of the adjacent geosynlhetics into the geonei. (3) chemical clogging and/or precipitation ofchemicals in the geonei core, and (4) biological clogging Conditions I and 2 are related to the level and period of loadingConditions 3 and 4 apply to cases where the geonei is used to transmit leachate Taking into account the effect of theseparameters on the capacity of the geonet. the allowable flow rale for a geonet can be estimated using Equation I
Where a = 0 / w ( ! ) (I)FSED X FSCR X FSCC x FSHC
a , = the allowable flow rate to be used in design. m'/sec8 = transmissivity of geonei. nr/seci • hydraulic gradient.w » width of geonei. mFSED = the factor of safety for elastic deformation of the adjacent geosynlhelics inio the geonet s core
space,FS,-, = the factor of safety for creep deformation of the geonei.FSrc = the factor of safety for chemical clogging of the geonet core space, andFSgc = the factor of safety for biological clogging of the geonet core space
For landfill applications, each factor of safety ranges from I 4 to 2 0 depending on the overburden pressure and the fluidtransmitted
Filtration Applications
Geotexules are commonly used in landfill filtration applications In these applications, the design calls for transmitting the(low through the geotextile itself while retaining the soil on Us upstream side To transfer the flow, the permittivity of the
-796-
geotextiles must be adequate To retain the soil panicles, the apparent opening size for the geolextiles must he adequateThe ability of the geotcxtiles to transfer the liquids is estimated as shown in Equation 2.
Where
; )FS^ xFSSCB x FSCR x FSCC x FSBC
a , = the allowable flow rate to he used in design, mVsec<p = permittivity of geolextile.Ah = the head loss, mA = cross area of geotextile. m:
FSE0 = the factor of safely for elastic deformation of the adjacent geosynthetics into the geotextile's corespace.
FSx, = the factor of safety for soil clogging and blinding,FSr, = the factor of safety for creep deformation of the geolextile.FSc,. = the factor of safety for chemical clogging of the geolextile 's core space, andFS K - the factor of safely for biological clogging of the gcotextile's core space
As for the case of the geonet. factors of safely are included to account for soil clogging, creep, intrusion, and chemical andbiological clogging For landfill applications, each factor of safety ranges from I 0 to 4 0 depending on the type of retainedsoil, overburden pressure, and type of liquid transferred (e.g.. water versus leachate)
The ability of the geotextiles to retain the soil particles is estimated based on the grain size distribution of the retained soilsand the apparent opening sze of the geotexuks. Several methods are available. One of the simplest methods was developedby Carroll"1. Based on this method, to provide adequate soil retention, the AOS (in millimeters) for the geotexlile must heless than 2 tunes the soil particle size in millimeters for which 85 percent of the soil is finer, d,, (i.e.. AOS < 2 d^).
Recent research m indicates that, for relatively mild landfill leachate. a nonwoven geolextiles with apparent opening size of0.212 millimeters (i.e., M 70 sieve) will provide adequate filtration.
Reinforcement Applications
Geotexules and geognds are the most commonly used materials for reinforcement applications. Any reinforcement materialsmust have relatively high elastic modulus and tensile strength. For these applications, ui order to account lor installationdamage, creep, and chemical and biological degradation, large factors of safety are normally used to define the allowabletensile strength Only high strength geolextiles can be used for reinforcement applications in landfill design Somegeotexules with low elastic modulus, including nonwoven gedexiiles, ore generally not suitable for landfill reinforcementapplication Typical applications inciude:
1I) Reinforcement of liner and cover systems on the slope to transfer weight of cover or drainage soils within the linersystem without inducing tensile stresses within the system. In this case, the reinforcing layer is placed above thelayers of the liner system that are not capable of transferring the load. The reinforcing layer is designed to transferthe load of the overlying soils by tension. The reinforcing layer is anchored at the lop of the slope. The anchorconfigurations are selected and designed to provide capacity that exceeds the expected tensile stresses within thereinforcing layer.
(2) Reinforcement of liner systems on the bottom of a vertical expansion to minimize the potential for excessivedifferenual settlement that may damage the new liner system. In this case, settlement of the new liner is expecteddue to mechanical compression and biodegradalion of the underlying waste. Since waste materials aremhomogeneous and nonuniform, the settlement is expected to vary and significant differential settlements mayoccur over small distances. Such settlement may cause damage to the overlying liner system. The reinforcing layerin this case is introduced below the liner system to bridge the areas of settlement and minimize the potential for
-797-
excessive differential settlement The reinforcing layer is designed to hridge the area of concern hy mobilizingtensile stresses. The design tensile stresses are estimated on the basis of a worse case differential and/or local izedsettlement that may occur due to significant changes in the types of waste
Containment Applications
Geomembranes and GCLs are usually used for containment. A general description of the geomembranes and GCL designis provided below
Geomembranes - The details for the design of geomembranes are beyond the scope of this paper However, it is noted thatthe selection of a geomembrone for use in a specific project must address issues related to the following:
• Subgrade settlement - the thickness and tensile strength of the geomembrane must be sufficient to withstand localizedsettlement in the subgrade soils In some cases, other methods of reinforcement including geotextile reinforcement areplaced below the geomembrane to provide adequate subgrade support
• Liner system stability during construction and filling - the interface friction angle between the geomembrane and othercomponents of the liner system must be sufficient to provide adequate factor of safety against sliding dunng constructionor waste filling The interlace friction angle can be determined using ASTM D 5321 The test must he performedunder conditions that simulate those that are expected in the field. Both textured and smooth geomembranes arecurrently available in the market Texturing can generally increase interface friction angles by as much as IO°-15°
• Thermal expansion of geomembranes - geomembranes have high coefficient of thermal expansion Therefore, theysustain relatively large shrinkage when temperatures decrease and sustain large expansion when temperatures increase.Depending on the climate of the project area and the season dunng which installation occurs, large deformations mayoccur between daylight and night hours. If the liner is expected to be installed in high temperatures, some slack mustbe introduced to avoid inducing tensile stresses once temperatures cool down. The selection of the amount of therequired slack can be estimated using the expected temperature change and coefficient of thermal expansion However,the implementation of such slack in the field is relatively difficult and site specific
Geosynthetic Clay Liners (GCL) - The selection of the GCL for containment applications must include an evaluation of thestability of the GCL after hydration. The bentonite component of the GCL as well as the interfaces between the GCL andother liner components are potential slip surfaces that must be evaluated. The evaluation must include estimating interfacesand internal shear strength parameters. Shear box testing in accordance with ASTM standards must he used to estimate theseparameters. The testing must be performed under condition similar to those expected in the field including bentonitehydration and stress levels Classical slope stability analyses are then performed to evaluate the factor of safety againstsliding.
3.2 Handling and Installation
Space limitations for this paper do not permit a detailed description of the installation procedure for the different type ofgeosynthetics A summary description highlighting the main concepts and issues is presented below for each type ofgeosynthelics.
Geonets are supplied to the site in rolls protected with a plastic wrap The geoncts are usually rolled down the slopes andalong the floor of the landfill Following installation, adjacent sheets of the geonet are joined using threaded loops at aspecified spacing. In general, geonets must be covered immediately after installation to minimize the potential for damageand fouling that can occur from soils transported by water and wind
Geognds are installed similarly to other geosynthetics However, the connection between the different rolls must be strongenough to transfer the expected loading The placement of the soil backfill must he performed in such a manner as tominimize damage to the geogrid or undue stresses
-798-
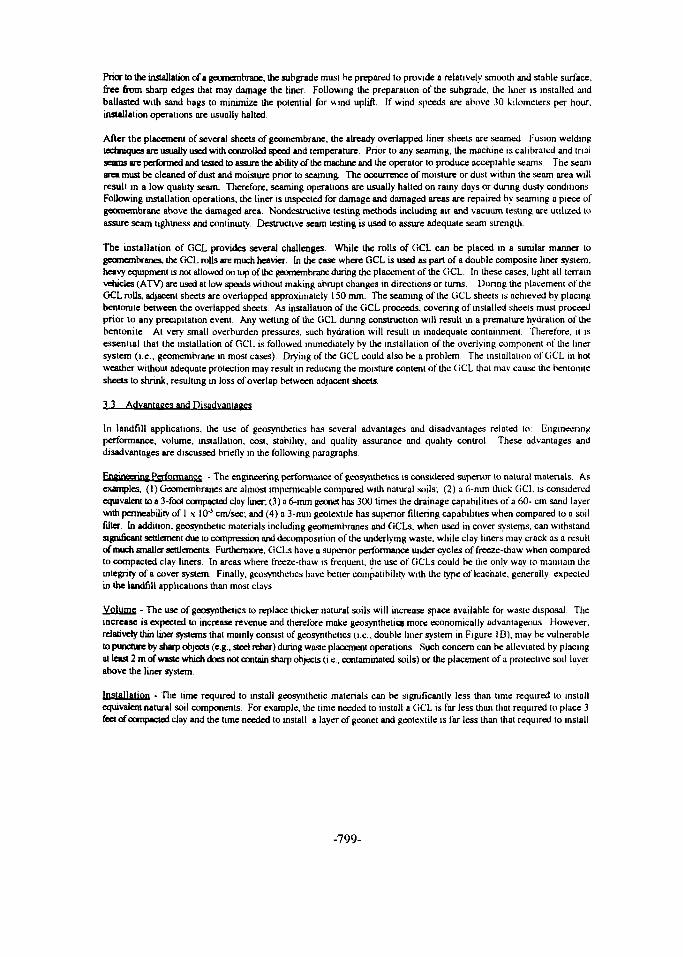
Prior to the installation of a geomembrane, the suhgrode must he prepared to provide a relatively smooth and stable surface,free from sharp edges that may damage the liner. Following the preparation of the subgrade. the liner is installed andballasted with sand bags to minimize the potential for wind uplift. If wind speeds are above 30 kilometers per hour,installation operations are usually halted.
After the placement of several sheets of geomembrane, the already overlapped liner sheets are seamed Fusion weldingtechniques are usually used with controlled speed and temperature. Prior to any seaming, the machine is calibrated and trialseams are performed and tested to assure the ability of the machine and the operator to produce acceptable seams The seamarea must be cleaned of dust and moisture prior to seaming. The occurrence of moisture or dust within the seam area willresult in a low quality seam. Therefore, seaming operations are usually halted on rainy days or during dusty conditions.Following installation operations, the liner is inspected for damage and damaged areas are repaired by seaming a piece ofgeomembrane above the damaged area. Nondestructive testing methods including air and vacuum testing are utilized toassure seam tightness and continuity Destructive seam testing is used to assure adequate seam strength.
The installation of GCL provides several challenges. While the rolls of GCL can be placed in a similar manner togeomembranes. the GCL rolls are much heavier. In the case where GCL is used as part of a double composite liner system,heavy equipment is not allowed on top of the geomembrane during the placement of the GCL In these cases, light all terrainvehicles (ATV) are used at low speeds without making abrupt changes in directions or turns During the placement of theGCL rolls, adjacent sheets are overlapped approximately 150 mm. The seaming of the GCL sheets is achieved by placingbentonite between the overlapped sheets. As installation of the GCL proceeds, covering of installed sheets must proceedprior to any precipitation event Any wetting of the GCL during construction will result in a premature hydxation of thebentonile At very small overburden pressures, such hydration will result in inadequate containment Therefore, it isessential that the installation of GCL is followed immediately by the installation of the overlying component of the linersystem (i.e., geomemhrane in most cases) Drying of the GCL could also be a problem The installation of GCL in hotweather without adequate protection may result in reducing the moisture content of the GCL that may cause the bentonitesheets to shrink, resulting in loss of overlap between adjacent sheets.
3.3 Advantages and Disadvantages
In landfill applications, the use of geosynthetics has several advantages and disadvantages relaled lo Engineeringperformance, volume, installation, cost, stability, and quality assurance and quality control These advantages anddisadvantages are discussed briefly in the following paragraphs
Engineering Performance - The engineering performance of geosynthetics is considered superior to natural materials. Asexamples, (I) Geomemhranes are almost impermeable compared with natural soils; (2) a6-mm thick GCL is consideredequivalent to a 3-foot compacted clay liner, (3) a 6-mm geonet has 300 times the drainage capabilities of a 60- cm sand layerwith permeability of 1x10 ' cm/sec, and (4) a 3-mm geotextile has superior filtering capabilities when compared to a soilfilter. In addition, geosynthelic materials including geomembranes and GCLs, when used in cover systems, can withstandsignificant settlement due to compression and decomposition of the underlying waste, while clay liners may crack as a resultof much smaller settlements. Furthermore, GCLs have a superior performance under cycles of freeze-thaw when comparedto compacted clay liners In areas where freeze-thaw is frequent, the use of GCLs could be the only way lo maintain theintegrity of a cover system. Finally, geosvntlielics have better compatibility with the type of leachate, generally expectedin the landfill applications than most clays
Volume - The use of geosynthetics to replace thicker natural soils will increase space available for waste disposal Theincrease is expected to increase revenue and therefore make geosynthelics more economically advantageous However,relatively thin liner systems that mainly consist of geosynlhetics (i.e., double liner system in Figure IB), may be vulnerableto puncture by sharp objects (e.g., steel rebar) during waste placement operations. Such concern can be alleviated by placingat least 2 m of waste which does not contain sharp objects (i.e., contaminated soils) or the placement of a protective soil layerabove the liner system.
Installation - The time required to install geosynthetic materials can be significantly less than time required to installequivalent natural soil components For example, the time needed to install a GCL is far less than that required to place 3feet of compacted clay and the time needed lo install a layer of geonet and geotexule is far less than that required to install
-799-

60 cm of sand. However, the installation of the geosynlhelics requires significant care to avoid damage to the geosynlheiicsor to its function. For example, physical damage to the geomembranes can occur due to walking with shoes that have sharpedges, GCL's can be damaged fry premature hydration due to rain, and geonets and geolextiies can be plugged by silt blownby high winds.
Coal - Depending on the availability and cost of placement of suitable natural soils, the cost of geosynthetics could becompetitive with that of natural soils. For example, in the areas where cohesive soils are scarce, the use of GCLs as areplacement is expected to show significant cost reduction compared to hauling and placement of suitable natural soilsFurthermore, in the areas where good drainage soils are scarce, the use of a geonet/geotexlile layer is considered cost •effective. In some cases, even though suitable natural soils are available, geosynthetic materials con be cost-effective dueto the high placement cost of natural soils or the inability of natural soils to meet design performance requirements withouttreatment..
Stability • The use of geosynthetics results in the creation of potential slip surfaces between the different layers of a coveror a liner system. Stability of such interfaces must be evaluated and in some cases additional reinforcement elementsincluding geognds or geotextiles must be incorporated in the design to assure adequate stability. The addition of suchelements could odd to the cost of using geosyntheiics in the liner system.
Quality Assurance/ Quality Control - Manufacturing, handling and installation of geosynthetics requires significant qualityassurance and quality control activities to assure that the materials meet the project requirements', that they are handled inan appropriate manner to minimize the potential for damage; and that they are installed in accordance with designrequirements Successful implementation of such programs requires significant personnel training and attention to details.
REFERENCES
[I] Koemer, R. M. ( 1990) " Designing with geosynthetics - Second Edition'" Prentice Hall. Englewood Cliffs. N. J
[2] Koerner, R M . and Koemer. G.R., "Leachnte Clogging Assessment of Geolextile and Soil Landfill Filters."Geosynthelic Research Institute. Drexel University. July 1995.
[3] Koemer, R. M and wilson-fahmy, R. (1995) " Geosynlhetics for Geoenvironmental Applications. " Proceedings ofGeotechnical and Geoenvironmenlal Applications of Geosynthetics" I99S. The 3rd Great LakesGeotechnical/Geoenvironmental Conference, hosted by The Cleveland Section. ASCE. Geosyntheiics technical andEnvironmental Committees. May 1995.
[4] Mitchell. J K . Seed. R.B and Seed, H. B. (1990)." Keltlemen Hills Waste Landfills Slope Failure I: Liner SystemProperties. " Journal of Geotechnical Engineering, Vol. 116.No 4. April.
[5] Daniel, D. E. and Koemer. R. M.." Landfill Liners fromTop-To-Bottom, " Civil Engineering. AS6E. Dec. 1991, pp46 - 49.
[6] Bonapane, R. and Gross, B. A (1993)." Impact of Subtitle D Regulations on Leachate Containment Capabilities ofLandfill Liner Systems." Geotechnical News. September.
[7] United States Environmental Protection Agency, "Quality Assurance and Quality Control for WasteContainment Facilities." Technical Guidance Document, Office of Research and Development, Washington. D C20460. EPA/6O0/R-93/I82, September 1993
-800-
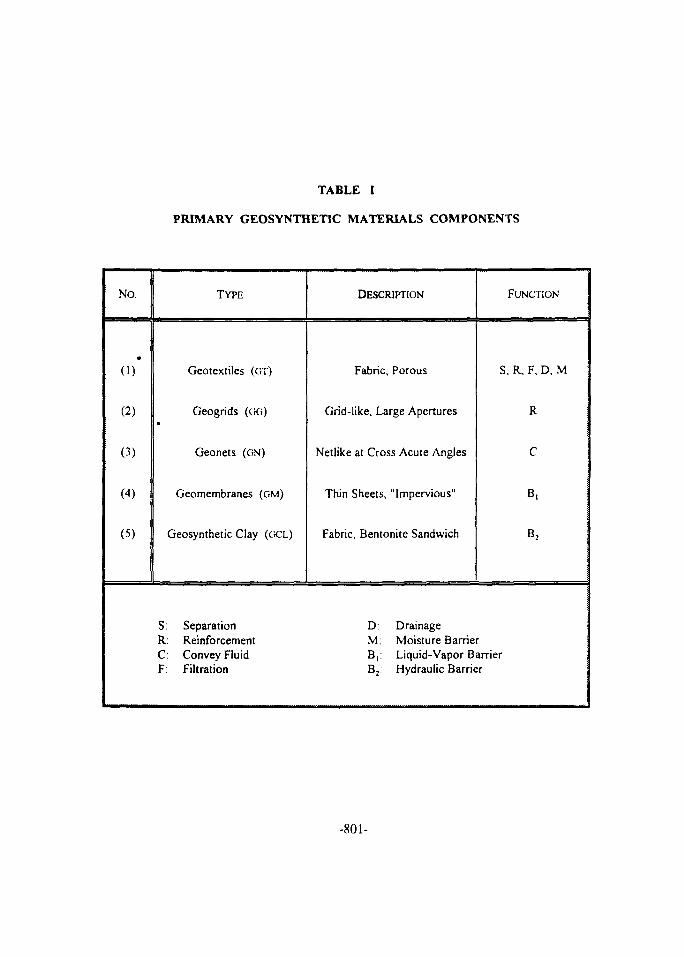
TABLE I
PRIMARY GEOSYNTHETIC MATERIALS COMPONENTS
No.
•
(1)
(2)
(3)
(4)
(5)
TYPE
Geotextiles (GT)
Geogrids («;)
•
Geonets (ON)
Geomembranes (GM)
Geosynthetic Clay (((CL)
DESCRIPTION
Fabric, Porous
Grid-like, Large Apertures
Netlike at Cross Acute Angles
Thin Sheets, "Impervious"
Fabric, Bentonite Sandwich
FUNCTION
S, R, F, D, M
R
C
B,
B2
S: Separation D: DrainageR: Reinforcement M: Moisture BarrierC: Convey Fluid B,: Liquid-Vapor BarrierF: Filtration B2: Hydraulic Barrier
-801-
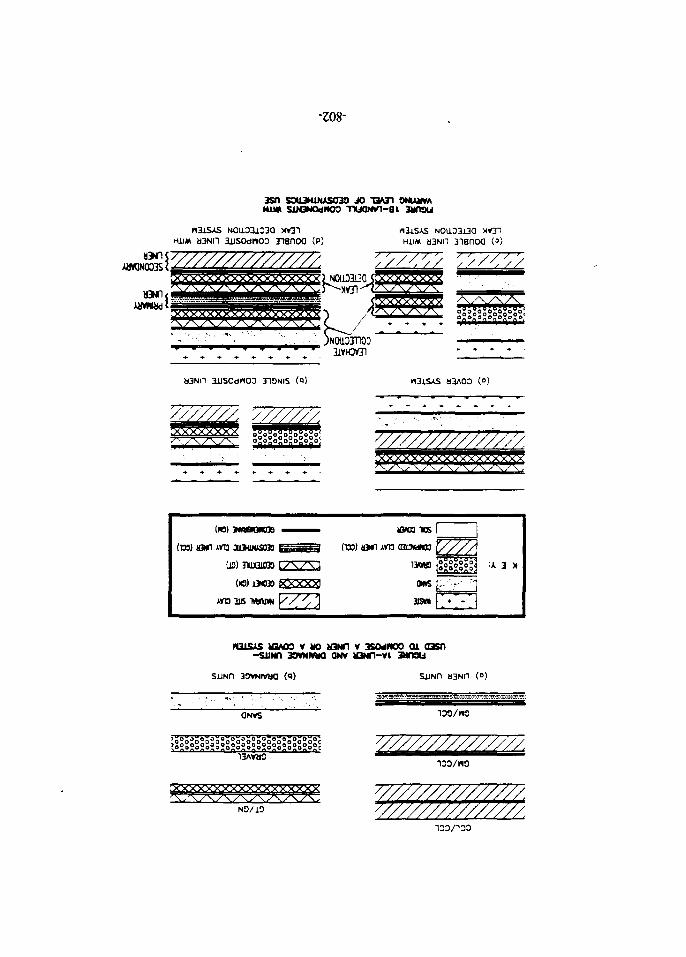
-Z08-
3S0 S3U3HUUS03S JO T3AJ1 ONUMVAHUM suGNOdnoo
W31SXS NOI103103Q XV31HUM a3Nn ausodnoo nanoo (P)
AHWNOO3Si V//////////////.
\/\/\/\/\/\/\/\/\ >0ll3in0331VH0VJ1
a3NO 3JJSOdW0D 310NIS (Q)
V///777/V77/7/
(IB) WWB0IK03
(to) tONn xra auMwsas
(iS) 311X3iO3D
(NS)13HO3D
xra aijs iw iuw
XXXXXI
( m ) o r A»TO CQIJWKD
3ISM [ ^ * * * ' j
N31SAS «3AOO V MO H3NT! V 3SOdWOO 0 1 03Snsum XMHMua an* OND-VI amsu
SilND 30VNWWQ (Q) SUNR H3NH
130/no
13AVU0 VX//////////77/,
•XXXXXXXXXXXXXXXXXX
NO/10
V/////////77777.V/////////7////,
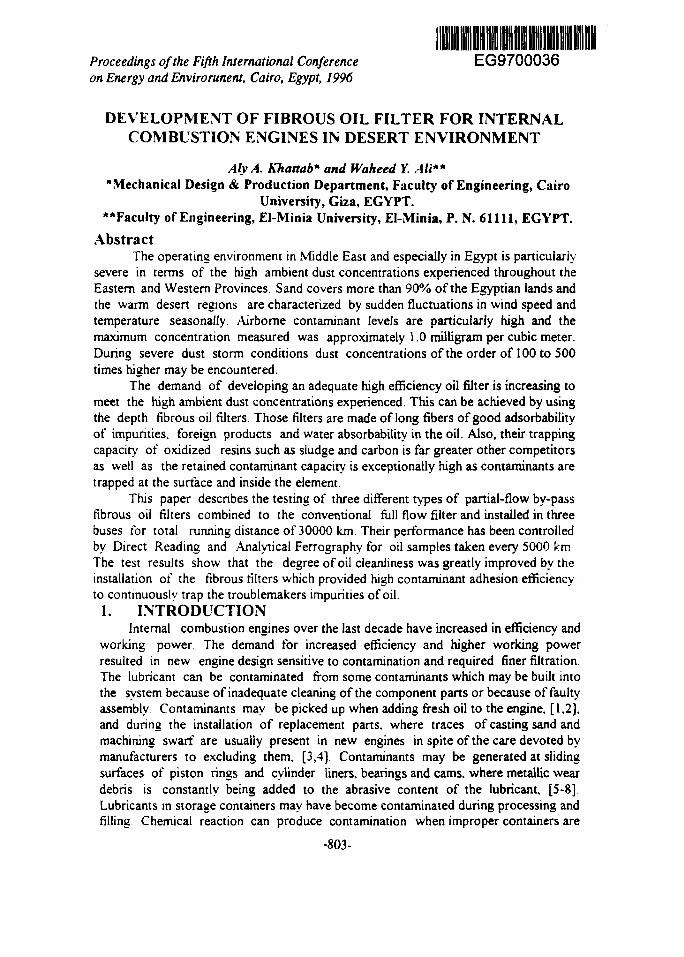
Proceedings of the Fifth International Conference EG9700036on Energy and Envirorunent, Cairo, Egypt, 1996
DEVELOPMENT OF FIBROUS OIL FILTER FOR INTERNALCOMBUSTION ENGINES IN DESERT ENVIRONMENT
AfyA. Khattab* and Waheed Y. Ali**"Mechanical Design & Production Department, Faculty of Engineering, Cairo
University, Giza, EGYPT.**Faculty of Engineering, El-Minia University, EI-Minia, P. N. 61111, EGYPT.
AbstractThe operating environment in Middle East and especially in Egypt is particularly
severe in terms of the high ambient dust concentrations experienced throughout theEastern and Western Provinces. Sand covers more than 90% of the Egyptian lands andthe warm desert regions are characterized by sudden fluctuations in wind speed andtemperature seasonally Airborne contaminant levels are particularly high and themaximum concentration measured was approximately 1.0 milligram per cubic meter.During severe dust storm conditions dust concentrations of the order of 100 to 500times higher may be encountered.
The demand of developing an adequate high efficiency oil filter is increasing tomeet the high ambient dust concentrations experienced. This can be achieved by usingthe depth fibrous oil filters. Those filters are made of long fibers of good adsorbabilityof impurities, foreign products and water absorbability in the oil. Also, their trappingcapacity of oxidized resins such as sludge and carbon is far greater other competitorsas well as the retained contaminant capacity is exceptionally high as contaminants aretrapped at the surface and inside the element.
This paper describes the testing of three different types of partial-flow by-passfibrous oil filters combined to the conventional full flow filter and installed in threebuses for total running distance of 30000 km. Their performance has been controlledby Direct Reading and .Analytical Ferrography for oil samples taken every 5000 kmThe test results show that the degree of oil cleanliness was greatly improved by theinstallation of the fibrous filters which provided high contaminant adhesion efficiencyto continuously trap the troublemakers impurities of oil.
1. INTRODUCTIONInternal combustion engines over the last decade have increased in efficiency and
working power The demand for increased efficiency and higher working powerresulted in new engine design sensitive to contamination and required finer filtration.The lubricant can be contaminated from some contaminants which may be built intothe system because of inadequate cleaning of the component parts or because of faultyassembly Contaminants may be picked up when adding fresh oil to the engine, [1,2],and during the installation of replacement parts, where traces of casting sand andmachining swarf are usually present in new engines in spite of the care devoted bymanufacturers to excluding them, [3,4]. Contaminants may be generated at slidingsurfaces of piston rings and cylinder liners, bearings and cams, where metallic weardebris is constantly being added to the abrasive content of the lubricant, [5-8]Lubricants in storage containers may have become contaminated during processing andfilling Chemical reaction can produce contamination when improper containers are
-803-
used. [9] Combustion soot contained in blow-by gases enters the crankcase oil.Under the influence of high temperature, the soft soot panicles harden andaealomerate into larger and more abrasive particles, [10] The major part of abrasivematerial in the engine lubricant is the sand which enters the crankcase through thebreather. Sand entering the cylinders through the carburetor may also enter thelubricant. The operating environment in Middle East and especially in Egypt isparticularly severe in terms of the high ambient dust concentrations experiencedthroughout the Eastern and Western Provinces. [II] . During severe dust stormconditions dust concentrations of the order of 100 to 500 times higher may beencountered. It was found that the vast majority of airborne in the Eastern Provinceare concentrated in the smaller sizes. 95% of ail particles are below 20 ^m and 50% ofill particles are below 1.5 urn in size. [12].
The fineness of commercial and fine filters used in internal combustion engines isranging from 15 jam to 25 urn and 10 u.m to 15 p.m respectively. These values offineness are not enough to capture the majority of sand particles entering thecrankcase. A good filter must balance between filtering accuracy and filteringcapacity. Filtering accuracy means to what size can a filter be capable of removingcontaminant panicles; filtering capacity means how much particles can a filter removeper hour and how much panicles can it retain. If a filter is to be increased with filteringaccuracy, the flow rate of the oil passing through the filter decreases as the filterqu'.ckJy becomes clogged High filtering accuracy can be obtained simply by adoptingvery fine mesh and its filter can trap many contaminants, but the mesh soon becomesdogged not allowing the rest of the oil to pass through, [13]. An air filter for smallcars has been designed to withstand the local environmental conditions so that theengines could exhibit less wear rate and therefore longer life. The filter has been testedunder homogeneous air flow using specially designed test rig, [14].
Depth filters consist of several layers of porous materials which form a tortuouspath through which the fluid must pass It is difficult to establish an absolute size ratingfor this filter since pores in adjacent layers do not line up. These filters have a largerdirt holding capacity than a surface filter and can trap a substantial amount ofcontamination between layers. The most common material used is resin impregnatedpaper Sintered phosphor bronze is also used and can be cleaned. Because of thewinding fluid paths through the layers, depth filters are very effective for removingfibres Under conditions of vibration, shock, high fluid flow and pressure surges;particles may be forced through the filter element. As the filter becomes loaded withcontaminants, it will trap finer and finer particles to move from one layer to anotheruntil they pass through the filter. The density of the fibres and their distribution arearranged so that porosity decreases in size towards the interior of the cartridge Thuscoarser particles are held at the outer edges whilst smaller particles are lodged deeperin the cartridge until the pore openings are smaller than the size of the panicles theyare designed to entrap This high absorptive capacity gives long cartridge life, andmakes the cartridges particularly suitable for filtration of liquids having a high dirt load,cind thus requiring a commensurate degree of purification, for example, fuels andlubricants, [15] A fibrous filter medium comprises a blend of coarse and fine fibreswith an increasing gradient density fibre packing from the dirty filter side to the cleanerfiltrate side was introduced, [16]. The filtration mechanism is one of sorption of finepaniculate on the fibre surface by impaction-impingement followed by depthmechanical sieving of coarser paniculate which pass through the initial open fibrousnetwork.
-804-
In the Egyptian environment concentration of dust in air is relatively high due tothe lack of rain and the vast area of desert. The inefficient filtration system as well asthe high concentration of dust in air cause an increase in wear rate As a consequence,period of lubricating oil change has been reduced to get rid of the contaminated oil asquickly as possible to avoid further wear This solution was not the proper one becauselubricating oil contains antiwar additive which needs longer time to react and give upthe required lubricating properties It was proposed to filter the used oil every 1000km in situ through a filtering mobile system fitted by coarse and fine filters of highcapacity It was aimed to extend the life time of the lubricating oil and make full use ofthe antiwar additives dispersed in the oil, [17]
In the present work, three different types of partial-flow by-pass fibrous oil filterscombined to the conventional full flow filter and installed in three buses for totalrunning distance of 30000 km were tested. Their performance has been controlled by-Direct Reading and Analytical Ferrography for oil samples taken every 5000 km.
2. KEYWORDSCrankcase filter, depth, surface, fibrous, contaminant. Direct Reading, Analytical
Ferrography and desert environment.
3. EXPERIMENTALThree oil filters of different types were tested in three buses for 30,000 Km. The
first filter (A) is multi-ply paper made of natural fibres and is set with special crepenessand density for high contaminant adsorbability and water absorbability The elementsremoves factors causing contamination such as sand, dust, silt, metal particles andwater in the oil. It also traps oxidized resins (sludge and carbon) so as to allow theviscosity of the fluid to be recovered to certain levels, and TAN to be recovered tonearly new oil values. It does not remove oil additives allowing the oil to functioncontinuously in the desired possible condition. The filter (A) functions on a 3-stagefiltration basis. The surface and second stage traps large contaminants. The secondstage, supported by a supporting wrap, is rolled under relatively low tension makingcontaminants accessible to the element. But the third stage, is pressurized to give it ahigher density compared with the second stage, so it captures all remainingcontaminant particles small enough to pass through the second stage. The third stage isprotected by a cardboard wrapping and coordinates with the housing's leakproof edgesto prevent leakage inside the housing, Fig. 1 The element is also secured by anunwoven cloth at the bottom. This system ensures any fluid entering the housing andelement from escaping with being filtered, and contaminants are perfectly held fromtop to bottom. Its high retaining contaminant capability leads to the element's longerlife, [13].
The second filter (B) consists of one or two elements where the oil flows axiallythrough the filter element made of natural materials. To avoid the channel formationthrough the fibrous layer, the flow is cut by so called homogenized layers. Due to thevery slow flow rate, the filter by absorption can remove such injurius impurities whichfull flow filters or even by pass centrifugal oil filters can not retain. The level of carbonsoot which may disturb the performance of ZDDP additive and reduce the ami wearcharacteristic of the oil and accelerate its oxidation can be minimized by application offilter (B) The separation of contaminants is done through the fibrous filter material of140 mm thickness. Every fibre consists of three smaller ones in a manner that the
-805-
filtering area is quite large. The blocking of this filter is difficult. The filtering materialis environmentally friend because it does not contain any adhesive material. The oilpressure helps in densing the filtering material. When a particle or a fluid flows in theoil stream it may be collected by the fibre of the filter . If the particle could not flow inthe oil stream it may be separated by inertial impact to the felt fibre. The very smallparticles follow the Brown motion. So, the filtration function of this filter isrepresented by adhesion of particle to each other or to the felt fibre while the smallerparticles are trapped inside the filter. The inlet of the filter is fitted by spiral reducer toprevent blocking. The felt is pressed through a screw fastened to the filter cover, Fig2. The function of the similar other depth filters depends on the conical filtration whichreduces the area of filter and consequently increases the flow velocity In this filter theoil is flowing through the whole cross section of the filter. The resistance of thehomogeneous layers is relatively low. The filtration process is repeated inside the filter25 times where every layer experiences single filtration process. The flow velocity isconstant across the filter. Also, the filter is fitted by polymeric screen to collect thefibres. The filter can absorb water contaminants as well as the fuel diluted in thelubricating oil, [18].
The third filter (C) tested in this work was binder free microfibre. This filter ischemically and biologically inert and temperature resistant, [19] The filter (C)guarantees a three dimensional filtration effect (filter area times the full depth generatesa large filter volume). The asymmetrical structure of the medium promotes depthfiltration and improves dirt retention. A further advantage of this filter is the two stagedepth filtration where coarse contaminants are retained by the first stage fibres whilesmaller particles are lodged deeper in the second stage fibres. The void volume of thisfilter is relatively large and represents about 94% of the filter volume. Increased flowrates and a lower pressure difference are the advantages of this filter. It means inpractice that the filter can be loaded much more still guaranteeing the highest constantefficiency and at the same time increasing the capacity to retain dirt. This may extendthe service life of the filter, and reduce the operating costs
The recommended depth filter can be installed on all engines. The "In" and "Out"installation can differ according to each engine model. The "In" installation can be bydiverging out from the pressure switch or from the blind plug on the main gallery The"Out" connection can be installed to the blind plug on the engine block, by replacingthe bolt on the return pipe of the injection pump, By tapping or welding on the oil fillerpipe and by removing an oil pan bolt, then drilling a hole through it and replacing withthe depth fibrous filter.
The three tested filters A, B and C were installed in three buses running in urbanarea besides the full flow filters and a fourth bus was equipped by the conventional fullflow filter of impregnated paper type and used as a base of comparison. Oil sampleswere taken from the engines of the four buses every 5000 km for total running distanceof 30000 km. The lubricant used in the experiments was Vanellus FE 10W/30. The oilsamples were heated to 65 °C for 30 minutes, shaken for 10 minutes and diluted(100:1) by suitable solvent. The oil samples were inspected by Analytical Ferrographyand Direct Reading (DR) Ferrography.
4. RESULTS AND DISCUSSIONThe Direct Reading (DR) Ferrography is designed as an instrument for rapid
on-site monitoring of wear in oil lubricated machinery. The prepared sample is placedin an elevated vial. The oil is siphoned down through a plastic capillary tube and into a
glass precipitator tube which is located in a highly divergent magnetic field. The DirectReading Ferrography magnetically precipitates the wear particles from the oil samplesand provides digital readings of the quantity of both large ( > 5 urn) and small( 1 to 2 nm) particles present in the oil sample, [20]. These numerical readings providea reliable basis for assessing the degree of wear occurring and the degree of oilcleanliness which reflects the performance of the filter. The Direct Reading values forthe four tested buses are illustrated in Figs 5 - 8 The Direct Reading Ferrographyprepared from crankcase oil of the bus that equipped only by the full flow filterrepresents relatively higher values of both DL and DS. The measured values increasewith increasing the running distance. Those readings reflect that the oil is contaminatedby considerably high concentration of wear particle and the filter can not clean theoil as planned. Fig. 6 displays the effect of the performance of filter (A) on reducingthe contaminant concentration in oil where the number of both the large particles (DL)and the small particles (DS) decreased after the installation of filter (A). The bestperformance was observed for the filter (B) where the Direct Reading values representminimum values and continue with no increase for 20000 km, Fig. 7. This performanceconfirms the high capacity of filter (B). The number of wear particles contaminated inthe crankcase oil of the bus that equipped by filter (C) decreased after the installationand continued for 15000 km then rapidly increased, Fig. 8. It c;in be concluded that theparticle increase is from the clogging of the filter.
The Analytical Ferrography is a technique where the ferrous particles aremagnetically collected from a sample of oil and deposited on to a thin microscope slidecalled a Ferrogram. The Ferrogram can then be examined by optical microscope, [21].The photomicrographs of Ferrograms prepared from crankcase oil of the bus thatequipped by the paper full flow filter are shown in Fig. 9. Normal wear particles areshown in Fig. 9, a for oil sample taken after 5000 km. As the running distanceincreased to 10000, 20000 and 30000 km, Fig. 9, b, c and d respectively, the wearparticles increased. The intensity of wear particles reveals the inefficient performanceof the impregnated paper full flow filter. The effect of the installation of filter (A) onthe degree of cleanliness of the crankcase oil is clearly shown in Fig. 10, a, b, c and dafter running distances of 5000, 10000, 20000 and 30000 km respectively. Theintensity of wear and abrasive sand particles is relatively low . The same trend ofimprovement can be observed for oil samples taken from the bus that equipped by filter(B), Fig. 11, where normal wear particles at low concentration are contaminated in oil.The Ferrograms of oil samples taken from the bus that equipped by filter (C) areshown in Fig. 12. The intensity of wear particles for 5000, 10000 and 20000 km, Fig.12, a, b and c respectively, can be considered as normal wear tod the degree of the oilcan be accepted. When the running distance increased to 30000 km wear intensityincreased especially the large particles, Fig. 12, d. The reason of this increase may befrom the limited capacity of filter (C).
5. CONCLUSIONSAfter the testing of the three filters by Direct Reading and Analytical Ferrography,
it can be concluded that the combination of a partial flow by pass fibrous filter of highcapacity with the conventional full flow filter can provide long term oil contaminationcontrol due to the following reasons:1 Smaller contaminants can be trapped and the oil cai/be cleaned thoroughly becauseof the filtering accuracy provided by the by pass fibrous filter.
-807-
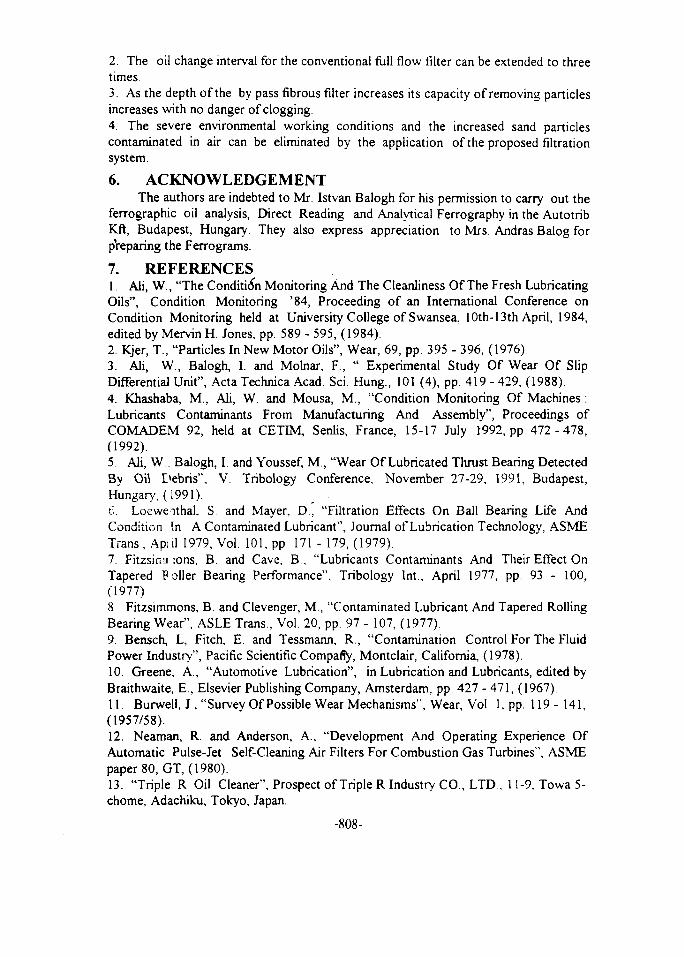
2. The oil change interval for the conventional full flow filter can be extended to threetimes.3. As the depth of the by pass fibrous filter increases its capacity of removing particlesincreases with no danger of clogging.4. The severe environmental working conditions and the increased sand particlescontaminated in air can be eliminated by the application of the proposed filtrationsystem.
6. ACKNOWLEDGEMENTThe authors are indebted to Mr. Istvan Balogh for his permission to carry out the
ferrographic oil analysis. Direct Reading and Analytical Ferrography in the AutotribKft, Budapest, Hungary. They also express appreciation to Mrs. Andras Balog forpreparing the Ferrograms.
7. REFERENCES1. Ali, W., "The Condition Monitoring And The Cleanliness Of The Fresh LubricatingOils", Condition Monitoring '84, Proceeding of an International Conference onCondition Monitoring held at University College of Swansea, 10th-13th April, 1984,edited by Mervin H. Jones, pp. 589 - 595, (1984).2. Kjer, T., "Particles In New Motor Oils", Wear, 69, pp. 395 - 396, (1976).3. Ali, W., Balogh, I. and Molnar, F., " Experimental Study Of Wear Of SlipDifferential Unit", Acta Technica Acad. Sci. Hung., 101 (4), pp. 419 - 429, (1988).4. Khashaba, M., Ali, W. and Mousa, M., "Condition Monitoring Of Machines :Lubricants Contaminants From Manufacturing And Assembly", Proceedings ofCOMADEM 92, held at CETIM, Senlis, France, 15-17 July 1992, pp. 472 - 478,(1992).5. Ali, W , Balogh, I. and Youssef, M., "Wear Of Lubricated Thrust Bearing DetectedBy Oil Debris", V. Tribology Conference, November 27-29, 1991, Budapest,Hungary, (i 991).6. Loeweithal, S. and Mayer, D., "Filtration Effects On Ball Bearing Life AndCondition In A Contaminated Lubricant", Journal of Lubrication Technology, ASMETrans , Apiil 1979, Vol. 101, pp. 171 - 179, (1979).7. Fitzsimi ions, B. and Cave, B., "Lubricants Contaminants And Their Effect OnTapered E oiler Bearing Performance", Tribology Int., April 1977, pp. 93 - 100,(1977).8 Fitzsimmons, B. and Clevenger, M., "Contaminated Lubricant And Tapered RollingBearing Wear", ASLE Trans., Vol. 20, pp. 97 - 107, (1977)9. Bensch, L, Fitch, E. and Tessmann, R, "Contamination Control For The FluidPower Industry", Pacific Scientific Compafiy, Montclair, California, (1978).10. Greene, A., "Automotive Lubrication", in Lubrication and Lubricants, edited byBraithwaite, E., Elsevier Publishing Company, Amsterdam, pp. 427 - 471, (1967).11. Burwell, J , "Survey Of Possible Wear Mechanisms", Wear, Vol. 1, pp. 119 - 141,(1957/58).12. Neaman, R. and Anderson, A., "Development And Operating Experience OfAutomatic Pulse-Jet Self-Cleaning Air Filters For Combustion Gas Turbines", ASMEpaper 80, GT, (1980).13. "Triple R Oil Cleaner", Prospect of Triple R Industry CO., LTD , 11-9, Towa 5-chome, Adachiku, Tokyo, Japan.
-808-

14 El-Kottb, M.. Khattab. A and Soliman, F , "Development Of Small Car's Air FilterTo Withstand The Severe Environmental Conditions", Journal of Engineering andApplied Science, Vol. 43, No. 2, April, 1996, Faculty of Engineering, CairoUniversity, (1996)15. Boll & Kirch, "Filters From The Specialist', Boll & Kirch Filterbau GMBH.Sindorf, Siemensstra$e. Germany, pp 25 - 26.16. Balogh, I. and Meszaros, G, "Modern Filtration Techniques", 24th Meeting OfBus And Coach Experts, Budapest, Hungary, September 27 - 29, (1993).17 Khattab, A., Youssef M and Ali, W, "Extending The Life Time Of Motor OilsBy Filtration", Technologies for Energy Efficiency and Environmental ProtectionConference. March 26-30, (1995)..18 Rodman, C A, "Filter Media Performance And Fibre Morphology", Filtration &Separation, November/December 1980, pp. 543 - 546, (1980).19. Morris, N. J. H., "Air, Gas And Liquid Filtration In The Pharmaceutical Industry",Filtration & Separation. July/August 1984, pp. 251 - 253, (1984).20. "Ferrography Oil Sampling Techniques' by Foxboro Analytical.21. Hofman. M. V. and Johnson, J H., "The Development Of Ferrography As ALaboratory Wear Measurement Method For The Study Of Engine OperatingConditions On Diesel Engine Wear", Wear, Vol. 44, No. 1, pp. 183 - 199, (1977)
-809-
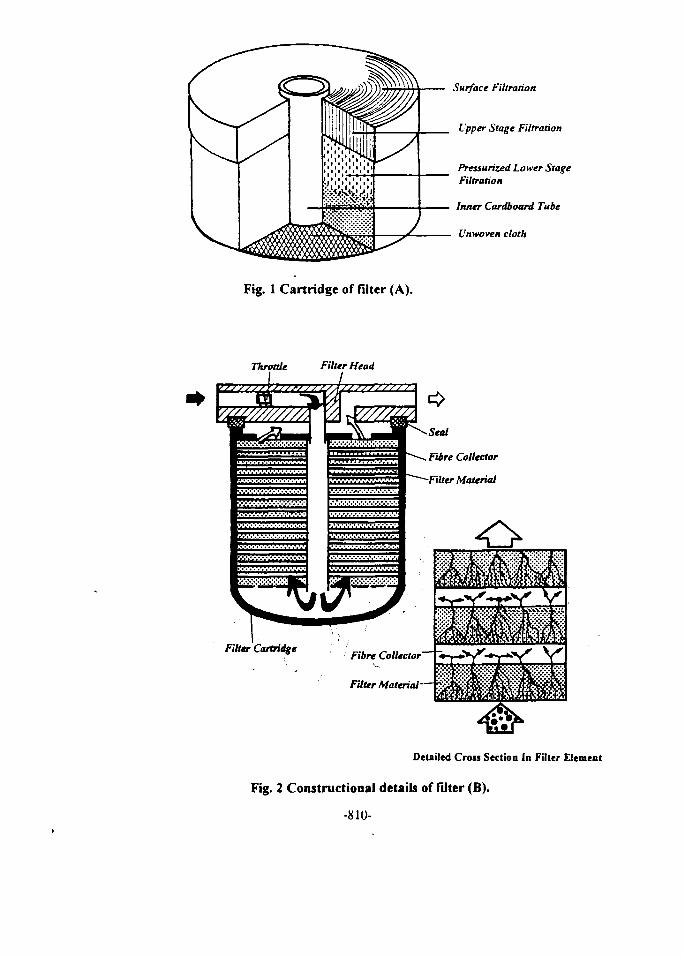
Surface Filtration
Upper Stage Filtration
Pressurized Lower StageFiltration
• Inner Cardboard Tube
- Unwoven cloth
Fig. 1 Cartridge of filter (A).
Throttle Filter Head
L
Seat
Fibre Collector
•Filter Material
Filler CartridgeFibre Collector'
Filter Material -
Detailed Cross Section In Filter Element
Fig. 2 Constructional details of filter (B).
-810-
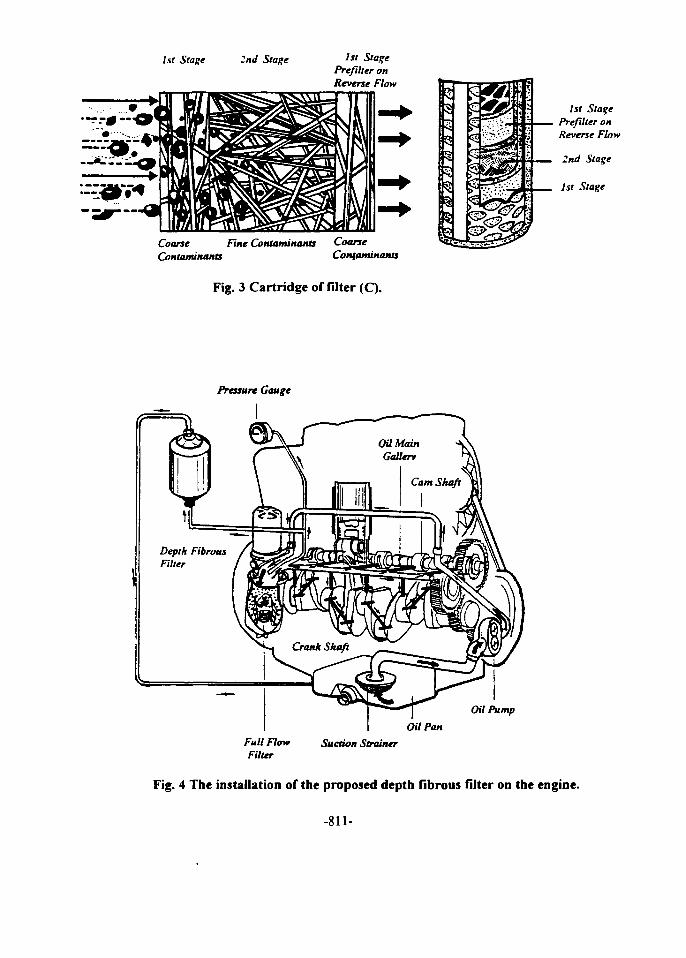
1st Stage 2nd Stage 1st StagePrefilter onReverse Flow
Coarse Fine Contaminants CoarseContaminants Contaminants
Fig. 3 Cartridge of filter (C).
1st StagePrefilter onReverse Flow
2nd Stage
1st Stage
Pressure Gauge
Oil PumpOil Pan
Full Flow Suction StrainerFilter
Fig. 4 The installation of the proposed depth fibrous filter on the engine.
-811-
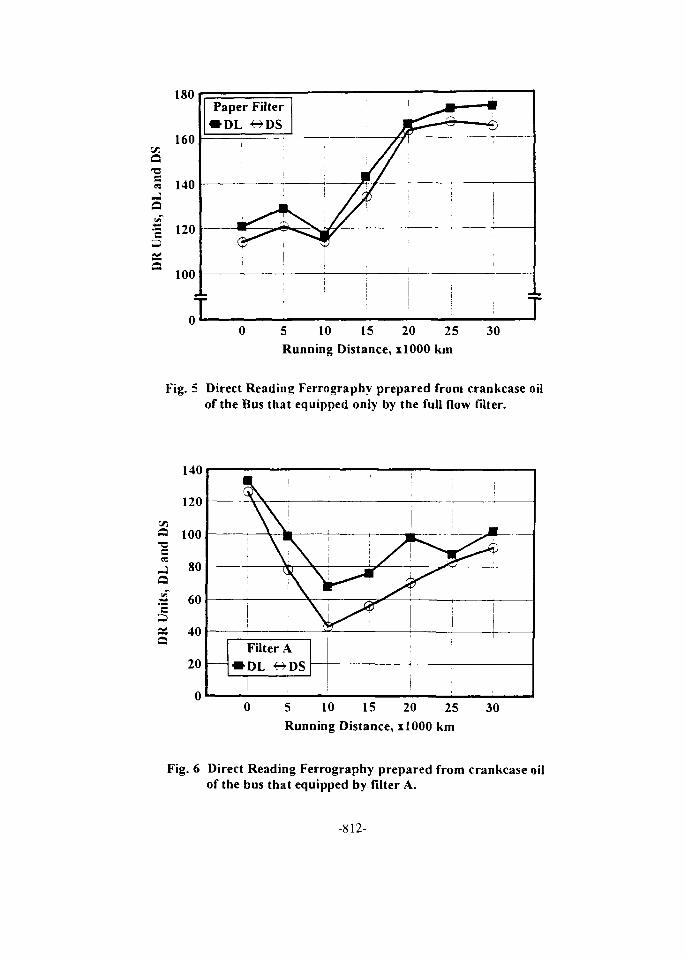
180
5 10 15 20 25Running Distance, xlOOO km
30
Fig. 5 Direct Reading Ferrography prepared from crankcase oilof the Bus that equipped only by the full flow filter.
140
120
a 100•a
XQ
80
~ 60s
40
20
\
\\
Filter A• DL «-*DS 1
5 10 15 20 25Running Distance, slOOO km
30
Fig. 6 Direct Reading Ferrography prepared from crankcase oilof the bus that equipped by filter A.
-812-
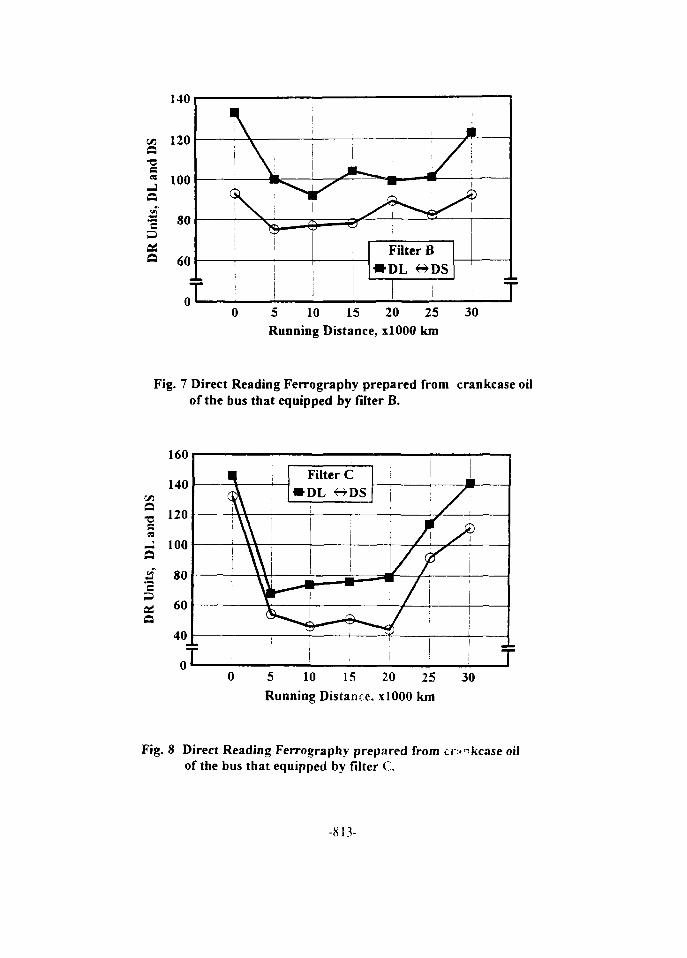
a•a
as
140
120
100
80
60
0
\ . •\
A
•> *
/ \
Filter B• D L ^ D S
)
5 10 15 20 25 30Running Distance, xlOOO km
Fig. 7 Direct Reading Ferrography prepared from crankcase oilof the bus that equipped by filter B.
1OU
140
e no
-! 100a
DR
Uni
ts,
- O
\ C
O
\ \
Filter C• DL « D S
I
1 • "1
•
T5 10 15 20 25 30Running Distance, xlOOO km
Fig. 8 Direct Reading Ferrography prepared from crrikcase oilof the bus that equipped by filter ( .
-813-
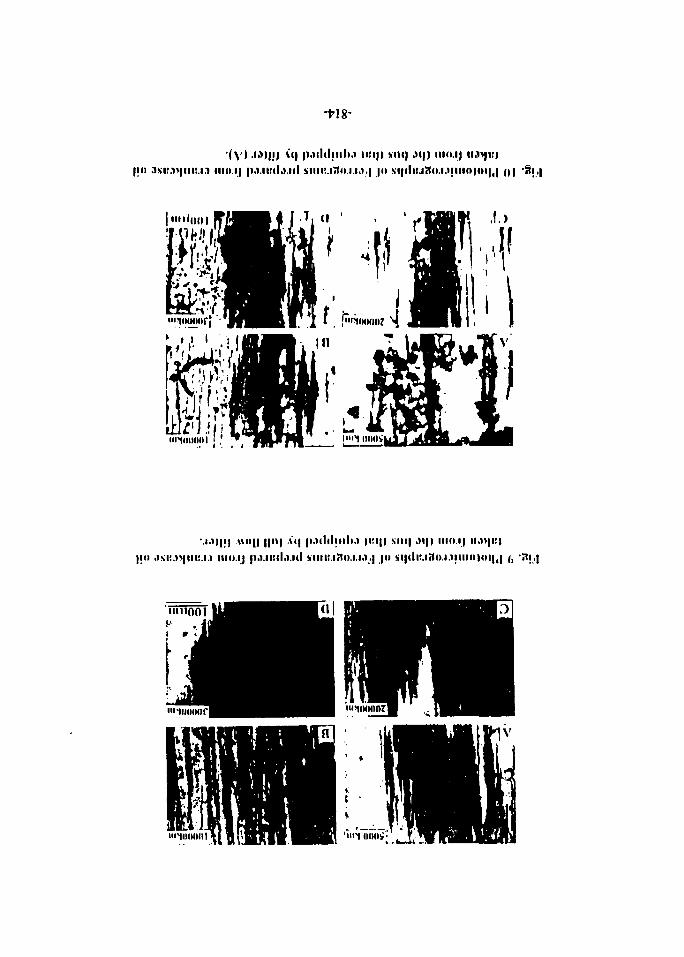
-W8-
\ ( | p.tililnih.t i t : i | | sn«| ,u|| ino.ijIIKI.IJ p.t.llillj.lll SIIII!.l7tO.I 1.1 ,| JO SI
!.i.) IIIO.IJ
p.nlihnli.) | i : i | | vii<| oi | | mo.ijt . | jo SI|(II:.
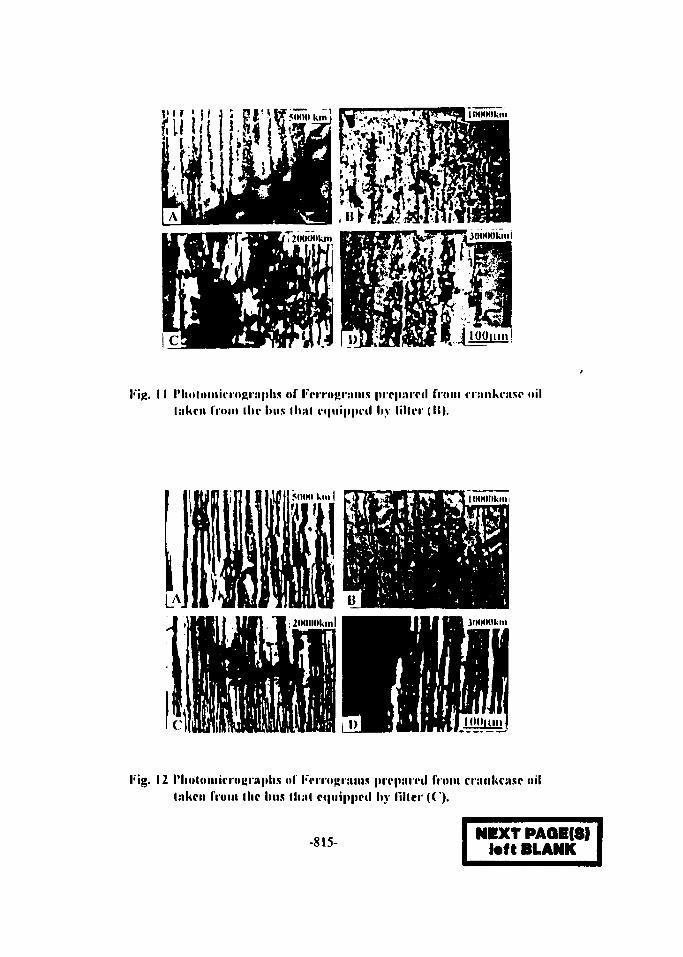
11 PlioloiiiitTOKriiplis of FriTogniins prrpi i r rd from a j i n k i n s o nill:ikin from I he bus Hull i-qnippi-d liv lilli'i (It).
I'ig. 12 riioliiiiiii-roi!r»pliN <il l'Vn(»j;ii»ins p r rpsu rd I'KIIII rnuikcii.sc nil
lakcii Iroiu Hie Ims lluil c<|iiippcd liy filler ( ( ' ) .
-815- NIXT PAQB(8)toft BLANK
Proceedings of the Fifth International Conference » / UUUo /on Energy and Environment, Cairo, Egypt, 1996
Analysis of Wastewater TreatmentPlant Influent Data
Ralph H. Kummler, C.C. Lin, and Young- Yun Rhee
Department of Chemical EngineeringWayne State UniversityDetroit, MI 48202
Abstract
Wastewater Treatment Plants are perceived to be major sources of conventionaland toxic contamination for the Detroit River (DR) In order to assess the currentloadings for the RAP Stage II process, the raw influent data of daily averageconcentrations provided by DWSD (Detroit Water and Sewerage Department)WWTP (Waste Water Treatment Plants) were used to analyze the trend of eachparameter's annual average influent conventional and toxic concentrations. Thefirst fiscal year (1983) and last fiscal year (1992) concentrations were calculatedusing a t-distribution and the 95% confidence limits were determined. Secondly,the ratio between the 1983 and 1992 annual average influent toxicantconcentrations for each parameter was calculated. Because of the City of Detroit'sIndustrial Pretreatment Program, the general decline of industrial activity in thearea, the conscientious efforts of industries to reduce discharges through pollutionprevention, and other factors, the current (1992) DR toxicant concentrations andloadings are substantially less than the 1979 toxicant concentrations and loadings.
1. Introduction
A major portion of the Detroit River basin encompasses the Detroit Metropolitanarea as shown in Figure 1. Urban development impacts on the Detroit River water qualitymake it necessary to carefully plan and implement good management practices for thesebasins. The population in the basin is approximately 4 million and the Detroit River
-817-
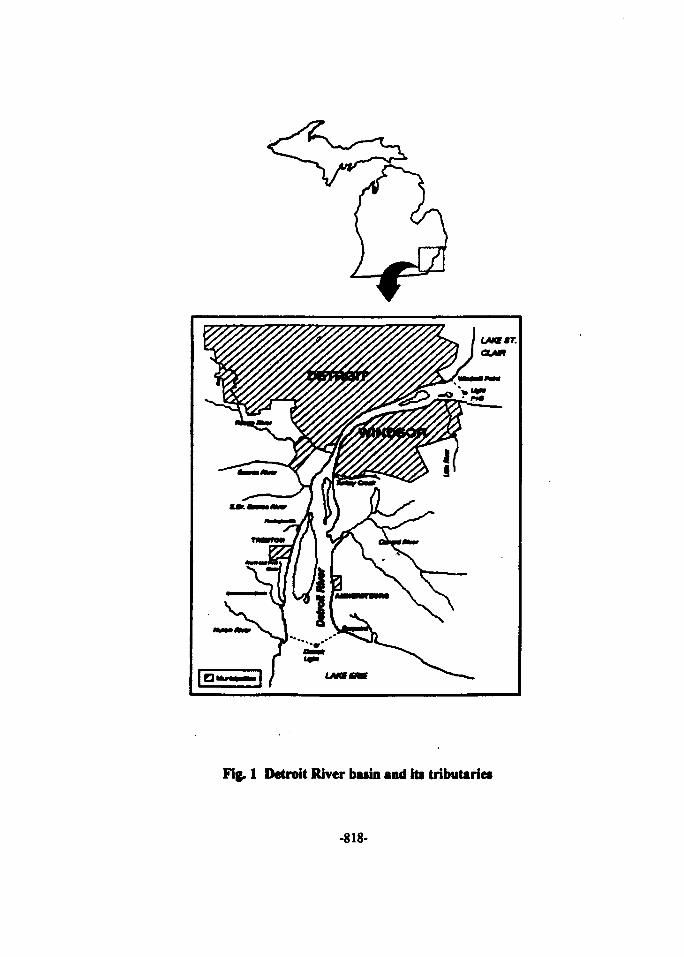
Fig. 1 Detroit River basin and its tribuUries
-818-
provides important habitat for fish and birds. Southeast Michigan is one of the nation's
foremost locations for motor vehicle manufacturing and a wide range of other
manufacturing activities which are characterized by a large sector of heavy industry with
primary and secondary processes including coke ovens, iron and steel industry,
incinerators, power generation facilities, lime and cement operations. Immediately across
the Canadian border, the urbanized areas in and around Windsor, Ontario, also have high
population density and a variety of manufacturing facilities. The Detroit River receives
treated and untreated waste water from the City of Detroit and suburban districts (Wayne
County, Macomb County, and Oakland County), industries, runoff from urban and
agricultural lands, and effluent from Combined Sewer Overflows (Lin, 1994; Roginski,
1981; USEPA and EC, 1988; Camp Dresser & McKee, 1993).
Atmospheric transport and deposition of chemical contaminants, leakage from
Michigan's Act 307 contaminated sites, and industrial effluents to the system provide a
source for a variety of toxic chemicals to the Detroit River through the Combined Sewer
Overflow (CSO) process (Arimoto, 1989; Michigan Department of Natural Resources,
1993). In early studies for many toxic substances, the ambient atmosphere has been
determined to be a substantial source of water quality degradation through both wet and
dry depositions (Eisenreich et al., 1981; Bidkman, 1988; Pirrone and Keeler, 1993;
Holsen et al., 1993). CSO's have been demonstrated to be a major source of conventional
and toxic contamination to the Detroit River (DR), for example, by the 1979-1980 major
monitoring and modeling work on the Section 201 Final Facilities Plan conducted by the
Joint Venture (Giffels et al., 1980), to characterize the DR CSO loadings. The quantity
and quality of the discharge for 10 constituents (Cadmium, Chloride, Copper, Lead,
Mercury, Nickel, PCBs, Total Phosphorus, Silver, and Zinc) from 45 City of Detroit
CSOs were summarized (Table 1) from among 23 constituents monitored during that
period. All of the CSOs studied discharge directly to the Detroit River except for three
that discharge to the Rouge River at its mouth near the confluence with the Detroit River.
The Detroit Water and Sewerage Department (DWSD) used a planning level collection
system model which determines the system-wide overflow quantity and quality of CSOs
(Kummler, 1982). This model was a computerized mathematical representation of
Detroit's combined sewer system which, for a given rainfall event, was capable of
determining the amount and quality of runoff and subsequent overflows which would
occur from the various overflow locations in the city. In 1979 the total CSO discharge
from the City of Detroit to the Detroit River was estimated to be 16.8 billion gallons and
the average yearly discharge was calculated as 12.45 billion gallons. The average year was
-819-

1965 and was determined to be statistically representative of typical rainfall patterns
(Giffels, et al., 1980; Combined Sewer Overflows Technical Workgroup, 1994).
Table 1 Mean contaminant concentrations of CombinedSewer Overflows for Detroit in 1979
Parameter
Cadmium
Chlorides
Copper
Lead
Mercury
Nickel
PCBs
Total
Phosphorus
Silver
Zinc
All Sites
(ug/1)
32
63000
165
252
39
361
13.4
5200
34
335
Rouge
River Sites
(ug/1)
28
74000
129
166
34
455
17.4
6200
33
222
Detroit
River Sites
(ug/1)
41
44000
218
447
45139
2.4
3900
38
555
A Remedial Action Plan (RAP) for the Detroit River was initiated in 1986; the
purpose of the Stage I RAP was to define and describe in detail the environmental
problems in the Detroit River including a definition of impaired beneficial uses, the causes
of impairment, a description of all known sources of pollutants involved, and an evaluation
of other possible sources (Michigan Department of Natural Resources and Ontario
Ministry of the Environment, 1991). Fish contaminant monitoring programs in the Detroit
River have shown elevated levels of Mercury and PCBs in some species of fish, for
example, the Walleye (Mercury) and Carp (PCBs) (Detroit River Remedial Action Plan,
1990-1991). The Stage I RAP used the 1979 CSO concentrations to estimate the CSO
loadings to the Detroit River. However, the population, industrial productivity and control
measures, and the Detroit Sewerage System Configuration has ail changed substantially
since the 1979 data were developed. Thus, the Stage I RAP document does not present a
current estimate of Detroit CSO loadings.
-820-
Stage II of the Detroit River Remedial Action Plan is designed to update the Stage
I DR RAP and a Technical Workgroup was established to review the current strategies
designed to solve the CSO problem, assess the adequacy of current CSO control activities
and Strategies (CSO Technical Workgroup, 1994). In order to more correctly assess the
current loadings for the Stage II RAP process, a new estimate in the absence of rww
measurements had to be made. The authors served as the data analysis team for the DR
RAP to estimate the CSO conventional and toxic concentrations from the analysis cf
DWSD Waste Water Treatment Plant (WWTP) influent data for the period 1983 throu^:
1992 (Michigan Department of Natural Resources and Ontario Ministry of the
Environment and Energy, 1995).
The objective of this study is to present a simple method utilizing the pds
measurement data (1979) of Combined Sewer Overflows to make reasonable predictions
of conventional and toxic concentrations for 10 constituents based upon antecedent
documented conditions in the DWSD WWTP influent
2. Methodology
First, DWSD provided daily data of DWWTP influent flow and concentrations fcj
the period July 1, 1982, through June 30, 1992, (called herein fiscal year 1983 through
fiscal year 1992) including the wet and dry weather days. The average number of sampk-,-.
per year is 285 (maximum 365 in fiscal year 1989, minimum 52 in fiscal year 1992; f; .-•
Mercury raw data, 361 (maximum 365 in fiscal year 1991, minimum 332 in fiscal year
1983) for Total Phosphorus raw data, and 16 (maximum 49 in fiscal year 1983, mirJ r T-.
11 in fiscal year 1991) for Silver raw data. Those raw data were used to analyse •
parameters (Total Phosphorus, Chloride, Total Suspended Solids, Arsenic, Carim^'.
Total Chromium, Hexavalent Chromium, Copper, Iron, Lead, Mercury, Nickel, Silver
Zinc, Oil/Grease, Phenols, Total PCBs). Both annual average influent concentrations and
loadings from fiscal year 1983 to fiscal year 1992 have been examined. The first fiscal year
(1983) and last fiscal year (1992) points are also calculated using a t-distribution and the
confidence intervals (95% confidence limits) are determined.
Secondly, the Technical Workgroup calculated the ratio of 1983 to 1992 DWWTP
annual average influent concentrations for each parameter. This ratio then was applied to
the 1979 CSO concentrations to estimate current CSO concentrations, because the ar.nusi
average CSO concentrations for the Detroit River can be assumed to be proportional fo
the DWWTP annual average influent concentrations.
-821-
3. Results and Discussion
The results (See Figure 2 for Mercury, Figure 3 for Total Phosphorus, and Figure
4 for Silver) displayed herein include the trends of each parameter's annual average
influent loadings and concentrations. The confidence intervals ( 9 5 * confidence limits) of
the first fiscal year (1983) and last fiscal year (1992) points are 0.107 and 0.09 for
Mercury loadings, 0.04 and 0.027 for Mercury concentrations. 368 and 196 for Total
Phosphorus loadings, 184 and 74 for Total Phosphorus concentrations, 4.84 and 6.09 for
Silver loadings, 1.81 and 2.11 for Silver concentrations. In addition. Tablet 2 and 3 show
the 17 parameter annual average influent loading and concentration reduction percentages
between first fiscal year (1983) and last fiscal year (1992) for the DWSD WWTP.
Because of the City of Detroit's Industrial Pretreatment Program, the general
decline of industrial activity in the area, the conscientious efforts of industries to reduce
discharges through pollution prevention, and other factors, Table 4 predicts the current
(1992) Detroit River CSO concentrations to be substantially less than the 1979 Detroit
River CSO concentrations.
4. Conclusions
Detailed and complete in situ field sampling, analysis and evaluation of the
magnitude CSO loadings, both temporally and spatially, and the effect of each
contaminant on all environment media is almost impossible from a financial point of view.
Hence we must utilize the past and current sampling to learn how to make reasonable
predictions of toxic loadings based upon antecedent document conditions. Based upon the
trends from 1983 through 1992 at the Detroit WWTP, it has been estimated that CSO
loadings for r'afowm? have been reduced by 18%, Copper 79%, Lead 77%, Mercury
50%, Nickel 72%, PCBs 95%, Phosphorus 24%, Silver 57%, and Zinc 53%. However the
CSO loading for Chloride has been increased by 13%. Further study is now being
conducted to provide an estimation of Event Mean Concentrations of toxicants during
storm events for several categories of Land Use to support the above analysis, using 1995
sampling data in selected Detroit River sites.
-822-
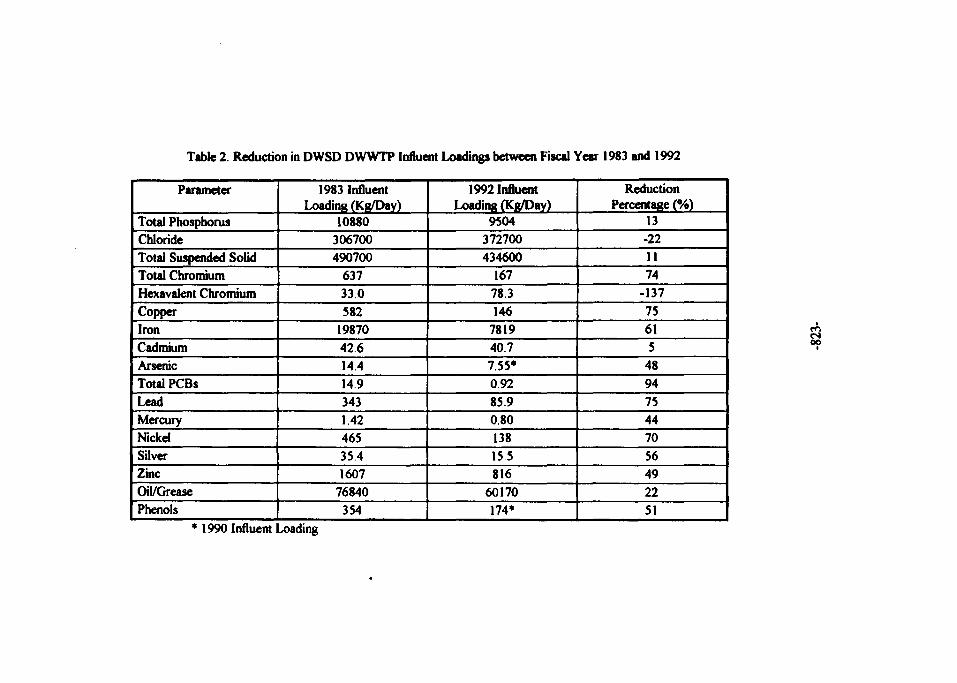
Table 2. Reduction in DWSD DWWTP Influent Loadings between Fiscal Year 1983 and 1992
Parameter
Total PhosphorusChlorideTotal Suspended SolidTotal ChromiumHexavalent ChromiumCopperIronCadmiumArsenicTotal PCBsLeadMercuryNickelSilverZincOil/GreasePhenols
1983 InfluentLoading (Kg/Day)
10880306700490700
63733.0582
1987042.61441493431.424653541607
76840354
1992 InfluentLoading (Kg/Day)
9504372700434600
16778.3146
781940.77.55*0.9285.90.80138155816
60170174*
ReductionPercentage (%)
13-221174
-13775615
489475447056492251
1990 Influent Loading
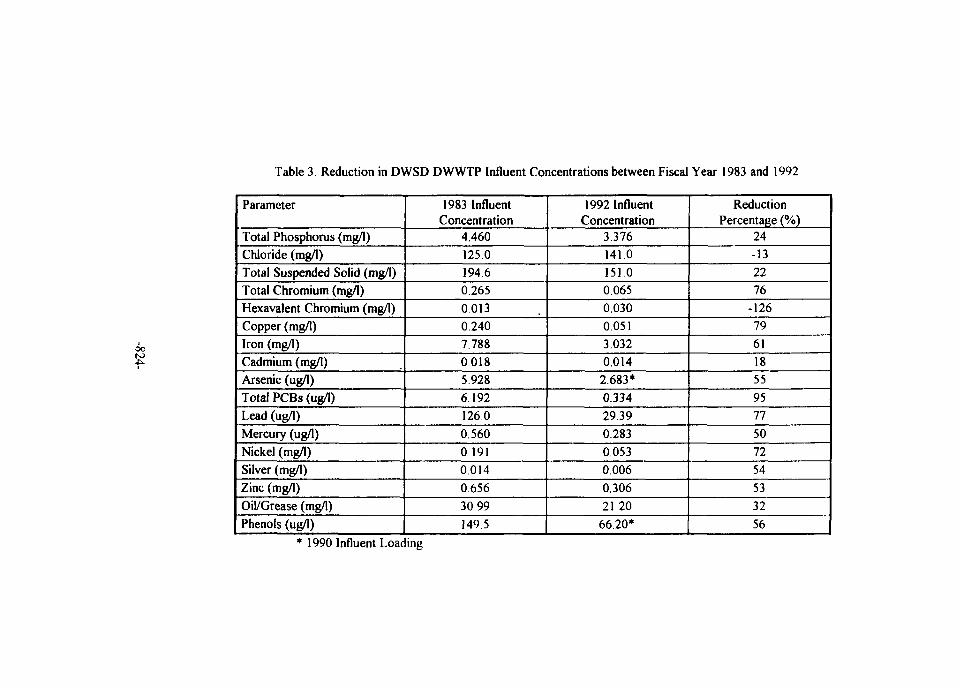
Table 3 Reduction in DWSD DWWTP Influent Concentrations between Fiscal Year 1983 and 1992
Parameter
Total Phosphorus (mg/l)Chloride (mg/l)Total Suspended Solid (mg/l)Total Chromium (mg/l)Hexavalent Chromium (mg/l)Copper (mg/l)Iron (mg/l)Cadmium (mg/l)Arsenic (ug/I)Total PCBs (ug/1)Lead (ug/1)Mercury (ug/1)Nickel (mg/l)Silver (mg/l)Zinc (mg/l)Oil/Grease (mg/l)Phenols (ug/1)
1983 InfluentConcentration
4.460125.0194.60.26500130.2407.78800185.9286.19212600.5600 19100140.65630.99149.5
1992 InfluentConcentration
3.376141.0151.00.0650.0300.0513.0320.0142.683*0.33429.390.2830.05300060.30621.20
66.20*
ReductionPercentage (%)
24-132276
-126796118559577507254533256
1990 Influent Loading
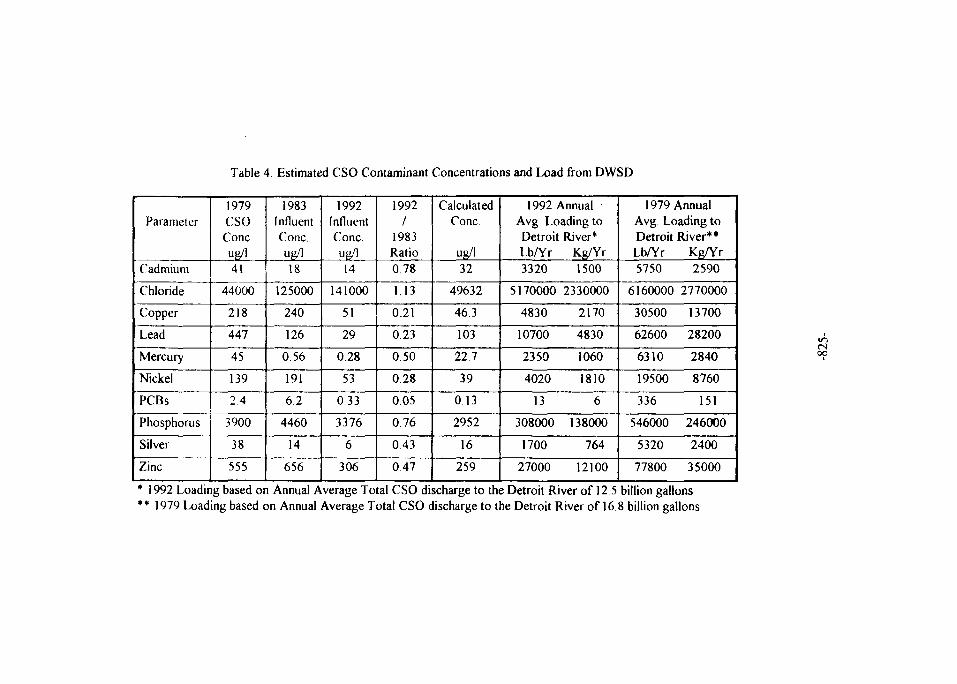
Table 4 Estimated CSO Contaminant Concentrations and Load from DWSD
Parameter
Cadmium
Chloride
Copper
Lead
Mercury
Nickel
PCBs
Phosphorus
Silver
Zinc
1979CSOConeug/141
44000
218
447
45
139
2.4
3900
38
555
1983InfluentConeug/118
125000
240
126
0.56
191
62
4460
14
656
1992InfluentCone.ug/114
141000
51
29
0.28
53
033
3376
6
306
1992/
1983Ratio0.78
1.13
0.21
023
050
0.28
005
0 76
043
047
CalculatedCone
ug/132
49632
46.3
103
22.7
39
0 13
2952
16
259
1992 AnnualAvg. Loading toDetroit River*Lb/Yr Kg/Yr3320 1500
5170000 2330000
4830 2170
10700 4830
2350 1060
4020 1810
13 6
308000 138000
1700 764
27000 12100
1979 AnnualAvg Loading toDetroit River**Lb/Yr Kg/Yr5750 2590
6160000 2770000
30500 13700
62600 28200
6310 2840
19500 8760
336 151
546000 246000
5320 2400
77800 35000
* 1992 Loading based on Annual Average Total CSO discharge to the Detroit River of 12.5 billion gallons•• 1979 Loading based on Annual Average Total CSO discharge to the Detroit River of 16.8 billion gallons
oo

1.5
I ,
0.5
DWWTP Hg Influent Loading
DWWTP Hg Influent Concentration
1.5
c
' I5
0.5
82 84 86 88Fiscal Year
90 92
Fig. 2 Trend of Annual Average Mercury InfluentLoadings and Concentrations to DWWTPfrom 1989 to 1992 (95% Confidence Limits)
-826-
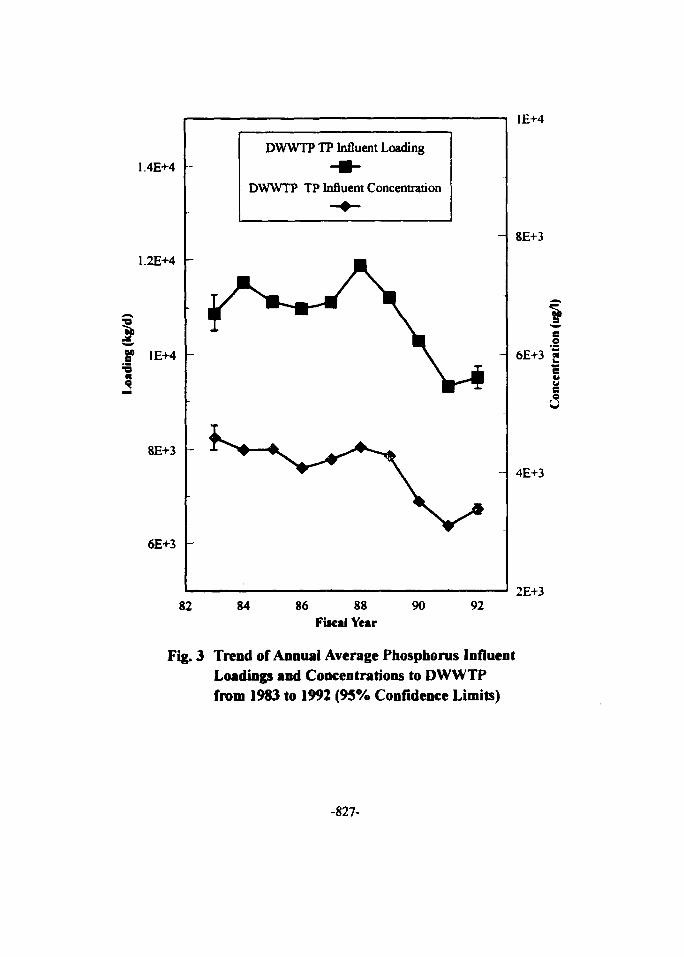
1.4E+4
1.2E+4
I
»1E+4
8E+3
6E+3
82
DWWTP TP Influent Loading
DWWTP TP Influent Concentration
1E+4
8E+3
Is
6E+3 f
4E+3
2E+384 86 88
Fiscal Year90 92
Fig. 3 Trend of Annual Average Phosphorus InfluentLoadings and Concentrations to DWWTPfrom 1983 to 1992 (95% Confidence Limits)
-827-
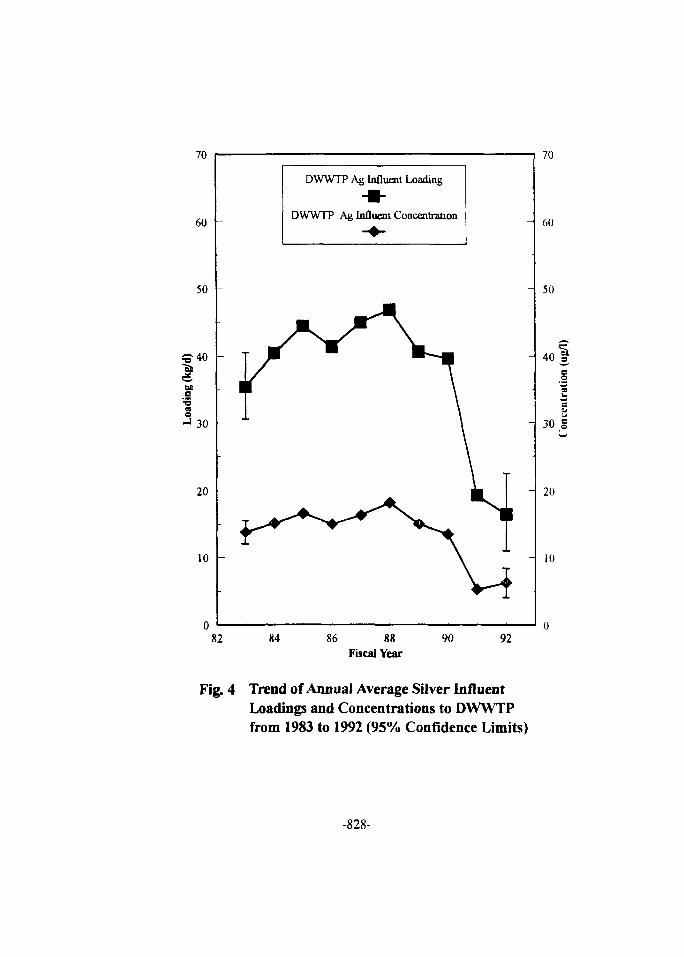
70
60 -
50
ۥ40
o
30
20
10
DWWTP Ag Influent Loading
DWWTP Ag Influent Concentration
82 84 86 88 90
Fiscal Year
70
60
50
40
30
20
10
92
Fig. 4 Trend of Annual Average Silver InfluentLoadings and Concentrations to DWWTPfrom 1983 to 1992 (95% Confidence Limits)
-828-
Acronyms
CSO: Combined Sewer Overflow
DWSD: Detroit Water and Sewerage Department
DWWTP: Detroit Wastewater Treatment Plant
RAP: Remedial Action Plan
PCB's: Polychlorinated Byphenyl's
References
Arimoto, R. 1989. Atmospheric Deposition of Chemical Contaminants to the Great Lakes.J. Great Lakes Res., 15(2). pp:339-356.
Bidleman, T.F. 1988. Atmospheric Processes. Environ. Sci. Technol., 22. pp:361-367.
Camp Dresser & McKee. 1993. Model Development Status Report. Prepared for theDetroit River Water and Sewerage Department. pp:27-61.
Combined Sewer Overflows Technical Workgroup. 1994. Stage 2 - Detroit RiverRemedial Action Plan: Final Draft.
Detroit River Remedial Action Plan. Winter 1990-91. Newsletter Issue Four.
Eisenreich, S.J., Looney, B.B. and J.D. Thornton. 1981. Airborne Organic Contaminantsin the Great Lakes Ecosystem. Environ. Sci. Techno!., 15. pp:3O-38.
Giffels/Black & Veatch. 1980. Quantity and Quality of Combined Sewer OverflowsVolume n. Prepared for the Detroit River Water and Sewerage Department.
Holsen, T.M., Noll, K.E., Fang, G.C., Lee, W.J., Lin, J.M. and GJ. Keeler. 1993. DryDeposition and Particle Size Distributions Measured during the Lake Michigan Urban AirToxics Study. Environ. Sci. Technol., 27: pp: 1327-1333.
Kummler, R. 1982. SWMM Modeling for the Detroit 201 Final Facilities Plan: FinalResults. SWMM User's Group Meeting, Ottawa, Canada.
Lin, C.C. 1994. Modeling the Detroit River Aquatic and Sediment Systems. Ph.D.dissertation. Dept of Chemical Engineering, Wayne State University, Detroit, Michigan.pp:l-5.
Michigan Department of Natural Resources. 1993. Proposed List for Michigan Sites ofEnvironmental Contamination.
-829-
Michigan Department of Natural Resources and Ontario Ministry of the Environment andEnergy. 1995. Remedial Action Plan for Detroit River Area of Concern. Draft BiennialReport
Michigan Department of Natural Resources and Ontario Ministry of the Environment1991. Remedial Action Plan Stage I for Detroit River Area of Concern.
Pirrone, N. and G.J. Keeler. Deposition of Trace Metals in Urban and Rural Areas in theLake Michigan Basin. Water Science and Technology, 28: pp:261-27O.
Roginski, G.T. 1981. A Finite Difference Model of Pollutant Concentrations in the DetroitRiver from Combined Sewer Overflows. Ph.D. dissertation. Dept of Chemical andMetallurgical Engineering, Wayne State University, Detroit, Michigan. pp:l-10.
U.S. EPA and EC. 1988. Upper Great Lakes Connecting Channels Study. Volume II.Final Report pp:4S6-476.
-830-
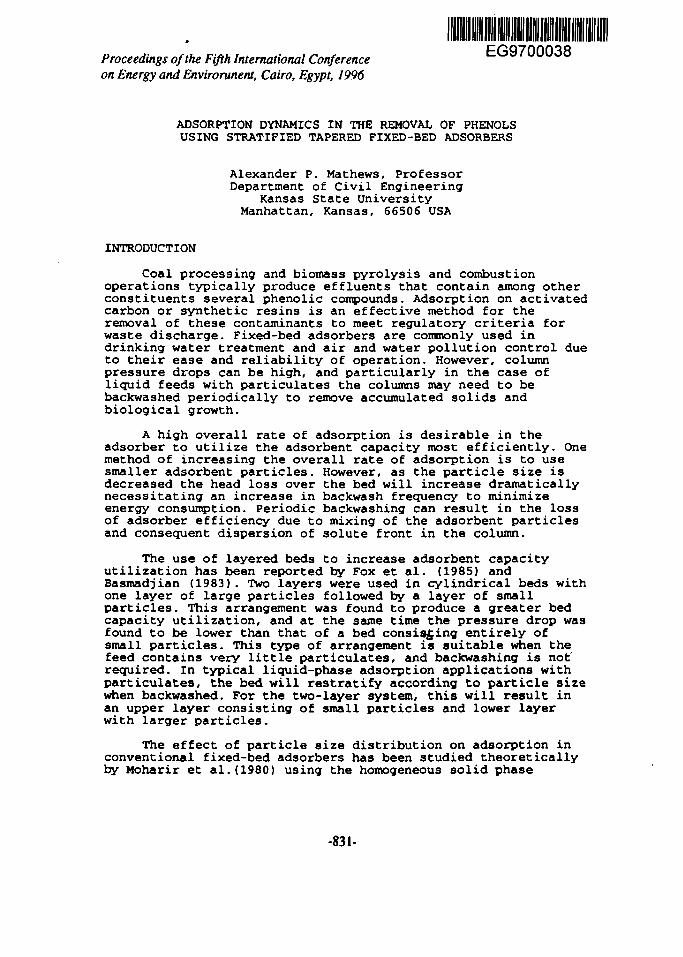
Proceedings of the Fifth International Conference fvUUooon Energy and Envirorunent, Cairo, Egypt, 1996
ADSORPTION DYNAMICS IN THE REMOVAL OF PHENOLSUSING STRATIFIED TAPERED FIXED-BED ADSORBERS
Alexander P. Mathews, ProfessorDepartment of Civil Engineering
Kansas State UniversityManhattan, Kansas, 66506 USA
INTRODUCTION
Coal processing and biomass pyrolysis and combustionoperations typically produce effluents that contain among otherconstituents several phenolic compounds. Adsorption on activatedcarbon or synthetic resins is an effective method for theremoval of these contaminants to meet regulatory criteria forwaste discharge. Fixed-bed adsorbers are commonly used indrinking water treatment and air and water pollution control dueto their ease and reliability of operation. However, columnpressure drops can be high, and particularly in the case ofliquid feeds with particulates the columns may need to bebackwashed periodically to remove accumulated solids andbiological growth.
A high overall rate of adsorption is desirable in theadsorber to utilize the adsorbent capacity most efficiently. Onemethod of increasing the overall rate of adsorption is to usesmaller adsorbent particles. However, as the particle size isdecreased the head loss over the bed will increase dramaticallynecessitating an increase in backwash frequency to minimizeenergy consumption. Periodic backwashing can result in the lossof adsorber efficiency due to mixing of the adsorbent particlesand consequent dispersion of solute front in the column.
The use of layered beds to increase adsorbent capacityutilization has been reported by Fox et al. (1985) andBasmadjian (1983). Two layers were used in cylindrical beds withone layer of large particles followed by a layer of smallparticles. This arrangement was found to produce a greater bedcapacity utilization, and at the same time the pressure drop wasfound to be lower than that of a bed consisting entirely ofsmall particles. This type of arrangement is suitable when thefeed contains very little particulates, and backwashing is notrequired. In typical liquid-phase adsorption applications withparticulates, the bed will restratify according to particle sizewhen backwashed. For the two-layer system, this will result inan upper layer consisting of small particles and lower layerwith larger particles.
The effect of particle size distribution on adsorption inconventional fixed-bed adsorbers has been studied theoreticallyby Moharir et al.(1980) using the homogeneous solid phase
-831-
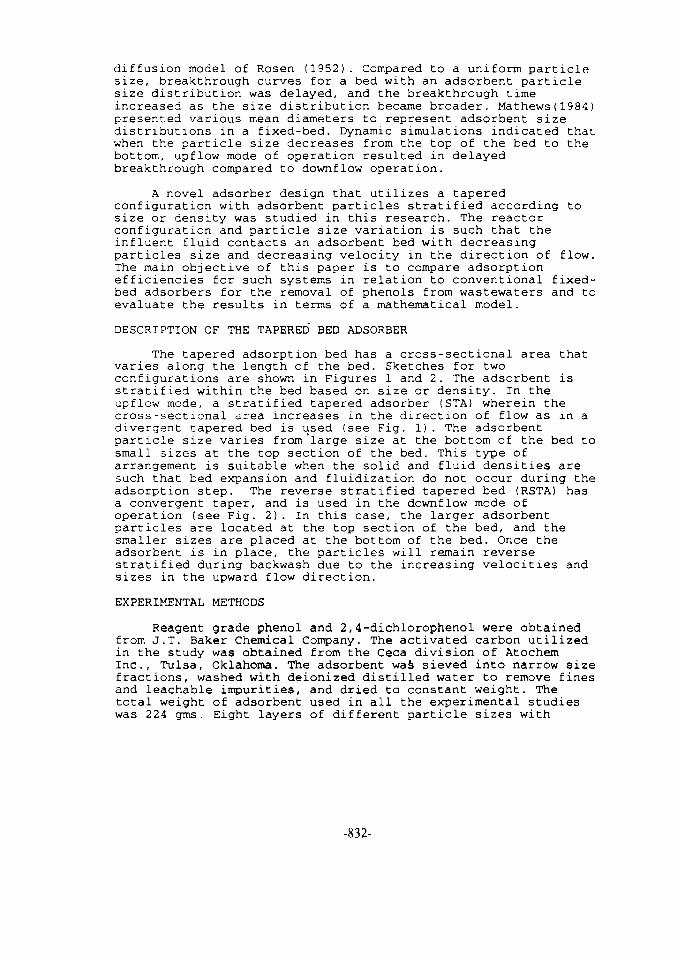
diffusion model of Rosen (1952). Compared to a uniform particlesize, breakthrough curves for a bed with an adsorbent particlesize distribution was delayed, and the breakthrough timeincreased as the size distribution became broader. Mathews(1984)presented various mean diameters to represent adsorbent sizedistributions in a fixed-bed. Dynamic simulations indicated thatwhen the particle size decreases from the top of the bed to thebottom, upflow mode of operation resulted in delayedbreakthrough compared to downflow operation.
A novel adsorber design that utilizes a taperedconfiguration with adsorbent particles stratified according tosize or density was studied in this research. The reactorconfiguration and particle size variation is such that theinfluent fluid contacts an adsorbent bed with decreasingparticles size and decreasing velocity in the direction of flow.The main objective of this paper is to compare adsorptionefficiencies for such systems in relation to conventional fixed-bed adsorbers for the removal of phenols from wastewaters and toevaluate the results in terms of a mathematical model.
DESCRIPTION OF THE TAPERED' BED ADSORBER
The tapered adsorption bed has a cross-sectional area thatvaries along the length of the bed. Sketches for twoconfigurations are shown in Figures 1 and 2. The adsorbent isstratified within the bed based on size or density. In theupflow mode, a stratified tapered adsorber (STA) wherein thecross-sectional area increases in the direction of flow as in adivergent tapered bed is used (see Fig. 1). The adsorbentparticle size varies from'large size at the bottom of the bed tosmall sizes at the top section of the bed. This type ofarrangement is suitable when the solid and fluid densities aresuch that bed expansion and fluidization do not occur during theadsorption step. The reverse stratified tapered bed (RSTA) hasa convergent taper, and is used in the downflow mode ofoperation (see Fig. 2). In this case, the larger adsorbentparticles are located at the top section of the bed, and thesmaller sizes are placed at the bottom of the bed. Once theadsorbent is in place, the particles will remain reversestratified during backwash due to the increasing velocities andsizes in the upward flow direction.
EXPERIMENTAL METHODS
Reagent grade phenol and 2,4-dichlorophenol were obtainedfrom J.T. Baker Chemical Company. The activated carbon utilizedin the study was obtained from the Ceca division of AtochemInc., Tulsa, Oklahoma. The adsorbent was sieved into narrow sizefractions, washed with deionized distilled water to remove finesand leachable impurities, and dried to constant weight. Thetotal weight of adsorbent used in all the experimental studieswas 224 gms. Eight layers of different particle sizes with
-832-
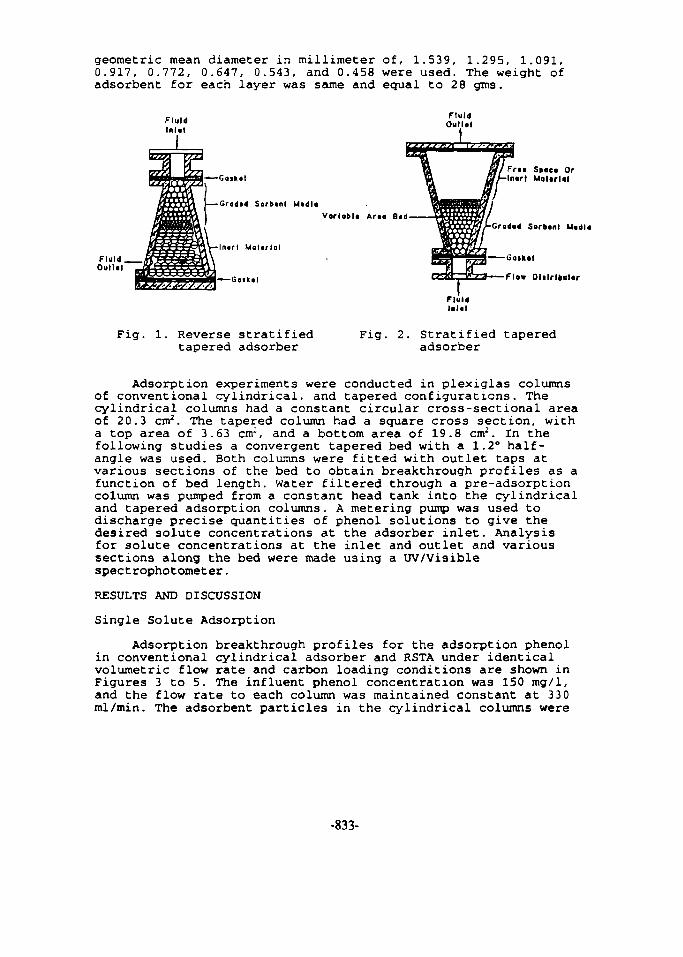
geometric mean diameter in millimeter of, 1.539, 1.295, 1.091,0.917, 0.772, 0.647, 0.543, and 0.458 were used. The weight ofadsorbent for each layer was same and equal to 28 gms.
Fluid.Oullal
Goikat
—Gradad Sorb.nl MadiaVorlobla Araa Bad
Inarf Malarial
-Gaikal
FluidOullal
Fraa Spaca OrInarl Malarial
Gradad Sorbanl Madia
Gatkat
Flow Olilrioutor
Fig. 1. Reverse stratified Fig. 2. Stratified taperedtapered adsorber adsorber
Adsorption experiments were conducted in plexiglas columnsof conventional cylindrical, and tapered configurations. Thecylindrical columns had a constant circular cross-sectional areaof 20.3 cm2. The tapered column had a square cross section, witha top area of 3.63 cm-, and a bottom area of 19.8 cm2. In thefollowing studies a convergent tapered bed with a 1.2° half-angle was used. Both columns were fitted with outlet taps atvarious sections of the bed to obtain breakthrough profiles as afunction of bed length. Water filtered through a pre-adsorptioncolumn was pumped from a constant head tank into the cylindricaland tapered adsorption columns. A metering pump was used todischarge precise quantities of phenol solutions to give thedesired solute concentrations at the adsorber inlet. Analysisfor solute concentrations at the inlet and outlet and varioussections along the bed were made using a UV/Visiblespectrophotometer.
RESULTS AND DISCUSSION
Single Solute Adsorption
Adsorption breakthrough profiles for the adsorption phenolin conventional cylindrical adsorber and RSTA under identicalvolumetric flow rate and carbon loading conditions are shown inFigures 3 to 5. The influent phenol concentration was 150 mg/1,and the flow rate to each column was maintained constant at 33 0ml/min. The adsorbent particles in the cylindrical columns were
-833-
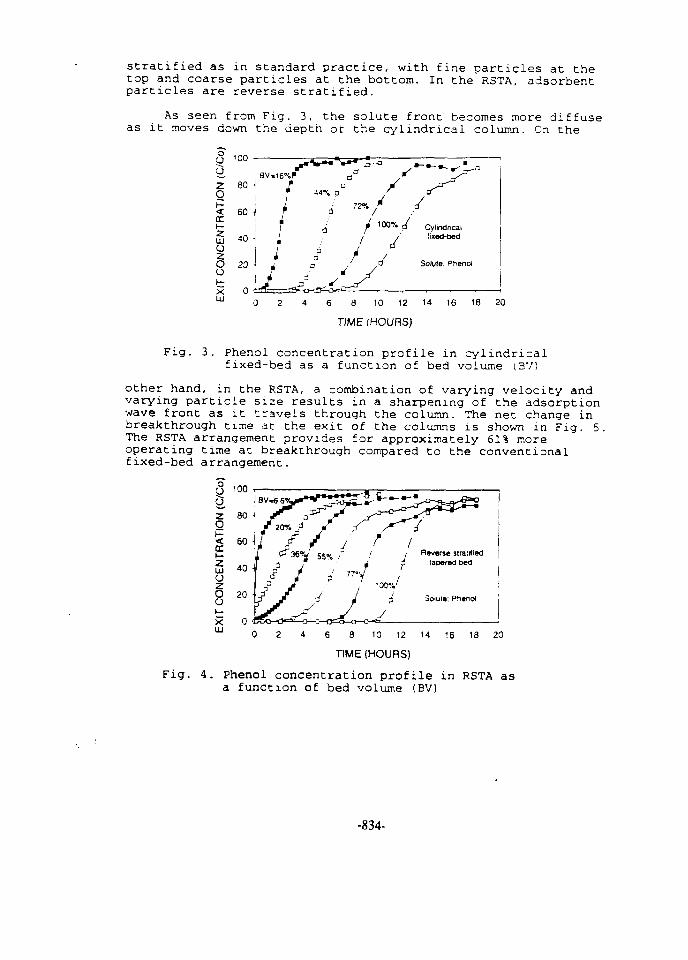
stratified as in standard practice, with fine particles at thetop and coarse particles at the bottom. In the RSTA, adsorbentparticles are reverse stratified.
As seen from Fig. 3, the solute front becomes more diffuseas it moves down the depth of the cylindrical column. On the
8 10 12 14
TIME (HOURS)
16 18 20
Fig. 3. Phenol concentration profile in cylindricalfixed-bed as a function of bed volume (BV)
other hand, in the RSTA, a combination of varying velocity andvarying particle size results in a sharpening of the adsorptionwave front as it travels through the column. The net change inbreakthrough time at the exit of the columns is shown in Fig. 5.The RSTA arrangement provides for approximately 61% moreoperating time at breakthrough compared to the conventionalfixed-bed arrangement.
Solute: Phenol
8 10 12 14 16 18 20
TIME (HOURS)
Fig. 4. Phenol concentration profile in RSTA asa function of bed volume (BV)
-834-
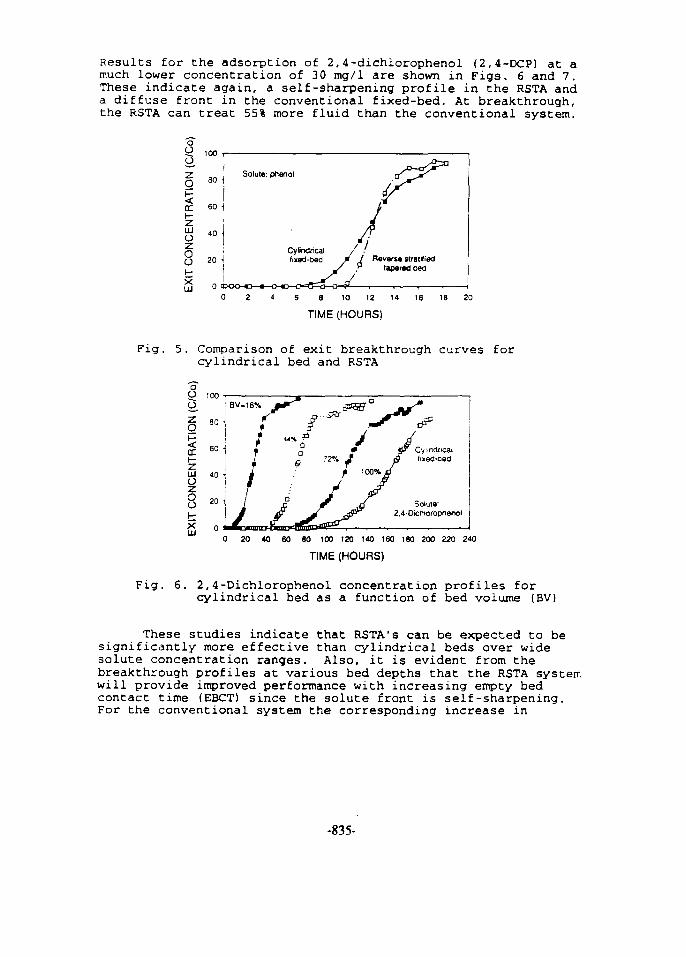
Results for Che adsorption of 2,4-dichlorophenol (2,4-DCP) at amuch lower concentration of 30 mg/1 are shown in Figs. 6 and 7.These indicate again, a self-sharpening profile in the RSTA anda diffuse front in the conventional fixed-bed. At breakthrough,the RSTA can treat 55% more fluid than the conventional system.
S 8 10 12 U 16 13 20
TIME (HOURS)
Fig. 5. Comparison of exit breakthrough curves forcylindrical bed and RSTA
oO 100O j BV*16%
0 20 40 60 SO 100 120 140 160 180 200 220 240
TIME (HOURS)
Fig. 6. 2,4-Dichlorophenol concentration profiles forcylindrical bed as a function of bed volume (BV)
These studies indicate that RSTA's can be expected to besignificantly more effective than cylindrical beds over widesolute concentration ranges. Also, it is evident from thebreakthrough profiles at various bed depths that the RSTA systemwill provide improved performance with increasing empty bedcontact time (EBCT) since the solute front is self-sharpening.For the conventional system the corresponding increase in
-835-
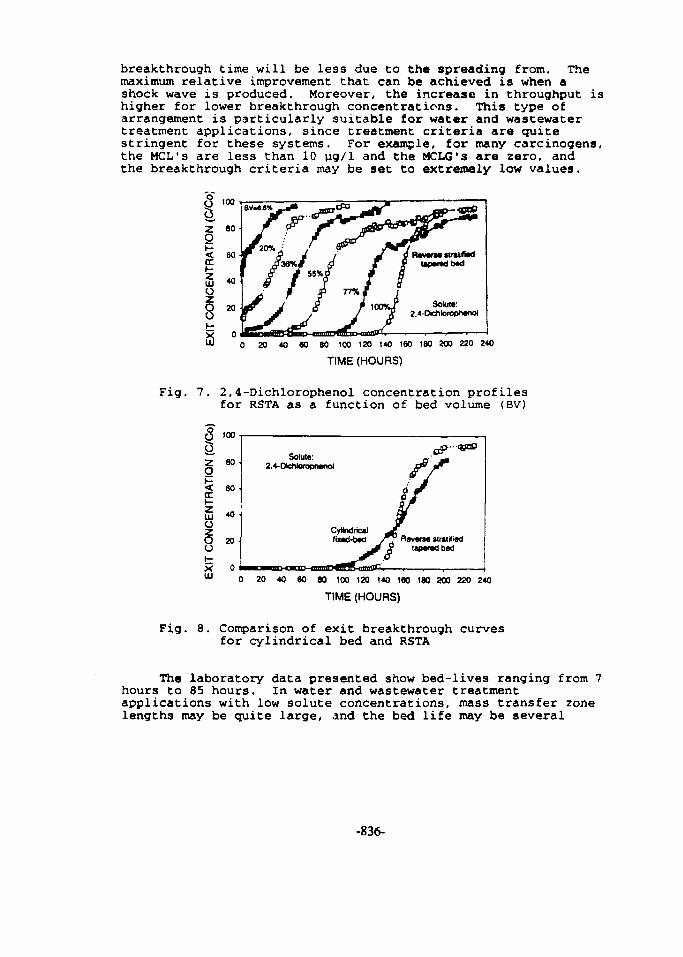
breakthrough time will be less due to the spreading from. Themaximum relative improvement that can be achieved is when ashock wave is produced. Moreover, the increase in throughput ishigher for lower breakthrough concentrations. This type ofarrangement is particularly suitable for water and wastewatertreatment applications, since treatment criteria are quitestringent for these systems. For example, for many carcinogens,the MCL's are less than 10 ug/1 and the MCLG'3 are zero, andthe breakthrough criteria may be set to extremely low values.
0 20 40 60 80 100 120 140 160 180 200 220 240
TIME (HOURS)
Fig. 7. 2,4-Dichlorophenol concentration profilesfor RSTA as a function of bed volume (BV)
Reverse stratifiedtapered bed
0 20 40 80 SO 100 120 140 160 180 200 220 240
TIME (HOURS)
Fig. 8. Comparison of exit breakthrough curvesfor cylindrical bed and RSTA
The laboratory data presented show bed-lives ranging from 7hours to 85 hours. In water and wastewater treatmentapplications with low solute concentrations, mass transfer zonelengths may be quite large, and the bed life may be several
-836-
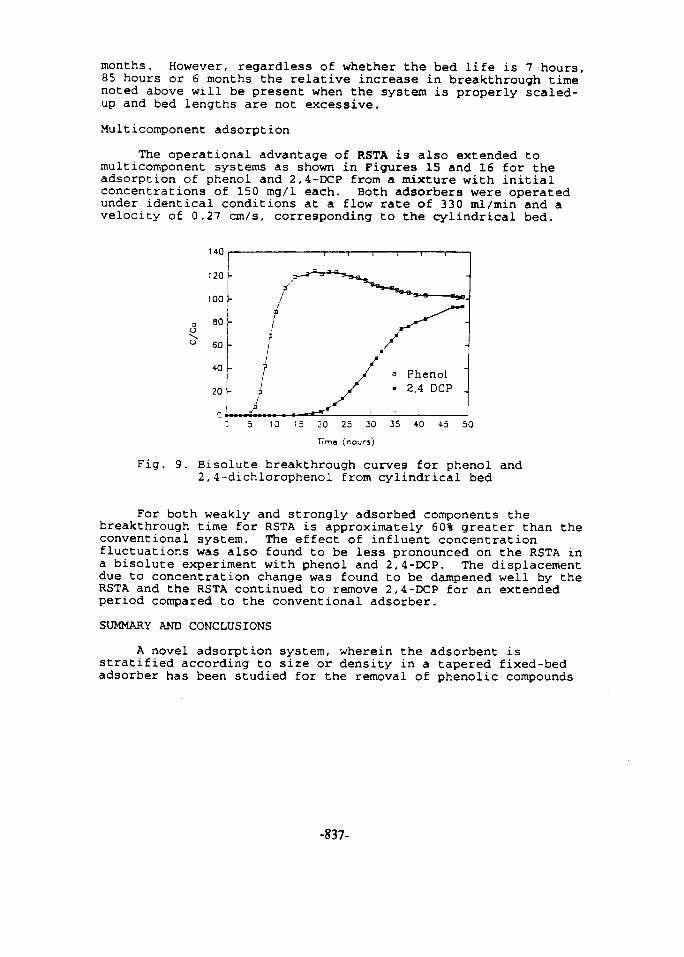
months. However, regardless of whether the bed life is 7 hours,85 hours or 6 months the relative increase in breakthrough timenoted above will be present when the system is properly scaled-up and bed lengths are not excessive.
Multicomponent adsorption
The operational advantage of RSTA is also extended tomulticomponent systems as shown in Figures 15 and 16 for theadsorption of phenol and 2,4-DCP from a mixture with initialconcentrations of 150 mg/1 each. Both adsorbers were operatedunder identical conditions at a flow rate of 330 ml/min and avelocity of 0.27 cm/s, corresponding to the cylindrical bed.
o Phenol• 2,4 DCP
10 15 20 25 20 35 40 +5 50
Time (hours)
Fig. 9. Bisolute breakthrough curves for phenol and2,4-dichlorophenol from cylindrical bed
For both weakly and strongly adsorbed components thebreakthrough time for RSTA is approximately 60% greater than theconventional system. The effect of influent concentrationfluctuations was also found to be less pronounced on the RSTA ina bisolute experiment with phenol and 2,4-DCP. The displacementdue to concentration change was found to be dampened well by theRSTA and the RSTA continued to remove 2,4-DCP for an extendedperiod compared to the conventional adsorber.
SUMMARY AND CONCLUSIONS
A novel adsorption system, wherein the adsorbent isstratified according to size or density in a tapered fixed-bedadsorber has been studied for the removal of phenolic compounds
-837-
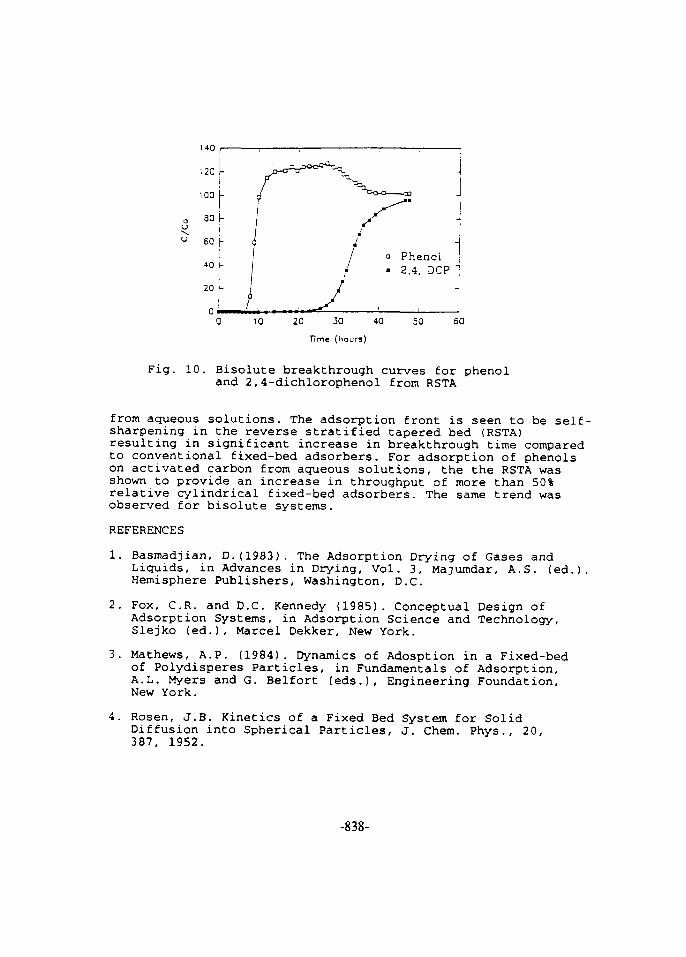
10 20 JO 40 50
Time (hours)
60
Fig. 10. Bisolute breakthrough curves for phenoland 2,4-dichlorophenol from RSTA
from aqueous solutions. The adsorption front is seen to be self-sharpening in the reverse stratified tapered bed (RSTA)resulting in significant increase in breakthrough time comparedto conventional fixed-bed adsorbers. For adsorption of phenolson activated carbon from aqueous solutions, the the RSTA wasshown to provide an increase in throughput of more than 50%relative cylindrical fixed-bed adsorbers. The same trend wasobserved for bisolute systems.
REFERENCES
1. Basmadjian, D.(1983). The Adsorption Drying of Gases andLiquids, in Advances in Drying, Vol. 3, Majumdar, A.S. (ed.).Hemisphere Publishers, Washington, D.C.
2. Fox, C.R. and D.C. Kennedy (1985). Conceptual Design ofAdsorption Systems, in Adsorption Science and Technology,Slejko (ed.), Marcel Dekker, New York.
3. Mathews, A.P. (1984). Dynamics of Adosption in a Fixed-bedof Polydisperes Particles, in Fundamentals of Adsorption,A.L. Myers and G. Belfort (eds.), Engineering Foundation,New York.
4. Rosen, J.B. Kinetics of a Fixed Bed System for SolidDiffusion into Spherical Particles, J. Chem. Phys., 20,387, 1952.
-838-
Proceedings of the Fifth International Conference EG9700039on Energy and Envirorunent, Cairo, Egypt, 1996
RECOVERY OF MOLYBDENUM AND COBALT POWDERSFROM SPENT HYDROGENATION CATALYST
M.A. Rabah, I.F. Hewaidy and F.E. FarghalyIndustrial Wastes laboratory,Extractive Metallurgy Dept.
CMRDI , P.O.Box 87 Helwan 11421,Cairo,Egypt.
Abstract
Free powders as well as compact shapes of molybdenum and cobalt have been
successfully recovered from spent hvdrogenation and desulphunzauon catalysts. A process
flow sheet was followed involving crushing, milling .particle sizing, hydrometallurgical acid
leaching, roasting of the obtained salts in an atmospheric oxygen to obtain the respective
oxides. These were reduced by hydrogen gas at I IOO°C and 900°C respectively. Parameters
affecting the properties of the products and the recovery efficiency value such as acid
concentration, particle diameter of the solid catalyst, , temperature . time , under a constant
mass flew rate of the hydrogen gas, have been investigated.
A mixture of cone, sulphuric and nitric actds(3:1 by volume) achieved adequate
recovery of both metals. The latter increased with the increase in acid concentration, time up
to 3 hours and temperature: IOO°C and with the decrease in particle diameter of the spent
catalyst. The pH of the obtained filtrate was adjusted to 2 with ammonia to precipitate
insoluble ammonium molybdate and a solution of cobalt sulphate. Cobalt hydroxide can be
precipitated from the latter solution at apH=7.6 using excess ammonium hydroxide solution.
The obtained results showed that the metallic products are technically pure meeting
the standard specifications. Compact shapes of molybdenum acquire density values
increasing with the increase of the pressing load whereby a maximum density value of 2 2 SO
kg/m3 is attained at > 0.75 MPa. Maximum recovery efficiency amounts to 96%.
-839-
A model explaining the obtained results assume that molybdenum and cobalt in the
spent catalvst cement to an alumina carrier Deposition of carbon usually poisoned the
catalyst during use. The weight ratio of carbon increases as the particle size of the catalyst
decreases. Nitric acid helps dissolution of these metals to form complex sulphate salts. High
oxide states of molybdenum and cobalt are formed by roasting in atmospheric oxygen.
Reduction with hydrogen gas takes place in two steps, the overall activation energy of which
amounts tol44.39 kJ.mot1 for molybdenum and 143.4 k).mot' for cobalt.
Metal powders are rough surface with irregular shape. Densificatian of these powders
by pressing takes place due to random movement of the metal particles. Under certain load,
minimum void volume is achieved and the particle-particle friction resists and overweighs
the magnitude and direction of the exerting load. An economic study has revealed that spent
catalyst contains molybdenum and cobalt that are recoverable. Cost of recovery is significant
and the process of recovery is simple.
1 INTRODUCTION
Recovery of metal powders and/or metal alloys have been a subject of investigations
reported in the literature. Two methods were given. The first involved hydrometallurgical
processing. Berrebi et al (1) showed that nickel and copper were separated by solvent
extraction to obtain pure metal. The process started with regeneration of the catalyst to
eliminate hydrocarbons . carbon and sulphur. After caustic roasting, the material was leached
to obtain a solution containing mainly molybdenum and vanadium and a solid containing
essentially alumina, cobalt and/or nickel. It has been also shown that Mo. Ni, V and W were
recovered from spent hydroprocessing catalyst. The catalyst was roasted in an oxygen-
containing gas by ammonia leaching and hydrogen peroxide (2, 3 ).
•840-
Molybdenum, cobalt, vanadium, cadmium and zinc metals were recovered by solvent
extraction from spent hydrosulphurizing catalyst (4). Recovery of these metals from spent
waste was carried out by anhydrous chlorination followed by caustic-acid leaching
processes* 5). Molybdenum was recovered by roasting followed by wateT leaching (6,7).
Hydrogen peroxide leaching (8). sodium hydroxide and sodium aluminate followed by oxygen
pressure leaching (9),were also reported. Rokukawa(lO) extracted Mo and V by sodium
carbonate containing hydrogen peroxide.Pyrometallurgically. Yong etal (11) roasted spent
catalyst at high temperature to recover Mo, Ni, W. Cu and chromium. High yield of extraction
of Mo and vanadium was effected by roasting the spent catalyst with sodium carbonate) 12.13).
Hubred (14) used ammonium carbonate and precipitated molybdenum sulphide by hydrogen
sulphide gas. Sujata (15) showed that the density value of the pressed shapes made of
compacted metal alloy powder was improved with increase in temperature. Mitkov (16)
reported that densification and the micro structure development during hot isostatic pressing of
API superalloy powder were influenced with pressure and temperature.The influence of
manufacturing parameters on the sintering of molybdenum alloy structure (17) and metallic
powder compacts (18) had been showed.
2 EXPERIMENTAL
The experimental part of this study included the preparation of the materials, the testing
rig and equipments, and measurements of the physico-chemical properties of the input and
output products
2.1 The Materials
2.1.1 The spent catalyst.
A spent catalyst sample weighing about 50 kg was supplied by Coke and Basic
chemicals company.Cairo.Egypt. The catalyst is usually used in industrial hydrogenation and
-841-

ammonia fixation ;is well as desulphurization processes. The sampie was visually inspected
vvherebv foreign contaminants were removed It was then classified with respect to particle size
by mechanical sieving with a set of sieves having4. 2 40. 120 and 0 35 mm opening
diameters I ive cuts were obtained I -4 down to -0 3 5 mm in diameter)
2.1.2 The chemicals
Mineral acids as well as caustic soda of pure grade were used as follows.
• Cone, sulphuric acid ( W o ) and nitric acid (70%) were used for acid leaching
processes (3:1 by volume).
• Caustic soda (60°o concentration by weight) was used for the hydrometallurgical
recovery of metal hydroxide.
• Lead acetate 4%. EDTA 0. IN, and zinc sulphate 0. IN were used for the
determination of molybdenum, cobalt and alumina respectively
2.2 Methods of Preparation of Molybdenum and Cobalt Powders
Figure [ I) shows the process tlow sheet followed for the preparation of metal powders
of molybdenum and cobalt However, reduction step was carried out in a tube furnace fitted
with hydrogen gas cylinder and gas purification system. Reduction was monitored at a
temperature range 500-900 JC for 1-3 hours. The metal oxide was charged in a porcelain boat
(25 g). After the temperature of the hot zone of the furnace have been brought at the required
level, the boat with the charge was introduced into the reaction zone. Hydrogen gas was
allowed to flow at a flow rate 0.5-1.5 liter/minute.
After each experiment, the furnace was switched off meanwhile hydrogen gas was
flowing When the temperature of the furnace and the sample were cooled down to » 100°C.
hydrogen gas cylinder was closed. The boat was then discharged and placed in a dissecator
The obtained metal powder was weighed and investigated. Plate 11] shows a photograph
of the used reduction test rig.
-842-
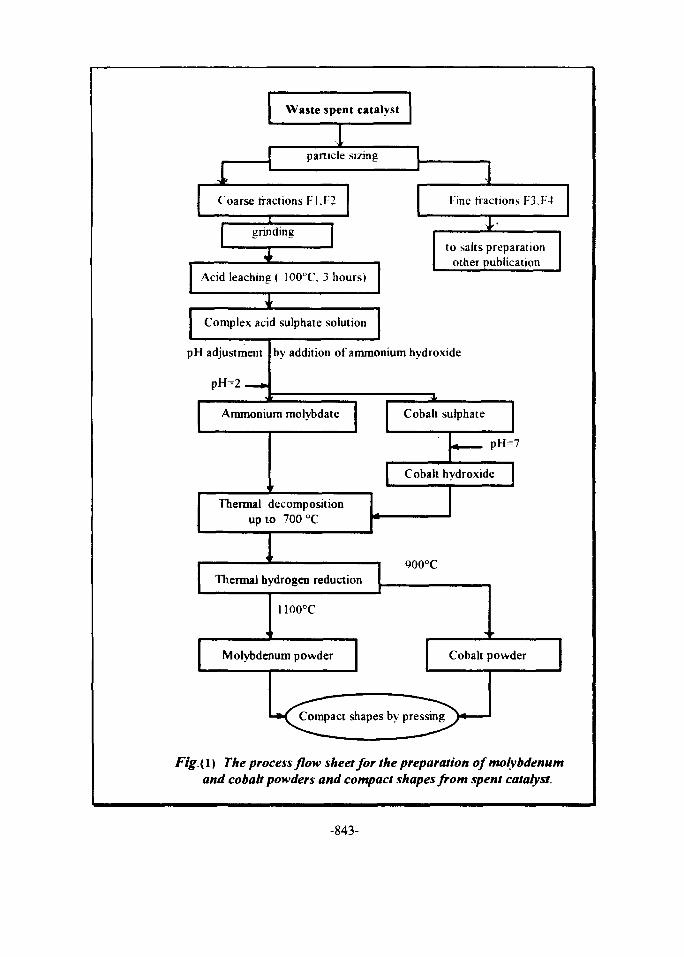
Waste spent catalyst
particle sizing
Coarse tractions F1.F2
grinding
Fine fractions F3.F4
Acid leaching ( I00°C. 3 hours)
Complex acid sulphate solution
pH adjustment
to salts preparationother oublication
by addition of ammonium hydroxide
Ammonium molybdate
1
Cobalt sulphate
F
Tiermal decompositi
up t
Thermal h
0 /UU I.
on
vdrogen reduction
* pH=7
Cobalt hydroxide
QOO°C
1100°C
Molybdenum powder
•-»^ Compact shapes by press
Cobalt powder
ng
Fig.(l) The process flow sheet for the preparation of molybdenumand cobalt powders and compact shapes from spent catalyst.
-843-
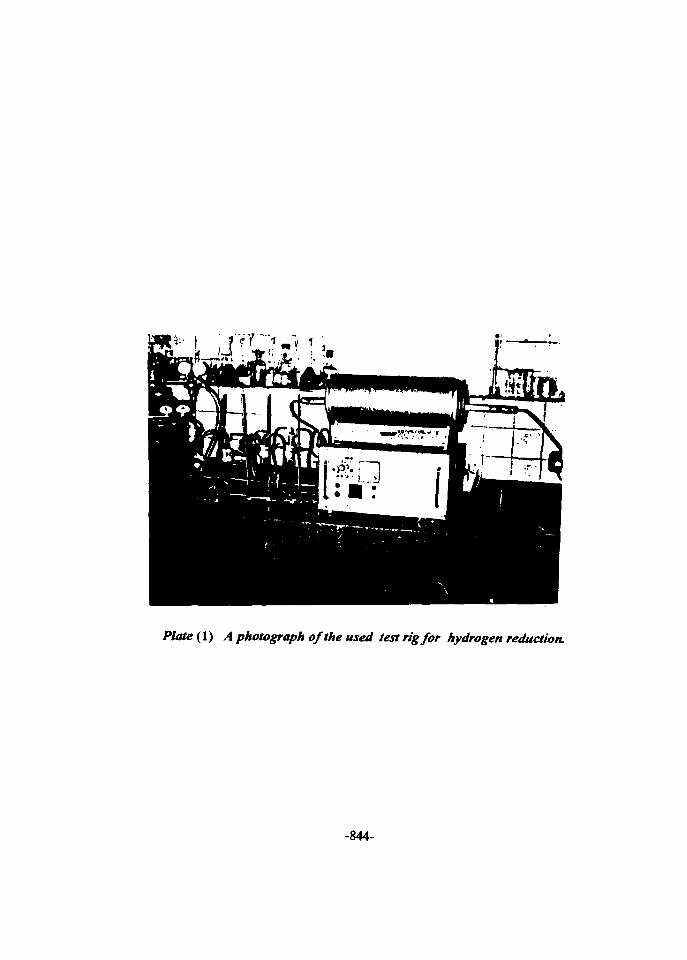
Plate (1) A photograph of the used test rig for hydrogen reduction.
-844-
2.3 Methods of Measurements of the Physico-Chemical Properties of the Input andOutput Products.
• Particle size (mean value) was determined by a sieve shaker type VEB MLW
Labortechnik iL Menau. Germany
• Specific surface area was determined by isothermal liquid nitrogen adsorption method
(BET).
• Density of the powder and compressed shapes were determined with the help of
density bottle using kerosene as a displacement fluid.
• Molybdenum was determined as lead moh/bdate (19).
• Cobalt was determined complexmetry with 0 IN EDTA and meroxide indicator (20).
• Recovery efficiency of molybdenum and cobalt from spent catalyst was determined
according to :-
weight of recovered metal x 100
weight determined of the metal in the sample
Efficiency of reduction was determined according to
weight loss ( at a given T & t) x 100
weight loss due to complete reduction
3- RESULTS
Table (I) shows the particle size distribution of the obtained spent catalyst sample. It
can be seen that the major part of the sample has a particle diameter of -0.3 5 mm whereas the
coarser fraction (+4 mm) amounts to 13.4 % by weight.The chemical composition of the
obtained four fractions ( Fl through F4) is given in Table (2). It can be seen that the coarser
fractions > 1.2 mm contain the highest content of molybdenum and cobalt and lowest carbon
content Figure (2) shows the weight loss percentage ( AW ) as a function of heating the
-845-
catalyst fractions Fl through F4 It is seen that AW values increase rapidly with increase in
temperature up to 500 C With further rise in temperature . AW values slightly increase
approaching a constant value at 700'C However, coarse fractions (Fl and F2) acquire lower
AW values (42%) as compared to the finer fractions F3 and F4 (60%).
Figure (3) shows the efficiency of recovery (;,ct ) value of molybdenum and cobalt
metals achieved at = 100 C as a function of leaching time and acid concentration It is
seen that (;,„. ) values are insignificant with dilute acid mixture.With cone acid
mixture. Ur<x ) values amount to 74 % after 30 minutes. It then increases gradually
with increase in time approaching a constant value of 9 2 % after about 300 minutes.
Figure (4) shows that (Cnx ) value increases with increase in particle diameter of the catalyst
sample. Maximum and constant(crec ) value of 94% is acquired with particle size of > 12 mm
Figure (5) shows the effect of leaching temperature on the (Crec ) value of molybdenum and
cobalt from coarse panicles (II and F2) of the catalyst. It can be seen that parabolic
relationship curves are obtained At the lower temperature level < 50 JC. (4rec ) value is
insignificant (• 15 %) With rise in temperature, a drastic increase in ( t r ec ) value takes place
passing through a maximum at 100 C amounting to 80% and 96% after 120 and 240 minutes
respectively With further rise in temperatures up to 150°C . (4rec ) value decreases rapidly
down to an insignificant value Figure (b) is the Arrhenius plot devoted to the hot acid
leaching process An activation energy value of 674.9 kJ.mol1 is obtained.
Figure I 7 ) illustrates the effect of temperature on the decomposition percentage and the
magnitude of loss in weight of ammonium molybdate to obtain molybdenum trioxide. It is seen
that up to 300 C only 23% weight loss is achieved However at 500°C. 54% weight loss that
corresponds to 94% decomposition is achieved. Complete decomposition takes place at
-846-
f)00 C Tigure (8) shows the reduction efficiencv of molybdenum tnoxide and cobalt oxide
with hydrogen gas to obtain molvbdenum and cobalt metal ponders It can be seen that with
molybdenum, a flat portion of the curve is achieved within the temperature range bOO-800 C
corresponding to (Cred ) value of I l°o. Increasing the temperature hring about higher values of
<4red ) vvherebv complete reduction is matched at MOOT With cobalt oxide, complete
reduction takes piace at 775-800 C
Figure (<)) shows the surface area of the obtained molybdenum and cobalt powders It
can be seen that similar set of curves as given in Fig. (8) with a maximum surface area of 120
square meters is obtained FiguTe (10) shows the density values ( pp ) of the prepared powders
as a function of compression load. It can be seen that pp value increases gradually with the
increase in pressing load. Maximum and constant pp value of 2420 kg m ' is obtained for
powder pressed at 570 kPa.
4- DISCUSSION
The spent catalyst under discussion is one of the recurring waste material that contains
valuable metals such as molybdenum and cobalt Die catalyst is manufactured by coatins
alumina carrier with active molybdenum and cobalt metals probably by impregnation
technique. The catalyst is used for hydrogenation and desulphurization of coal gas as well as m
ammonia fixation processes. The fresh catalyst is cylindrical pellets having 5 mm in diameter
and pale green in colour. During the catalytic action, coal gas undergoes excessive cracking so
that carbon particulates are one of the resultant species. Deposition of carbon smoke on
accessible surface of the catalyst is liable to take place. Legitimately, the catalyst becomes
black in color and is poisoned whereby its catalytic efficiency gradually diminishes. Also, pan
of the catalyst deforms to fines with no practical catalytic effect. Under these conditions.
-847-
cokeries usually remove the immaterial part of the catalyst by sieving The under size part is
discarded. It is our input waste material.
In the light of making use of industrial wastes, recovery of molybdenum and cobalt
powders from spent catalyst shed a special consideration. The investigated catalyst sample of
this work contains grains having different particle diameters as given in Table (1). The major
part of the sample (40% by weight) is under 0.35 mm size. Analysis of that part reveals it is
composed of 97.95 % by weight of carbon and alumina. In other words, only » 2% of the
sample contain molybdenum and cobalt metals. This finding may be reasonable.. The coarse
fractions (F3 and F4) contain higher weight ratio of the two metals. These are more feasible
for metals recovery.
The gradual increase in recovery efficiency ( £ , « ) with increase in particle diameter is
self explanatory. The fine catalyst part bears excessive carbon deposits per unit weight as
compared to the unbroken grains. That coating carbon deposit may establish a barrier to the
attack of the acidic leachant. Such effect becomes more pronounced with fine fractions. With
the coarse ones, however, incomplete coverage with carbon helps dissolution of the more
available metals in the corrosive fluid.
Under the conditions undertaken in this work, the effect of acid diffusion to the
particle boundary has been controlled by adequate stirring. The gradual increase of recovery
efficiency with increase in time stands for the corrosion resistance property of these metals.
The maximum recovery value amounts to nearly 92% after 300 minutes. Complete recovery
(100%) is not liable to take place. Minor part of the metals lies on the bottom of surface
contour of the alumina carrier. Diffusion of the attacking fluid through the alumina pores to the
metal lying on the bottom is controlled by a concentration gradient established across the pore
system of the carrier.
-848-
Acid dissolution of molybdenum and cobalt oxides is enhanced by increasing the
temperature of the system. From our measurements. AE amounting to 674.9 kJ.mol" would
be applied to promote acid dissolution. Such energy value might be satisfied at 100°C. At
higher temperatures ( corresponding to highly concentrated sulphuric acid) the leaching
process is gradually decreasing as the required aqueous medium is lacking.
Results given in Fig (7) can be ascribed on the premise that ammonium molybdate is
decomposed to molybdenum trioxide according to
heat(NH)4MoO., • MoO, + NH, + H2O [I]
The initial horizontal part of the curve achieved at as 300°C can be anticipated to the
dehydration of the input molybdate salt. The drastic increase in loss in weight value with
increase in temperature up to 700 °C illustrates the formation of molybdenum trioxide.
Most of the molybdenum metal is used as an alloying element in steels and certain
nonferrous alloys According to the Bureau of Mines . United States production of
molybdenum metal powder is approximately 416 tonnes. The largest consumption of cobalt is
in magnetic alloys, cutting and wear-resistant alloys and catalysts production.( 21,22).
Therefore, reduction of the prepared oxide with hydrogen to produce molybdenum
metal is our final goal. Reduction process takes place in two steps. The first involves reduction
to a lower oxide state. The second produces metal. Thus ;
600-900°CMoO, +H2 * MoO2 +H2O [2]
1100°CM0O2 + 2H2 > Mo + 2H2O [3]
With cobalt oxide, reduction with hydrogen takes place at 850°C . "rfe low value of
reduction efficiency obtained at < 600°C may be due to the formation oi lower oxides of
-849-
cobalt Hie obtained molybdenum and cobalt metals powders are needle-shaped crystals with
different shape and size lliese are investigated metallugraphicallv Plate (2) represents the
crystal structure of these two preparations. Particle size measurement shows that the major
part of these powders is 10-50 micron in size. This product find industrial applications as
pressed shapes. So we have prepared molybdenum and cobalt shapes by pressing their
powders. The bulk density v alues of these preparations are shown in Figure) 10) However
pressing of these powders does not bring about a density value of the casted metal (10200
kg.m"' for molybdenum and 8900 kg.m ' for cobalt) . This is logic as the prepared particles are
irregular in shape and size as is judged from metallography and surface area measurements
During pressing, random orientation of these panicles is effected. In other words, voids and
pores cannot be satisfied by solid particle rearrangement However, the particle-particle friction
resist the magnitude and direction of the exerted pressing load. With further increase in the
latter, the aforesaid resistance may overweigh extra pressing load. In this case, constant bulk
density values are acquired.
5-THl£ ECONOMIC STUDY
An economic study has been conducted to evaluate the techno-economic feasibility of
recovery of molybdenum and cobalt powders as well as pressed shapes from spent catalyst.
The study is based on cost centers principle by grouping two or more steps in one center to
achieve certain basic process. The prices of the materials .chemicals .power, manpower... etc.
are taken as the home prices of the year 1994. The SUS price equals to 3.399 Egyptian
pounds. Table (3) shows the cost elements and economy norms of the recovery process.
-850-
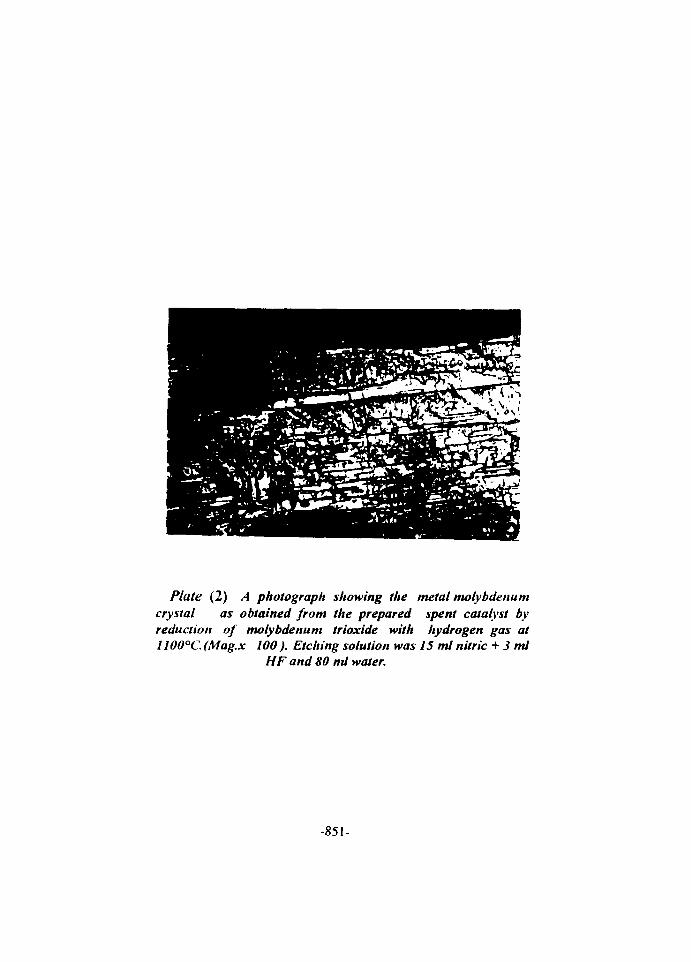
Plate (2) A photograph showing the metal molybdenumcrystal as obtained from the prepared spent catalyst byreduction of molybdenum trioxide with hydrogen gas at11OO°C. (Mag.x 100 ) . Etching solution was IS ml nitric + 3 ml
HF and 80 nd water.
-851-

6- CONCLUSION
The investigated sample of spent catalyst contains molybdenum and cobalt metals that
can be recovered. The obtained metals powders meet the standard specifications. Compact
shapes of these powders have been successfully prepared by pressing under >570 kPa.. The
recovery efficiency amounts to 97% and the applied technology of recovery is simple. The
recovery process is costly significant and the price of the products is competitive to the market
price.
-852-
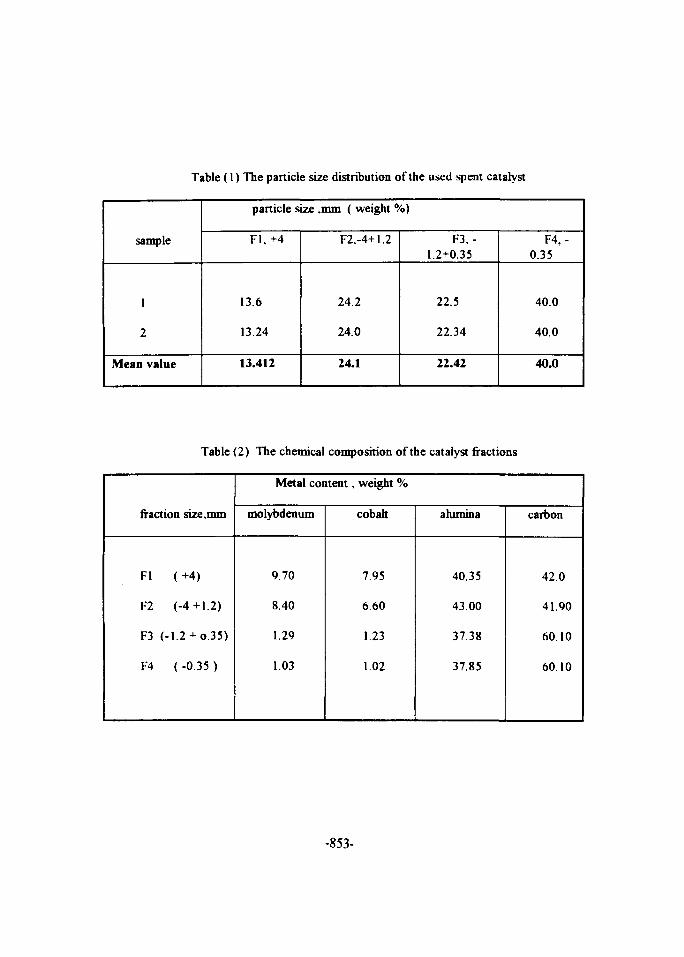
Table (1) The particle size distribution of the used spent catalyst
sample
1
2
Mean value
particle size .mm ( weight %)
F1.+4
13.6
13.24
13.412
F2.-4+1.2
24.2
24.0
24.1
F3. -1.2+0.35
22.5
22.34
22.42
F4,-0.35
40.0
40.0
40.0
Table (2) The chemical composition of the catalyst fractions
fraction size.mm
Fl ( +4)
F2 (-4+1.2)
F3 (-1.2 + 0.35)
F4 ( -0.35 )
Metal content, weight %
molybdenum
9.70
8.40
1.29
1.03
cobalt
7.95
6.60
1.23
1.02
alumina
40.35
43.00
37.38
37.85
carbon
42.0
41.90
60.10
60.10
-853-
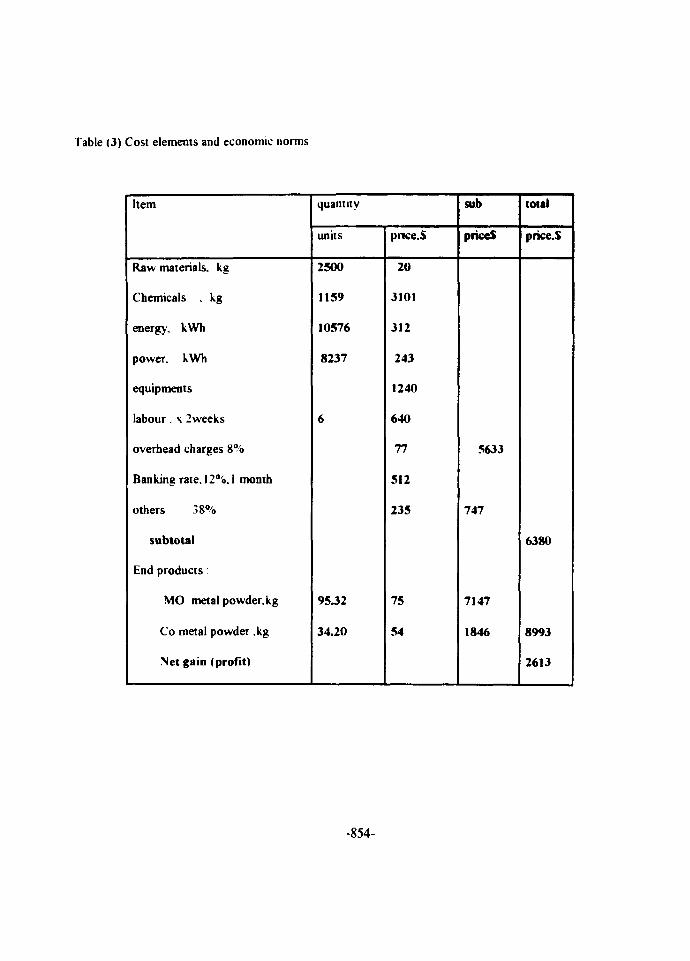
Table (3) Cost elements and economic norms
Item
Raw materials, kg
Chemicals . kg
energy. kWh
power. kWh
equipments
labour . x 2weeks
overhead charges 8%
Banking rate. 12%. 1 month
others 38%
subtotal
End products ;
MO metal powder, kg
Co metal powder .kg
Net gain (profit)
quantity
units
2500
1159
10576
8237
6
95.32
34.20
pnce.S
20
3101
312
243
1240
640
77
512
235
75
54
sub
priceS
5633
747
7147
1846
total
price.S
6380
8993
2613
-854-
6- REFERENCES
1. G. Berrebi; P.D.Dufresne and Y. Jacquier . The recycling of meials Conference.
Dosseidurf . Neuss . Gennany 13-15 May. 1992 .Publ. European Office. Rue de Tonne 19.B-
1040Brussels. Belgium. 1992. 31-36
2. PJ. Marcantonio. "" Leaching cobalt from metal containing particles". USA patent
5066469 . 9 Mar. 199O.(MA Number: 199203-42-0198).
3 PJ.Marcantonio. "Extracting metal values from metal-containing particles '
AuszEurPatemanmeld. 12 Jan 1987. 13(4), 139.
4 C.L.Van Deelen; D.Peterzzelli and A. Lopez." Recovery of metals from waste streams by
hydromeiallurgical processes". Conf Metals speciation. separation and recovery, Rome Italy.
14-19 May 1989
5. B.W. Jong; S.C. Rhoad; A.M. Stubbs and T.R. Stoelting. "Recovery' of principal metal
values from waste hydroprocessing catalysts". US Bur. Mines report Invest. 1989. pp27,
6. S.Toda and K.Matsuda. " Recovery of molybdenum and vanadium from spent
desulphurizing catalyst derived from heavy oil refining". Suiokwai-Shi ( Trans. Min. Metall.
Assoc. Kyoto) 1988. 20( 10), 686-692
7. S.Toda,"Alkaline roasting of spent catalyst containing molybdenum and vanadium". J Min
Matr Process Inst Jpn. 1989 .105(3), 261-264.
8. N. Rokukawa. " Fxtraction of rare metals from spent desulphurization catalyst with
hydrogen peroxide" J Min Metall. Inst Jpn.1987. 103(1195). 395-595
9 E.I.Wiewiorowski." Selective extraction of molybdenum and vanadium from spent catalysts
by oxidative leaching with sodium aluminate and caustic". US patent 4666685 . 9 May 1989
10. N. Rokukawa. " Fxtraction of molybdenum and vanadium from spent desulphurization
catalyst"J.Min.Metall. Inst Jpn 1983. 9Q.( 1145). 73-76
-855-
11. B.W. Jong and R.E. Siemens." Proposed methods for recovering critical metals from
spent catalysts". Conf. recycle and secondary recovery of metals", Ft. Lauderdale, Florida
USA. 1-4 Dec. 1985 Publ. The Metallurgical SocietyLAIME. 15086.USA, 1985 , 477-488.
12. K. iMatsuda. 'Recovery of metal values from spent catalizer derived from the
desulphurization of crude oil", Suiyokwa-Shi( Trans. Min.Metall. Assoc.Kyoto, Japan) 1985,
20(4),254-261.
13. S.Toda." Recovery of vanadium and molybdenum from spent catalizers disposed from the
desulphurization of crude oil by self-burning roast", J Min.Metall.Inst. Jpn ,1985,
101(1163).35-4O.
14. G.L. Hubred." Leaching nickel cobalt, molybdenum, tungsten and vanadium from spent
hydroprocessing catalysts". USA Patent 4514368 , 24 Sept. 1982.
15. M.Sujata; S.Bhargava and G.S.Ubadhyaya, " Densification of titanium-aluminium and
vanadium powder compacts prepared through premix or prealloyed routes* 11), Powder
Metallurgy International (PMI) 1993, 25(4), 26-32.
16. M.Mitkov; !M.Asian and W.A. Kaysser. Densification and tnicrostructure development
during hiping of API", Powder Metall. Intern. PMI 1989,21(1), 7-10.
17. H.Danninger and T.Kora. " Influence of manufacturing parameters on the sintering of
molybdenum alloyed structural steel. Powder Metall. Intern. PMI 1988,20(6), 24-29.
18. W.Schatt and M.Hinz." On the generalizability of defect activation sintering",Powder
Metall. Intern. PMI 1988 .20(6), 34-39.
19. R.L Vogel (Editor) Text Book of Quantitative inorganic analysis, (Longmans Green and
Co.(Publ. )London.N.York.Toronto ), 1939, Chapter IV-23. 523.
20. E.Merk( Editor) Compleximetric assay methods with titriplex, (E.Merk Permstadt
Publishing House.Germany) 3rd edition, 1961 . 32.
-856-

21. A. Clifford and Hampel (editors), Rare Metals Hand Book . 2nd edition 1971. 283.
22. U.L. Bennett.) to Bennett Engineering Co.) USA patent 3.576.734. April 27.1971. in
Encyclopedia of Chemical Technology . Kirk-Othmer and J. John et al. ( Editors). A
division of John Wiley & Sons Inc. New York. London. Sydney . 3rd edition. 1979 ,vol 6 . .
489.
-857-
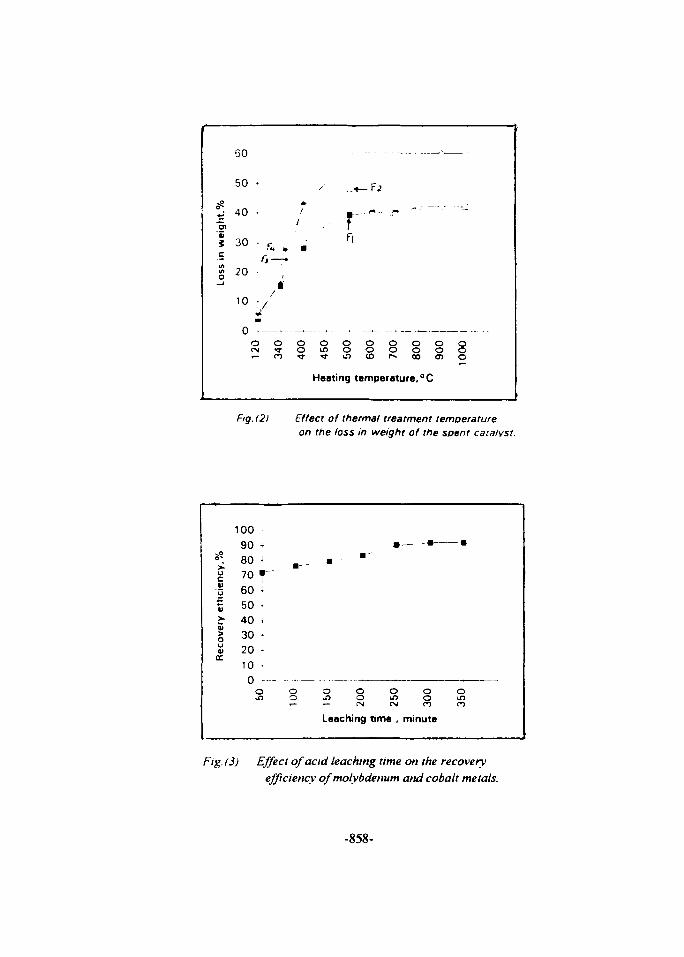
we
igh
t.%
Lo
ss i
n
50
50 •
4 0 •
30 - »
r,20 •
10 • /
a
o • -
120
i34
0
400
•-
,.
. rFl
. __o oin o«» m
-F2
,
600
. ,o oo or~ oo
Heating temperature.0
—-_
900
C
^
1000
Fig. 121 Effect of thermal treatment temperatureon the loss in weight of the spent catalyst.
uc
icie
iet
tio
v/er
yR
ec
10090 •>
80 470 •
60 i
50 -40 *30 •20 •10 •0 —-
oin
I—
100
•
o o ox> o in— CM CMLeaching time ,
- • •
o oo mo nminute
Fig. (3) Effect of acid leaching time on the recoveryefficiency of molybdenum and cobalt metals.
-858-
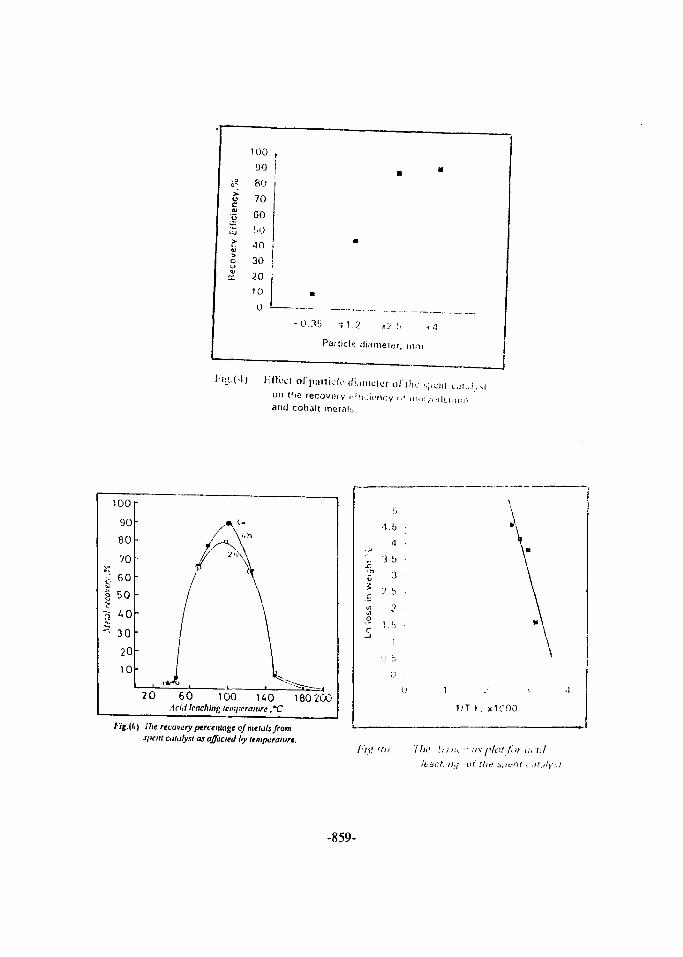
- 0 . 3 5 7 1.2 >'J .!< i
Particle riianieiar. mm
iK-cl o rp . - in ide<i i . imcH: ior i J ic - . j , , - ! . !on the recovery .rH.cii'iKy -f H M , ! ^ , , ^ ,and colwlt metals .
60 100 140Acidleachinv icm/ieraiure ,°C
i/ie recovery percentage of meltils froms/icnt cohtlysl as affected Uy temperature.
cVI•/)O
c:
.1
3 b
3
2.b
7
l .b
1
1/T K. xiOOO
/•'ltlt(')) Tlh- \nh,-:ispl,)l'\>rt:,ij
Ivschiiij ol Um SiH-m < sir,:/
-859-
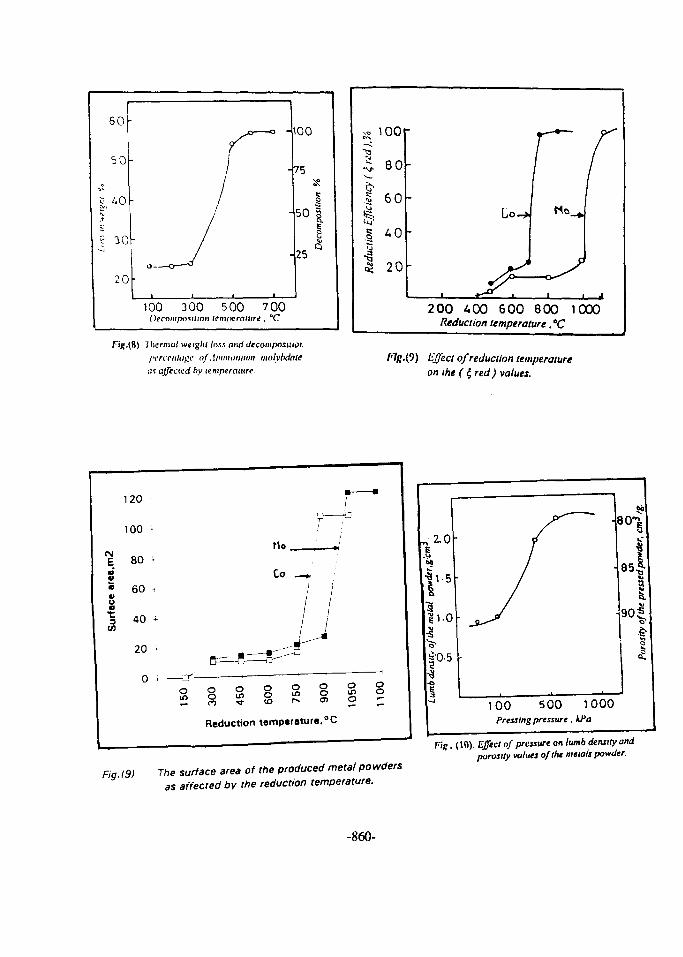
60
5 0
5 30
20o c
100Decn
J300
7
15 00
le mftcraiu
o -
-
1
7 00
0 0
75
50
25
1I
rix.(8) thermal weight tuss and decomposition
/HTi'ctitagc of Antintiniiwt molybdnlc
at affected hy temperature
« 100
; eo&§ 60§ 40
1 20
-
A
1
200 400 600 800 1000Reduction temperature, "C
/r'/g.(9) /(/?cc< of reduction temperatureon the ( 4 red) values.
Reduction temperature,°C
^•2.0.5bt
I'5"aIl.O•g| 0 ,
-o
/
•
100 500 1000Pressing pressure. kPa
<de
r. cm
i90*
&•s
Fig. 19) The surface area of the produced metal powdersas affected by the reduction temperature.
H f . (10) Effect nf pressure on lumb density andporosity values of the metals powder.
-860-
Proceedings of the Fifth International Conferenceon Energy and Environment, Cairo, Egypt, 1996
APPLICATION OF SHALLOW REFRACTION SEISMIC TECHNIQUE
FOR EVALUATING SITES SUITABLE FOR SOLID WASTE DUMPS
Hamdy H. Seisa, DepC of Geology, Faculty of Science, Mansoura University, El Mansoura, Egypt
Abstract:
Recently extensive research is being carried out to develop methodologies for safe
management of solid waste. Selection of a proper site for solid waste disposal is still annoying
the environmental managers. The geophysicists could help in solving this problem which has
particular importance in the every day life. Detailed knowledge of characteristic physical
properties of subsurface rocks, subsurface structures and the his essential if we are able to locate
the proper site for solid waste dumps. These sites which keep the solid waste and possible
pollutants in one place away from the surrounding environment should be characterized by the
following: completely isolated from the surrounding environment by impervious bedrock in
order to minimize leaching from getting into water system, free from any fissures, faults, voids
and sand bodies, and sufficiently remote from important water resources and the water table
should be at deep depths and there is no path ways between underground water and dumps.
It is shown that the shallow refraction seismic technique provides vital information about
shallow subsurface structures, boundaries between different layers and depths to the ground
water table or bed rocks. In this studv, . ,-e camples will be presented to demonstrate the
power of the this technique for evaluating the adequate sites to be used as solid waste dumps of a
city or other industrial residues.
Introduction
Solid materials include municipal waste (house hold), hospital waste and industrial
(hazardous and non hazardous) waste are usually defined as solid waste. Disposal of these solid
waste by burial represent serious problems for most countries. Since any land containing solid
waste is a potential threat to the ambient region, one of the requirements of landfill operations is
to ensure that the site is adequately sealed from the adjoining subsurface materials and
properly capped to prevent the refuse from being washed away from the site. When this
conditions are not met, surface and underground water may be heavily polluted as a result of
contamination by liquid and solid components of the waste.
According to Niefer (1988) and Mauritsch and Walach (1990) the sites in which the solid
wastes and possible pollutants should be kept, must be characterized by the following :
-861-
1 Completely isolated from the surrounding environment by impervious bedrock such as
massif igneous, metamorphic rocks and/or hard sediments like marl to minimize leached
elements from geiuna into water system. Permeable rocks like sandstone and conglomerate
could rapidly tr.uiMmt water containing pollutants.
2- Free from any fissures, faults, \oids. and sand bodies intrusions for the same reason
mentioned above.
3- Sufficiently remote from important water resources and the water table should be at deep
depth and there is no path ways between the underground water and dumps.
4- Away from weakness zones such as earthquakes, kind slides und/or volcanic zones.
All these concepts mentioned above have characteristic physical properties that make them
suitable targets for shallow refraction seismic investigation
Refraction seismic technique
The seismic refraction method utilizes seismic energy that returns to the surface after
traveling through the ground along refracted ray paths. The method is normally used to locate
interfaces separating layers of different seismic velocity varies smoothly as of depth or laterally.
Refraction surveying are usually carried out along profile lines which are normally arranged to
be sufficiently long to ensure that the refracted waves from target layers are recorded as first
arrivals (also head waves).
Refraction seismic technique is applied to a very wide range of scientific and technical
problems, from engineering site investigation surveys to large scale measurements designed to
study ilie structure of the entire crust or lithosphere. For environmental studies, shallow
refraction seismic method provides ati excellent technique for investigation of shallow
subsurface geological structures. Locating of sites suitable for solid waste dumps is considered to
be one of the important fields of this methcxi. This is because the lateral changes in seismic
velocities are usually related to the lateral variations either in lithology and/or in depth along the
subsurface interfaces (usually refractors or boundaries).
Since the early 1920s to the present several papers have been published on the subject of the
interpretation of seismic refraction travel time data. Depending on the travel path of the rays (or
-862-
wavesi, the interpretation methods of in-line reversed profiles have been cl:i>sified irim iwo mum
groups. The first group, the common refractor |x.>int methods, visualizes critical r.tvs emeruinj:
from a common point on the refractor. This group includes the wave front method (Thornbureh.
1930) and Hales method (Hales, 1958). T\\c second group, the common surface point methcxls.
makes use of ray paths converging in common surface point and includes ABC method
(Heilnad, 1963); the plus part of the plus-minus method (Hagedoorn, 1959). All these methods
used the total reversed travel time and are considered to be correct as long as the refracted rays
emerge from the same refracting interfaces or from the same refractor element. In this studv, the
Common Refractor Element (CRE) method, Seisa (1991) will be applied to interpret shallow
refraction seismic data. For more details about shallow refraction method refer lo Musgrave
(1967) and Seisa (1991).
The area of study
The area of study to be a solid waste dump (landfill) site is located near the city of Schwerien,
NE Germany. The regional geological stratification of the deposits comprises impervious marls
underlain by fluvioglacial sands which is considered as the main ground water reservoir. On the
basis of three bore hole data, the thickness of this marl layer, the impervious bed. is different
from 9 to 20 m, Burkhardt et. al. (1992). The aim of this investigation in this area using
refraction seismic profiles can be summarized in the following :
1- To detect the lateral variations along the marl layer, if existed,
2- To determine the depth to the ground water aquifer, and
3- To ensure that there is no paths through the marl layer to the aquifer i.e.. the sand deposits
are continuos beneath the thick impervious marl layer or these sands are found in separate sand
lenses or sand bodies.
In this paper, a synthetic model and two field examples o\ shallow relraeiion seismic
profiles will be used. The ray tracing program RAY LIN (Seisa and El Shafey, 1995) is used to
construct the travel time curve Surl of a subsurface model consists of three homogenous layers
.The first layer has a velocity of 400 m/s. the second layer corresponding to the impervious marl
layer with seismic velocity of 13 m/s. The third layer is ground water aquifer with seismic
velocity of 1750 m/s . In this model, the distance between the shot point and first geophone is 5
m and the distance between every two successive geophones is 10 m.
-863-
As a seismic source, a 10 kg hammer is used as usual in such near subsurface investigation.
The frequency of the vertical geophones (receivers) is 10 Hz. These profiles are SUR 2 and
SUR 3, with total distance of 48 in and 72 in respectively. The distance between the shot point
and the first geophone is 0.5 in and the distance between every two successive geophones is 1
in.
Results
The refraction seismic data (also usually called first arrivals or head waves) of three profiles
are shown in figures la, 2a and 3a, respectively. The CRE interpretation method was used to
calculate the refractor (subsurface interfaces or boundaries) velocities and depths.
In the first example Surl, which represent synthetic data, the interpretation of the travel time
curve shown in figure la indicate tl»at the velocity increases with depth (the slope of the travel
time segments decreases with increasing distance from the shot point). The used model in this
example represents the ideal condition for a landfill site.
In the other two field examples (Sur 2 and Sur 3), the thickness and composition of the marl
layer varies dramatically as shown in figures 2b and 3b. The thickness of this layer reaches its
maximum at the right sides with a seismic velocity of 12 to 1300 m/s, (figures 2b and 3b.) The
lack of parallelism of travel time curves in the left part of both (figures 2a and 3a) can be
interpreted as dry sand bodies within the marl layer where the seismic waves travel through the
sand bodies itself with different seismic velocities and not along the interfaces. The low
seismic velocity (700 - 800 m/s) in this part is another factor to confirm that the marl layer
contains dry sand bodies. The maximum depth to ground water surface of this aquifer is about
17 ni with a seismic velocity of 1700 - 1750 m/s. This means that the area represented by those
2 profiles have lateral changes within the impervious marl layer and the transmission risk of
pollutants through those sand bodies to the aquifer is high.
Conclusion
Geophysicists play a crucial role in the aspects of environmental contamination where the
land-water ecosystem is involved. Their knowledge of earth materials, the subsurface structures,
and the characteristics of surface and ground waters is essential for environmental managers.
-864-
This paper demonstrated the use of shallow refraction seismic technique in evaluating of
subsurface conditions of solid waste disposal sites. It is clear that the lateral variations either in
velocity (composition) and/or depth along an impervious layer can be easily detected using the
shallow refraction seismic technique. So, a subsurface picture of dump site could be drawn
which could give guidance to environmental managers to decide if this site is environmentally
safe or not.
A cknowledgment
The author is grateful to Dr. K. Schuster, Institute of Applied Geophysics, TU Berlin for
providing field data to interpret it using the CRE method.
References"Burkhardt H., Erbas, K., Radic, T., und Schuster, K. 1992: Bericht fiber den Einsatz von
seismischen und geoeiektrischen Verfahren zur charakerisierung des untergrundes imBereich des geplanten Deponiestandortes Augzin.
Hagedoorn, J.G. 1959: The plus-minus method of interpretation seismic refraction refractionsections: Geophys. Prosp., 7, 158 - 182.
Hales, F.W., 1958: An accurate graphical method for interpretation seismic refraction lines:Geophys. Prosp., 6, 285 - 294.
Heiland, C.A., 1963: Geophysical Exploration: New York, Prentice-Hall, Inc.
Mauritsch, H. J. und G. Walach 1990: Konzepte, Methoden und Beispiele zur Umweltgeophysikin Osterreich. Paper presented in 50th DGG Tagung in Leobon, Osterreich.
Musgrave, A.W., Ed., 1967: Seismic refraction prospecting: SEG, Tulsa.
Niefer, H. 1988: Modellstandortkonzeption Baden-Wuttemberg. Altlastensanierung '88, ZweiterInternationaler TNO/BMFT-KongreB iiber Altlastensananierung, Band 2, 1019-1026.
Seisa, H. H., 1991: A contribution to the interpretation of shallow refraction seismic data:Unpublished Ph. D. Thesis, TU Berlin.
Seisa, H. H. and El Shafey, M.S., 1995. A two dimensional Raytracing program. UnpublishedM. Sc. Thesis, El Mansoura University.
Thornburgh, H. R., 1930: Wavefront diagrams in seismic interpretation: AAPG Bull., 14, 185 -200.
-865-

List of Captions
Fig.l. The travel time curve, (la) and the corresponding subsurface model (lb).
Fig.2. The travel time curve, (2a) and the corresponding subsurface (2b). The marl layer has
different seismic velocities and consequently the composition may be varied from marl
to sand (low velocity of 700 - 800 m/s zone) at the middle part and to marly sand (zone
of 1000 m/s) at left part of the subsurface structure. The depth to the water aquifer is
about (7.5 m.
Fig.3. The travel time curve, (3a) and the corresponding subsurface (3b). The middle part of
the subsurface is characterized by low velocity zone (700 - 800 m/s) and this part is
easily to be interpreted as a sand body. The depth to the water aquifer is about 13 m.
-866-
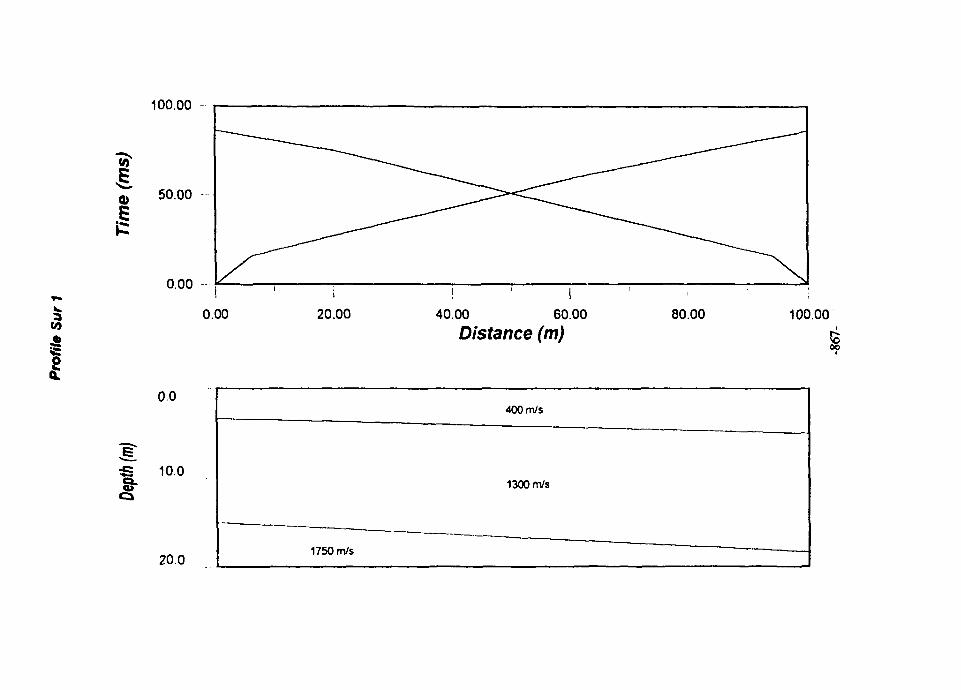
100.00
10)
50.00 -
0.00
0.00 20.00 40.00 60.00
Distance (m)80.00 100.00
00
« 10.0
20.01750 m/s
400 m/s
1300 m/s
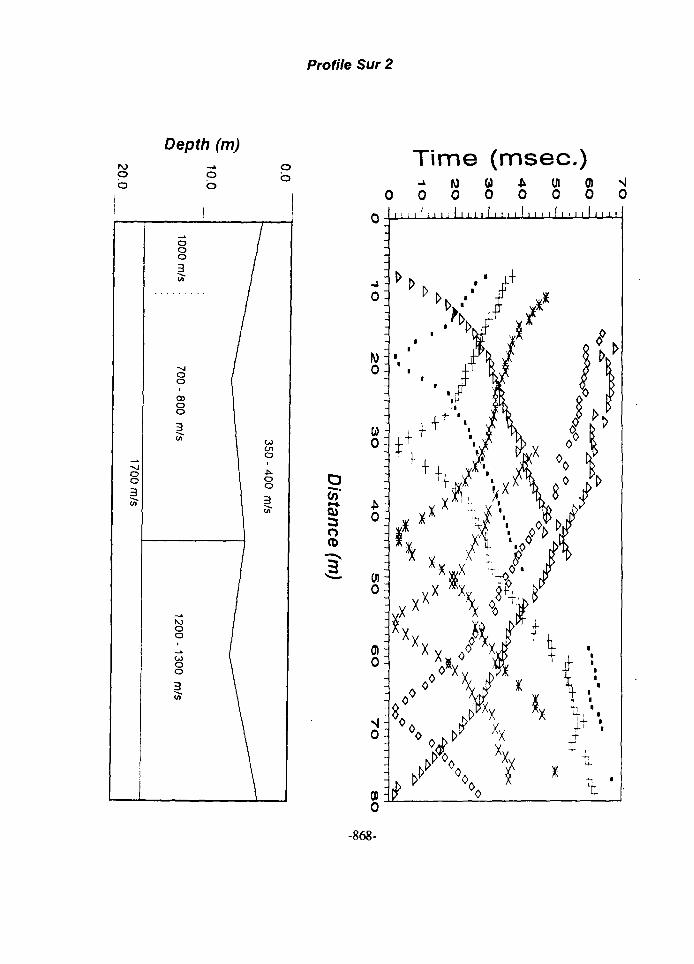
Profile Sur 2
Depth (m)
ob
oo35r
ob
1
ooo3Sr
o /oCDoo3
1200-130
1 \
b
///
//
/
COO l
o
oo
3
)
\
\
Time (msec.)
D55"sr3OCO
0 0 0 0 0| | | | | | | | | | | | 1 I | | I I ! I i 1 I I I I
-868-
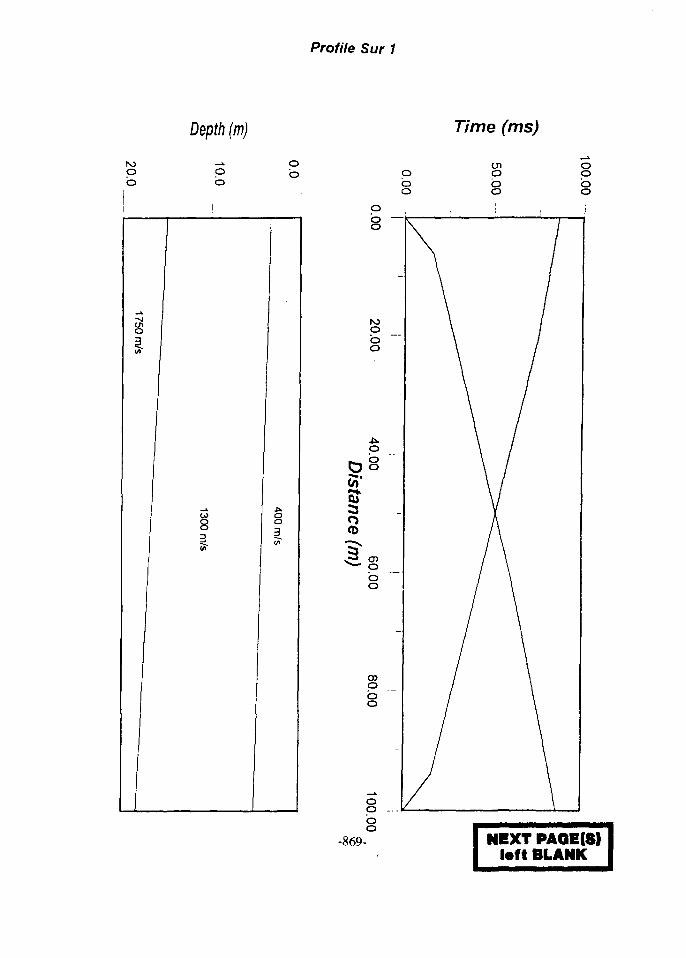
Profile Sur 1
Depth (m) Time (ms)
poo
enpbo
opbo
8
poo
oo
55'EToo
enpoo
ooobo
opbo
-869- NEXT PAQE(S)left BLANK
Proceedings of the Fifth International Conference EG9700041on Energy and Envirorunent, Cairo, Egypt, 1996
Soil - Water Partitioning and Mass Transfer for2,4,6-Trinitrotoluene Contaminated Soil
K. M. Qaisi, W. D. Constant, K.S. Ro, and L.J. Thibodeaux
Hazardous Substance Research Center3418 CEBA Bldg., Louisiana State University
Baton Rouge, LA 70803USA
1. ABSTRACT
The soil distribution coefficient for highly concentrated TNT soil isdetermined. Different amounts of TNT soil are placed into 250 ml of distilledwater, and the concentration of TNT in water is monitored throughout theexperiment. At the conclusion of the experiment, the remainder of TNT in thesoil is determined. The soil distribution coefficient is calculated by dividing theconcentration of TNT in the soil by the concentration of TNT in the water phase.The average soil distribution coefficient is found to be 4.86 L/kg
The mass transfer coefficient was determined for the static experiment.This experiment involves a comprehensive study of TNT distribution profiles inthe soil and solvent phases. The experiment was conducted under a controlledtemperature environment, for extensive periods of time. Samples were collectedon a regular basis and were analyzed promptly. The average value of the masstransfer coefficient was determined to be 3.4x10"3 hr1.
2. INTRODUCTION
The knowledge of physicochemical properties of the different types oforganic compounds is important for the environmental engineer in understandingand predicting the fate, effect, and potential of engineered processes for removalor control of these compounds. Physicochemical properties include, but are notlimited to, solubility, hydrophobicity, polarity, volatility, density, and energy
-871-
content. Solubility is somewhat related and useful in understanding thetendency of organics to partition between phases i.e. solid-liquid or liquid-gaspartitioning. Processes especially important in understanding the fate andremoval of organics found at contaminated sites are volatilization, sorption, andtransformation reactions.
The purpose of this experiment is to determine the soil distributioncoefficient of 2,4,6 Trinitrotoluene (TNT) and is defined as the approximatedistribution of a contaminant between the solid and liquid phase. The extent ofdesorption of TNT in water is monitored throughout the entire experiment. Thesoil distribution coefficient Kd is determined at the conclusion of the experiments.Also, the mass transfer coefficient, Ku is determined in a separate experiment.
3. MATERIALS AND METHODS
Partitioning ExperimentOven-dried TNT soil (1.0 g, 2.0 g, and 2.5 g) was added to 250 ml of
distilled water. Duplicates were made to measure the precision of theexperiment. The TNT-water solution was shaken for 6 days. Approximately 3 mlof sample was tafcen every 12 to 24 hours from each mixture using a syringe witha 0.20 um nylon filter. The concentration of TNT was determined by highperformance liquid chromatography (HPLC). The analytical equipment used wasa Hewlett Packard 1090 Series II HPLC equipped with a photodiode-arraydetection system to analyze TNT in the samples. In order to remain in thecalibration range of the HPLC, the extracted sample was analyzed for TNT usinga dilution factor of 2.5. The sample preparation was done by mixing 2 ml of TNT-water sample, 3 ml of HPLC-grade water, and 5 ml of acetonitrile. In this mannerthe HPLC calibration requirement of 50:50 acetonitrile:water ratio was achieved.
The remaining TNT-water solution was centrifuged and TNT soil wascollected. The soil was placed in a desiccator for approximately 2 days to get ridof the exoess water. Acetonitrile (20 ml) was added to the soil and sonicated for4 hours. The extracted sample from the shaken mixture was analyzed by HPLCand TNT on the soil was calculated.
interface Mass Transfer ExperimentOen-dried TNT soil (1.0 g, 1.5 g, 2.0 g, 2.5 g, and 4.0 g) was added to
250 ml of distilled water. Duplicates were made to measure the precision of theexperiment. The TNT-water solution were left in a 70°F environmental chamberfor 11 days. Approximately 3 ml of sample was taken every 24 to 48 hours fromeach mixture using a syringe with a 0.20 um nylon filter. The extracted samplewas analyzed for TNT using a dilution factor of 2.5. 2 ml of TNT-water samplewere added to 3 ml of HPLC-grade water, and 5 ml of acetonitrile. By doing sothe HPLC calibration requirement of 50:50 acetonitrile:water ratio was achieved.
The remaining TNT-water Solution was centrifuged and TNT soil wascollected. The soil was placed in a desiccator for approximately 2 days to get rid
-872-
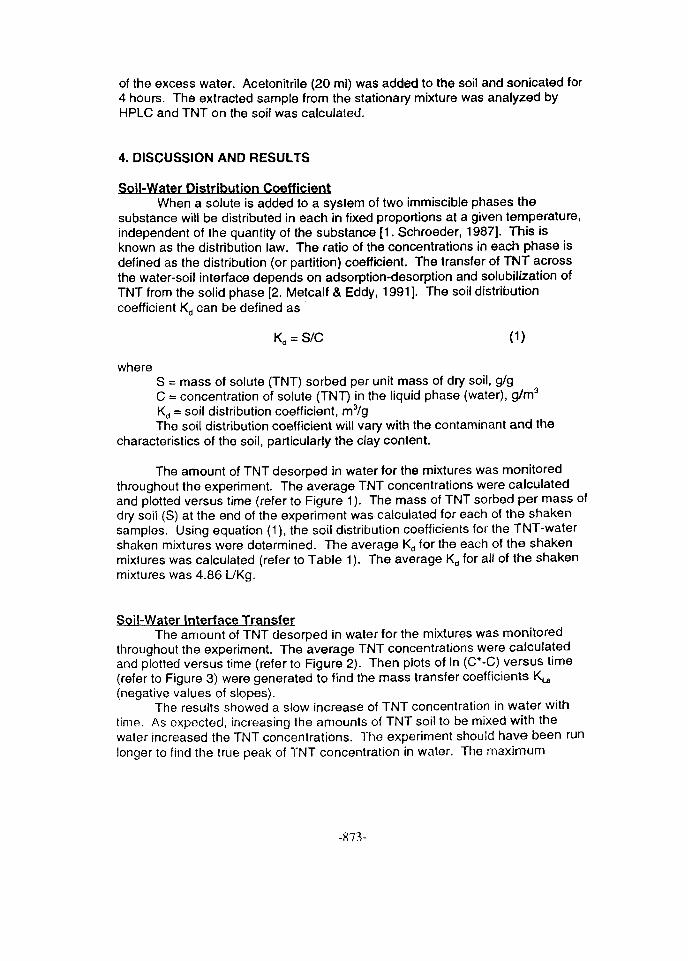
of the excess water. Acetonitrile (20 ml) was added to the soil and sonicated for4 hours. The extracted sample from the stationary mixture was analyzed byHPLC and TNT on the soil was calculated.
4. DISCUSSION AND RESULTS
Soil-Water Distribution CoefficientWhen a solute is added to a system of two immiscible phases the
substance will be distributed in each in fixed proportions at a given temperature,independent of the quantity of the substance [1. Schroeder, 1987]. This isknown as the distribution law. The ratio of the concentrations in each phase isdefined as the distribution (or partition) coefficient. The transfer of TNT acrossthe water-soil interface depends on adsorption-desorption and solubilization ofTNT from the solid phase [2. Metcalf & Eddy, 1991]. The soil distributioncoefficient Kd can be defined as
Kd = S/C (1)
whereS = mass of solute (TNT) sorbed per unit mass of dry soil, g/gC = concentration of solute (TNT) in the liquid phase (water), g/m3
Kd = soil distribution coefficient, m3/gThe soil distribution coefficient will vary with the contaminant and the
characteristics of the soil, particularly the clay content.
The amount of TNT desorped in water for the mixtures was monitoredthroughout the experiment. The average TNT concentrations were calculatedand plotted versus time (refer to Figure 1). The mass of TNT sorbed per mass ofdry soil (S) at the end of the experiment was calculated for each of the shakensamples. Using equation (1), the soil distribution coefficients for the TNT-watershaken mixtures were determined. The average Kd for the each of the shakenmixtures was calculated (refer to Table 1). The average Kd for all of the shakenmixtures was 4.86 L/Kg.
Soil-Water Interface TransferThe amount of TNT desorped in water for the mixtures was monitored
throughout the experiment. The average TNT concentrations were calculatedand plotted versus time (refer to Figure 2). Then plots of In (C*-C) versus time(refer to Figure 3) were generated to find the mass transfer coefficients Ku
(negative values of slopes).The results showed a slow increase of TNT concentration in water with
time. As expected, increasing the amounts of TNT soil to be mixed with thewater increased the TNT concentrations. The experiment should have been runlonger to find the true peak of TNT concentration in water. The maximum
-873-
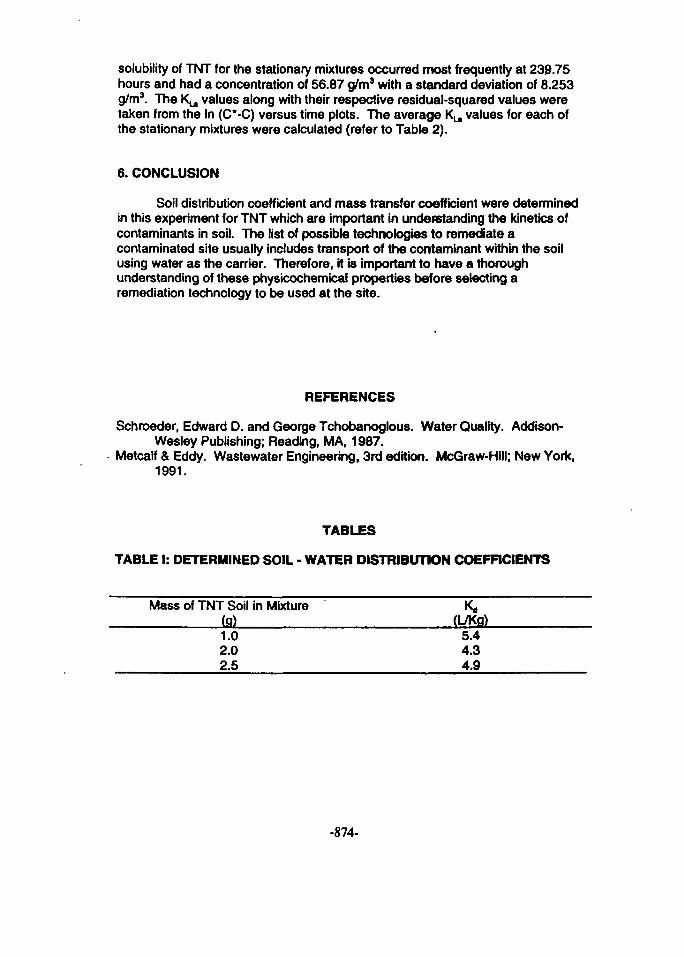
solubility of TNT for the stationary mixtures occurred most frequently at 239.75hours and had a concentration of 56.87 g/m3 with a standard deviation of 8.253g/m3. The Ku values along with their respective residual-squared values weretaken from the In (C*-C) versus time plots. The average Ku values for each ofthe stationary mixtures were calculated (refer to Table 2).
6. CONCLUSION
Soil distribution coefficient and mass transfer coefficient were determinedin this experiment for TNT which are important in understanding the kinetics ofcontaminants in soil. The list of possible technologies to remediate acontaminated site usually includes transport of the contaminant within the soilusing water as the carrier. Therefore, it is important to have a thoroughunderstanding of these physicochemical properties before selecting aremediation technology to be used at the site.
REFERENCES
Schroeder, Edward D. and George Tchobanoglous. Water Quality. Addison-Wesley Publishing; Reading, MA, 1987.
Metcalf & Eddy. Wastewater Engineering, 3rd edition. McGraw-Hill; New York,1991.
TABLES
TABLE I: DETERMINED SOIL - WATER DISTRIBUTION COEFFICIENTS
Mass of TNT Soil in Mixture K,,(g) (L/Kg)1.0 5.42.0 4.32.5 4.9
-874-
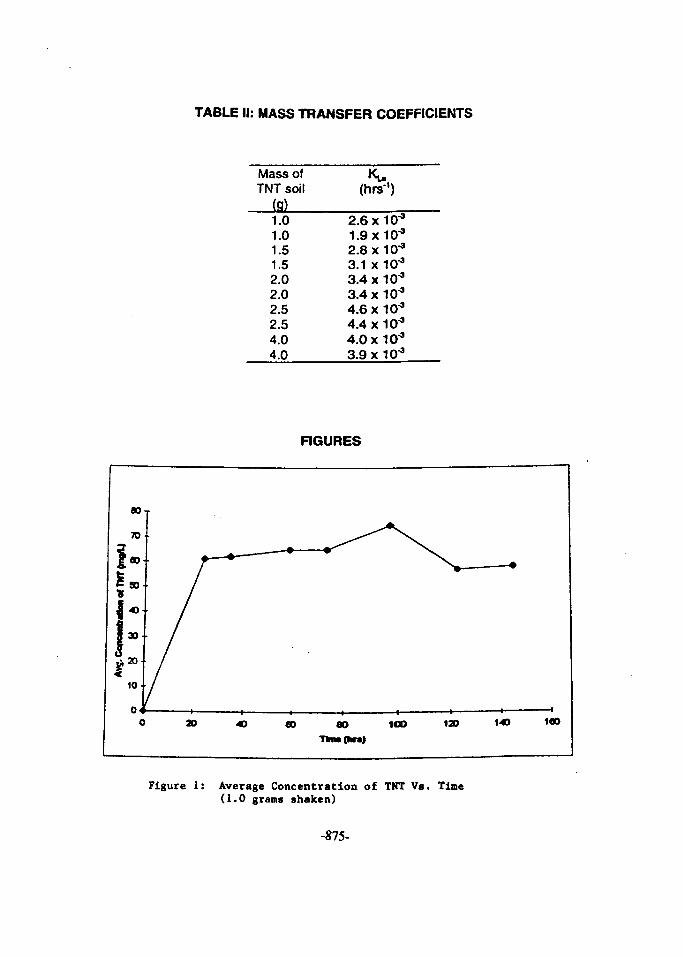
TABLE II: MASS TRANSFER COEFFICIENTS
Mass ofTNT soil
(g)1.01.01.51.52.02.02.52.54.04.0
(hrs1)
2.6 X10"3
1.9x10*2.8x10J
3.1 x 10"33.4X10⁻³
3.4X10⁻³
4.6 X10"3
4.4x10*4.0X10-3
3.9x10^
RGURES
Figure 1: Average Concentration of TNT Vs. Time(1.0 grains shaken)
-875-
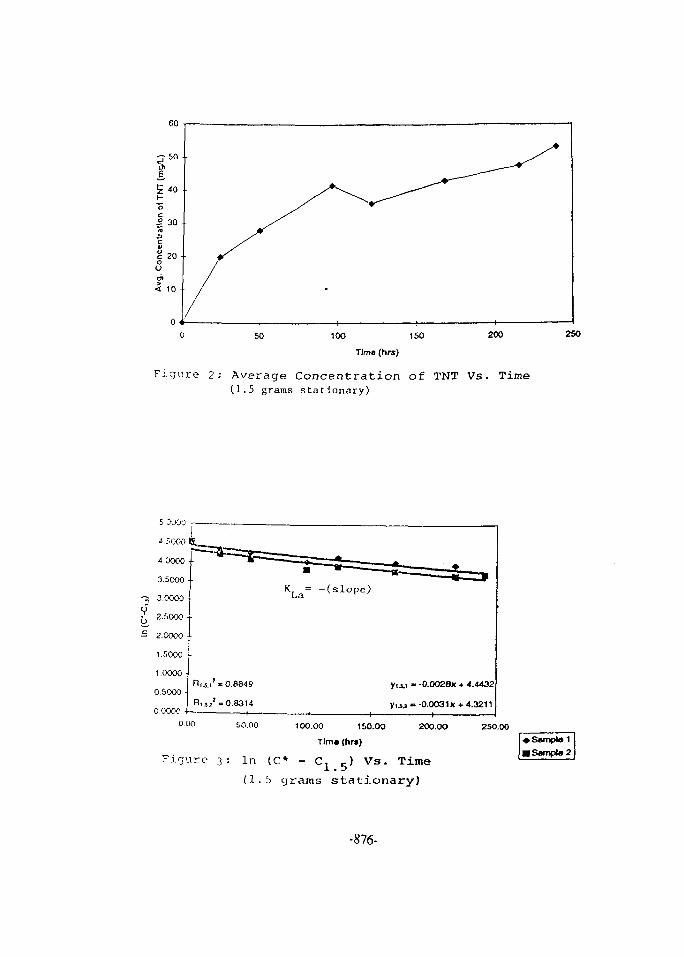
50 100 150
Time (hrs)
200 250
Figure 2: Average Concentration of TNT Vs. Time(1.5 grams stationary)
5.0000
•> 50O0
4.0000
3-5000
-} 3.0000o£ 2.5000 •
— 2.0000
1.5000
1.0000 •
0.5000 •
0.0000 10.00
Fiqure
Tfc—-
*» 0.8849
'=0.8314
50.00
3= In
( 1 .
I —• '" tHi • in 1 T T T ^ * ^ ~ ^ ~ M
KLa= -(s lope)
yij.i »-0.0028X + 4.4432
y u j » -0.0031 X + 4.3211
. .— -— * < t -
100.00 150.00 200.00 250.00Tim* (hr«)
(C* - c1 5) Vs. Time5 grams stationary)
* Sample 1MSampt»2
-876-
Proceedings of the Fifth International Conference FG9700042on Energy and Environment, Cairo, Egypt, 1996
Biological Processes Influencing Contaminant Release
from Sediments
Danny D. Reible, Director
South/Southwest Hazardous Substance Research Center
Louisiana State University/Georgia Tech University/Rice University
Baton Rouge, LA 70803
Abstract
The influence of biological processes, including bioturbation, on the mobility of
contaminants in freshwater sediments is described. Effective mass transfer coefficients
are estimated for tubificid oligochaetes as a function of worm behavior and biomass
density. The mass transfer coefficients were observed to be inversely proportional to
water oxygen content and proportional to the square root of biomass density. The
sediment reworking and contaminant release rates are contrasted with those of
freshwater amphipods. The implications of these and other biological processes for
contaminant release and in-situ remediation of soils and sediments are summarized.
1. INTRODUCTION
The Hazardous Substance Research Center/South and Southwest is a university
consortium led by Louisiana State University that also includes Rice University and
Georgia Tech University. The primary focus of the research conducted by the Center
is the assessment and remediation of contaminated sediments and dredged materials.
The Center provides fundamental technical support to the Superfund program,
developing the process understanding, tools and technologies that allow the region and
the nation to appropriately address contaminated site problems. The Center's activities
recognize that assessment, including characterization and evaluation of a
contaminated site, evaluation of natural recovery processes, and the identification of
appropriate environmental endpoints, are closely linked with removal technologies and
their successful selection and application. As part of that assessment effort, the Center
-877-
supports research by myself, K.T. Valsaraj and L.J. Thibodeaux into the interaction of
biological and physicochemical processes to influence contaminant transport and fate.
This paper focuses on recent results of that activity.
Hydrophobic organic and metal contaminants are generally strongly associated
with the paniculate fraction of soils and sediments and partition only weakly into air and
water. This often leads to the retention of these contaminants in the soil and sediments
resulting in releases to the air or water long after the original source has been
controlled. Assessment of the ecological and human health impact of these
contaminants is often difficult because only a portion of the contaminants are available
for release or uptake by organisms. Because it is a direct measure of the mobile and
available fraction, it is believed that the rate of release of contaminants is a better
indicator of contaminant impact than total sediment concentration. The current
research is directed toward identification and quantification of key processes
influencing the release rate.
For a contaminant that is essentially inert, its ultimate distribution in the
environment is controlled by physico-chemical equilibrium. For many organic
compounds, this distribution process is dominated by hydrophobic interactions, that is,
partitioning to the ait is governed by a Henry's Law constant and sorption to the soil is
governed by the amount of organic carbon in the soil and the organic carbon based
partition coefficient of the compound. For metallic and elemental species this process
is much more complicated due to the variety of forms which these species can take.
The ultimate distribution remains governed, however, by physico-chemical equilibrium.
Although the ultimate distribution is governed by physico-chemical processes,
the rate of movement toward this distribution is often influenced by biological
processes. For example, the sediment mixing processes associated with the normal
life-cycle activities of benthic organisms, bioturbation, is likely to be the most important
mechanism for release of sorbed contaminants from otherwise stable sedimentsu. The
physico-chemical processes of advection and diffusion only result in the migration of
contaminants in the porewater, a very small portion of the total sediment loading of
contaminants. Porewater transport of a strongly sorbed contaminant is characterized
-878-
by retardation by a factor given by the ratio of the total concentration in the sediment to
the concentration in the mobile phase. Bioturbation, however, often causes movement
of the sediment particles and their associated contaminants. Thus all of the
contaminant mass is mobile and the process is not subject to retardation. In addition,
the microbial degradation of organic matter leads to colloidal species in the porewater
of soils and sediments. For very hydrophobic compounds the presence of this
microbially generated organic matter can significantly increase the mass of
contaminant associated with the mobile fluid phase, reducing the retardation
associated with sorption.
Microbial processes also result in the oxidation and reduction of certain
elemental species such as selenium. Selenium is essentially immobile in its reduced
form but is soluble and thus more mobile in its oxidized forms. Certain bacteria use
selenium as they might sulfur during respiration. As a result, the cycling of selenium
may be the result of competition between two biological processes, microbial processes
that tend to reduce and thus immobilize selenium, and bioturbation, which through
reworking of the upper layers of sediment tends to oxidize that sediment and contribute
to the formation of the oxidized mobile forms of selenium.
The effect of biological processes on contaminant release will be illustrated in
the present paper by examining the movement of hydrophobic organic compounds in
sediments. A series of laboratory experiments with tubificid worms will be used to
illustrate the effect of bioturbation. The behavior of the tubificid worms will be
contrasted with the behavior of amphipods and the effect of dissolved and suspended
organic matter.
2. EXPERIMENTAL PROCEDURE
The laboratory experiments were conducted in small chambers 15 cm long, 5 cm
wide and 4.5 cm deep constructed from 0.64 cm thick Plexiglas. The depth of the
sediment layer was 3-3.5 cm. Continuous water flow across the sediment bed was
provided by a peristaltic pump. In experiments examining the influence of bioturbation,
either tubificid oligochaetes (Limnodrilus hoffmeisteri and Tubifex tubifex) or amphipods
-879-
(Hyallela azteca) were introduced to the sediment surface. The tubificids were
introduced to the sediment after an initial stabilization period at densities of 0, 6700
and 26,700 organisms-m"2. Each organism was 1-3 cm in length and exhibited a dry
weight of 200-500 ug. Amphipods were introduced in a similar manner at densities of
0, 4000 and about 9300 organisms-m'2. The amphipods measured 1-2 mm in length
and a dry weight of about 100 ug.
In these experiments, the sediments were contaminated with polyaromatic
hydrocarbons and the effect of bioturbation was ev* ja ted by monitoring the
contaminant flux from the sediments. In experiments evaluating the effect of microbial
production of colloidal organic matter, colloidal flux from the sediments was monitored
and used to support a model of the influence of colloidal matter migration on
contaminant transport. The sediments employed in all experiments were freshwater
sediments either contaminated in the field or contaminated by inoculation in the
laboratory. The field contaminated samples employed also exhibited a significant oil
and grease content of about 4%.
Contaminant flux was determined by analyzing 700-800 mL water samples
collected from the effluent of the experimental cells. The sample was either added to
0.5 L of hexane and extracted over 8 hours in a continuous extractor or extracted in a
simpler and faster three stage batch procedure. In the three stage extraction
procedure, 80 mL of hexane was added to 700 mL of sample and shaken for 45
minutes in the first stage, followed by two extractions with 60 mL of hexane with 15
minutes of shaking each time. Hot water immersion of the sealed sample was used to
break any emulsions formed during shaking. After extraction, the hexane was
concentrated to 2 mL and exchanged with acetonitrile during evaporation with nitrogen.
Analysis was then conducted via UV detection high performance liquid chromatography
(Hewlett-Packard Model 1090 HPLC) with a 70/30 acetonitrile/water carrier and
150x4.6 mm column packed with Envirosep-PP (a reversed phase C-18 column).
Average recovery of pyrene and phenanthrene by this process was 93.3 and 92.7%,
respectively, by continuous extractor, and 77±4.3% for pyrene, 93.70±1.1% for
phenanthrene and 83.9±6.5% for dibenzofuran by three stage extraction. Although
-880-
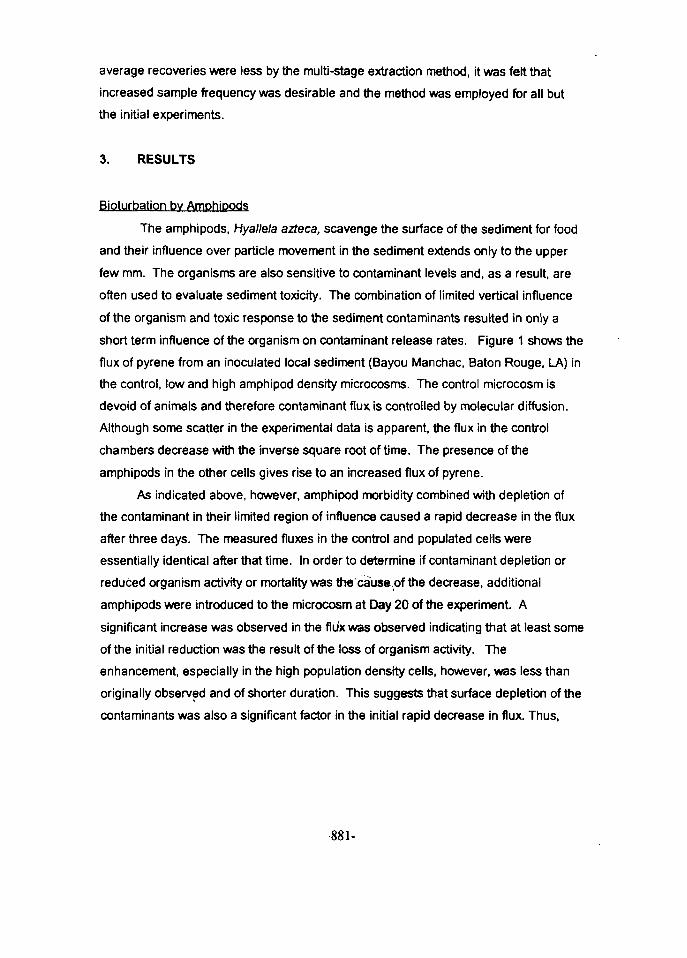
average recoveries were less by the multi-stage extraction method, it was felt that
increased sample frequency was desirable and the method was employed for all but
the initial experiments.
3. RESULTS
Bioturbation by Amphipods
The amphipods, Hyallela azteca, scavenge the surface of the sediment for food
and their influence over particle movement in the sediment extends only to the upper
few mm. The organisms are also sensitive to contaminant levels and, as a result, are
often used to evaluate sediment toxicity. The combination of limited vertical influence
of the organism and toxic response to the sediment contaminants resulted in only a
short term influence of the organism on contaminant release rates. Figure 1 shows the
flux of pyrene from an inoculated local sediment (Bayou Manchac, Baton Rouge, LA) in
the control, low and high amphipod density microcosms. The control microcosm is
devoid of animals and therefore contaminant flux is controlled by molecular diffusion.
Although some scatter in the experimental data is apparent, the flux in the control
chambers decrease with the inverse square root of time. The presence of the
amphipods in the other cells gives rise to an increased flux of pyrene.
As indicated above, however, amphipod morbidity combined with depletion of
the contaminant in their limited region of influence caused a rapid decrease in the flux
after three days. The measured fluxes in the control and populated cells were
essentially identical after that time. In order to determine if contaminant depletion or
reduced organism activity or mortality was the cause of the decrease, additional
amphipods were introduced to the microcosm at Day 20 of the experiment. A
significant increase was observed in the fliix was observed indicating that at least some
of the initial reduction was the result of the loss of organism activity. The
enhancement, especially in the high population density cells, however, was less than
originally observed and of shorter duration. This suggests that surface depletion of the
contaminants was also a significant factor in the initial rapid decrease in flux. Thus,
881-
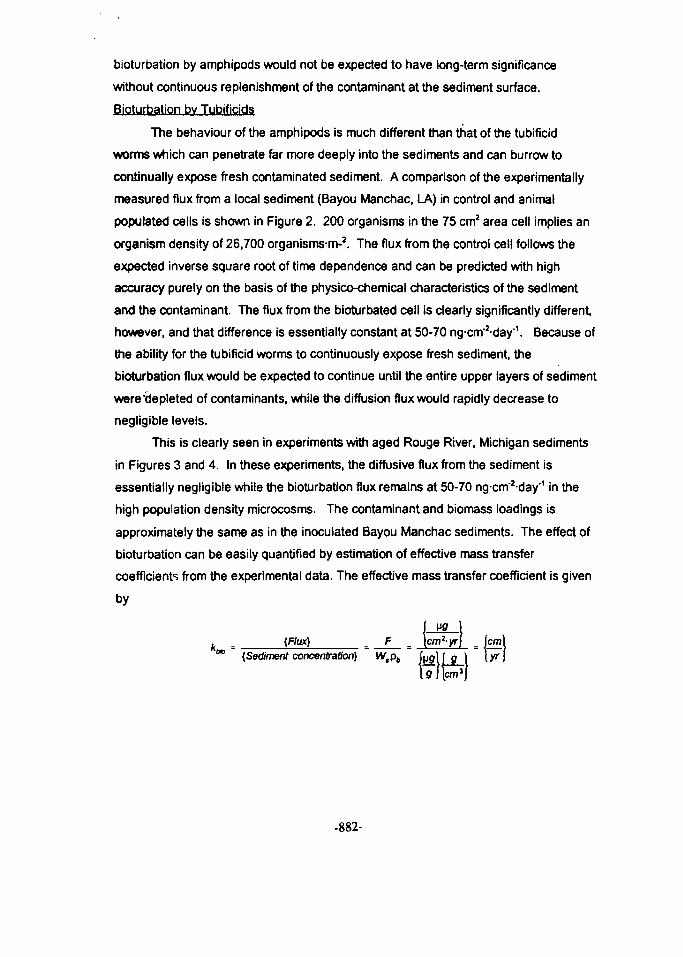
bioturbation by amphipods would not be expected to have long-term significance
without continuous replenishment of the contaminant at the sediment surface.
Bioturbation by Tubificids
The behaviour of the amphipods is much different than that of the tubificid
worms which can penetrate far more deeply into the sediments and can burrow to
continually expose fresh contaminated sediment. A comparison of the experimentally
measured flux from a local sediment (Bayou Manchac, LA) in control and animal
populated cells is shown in Figure 2. 200 organisms in the 75 cm2 area cell implies an
organism density of 26,700 organismsm-2. The flux from the control cell follows the
expected inverse square root of time dependence and can be predicted with high
accuracy purely on the basis of the physico-chemical characteristics of the sediment
and the contaminant. The flux from the bioturbated cell is clearly significantly different,
however, and that difference is essentially constant at 50-70 ngcm"2day\ Because of
the ability for the tubificid worms to continuously expose fresh sediment, the
bioturbation flux would be expected to continue until the entire upper layers of sediment
were'depleted of contaminants, while the diffusion flux would rapidly decrease to
negligible levels.
This is clearly seen in experiments with aged Rouge River, Michigan sediments
in Figures 3 and 4. In these experiments, the diffusive flux from the sediment is
essentially negligible while the bioturbation flux remains at 50-70 ngcm^day'1 in the
high population density microcosms. The contaminant and biomass loadings is
approximately the same as in the inoculated Bayou Manchac sediments. The effect of
bioturbation can be easily quantified by estimation of effective mass transfer
coefficients from the experimental data. The effective mass transfer coefficient is given
by
{Flux)Mff
cm^yr{Sediment concentration} W,pb
cm-
-882-
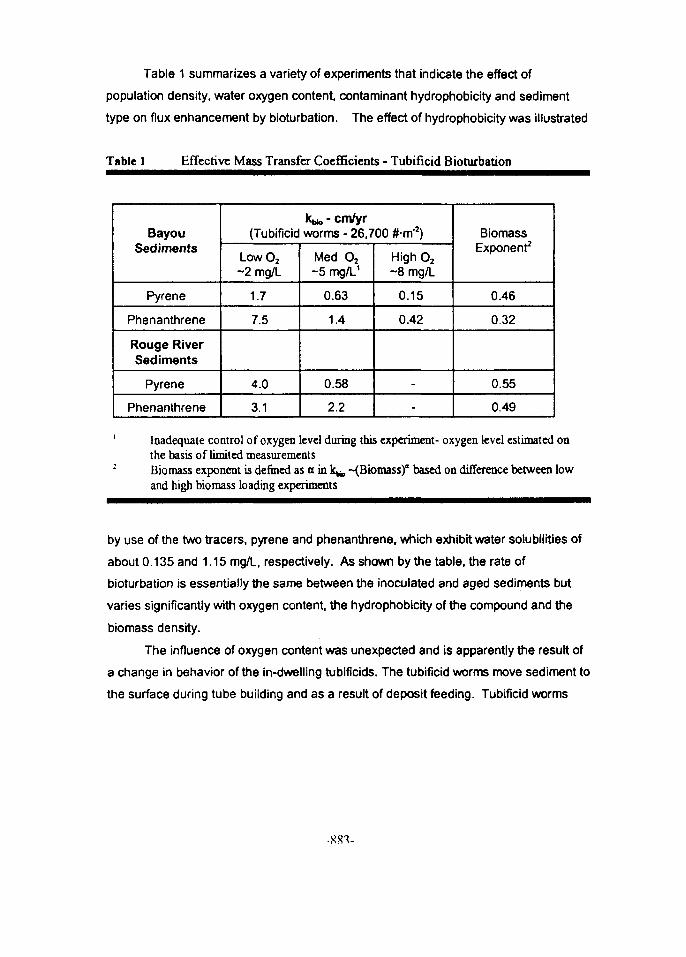
Table 1 summarizes a variety of experiments that indicate the effect of
population density, water oxygen content, contaminant hydrophobicity and sediment
type on flux enhancement by bioturbation. The effect of hydrophobicity was illustrated
Table 1 Effective Mass Transfer Coefficients - Tubificid Bioturbation
BayouSediments
Pyrene
Phenanthrene
Rouge RiverSediments
Pyrene
Phenanthrene
k^-cm/yr(Tubificid worms -26,700 #m'2)
LowO2
-2 mg/L
1.7
7.5
4.0
3.1
Med O2
- 5 mg/L1
0.63
1.4
0.58
2.2
High O2
- 8 mg/L
0.15
0.42
-
-
BiomassExponent2
0.46
0.32
0.55
0.49
Inadequate control of oxygen level during this experiment- oxygen level estimated onthe basis of limited measurementsBiomass exponent is defined as o in k^, -(Biomass)" based on difference between lowand high biomass loading experiments
by use of the two tracers, pyrene and phenanthrene, which exhibit water solubilities of
about 0.135 and 1.15 mg/L, respectively. As shown by the table, the rate of
bioturbation is essentially the same between the inoculated and aged sediments but
varies significantly with oxygen content, the hydrophobicity of the compound and the
biomass density.
The influence of oxygen content was unexpected and is apparently the result of
a change in behavior of the in-dwelling tubificids. The tubificid worms move sediment to
the surface during tube building and as a result of deposit feeding. Tubificid worms

have been shown to ingest and defecate several times their body weight daily. Under
our experimental conditions an average defecation rate of about 2.3 mg-worm"1-day'1
was measured by collection of the fecal matter. With an organism density of 26,700
worms-m'2 and a sediment bulk density of 1 g/cm3, this suggests that the sediment
reworking rate is governed by a mass transfer coefficient of about 2.2 cm/yr. This is
consistent with the observed mass transfer coefficient for pyrene under hypoxic or low
oxygen conditions as shown in Table 1. Under low oxygen conditions the worms
employ the motion of their tails to assist in oxygen exchange from the water. More time
must be spent at the surface where fecal matter that represents contaminated material
at depth can be deposited directly on the surface. Under higher oxygen conditions, the
need for interaction at the sediment surface is diminished and direct contaminant
transport to the surface is reduced. This result implies that the contaminant release
associated with bioturbation is strongly dependent upon temperature as a result of
both increased metabolic activity and the decreased oxygen solubility at higher
temperatures. Sediments that exhibit high sediment oxygen demands may also
increase the effect of bioturbation as a result of the low oxygen conditions.
The effect of hydrophobicity is to influence the relative importance of particle
movement vs. water movement in transporting contaminants. Phenanthrene is less
sorbing than pyrene and the fact that the effective mass transfer coefficient is greater
than expected by the defecation rate suggests that water-borne phenanthrene may be
a significant fraction of the mass released via bioturbation. In addition, release at the
surface is likely more rapid for the less sorbing phenanthrene.
Significant secondary porosity is also developed within the sediment as a result
of the tubificid bioturbation. Advective processes driven by porewater motion would
likely be considerably enhanced by the presence of this secondary porosity. The
experiments, however, were conducted such that advective transport normal to the
sediment-water interface was minimal.
Despite the differences in flux noted with different organisms and under different
experimental conditions, a surprisingly good correlation has been observed between
biomass density and effective bioturbation rates. Reible et al. (1996) compares
-884-
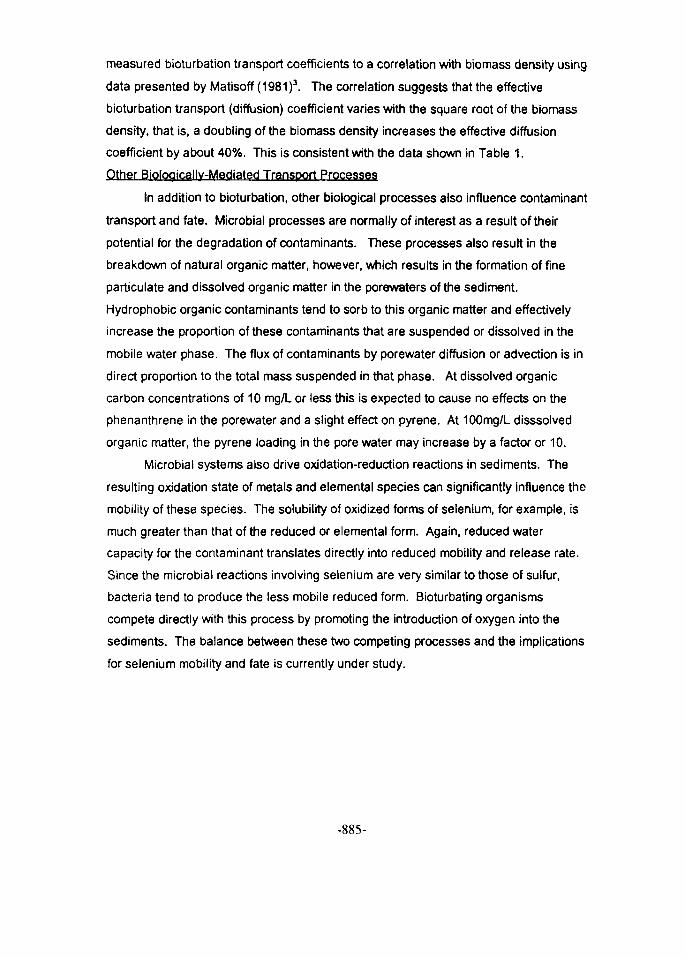
measured bioturbation transport coefficients to a correlation with biomass density using
data presented by Matisoff (1981)3. The correlation suggests that the effective
bioturbation transport (diffusion) coefficient varies with the square root of the biomass
density, that is, a doubling of the biomass density increases the effective diffusion
coefficient by about 40%. This is consistent with the data shown in Table 1.
Other Bioloqicallv-Mediated Transport Processes
In addition to bioturbation, other biological processes also influence contaminant
transport and fate. Microbial processes are normally of interest as a result of their
potential for the degradation of contaminants. These processes also result in the
breakdown of natural organic matter, however, which results in the formation of fine
particulate and dissolved organic matter in the porewaters of the sediment.
Hydrophobic organic contaminants tend to sorb to this organic matter and effectively
increase the proportion of these contaminants that are suspended or dissolved in the
mobile water phase. The flux of contaminants by porewater diffusion or advection is in
direct proportion to the total mass suspended in that phase. At dissolved organic
carbon concentrations of 10 mg/L or less this is expected to cause no effects on the
phenanthrene in the porewater and a slight effect on pyrene. At 100mg/L disssolved
organic matter, the pyrene loading in the pore water may increase by a factor or 10.
Microbial systems also drive oxidation-reduction reactions in sediments. The
resulting oxidation state of metals and elemental species can significantly influence the
mobility of these species. The solubility of oxidized forms of selenium, for example, is
much greater than that of the reduced or elemental form. Again, reduced water
capacity for the contaminant translates directly into reduced mobility and release rate.
Since the microbial reactions involving selenium are very similar to those of sulfur,
bacteria tend to produce the less mobile reduced form. Bioturbating organisms
compete directly with this process by promoting the introduction of oxygen into the
sediments. The balance between these two competing processes and the implications
for selenium mobility and fate is currently under study.
-885-
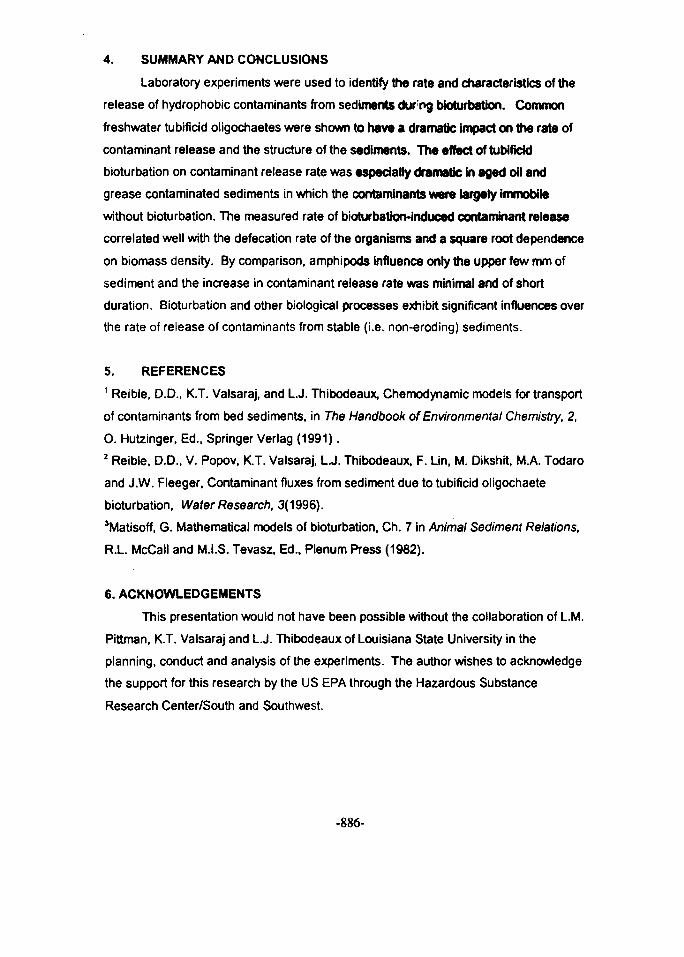
4. SUMMARY AND CONCLUSIONS
Laboratory experiments were used to identify the rate and characteristics of the
release of hydrophobic contaminants from sediments durng bioturbation. Common
freshwater tubificid oligochaetes were shown to have a dramatic impact on the rate of
contaminant release and the structure of the sediments. The effect of tubificid
bioturbation on contaminant release rate was especially dramatic in aged oil and
grease contaminated sediments in which the contaminants were largely immobile
without bioturbation. The measured rate of bioturbation-induced contaminant release
correlated well with the defecation rate of the organisms and a square root dependence
on biomass density. By comparison, amphipods influence only the upper few mm of
sediment and the increase in contaminant release rate was minimal and of short
duration. Bioturbation and other biological processes exhibit significant influences over
the rate of release of contaminants from stable (i.e. non-eroding) sediments.
5. REFERENCES1 Reible, D.D., K.T. Valsaraj, and L.J. Thibodeaux, Chemodynamic models for transport
of contaminants from bed sediments, in The Handbook of Environmental Chemistry, 2,
0 . Hutzinger, Ed., Springer Verlag (1991).2 Reible, D.D., V. Popov, K.T. Valsaraj, L.J. Thibodeaux, F. Lin, M. Dikshit, M.A. Todaro
and J.W. Fleeger, Contaminant fluxes from sediment due to tubificid oligochaete
bioturbation, Water Research, 3(1996).3Matisoff, G. Mathematical models of bioturbation, Ch. 7 in Animal Sediment Relations,
R.L. McCall and M.I.S. Tevasz, Ed., Plenum Press (1982).
6. ACKNOWLEDGEMENTS
This presentation would not have been possible without the collaboration of L.M.
Pittman, K.T. Valsaraj and L.J. Thibodeaux of Louisiana State University in the
planning, conduct and analysis of the experiments. The author wishes to acknowledge
the support for this research by the US EPA through the Hazardous Substance
Research Center/South and Southwest.
-886-
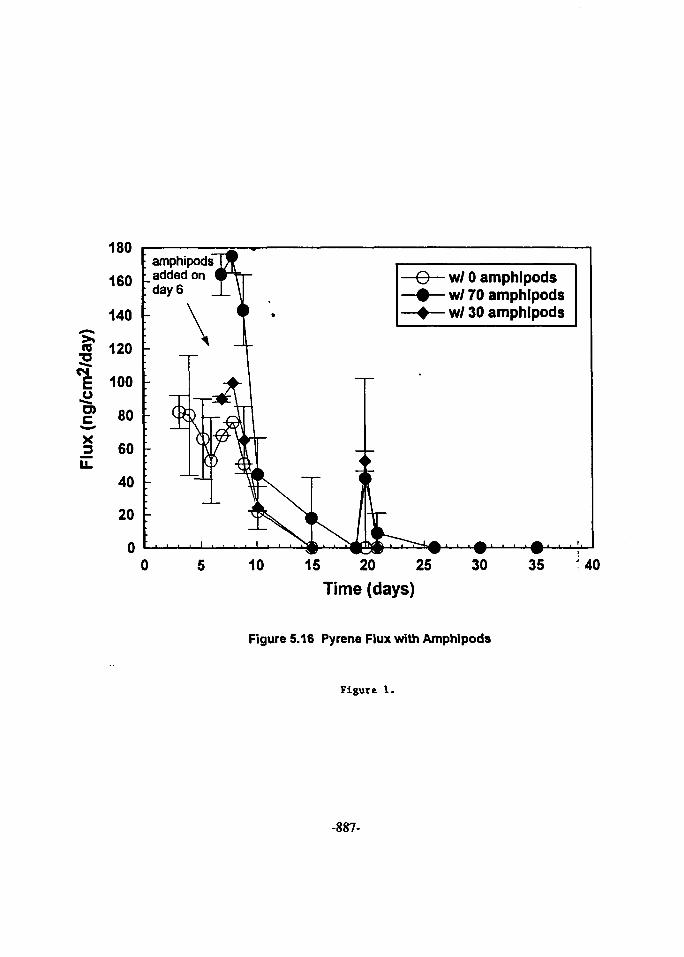
180
160
140
/day
[ng/
cm^
Flu
x!
120
100
80
60
40
20
0
amphipodsadded onday 6
10
w/ 0 amphipodsw/ 70 amphipodsw/ 30 amphipods
15 20 25
Time (days)30 3 5 -A0
Figure 5.16 Pyrene Flux with Amphipods
Figure 1.
-887-
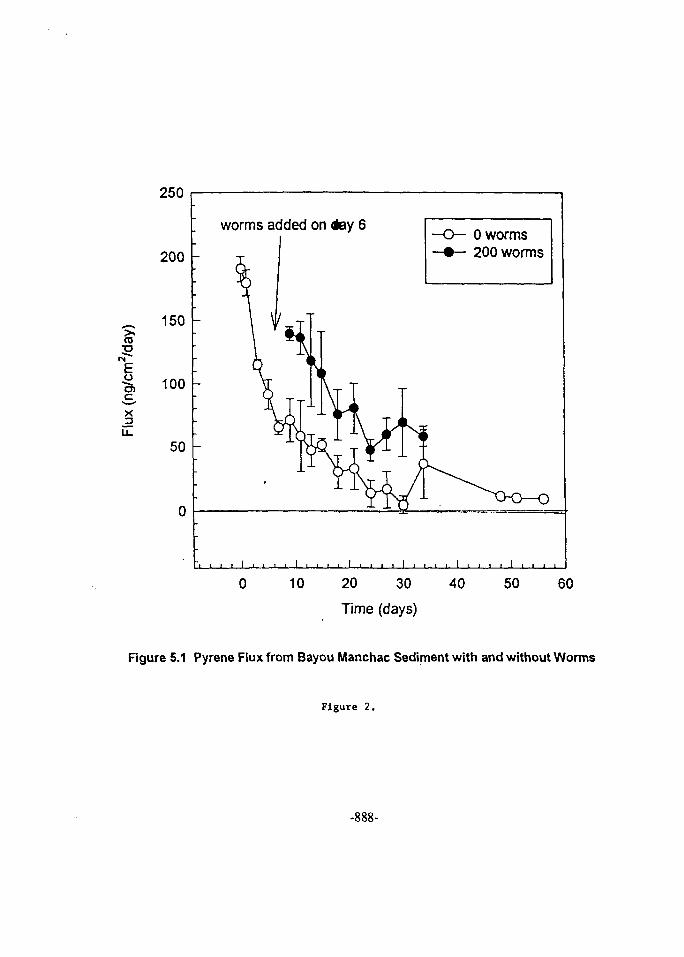
X
250
200 -
150
100
50
worms added on <tey 60 worms200 worms
i , i , , i i . . i
0 10 20 30 40 50 60
Time (days)
Figure 5.1 Pyrene Flux from Bayou Manchac Sediment with and without Worms
Figure 2.
140
120
->; 100CO
1
X3
80
60
40
20
worms added on day 11
,n n ,i
Oworms50worms
10 15 20 25
Time (days)30
n, n35 40
Figure 5.32 Fluoranthene Flux from Rouge River Sediment with 50 Worms-Run 2
Figure 3.
-889-
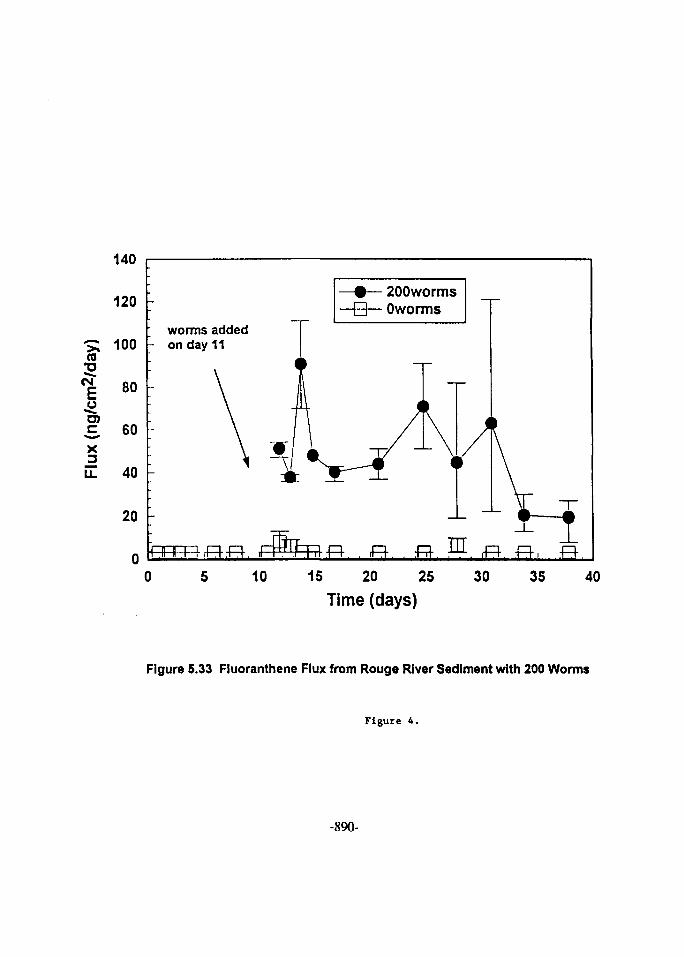
140
120
s ; 100
CM 80
S 60
X3
40
worms addedon day 11
200wormsOworms
10 15 20 25
Time (days)30 35 40
Figure 5.33 Fiuoranthene Flux from Rouge River Sediment with 200 Worms
Figure 4.
-890-
Water and Wastewater Treatment
NIXTPAQE(S)loft BLANK
Proceedings of the Fifth International Conference EG9700043on Energy and Environment, Cairo, Egypt, 1996
Effect Of Gas Sparging On The Cementation Of Copper Ions
From Industrial Waste Hater Using Zinc Bed
Asma. A.el-Sattar, Chem.Eng.Dep.Fac of Eng.,Minia Univ.Minia ,Egypt.
ABSTRACT
The effect of nitrogen sparging on the rate of cementation ofcopper on Zinc cylinders bed- and Zinc powder bed from a simulatedwaste solution of Copper Sulphate was studied .
Variables studied were nitrogen superficial velocity, diameterand height of the Zinc cylinders bed,temperature. These variableswere studied for their effect on the mass transfer coefficient ofcopper cementation.
KEY WORDS
Copper removal, Cementation, Metal displacement.
INTRODUCTION
Contamination of industrial waters by the discharge ofindustrial waste materials such as mercury,copper,cadmium,nickel,zinc and other metals or salts causing a universal concern.Metalcontamination renders water poisonous to aquatic life andunsuitable for domestic water supply on account oftoxicity'1'.Sources of waste effluent containing dissolved heavymetals include organic and tanning industries, electroplating,metal processing and refining, storage battery manufacture and dyeindustry '2'.With respect to copper as source of environmentalpollution, pickling and plating industries are its largestconsumers'3'.Cementation reaction is an electrochemical process bywhich a more noble ion is precipitated from solution and isreplaced in solution by a metal higher in the electromotiveseries.Cementation is used commercially to recover gold fromcyanide solutions and copper from leach solutions[4,5].The ratecontrolling step in these reactions is the diffusion of copper ionsto zinc surface.
-893-
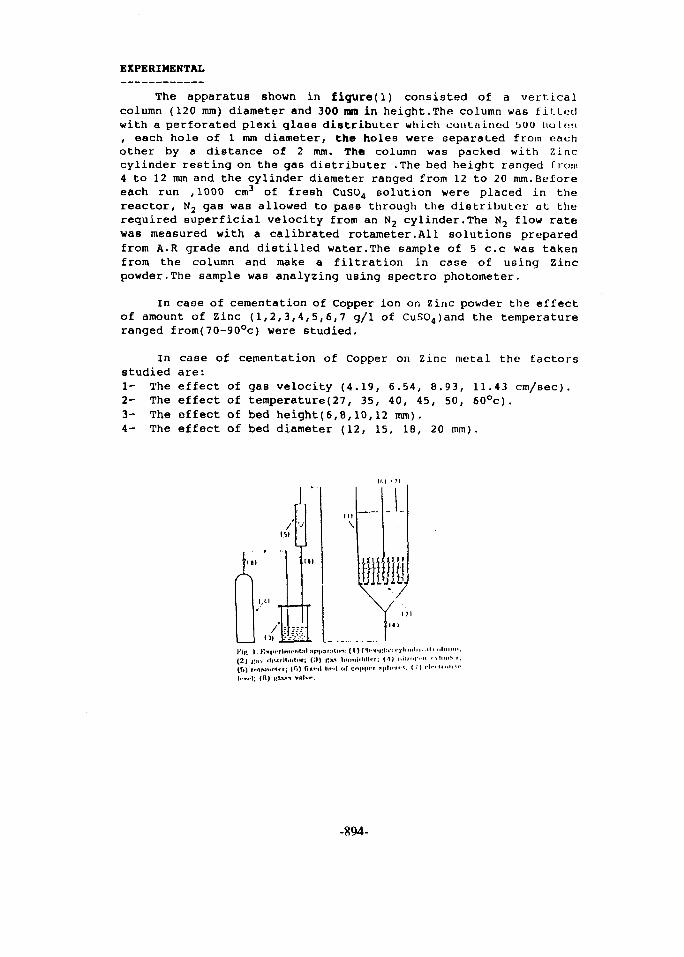
EXPERIMENTAL
The apparatus shown in figure(l) consisted of a verticalcolumn (120 mm) diameter and 300 mm in height.The column was fittodwith a perforated plexi glass distributer which contained 'JOO HUUMI, each hole of 1 nun diameter, the holes were separated from eachother by a distance of 2 mm. The column was packed with Zinccylinder resting on the gas distributer .The bed height ranged from4 to 12 mm and the cylinder diameter ranged from 12 to 20 mm.Beforeeach run ,1000 cm3 of fresh CuSO4 solution were placed in thereactor, N2 gas was allowed to pass through the distributer at therequired superficial velocity from an N2 cylinder.The N2 flow ratewas measured with a calibrated rotameter.All solutions preparedfrom A.R grade and distilled water.The sample of 5 c.c was takenfrom the column and make a filtration in case of using Zincpowder.The sample was analyzing using spectro photometer.
In case of cementation of Copper ion on Zinc powder the effectof amount of Zinc (1,2,3,4,5,6,7 g/1 of CuSO4)and the temperatureranged from(70-90°c) were studied.
In case of cementation of Copper on Zinc metal the factorsstudied are:1- The effect of gas velocity (4.19, 6.54, 8.93, 11.43 cm/sec).2- The effect of temperature(27, 35, 40, 45, 50, 60°c).3- The effect of bed height(6,8,10,12 mm).4- The effect of bed diameter (12, 15, IB, 20 mm).
j ,
Kin I. B.| .r,l ...1 »p1,,li.li.n: (I ) l l . - . . , ; !^ . y < „ ' • » '( 2 ) R i . i i l i M i l l n H . i r ; ( : i ) r . « I m i i i i i l i l l i - i : ( I ) • . •«»•-• - - '• • ><"">•( ! i ) t n t a m r t v i ; ( f t ) ("|«€- ( | ! « • < ! o ( c o | " l " ' ! « | i t i r i ' - * ; ( ' I H . . H . . I , 'l . - w l ; ( B ) | < l . v < i v a l v f .
-894-
RESULTS AND DISCUSSION
Figure (1) represents the effect of the amount of Zinc powderon the precipitation of cupric ions it is seen that the mosteffective concentration is 6 g/1.
Figure (2) represents a typical plot for the precipitation ofcupric ions from the solution for Zinc cylinders bed at varioustemperatures .Comparison figure (2) with figure(3) which representsthe precipitation of cupric ions from the solution for Zinc powderbed from these figures, the % removal of copper ions = (Co-C/Co) X100 was found as shown in the following table:-
Table (1): Comparison between the % removal of cupric ions in caseof using Zinc Powder bed and Zinc cylinders bed.
At
At
50°
40°
c
c
Zinc powder bed
%removal
90%
90%
time,min
16
18
Zinc cylinder bed
%removal
90%
90%
time,min
30
35
From this table it is seen that the time required for removalof 90% of cupric ions in the case of Zinc cylinders bed is twicethat required in case of Zinc powder bed (7gram zinc/litre of CuSO,(solution),and the same superficial velocity.
For the batch reactor used in the present work the rate ofdiffusion controlled copper cementation with Zinc can be expressedin terms of the disappearance of cupric ions from the solution bythe equation'6' :
-VB ( dC / dt ) = K A C (1)
Which on integration yields:
In Co/C = K A t / VB (2)
For Zinc cylinders bed the following results were obtained:-
Figure (4) shows a typical dependence of In Co/C on time.The masstransfer coefficient k was obtained from the slope of (In Co/C) vo.
-895-
t. line.Figure(5) shows the effect of the N2 superficial velocityon the mass transfer coefficient at different bed heights.The masstransfer coefficient increases with increasing gas superficialvelocity as seen in equation(3).
K = 0.034 vg0-88 (3)
Previous studies I7'8' on the effect of gas sparging on therate of heat and mass transfer to the vertical wall of bubblecolumns have shown that the value of the velocity exponent rangesfrom 0.15 to 0.37, while previous studies'9'on the effect of N2sparging on the rate of liquid-solid mass transfer at fixed beds ofspheres have shown that the values of the velocity exponent was0.5.The high value of the velocity exponent obtained in the presentstudy may be ascribed to the cylindrical geometry of the transfersurface where boundary layer separation and turbulent wakeformation is likely to take place.
Figure (6) confirms the decrease in the mass transfercoefficient with increasing bed height according to equation(4)
K oc hB - ° -4 5 8 • (4)
The observed decrease in the mass transfer coefficient with bedheight may be attributed to the fact that, as the gas liquiddispersion progress through the bed, the local CuSO4 concentrationdecreases along the bed with a consequent decrease in the rate ofmass transfer.
Figure (7) shows that for a given bed height and N2
superficial velocity the mass transfer coefficient increases withincreasing particle diameter according to equation (5).
K 0<d8 °-33 (5)
An overall mass transfer correlation was envistigated usingthe dimensionless groups J, Re, Fr usually used in correlating heatand mass transfer data in gas sparged systems I7'8!..A dimensionlesscorrelation in the form J = a(Fr _ R e)
b which is usually used incorrelating heat and mass transfer in bubble columnn won foundinsufficient for correlating the present data two extradimensionless groups were found necessary, namely dB/d and hB/d toaccount for the effect of the cylinder diameter ds and bed heighth . The use of the column diameter d in the formulating the two
-896-
dimensionless groups dB/d and hB/d is justified on the basis thatit effects the flow conditions and the axial dispersion coefficientin bubble columns'10'11'. The data can be represented in thefollowing equation for hB/d < 0.1
J = 1652.05(Fr.Re)-°-o27(dfl/d)
o-33(hfl/d)-°-'185 (6)
CONCLUSIONS
The following conclusions can be drawn from the presentstudy:-1- The mass transfer coefficient increases with increasing
superficial gas velocity .2- The mass transfer coefficient decreases with an increase in bed
height.3- JThe mass transfer coefficient increases with increasing
particle diameter.4- The scale factors (dB/d and hB/d) exert marked effects on mass
transfer coefficients for hB/d<0.1 .5- Solid -liquid mass transfer coefficients are well correlated by
eq."(6)in terms of froude number .Reynold, s number, and the scalefactors dB/d and ho/d.
6- Cementation of Copper ions on Zinc powder bed is better thanthat on Zinc cylinders bed,but in the first case it isdifficult in filtration.
-897-
Nomenclature
A ( " • ' . ( a r e a r . I . , i l : i 1 r . i n f n r r . ; . i r - : . . . I •. | . 1 , . \ < • - . f < . i n . l i , , | I , , | , , . , t >
C. r r i | t p r > r r . i l l f a i n r . .nr - r - i i • r ;> I. I c >• • .11 I I m f I.
C I I.I 1.1 nl cn|>|.r-i r-.nl r.-il o rn i« l i . i l i , , i i
cl l.f-rl <ll miml.'-i
<1 i i a r l t e a l fllnu»^*.nr
13 roppi>r r.nlf.TLo r\ I f f u-. I vl I. y
;j «;')1 tit. t on vl *-.ro': I l.y
p c o l ul. I o n '.l^n^.iLy
Vq r.tifier f I c i a i n"*«; v * * l o c l t y
I. t. I M.o Cinl r, }
T'V V ^(j i . l^ f r oiicl1? riuiul>*M
t| ;w t i ' l <-i :i l I m i > I M . - I o i|i n v l I y
K mar.s t r a n s f e r r w f r 1 c i onl.
I. I.--.I l,.-l.|l,i
Q solul.ton vol'imo
K o , i V . ! • ; , - , ( , ( • • . . y l , . , l . 1 - . • . . •.. .1 .. -,
f<_ , T . ; c l i " > l c l I .
k. v , ^tjwtl.#» . rtrt
Ml . TV- , in;i'". •: 1.1 a i r . I ' M ! ! .»• I i >i
i i n i i i h o r n f l ir»f|- .
-898-
REFERENCES
1) Maruyama , T. Hannah, S.A. Cohern, J.M., Water Pollut, ControlFied. 47 (1965) P,962.
2) Tara,V., Karra, S.B., Hass, C.N., Water, Aer, soil Pollut,22(1984) P.429.
3) Biswas, A.K., Davenport, W.G., Extractive Metalurgy ofCopper.Pergamon press, New York 1979.
4) P.H.Strickland and F.Laivson, Proc.Inst.Hin.Met.236(1970)25.
5) L.A.Meza, M.P.URIBE, ' and J.I.Ramirez, Dyna(Medellin,Colomb.)101(1982)66.
6) Madden, A.J.and Nelson, D.G., AIchEJ., 10 (1964) 415-430.
7) F.A.Katkout, A.A.Zatout, H.A.Farag and G.H.Sedahmed, CanJ.cHEM.eNG., 66(1988)497.
8) W.D.Deckwer. Chem.Eng.Sci., 35(1980)1341.
9) M.A.Zarraa, M.Z.El-Abd, Y.A.El-Twail, H.A.Fnrag andG. 11.Sedahmed, The Chemical Engineering Journal, 54( 1994 )51-b!>.
10) Y.T.sHAH, B.G.Kelkar,S.P.Godbole and W.D.Deckwer,AIChEJ. ,20(1982)353.
11) V.K.Patil and M.M Sharma, Chem Eng.Res., 61(1983)12.
-899-
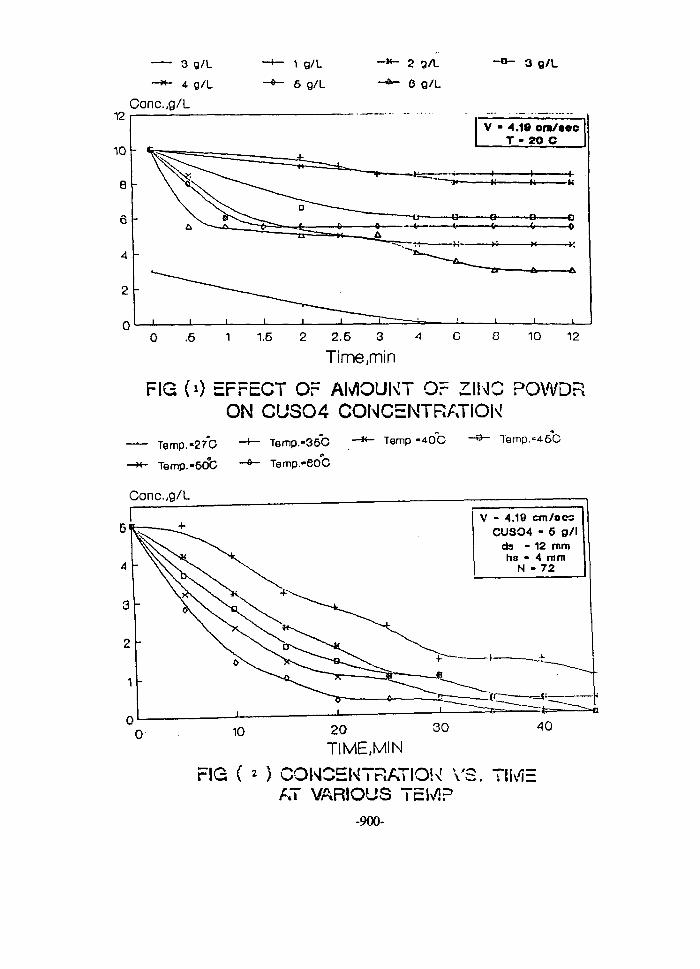
12
10
8
3 g/L
—*- 4 g/L
Concg/L
-*- 1 g/L
- * - 6 g/L
- H - - ° - 3 g/L0 g/L
V - 4.19 oro/aecT - 20 C
.6 1 1.6 2 2.6 3 4
Time.min10 12
FIG (i) EFFECT OF AMOUNT Or ZING POWDRON CUSO4 CONCENTRATION
Temp.-27C
Temp. -60°C
Temp.-36C
Temp."60C
Temp.«40G Temp. -=460
Conc.^g/l
V - 4.19 cm/oosCUSO4 - 6 g/l
do - 12 mmha - 4 mm
N - 72
20TIME.MIN
FIG ( O CONCENTRATION vAT VARIOUS TEMP
i \'P T\ur,=
-900-
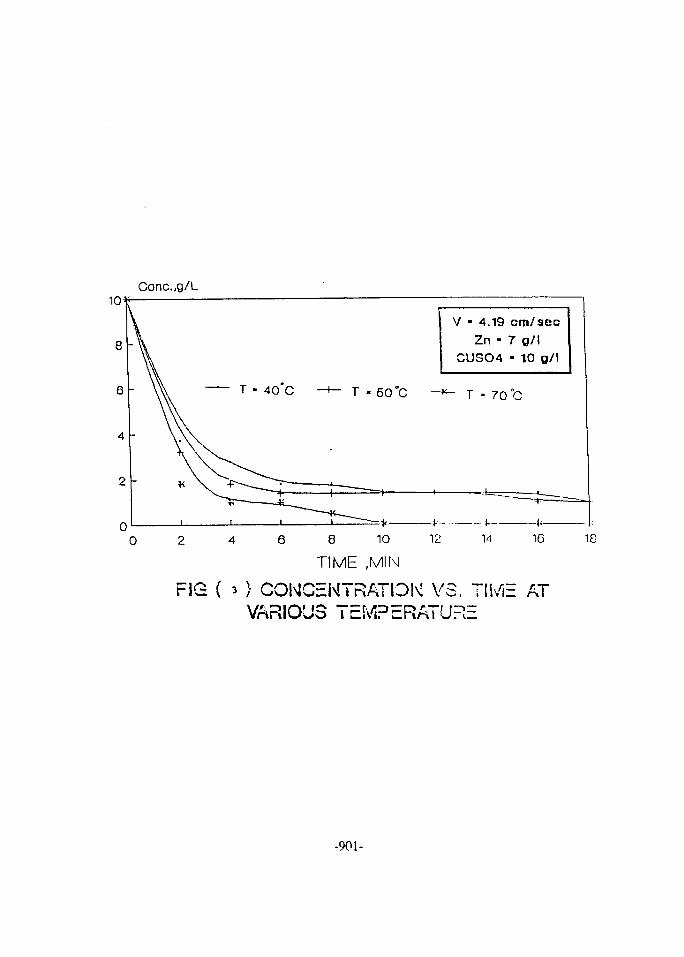
Conc.,g/L
V - 4.19 cm/secZn - 7 g/l
CUSO4 - 10 g/l
T - 60 °C T - 70 °C
12 14 162 4 6 8 10
TIME ,MIN
FIG ( 3 } CONCENTRATIDK VS. Tll/E ATVARIOUS TEMPERATURE
18
-901-
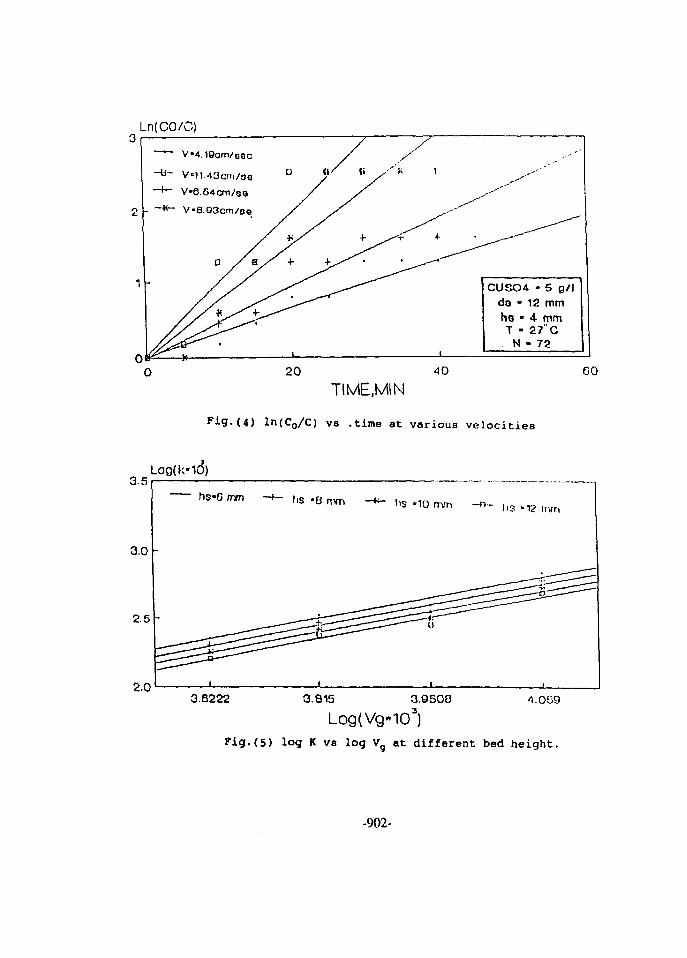
Ln(CO/C)
20 40
TIME,MIN
(4) ln(C0/C) vs .time at various velocities
3.5Log(k«1O)
hs*G mm**~ Its «10 uvn - n - I,- .T>nvri
3.0
2.5
2.0 _L
3.6222 3.815 3.9500
Log(Vg*iO3)1.0(39
Fig . (5 ) log K vs log V a t d i f f e ren t bed he igh t .
-902-
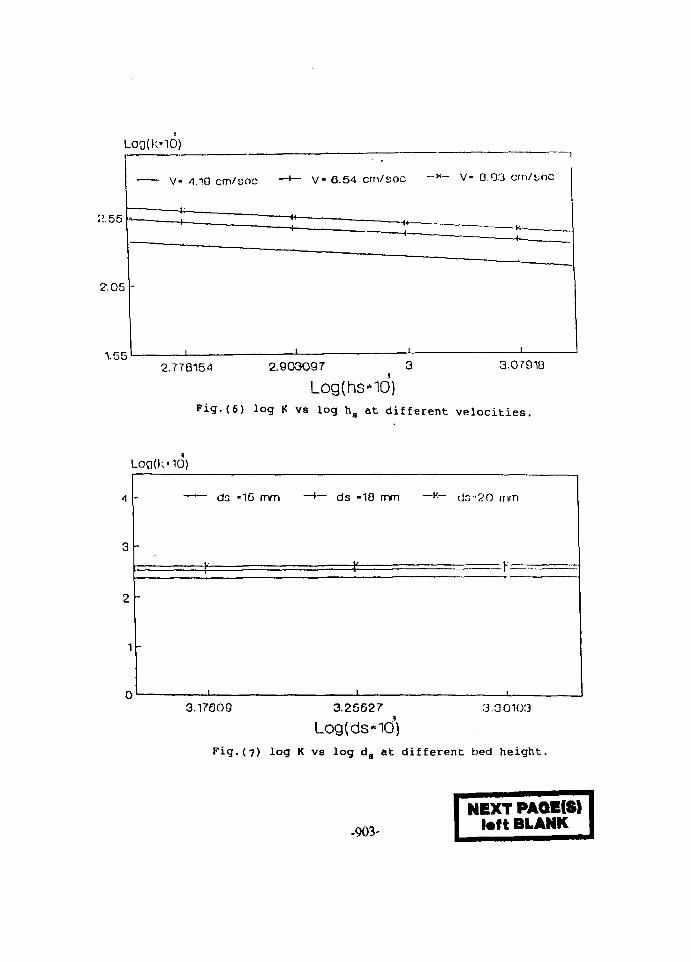
LOO(k-IO)
'.1.55
2.05 -
1.55
V- 6.54 cm/soc -"- V- 0.93 crn/<joc
2.778154 2.903O97 3
Log(hs*id)3.07910
Fig.(6) log K va log h8 at different velocit ies.
Load;
A
3
2
1
0
-
-
•10)
ds -16 mm
j -
"•— ds -18 mm —*— ds-20 mm
Y Y
3.17GO9 3.25527 3.00103
Log(dsMO)Fig.(7) log K vs log ds at different bed height.
-903-
NEXT PAQE(S)left BLANK
Proceedings of the Fifth International Conference EG9700044on Energy and Envirorunent, Cairo, Egypt, 1996
Control and Recovery of Phosphorous PentoxideEmission in a Rodencide Production Plant
O.E Abdel Salam* and S.I. Abou Elela"•Chemical Engineering Department, Cairo University, Giza, Egypt.
••Water Pollution Control Dept., National Research Center, Dokki, Giza, Egypt.
ABSTRACT
Control and recovery of phosphorous pentoxide emission as phosphoric acid, in a rodencideproduction plant was carried out. The control unit has been designed and fabricated on a semi-pilot scale. The results obtained showed that the water and air flow rates are important factorswhich affect the percentage recovery of P2O5 from the flue gas. Also, mist elimination is animportant step in the pollution control efficiency. The obtained results revealed that recirculationof phosphoric acid is very efficient in the absorption of P2O5. Full detailed engineering designsand cost estimation for a full scale system were carried out.
INTRODUCTION
During the manufacture of zinc phosphide rodencide, in a chemical industrial plant in Egypt,batches of phosphorous/zinc mixtures are burned outdoors and excess phosphorous is used tosupply heat to start the reaction. Phosphorous pentoxide is emitted as a waste material at a rate of10-15 tons/year. This emission is a source of air pollution in the area and represents a loss of redphosphorous which is used in the production process. Control and recovery of wasted materialsis the first logical step in tackling such a problem. Phosphoric acid is an important chemicalwhich is used by many industries and can be obtained by the reaction of phosphorous pentoxidewith water [1].
Therefore, the aim of this study is the control and recovery of phosphorous pentoxide inorder to protect the environment and to gain benefit as much as possible from wasted materials.
MATERIALS AND METHODS
A control unit of P2O5, based on a semi-pilot scale, has been designed and fabricated. Thesystem consists of two parts:
1. An efficient combustion system for the facilitation of the burning process and confinementinto one single stream which can be later treated in a subsequent step.
2. A water scrubber for the removal and possible recovery of P2O5 as phosphoric acid forfurther utilization . These are described in detail as follows:
-905-
Combustion Chamber
A prototype scale combustion chamber was designed and built up for efficient combustion ofphosphorous in the phosphorous-zinc mixture. Since zinc does not affect the amount of emissionof P2O5, it was decided to carry out the initial experiments using samples of red phosphorous in aconfined combustion chamber (I-'ig. I). The combustion chamber was constructed of carbon steelwilh inside diameter of 60 cm height and further insulated from the outside with IS cm height)which contain the phosphorous charge. Compressed air was introduced tangentially above themetal pot to induce circulatory motion and to enhance the mixing between phosphorous and air.The air was introduced from the side lube and its rale was adjusted to avoid the extinguishing ofthe phosphorous flame and at the same time to facilitate the How of P2O5 containing the Hue gasstream through different sections of the control system.
Water Scrubber
The water scrubber (Fig. 2) is constructed of carbon steel (it has been mentioned in theliterature that carbon steel is satisfactory in this case [2]) and has an inside diameter of 40 cmand height of 2 0 in., in addition to the top and bottom heads. The absorption section consisted oftwo successive layers of 40 cm. height tilled with P.V.C. raschig rings as a packing material tofacilitate the absorption of P2US in water. These were supported on steel screens and a liquidshower was fixed at the top. During the course of the experiments, it was found that it isnecessary to add a mist eliminator and to install a glass wool layer of a thickness 5 mm, inaddition to a chimney of 10 cm inside diameter and 44 cm height with tapered plates installed atthe top to trap the phosphoric acid mist which comes out the top of the scrubber.
In the initial experiments, the water flow rate was not controlled and its value was estimatedby the collection of diluent stream over a specified time period. Later on, a gate valve andcalibrated water How meter were used to control and measure the water llow rate.
Phosphoric acid concentration in the effluent stream was measured according to standardmethods (IW2).
RESULTS AND DISCUSSION
Initially, the assembled system was tested using phosphorous samples alone. To study thefactors affecting the efficiency of P2O5 removal, complete runs using samples of 200 gin of redphosphorous wilh different water flow rates were carried out. Average water flow rates wereestimated from the total volume of solution collected over a specific time. The results of theexperiments are summarized in Table I.
Two additional runs were carried out using zinc-phosphorous mixtures. Their results areshown in fable II.
-906-
From the preliminary experiments, it is obvious that the water Dow rate is a critical designparameter which deserves more investigation. Subsequent experiments were carried out whilecontrolling water flow rate using a gale valve and calibrated flow meter. The results of theseexperiments are shown in Table III.
From these experiments the effect of the investigated parameter can be summarized asfollows:
Effect of Water Flow Rate:
By comparing runs 1, 4, 5 and 6, we can see that the recovery efficiency of P1O5 decreasessteadily as the water How rate increases. Apparently, a water flow rate of 0.019 m/min results inthe highest recovery efficiency of 16% when the weight of phosphorous in the sample is 0.S kg.When (he weight of the phosphorous in the sample increased to 0.8 kg, the maximum recoveryefficiency increased to 57.5% at a flow rate of 0.026 m /min. In both runs 2 and 3, the recoveryefficiency was between 45-57 % compared to a value of 4-16 % for other runs. This can beexplained by the higher partial pressures of P2Os in the water scrubber since the amount ofphosphorous burned was higher which is accompanied by higher mass transfer rates in thescrubber.
Effect of Air Flow Rate
flic nir flow rate could not be measured directly. However, comparison between run 6 inwhich air is introduced by forced draft and run 7 in which air is introduced by natural draftshows that decreasing the air How rate resulted in higher recovery efficiency due to the increasein P1O5 partial pressure inside the scrubber.
Effect of Phosphoric Acid Circulation
It was reported in literature [I] that the absorption of P2O5 in phosphoric acid is faster thanthe absorption in water and therefore recirculation of the solvent is usually employed inphosphoric acid plants to enhance the absorption process. To test the effect of recirculation on(he removal rate, two tests were carried out using batches of 2 kg. of the phosphorous/zincmixtures (1:3 ratio) and using the same liquid flow rate of 0.019 m /min. In the first experimentlap water was used as the solvent but in the second case the accumulating H3PO4 in the effluentstream of the second experiment was 350 mg/l indicating an increase of the absorption rate by 5times upon recirculation.
The Need to Use a Mist Eliminator
Initial experiments showed that in the absence of a mist eliminator, a persistent white smokeis present in the stack inspite of the fact that P^O; reacts vigorously with water. It has beenstressed in literature [3] that mist elimination of the fine H3PO4 droplets is necessary.Incorporation of a 5 mm thick glass wool layer and a short stack with tapered plates at the top of
-907-
the scrubber was effective. This was obvious from the absence of any visible smoke which ischaracteristic of the H3PO4 mist.
Presence of Zinc Phosphide in the Flue Gas
Samples of the effluent gases were analyzed for the presence of zinc phosphide. Althoughthe phosphide radical was detected in the samples, no evidence for the presence of zinc radicalwas detected. This can be explained by the fact that the boiling point of Z^Pj is 1100°C. This ishigher than the actual flame temperature, which was measured during the experiments using achromel-alomel thermocouple, by about 100°C. Other metal phosphides e.g. iron phosphidewhich might result from the slow attack on the pot walls could be the source of the phosphideradical in the effluent gas.
DESIGN OF FULL SCALE UNIT
The outcome of our experimental study was encouraging and based on these results andother engineering considerations a full scale unit was designed. Sizing was based on standardprocedures [3-7]. The main components of that unit are:
Furnace
It consists of a cylindrical combustion chamber of a 6.2m inside diameter and 4m height anda top in the form of a dome of 2.2m height. The furnace body is made of high alumina firebrickand the floor is also made of high alumina firebrick resting on one layer of insulating brick andthen onto a reinforced concrete base. Two side doors of 1 m width and 2m height are used foreasy placement and dispatch of the pots. Steel pots of 62 cm diameter (20 are used per batch) arearranged in circular patter in two rows. Air for combustion and cooling is introduced from ablower and a flow rate of 2000 m /hr for a 4 hour period is considered to be enough forcombustion and cooling. Combustion is started by the burning of gas oil through side burnerswhich arc fed through a gear pump from a fuel storage tank. Once the reaction mixture reaches aspontaneous ignition temperature of red phosphorous, the reaction starts and a considerableamount of heat is released which can bring the temperatiure inside the furnace to ~IOOO°C.Cooling of the pots is affected by the flow of air to bring the temperature of the pots down toroom temperature. The hot combustion gases containing P2O3 flow to the scrubber through asteel pipe at the top of the furnace.
Scrubber
I'or the effective absorption of P2O5 and assuming a 99% removal efficiency, a tower withhn internal diameter and 3m height (height of packing is 1.5m, packing type: porcelain Raschigrings of 25mm diameter) is needed. The packing height is also adequate to reduce the effluentgas temperature down to 50°C. In order to resist the corrosive action of hot concentratedphosphoric acid , the material of construction should be 316 type stainless steel.
-908-
Phosphoric Acid Cooler
To remove the excessive heat of reaction of P2O5 with water and to cool down the furnacegases, it is necessary to cool the phosphoric acid leaving the scrubber down to 30cC beforerecirculation to the top of the scrubber. This is affected in a shell and tube heat exchanger with24 tubes (19mm OD and 4.8m length) arranged in square pitch for easy cleaning of shell side inwhich cooling water is pumped. The tubes are made of 316 stainless steel and the shell ofordinary carbon steel. The dilution of the acid is affected in an intermediate storage tank.
Mist Eliminator
A mist eliminator that can remove phosphoric acid droplets with high efficiency size rangeof Ijx or less is based on the fiber bed design [3]. Two stainless steel screens of Im and 80cmdiameter and 2m height are used with the space in between filled with fine glass wool. Gasesleaving the scrubber will flow from outside to inside the glass wool bed where clean gasescollect in the central tube and flow upwards whereas phosphoric acid droplets collect and drainat the bottom.
Chimney
A chimney of 75cin id and 100cm od with a height of 7m is necessary to carry out the fluegases to the atmosphere. In addition to the above items, pumps, storage tanks, product grinder,etc.. are needed.
COST ESTIMATION AND PAYBACK PERIOD PREDICTION
The estimated purchased prices are presented in Table IV. Using a Lange Factor of 3.63 [8]the estimate fixed capital investment [f.c.i] is L.E. 2,790,000.
The total costs for the production of zinc phosphide are estimated in Table V
For a total production of 462 tons/year of zinc phosphide, this amounts to L.E. 8.1 I/kg ofzinc phosphide and since the sale price of zinc phosphide product is L.E. 12 and of phosphoricacid product is L.E. 2.35/kg, the total annual profit after taxes is L.E. 1,449,000. The paybackperiod therefore is 1.6S years if the service life of the plant is 20 years and the plant runs at fullcapacity.
RESULTS AND CONCLUSIONS
A semi-pilot unit has been tested for the removal of P2O5 from gaseous emissions from zincphosphide manufacturing plant and recovery as phosphoric acid. Experiments showed the effectsof important design parameters and indicated the need of recirculation and cooling of phosphoricacid product and the need to use a mist eliminator to capture phosphoric acid droplets. A fullscall unit was designed and showed a payback period of 1.166 years.
-909-
REFERENCES
1. Kirk-Othmer, Encyclopedia of Chemical Technology, Vol. 17, pp437-44O, John Wiley, NewYor
2. II.Y. Allgood. hid. Eng. Clicin., 59(6), 19(1967).
3. J. Brink Jr., Can. J. Cliein. ELng., 41, 134(1963).
4. JR. Ujckhurst and J.I I. Marker, "Process Plant Design", Heinemann, London (1983).
5. J.M. C'oulson and J.I". Richardson. "Chemical Engineering" Vol. 6, Pergamon Press, Oxford,(1983).
6. Babcock and Wilcox, "Slcam", (1972).
7. I.I'.. ISrowimcll and K.I I. Young, "Process Equipment Design: Vessel Design", John Wiley.NewYork (1959).
X. M.S. Peters iind K.D. Timmerhaus, "Plant Design and Lconomics for Chemicall:.ngineers",Mi;Graw-Hill, NewYork (1981).
'). Standard Methods for the Examination of Water and Waste Water, APHA, AWWA, WPCF
-910-

TABLE I VARIATION OF IljPO, CONCENTRATION WITH WATER FLOW RATE(PHOSPHOROUS USED ALONE)
0.028230.01980.070.01
BBH—1141.6202.3192.2105.2
TABLE II VARIATION OF H,PO4 CONCENTRATION WITH WATER FLOWRATE (PHOSPHOROUS/ZINC MIXTURES ARE USED)
l'=65/.n=195l'=375Zn=ll25
0.UI9X
0.02775
3l.b
129.59
TABLE III VARIATION OF H,PO4 CONCENTRATION WITH WATER FLOWRATE (WATER FLOW RATE CONTROLLED)
1
23
4567
1 i2:32:31:31.31:31:3
li <
0.80.80.50.50.50.5
II III')
0.0260.020.0240.0440.0260.028
M «»
29129739.27.622.858.2
'" 157.5245.1611.44.067.7819.5
*ln experiment no. 7, air is fed only by natural draft
-911-
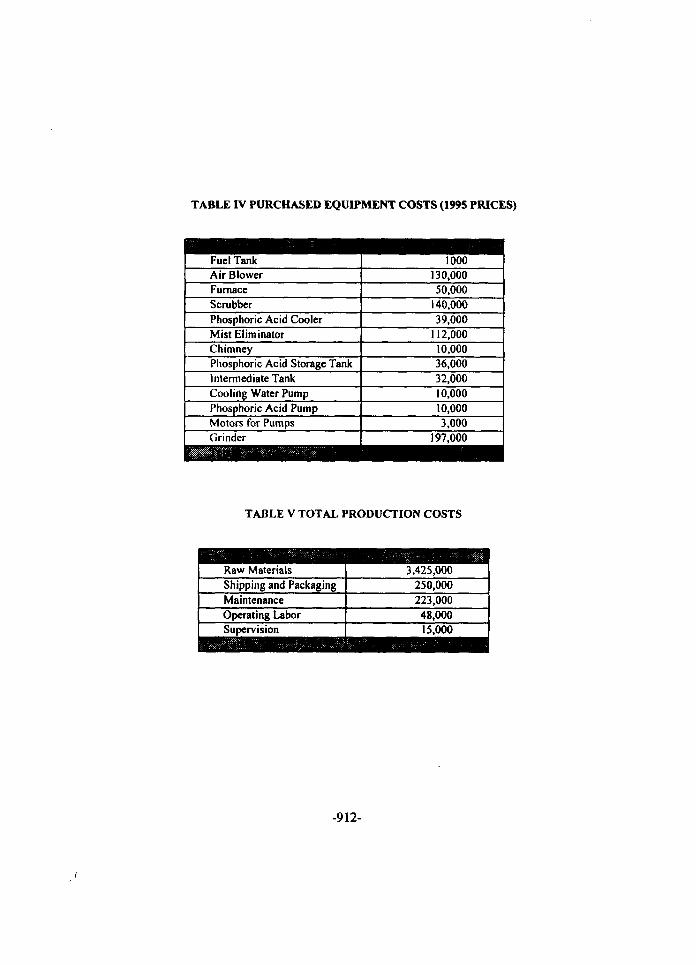
TABLE IV PURCHASED EQUIPMENT COSTS (1995 PRICES)
Fuel TankAir BlowerFurnaceScrubberPhosphoric Acid CoolerMist EliminatorChimneyPhosphoric Acid Storage TankIntermediate TankCooling Water PumpPhosphoric Acid PumpMotors for PumpsGrinder
1000130,00050,000
140,00039,000
112,00010,00036,00032,00010,00010,0003,000
197,000
TABLE V TOTAL PRODUCTION COSTS
Raw MaterialsShipping and Packaging
MaintenanceOperating LaborSupervision
3,425,000250,000
223,00048,00015,000
-912-
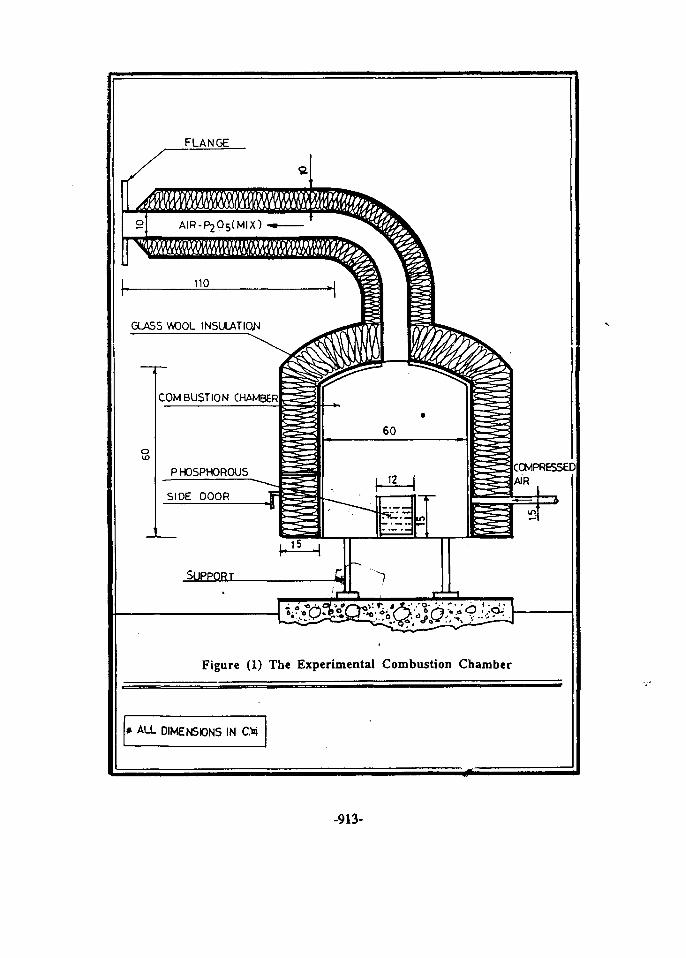
GLASS WDOL INSULATION
Figure (1) The Experimental Combustion Chamber
* ALL DIMENSIONS IN O4
-913-
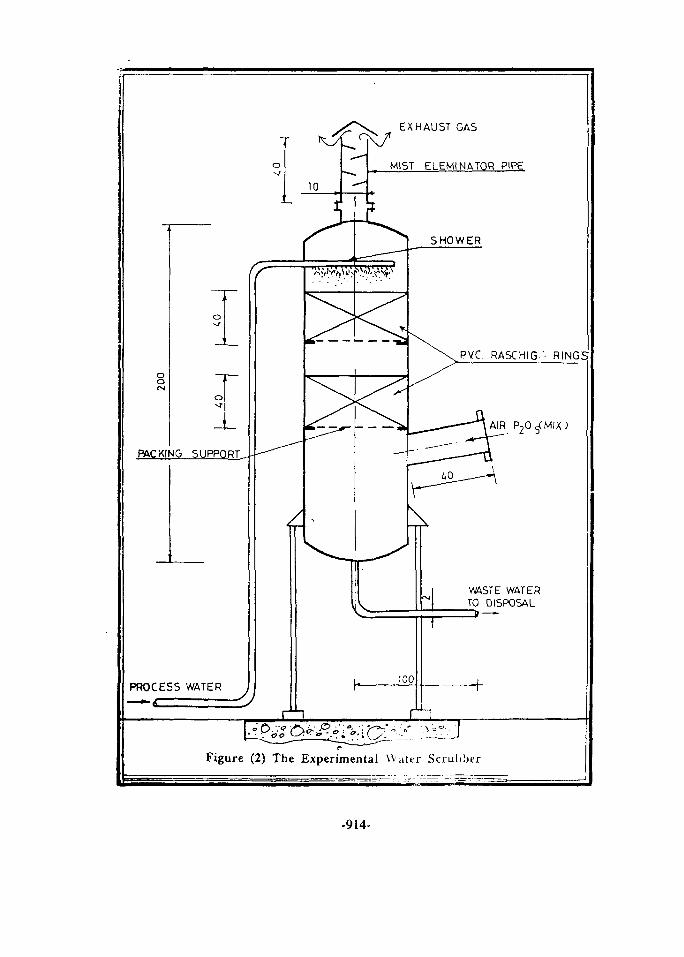
EXHAUST GAS
MIST ELEMINATQR PIPE
PACKING SUPPORT
PROCESS WATER
SHOWER
PVC. RASCHIG' RINGS
\
100
VWSTE WATERTO DISPOSAL
Figure (2) The Experimental Water Scrubber
-914-
Proceedings of the Fifth International Conference EG9700045on Energy and Environment, Cairo, Egypt, 1996
ASSESSMENT OF PULP AND PAPER SLUDGEADSORPTTVE CAPABILITIES
FOR USE AS A BARRIER MATERIAL
Hcaem l.Sakh', Raymond NY ong2, Abiiel Fatlah Youssef. A.MO. Mohamecf
' Civil F.ng Dept, Mcnoufia Univ., Shcbin El-Kom Egypt: Geolechiucal Research Centre, McGill Univ., Montreal, Canada
Abstract
The purpose of this study is to investigate the possibility of using sludge resultingfrom primary treatment of pulp and paper effluent as a liner material, this is applicable whenlandfilling the generated sludge. Therefore, the use of sludge as a liner material will dependon the sludge adsorptive and self seeling capacities. Investigation of the sludge ability towithstand contaminants through leaching investigation and migration profiles showedadsorption of several contaminants as magnesium and potassium that was referred to hydrogenbonding mechanisms through which cellulose fibres interact with contaminants. The hydraulicconductivity through the sludge showed a tendency to decrease upon leaching denoting apotential for use to self contain the existing contaminants in the industrial landfill site.
1. INTRODUCTION
The raw material used in the pulp and paper industry vary from wood (hard and soft)to non-wood raw material (bagasse, rice straw, reed, and wheat straw). Wood is a mixture ofthree natural polymers: cellulose, hemicellulose and lignin, in approximate abundance of50 2525%, in addition to small traces of extractives. The major component of the cell wallsof fibres is cellulose The molecular structure of cellulose is shown in fig. 1 [I]. Hydroxyl(OH) groups located along the length of the chain give cellulose a great capacity for forminghydrogen bonds Lignin is composed of carbon, hydrogen, and oxygen as shown in fig.2 [2],it is a polymeric substance of a very high molecular weight and serves as a cementing agent,llemicellulose is similar to cellulose in many ways as illustrated in fig.3 [3], it formshydrogen bonds and has great affinity for water.
Kraft pulp involves digesting raw material in an alkaline solution for several hours,during this time the chemicals attack the lignin molecules, breaking them into smallersegments which are dissolved and later removed The Kraft process is the dominant pulpingpiocess [4], and it is the process adopted in Rakta mill at Alexandria, Egypt. The millproduces 130 tons pulp from rice straw, and 300 tons paper per day from both local andimported pulp. From the 400 tons of rice straw used in pulping purposes, 270 tons areconverted to dissolved lignin and rejected suspended fibres.
-915-
The sludge is continuously generated and evokes need for management whenimplementing primary treatment to the effluent to comply with environmental standards andregulations. As landfiliing is one of the recommended options for final disposal of the sludge,the assessment of the sludge ability to retard the migration of various contaminants wasinvestigated in order to make use of the sludge as a barrier material. Several investigationson landfiliing pulp and paper sludge included the study of hydraulic conductivity throughsludge deposit [S] and compressive behaviour of fresh and older primary waste sludge [6].
Landfill disposal refers to the placement of waste on or beneath the surface of theground with the intent of isolating the wastes from the environment [7]. This will beencouraged, or discouraged, relying on regulations, the nature of waste generated, landavailability, transportation cost, reliability on landfiliing for long term, and other factors. Thechoice of a suitable barrier material aims the protection and conservation of groundwaterquality by the prevention or retardation of contaminants migration to aquifers.
To a certain extent, anything with which water comes in contact will be dissolved inor mixed with the flow Contaminants, once introduced into groundwater, may be carried forvery long distances and will be very difficult to remove, although natural processes such asadsorption, biodegradation, ion exchange, and dispersion may reduce concentrations to someextent [8]. Water passing through the refuse placed at a landfill site carries with it variousdissolved and suspended materials. The release of leachate first requires the generation ofleachate within the landfill. Sources of liquid that may eventually become leachate are mostlywater from: (i) precipitation falling directly onto the landfill, (ii) surface flow that has runonto the landfill, (iii) ground water inflow through a portion of the landfill lying below theground water table, and (iv) the liquid fraction of the waste disposed in the landfill.
2. EXPERIMENTATION
In order to investigate the interaction between sludge and various contaminantsgenerated from the waste pile, samples were collected from a kraft mill in Cornwall, Ontario,Canada. Samples included sludge and effluent from the mill primary treatment plant that wereanalyzed for initial characterization then stored. Leaching column experiments were used toinvestigate the migration of contaminants through the sludge landfilled on sand layer.Breakthrough curves and migration profiles of contaminants were developed to study theability of sludge to retard their migration. Other measured parameters as pH, electricalconductivity, turbidity, and redox were measured to highlight the sludge performance.
The variation in sludge moisture content affected its compaction and therefore thehydraulic conductivity, values of 425% to 100% moisture content of the sludge wereinvestigated and moisture content of 200% resulted in the lowest hydraulic conductivity of106 cm/sec, and was arbitrarily chosen for the experiments. Tables 1 and 2 summarizes thecharacteristics of the sludge and the mill effluent used in all leaching experiments. Table 3shows typical paper mill sludge elemental composition [9].
Leaching cells were filled with both sludge and sand then leached with the milleffluent. Concentrations of various ions were determined in: (a) the leachate collected fromthe cells, and (b) the pore fluid. All cells were screwed air-tight to a top cap and a bottom
-916-
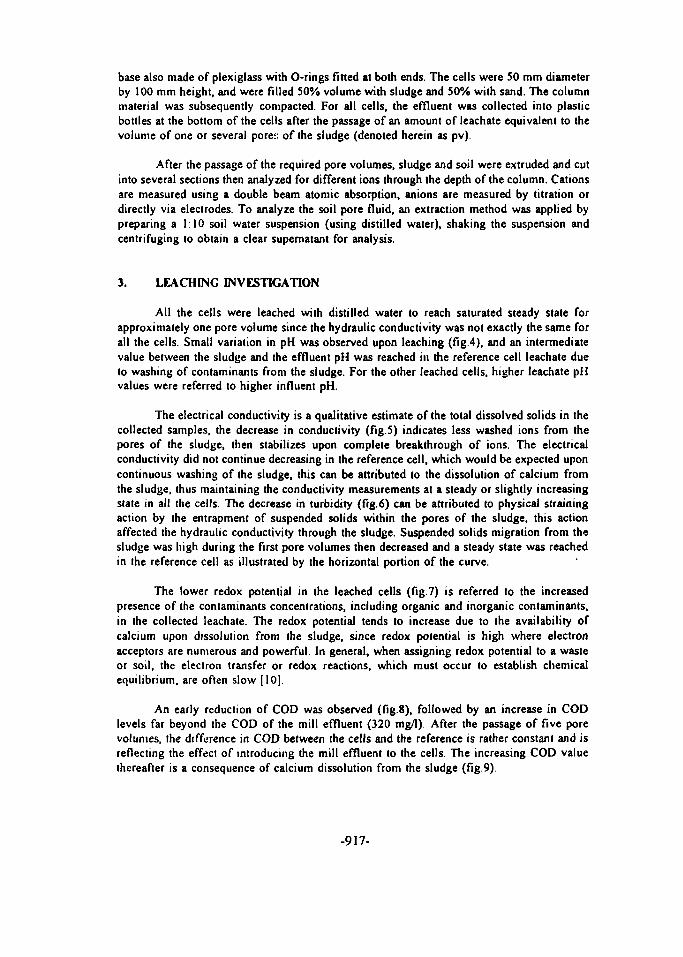
base also made of plexiglass with O-rings fitted at both ends. The cells were SO mm diameterby 100 mm height, and were filled 50% volume with sludge and 50% with sand. The columnmaterial was subsequently compacted. For all cells, the effluent was collected into plasticbottles at the bottom of the cells after the passage of an amount of leachate equivalent to thevolume of one or several pores of the sludge (denoted herein as pv).
After the passage of the required pore volumes, sludge and soil were extruded and cutinto several sections then analyzed for different ions through the depth of the column. Cationsare measured using a double beam atomic absorption, anions are measured by titration ordirectly via electrodes. To analyze the soil pore fluid, an extraction method was applied bypreparing a 1:10 soil water suspension (using distilled water), shaking the suspension andcentrifuging to obtain a clear supernatant for analysis.
3. LEACHING INVESTIGATION
All the cells were leached with distilled water to reach saturated steady state forapproximately one pore volume since the hydraulic conductivity was not exactly the same forall the cells. Small variation in pH was observed upon leaching (fig 4), and an intermediatevalue between the sludge and the effluent pH was reached in the reference cell leachate dueto washing of contaminants from the sludge. For the other leached cells, higher leachate pHvalues were referred to higher influent pH.
The electrical conductivity is a qualitative estimate of the total dissolved solids in thecollected samples, the decrease in conductivity (fig 5) indicates less washed ions from thepores of the sludge, then stabilizes upon complete breakthrough of ions. The electricalconductivity did not continue decreasing in the reference cell, which would be expected uponcontinuous washing of the sludge, this can be attributed to the dissolution of calcium fromthe sludge, thus maintaining the conductivity measurements at a steady or slightly increasingstate in all the cells. The decrease in turbidity (fig 6) can be attributed to physical strainingaction by the entrapment of suspended solids within the pores of the sludge, this actionaffected the hydraulic conductivity through the sludge. Suspended solids migration from thesludge was high during the first pore volumes then decreased and a steady state was reachedin the reference cell as illustrated by the horizontal portion of the curve.
The lower redox potential in the leached cells (fig 7) is referred to the increasedpresence of the contaminants concentrations, including organic and inorganic contaminants,in the collected leachate. The redox potential tends to increase due to the availability ofcalcium upon dissolution from the sludge, since redox potential is high where electronacceptors are numerous and powerful. In general, when assigning redox potential to a wasteor soil, the electron transfer or redox reactions, which must occur to establish chemicalequilibrium, are often slow [10].
An early reduction of COD was observed (fig.8), followed by an increase in CODlevels far beyond the COD of the mill effluent (320 mg/l). After the passage of five porevolumes, the difference in COD between the cells and the reference is rather constant and isreflecting the effect of introducing the mill effluent to the cells. The increasing COD valuethereafter is a consequence of calcium dissolution from the sludge (fig.9).
-917-
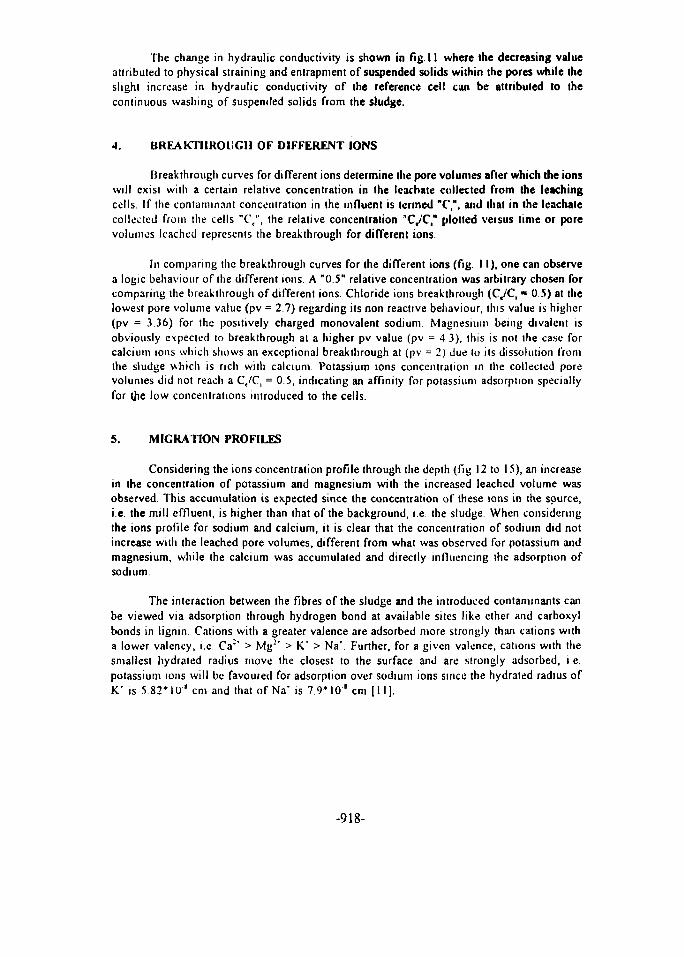
The change in hydraulic conductivity is shown in fig. II where the decreasing valueattributed to physical straining and entrapment of suspended solids within the pores while theslight increase in hydraulic conductivity of the reference eel! can be attributed to thecontinuous washing of suspended solids from the sludge.
4. BREAKTHROUGH OF DIFFERENT IONS
Breakthrough curves for different ions determine the pore volumes after which the ionswill exist with a certain relative concentration in the Icachate collected from the leachingcells If the contaminant concentration in the influent is termed "C,\ and thai in the Icachatecollected from the cells "C,", the relative concentration "C./C," plotted versus lime or porevolumes leached represents the breakthrough for different ions.
In comparing the breakthrough curves for the different ions (fig. 11), one can observea logic behaviour of the different ions. A "0.5" relative concentration was arbitrary chosen forcomparing the breakthrough of different ions. Chloride ions breakthrough {CJC, = 0.5) at thelowest pore volume value (pv = 2.7) regarding its non reactive behaviour, this value is higher(pv = 3.36) for the positively charged monovalent sodium Magnesium being divalent isobviously expected to breakthrough at a higher pv value (pv = 4 3), this is not the case forcalcium ions which shows an exceptional breakthrough at (pv = 2) due to its dissolution fromthe sludge which is rich with calcium. Potassium ions concentration in the collected porevolumes did not reach a C/C, = 0.5, indicating an affinity for potassium adsorption speciallyfor the low concentrations introduced to the cells.
5. MIGRATION PROFILES
Considering the ions concentration profile through the depth (fig 12 to 15), an increasein the concentration of potassium and magnesium with the increased leached volume wasobserved. This accumulation is expected since the concentration of these ions in the source,i.e. the mill effluent, is higher than that of the background, i.e. the sludge When consideringthe ions profile for sodium and calcium, it is clear that the concentration of sodium did notincrease with the leached pore volumes, different from what was observed for potassium andmagnesium, while the calcium was accumulated and directly influencing the adsorption ofsodium.
The interaction between the fibres of the sludge and the introduced contaminants canbe viewed via adsorption through hydrogen bond at available sites like ether and carboxylbonds in lignin Cations with a greater valence are adsorbed more strongly than cations witha lower valency, i.e. Ca : ' > Mg2* > K* > Na*. Further, for a given valence, cations with thesmallest hydraled radius move the closest to the surface and are strongly adsorbed, i.e.potassium ions will be favoured for adsorption over sodium ions since the hydraled radius ofK' is 5 82* 10* cm and that of Na' is 7 9*10" cm [11].
-918-
6. CONCLUSIONS
The hydraulic conductivity of the sludge is a major factor to be taken intoconsideration when evaluating the use of sludge as a liner material. The pulp and paper sludgeshowed variable tendencies foi compaction and workability depending on its moisture content,and resulted in the lowest hydraulic conductivity of 106 cm/sec when compacted at 200%moisture content. The hydraulic conductivity showed a slight tendency to decrease due tosuspended solids entrapment within the pores thus encouraging the use of the sludge as a linermaterial.
The pulp and paper sludge showed a capability to retain cations throughout its depth,this is viewed through hydrogen bonding which is characteristic for cellulose fibres.Adsorption is favoured for cations with higher valence such as magnesium, and cations withsmaller hydrated radius as potassium.
The dissolution of calcium was observed from the sludge, this was directly reflectedin an increase in calcium concentration, electrical conductivity, and COD in the leachate. Theredox potential was also affected by the variance of calcium concentrations.
REFERENCES
1. Reeve, D.W., 1989. "Bleaching Technology". In: Alkaline Pulping. The Joint TextbookCommittee of the Paper Industry, TAPPI, CPPA. p. 391-399.2. Hamilton F., Leopold B., Kocurek, M.J., 1987. "Secondary Fibres and Non-wood Pulping".Tappi Joint Textbook Committee of the Paper Industry, chpt. 1 and 6.3. Dixon, J.B, Weed, SB., 1989. "Minerals in Soil Environments". Second Edition. SoilScience of America, Madison, Wisconsin, USA. p. 948.4. Bruley, A.J., 1974. "Training Manual on the Basic Technology of the Pulp and PaperIndustry and its Waste Reduction Practices". Water Pollution Control DirectorateEnvironmental Protection Service. Report No. EPS MVP-74-3.5 Wardwell.R.E.; 1987. "Hydrogeologic considerations for paper mill sludge disposalfacilities". Environmental Conference, Proceedings of the Technical Association of the Pulp6 Paper Industry 1987Publ by TAPPI press, Atlanta, GA, USA p 249-255.6 Korman.M E ; Horvitz.GE.; Kleppe.J.H.; Dalton.MG.; 1987. "Material properties oflandfill primary waste, environmental Conference, Proceedings of the Technical Associationof the Pulp & Paper Industry. Publ by TAPPI press, Atlanta, GA, USA p 179-186.7. Dawson G.W , Mercer, B.W., 1986. "Hazardous Waste Management". John Wiley & Sons,p. 62-70.8. McGhee, T.J., 1991 "Water Supply and Sewerage". McGraw Hill, Inc., p. 103.9 Eliott, L.F ; Stevenson, F.J., 1977. "Soils for Management of Organic Wastes and WasteWaters". Soil Science Society of America, American Society of Agronomy, Crop ScienceSociety of America, Madison, Wisconsin, U.S.A. p. 75 & 303.10 Devinny, JS.; Everett, L.G; Lu, J.C.; Stollar, R.L.; 199O."Subsurface Migration ofHazardous Wastes". Van Nostrand Reinhold, p. 144-165.11. Mitchell, J K., 1976; "Fundamentals of Soil Behaviour", Series in Soil Engineering, JohnWiley and Sons, N Y , p. 46.
-919-

Table I IONS CONCENTRATION IN PULP AND PAPER SLUDGE (MG/L)
N«
C i "
ZnJ*
inits
25.07
115
ND>
K*
cr
Pb ! t
not delected
5.0
22
ND
Mg"
PH
Cr1*
w
4.44
7.96
ND
Table 2 PULP AND PAPER EFFLUENT CHARACTERISTICS.
Item mill effluent Item mill effluentpHCOD (mg/1)Ca1* (mg/I)Mg" (mg/1)Cr (mg/1)Na' (mg/1)
7.15
32062.012.525.0104
K.- (mg/1)Pb"(mg/I)Cr^mg/l)Cu^ing/l)Zn^mg/l)EC.1 ((iS/cm)
14.74ND'
..NDflDND65
Not Delected Electrical Conductivity
Table 3 PARTIAL CHEMICAL COMPOSITION OF SEVERAL PULP AND PAPER MILL SLUDGE.Mill %N %P */.Mg111HIIVV
2.33
0.150.270.990.62
0.500.290 160.42029
0.740.850.440.620.52
1.530.101.590.370.85
0.15
0.090.100.120.09
Figure 1 Stereo-chemical formula of
cellulose
I- c -
- c -
DCH3 H3CD QCH3
HO.XOOCISyc>.n nononer"
Figure 3 Stereo-chemical formula of hemi-cellulose Figure 2 Lignin monomers
-920-
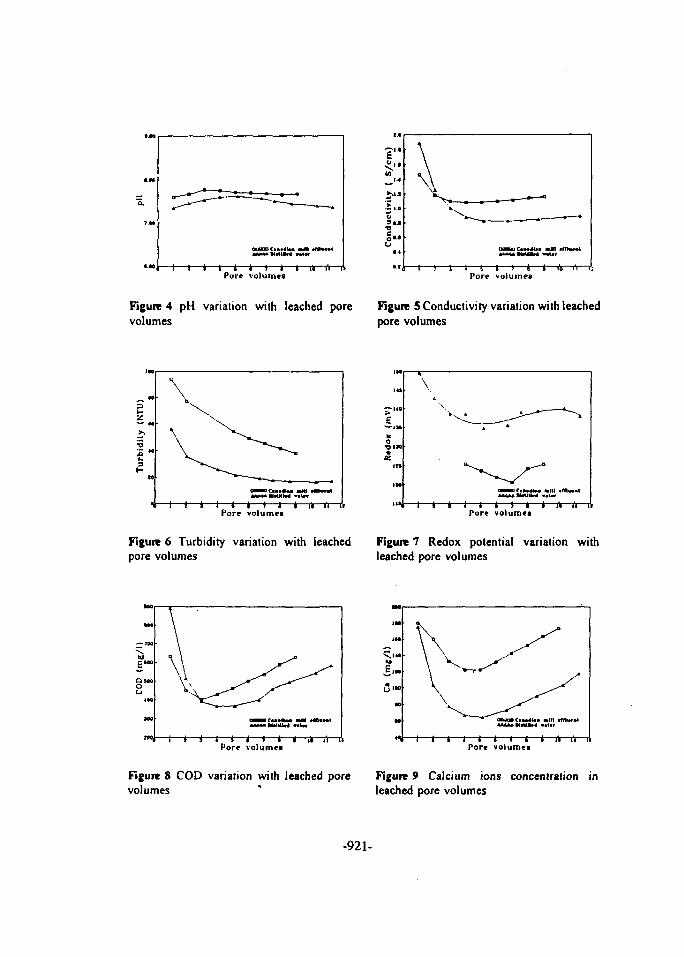
Pore volumes Pore volumes
Figure 4 pH variation with leached porevolumes
Figure 5 Conductivity variation with leachedpore volumes
Pore volumes Pore volumes
Figure 6 Turbidity variation with leachedpore volumes
Figure 7 Redox potential variation withleached pore volumes
-i—i—t—i—iPore volumes«—i—I—•> i\ i
Figure 8 COD variation with leached porevolumes *
Pore volumes
Figure 9 Calcium ions concentration inleached pore volumes
-921-
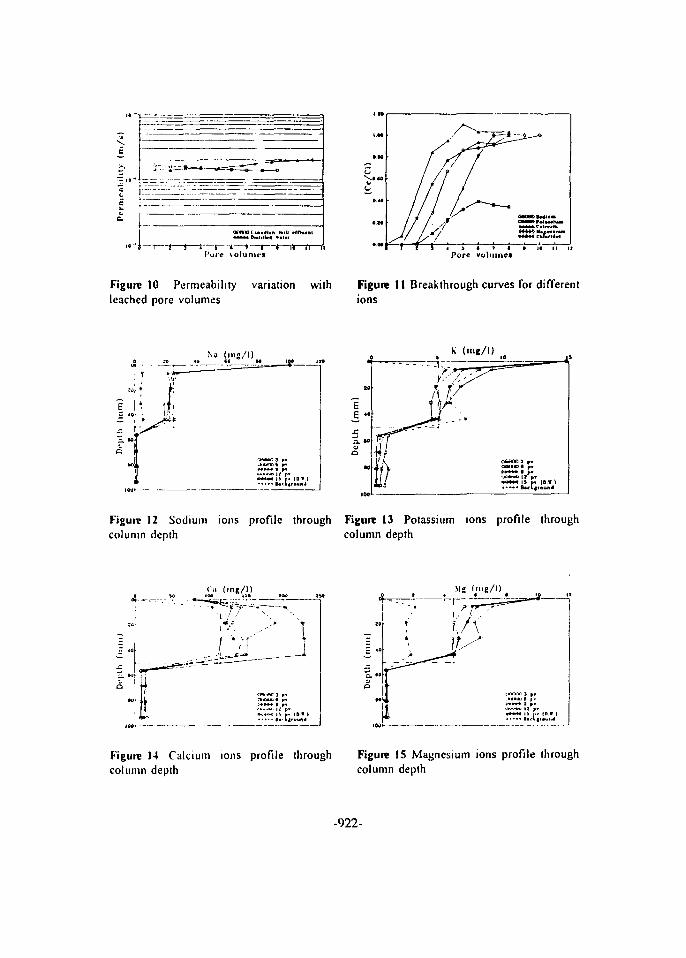
-T—t- —r- i—-t—i—ICure volumes Pore volumes
Figure 10 Permeability variation withleached pore volumes
Figure 11 Breakthrough curves for differentions
K (mg/l)
a. ••oa rJi/
s 10 j
Figure 12 Sodium ions profile through Figure 13 Potassium ions profile throughcolumn depth column depth
f<'» (nig/1)
IOO no
Figure 14 Calcium ions profile throughcolumn depth
Figure 15 Magnesium ions profile throughcolumn depth
-922-
Proceedings of the Fifth International Conference EG9700046on Energy and Envirorunent, Cairo, Egypt, 1996
TREATMENT OF LIQUID INDUSTRIAL WASTEFROM A KRAFT PULP AND PAPER MILL IN EGYPT
Ihccm 1.Soldi'. Muhamcd S.EI-Admvy1, Mohamed H.Abdel Megid1, Ahmed A Zaatout'
Department of Civil Engineering, Menoufia Univ., ligypt' Chairman. IJepurlmcnl of Sanilary Engineering, Alexandria Univ., Hgypl
1 l)c|'.iiinicnl ul'Chemical Engineering. Alexandria Univ. Kg) pi
Abstract
As the ecological conditions at Abou-Keer bay in Alexandria is declining due to theincreased pollution load disposed into it, there is an urgent need for its improvement. The aimof this work is to investigate the application of the sedimentation process to Rakta mill, oneof the biggest pulp and paper null in Egypt, l'lain sedimentation was applied on various typesof mill effluent as white water, bleaching effluent and final effluent Removal of suspendedsolids and COD reached '>()% and 60% respectively for paper machine effluent, 70% and 25%for final effluent, and 50% suspended solids removal for the bleaching effluent. Use ofcoagulant aids increased the efficiency of suspended solids removal, and finallysedimentation process i; recommended to be applied on Rakla mill effluent to enhance thequality of the discharged effluent
1. INTRODUCTION
The increase and spread of industrialization in Egypt created severe pollutionproblems Several industrial plants discharge their wastewater with no adequate treatment intothe receiving water streams Accordingly, development of laws and regulations to control thedisposal of these effluent led to the need of proper treatment process for wastewater.Pollutants discharge can first be limited by checking the industrial process itself to minimizespills and overflows resulting from equipment defeats It was estimated that in the averagepulp null, one third of the losses of BOD and fibre are caused by spills resulting fromequipment break down, poor operation, etc.. Fibre losses range from Vi to 4 percent of theproduction, installation of clan Hers is justified when large amount of good fibre is lost [I).
Different procedures for treating pulp and paper waste are: (i) reclamation or recoverypiocess for valuable chemicals used in the process, (u) sedimentation and flotation of effluentin concrete or steel sedimentation tanks, (in) chemical precipitation to remove colloids andcolours, (iv) activated sludge treatment, and (v) iagooning [2|
-923-
Various systems commonly used for the removal of suspended solids in pulp and papermills are: (i) gravity settling ponds, (ii) gravity clarifiers where circular and rectangularclanfiers are used with surface loading rates ranging from 24 to 48 mVmVday, and (iii)flotation clarifiers particularly used when suspended solids tend to float [3]. Most mills, whichapply treatment to their effluent, have selected conventional circular clarifiers for primarytreatment, although several mills use earthen settling ponds [4].
In warm climates where the density and viscosity of the water is low the settling rateis higher [5] Surface loading rates of 32 to 40 mVnr/day and 2 hours detention period werepracticed for the removal of a great part of the settleable solids in clarifiers [6]. Theseclarifiers were equipped with skimmers to remove the floating materials. Most mills modifiedtheir water systems so as to reduce the discharge with the precaution of not exceeding adissolved solid concentration of 5000 mg/1 [7], White water recovery is now almostuniversally practiced in the paper industry for a maximum profit of water, heat, fibre, fillersand other chemicals as well as a great reduction in stream pollution. Sedimentation processis low in cost, has little sensitivity to variation in flow and requires low maintenance, needsno specialized skills and relatively small land areas besides that 90% removal of settleablesolids could be expected. Sludge consistency leaving the basin is commonly 1.5% to 3% andcan be thickened producing a filter cake containing 30% solids. Generally the cake is disposedof by dumping into the land or pressed and burned.
2. WASTEWATER FROM RAKTA PULP AND PAPER MILL
The industrial process at Rakta mill involves pulping and paper manufacturingprocesses. The pulping process includes: (i) cleaning of rice straw bales, (ii) digestion usingNaOH (white liquor) in batch digesters, (iii) washing, screening and thickening, and (iv)bleaching. In the paper manufacturing process additives are added in the stock preparationsection then very diluted pulp stock passes through the head box of the paper machine to thewire part to form the sheet of paper, then passes to press section, and drier part (PM I&2 areold machines, PM 3 is a newer one).
The various liquid waste generated are rice straw washing water, black liquor fromwashers following the digesters, bleaching effluent from the bleaching plant, white water frompaper machines (PM effluent), floor washing, leakages, house hold effluent and rainfall drains,fig 1 shows the material balance and sources of wastewater in Rakta mill. The discharge ofpulp and paper wastewater will contaminate water bodies: (i) physically by sludge deposits,floating, debris, scum and foam, turbidity, colour and temperature, (ii) chemically byincreasing hardness, salinity, alkalinity, and (iii) biologically by introducing high BOD, andCOD loads to the receiving water.
It is estimated that water consumption in the paper mill is 15,000 m'/day (white water)while total water consumption in Rakta mill reaches 60,000 m'/day (final effluent). Theseconsiderable amounts encourage the concept of treating both effluent separately regarding thatpaper mill effluent is usually less susceptible to high levels of contamination and can beredirected for further use as practiced in some paper mills.
-924-
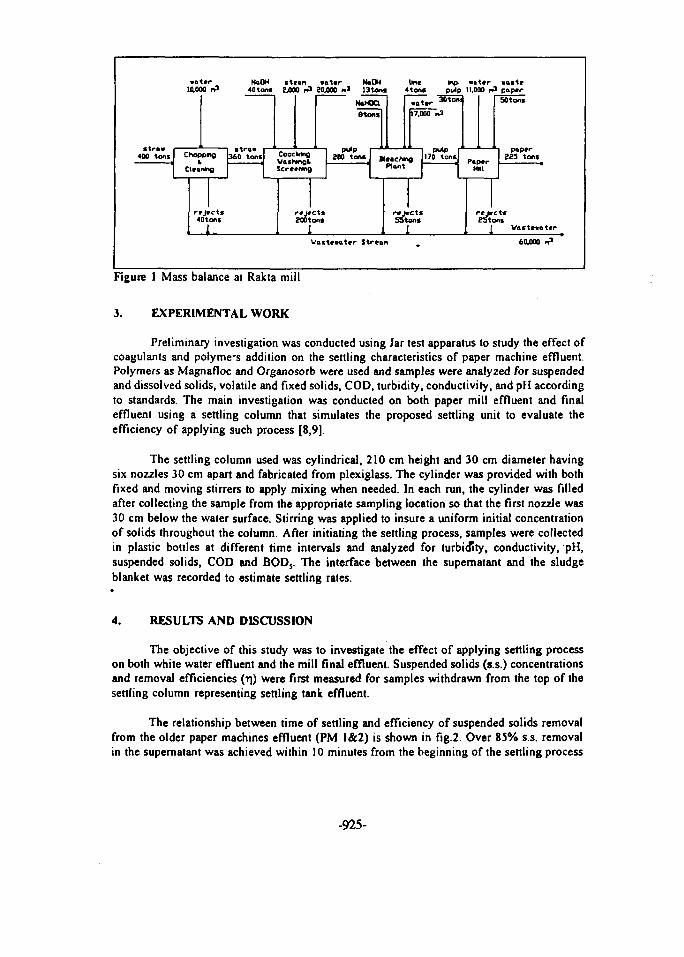
vat*r11000 r
NaOH40 torn
i t n n »ot«r2,000 n> 50.000 «
MoDH13toni
Chopping1
ClvonMQ
straw360 tons
8 ton.
CoockngVaihtnglScreiwno,
j40toni
pulp200 tons
mp. wattr wastepulp 11,000 rfl papgr
17,000
rtjtctsMOton* 55tons
1EStons
Vastcwatcr Strean 60.000 rr>
Figure 1 Mass balance at Rakta mill
3. EXPERIMENTAL WORK
Preliminary investigation was conducted using Jar test apparatus to study the effect ofcoagulants and polyme-s addition on the settling characteristics of paper machine effluent.Polymers as Magnafloc and Organosorb were used and samples were analyzed for suspendedand dissolved solids, volatile and fixed solids, COD, turbidity, conductivity, and pH accordingto standards. The main investigation was conducted on both paper mill effluent and finaleffluent using a settling column that simulates the proposed settling unit to evaluate theefficiency of applying such process [8,9].
The settling column used was cylindrical, 210 cm height and 30 cm diameter havingsix nozzles 30 cm apart and fabricated from plexiglass. The cylinder was provided with bothfixed and moving stirrers to apply mixing when needed. In each run, the cylinder was filledafter collecting the sample from the appropriate sampling location so that the first nozzle was30 cm below the water surface. Stirring was applied to insure a uniform initial concentrationof solids throughout the column. After initiating the settling process, samples were collectedin plastic bottles at different time intervals and analyzed for turbidity, conductivity, pH,suspended solids, COD and BOD,. The interface between the supernatant and the sludgeblanket was recorded to estimate settling rates.
4. RESULTS AND DISCUSSION
The objective of this study was to investigate the effect of applying settling processon both white water effluent and the mill final effluent. Suspended solids (s.s.) concentrationsand removal efficiencies (T|) were first measured for samples withdrawn from the top of thesettling column representing settling tank effluent.
The relationship between time of settling and efficiency of suspended solids removalfrom the older paper machines effluent (PM 1&2) is shown in fig.2. Over 85% s.s. removalin the supernatant was achieved within 10 minutes from the beginning of the settling process
-925-
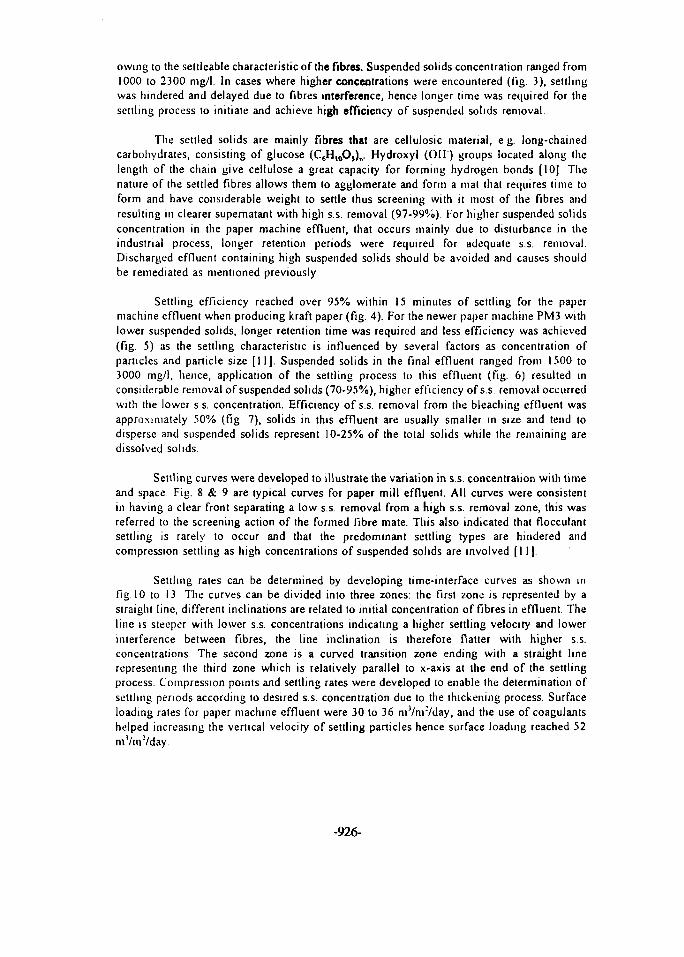
owing to the settleable characteristic of the fibres. Suspended solids concentration ranged from1000 to 2300 mg/l. In cases where higher concentrations were encountered (fig 3), settlingwas hindered and delayed due to fibres interference, hence longer lime was required for thesettling process to initiate and achieve high efficiency of suspended solids removal.
The settled solids are mainly fibres that are cellulosic material, eg. long-chainedcarbohydrates, consisting of glucose (C6H10Oj)n. Hydroxyl (Oil) groups located along thelength of the chain give cellulose a great capacity for forming hydrogen bonds [10] Thenature of the settled fibres allows them to agglomerate and form a mat that requires lime toform and have considerable weight to settle thus screening with it most of the fibres andresulting in clearer supernatant with high s.s. removal (97-99%) I'or higher suspended solidsconcentration in the paper machine effluent, that occurs mainly due to disturbance in theindustrial process, longer retention periods were required for adequate s.s. removal.Discharged effluent containing high suspended solids should be avoided and causes shouldbe remediated as mentioned previously.
Settling efficiency reached over 95% within 15 minutes of settling for the papermachine effluent when producing kraft paper (fig. 4). For the newer paper machine PM3 withlower suspended solids, longer retention time was required and less efficiency was achieved(fig. 5) as the settling characteristic is influenced by several factors as concentration ofparticles and particle size [11]. Suspended solids in the final effluent ranged from 1500 to3000 mg/l, hence, application of the settling process to this effluent (fig. 6) resulted inconsiderable removal of suspended solids (70-95%), higher efficiency of s.s. removal occurredwith the lower s.s. concentration. Efficiency of s.s. removal from the bleaching effluent wasapproximately 50% (fig 7), solids in this effluent are usually smaller in size and tend todisperse and suspended solids represent 10-25% of the total solids while the remaining aredissolved solids.
Settling curves were developed to illustrate the variation in s.s. concentration with timeand space Fig. 8 & 9 are typical curves for paper mill effluent. All curves were consistentin having a clear front separating a low s.s. removal from a high s.s. removal zone, this wasreferred to the screening action of the formed fibre mate. This also indicated that flocculantsettling is rarely to occur and that the predominant settling types are hindered andcompression settling as high concentrations of suspended solids are involved [II] .
Settling rates can be determined by developing time-interface curves as shown infig. 10 to 13 The curves can be divided into three zones: the first zone is represented by astraight line, different inclinations are related to initial concentration of fibres in effluent. Theline is steeper with lower s.s. concentrations indicating a higher settling velocity and lowerinterference between fibres, the line inclination is therefore flatter with higher s.s.concentrations The second zone is a curved transition zone ending with a straight linerepresenting the third zone which is relatively parallel to x-axis at the end of the settlingprocess. Compression points and settling rates were developed to enable the determination ofsettling periods according to desired s.s. concentration due to the thickening process. Surfaceloading rates for paper machine effluent were 30 to 36 mVnr/day, and the use of coagulantshelped increasing the vertical velocity of settling particles hence surface loading reached 52m'/nr/day.
-926-
Based on the previous settling experiments, a theoretical detention lime of 30 minuteswas consideied optimal for s.s. removal. Corresponding COD removal from white waterexceeded <>0% (fig. 14} while BOD removal was low (15%) regarding the low-biodegradablenature of cclluiosic fibres. The effect of polymers addition on solids removal from I'Meffluent is shown in fig. 15, ami is compared with plain sedimentation process. Ai.art from adistinguished change in surface loading rate, solids removal was not subject to considerablechange 1-urther investigation aboul the nature and doses of polymers to be used and theireconomic aspect can be conducted and compared with the results obtained herein.
Total solids in PM 1&2 effluent were 4000 mg/l (65% volatile solids and 35% fixedsolids). Fixed solids originate mainly from the fillers added in the paper manufacturingprocess to improve certain qualities of the paper. The commonly used fillers are clay (kaolin),calcium carbonate, calcium sulphate, and calcium silicate [12]. These inorganic constituentsbeing mainly dissolved, except clay, were subject to minor reduction in their concentration.Meanwhile, considerable reduction in volatile solids concentration was observed due to fibressettling, this was also reflected in 45-65% reduction in total solids of the treated effluent.
Settling process slightly enhanced suspended solids removal for the bleaching effluent(fig. 16) Low COD and DOD removals were attributed to increased dissolved solids and low-biodegradubiiiry of fibres in the effluent thus alterations in total solids for the bleachingeffluent (fig. 17) were far less than those encountered for paper machine effluent. Changesoccurring in total solids concentration for various wastes are shown in fig. 18. Otherparameters were investigated as electrical conductivity, turbidity and pH (fig. 19). bleedicalconductivity a:id pH for I'M effluent showed no change when using coagulant aids indicatingno appaient influence on dissolved solids. The decrease in effluent tuibidily is directly relatedto the effective removal of suspended solids.
5. CONCLUSIONS
Primary treatment is recommended to be applied at Rakta mill as commonly practicedat most mills due to the rapid settling velocity of suspended solids and fibres. Settling ratesreached 30 to 36 m7m /day for plain sedimentation and 52 m'/nr/day when using coagulants.Thus llie addition of coagulant aids slightly increased the efficiency of settling and decreasedthe required retention lime and consequently the volume required for settling.
Applying plain sedimentation on paper machine effluent (white water), a theoreticaldetention time of 30 nun is consideied sufficient for the removal of suspended solids andCOD of at least 90% and 60% respectively. The detention lime can be practically raised by100% to acconiodate for turbulencies in continuous flow. Fibres can be recovered upon furtherinvestigation on proper reuse in the process. The older paper machine (PM 1&2) effluentcontributed a potential source for fibre recovery view the lack of proper function of their save-all, compared with the rejected fibres horn PM3 that wore mainly fines with no practicalbenefit for fibre recovery.
The settling process when applied to the mill final effluent removed 60-80% ofsuspended solids with ilight removal of COD due to the increased dissolved solids contentin the wastewater, while efficiency of suspended solids removal for the bleaching effluentreached 50-75%.
-927-
6. NOMENCLATURE
r| efficiency of suspended solids removalD Depth through settling columnPM paper machineS.S. suspended solidsT time of settling
REFERENCES
1. World Dank & Beak Consultants Limited, 1980. "Environmental Considerations in the Pulp& Paper Industry". World Bank., Chpt. 4 p.44 - 45.2. Nemerrow, N.L., 1971. "Liquid Waste of Industry". Addison-Wesley Publishing Company,Chpt 24 p.371-379.3. Jank, BE., and Rimmer C.H., 1976. "Proceedings of Seminar on Water PollutionAbatement Technology in the Pulp and Paper Industry". Water Pollution Control Directorate,p. 29-33, and p 75-78.4. McCubbing, N., 1984. "State-of-the-Art of the Pulp & Paper Industry and Its EnvironmentalProtection Practices". Fconomic and Technical Review-Report EPS-3EP-84-3 p.96.5. Twort, A.C., Law, F.M. and Crowely, F.W., 1985. "Water Supply". Third Edition, ArnoldInc. p.257-262.6. Gehm, 11 W , 1969. "Pulp and Paper Manufacture". McGraw-Hill, Vol.11 Chpt. 6 p. 326-329.7. Kemmer, F.N., and McCallion, J., 1979. "The NALCO Water Handbook. Nalco ChemicalCompany". McGraw Hill, Chpt.3O.8f Eckenfelder, W.W., 1980. "Principles of Water Quality Management". CBI PublishingCompany, Inc. p 152-160.9. Hofkes, E.H., 1981. "Small Community Water Supplies. Technology of small supplysystems in Developing Countries". John Wiley & Sons, p 397- 401.10. Reeve, D.W., 1989. "Bleaching Technology in Alkaline Pulping". The Joint TextbookCommittee of the Paper Industry, TAPPI, CPPA, p. 391 - 399.11. Metcalf & Eddy, Inc., 1991. "Wastewater Engineering. Treatment, Disposal, and Reuse".McGraw-Hill, Inc.. p. 220-231 .12. Ingraham, H.G.. and Forslind, E.F, 1970. "Pulp and Paper Manufacture". McGraw Hill,Vol. Ill, p 206.
-928-
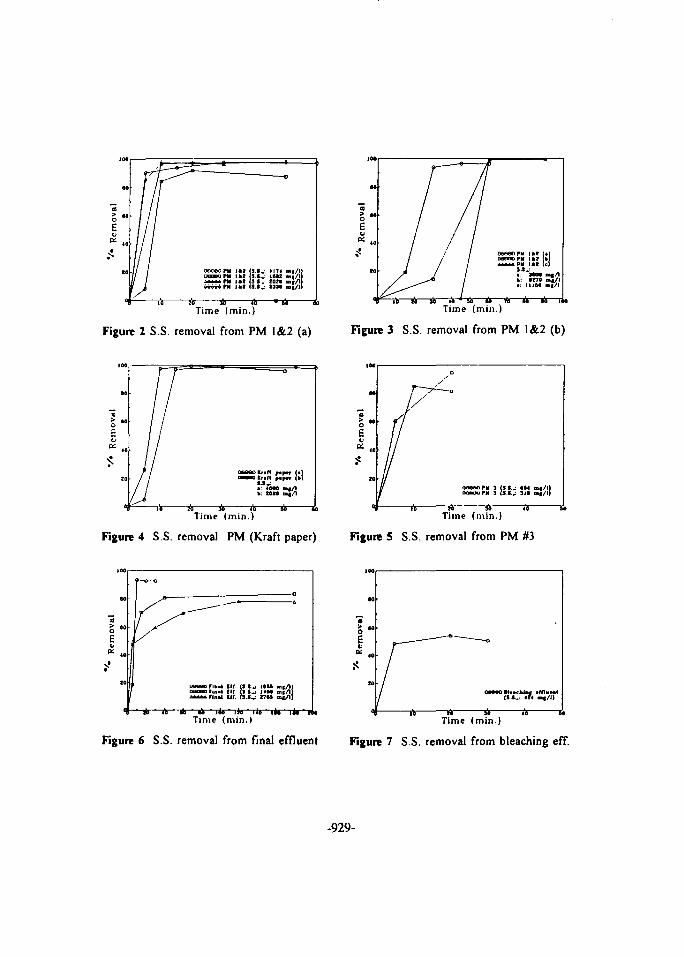
Time (min.)
Figure 2 S.S. removal from PM 1&2 (a)
Time (min.)
Figure 4 S.S. removal PM (Kraft paper)
Time (min.)
Figure 6 S.S. removal from final effluent
Figure 3 S.S. removal from PM 1&2 (b)
Time (min.)
Figure 5 S.S. removal from PM #3
Time (min.)
Figure 7 S.S. removal from bleaching eff.
-929-
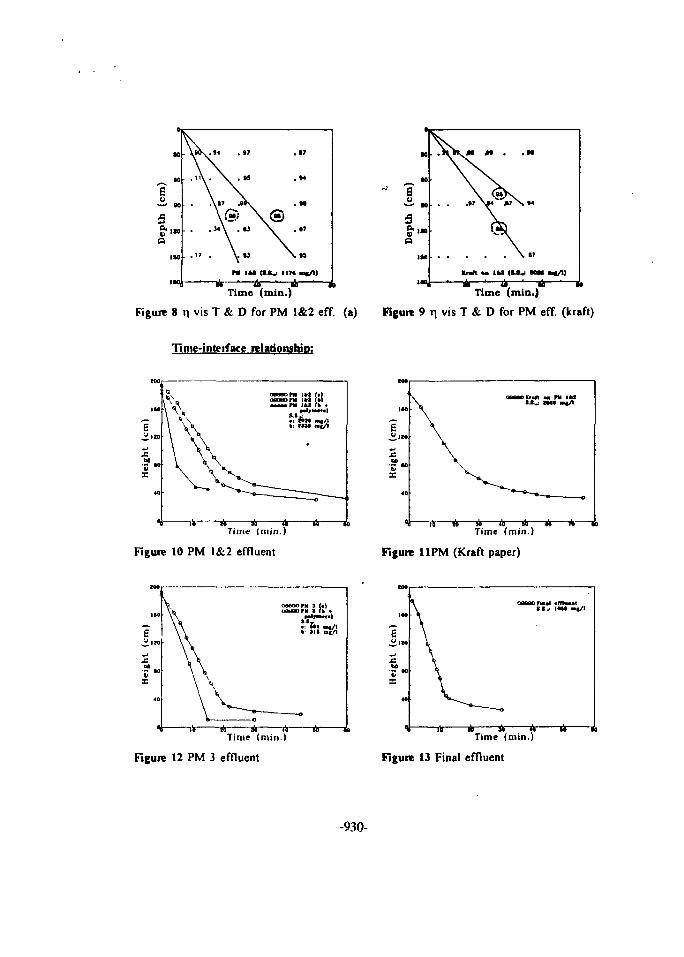
i toTime (min.)
Figure 8 T) vis T & D for PM 1&2 eff. (a)
Time-into if ace relationship:
M
•0
00
iJO
150
\
bail
A
M .
V'"
u IU <U
. M
\ n
•v aoM nt/i)
H •Time (min.)
Figure 9 TI vis T & D for PM eff. (kraft)
It) * Jfc it-Time (min.)
Figure 10 PM 1&2 effluent
too
ISO
I.H
eigh
t
40
0
\
\
rt A sir—
•!lv WH wc/1
^ O
-its A Ik * 1Time (min.)
Figure 11PM (Kraft paper)
Time (min.)
Figure 12 PM 3 effluent
Time (min.)
Figure 13 Final effluent
-930-
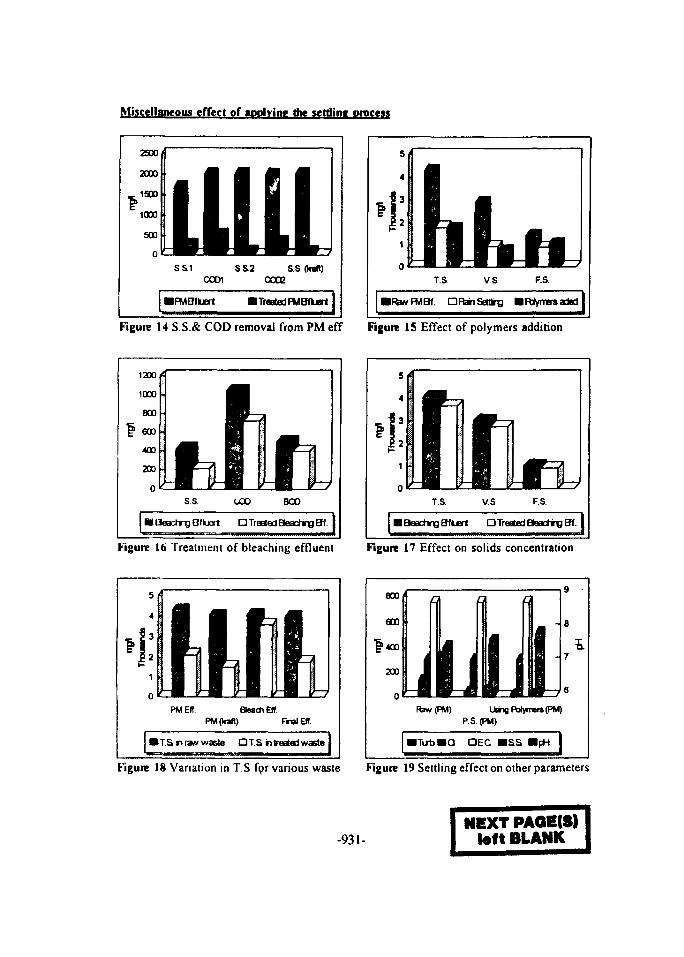
Miscellaneous effect of applying the settling process
2500
2000
1500
1000
500
0
_ |
l lS S I
COD1
•FMBfluert
I i 1111JLMLS S 2 S S (haft)
COO2
•TreatedFMBfluert | RwFMBf. DRanSettlng •Ftt/rrersaderi I
Figure 14 S.S.& COD removal from PM eff Figure 15 Effect of polymers addition
1200
1000
800
f 600
400
200
0
m
fS.S. COO BOO
• Beading Bfluert • Treated Beaching Bf. I BeachirflBfluert D Treated BeacrtngBf. I
Figure 16 Treatment of bleaching effluent Figure 17 Effect on solids concentration
5
4
3
2
1
0
•
1 • •=
PMEIT Beach EHPMflraft)
ISi.FralBf.
T.S n raw waste D T S h treated waste 1
800
600
l > 4 0 0
200
0
11il
LIB:Raw(PM)
1111 1JillUsing Polyn
PS. (PM)
M
ITBrsfPM
DEC ass mpH
9
8
7
S
i.
Figure 18 Variation in T.S for various waste Figure 19 Settling effect on other parameters
-931-NEXT PAQE(S)
toft BLANK
Proceedings of the Fifth International Conference EG9700047on Energy and Environment, Cairo, Egypt, 1996
THE VALUE OF ENVIRONMENTAL IMPACT ASSESSMENTS
Dennis D. SohockiDirector, Environmental Innovations
947 S. Williams StreetDenver, Colorado 80209, USA
Abstract
The environment and the economy are inextricably linked.Today the "environmental, economic, and social impacts associatedwith project and program decisions are at times of such amagnitude and duration that they exceed our ability tounderstand, let alone mitigate them. Energy production,distribution, pricing, policies, end uses, and externalitiesdemonstrate the need for wise planning and informed decision-making.
International cooperation, based upon mutually sharedrespect, responsibility, and innovative solutions is an essentialcomponent of addressing contemporary issues, impacts, andopportunities. Both Egypt and the United States have lawsrequiring environmental impact assessments. Just as Egypt canlearn from our successes and failures in the environmental impactassessment field over the past 3 6 years, the United States andother nations can learn as Egypt develops and innovates its ownapproaches and solutions.
1. INTRODUCTION
"The environmental crisis is an outward manifestationof a crisis of mind and spirit. There could be nogreater misconception of its meaning than to believe itto be concerned only with endangered wildlife, human-made ugliness, and pollution. These are part of it,but more importantly, the crisis is concerned with thekind of creatures we are and what we must become inorder to survive."1
The impacts associated with environmental and economicdecisions cross political, social, cultural, resource, andgeographic boundaries. For example, our production,distribution, and use of energy directly and indirectly impactsnot only our economic and physical environments, but also oursocial and cultural environments.
1Lynton Keith Caldwell, UNEP publication for the United NationsEnvironmental Earth Rest Day, 1-3 June, 1990.
-933-
We live in a world of tradeoffs where, as economists pointout, there is no such thing as a free lunch. We can pay now orpay later; but as a people and a species, we will collectively beheld accountable for our actions. We will either enjoy or sufferfrom the consequences of our choices, whether those choices aremade actively or passively.
In the United States, our energy-related choices haveimpacted our cultural, social, psychological, moral, andspiritual qualities, as well as our natural environment. Whenenvironmental, social, and cultural impacts are assessed alongwith our technological, scientific, and engineering choices, wediscover some dramatic and surprising consequences. For example,our choices (both conscious and de facto) of the automobile,cheap energy, and consumerism have lead to suburbia, television,refrigerators, freezers, and computers. These, in turn, havecontributed to social and psychological isolation as people lessfrequently walk to local markets or meet with friends and familyfor entertainment. Families are often spread over hundreds oreven thousands of miles. Workers may isolate with theircomputers at work and their televisions, VCRs, stereos, orcomputers at home. Children may know television personalitiesand day care workers better than their parents. Drug use andviolence increase as people feel less connected and lessresponsible.
In Egypt, choices regarding energy, transportation, andpricing have resulted in dramatic increases in lung diseases andlead poisoning. This threatens the physical and mental capacityof increasing numbers of Egyptian citizens. Similarly, Egypt'svaluable antiquities, which are a global heritage, aredeteriorating from pollution. This threatens Egypt's billiondollar tourism industry which is its second largest source offoreign exchange. Another example is Egypt's beautifulMediterranean and Red Sea coasts, marine resources, andfisheries' industry which are being negatively impacted byenvironmental contamination.2
The environmental, economic, and social impacts resultingfrom the choices our industrial and technological societies makecan overshadow our understanding and our abilities to mitigatethem. Today's impacts can be irreversible and irretrievable withconsequences of greater severity and duration than in the past.Over the long-term, these projects' costs can exceed theirbenefits. Yet, for a project or program to truly succeed andimprove the quality of life of its citizens, both current andfuture, it must reconcile and resolve these natural, human, andeconomic values.
2Environmental Action Plan of Egypt. Egyptian EnvironmentalAffairs Agency, 1992, pp 18, 68, 69.
-934-

Nowhere are these interrelationships better demonstratedthan in the field of energy, and its production, distribution,pricing, end use, and externalities. Often the solutions, whichbest respect the environment and society at large are alsosuperior from an economic perspective. The most profitable andleast costly sources of energy are conservation and demand sidemanagement. For example, by changing rate structures to reflectthe true costs, resources will be conserved by existing consumersand thereby available to meet future demand. These sources andothers such as solar and wind energy and natural gas are lessdamaging to the environment, allow social choice, financialflexibility, and are sustainable.
2. INTERNATIONAL COOPERATION
International cooperation is increasingly essential tounderstand and assess these environmentally, socially, andeconomically linked issues. A type of cooperation is neededwhich is not based upon the double standard of one group ofnations telling other countries or regions that they should notfollow in their resource intensive footsteps. Rather, a type ofcooperation is needed which is based upon mutually sharedresponsibility, respect, and solutions. A flexible cooperationis required which learns from successes and failures and honorsdifferences as well as similarities.
As we enter the next millennium, we face both a globalenvironment and global economy. For example:
o By the year 2000, it's estimated the world will haveused one-half of all of the oil ever found.
o Right now there is only one private car per every 1,700Chinese. If China were to use as much oil per person asJapan now does, it would need an amount of oil (61 millionbarrels daily) which is nearly .equal to current total worldproduction. In addition, China's population is expected togrow from 1.2 billion currently to 1.6 billion in 2030.
o The number of motor vehicles in the greater Cairo Areahas increased 10 percent per year from 1980 to 1990, whileelectricity consumption grew by almost 9 percent per annumduring the same period. Egypt's population is estimated toincrease from approximately 58 million currently to 86million by 2025.
o During the September 1994 International Conference onPopulation and Development held in Cairo and attended by 179nations, the participants agreed to a plan to stabilizeworld population at 8 to 9 billion by 2050 (compared to 12billion if population growth continues at its current rate).
-935-
Clearly, we must work together to address these futureglobal challenges. If developing nations decide to implementtechnology in the same way as the U.S., the results will not besustainable. We must change the patterns, paradigms, andpossibilities of our collective lifestyles. Otherwise, we shouldnot be surprised when we end up with predictably negativeoutcomes.
3. INNOVATIVE APPROACHES
Just as the symbol in Chinese for crisis also signifiesopportunity, within our global challenges lie our opportunities.As we come to understand our environment cradles our economy andthat quality of life is about more than per capita income orgross national product, new doors will open and old obstacleswill be overcome.
Like the designs of nature, "the best human designsrepresent interconnectedness, flexibility and feedback."3 In theUnited States, we are beginning to learn that we need to useexisting energy more efficiently and increase the development ofrenewable energy sources. We are realizing the cost of energyatnd other resource development depends on what costs are counted.Often we have designed our systems and priced our resource usewithout doing a full accounting of these costs and externalitiesassociated with our choices.
Hindsight, as we know, has 20/20 vision. It has becomeincreasingly clear in the United States that we have createdlaws, policies, and institutions that prejudice our productionand use of energy in ways that run counter to economic andenvironmental efficiency. We now better understand that ourindustrial and energy waste represent lost profits andcompetitive opportunities. In response, we are moving away fromregulated monopolies towards managed competition as a way todeliver lower cost energy. We are also trying to integrateexternalities into our decisionmaking and financial systems.
Cleaning up contemporary pollutants is so costly anddifficult that pollution prevention and sustainable design havebecome tha best pathways for U.S. public and private sectors."In the past, we've tended to look at symptoms of environmentaldegradation such as water pollution and hazardous waste sites andthink that they are the problem. Now we're beginning to lookupstream from the symptoms to the root causes."4
3Deep Design, by David Wann, p.3.
4Deep Design, by David Wann, p.6.
-936-
Now major U.S. Corporations, such as the 3M Company andGeneral Motors, are preventing pollution and saving money. Theyare reducing energy consumption, air and water emissions,resource inputs, and solid and hazardous waste. They are alsointegrating recycling and reusing more of their final products.Even the White House in Washington, D.C. has installed energy andwater efficiency devices throughout.
As we begin to move toward increased efficiency, renewableenergy, and pollution prevention, it is apparent the greatesthurdle is not the lack of available technology. Rather, it istaxes, tariffs, policies, financing, institutional entrenchment,and political will which are the greatest barriers. Sustainabledevelopment and redevelopment are key to reversing national aswell as global pollution problems.
With creative and innovative design, we can have essentialhuman values co-exist: economic, environmental, and social. Wecan develop and implement solutions which cost less, polluteless, and will succeed for the long term. Nations such as Egypthave the opportunity to set new standards and approaches toenergy and industrial development. When emerging nations are notbound by old infrastructures, designs, and policies, they canmake fresh choices that will better carry them into the future.If a nation has started down a traditional path, it still has theopportunity to make different, more informed decisions. Byavoiding some of the traditionally short sighted choices whichhave been made by other nations, developing countries can createnew alternatives from which we all can learn.
As we search for solutions, we must consider our underlyingpurpose and need and a wide range of alternatives. Theenvironmental assessment process can help us clarify theseconsiderations. For example, if the goal is to increase theworld's food supply, one approach is to clean up and bettermanage water supplies. Much of the world's food supply iseffectively lost through dysentery. World Health Organizationstatistics show 90,000 annual recorded deaths linked to water-borne diseases and millions more suffer from water-bornediseases. In Egypt, over»2.4 million feddams (6 million acres)of irrigated agricultural land suffer from salinization due topoor water management.5 We must recognize the interrelatednature of resources and the consequences of our managementchoices.
5EnvJronmental Action Plan of Egypt, 1992, p. 23.
-937-
4. THE UNITED STATES NATIONAL ENVIRONMENTAL POLICY ACT (NEPA)AND EGYPT'S UNIFIED LAW FOR THE ENVIRONMENT
Relative to environmental, legal, and regulatory approaches,there are many ways our two nations can share and learn from eachother. In 1970, NEPA was signed into U.S. law. In 1994, the
Unified Environmental Law was signed into Egyptian law. Bothlaws are fundamental laws which require the assessment andconsideration of the environment in the decision-making process.They both provide a foundation on which other environmental lawsand understandings can be built.
The Council on Environmental Quality (CEQ) regulations,which implemented the specifics of NEPA, followed the passage ofNEPA. Subsequently, each federal agency developed their ownregulations to implement NEPA as required by the CEQ. NEPApreceded numerous other U.S. environmental laws such as the CleanAir Act, the Clean Water Act, and the Resource Conservation andRecovery Act.
NEPA provided the philosophical foundation for subsequentU.S. environmental laws and regulations. With the passage ofNEPA, environmental values were required to be considered alongwith more traditional economic and engineering values for allmajor federal actions. This was a fundamental change in thinkingwhich is essential if a society is to address and integrate itsenvironmental responsibilities.
The CEQ regulations and* NEPA also require the use of ainterdisciplinary team which includes environmental, social,economic, and cultural resource specialists. This has helpedinclude other perspectives, values, and information in thedecision-making process. It also has changed the values of manyfederal agencies over time as these new voices have risen throughthe ranks.
An equally important component of NEPA and the CEQregulations is that they required public involvement from theearliest point of the process. This includes full publicdisclosure through the development and distribution ofenvironmental assessment documents, mandated public meetings, andrequired response to public comments.
NEPA and the CEQ regulations require the lead federal agencyor agencies and the project proponent to consider the fundamentalunderlying purpose and need of a project. The environmentalassessment must include a full range of reasonable alternatives(including the "no action alternative") and their associateddirect and indirect, long-term and short-term, and on-site andoff-site impacts. Potential mitigation measures (includingavoidance and minimization) must also be fully considered.
-938-
These key components support and reinforce one another. Forexample, the development of a broad underlying purpose and needpermits the consideration of a broad range of creativealternatives. These alternatives, as v/ell as mitigationmeasures, can be developed by the interdisciplinary team withdiverse public input and feedback.
Properly done, this approach leads to better decisions,better projects, advancements in scientific and resourceknowledge, cost savings, innovations, and environmentalprotection. Poorly done, it can lead to unnecessary paperworkjustifying decisions already made, unproductive legal delays,additional costs, and frustration.
Article 1 of the Egyptian Unified Law for the Environmentrequires the use of environmental impact assessments (EIAF;) whichare defined as, "Studying and analyzing the environmentalfeasibility of proposed projects, whose construction oractivities might affect the safety of the environment, with theaim of protecting the environment."5 Law Number 4 also createdthe Environmental Affairs Agency (EAA) as Egypt's keyenvironmental planning, policy, and implementation agency.
Among EAA's responsibilities are several related toenvironment impact assessments such as:
o The setting of principles and measures forenvironmental impact assessment of projects as well asenvironmental pollution standards (Article 5).
O The review and comment (within 60 days) on EIAsprepared by the competent administrative or licensingauthority (Articles 19, 20, and 21).
o The review and oversight of environmental impact datasubmitted by owners of establishments (Article 22).
o The supervision of environmental monitoring networks(Article 24).
There will necessarily be both similarities and differencesbetween Egyptian environmental impact assessment policies andpractices and those of the United States. It will be helpful forEgypt to learn from U.S. experience just as the U.S. and othernations should support and learn from Egyptian experience.
6Egyptian Unified Law for the Environment (Law Number 1, January1994), p. 9, Article 1 (36).
-939-
5. LESSONS LEARNED IN THE UNITED STATES
In the U.S., NEPA and its implementing regulations haveresulted in successes and benefits as well as some mistakes andcosts. Properly applied, the environmental impact assessmentprocess (which resulted from NEPA) has caused our agencies,planners, and public to more deeply consider:
o The underlying fundamental purpose and need for aproject or program.
o A broad range of reasonable alternatives (including therequired "no action alternative") and mitigation measuresdeveloped with broad public input for a project or program.
o A process and information source which is open to allinterested parties and is responsive to public concerns andsuggestions.
O Improved environmental and scientific understanding ofour resources, their vulnerabilities, and theirinterconnectedness.
o Better informed decision makers, publics, and decisionswhich lead to environmental and cost savings.
Our environmental impact assessment process has had itssetbacks and limitations which must also be considered. Forexample, sometimes:
o It has been too costly, benefitting lawyers,scientists, special interests, and bureaucrats more than theenvironment.
o Public input has been requested only to be laterignored.
o Data has been collected but not used and studies havebecome an end in themselves.
o It has been too cumbersome and confusing or used tojustify decisions already made.
o Measures of success have not been determined andfeedback loops have not been established relative toimplementation.
o When it has not been well linked with enforcement orfollow-up, there have been inconsistencies between what iswritten and what is actually done.
-940-
Yet, for all its flaws, our environmental impact assessmentprocess has been one of our most successful planning anddecision-making tools. It has helped to change, clarify, andchallenge our relationship with our environment.
6. CONCLUSIONS
We have an expression in the United States: "Be carefulwhat you ask for because you just might get it." Perhaps it istime we all ask, what is it we truly want and need in life andwhy? And if we fulfill our desires, what will it mean for usall?
I .believe the environmental impact assessment approach is animportant tool which can help us both ask and answer thesequestions. We can use it to frame our options, consider theirimplications, and work with and thereby better serve the public.It will be helpful for us all to understand how the environmentalimpact assessment process is adapted not only in the U.S. andEgypt, but also worldwide.
"The man who sits on the ground meditating on life andits meaning, accepting the kinship of all creatures andacknowledging unity with the universe of things infusesinto his being the true essence of civilization."[Lakota Chief Luther Standing Bear].
-941-
REFERENCES
Council on Environmental Quality regulations implementing NEPA, 40CFR, Parts 1500-1508 (as of July 1, 1986).
Deep Design, by David Wann, 1996.
Egyptian Unified Law for the Environment. (Law Number 4, January1994) , Article 1 (36).
Environmental Action Plan of Egypt. Egyptian Environmental AffairsAgency, 1992.
1995 Environmental Almanac. World Resources Institute.
Memorandum by CEQ, Questions and Answers About the NEPARegulations, March 16, 1981.
Memorandum by CEQ on Scoping Guidance, April 30, 1981.
National Environmental Policy Act, Pub.L. 91-190, 42 U.S.C.4321-4347, Jan 1, 1970 as amended by Pub.L. 94-52, July 3,1975, and Pub.L. 94-83, August 9, 1975.
State of the World 1995. 1995, WorldWatch Institute Report.
-942-
Proceedings of the Fifth International Conference '" EG9700048on Energy and Environment, Cairo, Egypt, 1996
APPLICATION OF OZONE IN INDUSTRIALEFFLUENT TREATMENT
G. El-Diwani, H. El-Abd and S. HawashChemical Engineering and Pilot Plant Department
National Research Centre,Dokki, Cairo, Egypt
ABSTRACT
Ozone, being a strong oxidizer for both organic and inorganic pollutants;makes ozonation treatment of waste effluent a valuable alternative for meetingstringent environmental limitations. Applications of ozone on effluents fromdifferent local factories concerning dose determination, combination with othertreatment processes and cost estimation for achieving allowable limits in theenvironmental pollution low are collected in the present work. Successfulresults have been achieved for application in food, textile, petroleum refineries,and chemical industrial effluents.
INTRODUCTION
Ozone has been used since the turn of the century as a disinfectant inEurope. The advantages of ozone desinfection, as compared to chlorinedesinfection, are multiple. The desinfected water is safe to the receiving streamwhere as chlorination destroys fishes and other forms of aquatic life. Thedissolved oxygen content of the wastewater is at its maximum value becauseozone is injected at a 2% wt. concentration with 98% air.
Ozone is a more effective than chlorine and remove all types of viruses.Co-current to the desinfection process ozone simultaneously lowers the colour,chemical oxygen demand and turbidityC).
Ozone also, removes suspended solids by an ozone-induced flotationprocess(2). The matrix of suspended solids forms a froth on the surface of thewater in the contact chamber and is removed by skimming. Ozone removescolour, odour and taste(3"4) and also removes organic substances^4"7).
Finally unlike chlorine, ozone does not change the pH of the water, nordoes it react with the remaining organics in water to form carcinogenictrihalomethanes.
-943-
Waste effluents from "El-Nasr for Coke and Essential Chemicals(8),Production", Kaha for Food Production"(9), "Mostorod for PetroleumRefining"Cu), Dye WorksOl) (synthetic solutions) have been treated by ozonealone or combined with other processes in bench scale experimentalprocedure. Relationship between degree of pollutants and oxidant dosesengineering data required for full scale design and preliminary economicevaluations were determined for each case.
A number of treatment methods are available which may be broadlyclassified as physical, chemical, biological, and ultimate disposal. Frequently acombination of two or more methods is required, and the waste disposal systemmay be taitor-made for a given waste, which can be accomplished through anextensive pilot plant or laboratory work to the particulate waste.
2. EXPERIMENTAL
. 2.1. Waste water Characteristics
2.1.1. El-Nasr for Coke and Chemicals Manufacture
Representative composite sample was collected from the factory in year1987(8).
Representative samples of the industrial polluted wastewater arccollected from a stream of combined effluents from coke oven and by-productrecovery plants. They are stored in 20 litres plastic container at 0°C.
The specifications of the industrial wastewater were analyzed as shownin Table (I).
It is clear from Table (I) that phenols and cyanides are the majorpollutants. The cyanides were 20-40 mg/l which is very high and toxic ifcompared with the allowable standard (0.01 mg/l) while phenols are100-400 mg/l which is also very high and toxic (the allowable standard is2 ppb).
2.1.2. Kaha for Food Manufacture
Samples collected in the year 1987 from the 600 m'/day, resulting wastewater from "Kaha" industry in the citrus season (February) are analyzed, Table(II) summarizes the characteristics of waste stream after screened through a gritin the industry.
From comparison of actual values and those allowable characteristicvalues, it is shown that BOD value is the major defect together with colour andphenol reduction.
-944-
2.1.3. Mostorod Petroleum Refinery
Table (III) represents the analysis of the wastewater effluent from thefactory after free oil removal by settling (which is reduced from 2000 ppm to20ppm.
2.1.4. Dye Contaminated Effluent
Soluble dyes, such as direct dyes, acid dyes and basic dyes arecompletely and rapidly decolorized by ozone, where as insoluble and dispersiondyes are removed by means of chemical evaqulants. The principal deterrent tothe use of ozone for dye wastewater treatment was the cost. The high cost ofozone generation requires a high ozone utilization efficiency.
»p-Toluedene azo-dye pure powder is prepared from its pure component
and dissolved in 0.1N sodium hydroxide. Dye concentration (initial =2.6x 10⁻⁵mol/l) change is determined on a Graphicord U.V.2. (im. ShimodzoU.V.-Visible type spectrophotometerO2).
2.2. Preozonation Treatment
2.2.1. El Nasr for Coke and Essential Chemical Manufacture
Wastewater contains high concentration of phenols and cyanides whichmay be toxic to micro-organisms, and cause troubles in the biological oxidationtreatment. The screened wastewater is physically separated by settling for onehour into two separate phases. The upper layer constitutes 15% of the totalvolume, is a dark oily layer. By removal of the up-per oily layer the COD of hepretreated wastewater obtained is reduced to 800 and its BOD to 615 mg/l.
Two proposed treatment techniques are tested on pretreated wastewatercoke effluent. The first technique is ozonation of diluted effluent to 10%. Thesecond technique is based on biological treatment by aeration followed byozonation of aerated stream. Both techniques are tested on bench scaleexperiments.
Biological Treatment
Air is compressed passing by a flowmeter, then through a porous medium,till bubbled into wastewater through a perforated glass tube (Fig. 1). Diameterof the perforation is 0.1 cm and the number of perforations is twenty. Airflowrate is fixed at 350 L/hr. The volume of wastewater treated is 600 ml.Samples are collected for COD analysis at one hour interval times. Totalreaction time is 5hr.
-945-
2.2.2. Kaha for Food Manufacture
The treatment plant is based on biological treatment in an aerobic,activated sludge, followed by ozonation. The proposed treatment is checked onbench scale experiments.
Air is compressed passing by a flowmeter, then through a porous medium,till bubbled into waste water through a perforated glass tube (Fig. 1). Diameterof the perforation is 0.1 cm, the No. of perforations i30. Air flow rare is settledabout 350 L/hr. This sample of waste water treated is 250 ml.
Samples are collected for COD analysis at 1 hr interval time. Totalexperimental time is 4 hrs.
2.2.3. Mostorod Petroleum Refinery
Catalytic photooxidation using ozone/UV is used for degrading toxichydrocarbon compounds present in petroleum refinery wastewaters. Fe(lll)tetracarboxyphthalocyanine catalyst is prepared using modified reportedmethodOS), the converted to the oil soluble cetyamine salt. The catalyst at aconcentration of 2% based on emulsified oil in wastewater after free oil removalby flotation.
2.3. Ozonation System
Ozone occurs as a gas present in weak solution in air or oxygen. Ozonecan be produced economically in air with a concentration of 10 to 30 g/m3 atNTP. The gas must be brought into intimate contact with the water to enable itto react with the substances contained in it. This operation is performed inmixing equipment such as plates, contact-beds on bubble columns, ...etc. Thepurpose of the mixing system is to ensure that the ozone reacts completely,without losses. This means that it must be suited to the specific application.There is no single system which is suitable for the whole range of dutiesO4).
Chemicai Ozone Demand of the Waste Sample by Laboratory Evaluation
Tests can be performed in a pilot plant which is the best way for theextrapolation of the results leading to a treatment plant. The analysis show thetrue kinetics of the ozonization procesa according to the time and the changesin water quality. This method offers some disadvantages, namely the use ofimportant quantities of water investment of the ozone generator, the pilot stationand full time employment. These are the reasons why batch experiments areoften satisfactory, even if they are run in a laboratory.
-946-
One the used methodsCS) consisting of bubbling ozone into a flaskcontaining the water to be studied, is used in the present work. (Fig. 2).Gaseous ozone generated in a "Fisher" type ozonizer (capacity 7 mg/mn ofozone) using oxygen, is bubbled at different rates into 750 ml (concentration1%) sample for 2 mn. After settling for 4 minutes, water is taken out and theozone residual is measured by classical iodometric method.
3. RESULTS AND DISCUSSIONS
3.1. El Nasr for Coke and Chemicals Manufacture
a) COD Time Dependence by Biological Treatment
In this set of experiments aeration of concentrated waste takes place. Thechange of COD after five hours treatment, for each one hour interval time isshown (Fig. 3). It is observed that COD is decreased from 850 mg/l to 660 mg/lafter five hours. From this figure, it is clear that there is a peak after one hourwhich indicates that the organic compounds is increased due to primaryoxidation product and then biodegraded by the action of microorganisms to acertain limit. Complete removal of organic pollutants is not obtained whichassure the necessity of further chemical treatment to eliminate the biochemicalresistant substances.
The estimated quantity of oxygen necessary for treatment is found bysubstracting the final mixture COD from the initial value 02 necessary = (850-660) = 190 mg/l. Because air is only 20% oxygen, and oxygen transferefficiencies are of the order of 5%, the amount of air necessary will beapproximately 19 g/l (C,' = 1.29) or 24.51 L/L.
b) Ozonation of Pretreated Wastewater
Chemical oxygen demand is plotted against the ozone flow rate as shownin Fig. (4). Changes in COD as a function of ozone dosage is represented by astraight line. The removal of COD can then be expressed by the equation.
COD = A. (ozone applied) + B (1)
Where A is the slope of the straight line relationship, B is the intercept of thestraight line with the y axis, and are obtained from Fig. (4).
By replacing the values of A and B in equation (1) the followingrelationship is obtained:
COD = -0.69. (ozone dosage) + 843 (2)
-947-
According to this equation, to a COD value of 100 mg/l the ozone appliedshould be 1000 mg/l.
c) Ozonatlon of pretreatod, aerated wastewater
Chemical oxygen demand is plotted against ozone flow rate (Fig. 5), astraight line relationship is obtained from which ozone dosage can be calculatedfrom the equation:
COD = A* (ozone dosage) + B1 (3)
where A' is the slope of the straight line, B' is its intercept with the y-axis. FromFig. (5), A' and B' are evaluated as follows:
A' = 0.576 and B' = 613.8; By replacement in the equation (3).
COD = -0.576. (ozone dosage) + 613.8 (4)
From equation (4) the ozone dose required to reach a COD of 100 is900 mg/l.
3.2. Kaha for Food Manufacture
a) Time Dependence COD by the Biological Treatment
It is shown from Fig. (6) that COD of the waste water sample treated isdecreased to 230 ppm after 2.5 hr of treatment.
The estimated quantity of oxygen necessary for treatment is found bysubstracting the final mixture COD from the initial value.
02 necessary = (435-230) - 205 mg/l
Because air is only 20% oxygen, and oxygen-transfer efficiencies are ofthe order of 5%, the amount of air necessary will be approximately 20.5 g/l (C, -1.29) (15.89 L/L)(5)
According to literature^) 50 L air required for one liter solution of wastewater for complete removal of BOD content.
But from experiment it is shown that the biological treatment can be onlyefficient till 15.89 L/L leading a COD content of 230 ppm or BOD content ofextended aeration do not cause any amelioration or decrease in the COD.
-948-
Fig. (7) shows a In-ln plot of COD removed versus ozone dosage (range62 to 82 mg/l ozone), a straight line is obtained. The removal of COD can thenbe expressed by the function(B) of:
In (COD removed) = 1.25 In (ozone applied) + 1.105
According to the last equation, to reach COD 100mg/l or COD removedwould be 800 mg/l, Ozone applied should be: 86.5mg/l; if initial COD is230mg/l, C OD removed would be 360 mg/l and ozone applied should be:45.6mg/l.
b) Dose of Ozone Determination
The dilution (1 %) of the "Kaha" industrial waste permits the evaluation ofozone dose required to remove organic matter in the waste and this required forits desinfection. From the extrapolation of the straight line relationship (Fig. 8)obtained by plotting residual ozone against rate of ozonation, the rate ofozonalton corresponding to 0 residual is that rate to eliminate organiccontaminants in the wastewater (diluted 1%), which means 2.8 mg/l.
For the original waste concentration it will be 2.8 x 100 = 280 mg/l.
And for desinfection, the residual has to be 0.4 mg/l, at this pointcorresponding rate is 3 mg/l. For the original waste concentration it will be 3 x100 = 300 mg/l.
It is to be noted that these doses would be correct if no other inorganic orrefractory matters which would require excess of ozone.
c) Removal of COD
Changes in COD as a function of ozone dosage is given in Fig. (9). Uponinitial treatment with ozone from 0.0 to 5.5 mg/l late, the COD in increased100% But as the ozone dosage was increased further, COD peaked, and thendecreased as a function of ozone dosage. Treatment of effluents with 62,72.82reduced the COD to 410, 280, 130 respectively.
3.3. Mostorod Petroleum Refinary
The effects of Ozone UV catalytic photooxidation on oil degradation using15 or 75 Watt UV lamp (compared with non catalytic process) are shown n Figs.(l0 and ll).
Data presented in the Fgures show that the oil pollutant in wastewater is6jgnificantly decreased during the ozone/UV catalytic process, which suggests
-949-
the Fe(lll) catalyst has accelerating photooxidalion activity. An enhanced oildegradation role for the catalyst is proposed based upon the furtherimprovement of ozone/UV photooxida tion.
3.4. Dye Contaminated Effluent
Effect of Ozone Dosage on Removal of Pollutants
Effect of ozone dosage on color removal of treated solution at differentozone dosage is represented in Fig. (12J.
It is shown from the figure that In-ln function of color removed versusozone applied relationship is a straight line represented by the followingequation:
In y = 4.6 In x + 54 (5)
From the above results, it is deduced that the removal of color by 10mg/lozone dosage, is average 10%.
4. CONCLUSION
4.1. It has been established, with various coke plant wastes that differentozone dosages are required to oxidized the phenol. The ozone demand isarbitrary defined as that required for 99% removal of phenols. It is known fromliterature that phenol to ozone rate in pure phenol solution is 1:1 which meansabout 200mg/l ozone.
In the actual case more ozone is required; about 100 mg/l. This fact isdue to the addition COD present exerting also an ozone demand and consistingof cyanides, thiosulphates, thiocyanates, sulphides and another complexorganics.
The effect of preparation of waste coke effluents is remarked on thedecrease of ozone demand (900 mg/l) of the effluent.
Based on this study, the recommended treatment of the "CokeWastewater Effluent" can be represented by Fig. (12). It is interesting to notethat in a single unit process, ozone removes COD, phenols, cyanides,thiocyanates, sulphides and colour from coke effluents without the production ofany side pollutant.
4.2. The recommended treatment of the "Kaha" waste water effluent isthat represented by the flow sheet in Fig. (\4).
-950-
The specifications of the produced treated wastewater are represented inTable (IV).
4.3. Apparent increased % oil removal might be explained as tfte Fe(lll)catalyst produces more free radicals which cause the over-all reaction Joproceed much faster.
Ozone can be reduced from about 10mg/l sample to 1 mg/l in case of lowoil concentration (5ppm) or 3mg/l in case of 30 ppm initial dissolved oilconcentration.
4.4. Ozone treatment is effective for removal of color generated fromazo-dyes.
On typical synthetic solution of p-toluedene azo-dye 10 mg/l ozoneremoved 10% of color. The mathematical relation (5) represents the effect ofozone dosage on color removal. From Fig. (\z), it is found that complete colorremoval can be obtained by applying 125 mg/l ozone dosage, when initial dyesconcentration was 2.5 x 10~5mol/l. But generally in dye works wastewater dyeconcentration would be about 3mg/l and complete decoloration can be achievedby injection of 30 mg/l or 30g/m 3 of ozone.
4.5. Economic Indicators
Referring to Hackensak water company which is an American WaterTreatment Plant in New Jersey, of 200 mgd, serving 700,000 people, the finalfigure of their ozone production cost is 0.77 $/lbO6) or 5.78 LE/kg* ozone.Based on required dose estimated for each type of wastewater presented thefollowing Table (V) represents the ozone dosage cost for treating 1m 3 fromthese effluents.
REFERENCES
1. G. Davis, Proceeding of the Second International Symposium on OzoneTechnology (1945).
2. C. Nebel and Co-workers, J. Boston Soc. Civil Eng., 62, 161 (1976).
3. Hartmann, P. etal., Proc. of Ozone/Chlorine Oxidation Product of OrganicMaterials, Nov. 17-19 (1976). Int. Ozone Press, p. 82 (1978).
4. Majumadas, S., Ceckler, W. and Sproul, O., J. Water Poll. Fed., 46, 2048(1974).
-951-
5. Symons, J. ef a/., USEPA Progress Rep. May (1979), and "InterimTreatment Guide for the Control of Chloroform Trihalomethanes", USEPAReport, June (1976).
6. Delipkouski, H., Tech. Sanit Munic, 32, 54 (1937).
7. Miller, G.W., Water Supply Symposium of the Int. Bank forRecommendation and Develop., Washington, D C , Jan. 9-13 (1978).
8. A. Hofer, G. El-Diwani and S. Hawash, Revista De Quimica Teorica YApplicada (AFINIDAD), XLIV(412). 471 (1987).
9. G. El-Diwani, A. Hafez, S. Hawash, Revista De Quimica Teorice YApplicada (AFINIDAD), XLIV(409), 221 (1987).
10. A.M. Badawi, FA. Fahim, G. El Diwani, A. Hawash, Sh. El Rafei and A.M.El Sabbagh, Under Publication (1995).
11. G. El Diwani, A. Hafez and S. Hawash, Chemie Ingenieur Technik, 59(8),654-656(1987).
12. Matsui, M., Hibino, T., Shibata, K. and V. Takase, American DyestuffReporter, 72, 40 (1983).
13. Webber, J. et a/., Inorg. Chem., 44, 469 (1965).
14. K.H. Gerber, Zurich, Waste and Environmental Pollution Control",Publication No. CH-XW 010023 E, BBC.
15. J.P. Legeron, "Chemical Ozone Demand on a Water Sample by LaboratoryEvaluations", Symposium on Advanced Ozone Technology Sponsied byThe Int. Ozone Institute, Nov. 16-18 (1977), Toronto, Canada.
16. G. El Diwani, S. Hawash, AMSE transactions, AMSE Press, 7(1), 53-64(1991).
-952-
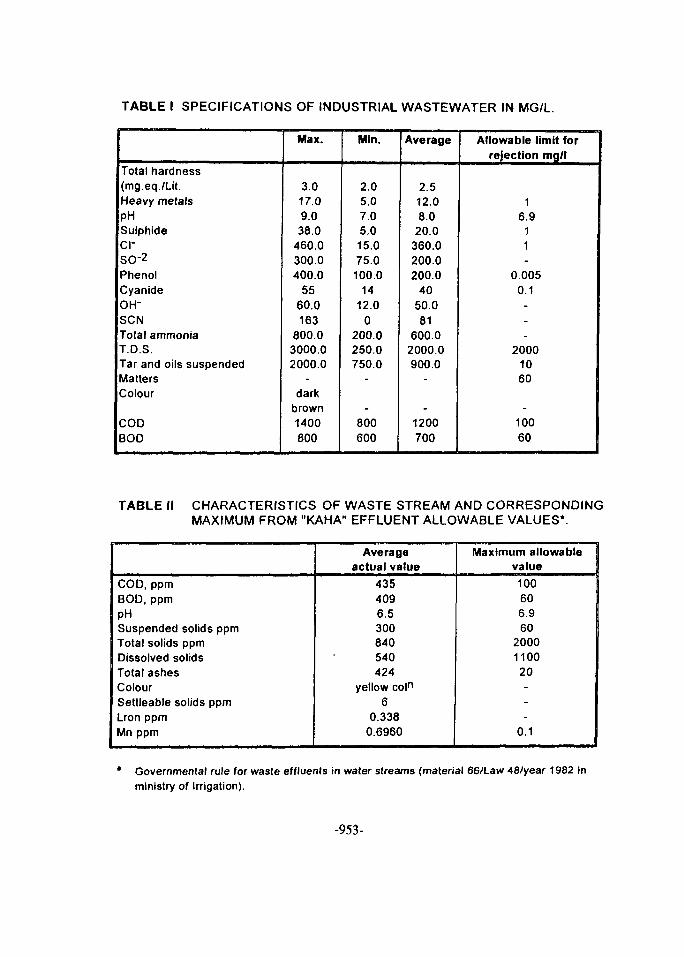
TABLE I SPECIFICATIONS OF INDUSTRIAL WASTEWATER IN MG/L.
Total hardness(mg.eq./Lit.Heavy metalsPHSulphideci-SO-2PhenolCyanideOH-SCNTotal ammoniaT.D.S.Tar and oils suspendedMattersColour
CODBOD
Max.
3.017.09.038.0
460.0300.0400.0
5560.0163
800.03000.02000.0
-
darkbrown1400800
Min.
2.05.07.05.015.075.0100.0
1412.0
0200.0250.0750.0
-
-
800600
Average
2.512.08.0
20.0360.0200.0200.0
4050.081
600.02000.0900.0
-
-
1200700
Allowable limit forrejection mg/l
16.9
11-
0.0050.1
---
20001060
-10060
TABLE II CHARACTERISTICS OF WASTE STREAM AND CORRESPONDINGMAXIMUM FROM "KAHA" EFFLUENT ALLOWABLE VALUES*.
COD, ppmBOD, ppmPHSuspended solids ppmTotal solids ppmDissolved solidsTotal ashesColourSettleable solids ppmLron ppmMn ppm
Averageactual value
4354096.5300840540424
yellow coln
60.338
0.6960
Maximum allowablevalue100606.960
2000110020---
0.1
• Governmental rule for waste effluents in water streams (material 66/Law 48/year 1982 inministry of Irrigation).
-953-

TABLE III WASTEWATER SAMPLE FROM CAIRO REFINERY (MOSTOROD).
Parameter
PHTSSSTDSOil totalDissolvedPhenolsSulphidesCODBODPbCrNiCu
HgCOFree oil
Maximumallowable
limits
7-8.51000
301000100
50.02
14030
0.050.050.1
10.0010.01
Concentration in mg/lBefore
treatment inDAF6.4
1505262129648.528.5
0.026zero3882920.15
0.0430.25
0.1750.050.01
20 ml/l
Aftertreatment in
DAF6.5647405852116
zero1461220.15
0.0430.25
0.2250.0320.025 ml/l
TABLE IV TREATED "KAHE" WASTEWATER SPECIFICATIONS.
COD
ppm
178
BOD
ppm
80
PH
6.5
Suspendedsolids
0
Iron
ppm
0.2
Manganese
ppm
0.4
Colour
no
TABLE V DOSAGE OZONE COST FOR DIFFERENT STUDIED EFFLUENTS.
Type of effluent
1. El Nasr for Coke and Chemicals2. Kaha for Food Manufacture3. Mostorod Petroleum refinary4. Dye Contaminated Effluent
Ozone doseg/m3
90045.69
10125
Ozone dose costLE/mJ
5.190.26
0.05740.173
'Based on 1 $ = 3.4 LE as present value.
-954-
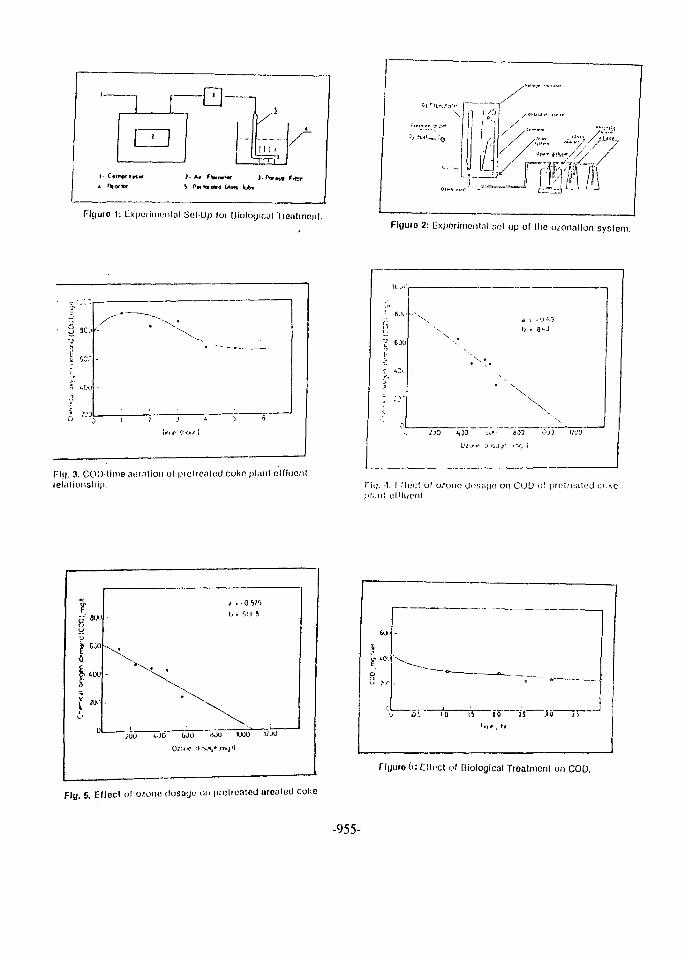
" I fCD
I—I
"IV*,
III 1T t r j '
Fijiuto 1: Cx|)ciinic'iital SolUp loi Uioloyicjl Tieolincnl.
IS ft/Fl(juio 2: lixporirnental sol up o( the ozonallon system.
S»
b'
'•(.J
5CJ
5S."
too -
) • '(
•
j i. S 6
Pit). 3. COD-time ai.'jalion ul incltoaled coko plant elducntlelaliunsttip.
"xX ,
t; i-Of.!8--J
r i i ; . •!. r f l i ;cl ol ozone UKSUCJU on COU of prnlru.'itcJI'l.inl ulfluenl.
Io
s. too3
b= 'jij 8
"X
^00 i JO WO IWU 1OJ0 "JO
i
?.c>
600
r
—<
i_>u
r iuuro6: Cflocl ol Qiologlcal Treatment on COD.
Fig. 5. Ellecl ol o/oiic ilospgu on piulroateJ areated coke
-955-
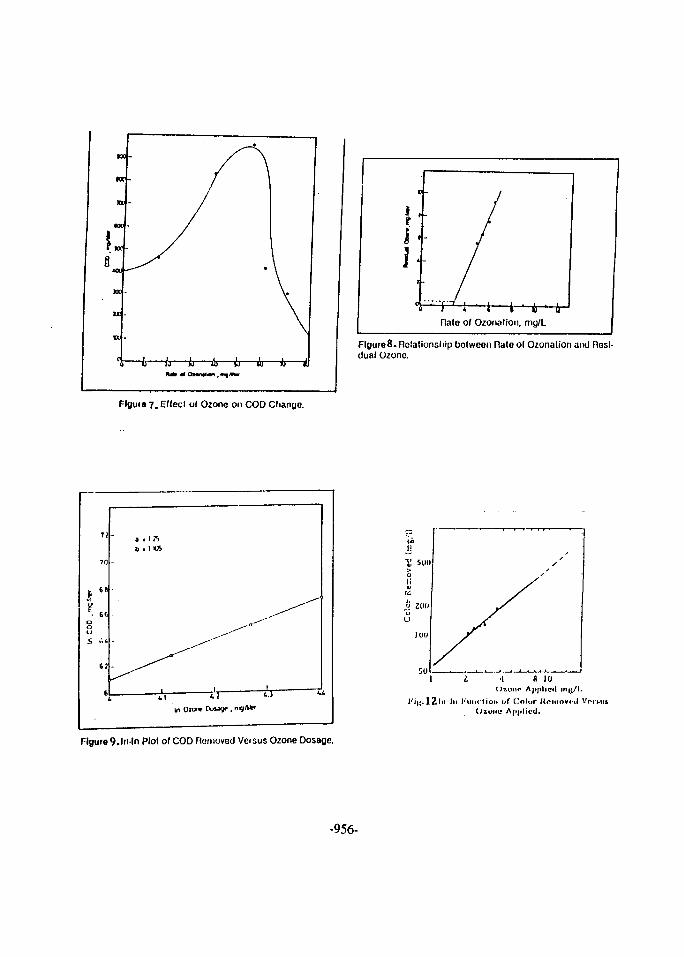
Fl(jui» 7. Eflecl ol Ozone on COD Change.
8s
11
70
66
6G
» '
S I
tb
I,
.in
4.11 ' l Z
u *»AW
rtale of Ozonalion, mg/L
FlBi"s8- Relationship between Rale ol Ozonalion and Resi-dual Ozone.
ni(i/l.
l''i|;.lZlit-ln I'linclion of Color Uriiiovrd VPIMISC^ZOIIU Apjilicd.
Figure 9.ln-ln Plol of COD nofiioved Versus Ozone Dosage.
-956-
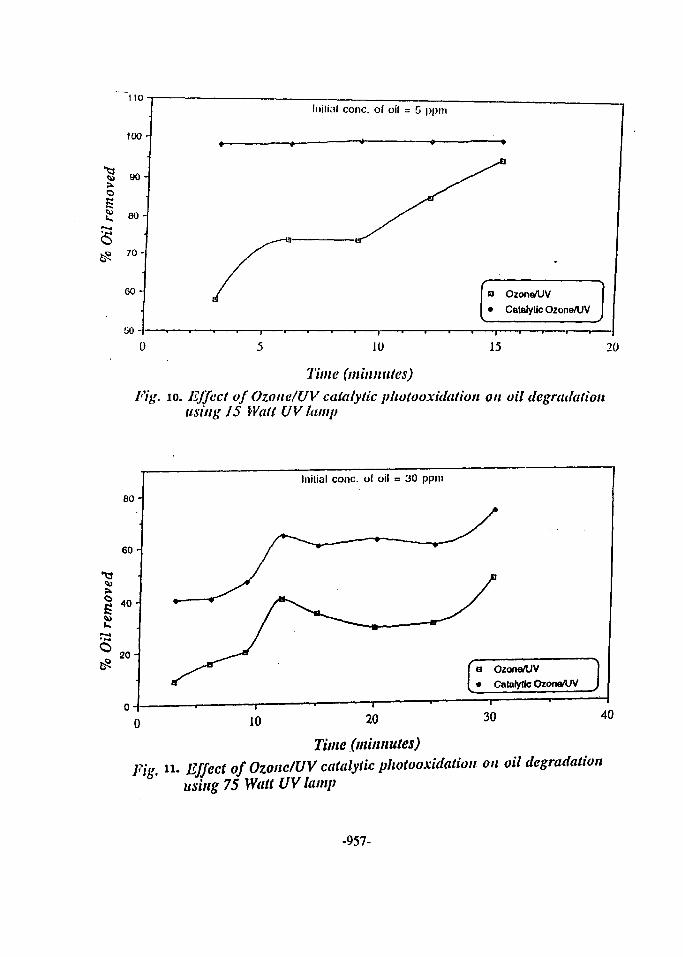
110
100
*§ 90©S2!
70
60
'M
Initial cone, of oil = G ppm
Q Ozone/UV
• Catalytic Ozone/UV
10 15 20
Time (minnutes)
Fig. IO. Effect of Ozone/UV catalytic photooxidation on oil degradationusing 15 Wait UV lamp
80
60
§ < o H
20 i
Initial cone, ol oil = 30 ppm
Ozona/UVCatalytic Ozone/UV
10 20 30 40
Time (minnutes)ii- Effect of Ozone/UV catalytic photooxidation on oil degradation
using 75 Walt UV lamp
-957-
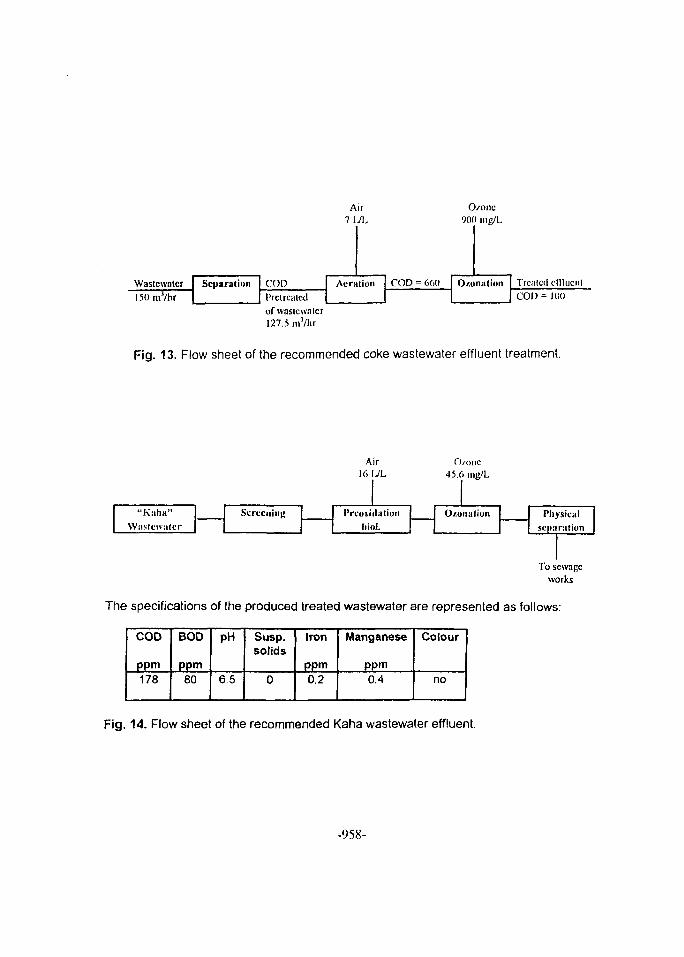
Air1UL
O/onc900 mg/L
Wastcwalcr[50 mVhr
Separation CODPrclrciilcd
Aeration COD = 6G0 O/.onalion Trcalccl cdlucnlCOD= 100
ofwaslcwatcr127.5 mVhr
Fig. 13. Flow sheet of the recommended coke wastewater effluent treatment.
"Kiiha"WsiMctvalcr
Screening
AirI6IVL
I'mniilationliiol.
n45.(
/one> mg/L
O/.uiialion Physicalseparation
Tosw
cwagcarks
The specifications of the produced treated wastewater are represented as follows:
COD
ppm178
BOD
ppm80
pH
6.5
Susp.solids
0
Iron
ppm0.2
Manganese
ppm0.4
Colour
no
Fig. 14. Flow sheet of the recommended Kaha wastewater effluent.
-958-
l H111II «'" Hi ' I"*' ' - A
Proceedings of the Fifth International Conference EG970004aon Energy and Envirorunent, Cairo, Egypt, 1996
FUTURE INDUSTRIAL AND MUNICIPAL WASTE MANAGEMENT IN POLAND -THE POLISH CHALLENGE"
Janusz Nowakowski', Lars Sorum", Johar E. Hustad"* Technical University of Szczecin, Department of Heat Engineering
Al Piastow 19, PL-70-310 Szczecin, Poland" Norwegian University of Science and Technology
Department of Thermal Energy and Hydro PowerKolbjarn Hejes v 1 A, N-7034 Trondheim, Norway
AbstractPoland now face a very interesting discussion on modern waste treatment methods, although the
waste problems are very old. This paper presents a total waste management view from the formationprocess to recycling, utilisation and landfilling. The average municipal solid waste (MSW) annual percapita generation in Poland is 250 kg per person, which is half of the waste amount generated in Norwayand one third of the amount in USA. The present low per capita generation, large variations in MSWproperties and an expected growth in the standard of living make the decisions regarding future Polishwaste management systems very important. Waste management must be handled carefully to prevent arapid growth of waste generation - this is the "Polish challenge", both now and for the future. Threedifferent possibilities for future waste management systems for rural areas, small cities and larger citiesare discussed in the paper.
1. INTRODUCTIONThe amount of MSW in Poland has increased with 80 vol% from 1975 to 1992 |11. The economy
system in Poland changed to market economy in 1989 and since there has been a stagnation period onwaste generation The composition of MSW in Poland is different from other (western) countries,distinguished with a lower content of paper and plastics and a higher content of organic and inorganicwaste. However, these characteristics are expected to be more comparable in the future.The paper is divided into two parts - the first part presents the state-of-the-art in Polish waste generation,characterisation and waste management. The second part presents the government plans for future wastemanagement systems and three different possibilities for future waste management systems for ruralareas, small cities and large cities. Since 98,7% of MSW generated in Poland today is landfilled [11 andlack of landfill sites is expected for the future, it seems necessary to employ other methods for volumereduction of waste in the future. Energy estimations for different treatment methods of MSW areperformed.Since household waste is a very small percentage (typically in Europe 6-10%) |2] of total waste created, itis apparent that individuals only can have a small impact on overall waste volumes generated and that thelargest contribution to reducing waste must come from government waste policy and manufacturingindustry, agriculture and from the construction and demolition sectors. The only influence individuals haveon waste generation is to buy less, buy longer life products and to re-use items.The average MSW per capita generation in Poland is 250 kg per person a year, which is one third of theamount generated in USA [3] and half the amount generated in Norway [4|. Previous studies have shownthat the variation in waste properties is large in Poland so waste management must be handled verycarefully.Laws, rules and regulations should create possibilities for a good and proper environmental protectionThis includes proper waste management systems and providing basic directions and constraintsconcerning water, ground, and air pollution. The appropriate waste management hierarchy should setspecific succession in decision making on Ministry and Parliament level |5|:
-959-
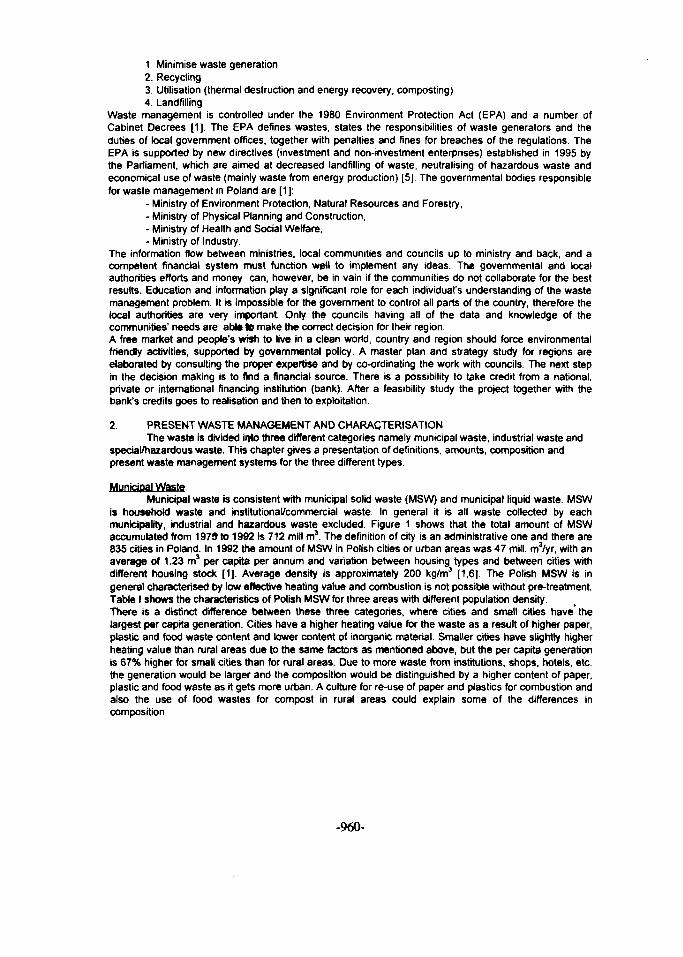
1. Minimise waste generation2. Recycling3. Utilisation (thermal destruction and energy recovery, composting)4. Landfilling
Waste management is controlled under the 1980 Environment Protection Act (EPA) and a number ofCabinet Decrees [1]. The EPA defines wastes, states the responsibilities of waste generators and theduties of local government offices, together with penalties and fines for breaches of the regulations. TheEPA is supported by new directives (investment and non-investment enterprises) established in 1995 bythe Parliament, which are aimed at decreased landfilling of waste, neutralising of hazardous waste andeconomical use of waste (mainly waste from energy production) [5]. The governmental bodies responsiblefor waste management in Poland are [1]:
- Ministry of Environment Protection, Natural Resources and Forestry,- Ministry of Physical Planning and Construction,- Ministry of Health and Social Welfare,- Ministry of Industry.
The information flow between ministries, local communities and councils up to ministry and back, and acompetent financial system must function welt to implement any ideas. The governmental and localauthorities efforts and money can, however, be in vain if the communities do not collaborate for the bestresults. Education and information play a significant role for each individual's understanding of the wastemanagement problem. It is impossible for the government to control all parts of the country, therefore thelocal authorities are very important. Only the councils having all of the data and knowledge of thecommunities' needs are abte I t make the correct decision for their region.A free market and people's wish to live in a clean world, country and region should force environmentalfriendly activities, supported by governmental policy. A master plan and strategy study for regions areelaborated by consulting the proper expertise and by co-ordinating the work with councils. The next stepin the decision making is to find a financial source. There is a possibility to take credit from a national,private or international financing institution (bank). After a feasibility study the project together with thebank's credits goes to realisation and then to exploitation.
2. PRESENT WASTE MANAGEMENT AND CHARACTERISATIONThe waste is divided into three different categories namely municipal waste, industrial waste and
special/hazardous waste. This chapter gives a presentation of definitions, amounts, composition andpresent waste management systems for the three different types.
Municipal WasteMunicipal waste is consistent with municipal solid waste (MSW) and municipal liquid waste. MSW
is household waste and institutional/commercial waste. In general it is all waste collected by eachmunicipality, industrial and hazardous waste excluded. Figure 1 shows that the total amount of MSWaccumulated from 1979 to 1992 is 712 mill m3. The definition of city is an administrative one and there are835 cities in Poland. In 1992 the amount of MSW in Polish cities or urban areas was 47 mill. nWyr, with anaverage of 1.23 m3 per capita per annum and variation between housing types and between cities withdifferent housing stock [1]. Average density is approximately 200 kg/m3 [1,6]. The Polish MSW is ingeneral characterised by low effective heating value and combustion is not possible without pre-treatment.Table I shows the characteristics of Polish MSW for three areas with different population density.There is a distinct difference between these three categories, where cities and small cities have'thelargest per capita generation. Cities have a higher heating value for the waste as a result of higher paper,plastic and food waste content and lower content of inorganic material. Smaller cities have slightly higherheating value than rural areas due to the same factors as mentioned above, but the per capita generationis 67% higher for small cities than for rural areas. Due to more waste from institutions, shops, hotels, etc.the generation would be larger and the composition would be distinguished by a higher content of paper,plastic and food waste as it gets more urban. A culture for re-use of paper and plastics for combustion andalso the use of food wastes for compost in rural areas could explain some of the differences incomposition.
-960-
The variation in composition for MSW is dependent on several factors [1] Seasonally, heating system(ash content in MSW), standard of living, packaging, overcrowding (recycling/composting is difficult).MSW collection in Poland is carried out by the Public Cleansing Enterprise of each community'senvironmental protection department, or by private enterprises authorised by them. The service coversurban areas, but it is estimated that between 20% and 40% of rural areas are covered at best. Theaverage service coverage factor for Poland was 55% in 1990 [1]. Collection methods for MSW vary, butthere is an emphasis on use of large containers in apartment blocks and at special collection points. Thefrequency of collection is 2 to 3 times per week from apartment buildings, and weekly from scatteredhousing areas, detached houses and suburban buildings. There are currently three methods in use fortreatment and disposal of MSW in Poland, namely landfilling, composting and recycling. In 1992 the 47million m3 of MSW generated were disposed as follows [1].
- Landfilling 98.7 %- Composting 1.3 %- Recycling Negligible post-consumer
There are currently some pilot projects carried out on recycling of not separated glass and paper inselected areas in Poland. At the end of 1995, contracts were signed for the construction of Poland's firstglass recycling plant in the city of Kutno [7|.The generation of municipal liquid waste or sewage sludge in 1993 was 14.9 mill m3 |5). Sewage sludgeis presently for rural areas treated at source, smaller cities have treatment plants (biogas, chemical andbiological treatment) and larger cities dump the sewage sludge (into rivers, landfilling).
«Industrial Waste.
The waste generated during any production process by small and large factories which can not beused in further processes are named "industrial waste". The waste "producers" are responsible forremoving, collecting and managing of the refuse. The waste management system should therefore be apart of the production line. Poland generated in 1993 120,5 million tons of industrial waste that wastreated as follows:
- 53,6 % Utilised for site levelling, filling of mining excavations, building and road industry- 0,3 % Neutralised- 46,1 % Landfilled, dumped on heaps and in sediment ponds
As we can see almost half of the generated industrial waste was landfilled which will increase the problemwith lack of landfill sites Accumulated amount of industrial waste was in 1993 1834,9 million ton [5]. Theindustrial waste composition is as follows [5]:
- 42,6 % Mining refuse - 2,0 % Sodium industry refuse- 30,0 % Floatation sludge - 0,4 % Metallurgic gas cleaning sludge and dust-15,0 % Fly ash/slag from energy prod. - 0,4 % Waste water treatment plant sludge,- 4,4 % Metallurgical slag - 0,3 % Calcium carbide,- 3,0 % Phospho-gypsum - 1,9 % Others.
Special / Hazardous Waste.Waste which is dangerous for human life or health or for environment due to its origin, chemical or
biological composition or other properties like: toxic, flammable, explosive or radioactive, are namedspecial / hazardous wastes [6]. The producers of hazardous refuses are mainly chemical industry andhospitals. There exists a few hospital waste incineration plants nearby hospitals, some are justincinerating hospital refuse and some are able to produce steam and hot water for hospital needsIn 1993 the Polish industry produced 3,44 million tons of hazardous waste where 66,2 % wereeconomically used, 0,9 % were specially neutralised and the rest was dumped 1369 dumping sites haveaccumulated 258.24 million tons of special / hazardous waste (1993) [5|. The hazardous waste producersare specially equipped and trained for safety handling and transport, also in the case of an emergency.
3. FUTURE WASTE MANAGEMENT SYSTEMS - "THE POLISH CHALLENGE"Future waste management systems in Poland should be based on a socio-economic correct
treatment of waste as a resource and problem. Where economic aspects concerning both investment
-961-
costs and pay back time for different treatment systems should be compared to environmental aspectssuch as air, soil and water pollution and the potential costs for solving these problems for the differentwaste management systems. Poland's economy and energy infra-structure should also be taken intoconsideration when new waste management systems are planned.Figure 2 shows the development of per capita generation of MSW from 1975 to 199? From 1992 to 2010we have made three different scenarios for the per capita generation Since Poland has a very low pe'capita generation, there is a very good opportunity to level out this development for the future and for 2010may be reach a per capita generation of 300 kg/yr (scenario I) This is an increase of 20s'i. cnmpnred to1992 and could be a realistic goal for 2010. Since Poland is a country in great development and willprobably, after a stabilisation period with implementation of market economy in 1969. aqam increase theirper capita generation towards the year 2010 due to an expected 'ncrease in standard of living Scenario Hand III which is typical generation for western countries should be avoided The assumed increase '•••••standard of living will also be a major factor for the changes in composition of MSW in the future It isassumed that there will be an increase in combustible matter and a higher calorific value and a Jeaoasein moisture content.
Poland's starting point for implementation of new waste management systems is very good due lo the lowper capita generation and it is possible to enforce the firsl law in the waste management hierarchy namelvminimisation of waste generation.The estimation of future generation of industrial waste is more complex Industrial waste comes mamlvfrom coal mining and an increase in living standard should give an increase in energy consumption andhence an increase in industrial waste. On the other hand export of coal could decrease due tocarbondioxide taxes for instance, and hence the industrial waste generation could level out or evendecrease. Therefore, any assumption on industrial waste generation for the future is not includedWaste management systems for Poland are divided into three different categories dependent onpopulation density. The reason for that is that Poland have a distinct difference in composition and alsogeneration of MSW for areas with different population density and hence a need tor different wastemanagement systems. Industry and industrial waste are also dependent on population density, whereagriculture waste dominates the rural areas, wood waste from wood processing and waste from foodproducers dominates the smaller cities and waste from coal mining dominates the coal basin (larger!cities.
The government have the following future plans for waste management within year 2000 [5| Build 2incineration plants with capacity of 600 ton/day each for MSW Build 10 composting plants with capacity of100 ton/day each. Implement source separation collecting systems in 20 communities Build 10 largeregional dumping sites and numerous communal dumping sites Build 3 regional neutralising plants withcapacity 20 ton/day each for hazardous waste. Organise 20 regional systems for neutralising of hospitalwaste. Build 10 installations to locate mining and waste from energy production m mining excavations (30million ton/year). Build installation for generating market gypsum from tlue gas desulfurisation products
Wa.sJe_ManagejTientjn_R.uraJ_AreasDue to the low coverage factor for collecting MSW (20-40%) and laige amount of illegal landfill
sites, waste should to a great extent be source separated and utilised at source in rural areas MSWgeneration in rural areas is 60 vol% less compared to small and larger cities The jj ir.position isdistinguished by a high content of inorganic materials and fines (0-10mm) and low content of food wastes,paper and plastics. The waste has a low heating value due to the low content of combustible matter (12weight%). therefore collection of rural MSW for combustion would be very expensive clue to severalfactors such as:
- Collecting distances - Small quantities- Processing - Poor quality of waste
A process scheme for a waste management system for rural areas is shown in figure 3 Sewage sludoe iscollected in a collecting tank and transported to small or larger cities for treatment MSW should be sourceseparated Glass which is one of the five main components of rural MSW is subjected I " recycling j n dshould be collected in a separate container Paper should be combusted at source for h;-ating purposesduring the cold period, which is the present common practice Otherwise paper could be collected in aseparate container for recycling Plant and animal origin food wastes and remaining organic wastes
-962-

according to table 1 should be composted at source. Many people in rural areas already compost organicwastes today, so this should be easy to implement. The rest fraction after utilisation of organic, glass andpaper wastes should be collected and landfilled.We have focused on making a simple realistic system which could be implemented without too muchefforts and investments put into a new waste management system.In rural areas agriculture could be looked upon as "industry" and a source separation of different wastesinto three different categories would be suitable. Plant origin wastes and food wastes should becomposted at source. Straw which today is burnt out in the fields should be utilised for energy production.The straw should be transported to small or larger cities for energy recovery, because it is not possible toutilise straw for energy recovery in an economic way in rural areas. There is presently a collaborator,between Poland and Denmark on utilisation of straw for energy recovery.
Higher population density and a larger fraction of combustible components makes small citiessuitable for a more integrated waste management system with source separation, recycling and RDF(Refuse Derived Fuel) production. RDF processing facilities will become more common in the futurebecause of the increasing interest in material recovery from waste. Figure 4 shows a proposed wastemanagement system for small cities. Sewage sludge from rural areas anrl smaller cities should be treatedat a biogas plant. The gas should be utilised for electricity and heat production and the rest fraction fromprocessing should be used as fertiliser. Small cities should soit out glass from MSW at source forrecycling. The rest should be handled at a RDF processing facility |8,9| In general the RDF processingfacilities processes the waste to a combustible fraction, wet organic fraction and a metal fraction |9j Thecombustible fraction could also include wet organic waste in order to increase the energy output from RDFand decrease the rest fraction from processing [10). The industry could also deliver pre-sortericombustible waste to the RDF processing facility and receive RDF fuel in return at a reasonable priceThis fuel could be used for co-combustion in already existing coal firing plants (fluidized bed, grate firing)The RDF fuel should be densified and classified to meet the requirements for use in co-combustion withcoal [11| RDF fuel is also suitable for combustion in a fluidized bed alone |12|. Fluff RDF could be usedfor grate firing or in a fluidized bed with the advantage of one processing step less (densifying). Thpresidue from combustion of RDF should be landfilled.
Metals sorted out from the RDF facility should be landfilled, but in the future recycling could be an optionWet organic waste if not utilised for combustion, should be compostedIndustrial waste should be source separated and the combustible fraction could either cover energy needswithout any upgrading or it could be sent to the RDF facility for upgrading. Residues from combustion ofcombustible fraction should be properly landfilled. The rest fraction from source separation of industrialwaste should also be landfilled.Hazardous waste should be taken care of with a special collecting system and transported to larger citiesfor treatment.Straw collected in rural areas should be utilised for energy production in special designed boilers for stra*combustion (low exit furnace temperatures) and the energy should be used for district heating.
Waste Management in Larger Cities, Urban Areas.The MSW composition in larger cities is characterised by a larger content of paper, plastics and
food wastes and a lower content of inorganic material than the case is for niral areas and small cities. Theheating value is higher due to the above mentioned factors. Industrial war.to in larger cities mostly consistof waste Irom coal and energy industry. Larger cities and urban areas in Poland are characterised b.many high-rise buildings which were built in 1970s and 1930s with limited possibilities for sourceseparation of MSW. Just one vertical tunnel per slairv/ay enables people to get rid of different kinds o'waste into one container. The high population density in these areas makes source separation of wastesand subsequent re-use, recycling and composting very difficult.Figure 4 shows a proposed waste management system for larger citiesSewage sludge from larger cities and rural areas is collected in tanks and then transposed to a Diogarproduction plant Sewage sludge together with green wastes are processed for biogas production. Thebiogas production is an anaerobic process which mainly produces methnne (50 05%; and carbon dioxide
-963-
A gas motor fuelled by biogas is driving an electricity generator and heat can also be recovered through aheat exchanger. The multifunctional system with a relatively simple technique and relative low investmenlcost for biogas production and utilisation serves the following advantages: energy productionimprovement of sanitation, control of erosion by recycling organic Tiatter into soil, degradation of toxiccomponents. The total conversion efficiency is between 20 and 40% Vol jme reduction for a biogas plantis between 65 to 90% [13,14].MSW in larger cities is not subjected to source separation but is transported directly to a RDF processingfacility. For utilisation of MSW for energy production one need pre-treatment due to the low effectiveheating value of raw MSW The RDF plant for larger cities should consist of grinding, sieving, magneticmetal separator and a ballistic separator. This system will increase the heating value of MSW by takingout metals, fines (mostly ashes) and the heavy fraction (glass, stones, remaining metals, ceramics, etc.)Heavy fraction and fines together with metals should be landfilled and RDF utilised for energy recoveryResidue from combustion should also be landfilled As pointed out in figure 5 energy from combustion ofRDF can be utilised in a steam turbine for electricity production witn an efficiency factor between 30 to33%, utilised in a combined heat and power plant one would have an efficiency factor between 50 to 60%For district heating one would typically have an efficiency factor around 80% To choose between thesedifferent methods one would have to take into consideration the energy infrastructure in the actual areaand future demands for energy. Figure 5 has marked with a dotted line that gasification of pre-treatedMSW as a high-technology process is an opportunity for the future The product gas from gasificationoffers a wide range of possibilities for utilisation: production of industrial heat or steam, gaseous fuel forgeneration of electric power, substitute gas for natural gas and as a synthesis gas for production of liquidfuels or chemicals. The advantage of gasification compared to direct combustion is a higher electricityproduction efficiency (up to 45%), if the power is generated in a combined cycle (gas turbine, steamturbine and generator). Since gasification is not a well developed process and have high investment costsand because of the relative low prices of other energy carriers, this will be a technique for thefuture[ 15,16).
Industrial waste should be treated as industrial waste in smaller cities is treated, with source separationand energy recovery, but here most of the waste is non-combustible and this is landfilled.Energy recovery from straw collected in rural areas is also a possibility for larger cities.Hazardous waste for larger cities should be collected and treated at treatment plant which meets theenvironmental standards for pollutants. One or two larger plants should be built located nearby the largestindustrial areas, where most of the producers of special/hazardous waste are situatedThere are several different treatment methods for hazardous waste; for instance chemical treatment,physical treatment, biological treatment, landfill and several different thermal destruction methods.Decision on which method or methods that should be used is dependent on: amounts and composition ofwaste, economy, politics, technical solutions and even feelings. Feelings are involved because no onewants to have a treatment plant for hazardous waste close to where they live and people want a methodthat is environmental friendly, so the public opinion have to be taken into consideration The Polishhazardous waste is mainly generated from hospitals and chemical industries and therefore there is a needfor both thermal treatment method for volume reduction and destruction/decomposing of toxic/infectedwaste and a need for a well controlled landfill site for non-organic hazardous waste. The most commonthermal destruction method for hazardous waste is combustion and this would be the most suitablemethod for Poland at this stage. In addition to combustion there is plasma pyrolysis, which decomposesthe waste at a very high temperature, 5000-12000 °C This technology is, however, new and still indevelopment [17]. The pyrolysis alternative is in figure 5 marked with a dotted line as possibility for thefuture.
5 ENERGY ESTIMATIONSPoland consumed 3950 PJ of primary energy in 1993 [18], the energy calculations will be
refereed to this figure.1 ton of average composition MSW [19,20] was used for the energy estimation:
C^ = 9,0 MJ / kg total amount of MSW was 8.2 million ton in 1993
-964-
Landfill Gas Production (LFG).
The period for LFG production in a typical landfill is between 25 and 30 years (taken t = 25).
G, = 183.6 ( 1 - 10" O 0 3 ' 2 5 ) = 151 m 3 / t o n (1)
C,= 18MJ/m3
E, = G, *C,: 25= 108,7 MJ / ton and 0.89 PJ/y (2)LFG production and utilisation is restricted by the following decreasing energy conversion factors [1]:
• only larger landfill sites can use gas extraction systems, it means that the share of landfill sitesthat can be used for LFG extraction and utilisation is 60 - 80% of total registered landfills
- approximately 50% of generated LFG can be extracted- utilisation method
The total energy conversion factor for LFG production and utilisation is between 2 - 5 %.
Biogas Production.Period for biogas production is between 10 and 30 days and average biogas yield is 145 m3 /ton.
Eb = 145 • Cb = 3234 MJ / ton and 26,6 PJ/y (3)
Biogas production is characterised by energy conversion efficiency between 25 - 60% depending onfeedstock The total energy conversion factor for biogas production and utilisation is between 12 - 54%.
RDF Production.Two different methods for RDF production [19] are used for energy estimations:
a) RDF production without food wastes in combustible fraction. Mass reduction is 21%, which gives us210 kg of RDF from one ton of waste.
Cpa= 16,5 MJ/ kg
Ep = 210 ' Cpa = 3465 MJ / ton and 28,4 PJ/y (4)
b) RDF production including food wastes in combustible fraction. Mass reduction is 58%, which gives us580 kg of RDF from one ton of waste.
Cpb= 12,6 MJ/kg
Ep = 580 * Cpb = 7308 MJ / ton and 59,9 PJ/y (5)
RDF production is characterised by conversion efficiency between 40-80% depending on method andfeed-stock The total energy conversion factor for RDF production and utilisation is between 22- 64%
Straw for Energy Purposes.Straw can be regarded both as biomass and as waste from agriculture production. In Poland it is
mostly considered as waste For combustion of straw one should use special constructed boilers withlarge combustion chambers and heating area to avoid high temperature corrosion because of the highcontent of alkalies The feeding system should be adapted for burning straw in ballots and a gas cleaningsystem should be implemented. Energy recovery from straw would also give a net reduction of pollutantsThe straw production in Poland was 14 million ton in 1994 [21].
-965-

Cs = 14,3 M J / k g
E s = 14 ' C , = 2 0 0 PJ/y (6)
Utilisation. Methods,Different utilisation methods are shown in figure 5, each of these methods are characterised by
different efficiency factors, so the final energy amount can be different depending on the method used.The preliminary assessments were carried out in reference to the total energy contained in wastes, whichwill not be achieved since the conversion efficiency is lower than 100%, in some cases much lower Themost common utilisation methods for energy recovery from waste, as mentioned above, are1 Combust ion of gaseous fuels in a gas boilers with relatively high combust ion efficiency for heatproduction up to 95%.2. Fuelling (gaseous fuels) of gas engines to produce mechanical / electrical energy and heat with totalefficiencies between 50 - 70%.3 Combust ion of solid fuels (RDF, straw, RDF mixed with coal or wood) in moving grate furnaces toproduce hot water for district heating purposes with efficiency about 80%,4 Combustion of solid fuels (RDF, straw, RDF mixed with coal or wood) in moving grate furnaces orfluidized bed furnaces to generate heat, process steam and electricity with efficiencies between 55 - 7 0 %If sum up the energy in wastes (2)+(6) or (3)+(6) or (4)+(6) or (5)+(6), the average calculated energy inwastes will be 228,9 PJ/y and 28,9 PJ/y (without straw) Multiplied with an average conversion factor of30% for MSW and add 200 PJ/y for straw multiplied with an conversion factor of 8 0 % the result is 168.7PJ.'y. This is 4 ,3% of the primary energy consumption in Poland, The calculated energy in M S W usingdifferent methods and an efficiency factor of 30% is 8,67 PJ/y, in comparison to only LFG production andutilisation which gives 0,03 PJ/y
6. CONCLUSIONSPoland have a good opportunity to control the development of annual per capita generation of
MSW and preserve the present low level if proper waste management systems are implemented Due tothe large variations in properties for Polish MSW and an expected growth in the standard of living, it isimportant to handle waste management carefully Different and more integrated waste managementsystems for the future for both industrial and municipal waste are suggested for rural areas, smaller citiesand larger cities
7. NOMENCLATURECb biogas calorific value, Eb calculated energy in biogas,C, LFG calorific value. E, calculated energy in LFG.Cpa „ RDF calorific value, Ep calculated energy in pellets,Cs straw calorific value, Es calculated energy in straw,Cwh higher waste calorific value. G, LFG yield (t - yielding time),
8. A C K N O W L E D G E M E N T SThe authors would like to thank the Norwegian Foreign Department (East-Europe Secretariat) for
funding of this work.
REFERENCES1. The Energy Potential of Landfill Sites in Poland, Thermie Programme Action BM 25/Dec. 19942 PRISM, World Resource Foundation, Information sheet on waste minimisation, 19963 EPA Waste Characterisation Report, Franklin A s s o c , 19944 Waste Statistics, Municipal Waste 1992, Official Statistics of Norway, 19945. Waste Management and Treatment, Strategies and Methods, International Symposium
proceedings, April 26-28, 1995, Miedzyzdroje, Poland6. Szymanski K : Gospodarka I Unieszkodliwianie Odpadow Komunalnych, Koszalm 19947. Warmer Bulletin No 48/1996. p. 38. Rosvold H.: Fab fra Djupvik Behandlingsanlegg, Analyse, Produksion og Bruk, SINTEF Report
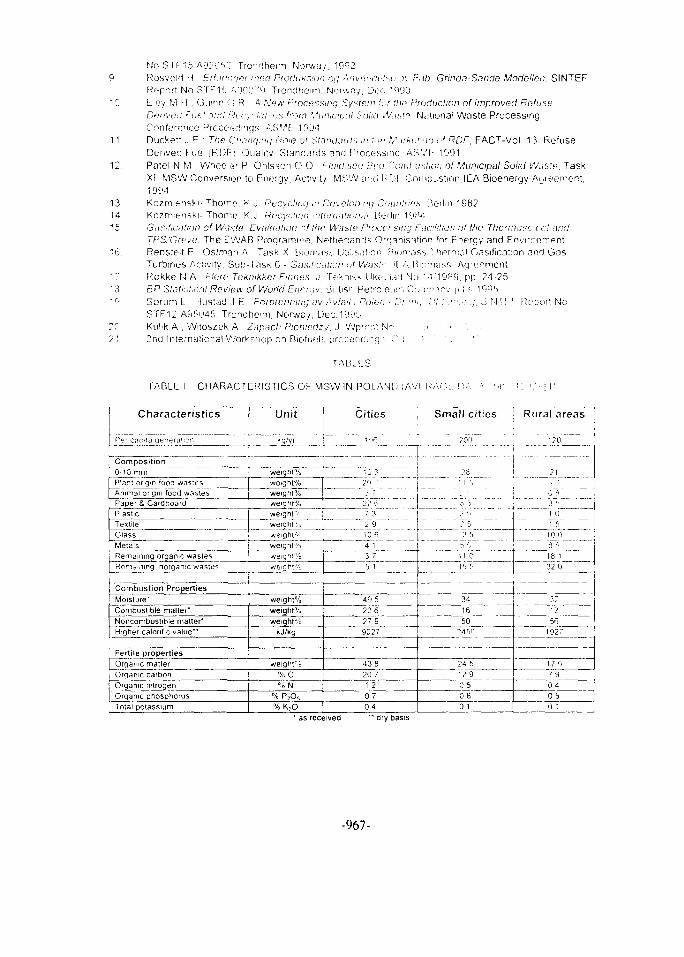
No STF15 A9?C^.'.', Tran^heim. Norway, 1992
9 Rosvolri H Erfarnuiryr mod Produks'on oq A.'ivtvx't-.Sr .-n- Fab Gnndn-Sande Modellen. SINTEF
He-port No STf:1'j APC07cJ Trondheim, Norway, Doc '990
10 Eley M H , Gmnn (.; R 4 /YVw Processing System for !he Production of Improved Refuse
De'ii'i.1!:' ri:f,'l O:K! Rfcyi.Linlns from Municipal Solid Waste National Waste Processing
Conference Proceedings ASMF 199-1
11 Duckett J E The Changim; Role of Standards in Hit* Mai^rtmu U! RDF, FACT-Vo l 13 Refuse
Derived Fuel (RDF* Quality. Standards and Processing ASML- 1991
12 Patel N M , Wheeler P Ohlsson O O Flwdised Bud ComhuKtion of Municipal Solid Waste, Task
XI MSW Conversion to Energy, Activity MSW acci RDF Combustion,IEA Bioenergy Ayieement
199413 Kozmienftki- Tho'Tie K J Recycling in Developing C'Hinlnrts Beilm 19B2
14 Kozrnienski- Thome K.J Rocyc.tino !ntorn;i!n>n<!> Be'lin 19R4
15 Gasification of Waste Evaluation of the Waste Processing Facilities of the Thcnriosdcc! and
TPS/Greve The EWAB Programme!. Netherlanrls Organisation fnr Fnergy and Environment
'6 Renstelt E , Oslman A Task X Bionias!-.. Utilisation, Rmmass Thermal Gasification and Gas
Turbines Activity, Sub-TasK 6 - Gasification of Was!" if-ARiomass Agreement
17 Rokke N A Flare Tcknikkcr Ftnnes J Tekni-ik UkeL KJI] NO 14/1989, p\i ?4-25
13 BP Statistical Review of World Enrrtiv. Bntisn Petro leum & ; i i T i r v p i • 1GC'(i
1 r ' S o r u m L Hustad J E Foibrenning av Avfall i Po/en - Di '<>•<; t'i ! : I " i « 1 ' . ; , o ' M l i i F?r-porl No
STF12 A95'J45, Trondhe im, Nonway, Dec 199d
20 Kulik A , Wi toszek A Zapach Picnicdzy. J Wpro-"! N-- ' • • . ' ' • ; . •
21 2nd Internal icna! Workshop en Biofueis proceccf',n<], G ; •• ' I ,
T A B L E S
TABLE I C H A R A C T E R I S T I C S OF M S W IN P O L A N D (AVI RAGE HA f •'• 1'pt" '•: '.'.• ; i [
Characteristics
Per capita qetierai^od
Composition0-10 mmPlant origin food wastesAnimal origin food wastesPaper & CardboardPlasticTextileGlassMetalsRemaining organic wastesRemaining inorganic wastes
Combustion PropertiesMoisture"Combustible malter*Noncombustible matter*Higher calorific value**
Fertile propertiesOrqamc matterOrganic carbonOrganic nitrogenOrganic phosphorusTotal potassium
r Unit
kg Ayr
wetght%
weight%
weight %
weight%
weigh t%
weight1:^
weight%
weigh|%
weight%
weight%
weight%weighi%weight%
kJ/kg
weight0'*)% C% N
% P?O5
% K;O' as received
Cities
i < >• '
Tj 3
?:• 6
2 91064 13 75 1
49 522 62799027
43 820.71 20704" dry basis
Small cities
: i r-,
r i '•'-'
? *"'
? 5
" "lav
11 0
1 5 b
341650
?4 50
24 512 90 50 60 1
Rural areas
'?0
? i
0 B
3 '!
1015
' "• foTf -3 5
18 1 j" 32 0 ]
321256
1927
17 5
790 40 5
0 1
-967-
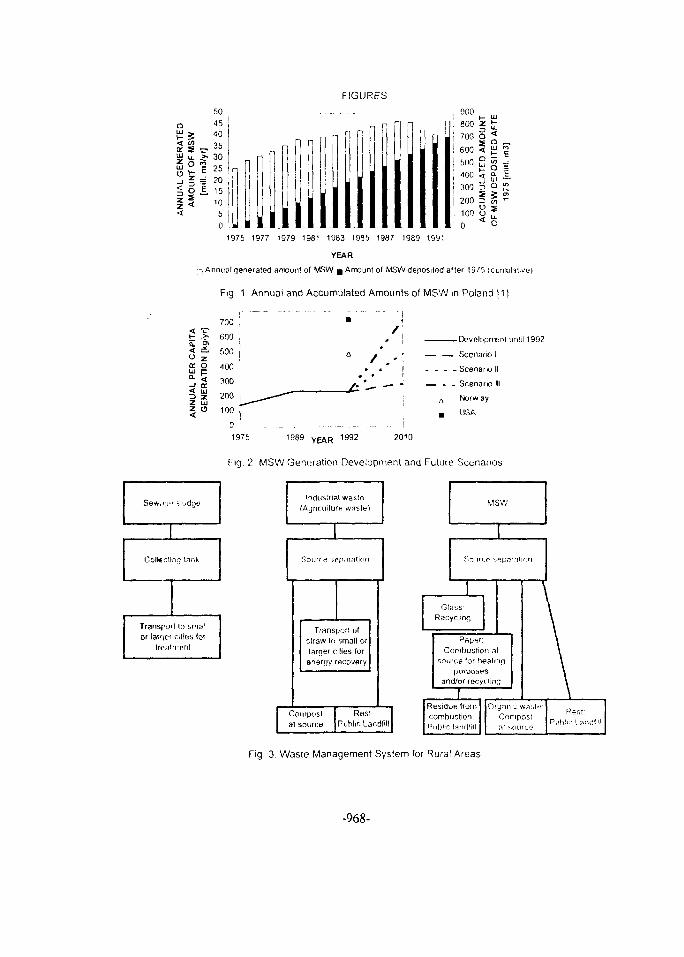
FIGURES000
eoo z700 O
600 <MO S100:ioo r>
200 Iu100 O0 "*
t E
S!U J * - •a jo
1977 1979 1981 1963 1985 1937 1989 1991
YEAR
; j Annual generated amount of MSW g Amount of MSW deposited after 1975 (cunxjI
Fig 1 Annual and Accumulated Amounts of MSW in Poland | 1 |
-Development until 1992
__ Scenario I
- - Scenario It
- - Scenario III
A Norway
• USA
1989 YEAR 1 9 9 2 2010
Fig 2 MSW Generation Development and Future Scenarios
nq tank
Transport to smallor larr5Cf oties lor
Industrial waste(AyrieuiturH w-isM
Trnnsport ufdraw to small orlarger cilies for
anerr/y rHCov^ry
Contpostat source
Restblir. Landfill
MSW
Source s**pnrnl
1Recycling
Combustion nsource for healing
purposesand/or recycling
iResidue fromcombustion:P iblrc lnndfiit
r,n
\
\
\
\
\
\
\
Organic wa*;l*Compost:\\ soitrco
Pvihlir. L nnrff.tl
Fig 3. Waste Management System for Rural Areas
-968-
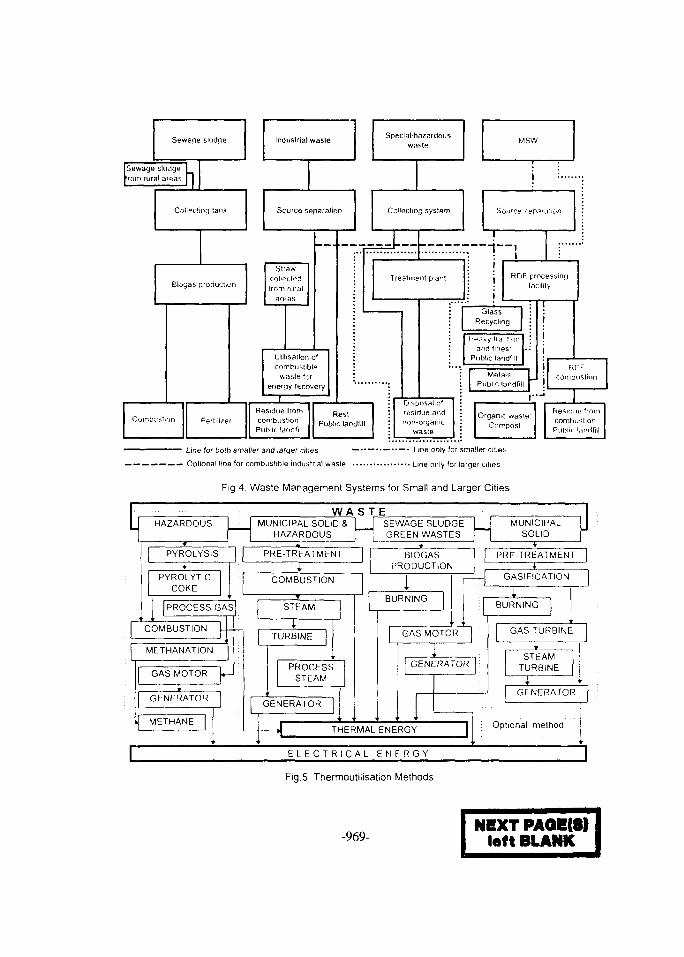
Sewape sludne
Sewage kludgefrom rural areas
Collectinc} tank
Bbyas production
Combustion
Industrial wasle
Source separalion
Strawcollectedfrom rural
Ulilisallon of
waste forenergy recovery
Residue Iromcombust'on:Public landfill
Rest:Public landfill
——^~-"~~ Line for bo!h smaller and larger cilies
Optional line for combustible industrial waste
Special hazardouswaste
Collecling system
Treatment plant
Disposal ofresidue andnon-organic
waste
Source separation
RDF processingfacility
Glass.Recycling
l-^.ivy fra:.tiufant! fines:
Public landfill
MetalsPublic landfill
combustion
r-Organic waste:
Compost.
Residue fromcombustionPubiir i.indfiil
• Line only for smaller cities
• Line only for larger cilies
Fig 4 Waste Management Systems for Small and Larger Cities
HAZARDOUSWASTE
PYROLYSIS
PYROLYTICCOKE
PROCESS GAS
COMBUSTION
METHANATION
GAS MOTOR
GENERATOR
METHANE
MUNICIPAL SOLID &HAZARDOUS
SEWAGE SLUDGEGREEN WASTES
PRE-TREATMENT
COMBUSTION
STEAM
TURBINE
PROCESSSTEAM
GENERATOR
BIOGASPRODUCTION
BURNING
GAS MOTOR
GENERATOR
THERMAL ENERGY
MUNICIPALSOLID
| PRE-TREATMENT
J GASIFICATION
BURNING
GAS TURBINE
STEAM
TURBINE
GENERATOR
Optional method
E L E C T R I C A L E N E R G Y
Fig.5. Thermoutilisation Methods
-969-NEXTPA0E(8)
left BLANK
Proceedings of the Fifth International Conferenceon Energy and Environment, Cairo, Egypt, 1996
Production Of Ethanol From Celluloslc WastesS.A. EL-NAWAWI, A. ABD-EL KADER
National lies earth Center.
ABSTRACT
Ethanol- alkali pulping was used as a pretreatment method of wheat straw Tor itssubsequent sncchniificntion by Trichoderma virdi ceUnlose. The basic hyoirolysisparameters, i.e., reaction time, pH, temperature, and enzyme and substrate concentration,were optimized lo maximize sugar yields from clhanol-alkali modified straw. Thus, a 85%conversion of 4% straw malciial to sugar syrup was reached in 48 h using 40 filter paperunits /g hyilrolyzed sul>strale. The Pretreated wheat straw was then fermented to ethanolat 40 c in the simultaneous sacchaiification and fermentation (SSF) process using T.virdic ell ill as e and Khtyvcromyces fiagilis cells. From 8% (w/v) of chemically treated straw (drymatter). 2.6% (w/v) ethanol was obtained after 48 h. When the T. Virdi cellulase systemwas supplemented with B-glucosidase from Aspergillns niger, the ethanol yield in the SSFprocess increased lo 3.2% (w/v) and the reaction time was shortened to 24 h.
INTRODUCTION
With the increasing shortage of petroleum reserves, agricultural residues have beenrecognized as promising alternative resources to supply our chemical and energy needs [1-8]. One way of using these readily available materials is to hydrolyze them enzymnticallyinto reducing sugars. In turn, these sugars can be used as substrates to produce single cellprotein or fcuuentiUlon chemicals.
In the saccharificnlion process of cellulose it is essential that a high sugar yield per enzymeunit is obtained. Many factors affect this yield, including pretreatment, inhibition ofenzyme action by heat or by the degradation products, enzyme and substrateconcentrations, adsorption of ccllulase to cellulose, speed of enzyme action, and degree ofagitation. Thus optimization of hydrolysis conditions plays a significant role in the economyof the sacchaiificntion process.The direct conversion of cellulose to ethanol has been reported in which thesflfchnrificnllon and fermentation were combined into a one-step operation. This wasachieved by the simultaneous sacchaiification and fermentation (SSF) process [9-14].In the SSF system, the glucose concentration was maintained at a low Level through rapidassimilation by elhnnol-prodticing microbes. Product inhibition caused by cellobiose andglucose was replaced by the less Inhibitory ethanol.[15-19].The alleviation of the endproduct inhibition in the SSF process resulted in an increase of conversion of cellulose toethanol by 10 to 30% compared to separate process of saccharification and fermentation[20-23].The purpose of these Investigations was to find the best operating conditions for theeffective enzymatic hydrolysis of pretreated wheat straw, and to test the ethanolproduction efficiency of K.Frngilis in an SSF-type system using Ttiichoderma virdicellulase.
-971-
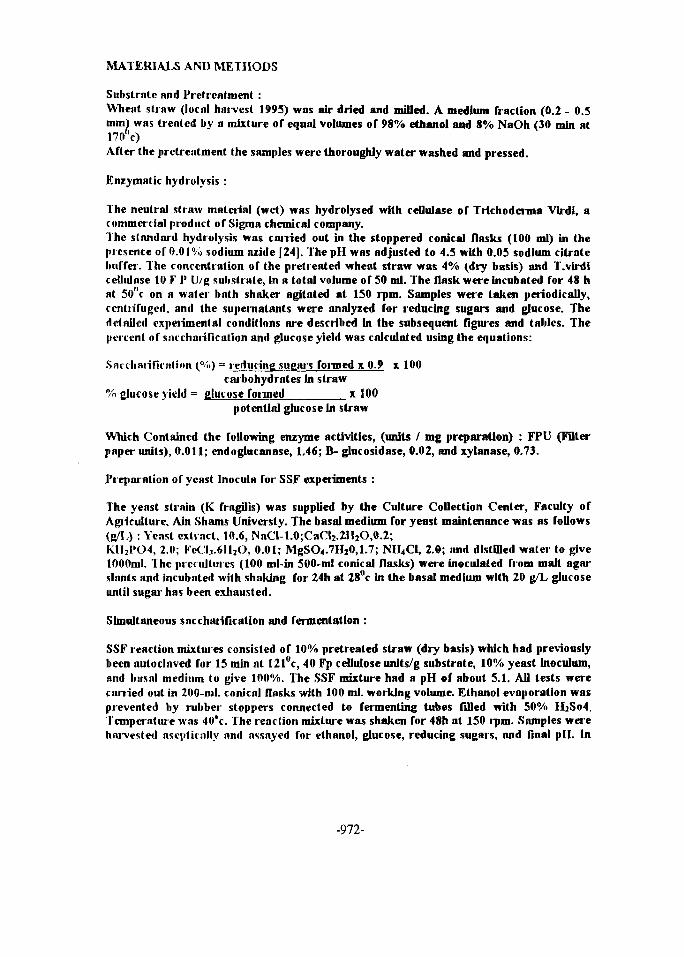
MATERIALS AND METHODS
Substrate and Presentment:Wheat straw (local harvest 1995) was air dried and milled. A medium fraction (0.2 - 0.5mm) was treated by a mixture of equal volumes of 98% eUianoI and 8% NaOh (30 min at170° c)After the presentment the samples were thoroughly water washed and pressed.
Enzymatic hydrolysis :
The neutral straw material (wet) was hydrolysed with ceflulase of Trichoderma Vlrdl, acommercial product of Sigma chemical company.The standard hydrolysis was carried out in the stoppered conical flasks (100 ml) in thepresence of 0.01% sodium azide [24]. ThepH was adjusted to 4.5 with 0.05 sodium citratebuffer. The concentration of the pretreated wheat straw was 4% (dry basis) and T.virdicellulose 10 F P U/g substrate, in a total volume of 50 ml. The flask were incubated for 48 hat 50nc on a water bath shaker agitated at 150 rpm. Samples were taken periodically,ccntiifugcd, and the superaatants were analyzed for reducing sugars and glucose. Thedetailed experimental conditions me described in the subsequent figures and tables. Thepercent of sacchaiification and glucose yield was calculated using the equations:
Sai'clinrificiition (%) = i'educing sugars fanned x 0.9 x 100carbohydrates In straw
% glucose yield = glucose formed x 100potential glucose In straw
Which Contained the following enzyme activities, (units / mg preparation) : FPU (Filterpaper units), 0.011; cndoglucanase, 1.46; B- glucosidase, 0.02, and xylanase, 0.73.
Preparation of yeast Inocula for SSF experiments :
The yeast strain (K ft ngilis) was supplied by the Culture Collection Center, Faculty ofAgriculture, Ain Shams Universty. The basal medium for yeast maintenance was as follows(g/L) : Yeast extinct, 10.6, NaCl-1.0;CaCI2.2H2O,0.2;KI12PO4, 2.0; Fc(.'b.6II2O, 0.01; MgSO4.7Hj0,1.7; NII4CI, 2.0; and distilled water to give1000ml. The prei ultin es (100 ml-in 500-ml conical flasks) were inoculated from malt agarslants and incubated with shaking for 24h at 28°c In the basal medium with 20 g/L glucoseuntil sugar has been exhausted.
Simultaneous sacchaiification and fermentation :
SSF reaction mixtures consisted of 10% pretreated straw (dry basis) which had previouslybeen autoclaved for 15 min nt 121°c, 40 Fp cellulose unlts/g substrate, 10% yeast Inoculum,and basnl medium to give 100%. The SSF mixture had a pH of about 5.1. All tests werecarried out in 200-nil. conical flasks with 100 ml. working volume. Elhanol evaporation wasprevented by rubber stoppers connected to fermenting tubes filled with 50% HaSo4.Temperature was 40*c. The reaction mixture was shaken for 48h at 150 rpm. Samples wereharvested ascptically nnd assayed for ethanol, glucose, reducing sugars, and final pll. In
-972-
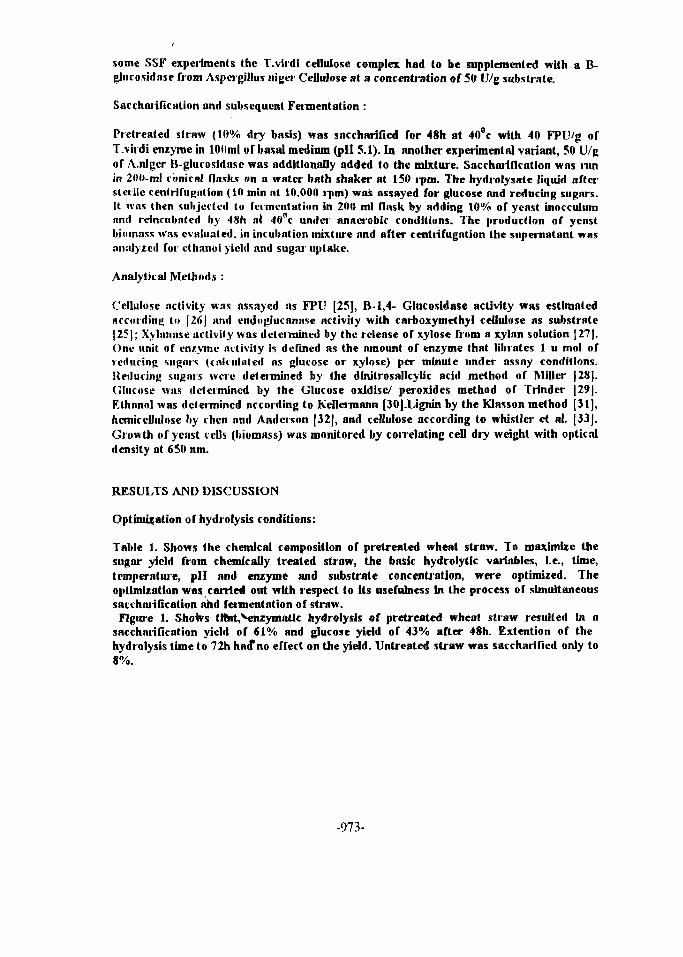
some SSF experiments the T.virdi cellulose complex had to be supplemented with a B-glucosidase from Aspergillus niger Cellulose at a concentration of 50 V/g substrate.
Sacchaiificalion and subsequent Fermentation :
Prctreated straw (10% dry basis) was saccharified for 48h at 40°c with 40 FPU/g ofT.viidi enzyme in KNlml of basal medium (pll 5.1). In another experimental variant, 50 U/gor A.nlger R-glucosldasc was additionally added to the mixture. Sacchariflratlon was runin 200-ml conical Dusks on a water bath shaker at 150 rpm. The hydiolysate liquid aftersterile centrifugation (10 min nt 10,000 rpm) was assayed for glucose and reducing sugars.It was then subjected to fermenta(ion in 200 ml flask by adding 10% of yeast inocculumnnd reinriibnteri by 48h nl 40nc under anaerobic conditions. The production of yeastliitimass Was evaluated, in incubation mixture and after centiifugation the supernatant wasanalyzed for ethnnol yield and sugar uptake.
Analytical Methods :
Cellulose activity was assayed as FPU [25], B-1,4- Glncosidase activity was estimatedaccording to [26] and endoglucanase activity with carboxymethyl cellulose as substrate[25]; Xylannse activity was delciinined by the release of xylose from a xylnn solution [27].One unit of enzyme activity is defined as the amount of enzyme that librates 1 u mol ofreducing sitgms (mlt ulsiteci as glucose or xylose) per minute under assay conditions.Reducing sugars were determined by the dinitrosalicylic add method of Miller [28).Glucose was determined by the Glucose oxidise/ peroxides method of Trinder [29J.Ethnnol was determined according to Kellermann [30].Lignin by the Klasson method [31],hcmicclliilose liy then and Anderson [32J, and cellulose according to whistler et al. [33].Growth of yeast cells (biomass) was monitored by con elating cell dry weight with opticaldensity at 650 nm.
RESULTS AND DISCUSSION
Optimisation of hydrolysis conditions:
Table 1. Shows the chemical composition of pretreated wheat straw. To maximize thesugar yield from chemically treated straw, the basic hydrolytic variables, I.e., time,temperature, pll and enzyme and substrate concentration, were optimized. Theoptimization was carried out with respect to Its usefulness In the process of simultaneoussacchaiificalion and fermentation of straw.Figure 1. Shows tlnU,veiizymaUc hydrolysis of pretrcated wheat straw resulted In a
snecharification yield of 61% and glucose yield of 43% after 48h. Extention of thehydrolysis time to 72h had*no effect on the yield. Untreated straw was saccharified only to8%.
-973-
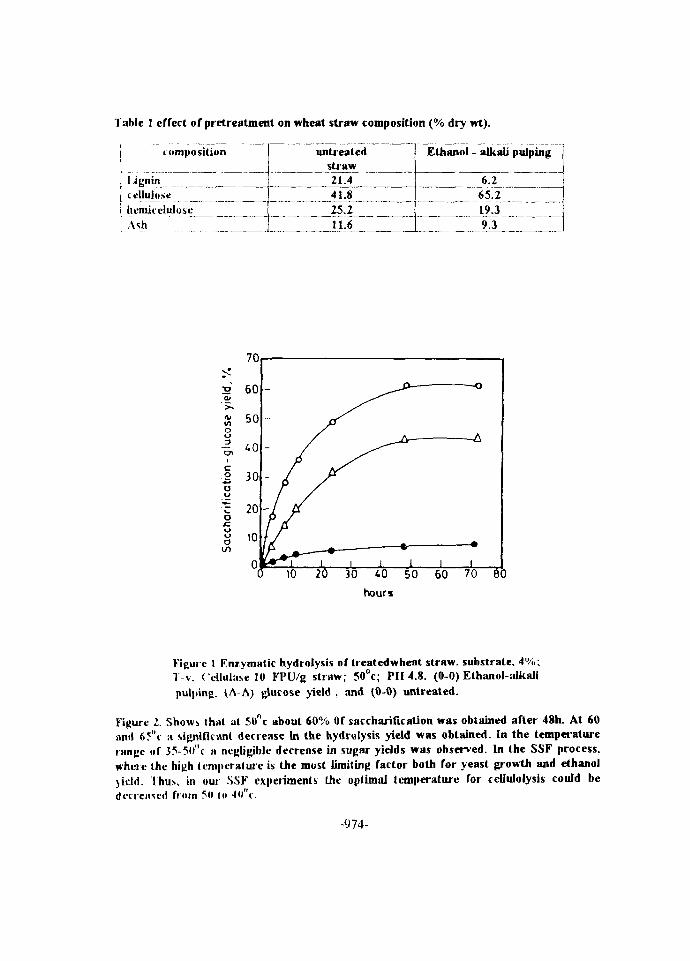
Table 1 effect of pretreatment on wheat straw composition (% dry wt).
composition
UgnincellulosehcmheluloSL-Ash
untreatedstraw21.441.825.211.6
Ethanol - alkali pulping
6.265.219.39.3
hours
Figure 1 Enzymatic hydrolysis of treated wheat straw, substrate, 4%;T v. (cllulasc 10 FPU/g straw; 50°c; PII 4.8. (0-0) Ethanol-alkalipulping, (A-A) glucose yield , and (0-0) untreated.
Figure 2. Shows that at 50°c about 60% Of saccharification was obtained after 48h. At 60and 6?"c a significant decrease in the hydrolysis yield was obtained. In the temperaturerange of 35-?ll"c a negligible decrease in sugar yields was observed. In the SSF process,where the high temperature is the most limiting factor both for yeast growth and ethanoljicld. Thus, in our SSF experiments the optimal temperature for ceUuIolysis could bedecreased from 511 lo 4O1 c.
-974-
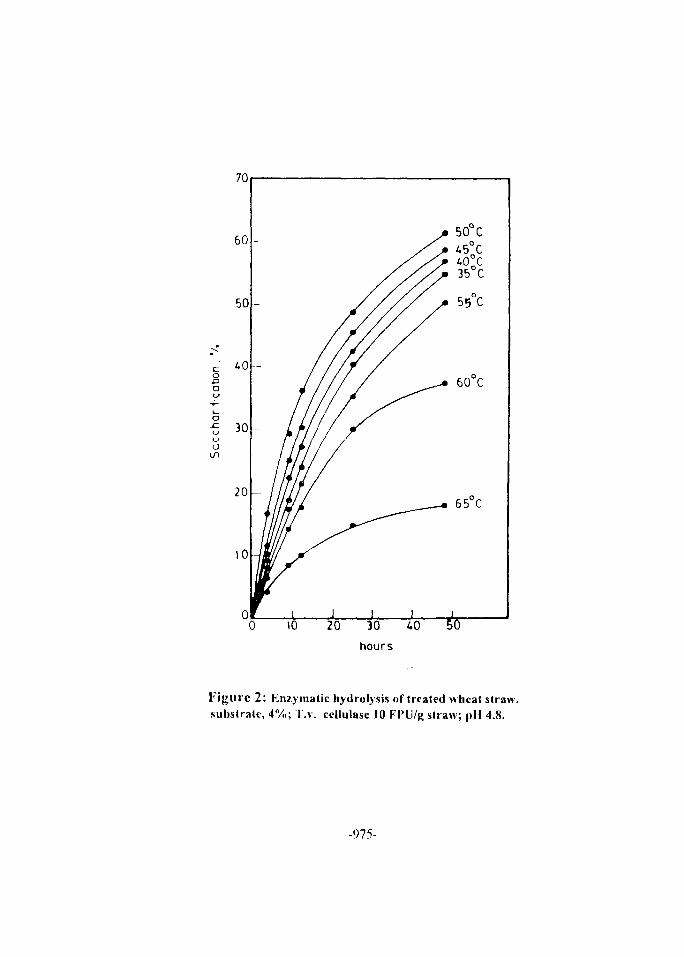
co
o
10 20 30
hours
Figure 2: Enzymatic hydrolysis of treated wheat straw,substrate, 4%; T.v. ccllulase 10 FPU/g straw; p l l 4.8.
-975-
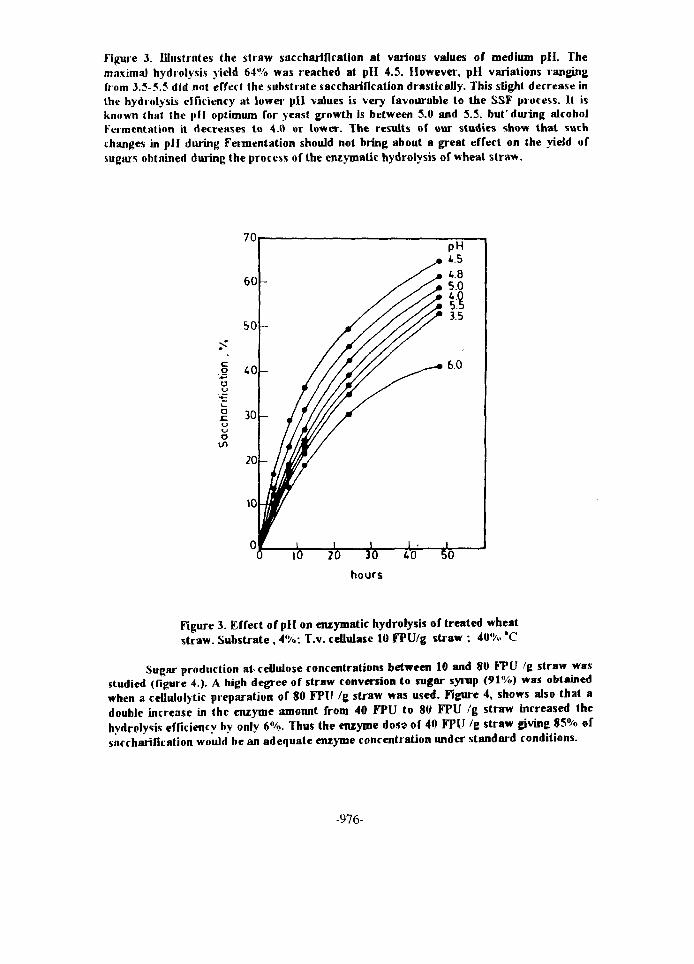
Figure 3. Illustrates the straw saccharification at various values of medium pll. Themaximal hydrolysis yield 64% was reached at pH 4.5. However, pH variations rangingfrom 3.5-5.5 did not effect the substrate saccharificatlon drastically. This slight decrease inthe hydrolysis efficiency at lower pll values is very favourable to the SSF process. It isknown that the pH optimum for yeasl growth is between 5.0 and 5.5. but'during alcoholFermentation it decreases to 4.0 or lower. The results of our studies show that suchchanges in pi I during Fermentation should not bring about a great effect on the yield ofsugars obtained during the process of the enzymatic hydrolysis of wheat straw.
I
o
o
10
40 50
hours
Figure 3. Effect of pH on enzymatic hydrolysis of treated wheatstraw. Substrate , 4%: T.v. ceUulase 10 FPU/g straw ; 40% 'C
Sugar production at cellulose concentrations between 10 and 80 FPU g straw wasstudied (figure 4.). A high degree of straw conversion to sugar syrup (91%) was obtainedwhen a ccllulolytic preparation of 80 FPU /g straw was used. Figure 4, shows also that adouble increase in the enzyme amount from 40 FPU to 80 FPU /g straw increased thehydrolysis efficiency by only 6%. Thus the enzyme doss of 40 FPU /g straw giving 85% ofsnecharification would be an adequate enzyme concentration under standard conditions.
-976-
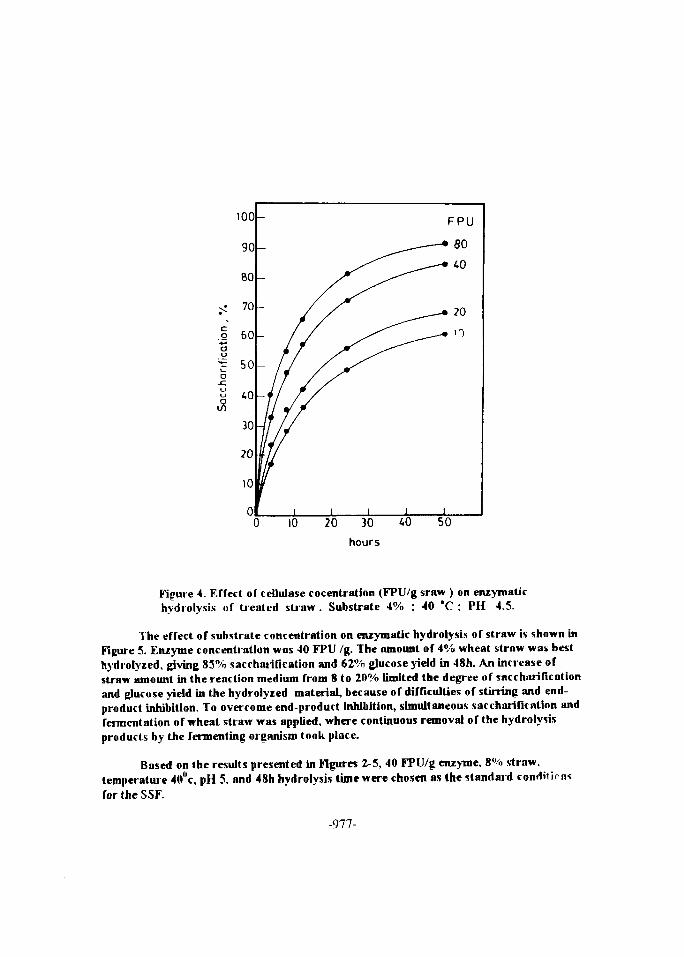
Figure 4. Effect of ceiiulase cocentration (FPU/g sraw ) on enzymatichydrolysis of treated straw . Substrate 4% ; 40 "C ; PH 4.5.
The effect of substrate concentration on enzymatic hydrolysis of straw is shown inFigure 5. Enzyme concentration was 40 FPU /g. The amount of 4% wheat straw was besthydi olyzed, giving 83% sacchaiification and 62% glucose yield in 48h. An increase ofstraw amount in the reaction medium from 8 to 20% limited the degree of saccharificationand glucose yield in the hydrolyzed material, because of difficulties of stirring and end-product inhibition. To overcome end-product inhibition, simultaneous saccharification andfermentation of wheat straw was applied, where continuous removal of the hydrolysisproducts by the fermenting organism took place.
Based on the results presented in Figures 2-5, 40 FPU/g enzyme. 8% straw,temperature 40°c, pH 5, and 48h hydrolysis time were chosen as the standard Hfor the SSF.
-977-
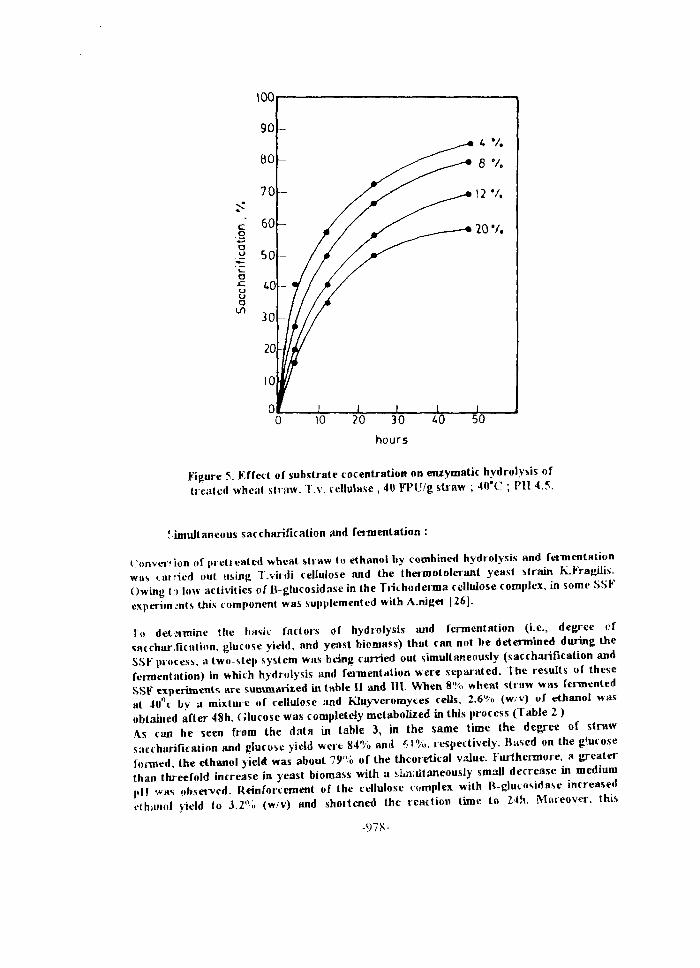
Figure 5. Effect of substrate cocentration on enzymatic hydrolysis oftreated wheat straw. T.v. cellulasc , 40 Fl'U/g straw ; 40*C ; PH 4.5.
! imullaneous saccharification and feimentation :
( onvetion of pielrealed wheat straw to ethanol by combined hydrolysis and fermentationwav cat lied out using T.vhdi ceUulose and the thennotolerant yeast strain k-Fragilis.Owing t:> low activities of ll-glucosidasc in the Trichoderma cellulose complex, in some SSFexperiments this component was supplemented with A.niget |26J.
To determine the bask factors or hydrolysis and fermentation (i.e., degree cfsacchar fication. glucose yield, and yeast biomass) that can not be determined during theSSF process a two step system was being carried out simultaneously (saccharification andfermentation) in which hydrolysis and fomentation were separated. The results or theseSSF experiments are summarired in table U and III. When 8% wheat straw was fennentedat 4U°c by a mixture of cellulose and Wuyveromytes cells, 2.6% (w/v) of ethanol wasobtained after 48h. Glucose was completely metabolized in this process (Table 2 )\ s can he seen from the dnta in table 3, in the same time the degree of strawsaccharification and glucose yield were 84% and fit%, respectively. Based on the glucoseformed the ethanol yield was about 79% of the theoretical value. Furthermore, a greaterthan threefold increase in yeast biomass with a si^iitaneously small decrease ui medium•.I! was observed. Reinforcement of the cellulose complex with B-0uc<.si<iase increasedethiuiol yield lo 3.2% (w/v) and shortened the reaction time to 2ih. Moreover, tins
-97 S-
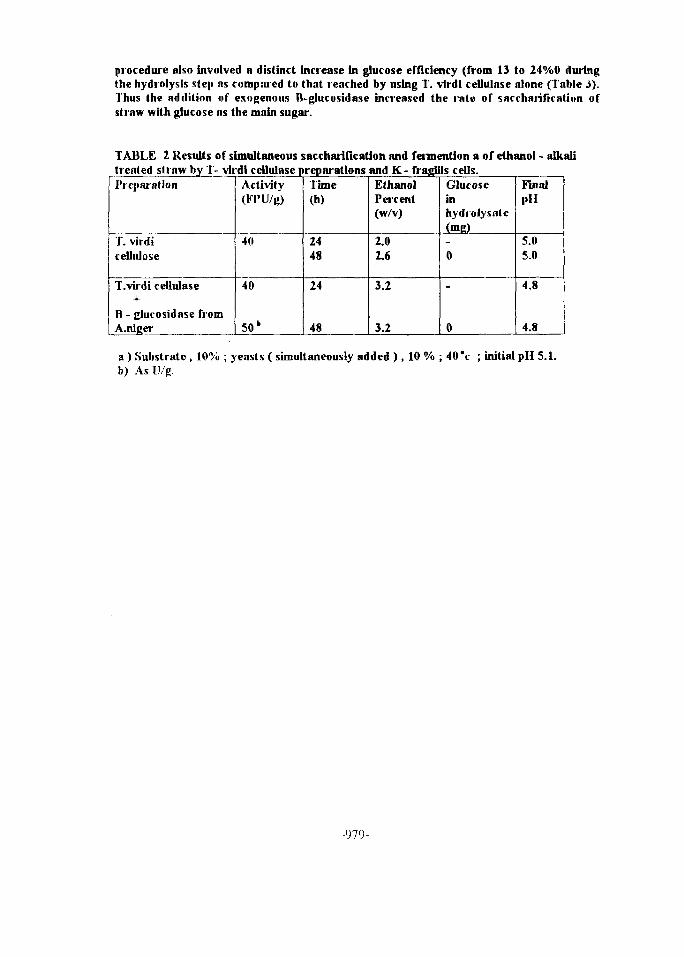
procedure also involved a distinct increase in glucose efficiency (from 13 to 24%0 duringthe hydrolysis step as compared to that reached by using T. \irdl cellulase alone (Table 3).Thus the ndditinn of exogenous R-glucosidase increased the rale of sacchatification ofstraw with glucose as the main sugar.
TABLE 2 Results of simultaneous saccharification and fermention a of ethanol - alkalitreated straw by T- vlrdi ceilulase preparations and K- fragUls cells.Preparation
T. virdicellulose
T.virdi cellulase+
B - glucosidase fromA.niger
Activity(Fl'U/g)
40
40
50k
Time(h)
2448
24
48
EthanolPei cent(w/v)
2.02.6
3.2
3.2
Glucoseinhydrolysntc(niE)
0
0
FinalPII
5.05.0
4.8
4.8
a ) Substrate , 10% ; yeasts ( simultaneously added ) , 10 % ; 40'c ; initial pH 5.1.b) As U/g.
-979-
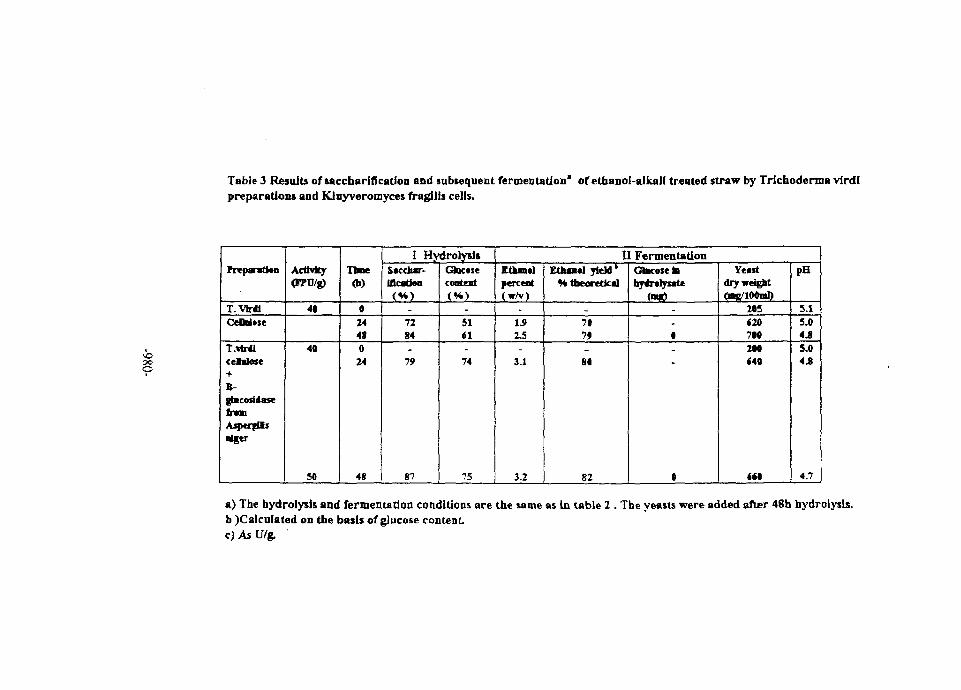
Table 3 Results of saccharification and subsequent fermentation* of etbanol-alkali treated straw by Trichodenna virdipreparations and Klnyveromyces fragilis cells.
00
o
Preparation
T. VirdiCeOoitse
T.vtrdicdhdose
B-gntcosidasetmn
Dlger
Activity<RPU/g)
4«
4«
50
Tine(h)
0244*024
48
I HydrolysisSacdiar-fficatfen<*)
-7284
79
87
Gtactseconteat(H)
-$141
74
75
II FermentationEtkantlpercent(w/v)
-
15
3.1
3.2
•* theoretical
_
7»
81
82
Giacosetataydi tly&ate
-
Yeastdrywei^t
2*5<207M2tO•40
«<0
pH
5.15.04.85.04.8
4.7
a) The hydrolysis and fermentation conditions are the same as In table 2 . The yeasts were added after 48h hydrolysis.b )Calculated on the basis of glucose contentc)AsU/g.
The presented results show the good compatibility of KFragllis cells with T.virdi cellulase.1 he fetmenUng yeasts at 40°c tolerated the enzyme concentration of 40 FPU in reactionmedium and had a considerable tolerance to ethanol under such condition. The use in ourSSF experiments of theimotolerant yeast strain fermenting sugars under ceUuloIyticconditions enabled us to obtain a relatively high production efficiency of ethanol fromwheat straw in a short time. For example, Arai et al. [34], testing the ethanol productionefficiency of Sacchoromyces cerevisiae in an SSF-type system using Aspergillus aculeatusand Tiichoderma viidi cellulases and xylose isomerase preparation, obtained 11.1-11.5%of ethanol from 25% alkali-treated rice straw. However, at 30°c they reached this effectonly after 5-8 days of fermentation. Also, Saddler et al. [35], based on Trichoderraacclliilnse and zymomonns mobilis or S. Cerevisiae cells in combined hydrolysis andfermentation obtained, after 6 days at 37°c, 2% (w/v) of ethanol from 5% Solca floe orsteam-exploded wood. It should be noted that al 45° c the yield of ethanol was 0.33% and asignificant proportion of glucose remained unmetabolized.
CONCLUSION
Based on the above results, It Is abvious that Finding a more thermotolerant organism can• educe the cost of ethanol from cellulose and is an important step in mastering the SSFprocess. On (he other hand, an organism fermenting at high temperatures should have ahigh tolerance to cellulose and ethanol. It can be stated that the yeast strain K-fragilis,tested in the SSF system, fulfills this function well and this Is promising in its widerutilization in conversion of cellulose to ethanol.
References :
1. M. R. LadiRch & .!. A. Svartzkopf, Ethanol production and the cost of fermentableSugars from Biomass, Diorcsource, Technology, 36, 83-95 (1991).
2. VV. Worth)', Ijgnocelmloses promise unproved products for materials industries,Chem.Eng. News, 86 (3), 19 (1990).
3. LA'aliandcr and K. E. L. Erikson, Production of Ethanol from LignocellulosicMaterials, Advances in Biochemical Engineering / Biotechnology, 42, 64 (1990)
4. P. Weiland and Ch. Scholz, Ethanol Feimentation in a solid-Phase Process, DechemaBiotechnology Conferences, 4, 855 (1990)
5. G. Zayed, Utilization or whey for reconstituted skim milk for SCP production,CulLDairy Prod.J. 26 (1), 29 (1991).
6. S.Yu, M.Wayman, and S. K. Parekh, Fermentation to Ethanol of Pentose ContainingSpent Sulphite Liquor, Biotech.Bioeng., XXK, 1144 (1987).
7. D. Fond and J. M. Engasser, the Acetone Butanol Fermentation on Glucose andxylose,Biotech.Bioeng., XXV11I, 160 (1986.
8. J. N. Saddler, M. M Hailree, and H. II. Brownell, Enzymatic Hydrolysis of variousPretreated Lignocellulosic Substrates and Fermentation of Ubrated Sugars to Ethanoland Btanediol, Biotech.A Bioeng. Symp, Fifth Symposium on Biotechnology for fuelsand chemicals, No. 13, 225 (1983)
9. S. Y. Huang and J. C. Chen, Ethanol Production fat Simultaneous Saccharifkation andfermentation of Cellulose with Temperature Profiling, J.Ferment. TechnoL, 66 (5), 509(1988).
-981-
JO.N. Kurose.J. Yojtyu, and A. Obayashi, Evaluation of Ethanol Productivity fromCellulose by Clostiiditim Thcnnocellum, J. Ferment. Technol., 46 (5), 447 (1986).
11. G. P. Casey, Ethanol Tolerance in Yea-Is, CRC CritkaJ Reviews in Microbiology, 13,219 (1986).
12. C. E. Wym.in, I> .D.Spindlcr, and S. M. Lastkk, Simuitaronus Saccharification andFermentation of Cellulose with the Yeast Brettan<,niycer; ciausenii, Biotech. BioengSymp. No. 17, 221 (1986).
13. C. L. Weller, M. P. Steimherg, and Rodda, Fuel Ethunoi from Raw Com hy AspergiUlHydrolysis with concurrent Yeast Fermentation, Biotech. Bioeng Symposium, 13, 447(1983).
14. J. Szrr.adrak & Z. Targonski, Selection of Thertnotolcrant Yeast Strains forSimultnncous Sncchariflcntion and Fermentation of Cellulose, Diolech. Biocng., 31, 3oo-303 (1988).
35. P. Gonde, and P.Galzy, Cellobiose Feiincnlation by Several Y'easl Strains, ThirdEuropean Congress on Biotechnology, Muenchcn, F. R. Germany, 15 - 20 (1984)
16. S. Kundu. T. K Ghose, and S. N. Mukhopadhyag, Byconversion of Cellulose intoEthanol by Closfiidum iheiTOOccUumProdiict Inhibition, Biotech. Bioeng., XXV, 1109-1126 (1983)
17. JVI. Takagi, G. 11. Emert, and N. Yata, Simultaneous Saccharification and fermentationof Cellulose. Effect of Ethanol on Enzymatic Saccharifkation of Cellulose, Bioteth.Biocng., 27, 389-397, (1985).
18. E.T Wnugh and B.S. Purchase, The Influence of Glucose and Ethanol on EnzymaticHydrolysis or Steam-Exploded Baggase, Biotechnology letters. 9(2), 151 -156 (1987
19. P. Ghosh. VV.R.B. Mailin, Simultaneous Saccharification and fermentation of Cellulose. Effect of B -1)- glucosidase activity and Ethanol inhibition of Cellulases, EnzymeMicrob. Tcchnol.. 4, 425 - 430 (19982)
20. N. Kosaric, A. Wicczorcck, and J. E. Prenosil, Elhanol fennentalion Energy fromRenewable Resources, Ed: II. Ucllweg, ISBN -3- 527- 25765 -9 (Wcinheim, Basel.), 256,(1983)
21. M.Voloch, i\l. Indisch, and G. T. Tsao, Bioutilization of Cereal Lignocelhilosc, inCereal Polysaccharides In Technology and Nutrition, V. F. Rasper, ed., Am. Assoc. ofCereal Chemists. St. Paul, Minnesota, 103 - 125 (1984)
22. It. VV. Detroy Q. R. L. Cunnigham, Bisconvcrsion of wheat Straw Cellulose/Hcmicclltilosc to Ethanol by Saccharomyces uvarum and Pachysolen tannophilus,Biotech. Biocng. 24, 1105- 1113 (1982)
23.R.W. Detroy & W.L. ORION, Bioconversion of wheat Straw to Ethanol: chemicalModification, Enzymatic hydrolysis, and Fermentation, Biotech. Bioeng., XXIII, 1527-1535(1981)
24.B.Hahn -Hagerdal. B. Mattiason, Azlde Sterilization of fermentation Media, Eur. J.Appl. Mictobiol. Biotechnol., 14,140 - 143 (1982)
25.M. A. Mnndels, A.R.Baker, and C.Roche, Measurement of Saccharifying Cellulasc,Biotech. Symp., 6,21-23,(1976)
26.P. Stetnbetg &E.T. Reese, Can .J. Mlcroblol., 23,139,(1977)27.F. Deschamps and M.C. Huet, Appl. Microbiol. Biotechnol., 22, 177(1985)2S.G. L. Miller, Use of dinitrosalicylic acid for determination of reducing sugars, Anal.,
Chcm., 426-428 (1959);?.P. Trinder, Deleimuiation of Glucose in blood using alternative oxygen acceptor, Ann.
Clin. Bioch. 6.24(1969)30.E. Kellcnnann, Kvasny prumysl, 6, 11 (1960)
-982-

31.K.V. Swmkanens, C.II. Ludwig, Lignin Occurance, Formation Structure and reaction,Wiley Interscience, New York, 190(1971)
32. W.P.Chen & A. W. Anderson, Extraction of hcmicellulose from rye grass straw for theproduction of residue for animal feed, Biotech. Bioeng.,m 22, 519-531 (1981)
33.R.I,. Whistler, .Miachrnch A D.Bowman, Preparation and properties of com cobsilollocclliilnse. Arch. Biochem., 19, 25-33 (1980)
34.1YI.Arai, Jl.Ilngnslii, and E.T.Reesc, Can.J. Microbiol., 23, 139 (1985).35.J.N.Saddlci, C.IIognn, M.K.H.Chan, and G.Louli.Seize, Can.J. Microbid., 28, 1311
(19S2).
-983-
NEXT PAQE(S)left BLANK
Proceedings of the Fifth International Conferenceon Energy and Envirorunent, Cairo, Egypt, 1996
UTILIZATION OF AKALONA FOR ETIIANOL ANDSINGLE CELL PROTEIN PRODUCTION
G. Zayed* , M. S. Safwat F. S. AH and M. N. Z. El-AbedecnDepartment of Agricultural MicrobiologyFaculty of Agriculture, Minia University,
Minia, Egypt.
AbstractSaccharification of Akalona by using NaOH 0.5% and sulfuric acid 2% and auloclaving for
0.5 h. was selected as the best method. The yield of soluble sugars using this method was up to472.1 mg/gm Akalona. Akalona hydrolysate is a suitable substrate for S.C.P production byCandida utilis EMCC 28 which yielded biomass up to 12 g/L, with protein content of 58%.Saccharomyces cerevisiae EMCC 14, was selected in this study as the most suitable strain for thefermentation of Akalona hydrolysate to ethanol. Akalona hydrolysate containing sugars up to 20%was employed successfully as an alternative substrate for alcohol production by using the agarimmobilization system. The amounts of alcohol by using the agar immobilization system was8.67% at sugar concentration of 20% with cell numbers of 140 x 10"/gm of agar beads andresidual sugars of zero.
1 INTRODUCTIONIn Egyptian milling, the waste bruise called "Akalona" is one of the cellulose wastes. It is
the outer portion (epidermis) of the wheat grains which results from the scouring of the wheatgrains during milling process. It contains some broken grains of wheat and other strange grainsproduced during the cleanup process. The chemical analysis of Akalona is as follows : Moisture12%, protein 4.82%, lipides 2.36%, ashy3.60%, fibers 24.51%, carbohydrate 64.40%, solublesugar 1.45%, hemiicellulosey7.36%, cellulose 31.31% and lignin 10.36%. Akalona was used bysome research workers as natural soil conditioner (Morsy el al 1982) and biogas productionsubstrate (El-Badry 1983) , El-Abdeen (1987) found that the application of compost preparedfrom akalona improved soil biological activity, fertility and productivity. Hassan (1992) usedakalona to improve the bioactivity of soil microorganisms during reclamation of calcareous soils.
Aside from the mentioned studies on Akalona, it is necessary to mention that dataconcerning Akalona are very rare in the literature available. To utilize Akalona via fermentation, itis essential to convert it into fermentable sugars.
The aim of this work was to study the possibility of using Akalona as a raw material aftersaccharilication to produce single cell protein (SCP) using different genera of yeasts and toproduce ethyl alcohol using free and immobilized yeasts.
-985-

2. MATIRIAI AND MI-THUDSRaw MaterialAkalona was obtained from llic Middle I'pypi Milling Company in I I-Minia.Microorganisms•1 iut;cr and A. nryzac NRK1. 2217 were obtained from llic Depl. ofl'laut Pathology. I ac ofAgric. Tanta University. I gypt. and maintained on potato dextrose ap.ar medium. The veastsS d C i ' l i c i r m m v c x c i ' r t ' v i . i i t u 1 , S a c c l i a r o n n v f s <v r< ' i 7 ,v / r / c [ - M C C I t , ( ' m i t i i i / i i i m h s I \ 1 ( ( 2 X .
Kluyvcramvccx fragilis I 'MCC 2 ° . and Haiisemrfa culifoniica were obtained from Cairo
(MIRCTN). I acuity of Agric, Ain Shams University. I'gypt and maintained on yeast malt agarmedium (YM agar).Chemical Hydrolysis of AkalonaAkalona was first delegnilied by mixing 10 g of it with 200 ml NaOIl (0.5%) and atitoclaved Thesolid residues were washed by distilled water, then treated by 200 ml I b-SO.j (2"<, . 4% or (V\,)
and autoclavedliiological Hydrolysis of Akalonalive hundred ml conical flasks each containing 10 g ol'Akalona mixed with 200 nil distilled waterwere sterilized, then inoculated with A. iiiger or -I. orvzac NRRI. 22 17 and incubiiled at 30"C.Samples were withdrawn every 24 h. to detennine total reducing sugars. At the maximum simarconcentration time, the fungi and the Akalona hydrolysate were separated by centrifugation.SCI' and P.thanol production mediaI'or SCI' production, conical flasks 250 ml each containing 100 ml of hydrolysaie, weie iiioailaledwith 4"o {v'v) of the desired yeast suspension. The media were supplemented with yeast extract (">g/l.) and ammonium sulphate (3 g/L) and kept at 30°C for X I h, on rotar\ shakci .('ell biomas-.were hanested by centrifugation at 5500 qim for 20 minutes, dried at 10<;oC over night andweighed.lor ethanol production the pll of hydrolysates was adjusled to 4.5 and Ihc media were transferredinto 0.5 I. serum stoppered bottles each containing 200 ml and steiili/ed No external oxygen wassupplied except that found in head space of the bodies Bottles weie inoculated with the desiredyeasts, incubated at 30°C for 72 h. and samples were withdrawn even 24 h. I'or suhse()iienlanalysis.Immobili/ation methodsAgar immobilization method described by Zaved and I lunter (I'J'M | was used.Analytical methodsTotal reducing sugar was determined using the phenol sulphuric acid method described by I IciberttV (7/(1^71).Determination of alcohol was carried out by the Density liotlle Method described by /aved(1987). Protein was determined speclrophotomelrically at 750 nm as described by Herbert ci <:l( 1071) Amino acids analysis was canied out by Gas chromatography (Model , varian 370O|
v Rl SUITS AND DISCUSSIONChemical method for sacchariticatipn ofAkalonaThe results showed that atitoclaving akalona with distilled water for 0 5 h. yielded lOonigolsoluble sugars/gm of akalona. Removal of lignin increased the yield ol sugars lo I2(v45nm< gm ofakalona The increase in sugars yield as a result of dclignilication may be explained by ihe (act thatmodifying substrates by removal of lignin with autoclav ing.improved their susceptibility to heat
-«J86-
attack for conversion of polysaceharide to glucose. The amounts of sugar produced by sulfuricacid 2% after lignin removal greatly increased to 472.1 mg of akalona (Table 1).Manderson et al (1989) reported that acid hydrolysis is currently ille preferred route to hydrolysisof cellulose compounds because enzymatic liydtolysis is uneconomic.At higher sulliiric acid concentration (-1% and 6%), the produced sugars were less lhan usingstilfuric acid 2%. This could be due to the formation oi complex compounds from sugars andsulfuric acid (al high concentration) under high temperature.Biological method for saccliarificaiion of AkalonaResults in Table (2) show the saccharification process ol Akalona medium by Aspi'rgilln.s niger.The results showed that the yield of sugar was 236 mg ol sugai 'gm ol Akalona aller three days ofgrowth. On the fourth day. sugar concentration declined sharply to 4-t mg/gm due lo theutilization of these easy fermentable sugars by fungi. The results showed that the fungus strainAspergitltis oryzae NIU.L. 22 17 was less efficient than Aspergilltis mger. It produced only 174 nigol sugar / gm of Akalona. Heir el a! (1978) found that Aspergillus wger and Tncluxicrma/ignorant, exhibited considerable cellulytic activities.Zayed and Mostafa (I 'l Q 2) produced 7.8% of fermentable sugar after growing Aspcr^ilhis nigeron optimized baggasse medium for -I days. Based on the yield of soluble sugar, snccharilication ofAkalona by using NaOl I 0.5% and sulfuric acid 2% and autoclaving for 0.5 h.. was selected as thebest method and was used for subsequent experiments.Production of single cell proteinI ig l(.i-il) show that the uelds of biomass and the residual sugar during different growl)) limes ofdifferent yeasts on Akalona bydrolysate contained 5% soluble sugars. Candida titdis I:MC'C 28was selected as the preferred yeast for S C I ' production. The cell biomass yield of this strain was•4.8 g/l. with a residual sugar of zero after 36 h. of growth while the next best strain (Saccliiiromyct's cerevisiae I MCC 14 ) gave 3 "g of biomass/l. of growth medium n ilh residualsugar of 1% after the same growih timeThe results of Cysewski and VVilke (1976) and Zayed (1991) showed that the besl growth ofdifferent yeasts to produce S.C.P, is strain and substrate dependentResults in Fig.2 indicate that the yield of yeas! biomass was substantially influenced by the sugarconcentration in akalona hydrolysate. Increasing sugai concentration from 5% to 10% resulted inalmost a doubling of the yield. At sugar concentration of 20%. the yield of biomass declined anddid not exceed 8.0 g/L. and residual sugar was more than 12%. These results show that substrateinhibition occurs probably by factors such as an increase in osmotic pressure and or high ratio ofsugars to the other solids which may upset the nutrient balance for yeasts lo utilize all the sugars.At a high sugar concentration (20%) with aerobic conditions, some alcohol (1.7%) was produced.'Iliis presence ol alcohol may be an additional factor for yeasts growth inhibition. These results arein general agreement with those of Marwaha and Kennedy) 19X4). Viemie and Vonstocker (I°S5)and Zayed (1991).Ilie results showed that at sugar concentration of 25%. the yield of biomass was zeroIt is ijiiilo evident from fable (3) that high protein content was observed in young cells (after I 2-21 It. of growth) and then decreased thereafter. This iliflorenee might be explained because maturecells contain high amounts of carbohydrates which are stored materials such as starch andglucogen. The cells grown on Akalona medium, supplemented with yeast extract and ammoniumsulphate, had a protein content higher then the unsupplemenled ones, and this could be related lothe high amount of biomass produced as a result ol'these compound-, present decrease of yields
-987-
after 48 li. may be due to death after exhaustion of one or more limiting nutrients of growthfactors and possibly autolysis.The protein content of Candida utilis EMCC 28 grown on supplemented or unsupplcmentcdakalona medium, has the same amino acids composition which is illustrated in Table (4).Production of ethanolThe results in Fig 3(a-e) showed that Saccharomyces cerevisiae EMCC 14 was the most efficientstrain for alcohol production from Akalona hydrolysate. This strain produced 2.3% of alcoholfrom 5% total sugar concentration after only 24h. of growth. This value is equal to 90% of thetheoretical value. The utilization of sugar was complete.Results in Table (5) showed that increasing sugar concentration to 10% led to an increase in thegrowth of yeast cells. The consumption of sugar was complete and the yield of ethanol was 4.5%.This percentage of ethanol production was equal to more than 88% of the theoretical value. At
20% sugar concentration, the growth decreased sharply to 12x10^, the residual sugar level wasvery high (12%), and the alcohol concentration was only 2%. Increasing sugar concentration to25%, completely inhibitied the growth of yeast cells.Jones et al (1981) found inter-strain differences among yeasts in osmosensitivity and also in their 2alcohol and carbon dioxide tolerances and noted the higher tolerance of Saccharomyces cerevisiaeto adverse environmental conditions. These results showed that after hydrolysate sugarconcentration was depleted, the ethanol concentration declined suggesting that Saccharomycescerevisiae assimilated ethanol as a source of energy.Immobilized cell system was tried to improve the growth and activity at higher sugarconcentration.Results in Table (6) showed that sugar concentration of 20% did not affect the growth and activityof immobilized cells. The consumption of sugar was complete and the ethanol yield was 85% ofthe theoretical value. At 30% sugar concentration, the immobilized yeast produced ethanol at 55%of the theoretical value. The residual sugar was 12.5% and the number of viable cells decreased to43xl06 / gram of agar beads. At 35% of sugar concentration, the yeast produced ethanol at only15% of the theoretical value, the viable cell numbers sharply decreased to 15x106/gram of agarbeads and the residual sugar concentration was 28%.
These results showed that immobilization system significantly enhanced ethanol yield compared tosuspended cells under similar conditions. Complete sugar utilization and maximum ethanol yieldsfrom 10, 15, 20 and 25% sugar concentration were observed. The immobilization step appears toprotect the cells from adverse environmental conditions. The stimulation effect of immobilizedcells be in part related to the major advantage of immobilized cells which is that a highconcentration of biocatalyst may be entrapped into support matrixes, resulting'in faster processingand higher volumetric productivity than conventional fermentation. The immobilized cells remainalive and able to multiply. They can carry out multistep enzymatic reaction, regenerate cofactorsand can be used repeatedly.
REFERENCES1. Cysewski, G.R. and Wilke, C.R. (1976): Utilization of cellulosic materials enzymatic hydrolysis.
1. Fermentation of hydrolysate to ethanol and single-cell protein.Biotechnol. Bioengin. 28, 1297-1313.
2. El- Abdeen, M.N.Z. (1987): Microbiological studies on the utilization of Akalona.M. Sc. Thesis, Fac. Agric, Minia Univ.
-988-
3. El- Badry, MM. (1983): Studies on biogas production.M. Sc. Thesis, Fac. Agric, Cairo Univ.
4. Hassan, H. (1992): Occurrence and bioactivity of soil microorganisms during reclamation ofcalcareous soils.M. Sc. Thesis, Fac. Agric, Minia Univ.
5. Herbert, D., Phips, P.T. and Strang, R.E. (1971): Chemical analysis of microbial cells.Methods in Micro. 5B, 209-344.
6. Herr, D., Luck, G. and Dellweg, H. (1978): Cellulose. Fungi J. Ferment. Technol. 56, 273-281.7. Jones, R. P.; Pamment, N. and Greenfield, P.F. (1981): Alcohol fermentation by yeasts-the
effect of environmental and other variables.Process Biochem. 4, 42-49.
8. Manderson, G.J.; Spencer, K.; Paterson, A.H.J.; Quroshi, N. and Janseen, D.E. (1989): Pricesensitivity of bioethanol produced in New Zealand from pinus radiata wood.Energy Sources. II , 135-150.
9. Marwaha, S.S. and Kennedy, J.F. (1984): Alcohol production from whey permeate byimmobilized and free cells of Kluyveromyces marxians NCYC 179.Process biochem. 12,6-10.
10. Morsy, M.A., Abdallah, A.R. and Kishk, MA. (1982): Effect of soil amendment on theimprovement of newly reclaimed sandy calcareous soils of Minia Govemorate.First National Conference on the problems of Land Degradation in Egypt, held in El-Minia, 2-5February.
11. Vienne, P. and VonstocKer, U. (1985): Metabolic physiological and Kinetic aspects of tliefermentation of whey permeate by Kluyveromyces fragilis NRRL 665 and Kluyveromyceslactis NCYC 571.Enzyme Microb. Technol. 7, 237-294.
12. Zayed, G. (1987): Microbiological studies on production of ethanol from certain wastematerials.Ph. D. Thesis, Fac. Agric., Minia Univ.
13. Zayed, G. (1991): Utilization of whey from reconstituted skim milk for single cell proteinproduction.Cultured Dairy Products Journal. 26, 22-28.
14. Zayed, G. and Hunter, J. (1991): Ethanol production from salt whey using free and agaroseimmobilized yeasts.Milch wissenschaft. 1, 1-7.
15. Zayed, G. and Mostafa, N. (1992): Studies on the production and kinetic aspects of single cellprotein from sugar cane bagasse saccharified by AspergiIlus niger.Biomass and Bioenergy, 3: 363-367.
-989-
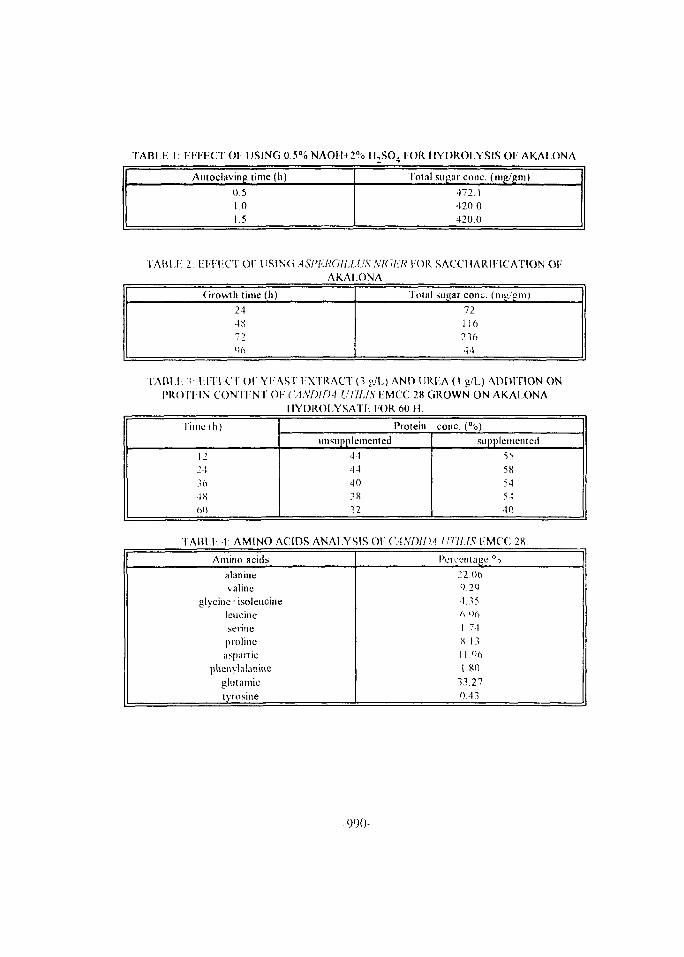
TABLE 1; EFFECT OF USING 0.5% NAOH+2% H ;SO4 FOR HYDROLYSIS OF AKALONA
Autoclaving time (h)
0.5101.5
Total sugar cone, (mg/gm)
472.1420.0420.0
TABLE 2: EFFECT OF USING ASPERGUJ.US NIGER FOR. SACCHAR1ITCATION OFAKALONA
Growth time (h)
2448
1">%
Total sugar cone, (mg/gm)
7211623644
TABl.L 3 I I I I C T OF YF.AST EXTRACT (3 g/l.) AND UREA (1 g/L) ADDITION ONI'RO TITN CONTENT OF CANDIDA UTIUS EMCC 28 GROWN ON AKALONA
HYDROLYSATE FOR 60 H.
Time (h)
1224364S60
Protein cone. (%)
tmsupplemented
44444038
32
supplemented
5558545 140
TABLE 4. AMINO ACIDS ANALYSIS OF CANDIDA IJTIIJS l-MCC 28.
Amino acids
alaninevaline
glycine*isoleucineleucineserineprolincaspaitic
phenvlalanitieglut antictyrosme
Percentage %
22.0d9.2')4.356 %1.74X 131 1 %1.80
33.270.43
990-
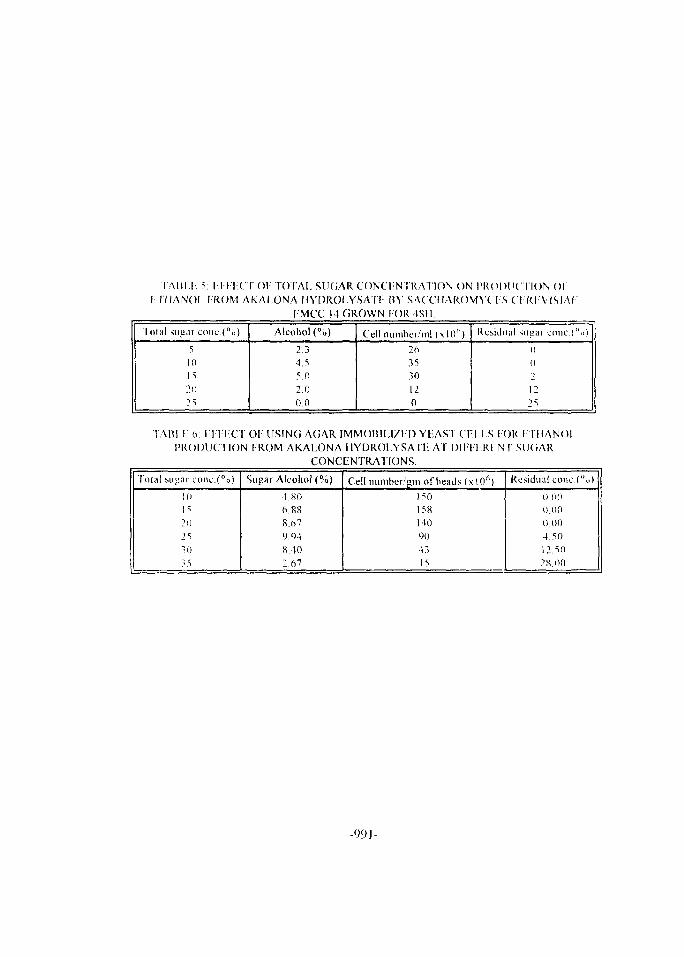
IAIJI . I . 5: [ M I C I O F T O T A L S U G A R C O N C E N T R A T I O N ON P R O D U C T I O N O F
I ( H A N O I . I-ROM A K A L O N A H Y D R O L Y S A T i - BY S A C C H A R O M Y C [ S Cl K I V I S I A I
F M C C 14 G R O W N FOR 4811.
Total sugar cone.(°b)
5
1015
2025
Alcohol (%)
2.34.55 02.00.0
Cell number/ml (xl() ( l)
263530
120
Residual sugar conc.("»)
00"1
12
IABI 1 (v PITT 'CT OF U S I N G A G A R IMMOUIL1ZFD YF.AST CP.l.l.S I O R I-.THANO1.
P R O D U C T I O N ("ROM A K A L O N A H Y D R O L Y S A T L AT DIIT1 R 1 N I SIKiAR
C O N C E N T R A T I O N S .
Total susiar conc.(°o)
Id
1?
20J5
30
;,>
Sugar Alcohol (%)
-1 SO
6.888.67<).Q48.402.67
Cell lnimbcr/gm ofbeads (\ 10°)150
158
140
90
4315
Residual cone Co)
().(«)0.000.004.5012.5028.00
-99 J-
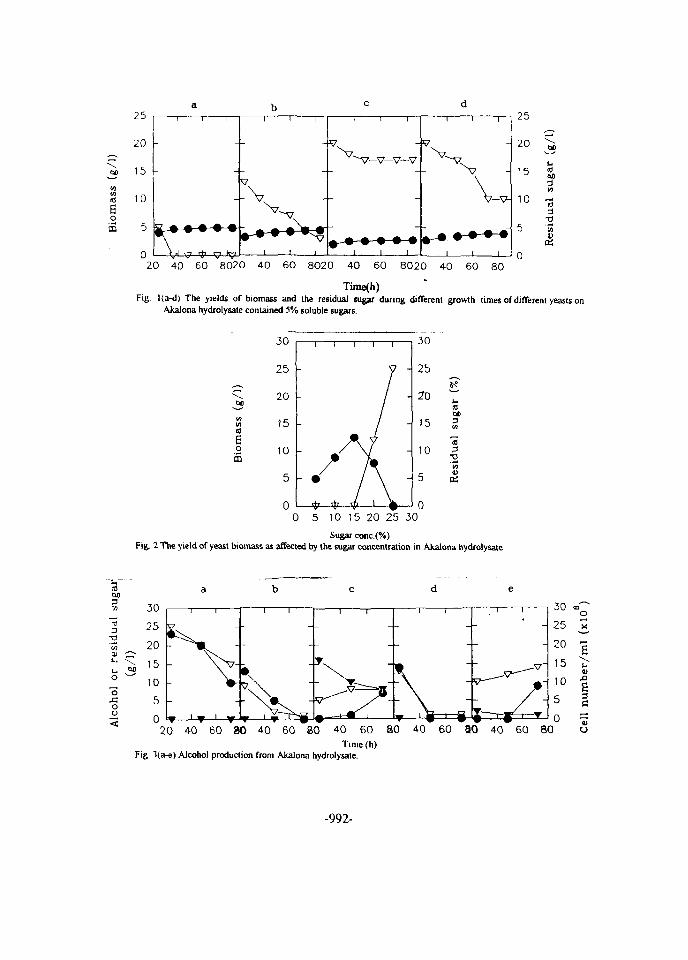
25
20
^ 15 -in
S ioEo
£ 50
1 1
-
\ , „*,
- • - %
1
V
-V
i
1 |
v-~v—v—v-
»-•-• • •1 1
- V
1
! 1 1
[ V .
1 1 1
25
20
15
10
5
0
an
p i
"io3"2
20 40 60 8020 40 60 8020 40 60 8020 40 60 80
Time(h)Fig. l(a-d) The yields of biomass and the residual sugar during different growth times of different yeasts on
Akalona hydrolysate contained 5% soluble sugars.
0 5 10 15 20 25 30Sugar conc.(%)
Fig. 2 The yield of yeast biomass as affected by the sugar concentration in Akalona hydrolysate
i
(0
3
IT)
T3
ooo
20 40 60 30 40 60 SO 40 60 80 40 60 80 40 60 80 oTime (h)
Fig 3(a-e) Alcohol production from Akalona hydrolysate.
-992-
Proceedings of the Fifth International Conferenceon Energy and Environment, Cairo, Egypt, 1996
DYE ADSORBENT-BAGASSE, A NEW POTENTIALSOURCE FOR ENERGY CONVERSION
Mamdouh M. Nassar, Eman A. Ashour and Vehia H. Magdy
Chemical Engineering Dept., Faculty of Engineering,EL-Minia University, Egypt
Abstract:Recently, much research are directed for finding low cost adsorbent for
clarifying colored effluents. Agricultural residues was found to be effectiveadsorbent, which is used once and then discarded by burning them as fuel. Bagassepith was used as adsorbent. The pith is a waste product from the sugar cane industry.
Thermal behavior of untreated and treated pith with acidic and basic dyes wasinvestigated using differential thermal analysis (DTA) and tiiennogravimetric thennalanalysis (TGA). The results showed that the thermal decomposition pattern can bedivided into three peaks. The first peak is endothennic while the second and thethird peaks are exothermic. The peak intensities and corresponding temperatureswere different for the untreated and treated materials the decompositionthermographs of the reacted acid dye differ than that of basic dye, this is due to thedifferences in adsorption behavior and differences in the adsorption capacity of eachdye toward bagasse.
The reaction rate, activation energy, entropy change, enthalpy change andGibbs free energy for the treated and untreated pith were calculated. The calorificvalues of the treated pith are higher than untreated.
-993-
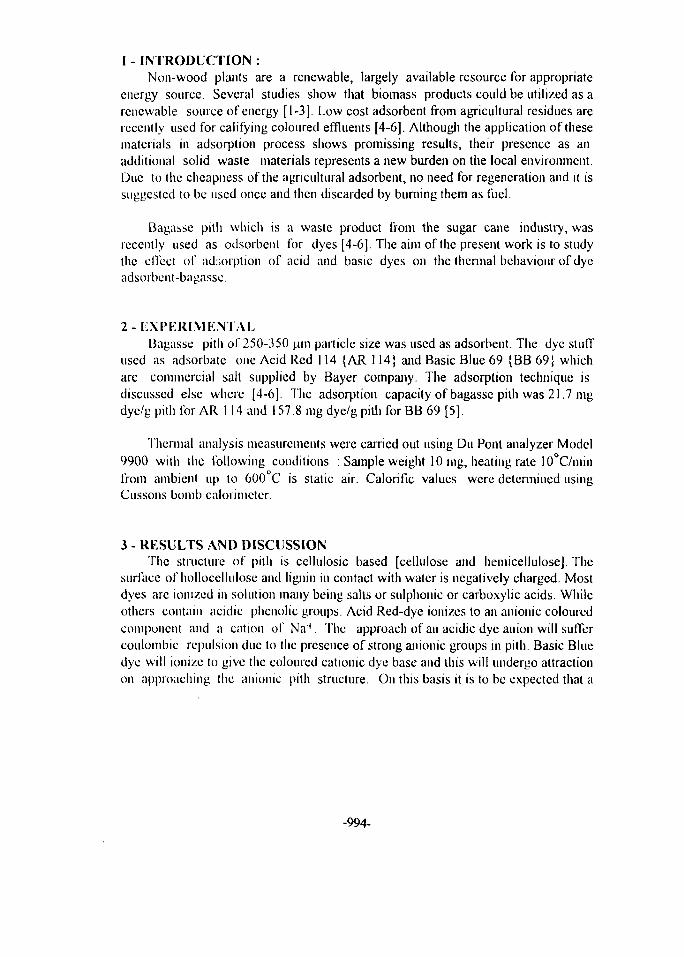
1 - INTRODUCTION :Non-wood plants are a renewable, largely available resource for appropriate
energy source. Several studies show that biomass products could be utilized as arenewable source of energy [1-3]. Low cost adsorbent from agricultural residues arerecently used for califying coloured effluents [4-6]. Although the application of thesematerials in adsorption process shows promissing results, their presence as anadditional solid waste materials represents a new burden on the local environment.Due to the cheapness of the agricultural adsorbent, no need for regeneration and it issuggested to be used once and then discarded by burning them as fuel.
Bagasse pith which is a waste product from the sugar cane industry, wasrecently used as odsorbent for dyes [4-6]. The aim of the present work is to studythe effect of adsorption of acid and basic dyes on the thermal behaviour of dyeadsorbent-bagasse.
2-EXPERIMENTALBagasse pith of 250-350 jiin particle size was used as adsorbent. The dye stuff
used as adsorbate one Acid Red 114 {AR 114} and Basic Blue 69 {BB 69} whichare commercial salt supplied by Bayer company. The adsorption technique isdiscussed else where [4-6]. The adsorption capacity of bagasse pith was 21.7 ingdye/g pith for AR 114 and 157.8 mg dye/g pith for BB 69 [5],
Thermal analysis measurements were carried out using Du Pont analyzer Model9900 with the following conditions : Sample weight 10 mg, heating rate 10°C/minfrom ambient up to 600 C is static air. Calorific values were determined usingCussons bomb calorimeter.
3 - RESULTS AND DISCUSSIONThe structure of pith is cellulosic based [cellulose and hemicellulosej. The
surface of hollocellulose and lignin in contact with water is negatively charged. Mostdyes are ionized in solution many being salts or sulphonic or carboxylic acids. Whileothers contain acidic phenolic groups. Acid Red-dye ionizes to an anionic colouredcomponent and a cation of Na+. The approach of an acidic dye anion will suffercoulombic repulsion due to the presence of strong anionic groups in pith. Basic Bluedye will ionize to give the coloured cationic dye base and this will undergo attractionon approaching the anionic pith structure. On this basis it is to be expected that a
-994-
basic dye have a strong adsorption affinity for pith. The adsorption capacity of pithfor AR 1 14 is 21.7 mg dye/g pith and for BB 69 is 157.8 ing dye/g pith [5].
The thermal degradation of cellulosic materials is known to proceed through acomplex process involving dehydration, depolymerization, oxidation, hydrolysis,cyclisation and charring. The process may be follow two routes : one involvesdepolymerisation with the formation of combustible volatile fragments which feedthe flame (flame combustion); the second involves dehydration and formation ofcarbonaceous char leading to a slower glowing ignition [7]. While the thermaldegradation of lignin leads only to char [8].
DTA thennograins of untreated pith and dye adsorbent-pith are shown inFig. I. In general, similar thermal decomposition trend for the three materials areobserved; with an endolhermic at about 100°C and two exotherms between 300-500°C. The erdothenn is pronounced for the untreated pith which is due toevaporation of the adsorbed moisture inside the pith pores, this erdothenn is veryweek for the dye. adsorbed-pith since the pores are filled with adsorbed dyes. Thefirst exothermic peak is due to the oxidation of both the less stable components ofthe char and volatile components fonned during the combustion occurs in the secondstage, while the second exothenn is due to the oxidation of the more stable charcomponents which is known as carbon bum off stage f9- 10J. The comparison ofpeak temperature in case of treated and untreated materials indicates that there is asignificant increase in temperature about 15°C at which the combustion of thevolatile occurs (first exothenn) for treated materials than untreated one as shown inFig. 1, also the peaks of the treated materials are less intense.
In order to give more interpretation of DTA results, it is desirable to compareDTA data with that from TGA. Fig. 2 shows the experimental TGA curves for theuntreated and dye-treated pith. The three thermograms have three stages of weightloss; first stage exhibits small weight loss ~ 8% which corresponds to the endothennin D FA. The second stage (first exothenn) is the major thermal decomposition forthe three materials occurs within a steep region from 300 to 390°C where an 64, 63and 55% weight loss for untreated pith., acid-dye adsorption and basic dyeadsorption respectively. The third stage (second exothenn) has weight loss rangesbetween 17 to 18%. The ultimate char residue becomes about 11 % for untreated andacid-dye adsorption pith and 20% for basic-dye adsorption pith.
It can be stated, therefore, that in the high of results obtained from DTA andTGA thennograms for untreated and dye-treated pith the thermal belaviour of the
-995-
treated pith can be explained according to the reactions that occur in the combustionprocess. It is known that the combustion of cellulosic materials is characterized by aleast two major competitive reactions which are temperature dependent I11> l 2 l Thefirst reaction produces mainly water, oxides of carbon and char. The second reactionsupplies the levoglucosan, which is one of the major flammable componentsproduced from the decomposition of the cellulosic materials. The adsorption of thedye may interfere with the mode of the decomposition reaction, where the treatedmaterials decompose at higher temperature on one band, and on the other, it mayblocked the pith pores and thus reduces the evaporation rate of the volatiles andcondenses them and thus produces more char-residue than untreated material. Thiseffect is very clear for case of adsorption of basic dye with its high adsorptioncapacity where 20% char residue compared to 11% for untreated. The calorificvalues confirm this finding where the calorific value of basic-dye adsorbed pith isincreased by 100 cal/gm for untreated Table I.
Using TGA analysis, based on references I'3, 14] s o n i e kinetic andthennodynamic parameters such as rate constant K, activation energy E, enthalpychange AH, entropy change AS and Gibbs free energy AG° for the volatilization andcarbonization stages in case untreated and dye-treated pith were calculated.
For pseudo homogeneous kinetics, the irreversible first order rate of conversionof the weight fraction for thermal decomposition reaction may be expressed by thefollowing equation
dw/d t = Kw (1)
Recalling the Arrhenius equation, equation (1) can be written in the form
In (-dw / dt) = In A - E / RT (2)
From equations 1 and 2, rate constant K and activation energy E werecalculated and tabulated in Table II.
According to the rate theory l9l, the rate of reaction can be expressed as :
(3)
-996-
Expressing the change in free energy AG° in terms of entropy change AS andenthalpy change AH, equation 3 can be put in the form
K = kJ_eAS/Re-AH/RT (4)
From equation 3 and 4, the thermodynamic parameters AG° , AS and AH canbe calculated, and they are tabulated in Table II.
As shown from Table II, the activation of untreated pith is larger than those ofdye-treated energies pith which indicate that untreated pith is thermally more stable.The positive values of the Gibbs free energy change indicate the non spontaneousnature of the reactions as the free energy of the products is higher than those of thereactants.
4-CONCLUSION1- Adsorption of dyes on pith effects the thermal behavior of pith, especially with
basic dye where more char-residue can be obtained.
2 - The thermal studies for the dye-adsorbed bagasse, supports the trend for usingthis waste as a new potential source for energy conversion.
REFERENCES
1 - Nassar, M. M. "Kinetic studies on thermal degradation of non wood plants".Wood and Fiber Science, 17, 2, 266-273 (1985).
2 - Nassar, M. M. and Mackay, G. D. "Studies on the mechanism of flameretarding". Thermochimica Acta, 81, 9, 9-14 (1984).
3 - Nassar, M. M. "Thermal decomposition of agricultural residue". WorldConference on Flammability and Flame Retardant, Vienna-Austria, May(1990).
4 - Nassar, M. M. and El-Geundi, M. "Comparative cost of the colour removalfrom textile effluents using natural adsorbants". J. Chem. Technol &Biotechnol 50, 2, 257-264 (1991).
-997-
5 - Mckay, G. D., El-Geundi, M. and Nassar, M. M. "Equilibrium studies duringthe removal of dyestuffs from aqueous solutions using bagasse pith". WaterRes. 21, 12, 1513-1520(1987).
6 - Mckay, G. D., El-Geundi, M. and Nassar, M. M. "External mass transportprocess during adsorption of dyes onto bagasse pith". Water Res. 22, 12,1527-1533(1988).
8 - Nassar, M. M. and Mackay, G. D. "Mechanism of thermal decomposition oflignin". Wood and Fiber Science 16, 3, 441-453 (1984).
9 - Sekiguchi, J. F. and Shafizeh, F. "Structure and formation of cellulosic chows".J. Appl. Polymer Sci., 28, 3513-3525 (1983).
10 - Khattab, M., Price, D. and Horrocks A. "The inhibition of spontaneous ignitionby flame retarding cotton fabrics". J. Appl. Polymer Sci, 41, 3069-3078(1990).
11- Shafizadeh, F. "Industrial pyrolysis of cellulosic materials". Applied PolymerSymposium, 28, 153-174 (1975).
12- Bradbury, A. G. W., Sakai, Y. and Shafizadeh, F. "A kinetic model forpyrolysis of cellulose". J. Appl. Polym. Sci, 23, 3271-3280 (1979).
13 - Fanner, R. W. "Air force aeronautical systems". Division Rep. ASD-TDR-62-1043(1963).
14 - Glasston, S. "Text book of physical chemistry". MacMillan Co. ,London, 828(1962).
-998-
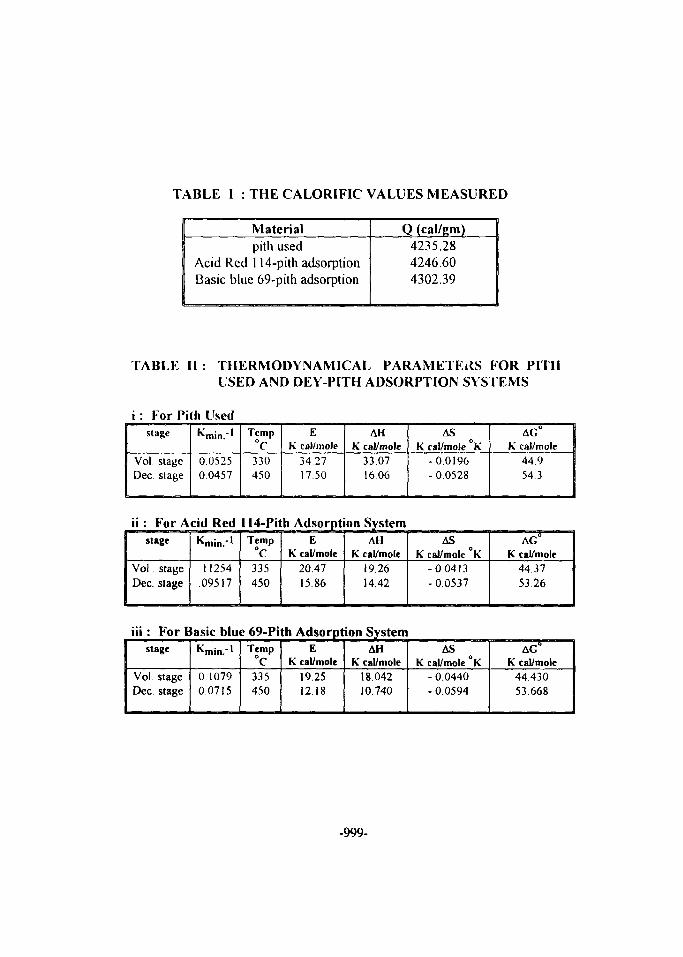
TABLE I : THE CALORIFIC VALUES MEASURED
Materialpith used
Acid Red 114-pith adsorptionBasic blue 69-pith adsorption
Q (cal/gm)4235.284246.604302.39
TABLE II : THERMODYNAMICAL PARAMETERS FOR PITHUSED AND DEY-PITH ADSORPTION SYSTEMS
i : For Pith Usedstage
Vol stageDec. stage
0.05250.0457
Temp°C330450
EK cal/mole
34.2717.50
AHK cal/mole
33.0716.06
ASK cal/mole K
-0.0196- 0.0528
AG°K cal/mole
44.954.3
ii : For Acid Red 114-Pith Adsorption Systemstage
Vol. stageDec. stage
IS . 1
•^min."1
11254.09517
Temp°C335450
EK cal/mole
20.4715.86
AHK cal/mole
19.2614.42
ASK cal/mole °K
-0.0413- 0.0537
AG°K cal/mole
44375326
iii: For Basic blue 69-Pith Adsorption Systemstage
Vol. stageDec stage
Kmin.~l
0.10790.0715
Temp°C335450
EK cal/mole
19.2512.18
AHK cal/mole
18.04210.740
ASK cal/mole °K
- 0.0440- 0.0594
AG°K cal/mole
44.43053.668
-999-
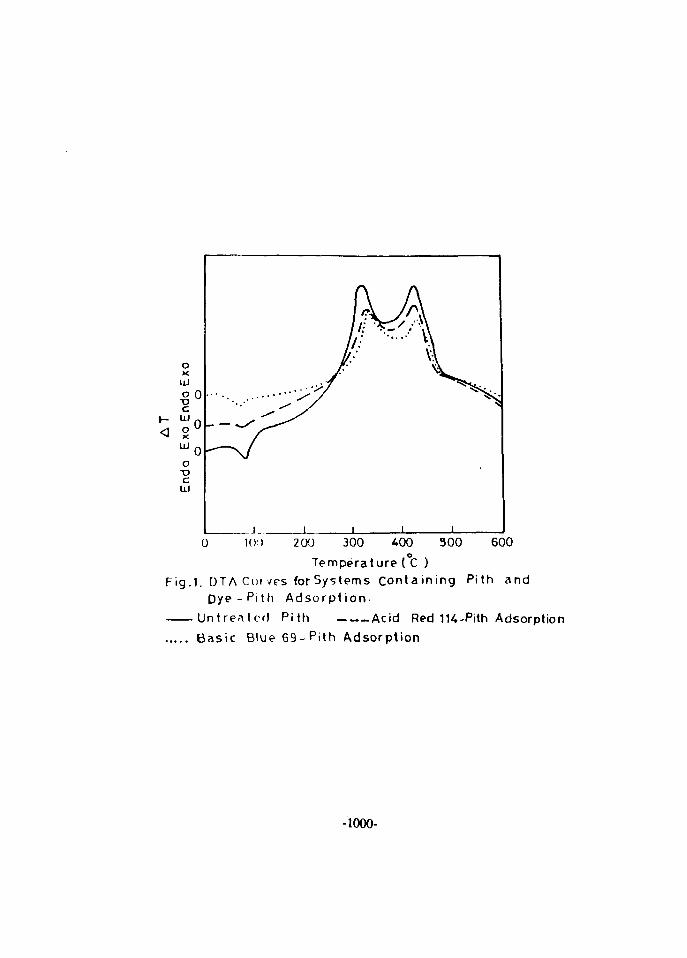
0 300 6002 00 300 400
Temperature ( C )Fig.1. DTA Cur vps for Systems Containing Pith and
Dye -P i t h Adso rp t i on .
Untreated Pith Acid Red 1K-Pith AdsorptionBasic B l u e 6 9 - p i t h Adsorpt ion
-1000-
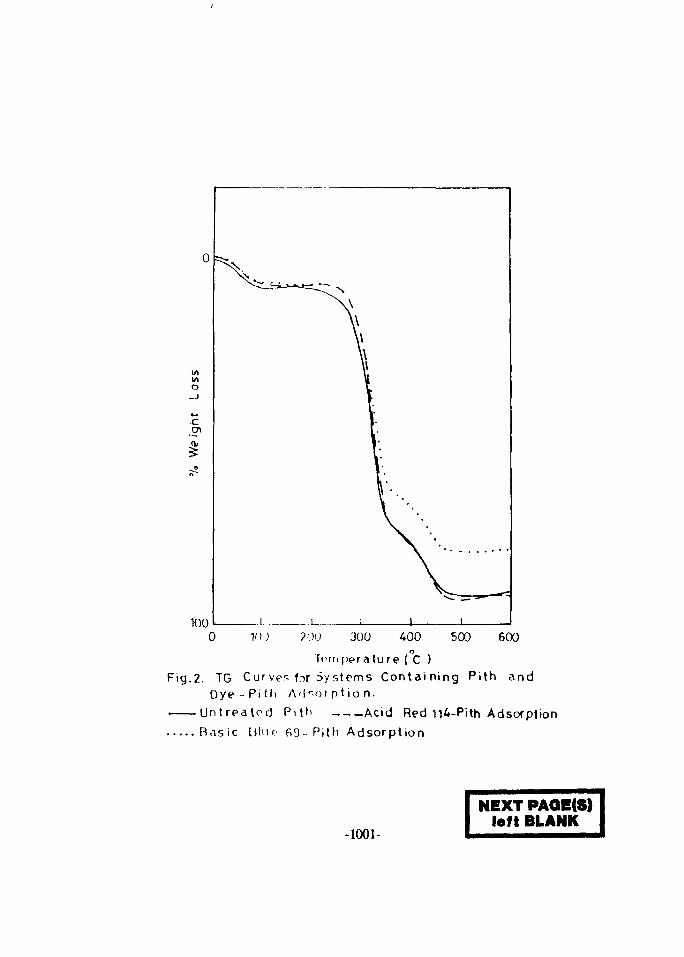
70') ?00 300 500 600400o
Temperature ( C )Fig.2. TG Curves for Systems Conta in ing Pith and
Oye - P i t h A'l^-oi p t io n.
U n t r e a t e d P i t h Acid Red n4-Pith Adsorption
Bas i c t t lue 6 9 - P i t h Adsorpt ion
-1001-
NEXT PAOE(S)left BLANK
Proceedings of the Fifth International Conferenceon Energy and Environment, Cairo, Egypt, 1996
KINETICS OF THERMAL DEGRADATION OF BAGASSEAND FLAX PARTICLE BOARDS
Eman A. AshourChemical Engineering Dept., Faculty of Engineering,
Minia University, Egypt
Abstract :Bagasse and flax particle boards arc manufactured by binding small particles of each raw material
with urea formaldehyde resin Evaluation of the effect of the resin on the thermal analysis was done byusing differential thermal (DT) and thcrmogravimetric (TG) analysis The pattern of thermal curves forboth particle boards were similar with one endothcrmic and two exothermic peaks.
Compared to the raw bagasse and flax, DT and TG analysis showed that the presence of the bindingresin reduced the amount of volatilcs during the thermal decomposition, which proves that the resin alsoacts as a flame retardant. The mechanism of flame retardants of the urea formaldehyde resin was discussed
Kinetic thermal studies were based on weight loss obtained from TG analysis It was found thatthermal degradation of both particle boards can be considered as first order reaction. Two stages of thermaldecomposition were found; volatilization and decarbonization stages. Activation energies for thedecarbonization stage are smaller than those of volatilization stage values of activation energies for the twoparticle boards were different due the differences in chemical composition
1 - INTRODUCTIONUrea-formaldehyde resin has found a wide range of application, Particularly as an adhesive in particle
board manufacture, in insulation materials as chemical agents in paper technology, it is also used inconjunction with other substances for the flamc-rctardant treatment of textiles, rubber and nylon. Urca-formaldchydc resin (U.F.R) is difficult to ignite, generate little smoke during combustion and acts as asource of nitrogen. 111
Particle board is manufactured, in Egypt as well as in other developing countries, from bagasse |afibrous solid waste produced from sugar cane milling industry after crushing and extraction of the canejuice] or from flax chives. Bagasse and flax are cut into small sizes and cemented together by urea-formaldehyde resin under pressure and temperature |2 | . The presence of resin inside the fibers, citherphysically adsorbed or chemically incorporated into the bonding system, is expected to affect their thermalbehaviour
The aim of the present work to explore the pyrolysis behaviour of the particle board manufacturedfrom bagasse and flax using differential thermal analysis (DTA) and thermal gravimetric analysis (TGA &DTG).
-1003-
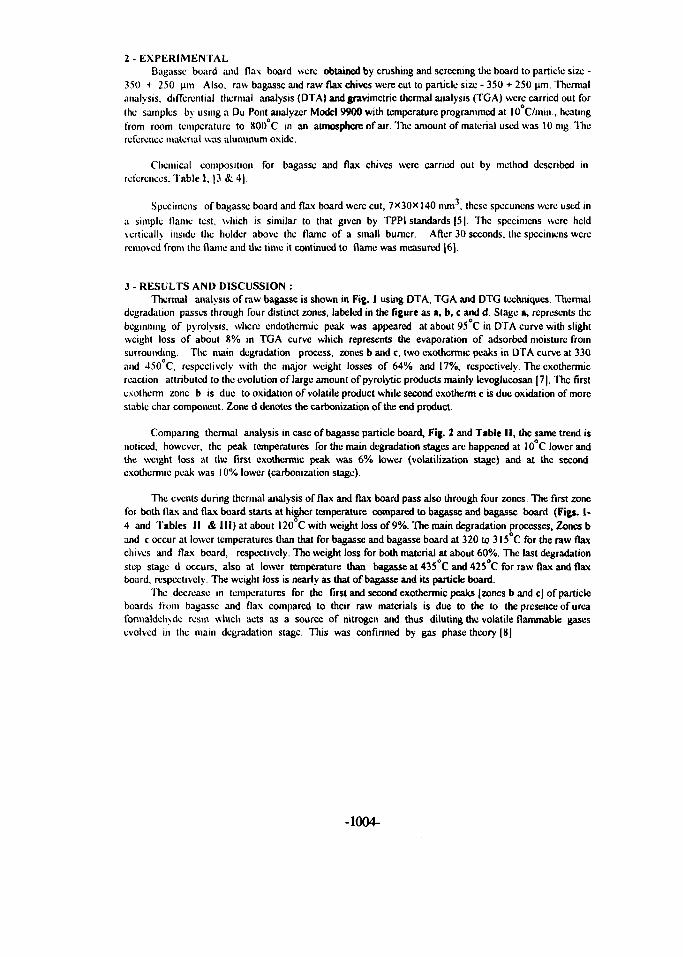
2-EXPERIMENTALBagasse board and flax board were obtained by crushing and screening the board to particle size -
350 + 250 \im Also, raw bagasse and raw flax chives were cut to particle size - 350 + 250 urn. Thermalanalysis, differential thermal analysis (DTA) and gravimetric thermal analysis (TGA) were carried out for(he samples by using a Du Pont analyzer Model 9900 with temperature programmed at 10 C/inin., heatingfrom room temperature to 800 C in an atmosphere of air. The amount of material used was 10 mg Thereference material was aluminum oxide.
Chemical composition for bagasse and flax chives were carried out by method described inreferences. Table I, | 3& 4).
Specimens of bagasse board and flax board were cut, 7x30* 140 mm', these specimens were ustd ina simple flame test, which is similar to that given by TPP1 standards |5|. The specimens were heldvertically inside the holder above the flame of a small burner. After 30 seconds, the specimens wereremoved from the flame and the time it continued to flame was measured [6).
3 - RESULTS AND DISCUSSION :Thermal analysis of raw bagasse is shown in Fig. 1 using DTA, TGA and DTG techniques. Thermal
degradation passes through four distinct zones, labeled in the figure as a, b, c and d. Stage a, represents thebeginning of pyrolysis. where endothermic peak was appeared at about 95 C in DTA curve with slightweight loss of about 8% in TGA curve which represents the evaporation of adsorbed moisture fromsurrounding. The main degradation process, zones b and c, two exothermic peaks in DTA curve at 330and 450°C, respectively with the major weight losses of 64% and 17%, respectively. The exothermicreaction attributed to the evolution of large amount of pyrolytic products mainly Icvoglucosan [7|. The firstexotherm zone b is due to oxidation of volatile product while second exotherm c is due oxidation of morestable char component. Zone d denotes the carbonization of the end product.
Comparing thermal analysis in case of bagasse particle board, Fig. 2 and Table II, the same trend isnoticed, however, the peak temperatures for the main degradation stages arc happened at 10 C lower andthe weight loss at the first exothermic peak was 6% lower (volatilization stage) and at the secondexothermic peak was 10% lower (carbonization stage).
The events during thermal analysis of flax and flax board pass also through four zones. The first zonefor both flax and flax board starts at higher temperature compared to bagasse and bagasse board (Figs. 1-4 and Tables II & HI) at about 120 C with weight loss of 9%. The main degradation processes. Zones band c occur at lower temperatures than that for bagasse and bagasse board at 320 to 315 C for the raw flaxchives and flax board, respectively. The weight loss for both material at about 60%. The last degradationstep stage d occurs, also at lower temperature than bagasse at 43S C and 425 C for raw flax and flaxboard, respectively. The weight loss is nearly as that of bagasse and its particle board.
The decrease in temperatures for the first and second exothermic peaks [zones b and cj of particleboards from bagasse and flax compared to their raw materials is due to the to the presence of ureafoniialdeli\de resin which acts as a source of nitrogen and thus diluting the volatile flammable gasesevolved in the main degradation stage. This was confirmed by gas phase theory |8|
-1004-
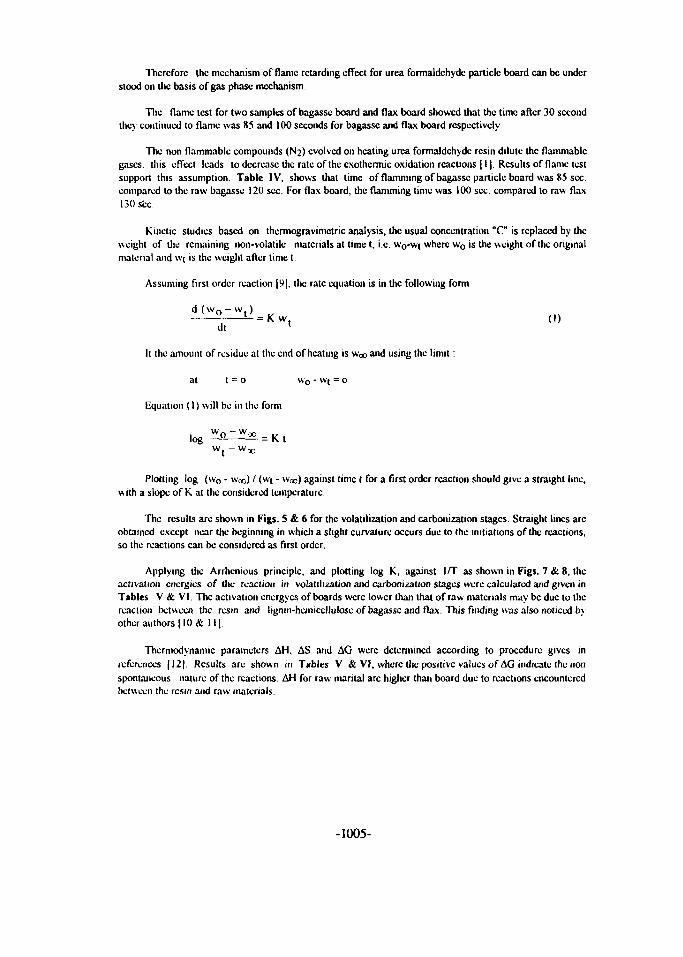
Therefore the mechanism of flame retarding effect for urea formaldehyde particle board can be understood on the basis of gas phase mechanism.
The flame test for two samples of bagasse board and flax board showed that the time after 30 secondthey continued to flame was 85 and 100 seconds for bagasse and flax board respectively
The non flammable compounds (N2) evolved on heating urea formaldehyde resin dilute the flammablegases, this effect leads to decrease the rate of the exothermic oxidation reactions [11. Results of flame testsupport this assumption. Table IV, shows that time of flamming of bagasse particle board was 85 seccompared to the raw bagasse 120 sec. For flax board, the flamming time was 100 sec. compared to raw flax130 sec
Kinetic studies based on thermogravimctric analysis, the usual concentration "C" is replaced by theweight of the remaining non-volatile materials at time t, i.e. wo-wt where w 0 is the weight of the originalmaterial and wrt is the weight after time t.
Assuming first order reaction | u | , the rate equation is in the following form
d ( w o - w , )
dt l
It the amount of residue at the end of heating is Woo and using the limit:
at t = o w0 - w( = o
Equation (1) will be 111 the form
log w o - w « = K t
Plotting log (w0 - woo) / (wt - wco) against time t for a first order reaction should give a straight line,with a slope of K at the considered temperature.
The results are shown in Figs. 5 & 6 for the volatilization and carbonization stages. Straight lines arcobtained except near the beginning in which a slight curvature occurs due to the initiations of the reactions,so the reactions can be considered as first order.
Applying the Arrhcmous principle, and plotting log K. against 1/T as shown in Figs. 7 & 8, theactivation energies of the reaction in volatilization and carbonization stages were calculated and given inTables V & VI. The activation energyes of boards were lower than that of raw materials may be due to thereaction between the resin and lignin-hemiccllulosc of bagasse and flax. This finding was also noticed byother authors 110 & 111
Thcrniodynamic parameters AH, AS and AG were determined according to procedure gives inreferences | I 2 | Results are shown in Tables V & VI, where the positive values of AG indicate the nonspontaneous nature of the reactions. AH for raw marital arc higher than board due to reactions encounteredbetween the resin and raw materials.
-1005-
4-CONCLUSION :1 - Thermal analysis of particle board made from bagasse and flax allow the same trend as their raw
materials of four degradation steps The main degradation steps for particle boards (volatilization andcarbonization) were occurred at lower temperatures than the raw material and with lower activationenergy. This is due to the evolution of nitrogen gas during pyrolysis of resin.
2 - The use of resin is, therefore, not mainly a binding material but also acts as a flame retarding
REFERENCES
1 - C'ullis. C F and Ilirschlcr. M. M. "The combustion of organic polymers", Oxford Clarendon Press.New York. 343 (IWI)
2 - Ronald, G. M. and John. N F , "Pulp and paper manufacture" Vol. 2. 2 nd Eddition. Me Graw-Ilill. New York. 422-428 (l%9).
3 - Nassar. M. M . "Kinetic studies on thermal degradation of nonwood plants", wood and fiber Science,Vol. 17. No. 2. 2i.6-.773 (19X5).
4 - Sharma. H. S , S "Thermogravimetric analysis of flax chives degraded by pleurotus ostrcatus andccraceoimces sublaevis". Thcmoclumica Acta, Vol. 138, No. I, 347-357 (1989).
5 - Apparatus for measuring flame resistance, TAI'PI standard, (1968).6- lilhs. W. I ) . "Therniogravimotry of wood reacted with hcxamethylphophorous tnamide as a flainc
retardaiil treatment'. Thermochimica Acta, Vol. 188, No I, 213-219 (1991)7 - Sliafiiadch. F and [iradbury. A G W . "Thermal degradation of cellulose in air and nitrogen at low
temperatures". J APPI Sci .Vol. 23.143 1-1442 (1979).X- Kuryla.W C and Papa. A.J.. "Flame retardancy of polymeric materials". Vol. 4 Marcel Dekker,
Inc.. New York. 15 (1978).
*> - rainier. K W "Air Force Aeronautical Systems Division Rep. ASD-TDR-62-1043. (19o3).Hi - Tang. W K.. "Effect of inorganic salts on pyrolysis of wood" U S Forest Service Research Paper
FPL 71. (|9{.7).11- Sefain. M Z . Nagieb. Z A . El-Wakil, N A. and Naoum, M. M, "Thermal degradation of paper
sheet made from wood treated with phenolic resin and bagasse pulps", Themiochinnca Acta,Vol.191. No. I, 21-27(1991)
12- Glasston. S "Tc\t book of physical chemistry", MacMillan Co., London, X28 (1962).
-1006-
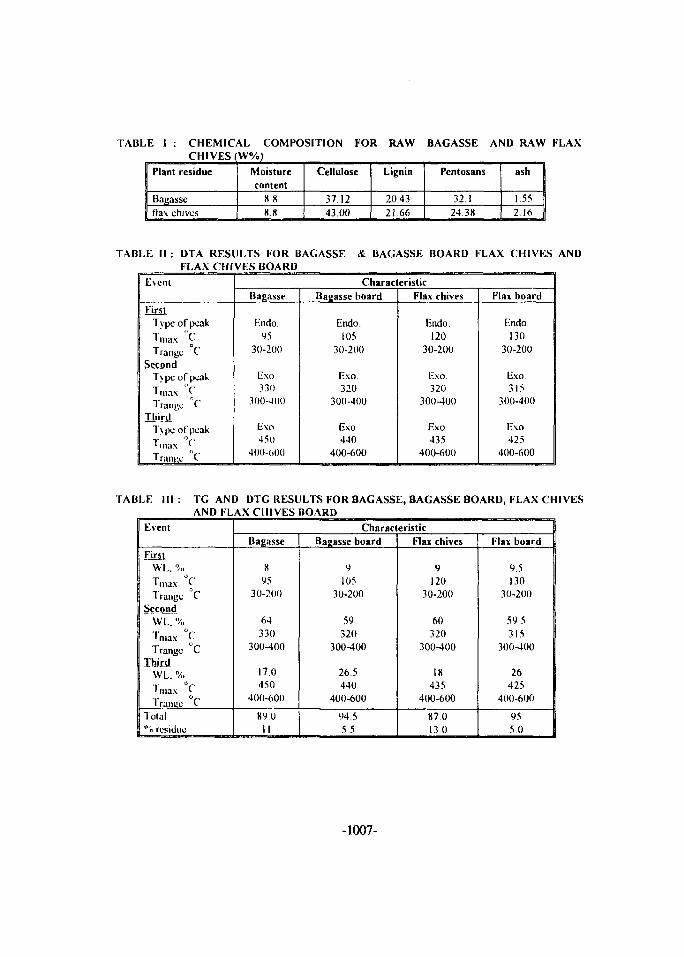
TABLE I : CHEMICAL COMPOSITION FOR RAW BAGASSE AND RAW FLAXCHIVES (W%)
Plant residue
Bagasseflax chives
Moisturecontent
«.«
Cellulose
37.1243 00
Lignin
20.4321.66
Pentosans
32.124.38
ash
1.552.16
TABLE II : DTA RESULTS FOR BAGASSE & BAGASSE BOARD FLAX CHIVESFLAX CHIVES BOARD
AND
Event
FirstType of peak
r»iax CTrange C
SecondType of peak1 max ^Trange C
ThirdType of peakT ('TraiiKC C
CharacteristicBagasse
Endo.95
30-200
Exo330
300-400
Exo450
400-600
Bagasse board
Endo.105
30-200
Exo320
300-400
Exo440
400-600
Flax chives
Endo.120
30-200
Exo320
300-400
Exo435
400-600
Flax board
Endo.130
30-200
Exo315
300-400
Exo.425
400-600
TABLE III: TG AND DTG RESULTS FOR BAGASSE, BAGASSE BOARD, FLAX CHIVESAND FLAX CHIVES BOARD
Event
EkstWL. %
T range CSecond.
WL. %
' max £-'1 range C
Third.WL. %
T V1ranuc ITotal
"•'a residue
CharacteristicBagasse
895
30-200
64330
300-400
170450
400-600
890II
Bagasse board
9105
30-200
59320
300-400
26.5440
400-600
94.55.5
Flax chives
9120
30-200
60320
300-400
18435
400-600
87.013.0
Flax board
9 5130
30-200
59.5315
300-400
26425
400-600
955 0
-1007-
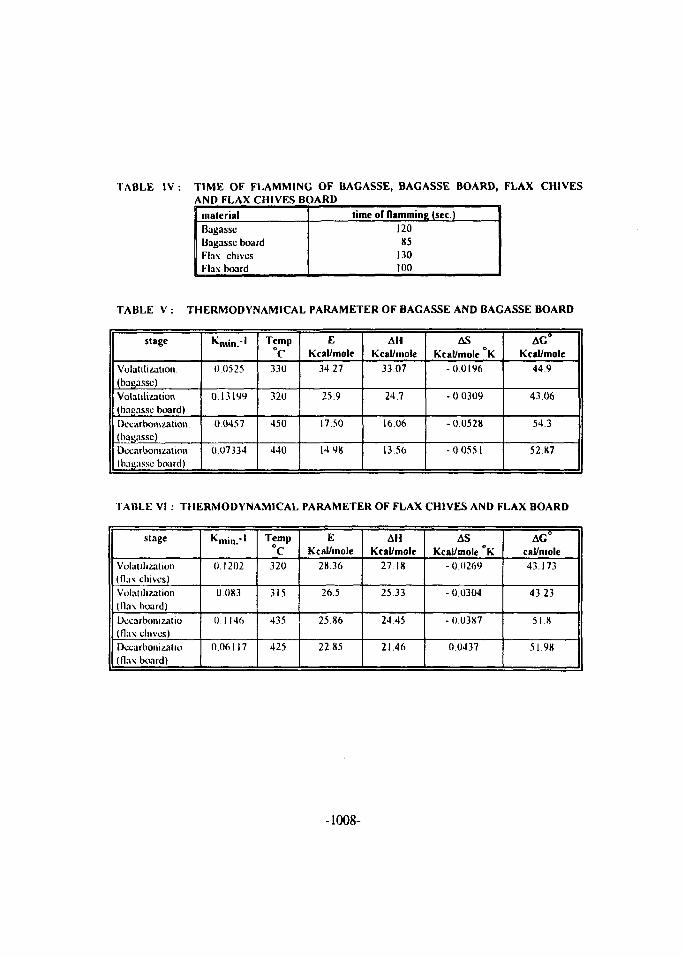
TABLE IV : TIME OF FLAMMING OF BAGASSE, BAGASSE BOARD, FLAX CHIVESAND FLAX CHIVES BOARD
materialBagasseBagasse boardFlax chivesFlax board
time of flamming (sec.)12085
130100
TABLE V : THERMODYNAMICAL PARAMETER OF BAGASSE AND BAGASSE BOARD
stage
Volatilization(bagasse)Volatilization(bagasse board)Dccarbonization(bagasse)Deearbonization(bagasse board)
^min."'
0.0525
0 13199
0.0457
0 07334
Temp°C330
320
450
440
EKcal/mole
34.27
25.9
17 50
1498
AHKcal/mole
33.07
24.7
16 06
13.50
ASKcal/mole °K
-0 0196
-0 0309
- 0.0528
-0 0551
AC"Kcal/mole
44.9
43.06
54.3
52.87
TABLE VI : THERMODYNAMICAL PARAMETER OF FLAX CHIVES AND FLAX BOARD
stage
Volatilization(flax chives)Volatilization(flax board)Decarbonizatio(flax chives)Decarbomzatio(flax board)
k|iiin.*'
0.1202
0.083
0.1146
0.061 17
Temp°C320
315
435
425
EKcal/mole
2836
26.5
25.86
22.85
AHKcal/mole
27.18
25.33
2445
21.46
ASKcal/mole °K
- 0.0269
- 0.0304
-0 0387
0.0437
AC°cal/inole
43.173
43.23
518
51.98
-1008-
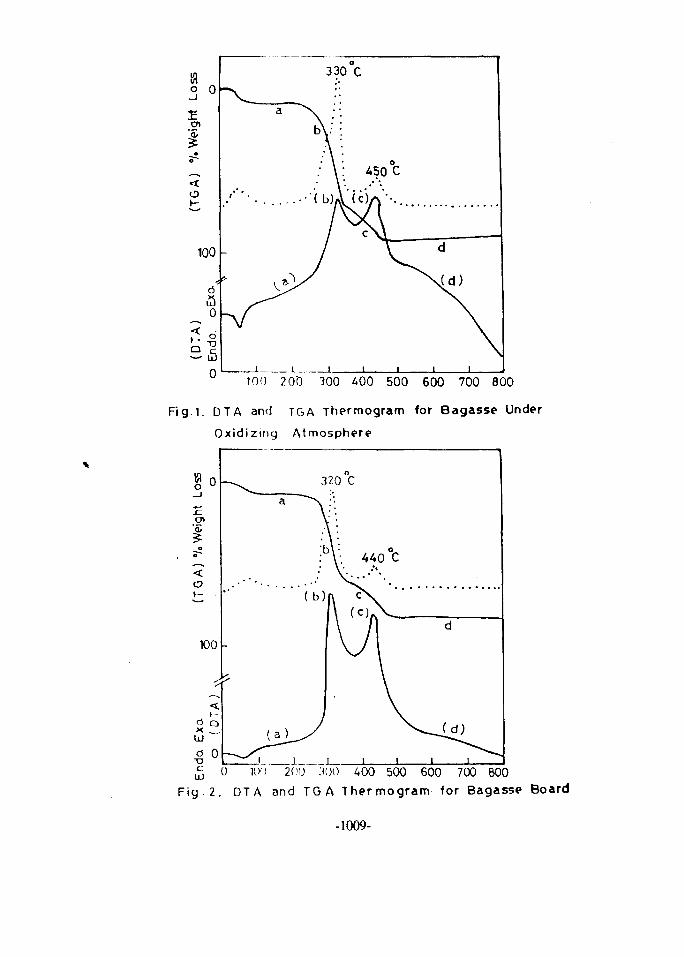
100 200 300 400 500 600 700 800
Fig.1. DTA and TGA Thermogram for Bagasse Under
Oxidizing Atmosphere
UJ 100 200 300 400 500 600 700 800Fig . 2. DTA and TGA Thermogram for Bagasse Board
-1009-
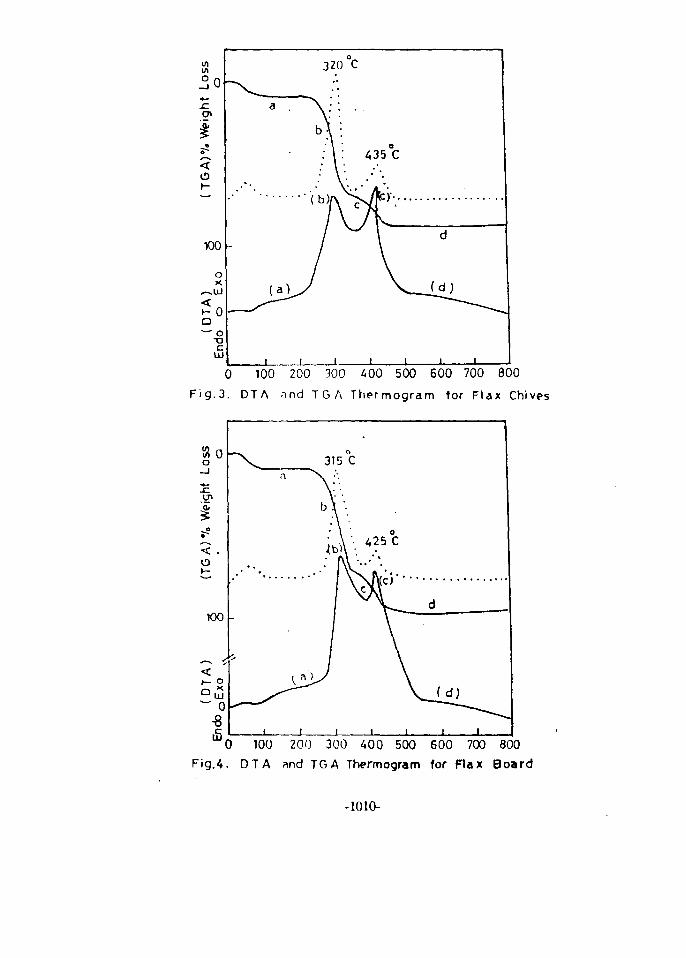
0 100 200 300 400 500 600 700 800
F i g . 3 . DTA nnd TGA Ther mogram tor F lax Chives
0 100 200 300 400 500 600 700 800
Fig.4. DTA and TGA Thermogram for Flax Board
-1010-
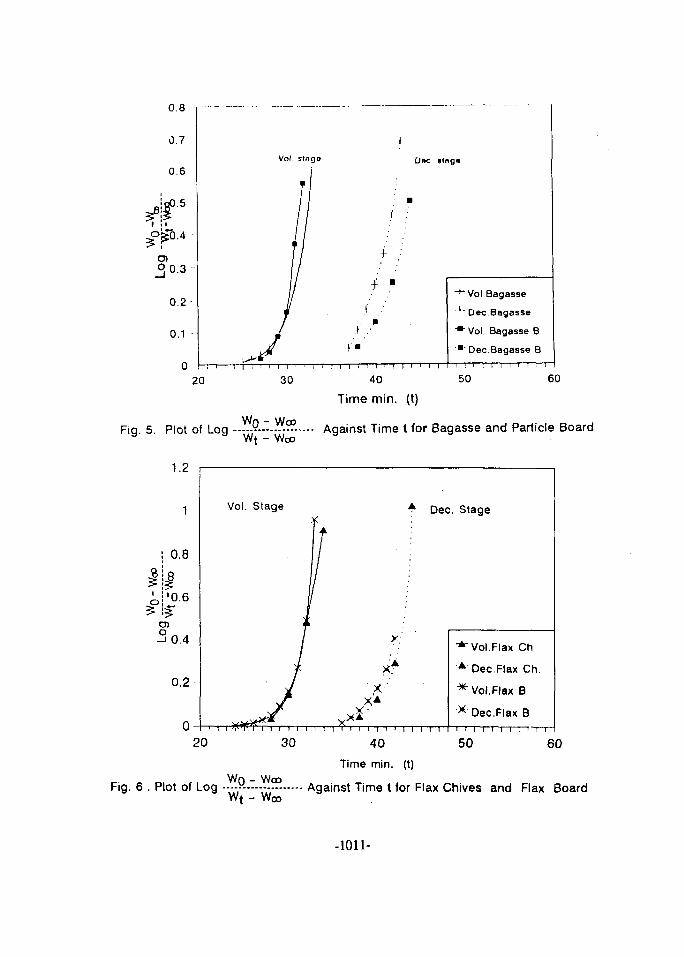
0.8
0.7
0.6
i 11
O)0.3
0.2
0.1 -
0
VoJ singe One «tng«
20
f ;
f ••
+ •
i i i i i i i i i i i i i i i i i i i I
40
Time min. (t)
~>Vol Bagasse
'I' Dec.Bagasse
• * Vol. Bagasse B
'•• Dec Bagasse B
50 60
Fig. 5. Plot of Log —--?-"---??----- Against Time t for Bagasse and Particle Board
1.2
! 0.8
eno
0.4
0.2
0 -
Vol. Stage
20
^ Dec. Stage
XX *
I I i i i I i T i i i i i I I I I i I
"*• Vol.Flax Ch
A Dec.Flax Ch.
* Vol. Flax B
* Dec.Flax B
40
Time min. (t)
i i i i i i i i i i i
50 60
Fig. 6 . Plot of Log .—P-T....5?. Against Time t for Flax Chives and Flax BoardWj - Woo
-1011-
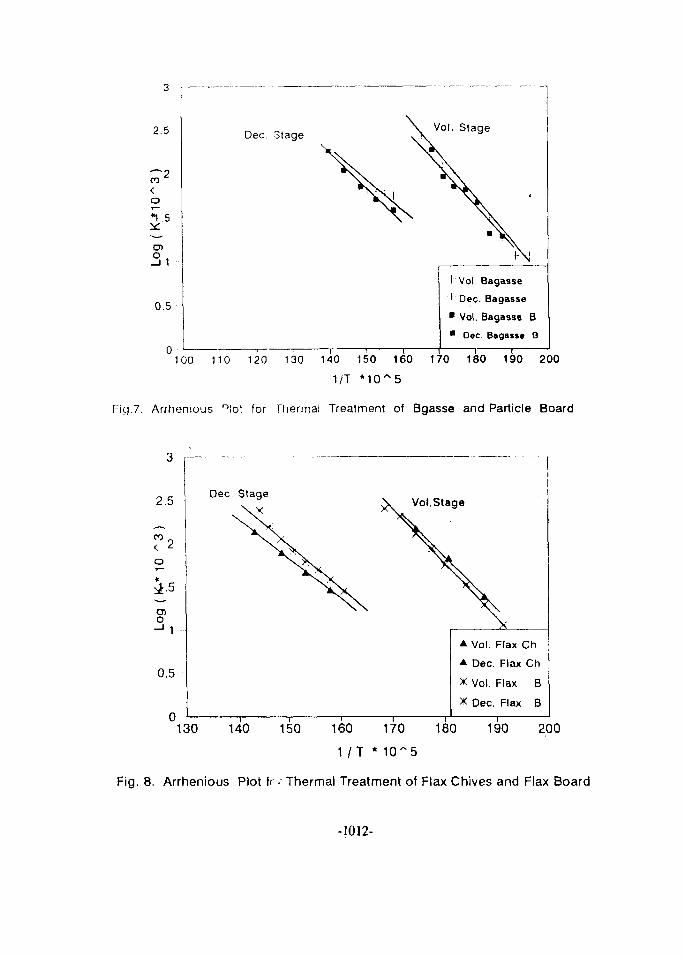
2.5
o
1 -
0.5
Dec. StageVol. Stage
"I Vol. Bagasse
t Dec. Bagasse
• Vol. Bagasse B
• Dec Bagasse B
100 110 120 130 140 150 160 170 180 190 200
1/T * 1 0 ~ 5
Fig.7. Arrhenious °lot for Thermal Treatment of Bgasse and Particle Board
2.5
i5
o
0.5
Dec. StageVol.Stage
Vol. Flax Ch
Dec. Flax Ch
Vol. Flax B
Dec. Flax B
130 140 150 160 170 180 190 200
1 /T * 10^5
Fig. 8. Arrhenious Plot f< , Thermal Treatment of Flax Chives and Flax Board
-1012-