actin filament elasticity and retrograde flow shape the force-velocity relation of motile cells
TRANSCRIPT
Biophysical Journal Volume 102 January 2012 287–295 287
Actin Filament Elasticity and Retrograde Flow Shape the Force-VelocityRelation of Motile Cells
Juliane Zimmermann,†* Claudia Brunner,‡ Mihaela Enculescu,† Michael Goegler,‡ Allen Ehrlicher,‡ Josef Kas,‡
and Martin Falcke††Mathematical Cell Physiology, Max-Delbruck-Center for Molecular Medicine, Berlin, Germany; and ‡Division of Soft Matter Physics,Department of Physics, University of Leipzig, Leipzig, Germany
ABSTRACT Cells migrate through a crowded environment during processes such as metastasis or wound healing, and mustgenerate and withstand substantial forces. The cellular motility responses to environmental forces are represented by theirforce-velocity relation, which has been measured for fish keratocytes but remains unexplained. Even pN opposing forcesslow down lamellipodiummotion by three orders of magnitude. At larger opposing forces, the retrograde flow of the actin networkaccelerates until it compensates for polymerization, and cell motion stalls. Subsequently, the lamellipodium adapts to the stalledstate. We present a mechanism quantitatively explaining the cell’s force-velocity relation and its changes upon application ofdrugs that hinder actin polymerization or actomyosin-based contractility. Elastic properties of filaments, close to the lamellipo-dium leading edge, and retrograde flow shape the force-velocity relation. To our knowledge, our results shed new light on howthese migratory responses are regulated, and on the mechanics and structure of the lamellipodium.
INTRODUCTION
Cell motility is instrumental in virtually all aspects of life,including development, immune response, wound healing,and tumor metastasis. Many motile cells form a flatmembrane protrusion, known as the lamellipodium, in thedirection of movement. Lamellipodium movement is drivenby the polymerization of actin filaments against its leading-edge membrane (1–4). The filaments can exert force,because their barbed ends polymerize and push against themembrane, whereas their pointed ends are anchored in anactin gel formed by entanglement and cross-linking. Thecell velocity is determined by polymerization forces at thelamellipodium leading edge, contraction of the actin gelby myosin motors, cell adhesion to the substrate, and thebackward-directed actin gel retrograde flow (5,6). Theseprocesses establish the force-velocity relation, which deter-mines the cell’s shape and movement (6). This relation hasbeen measured with a scanning force microscope (SFM) forfish keratocytes (7–9) by placing a flexible cantilever in thecell’s migration path. The force exerted on the cell’s leadingedge as well as the lamellipodium protrusion velocity can bededuced from the time course of cantilever deflection.
The force-velocity relation of lamellipodium protrusionhas several unexpected properties. Upon first contact withan obstacle such as the SFM cantilever, the velocity ofthe lamellipodium leading edge drops substantially, eventhough the cantilever presents a force below the thresholdof measurement at this time. Subsequently, the lamellipo-dium then surprisingly pushes forward with an increasingvelocity against an increasing force. As the lamellipodium
Submitted October 6, 2011, and accepted for publication December 13,
2011.
*Correspondence: [email protected]
Editor: Charles Wolgemuth.
� 2012 by the Biophysical Society
0006-3495/12/01/0287/9 $2.00
nears its maximum protrusion force, its velocity decreasesuntil the cantilever force balances with protrusion forceand stalls lamellipodium motion (7). This part of theforce-velocity relation is clearly not convex, contrary toexpectations and theoretical predictions (4,10–12) anddespite actin polymerization at the leading edge having aconvex force dependency (4,13). The organization of theactin propulsion engine, which generates a concave force-velocity relation, pauses at pN forces, yet only stalls atforces an order-of-magnitude larger, is an essential featureof the lamellipodium that is not understood.
Here, we measure the force-velocity relationship of fishkeratocytes using spherical-probe-based SFM. We presenta mathematical model that accurately explains all phasesof the force-velocity relation, predicts the effects of drugs,and reproduces the diverse experimental results from avariety of studies (7,8).
MATERIALS AND METHODS
Force-velocity curves are measured withspherical probe-based scanning forcemicroscopy
We measure the protrusion stall force of fish keratocytes with a recently
established SFM-technique (14) (Fig. 1). It uses the vertical and lateral
deflection of a SFM-cantilever modified by a spherical probe (14). A poly-
styrene bead is bound to an SFM cantilever tip (14) and positioned on the
substrate in front of a migrating cell with a preset force to assure tight
contact. Cells move unhindered until they encounter the bead, push it, and
cause torsion of the cantilever (Fig. 1). Because of the high normal force
of the cantilever, the cell can only push the bead within its plane of move-
ment until the opposing load reaches the cell’s stall force (Fig. 1). The
torsional motion lifts the spherical probe from the substrate. Nevertheless,
the bead still completely stalls the motion and the lamellipodium cannot
slip through under the probe. If the vertical preset force was chosen very
doi: 10.1016/j.bpj.2011.12.023

FIGURE 1 Spherical probe attached to an SFM-cantilever. (A) The probe
is placed with a preset force of 10 nN in the path of the cell. (B) The probe
stalls the leading edge of a forward moving cell. The torsional bending of
the cantilever measures the force.
288 Zimmermann et al.
low (<1 nN), the cell would be able to squeeze beyond the bead and to push
the cantilever upwards. High-resolution interference reflection microscopy
measures the free cell velocity and monitors precisely the position of the
lamellipodial edge with respect to the spherical probe to additionally assure
that the lamellipodium does not slip under the probe and that the cell is fully
stalled by the bead as obstacle. The validity of this technique has been
recently verified by the fact that similar approaches produced the same quan-
titative results (7,8). In addition, we use lamellipodium feature tracking
analysis to measure the retrograde flow in some cells during unhindered
motion (see Table S2 and Methods in the Supporting Material).
Force analysis
Vertical and rotational sensitivity sF (nm/V and rad/V, respectively) and
normal and rotational spring constant kF (mN/m and Nm/rad, respectively)
of the cantilever allow the conversion of the vertical signal into height and
of the lateral signal into torque t. The lateral force FL can be evaluated
using the general relation FL¼t/l, where t ¼ sFkFDVL, and l is the moment
arm. It consists of the tip length plus a certain fraction of the bead diameter,
depending on the height of the lamellipodium, which was derived from
topographical scans.
Cell culture and cytoskeletal drug treatment
Primary goldfish epithelial keratocytes were cultured in Dulbecco’s modi-
fied Eagle’s medium (E15-810; PAA, Etobicoke, Ontario, Canada) supple-
mented with 20% fetal calf serum (Cat. No. A15-043; PAA), 10 mM
HEPES (H4034; Sigma, St. Louis, MO), and 100 U/ml penicillin-strepto-
mycin (P0781; Sigma) in a custom-built experimental dish, which consists
of a commercial petri dish with a 3-cm hole in the bottom and a 4-cm round
glass coverslip (631-0177; VWR International, West Chester, PA) glued to
it. The cells were cultured at room temperature and 5% CO2.
Cytoskeletal drugs (ML-7, 750nM;cytochalasinD, 80nM)wereapplied to
the cellmediumat least 12 h before anymeasurement, and itwas assumed that
the drug concentration inside and outside the cell reached equilibrium during
that time. Cells remained viable and motile, with no observed apoptosis.
Modeling the force-velocity relation
A detailed model description can be found in the Supporting Material.
FIGURE 2 Illustration of the modeled lamellipodial structure. The
lamellipodium is a flat membrane protrusion extended by motile cells in
the direction of motion. The actin network inside forms a cross-linked
gel (solid green) and a semiflexible region (SR) dominated by single fila-
ments. The mathematical model describes the dynamics of gel retrograde
flow, adhesion, SR depth, free filament length in the SR, filament attach-
ment and detachment, gel boundary motion, and leading-edge membrane
motion.
RESULTS AND DISCUSSION
Processes and interactions contributingto the force-velocity relation and enteringthe mathematical model
The mathematical model (15–17) (see Supporting Material)is based upon properties of individual actin filaments at the
Biophysical Journal 102(2) 287–295
leading edge, cross-linked filaments in the more proximalregions of the lamellipodium, and examines their forcesagainst the plasma membrane (Fig. 2). Network behaviorat the leading edge is dominated by semiflexible single poly-mer properties, because cross-linking molecules have notbound to the newly polymerized filaments yet (17). More-over, the branch point density (arising from filament nucle-ation, see below) is also very low in that region (18), suchthat branching does not contribute essentially to cross-link-ing, which further validates the dominance of single fila-ment behavior. We call this area the semiflexible region(SR). The network is more strongly cross-linked furtheraway from the leading edge, because molecules had timeto bind to longer existing filament parts. This cross-linkinggradient is also reflected by the network structure withsingle actin filaments present at the periphery and bundlednetworks filling the proximal part (5,19–23). Network prop-erties are thus more gel-like further back toward the cellbody (24). The transition from SR to gel is gradual, butwe approximate it by a sharp gel boundary in the mathemat-ical model. Although these two regions are structurallydistinct, they are mutually dependent and connected, asthe SR drives retrograde flow and pushes the gel rearward.Vice versa, the difference between the leading-edge velocityand the gel boundary velocity determines the dynamics ofthe SR depth, the length of polymers in the SR, and conse-quently the force they transmit (17).
Actin Filament Elasticity and Retrograde Flow 289
The leading-edge velocity of the lamellipodium is setby the balance of forces exerted by filaments on the mem-brane, the external cantilever force, and all viscous forcesresisting membrane motion (15,25). Filament cross-linking,entanglement, and retrograde flow determine the progres-sion of the gel boundary (17). These processes depend onthe filament lengths in the SR. If the filaments in the SRare very short, gel protrusion stops, as these filaments cannotentangle, nor can they bind cross-linkers. Conversely, gelprogression increases with longer free lengths, eventuallysaturating at a value determined by cross-linker concen-tration (15,17). The cross-linking rate increases with fila-ment density, because denser filament packing permitscross-linkers to span the interfilament distance morefrequently (17).
Retrograde flow is maintained by polymerization at theleading edge and myosin contraction of the network at theboundary between the lamellipodium and the cell body,whereas contraction by myosin in the central lamellipodiumcontributes little (6,26–28). We model the retrograde flowusing a gel theory that captures the viscoelastic propertiesof the actin network, polarization due to alignment of fila-ments into the direction of motion, and contraction bymyosin (29). Force transmission from substrate adhesionto the actin gel is described by friction in this theory.
New filaments are nucleated close to the leading edge(3,30). Polymerization is terminated by binding of cappingproteins to the filament barbed ends (3,30), and cappedends move into the gel region. The steady motion and shapeof fish keratocytes implies that capping and nucleationmaintain a constant actin filament density in the SR (6).According to the dendritic-nucleation model, new filamentsgrow from actin-related protein 2/3 complex (Arp2/3),which is bound to existing filaments. This branching requiresactivation of Arp2/3 by membrane-bound Wiskott AldrichSyndrome protein (3,30). Branch points are formed at themembrane and move within seconds into the gel as fila-ments are cross-linked. Response times of filament densityto external force in an in vitro experiment (31) and theslow filament nucleation rate (18) support the assumptionthat the filament density remains constant during ourmeasurements.
The binding of filaments to the plasma membrane affectstheir force generation, because attached filaments eitherpush or pull the membrane depending on their free lengthand the SR depth. Experimental evidence suggests thatfilaments transiently attach to the leading-edge membraneduring the nucleation process (21,32–35), but are also inde-pendent from nucleation via nucleation-promoting factors(16,30,34–36) and other F-actin-membrane-linking proteins(37). Therefore, we incorporate attached and detached fila-ments in the model (4,15). Detached filaments polymerizeand push against the leading-edge membrane, whereasattached filaments do not polymerize in our model andcan exert either a pushing or a pulling force.
The mathematical model (see description and the expres-sions in Eq. S3 in the Supporting Material) comprises thedynamics of the number and length of attached and detachedfilaments in the SR, and the positions and velocities of boththe gel boundary and the leading-edge membrane (Fig. 3).The leading-edge position is equal to cantilever deflectionafter cantilever contact. We fit the model simulations byeye to the measurements. We only change the parametersshown in Table 1 to account for cell variability and drugeffects. All other parameter values are either determinedby the experimental setup, taken from the literature when-ever available, or fitted once and then kept fixed (seeTable S1 in the Supporting Material). Simulations startwith parameter values that reproduce the velocity of theindividual free running cell and the population average ofthe retrograde flow (see Table S2). Velocity and retrogradeflow fix the value of the model’s maximum cross-linkingrate, because it has to be equal to the sum of both duringfree steady motion. Gel viscosity, friction, and contractilestress determine the retrograde flow velocity. Those param-eters, as well as the filament density and polymerizationrate, also affect the other phases of the force-velocity rela-tion and are determined by fitting the cantilever deflectionthrough all three of them (Fig. 3).
Initial velocity drop
Upon first contact with the cantilever, the leading-edgevelocity drops from ~260 nm/s to <0.1 nm/s both in exper-iments and simulations (Fig. 3 D). The velocity drop isthe difference between the free cell velocity and the firstdetectable cantilever deflection velocity. The ensuing slowcell motion causes the force-velocity relations shown inFig. 3, A–C.
The boundary between the SR and gel decelerates slowly,but the initial leading-edge velocity drop appears to beinstantaneous (Fig. 3 D), and simulations suggest that itoccurs within a few milliseconds. The forces causing thisabrupt leading-edge deceleration are in the range of thezero point fluctuations of the cantilever of ~0.05 nN (seeFig. S1 in the Supporting Material). The model explainsthe sensitive response of the leading edge to these minuteforces by the rather long free polymer length in the SR.Fits of the model to measurements result in a filament lengthof the freely running cell of ~1.8 mm (Fig. 3 E). Such longfilaments easily bend elastically (see Eqs. S1 and S2 in theSupporting Material) (11,13).
For given maximum cross-linking and polymerizationrates, the free filament length is determined by the forceper filament, which in turn depends on filament density.Small force per filament entails long free length. We willsee in the next section how the free filament length adaptsto force changes. The free filament length also cruciallyaffects the time course of the concave phase, in particularthe time until stalling. Hence, the fitting procedure results
Biophysical Journal 102(2) 287–295

0
200
400
0 10 20 30
Vel
ociti
es (n
m/s
)
Time (s)
0
0.1
0.2
0 0.2 0.4 0.6Force (nN)
0
0.1
0.2
0 0.2 0.4 0.6Force (nN)
0
0.1
0.2
0 0.2 0.4 0.6
Vel
ocity
(nm
/s)
Force (nN)
0
0.2
0.4
0.6
0 5 10 15 20 250
0.2
0.4
Forc
e (n
N)
Time (s)
0
0.2
0.4
0.6
0 3 6 9 120
0.1
0.2
0.3
Deflection (nm
)
Time (s)
0
1
2
0 10 20 30
0.6
0.8
1.0
Leng
th o
f det
ache
d fi
lam
ents
(µm
)
Ratio of S
R depth to
filament length
Time (s)
0
0.2
0.4
0.6
0 5 10 15 200
0.4
0.8
Time (s)
0.2
0.4
0.6
0 10 20 30
Frac
tion
of a
ttach
ed fi
lam
ents
Time (s)
Control C
D E
A B Cytochalasin D ML−7
F
FIGURE 3 Cantilever deflections, force-velocity
relations, and SR properties. (A–C) Comparison of
simulations (black) and experiments (red) for (A)
a control cell and cells influenced by the applica-
tion of (B) cytochalasin D and (C) ML-7. (Upper
row) Time course of the cantilever deflection
due to the lamellipodium’s leading edge pushing
against the bead on the cantilever; (lower row)
force-velocity relation. (D–F) Simulated develop-
ment of velocities and the semiflexible region
(SR) after cantilever contact for the control cell.
(Brown dots) First cantilever contact; (yellow
dots) time when motion stalls. (D) Development
of the leading-edge velocity (black), the gel
boundary velocity (blue), retrograde flow velocity
(red), and the sum of the gel boundary and retro-
grade flow velocities (dashed magenta), which is
essentially constant. (E) Time course of the ratio
of SR depth to length of detached filaments
(blue) and the filament length (black). The differ-
ential stiffness of the filaments is proportional to
(free filament length)�4 (see Eq. S1 in the Support-
ing Material). (F) Time course of the fraction of
filaments attached to the membrane. Parameter
values for simulations are given in Table S1. See
also Fig. 1 and Fig. S1 and Fig. S5.
290 Zimmermann et al.
in a filament density value (and polymerization rate),providing for a force per filament and free filament lengthin the freely running cell—which explains the sensitiveinitial response and is compatible with the time course ofthe concave phase.
Retrograde flow accelerates
The concave phase follows the initial velocity drop (Fig. 3A). It lasts until the first force maximum of the deflectioncurve, where the stall force is reached. The leading-edgevelocity increases slightly in the beginning, then it decreasesand lamellipodium motion stalls. The leading-edge velocityis small initially, because filaments are long and the SR issoft. Long filaments cannot transmit the external force tothe gel effectively. Thus, the gel keeps moving forward,the SR depth shrinks, and filaments bend (Fig. 3 E). Bentfilaments are cross-linked into the gel more quickly as theSR depth decreases. They shorten and become stiffer, which
TABLE 1 Statistics of parameter values to describe control and dr
Parameter Control Cytoch
Filament density 302 5 42 181
Maximum value of the polymerization rate 611 5 205 588
Maximum value of the cross-linking rate 306 5 75 129
Viscosity of the actin gel 0.91 5 0.38 0.90
Friction coefficient modeling adhesion 0.23 5 0.12 0.22
Active contractile stress in the actin gel 8.33 8
List of parameter values (mean5 SD) resulting from fitting experimentally meas
Results of all simulations are shown in Fig. 4. Parameter values for the surfac
viscosity and friction coefficient correspond to lower surface in Fig. 4 B, h
Table S1. The active contractile stress value 8.33 pN/mm2 is small compared to
Material), which can be estimated as 1–4 nN/mm2.
Biophysical Journal 102(2) 287–295
enables them to transmit larger forces without furtherbending, to straighten out and to cause the slight velocityincrease.
Because the external opposing force prevents forwardprotrusion, the ongoing polymerization pressure pushesthe actin gel rearward. Retrograde flow accelerates duringthe entire concave phase, as the force transmitted by thefilaments in the SR increases with increasing stiffness(Fig. 3 D). The external force shifts the partitioning of thepolymerization velocity between forward protrusion andretrograde flow towards retrograde flow. The cell slowsdown as retrograde flow speeds up (Fig. 3 D). Cell motionstalls when all polymerization velocity is converted intoretrograde flow, in agreement with experimental reportsshowing the sum of protrusion velocity and retrogradeflow to be approximately constant (26).
The polymerization rate decreases exponentially withincreasing force (4,13). Nevertheless, forces per detachedfilament stay at <1 pN (see Fig. S2), which is the single
ug applications
alasin D ML-7 Surfaces (Fig. 4) Units
5 32 300 5 0 Variable mm�1
5 80 613 5 106 617 nm/s
5 73 157 5 52 Variable nm/s
5 0.37 1.03 5 0.17 0.5, 0.833, 1.33 nNs/mm2
5 0.11 0.243 5 0.053 0.1, 0.233, 0.4 nNs/mm3
.33 0 8.33 pN/mm2
ured deflection curves (control N¼ 13, cytochalasin D N¼ 8, ML-7 N¼ 7).
es shown in Fig. 4 are given in the fifth column (smaller values of the gel
igher values to upper surface). All other parameter values are listed in
the other term in the constitutive equation (see Methods in the Supporting
100
300
500
100 200 300 4000
0.4
0.8
Sta
ll fo
rce
(nN
)
Max. cross-linking rate (nm/s)Filament
density (µm-1 )
100
300
500
100 200 300 4000
0.4
0.8
Sta
ll fo
rce
(nN
)
Max. cross-linking rate (nm/s)Filament
density (µm-1 )
100
300
500
100 200 300 4000
0.4
0.8
Sta
ll fo
rce
(nN
)
Max. cross-linking rate (nm/s)Filament
density (µm-1 )
100 500 100 200 300 4000
0.4
0.8
1.2
Sta
ll fo
rce
(nN
)
ilamentm
-1 ) 100 500 100 200 300 400
0
0.4
0.8
1.2
Sta
ll fo
rce
(nN
)
ilamentm
-1 )
A
B
Actin Filament Elasticity and Retrograde Flow 291
filament polymerization stall force (11,38). Therefore,a reduction of the polymerization rate by the load per fila-ment is not the crucial factor in cell deceleration. It is notthe force-dependence of polymerization that shapes theforce-velocity curve of the lamellipodium, but the interplaybetween filament shortening and bending in the SR and gelretrograde flow. Because the actin filaments continue topolymerize, retrograde flow is fast in the stalled state, andthe polymerization force that pushes retrograde flowbalances the external force when the cell stalls.
The magnitude of the stall force is determined by themaximum polymerization rate and gel properties likeviscosity and adhesion. The polymerization rate influencesalso the free filament length. The time to reach the stall forceincreases with increasing filament density because the forceper filament decreases, filaments are longer, and it takeslonger to shorten them.
F density (µMax. cross-linking rate (nm/s)F density (µMax. cross-linking rate (nm/s)
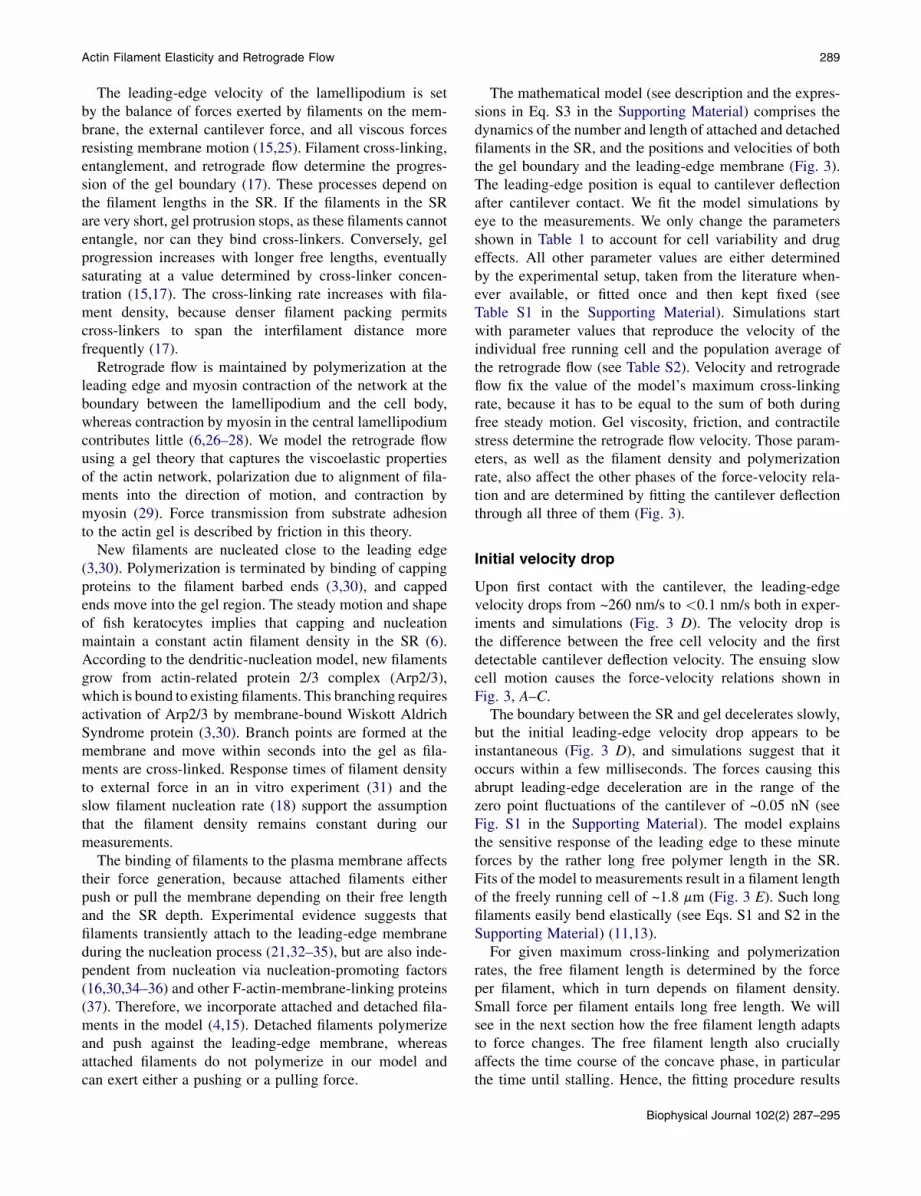
FIGURE 4 Dependence of the stall force on maximum cross-linking rate
and filament density. (A) (Black surface) Prediction of the mathematical
model for the control parameter values from Table S1. (Dots) Results for
cross-linking rate and filament density from fits of the model to measure-
ments like those shown in Fig. 3 (magenta rectangles, control; green
circles, cytochalasin D; blue triangles, ML-7). (B) The same data from
a different angle of view showing the scatter of experimental data more
clearly. The two additional surfaces demonstrate that all measured stall
forces can be explained by the model within a realistic parameter value
range for such parameters as cross-linking rate, filament density, the friction
coefficient modeling adhesion, and viscosity of the actin gel (see Table 1
and Table S1 for parameter values).
Adaptation to the stalled state
When the first maximum of the deflection is reached, thelamellipodium has not adapted to the larger external forceyet. The ensuing adaptation to the stalled state causes a thirdphase of the force-velocity relation, which starts with a slightleading-edge retraction followed by irregular and transientoscillations with decreasing amplitude around the stall force(Fig. 3 A). The durations and time courses of the transientsare not generalizable and vary between cells, comprisinganything between several undulations of force and velocityand a single incomplete one. However, the existence of anadaptation phase is a universal feature of the force-velocitycurve, and has been observed in all simulations and experi-ments. Adaptation demonstrates that the force-velocity rela-tion is a dynamic phenomenon. It does not describe thestationary velocity of the lamellipodium for a given force.
During the adaptation phase, the depth of the SR shrinksand filaments in the SR straighten further (Fig. 3 E). Thedetachment rate of bound filaments increases exponentiallywith the pulling force (see Eq. S4 in the Supporting Mate-rial) (4,39). Therefore, whereas the fraction of attachedfilaments increases during the second phase due to theincreasing external pushing force, during the third phase itdecreases to the value in the stalled state (Fig. 3 F).
Applications of cytochalasin D and ML-7
The mechanism is confirmed by the predictions of themodel for the keratocytes’ force-velocity relation, whenthe behavior of cytoskeletal proteins is modulated by drugs(Fig. 4). We compare model predictions with experiments intwo steps: First, we fit the model to the individual measure-ments as described above. Second, we assess whether signif-icant changes of parameter values of drug-treated cells withrespect to control cells are in line with the generally estab-lished knowledge about the action of the drug. We find
that only the values of those parameters change signifi-cantly, which reflect the action of the drugs (Table 1). Allthe other model parameters vary within a reasonable range,but are not significantly different between control and drugapplications.
Cytochalasin D caps barbed filament ends, thus termi-nating their polymerization (40). Consequently, it reducesthe density of filaments, and also the cross-linking rate.Fits of the model to eight cells demonstrate that onlythe parameter values of filament density (Student’st-test p ¼ 7 10�7) and cross-linking rate (p ¼ 8 10�5)decrease significantly relative to control samples uponcytochalasin D application (Table 1). As a consequence,cytochalasin D reduces the velocity of an unhindered cell(see Table S2) and delays stalling by the cantilever (Fig. 3B). Additionally, the stall force is approximately one-thirdof the control value. All these properties are found in exper-iments and simulations.
Myosin can contract the actin gel; however, myosincontraction does not contribute significantly to centripetalactin network flow in the central lamellipodium of fish ker-atocytes (6,26–28). Accordingly, fits of the model to controlexperiments resulted in a small value of the contractilityparameter. Myosin motors act also as cross-linkers. Fittingthe model to seven cells shows that the effect of inhibiting
Biophysical Journal 102(2) 287–295

292 Zimmermann et al.
myosin by ML-7 (41) can be well described by a reductionof the cross-linking rate (p ¼ 7 10�5) and vanishing gelcontraction (Fig. 3 C, Table 1). ML-7 also delays stallingby the cantilever, but the average stall force does not changewith respect to controls. The quantitative agreementbetween experiments and simulations suggests that theprotrusion mechanisms are accurately reproduced by ourmodel.
Softer cantilevers
The velocity dropped less in experiments by the Radmacherlab (to ~20 nm/s) (7,8) than in our experiments (to~0.1 nm/s, Fig. 3). Accordingly, velocities in the concavephase were also larger in their experiments than in ours.The major difference between the experiments was the forceconstant of the cantilevers; Prass et al. (7) used a muchsofter cantilever (force constant 1.4 nN mm�2) than we did(290 nN mm�2). Simulations showed that the velocities inthe concave phase are inversely proportional to the forceconstant (Fig. 5), which explains the different measuredvelocities. The good agreement of the simulations withboth sets of experimental results (7,8) (Fig. 5) shows thatthe force-velocity curve and the magnitude of the velocitydrop depend on the stiffness of the cantilever, and thatsimply the different values of the cantilever force constantsexplain the differences between studies. The stall force,however, does not depend on cantilever stiffness, whichconfirms that it is an intrinsic lamellipodium property.
CONCLUSION
We have considered for the first time all phases of the force-velocity relation: the initial velocity drop upon cantilevercontact, the concave relation up to the stall force, andthe adaptation to the stalled state. They are explained bythe interaction of a semiflexible actin network region
0.00
0.05
0.10
0.15
0 2 4 6 8 10
Forc
e (n
N/µ
m)
Time (s)
0
100
200
0.00 0.05 0.10 0.15
Vel
ocity
(nm
/s)
Force (nN/µm)
FIGURE 5 Simulated force-velocity curves for different force constants
k of the SFM cantilever. Cantilever force time courses and the correspond-
ing force-velocity relations are shown. Smaller cantilever force constants
result in larger deflections for a given force, and larger velocities in
the force-velocity relation. (Dashed-dotted curve) k ¼ 290 nN mm�2
(force constant used in our study, see also Fig. 3); (dotted curve) k ¼ 1.4
nN mm�2 (force constant used in the study by Prass et al. (7)); (dashed
curve) k ¼ 0.28 nN mm�2; (solid curve) k ¼ 0.056 nN mm�2. Simulations
also show that the velocities in the concave phase are approximately propor-
tional to 1/k, aside from the softest cantilever. All other parameter values as
for control in Fig. 3.
Biophysical Journal 102(2) 287–295
near the leading edge with a gel-like actin network furtherback in the bulk of the lamellipodium (Fig. 6). A small forceof the order of the resulting filament forces of the freelyrunning cell suffices to almost stop the lamellipodiumleading edge, whereas the actin gel further back keepsmoving. Consequently, the width of the SR shrinks andthe filaments bend. Bent filaments transmit a higher forcebetween the membrane and the gel, which leads to a slightincrease of the leading-edge velocity before stalling. As fila-ments in the SR shorten, stronger external force is trans-mitted to the gel and retrograde flow increases. Retrogradeflow compensates for polymerization in the stalled state.The force-velocity curve is a dynamic phenomenon. Itdoes not reflect the velocity of the cell after long stationaryapplication of an external force.
The mechanism reconciles the ideas on force generationby actin polymerization (2,3,6,42) at the leading edge withthe shape of the force-velocity relation. The exponentialdecrease of the polymerization rate with increasing forcedoes not appear in the force-velocity relation, because retro-grade flow responds more sensitively than the polymeriza-tion rate.
Our mechanism reproduces measured force-velocity rela-tions in a range of parameter values accounting for cell vari-ability (Fig. 4, Table 1, and see Table S2) and uncertainparameter values like the persistence length (see Fig. S3).We also examined the possibility of catch bonds in focaladhesions shaping the force-velocity relation within ourmodel by introducing a positive feedback from the forceexerted on the leading edge to the friction coefficient thatdescribes adhesion and found that they are not necessaryto describe our experimental results (see Fig. S4).
We and others (7,8,43) found the leading-edge motion ofthe freely running cell to respond sensitively to very smallforces. The SR is very compliant due to the rather longfree filament length in the free cell. Thus, our results con-tribute to an ongoing discussion about the structure of thelamellipodium actin network, in which the length of fila-ments is a central topic. Long filaments imply small cappingrates and consequently also small nucleation rates forsteadily moving cells, whereas short filaments imply largerates (44,45). The discussion (45–48) is mainly based onelectron microscopy studies resulting in either long fila-ments (~1 mm) (18,44) or short ones (~0.2 mm) (3,28). Arecent evaluation of the branch point density in the samesample from 3T3 fibroblasts by two independent groupsproduced values of 277 mm�2 (49) and 140 mm�2 (48).Taking filament line density of ~200 mm�1 (18) intoaccount, we obtain an average free filament length betweenbranch points of ~0.72 mm and 1.4 mm, respectively.Whether filaments with these free lengths bend at the forcesper filament occurring during the measurement can beestimated by the Euler buckling force. Gholami et al. (13)showed that semiflexible filaments are severely bent atthis force. We obtain 0.2 pN with the smaller value of free

gelattachment protein retrograde flow
SR
leading edgemembrane
actin filaments cross−linker protrusion
Freely moving cell Concave phase Stalled stateBA C
FIGURE 6 Summary of the mechanism. (A) Protrusion velocity is much faster than retrograde flow in the freely running cell. The depth of the SR and the
free filament length are determined by the force per filament required for protrusion. (B) Filaments bend and shorten upon contact with the spherical probe.
Protrusion velocity is very small and retrograde flow is increasing. (C) Free filament length is sufficiently short for transmission of the stall force to the gel.
Filaments are stiffer, because they are shorter than in the freely running cell. Retrograde flow in the stalled state is approximately equal to the sum of retro-
grade flow and protrusion in the freely running cell, and also equal to the polymerization velocity. The force required to drive retrograde flow with the velocity
of ongoing polymerization is the stall force, because contractile forces contribute little to retrograde flow in the central fish keratocyte lamellipodium.
Actin Filament Elasticity and Retrograde Flow 293
length and 0.07 pN with the larger one using a persistencelength of 10 mm. Clearly, actin filaments bend with bothvalues of free length at the forces per filament occurringduring the force-velocity measurements (see Fig. S2), whichconfirms our explanation for the SR elasticity.
Our approach is independent from electron microscopystudies and supports free filament lengths in the range of1 mm. The model result of ~1.8 mm for control is a littlelonger than the above values and the 1.3 mm previously re-ported (44); however, the absolute values of free filamentlength resulting from the simulations depend on the param-eter value of the persistence length. We use the in vitro value15 mm (50,51), because we are not aware of any in vivomeasurements. Other in vitro measurements report valuesbetween 9 mm and 13.5 mm depending on the specific condi-tions (52). The in vivo persistence length is most likelyshorter, because cofilin can reduce it down to 2.2 mm(53,54). If we use a persistence length of 7.5 mm, simula-tions yield a free polymer length of ~1.2 mm (see Fig. S3),which is in the range of the measured values. It also suggestsa scaling of free polymer length with approximately thesquare root of the persistence length in agreement with theforce extension relations (13,55). A low branch point andcross-linker density in the SR is required for the validityof our results, but not a branch point and cross-link freeregion. This model assumption is supported by the calcu-lated differential SR stiffness of ~60 Pa, which is in goodagreement with values of weakly cross-linked F-actinnetworks (56,57).
Our results imply that filaments do not behave like stiffrods in the free cell at low forces, but only at larger forcesin the later parts of the force-velocity relation, when freefilament length has shortened: The lamellipodium stiffnessadapts to the external force. This scenario corresponds tothe explanation for the initial drop and ensuing increase ofthe velocity by Heinemann et al. (8) to result from the elastic
response of a spring with increasing stiffness. Our modelexhibits this adaptation of stiffness to force because free fila-ment length is considered as a dynamic variable (not asa fixed parameter), and because force not only determineslength dynamics but also length the force that can be exerted(see Eqs. S1 and S2 in the Supporting Material). Due to thesensitive dependence of stiffness on free length, it can adaptover two orders of magnitude and reach values comparableto the elastic modulus of cells (14). The mechanism guaran-tees stiffness adaptation as fast as the cell moves, becausethe adaptation rate is set by the cross-linking rate that issimilar to the free cell velocity.
The insight into actin-based force generation obtainedhere will improve our understanding of how cells forcetheir way through tissue by dynamically adjusting theirstiffness and load resistance. Cell motility is a critical pro-cess during metastasis of cancer cells (58), when neuronalgrowth cones find their way during development, or whenwounds heal.
SUPPORTING MATERIAL
Five figures, two tables, methods, the mathematical model, and references
(59–82) are available at http://www.biophysj.org/biophysj/supplemental/
S0006-3495(11)05425-7.
REFERENCES
1. Theriot, J. A., and T. J. Mitchison. 1991. Actin microfilament dynamicsin locomoting cells. Nature. 352:126–131.
2. Carlier, M.-F., S. Wiesner,., D. Pantaloni. 2003. Actin-based motilityas a self-organized system: mechanism and reconstitution in vitro.C. R.Biol. 326:161–170.
3. Pollard, T. D., and G. G. Borisy. 2003. Cellular motility driven byassembly and disassembly of actin filaments. Cell. 112:453–465.
4. Mogilner, A., and G. Oster. 2003. Force generation by actin polymer-ization II: the elastic ratchet and tethered filaments. Biophys. J.84:1591–1605.
Biophysical Journal 102(2) 287–295

294 Zimmermann et al.
5. Ji, L., J. Lim, and G. Danuser. 2008. Fluctuations of intracellular forcesduring cell protrusion. Nat. Cell Biol. 10:1393–1400.
6. Keren, K., Z. Pincus, ., J. A. Theriot. 2008. Mechanism of shapedetermination in motile cells. Nature. 453:475–480.
7. Prass, M., K. Jacobson, ., M. Radmacher. 2006. Direct measurementof the lamellipodial protrusive force in a migrating cell. J. Cell Biol.174:767–772.
8. Heinemann, F., H. Doschke, and M. Radmacher. 2011. Keratocytelamellipodial protrusion is characterized by a concave force-velocityrelation. Biophys. J. 100:1420–1427.
9. Brunner, C., A. Niendorf, and J. Kas. 2009. Passive and active single-cell biomechanics: a new perspective in cancer diagnosis. Soft Matter.5:2171–2178.
10. Mogilner, A. 2006. On the edge: modeling protrusion. Curr. Opin. CellBiol. 18:32–39.
11. Mogilner, A., and G. Oster. 1996. Cell motility driven by actin poly-merization. Biophys. J. 71:3030–3045.
12. Carlsson, A. E. 2001. Growth of branched actin networks againstobstacles. Biophys. J. 81:1907–1923.
13. Gholami, A., J. Wilhelm, and E. Frey. 2006. Entropic forces generatedby grafted semiflexible polymers. Phys. Rev. E. 74:041803.
14. Brunner, C. A., A. Ehrlicher, ., M. Goegler. 2006. Cell migrationthrough small gaps. Eur. Biophys. J. 35:713–719.
15. Enculescu, M., A. Gholami, and M. Falcke. 2008. Dynamic regimesand bifurcations in a model of actin-based motility. Phys. Rev. E.78:031915.
16. Enculescu, M., M. Sabouri-Ghomi, ., M. Falcke. 2010. Modeling ofprotrusion phenotypes driven by the actin-membrane interaction.Biophys. J. 98:1571–1581.
17. Zimmermann, J., M. Enculescu, and M. Falcke. 2010. Leading-edge-gel coupling in lamellipodium motion. Phys. Rev. E. 82:051925.
18. Urban, E., S. Jacob,., J. V. Small. 2010. Electron tomography revealsunbranched networks of actin filaments in lamellipodia. Nat. Cell Biol.12:429–435.
19. Bugyi, B., C. Le Clainche,., M. F. Carlier. 2008. How do in vitro re-constituted actin-based motility assays provide insight into in vivobehavior? FEBS Lett. 582:2086–2092.
20. Ponti, A., M. Machacek, ., G. Danuser. 2004. Two distinct actinnetworks drive the protrusion of migrating cells. Science. 305:1782–1786.
21. Koestler, S. A., S. Auinger, ., J. V. Small. 2008. Differentiallyoriented populations of actin filaments generated in lamellipodiacollaborate in pushing and pausing at the cell front. Nat. Cell Biol.10:306–313.
22. Giannone, G., B. J. Dubin-Thaler, ., M. P. Sheetz. 2007. Lamellipo-dial actin mechanically links myosin activity with adhesion-site forma-tion. Cell. 128:561–575.
23. Shemesh, T., A. B. Verkhovsky,., M. M. Kozlov. 2009. Role of focaladhesions and mechanical stresses in the formation and progression ofthe lamellum interface [corrected]. Biophys. J. 97:1254–1264.
24. Laurent, V. M., S. Kasas,., J. J. Meister. 2005. Gradient of rigidity inthe lamellipodia of migrating cells revealed by atomic force micros-copy. Biophys. J. 89:667–675.
25. Gholami, A., M. Falcke, and E. Frey. 2008. Velocity oscillations inactin-based motility. New J. Phys. 10:033022.
26. Vallotton, P., G. Danuser, ., A. B. Verkhovsky. 2005. Tracking retro-grade flow in keratocytes: news from the front. Mol. Biol. Cell.16:1223–1231.
27. Rubinstein, B., M. F. Fournier, ., A. Mogilner. 2009. Actin-myosinviscoelastic flow in the keratocyte lamellipod. Biophys. J. 97:1853–1863.
28. Svitkina, T. M., A. B. Verkhovsky, ., G. G. Borisy. 1997. Analysis ofthe actin-myosin II system in fish epidermal keratocytes: mechanism ofcell body translocation. J. Cell Biol. 139:397–415.
Biophysical Journal 102(2) 287–295
29. Kruse, K., J. F. Joanny, ., J. Prost. 2006. Contractility and retrogradeflow in lamellipodium motion. Phys. Biol. 3:130–137.
30. Carlier, M.-F., and D. Pantaloni. 2007. Control of actin assemblydynamics in cell motility. J. Biol. Chem. 282:23005–23009.
31. Parekh, S. H., O. Chaudhuri, ., D. A. Fletcher. 2005. Loading historydetermines the velocity of actin-network growth. Nat. Cell Biol.7:1219–1223.
32. Svitkina, T. 2007. N-WASP generates a buzz at membranes on themove. Cell. 128:828–830.
33. Upadhyaya, A., and A. van Oudenaarden. 2003. Biomimetic systemsfor studying actin-based motility. Curr. Biol. 13:R734–R744.
34. Weisswange, I., T. P. Newsome, ., M. Way. 2009. The rate ofN-WASP exchange limits the extent of ARP2/3-complex-dependentactin-based motility. Nature. 458:87–91.
35. Akin, O., and R. D. Mullins. 2008. Capping protein increases the rate ofactin-based motility by promoting filament nucleation by the Arp2/3complex. Cell. 133:841–851.
36. Co, C., D. T. Wong,., J. Taunton. 2007. Mechanism of actin networkattachment to moving membranes: barbed end capture by N-WASPWH2 domains. Cell. 128:901–913.
37. Enculescu, M., and M. Falcke. 2011. Modeling morphodynamicphenotypes and dynamic regimes of cell motion. In Advances inSystems Biology, Vol. 736 of Advances in Experimental Medicineand Biology. I. I. Goryanin and A. B. Goryachev, editors. Springer,New York. 337–358.
38. Footer, M. J., J. W. J. Kerssemakers, ., M. Dogterom. 2007. Directmeasurement of force generation by actin filament polymerizationusing an optical trap. Proc. Natl. Acad. Sci. USA. 104:2181–2186.
39. Evans, E. 2001. Probing the relation between force—lifetime—andchemistry in single molecular bonds. Annu. Rev. Biophys. Biomol.Struct. 30:105–128.
40. May, J. A., H. Ratan, ., S. Heptinstall. 1998. GPIIb-IIIa antagonistscause rapid disaggregation of platelets pre-treated with cytochalasinD. Evidence that the stability of platelet aggregates depends on normalcytoskeletal assembly. Platelets. 9:227–232.
41. Bain, J., H. McLauchlan, ., P. Cohen. 2003. The specificities ofprotein kinase inhibitors: an update. Biochem. J. 371:199–204.
42. Pollard, T. D. 2003. The cytoskeleton, cellular motility and the reduc-tionist agenda. Nature. 422:741–745.
43. Bohnet, S., R. Ananthakrishnan, ., A. B. Verkhovsky. 2006. Weakforce stalls protrusion at the leading edge of the lamellipodium.Biophys. J. 90:1810–1820.
44. Schaub, S., J.-J. Meister, and A. B. Verkhovsky. 2007. Analysis of actinfilament network organization in lamellipodia by comparing experi-mental and simulated images. J. Cell Sci. 120:1491–1500.
45. Insall, R. H. 2011. Dogma bites back—the evidence for branched actin.Trends Cell Biol. 21:2, author reply 4–5.
46. Higgs, H. N. 2011. Discussing the morphology of actin filaments in la-mellipodia. Trends Cell Biol. 21:2–4, author reply 4–5.
47. Small, J. V. 2011. Actin networking in lamellipodia and beyond. TrendsCell Biol. 21:4–5.
48. Small, J. V., C. Winkler, ., C. Schmeiser. 2011. Reply: Visualizingbranched actin filaments in lamellipodia by electron tomography.Nat. Cell Biol. 13:1013–1014.
49. Yang, C., and T. Svitkina. 2011. Visualizing branched actin filaments inlamellipodia by electron tomography. Nat. Cell Biol. 13:1012–1013,author reply 1013–1014.
50. Le Goff, L., O. Hallatschek,., F. Amblard. 2002. Tracer studies on f-actin fluctuations. Phys. Rev. Lett. 89:258101.
51. Gardel, M. L., J. H. Shin, ., D. A. Weitz. 2004. Elastic behavior ofcross-linked and bundled actin networks. Science. 304:1301–1305.
52. Isambert, H., P. Venier, ., M. F. Carlier. 1995. Flexibility of actinfilaments derived from thermal fluctuations. Effect of bound nucleo-tide, phalloidin, and muscle regulatory proteins. J. Biol. Chem.270:11437–11444.
Actin Filament Elasticity and Retrograde Flow 295
53. McCullough, B. R., L. Blanchoin, ., E. M. De la Cruz. 2008. Cofilinincreases the bending flexibility of actin filaments: implications forsevering and cell mechanics. J. Mol. Biol. 381:550–558.
54. Pfaendtner, J., E. M. De La Cruz, and G. A. Voth. 2010. Actin filamentremodeling by actin depolymerization factor/cofilin. Proc. Natl. Acad.Sci. USA. 107:7299–7304.
55. Kroy, K., and E. Frey. 1996. Force-extension relation and plateaumodulus for wormlike chains. Phys. Rev. Lett. 77:306–309.
56. Gardel, M. L., F. Nakamura,., D. A. Weitz. 2006. Prestressed F-actinnetworks cross-linked by hinged filamins replicate mechanical proper-ties of cells. Proc. Natl. Acad. Sci. USA. 103:1762–1767.
57. Lieleg, O., M. M. A. E. Claessens, and A. R. Bausch. 2010. Structureand dynamics of cross-linked actin networks. Soft Matter. 6:218–225.
58. Wirtz, D., K. Konstantopoulos, and P. C. Searson. 2011. The physics ofcancer: the role of physical interactions and mechanical forces inmetastasis. Nat. Rev. Cancer. 11:512–522.
59. Abraham, V. C., V. Krishnamurthi,., F. Lanni. 1999. The actin-basednanomachine at the leading edge of migrating cells. Biophys. J.77:1721–1732.
60. Shaevitz, J. W., and D. A. Fletcher. 2007. Load fluctuations drive actinnetwork growth. Proc. Natl. Acad. Sci. USA. 104:15688–15692.
61. Berg, H. 1983. Random Walks in Biology. Princeton University Press,Ithaca, NY.
62. Mogilner, A. 2009. Mathematics of cell motility: have we got itsnumber? J. Math. Biol. 58:105–134.
63. Bausch, A. R., F. Ziemann, ., E. Sackmann. 1998. Local measure-ments of viscoelastic parameters of adherent cell surfaces by magneticbead microrheometry. Biophys. J. 75:2038–2049.
64. Yanai, M., J. P. Butler, ., H. Higuchi. 2004. Regional rheologicaldifferences in locomoting neutrophils. Am. J. Physiol. Cell Physiol.287:C603–C611.
65. Doyle, A., W. Marganski, and J. Lee. 2004. Calcium transients inducespatially coordinated increases in traction force during the movementof fish keratocytes. J. Cell Sci. 117:2203–2214.
66. Anderson, K. I., Y. L. Wang, and J. V. Small. 1996. Coordination ofprotrusion and translocation of the keratocyte involves rolling of thecell body. J. Cell Biol. 134:1209–1218.
67. Izzard, C. S., and L. R. Lochner. 1976. Cell-to-substrate contacts inliving fibroblasts: an interference reflexion study with an evaluationof the technique. J. Cell Sci. 21:129–159.
68. Jurado, C., J. R. Haserick, and J. Lee. 2005. Slipping or gripping? Fluo-rescent speckle microscopy in fish keratocytes reveals two differentmechanisms for generating a retrograde flow of actin. Mol. Biol.Cell. 16:507–518.
69. Betz, T., D. Lim, and J. A. Kas. 2006. Neuronal growth: a bistablestochastic process. Phys. Rev. Lett. 96:098103.
70. Betz, T., D. Koch, ., J. Kas. 2007. Statistical analysis of neuronalgrowth: edge dynamics and the effect of a focused laser on growthcone motility. New J. Phys. 9:426.
71. Verkhovsky, A. B., O. Y. Chaga, ., G. G. Borisy. 2003. Orientationalorder of the lamellipodial actin network as demonstrated in livingmotile cells. Mol. Biol. Cell. 14:4667–4675.
72. Frey, E., K. Kroy, ., E. Sackmann. 1998. Dynamical Networks inPhysics and Biology. Springer-Verlag, Berlin, Germany.
73. Kroy, K. 1998. Viscoelasticity of Solutions of Semiflexible Polymers.Hieronymus, Munich, Germany.
74. MacKintosh, F. C., J. Kas, and P. A. Janmey. 1995. Elasticity ofsemiflexible biopolymer networks. Phys. Rev. Lett. 75:4425–4428.
75. Gholami, A. 2007. Actin-Based Motility. Department of Physics,Ludwig Maximilians Universitat, Munich, Germany.
76. Kruse, K., J. F. Joanny,., K. Sekimoto. 2005. Generic theory of activepolar gels: a paradigm for cytoskeletal dynamics. Eur Phys J E SoftMatter. 16:5–16.
77. Lin, C. H., E. M. Espreafico,., P. Forscher. 1996. Myosin drives retro-grade F-actin flow in neuronal growth cones. Neuron. 16:769–782.
78. Lin, C.-H., and P. Forscher. 1995. Growth cone advance is inverselyproportional to retrograde F-actin flow. Neuron. 14:763–771.
79. Zhu, J., and A. E. Carlsson. 2010. Effects of molecular-scale processeson observable growth properties of actin networks. Phys. Rev. E s.81:031914.
80. Schreiber, C. H., M. Stewart, and T. Duke. 2010. Simulation of cellmotility that reproduces the force-velocity relationship. Proc. Natl.Acad. Sci. USA. 107:9141–9146.
81. Lee, K.-C., and A. J. Liu. 2009. Force-velocity relation for actin-polymerization-driven motility from Brownian dynamics simulations.Biophys. J. 97:1295–1304.
82. Weichsel, J., and U. S. Schwarz. 2010. Two competing orientationpatterns explain experimentally observed anomalies in growing actinnetworks. Proc. Natl. Acad. Sci. USA. 107:6304–6309.
Biophysical Journal 102(2) 287–295

Actin Filament Elasticity and Retrograde Flow Shape the Force-Velocity Relation of Motile Cells
Juliane Zimmermann,† Claudia Brunner,‡ Mihaela Enculescu,† Michael Goegler,‡ Allen Ehrlicher,‡ Josef Käs,‡ and Martin Falcke† †Mathematical Cell Physiology, Max-Delbrück-Center for Molecular Medicine, Berlin, Germany; and ‡
Supporting Material
Division of Soft Matter Physics, Department of Physics, University of Leipzig, Leipzig, Germany
Supporting Figures
Figure S1: Lateral deflection data from lamellipodium stall force measurement (“Control” in Fig. 3A of the main paper).
Figure S2: Simulation results for single filament forces and for the total forces of all attached and detached filaments for “Control” (see Fig. 3 of the main paper). Forces with a positive value push the leading edge membrane.
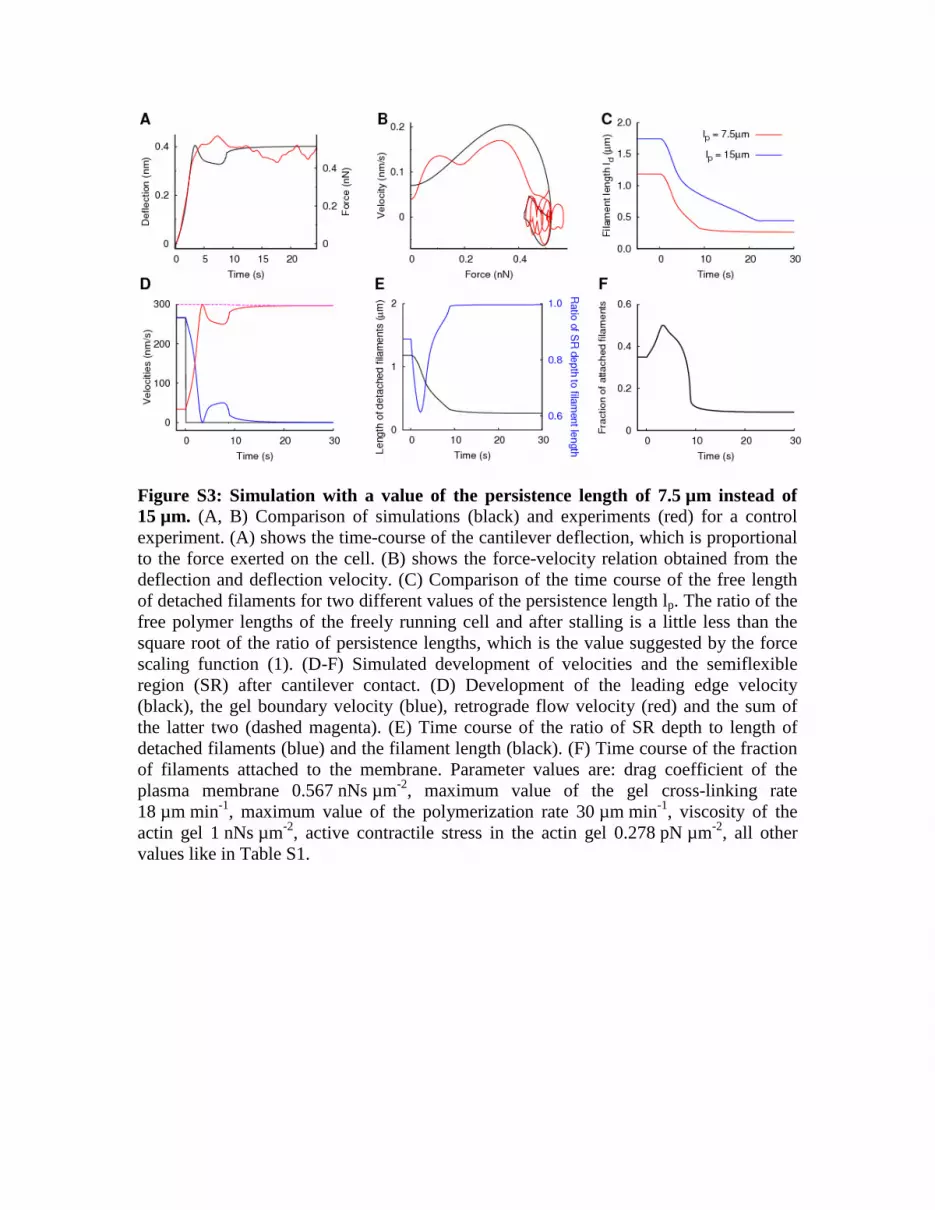
Figure S3: Simulation with a value of the persistence length of 7.5 µm instead of 15 µm. (A, B) Comparison of simulations (black) and experiments (red) for a control experiment. (A) shows the time-course of the cantilever deflection, which is proportional to the force exerted on the cell. (B) shows the force-velocity relation obtained from the deflection and deflection velocity. (C) Comparison of the time course of the free length of detached filaments for two different values of the persistence length lp. The ratio of the free polymer lengths of the freely running cell and after stalling is a little less than the square root of the ratio of persistence lengths, which is the value suggested by the force scaling function (1). (D-F) Simulated development of velocities and the semiflexible region (SR) after cantilever contact. (D) Development of the leading edge velocity (black), the gel boundary velocity (blue), retrograde flow velocity (red) and the sum of the latter two (dashed magenta). (E) Time course of the ratio of SR depth to length of detached filaments (blue) and the filament length (black). (F) Time course of the fraction of filaments attached to the membrane. Parameter values are: drag coefficient of the plasma membrane 0.567 nNs µm-2, maximum value of the gel cross-linking rate 18 µm min-1, maximum value of the polymerization rate 30 µm min-1, viscosity of the actin gel 1 nNs µm-2, active contractile stress in the actin gel 0.278 pN µm-2, all other values like in Table S1.
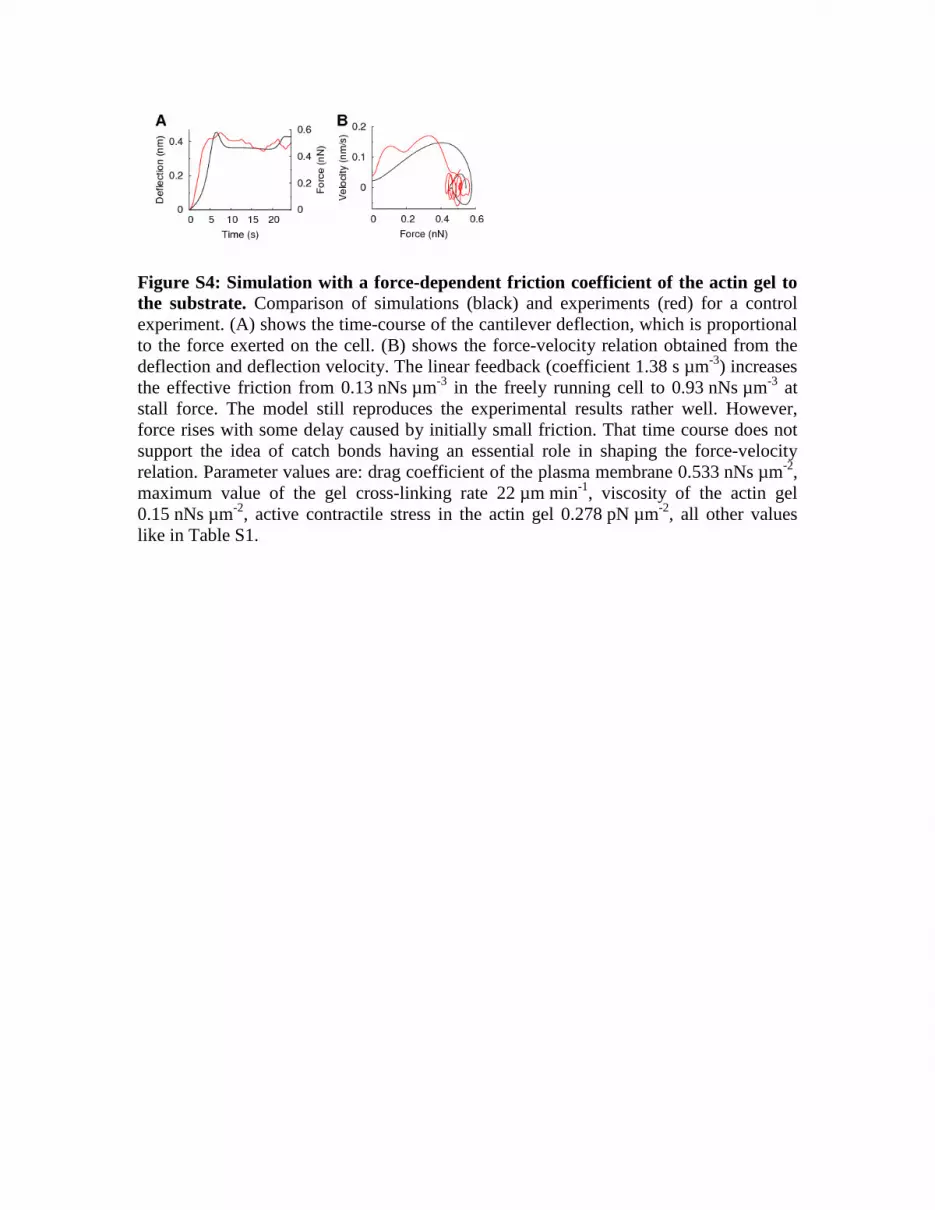
Figure S4: Simulation with a force-dependent friction coefficient of the actin gel to the substrate. Comparison of simulations (black) and experiments (red) for a control experiment. (A) shows the time-course of the cantilever deflection, which is proportional to the force exerted on the cell. (B) shows the force-velocity relation obtained from the deflection and deflection velocity. The linear feedback (coefficient 1.38 s µm-3) increases the effective friction from 0.13 nNs µm-3 in the freely running cell to 0.93 nNs µm-3 at stall force. The model still reproduces the experimental results rather well. However, force rises with some delay caused by initially small friction. That time course does not support the idea of catch bonds having an essential role in shaping the force-velocity relation. Parameter values are: drag coefficient of the plasma membrane 0.533 nNs µm-2, maximum value of the gel cross-linking rate 22 µm min-1, viscosity of the actin gel 0.15 nNs µm-2, active contractile stress in the actin gel 0.278 pN µm-2, all other values like in Table S1.
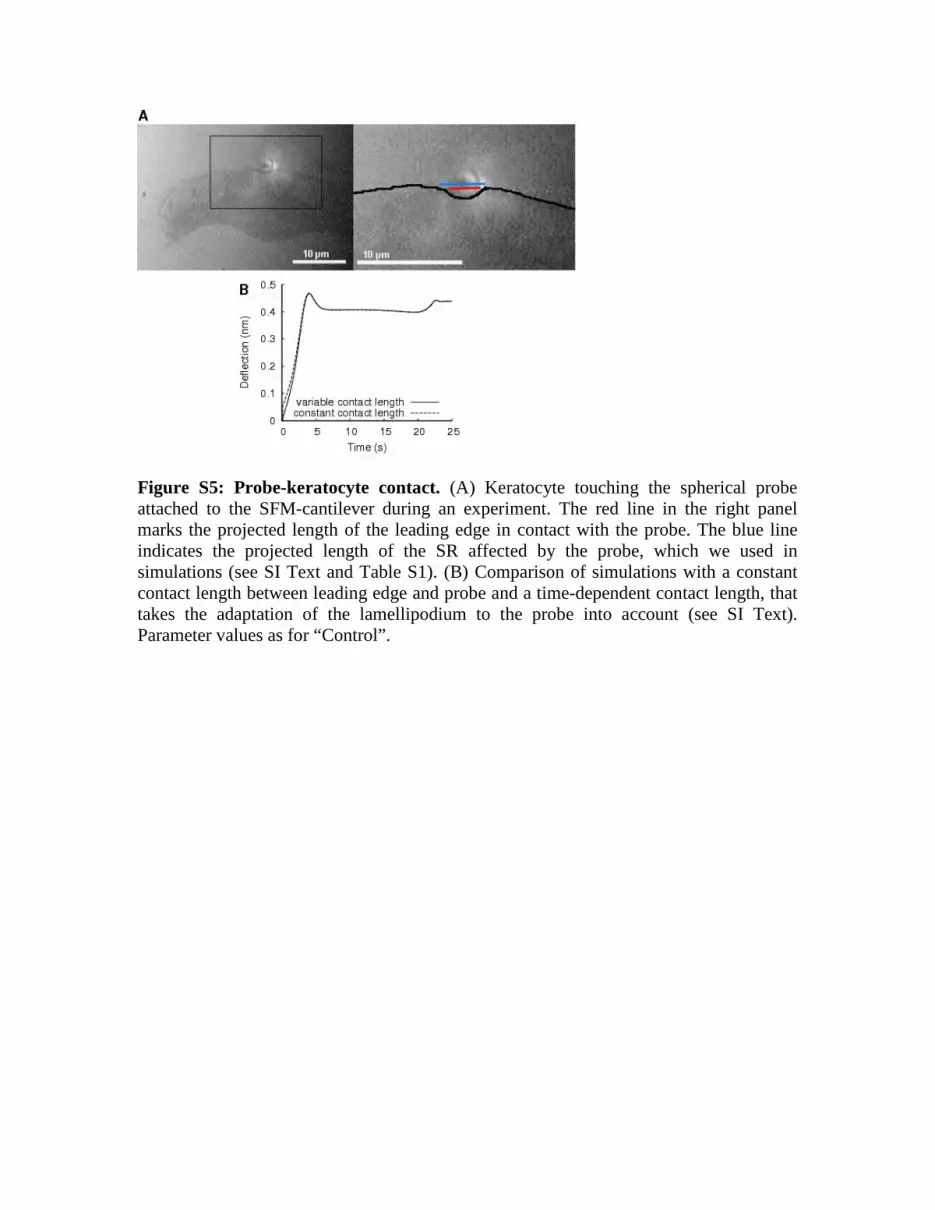
Figure S5: Probe-keratocyte contact. (A) Keratocyte touching the spherical probe attached to the SFM-cantilever during an experiment. The red line in the right panel marks the projected length of the leading edge in contact with the probe. The blue line indicates the projected length of the SR affected by the probe, which we used in simulations (see SI Text and Table S1). (B) Comparison of simulations with a constant contact length between leading edge and probe and a time-dependent contact length, that takes the adaptation of the lamellipodium to the probe into account (see SI Text). Parameter values as for “Control”.
Supporting Tables
Symbol Meaning Control CD ML-7 Units Reference
n Total filament density 300 230 300 μm-1 (2)
ka Attachment rate of filaments
to membrane 10.0 s-1 10/s in (3) 0dk Detachment constant 25.0 s-1 fitted
maxpv
Maximum value of polymerization velocity 692 nm/s 500°nm/s in (4)
maxgv
Maximum value of gel cross-linking rate 350 133 158 nm/s fitted1
l
Saturation length of cross-
linking rate 0.1 μm assumed
κ Drag coefficient of plasma membrane 0.113 nNs/μm2 (5)
k Elastic modulus of SFM cantilever 291 148 348 nN/μm2 as in experiments
d Actin monomer radius 2.7 nm (6) lp Persistence length of actin 15 μm (7)
kl Spring constant of linker
protein 1 nN/μm (4, 8)
η Viscosity of actin gel 0.833 0.5 0.783 nNs/μm2 (9, 10)
ξ Friction coefficient of actin gel with adhesion sites 0.2 nNs/μm3 (11)
μ Active contractile stress in actin gel 8.33 8.33 0 pN/μm2 fitted2
h0
Height of lamellipodium at leading edge 0.25 μm (12, 13)
L Depth of gel part of lamellipodium 10 μm (12, 14)
Contact length with bead 4.4 μm as in experiments (see also Fig. S5)
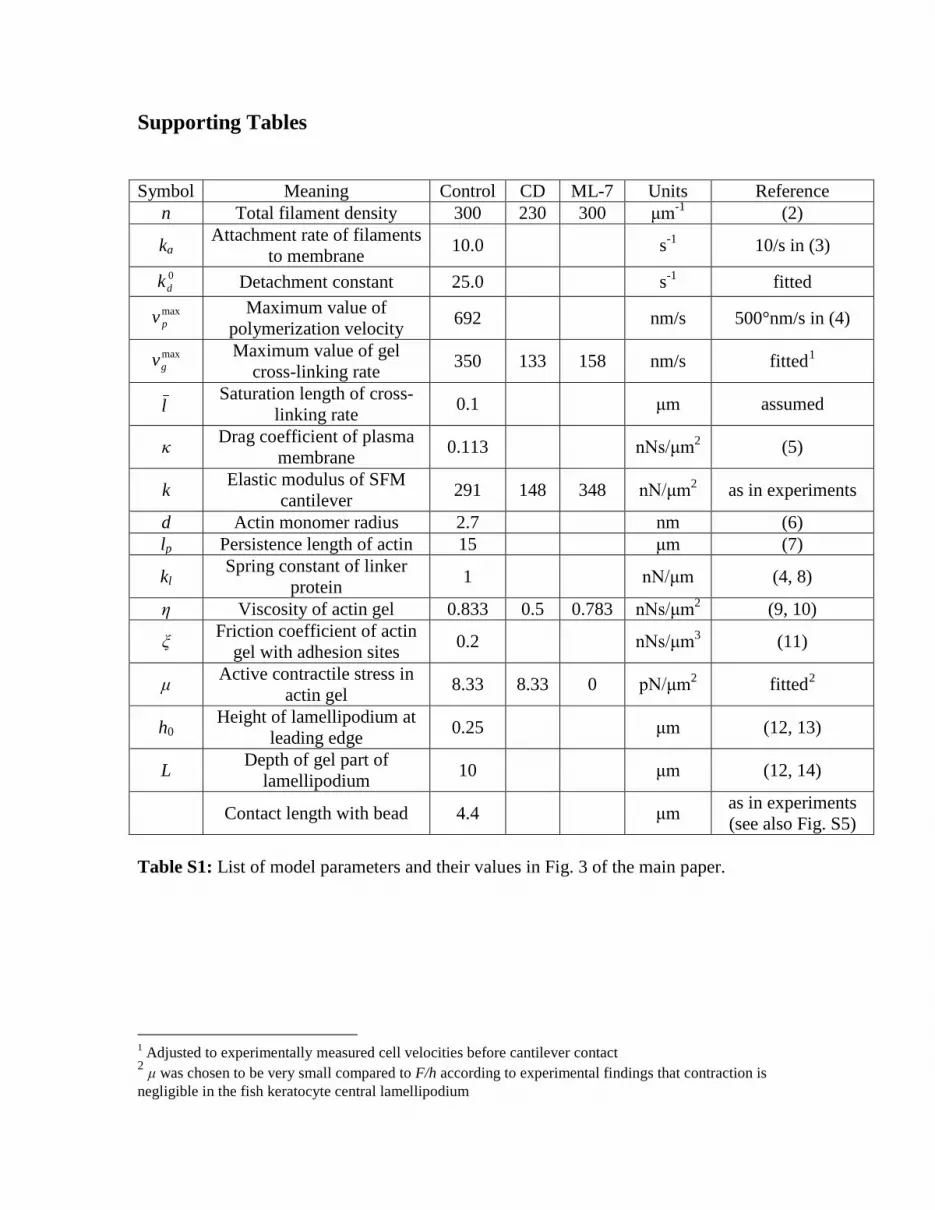
Table S1: List of model parameters and their values in Fig. 3 of the main paper.
1 Adjusted to experimentally measured cell velocities before cantilever contact 2 μ was chosen to be very small compared to F/h according to experimental findings that contraction is negligible in the fish keratocyte central lamellipodium

Control
Measured Simulated
CD Measured Simulated
ML-7 Measured Simulated
Velocity of unhindered cell (nm/s)
240 ± 47 233 ± 47
98 ± 53 93 ± 47
127 ± 43 128 ± 45
Retrograde flow velocity of unhindered
cell (nm/s)
68 ± 30 72 ± 35
27 ± 11 35 ± 27
42 ± 12 28 ± 8.8
Table S2: Measured and simulated velocities before cantilever contact for control and application of CD and ML-7.
Supplementary Methods Microscopy A commercial scanning force microscope (SFM) (Nano Wizard, JPK Instruments AG) was mounted on an inverted microscope (DM IRB, Leica) that allowed positioning of the cantilever tip and imaging of cell movement in phase contrast (40x/0.55 Corr Ph2 Air) as well as in interference reflection microscopy (IRM) (63x/1.25 Ph3 Oil)(15, 16). By inhomogeneously illuminating the sample, reflections from the cantilever were eliminated and the bead’s position and the cell’s contour were still precisely visible. Images were generally recorded with IRM every second with a standard CCD camera controlled by a LabVIEW program. IRM is ideally suited to follow the motion of the leading edge with respect to the spherical probe. Fig. 1 of the main paper displays the adhered leading edge and the polystyrene bead that acts as stalling obstacle. Keratocyte culture medium was exchanged every hour to prevent pH drift. Cantilever preparation and calibration was done as previously described (17). Cantilever bending and rotation were measured during an experiment as vertical and lateral deflection signals (VV and VL) respectively. The signals were generally read out with 100 Hz for the lamellipodium stall force measurements. Feature Tracking Microscopy and Retrograde Flow Analysis A 100x phase contrast oil immersion objective (100x/1.35 Ph3 Oil, Leica) in conjunction with a 12-bit CCD camera (ORCA, Hamamatsu Incorporation) controlled by a LabVIEW program was used to image the keratocytes with a resolution of was 63 nm per pixel, which was sufficient for internal flow analysis. The time between recorded images was typically 2 s. The lamellipodium protrusion and retrograde flow was investigated with a high resolution edge detection routine (18, 19), which is based on a combination of the shape detection described in the previous section and a cross-correlation algorithm (20). The program finds the movement of features in successive images by cross-correlation. These features are mainly due to the criss-cross pattern and inhomogeneities in the actin network of the lamellipodium (20, 21). In brief, a meshgrid with a grid point distance of 0.5 µm is defined on the keratocyte image within the detected coarse shape. At each grid point a template area of size 1.5x1.5 µm is cropped which is overlaid at each pixel in a larger search area of the subsequent image. The cross-correlation value is calculated for each pixel. The highest cross correlation value defines the displacement vector at each grid point which results in a discrete displacement vector field. The retrograde flow field is then obtained from spatial and temporal interpolation and filtering. Cell Velocity Study An inverted microscope (DM IRB; Leica) was used for keratocyte observations. Phase contrast time-lapse image series were acquired at 2 s intervals with an oil immersion objective (63x/1.25 Ph3 Oil, Leica) and a CCD camera (DS-21-02M30, Dalsa) controlled by a LabVIEW program (LabVIEW, National Instruments). Cell velocities were evaluated with a Matlab-based cell shape detection routine. A pixel based center of mass (COM) was calculated from each binary shape and the movement of this COM was used to calculate the speed of a cell. Due to the constant movement of keratocytes a linear fit
was used to determine the cell speed. A histogram of the translocation speeds of the COM was alternatively used to evaluate the mean and variance of speed for a single cell. The Mathematical Model Modeling Concept We simulate processes in a radial cross section extending from the contact point of the SFM cantilever in the middle of the lamellipodial leading edge about 10 μm into the lamellipodium. We distinguish two regions in the lamellipodium of a motile cell and use different modeling approaches for them (22). The bulk of the lamellipodium consists of a dense network of long actin filaments. Myosin motors cross-link filaments and can also contract the network. We call this part actin gel and use a continuum theory for its description (22, 23). At the leading edge of the lamellipodium, actin filaments polymerize. The newly polymerized tips of filaments are not firmly cross-linked into the actin gel yet. We call that part of the actin network semiflexible region (SR). It comprises the range between the leading edge plasma membrane and the average position of a concentration of filament-bound cross-linkers causing the gel properties, i.e., the gel boundary. The transition between SR and gel is of course gradual, nevertheless we approximate it by the sharp gel boundary. The depth of the SR is denoted by z. With less than 2 μm (24) it is small compared to the gel depth of typically 10 μm or more. Forces of Attached and Detached Filaments We consider two different filament populations in the semiflexible region: filaments are either attached to the membrane by some protein complex or detached from it. The actin gel provides support for the filaments in the semiflexible region, so that they can transfer mechanical momentum to the membrane. The freely fluctuating part of a filament measured from the gel boundary to the tip is flexed by Brownian motion and can be characterized by its free length l. We assume that all filaments are directed normal to the membrane. Detached filaments exert the force fd. The probability density distribution P(z) of the filament end-to-end distance defines a free energy )(ln)( zPTkzF B= , from which the average normal force on the membrane can be derived as (25)
( ) )~(~)( ηdcd ffzzFzf =
∂∂
−= .
The scale of this force is given by the Euler buckling force
2
2
4 ll
Tkf pBc
π= ,
where lp denotes the persistence length of the filament (1, 26), and the scaling parameter is given by ( ) 2/~ lzll p −=η . In the following, we use the force dependence on free length and semiflexible region depth in the weakly bending rod approximation (1). The derivation shows that for small compression 2.0~ ≤η the scaled force reads

−
−
=
ηπηπ
η
~21erfc21~
~41exp4
~
2/32/5
df
[S1]
and for strong compression ( )( )ηπ
ηπ~2exp
311
~2exp31~2
2
−−
−−=df
[S2]
It is believed that the directionality of cell protrusions is maintained by directed growth (27). While detached filaments always push the membrane, filaments can also exert a pulling force during attachment, depending on their length and position relative to the membrane. The molecular details of filament-membrane links are not yet fully understood. We therefore assume that single filaments can transiently attach to the membrane via linker proteins that behave like elastic springs. We distinguish three regimes for the force fa exerted by the serial arrangement of polymer and linker, depending on the relation between the depth of the semiflexible region z, the equilibrium end-to-end distance ( )plllR 2/1|| −= , and the free length l (28):
( )( )
( ) ( ) (iii)(ii)(i)
.,,,
,,
||
||||
||||||
≥−−−−<<−−
≤−−=
lzRlklzklzRRzk
RzRzkf
effl
effa
The three cases correspond to; i) a compressed filament pushes against the membrane; ii) filament and linker pull the membrane while being stretched together; iii) a filament is fully stretched but the linker continues to pull the membrane by being stretched further. Here, k||, kl and keff are the linear elastic coefficients of polymer, linker and serial polymer-linker arrangement, respectively. For k|| we use the linear response coefficient of a worm-like chain grafted at both ends 42
|| /6 llTkk pB= (29, 30). Both af and df are strictly valid only in the weak bending approximation, which is not given in all phases of the force velocity relation. The weak bending approximation applies to the stiff filaments in the asymptotic state of the stalled lamellipodium. The force is mainly carried by attached filaments in the freely running cell and during the second phase of the force velocity relation. The filaments are in the regime z ≤ R|| at this time, i.e. the elastic regime with a response coefficient k||. That regime is valid for 22 / apBa llTkf π≤ (31), which applies to the freely running cell and at the beginning of the second phase. In the example of Fig. 3 in the main paper, the criterion is violated at the end of the second phase but is met later in the adaptation phase again. Hence, in the late part of the second phase, af would be better described by a non-linear response, which would be stronger than the linear one. Possibly, that would entail a little less bending of the filaments than shown in Fig. 3E, but would not change results qualitatively.
A. Gholami has shown, that the weak bending approximation for df at 1.0/ ≈pd ll is
rather good up to ( ) 2/η 2 ≈−= ddp lzll , which is the range applying to our simulations (32). Dynamic Processes in the Semiflexible Region The dynamics of the filaments in the semiflexible region are captured by the following set of equations (28):
( )( ) ( ) ( ) ( )
( ) ( )
( ) ( )[ ],
,)(,,1
,,
,,,~,
,,
uy
yfzlfnzlfny
llnn
kzlvl
llnn
zlkzlvzlvl
nzlknkn
gt
extdddaaat
ada
daagat
dad
aaddgdpdt
aaddaat
=∂
−+=∂
−+−=∂
−+−=∂
−=∂
κ
[S3]
with gyyz −= . We assume that nucleation of new filaments and capping of existing ones conserves the total number density n. The number densities of attached and detached filaments na and nd vary due to transitions between the two populations. The dynamics of na is described by the first of Equations S3. Detached filaments attach to the membrane with a constant attachment rate ka. The detachment of attached filaments is force-dependent since a pulling force exerted on attached filaments accelerates detachment. The detachment rate can be expressed as
( )Tkdfkk Badd /exp0 −= , [S4] with the force-free detachment rate 0
dk . d = 2.7 nm is the length added by an actin monomer to the filament. The density of detached filaments is ad nnn −= . The second and third equation comprise the variation of the filaments’ average free lengths. The length of detached filaments ld increases by polymerization. The polymerization velocity is force-dependent (26): ( )Tkdfvv Bdpp /expmax −= , with the
force-free polymerization velocity maxpv . The length decreases by progression of the actin
gel boundary. The gel boundary advances by microscopic processes causing gelation, like cross-linking of newly polymerized filaments and entanglement. The cross-linking velocity vg depends on the free length, since the binding probability of cross-linkers vanishes for 0→l . It can be written as
( ) ( )llvlv gg /tanhmax= , [S5] with a characteristic length l and a maximum velocity max
gv . This expression can be
derived from the cross-linker binding dynamics, with ( ) 1−= bDnl and
critbfg CbDnCv /0max = (22). The binding rate of cross-linkers to the filaments is
proportional to bn2. D is the diffusion coefficient of cross-linkers, 0fC the concentration
of free cross-linkers in the bulk and critbC a concentration of filament-bound cross-linkers,
above which the actin network can be considered a gel. The velocity maxgv is proportional,
the length l inversely proportional to filament density n. We keep l constant at 100 nm when changing n, since it is much smaller than the filament length l, which stays above 400 nm throughout our simulations. If filaments are bend (l > z), progression of the gel consumes zl / times more free length of filaments than distance traveled in the lab frame. That causes the factor ( )zl /,1max in the rate of filament shortening
( ) ( ) ( )lvzlzlv gg /,1max,~ = (28, 33). The last term of the ld-dynamics describes the change of the average length of detached filaments due to detachment of attached filaments. The dynamics of la is analogous but lacks polymerization. The fourth equation describes the dynamics of the leading edge position y. The velocity of the membrane is proportional to the total force exerted on it, i.e., the sum of an external force density fext and the force from all filaments. All friction forces or viscous drag counteracting membrane motion are captured by the drag coefficient κ. In the SFM experiment, the lamellipodium deflects the SFM cantilever. Therefore, the external force fext acting on the leading edge plasma membrane is proportional to the position of the leading edge y when the cell is in contact with the SFM cantilever. This is expressed by ( )cext yykf −= , with the elastic modulus of the cantilever k, for cyy ≥ , and 0=extf for cyy < . Gel Dynamics The last Equation of S3 expresses the behavior of the gel boundary yg. The force exerted by the filaments in the semiflexible region on the membrane acts also on the gel front. That will provide us with the force boundary condition required to calculate the gel flow. We calculate the velocity u of the gel front in the lab frame with the theory developed by Kruse et al. (34) that captures visco-elastic properties of the actin network, polarization of the network due to alignment of filaments into the direction of motion and active contractions of the network by myosin (see Equations S6-S8). We use the simplified one-dimensional equations derived in (23, 34). Taking a radial cross-section through the lamellipodium and averaging over its height (thin film approximation) yields the constitutive equation (23)
−= µ
η )()(
41
xhxf
dxdv , [S6]
with the gel viscosity η and the active contractile stress μ from motor molecules. Stress in the gel is described by )(xf . )(xh is the height of the gel film and )(xv the flow field in the lab frame. We neglect inertial forces in the force-balance
)(xvdxdf ξ= , [S7]
where ξ is the friction coefficient of the gel to adhesion sites (23). Equations S6, S7 can be solved when boundary conditions for the force at the gel front ( ) 00 ff = and at the cell body ( ) LfLf = are specified. We assume that 0=Lf (22).
Furthermore, an expression for the height profile )(xh is needed. This expression can be obtained from integrating the continuity equation

( ) ( )( ) ( )[ ] ( )xvhxhvvxvdxd
linklink δ00 =−+ . [S8]
Gel is produced at the gel front x = 0 (with height ( ) 00 hh = ) by cross-linking the filaments of the semiflexible region with a velocity vlink. The velocity of the gel front is given by ( )0vvu link −= . We use the same velocity definitions as Kruse et al., i.e., )(xv is directed opposite to u and vlink. Solving the gel Equations S6-S8 can be reduced to determining three coefficients depending on two dimensionless parameters only. A fit of these dependencies and scaling back to physical units leads to the approximation (22)
.4
03.00.14
92.00.1
,
412.00.2
1
,14
2/1
0
2
2
0
21
201
+
+=
+=
+−≈
link
link
vL
hLg
hL
g
gL
fgLvu
ηµ
ηξ
ηξ
ξηµ
[S9]
We have fit g1 and g2 for 504
00
2
≤≤h
Lηξ . Equations S9 are valid on condition that
14
≤linkvL
ηµ , since the solution of the gel Equations S6-S8 diverges at finite L3
The gel front moves slower than the cross-linking rate vlink since the gel flows backward. This is called retrograde flow and is observed in moving cells (
.
16, 20, 35, 36). The second term on the right-hand side of Equation S9 characterizes the retrograde flow due to contraction by myosin motors in the absence of external forces. The term proportional to f0 reflects the retrograde flow due to filaments of the semiflexible region pushing against the gel front. A negative value of f0 corresponds to a pushing force, which increases the retrograde flow and decreases the gel velocity u. The active contractile stress µ and the friction coefficient ξ describing adhesion appear only in a product with lamellipodium depth L in Equation S9. This illustrates that the velocity of the gel boundary depends on the friction and contraction integrated over the lamellipodium depth but not on spatial detail in the lamellipodial structure like small variations of the height. The gel model yields for small external forces a slight monotonous increase of lamellipodial height towards the cell body (23), while experimental profiles exhibit a small maximum a few micrometers from the leading edge (37). We assume that these differences do not crucially affect our results due to the integration mentioned above. We can now use Equation S9 to express the gel boundary velocity in the system S3. The total force that all filaments exert on the membrane also acts on the gel front and therefore the force boundary condition is
3Despite that condition, there is a solution at 0=linkv , with uxv −=)( , ( ) ( )ξLffu L /0 −= and
)()( xfxh µ= , i.e., contraction forces exactly balance )(xf , and motion arises for 00 ≠− Lff only.
( ) ( )[ ]zlfnzlfnf dddaaa ,,0 +−= . The gel formation velocity equals the average cross-linking rate:
( ) ( )[ ] nlvnlvnv dgdagalink /+= . Simulation Parameters and Contact Length In Fig. 3 of the main paper, solutions of the model (Equations S3) after cantilever contact ( cyy ≥ ) are shown. Nevertheless, we always started simulations before cantilever contact ( cyy < ). Parameter values are shown in Table S1 and Table 1 of the main paper. We chose parameters such that velocity and retrograde flow of the freely running cell were consistent with the experimentally measured data (see Table S2). Force constants of the cantilever were the same as in the specific experiment. Considering only the geometry of the system, one can express the projected contact length L between the spherical probe and lamellipodium as ( )hhDL −= 2 . The probe attached to the cantilever has a diameter D of 6 μm. With the lamellipodium height h of 250 nm, this results in a contact length of 2.4 μm. Images of the cell touching the probe suggest that the range of leading edge membrane affected by the probe is slightly longer, i.e. about 3 μm (see Fig. S5). The range in which forces act on the gel boundary is also broader than the contact length between membrane and bead, due to the tilt of filaments with respect to the direction of motion (24). An SR-depth of 2 μm and a branching angle of 35° lead to an additional contribution of maximal 2.8 μm. In agreement with geometric considerations and measurements (Fig. S5), force densities were integrated over an effective contact length of 4.4 μm to get absolute force values. Actually, the contact length is not constant during cantilever deflection since the lamellipodium adapts to the spherical shape of the probe. We took this effect into account by performing a simulation with 000 )(2~ LtvLtvL +−= as time-dependent contact length. We assume that those parts of the lamellipodium, that are not affected by the probe keep moving with the constant protrusion velocity before cantilever contact 0v . L is the geometric contact length, i.e. 2.4 μm, and 0L the lamellipodium length that is additional affected due to tilted filaments, i.e. 2.0 μm. Hence the contact length changes from 2.0 μm at first cantilever contact to 4.4 μm and stays constant when this value has been reached. The results of that simulation for control parameters are shown in Fig. S5. They are not significantly different from those obtained with constant contact length. Therefore we used a constant contact length in our simulations. Comparison with other theoretical studies Our observation that both SR and gel shape the force-velocity relation is confirmed by comparison to other theoretical studies. Zhu et al. investigated a variety of models using a branch point distance of 200 nm on elastic filaments (38). Models differed with respect to nucleation dynamics and filament-membrane attachment mechanisms. The experimentally measured force-velocity relation of the fish keratocyte lamellipodium could not be reproduced. Simulations of branched actin networks made of rigid rod-like filaments with excluded volume effects taken into account (39) produce a concave-down force-velocity relation. However, they predict stall forces by a factor of 20-50 too large. Brownian dynamics simulations of actin filaments with persistence length of 0.1 µm (40)
also give rise to a concave shaped force-velocity curve, but velocities at half stall force are orders of magnitude faster than in experiments with fish keratocytes and stall force density is by about one order of magnitude too small (40). No retrograde flow is found in actin networks growing under an AFM cantilever (41). The shape of the force-velocity curve of those systems resembles that of keratocytes, though on much different scales. It takes several minutes to reach the stall force which is on the order of 300 nN. Weichsel and Schwarz suggested to explain this behavior by a configurational bistability of the actin network (42). However, this bistability has recently been excluded as the mechanism of the force-velocity relation in fish keratocytes by Heinemann et al. (43), who repeated the measurement with the same cell after a time lag of 30-40 s. The second measurement should have provided results different from the first one, if the actin network exhibited a configurational bistability and a state transition shaped the force-velocity relation. However, two repetitions showed the same outcome as the first measurement. Heinemann et al. excluded the autocatalytic branching model by the same reasoning. This model explains the plateau after the initial drop by growing filament density (44). Such an increase in density should also affect the second and third measurement according to ref. (43). This was not observed in the experiments. In contrast, the relaxation times of our mechanism are in agreement with the repeated experiments (see Fig. 3 of the main paper). Moreover none of the mentioned theoretical studies takes the initial velocity drop or the adaptation phase into account.

Supporting References 1. Gholami, A., J. Wilhelm, and E. Frey. 2006. Entropic forces generated by grafted
semiflexible polymers. Phys Rev E 74:041803. 2. Abraham, V. C., V. Krishnamurthi, D. L. Taylor, and F. Lanni. 1999. The Actin-
Based Nanomachine at the Leading Edge of Migrating Cells. Biophys J 77:1721-1732.
3. Shaevitz, J. W., and D. A. Fletcher. 2007. Load fluctuations drive actin network growth. Proc Nat Acad Sci USA 104:15688-15692.
4. Mogilner, A., and G. Oster. 2003. Force Generation by Actin Polymerization II: The Elastic Ratchet and Tethered Filaments. Biophys J 84:1591–1605.
5. Berg, H. 1983. Random walks in Biology. Princeton University Press. 6. Mogilner, A. 2009. Mathematics of cell motility: have we got its number? J Math
Biol 58:105-134. 7. Le Goff, L., O. Hallatschek, E. Frey, and F. Amblard. 2002. Tracer Studies on F-
Actin Fluctuations. Phys Rev Lett 89:258101. 8. Evans, E. 2001 Probing the relation between force--lifetime--and chemistry in
single molecular bonds. Annu Rev Biophys Biomol Struct 30:105-128. 9. Bausch, A. R., F. Ziemann, A. A. Boulbitch, K. Jacobson, and E. Sackmann.
1998. Local Measurements of Viscoelastic Parameters of Adherent Cell Surfaces by Magnetic Bead Microrheometry. Biophys. J. 75:2038-2049.
10. Yanai, M., J. P. Butler, T. Suzuki, H. Sasaki, and H. Higuchi. 2004. Regional rheological differences in locomoting neutrophils. Am J Physiol Cell Physiol 287:C603-611.
11. Doyle, A., W. Marganski, and J. Lee. 2004. Calcium transients induce spatially coordinated increases in traction force during the movement of fish keratocytes. J. Cell Sci. 117:2203-2214.
12. Brunner, C. A., A. Ehrlicher, B. Kohlstrunk, D. Knebel, J. A. Kas, and M. Goegler. 2006. Cell migration through small gaps. Eur Biophys J 35:713-719.
13. Anderson, K. I., Y. L. Wang, and J. V. Small. 1996. Coordination of protrusion and translocation of the keratocyte involves rolling of the cell body. J. Cell Biol. 134:1209-1218.
14. Svitkina, T. M., A. B. Verkhovsky, K. M. McQuade, and G. G. Borisy. 1997. Analysis of the Actin-Myosin II System in Fish Epidermal Keratocytes: Mechanism of Cell Body Translocation. J Cell Biol 139:397-415.
15. Izzard, C. S., and L. R. Lochner. 1976. Cell-to-substrate contacts in living fibroblasts: an interference reflexion study with an evaluation of the technique. J Cell Sci 21:129-159.
16. Jurado, C., J. R. Haserick, and J. Lee. 2005. Slipping or Gripping? Fluorescent Speckle Microscopy in Fish Keratocytes Reveals Two Different Mechanisms for Generating a Retrograde Flow of Actin. Mol Biol Cell 16:507-518.
17. Brunner, C., A. Ehrlicher, B. Kohlstrunk, D. Knebel, J. Käs, and M. Goegler. 2006. Cell migration through small gaps. Eur Biophys J 35:713-719.
18. Betz, T., D. Lim, and J. A. Kas. 2006. Neuronal growth: a bistable stochastic process. Phys Rev Lett 96:098103.
19. Betz, T., D. Koch, B. Stuhrmann, A. Ehrlicher, and J. Käs. 2007. Statistical analysis of neuronal growth: edge dynamics and the effect of a focused laser on growth cone motility. New J Phys 9:426.
20. Vallotton, P., G. Danuser, S. Bohnet, J.-J. Meister, and A. B. Verkhovsky. 2005. Tracking Retrograde Flow in Keratocytes: News from the Front. Mol Biol Cell 16:1223-1231.
21. Verkhovsky, A. B., O. Y. Chaga, S. Schaub, T. M. Svitkina, J.-J. Meister, and G. G. Borisy. 2003. Orientational Order of the Lamellipodial Actin Network as Demonstrated in Living Motile Cells. Mol Biol Cell 14:4667-4675.
22. Zimmermann, J., M. Enculescu, and M. Falcke. 2010. Leading edge - gel coupling in lamellipodium motion. Phys Rev E 82:051925.
23. Kruse, K., J. Joanny, F. Jülicher, and J. Prost. 2006. Contractility and retrograde flow in lamellipodium motion. Phys Biol 3:130-137.
24. Koestler, S. A., S. Auinger, M. Vinzenz, K. Rottner, and J. V. Small. 2008. Differentially oriented populations of actin filaments generated in lamellipodia collaborate in pushing and pausing at the cell front. Nat Cell Biol 10:306-313.
25. Frey, E., K. Kroy, J. Wilhelm, and E. Sackmann. 1998. Dynamical Networks in Physics and Biology. Springer Verlag, Berlin.
26. Mogilner, A., and G. Oster. 1996. Cell motility driven by actin polymerization. Biophys J 71:3030-3045.
27. Carlier, M.-F., and D. Pantaloni. 2007. Control of Actin Assembly Dynamics in Cell Motility. J Biol Chem 282:23005-23009.
28. Gholami, A., M. Falcke, and E. Frey. 2008. Velocity oscillations in actin-based motility. New J Phys 10:033022.
29. Kroy, K., and E. Frey. 1996. Force-Extension Relation and Plateau Modulus for Wormlike Chains. Phys Rev Lett 77:306.
30. Kroy, K. 1998. Viskoelastizität von Lösungen halbsteifer Polymere. 31. MacKintosh, F. C., J. Käs, and P. A. Janmey. 1995. Elasticity of Semiflexible
Biopolymer Networks. Physical Review Letters 75:4425-4428. 32. Gholami, A. 2007. Actin-based motility. In Dept. of Physics. Ludwig
Maximilians Universität, Munich. 33. Enculescu, M., A. Gholami, and M. Falcke. 2008. Dynamic regimes and
bifurcations in a model of actin-based motility. Phys Rev E 78:031915. 34. Kruse, K., J. Joanny, F. Jülicher, J. Prost, and K. Sekimoto. 2005. Generic theory
of active polar gels: a paradigm for cytoskeletal dynamics. Eur Phys J E 16:5-16. 35. Lin, C. H., E. M. Espreafico, M. S. Mooseker, and P. Forscher. 1996. Myosin
Drives Retrograde F-Actin Flow in Neuronal Growth Cones. Neuron 16:769-782. 36. Lin, C.-H., and P. Forscher. 1995. Growth cone advance is inversely proportional
to retrograde F-actin flow. Neuron 14. 37. Urban, E., S. Jacob, M. Nemethova, G. P. Resch, and J. V. Small. 2010. Electron
tomography reveals unbranched networks of actin filaments in lamellipodia. Nat Cell Biol 12:429-435.
38. Zhu, J., and A. E. Carlsson. 2010. Effects of molecular-scale processes on observable growth properties of actin networks. Phys Rev E 81:031914.

39. Schreiber, C. H., M. Stewart, and T. Duke. 2010. Simulation of cell motility that reproduces the force-velocity relationship. Proc Nat Acad Sci USA 107:9141-9146.
40. Lee, K.-C., and A. J. Liu. 2009. Force-Velocity Relation for Actin-Polymerization-Driven Motility from Brownian Dynamics Simulations. Biophys J 97:1295-1304.
41. Parekh, S. H., O. Chaudhuri, J. A. Theriot, and D. A. Fletcher. 2005. Loading history determines the velocity of actin-network growth. Nat Cell Biol 7:1219-1223.
42. Weichsel, J., and U. S. Schwarz. 2010. Two competing orientation patterns explain experimentally observed anomalies in growing actin networks. Proc Natl Acad Sci USA 107:6304-6309.
43. Heinemann, F., H. Doschke, and M. Radmacher. 2011. Keratocyte Lamellipodial Protrusion Is Characterized by a Concave Force-Velocity Relation. Biophys J 100:1420-1427.
44. Carlsson, A. E. 2001. Growth of Branched Actin Networks against Obstacles. Biophys J 81:1907-1923.