a sublayer model for turbulent deposition of particles in vertical ducts with smooth and rough...
TRANSCRIPT
J. Aerosol Sci,, Vol. 24, No. 1, pp. 45-64, 1993 0021 8502/93 $6.00+0.00 Printed in Great Britain. ~ 1993 Pergamon Press Ltd
A SUBLAYER MODEL FOR TURBULENT DEPOSITION OF PARTICLES IN VERTICAL DUCTS WITH SMOOTH
AND ROUGH SURFACES
FA-GUNG FAN and GOODARZ AHMADI
Department of Mechanical and Aeronautical Engineering, Clarkson University, Potsdam, NY 13699, U.S.A.
(Received 1 August 1991; and in final form 10 August 1992)
A~traet--The sublayer model for deposition of spherical particles from turbulent air streams in vertical ducts with smooth and rough walls is described. The formulation is based on the coherent vortical structure of near-waU turbulence and the detailed analysis of particle trajectories in this flow field. The Stokes drag, the Saffman lift force, and the gravitational force are included in the equations of particle motion. The wall roughness is taken into account by an appropriate modification of the boundary condition for the particle capture trajectories. The predicted deposition rates under various conditions are compared with the available experimental data and a reasonable agreement is observed. It is noticed that the particle-to-fluid density ratio, the shear-induced lift force, the wall roughness, the gravity direction and the flow Reynolds number have profound effects on the particle deposition rate. Based on a perturbation method, a simplified empirical equation for evaluating the turbulent deposition rate is also proposed.
I N T R O D U C T I O N
Deposition of small solid or liquid spherical particles from a turbulent air stream to a surface has received considerable attention in the past few decades due to its significance in numerous engineering applications. The earlier applications were directed toward air and water pollution and pneumatic transport. Recently, the need of microelectronic and com- puter manufacturing industries to control microcontamination processes has generated considerable new interest on the subject. In particular, particulate contamination has been identified as the leading cause for loss of yield in manufacturing integrated-circuits micro- chips (Cooper, 1986).
While mass diffusion in laminar flows is a relatively well-established field (Levich, 1962), the mechanisms for turbulent dispersion and deposition processes are not, as yet, well understood. Numerous analytical and experimental studies have suggested that the aerosol particle diffusivity is roughly equal to the turbulence eddy diffusivity in the core and the inertia sublayer regions. In the viscous sublayer, contributions of the Brownian motion for submicron particles may become quite significant. In the neighborhood of the wall, where the turbulence fluctuation dies down, submicron particles are transported toward the wall mainly by molecular diffusion. This diffusion theory provides reasonable results for depos- ition rates of submicron aerosols. For particles larger than a few micron, the experimental deposition rates were found to be much larger than those predicted by the simple diffusion model.
Extensive reviews of earlier and recent developments of the theories of turbulent depos- ition processes and related experimental studies were provided by Wood (1981a) and Papavergos and Hedley (1984). Therefore, only those works directly related to the present study are reviewed here briefly. In their pioneering work on turbulent deposition processes, Friedlander and Johnstone (1957) proposed their free-flight model. Accordingly, particles are detached from the turbulent eddies at a stopping distance from the wall and are projected toward the wall in free-flight motion. The stopping distance is defined as the distance that a particle with a specified initial velocity would travel through a quiescent fluid before coming to rest. Friedlander and Johnstone (1957) used the root-mean-square fluctuation velocity in the core region as the initial free-flight velocity. However, analysis shows that the free-flight starts at a distance which is quite close to the wall, so that the vertical fluctuation velocity is quite different from that in the core region. Davies (1966a)
45
46 F .G. FAN and G. AHMAD1
corrected Friedlander and Johnston's theory by using the proper initial free-flight velocity. This modified theory, though based on more realistic assumptions, underestimates the experimental data by two orders of magnitude.
Owen (1969) suggested that the particles were convected to the wall by the coherent eddies in the near-wall region. Following the idea described by Owen, Cleaver and Yates (1975) developed a turbulent deposition model which was based on the detailed flow pattern of near-wall turbulence. Both inertia- and diffusion-controlled deposition processes were studied. A viscous two-dimensional plane stagnation point flow was used to model the turbulent near-wall eddies. Cleaver and Yates neglected the lift force and used a perturba- tion method for evaluating the particle deposition rate. Their results suggest that the particle deposition velocity depends on the particle-to-fluid density ratio. However, an ad hoc factor accounting for the convective transport in the direction of main flow was needed to improve the agreement with the experimental data.
Fichman et al. (1988) proposed a model which included the Saffman lift force generated by the mean shear in the flow direction. Similar to the work of Cleaver and Yates (1975), a plane stagnation point flow was used as a model for the turbulence near-wall down sweep flow. The flow field was divided into three regions and analytical expressions for the velocity fields in these regions were provided. The equation of particle motion was also solved analytically, and the deposition rate was evaluated based on the resulting particle traject- ories. Fichman et al. (1988) reported better agreement with the experimental data without the use of any correction factor. However, there appear to be some seemly erroneous constants in the analytical expression for the flow field used by Fichman et al. (1988).
In addition to the theoretical development and experimental studies, many computer simulations on the turbulent deposition processes have been performed. McLaughlin (1989), Ounis et al. (1991) and Brooke et al. (1992) computed the turbulent deposition in a channel flow using a pseudospectral computer code to simulate the instantaneous turbulent flow field. Abuzeid et al. (1991) and Li and Ahmadi (1992, 1993) used a simple simulation technique to study the dispersion and deposition processes of suspended par- ticles in turbulent channel flows.
Most earlier studies were concerned with ideal smooth surfaces. In practical applications, however, surfaces are not perfectly smooth. In addition, when particles are deposited on an initially smooth surfaces, it becomes partially rough. A number of earlier and recent experimental and theoretical works on turbulent deposition on rough surfaces were re- viewed by Wood (1981 a) and Papavergos and Hedley (1984). These studies showed that the surface roughness significantly increases the particle deposition rate even for very small roughnesses.
Despite its significance in numerous applications, understanding of the rough-wall deposition process is far less complete when compared with its smooth-wall counterpart. Browne (1974) extended the approach of Davies (1966b) to rough wall conditions. To account for the effect of surface roughness, a roughness-induced effective particle-capture distance was used. Moreover, by shifting the position of the origin of the velocity profile, the expression for the transverse velocity fluctuations for the smooth wall was used for the rough wall condition. Wood (1981b) adopted a method similar to that of Browne and obtained an analytical expression for the particle deposition velocity. Im and Ahluwalia (1989) provided an analytical model for turbulent deposition of particles on smooth and rough walls. These earlier studies were based on the concept of stopping distance. However, the recent works of Cleaver and Yates (1975), Fichman et al. (1988), McLaughlin (1989) and Ounis et al. (1991) showed that the near-wall vortices of turbulent streams (which are ignored in the stopping distance models) play a decisive role in the deposition processes.
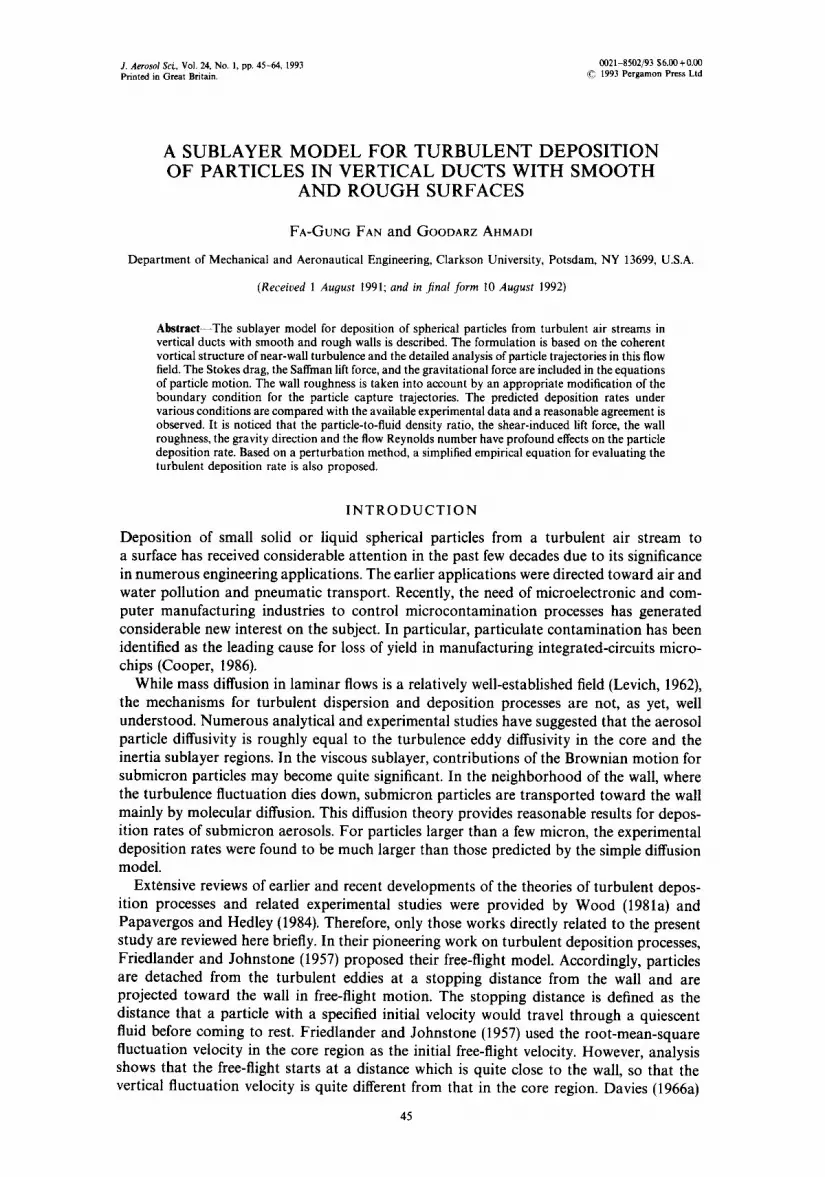
In this work, the problem of deposition of spherical particles from turbulent air streams in vertical ducts with smooth, as well as rough walls is considered. A schematic diagram of the flow geometry is shown in Fig. 1. For this vertical flow geometry, the gravitational force does not directly enhance the deposition rate through sedimentation. However, the gravity affects the deposition process through the shear-induced lift force. A viscous plane stagna-
Turbulent deposition of particles in vertical ducts 47
s I s
s I
s " i
1
Fig. 1. Schematic diagram of the vertical channel.
tion point flow as described in Schlichting (1979) is used as the model for the near-wall down sweep flows generated by the turbulence coherent eddies. The particle trajectories are obtained by numerically solving the appropriate governing equations of motion. The Stokes drag, the gravitational force, and the Saffman (1965, 1968) lift forces generated by the flow shears in the streamwise and spanwise directions are included in the analysis. The wall roughness is taken into account by an appropriate modification of the boundary condition for the particle capture trajectories. Effects of the particle-to-fluid density ratio, the lift force, the wall roughness, the gravity direction, and the flow Reynolds number on wall deposition rate are studied. The deposition velocities predicted by the present model are compared with the available experimental data and a reasonable agreement is observed. Based on the results obtained via a perturbation method, a simplified empirical equation for evaluating the deposition velocities for smooth and rough surfaces is also proposed.
The following sections start with descriptions of the model for turbulence near-wall coherent eddies, and the deposition models for smooth and rough surfaces. These are followed by the equations of motion for a rigid spherical particle suspended in a shear field. The numerical procedure for obtaining the particle limiting trajectories are then described. Based on these limiting trajectories, the inertia-interception deposition rates are evaluated. An empirical equation for evaluating the turbulent deposition rate is developed sub- sequently. The section on numerical results compares the deposition velocities predicted by the present model with the available experimental data for smooth and rough wall conditions. The predictions of the proposed empirical equation for deposition rates are also reported.
AS 24:1-D

48 F.G. FAN and G. AHMADI
FLOW MODEL FOR NEAR-WALL TURBULENCE STRUCTURE
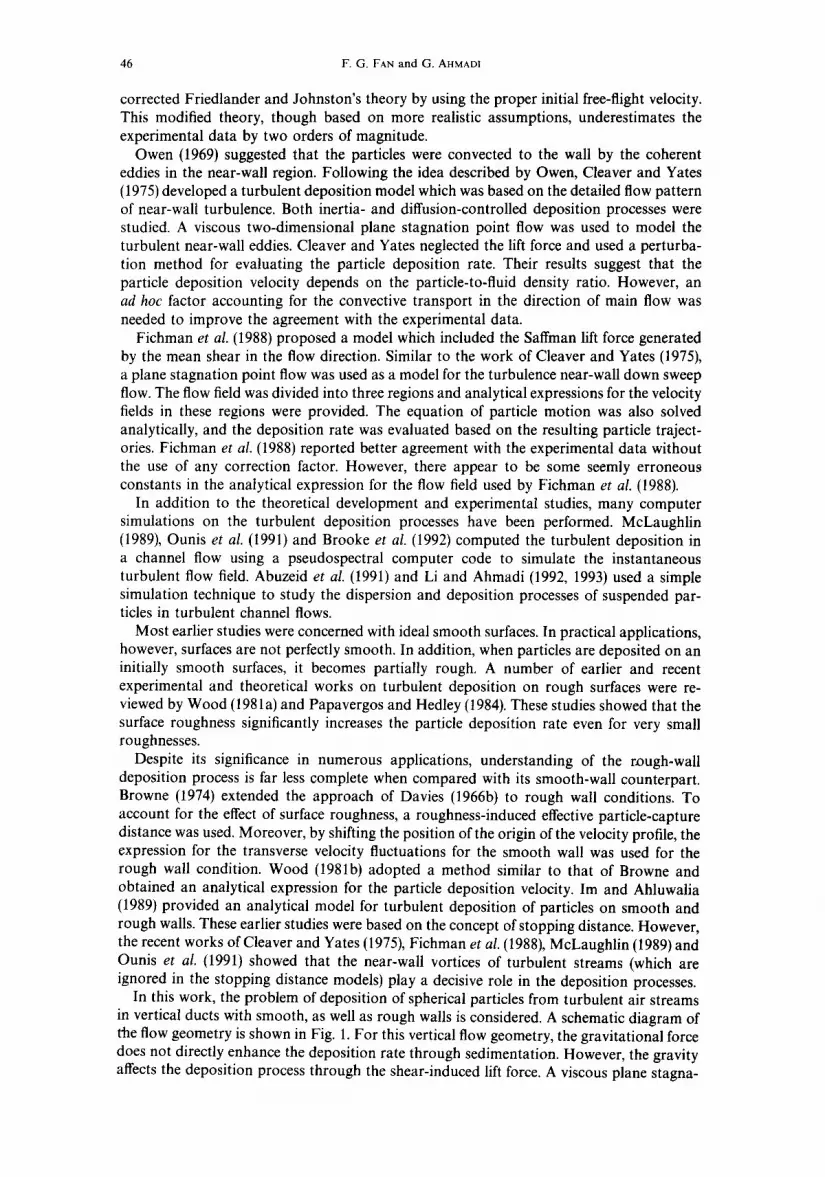
It is well known that the turbulent near-wall flow is a region of strong dynamic interactions where most of the turbulence fluctuation energy is generated. For many years, it was believed that turbulent motions were entirely random with no distinct structures. From numerous flow visualization experiments (Schraub et al., 1965; Kline et al., 1967) and direct numerical simulations (Kim et al., 1987; Ounis et al., 1991), it is now well recognized that the turbulence near-wall region is dominated by coherent vortical structures and roughly cyclic bursting phenomena. A mechanism for these phenomena was described by Kline et al. (1967) and Corino and Brodkey (1969). They suggested that low-speed vortices which are formed in the wall region are stretched for a rather long duration of time and are eventually lifted into the core region through a bursting motion. The stretched vortices are deformed by the flow into the elongated U-shaped loops which lead to the observed low speed streamwise streaks, Hinze (1975) provided a description for the general features of formation of coherent vortices and down sweep and bursting processes. Accordingly, the spacing between the streaks are about 100 wall units (A + -~ 100). The near-wall flow pattern between the streamwise vortices is schematically shown in Fig. 2. Here, it is assumed that the presence of small roughness does not alter the structure of the near-wall vortices.
The near-wall vortical motions are believed to be responsible for turbulent deposition of small particles. The simulation results of Ounis et al. (1991) showed that the downsweep flow generated by these persisting coherent vortices are the main mechanism that carry the particles to the wall. Since the upflow regions do not contribute to particle deposition, only the flow pattern toward the wall needs to be modeled.
In this work, along the line of Cleaver and Yates (1975) and Fichman et al. (1988), it is assumed that the down sweep flow pattern generated by the coherent wall vortices may be approximated by a steady plane viscous stagnation point flow. The observed prolonged persistance of streamwise coherent vortices justifies the assumption of steady flow condi- tion. Additional justifications for the use of such a model were described by Fichman et al. (1988). The nondimensional velocity field for the plane stagnation point flow is given by,
where
v + - (1) u*
\ u* j 4;z+' (2)
X//~ y +. r/= --~-- (3)
Here, v is the kinematic viscosity of the fluid, ~t is a constant, u* is the friction velocity and the numerical values of $(r/) are given in Schlichting (1979). In equations (1)-(3). the dimensionless quantities are defined as
v + = v / u *, w + = w / u *, (4) and
u* u* Y + = - - Y , z + = - - z . (5)
v
Here, v and w are the fluid velocities in the y- and z-directions, respectively. To model the flow pattern in the turbulent near-wall region, the y-component velocity as
given by equation (1) is matched with the characteristic downward velocity v + at a specified distance y+ from the wall as obtained from experimental data or direct numerical simula- tion results. That is,
= - - u--W- qg ~ ~ - Yc • (6)
Turbulent deposition of particles in vertical ducts 49
Equation (6) then provides an implicit expression for x /~/u* . Cleaver and Yates (1975) and Fichman et al. (1988) used the y-direction root-mean-square (RMS) fluctuation velocities to
determine x /~ /u* . The experimentally measured y-direction RMS fluctuation velocity is about 0.3 at y+- -12 (Hinze, 1975). Here, it is assumed that the spatially averaged RMS fluctuation velocity is equal to that obtained by the time averaging. Considering that the velocity is decreasing as the center of a viscous vortex (i.e. z + = 4-A+/4) is approached, and the fact that most particles depositing on the wall originate from the neighborhood of the centerline (z + --0), a characteristic downward velocity is evaluated. Accordingly, v + -- - 0 . 7 and y+ = 12 is used in this study. Interestingly, the recent simulation results of Brooke et al. (1992) showed that the averaged y-component velocities of particles that deposit on the wall are in the range of 0.5-1.0 at y + = 12.
For the mean velocity profile in the streamwise direction, an expression given by Rannie (1956) is used, i.e.
u+ _--1 tanh(qy + ), (7) q
where u + = u/u* is the mean streamwise velocity in wall units and q--0.0688 is a constant.
D E P O S I T I O N ON S M O O T H AND R O U G H SURFACES
As particles are being transported and dispersed by turbulence, they may deposit on the wall. For a smooth surface, it is assumed that a particle is being captured by wall when it touches the wall. For rough surfaces, the situation is more complicated, and is described as follows.
It was suggested by Moore (1951) that the mean flow condition in a turbulent boundary layer near a slightly rough wall is the same as that for a smooth wall with the origin of the mean velocity being shifted by certain distance below the crests of the roughness elements (Perry et al., 1969; Rotta, 1962; Grass, 1971). This picture of turbulence behavior near a slightly rough surface is adopted here. It is also assumed that a small roughness does not significantly alter the turbulence vortical structure near a wall. Thus, the plane stagnation point flow model for the coherent eddies as described in the previous section is used also for rough wall conditions with an appropriate shift in the origin of the mean flow velocity field.
Figure 2 shows the schematic diagram of the rough-wall deposition model. In this figure, k denotes the averaged roughness height, o- k is the standard deviation of the roughness element. An estimation of o k based on k as suggested by Browne (1974) is given by
O" k = 0 . 1 7 k . (8)
I ZI 2
r
l
' bK-5 ° ,
Fig. 2. Schematic diagram of the deposition model.

50 F .G. FAN and G. AHMADI
Using the experimental data of Grass (1971) and based on Moore's argument, Browne (1974) provided an expression for the position of the displaced origin. For small roughness, this expression may be approximated as
e=0.53k. (9)
In this study, it is assumed that the particle is captured by the wall when it reaches the height of one standard deviation of the roughness element above the mean, i.e.
y = k + t~k-e + d/2 , (10)
where d is the particle diameter and y is the capture distance from the origin of mean velocity. As k--*0, equation (10) reduces to y = d/2, which corresponds to the special case of deposition on a smooth wall.
EQUATIONS OF PARTICLE MOTION
The motion of a spherical particle suspended in a general flow field is described by the modified BBO (Basset-Boussinesq-Oseen) equation as given by Maxey and Riley (1983). For a small particle, the effects of added mass, Basset force, pressure gradient and Faxen correction may be neglected. On the other hand, the shear-induced lift force may be significant for particles moving in a strong shear field. These lead to a set of equations which are given as,
du p "r- -~-=u-uV + z9, (11)
d/) p z ~ = v - v v + "rLa (u - u v) + zL2 (w - wV), (12)
where u p, v p, w v are, respectively, the particle velocity components in the x-, y-, and z- directions, t is the time and 0=9 .807ms -2 is the acceleration of gravity. Note that 9 = - 9 . 8 0 7 ms -2 when the gravitational force is opposite to the flow direction.
The particle relaxation time is defined as
pVCcd2 z= 18/~ ' (14)
where pP is the particle density, d is the particle diameter,/~ is the fluid dynamic viscosity and Cc is the Cunningham correction factor given by,
Co= 1 + 1.257 Kn+0.4 Kne - ll/Kn, (15)
where the Knudson number Kn is the ratio of the gas mean free path (2) to particle radius, i.e.
and
22 Kn = - - . (16)
d
In equation (12), L1 and L 2 a r e defined as
du/dy / Lx =3.08/~ idu/dylX/2 (pV dvl/2),
Lz=3.08g ~ 2 /(pPdvl/2) ' (18) dw/dy ' /
which are, respectively, the coefficients for Saffman lift forces induced by the flow shears in the main flow and the lateral directions.
(17)
d w p z --~-[- = w - w p, (13)
Turbulent deposition of particles in vertical ducts 51
For the present study, it is convenient to restate the equations of motion in nondimen- sional form. Introducing the dimensionless quantities,
uP+=uP/u *, vP+=vP/u *, wP+=wP/u *, (19) and
d + = U ' d , t + U . 2
= t. (20) V
Equations (11)-(13)may be restated as,
du p+ T+ + dt + =u - u p+ +z+9 +, (21)
dv p+ z + = v + - v P + + z + L ~ ( u + - u P + ) + z + L ~ ( w + - w P + ) , (22)
dt +
dw p+ z + = w + - w p +, (23)
dt +
where equations (4) and (5) are also used. In these equations, the nondimensional particle relaxation time, and the nondimensional acceleration of gravity are defined by,
Z+ SCed +2 9+ V - 18 ' = ~ - 3 g, (24)
where S= pp/pl is the particle-to-fluid density ratio. Here, L~ and L~- are given by
du +/dy + / + L~- =3.08 idu+ /dy + 11/2 (Sd ), /
and
(25)
dw+/dy + / L~ =3.08 /(Sd+), (26)
Idw+/dv + I1/2
respectively. With the fluid velocity given by equations (1), (2), and (7) and specified particle initial
location and velocity, equations (21)-(23) may be solved numerically and the particle trajectory in the near-wall region may be determined. In this study, it is assumed that the particles start their flight at a distance of y ÷ = 12 with their initial velocities being the same as the local velocities of the carrying fluid.
L IMITING TRAJECTORIES AND DEPOSITION RATES
The limiting trajectory is defined as the trajectory for which the particle touches the wall just before being swept back into the core region. Thus, the limiting trajectories for rough walls are identified by the terminal condition given as
y + = k + + a ~ - - e ++d+/2 at z +=A+/4, (27)
where k + = u*k/v, ak = U*ak/V and e + = u*e/v are used. For smooth surfaces, equation (27) reduces to
y+=d+/2 at z+=A+/4. (28)
In the subsequent sections, the fourth-order Runge-Kutta scheme with the shooting method are used for determining the limiting trajectories.
Assuming the particles that fall within the limiting trajectory would eventually be captured by the surface while those outside the limiting trajectory would be carried back to the outer region by the coherent vortical motion, the inertia-interception deposition
+ velocity, (ud)i, may be evaluated. That is,
(uff)i = 2 z1+21 vf I A ÷ , (29)
52 F .O . FAN and G. AHMADI
where z~-2 is the distance between the limiting trajectory and the centerline at y+ = 12 and v~ = -0.7. It should be emphasized here that the particle rebound effect has been neglected in this formulation, and it is also assumed that the particle concentration remain uniform down to y+ = 12.
It is expected that the particle trajectories would approach the fluid streamlines as the particle relaxation time reduces. Thus the value ofz~2, and therefore, (uf)i, decreases as the particle size decreases. However, this argument breaks down as the size of the particle becomes sufficiently small so that the Brownian effects becomes significant. For particles smaller than 0.1 ~m, the deposition mechanism is significantly affected by the molecular diffusion process. Cleaver and Yates (1975) analysed the diffusion process of small particles in the plane stagnation point flow with a smooth wall. Accordingly, the diffusion deposition velocity takes the form,
(Ud)d = 0 , 0 8 4 Sc - 2/3, Sc = v/D. (30)
Here, Sc is the Schmidt number and D is the Brownian diffusivity defined as
D =xTCc (31) 3~rgd'
where x = 1.38 × 10⁻²³ JK- 1 is the Boltzmann's constant and Tis the absolute temperature. In this study, for the diffusion deposition velocity, the expression as given by equation
(30) is used for both smooth and rough surface conditions. It will become clear later that, for the particle sizes considered, the deposition on rough surface is dominated by the inertia-interception mechanism, and the diffusion process plays a relatively insignificant role. The overall turbulent deposition rate then is the sum of the inertia-interception and the diffusion deposition velocities. That is,
U~ + + =(ud )i+(Ud )d. (32)
It is observed that the deposition rate is dominated by the inertia eddy impaction and interception processes for larger size particles or for rough walls, while it is controlled by the diffusion process for submicron particles at smooth wall condition. A minimum deposition rate exists for smooth walls at the transition range where both of these mechanisms are insignificant.
EMPIRICAL EQUATION FOR DEPOSITION RATE
In this section, a simple empirical equation for evaluating the turbulent deposition rates for smooth as well as rough surfaces is proposed. The equation is based on the perturbation solution to the equations of motion for small particle relaxation time.
An analytical expression for the flow velocity is first introduced to facilitate the analysis. The function ~b(r/) in equation (1) may be approximated by linear and quadratic algebraic expressions given as,
f a~l+b a=0.986, b - - - 0 . 6 for r/~>l.4845 (Region I)
a=0.829, b=-0 .3669 for 0.8367 ~< r/ ~1.4845 (Region II)
~b= a=0.5604, b---0 .1422 for0.4993~<r/~<0.8367 (Region III)
cr /2 c=0.552, for r/~<0.4993 (Region IV). (33)
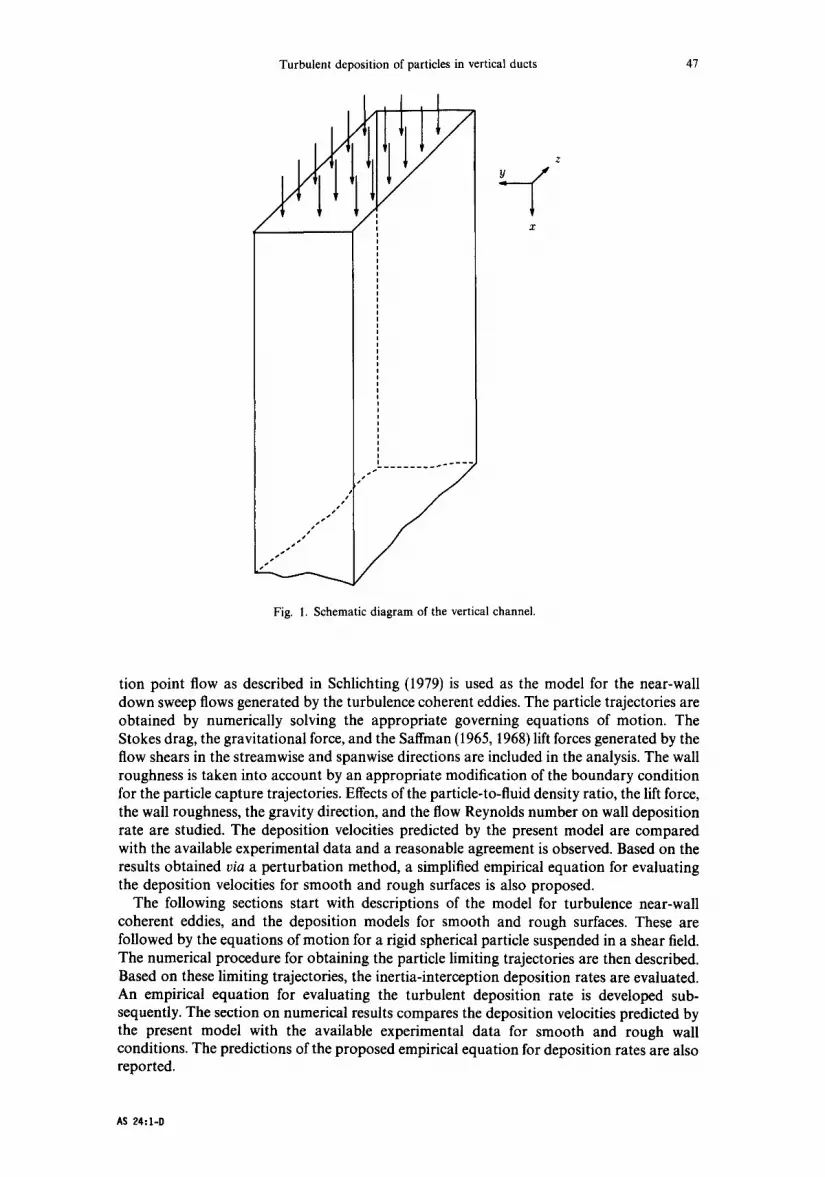
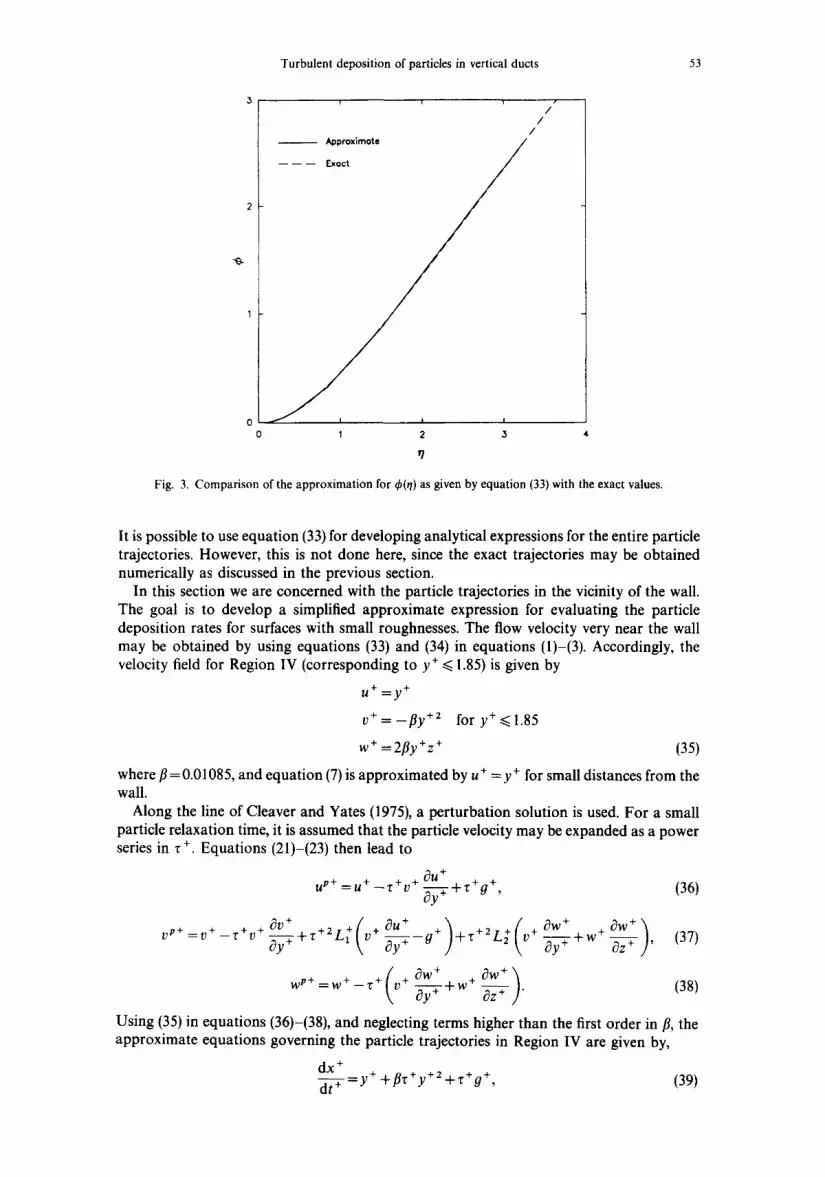
Figure 3 compares the approximation for ~b(r/) as given by equation (33) with the tabulated values in Schlichting (1979). It is observed that equation (33) is in excellent agreement with the exact values for ~b. Substituting equation (33) in equation (6) and matching the y-component velocity with v~ + = -0 .7 at y+ = 12, the constant x/~/u* may be determined. This leads to
u~,~v = 0.2699. (34)
Turbulent deposition of particles in vertical ducts 53
/ /
/ - - A,oproxlmote /
- - - - - - Exoct
0 1 2 3
Fig. 3. Comparison of the approximation for ~b(~/) as given by equation (33) with the exact values.
It is possible to use equation (33) for developing analytical expressions for the entire particle trajectories. However, this is not done here, since the exact trajectories may be obtained numerically as discussed in the previous section.
In this section we are concerned with the particle trajectories in the vicinity of the wall. The goal is to develop a simplified approximate expression for evaluating the particle deposition rates for surfaces with small roughnesses. The flow velocity very near the wall may be obtained by using equations (33) and (34) in equations (1)-(3). Accordingly, the velocity field for Region IV (corresponding to y+ ~< 1.85) is given by
u + = y +
V + = _ f l y + 2 f o r y + ~ 1 . 8 5
w + =2fly+z + (35)
where fl =0.01085, and equation (7) is approximated by u + =y+ for small distances from the wall.
Along the line of Cleaver and Yates (1975), a perturbation solution is used. For a small particle relaxation time, it is assumed that the particle velocity may be expanded as a power series in z +. Equations (21)-(23) then lead to
g p + = u + ,[+V+ ~ u + + + - ~ + r g , (36)
+2-+/'+ ou+ +2-+( Ow + Ow+' --c~y + -i--'r LX tV ~--~---g J-i-'r L2 .V + ~----~-~ + iV+ ~T . ] , (37)
°w+ d-f;- + Oz + ] . (38)
Using (35) in equations (36)-(38), and neglecting terms higher than the first order in fl, the approximate equations governing the particle trajectories in Region IV are given by,
dx + dt + =Y+ +f l z+y+2+z+g +, (39)
54 F.G. FAN and G. AHMADI
dy + dr--7- = -fl(1 +z+2L~)y+2-z+2L~g +, (40)
dz + dt ÷ =2fly+z +. (41)
It is noticed that equations (40) and (41) are decoupled from equation (39). Dividing equation (40) by equation (41), a first-order differential equation governing the particle trajectory in the yz-plane follows. That is,
dy + - f l ( l + z + 2 L + ) y + 2 - z + 2 L ~ a + dz + = 2//y + z + (42)
This equation can be solved in closed form. Using the terminal condition given by equation (27), an expression for limiting trajectory in the vicinity of the wall (y+~< 1.85) may be obtained, i.e.
r/ d + \ 2 +2 +L + -7 1/(I+r+2L:) [0.64k + + - ~ + ~ - ~ + - [ 2 : L1) /
z + . . . . . . . . (43) .+2. ~+2o+L~ [ '
where L~ =3.08/(Sd+). It should be mentioned that equation (43) is applicable only to small wall roughnesses (about k + < 1.5).
Assuming that the particle concentration remains unchanged down to y + = 1.85, the inertia-interception deposition rate may be evaluated from
(u~")i = 2z~-.s~ J v~'.s5 I A+ , (44)
where v~-.ss is the particle velocity at y+ = 1.85, and may be evaluated from equation (40). The corresponding expression for the deposition velocity then is given by
1 (U;)i =~
I d + x~2 .~+ 20+ L~I- !-~ 1/(1 +r'2L~ , 0.64k + ~ - ) + 0.01085(1 + z +2 L•
+
J z+2g+L~ - 3"42+0.01085(1 +r+2L~)
x [0.037(1 +z+2L~)+z+2L~o+]. (45)
Equation (45) is valid for small z +. For larger r +, the approximated deposition rates given by equation (45) will deviate from those obtained by numerically solving the govern- ing equation. However, based on equation (45), an improved empirical equation for evaluating the total deposition rate may be proposed, i.e.
F / d + \ 2 ~+ 2~+ T+ 1 / 0 6 4 k + + - - / -t L ~-&-~--L
1 1 \ ' 2 ] 0.01085(l+z+2L~) 0.084Sc -2/3 + - I . . . . .
2 1 _ ._ r 0 L1 3.42, bTdl0-
u2 = x [1 + 8e -('÷ -1o)2/a2] 0.037
1/(1 +r + 2L+)
if u~ < 0.14, (46)
O. 14 otherwise,
Turbulent deposition of particles in vertical ducts 55
where L~-= 3.08/(Sd + ). For small z +, the inertia-interception part of equation (46) agree with equation (45) up to the second order terms in z ÷ within a constant. It is worth mentioning here that equations (45) and (46) predict that the inertia-interception deposition rate depends on the density ratio, the wall roughness, the direction of gravity and the flow Reynolds number. Effects of the direction of gravity appears to have been ignored in the current literatures. It should be pointed out that, McLaughlin (1989) noted that the gravitational force may affect the deposition rate in vertical channel through the lift force. However, he has neglected the gravitational effect in his simulation studies.
NUMERICAL RESULTS
In this section, the turbulent deposition of small aerosol particles from air streams in a 1.5 cm wide channel which has a hydraulic diameter of 3 cm is considered. The dynamic and the kinematic viscosities for air at 15°C are 1 .84x10-Skgm- l s -1 and 1.502 x 10⁻⁵ m 2 s-1, respectively. The time step, At +, used for integrating the equations of motion varies between 0.02 and 0.1 depending on the particle size. The predicted deposition velocities under various conditions are compared with the experimental data of Friedlander and Johnstone (1957), Schwendiman and Postma (1961), Sehmel (1968), Wells and Chamberlain (1967, 1969), Farmer (1969), Ilori (1971), Liu and Agarwal (1974), and Forney and Spielman (1974) for vertical ducts as collected by Papavergos and Hedley (1984) and the digital simulation results of McLaughlin (1989) and Li and Ahmadi (1993). The flow conditions and procedures used in these experiments were summarized by Cleaver and Yates (1975) and McCoy and Hanratty (1977); hence, they need not be repeated here. The experimental data are shown by solid dots in Figs 4, 5 and 7-12. In Fig. 6, the experimental data of different authors are identified by different symbols. The effects of the Saffman lift force, the density ratio, the wall roughness, the direction of gravity and the flow Reynolds number on turbulent deposition rates of small particles are also studied.
For the flow geometry considered, the friction velocity is related to the friction factor f by
u* = ~ , (47)
where /7 is the mean bulk flow velocity. An empirical equation for the friction factor as reported by White (1986) is given by,
1 I6.9 (k/Dh) H1] fl/z-~--l.81Og~o ~ee + ~ - , (48)
where UDh
Re = , (49) V
is the flow Reynolds number. In these equations, Dh is the hydraulic diameter of the channel (Dh = 3 cm). Table 1 shows a list of flow conditions used in this study.
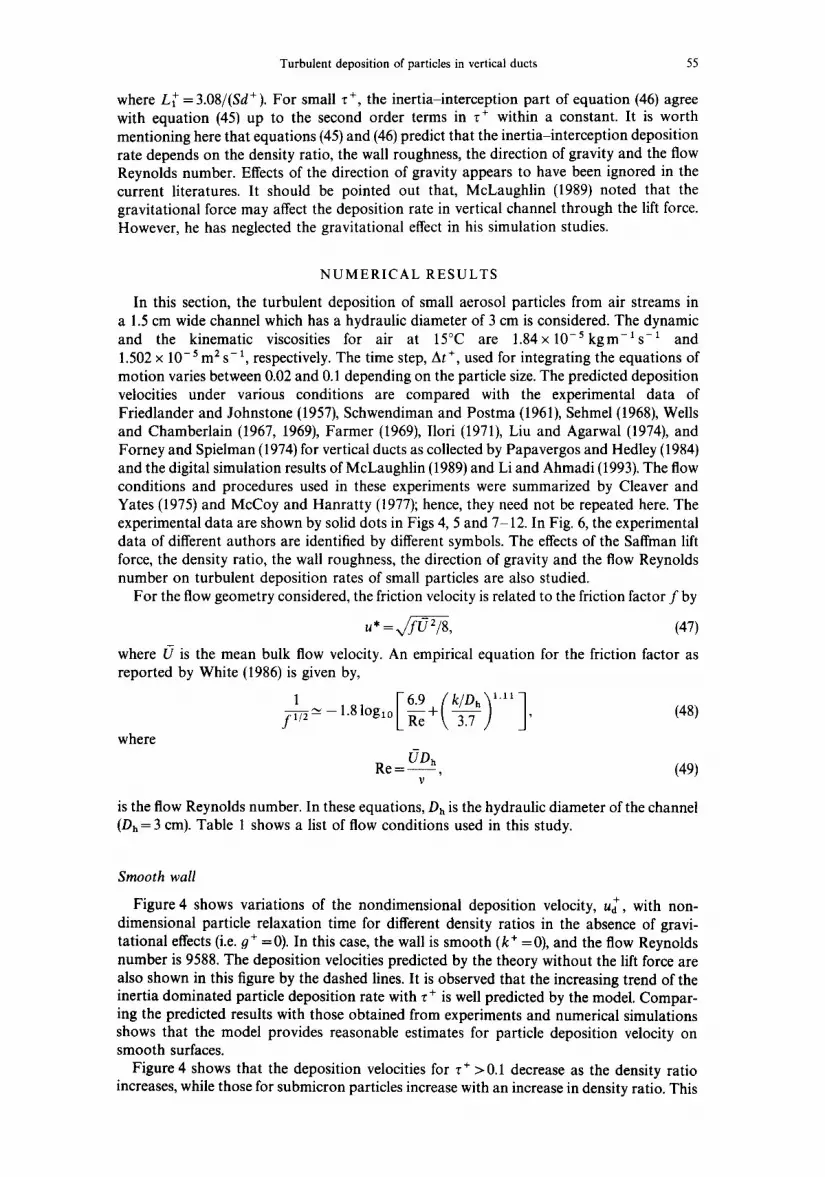
Smooth wall Figure 4 shows variations of the nondimensional deposition velocity, + Ud, with non-
dimensional particle relaxation time for different density ratios in the absence of gravi- tational effects (i.e. g+ =0). In this case, the wall is smooth (k + =0), and the flow Reynolds number is 9588. The deposition velocities predicted by the theory without the lift force are also shown in this figure by the dashed lines. It is observed that the increasing trend of the inertia dominated particle deposition rate with z + is well predicted by the model. Compar- ing the predicted results with those obtained from experiments and numerical simulations shows that the model provides reasonable estimates for particle deposition velocity on smooth surfaces.
Figure 4 shows that the deposition velocities for r+> 0.1 decrease as the density ratio increases, while those for submicron particles increase with an increase in density ratio. This
56 F. G. FAN and G. AHMAOI
Table 1. Flow conditions used in this study
Wall roughness Mean flow velocity Reynolds number Friction velocity k (ram) /.7 (m s- 1) Re u* (m s- ~) k ÷
0 2.99 5 974 0.2 0 0 4.80 9 588 0.3 0 0 8.65 17,280 0.5 0 0 10.66 21,289 0.6 0 0.01 4.80 9 588 0.302 0.2 0.04 4.80 9 588 0.308 0.82 0.1 4.80 9 588 0.32 2.13
1 0 °'° t } oo,h Wo,, Simulations
¢ S=713 f rom McLoughlln (1989) 10 -L° ~ S=1500 , / ~
o S=750 "~ f rom Li and Ahmadi (199"1) I ~ i " * S=2000 J
10-2,o Experiments : ; , /~
H e d l e y " ¢ • f r o m P a p o v e r g o s and
(1984) ":'~ • . . ." /
+ ~ l O - J O , • . .¢ ,= .'. / /
: . ' !
S=965 ' " " /
10 -*'~ S=500 \ " " " Y
,o-,o ".'."
S=1500
• °
g+=O
With Lift
Without L;ft
1 0 -e'° [ J f I I 10 -2'° 10 -~'° 10 °'° 10 ~'° 10 2'°
T +
Fig. 4. Variations of deposition velocity with particle relaxation time for different density ratios for smooth wails.
is because, for a fixed z +, as density ratio increases, particle size decreases. The interception capturing process by the surface is less efficient for smaller particles which causes the inertia-interception deposition rate to decrease. On the other hand, the Brownian motion is more significant for smaller particles which leads to an increase in diffusion deposition rate. Figure 4 also shows that, as the density ratio increases, the location of minimum deposition shifts to larger values of particle relaxation time.
A comparison of the deposition velocities predicted by the theory including the lift force to those obtained in the absence of lift shows that the shear-induced lift force enhances the deposition significantly for 1 < z+ < 10. The reason may be explained as follows. As a par- tide being moved toward the wall by the down sweep motion of the coherent eddies, its streamwise velocity is larger than that of the fluid; therefore, the particle experiences a force toward the wall. Figure 4 also shows that the density ratio and the lift force do not affect the deposition velocity significantly for T+> 10. For rather large particles, the inertia force is dominant and carries the particles to the wall. The paths of such large particles are, essentially, not affected by other forces.

Turbulent deposition of particles in vertical ducts 57
Figure 5 displays variations of deposition velocity with ~ ÷ for a density ratio of S = 965 and different flow Reynolds numbers. The model predictions with and without the lift force are shown in this figure by solid and dashed lines, respectively. The gravity is neglected in these analyses. It is observed that the inertia-interception deposition as predicted by present model is independent of flow Reynolds number while the diffusion deposition increases as Re increases.
In Figs 4 and 5, the effects of the gravitational force are not included. The predicted deposition velocities are, therefore, independent of the direction of gravity. However, as noted before, gravity affects the deposition velocities in a vertical duct through the shear-induced lift force. Figure 6 shows the effects of gravity direction on the deposition velocity for various flow Reynolds numbers. The surface is smooth and a particle-to-fluid density ratio of S = 965 is assumed. In this figure, the solid lines correspond to the cases when g ÷ = 0. Note also that there are two dashed lines accompanying each solid line. The one above the solid line corresponds to the system in which the gravity is in the direction of flow, while the one below the solid line is for the system in which the gravity direction is opposing the flow. This figure shows that the particle deposition in a vertical channel is enhanced when the gravity is in the direction of flow and is reduced when the gravity opposes the flow. The magnitude of the deviation depends on the flow Reynolds number. The variation of deposition velocity with the direction of gravity is more significant for flows with lower Reynolds numbers. Variations of the deposition velocity with density ratio and gravity direction may provide an explanation for the scatter of the experimental data shown in the figure.
From Fig. 6, it is also noticed that some dashed lines for the system with gravity direction opposing the flow do not cover the entire range of ~ ÷ considered. This is because the shear-induced lift force tends to reduce the particle deposition rate. As the particle size increases, the magnitude of the lift force also increases to the level that eventually prevents
10 °'°
10 -1'°
1 0 -2.t]
+~= 10 -3.0
10 -4.0
1 0 -5.0
Re=17280
RF=9588
Re=5974
I i
Smooth Wall
° . °
• . o o : ° • • °
o . • ° -J ~ .'...
° . • ° .
;...:: :it
• ° ° " i " :'" :": I .
• ° . . / . '
- i . . . ' : / . "
• /°. ~,g
:1"" "I /
10 - s ° I I I I
10 -z° 10 -1"° 10 °'° 10 t"°
T +
g + = o
With Lift
Without Lift
10 2.0
Fig. 5. Variations of deposition velocity with particle relaxation time for smooth walls, S = 965, and different flow Reynolds numbers.

58 F.G. FAN and G. AHMAD!
+'1=
10 °'°
10 -1"0
10 -2'0
,{ 0-3.0
10 -4.0
10 -5.0
i i i
Smooth Woll Experimentot Doto
• Friedlonder & Johnstone (1957)
+ Schwendimon & Postmo (1961) / , , ~ L:J
O Sehmel (1968) (S) ,~ 4- A Wells & Chornberloln (1967) • I
Q Uu & Agorwol (1974) ~' o • , ':~, ~. o
X Forney & Spielmon (1974) . O
Re=21289 ; / ~
/ " Re=9588 . ,, /
Re=5974
/ 0
<30
S=965
10 -II.o
10 .2.0 10 -1 .o 10 °.o 101.° 102.0
I- +
Fig. 6. Effects of the direction of gravity on deposition velocity for S=965 and various flow Reynolds numbers.
the particles from being deposited. It must be pointed out, however, that the averaged streamwise velocity as given by equation (7) is used in present analysis. In turbulent flows, the streamwise velocity field fluctuates randomly due to the bursting process. That could allow for a small amount of particle deposition in a certain period of time. However, this latter effect is neglected in this study.
Rough wall
Figure 7 shows variations of nondimensional deposition velocity with particle relaxation time for a density ratio of S = 2000 and different wall roughnesses. The Saffman lift is included, while the gravitational effect is neglected in these analyses. Here, k + is the averaged height of the surface roughness in wall units. For a small roughness, as r + increases, the deposition velocity first decreases to a minimum value. Beyond this minimum, the deposition velocity increases rapidly with particle relaxation time up to : + of about 10. For T + > 10, the deposition velocity remains almost constant with u~ ~-0.14. The decrease of u~- with an increase in T + for small particles is due to the reduction of Brownian diffusion effects. For large particles, the deposition is mainly controlled by the inertia-interception process. Thus, the deposition velocity increase with an increase in z+.
Figure 7 also shows that the deposition rate increases significantly with wall roughness for ~+ < 5. In the rough wall conditions, the particle deposition is mainly controlled by the inertia-interception process for the range of particle sizes considered. It is also observed
+ that, as wall roughness increases, ud becomes almost independent of z + for small to moderate particle relaxation times. Experimental data for particle deposition on rough walls are rather scarce. Montgomery and Corn (1970) reported a limited number of experimental data which are reproduced in Fig. 7. It is observed that the model predictions

T u r b u l e n t d e p o s i t i o n o f p a r t i c l e s i n v e r t i c a l d u c t s 5 9
100"0
10 -1°
10 -2.0
+"= 10 -3.0
10 -4.0
10 -5°
S = 2 0 0 0
: . . ' : i ~. " ....:i i o • • •
k + = 2 . 1 3
k + = 0 . 8 2 • o ; . " ; " " " Exper imento l Dote
,1~ x " • ° " . ~
x o k + = 2 . 4 , 2 . 5
¢ k + =1 .8
zx k + =0.3 , 0.4
O . . . . • • (from Montgomery ond
• Smooth Woll
(from Popovergos ond Hedley 0984))
10 -6° I I I
10 -z° 10 -1° 10 °'° 101'° 102.0
,T +
Fig. 7. Variations of deposition velocity with particle relaxation time for S=2000 and different wall roughness.
provide reasonable estimates for the deposition velocity which are in qualitative agreement with the experimental data.
Figure 8 shows the effects of density ratio on deposition velocity for various wall roughnesses for g ÷ = 0. In this figure, the solid lines, the dashed lines and the dotted-dashed lines denote the deposition velocities for k ÷ = 0.0, 0.2, and 0.82, respectively. It is observed that, for small roughnesses, the density ratio alters the deposition rate for the entire range of
+ < 10. As noted before, due to the dominating effect of inertia-interception deposition for +
÷ > 0.1, the value of u~- decreases as S increases. On the other hand, u d increases as S increases for r + < 0.1 due to the significance of diffusion deposition for submicron particles. However, as the wall roughness increases, the sensitivity to variation in density ratio for particles with small z+ decreases. Moreover, the Brownian motion induced variation of u~- due to a change of S for z÷ <0.1 also vanishes. This observation suggests that wall roughness reduces the significance of diffusion deposition. That is, for rough walls, the inertia-interception process is the dominant deposition mechanism for the particle sizes considered.
The effects of gravity direction on the particle deposition rate for rough surfaces in a vertical channel are shown in Fig. 9. Here, a density ratio of S= 965 is used and the gravitational force and the shear-induced Saffman lift are included in the analysis. In this figure, the solid lines correspond to the cases when g ÷ = 0. The dashed line above the solid line corresponds to the system in whch the gravity is in the direction of flow, while the one below the solid line is for the system in which the gravity direction is opposing the flow. It is observed that the particle deposition rate in a vertical channel is enhanced when the gravity is in the direction of flow and is reduced when the gravity is in the opposite direction. Figure 9 also shows that the effect of gravity direction on the turbulent deposition rate is more significant for smooth surfaces than rough surfaces. As the wall roughness increases, the deposition velocity becomes almost independent of the gravity direction.

60 F .G. FAN and G. AHMADI
100.0
1 0 -1"0
1 0 -2'0
+ ~ 10 -2.0
I 0 -4°
1 0 -$'0
k+ =0.82
k + =0.2
, ~ . : . s=2o"oo / .': • :
. . . . - . \ ~ . . , / . .
/,, s=zooq " / ,
s.5OOs=965 ~ >.;,-, ,~
-__- ~ ~-~- ~ . :
S=2000
: ° o. •
° :
I ° , o\ S = 9 6 5
S=500
1 0 -e° ~ i i
10 - z ° 10 -1'° 10 °'° 101"° 102.0
T +
Fig. 8. Effects of density ratio on deposition velocity for various wall roughnesses.
10 °'°
10-"°
10 -z°
+ '~ 10 -3"°
1 O -4"°
"~ 0-$,0
1 0 -8.0
10 -z°
S=965
D
k + =0.82 J J " , ¢ , - J
x * " * /
k + =0.2 A
_ . . "~/" "
o " " " / - / " " .> : . . . . - . . .
I I
10 -1"° 10 °'°
T +
./
Y Y
:w •
~:" -.
• "%.. • ., o:
• Experimental Data
o k + =2.4, 2.5
0 k + =1.8
* k + = 0 . 7
a k + =0.3, 0.4
( f rom Montgomery ant cam (197o))
• Smooth Wall ( f rom Papavergo) ant Hed R~y ( t 984 ) )
I
10 I.o 102.0
Fig. 9. Effects of the direction of gravity on deposition velocity for S = 965 and different wall roughnesses.
Turbulent deposition of particles in vertical ducts 61
10 °'°
10 -1"°
10 - l ' °
+ ' e 10 -~'°
10 -4.0
1 0 -5"0
10 -e'° 1 i
10 -2"° 10 - l ' ° 10 °'°
T +
i I i
. . :: .':
~ Y " 2 " . " ' '
" ~==0 ~ 7 • Experimental Dora
.
. . . . k+.02 / ( / / " . . a k + =0.3, 0.4- • o s / * o ,
• \ .,.' .,, • . • . . (frown Mon tgomery one / / / / . • " " Corn (1970) )
• Smooth WoN 7 k + =0.0 k + = 0 " 0 (f,'*,',, e,n=*~,,,~*, * ~ l
v,~tl~ (19~)) /
I
10 l'° 10 l~
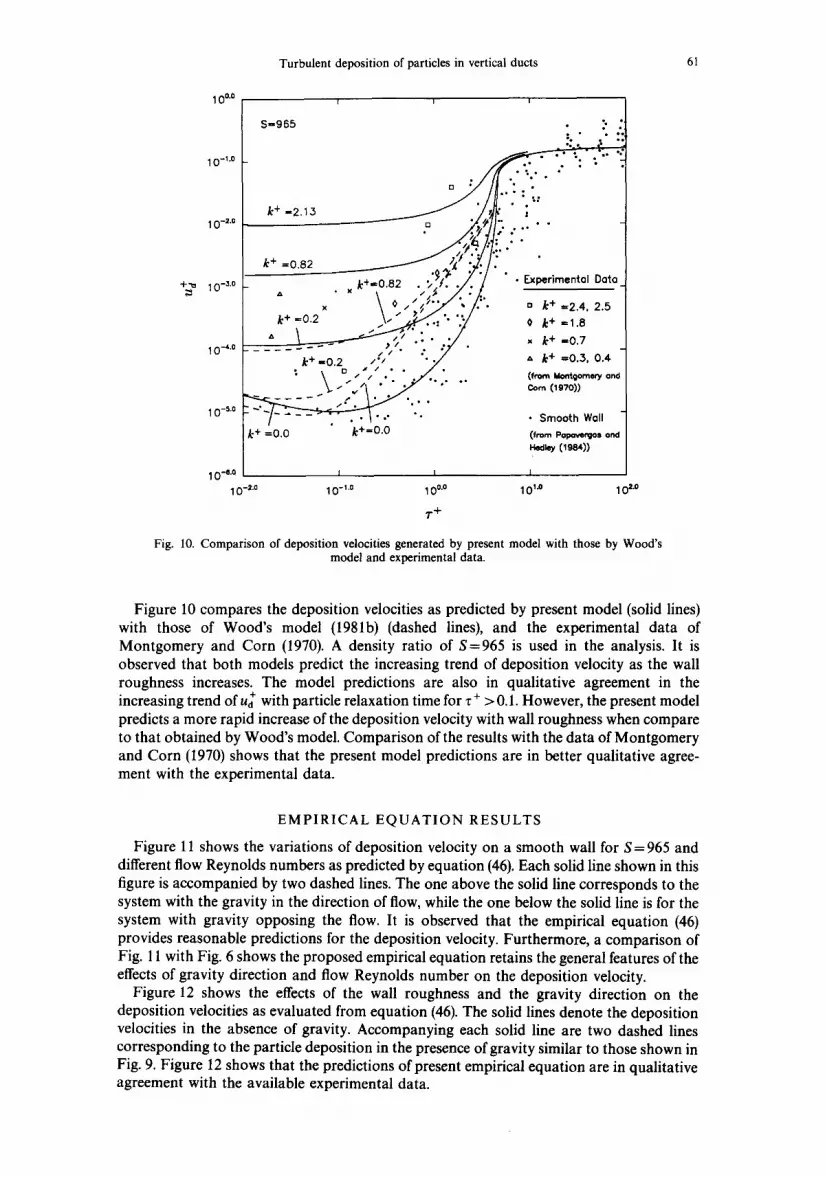
Fig. 10. Comparison of deposition velocities generated by present model with those by Wood's model and experimental data.
Figure 10 compares the deposition velocities as predicted by present model (solid lines) with those of Wood's model (1981b) (dashed lines), and the experimental data of Montgomery and Corn (1970). A density ratio of S=965 is used in the analysis. It is observed that both models predict the increasing trend of deposition velocity as the wall roughness increases. The model predictions are also in qualitative agreement in the • . ÷
increasing trend of ud with particle relaxation time for z ÷ > 0.1. However, the present model predicts a more rapid increase of the deposition velocity with wall roughness when compare to that obtained by Wood's model. Comparison of the results with the data of Montgomery and Corn (1970) shows that the present model predictions are in better qualitative agree- ment with the experimental data.
EMPIRICAL EQUATION RESULTS
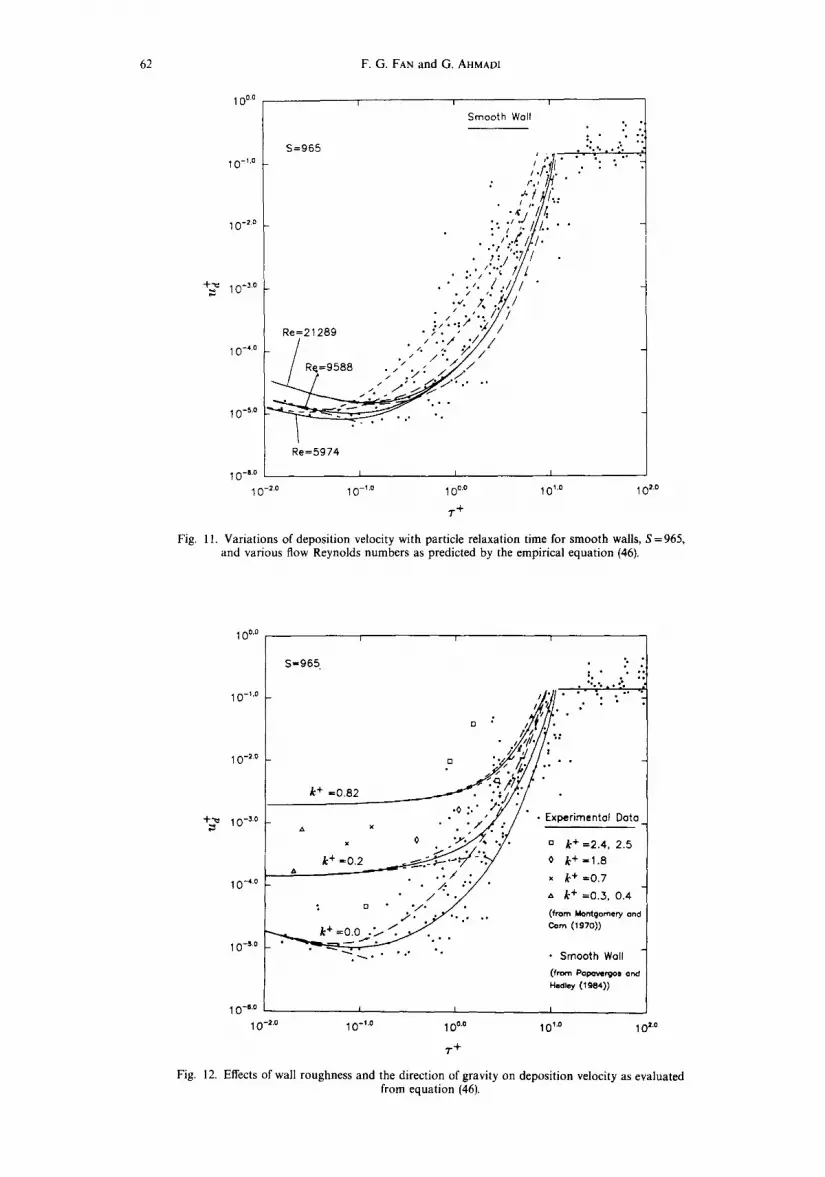
Figure 11 shows the variations of deposition velocity on a smooth wall for S = 965 and different flow Reynolds numbers as predicted by equation (46). Each solid line shown in this figure is accompanied by two dashed lines. The one above the solid line corresponds to the system with the gravity in the direction of flow, while the one below the solid line is for the system with gravity opposing the flow. It is observed that the empirical equation (46) provides reasonable predictions for the deposition velocity. Furthermore, a comparison of Fig. 11 with Fig. 6 shows the proposed empirical equation retains the general features of the effects of gravity direction and flow Reynolds number on the deposition velocity.
Figure 12 shows the effects of the wall roughness and the gravity direction on the deposition velocities as evaluated from equation (46). The solid lines denote the deposition velocities in the absence of gravity. Accompanying each solid line are two dashed lines corresponding to the particle deposition in the presence of gravity similar to those shown in Fig. 9. Figure 12 shows that the predictions of present empirical equation are in qualitative agreement with the available experimental data.
62 F .G. FAN and G. AHMADI
I 0 °'°
10 -;'°
10 -2.0
+-e 10 -~°
10 - ( °
• ~ 0-5.0
I 0 -s'°
S=965
Re=21289
/ R q = 9 5 8 8
I
Smooth Wall
i I i t./"
,* I% i
• / #.
: : ; , . I / I . • . :,, .<///.
•
•
. . ;,. i l l / • :/ 7,'.#1
• , >,.. i / / ; . ' I "
, , ' . < .,,.: ..
Re=5974
I 0 -2° 10 -I .o I 0 °'° 10 I"° 10 2.0
i- +
Fig. 11. Variations of deposition velocity with particle relaxation time for smooth walls, S=965, and various flow Reynolds numbers as predicted by the empirical equation (46).
I 0 °'°
10 -1'°
1 0 -2.0
+'~ 1 0 - ~ °
I 0 -4'°
I 0 - s °
S=965,
k + =0.82
x
x
k + =0.2
/ ~' o , "
0 ; I , "
/; i', t
• 0 :." '
o " .;..'~. . ~ - - - - - . • / /
,4.. ;z o " / ,
k + =o.o .> < y - ' ~ . - '
0 0
Experimental Data
a k + =2.4, 2.5 |
0 k + =1.8
x k+ =0.7
k + =0.3, 0.4
(from Montgomery and cam (197o))
• Smooth Wall "] /
(from Popovetgon and| : ' d ley (1984)) /
1 0 -a'° I I I
10 -z'° 10 -1'° 10 °'° 101'° 10 z°
T +
Fig. 12. Effects of wall roughness and the direction of gravity on deposition velocity as evaluated from equation (46).

Turbulent deposition of particles in vertical ducts 63
It is also observed that variations of the deposition velocity as predicted by equation (46) with changes in wall roughness, density ratio, and the gravity direction are similar to those obtained by numerical solution of the equations of motion as shown in Fig. 9. A more careful comparison of Figs 6 and 11, as well as Figs 9 and 12 shows that, for small r ÷ less than 1, the empirical results are almost identical to the numerical ones. For 1 < r + < 10, the empirical expression somewhat underestimates the numerical results, but its predictions are in reasonable agreement with the experimental and simulation data.
CONCLUSIONS
In this study, a sublayer model for deposition of spherical particles from turbulent air streams in vertical ducts with smooth as well as rough walls is developed. The model is based on the coherent vortical structure of near wall turbulence and the detailed analysis of particle trajectories in this flow field. The predicted deposition velocities under various conditions are compared with the available experimental data and simulation results and a reasonable agreement is observed. An empirical expression for evaluating the turbulent deposition rate on smooth and rough surfaces is also proposed. Based on the presented results, the following conclusions may be drawn.
(1) The particle deposition velocity, u f , follows a V-shape variation with a minimum in the range of z ÷ -~ 0.1.
(2) For the inertia-interception regimes, 1 < z ÷ < 10, the deposition velocity increases rapidly with z÷.
(3) The shear-induced lift force affects the turbulent deposition velocity significantly. (4) The deposition rate increases rapidly with wall roughness. (5) The wall roughness reduces the significance of diffusion-controlled deposition. For
rough wall, the inertia-interception process is the dominant deposition mechanism even for the range of 0.01 < r + <0.I.
(6) The gravity affects the deposition rate in vertical ducts via the shear-induced lift force. The shear-induced lift force enhances the particle deposition rate when the gravity is in the direction of flow, and reduces the deposition velocity when the gravity is opposing the flow. The effect of gravity direction seemingly failed to capture attention in the current literature.
(7) The significance of the effects of the gravity direction depends on the flow Reynolds number and wall roughness. The variation of deposition velocities with the gravity direction is more significant for flows with lower Reynolds numbers and smaller wall roughnesses.
(8) The effects of density ratio on the deposition rate are more significant for smooth walls when compared with the rough walls.
(9) For duct flows with rough wall, effects of density ratio and gravity direction on deposition velocity are noticeable only in the range of 0.5 < z+< 10.
(10) The deposition velocities for aerosol particles depend on the density ratio, wall roughness, the gravity direction, and the flow Reynolds number. This may provide an explanation for the observed scatter in the experimental data.
(11) The proposed empirical expression provides reasonable predictions for the deposi- tion velocities.
Acknowledgements--Thanks are given to Mr Raymond G. Bayer, Mr Michael A. Gaynes and Mr Allen Smith of IBM-Endicott, and Dr Douglas W. Cooper of IBM T. J. Watson Research Center for their many helpful suggestions and comments. The financial support of IBM-Endicott and New York State Science and Technology Foundation through CAMP of Clarkson University is also gratefully acknowledged.
REFERENCES
Abuzeid, S., Busnaina, A. A. and Ahmadi, G. (1991) Wall deposition of aerosol particle in a turbulent channel flow. J. Aerosol Sci. 22, 43-62.
Brooke, J. W., Kontomaris, K., Hanratty, T. J. and McLaughlin, J. B. (1992) Turbulent deposition and trapping of aerosols at a wall. Phys. Fluids ,4 4, 825 834.
AS 24:1-E
64 F.G. FAN and G. AHMAD!
Browne, L. W. B. (1974) Deposition of particles on rough surfaces during turbulent gas-flow in a pipe. Atmos. Envir. 8, 801-816.
Cleaver, J. W. and Yates, B. (1975) A sub layer model for the deposition of particles from a turbulent flow. Chem. Eng. Sci. 30, 983-992.
Cooper, D. W. (1986) Particulate contamination and microelectronics manufacturing: an introduction. Aerosol. Sci. Technol. 5, 287 -299.
Corino, E. R. and Brodkey, R. S. (1969) A visual investigation of the wall region in turbulent flow. J. Fluid Mech. 37, 1-30.
Davies, C. N. (1966a) Deposition of aerosols from turbulent flow through pipes. Proc. Roy. Soc. A 289, 235-246. Davies, C. N. (1966b) Deposition from moving aerosols. In Aerosol Science (Edited by Davies, C. N.), pp. 393-446.
Academic Press, New York. Farmer, R. A. (1969) Liquid droplet trajectories in two-phase flow. Sc.D. Thesis, M1T. Fichman, M., Gutfinger, C. and Pnueli, D. (1988) A model for turbulent deposition of aerosols. J. Aerosol Sci.
19, 123-136. Forney, L. J. and Spielman, L. A. (1974) Deposition of coarse aerosols from turbulent flow. J. Aerosol Sci.
5, 257-271. Friedlander, S. K. and Johnstone, H. T. (1957) Deposition of suspended particles from turbulent gas streams. Ind.
Engng Chem. 49, 1151-1156. Grass, A. J. (1971) Structural features of turbulent flow over smooth and rough boundaries. J. Fluid Mech.
50, 233-255. Hinze, J. O. (1975) Turbulence, 2nd ed. McGraw-Hill, New York. Ilori, T. A. (1971) Turbulent deposition of aerosol particles inside pipes. Ph.D. Thesis, University of Minnesota. Im, K. H. and Ahluwalia, R. K. (1989) Turbulent eddy deposition of particles on smooth and rough surfaces.
J. Aerosol Sci. 20, 431-436. Kim, J., Moin, P. and Moser, R. (1987) Turbulence statistics in fully developed channel flow at low Reynolds
number. J. Fluid Mech. 177, 133-166. Kline, S. J., Reynolds, W. C., Schraub, F. A. and Runstadler, P. W. (1967) The structure of turbulent boundary
layers. J. Fluid Mech. 30, 741-773. Levich, V. G. (1962) Physicochemical Hydrodynamics. Prentice-Hall, Englewood Cliffs, New Jersey. Li, A. and Ahmadi, G. (1992) Dispersion and deposition of spherical particles from point sources in a turbulent
channel flow. Aerosol Sci. Technol. 16, 209-226. Li, A. and Ahmadi, G. (1993) Deposition of aerosols on surfaces in a turbulent channel flow. Int. J. Engnq Sci.
(in press). Also Rept. Number MAE-233 Clarkson University. Liu, B. Y. H. and Agarwal, J. K. (1974) Experimental observation of aerosol deposition in turbulent flows.
J. Aerosol Sci. 5, 145-155. Maxey, M. R. and Riley, J. J. (1983) Equation of motion for a small rigid sphere in a nonuniform flow. Phys. Fluids
26, 883-889. McCoy, D. D. and Hanratty, T. J. (1977) Rate of deposition of droplets in annular two-phase flow. Int. J.
Multiphase Flow 3, 319-331. McLaughlin, J. B. (1989) Aerosol particle deposition in a numerically simulated channel flow. Phys. Fluids A
1, 1211-1224. Moore, W. L. (1951) Ph.D. Thesis, State University, Iowa. Montgomery, T. L. and Corn, M. (1970) Aerosol deposition in a pipe with turbulent airflow. J. Aerosol Sci.
1, 185-213. Ounis, H., Ahmadi, G. and McLaughlin, J. B. (1991) Dispersion and deposition of Brownian particles from point
sources in a simulated turbulent channel flow. J. Colloid Interface Sci. 147, 233-250. Owen, P. R. (1969) Pneumatic transport. J. Fluid Mech. 39, 407-432. Papavergos, P. G. and Hedley, A. B. (1984) Particle deposition behaviour from turbulent flows. Chem. Eng. Res.
Des. 62, 275-295. Perry, A. E., Schofield, W. H. and Joubert, P. N. (1969) Rough wall turbulent boundary layers. J. Fluid Mech.
37, 383-413. Rannie, W. D. (1956) Heat transfer in turbulent shear flow. J. Aeronaut. Sci. 23, 485-489. Rotta, J. C. (1962) Turbulent boundary layers in incompressible flow. Progress in Aeronautical Sci., Vol. 2, p. 75.
Macmillan, New York. Saffman, P. G. (1965) The lift on a small shear in a slow shear flow. J. Fluid Mech. 22, 385-400. Saffman, P. G. (1968) Corrigendum. J. Fluid Mech. 31, 624. Schlichting, H. (1979) Boundary Layer Theory, 7th ed. McGraw-Hill, New York. Schraub, F. A., Kline, S. J., Henry, J., Runstadler, P. W. and Littell, A. (1965) Use of hydrogen bubbles for
qualitative determination of time-dependent velocity field in low-speed water flows. Trans. ASME (Ser. D) 87, 429-444.
Schwendiman, L. C. and Postma, A. K. (1961) Hartford Lab. Rep. HW-SA-2236, Richland, Washington, U.S.A.; also (1962) Tech. Inf. Div. Rep. TID-7628, Book 1 (USAEC) 1.
Sehmel, G. A. (1968) Aerosol deposition from turbulent airstreams in vertical conduits, Batelle Northwest Lab. Rep. BNWL-578, Richland, Washington, USA.
Wells, A. C. and Chamberlain, A. C. (1967) Transport of small particles to vertical surfaces. Brit. J. appl. Phys. 18, 1793-1799.
Wells, A. C. and Chamberlain, A. C. (1969) Deposition of dust from turbulent gas streams. Atmos. Era, Jr. 3, 494-496.
White, F. M. (1986) Fluid Mechanics, 2nd ed. McGraw-Hill, New York. Wood, N. B. (1981a) The mass transfer of particles and acid vapour to cooled surfaces. J. Inst. Energy 76, 76-93. Wood, N. B. (1981b) A simple method for the calculation of turbulent deposition to smooth and rough surfaces.
J. Aerosol Sci. 12, 275-290.