a matter of perspective: the effect of race of rater and ratee on managerial performance feedback
TRANSCRIPT
Darden Graduate School of Business Administration University of Virginia
Working Paper No. 02-03
A Matter of Perspective: The Effect of Race of Rater and Ratee on Managerial
Performance Feedback
Martin Davidson Silvia Swigert
Marian Ruderman
This paper can be downloaded without charge from the Social Science Research Network Electronic Paper Collection at:
http://ssrn.com/abstract=392422

A MATTER OF PERSPECTIVE: THE EFFECT OF RACE
OF RATER AND RATEE ON MANAGERIAL PERFORMANCE FEEDBACK
MARTIN N. DAVIDSON Darden Business School University of Virginia
P.O. Box 6550 Charlottesville, VA 22906-6550
[email protected] 804/924-4483
Fax: 804/243-5020
SILVIA SWIGERT MARIAN RUDERMAN
Center for Creative Leadership One Leadership Place
P.O. Box 26300 Greensboro, NC 27438-6300
[email protected] [email protected]
336/288-7210 Fax: 336/288-3999
April 26, 2000
Running Head: Rater-Ratee Race

Rater-Ratee Race
2
A MATTER OF PERSPECTIVE: THE EFFECT OF RACE OF RATER
AND RATEE ON MANAGERIAL PERFORMANCE FEEDBACK
The credibility 360-degree feedback may be threatened by perceived race bias. Analysis
of black and white raters’ and ratees’ performance ratings showed psychological similarity was
more important to effectiveness for different-race than for same-race pairs; and psychological
similarity and attractiveness were more important to effectiveness for white than black ratees.
Implications are discussed.
Keywords: feedback, race, similarity

Rater-Ratee Race
3
One of the most critical pieces of information for developing managers is feedback on
their performance. Performance appraisals have typically been used with one of two objectives
in mind (though sometimes these objectives become commingled). The first objective is
administrative: appraisal is used to mete out managers’ raises or promotions. The second
objective, and the one upon which our study focuses, is to help managers develop their career
and professional competence. While at one time a manager’s only source of developmental
feedback was a superior’s performance appraisal, emergent organizational structures and
practices that emphasize coordination, cooperation, and relationship-building among peers call
for more variety in the sources of that feedback (Handy, 1995; Miles & Snow, 1995). In
response, uni-directional methods of supplying feedback are being supplemented by multirater or
“360-degree” feedback. The assumption underlying 360-degree feedback is that one’s superior,
subordinates, and peers all have critical information to offer regarding a manager’s effectiveness
(Borman, 1974; Hazucha, Hezlett, & Schneider, 1993).
The ultimate purpose of developmental 360-degree feedback is to motivate individuals to
change problematic behaviors and sustain constructive behaviors. But in order for this feedback
to be effective, it must be seen as credible by the recipient: an individual must have confidence
that the feedback is likely to be accurate, or else the individual will not act on it. One of the
greatest threats to credibility is bias, both real and perceived. There is a great deal of research
documenting the extent to which appraisals are conducted unfairly, and the consequences of such
behavior can be damaging (Cox & Nkomo, 1986; Igbaria & Wormley, 1995; Quinn, 1969;
Robbins & DeNisi, 1993). Moreover, subjective processes such as performance ratings are
especially susceptible to such bias. In the present study, we explore one domain in which bias
has been found to exist in appraisals—the area of race effects. Our research goal was to examine
Rater-Ratee Race
4
how race influences the way developmental feedback is generated. To that end, we examined
rater-ratee race effects in developmental performance ratings for black and white managers.
Specifically, we tested 1) whether racial similarity between rater and ratees affected ratings of
effectiveness of those ratees, and 2) whether racial similarity was associated with psychological
similarity and attraction.
Race Effects In Performance Feedback
The majority of the research on bias in performance ratings identifies characteristics of
raters and ratees that are likely to engender bias and then examines the impact of those
characteristics on relevant outcomes. One of the more widely examined characteristics, race, has
yielded a series of interesting, if not always consistent, results. For example, Kraiger & Ford
(1985) conducted a meta-analysis of how the race of the ratee affected performance ratings by
examining 74 studies with a total sample of 17,159 ratees for white raters and 14 studies with
2,428 ratees for black raters. Results showed that both black and white raters gave significantly
higher ratings to members of their own race, and that these race effects were more likely in field
settings when blacks composed a small percentage of the work force. Also, in a more recent
study of 360 degree performance feedback, black raters from all perspectives (peers,
subordinates, and bosses) assigned more favorable ratings to ratees of their own race, whereas
white bosses assigned more favorable ratings to ratees of their own race, but white subordinates
did not. Both white and black managers received higher ratings from black raters than from
white raters (Mount, Sytsma, Hazucha, & Holt, 1997). Finally, Tsui & O'Reilly (1989) found
that mixed-race superior subordinate dyads were associated with higher levels of role ambiguity.
Specifically, white subordinates reporting to black superiors reported the highest levels of role
ambiguity and conflict, while black subordinates reporting to white superiors reported the lowest
Rater-Ratee Race
5
level of role ambiguity. The thrust of these results suggest that raters made distinctions, at a
group level, between black and white managers.
Though most of these studies do not have strong theoretical bases for explaining the
direction of the observed race differences, many of the results are consistent with a social
identity explanation (Tajfel, 1978). Social identity theory posits that one psychologically
identifies with a group as a means of sustaining and enhancing one’s own self-concept. This
identification becomes especially powerful when one can compare one’s own group (ingroup) to
another group (outgroup). Typically this comparison takes on a well documented flavor: one
tends to favor members of one’s ingroup and derogate members of an outgroup. Interracial
interaction is one domain in which such comparison is obviously salient. Several results above
reveal raters favoring managers of the same race and derogate managers of a different race.
Recall that Kraiger and Ford (1985) found that both black and white raters gave significantly
higher ratings to members of their own race, and Mount et al. (1997) found that black raters
rated black managers higher than white managers—all outcomes consistent with social identity
theory.
However, even results from the Mount et al. study do not lend themselves unequivocally
to a social identity explanation. For example, the theory does not offer a reason why black raters
would rate all managers higher than would white raters. The picture becomes even more
complicated in light of a second set of studies. Sackett & DuBois (1991) examined the effects of
rater and ratee race on performance ratings by comparing data from 3 sources: a large-scale
civilian study, a large-scale military study and Kraiger and Ford’s (1985) meta-analytic study.
Results from the civilian and military data converged, but they differed from the meta-analytic
results: whites rated white managers higher than blacks in the civilian study, but black raters did
Rater-Ratee Race
6
not rate blacks higher than whites. Moreover, in the military data, race effects depended upon
which dimension was examined. The authors suggests that the Kraiger and Ford findings could
result from the preponderance of lab studies in their analysis. A further meta-analysis confirmed
the Sackett and DuBois results (Oppler, Campbell, Pulakos, & Borman, 1992). This set of
findings is wholly inconsistent with a pure social identity explanation. Thus we are left with a
set of findings regarding race differences that are unclear in revealing precisely what the pattern
of differences is, yet unequivocal in demonstrating that differences do emerge. Our approach,
then is to explore another model that could offer a more parsimonious explanation for these
findings.
The Impact of Similarity on Race-Based Ratings Differences
As a means of clarifying these issues, we utilize the similarity-attraction paradigm
(Berscheid & Walster, 1969; Byrne, 1971) as a theoretical tool to help understand what affects
the observed race-effects. Our model is shown in Figure 1.
Insert Figure 1 about here
This paradigm suggests that racial demographic similarity between a rater and ratee will lead to
the rater’s perceived similarity to the ratee. Moreover, racial similarity will lead to interpersonal
attraction as well as positive effectiveness ratings. Perceived similarity has been found to
influence strongly managers’ rating of their subordinates’ performance (e.g., Rand & Wexley,
1975). For example, managers and subordinates provided the most positive evaluations of each
other when both perceived themselves as similar; the least positive evaluations occurred when
both saw themselves as dissimilar (Pulakos & Wexley, 1983). Additionally, increasing

Rater-Ratee Race
7
dissimilarity in superior-subordinate demographic characteristics, (relational demography) is
associated with lower effectiveness as perceived by superiors, less personal attraction on the part
of superiors for subordinates, and increased role ambiguity experienced by subordinates (Tsui &
O'Reilly, 1989). Following the formal similarity-attraction model, perceived similarity also
leads to interpersonal attraction, as has been observed in interview settings (Keenan, 1977).
Finally, interpersonal attraction is hypothesized to lead to positive judgments of effectiveness.
Research examining the effect of sex similarity on recruiters' evaluations of actual
applicants used this model as a theoretical framework (Graves & Powell, 1995). The authors
tested whether perceived similarity and interpersonal attraction mediated sex-differentiated
judgments. The results revealed complex effects of sex similarity on recruiters' decision
processes. Perceived similarity and interpersonal attraction mediated the effect of sex similarity
on female recruiters’ assessments of applicants’ qualifications. Surprisingly, female recruiters
saw male applicants as more similar to themselves and more qualified than female applicants.
For male recruiters, interview outcomes were not affected by sex similarity. In addition, Liden,
Wayne, & Stilwell (1993) examined perceived similarity, liking, demographic similarity, and
performance as determinants of leader-member exchanges and found that perceived similarity
and liking from both the leaders’ and members’ perspectives predicted the quality of a leader-
member exchange.
Thus, the similarity-attraction paradigm offers a way of exploring interracial and
intraracial dynamics in 360-degree feedback. Our model suggests the following hypotheses:
Hypothesis 1: Racial similarity is positively related to a) psychological similarity; b)
attractiveness; and c) effectiveness.
Hypothesis 2: Psychological similarity is positively related to attractiveness.

Rater-Ratee Race
8
Hypothesis 3: Attractiveness is positively related to effectiveness.
METHODS
Data Collection Procedures and Samples
Data were collected from two different types of managers: The ratees and the raters. The
ratees were evaluated by the raters. The ratees were managers participating in leadership
development programs run by an American management development organization. Participants
in 5 sessions of a program for only African-American managers and participants from 10
sessions of a program for the managerial population at large were asked to participate. Both
programs feature intensive assessment for development and are intended for mid-level managers
in large organizations. A total of 299 managers participated in these programs.
As part of the leadership development program, each ratee was asked to identify others in
the work environment he or she wanted to use as raters on Benchmarks (Dalton et al., 1997), a
multi-rater assessment for development instrument. Raters were either bosses, peers, or direct
reports. The data from Benchmarks was fed back to the ratees during their training program.
For the purposes of the study reported here, raters were asked to complete a supplemental survey
asking about their demographics, perceived similarity to the ratee, attraction to the ratee, and
overall effectiveness of the ratee. Both Benchmarks and the supplemental surveys were sent by
mail to the raters of the mangers. In addition, all raters received information explaining that they
were being invited to participate in a study of Benchmark rating processes. Participation in such
a study required completing the supplemental survey. Raters were instructed to send both their
Benchmarks’ ratings and supplemental surveys directly to the testing offices of the management
Rater-Ratee Race
9
development organization. Participation in the study was voluntary and confidentiality was
assured.
The supplemental surveys were sent to potential raters of the ratees. We received 2,094
surveys back, which is an average of 8 raters per person. The ratees themselves were asked to
complete the self-report version of Benchmarks and a biographical information form. They did
not fill out a supplemental survey. They gave permission for their biographical data to be used
in research.
From this group of ratees and raters, we selected a sample suitable for use in our
analyses. We wanted a sample of only African-American and white managers, each of whom
was rated by a pair of raters with each pair consisting of one African-American and one white
manager from the same rater category. The first step was to identify all ratees who were either
African-American or white. All other ratees and their associated raters were eliminated from the
sample. Next we selected only the peer and direct report rater groups since it was unlikely for a
meaningful analysisthat enough of the managers would have a racially different pair of raters
who were bosses. Next, we examined each case to identify cases with a racially different pair of
raters in one of the two rater groups. Of the 299 managers, 60% did not have a single African-
American rater and 2% did not have a single white rater. In many cases there was more than one
rater of the same race for a given category of rater. In this case, one rater was randomly selected
for inclusion in the data set. The requirement for a racially mixed pair of raters reduced the
number of ratees to 99, 33% of the starting sample. Since there was a pair of raters for each
ratee, we had 198 raters. Of the 99 pairs of raters, 53 were direct reports and 46 were peers.
Rater-Ratee Race
10
The Ratees
Of the 99 ratees, 54 were African American and 45 were white. Appropriate chi-square
and t-tests were conducted on key demographic and background variables to determine the
comparability of the African-American and white managers. No significant differences were
found with regard to distributions of gender or level in the organization. Of the total sample,
58% were female. Over 70% of the total sample described themselves as either middle- or
upper-middle-level managers. There were some differences with regard to the types of
organizations the managers came from (Chi-square=20.05, p<.05), with more whites in service
organizations and more African Americans in manufacturing and public service organizations.
There were also differences with regard to function (Chi-square=29.91, p<.05), with more
African Americans in human resource functions than the whites. There were no differences
between the two groups with regard to age.
The Raters
Of the 198 raters, 99 were African American and 99 were white. Chi-square tests were
conducted on key demographic and background variables to determine the comparability of
these raters. No significant differences were found with regard to the gender distribution, level
of education, and function of raters in the African-American and white groups. Both groups of
raters are highly educated and have members from a variety of functions.
Measures
Demographic information. For the ratees, demographic characteristics assessed via a
biographical information form included: title, sex, age, race or ethnic origin, number of years of
school, highest degree earned, type of organization, organizational level, function, country of

Rater-Ratee Race
11
birth, and country of current residence. Demographic information for the raters was assessed via
the supplemental survey and included gender, race or ethnic origin, highest degree earned,
function, country of birth, and country of current residence. Racial similarity between the ratee
and each rater was calculated. Racial similarity was coded as 1 if it was the same for the rater
and ratee and 0 if it was different.
Perceived similarity. The measure of perceived similarity is an adaptation of the scale
used by Liden (Liden et al., 1993). Liden et al. took the first three items of their scale from a
measure of Turban (Turban & Jones, 1988) and then added 3 of their own for a total of 6 items.
Since Liden et al. had studied only supervisor-subordinate pairs, we changed the phrasing, “My
supervisor and I” to “This person and I.” The six items used are: “This person and I are alike in
a number of areas,” “This person and I are similar in terms of our outlook, perspective, and
values,” “This person and I see things in the same way,” “This person and I handle problems in a
similar way,” “This person and I think alike in terms of coming up with a similar solution for a
problem,” “This person and I analyze problems in a similar way.”
Raters responded to these items on a 5-point scale ranging from (1) Strongly disagree to
(5) Strongly agree. This is a departure from the 7-point scale used by Liden et al. A 5-point
scale was used in order to be consistent with the scales on Benchmarks. The measure of
perceived rater-ratee similarity was created by summing the 6 items. The scale had an alpha of
.84 in our sample, slightly lower than the .91 in Liden et al.’s sample. They also found the scale
to have moderate test-retest reliabilities during several different intervals of time.
Attraction. The scale measuring attraction was an adaptation of the Liden scale for
assessing liking of a leader. Their scale was taken from the work of (Wayne & Ferris, 1990).
The wording was changed to make the scale more generic, and an additional item was added.

Rater-Ratee Race
12
The items are: “I like this person very much,” “This person would make a good friend,” and “I
enjoy spending time with this person.” The response scale ranged from (1) Strongly disagree to
(5) Strongly agree. This is in contrast to the 7-point scale used by Liden. The scale was formed
by summing these items. The alpha in our sample is .92, slightly higher than the .86 reported by
Liden.
Effectiveness. Effectiveness was measured by two items summed to make a scale. These
items are adaptations of the effectiveness criterion measures used in the validity studies of
Benchmarks (Dalton et al., 1997; McCauley, Lombardo, & Usher, 1989). Since the validity
items were framed from the perspective of the boss, these items were rewritten to reflect more
generically the perspective of a peer or direct report. Rated on a 5-point scale with (1)
Unacceptable and (5) One of the best ever; a star, raters were asked “What is this person’s level
of performance in his/her present job”? The second question asked, “In all, how satisfied are
you with this person as a leader?” with a 5-point response scale ranging from (1) Very
dissatisfied to (5) Very satisfied. The alpha coefficient for this scale is .83.
RESULTS
Analysis of race, psychological similarity, attraction, and effectiveness
Design Strategy. A matched rater-ratee sample was used in the analyses that follow.
Within ratees in this design, rater race and race similarity represented conditions that were
essentially equivalent. That is, each ratee was either black or white and each had two raters who
were: (1) racially black and racially white (rater race variable) and, (2) racially similar and
racially dissimilar (race similarity). For the rater, however, rater race and race similarity were
between-subject variables: each rater was either racially similar or racially dissimilar to the ratee,

Rater-Ratee Race
13
and each had a black or a white ratee. In sum, rater race and race similarity were within-subject
variables for ratees and between-subject variables for raters. Ratee race was a between-subjects
variable.
The first hypothesis involved the race similarity variable, and, consistent with our design
specifications, this variable was used as a between-rater variable and as a within-ratee variable.
When within-ratee variables of rater race and race similarity are used in the comparison analysis,
some additional power is gained by using a within-ratee design (Kraemer & Thiemann, 1987, p.
47). On the other hand, it was simpler to compare the two types of analyses (one-way ANOVA
with the race similarity variable and a two-way ANOVA with the rater race and ratee race
variables) in an overall between-rater design. Given these advantages and disadvantages, all of
the analyses were replicated using a between- and within- multivariate MANOVA (rater race
and race similarity as within variables, ratee race as the between variable).
Analysis. Table 1 shows the intercorrelations between the variables in the analyses.
Table 2 shows the means, standard deviations, and standardized differences for each of the
similarity-attraction variables by race variable. Hypothesis 1 stated that racial similarity between
rater and ratee would be positively related to the psychological similarity, attractiveness, and
effectiveness. No direct support for this hypothesis was observed, since racial similarity was not
correlated with psychological similarity (r = .06, ns) , attractiveness (r = -.06, ns), or
effectiveness (r = .06, ns). However, significant correlations between ratee race and
attractiveness (r=.17, p < .05) and between rater race and effectiveness (r = .15, p < .05) led us to
explore more deeply the possible impact race had on these variables. To this end, we sought to
understand whether the race variables (rater race and ratee race) might also moderate the

Rater-Ratee Race
14
relationships between psychological similarity and attractiveness, and between these variables
and effectiveness.
Insert Table 1 about here
Insert Table 2 about here
To explore this possibility, we examined relationships between the relevant variables for
separate race groups of rater and ratees. All of the subgroup correlations were statistically
significant (alpha of .05, two-tailed). Z-tests of the differences between the Fisher z transformed
correlations in each race category (by variable) were statistically significant in 4 out of 9
subgroup comparisons. In the first comparison using race similarity, the correlation between
psychological similarity and effectiveness was .638 (n = 98) in different race pairs compared to
.400 in same race pairs (n = 94) (z = 2.258, p = .023); in the second between rater race, the
correlation between attraction and effectiveness was .543 for black raters (n = 95) compared to
.270 (n = 98) for white raters (z = 2.267, p =.023); in the third, between manager or ratee race,
the correlation between psychological similarity and effectiveness was .398 for black ratees (n =
106) compared to .682 for white ratees (n = 87) (z = 2.872, p = .004). Finally in the fourth, the
correlation between attraction and effectiveness was .264 for black ratees (n = 105) compared to
.527 for white ratees (n = 88) z = 2.149, p = .032).
These results show that when each race variable is considered alone, psychological
similarity is more important to effectiveness in different as opposed to same race pairs, attraction
is more important to effectiveness for black raters compared to white raters, and psychological

Rater-Ratee Race
15
similarity and attraction are each more important to effectiveness for white ratees compared to
black ratees.
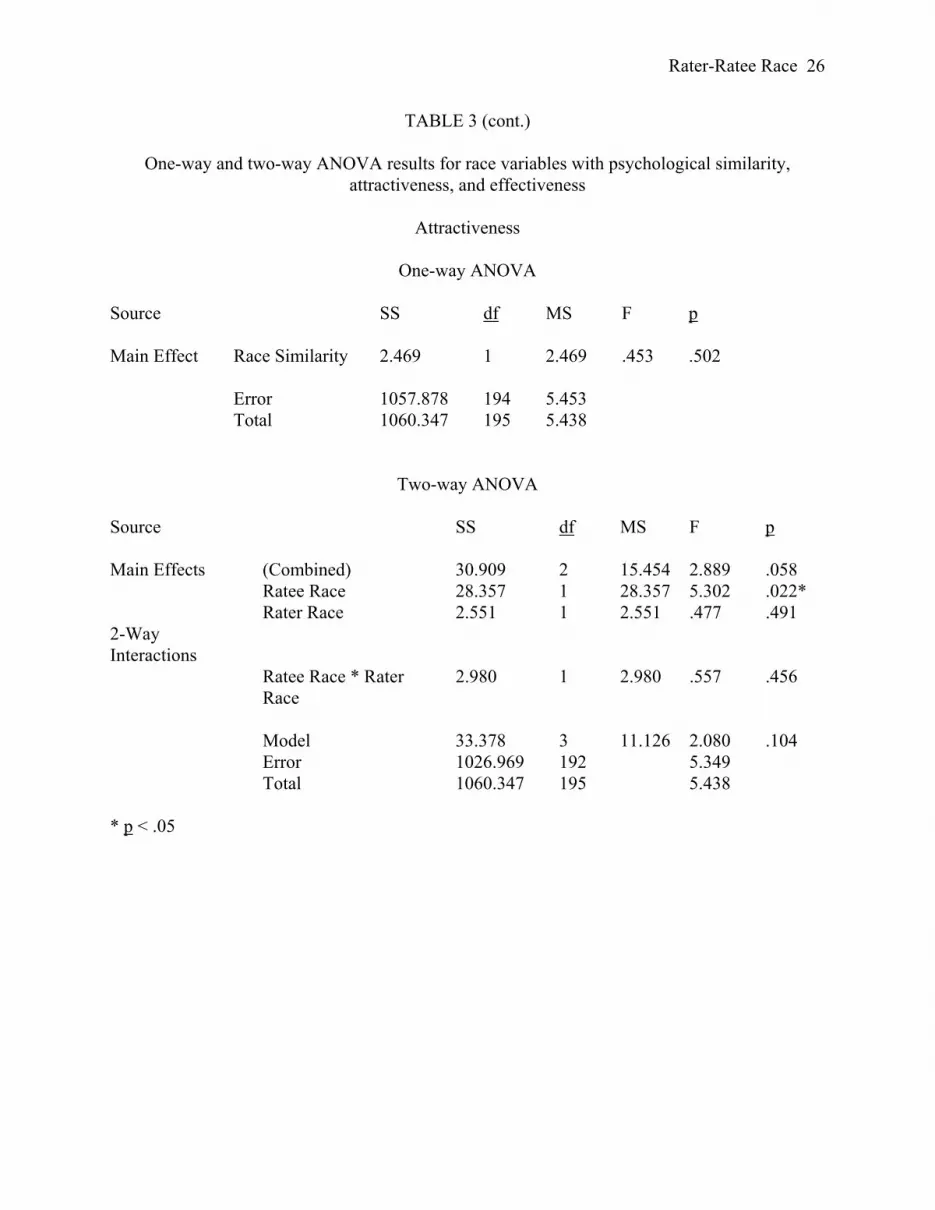
Mean differences. To further explore the impact of race on the key dependent variables,
six ANOVAs were conducted to examine the effects of race similarity, rater race and ratee race
with respect to this hypothesis 1. The results of these analyses are shown in Table 3. None of
the effects of the one-way ANOVAs with race similarity as the independent variable were
statistically significant. However, in conducting two-way ANOVAs using rater race and ratee
race as independent variables, two significant main effects were observed. Black ratees (M =
12.44) were rated as more attractive than white ratees (M = 11.67) [F (1,195) = 5.30, p = .022],
and black raters (M = 8.12) judged their ratees as more effective than white raters (M = 7.63),
regardless of the race of the ratee [F (1,194) = 4.08, p = .045]. None of the interactions between
the rater race and ratee race variables were significant.
Insert Table 3 about here
These main effects are consistent with results of inspection of standard differences in means ( d
). It is evident that black ratees were rated as more attractive than white ratees ( d = .33) and that
blacks raters judged their ratees as more effective than white raters ( d = .30), regardless of the
race of the ratee (Cohen's d; equivalent to units of standard deviation, see Howell, (1992), p.
207). These effects, considered small in size (.20 = small; .50 = medium; .80 = large), were the
only differences that were statistically significant, as shown in the ANOVA results in Table 3.
The value of using race similarity in this analysis rests in the increased power it offers
(e.g., fewer degrees of freedom used, smaller sample required). However, unless there is a
significant interaction between rater race and ratee race, the main effects of the component

Rater-Ratee Race
16
variables provide more information. When the interaction in the two-way ANOVA is compared
to the main effect in the one-way ANOVA (i.e., race similarity), there is a small but insignificant
loss of power. The exception to this appears to be in effectiveness, which has the most
significant ( p = .377) race similarity (or interaction) effect; however further probing in a later
section shows that rater race is the more powerful effect and supersedes ratee race entirely.
Relationships between the Similarity-Attraction Variables
The second and third hypotheses involved average effects (i.e., all-rater) first, then race
variable subgroup comparisons. Because the point of these analyses was to compare and
contrast correlations between the similarity-attraction variables and the race variables, we used a
between-rater design as an analytic strategy.
Hypotheses 2 and 3 stated that attractiveness would be positively related to psychological
similarity and that psychological similarity would be positively related to effectiveness. Both of
these hypotheses were supported in the full sample analysis, as shown by highly significant zero-
order correlations between attractiveness and psychological similarity (r = .45, p = .001), and
between psychological similarity and effectiveness (r = .53, p = .001) (see Table 1).
In sum, the race variables independently moderated the relationship between the
similarity-attraction paradigm variables in four of nine ways. Only one of the cross-matched
race group subgroupings further improved the results by showing an increased measure of
relatedness, and this was between rater race, race similarity, and effectiveness ratings in which
black raters gave higher ratings to both black and white ratees (e.g., same and different ratees)
compared to white raters. This was only significant to black ratees in same race pairs compared
to white ratees in same race pairs. This means that white ratees received higher effectiveness
Rater-Ratee Race
17
ratings from black raters, but not as high or significantly different from white raters in same race
pairs, compared to black ratees in same race pairs.
DISCUSSION
In the pursuit of an increased understanding of the role race plays in the presentation of
developmental feedback, the present study looked at what difference racial similarity makes by
looking at perceived similarity with regard to value, outlook, and perspectives at work as a
mediating variable. The similarity-attraction paradigm was introduced as a conceptual means for
examining the relationship between racial similarity and performance effectiveness ratings.
The analysis presented here found some general trends. While we did not find strong
simple effect of racial similarity, race plays a much more complicated role in feedback. These
results show that when each race variable is considered alone, psychological similarity is more
important to effectiveness in different as opposed to same race pairs, attraction is more important
to effectiveness for black raters compared to white raters, and psychological similarity and
attraction are each more important to effectiveness for white ratees compared to black ratees.
Perceived psychological similarity—similarity of outlook, values, etc.—is a better explanatory
device than racial similarity as perceived similarity. This is probably because these more
generalized types of similarity are more task-related than racial similarity.
The results dealing with mean racial differences were also intriguing. Whether a
manager is of the same or different race from the rater had no impact on the rater’s attractiveness
rating of the manager. However, black mangers received higher ratings from all raters than did
white managers. One explanation for this effect is that it is socially desirable to have a positive
opinion of a black manager in non-“bottom-line” regards such as attractiveness or liking. Blacks
liked black managers because they are ingroup and whites liked black managers because if they

Rater-Ratee Race
18
don’t, they are vulnerable pragmatically and psychologically. Pragmatic vulnerability stems
from the legal and social environment in which a white person’s misstatement about race is
reacted to by blacks and other whites forcefully. High-profile examples of whites being
punished for a misstatement discourages whites from behaving any way but conservatively in
interracial interactions. Psychological vulnerability stems from the genuine desire many whites
have to not to see themselves as biased or racist (Steele, 1990). The United States experience of
white racism against blacks so dominates U.S. whites’ perceptions of themselves in race
relations that they staunchly hold onto any positive attitudes they can that do not cause
dissonance (Dalton, 1995). Thus, if a white rater has a negative rating of a black manager
(whether biased or accurate), the white rater will overcompensate by saying how much he or she
likes the black manager so that the white rater doesn’t feel bad—i.e., prejudiced, racist—about
negatively evaluating a black.
What do these findings suggest for those management development specialists using 360-
degree development tools in diverse organizations? Unfortunately at this point in time there is
no easy answer to this question. This study has opened up more questions than it has answered.
However these results suggest that in debriefing 360-degree instruments it may be important to
talk about the source of the ratings and the impact of prejudice on perceptions. It is also
important to discuss the role of perceived similarity in predicting overall effectiveness.
Managers may want to consider that ratings from those who feel more dissimilar may be more
critical. They may purposely want to query a group of raters that combines both those who are
similar and dissimilar in order to get a true 360-degree perspective. Management development
specialists need to carefully handle conversations about raters. Too much emphasis on the
dissimilarity of the raters may cause managers to dismiss critical feedback. The discussion

Rater-Ratee Race
19
needs to be handled in such a way so that managers understand that the perceptions of dissimilar
others are important and contribute to their everyday reality.
Rater-Ratee Race
20
REFERENCES
Berscheid, E., & Walster, E. H. 1969. Interpersonal attraction. Reading, MA: Addison-Wesley.
Borman, W. C. 1974. The rating of individuals in organizations: An alternate approach.
Organizational Behavior & Human Performance, 12(1): 105-124.
Byrne, D. 1971. The attraction paradigm. New York: Academic Press.
Cox, T., Jr., & Nkomo, S. M. 1986. Differential performance appraisal criteria: A field study of
black and white managers. Group and Organization Studies, 11(1/2): 101-119.
Dalton, H. L. 1995. Racial healing: Confronting the fear between blacks and whites. New York:
Doubleday.
Dalton, M., Lombardo, M. M., McCauley, C. D., McDonald-Mann, D., Moxley, R., & Wachhoz,
J. 1997. Benchmarks: A manual and trainer's guide. Greensboro, NC: Center for Creative
Leadership.
Graves, L. M., & Powell, G. N. 1995. The effect of sex similarity on recruiters' evaluations of
actual applicants: A test of the similarity-attraction paradigm. Personnel Psychology,
48(1): 85-98.
Handy, C. 1995. Trust and the virtual organization. Harvard Business Review, 73(3): 40-50.
Hazucha, J. F., Hezlett, S. A., & Schneider, R. J. 1993. The impact of 360-degree feedback on
management skills development. Human Resource Management, 32(2,3): 325-351.
Howell, D. C. 1992. Statistical methods for psychology (3rd ed.). Belmont, CA: Duxbury Press.
Igbaria, M., & Wormley, W. M. 1995. Race differences in job performance and career success.
Communications of the ACM, 38(3): 82-92.

Rater-Ratee Race
21
Keenan, A. 1977. Some relationships between interviewers' personal feelings about candidates
and their general evaluation of them. Journal of Occupational Psychology, 50(4): 275-
283.
Kraemer, H. C., & Thiemann, S. 1987. How many subjects? Statistical power analysis in
research. Newbury Park: Sage Publications.
Kraiger, K., & Ford, J. K. 1985. A meta-analysis of ratee race effects in performance ratings.
Journal of Applied Psychology, 70(1): 56-65.
Liden, R. C., Wayne, S. J., & Stilwell, D. 1993. A longitudinal study on the early development
of leader-member exchanges. Journal of Applied Psychology, 78(4): 662-674.
McCauley, C. D., Lombardo, M. M., & Usher, C. J. 1989. Diagnosing management
development needs: An instrument based on how managers develop. Journal of
Management, 15(3): 389-403.
Miles, R. E., & Snow, C. C. 1995. The new network firm: A spherical structure built on a
human investment philosophy. Organizational Dynamics, 23(4): 4-18.
Mount, M. K., Sytsma, M. R., Hazucha, J. F., & Holt, K. E. 1997. Rater-ratee race effects in
developmental performance ratings of managers. Personnel Psychology, 50(1): 51-69.
Oppler, S. H., Campbell, J. P., Pulakos, E. D., & Borman, W. C. 1992. Three approaches to the
investigation of subgroup bias in performance measurement: Review, results, and
conclusions. Journal of Applied Psychology, 77(2): 201-217.
Pulakos, E. D., & Wexley, K. N. 1983. The relationship among perceptual similarity, sex, and
performance ratings in manager-subordinate dyads. Academy of Management Journal,
26(1): 129-139.
Quinn, J. L. 1969. Bias in performance appraisal. Personnel Administration, 32(1): 40-43.

Rater-Ratee Race
22
Rand, T. M., & Wexley, K. N. 1975. Demonstration of the effect, ''similar to me,'' in simulated
employment interviews. Psychological Reports, 36(2): 535-544.
Robbins, T. L., & DeNisi, A. S. 1993. Moderators of sex bias in the performance appraisal
process: A cognitive analysis. Journal of Management, 19(1): 113-126.
Sackett, P. R., & DuBois, C. L. 1991. Rater-ratee race effects on performance evaluation:
Challenging meta-analytic conclusions. Journal of Applied Psychology, 76(6): 873-877.
Steele, S. 1990. The content of our character. New York: St. Martin's Press.
Tajfel, H. 1978. Differentiation between social groups: Studies in the social psychology of
intergroup relations. New York: Academic Press.
Tsui, A. S., & O'Reilly, C. A. 1989. Beyond simple demographic effects: The importance of
relational demography in superior-subordinate dyads. Academy of Management Journal,
32(2): 402-423.
Turban, D. B., & Jones, A. P. 1988. Supervisor-subordinate similarity: Types, effects, and
mechanisms. Journal of Applied Psychology, 73(2): 228-234.
Wayne, S. J., & Ferris, G. R. 1990. Influence tactics, affect, and exchange quality in supervisor-
subordinate interactions: A laboratory experiment and field study. Journal of Applied
Psychology, 75(5): 487-499.

Rater-Ratee Race
23
TABLE 1
Means, Standard Deviations, and Intercorrelations
Variable n M SD 1 2 3 4 5 6 7 8 9 10 1. Ratee Age 83 42.84 6.38
2. Rater Ed. Degree 198 3.02 1.03 -.11
3. Ratee Sexa 81 .42 .50 .09 .04
4. Rater Sexb 197 .49 .50 -.10 .16* .10
5. Ratee Racec 198 .56 .50 -.04 -.02 -.05 -.18*
6. Rater Raced 198 .50 .50 .00 .04 .00 -.04 .00
7. Rater Relatione 198 .46 .50 -.01 .27** -.15* .13 .06 .00
8. Race Similarityf 198 .50 .50 .00 .07 .00 .01 .00 .11 .00
9. Attract 196 12.09 2.33 -.09 -.01 -.17* .09 .17* .03 .17* -.06
10. Effective 195 7.87 1.67 .01 -.11 -.02 .16* -.01 .15* .05 .06 .40**
11. Similar 194 19.68 3.93 -.12 -.21** -.11 .14 -.04 .09 -.09 .06 .45** .53**
aRatee Sex (1=Male, 0=Female) **Correlation is significant at the 0.01 level (2-tailed). bRater Sex (1=Male, 0=Female) *Correlation is significant at the 0.05 level (2-tailed). cRatee Race from Ratee Bio Form (1=Black, 0=white) dRater Race(1=Black, 0=white) eRater Relation(1=Peer, 0=Subordinate) fRace Similarity(1=Same, 0=Different)

Rater-Ratee Race
24
TABLE 2
Means of psychological similarity, attractiveness, and effectiveness by race variables
Psych similarity
Attractiveness
Effectiveness
Race Variable
n Mean SD n Mean SD n Mean SD
Race Similarity
Same 96 19.90 3.97 98 11.98 2.52 96 7.98 1.54 Differen
t 98 19.46 3.90 98 12.20 2.14 99 7.77 1.79
da .18 .09 .13 Ratee Race
Black 107 19.55 3.97 108 12.44 2.11 107 7.86 1.56 white 87 19.83 3.90 88 11.67 2.53 88 7.89 1.80 d .07 .33 .02 Rater Race
Black 97 20.03 4.15 98 12.19 2.21 96 8.12 1.63 white 97 19.32 3.68 98 11.99 2.45 99 7.63 1.68 d .18 .09 .30 a d is the standardized difference between means (Howell, 1987)

Rater-Ratee Race
25
TABLE 3
One-way and two-way ANOVA results for race variables with psychological similarity, attractiveness, and effectiveness
Psychological Similarity
One-way ANOVA
Source SS df MS F p Main Effect Race Similarity 9.246 1 9.246 .598 .440 Error 2969.295 192 15.465 Total 2978.541 193 15.433
Two-way ANOVA Source SS df MS F p Main Effects (Combined) 25.252 2 12.626 .815 .444 Ratee Race 3.487 1 3.487 .225 .636 Rater Race 21.579 1 21.579 1.393 .239 2-Way Interactions
Ratee Race * Rater Race 6.490 1 6.490 .419 .518 Model 34.498 3 11.499 .742 .528 Error 2944.043 190 15.495 Total 2978.541 193 15.433 * p < .05
Rater-Ratee Race
26
TABLE 3 (cont.)
One-way and two-way ANOVA results for race variables with psychological similarity, attractiveness, and effectiveness
Attractiveness
One-way ANOVA
Source SS df MS F p Main Effect Race Similarity 2.469 1 2.469 .453 .502 Error 1057.878 194 5.453 Total 1060.347 195 5.438
Two-way ANOVA
Source SS df MS F p Main Effects (Combined) 30.909 2 15.454 2.889 .058 Ratee Race 28.357 1 28.357 5.302 .022* Rater Race 2.551 1 2.551 .477 .491 2-Way Interactions
Ratee Race * Rater Race
2.980 1 2.980 .557 .456
Model 33.378 3 11.126 2.080 .104 Error 1026.969 192 5.349 Total 1060.347 195 5.438 * p < .05

Rater-Ratee Race
27
TABLE 3 (cont.)
One-way and two-way ANOVA results for race variables with psychological similarity, attractiveness, and effectiveness
Effectiveness
One-way ANOVA
Source SS df MS F p Main Effect Race Similarity 2.180 1 2.180 .783 .377 Error 537.615 193 2.786 Total 539.795 194 2.782
Two-way ANOVA
Source SS df MS F p Main Effects (Combined) 11.265 2 5.633 2.044 .132 Ratee Race 1.475E-02 1 1.475E-02 .005 .942 Rater Race 11.238 1 11.238 4.078 .045* 2-Way Interactions
Ratee Race * Rater Race
1.304 1 1.304 .473 .492
Model 13.445 3 4.482 1.626 .185 Error 526.350 191 2.756 Total 539.795 194 2.782 * p < .05

Rater-Ratee Race
28
FIGURE 1
Model of Hypothesized Relationships
Race Perceived Similarity
Attraction
Effectiveness
b