rater fairness in music performance assessment: evaluating model-data fit and differential rater...
TRANSCRIPT

Musicae Scientiae2015, Vol. 19(2) 147 –170
© The Author(s) 2015Reprints and permissions:
sagepub.co.uk/journalsPermissions.navDOI: 10.1177/1029864915589014
msx.sagepub.com
Rater fairness in music performance assessment: Evaluating model-data fit and differential rater functioning
Brian C. WesolowskiThe University of Georgia, USA
Stefanie A. WindThe University of Alabama, USA
George Engelhard, Jr.The University of Georgia, USA
AbstractThe purpose of this study was to investigate model-data fit and differential rater functioning in the context of large group music performance assessment using the Many-Facet Rasch Partial Credit Measurement Model. In particular, we sought to identify whether or not expert raters’ (N = 24) severity was invariant across four school levels (middle school, high school, collegiate, professional). Interaction analyses suggested that differential rater functioning existed for both the group of raters and some individual raters based on their expected locations on the logit scale. This indicates that expert raters did not demonstrate invariant levels of severity when rating subgroups of ensembles across the four school levels. Of the 92 potential pairwise interactions examined, 14 (15.2%) interactions were found to be statistically significant, indicating that 10 individual raters demonstrated differential severity across at least one school level. Interpretations of meaningful systematic patterns emerged for some raters after investigating individual pairwise interactions. Implications for improving the fairness and equity in large group music performance evaluations are discussed.
Keywordsbig band performance, differential rater functioning, invariant measurement theory, item response theory, Many-Facet Partial Credit Model, music performance assessment, music performance evaluation, Rasch model
Corresponding author:Brian C. Wesolowski, Hugh Hodgson School of Music, The University of Georgia, 250 River Rd., Athens, GA 30602, USA. Email: [email protected]
589014 MSX0010.1177/1029864915589014Musicae ScientiaeWesolowski et al.research-article2015
Article
at UNIV OF GEORGIA LIBRARIES on May 22, 2015msx.sagepub.comDownloaded from

148 Musicae Scientiae 19(2)
Student participation in music performance evaluations is an important part of the school music experience. Program involvement in such events yields improved student motivation, higher student self-efficacy, and increased quality of student musicianship (Austin, 1988; Banister, 1992; Franklin, 1979; K. K. Howard, 1994; Hurst, 1994; Sweeney, 1998). Yearly repertoire considerations and supporting curricular content are often selected and prepared specifically for these evaluations (Crochet, 2006), and results of such evaluations often serve as a basis for the establishment of related classroom performance objectives, long-range goals, and curricular reform (Abeles, Hoffer, & Klottman, 1994; R. L. Howard, 2002).
According to Colwell (1970), adjudicator feedback at these evaluations “can be the most meaningful evaluation of performance the student receives” (p. 105). Both directors and students define program success partially by the obtained scores (Sivill, 2004). Moreover, ensemble scores and rankings can have a direct effect on community and administrator percep-tions of teacher effectiveness and program quality (Boyle, 1992; Burnsed, Hinkle, & King, 1985; Kirchhoff, 1988). According to Kirchhoff,
… the band contest has become the means of assessment most often used by administrators to evaluate the effectiveness of an instrumental music program. In some school districts the rating achieved by ensembles is used by administration and by the community as a barometer of their educational success or failure. (p. 274)
The results of large group music performance evaluations carry great importance to students, teachers, administrators, and communities. Therefore, it is important that judges’ scores accu-rately reflect each ensemble’s true performance ability. The problem, however, is that the results from rater-mediated performance assessments are more often associated with characteristics of the raters and less with performances themselves (Engelhard, 2002).
Raters’ evaluations of musical performances are often conducted on intuition rather than systematic procedure (Davidson & Coimbra, 2001; Forbes, 1994; Mills, 1991). According to Stanley, Brooker, and Gilbert (2002):
… initially, they [raters] adopt a “holistic” approach, relying on a “gut reaction”, an “intuitive or emotional response which is basically one of enjoyment: Am I enjoying this playing?” This early process of global assessment frequently involves respondents arriving at a tentative grade. As one examiner noted: “I look at them and I say ‘Distinction, high credit’. I have bands in my own mind and then the number is immaterial – to me the number is way more negotiable than the actual range ….” (p. 51)
General impression marking and related holistic scoring schemes are conducive as one method to diagnose musical performances, as qualitative feedback can offer valuable and nuanced feedback tailored to individual performances. However, the utilization of such methods for summative, product-based evaluation purposes poses many concerns related to validity, relia-bility, and fairness (Charney, 1984; Huot, 1990). According to Davidson and Coimbra (2001):
At one level … there is a clearly shared code of assessment criteria, even though it is not [always] precisely articulated. However, at another level, this lack of articulation means that no individual assessor is really sure of what their own or another assessor’s thoughts and beliefs lead to a particular decision about the performance. (p. 33)
As music organizations such as the National Association for Music Education (NAfME) and the Associated Board of the Royal Schools of Music (ABRSM) move towards assessment models
at UNIV OF GEORGIA LIBRARIES on May 22, 2015msx.sagepub.comDownloaded from

Wesolowski et al. 149
that demand a need to standardize and benchmark music performance assessments, holistic scoring procedures are not suitable. Therefore, the demand for reliable, valid, and equitable trait-specific scoring mechanisms is increasing for performance-related assessments in music (Colwell, 2007; Wesolowski, 2014). Such techniques, however, are also subject to problems related to reliability, validity, and fairness. Additionally, statistical frameworks such as Classical Test Theory (CTT) often limit previous inquiry into reliability, validity, and fairness in music evaluation and measurement. Therefore, newer empirical methods for evaluating such obsta-cles, such as Rasch Measurement Theory, can improve objectivity in the assessment process.
McPherson and Thompson (1998) and McPherson and Schubert (2004) offer process models for assessing musical performance positing that fairness in the evaluation process can be affected by extra-musical factors including performer-centered characteristics, con-textual characteristics, and rater-centered characteristics. Examples of performer-centered characteristics include variance in musical expression (Schubert, 2002), physical attrac-tiveness (Bermingham, 2000; Davidson & Coimbra, 2001; Wapnick, Darrow, Kovacs, & Dalrymple, 1997; Wapnick, Mazza, & Darrow, 1998, 2000), and expressive communication via body movement (Davidson, 1993, 1994, 1995, 2001). Contextual characteristics include performers’ clear communication of expressive intentions (Aiello & Williamon, 2002), environmental effect on acoustics (Ando, 1988), social factors (McPherson & Thompson, 1998), and audience engagement (LeBlanc, Jin, Obert, & Siivola, 1997). Rater-centered characteristics include personality (Cattell & Anderson, 1953), musical prefer-ences, personality, and their interactions (Langmeyer, Guglhör-Rudan, & Tarnai, 2012), emotional state (Loewenstein & Lerner, 2003), musical experiences (Alluisi, 1962), musical abilities (Duerksen, 1972), and familiarity with the repertoire (Flores & Gonsburgh, 1996). Additionally, rater errors may be derived from the assessment condition itself (Johnson, Penny, & Gordon, 2009). Examples of these types of rater errors are outlined in Table 1. According to Bond and Fox (2007):
Why then, in important evaluation situations, do we continue to act as though the judge, rater, or examiner has merely a benign role? On a personal level, we might try to avoid a tough marker, complain that some judges are biased against us, or avoid the examiner’s specialist topic, but we might as well face it … we often have the suspicion that the marker, not the candidate or the test, might mean the difference between pass and fail, that the scorer rather than the performance determines silver, not gold. (p. 144)
Rater-mediated performance assessments therefore call for special concerns regarding the validity, reliability, and fairness of raters’ judgments. Developments in modern measurement theory can offer new approaches for improved fairness and equitability of rater-mediated per-formance assessments in the field of music. The purpose of this study is to investigate model-data fit and differential rater functioning using the Many-Facet Rasch Partial Credit (MFR-PC) Measurement Model in the context of large group music performance assessment. This study is guided by the following research questions:
1. As a group, do the raters maintain invariant levels of severity when rating subgroups of ensembles (e.g., middle school, high school, collegiate, professional)?
2. Do individual raters maintain invariant levels of severity when rating subgroups of ensembles (e.g., middle school, high school, collegiate, professional)?
3. Do meaningful patterns of differential severity emerge for individual raters according to school level?
at UNIV OF GEORGIA LIBRARIES on May 22, 2015msx.sagepub.comDownloaded from

150 Musicae Scientiae 19(2)
Sources of variability and the MFR-PC modelFairness in testing refers to the equitable treatment of all test takers throughout the testing process. In particular, the approach to universal test design posits that the evaluation process should seek to “maximize accessibility for all intended examinees” (AERA, APA, & NCME, 2014, p. 50). Extraneous sources of variability in scoring, however, can occur as a result of several testing facets: (a) the nature of the task (i.e., item difficulty); (b) students’ background and interest in the problem presented (i.e., person ability); (c) the raters’ judgments of the per-formance (i.e., rater severity); and (d) interactions among these and other possible facets of interest (Sudweeks, Reeve, & Bradshaw, 2004). The application of traditional CTT consensus estimates (i.e., intra-rater reliability) and consistency estimates (i.e., inter-rater reliability) is an accepted and heavily utilized method for evaluating human responses to musical performance (Bergee, 2003; Brakel, 2006; Burnsed et al., 1985; Conrad, 2003; Fiske, 1983; Hash, 2012; King & Burnsed, 2007; Norris & Borst, 2007; Silvey, 2009). However, this method is
Table 1. Types of rater errors.
Types of errors Tendency for a rater to:
Clashing standards Score lower because his or her personal grading standards conflict with standards expressed in the measurement tool
Clashing values Score lower because when the values expressed in the performance conflict with those of the rater
Fatigue Allow scores to be affected by being tiredHalo effect Fails to distinguish between conceptually distinct and independent
aspects of person performancesItem-to-item carryover Score higher a response because the ensemble’s performance on
the preceding item was exemplaryLength Score longer performances higherLeniency/severity Consistently provide higher or lower ratings than warranted by
person performancesPersonality clash Lower a score because he or she dislikes a particular piece of musicRepetition factor Lower a score because he/she has heard the same/similar piece of
music repeatedlyResponse sets (central tendency) Interpret and use rating scale categories in an idiosyncratic
fashion. Rater overuses middle categories of rating scale when not warranted by person performance
Self-scoring Read more into the performance than is thereScore range restriction Not discriminate between persons on the latent variableSkimming Evaluated the performance holisticallySudden death Score lower due to some aspect of the performance that provokes a
negative rater responseSympathy score Allows the performance to appeal to his or her emotions or allow a
sparse performance to elicit his or her desire to reward effortTest-to-test carryover Score lower a response that meets the pre-stated expectations,
but the response appears somewhat lackluster as compared to exemplary responses that preceded it
Trait Focus on one aspect (i.e., trait), such as tone, and give too much weight to this trait in arriving at a score
Note. Adapted from Johnson, Penny, & Gordon (2009, p. 211) and Engelhard (2013, p. 212).
at UNIV OF GEORGIA LIBRARIES on May 22, 2015msx.sagepub.comDownloaded from

Wesolowski et al. 151
problematic for the evaluation of reliability and fairness in rater-mediated assessments. According to Henning (1997):
… two raters may agree in their score assignments and both be wrong in their judgments simultaneously in the same direction, whether by overestimating or underestimating true ability. If this happens, then we have a situation in which raters agree, but assessment is not accurate or reliable because the ratings fail to provide an accurate approximation of the true ability score. Similarly, it is possible that two raters may disagree by committing counterbalancing errors in opposite directions; that is where one rater overestimates true ability, and the other rater underestimates true ability. In this latter situation, it happens that the average of the two raters’ scores may be an accurate and reliable reflection of true ability, even though the two raters do not agree in their ratings. (pp. 53–54)
The major benefit of the Rasch model is that, when adequate rater fit to the model is observed, rater-invariant measurement is achieved. In the context of rater-mediated music ensemble per-formance assessments, invariant measurement implies that estimates of ensemble achieve-ment are not influenced by which rater scores them, and estimates of rater severity are not influenced by which ensembles they are scoring. Rasch models use probabilistic distributions of responses as a logistic function of person and item parameters in order to define a unidimen-sional latent trait. In contrast to CTT where raw scores are directly used in the analyses, Rasch measurement theory converts raw scores to a log-odds scale using a logistic transformation. The transformed test score data can then be conceptualized as a dependent variable with mul-tiple independent variables (i.e., facets) of interest, including measures of rater severity and leniency, item difficulty, task difficulty, and performance achievement level. In the event that ensembles hold the same amount of the latent trait being evaluated (in this case, performance achievement) and consequently are expected to have the same score, yet the scoring outcomes demonstrate group differences due to rater error, significant interactions between rater severity and school level can provide empirical evidence of unfair testing conditions. The purpose of this study was to utilize the MFR-PC model in order to investigate rater fairness; in particular, we sought to investigate interaction analyses between the degree of severity of raters’ judgments and subgroups of ensemble school levels in order to answer whether raters, both individually and collectively, maintain invariant levels of severity when rating subgroups of ensembles. The MFR-PC model used in this study includes facets for ensemble performances, scale items, raters, and school level. The model is specified as follows:
lnP
P=nijmk
nijmkn i j m ik
!! ! ! !
1
"
#$
%
&' ( ) * + , (1)
whereln[Pnijmk/Pnijmk-1] = the probability that Performance n rated by Rater i on Item j in level m receives a rating in category k rather than category k-1,Tn = the logit-scale location (e.g., achievement) of Performance n,Oi = the logit-scale location (e.g., severity) of Rater i,Gj = the logit-scale location (e.g., difficulty) of Item j,Jm = the logit-scale location (e.g., achievement) of School Level m, andWik = the logit-scale location where rating scale categories k and k-1 are equally probable for Rater i.1
Equation 1 specifies the probability for a rating in category k, rather than k–1 as a function of the logit-scale locations (i.e., locations on the latent variable, or construct) for four facets:
at UNIV OF GEORGIA LIBRARIES on May 22, 2015msx.sagepub.comDownloaded from

152 Musicae Scientiae 19(2)
performances (T), raters (O), items (G), and school levels (J). The last variable on the right side of the equation (W) represents the threshold between rating scale categories. The partial-credit for-mulation of the MFR model allows for the investigation of differences in the locations of rating scale categories for individual raters. This feature of the model is indicated by the subscripts on the threshold parameter, where a separate rating scale structure is specified for each individual rater. When the Rasch model is applied, two statistics can be calculated for each facet that describe differences in the logit-scale locations of individual elements within a facet (in this case, individual performances, raters, items, and school levels). When data fit the model, the Rasch reliability of separation statistic (Rel) for the performances is interpreted in a comparable fashion to coefficient alpha; for other facets, Rel describes the spread of elements on the logit scale. Rasch separation statistics also include the use of a chi-square statistic that is a summary of all possible comparisons of pairs of elements within a facet that describes whether the differ-ences among logit-scale locations within each facet are significant.
Operational definitionsEvaluating model-data fit and rater error indices. Model-data fit is used as an indicator of the degree to which invariant measurement is met. As characterized by the Rasch measurement model, there are five important requirements for rater invariant measurement to be achieved in the context of rater-mediated assessments: (a) rater-invariant measurement of persons (i.e., the measurement of persons must be independent of the particular raters that happen to be used for the measuring); (b) non-crossing person response functions (i.e., a more able person must always have a better chance of obtaining higher ratings from raters than a less able person); (c) person-invariant calibration of raters (i.e., the calibration of the raters must be independent of the particular persons used for calibration); (d) non-crossing rater response functions (i.e., any person must have a better chance of obtaining a higher rating from lenient raters than from more severe raters); and (e) variable map (i.e., persons and raters must be simultaneously located on a single underlying latent variable) (Engelhard, 2013). When adequate fit to the model occurs, rater-invariant measurement of ensemble performances is achieved.
The Rasch model is an idealization and perfect adherence to its underlying requirements can never be achieved by real data. Therefore, some degree of model-data misfit of items, persons, and/or raters is almost always expected. Misfit diagnosis is conducted by analyzing the residu-als of fit statistics. In assessment situations where the scoring is rater-mediated, analysis of rater misfit provides empirical evidence of rating quality. A list of frequent rater errors is pro-vided in Table 1. According to Saal, Downey, and Lahey (1980) and Engelhard, (2013) the four most common categories of rater errors include: (a) leniency/severity; (b) halo error; (c) response sets (central tendency); and (d) score range restriction.
Bias versus differential facet functioning. In the field of psychometrics, modern use of the term “bias” is reserved for situations where unfair or prejudiced flaws in item functioning occur (Angoff, 1993). As an example, a test item may demonstrate consistent under- or over-estimation of dif-ferential item probability (i.e., model-data misfit of an item) between two or more groups within a facet of interest (e.g., gender, social economic status, access to technology, etc.). In these instances, if meaningful, significant “systematic subpatterns” (Wigglesworth, 1993, p. 240) of model-data misfit occur in the performance of a particular test item, the item is considered to be biased. Systematic patterns can occur, however, without structural or operational flaws in the testing items or procedures (Engelhard & Wind, 2013). Use of the term “differential facet func-tioning” (DFF) applies to these situations.
at UNIV OF GEORGIA LIBRARIES on May 22, 2015msx.sagepub.comDownloaded from

Wesolowski et al. 153
DFF can be operationally defined as the examination of the conditional probabilities of suc-cess on a facet between subgroups that have comparable locations on the latent variable (Engelhard, 2013). DFF analysis is used to identify construct-irrelevant variability with an empirical interpretation of how well the measurement model fits the overall collected data (model-data fit). According to (Linacre, n.d.), DFF analyses serve four purposes:
1. Diagnosing misfit. The response residuals are partitioned by element, e.g., by judge-item pairs, and converted into a logit measure. Estimates of unexpected size and statistical significance flag systematic misfit, focusing the misfit investigation;
2. Investigating validity. A systematic, but small, DFF in an item or a judge, for or against any group of persons, may be overwhelmed by the general stochastic component in the responses. Consequently it may not be detected by the usual summary fit statistics. Specifying interactions between elements of facets of particular importance provides a powerful means of investigating and verifying the fairness and functioning of a test;
3. Assessing the effect of DFF. Since terms flagged for DFF have a measure and a standard error (precision), their size and significance (t-statistic) are reported. This permits the effect of DFF to be expressed in the same frame of reference as the element measures. Thus each element measure can be adjusted for any interaction that has affected its estimation. Then the practical implications of removing DFF can be determined. Does adjustment for DFF alter the pass–fail decision? Does adjustment for DFF affect the relative performance of two groups in a meaningful way?; and
4. Partitioning unexplained “error” variance. The DFF logit sample standard deviation corrected for its measurement error (para. 3) can be an estimate of the amount of systematic error in the error variance (RMSE).
The distinction between the terms “bias” and “differential facet functioning” is important in appropriately evaluating data for evidence of testing fairness. Millsap (2011) notes that DFF terminology exists “as a device for separating the statistical phenomenon (group differences that remain after attempted matching) from what the explanation for the phenomenon might be” (p. 8). The number of statistically significant interaction effects is empirical evidence of DFF. Potential bias can be described qualitatively when meaningful patterns emerge from these sig-nificant interaction effects. The term “potential” is of note, as bias cannot be confirmed empiri-cally with quantitative analysis alone. Bias can only be explained qualitatively through expert judgment and interpretation of systematic patterns of misfit. The term “meaningful” is also of note, as bias in raters can only be described qualitatively. In instances when potential bias is suspected, DFF can inform us to its presence (Bond & Fox, 2007). DFF is not necessarily evi-dence of potential bias at the element level, however. In instances when an individual element is flagged as misfit, it still may be relevant to measuring the latent construct. In these instances, interpretation and validation using a mixed method approach may be undertaken by a group of experts (Engelhard & Myford, 2003). Additionally, although DFF may not be detected at the group level, individual elements may exhibit differential probabilistic patterns (Engelhard & Myford, 2003). Therefore, a full investigation into individual element residuals is even more important to detect potential bias and to better inform the conditions of the testing situation. Facets flagged as demonstrating DFF therefore can be further evaluated for meaningful pat-terns emerging from significant interaction statistics by evaluating residuals for each element within that facet (e.g., individual rater, individual item, individual person, individual ensemble, etc.) According to Wright (1984), a facet flagged for DFF:
at UNIV OF GEORGIA LIBRARIES on May 22, 2015msx.sagepub.comDownloaded from

154 Musicae Scientiae 19(2)
… is never uniformly present among members of the groups or uniformly absent among those not in the group. For the analysis … to do individuals any good … it will have to be done on the individual level. (p. 285)
Using the MFR-PC measurement model, DFF has been shown to cause significant variance in scores (Du, Wright, & Brown, 1996; Engelhard, 1992, 1996b; Kondo-Brown, 2002; Lumley, 2002, 2005; McNamara, 1996; Myford & Wolfe, 2003, 2004; Wigglesworth, 1993, 1994). The benefits of conducting DFF analyses using the MFR-PC model include (a) evaluation of rater-invariant measurement of performances; (b) linear logistic transformation of ordinal-level raw scores into interval-scaled measures; (c) use of unidimensional measures of a latent construct; (d) separation of item calibration and person measures (i.e., specific objectivity); and (e) a probabilistic, sample-free approach to measurement.
Differential facet functioning is quantified by the number of significant interactions between facets and or other elements of interest (Engelhard, 2013). Interaction analyses can be investi-gated for items (differential item functioning), persons (differential person functioning), raters (differential rater functioning), or any other facet of interest. In instances when the items are of interest, differential item functioning (DIF) analysis can be conducted. DIF can be defined as “the examination of sample-invariant calibration when it is defined as item performance differ-ences between persons with equivalent locations on the latent variable” (Engelhard, 2009, p. 588). In instances when the person is of interest, differential person functioning analysis (DPF) can be conducted. DPF can be defined as “unexpected differences between the observed and expected performance of persons on a set of items” (p. 257). This study explored differential rater functioning (DRF) by investigating interactions between raters, collectively and individu-ally, and four subgroups of ensemble school levels (middle school, high school, collegiate, and professional).
Differential rater functioning and related interaction models. In the context of rater-mediated assess-ments, principles of DFF can be extended to evaluate rater behaviors and their overall quality of ratings. Differential rater functioning (DRF) can “alert us to the presence of the rater who (un)wittingly changes severity accordingly to some group characteristic” (Bond & Fox, 2007, p. 95). This paper focused on DRF as a means to evaluate rater quality in the context of large group music performance assessment. More specifically, it explored the null hypothesis that raters, collectively and individually, share a common interpretation of music ensemble perfor-mance achievement within different subgroups (e.g., middle school, high school, collegiate, and professional). Interactions between raters and school level were evaluated using the Many-Facet Rasch Partial Credit (MFR-PC) measurement model.
MFR-PC interaction modelIn the context of a rater-mediated assessment, interactions provide a method for identifying whether or not rater severity is invariant across facets of interest. More specifically, differen-tial rater functioning (DRF) demonstrates differential rater severity within different sub-groups of interest. These interaction terms can be added to MFR Models in order to examine whether rater interpretation of the construct is consistent across facets. Tests for significant interactions based on the MFR model test the null hypothesis that there is no significant interaction between the logit-scale locations for particular facets. In this study, the interac-tion between rater severity and ensemble level (middle school, high school, collegiate, profes-sional) was examined.
at UNIV OF GEORGIA LIBRARIES on May 22, 2015msx.sagepub.comDownloaded from

Wesolowski et al. 155
First, an interaction term between the two facets of interest is added to the model. Rater severity (O) and school level (J) are already included as facets in the MFR-PC model used in this study (Equation 1). The interaction (OiJm) term is added to Equation 1 as follows:
lnP
P=( )nijmk
nijmkn i j m ik i m
!
"##
$
%&&
' ( ) * + ( *, , , , , , (2)
where OiJm is the interaction between rater severity and judged school level achievement.The FACETS computer program (Linacre, 2014) was used to calculate an overall fixed chi-
square (F2) test for the significance of a set of interactions. This test statistic confirms or discon-firms the null hypothesis that the overall set of interactions is not significantly different from zero, after allowing for measurement error. In other words, the significance test for this statistic answers the question: Is the overall set of interactions between these two facets significantly different from zero? A significant value for the chi-square statistic suggests that the interaction between the two specified facets is significant at an overall level. For the interaction between raters and ensemble level (middle school through professional), the omnibus test examines the null hypothesis that the interactions between individual raters and the judged achievement of each ensemble level are not significant. In addition to the overall test for significant interactions, it is possible to examine individual interactions between elements within two facets. These individ-ual terms provide information about the direction and magnitude of each interaction, and they are useful for identifying patterns in data that can be used to inform the interpretation of meas-urement outcomes. Visual displays that illustrate these interaction terms are particularly use-ful for this purpose. Individual interaction terms are calibrated on the logit scale, and their precision is described using standard errors. The interaction terms are calculated as t-statistics, and they approximate the normal distribution (i.e., M = 0, SD = 1, or a z-score) with many observations. The significance tests for individual interaction terms can be used as a test for the statistical significance of the size of each pairwise interaction. A type of standardized effect size, these test statistics are primarily used as descriptors of patterns within rating data that may signal rater effects of substantive interest. As a result, significance tests are not of primary importance. However, a general practice in the interpretation of these statistics is to use an absolute value of 2.00 to identify interactions that may warrant further investigation (Engelhard, 2009). Furthermore, differences less than 0.30 logits do not carry substantive meaning (Engelhard & Myford, 2003). In this study, statistically significant interactions sug-gest that rater severity is meaningfully higher or lower than expected for an ensemble level, based on its expected location on the logit scale (across the group of raters, based on the esti-mate under the MFR-PC Model).
Limitations of previous methodologies in musicSeveral studies in music performance assessment claim to evaluate rater “bias” (see Platz & Kopiez, 2012 for a review and meta-analysis). From a modern measurement theory perspec-tive, the methodology utilized in these “bias” studies is limited and results can be misinterpreted due to: (a) utilization of classical test theory as a method for evaluating rater behaviors, and (b) misappropriation of the term “bias.” More specifically:
1. The use of classical test theory methodology as a means to analyzing rater-mediated assessment data is limited by sample and test dependency. Furthermore, separate
at UNIV OF GEORGIA LIBRARIES on May 22, 2015msx.sagepub.comDownloaded from

156 Musicae Scientiae 19(2)
estimations of person ability, item difficulty, and rater severity under the requirements of invariant measurement could not be characterized;
2. Separate parameterization estimation of the rating scale structure was not conducted, thereby working under the false assumption that each rater utilized the rating scale cat-egories in a similar manner;
3. Statistical routines were conducted on observed data in order to detect group differ-ences, thereby falsely working under the assumption that the observed ratings were interval-scaled; and
4. Consistent over- and under-estimation of groups of raters was detected by summing rat-ing scale scores; however, individual rater analyses with separate estimations of person ability, item difficulty, and rater severity were not conducted. Therefore, rater errors may have been detected, but DRF and claims of rater “bias” were unfounded.
DRF analysis can lead to important substantive interpretations of two particular questions regarding rater behavior: (a) are the ratings of each rater invariant over construct irrelevant components? and (b) are the raters invariant over construct irrelevant components for the overall assessment system? (Engelhard, 2013, p. 212). In the instances of previous research, this specificity of rater behaviors could not be verified. This study investigated rater behaviors at both the group and individual levels using the Many-Facet Rasch Partial Credit Measurement Model. The application of modern measurement theory to investigate model-data fit, rater errors, and differential rater functioning helps overcome the limitations of previously existing literature, thereby providing a more sound methodology for improving objectivity and fairness of rater-mediated large group music performance assessments.
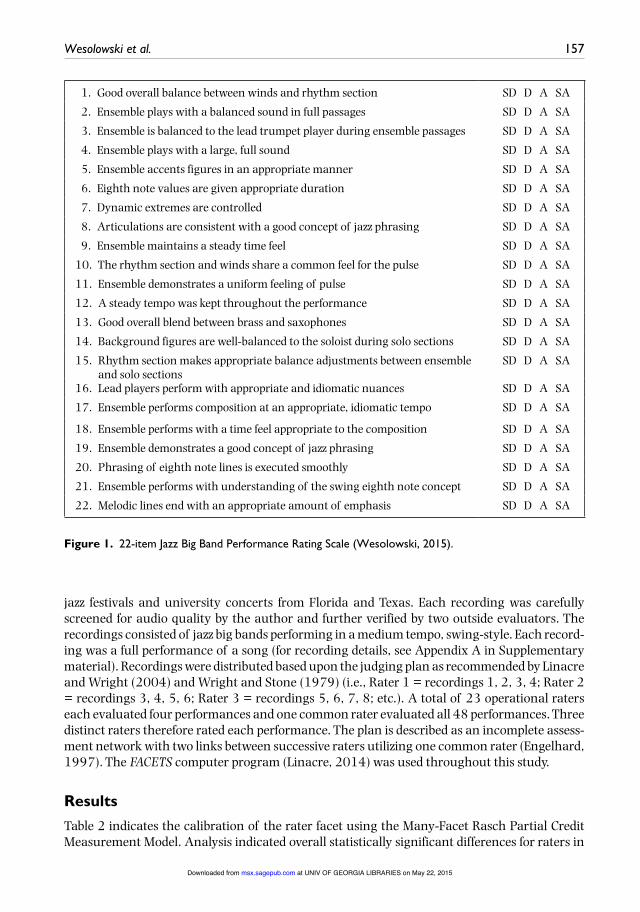
MethodThe Jazz Big Band Performance Rating Scale (JBBPRS) was used as the evaluative tool in this study (Wesolowski, 2015). The JBBPRS was developed from a facet-factorial method of scale construction, whereby 22 original items were reduced to 18 items. Recognizing that factor anal-ysis is a statistical method that produces results bound by sample dependency, it is conceivable that different results of the factor structure and item reduction may have occurred with a differ-ent rater and ensemble pool. Therefore, this study utilized all 22 original items (see Figure 1).
A panel of expert jazz educators (N = 23) were solicited to each evaluate four anonymous recordings (middle school, n = 1; high school, n = 1, collegiate, n = 1, professional, n = 1). Raters were aware of school level. Each panel member (i.e., rater) holds a minimum of a Master’s degree in music with an emphasis in jazz studies. At the time of the study, each rater held a university teaching position that included directing a jazz big band as part of their course responsibilities. Each rater has a minimum of 15 years of professional adjudication experience at formalized district and state large group performance evaluations throughout the United States (M = 22.74, SD = 3.46). All raters were supplied with an instructional packet that detailed the study. Raters were asked to evaluate each recording to the best of their ability using the supplied rating scale. They were allowed to review each recording as many times as needed. In formalized large group music performance assessments, raters are not often trained using exemplars (Forbes, 1994; Mills, 1991). Therefore, anchor recordings or other exemplars asso-ciated with measure benchmarking were purposely not provided to raters in order to foster a more authentic adjudication experience with the measurement tool. Middle school and high school recordings were gathered from district and state large group music performance evalua-tions from Florida, United States. Collegiate and professional recordings were gathered from
at UNIV OF GEORGIA LIBRARIES on May 22, 2015msx.sagepub.comDownloaded from
Wesolowski et al. 157
jazz festivals and university concerts from Florida and Texas. Each recording was carefully screened for audio quality by the author and further verified by two outside evaluators. The recordings consisted of jazz big bands performing in a medium tempo, swing-style. Each record-ing was a full performance of a song (for recording details, see Appendix A in Supplementary material). Recordings were distributed based upon the judging plan as recommended by Linacre and Wright (2004) and Wright and Stone (1979) (i.e., Rater 1 = recordings 1, 2, 3, 4; Rater 2 = recordings 3, 4, 5, 6; Rater 3 = recordings 5, 6, 7, 8; etc.). A total of 23 operational raters each evaluated four performances and one common rater evaluated all 48 performances. Three distinct raters therefore rated each performance. The plan is described as an incomplete assess-ment network with two links between successive raters utilizing one common rater (Engelhard, 1997). The FACETS computer program (Linacre, 2014) was used throughout this study.
ResultsTable 2 indicates the calibration of the rater facet using the Many-Facet Rasch Partial Credit Measurement Model. Analysis indicated overall statistically significant differences for raters in
Figure 1. 22-item Jazz Big Band Performance Rating Scale (Wesolowski, 2015).
1. Good overall balance between winds and rhythm section SD D A SA
2. Ensemble plays with a balanced sound in full passages SD D A SA
3. Ensemble is balanced to the lead trumpet player during ensemble passages SD D A SA
4. Ensemble plays with a large, full sound SD D A SA
5. Ensemble accents figures in an appropriate manner SD D A SA
6. Eighth note values are given appropriate duration SD D A SA
7. Dynamic extremes are controlled SD D A SA
8. Articulations are consistent with a good concept of jazz phrasing SD D A SA
9. Ensemble maintains a steady time feel SD D A SA
10. The rhythm section and winds share a common feel for the pulse SD D A SA
11. Ensemble demonstrates a uniform feeling of pulse SD D A SA
12. A steady tempo was kept throughout the performance SD D A SA
13. Good overall blend between brass and saxophones SD D A SA
14. Background figures are well-balanced to the soloist during solo sections SD D A SA
15. Rhythm section makes appropriate balance adjustments between ensemble and solo sections
SD D A SA
16. Lead players perform with appropriate and idiomatic nuances SD D A SA
17. Ensemble performs composition at an appropriate, idiomatic tempo SD D A SA
18. Ensemble performs with a time feel appropriate to the composition SD D A SA
19. Ensemble demonstrates a good concept of jazz phrasing SD D A SA
20. Phrasing of eighth note lines is executed smoothly SD D A SA
21. Ensemble performs with understanding of the swing eighth note concept SD D A SA
22. Melodic lines end with an appropriate amount of emphasis SD D A SA
at UNIV OF GEORGIA LIBRARIES on May 22, 2015msx.sagepub.comDownloaded from

158 Musicae Scientiae 19(2)
terms of their severity locations on the logit scale (F2(23) = 141.10, p < .05), with a high reliabil-ity of separation (Rel = 0.83).2 The directionality of the rater severity measure on the logit scale indicates that rater 7 was the most severe rater with a logit value of 0.65. Oppositely, rater 21 was the most lenient rater, with a logit value of -1.19. Raters 11 (Infit MSE = 0.70), 18 (Infit MSE = 0.77), and 19 (Infit MSE = 0.73) demonstrated muted ratings as evidenced by Infit MSE statistics less than 0.80. Muted rating patterns indicate scoring that is more uniform than pre-dicted by the measurement model. Raters 2 (Infit MSE = 1.24), 3 (Infit MSE = 1.25), 10 (Infit MSE = 1.40), and 24 (Infit MSE = 1.25) demonstrated noisy ratings as evidenced by Infit MSE statistics above 1.20. Noisy rating patterns indicate scoring that is excessively more random than predicted by the measurement model.
In order to determine if the raters as a group demonstrated differential patterns of severity or leniency according to school level, a DRF analysis was conducted by crossing rater and school level facets. An overall differential achievement measure for each school level was calcu-lated in the FACETS computer program (Linacre, 2014) based upon standardized ratings for each school level. As indicated in Table 3, the analysis indicated overall statistically significant
Table 2. Calibration of the rater facet.
Rater number
Observed average rating
Rater severity (logit scale measure)
SE Infit MSE Std. infit MSE
Outfit MSE Std. outfit MSE
7 2.42 0.65 0.17 0.88 !0.87 0.87 !0.9212 2.44 0.62 0.17 0.93 !0.44 0.94 !0.3815 2.41 0.57 0.18 1.07 0.51 1.06 0.4723 2.61 0.40 0.18 0.90 !0.72 0.91 !0.6420 2.45 0.34 0.18 1.03 0.23 1.02 0.186 2.70 0.16 0.19 1.12 0.74 1.18 1.049 2.58 0.16 0.18 0.97 !0.15 0.91 !0.5313 2.68 0.15 0.18 0.96 !0.19 0.90 !0.5022 2.67 0.15 0.17 0.99 !0.05 1.00 0.03Common 2.60 0.14 0.07 0.93 !1.26 0.92 !1.388 2.66 0.14 0.16 0.86 !0.90 0.97 !0.1516 2.58 0.11 0.17 0.62 !2.98 0.63 !2.902 2.56 0.09 0.19 1.24 1.67 1.24 1.6914 2.56 0.09 0.18 1.05 0.39 1.09 0.6617 2.56 0.09 0.18 0.89 !0.79 0.90 !0.6910 2.62 0.02 0.17 1.40 2.45 1.38 2.304 2.70 !0.05 0.20 1.17 1.17 1.18 1.1911 2.70 !0.21 0.18 0.70 !2.19 0.68 !2.1919 2.51 !0.30 0.18 0.73 !1.98 0.72 !2.035 2.86 !0.42 0.17 0.88 !0.81 0.81 !1.1518 2.65 !0.45 0.19 0.77 !1.70 0.79 !1.5124 2.86 !0.49 0.20 1.25 1.56 1.28 1.743 2.27 !0.80 0.18 1.25 1.71 1.36 2.0821 2.89 !1.19 0.17 1.13 1.00 1.18 1.26Mean 2.61 0.00 0.17 0.99 !0.15 1.00 !0.10SD 0.15 0.44 0.02 0.19 1.36 0.21 1.40
Note. The raters are arranged in Measure (severity) order, from high to low, ( F 2(23) = 10, p < .05; Rel = 0.83).
at UNIV OF GEORGIA LIBRARIES on May 22, 2015msx.sagepub.comDownloaded from

Wesolowski et al. 159
group differences ( F 2 (3) = 2115.30, p < .05). The differential achievement levels for each school level were as follows: middle school (-2.02 logits, n = 30), high school (.04 logits, n = 30), collegiate (.50 logits, n = 30), and professional (2.57 logits, n = 25). All differences are substan-tively significant, as each difference in logits between school levels is above 0.30 (Engelhard & Myford, 2003).
To investigate meaningful interpretations of patterns of differential severity and/or leniency related to individual raters, an interaction analysis between rater and school level was con-ducted. In order to detect individual patterns, pairwise interaction analyses were conducted between all raters and all school levels. As seen in Table 4, 92 interaction terms were detected. Of the 92 interaction terms, 14 were found to be significantly differential. Significant interac-tion terms are defined by | Z | ⩾ 2.0. Figure 2 depicts each rater’s interaction term (Z) accord-ing to school level.
Of the 24 raters, 10 raters (raters 3, 5, 8, 9, 10, 11, 14, 20, 21, 24) demonstrated a form of unexpected differential severity within at least one school level subgroup. Table 5 provides a summary of differential rater statistics for selected raters demonstrating unexpected differen-tial severity and/or leniency (i.e., | Z | > = 2.0). As seen in Table 5, rater 5 consistently under-estimates high school ensembles (z = 2.40). As an example, the total expected scores for high school-level ensembles for rater 5 were 59.17, and the total observed scores were 51.00. This is an observed difference of -8.17 points on the raw score scale (standardized residual of -.37 logits). As another example, rater 8 consistently overestimates college-level ensembles (z = 2.96, observed difference = +9.13 points, standardized residual = .42 logits) and consistently underestimates professional-level ensembles (z = -2.55, observed difference = -5.97, standard-ized residual = -.27 logits).
Interestingly, if the calibration of rater facets (Table 2) is compared to raters demonstrating unexpected differential severity within the school level facet (Table 5), three important observa-tions can be made:
1. Raters 3, 10, 11, and 24 demonstrated unexpectedly noisy and/or muted fit statistics (i.e., Infit or Outfit MSE > 1.2, < .80) and differential severity/leniency (| Z | ⩾ = 2.0);
2. Raters 2, 16, 18, and 19 demonstrated unexpected noisy and/or muted fit statistics but not differential severity/leniency;
3. Raters 5, 8, 9, 14, 20, and 21 did not demonstrate unexpectedly noisy and/or muted fit statistics but demonstrated differential severity/leniency.
Table 3. Differences in group ratings related to school ensemble level.
School Level Measure Mean differences in achievement
Middle school High school Collegiate Professional
Middle school !2.02 – 2.06* 2.52* 4.59*High school .04 – .46* 2.53*Collegiate .50 – 2.07*Professional 2.57 –Chi-square 2115.3* Df 3
Note.*p < .01.
at UNIV OF GEORGIA LIBRARIES on May 22, 2015msx.sagepub.comDownloaded from

160 Musicae Scientiae 19(2)
These findings provide evidence that raters may use the rating scale in a manner that is incon-sistent with expected scores without indicating differential severity and/or leniency (i.e., poten-tial “bias” towards a particular school level subgroup). Furthermore, raters may demonstrate differential severity and/or leniency that is not detected by evaluating fit statistics. These find-ings highlight the limitation noted above that a full picture of rater behavior is evidenced not only through group-level analyses, but in conjunction with individual-level analyses.
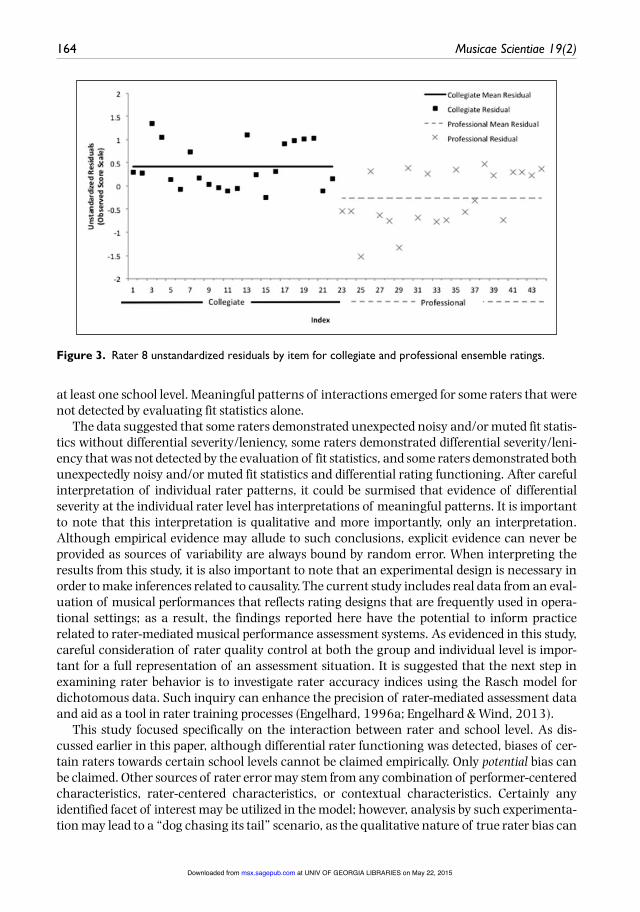
In order to better interpret behaviors of specific raters, quality control tables can elaborate on the details of rater calibrations (as seen in Table 2) and rater interactions (as seen in Table 5). An example quality control chart for Rater 8 is provided in Table 6. A visual representation is demonstrated in Figure 3. Using the threshold guidelines of r 2.0 for standardized residuals as a guide for detecting misfit (Linacre, 2002), Table 2 provides evidence that Rater 8 has good data fit to the model (Infit MSE = 0.86, SE = 0.16). However, Table 5 indicates that Rater 8 demonstrated DRF for two elements of the school level facet: consistent overestimation of col-legiate ensembles (Z = 2.96, SE = .37, standardized residual = .42) and consistent underesti-mation of professional ensembles (Z = -2.55, SE = .38, standardized residual = -.27). The quality control chart for Rater 8 (Table 6) provides observed responses, expected responses, residuals, and standardized residuals for each rating (by item) for both elements demonstrating differential severity and/or leniency. The table only provides evidence of one item as demon-strating significant underestimation (item 3 [Ensemble is balanced to the lead trumpet player during ensemble passages], Z = -2.84). With only one misfitting item, it can be assumed that Rater 8 demonstrates these differential tendencies holistically, versus by specific items. Therefore, an evaluation of overall patterns should be investigated. As an example, in evaluat-ing professional recordings, Rater 8 underestimated items 1 (standardized residual = -1.04), 2 (standardized residual = -1.05), 3 (standardized residual = -2.84), 14 (standardized residual = -1.10), 15 (standardized residual = -0.57), 18 (standardized residual = -1.62). All of these items related to matters of balance. Additionally, items 11 (standardized residual = -1.82) and 12 (standardized residual = -1.66) were underestimated. These items related to matters of tempo and pulse. Therefore, a conclusion can be drawn that Rater 8’s expectations for a profes-sional ensemble’s execution of balance and time-feel were higher than expected by the proba-bilistic model.
Discussion and conclusionsThe contribution of this study is to demonstrate the use of Rasch measurement theory as a means to strengthen the equity and fairness of music performance assessments that utilize rater-mediated data through the investigation of differential rater functioning and bias interac-tion effects. In the context of rater-mediated assessments, the application of the Many-Facet Rasch Partial Credit (MFR-PC) measurement model allows for the close examination of rater calibrations. In this study, analysis of model-data fit and differential rater functioning (DRF)
Table 4. Summary of differential rater functioning (interaction terms) by school level.
Count of interaction terms 92| Z | > = 2.0 14% statistically significant 15.2%Chi-square 161.4*Df 92
Note. *p < .01.
at UNIV OF GEORGIA LIBRARIES on May 22, 2015msx.sagepub.comDownloaded from

Wesolowski et al. 161
Figu
re 2
. D
iffer
entia
l rat
er s
tatis
tics
by s
choo
l lev
el.
at UNIV OF GEORGIA LIBRARIES on May 22, 2015msx.sagepub.comDownloaded from

162 Musicae Scientiae 19(2)
and using the MFR-PC model further explore rater behaviors by specifically examining raters’ systematic subpatterns of leniency and severity among subgroups both as a group and as indi-viduals. The overall analysis with the MFR-PC model indicated a wide range in rater severity on the logit scale (F2(23) = 10, p < .05; Rel = 0.83); this finding matches previous research in which significant differences in rater severity have been found to persist despite rater training (Lunz & Stahl, 1990; Lunz, Stahl, & Wright, 1996; O’Neill & Lunz, 2000; Raymond, Webb, & Houston, 1991). In addition, interaction analyses indicated that DRF existed for both the group of raters and some individual raters based on their expected locations on the logit scale. Of the 92 potential pairwise interactions examined, 14 (15.2%) interactions were found to be statisti-cally significant, indicating that 10 individual raters demonstrated differential severity across
Table 5. Summary of differential rater functioning statistics (rater interactions) for selected raters exhibiting | Z | > = 2.0.
Rater School level
Infit MSQ Outfit MSQ
Total observed
Total expected
Stand. Mean Residual (obs-exp)
Bias logit
SE Z
5 MS .80 .80 44 43.58 .02 .05 .33 .14 HS .90 .80 51 59.17 !.37 !.74 .31 !2.40 Col .80 .80 72 66.36 .26 .53 .32 1.67 Prof .90 .80 85 83.02 .09 .57 .60 .948 MS .60 .50 27 33.42 !.29 !.84 .44 !1.91 HS .80 .80 61 57.76 .15 .29 .31 .95 Col .70 .70 72 62.87 .42 1.10 .37 2.96 Prof 1.10 1.10 74 79.97 !.27 !.97 .38 !2.559 MS .80 .70 34 37.00 !.14 !.32 .34 !.95 HS 1.10 1.00 65 56.90 .37 1.18 .42 2.83 Col .70 .70 57 60.47 !.16 !.45 .35 !1.31 Prof 1.10 1.10 71 72.55 !.07 !.27 .42 !.6410 MS 1.00 .90 40 37.04 .13 .28 .30 .93 HS 2.30 2.40 56 57.28 !.06 !.14 .33 !.43 Col .90 .90 68 62.53 .25 .79 .39 2.03 Prof .60 .60 67 74.15 !.33 !1.11 .39 !2.8611 MS .90 .80 45 43.72 .06 .22 .41 .53 HS .50 .50 53 53.91 !.04 !.11 .35 !.31 Col .80 .80 55 61.23 !.28 !.65 .34 !1.94 Prof .70 .60 85 79.26 .26 1.28 .61 2.1114 MS 1.90 1.90 40 37.00 .14 .45 .38 1.17 HS 1.00 1.00 50 51.18 !.05 !.14 .35 !.40 Col .70 .70 52 58.57 !.30 !.69 .34 !2.05 Prof .80 .60 83 78.36 .21 .83 .49 1.7124 MS 1.00 1.00 44 44.43 !.02 !.07 .42 !.18 HS .80 .80 58 59.92 !.09 !.26 .37 !.71 Col .90 .90 76 66.82 .42 1.31 .39 3.33 Prof 1.20 1.20 74 80.82 !.31 !1.13 .38 !2.95
Note. In the context of rater-mediated assessments, Infit and Outfit MSE statistics below 0.80 have been found to suggest “muted” ratings (i.e., possible dependencies), and values greater than 1.20 have been found to suggest “noisy” ratings (i.e., many unexpected observations; Engelhard, 2013).
at UNIV OF GEORGIA LIBRARIES on May 22, 2015msx.sagepub.comDownloaded from

Wesolowski et al. 163
Table 6. Quality control table for Rater 8.
Item Level Obs. rating Exp. rating Residual SE Stand res (Z)
1 Col 3 2.71 0.29 0.51 0.412 Col 3 2.72 0.28 0.51 0.393 Col 4 2.66 1.34 0.54 1.834 Col 4 2.95 1.05 0.40 1.665 Col 3 2.87 0.13 0.43 0.196 Col 3 3.08 !0.08 0.36 !0.137 Col 3 2.27 0.73 0.68 0.888 Col 3 2.82 0.18 0.46 0.279 Col 3 2.96 0.04 0.40 0.0610 Col 3 3.04 !0.04 0.37 !0.0711 Col 3 3.11 !0.11 0.35 !0.1912 Col 3 3.05 !0.05 0.37 !0.0913 Col 4 2.90 1.10 0.42 1.7014 Col 3 2.75 0.25 0.49 0.3515 Col 2 2.25 !0.25 0.69 !0.3116 Col 3 2.68 0.32 0.53 0.4417 Col 4 3.10 0.90 0.35 1.5118 Col 4 3.03 0.97 0.37 1.5919 Col 4 2.98 1.02 0.39 1.6420 Col 4 2.97 1.03 0.39 1.6421 Col 3 3.10 !0.10 0.36 !0.1622 Col 3 2.85 0.15 0.44 0.221 Pro 3 3.55 !0.55 0.28 !1.042 Pro 3 3.55 !0.55 0.28 !1.053 Pro 2 3.52 !1.52 0.29 !2.844 Pro 4 3.69 0.31 0.23 0.665 Pro 3 3.64 !0.64 0.25 !1.296 Pro 3 3.76 !0.76 0.19 !1.737 Pro 2 3.33 !1.33 0.32 !2.358 Pro 4 3.61 0.39 0.26 0.769 Pro 3 3.69 !0.69 0.23 !1.4510 Pro 4 3.74 0.26 0.20 0.5811 Pro 3 3.77 !0.77 0.18 !1.8212 Pro 3 3.74 !0.74 0.20 !1.6613 Pro 4 3.66 0.34 0.24 0.7014 Pro 3 3.57 !0.57 0.27 !1.1015 Pro 3 3.32 !0.32 0.32 !0.5716 Pro 4 3.53 0.47 0.28 0.8717 Pro 4 3.77 0.23 0.18 0.5418 Pro 3 3.73 !0.73 0.20 !1.6219 Pro 4 3.70 0.30 0.22 0.6420 Pro 4 3.70 0.30 0.22 0.6421 Pro 4 3.77 0.23 0.19 0.5422 Pro 4 3.63 0.26 0.25 0.74
at UNIV OF GEORGIA LIBRARIES on May 22, 2015msx.sagepub.comDownloaded from
164 Musicae Scientiae 19(2)
at least one school level. Meaningful patterns of interactions emerged for some raters that were not detected by evaluating fit statistics alone.
The data suggested that some raters demonstrated unexpected noisy and/or muted fit statis-tics without differential severity/leniency, some raters demonstrated differential severity/leni-ency that was not detected by the evaluation of fit statistics, and some raters demonstrated both unexpectedly noisy and/or muted fit statistics and differential rating functioning. After careful interpretation of individual rater patterns, it could be surmised that evidence of differential severity at the individual rater level has interpretations of meaningful patterns. It is important to note that this interpretation is qualitative and more importantly, only an interpretation. Although empirical evidence may allude to such conclusions, explicit evidence can never be provided as sources of variability are always bound by random error. When interpreting the results from this study, it is also important to note that an experimental design is necessary in order to make inferences related to causality. The current study includes real data from an eval-uation of musical performances that reflects rating designs that are frequently used in opera-tional settings; as a result, the findings reported here have the potential to inform practice related to rater-mediated musical performance assessment systems. As evidenced in this study, careful consideration of rater quality control at both the group and individual level is impor-tant for a full representation of an assessment situation. It is suggested that the next step in examining rater behavior is to investigate rater accuracy indices using the Rasch model for dichotomous data. Such inquiry can enhance the precision of rater-mediated assessment data and aid as a tool in rater training processes (Engelhard, 1996a; Engelhard & Wind, 2013).
This study focused specifically on the interaction between rater and school level. As dis-cussed earlier in this paper, although differential rater functioning was detected, biases of cer-tain raters towards certain school levels cannot be claimed empirically. Only potential bias can be claimed. Other sources of rater error may stem from any combination of performer-centered characteristics, rater-centered characteristics, or contextual characteristics. Certainly any identified facet of interest may be utilized in the model; however, analysis by such experimenta-tion may lead to a “dog chasing its tail” scenario, as the qualitative nature of true rater bias can
Figure 3. Rater 8 unstandardized residuals by item for collegiate and professional ensemble ratings.
at UNIV OF GEORGIA LIBRARIES on May 22, 2015msx.sagepub.comDownloaded from

Wesolowski et al. 165
never be quantified. From a CTT perspective, it may seem advantageous to utilize a measure-ment model with as many parameters of interest in order to account for as much variance as possible. However, the philosophy of Rasch measurement theory is not to fit the model to the data, but to fit the data to a model supported by requirements of invariance (i.e., ideal-type model). As such, the principle of parsimony (i.e., Occam’s razor) dictates that measurement data should be fit by simple models (Embretson & Hershberger, 1999). According to Wilson and Gochyyev (2013):
Generally the more parsimonious models (models with fewer parameters and more degrees of freedom) will offer interpretational advantages … A more parsimonious model should be (and will be) a consequence of good design, and in this context, good design includes careful development and selection of items. (p. 19)
Shaw (1991) specifically argues that those proposing to utilize more liberal models with the intent of fitting the model to the data:
… seem to imply that the Rasch model is just a stripped-down version of more complicated models which “must be better” because they account for more of the “presumed reality” of traditional test theory. Quite apart from Occam’s razor (that entities are not multiplied beyond necessity), this interpretation is shallow in an essential way. That the Rasch model can be reached by simplifying more complicated models has nothing to do with its genesis or rationale, or with the theory of measurement (p. 131)
In the instance that differential rater functioning is detected in a real-world music assessment situation, a mixed method approach utilizing qualitative inquiry and investigation into specific behaviors of raters coupled with rater training and consistent monitoring and recalibration of the measurement tool is suggested over other empirical investigations.
Best practice in the selection and utilization of adjudicators in the field of music performance suggests that expert teachers and performers offer the best chance for providing a fair and equi-table assessment. This study, however, provides evidence that expert raters with copious amounts of teaching, performing, and adjudicating experiences demonstrate DRF. In order to optimize this rating scale under true assessment conditions, it is suggested that a combination of rater training, development of exemplars and anchors to accompany the scale, and a clear benchmarking and cut score system be developed. The utility of benchmarking assessments is predicated largely upon a sound interpretation by the rater. Therefore, future investigations into how diverse groups of raters (i.e., non-jazz experts, practicing educators, students) utilize the scale are essential in providing evidence of scale functioning.
The rater behavior analysis focused on improving the fairness, and equity of large group music performance assessments. In the context of using rater-mediated data in experimental research, Thompson and Williamon (2003) claim:
… researchers who wish to employ performance assessment as a dependent measure in experimental studies may have to accept that musical performances are simply not open to reliable and consistent scrutiny of the type we may wish. (p. 38)
In these instances, music research has been limited by traditional psychometric approaches to measurement (e.g., Classical test theory) through the application of consensus and consistency estimates to directly evaluate rater effectiveness. As Bock and Jones (1968) note:
In a well-developed science, measurement can be made to yield invariant results over a variety of measurement models and over a range of experimental conditions for any one method. (p. 9)
at UNIV OF GEORGIA LIBRARIES on May 22, 2015msx.sagepub.comDownloaded from

166 Musicae Scientiae 19(2)
The application of modern measurement theory (in particular, Rasch measurement models) to music research utilizing any rater-mediated evaluative data can improve objectivity of the measure. The simplicity of the Rasch Model combined with its strict requirements based on the same fundamental requirements for measurement in the physical sciences allows for independ-ent and concurrent estimation of person ability and item difficulty on the same linear metric with invariant results. This is done in a manner that, compared to other models, “maximizes the homogeneity of the trait and … allows greater reduction of redundancy at no sacrifice of measurement information by decreasing items and/or scoring levels to yield a more valid and simple measure” (Granger, 2008, p. 1122). A construct modeling approach to measurement is a theoretical framework that allows for direct connections between items, persons, raters, or other variables of interest (i.e., facets) by calibrating elements on a continuous log odds scale. In order to utilize this data in an experimental research situation as brought to light by Thompson and Williamon (2003), Wilson (2005) explains:
Where there are other external variables that the construct should (according to theory) predict … a strong relation (or lack of a strong relation) between the instrument under scrutiny and these external variables can be used as validity evidence … [A] source of external variables are treatment studies—where the measurer has good evidence that a treatment affects the construct; then the contrast between the treatment and a control group can be used as an external variable …. A reasonably straightforward indicator of this relationship is the Pearson correlation coefficient between the respondents’ estimated locations [on the latent construct] and the external variable. (p. 169)
Research in the behavioral sciences and more specifically, music education and psychology, is often bound by rater judgment and subjectivity. However, steps can be taken to foster an assess-ment system that produces reliable and valid ratings using the series of quality control investi-gations as demonstrated in this study.
FundingThis research received no specific grant from any funding agency in the public, commercial, or not-for-profit sectors.
Notes1. In applications of the MFR model to educational achievement tests, the term for performances (Tn) is
often described as “person ability”, and the term for items (Gj) is often described as “item difficulty.”2. In order to provide alignment between the current study and previous research related to rating
quality, a percent exact agreement statistic was calculated for the raters that describes the percentage of times a given rater assigns a matching rating to another rater in identical circumstances (in this case, two raters score the same band on the same item). For this study, rater percent exact agreement statistics ranged from 22.7% to 65.2% agreement (M = 44.24, SD = 11.47).
ReferencesAbeles, H. F., Hoffer, C. R., & Klottman, R. H. (1994). Foundations of music education (2nd ed.). New York,
NY: Schirmer Books.AERA, APA, & NCME. (2014). Standards for educational and psychological testing (2nd ed.). Washington,
DC: American Educational Research Association (AERA).Aiello, R., & Williamon, A. (2002). Memory. In R. Parncutt & G. E. McPherson (Eds.), The science and psy-
chology of music performance: Creative strategies for teaching and learning (pp. 167–181). Oxford, UK: Oxford University Press.
Alluisi, E. A. (1962). Rater-rater reliabilities in judging musical performances. Perceptual and Motor Skills, 14, 145–146.
at UNIV OF GEORGIA LIBRARIES on May 22, 2015msx.sagepub.comDownloaded from

Wesolowski et al. 167
Ando, Y. (1988). Architectural acoustics: Blending sound sources, sound fields, and listeners. New York, NY: Springer.
Angoff, W. H. (1993). Perspectives on differential item functioning methodology. In P. W. Holland & H. Wainer (Eds.), Differential item functioning (pp. 3–23). Hillside, NJ: Lawrence Erlbaum.
Austin, J. R. (1988). The effect of music contest format on self-concept, motivation, achievement, and attitude of elementary band students. Journal of Research in Music Education, 36(2), 95–107.
Banister, S. (1992). Attitudes of high school band directors toward the value of marching band and con-cert band contests and selected aspects of the overall band program. Missouri Journal of Research in Music Education, 29, 49–57.
Bergee, M. J. (2003). Faculty interjudge reliability of music performance evaluation. Journal of Research in Music Education, 51(2), 137–150.
Bermingham, G. A. (2000). Effects of performers’ external characteristics on performance evaluations. Update: Applications of Research in Music Education, 18(2), 3–7.
Bock, R. D., & Jones, L. V. (1968). The measurement and prediction of judgment and choice. San Francisco, CA: Holden-Day.
Bond, T. G., & Fox, C. M. (2007). Applying the Rasch model: Fundamental measurement in the human sciences. New York, NY: Routledge.
Boyle, D. J. (1992). Program evaluation for secondary school music programs. NASSAP Bulletin, 76(544), 63–68.
Brakel, T. D. (2006). Inter-judge reliability of the Indiana State School Music Association high school instrumental festival. Journal of Band Research, 42(1), 59–69.
Burnsed, V., Hinkle, D., & King, S. (1985). Performance evaluation reliability at selected concert festivals. Journal of Band Research, 21(1), 22–29.
Cattell, R. B., & Anderson, J. C. (1953). The measurement of personality and behavior disorders by the I.P.A.T. Music Preference Test. Journal of Applied Psychology, 37(6), 446–454.
Charney, D. A. (1984). The validity of using holistic scoring to evaluate writing: A critical overview. Research in the Teaching of English, 18(1), 65–81.
Colwell, R. (1970). The evaluation of music teaching and learning. Engelwood Cliffs, NJ: Prentice-Hall.Colwell, R. (2007). Music assessment in an increasingly politicized, accountability-driven educational
environment. In T. S. Brophy (Ed.), Proceedings of the 2007 Symposium on Assessment in Music Education (pp. 3–16). Chicago, IL: GIA.
Conrad, D. (2003). Judging the judges: Improving rater reliability at music contests. NFHS Music Association Journal, 20(2), 27–31.
Crochet, L. S. (2006). Repertoire selection practices of band directors as a function of teaching experience, train-ing, instructional level, and degree of success (Unpublished doctoral dissertation). University of Miami, Coral Gables, FL.
Davidson, J. W. (1993). Visual perception of performance manner in the movements of solo musicians. Psychology of Music, 21, 103–113.
Davidson, J. W. (1994). Which areas of a pianist’s body convey information about expressive intention to an audience? Journal of Human Movement Studies, 26, 279–301.
Davidson, J. W. (1995). What does the visual information contained in musical performances offer the observer? Some preliminary throughts. In R. Steinberg (Ed.), The music machine: Psychophysiology and psychopathology of the sense of music (pp. 105–113). Berlin, Germany: Springer-Verlag.
Davidson, J. W. (2001). The role of the body in the production and perception of solo vocal performance: A case study of Annie Lennox. Musicae Scientiae, 5(2), 235–256.
Davidson, J. W., & Coimbra, D. D. C. (2001). Investigating performance evaluation by assessors of singers in a music college setting. Musicae Scientiae, 5, 33–53.
Du, Y., Wright, B. D., & Brown, W. L. (1996, April). Differential facet functioning detection in direct writ-ing assessment. Paper presented at the Annual Meeting of the American Educational Research Association, New York, NY.
Duerksen, G. L. (1972). Some effects of expectation on evaluation of recorded musical performance. Journal of Research in Music Education, 20(2), 268–272.
at UNIV OF GEORGIA LIBRARIES on May 22, 2015msx.sagepub.comDownloaded from

168 Musicae Scientiae 19(2)
Embretson, S. E., & Hershberger, S. L. (Eds.). (1999). The new rules of measurement: What every psychologist and educator should know. Mahwah, NJ: Erlbaum.
Engelhard, G., Jr. (1992). The measurement of writing ability with a many-faceted Rasch model. Applied Measurement in Education, 5(3), 171–191.
Engelhard, G., Jr. (1996a). Evaluating rater accuracy in performance assessments. Journal of Educational Measurement, 33(1), 56–70.
Engelhard, G., Jr. (1996b). Examining rater errors in the assessment of written composition with a many-faceted Rasch model. Journal of Educational Measurement, 33(2), 115–116.
Engelhard, G., Jr. (1997). Constructing rater and task banks for performance assessments. Journal of Outcome Measurement, 1(1), 19–33.
Engelhard, G., Jr. (2002). Monitoring raters in performance assessments. In G. Tindal & T. Haladyna (Eds.), Large-scale assessment programs for all students: Development, implementation, and analysis (pp. 261–287). Mahwah, NJ: Erlbaum.
Engelhard, G., Jr. (2009). Using item response theory and model-data fit to conceptualize differential item and person functioning for students with disabilities. Educational and Psychological Measurement, 69(4), 585–602.
Engelhard, G., Jr. (2013). Invariant measurement: Using Rasch models in the social, behavioral, and health sci-ences. New York, NY: Routledge.
Engelhard, G., Jr., & Myford, C. M. (2003). Monitoring faculty consultant performance in the advanced place-ment English literature and composition program with a Many-faceted Rasch Model (ETS Research Report). Retrieved from http://www.ets.org/research/policy_research_reports/publications/report/2003/ihav
Engelhard, G., Jr., & Wind, S. A. (2013). Rating quality studies using Rasch measurement theory (Research Report 2013-3). New York: The College Board. Retrieved from https://research.collegeboard.org/sites/default/files/publications/2013/8/researchreport-2013-3-rating-quality-studies-using-rasch-measurement-theory.pdf
Fiske, H. E. (1983). The effect of a training procedure in music performance evaluation on judge reliability. Toronto, Canada: Ontario Ministry of Education.
Flores, J. R. G., & Gonsburgh, V. A. (1996). The Queen Elizabeth musical competition: How fair is the final ranking? Journal of the Royal Statistical Society. Series D (The Statistician), 45(1), 97–104.
Forbes, G. W. (1994). Evaluating music festivals and contests – are they fair? Update: Applications of Research in Music Education, 12(2), 16–20.
Franklin, J. O. (1979). Attitudes of school administrators, band directors, and band students towards selected activities of the public school band program (Unpublished doctoral dissertation). Northwestern State University of Louisiana, Natchitoches, LA.
Granger, C. V. (2008). Rasch analysis is important to understand and use for measurement. Rasch Measurement Transactions, 21(3), 1122–1123.
Hash, P. M. (2012). An analysis of the ratings and interrater reliability of high school band contests. Journal of Research in Music Education, 60(1), 81–100.
Henning, G. (1997). Accounting for nonsystematic error in performance ratings. Language Testing, 13(1), 53–63.
Howard, K. K. (1994). A survey of Iowa high school band students’ self-perceptions and attitudes toward types of music contests (Unpublished doctoral dissertation). University of Iowa, Iowa City, IA.
Howard, R. L. (2002). Repertoire selection practices and the development of a core repertoire for the middle school concert band (Unpublished doctoral dissertation). University of Florida, Gainsville, FL.
Huot, B. (1990). Reliability, validity, and holistic scoring: What we know and what we need to know. College Composition and Communication, 41(2), 201–213.
Hurst, C. W. (1994). A nationwide investigation of high school band directors’ reasons for participating in music competitions (Unpublished doctoral dissertation). The University of North Texas, Denton, TX.
Johnson, R. L., Penny, J. A., & Gordon, B. (2009). Assessing performance: Developing, scoring, and validating performance tasks. New York, NY: Guilford Press.
King, S. E., & Burnsed, V. (2007). A study of the reliability of adjudicator ratings at the 2005 Virginia band and orchestra directors association state marching band festivals. Journal of Band Research, 27–33.
at UNIV OF GEORGIA LIBRARIES on May 22, 2015msx.sagepub.comDownloaded from

Wesolowski et al. 169
Kirchhoff, C. (1988). The school and college band: Wind band pedagogy in the United States. In J. T. Gates (Ed.), Music education in the United States: Contemporary issues (pp. 259–276). Tuscaloosa, AL: The University of Alabama Press.
Kondo-Brown, K. (2002). A FACETS analysis of rater bias in measuring Japanese second language writ-ing performance. Language Testing, 19(1), 3–31.
Langmeyer, A., Guglhör-Rudan, A., & Tarnai, C. (2012). What do music preferences reveal about person-ality? Journal of Individual Differences, 33(2), 119–130.
LeBlanc, A., Jin, Y. C., Obert, M., & Siivola, C. (1997). Effects of audience on music performance anxiety. Journal of Research in Music Education, 45(3), 480–496.
Linacre, J. M. (2002). Optimizing rating scale category effectiveness. Journal of Applied Measurement, 3, 86–106.
Linacre, J. M. (2014). Facets. Chicago, IL: MESA Press.Linacre, J. M. (n.d.). Bias interaction DIF DPF DRF estimation: Help for Facets Rasch Measurement
Software. Retrieved from www.winsteps.com/facetman/biasestimation.htmLinacre, J. M., & Wright, B. D. (2004). Construction of measures from many-facet data. In E. V. Smith & R.
M. Smith (Eds.), Introduction to Rasch measurement: Theories, models, and applications (pp. 296–321). Maple Grove, MN: JAM Press.
Loewenstein, G., & Lerner, J. S. (2003). The role of affect in decision making. In R. J. Davidson, K. R. Scherer, & H. H. Goldsmith (Eds.), Handbook of affective sciences (pp. 619–642). Oxford, UK: Oxford University Press.
Lumley, T. (2002). Assessment criteria in a large-scale writing test: What do they really mean to the raters? Language Testing, 19(3), 246–276.
Lumley, T. (2005). Assessing second language writing: The rater’s perspective. Frankfurt am Main, Germany: Peter Lang.
Lunz, M. E., & Stahl, J. A. (1990). Judge consistency and severity across grading periods. Evaluation and the Health Professions, 13, 425–444.
Lunz, M. E., Stahl, J. A., & Wright, B. D. (1996). The invariance of rater severity calibrations. In G. Engelhard, Jr., & M. Wilson (Eds.), Objective measurement: Theory into practice (Vol. 3, pp. 99–112). Norwood, NJ: Ablex.
McNamara, T. (1996). Measuring second language performance: Applied linguistics and language study. New York, NY: Longman.
McPherson, G. E., & Schubert, E. (2004). Measuring performance enhancement in music. In A. Williamon (Ed.), Musical excellence: Strategies and techniques to enhance performance (pp. 61–82). Oxford, UK: Oxford University Press.
McPherson, G. E., & Thompson, W. F. (1998). Assessing music performance: Issues and influences. Research Studies in Music Education, 10(1), 12–24.
Mills, J. (1991). Assessing musical performance musically. Educational Studies, 17(2), 173–181.Millsap, R. E. (2011). Statistical approaches to measurement invariance. New York, NY: Routledge.Myford, C. M., & Wolfe, E. W. (2003). Detecting and measuring rater effects using many-facet Rasch
measurement: Part I. Journal of Applied Measurement, 4(4), 386–422.Myford, C. M., & Wolfe, E. W. (2004). Detecting and measuring rater effects using many-facet Rasch
measurement: Part II. Journal of Applied Measurement, 5(2), 189–227.Norris, C. E., & Borst, J. D. (2007). An examination of the reliabilities of two choral festival adjudication
forms. Journal of Research in Music Education, 55(3), 237–251.O’Neill, T. R., & Lunz, M. E. (2000). A method to study rater severity across several administrations. In M.
Wilson & G. Engelhard, Jr. (Eds.), Objective measurement: Theory into practice (Vol. 5, pp. 135–146). Stamford, CT: Ablex.
Platz, F., & Kopiez, R. (2012). When the eye listens: A meta-analysis of how audio-visual presentation enhances the appreciation of music performance. Music Perception, 30(1), 71–83.
Raymond, M. R., Webb, L. C., & Houston, W. M. (1991). Correcting performance-rating errors in oral examinations. Evaluation and the Health Professions, 14(1), 100–122.
Saal, F. E., Downey, R. G., & Lahey, M. A. (1980). Rating the ratings: Assessing the psychometric quality of rating data. Psychological Bulletin, 88(2), 413–428.
at UNIV OF GEORGIA LIBRARIES on May 22, 2015msx.sagepub.comDownloaded from

170 Musicae Scientiae 19(2)
Schubert, E. (2002). Continuous response methodology applied to expressive performance. In C. Stevens, D. Burnham, G. McPherson, E. Schubert, & J. Renwick (Eds.), Proceedings of the Seventh International Conference on Music Perception and Cognition (pp. 83–86). Adelaide, Australia: Causal Productions.
Shaw, F. (1991). Descriptive IRT vs . prescriptive Rasch. Rasch Measurement Transactions, 5(1), 2–5.Silvey, B. A. (2009). The effects of band labels on evaluators’ judgments of musical performance. Update:
Applications of Research in Music Education, 28(1), 47–52.Sivill, J. R. (2004). Students’ and directors’ perceptions of high school band competitions (Unpublished doctoral
dissertation). Bowling Green State University, Bowling Green, OH.Stanley, M., Brooker, R., & Gilbert, R. (2002). Examiner perceptions of using criteria in music perfor-
mance assessment. Research Studies in Music Education, 18(1), 46–56.Sudweeks, R. R., Reeve, S., & Bradshaw, W. S. (2004). A comparison of generalizability theory and many-
facet Rasch measurement in an analysis of college sophomore writing. Assessing Writing, 9(3), 239–261.
Sweeney, C. R. (1998). A description of student and band director attitudes toward concert band competition (Unpublished master’s thesis). University of Miami, Coral Gables, FL.
Thompson, S., & Williamon, A. (2003). Evaluating evaluation: Musical performance assessment as a research tool. Music Perception, 21(1), 21–41.
Wapnick, J., Darrow, A. A., Kovacs, J., & Dalrymple, L. (1997). Effects of physical attractiveness on evalu-ation of vocal performance. Journal of Research in Music Education, 45(3), 470–479.
Wapnick, J., Mazza, J. K., & Darrow, A. A. (1998). Effects of performer attractiveness, stage behavior, and dress on evaluation of violin performance evaluation. Journal of Research in Music Education, 46(4), 510–521.
Wapnick, J., Mazza, J. K., & Darrow, A. A. (2000). Effects of performer attractiveness, stage behavior, and dress on evaluation of children’s piano performances. Journal of Research in Music Education, 48(4), 323–335.
Wesolowski, B. C. (2014). Documenting student learning in music performance: A framework. Music Educators Journal, 101, 77–85.
Wesolowski, B. C. (2015). Assessing jazz big band performance: The development, validation, and application of a facet-factorial rating scale. Psychology of Music. Advance online publication. doi: 10.1177/0305735614567700
Wigglesworth, G. (1993). Exploring bias analysis as a tool for improving rater consistency in assessing oral interaction. Language Testing, 10, 305–335.
Wigglesworth, G. (1994). Patterns of rater behavior in te assessment of an oral interction test. Australian Review of Applied Linguistics, 17(2), 77–103.
Wilson, M. (2005). Constructing measures: An item response modeling approach. New York, NY: Taylor & Francis.
Wilson, M., & Gochyyev, P. (2013). Psychometrics. In T. Teo (Ed.), Handbook of quantitative methods for educational research (pp. 1–53). Rotterdam, the Netherlands: Sense.
Wright, B. D. (1984). Despair and hope for educational measurement. Contemporary Education Review, 3(1), 281–285.
Wright, B. D., & Stone, M. H. (1979). Best test design. Chicago, IL: MESA Press.
at UNIV OF GEORGIA LIBRARIES on May 22, 2015msx.sagepub.comDownloaded from