a cost-effectiveness analysis of a hypothetical dengue
TRANSCRIPT
A Cost-Effectiveness Analysis of a
Hypothetical Dengue Vaccination
Campaign in Bolivia
Author: Dominik Elsner Supervisors: David Granlund, Ph.D; Lars Lindholm, Ph.D
i
Acknowledgement I would like to thank David Granlund, Senior Lecturer at Umeå School of Business and Economics
and Lars Lindholm, Professor at the Faculty of Public Health and Epidemiology at Umeå University
for their valuable support and guidance as supervisors during this thesis. My gratitude also goes to
Pablo Wenceslao Orellano who provided valuable input and patience when explaining details of the
model that this thesis is based on.
Sincerely,
__________________________
Dominik Elsner
ii
Abstract
This thesis aims to perform a cost-effectiveness analysis for a hypothetical vaccination
campaign against dengue fever in Bolivia, a low-income country with endemic risk of Dengue
in the eastern lowlands of the country. A vaccination campaign is evaluated using a societal
perspective and accounting for different disease incidence rates. The analysis is based on a
Markov model previously used in neighboring Argentina and adapted to the Bolivian context
by use of information published in scientific journals and information obtained by personal
communication with Bolivian doctors. The vaccination campaign was found likely to be cost-
effective when the clinical/suspected case incidence is used. Cost-effectiveness is not given
when only the laboratory confirmed case incidence is used. The results are similar for a
sensitivity analysis that accounted for differences in costs for treatment or vaccination. A
probabilistic analysis yielded a probability of 100% at the three-times GDP per capita
threshold of 9,231 US$ for the clinical incidence and correspondingly a 56% probability of
cost-effectiveness for the lower incidence measure.
Key words: Dengue, Cost-Utility Analysis, Cost-Effectiveness, Vaccination Campaign,
Markov-model, Bolivia.
iii
Table of Contents
Abstract ...................................................................................................................................... ii
List of Figures and Tables ......................................................................................................... iv
1. Introduction ......................................................................................................................... 1
2. Concepts and Theory ........................................................................................................... 3
2.1 Extra-Welfarism vs. Welfarism ................................................................................... 3
2.2 Measuring Health Outcomes and QALY or DALY as Generic Measures .................. 8
2.2.1 QALYs ....................................................................................................................... 10
2.2.2. DALYs ...................................................................................................................... 14
2.3 Measurement and Inclusion of Costs ......................................................................... 15
2.4 Overview on Cost-Effectiveness Studies with Markov Modeling ............................ 17
3. Overview on Dengue Fever and the Dengue Vaccine ...................................................... 20
3.1 Dengue Fever ............................................................................................................. 20
3.1.1 The virus, cause and way of infection ...................................................................... 20
3.1.2 Clinical description of the disease ........................................................................... 21
3.1.3 The course of dengue illness .................................................................................... 22
3.1.4 Diagnosis .................................................................................................................. 23
3.1.5 Treatment ................................................................................................................. 23
3.2 Dengue Vaccination .................................................................................................. 24
3.3 Previous Studies ............................................................................................................ 25
4. Model and Data for a Hypothetical Dengue Vaccination Campaign in Bolivia ............... 28
4.1 The Model .................................................................................................................. 28
4.2 Probability Data ......................................................................................................... 30
4.3 Cost Data ................................................................................................................... 31
4.4 Probabilistic Assumptions ......................................................................................... 33
5. Results ............................................................................................................................... 35
5.1 Deterministic analysis ................................................................................................ 35
5.1.1 Sensitivity Analysis ................................................................................................. 36
5.2 Probabilistic Analysis ................................................................................................ 37
6. Discussion, Summary and Concluding Remarks .............................................................. 38
References ................................................................................................................................ 41
Appendix .................................................................................................................................. 50
iv
List of Figures and Tables
Figure 1: QALY calculation ..................................................................................................... 11 Figure 2: Schematic illustration of a Markov model ................................................................ 18 Figure 3: Cost-efficient vaccination prices .............................................................................. 35 Figure 4: Probability of cost-effectiveness of vaccination strategy ......................................... 37
Figure 5: Probabilistic ICER-distribution for low incidence rate
(laboratory confirmed cases only) ............................................................................. 37 Figure 6: Probabilistic ICER-distribution for High incidence rate
(clinical/suspected dengue cases) .............................................................................. 37 Figure 7: Markov model for dengue Disease with two possible infections by Orellano et al.
(2016) – Vaccination Branch .................................................................................... 50
Table 1: Transition probabilities .............................................................................................. 30 Table 2: Summary of results from deterministic and sensitivity analysis ................................ 36
1
1. Introduction
Dengue is the most common and most rapidly spreading arboviral disease today and its four
serotypes can occur worldwide. Dengue, like Malaria, Zika, Yellow Fever and Chikungunya,
is an arthropod-borne disease, meaning that human to human infection takes place mostly by
means of a vector – in this case by Aedes Aegypti-Mosquitoes (Brémond et al., 2015; WHO,
2009). In the past decades, the prevalence of dengue has increased 30-fold and expanded to
new countries and recently also from urban to rural locations. The WHO estimated around
50–100 million new infections annually in more than 100 endemic countries and
approximately 2.5 billion people live in affected, mostly tropical and subtropical regions
(Guzman and Kouri, 2002; WHO, 2014; Brémond et al., 2015). From the estimated
infections, approximately 20,000 result in death (Scientific Working Group on Dengue,
2007). Especially poorer countries are struck hard due to limited resources for vector combat,
inadequate public health infrastructure, and limited health care services (Gubler and Clark,
1995). While the exact numbers are difficult to obtain due to underreporting or
misclassification (Suaya et al., 2007; Castro et al., 2017), estimations by the Global Burden of
Disease Study (2013) indicate that Dengue is responsible for 1.14 million disability-adjusted
life-years in 2013, which equals a 61% increase in comparison to 1990 (Stanaway et al., 2013;
Hotez et al., 2014)
Due to climate changes, developed nations are now more and more becoming threatened by
this disease which further stresses the urgency of actions needed to be taken to contain this
threat to public health. With Dengvaxia® by Sanofi Pasteur, the first dengue vaccine, the
toolbox against the disease has been amplified. The vaccine is licensed for countries with
endemic dengue risk and was first licensed in Mexico 2015 and is now licensed in 19
countries (WHO 2017a, 2017b; Shim, 2018; Zeng et al. 2018).
This thesis aims to perform a cost-effectiveness analysis for a hypothetical vaccination
campaign against Dengue Fever in Bolivia, a low-income country with endemic risk of
dengue in the eastern lowlands of the country. The analysis is based on a Markov model
previously used in neighboring Argentina and adapted to the Bolivian context by use of
information published in scientific journals and information obtained by personal
communication with Bolivian doctors.
2
Before Dengvaxia® was invented, only vector containment measures were available to reduce
the burden of disease with varying effect and success. Measures like an Aedes aegypti
eradication campaign in the 1960s and early 1970s initially helped to reduce dengue
transmission in the Americas. Unfortunately, these containment measures were not continued
which led to a surge in outbreaks again (PAHO, 1997; WHO 2009). In general, there has been
an increase in cases since the 1980s due to amongst other urbanization together with poor
living conditions, inadequate vector control, virus evolution and international travel (Rigau-
Perez et al., 1994, Guzman and Kouri 2002).
The question of cost effectiveness is an important question. For people health represents the
ability to work and to improve their lives. Healthier people can work more or invest more in
human capital. People do also value health itself as health directly improves the quality of life
of individuals (Hurley, 2000). As still mostly low- and middle-income countries are affected
by dengue, the question of cost-effectiveness of a vaccination campaign needs to be carefully
assessed. Here, on the one hand, additional costs from vaccination are expected to have a
significant effect on the respective countries’ health budgets. On the other hand, a vaccine can
reduce the burden of disease which means a lower number of infected individuals and thus
potentially beneficial outcomes in terms of labor supply. Also, the lower risk of infection or,
for example, less exposure to fumigation against mosquitoes could be expected to have
beneficial effects on the quality of life. A dengue epidemy in 2008-2009 caused costs of
nearly 9 million US$ (0,06% of GDP in 2008) in Bolivia while 63% of this was financed by
households through costs caused by labor absenteeism and out-of-pocket payment for medical
treatment which pose challenges for affected low-income households (CEPAL, 2009).
Cost-effectiveness studies of dengue vaccination have been performed for a number of
countries and data from phase III of the Dengvaxia trials is often used. In the Latin American
context, Brazil, Colombia, Honduras, Mexico, Puerto Rico are countries where the trials were
performed, and cost-effectiveness studies were performed with special interest for Brazil and
Mexico. One study (Orellano et al., 2016) conducts a cost-effectiveness analysis for
Argentina. A more detailed summary and description of the reviewed studies is presented in
section 3.3 below. The contribution of this thesis is a cost-effectiveness study for a dengue
vaccination campaign, based on the model of Orellano et al. (2016) for Bolivia. For that
country, to the knowledge of the author, no study has been performed so far.
This thesis is separated into six sections. After this first introducing section, section 2 presents
important concepts and theory for readers that are unfamiliar with concepts of health
3
economic evaluations. We depart from an essential discussion of extra-welfarism versus
welfarism as central conceptual and philosophical approach that permits to use health
outcome measures in health economic evaluations. Furthermore, QALYs and DALYs will be
described as two examples of conceptual tools of measurement of health. Since this thesis will
use Markov-modeling in section 5, a short summary and intuition for cost-effectiveness
studies with help of Markov-models will also be given. Section 3 provides an overview on
dengue fever. It will be given in terms of a short clinical description of the disease and
provide a summary on the newly available vaccine. Additionally, it reviews previous cost-
effectiveness studies and their result concerning dengue vaccination with a special focus on
Latin America. Section 4 is devoted to the cost-effectiveness analysis of a hypothetical
vaccination campaign in Bolivia. The respective model will be presented as well as the
provenience of data. It is followed by a discussion of the assumptions made. The results from
deterministic as well as probabilistic analyses are presented there. Finally, section 6 presents a
discussion of the findings, limitation and concluding remarks.
2. Concepts and Theory
2.1 Extra-Welfarism vs. Welfarism
In order to clarify the conceptual and theoretical assumptions as well as foundations cost-
effectiveness analysis builds on, one essential part is the separation of welfarism and extra-
welfarism. Both represent two concepts and argue for different assumptions and methods to
be viable in economic analysis. They also differ in their concepts on how to rank resource
allocations and policies they stem from. At first glance, they may appear to be similar in
practice and the only apparent difference is the use of different measures of costs and benefits
in economic evaluations. This notion is, however, wrong as the underlying assumptions are
different (Hurley 2000).
The classic and widely used approach within economics is cost-benefit analysis (henceforth
CBA). CBA measures both costs and benefits in the same unit – namely monetary units
(Johannesson 1995; Neumann et al., 2000) and is traditionally rooted in welfarist economic
thinking. Especially neo-classical welfare economics has four tenets or key attributes that are
attributed to this school of thought. First, the desirability and choice of a particular policy is
evaluated according to the concept of individuals rationally maximizing their welfare. Second,
individual sovereignty according to which individuals are the best judges of their welfare and
paternalistic options of a third party to act as optimizing agent for them are rejected. Third,
4
consequentialism refers to utility being derived from outcomes rather than processes. Finally,
welfarism states that only utilities and utility information constitute the basis of judgement for
the ‘goodness’ of states – not taking into account any non-utility aspects (Brouwer et al. 2008,
Hurley 2000).
CBA that is performed in line with a welfarist school of thought understands social welfare as
a weighted sum of individual utilities (Brouwer et al. 2008). Especially the Pareto criterion or
the Kaldor-Hicks standard are of relevance for advocates of this framework. The Pareto
criterion is based on the principle that any project, intervention or policy that makes at least
one person better-off without harming any other is worth to be pursued. The Kaldor-Hicks
standard, also known as potential Pareto criterion or the method of compensating, states that
any project is worth to be implemented as long as the winners are made better off by an
amount that is sufficiently high to overcompensate the losers.
On the one hand, the Pareto criterion is very strong and limiting as only a few interventions
are thinkable to satisfy the condition that no individual is made worse-off. The Kaldor-Hicks
standard on the other hand, only requires that the compensation should be possible in theory.
It does not necessarily have to take place and may merely be hypothetical.
Since the Pareto criterium is very restrictive, modern CBA is based on compensation tests as
more projects will result feasible under the Kaldor-Hicks criterion (Brouwer et al., 2008;
Alder and Posner, 1999; Hurley, 2000). Due to criticism to the Pareto and Kaldor-Hicks
criterion, a part of the literature argues for the use of distributional weights when calculating
the compensating variation (Alder and Posner, 1999). Weighting a person’s compensating
variation according to his marginal utility of money is an example given by Alder and Posner
(1999). Doing so would prevent bias in favor of ‘rich’ people in a project by giving more
weight to poor people’s compensating variation under the assumption that poor people have a
higher marginal utility of money.
Welfarist theory can furthermore be separated into two traditions – classical and neo-classical,
with the main difference being that the latter tradition deviates from a cardinal measurement
of utility and rather makes use of an ordinal measurement. Neo-classical welfarists either
recur to the Pareto principle that makes interpersonal comparisons of utility impossible or the
use of the Bergson-Samuelson social welfare function that allows for this kind of comparison.
The Bergson-Samuelson social welfare function is constructed by exclusive use of the
individual utilities that are the result of preference orderings of all members of the society.
Often classic utilitarianism with the objective of maximization of total welfare or utility

5
served as the most supported welfarist economic approach where individual welfares and
utilities were summed up to yield the societal welfare. (Brouwer at al. 2008, Bergson 1938).
In health economics, cost-effectiveness analysis (henceforth CEA) is a very common
approach that differs from CBA by using different measures for costs and benefits. While
costs are still measured in monetary terms, health outcomes are measured using e.g. Quality
Adjusted Life Years (QALYs) (Neumann et al., 2000).1 While the use of different outcome
measures is the primary and most apparent difference between CBA and CEA, Johannesson
(1995) identifies CEA as a subset of CBA with an aim of estimating the cost function of the
production of health effects. While CBA allows for different willingness to pay for health
benefits, CEA assumes the value of the health benefit (e.g. QALYs) to be identical for all
individuals and to be constant for all sizes of changes in the QALYs due to the intervention.
The implication from this is that a CBA that assumes the marginal willingness to pay to be
constant and identical between individuals would yield the same results as a CEA provided
that the CEA included all the relevant societal costs.
CEAs are often evaluated from two main perspectives – the health care provider or the
societal perspective. The former maximizes the health benefits for a given health care budget
while the latter societal perspective takes into account all the costs that are related to the
interventions such as costs accruing to the individual from work-absence or costs to get
treatment in form of transportation costs (Walker et al., 2011; Drummond et al., 2015). In
CEA performed with a health care provider perspective, QALYs are maximized by choosing
between different mutually excluding programs or interventions. The program with the
highest incremental cost-effectiveness ratio (ICER) under the assumption that those programs
are scalable to any discretionary degree without altering the ICER is then chosen
(Johannesson, 1995). In this case, the results from a CEA are inconsistent with traditional
CBA results as only prices as well as costs faced by the health care provider are considered.
Such prices are, for example, the prices payed for medication by a hospital which may not
reflect the appropriate opportunity costs, for example due to subsidies. In practice, only taking
into account costs directly incurring to the health care system and not considering other costs
that are caused or related to the program leads to an omission of costs that should have been
taken in to account under a CBA which stresses the inclusion of “[…] all costs and benefits
irrespective of to whom they accrue” (Johannesson, 1995: 484).
1 See chapter sections 2.2 below for a more detailed discussion
6
Although CBA and CEA performed from a societal perspective, under some assumptions can
be transformed into one another, they have different underlying theoretical foundations where
Johannesson (1995) states that CEA lacks theoretical foundation in welfare economics. CEA
is often claimed to be in line with extra-welfarist theory and is frequently used in health
economics. Using non-monetary health benefits in health economics is intuitive given the
difficulty to measure and value health outcomes or individual welfares in monetary terms
(Brouwer at al. 2008). Furthermore, using QALYs as outcome measure explicitly makes
interpersonal comparisons possible as QALYs (or also DALYs) assign values to different
health states on a scale (Hurley, 2000). Brouwer et al. (2008), Cookson (2005) and Sen (1977)
are here classic representatives of the extra-welfarist school of thought. Resorting to QALYs
also incorporates the normative concept of integrating efficiency and equity considerations in
the provision of health care in health economics where health is seen as one of the “[…] most
important conditions of human life and a critically significant constituent of human
capabilities” (Sen, 2002: 660).
Inequality aversion and equity are subject of debate in both welfarist and extra-welfarist
approaches. While some inequality incomes may be legitimized by differences in individuals’
skills and effort, for health on the other hand it is argued that it should be distributed more
equally and differences in health are mostly not due to differences in the incentives to have
good health by individuals (Sen, 1985; 2002; Tobin, 1970). In welfarist economics a vast
literature is available that concentrates on the concern with inequality-aversion or the equity-
efficiency trade-off (Carlsson et al., 2005). It also draws back to authors like Rawls (1971) or
also relates to the literature on risk aversion (Johansson-Stenman et al., 2002; Folkesson,
2017). Weights in the social welfare function that give weight to more unfortunate individuals
in society is a way of formalizing this in the economic literature and goes in the same vein as
the above-mentioned distribution weights used in CBA analysis (Anand, 2000; Folkesson,
2017).
Taking up the previous discussion of welfarism, the extra-welfarist approach, according to
Brouwer et al. (2008), differs in four important ways from welfarism. First, outcomes other
than utility are permitted. Second, the affected individual is no longer the only source of
valuation. Third, the weighting of outcomes in terms of utility or other alternative measures
no longer have to be necessarily preference based. Finally, an interpersonal comparison of
well-being is possible in a variety of dimensions, thus allowing for assessments beyond
Paretian economics (Brouwer at al., 2008, Alder and Posner, 1999).
7
The deviation of extra-welfarism from welfarism is to some extent debated as a clear
consensus on the notion of ‘extra-welfarism’ is lacking as well as some parts of the literature
also relate the term ‘non-welfarism’ to this approach, indicating that this may be a general
lack of theoretical foundation (Brouwer at al., 2008; Alder and Posner, 1999).2
Extra-welfarists refute the idea that individuals exclusively derive utility from consumption or
possession of goods and rather capabilities or “[…] what goods and states enabled people to
do and be” (Brouwer at al. 2008: 331) and a less strict reliance on the pareto criterium when
evaluating projects, policies or interventions. Especially, when allocating health care, a
normatively postulated target of government is often the will to provide needed medical care
irrespective of ability to pay. This often coincides with the politically stated emphasis and
goal to improve or maximize health rather than general welfare or the utility derived from
health (Brouwer et al., 2008; Cookson, 2005).
As a result, extra-welfarism concedes a place for notions of welfare that are not exclusively
based on utilities. The possibility that judgements can be made on behalf of the affected
individuals rather than by them on their own in the context of merit goods such as health is
here especially relevant (Brouwer et al., 2008; Cookson, 2005).3
While decision-makers act as agents for the public in extra-welfarism, the question arises how
the benefits are to be weighted to define the wished-for outcome. One concept of weighting
health benefits according to its beneficiaries’ characteristics to assess the social value of the
health gain is the one of the ‘fair innings’ (Williams, 1997; Brouwer at al., 2008). The
underlying question here is whether some people should be valued more or be given priority
over others. With fair innings, Williams (1997) argues for an individual’s entitlement to a
normal life span thus propagating equity concerns of equal lifetime experiences between
generations. This implies putting higher weight to health gains by younger than older persons,
who already had their fair innings (Williams, 1997; Brouwer et al., 2008). Putting higher
weights on health gains of younger members of society is also performed from a more
2 Nonetheless, extra-welfarism is seen as an expansion of welfarism in the sense that it supplements the
individual welfares with aspects like the desire for equality in society and the idea of an allocation of merit goods
such as health care. This resulted in the conclusion that focusing exclusively on individual utility to determine
the social optimum was a too narrow concept. 3 This leads to the notion of paternalistic approaches which also exist in welfarist or neo-classic welfare
economics. A corrective role of a government is deemed possible as individuals may not be fully rational
(Aronsson and Sjögren, 2016). Aronsson and Johanson-Stenman (2018) analyze among other approaches a
paternalistic approach which excludes welfare effects of relative consumption form the social objective function.
As the authors discuss, social preferences that are antisocial – such as, for example, envy – are sometimes argued
to be excluded from the social objective function. Situations where individuals make inconsistent choices are
also very common in behavioral welfare economic approaches (Bernheim and Rangel, 2007).
8
economic rationale, namely the idea that individuals between 20 and 50 are those that yield
the highest economic return to society in terms of them being in their years of procreation and
child-rearing as well as actively participating in the labor market (Williams, 1997).
2.2 Measuring Health Outcomes and QALY or DALY as Generic Measures
Once the maximization or improvement of health is seen as the purpose of health care, the
challenge is to measure health. In the literature, health outcomes from interventions are
measured in different ways. Often clinical or disease specific measures and other
epidemiological indicators are reported in the literature (Prieto and Sacristán, 2003). This can,
be for example, outcomes on the CD4 count for HIV patients, survival rates, or pain-free days
(Drummond et al., 2015; Whitehead and Ali, 2010). Drummond et al (2015) argue that this
kind of measures are not measures of the health outcome itself but rather represent
intermediate outcomes that need to be linked to changes in the health outcome. As well in
practical terms, for example, data from trials for different diseases do not provide information
on mean survival duration due to too-short follow up time (Walker et al., 2011).
Other measures of health outcome are often separated into single or multidimensional
measures. The former measures only one dimension or aspect of health such as changes in
mortality or survival. These measures have some benefits in the way that the comparison
across treatments is feasible in terms of gained or lost life-time. However, one problem may
appear when trying to use this kind of measurement when comparing, for example, mental
illnesses or dermatological issues where the effects of a health intervention should be
arguably quite unrelated with the overall survival rate. These measures therefore neglect that
also quality of life is an important aspect. In general, scientific and technical advances in
medicine as well as improved living conditions in terms of housing, hygiene and food resulted
in increases in life expectancy and changes in the dominant patterns of morbidity. Especially
in developed nations, the focus shifted from highly-lethal acute diseases to disabling chronic
conditions. These changes make an exclusive consideration of quantity of life obsolete and
now the individuals' need of quality of life is being expected to be taken into consideration
(Prieto and Sacristán, 2003).
This led to the development of different, multidimensional measures of health-related quality
of life that – besides the aforementioned effects of an intervention on longevity – also include
a measure of the quality in which the additional life years are lived (Drummer et al., 2015).
Multidimensional measures themselves can again only be disease specific and try to evaluate
the most important aspects of health for certain patients. They can also be generic, i.e. all
9
states of health are to be reflected in the measures and should therefore make outcomes from
different diseases comparable (Lorgelly et al., 2017; Drummond et al., 2015).
Multidimensional measures either simply report and profile the measurements of health for
the different dimensions or they are summarized into an index. Examples for a disease
specific and a generic multidimensional profile are the EDSS or the SF36, respectively. A
disease specific and generic index is, for example, the EORTC-8 or EQ5D, respectively.4
Profiles often yield a score that results from adding the individual scores among the different
dimensions. Using an index, although, poses the challenge on how the different aspects of
health are to be weighted and who should be the one providing the weights (Drummond et al.,
2015).
As Drummond et al. (2015) and Walker et al. (2011) argue, generic measures rather than
disease specific measures of health outcomes should be used. One reason is that interventions
will, on the one hand, affect the health outcomes on the targeted disease or condition. The
intervention may, on the other hand, very well also have effects on other aspects of health in
form of unintended consequences and side effects that may then not be captured by the
specific measure. A new drug, for example, may be suitable for more therapeutic areas than
the comparator and those additional effects may not be accounted for without the use of a
generic health measure. Also, in terms of accountability, using a measure that is comparable
between different conditions and different patient groups can help to achieve more consistent
decision-making (Walker et al., 2011).
Most importantly, Drummond et al. (2015) argue therefore, that a generic and comparable
health measure “enables a comparison of the health expected to be gained with the health
expected to be lost elsewhere” (Drummond et al., 2015: 31). In decision-making between
different interventions, it is therefore necessary to be able to compare the effects of the input
on the outcomes that can vary a lot between different disease conditions. When deciding for
an intervention that has additional costs but positive effects on the health outcome measure
4 EDSS: Expanded Disability Status Scale used for multiple sclerosis. “The EDSS scale ranges from 0 to 10 in
0.5 unit increments that represent higher levels of disability. Scoring is based on an examination by a
neurologist.” (Mstrust, 2018: https://www.mstrust.org.uk/a-z/expanded-disability-status-scale-edss); SF36: 36-
Item Short Form Health Survey. “The SF-36 is a set of generic, coherent, and easily administered quality-of-life
measures [...] widely utilized by managed care organizations and by Medicare for routine monitoring and
assessment of care outcomes in adult patients.” (RAND, 2018:
https://www.rand.org/health/surveys_tools/mos/36-item-short-form.html); EORTC-8D: Instrument developed by
the European Organization for Research and Treatment of Cancer (EORTC) to measure health outcomes of
Cancer patients on eight dimensions (physical functioning, role functioning, pain, emotional functioning, social
functioning, nausea, fatigue and sleep disturbance, and constipation and diarrhea) (Lorgelly et al., 2017: 1165) ;
EQ5D: “The scores on these five dimensions can be presented as a health profile or can be converted to a single
summary index number (utility) reflecting preferability compared to other health profiles” (Euroqol, 2018:
https://euroqol.org/eq-5d-instruments/).
10
often entails that other options are no longer feasible. In the end, from an economic point of
view when faced with constrained choices, using a comparative generic measure of the effect
of different interventions therefore permits more informed judgement and decision-making
(Drummond et al., 2015).
Drummond et al. (2015) argue that ideally, for an economic evaluation, the used generic
health measure meets the following two criteria. First, it contains all the major elements of
changes in quality as well as life lengths of the affected individual. Secondly, it contains and
is based on preferences for health states (see also Whitehead and Ali, 2010 and Winestein et
al., 2009).
Summarizing, health outcome measures that – besides of the effect of an intervention on
mortality and survival rates – also consider the health-related quality of life, can be
conceptually separated into disease-specific or generic measures. Generic measures are in
addition argued to be most suited for economic evaluations due to their ability to better inform
on the effects on a comparable health outcome measure by different interventions. Two
popular and often generic health measures are the QALY and DALY measures.
2.2.1 QALYs
The Quality Adjusted Life Year – QALY – represents one of the most widely used generic
health outcome measures of cost-effectiveness studies and it encompasses both changes in
life-length and therefore the quantity of life as well as the health-related quality of life state
(Drummond et al., 2015; Walker et al., 2011; Weinstein et al., 2009; Weinstein and Ali, 2010;
Prieto and Sacristán, 2003). It is also often recommended as the appropriate measure by
different national regulatory agencies of health technology assessment such as NICE in the
UK or the Panel on cost-effectiveness in Health and Medicine in the US (Sassi, 2006; Walker
et al., 2011).
Concerning terminology, cost-effectiveness analyses that use the QALY as outcome measure
are also often addressed as Cost-Utility analyses, a notion that will become clear from the
discussion of the construction of the QALY below in this section (Neumann et al., 2000).
The QALY is generated from the summation of the time spent in a health state multiplied by a
quality weight that is attached to that particular health state. This health-related quality of life
weight is also known and referred to as health utility. The utilities or QALY-weights are
preference weights and supposed to reflect preferences for different health conditions. A
preferred health state is given a higher weight than a less preferred health condition. The
11
measurement of the utilities is based on an interval scale ranging from zero to one. A value of
one is equaled with perfect health or complete absence of disease, while a value of zero is the
value for a situation equivalent to death or death itself. While a situation that is better than
perfect health is not accounted for (implying values greater one), a situation that can be
thought of as being worse than death is accounted for by negative values (Whitehead and Ali,
2010).
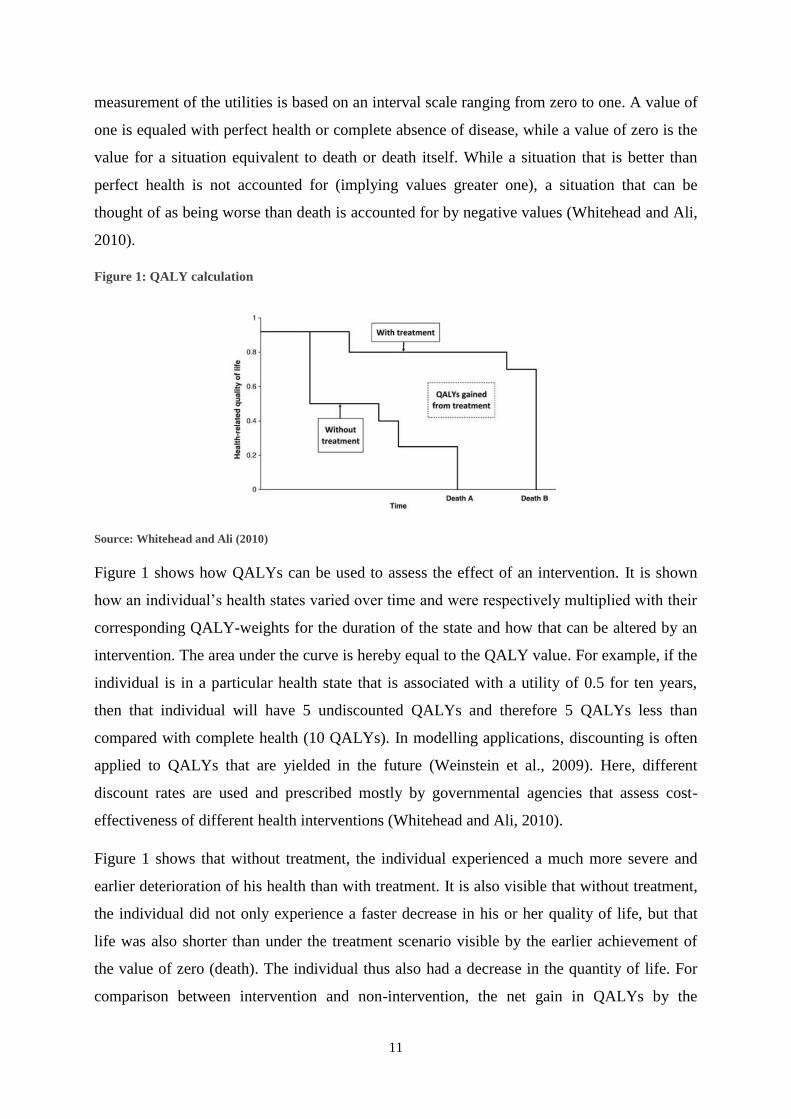
Figure 1: QALY calculation
Source: Whitehead and Ali (2010)
Figure 1 shows how QALYs can be used to assess the effect of an intervention. It is shown
how an individual’s health states varied over time and were respectively multiplied with their
corresponding QALY-weights for the duration of the state and how that can be altered by an
intervention. The area under the curve is hereby equal to the QALY value. For example, if the
individual is in a particular health state that is associated with a utility of 0.5 for ten years,
then that individual will have 5 undiscounted QALYs and therefore 5 QALYs less than
compared with complete health (10 QALYs). In modelling applications, discounting is often
applied to QALYs that are yielded in the future (Weinstein et al., 2009). Here, different
discount rates are used and prescribed mostly by governmental agencies that assess cost-
effectiveness of different health interventions (Whitehead and Ali, 2010).
Figure 1 shows that without treatment, the individual experienced a much more severe and
earlier deterioration of his health than with treatment. It is also visible that without treatment,
the individual did not only experience a faster decrease in his or her quality of life, but that
life was also shorter than under the treatment scenario visible by the earlier achievement of
the value of zero (death). The individual thus also had a decrease in the quantity of life. For
comparison between intervention and non-intervention, the net gain in QALYs by the

12
intervention is equal to the area between the treatment-curve and the non-treatment-curve
(Whitehead and Ali, 2010).
As a result, the QALY measure uses the assumptions that first, health is defined as life-years
weighted by their quality. Second, preferences are the base for the utilities or values attributed
to different states. Third, it is possible to aggregate individual preferences and thus yield
preferences for a group. Fourth, it is possible to aggregate QALYs across individuals,
irrespective of who gains or loses them (Whitehead and Ali, 2010; Weinstein et al., 2009;
Walker et al., 2011).
Cookson (2005) argues that the QALY can be interpreted differently in the literature. Above,
the QALY is seen as a cardinal and interpersonally comparable index of health. Some authors,
however, interpret it as a normative representation of individual’s preferences between
uncertain outcomes and therefore often incorporate attitudes towards risk. As a result,
according to Cookson (2005), the QALY is seen as an index of von Neumann-Morgenstern
expected utility.
Having QALY weights that have to be based on preferences for different health states with
higher weights for better health states and situated within the scale of zero and one, different
weights now have to be assigned to the possible health states. This leads to the question of
whose preferences should be used in order to estimate those weights. Mostly, this is solved by
using the preferences of the general public or the affected patients (Whitehead and Ali, 2010;
Weinstein et al., 2009). Furthermore, the weights have to be estimated according to
preferences in the selected group. The most common approaches for estimation are the rating
scale-method and its variants, the time trade-off (TTO)-method and standard gamble (SG)-
method (Drummond et al., 2015; Walker et al., 2011; Whitehead and Ali, 2010).
The rating scale method represents one of the simplest methods to estimate weights for health
outcomes. Individuals are asked to rank the outcomes from least to most preferred and to
place them on a scale so that differences in the spacing of the intervals between states
represent the difference in preferences of the individual (Whitehead and Ali, 2010). Attention
has to be brought to the fact that the individual ranks the states on an interval scale. When
assessing the desirability or preferences for states, the correct comparisons have to be made
like “[…] the difference in desirability between outcomes A and B is twice as great as the
difference between C and D, hence I will make the interval between A and B twice as large”
(Drummond et al., 2015: 137) rather than comparisons often performed on a ratio scale (“[…]

13
outcome A is twice as desirable as outcome B and so I will place it twice as high on the scale”
(Drummond et al., 2015: 137)).
The TTO-method derives the weight attached to a health state by means of asking individuals
to choose whether they prefer living the rest of their life, time t, in a specific health state or
living for a shorter time, x, in perfect health. The idea here is that the quality weight of perfect
health is known and equal to one. The weight of the alternative health state, h, on the other
hand, is unknown and derived by variation of the time x until the respondent is indifferent
between both health states. As a result, the weight is calculated as the ratio of x/t (Walker et
al., 2011; Drummond et al., 2015).
The standard gamble-method also requires individuals to choose between health states. Here,
an individual faces the choice between being in a specific health state with an - at that point in
time - unknown quality of life x, and an alternative state that has two possible outcomes, death
and perfect health. The probability of perfect health is p and thus the probability of death
equals the converse probability 1-p. p is now varied until the individual reaches indifference
between the certain health state x or the gamble. The weight attributed to the health state x is
then set equal to p (Walker et al., 2011; Drummond et al., 2015).
At this point it is possible to pick up the discussion of welfarism vs. extra-welfarism and point
out that this utility is different from the classic neo-welfarist notion of utility (Walker et al.,
2011). While the terms utility and preferences are often used interchangeably and often
synonymously in most of the economic literature, caution is required when speaking of utility
in the context of QALYs. The origin of the term is rooted in in the theory of decision-making
under uncertainty and thus von Neumann-Morgenstern utilities (Weinstein at al., 2009;
Neumann et al., 2000). To be precise and to follow the definition of that kind of utility, for
QALY-weights to represent utilities depends on the method that was used to derive them.
Once QALY-weights are measured or estimated by means of most methods, the appropriate
term would be values rather than utilities, which are different types of preferences. Most
methods do not apply choice under uncertainty when estimating the weights and even QALY
yielded from the standard gamble are utilities in the strict sense of the word under some
assumptions (Drummond et al., 2015). Those assumptions are: First, the preference over
gambles on quality of life (quantity of life) is independent of the amount of quantity of life
(quality of life). Second, constant proportional trade-off of quantity for quality of life. Third:
risk neutrality in respect of time (linear utility function for additional life years for fixed
quality level) (Drummond et al., 2015; Walker et al., 2011, Whitehead and Ali, 2010).
14
Using the QALY as health outcome is, although widely used and very popular in health
economics, not devoid of criticism. The first is the already mentioned fact that QALYs do not
represent utilities that are consistent with their conventional definition in economics in most
of the cases despite the frequent use of the term utility (Drummond et al., 2015). Secondly, the
QALY measure has two restrictive assumptions, namely constant proportionality and additive
independence. The former refers to the fact that the valuation of states does not depend on the
time spent in a health state and the latter that the order in which the health states are
experienced is not relevant (Drummond et al., 2015). Third, QALYs do not contain all
relevant attributes to health care as only improvements in terms of quantity and quality are
taken in to account. Other dimensions such as increased convenience of use as well as access
to health care are not defined in the traditional QALY measure (Drummond et al., 2015).
Finally, all QALYs gained from a health intervention are aggregated across individuals
whereby all QALYs are treated equally irrespective of who attains them. A QALY gained
from someone suffering from a relatively mild condition is also worth the same as a QALY
gained from someone from a graver condition (Whitehead et al., 2010; Walker et al. 2011;
Prieto and Sacristán, 2003). Social values and equity considerations are thus not reflected in
the QALYs. They are rather an aggregation of “[…] preferences and trade-offs that
individuals hold for their own health” (Drummond et al., 2015: 169-170).
2.2.2. DALYs
An alternative health outcome measure to the above mentioned QALY is the disability-
adjusted life-year (DALY) originated from the Global Burden of Disease (GBD)-study from
the 1990s. DALYs represent the health outcome measure that is supposed to help quantify the
burden of disease and injury in different countries and populations worldwide (Neumann et
al., 2000; IHME, 2018; Sassi, 2006) and one lost DALY is equal to the loss of a year of life.
The aggregated DALYS across the population are referred to as burden of disease in the
population and “[…] can be thought of as a measurement of the gap between current health
status and an ideal health situation where the entire population lives to an advanced age, free
of disease and disability” (WHO, 2018). The idea behind the DALY is similar to that for the
QALY and it aims to encompass both quantity and quality of life on a scale between zero and
one by giving every disease or disability a disability weight, depending on the severity of the
disease (WHO, 2018b; Sassi, 2006).
According to Sassi (2006), systematic differences between QALY and DALY weights are
likely and both measures differ in several aspects. Unlike QALY-weights, the DALY-weights
15
are based on expert valuation5 (Sassi, 2006; Neumann et al., 2000). It is also important that
DALYs include an age-weighting function that is implicitly based on productivity and assigns
higher weights (meaning that the same disease is seen as worse) for young and middle-aged
individuals while the weights for the elderly and young children are lower. This gives more
valuation to those individuals that can contribute more to society, especially via the labor
market (Sassi, 2006; Neumann et al., 2000).
The most prominent difference between DALYs and QALYs concerns the zero to one scale
where, in contrast to QALYs, a value of zero represents a health state free of disease and one
equal to death (Sassi, 2006; Neumann et al., 2000). The DALY, however, con be interpreted
to some extent as the inverse of the QALY where life-years lost and years lived with a
disability (number of years lived with a condition multiplied with the corresponding DALY
weight of the disease) are included. Both life-years lost, and years lived with disability can be
seen as the opposite of the measure of years alive and years lived in a certain health condition
multiplied with the QALY weight for the condition, respectably. In practical calculations, the
transformation of QALY weights into DALY disability weights as being equal to 1 – QALY-
weight or vice versa 1 – DALY-weight is often performed (Sassi, 2006).
2.3 Measurement and Inclusion of Costs
Health interventions can imply costs not just for the health care sector but also for patients,
their relatives and other sectors. In addition, they can cause costs or benefits due to changes in
productivity (Drummond et al., 2015; Walker et al., 2011). Whether any of those costs are
relevant in the analysis depends on the perspective. As mentioned, two common perspectives
in CEA - the decision-maker/health care sector or societal perspective - exist. The former will
not include costs from resource use by patients, their relatives or costs due to productivity
changes as the interest here lies more in maximizing health within a given budget that the
health sector faces. Only ‘direct’ costs that the provider (thinkable is the perspective of a
health ministry, the general government, or agency) must bear itself or that fall in its
respective budget usually included (Drummond et al., 2015). The latter approach would in
contrast include those (in the literature also often called ‘indirect’) costs that reflect the effects
of, e.g. a treatment, on productivity in form of decreased work absence or costs from other
sectors such the need to use a taxi to get to the hospital (Walker et al., 2011).
5 DALY weights for different diseases are made available by the WHO (2004) where, for example, Dengue and
Dengue hemorrhagic fever are respectively given a DALY-weight of 0.197 and 0.545 that also varies with age
(WHO, 2004; Orellano et al. 2016)
16
Once the appropriate perspective is chosen for the analysis, the next challenge for the
researcher lies in the measuring and valuing of costs. As in any comparative assessment of
costs between two projects in the field of economics, opportunity costs rather than the
monetary costs of consumed resources are what the economist is interested in. When
assessing the resource costs associated with an activity, prices often do not fully reflect the
opportunity costs in the health care sector, i.e. the price of the next best option that could be
provided if the resource was not used for the current purpose. This is due to subsidies, for
example, on medicine. Monopolistic conditions, for example, for hospital services or
medicine are also thinkable. In practice, the existing price is used under the assumption that
the market price would reflect the opportunity costs under ideal market conditions (Walker et
al., 2011). Other resources may also be non-market resources and have no market-price at all.
Examples of such resources are volunteer time, leisure time or informal caregiving. Using net
wage rates represents one way of indirectly attributing a market-price to them (Drummond et
al., 2015). Thus, the value of some resources in monetary terms as well as the physical
quantities of the resources that were consumed are available (e.g. the working hours of nurses
and doctors per patient, days at the hospital, doses of medicine prescribed). An estimation and
valuation of those costs is then straightforward. Those costs are often assessed using data on
resource use as part of randomized controlled trials that are used to evaluate different
alternative treatments (Walker at al. 2011; Drummond et al., 2015).
Societal costs such as costs due to productivity changes or costs due to use of resources in
other sectors are much more cumbersome to estimate and value. For example, when using a
societal perspective, the costs of a spouse taking care of his (her) wife (husband) are not
immediately quantifiable and evident. One way to address this problem is by means of patient
questionnaires.
The valuation of productivity related costs is then made either with the human capital
approach or the friction cost method (Walker at al. 2011; Drummond et al., 2015). The human
capital approach uses wage data to estimate the effect of change of productivity. The cost of
absence from the workplace is then estimated to be equal to the absence multiplied with the
wage of the individual. In contrast to this, the friction cost method stems from criticism of the
human capital approach. The argument is that the costs of productivity losses are merely
reflected by the time and cost of organizing the replacement, and the resulting adjustments in
the economy more generally (Drummond et al. 2015: 247). When costs are estimated as in the
human capital approach, then the costs are likely to be overestimated as short-term absence
17
may be compensated by the worker once returned (e.g. the worker may work more
‘intensively’ than he usually does for his wage) (Drummond et al., 2015).
2.4 Overview on Cost-Effectiveness Studies with Markov Modeling
Cost-effectiveness studies are often based and evaluated by means of models. In the model,
the estimated and valued costs for different interventions as well as the health state or health
outcome measures meet. The use of Markov models has so far been a popular and powerful
tool for economic evaluation of health care interventions due to the fact that they allow for an
intuitive handling of outcomes and costs (Briggs and Schulpher, 1998; Barton et al., 2004).
Markov models, as one form of a cohort model, are used to represent stochastic processes
over time. With respect to health economic evaluations, the Markov model represents a model
of progression of a disease where the disease is divided into different and mutually exclusive
health states. These states are also called Markov states. Over a certain and discrete time
period – the Markov cycle – transition between the different states is possible with specified
transition probabilities. Costs and outcome measures can be attached to different states in
such a way that by iteration of the model over multiple cycles, long-term developments in
terms of costs and outcomes can be simulated (Briggs and Schulpher, 1998; Briggs et al.,
2006; Barton et al., 2004).
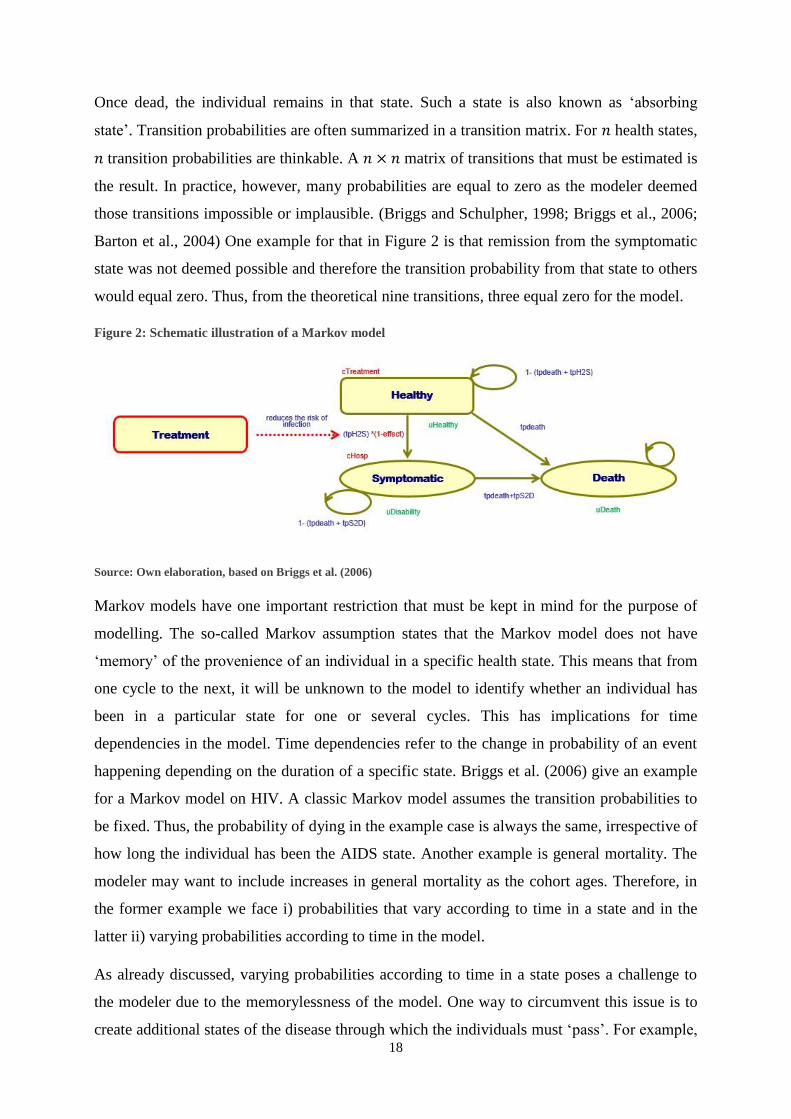
Figure 2 shows a simple illustration of a Markov model were the Markov states are
represented by ovals and the arrows connecting them indicate the transition probabilities as
well as the direction of movement within the different states in the model. For simplicity, the
model in Figure 2 shows a three-state model. The first state represents an asymptomatic state
where the probability of death, tpdeath, is equal to the general mortality in the population as
the individual does not yet show any symptoms or problems related to the contracted disease.
With a certain probability an asymptomatic infection becomes symptomatic and therefore the
individual passes from the asymptomatic state to the symptomatic state with a transition
probability equaling the probability of developing symptoms, tpH2S. It is also possible for the
individual to remain asymptomatic. This is indicated by the backwards-bend arrow. The
probability for that is the complementary probability and using the fact that the probabilities
have to sum to unity it equals one minus the probabilities of moving to the states death or
symptomatic (1-(tpdeath+tpH2S)). From the symptomatic state, an individual either survives
and remains in the state during one cycle, 1-(tpdeath+tpS2D), or the individual dies and
moves to the death state with the transition probability, tpS2D+tpdeath. In the latter, death
from other causes than the disease, tpdeath, must also be accounted for – thus the addition.
18
Once dead, the individual remains in that state. Such a state is also known as ‘absorbing
state’. Transition probabilities are often summarized in a transition matrix. For 𝑛 health states,
𝑛 transition probabilities are thinkable. A 𝑛 × 𝑛 matrix of transitions that must be estimated is
the result. In practice, however, many probabilities are equal to zero as the modeler deemed
those transitions impossible or implausible. (Briggs and Schulpher, 1998; Briggs et al., 2006;
Barton et al., 2004) One example for that in Figure 2 is that remission from the symptomatic
state was not deemed possible and therefore the transition probability from that state to others
would equal zero. Thus, from the theoretical nine transitions, three equal zero for the model.
Figure 2: Schematic illustration of a Markov model
Source: Own elaboration, based on Briggs et al. (2006)
Markov models have one important restriction that must be kept in mind for the purpose of
modelling. The so-called Markov assumption states that the Markov model does not have
‘memory’ of the provenience of an individual in a specific health state. This means that from
one cycle to the next, it will be unknown to the model to identify whether an individual has
been in a particular state for one or several cycles. This has implications for time
dependencies in the model. Time dependencies refer to the change in probability of an event
happening depending on the duration of a specific state. Briggs et al. (2006) give an example
for a Markov model on HIV. A classic Markov model assumes the transition probabilities to
be fixed. Thus, the probability of dying in the example case is always the same, irrespective of
how long the individual has been the AIDS state. Another example is general mortality. The
modeler may want to include increases in general mortality as the cohort ages. Therefore, in
the former example we face i) probabilities that vary according to time in a state and in the
latter ii) varying probabilities according to time in the model.
As already discussed, varying probabilities according to time in a state poses a challenge to
the modeler due to the memorylessness of the model. One way to circumvent this issue is to
create additional states of the disease through which the individuals must ‘pass’. For example,
19
three health states (without transition possibility to remain in the state) may be added to the
state ‘symptomatic’ in Figure 2 to simulate year one, two, three, and four of symptomatic
disease and this includes memory to some extent into the model (Briggs et al., 2006).
On the other hand, modelling of varying transition probabilities according to time in the
model is more straight-forward. Here, the probabilities may be altered depending on the
number of cycles the model was iterated.
As shown in green below the Markov states in Figure 2, one can attribute outcome values to
different states. In the case of CEA, these outcomes can be QALYs or DALYs that are
attributed to different health states. The non-symptomatic state, for example, may get a
QALY of one, while the symptomatic case is given a lower utility due to the negative effects
of the disease. Also, the costs are attributed analogously and shown in red above the Markov
states. Costs may, for example, accrue in case of treatment in form of fixed costs at the start of
the Markov-cohort simulation. In case of being in the symptomatic state, additional
hospitalization costs are thinkable as for the hypothetical disease modelled in Figure 2. CEA
comparisons are now possible by comparing the results of the model in terms of costs and
outcomes under the different interventions. For example, a treatment where the cohort is
treated once at the start of the model may be compared with a scenario of non-intervention.
The treatment is modelled in the way that it reduces the transition probability to transfer from
the non-symptomatic to the symptomatic state by one minus the effect times of the treatment.
To calculate expected costs and outcomes, all costs and outcomes in each state are added. In
case of a cohort model, the costs and outcomes are weighted according to the proportion of
the cohort in the respective state for each cycle. Discounting of costs and outcomes is frequent
so that all values are yielded in present value (Briggs et al., 2006).
Ideally, to yield cost-efficiency, additional costs for the treatment, when compared with the
non-intervention scenario, are offset by an improvement in the outcome dimension, e.g. due to
the decrease in symptomatic disease and less costs due to hospitalization.
The comparison of interventions is eventually performed using the incremental cost-
effectiveness ratio (ICER). The cumulated cost and effects of the health interventions that are
to be compared are subtracted from another, yielding respectively the increment in costs and
benefits for the intervention relative to the comparator. The ICER then equals the ratio of
incremental costs to benefits and thus an estimate of the costs per unit of effectiveness
20
measure – frequently as cost per gained QALY or cost per averted DALY (Drummond et al.,
2015; Walker et al., 2011; Barton et al., 2004).
ICER value is then compared with threshold values. If the ICER value remains below the
threshold value, it is deemed cost efficient. The value of the threshold varies between
countries. The WHO, according to Woods et al. (2016), suggests threshold values around one
to three times per capita GDP.
3. Overview on Dengue Fever and the Dengue Vaccine
3.1 Dengue Fever
3.1.1 The virus, cause and way of infection
Dengue disease is caused by the dengue virus which belongs to the genus Flavivirus and
Flaviviridae family. Four distinct serotypes of the virus exist and are denominated as DEN-1,
DEN-2, DEN-3 and DEN-4 (WHO, 2009, Guzman and Harris, 2015; Katzelnick et al., 2016).
The four different genotypes are genetically different and with only around 70% identity at
the aminoacidic level (Guzman and Harris, 2015). Often, one or two serotypes are
predominant in endemic areas in different combinations while the presence of all four
serotypes at the same time seems less likely. For example, in South America, the most
frequent serotypes have been DEN-1, DEN-2 and DEN-3 (Brémond et al., 2015; Guzman and
Istúriz, 2010). In the case of Bolivia, DEN-2 and DEN-3 are the most prominent serotypes
with reappearance of DEN-1 (Roca et al., 2009). Messina et al. (2014) report the presence of
all four serotypes especially from the year 2000 to 2013 in South America while for Bolivia,
DEN-3 is discussed to predominate together with reported cases of DEN-2 at bordering
regions of Paraguay.
Dengue is the most prominent arboviral or arthropod-borne disease in humans. An arthropod-
borne disease is transmitted by an arthropod. The arthropod in this case is the mosquitoe from
the Aedes species., especially Aedes Aegiptii and Aeded Albopictus which are day-time biting
(Katzelnik et al., 2016; Guzman and Istúriz, 2010; Kyle and Harris, 2008). The infectious
cycle between human and mosquito can be distinguished, as for other arboviral diseases like
yellow fever, into jungle or urban cycle (Kyle and Harris, 2008). It is separated in the way the
virus was acquired. In the former case, infections of humans occur through bites by selvatic
mosquitoes that previously fed on viremic monkeys. The latter is caused by man-mosquito-
man transmission of the virus in urban environment –mostly by Aedes Aegypti, which is very
21
well adapted to human habitats. There, a mosquito bites an infected individual and spreads the
virus on to other humans from migration and house-to-house movement of the latter (Simoy
et al., 2015; Katzelnik et al., 2016; Guzman and Harris, 2015). The epidemiology can also be
mixed with transmission from selvatic and urban vectors. A potential channel of infection
with dengue via blood transfusions is also discussed by Guzman and Harris (2015).
3.1.2 Clinical description of the disease
Dengue is a disease with non-symptomatic or symptomatic occurrence. The symptomatic
infection may lead to undifferentiated fever, dengue fever (DF) or dengue hemorrhagic fever
(DHF). The latter is characterized by severe interior bleeding, often from the gastrointestinal
tract and blood plasma leakage which can lead to dengue hemorrhagic shock syndrome
(DSS). DHF is furthermore classified into four grades of severity of which DSS was defined
as stages three and four (WHO, 1997, 2009; PAHO, 2010). The clinical manifestation of
dengue depends on the patient’s age. In endemic areas, young children are often infected at
least once in the first ten live years. At that age, most infections are inapparent and some may
cause undifferentiated fever. DF mostly affects older children and adults with symptoms like
febrile illness and non-specific symptoms like headache, retroorbital pain (i.e. pain behind the
eyes), myalgia (i.e. muscle pain), nausea or vomiting and sometimes light hemorrhagic
manifestations (i.e. bleeding). A minority of patients progress to the severe form of the
disease, DHF. The symptoms mostly found in this case are high fever, hemorrhagic
phenomena (i.e. interior bleeding), hepatomegaly (i.e. enlargement of the liver) and
circulatory failure. Other possible complications may be hepatic (i.e. liver) failure and
encephalopathy (i.e. disfunctions of the brain). As discussed above, the main differentiation
between DF and DHF is made on whether plasma leakage is present or not (Srikiatkhachorn,
2009; WH0, 1997; PAHO, 2010). DSS comes as the result of the loss of a critical volume of
plasma and it is frequently preceded by warning signs such as low body temperature and an
increase of total white blood cell count (WHO, 2009).
In general, due to symptoms that coincide with relatively harmless illnesses in the beginning
of the disease as well as some similarities in the symptoms with other arthropod-borne
diseases such as chikungunya complicates a differential diagnosis of DF and DHF (WHO,
1997; PAHO, 2010). Besides this traditional case characterization often found in the
literature, the WHO changed the classification to dengue with or without warning signs and
severe dengue (Guzman and Harris, 2015; WHO, 2009). A change in the classification was
requested as the previous classification into DF/DHF/DSS made the application of the strict
22
criteria difficult in a clinical situation and the number of severe cases that did not fulfil all
criteria for DHF increased as well. The new classification deems dengue probable if one
individual lives or travels in a dengue endemic area and has fever together with two of the
following symptoms: nausea/vomiting, rash, aches and pains, positive tourniquet test,
leukopenia (i.e. low number of white blood cells) or any of the warning signs associated to
‘dengue with warning signs’: abdominal pain or tenderness, persistent vomiting, clinical fluid
accumulation, mucosal bleed, lethargy/ restlessness, liver enlargement greater than two
centimeters and laboratory increase in HCT concurrent with rapid decrease in platelet count.
Severe dengue was now identified with severe plasma leakage (leading to shock (DSS)) or
fluid accumulation with respiratory distress), severe hemorrhage or severe organ impairment
(liver, heart and/or other organs) (WHO, 2009). Nonetheless, both classification systems are
encountered in the literature and were thus worth discussing in this thesis.
In the case of Dengue, secondary infections with a different serotype after having been
infected at a previous point in time play a special role that also has implications for the
development of vaccines. While lifelong protection is acquired against the infecting serotype,
research points out that, although cross-immunity is achieved for a limited period of time – on
average two years (Montoya et al., 2013), the probability or risk of DHF or DSS is increased
for secondary infections due to antibody-dependent enhancement where the antibodies to a
different dengue serotype stimulate the reproduction of the infecting viruses. This is the case
for individuals that were previously infected with a different serotype as well as infants with
primary infection born to dengue-immune mothers. The effect of tertiary and quartary
infections on severity of disease, on the other hand, is suggested to be low, based on
seroepidemiological and hospital studies (Guzman and Harris, 2015).
3.1.3 The course of dengue illness
The clinical course of DF and DHF starts with a sudden onset of fever after an incubation
time of four to eight days and is followed by three phases, febrile, critical and recovery
(Guzman and Harris, 2015). The febrile period typically lasts between two to seven days. The
patient is viremic and able to infect others for four to five days after onset of the fever
(Guzman and Harris, 2015). Around defervescence (i.e. period of reduction of fever) the
patient is in the critical phase where DF cases recover and achieve lifelong immunity against
the dengue serotype while –on days three to seven of the disease, usually between the fourth
and fifth day– plasma leakage would set on for 24 to 48 hours for those patients that develop
DHF (Guzman and Harris, 2015; WHO 1997; WHO 2009). Before the onset of the critical
23
phase, DF and DHF are undistinguishable. After the critical phase and in case the patient
survives the critical 24-48 hours, fluid reabsorption takes place in the phase of recovery that
lasts around 48 to 72 hours. Problems encountered at this phase may be hypervolemia (i.e.
excess of fluid in the blood) for the case that intravenous fluid replacement has been
prolonged or excessive to that point (WHO, 2009).
3.1.4 Diagnosis
Early recognition at primary to tertiary health care levels is important while primary and
secondary levels are responsible for screening and identification of the disease (WHO, 2009).
As discussed above, diagnosing dengue may be difficult due to other conditions that may
mimic symptoms that are encountered during the febrile phase of dengue and are also
common with less complicated and relatively harmless conditions. For example, similar flu-
like symptoms may be caused by influenza, measles chikungunya, rotavirus or other enteric
infections that may result in diarrheal diseases and vomiting. Also, illness with rash may be
the result of rubella, measles or drug reactions (WHO, 2009). The WHO (2009) handbook on
dengue describes admission criteria for patients into health centers for suspicion of having
dengue. Those criteria are any of the warning signs as discussed above, as well as possible
signs and symptoms for possible plasma leakage (dehydration, inability to tolerate oral fluids,
hypertension, cold extremities and other), bleeding, organ impairment and social
circumstances such as living alone, far from health facility or without reliable means of
transport. A full blood count test (FBC) as well as hematocrit (HCT) test are then helpful to
assess whether the disease is dengue or not (WHO, 2009) as well as rapid test for dengue are
becoming available (Guzman and Harris, 2015).
3.1.5 Treatment
Severe dengue can lead to mortality of around 20% if untreated and of less than one percent if
appropriate measures are taken (Guzman and Harris, 2015). Depending whether the patient
has dengue without warning signs, with warning signs or severe dengue, the treatment varies.
In the first case, treatment usually comprises bed rest, adequate fluid intake, and the
administration of Paracetamol6. Once HCT-levels are stable, the patients can be sent home. In
the case of dengue with warning signs, depending whether oral fluid intake is tolerated,
intravenous fluid therapy is recommended. Isotonic solutions7 are administered at varying
6 A maximum dose of 4 gr. per day for adults, a lower dose is suggested for children (WHO, 2009) 7 0.9% saline or Ringer’s lactate (WHO, 2009)
24
volumes according to the patient’s HCT-values8 as well as according to clinical response.
Monitoring measures comprise blood glucose levels, other organ functions and urine output.
Severe dengue and treatment of compensated or hypotensive shock is performed by
administering IV fluids in form of isotonic crystalloid solutions and, if required, blood
transfusions for treatment of hemorrhagic complications (WHO, 2009).
3.2 Dengue Vaccination
Due to the large population at risk, a vaccine against dengue would be a very plausible way to
tackle the problem, especially since vaccination with live attenuated flaviviruses proved to be
very effective in the fight against, e.g. yellow fever or Japanese encephalitis (Garske et al.,
2014; WHO, 2011). Also, the rapid spread of dengue and hitherto relatively ineffective and
very costly vector control measures give vaccine development a lot of importance in WHO’s
goals of reducing the burden of dengue (Scott, 2016; WHO, 2011).
The development of a vaccine against dengue, although, encountered difficulties and
challenges due to the presence of the four serotypes of the virus. Given the risk of antibody-
dependent enhancement that plays a role in the development of dengue fever and dengue
hemorrhagic fever, a tetravalent vaccine that simultaneously provides immunity against all
four serotypes is the most promising research direction. Challenges here were difficulties to
achieve balanced immune reactions to all serotypes (Guzman and Harris, 2015).
The first tetravalent vaccine to be approved for the prevention of dengue serotypes DEN-1 to
DEN-4 is Dengvaxia also known as CYD-TDV (WHO, 2017c), by Sanofi Pasteur. The
vaccine is based on an attenuated 17D yellow fever virus (WHO, 2011). Approval was given
for the vaccination of individuals aged 9 to 45 years or 9 to 60 in high endemic areas. The
vaccine showed a reduction of severe dengue and hospitalization cases by 93 and 81%,
respectively, during the first 25 months of the Phase III trials. An increase in the
hospitalization rate was registered, however, for children aged two to five which led to the
conservative licensing from age nine onwards (Moll, 2017). The vaccine is administered in
three doses with a 0, 6, 12-month schedule (Scott, 2016; WHO, 2017). According to WHO
(2017c), the vaccine is conditionally recommended in highly endemic areas. The reason is
that a seroprevalence rate of dengue antibodies should be higher or equal 70% according to
mathematical modelling due to a theoretically elevated risk of hospitalized and severe dengue
in seronegative individuals at the time of first vaccination (antibody-dependent enhancement -
ADE) as well as a lower protective effect (WHO, 2016). Therefore, vaccination is
8 Tests performed before and after fluid replacement, then every six to twelve hours (WHO, 2009)

25
recommended only for those who are known to have been infected prior to vaccination
(WHO, 2017c; Moll, 2017).
3.3 Previous Studies
In the last years, plenty of research on the potential cost-effectiveness of dengue vaccination
has been done in different Latin American and Asian countries with endemic dengue risk. So
far, dengue vaccination has been shown to be highly cost-effective in seven countries, cost-
effective in five countries and cost saving in three. ‘High cost-effectiveness’ and ‘cost-
effectiveness’ are sometimes defined as the ICER being below one time per capita GDP and
between one to three times GD per capita, respectively (Zeng et al., 2018).
Zeng et. al. (2018) conducted a cost-effectiveness analysis from a societal and health provider
perspective for ten countries for which clinical trials (phase III) for Sanofi Pasteur’s
Dengvaxia vaccine were performed (Brazil, Colombia, Honduras, Mexico, Puerto Rico,
Indonesia, Malaysia, Philippines, Thailand, Vietnam). In the study, vaccination was compared
with a non-vaccination scenario. The authors assumed the three-dose vaccination schedule
with six-months intervals for a cohort of children aged nine years and an optional catch up
campaign. A time horizon of 30 years was used and vaccine coverage for the three doses was
80, 75 and 70 percent, respectively. The authors used an age-structured, host-vector, serotype-
specific compartmental model that included seasonality and accounted for the transmission
dynamics of the four dengue serotypes in humans and mosquitoes at the population level
where they incorporated various types of serotype interactions: temporary cross-protection
(i.e. immunity to secondary infection from a different dengue serotype), cross-enhancement
(i.e. change in the risk for symptomatic cases after additional infection), or a combination of
both.
The results of Zeng et al. (2018) showed an average ICER of US$ 4,216 per averted DALY in
Latin America and US$ 3,751 in Asia from a health provider perspective. With a societal
perspective, the negative ICER on average was US$ -5,474 per averted DALY that indicated
cost-savings due to vaccination. This value, however, was driven by the very large negative
value for Puerto Rico (-29,008) and a negative value for Brazil (-2,811). For the other
countries the values were positive but indicated high cost-efficiency in Colombia and Mexico
and cost-efficiency in Honduras9. The authors furthermore conclude that dengue vaccination
9 Colombia ICER:518US$/avert. DALY, GDP-Per Cap.:6084US$; Honduras ICER: 3188/avert. DALY, GDP-
Per Cap.: 2407 US$; Mexico: ICER: 742/avert. DALY, GDP-Per Cap.: 9009 US$ (Zeng et al., 2018)
26
shows to be more cost-effective under the societal perspective as indirect costs, in terms of
productivity losses, are much higher than direct costs for this disease. The driving factors that
are identified for cost-effectiveness are high incidence of dengue, high seroprevalence and
high costs per case. For the first, high incidence will increase seroprevalence. Second, for
higher seroprevalence, the vaccine’s impact and effectiveness are improved. Lastly, costs
from productivity losses and costs for treatment are linked together via a country’s GDP.
Zeng et al. (2018) furthermore discuss as weakness of their study that neither potential
synergy effects of vector control measure and vaccination nor effects of herd-immunity were
considered. Furthermore, the incidence was assumed to be constant over the whole period of
the model. This is argued to be reasonable due to the observed increase in the real-world
incidence in the last years (Zeng et al., 2018). Underestimated positive effects from not taking
herd immunity into account may be outweighed by negative effects of an increased incidence.
Against this it could be argued, however, that herd immunity and or vector control measures
may contribute to reduce the incidence over the years.
Additional cost-efficiency studies with a societal and health provider perspective were done
for some of the above-mentioned countries. Shim (2017) studied vaccination of nine-year olds
in Brazil and assumed a 70% vaccination coverage in the baseline scenario. The modelling
period was ten years and made use of a model that took vaccine induced antibody-dependent
enhancement (ADE) into account. The result shows that a 50% vaccine coverage yields an
ICER of 11,208 US$ per QALY gained using a health care perspective and a cost-limit of
vaccination of 100 US$. For routine vaccination of 90% of nine-year olds, the cost-efficiency
threshold (below three times GDP per QALY gained) is met at vaccination costs equaling 262
US$. As a result, the authors conclude that a high level of vaccination is feasible and cost-
efficient in the Brazilian setting (Shim 2017a).
In a similar study for Yucatan, Mexico, Shim (2017b) evaluates cost-efficiency for a 20-year
period. For vaccination costs below 89 US$, 90% of symptomatic DF and DHF cases and
deaths would be prevented per year and thus lead to net savings from performing vaccination.
From the provider perspective and for a vaccination price of 140 US$ or lower, an ICER of
10,307 US$ or less is reached. 10,307 US$ equals the 2017 per capita GDP for Mexico and
thus reflects high cost-effectiveness. For high cost-efficiency from the societal perspective,
vaccination costs per person of up to 214 US$ are calculated. For cost efficiency (threshold up
to three times per capita GDP: 30,921), vaccination prices below 245 US$ and 315 US$ from
the provider and societal perspective, respectively are needed for the vaccination. For a price
27
of 250 US$, vaccination was deemed cost-efficient 88% of the time under a societal
perspective (provider: 43%) with an ICER of 17,878 per QALY gained (Shim, 2017b).
Shafie et al. (2017) cite five cost-effectiveness studies for dengue vaccination that were
respectively performed for the Philippines, Brazil, Thailand, Singapore and South East Asia.
All showed cost effectivity for vaccination for vaccine-dose costs ranges between US$ 0.50 to
270 in 2013 prices. Shafie et al. (2017) contribute to the literature by performing an analysis
for Malaysia. The study uses a similar model as Zeng et al. (2018). Calibration of the model
was performed by adapting Malaysia-specific data on age-specific annual incidence, case
fatality rate, demographic data as well as seroprevalence and disease impact. The study
evaluated a health-care provider as well as societal perspective. Six different vaccination
scenarios – nationwide or merely targeted hotspot vaccination for the regions with highest
burden – were analyzed for the age groups 13-30, 9-30 and 9-1710. Further, depending on age,
vaccination-programs were divided into school-based and community based. Vaccination
coverage rates were assumed to be 95% for school- based and merely 50% for community-
based programs. As in Zeng et al. (2018), the main comparison is done between vaccination
and non-vaccination and the simulation was performed for a ten-year period (2016-2025).
(High) cost-effectiveness for the vaccine was evaluated using a value-based pricing method
that evaluates the highest possible cost for a vaccine that still meets a cost-efficient ICER
threshold level (at or three times per capita GDP 11 ). The result shows that high cost-
efficiency between different scenarios is met for a vaccine costs between 22 and 75 US$ per
dose and 40 to 123 US$ per dose for cost efficiency using a societal perspective. The
respective values for a provider perspective are 14 to 48 US$ and 32 to 101 US$. The authors
concluded that routine vaccination of a population aged 13 and a catch-up cohort 14-30 in
specifically dengue threatened areas was the most cost-efficient strategy (Shafie et al., 2017).
Orellano et al. (2016) present a cost-effectiveness study for dengue vaccination based on a
Markov model for Argentina which represents a country with a heterogenous risk of dengue
transmission. Heterogenous risk refers to a restriction of virus transmission in the summer and
only certain regions of the country. The analysis was performed from the societal perspective
and studied vaccination of two-year old children12. The cohort was followed until death and
10 The age groups were chosen after findings that those report the highest number of infections. 11 Malaysia (2013): 10,457 – 31,371US$ per DALY averted for cost effectiveness (Shafie et al., 2017) 12 In contrast to the other studies reviewed here that are almost entirely based on results of the Sanofi Pasteur,
Dengvaxia vaccine, Orellano et al. (2016) also based their study on a second vaccine, Buthanan-DV that also
was in a high state of development at the time of writing. For example, cost data and the optimal vaccination age
was derived from the latter (Orellano & Salomon, 2016).
28
thus the time horizon was 76 years, which was life expectancy value for the Argentinian
population from birth.
The Markov model of Orellano et al. (2016) had five health states: susceptible, immune by
vaccination, immune to one serotype by natural infection, immune to two serotypes by natural
infection, and dead, while DF and DHF were incorporated in the model as transitional states.
Cost-effectiveness was also addressed using the WHO threshold of one to three times GDP
per capita. Thus, GDP of 38 619 US$ for cost-effectiveness. Orellano et al. (2016) report an
ICER of 5,714 US$ per DALY averted for their nationwide deterministic base-scenario that
compares vaccination against non-vaccination. Probabilistic results increased the median
ICER to 27,410 US$. Cost-effectiveness under the three times GDP threshold level had a
probability of 54.9%. The highest vaccine-dose price that would still yield cost-efficiency in
this study was 1.49 US$ in the nationwide vaccination scenario and 28.72 US$ for the
scenario of exclusive vaccination in high transmission areas such as the San Martin
department in the north of the country (Orellano et al., 2016). One reason why the permissible
costs for the vaccine are markedly lower than in the above cited studies is that here the price
per dose is referred to. Previously the price was estimated per vaccinated person which
included the three-dose vaccination. Furthermore, Orellano et al. (2016) use production costs
per dose as cost input. Production costs may be very much lower than final market prices for
pharmaceuticals and marginal production costs were assumed to represent a better proxy for
costs (Orellano and Salomon, 2016).
4. Model and Data for a Hypothetical Dengue Vaccination Campaign
in Bolivia
4.1 The Model
The model used in this thesis to assess cost-effectiveness of dengue vaccination is based on
the model developed by Orellano et al. (2016) and uses Microsoft EXCEL. It is a Markov
transition model with yearly cycles and different health states: Susceptible, immune to one
serotype by natural infection, immune to two serotypes by natural infection, and dead. For the
vaccination simulation the state immune by vaccination was also included. A cohort of
100,000 individuals departs from the healthy state. Contrary to Orellano et al. (2016), this
thesis models the vaccination of a cohort of individuals aged nine years as this is the earliest
possible vaccination age according to the currently available and most developed vaccine.
Also, yearly costs for individuals that dies from dengue were not considered as productivity
29
costs either. They should be balanced with savings from non-consumption assuming that
lifetime consumption equals lifetime earnings of individuals. As in Orellano et al. (2016), DF
and DHF and inapparent infection were incorporated in the model as transitional states.
A schematic representation of the vaccination branch of the model can be found in the
Appendix. Starting from the susceptible state, an individual can either remain susceptible, die
or attract a primary infection. Once infected (primary or secondary infection), the individual
will go through the transitional state during the cycle. Therefore, the infected individual will
either have an inapparent infection and be immune to the attracted serotype at the end of the
cycle or the individual will be a clinical case with either DF or DHF. Both can lead to an
ambulatory or hospitalized case. For DF, natural immunity to one or two serotypes is the
health state reached by the end of the cycle. In the case of DHF, either natural immunity to
one or two serotypes or death can be the states at the cycle end. Individuals that are immune to
one serotype from natural infection can either remain in this state, die from other causes or
get a secondary infection that is modelled analogously as for primary infections and either die
from dengue or be immune to two serotypes. The probabilities for secondary infection are
lower while the probability of being hospitalized are greater when comparing the transition
between primary and secondary infection. Vaccination in the model follows Orellano et al.
(2016) and is performed once in a lifetime for 73% of the population in the deterministic
model and the probability of being immune is equal to the vaccines’ efficacy times the
vaccine coverage. In the probabilistic model, vaccination rates are varied between 71% and
76%. Individuals once immune are immune for the remainder of their lives in this model.
Both costs and QALY measures in the model are discounted with 3% yearly (Orellano et al.,
2016).
Like in the base model, only two infections with dengue are deemed possible. This
assumption was made based on an analysis of repeated hospital admissions for dengue that
analyzed the frequency of DF and DHF cases that resulted from tertiary or quartary infection
on Thai children which concluded that the number of admissions due to such an infection was
“extremely low” (Gibbons et al., 2007). Furthermore, as described above, DEN-2 and DEN-3
being the foremost serotypes present in the country make this assumption appropriate.
According to the Panamerican Health Organisation (PAHO) (2018), in Bolivia the number of
serotypes even decreased from two to one from 1990 to 2010. This, simplicity reasons as well
as time constraint considerations were decisive for this assumption.
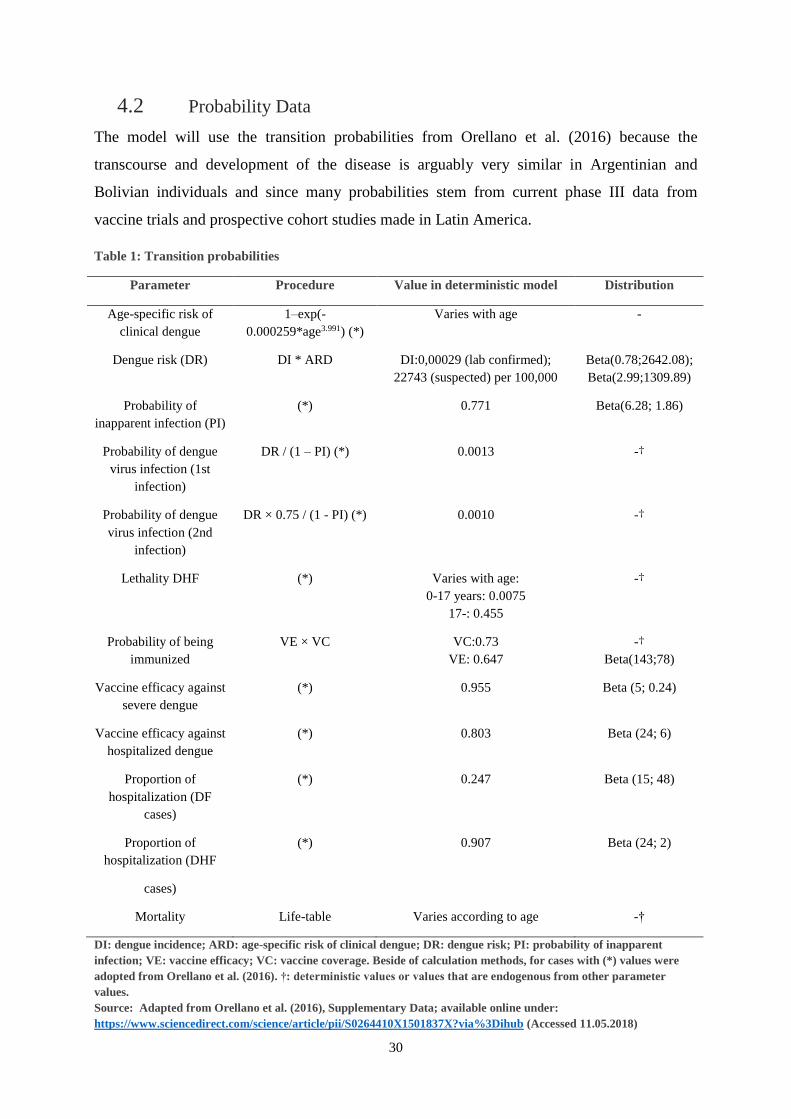
30
4.2 Probability Data
The model will use the transition probabilities from Orellano et al. (2016) because the
transcourse and development of the disease is arguably very similar in Argentinian and
Bolivian individuals and since many probabilities stem from current phase III data from
vaccine trials and prospective cohort studies made in Latin America.
Table 1: Transition probabilities
Parameter Procedure Value in deterministic model Distribution
Age-specific risk of
clinical dengue
1–exp(-
0.000259*age3.991) (*)
Varies with age -
Dengue risk (DR) DI * ARD DI:0,00029 (lab confirmed);
22743 (suspected) per 100,000
Beta(0.78;2642.08);
Beta(2.99;1309.89)
Probability of
inapparent infection (PI)
(*) 0.771 Beta(6.28; 1.86)
Probability of dengue
virus infection (1st
infection)
DR / (1 – PI) (*) 0.0013 -†
Probability of dengue
virus infection (2nd
infection)
DR × 0.75 / (1 - PI) (*) 0.0010 -†
Lethality DHF (*) Varies with age:
0-17 years: 0.0075
17-: 0.455
-†
Probability of being
immunized
VE × VC VC:0.73
VE: 0.647
-†
Beta(143;78)
Vaccine efficacy against
severe dengue
(*) 0.955 Beta (5; 0.24)
Vaccine efficacy against
hospitalized dengue
(*) 0.803 Beta (24; 6)
Proportion of
hospitalization (DF
cases)
(*) 0.247 Beta (15; 48)
Proportion of
hospitalization (DHF
cases)
(*) 0.907 Beta (24; 2)
Mortality Life-table Varies according to age -†
DI: dengue incidence; ARD: age-specific risk of clinical dengue; DR: dengue risk; PI: probability of inapparent
infection; VE: vaccine efficacy; VC: vaccine coverage. Beside of calculation methods, for cases with (*) values were
adopted from Orellano et al. (2016). †: deterministic values or values that are endogenous from other parameter
values.
Source: Adapted from Orellano et al. (2016), Supplementary Data; available online under:
https://www.sciencedirect.com/science/article/pii/S0264410X1501837X?via%3Dihub (Accessed 11.05.2018)
31
Probabilities of DF, DHF and hospitalization were thus kept from the original model. The
model is nonetheless adapted to the Bolivian environment by using the appropriate dengue
risk which, as in the original paper, is yielded from the annual incidence of dengue from the
2010-2015 according to PAHO (2018). The PAHO reports either the incidence for lab
confirmed dengue or suspected dengue cases. The incidence rate for dengue that includes
suspected/clinical (high incidence) cases, for example, is nearly ten times higher than
laboratory confirmed cases (227 and 29 per 100,000, respectively). Results for the use of both
incidence types will be reported below. The true incidence of dengue will possibly lie closer
to the high incidence as laboratory confirmation is only performed to a proportion of
suspected cases during an epidemic situation13. An overestimation by the dengue incidence
may occur due to the already described difficulty of diagnosis of dengue. The model also
differs as it is iterated for 64 cycles to match the life expectancy of 64 years in Bolivia for
individuals born in the year 2006, according to the World Bank’s database (2018a).
Individuals born in that year are in their 9th life year and thus fulfill the age requirements for
vaccination in the campaign which was set to the year 2015 for convenience of data
availability. The model thus follows individuals from their birth to their statistical death.
4.3 Cost Data
Cost for DF and DHF in both ambulatory and hospitalized settings are calculated in a similar
way as Orellano et al. (2016) and are shown in Table 2 below.
A report for the Economic Commission for Latin America and the Caribbean (CEPAL)
(2010) evaluated the economic effects of a dengue epidemic in Bolivia in the year 2009 and
point estimates for doctoral consultation costs were reported there to be BOB 40 in 2009
(BOB 55.25 in 2015 - US$ 7.94). After conversation with Bolivian doctors, for all non-
hemorrhageous cases, exclusive administration of paracetamol is the usual treatment. Besides
this information, also the costs of treatment of paracetamol for three days as well as costs for
infusion for fluid replacement are reported. Additionally, pharmacies in Bolivia were
contacted and asked for their prices per tablet of paracetamol and liter of ringer infusion14.
Furthermore, literature and internet research yielded costs for per day hospital bed costs as
well as costs of intensive care units. This permitted giving an estimate of the costs of DF and
DHF analogous to Orellano et al. (2016).
13 Information received through correspondence with Pablo Wenceslao-Orellano. The argument is that a
laboratory confirmation in epidemic situations would only increases costs. 14 For example, one responding pharmacy from Cochabamba reported costs of BOB 0.16 per tablet paracetamol
and BOB 12 per liter of ringer solution
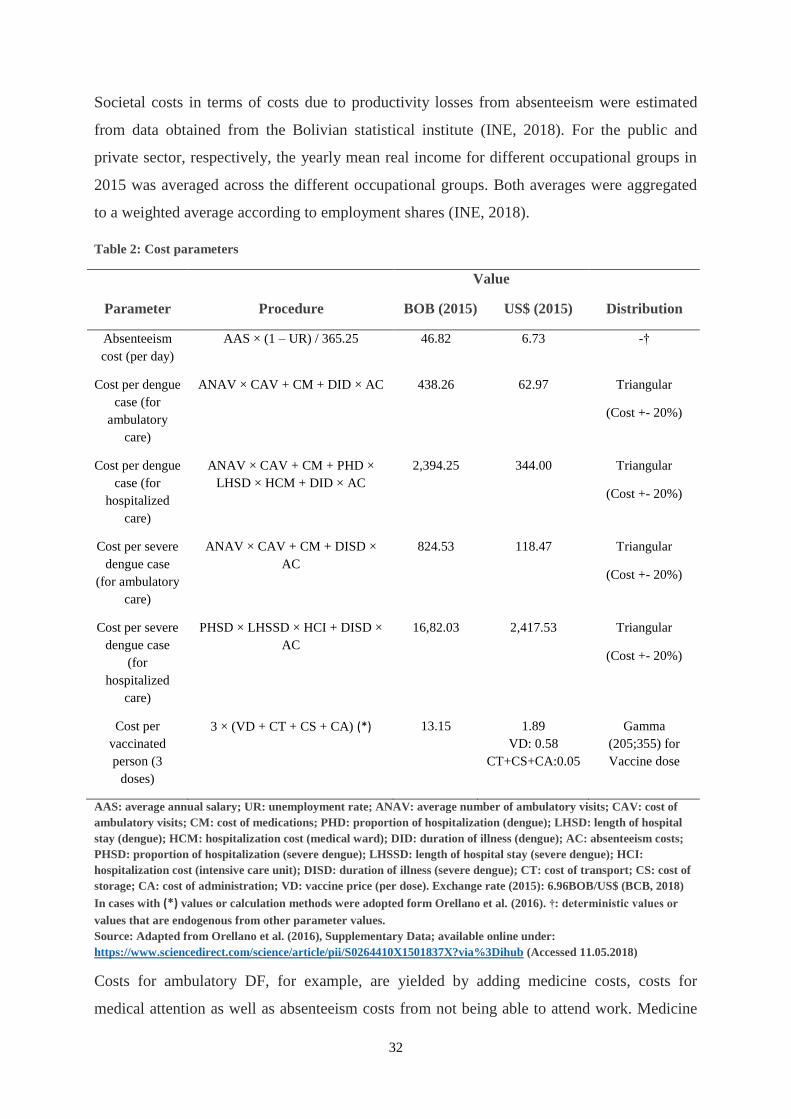
32
Societal costs in terms of costs due to productivity losses from absenteeism were estimated
from data obtained from the Bolivian statistical institute (INE, 2018). For the public and
private sector, respectively, the yearly mean real income for different occupational groups in
2015 was averaged across the different occupational groups. Both averages were aggregated
to a weighted average according to employment shares (INE, 2018).
Table 2: Cost parameters
Parameter Procedure
Value
Distribution BOB (2015) US$ (2015)
Absenteeism
cost (per day)
AAS × (1 – UR) / 365.25 46.82 6.73 -†
Cost per dengue
case (for
ambulatory
care)
ANAV × CAV + CM + DID × AC 438.26
62.97
Triangular
(Cost +- 20%)
Cost per dengue
case (for
hospitalized
care)
ANAV × CAV + CM + PHD ×
LHSD × HCM + DID × AC
2,394.25
344.00
Triangular
(Cost +- 20%)
Cost per severe
dengue case
(for ambulatory
care)
ANAV × CAV + CM + DISD ×
AC
824.53
118.47
Triangular
(Cost +- 20%)
Cost per severe
dengue case
(for
hospitalized
care)
PHSD × LHSSD × HCI + DISD ×
AC
16,82.03
2,417.53
Triangular
(Cost +- 20%)
Cost per
vaccinated
person (3
doses)
3 × (VD + CT + CS + CA) (*) 13.15
1.89
VD: 0.58
CT+CS+CA:0.05
Gamma
(205;355) for
Vaccine dose
AAS: average annual salary; UR: unemployment rate; ANAV: average number of ambulatory visits; CAV: cost of
ambulatory visits; CM: cost of medications; PHD: proportion of hospitalization (dengue); LHSD: length of hospital
stay (dengue); HCM: hospitalization cost (medical ward); DID: duration of illness (dengue); AC: absenteeism costs;
PHSD: proportion of hospitalization (severe dengue); LHSSD: length of hospital stay (severe dengue); HCI:
hospitalization cost (intensive care unit); DISD: duration of illness (severe dengue); CT: cost of transport; CS: cost of
storage; CA: cost of administration; VD: vaccine price (per dose). Exchange rate (2015): 6.96BOB/US$ (BCB, 2018)
In cases with (*) values or calculation methods were adopted form Orellano et al. (2016). †: deterministic values or
values that are endogenous from other parameter values.
Source: Adapted from Orellano et al. (2016), Supplementary Data; available online under:
https://www.sciencedirect.com/science/article/pii/S0264410X1501837X?via%3Dihub (Accessed 11.05.2018)
Costs for ambulatory DF, for example, are yielded by adding medicine costs, costs for
medical attention as well as absenteeism costs from not being able to attend work. Medicine
33
costs are calculated from paracetamol intake of three 500mg units daily for the average
duration of disease of 4.36 days (Orellano et al., 2016) and yielded an estimate for medicine
costs of BOB 2.20 (US$ 0.30). Costs for medical attention are the average ambulatory visits
(4.2) multiplied with their costs (BOB 55.25 - US$ 7.94). Absenteeism costs are yielded by
multiplying the daily average real wage with the average duration of the disease.
According to Orellano et al. (2016), average hospitalization due to DH and DHF was
estimated to last 3.8 and 5 days, respectively. For hospitalized DF, paracetamol and fluid
replacement costs were used while CEPAL (2009) indicates an average use of two liters per
day. Hospital bed costs were also added15 as well as absenteeism costs and consultation costs.
For DHF, intensive care unit costs that included medicines were used.16
The departmental health services in Santa Cruz de la Sierra and La Paz (Servicio
Departamental de Salud - SEDES) that are responsible for disease prevention programs at
departmental level in Bolivia, were contacted with the request to provide information on the
costs for a dengue vaccine in Bolivia. According to their information and additional
information from doctors that were also contacted, neither Dengvaxia nor any other dengue
vaccine was or is currently in use in Bolivia and thus also prices are not available. Thus, the
same per dose vaccine prices as well as administration costs of US$ 1.89 as in Orellano et al.
(2016) are used in the baseline model. Since Bolivia is a poorer country than Argentina, lower
distribution and per dose prices due to lower wages and different pricing strategies by the
pharma companies are thinkable. A study that analyzed the cost of vaccine programs across
94 countries estimated the cost per program dose to a total of 2.18 US$ across 2011 to 2020
for lower middle-income countries. These costs are comprised of vaccine, supply chain and
service delivery costs of 0.78, 0.23, and 1.26 US$, respectively (Portnoy et al., 2015) and
were used in a sensitivity analysis below.
4.4 Probabilistic Assumptions
To account for uncertainty in the used input parameters, a probabilistic analysis is performed
by means of Monte-Carlo simulation. The model is hereby iterated 1,000 times with different
input parameters. The resulting output parameters and especially the ICER can then be
evaluated. The variation in the used input parameters is achieved by means of random draw
15 Smith et al. (2011) report average healthcare costs paid by Bolivian healthcare facilities per hospitalized or
emergency department patient. Here the cost of US$ 205.19 for hospitals in Santa Cruz were chosen as HCM
Santa Cruz represents one Department in the eastern lowlands where dengue is present in Bolivia. 16A Value of BOB 2500 – 3000 in 2009 prices (US$ 360-431) that included medicine costs form a private sector
hospital (as prices here may be less subsidized) were used here and adapted to 2015 values (Clinica del Sur,
2009) and used for HCI in table 2.
34
from underlying distributions for the parameters which are based on literature research and
are mostly inferred from results of experimental trials, prospective cohort studies or meta
analyses (Briggs et al., 2006). Briggs et al. (2006) discuss the suitability of different
distributions in cost-effectiveness studies that vary depending on whether probabilities, cost
or utility data is analyzed in their handbook on health economic evaluation.
Costs mostly face the restriction of having to be non-negative but are not limited into the
positive direction. The Gamma or lognormal distribution are often used for this purpose. Also,
a triangular distribution is encountered when only point estimates and endpoints of an interval
around this value are available. Those endpoints can often represent ‘educated’ guesses by
experts.
As probabilities as well as QALY weights are limited in the range of zero to one, it is
necessary to draw from a distribution that meets this requirement. The beta distribution does
this and is yielded by means of Bayesian statistics where a beta distributed posterior
distribution is yielded from data with a bernoulli or binomial prior distribution (Briggs et al.,
2006). For example, the probability for hospitalization for DHF has a point estimate of 0.907
(the share of hospitalized cases for DHF positive individuals in the study) and probabilistic
values are drawn from a beta distribution with the respective alpha and beta parameters of 24
and 2 (Beta (24; 2))17 by Orellano et al., (2016). The parameters alpha and beta can be yielded
from results of studies, where alpha equals the number of positive results 𝑥 out of 𝑛 observed
individuals and beta equals the 𝑛 − 𝑥 non-positive results. Alternative ways of yielding the
parameter values is by means of method of moments where the variance and mean of a
sample can be used to solve for the parameters, or by Maximum Likelihood approach where
the parameters that best describe the distribution between a minimum and maximum value are
searched for.
The distributions that were assumed as well as their parameters are reported for each input in
Tables1 and 2 above.
17 These specific values were obtained by inferencing a confidence interval around the estimate of 0.907. That
confidence interval was then used as the possible range and a standard deviation was estimated from it. The
corresponding beta-distribution was then derived with this.
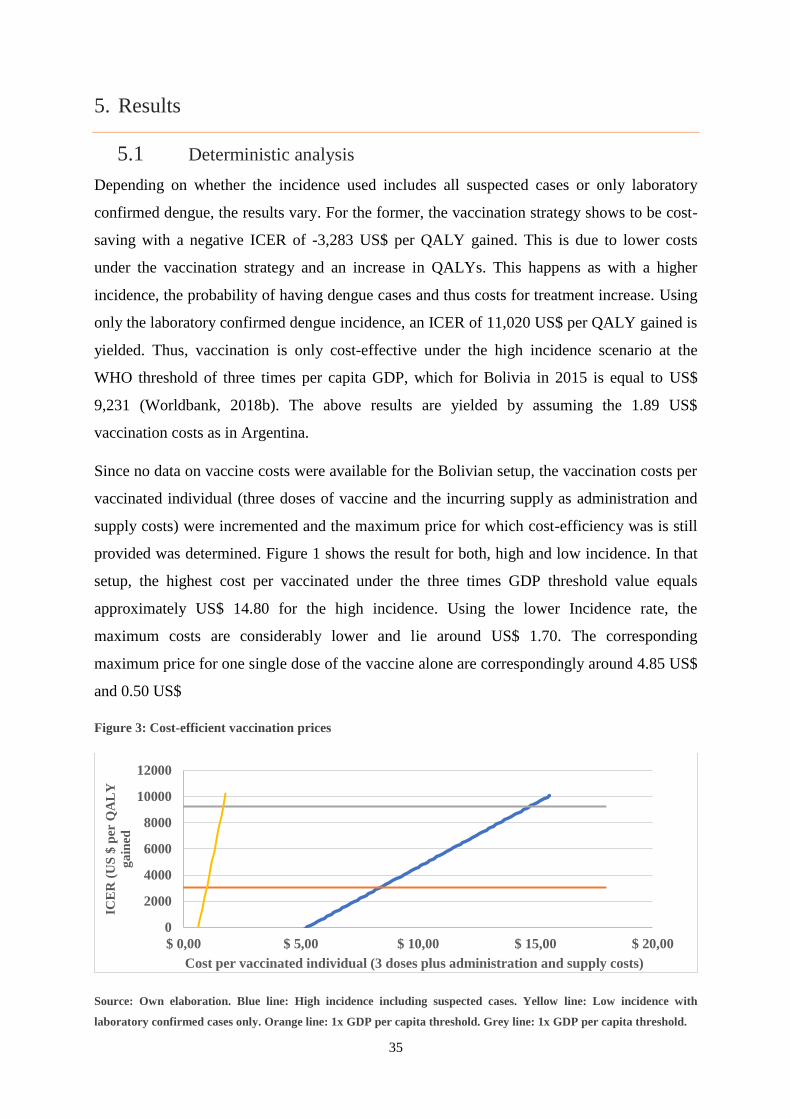
35
5. Results
5.1 Deterministic analysis
Depending on whether the incidence used includes all suspected cases or only laboratory
confirmed dengue, the results vary. For the former, the vaccination strategy shows to be cost-
saving with a negative ICER of -3,283 US$ per QALY gained. This is due to lower costs
under the vaccination strategy and an increase in QALYs. This happens as with a higher
incidence, the probability of having dengue cases and thus costs for treatment increase. Using
only the laboratory confirmed dengue incidence, an ICER of 11,020 US$ per QALY gained is
yielded. Thus, vaccination is only cost-effective under the high incidence scenario at the
WHO threshold of three times per capita GDP, which for Bolivia in 2015 is equal to US$
9,231 (Worldbank, 2018b). The above results are yielded by assuming the 1.89 US$
vaccination costs as in Argentina.
Since no data on vaccine costs were available for the Bolivian setup, the vaccination costs per
vaccinated individual (three doses of vaccine and the incurring supply as administration and
supply costs) were incremented and the maximum price for which cost-efficiency was is still
provided was determined. Figure 1 shows the result for both, high and low incidence. In that
setup, the highest cost per vaccinated under the three times GDP threshold value equals
approximately US$ 14.80 for the high incidence. Using the lower Incidence rate, the
maximum costs are considerably lower and lie around US$ 1.70. The corresponding
maximum price for one single dose of the vaccine alone are correspondingly around 4.85 US$
and 0.50 US$
Figure 3: Cost-efficient vaccination prices
Source: Own elaboration. Blue line: High incidence including suspected cases. Yellow line: Low incidence with
laboratory confirmed cases only. Orange line: 1x GDP per capita threshold. Grey line: 1x GDP per capita threshold.
0
2000
4000
6000
8000
10000
12000
$ 0,00 $ 5,00 $ 10,00 $ 15,00 $ 20,00
ICE
R (
US
$ p
er Q
AL
Y
ga
ined
Cost per vaccinated individual (3 doses plus administration and supply costs)
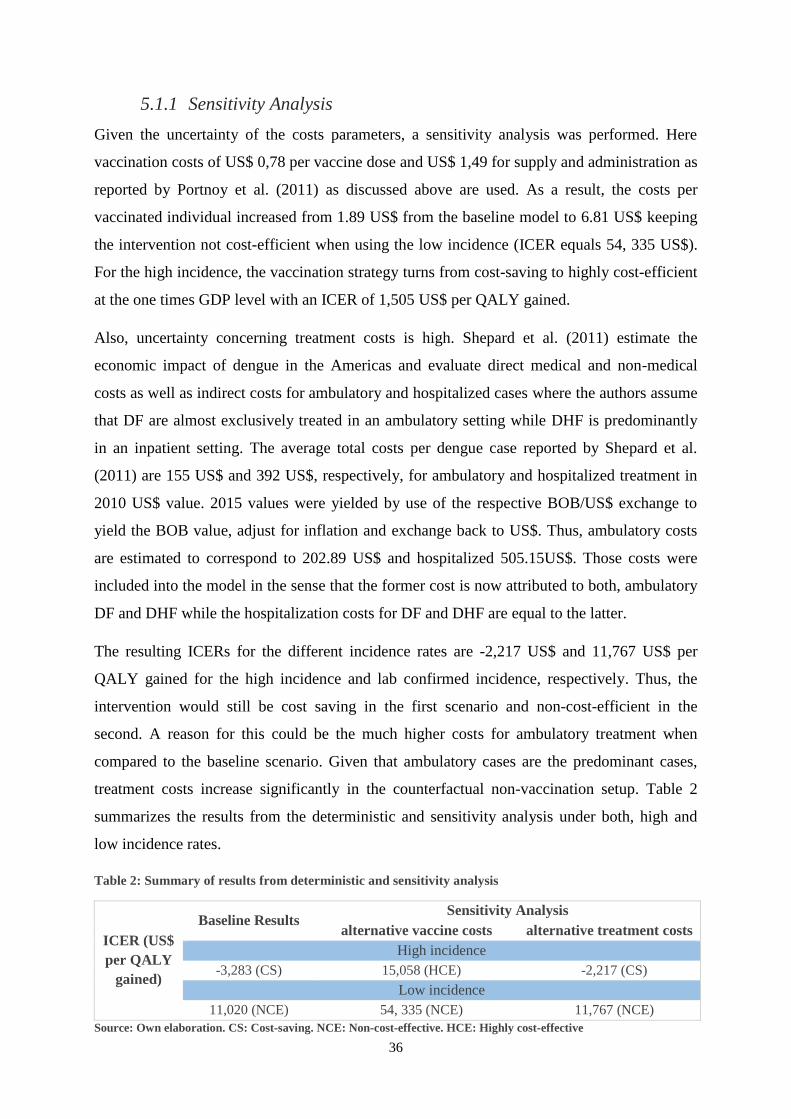
36
5.1.1 Sensitivity Analysis
Given the uncertainty of the costs parameters, a sensitivity analysis was performed. Here
vaccination costs of US$ 0,78 per vaccine dose and US$ 1,49 for supply and administration as
reported by Portnoy et al. (2011) as discussed above are used. As a result, the costs per
vaccinated individual increased from 1.89 US$ from the baseline model to 6.81 US$ keeping
the intervention not cost-efficient when using the low incidence (ICER equals 54, 335 US$).
For the high incidence, the vaccination strategy turns from cost-saving to highly cost-efficient
at the one times GDP level with an ICER of 1,505 US$ per QALY gained.
Also, uncertainty concerning treatment costs is high. Shepard et al. (2011) estimate the
economic impact of dengue in the Americas and evaluate direct medical and non-medical
costs as well as indirect costs for ambulatory and hospitalized cases where the authors assume
that DF are almost exclusively treated in an ambulatory setting while DHF is predominantly
in an inpatient setting. The average total costs per dengue case reported by Shepard et al.
(2011) are 155 US$ and 392 US$, respectively, for ambulatory and hospitalized treatment in
2010 US$ value. 2015 values were yielded by use of the respective BOB/US$ exchange to
yield the BOB value, adjust for inflation and exchange back to US$. Thus, ambulatory costs
are estimated to correspond to 202.89 US$ and hospitalized 505.15US$. Those costs were
included into the model in the sense that the former cost is now attributed to both, ambulatory
DF and DHF while the hospitalization costs for DF and DHF are equal to the latter.
The resulting ICERs for the different incidence rates are -2,217 US$ and 11,767 US$ per
QALY gained for the high incidence and lab confirmed incidence, respectively. Thus, the
intervention would still be cost saving in the first scenario and non-cost-efficient in the
second. A reason for this could be the much higher costs for ambulatory treatment when
compared to the baseline scenario. Given that ambulatory cases are the predominant cases,
treatment costs increase significantly in the counterfactual non-vaccination setup. Table 2
summarizes the results from the deterministic and sensitivity analysis under both, high and
low incidence rates.
Table 2: Summary of results from deterministic and sensitivity analysis
ICER (US$
per QALY
gained)
Baseline Results Sensitivity Analysis
alternative vaccine costs alternative treatment costs
High incidence
-3,283 (CS) 15,058 (HCE) -2,217 (CS)
Low incidence
11,020 (NCE) 54, 335 (NCE) 11,767 (NCE)
Source: Own elaboration. CS: Cost-saving. NCE: Non-cost-effective. HCE: Highly cost-effective
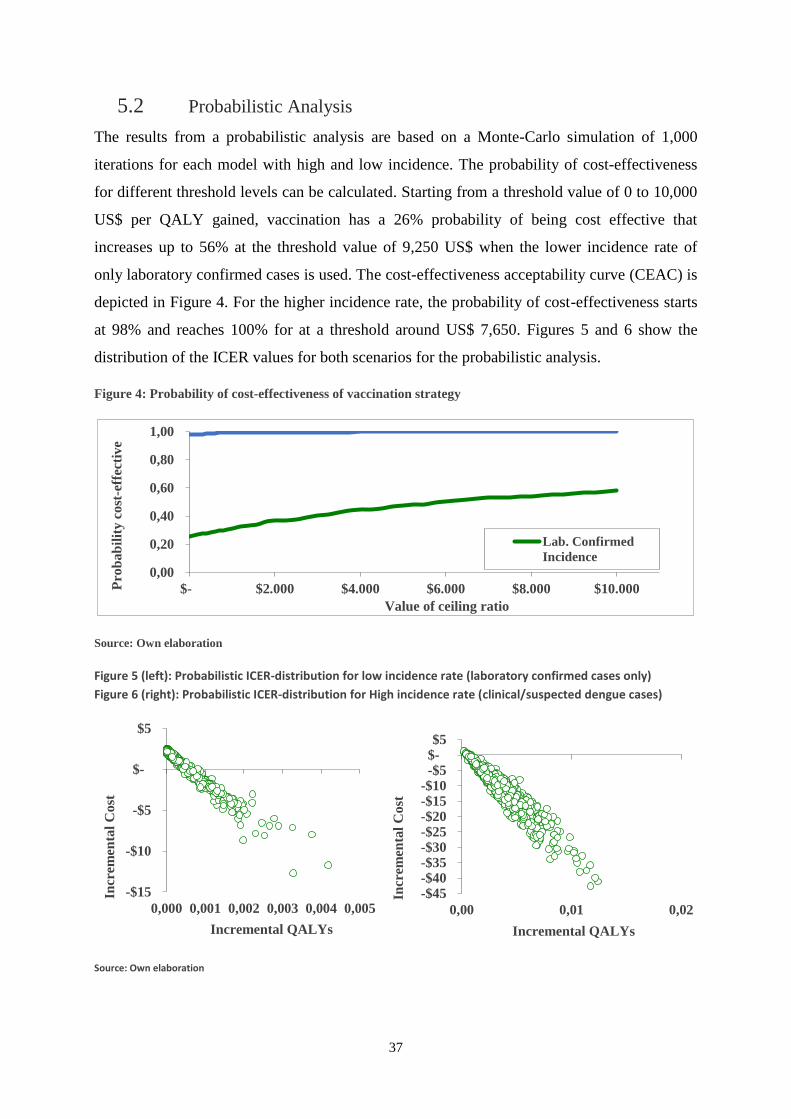
37
5.2 Probabilistic Analysis
The results from a probabilistic analysis are based on a Monte-Carlo simulation of 1,000
iterations for each model with high and low incidence. The probability of cost-effectiveness
for different threshold levels can be calculated. Starting from a threshold value of 0 to 10,000
US$ per QALY gained, vaccination has a 26% probability of being cost effective that
increases up to 56% at the threshold value of 9,250 US$ when the lower incidence rate of
only laboratory confirmed cases is used. The cost-effectiveness acceptability curve (CEAC) is
depicted in Figure 4. For the higher incidence rate, the probability of cost-effectiveness starts
at 98% and reaches 100% for at a threshold around US$ 7,650. Figures 5 and 6 show the
distribution of the ICER values for both scenarios for the probabilistic analysis.
Figure 4: Probability of cost-effectiveness of vaccination strategy
Source: Own elaboration
Figure 5 (left): Probabilistic ICER-distribution for low incidence rate (laboratory confirmed cases only)
Figure 6 (right): Probabilistic ICER-distribution for High incidence rate (clinical/suspected dengue cases)
Source: Own elaboration
0,00
0,20
0,40
0,60
0,80
1,00
$- $2.000 $4.000 $6.000 $8.000 $10.000Pro
bab
ilit
y c
ost
-eff
ecti
ve
Value of ceiling ratio
Lab. Confirmed
Incidence
-$15
-$10
-$5
$-
$5
0,000 0,001 0,002 0,003 0,004 0,005
Incr
emen
tal
Cost
Incremental QALYs
-$45-$40-$35-$30-$25-$20-$15-$10-$5 $- $5
0,00 0,01 0,02
Incr
emen
tal
Cost
Incremental QALYs
38
6. Discussion, Summary and Concluding Remarks
The results from the previous section give a hint that a vaccination campaign in Bolivia is
likely to be very cost-effective or even lead to costs savings. One main contributing factor to
this is the high incidence for dengue. However, the results rest on several assumptions that
lead to several limitations that should be kept in mind by the reader when evaluating the
results. First, cross immunity which is on average reported to be around two years (Montoya
et al., 2013), was not directly included as changes in transition probabilities depending on the
time spent in a health state was not possible in the used Markov model. An implementation of
a Markov model with weekly cycles which may have made it possible to model such cross-
immunity was considered but was abandoned due to the model becoming very unhandy18. In
the present approach, an individual can be re-infected immediately in the next cycle after
having had a previous infection. This may bias the result in favor of the cost-effectiveness. In
practice, the highest share of secondary infections within one year after a primary infection
was only 0.74%, suggesting that bias is quite small. Also, the limitation of only two infections
may be too limited but as argued in section 4.1, the existing scientific knowledge suggests that
it may not be too unrealistic.
Furthermore, immunity for lifetime is assumed for those who were successfully vaccinated or
survived any kind of natural infection. Due to the very recent development of dengue
vaccines, limited knowledge on the long-term effectivity of the disease is available. When
comparing the dengue vaccine with the vaccine against yellow fever as another arboviral
disease, though, one single vaccine dose is sufficient to grant lifelong immunity as declared in
2013 by the WHO. Thus, the practice of booster vaccination every ten years that was followed
for decades was abandoned (WHO, 2013). Similar implications may be valid for dengue,
especially since the currently most advanced anti-dengue vaccine is based on the yellow fever
vaccine.
Additionally, this thesis assumes a safe vaccine that only has beneficial effects in form of
protection against infection and reduction of the probability of hospitalization due to dengue.
This fact should be taken into account given the controversy and discussions around the safety
of the currently available dengue vaccine that this thesis used as basis (Aurelio, 2018;
Vaccineconfidence.org, 2018; Sanofi, 2018).
18When first used, the – weekly– deterministic model turned out the be very hardware demanding. Including
probabilistic modelling would have worsened the issue considerably as well.
39
Dengue fever represents a serious illness in Bolivia with a local concentration of potential
cases. The maximum vaccine price per dose for which a vaccination campaign will be cost-
effective was estimated between US$ 0.50 and US$ 4.85. This can be compared with
estimates of vaccine-dose prices for other illnesses for Bolivia. Smith et al. (2011), for
example, discuss the high comparable costs for new vaccines compared with old vaccines. In
their cost-effectiveness study for vaccination against rotavirus that causes severe
gastroenteritis among children under five years, they estimated that cost effectiveness of their
vaccine would still be given up to a per dose price of US$ 194.10 (2008) while the vaccine
was sold at US$ 9. The most important drivers of vaccine cost-effectiveness were diarrheal
mortality and hospitalization inputs. The same is the case for dengue where most cases are
asymptomatic. Given a comparably high under five mortality of 45 per 1,000 live births
(Smith et al., 2011), for which diarrheal-related deaths and hospitalizations are one large
contributor and are not geographically limited therefore explains the much higher maximum
cost per vaccine dose, compared to dengue. The high estimate of the dengue incidence for
instance is 2.27 per 1,000 individuals.
To summarize, this thesis presented the theoretic foundation of cost-effectiveness analysis
that is rooted in extra-welfarist theory. Furthermore, an overview on the use of health
measures such as DALYs or QALYs was given and this was followed by an overview on the
dengue disease to provide the reader with an idea of the cause, clinical description, diagnosis
and treatment of dengue along with a discussion on the availability and possibility to
inoculate against the illness. Based on different dengue incidence rates, a sensitivity analysis
that used alternative estimates for vaccine price costs as well as treatment costs and a
probabilistic analysis, vaccination against dengue was found to be very likely to be very cost-
effective or even cost-saving under a scenario that accounts clinical/suspected dengue
incidence. This is in line with previous studies that all found vaccination against dengue to be
cost-effective and even cost-saving in some cases. The results were based on a Markov model
that assumed a 100,000 nine-year olds to be vaccinated and followed until their statistical end
of life at age 63 whereas the immunizing effects of the vaccine were assumed to grand
lifelong immunity against all dengue serotypes.
An interesting topic for further research will be to evaluate dengue vaccine cost-effectiveness
in Bolivia using a modelling approach that allows for cross-immunity. Such a possibility
could be to use similar models as those used by Zeng et al. (2018) or Coudeville et al. (2016).
Also, with the pass of time, additional information from the trials of currently tested vaccines

40
will be available along with more data on dengue may become available for Bolivia to include
and refine the model.
41
References
Adler M. D. and Posner, E. A. (1999), ‘Rethinking Cost-Benefit-Analysis’, The Yale law
Journal, 109(2), 165–247.
Anand, S. (2002), ‘The Concern for Equity in Health’, Journal of Epidemiology and
Community Health, 56(7), 485-487.
Aronsson, T. and Johansson-Stenman, O. (2018), ‘Paternalism Against Veblen: Optimal
Taxation and Non-Respected Preferences for Social Comparisons’, American Economic
Journal: Economic Policy, 10(1), 39-76.
Aronsson, T. and Sjögren, T. (2016), ‘Quasi-Hyperbolic Discounting, Paternalism and
Optimal Mixed Taxation’, Mathematicsal Social Sciences, 84, 24-36.
Aurelio, J. M. (2018), ‘DOH Says 62 Kids May Have Died After Receiving Dengvaxia’,
Philipine Daily Inquirer, 7 April. Available from: http://newsinfo.inquirer.net/980755/doh-
says-62-kids-may-have-died-after-receiving-dengvaxia (Accessed 03.06.2018).
Banco Central de Bolivia (BCB) (2018), Cotizaciones Oficiales del Boliviano con Relación al
Dólar Estadounidense (Official Exchange Rate Boliviano – US Dollar),
https://www.bcb.gob.bo/tiposDeCambioHistorico/index.php?anio=2015 (Accessed 16.05.18).
Barton, P., Bryan, S. and Robinson, S. (2004), ‘Modelling in the Economic Evaluation of
Health Care: Selecting the Appropriate Approach’, Journal of Health Services and Research
and Policy, 9(2), 110-118.
Bergson, A. (1938), ‘A Reformulation of Certain Aspects of Welfare Economics’, Quarterly
journal of Ecomics, 52(2), 310–334.
Bernheim, D. and Rangel, A. (2007), ‘Toward Choice-Theoretic Foundations for Behavioural
Welfare Economics’, The American Economic Review, 97(2), 464-470.
Brémond, P., Roca, Y., Brenière, S. F., Walter, A., Barja-Simon, Z., Torres Fernandez, R. T.
and Vargas, J. (2015), ‘Evolution of Dengue Disease and Entomological Monitoring in Santa
Cruz, Bolivia 2002 – 2008’, PLoS ONE, 10(2), e0118337, 1-20.
Briggs, A and Sculpher, M. (1998), ‘An Introduction to Markov Modelling for Economic
Evaluation’, Pharmacoeconomics, 13(4), 397-409.
42
Briggs, A., Claxton, K. and Sculpher, M. (2006), Decision Modelling for Health Economic
Evaluation, Oxford: Oxford University Press.
Brouwer, B. F., Culyer, J. C. van Exel, N. J A. and Rutten, F. F. H. (2008), ‘Welfarism vs.
Extra-Welfarism’, journal of Health Economics, 27(2), 325–338.
Carlsson, F., Daruvala, D., Johansson‐ Stenman, O. (2005), ’Are People Inequality‐Averse, or
Just Risk‐Averse?’, Economica, 72(287), 375-396.
Clinica Del Sur (2009), La Atención de Terapia Intensiva en la Ciudad de La Paz,
http://www.clinicadelsur.com.bo/not_uti_callis.htm (Accessed 16.05.18).
Cookson, R. (2005), ‘QALY and the Capability Approach’, Health Economics, 14(8), 817–
829.
Couvdeville, L., Baurin, N., L’Azou, M. and Guy, B. (2016), ‘Potential Impact of Dengue
Vaccination: Insights From Two Large-Scale Phase III Trials With a Tetravalent Dengue
Vaccine’, Vaccine, 34, 6426-6435.
Drummond, M. F., Sculpher, M. J., Claxton, K. Stoddardt, G. L. and Torrance G. W. (2015),
Methods for the Economic Evaluation of Health Care Programmes, Fourth Edition, Oxford:
Oxford University Press.
Economic Commission for Latin America and the Caribbean (CEPAL) (2010), ‘Evaluación
de la Epidemia de Dengue en el Estado Plurinacional de Bolivia en 2009’, Report LC/W.282,
Santiago de Chile: United Nations, 1-65.
Euroqol (2018), EQ-5D Instruments. About EQ-5D, https://euroqol.org/eq-5d-instruments/
(Accessed 25.04.2018).
Folkesson, H. (2017), ‘How Much Are You Willing to Sacrifice to Reduce Inequality?: An
Experimental Analysis of Individuals’ Preferences for Inequality in Income and Health’,
Master Dissertation at Umeå School of Business and Economics, retrieved from
http://urn.kb.se/resolve?urn=urn:nbn:se:umu:diva-137364 (Accessed: 21.05.2018).
Garske T., Van Kerkhove M. D., Yactayo, S., Ronveaux O., Lewis R. F., Staples, J.E., Perea,
W., Ferguson, N. M. (2014), ‘Yellow Fever in Africa: Estimating the Burden of Disease and
Impact of Mass Vaccination from Outbreak and Serological Data’, PLOS Medicine 11(5): 1-
17.
43
Gibbons, R. V., Kalanarooj, S. K., Jarman, R. G., Nisalak, A., Vaughn, D. W., Endy, P. E.,
Mammen, M. P. and Srikiatkhachorn, A. (2007), ‘Analysis of Repeat Hospital Admissions for
Dengue to Estimate the Frequency of Third or Fourth Dengue Infections Resulting in
Admissions and Dengue Hemorrhagic Fever, and Serotype Sequences’, American Journal of
Tropical Medicine and Hygiene, 77(5), 910-913.
Gubler, D. J. and Clark, G. G. (1995), ‘Dengue/Dengue Hemorrhagic Fever: The Emergence
of a Global Health Problem’, Emerging Infectious Diseases, 1(2), 55–57
Guzman, A. and Istúriz, R. E. (2010), ‚Update on the Global Spread of Dengue’, International
Journal of Antimicrobial Agents, 36(S), S40-S42.
Guzman, M. G and Harris, E. (2015), ‚Dengue‘, Lancet, 385(9966), 453-465.
Guzman, M. G. and Kouri, G. (2002), ‘Dengue: An Update’, Lancet Infectious Diseases, 2(1),
33–42.
Hotez P.J., Alvarado M., Basanez M-G, et al. (2014), ‘The Global Burden of Disease Study
2010: Interpretation and Implications for the Neglected Tropical Diseases’, PLoS Neglected
Tropical Diseases, 8(7), e2865.
Hurley, J. (2000),’An Overview of the Normative Economics of the health Sector’, in: Culyer,
A. J. and Newhouse, J. P., Handbook of Health Economics, Volume 1A, Amsterdam.:
Elsevier Science, 55-110.
Institute for Health Metrics and Evaluation (IHME) (2018), GBD History,
www.healthdata.org/gbd/about/history (Accessed 26.04.18).
Instituto Nacional de Estadística (INE) (2018), Estadísticas del Mercado Laboral,
https://www.ine.gob.bo/index.php/mercado-laboral/introduccion (Accessed 13.05.2018).
Johannesson, M. (1995), ‘The Relationship between Cost-Effectiveness Analysis and Cost-
Benefit Analysis’, Social Science and Medicine, 41(4), 483–489.
Johansson‐Stenman, O., Carlsson, F., and Daruvala, D. (2002), ‘Measuring Future
Grandparents' Preferences for Equality and Relative Standing’, The Economic Journal,
112(479), 362-383.
Katzelnick, L. C., Coloma, J. and Harris, E. (2016), ‘Dengue: Knowledge Gaps, Unmet
Needs, and Research Priorities’, Lancet Infectious Diseases, 17(3), e88-e100.
44
Kyle, J. L. and Harris, E. (2008), ‘Global Spread and Persistence of Dengue’, Annual Review
of Microbiology, 62, 71-92.
Lorgelly, P. K., Doble, B., Rowen, D. and Brazier, J. (2017), ‘Condition-Specific or Generic
Preference-Based Measures in Oncology? A Comparison of the EORTC-8D and the EQ-5D-
3L’, Quality of Life Research, 26(5), 1163-1176.
Messina, J. P., Brady, O. J., Scott, T. W., Zou, C., Pigott, D. M., Duda, K. A., Bhatt, S.,
Katzelnick, L., Howes, R. E., Battle, K. E., Simmons, C. P. and Hay, S. I. (2014), ‘Global
Spread of Dengue Virus Types: Mapping the 70 Year History’, Trend in Microbiology, 22(3),
138-146.
Moll, D. (2017), ‘Warum Sanofi vom Eigenen Impfstoff Abrät’, Deutsche Apotheker Zeitung
(DAZ), 06.12.2017, online edition: https://www.deutsche-apotheker-
zeitung.de/news/artikel/2017/12/06/warum-sanofi-vom-eigenen-impfstoff-abraet/chapter:1
(Accessed 02.05.2018).
Montoya, M., Gresh, L., Mercado, J. C., Williams, K. L., Vargas M. J., Gutierrez, G., Kuan,
G., Gordon, A., Balmaseda, A. and Harris, E. (2013), ‘Symptomatic Versus Inapparent
Outcome in Repeat Dengue Virus Infections Is Influenced by the Time Interval between
Infections and Study Year’, PLoS Neglected Tropical Diseases, 7(8), e2357, 1-10.
Mstrust (2018), Expanded Disability Status Scale (EDSS), https://www.mstrust.org.uk/a-
z/expanded-disability-status-scale-edss (accessed 25.04.2018).
Neumann, P. J., Goldie S. J. and Weinstein, M. C. (2000), ‘Preference-Based Measures in
Economic Evaluation in Health Care’, Annual Review of Public Health, 21(1), 587-611.
Orellano, P. W. and Salomon, O. D. (2016), ‘Will Dengue Vaccination be Cost-Effective for
Argentina? Reply to Letter by Urueña et al. Regarding “Cost-Utility Analysis of Dengue
Aaccination in a Country with Heterogeneous Risk of Dengue Transmission”’, Vaccine,
34(28), 3221.
Orellano, P. W., Itati Reynoso, J., Stahl, H.-C. and Salomon, O. D. (2016), ‘Cost-Utility
Analysis of Dengue Vaccination in a Country With Heterogeneous Risk of Dengue
Transmission’, Vaccine, 34(5), 616-621.
Pan American Health Organization (PAHO) (1997), ‘Plan Continental de Ampliación e
Intensificación del Combate al Aedes Aegypti. Informe de un Grupo de Trabajo’, Report,
45
Caracas, Venezuela. Washington, DC . Available online under:
http://www.paho.org/Spanish/AD/DPC/CD/doc407.pdf (accessed 19.04.2018).
Pan American Health Organization (PAHO) (2010), ‘Guías de Atención Para Enfermos de
Dengue en la Région de las Américas’, Report, La Paz: PAHO, 1-47.
Pan American Health Organization (PAHO) (2018), Dengue: Data, Maps and Statistics,
https://www.paho.org/hq/index.php?option=com_topicsandview=readallandcid=3273
(Accessed 11.05.2018).
Portnoy, A., Ozawa, S., Grewal, S., Norman, B. A., Rajgopal, K. M., Haidari, L. A., Brown,
S. T., and Lee, B. Y. (2015), ‘Costs of Vaccine Programs Across 94 Low- and Middle-Income
Countries’, Vaccine, 33(Supplement 1), A99-A108.
Prieto, L and Sacristán, J. A. (2003), ‘Problems and Solutions in Calculating Quality-
Adjusted Life Years (QALYs)’, health and Quality of Life Outcomes, 1, 80-88.
RAND (2018), 36-Item Short Form Survey (SF-36),
https://www.rand.org/health/surveys_tools/mos/36-item-short-form.html (Accessed
25.04.2018).
Rawls, J. (1971). A theory of justice. New York: Oxford University Press.
Rigau-Perez, J. G., Gubler, D. J., Vorndam, A. V. and Clark, G. G. (1994), ‘Dengue
Surveillance. United States. 1986-1992’, Morbidity and Mortality Weekly Report CDC
Surveillance Summary, 43(2), 7–19.
Roca Y., Avila C., Galarza E., Pachuri J., Vargas J., Walter A., and Herve J. P. (2009),
‘Caracteristicas de las Epidemias de Dengue en la Ciudad de Santa Cruz (2003–2007)’,
Revista de Enfermedades Infecciosas y Tropicales, 1, 6–11.
Sanofi (2018), Sanofi Maintains Confidence in Dengvaxia® Vaccine,
http://mediaroom.sanofi.com/sanofi-maintains-confidence-in-dengvaxia-vaccine/ (Accessed
03.06.2018).
Sassy, F. (2006),’ Calculating QALYs, Comparing QALY and DALY Calculations’, Health
Policy and Planning, 21(5), 402-408.
Scott, L. J. (2016), ‘Tetravalent Dengue Vaccine: A Review in the Prevention of Dengue
Disease’, Drugs, 76, 1301-1312.
46
Sen, A. (1977), ‘Rational Fools: A Critique of the Behavioral Foundations of Economic
Theory’, Philosophy and Public Affairs, 6(4), 317–344.
Sen, A. (1985). Commodities and Capabilities, Amsterdam: North-Holland.
Sen, A. (2002), ‘Why Health Equity’, Health Economics, 11(8), 659-666.
Shafie, A. A., Yeo, H. Y., Coudeville, L., Steinberg, L., Gill, B. S., Jahis, R. and HSS, A-S.
(2017), ‘The Potential Cost Effectiveness of Different Dengue Vaccination Programmes in
Malaysia: A Value-Based Pricing Assessment Using Dynamic Transmission Mathematical
Modelling’, Pharmaeconomics, 35, 575-589.
Shepard, D. S., Coudeville, L., Halasa, Y. A., Zambrano, B. and Dayan, Gustavo (2011),
Economic Impact of Dengue Illness in the Americas, American Journal of Medicine and
Hygiene, 84(2), 200-207.
Shim, E. (2017a), ‘Cost-Effectiveness of Dengue Vaccination Programs in Brazil’, American
Journal of Tropical Medicine and Hygiene, 96(5), 1227-1234.
Shim, E. (2017b), ‘Cost-Effectiveness of Dengue Vaccination in Yucatán, Mexico Using a
Dynamic Dengue Transmission Model’, PLoS ONE, 12(4), e0175020, 1-17.
Simoy M. I., Simoy M. V., Canziani G. A. (2015), ‘The Effect of Temperature on the Popula-
tion Dynamics of Aedes Aegypti’, Ecological Modelling, 314, 100-110.
Srikiatkhachorn, A. (2009), ‘Plasma Leakage in Dengue Hemorrhagic Fever’, Thrombosis
and Haemostasis, 102(6), 1042-1049.
Stanaway J. D., Shepard, D. S., Undurraga, E. A., Coffeng, L. E., Brady, O. J., Hay, S. I.,
Bedi, N., Bensenor, I. M., Castaneda-Orjuela, C. A., Chuang, T. W., Gibney, K. B., Memish,
Z. A., Rafay, A., Ukwaja,K. N., Yonemoto, N. and Murray, C. J. L. (2016), ‘The Global
Burden of Dengue: An Analysis From the Global Burden of Disease Study 2013’, Lancet
Infectious Diseases, 16(6), 712–723.
Suaya, J. A., Shepard, D. S., Chang, M. S., Caram, M., Hoyer, S., Socheat, D., Chantha, N.
and Nathan, M. B. (2007), ‘Cost-Effectiveness of Annual Targeted Larviciding Campaigns in
Cambodia Against the Dengue Vector Aedes Aegypti, Tropical Medical International Health,
12(9), 1026–1236.
Tobin, J. (1970). ‘On Limiting the Domain of Inequality’, The Journal of Law and
Economics, 13(2), 263-277.
47
Vaccineconfidence.org (2018), Philippines: Dengvaxia Scare -Turning A Serious Health Issue
To A Political Witch-Hunt, http://www.vaccineconfidence.org/philippines-dengvaxia-scare-
turning-serious-health-issue-political-witch-hunt/ (Accessed 03.06.2018).
Walker, S., Sculpher, M. and Drummond, M. (2011), ‘The Methods of Cost-Effectiveness
Analysis to Inform Decisions About the Use of Health Care Interventions and Programs’, in:
Glied, S. and Smith, P. C., The Oxford Handbook of health Economics, Oxford: Oxford
University Press, 733-758.
Weinstein, M. C., Torrance G. and McGuire, A. (2009), ‘QALYs: The Basics‘, Value in
Health, 12(S1), S5-S9.
Whitehead, S. J. and Ali, S. (2010), ‘Health Outcomes in Economic Evaluation: The QALY
and Utilities’, British Medical Bulletin, 96, 5-21.
Williams, A. (1997), ‘Intergenerational Equity: An Exploration of the ‘Fair Innings’
Argument’, Health Economics, 6(2), 117–132.
Woods B. S., Revill P., Sculpher M. J., and Claxtoon K. (2016), ‘Country-Level Cost-
Effectiveness Thresholds: Tnitial Estimates and the Need for Further Research’, Value in
Health, 19, 929-935.
World Bank (2018a), Life expectancy at birth, total (years),
https://data.worldbank.org/indicator/SP.DYN.LE00.IN?end=2016andlocations=BOandstart=2
002 (Accessed 11.05.2018).
World Bank (2018b), World Bank 2018a, Life expectancy at birth, total (years),
https://data.worldbank.org/indicator/NY.GDP.PCAP.CD (Accessed 20.05.2018).),
https://data.worldbank.org/indicator/SP.DYN.LE00.IN?end=2016andlocations=BOandstart=2
002 (Accessed 11.05.2018).
World Health Organization (WHO) (1997), Dengue Hemorrhagic Fever. Diagnosis,
Treatment, Prevention and Control, Second Edition, Geneva. Available online under
http://www.who.int/csr/resources/publications/dengue/Denguepublication/en/ (Accessed
19.04.18).
World Health Organization (WHO) (2004), Global Burden of Disease 2004 Update:
Disability Weights for Diseases and Conditions,
www.who.int/healthinfo/global_burden_disease/GBD2004_DisabilityWeights.pdf?ua=1
(Accessed 26.04.18).
48
World Health Organization (WHO) (2007), Report of the Scientific Working Group on
Dengue, Report, Geneva. Available online under:
www.who.int/tdr/publications/documents/swg_dengue_2.pdf (Accessed 19.04.2018).
World Health Organization (WHO) (2009), ‘Dengue. Guidelines for Diagnosis, Treatment,
Prevention and Control’, New Edition 2009, Report, Geneva: WHO.
World Health Organization (WHO) (2011), Expert Commitee On Biological Standardization,
Guidelines on the Quality, Safety and Efficacy of Dengue Tetravalent 11 Vaccines (Live,
Attenuated), WHO/BS/11.2159,
http://www.who.int/biologicals/BS2159_Dengue_WITH_LINE_NUMBERS_TRS_v47_18Ju
l2011_sub2.pdf (Accessed 02.05.2018)
World Health Organization (WHO) (2013), ‘Vaccines and Vaccination Against Yellow
Fever’, WHO Position Paper – June 2013. Weekly Epidemiological record, 27: 269-284.
World Health Organization (WHO) (2014), Dengue and Severe Dengue. Factsheet no. 117,
http://www.searo.who.int/thailand/factsheets/fs0008/en/ (Accessed 19.04.2018).
World Health Organization (WHO) (2016), Dengue Background Paper on Dengue Vaccines,
Prepared by the SAGE Working Groupon Dengue Vaccines and WHO Secretariat, 17 March
2016,
http://www.who.int/immunization/sage/meetings/2016/april/1_Background_Paper_Dengue_V
accines_2016_03_17.pdf?ua=1 (Accessed 02.05.2018).
World Health Organization (WHO) (2017a), Updated Questions and Answers related to
information presented in the Sanofi Pasteur press release on 30 November 2017 with regards
to the dengue vaccine Dengvaxia,
http://www.who.int/immunization/diseases/dengue/q_and_a_dengue_vaccine_dengvaxia/en/
(Accessed 19.04.2018).
World Health Organization (WHO) (2017b), Dengue vaccine research,
http://www.who.int/immunization/research/development/dengue_vaccines/en/ (Accessed
19.04.2018).
World Health Organization (WHO) (2017c), Updated Questions and Answers related to
information presented in the Sanofi Pasteur press release on 30 November 2017 with regards
to the dengue vaccine Dengvaxia®,
49
http://www.who.int/immunization/diseases/dengue/q_and_a_dengue_vaccine_dengvaxia/en/
(Accessed 02.05.2018).
World Health Organization (WHO) (2018a), Metrics: Disability-Adjusted Life Year (DALY),
www.who.int/healthinfo/global_burden_disease/metrics_daly/en/ (Accessed 26.04.18).
World Health Organization (WHO) (2018b), Disability weights, discounting and age
weighting of DALYs,
www.who.int/healthinfo/global_burden_disease/daly_disability_weight/en/ (Accessed
26.04.18).
Zeng, W., Halasa-Rappel, Y. A., Baurin, N., Coudeville, L. and Shepard, D. S. (2018), ‘Cost-
Effectiveness of Dengue Vaccination in Ten Endemic Countries’, Vaccine, 36, 413-420.
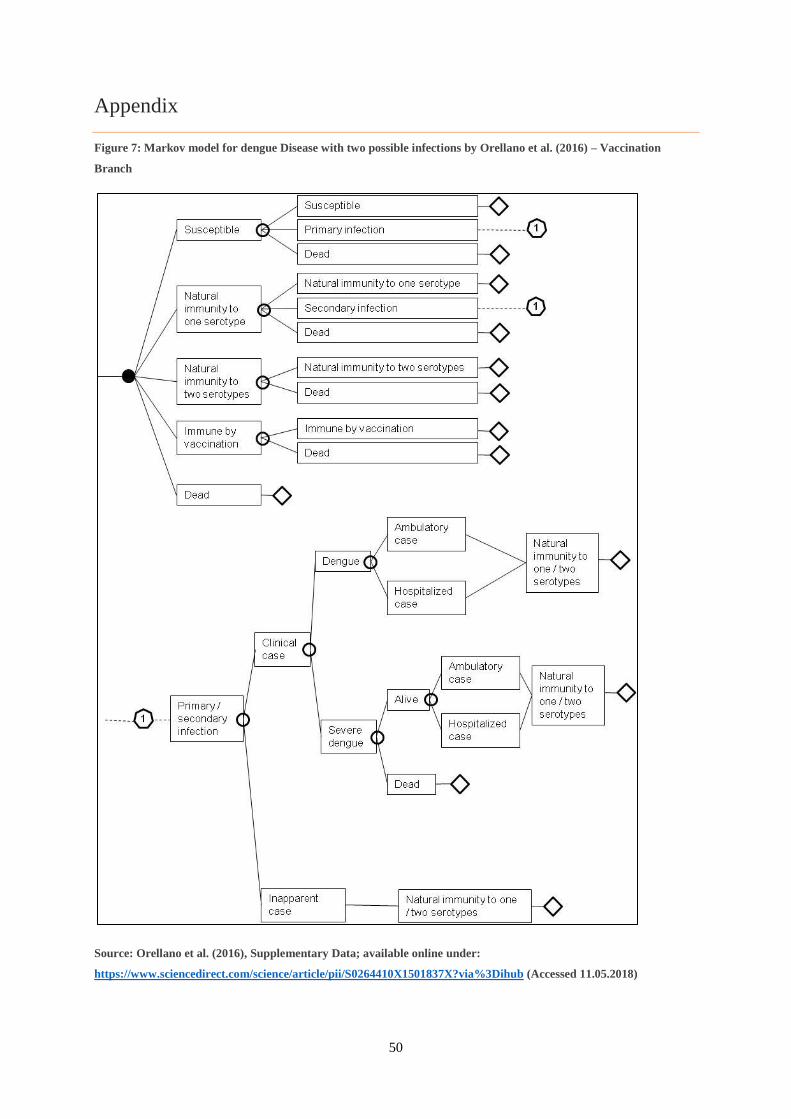
50
Appendix
Figure 7: Markov model for dengue Disease with two possible infections by Orellano et al. (2016) – Vaccination
Branch
Source: Orellano et al. (2016), Supplementary Data; available online under:
https://www.sciencedirect.com/science/article/pii/S0264410X1501837X?via%3Dihub (Accessed 11.05.2018)