a bim-based ar defect management system for construction
TRANSCRIPT
�����������������
Citation: May, K.W.; KC, C.; Ochoa,
J.J; Gu, N.; Walsh, J.; Smith, R.T.;
Thomas, B.H. The Identification,
Development, and Evaluation of
BIM-ARDM: A BIM-Based AR Defect
Management System for
Construction Inspections. Buildings
2022, 12, 140. https://doi.org/
10.3390/buildings12020140
Academic Editor: Xianbo Zhao
Received: 24 December 2021
Accepted: 24 January 2022
Published: 28 January 2022
Publisher’s Note: MDPI stays neutral
with regard to jurisdictional claims in
published maps and institutional affil-
iations.
Copyright: © 2022 by the authors.
Licensee MDPI, Basel, Switzerland.
This article is an open access article
distributed under the terms and
conditions of the Creative Commons
Attribution (CC BY) license (https://
creativecommons.org/licenses/by/
4.0/).
buildings
Article
The Identification, Development, and Evaluation ofBIM-ARDM: A BIM-Based AR Defect Management System forConstruction InspectionsKieran W. May * , Chandani KC , Jose Jorge Ochoa , Ning Gu , James Walsh , Ross T. Smithand Bruce H. Thomas
Australian Research Centre for Interactive and Virtual Environments, University of South Australia,Adelaide, SA 5095, Australia; [email protected] (C.K.); [email protected] (J.J.O.);[email protected] (N.G.); [email protected] (J.W.); [email protected] (R.T.S.);[email protected] (B.H.T.)* Correspondence: [email protected]
Abstract: This article presents our findings from a three-stage research project, which consists ofthe identification, development, and evaluation of a defect management Augmented Reality (AR)prototype that incorporates Building Information Modelling (BIM) technologies. Within the firststage, we conducted a workshop with four construction-industry representatives to capture theiropinions and perceptions of the potentials and barriers associated with the integration of BIM and ARin the construction industry. The workshop findings led us to the second stage, which consisted of thedevelopment of an on-site BIM-based AR defect management (BIM-ARDM) system for constructioninspections. Finally, a study was conducted to evaluate BIM-ARDM in comparison to the currentpaper-based defect management inspection approach employed on construction sites. The findingsfrom the study revealed BIM-ARDM significantly outperformed current approaches in terms ofusability, workload, performance, completion time, identifying defects, locating building elements,and assisting the user with the inspection task.
Keywords: Augmented Reality; mixed reality; Building Information Modelling; defect management;construction inspection; quality assurance; immersive visualisation
1. Introduction
Within the last decade, Building Information Modelling (BIM) has received increasedattention from the academic community with a trend towards integrating BIM within thearchitectural design process (Figure 1). BIM improves the quality of the documentationproduced, enabling the BIM model to be leveraged throughout the construction-projectlife-cycle. Due to the comprehensive data provided by BIM models, advanced visualisationtools such as Augmented Reality (AR) and Virtual Reality (VR) have been recognized aseffective media to visualise and interact with BIM data. AR is defined as a tool that combinesthe real and virtual worlds by superimposing virtual content onto the physical world.Using this concept, researchers have explored the integration of AR with BIM models in theconstruction-project life-cycle. Some common examples include Safety and Training [1,2],Risk Management [3,4], Architectural Design [5–7], Facilities Management [8,9], Educationand Learning [10,11], and Building Performance Simulation [12,13].
In this article, we present our findings from a three-stage research project consisting ofthe identification, development, and evaluation of a BIM-based AR defect management(BIM-ARDM) system for conducting on-site construction inspections. In the first stage, weidentified and examined the current uses, barriers, and potential uses for the integrationof immersive AR and BIM within the Architecture, Engineering, and Construction (AEC)
Buildings 2022, 12, 140. https://doi.org/10.3390/buildings12020140 https://www.mdpi.com/journal/buildings
Buildings 2022, 12, 140 2 of 30
industries. This was achieved by conducting a workshop consisting of focus-group inter-views with four construction-industry representatives, each with varying roles and levelsof experience working in the construction industry.
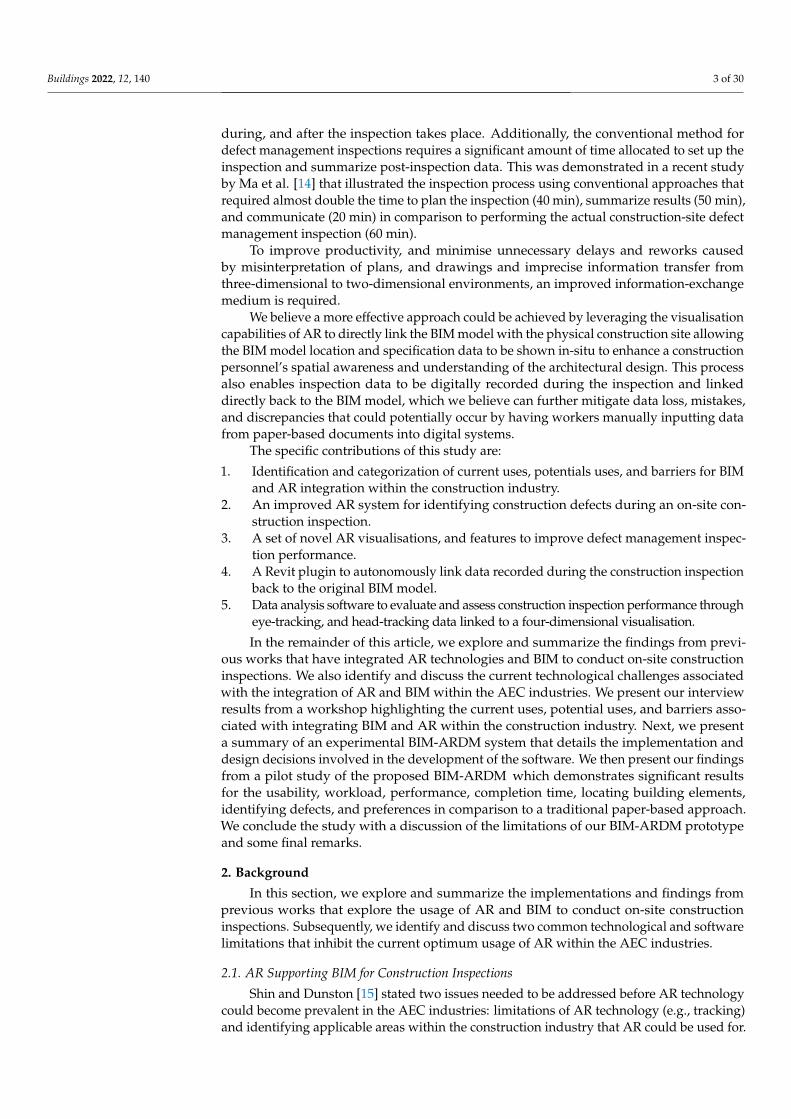
Figure 1. The growth of BIM and BIM + AR based on the yearly Google Scholar article mentions(patents and citations excluded). The following query terms were used: BIM—(“Building InformationModeling” OR "Building Information Modelling”), BIM + AR—(“Building Information Modeling”OR “Building Information Modelling”), AND (“Augmented Reality” OR “AR” OR “Mixed Reality”).
The findings from this workshop led us to the second stage, which consisted ofthe development of an on-site defect management BIM-ARDM prototype. The technicalimplementation was designed to address the concerns and potential features highlightedby the industry representatives during the focus-group interviews. In the subsequent thirdstage, we conducted a pilot study with 11 participants to evaluate the experimental BIM-ARDM system by comparing it to the current defect management techniques employed inthe construction industry.
Currently, digital technologies have not been adequately adopted in the constructionindustry, and their potential is yet to be fully exploited. Current construction processes suchas conducting defect management inspections on buildings remain relatively traditionaland primarily consist of extracting analogue drawings and building information datafrom BIM models and printing them as paper-based documents to use during the on-siteconstruction inspection. Due to the level of detail required for construction personnel tosufficiently conduct defect management inspections, a significant amount of paper-baseddocuments are generally required on-site. Whilst conducting the inspection, analoguedrawings of the architectural model are used as a reference by the inspector to comparehow elements, such as a light switch or door, compare to the architectural plans.
Identifying construction defects from printed drawings can be challenging and re-quires extensive training to precisely read the 2D drawings and understand their spatiallocation in the physical space. During the inspection, building-defect data are managedby writing inspections notes onto a paper-based or digital checklist. Due to the conven-tional approach for conducting on-site inspections involving a highly manual component,this process could potentially lead to errors, mistakes, or loss of data occurring before,
Buildings 2022, 12, 140 3 of 30
during, and after the inspection takes place. Additionally, the conventional method fordefect management inspections requires a significant amount of time allocated to set up theinspection and summarize post-inspection data. This was demonstrated in a recent studyby Ma et al. [14] that illustrated the inspection process using conventional approaches thatrequired almost double the time to plan the inspection (40 min), summarize results (50 min),and communicate (20 min) in comparison to performing the actual construction-site defectmanagement inspection (60 min).
To improve productivity, and minimise unnecessary delays and reworks causedby misinterpretation of plans, and drawings and imprecise information transfer fromthree-dimensional to two-dimensional environments, an improved information-exchangemedium is required.
We believe a more effective approach could be achieved by leveraging the visualisationcapabilities of AR to directly link the BIM model with the physical construction site allowingthe BIM model location and specification data to be shown in-situ to enhance a constructionpersonnel’s spatial awareness and understanding of the architectural design. This processalso enables inspection data to be digitally recorded during the inspection and linkeddirectly back to the BIM model, which we believe can further mitigate data loss, mistakes,and discrepancies that could potentially occur by having workers manually inputting datafrom paper-based documents into digital systems.
The specific contributions of this study are:
1. Identification and categorization of current uses, potentials uses, and barriers for BIMand AR integration within the construction industry.
2. An improved AR system for identifying construction defects during an on-site con-struction inspection.
3. A set of novel AR visualisations, and features to improve defect management inspec-tion performance.
4. A Revit plugin to autonomously link data recorded during the construction inspectionback to the original BIM model.
5. Data analysis software to evaluate and assess construction inspection performance througheye-tracking, and head-tracking data linked to a four-dimensional visualisation.
In the remainder of this article, we explore and summarize the findings from previ-ous works that have integrated AR technologies and BIM to conduct on-site constructioninspections. We also identify and discuss the current technological challenges associatedwith the integration of AR and BIM within the AEC industries. We present our interviewresults from a workshop highlighting the current uses, potential uses, and barriers asso-ciated with integrating BIM and AR within the construction industry. Next, we presenta summary of an experimental BIM-ARDM system that details the implementation anddesign decisions involved in the development of the software. We then present our findingsfrom a pilot study of the proposed BIM-ARDM which demonstrates significant resultsfor the usability, workload, performance, completion time, locating building elements,identifying defects, and preferences in comparison to a traditional paper-based approach.We conclude the study with a discussion of the limitations of our BIM-ARDM prototypeand some final remarks.
2. Background
In this section, we explore and summarize the implementations and findings fromprevious works that explore the usage of AR and BIM to conduct on-site constructioninspections. Subsequently, we identify and discuss two common technological and softwarelimitations that inhibit the current optimum usage of AR within the AEC industries.
2.1. AR Supporting BIM for Construction Inspections
Shin and Dunston [15] stated two issues needed to be addressed before AR technologycould become prevalent in the AEC industries: limitations of AR technology (e.g., tracking)and identifying applicable areas within the construction industry that AR could be used for.
Buildings 2022, 12, 140 4 of 30
The researchers identified eight tasks where AR could benefit the construction industry:layout, excavation, positioning, inspection, coordination, supervision, commenting, andstrategising. The following year Shin and Dunston [16] presented ARCam: an AR-basedprototype aimed at improving the performance of steel-column inspections. The hardwareconsisted of a mounted stationary video camera attached to a HiBall-3100 tracking system.Inspectors observed virtual content superimposed onto the physical steel columns througha traditional touch-screen display. A study with sixteen graduate civil engineering studentswas conducted to compare ARCam with conventional methods for steel-column inspections.The findings demonstrated that ARCam required less task load based on the NASA-Task-Load-Index results [17] and was a more intuitive mode of operation for conducting theinspection task. However, conventional methods outperformed ARCam in regards toinspection precision and performance. The authors concluded the graphical appearance ofthe virtual model, tracking, and calibration set up all required improvements to improvethe feasibility of ARCam.
In recent years, researchers have utilized more modern immersive AR displays forconstruction-based inspections. Portalés et al. [18] developed an AR tablet-based on-site inspection tool that incorporated visualisations to superimpose virtual content ontoprefabricated buildings. Similarly, García-Pereira et al. [19] presented an annotation-based tablet AR inspection tool for prefabricated buildings. The system consisted of avisualisation that allowed inspectors to change the transparency of the virtual buildingmodel by manipulating the value of a virtual slider. Various types of annotations were alsoincorporated into the system including text-based annotations, photographic annotations,and 2D-drawing annotations. A study with 11 participants that had previous experience inconstruction-based inspections was conducted to test the various functions in the system.Participants were tasked to calibrate the virtual model, change the transparency of thevirtual model, revisit a pre-existing annotation, make two new annotations, revisit oneof their own annotations, and delete an annotation. The results from the study showedthat the usability of the system received an 81.36 (excellent) ranking based on the SystemUsability Scale (SUS) [20]. A Likert-based ranking (1 strongly disagree to 5 strongly agree)revealed participants believed the presented system could reduce the inspection time(mean = 4.18), improve documentation during the inspection process (mean = 4.09), besuitable for real work environments (mean = 4.45), and be valuable for documenting thegeometry of elements during inspections (mean = 4.73).
Feng et al. [21] used the HoloLens to develop an AR-based inspection tool thatsuperimposed BIM models onto a physical construction site. The researchers utilizedan AR-based interface allowing inspectors to check off construction elements within avirtual holographic checklist. Park et al. [22] proposed a conceptual proactive constructiondefect management framework that integrated BIM, AR, and data-collection methods toimprove upon the conventional manual construction-inspection processes. The proposedframework presents a solution to address each of the three stages required in a typicalknowledge-management process: 1. capture, 2. retrieval, and 3. reuse. The presentedsolutions consisted of (1) a proposed data-collection template to improve the quality ofdata captured during the inspection, (2) a defect domain ontology for improved retrievaland access of defect data, and (3) an AR-based system that incorporates image-matchingtechniques to overcome the conventional manual construction-inspection practices. Thefollowing year Kwon and Park et al. [23] presented two AR-based prototypes to conductdefect management inspections both remotely and on-site. The remote system consistedof having an on-site worker take a picture of the physical element, which is relayedinto a server. The 2D image is then run through an image-matching system to identifythe corresponding virtual element to compare the differences between the physical andvirtual elements. The on-site defect management system consisted of a mobile-based ARapplication that superimposed virtual building models onto the physical building usinga marker-based tracking technique. Zhou et al. [24] developed an AR system to inspectsegment displacement during tunnel construction. Th eresults from a case study comparing
Buildings 2022, 12, 140 5 of 30
the proposed AR system to conventional methods demonstrated that the AR system canreduce the total duration of the inspection. Furthermore, participants claimed the ARsystem was more intuitive and overall a more-effective approach to diagnose segmentdisplacement in comparison to conventional methods. Other works have proposed theusage of an IFC-based framework to improve the interoperability of equipment used toconduct self-inspections of buildings [25].
Other prototypes that do not directly support AR, but that demonstrated potential ben-efits for construction inspections, were presented by Ma et al. [14]. The authors proposeda non-immersive collaborative tablet-based quality-management inspection applicationthat integrated BIM models and indoor positioning. The system was tested by having aconstruction manager conduct an on-site inspection using both the proposed tablet-basedsystem and a traditional paper-based system. The results revealed that the constructionmanager spent approximately 30% more time using the proposed tablet-based system forconducting the actual on-site inspection. However, taking into consideration other factorsassociated with the entire inspection process (i.e., inspection-task planning, inspectionresults summarizing, and communication), the researchers concluded the system couldsave approximately 50% of the time for the entire inspection process. The results fromthis test were shown to seven construction site engineers to gather qualitative feedback onthe system. The engineers stated the ability to avoid manually entering inspection datafrom paper records into computers, maintain the latest inspection progress from the BIMmodel, adhere to inspection standards, and improve stakeholder communication as the keyadvantages of the proposed tablet system.
2.2. Current Challenges
Based on our previous literature review of AR supporting BIM for construction inspec-tions and the results from our workshop, we identified two common technical limitationsthat we believe require improvements before BIM-based AR technologies can be adoptedfrom research into the construction industry. Firstly, before developing a BIM-based AR tool,a workflow is required to transfer the BIM model from a BIM-based CAD platform (e.g.,Revit) into an AR-supported software development kit (SDK) or game engine (e.g., Unityor Unreal) without loss of BIM metadata. Once this has been achieved, a tracking techniqueis then required to superimpose the virtual BIM model onto the physical construction siteat a one-to-one mapping whilst the user navigates through the environment.
2.2.1. Integrating BIM Models from CAD Platforms to Game Engines and SDKs
The lack of interoperability to communicate BIM data across different platforms hasbeen one of the primary technical barriers associated with the development of BIM-basedAR/VR prototypes built off SDKs or game engines. Currently, the Industry FoundationClass (IFC) remains the most widely adopted approach for transferring BIM models acrossplatforms. IFC is defined by BuildingSMART as a data model that “can define physicalcomponents of buildings, manufactured products, mechanical/electrical systems, structuralanalysis models, energy analysis models, cost breakdowns, work schedules, and more” [26].This process allows partial metadata associated with the BIM model to be saved within asingle file format, which can be exported and imported across BIM-based CAD platformsthat provide native IFC support. However, game engines, such as Unity, do not providenative support for IFCs, and third-party libraries [27–29] have been released to parse andimport IFC models into game engines. The primary limitation associated with IFC is thatonly specific metadata associated with the BIM model are maintained that can result in asignificant loss of BIM metadata when exporting from the native CAD format (e.g., rvt fileformat) to IFC.
However, recently, the Unity Development team released Unity Reflect: A softwarepackage that creates a natural uni-directional linkage between a CAD platform (Revit)and the Unity game engine (https://unity.com/products/unity-reflect, accessed on 20
Buildings 2022, 12, 140 6 of 30
December 2021). Although, future work is still required to achieve a natural bi-directionalexchange of BIM data between CAD platforms and game engines.
2.2.2. Tracking and Registration
The tracking accuracy associated with the alignment of virtual holographic modelsonto the physical world remains one of the prominent ongoing research fields within the ARresearch community. Typically, AR tracking techniques [30] are camera-based, and they aredefined through two categorizations: marker-based [31] and marker-less tracking [32,33].Marker-based tracking methods rely on tracking the position of physical markers (e.g., Vu-foria [34] frame targets, image targets, QR codes, or ARToolKit markers [35]) to achieve analignment between the virtual world and the real world. Although marker-based trackingtechniques yield a more-precise tracking accuracy than marker-less techniques, specificlimitations associated with marker-based techniques make it difficult to employ within areal-world construction site. Firstly, the most obvious limitation is that physical markers arerequired for the tracking to be achieved. As a result, various physical markers would beneeded to be set up on the physical construction site, which would be tedious. Furthermore,the placement of these physical markers would have to match the exact position of corre-sponding virtual markers on the BIM model at a one-to-one mapping. This means a pointcloud or spatial map of the construction site would be required as a reference to ensure thevirtual building model is precisely placed at the corresponding position of the real-worldconstruction site.
Alternatively, marker-less tracking techniques rely strictly on the depth sensors andcameras built into the AR hardware to simultaneously map and localize the virtual worldin real time. Although currently tracking performance is sacrificed when using marker-lesstracking techniques, as AR hardware and tracking algorithms continue to advance, marker-less tracking techniques for on-site construction inspections will become more feasible.Research by Kopsida and Brilakis [36] explored three AR tracking techniques that wouldbe suitable for on-site construction inspections: model-based, marker-less using monocularSLAM, and marker-less using Red-Green-Blue—Depth (RGB-D) devices. The researchersconcluded that using the built-in RGB-D depth-sensors of devices such as the MicrosoftKinect and Google Project Tango was the most feasible out of the three marker-less trackingsolutions for on-site construction-inspection accuracy. Recent works by Hübner et al. [37]have further validated this claim by demonstrating the accuracy of RGB-D sensors built intothe Microsoft Hololens 1 Head-Mounted Display (HMD), which were capable of trackingwithin a two-centimetre accuracy in indoor environments.
3. Workshop
A workshop was conducted to facilitate focus-group interviews with four construction-industry representatives in attendance, each with different roles and levels of experienceworking within the construction industries. All participants were active professionals withmultiple years of prior experience working in the construction industry. Each participantwas selected from different construction companies to represent a range of practices inthe construction sector including sole trader, small to medium enterprises, and largerpractices. The specific roles and expertise of each participant are displayed in Table 1.Due to the data collected in the focus-group interviews being entirely qualitative, withthe workshop process involving demonstrations and open discussions, the number ofparticipants selected to take part in the workshop was purposefully kept to a smallerscale. The primary goal of this workshop was to capture the participants’ opinions andperceptions regarding the potentials and barriers associated with the integration of BIMand AR within the construction industry. Specifically, the workshop explored the followingresearch questions:
1. What is the current adoption related to the integration of BIM and AR within theconstruction industry?
Buildings 2022, 12, 140 7 of 30
2. What are the barriers associated with integrating BIM and AR within the construc-tion industry?
3. What potential scenarios across the entire construction-project life-cycle could BIMand AR be integrated for?
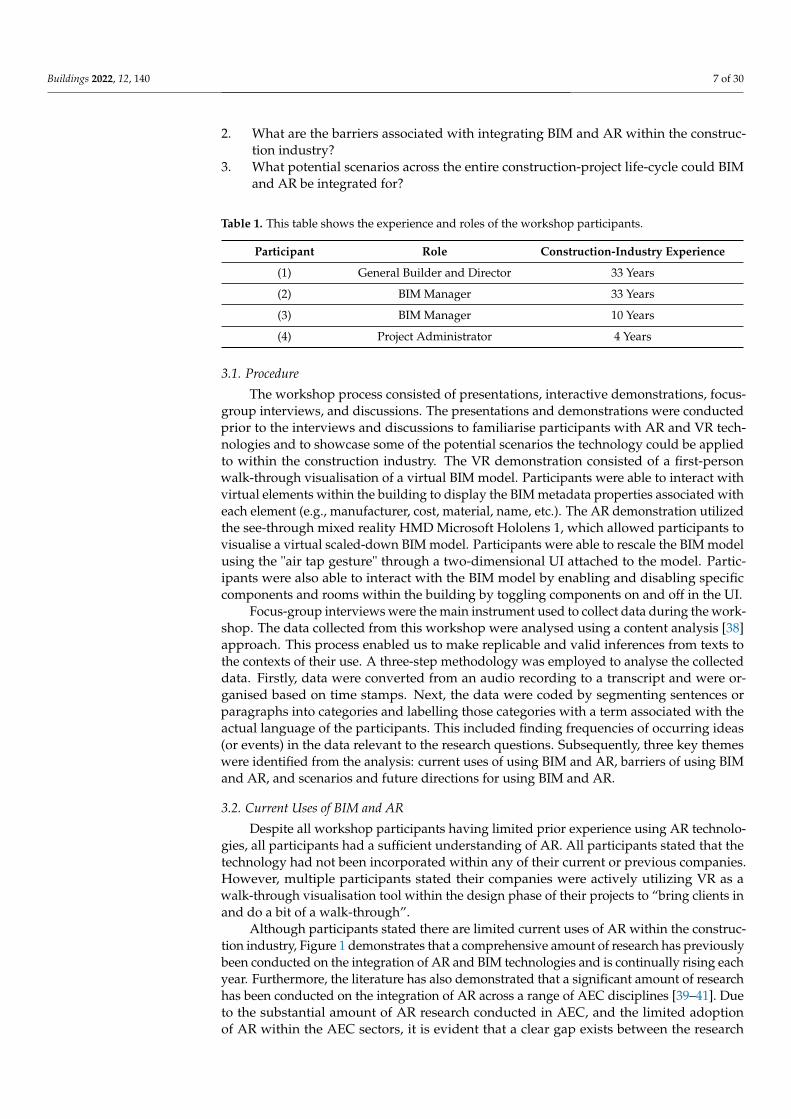
Table 1. This table shows the experience and roles of the workshop participants.
Participant Role Construction-Industry Experience
(1) General Builder and Director 33 Years
(2) BIM Manager 33 Years
(3) BIM Manager 10 Years
(4) Project Administrator 4 Years
3.1. Procedure
The workshop process consisted of presentations, interactive demonstrations, focus-group interviews, and discussions. The presentations and demonstrations were conductedprior to the interviews and discussions to familiarise participants with AR and VR tech-nologies and to showcase some of the potential scenarios the technology could be appliedto within the construction industry. The VR demonstration consisted of a first-personwalk-through visualisation of a virtual BIM model. Participants were able to interact withvirtual elements within the building to display the BIM metadata properties associated witheach element (e.g., manufacturer, cost, material, name, etc.). The AR demonstration utilizedthe see-through mixed reality HMD Microsoft Hololens 1, which allowed participants tovisualise a virtual scaled-down BIM model. Participants were able to rescale the BIM modelusing the "air tap gesture" through a two-dimensional UI attached to the model. Partic-ipants were also able to interact with the BIM model by enabling and disabling specificcomponents and rooms within the building by toggling components on and off in the UI.
Focus-group interviews were the main instrument used to collect data during the work-shop. The data collected from this workshop were analysed using a content analysis [38]approach. This process enabled us to make replicable and valid inferences from texts tothe contexts of their use. A three-step methodology was employed to analyse the collecteddata. Firstly, data were converted from an audio recording to a transcript and were or-ganised based on time stamps. Next, the data were coded by segmenting sentences orparagraphs into categories and labelling those categories with a term associated with theactual language of the participants. This included finding frequencies of occurring ideas(or events) in the data relevant to the research questions. Subsequently, three key themeswere identified from the analysis: current uses of using BIM and AR, barriers of using BIMand AR, and scenarios and future directions for using BIM and AR.
3.2. Current Uses of BIM and AR
Despite all workshop participants having limited prior experience using AR technolo-gies, all participants had a sufficient understanding of AR. All participants stated that thetechnology had not been incorporated within any of their current or previous companies.However, multiple participants stated their companies were actively utilizing VR as awalk-through visualisation tool within the design phase of their projects to “bring clients inand do a bit of a walk-through”.
Although participants stated there are limited current uses of AR within the construc-tion industry, Figure 1 demonstrates that a comprehensive amount of research has previouslybeen conducted on the integration of AR and BIM technologies and is continually rising eachyear. Furthermore, the literature has also demonstrated that a significant amount of researchhas been conducted on the integration of AR across a range of AEC disciplines [39–41]. Dueto the substantial amount of AR research conducted in AEC, and the limited adoptionof AR within the AEC sectors, it is evident that a clear gap exists between the research
Buildings 2022, 12, 140 8 of 30
and industry. The broader impact of AR on AEC projects is not well understood. Furtherdiscussions with AEC experts to understand the current barriers surrounding BIM and AR,and to identify applicable areas for the integration of AR and BIM in the AEC industries,are required to bridge the gap between the research and practice.
3.3. Current Barriers Surrounding BIM and AR
Before AR technology can be applied to the construction industry, it is necessaryto identify the current barriers inhibiting the optimum usage of AR in construction. Inthis section, we explore non-technical aspects from the perspective of experts within theconstruction industry that need to be overcome before AR and BIM can become prevalentwithin the construction industry. The specific barriers identified by participants that wediscuss include (1) maturity and reliability, (2) accessibility, (3) standards and data exchange,and (4) stakeholder perception and organisational culture.
3.3.1. Maturity and Reliability
Participants described the lack of maturity and reliability associated with current ARtechnologies as one of the leading factors for why their companies had yet to adopt ARtechnologies. One participant stated that “we still don’t see huge benefits in jumping intoAR at the moment until the technology matures a little bit more”. We believe that the acces-sibility and tracking limitations associated with AR technologies are factors that directlycorrelate with the advancement of the maturity and reliability of future AR technologies.
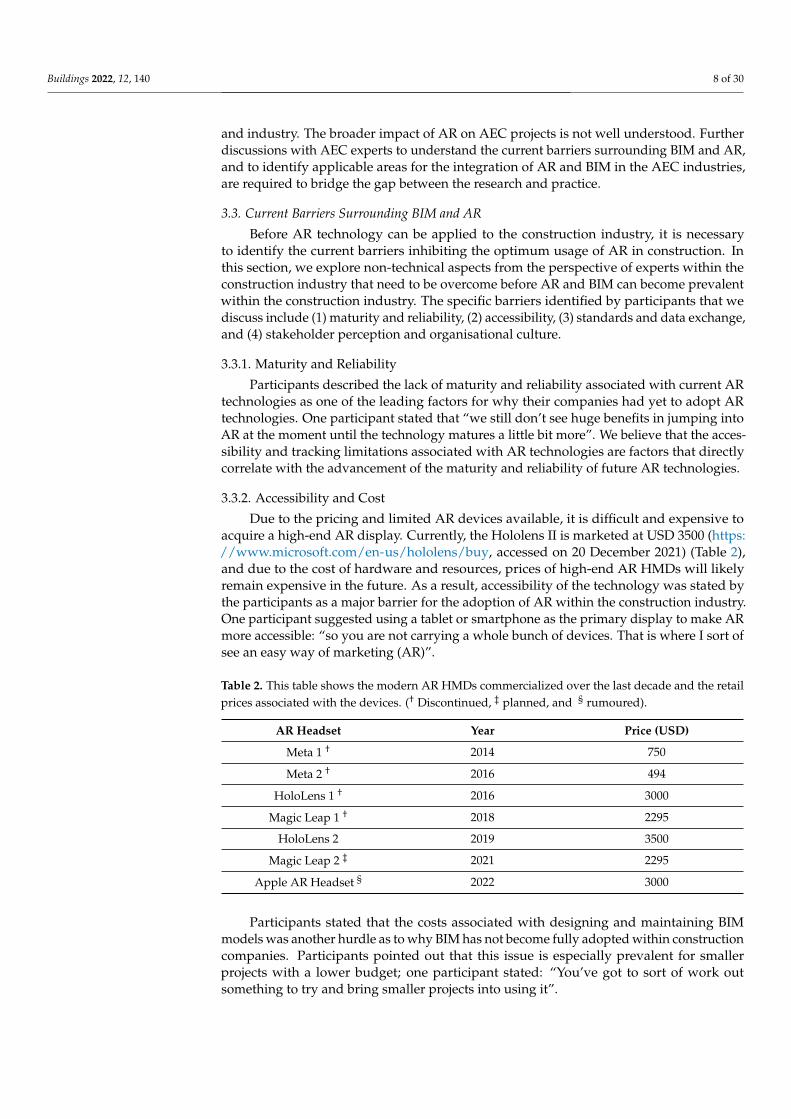
3.3.2. Accessibility and Cost
Due to the pricing and limited AR devices available, it is difficult and expensive toacquire a high-end AR display. Currently, the Hololens II is marketed at USD 3500 (https://www.microsoft.com/en-us/hololens/buy, accessed on 20 December 2021) (Table 2),and due to the cost of hardware and resources, prices of high-end AR HMDs will likelyremain expensive in the future. As a result, accessibility of the technology was stated bythe participants as a major barrier for the adoption of AR within the construction industry.One participant suggested using a tablet or smartphone as the primary display to make ARmore accessible: “so you are not carrying a whole bunch of devices. That is where I sort ofsee an easy way of marketing (AR)”.
Table 2. This table shows the modern AR HMDs commercialized over the last decade and the retailprices associated with the devices. († Discontinued, ‡ planned, and § rumoured).
AR Headset Year Price (USD)
Meta 1 † 2014 750
Meta 2 † 2016 494
HoloLens 1 † 2016 3000
Magic Leap 1 † 2018 2295
HoloLens 2 2019 3500
Magic Leap 2 ‡ 2021 2295
Apple AR Headset § 2022 3000
Participants stated that the costs associated with designing and maintaining BIMmodels was another hurdle as to why BIM has not become fully adopted within constructioncompanies. Participants pointed out that this issue is especially prevalent for smallerprojects with a lower budget; one participant stated: “You’ve got to sort of work outsomething to try and bring smaller projects into using it”.
Buildings 2022, 12, 140 9 of 30
3.3.3. Standards and Data Exchange
Interoperability and lack of support provided to exchange BIM data across differentplatforms is another key barrier associated with the adoption of BIM and AR technologies.One participant stated, “the models coming through are actually being dumbed downand all the data is stripped out of them”. Although IFC was introduced as a standardizeddata model to exchange BIM data across platforms, only a limited portion of meta-dataassociated with the BIM are maintained when exporting to IFC. The participant furthercommented: “We have seen an increase in people sharing models in IFC rather than nativeRevit or Techno or whatever else. That’s great as you get some geometry with it, but you’velost a whole heap of data”.
Finally, the other challenges are related to the highly fragmented and inconsistentcapabilities across hardware platforms and operating systems. There is an imbalance inthe projects within the construction industry itself with architects, services, and structuralindustries still using basic CAD and 2D media. The level of inconsistencies in the platformsused by different industries including architects, consultants, and construction professionalsaffect the level of accuracy through the supply chain. One participant stated, “we’re gettingjobs where we still get CAD and 2D drawings”.
3.3.4. Stakeholder Perception and Organisational Culture
Stakeholder perception and organisational culture also pose challenges for the integra-tion of AR and BIM technologies within the construction industry. This was highlighted bya participant who claimed “the major holdup to the advancement and development (of ARin construction) is not the technology, it is actually the people and processes”. Most of theconstruction industry is still very traditional and is quite reluctant to adopt new technology,especially related to the usage of BIM and AR. One participant stated “there are negativeperceptions created when using new technology,” and “people really have to build theconfidence before they take the next step”.
One participant also commented on the architectural designers’ reluctance to designand develop BIM models: “The payoff for (BIM) is for the person in front. This meansthe driver either has to be the end user clients that are going to see a potential payoff ifthe entire tool chain is using BIM to its full extent”. As a solution to the aforementionedissue, one participant commented: “I think the only way to push the clientele to drive BIMthrough the process is to make it an industry standard”.
3.4. Potential and Future Directions for Using BIM and AR
AR systems provide fast and easy access to information through a three-dimensionalmedium that creates huge opportunities and potential for the adoption of AR in a rangeof construction disciplines. Some of the potential uses of AR in construction mentionedby participants were as follows: (1) quality assurance and defect management inspections,(2) safety inductions and training, (3) risk management, (4) facilities management, and (5)building performance simulation.
3.4.1. Quality Assurance and Defect Management Inspections
Using AR to conduct quality assurance or defect management inspections was oneparticular area of interest mentioned by multiple participants throughout the workshop.Some of the comments from the participants included the following: (1) “I see (AR) asparticularly valuable at this stage in terms of reviewing things before you install ceilingsbefore you clad walls or things where you actually should be doing your QA checks”; (2) ”Ifyou have an AR environment (where) you can go into the room so you don’t necessarilyneed 100% accuracy of measurement, you are not actually constructing but you just have todo a building review—’Are all the elements that should be in this room actually installed?Can I sign off’?”; and (3) “Just doing QA work is a really good use (for AR) and there is noreason why you can’t do that right now”.
Buildings 2022, 12, 140 10 of 30
3.4.2. Safety Inductions and Training
Participants also described the possibilities of using AR to train construction workerson the safety implications associated with the construction site: “the only (way) we wouldpotentially use (AR) is probably safety and design upfront. Walking around (a BIM) and asyou’re going through the safety and design review phase looking at certain areas that youpotentially might have some concerns”. The benefit of using AR for safety and training isthat users can simulate, share, and exchange valuable information without any physicalmedium. A participant further stated “I think one of the uses for (AR) is safety inductionbecause you want to familiarise some person with the safety of the site, the egress paths,where areas are restricted. There’s no reason why all that information can’t be containedwithin a model which then could be used in a training environment to familiarise someonewith the building very quickly”. One participant also stated the following negative aspectof using AR for safety and training: “I think it’s very difficult to replace a real-life situationwith a virtual situation, you might be able to visualise it but to get all other interaction thatyou would have on a construction site, and all the other safety factors you got to be awareof, I still think it is not quite there”.
3.4.3. Risk Management
Similarly, participants identified risk management as another area of interest for theintegration of AR and BIM. Participants described developing a potential AR applicationwhich “provides live visualisation of a building along with the associated high-risk areas,and exclusion zones, and the ability to manage risks and report them”. Linking geolocationcoordinates and the project schedule to the BIM could be further integrated to providefour-dimensional visualisations of the BIM model [42].
3.4.4. Facilities Management
Facilities management was described by participants as “a major driver for AR, itcomes into great usage for AR”. The ability to use AR for see-through objects and tovisualise occluded elements was referenced many times throughout the workshop as apotentially valuable use of the technology. One participant described the following scenario:“if you can walk into a building and look up at the ceiling and you know what’s aboveit, you can point at the ceiling and go: where is the air-conditioning unit for this room?”Previous research such as ARWindow has demonstrated an optimistic outlook to adopt ARtechnologies within facilities management (FM) from the perspective of industrial facilitymanagers [43].
3.4.5. Building Performance Simulation and Visualisation
Using the immersive three-dimensional qualities of AR to simulate and assess theperformance of building design features was also described as one of the potential uses forAR within the construction industry. One of the participants stated, “say acoustically youhave to meet certain acoustic requirements, if you could integrate something that spreadout certain sound levels in a room there definitely is a benefit”.
3.5. Potential Features
Throughout the workshop, participants highlighted several features when describingtheir optimal AR applications for construction. Specifically, participants mentioned thefollowing: (1) visualisation and sequencing, (2) UI design and user-friendliness, and (3) ac-cessibility as important features when developing an AR-based construction application.
3.5.1. Visualisation and Sequencing
Participants described the ability to visualise sequences and the ability to “pull aparta model and put it back together” to develop a better understanding of “what you needto go in first” as a potential feature for an AR system. Similarly, another participantstated: “in terms of interaction, turning things on and off (in the BIM) so people can
Buildings 2022, 12, 140 11 of 30
deconstruct and reconstruct the building as many times as they want until they get itright and say OK this is the way I want to do it”. The ability to sequence componentsis demonstrated in commercial AR-based construction applications such as Gamma AR(https://gamma-ar.com/, accessed on 20 December 2021) and Trimble Connect (https://connect.trimble.com/, accessed on 20 December 2021). Colour-coding virtual buildingelements, and visualising occluded elements, was also a feature demonstrated by BIMHoloview (http://www.bimholoview.com/, accessed on 20 December 2021).
3.5.2. UI Design and User-Friendliness
The user-friendliness of the technology was a continuous theme throughout the work-shop. Participants were asked to describe their optimal AR applications, and participantsresponded that it “has to be really simple to use”, with an intuitive UI design. Furthermore,it should be a “really easy process, so you can wander around a site, point an iPad in adirection, and it knows exactly where they are and shows them what they should be seeing.You actually take the human element out of it”.
3.5.3. Accessibility
Integrating AR with existing BIM-based CAD platforms can also make AR moreattractive and accessible to construction companies. One participant stated “you getsomeone comfortable in one platform and then the next job they go to its working on adifferent platform and what they are able to do one they are not able to do (in the other). Itjust brings frustration for people”. However, due to the lack of development tools, support,and flexibility provided by BIM-based CAD platforms, developers tend to utilize SDKs andgame engines such as Unreal (https://www.unrealengine.com/, accessed on 20 December2021) or Unity (https://unity.com/, accessed on 20 December 2021) for AR softwaredevelopment. Participants also discussed the potential of using AR to access everythingneeded during a construction task within a single compact device. When referring to anAR inspection application, one participant commented “if you’ve got everything in youriPad you can then actually start using checklists and whatever else you need in one deviceso you (don’t need to) carry a whole bunch of devices”.
3.6. Summary
A summary of the potential future applications proposed by the workshop respon-dents is as below:
A1. Using AR technologies to conduct on-site quality assurance and defect managementinspections on a construction site.
A2. The ability to use AR technologies to visualise BIM models and go through the safetyand design review phase and identify which areas on the construction site may havesome potential safety concerns.
A3. An AR-based learning/educational/training risk-management application designedto familiarise a person with the safety requirements and hazards associated with theconstruction site.
A4. A facilities-management-focused AR application that allows facility managers tovisualise obstructed or invisible objects within a physical building.
A5. An AR-based building performance simulation and analysis tool that provides the userfeedback on whether a room in the building meets specific performance requirements(e.g., acoustics).
Throughout the workshop, the participants also proposed several potential featureswhen describing their optimal AR applications. We categorized and summarized the poten-tial features highlighted by workshop participants into four categorizations: visualisations,interface, tracking, and data exchange.
Visualisations
F1. Using AR to visualise occluded objects (e.g., wiring, pipes) on a construction site.
Buildings 2022, 12, 140 12 of 30
F2. Sequencing a BIM model into specific components to insert things, and having a UIproviding visual feedback on the insertion process.
F3. Representing data using three-dimensional visualisations as opposed to traditionaltwo-dimensional architectural analogue drawings.
F4. Design the AR application to be highly interactive. Users should have the ability tovisualise the building and turn specific components on and off.
Interface
F5. Ensuring the general user-friendliness of the AR application and UI is a priority. Itneeds to be very simple and easy to use for a non-technical user.
F6. Having checklists and other documents required for a construction task to be allaccessible within a single device.
F7. An integration of the AR system with existing BIM platforms to improve accessibility.
Tracking
F8. An improved AR tracking system that is very simple to use and setup.F9. Linking AR to digital point survey type accuracy for improved tracking.
Data Exchange
F10. A system or workflow capable of maintaining BIM data when exchanging BIM dataacross platforms to avoid loss of data.
In the remainder of this article, we explore the implementation of A1. Using AR toconduct on-site construction inspections from the above-listed potential applications. Wealso present the implementation of several features integrated within the system highlightedby participants from the list of potential features. Specifically, we address all the listedpotential features (F1–F9) in the BIM-ARDM system with the exception of F10 due to thescope of the development.
The decision-making process, which led to the selection of an AR-based defect man-agement application from the above list of potential applications identified by workshopparticipants, was based on the following factors. Firstly, we narrowed down the primarypotential applications that received the most optimistic responses amongst the workshopparticipants. We then consulted with AEC experts from both the research and industrialsectors to discuss which of the potential applications AR could have the most significantimpact. Finally, a discussion amongst the researchers who have an extensive backgroundworking with AR technologies determined that implementing an AR-based defect manage-ment application would be feasible to develop as the first step for adopting the results ofthe focus-group interviews to advance AR development and adoption in AEC.
4. BIM-ARDM System Development
Current industry approaches for identifying defects on a construction site are stillrelatively manual and require construction inspectors to make estimations based on paper-based, two-dimensional plans and analogue drawings. Higher-tier AEC firms have be-gun integrating tablet-based application such as Aconex Field (https://help.aconex.com/aconex/our-main-application/using-aconex/field, accessed on 20 December 2021) intotheir project workflow. These applications are designed to improve the data-managementprocess by having inspectors input data directly into a UI containing digital checklists asthey conduct their inspections. Additionally, the quality of inspection data captured duringon-site inspections still requires inspectors to interpret two-dimensional plans and analoguedrawings to make estimations on whether elements were built correctly. Furthermore, thesetools only provide the capability of storing inspection data into independent databases andinformation-management systems separate from the BIM model. As an alternative to theconventional inspection systems, researchers have proposed the usage of AR technology tosuperimpose the virtual BIM model onto the physical construction site. However, fromthe previous work highlighted in Section 2.1, we identified the following drawbacks ofprevious AR systems, which are specifically addressed in the BIM-ARDM system:

Buildings 2022, 12, 140 13 of 30
1. All AR implementations that incorporated HMDs used a holographic interface toinput and record data (e.g., checklists). We describe in Section 4.2.1 why we believethis design consideration would not be suitable on a real-world construction site.
2. No AR systems were proven to perform more effectively than conventional ap-proaches for conducting on-site construction inspections.
3. Limited AR features and visualisations were integrated to support the inspector withtheir on-site inspection performance.
4. No AR systems were tested on a real-world construction project.5. No AR systems were capable of storing inspection data back to the original BIM
model.6. No systems were capable of quantitatively assessing or evaluating the on-site inspection
performance.
Based on the aforementioned issues and potential features previously highlighted byworkshop participants in Section 3, we designed and developed an on-site BIM-ARDMsystem for construction defect management inspections. The primary goal during thedevelopment phase was to develop a prototype that improved upon the conventional paper-based methods that utilizes two-dimensional plans and analogue drawings to conductdefect management inspections. Our approach for achieving this was to leverage thevisualisation capabilities provided by AR technologies (Microsoft HoloLens 2) to visualisethe three-dimensional BIM model superimposed at a one-to-one mapping over the physicalconstruction site (Figure 2).
Our system also incorporates a handheld tablet-based interface that connects directlyto the HoloLens 2 through a customized TCP/IP network architecture allowing a two-way transmission of data between the two devices. The handheld tablet-based applicationcontains a dynamically produced checklist providing inspectors with an interface to directlyinput inspection data into.
In this section, we provide a complete overview of the BIM-ARDM prototype andpresent the four major components involved in the development of the overall BIM-ARDMsystem.
Figure 2. This figure shows a third-person perspective of the BIM-ARDM system. The BIM model issuperimposed over the physical site at a one-to-one mapping. A colour-coded visualisation representscorrect (green), minor (yellow), and major (red) defects.
4.1. Implementation
The BIM-ARDM system was developed to run off a specific set of hardware andsoftware components. For the hardware, the see-through AR head-mounted displayMicrosoft HoloLens 2 was used to show the virtual BIM model on the physical constructionsite. Additionally, a Samsung Galaxy S6 Lite tablet was used in-synch with the HoloLens2 to provide inspectors with a tablet-based UI to input inspection data and control thevarious visualisations and features integrated within the BIM-ARDM system.
In terms of the software, all software components in the BIM-ARDM system weredeveloped entirely in the C# programming language. The AR and playback analysis applica-
Buildings 2022, 12, 140 14 of 30
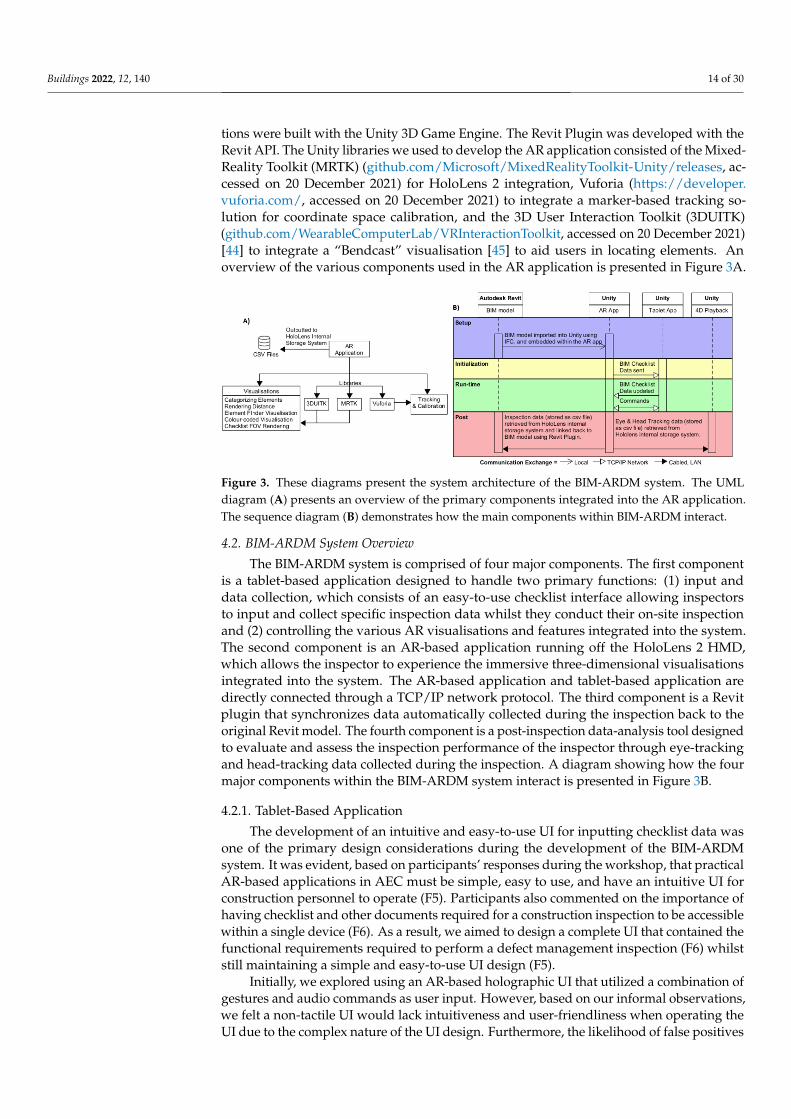
tions were built with the Unity 3D Game Engine. The Revit Plugin was developed with theRevit API. The Unity libraries we used to develop the AR application consisted of the Mixed-Reality Toolkit (MRTK) (github.com/Microsoft/MixedRealityToolkit-Unity/releases, ac-cessed on 20 December 2021) for HoloLens 2 integration, Vuforia (https://developer.vuforia.com/, accessed on 20 December 2021) to integrate a marker-based tracking so-lution for coordinate space calibration, and the 3D User Interaction Toolkit (3DUITK)(github.com/WearableComputerLab/VRInteractionToolkit, accessed on 20 December 2021)[44] to integrate a “Bendcast” visualisation [45] to aid users in locating elements. Anoverview of the various components used in the AR application is presented in Figure 3A.
Figure 3. These diagrams present the system architecture of the BIM-ARDM system. The UMLdiagram (A) presents an overview of the primary components integrated into the AR application.The sequence diagram (B) demonstrates how the main components within BIM-ARDM interact.
4.2. BIM-ARDM System Overview
The BIM-ARDM system is comprised of four major components. The first componentis a tablet-based application designed to handle two primary functions: (1) input anddata collection, which consists of an easy-to-use checklist interface allowing inspectorsto input and collect specific inspection data whilst they conduct their on-site inspectionand (2) controlling the various AR visualisations and features integrated into the system.The second component is an AR-based application running off the HoloLens 2 HMD,which allows the inspector to experience the immersive three-dimensional visualisationsintegrated into the system. The AR-based application and tablet-based application aredirectly connected through a TCP/IP network protocol. The third component is a Revitplugin that synchronizes data automatically collected during the inspection back to theoriginal Revit model. The fourth component is a post-inspection data-analysis tool designedto evaluate and assess the inspection performance of the inspector through eye-trackingand head-tracking data collected during the inspection. A diagram showing how the fourmajor components within the BIM-ARDM system interact is presented in Figure 3B.
4.2.1. Tablet-Based Application
The development of an intuitive and easy-to-use UI for inputting checklist data wasone of the primary design considerations during the development of the BIM-ARDMsystem. It was evident, based on participants’ responses during the workshop, that practicalAR-based applications in AEC must be simple, easy to use, and have an intuitive UI forconstruction personnel to operate (F5). Participants also commented on the importance ofhaving checklist and other documents required for a construction inspection to be accessiblewithin a single device (F6). As a result, we aimed to design a complete UI that contained thefunctional requirements required to perform a defect management inspection (F6) whilststill maintaining a simple and easy-to-use UI design (F5).
Initially, we explored using an AR-based holographic UI that utilized a combination ofgestures and audio commands as user input. However, based on our informal observations,we felt a non-tactile UI would lack intuitiveness and user-friendliness when operating theUI due to the complex nature of the UI design. Furthermore, the likelihood of false positives
Buildings 2022, 12, 140 15 of 30
occurring when using a gesture-based interface would likely contribute to increased errorsoccurring whilst the inspector conducts their inspections. We also discussed the potentialof using a speech-based input system; however, due to construction sites being relativelynoisy environments, we concluded that a speech-based input system would not be suitablefor a real-world construction site.
We concluded that a tablet-based interface that could seamlessly communicate datawith the HoloLens II was the most viable and user-friendly approach for inspectors tooperate on a real-world construction site. To achieve this, we developed a TCP/IP networkarchitecture where a local server is hosted off the Android tablet, and the HoloLens II con-nects to the local server as a client. This allowed us to create a bi-directional communication,allowing us to synchronously transmit commands and data between both devices.
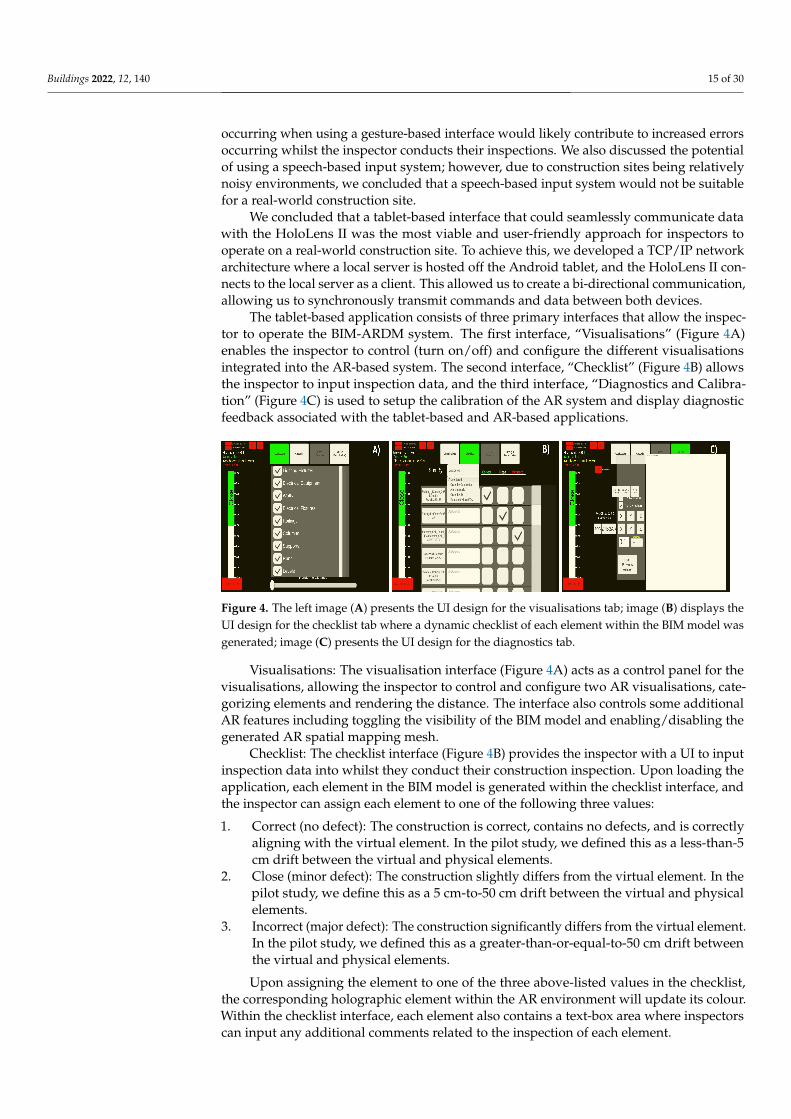
The tablet-based application consists of three primary interfaces that allow the inspec-tor to operate the BIM-ARDM system. The first interface, “Visualisations” (Figure 4A)enables the inspector to control (turn on/off) and configure the different visualisationsintegrated into the AR-based system. The second interface, “Checklist” (Figure 4B) allowsthe inspector to input inspection data, and the third interface, “Diagnostics and Calibra-tion” (Figure 4C) is used to setup the calibration of the AR system and display diagnosticfeedback associated with the tablet-based and AR-based applications.
Figure 4. The left image (A) presents the UI design for the visualisations tab; image (B) displays theUI design for the checklist tab where a dynamic checklist of each element within the BIM model wasgenerated; image (C) presents the UI design for the diagnostics tab.
Visualisations: The visualisation interface (Figure 4A) acts as a control panel for thevisualisations, allowing the inspector to control and configure two AR visualisations, cate-gorizing elements and rendering the distance. The interface also controls some additionalAR features including toggling the visibility of the BIM model and enabling/disabling thegenerated AR spatial mapping mesh.
Checklist: The checklist interface (Figure 4B) provides the inspector with a UI to inputinspection data into whilst they conduct their construction inspection. Upon loading theapplication, each element in the BIM model is generated within the checklist interface, andthe inspector can assign each element to one of the following three values:
1. Correct (no defect): The construction is correct, contains no defects, and is correctlyaligning with the virtual element. In the pilot study, we defined this as a less-than-5cm drift between the virtual and physical elements.
2. Close (minor defect): The construction slightly differs from the virtual element. In thepilot study, we define this as a 5 cm-to-50 cm drift between the virtual and physicalelements.
3. Incorrect (major defect): The construction significantly differs from the virtual element.In the pilot study, we defined this as a greater-than-or-equal-to-50 cm drift betweenthe virtual and physical elements.
Upon assigning the element to one of the three above-listed values in the checklist,the corresponding holographic element within the AR environment will update its colour.Within the checklist interface, each element also contains a text-box area where inspectorscan input any additional comments related to the inspection of each element.
Buildings 2022, 12, 140 16 of 30
The checklist interface also consists of a built-in sorting option feature that allows theinspector to sort elements based on the following categorizations:
1. Unordered: Displays elements in their default, randomly generated order.2. Sort by completion: Sorts elements that are currently unassigned before elements that
have been assigned.3. Alphabetical order: Sorts elements by alphabetical order.4. Sort by ID: Sorts elements numerically based on their Revit models unique ID.5. Rendered within field of view (FOV): Only displays checklist elements that are actively
being rendered within the inspector’s FOV.
The system also provides the capability for inspectors to capture images of individualelements by selecting an element within the checklist UI and pressing the capture-imagebutton. Images are captured through the HoloLens 2’s built-in camera and stored withinthe HoloLens 2 internal storage system. Subsequently, checklist data inputted into thetablet application during the inspection are autonomously logged to a .csv file, which isalso stored within the HoloLens 2 internal storage system. We also integrated support toload previous .csv files within the AR-based application, which allows inspectors to loadtheir previous inspection sessions. Finally, a Revit plugin was developed to import all datarecorded in the BIM-ARDM system back to the original Revit model.
Diagnostics and Calibration: The diagnostics and calibration interface (Figure 4C) wasdesigned to support two primary functions. Firstly, if a potential issue emerges whilstoperating the BIM-ARDM system, this interface allows the inspector to determine theproblem that caused the issue to occur. This is achieved by having a console UI thatdisplays the various debug statements outputted by the BIM-ARDM system. Secondly, themenu contains a set of buttons that allow the inspector to setup and configure the trackingcalibration process.
4.2.2. AR-Based Application
The AR-based application is comprised of two primary functions. The first functionis the visualisations and features that we developed to support inspectors with their on-site construction inspection performance. The second function is the developed trackingand calibration system that is used to superimpose the BIM model onto the real-worldconstruction site at a one-to-one mapping.
Visualisations and Features: User-friendliness (F5) and interactivity (F4) were twofeatures mentioned by several participants throughout the workshop. Participants alsoencouraged representing data through three-dimensional visualisations as opposed totraditional two-dimensional analogue drawings (F3). To achieve this, we developed a setof five three-dimensional visualisations designed to assist the inspector with conductingtheir inspection. The developed AR visualisations can be controlled and configured by theinspector directly through the tablet-based application. The specific visualisations were(1) the ability to visualise specific elements based on their categorizations (F2 and F4), (2)controlling the camera’s rendering distance to only visualise specific elements within aspecified distance from the user, (3) an element location-finder visualisation, (4) an elementcolour-coded visualisation, and (5) a tool that only displays elements within the checklistUI that are currently being looked at by the inspector. A more-detailed description andoverview of the design motivations associated with each of the visualisations is presentedbelow.
1. Categorizing elements: The ability to turn on and off specific elements was a featurehighlighted by workshop participants (F4). Due to our system workflow consisting of anIFC-based approach to import BIM models into Unity, partial metadata associated with theBIM are maintained. As a result, unique IDs and categorizations of building elements thatare automatically generated in Revit are accessible within the Unity game engine. Usingthis data, we developed an approach to automatically and dynamically generate a listof categorizations based on the corresponding categories associated with each buildingelement. Within the tablet interface, inspectors can toggle on or off different categories
Buildings 2022, 12, 140 17 of 30
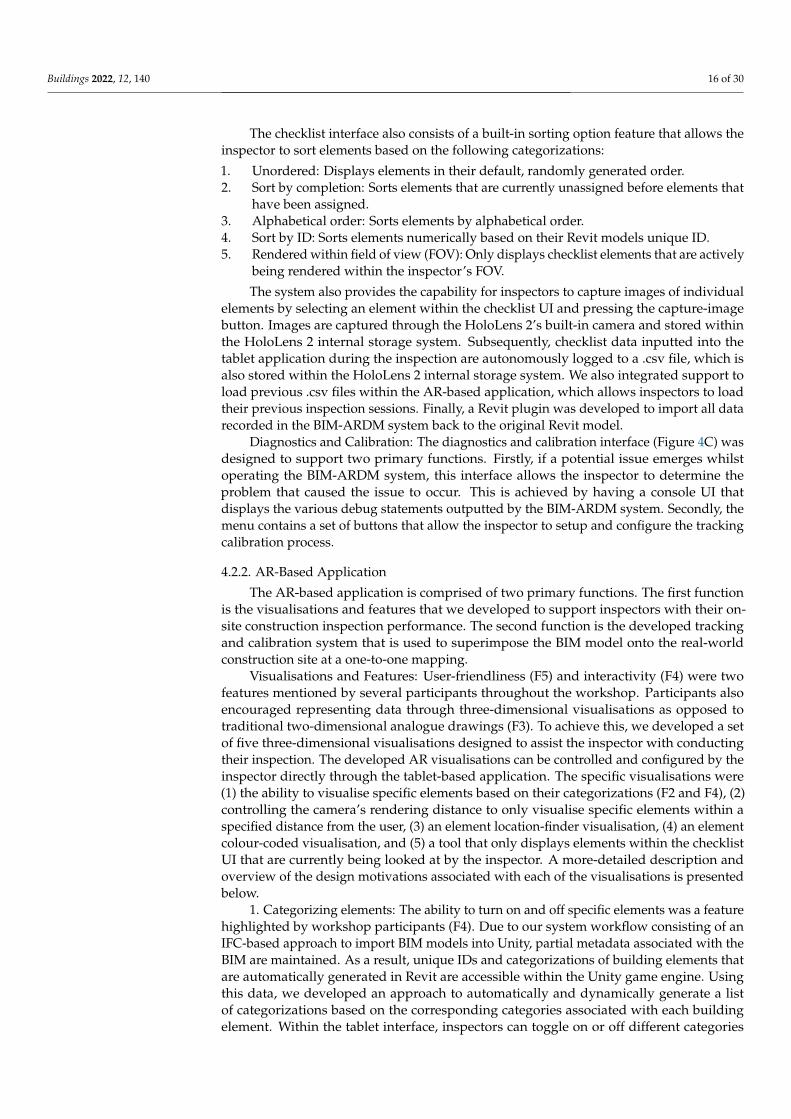
to enable or disable the visibility of each AR building element associated with the givencategory; for example, electrical fixtures or signs as illustrated in Figure 5. Based on ourinformal observations, we believe this visualisation to be most effective when inspectingcomplex and dense BIM models. The primary advantage of the visualisation is that itallows the inspector to focus on specific elements and filter out any irrelevant elements toavoid confusion and improve visibility.
Figure 5. This figure demonstrates the categorizing elements’ visualisation, which only displaysspecific elements in the AR view (B) that have been enabled by the inspector on the tablet UI (A).
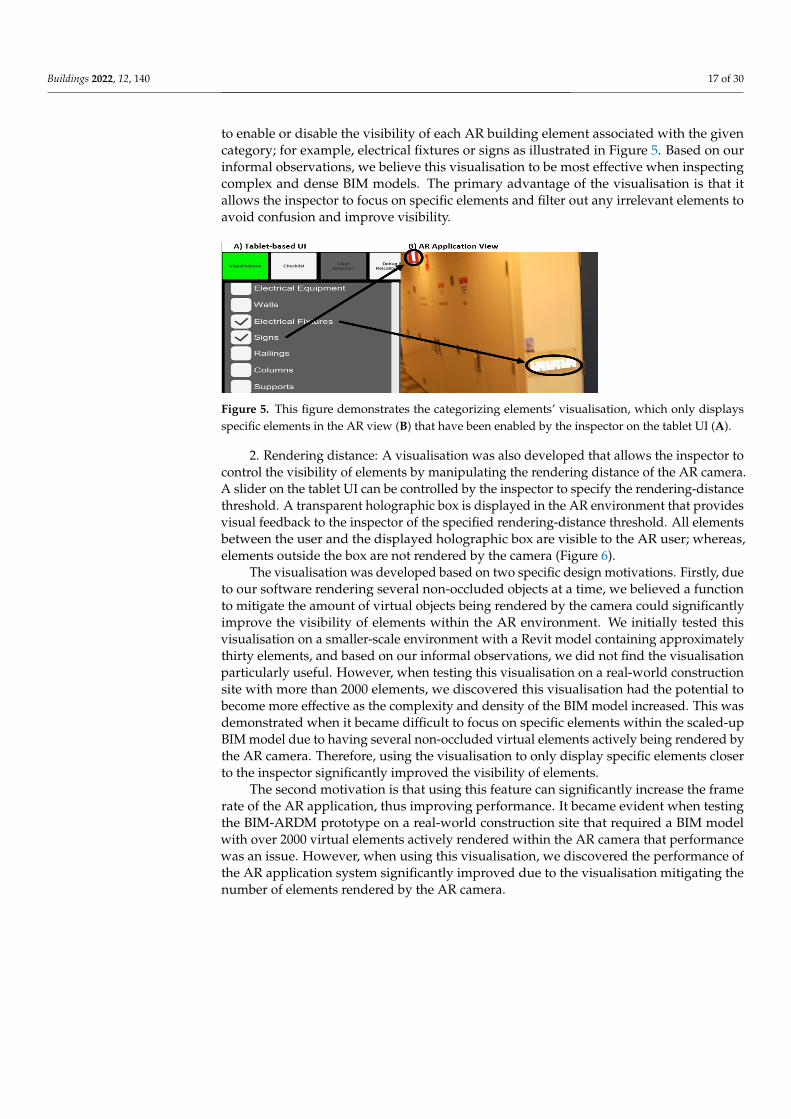
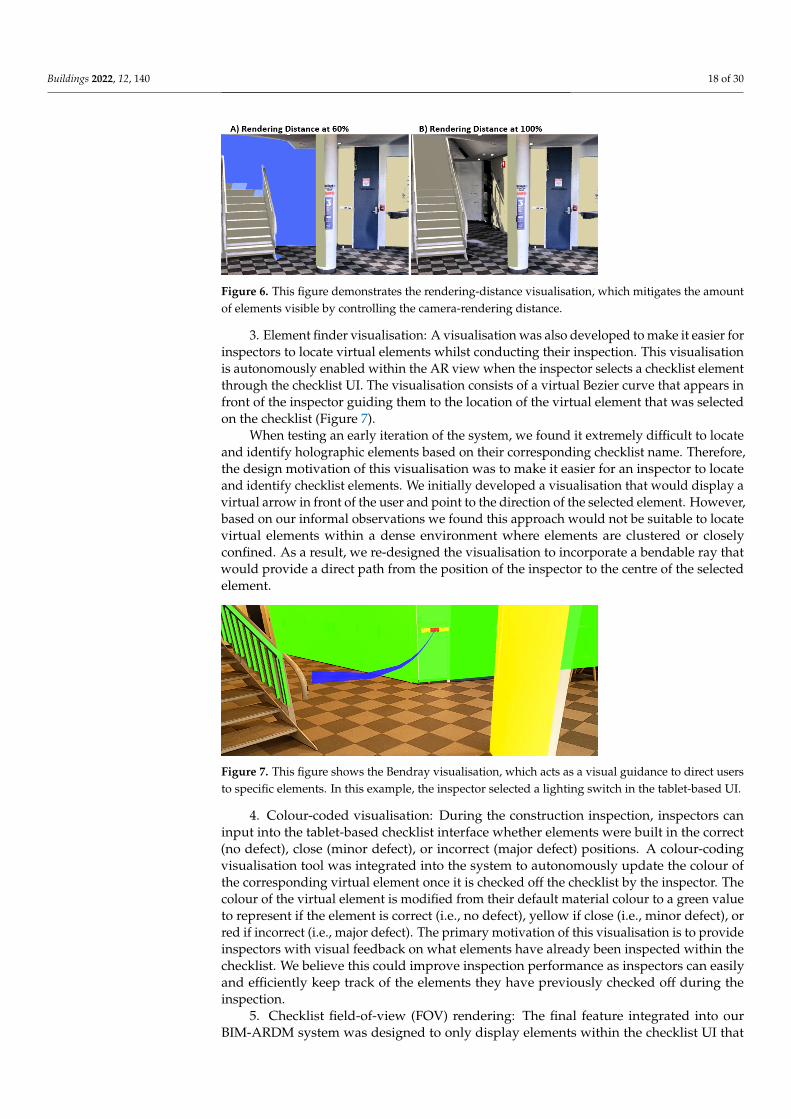
2. Rendering distance: A visualisation was also developed that allows the inspector tocontrol the visibility of elements by manipulating the rendering distance of the AR camera.A slider on the tablet UI can be controlled by the inspector to specify the rendering-distancethreshold. A transparent holographic box is displayed in the AR environment that providesvisual feedback to the inspector of the specified rendering-distance threshold. All elementsbetween the user and the displayed holographic box are visible to the AR user; whereas,elements outside the box are not rendered by the camera (Figure 6).
The visualisation was developed based on two specific design motivations. Firstly, dueto our software rendering several non-occluded objects at a time, we believed a functionto mitigate the amount of virtual objects being rendered by the camera could significantlyimprove the visibility of elements within the AR environment. We initially tested thisvisualisation on a smaller-scale environment with a Revit model containing approximatelythirty elements, and based on our informal observations, we did not find the visualisationparticularly useful. However, when testing this visualisation on a real-world constructionsite with more than 2000 elements, we discovered this visualisation had the potential tobecome more effective as the complexity and density of the BIM model increased. This wasdemonstrated when it became difficult to focus on specific elements within the scaled-upBIM model due to having several non-occluded virtual elements actively being rendered bythe AR camera. Therefore, using the visualisation to only display specific elements closerto the inspector significantly improved the visibility of elements.
The second motivation is that using this feature can significantly increase the framerate of the AR application, thus improving performance. It became evident when testingthe BIM-ARDM prototype on a real-world construction site that required a BIM modelwith over 2000 virtual elements actively rendered within the AR camera that performancewas an issue. However, when using this visualisation, we discovered the performance ofthe AR application system significantly improved due to the visualisation mitigating thenumber of elements rendered by the AR camera.
Buildings 2022, 12, 140 18 of 30
Figure 6. This figure demonstrates the rendering-distance visualisation, which mitigates the amountof elements visible by controlling the camera-rendering distance.
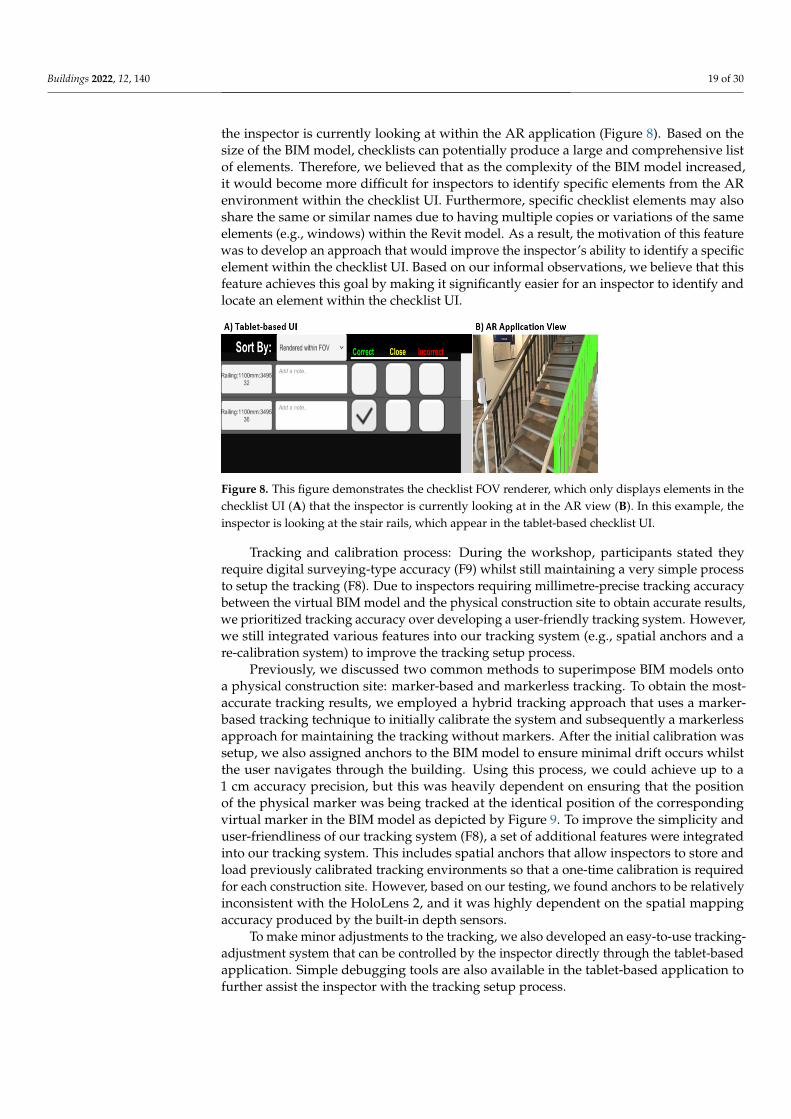
3. Element finder visualisation: A visualisation was also developed to make it easier forinspectors to locate virtual elements whilst conducting their inspection. This visualisationis autonomously enabled within the AR view when the inspector selects a checklist elementthrough the checklist UI. The visualisation consists of a virtual Bezier curve that appears infront of the inspector guiding them to the location of the virtual element that was selectedon the checklist (Figure 7).
When testing an early iteration of the system, we found it extremely difficult to locateand identify holographic elements based on their corresponding checklist name. Therefore,the design motivation of this visualisation was to make it easier for an inspector to locateand identify checklist elements. We initially developed a visualisation that would display avirtual arrow in front of the user and point to the direction of the selected element. However,based on our informal observations we found this approach would not be suitable to locatevirtual elements within a dense environment where elements are clustered or closelyconfined. As a result, we re-designed the visualisation to incorporate a bendable ray thatwould provide a direct path from the position of the inspector to the centre of the selectedelement.
Figure 7. This figure shows the Bendray visualisation, which acts as a visual guidance to direct usersto specific elements. In this example, the inspector selected a lighting switch in the tablet-based UI.
4. Colour-coded visualisation: During the construction inspection, inspectors caninput into the tablet-based checklist interface whether elements were built in the correct(no defect), close (minor defect), or incorrect (major defect) positions. A colour-codingvisualisation tool was integrated into the system to autonomously update the colour ofthe corresponding virtual element once it is checked off the checklist by the inspector. Thecolour of the virtual element is modified from their default material colour to a green valueto represent if the element is correct (i.e., no defect), yellow if close (i.e., minor defect), orred if incorrect (i.e., major defect). The primary motivation of this visualisation is to provideinspectors with visual feedback on what elements have already been inspected within thechecklist. We believe this could improve inspection performance as inspectors can easilyand efficiently keep track of the elements they have previously checked off during theinspection.
5. Checklist field-of-view (FOV) rendering: The final feature integrated into ourBIM-ARDM system was designed to only display elements within the checklist UI that
Buildings 2022, 12, 140 19 of 30
the inspector is currently looking at within the AR application (Figure 8). Based on thesize of the BIM model, checklists can potentially produce a large and comprehensive listof elements. Therefore, we believed that as the complexity of the BIM model increased,it would become more difficult for inspectors to identify specific elements from the ARenvironment within the checklist UI. Furthermore, specific checklist elements may alsoshare the same or similar names due to having multiple copies or variations of the sameelements (e.g., windows) within the Revit model. As a result, the motivation of this featurewas to develop an approach that would improve the inspector’s ability to identify a specificelement within the checklist UI. Based on our informal observations, we believe that thisfeature achieves this goal by making it significantly easier for an inspector to identify andlocate an element within the checklist UI.
Figure 8. This figure demonstrates the checklist FOV renderer, which only displays elements in thechecklist UI (A) that the inspector is currently looking at in the AR view (B). In this example, theinspector is looking at the stair rails, which appear in the tablet-based checklist UI.
Tracking and calibration process: During the workshop, participants stated theyrequire digital surveying-type accuracy (F9) whilst still maintaining a very simple processto setup the tracking (F8). Due to inspectors requiring millimetre-precise tracking accuracybetween the virtual BIM model and the physical construction site to obtain accurate results,we prioritized tracking accuracy over developing a user-friendly tracking system. However,we still integrated various features into our tracking system (e.g., spatial anchors and are-calibration system) to improve the tracking setup process.
Previously, we discussed two common methods to superimpose BIM models ontoa physical construction site: marker-based and markerless tracking. To obtain the most-accurate tracking results, we employed a hybrid tracking approach that uses a marker-based tracking technique to initially calibrate the system and subsequently a markerlessapproach for maintaining the tracking without markers. After the initial calibration wassetup, we also assigned anchors to the BIM model to ensure minimal drift occurs whilstthe user navigates through the building. Using this process, we could achieve up to a1 cm accuracy precision, but this was heavily dependent on ensuring that the positionof the physical marker was being tracked at the identical position of the correspondingvirtual marker in the BIM model as depicted by Figure 9. To improve the simplicity anduser-friendliness of our tracking system (F8), a set of additional features were integratedinto our tracking system. This includes spatial anchors that allow inspectors to store andload previously calibrated tracking environments so that a one-time calibration is requiredfor each construction site. However, based on our testing, we found anchors to be relativelyinconsistent with the HoloLens 2, and it was highly dependent on the spatial mappingaccuracy produced by the built-in depth sensors.
To make minor adjustments to the tracking, we also developed an easy-to-use tracking-adjustment system that can be controlled by the inspector directly through the tablet-basedapplication. Simple debugging tools are also available in the tablet-based application tofurther assist the inspector with the tracking setup process.
Buildings 2022, 12, 140 20 of 30
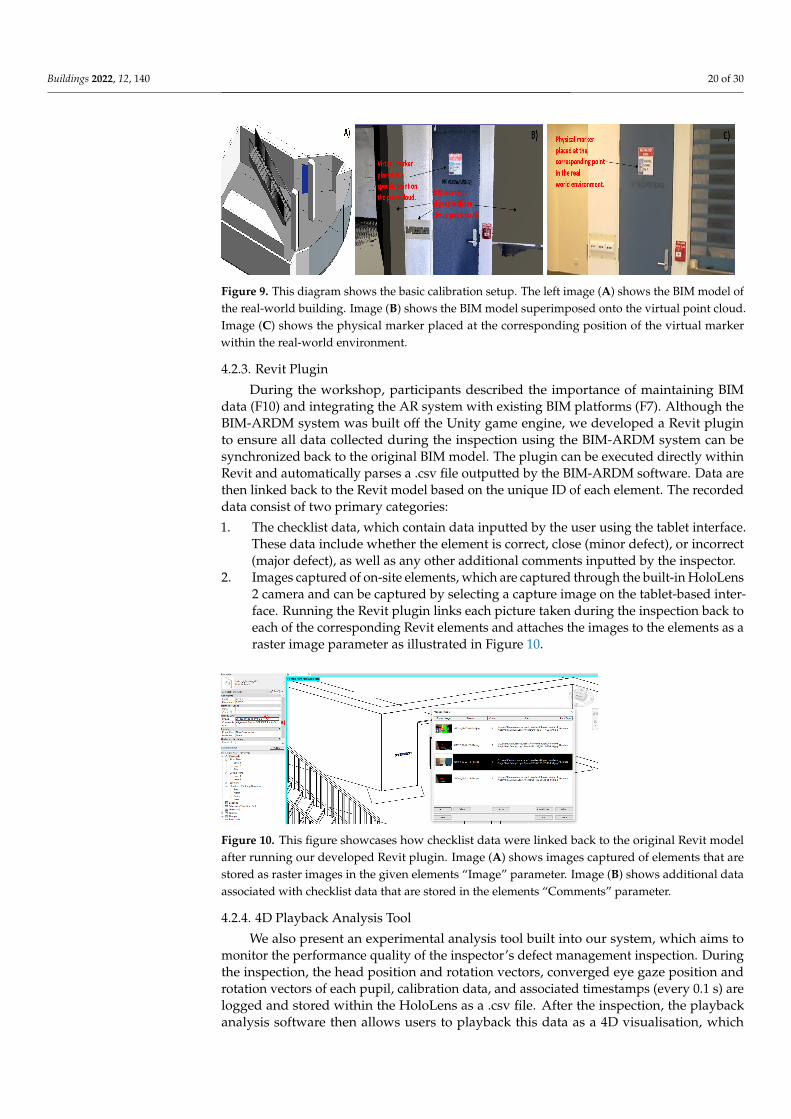
Figure 9. This diagram shows the basic calibration setup. The left image (A) shows the BIM model ofthe real-world building. Image (B) shows the BIM model superimposed onto the virtual point cloud.Image (C) shows the physical marker placed at the corresponding position of the virtual markerwithin the real-world environment.
4.2.3. Revit Plugin
During the workshop, participants described the importance of maintaining BIMdata (F10) and integrating the AR system with existing BIM platforms (F7). Although theBIM-ARDM system was built off the Unity game engine, we developed a Revit pluginto ensure all data collected during the inspection using the BIM-ARDM system can besynchronized back to the original BIM model. The plugin can be executed directly withinRevit and automatically parses a .csv file outputted by the BIM-ARDM software. Data arethen linked back to the Revit model based on the unique ID of each element. The recordeddata consist of two primary categories:
1. The checklist data, which contain data inputted by the user using the tablet interface.These data include whether the element is correct, close (minor defect), or incorrect(major defect), as well as any other additional comments inputted by the inspector.
2. Images captured of on-site elements, which are captured through the built-in HoloLens2 camera and can be captured by selecting a capture image on the tablet-based inter-face. Running the Revit plugin links each picture taken during the inspection back toeach of the corresponding Revit elements and attaches the images to the elements as araster image parameter as illustrated in Figure 10.
Figure 10. This figure showcases how checklist data were linked back to the original Revit modelafter running our developed Revit plugin. Image (A) shows images captured of elements that arestored as raster images in the given elements “Image” parameter. Image (B) shows additional dataassociated with checklist data that are stored in the elements “Comments” parameter.
4.2.4. 4D Playback Analysis Tool
We also present an experimental analysis tool built into our system, which aims tomonitor the performance quality of the inspector’s defect management inspection. Duringthe inspection, the head position and rotation vectors, converged eye gaze position androtation vectors of each pupil, calibration data, and associated timestamps (every 0.1 s) arelogged and stored within the HoloLens as a .csv file. After the inspection, the playbackanalysis software then allows users to playback this data as a 4D visualisation, which
Buildings 2022, 12, 140 21 of 30
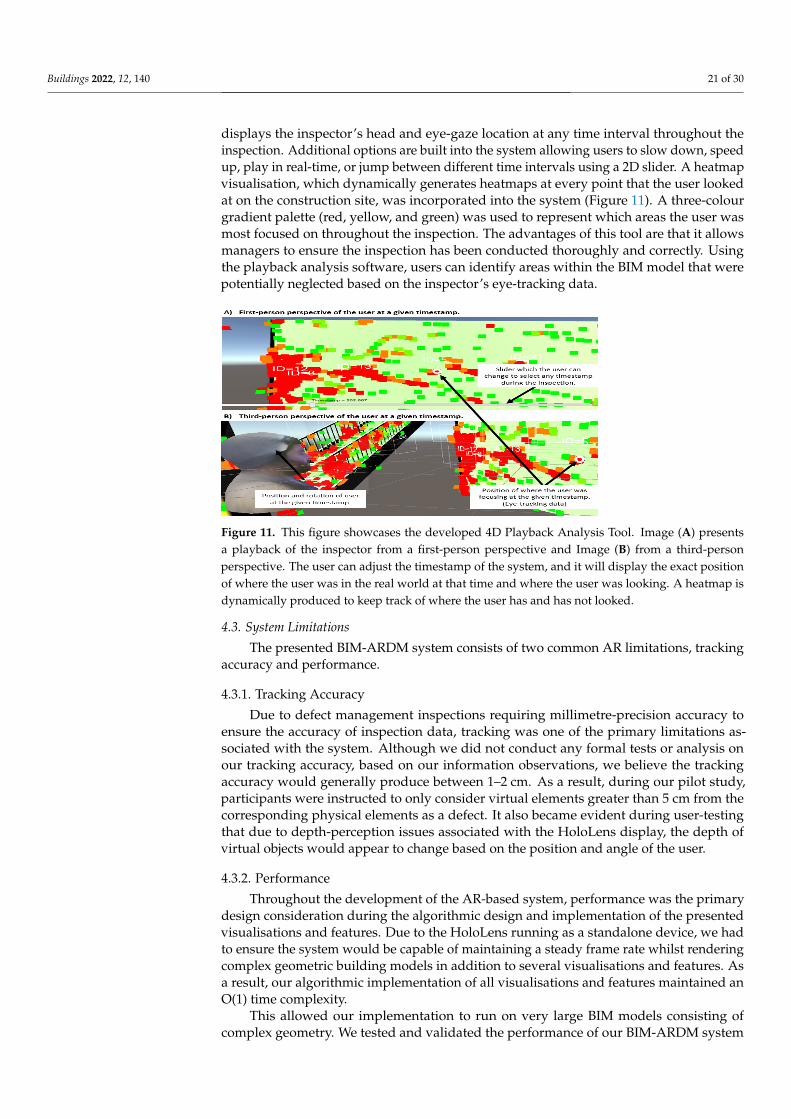
displays the inspector’s head and eye-gaze location at any time interval throughout theinspection. Additional options are built into the system allowing users to slow down, speedup, play in real-time, or jump between different time intervals using a 2D slider. A heatmapvisualisation, which dynamically generates heatmaps at every point that the user lookedat on the construction site, was incorporated into the system (Figure 11). A three-colourgradient palette (red, yellow, and green) was used to represent which areas the user wasmost focused on throughout the inspection. The advantages of this tool are that it allowsmanagers to ensure the inspection has been conducted thoroughly and correctly. Usingthe playback analysis software, users can identify areas within the BIM model that werepotentially neglected based on the inspector’s eye-tracking data.
Figure 11. This figure showcases the developed 4D Playback Analysis Tool. Image (A) presentsa playback of the inspector from a first-person perspective and Image (B) from a third-personperspective. The user can adjust the timestamp of the system, and it will display the exact positionof where the user was in the real world at that time and where the user was looking. A heatmap isdynamically produced to keep track of where the user has and has not looked.
4.3. System Limitations
The presented BIM-ARDM system consists of two common AR limitations, trackingaccuracy and performance.
4.3.1. Tracking Accuracy
Due to defect management inspections requiring millimetre-precision accuracy toensure the accuracy of inspection data, tracking was one of the primary limitations as-sociated with the system. Although we did not conduct any formal tests or analysis onour tracking accuracy, based on our information observations, we believe the trackingaccuracy would generally produce between 1–2 cm. As a result, during our pilot study,participants were instructed to only consider virtual elements greater than 5 cm from thecorresponding physical elements as a defect. It also became evident during user-testingthat due to depth-perception issues associated with the HoloLens display, the depth ofvirtual objects would appear to change based on the position and angle of the user.
4.3.2. Performance
Throughout the development of the AR-based system, performance was the primarydesign consideration during the algorithmic design and implementation of the presentedvisualisations and features. Due to the HoloLens running as a standalone device, we hadto ensure the system would be capable of maintaining a steady frame rate whilst renderingcomplex geometric building models in addition to several visualisations and features. Asa result, our algorithmic implementation of all visualisations and features maintained anO(1) time complexity.
This allowed our implementation to run on very large BIM models consisting ofcomplex geometry. We tested and validated the performance of our BIM-ARDM system
Buildings 2022, 12, 140 22 of 30
on a real-world construction site (Adelaide Festival Plaza (https://armarchitecture.com.au/projects/adelaide-festival-plaza-precinct-masterplan/, accessed on 20 December 2021)that consisted of a complex BIM model containing over 2000 virtual models. The resultsfrom this test demonstrated that the system was capable of running at a steady frame rateof 10–15 FPS. However, using the rendering-distance visualisation further improved thesystem’s frame rate.
Despite these results demonstrating the scalability of the BIM-ARDM system, theperformance-design limitation resulted in specific features being cut from the system dueto not meeting performance requirements. Future iterations of AR displays will continueto improve their processing capabilities, and, as a result, more performance-demandingvisualisations and features will become feasible in the future for standalone AR displays.
5. User Study
A comparability pilot study with 11 participants was conducted to assess the perfor-mance of our proposed BIM-ARDM system in comparison to the conventional paper-baseddefect management techniques currently employed within the construction industry. The11 participants primarily consisted of researchers from the university. All participants whovolunteered to take part in the study had some prior experience using AR technology (45%use AR 1–10 times per month, 27.3% daily, 18.2% 1–10 times per year, and 9.1% weekly).From the selection of 11 participants, 10 participants lacked prior experience in conductingon-site construction inspections within a professional capacity.
5.1. Experimental Design
The experiment comprised of two conditions. The first condition was the conven-tional approach for conducting defect management inspections, which utilized a three-dimensional perspective and two-dimensional orthographic paper-based drawings of thebuilding model as a reference. The second condition was the experimental BIM-ARDMprototype, which superimposes the virtual building model onto the physical constructionsite and incorporates several visualisations and features as described in Section 4. Theexperiment consisted of a within-study design, and the order of conditions varied for eachparticipant to counterbalance data. The different AR visualisations provided in the ARcondition could be toggled on and off based on the participant’s preference. However,participants were encouraged to test each visualisation at least once. During each condition,participants were instructed to complete a defect management inspection task that involvedidentifying and recording on-site construction defects within a building at the university.
The types of defects we focused on during the study was whether the placement(position or rotation) of a physical constructed element matched the position of the cor-responding virtual building element. Participants were instructed to categorize defectsinto three categorizations: correct (i.e., no defect) when the virtual element was less than5 cm of the constructed element, close (i.e., minor defect) when the virtual element wasbetween 5 cm and 50 cm, and incorrect (i.e., major defect) when the virtual element wasgreater than or equal to 50 cm from the constructed element. During each condition, partic-ipants were required to inspect a total of thirty elements within the building and recordwhether each element was correct, close, or incorrect into a tablet-based checklist interface(Figure 4). From the thirty elements inspected by participants in each condition, eighteenof the elements were correct (no defects), eight elements were close (minor defects), andfour elements were incorrect (major defects). Each condition contained a different setof defects and correctly positioned elements, and these elements were counterbalancedbetween the two conditions. Despite the paper-based condition relying entirely on usingpaper-based drawings, participants still wore a HoloLens 2 HMD with a blank display fordata-collection purposes and to replicate the environmental conditions of the AR condition.
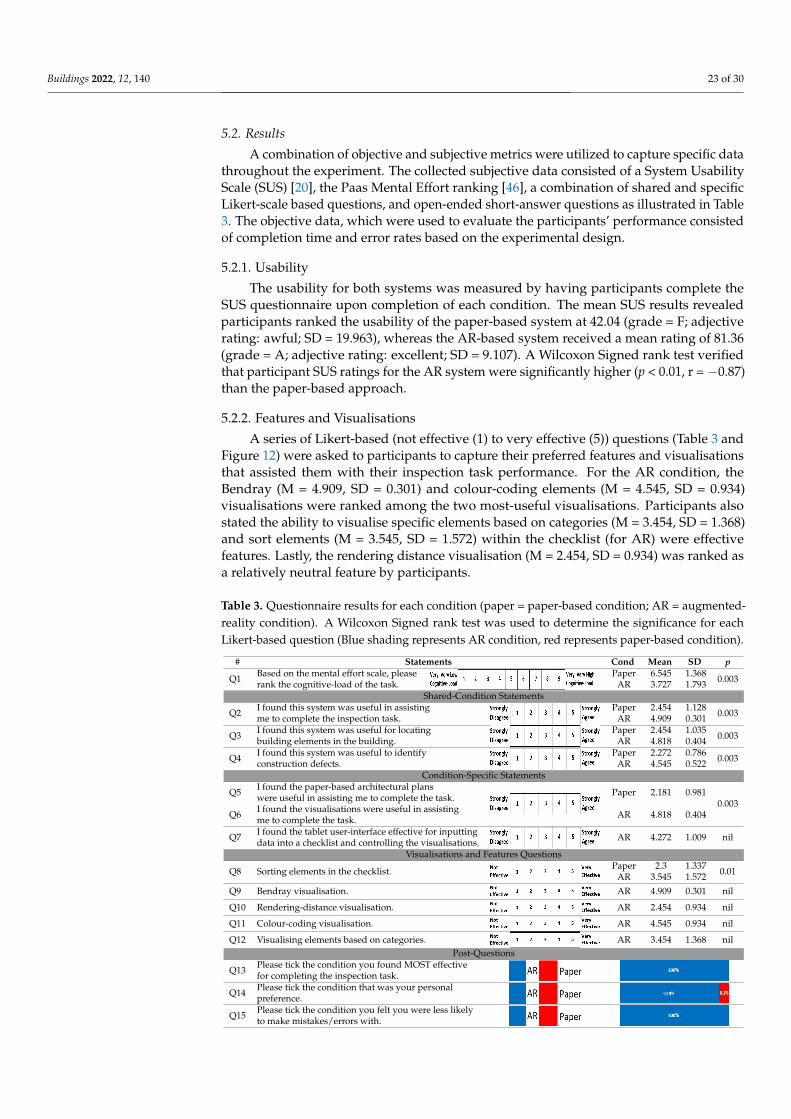
Buildings 2022, 12, 140 23 of 30
5.2. Results
A combination of objective and subjective metrics were utilized to capture specific datathroughout the experiment. The collected subjective data consisted of a System UsabilityScale (SUS) [20], the Paas Mental Effort ranking [46], a combination of shared and specificLikert-scale based questions, and open-ended short-answer questions as illustrated in Table3. The objective data, which were used to evaluate the participants’ performance consistedof completion time and error rates based on the experimental design.
5.2.1. Usability
The usability for both systems was measured by having participants complete theSUS questionnaire upon completion of each condition. The mean SUS results revealedparticipants ranked the usability of the paper-based system at 42.04 (grade = F; adjectiverating: awful; SD = 19.963), whereas the AR-based system received a mean rating of 81.36(grade = A; adjective rating: excellent; SD = 9.107). A Wilcoxon Signed rank test verifiedthat participant SUS ratings for the AR system were significantly higher (p < 0.01, r = −0.87)than the paper-based approach.
5.2.2. Features and Visualisations
A series of Likert-based (not effective (1) to very effective (5)) questions (Table 3 andFigure 12) were asked to participants to capture their preferred features and visualisationsthat assisted them with their inspection task performance. For the AR condition, theBendray (M = 4.909, SD = 0.301) and colour-coding elements (M = 4.545, SD = 0.934)visualisations were ranked among the two most-useful visualisations. Participants alsostated the ability to visualise specific elements based on categories (M = 3.454, SD = 1.368)and sort elements (M = 3.545, SD = 1.572) within the checklist (for AR) were effectivefeatures. Lastly, the rendering distance visualisation (M = 2.454, SD = 0.934) was ranked asa relatively neutral feature by participants.
Table 3. Questionnaire results for each condition (paper = paper-based condition; AR = augmented-reality condition). A Wilcoxon Signed rank test was used to determine the significance for eachLikert-based question (Blue shading represents AR condition, red represents paper-based condition).
# Statements Cond Mean SD p
Q1 Based on the mental effort scale, pleaserank the cognitive-load of the task.
PaperAR
6.5453.727
1.3681.793 0.003
Shared-Condition Statements
Q2 I found this system was useful in assistingme to complete the inspection task.
PaperAR
2.4544.909
1.1280.301 0.003
Q3 I found this system was useful for locatingbuilding elements in the building.
PaperAR
2.4544.818
1.0350.404 0.003
Q4 I found this system was useful to identifyconstruction defects.
PaperAR
2.2724.545
0.7860.522 0.003
Condition-Specific Statements
Q5
Q6
I found the paper-based architectural planswere useful in assisting me to complete the task.I found the visualisations were useful in assistingme to complete the task.
Paper
AR
2.181
4.818
0.981
0.4040.003
Q7 I found the tablet user-interface effective for inputtingdata into a checklist and controlling the visualisations. AR 4.272 1.009 nil
Visualisations and Features Questions
Q8 Sorting elements in the checklist. PaperAR
2.33.545
1.3371.572 0.01
Q9 Bendray visualisation. AR 4.909 0.301 nil
Q10 Rendering-distance visualisation. AR 2.454 0.934 nil
Q11 Colour-coding visualisation. AR 4.545 0.934 nil
Q12 Visualising elements based on categories. AR 3.454 1.368 nilPost-Questions
Q13 Please tick the condition you found MOST effectivefor completing the inspection task.
Q14 Please tick the condition that was your personalpreference.
Q15 Please tick the condition you felt you were less likelyto make mistakes/errors with.
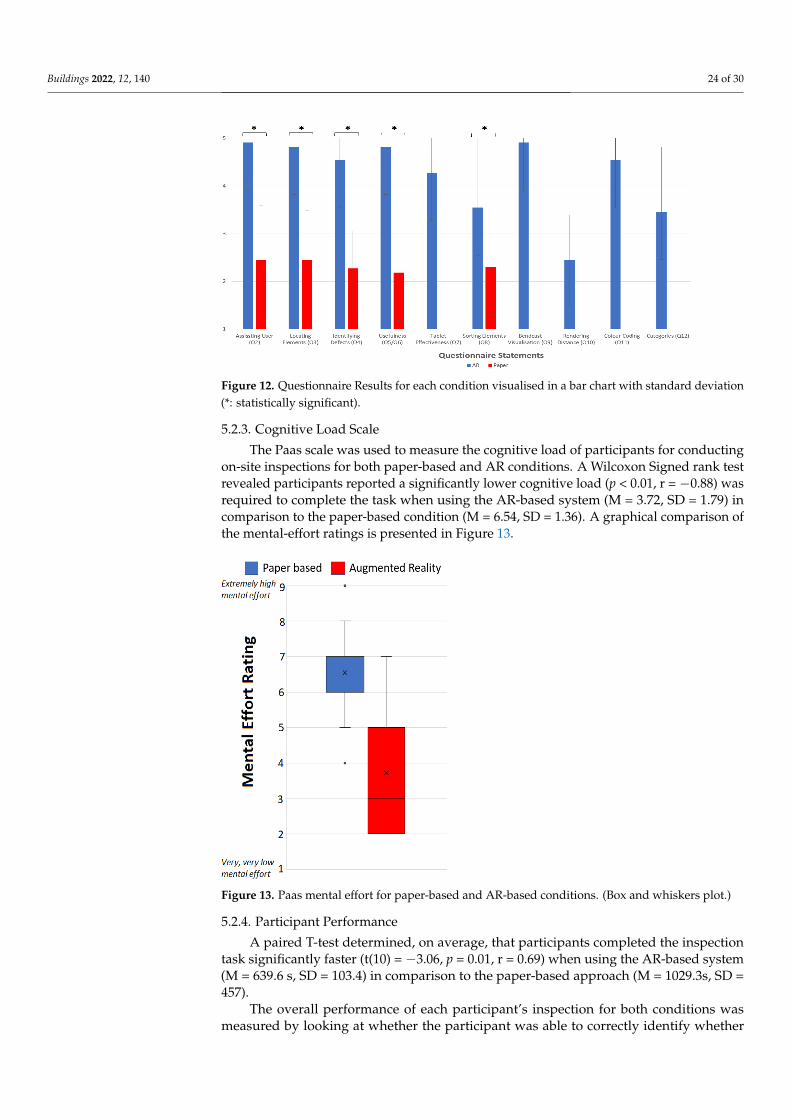
Buildings 2022, 12, 140 24 of 30
Figure 12. Questionnaire Results for each condition visualised in a bar chart with standard deviation(*: statistically significant).
5.2.3. Cognitive Load Scale
The Paas scale was used to measure the cognitive load of participants for conductingon-site inspections for both paper-based and AR conditions. A Wilcoxon Signed rank testrevealed participants reported a significantly lower cognitive load (p < 0.01, r = −0.88) wasrequired to complete the task when using the AR-based system (M = 3.72, SD = 1.79) incomparison to the paper-based condition (M = 6.54, SD = 1.36). A graphical comparison ofthe mental-effort ratings is presented in Figure 13.
Figure 13. Paas mental effort for paper-based and AR-based conditions. (Box and whiskers plot.)
5.2.4. Participant Performance
A paired T-test determined, on average, that participants completed the inspectiontask significantly faster (t(10) = −3.06, p = 0.01, r = 0.69) when using the AR-based system(M = 639.6 s, SD = 103.4) in comparison to the paper-based approach (M = 1029.3s, SD =457).
The overall performance of each participant’s inspection for both conditions wasmeasured by looking at whether the participant was able to correctly identify whether
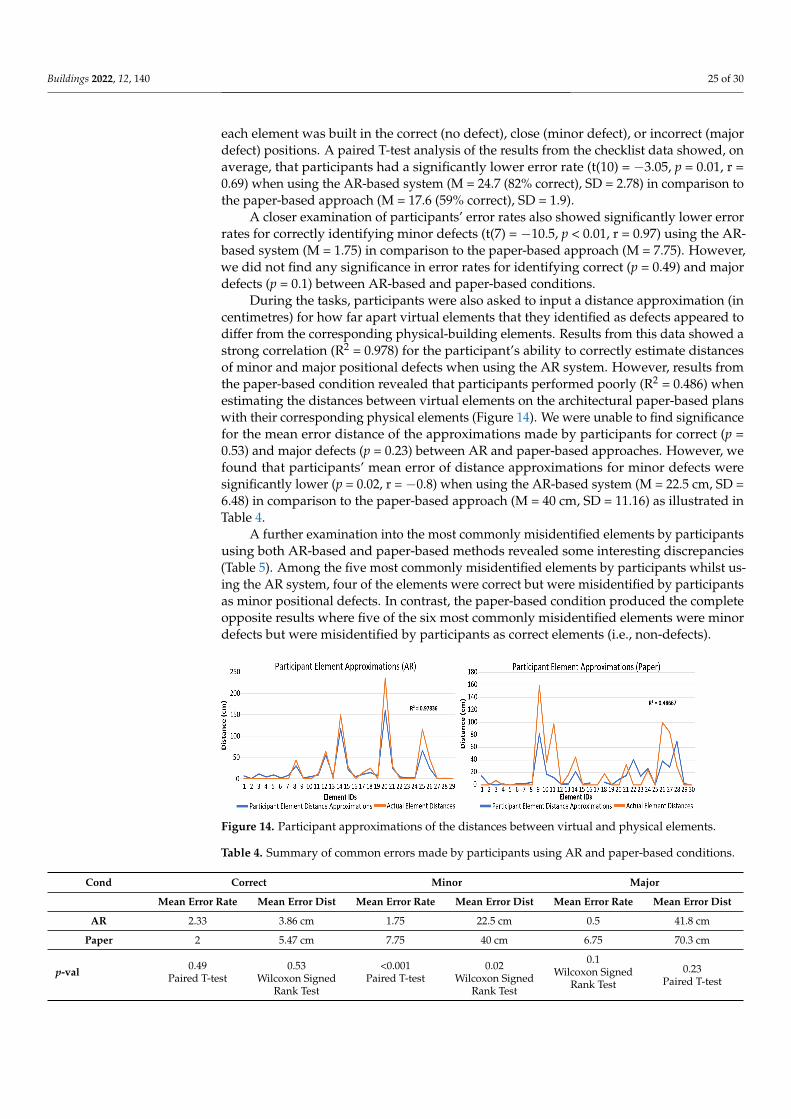
Buildings 2022, 12, 140 25 of 30
each element was built in the correct (no defect), close (minor defect), or incorrect (majordefect) positions. A paired T-test analysis of the results from the checklist data showed, onaverage, that participants had a significantly lower error rate (t(10) = −3.05, p = 0.01, r =0.69) when using the AR-based system (M = 24.7 (82% correct), SD = 2.78) in comparison tothe paper-based approach (M = 17.6 (59% correct), SD = 1.9).
A closer examination of participants’ error rates also showed significantly lower errorrates for correctly identifying minor defects (t(7) = −10.5, p < 0.01, r = 0.97) using the AR-based system (M = 1.75) in comparison to the paper-based approach (M = 7.75). However,we did not find any significance in error rates for identifying correct (p = 0.49) and majordefects (p = 0.1) between AR-based and paper-based conditions.
During the tasks, participants were also asked to input a distance approximation (incentimetres) for how far apart virtual elements that they identified as defects appeared todiffer from the corresponding physical-building elements. Results from this data showed astrong correlation (R2 = 0.978) for the participant’s ability to correctly estimate distancesof minor and major positional defects when using the AR system. However, results fromthe paper-based condition revealed that participants performed poorly (R2 = 0.486) whenestimating the distances between virtual elements on the architectural paper-based planswith their corresponding physical elements (Figure 14). We were unable to find significancefor the mean error distance of the approximations made by participants for correct (p =0.53) and major defects (p = 0.23) between AR and paper-based approaches. However, wefound that participants’ mean error of distance approximations for minor defects weresignificantly lower (p = 0.02, r = −0.8) when using the AR-based system (M = 22.5 cm, SD =6.48) in comparison to the paper-based approach (M = 40 cm, SD = 11.16) as illustrated inTable 4.
A further examination into the most commonly misidentified elements by participantsusing both AR-based and paper-based methods revealed some interesting discrepancies(Table 5). Among the five most commonly misidentified elements by participants whilst us-ing the AR system, four of the elements were correct but were misidentified by participantsas minor positional defects. In contrast, the paper-based condition produced the completeopposite results where five of the six most commonly misidentified elements were minordefects but were misidentified by participants as correct elements (i.e., non-defects).
Figure 14. Participant approximations of the distances between virtual and physical elements.
Table 4. Summary of common errors made by participants using AR and paper-based conditions.
Cond Correct Minor Major
Mean Error Rate Mean Error Dist Mean Error Rate Mean Error Dist Mean Error Rate Mean Error Dist
AR 2.33 3.86 cm 1.75 22.5 cm 0.5 41.8 cm
Paper 2 5.47 cm 7.75 40 cm 6.75 70.3 cm
p-val 0.49Paired T-test
0.53Wilcoxon Signed
Rank Test
<0.001Paired T-test
0.02Wilcoxon Signed
Rank Test
0.1Wilcoxon Signed
Rank Test0.23
Paired T-test
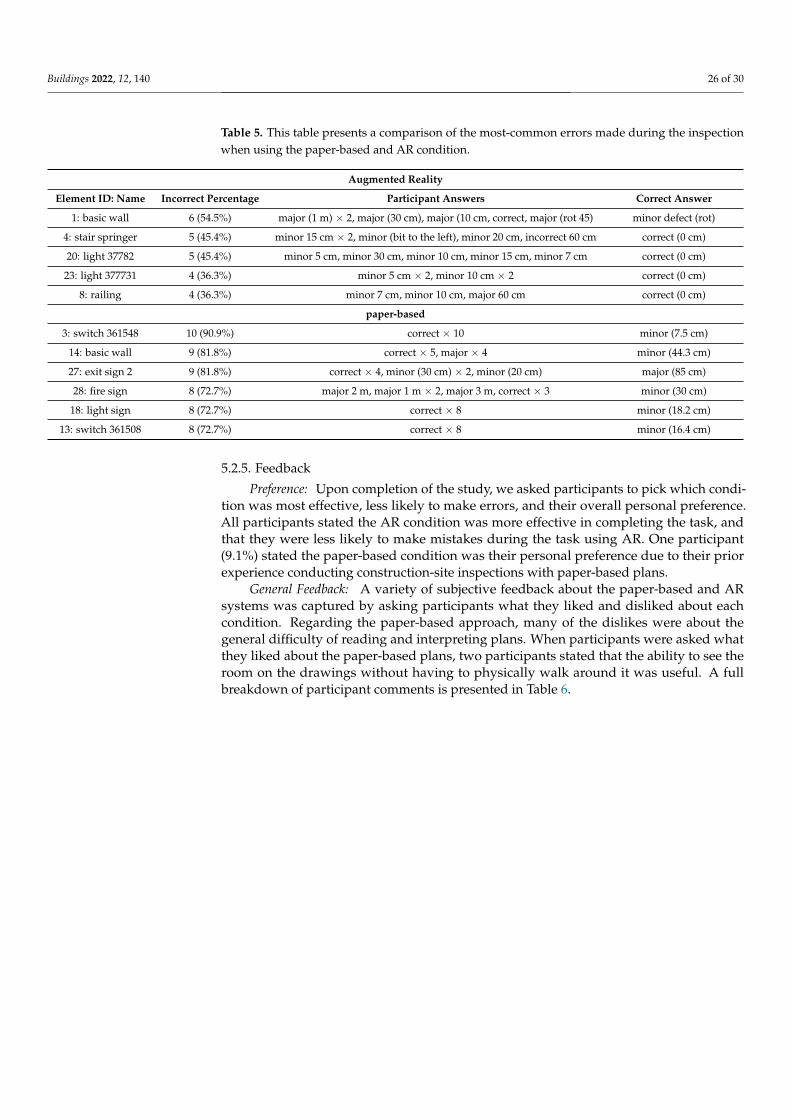
Buildings 2022, 12, 140 26 of 30
Table 5. This table presents a comparison of the most-common errors made during the inspectionwhen using the paper-based and AR condition.
Augmented Reality
Element ID: Name Incorrect Percentage Participant Answers Correct Answer
1: basic wall 6 (54.5%) major (1 m) × 2, major (30 cm), major (10 cm, correct, major (rot 45) minor defect (rot)
4: stair springer 5 (45.4%) minor 15 cm × 2, minor (bit to the left), minor 20 cm, incorrect 60 cm correct (0 cm)
20: light 37782 5 (45.4%) minor 5 cm, minor 30 cm, minor 10 cm, minor 15 cm, minor 7 cm correct (0 cm)
23: light 377731 4 (36.3%) minor 5 cm × 2, minor 10 cm × 2 correct (0 cm)
8: railing 4 (36.3%) minor 7 cm, minor 10 cm, major 60 cm correct (0 cm)
paper-based
3: switch 361548 10 (90.9%) correct × 10 minor (7.5 cm)
14: basic wall 9 (81.8%) correct × 5, major × 4 minor (44.3 cm)
27: exit sign 2 9 (81.8%) correct × 4, minor (30 cm) × 2, minor (20 cm) major (85 cm)
28: fire sign 8 (72.7%) major 2 m, major 1 m × 2, major 3 m, correct × 3 minor (30 cm)
18: light sign 8 (72.7%) correct × 8 minor (18.2 cm)
13: switch 361508 8 (72.7%) correct × 8 minor (16.4 cm)
5.2.5. Feedback
Preference: Upon completion of the study, we asked participants to pick which condi-tion was most effective, less likely to make errors, and their overall personal preference.All participants stated the AR condition was more effective in completing the task, andthat they were less likely to make mistakes during the task using AR. One participant(9.1%) stated the paper-based condition was their personal preference due to their priorexperience conducting construction-site inspections with paper-based plans.
General Feedback: A variety of subjective feedback about the paper-based and ARsystems was captured by asking participants what they liked and disliked about eachcondition. Regarding the paper-based approach, many of the dislikes were about thegeneral difficulty of reading and interpreting plans. When participants were asked whatthey liked about the paper-based plans, two participants stated that the ability to see theroom on the drawings without having to physically walk around it was useful. A fullbreakdown of participant comments is presented in Table 6.
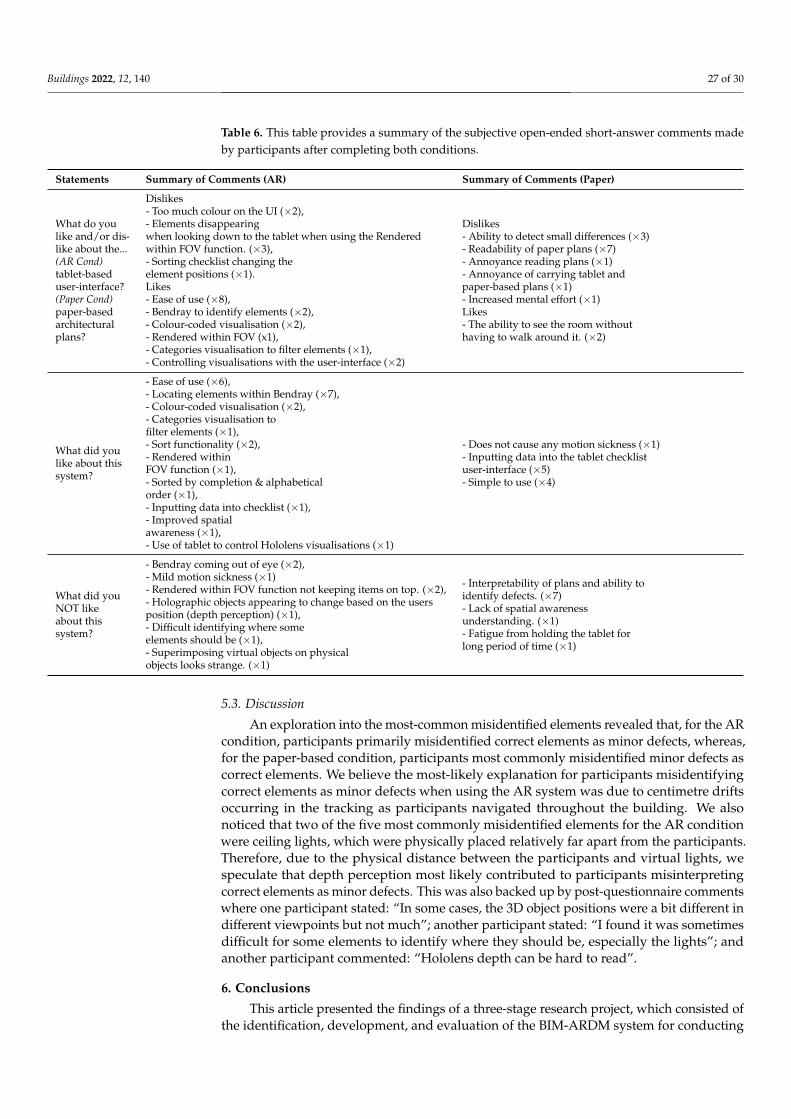
Buildings 2022, 12, 140 27 of 30
Table 6. This table provides a summary of the subjective open-ended short-answer comments madeby participants after completing both conditions.
Statements Summary of Comments (AR) Summary of Comments (Paper)
What do youlike and/or dis-like about the...(AR Cond)tablet-baseduser-interface?(Paper Cond)paper-basedarchitecturalplans?
Dislikes- Too much colour on the UI (×2),- Elements disappearingwhen looking down to the tablet when using the Renderedwithin FOV function. (×3),- Sorting checklist changing theelement positions (×1).Likes- Ease of use (×8),- Bendray to identify elements (×2),- Colour-coded visualisation (×2),- Rendered within FOV (x1),- Categories visualisation to filter elements (×1),- Controlling visualisations with the user-interface (×2)
Dislikes- Ability to detect small differences (×3)- Readability of paper plans (×7)- Annoyance reading plans (×1)- Annoyance of carrying tablet andpaper-based plans (×1)- Increased mental effort (×1)Likes- The ability to see the room withouthaving to walk around it. (×2)
What did youlike about thissystem?
- Ease of use (×6),- Locating elements within Bendray (×7),- Colour-coded visualisation (×2),- Categories visualisation tofilter elements (×1),- Sort functionality (×2),- Rendered withinFOV function (×1),- Sorted by completion & alphabeticalorder (×1),- Inputting data into checklist (×1),- Improved spatialawareness (×1),- Use of tablet to control Hololens visualisations (×1)
- Does not cause any motion sickness (×1)- Inputting data into the tablet checklistuser-interface (×5)- Simple to use (×4)
What did youNOT likeabout thissystem?
- Bendray coming out of eye (×2),- Mild motion sickness (×1)- Rendered within FOV function not keeping items on top. (×2),- Holographic objects appearing to change based on the usersposition (depth perception) (×1),- Difficult identifying where someelements should be (×1),- Superimposing virtual objects on physicalobjects looks strange. (×1)
- Interpretability of plans and ability toidentify defects. (×7)- Lack of spatial awarenessunderstanding. (×1)- Fatigue from holding the tablet forlong period of time (×1)
5.3. Discussion
An exploration into the most-common misidentified elements revealed that, for the ARcondition, participants primarily misidentified correct elements as minor defects, whereas,for the paper-based condition, participants most commonly misidentified minor defects ascorrect elements. We believe the most-likely explanation for participants misidentifyingcorrect elements as minor defects when using the AR system was due to centimetre driftsoccurring in the tracking as participants navigated throughout the building. We alsonoticed that two of the five most commonly misidentified elements for the AR conditionwere ceiling lights, which were physically placed relatively far apart from the participants.Therefore, due to the physical distance between the participants and virtual lights, wespeculate that depth perception most likely contributed to participants misinterpretingcorrect elements as minor defects. This was also backed up by post-questionnaire commentswhere one participant stated: “In some cases, the 3D object positions were a bit different indifferent viewpoints but not much”; another participant stated: “I found it was sometimesdifficult for some elements to identify where they should be, especially the lights”; andanother participant commented: “Hololens depth can be hard to read”.
6. Conclusions
This article presented the findings of a three-stage research project, which consisted ofthe identification, development, and evaluation of the BIM-ARDM system for conducting
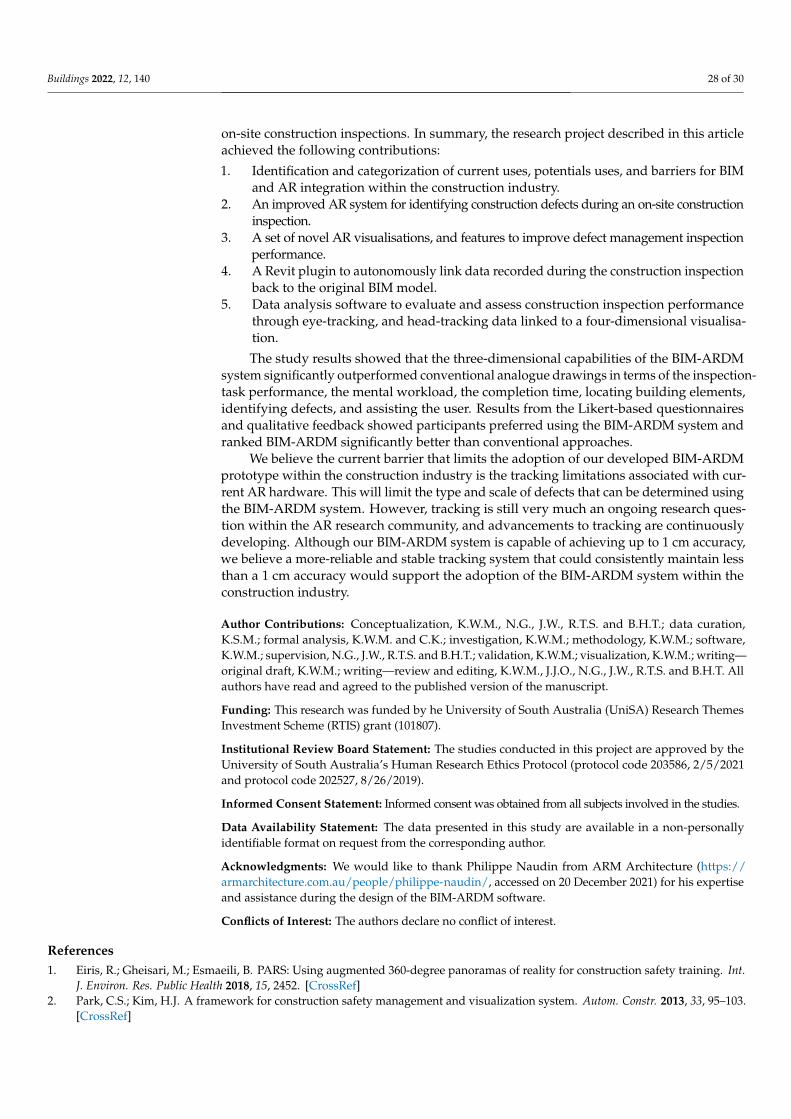
Buildings 2022, 12, 140 28 of 30
on-site construction inspections. In summary, the research project described in this articleachieved the following contributions:
1. Identification and categorization of current uses, potentials uses, and barriers for BIMand AR integration within the construction industry.
2. An improved AR system for identifying construction defects during an on-site constructioninspection.
3. A set of novel AR visualisations, and features to improve defect management inspectionperformance.
4. A Revit plugin to autonomously link data recorded during the construction inspectionback to the original BIM model.
5. Data analysis software to evaluate and assess construction inspection performancethrough eye-tracking, and head-tracking data linked to a four-dimensional visualisa-tion.
The study results showed that the three-dimensional capabilities of the BIM-ARDMsystem significantly outperformed conventional analogue drawings in terms of the inspection-task performance, the mental workload, the completion time, locating building elements,identifying defects, and assisting the user. Results from the Likert-based questionnairesand qualitative feedback showed participants preferred using the BIM-ARDM system andranked BIM-ARDM significantly better than conventional approaches.
We believe the current barrier that limits the adoption of our developed BIM-ARDMprototype within the construction industry is the tracking limitations associated with cur-rent AR hardware. This will limit the type and scale of defects that can be determined usingthe BIM-ARDM system. However, tracking is still very much an ongoing research ques-tion within the AR research community, and advancements to tracking are continuouslydeveloping. Although our BIM-ARDM system is capable of achieving up to 1 cm accuracy,we believe a more-reliable and stable tracking system that could consistently maintain lessthan a 1 cm accuracy would support the adoption of the BIM-ARDM system within theconstruction industry.
Author Contributions: Conceptualization, K.W.M., N.G., J.W., R.T.S. and B.H.T.; data curation,K.S.M.; formal analysis, K.W.M. and C.K.; investigation, K.W.M.; methodology, K.W.M.; software,K.W.M.; supervision, N.G., J.W., R.T.S. and B.H.T.; validation, K.W.M.; visualization, K.W.M.; writing—original draft, K.W.M.; writing—review and editing, K.W.M., J.J.O., N.G., J.W., R.T.S. and B.H.T. Allauthors have read and agreed to the published version of the manuscript.
Funding: This research was funded by he University of South Australia (UniSA) Research ThemesInvestment Scheme (RTIS) grant (101807).
Institutional Review Board Statement: The studies conducted in this project are approved by theUniversity of South Australia’s Human Research Ethics Protocol (protocol code 203586, 2/5/2021and protocol code 202527, 8/26/2019).
Informed Consent Statement: Informed consent was obtained from all subjects involved in the studies.
Data Availability Statement: The data presented in this study are available in a non-personallyidentifiable format on request from the corresponding author.
Acknowledgments: We would like to thank Philippe Naudin from ARM Architecture (https://armarchitecture.com.au/people/philippe-naudin/, accessed on 20 December 2021) for his expertiseand assistance during the design of the BIM-ARDM software.
Conflicts of Interest: The authors declare no conflict of interest.
References1. Eiris, R.; Gheisari, M.; Esmaeili, B. PARS: Using augmented 360-degree panoramas of reality for construction safety training. Int.
J. Environ. Res. Public Health 2018, 15, 2452. [CrossRef]2. Park, C.S.; Kim, H.J. A framework for construction safety management and visualization system. Autom. Constr. 2013, 33, 95–103.
[CrossRef]
Buildings 2022, 12, 140 29 of 30
3. Albert, A.; Hallowell, M.R.; Kleiner, B.; Chen, A.; Golparvar-Fard, M. Enhancing construction hazard recognition with high-fidelityaugmented virtuality. J. Constr. Eng. Manag. 2014, 140, 04014024. [CrossRef]
4. Kim, K.; Kim, H.; Kim, H. Image-based construction hazard avoidance system using augmented reality in wearable device.Autom. Constr. 2017, 83, 390–403. [CrossRef]
5. Carrasco, M.D.O.; Chen, P.H. Application of mixed reality for improving architectural design comprehension effectiveness.Autom. Constr. 2021, 126, 103677. [CrossRef]
6. Ahn, K.; Ko, D.S.; Gim, S.H. A study on the architecture of mixed reality application for architectural design collaboration. InProceedings of the International Conference on Applied Computing and Information Technology ; Springer: Berlin/Heidelberg, Germany,2018; pp. 48–61. [CrossRef]
7. Walsh, J.A.; Baumeister, J.; Thomas, B.H. Spatial Augmented Reality Visibility and Line-of-Sight Cues for Building Design. InProceedings of the 27th ACM Symposium on Virtual Reality Software and Technology, Osaka, Japan, 8–10 December 2021;Association for Computing Machinery: New York, NY, USA, 2021. [CrossRef]
8. El Ammari, K.; Hammad, A. Remote interactive collaboration in facilities management using BIM-based mixed reality. Autom.Constr. 2019, 107, 102940. [CrossRef]
9. Ammari, K.E.; Hammad, A. Collaborative BIM-based markerless mixed reality framework for facilities maintenance. InProceedings of the 2014 International Conference on Computing in Civil and Buidling Engineering, Orlando, FL, USA, 23–25June 2014; pp. 657–664. [CrossRef]
10. Messadi, T.; Newman, W.E.; Braham, A.; Nutter, D. Immersive learning for sustainable building design and construction practices.J. Civ. Eng. Archit 2017, 11, 841–852. [CrossRef]
11. Osello, A.; Del Giudice, M.; Guinea, A.M.; Rapetti, N.; Ronzino, A.; Ugliotti, F.; Migliarino, L. Augmented Reality andgamification approach within the DIMMER Project. In Proceedings of the INTED2015 9th International Technology, Educationand Development Conference, Madrid, Spain, 2–4 March 2015; pp. 2707–2714.
12. Fukuda, T.; Yokoi, K.; Yabuki, N.; Motamedi, A. An indoor thermal environment design system for renovation using augmentedreality. J. Comput. Des. Eng. 2019, 6, 179–188. [CrossRef]
13. May, K.W.; Walsh, J.; Smith, R.T.; Gu, N.; Thomas, B.H. VRGlare: A Virtual Reality Lighting Performance Simulator for real-timeThree-Dimensional Glare Simulation and Analysis. ISARC. In Proceedings of the International Symposium on Automation andRobotics in Construction, Kitakyushu, Japan, 26–30 October 2020; Volume 37, pp. 32–39. [CrossRef]
14. Ma, Z.; Cai, S.; Mao, N.; Yang, Q.; Feng, J.; Wang, P. Construction quality management based on a collaborative system using BIMand indoor positioning. Autom. Constr. 2018, 92, 35–45. [CrossRef]
15. Shin, D.H.; Dunston, P.S. Identification of application areas for Augmented Reality in industrial construction based on technologysuitability. Autom. Constr. 2008, 17, 882–894. [CrossRef]
16. Shin, D.H.; Dunston, P.S. Evaluation of Augmented Reality in steel column inspection. Autom. Constr. 2009, 18, 118–129.[CrossRef]
17. Hart, S.G.; Staveland, L.E. Development of NASA-TLX (Task Load Index): Results of Empirical and Theoretical Research. InHuman Mental Workload; Hancock, P.A., Meshkati, N., Eds.; Advances in Psychology; Elsevier: Amsterdam, The Netherlands,1988; Volume 52, pp. 139–183. [CrossRef]
18. Portalés, C.; Casas, S.; Gimeno, J.; Fernández, M.; Poza, M. From the paper to the tablet: on the design of an AR-based tool for theinspection of pre-fab buildings. Preliminary results of the SIRAE project. Sensors 2018, 18, 1262. [CrossRef]
19. García-Pereira, I.; Portalés, C.; Gimeno, J.; Casas, S. A collaborative augmented reality annotation tool for the inspection ofprefabricated buildings. Multimed. Tools Appl. 2019, 79, 6483–6501. [CrossRef]
20. Brooke, J. “SUS-A Quick and Dirty Usability Scale”. Usability Evaluation in Industry; CRC Press: Boca Raton, FL, USA, 1996.ISBN 9780748404605.
21. Feng, C.W.; Chen, C.W. Using bim and Mr to improve the process of job site construction and inspection. Wit Trans. Built Environ.2019, 192, 21–32. [CrossRef]
22. Park, C.S.; Lee, D.Y.; Kwon, O.S.; Wang, X. A framework for proactive construction defect management using BIM, augmentedreality and ontology-based data collection template. Autom. Constr. 2013, 33, 61–71. [CrossRef]
23. Kwon, O.S.; Park, C.S.; Lim, C.R. A defect management system for reinforced concrete work utilizing BIM, image-matching andaugmented reality. Autom. Constr. 2014, 46, 74–81. [CrossRef]
24. Zhou, Y.; Luo, H.; Yang, Y. Implementation of augmented reality for segment displacement inspection during tunnelingconstruction. Autom. Constr. 2017, 82, 112–121. [CrossRef]
25. Hernández, J.L.; Martín Lerones, P.; Bonsma, P.; Van Delft, A.; Deighton, R.; Braun, J.D. An IFC interoperability framework forself-inspection process in buildings. Buildings 2018, 8, 32. [CrossRef]
26. Available online: https://technical.buildingsmart.org/standards/ifc/ (accessed on 20 December 2021).27. Available online: https://www.tridify.com/ (accessed on 20 December 2021).28. Available online: https://github.com/helpsterTee/Unity-IFCEngine (accessed on 20 December 2021).29. Available online: https://www.pixyz-software.com/ (accessed on 20 December 2021).30. Marchand, E.; Uchiyama, H.; Spindler, F. Pose estimation for augmented reality: A hands-on survey. IEEE Trans. Vis. Comput.
Graph. 2015, 22, 2633–2651. [CrossRef]
Buildings 2022, 12, 140 30 of 30
31. Wagner, D.; Langlotz, T.; Schmalstieg, D. Robust and unobtrusive marker tracking on mobile phones. In Proceedings of the2008 7th IEEE/ACM International Symposium on Mixed and Augmented Reality, Washington, DC, USA, 15–18 September 2008;pp. 121–124. [CrossRef]
32. Comport, A.I.; Marchand, E.; Pressigout, M.; Chaumette, F. Real-time markerless tracking for augmented reality: The virtualvisual servoing framework. IEEE Trans. Vis. Comput. Graph. 2006, 12, 615–628. [CrossRef]
33. Simon, G.; Fitzgibbon, A.W.; Zisserman, A. Markerless tracking using planar structures in the scene. In Proceedings of theIEEE and ACM International Symposium on Augmented Reality (ISAR 2000), Munich, Germany, 5–6 October 2000; pp. 120–128.[CrossRef]
34. Xiao, C.; Lifeng, Z. Implementation of mobile augmented reality based on Vuforia and Rawajali. In Proceedings of the 2014IEEE 5th International Conference on Software Engineering and Service Science, Beijing, China, 27–29 June 2014; pp. 912–915.[CrossRef]
35. Kato, H.; Billinghurst, M. Marker tracking and hmd calibration for a video-based augmented reality conferencing system. InProceedings of the 2nd IEEE and ACM International Workshop on Augmented Reality (IWAR’99), San Francisco, CA, USA, 20–21October 1999; pp. 85–94. [CrossRef]
36. Kopsida, M.; Brilakis, I. BIM Registration Methods for Mobile Augmented Reality-Based Inspection. In Proceedings of 11thEuropean Conference on Product and Process Modelling eWork and eBusiness in Architecture, Engineering and Construction,(ECPPM 2016), Limassol, Cyprus, 7–9 September 2016; Christodoulou, S., Scherer, R., Eds.; CRC Press: Boca Raton, FL, USA, 2016.[CrossRef]
37. Hübner, P.; Clintworth, K.; Liu, Q.; Weinmann, M.; Wursthorn, S. Evaluation of HoloLens Tracking and Depth Sensing for IndoorMapping Applications. Sensors 2020, 20, 1021. [CrossRef]
38. Krippendorff, K. Content Analysis: An Introduction to Its Methodology, 2nd ed.; Sage Publications: Thousand Oaks, CA, USA, 2004.39. Rankohi, S.; Waugh, L. Review and analysis of augmented reality literature for construction industry. Vis. Eng. 2013, 1, 1–18.
[CrossRef]40. Ahmed, S. A review on using opportunities of augmented reality and virtual reality in construction project management. Organ.
Technol. Manag. Constr. Int. J. 2018, 10, 1839–1852. [CrossRef]41. Alizadehsalehi, S.; Hadavi, A.; Huang, J.C. From BIM to extended reality in AEC industry. Autom. Constr. 2020, 116, 103254.
[CrossRef]42. Hakkarainen, M.; Woodward, C.; Rainio, K. Software architecture for mobile mixed reality and 4D BIM interaction. In
Proceedings of CIB-W78 25th International Conference on Information Technology in Construction, Santiago, Chile, 15–17 July2008, Rischmoller, L., Eds; Universidad de Talca: Talca, Chile, 2009; pp. 1–8.
43. Gheisari, M.; Goodman, S.; Schmidt, J.; Williams, G.; Irizarry, J. Exploring BIM and mobile augmented reality use in facilitiesmanagement. In Proceedings of the 2014 Construction Research Congress: Construction in a Global Network, Atlanta, GA, USA,19–21 May 2014; Castro-Lacouture, D., Irizarry, J., Ashuri, B., Eds.; American Society of Civil Engineers: Reston, VA, USA, 2014;pp. 1941–1950. [CrossRef]
44. May, K.; Hanan, I.; Cunningham, A.; Thomas, B. 3DUITK: An Opensource Toolkit for Thirty Years of Three-DimensionalInteraction Research. In Proceedings of the 2019 IEEE International Symposium on Mixed and Augmented Reality Adjunct(ISMAR-Adjunct) Beijing, China, 10–18 October 2019; pp. 175–180. [CrossRef]
45. Riege, K.; Holtkamper, T.; Wesche, G.; Frohlich, B. The bent pick ray: An extended pointing technique for multi-user interaction.In Proceedings of IEEE Symposium on 3D User Interfaces (3DUI), Alexandria, VA, USA, 25–26 March 2006; pp. 62–65. [CrossRef]
46. Paas, F. Training Strategies for Attaining Transfer of Problem-Solving Skill in Statistics: A Cognitive-Load Approach. J. Educ.Psychol. 1992, 84, 429–434. [CrossRef]